UNITED STATES
SECURITIES AND EXCHANGE COMMISSION
Washington, D.C. 20549
FORM N-CSR
CERTIFIED SHAREHOLDER REPORT OF
REGISTERED MANAGEMENT INVESTMENT COMPANIES
Investment Company Act file number 811-04777
MFS SERIES TRUST I
(Exact name of registrant as specified in charter)
111 Huntington Avenue, Boston, Massachusetts 02199
(Address of principal executive offices) (Zip code)
Christopher R. Bohane
Massachusetts Financial Services Company
111 Huntington Avenue
Boston, Massachusetts 02199
(Name and address of agents for service)
Registrant’s telephone number, including area code: (617) 954-5000
Date of fiscal year end: August 31
Date of reporting period: February 28, 2022
| ITEM 1. | REPORTS TO STOCKHOLDERS. |
1(a):


| 1 | |
| 2 | |
| 3 | |
| 5 | |
| 14 | |
| 16 | |
| 17 | |
| 18 | |
| 27 | |
| 38 | |
| 38 | |
| 38 | |
| 38 | |
| 38 |
| back cover |


| Apple, Inc. | 6.4% |
| Microsoft Corp. | 6.0% |
| Alphabet, Inc., “A” | 4.6% |
| Amazon.com, Inc. | 3.6% |
| Visa, Inc., “A” | 1.6% |
| JPMorgan Chase & Co. | 1.5% |
| Johnson & Johnson | 1.4% |
| Chevron Corp. | 1.3% |
| Merck & Co., Inc. | 1.2% |
| Truist Financial Corp. | 1.2% |
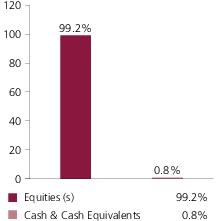
| Technology | 31.8% |
| Financial Services | 14.6% |
| Health Care (s) | 14.3% |
| Capital Goods | 13.4% |
| Consumer Cyclicals | 12.2% |
| Energy | 6.2% |
| Consumer Staples | 4.4% |
| Telecommunications/Cable Television (s) | 2.3% |
| (k) | The sectors set forth above and the associated portfolio composition are based on MFS’ own custom sector classification methodology. |
| (s) | Includes securities sold short. |
September 1, 2021 through February 28, 2022
| Share Class | Annualized Expense Ratio | Beginning Account Value 9/01/21 | Ending Account Value 2/28/22 | Expenses Paid During Period (p) 9/01/21-2/28/22 | |
| A | Actual | 0.90% | $1,000.00 | $953.31 | $4.36 |
| Hypothetical (h) | 0.90% | $1,000.00 | $1,020.33 | $4.51 | |
| B | Actual | 1.65% | $1,000.00 | $949.85 | $7.98 |
| Hypothetical (h) | 1.65% | $1,000.00 | $1,016.61 | $8.25 | |
| C | Actual | 1.65% | $1,000.00 | $949.78 | $7.98 |
| Hypothetical (h) | 1.65% | $1,000.00 | $1,016.61 | $8.25 | |
| I | Actual | 0.65% | $1,000.00 | $954.34 | $3.15 |
| Hypothetical (h) | 0.65% | $1,000.00 | $1,021.57 | $3.26 | |
| R1 | Actual | 1.65% | $1,000.00 | $949.86 | $7.98 |
| Hypothetical (h) | 1.65% | $1,000.00 | $1,016.61 | $8.25 | |
| R2 | Actual | 1.13% | $1,000.00 | $952.17 | $5.47 |
| Hypothetical (h) | 1.13% | $1,000.00 | $1,019.19 | $5.66 | |
| R3 | Actual | 0.90% | $1,000.00 | $953.35 | $4.36 |
| Hypothetical (h) | 0.90% | $1,000.00 | $1,020.33 | $4.51 | |
| R4 | Actual | 0.65% | $1,000.00 | $954.51 | $3.15 |
| Hypothetical (h) | 0.65% | $1,000.00 | $1,021.57 | $3.26 | |
| R6 | Actual | 0.57% | $1,000.00 | $954.88 | $2.76 |
| Hypothetical (h) | 0.57% | $1,000.00 | $1,021.97 | $2.86 |
| (h) | 5% class return per year before expenses. |
| (p) | “Expenses Paid During Period” are equal to each class’s annualized expense ratio, as shown above, multiplied by the average account value over the period, multiplied by 181/365 (to reflect the one-half year period). Expenses paid do not include any applicable sales charges (loads). If these transaction costs had been included, your costs would have been higher. |
| Issuer | Shares/Par | Value ($) | ||
| Common Stocks – 99.6% | ||||
| Aerospace & Defense – 2.7% | ||||
| CACI International, Inc., “A” (a) | 22,725 | $ 6,358,228 | ||
| Curtiss-Wright Corp. | 77,440 | 11,423,949 | ||
| General Dynamics Corp. | 43,983 | 10,311,814 | ||
| Honeywell International, Inc. | 193,994 | 36,810,362 | ||
| Howmet Aerospace, Inc. | 524,938 | 18,855,773 | ||
| L3Harris Technologies, Inc. | 33,840 | 8,538,170 | ||
| Leidos Holdings, Inc. | 69,162 | 7,043,458 | ||
| Northrop Grumman Corp. | 35,310 | 15,611,963 | ||
| Parsons Corp. (a) | 145,721 | 5,050,690 | ||
| Raytheon Technologies Corp. | 413,911 | 42,508,660 | ||
| $162,513,067 | ||||
| Alcoholic Beverages – 0.3% | ||||
| Constellation Brands, Inc., “A” | 72,137 | $ 15,554,180 | ||
| Apparel Manufacturers – 0.5% | ||||
| NIKE, Inc., “B” | 121,113 | $ 16,537,980 | ||
| Skechers USA, Inc., “A” (a) | 256,707 | 11,803,388 | ||
| $28,341,368 | ||||
| Automotive – 1.1% | ||||
| Aptiv PLC (a) | 153,348 | $ 19,849,365 | ||
| LKQ Corp. | 760,021 | 35,682,986 | ||
| Magna International, Inc. | 142,834 | 10,608,281 | ||
| $66,140,632 | ||||
| Biotechnology – 1.3% | ||||
| Adaptive Biotechnologies Corp. (a) | 287,090 | $ 4,142,709 | ||
| Biogen, Inc. (a) | 72,527 | 15,303,922 | ||
| Illumina, Inc. (a) | 33,182 | 10,837,241 | ||
| Oxford Nanopore Technologies PLC (a) | 377,802 | 2,328,845 | ||
| Vertex Pharmaceuticals, Inc. (a) | 208,266 | 47,905,345 | ||
| $80,518,062 | ||||
| Broadcasting – 1.4% | ||||
| Discovery Communications, Inc., “C” (a) | 930,399 | $ 26,023,260 | ||
| Walt Disney Co. (a) | 399,042 | 59,241,775 | ||
| $85,265,035 | ||||
| Issuer | Shares/Par | Value ($) | ||
| Common Stocks – continued | ||||
| Brokerage & Asset Managers – 2.0% | ||||
| Charles Schwab Corp. | 408,611 | $ 34,511,285 | ||
| CME Group, Inc. | 111,410 | 26,351,807 | ||
| Invesco Ltd. | 556,407 | 11,818,085 | ||
| KKR & Co., Inc. | 199,517 | 11,994,962 | ||
| Raymond James Financial, Inc. | 303,554 | 33,284,696 | ||
| $117,960,835 | ||||
| Business Services – 3.4% | ||||
| Accenture PLC, “A” | 125,752 | $ 39,740,147 | ||
| Amdocs Ltd. | 181,699 | 14,299,711 | ||
| Clarivate PLC (a) | 1,753,462 | 26,266,861 | ||
| Cognizant Technology Solutions Corp., “A” | 308,109 | 26,537,428 | ||
| Fidelity National Information Services, Inc. | 209,505 | 19,951,161 | ||
| Fiserv, Inc. (a) | 219,380 | 21,426,845 | ||
| Global Payments, Inc. | 131,789 | 17,578,017 | ||
| PayPal Holdings, Inc. (a) | 201,704 | 22,576,729 | ||
| Thoughtworks Holding, Inc. (a) | 640,035 | 14,631,200 | ||
| $203,008,099 | ||||
| Cable TV – 0.1% | ||||
| Cable One, Inc. | 3,127 | $ 4,480,522 | ||
| Chemicals – 0.5% | ||||
| Element Solutions, Inc. | 848,097 | $ 20,846,224 | ||
| FMC Corp. | 77,378 | 9,072,571 | ||
| $29,918,795 | ||||
| Computer Software – 10.0% | ||||
| Adobe Systems, Inc. (a) | 146,617 | $ 68,569,839 | ||
| Atlassian Corp. PLC, “A” (a) | 133,002 | 40,661,372 | ||
| Avalara, Inc. (a) | 120,926 | 12,565,421 | ||
| Black Knight, Inc. (a) | 158,797 | 8,922,803 | ||
| Cadence Design Systems, Inc. (a) | 312,245 | 47,283,260 | ||
| Microsoft Corp. (s) | 1,202,089 | 359,172,172 | ||
| Ping Identity Holding Corp. (a) | 280,979 | 5,911,798 | ||
| salesforce.com, inc. (a) | 275,789 | 58,061,858 | ||
| $601,148,523 | ||||
| Computer Software - Systems – 8.5% | ||||
| Apple, Inc. (s) | 2,329,216 | $ 384,600,146 | ||
| Block, Inc., “A” (a) | 118,357 | 15,090,517 | ||
| NICE Systems Ltd., ADR (a) | 88,607 | 20,047,334 | ||
| Rapid7, Inc. (a) | 166,060 | 17,180,568 | ||
| ServiceNow, Inc. (a) | 93,315 | 54,115,235 | ||
| Issuer | Shares/Par | Value ($) | ||
| Common Stocks – continued | ||||
| Computer Software - Systems – continued | ||||
| Zebra Technologies Corp., “A” (a) | 45,057 | $ 18,623,860 | ||
| $509,657,660 | ||||
| Construction – 1.4% | ||||
| AvalonBay Communities, Inc., REIT | 79,043 | $ 18,858,869 | ||
| AZEK Co., Inc. (a) | 482,841 | 14,238,981 | ||
| Masco Corp. | 340,740 | 19,095,070 | ||
| Otis Worldwide Corp. | 130,201 | 10,198,644 | ||
| Sherwin-Williams Co. | 31,535 | 8,297,805 | ||
| Vulcan Materials Co. | 90,803 | 16,476,204 | ||
| $87,165,573 | ||||
| Consumer Products – 1.3% | ||||
| Colgate-Palmolive Co. | 305,419 | $ 23,501,992 | ||
| International Flavors & Fragrances, Inc. | 70,522 | 9,379,426 | ||
| Kimberly-Clark Corp. | 144,048 | 18,747,847 | ||
| Procter & Gamble Co. | 183,871 | 28,663,650 | ||
| $80,292,915 | ||||
| Consumer Services – 0.7% | ||||
| Booking Holdings, Inc. (a) | 6,880 | $ 14,945,080 | ||
| Bright Horizons Family Solutions, Inc. (a) | 109,855 | 14,351,457 | ||
| Grand Canyon Education, Inc. (a) | 119,846 | 10,406,228 | ||
| $39,702,765 | ||||
| Containers – 0.2% | ||||
| Ball Corp. | 157,274 | $ 14,113,769 | ||
| Electrical Equipment – 1.3% | ||||
| AMETEK, Inc. | 53,533 | $ 6,948,048 | ||
| Amphenol Corp., “A” | 83,512 | 6,347,747 | ||
| Fortive Corp. | 86,042 | 5,571,220 | ||
| Johnson Controls International PLC | 357,158 | 23,200,984 | ||
| nVent Electric PLC | 175,351 | 5,949,659 | ||
| Sensata Technologies Holding PLC (a) | 446,511 | 25,857,452 | ||
| TE Connectivity Ltd. | 50,011 | 7,123,067 | ||
| $80,998,177 | ||||
| Electronics – 5.0% | ||||
| Advanced Micro Devices (a) | 339,799 | $ 41,910,809 | ||
| Analog Devices, Inc. | 153,753 | 24,645,068 | ||
| Applied Materials, Inc. | 306,376 | 41,115,659 | ||
| Broadcom, Inc. | 99,330 | 58,350,415 | ||
| Intel Corp. | 504,637 | 24,071,185 | ||
| Lam Research Corp. | 48,831 | 27,411,282 | ||
| Issuer | Shares/Par | Value ($) | ||
| Common Stocks – continued | ||||
| Electronics – continued | ||||
| Monolithic Power Systems, Inc. | 33,658 | $ 15,438,925 | ||
| NXP Semiconductors N.V. | 176,770 | 33,607,512 | ||
| Texas Instruments, Inc. | 207,813 | 35,326,132 | ||
| $301,876,987 | ||||
| Energy - Independent – 1.3% | ||||
| ConocoPhillips | 331,585 | $ 31,454,153 | ||
| Diamondback Energy, Inc. | 129,391 | 17,868,897 | ||
| Hess Corp. | 178,154 | 18,004,244 | ||
| Valero Energy Corp. | 155,757 | 13,007,267 | ||
| $80,334,561 | ||||
| Energy - Integrated – 1.3% | ||||
| Chevron Corp. | 534,925 | $ 77,029,200 | ||
| Energy - Renewables – 0.2% | ||||
| Generac Holdings, Inc. (a) | 33,521 | $ 10,574,870 | ||
| Engineering - Construction – 0.2% | ||||
| APi Group, Inc. (a) | 584,266 | $ 12,602,618 | ||
| Entertainment – 0.1% | ||||
| Vivid Seats, Inc., “A” | 366,149 | $ 4,276,620 | ||
| Food & Beverages – 2.4% | ||||
| Archer Daniels Midland Co. | 265,548 | $ 20,832,241 | ||
| Coca-Cola Co. | 161,250 | 10,036,200 | ||
| Coca-Cola Europacific Partners PLC | 153,293 | 7,850,135 | ||
| Hostess Brands, Inc. (a) | 198,799 | 4,282,130 | ||
| J.M. Smucker Co. | 66,285 | 8,931,904 | ||
| Mondelez International, Inc. | 568,907 | 37,252,030 | ||
| Oatly Group AB, ADR (a) | 760,634 | 5,134,279 | ||
| PepsiCo, Inc. | 300,461 | 49,197,484 | ||
| $143,516,403 | ||||
| Food & Drug Stores – 0.4% | ||||
| Wal-Mart Stores, Inc. | 197,270 | $ 26,663,013 | ||
| Forest & Paper Products – 0.4% | ||||
| Rayonier, Inc., REIT | 661,348 | $ 26,255,516 | ||
| Gaming & Lodging – 0.6% | ||||
| International Game Technology PLC | 452,315 | $ 13,849,885 | ||
| Las Vegas Sands Corp. (a) | 81,532 | 3,494,462 | ||
| Marriott International, Inc., “A” (a) | 95,905 | 16,317,277 | ||
| $33,661,624 | ||||
| Issuer | Shares/Par | Value ($) | ||
| Common Stocks – continued | ||||
| General Merchandise – 1.0% | ||||
| Dollar General Corp. | 165,475 | $ 32,820,312 | ||
| Dollar Tree, Inc. (a) | 211,280 | 30,018,662 | ||
| $62,838,974 | ||||
| Health Maintenance Organizations – 1.6% | ||||
| Cigna Corp. | 275,859 | $ 65,593,753 | ||
| Humana, Inc. | 75,067 | 32,603,099 | ||
| $98,196,852 | ||||
| Insurance – 3.4% | ||||
| Aon PLC | 222,489 | $ 64,997,937 | ||
| Arthur J. Gallagher & Co. | 213,264 | 33,736,232 | ||
| Chubb Ltd. | 184,508 | 37,573,209 | ||
| Hartford Financial Services Group, Inc. | 255,096 | 17,724,070 | ||
| MetLife, Inc. | 245,700 | 16,597,035 | ||
| Primerica, Inc. | 85,800 | 11,144,562 | ||
| Reinsurance Group of America, Inc. | 113,199 | 12,549,241 | ||
| Voya Financial, Inc. | 180,733 | 12,172,368 | ||
| $206,494,654 | ||||
| Internet – 4.6% | ||||
| Alphabet, Inc., “A” (a)(s) | 102,124 | $ 275,851,221 | ||
| Leisure & Toys – 0.7% | ||||
| Electronic Arts, Inc. | 261,925 | $ 34,073,824 | ||
| Roblox Corp., “A” (a) | 151,125 | 7,793,516 | ||
| $41,867,340 | ||||
| Machinery & Tools – 2.4% | ||||
| Eaton Corp. PLC | 231,594 | $ 35,732,638 | ||
| IDEX Corp. | 27,762 | 5,327,528 | ||
| Ingersoll Rand, Inc. | 443,870 | 22,424,312 | ||
| PACCAR, Inc. | 325,990 | 29,929,142 | ||
| Regal Rexnord Corp. | 100,669 | 16,142,274 | ||
| Roper Technologies, Inc. | 79,598 | 35,677,416 | ||
| $145,233,310 | ||||
| Major Banks – 3.2% | ||||
| JPMorgan Chase & Co. | 647,074 | $ 91,755,093 | ||
| Morgan Stanley | 475,437 | 43,141,154 | ||
| PNC Financial Services Group, Inc. | 294,588 | 58,696,659 | ||
| $193,592,906 | ||||
| Issuer | Shares/Par | Value ($) | ||
| Common Stocks – continued | ||||
| Medical & Health Technology & Services – 1.6% | ||||
| ICON PLC (a) | 105,848 | $ 25,192,883 | ||
| McKesson Corp. | 204,141 | 56,130,609 | ||
| Syneos Health, Inc. (a) | 205,862 | 16,304,270 | ||
| $97,627,762 | ||||
| Medical Equipment – 5.2% | ||||
| Align Technology, Inc. (a) | 20,307 | $ 10,386,218 | ||
| Becton, Dickinson and Co. | 205,631 | 55,783,578 | ||
| Boston Scientific Corp. (a)(s) | 1,200,013 | 53,004,574 | ||
| Envista Holdings Corp. (a) | 299,757 | 14,388,336 | ||
| Maravai Lifesciences Holdings, Inc., “A” (a) | 1,163,884 | 45,472,948 | ||
| Medtronic PLC | 482,896 | 50,699,251 | ||
| Quidel Corp. (a) | 135,786 | 14,364,801 | ||
| STERIS PLC | 112,270 | 26,944,800 | ||
| Thermo Fisher Scientific, Inc. | 81,302 | 44,228,288 | ||
| $315,272,794 | ||||
| Natural Gas - Pipeline – 0.4% | ||||
| Cheniere Energy, Inc. | 85,178 | $ 11,320,156 | ||
| Enterprise Products Partners LP | 442,898 | 10,815,569 | ||
| $22,135,725 | ||||
| Network & Telecom – 0.5% | ||||
| Equinix, Inc., REIT | 40,403 | $ 28,675,221 | ||
| Oil Services – 0.4% | ||||
| Cactus, Inc., “A” | 231,929 | $ 11,749,523 | ||
| Schlumberger Ltd. | 352,982 | 13,851,014 | ||
| $25,600,537 | ||||
| Other Banks & Diversified Financials – 4.7% | ||||
| Bank OZK | 197,553 | $ 9,288,942 | ||
| First Interstate BancSystem, Inc. | 388,520 | 15,773,912 | ||
| Moody's Corp. | 65,344 | 21,042,728 | ||
| Northern Trust Corp. | 140,769 | 16,033,589 | ||
| Signature Bank | 55,638 | 19,188,990 | ||
| SLM Corp. | 898,930 | 17,708,921 | ||
| Truist Financial Corp. | 1,145,348 | 71,263,552 | ||
| United Community Bank, Inc. | 391,504 | 15,135,545 | ||
| Visa, Inc., “A” | 443,857 | 95,926,375 | ||
| $281,362,554 | ||||
| Issuer | Shares/Par | Value ($) | ||
| Common Stocks – continued | ||||
| Pharmaceuticals – 4.7% | ||||
| Eli Lilly & Co. | 207,495 | $ 51,863,375 | ||
| Johnson & Johnson | 518,795 | 85,378,093 | ||
| Merck & Co., Inc. | 955,468 | 73,169,739 | ||
| Organon & Co. | 662,126 | 24,717,164 | ||
| Zoetis, Inc. | 255,603 | 49,497,521 | ||
| $284,625,892 | ||||
| Pollution Control – 0.3% | ||||
| GFL Environmental, Inc. | 677,469 | $ 19,815,968 | ||
| Printing & Publishing – 0.1% | ||||
| Warner Music Group Corp. | 150,623 | $ 5,455,565 | ||
| Railroad & Shipping – 1.2% | ||||
| Canadian Pacific Railway Ltd. | 675,114 | $ 47,447,012 | ||
| CSX Corp. | 785,789 | 26,646,105 | ||
| $74,093,117 | ||||
| Real Estate – 1.3% | ||||
| Broadstone Net Lease, Inc., REIT | 558,957 | $ 12,107,009 | ||
| Empire State Realty Trust, REIT, “A” | 1,388,076 | 13,131,199 | ||
| Extra Space Storage, Inc., REIT | 83,046 | 15,625,105 | ||
| Innovative Industrial Properties, Inc., REIT | 38,112 | 7,182,587 | ||
| STORE Capital Corp., REIT | 728,605 | 22,382,746 | ||
| Sun Communities, Inc., REIT | 41,315 | 7,478,015 | ||
| $77,906,661 | ||||
| Restaurants – 1.3% | ||||
| Starbucks Corp. | 574,549 | $ 52,737,853 | ||
| Wendy's Co. | 1,239,286 | 28,181,363 | ||
| $80,919,216 | ||||
| Specialty Chemicals – 1.5% | ||||
| Air Products & Chemicals, Inc. | 51,967 | $ 12,279,802 | ||
| Ashland Global Holdings, Inc. | 162,590 | 15,003,805 | ||
| Avient Corp. | 266,170 | 13,944,646 | ||
| Axalta Coating Systems Ltd. (a) | 472,035 | 12,763,826 | ||
| Chemours Co. | 158,308 | 4,369,301 | ||
| Diversey Holdings Ltd. (a) | 1,363,813 | 13,051,691 | ||
| DuPont de Nemours, Inc. | 225,591 | 17,453,976 | ||
| $88,867,047 | ||||
| Issuer | Shares/Par | Value ($) | ||
| Common Stocks – continued | ||||
| Specialty Stores – 5.4% | ||||
| Amazon.com, Inc. (a)(s) | 70,518 | $ 216,579,113 | ||
| Burlington Stores, Inc. (a) | 44,772 | 10,113,547 | ||
| Home Depot, Inc. | 224,468 | 70,893,728 | ||
| Ross Stores, Inc. | 308,735 | 28,215,292 | ||
| $325,801,680 | ||||
| Telecommunications - Wireless – 2.2% | ||||
| Liberty Broadband Corp. (a) | 232,593 | $ 34,121,393 | ||
| SBA Communications Corp., REIT | 118,871 | 36,064,273 | ||
| T-Mobile US, Inc. (a) | 515,772 | 63,548,268 | ||
| $133,733,934 | ||||
| Telephone Services – 0.2% | ||||
| Altice USA, Inc., “A” (a) | 833,304 | $ 9,632,994 | ||
| Tobacco – 0.5% | ||||
| Philip Morris International, Inc. | 276,316 | $ 27,927,258 | ||
| Utilities - Electric Power – 2.6% | ||||
| American Electric Power Co., Inc. | 132,209 | $ 11,984,746 | ||
| CenterPoint Energy, Inc. | 671,754 | 18,372,472 | ||
| Constellation Energy | 98,530 | 4,530,409 | ||
| Dominion Energy, Inc. | 108,444 | 8,624,551 | ||
| Duke Energy Corp. | 137,555 | 13,811,898 | ||
| Evergy, Inc. | 169,270 | 10,564,141 | ||
| Exelon Corp. | 295,590 | 12,580,310 | ||
| NextEra Energy, Inc. | 424,281 | 33,208,474 | ||
| PG&E Corp. (a) | 1,479,589 | 16,822,927 | ||
| Pinnacle West Capital Corp. | 29,798 | 2,110,592 | ||
| Southern Co. | 183,223 | 11,867,354 | ||
| Xcel Energy, Inc. | 188,157 | 12,668,611 | ||
| $157,146,485 | ||||
| Total Common Stocks (Identified Cost, $4,349,896,117) | $6,004,247,056 | |||
| Investment Companies (h) – 0.7% | ||||
| Money Market Funds – 0.7% | ||||
| MFS Institutional Money Market Portfolio, 0.06% (v) (Identified Cost, $43,675,433) | 43,675,881 | $ 43,675,881 | ||
| Securities Sold Short – (0.4)% | ||||
| Medical & Health Technology & Services – (0.3)% | ||||
| Healthcare Services Group, Inc. | (923,682) | $ (14,612,649) | ||
| Issuer | Shares/Par | Value ($) | ||
| Securities Sold Short – continued | ||||
| Telecommunications - Wireless – (0.1)% | ||||
| Crown Castle International Corp., REIT | (44,300) | $ (7,379,937) | ||
| Total Securities Sold Short (Proceeds Received, $29,571,636) | $ (21,992,586) | |||
| Other Assets, Less Liabilities – 0.1% | 6,284,937 | |||
| Net Assets – 100.0% | $6,032,215,288 | |||
| (a) | Non-income producing security. | |||
| (h) | An affiliated issuer, which may be considered one in which the fund owns 5% or more of the outstanding voting securities, or a company which is under common control. At period end, the aggregate values of the fund's investments in affiliated issuers and in unaffiliated issuers were $43,675,881 and $6,004,247,056, respectively. | |||
| (s) | Security or a portion of the security was pledged to cover collateral requirements for securities sold short. | |||
| (v) | Affiliated issuer that is available only to investment companies managed by MFS. The rate quoted for the MFS Institutional Money Market Portfolio is the annualized seven-day yield of the fund at period end. |
| The following abbreviations are used in this report and are defined: | |
| ADR | American Depositary Receipt |
| REIT | Real Estate Investment Trust |
| Assets | |
| Investments in unaffiliated issuers, at value (identified cost, $4,349,896,117) | $6,004,247,056 |
| Investments in affiliated issuers, at value (identified cost, $43,675,433) | 43,675,881 |
| Cash | 974,558 |
| Deposits with brokers for | |
| Securities sold short | 390,903 |
| Receivables for | |
| Fund shares sold | 11,894,520 |
| Dividends | 6,926,931 |
| Other assets | 77,685 |
| Total assets | $6,068,187,534 |
| Liabilities | |
| Payables for | |
| Dividends on securities sold short | $195,128 |
| Securities sold short, at value (proceeds received, $29,571,636) | 21,992,586 |
| Investments purchased | 974,558 |
| Fund shares reacquired | 11,347,418 |
| Payable to affiliates | |
| Investment adviser | 333,008 |
| Administrative services fee | 6,392 |
| Shareholder servicing costs | 881,894 |
| Distribution and service fees | 81,929 |
| Payable for independent Trustees' compensation | 17,315 |
| Accrued expenses and other liabilities | 142,018 |
| Total liabilities | $35,972,246 |
| Net assets | $6,032,215,288 |
| Net assets consist of | |
| Paid-in capital | $4,192,545,666 |
| Total distributable earnings (loss) | 1,839,669,622 |
| Net assets | $6,032,215,288 |
| Shares of beneficial interest outstanding | 133,110,029 |
| Net assets | Shares outstanding | Net asset value per share (a) | |
| Class A | $2,350,503,518 | 53,618,913 | $43.84 |
| Class B | 20,074,373 | 539,636 | 37.20 |
| Class C | 125,180,124 | 3,423,294 | 36.57 |
| Class I | 1,495,716,421 | 31,902,178 | 46.88 |
| Class R1 | 3,653,841 | 99,762 | 36.63 |
| Class R2 | 19,394,507 | 455,462 | 42.58 |
| Class R3 | 70,379,469 | 1,610,564 | 43.70 |
| Class R4 | 39,943,108 | 901,123 | 44.33 |
| Class R6 | 1,907,369,927 | 40,559,097 | 47.03 |
| (a) | Maximum offering price per share was equal to the net asset value per share for all share classes, except for Class A, for which the maximum offering price per share was $46.51 [100 / 94.25 x $43.84]. On sales of $50,000 or more, the maximum offering price of Class A shares is reduced. A contingent deferred sales charge may be imposed on redemptions of Class A, Class B, and Class C shares. Redemption price per share was equal to the net asset value per share for Classes I, R1, R2, R3, R4, and R6. |
| Net investment income (loss) | |
| Income | |
| Dividends | $35,983,615 |
| Other | 127,517 |
| Dividends from affiliated issuers | 22,465 |
| Income on securities loaned | 1,114 |
| Foreign taxes withheld | (77,627) |
| Total investment income | $36,057,084 |
| Expenses | |
| Management fee | $16,004,699 |
| Distribution and service fees | 3,988,614 |
| Shareholder servicing costs | 2,105,154 |
| Administrative services fee | 283,563 |
| Independent Trustees' compensation | 37,163 |
| Custodian fee | 63,634 |
| Shareholder communications | 115,429 |
| Audit and tax fees | 30,077 |
| Legal fees | 14,217 |
| Dividend and interest expense on securities sold short | 629,461 |
| Interest expense and fees | 10,197 |
| Miscellaneous | 181,328 |
| Total expenses | $23,463,536 |
| Reduction of expenses by investment adviser and distributor | (423,499) |
| Net expenses | $23,040,037 |
| Net investment income (loss) | $13,017,047 |
| Realized and unrealized gain (loss) | |
| Realized gain (loss) (identified cost basis) | |
| Unaffiliated issuers | $181,043,626 |
| Foreign currency | 1,608 |
| Net realized gain (loss) | $181,045,234 |
| Change in unrealized appreciation or depreciation | |
| Unaffiliated issuers | $(493,327,073) |
| Affiliated issuers | 1 |
| Securities sold short | 10,612,748 |
| Net unrealized gain (loss) | $(482,714,324) |
| Net realized and unrealized gain (loss) | $(301,669,090) |
| Change in net assets from operations | $(288,652,043) |
| Six months ended | Year ended | |
| 2/28/22 (unaudited) | 8/31/21 | |
| Change in net assets | ||
| From operations | ||
| Net investment income (loss) | $13,017,047 | $17,954,451 |
| Net realized gain (loss) | 181,045,234 | 442,763,411 |
| Net unrealized gain (loss) | (482,714,324) | 914,363,857 |
| Change in net assets from operations | $(288,652,043) | $1,375,081,719 |
| Total distributions to shareholders | $(433,307,610) | $(74,503,092) |
| Change in net assets from fund share transactions | $660,147,756 | $413,702,147 |
| Total change in net assets | $(61,811,897) | $1,714,280,774 |
| Net assets | ||
| At beginning of period | 6,094,027,185 | 4,379,746,411 |
| At end of period | $6,032,215,288 | $6,094,027,185 |
| Class A | Six months ended | Year ended | ||||
| 2/28/22 (unaudited) | 8/31/21 | 8/31/20 | 8/31/19 | 8/31/18 | 8/31/17 | |
| Net asset value, beginning of period | $49.38 | $38.41 | $32.45 | $34.18 | $30.46 | $26.72 |
| Income (loss) from investment operations | ||||||
| Net investment income (loss) (d) | $0.07 | $0.09 | $0.19 | $0.20 | $0.20 | $0.18(c) |
| Net realized and unrealized gain (loss) | (2.15) | 11.50 | 6.41 | 1.05 | 5.63 | 4.53 |
| Total from investment operations | $(2.08) | $11.59 | $6.60 | $1.25 | $5.83 | $4.71 |
| Less distributions declared to shareholders | ||||||
| From net investment income | $(0.08) | $(0.15) | $(0.15) | $(0.16) | $(0.17) | $(0.16) |
| From net realized gain | (3.39) | (0.47) | (0.49) | (2.82) | (1.94) | (0.81) |
| Total distributions declared to shareholders | $(3.46) | $(0.62) | $(0.64) | $(2.98) | $(2.11) | $(0.97) |
| Net asset value, end of period (x) | $43.84 | $49.38 | $38.41 | $32.45 | $34.18 | $30.46 |
| Total return (%) (r)(s)(t)(x) | (4.67)(n) | 30.57 | 20.59 | 4.94 | 19.89 | 18.11(c) |
| Ratios (%) (to average net assets) and Supplemental data: | ||||||
| Expenses before expense reductions | 0.91(a) | 0.94 | 0.97 | 1.00 | 1.00 | 1.03(c) |
| Expenses after expense reductions | 0.90(a) | 0.92 | 0.96 | 0.98 | 0.99 | 1.01(c) |
| Net investment income (loss) | 0.28(a) | 0.22 | 0.56 | 0.65 | 0.62 | 0.63(c) |
| Portfolio turnover | 14(n) | 38 | 46 | 39 | 42 | 46 |
| Net assets at end of period (000 omitted) | $2,350,504 | $2,462,032 | $1,960,597 | $1,373,524 | $1,184,976 | $992,736 |
| Supplemental Ratios (%): | ||||||
| Ratios of expenses to average net assets after expense reductions excluding short sale expenses and interest expense and fees | 0.88(a) | 0.90 | 0.93 | 0.96 | 0.97 | 1.00(c) |
| Class B | Six months ended | Year ended | ||||
| 2/28/22 (unaudited) | 8/31/21 | 8/31/20 | 8/31/19 | 8/31/18 | 8/31/17 | |
| Net asset value, beginning of period | $42.49 | $33.24 | $28.23 | $30.19 | $27.17 | $23.96 |
| Income (loss) from investment operations | ||||||
| Net investment income (loss) (d) | $(0.10) | $(0.19) | $(0.05) | $(0.03) | $(0.04) | $(0.03)(c) |
| Net realized and unrealized gain (loss) | (1.80) | 9.91 | 5.55 | 0.89 | 5.00 | 4.05 |
| Total from investment operations | $(1.90) | $9.72 | $5.50 | $0.86 | $4.96 | $4.02 |
| Less distributions declared to shareholders | ||||||
| From net investment income | $— | $— | $— | $— | $— | $— |
| From net realized gain | (3.39) | (0.47) | (0.49) | (2.82) | (1.94) | (0.81) |
| Total distributions declared to shareholders | $(3.39) | $(0.47) | $(0.49) | $(2.82) | $(1.94) | $(0.81) |
| Net asset value, end of period (x) | $37.20 | $42.49 | $33.24 | $28.23 | $30.19 | $27.17 |
| Total return (%) (r)(s)(t)(x) | (5.02)(n) | 29.58 | 19.69 | 4.16 | 19.01 | 17.21(c) |
| Ratios (%) (to average net assets) and Supplemental data: | ||||||
| Expenses before expense reductions | 1.66(a) | 1.69 | 1.72 | 1.75 | 1.75 | 1.78(c) |
| Expenses after expense reductions | 1.65(a) | 1.67 | 1.71 | 1.73 | 1.74 | 1.77(c) |
| Net investment income (loss) | (0.48)(a) | (0.53) | (0.18) | (0.11) | (0.14) | (0.12)(c) |
| Portfolio turnover | 14(n) | 38 | 46 | 39 | 42 | 46 |
| Net assets at end of period (000 omitted) | $20,074 | $24,861 | $25,018 | $22,759 | $26,993 | $27,139 |
| Supplemental Ratios (%): | ||||||
| Ratios of expenses to average net assets after expense reductions excluding short sale expenses and interest expense and fees | 1.63(a) | 1.65 | 1.68 | 1.71 | 1.72 | 1.75(c) |
| Class C | Six months ended | Year ended | ||||
| 2/28/22 (unaudited) | 8/31/21 | 8/31/20 | 8/31/19 | 8/31/18 | 8/31/17 | |
| Net asset value, beginning of period | $41.83 | $32.72 | $27.86 | $29.84 | $26.88 | $23.71 |
| Income (loss) from investment operations | ||||||
| Net investment income (loss) (d) | $(0.09) | $(0.19) | $(0.05) | $(0.03) | $(0.05) | $(0.03)(c) |
| Net realized and unrealized gain (loss) | (1.78) | 9.77 | 5.46 | 0.87 | 4.95 | 4.01 |
| Total from investment operations | $(1.87) | $9.58 | $5.41 | $0.84 | $4.90 | $3.98 |
| Less distributions declared to shareholders | ||||||
| From net investment income | $— | $— | $(0.06) | $— | $— | $— |
| From net realized gain | (3.39) | (0.47) | (0.49) | (2.82) | (1.94) | (0.81) |
| Total distributions declared to shareholders | $(3.39) | $(0.47) | $(0.55) | $(2.82) | $(1.94) | $(0.81) |
| Net asset value, end of period (x) | $36.57 | $41.83 | $32.72 | $27.86 | $29.84 | $26.88 |
| Total return (%) (r)(s)(t)(x) | (5.02)(n) | 29.62 | 19.66 | 4.14 | 18.98 | 17.22(c) |
| Ratios (%) (to average net assets) and Supplemental data: | ||||||
| Expenses before expense reductions | 1.66(a) | 1.69 | 1.72 | 1.75 | 1.75 | 1.78(c) |
| Expenses after expense reductions | 1.65(a) | 1.67 | 1.71 | 1.74 | 1.74 | 1.77(c) |
| Net investment income (loss) | (0.47)(a) | (0.53) | (0.18) | (0.10) | (0.17) | (0.12)(c) |
| Portfolio turnover | 14(n) | 38 | 46 | 39 | 42 | 46 |
| Net assets at end of period (000 omitted) | $125,180 | $140,242 | $128,709 | $72,093 | $56,413 | $89,946 |
| Supplemental Ratios (%): | ||||||
| Ratios of expenses to average net assets after expense reductions excluding short sale expenses and interest expense and fees | 1.63(a) | 1.65 | 1.69 | 1.71 | 1.72 | 1.75(c) |
| Class I | Six months ended | Year ended | ||||
| 2/28/22 (unaudited) | 8/31/21 | 8/31/20 | 8/31/19 | 8/31/18 | 8/31/17 | |
| Net asset value, beginning of period | $52.62 | $40.87 | $34.47 | $36.12 | $32.07 | $28.10 |
| Income (loss) from investment operations | ||||||
| Net investment income (loss) (d) | $0.13 | $0.22 | $0.29 | $0.30 | $0.30 | $0.26(c) |
| Net realized and unrealized gain (loss) | (2.30) | 12.24 | 6.82 | 1.11 | 5.93 | 4.76 |
| Total from investment operations | $(2.17) | $12.46 | $7.11 | $1.41 | $6.23 | $5.02 |
| Less distributions declared to shareholders | ||||||
| From net investment income | $(0.18) | $(0.24) | $(0.22) | $(0.24) | $(0.24) | $(0.24) |
| From net realized gain | (3.39) | (0.47) | (0.49) | (2.82) | (1.94) | (0.81) |
| Total distributions declared to shareholders | $(3.57) | $(0.71) | $(0.71) | $(3.06) | $(2.18) | $(1.05) |
| Net asset value, end of period (x) | $46.88 | $52.62 | $40.87 | $34.47 | $36.12 | $32.07 |
| Total return (%) (r)(s)(t)(x) | (4.57)(n) | 30.91 | 20.89 | 5.17 | 20.21 | 18.38(c) |
| Ratios (%) (to average net assets) and Supplemental data: | ||||||
| Expenses before expense reductions | 0.66(a) | 0.68 | 0.72 | 0.75 | 0.75 | 0.78(c) |
| Expenses after expense reductions | 0.65(a) | 0.67 | 0.71 | 0.74 | 0.74 | 0.77(c) |
| Net investment income (loss) | 0.53(a) | 0.47 | 0.81 | 0.90 | 0.88 | 0.88(c) |
| Portfolio turnover | 14(n) | 38 | 46 | 39 | 42 | 46 |
| Net assets at end of period (000 omitted) | $1,495,716 | $1,416,134 | $841,296 | $467,860 | $246,779 | $122,055 |
| Supplemental Ratios (%): | ||||||
| Ratios of expenses to average net assets after expense reductions excluding short sale expenses and interest expense and fees | 0.63(a) | 0.65 | 0.69 | 0.72 | 0.73 | 0.75(c) |
| Class R1 | Six months ended | Year ended | ||||
| 2/28/22 (unaudited) | 8/31/21 | 8/31/20 | 8/31/19 | 8/31/18 | 8/31/17 | |
| Net asset value, beginning of period | $41.89 | $32.77 | $27.84 | $29.82 | $26.86 | $23.70 |
| Income (loss) from investment operations | ||||||
| Net investment income (loss) (d) | $(0.09) | $(0.19) | $(0.06) | $(0.03) | $(0.04) | $(0.03)(c) |
| Net realized and unrealized gain (loss) | (1.78) | 9.78 | 5.48 | 0.87 | 4.94 | 4.00 |
| Total from investment operations | $(1.87) | $9.59 | $5.42 | $0.84 | $4.90 | $3.97 |
| Less distributions declared to shareholders | ||||||
| From net investment income | $— | $— | $— | $— | $— | $— |
| From net realized gain | (3.39) | (0.47) | (0.49) | (2.82) | (1.94) | (0.81) |
| Total distributions declared to shareholders | $(3.39) | $(0.47) | $(0.49) | $(2.82) | $(1.94) | $(0.81) |
| Net asset value, end of period (x) | $36.63 | $41.89 | $32.77 | $27.84 | $29.82 | $26.86 |
| Total return (%) (r)(s)(t)(x) | (5.01)(n) | 29.60 | 19.68 | 4.14 | 19.00 | 17.19(c) |
| Ratios (%) (to average net assets) and Supplemental data: | ||||||
| Expenses before expense reductions | 1.66(a) | 1.69 | 1.72 | 1.75 | 1.75 | 1.78(c) |
| Expenses after expense reductions | 1.65(a) | 1.67 | 1.71 | 1.74 | 1.74 | 1.77(c) |
| Net investment income (loss) | (0.47)(a) | (0.53) | (0.20) | (0.11) | (0.14) | (0.13)(c) |
| Portfolio turnover | 14(n) | 38 | 46 | 39 | 42 | 46 |
| Net assets at end of period (000 omitted) | $3,654 | $3,791 | $3,816 | $3,186 | $3,448 | $3,103 |
| Supplemental Ratios (%): | ||||||
| Ratios of expenses to average net assets after expense reductions excluding short sale expenses and interest expense and fees | 1.63(a) | 1.65 | 1.69 | 1.71 | 1.73 | 1.75(c) |
| Class R2 | Six months ended | Year ended | ||||
| 2/28/22 (unaudited) | 8/31/21 | 8/31/20 | 8/31/19 | 8/31/18 | 8/31/17 | |
| Net asset value, beginning of period | $48.04 | $37.40 | $31.61 | $33.33 | $29.75 | $26.12 |
| Income (loss) from investment operations | ||||||
| Net investment income (loss) (d) | $0.01 | $(0.01) | $0.10 | $0.12 | $0.11 | $0.10(c) |
| Net realized and unrealized gain (loss) | (2.08) | 11.20 | 6.24 | 1.02 | 5.50 | 4.43 |
| Total from investment operations | $(2.07) | $11.19 | $6.34 | $1.14 | $5.61 | $4.53 |
| Less distributions declared to shareholders | ||||||
| From net investment income | $— | $(0.08) | $(0.06) | $(0.04) | $(0.09) | $(0.09) |
| From net realized gain | (3.39) | (0.47) | (0.49) | (2.82) | (1.94) | (0.81) |
| Total distributions declared to shareholders | $(3.39) | $(0.55) | $(0.55) | $(2.86) | $(2.03) | $(0.90) |
| Net asset value, end of period (x) | $42.58 | $48.04 | $37.40 | $31.61 | $33.33 | $29.75 |
| Total return (%) (r)(s)(t)(x) | (4.78)(n) | 30.27 | 20.28 | 4.66 | 19.61 | 17.80(c) |
| Ratios (%) (to average net assets) and Supplemental data: | ||||||
| Expenses before expense reductions | 1.16(a) | 1.19 | 1.22 | 1.25 | 1.25 | 1.28(c) |
| Expenses after expense reductions | 1.13(a) | 1.16 | 1.20 | 1.23 | 1.24 | 1.27(c) |
| Net investment income (loss) | 0.04(a) | (0.02) | 0.31 | 0.39 | 0.35 | 0.38(c) |
| Portfolio turnover | 14(n) | 38 | 46 | 39 | 42 | 46 |
| Net assets at end of period (000 omitted) | $19,395 | $21,214 | $17,335 | $13,416 | $15,202 | $16,508 |
| Supplemental Ratios (%): | ||||||
| Ratios of expenses to average net assets after expense reductions excluding short sale expenses and interest expense and fees | 1.11(a) | 1.14 | 1.17 | 1.20 | 1.22 | 1.25(c) |
| Class R3 | Six months ended | Year ended | ||||
| 2/28/22 (unaudited) | 8/31/21 | 8/31/20 | 8/31/19 | 8/31/18 | 8/31/17 | |
| Net asset value, beginning of period | $49.22 | $38.29 | $32.36 | $34.11 | $30.33 | $26.61 |
| Income (loss) from investment operations | ||||||
| Net investment income (loss) (d) | $0.06 | $0.09 | $0.19 | $0.20 | $0.20 | $0.17(c) |
| Net realized and unrealized gain (loss) | (2.13) | 11.47 | 6.38 | 1.04 | 5.61 | 4.52 |
| Total from investment operations | $(2.07) | $11.56 | $6.57 | $1.24 | $5.81 | $4.69 |
| Less distributions declared to shareholders | ||||||
| From net investment income | $(0.06) | $(0.16) | $(0.15) | $(0.17) | $(0.09) | $(0.16) |
| From net realized gain | (3.39) | (0.47) | (0.49) | (2.82) | (1.94) | (0.81) |
| Total distributions declared to shareholders | $(3.45) | $(0.63) | $(0.64) | $(2.99) | $(2.03) | $(0.97) |
| Net asset value, end of period (x) | $43.70 | $49.22 | $38.29 | $32.36 | $34.11 | $30.33 |
| Total return (%) (r)(s)(t)(x) | (4.66)(n) | 30.59 | 20.56 | 4.91 | 19.91 | 18.10(c) |
| Ratios (%) (to average net assets) and Supplemental data: | ||||||
| Expenses before expense reductions | 0.91(a) | 0.94 | 0.97 | 1.00 | 1.00 | 1.02(c) |
| Expenses after expense reductions | 0.90(a) | 0.92 | 0.96 | 0.99 | 0.99 | 1.02(c) |
| Net investment income (loss) | 0.28(a) | 0.22 | 0.56 | 0.64 | 0.61 | 0.62(c) |
| Portfolio turnover | 14(n) | 38 | 46 | 39 | 42 | 46 |
| Net assets at end of period (000 omitted) | $70,379 | $77,453 | $63,347 | $42,199 | $34,916 | $28,075 |
| Supplemental Ratios (%): | ||||||
| Ratios of expenses to average net assets after expense reductions excluding short sale expenses and interest expense and fees | 0.88(a) | 0.90 | 0.94 | 0.96 | 0.98 | 1.00(c) |
| Class R4 | Six months ended | Year ended | ||||
| 2/28/22 (unaudited) | 8/31/21 | 8/31/20 | 8/31/19 | 8/31/18 | 8/31/17 | |
| Net asset value, beginning of period | $49.93 | $38.81 | $32.76 | $34.48 | $30.71 | $26.93 |
| Income (loss) from investment operations | ||||||
| Net investment income (loss) (d) | $0.13 | $0.20 | $0.27 | $0.28 | $0.28 | $0.25(c) |
| Net realized and unrealized gain (loss) | (2.17) | 11.63 | 6.48 | 1.05 | 5.67 | 4.57 |
| Total from investment operations | $(2.04) | $11.83 | $6.75 | $1.33 | $5.95 | $4.82 |
| Less distributions declared to shareholders | ||||||
| From net investment income | $(0.17) | $(0.24) | $(0.21) | $(0.23) | $(0.24) | $(0.23) |
| From net realized gain | (3.39) | (0.47) | (0.49) | (2.82) | (1.94) | (0.81) |
| Total distributions declared to shareholders | $(3.56) | $(0.71) | $(0.70) | $(3.05) | $(2.18) | $(1.04) |
| Net asset value, end of period (x) | $44.33 | $49.93 | $38.81 | $32.76 | $34.48 | $30.71 |
| Total return (%) (r)(s)(t)(x) | (4.55)(n) | 30.92 | 20.88 | 5.18 | 20.18 | 18.40(c) |
| Ratios (%) (to average net assets) and Supplemental data: | ||||||
| Expenses before expense reductions | 0.66(a) | 0.69 | 0.72 | 0.75 | 0.75 | 0.78(c) |
| Expenses after expense reductions | 0.65(a) | 0.67 | 0.71 | 0.74 | 0.74 | 0.77(c) |
| Net investment income (loss) | 0.53(a) | 0.47 | 0.80 | 0.89 | 0.86 | 0.87(c) |
| Portfolio turnover | 14(n) | 38 | 46 | 39 | 42 | 46 |
| Net assets at end of period (000 omitted) | $39,943 | $42,883 | $35,770 | $29,218 | $27,707 | $22,494 |
| Supplemental Ratios (%): | ||||||
| Ratios of expenses to average net assets after expense reductions excluding short sale expenses and interest expense and fees | 0.63(a) | 0.65 | 0.69 | 0.71 | 0.73 | 0.76(c) |
| Class R6 | Six months ended | Year ended | ||||
| 2/28/22 (unaudited) | 8/31/21 | 8/31/20 | 8/31/19 | 8/31/18 | 8/31/17 | |
| Net asset value, beginning of period | $52.78 | $40.98 | $34.55 | $36.18 | $32.12 | $28.13 |
| Income (loss) from investment operations | ||||||
| Net investment income (loss) (d) | $0.15 | $0.25 | $0.32 | $0.32 | $0.32 | $0.29(c) |
| Net realized and unrealized gain (loss) | (2.30) | 12.29 | 6.83 | 1.13 | 5.95 | 4.77 |
| Total from investment operations | $(2.15) | $12.54 | $7.15 | $1.45 | $6.27 | $5.06 |
| Less distributions declared to shareholders | ||||||
| From net investment income | $(0.22) | $(0.27) | $(0.23) | $(0.26) | $(0.27) | $(0.26) |
| From net realized gain | (3.39) | (0.47) | (0.49) | (2.82) | (1.94) | (0.81) |
| Total distributions declared to shareholders | $(3.60) | $(0.74) | $(0.72) | $(3.08) | $(2.21) | $(1.07) |
| Net asset value, end of period (x) | $47.03 | $52.78 | $40.98 | $34.55 | $36.18 | $32.12 |
| Total return (%) (r)(s)(t)(x) | (4.51)(n) | 31.03 | 20.98 | 5.28 | 20.29 | 18.49(c) |
| Ratios (%) (to average net assets) and Supplemental data: | ||||||
| Expenses before expense reductions | 0.58(a) | 0.60 | 0.64 | 0.67 | 0.67 | 0.69(c) |
| Expenses after expense reductions | 0.57(a) | 0.59 | 0.63 | 0.66 | 0.66 | 0.68(c) |
| Net investment income (loss) | 0.61(a) | 0.56 | 0.89 | 0.98 | 0.95 | 0.97(c) |
| Portfolio turnover | 14(n) | 38 | 46 | 39 | 42 | 46 |
| Net assets at end of period (000 omitted) | $1,907,370 | $1,905,417 | $1,303,858 | $783,340 | $577,588 | $393,153 |
| Supplemental Ratios (%): | ||||||
| Ratios of expenses to average net assets after expense reductions excluding short sale expenses and interest expense and fees | 0.55(a) | 0.57 | 0.60 | 0.63 | 0.65 | 0.66(c) |
| (a) | Annualized. |
| (c) | Amount reflects a one-time reimbursement of expenses by the custodian (or former custodian) without which net investment income and performance would be lower and expenses would be higher. |
| (d) | Per share data is based on average shares outstanding. |
| (n) | Not annualized. |
| (r) | Certain expenses have been reduced without which performance would have been lower. |
| (s) | From time to time the fund may receive proceeds from litigation settlements, without which performance would be lower. Excluding the effect of the proceeds received from a non-recurring litigation settlement against Household International, Inc., the total return for the year ended August 31, 2017 would have been lower by approximately 0.85%. |
| (t) | Total returns do not include any applicable sales charges. |
| (x) | The net asset values and total returns have been calculated on net assets which include adjustments made in accordance with U.S. generally accepted accounting principles required at period end for financial reporting purposes. |
| Financial Instruments | Level 1 | Level 2 | Level 3 | Total |
| Equity Securities | $6,004,247,056 | $— | $— | $6,004,247,056 |
| Mutual Funds | 43,675,881 | — | — | 43,675,881 |
| Total | $6,047,922,937 | $— | $— | $6,047,922,937 |
| Securities Sold Short | $(21,992,586) | $— | $— | $(21,992,586) |
| Year ended 8/31/21 | |
| Ordinary income (including any short-term capital gains) | $21,997,904 |
| Long-term capital gains | 52,505,188 |
| Total distributions | $74,503,092 |
| As of 2/28/22 | |
| Cost of investments | $4,408,874,478 |
| Gross appreciation | 1,789,690,771 |
| Gross depreciation | (150,642,312) |
| Net unrealized appreciation (depreciation) | $1,639,048,459 |
| As of 8/31/21 | |
| Undistributed ordinary income | 182,423,257 |
| Undistributed long-term capital gain | 245,998,837 |
| Other temporary differences | 3,865,348 |
| Net unrealized appreciation (depreciation) | 2,129,341,833 |
| Six months ended 2/28/22 | Year ended 8/31/21 | ||
| Class A | $172,852,603 | $30,040,189 | |
| Class B | 1,835,488 | 331,454 | |
| Class C | 11,222,207 | 1,808,146 | |
| Class I | 102,395,888 | 15,698,076 | |
| Class R1 | 303,682 | 46,383 | |
| Class R2 | 1,478,984 | 249,807 | |
| Class R3 | 5,462,151 | 1,071,678 | |
| Class R4 | 2,852,391 | 669,489 | |
| Class R6 | 134,904,216 | 24,587,870 | |
| Total | $433,307,610 | $74,503,092 |
| Up to $500 million | 0.65% |
| In excess of $500 million and up to $2.5 billion | 0.55% |
| In excess of $2.5 billion and up to $5 billion | 0.50% |
| In excess of $5 billion and up to $10 billion | 0.47% |
| In excess of $10 billion | 0.45% |
| Distribution Fee Rate (d) | Service Fee Rate (d) | Total Distribution Plan (d) | Annual Effective Rate (e) | Distribution and Service Fee | |
| Class A | — | 0.25% | 0.25% | 0.25% | $ 3,033,786 |
| Class B | 0.75% | 0.25% | 1.00% | 1.00% | 113,687 |
| Class C | 0.75% | 0.25% | 1.00% | 1.00% | 676,618 |
| Class R1 | 0.75% | 0.25% | 1.00% | 1.00% | 18,867 |
| Class R2 | 0.25% | 0.25% | 0.50% | 0.49% | 50,898 |
| Class R3 | — | 0.25% | 0.25% | 0.25% | 94,758 |
| Total Distribution and Service Fees | $3,988,614 |
| (d) | In accordance with the distribution plan for certain classes, the fund pays distribution and/or service fees equal to these annual percentage rates of each class’s average daily net assets. The distribution and service fee rates disclosed by class represent the current rates in effect at the end of the reporting period. Any rate changes, if applicable, are detailed below. |
| (e) | The annual effective rates represent actual fees incurred under the distribution plan for the six months ended February 28, 2022 based on each class's average daily net assets. MFD has voluntarily agreed to rebate a portion of each class's 0.25% service fee attributable to accounts for which there is no financial intermediary specified on the account except for accounts attributable to MFS or its affiliates' seed money. For the six months ended February 28, 2022, this rebate amounted to $1,030, $2, $18, and $1,466 for Class A, Class B, Class C, and Class R2, respectively, and is included in the reduction of total expenses in the Statement of Operations. |
| Amount | |
| Class A | $14,167 |
| Class B | 3,811 |
| Class C | 4,145 |
| Six months ended 2/28/22 | Year ended 8/31/21 | ||||
| Shares | Amount | Shares | Amount | ||
| Shares sold | |||||
| Class A | 3,538,079 | $166,245,367 | 9,211,619 | $393,647,217 | |
| Class B | 3,851 | 156,241 | 11,050 | 402,439 | |
| Class C | 249,318 | 10,079,285 | 685,105 | 24,071,525 | |
| Class I | 7,617,168 | 381,169,758 | 11,744,494 | 537,407,557 | |
| Class R1 | 17,536 | 685,048 | 14,117 | 505,091 | |
| Class R2 | 58,104 | 2,654,503 | 116,552 | 4,749,423 | |
| Class R3 | 190,857 | 8,718,306 | 424,323 | 17,624,848 | |
| Class R4 | 101,725 | 4,784,604 | 164,900 | 6,980,564 | |
| Class R6 | 5,660,877 | 287,550,003 | 12,032,991 | 545,382,832 | |
| 17,437,515 | $862,043,115 | 34,405,151 | $1,530,771,496 | ||
| Shares issued to shareholders in reinvestment of distributions | |||||
| Class A | 3,562,980 | $167,210,640 | 724,146 | $28,994,825 | |
| Class B | 45,078 | 1,798,152 | 9,268 | 321,121 | |
| Class C | 267,931 | 10,505,565 | 49,935 | 1,703,281 | |
| Class I | 1,818,846 | 91,233,292 | 348,791 | 14,855,003 | |
| Class R1 | 7,733 | 303,682 | 1,358 | 46,383 | |
| Class R2 | 32,394 | 1,477,502 | 6,393 | 249,513 | |
| Class R3 | 116,763 | 5,462,151 | 26,846 | 1,071,678 | |
| Class R4 | 59,453 | 2,819,255 | 16,273 | 657,586 | |
| Class R6 | 2,641,838 | 132,884,430 | 556,640 | 23,768,523 | |
| 8,553,016 | $413,694,669 | 1,739,650 | $71,667,913 | ||
| Shares reacquired | |||||
| Class A | (3,343,611) | $(157,630,306) | (11,122,341) | $(453,678,972) | |
| Class B | (94,339) | (3,777,340) | (188,005) | (6,835,400) | |
| Class C | (446,787) | (17,563,189) | (1,315,610) | (46,164,817) | |
| Class I | (4,447,757) | (220,576,855) | (5,763,622) | (260,966,836) | |
| Class R1 | (16,016) | (630,302) | (41,418) | (1,451,025) | |
| Class R2 | (76,619) | (3,478,078) | (144,822) | (5,992,608) | |
| Class R3 | (270,629) | (12,353,605) | (531,877) | (22,914,796) | |
| Class R4 | (118,974) | (5,719,154) | (243,901) | (10,478,244) | |
| Class R6 | (3,847,011) | (193,861,199) | (8,303,149) | (380,254,564) | |
| (12,661,743) | $(615,590,028) | (27,654,745) | $(1,188,737,262) | ||
| Six months ended 2/28/22 | Year ended 8/31/21 | ||||
| Shares | Amount | Shares | Amount | ||
| Net change | |||||
| Class A | 3,757,448 | $175,825,701 | (1,186,576) | $(31,036,930) | |
| Class B | (45,410) | (1,822,947) | (167,687) | (6,111,840) | |
| Class C | 70,462 | 3,021,661 | (580,570) | (20,390,011) | |
| Class I | 4,988,257 | 251,826,195 | 6,329,663 | 291,295,724 | |
| Class R1 | 9,253 | 358,428 | (25,943) | (899,551) | |
| Class R2 | 13,879 | 653,927 | (21,877) | (993,672) | |
| Class R3 | 36,991 | 1,826,852 | (80,708) | (4,218,270) | |
| Class R4 | 42,204 | 1,884,705 | (62,728) | (2,840,094) | |
| Class R6 | 4,455,704 | 226,573,234 | 4,286,482 | 188,896,791 | |
| 13,328,788 | $660,147,756 | 8,490,056 | $413,702,147 | ||
| Affiliated Issuers | Beginning Value | Purchases | Sales Proceeds | Realized Gain (Loss) | Change in Unrealized Appreciation or Depreciation | Ending Value |
| MFS Institutional Money Market Portfolio | $91,616,920 | $546,009,502 | $593,950,542 | $— | $1 | $43,675,881 |
| Affiliated Issuers | Dividend Income | Capital Gain Distributions |
| MFS Institutional Money Market Portfolio | $22,465 | $— |


Equity Fund

Equity Fund
| 1 | |
| 2 | |
| 4 | |
| 6 | |
| 11 | |
| 13 | |
| 14 | |
| 15 | |
| 24 | |
| 35 | |
| 35 | |
| 35 | |
| 35 | |
| 35 |
| back cover |


| CLP Holdings Ltd. | 2.7% |
| Roche Holding AG | 2.7% |
| Johnson & Johnson | 2.7% |
| Novo Nordisk A.S., “B” | 2.7% |
| Taiwan Semiconductor Manufacturing Co. Ltd., ADR | 2.7% |
| KDDI Corp. | 2.6% |
| Microsoft Corp. | 2.3% |
| McKesson Corp. | 2.3% |
| Adobe Systems, Inc. | 2.2% |
| Alphabet, Inc., “A” | 2.1% |
| Information Technology | 16.3% |
| Health Care | 16.1% |
| Consumer Staples | 11.9% |
| Financials | 11.7% |
| Communication Services | 11.7% |
| Consumer Discretionary | 8.0% |
| Utilities | 7.5% |
| Industrials | 6.1% |
| Real Estate | 5.2% |
| Materials | 3.5% |
| United States | 50.7% |
| Japan | 10.6% |
| Canada | 6.5% |
| Switzerland | 5.4% |
| Hong Kong | 4.4% |
| United Kingdom | 2.9% |
| Germany | 2.7% |
| Denmark | 2.7% |
| Taiwan | 2.7% |
| Other Countries | 11.4% |
| United States Dollar | 53.0% |
| Japanese Yen | 10.6% |
| Swiss Franc | 5.4% |
| Hong Kong Dollar | 5.1% |
| Euro | 5.0% |
| Canadian Dollar | 4.9% |
| British Pound Sterling | 2.9% |
| Danish Krone | 2.7% |
| Taiwan Dollar | 2.7% |
| Other Currencies | 7.7% |
| (g) | The Global Industry Classification Standard (GICS®) was developed by and/or is the exclusive property of MSCI, Inc. and S&P Global Market Intelligence Inc. (“S&P Global Market Intelligence”). GICS is a service mark of MSCI and S&P Global Market Intelligence and has been licensed for use by MFS. MFS has applied its own internal sector/industry classification methodology for equity securities and non-equity securities that are unclassified by GICS. |
| (x) | Represents the portfolio’s exposure to issuer countries as a percentage of a portfolio’s net assets. For purposes of this presentation, United States includes Cash & Cash Equivalents. |
| (y) | Represents the portfolio’s exposure to a particular currency as a percentage of a portfolio's net assets. For purposes of this presentation, United States Dollar includes Cash & Cash Equivalents. |
September 1, 2021 through February 28, 2022
| Share Class | Annualized Expense Ratio | Beginning Account Value 9/01/21 | Ending Account Value 2/28/22 | Expenses Paid During Period (p) 9/01/21-2/28/22 | |
| A | Actual | 0.99% | $1,000.00 | $970.52 | $4.84 |
| Hypothetical (h) | 0.99% | $1,000.00 | $1,019.89 | $4.96 | |
| B | Actual | 1.74% | $1,000.00 | $967.23 | $8.49 |
| Hypothetical (h) | 1.74% | $1,000.00 | $1,016.17 | $8.70 | |
| C | Actual | 1.74% | $1,000.00 | $967.13 | $8.49 |
| Hypothetical (h) | 1.74% | $1,000.00 | $1,016.17 | $8.70 | |
| I | Actual | 0.74% | $1,000.00 | $971.74 | $3.62 |
| Hypothetical (h) | 0.74% | $1,000.00 | $1,021.12 | $3.71 | |
| R1 | Actual | 1.74% | $1,000.00 | $967.43 | $8.49 |
| Hypothetical (h) | 1.74% | $1,000.00 | $1,016.17 | $8.70 | |
| R2 | Actual | 1.24% | $1,000.00 | $968.88 | $6.05 |
| Hypothetical (h) | 1.24% | $1,000.00 | $1,018.65 | $6.21 | |
| R3 | Actual | 0.99% | $1,000.00 | $970.56 | $4.84 |
| Hypothetical (h) | 0.99% | $1,000.00 | $1,019.89 | $4.96 | |
| R4 | Actual | 0.74% | $1,000.00 | $971.74 | $3.62 |
| Hypothetical (h) | 0.74% | $1,000.00 | $1,021.12 | $3.71 | |
| R6 | Actual | 0.66% | $1,000.00 | $972.03 | $3.23 |
| Hypothetical (h) | 0.66% | $1,000.00 | $1,021.52 | $3.31 |
| (h) | 5% class return per year before expenses. |
| (p) | “Expenses Paid During Period” are equal to each class’s annualized expense ratio, as shown above, multiplied by the average account value over the period, multiplied by 181/365 (to reflect the one-half year period). Expenses paid do not include any applicable sales charges (loads). If these transaction costs had been included, your costs would have been higher. |
| Issuer | Shares/Par | Value ($) | ||
| Common Stocks – 97.1% | ||||
| Aerospace & Defense – 0.6% | ||||
| Singapore Technologies Engineering Ltd. | 482,000 | $ 1,358,147 | ||
| Automotive – 0.4% | ||||
| Bridgestone Corp. | 24,800 | $ 1,024,121 | ||
| Biotechnology – 0.7% | ||||
| Vertex Pharmaceuticals, Inc. (a) | 7,446 | $ 1,712,729 | ||
| Brokerage & Asset Managers – 0.8% | ||||
| ASX Ltd. | 19,043 | $ 1,153,132 | ||
| IG Group Holdings PLC | 80,947 | 848,634 | ||
| $2,001,766 | ||||
| Business Services – 1.9% | ||||
| Dropbox, Inc. (a) | 116,824 | $ 2,650,736 | ||
| Fiserv, Inc. (a) | 8,788 | 858,324 | ||
| Sohgo Security Services Co. Ltd. | 25,200 | 909,763 | ||
| $4,418,823 | ||||
| Cable TV – 0.8% | ||||
| Charter Communications, Inc., “A” (a) | 1,615 | $ 971,875 | ||
| Comcast Corp., “A” | 18,496 | 864,873 | ||
| $1,836,748 | ||||
| Computer Software – 4.9% | ||||
| Adobe Systems, Inc. (a) | 11,238 | $ 5,255,788 | ||
| Microsoft Corp. | 18,415 | 5,502,218 | ||
| Oracle Corp. | 12,110 | 919,996 | ||
| $11,678,002 | ||||
| Computer Software - Systems – 4.8% | ||||
| Constellation Software, Inc. | 2,681 | $ 4,518,379 | ||
| Fujitsu Ltd. | 14,900 | 2,181,103 | ||
| Hitachi Ltd. | 28,300 | 1,395,759 | ||
| NICE Systems Ltd., ADR (a) | 9,193 | 2,079,916 | ||
| Venture Corp. Ltd. | 94,300 | 1,219,355 | ||
| $11,394,512 | ||||
| Construction – 1.2% | ||||
| AvalonBay Communities, Inc., REIT | 7,951 | $ 1,897,029 | ||
| Otis Worldwide Corp. | 12,897 | 1,010,222 | ||
| $2,907,251 | ||||
| Issuer | Shares/Par | Value ($) | ||
| Common Stocks – continued | ||||
| Consumer Products – 2.2% | ||||
| Colgate-Palmolive Co. | 25,116 | $ 1,932,676 | ||
| Kimberly-Clark Corp. | 14,769 | 1,922,186 | ||
| Procter & Gamble Co. | 9,508 | 1,482,202 | ||
| $5,337,064 | ||||
| Electronics – 3.8% | ||||
| Kyocera Corp. | 46,700 | $ 2,682,243 | ||
| Taiwan Semiconductor Manufacturing Co. Ltd., ADR | 59,491 | 6,366,132 | ||
| $9,048,375 | ||||
| Food & Beverages – 5.9% | ||||
| General Mills, Inc. | 53,419 | $ 3,602,043 | ||
| J.M. Smucker Co. | 8,248 | 1,111,418 | ||
| Mondelez International, Inc. | 33,468 | 2,191,485 | ||
| Nestle S.A. | 29,273 | 3,823,269 | ||
| PepsiCo, Inc. | 20,621 | 3,376,482 | ||
| $14,104,697 | ||||
| Food & Drug Stores – 2.8% | ||||
| Seven & I Holdings Co. Ltd. | 54,700 | $ 2,667,353 | ||
| Sundrug Co. Ltd. | 38,600 | 1,047,554 | ||
| Tesco PLC | 308,320 | 1,198,439 | ||
| Wal-Mart Stores, Inc. | 13,453 | 1,818,307 | ||
| $6,731,653 | ||||
| General Merchandise – 2.7% | ||||
| B&M European Value Retail S.A. | 310,904 | $ 2,524,989 | ||
| Dollar General Corp. | 14,806 | 2,936,622 | ||
| Dollarama, Inc. | 20,514 | ��� 1,060,093 | ||
| $6,521,704 | ||||
| Insurance – 3.9% | ||||
| Everest Re Group Ltd. | 14,993 | $ 4,471,212 | ||
| Fairfax Financial Holdings Ltd. | 3,800 | 1,842,138 | ||
| Samsung Fire & Marine Insurance Co. Ltd. | 9,686 | 1,547,922 | ||
| Zurich Insurance Group AG | 3,358 | 1,543,706 | ||
| $9,404,978 | ||||
| Internet – 3.5% | ||||
| Alphabet, Inc., “A” (a) | 1,817 | $ 4,907,971 | ||
| Alphabet, Inc., “C” (a) | 379 | 1,022,474 | ||
| Gartner, Inc. (a) | 8,959 | 2,512,283 | ||
| $8,442,728 | ||||
| Issuer | Shares/Par | Value ($) | ||
| Common Stocks – continued | ||||
| Leisure & Toys – 3.3% | ||||
| DeNA Co. Ltd. | 57,900 | $ 891,356 | ||
| Electronic Arts, Inc. | 31,044 | 4,038,514 | ||
| Nintendo Co. Ltd. | 2,800 | 1,415,561 | ||
| SEGA SAMMY Holdings, Inc. | 77,100 | 1,411,576 | ||
| $7,757,007 | ||||
| Machinery & Tools – 1.0% | ||||
| Eaton Corp. PLC | 14,883 | $ 2,296,298 | ||
| Major Banks – 5.0% | ||||
| Bank of Nova Scotia | 16,962 | $ 1,227,031 | ||
| BOC Hong Kong Holdings Ltd. | 1,065,500 | 3,826,119 | ||
| DBS Group Holdings Ltd. | 111,100 | 2,788,454 | ||
| JPMorgan Chase & Co. | 19,679 | 2,790,482 | ||
| Royal Bank of Canada | 12,318 | 1,360,154 | ||
| $11,992,240 | ||||
| Medical & Health Technology & Services – 2.7% | ||||
| McKesson Corp. | 19,677 | $ 5,410,388 | ||
| Quest Diagnostics, Inc. | 7,279 | 955,514 | ||
| $6,365,902 | ||||
| Medical Equipment – 2.1% | ||||
| Becton, Dickinson and Co. | 4,935 | $ 1,338,767 | ||
| Koninklijke Philips N.V. | 26,842 | 913,130 | ||
| Medtronic PLC | 14,083 | 1,478,574 | ||
| Terumo Corp. | 35,600 | 1,154,626 | ||
| $4,885,097 | ||||
| Metals & Mining – 0.5% | ||||
| Rio Tinto PLC | 14,988 | $ 1,164,362 | ||
| Natural Gas - Distribution – 1.3% | ||||
| Italgas S.p.A. | 494,418 | $ 3,203,127 | ||
| Other Banks & Diversified Financials – 1.9% | ||||
| China Merchants Bank Co. Ltd. | 211,000 | $ 1,780,586 | ||
| U.S. Bancorp | 47,581 | 2,690,230 | ||
| $4,470,816 | ||||
| Pharmaceuticals – 10.7% | ||||
| Eli Lilly & Co. | 9,336 | $ 2,333,533 | ||
| Johnson & Johnson | 39,019 | 6,421,357 | ||
| Merck & Co., Inc. | 36,826 | 2,820,135 | ||
| Novartis AG | 12,301 | 1,077,595 | ||
| Issuer | Shares/Par | Value ($) | ||
| Common Stocks – continued | ||||
| Pharmaceuticals – continued | ||||
| Novo Nordisk A.S., “B” | 62,238 | $ 6,400,202 | ||
| Roche Holding AG | 16,889 | 6,442,718 | ||
| $25,495,540 | ||||
| Pollution Control – 0.9% | ||||
| Republic Services, Inc. | 18,593 | $ 2,236,366 | ||
| Precious Metals & Minerals – 1.8% | ||||
| Franco-Nevada Corp. | 29,202 | $ 4,300,470 | ||
| Railroad & Shipping – 1.1% | ||||
| Canadian Pacific Railway Ltd. | 18,008 | $ 1,265,602 | ||
| Sankyu, Inc. | 35,500 | 1,233,836 | ||
| $2,499,438 | ||||
| Real Estate – 4.4% | ||||
| Extra Space Storage, Inc., REIT | 4,978 | $ 936,611 | ||
| Grand City Properties S.A. | 119,881 | 2,625,155 | ||
| Life Storage, Inc., REIT | 19,170 | 2,426,730 | ||
| Public Storage, Inc., REIT | 6,042 | 2,145,031 | ||
| Sun Communities, Inc., REIT | 12,699 | 2,298,519 | ||
| $10,432,046 | ||||
| Restaurants – 3.4% | ||||
| McDonald's Corp. | 11,053 | $ 2,705,443 | ||
| Starbucks Corp. | 40,384 | 3,706,847 | ||
| Yum China Holdings, Inc. | 30,890 | 1,606,898 | ||
| $8,019,188 | ||||
| Specialty Chemicals – 1.2% | ||||
| Symrise AG | 23,758 | $ 2,837,016 | ||
| Specialty Stores – 0.9% | ||||
| AutoZone, Inc. (a) | 593 | $ 1,104,990 | ||
| Target Corp. | 5,264 | 1,051,590 | ||
| $2,156,580 | ||||
| Telecommunications - Wireless – 5.2% | ||||
| Advanced Info Service Public Co. Ltd. | 628,800 | $ 4,406,892 | ||
| KDDI Corp. | 188,500 | 6,166,602 | ||
| PLDT, Inc. | 50,410 | 1,768,824 | ||
| $12,342,318 | ||||
| Telephone Services – 0.6% | ||||
| Orange S.A. | 114,044 | $ 1,382,806 | ||
| Issuer | Shares/Par | Value ($) | ||
| Common Stocks – continued | ||||
| Tobacco – 0.9% | ||||
| British American Tobacco PLC | 27,541 | $ 1,205,002 | ||
| Japan Tobacco, Inc. | 52,800 | 975,637 | ||
| $2,180,639 | ||||
| Trucking – 1.2% | ||||
| Knight-Swift Transportation Holdings, Inc. | 28,157 | $ 1,533,993 | ||
| United Parcel Service, Inc., “B” | 6,138 | 1,291,558 | ||
| $2,825,551 | ||||
| Utilities - Electric Power – 6.1% | ||||
| American Electric Power Co., Inc. | 24,542 | $ 2,224,732 | ||
| CLP Holdings Ltd. | 641,000 | 6,525,165 | ||
| Duke Energy Corp. | 9,318 | 935,620 | ||
| E.ON SE | 79,315 | 1,077,677 | ||
| Evergy, Inc. | 17,414 | 1,086,808 | ||
| Xcel Energy, Inc. | 41,212 | 2,774,804 | ||
| $14,624,806 | ||||
| Total Common Stocks (Identified Cost, $181,678,760) | $ 231,390,911 | |||
| Preferred Stocks – 0.9% | ||||
| Computer Software - Systems – 0.9% | ||||
| Samsung Electronics Co. Ltd. (Identified Cost, $2,414,713) | 37,090 | $ 2,042,816 | ||
| Investment Companies (h) – 0.3% | ||||
| Money Market Funds – 0.3% | ||||
| MFS Institutional Money Market Portfolio, 0.06% (v) (Identified Cost, $609,573) | 609,573 | $ 609,573 | ||
| Other Assets, Less Liabilities – 1.7% | 4,142,847 | |||
| Net Assets – 100.0% | $ 238,186,147 | |||
| (a) | Non-income producing security. | |||
| (h) | An affiliated issuer, which may be considered one in which the fund owns 5% or more of the outstanding voting securities, or a company which is under common control. At period end, the aggregate values of the fund's investments in affiliated issuers and in unaffiliated issuers were $609,573 and $233,433,727, respectively. | |||
| (v) | Affiliated issuer that is available only to investment companies managed by MFS. The rate quoted for the MFS Institutional Money Market Portfolio is the annualized seven-day yield of the fund at period end. |
| The following abbreviations are used in this report and are defined: | |
| ADR | American Depositary Receipt |
| REIT | Real Estate Investment Trust |
| Assets | |
| Investments in unaffiliated issuers, at value (identified cost, $184,093,473) | $233,433,727 |
| Investments in affiliated issuers, at value (identified cost, $609,573) | 609,573 |
| Receivables for | |
| Fund shares sold | 3,918,896 |
| Dividends | 698,863 |
| Other assets | 43,093 |
| Total assets | $238,704,152 |
| Liabilities | |
| Payables for | |
| Investments purchased | $3,506 |
| Fund shares reacquired | 294,081 |
| Payable to affiliates | |
| Investment adviser | 5,967 |
| Administrative services fee | 461 |
| Shareholder servicing costs | 21,647 |
| Distribution and service fees | 1,080 |
| Payable for independent Trustees' compensation | 999 |
| Deferred country tax expense payable | 126,232 |
| Accrued expenses and other liabilities | 64,032 |
| Total liabilities | $518,005 |
| Net assets | $238,186,147 |
| Net assets consist of | |
| Paid-in capital | $187,277,010 |
| Total distributable earnings (loss) | 50,909,137 |
| Net assets | $238,186,147 |
| Shares of beneficial interest outstanding | 15,628,036 |
| Net assets | Shares outstanding | Net asset value per share (a) | |
| Class A | $24,846,073 | 1,630,051 | $15.24 |
| Class B | 458,053 | 30,328 | 15.10 |
| Class C | 3,047,172 | 202,084 | 15.08 |
| Class I | 125,096,896 | 8,203,360 | 15.25 |
| Class R1 | 146,630 | 9,667 | 15.17 |
| Class R2 | 146,015 | 9,578 | 15.24 |
| Class R3 | 95,344 | 6,247 | 15.26 |
| Class R4 | 89,345 | 5,858 | 15.25 |
| Class R6 | 84,260,619 | 5,530,863 | 15.23 |
| (a) | Maximum offering price per share was equal to the net asset value per share for all share classes, except for Class A, for which the maximum offering price per share was $16.17 [100 / 94.25 x $15.24]. On sales of $50,000 or more, the maximum offering price of Class A shares is reduced. A contingent deferred sales charge may be imposed on redemptions of Class A, Class B, and Class C shares. Redemption price per share was equal to the net asset value per share for Classes I, R1, R2, R3, R4, and R6. |
| Net investment income (loss) | |
| Income | |
| Dividends | $1,978,160 |
| Other | 4,248 |
| Income on securities loaned | 1,144 |
| Dividends from affiliated issuers | 334 |
| Foreign taxes withheld | (100,822) |
| Total investment income | $1,883,064 |
| Expenses | |
| Management fee | $619,742 |
| Distribution and service fees | 50,506 |
| Shareholder servicing costs | 62,035 |
| Administrative services fee | 20,279 |
| Independent Trustees' compensation | 2,507 |
| Custodian fee | 29,728 |
| Shareholder communications | 7,715 |
| Audit and tax fees | 28,864 |
| Legal fees | 592 |
| Registration fees | 62,365 |
| Miscellaneous | 18,347 |
| Total expenses | $902,680 |
| Reduction of expenses by investment adviser | (54,357) |
| Net expenses | $848,323 |
| Net investment income (loss) | $1,034,741 |
| Realized and unrealized gain (loss) | |
| Realized gain (loss) (identified cost basis) | |
| Unaffiliated issuers (net of $6,198 country tax) | $10,865,351 |
| Foreign currency | (33,925) |
| Net realized gain (loss) | $10,831,426 |
| Change in unrealized appreciation or depreciation | |
| Unaffiliated issuers (net of $101,393 increase in deferred country tax) | $(18,107,096) |
| Translation of assets and liabilities in foreign currencies | (9,048) |
| Net unrealized gain (loss) | $(18,116,144) |
| Net realized and unrealized gain (loss) | $(7,284,718) |
| Change in net assets from operations | $(6,249,977) |
| Six months ended | Year ended | |
| 2/28/22 (unaudited) | 8/31/21 | |
| Change in net assets | ||
| From operations | ||
| Net investment income (loss) | $1,034,741 | $2,951,227 |
| Net realized gain (loss) | 10,831,426 | 19,921,730 |
| Net unrealized gain (loss) | (18,116,144) | 20,604,441 |
| Change in net assets from operations | $(6,249,977) | $43,477,398 |
| Total distributions to shareholders | $(18,718,617) | $(3,422,711) |
| Change in net assets from fund share transactions | $35,419,960 | $(31,397,844) |
| Total change in net assets | $10,451,366 | $8,656,843 |
| Net assets | ||
| At beginning of period | 227,734,781 | 219,077,938 |
| At end of period | $238,186,147 | $227,734,781 |
| Class A | Six months ended | Year ended | ||||
| 2/28/22 (unaudited) | 8/31/21 | 8/31/20 | 8/31/19 | 8/31/18 | 8/31/17 | |
| Net asset value, beginning of period | $17.04 | $14.18 | $13.92 | $13.73 | $12.82 | $11.87 |
| Income (loss) from investment operations | ||||||
| Net investment income (loss) (d) | $0.06 | $0.17 | $0.23 | $0.25 | $0.23 | $0.19 |
| Net realized and unrealized gain (loss) | (0.51) | 2.90 | 0.39 | 0.56 | 0.92 | 0.91 |
| Total from investment operations | $(0.45) | $3.07 | $0.62 | $0.81 | $1.15 | $1.10 |
| Less distributions declared to shareholders | ||||||
| From net investment income | $(0.06) | $(0.21) | $(0.27) | $(0.23) | $(0.24) | $(0.15) |
| From net realized gain | (1.29) | — | (0.09) | (0.39) | — | — |
| Total distributions declared to shareholders | $(1.35) | $(0.21) | $(0.36) | $(0.62) | $(0.24) | $(0.15) |
| Net asset value, end of period (x) | $15.24 | $17.04 | $14.18 | $13.92 | $13.73 | $12.82 |
| Total return (%) (r)(s)(t)(x) | (2.95)(n) | 21.83 | 4.60 | 6.38 | 9.09 | 9.36 |
| Ratios (%) (to average net assets) and Supplemental data: | ||||||
| Expenses before expense reductions | 1.04(a) | 1.04 | 1.05 | 1.05 | 1.06 | 1.23 |
| Expenses after expense reductions | 0.99(a) | 0.99 | 0.99 | 0.98 | 0.97 | 1.17 |
| Net investment income (loss) | 0.69(a)(l) | 1.14 | 1.68 | 1.86 | 1.75 | 1.55 |
| Portfolio turnover | 24(n) | 36 | 43 | 65 | 41 | 24 |
| Net assets at end of period (000 omitted) | $24,846 | $25,815 | $23,494 | $19,981 | $9,102 | $9,215 |
| Class B | Six months ended | Year ended | ||||
| 2/28/22 (unaudited) | 8/31/21 | 8/31/20 | 8/31/19 | 8/31/18 | 8/31/17 | |
| Net asset value, beginning of period | $16.90 | $14.08 | $13.82 | $13.63 | $12.73 | $11.79 |
| Income (loss) from investment operations | ||||||
| Net investment income (loss) (d) | $(0.01) | $0.06 | $0.12 | $0.14 | $0.13 | $0.09 |
| Net realized and unrealized gain (loss) | (0.49) | 2.86 | 0.40 | 0.57 | 0.91 | 0.91 |
| Total from investment operations | $(0.50) | $2.92 | $0.52 | $0.71 | $1.04 | $1.00 |
| Less distributions declared to shareholders | ||||||
| From net investment income | $(0.01) | $(0.10) | $(0.17) | $(0.13) | $(0.14) | $(0.06) |
| From net realized gain | (1.29) | — | (0.09) | (0.39) | — | — |
| Total distributions declared to shareholders | $(1.30) | $(0.10) | $(0.26) | $(0.52) | $(0.14) | $(0.06) |
| Net asset value, end of period (x) | $15.10 | $16.90 | $14.08 | $13.82 | $13.63 | $12.73 |
| Total return (%) (r)(s)(t)(x) | (3.28)(n) | 20.88 | 3.81 | 5.60 | 8.25 | 8.48 |
| Ratios (%) (to average net assets) and Supplemental data: | ||||||
| Expenses before expense reductions | 1.79(a) | 1.78 | 1.80 | 1.79 | 1.81 | 1.98 |
| Expenses after expense reductions | 1.74(a) | 1.74 | 1.75 | 1.74 | 1.74 | 1.96 |
| Net investment income (loss) | (0.06)(a)(l) | 0.40 | 0.88 | 1.03 | 1.02 | 0.73 |
| Portfolio turnover | 24(n) | 36 | 43 | 65 | 41 | 24 |
| Net assets at end of period (000 omitted) | $458 | $475 | $410 | $410 | $380 | $350 |
| Class C | Six months ended | Year ended | ||||
| 2/28/22 (unaudited) | 8/31/21 | 8/31/20 | 8/31/19 | 8/31/18 | 8/31/17 | |
| Net asset value, beginning of period | $16.88 | $14.05 | $13.80 | $13.62 | $12.71 | $11.78 |
| Income (loss) from investment operations | ||||||
| Net investment income (loss) (d) | $(0.00)(w) | $0.06 | $0.12 | $0.14 | $0.13 | $0.09 |
| Net realized and unrealized gain (loss) | (0.50) | 2.88 | 0.39 | 0.57 | 0.92 | 0.91 |
| Total from investment operations | $(0.50) | $2.94 | $0.51 | $0.71 | $1.05 | $1.00 |
| Less distributions declared to shareholders | ||||||
| From net investment income | $(0.01) | $(0.11) | $(0.17) | $(0.14) | $(0.14) | $(0.07) |
| From net realized gain | (1.29) | — | (0.09) | (0.39) | — | — |
| Total distributions declared to shareholders | $(1.30) | $(0.11) | $(0.26) | $(0.53) | $(0.14) | $(0.07) |
| Net asset value, end of period (x) | $15.08 | $16.88 | $14.05 | $13.80 | $13.62 | $12.71 |
| Total return (%) (r)(s)(t)(x) | (3.29)(n) | 21.00 | 3.77 | 5.57 | 8.28 | 8.49 |
| Ratios (%) (to average net assets) and Supplemental data: | ||||||
| Expenses before expense reductions | 1.79(a) | 1.79 | 1.80 | 1.80 | 1.81 | 1.98 |
| Expenses after expense reductions | 1.74(a) | 1.74 | 1.75 | 1.74 | 1.74 | 1.96 |
| Net investment income (loss) | (0.06)(a)(l) | 0.39 | 0.90 | 1.02 | 1.01 | 0.76 |
| Portfolio turnover | 24(n) | 36 | 43 | 65 | 41 | 24 |
| Net assets at end of period (000 omitted) | $3,047 | $3,133 | $3,261 | $2,876 | $1,773 | $1,924 |
| Class I | Six months ended | Year ended | ||||
| 2/28/22 (unaudited) | 8/31/21 | 8/31/20 | 8/31/19 | 8/31/18 | 8/31/17 | |
| Net asset value, beginning of period | $17.05 | $14.18 | $13.92 | $13.73 | $12.82 | $11.87 |
| Income (loss) from investment operations | ||||||
| Net investment income (loss) (d) | $0.07 | $0.21 | $0.26 | $0.28 | $0.27 | $0.23 |
| Net realized and unrealized gain (loss) | (0.50) | 2.90 | 0.39 | 0.56 | 0.91 | 0.90 |
| Total from investment operations | $(0.43) | $3.11 | $0.65 | $0.84 | $1.18 | $1.13 |
| Less distributions declared to shareholders | ||||||
| From net investment income | $(0.08) | $(0.24) | $(0.30) | $(0.26) | $(0.27) | $(0.18) |
| From net realized gain | (1.29) | — | (0.09) | (0.39) | — | — |
| Total distributions declared to shareholders | $(1.37) | $(0.24) | $(0.39) | $(0.65) | $(0.27) | $(0.18) |
| Net asset value, end of period (x) | $15.25 | $17.05 | $14.18 | $13.92 | $13.73 | $12.82 |
| Total return (%) (r)(s)(t)(x) | (2.83)(n) | 22.21 | 4.85 | 6.61 | 9.34 | 9.59 |
| Ratios (%) (to average net assets) and Supplemental data: | ||||||
| Expenses before expense reductions | 0.79(a) | 0.79 | 0.80 | 0.79 | 0.81 | 0.94 |
| Expenses after expense reductions | 0.74(a) | 0.74 | 0.75 | 0.74 | 0.74 | 0.90 |
| Net investment income (loss) | 0.92(a)(l) | 1.38 | 1.88 | 2.09 | 2.03 | 1.87 |
| Portfolio turnover | 24(n) | 36 | 43 | 65 | 41 | 24 |
| Net assets at end of period (000 omitted) | $125,097 | $102,723 | $106,849 | $118,907 | $114,259 | $97,952 |
| Class R1 | Six months ended | Year ended | ||||
| 2/28/22 (unaudited) | 8/31/21 | 8/31/20 | 8/31/19 | 8/31/18 | 8/31/17 | |
| Net asset value, beginning of period | $16.97 | $14.13 | $13.88 | $13.69 | $12.78 | $11.84 |
| Income (loss) from investment operations | ||||||
| Net investment income (loss) (d) | $(0.01) | $0.06 | $0.12 | $0.14 | $0.14 | $0.09 |
| Net realized and unrealized gain (loss) | (0.49) | 2.89 | 0.39 | 0.58 | 0.91 | 0.91 |
| Total from investment operations | $(0.50) | $2.95 | $0.51 | $0.72 | $1.05 | $1.00 |
| Less distributions declared to shareholders | ||||||
| From net investment income | $(0.01) | $(0.11) | $(0.17) | $(0.14) | $(0.14) | $(0.06) |
| From net realized gain | (1.29) | — | (0.09) | (0.39) | — | — |
| Total distributions declared to shareholders | $(1.30) | $(0.11) | $(0.26) | $(0.53) | $(0.14) | $(0.06) |
| Net asset value, end of period (x) | $15.17 | $16.97 | $14.13 | $13.88 | $13.69 | $12.78 |
| Total return (%) (r)(s)(t)(x) | (3.26)(n) | 20.96 | 3.74 | 5.61 | 8.29 | 8.47 |
| Ratios (%) (to average net assets) and Supplemental data: | ||||||
| Expenses before expense reductions | 1.79(a) | 1.78 | 1.80 | 1.79 | 1.81 | 1.98 |
| Expenses after expense reductions | 1.74(a) | 1.74 | 1.75 | 1.74 | 1.74 | 1.96 |
| Net investment income (loss) | (0.06)(a)(l) | 0.40 | 0.90 | 1.03 | 1.03 | 0.75 |
| Portfolio turnover | 24(n) | 36 | 43 | 65 | 41 | 24 |
| Net assets at end of period (000 omitted) | $147 | $149 | $109 | $96 | $74 | $68 |
| Class R2 | Six months ended | Year ended | ||||
| 2/28/22 (unaudited) | 8/31/21 | 8/31/20 | 8/31/19 | 8/31/18 | 8/31/17 | |
| Net asset value, beginning of period | $17.04 | $14.18 | $13.92 | $13.73 | $12.81 | $11.87 |
| Income (loss) from investment operations | ||||||
| Net investment income (loss) (d) | $0.04 | $0.15 | $0.19 | $0.21 | $0.20 | $0.15 |
| Net realized and unrealized gain (loss) | (0.52) | 2.88 | 0.40 | 0.57 | 0.92 | 0.90 |
| Total from investment operations | $(0.48) | $3.03 | $0.59 | $0.78 | $1.12 | $1.05 |
| Less distributions declared to shareholders | ||||||
| From net investment income | $(0.03) | $(0.17) | $(0.24) | $(0.20) | $(0.20) | $(0.11) |
| From net realized gain | (1.29) | — | (0.09) | (0.39) | — | — |
| Total distributions declared to shareholders | $(1.32) | $(0.17) | $(0.33) | $(0.59) | $(0.20) | $(0.11) |
| Net asset value, end of period (x) | $15.24 | $17.04 | $14.18 | $13.92 | $13.73 | $12.81 |
| Total return (%) (r)(s)(t)(x) | (3.11)(n) | 21.56 | 4.33 | 6.09 | 8.87 | 8.94 |
| Ratios (%) (to average net assets) and Supplemental data: | ||||||
| Expenses before expense reductions | 1.29(a) | 1.28 | 1.30 | 1.29 | 1.31 | 1.49 |
| Expenses after expense reductions | 1.24(a) | 1.24 | 1.25 | 1.24 | 1.24 | 1.47 |
| Net investment income (loss) | 0.55(a)(l) | 0.94 | 1.37 | 1.53 | 1.52 | 1.24 |
| Portfolio turnover | 24(n) | 36 | 43 | 65 | 41 | 24 |
| Net assets at end of period (000 omitted) | $146 | $263 | $170 | $75 | $66 | $61 |
| Class R3 | Six months ended | Year ended | ||||
| 2/28/22 (unaudited) | 8/31/21 | 8/31/20 | 8/31/19 | 8/31/18 | 8/31/17 | |
| Net asset value, beginning of period | $17.06 | $14.20 | $13.94 | $13.74 | $12.82 | $11.88 |
| Income (loss) from investment operations | ||||||
| Net investment income (loss) (d) | $0.06 | $0.18 | $0.23 | $0.24 | $0.22 | $0.19 |
| Net realized and unrealized gain (loss) | (0.51) | 2.89 | 0.39 | 0.58 | 0.93 | 0.90 |
| Total from investment operations | $(0.45) | $3.07 | $0.62 | $0.82 | $1.15 | $1.09 |
| Less distributions declared to shareholders | ||||||
| From net investment income | $(0.06) | $(0.21) | $(0.27) | $(0.23) | $(0.23) | $(0.15) |
| From net realized gain | (1.29) | — | (0.09) | (0.39) | — | — |
| Total distributions declared to shareholders | $(1.35) | $(0.21) | $(0.36) | $(0.62) | $(0.23) | $(0.15) |
| Net asset value, end of period (x) | $15.26 | $17.06 | $14.20 | $13.94 | $13.74 | $12.82 |
| Total return (%) (r)(s)(t)(x) | (2.94)(n) | 21.81 | 4.58 | 6.42 | 9.11 | 9.24 |
| Ratios (%) (to average net assets) and Supplemental data: | ||||||
| Expenses before expense reductions | 1.04(a) | 1.04 | 1.05 | 1.04 | 1.05 | 1.21 |
| Expenses after expense reductions | 0.99(a) | 0.99 | 1.00 | 0.99 | 0.99 | 1.18 |
| Net investment income (loss) | 0.68(a)(l) | 1.15 | 1.65 | 1.78 | 1.69 | 1.55 |
| Portfolio turnover | 24(n) | 36 | 43 | 65 | 41 | 24 |
| Net assets at end of period (000 omitted) | $95 | $98 | $79 | $71 | $67 | $151 |
| Class R4 | Six months ended | Year ended | ||||
| 2/28/22 (unaudited) | 8/31/21 | 8/31/20 | 8/31/19 | 8/31/18 | 8/31/17 | |
| Net asset value, beginning of period | $17.05 | $14.18 | $13.92 | $13.73 | $12.82 | $11.87 |
| Income (loss) from investment operations | ||||||
| Net investment income (loss) (d) | $0.08 | $0.21 | $0.26 | $0.27 | $0.27 | $0.21 |
| Net realized and unrealized gain (loss) | (0.51) | 2.90 | 0.39 | 0.57 | 0.91 | 0.92 |
| Total from investment operations | $(0.43) | $3.11 | $0.65 | $0.84 | $1.18 | $1.13 |
| Less distributions declared to shareholders | ||||||
| From net investment income | $(0.08) | $(0.24) | $(0.30) | $(0.26) | $(0.27) | $(0.18) |
| From net realized gain | (1.29) | — | (0.09) | (0.39) | — | — |
| Total distributions declared to shareholders | $(1.37) | $(0.24) | $(0.39) | $(0.65) | $(0.27) | $(0.18) |
| Net asset value, end of period (x) | $15.25 | $17.05 | $14.18 | $13.92 | $13.73 | $12.82 |
| Total return (%) (r)(s)(t)(x) | (2.83)(n) | 22.21 | 4.85 | 6.61 | 9.34 | 9.58 |
| Ratios (%) (to average net assets) and Supplemental data: | ||||||
| Expenses before expense reductions | 0.79(a) | 0.79 | 0.81 | 0.79 | 0.81 | 0.98 |
| Expenses after expense reductions | 0.74(a) | 0.74 | 0.75 | 0.74 | 0.74 | 0.96 |
| Net investment income (loss) | 0.93(a)(l) | 1.40 | 1.89 | 2.03 | 2.02 | 1.74 |
| Portfolio turnover | 24(n) | 36 | 43 | 65 | 41 | 24 |
| Net assets at end of period (000 omitted) | $89 | $92 | $75 | $72 | $67 | $62 |
| Class R6 | Six months ended | Year ended | ||||
| 2/28/22 (unaudited) | 8/31/21 | 8/31/20 | 8/31/19 | 8/31/18 | 8/31/17 | |
| Net asset value, beginning of period | $17.03 | $14.17 | $13.91 | $13.72 | $12.81 | $11.86 |
| Income (loss) from investment operations | ||||||
| Net investment income (loss) (d) | $0.08 | $0.22 | $0.27 | $0.28 | $0.27 | $0.21 |
| Net realized and unrealized gain (loss) | (0.50) | 2.90 | 0.40 | 0.57 | 0.92 | 0.92 |
| Total from investment operations | $(0.42) | $3.12 | $0.67 | $0.85 | $1.19 | $1.13 |
| Less distributions declared to shareholders | ||||||
| From net investment income | $(0.09) | $(0.26) | $(0.32) | $(0.27) | $(0.28) | $(0.18) |
| From net realized gain | (1.29) | — | (0.09) | (0.39) | — | — |
| Total distributions declared to shareholders | $(1.38) | $(0.26) | $(0.41) | $(0.66) | $(0.28) | $(0.18) |
| Net asset value, end of period (x) | $15.23 | $17.03 | $14.17 | $13.91 | $13.72 | $12.81 |
| Total return (%) (r)(s)(t)(x) | (2.80)(n) | 22.25 | 4.94 | 6.68 | 9.42 | 9.63 |
| Ratios (%) (to average net assets) and Supplemental data: | ||||||
| Expenses before expense reductions | 0.71(a) | 0.71 | 0.73 | 0.72 | 0.74 | 0.94 |
| Expenses after expense reductions | 0.66(a) | 0.67 | 0.67 | 0.67 | 0.67 | 0.92 |
| Net investment income (loss) | 1.02(a)(l) | 1.44 | 2.01 | 2.11 | 2.08 | 1.77 |
| Portfolio turnover | 24(n) | 36 | 43 | 65 | 41 | 24 |
| Net assets at end of period (000 omitted) | $84,261 | $94,987 | $84,631 | $76,901 | $69,385 | $68,569 |
| (a) | Annualized. |
| (d) | Per share data is based on average shares outstanding. |
| (l) | Recognition of net investment income by the fund may be affected by the timing of the declaration of dividends by companies in which the fund invests and the actual annual net investment income ratio may differ. |
| (n) | Not annualized. |
| (r) | Certain expenses have been reduced without which performance would have been lower. |
| (s) | From time to time the fund may receive proceeds from litigation settlements, without which performance would be lower. |
| (t) | Total returns do not include any applicable sales charges. |
| (w) | Per share amount was less than $0.01. |
| (x) | The net asset values and total returns have been calculated on net assets which include adjustments made in accordance with U.S. generally accepted accounting principles required at period end for financial reporting purposes. |
| Financial Instruments | Level 1 | Level 2 | Level 3 | Total |
| Equity Securities: | ||||
| United States | $115,964,585 | $— | $— | $115,964,585 |
| Japan | 1,047,554 | 24,109,536 | — | 25,157,090 |
| Canada | 15,573,867 | — | — | 15,573,867 |
| Switzerland | 12,887,288 | — | — | 12,887,288 |
| Hong Kong | 6,525,165 | 3,826,119 | — | 10,351,284 |
| United Kingdom | 6,941,426 | — | — | 6,941,426 |
| Germany | 6,539,848 | — | — | 6,539,848 |
| Denmark | 6,400,202 | — | — | 6,400,202 |
| Taiwan | 6,366,132 | — | — | 6,366,132 |
| Other Countries | 13,532,203 | 13,719,802 | — | 27,252,005 |
| Mutual Funds | 609,573 | — | — | 609,573 |
| Total | $192,387,843 | $41,655,457 | $— | $234,043,300 |
| Year ended 8/31/21 | |
| Ordinary income (including any short-term capital gains) | $3,422,711 |
| As of 2/28/22 | |
| Cost of investments | $186,856,224 |
| Gross appreciation | 51,300,134 |
| Gross depreciation | (4,113,058) |
| Net unrealized appreciation (depreciation) | $ 47,187,076 |
| As of 8/31/21 | |
| Undistributed ordinary income | 375,421 |
| Undistributed long-term capital gain | 10,296,568 |
| Other temporary differences | (37,303) |
| Net unrealized appreciation (depreciation) | 65,243,045 |
| Six months ended 2/28/22 | Year ended 8/31/21 | ||
| Class A | $2,027,442 | $320,694 | |
| Class B | 36,515 | 2,976 | |
| Class C | 249,639 | 22,960 | |
| Class I | 8,568,369 | 1,628,467 | |
| Class R1 | 11,493 | 904 | |
| Class R2 | 12,006 | 2,441 | |
| Class R3 | 7,774 | 1,170 | |
| Class R4 | 7,405 | 1,303 | |
| Class R6 | 7,797,974 | 1,441,796 | |
| Total | $18,718,617 | $3,422,711 |
| Up to $1 billion | 0.55% |
| In excess of $1 billion and up to $2.5 billion | 0.525% |
| In excess of $2.5 billion | 0.50% |
| Classes | ||||||||
| A | B | C | I | R1 | R2 | R3 | R4 | R6 |
| 0.99% | 1.74% | 1.74% | 0.74% | 1.74% | 1.24% | 0.99% | 0.74% | 0.68% |
| Distribution Fee Rate (d) | Service Fee Rate (d) | Total Distribution Plan (d) | Annual Effective Rate (e) | Distribution and Service Fee | |
| Class A | — | 0.25% | 0.25% | 0.25% | $ 31,459 |
| Class B | 0.75% | 0.25% | 1.00% | 1.00% | 2,334 |
| Class C | 0.75% | 0.25% | 1.00% | 1.00% | 15,397 |
| Class R1 | 0.75% | 0.25% | 1.00% | 1.00% | 737 |
| Class R2 | 0.25% | 0.25% | 0.50% | 0.50% | 458 |
| Class R3 | — | 0.25% | 0.25% | 0.25% | 121 |
| Total Distribution and Service Fees | $50,506 |
| (d) | In accordance with the distribution plan for certain classes, the fund pays distribution and/or service fees equal to these annual percentage rates of each class’s average daily net assets. The distribution and service fee rates disclosed by class represent the current rates in effect at the end of the reporting period. Any rate changes, if applicable, are detailed below. |
| (e) | The annual effective rates represent actual fees incurred under the distribution plan for the six months ended February 28, 2022 based on each class's average daily net assets. MFD has voluntarily agreed to rebate a portion of each class's 0.25% service fee attributable to accounts for which there is no financial intermediary specified on the account except for accounts attributable to MFS or its affiliates' seed money. There were no service fee rebates for the six months ended February 28, 2022. |
| Amount | |
| Class A | $496 |
| Class B | — |
| Class C | 592 |
| Six months ended 2/28/22 | Year ended 8/31/21 | ||||
| Shares | Amount | Shares | Amount | ||
| Shares sold | |||||
| Class A | 102,875 | $1,660,051 | 238,665 | $3,677,447 | |
| Class B | 19 | 296 | 63 | 1,000 | |
| Class C | 14,311 | 238,131 | 39,969 | 589,206 | |
| Class I | 2,602,753 | 40,643,281 | 1,328,671 | 20,430,896 | |
| Class R1 | 178 | 2,874 | 1,001 | 14,668 | |
| Class R2 | 298 | 5,067 | 3,664 | 55,033 | |
| Class R3 | 21 | 321 | 61 | 965 | |
| Class R6 | 294,492 | 4,928,548 | 1,210,679 | 18,635,799 | |
| 3,014,947 | $47,478,569 | 2,822,773 | $43,405,014 | ||
| Shares issued to shareholders in reinvestment of distributions | |||||
| Class A | 127,633 | $2,027,442 | 21,522 | $320,507 | |
| Class B | 2,319 | 36,515 | 201 | 2,976 | |
| Class C | 15,885 | 249,639 | 1,554 | 22,794 | |
| Class I | 454,144 | 7,214,294 | 90,681 | 1,348,772 | |
| Class R1 | 727 | 11,493 | 61 | 904 | |
| Class R2 | 755 | 12,006 | 162 | 2,441 | |
| Class R3 | 489 | 7,774 | 78 | 1,170 | |
| Class R4 | 466 | 7,405 | 87 | 1,303 | |
| Class R6 | 481,047 | 7,634,976 | 93,082 | 1,384,402 | |
| 1,083,465 | $17,201,544 | 207,428 | $3,085,269 | ||
| Shares reacquired | |||||
| Class A | (115,630) | $(1,895,809) | (402,341) | $(6,090,235) | |
| Class B | (135) | (2,152) | (1,256) | (18,832) | |
| Class C | (13,743) | (221,411) | (87,888) | (1,322,033) | |
| Class I | (880,036) | (14,084,868) | (2,926,885) | (44,656,104) | |
| Class R1 | (6) | (104) | (5) | (70) | |
| Class R2 | (6,892) | (116,988) | (377) | (6,259) | |
| Class R3 | (1) | (10) | (1) | (17) | |
| Class R6 | (822,875) | (12,938,811) | (1,698,825) | (25,794,577) | |
| (1,839,318) | $(29,260,153) | (5,117,578) | $(77,888,127) | ||
| Six months ended 2/28/22 | Year ended 8/31/21 | ||||
| Shares | Amount | Shares | Amount | ||
| Net change | |||||
| Class A | 114,878 | $1,791,684 | (142,154) | $(2,092,281) | |
| Class B | 2,203 | 34,659 | (992) | (14,856) | |
| Class C | 16,453 | 266,359 | (46,365) | (710,033) | |
| Class I | 2,176,861 | 33,772,707 | (1,507,533) | (22,876,436) | |
| Class R1 | 899 | 14,263 | 1,057 | 15,502 | |
| Class R2 | (5,839) | (99,915) | 3,449 | 51,215 | |
| Class R3 | 509 | 8,085 | 138 | 2,118 | |
| Class R4 | 466 | 7,405 | 87 | 1,303 | |
| Class R6 | (47,336) | (375,287) | (395,064) | (5,774,376) | |
| 2,259,094 | $35,419,960 | (2,087,377) | $(31,397,844) | ||
| Affiliated Issuers | Beginning Value | Purchases | Sales Proceeds | Realized Gain (Loss) | Change in Unrealized Appreciation or Depreciation | Ending Value |
| MFS Institutional Money Market Portfolio | $517,066 | $38,889,275 | $38,796,768 | $— | $— | $609,573 |
| Affiliated Issuers | Dividend Income | Capital Gain Distributions |
| MFS Institutional Money Market Portfolio | $334 | $— |


Equity Fund

Equity Fund
| 1 | |
| 2 | |
| 3 | |
| 5 | |
| 10 | |
| 12 | |
| 13 | |
| 14 | |
| 23 | |
| 33 | |
| 33 | |
| 33 | |
| 33 | |
| 33 |
| back cover |


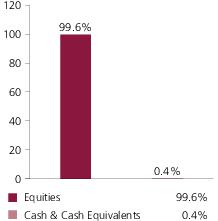
| Microsoft Corp. | 3.7% |
| Alphabet, Inc., “A” | 3.6% |
| Eli Lilly & Co. | 3.1% |
| Johnson & Johnson | 2.7% |
| Accenture PLC, “A” | 2.6% |
| Adobe Systems, Inc. | 2.5% |
| PepsiCo, Inc. | 2.2% |
| Everest Re Group Ltd. | 2.1% |
| Amdocs Ltd. | 2.1% |
| Target Corp. | 2.1% |
| Information Technology | 22.2% |
| Health Care | 16.8% |
| Industrials | 12.7% |
| Consumer Staples | 10.9% |
| Communication Services | 10.7% |
| Utilities | 7.3% |
| Consumer Discretionary | 6.8% |
| Financials | 6.7% |
| Real Estate | 3.3% |
| Materials | 2.2% |
| (g) | The Global Industry Classification Standard (GICS®) was developed by and/or is the exclusive property of MSCI, Inc. and S&P Global Market Intelligence Inc. (“S&P Global Market Intelligence”). GICS is a service mark of MSCI and S&P Global Market Intelligence and has been licensed for use by MFS. MFS has applied its own internal sector/industry classification methodology for equity securities and non-equity securities that are unclassified by GICS. |
September 1, 2021 through February 28, 2022
| Share Class | Annualized Expense Ratio | Beginning Account Value 9/01/21 | Ending Account Value 2/28/22 | Expenses Paid During Period (p) 9/01/21-2/28/22 | |
| A | Actual | 0.89% | $1,000.00 | $943.20 | $4.29 |
| Hypothetical (h) | 0.89% | $1,000.00 | $1,020.38 | $4.46 | |
| B | Actual | 1.64% | $1,000.00 | $939.99 | $7.89 |
| Hypothetical (h) | 1.64% | $1,000.00 | $1,016.66 | $8.20 | |
| C | Actual | 1.64% | $1,000.00 | $939.74 | $7.89 |
| Hypothetical (h) | 1.64% | $1,000.00 | $1,016.66 | $8.20 | |
| I | Actual | 0.64% | $1,000.00 | $944.45 | $3.09 |
| Hypothetical (h) | 0.64% | $1,000.00 | $1,021.62 | $3.21 | |
| R1 | Actual | 1.64% | $1,000.00 | $940.10 | $7.89 |
| Hypothetical (h) | 1.64% | $1,000.00 | $1,016.66 | $8.20 | |
| R2 | Actual | 1.14% | $1,000.00 | $941.93 | $5.49 |
| Hypothetical (h) | 1.14% | $1,000.00 | $1,019.14 | $5.71 | |
| R3 | Actual | 0.89% | $1,000.00 | $943.38 | $4.29 |
| Hypothetical (h) | 0.89% | $1,000.00 | $1,020.38 | $4.46 | |
| R4 | Actual | 0.64% | $1,000.00 | $944.45 | $3.09 |
| Hypothetical (h) | 0.64% | $1,000.00 | $1,021.62 | $3.21 | |
| R6 | Actual | 0.55% | $1,000.00 | $944.87 | $2.65 |
| Hypothetical (h) | 0.55% | $1,000.00 | $1,022.07 | $2.76 |
| (h) | 5% class return per year before expenses. |
| (p) | “Expenses Paid During Period” are equal to each class’s annualized expense ratio, as shown above, multiplied by the average account value over the period, multiplied by 181/365 (to reflect the one-half year period). Expenses paid do not include any applicable sales charges (loads). If these transaction costs had been included, your costs would have been higher. |
| Issuer | Shares/Par | Value ($) | ||
| Common Stocks – 99.6% | ||||
| Aerospace & Defense – 1.3% | ||||
| CACI International, Inc., “A” (a) | 16,076 | $ 4,497,904 | ||
| Honeywell International, Inc. | 14,078 | 2,671,301 | ||
| $7,169,205 | ||||
| Business Services – 6.7% | ||||
| Accenture PLC, “A” | 43,396 | $ 13,714,004 | ||
| Amdocs Ltd. | 141,618 | 11,145,337 | ||
| Fidelity National Information Services, Inc. | 27,473 | 2,616,254 | ||
| Fiserv, Inc. (a) | 26,058 | 2,545,085 | ||
| FleetCor Technologies, Inc. (a) | 15,132 | 3,543,914 | ||
| Verisk Analytics, Inc., “A” | 12,241 | 2,170,819 | ||
| $35,735,413 | ||||
| Cable TV – 2.9% | ||||
| Cable One, Inc. | 3,600 | $ 5,158,260 | ||
| Charter Communications, Inc., “A” (a) | 11,127 | 6,696,006 | ||
| Comcast Corp., “A” | 80,612 | 3,769,417 | ||
| $15,623,683 | ||||
| Computer Software – 7.8% | ||||
| Adobe Systems, Inc. (a) | 28,061 | $ 13,123,568 | ||
| Cadence Design Systems, Inc. (a) | 18,943 | 2,868,539 | ||
| Intuit, Inc. | 12,589 | 5,971,844 | ||
| Microsoft Corp. | 66,293 | 19,807,685 | ||
| $41,771,636 | ||||
| Computer Software - Systems – 1.0% | ||||
| Apple, Inc. | 31,635 | $ 5,223,571 | ||
| Construction – 0.6% | ||||
| AvalonBay Communities, Inc., REIT | 12,770 | $ 3,046,794 | ||
| Consumer Products – 2.7% | ||||
| Colgate-Palmolive Co. | 63,708 | $ 4,902,330 | ||
| Procter & Gamble Co. | 60,138 | 9,374,913 | ||
| $14,277,243 | ||||
| Electrical Equipment – 3.2% | ||||
| AMETEK, Inc. | 19,796 | $ 2,569,323 | ||
| Emerson Electric Co. | 24,299 | 2,257,863 | ||
| Johnson Controls International PLC | 69,130 | 4,490,685 | ||
| Issuer | Shares/Par | Value ($) | ||
| Common Stocks – continued | ||||
| Electrical Equipment – continued | ||||
| TE Connectivity Ltd. | 52,833 | $ 7,525,004 | ||
| $16,842,875 | ||||
| Electronics – 1.4% | ||||
| Texas Instruments, Inc. | 45,317 | $ 7,703,437 | ||
| Food & Beverages – 5.1% | ||||
| General Mills, Inc. | 106,012 | $ 7,148,389 | ||
| Ingredion, Inc. | 26,113 | 2,317,268 | ||
| J.M. Smucker Co. | 18,169 | 2,448,273 | ||
| Mondelez International, Inc. | 51,306 | 3,359,517 | ||
| PepsiCo, Inc. | 72,303 | 11,838,893 | ||
| $27,112,340 | ||||
| Food & Drug Stores – 2.5% | ||||
| Kroger Co. | 105,539 | $ 4,939,225 | ||
| Wal-Mart Stores, Inc. | 62,923 | 8,504,673 | ||
| $13,443,898 | ||||
| General Merchandise – 0.7% | ||||
| Costco Wholesale Corp. | 6,882 | $ 3,573,479 | ||
| Health Maintenance Organizations – 0.5% | ||||
| UnitedHealth Group, Inc. | 5,174 | $ 2,462,151 | ||
| Insurance – 5.6% | ||||
| Aon PLC | 20,661 | $ 6,035,905 | ||
| Assurant, Inc. | 21,200 | 3,597,852 | ||
| Chubb Ltd. | 29,059 | 5,917,575 | ||
| Everest Re Group Ltd. | 37,420 | 11,159,392 | ||
| MetLife, Inc. | 49,337 | 3,332,714 | ||
| $30,043,438 | ||||
| Internet – 5.1% | ||||
| Alphabet, Inc., “A” (a) | 7,132 | $ 19,264,530 | ||
| Alphabet, Inc., “C” (a) | 2,958 | 7,980,152 | ||
| $27,244,682 | ||||
| Leisure & Toys – 0.5% | ||||
| Electronic Arts, Inc. | 22,042 | $ 2,867,444 | ||
| Machinery & Tools – 2.2% | ||||
| Eaton Corp. PLC | 60,890 | $ 9,394,718 | ||
| Roper Technologies, Inc. | 5,169 | 2,316,849 | ||
| $11,711,567 | ||||
| Issuer | Shares/Par | Value ($) | ||
| Common Stocks – continued | ||||
| Medical & Health Technology & Services – 1.8% | ||||
| Charles River Laboratories International, Inc. (a) | 11,393 | $ 3,317,186 | ||
| McKesson Corp. | 22,667 | 6,232,518 | ||
| $9,549,704 | ||||
| Medical Equipment – 5.3% | ||||
| Abbott Laboratories | 18,870 | $ 2,276,099 | ||
| Danaher Corp. | 19,542 | 5,362,520 | ||
| Medtronic PLC | 72,538 | 7,615,765 | ||
| STERIS PLC | 41,588 | 9,981,120 | ||
| Thermo Fisher Scientific, Inc. | 5,438 | 2,958,272 | ||
| $28,193,776 | ||||
| Network & Telecom – 0.9% | ||||
| Motorola Solutions, Inc. | 22,880 | $ 5,043,438 | ||
| Other Banks & Diversified Financials – 4.4% | ||||
| Mastercard, Inc., “A” | 27,201 | $ 9,814,665 | ||
| S&P Global, Inc. | 7,579 | 2,847,430 | ||
| U.S. Bancorp | 47,771 | 2,700,972 | ||
| Visa, Inc., “A” | 37,990 | 8,210,399 | ||
| $23,573,466 | ||||
| Pharmaceuticals – 9.3% | ||||
| Eli Lilly & Co. | 67,189 | $ 16,793,891 | ||
| Johnson & Johnson | 86,443 | 14,225,924 | ||
| Merck & Co., Inc. | 88,873 | 6,805,894 | ||
| Pfizer, Inc. | 163,161 | 7,658,777 | ||
| Zoetis, Inc. | 20,987 | 4,064,133 | ||
| $49,548,619 | ||||
| Pollution Control – 4.0% | ||||
| Republic Services, Inc. | 77,156 | $ 9,280,324 | ||
| Waste Connections, Inc. | 58,556 | 7,231,081 | ||
| Waste Management, Inc. | 33,471 | 4,833,212 | ||
| $21,344,617 | ||||
| Precious Metals & Minerals – 1.2% | ||||
| Newmont Corp. | 92,806 | $ 6,143,757 | ||
| Real Estate – 2.7% | ||||
| Extra Space Storage, Inc., REIT | 16,715 | $ 3,144,927 | ||
| Public Storage, Inc., REIT | 15,967 | 5,668,604 | ||
| STAG Industrial, Inc., REIT | 82,885 | 3,229,200 | ||
| Sun Communities, Inc., REIT | 13,499 | 2,443,319 | ||
| $14,486,050 | ||||
| Issuer | Shares/Par | Value ($) | ||
| Common Stocks – continued | ||||
| Restaurants – 2.0% | ||||
| McDonald's Corp. | 13,940 | $ 3,412,094 | ||
| Starbucks Corp. | 76,707 | 7,040,935 | ||
| $10,453,029 | ||||
| Specialty Chemicals – 1.0% | ||||
| Ashland Global Holdings, Inc. | 25,224 | $ 2,327,671 | ||
| Ecolab, Inc. | 17,646 | 3,110,284 | ||
| $5,437,955 | ||||
| Specialty Stores – 4.8% | ||||
| Amazon.com, Inc. (a) | 2,733 | $ 8,393,754 | ||
| AutoZone, Inc. (a) | 2,061 | 3,840,447 | ||
| Home Depot, Inc. | 8,093 | 2,556,012 | ||
| Target Corp. | 55,629 | 11,113,005 | ||
| $25,903,218 | ||||
| Telecommunications - Wireless – 1.6% | ||||
| T-Mobile US, Inc. (a) | 71,350 | $ 8,791,034 | ||
| Telephone Services – 0.5% | ||||
| Verizon Communications, Inc. | 51,131 | $ 2,744,201 | ||
| Trucking – 3.1% | ||||
| Expeditors International of Washington, Inc. | 27,548 | $ 2,847,361 | ||
| J.B. Hunt Transport Services, Inc. | 14,350 | 2,912,046 | ||
| Landstar System, Inc. | 19,615 | 3,028,752 | ||
| Old Dominion Freight Line, Inc. | 23,920 | 7,511,598 | ||
| $16,299,757 | ||||
| Utilities - Electric Power – 7.2% | ||||
| American Electric Power Co., Inc. | 42,458 | $ 3,848,818 | ||
| DTE Energy Co. | 31,312 | 3,807,226 | ||
| Duke Energy Corp. | 44,477 | 4,465,936 | ||
| Evergy, Inc. | 46,447 | 2,898,757 | ||
| Exelon Corp. | 175,807 | 7,482,346 | ||
| NextEra Energy, Inc. | 90,178 | 7,058,232 | ||
| Sempra Energy | 23,733 | 3,422,773 | ||
| Xcel Energy, Inc. | 84,841 | 5,712,344 | ||
| $38,696,432 | ||||
| Total Common Stocks (Identified Cost, $381,291,243) | $532,061,909 | |||
| Issuer | Shares/Par | Value ($) | ||
| Investment Companies (h) – 0.3% | ||||
| Money Market Funds – 0.3% | ||||
| MFS Institutional Money Market Portfolio, 0.06% (v) (Identified Cost, $1,772,061) | 1,772,061 | $ 1,772,061 | ||
| Other Assets, Less Liabilities – 0.1% | 571,834 | |||
| Net Assets – 100.0% | $534,405,804 | |||
| (a) | Non-income producing security. | |||
| (h) | An affiliated issuer, which may be considered one in which the fund owns 5% or more of the outstanding voting securities, or a company which is under common control. At period end, the aggregate values of the fund's investments in affiliated issuers and in unaffiliated issuers were $1,772,061 and $532,061,909, respectively. | |||
| (v) | Affiliated issuer that is available only to investment companies managed by MFS. The rate quoted for the MFS Institutional Money Market Portfolio is the annualized seven-day yield of the fund at period end. |
| The following abbreviations are used in this report and are defined: | |
| REIT | Real Estate Investment Trust |
| Assets | |
| Investments in unaffiliated issuers, at value (identified cost, $381,291,243) | $532,061,909 |
| Investments in affiliated issuers, at value (identified cost, $1,772,061) | 1,772,061 |
| Receivables for | |
| Fund shares sold | 688,524 |
| Dividends | 769,709 |
| Other assets | 52,383 |
| Total assets | $535,344,586 |
| Liabilities | |
| Payables for | |
| Fund shares reacquired | $760,861 |
| Payable to affiliates | |
| Investment adviser | 14,218 |
| Administrative services fee | 898 |
| Shareholder servicing costs | 98,900 |
| Distribution and service fees | 7,888 |
| Payable for independent Trustees' compensation | 1,807 |
| Accrued expenses and other liabilities | 54,210 |
| Total liabilities | $938,782 |
| Net assets | $534,405,804 |
| Net assets consist of | |
| Paid-in capital | $360,144,527 |
| Total distributable earnings (loss) | 174,261,277 |
| Net assets | $534,405,804 |
| Shares of beneficial interest outstanding | 26,379,369 |
| Net assets | Shares outstanding | Net asset value per share (a) | |
| Class A | $162,711,588 | 8,038,198 | $20.24 |
| Class B | 2,199,526 | 109,053 | 20.17 |
| Class C | 29,124,391 | 1,450,143 | 20.08 |
| Class I | 259,594,194 | 12,803,121 | 20.28 |
| Class R1 | 542,009 | 26,825 | 20.21 |
| Class R2 | 505,322 | 24,854 | 20.33 |
| Class R3 | 702,226 | 34,567 | 20.32 |
| Class R4 | 100,593 | 4,957 | 20.29 |
| Class R6 | 78,925,955 | 3,887,651 | 20.30 |
| (a) | Maximum offering price per share was equal to the net asset value per share for all share classes, except for Class A, for which the maximum offering price per share was $21.47 [100 / 94.25 x $20.24]. On sales of $50,000 or more, the maximum offering price of Class A shares is reduced. A contingent deferred sales charge may be imposed on redemptions of Class A, Class B, and Class C shares. Redemption price per share was equal to the net asset value per share for Classes I, R1, R2, R3, R4, and R6. |
| Net investment income (loss) | |
| Income | |
| Dividends | $4,037,718 |
| Other | 1,800 |
| Dividends from affiliated issuers | 867 |
| Foreign taxes withheld | (2,556) |
| Total investment income | $4,037,829 |
| Expenses | |
| Management fee | $1,506,854 |
| Distribution and service fees | 384,957 |
| Shareholder servicing costs | 256,047 |
| Administrative services fee | 45,174 |
| Independent Trustees' compensation | 4,758 |
| Custodian fee | 18,970 |
| Shareholder communications | 22,915 |
| Audit and tax fees | 26,404 |
| Legal fees | 1,620 |
| Miscellaneous | 94,861 |
| Total expenses | $2,362,560 |
| Reduction of expenses by investment adviser and distributor | (80,438) |
| Net expenses | $2,282,122 |
| Net investment income (loss) | $1,755,707 |
| Realized and unrealized gain (loss) | |
| Realized gain (loss) (identified cost basis) | |
| Unaffiliated issuers | $35,738,430 |
| Foreign currency | (15) |
| Net realized gain (loss) | $35,738,415 |
| Change in unrealized appreciation or depreciation | |
| Unaffiliated issuers | $(72,587,928) |
| Translation of assets and liabilities in foreign currencies | (7) |
| Net unrealized gain (loss) | $(72,587,935) |
| Net realized and unrealized gain (loss) | $(36,849,520) |
| Change in net assets from operations | $(35,093,813) |
| Six months ended | Year ended | |
| 2/28/22 (unaudited) | 8/31/21 | |
| Change in net assets | ||
| From operations | ||
| Net investment income (loss) | $1,755,707 | $5,312,280 |
| Net realized gain (loss) | 35,738,415 | 45,239,789 |
| Net unrealized gain (loss) | (72,587,935) | 112,943,592 |
| Change in net assets from operations | $(35,093,813) | $163,495,661 |
| Total distributions to shareholders | $(29,477,281) | $(6,341,771) |
| Change in net assets from fund share transactions | $(29,604,754) | $(240,280,530) |
| Total change in net assets | $(94,175,848) | $(83,126,640) |
| Net assets | ||
| At beginning of period | 628,581,652 | 711,708,292 |
| At end of period | $534,405,804 | $628,581,652 |
| Class A | Six months ended | Year ended | ||||
| 2/28/22 (unaudited) | 8/31/21 | 8/31/20 | 8/31/19 | 8/31/18 | 8/31/17 | |
| Net asset value, beginning of period | $22.51 | $17.32 | $16.28 | $15.05 | $13.77 | $12.56 |
| Income (loss) from investment operations | ||||||
| Net investment income (loss) (d) | $0.05 | $0.14 | $0.18 | $0.18 | $0.18 | $0.16 |
| Net realized and unrealized gain (loss) | (1.26) | 5.22 | 1.04 | 1.68 | 1.47 | 1.23 |
| Total from investment operations | $(1.21) | $5.36 | $1.22 | $1.86 | $1.65 | $1.39 |
| Less distributions declared to shareholders | ||||||
| From net investment income | $(0.05) | $(0.17) | $(0.16) | $(0.17) | $(0.18) | $(0.15) |
| From net realized gain | (1.01) | — | (0.02) | (0.46) | (0.19) | (0.03) |
| Total distributions declared to shareholders | $(1.06) | $(0.17) | $(0.18) | $(0.63) | $(0.37) | $(0.18) |
| Net asset value, end of period (x) | $20.24 | $22.51 | $17.32 | $16.28 | $15.05 | $13.77 |
| Total return (%) (r)(s)(t)(x) | (5.68)(n) | 31.16 | 7.64 | 13.23 | 12.14 | 11.18 |
| Ratios (%) (to average net assets) and Supplemental data: | ||||||
| Expenses before expense reductions | 0.92(a) | 0.92 | 0.92 | 1.05 | 1.16 | 1.33 |
| Expenses after expense reductions | 0.89(a) | 0.89 | 0.89 | 0.89 | 0.88 | 1.16 |
| Net investment income (loss) | 0.45(a)(l) | 0.71 | 1.11 | 1.22 | 1.25 | 1.19 |
| Portfolio turnover | 20(n) | 20 | 34 | 28 | 30 | 36 |
| Net assets at end of period (000 omitted) | $162,712 | $171,216 | $135,199 | $85,022 | $41,177 | $39,568 |
| Class B | Six months ended | Year ended | ||||
| 2/28/22 (unaudited) | 8/31/21 | 8/31/20 | 8/31/19 | 8/31/18 | 8/31/17 | |
| Net asset value, beginning of period | $22.46 | $17.29 | $16.25 | $15.02 | $13.74 | $12.53 |
| Income (loss) from investment operations | ||||||
| Net investment income (loss) (d) | $(0.03) | $(0.01) | $0.06 | $0.07 | $0.07 | $0.06 |
| Net realized and unrealized gain (loss) | (1.25) | 5.22 | 1.03 | 1.68 | 1.47 | 1.23 |
| Total from investment operations | $(1.28) | $5.21 | $1.09 | $1.75 | $1.54 | $1.29 |
| Less distributions declared to shareholders | ||||||
| From net investment income | $— | $(0.04) | $(0.03) | $(0.06) | $(0.07) | $(0.05) |
| From net realized gain | (1.01) | — | (0.02) | (0.46) | (0.19) | (0.03) |
| Total distributions declared to shareholders | $(1.01) | $(0.04) | $(0.05) | $(0.52) | $(0.26) | $(0.08) |
| Net asset value, end of period (x) | $20.17 | $22.46 | $17.29 | $16.25 | $15.02 | $13.74 |
| Total return (%) (r)(s)(t)(x) | (6.00)(n) | 30.19 | 6.77 | 12.41 | 11.32 | 10.36 |
| Ratios (%) (to average net assets) and Supplemental data: | ||||||
| Expenses before expense reductions | 1.67(a) | 1.67 | 1.67 | 1.81 | 1.91 | 2.08 |
| Expenses after expense reductions | 1.64(a) | 1.64 | 1.64 | 1.64 | 1.64 | 1.92 |
| Net investment income (loss) | (0.30)(a)(l) | (0.04) | 0.35 | 0.48 | 0.50 | 0.43 |
| Portfolio turnover | 20(n) | 20 | 34 | 28 | 30 | 36 |
| Net assets at end of period (000 omitted) | $2,200 | $2,511 | $2,198 | $2,558 | $2,211 | $2,081 |
| Class C | Six months ended | Year ended | ||||
| 2/28/22 (unaudited) | 8/31/21 | 8/31/20 | 8/31/19 | 8/31/18 | 8/31/17 | |
| Net asset value, beginning of period | $22.37 | $17.22 | $16.20 | $14.98 | $13.70 | $12.50 |
| Income (loss) from investment operations | ||||||
| Net investment income (loss) (d) | $(0.03) | $(0.01) | $0.06 | $0.07 | $0.07 | $0.06 |
| Net realized and unrealized gain (loss) | (1.25) | 5.20 | 1.03 | 1.67 | 1.48 | 1.23 |
| Total from investment operations | $(1.28) | $5.19 | $1.09 | $1.74 | $1.55 | $1.29 |
| Less distributions declared to shareholders | ||||||
| From net investment income | $— | $(0.04) | $(0.05) | $(0.06) | $(0.08) | $(0.06) |
| From net realized gain | (1.01) | — | (0.02) | (0.46) | (0.19) | (0.03) |
| Total distributions declared to shareholders | $(1.01) | $(0.04) | $(0.07) | $(0.52) | $(0.27) | $(0.09) |
| Net asset value, end of period (x) | $20.08 | $22.37 | $17.22 | $16.20 | $14.98 | $13.70 |
| Total return (%) (r)(s)(t)(x) | (6.03)(n) | 30.20 | 6.75 | 12.40 | 11.36 | 10.36 |
| Ratios (%) (to average net assets) and Supplemental data: | ||||||
| Expenses before expense reductions | 1.67(a) | 1.67 | 1.67 | 1.81 | 1.91 | 2.08 |
| Expenses after expense reductions | 1.64(a) | 1.64 | 1.64 | 1.64 | 1.64 | 1.92 |
| Net investment income (loss) | (0.30)(a)(l) | (0.03) | 0.35 | 0.47 | 0.50 | 0.43 |
| Portfolio turnover | 20(n) | 20 | 34 | 28 | 30 | 36 |
| Net assets at end of period (000 omitted) | $29,124 | $32,839 | $29,429 | $21,859 | $13,942 | $12,422 |
| Class I | Six months ended | Year ended | ||||
| 2/28/22 (unaudited) | 8/31/21 | 8/31/20 | 8/31/19 | 8/31/18 | 8/31/17 | |
| Net asset value, beginning of period | $22.55 | $17.34 | $16.31 | $15.07 | $13.78 | $12.57 |
| Income (loss) from investment operations | ||||||
| Net investment income (loss) (d) | $0.08 | $0.19 | $0.22 | $0.23 | $0.21 | $0.19 |
| Net realized and unrealized gain (loss) | (1.26) | 5.23 | 1.03 | 1.68 | 1.49 | 1.23 |
| Total from investment operations | $(1.18) | $5.42 | $1.25 | $1.91 | $1.70 | $1.42 |
| Less distributions declared to shareholders | ||||||
| From net investment income | $(0.08) | $(0.21) | $(0.20) | $(0.21) | $(0.22) | $(0.18) |
| From net realized gain | (1.01) | — | (0.02) | (0.46) | (0.19) | (0.03) |
| Total distributions declared to shareholders | $(1.09) | $(0.21) | $(0.22) | $(0.67) | $(0.41) | $(0.21) |
| Net asset value, end of period (x) | $20.28 | $22.55 | $17.34 | $16.31 | $15.07 | $13.78 |
| Total return (%) (r)(s)(t)(x) | (5.56)(n) | 31.55 | 7.82 | 13.55 | 12.49 | 11.44 |
| Ratios (%) (to average net assets) and Supplemental data: | ||||||
| Expenses before expense reductions | 0.67(a) | 0.67 | 0.67 | 0.78 | 0.91 | 1.07 |
| Expenses after expense reductions | 0.64(a) | 0.64 | 0.64 | 0.64 | 0.64 | 0.92 |
| Net investment income (loss) | 0.70(a)(l) | 0.99 | 1.35 | 1.46 | 1.50 | 1.47 |
| Portfolio turnover | 20(n) | 20 | 34 | 28 | 30 | 36 |
| Net assets at end of period (000 omitted) | $259,594 | $335,165 | $464,428 | $246,245 | $30,751 | $21,814 |
| Class R1 | Six months ended | Year ended | ||||
| 2/28/22 (unaudited) | 8/31/21 | 8/31/20 | 8/31/19 | 8/31/18 | 8/31/17 | |
| Net asset value, beginning of period | $22.50 | $17.33 | $16.29 | $15.06 | $13.77 | $12.57 |
| Income (loss) from investment operations | ||||||
| Net investment income (loss) (d) | $(0.03) | $(0.01) | $0.05 | $0.07 | $0.07 | $0.05 |
| Net realized and unrealized gain (loss) | (1.25) | 5.23 | 1.05 | 1.68 | 1.48 | 1.24 |
| Total from investment operations | $(1.28) | $5.22 | $1.10 | $1.75 | $1.55 | $1.29 |
| Less distributions declared to shareholders | ||||||
| From net investment income | $— | $(0.05) | $(0.04) | $(0.06) | $(0.07) | $(0.06) |
| From net realized gain | (1.01) | — | (0.02) | (0.46) | (0.19) | (0.03) |
| Total distributions declared to shareholders | $(1.01) | $(0.05) | $(0.06) | $(0.52) | $(0.26) | $(0.09) |
| Net asset value, end of period (x) | $20.21 | $22.50 | $17.33 | $16.29 | $15.06 | $13.77 |
| Total return (%) (r)(s)(t)(x) | (5.99)(n) | 30.18 | 6.79 | 12.37 | 11.36 | 10.33 |
| Ratios (%) (to average net assets) and Supplemental data: | ||||||
| Expenses before expense reductions | 1.67(a) | 1.67 | 1.67 | 1.81 | 1.91 | 2.07 |
| Expenses after expense reductions | 1.64(a) | 1.64 | 1.64 | 1.64 | 1.64 | 1.91 |
| Net investment income (loss) | (0.31)(a)(l) | (0.07) | 0.34 | 0.48 | 0.49 | 0.41 |
| Portfolio turnover | 20(n) | 20 | 34 | 28 | 30 | 36 |
| Net assets at end of period (000 omitted) | $542 | $683 | $340 | $164 | $136 | $108 |
| Class R2 | Six months ended | Year ended | ||||
| 2/28/22 (unaudited) | 8/31/21 | 8/31/20 | 8/31/19 | 8/31/18 | 8/31/17 | |
| Net asset value, beginning of period | $22.61 | $17.39 | $16.36 | $15.12 | $13.83 | $12.61 |
| Income (loss) from investment operations | ||||||
| Net investment income (loss) (d) | $0.02 | $0.09 | $0.14 | $0.15 | $0.14 | $0.12 |
| Net realized and unrealized gain (loss) | (1.26) | 5.25 | 1.04 | 1.68 | 1.49 | 1.25 |
| Total from investment operations | $(1.24) | $5.34 | $1.18 | $1.83 | $1.63 | $1.37 |
| Less distributions declared to shareholders | ||||||
| From net investment income | $(0.03) | $(0.12) | $(0.13) | $(0.13) | $(0.15) | $(0.12) |
| From net realized gain | (1.01) | — | (0.02) | (0.46) | (0.19) | (0.03) |
| Total distributions declared to shareholders | $(1.04) | $(0.12) | $(0.15) | $(0.59) | $(0.34) | $(0.15) |
| Net asset value, end of period (x) | $20.33 | $22.61 | $17.39 | $16.36 | $15.12 | $13.83 |
| Total return (%) (r)(s)(t)(x) | (5.81)(n) | 30.88 | 7.29 | 12.94 | 11.93 | 10.93 |
| Ratios (%) (to average net assets) and Supplemental data: | ||||||
| Expenses before expense reductions | 1.17(a) | 1.17 | 1.17 | 1.30 | 1.42 | 1.58 |
| Expenses after expense reductions | 1.14(a) | 1.14 | 1.14 | 1.14 | 1.14 | 1.42 |
| Net investment income (loss) | 0.19(a)(l) | 0.45 | 0.86 | 0.98 | 1.01 | 0.91 |
| Portfolio turnover | 20(n) | 20 | 34 | 28 | 30 | 36 |
| Net assets at end of period (000 omitted) | $505 | $742 | $531 | $368 | $156 | $74 |
| Class R3 | Six months ended | Year ended | ||||
| 2/28/22 (unaudited) | 8/31/21 | 8/31/20 | 8/31/19 | 8/31/18 | 8/31/17 | |
| Net asset value, beginning of period | $22.59 | $17.38 | $16.34 | $15.10 | $13.81 | $12.59 |
| Income (loss) from investment operations | ||||||
| Net investment income (loss) (d) | $0.05 | $0.14 | $0.18 | $0.19 | $0.18 | $0.15 |
| Net realized and unrealized gain (loss) | (1.26) | 5.24 | 1.05 | 1.68 | 1.48 | 1.25 |
| Total from investment operations | $(1.21) | $5.38 | $1.23 | $1.87 | $1.66 | $1.40 |
| Less distributions declared to shareholders | ||||||
| From net investment income | $(0.05) | $(0.17) | $(0.17) | $(0.17) | $(0.18) | $(0.15) |
| From net realized gain | (1.01) | — | (0.02) | (0.46) | (0.19) | (0.03) |
| Total distributions declared to shareholders | $(1.06) | $(0.17) | $(0.19) | $(0.63) | $(0.37) | $(0.18) |
| Net asset value, end of period (x) | $20.32 | $22.59 | $17.38 | $16.34 | $15.10 | $13.81 |
| Total return (%) (r)(s)(t)(x) | (5.66)(n) | 31.17 | 7.65 | 13.24 | 12.18 | 11.22 |
| Ratios (%) (to average net assets) and Supplemental data: | ||||||
| Expenses before expense reductions | 0.92(a) | 0.92 | 0.93 | 1.05 | 1.16 | 1.33 |
| Expenses after expense reductions | 0.89(a) | 0.89 | 0.89 | 0.89 | 0.89 | 1.17 |
| Net investment income (loss) | 0.46(a)(l) | 0.70 | 1.15 | 1.22 | 1.25 | 1.18 |
| Portfolio turnover | 20(n) | 20 | 34 | 28 | 30 | 36 |
| Net assets at end of period (000 omitted) | $702 | $786 | $573 | $100 | $67 | $59 |
| Class R4 | Six months ended | Year ended | ||||
| 2/28/22 (unaudited) | 8/31/21 | 8/31/20 | 8/31/19 | 8/31/18 | 8/31/17 | |
| Net asset value, beginning of period | $22.56 | $17.36 | $16.32 | $15.08 | $13.79 | $12.58 |
| Income (loss) from investment operations | ||||||
| Net investment income (loss) (d) | $0.08 | $0.18 | $0.22 | $0.22 | $0.21 | $0.19 |
| Net realized and unrealized gain (loss) | (1.26) | 5.23 | 1.04 | 1.69 | 1.49 | 1.23 |
| Total from investment operations | $(1.18) | $5.41 | $1.26 | $1.91 | $1.70 | $1.42 |
| Less distributions declared to shareholders | ||||||
| From net investment income | $(0.08) | $(0.21) | $(0.20) | $(0.21) | $(0.22) | $(0.18) |
| From net realized gain | (1.01) | — | (0.02) | (0.46) | (0.19) | (0.03) |
| Total distributions declared to shareholders | $(1.09) | $(0.21) | $(0.22) | $(0.67) | $(0.41) | $(0.21) |
| Net asset value, end of period (x) | $20.29 | $22.56 | $17.36 | $16.32 | $15.08 | $13.79 |
| Total return (%) (r)(s)(t)(x) | (5.56)(n) | 31.47 | 7.87 | 13.53 | 12.48 | 11.42 |
| Ratios (%) (to average net assets) and Supplemental data: | ||||||
| Expenses before expense reductions | 0.67(a) | 0.66 | 0.67 | 0.81 | 0.91 | 1.08 |
| Expenses after expense reductions | 0.64(a) | 0.64 | 0.64 | 0.64 | 0.64 | 0.92 |
| Net investment income (loss) | 0.70(a)(l) | 0.96 | 1.35 | 1.48 | 1.50 | 1.42 |
| Portfolio turnover | 20(n) | 20 | 34 | 28 | 30 | 36 |
| Net assets at end of period (000 omitted) | $101 | $107 | $81 | $75 | $66 | $59 |
| Class R6 | Six months ended | Year ended | ||||
| 2/28/22 (unaudited) | 8/31/21 | 8/31/20 | 8/31/19 | 8/31/18 | 8/31/17 | |
| Net asset value, beginning of period | $22.57 | $17.37 | $16.32 | $15.09 | $13.80 | $12.58 |
| Income (loss) from investment operations | ||||||
| Net investment income (loss) (d) | $0.09 | $0.20 | $0.23 | $0.23 | $0.23 | $0.18 |
| Net realized and unrealized gain (loss) | (1.26) | 5.23 | 1.05 | 1.68 | 1.48 | 1.27 |
| Total from investment operations | $(1.17) | $5.43 | $1.28 | $1.91 | $1.71 | $1.45 |
| Less distributions declared to shareholders | ||||||
| From net investment income | $(0.09) | $(0.23) | $(0.21) | $(0.22) | $(0.23) | $(0.20) |
| From net realized gain | (1.01) | — | (0.02) | (0.46) | (0.19) | (0.03) |
| Total distributions declared to shareholders | $(1.10) | $(0.23) | $(0.23) | $(0.68) | $(0.42) | $(0.23) |
| Net asset value, end of period (x) | $20.30 | $22.57 | $17.37 | $16.32 | $15.09 | $13.80 |
| Total return (%) (r)(s)(t)(x) | (5.51)(n) | 31.57 | 8.02 | 13.56 | 12.57 | 11.61 |
| Ratios (%) (to average net assets) and Supplemental data: | ||||||
| Expenses before expense reductions | 0.58(a) | 0.58 | 0.59 | 0.71 | 0.82 | 0.97 |
| Expenses after expense reductions | 0.55(a) | 0.55 | 0.56 | 0.56 | 0.54 | 0.78 |
| Net investment income (loss) | 0.79(a)(l) | 1.06 | 1.45 | 1.53 | 1.60 | 1.38 |
| Portfolio turnover | 20(n) | 20 | 34 | 28 | 30 | 36 |
| Net assets at end of period (000 omitted) | $78,926 | $84,532 | $78,929 | $31,283 | $8,632 | $6,515 |
| (a) | Annualized. |
| (d) | Per share data is based on average shares outstanding. |
| (l) | The net investment income ratio does not vary by the class specific expense differential because of the timing of sales of fund shares and the allocation of fund level income at such time. |
| (n) | Not annualized. |
| (r) | Certain expenses have been reduced without which performance would have been lower. |
| (s) | From time to time the fund may receive proceeds from litigation settlements, without which performance would be lower. |
| (t) | Total returns do not include any applicable sales charges. |
| (x) | The net asset values and total returns have been calculated on net assets which include adjustments made in accordance with U.S. generally accepted accounting principles required at period end for financial reporting purposes. |
| Financial Instruments | Level 1 | Level 2 | Level 3 | Total |
| Equity Securities | $532,061,909 | $— | $— | $532,061,909 |
| Mutual Funds | 1,772,061 | — | — | 1,772,061 |
| Total | $533,833,970 | $— | $— | $533,833,970 |
| Year ended 8/31/21 | |
| Ordinary income (including any short-term capital gains) | $6,341,771 |
| As of 2/28/22 | |
| Cost of investments | $387,186,047 |
| Gross appreciation | 151,167,858 |
| Gross depreciation | (4,519,935) |
| Net unrealized appreciation (depreciation) | $146,647,923 |
| As of 8/31/21 | |
| Undistributed ordinary income | 418,493 |
| Undistributed long-term capital gain | 19,034,760 |
| Other temporary differences | 7 |
| Net unrealized appreciation (depreciation) | 219,379,111 |
| Six months ended 2/28/22 | Year ended 8/31/21 | ||
| Class A | $8,193,614 | $1,273,579 | |
| Class B | 112,446 | 4,711 | |
| Class C | 1,444,870 | 67,219 | |
| Class I | 15,543,537 | 4,015,188 | |
| Class R1 | 29,927 | 1,078 | |
| Class R2 | 35,914 | 3,771 | |
| Class R3 | 35,889 | 5,668 | |
| Class R4 | 5,168 | 1,005 | |
| Class R6 | 4,075,916 | 969,552 | |
| Total | $29,477,281 | $6,341,771 |
| Up to $1 billion | 0.50% |
| In excess of $1 billion and up to $2.5 billion | 0.475% |
| In excess of $2.5 billion | 0.45% |
| Classes | ||||||||
| A | B | C | I | R1 | R2 | R3 | R4 | R6 |
| 0.89% | 1.64% | 1.64% | 0.64% | 1.64% | 1.14% | 0.89% | 0.64% | 0.57% |
| Distribution Fee Rate (d) | Service Fee Rate (d) | Total Distribution Plan (d) | Annual Effective Rate (e) | Distribution and Service Fee | |
| Class A | — | 0.25% | 0.25% | 0.25% | $ 210,649 |
| Class B | 0.75% | 0.25% | 1.00% | 1.00% | 12,045 |
| Class C | 0.75% | 0.25% | 1.00% | 1.00% | 156,401 |
| Class R1 | 0.75% | 0.25% | 1.00% | 1.00% | 3,179 |
| Class R2 | 0.25% | 0.25% | 0.50% | 0.50% | 1,740 |
| Class R3 | — | 0.25% | 0.25% | 0.25% | 943 |
| Total Distribution and Service Fees | $384,957 |
| (d) | In accordance with the distribution plan for certain classes, the fund pays distribution and/or service fees equal to these annual percentage rates of each class’s average daily net assets. The distribution and service fee rates disclosed by class represent the current rates in effect at the end of the reporting period. Any rate changes, if applicable, are detailed below. |
| (e) | The annual effective rates represent actual fees incurred under the distribution plan for the six months ended February 28, 2022 based on each class's average daily net assets. MFD has voluntarily agreed to rebate a portion of each class's 0.25% service fee attributable to accounts for which there is no financial intermediary specified on the account except for accounts attributable to MFS or its affiliates' seed money. For the six months ended February 28, 2022, this rebate amounted to $26 and $6 for Class A and Class C, respectively, and is included in the reduction of total expenses in the Statement of Operations. |
| Amount | |
| Class A | $198 |
| Class B | 519 |
| Class C | 715 |
| Six months ended 2/28/22 | Year ended 8/31/21 | ||||
| Shares | Amount | Shares | Amount | ||
| Shares sold | |||||
| Class A | 783,638 | $17,011,796 | 1,446,349 | $28,293,888 | |
| Class B | — | — | 780 | 14,181 | |
| Class C | 54,812 | 1,189,573 | 149,260 | 2,862,645 | |
| Class I | 3,121,884 | 67,465,418 | 7,366,451 | 140,374,827 | |
| Class R1 | 1,648 | 34,460 | 16,023 | 299,834 | |
| Class R2 | 2,511 | 55,563 | 2,305 | 45,945 | |
| Class R3 | 1,955 | 44,079 | 2,690 | 53,266 | |
| Class R4 | — | — | 7 | 123 | |
| Class R6 | 397,129 | 8,540,330 | 888,166 | 16,652,858 | |
| 4,363,577 | $94,341,219 | 9,872,031 | $188,597,567 | ||
| Six months ended 2/28/22 | Year ended 8/31/21 | ||||
| Shares | Amount | Shares | Amount | ||
| Shares issued to shareholders in reinvestment of distributions | |||||
| Class A | 376,146 | $8,186,925 | 69,426 | $1,272,856 | |
| Class B | 5,179 | 112,446 | 263 | 4,711 | |
| Class C | 66,811 | 1,444,445 | 3,757 | 67,173 | |
| Class I | 489,938 | 10,675,179 | 222,072 | 4,012,372 | |
| Class R1 | 1,376 | 29,927 | 60 | 1,078 | |
| Class R2 | 1,643 | 35,914 | 205 | 3,771 | |
| Class R3 | 1,644 | 35,889 | 307 | 5,668 | |
| Class R4 | 228 | 4,996 | 55 | 1,005 | |
| Class R6 | 183,567 | 4,003,424 | 51,135 | 939,815 | |
| 1,126,532 | $24,529,145 | 347,280 | $6,308,449 | ||
| Shares reacquired | |||||
| Class A | (727,633) | $(15,681,893) | (1,715,939) | $(32,744,101) | |
| Class B | (7,918) | (166,575) | (16,332) | (302,187) | |
| Class C | (139,283) | (2,989,066) | (393,734) | (7,379,328) | |
| Class I | (5,674,901) | (119,655,431) | (19,501,281) | (361,829,953) | |
| Class R1 | (6,559) | (135,178) | (5,334) | (102,212) | |
| Class R2 | (12,145) | (252,852) | (209) | (4,462) | |
| Class R3 | (3,826) | (85,016) | (1,200) | (23,867) | |
| Class R6 | (438,108) | (9,509,107) | (1,739,204) | (32,800,436) | |
| (7,010,373) | $(148,475,118) | (23,373,233) | $(435,186,546) | ||
| Net change | |||||
| Class A | 432,151 | $9,516,828 | (200,164) | $(3,177,357) | |
| Class B | (2,739) | (54,129) | (15,289) | (283,295) | |
| Class C | (17,660) | (355,048) | (240,717) | (4,449,510) | |
| Class I | (2,063,079) | (41,514,834) | (11,912,758) | (217,442,754) | |
| Class R1 | (3,535) | (70,791) | 10,749 | 198,700 | |
| Class R2 | (7,991) | (161,375) | 2,301 | 45,254 | |
| Class R3 | (227) | (5,048) | 1,797 | 35,067 | |
| Class R4 | 228 | 4,996 | 62 | 1,128 | |
| Class R6 | 142,588 | 3,034,647 | (799,903) | (15,207,763) | |
| (1,520,264) | $(29,604,754) | (13,153,922) | $(240,280,530) | ||
| Affiliated Issuers | Beginning Value | Purchases | Sales Proceeds | Realized Gain (Loss) | Change in Unrealized Appreciation or Depreciation | Ending Value |
| MFS Institutional Money Market Portfolio | $6,858,031 | $63,230,076 | $68,316,046 | $— | $— | $1,772,061 |
| Affiliated Issuers | Dividend Income | Capital Gain Distributions |
| MFS Institutional Money Market Portfolio | $867 | $— |


| 1 | |
| 2 | |
| 3 | |
| 5 | |
| 10 | |
| 12 | |
| 13 | |
| 14 | |
| 20 | |
| 32 | |
| 32 | |
| 32 | |
| 32 | |
| 32 |
| back cover |


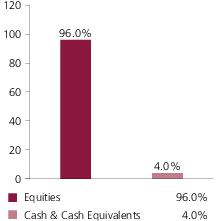
| CACI International, Inc., “A” | 2.3% |
| Leslie's, Inc. | 2.2% |
| AZEK Co., Inc. | 2.0% |
| Sensata Technologies Holding PLC | 1.9% |
| Element Solutions, Inc. | 1.9% |
| Rapid7, Inc. | 1.8% |
| ExlService Holdings, Inc. | 1.8% |
| Skechers USA, Inc., “A” | 1.8% |
| Q2 Holdings, Inc. | 1.8% |
| WNS (Holdings) Ltd., ADR | 1.8% |
| Information Technology | 29.4% |
| Industrials | 18.7% |
| Health Care | 14.8% |
| Consumer Discretionary | 11.8% |
| Financials | 9.4% |
| Materials | 4.9% |
| Real Estate | 3.2% |
| Communication Services | 2.5% |
| Consumer Staples | 1.3% |
| (g) | The Global Industry Classification Standard (GICS®) was developed by and/or is the exclusive property of MSCI, Inc. and S&P Global Market Intelligence Inc. (“S&P Global Market Intelligence”). GICS is a service mark of MSCI and S&P Global Market Intelligence and has been licensed for use by MFS. MFS has applied its own internal sector/industry classification methodology for equity securities and non-equity securities that are unclassified by GICS. |
September 1, 2021 through February 28, 2022
| Share Class | Annualized Expense Ratio | Beginning Account Value 9/01/21 | Ending Account Value 2/28/22 | Expenses Paid During Period (p) 9/01/21-2/28/22 | |
| A | Actual | 1.21% | $1,000.00 | $771.78 | $5.32 |
| Hypothetical (h) | 1.21% | $1,000.00 | $1,018.79 | $6.06 | |
| B | Actual | 1.96% | $1,000.00 | $769.00 | $8.60 |
| Hypothetical (h) | 1.96% | $1,000.00 | $1,015.08 | $9.79 | |
| C | Actual | 1.96% | $1,000.00 | $768.68 | $8.60 |
| Hypothetical (h) | 1.96% | $1,000.00 | $1,015.08 | $9.79 | |
| I | Actual | 0.96% | $1,000.00 | $772.91 | $4.22 |
| Hypothetical (h) | 0.96% | $1,000.00 | $1,020.03 | $4.81 | |
| R1 | Actual | 1.96% | $1,000.00 | $768.94 | $8.60 |
| Hypothetical (h) | 1.96% | $1,000.00 | $1,015.08 | $9.79 | |
| R2 | Actual | 1.46% | $1,000.00 | $770.86 | $6.41 |
| Hypothetical (h) | 1.46% | $1,000.00 | $1,017.55 | $7.30 | |
| R3 | Actual | 1.21% | $1,000.00 | $771.86 | $5.32 |
| Hypothetical (h) | 1.21% | $1,000.00 | $1,018.79 | $6.06 | |
| R4 | Actual | 0.96% | $1,000.00 | $772.71 | $4.22 |
| Hypothetical (h) | 0.96% | $1,000.00 | $1,020.03 | $4.81 | |
| R6 | Actual | 0.86% | $1,000.00 | $773.09 | $3.78 |
| Hypothetical (h) | 0.86% | $1,000.00 | $1,020.53 | $4.31 |
| (h) | 5% class return per year before expenses. |
| (p) | “Expenses Paid During Period” are equal to each class’s annualized expense ratio, as shown above, multiplied by the average account value over the period, multiplied by 181/365 (to reflect the one-half year period). Expenses paid do not include any applicable sales charges (loads). If these transaction costs had been included, your costs would have been higher. |
| Issuer | Shares/Par | Value ($) | ||
| Common Stocks – 96.0% | ||||
| Aerospace & Defense – 2.3% | ||||
| CACI International, Inc., “A” (a) | 228,755 | $ 64,003,361 | ||
| Airlines – 1.6% | ||||
| JetBlue Airways Corp. (a) | 3,007,107 | $ 45,918,524 | ||
| Apparel Manufacturers – 2.3% | ||||
| Allbirds, Inc., “A” (a)(l) | 780,566 | $ 6,150,860 | ||
| On Holding AG (a) | 320,192 | 7,796,675 | ||
| Skechers USA, Inc., “A” (a) | 1,113,419 | 51,195,006 | ||
| $65,142,541 | ||||
| Automotive – 2.1% | ||||
| Methode Electronics, Inc. | 606,984 | $ 27,702,750 | ||
| Visteon Corp. (a) | 269,178 | 32,347,120 | ||
| $60,049,870 | ||||
| Biotechnology – 4.0% | ||||
| Abcam PLC (a) | 1,384,373 | $ 23,028,498 | ||
| Adaptive Biotechnologies Corp. (a) | 560,901 | 8,093,802 | ||
| AlloVir, Inc. (a) | 533,582 | 4,802,238 | ||
| BioAtla, Inc. (a) | 339,507 | 2,200,005 | ||
| BioXcel Therapeutics, Inc. (a) | 290,670 | 5,322,168 | ||
| Immunocore Holdings PLC, ADR (a) | 233,584 | 5,162,206 | ||
| Lyell Immunopharma, Inc. (a) | 676,627 | 4,898,780 | ||
| MaxCyte, Inc. (a) | 1,288,896 | 8,970,716 | ||
| Neurocrine Biosciences, Inc. (a) | 149,559 | 13,440,867 | ||
| Olink Holding AB (a) | 331,902 | 5,672,205 | ||
| Oxford Nanopore Technologies PLC (a) | 810,747 | 4,997,602 | ||
| Prelude Therapeutics, Inc. (a) | 327,699 | 2,893,582 | ||
| Recursion Pharmaceuticals, Inc. (a) | 919,677 | 10,070,463 | ||
| Sana Biotechnology, Inc. (a) | 522,248 | 3,373,722 | ||
| Twist Bioscience Corp. (a) | 192,241 | 10,753,962 | ||
| $113,680,816 | ||||
| Brokerage & Asset Managers – 4.5% | ||||
| Focus Financial Partners, “A” (a) | 714,131 | $ 35,735,115 | ||
| GCM Grosvenor, Inc. (l) | 853,809 | 8,529,552 | ||
| GCM Grosvenor, Inc. (PIPE) (a) | 1,262,527 | 12,612,645 | ||
| Hamilton Lane, Inc., “A” | 554,629 | 43,316,525 | ||
| WisdomTree Investments, Inc. | 4,691,376 | 26,412,447 | ||
| $126,606,284 | ||||
| Issuer | Shares/Par | Value ($) | ||
| Common Stocks – continued | ||||
| Business Services – 12.8% | ||||
| Endava PLC, ADR (a) | 185,459 | $ 24,699,430 | ||
| EVO Payments, Inc., “A” (a) | 1,984,478 | 47,845,765 | ||
| ExlService Holdings, Inc. (a) | 425,726 | 51,423,443 | ||
| Keywords Studios PLC | 1,119,468 | 36,252,649 | ||
| LegalZoom.com, Inc. (a) | 1,297,451 | 20,253,210 | ||
| Payoneer Global, Inc. (a) | 3,950,468 | 19,041,256 | ||
| Remitly Global, Inc. (a) | 2,211,340 | 24,214,173 | ||
| TaskUs, Inc., “A” (a) | 1,088,736 | 31,268,498 | ||
| Thoughtworks Holding, Inc. (a) | 1,595,900 | 36,482,274 | ||
| TriNet Group, Inc. (a) | 223,431 | 19,507,761 | ||
| WNS (Holdings) Ltd., ADR (a) | 612,077 | 50,575,922 | ||
| $361,564,381 | ||||
| Chemicals – 3.2% | ||||
| Element Solutions, Inc. | 2,184,900 | $ 53,704,842 | ||
| Ingevity Corp. (a) | 540,329 | 36,866,648 | ||
| $90,571,490 | ||||
| Computer Software – 9.8% | ||||
| Alkami Technology, Inc. (a) | 1,620,458 | $ 25,538,418 | ||
| Avalara, Inc. (a) | 215,439 | 22,386,267 | ||
| Definitive Healthcare Corp. (a) | 586,759 | 13,565,868 | ||
| DoubleVerify Holdings, Inc. (a) | 959,433 | 26,528,322 | ||
| Everbridge, Inc. (a) | 496,732 | 19,630,849 | ||
| Expensify, Inc., “A” (a) | 525,814 | 10,779,187 | ||
| nCino, Inc. (a) | 408,022 | 18,740,450 | ||
| Open Lending Corp., “A” (a) | 1,832,841 | 38,178,078 | ||
| Pagerduty, Inc. (a) | 423,682 | 14,328,925 | ||
| Paycor HCM, Inc. (a) | 1,674,901 | 47,014,471 | ||
| Paylocity Holding Corp. (a) | 81,386 | 17,289,642 | ||
| Procore Technologies, Inc. (a) | 343,653 | 22,402,739 | ||
| $276,383,216 | ||||
| Computer Software - Systems – 5.5% | ||||
| Five9, Inc. (a) | 220,722 | $ 24,279,420 | ||
| Nuvei Corp. (a) | 520,178 | 28,240,464 | ||
| Q2 Holdings, Inc. (a) | 781,272 | 50,821,744 | ||
| Rapid7, Inc. (a) | 504,114 | 52,155,634 | ||
| $155,497,262 | ||||
| Construction – 2.5% | ||||
| AZEK Co., Inc. (a) | 1,885,267 | $ 55,596,524 | ||
| Trex Co., Inc. (a) | 156,354 | 14,359,551 | ||
| $69,956,075 | ||||
| Issuer | Shares/Par | Value ($) | ||
| Common Stocks – continued | ||||
| Consumer Services – 2.7% | ||||
| Boyd Group Services, Inc. | 146,887 | $ 19,175,852 | ||
| Bright Horizons Family Solutions, Inc. (a) | 176,750 | 23,090,620 | ||
| European Wax Center, Inc., “A” (a) | 563,489 | 14,013,971 | ||
| F45 Training Holdings, Inc. (a) | 1,326,660 | 20,404,031 | ||
| $76,684,474 | ||||
| Electrical Equipment – 3.8% | ||||
| Advanced Drainage Systems, Inc. | 273,096 | $ 31,875,765 | ||
| Littlefuse, Inc. | 76,187 | 19,672,245 | ||
| Sensata Technologies Holding PLC (a) | 935,170 | 54,155,695 | ||
| $105,703,705 | ||||
| Electronics – 1.6% | ||||
| Advanced Energy Industries, Inc. | 528,538 | $ 45,374,987 | ||
| Energy - Renewables – 0.9% | ||||
| Shoals Technologies Group, Inc. (a) | 1,509,800 | $ 23,869,938 | ||
| Entertainment – 2.0% | ||||
| Manchester United PLC, “A” | 2,243,774 | $ 30,178,761 | ||
| Vivid Seats, Inc., “A” | 2,260,643 | 26,404,310 | ||
| $56,583,071 | ||||
| Food & Beverages – 1.3% | ||||
| Duckhorn Portfolio, Inc. (a) | 1,218,856 | $ 23,913,954 | ||
| Oatly Group AB, ADR (a) | 2,066,025 | 13,945,669 | ||
| $37,859,623 | ||||
| Gaming & Lodging – 1.6% | ||||
| Genius Sports Ltd. (a) | 2,578,078 | $ 14,566,141 | ||
| Penn National Gaming, Inc. (a) | 594,870 | 30,546,574 | ||
| $45,112,715 | ||||
| Leisure & Toys – 2.4% | ||||
| Corsair Gaming, Inc. (a)(l) | 852,966 | $ 19,686,455 | ||
| Malibu Boats, Inc., “A” (a) | 668,077 | 46,544,925 | ||
| $66,231,380 | ||||
| Machinery & Tools – 2.1% | ||||
| Hydrofarm Holdings Group, Inc. (a) | 1,054,122 | $ 21,345,970 | ||
| Ritchie Bros. Auctioneers, Inc. | 716,486 | 37,529,537 | ||
| $58,875,507 | ||||
| Issuer | Shares/Par | Value ($) | ||
| Common Stocks – continued | ||||
| Medical & Health Technology & Services – 4.1% | ||||
| Certara, Inc. (a) | 1,512,388 | $ 38,323,912 | ||
| Guardant Health, Inc. (a) | 133,553 | 8,850,557 | ||
| HealthEquity, Inc. (a) | 503,178 | 27,025,690 | ||
| Syneos Health, Inc. (a) | 519,723 | ���41,162,062 | ||
| $115,362,221 | ||||
| Medical Equipment – 4.3% | ||||
| Gerresheimer AG | 437,126 | $ 31,613,217 | ||
| Maravai Lifesciences Holdings, Inc., “A” (a) | 730,189 | 28,528,484 | ||
| Nevro Corp. (a) | 225,091 | 16,139,025 | ||
| OptiNose, Inc. (a)(l) | 1,188,905 | 3,483,492 | ||
| Outset Medical, Inc. (a) | 324,853 | 14,283,786 | ||
| PROCEPT BioRobotics Corp. (a) | 630,226 | 15,743,045 | ||
| Silk Road Medical, Inc. (a) | 266,473 | 9,894,143 | ||
| $119,685,192 | ||||
| Other Banks & Diversified Financials – 3.5% | ||||
| First Interstate BancSystem, Inc. | 901,861 | $ 36,615,557 | ||
| Prosperity Bancshares, Inc. | 492,281 | 36,655,243 | ||
| United Community Bank, Inc. | 685,233 | 26,491,108 | ||
| $99,761,908 | ||||
| Pharmaceuticals – 1.8% | ||||
| Annexon, Inc. (a) | 495,468 | $ 2,405,497 | ||
| Collegium Pharmaceutical, Inc. (a) | 519,893 | 10,122,317 | ||
| Harmony Biosciences Holdings (a) | 395,767 | 15,814,849 | ||
| SpringWorks Therapeutics, Inc. (a) | 265,143 | 15,004,443 | ||
| Turning Point Therapeutics, Inc. (a) | 250,379 | 7,926,999 | ||
| $51,274,105 | ||||
| Pollution Control – 0.9% | ||||
| GFL Environmental, Inc. | 873,718 | $ 25,556,251 | ||
| Real Estate – 3.2% | ||||
| Big Yellow Group PLC, REIT | 1,051,190 | $ 19,953,931 | ||
| Innovative Industrial Properties, Inc., REIT | 131,887 | 24,855,424 | ||
| STAG Industrial, Inc., REIT | 1,184,306 | 46,140,562 | ||
| $90,949,917 | ||||
| Specialty Chemicals – 1.7% | ||||
| Axalta Coating Systems Ltd. (a) | 1,769,195 | $ 47,839,033 | ||
| Issuer | Shares/Par | Value ($) | ||
| Common Stocks – continued | ||||
| Specialty Stores – 4.8% | ||||
| ACV Auctions, Inc. (a) | 2,620,125 | $ 34,559,449 | ||
| Leslie's, Inc. (a) | 2,883,120 | 61,439,287 | ||
| Petco Health & Wellness Co., Inc. (a) | 1,583,469 | 27,742,377 | ||
| Vroom, Inc. (a) | 1,668,015 | 10,141,531 | ||
| $133,882,644 | ||||
| Trucking – 2.7% | ||||
| CryoPort, Inc. (a) | 514,203 | $ 17,652,589 | ||
| Knight-Swift Transportation Holdings, Inc. | 785,839 | 42,812,509 | ||
| Schneider National, Inc. | 636,094 | 16,614,775 | ||
| $77,079,873 | ||||
| Total Common Stocks (Identified Cost, $2,834,710,862) | $2,707,060,364 | |||
| Investment Companies (h) – 3.6% | ||||
| Money Market Funds – 3.6% | ||||
| MFS Institutional Money Market Portfolio, 0.06% (v) (Identified Cost, $101,864,100) | 101,868,651 | $ 101,868,650 | ||
| Collateral for Securities Loaned – 0.2% | ||||
| State Street Navigator Securities Lending Government Money Market Portfolio, 0.06% (j) (Identified Cost, $3,482,704) | 3,482,704 | $ 3,482,704 | ||
| Other Assets, Less Liabilities – 0.2% | 6,790,199 | |||
| Net Assets – 100.0% | $2,819,201,917 | |||
| (a) | Non-income producing security. | |||
| (h) | An affiliated issuer, which may be considered one in which the fund owns 5% or more of the outstanding voting securities, or a company which is under common control. At period end, the aggregate values of the fund's investments in affiliated issuers and in unaffiliated issuers were $101,868,650 and $2,710,543,068, respectively. | |||
| (j) | The rate quoted is the annualized seven-day yield of the fund at period end. | |||
| (l) | A portion of this security is on loan. See Note 2 for additional information. | |||
| (v) | Affiliated issuer that is available only to investment companies managed by MFS. The rate quoted for the MFS Institutional Money Market Portfolio is the annualized seven-day yield of the fund at period end. |
| The following abbreviations are used in this report and are defined: | |
| ADR | American Depositary Receipt |
| PIPE | Private Investment in Public Equity |
| REIT | Real Estate Investment Trust |
| Assets | |
| Investments in unaffiliated issuers, at value, including $4,870,644 of securities on loan (identified cost, $2,838,193,566) | $2,710,543,068 |
| Investments in affiliated issuers, at value (identified cost, $101,864,100) | 101,868,650 |
| Foreign currency, at value (identified cost, $2,652,368) | 2,652,369 |
| Receivables for | |
| Investments sold | 11,468,171 |
| Fund shares sold | 8,090,217 |
| Interest and dividends | 1,422,056 |
| Other assets | 62,545 |
| Total assets | $2,836,107,076 |
| Liabilities | |
| Payables for | |
| Investments purchased | $8,073,740 |
| Fund shares reacquired | 4,432,558 |
| Collateral for securities loaned, at value (c) | 3,482,704 |
| Payable to affiliates | |
| Investment adviser | 247,246 |
| Administrative services fee | 4,192 |
| Shareholder servicing costs | 487,344 |
| Distribution and service fees | 34,549 |
| Payable for independent Trustees' compensation | 8,282 |
| Accrued expenses and other liabilities | 134,544 |
| Total liabilities | $16,905,159 |
| Net assets | $2,819,201,917 |
| Net assets consist of | |
| Paid-in capital | $2,943,052,082 |
| Total distributable earnings (loss) | (123,850,165) |
| Net assets | $2,819,201,917 |
| Shares of beneficial interest outstanding | 101,146,189 |
| (c) | Non-cash collateral is not included. |
| Net assets | Shares outstanding | Net asset value per share (a) | |
| Class A | $900,846,344 | 35,890,718 | $25.10 |
| Class B | 10,134,842 | 662,536 | 15.30 |
| Class C | 38,441,519 | 2,500,627 | 15.37 |
| Class I | 467,160,832 | 15,344,716 | 30.44 |
| Class R1 | 4,065,728 | 270,747 | 15.02 |
| Class R2 | 23,281,541 | 1,058,737 | 21.99 |
| Class R3 | 131,980,535 | 5,271,352 | 25.04 |
| Class R4 | 21,918,953 | 785,601 | 27.90 |
| Class R6 | 1,221,371,623 | 39,361,155 | 31.03 |
| (a) | Maximum offering price per share was equal to the net asset value per share for all share classes, except for Class A, for which the maximum offering price per share was $26.63 [100 / 94.25 x $25.10]. On sales of $50,000 or more, the maximum offering price of Class A shares is reduced. A contingent deferred sales charge may be imposed on redemptions of Class A, Class B, and Class C shares. Redemption price per share was equal to the net asset value per share for Classes I, R1, R2, R3, R4, and R6. |
| Net investment income (loss) | |
| Income | |
| Dividends | $6,486,324 |
| Other | 282,873 |
| Income on securities loaned | 130,088 |
| Dividends from affiliated issuers | 31,068 |
| Foreign taxes withheld | (115,035) |
| Total investment income | $6,815,318 |
| Expenses | |
| Management fee | $12,825,621 |
| Distribution and service fees | 1,929,217 |
| Shareholder servicing costs | 1,157,048 |
| Administrative services fee | 211,858 |
| Independent Trustees' compensation | 20,525 |
| Custodian fee | 72,144 |
| Shareholder communications | 98,980 |
| Audit and tax fees | 30,160 |
| Legal fees | 7,816 |
| Miscellaneous | 148,296 |
| Total expenses | $16,501,665 |
| Reduction of expenses by investment adviser and distributor | (215,318) |
| Net expenses | $16,286,347 |
| Net investment income (loss) | $(9,471,029) |
| Realized and unrealized gain (loss) | |
| Realized gain (loss) (identified cost basis) | |
| Unaffiliated issuers | $105,917,284 |
| Foreign currency | 12,565 |
| Net realized gain (loss) | $105,929,849 |
| Change in unrealized appreciation or depreciation | |
| Unaffiliated issuers | $(889,146,525) |
| Translation of assets and liabilities in foreign currencies | (8,565) |
| Net unrealized gain (loss) | $(889,155,090) |
| Net realized and unrealized gain (loss) | $(783,225,241) |
| Change in net assets from operations | $(792,696,270) |
| Six months ended | Year ended | |
| 2/28/22 (unaudited) | 8/31/21 | |
| Change in net assets | ||
| From operations | ||
| Net investment income (loss) | $(9,471,029) | $(13,180,424) |
| Net realized gain (loss) | 105,929,849 | 684,764,185 |
| Net unrealized gain (loss) | (889,155,090) | 200,559,116 |
| Change in net assets from operations | $(792,696,270) | $872,142,877 |
| Total distributions to shareholders | $(586,440,707) | $(245,280,652) |
| Change in net assets from fund share transactions | $837,270,698 | $654,561,520 |
| Total change in net assets | $(541,866,279) | $1,281,423,745 |
| Net assets | ||
| At beginning of period | 3,361,068,196 | 2,079,644,451 |
| At end of period | $2,819,201,917 | $3,361,068,196 |
| Class A | Six months ended | Year ended | ||||
| 2/28/22 (unaudited) | 8/31/21 | 8/31/20 | 8/31/19 | 8/31/18 | 8/31/17 | |
| Net asset value, beginning of period | $40.53 | $32.45 | $27.56 | $33.30 | $27.27 | $24.11 |
| Income (loss) from investment operations | ||||||
| Net investment income (loss) (d) | $(0.13) | $(0.23) | $(0.18) | $(0.19) | $(0.23) | $(0.18)(c) |
| Net realized and unrealized gain (loss) | (7.90) | 12.20 | 7.31 | 0.06(g) | 9.07 | 3.92 |
| Total from investment operations | $(8.03) | $11.97 | $7.13 | $(0.13) | $8.84 | $3.74 |
| Less distributions declared to shareholders | ||||||
| From net realized gain | $(7.40) | $(3.89) | $(2.24) | $(5.61) | $(2.81) | $(0.58) |
| Net asset value, end of period (x) | $25.10 | $40.53 | $32.45 | $27.56 | $33.30 | $27.27 |
| Total return (%) (r)(s)(t)(x) | (22.82)(n) | 39.23 | 27.51 | 3.49 | 34.98 | 15.83(c) |
| Ratios (%) (to average net assets) and Supplemental data: | ||||||
| Expenses before expense reductions | 1.23(a) | 1.23 | 1.29 | 1.30 | 1.33 | 1.35(c) |
| Expenses after expense reductions | 1.21(a) | 1.22 | 1.27 | 1.29 | 1.31 | 1.33(c) |
| Net investment income (loss) | (0.78)(a) | (0.63) | (0.66) | (0.70) | (0.80) | (0.70)(c) |
| Portfolio turnover | 31(n) | 71 | 64 | 69 | 67 | 53 |
| Net assets at end of period (000 omitted) | $900,846 | $1,171,166 | $755,202 | $549,660 | $525,698 | $394,878 |
| Class B | Six months ended | Year ended | ||||
| 2/28/22 (unaudited) | 8/31/21 | 8/31/20 | 8/31/19 | 8/31/18 | 8/31/17 | |
| Net asset value, beginning of period | $27.92 | $23.55 | $20.72 | $26.86 | $22.65 | $20.27 |
| Income (loss) from investment operations | ||||||
| Net investment income (loss) (d) | $(0.17) | $(0.36) | $(0.28) | $(0.30) | $(0.37) | $(0.30)(c) |
| Net realized and unrealized gain (loss) | (5.05) | 8.62 | 5.35 | (0.23)(g) | 7.39 | 3.26 |
| Total from investment operations | $(5.22) | $8.26 | $5.07 | $(0.53) | $7.02 | $2.96 |
| Less distributions declared to shareholders | ||||||
| From net realized gain | $(7.40) | $(3.89) | $(2.24) | $(5.61) | $(2.81) | $(0.58) |
| Net asset value, end of period (x) | $15.30 | $27.92 | $23.55 | $20.72 | $26.86 | $22.65 |
| Total return (%) (r)(s)(t)(x) | (23.10)(n) | 38.19 | 26.58 | 2.69 | 34.00 | 14.97(c) |
| Ratios (%) (to average net assets) and Supplemental data: | ||||||
| Expenses before expense reductions | 1.98(a) | 1.99 | 2.04 | 2.06 | 2.08 | 2.10(c) |
| Expenses after expense reductions | 1.96(a) | 1.98 | 2.02 | 2.04 | 2.06 | 2.08(c) |
| Net investment income (loss) | (1.55)(a) | (1.40) | (1.40) | (1.45) | (1.55) | (1.45)(c) |
| Portfolio turnover | 31(n) | 71 | 64 | 69 | 67 | 53 |
| Net assets at end of period (000 omitted) | $10,135 | $16,701 | $16,502 | $18,708 | $23,424 | $20,143 |
| Class C | Six months ended | Year ended | ||||
| 2/28/22 (unaudited) | 8/31/21 | 8/31/20 | 8/31/19 | 8/31/18 | 8/31/17 | |
| Net asset value, beginning of period | $28.02 | $23.62 | $20.78 | $26.91 | $22.70 | $20.31 |
| Income (loss) from investment operations | ||||||
| Net investment income (loss) (d) | $(0.17) | $(0.36) | $(0.28) | $(0.30) | $(0.37) | $(0.31)(c) |
| Net realized and unrealized gain (loss) | (5.08) | 8.65 | 5.36 | (0.22)(g) | 7.39 | 3.28 |
| Total from investment operations | $(5.25) | $8.29 | $5.08 | $(0.52) | $7.02 | $2.97 |
| Less distributions declared to shareholders | ||||||
| From net realized gain | $(7.40) | $(3.89) | $(2.24) | $(5.61) | $(2.81) | $(0.58) |
| Net asset value, end of period (x) | $15.37 | $28.02 | $23.62 | $20.78 | $26.91 | $22.70 |
| Total return (%) (r)(s)(t)(x) | (23.13)(n) | 38.21 | 26.55 | 2.72 | 33.92 | 14.99(c) |
| Ratios (%) (to average net assets) and Supplemental data: | ||||||
| Expenses before expense reductions | 1.98(a) | 1.99 | 2.04 | 2.05 | 2.08 | 2.10(c) |
| Expenses after expense reductions | 1.96(a) | 1.98 | 2.03 | 2.04 | 2.07 | 2.09(c) |
| Net investment income (loss) | (1.54)(a) | (1.40) | (1.41) | (1.45) | (1.55) | (1.45)(c) |
| Portfolio turnover | 31(n) | 71 | 64 | 69 | 67 | 53 |
| Net assets at end of period (000 omitted) | $38,442 | $56,833 | $58,057 | $59,253 | $69,498 | $76,724 |
| Class I | Six months ended | Year ended | ||||
| 2/28/22 (unaudited) | 8/31/21 | 8/31/20 | 8/31/19 | 8/31/18 | 8/31/17 | |
| Net asset value, beginning of period | $47.41 | $37.30 | $31.29 | $36.82 | $29.81 | $26.24 |
| Income (loss) from investment operations | ||||||
| Net investment income (loss) (d) | $(0.11) | $(0.16) | $(0.14) | $(0.14) | $(0.18) | $(0.12)(c) |
| Net realized and unrealized gain (loss) | (9.46) | 14.16 | 8.39 | 0.22(g) | 10.00 | 4.27 |
| Total from investment operations | $(9.57) | $14.00 | $8.25 | $0.08 | $9.82 | $4.15 |
| Less distributions declared to shareholders | ||||||
| From net realized gain | $(7.40) | $(3.89) | $(2.24) | $(5.61) | $(2.81) | $(0.58) |
| Net asset value, end of period (x) | $30.44 | $47.41 | $37.30 | $31.29 | $36.82 | $29.81 |
| Total return (%) (r)(s)(t)(x) | (22.75)(n) | 39.60 | 27.83 | 3.76 | 35.31 | 16.12(c) |
| Ratios (%) (to average net assets) and Supplemental data: | ||||||
| Expenses before expense reductions | 0.97(a) | 0.98 | 1.04 | 1.05 | 1.08 | 1.10(c) |
| Expenses after expense reductions | 0.96(a) | 0.97 | 1.03 | 1.05 | 1.07 | 1.09(c) |
| Net investment income (loss) | (0.54)(a) | (0.37) | (0.43) | (0.45) | (0.55) | (0.45)(c) |
| Portfolio turnover | 31(n) | 71 | 64 | 69 | 67 | 53 |
| Net assets at end of period (000 omitted) | $467,161 | $621,379 | $331,177 | $164,593 | $180,591 | $106,459 |
| Class R1 | Six months ended | Year ended | ||||
| 2/28/22 (unaudited) | 8/31/21 | 8/31/20 | 8/31/19 | 8/31/18 | 8/31/17 | |
| Net asset value, beginning of period | $27.56 | $23.29 | $20.51 | $26.66 | $22.50 | $20.15 |
| Income (loss) from investment operations | ||||||
| Net investment income (loss) (d) | $(0.16) | $(0.35) | $(0.28) | $(0.30) | $(0.37) | $(0.30)(c) |
| Net realized and unrealized gain (loss) | (4.98) | 8.51 | 5.30 | (0.24)(g) | 7.34 | 3.23 |
| Total from investment operations | $(5.14) | $8.16 | $5.02 | $(0.54) | $6.97 | $2.93 |
| Less distributions declared to shareholders | ||||||
| From net realized gain | $(7.40) | $(3.89) | $(2.24) | $(5.61) | $(2.81) | $(0.58) |
| Net asset value, end of period (x) | $15.02 | $27.56 | $23.29 | $20.51 | $26.66 | $22.50 |
| Total return (%) (r)(s)(t)(x) | (23.11)(n) | 38.20 | 26.61 | 2.67 | 34.01 | 14.91(c) |
| Ratios (%) (to average net assets) and Supplemental data: | ||||||
| Expenses before expense reductions | 1.98(a) | 1.99 | 2.04 | 2.05 | 2.08 | 2.10(c) |
| Expenses after expense reductions | 1.96(a) | 1.97 | 2.03 | 2.05 | 2.07 | 2.09(c) |
| Net investment income (loss) | (1.53)(a) | (1.39) | (1.41) | (1.45) | (1.55) | (1.45)(c) |
| Portfolio turnover | 31(n) | 71 | 64 | 69 | 67 | 53 |
| Net assets at end of period (000 omitted) | $4,066 | $5,923 | $4,946 | $4,652 | $5,342 | $4,377 |
| Class R2 | Six months ended | Year ended | ||||
| 2/28/22 (unaudited) | 8/31/21 | 8/31/20 | 8/31/19 | 8/31/18 | 8/31/17 | |
| Net asset value, beginning of period | $36.54 | $29.65 | $25.42 | $31.31 | $25.85 | $22.95 |
| Income (loss) from investment operations | ||||||
| Net investment income (loss) (d) | $(0.15) | $(0.30) | $(0.23) | $(0.24) | $(0.29) | $(0.23)(c) |
| Net realized and unrealized gain (loss) | (7.00) | 11.08 | 6.70 | (0.04)(g) | 8.56 | 3.71 |
| Total from investment operations | $(7.15) | $10.78 | $6.47 | $(0.28) | $8.27 | $3.48 |
| Less distributions declared to shareholders | ||||||
| From net realized gain | $(7.40) | $(3.89) | $(2.24) | $(5.61) | $(2.81) | $(0.58) |
| Net asset value, end of period (x) | $21.99 | $36.54 | $29.65 | $25.42 | $31.31 | $25.85 |
| Total return (%) (r)(s)(t)(x) | (22.91)(n) | 38.89 | 27.21 | 3.19 | 34.68 | 15.50(c) |
| Ratios (%) (to average net assets) and Supplemental data: | ||||||
| Expenses before expense reductions | 1.48(a) | 1.49 | 1.54 | 1.56 | 1.58 | 1.60(c) |
| Expenses after expense reductions | 1.46(a) | 1.47 | 1.53 | 1.54 | 1.57 | 1.59(c) |
| Net investment income (loss) | (1.04)(a) | (0.89) | (0.90) | (0.95) | (1.05) | (0.95)(c) |
| Portfolio turnover | 31(n) | 71 | 64 | 69 | 67 | 53 |
| Net assets at end of period (000 omitted) | $23,282 | $34,688 | $30,149 | $32,381 | $36,272 | $29,130 |
| Class R3 | Six months ended | Year ended | ||||
| 2/28/22 (unaudited) | 8/31/21 | 8/31/20 | 8/31/19 | 8/31/18 | 8/31/17 | |
| Net asset value, beginning of period | $40.45 | $32.39 | $27.51 | $33.26 | $27.24 | $24.09 |
| Income (loss) from investment operations | ||||||
| Net investment income (loss) (d) | $(0.13) | $(0.22) | $(0.18) | $(0.19) | $(0.24) | $(0.17)(c) |
| Net realized and unrealized gain (loss) | (7.88) | 12.17 | 7.30 | 0.05(g) | 9.07 | 3.90 |
| Total from investment operations | $(8.01) | $11.95 | $7.12 | $(0.14) | $8.83 | $3.73 |
| Less distributions declared to shareholders | ||||||
| From net realized gain | $(7.40) | $(3.89) | $(2.24) | $(5.61) | $(2.81) | $(0.58) |
| Net asset value, end of period (x) | $25.04 | $40.45 | $32.39 | $27.51 | $33.26 | $27.24 |
| Total return (%) (r)(s)(t)(x) | (22.81)(n) | 39.24 | 27.52 | 3.45 | 34.98 | 15.81(c) |
| Ratios (%) (to average net assets) and Supplemental data: | ||||||
| Expenses before expense reductions | 1.23(a) | 1.23 | 1.29 | 1.30 | 1.33 | 1.35(c) |
| Expenses after expense reductions | 1.21(a) | 1.22 | 1.28 | 1.30 | 1.32 | 1.34(c) |
| Net investment income (loss) | (0.78)(a) | (0.61) | (0.67) | (0.70) | (0.80) | (0.70)(c) |
| Portfolio turnover | 31(n) | 71 | 64 | 69 | 67 | 53 |
| Net assets at end of period (000 omitted) | $131,981 | $178,005 | $71,489 | $52,559 | $50,895 | $42,346 |
| Class R4 | Six months ended | Year ended | ||||
| 2/28/22 (unaudited) | 8/31/21 | 8/31/20 | 8/31/19 | 8/31/18 | 8/31/17 | |
| Net asset value, beginning of period | $44.11 | $34.94 | $29.44 | $35.05 | $28.48 | $25.09 |
| Income (loss) from investment operations | ||||||
| Net investment income (loss) (d) | $(0.09) | $(0.15) | $(0.13) | $(0.13) | $(0.15) | $(0.12)(c) |
| Net realized and unrealized gain (loss) | (8.72) | 13.21 | 7.87 | 0.13(g) | 9.53 | 4.09 |
| Total from investment operations | $(8.81) | $13.06 | $7.74 | $0.00(w) | $9.38 | $3.97 |
| Less distributions declared to shareholders | ||||||
| From net realized gain | $(7.40) | $(3.89) | $(2.24) | $(5.61) | $(2.81) | $(0.58) |
| Net asset value, end of period (x) | $27.90 | $44.11 | $34.94 | $29.44 | $35.05 | $28.48 |
| Total return (%) (r)(s)(t)(x) | (22.73)(n) | 39.58 | 27.84 | 3.72 | 35.42 | 16.14(c) |
| Ratios (%) (to average net assets) and Supplemental data: | ||||||
| Expenses before expense reductions | 0.97(a) | 0.99 | 1.04 | 1.05 | 1.08 | 1.10(c) |
| Expenses after expense reductions | 0.96(a) | 0.97 | 1.03 | 1.05 | 1.07 | 1.09(c) |
| Net investment income (loss) | (0.53)(a) | (0.37) | (0.43) | (0.45) | (0.51) | (0.45)(c) |
| Portfolio turnover | 31(n) | 71 | 64 | 69 | 67 | 53 |
| Net assets at end of period (000 omitted) | $21,919 | $27,863 | $16,509 | $8,384 | $10,612 | $83,186 |
| Class R6 | Six months ended | Year ended | ||||
| 2/28/22 (unaudited) | 8/31/21 | 8/31/20 | 8/31/19 | 8/31/18 | 8/31/17 | |
| Net asset value, beginning of period | $48.14 | $37.79 | $31.64 | $37.13 | $30.01 | $26.38 |
| Income (loss) from investment operations | ||||||
| Net investment income (loss) (d) | $(0.08) | $(0.12) | $(0.10) | $(0.11) | $(0.14) | $(0.09)(c) |
| Net realized and unrealized gain (loss) | (9.63) | 14.36 | 8.49 | 0.23(g) | 10.07 | 4.30 |
| Total from investment operations | $(9.71) | $14.24 | $8.39 | $0.12 | $9.93 | $4.21 |
| Less distributions declared to shareholders | ||||||
| From net realized gain | $(7.40) | $(3.89) | $(2.24) | $(5.61) | $(2.81) | $(0.58) |
| Net asset value, end of period (x) | $31.03 | $48.14 | $37.79 | $31.64 | $37.13 | $30.01 |
| Total return (%) (r)(s)(t)(x) | (22.69)(n) | 39.73 | 27.97 | 3.85 | 35.45 | 16.26(c) |
| Ratios (%) (to average net assets) and Supplemental data: | ||||||
| Expenses before expense reductions | 0.87(a) | 0.89 | 0.94 | 0.96 | 0.97 | 0.98(c) |
| Expenses after expense reductions | 0.86(a) | 0.88 | 0.92 | 0.95 | 0.96 | 0.97(c) |
| Net investment income (loss) | (0.40)(a) | (0.28) | (0.32) | (0.35) | (0.44) | (0.34)(c) |
| Portfolio turnover | 31(n) | 71 | 64 | 69 | 67 | 53 |
| Net assets at end of period (000 omitted) | $1,221,372 | $1,248,511 | $795,613 | $541,266 | $477,818 | $385,440 |
| (a) | Annualized. |
| (c) | Amount reflects a one-time reimbursement of expenses by the custodian (or former custodian) without which net investment income and performance would be lower and expenses would be higher. |
| (d) | Per share data is based on average shares outstanding. |
| (g) | The per share amount varies from the net realized and unrealized gain/loss for the period because of the timing of sales of fund shares and the per share amount of realized and unrealized gains and losses at such time. |
| (n) | Not annualized. |
| (r) | Certain expenses have been reduced without which performance would have been lower. |
| (s) | From time to time the fund may receive proceeds from litigation settlements, without which performance would be lower. |
| (t) | Total returns do not include any applicable sales charges. |
| (w) | Per share amount was less than $0.01. |
| (x) | The net asset values and total returns have been calculated on net assets which include adjustments made in accordance with U.S. generally accepted accounting principles required at period end for financial reporting purposes. |
| Financial Instruments | Level 1 | Level 2 | Level 3 | Total |
| Equity Securities: | ||||
| United States | $2,298,179,880 | $12,612,645 | $— | $2,310,792,525 |
| United Kingdom | 158,839,218 | — | — | 158,839,218 |
| Canada | 110,502,104 | — | — | 110,502,104 |
| India | 50,575,922 | — | — | 50,575,922 |
| Germany | 31,613,217 | — | — | 31,613,217 |
| Philippines | 31,268,498 | — | — | 31,268,498 |
| Switzerland | 7,796,675 | — | — | 7,796,675 |
| Sweden | 5,672,205 | — | — | 5,672,205 |
| Mutual Funds | 105,351,354 | — | — | 105,351,354 |
| Total | $2,799,799,073 | $12,612,645 | $— | $2,812,411,718 |
| Year ended 8/31/21 | |
| Ordinary income (including any short-term capital gains) | $102,280,212 |
| Long-term capital gains | 143,000,440 |
| Total distributions | $245,280,652 |
| As of 2/28/22 | |
| Cost of investments | $2,949,421,838 |
| Gross appreciation | 355,866,939 |
| Gross depreciation | (492,877,059) |
| Net unrealized appreciation (depreciation) | $ (137,010,120) |
| As of 8/31/21 | |
| Undistributed ordinary income | 241,781,136 |
| Undistributed long-term capital gain | 261,359,755 |
| Other temporary differences | 9,516 |
| Net unrealized appreciation (depreciation) | 752,136,405 |
| Six months ended 2/28/22 | Year ended 8/31/21 | ||
| Class A | $215,358,617 | $92,576,529 | |
| Class B | 3,997,534 | 2,578,960 | |
| Class C | 14,579,563 | 9,212,244 | |
| Class I | 100,195,846 | 37,222,351 | |
| Class R1 | 1,463,235 | 726,956 | |
| Class R2 | 6,788,083 | 3,705,529 | |
| Class R3 | 31,919,712 | 11,238,415 | |
| Class R4 | 4,708,685 | 2,003,239 | |
| Class R6 | 207,429,432 | 86,016,429 | |
| Total | $586,440,707 | $245,280,652 |
| Up to $1 billion | 0.90% |
| In excess of $1 billion and up to $2.5 billion | 0.80% |
| In excess of $2.5 billion and up to $5 billion | 0.75% |
| In excess of $5 billion | 0.70% |
| Distribution Fee Rate (d) | Service Fee Rate (d) | Total Distribution Plan (d) | Annual Effective Rate (e) | Distribution and Service Fee | |
| Class A | — | 0.25% | 0.25% | 0.25% | $ 1,321,568 |
| Class B | 0.75% | 0.25% | 1.00% | 1.00% | 68,003 |
| Class C | 0.75% | 0.25% | 1.00% | 1.00% | 244,458 |
| Class R1 | 0.75% | 0.25% | 1.00% | 1.00% | 24,810 |
| Class R2 | 0.25% | 0.25% | 0.50% | 0.50% | 74,402 |
| Class R3 | — | 0.25% | 0.25% | 0.25% | 195,976 |
| Total Distribution and Service Fees | $1,929,217 |
| (d) | In accordance with the distribution plan for certain classes, the fund pays distribution and/or service fees equal to these annual percentage rates of each class’s average daily net assets. The distribution and service fee rates disclosed by class represent the current rates in effect at the end of the reporting period. Any rate changes, if applicable, are detailed below. |
| (e) | The annual effective rates represent actual fees incurred under the distribution plan for the six months ended February 28, 2022 based on each class's average daily net assets. MFD has voluntarily agreed to rebate a portion of each class's 0.25% service fee attributable to accounts for which there is no financial intermediary specified on the account except for accounts attributable to MFS or its affiliates' seed money. For the six months ended February 28, 2022, this rebate amounted to $285, $5, and $161 for Class A, Class C, and Class R2, respectively, and is included in the reduction of total expenses in the Statement of Operations. |
| Amount | |
| Class A | $13,815 |
| Class B | 1,533 |
| Class C | 2,551 |
| Six months ended 2/28/22 | Year ended 8/31/21 | ||||
| Shares | Amount | Shares | Amount | ||
| Shares sold | |||||
| Class A | 3,359,376 | $106,688,223 | 7,106,115 | $261,808,137 | |
| Class B | 4,953 | 109,466 | 32,268 | 829,093 | |
| Class C | 235,907 | 5,047,595 | 433,146 | 11,169,435 | |
| Class I | 3,949,590 | 150,534,554 | 6,149,518 | 265,117,227 | |
| Class R1 | 15,850 | 300,868 | 37,214 | 935,098 | |
| Class R2 | 105,339 | 2,898,287 | 276,164 | 9,252,364 | |
| Class R3 | 629,138 | 18,704,820 | 2,991,128 | 107,921,783 | |
| Class R4 | 186,446 | 6,204,335 | 351,621 | 13,821,861 | |
| Class R6 | 10,842,135 | 395,982,050 | 8,815,568 | 383,830,450 | |
| 19,328,734 | $686,470,198 | 26,192,742 | $1,054,685,448 | ||
| Shares issued to shareholders in reinvestment of distributions | |||||
| Class A | 6,998,076 | $210,222,217 | 2,657,076 | $90,181,174 | |
| Class B | 214,568 | 3,935,178 | 107,147 | 2,519,035 | |
| Class C | 762,461 | 14,052,153 | 382,598 | 9,025,492 | |
| Class I | 2,543,591 | 92,612,157 | 847,170 | 33,564,887 | |
| Class R1 | 81,291 | 1,463,235 | 31,334 | 726,956 | |
| Class R2 | 251,763 | 6,628,908 | 118,275 | 3,626,302 | |
| Class R3 | 1,065,411 | 31,919,712 | 331,810 | 11,238,415 | |
| Class R4 | 135,485 | 4,521,134 | 52,565 | 1,938,081 | |
| Class R6 | 5,467,893 | 202,858,835 | 2,042,242 | 82,118,540 | |
| 17,520,539 | $568,213,529 | 6,570,217 | $234,938,882 | ||
| Shares reacquired | |||||
| Class A | (3,360,881) | $(104,322,810) | (4,140,746) | $(151,599,181) | |
| Class B | (155,145) | (3,177,911) | (241,968) | (6,228,496) | |
| Class C | (526,121) | (10,401,647) | (1,245,222) | (31,877,029) | |
| Class I | (4,256,206) | (154,343,036) | (2,767,511) | (118,446,634) | |
| Class R1 | (41,324) | (899,265) | (66,023) | (1,650,096) | |
| Class R2 | (247,545) | (6,676,288) | (461,956) | (15,379,445) | |
| Class R3 | (823,427) | (25,232,778) | (1,129,535) | (41,368,610) | |
| Class R4 | (167,954) | (5,648,829) | (245,037) | (9,729,753) | |
| Class R6 | (2,883,174) | (106,710,465) | (5,975,879) | (258,783,566) | |
| (12,461,777) | $(417,413,029) | (16,273,877) | $(635,062,810) | ||
| Six months ended 2/28/22 | Year ended 8/31/21 | ||||
| Shares | Amount | Shares | Amount | ||
| Net change | |||||
| Class A | 6,996,571 | $212,587,630 | 5,622,445 | $200,390,130 | |
| Class B | 64,376 | 866,733 | (102,553) | (2,880,368) | |
| Class C | 472,247 | 8,698,101 | (429,478) | (11,682,102) | |
| Class I | 2,236,975 | 88,803,675 | 4,229,177 | 180,235,480 | |
| Class R1 | 55,817 | 864,838 | 2,525 | 11,958 | |
| Class R2 | 109,557 | 2,850,907 | (67,517) | (2,500,779) | |
| Class R3 | 871,122 | 25,391,754 | 2,193,403 | 77,791,588 | |
| Class R4 | 153,977 | 5,076,640 | 159,149 | 6,030,189 | |
| Class R6 | 13,426,854 | 492,130,420 | 4,881,931 | 207,165,424 | |
| 24,387,496 | $837,270,698 | 16,489,082 | $654,561,520 | ||
| Affiliated Issuers | Beginning Value | Purchases | Sales Proceeds | Realized Gain (Loss) | Change in Unrealized Appreciation or Depreciation | Ending Value |
| MFS Institutional Money Market Portfolio | $122,912,898 | $557,781,045 | $578,825,293 | $— | $— | $101,868,650 |
| Affiliated Issuers | Dividend Income | Capital Gain Distributions |
| MFS Institutional Money Market Portfolio | $31,068 | $— |


International Fund

International Fund
| 1 | |
| 2 | |
| 4 | |
| 6 | |
| 12 | |
| 14 | |
| 15 | |
| 16 | |
| 28 | |
| 40 | |
| 40 | |
| 40 | |
| 40 | |
| 40 |
| back cover |


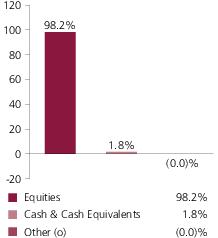
| Roche Holding AG | 3.4% |
| Nestle S.A. | 3.3% |
| Novo Nordisk A.S., “B” | 3.3% |
| Schneider Electric SE | 2.5% |
| Linde PLC | 2.4% |
| LVMH Moet Hennessy Louis Vuitton SE | 2.3% |
| Aon PLC | 1.7% |
| Hitachi Ltd. | 1.6% |
| UBS Group AG | 1.6% |
| BNP Paribas | 1.5% |
| Capital Goods | 23.7% |
| Financial Services | 20.4% |
| Health Care | 12.3% |
| Technology | 11.9% |
| Consumer Cyclicals | 10.0% |
| Consumer Staples | 9.3% |
| Energy | 7.5% |
| Telecommunications/Cable Television | 3.1% |
| Japan | 19.3% |
| Switzerland | 13.1% |
| United Kingdom | 12.5% |
| France | 9.1% |
| Germany | 8.7% |
| United States | 8.2% |
| Hong Kong | 4.2% |
| Netherlands | 3.7% |
| Denmark | 3.7% |
| Other Countries | 17.5% |
| Euro | 29.5% |
| Japanese Yen | 19.3% |
| Swiss Franc | 13.1% |
| British Pound Sterling | 12.9% |
| Hong Kong Dollar | 6.7% |
| United States Dollar | 6.6% |
| Danish Krone | 3.7% |
| Australian Dollar | 2.4% |
| Canadian Dollar | 2.1% |
| Other Currencies | 3.7% |
| (k) | The sectors set forth above and the associated portfolio composition are based on MFS’ own custom sector classification methodology. |
| (o) | Less than 0.1%. |
| (x) | Represents the portfolio’s exposure to issuer countries as a percentage of a portfolio’s net assets. For purposes of this presentation, United States includes Cash & Cash Equivalents and Other. |
| (y) | Represents the portfolio’s exposure to a particular currency as a percentage of a portfolio's net assets. For purposes of this presentation, United States Dollar includes Cash & Cash Equivalents. |
September 1, 2021 through February 28, 2022
| Share Class | Annualized Expense Ratio | Beginning Account Value 9/01/21 | Ending Account Value 2/28/22 | Expenses Paid During Period (p) 9/01/21-2/28/22 | |
| A | Actual | 0.99% | $1,000.00 | $911.79 | $4.69 |
| Hypothetical (h) | 0.99% | $1,000.00 | $1,019.89 | $4.96 | |
| B | Actual | 1.74% | $1,000.00 | $908.54 | $8.23 |
| Hypothetical (h) | 1.74% | $1,000.00 | $1,016.17 | $8.70 | |
| C | Actual | 1.74% | $1,000.00 | $908.32 | $8.23 |
| Hypothetical (h) | 1.74% | $1,000.00 | $1,016.17 | $8.70 | |
| I | Actual | 0.74% | $1,000.00 | $912.60 | $3.51 |
| Hypothetical (h) | 0.74% | $1,000.00 | $1,021.12 | $3.71 | |
| R1 | Actual | 1.74% | $1,000.00 | $908.23 | $8.23 |
| Hypothetical (h) | 1.74% | $1,000.00 | $1,016.17 | $8.70 | |
| R2 | Actual | 1.24% | $1,000.00 | $910.37 | $5.87 |
| Hypothetical (h) | 1.24% | $1,000.00 | $1,018.65 | $6.21 | |
| R3 | Actual | 0.99% | $1,000.00 | $911.59 | $4.69 |
| Hypothetical (h) | 0.99% | $1,000.00 | $1,019.89 | $4.96 | |
| R4 | Actual | 0.74% | $1,000.00 | $913.04 | $3.51 |
| Hypothetical (h) | 0.74% | $1,000.00 | $1,021.12 | $3.71 | |
| R6 | Actual | 0.63% | $1,000.00 | $913.23 | $2.99 |
| Hypothetical (h) | 0.63% | $1,000.00 | $1,021.67 | $3.16 | |
| 529A | Actual | 1.02% | $1,000.00 | $911.76 | $4.83 |
| Hypothetical (h) | 1.02% | $1,000.00 | $1,019.74 | $5.11 | |
| 529B | Actual | 1.79% | $1,000.00 | $908.42 | $8.47 |
| Hypothetical (h) | 1.79% | $1,000.00 | $1,015.92 | $8.95 | |
| 529C | Actual | 1.79% | $1,000.00 | $908.00 | $8.47 |
| Hypothetical (h) | 1.79% | $1,000.00 | $1,015.92 | $8.95 |
| (h) | 5% class return per year before expenses. |
| (p) | “Expenses Paid During Period” are equal to each class’s annualized expense ratio, as shown above, multiplied by the average account value over the period, multiplied by 181/365 (to reflect the one-half year period). Expenses paid do not include any applicable sales charges (loads). If these transaction costs had been included, your costs would have been higher. |
| Issuer | Shares/Par | Value ($) | ||
| Common Stocks – 98.2% | ||||
| Aerospace & Defense – 0.9% | ||||
| MTU Aero Engines Holding AG | 570,362 | $ 138,263,839 | ||
| Airlines – 0.5% | ||||
| Ryanair Holdings PLC, ADR (a) | 744,422 | $ 74,226,318 | ||
| Alcoholic Beverages – 2.0% | ||||
| Diageo PLC | 4,801,104 | $ 239,915,437 | ||
| Kirin Holdings Co. Ltd. | 5,470,200 | 90,894,468 | ||
| $330,809,905 | ||||
| Apparel Manufacturers – 4.7% | ||||
| Adidas AG | 767,210 | $ 182,412,616 | ||
| Burberry Group PLC | 1,961,961 | 51,060,246 | ||
| Compagnie Financiere Richemont S.A. | 1,171,820 | 159,845,908 | ||
| LVMH Moet Hennessy Louis Vuitton SE | 508,485 | 376,234,497 | ||
| $769,553,267 | ||||
| Automotive – 2.7% | ||||
| Bridgestone Corp. | 2,155,700 | $ 89,020,109 | ||
| Continental AG (a) | 848,508 | 73,066,701 | ||
| Koito Manufacturing Co. Ltd. | 2,709,800 | 140,086,366 | ||
| Toyota Industries Corp. | 1,874,900 | 143,142,128 | ||
| $445,315,304 | ||||
| Brokerage & Asset Managers – 2.1% | ||||
| Euronext N.V. | 1,699,870 | $ 154,098,380 | ||
| Hong Kong Exchanges & Clearing Ltd. | 1,831,900 | 88,262,753 | ||
| London Stock Exchange Group | 1,066,028 | 94,013,261 | ||
| $336,374,394 | ||||
| Business Services – 0.8% | ||||
| Nomura Research Institute Ltd. | 3,885,000 | $ 135,674,318 | ||
| Computer Software – 2.4% | ||||
| Cadence Design Systems, Inc. (a) | 662,211 | $ 100,278,612 | ||
| Naver Corp. | 340,504 | 91,069,801 | ||
| NetEase.com, Inc., ADR | 1,997,627 | 190,453,758 | ||
| $381,802,171 | ||||
| Issuer | Shares/Par | Value ($) | ||
| Common Stocks – continued | ||||
| Computer Software - Systems – 5.4% | ||||
| Amadeus IT Group S.A. (a) | 1,879,141 | $ 126,292,758 | ||
| Constellation Software, Inc. | 94,850 | 159,853,867 | ||
| EPAM Systems, Inc. (a) | 166,962 | 34,686,356 | ||
| Fujitsu Ltd. | 1,227,200 | 179,640,955 | ||
| Hitachi Ltd. | 5,381,300 | 265,406,275 | ||
| Samsung Electronics Co. Ltd. | 1,751,214 | 105,657,799 | ||
| $871,538,010 | ||||
| Construction – 1.1% | ||||
| Techtronic Industries Co. Ltd. | 10,830,000 | $ 180,405,919 | ||
| Consumer Products – 1.8% | ||||
| Kao Corp. | 2,039,800 | $ 96,110,474 | ||
| Reckitt Benckiser Group PLC | 2,260,906 | 191,716,327 | ||
| $287,826,801 | ||||
| Consumer Services – 0.9% | ||||
| Carsales.com Ltd. | 2,732,604 | $ 41,511,212 | ||
| Persol Holdings Co. Ltd. | 2,685,700 | 59,977,110 | ||
| SEEK Ltd. | 2,444,663 | 48,102,662 | ||
| $149,590,984 | ||||
| Electrical Equipment – 3.6% | ||||
| Legrand S.A. | 1,882,296 | $ 179,014,631 | ||
| Schneider Electric SE | 2,623,420 | 411,164,112 | ||
| $590,178,743 | ||||
| Electronics – 2.2% | ||||
| ASML Holding N.V. | 19,100 | $ 12,825,964 | ||
| Kyocera Corp. | 1,668,300 | 95,819,840 | ||
| NXP Semiconductors N.V. | 593,549 | 112,845,536 | ||
| Taiwan Semiconductor Manufacturing Co. Ltd. | 6,513,326 | 138,681,995 | ||
| $360,173,335 | ||||
| Energy - Independent – 0.6% | ||||
| Woodside Petroleum Ltd. | 4,331,984 | $ 91,409,663 | ||
| Energy - Integrated – 2.9% | ||||
| Capricorn Energy PLC (a)(l) | 23,358,386 | $ 69,627,001 | ||
| Eni S.p.A. | 11,218,762 | 173,993,192 | ||
| Galp Energia SGPS S.A., “B” | 12,144,768 | 134,239,515 | ||
| Idemitsu Kosan Co. Ltd. | 3,529,000 | 95,852,058 | ||
| $473,711,766 | ||||
| Issuer | Shares/Par | Value ($) | ||
| Common Stocks – continued | ||||
| Energy - Renewables – 0.4% | ||||
| Orsted A/S | 561,572 | $ 72,912,077 | ||
| Food & Beverages – 3.9% | ||||
| Danone S.A. | 1,727,833 | $ 105,216,514 | ||
| Nestle S.A. | 4,089,481 | 534,116,273 | ||
| $639,332,787 | ||||
| Food & Drug Stores – 0.3% | ||||
| Sugi Holdings Co. Ltd. | 776,400 | $ 44,275,448 | ||
| Gaming & Lodging – 0.8% | ||||
| Flutter Entertainment PLC (a) | 463,917 | $ 67,182,125 | ||
| Whitbread PLC (a) | 1,601,334 | 62,813,081 | ||
| $129,995,206 | ||||
| Insurance – 4.9% | ||||
| AIA Group Ltd. | 21,955,600 | $ 228,276,879 | ||
| Aon PLC | 957,413 | 279,698,634 | ||
| Beazley PLC | 7,322,003 | 44,260,049 | ||
| Hiscox Ltd. | 5,228,224 | 64,651,960 | ||
| Zurich Insurance Group AG | 375,280 | 172,519,952 | ||
| $789,407,474 | ||||
| Internet – 1.1% | ||||
| Scout24 AG | 638,137 | $ 37,349,670 | ||
| Tencent Holdings Ltd. | 2,719,400 | 147,796,839 | ||
| $185,146,509 | ||||
| Leisure & Toys – 0.7% | ||||
| Prosus N.V. | 855,148 | $ 53,138,605 | ||
| Yamaha Corp. | 1,436,500 | 67,225,395 | ||
| $120,364,000 | ||||
| Machinery & Tools – 6.4% | ||||
| Daikin Industries Ltd. | 1,138,600 | $ 211,212,913 | ||
| GEA Group AG | 3,276,413 | 143,530,564 | ||
| Kubota Corp. | 9,716,900 | 174,923,336 | ||
| Ritchie Bros. Auctioneers, Inc. | 1,364,686 | 71,523,543 | ||
| Schindler Holding AG | 572,702 | 132,075,535 | ||
| SMC Corp. | 379,700 | 226,001,820 | ||
| Weir Group PLC | 3,620,431 | 76,859,012 | ||
| $1,036,126,723 | ||||
| Issuer | Shares/Par | Value ($) | ||
| Common Stocks – continued | ||||
| Major Banks – 7.1% | ||||
| Barclays PLC | 70,904,971 | $ 173,953,712 | ||
| BNP Paribas | 4,243,824 | 249,862,869 | ||
| ING Groep N.V. | 11,269,647 | 132,653,655 | ||
| Mitsubishi UFJ Financial Group, Inc. | 17,022,800 | 105,797,816 | ||
| NatWest Group PLC | 76,928,251 | 237,048,743 | ||
| UBS Group AG | 14,012,829 | 257,994,349 | ||
| $1,157,311,144 | ||||
| Medical Equipment – 3.1% | ||||
| ConvaTec Group PLC | 29,178,486 | $ 70,555,168 | ||
| Koninklijke Philips N.V. | 4,497,797 | 153,009,278 | ||
| QIAGEN N.V. (a) | 3,806,404 | 191,203,235 | ||
| Terumo Corp. | 2,872,900 | 93,177,639 | ||
| $507,945,320 | ||||
| Metals & Mining – 1.2% | ||||
| Glencore PLC | 32,270,667 | $ 191,411,653 | ||
| Natural Gas - Distribution – 0.4% | ||||
| China Resources Gas Group Ltd. | 14,946,000 | $ 68,565,774 | ||
| Natural Gas - Pipeline – 1.0% | ||||
| APA Group | 7,893,561 | $ 57,822,171 | ||
| TC Energy Corp. | 1,908,343 | 102,531,091 | ||
| $160,353,262 | ||||
| Other Banks & Diversified Financials – 4.0% | ||||
| AIB Group PLC | 24,781,671 | $ 65,214,778 | ||
| HDFC Bank Ltd. | 9,772,754 | 185,755,054 | ||
| Julius Baer Group Ltd. | 2,169,908 | 127,293,698 | ||
| Macquarie Group Ltd. | 1,128,963 | 149,127,218 | ||
| Visa, Inc., “A” | 568,886 | 122,947,642 | ||
| $650,338,390 | ||||
| Pharmaceuticals – 9.2% | ||||
| Bayer AG | 1,760,849 | $ 101,698,841 | ||
| Kyowa Kirin Co. Ltd. | 6,392,000 | 164,990,609 | ||
| Novo Nordisk A.S., “B” | 5,187,051 | 533,406,828 | ||
| Roche Holding AG | 1,462,799 | 558,020,096 | ||
| Santen Pharmaceutical Co. Ltd. | 11,364,200 | 130,636,553 | ||
| $1,488,752,927 | ||||
| Printing & Publishing – 0.7% | ||||
| Wolters Kluwer N.V. | 1,052,547 | $ 107,182,858 | ||
| Issuer | Shares/Par | Value ($) | ||
| Common Stocks – continued | ||||
| Real Estate – 2.3% | ||||
| ESR Cayman Ltd. (a) | 27,789,200 | $ 85,652,341 | ||
| Grand City Properties S.A. | 5,289,372 | 115,826,703 | ||
| LEG Immobilien SE | 1,361,195 | 175,975,413 | ||
| $377,454,457 | ||||
| Restaurants – 0.8% | ||||
| Yum China Holdings, Inc. | 2,541,614 | $ 132,214,760 | ||
| Specialty Chemicals – 7.8% | ||||
| Akzo Nobel N.V. | 1,553,804 | $ 148,087,193 | ||
| Croda International PLC | 1,805,202 | 181,238,470 | ||
| Kansai Paint Co. Ltd. | 3,387,800 | 67,927,164 | ||
| Linde PLC | 1,317,990 | 385,113,609 | ||
| Nitto Denko Corp. | 1,911,400 | 139,458,034 | ||
| Sika AG | 566,018 | 188,857,821 | ||
| Symrise AG | 1,318,443 | 157,439,357 | ||
| $1,268,121,648 | ||||
| Specialty Stores – 0.6% | ||||
| JD.com, Inc., “A” (a) | 142,959 | $ 5,146,676 | ||
| Ocado Group PLC (a) | 1,785,048 | 32,878,443 | ||
| ZOZO, Inc. | 2,227,900 | 63,781,740 | ||
| $101,806,859 | ||||
| Telecommunications - Wireless – 2.7% | ||||
| Advanced Info Service Public Co. Ltd. | 11,569,600 | $ 81,084,572 | ||
| Cellnex Telecom S.A. | 2,059,963 | 93,867,545 | ||
| KDDI Corp. | 5,141,700 | 168,205,929 | ||
| SoftBank Group Corp. | 2,090,700 | 93,825,591 | ||
| $436,983,637 | ||||
| Telephone Services – 0.5% | ||||
| Hellenic Telecommunications Organization S.A. | 3,790,427 | $ 75,650,269 | ||
| Tobacco – 1.5% | ||||
| British American Tobacco PLC | 5,648,198 | $ 247,125,806 | ||
| Utilities - Electric Power – 2.2% | ||||
| CLP Holdings Ltd. | 8,881,000 | $ 90,405,593 | ||
| E.ON SE | 7,325,583 | 99,534,922 | ||
| Iberdrola S.A. | 14,610,053 | 166,763,849 | ||
| $356,704,364 | ||||
| Total Common Stocks (Identified Cost, $12,694,220,693) | $15,962,338,089 | |||
| Issuer | Strike Price | First Exercise | Shares/Par | Value ($) |
| Warrants – 0.0% | ||||
| Apparel Manufacturers – 0.0% | ||||
| Compagnie Financiere Richemont S.A. (1 share for 2 warrants, Expiration 12/04/23) (a) (Identified Cost, $18,000) | CHF 67.00 | 11/20/23 | 2,052,106 | $ 1,812,459 |
| Investment Companies (h) – 1.6% | ||||
| Money Market Funds – 1.6% | ||||
| MFS Institutional Money Market Portfolio, 0.06% (v) (Identified Cost, $260,022,667) | 260,023,175 | $ 260,023,175 | ||
| Collateral for Securities Loaned – 0.0% | ||||
| State Street Navigator Securities Lending Government Money Market Portfolio, 0.06% (j) (Identified Cost, $440,874) | 440,874 | $ 440,874 | ||
| Other Assets, Less Liabilities – 0.2% | 32,694,602 | |||
| Net Assets – 100.0% | $16,257,309,199 | |||
| (a) | Non-income producing security. | |||
| (h) | An affiliated issuer, which may be considered one in which the fund owns 5% or more of the outstanding voting securities, or a company which is under common control. At period end, the aggregate values of the fund's investments in affiliated issuers and in unaffiliated issuers were $260,023,175 and $15,964,591,422, respectively. | |||
| (j) | The rate quoted is the annualized seven-day yield of the fund at period end. | |||
| (l) | A portion of this security is on loan. See Note 2 for additional information. | |||
| (v) | Affiliated issuer that is available only to investment companies managed by MFS. The rate quoted for the MFS Institutional Money Market Portfolio is the annualized seven-day yield of the fund at period end. |
| The following abbreviations are used in this report and are defined: | |
| ADR | American Depositary Receipt |
| Abbreviations indicate amounts shown in currencies other than the U.S. dollar. All amounts are stated in U.S. dollars unless otherwise indicated. A list of abbreviations is shown below: | |
| CHF | Swiss Franc |
| Assets | |
| Investments in unaffiliated issuers, at value, including $1,719,874 of securities on loan (identified cost, $12,694,679,567) | $15,964,591,422 |
| Investments in affiliated issuers, at value (identified cost, $260,022,667) | 260,023,175 |
| Foreign currency, at value (identified cost, $9,662,373) | 9,662,373 |
| Receivables for | |
| Investments sold | 31,330,892 |
| Fund shares sold | 29,944,934 |
| Interest and dividends | 56,986,696 |
| Other assets | 94,493 |
| Total assets | $16,352,633,985 |
| Liabilities | |
| Payables for | |
| Investments purchased | $81,652,768 |
| Fund shares reacquired | 4,309,467 |
| Collateral for securities loaned, at value (c) | 440,874 |
| Payable to affiliates | |
| Investment adviser | 1,087,394 |
| Administrative services fee | 6,392 |
| Shareholder servicing costs | 736,113 |
| Distribution and service fees | 28,577 |
| Program manager fees | 97 |
| Payable for independent Trustees' compensation | 19,132 |
| Deferred country tax expense payable | 6,021,546 |
| Accrued expenses and other liabilities | 1,022,426 |
| Total liabilities | $95,324,786 |
| Net assets | $16,257,309,199 |
| Net assets consist of | |
| Paid-in capital | $13,120,770,947 |
| Total distributable earnings (loss) | 3,136,538,252 |
| Net assets | $16,257,309,199 |
| Shares of beneficial interest outstanding | 728,464,965 |
| (c) | Non-cash collateral is not included. |
| Net assets | Shares outstanding | Net asset value per share (a) | |
| Class A | $730,730,557 | 32,673,577 | $22.36 |
| Class B | 1,615,664 | 74,629 | 21.65 |
| Class C | 13,332,094 | 633,549 | 21.04 |
| Class I | 1,724,007,382 | 74,319,389 | 23.20 |
| Class R1 | 4,224,411 | 205,575 | 20.55 |
| Class R2 | 89,447,451 | 4,145,924 | 21.57 |
| Class R3 | 68,128,872 | 3,079,755 | 22.12 |
| Class R4 | 78,601,118 | 3,508,773 | 22.40 |
| Class R6 | 13,529,379,890 | 609,001,429 | 22.22 |
| Class 529A | 15,942,012 | 728,327 | 21.89 |
| Class 529B | 111,851 | 5,416 | 20.65 |
| Class 529C | 1,787,897 | 88,622 | 20.17 |
| (a) | Maximum offering price per share was equal to the net asset value per share for all share classes, except for Classes A and 529A, for which the maximum offering prices per share were $23.72 [100 / 94.25 x $22.36] and $23.23 [100 / 94.25 x $21.89], respectively. On sales of $50,000 or more, the maximum offering prices of Class A and Class 529A shares are reduced. A contingent deferred sales charge may be imposed on redemptions of Class A, Class B, Class C, Class 529B, and Class 529C shares. Redemption price per share was equal to the net asset value per share for Classes I, R1, R2, R3, R4, R6, and 529A. |
| Net investment income (loss) | |
| Income | |
| Dividends | $109,531,206 |
| Income on securities loaned | 57,129 |
| Dividends from affiliated issuers | 38,962 |
| Interest | 5,056 |
| Foreign taxes withheld | (7,671,532) |
| Total investment income | $101,960,821 |
| Expenses | |
| Management fee | $52,942,416 |
| Distribution and service fees | 1,456,103 |
| Shareholder servicing costs | 1,705,135 |
| Program manager fees | 4,784 |
| Administrative services fee | 283,563 |
| Independent Trustees' compensation | 47,892 |
| Custodian fee | 819,382 |
| Shareholder communications | 81,671 |
| Audit and tax fees | 42,435 |
| Legal fees | 40,813 |
| Miscellaneous | 211,869 |
| Total expenses | $57,636,063 |
| Reduction of expenses by investment adviser and distributor | (1,164,532) |
| Net expenses | $56,471,531 |
| Net investment income (loss) | $45,489,290 |
| Realized and unrealized gain (loss) | |
| Realized gain (loss) (identified cost basis) | |
| Unaffiliated issuers (net of $747,847 country tax) | $41,079,028 |
| Affiliated issuers | 2,746 |
| Foreign currency | 194,789 |
| Net realized gain (loss) | $41,276,563 |
| Change in unrealized appreciation or depreciation | |
| Unaffiliated issuers (net of $1,384,220 decrease in deferred country tax) | $(1,611,178,246) |
| Affiliated issuers | (2,746) |
| Translation of assets and liabilities in foreign currencies | (1,045,831) |
| Net unrealized gain (loss) | $(1,612,226,823) |
| Net realized and unrealized gain (loss) | $(1,570,950,260) |
| Change in net assets from operations | $(1,525,460,970) |
| Six months ended | Year ended | |
| 2/28/22 (unaudited) | 8/31/21 | |
| Change in net assets | ||
| From operations | ||
| Net investment income (loss) | $45,489,290 | $184,500,701 |
| Net realized gain (loss) | 41,276,563 | 90,764,359 |
| Net unrealized gain (loss) | (1,612,226,823) | 2,885,281,816 |
| Change in net assets from operations | $(1,525,460,970) | $3,160,546,876 |
| Total distributions to shareholders | $(237,804,624) | $(135,001,732) |
| Change in net assets from fund share transactions | $774,706,750 | $2,527,692,762 |
| Total change in net assets | $(988,558,844) | $5,553,237,906 |
| Net assets | ||
| At beginning of period | 17,245,868,043 | 11,692,630,137 |
| At end of period | $16,257,309,199 | $17,245,868,043 |
| Class A | Six months ended | Year ended | ||||
| 2/28/22 (unaudited) | 8/31/21 | 8/31/20 | 8/31/19 | 8/31/18 | 8/31/17 | |
| Net asset value, beginning of period | $24.78 | $20.09 | $17.89 | $19.19 | $18.16 | $15.83 |
| Income (loss) from investment operations | ||||||
| Net investment income (loss) (d) | $0.03 | $0.21 | $0.19 | $0.32 | $0.26 | $0.20(c) |
| Net realized and unrealized gain (loss) | (2.20) | 4.64 | 2.33 | (0.77) | 0.97 | 2.39 |
| Total from investment operations | $(2.17) | $4.85 | $2.52 | $(0.45) | $1.23 | $2.59 |
| Less distributions declared to shareholders | ||||||
| From net investment income | $(0.25) | $(0.16) | $(0.32) | $(0.72) | $(0.20) | $(0.26) |
| From net realized gain | — | — | — | (0.13) | — | — |
| Total distributions declared to shareholders | $(0.25) | $(0.16) | $(0.32) | $(0.85) | $(0.20) | $(0.26) |
| Net asset value, end of period (x) | $22.36 | $24.78 | $20.09 | $17.89 | $19.19 | $18.16 |
| Total return (%) (r)(s)(t)(x) | (8.82)(n) | 24.28 | 14.19 | (1.82) | 6.79 | 16.66(c) |
| Ratios (%) (to average net assets) and Supplemental data: | ||||||
| Expenses before expense reductions | 1.01(a) | 1.02 | 1.07 | 1.10 | 1.09 | 1.12(c) |
| Expenses after expense reductions | 0.99(a) | 1.00 | 1.06 | 1.09 | 1.08 | 1.10(c) |
| Net investment income (loss) | 0.22(a)(l) | 0.93 | 1.02 | 1.79 | 1.37 | 1.25(c) |
| Portfolio turnover | 7(n) | 19 | 22 | 22 | 25 | 33 |
| Net assets at end of period (000 omitted) | $730,731 | $963,468 | $772,695 | $622,639 | $686,128 | $693,538 |
| Class B | Six months ended | Year ended | ||||
| 2/28/22 (unaudited) | 8/31/21 | 8/31/20 | 8/31/19 | 8/31/18 | 8/31/17 | |
| Net asset value, beginning of period | $23.88 | $19.36 | $17.23 | $18.48 | $17.48 | $15.21 |
| Income (loss) from investment operations | ||||||
| Net investment income (loss) (d) | $(0.06) | $0.04 | $0.04 | $0.16 | $0.10 | $0.10(c) |
| Net realized and unrealized gain (loss) | (2.12) | 4.48 | 2.26 | (0.72) | 0.95 | 2.28 |
| Total from investment operations | $(2.18) | $4.52 | $2.30 | $(0.56) | $1.05 | $2.38 |
| Less distributions declared to shareholders | ||||||
| From net investment income | $(0.05) | $— | $(0.17) | $(0.56) | $(0.05) | $(0.11) |
| From net realized gain | — | — | — | (0.13) | — | — |
| Total distributions declared to shareholders | $(0.05) | $— | $(0.17) | $(0.69) | $(0.05) | $(0.11) |
| Net asset value, end of period (x) | $21.65 | $23.88 | $19.36 | $17.23 | $18.48 | $17.48 |
| Total return (%) (r)(s)(t)(x) | (9.15)(n) | 23.35 | 13.38 | (2.63) | 6.01 | 15.77(c) |
| Ratios (%) (to average net assets) and Supplemental data: | ||||||
| Expenses before expense reductions | 1.76(a) | 1.77 | 1.82 | 1.85 | 1.84 | 1.87(c) |
| Expenses after expense reductions | 1.74(a) | 1.76 | 1.81 | 1.84 | 1.82 | 1.85(c) |
| Net investment income (loss) | (0.49)(a)(l) | 0.17 | 0.21 | 0.97 | 0.55 | 0.61(c) |
| Portfolio turnover | 7(n) | 19 | 22 | 22 | 25 | 33 |
| Net assets at end of period (000 omitted) | $1,616 | $2,211 | $2,631 | $3,347 | $4,922 | $6,228 |
| Class C | Six months ended | Year ended | ||||
| 2/28/22 (unaudited) | 8/31/21 | 8/31/20 | 8/31/19 | 8/31/18 | 8/31/17 | |
| Net asset value, beginning of period | $23.25 | $18.85 | $16.79 | $17.99 | $17.03 | $14.85 |
| Income (loss) from investment operations | ||||||
| Net investment income (loss) (d) | $(0.06) | $0.03 | $0.04 | $0.17 | $0.08 | $0.10(c) |
| Net realized and unrealized gain (loss) | (2.06) | 4.37 | 2.19 | (0.70) | 0.94 | 2.21 |
| Total from investment operations | $(2.12) | $4.40 | $2.23 | $(0.53) | $1.02 | $2.31 |
| Less distributions declared to shareholders | ||||||
| From net investment income | $(0.09) | $— | $(0.17) | $(0.54) | $(0.06) | $(0.13) |
| From net realized gain | — | — | — | (0.13) | — | — |
| Total distributions declared to shareholders | $(0.09) | $— | $(0.17) | $(0.67) | $(0.06) | $(0.13) |
| Net asset value, end of period (x) | $21.04 | $23.25 | $18.85 | $16.79 | $17.99 | $17.03 |
| Total return (%) (r)(s)(t)(x) | (9.17)(n) | 23.34 | 13.36 | (2.56) | 5.97 | 15.74(c) |
| Ratios (%) (to average net assets) and Supplemental data: | ||||||
| Expenses before expense reductions | 1.76(a) | 1.77 | 1.82 | 1.85 | 1.84 | 1.87(c) |
| Expenses after expense reductions | 1.74(a) | 1.75 | 1.81 | 1.84 | 1.83 | 1.85(c) |
| Net investment income (loss) | (0.52)(a)(l) | 0.16 | 0.23 | 1.05 | 0.44 | 0.64(c) |
| Portfolio turnover | 7(n) | 19 | 22 | 22 | 25 | 33 |
| Net assets at end of period (000 omitted) | $13,332 | $15,664 | $17,620 | $22,825 | $27,800 | $48,570 |
| Class I | Six months ended | Year ended | ||||
| 2/28/22 (unaudited) | 8/31/21 | 8/31/20 | 8/31/19 | 8/31/18 | 8/31/17 | |
| Net asset value, beginning of period | $25.74 | $20.85 | $18.55 | $19.87 | $18.79 | $16.38 |
| Income (loss) from investment operations | ||||||
| Net investment income (loss) (d) | $0.06 | $0.28 | $0.24 | $0.37 | $0.26 | $0.30(c) |
| Net realized and unrealized gain (loss) | (2.27) | 4.82 | 2.43 | (0.80) | 1.06 | 2.42 |
| Total from investment operations | $(2.21) | $5.10 | $2.67 | $(0.43) | $1.32 | $2.72 |
| Less distributions declared to shareholders | ||||||
| From net investment income | $(0.33) | $(0.21) | $(0.37) | $(0.76) | $(0.24) | $(0.31) |
| From net realized gain | — | — | — | (0.13) | — | — |
| Total distributions declared to shareholders | $(0.33) | $(0.21) | $(0.37) | $(0.89) | $(0.24) | $(0.31) |
| Net asset value, end of period (x) | $23.20 | $25.74 | $20.85 | $18.55 | $19.87 | $18.79 |
| Total return (%) (r)(s)(t)(x) | (8.70)(n) | 24.62 | 14.48 | (1.61) | 7.05 | 16.95(c) |
| Ratios (%) (to average net assets) and Supplemental data: | ||||||
| Expenses before expense reductions | 0.76(a) | 0.76 | 0.82 | 0.85 | 0.84 | 0.87(c) |
| Expenses after expense reductions | 0.74(a) | 0.75 | 0.81 | 0.84 | 0.83 | 0.86(c) |
| Net investment income (loss) | 0.45(a)(l) | 1.21 | 1.25 | 2.03 | 1.31 | 1.79(c) |
| Portfolio turnover | 7(n) | 19 | 22 | 22 | 25 | 33 |
| Net assets at end of period (000 omitted) | $1,724,007 | $1,530,130 | $898,821 | $593,064 | $658,193 | $1,099,134 |
| Class R1 | Six months ended | Year ended | ||||
| 2/28/22 (unaudited) | 8/31/21 | 8/31/20 | 8/31/19 | 8/31/18 | 8/31/17 | |
| Net asset value, beginning of period | $22.75 | $18.45 | $16.46 | $17.72 | $16.80 | $14.63 |
| Income (loss) from investment operations | ||||||
| Net investment income (loss) (d) | $(0.06) | $0.05 | $0.03 | $0.15 | $0.11 | $0.09(c) |
| Net realized and unrealized gain (loss) | (2.02) | 4.26 | 2.17 | (0.69) | 0.90 | 2.20 |
| Total from investment operations | $(2.08) | $4.31 | $2.20 | $(0.54) | $1.01 | $2.29 |
| Less distributions declared to shareholders | ||||||
| From net investment income | $(0.12) | $(0.01) | $(0.21) | $(0.59) | $(0.09) | $(0.12) |
| From net realized gain | — | — | — | (0.13) | — | — |
| Total distributions declared to shareholders | $(0.12) | $(0.01) | $(0.21) | $(0.72) | $(0.09) | $(0.12) |
| Net asset value, end of period (x) | $20.55 | $22.75 | $18.45 | $16.46 | $17.72 | $16.80 |
| Total return (%) (r)(s)(t)(x) | (9.18)(n) | 23.39 | 13.40 | (2.62) | 5.99 | 15.79(c) |
| Ratios (%) (to average net assets) and Supplemental data: | ||||||
| Expenses before expense reductions | 1.76(a) | 1.76 | 1.82 | 1.85 | 1.84 | 1.87(c) |
| Expenses after expense reductions | 1.74(a) | 1.75 | 1.81 | 1.84 | 1.83 | 1.85(c) |
| Net investment income (loss) | (0.53)(a)(l) | 0.24 | 0.19 | 0.95 | 0.60 | 0.61(c) |
| Portfolio turnover | 7(n) | 19 | 22 | 22 | 25 | 33 |
| Net assets at end of period (000 omitted) | $4,224 | $3,042 | $1,628 | $1,751 | $2,153 | $2,089 |
| Class R2 | Six months ended | Year ended | ||||
| 2/28/22 (unaudited) | 8/31/21 | 8/31/20 | 8/31/19 | 8/31/18 | 8/31/17 | |
| Net asset value, beginning of period | $23.90 | $19.37 | $17.25 | $18.53 | $17.55 | $15.31 |
| Income (loss) from investment operations | ||||||
| Net investment income (loss) (d) | $(0.00)(w) | $0.15 | $0.13 | $0.26 | $0.19 | $0.17(c) |
| Net realized and unrealized gain (loss) | (2.13) | 4.49 | 2.26 | (0.75) | 0.95 | 2.30 |
| Total from investment operations | $(2.13) | $4.64 | $2.39 | $(0.49) | $1.14 | $2.47 |
| Less distributions declared to shareholders | ||||||
| From net investment income | $(0.20) | $(0.11) | $(0.27) | $(0.66) | $(0.16) | $(0.23) |
| From net realized gain | — | — | — | (0.13) | — | — |
| Total distributions declared to shareholders | $(0.20) | $(0.11) | $(0.27) | $(0.79) | $(0.16) | $(0.23) |
| Net asset value, end of period (x) | $21.57 | $23.90 | $19.37 | $17.25 | $18.53 | $17.55 |
| Total return (%) (r)(s)(t)(x) | (8.96)(n) | 24.02 | 13.95 | (2.14) | 6.49 | 16.37(c) |
| Ratios (%) (to average net assets) and Supplemental data: | ||||||
| Expenses before expense reductions | 1.26(a) | 1.27 | 1.32 | 1.35 | 1.34 | 1.37(c) |
| Expenses after expense reductions | 1.24(a) | 1.25 | 1.31 | 1.34 | 1.33 | 1.35(c) |
| Net investment income (loss) | (0.02)(a)(l) | 0.70 | 0.73 | 1.51 | 1.04 | 1.10(c) |
| Portfolio turnover | 7(n) | 19 | 22 | 22 | 25 | 33 |
| Net assets at end of period (000 omitted) | $89,447 | $104,975 | $89,943 | $98,935 | $121,197 | $132,988 |
| Class R3 | Six months ended | Year ended | ||||
| 2/28/22 (unaudited) | 8/31/21 | 8/31/20 | 8/31/19 | 8/31/18 | 8/31/17 | |
| Net asset value, beginning of period | $24.53 | $19.88 | $17.70 | $18.99 | $17.98 | $15.67 |
| Income (loss) from investment operations | ||||||
| Net investment income (loss) (d) | $0.03 | $0.21 | $0.18 | $0.30 | $0.25 | $0.22(c) |
| Net realized and unrealized gain (loss) | (2.18) | 4.60 | 2.32 | (0.75) | 0.96 | 2.35 |
| Total from investment operations | $(2.15) | $4.81 | $2.50 | $(0.45) | $1.21 | $2.57 |
| Less distributions declared to shareholders | ||||||
| From net investment income | $(0.26) | $(0.16) | $(0.32) | $(0.71) | $(0.20) | $(0.26) |
| From net realized gain | — | — | — | (0.13) | — | — |
| Total distributions declared to shareholders | $(0.26) | $(0.16) | $(0.32) | $(0.84) | $(0.20) | $(0.26) |
| Net asset value, end of period (x) | $22.12 | $24.53 | $19.88 | $17.70 | $18.99 | $17.98 |
| Total return (%) (r)(s)(t)(x) | (8.84)(n) | 24.30 | 14.21 | (1.83) | 6.75 | 16.67(c) |
| Ratios (%) (to average net assets) and Supplemental data: | ||||||
| Expenses before expense reductions | 1.01(a) | 1.02 | 1.07 | 1.10 | 1.09 | 1.12(c) |
| Expenses after expense reductions | 0.99(a) | 1.00 | 1.06 | 1.09 | 1.08 | 1.10(c) |
| Net investment income (loss) | 0.22(a)(l) | 0.96 | 0.99 | 1.73 | 1.31 | 1.37(c) |
| Portfolio turnover | 7(n) | 19 | 22 | 22 | 25 | 33 |
| Net assets at end of period (000 omitted) | $68,129 | $76,512 | $63,920 | $61,214 | $82,289 | $91,653 |
| Class R4 | Six months ended | Year ended | ||||
| 2/28/22 (unaudited) | 8/31/21 | 8/31/20 | 8/31/19 | 8/31/18 | 8/31/17 | |
| Net asset value, beginning of period | $24.86 | $20.15 | $17.93 | $19.25 | $18.21 | $15.86 |
| Income (loss) from investment operations | ||||||
| Net investment income (loss) (d) | $0.06 | $0.29 | $0.23 | $0.36 | $0.30 | $0.28(c) |
| Net realized and unrealized gain (loss) | (2.20) | 4.63 | 2.35 | (0.78) | 0.98 | 2.35 |
| Total from investment operations | $(2.14) | $4.92 | $2.58 | $(0.42) | $1.28 | $2.63 |
| Less distributions declared to shareholders | ||||||
| From net investment income | $(0.32) | $(0.21) | $(0.36) | $(0.77) | $(0.24) | $(0.28) |
| From net realized gain | — | — | — | (0.13) | — | — |
| Total distributions declared to shareholders | $(0.32) | $(0.21) | $(0.36) | $(0.90) | $(0.24) | $(0.28) |
| Net asset value, end of period (x) | $22.40 | $24.86 | $20.15 | $17.93 | $19.25 | $18.21 |
| Total return (%) (r)(s)(t)(x) | (8.70)(n) | 24.58 | 14.49 | (1.65) | 7.07 | 16.92(c) |
| Ratios (%) (to average net assets) and Supplemental data: | ||||||
| Expenses before expense reductions | 0.75(a) | 0.76 | 0.82 | 0.85 | 0.84 | 0.87(c) |
| Expenses after expense reductions | 0.74(a) | 0.75 | 0.81 | 0.84 | 0.83 | 0.86(c) |
| Net investment income (loss) | 0.48(a)(l) | 1.26 | 1.24 | 2.04 | 1.57 | 1.73(c) |
| Portfolio turnover | 7(n) | 19 | 22 | 22 | 25 | 33 |
| Net assets at end of period (000 omitted) | $78,601 | $96,499 | $41,619 | $54,352 | $58,578 | $63,884 |
| Class R6 | Six months ended | Year ended | ||||
| 2/28/22 (unaudited) | 8/31/21 | 8/31/20 | 8/31/19 | 8/31/18 | 8/31/17 | |
| Net asset value, beginning of period | $24.67 | $19.99 | $17.80 | $19.11 | $18.10 | $15.79 |
| Income (loss) from investment operations | ||||||
| Net investment income (loss) (d) | $0.07 | $0.29 | $0.25 | $0.38 | $0.34 | $0.28(c) |
| Net realized and unrealized gain (loss) | (2.17) | 4.62 | 2.33 | (0.77) | 0.95 | 2.36 |
| Total from investment operations | $(2.10) | $4.91 | $2.58 | $(0.39) | $1.29 | $2.64 |
| Less distributions declared to shareholders | ||||||
| From net investment income | $(0.35) | $(0.23) | $(0.39) | $(0.79) | $(0.28) | $(0.33) |
| From net realized gain | — | — | — | (0.13) | — | — |
| Total distributions declared to shareholders | $(0.35) | $(0.23) | $(0.39) | $(0.92) | $(0.28) | $(0.33) |
| Net asset value, end of period (x) | $22.22 | $24.67 | $19.99 | $17.80 | $19.11 | $18.10 |
| Total return (%) (r)(s)(t)(x) | (8.64)(n) | 24.74 | 14.61 | (1.48) | 7.12 | 17.07(c) |
| Ratios (%) (to average net assets) and Supplemental data: | ||||||
| Expenses before expense reductions | 0.65(a) | 0.67 | 0.71 | 0.74 | 0.74 | 0.77(c) |
| Expenses after expense reductions | 0.63(a) | 0.65 | 0.70 | 0.73 | 0.73 | 0.76(c) |
| Net investment income (loss) | 0.57(a)(l) | 1.30 | 1.37 | 2.18 | 1.80 | 1.72(c) |
| Portfolio turnover | 7(n) | 19 | 22 | 22 | 25 | 33 |
| Net assets at end of period (000 omitted) | $13,529,380 | $14,433,482 | $9,787,763 | $7,350,641 | $6,756,773 | $5,228,377 |
| Class 529A | Six months ended | Year ended | ||||
| 2/28/22 (unaudited) | 8/31/21 | 8/31/20 | 8/31/19 | 8/31/18 | 8/31/17 | |
| Net asset value, beginning of period | $24.27 | $19.68 | $17.52 | $18.83 | $17.84 | $15.61 |
| Income (loss) from investment operations | ||||||
| Net investment income (loss) (d) | $0.02 | $0.20 | $0.17 | $0.31 | $0.26 | $0.23(c) |
| Net realized and unrealized gain (loss) | (2.14) | 4.54 | 2.31 | (0.77) | 0.95 | 2.31 |
| Total from investment operations | $(2.12) | $4.74 | $2.48 | $(0.46) | $1.21 | $2.54 |
| Less distributions declared to shareholders | ||||||
| From net investment income | $(0.26) | $(0.15) | $(0.32) | $(0.72) | $(0.22) | $(0.31) |
| From net realized gain | — | — | — | (0.13) | — | — |
| Total distributions declared to shareholders | $(0.26) | $(0.15) | $(0.32) | $(0.85) | $(0.22) | $(0.31) |
| Net asset value, end of period (x) | $21.89 | $24.27 | $19.68 | $17.52 | $18.83 | $17.84 |
| Total return (%) (r)(s)(t)(x) | (8.82)(n) | 24.23 | 14.23 | (1.94) | 6.78 | 16.60(c) |
| Ratios (%) (to average net assets) and Supplemental data: | ||||||
| Expenses before expense reductions | 1.06(a) | 1.06 | 1.12 | 1.15 | 1.15 | 1.22(c) |
| Expenses after expense reductions | 1.02(a) | 1.03 | 1.09 | 1.13 | 1.11 | 1.13(c) |
| Net investment income (loss) | 0.19(a)(l) | 0.91 | 0.96 | 1.77 | 1.37 | 1.39(c) |
| Portfolio turnover | 7(n) | 19 | 22 | 22 | 25 | 33 |
| Net assets at end of period (000 omitted) | $15,942 | $17,630 | $13,072 | $11,805 | $12,615 | $10,464 |
| Class 529B | Six months ended | Year ended | ||||
| 2/28/22 (unaudited) | 8/31/21 | 8/31/20 | 8/31/19 | 8/31/18 | 8/31/17 | |
| Net asset value, beginning of period | $22.78 | $18.48 | $16.47 | $17.72 | $16.79 | $14.78 |
| Income (loss) from investment operations | ||||||
| Net investment income (loss) (d) | $(0.06) | $0.03 | $0.03 | $0.16 | $0.10 | $0.09(c) |
| Net realized and unrealized gain (loss) | (2.02) | 4.27 | 2.16 | (0.71) | 0.90 | 2.18 |
| Total from investment operations | $(2.08) | $4.30 | $2.19 | $(0.55) | $1.00 | $2.27 |
| Less distributions declared to shareholders | ||||||
| From net investment income | $(0.05) | $— | $(0.18) | $(0.57) | $(0.07) | $(0.26) |
| From net realized gain | — | — | — | (0.13) | — | — |
| Total distributions declared to shareholders | $(0.05) | $— | $(0.18) | $(0.70) | $(0.07) | $(0.26) |
| Net asset value, end of period (x) | $20.65 | $22.78 | $18.48 | $16.47 | $17.72 | $16.79 |
| Total return (%) (r)(s)(t)(x) | (9.16)(n) | 23.27 | 13.33 | (2.64) | 5.94 | 15.68(c) |
| Ratios (%) (to average net assets) and Supplemental data: | ||||||
| Expenses before expense reductions | 1.80(a) | 1.82 | 1.87 | 1.90 | 1.90 | 1.97(c) |
| Expenses after expense reductions | 1.79(a) | 1.80 | 1.86 | 1.89 | 1.88 | 1.90(c) |
| Net investment income (loss) | (0.58)(a)(l) | 0.15 | 0.16 | 1.00 | 0.56 | 0.58(c) |
| Portfolio turnover | 7(n) | 19 | 22 | 22 | 25 | 33 |
| Net assets at end of period (000 omitted) | $112 | $185 | $230 | $287 | $358 | $386 |
| Class 529C | Six months ended | Year ended | ||||
| 2/28/22 (unaudited) | 8/31/21 | 8/31/20 | 8/31/19 | 8/31/18 | 8/31/17 | |
| Net asset value, beginning of period | $22.30 | $18.10 | $16.13 | $17.38 | $16.51 | $14.53 |
| Income (loss) from investment operations | ||||||
| Net investment income (loss) (d) | $(0.06) | $0.02 | $0.03 | $0.15 | $0.09 | $0.10(c) |
| Net realized and unrealized gain (loss) | (1.98) | 4.19 | 2.12 | (0.69) | 0.89 | 2.15 |
| Total from investment operations | $(2.04) | $4.21 | $2.15 | $(0.54) | $0.98 | $2.25 |
| Less distributions declared to shareholders | ||||||
| From net investment income | $(0.09) | $(0.01) | $(0.18) | $(0.58) | $(0.11) | $(0.27) |
| From net realized gain | — | — | — | (0.13) | — | — |
| Total distributions declared to shareholders | $(0.09) | $(0.01) | $(0.18) | $(0.71) | $(0.11) | $(0.27) |
| Net asset value, end of period (x) | $20.17 | $22.30 | $18.10 | $16.13 | $17.38 | $16.51 |
| Total return (%) (r)(s)(t)(x) | (9.20)(n) | 23.27 | 13.39 | (2.68) | 5.93 | 15.78(c) |
| Ratios (%) (to average net assets) and Supplemental data: | ||||||
| Expenses before expense reductions | 1.81(a) | 1.82 | 1.87 | 1.90 | 1.90 | 1.97(c) |
| Expenses after expense reductions | 1.79(a) | 1.80 | 1.85 | 1.89 | 1.87 | 1.89(c) |
| Net investment income (loss) | (0.58)(a)(l) | 0.08 | 0.18 | 0.95 | 0.53 | 0.63(c) |
| Portfolio turnover | 7(n) | 19 | 22 | 22 | 25 | 33 |
| Net assets at end of period (000 omitted) | $1,788 | $2,071 | $2,688 | $2,981 | $3,572 | $3,856 |
| (a) | Annualized. |
| (c) | Amount reflects a one-time reimbursement of expenses by the custodian (or former custodian) without which net investment income and performance would be lower and expenses would be higher. |
| (d) | Per share data is based on average shares outstanding. |
| (l) | Recognition of net investment income by the fund may be affected by the timing of the declaration of dividends by companies in which the fund invests and the actual annual net investment income ratio may differ. |
| (n) | Not annualized. |
| (r) | Certain expenses have been reduced without which performance would have been lower. |
| (s) | From time to time the fund may receive proceeds from litigation settlements, without which performance would be lower. |
| (t) | Total returns do not include any applicable sales charges. |
| (w) | Per share amount was less than $0.01. |
| (x) | The net asset values and total returns have been calculated on net assets which include adjustments made in accordance with U.S. generally accepted accounting principles required at period end for financial reporting purposes. |
| Financial Instruments | Level 1 | Level 2 | Level 3 | Total |
| Equity Securities: | ||||
| Japan | $— | $3,143,064,088 | $— | $3,143,064,088 |
| Switzerland | 2,132,536,091 | — | — | 2,132,536,091 |
| United Kingdom | 2,029,128,369 | — | — | 2,029,128,369 |
| France | 1,475,591,003 | — | — | 1,475,591,003 |
| Germany | 1,416,301,861 | — | — | 1,416,301,861 |
| United States | 1,035,570,389 | — | — | 1,035,570,389 |
| Hong Kong | 318,682,472 | 354,321,013 | — | 673,003,485 |
| Netherlands | 606,897,553 | — | — | 606,897,553 |
| Denmark | 606,318,905 | — | — | 606,318,905 |
| Other Countries | 1,702,573,142 | 1,143,165,662 | — | 2,845,738,804 |
| Mutual Funds | 260,464,049 | — | — | 260,464,049 |
| Total | $11,584,063,834 | $4,640,550,763 | $— | $16,224,614,597 |
| Year ended 8/31/21 | |
| Ordinary income (including any short-term capital gains) | $135,001,732 |
| As of 2/28/22 | |
| Cost of investments | $13,035,073,841 |
| Gross appreciation | 3,691,856,733 |
| Gross depreciation | (502,315,977) |
| Net unrealized appreciation (depreciation) | $ 3,189,540,756 |
| As of 8/31/21 | |
| Undistributed ordinary income | 156,144,051 |
| Capital loss carryforwards | (50,831,739) |
| Other temporary differences | (208,667) |
| Net unrealized appreciation (depreciation) | 4,794,700,201 |
| Long-Term | $(50,831,739) |
| Six months ended 2/28/22 | Year ended 8/31/21 | ||
| Class A | $8,307,737 | $6,373,940 | |
| Class B | 4,207 | — | |
| Class C | 55,254 | — | |
| Class I | 22,580,996 | 10,184,538 | |
| Class R1 | 15,980 | 1,070 | |
| Class R2 | 851,018 | 476,506 | |
| Class R3 | 809,844 | 492,210 | |
| Class R4 | 1,243,811 | 503,547 | |
| Class R6 | 203,740,590 | 116,864,930 | |
| Class 529A | 186,947 | 103,537 | |
| Class 529B | 376 | — | |
| Class 529C | 7,864 | 1,454 | |
| Total | $237,804,624 | $135,001,732 |
| Up to $1 billion | 0.90% |
| In excess of $1 billion and up to $2 billion | 0.80% |
| In excess of $2 billion and up to $5 billion | 0.70% |
| In excess of $5 billion and up to $10 billion | 0.60% |
| In excess of $10 billion and up to $20 billion | 0.55% |
| In excess of $20 billion | 0.50% |
| Distribution Fee Rate (d) | Service Fee Rate (d) | Total Distribution Plan (d) | Annual Effective Rate (e) | Distribution and Service Fee | |
| Class A | — | 0.25% | 0.25% | 0.25% | $ 989,857 |
| Class B | 0.75% | 0.25% | 1.00% | 1.00% | 9,671 |
| Class C | 0.75% | 0.25% | 1.00% | 1.00% | 73,312 |
| Class R1 | 0.75% | 0.25% | 1.00% | 1.00% | 14,648 |
| Class R2 | 0.25% | 0.25% | 0.50% | 0.50% | 243,904 |
| Class R3 | — | 0.25% | 0.25% | 0.25% | 92,724 |
| Class 529A | — | 0.25% | 0.25% | 0.23% | 21,233 |
| Class 529B | 0.75% | 0.25% | 1.00% | 1.00% | 855 |
| Class 529C | 0.75% | 0.25% | 1.00% | 1.00% | 9,899 |
| Total Distribution and Service Fees | $1,456,103 |
| (d) | In accordance with the distribution plan for certain classes, the fund pays distribution and/or service fees equal to these annual percentage rates of each class’s average daily net assets. The distribution and service fee rates disclosed by class represent the current rates in effect at the end of the reporting period. Any rate changes, if applicable, are detailed below. |
| (e) | The annual effective rates represent actual fees incurred under the distribution plan for the six months ended February 28, 2022 based on each class's average daily net assets. MFD has voluntarily agreed to rebate a portion of each class's 0.25% service fee attributable to accounts for which there is no financial intermediary specified on the account except for accounts attributable to MFS or its affiliates' seed money. For the six months ended February 28, 2022, this rebate amounted to $58, $3, $147, $1,646, and $18 for Class A, Class B, Class R2, Class 529A, and Class 529C, respectively, and is included in the reduction of total expenses in the Statement of Operations. |
| Amount | |
| Class A | $7,804 |
| Class B | 709 |
| Class C | 252 |
| Class 529B | 151 |
| Class 529C | — |
| Fee | |
| Class 529A | $4,246 |
| Class 529B | 43 |
| Class 529C | 495 |
| Total Program Manager Fees | $4,784 |
| Six months ended 2/28/22 | Year ended 8/31/21 | ||||
| Shares | Amount | Shares | Amount | ||
| Shares sold | |||||
| Class A | 2,985,898 | $71,548,200 | 7,988,814 | $177,803,102 | |
| Class B | 213 | 4,704 | 819 | 18,247 | |
| Class C | 43,325 | 981,323 | 81,953 | 1,754,921 | |
| Class I | 22,337,618 | 563,468,068 | 27,732,560 | 641,832,578 | |
| Class R1 | 86,557 | 1,810,082 | 73,014 | 1,530,968 | |
| Class R2 | 468,544 | 10,615,180 | 980,214 | 21,710,541 | |
| Class R3 | 513,385 | 12,001,529 | 970,133 | 21,215,643 | |
| Class R4 | 242,298 | 5,800,097 | 2,630,087 | 57,931,014 | |
| Class R6 | 26,484,955 | 628,305,956 | 111,039,191 | 2,475,567,361 | |
| Class 529A | 37,662 | 878,229 | 127,430 | 2,796,879 | |
| Class 529B | 740 | 16,396 | 433 | 9,509 | |
| Class 529C | 9,362 | 203,869 | 12,771 | 256,471 | |
| 53,210,557 | $1,295,633,633 | 151,637,419 | $3,402,427,234 | ||
| Shares issued to shareholders in reinvestment of distributions | |||||
| Class A | 313,946 | $7,619,463 | 226,334 | $4,852,592 | |
| Class B | 143 | 3,364 | — | — | |
| Class C | 2,268 | 51,886 | — | — | |
| Class I | 795,596 | 20,017,192 | 403,189 | 8,958,852 | |
| Class R1 | 715 | 15,980 | 54 | 1,070 | |
| Class R2 | 36,242 | 849,152 | 22,928 | 474,842 | |
| Class R3 | 33,729 | 809,844 | 23,207 | 492,210 | |
| Class R4 | 49,603 | 1,205,350 | 22,208 | 476,800 | |
| Class R6 | 7,918,001 | 190,744,636 | 5,117,127 | 108,943,629 | |
| Class 529A | 7,774 | 184,710 | 4,868 | 102,228 | |
| Class 529B | 17 | 376 | — | — | |
| Class 529C | 356 | 7,817 | 75 | 1,454 | |
| 9,158,390 | $221,509,770 | 5,819,990 | $124,303,677 | ||
| Six months ended 2/28/22 | Year ended 8/31/21 | ||||
| Shares | Amount | Shares | Amount | ||
| Shares reacquired | |||||
| Class A | (9,501,218) | $(234,684,156) | (7,800,633) | $(173,343,749) | |
| Class B | (18,322) | (423,615) | (44,123) | (949,284) | |
| Class C | (85,712) | (1,937,959) | (343,142) | (7,041,169) | |
| Class I | (8,265,686) | (205,459,135) | (11,790,913) | (275,284,618) | |
| Class R1 | (15,419) | (337,321) | (27,583) | (567,359) | |
| Class R2 | (751,791) | (17,214,890) | (1,252,832) | (27,165,069) | |
| Class R3 | (587,076) | (13,744,789) | (1,089,197) | (24,160,347) | |
| Class R4 | (664,275) | (16,001,587) | (836,491) | (18,679,345) | |
| Class R6 | (10,462,865) | (251,228,099) | (20,701,755) | (468,833,018) | |
| Class 529A | (43,536) | (1,033,005) | (70,237) | (1,550,370) | |
| Class 529B | (3,440) | (73,566) | (4,806) | (99,768) | |
| Class 529C | (13,981) | (298,531) | (68,530) | (1,364,053) | |
| (30,413,321) | $(742,436,653) | (44,030,242) | $(999,038,149) | ||
| Net change | |||||
| Class A | (6,201,374) | $(155,516,493) | 414,515 | $9,311,945 | |
| Class B | (17,966) | (415,547) | (43,304) | (931,037) | |
| Class C | (40,119) | (904,750) | (261,189) | (5,286,248) | |
| Class I | 14,867,528 | 378,026,125 | 16,344,836 | 375,506,812 | |
| Class R1 | 71,853 | 1,488,741 | 45,485 | 964,679 | |
| Class R2 | (247,005) | (5,750,558) | (249,690) | (4,979,686) | |
| Class R3 | (39,962) | (933,416) | (95,857) | (2,452,494) | |
| Class R4 | (372,374) | (8,996,140) | 1,815,804 | 39,728,469 | |
| Class R6 | 23,940,091 | 567,822,493 | 95,454,563 | 2,115,677,972 | |
| Class 529A | 1,900 | 29,934 | 62,061 | 1,348,737 | |
| Class 529B | (2,683) | (56,794) | (4,373) | (90,259) | |
| Class 529C | (4,263) | (86,845) | (55,684) | (1,106,128) | |
| 31,955,626 | $774,706,750 | 113,427,167 | $2,527,692,762 | ||
| Affiliated Issuers | Beginning Value | Purchases | Sales Proceeds | Realized Gain (Loss) | Change in Unrealized Appreciation or Depreciation | Ending Value |
| MFS Institutional Money Market Portfolio | $241,842,376 | $825,924,376 | $807,743,577 | $2,746 | $(2,746) | $260,023,175 |
| Affiliated Issuers | Dividend Income | Capital Gain Distributions |
| MFS Institutional Money Market Portfolio | $38,962 | $— |


| 1 | |
| 2 | |
| 3 | |
| 5 | |
| 9 | |
| 11 | |
| 12 | |
| 13 | |
| 22 | |
| 34 | |
| 34 | |
| 34 | |
| 34 | |
| 34 |
| back cover |


| Microsoft Corp. | 11.9% |
| Amazon.com, Inc. | 9.8% |
| Alphabet, Inc., “A” | 9.8% |
| Mastercard, Inc., “A” | 4.8% |
| Adobe Systems, Inc. | 3.4% |
| NVIDIA Corp. | 3.4% |
| Global Payments, Inc. | 3.0% |
| Booking Holdings, Inc. | 3.0% |
| Advanced Micro Devices | 2.7% |
| salesforce.com, inc. | 2.2% |
| Computer Software | 23.8% |
| Business Services | 14.4% |
| Internet | 12.8% |
| Electronics | 11.3% |
| Specialty Stores | 10.3% |
September 1, 2021 through February 28, 2022
| Share Class | Annualized Expense Ratio | Beginning Account Value 9/01/21 | Ending Account Value 2/28/22 | Expenses Paid During Period (p) 9/01/21-2/28/22 | |
| A | Actual | 1.11% | $1,000.00 | $841.59 | $5.07 |
| Hypothetical (h) | 1.11% | $1,000.00 | $1,019.29 | $5.56 | |
| B | Actual | 1.86% | $1,000.00 | $838.43 | $8.48 |
| Hypothetical (h) | 1.86% | $1,000.00 | $1,015.57 | $9.30 | |
| C | Actual | 1.86% | $1,000.00 | $838.33 | $8.48 |
| Hypothetical (h) | 1.86% | $1,000.00 | $1,015.57 | $9.30 | |
| I | Actual | 0.86% | $1,000.00 | $842.54 | $3.93 |
| Hypothetical (h) | 0.86% | $1,000.00 | $1,020.53 | $4.31 | |
| R1 | Actual | 1.87% | $1,000.00 | $838.44 | $8.52 |
| Hypothetical (h) | 1.87% | $1,000.00 | $1,015.52 | $9.35 | |
| R2 | Actual | 1.36% | $1,000.00 | $840.44 | $6.21 |
| Hypothetical (h) | 1.36% | $1,000.00 | $1,018.05 | $6.80 | |
| R3 | Actual | 1.11% | $1,000.00 | $841.47 | $5.07 |
| Hypothetical (h) | 1.11% | $1,000.00 | $1,019.29 | $5.56 | |
| R4 | Actual | 0.86% | $1,000.00 | $842.48 | $3.93 |
| Hypothetical (h) | 0.86% | $1,000.00 | $1,020.53 | $4.31 | |
| R6 | Actual | 0.76% | $1,000.00 | $843.02 | $3.47 |
| Hypothetical (h) | 0.76% | $1,000.00 | $1,021.03 | $3.81 |
| (h) | 5% class return per year before expenses. |
| (p) | “Expenses Paid During Period” are equal to each class’s annualized expense ratio, as shown above, multiplied by the average account value over the period, multiplied by 181/365 (to reflect the one-half year period). Expenses paid do not include any applicable sales charges (loads). If these transaction costs had been included, your costs would have been higher. |
| Issuer | Shares/Par | Value ($) | ||
| Common Stocks – 96.7% | ||||
| Broadcasting – 0.4% | ||||
| Netflix, Inc. (a) | 19,851 | $ 7,831,616 | ||
| Brokerage & Asset Managers – 2.8% | ||||
| Charles Schwab Corp. | 214,891 | $ 18,149,694 | ||
| CME Group, Inc. | 62,101 | 14,688,749 | ||
| Morningstar, Inc. | 26,445 | 7,421,789 | ||
| Tradeweb Markets, Inc. | 112,693 | 9,520,305 | ||
| $49,780,537 | ||||
| Business Services – 14.4% | ||||
| Accenture PLC, “A” | 47,796 | $ 15,104,492 | ||
| Clarivate PLC (a) | 709,114 | 10,622,528 | ||
| Endava PLC, ADR (a) | 156,988 | 20,907,662 | ||
| Equifax, Inc. | 43,418 | 9,479,886 | ||
| Fidelity National Information Services, Inc. | 312,455 | 29,755,090 | ||
| FleetCor Technologies, Inc. (a) | 92,340 | 21,626,028 | ||
| Global Payments, Inc. | 403,580 | 53,829,505 | ||
| MSCI, Inc. | 15,634 | 7,843,421 | ||
| Paya, Inc. (a) | 1,443,906 | 9,313,194 | ||
| PayPal Holdings, Inc. (a) | 226,912 | 25,398,260 | ||
| TaskUs, Inc., “A” (a) | 186,516 | 5,356,739 | ||
| Thoughtworks Holding, Inc. (a) | 615,130 | 14,061,872 | ||
| Verisk Analytics, Inc., “A” | 67,683 | 12,002,903 | ||
| WEX, Inc. (a) | 146,725 | 24,724,630 | ||
| $260,026,210 | ||||
| Cable TV – 0.2% | ||||
| Charter Communications, Inc., “A” (a) | 6,367 | $ 3,831,533 | ||
| Computer Software – 23.8% | ||||
| Adobe Systems, Inc. (a) | 133,060 | $ 62,229,501 | ||
| Asana, Inc. (a) | 20,783 | 1,138,701 | ||
| Atlassian Corp. PLC, “A” (a) | 42,324 | 12,939,293 | ||
| Autodesk, Inc. (a) | 49,481 | 10,897,201 | ||
| Avalara, Inc. (a) | 45,720 | 4,750,765 | ||
| Black Knight, Inc. (a) | 206,970 | 11,629,644 | ||
| Dun & Bradstreet Holdings, Inc. (a) | 461,096 | 8,557,942 | ||
| Eventbrite, Inc. (a) | 65,150 | 984,416 | ||
| Freshworks, Inc, “A” (a) | 99,712 | 1,826,724 | ||
| Intuit, Inc. | 63,872 | 30,298,961 | ||
| Microsoft Corp. (s) | 720,072 | 215,150,313 | ||
| Issuer | Shares/Par | Value ($) | ||
| Common Stocks – continued | ||||
| Computer Software – continued | ||||
| Paycor HCM, Inc. (a) | 301,552 | $ 8,464,565 | ||
| Qualtrics International, “A” (a) | 135,143 | 4,098,887 | ||
| RAKUS Co. Ltd. | 41,000 | 696,128 | ||
| RingCentral, Inc. (a) | 74,617 | 9,762,888 | ||
| salesforce.com, inc. (a) | 188,053 | 39,590,798 | ||
| Topicus.com, Inc. (a) | 105,492 | 7,417,315 | ||
| $430,434,042 | ||||
| Computer Software - Systems – 7.5% | ||||
| Apple, Inc. (s) | 128,385 | $ 21,198,931 | ||
| Block, Inc., “A” (a) | 41,628 | 5,307,570 | ||
| Constellation Software, Inc. | 11,845 | 19,962,773 | ||
| Descartes Systems Group, Inc. (a) | 179,004 | 12,755,536 | ||
| HubSpot, Inc. (a) | 24,125 | 12,665,625 | ||
| Nuvei Corp. (a) | 87,812 | 4,767,313 | ||
| Q2 Holdings, Inc. (a) | 109,947 | 7,152,052 | ||
| ServiceNow, Inc. (a) | 59,451 | 34,476,824 | ||
| TransUnion | 129,823 | 11,782,736 | ||
| Wix.com Ltd. (a) | 57,075 | 5,226,929 | ||
| $135,296,289 | ||||
| Consumer Services – 3.5% | ||||
| Booking Holdings, Inc. (a) | 24,728 | $ 53,715,398 | ||
| Uber Technologies, Inc. (a) | 286,498 | 10,322,523 | ||
| $64,037,921 | ||||
| Electronics – 11.3% | ||||
| Advanced Micro Devices (a)(s) | 395,205 | $ 48,744,599 | ||
| KLA Corp. | 64,395 | 22,441,658 | ||
| Lam Research Corp. | 50,915 | 28,581,135 | ||
| Marvell Technology, Inc. | 347,789 | 23,764,422 | ||
| Micron Technology, Inc. | 215,584 | 19,156,794 | ||
| NVIDIA Corp. | 253,781 | 61,884,497 | ||
| $204,573,105 | ||||
| Insurance – 0.9% | ||||
| Arthur J. Gallagher & Co. | 96,620 | $ 15,284,318 | ||
| Internet – 12.8% | ||||
| Alphabet, Inc., “A” (a)(s) | 65,317 | $ 176,430,361 | ||
| Match Group, Inc. (a) | 34,472 | 3,843,283 | ||
| Mercadolibre, Inc. (a) | 7,466 | 8,411,569 | ||
| Meta Platforms, Inc., “A” (a) | 83,713 | 17,665,955 | ||
| Pinterest, Inc. (a) | 101,343 | 2,710,925 | ||
| Issuer | Shares/Par | Value ($) | ||
| Common Stocks – continued | ||||
| Internet – continued | ||||
| Tencent Holdings Ltd. | 409,300 | $ 22,245,071 | ||
| $231,307,164 | ||||
| Leisure & Toys – 1.3% | ||||
| Activision Blizzard, Inc. | 136,800 | $ 11,149,200 | ||
| Take-Two Interactive Software, Inc. (a) | 78,116 | 12,654,792 | ||
| $23,803,992 | ||||
| Machinery & Tools – 0.0% | ||||
| Xometry, Inc., “A” (a)(l) | 16,147 | $ 789,750 | ||
| Medical & Health Technology & Services – 0.2% | ||||
| Guardant Health, Inc. (a) | 55,006 | $ 3,645,248 | ||
| Medical Equipment – 0.7% | ||||
| Bio-Techne Corp. | 9,215 | $ 3,864,863 | ||
| Maravai Lifesciences Holdings, Inc., “A” (a) | 216,905 | 8,474,478 | ||
| $12,339,341 | ||||
| Other Banks & Diversified Financials – 6.6% | ||||
| Mastercard, Inc., “A” | 240,805 | $ 86,887,260 | ||
| Visa, Inc., “A” | 145,972 | 31,547,469 | ||
| $118,434,729 | ||||
| Specialty Stores – 10.3% | ||||
| Amazon.com, Inc. (a)(s) | 57,904 | $ 177,838,239 | ||
| Farfetch Ltd., “A” (a) | 179,094 | 3,411,741 | ||
| JD.com, Inc., “A” (a) | 19,490 | 701,661 | ||
| Pinduoduo, Inc., ADR (a) | 71,520 | 3,709,027 | ||
| Sea Ltd., ADR (a) | 5,644 | 821,766 | ||
| $186,482,434 | ||||
| Total Common Stocks (Identified Cost, $969,395,083) | $ 1,747,898,229 | |||
| Investment Companies (h) – 3.3% | ||||
| Money Market Funds – 3.3% | ||||
| MFS Institutional Money Market Portfolio, 0.06% (v) (Identified Cost, $58,451,025) | 58,451,025 | $ 58,451,025 | ||
| Collateral for Securities Loaned – 0.0% | ||||
| State Street Navigator Securities Lending Government Money Market Portfolio, 0.06% (j) (Identified Cost, $383,468) | 383,468 | $ 383,468 | ||
| Other Assets, Less Liabilities – 0.0% | 269,853 | |||
| Net Assets – 100.0% | $ 1,807,002,575 | |||
| (a) | Non-income producing security. | |||
| (h) | An affiliated issuer, which may be considered one in which the fund owns 5% or more of the outstanding voting securities, or a company which is under common control. At period end, the aggregate values of the fund's investments in affiliated issuers and in unaffiliated issuers were $58,451,025 and $1,748,281,697, respectively. | |||
| (j) | The rate quoted is the annualized seven-day yield of the fund at period end. | |||
| (l) | A portion of this security is on loan. See Note 2 for additional information. | |||
| (s) | Security or a portion of the security was pledged to cover collateral requirements for securities sold short and/or certain derivative transactions. | |||
| (v) | Affiliated issuer that is available only to investment companies managed by MFS. The rate quoted for the MFS Institutional Money Market Portfolio is the annualized seven-day yield of the fund at period end. |
| The following abbreviations are used in this report and are defined: | |
| ADR | American Depositary Receipt |
| Assets | |
| Investments in unaffiliated issuers, at value, including $394,850 of securities on loan (identified cost, $969,778,551) | $1,748,281,697 |
| Investments in affiliated issuers, at value (identified cost, $58,451,025) | 58,451,025 |
| Deposits with brokers for | |
| Securities sold short | 57,207 |
| Receivables for | |
| Investments sold | 1,687,227 |
| Fund shares sold | 2,392,856 |
| Interest and dividends | 1,306,583 |
| Other assets | 54,162 |
| Total assets | $1,812,230,757 |
| Liabilities | |
| Payables for | |
| Investments purchased | $1,484,066 |
| Fund shares reacquired | 2,711,912 |
| Collateral for securities loaned, at value | 383,468 |
| Payable to affiliates | |
| Investment adviser | 140,510 |
| Administrative services fee | 2,769 |
| Shareholder servicing costs | 339,328 |
| Distribution and service fees | 43,564 |
| Payable for independent Trustees' compensation | 6,152 |
| Accrued expenses and other liabilities | 116,413 |
| Total liabilities | $5,228,182 |
| Net assets | $1,807,002,575 |
| Net assets consist of | |
| Paid-in capital | $898,957,765 |
| Total distributable earnings (loss) | 908,044,810 |
| Net assets | $1,807,002,575 |
| Shares of beneficial interest outstanding | 31,533,429 |
| Net assets | Shares outstanding | Net asset value per share (a) | |
| Class A | $710,875,697 | 12,569,559 | $56.56 |
| Class B | 32,481,179 | 714,719 | 45.45 |
| Class C | 150,670,880 | 3,324,510 | 45.32 |
| Class I | 476,251,422 | 7,677,525 | 62.03 |
| Class R1 | 9,088,324 | 201,078 | 45.20 |
| Class R2 | 28,635,092 | 543,691 | 52.67 |
| Class R3 | 67,627,593 | 1,196,745 | 56.51 |
| Class R4 | 33,768,815 | 562,610 | 60.02 |
| Class R6 | 297,603,573 | 4,742,992 | 62.75 |
| (a) | Maximum offering price per share was equal to the net asset value per share for all share classes, except for Class A, for which the maximum offering price per share was $60.01 [100 / 94.25 x $56.56]. On sales of $50,000 or more, the maximum offering price of Class A shares is reduced. A contingent deferred sales charge may be imposed on redemptions of Class A, Class B, and Class C shares. Redemption price per share was equal to the net asset value per share for Classes I, R1, R2, R3, R4, and R6. |
| Net investment income (loss) | |
| Income | |
| Dividends | $3,247,996 |
| Other | 51,284 |
| Dividends from affiliated issuers | 9,625 |
| Income on securities loaned | 3,848 |
| Foreign taxes withheld | (3,797) |
| Total investment income | $3,308,956 |
| Expenses | |
| Management fee | $7,765,346 |
| Distribution and service fees | 2,361,771 |
| Shareholder servicing costs | 1,038,863 |
| Administrative services fee | 147,087 |
| Independent Trustees' compensation | 14,987 |
| Custodian fee | 59,122 |
| Shareholder communications | 36,866 |
| Audit and tax fees | 30,918 |
| Legal fees | 6,030 |
| Miscellaneous | 117,288 |
| Total expenses | $11,578,278 |
| Reduction of expenses by investment adviser and distributor | (147,927) |
| Net expenses | $11,430,351 |
| Net investment income (loss) | $(8,121,395) |
| Realized and unrealized gain (loss) | |
| Realized gain (loss) (identified cost basis) | |
| Unaffiliated issuers | $191,598,963 |
| Foreign currency | 6,053 |
| Net realized gain (loss) | $191,605,016 |
| Change in unrealized appreciation or depreciation | |
| Unaffiliated issuers | $(535,256,638) |
| Translation of assets and liabilities in foreign currencies | (64) |
| Net unrealized gain (loss) | $(535,256,702) |
| Net realized and unrealized gain (loss) | $(343,651,686) |
| Change in net assets from operations | $(351,773,081) |
| Six months ended | Year ended | |
| 2/28/22 (unaudited) | 8/31/21 | |
| Change in net assets | ||
| From operations | ||
| Net investment income (loss) | $(8,121,395) | $(17,168,546) |
| Net realized gain (loss) | 191,605,016 | 262,544,681 |
| Net unrealized gain (loss) | (535,256,702) | 206,014,483 |
| Change in net assets from operations | $(351,773,081) | $451,390,618 |
| Total distributions to shareholders | $(249,750,373) | $(109,208,449) |
| Change in net assets from fund share transactions | $75,735,026 | $(52,798,844) |
| Total change in net assets | $(525,788,428) | $289,383,325 |
| Net assets | ||
| At beginning of period | 2,332,791,003 | 2,043,407,678 |
| At end of period | $1,807,002,575 | $2,332,791,003 |
| Class A | Six months ended | Year ended | ||||
| 2/28/22 (unaudited) | 8/31/21 | 8/31/20 | 8/31/19 | 8/31/18 | 8/31/17 | |
| Net asset value, beginning of period | $75.65 | $64.90 | $44.73 | $45.65 | $35.67 | $28.27 |
| Income (loss) from investment operations | ||||||
| Net investment income (loss) (d) | $(0.27) | $(0.57) | $(0.35) | $(0.27) | $(0.26) | $(0.19)(c) |
| Net realized and unrealized gain (loss) | (10.47) | 14.83 | 21.50 | 1.24 | 11.61 | 8.13 |
| Total from investment operations | $(10.74) | $14.26 | $21.15 | $0.97 | $11.35 | $7.94 |
| Less distributions declared to shareholders | ||||||
| From net realized gain | $(8.35) | $(3.51) | $(0.98) | $(1.89) | $(1.37) | $(0.54) |
| Net asset value, end of period (x) | $56.56 | $75.65 | $64.90 | $44.73 | $45.65 | $35.67 |
| Total return (%) (r)(s)(t)(x) | (15.84)(n) | 22.97 | 48.23 | 2.97 | 32.79 | 28.58(c) |
| Ratios (%) (to average net assets) and Supplemental data: | ||||||
| Expenses before expense reductions | 1.13(a) | 1.12 | 1.18 | 1.19 | 1.24 | 1.24(c) |
| Expenses after expense reductions | 1.11(a) | 1.11 | 1.16 | 1.18 | 1.22 | 1.23(c) |
| Net investment income (loss) | (0.80)(a) | (0.85) | (0.71) | (0.64) | (0.66) | (0.63)(c) |
| Portfolio turnover | 20(n) | 36 | 46 | 32 | 30 | 43 |
| Net assets at end of period (000 omitted) | $710,876 | $888,416 | $745,157 | $471,468 | $484,477 | $359,698 |
| Supplemental Ratios (%): | ||||||
| Ratios of expenses to average net assets after expense reductions excluding short sale expenses and interest expense and fees | N/A | 1.11 | 1.13 | 1.15 | 1.16 | 1.19(c) |
| Class B | Six months ended | Year ended | ||||
| 2/28/22 (unaudited) | 8/31/21 | 8/31/20 | 8/31/19 | 8/31/18 | 8/31/17 | |
| Net asset value, beginning of period | $62.67 | $54.73 | $38.16 | $39.55 | $31.31 | $25.06 |
| Income (loss) from investment operations | ||||||
| Net investment income (loss) (d) | $(0.43) | $(0.89) | $(0.61) | $(0.50) | $(0.49) | $(0.38)(c) |
| Net realized and unrealized gain (loss) | (8.44) | 12.34 | 18.16 | 1.00 | 10.10 | 7.17 |
| Total from investment operations | $(8.87) | $11.45 | $17.55 | $0.50 | $9.61 | $6.79 |
| Less distributions declared to shareholders | ||||||
| From net realized gain | $(8.35) | $(3.51) | $(0.98) | $(1.89) | $(1.37) | $(0.54) |
| Net asset value, end of period (x) | $45.45 | $62.67 | $54.73 | $38.16 | $39.55 | $31.31 |
| Total return (%) (r)(s)(t)(x) | (16.16)(n) | 22.06 | 47.07 | 2.21 | 31.77 | 27.64(c) |
| Ratios (%) (to average net assets) and Supplemental data: | ||||||
| Expenses before expense reductions | 1.88(a) | 1.87 | 1.93 | 1.94 | 1.99 | 1.99(c) |
| Expenses after expense reductions | 1.86(a) | 1.86 | 1.92 | 1.93 | 1.98 | 1.98(c) |
| Net investment income (loss) | (1.56)(a) | (1.59) | (1.46) | (1.39) | (1.41) | (1.38)(c) |
| Portfolio turnover | 20(n) | 36 | 46 | 32 | 30 | 43 |
| Net assets at end of period (000 omitted) | $32,481 | $44,390 | $46,224 | $41,017 | $45,337 | $34,396 |
| Supplemental Ratios (%): | ||||||
| Ratios of expenses to average net assets after expense reductions excluding short sale expenses and interest expense and fees | N/A | 1.86 | 1.88 | 1.90 | 1.92 | 1.94(c) |
| Class C | Six months ended | Year ended | ||||
| 2/28/22 (unaudited) | 8/31/21 | 8/31/20 | 8/31/19 | 8/31/18 | 8/31/17 | |
| Net asset value, beginning of period | $62.52 | $54.61 | $38.07 | $39.47 | $31.24 | $25.01 |
| Income (loss) from investment operations | ||||||
| Net investment income (loss) (d) | $(0.43) | $(0.88) | $(0.61) | $(0.50) | $(0.49) | $(0.38)(c) |
| Net realized and unrealized gain (loss) | (8.42) | 12.30 | 18.13 | 0.99 | 10.09 | 7.15 |
| Total from investment operations | $(8.85) | $11.42 | $17.52 | $0.49 | $9.60 | $6.77 |
| Less distributions declared to shareholders | ||||||
| From net realized gain | $(8.35) | $(3.51) | $(0.98) | $(1.89) | $(1.37) | $(0.54) |
| Net asset value, end of period (x) | $45.32 | $62.52 | $54.61 | $38.07 | $39.47 | $31.24 |
| Total return (%) (r)(s)(t)(x) | (16.17)(n) | 22.06 | 47.11 | 2.19 | 31.81 | 27.62(c) |
| Ratios (%) (to average net assets) and Supplemental data: | ||||||
| Expenses before expense reductions | 1.88(a) | 1.87 | 1.93 | 1.94 | 1.98 | 1.99(c) |
| Expenses after expense reductions | 1.86(a) | 1.86 | 1.92 | 1.93 | 1.97 | 1.98(c) |
| Net investment income (loss) | (1.56)(a) | (1.59) | (1.46) | (1.40) | (1.41) | (1.38)(c) |
| Portfolio turnover | 20(n) | 36 | 46 | 32 | 30 | 43 |
| Net assets at end of period (000 omitted) | $150,671 | $194,857 | $183,286 | $128,817 | $128,707 | $101,656 |
| Supplemental Ratios (%): | ||||||
| Ratios of expenses to average net assets after expense reductions excluding short sale expenses and interest expense and fees | N/A | 1.86 | 1.88 | 1.91 | 1.92 | 1.94(c) |
| Class I | Six months ended | Year ended | ||||
| 2/28/22 (unaudited) | 8/31/21 | 8/31/20 | 8/31/19 | 8/31/18 | 8/31/17 | |
| Net asset value, beginning of period | $82.06 | $69.94 | $48.02 | $48.74 | $37.90 | $29.93 |
| Income (loss) from investment operations | ||||||
| Net investment income (loss) (d) | $(0.20) | $(0.43) | $(0.25) | $(0.18) | $(0.18) | $(0.13)(c) |
| Net realized and unrealized gain (loss) | (11.48) | 16.06 | 23.15 | 1.35 | 12.39 | 8.64 |
| Total from investment operations | $(11.68) | $15.63 | $22.90 | $1.17 | $12.21 | $8.51 |
| Less distributions declared to shareholders | ||||||
| From net realized gain | $(8.35) | $(3.51) | $(0.98) | $(1.89) | $(1.37) | $(0.54) |
| Net asset value, end of period (x) | $62.03 | $82.06 | $69.94 | $48.02 | $48.74 | $37.90 |
| Total return (%) (r)(s)(t)(x) | (15.75)(n) | 23.28 | 48.57 | 3.20 | 33.14 | 28.91(c) |
| Ratios (%) (to average net assets) and Supplemental data: | ||||||
| Expenses before expense reductions | 0.88(a) | 0.87 | 0.93 | 0.94 | 0.99 | 0.99(c) |
| Expenses after expense reductions | 0.86(a) | 0.86 | 0.92 | 0.93 | 0.98 | 0.98(c) |
| Net investment income (loss) | (0.55)(a) | (0.59) | (0.46) | (0.40) | (0.41) | (0.39)(c) |
| Portfolio turnover | 20(n) | 36 | 46 | 32 | 30 | 43 |
| Net assets at end of period (000 omitted) | $476,251 | $608,833 | $561,531 | $315,655 | $303,359 | $174,275 |
| Supplemental Ratios (%): | ||||||
| Ratios of expenses to average net assets after expense reductions excluding short sale expenses and interest expense and fees | N/A | 0.86 | 0.88 | 0.91 | 0.92 | 0.95(c) |
| Class R1 | Six months ended | Year ended | ||||
| 2/28/22 (unaudited) | 8/31/21 | 8/31/20 | 8/31/19 | 8/31/18 | 8/31/17 | |
| Net asset value, beginning of period | $62.37 | $54.49 | $37.99 | $39.39 | $31.18 | $24.96 |
| Income (loss) from investment operations | ||||||
| Net investment income (loss) (d) | $(0.43) | $(0.89) | $(0.62) | $(0.50) | $(0.49) | $(0.38)(c) |
| Net realized and unrealized gain (loss) | (8.39) | 12.28 | 18.10 | 0.99 | 10.07 | 7.14 |
| Total from investment operations | $(8.82) | $11.39 | $17.48 | $0.49 | $9.58 | $6.76 |
| Less distributions declared to shareholders | ||||||
| From net realized gain | $(8.35) | $(3.51) | $(0.98) | $(1.89) | $(1.37) | $(0.54) |
| Net asset value, end of period (x) | $45.20 | $62.37 | $54.49 | $37.99 | $39.39 | $31.18 |
| Total return (%) (r)(s)(t)(x) | (16.16)(n) | 22.05 | 47.10 | 2.19 | 31.80 | 27.63(c) |
| Ratios (%) (to average net assets) and Supplemental data: | ||||||
| Expenses before expense reductions | 1.88(a) | 1.87 | 1.93 | 1.94 | 1.99 | 1.99(c) |
| Expenses after expense reductions | 1.87(a) | 1.86 | 1.91 | 1.93 | 1.98 | 1.98(c) |
| Net investment income (loss) | (1.55)(a) | (1.59) | (1.47) | (1.40) | (1.41) | (1.38)(c) |
| Portfolio turnover | 20(n) | 36 | 46 | 32 | 30 | 43 |
| Net assets at end of period (000 omitted) | $9,088 | $10,498 | $9,882 | $5,715 | $5,534 | $4,256 |
| Supplemental Ratios (%): | ||||||
| Ratios of expenses to average net assets after expense reductions excluding short sale expenses and interest expense and fees | N/A | 1.86 | 1.88 | 1.91 | 1.92 | 1.95(c) |
| Class R2 | Six months ended | Year ended | ||||
| 2/28/22 (unaudited) | 8/31/21 | 8/31/20 | 8/31/19 | 8/31/18 | 8/31/17 | |
| Net asset value, beginning of period | $71.12 | $61.36 | $42.45 | $43.55 | $34.17 | $27.17 |
| Income (loss) from investment operations | ||||||
| Net investment income (loss) (d) | $(0.33) | $(0.68) | $(0.45) | $(0.36) | $(0.35) | $(0.26)(c) |
| Net realized and unrealized gain (loss) | (9.77) | 13.95 | 20.34 | 1.15 | 11.10 | 7.80 |
| Total from investment operations | $(10.10) | $13.27 | $19.89 | $0.79 | $10.75 | $7.54 |
| Less distributions declared to shareholders | ||||||
| From net realized gain | $(8.35) | $(3.51) | $(0.98) | $(1.89) | $(1.37) | $(0.54) |
| Net asset value, end of period (x) | $52.67 | $71.12 | $61.36 | $42.45 | $43.55 | $34.17 |
| Total return (%) (r)(s)(t)(x) | (15.96)(n) | 22.67 | 47.84 | 2.69 | 32.46 | 28.27(c) |
| Ratios (%) (to average net assets) and Supplemental data: | ||||||
| Expenses before expense reductions | 1.38(a) | 1.37 | 1.43 | 1.44 | 1.48 | 1.49(c) |
| Expenses after expense reductions | 1.36(a) | 1.36 | 1.42 | 1.43 | 1.48 | 1.49(c) |
| Net investment income (loss) | (1.05)(a) | (1.09) | (0.97) | (0.90) | (0.91) | (0.89)(c) |
| Portfolio turnover | 20(n) | 36 | 46 | 32 | 30 | 43 |
| Net assets at end of period (000 omitted) | $28,635 | $37,797 | $38,511 | $29,339 | $28,071 | $23,625 |
| Supplemental Ratios (%): | ||||||
| Ratios of expenses to average net assets after expense reductions excluding short sale expenses and interest expense and fees | N/A | 1.36 | 1.38 | 1.41 | 1.42 | 1.45(c) |
| Class R3 | Six months ended | Year ended | ||||
| 2/28/22 (unaudited) | 8/31/21 | 8/31/20 | 8/31/19 | 8/31/18 | 8/31/17 | |
| Net asset value, beginning of period | $75.60 | $64.85 | $44.71 | $45.63 | $35.66 | $28.26 |
| Income (loss) from investment operations | ||||||
| Net investment income (loss) (d) | $(0.27) | $(0.56) | $(0.35) | $(0.27) | $(0.27) | $(0.20)(c) |
| Net realized and unrealized gain (loss) | (10.47) | 14.82 | 21.47 | 1.24 | 11.61 | 8.14 |
| Total from investment operations | $(10.74) | $14.26 | $21.12 | $0.97 | $11.34 | $7.94 |
| Less distributions declared to shareholders | ||||||
| From net realized gain | $(8.35) | $(3.51) | $(0.98) | $(1.89) | $(1.37) | $(0.54) |
| Net asset value, end of period (x) | $56.51 | $75.60 | $64.85 | $44.71 | $45.63 | $35.66 |
| Total return (%) (r)(s)(t)(x) | (15.85)(n) | 22.99 | 48.18 | 2.97 | 32.77 | 28.59(c) |
| Ratios (%) (to average net assets) and Supplemental data: | ||||||
| Expenses before expense reductions | 1.13(a) | 1.13 | 1.18 | 1.19 | 1.24 | 1.24(c) |
| Expenses after expense reductions | 1.11(a) | 1.11 | 1.17 | 1.18 | 1.23 | 1.23(c) |
| Net investment income (loss) | (0.81)(a) | (0.84) | (0.71) | (0.65) | (0.66) | (0.65)(c) |
| Portfolio turnover | 20(n) | 36 | 46 | 32 | 30 | 43 |
| Net assets at end of period (000 omitted) | $67,628 | $96,784 | $109,884 | $80,242 | $79,534 | $53,199 |
| Supplemental Ratios (%): | ||||||
| Ratios of expenses to average net assets after expense reductions excluding short sale expenses and interest expense and fees | N/A | 1.11 | 1.13 | 1.16 | 1.17 | 1.20(c) |
| Class R4 | Six months ended | Year ended | ||||
| 2/28/22 (unaudited) | 8/31/21 | 8/31/20 | 8/31/19 | 8/31/18 | 8/31/17 | |
| Net asset value, beginning of period | $79.68 | $68.01 | $46.72 | $47.47 | $36.95 | $29.19 |
| Income (loss) from investment operations | ||||||
| Net investment income (loss) (d) | $(0.20) | $(0.42) | $(0.24) | $(0.17) | $(0.17) | $(0.13)(c) |
| Net realized and unrealized gain (loss) | (11.11) | 15.60 | 22.51 | 1.31 | 12.06 | 8.43 |
| Total from investment operations | $(11.31) | $15.18 | $22.27 | $1.14 | $11.89 | $8.30 |
| Less distributions declared to shareholders | ||||||
| From net realized gain | $(8.35) | $(3.51) | $(0.98) | $(1.89) | $(1.37) | $(0.54) |
| Net asset value, end of period (x) | $60.02 | $79.68 | $68.01 | $46.72 | $47.47 | $36.95 |
| Total return (%) (r)(s)(t)(x) | (15.75)(n) | 23.28 | 48.57 | 3.22 | 33.12 | 28.92(c) |
| Ratios (%) (to average net assets) and Supplemental data: | ||||||
| Expenses before expense reductions | 0.88(a) | 0.87 | 0.93 | 0.94 | 0.99 | 0.99(c) |
| Expenses after expense reductions | 0.86(a) | 0.86 | 0.92 | 0.93 | 0.98 | 0.99(c) |
| Net investment income (loss) | (0.56)(a) | (0.59) | (0.47) | (0.40) | (0.41) | (0.39)(c) |
| Portfolio turnover | 20(n) | 36 | 46 | 32 | 30 | 43 |
| Net assets at end of period (000 omitted) | $33,769 | $47,324 | $32,530 | $25,310 | $23,004 | $14,443 |
| Supplemental Ratios (%): | ||||||
| Ratios of expenses to average net assets after expense reductions excluding short sale expenses and interest expense and fees | N/A | 0.85 | 0.89 | 0.91 | 0.92 | 0.95(c) |
| Class R6 | Six months ended | Year ended | ||||
| 2/28/22 (unaudited) | 8/31/21 | 8/31/20 | 8/31/19 | 8/31/18 | 8/31/17 | |
| Net asset value, beginning of period | $82.87 | $70.54 | $48.38 | $49.03 | $38.09 | $30.05 |
| Income (loss) from investment operations | ||||||
| Net investment income (loss) (d) | $(0.17) | $(0.37) | $(0.20) | $(0.13) | $(0.13) | $(0.10)(c) |
| Net realized and unrealized gain (loss) | (11.60) | 16.21 | 23.34 | 1.37 | 12.44 | 8.68 |
| Total from investment operations | $(11.77) | $15.84 | $23.14 | $1.24 | $12.31 | $8.58 |
| Less distributions declared to shareholders | ||||||
| From net realized gain | $(8.35) | $(3.51) | $(0.98) | $(1.89) | $(1.37) | $(0.54) |
| Net asset value, end of period (x) | $62.75 | $82.87 | $70.54 | $48.38 | $49.03 | $38.09 |
| Total return (%) (r)(s)(t)(x) | (15.70)(n) | 23.39 | 48.71 | 3.33 | 33.24 | 29.03(c) |
| Ratios (%) (to average net assets) and Supplemental data: | ||||||
| Expenses before expense reductions | 0.78(a) | 0.78 | 0.84 | 0.84 | 0.89 | 0.90(c) |
| Expenses after expense reductions | 0.76(a) | 0.77 | 0.82 | 0.83 | 0.88 | 0.89(c) |
| Net investment income (loss) | (0.46)(a) | (0.50) | (0.37) | (0.30) | (0.31) | (0.30)(c) |
| Portfolio turnover | 20(n) | 36 | 46 | 32 | 30 | 43 |
| Net assets at end of period (000 omitted) | $297,604 | $403,893 | $316,404 | $168,352 | $138,924 | $95,534 |
| Supplemental Ratios (%): | ||||||
| Ratios of expenses to average net assets after expense reductions excluding short sale expenses and interest expense and fees | N/A | 0.77 | 0.79 | 0.81 | 0.82 | 0.85(c) |
| (a) | Annualized. |
| (c) | Amount reflects a one-time reimbursement of expenses by the custodian (or former custodian) without which net investment income and performance would be lower and expenses would be higher. |
| (d) | Per share data is based on average shares outstanding. |
| (n) | Not annualized. |
| (r) | Certain expenses have been reduced without which performance would have been lower. |
| (s) | From time to time the fund may receive proceeds from litigation settlements, without which performance would be lower. |
| (t) | Total returns do not include any applicable sales charges. |
| (x) | The net asset values and total returns have been calculated on net assets which include adjustments made in accordance with U.S. generally accepted accounting principles required at period end for financial reporting purposes. |
| Financial Instruments | Level 1 | Level 2 | Level 3 | Total |
| Equity Securities: | ||||
| United States | $1,629,296,040 | $— | $— | $1,629,296,040 |
| Canada | 44,902,937 | — | — | 44,902,937 |
| United Kingdom | 34,941,931 | — | — | 34,941,931 |
| China | 3,709,027 | 22,946,732 | — | 26,655,759 |
| Philippines | 5,356,739 | — | — | 5,356,739 |
| Israel | 5,226,929 | — | — | 5,226,929 |
| Singapore | 821,766 | — | — | 821,766 |
| Japan | — | 696,128 | — | 696,128 |
| Mutual Funds | 58,834,493 | — | — | 58,834,493 |
| Total | $1,783,089,862 | $23,642,860 | $— | $1,806,732,722 |
| Year ended 8/31/21 | |
| Long-term capital gains | $109,208,449 |
| As of 2/28/22 | |
| Cost of investments | $1,032,800,298 |
| Gross appreciation | 847,829,037 |
| Gross depreciation | (73,896,613) |
| Net unrealized appreciation (depreciation) | $ 773,932,424 |
| As of 8/31/21 | |
| Undistributed ordinary income | 64,444,592 |
| Undistributed long-term capital gain | 135,934,610 |
| Net unrealized appreciation (depreciation) | 1,309,189,062 |
| Six months ended 2/28/22 | Year ended 8/31/21 | |
| Class A | $97,004,773 | $39,981,871 |
| Class B | 5,633,192 | 2,836,401 |
| Class C | 25,137,122 | 11,727,115 |
| Class I | 62,813,302 | 27,987,681 |
| Class R1 | 1,457,279 | 660,107 |
| Class R2 | 4,354,112 | 2,189,374 |
| Class R3 | 9,789,520 | 6,034,105 |
| Class R4 | 4,407,863 | 1,741,234 |
| Class R6 | 39,153,210 | 16,050,561 |
| Total | $249,750,373 | $109,208,449 |
| Up to $1 billion | 0.75% |
| In excess of $1 billion and up to $2.5 billion | 0.70% |
| In excess of $2.5 billion | 0.65% |
| Distribution Fee Rate (d) | Service Fee Rate (d) | Total Distribution Plan (d) | Annual Effective Rate (e) | Distribution and Service Fee | |
| Class A | — | 0.25% | 0.25% | 0.25% | $ 1,033,935 |
| Class B | 0.75% | 0.25% | 1.00% | 1.00% | 198,785 |
| Class C | 0.75% | 0.25% | 1.00% | 1.00% | 887,159 |
| Class R1 | 0.75% | 0.25% | 1.00% | 1.00% | 50,973 |
| Class R2 | 0.25% | 0.25% | 0.50% | 0.50% | 86,564 |
| Class R3 | — | 0.25% | 0.25% | 0.25% | 104,355 |
| Total Distribution and Service Fees | $2,361,771 |
| (d) | In accordance with the distribution plan for certain classes, the fund pays distribution and/or service fees equal to these annual percentage rates of each class’s average daily net assets. The distribution and service fee rates disclosed by class represent the current rates in effect at the end of the reporting period. Any rate changes, if applicable, are detailed below. |
| (e) | The annual effective rates represent actual fees incurred under the distribution plan for the six months ended February 28, 2022 based on each class's average daily net assets. MFD has voluntarily agreed to rebate a portion of each class's 0.25% service fee attributable to accounts for which there is no financial intermediary specified on the account except for accounts attributable to MFS or its affiliates' seed money. For the six months ended February 28, 2022, this rebate amounted to $464 and $7 for Class A and Class B, respectively, and is included in the reduction of total expenses in the Statement of Operations. |
| Amount | |
| Class A | $5,676 |
| Class B | 5,332 |
| Class C | 4,147 |
| Six months ended 2/28/22 | Year ended 8/31/21 | ||||
| Shares | Amount | Shares | Amount | ||
| Shares sold | |||||
| Class A | 778,284 | $52,098,910 | 2,041,235 | $135,528,348 | |
| Class B | 2,339 | 128,415 | 19,385 | 1,072,422 | |
| Class C | 120,210 | 6,502,304 | 388,800 | 21,337,233 | |
| Class I | 822,092 | 61,111,604 | 1,964,028 | 139,976,502 | |
| Class R1 | 33,660 | 1,786,442 | 62,331 | 3,426,469 | |
| Class R2 | 70,406 | 4,322,583 | 196,801 | 12,228,587 | |
| Class R3 | 122,423 | 8,088,201 | 553,491 | 36,617,031 | |
| Class R4 | 63,163 | 4,397,085 | 272,966 | 19,306,122 | |
| Class R6 | 452,420 | 33,700,406 | 1,945,342 | 140,788,322 | |
| 2,464,997 | $172,135,950 | 7,444,379 | $510,281,036 | ||
| Shares issued to shareholders in reinvestment of distributions | |||||
| Class A | 1,420,260 | $94,362,044 | 606,720 | $38,781,516 | |
| Class B | 103,866 | 5,554,746 | 52,636 | 2,802,337 | |
| Class C | 451,349 | 24,074,933 | 208,877 | 11,093,450 | |
| Class I | 788,615 | 57,442,721 | 364,594 | 25,233,552 | |
| Class R1 | 27,311 | 1,452,667 | 12,421 | 658,166 | |
| Class R2 | 69,869 | 4,325,571 | 35,971 | 2,165,483 | |
| Class R3 | 147,455 | 9,789,520 | 94,475 | 6,034,105 | |
| Class R4 | 54,585 | 3,847,149 | 22,758 | 1,529,365 | |
| Class R6 | 477,615 | 35,181,103 | 194,133 | 13,560,203 | |
| 3,540,925 | $236,030,454 | 1,592,585 | $101,858,177 | ||
| Six months ended 2/28/22 | Year ended 8/31/21 | ||||
| Shares | Amount | Shares | Amount | ||
| Shares reacquired | |||||
| Class A | (1,372,321) | $(90,082,702) | (2,387,042) | $(158,552,829) | |
| Class B | (99,800) | (5,337,547) | (208,269) | (11,542,946) | |
| Class C | (363,768) | (19,725,915) | (837,296) | (46,360,016) | |
| Class I | (1,352,244) | (94,900,018) | (2,938,120) | (211,435,850) | |
| Class R1 | (28,200) | (1,447,155) | (87,800) | (4,960,576) | |
| Class R2 | (128,061) | (7,701,373) | (328,957) | (20,461,503) | |
| Class R3 | (353,378) | (23,828,111) | (1,062,054) | (71,182,913) | |
| Class R4 | (149,082) | (11,071,701) | (180,112) | (12,634,502) | |
| Class R6 | (1,060,704) | (78,336,856) | (1,751,522) | (127,806,922) | |
| (4,907,558) | $(332,431,378) | (9,781,172) | $(664,938,057) | ||
| Net change | |||||
| Class A | 826,223 | $56,378,252 | 260,913 | $15,757,035 | |
| Class B | 6,405 | 345,614 | (136,248) | (7,668,187) | |
| Class C | 207,791 | 10,851,322 | (239,619) | (13,929,333) | |
| Class I | 258,463 | 23,654,307 | (609,498) | (46,225,796) | |
| Class R1 | 32,771 | 1,791,954 | (13,048) | (875,941) | |
| Class R2 | 12,214 | 946,781 | (96,185) | (6,067,433) | |
| Class R3 | (83,500) | (5,950,390) | (414,088) | (28,531,777) | |
| Class R4 | (31,334) | (2,827,467) | 115,612 | 8,200,985 | |
| Class R6 | (130,669) | (9,455,347) | 387,953 | 26,541,603 | |
| 1,098,364 | $75,735,026 | (744,208) | $(52,798,844) | ||
| Affiliated Issuers | Beginning Value | Purchases | Sales Proceeds | Realized Gain (Loss) | Change in Unrealized Appreciation or Depreciation | Ending Value |
| MFS Institutional Money Market Portfolio | $16,102,802 | $273,478,213 | $231,129,990 | $— | $— | $58,451,025 |
| Affiliated Issuers | Dividend Income | Capital Gain Distributions |
| MFS Institutional Money Market Portfolio | $9,625 | $— |


| 1 | |
| 2 | |
| 3 | |
| 5 | |
| 7 | |
| 9 | |
| 10 | |
| 11 | |
| 21 | |
| 31 | |
| 31 | |
| 31 | |
| 31 | |
| 31 |
| back cover |


| A-1+ | 52.3% |
| A-1 | 47.6% |
| Other Assets Less Liabilities | 0.1% |
| 0 - 7 days | 44.3% |
| 8 - 29 days | 49.7% |
| 30 - 59 days | 5.9% |
| 60 - 89 days | 0.0% |
| Other Assets Less Liabilities | 0.1% |
| (a) | Ratings are assigned to portfolio securities utilizing ratings from Moody’s, Fitch, and Standard & Poor’s rating agencies and applying the following hierarchy: If all three agencies provide a rating, the middle rating (after dropping the highest and lowest ratings) is assigned; if two of the three agencies rate a security, the lower of the two is assigned. Ratings are shown in the S&P scale. All ratings are subject to change. The fund did not hold unrated securities. The fund is not rated by these agencies. |
| (u) | For purposes of this presentation, accrued interest, where applicable, is included. |
September 1, 2021 through February 28, 2022
| Share Class | Annualized Expense Ratio | Beginning Account Value 9/01/21 | Ending Account Value 2/28/22 | Expenses Paid During Period (p) 9/01/21-2/28/22 | |
| A | Actual | 0.04% | $1,000.00 | $1,000.14 | $0.20 |
| Hypothetical (h) | 0.04% | $1,000.00 | $1,024.60 | $0.20 | |
| B | Actual | 0.04% | $1,000.00 | $1,000.14 | $0.20 |
| Hypothetical (h) | 0.04% | $1,000.00 | $1,024.60 | $0.20 | |
| C | Actual | 0.04% | $1,000.00 | $1,000.14 | $0.20 |
| Hypothetical (h) | 0.04% | $1,000.00 | $1,024.60 | $0.20 | |
| I | Actual | 0.04% | $1,000.00 | $1,000.14 | $0.20 |
| Hypothetical (h) | 0.04% | $1,000.00 | $1,024.60 | $0.20 | |
| R1 | Actual | 0.04% | $1,000.00 | $1,000.14 | $0.20 |
| Hypothetical (h) | 0.04% | $1,000.00 | $1,024.60 | $0.20 | |
| R2 | Actual | 0.04% | $1,000.00 | $1,000.14 | $0.20 |
| Hypothetical (h) | 0.04% | $1,000.00 | $1,024.60 | $0.20 | |
| R3 | Actual | 0.04% | $1,000.00 | $1,000.14 | $0.20 |
| Hypothetical (h) | 0.04% | $1,000.00 | $1,024.60 | $0.20 | |
| R4 | Actual | 0.04% | $1,000.00 | $1,000.14 | $0.20 |
| Hypothetical (h) | 0.04% | $1,000.00 | $1,024.60 | $0.20 | |
| R6 | Actual | 0.04% | $1,000.00 | $1,000.14 | $0.20 |
| Hypothetical (h) | 0.04% | $1,000.00 | $1,024.60 | $0.20 | |
| 529A | Actual | 0.04% | $1,000.00 | $1,000.14 | $0.20 |
| Hypothetical (h) | 0.04% | $1,000.00 | $1,024.60 | $0.20 | |
| 529B | Actual | 0.04% | $1,000.00 | $1,000.14 | $0.20 |
| Hypothetical (h) | 0.04% | $1,000.00 | $1,024.60 | $0.20 | |
| 529C | Actual | 0.04% | $1,000.00 | $1,000.14 | $0.20 |
| Hypothetical (h) | 0.04% | $1,000.00 | $1,024.60 | $0.20 |
| (h) | 5% class return per year before expenses. |
| (p) | “Expenses Paid During Period” are equal to each class’s annualized expense ratio, as shown above, multiplied by the average account value over the period, multiplied by 181/365 (to reflect the one-half year period). Expenses paid do not include any applicable sales charges (loads). If these transaction costs had been included, your costs would have been higher. |
| Issuer | Shares/Par | Value ($) | ||
| U.S. Government Agencies and Equivalents (y) – 86.1% | ||||
| Fannie Mae, 0.044%, due 3/02/2022 | $ 4,402,000 | $ 4,401,995 | ||
| Fannie Mae, 0.054%, due 3/09/2022 | 5,705,000 | 5,704,933 | ||
| Fannie Mae, 0.046%, due 3/16/2022 | 1,455,000 | 1,454,973 | ||
| Fannie Mae, 0.03%, due 3/16/2022 | 1,448,000 | 1,447,982 | ||
| Fannie Mae, 0.025%, due 3/23/2022 | 7,428,000 | 7,427,887 | ||
| Federal Farm Credit Bank, 0.03%, due 3/03/2022 | 13,453,000 | 13,452,978 | ||
| Federal Farm Credit Bank, 0.041%, due 3/16/2022 | 7,414,000 | 7,413,876 | ||
| Federal Home Loan Bank, 0.022%, due 3/04/2022 | 15,075,000 | 15,074,972 | ||
| Federal Home Loan Bank, 0.03%, due 3/14/2022 | 5,000,000 | 4,999,946 | ||
| Federal Home Loan Bank, 0.02%, due 3/23/2022 | 16,000,000 | 15,999,804 | ||
| Freddie Mac, 0.041%, due 3/17/2022 | 14,618,000 | 14,617,740 | ||
| U.S. Treasury Bill, 0.025%, due 3/01/2022 | 6,350,000 | 6,350,000 | ||
| U.S. Treasury Bill, 0.051%, due 3/01/2022 | 13,895,000 | 13,895,000 | ||
| U.S. Treasury Bill, 0.025%, due 3/03/2022 | 6,350,000 | 6,349,991 | ||
| U.S. Treasury Bill, 0.041%, due 3/03/2022 | 12,141,000 | 12,140,973 | ||
| U.S. Treasury Bill, 0.037%, due 3/08/2022 | 3,721,000 | 3,720,974 | ||
| U.S. Treasury Bill, 0.046%, due 3/08/2022 | 7,623,000 | 7,622,933 | ||
| U.S. Treasury Bill, 0.042%, due 3/10/2022 | 3,721,000 | 3,720,962 | ||
| U.S. Treasury Bill, 0.046%, due 3/10/2022 | 5,030,000 | 5,029,943 | ||
| U.S. Treasury Bill, 0.01%, due 3/15/2022 | 12,064,000 | 12,063,953 | ||
| U.S. Treasury Bill, 0.03%, due 3/15/2022 | 3,447,000 | 3,446,960 | ||
| U.S. Treasury Bill, 0.046%, due 3/15/2022 | 6,562,000 | 6,561,885 | ||
| U.S. Treasury Bill, 0.023%, due 3/17/2022 | 4,418,000 | 4,417,956 | ||
| U.S. Treasury Bill, 0.046%, due 3/17/2022 | 3,000,000 | 2,999,940 | ||
| U.S. Treasury Bill, 0.041%, due 3/24/2022 | 22,723,000 | 22,722,419 | ||
| U.S. Treasury Bill, 0.051%, due 3/29/2022 | 15,036,000 | 15,035,415 | ||
| U.S. Treasury Bill, 0.033%, due 4/05/2022 | 16,000,000 | 15,999,495 | ||
| Total U.S. Government Agencies and Equivalents, at Amortized Cost and Value | $234,075,885 | |||
| Issuer | Shares/Par | Value ($) | ||
| Repurchase Agreements – 13.8% | ||||
| Bank of America Corp. Repurchase Agreement, 0.05%, dated 2/28/2022, due 3/01/2022, total to be received $18,650,026 (secured by U.S. Treasury obligations valued at $19,029,282) | $ 18,650,000 | $ 18,650,000 | ||
| JPMorgan Chase & Co. Repurchase Agreement, 0.05%, dated 2/28/2022, due 3/01/2022, total to be received $18,746,026 (secured by U.S. Treasury obligations valued at $19,086,341) | 18,746,000 | 18,746,000 | ||
| Total Repurchase Agreements, at Cost and Value | $ 37,396,000 | |||
| Other Assets, Less Liabilities – 0.1% | 322,596 | |||
| Net Assets – 100.0% | $271,794,481 | |||
| (y) | The rate shown represents an annualized yield at time of purchase. |
| Assets | |
| Investments in unaffiliated issuers, at cost and value | $234,075,885 |
| Investments in unaffiliated repurchase agreements, at cost and value | 37,396,000 |
| Cash | 574 |
| Receivables for | |
| Fund shares sold | 1,338,493 |
| Interest | 52 |
| Receivable from investment adviser and distributor | 78,696 |
| Other assets | 15,245 |
| Total assets | $272,904,945 |
| Liabilities | |
| Payables for | |
| Fund shares reacquired | $1,003,584 |
| Payable to affiliates | |
| Administrative services fee | 518 |
| Shareholder servicing costs | 65,949 |
| Program manager fees | 180 |
| Payable for independent Trustees' compensation | 4,889 |
| Accrued expenses and other liabilities | 35,344 |
| Total liabilities | $1,110,464 |
| Net assets | $271,794,481 |
| Net assets consist of | |
| Paid-in capital | $271,803,768 |
| Total distributable earnings (loss) | (9,287) |
| Net assets | $271,794,481 |
| Shares of beneficial interest outstanding | 272,029,286 |
| Net assets | Shares outstanding | Net asset value per share | |
| Class A | $137,022,475 | 137,140,959 | $1.00 |
| Class B | 5,622,086 | 5,626,875 | 1.00 |
| Class C | 29,898,561 | 29,924,038 | 1.00 |
| Class I | 14,954,260 | 14,967,255 | 1.00 |
| Class R1 | 8,462,717 | 8,470,257 | 1.00 |
| Class R2 | 24,058,425 | 24,079,178 | 1.00 |
| Class R3 | 16,046,290 | 16,060,126 | 1.00 |
| Class R4 | 2,675,741 | 2,678,058 | 1.00 |
| Class R6 | 112,565 | 112,664 | 1.00 |
| Class 529A | 28,163,462 | 28,187,790 | 1.00 |
| Class 529B | 139,048 | 139,167 | 1.00 |
| Class 529C | 4,638,851 | 4,642,919 | 1.00 |
| Net investment income (loss) | |
| Income | |
| Interest | $52,710 |
| Other | 1,009 |
| Total investment income | $53,719 |
| Expenses | |
| Management fee | $508,565 |
| Distribution and service fees | 481,908 |
| Shareholder servicing costs | 210,202 |
| Program manager fees | 8,272 |
| Administrative services fee | 22,186 |
| Independent Trustees' compensation | 2,878 |
| Custodian fee | 9,914 |
| Shareholder communications | 6,178 |
| Audit and tax fees | 19,850 |
| Legal fees | 806 |
| Miscellaneous | 87,848 |
| Total expenses | $1,358,607 |
| Reduction of expenses by investment adviser and distributor | (1,304,888) |
| Net expenses | $53,719 |
| Net investment income (loss) | $0 |
| Realized gain (loss) (identified cost basis) | |
| Unaffiliated issuers | $(4,685) |
| Change in net assets from operations | $(4,685) |
| Six months ended | Year ended | |
| 2/28/22 (unaudited) | 8/31/21 | |
| Change in net assets | ||
| From operations | ||
| Net investment income (loss) | $0 | $0 |
| Net realized gain (loss) | (4,685) | 34,722 |
| Change in net assets from operations | $(4,685) | $34,722 |
| Total distributions to shareholders | $(34,935) | $— |
| Change in net assets from fund share transactions | $6,579,566 | $(36,517,974) |
| Total change in net assets | $6,539,946 | $(36,483,252) |
| Net assets | ||
| At beginning of period | 265,254,535 | 301,737,787 |
| At end of period | $271,794,481 | $265,254,535 |
| Class A | Six months ended | Year ended | ||||
| 2/28/22 (unaudited) | 8/31/21 | 8/31/20 | 8/31/19 | 8/31/18 | 8/31/17 | |
| Net asset value, beginning of period | $1.00 | $1.00 | $1.00 | $1.00 | $1.00 | $1.00 |
| Income (loss) from investment operations | ||||||
| Net investment income (loss) (d) | $0.00 | $0.00 | $0.00(w) | $0.02 | $0.01 | $0.00(c)(w) |
| Net realized and unrealized gain (loss) | (0.00)(w) | 0.00(w) | 0.00(w) | 0.00(w) | — | (0.00)(w) |
| Total from investment operations | $(0.00)(w) | $0.00(w) | $0.00(w) | $0.02 | $0.01 | $0.00(w) |
| Less distributions declared to shareholders | ||||||
| From net investment income | $— | $— | $(0.00)(w) | $(0.02) | $(0.01) | $(0.00)(w) |
| From net realized gain | (0.00)(w) | — | — | — | — | — |
| Net asset value, end of period | $1.00 | $1.00 | $1.00 | $1.00 | $1.00 | $1.00 |
| Total return (%) (r)(t) | 0.01(n) | 0.00 | 0.54 | 1.58 | 0.76 | 0.08(c) |
| Ratios (%) (to average net assets) and Supplemental data: | ||||||
| Expenses before expense reductions | 0.93(a) | 0.91 | 0.96 | 0.98 | 0.94 | 0.91(c) |
| Expenses after expense reductions | 0.04(a) | 0.05 | 0.44 | 0.72 | 0.68 | 0.50(c) |
| Net investment income (loss) | 0.00(a) | 0.00 | 0.44 | 1.57 | 0.76 | 0.08(c) |
| Net assets at end of period (000 omitted) | $137,022 | $128,482 | $140,426 | $99,511 | $100,463 | $105,859 |
| Class B | Six months ended | Year ended | ||||
| 2/28/22 (unaudited) | 8/31/21 | 8/31/20 | 8/31/19 | 8/31/18 | 8/31/17 | |
| Net asset value, beginning of period | $1.00 | $1.00 | $1.00 | $1.00 | $1.00 | $1.00 |
| Income (loss) from investment operations | ||||||
| Net investment income (loss) (d) | $0.00 | $0.00 | $0.00(w) | $0.02 | $0.01 | $0.00(c)(w) |
| Net realized and unrealized gain (loss) | (0.00)(w) | 0.00(w) | 0.00(w) | 0.00(w) | — | (0.00)(w) |
| Total from investment operations | $(0.00)(w) | $0.00(w) | $0.00(w) | $0.02 | $0.01 | $0.00(w) |
| Less distributions declared to shareholders | ||||||
| From net investment income | $— | $— | $(0.00)(w) | $(0.02) | $(0.01) | $(0.00)(w) |
| From net realized gain | (0.00)(w) | — | — | — | — | — |
| Net asset value, end of period | $1.00 | $1.00 | $1.00 | $1.00 | $1.00 | $1.00 |
| Total return (%) (r)(t) | 0.01(n) | 0.00 | 0.54 | 1.58 | 0.76 | 0.08(c) |
| Ratios (%) (to average net assets) and Supplemental data: | ||||||
| Expenses before expense reductions | 1.68(a) | 1.66 | 1.71 | 1.73 | 1.69 | 1.66(c) |
| Expenses after expense reductions | 0.04(a) | 0.05 | 0.47 | 0.72 | 0.68 | 0.51(c) |
| Net investment income (loss) | 0.00(a) | 0.00 | 0.49 | 1.57 | 0.72 | 0.07(c) |
| Net assets at end of period (000 omitted) | $5,622 | $6,792 | $9,528 | $8,977 | $11,664 | $17,338 |
| Class C | Six months ended | Year ended | ||||
| 2/28/22 (unaudited) | 8/31/21 | 8/31/20 | 8/31/19 | 8/31/18 | 8/31/17 | |
| Net asset value, beginning of period | $1.00 | $1.00 | $1.00 | $1.00 | $1.00 | $1.00 |
| Income (loss) from investment operations | ||||||
| Net investment income (loss) (d) | $0.00 | $0.00 | $0.00(w) | $0.02 | $0.01 | $0.00(c)(w) |
| Net realized and unrealized gain (loss) | (0.00)(w) | 0.00(w) | 0.00(w) | 0.00(w) | — | (0.00)(w) |
| Total from investment operations | $(0.00)(w) | $0.00(w) | $0.00(w) | $0.02 | $0.01 | $0.00(w) |
| Less distributions declared to shareholders | ||||||
| From net investment income | $— | $— | $(0.00)(w) | $(0.02) | $(0.01) | $(0.00)(w) |
| From net realized gain | (0.00)(w) | — | — | — | — | — |
| Net asset value, end of period | $1.00 | $1.00 | $1.00 | $1.00 | $1.00 | $1.00 |
| Total return (%) (r)(t) | 0.01(n) | 0.00 | 0.54 | 1.58 | 0.76 | 0.08(c) |
| Ratios (%) (to average net assets) and Supplemental data: | ||||||
| Expenses before expense reductions | 1.68(a) | 1.66 | 1.71 | 1.73 | 1.69 | 1.66(c) |
| Expenses after expense reductions | 0.04(a) | 0.05 | 0.40 | 0.72 | 0.68 | 0.50(c) |
| Net investment income (loss) | 0.00(a) | 0.00 | 0.37 | 1.57 | 0.68 | 0.07(c) |
| Net assets at end of period (000 omitted) | $29,899 | $23,748 | $34,508 | $19,438 | $18,451 | $38,458 |
| Class I | Six months ended | Year ended | ||
| 2/28/22 (unaudited) | 8/31/21 | 8/31/20 | 8/31/19(i) | |
| Net asset value, beginning of period | $1.00 | $1.00 | $1.00 | $1.00 |
| Income (loss) from investment operations | ||||
| Net investment income (loss) (d) | $0.00 | $0.00 | $0.00(w) | $0.02 |
| Net realized and unrealized gain (loss) | (0.00)(w) | 0.00(w) | 0.00(w) | 0.00(w) |
| Total from investment operations | $(0.00)(w) | $0.00(w) | $0.00(w) | $0.02 |
| Less distributions declared to shareholders | ||||
| From net investment income | $— | $— | $(0.00)(w) | $(0.02) |
| From net realized gain | (0.00)(w) | — | — | — |
| Net asset value, end of period | $1.00 | $1.00 | $1.00 | $1.00 |
| Total return (%) (r)(t) | 0.01(n) | 0.00 | 0.54 | 1.52(n) |
| Ratios (%) (to average net assets) and Supplemental data: | ||||
| Expenses before expense reductions | 0.68(a) | 0.65 | 0.69 | 0.73(a) |
| Expenses after expense reductions | 0.04(a) | 0.05 | 0.23 | 0.72(a) |
| Net investment income (loss) | 0.00(a) | 0.00 | 0.06 | 1.60(a) |
| Net assets at end of period (000 omitted) | $14,954 | $12,819 | $9,797 | $56 |
| Class R1 | Six months ended | Year ended | ||||
| 2/28/22 (unaudited) | 8/31/21 | 8/31/20 | 8/31/19 | 8/31/18 | 8/31/17 | |
| Net asset value, beginning of period | $1.00 | $1.00 | $1.00 | $1.00 | $1.00 | $1.00 |
| Income (loss) from investment operations | ||||||
| Net investment income (loss) (d) | $0.00 | $0.00 | $0.00(w) | $0.02 | $0.01 | $0.00(c)(w) |
| Net realized and unrealized gain (loss) | (0.00)(w) | 0.00(w) | 0.00(w) | 0.00(w) | — | (0.00)(w) |
| Total from investment operations | $(0.00)(w) | $0.00(w) | $0.00(w) | $0.02 | $0.01 | $0.00(w) |
| Less distributions declared to shareholders | ||||||
| From net investment income | $— | $— | $(0.00)(w) | $(0.02) | $(0.01) | $(0.00)(w) |
| From net realized gain | (0.00)(w) | — | — | — | — | — |
| Net asset value, end of period | $1.00 | $1.00 | $1.00 | $1.00 | $1.00 | $1.00 |
| Total return (%) (r)(t) | 0.01(n) | 0.00 | 0.54 | 1.57 | 0.76 | 0.08(c) |
| Ratios (%) (to average net assets) and Supplemental data: | ||||||
| Expenses before expense reductions | 1.68(a) | 1.65 | 1.71 | 1.73 | 1.69 | 1.66(c) |
| Expenses after expense reductions | 0.04(a) | 0.05 | 0.47 | 0.72 | 0.68 | 0.50(c) |
| Net investment income (loss) | 0.00(a) | 0.00 | 0.48 | 1.57 | 0.72 | 0.07(c) |
| Net assets at end of period (000 omitted) | $8,463 | $8,761 | $9,209 | $7,610 | $8,305 | $12,236 |
| Class R2 | Six months ended | Year ended | ||||
| 2/28/22 (unaudited) | 8/31/21 | 8/31/20 | 8/31/19 | 8/31/18 | 8/31/17 | |
| Net asset value, beginning of period | $1.00 | $1.00 | $1.00 | $1.00 | $1.00 | $1.00 |
| Income (loss) from investment operations | ||||||
| Net investment income (loss) (d) | $0.00 | $0.00 | $0.01 | $0.02 | $0.01 | $0.00(c)(w) |
| Net realized and unrealized gain (loss) | (0.00)(w) | 0.00(w) | 0.00(w) | 0.00(w) | — | (0.00)(w) |
| Total from investment operations | $(0.00)(w) | $0.00(w) | $0.01 | $0.02 | $0.01 | $0.00(w) |
| Less distributions declared to shareholders | ||||||
| From net investment income | $— | $— | $(0.01) | $(0.02) | $(0.01) | $(0.00)(w) |
| From net realized gain | (0.00)(w) | — | — | — | — | — |
| Net asset value, end of period | $1.00 | $1.00 | $1.00 | $1.00 | $1.00 | $1.00 |
| Total return (%) (r)(t) | 0.01(n) | 0.00 | 0.54 | 1.57 | 0.76 | 0.08(c) |
| Ratios (%) (to average net assets) and Supplemental data: | ||||||
| Expenses before expense reductions | 1.18(a) | 1.16 | 1.21 | 1.23 | 1.19 | 1.16(c) |
| Expenses after expense reductions | 0.04(a) | 0.05 | 0.48 | 0.72 | 0.68 | 0.51(c) |
| Net investment income (loss) | 0.00(a) | 0.00 | 0.51 | 1.57 | 0.73 | 0.08(c) |
| Net assets at end of period (000 omitted) | $24,058 | $26,432 | $33,676 | $31,672 | $34,993 | $48,184 |
| Class R3 | Six months ended | Year ended | ||||
| 2/28/22 (unaudited) | 8/31/21 | 8/31/20 | 8/31/19 | 8/31/18 | 8/31/17 | |
| Net asset value, beginning of period | $1.00 | $1.00 | $1.00 | $1.00 | $1.00 | $1.00 |
| Income (loss) from investment operations | ||||||
| Net investment income (loss) (d) | $0.00 | $0.00 | $0.00(w) | $0.02 | $0.01 | $0.00(c)(w) |
| Net realized and unrealized gain (loss) | (0.00)(w) | 0.00(w) | 0.00(w) | 0.00(w) | — | (0.00)(w) |
| Total from investment operations | $(0.00)(w) | $0.00(w) | $0.00(w) | $0.02 | $0.01 | $0.00(w) |
| Less distributions declared to shareholders | ||||||
| From net investment income | $— | $— | $(0.00)(w) | $(0.02) | $(0.01) | $(0.00)(w) |
| From net realized gain | (0.00)(w) | — | — | — | — | — |
| Net asset value, end of period | $1.00 | $1.00 | $1.00 | $1.00 | $1.00 | $1.00 |
| Total return (%) (r)(t) | 0.01(n) | 0.00 | 0.54 | 1.57 | 0.76 | 0.08(c) |
| Ratios (%) (to average net assets) and Supplemental data: | ||||||
| Expenses before expense reductions | 0.93(a) | 0.90 | 0.96 | 0.98 | 0.94 | 0.91(c) |
| Expenses after expense reductions | 0.04(a) | 0.05 | 0.44 | 0.72 | 0.68 | 0.51(c) |
| Net investment income (loss) | 0.00(a) | 0.00 | 0.44 | 1.55 | 0.73 | 0.08(c) |
| Net assets at end of period (000 omitted) | $16,046 | $21,266 | $24,536 | $16,471 | $26,227 | $35,196 |
| Class R4 | Six months ended | Year ended | ||||
| 2/28/22 (unaudited) | 8/31/21 | 8/31/20 | 8/31/19 | 8/31/18 | 8/31/17 | |
| Net asset value, beginning of period | $1.00 | $1.00 | $1.00 | $1.00 | $1.00 | $1.00 |
| Income (loss) from investment operations | ||||||
| Net investment income (loss) (d) | $0.00 | $0.00 | $0.01 | $0.02 | $0.01 | $0.00(c)(w) |
| Net realized and unrealized gain (loss) | (0.00)(w) | 0.00(w) | 0.00(w) | 0.00(w) | — | (0.00)(w) |
| Total from investment operations | $(0.00)(w) | $0.00(w) | $0.01 | $0.02 | $0.01 | $0.00(w) |
| Less distributions declared to shareholders | ||||||
| From net investment income | $— | $— | $(0.01) | $(0.02) | $(0.01) | $(0.00)(w) |
| From net realized gain | (0.00)(w) | — | — | — | — | — |
| Net asset value, end of period | $1.00 | $1.00 | $1.00 | $1.00 | $1.00 | $1.00 |
| Total return (%) (r)(t) | 0.01(n) | 0.00 | 0.54 | 1.57 | 0.76 | 0.08(c) |
| Ratios (%) (to average net assets) and Supplemental data: | ||||||
| Expenses before expense reductions | 0.68(a) | 0.65 | 0.71 | 0.73 | 0.69 | 0.67(c) |
| Expenses after expense reductions | 0.04(a) | 0.05 | 0.49 | 0.72 | 0.68 | 0.52(c) |
| Net investment income (loss) | 0.00(a) | 0.00 | 0.54 | 1.57 | 0.74 | 0.08(c) |
| Net assets at end of period (000 omitted) | $2,676 | $2,676 | $2,709 | $2,676 | $2,729 | $3,250 |
| Class R6 | Six months ended | Year ended | ||
| 2/28/22 (unaudited) | 8/31/21 | 8/31/20 | 8/31/19(i) | |
| Net asset value, beginning of period | $1.00 | $1.00 | $1.00 | $1.00 |
| Income (loss) from investment operations | ||||
| Net investment income (loss) (d) | $0.00 | $0.00 | $0.00(w) | $0.02 |
| Net realized and unrealized gain (loss) | (0.00)(w) | 0.00(w) | 0.00(w) | 0.00(w) |
| Total from investment operations | $(0.00)(w) | $0.00(w) | $0.00(w) | $0.02 |
| Less distributions declared to shareholders | ||||
| From net investment income | $— | $— | $(0.00)(w) | $(0.02) |
| From net realized gain | (0.00)(w) | — | — | — |
| Net asset value, end of period | $1.00 | $1.00 | $1.00 | $1.00 |
| Total return (%) (r)(t) | 0.01(n) | 0.00 | 0.58 | 1.58(n) |
| Ratios (%) (to average net assets) and Supplemental data: | ||||
| Expenses before expense reductions | 0.62(a) | 0.59 | 0.65 | 0.66(a) |
| Expenses after expense reductions | 0.04(a) | 0.05 | 0.42 | 0.65(a) |
| Net investment income (loss) | 0.00(a) | 0.00 | 0.46 | 1.65(a) |
| Net assets at end of period (000 omitted) | $113 | $113 | $113 | $54 |
| Class 529A | Six months ended | Year ended | ||||
| 2/28/22 (unaudited) | 8/31/21 | 8/31/20 | 8/31/19 | 8/31/18 | 8/31/17 | |
| Net asset value, beginning of period | $1.00 | $1.00 | $1.00 | $1.00 | $1.00 | $1.00 |
| Income (loss) from investment operations | ||||||
| Net investment income (loss) (d) | $0.00 | $0.00 | $0.00(w) | $0.02 | $0.01 | $0.00(c)(w) |
| Net realized and unrealized gain (loss) | (0.00)(w) | 0.00(w) | 0.00(w) | 0.00(w) | — | (0.00)(w) |
| Total from investment operations | $(0.00)(w) | $0.00(w) | $0.00(w) | $0.02 | $0.01 | $0.00(w) |
| Less distributions declared to shareholders | ||||||
| From net investment income | $— | $— | $(0.00)(w) | $(0.02) | $(0.01) | $(0.00)(w) |
| From net realized gain | (0.00)(w) | — | — | — | — | — |
| Net asset value, end of period | $1.00 | $1.00 | $1.00 | $1.00 | $1.00 | $1.00 |
| Total return (%) (r)(t) | 0.01(n) | 0.00 | 0.51 | 1.53 | 0.71 | 0.06(c) |
| Ratios (%) (to average net assets) and Supplemental data: | ||||||
| Expenses before expense reductions | 0.98(a) | 0.95 | 1.01 | 1.03 | 1.00 | 1.01(c) |
| Expenses after expense reductions | 0.04(a) | 0.05 | 0.47 | 0.77 | 0.73 | 0.53(c) |
| Net investment income (loss) | 0.00(a) | 0.00 | 0.44 | 1.52 | 0.73 | 0.06(c) |
| Net assets at end of period (000 omitted) | $28,163 | $27,919 | $28,695 | $19,061 | $15,197 | $13,208 |
| Class 529B | Six months ended | Year ended | ||||
| 2/28/22 (unaudited) | 8/31/21 | 8/31/20 | 8/31/19 | 8/31/18 | 8/31/17 | |
| Net asset value, beginning of period | $1.00 | $1.00 | $1.00 | $1.00 | $1.00 | $1.00 |
| Income (loss) from investment operations | ||||||
| Net investment income (loss) (d) | $0.00 | $0.00 | $0.01 | $0.02 | $0.01 | $0.00(c)(w) |
| Net realized and unrealized gain (loss) | (0.00)(w) | 0.00(w) | 0.00(w) | 0.00(w) | — | (0.00)(w) |
| Total from investment operations | $(0.00)(w) | $0.00(w) | $0.01 | $0.02 | $0.01 | $0.00(w) |
| Less distributions declared to shareholders | ||||||
| From net investment income | $— | $— | $(0.01) | $(0.02) | $(0.01) | $(0.00)(w) |
| From net realized gain | (0.00)(w) | — | — | — | — | — |
| Net asset value, end of period | $1.00 | $1.00 | $1.00 | $1.00 | $1.00 | $1.00 |
| Total return (%) (r)(t) | 0.01(n) | 0.00 | 0.51 | 1.53 | 0.71 | 0.06(c) |
| Ratios (%) (to average net assets) and Supplemental data: | ||||||
| Expenses before expense reductions | 1.73(a) | 1.71 | 1.76 | 1.78 | 1.75 | 1.76(c) |
| Expenses after expense reductions | 0.04(a) | 0.05 | 0.53 | 0.77 | 0.73 | 0.53(c) |
| Net investment income (loss) | 0.00(a) | 0.00 | 0.53 | 1.51 | 0.71 | 0.06(c) |
| Net assets at end of period (000 omitted) | $139 | $182 | $183 | $247 | $293 | $348 |
| Class 529C | Six months ended | Year ended | ||||
| 2/28/22 (unaudited) | 8/31/21 | 8/31/20 | 8/31/19 | 8/31/18 | 8/31/17 | |
| Net asset value, beginning of period | $1.00 | $1.00 | $1.00 | $1.00 | $1.00 | $1.00 |
| Income (loss) from investment operations | ||||||
| Net investment income (loss) (d) | $0.00 | $0.00 | $0.00(w) | $0.02 | $0.01 | $0.00(c)(w) |
| Net realized and unrealized gain (loss) | (0.00)(w) | 0.00(w) | 0.00(w) | 0.00(w) | — | (0.00)(w) |
| Total from investment operations | $(0.00)(w) | $0.00(w) | $0.00(w) | $0.02 | $0.01 | $0.00(w) |
| Less distributions declared to shareholders | ||||||
| From net investment income | $— | $— | $(0.00)(w) | $(0.02) | $(0.01) | $(0.00)(w) |
| From net realized gain | (0.00)(w) | — | — | — | — | — |
| Net asset value, end of period | $1.00 | $1.00 | $1.00 | $1.00 | $1.00 | $1.00 |
| Total return (%) (r)(t) | 0.01(n) | 0.00 | 0.51 | 1.53 | 0.71 | 0.06(c) |
| Ratios (%) (to average net assets) and Supplemental data: | ||||||
| Expenses before expense reductions | 1.73(a) | 1.71 | 1.76 | 1.78 | 1.75 | 1.76(c) |
| Expenses after expense reductions | 0.04(a) | 0.05 | 0.49 | 0.77 | 0.73 | 0.54(c) |
| Net investment income (loss) | 0.00(a) | 0.00 | 0.46 | 1.52 | 0.70 | 0.06(c) |
| Net assets at end of period (000 omitted) | $4,639 | $6,062 | $8,360 | $6,437 | $6,419 | $6,957 |
| (a) | Annualized. |
| (c) | Amount reflects a one-time reimbursement of expenses by the custodian (or former custodian) without which net investment income and performance would be lower and expenses would be higher. |
| (d) | Per share data is based on average shares outstanding. |
| (i) | For Class I and Class R6, the period is from the class inception, September 18, 2018, through the stated period end. |
| (n) | Not annualized. |
| (r) | Certain expenses have been reduced without which performance would have been lower. |
| (t) | Total returns do not include any applicable sales charges. |
| (w) | Per share amount was less than $0.01 and total return or ratio was less than 0.01%, as applicable. |
| Financial Instruments | Level 1 | Level 2 | Level 3 | Total |
| Short-Term Securities | $— | $271,471,885 | $— | $271,471,885 |
| As of 2/28/22 | |
| Cost of investments | $271,471,885 |
| As of 8/31/21 | |
| Undistributed ordinary income | 34,282 |
| Other temporary differences | (3,949) |
| Six months ended 2/28/22 | Year ended 8/31/21 | |
| Class A | $17,280 | $— |
| Class B | 819 | — |
| Class C | 2,445 | — |
| Class I | 1,794 | — |
| Class R1 | 1,279 | — |
| Class R2 | 3,572 | — |
| Class R3 | 2,638 | — |
| Class R4 | 375 | — |
| Class R6 | 16 | — |
| Class 529A | 3,979 | — |
| Class 529B | 18 | — |
| Class 529C | 720 | — |
| Total | $34,935 | $— |
| Up to $1 billion | 0.40% |
| In excess of $1 billion | 0.35% |
| Classes | |||||||||||
| A | B | C | I | R1 | R2 | R3 | R4 | R6 | 529A | 529B | 529C |
| 0.45% | 0.45% | 0.45% | 0.45% | 0.45% | 0.45% | 0.45% | 0.45% | 0.37% | 0.50% | 0.50% | 0.50% |
| Distribution Fee Rate (d) | Service Fee Rate (d) | Total Distribution Plan (d) | Annual Effective Rate (e) | Distribution and Service Fee | |
| Class A | — | 0.25% | 0.25% | 0.00% | $ 157,349 |
| Class B | 0.75% | 0.25% | 1.00% | 0.00% | 29,859 |
| Class C | 0.75% | 0.25% | 1.00% | 0.00% | 103,509 |
| Class R1 | 0.75% | 0.25% | 1.00% | 0.00% | 44,539 |
| Class R2 | 0.25% | 0.25% | 0.50% | 0.00% | 62,414 |
| Class R3 | — | 0.25% | 0.25% | 0.00% | 23,221 |
| Class 529A | — | 0.25% | 0.25% | 0.00% | 34,807 |
| Class 529B | 0.75% | 0.25% | 1.00% | 0.00% | 742 |
| Class 529C | 0.75% | 0.25% | 1.00% | 0.00% | 25,468 |
| Total Distribution and Service Fees | $481,908 |
| (d) | In accordance with the distribution plan for certain classes, the fund pays distribution and/or service fees equal to these annual percentage rates of each class’s average daily net assets. The distribution and service fee rates disclosed by class represent the current rates in effect at the end of the reporting period. Any rate changes, if applicable, are detailed below. |
| (e) | The annual effective rates represent actual fees incurred under the distribution plan for the six months ended February 28, 2022 based on each class's average daily net assets. MFD has agreed in writing to waive any distribution and/or service fees for Class A, Class B, Class C, Class R1, Class R2, Class R3, Class 529A, Class 529B, and Class 529C. This written agreement will continue until modified by the fund’s Board of Trustees, but such agreement will continue until at least December 31, 2022. These reductions, for the six months ended February 28,2022, for Class A, Class B, Class C, Class R1, Class R2, Class R3, Class 529A, Class 529B, and Class 529C amounted to $157,349, $29,859, $103,509, $44,539, $62,414, $23,221, $34,807, $742, and $25,468, respectively, and are included in the reduction of total expenses in the Statement of Operations |
| Amount | |
| Class A | $1,166 |
| Class B | 2,176 |
| Class C | 234 |
| Class 529B | — |
| Class 529C | 411 |
| Fee | Waiver | |
| Class 529A | $6,962 | $6,962 |
| Class 529B | 37 | 37 |
| Class 529C | 1,273 | 1,273 |
| Total Program Manager Fees and Waivers | $8,272 | $8,272 |
| Six months ended 2/28/22 | Year ended 8/31/21 | ||
| Shares sold | |||
| Class A | 40,527,366 | 97,787,393 | |
| Class B | 1,043,465 | 4,831,542 | |
| Class C | 17,027,446 | 19,196,047 | |
| Class I | 5,704,113 | 8,377,442 | |
| Class R1 | 2,961,241 | 6,051,818 | |
| Class R2 | 3,638,571 | 9,662,586 | |
| Class R3 | 3,137,520 | 11,062,318 | |
| Class R4 | — | 6,597 | |
| Class R6 | 246 | 436 | |
| Class 529A | 5,638,983 | 13,853,558 | |
| Class 529B | 27,132 | 124,416 | |
| Class 529C | 791,918 | 3,513,764 | |
| 80,498,001 | 174,467,917 |
| Six months ended 2/28/22 | Year ended 8/31/21 | ||
| Shares issued to shareholders in reinvestment of distributions | |||
| Class A | 16,728 | — | |
| Class B | 783 | — | |
| Class C | 2,430 | — | |
| Class I | 1,784 | — | |
| Class R1 | 1,279 | — | |
| Class R2 | 3,572 | — | |
| Class R3 | 2,639 | — | |
| Class R4 | 375 | — | |
| Class R6 | 16 | — | |
| Class 529A | 3,968 | — | |
| Class 529B | 19 | — | |
| Class 529C | 719 | — | |
| 34,312 | — | ||
| Shares reacquired | |||
| Class A | (31,980,227) | (109,743,581) | |
| Class B | (2,214,793) | (7,568,950) | |
| Class C | (10,871,348) | (29,965,240) | |
| Class I | (3,567,572) | (5,352,725) | |
| Class R1 | (3,260,152) | (6,499,432) | |
| Class R2 | (6,014,577) | (16,912,492) | |
| Class R3 | (8,362,099) | (14,334,675) | |
| Class R4 | — | (39,756) | |
| Class R6 | (234) | (549) | |
| Class 529A | (5,395,187) | (14,630,123) | |
| Class 529B | (70,219) | (125,318) | |
| Class 529C | (2,216,339) | (5,813,050) | |
| (73,952,747) | (210,985,891) |
| Six months ended 2/28/22 | Year ended 8/31/21 | ||
| Net change | |||
| Class A | 8,563,867 | (11,956,188) | |
| Class B | (1,170,545) | (2,737,408) | |
| Class C | 6,158,528 | (10,769,193) | |
| Class I | 2,138,325 | 3,024,717 | |
| Class R1 | (297,632) | (447,614) | |
| Class R2 | (2,372,434) | (7,249,906) | |
| Class R3 | (5,221,940) | (3,272,357) | |
| Class R4 | 375 | (33,159) | |
| Class R6 | 28 | (113) | |
| Class 529A | 247,764 | (776,565) | |
| Class 529B | (43,068) | (902) | |
| Class 529C | (1,423,702) | (2,299,286) | |
| 6,579,566 | (36,517,974) |


| 1 | |
| 2 | |
| 3 | |
| 6 | |
| 10 | |
| 12 | |
| 13 | |
| 14 | |
| 26 | |
| 40 | |
| 40 | |
| 40 | |
| 40 | |
| 40 |
| back cover |


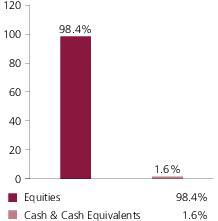
| JPMorgan Chase & Co. | 3.9% |
| Johnson & Johnson | 3.4% |
| Aon PLC | 2.7% |
| Comcast Corp., “A” | 2.5% |
| Northrop Grumman Corp. | 2.5% |
| Accenture PLC, “A” | 2.3% |
| Texas Instruments, Inc. | 2.3% |
| Chubb Ltd. | 2.3% |
| Honeywell International, Inc. | 2.2% |
| Cigna Corp. | 2.1% |
| Financials | 27.6% |
| Health Care | 18.5% |
| Industrials | 18.1% |
| Information Technology | 7.9% |
| Consumer Staples | 6.8% |
| Utilities | 6.4% |
| Materials | 4.0% |
| Communication Services | 3.2% |
| Energy | 2.8% |
| Consumer Discretionary | 2.6% |
| Real Estate | 0.5% |
| (g) | The Global Industry Classification Standard (GICS®) was developed by and/or is the exclusive property of MSCI, Inc. and S&P Global Market Intelligence Inc. (“S&P Global Market Intelligence”). GICS is a service mark of MSCI and S&P Global Market Intelligence and has been licensed for use by MFS. MFS has applied its own internal sector/industry classification methodology for equity securities and non-equity securities that are unclassified by GICS. |
September 1, 2021 through February 28, 2022
| Share Class | Annualized Expense Ratio | Beginning Account Value 9/01/21 | Ending Account Value 2/28/22 | Expenses Paid During Period (p) 9/01/21-2/28/22 | |
| A | Actual | 0.78% | $1,000.00 | $976.76 | $3.82 |
| Hypothetical (h) | 0.78% | $1,000.00 | $1,020.93 | $3.91 | |
| B | Actual | 1.53% | $1,000.00 | $972.98 | $7.48 |
| Hypothetical (h) | 1.53% | $1,000.00 | $1,017.21 | $7.65 | |
| C | Actual | 1.53% | $1,000.00 | $973.10 | $7.49 |
| Hypothetical (h) | 1.53% | $1,000.00 | $1,017.21 | $7.65 | |
| I | Actual | 0.53% | $1,000.00 | $977.90 | $2.60 |
| Hypothetical (h) | 0.53% | $1,000.00 | $1,022.17 | $2.66 | |
| R1 | Actual | 1.53% | $1,000.00 | $973.13 | $7.49 |
| Hypothetical (h) | 1.53% | $1,000.00 | $1,017.21 | $7.65 | |
| R2 | Actual | 1.03% | $1,000.00 | $975.51 | $5.05 |
| Hypothetical (h) | 1.03% | $1,000.00 | $1,019.69 | $5.16 | |
| R3 | Actual | 0.78% | $1,000.00 | $976.69 | $3.82 |
| Hypothetical (h) | 0.78% | $1,000.00 | $1,020.93 | $3.91 | |
| R4 | Actual | 0.53% | $1,000.00 | $977.94 | $2.60 |
| Hypothetical (h) | 0.53% | $1,000.00 | $1,022.17 | $2.66 | |
| R6 | Actual | 0.42% | $1,000.00 | $978.39 | $2.06 |
| Hypothetical (h) | 0.42% | $1,000.00 | $1,022.71 | $2.11 | |
| 529A | Actual | 0.81% | $1,000.00 | $976.48 | $3.97 |
| Hypothetical (h) | 0.81% | $1,000.00 | $1,020.78 | $4.06 | |
| 529B | Actual | 0.83% | $1,000.00 | $976.49 | $4.07 |
| Hypothetical (h) | 0.83% | $1,000.00 | $1,020.68 | $4.16 | |
| 529C | Actual | 1.58% | $1,000.00 | $972.93 | $7.73 |
| Hypothetical (h) | 1.58% | $1,000.00 | $1,016.96 | $7.90 |
| (h) | 5% class return per year before expenses. |
| (p) | “Expenses Paid During Period” are equal to each class’s annualized expense ratio, as shown above, multiplied by the average account value over the period, multiplied by 181/365 (to reflect the one-half year period). Expenses paid do not include any applicable sales charges (loads). If these transaction costs had been included, your costs would have been higher. |
| Issuer | Shares/Par | Value ($) | ||
| Common Stocks – 98.4% | ||||
| Aerospace & Defense – 6.5% | ||||
| Honeywell International, Inc. | 7,253,197 | $ 1,376,294,131 | ||
| Lockheed Martin Corp. | 1,206,466 | 523,364,951 | ||
| Northrop Grumman Corp. | 3,658,688 | 1,617,652,312 | ||
| Raytheon Technologies Corp. | 5,886,214 | 604,514,178 | ||
| $4,121,825,572 | ||||
| Alcoholic Beverages – 1.5% | ||||
| Diageo PLC | 19,540,269 | $ 976,444,622 | ||
| Brokerage & Asset Managers – 3.4% | ||||
| BlackRock, Inc. | 1,096,910 | $ 815,980,380 | ||
| KKR & Co., Inc. | 5,942,286 | 357,250,234 | ||
| NASDAQ, Inc. | 5,763,441 | 986,412,927 | ||
| $2,159,643,541 | ||||
| Business Services – 4.4% | ||||
| Accenture PLC, “A” | 4,660,797 | $ 1,472,905,068 | ||
| Equifax, Inc. | 3,295,700 | 719,583,138 | ||
| Fidelity National Information Services, Inc. | 5,029,051 | 478,916,527 | ||
| Fiserv, Inc. (a) | 1,243,687 | 121,470,909 | ||
| $2,792,875,642 | ||||
| Cable TV – 3.2% | ||||
| Charter Communications, Inc., “A” (a) | 718,011 | $ 432,084,660 | ||
| Comcast Corp., “A” | 34,830,750 | 1,628,685,870 | ||
| $2,060,770,530 | ||||
| Chemicals – 1.4% | ||||
| PPG Industries, Inc. | 6,782,274 | $ 905,094,465 | ||
| Construction – 3.0% | ||||
| Masco Corp. | 8,023,642 | $ 449,644,898 | ||
| Otis Worldwide Corp. | 2,517,096 | 197,164,130 | ||
| Sherwin-Williams Co. | 2,473,602 | 650,878,894 | ||
| Stanley Black & Decker, Inc. | 3,636,808 | 591,708,661 | ||
| $1,889,396,583 | ||||
| Consumer Products – 2.4% | ||||
| Colgate-Palmolive Co. | 5,679,774 | $ 437,058,609 | ||
| International Flavors & Fragrances, Inc. | 1,921,703 | 255,586,499 | ||
| Kimberly-Clark Corp. | 3,983,813 | 518,493,262 | ||
| Issuer | Shares/Par | Value ($) | ||
| Common Stocks – continued | ||||
| Consumer Products – continued | ||||
| Reckitt Benckiser Group PLC | 3,928,162 | $ 333,093,366 | ||
| $1,544,231,736 | ||||
| Electrical Equipment – 1.3% | ||||
| Johnson Controls International PLC | 13,000,703 | $ 844,525,667 | ||
| Electronics – 4.6% | ||||
| Analog Devices, Inc. | 2,849,133 | $ 456,687,528 | ||
| Intel Corp. | 9,054,760 | 431,912,052 | ||
| NXP Semiconductors N.V. | 3,270,724 | 621,830,047 | ||
| Texas Instruments, Inc. | 8,509,121 | 1,446,465,479 | ||
| $2,956,895,106 | ||||
| Energy - Independent – 2.8% | ||||
| ConocoPhillips | 8,617,941 | $ 817,497,883 | ||
| EOG Resources, Inc. | 4,526,042 | 520,132,747 | ||
| Pioneer Natural Resources Co. | 1,910,635 | 457,788,146 | ||
| $1,795,418,776 | ||||
| Food & Beverages – 3.2% | ||||
| Archer Daniels Midland Co. | 3,675,788 | $ 288,365,568 | ||
| Nestle S.A. | 8,228,697 | 1,074,728,303 | ||
| PepsiCo, Inc. | 4,314,736 | 706,494,873 | ||
| $2,069,588,744 | ||||
| Gaming & Lodging – 1.0% | ||||
| Marriott International, Inc., “A” (a) | 3,744,300 | $ 637,055,202 | ||
| Health Maintenance Organizations – 2.1% | ||||
| Cigna Corp. | 5,716,570 | $ 1,359,286,015 | ||
| Insurance – 10.3% | ||||
| Aon PLC | 5,928,590 | $ 1,731,978,283 | ||
| Chubb Ltd. | 7,089,435 | 1,443,692,543 | ||
| Marsh & McLennan Cos., Inc. | 8,679,092 | 1,348,817,688 | ||
| Progressive Corp. | 11,207,795 | 1,187,241,724 | ||
| Travelers Cos., Inc. | 5,189,623 | 891,732,920 | ||
| $6,603,463,158 | ||||
| Machinery & Tools – 4.7% | ||||
| Eaton Corp. PLC | 6,714,451 | $ 1,035,972,645 | ||
| Illinois Tool Works, Inc. | 4,686,551 | 1,013,888,443 | ||
| PACCAR, Inc. | 3,677,526 | 337,633,662 | ||
| Trane Technologies PLC | 3,977,467 | 612,251,495 | ||
| $2,999,746,245 | ||||
| Issuer | Shares/Par | Value ($) | ||
| Common Stocks – continued | ||||
| Major Banks – 8.3% | ||||
| Goldman Sachs Group, Inc. | 2,084,545 | $ 711,434,363 | ||
| JPMorgan Chase & Co. | 17,745,574 | 2,516,322,393 | ||
| Morgan Stanley | 13,374,512 | 1,213,603,219 | ||
| PNC Financial Services Group, Inc. | 4,259,975 | 848,800,019 | ||
| $5,290,159,994 | ||||
| Medical & Health Technology & Services – 1.2% | ||||
| McKesson Corp. | 2,893,200 | $ 795,514,272 | ||
| Medical Equipment – 7.8% | ||||
| Abbott Laboratories | 7,985,777 | $ 963,244,422 | ||
| Boston Scientific Corp. (a) | 14,347,041 | 633,708,801 | ||
| Danaher Corp. | 3,332,317 | 914,421,108 | ||
| Medtronic PLC | 11,635,741 | 1,221,636,447 | ||
| Thermo Fisher Scientific, Inc. | 2,235,757 | 1,216,251,808 | ||
| $4,949,262,586 | ||||
| Other Banks & Diversified Financials – 5.6% | ||||
| American Express Co. | 6,166,402 | $ 1,199,611,845 | ||
| Citigroup, Inc. | 17,946,981 | 1,062,999,685 | ||
| Moody's Corp. | 853,110 | 274,727,013 | ||
| Truist Financial Corp. | 7,696,026 | 478,846,738 | ||
| U.S. Bancorp | 9,938,809 | 561,940,261 | ||
| $3,578,125,542 | ||||
| Pharmaceuticals – 7.4% | ||||
| Johnson & Johnson | 13,321,193 | $ 2,192,268,732 | ||
| Merck & Co., Inc. | 12,359,708 | 946,506,438 | ||
| Pfizer, Inc. | 28,887,402 | 1,355,974,650 | ||
| Roche Holding AG | 564,650 | 215,399,414 | ||
| $4,710,149,234 | ||||
| Railroad & Shipping – 2.6% | ||||
| Canadian National Railway Co. | 3,219,522 | $ 399,188,533 | ||
| Union Pacific Corp. | 5,016,804 | 1,233,882,944 | ||
| $1,633,071,477 | ||||
| Real Estate – 0.5% | ||||
| Public Storage, Inc., REIT | 832,182 | $ 295,441,254 | ||
| Specialty Chemicals – 1.1% | ||||
| DuPont de Nemours, Inc. | 9,293,908 | $ 719,069,662 | ||
| Specialty Stores – 1.6% | ||||
| Lowe's Cos., Inc. | 4,701,453 | $ 1,039,303,200 | ||
| Issuer | Shares/Par | Value ($) | ||
| Common Stocks – continued | ||||
| Utilities - Electric Power – 6.5% | ||||
| American Electric Power Co., Inc. | 5,174,394 | $ 469,058,816 | ||
| Dominion Energy, Inc. | 12,487,840 | 993,157,915 | ||
| Duke Energy Corp. | 13,032,960 | 1,308,639,514 | ||
| Southern Co. | 16,130,136 | 1,044,748,909 | ||
| Xcel Energy, Inc. | 4,537,437 | 305,505,633 | ||
| $4,121,110,787 | ||||
| Total Common Stocks (Identified Cost, $33,502,662,476) | $62,847,469,612 | |||
| Investment Companies (h) – 1.4% | ||||
| Money Market Funds – 1.4% | ||||
| MFS Institutional Money Market Portfolio, 0.06% (v) (Identified Cost, $901,901,903) | 901,901,903 | $ 901,901,902 | ||
| Other Assets, Less Liabilities – 0.2% | 144,753,337 | |||
| Net Assets – 100.0% | $63,894,124,851 | |||
| (a) | Non-income producing security. | |||
| (h) | An affiliated issuer, which may be considered one in which the fund owns 5% or more of the outstanding voting securities, or a company which is under common control. At period end, the aggregate values of the fund's investments in affiliated issuers and in unaffiliated issuers were $901,901,902 and $62,847,469,612, respectively. | |||
| (v) | Affiliated issuer that is available only to investment companies managed by MFS. The rate quoted for the MFS Institutional Money Market Portfolio is the annualized seven-day yield of the fund at period end. |
| The following abbreviations are used in this report and are defined: | |
| REIT | Real Estate Investment Trust |
| Assets | |
| Investments in unaffiliated issuers, at value (identified cost, $33,502,662,476) | $62,847,469,612 |
| Investments in affiliated issuers, at value (identified cost, $901,901,903) | 901,901,902 |
| Receivables for | |
| Investments sold | 60,159,038 |
| Fund shares sold | 90,286,596 |
| Dividends | 146,117,593 |
| Other assets | 185,822 |
| Total assets | $64,046,120,563 |
| Liabilities | |
| Payables for | |
| Investments purchased | $66,720,003 |
| Fund shares reacquired | 71,262,657 |
| Payable to affiliates | |
| Investment adviser | 2,861,831 |
| Administrative services fee | 6,392 |
| Shareholder servicing costs | 9,450,483 |
| Distribution and service fees | 384,804 |
| Program manager fees | 237 |
| Payable for independent Trustees' compensation | 19,153 |
| Accrued expenses and other liabilities | 1,290,152 |
| Total liabilities | $151,995,712 |
| Net assets | $63,894,124,851 |
| Net assets consist of | |
| Paid-in capital | $33,372,202,545 |
| Total distributable earnings (loss) | 30,521,922,306 |
| Net assets | $63,894,124,851 |
| Shares of beneficial interest outstanding | 1,248,880,841 |
| Net assets | Shares outstanding | Net asset value per share (a) | |
| Class A | $8,106,991,022 | 158,837,976 | $51.04 |
| Class B | 43,699,563 | 859,864 | 50.82 |
| Class C | 636,373,233 | 12,629,065 | 50.39 |
| Class I | 27,165,119,750 | 528,814,934 | 51.37 |
| Class R1 | 18,053,567 | 361,583 | 49.93 |
| Class R2 | 357,166,502 | 7,078,446 | 50.46 |
| Class R3 | 2,680,018,535 | 52,742,641 | 50.81 |
| Class R4 | 2,361,520,554 | 46,262,882 | 51.05 |
| Class R6 | 22,481,313,322 | 440,424,254 | 51.04 |
| Class 529A | 39,765,126 | 786,611 | 50.55 |
| Class 529B | 417,299 | 8,346 | 50.00 |
| Class 529C | 3,686,378 | 74,239 | 49.66 |
| (a) | Maximum offering price per share was equal to the net asset value per share for all share classes, except for Classes A and 529A, for which the maximum offering prices per share were $54.15 [100 / 94.25 x $51.04] and $53.63 [100 / 94.25 x $50.55], respectively. On sales of $50,000 or more, the maximum offering prices of Class A and Class 529A shares are reduced. A contingent deferred sales charge may be imposed on redemptions of Class A, Class B, Class C, Class 529B, and Class 529C shares. Redemption price per share was equal to the net asset value per share for Classes I, R1, R2, R3, R4, R6, and 529A. |
| Net investment income (loss) | |
| Income | |
| Dividends | $646,418,737 |
| Other | 243,144 |
| Dividends from affiliated issuers | 197,529 |
| Income on securities loaned | 2,052 |
| Foreign taxes withheld | (921,043) |
| Total investment income | $645,940,419 |
| Expenses | |
| Management fee | $138,238,983 |
| Distribution and service fees | 18,429,781 |
| Shareholder servicing costs | 24,640,541 |
| Program manager fees | 11,087 |
| Administrative services fee | 283,563 |
| Independent Trustees' compensation | 48,079 |
| Custodian fee | 262,815 |
| Shareholder communications | 871,871 |
| Audit and tax fees | 150,768 |
| Legal fees | 159,360 |
| Miscellaneous | 734,008 |
| Total expenses | $183,830,856 |
| Reduction of expenses by investment adviser and distributor | (4,482,656) |
| Net expenses | $179,348,200 |
| Net investment income (loss) | $466,592,219 |
| Realized and unrealized gain (loss) | |
| Realized gain (loss) (identified cost basis) | |
| Unaffiliated issuers | $1,397,054,452 |
| Foreign currency | 406,526 |
| Net realized gain (loss) | $1,397,460,978 |
| Change in unrealized appreciation or depreciation | |
| Unaffiliated issuers | $(3,310,242,655) |
| Affiliated issuers | (1) |
| Translation of assets and liabilities in foreign currencies | (455,345) |
| Net unrealized gain (loss) | $(3,310,698,001) |
| Net realized and unrealized gain (loss) | $(1,913,237,023) |
| Change in net assets from operations | $(1,446,644,804) |
| Six months ended | Year ended | |
| 2/28/22 (unaudited) | 8/31/21 | |
| Change in net assets | ||
| From operations | ||
| Net investment income (loss) | $466,592,219 | $841,409,798 |
| Net realized gain (loss) | 1,397,460,978 | 1,154,718,165 |
| Net unrealized gain (loss) | (3,310,698,001) | 14,298,325,745 |
| Change in net assets from operations | $(1,446,644,804) | $16,294,453,708 |
| Total distributions to shareholders | $(1,754,968,215) | $(1,398,636,931) |
| Change in net assets from fund share transactions | $1,603,300,100 | $1,471,547,469 |
| Total change in net assets | $(1,598,312,919) | $16,367,364,246 |
| Net assets | ||
| At beginning of period | 65,492,437,770 | 49,125,073,524 |
| At end of period | $63,894,124,851 | $65,492,437,770 |
| Class A | Six months ended | Year ended | ||||
| 2/28/22 (unaudited) | 8/31/21 | 8/31/20 | 8/31/19 | 8/31/18 | 8/31/17 | |
| Net asset value, beginning of period | $53.60 | $41.31 | $41.31 | $40.82 | $39.00 | $35.93 |
| Income (loss) from investment operations | ||||||
| Net investment income (loss) (d) | $0.32 | $0.59 | $0.63 | $0.79 | $0.59 | $0.66(c) |
| Net realized and unrealized gain (loss) | (1.51) | 12.77 | 0.57 | 1.03 | 3.04 | 3.65 |
| Total from investment operations | $(1.19) | $13.36 | $1.20 | $1.82 | $3.63 | $4.31 |
| Less distributions declared to shareholders | ||||||
| From net investment income | $(0.31) | $(0.60) | $(0.65) | $(0.79) | $(0.60) | $(0.62) |
| From net realized gain | (1.06) | (0.47) | (0.55) | (0.54) | (1.21) | (0.62) |
| Total distributions declared to shareholders | $(1.37) | $(1.07) | $(1.20) | $(1.33) | $(1.81) | $(1.24) |
| Net asset value, end of period (x) | $51.04 | $53.60 | $41.31 | $41.31 | $40.82 | $39.00 |
| Total return (%) (r)(s)(t)(x) | (2.32)(n) | 32.85 | 2.93 | 4.85 | 9.42 | 12.24(c) |
| Ratios (%) (to average net assets) and Supplemental data: | ||||||
| Expenses before expense reductions | 0.80(a) | 0.80 | 0.83 | 0.83 | 0.82 | 0.86(c) |
| Expenses after expense reductions | 0.78(a) | 0.79 | 0.82 | 0.82 | 0.81 | 0.84(c) |
| Net investment income (loss) | 1.20(a) | 1.25 | 1.56 | 2.00 | 1.46 | 1.77(c) |
| Portfolio turnover | 4(n) | 8 | 16 | 11 | 11 | 14 |
| Net assets at end of period (000 omitted) | $8,106,991 | $8,523,158 | $6,460,837 | $6,520,132 | $6,736,296 | $6,344,965 |
| Class B | Six months ended | Year ended | ||||
| 2/28/22 (unaudited) | 8/31/21 | 8/31/20 | 8/31/19 | 8/31/18 | 8/31/17 | |
| Net asset value, beginning of period | $53.38 | $41.12 | $41.09 | $40.59 | $38.76 | $35.72 |
| Income (loss) from investment operations | ||||||
| Net investment income (loss) (d) | $0.12 | $0.23 | $0.32 | $0.49 | $0.28 | $0.37(c) |
| Net realized and unrealized gain (loss) | (1.51) | 12.74 | 0.58 | 1.03 | 3.04 | 3.64 |
| Total from investment operations | $(1.39) | $12.97 | $0.90 | $1.52 | $3.32 | $4.01 |
| Less distributions declared to shareholders | ||||||
| From net investment income | $(0.11) | $(0.24) | $(0.32) | $(0.48) | $(0.28) | $(0.35) |
| From net realized gain | (1.06) | (0.47) | (0.55) | (0.54) | (1.21) | (0.62) |
| Total distributions declared to shareholders | $(1.17) | $(0.71) | $(0.87) | $(1.02) | $(1.49) | $(0.97) |
| Net asset value, end of period (x) | $50.82 | $53.38 | $41.12 | $41.09 | $40.59 | $38.76 |
| Total return (%) (r)(s)(t)(x) | (2.70)(n) | 31.87 | 2.15 | 4.08 | 8.62 | 11.40(c) |
| Ratios (%) (to average net assets) and Supplemental data: | ||||||
| Expenses before expense reductions | 1.55(a) | 1.55 | 1.58 | 1.58 | 1.57 | 1.61(c) |
| Expenses after expense reductions | 1.53(a) | 1.54 | 1.56 | 1.57 | 1.56 | 1.59(c) |
| Net investment income (loss) | 0.44(a) | 0.50 | 0.79 | 1.24 | 0.71 | 0.99(c) |
| Portfolio turnover | 4(n) | 8 | 16 | 11 | 11 | 14 |
| Net assets at end of period (000 omitted) | $43,700 | $52,833 | $55,897 | $84,737 | $111,494 | $137,361 |
| Class C | Six months ended | Year ended | ||||
| 2/28/22 (unaudited) | 8/31/21 | 8/31/20 | 8/31/19 | 8/31/18 | 8/31/17 | |
| Net asset value, beginning of period | $52.94 | $40.80 | $40.80 | $40.31 | $38.52 | $35.50 |
| Income (loss) from investment operations | ||||||
| Net investment income (loss) (d) | $0.12 | $0.23 | $0.32 | $0.49 | $0.28 | $0.37(c) |
| Net realized and unrealized gain (loss) | (1.49) | 12.63 | 0.56 | 1.03 | 3.01 | 3.62 |
| Total from investment operations | $(1.37) | $12.86 | $0.88 | $1.52 | $3.29 | $3.99 |
| Less distributions declared to shareholders | ||||||
| From net investment income | $(0.12) | $(0.25) | $(0.33) | $(0.49) | $(0.29) | $(0.35) |
| From net realized gain | (1.06) | (0.47) | (0.55) | (0.54) | (1.21) | (0.62) |
| Total distributions declared to shareholders | $(1.18) | $(0.72) | $(0.88) | $(1.03) | $(1.50) | $(0.97) |
| Net asset value, end of period (x) | $50.39 | $52.94 | $40.80 | $40.80 | $40.31 | $38.52 |
| Total return (%) (r)(s)(t)(x) | (2.69)(n) | 31.86 | 2.14 | 4.10 | 8.58 | 11.43(c) |
| Ratios (%) (to average net assets) and Supplemental data: | ||||||
| Expenses before expense reductions | 1.55(a) | 1.55 | 1.58 | 1.58 | 1.57 | 1.61(c) |
| Expenses after expense reductions | 1.53(a) | 1.54 | 1.57 | 1.57 | 1.56 | 1.59(c) |
| Net investment income (loss) | 0.45(a) | 0.50 | 0.80 | 1.24 | 0.71 | 0.99(c) |
| Portfolio turnover | 4(n) | 8 | 16 | 11 | 11 | 14 |
| Net assets at end of period (000 omitted) | $636,373 | $686,442 | $650,697 | $881,020 | $1,050,477 | $1,389,685 |
| Class I | Six months ended | Year ended | ||||
| 2/28/22 (unaudited) | 8/31/21 | 8/31/20 | 8/31/19 | 8/31/18 | 8/31/17 | |
| Net asset value, beginning of period | $53.94 | $41.56 | $41.56 | $41.06 | $39.22 | $36.13 |
| Income (loss) from investment operations | ||||||
| Net investment income (loss) (d) | $0.38 | $0.71 | $0.74 | $0.90 | $0.70 | $0.74(c) |
| Net realized and unrealized gain (loss) | (1.51) | 12.85 | 0.56 | 1.02 | 3.05 | 3.70 |
| Total from investment operations | $(1.13) | $13.56 | $1.30 | $1.92 | $3.75 | $4.44 |
| Less distributions declared to shareholders | ||||||
| From net investment income | $(0.38) | $(0.71) | $(0.75) | $(0.88) | $(0.70) | $(0.73) |
| From net realized gain | (1.06) | (0.47) | (0.55) | (0.54) | (1.21) | (0.62) |
| Total distributions declared to shareholders | $(1.44) | $(1.18) | $(1.30) | $(1.42) | $(1.91) | $(1.35) |
| Net asset value, end of period (x) | $51.37 | $53.94 | $41.56 | $41.56 | $41.06 | $39.22 |
| Total return (%) (r)(s)(t)(x) | (2.21)(n) | 33.20 | 3.18 | 5.11 | 9.69 | 12.54(c) |
| Ratios (%) (to average net assets) and Supplemental data: | ||||||
| Expenses before expense reductions | 0.55(a) | 0.55 | 0.58 | 0.58 | 0.57 | 0.61(c) |
| Expenses after expense reductions | 0.53(a) | 0.54 | 0.57 | 0.57 | 0.57 | 0.59(c) |
| Net investment income (loss) | 1.45(a) | 1.50 | 1.81 | 2.25 | 1.72 | 1.98(c) |
| Portfolio turnover | 4(n) | 8 | 16 | 11 | 11 | 14 |
| Net assets at end of period (000 omitted) | $27,165,120 | $27,444,959 | $21,027,882 | $20,076,773 | $20,727,676 | $19,624,016 |
| Class R1 | Six months ended | Year ended | ||||
| 2/28/22 (unaudited) | 8/31/21 | 8/31/20 | 8/31/19 | 8/31/18 | 8/31/17 | |
| Net asset value, beginning of period | $52.47 | $40.45 | $40.47 | $40.01 | $38.25 | $35.27 |
| Income (loss) from investment operations | ||||||
| Net investment income (loss) (d) | $0.12 | $0.23 | $0.32 | $0.48 | $0.28 | $0.36(c) |
| Net realized and unrealized gain (loss) | (1.48) | 12.52 | 0.55 | 1.02 | 2.99 | 3.60 |
| Total from investment operations | $(1.36) | $12.75 | $0.87 | $1.50 | $3.27 | $3.96 |
| Less distributions declared to shareholders | ||||||
| From net investment income | $(0.12) | $(0.26) | $(0.34) | $(0.50) | $(0.30) | $(0.36) |
| From net realized gain | (1.06) | (0.47) | (0.55) | (0.54) | (1.21) | (0.62) |
| Total distributions declared to shareholders | $(1.18) | $(0.73) | $(0.89) | $(1.04) | $(1.51) | $(0.98) |
| Net asset value, end of period (x) | $49.93 | $52.47 | $40.45 | $40.47 | $40.01 | $38.25 |
| Total return (%) (r)(s)(t)(x) | (2.69)(n) | 31.88 | 2.13 | 4.08 | 8.61 | 11.40(c) |
| Ratios (%) (to average net assets) and Supplemental data: | ||||||
| Expenses before expense reductions | 1.55(a) | 1.55 | 1.58 | 1.58 | 1.57 | 1.61(c) |
| Expenses after expense reductions | 1.53(a) | 1.54 | 1.57 | 1.57 | 1.56 | 1.59(c) |
| Net investment income (loss) | 0.45(a) | 0.50 | 0.80 | 1.24 | 0.72 | 0.99(c) |
| Portfolio turnover | 4(n) | 8 | 16 | 11 | 11 | 14 |
| Net assets at end of period (000 omitted) | $18,054 | $20,580 | $18,914 | $21,820 | $24,791 | $26,663 |
| Class R2 | Six months ended | Year ended | ||||
| 2/28/22 (unaudited) | 8/31/21 | 8/31/20 | 8/31/19 | 8/31/18 | 8/31/17 | |
| Net asset value, beginning of period | $53.01 | $40.86 | $40.87 | $40.39 | $38.60 | $35.59 |
| Income (loss) from investment operations | ||||||
| Net investment income (loss) (d) | $0.25 | $0.46 | $0.52 | $0.68 | $0.48 | $0.55(c) |
| Net realized and unrealized gain (loss) | (1.49) | 12.64 | 0.56 | 1.03 | 3.02 | 3.62 |
| Total from investment operations | $(1.24) | $13.10 | $1.08 | $1.71 | $3.50 | $4.17 |
| Less distributions declared to shareholders | ||||||
| From net investment income | $(0.25) | $(0.48) | $(0.54) | $(0.69) | $(0.50) | $(0.54) |
| From net realized gain | (1.06) | (0.47) | (0.55) | (0.54) | (1.21) | (0.62) |
| Total distributions declared to shareholders | $(1.31) | $(0.95) | $(1.09) | $(1.23) | $(1.71) | $(1.16) |
| Net asset value, end of period (x) | $50.46 | $53.01 | $40.86 | $40.87 | $40.39 | $38.60 |
| Total return (%) (r)(s)(t)(x) | (2.45)(n) | 32.53 | 2.66 | 4.60 | 9.15 | 11.95(c) |
| Ratios (%) (to average net assets) and Supplemental data: | ||||||
| Expenses before expense reductions | 1.05(a) | 1.05 | 1.08 | 1.08 | 1.07 | 1.11(c) |
| Expenses after expense reductions | 1.03(a) | 1.04 | 1.07 | 1.07 | 1.07 | 1.09(c) |
| Net investment income (loss) | 0.95(a) | 1.00 | 1.30 | 1.73 | 1.21 | 1.49(c) |
| Portfolio turnover | 4(n) | 8 | 16 | 11 | 11 | 14 |
| Net assets at end of period (000 omitted) | $357,167 | $409,939 | $359,598 | $437,221 | $550,200 | $614,044 |
| Class R3 | Six months ended | Year ended | ||||
| 2/28/22 (unaudited) | 8/31/21 | 8/31/20 | 8/31/19 | 8/31/18 | 8/31/17 | |
| Net asset value, beginning of period | $53.37 | $41.14 | $41.15 | $40.66 | $38.85 | $35.81 |
| Income (loss) from investment operations | ||||||
| Net investment income (loss) (d) | $0.32 | $0.59 | $0.63 | $0.79 | $0.59 | $0.65(c) |
| Net realized and unrealized gain (loss) | (1.51) | 12.71 | 0.56 | 1.03 | 3.03 | 3.64 |
| Total from investment operations | $(1.19) | $13.30 | $1.19 | $1.82 | $3.62 | $4.29 |
| Less distributions declared to shareholders | ||||||
| From net investment income | $(0.31) | $(0.60) | $(0.65) | $(0.79) | $(0.60) | $(0.63) |
| From net realized gain | (1.06) | (0.47) | (0.55) | (0.54) | (1.21) | (0.62) |
| Total distributions declared to shareholders | $(1.37) | $(1.07) | $(1.20) | $(1.33) | $(1.81) | $(1.25) |
| Net asset value, end of period (x) | $50.81 | $53.37 | $41.14 | $41.15 | $40.66 | $38.85 |
| Total return (%) (r)(s)(t)(x) | (2.33)(n) | 32.85 | 2.92 | 4.87 | 9.43 | 12.23(c) |
| Ratios (%) (to average net assets) and Supplemental data: | ||||||
| Expenses before expense reductions | 0.80(a) | 0.80 | 0.83 | 0.83 | 0.82 | 0.86(c) |
| Expenses after expense reductions | 0.78(a) | 0.79 | 0.82 | 0.82 | 0.82 | 0.84(c) |
| Net investment income (loss) | 1.20(a) | 1.25 | 1.56 | 1.99 | 1.47 | 1.74(c) |
| Portfolio turnover | 4(n) | 8 | 16 | 11 | 11 | 14 |
| Net assets at end of period (000 omitted) | $2,680,019 | $2,774,355 | $2,036,093 | $2,096,743 | $2,259,562 | $2,030,023 |
| Class R4 | Six months ended | Year ended | ||||
| 2/28/22 (unaudited) | 8/31/21 | 8/31/20 | 8/31/19 | 8/31/18 | 8/31/17 | |
| Net asset value, beginning of period | $53.61 | $41.31 | $41.32 | $40.82 | $39.00 | $35.94 |
| Income (loss) from investment operations | ||||||
| Net investment income (loss) (d) | $0.38 | $0.70 | $0.73 | $0.89 | $0.69 | $0.74(c) |
| Net realized and unrealized gain (loss) | (1.50) | 12.78 | 0.56 | 1.03 | 3.04 | 3.67 |
| Total from investment operations | $(1.12) | $13.48 | $1.29 | $1.92 | $3.73 | $4.41 |
| Less distributions declared to shareholders | ||||||
| From net investment income | $(0.38) | $(0.71) | $(0.75) | $(0.88) | $(0.70) | $(0.73) |
| From net realized gain | (1.06) | (0.47) | (0.55) | (0.54) | (1.21) | (0.62) |
| Total distributions declared to shareholders | $(1.44) | $(1.18) | $(1.30) | $(1.42) | $(1.91) | $(1.35) |
| Net asset value, end of period (x) | $51.05 | $53.61 | $41.31 | $41.32 | $40.82 | $39.00 |
| Total return (%) (r)(s)(t)(x) | (2.21)(n) | 33.20 | 3.17 | 5.14 | 9.70 | 12.52(c) |
| Ratios (%) (to average net assets) and Supplemental data: | ||||||
| Expenses before expense reductions | 0.55(a) | 0.55 | 0.58 | 0.58 | 0.57 | 0.61(c) |
| Expenses after expense reductions | 0.53(a) | 0.54 | 0.57 | 0.57 | 0.57 | 0.59(c) |
| Net investment income (loss) | 1.45(a) | 1.50 | 1.80 | 2.24 | 1.72 | 1.99(c) |
| Portfolio turnover | 4(n) | 8 | 16 | 11 | 11 | 14 |
| Net assets at end of period (000 omitted) | $2,361,521 | $2,625,508 | $2,323,830 | $2,916,674 | $3,201,331 | $3,060,883 |
| Class R6 | Six months ended | Year ended | ||||
| 2/28/22 (unaudited) | 8/31/21 | 8/31/20 | 8/31/19 | 8/31/18 | 8/31/17 | |
| Net asset value, beginning of period | $53.60 | $41.31 | $41.32 | $40.83 | $39.01 | $35.94 |
| Income (loss) from investment operations | ||||||
| Net investment income (loss) (d) | $0.41 | $0.76 | $0.78 | $0.93 | $0.73 | $0.76(c) |
| Net realized and unrealized gain (loss) | (1.51) | 12.76 | 0.55 | 1.02 | 3.04 | 3.69 |
| Total from investment operations | $(1.10) | $13.52 | $1.33 | $1.95 | $3.77 | $4.45 |
| Less distributions declared to shareholders | ||||||
| From net investment income | $(0.40) | $(0.76) | $(0.79) | $(0.92) | $(0.74) | $(0.76) |
| From net realized gain | (1.06) | (0.47) | (0.55) | (0.54) | (1.21) | (0.62) |
| Total distributions declared to shareholders | $(1.46) | $(1.23) | $(1.34) | $(1.46) | $(1.95) | $(1.38) |
| Net asset value, end of period (x) | $51.04 | $53.60 | $41.31 | $41.32 | $40.83 | $39.01 |
| Total return (%) (r)(s)(t)(x) | (2.16)(n) | 33.33 | 3.29 | 5.22 | 9.81 | 12.66(c) |
| Ratios (%) (to average net assets) and Supplemental data: | ||||||
| Expenses before expense reductions | 0.44(a) | 0.45 | 0.47 | 0.48 | 0.47 | 0.51(c) |
| Expenses after expense reductions | 0.42(a) | 0.44 | 0.46 | 0.47 | 0.47 | 0.49(c) |
| Net investment income (loss) | 1.56(a) | 1.60 | 1.92 | 2.35 | 1.83 | 2.04(c) |
| Portfolio turnover | 4(n) | 8 | 16 | 11 | 11 | 14 |
| Net assets at end of period (000 omitted) | $22,481,313 | $22,910,207 | $16,158,507 | $14,716,194 | $13,941,823 | $10,957,734 |
| Class 529A | Six months ended | Year ended | ||||
| 2/28/22 (unaudited) | 8/31/21 | 8/31/20 | 8/31/19 | 8/31/18 | 8/31/17 | |
| Net asset value, beginning of period | $53.11 | $40.94 | $40.96 | $40.48 | $38.69 | $35.67 |
| Income (loss) from investment operations | ||||||
| Net investment income (loss) (d) | $0.31 | $0.57 | $0.62 | $0.78 | $0.58 | $0.63(c) |
| Net realized and unrealized gain (loss) | (1.50) | 12.66 | 0.55 | 1.02 | 3.02 | 3.64 |
| Total from investment operations | $(1.19) | $13.23 | $1.17 | $1.80 | $3.60 | $4.27 |
| Less distributions declared to shareholders | ||||||
| From net investment income | $(0.31) | $(0.59) | $(0.64) | $(0.78) | $(0.60) | $(0.63) |
| From net realized gain | (1.06) | (0.47) | (0.55) | (0.54) | (1.21) | (0.62) |
| Total distributions declared to shareholders | $(1.37) | $(1.06) | $(1.19) | $(1.32) | $(1.81) | $(1.25) |
| Net asset value, end of period (x) | $50.55 | $53.11 | $40.94 | $40.96 | $40.48 | $38.69 |
| Total return (%) (r)(s)(t)(x) | (2.35)(n) | 32.83 | 2.89 | 4.85 | 9.40 | 12.21(c) |
| Ratios (%) (to average net assets) and Supplemental data: | ||||||
| Expenses before expense reductions | 0.85(a) | 0.85 | 0.88 | 0.88 | 0.89 | 0.96(c) |
| Expenses after expense reductions | 0.81(a) | 0.81 | 0.84 | 0.84 | 0.83 | 0.85(c) |
| Net investment income (loss) | 1.18(a) | 1.22 | 1.54 | 1.98 | 1.45 | 1.71(c) |
| Portfolio turnover | 4(n) | 8 | 16 | 11 | 11 | 14 |
| Net assets at end of period (000 omitted) | $39,765 | $39,754 | $28,038 | $27,149 | $25,416 | $22,490 |
| Class 529B | Six months ended | Year ended | ||||
| 2/28/22 (unaudited) | 8/31/21 | 8/31/20 | 8/31/19 | 8/31/18 | 8/31/17 | |
| Net asset value, beginning of period | $52.54 | $40.50 | $40.46 | $40.05 | $38.23 | $35.27 |
| Income (loss) from investment operations | ||||||
| Net investment income (loss) (d) | $0.30 | $0.55 | $0.57 | $0.63 | $0.43 | $0.47(c) |
| Net realized and unrealized gain (loss) | (1.48) | 12.53 | 0.55 | 1.00 | 3.00 | 3.61 |
| Total from investment operations | $(1.18) | $13.08 | $1.12 | $1.63 | $3.43 | $4.08 |
| Less distributions declared to shareholders | ||||||
| From net investment income | $(0.30) | $(0.57) | $(0.53) | $(0.68) | $(0.40) | $(0.50) |
| From net realized gain | (1.06) | (0.47) | (0.55) | (0.54) | (1.21) | (0.62) |
| Total distributions declared to shareholders | $(1.36) | $(1.04) | $(1.08) | $(1.22) | $(1.61) | $(1.12) |
| Net asset value, end of period (x) | $50.00 | $52.54 | $40.50 | $40.46 | $40.05 | $38.23 |
| Total return (%) (r)(s)(t)(x) | (2.35)(n) | 32.82 | 2.79 | 4.46 | 9.05 | 11.78(c) |
| Ratios (%) (to average net assets) and Supplemental data: | ||||||
| Expenses before expense reductions | 0.85(a) | 0.85 | 0.95 | 1.22 | 1.22 | 1.34(c) |
| Expenses after expense reductions | 0.83(a) | 0.84 | 0.94 | 1.20 | 1.19 | 1.26(c) |
| Net investment income (loss) | 1.15(a) | 1.20 | 1.42 | 1.61 | 1.10 | 1.28(c) |
| Portfolio turnover | 4(n) | 8 | 16 | 11 | 11 | 14 |
| Net assets at end of period (000 omitted) | $417 | $479 | $474 | $680 | $835 | $908 |
| Class 529C | Six months ended | Year ended | ||||
| 2/28/22 (unaudited) | 8/31/21 | 8/31/20 | 8/31/19 | 8/31/18 | 8/31/17 | |
| Net asset value, beginning of period | $52.19 | $40.24 | $40.26 | $39.81 | $38.07 | $35.11 |
| Income (loss) from investment operations | ||||||
| Net investment income (loss) (d) | $0.10 | $0.21 | $0.30 | $0.46 | $0.26 | $0.34(c) |
| Net realized and unrealized gain (loss) | (1.46) | 12.45 | 0.56 | 1.01 | 2.97 | 3.59 |
| Total from investment operations | $(1.36) | $12.66 | $0.86 | $1.47 | $3.23 | $3.93 |
| Less distributions declared to shareholders | ||||||
| From net investment income | $(0.11) | $(0.24) | $(0.33) | $(0.48) | $(0.28) | $(0.35) |
| From net realized gain | (1.06) | (0.47) | (0.55) | (0.54) | (1.21) | (0.62) |
| Total distributions declared to shareholders | $(1.17) | $(0.71) | $(0.88) | $(1.02) | $(1.49) | $(0.97) |
| Net asset value, end of period (x) | $49.66 | $52.19 | $40.24 | $40.26 | $39.81 | $38.07 |
| Total return (%) (r)(s)(t)(x) | (2.71)(n) | 31.82 | 2.10 | 4.04 | 8.54 | 11.38(c) |
| Ratios (%) (to average net assets) and Supplemental data: | ||||||
| Expenses before expense reductions | 1.60(a) | 1.60 | 1.63 | 1.63 | 1.64 | 1.71(c) |
| Expenses after expense reductions | 1.58(a) | 1.59 | 1.62 | 1.61 | 1.61 | 1.63(c) |
| Net investment income (loss) | 0.40(a) | 0.45 | 0.76 | 1.19 | 0.67 | 0.93(c) |
| Portfolio turnover | 4(n) | 8 | 16 | 11 | 11 | 14 |
| Net assets at end of period (000 omitted) | $3,686 | $4,224 | $4,308 | $4,947 | $5,320 | $5,924 |
| (a) | Annualized. |
| (c) | Amount reflects a one-time reimbursement of expenses by the custodian (or former custodian) without which net investment income and performance would be lower and expenses would be higher. |
| (d) | Per share data is based on average shares outstanding. |
| (n) | Not annualized. |
| (r) | Certain expenses have been reduced without which performance would have been lower. |
| (s) | From time to time the fund may receive proceeds from litigation settlements, without which performance would be lower. |
| (t) | Total returns do not include any applicable sales charges. |
| (x) | The net asset values and total returns have been calculated on net assets which include adjustments made in accordance with U.S. generally accepted accounting principles required at period end for financial reporting purposes. |
| Financial Instruments | Level 1 | Level 2 | Level 3 | Total |
| Equity Securities | $62,847,469,612 | $— | $— | $62,847,469,612 |
| Mutual Funds | 901,901,902 | — | — | 901,901,902 |
| Total | $63,749,371,514 | $— | $— | $63,749,371,514 |
| Year ended 8/31/21 | |
| Ordinary income (including any short-term capital gains) | $845,025,639 |
| Long-term capital gains | 553,611,292 |
| Total distributions | $1,398,636,931 |
| As of 2/28/22 | |
| Cost of investments | $34,527,779,031 |
| Gross appreciation | 29,412,609,119 |
| Gross depreciation | (191,016,636) |
| Net unrealized appreciation (depreciation) | $29,221,592,483 |
| As of 8/31/21 | |
| Undistributed ordinary income | 160,427,763 |
| Undistributed long-term capital gain | 995,763,961 |
| Other temporary differences | 1,577,228 |
| Net unrealized appreciation (depreciation) | 32,565,766,373 |
| Six months ended 2/28/22 | Year ended 8/31/21 | ||
| Class A | $212,740,712 | $166,686,442 | |
| Class B | 1,076,179 | 854,581 | |
| Class C | 14,764,763 | 10,645,760 | |
| Class I | 743,766,315 | 599,084,638 | |
| Class R1 | 432,729 | 324,628 | |
| Class R2 | 9,653,759 | 7,992,962 | |
| Class R3 | 71,988,962 | 52,802,673 | |
| Class R4 | 67,954,534 | 63,308,969 | |
| Class R6 | 631,447,542 | 496,112,338 | |
| Class 529A | 1,039,124 | 740,732 | |
| Class 529B | 12,068 | 11,656 | |
| Class 529C | 91,528 | 71,552 | |
| Total | $1,754,968,215 | $1,398,636,931 |
| Up to $7.5 billion | 0.60% |
| In excess of $7.5 billion and up to $10 billion | 0.53% |
| In excess of $10 billion and up to $20 billion | 0.50% |
| In excess of $20 billion and up to $25 billion | 0.45% |
| In excess of $25 billion and up to $30 billion | 0.42% |
| In excess of $30 billion and up to $35 billion | 0.40% |
| In excess of $35 billion and up to $40 billion | 0.38% |
| In excess of $40 billion and up to $45 billion | 0.36% |
| In excess of $45 billion and up to $50 billion | 0.35% |
| In excess of $50 billion and up to $60 billion | 0.34% |
| In excess of $60 billion | 0.33% |
| Distribution Fee Rate (d) | Service Fee Rate (d) | Total Distribution Plan (d) | Annual Effective Rate (e) | Distribution and Service Fee | |
| Class A | — | 0.25% | 0.25% | 0.25% | $ 10,300,881 |
| Class B | 0.75% | 0.25% | 1.00% | 1.00% | 243,107 |
| Class C | 0.75% | 0.25% | 1.00% | 1.00% | 3,300,369 |
| Class R1 | 0.75% | 0.25% | 1.00% | 1.00% | 95,043 |
| Class R2 | 0.25% | 0.25% | 0.50% | 0.50% | 967,038 |
| Class R3 | — | 0.25% | 0.25% | 0.25% | 3,452,874 |
| Class 529A | — | 0.25% | 0.25% | 0.22% | 49,851 |
| Class 529B | 0.75% | 0.25% | 1.00% | 0.25% | 573 |
| Class 529C | 0.75% | 0.25% | 1.00% | 1.00% | 20,045 |
| Total Distribution and Service Fees | $18,429,781 |
| (d) | In accordance with the distribution plan for certain classes, the fund pays distribution and/or service fees equal to these annual percentage rates of each class’s average daily net assets. The distribution and service fee rates disclosed by class represent the current rates in effect at the end of the reporting period. Any rate changes, if applicable, are detailed below. |
| (e) | The annual effective rates represent actual fees incurred under the distribution plan for the six months ended February 28, 2022 based on each class's average daily net assets. MFD has voluntarily agreed to rebate a portion of each class’s 0.25% service fee attributable to accounts for which there is no financial intermediary specified on the account except for accounts attributable to MFS or its affiliates’ seed money. For the six months ended February 28, 2022, this rebate amounted to $1,994, $21, $50, $447, $21, $5,614, $2, and $46 for Class A, Class B, Class C, Class R2, Class R3, Class 529A, Class 529B, and Class 529C, respectively, and is included in the reduction of total expenses in the Statement of Operations. For the six months ended February 28, 2022, the 0.75% distribution fee was not imposed for Class 529B shares due to the sales charge limitations contained in Financial Industry Regulatory Authority (“FINRA”) Rule 2341. |
| Amount | |
| Class A | $39,390 |
| Class B | 9,106 |
| Class C | 22,091 |
| Class 529B | — |
| Class 529C | 271 |
| Fee | |
| Class 529A | $9,970 |
| Class 529B | 115 |
| Class 529C | 1,002 |
| Total Program Manager Fees | $11,087 |
| Six months ended 2/28/22 | Year ended 8/31/21 | ||||
| Shares | Amount | Shares | Amount | ||
| Shares sold | |||||
| Class A | 12,515,832 | $662,231,196 | 28,467,122 | $1,335,871,741 | |
| Class B | 7,253 | 378,585 | 18,355 | 874,259 | |
| Class C | 1,255,456 | 65,896,027 | 2,203,360 | 103,181,176 | |
| Class I | 58,092,387 | 3,097,514,346 | 119,673,145 | 5,633,928,091 | |
| Class R1 | 33,598 | 1,743,114 | 79,348 | 3,645,867 | |
| Class R2 | 551,628 | 28,703,219 | 1,472,853 | 68,231,472 | |
| Class R3 | 4,610,053 | 242,923,709 | 13,882,669 | 660,290,908 | |
| Class R4 | 4,817,609 | 256,655,312 | 13,206,607 | 626,397,953 | |
| Class R6 | 37,109,580 | 1,970,553,849 | 101,272,140 | 4,774,788,639 | |
| Class 529A | 57,453 | 3,005,819 | 128,819 | 6,014,946 | |
| Class 529B | — | — | 212 | 8,522 | |
| Class 529C | 3,711 | 189,761 | 14,032 | 653,864 | |
| 119,054,560 | $6,329,794,937 | 280,418,662 | $13,213,887,438 | ||
| Shares issued to shareholders in reinvestment of distributions | |||||
| Class A | 3,242,131 | $173,895,341 | 2,948,136 | $132,331,922 | |
| Class B | 18,840 | 1,009,110 | 17,937 | 793,854 | |
| Class C | 229,595 | 12,193,864 | 201,951 | 8,884,397 | |
| Class I | 11,447,498 | 617,420,061 | 10,781,776 | 487,679,647 | |
| Class R1 | 8,222 | 432,636 | 7,450 | 324,625 | |
| Class R2 | 181,182 | 9,615,810 | 179,495 | 7,938,727 | |
| Class R3 | 1,348,164 | 71,987,037 | 1,180,319 | 52,802,507 | |
| Class R4 | 1,240,351 | 66,469,210 | 1,378,461 | 61,719,795 | |
| Class R6 | 10,671,685 | 571,801,797 | 10,032,624 | 451,225,773 | |
| Class 529A | 19,150 | 1,017,433 | 16,317 | 726,941 | |
| Class 529B | 230 | 12,068 | 266 | 11,654 | |
| Class 529C | 1,666 | 87,208 | 1,614 | 69,859 | |
| 28,408,714 | $1,525,941,575 | 26,746,346 | $1,204,509,701 | ||
| Six months ended 2/28/22 | Year ended 8/31/21 | ||||
| Shares | Amount | Shares | Amount | ||
| Shares reacquired | |||||
| Class A | (15,920,656) | $(844,392,972) | (28,818,719) | $(1,350,239,633) | |
| Class B | (156,001) | (8,181,766) | (405,941) | (18,801,714) | |
| Class C | (1,821,578) | (95,132,122) | (5,388,848) | (245,619,155) | |
| Class I | (49,520,155) | (2,640,838,812) | (127,622,763) | (6,059,259,926) | |
| Class R1 | (72,431) | (3,703,840) | (162,150) | (7,593,710) | |
| Class R2 | (1,387,353) | (72,809,767) | (2,720,085) | (127,175,585) | |
| Class R3 | (5,194,518) | (274,438,110) | (12,579,306) | (586,782,535) | |
| Class R4 | (8,769,843) | (465,573,338) | (21,863,125) | (1,031,400,326) | |
| Class R6 | (34,755,800) | (1,844,673,630) | (75,057,631) | (3,514,148,142) | |
| Class 529A | (38,512) | (2,022,027) | (81,454) | (3,800,524) | |
| Class 529B | (1,001) | (51,261) | (3,055) | (143,013) | |
| Class 529C | (12,080) | (618,767) | (41,768) | (1,885,407) | |
| (117,649,928) | $(6,252,436,412) | (274,744,845) | $(12,946,849,670) | ||
| Net change | |||||
| Class A | (162,693) | $(8,266,435) | 2,596,539 | $117,964,030 | |
| Class B | (129,908) | (6,794,071) | (369,649) | (17,133,601) | |
| Class C | (336,527) | (17,042,231) | (2,983,537) | (133,553,582) | |
| Class I | 20,019,730 | 1,074,095,595 | 2,832,158 | 62,347,812 | |
| Class R1 | (30,611) | (1,528,090) | (75,352) | (3,623,218) | |
| Class R2 | (654,543) | (34,490,738) | (1,067,737) | (51,005,386) | |
| Class R3 | 763,699 | 40,472,636 | 2,483,682 | 126,310,880 | |
| Class R4 | (2,711,883) | (142,448,816) | (7,278,057) | (343,282,578) | |
| Class R6 | 13,025,465 | 697,682,016 | 36,247,133 | 1,711,866,270 | |
| Class 529A | 38,091 | 2,001,225 | 63,682 | 2,941,363 | |
| Class 529B | (771) | (39,193) | (2,577) | (122,837) | |
| Class 529C | (6,703) | (341,798) | (26,122) | (1,161,684) | |
| 29,813,346 | $1,603,300,100 | 32,420,163 | $1,471,547,469 | ||
| Affiliated Issuers | Beginning Value | Purchases | Sales Proceeds | Realized Gain (Loss) | Change in Unrealized Appreciation or Depreciation | Ending Value |
| MFS Institutional Money Market Portfolio | $658,689,844 | $1,696,981,785 | $1,453,769,726 | $— | $(1) | $901,901,902 |
| Affiliated Issuers | Dividend Income | Capital Gain Distributions |
| MFS Institutional Money Market Portfolio | $197,529 | $— |

1(b):
Not applicable.
| ITEM 2. | CODE OF ETHICS. |
During the period covered by this report, the Registrant has not amended any provision in its Code of Ethics (the “Code”) that relates to an element of the Code’s definitions enumerated in paragraph (b) of Item 2 of this Form N-CSR. During the period covered by this report, the Registrant did not grant a waiver, including an implicit waiver, from any provision of the Code.
| ITEM 3. | AUDIT COMMITTEE FINANCIAL EXPERT. |
Not applicable for semi-annual reports.
| ITEM 4. | PRINCIPAL ACCOUNTANT FEES AND SERVICES. |
Not applicable for semi-annual reports.
| ITEM 5. | AUDIT COMMITTEE OF LISTED REGISTRANTS. |
Not applicable to the Registrant.
| ITEM 6. | INVESTMENTS |
A schedule of investments for each series of the Registrant is included as part of the report to shareholders of such series under Item 1(a) of this Form N-CSR.
| ITEM 7. | DISCLOSURE OF PROXY VOTING POLICIES AND PROCEDURES FOR CLOSED-END MANAGEMENT INVESTMENT COMPANIES. |
Not applicable to the Registrant.
| ITEM 8. | PORTFOLIO MANAGERS OF CLOSED-END MANAGEMENT INVESTMENT COMPANIES. |
Not applicable to the Registrant.
| ITEM 9. | PURCHASES OF EQUITY SECURITIES BY CLOSED-END MANAGEMENT INVESTMENT COMPANY AND AFFILIATED PURCHASERS. |
Not applicable to the Registrant.
| ITEM 10. | SUBMISSION OF MATTERS TO A VOTE OF SECURITY HOLDERS. |
There were no material changes to the procedures by which shareholders may send recommendations to the Board for nominees to the Registrant’s Board since the Registrant last provided disclosure as to such procedures in response to the requirements of Item 407 (c)(2)(iv) of Regulation S-K or this Item.
| ITEM 11. | CONTROLS AND PROCEDURES. |
| (a) | Based upon their evaluation of the effectiveness of the registrant’s disclosure controls and procedures (as defined in Rule 30a-3(c) under the Investment Company Act of 1940 (the “Act”)) as conducted within 90 days of the filing date of this report on Form N-CSR, the registrant’s principal financial officer and principal executive officer have concluded that those disclosure controls and procedures provide reasonable assurance that the material information required to be disclosed by the registrant on this report is recorded, processed, summarized and reported within the time periods specified in the Securities and Exchange Commission’s rules and forms. |
| (b) | There were no changes in the registrant’s internal controls over financial reporting (as defined in Rule 30a-3(d) under the Act) that occurred during the period covered by the report that have materially affected, or are reasonably likely to materially affect, the registrant’s internal control over financial reporting. |
| ITEM 12. | DISCLOSURE OF SECURITIES LENDING ACTIVITIES FOR CLOSED-END MANAGEMENT INVESTMENT COMPANIES. |
Not applicable to the Registrant.
| ITEM 13. | EXHIBITS. |
| (a) | File the exhibits listed below as part of this form. Letter or number the exhibits in the sequence indicated. |
| (1) | Any code of ethics, or amendment thereto, that is the subject of the disclosure required by Item 2, to the extent that the registrant intends to satisfy the Item 2 requirements through filing of an exhibit. Not applicable. |
| (2) | A separate certification for each principal executive officer and principal financial officer of the registrant as required by Rule 30a-2(a) under the Act (17 CFR 270.30a-2): Attached hereto as EX-99.302CERT. |
| (3) | Any written solicitation to purchase securities under Rule 23c-1 under the Act (17 CFR 270.23c-1) sent or given during the period covered by the report by or on behalf of the registrant to 10 or more persons. Not applicable. |
| (4) | Change in the registrant’s independent public accountant. Not applicable. |
| (b) | If the report is filed under Section 13(a) or 15(d) of the Exchange Act, provide the certifications required by Rule 30a-2(b) under the Act (17 CFR 270.30a-2(b)), Rule 13a-14(b) or Rule 15d-14(b) under the Exchange Act (17 CFR 240.13a-14(b) or 240.15d-14(b)) and Section 1350 of Chapter 63 of Title 18 of the United States Code (18 U.S.C. 1350) as an exhibit. A certification furnished pursuant to this paragraph will not be deemed “filed” for the purposes of Section 18 of the Exchange Act (15 U.S.C. 78r), or otherwise subject to the liability of that section. Such certification will not be deemed to be incorporated by reference into any filing under the Securities Act of 1933 or the Exchange Act, except to the extent that the registrant specifically incorporates it by reference: Attached hereto as EX-99.906CERT. |
Notice
A copy of the Amended and Restated Declaration of Trust, as amended, of the Registrant is on file with the Secretary of State of The Commonwealth of Massachusetts and notice is hereby given that this instrument is executed on behalf of the Registrant by an officer of the Registrant as an officer and not individually and the obligations of or arising out of this instrument are not binding upon any of the Trustees or shareholders individually, but are binding only upon the assets and property of the respective constituent series of the Registrant.
SIGNATURES
Pursuant to the requirements of the Securities Exchange Act of 1934 and the Investment Company Act of 1940, the registrant has duly caused this report to be signed on its behalf by the undersigned, thereunto duly authorized.
(Registrant) MFS SERIES TRUST I
| By (Signature and Title)* | /S/ DAVID L. DILORENZO | |
| David L. DiLorenzo, President |
Date: April 14, 2022
Pursuant to the requirements of the Securities Exchange Act of 1934 and the Investment Company Act of 1940, this report has been signed below by the following persons on behalf of the registrant and in the capacities and on the dates indicated.
| By (Signature and Title)* | /S/ DAVID L. DILORENZO | |
| David L. DiLorenzo, President (Principal Executive Officer) |
Date: April 14, 2022
| By (Signature and Title)* | /S/ JAMES O. YOST | |
| James O. Yost, Treasurer (Principal Financial Officer and Accounting Officer) |
Date: April 14, 2022
| * | Print name and title of each signing officer under his or her signature. |