UNITED STATES
SECURITIES AND EXCHANGE COMMISSION
Washington, D.C. 20549
FORM N-CSR
CERTIFIED SHAREHOLDER REPORT
OF
REGISTERED MANAGEMENT INVESTMENT COMPANIES
| Investment Company Act file number: | 811-04526 | |
Name of Registrant: | Vanguard Quantitative Funds | |
Address of Registrant: | P.O. Box 2600 | |
| Valley Forge, PA 19482 | ||
Name and address of agent for service: | Anne E. Robinson, Esquire | |
| P.O. Box 876 | ||
| Valley Forge, PA 19482 | ||
Registrant’s telephone number, including area code: (610) 669-1000 | ||
Date of fiscal year end: September 30 | ||
Date of reporting period: October 1, 2015 – September 30, 2016 | ||
Item 1: Reports to Shareholders | ||
Annual Report | September 30, 2016
Vanguard Growth and Income Fund
A new format, unwavering commitment
As you begin reading this report, you’ll notice that we’ve made some improvements to the opening sections—based on feedback from you, our clients.
Page 1 starts with a new ”Your Fund’s Performance at a Glance,” a concise, handy summary of how your fund performed during the period.
In the renamed ”Chairman’s Perspective,” Bill McNabb will focus on enduring principles and investment insights.
We’ve modified some tables, and eliminated some redundancy, but we haven’t removed any information.
At Vanguard, we’re always looking for better ways to communicate and to help you make sound investment decisions. Thank you for entrusting your assets to us.
| Contents | |
| Your Fund’s Performance at a Glance. | 1 |
| Chairman’s Perspective. | 3 |
| Advisors’ Report. | 6 |
| Fund Profile. | 11 |
| Performance Summary. | 13 |
| Financial Statements. | 15 |
| Your Fund’s After-Tax Returns. | 38 |
| About Your Fund’s Expenses. | 39 |
| Trustees Approve Advisory Arrangements. | 41 |
| Glossary. | 43 |
Please note: The opinions expressed in this report are just that—informed opinions. They should not be considered promises or advice.
Also, please keep in mind that the information and opinions cover the period through the date on the front of this report. Of course, the
risks of investing in your fund are spelled out in the prospectus.
See the Glossary for definitions of investment terms used in this report.
About the cover: No matter what language you speak, Vanguard has one consistent message and set of principles. Our primary
focus is on you, our clients. We conduct our business with integrity as a faithful steward of your assets. This message is shown
translated into seven languages, reflecting our expanding global presence.
Your Fund’s Performance at a Glance
• The fund returned nearly 15% for the 12 months ended September 30, 2016. It trailed its benchmark’s 15.43% return but exceeded the 12.38% average return of its peers.
• All industry sectors represented in the fund posted positive results. Information technology, the largest sector by assets on average, was the fund’s most significant contributor and the second-leading outperformer, returning about 24%. The advisors’ IT services and software selections were strong subsectors.
• Financial stocks also outperformed the benchmark. Real estate investment trusts (REITs) were one of the best-performing subsectors as investors favored their steady income. Near the end of the period, real estate was designated as a separate sector, the 11th in the benchmark.
• Energy (+11%) and health care (+9%) were relative underperformers.
• Over the past ten years, the fund’s average annual return trailed that of its benchmark index but outdistanced its peer group.
| Total Returns: Fiscal Year Ended September 30, 2016 | |
| Total | |
| Returns | |
| Vanguard Growth and Income Fund | |
| Investor Shares | 14.79% |
| Admiral™ Shares | 14.91 |
| S&P 500 Index | 15.43 |
| Large-Cap Core Funds Average | 12.38 |
| Large-Cap Core Funds Average: Derived from data provided by Lipper, a Thomson Reuters Company. | |
| Admiral Shares carry lower expenses and are available to investors who meet certain account-balance requirements. | |
| Total Returns: Ten Years Ended September 30, 2016 | |
| Average | |
| Annual Return | |
| Growth and Income Fund Investor Shares | 6.64% |
| S&P 500 Index | 7.24 |
| Large-Cap Core Funds Average | 5.89 |
| Large-Cap Core Funds Average: Derived from data provided by Lipper, a Thomson Reuters Company. | |
The figures shown represent past performance, which is not a guarantee of future results. (Current performance may be
lower or higher than the performance data cited. For performance data current to the most recent month-end, visit our
website at vanguard.com/performance.) Note, too, that both investment returns and principal value can fluctuate widely, so
an investor’s shares, when sold, could be worth more or less than their original cost.
1
| Expense Ratios | |||
| Your Fund Compared With Its Peer Group | |||
| Investor | Admiral | Peer Group | |
| Shares | Shares | Average | |
| Growth and Income Fund | 0.34% | 0.23% | 1.11% |
The fund expense ratios shown are from the prospectus dated January 26, 2016, and represent estimated costs for the current fiscal year. For
the fiscal year ended September 30, 2016, the fund’s expense ratios were 0.34% for Investor Shares and 0.23% for Admiral Shares. The
peer-group expense ratio is derived from data provided by Lipper, a Thomson Reuters Company, and captures information through year-end
2015.
Peer group: Large-Cap Core Funds.
2
Chairman’s Perspective

Bill McNabb
Chairman and Chief Executive Officer
Dear Shareholder,
If you think you’ve had reason to feel uneasy about the investment environment lately, you’re not imagining things. In just the past few months, we’ve seen economic uncertainty, intense political polarization, and super-low bond yields. Yet at the same time, the stock market kept pushing higher.
In this confusing and sometimes contradictory climate, you may be asking yourself a question that I hear often: How do I make sense of all this, keep investing, and still get a good night’s sleep?
As with any problem, there are multiple ways to go at it. But there’s one approach in particular that is simple, straightforward, and nearly foolproof: Save more money. Not only can saving more give you a greater sense of control over your investment plan, it can help compensate for long-term returns that, in our estimation, could fall short of historical averages.
I love the way one of our investment pros put it. Fran Kinniry this summer told The Wall Street Journal, “Investing is always a partnership between you and the markets.” He explained that the markets carried more than their fair share of the weight for a couple of decades, through the 1990s, providing outsized returns that made the investor’s half of the partnership relatively light work. “But now you are going to have to be the majority partner.”
Sobering? Sure. Hopeless? Definitely not.
3
Over the 12 months since last September, U.S. stocks returned 15%, though the rise has not been a one-way ticket straight up. International markets have also posted strong returns, but lower than those of the broad U.S. market. The decision by United Kingdom voters in June to exit the European Union came as a surprise but caused market heartburn for only a few days.
In fixed income, yields remained extremely low—about 1.60% on the 10-year U.S. Treasury note at the end of September, after dipping below 1.40% over the summer. And bond yields in some international markets were negative.
Even this relatively small window of time illustrates a truism of the financial markets: There will always be segments that perform well and others that don’t. Saving more saves you from trying to control the uncontrollable—how economies and the markets perform. And it keeps you in control of one of the most vital parts of your investment program.
Although the “save more” logic is easy to grasp, it’s not always easy to follow. Bills, illness, the loss of a job—these can affect any of us.
But whatever our circumstances, figuring out how to save more is worth the effort. It requires that we make difficult decisions to forgo some consumption today to increase the likelihood of consuming (or consuming more) in the future. This is the very heart of investing. Sacrifices are never fun, so consider carrying them out systematically and in doses that you
| Market Barometer | |||
| Average Annual Total Returns | |||
| Periods Ended September 30, 2016 | |||
| One | Three | Five | |
| Year | Years | Years | |
| Stocks | |||
| Russell 1000 Index (Large-caps) | 14.93% | 10.78% | 16.41% |
| Russell 2000 Index (Small-caps) | 15.47 | 6.71 | 15.82 |
| Russell 3000 Index (Broad U.S. market) | 14.96 | 10.44 | 16.36 |
| FTSE All-World ex US Index (International) | 9.62 | 0.71 | 6.50 |
| Bonds | |||
| Bloomberg Barclays U.S. Aggregate Bond Index | |||
| (Broad taxable market) | 5.19% | 4.03% | 3.08% |
| Bloomberg Barclays Municipal Bond Index | |||
| (Broad tax-exempt market) | 5.58 | 5.54 | 4.48 |
| Citigroup Three-Month U.S. Treasury Bill Index | 0.20 | 0.06 | 0.06 |
| CPI | |||
| Consumer Price Index | 1.46% | 1.03% | 1.25% |
4
can be comfortable with—for instance, gradually getting up to the max in your IRA, or adding a percentage point or so to the amount you stash in your employer’s retirement plan. As a point of reference, we generally suggest that investors strive for a retirement savings rate of 12%–15%, including any employer contributions.
If you need more convincing about the wisdom of the “save more” course of action, it might be helpful to examine your alternatives. This list is by no means exhaustive, but it hits on a few of the big ones, and none are without risk.
• Reach for yield. With yields so low on many types of bonds, it’s tempting to find the corners of the fixed income market where payouts are juicier. But with the juice comes considerable risk. You need to be aware that you’d be taking on more risk—and how much more.
• Go all-in on a hot-performing asset class or fund. By now, you know better than that, right?
• Sit tight. This approach isn’t a terrible idea; it’s better than panicking and deciding to just “do something,” particularly if that means changing your approach in response to the market’s movements.
Here’s the inescapably challenging part of your partnership with the markets: In the short run, your “partner” is fickle, emotional, and wildly unpredictable. But in the long run, your partner is mostly rational and extremely helpful.
The best way to minimize your vulnerability to the market’s mood swings, and to maximize the benefit of your partner’s longer-term strengths, is to expect less and save more. Maybe the markets will deliver better-than-expected returns. Maybe they’ll be consistent with our more modest expectations. In either case, a higher savings rate can help put you in a better position to reach your goals.
As always, thank you for investing with Vanguard.
Sincerely,

F. William McNabb III
Chairman and Chief Executive Officer
October 18, 2016
5
Advisors’ Report
Vanguard Growth and Income Fund’s Investor Shares returned 14.79% for the 12 months ended September 30, 2016. The Admiral Shares returned 14.91%. The Standard & Poor’s 500 Index returned 15.43%, and the average return of large-capitalization core funds was 12.38%.
Your fund is managed by three independent advisors, a strategy that enhances the fund’s diversification by providing exposure to distinct yet complementary investment approaches. It is not uncommon for different advisors to have different views about individual securities or the broader investment environment. (Note: The fund will mark the 30th anniversary of its inception on December 10, 2016.)
The advisors, the percentage of fund assets each manages, and brief descriptions of their investment strategies are presented in the table below. The advisors have also prepared a discussion of the investment environment that existed during the fiscal year and of how the portfolio’s positioning reflects this assessment. (Please note that Los Angeles Capital’s discussion refers to industry sectors as defined by Russell classifications, rather than by the Global
| Vanguard Growth and Income Fund Investment Advisors | |||
| Fund Assets Managed | |||
| Investment Advisor | % | $ Million | Investment Strategy |
| D. E. Shaw Investment | 33 | 2,198 | Employs quantitative models that seek to capture |
| Management, L.L.C. | predominantly bottom-up stock-specific return | ||
| opportunities. The portfolio’s sector weights, size, and | |||
| style characteristics may differ modestly from the | |||
| benchmark in a risk-controlled manner. | |||
| Los Angeles Capital | 33 | 2,172 | Employs a quantitative model that emphasizes stocks |
| with characteristics investors are currently seeking and | |||
| underweights stocks with characteristics investors are | |||
| currently avoiding. The portfolio’s sector weights, size, | |||
| and style characteristics may differ modestly from the | |||
| benchmark in a risk-controlled manner. | |||
| Vanguard Quantitative Equity | 32 | 2,143 | Employs a quantitative fundamental management |
| Group | approach, using models that assess valuation, growth | ||
| prospects, management decisions, market sentiment, | |||
| and earnings and balance-sheet quality of companies | |||
| as compared with their peers. | |||
| Cash Investments | 2 | 121 | These short-term reserves are invested by Vanguard in |
| equity index products to simulate investments in | |||
| stocks. Each advisor also may maintain a modest cash | |||
| position. | |||
6
Industry Classification Standard used elsewhere in this report.) These comments were prepared on October 18, 2016.
D. E. Shaw Investment
Management, L.L.C.
Portfolio Managers:
Anne Dinning, Ph.D., Managing Director
and Chief Investment Officer
Philip Kearns, Ph.D., Managing Director
The S&P 500 fluctuated significantly during the period, first gaining 10% by early November before more than erasing that gain by mid-February, and then mounting a sustained rally to return just over 15% by the fiscal year’s end. In the United States, two events seemed to occupy investors for a good portion of the period: U.S. Federal Reserve rate hikes (both actual and anticipated) and Brexit—the United Kingdom’s vote to leave the European Union. After much anticipation, the Fed raised interest rates in mid-December, with little apparent impact on equity markets. In contrast, global equity markets did react to the surprising results of the Brexit vote, albeit briefly. The MSCI World Index fell a little over 7% in two days, only to completely recover within two weeks.
Global equity markets exhibited mixed performances in local currencies, with negative returns from the Nikkei 225 and the Euro Stoxx 50, while the FTSE 100 returned more than 18%. The FTSE 100 performance is perhaps surprising given the volatility around Brexit and the uncertainty that lies ahead for the United Kingdom and Europe.
Within capital markets, Brexit’s impact thus far has been most discernible in the foreign exchange market. Following the vote in June, the British pound fell about 11% against the U.S. dollar in only two days and was down about 14% for the 12 months. Expressed in U.S. dollar terms, the FTSE 100’s performance was far less impressive, returning only 1.5% for the period.
While we actively monitor market activity, we generally do not make portfolio decisions based on a subjective analysis of the investment environment, except to try to mitigate new risk factors that we identify. We found no such risks during the period.
Our quantitative investment process deploys models that seek to forecast individual stock returns while limiting overweightings to industries, sectors, and common risk factors. The resulting portfolio may exhibit small to moderate overweightings to industries, sectors, and risk factors as a byproduct of our focus on bottom-up stock selection. We therefore generally attribute our performance to three major sources: bottom-up stock selection; exposure to industry groups; and risk factors such as value, growth, and market capitalization.
7
Our performance during the period was driven mostly by stock selection, followed by exposure to fundamental risk factors. Exposure to certain industry groups detracted from relative performance, most notably an overweight exposure to biotechnology companies. Among fundamental risk factors, overweight exposure to small-cap stocks helped relative performance, while underweight exposure to dividend-paying stocks detracted somewhat.
The three largest stock contributors to our relative performance were overweightings in Amazon.com and AT&T and an underweight position in Bank of America. The three largest stock detractors from relative performance were an underweight position in Facebook, an initial underweight and subsequent overweight position in McDonald’s, and an overweight position in Bristol-Myers Squibb.
In our view, the U.S. economy appears to be stable and showing small signs of strength. Recent employment reports have been reasonably strong, but so far not enough to prompt the Fed to increase the pace of rate hikes. Globally, many economies are still struggling to recover from the financial crisis, with monetary stimulus via bond purchasing programs driving many developed-market government interest rates into negative territory. At the end of the period, Japan, Germany, and Switzerland all showed negative yields for maturities up to 10 years and, in the case of Switzerland, beyond. The U.S. presidential election in the short term and the effects of Brexit in the longer term could become significant drivers of global markets.
Los Angeles Capital
Portfolio Managers:
Thomas D. Stevens, CFA,
Chairman and Principal
Hal W. Reynolds, CFA,
Chief Investment Officer and Principal
Against a backdrop of slowing growth rates, declining corporate profits, and a rise in global populism, the S&P 500 Index rose 15.43% for the period. For only the third time in the last ten years, value stocks outperformed growth stocks. While all sectors advanced over the period, telecommunications, materials, and capital goods were particularly strong while growth-oriented cyclicals and biotechnology underperformed. Despite a considerable rise in commodity prices from January lows, long-term interest rates remained historically low, propelling investors toward equity securities in search of both current yield and capital appreciation. Today’s equity market faces a number of potential challenges, including muted earnings growth, extended valuations, the prospect of higher interest rates, and growing trade uncertainty following Brexit and opposition to the Trans-Pacific Partnership.
8
An analysis of our equity factors over the trailing year shows that while riskier factors such as financial risk gained momentum, quality still prevailed, with analyst insight, yield, earnings quality, and profit margin all outperforming. Despite a reversal in the third quarter, low-volatility stocks outperformed for the year as investor interest in low-volatility assets remained strong globally. Notably, one-year and three-year momentum were both negative as yesterday’s winners underperformed. The portfolio’s tilt toward higher-yielding, low-volatility stocks with strong analyst insight added value over the period. The commodities-linked energy and materials sectors both rebounded after sustained losses. Within the portfolio, an overweight to materials added value while an underweight to capital goods detracted.
Over the period, the portfolio shifted out of retail and finance and into technology and energy. The portfolio reduced its exposure to momentum factors and generally increased its exposure to value factors, with yield and book-to-price measures both increasing notably. Today, the portfolio is positioned away from larger-cap companies and toward higher-yielding companies with favorable valuations. The portfolio is overweight the technology and energy sectors and underweight retail, internet, and capital goods.
Vanguard Quantitative Equity Group
Portfolio Managers:
Michael R. Roach, CFA
James P. Stetler, Principal
Binbin Guo, Principal, Head of Equity
Research and Portfolio Strategies
Growth around the globe remains subdued. The International Monetary Fund estimated global growth at 2.9% in the first half of 2016. The U.S. economy grew at an annual rate of 1.4% in the second quarter of 2016, an increase from an earlier estimate. This reflected positive contributions from personal consumption expenditures, exports, and nonresidential fixed investments.
Brexit is still unfolding, as the long-term arrangements between the United Kingdom and the European Union will be uncertain for some time. There was also a partial recovery in commodity prices. After hitting a 10-year low in January 2016, oil prices rallied by 50 percent to $45 in August, mostly due to production outages.
We regularly point out that while it’s important to understand how overall portfolio performance is affected by the macro factors described above,
9
our approach emphasizes specific stock fundamentals. We use a strict quantitative process to compare all stocks in our investment universe within the same industry group to identify those with characteristics that we believe will outperform over the long run. We believe that attractive stocks exhibit five key characteristics: 1) healthy balance sheets and steady cash-flow generation; 2) effective use of capital, with sound investment policies that favor internal funding over external funding; 3) consistent earnings growth, with the ability to grow earnings year after year; 4) strong market sentiment; and 5) reasonable valuation (we strive to avoid overpriced stocks). The interaction of these characteristics generates an opinion on all the stocks in our universe as our model seeks to capitalize on investor biases across the market.
Our portfolio focuses on the attractive stocks from the model that we expect to exhibit future outperformance over time. However, as with any investment management process, there will be periods when our model does not perform as expected. Unfortunately, over the current annual period, the stocks that outperformed had characteristics that our model did not pursue. While we are disappointed with the performance results, it is important to remind our investors that through different market environments, we maintain our commitment to invest in stocks with solid fundamentals that we believe will outperform in the long run.
Our strongest results were in the financial sector, and our worst performance was in energy. In financials, the largest contributors came from overweight positions in Navient and Nasdaq. In addition, we benefited from underweighting or avoiding poorly performing stocks such as Wells Fargo and Goldman Sachs. Within energy, our overweight positions in Ensco and Noble and underweight positions in Exxon Mobil did not perform as expected.
10
Growth and Income Fund
Fund Profile
As of September 30, 2016
| Share-Class Characteristics | ||
| Investor | Admiral | |
| Shares | Shares | |
| Ticker Symbol | VQNPX | VGIAX |
| Expense Ratio1 | 0.34% | 0.23% |
| 30-Day SEC Yield | 1.83% | 1.94% |
| Portfolio Characteristics | |||
| DJ | |||
| U.S. | |||
| Total | |||
| Market | |||
| S&P 500 | FA | ||
| Fund | Index | Index | |
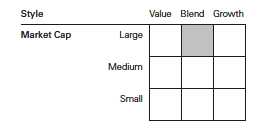
| Number of Stocks | 1,074 | 505 | 3,850 |
| Median Market Cap | $44.6B | $81.0B | $51.8B |
| Price/Earnings Ratio | 20.4x | 22.2x | 23.7x |
| Price/Book Ratio | 2.8x | 2.9x | 2.8x |
| Return on Equity | 16.6% | 17.5% | 16.6% |
| Earnings Growth | |||
| Rate | 7.1% | 7.3% | 7.6% |
| Dividend Yield | 2.2% | 2.1% | 2.0% |
| Foreign Holdings | 0.3% | 0.0% | 0.0% |
| Turnover Rate | 96% | — | — |
| Short-Term Reserves | 0.3% | — | — |
| Volatility Measures | ||
| DJ | ||
| U.S. Total | ||
| S&P 500 | Market | |
| Index | FA Index | |
| R-Squared | 0.99 | 0.99 |
| Beta | 0.97 | 0.95 |
| These measures show the degree and timing of the fund’s fluctuations compared with the indexes over 36 months. | ||
| Ten Largest Holdings (% of total net assets) | ||
| Apple Inc. | Technology | |
| Hardware, Storage & | ||
| Peripherals | 2.6% | |
| Johnson & Johnson | Pharmaceuticals | 1.9 |
| Microsoft Corp. | Systems Software | 1.9 |
| Exxon Mobil Corp. | Integrated Oil & Gas | 1.7 |
| Amazon.com Inc. | Internet Retail | 1.6 |
| Alphabet Inc. | Internet Software & | |
| Services | 1.4 | |
| General Electric Co. | Industrial | |
| Conglomerates | 1.4 | |
| AT&T Inc. | Integrated | |
| Telecommunication | ||
| Services | 1.2 | |
| Procter & Gamble Co. | Household Products | 1.1 |
| Citigroup Inc. | Diversified Banks | 1.1 |
| Top Ten | 15.9% | |
| The holdings listed exclude any temporary cash investments and equity index products. | ||
Investment Focus
1 The expense ratios shown are from the prospectus dated January 26, 2016, and represent estimated costs for the current fiscal year. For the fiscal
year ended September 30, 2016, the expense ratios were 0.34% for Investor Shares and 0.23% for Admiral Shares.
11
Growth and Income Fund
| Sector Diversification (% of equity exposure) | |||
| DJ | |||
| U.S. Total | |||
| S&P 500 | Market | ||
| Fund | Index FA Index | ||
| Consumer | |||
| Discretionary | 11.4% | 12.5% | 12.8% |
| Consumer Staples | 10.5 | 9.9 | 8.7 |
| Energy | 7.8 | 7.3 | 6.7 |
| Financials | 12.3 | 12.8 | 13.3 |
| Health Care | 14.3 | 14.7 | 14.2 |
| Industrials | 9.6 | 9.7 | 10.3 |
| Information | |||
| Technology | 21.3 | 21.2 | 20.7 |
| Materials | 3.5 | 2.9 | 3.3 |
| Real Estate | 3.5 | 3.1 | 4.3 |
| Telecommunication | |||
| Services | 2.5 | 2.6 | 2.4 |
| Utilities | 3.3 | 3.3 | 3.3 |
12
Growth and Income Fund
Performance Summary
All of the returns in this report represent past performance, which is not a guarantee of future results that may be achieved by the fund. (Current performance may be lower or higher than the performance data cited. For performance data current to the most recent month-end, visit our website at vanguard.com/performance.) Note, too, that both investment returns and principal value can fluctuate widely, so an investor’s shares, when sold, could be worth more or less than their original cost. The returns shown do not reflect taxes that a shareholder would pay on fund distributions or on the sale of fund shares.
Cumulative Performance: September 30, 2006, Through September 30, 2016
Initial Investment of $10,000
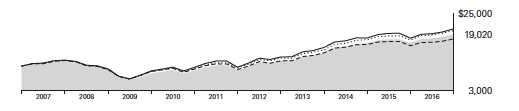
| Average Annual Total Returns | |||||
| Periods Ended September 30, 2016 | |||||
| Final Value | |||||
| One | Five | Ten | of a $10,000 | ||
| Year | Years | Years | Investment | ||
| Growth and Income Fund Investor | |||||
| Shares | 14.79% | 16.80% | 6.64% | $19,020 | |
| •••••••• | S&P 500 Index | 15.43 | 16.37 | 7.24 | 20,114 |
| – – – – | Large-Cap Core Funds Average | 12.38 | 14.49 | 5.89 | 17,731 |
| Dow Jones U.S. Total Stock Market | |||||
| Float Adjusted Index | 14.93 | 16.30 | 7.49 | 20,592 | |
| Large-Cap Core Funds Average: Derived from data provided by Lipper, a Thomson Reuters Company. | |||||
| Final Value | ||||
| One | Five | Ten | of a $50,000 | |
| Year | Years | Years | Investment | |
| Growth and Income Fund Admiral Shares | 14.91% | 16.93% | 6.77% | $96,227 |
| S&P 500 Index | 15.43 | 16.37 | 7.24 | 100,568 |
| Dow Jones U.S. Total Stock Market Float | ||||
| Adjusted Index | 14.93 | 16.30 | 7.49 | 102,961 |
See Financial Highlights for dividend and capital gains information.
13
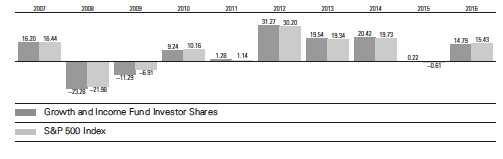
Growth and Income Fund
Fiscal-Year Total Returns (%): September 30, 2006, Through September 30, 2016
14
Growth and Income Fund
Financial Statements
Statement of Net Assets
As of September 30, 2016
The fund reports a complete list of its holdings in regulatory filings four times in each fiscal year, at the quarter-ends. For the second and fourth fiscal quarters, the lists appear in the fund’s semiannual and annual reports to shareholders. For the first and third fiscal quarters, the fund files the lists with the Securities and Exchange Commission on Form N-Q. Shareholders can look up the fund’s Forms N-Q on the SEC’s website at sec.gov. Forms N-Q may also be reviewed and copied at the SEC’s Public Reference Room (see the back cover of this report for further information).
| Market | |||
| Value• | |||
| Shares | ($000) | ||
| Common Stocks (97.8%)1 | |||
| Consumer Discretionary (11.0%) | |||
| * | Amazon.com Inc. | 130,421 | 109,203 |
| Home Depot Inc. | 336,003 | 43,237 | |
| McDonald’s Corp. | 323,122 | 37,275 | |
| Walt Disney Co. | 319,804 | 29,697 | |
| Target Corp. | 323,855 | 22,242 | |
| Darden Restaurants Inc. | 355,448 | 21,796 | |
| General Motors Co. | 630,895 | 20,044 | |
| Ford Motor Co. | 1,599,225 | 19,303 | |
| Marriott International Inc. | |||
| Class A | 281,731 | 18,969 | |
| Omnicom Group Inc. | 215,102 | 18,284 | |
| Leggett & Platt Inc. | 365,539 | 16,661 | |
| Comcast Corp. Class A | 241,788 | 16,040 | |
| Time Warner Inc. | 181,495 | 14,449 | |
| * | Michael Kors Holdings Ltd. | 298,607 | 13,972 |
| Carnival Corp. | 262,350 | 12,808 | |
| ^ | Nordstrom Inc. | 243,117 | 12,613 |
| Best Buy Co. Inc. | 329,070 | 12,564 | |
| * | O’Reilly Automotive Inc. | 44,613 | 12,497 |
| Kohl’s Corp. | 284,570 | 12,450 | |
| Goodyear Tire & Rubber | |||
| Co. | 376,701 | 12,167 | |
| Lowe’s Cos. Inc. | 164,331 | 11,866 | |
| * | Discovery | ||
| Communications Inc. | |||
| Class A | 437,303 | 11,772 | |
| * | Urban Outfitters Inc. | 340,158 | 11,742 |
| News Corp. Class B | 781,677 | 11,115 | |
| CBS Corp. Class B | 177,781 | 9,732 | |
| Wyndham Worldwide | |||
| Corp. | 129,750 | 8,736 | |
| Mattel Inc. | 280,254 | 8,486 | |
| PVH Corp. | 75,346 | 8,326 | |
| Interpublic Group of Cos. | |||
| Inc. | 368,445 | 8,235 | |
| Ralph Lauren Corp. | |||
| Class A | 80,180 | 8,109 | |
| L Brands Inc. | 111,220 | 7,871 | |
| NIKE Inc. Class B | 149,400 | 7,866 | |
| TEGNA Inc. | 358,175 | 7,830 | |
| Twenty-First Century | |||
| Fox Inc. Class A | 315,300 | 7,637 | |
| * | Charter Communications | ||
| Inc. Class A | 27,200 | 7,343 | |
| Macy’s Inc. | 186,914 | 6,925 | |
| Viacom Inc. Class B | 180,220 | 6,866 | |
| Yum! Brands Inc. | 69,200 | 6,284 | |
| Gap Inc. | 273,090 | 6,073 | |
| * | Netflix Inc. | 57,800 | 5,696 |
| Staples Inc. | 619,253 | 5,295 | |
| TJX Cos. Inc. | 69,900 | 5,227 | |
| * | Mohawk Industries Inc. | 23,080 | 4,624 |
| Whirlpool Corp. | 26,000 | 4,216 | |
| Coach Inc. | 104,502 | 3,821 | |
| Signet Jewelers Ltd. | 51,060 | 3,805 | |
| * | Ulta Salon Cosmetics & | ||
| Fragrance Inc. | 15,100 | 3,593 | |
| * | Liberty Global plc | 106,385 | 3,515 |
| Ross Stores Inc. | 52,600 | 3,382 | |
| * | TripAdvisor Inc. | 51,550 | 3,257 |
| Genuine Parts Co. | 29,500 | 2,963 | |
| News Corp. Class A | 208,100 | 2,909 | |
| Tiffany & Co. | 39,740 | 2,886 | |
| Hasbro Inc. | 23,627 | 1,874 | |
| Twenty-First Century Fox | |||
| Inc. | 70,100 | 1,734 | |
| Bed Bath & Beyond Inc. | 37,460 | 1,615 | |
| * | Chipotle Mexican Grill Inc. | ||
| Class A | 3,810 | 1,614 | |
| Carter’s Inc. | 16,400 | 1,422 | |
| Aramark | 35,700 | 1,358 | |
| Starbucks Corp. | 23,709 | 1,284 | |
| Bloomin’ Brands Inc. | 69,700 | 1,202 | |
| Cable One Inc. | 2,055 | 1,200 | |
| DR Horton Inc. | 36,300 | 1,096 | |
| Graham Holdings Co. | |||
| Class B | 2,254 | 1,085 |
15
Growth and Income Fund
| Market | |||
| Value• | |||
| Shares | ($000) | ||
| BorgWarner Inc. | 24,950 | 878 | |
| H&R Block Inc. | 37,250 | 862 | |
| * | Discovery Communications | ||
| Inc. | 31,600 | 831 | |
| VF Corp. | 14,500 | 813 | |
| DeVry Education Group Inc. | 31,300 | 722 | |
| Rent-A-Center Inc. | 55,510 | 702 | |
| * | Vista Outdoor Inc. | 16,400 | 654 |
| * | Express Inc. | 54,500 | 643 |
| Gannett Co. Inc. | 54,195 | 631 | |
| * | LKQ Corp. | 17,400 | 617 |
| * | Fossil Group Inc. | 21,475 | 596 |
| Visteon Corp. | 7,800 | 559 | |
| * | Liberty Ventures Class A | 13,500 | 538 |
| Restaurant Brands | |||
| International Inc. | 11,100 | 495 | |
| Hanesbrands Inc. | 16,300 | 412 | |
| * | Michaels Cos. Inc. | 16,000 | 387 |
| Dollar General Corp. | 4,500 | 315 | |
| Advance Auto Parts Inc. | 2,104 | 314 | |
| * | Sally Beauty Holdings Inc. | 12,100 | 311 |
| * | DISH Network Corp. | ||
| Class A | 5,600 | 307 | |
| * | ServiceMaster Global | ||
| Holdings Inc. | 8,800 | 296 | |
| La-Z-Boy Inc. | 11,900 | 292 | |
| * | Denny’s Corp. | 23,000 | 246 |
| * | Isle of Capri Casinos Inc. | 10,900 | 243 |
| * | Etsy Inc. | 16,600 | 237 |
| * | Liberty SiriusXM Group | ||
| Class C | 6,400 | 214 | |
| Wendy’s Co. | 19,200 | 207 | |
| CST Brands Inc. | 3,511 | 169 | |
| * | Lumber Liquidators | ||
| Holdings Inc. | 8,500 | 167 | |
| * | AutoNation Inc. | 3,400 | 166 |
| Service Corp. International | 5,600 | 149 | |
| * | Priceline Group Inc. | 100 | 147 |
| * | Liberty Media Group LLC | 4,600 | 129 |
| * | Liberty TripAdvisor Holdings | ||
| Inc. Class A | 5,600 | 122 | |
| * | Apollo Education Group Inc. | 15,000 | 119 |
| Aaron’s Inc. | 4,500 | 114 | |
| Chico’s FAS Inc. | 9,255 | 110 | |
| * | La Quinta Holdings Inc. | 9,300 | 104 |
| * | TopBuild Corp. | 3,000 | 100 |
| * | Liberty SiriusXM Group | ||
| Class A | 2,882 | 98 | |
| Ethan Allen Interiors Inc. | 3,100 | 97 | |
| * | Houghton Mifflin Harcourt | ||
| Co. | 6,600 | 88 | |
| Garmin Ltd. | 1,480 | 71 | |
| Libbey Inc. | 3,900 | 70 | |
| * | Hyatt Hotels Corp. Class A | 1,400 | 69 |
| * | Live Nation Entertainment | ||
| Inc. | 2,500 | 69 | |
| * | MSG Networks Inc. | 3,600 | 67 |
| Sonic Automotive Inc. | |||
| Class A | 2,400 | 45 | |
| DSW Inc. Class A | 2,200 | 45 | |
| * | Liberty Global PLC LiLAC | 1,600 | 45 |
| Big 5 Sporting Goods Corp. | 2,700 | 37 | |
| * | Bravo Brio Restaurant | ||
| Group Inc. | 6,912 | 33 | |
| Interval Leisure Group Inc. | 1,800 | 31 | |
| * | Bojangles’ Inc. | 1,900 | 30 |
| * | Beazer Homes USA Inc. | 2,400 | 28 |
| * | New York & Co. Inc. | 12,200 | 28 |
| * | Liberty Global PLC LiLAC | ||
| Class A | 900 | 25 | |
| * | Chegg Inc. | 3,500 | 25 |
| * | Burlington Stores Inc. | 300 | 24 |
| * | MGM Resorts International | 900 | 23 |
| Cato Corp. Class A | 700 | 23 | |
| Ruth’s Hospitality Group Inc. | 1,600 | 23 | |
| * | Liberty Broadband Corp. | 300 | 21 |
| * | TRI Pointe Group Inc. | 1,600 | 21 |
| * | Wayfair Inc. | 500 | 20 |
| ^,* | Sears Holdings Corp. | 1,590 | 18 |
| Bassett Furniture Industries | |||
| Inc. | 689 | 16 | |
| HSN Inc. | 400 | 16 | |
| * | Liberty Braves Group | 880 | 15 |
| * | Biglari Holdings Inc. | 34 | 15 |
| Churchill Downs Inc. | 100 | 15 | |
| GNC Holdings Inc. Class A | 700 | 14 | |
| * | Murphy USA Inc. | 200 | 14 |
| SeaWorld Entertainment Inc. | 1,024 | 14 | |
| * | tronc Inc. | 700 | 12 |
| Lennar Corp. Class A | 276 | 12 | |
| * | Scientific Games Corp. | ||
| Class A | 1,000 | 11 | |
| * | Groupon Inc. Class A | 2,100 | 11 |
| * | Select Comfort Corp. | 500 | 11 |
| * | Townsquare Media Inc. | ||
| Class A | 1,084 | 10 | |
| * | Caesars Entertainment Corp. | 1,300 | 10 |
| * | Liberty Media Group LLC | ||
| Class A | 300 | 9 | |
| * | Liberty Interactive Corp. | ||
| QVC Group Class A | 400 | 8 | |
| Office Depot Inc. | 2,200 | 8 | |
| * | Monarch Casino & Resort | ||
| Inc. | 300 | 8 | |
| * | Regis Corp. | 600 | 7 |
| Marriott Vacations | |||
| Worldwide Corp. | 100 | 7 | |
| * | Tuesday Morning Corp. | 1,190 | 7 |
| * | Starz | 200 | 6 |
16
Growth and Income Fund
| Market | |||||
| Value• | |||||
| Shares | ($000) | ||||
| * | Carrols Restaurant Group Inc. | 454 | 6 | ||
| * | Asbury Automotive Group Inc. | 100 | 6 | ||
| * | Habit Restaurants Inc. | ||||
| Class A | 380 | 5 | |||
| * | Sirius XM Holdings Inc. | 1,000 | 4 | ||
| * | Perry Ellis International Inc. | 200 | 4 | ||
| * | DavidsTea Inc. | 200 | 2 | ||
| * | Ascent Capital Group Inc. | ||||
| Class A | 100 | 2 | |||
| * | Under Armour Inc. | 63 | 2 | ||
| * | Cherokee Inc. | 200 | 2 | ||
| 726,139 | |||||
| Consumer Staples (10.2%) | |||||
| ^ | Procter & Gamble Co. | 800,163 | 71,815 | ||
| Wal-Mart Stores Inc. | 966,146 | 69,679 | |||
| Altria Group Inc. | 987,892 | 62,464 | |||
| Coca-Cola Co. | 1,362,717 | 57,670 | |||
| PepsiCo Inc. | 498,711 | 54,245 | |||
| Philip Morris | |||||
| International Inc. | 411,795 | 40,035 | |||
| Kimberly-Clark Corp. | 275,931 | 34,806 | |||
| Colgate-Palmolive Co. | 429,230 | 31,823 | |||
| General Mills Inc. | 448,889 | 28,675 | |||
| ConAgra Foods Inc. | 523,364 | 24,656 | |||
| CVS Health Corp. | 275,659 | 24,531 | |||
| Kraft Heinz Co. | 206,700 | 18,502 | |||
| Kroger Co. | 620,159 | 18,406 | |||
| Sysco Corp. | 341,939 | 16,758 | |||
| Costco Wholesale Corp. | 106,996 | 16,318 | |||
| Dr Pepper Snapple Group | |||||
| Inc. | 174,829 | 15,964 | |||
| Campbell Soup Co. | 291,744 | 15,958 | |||
| Tyson Foods Inc. Class A | 194,783 | 14,544 | |||
| JM Smucker Co. | 84,201 | 11,413 | |||
| Clorox Co. | 88,637 | 11,096 | |||
| Kellogg Co. | 130,869 | 10,138 | |||
| Archer-Daniels-Midland Co. | 124,300 | 5,242 | |||
| Hershey Co. | 53,455 | 5,110 | |||
| Constellation Brands Inc. | |||||
| Class A | 27,800 | 4,628 | |||
| Walgreens Boots Alliance | |||||
| Inc. | 38,400 | 3,096 | |||
| Mondelez International Inc. | |||||
| Class A | 65,760 | 2,887 | |||
| Mead Johnson Nutrition Co. | 25,630 | 2,025 | |||
| Whole Foods Market Inc. | 67,000 | 1,900 | |||
| * | Monster Beverage Corp. | 7,700 | 1,130 | ||
| Pilgrim’s Pride Corp. | 42,383 | 895 | |||
| Bunge Ltd. | 15,100 | 894 | |||
| * | Sprouts Farmers Market | ||||
| Inc. | 15,600 | 322 | |||
| Estee Lauder Cos. Inc. | |||||
| Class A | 3,500 | 310 | |||
| * | Edgewell Personal Care Co. | 2,500 | 199 | ||
| * | US Foods Holding Corp. | 5,000 | 118 | ||
| * | Adecoagro SA | 6,100 | 70 | |
| John B Sanfilippo & Son Inc. | 1,045 | 54 | ||
| Energizer Holdings Inc. | 1,000 | 50 | ||
| Lancaster Colony Corp. | 300 | 40 | ||
| ^ | Coty Inc. Class A | 1,200 | 28 | |
| * | Chefs’ Warehouse Inc. | 1,598 | 18 | |
| * | Central Garden & Pet Co. | |||
| Class A | 700 | 17 | ||
| * | Smart & Final Stores Inc. | 1,198 | 15 | |
| Coca-Cola European | ||||
| Partners plc | 361 | 14 | ||
| * | USANA Health Sciences Inc. | 100 | 14 | |
| Hormel Foods Corp. | 341 | 13 | ||
| * | Performance Food Group Co. | 500 | 12 | |
| Church & Dwight Co. Inc. | 200 | 10 | ||
| Reynolds American Inc. | 174 | 8 | ||
| * | Hain Celestial Group Inc. | 200 | 7 | |
| * | Natural Grocers by Vitamin | |||
| Cottage Inc. | 200 | 2 | ||
| 678,624 | ||||
| Energy (7.6%) | ||||
| Exxon Mobil Corp. | 1,262,102 | 110,156 | ||
| Occidental Petroleum | ||||
| Corp. | 462,680 | 33,739 | ||
| Chevron Corp. | 285,370 | 29,370 | ||
| Schlumberger Ltd. | 298,517 | 23,475 | ||
| Apache Corp. | 334,451 | 21,361 | ||
| Devon Energy Corp. | 483,067 | 21,308 | ||
| ConocoPhillips | 484,941 | 21,080 | ||
| Anadarko Petroleum Corp. | 331,149 | 20,982 | ||
| * | FMC Technologies Inc. | 695,598 | 20,638 | |
| Phillips 66 | 215,268 | 17,340 | ||
| * | Newfield Exploration Co. | 358,992 | 15,602 | |
| * | Southwestern Energy Co. | 1,003,430 | 13,888 | |
| ^,* | Transocean Ltd. | 1,111,153 | 11,845 | |
| Ensco plc Class A | 1,271,514 | 10,808 | ||
| Marathon Oil Corp. | 681,180 | 10,769 | ||
| Williams Cos. Inc. | 344,990 | 10,602 | ||
| Cimarex Energy Co. | 76,493 | 10,278 | ||
| EOG Resources Inc. | 104,261 | 10,083 | ||
| Diamond Offshore | ||||
| Drilling Inc. | 562,766 | 9,910 | ||
| Kinder Morgan Inc. | 409,580 | 9,474 | ||
| Tesoro Corp. | 112,975 | 8,988 | ||
| Cabot Oil & Gas Corp. | 336,294 | 8,676 | ||
| Noble Energy Inc. | 229,310 | 8,196 | ||
| Hess Corp. | 122,860 | 6,588 | ||
| Murphy Oil Corp. | 201,519 | 6,126 | ||
| Valero Energy Corp. | 102,900 | 5,454 | ||
| National Oilwell Varco Inc. | 132,372 | 4,863 | ||
| Pioneer Natural | ||||
| Resources Co. | 21,840 | 4,055 | ||
| ONEOK Inc. | 72,116 | 3,706 | ||
| EQT Corp. | 44,200 | 3,210 | ||
| Spectra Energy Corp. | 67,940 | 2,904 | ||
17
Growth and Income Fund
| Market | |||
| Value• | |||
| Shares | ($000) | ||
| Marathon Petroleum Corp. | 61,846 | 2,510 | |
| Baker Hughes Inc. | 45,471 | 2,295 | |
| Energen Corp. | 38,000 | 2,193 | |
| Range Resources Corp. | 28,300 | 1,097 | |
| * | Gulfport Energy Corp. | 30,600 | 864 |
| * | Kosmos Energy Ltd. | 36,500 | 234 |
| Oceaneering International | |||
| Inc. | 4,700 | 129 | |
| * | Chesapeake Energy Corp. | 16,600 | 104 |
| Aegean Marine Petroleum | |||
| Network Inc. | 7,500 | 75 | |
| Archrock Inc. | 5,081 | 67 | |
| Golar LNG Partners LP | 3,353 | 66 | |
| Nabors Industries Ltd. | 5,200 | 63 | |
| Noble Corp. plc | 7,229 | 46 | |
| Frank’s International NV | 1,900 | 25 | |
| Cameco Corp. | 2,700 | 23 | |
| * | Matrix Service Co. | 1,100 | 21 |
| * | Cobalt International Energy | ||
| Inc. | 14,933 | 19 | |
| * | Eclipse Resources Corp. | 5,400 | 18 |
| QEP Resources Inc. | 800 | 16 | |
| * | Fairmount Santrol Holdings | ||
| Inc. | 1,400 | 12 | |
| EnLink Midstream LLC | 700 | 12 | |
| * | TransAtlantic Petroleum Ltd. | 8,887 | 11 |
| CARBO Ceramics Inc. | 956 | 10 | |
| Golar LNG Ltd. | 300 | 6 | |
| * | Newpark Resources Inc. | 600 | 4 |
| * | Denbury Resources Inc. | 1,300 | 4 |
| * | Contango Oil & Gas Co. | 100 | 1 |
| 505,399 | |||
| Financials (12.0%) | |||
| Citigroup Inc. | 1,488,517 | 70,303 | |
| Wells Fargo & Co. | 1,524,904 | 67,523 | |
| JPMorgan Chase & Co. | 925,103 | 61,603 | |
| * | Berkshire Hathaway Inc. | ||
| Class B | 268,988 | 38,861 | |
| Bank of America Corp. | 2,239,699 | 35,051 | |
| American Express Co. | 457,361 | 29,289 | |
| Bank of New York | |||
| Mellon Corp. | 722,165 | 28,800 | |
| Travelers Cos. Inc. | 228,257 | 26,147 | |
| Prudential Financial Inc. | 276,583 | 22,583 | |
| Aflac Inc. | 272,156 | 19,560 | |
| Chubb Ltd. | 148,220 | 18,624 | |
| S&P Global Inc. | 134,116 | 16,974 | |
| Navient Corp. | 1,137,687 | 16,462 | |
| Ameriprise Financial Inc. | 159,672 | 15,930 | |
| SunTrust Banks Inc. | 359,990 | 15,768 | |
| Fifth Third Bancorp | 735,796 | 15,054 | |
| Capital One Financial Corp. | 209,300 | 15,034 | |
| Goldman Sachs Group Inc. | 89,063 | 14,363 | |
| Discover Financial Services | 249,427 | 14,105 | |
| Aon plc | 125,219 | 14,086 | |
| People’s United Financial | |||
| Inc. | 773,302 | 12,234 | |
| Unum Group | 323,971 | 11,439 | |
| Cincinnati Financial Corp. | 150,140 | 11,324 | |
| MetLife Inc. | 237,644 | 10,559 | |
| CME Group Inc. | 99,400 | 10,389 | |
| US Bancorp | 230,220 | 9,874 | |
| Willis Towers Watson plc | 71,812 | 9,534 | |
| Intercontinental Exchange | |||
| Inc. | 34,740 | 9,358 | |
| Moody’s Corp. | 85,300 | 9,236 | |
| PNC Financial Services | |||
| Group Inc. | 102,500 | 9,234 | |
| BlackRock Inc. | 24,980 | 9,054 | |
| Progressive Corp. | 278,775 | 8,781 | |
| Arthur J Gallagher & Co. | 171,070 | 8,702 | |
| Allstate Corp. | 105,100 | 7,271 | |
| Hartford Financial | |||
| Services Group Inc. | 158,645 | 6,793 | |
| Synchrony Financial | 238,600 | 6,681 | |
| Leucadia National Corp. | 344,896 | 6,567 | |
| Huntington Bancshares | |||
| Inc. | 635,537 | 6,266 | |
| Marsh & McLennan Cos. | |||
| Inc. | 77,680 | 5,224 | |
| Loews Corp. | 116,730 | 4,803 | |
| First Horizon National | |||
| Corp. | 312,770 | 4,763 | |
| Lincoln National Corp. | 95,759 | 4,499 | |
| Principal Financial Group | |||
| Inc. | 84,869 | 4,372 | |
| Morgan Stanley | 125,080 | 4,010 | |
| American International | |||
| Group Inc. | 66,700 | 3,958 | |
| Assurant Inc. | 42,614 | 3,931 | |
| Legg Mason Inc. | 114,868 | 3,846 | |
| Regions Financial Corp. | 388,747 | 3,837 | |
| Voya Financial Inc. | 111,156 | 3,204 | |
| Zions Bancorporation | 100,380 | 3,114 | |
| Torchmark Corp. | 35,720 | 2,282 | |
| KeyCorp | 183,841 | 2,237 | |
| Franklin Resources Inc. | 52,572 | 1,870 | |
| East West Bancorp Inc. | 44,400 | 1,630 | |
| Northern Trust Corp. | 15,792 | 1,074 | |
| FNF Group | 28,700 | 1,059 | |
| Synovus Financial Corp. | 31,764 | 1,033 | |
| Endurance Specialty | |||
| Holdings Ltd. | 15,592 | 1,021 | |
| Aspen Insurance Holdings | |||
| Ltd. | 19,800 | 922 | |
| State Street Corp. | 11,900 | 829 | |
| * | E*TRADE Financial Corp. | 28,300 | 824 |
| TCF Financial Corp. | 52,000 | 755 | |
| Ares Capital Corp. | 46,600 | 722 | |
| Popular Inc. | 18,600 | 711 |
18
Growth and Income Fund
| Market | |||
| Value• | |||
| Shares | ($000) | ||
| * | Signature Bank | 5,568 | 660 |
| Charles Schwab Corp. | 16,900 | 534 | |
| American Equity Investment | |||
| Life Holding Co. | 28,500 | 505 | |
| Financial Engines Inc. | 16,900 | 502 | |
| Old Republic International | |||
| Corp. | 23,980 | 423 | |
| Great Western Bancorp Inc. | 12,102 | 403 | |
| Hancock Holding Co. | 12,301 | 399 | |
| MarketAxess Holdings Inc. | 2,300 | 381 | |
| * | Flagstar Bancorp Inc. | 13,700 | 380 |
| WR Berkley Corp. | 6,200 | 358 | |
| * | Arch Capital Group Ltd. | 4,500 | 357 |
| RLI Corp. | 4,800 | 328 | |
| ^ | Prospect Capital Corp. | 39,700 | 322 |
| Assured Guaranty Ltd. | 11,499 | 319 | |
| United Bankshares Inc. | 8,400 | 316 | |
| ProAssurance Corp. | 5,055 | 265 | |
| * | MGIC Investment Corp. | 32,300 | 258 |
| Argo Group International | |||
| Holdings Ltd. | 4,500 | 254 | |
| Invesco Ltd. | 7,860 | 246 | |
| Apollo Investment Corp. | 41,089 | 238 | |
| Axis Capital Holdings Ltd. | 4,100 | 223 | |
| XL Group Ltd. | 6,500 | 219 | |
| Wintrust Financial Corp. | 3,900 | 217 | |
| Beneficial Bancorp Inc. | 14,700 | 216 | |
| First American Financial | |||
| Corp. | 4,500 | 177 | |
| Greenhill & Co. Inc. | 6,500 | 153 | |
| Umpqua Holdings Corp. | 8,800 | 132 | |
| BancorpSouth Inc. | 5,300 | 123 | |
| Kearny Financial Corp. | 8,500 | 116 | |
| Hanover Insurance Group Inc. | 1,400 | 106 | |
| AmTrust Financial Services | |||
| Inc. | 3,274 | 88 | |
| Federated Investors Inc. | |||
| Class B | 2,900 | 86 | |
| Nelnet Inc. Class A | 2,100 | 85 | |
| Chimera Investment Corp. | 5,300 | 85 | |
| Prosperity Bancshares Inc. | 1,539 | 84 | |
| * | Santander Consumer USA | ||
| Holdings Inc. | 6,900 | 84 | |
| Allied World Assurance Co. | |||
| Holdings AG | 1,981 | 80 | |
| Trustmark Corp. | 2,800 | 77 | |
| Radian Group Inc. | 5,300 | 72 | |
| Banner Corp. | 1,600 | 70 | |
| Meridian Bancorp Inc. | 4,200 | 65 | |
| WisdomTree Investments | |||
| Inc. | 5,975 | 61 | |
| * | Essent Group Ltd. | 2,300 | 61 |
| Cathay General Bancorp | 1,961 | 60 | |
| UMB Financial Corp. | 1,004 | 60 | |
| FNB Corp. | 4,300 | 53 |
| Erie Indemnity Co. Class A | 500 | 51 | |
| CNO Financial Group Inc. | 3,300 | 50 | |
| Brookline Bancorp Inc. | 3,700 | 45 | |
| * | Western Alliance Bancorp | 1,200 | 45 |
| * | FNFV Group | 3,600 | 45 |
| * | Third Point Reinsurance Ltd. | 3,400 | 41 |
| First Financial Bancorp | 1,427 | 31 | |
| Employers Holdings Inc. | 988 | 29 | |
| Glacier Bancorp Inc. | 1,000 | 29 | |
| Boston Private Financial | |||
| Holdings Inc. | 2,200 | 28 | |
| Preferred Bank | 788 | 28 | |
| Heritage Financial Corp. | 1,488 | 27 | |
| BlackRock Capital | |||
| Investment Corp. | 3,216 | 27 | |
| CBOE Holdings Inc. | 400 | 26 | |
| United Community Banks | |||
| Inc. | 1,200 | 25 | |
| Two Harbors Investment | |||
| Corp. | 2,900 | 25 | |
| Fulton Financial Corp. | 1,700 | 25 | |
| * | NewStar Financial Inc. | 2,500 | 24 |
| Blackstone Mortgage Trust | |||
| Inc. Class A | 796 | 23 | |
| M&T Bank Corp. | 200 | 23 | |
| AG Mortgage Investment | |||
| Trust Inc. | 1,405 | 22 | |
| Arbor Realty Trust Inc. | 2,861 | 21 | |
| * | World Acceptance Corp. | 400 | 20 |
| OneBeacon Insurance Group | |||
| Ltd. Class A | 1,362 | 19 | |
| Central Pacific Financial Corp. | 770 | 19 | |
| Capital Bank Financial Corp. | 600 | 19 | |
| BankFinancial Corp. | 1,502 | 19 | |
| Anworth Mortgage Asset | |||
| Corp. | 3,400 | 17 | |
| National Bank Holdings Corp. | |||
| Class A | 715 | 17 | |
| Ladder Capital Corp. | 1,200 | 16 | |
| American Capital Agency | |||
| Corp. | 800 | 16 | |
| Credicorp Ltd. | 100 | 15 | |
| * | Stifel Financial Corp. | 336 | 13 |
| Fifth Street Finance Corp. | 2,200 | 13 | |
| Old National Bancorp | 900 | 13 | |
| * | KCG Holdings Inc. Class A | 800 | 12 |
| THL Credit Inc. | 1,207 | 12 | |
| Washington Federal Inc. | 425 | 11 | |
| KCAP Financial Inc. | 2,357 | 11 | |
| TD Ameritrade Holding Corp. | 300 | 11 | |
| * | First BanCorp | 2,000 | 10 |
| * | Hope Bancorp Inc. | 579 | 10 |
| Associated Banc-Corp | 500 | 10 | |
| Comerica Inc. | 205 | 10 | |
| Chemical Financial Corp. | 200 | 9 |
19
Growth and Income Fund
| Market | ||||
| Value• | ||||
| Shares | ($000) | |||
| United Financial Bancorp Inc. | 600 | 8 | ||
| Southwest Bancorp Inc. | 400 | 8 | ||
| Opus Bank | 200 | 7 | ||
| West Bancorporation Inc. | 352 | 7 | ||
| Newtek Business Services | ||||
| Corp. | 400 | 6 | ||
| Berkshire Hills Bancorp Inc. | 200 | 6 | ||
| Garrison Capital Inc. | 500 | 5 | ||
| Capital Southwest Corp. | 301 | 4 | ||
| MB Financial Inc. | 100 | 4 | ||
| MVC Capital Inc. | 457 | 4 | ||
| * | PRA Group Inc. | 100 | 3 | |
| Capitol Federal Financial Inc. | 245 | 3 | ||
| Columbia Banking System Inc. 100 | 3 | |||
| Annaly Capital Management | ||||
| Inc. | 300 | 3 | ||
| Artisan Partners Asset | ||||
| Management Inc. Class A | 100 | 3 | ||
| MFA Financial Inc. | 290 | 2 | ||
| 797,335 | ||||
| Health Care (14.0%) | ||||
| Johnson & Johnson | 1,086,803 | 128,384 | ||
| Pfizer Inc. | 1,949,835 | 66,041 | ||
| Merck & Co. Inc. | 948,028 | 59,167 | ||
| Bristol-Myers Squibb Co. | 976,969 | 52,678 | ||
| Eli Lilly & Co. | 640,733 | 51,425 | ||
| Amgen Inc. | 217,002 | 36,198 | ||
| Gilead Sciences Inc. | 345,520 | 27,338 | ||
| AbbVie Inc. | 427,045 | 26,934 | ||
| UnitedHealth Group Inc. | 176,470 | 24,706 | ||
| * | Express Scripts Holding | |||
| Co. | 337,407 | 23,797 | ||
| Agilent Technologies Inc. | 499,543 | 23,523 | ||
| Anthem Inc. | 175,574 | 22,001 | ||
| McKesson Corp. | 131,814 | 21,980 | ||
| Baxter International Inc. | 460,334 | 21,912 | ||
| Cardinal Health Inc. | 270,270 | 21,000 | ||
| AmerisourceBergen Corp. | ||||
| Class A | 259,683 | 20,977 | ||
| Abbott Laboratories | 469,286 | 19,846 | ||
| * | Hologic Inc. | 508,655 | 19,751 | |
| * | HCA Holdings Inc. | 241,925 | 18,297 | |
| CR Bard Inc. | 75,890 | 17,021 | ||
| * | Biogen Inc. | 53,465 | 16,736 | |
| * | DaVita Inc. | 232,160 | 15,339 | |
| Zoetis Inc. | 289,750 | 15,070 | ||
| Medtronic plc | 157,984 | 13,650 | ||
| Zimmer Biomet Holdings | ||||
| Inc. | 88,000 | 11,442 | ||
| Cigna Corp. | 87,130 | 11,355 | ||
| Thermo Fisher Scientific | ||||
| Inc. | 68,675 | 10,923 | ||
| Aetna Inc. | 89,588 | 10,343 | ||
| * | Vertex Pharmaceuticals | |||
| Inc. | 111,556 | 9,729 | ||
| * | Mettler-Toledo | ||
| International Inc. | 19,500 | 8,187 | |
| Perrigo Co. plc | 87,736 | 8,101 | |
| * | Intuitive Surgical Inc. | 10,920 | 7,915 |
| Stryker Corp. | 63,990 | 7,449 | |
| PerkinElmer Inc. | 114,737 | 6,438 | |
| Quest Diagnostics Inc. | 73,780 | 6,244 | |
| * | Mallinckrodt plc | 84,930 | 5,926 |
| * | Allergan plc | 25,070 | 5,774 |
| Patterson Cos. Inc. | 124,120 | 5,702 | |
| * | Boston Scientific Corp. | 232,000 | 5,522 |
| Humana Inc. | 29,300 | 5,183 | |
| Dentsply Sirona Inc. | 83,775 | 4,979 | |
| Becton Dickinson and Co. | 25,922 | 4,659 | |
| * | Endo International plc | 174,589 | 3,518 |
| * | Alexion Pharmaceuticals | ||
| Inc. | 25,033 | 3,068 | |
| Danaher Corp. | 28,502 | 2,234 | |
| * | Laboratory Corp. of | ||
| America Holdings | 12,800 | 1,760 | |
| * | Molina Healthcare Inc. | 30,000 | 1,750 |
| * | Celgene Corp. | 13,800 | 1,443 |
| * | Neurocrine Biosciences Inc. | 24,800 | 1,256 |
| Universal Health Services | |||
| Inc. Class B | 9,615 | 1,185 | |
| * | WellCare Health Plans Inc. | 9,700 | 1,136 |
| * | Quintiles Transnational | ||
| Holdings Inc. | 13,300 | 1,078 | |
| * | Mylan NV | 27,300 | 1,041 |
| Hill-Rom Holdings Inc. | 13,200 | 818 | |
| * | United Therapeutics Corp. | 5,700 | 673 |
| * | VCA Inc. | 9,200 | 644 |
| * | Charles River Laboratories | ||
| International Inc. | 7,500 | 625 | |
| * | Myriad Genetics Inc. | 24,900 | 512 |
| * | IMS Health Holdings Inc. | 12,800 | 401 |
| * | Alkermes plc | 8,365 | 393 |
| * | OraSure Technologies Inc. | 46,700 | 372 |
| * | LivaNova plc | 5,100 | 307 |
| * | Varian Medical Systems Inc. | 3,066 | 305 |
| * | Acorda Therapeutics Inc. | 14,500 | 303 |
| Bruker Corp. | 12,600 | 285 | |
| Invacare Corp. | 17,600 | 197 | |
| * | IDEXX Laboratories Inc. | 1,600 | 180 |
| * | PTC Therapeutics Inc. | 12,700 | 178 |
| * | Five Prime Therapeutics Inc. | 3,317 | 174 |
| * | Momenta Pharmaceuticals | ||
| Inc. | 14,000 | 164 | |
| * | Lexicon Pharmaceuticals | ||
| Inc. | 8,900 | 161 | |
| * | Magellan Health Inc. | 2,900 | 156 |
| * | Seres Therapeutics Inc. | 11,300 | 139 |
| * | Insulet Corp. | 3,000 | 123 |
| * | Rockwell Medical Inc. | 15,536 | 104 |
| * | Portola Pharmaceuticals Inc. | 4,500 | 102 |
20
Growth and Income Fund
| Market | ||||
| Value• | ||||
| Shares | ($000) | |||
| * | Novavax Inc. | 45,600 | 95 | |
| * | Rigel Pharmaceuticals Inc. | 25,100 | 92 | |
| * | Medicines Co. | 2,100 | 79 | |
| * | Aratana Therapeutics Inc. | 8,400 | 79 | |
| * | Triple-S Management Corp. | |||
| Class B | 3,400 | 75 | ||
| * | Innoviva Inc. | 6,500 | 71 | |
| * | Vanda Pharmaceuticals Inc. | 4,100 | 68 | |
| * | Luminex Corp. | 3,000 | 68 | |
| * | Chimerix Inc. | 12,000 | 66 | |
| ^,* | MannKind Corp. | 101,757 | 63 | |
| * | Pain Therapeutics Inc. | 60,444 | 60 | |
| * | VWR Corp. | 2,100 | 60 | |
| * | Coherus Biosciences Inc. | 2,114 | 57 | |
| * | AMAG Pharmaceuticals Inc. | 2,300 | 56 | |
| * | Intrexon Corp. | 2,000 | 56 | |
| * | AtriCure Inc. | 3,405 | 54 | |
| * | OvaScience Inc. | 7,000 | 50 | |
| * | Pacific Biosciences of | |||
| California Inc. | 5,400 | 48 | ||
| * | Puma Biotechnology Inc. | 700 | 47 | |
| * | Align Technology Inc. | 500 | 47 | |
| * | Envision Healthcare | |||
| Holdings Inc. | 2,100 | 47 | ||
| * | Impax Laboratories Inc. | 1,800 | 43 | |
| * | Exelixis Inc. | 3,300 | 42 | |
| * | Regeneron Pharmaceuticals | |||
| Inc. | 100 | 40 | ||
| * | Omeros Corp. | 3,300 | 37 | |
| ^,* | Organovo Holdings Inc. | 9,200 | 35 | |
| * | BioTelemetry Inc. | 1,800 | 33 | |
| * | FibroGen Inc. | 1,500 | 31 | |
| * | BioCryst Pharmaceuticals Inc. | 6,200 | 27 | |
| * | Karyopharm Therapeutics Inc. | 2,719 | 26 | |
| ResMed Inc. | 400 | 26 | ||
| * | Enzo Biochem Inc. | 4,600 | 23 | |
| * | NxStage Medical Inc. | 900 | 22 | |
| * | Esperion Therapeutics Inc. | 1,600 | 22 | |
| * | Orthofix International NV | 500 | 21 | |
| * | Tokai Pharmaceuticals Inc. | 12,800 | 20 | |
| * | Inotek Pharmaceuticals Corp. | 2,000 | 19 | |
| * | Alere Inc. | 425 | 18 | |
| * | Halyard Health Inc. | 500 | 17 | |
| * | Regulus Therapeutics Inc. | 4,700 | 16 | |
| * | ArQule Inc. | 8,649 | 15 | |
| * | Spectrum Pharmaceuticals | |||
| Inc. | 3,300 | 15 | ||
| * | Xencor Inc. | 600 | 15 | |
| * | Syneron Medical Ltd. | 1,900 | 14 | |
| * | Allscripts Healthcare | |||
| Solutions Inc. | 1,000 | 13 | ||
| ^,* | Insys Therapeutics Inc. | 1,100 | 13 | |
| * | Quorum Health Corp. | 1,959 | 12 | |
| * | Merit Medical Systems Inc. | 500 | 12 | |
| LeMaitre Vascular Inc. | 594 | 12 | ||
| * | SciClone Pharmaceuticals Inc. | 1,100 | 11 | |
| * | NewLink Genetics Corp. | 700 | 11 | |
| * | Brookdale Senior Living Inc. | 600 | 10 | |
| * | NanoString Technologies Inc. | 500 | 10 | |
| * | Raptor Pharmaceutical Corp. | 1,100 | 10 | |
| St. Jude Medical Inc. | 118 | 9 | ||
| * | Infinity Pharmaceuticals Inc. | 6,000 | 9 | |
| * | Genomic Health Inc. | 300 | 9 | |
| * | ARIAD Pharmaceuticals Inc. | 476 | 7 | |
| * | Mirati Therapeutics Inc. | 855 | 6 | |
| * | Cytokinetics Inc. | 600 | 5 | |
| * | AngioDynamics Inc. | 303 | 5 | |
| * | Surgical Care Affiliates Inc. | 100 | 5 | |
| * | GTx Inc. | 4,487 | 4 | |
| * | Advaxis Inc. | 300 | 3 | |
| * | HealthStream Inc. | 100 | 3 | |
| * | Cardiovascular Systems Inc. | 41 | 1 | |
| 928,522 | ||||
| Industrials (9.5%) | ||||
| General Electric Co. | 3,101,188 | 91,857 | ||
| General Dynamics Corp. | 212,550 | 32,979 | ||
| Ingersoll-Rand plc | 434,580 | 29,525 | ||
| United Parcel Service Inc. | ||||
| Class B | 244,997 | 26,793 | ||
| Raytheon Co. | 168,720 | 22,968 | ||
| Stanley Black & Decker | ||||
| Inc. | 184,588 | 22,701 | ||
| United Technologies Corp. | 199,470 | 20,266 | ||
| Masco Corp. | 575,992 | 19,762 | ||
| L-3 Communications | ||||
| Holdings Inc. | 127,697 | 19,248 | ||
| Delta Air Lines Inc. | 397,057 | 15,628 | ||
| Alaska Air Group Inc. | 234,642 | 15,454 | ||
| Waste Management Inc. | 227,837 | 14,527 | ||
| Southwest Airlines Co. | 341,348 | 13,275 | ||
| * | Quanta Services Inc. | 458,550 | 12,835 | |
| 3M Co. | 70,358 | 12,399 | ||
| * | United Rentals Inc. | 156,700 | 12,299 | |
| Republic Services Inc. | ||||
| Class A | 236,597 | 11,936 | ||
| Northrop Grumman Corp. | 54,843 | 11,734 | ||
| Pitney Bowes Inc. | 645,570 | 11,724 | ||
| Cintas Corp. | 101,043 | 11,377 | ||
| * | United Continental | |||
| Holdings Inc. | 208,423 | 10,936 | ||
| Equifax Inc. | 80,440 | 10,826 | ||
| Allison Transmission | ||||
| Holdings Inc. | 377,300 | 10,821 | ||
| Dun & Bradstreet Corp. | 77,130 | 10,537 | ||
| Caterpillar Inc. | 111,604 | 9,907 | ||
| Union Pacific Corp. | 101,000 | 9,851 | ||
| Rockwell Automation Inc. | 79,801 | 9,763 | ||
| PACCAR Inc. | 163,942 | 9,637 | ||
| Eaton Corp. plc | 125,293 | 8,233 | ||
| Honeywell International Inc. | 68,031 | 7,932 | ||
| Deere & Co. | 88,590 | 7,561 | ||
21
Growth and Income Fund
| Market | |||
| Value• | |||
| Shares | ($000) | ||
| * | Johnson Controls | ||
| International plc | 157,300 | 7,319 | |
| Emerson Electric Co. | 131,400 | 7,163 | |
| Illinois Tool Works Inc. | 54,762 | 6,563 | |
| Boeing Co. | 48,575 | 6,399 | |
| KAR Auction Services Inc. | 133,100 | 5,745 | |
| * | Spirit AeroSystems | ||
| Holdings Inc. Class A | 118,700 | 5,287 | |
| American Airlines Group | |||
| Inc. | 122,800 | 4,496 | |
| Allegion plc | 64,327 | 4,433 | |
| Expeditors International | |||
| of Washington Inc. | 77,307 | 3,983 | |
| Parker-Hannifin Corp. | 29,732 | 3,732 | |
| Nielsen Holdings plc | 66,175 | 3,545 | |
| Fortive Corp. | 68,851 | 3,505 | |
| Kansas City Southern | 33,000 | 3,080 | |
| * | Jacobs Engineering Group | ||
| Inc. | 52,959 | 2,739 | |
| * | AerCap Holdings NV | 67,400 | 2,594 |
| BWX Technologies Inc. | 63,300 | 2,429 | |
| Huntington Ingalls | |||
| Industries Inc. | 11,700 | 1,795 | |
| Fluor Corp. | 26,036 | 1,336 | |
| FedEx Corp. | 7,500 | 1,310 | |
| * | WABCO Holdings Inc. | 9,597 | 1,090 |
| MSC Industrial Direct Co. | |||
| Inc. Class A | 14,000 | 1,028 | |
| Carlisle Cos. Inc. | 7,400 | 759 | |
| Cummins Inc. | 5,801 | 743 | |
| Snap-on Inc. | 4,330 | 658 | |
| Insperity Inc. | 8,900 | 646 | |
| * | Armstrong World Industries | ||
| Inc. | 15,500 | 640 | |
| * | RPX Corp. | 54,800 | 586 |
| * | HD Supply Holdings Inc. | 16,100 | 515 |
| * | Babcock & Wilcox | ||
| Enterprises Inc. | 31,100 | 513 | |
| * | Continental Building | ||
| Products Inc. | 23,200 | 487 | |
| * | Moog Inc. Class A | 7,800 | 464 |
| ManpowerGroup Inc. | 4,918 | 355 | |
| Brady Corp. Class A | 10,134 | 351 | |
| Landstar System Inc. | 5,000 | 340 | |
| Chicago Bridge & Iron Co. | |||
| NV | 11,700 | 328 | |
| Orbital ATK Inc. | 4,300 | 328 | |
| * | IHS Markit Ltd. | 7,500 | 282 |
| Fastenal Co. | 6,600 | 276 | |
| Hubbell Inc. Class B | 2,200 | 237 | |
| * | SPX Corp. | 11,100 | 224 |
| Quad/Graphics Inc. | 8,200 | 219 | |
| JB Hunt Transport | |||
| Services Inc. | 2,600 | 211 | |
| * | Kratos Defense & Security | ||
| Solutions Inc. | 28,348 | 195 |
| * | DigitalGlobe Inc. | 6,900 | 190 |
| Knoll Inc. | 8,190 | 187 | |
| * | JetBlue Airways Corp. | 10,800 | 186 |
| Watsco Inc. | 1,300 | 183 | |
| * | Swift Transportation Co. | 8,500 | 182 |
| * | Rexnord Corp. | 8,500 | 182 |
| Covanta Holding Corp. | 10,900 | 168 | |
| Regal Beloit Corp. | 2,800 | 167 | |
| * | NCI Building Systems Inc. | 10,000 | 146 |
| Greenbrier Cos. Inc. | 3,800 | 134 | |
| Federal Signal Corp. | 9,243 | 123 | |
| West Corp. | 5,100 | 113 | |
| Albany International Corp. | 2,600 | 110 | |
| * | Mistras Group Inc. | 4,586 | 108 |
| Woodward Inc. | 1,500 | 94 | |
| B/E Aerospace Inc. | 1,700 | 88 | |
| KBR Inc. | 5,700 | 86 | |
| Owens Corning | 1,600 | 85 | |
| Textron Inc. | 1,700 | 68 | |
| Kennametal Inc. | 2,100 | 61 | |
| * | Hub Group Inc. Class A | 1,400 | 57 |
| RR Donnelley & Sons Co. | 3,594 | 56 | |
| * | DXP Enterprises Inc. | 1,957 | 55 |
| * | MYR Group Inc. | 1,600 | 48 |
| * | Armstrong Flooring Inc. | 2,400 | 45 |
| * | ARC Document Solutions | ||
| Inc. | 11,400 | 43 | |
| * | MFC Bancorp Ltd. | 19,117 | 39 |
| * | Masonite International Corp. | 600 | 37 |
| Barnes Group Inc. | 897 | 36 | |
| CH Robinson Worldwide Inc. | 488 | 34 | |
| Lockheed Martin Corp. | 136 | 33 | |
| Exponent Inc. | 600 | 31 | |
| * | Navigant Consulting Inc. | 1,400 | 28 |
| LB Foster Co. Class A | 2,100 | 25 | |
| Joy Global Inc. | 800 | 22 | |
| Heartland Express Inc. | 1,086 | 21 | |
| Triumph Group Inc. | 700 | 20 | |
| Trinity Industries Inc. | 800 | 19 | |
| WW Grainger Inc. | 83 | 19 | |
| * | Huron Consulting Group Inc. | 300 | 18 |
| Global Brass & Copper | |||
| Holdings Inc. | 600 | 17 | |
| * | TriNet Group Inc. | 800 | 17 |
| Ennis Inc. | 1,000 | 17 | |
| Aircastle Ltd. | 700 | 14 | |
| * | Herc Holdings Inc. | 400 | 13 |
| * | WageWorks Inc. | 211 | 13 |
| Hillenbrand Inc. | 400 | 13 | |
| Steelcase Inc. Class A | 900 | 13 | |
| * | Air Transport Services Group | ||
| Inc. | 800 | 11 | |
| CSX Corp. | 300 | 9 | |
| * | Hertz Global Holdings Inc. | 200 | 8 |
| * | Civeo Corp. | 6,379 | 7 |
| Lincoln Electric Holdings Inc. | 100 | 6 |
22
Growth and Income Fund
| Market | |||
| Value• | |||
| Shares | ($000) | ||
| Flowserve Corp. | 126 | 6 | |
| Apogee Enterprises Inc. | 127 | 6 | |
| AMETEK Inc. | 100 | 5 | |
| * | Saia Inc. | 143 | 4 |
| EnPro Industries Inc. | 73 | 4 | |
| Matson Inc. | 100 | 4 | |
| * | Accuride Corp. | 1,500 | 4 |
| * | TransUnion | 100 | 3 |
| Interface Inc. Class A | 200 | 3 | |
| * | YRC Worldwide Inc. | 100 | 1 |
| 627,764 | |||
| Information Technology (20.8%) | |||
| Apple Inc. | 1,505,249 | 170,168 | |
| Microsoft Corp. | 2,131,680 | 122,785 | |
| * | Facebook Inc. Class A | 509,357 | 65,335 |
| International Business | |||
| Machines Corp. | 396,241 | 62,943 | |
| Visa Inc. Class A | 741,891 | 61,354 | |
| * | Alphabet Inc. Class A | 73,465 | 59,070 |
| Symantec Corp. | 1,848,946 | 46,409 | |
| QUALCOMM Inc. | 637,823 | 43,691 | |
| Cisco Systems Inc. | 1,199,741 | 38,056 | |
| * | Alphabet Inc. Class C | 43,467 | 33,786 |
| Intuit Inc. | 283,779 | 31,219 | |
| Texas Instruments Inc. | 440,175 | 30,891 | |
| Applied Materials Inc. | 1,003,502 | 30,256 | |
| Intel Corp. | 737,707 | 27,848 | |
| Mastercard Inc. | 270,360 | 27,515 | |
| Fidelity National | |||
| Information Services Inc. | 335,190 | 25,820 | |
| HP Inc. | 1,633,417 | 25,367 | |
| * | Teradata Corp. | 803,570 | 24,911 |
| Western Union Co. | 1,166,272 | 24,282 | |
| Accenture plc Class A | 191,063 | 23,342 | |
| Seagate Technology plc | 595,654 | 22,962 | |
| * | Citrix Systems Inc. | 259,671 | 22,129 |
| CSRA Inc. | 740,341 | 19,915 | |
| * | Fiserv Inc. | 176,172 | 17,524 |
| * | eBay Inc. | 516,432 | 16,991 |
| NVIDIA Corp. | 243,538 | 16,687 | |
| Xerox Corp. | 1,644,745 | 16,661 | |
| * | F5 Networks Inc. | 130,322 | 16,243 |
| Lam Research Corp. | 157,807 | 14,946 | |
| * | VeriSign Inc. | 183,560 | 14,362 |
| NetApp Inc. | 398,790 | 14,285 | |
| Hewlett Packard | |||
| Enterprise Co. | 615,414 | 14,001 | |
| Motorola Solutions Inc. | 177,601 | 13,547 | |
| Western Digital Corp. | 208,142 | 12,170 | |
| Broadcom Ltd. | 68,500 | 11,818 | |
| Computer Sciences Corp. | 216,480 | 11,302 | |
| * | Autodesk Inc. | 137,710 | 9,961 |
| Paychex Inc. | 170,867 | 9,888 | |
| Analog Devices Inc. | 143,151 | 9,226 | |
| TE Connectivity Ltd. | 129,207 | 8,318 | |
| Juniper Networks Inc. | 335,448 | 8,071 | |
| * | Adobe Systems Inc. | 74,230 | 8,057 |
| * | Red Hat Inc. | 99,240 | 8,022 |
| Xilinx Inc. | 136,530 | 7,419 | |
| * | Electronic Arts Inc. | 78,940 | 6,741 |
| Corning Inc. | 284,175 | 6,721 | |
| * | Cognizant Technology | ||
| Solutions Corp. Class A | 132,700 | 6,331 | |
| Harris Corp. | 68,380 | 6,264 | |
| Oracle Corp. | 152,685 | 5,997 | |
| CA Inc. | 169,580 | 5,610 | |
| Total System Services Inc. | 87,135 | 4,108 | |
| * | PayPal Holdings Inc. | 85,070 | 3,485 |
| * | Micron Technology Inc. | 195,900 | 3,483 |
| ^,* | VMware Inc. Class A | 41,100 | 3,015 |
| * | salesforce.com Inc. | 37,191 | 2,653 |
| Microchip Technology Inc. | 39,729 | 2,469 | |
| * | Alliance Data Systems Corp. | 9,380 | 2,012 |
| * | Qorvo Inc. | 36,042 | 2,009 |
| * | CoreLogic Inc. | 43,800 | 1,718 |
| * | Twitter Inc. | 65,700 | 1,514 |
| Automatic Data | |||
| Processing Inc. | 13,700 | 1,208 | |
| FLIR Systems Inc. | 32,600 | 1,024 | |
| IAC/InterActiveCorp | 15,697 | 981 | |
| * | MicroStrategy Inc. Class A | 4,901 | 821 |
| * | Flex Ltd. | 56,991 | 776 |
| * | Yahoo! Inc. | 17,400 | 750 |
| Amdocs Ltd. | 12,680 | 734 | |
| * | InterXion Holding NV | 15,700 | 569 |
| Skyworks Solutions Inc. | 7,190 | 547 | |
| Linear Technology Corp. | 8,485 | 503 | |
| * | Synaptics Inc. | 7,600 | 445 |
| * | FireEye Inc. | 29,700 | 437 |
| Brocade Communications | |||
| Systems Inc. | 46,600 | 430 | |
| InterDigital Inc. | 5,300 | 420 | |
| Tessera Technologies Inc. | 10,600 | 407 | |
| EarthLink Holdings Corp. | 58,800 | 364 | |
| * | Genpact Ltd. | 14,600 | 350 |
| Marvell Technology | |||
| Group Ltd. | 25,200 | 334 | |
| * | Sohu.com Inc. | 6,900 | 305 |
| * | Cree Inc. | 11,200 | 288 |
| * | Photronics Inc. | 26,839 | 277 |
| Maxim Integrated | |||
| Products Inc. | 6,500 | 260 | |
| * | Nuance Communications | ||
| Inc. | 17,051 | 247 | |
| * | RetailMeNot Inc. | 24,647 | 244 |
| * | WebMD Health Corp. | 4,700 | 234 |
| NIC Inc. | 9,700 | 228 | |
| * | Take-Two Interactive | ||
| Software Inc. | 4,600 | 207 | |
| * | First Solar Inc. | 4,540 | 179 |
| * | CommScope Holding Co. | ||
| Inc. | 5,900 | 178 |
23
Growth and Income Fund
| Market | |||
| Value• | |||
| Shares | ($000) | ||
| * | Bankrate Inc. | 20,300 | 172 |
| * | II-VI Inc. | 6,934 | 169 |
| * | CommVault Systems Inc. | 3,100 | 165 |
| * | NeuStar Inc. Class A | 5,500 | 146 |
| * | Blackhawk Network | ||
| Holdings Inc. | 4,564 | 138 | |
| * | Keysight Technologies Inc. | 4,100 | 130 |
| * | Shutterstock Inc. | 2,000 | 127 |
| * | ON Semiconductor Corp. | 10,200 | 126 |
| * | Synopsys Inc. | 2,100 | 125 |
| * | Kulicke & Soffa Industries | ||
| Inc. | 9,581 | 124 | |
| * | Akamai Technologies Inc. | 2,100 | 111 |
| * | EchoStar Corp. Class A | 2,507 | 110 |
| * | Acxiom Corp. | 4,100 | 109 |
| Vishay Intertechnology Inc. | 7,600 | 107 | |
| * | Rudolph Technologies Inc. | 5,900 | 105 |
| * | Net 1 UEPS Technologies | ||
| Inc. | 12,100 | 104 | |
| * | DHI Group Inc. | 11,500 | 91 |
| * | Alpha & Omega | ||
| Semiconductor Ltd. | 3,900 | 85 | |
| * | ShoreTel Inc. | 10,155 | 81 |
| * | Trimble Navigation Ltd. | 2,800 | 80 |
| * | Endurance International | ||
| Group Holdings Inc. | 8,033 | 70 | |
| * | Calix Inc. | 9,563 | 70 |
| * | Yelp Inc. Class A | 1,600 | 67 |
| * | Zynga Inc. Class A | 22,600 | 66 |
| Teradyne Inc. | 3,000 | 65 | |
| * | CyberArk Software Ltd. | 1,300 | 64 |
| * | InvenSense Inc. | 8,400 | 62 |
| * | Cimpress NV | 600 | 61 |
| * | Advanced Energy Industries | ||
| Inc. | 1,100 | 52 | |
| * | Silicon Laboratories Inc. | 800 | 47 |
| EVERTEC Inc. | 2,800 | 47 | |
| * | Sanmina Corp. | 1,600 | 46 |
| * | Infoblox Inc. | 1,700 | 45 |
| * | Semtech Corp. | 1,600 | 44 |
| * | Intralinks Holdings Inc. | 4,300 | 43 |
| * | CommerceHub Inc. | 2,700 | 43 |
| * | Amkor Technology Inc. | 4,300 | 42 |
| * | Rackspace Hosting Inc. | 1,300 | 41 |
| NVE Corp. | 682 | 40 | |
| * | Sonus Networks Inc. | 5,100 | 40 |
| * | TiVo Corp. | 1,900 | 37 |
| * | Blucora Inc. | 3,300 | 37 |
| ^ | CPI Card Group Inc. | 6,100 | 37 |
| * | XO Group Inc. | 1,821 | 35 |
| * | TechTarget Inc. | 4,200 | 34 |
| * | Lionbridge Technologies Inc. | 5,700 | 28 |
| * | Ultratech Inc. | 1,107 | 26 |
| * | Progress Software Corp. | 900 | 24 |
| * | Web.com Group Inc. | 1,400 | 24 |
| * | Angie’s List Inc. | 2,300 | 23 |
| * | Zix Corp. | 5,500 | 23 |
| * | CommerceHub Inc. Class A | 1,350 | 21 |
| * | SunEdison Semiconductor | ||
| Ltd. | 1,694 | 19 | |
| * | Orbotech Ltd. | 600 | 18 |
| * | Cavium Inc. | 301 | 18 |
| Daktronics Inc. | 1,600 | 15 | |
| * | Aspen Technology Inc. | 300 | 14 |
| * | A10 Networks Inc. | 1,300 | 14 |
| * | Nimble Storage Inc. | 1,500 | 13 |
| Amphenol Corp. Class A | 200 | 13 | |
| * | Ixia | 1,000 | 12 |
| * | VASCO Data Security | ||
| International Inc. | 700 | 12 | |
| * | Carbonite Inc. | 778 | 12 |
| * | Brightcove Inc. | 900 | 12 |
| * | ACI Worldwide Inc. | 600 | 12 |
| CDK Global Inc. | 200 | 11 | |
| Cognex Corp. | 200 | 11 | |
| * | Entegris Inc. | 600 | 10 |
| * | Bazaarvoice Inc. | 1,700 | 10 |
| * | NCR Corp. | 300 | 10 |
| Jabil Circuit Inc. | 400 | 9 | |
| * | comScore Inc. | 279 | 9 |
| * | SPS Commerce Inc. | 100 | 7 |
| * | ScanSource Inc. | 200 | 7 |
| * | Kemet Corp. | 2,000 | 7 |
| * | OSI Systems Inc. | 100 | 7 |
| * | Anixter International Inc. | 100 | 6 |
| Plantronics Inc. | 100 | 5 | |
| Comtech | |||
| Telecommunications Corp. | 402 | 5 | |
| * | Wix.com Ltd. | 110 | 5 |
| * | Care.com Inc. | 400 | 4 |
| * | 2U Inc. | 100 | 4 |
| Convergys Corp. | 100 | 3 | |
| Brooks Automation Inc. | 200 | 3 | |
| * | Ciber Inc. | 1,744 | 2 |
| * | Dell Technologies Inc - | ||
| VMware Inc | 18 | 1 | |
| 1,381,559 | |||
| Materials (3.5%) | |||
| Dow Chemical Co. | 576,754 | 29,893 | |
| Air Products & Chemicals | |||
| Inc. | 152,557 | 22,935 | |
| LyondellBasell Industries | |||
| NV Class A | 271,236 | 21,878 | |
| Avery Dennison Corp. | 267,415 | 20,802 | |
| Monsanto Co. | 199,292 | 20,368 | |
| Sealed Air Corp. | 393,054 | 18,010 | |
| Praxair Inc. | 97,910 | 11,830 | |
| International Paper Co. | 225,646 | 10,827 | |
| Nucor Corp. | 188,969 | 9,345 | |
| Mosaic Co. | 323,760 | 7,919 | |
24
Growth and Income Fund
| Market | |||
| Value• | |||
| Shares | ($000) | ||
| PPG Industries Inc. | 76,045 | 7,860 | |
| EI du Pont de Nemours | |||
| & Co. | 97,200 | 6,510 | |
| CF Industries Holdings Inc. | 264,760 | 6,447 | |
| Eastman Chemical Co. | 77,671 | 5,257 | |
| Vulcan Materials Co. | 40,300 | 4,583 | |
| Freeport-McMoRan Inc. | 417,390 | 4,533 | |
| Sherwin-Williams Co. | 14,310 | 3,959 | |
| Martin Marietta Materials | |||
| Inc. | 11,095 | 1,987 | |
| Ecolab Inc. | 15,166 | 1,846 | |
| Graphic Packaging | |||
| Holding Co. | 124,300 | 1,739 | |
| Newmont Mining Corp. | 41,500 | 1,631 | |
| FMC Corp. | 31,166 | 1,507 | |
| WR Grace & Co. | 18,400 | 1,358 | |
| International Flavors & | |||
| Fragrances Inc. | 8,848 | 1,265 | |
| Celanese Corp. Class A | 18,700 | 1,245 | |
| Barrick Gold Corp. | 64,900 | 1,150 | |
| * | Crown Holdings Inc. | 12,600 | 719 |
| Ferroglobe plc | 49,224 | 445 | |
| SunCoke Energy Inc. | 29,701 | 238 | |
| * | Louisiana-Pacific Corp. | 12,100 | 228 |
| Reliance Steel & | |||
| Aluminum Co. | 2,900 | 209 | |
| Southern Copper Corp. | 7,000 | 184 | |
| * | Berry Plastics Group Inc. | 4,100 | 180 |
| * | Owens-Illinois Inc. | 6,943 | 128 |
| Trinseo SA | 2,100 | 119 | |
| * | Constellium NV Class A | 15,400 | 111 |
| * | Axalta Coating Systems Ltd. | 3,751 | 106 |
| Steel Dynamics Inc. | 4,100 | 102 | |
| Agnico Eagle Mines Ltd. | 1,596 | 86 | |
| HB Fuller Co. | 1,800 | 84 | |
| * | Boise Cascade Co. | 3,200 | 81 |
| Mercer International Inc. | 7,600 | 64 | |
| Valspar Corp. | 500 | 53 | |
| Schweitzer-Mauduit | |||
| International Inc. | 1,200 | 46 | |
| Orion Engineered | |||
| Carbons SA | 2,088 | 39 | |
| Olympic Steel Inc. | 1,700 | 38 | |
| * | Ryerson Holding Corp. | 3,200 | 36 |
| Olin Corp. | 1,500 | 31 | |
| * | TimkenSteel Corp. | 2,600 | 27 |
| * | Intrepid Potash Inc. | 22,100 | 25 |
| * | Coeur Mining Inc. | 1,900 | 22 |
| Silgan Holdings Inc. | 400 | 20 | |
| KMG Chemicals Inc. | 600 | 17 | |
| * | Headwaters Inc. | 848 | 14 |
| PH Glatfelter Co. | 640 | 14 | |
| * | GCP Applied Technologies Inc. | 400 | 11 |
| Materion Corp. | 299 | 9 |
| * | Turquoise Hill Resources Ltd. 2,184 | 7 | |
| * | Flotek Industries Inc. | 428 | 6 |
| * | Cliffs Natural Resources Inc. | 891 | 5 |
| * | Ferro Corp. | 95 | 1 |
| 230,189 | |||
| Other (0.2%) | |||
| SPDR S&P 500 ETF Trust | 51,072 | 11,047 | |
| * | Safeway Inc. CVR (Casa Ley) | ||
| Exp. 01/30/2018 | 75,810 | 10 | |
| * | Safeway Inc. CVR (PDC) | ||
| Exp. 01/30/2017 | 75,810 | 4 | |
| 11,061 | |||
| Real Estate (3.4%) | |||
| Macerich Co. | 390,586 | 31,587 | |
| Prologis Inc. | 580,804 | 31,096 | |
| Crown Castle | |||
| International Corp. | 208,958 | 19,686 | |
| Public Storage | 76,320 | 17,030 | |
| HCP Inc. | 422,612 | 16,038 | |
| Host Hotels & Resorts Inc. | 975,042 | 15,181 | |
| Kimco Realty Corp. | 514,630 | 14,899 | |
| Equity Residential | 184,799 | 11,888 | |
| Welltower Inc. | 111,838 | 8,362 | |
| Simon Property Group Inc. | 30,607 | 6,336 | |
| Realty Income Corp. | 94,198 | 6,305 | |
| Weyerhaeuser Co. | 177,745 | 5,677 | |
| UDR Inc. | 141,460 | 5,091 | |
| Equity LifeStyle Properties | |||
| Inc. | 61,300 | 4,731 | |
| Realogy Holdings Corp. | 165,500 | 4,280 | |
| General Growth | |||
| Properties Inc. | 135,330 | 3,735 | |
| Federal Realty Investment | |||
| Trust | 22,920 | 3,528 | |
| Digital Realty Trust Inc. | 33,200 | 3,224 | |
| Ventas Inc. | 37,547 | 2,652 | |
| SL Green Realty Corp. | 23,700 | 2,562 | |
| Iron Mountain Inc. | 67,590 | 2,537 | |
| Apartment Investment & | |||
| Management Co. | 54,620 | 2,508 | |
| Retail Properties of | |||
| America Inc. | 94,400 | 1,586 | |
| * | Equity Commonwealth | 48,900 | 1,478 |
| Boston Properties Inc. | 8,562 | 1,167 | |
| AvalonBay Communities Inc. | 5,265 | 936 | |
| Vornado Realty Trust | 8,844 | 895 | |
| Four Corners Property | |||
| Trust Inc. | 40,604 | 866 | |
| Paramount Group Inc. | 31,426 | 515 | |
| Brixmor Property Group Inc. | 16,200 | 450 | |
| Columbia Property Trust Inc. | 12,200 | 273 | |
| Brandywine Realty Trust | 14,100 | 220 | |
| Spirit Realty Capital Inc. | 13,800 | 184 | |
| Care Capital Properties Inc. | 5,500 | 157 | |
25
Growth and Income Fund
| Market | ||||
| Value• | ||||
| Shares | ($000) | |||
| Forest City Realty Trust Inc. | ||||
| Class A | 6,000 | 139 | ||
| Post Properties Inc. | 1,765 | 117 | ||
| Outfront Media Inc. | 4,700 | 111 | ||
| American Assets Trust Inc. | 2,203 | 96 | ||
| Apple Hospitality REIT Inc. | 3,100 | 57 | ||
| Ryman Hospitality | ||||
| Properties Inc. | 1,000 | 48 | ||
| Sun Communities Inc. | 600 | 47 | ||
| American Campus | ||||
| Communities Inc. | 800 | 41 | ||
| InfraREIT Inc. | 2,243 | 41 | ||
| CareTrust REIT Inc. | 1,900 | 28 | ||
| Community Healthcare | ||||
| Trust Inc. | 900 | 20 | ||
| WP Carey Inc. | 300 | 19 | ||
| Empire State Realty Trust Inc. | 819 | 17 | ||
| HFF Inc. Class A | 600 | 17 | ||
| Taubman Centers Inc. | 208 | 15 | ||
| Monogram Residential | ||||
| Trust Inc. | 1,400 | 15 | ||
| Essex Property Trust Inc. | 57 | 13 | ||
| Washington REIT | 300 | 9 | ||
| Hospitality Properties Trust | 300 | 9 | ||
| Parkway Properties Inc. | 500 | 8 | ||
| National Health Investors Inc. | 100 | 8 | ||
| Tier REIT Inc. | 500 | 8 | ||
| Global Net Lease Inc. | 400 | 3 | ||
| Kennedy-Wilson Holdings Inc. | 98 | 2 | ||
| 228,548 | ||||
| Telecommunication Services (2.4%) | ||||
| AT&T Inc. | 1,880,099 | 76,351 | ||
| Verizon Communications | ||||
| Inc. | 1,167,978 | 60,711 | ||
| CenturyLink Inc. | 555,021 | 15,224 | ||
| * | Level 3 Communications | |||
| Inc. | 158,100 | 7,333 | ||
| Frontier Communications | ||||
| Corp. | 279,200 | 1,161 | ||
| * | Zayo Group Holdings Inc. | 21,800 | 648 | |
| * | SBA Communications | |||
| Corp. Class A | 5,500 | 617 | ||
| * | Globalstar Inc. | 71,000 | 86 | |
| Telephone & Data | ||||
| Systems Inc. | 1,347 | 37 | ||
| * | United States Cellular Corp. | 519 | 19 | |
| Windstream Holdings Inc. | 1,200 | 12 | ||
| 162,199 | ||||
| Utilities (3.2%) | ||||
| American Electric Power | ||||
| Co. Inc. | 303,996 | 19,520 | ||
| Entergy Corp. | 248,922 | 19,100 | ||
| FirstEnergy Corp. | 531,374 | 17,578 | |
| NextEra Energy Inc. | 138,920 | 16,993 | |
| NiSource Inc. | 615,342 | 14,836 | |
| PPL Corp. | 399,040 | 13,795 | |
| CenterPoint Energy Inc. | 540,650 | 12,559 | |
| Sempra Energy | 113,210 | 12,135 | |
| Southern Co. | 217,910 | 11,179 | |
| Edison International | 139,975 | 10,113 | |
| Ameren Corp. | 199,749 | 9,824 | |
| Duke Energy Corp. | 119,420 | 9,558 | |
| NRG Energy Inc. | 845,735 | 9,481 | |
| PG&E Corp. | 118,406 | 7,243 | |
| Pinnacle West Capital Corp. | 75,076 | 5,705 | |
| Dominion Resources Inc. | 74,984 | 5,569 | |
| DTE Energy Co. | 38,990 | 3,652 | |
| Exelon Corp. | 109,600 | 3,649 | |
| AES Corp. | 202,831 | 2,606 | |
| Eversource Energy | 42,355 | 2,295 | |
| SCANA Corp. | 18,620 | 1,347 | |
| Public Service Enterprise | |||
| Group Inc. | 25,430 | 1,065 | |
| Alliant Energy Corp. | 21,700 | 831 | |
| Avangrid Inc. | 8,700 | 363 | |
| Atlantic Power Corp. | 99,700 | 246 | |
| Atmos Energy Corp. | 2,695 | 201 | |
| WGL Holdings Inc. | 2,820 | 177 | |
| NRG Yield Inc. | 6,700 | 114 | |
| * | Dynegy Inc. | 6,900 | 85 |
| Hawaiian Electric | |||
| Industries Inc. | 2,800 | 84 | |
| ALLETE Inc. | 1,301 | 77 | |
| Vectren Corp. | 1,200 | 60 | |
| New Jersey Resources Corp. | 1,700 | 56 | |
| Chesapeake Utilities Corp. | 688 | 42 | |
| OGE Energy Corp. | 1,300 | 41 | |
| Black Hills Corp. | 600 | 37 | |
| PNM Resources Inc. | 1,000 | 33 | |
| National Fuel Gas Co. | 500 | 27 | |
| ONE Gas Inc. | 300 | 18 | |
| MGE Energy Inc. | 300 | 17 | |
| El Paso Electric Co. | 300 | 14 | |
| Spire Inc. | 200 | 13 | |
| Consolidated Edison Inc. | 146 | 11 | |
| MDU Resources Group Inc. | 400 | 10 | |
| 212,359 | |||
| Total Common Stocks | |||
| (Cost $5,544,577) | 6,489,698 | ||
| Temporary Cash Investments (2.4%)1 | |||
| Money Market Fund (2.2%) | |||
| 2,3 | Vanguard Market | ||
| Liquidity Fund, 0.640% | 1,441,460 | 144,160 | |
26
Growth and Income Fund
| Face | Market | ||
| Amount | Value• | ||
| ($000) | ($000) | ||
| U.S. Government and Agency Obligations (0.2%) | |||
| 4 | Federal Home Loan | ||
| Bank Discount Notes, | |||
| 0.431%, 1/25/17 | 6,600 | 6,593 | |
| 5 | United States Treasury | ||
| Bill, 0.318%, 10/20/16 | 6,000 | 6,000 | |
| 12,593 | |||
| Total Temporary Cash Investments | |||
| (Cost $156,733) | 156,753 | ||
| Total Investments (100.2%) | |||
| (Cost $5,701,310) | 6,646,451 | ||
| Amount | |||
| ($000) | |||
| Other Assets and Liabilities (-0.2%) | |||
| Other Assets | |||
| Investment in VGI | 511 | ||
| Receivables for Investment Securities Sold 52,706 | |||
| Receivables for Accrued Income | 8,695 | ||
| Receivables for Capital Shares Issued | 2,310 | ||
| Other Assets | 853 | ||
| Total Other Assets | 65,075 | ||
| Liabilities | |||
| Payables for Investment Securities | |||
| Purchased | (52,771) | ||
| Collateral for Securities on Loan | (8,671) | ||
| Payables to Investment Advisor | (1,523) | ||
| Payables for Capital Shares Redeemed | (3,173) | ||
| Payables to Vanguard | (11,730) | ||
| Other Liabilities | (5) | ||
| Total Liabilities | (77,873) | ||
| Net Assets (100%) | 6,633,653 | ||
| At September 30, 2016, net assets consisted of: | |
| Amount | |
| ($000) | |
| Paid-in Capital | 5,403,565 |
| Undistributed Net Investment Income | 27,778 |
| Accumulated Net Realized Gains | 255,837 |
| Unrealized Appreciation (Depreciation) | |
| Investment Securities | 945,141 |
| Futures Contracts | 1,332 |
| Net Assets | 6,633,653 |
| Investor Shares—Net Assets | |
| Applicable to 66,447,343 outstanding | |
| $.001 par value shares of beneficial | |
| interest (unlimited authorization) | 2,801,145 |
| Net Asset Value Per Share— | |
| Investor Shares | $42.16 |
| Admiral Shares—Net Assets | |
| Applicable to 55,681,379 outstanding | |
| $.001 par value shares of beneficial | |
| interest (unlimited authorization) | 3,832,508 |
| Net Asset Value Per Share— | |
| Admiral Shares | $68.83 |
• See Note A in Notes to Financial Statements.
^ Includes partial security positions on loan to broker-dealers. The total value of securities on loan is $8,443,000.
* Non-income-producing security.
1 The fund invests a portion of its cash reserves in equity markets through the use of index futures contracts. After giving effect to futures
investments, the fund’s effective common stock and temporary cash investment positions represent 99.7% and 0.5%, respectively, of
net assets.
2 Affiliated money market fund available only to Vanguard funds and certain trusts and accounts managed by Vanguard. Rate shown is the
7-day yield.
3 Includes $8,671,000 of collateral received for securities on loan.
4 The issuer operates under a congressional charter; its securities are generally neither guaranteed by the U.S. Treasury nor backed by the full
faith and credit of the U.S. government.
5 Securities with a value of $5,300,000 have been segregated as initial margin for open futures contracts.
CVR—Contingent Value Rights.
REIT—Real Estate Investment Trust.
See accompanying Notes, which are an integral part of the Financial Statements.
27
Growth and Income Fund
Statement of Operations
| Year Ended | |
| September 30, 2016 | |
| ($000) | |
| Investment Income | |
| Income | |
| Dividends1 | 151,368 |
| Interest2 | 719 |
| Securities Lending—Net | 311 |
| Total Income | 152,398 |
| Expenses | |
| Investment Advisory Fees—Note B | |
| Basic Fee | 7,103 |
| Performance Adjustment | (154) |
| The Vanguard Group—Note C | |
| Management and Administrative—Investor Shares | 5,640 |
| Management and Administrative—Admiral Shares | 3,647 |
| Marketing and Distribution—Investor Shares | 503 |
| Marketing and Distribution—Admiral Shares | 260 |
| Custodian Fees | 227 |
| Auditing Fees | 41 |
| Shareholders’ Reports—Investor Shares | 70 |
| Shareholders’ Reports—Admiral Shares | 20 |
| Trustees’ Fees and Expenses | 9 |
| Total Expenses | 17,366 |
| Net Investment Income | 135,032 |
| Realized Net Gain (Loss) | |
| Investment Securities Sold2 | 298,854 |
| Futures Contracts | 17,101 |
| Realized Net Gain (Loss) | 315,955 |
| Change in Unrealized Appreciation (Depreciation) | |
| Investment Securities | 409,832 |
| Futures Contracts | 3,760 |
| Change in Unrealized Appreciation (Depreciation) | 413,592 |
| Net Increase (Decrease) in Net Assets Resulting from Operations | 864,579 |
| 1 Dividends are net of foreign withholding taxes of $11,000. | |
| 2 Interest income and realized net gain (loss) from an affiliated company of the fund were $686,000 and ($3,000), respectively. | |
See accompanying Notes, which are an integral part of the Financial Statements.
28
Growth and Income Fund
Statement of Changes in Net Assets
| Year Ended September 30, | ||
| 2016 | 2015 | |
| ($000) | ($000) | |
| Increase (Decrease) in Net Assets | ||
| Operations | ||
| Net Investment Income | 135,032 | 109,469 |
| Realized Net Gain (Loss) | 315,955 | 348,167 |
| Change in Unrealized Appreciation (Depreciation) | 413,592 | (438,192) |
| Net Increase (Decrease) in Net Assets Resulting from Operations | 864,579 | 19,444 |
| Distributions | ||
| Net Investment Income | ||
| Investor Shares | (53,764) | (50,108) |
| Admiral Shares | (70,386) | (57,404) |
| Realized Capital Gain1 | ||
| Investor Shares | (152,494) | (180,933) |
| Admiral Shares | (181,922) | (179,399) |
| Total Distributions | (458,566) | (467,844) |
| Capital Share Transactions | ||
| Investor Shares | (67,371) | (82,169) |
| Admiral Shares | 427,504 | 501,641 |
| Net Increase (Decrease) from Capital Share Transactions | 360,133 | 419,472 |
| Total Increase (Decrease) | 766,146 | (28,928) |
| Net Assets | ||
| Beginning of Period | 5,867,507 | 5,896,435 |
| End of Period2 | 6,633,653 | 5,867,507 |
| 1 Includes fiscal 2016 and 2015 short-term gain distributions totaling $65,407,000 and $830,000, respectively. Short-term gain distributions | ||
| are treated as ordinary income dividends for tax purposes. | ||
| 2 Net Assets—End of Period includes undistributed (overdistributed) net investment income of $27,778,000 and $16,881,000. | ||
See accompanying Notes, which are an integral part of the Financial Statements.
29
Growth and Income Fund
Financial Highlights
| Investor Shares | |||||
| For a Share Outstanding | Year Ended September 30, | ||||
| Throughout Each Period | 2016 | 2015 | 2014 | 2013 | 2012 |
| Net Asset Value, Beginning of Period | $39.55 | $42.69 | $36.02 | $30.73 | $23.86 |
| Investment Operations | |||||
| Net Investment Income | . 852 | .729 | . 671 | . 631 | . 549 |
| Net Realized and Unrealized Gain (Loss) | |||||
| on Investments | 4.813 | (.541) | 6.639 | 5.288 | 6.846 |
| Total from Investment Operations | 5.665 | .188 | 7.310 | 5.919 | 7.395 |
| Distributions | |||||
| Dividends from Net Investment Income | (.790) | (.724) | (. 640) | (. 629) | (. 525) |
| Distributions from Realized Capital Gains | (2.265) | (2.604) | — | — | — |
| Total Distributions | (3.055) | (3.328) | (.640) | (.629) | (.525) |
| Net Asset Value, End of Period | $42.16 | $39.55 | $42.69 | $36.02 | $30.73 |
| Total Return1 | 14.79% | 0.22% | 20.42% | 19.54% | 31.27% |
| Ratios/Supplemental Data | |||||
| Net Assets, End of Period (Millions) | $2,801 | $2,691 | $2,979 | $2,869 | $2,798 |
| Ratio of Total Expenses to | |||||
| Average Net Assets2 | 0.34% | 0.34% | 0.37% | 0.36% | 0.36% |
| Ratio of Net Investment Income to | |||||
| Average Net Assets | 2.09% | 1.70% | 1.67% | 1.90% | 1.94% |
| Portfolio Turnover Rate | 96% | 116% | 133% | 109% | 102% |
1 Total returns do not include account service fees that may have applied in the periods shown. Fund prospectuses provide information about any applicable account service fees.
2 Includes performance-based investment advisory fee increases (decreases) of 0.00%, 0.00%, 0.02%, 0.01%, and 0.01%.
See accompanying Notes, which are an integral part of the Financial Statements.
30
Growth and Income Fund
Financial Highlights
| Admiral Shares | |||||
| For a Share Outstanding | Year Ended September 30, | ||||
| Throughout Each Period | 2016 | 2015 | 2014 | 2013 | 2012 |
| Net Asset Value, Beginning of Period | $64.57 | $69.71 | $58.82 | $50.18 | $38.97 |
| Investment Operations | |||||
| Net Investment Income | 1.466 | 1.272 | 1.176 | 1.097 | .952 |
| Net Realized and Unrealized Gain (Loss) | |||||
| on Investments | 7.855 | (.897) | 10.833 | 8.633 | 11.168 |
| Total from Investment Operations | 9.321 | .375 | 12.009 | 9.730 | 12.120 |
| Distributions | |||||
| Dividends from Net Investment Income | (1.364) | (1.264) | (1.119) | (1.090) | (.910) |
| Distributions from Realized Capital Gains | (3.697) | (4.251) | — | — | — |
| Total Distributions | (5.061) | (5.515) | (1.119) | (1.090) | (.910) |
| Net Asset Value, End of Period | $68.83 | $64.57 | $69.71 | $58.82 | $50.18 |
| Total Return1 | 14.91% | 0.31% | 20.55% | 19.69% | 31.40% |
| Ratios/Supplemental Data | |||||
| Net Assets, End of Period (Millions) | $3,833 | $3,177 | $2,917 | $2,157 | $1,591 |
| Ratio of Total Expenses to | |||||
| Average Net Assets2 | 0.23% | 0.23% | 0.26% | 0.26% | 0.25% |
| Ratio of Net Investment Income to | |||||
| Average Net Assets | 2.20% | 1.81% | 1.78% | 2.00% | 2.05% |
| Portfolio Turnover Rate | 96% | 116% | 133% | 109% | 102% |
1 Total returns do not include account service fees that may have applied in the periods shown. Fund prospectuses provide information about any applicable account service fees.
2 Includes performance-based investment advisory fee increases (decreases) of 0.00%, 0.00%, 0.02%, 0.01%, and 0.01%.
See accompanying Notes, which are an integral part of the Financial Statements.
31
Growth and Income Fund
Notes to Financial Statements
Vanguard Growth and Income Fund is registered under the Investment Company Act of 1940 as an open-end investment company, or mutual fund. The fund offers two classes of shares: Investor Shares and Admiral Shares. Investor Shares are available to any investor who meets the fund’s minimum purchase requirements. Admiral Shares are designed for investors who meet certain administrative, service, and account-size criteria.
A. The following significant accounting policies conform to generally accepted accounting principles for U.S. investment companies. The fund consistently follows such policies in preparing its financial statements.
1. Security Valuation: Securities are valued as of the close of trading on the New York Stock Exchange (generally 4 p.m., Eastern time) on the valuation date. Equity securities are valued at the latest quoted sales prices or official closing prices taken from the primary market in which each security trades; such securities not traded on the valuation date are valued at the mean of the latest quoted bid and asked prices. Securities for which market quotations are not readily available, or whose values have been materially affected by events occurring before the fund’s pricing time but after the close of the securities’ primary markets, are valued by methods deemed by the board of trustees to represent fair value. Investments in Vanguard Market Liquidity Fund are valued at that fund’s net asset value. Temporary cash investments acquired over 60 days to maturity are valued using the latest bid prices or using valuations based on a matrix system (which considers such factors as security prices, yields, maturities, and ratings), both as furnished by independent pricing services. Other temporary cash investments are valued at amortized cost, which approximates market value.
2. Futures Contracts: The fund uses index futures contracts to a limited extent, with the objective of maintaining full exposure to the stock market while maintaining liquidity. The fund may purchase or sell futures contracts to achieve a desired level of investment, whether to accommodate portfolio turnover or cash flows from capital share transactions. The primary risks associated with the use of futures contracts are imperfect correlation between changes in market values of stocks held by the fund and the prices of futures contracts, and the possibility of an illiquid market. Counterparty risk involving futures is mitigated because a regulated clearinghouse is the counterparty instead of the clearing broker. To further mitigate counterparty risk, the fund trades futures contracts on an exchange, monitors the financial strength of its clearing brokers and clearinghouse, and has entered into clearing agreements with its clearing brokers. The clearinghouse imposes initial margin requirements to secure the fund’s performance and requires daily settlement of variation margin representing changes in the market value of each contract.
Futures contracts are valued at their quoted daily settlement prices. The aggregate settlement values of the contracts are not recorded in the Statement of Net Assets. Fluctuations in the value of the contracts are recorded in the Statement of Net Assets as an asset (liability) and in the Statement of Operations as unrealized appreciation (depreciation) until the contracts are closed, when they are recorded as realized futures gains (losses).
During the year ended September 30, 2016, the fund’s average investments in long and short futures contracts represented 2% and 0% of net assets, respectively, based on the average of aggregate settlement values at each quarter-end during the period.
3. Federal Income Taxes: The fund intends to continue to qualify as a regulated investment company and distribute all of its taxable income. Management has analyzed the fund’s tax positions taken for all open federal income tax years (September 30, 2013–2016), and has concluded that no provision for federal income tax is required in the fund’s financial statements.
32
Growth and Income Fund
4. Distributions: Distributions to shareholders are recorded on the ex-dividend date.
5. Securities Lending: To earn additional income, the fund lends its securities to qualified institutional borrowers. Security loans are subject to termination by the fund at any time, and are required to be secured at all times by collateral in an amount at least equal to the market value of securities loaned. Daily market fluctuations could cause the value of loaned securities to be more or less than the value of the collateral received. When this occurs, the collateral is adjusted and settled on the next business day. The fund further mitigates its counterparty risk by entering into securities lending transactions only with a diverse group of prequalified counterparties, monitoring their financial strength, and entering into master securities lending agreements with its counterparties. The master securities lending agreements provide that, in the event of a counterparty’s default (including bankruptcy), the fund may terminate any loans with that borrower, determine the net amount owed, and sell or retain the collateral up to the net amount owed to the fund; however, such actions may be subject to legal proceedings. While collateral mitigates counterparty risk, in the absence of a default the fund may experience delays and costs in recovering the securities loaned. The fund invests cash collateral received in Vanguard Market Liquidity Fund, and records a liability in the Statement of Net Assets for the return of the collateral, during the period the securities are on loan. Securities lending income represents fees charged to borrowers plus income earned on invested cash collateral, less expenses associated with the loan. During the term of the loan, the fund is entitled to all distributions made on or in respect of the loaned securities.
6. Credit Facility: The fund and certain other funds managed by The Vanguard Group (“Vanguard”) participate in a $3.1 billion committed credit facility provided by a syndicate of lenders pursuant to a credit agreement that may be renewed annually; each fund is individually liable for its borrowings, if any, under the credit facility. Borrowings may be utilized for temporary and emergency purposes, and are subject to the fund’s regulatory and contractual borrowing restrictions. The participating funds are charged administrative fees and an annual commitment fee of 0.10% of the undrawn amount of the facility; these fees are allocated to the funds based on a method approved by the fund’s board of trustees and included in Management and Administrative expenses on the fund’s Statement of Operations. Any borrowings under this facility bear interest at a rate based upon the higher of the one-month London Interbank Offered Rate, federal funds effective rate, or overnight bank funding rate plus an agreed-upon spread.
The fund had no borrowings outstanding at September 30, 2016, or at any time during the period then ended.
7. Other: Dividend income is recorded on the ex-dividend date. Interest income includes income distributions received from Vanguard Market Liquidity Fund and is accrued daily. Premiums and discounts on debt securities purchased are amortized and accreted, respectively, to interest income over the lives of the respective securities. Security transactions are accounted for on the date securities are bought or sold. Costs used to determine realized gains (losses) on the sale of investment securities are those of the specific securities sold.
Each class of shares has equal rights as to assets and earnings, except that each class separately bears certain class-specific expenses related to maintenance of shareholder accounts (included in Management and Administrative expenses) and shareholder reporting. Marketing and distribution expenses are allocated to each class of shares based on a method approved by the board of trustees. Income, other non-class-specific expenses, and gains and losses on investments are allocated to each class of shares based on its relative net assets.
33
Growth and Income Fund
B. The investment advisory firms D. E. Shaw Investment Management, L.L.C., and Los Angeles Capital Management and Equity Research, Inc., each provide investment advisory services to a portion of the fund for a fee calculated at an annual percentage rate of average net assets managed by the advisor. The basic fees of D. E. Shaw Investment Management, L.L.C., and Los Angeles Capital Management and Equity Research, Inc. are subject to quarterly adjustments based on performance relative to the S&P 500 Index for the preceding three years.
Vanguard provides investment advisory services to a portion of the fund as described below; the fund paid Vanguard advisory fees of $1,425,000 for the year ended September 30, 2016.
For the year ended September 30, 2016, the aggregate investment advisory fee paid to all advisors represented an effective annual basic rate of 0.11% of the fund’s average net assets, before a decrease of $154,000 (0.00%) based on performance.
C. In accordance with the terms of a Funds’ Service Agreement (the “FSA”) between Vanguard and the fund, Vanguard furnishes to the fund investment advisory, corporate management, administrative, marketing, and distribution services at Vanguard’s cost of operations (as defined by the FSA). These costs of operations are allocated to the fund based on methods and guidelines approved by the board of trustees. Vanguard does not require reimbursement in the current period for certain costs of operations (such as deferred compensation/benefits and risk/insurance costs); the fund’s liability for these costs of operations is included in Payables to Vanguard on the Statement of Net Assets.
Upon the request of Vanguard, the fund may invest up to 0.40% of its net assets as capital in Vanguard. At September 30, 2016, the fund had contributed to Vanguard capital in the amount of $511,000, representing 0.01% of the fund’s net assets and 0.20% of Vanguard’s capitalization. The fund’s trustees and officers are also directors and employees, respectively, of Vanguard.
D. Various inputs may be used to determine the value of the fund’s investments. These inputs are summarized in three broad levels for financial statement purposes. The inputs or methodologies used to value securities are not necessarily an indication of the risk associated with investing in those securities.
Level 1—Quoted prices in active markets for identical securities.
Level 2—Other significant observable inputs (including quoted prices for similar securities, interest rates, prepayment speeds, credit risk, etc.).
Level 3—Significant unobservable inputs (including the fund’s own assumptions used to determine the fair value of investments).
The following table summarizes the market value of the fund’s investments as of September 30, 2016, based on the inputs used to value them:
| Level 1 | Level 2 | Level 3 | |
| Investments | ($000) | ($000) | ($000) |
| Common Stocks | 6,489,684 | — | 14 |
| Temporary Cash Investments | 144,160 | 12,593 | — |
| Futures Contracts—Assets1 | 688 | — | — |
| Futures Contracts—Liabilities1 | (5) | — | — |
| Total | 6,634,527 | 12,593 | 14 |
| 1 Represents variation margin on the last day of the reporting period. | |||
34
Growth and Income Fund
E. At September 30, 2016, the aggregate settlement value of open futures contracts and the related unrealized appreciation (depreciation) were:
| ($000) | ||||
| Aggregate | ||||
| Number of | Settlement | Unrealized | ||
| Long (Short) | Value | Appreciation | ||
| Futures Contracts | Expiration | Contracts | Long (Short) | (Depreciation) |
| E-mini S&P 500 Index | December 2016 | 1,158 | 125,087 | 1,332 |
Unrealized appreciation (depreciation) on open futures contracts is required to be treated as realized gain (loss) for tax purposes.
F. Distributions are determined on a tax basis and may differ from net investment income and realized capital gains for financial reporting purposes. Differences may be permanent or temporary. Permanent differences are reclassified among capital accounts in the financial statements to reflect their tax character. Temporary differences arise when certain items of income, expense, gain, or loss are recognized in different periods for financial statement and tax purposes. These differences will reverse at some time in the future. Differences in classification may also result from the treatment of short-term gains as ordinary income for tax purposes.
Certain of the fund’s investments are in securities considered to be passive foreign investment companies, for which any unrealized appreciation and/or realized gains are required to be included in distributable net income for tax purposes. During the year ended September 30, 2016, the fund realized gains on the sale of passive foreign investment companies of $15,000, which have been included in current and prior periods’ taxable income; accordingly, such gains have been reclassified from accumulated net realized gains to undistributed net investment income.
The fund used a tax accounting practice to treat a portion of the price of capital shares redeemed during the year as distributions from realized capital gains. Accordingly, the fund has reclassified $16,714,000 from accumulated net realized gains to paid-in capital.
For tax purposes, at September 30, 2016, the fund had $52,319,000 of ordinary income and $256,251,000 of long-term capital gains available for distribution.
At September 30, 2016, the cost of investment securities for tax purposes was $5,713,802,000. Net unrealized appreciation of investment securities for tax purposes was $932,649,000, consisting of unrealized gains of $1,049,270,000 on securities that had risen in value since their purchase and $116,621,000 in unrealized losses on securities that had fallen in value since their purchase.
G. During the year ended September 30, 2016, the fund purchased $5,951,721,000 of investment securities and sold $5,886,853,000 of investment securities, other than temporary cash investments.
35
Growth and Income Fund
H. Capital share transactions for each class of shares were:
| Year Ended September 30, | ||||
| 2016 | 2015 | |||
| Amount | Shares | Amount | Shares | |
| ($000) | (000) | ($000) | (000) | |
| Investor Shares | ||||
| Issued | 230,757 | 5,725 | 316,336 | 7,469 |
| Issued in Lieu of Cash Distributions | 200,200 | 4,990 | 225,186 | 5,491 |
| Redeemed | (498,328) | (12,298) | (623,691) | (14,720) |
| Net Increase (Decrease)—Investor Shares | (67,371) | (1,583) | (82,169) | (1,760) |
| Admiral Shares | ||||
| Issued | 543,550 | 8,207 | 646,610 | 9,344 |
| Issued in Lieu of Cash Distributions | 235,763 | 3,601 | 221,904 | 3,311 |
| Redeemed | (351,809) | (5,325) | (366,873) | (5,305) |
| Net Increase (Decrease)—Admiral Shares | 427,504 | 6,483 | 501,641 | 7,350 |
I. Management has determined that no material events or transactions occurred subsequent to September 30, 2016, that would require recognition or disclosure in these financial statements.
36
Report of Independent Registered
Public Accounting Firm
To the Board of Trustees of Vanguard Quantitative Funds and the Shareholders of Vanguard Growth and Income Fund:
In our opinion, the accompanying statement of net assets and the related statements of operations and of changes in net assets and the financial highlights present fairly, in all material respects, the financial position of Vanguard Growth and Income Fund (constituting a separate portfolio of Vanguard Quantitative Funds, hereafter referred to as the “Fund”) at September 30, 2016, the results of its operations for the year then ended, the changes in its net assets for each of the two years in the period then ended, and the financial highlights for each of the five years in the period then ended, in conformity with accounting principles generally accepted in the United States of America. These financial statements and financial highlights (hereafter referred to as “financial statements”) are the responsibility of the Fund’s management. Our responsibility is to express an opinion on these financial statements based on our audits. We conducted our audits of these financial statements in accordance with the standards of the Public Company Accounting Oversight Board (United States). Those standards require that we plan and perform the audit to obtain reasonable assurance about whether the financial statements are free of material misstatement. An audit includes examining, on a test basis, evidence supporting the amounts and disclosures in the financial statements, assessing the accounting principles used and significant estimates made by management, and evaluating the overall financial statement presentation. We believe that our audits, which included confirmation of securities at September 30, 2016 by correspondence with the custodian and brokers and by agreement to the underlying ownership records of the transfer agent, provide a reasonable basis for our opinion.
/s/PricewaterhouseCoopers LLP
Philadelphia, Pennsylvania
November 10, 2016

Special 2016 tax information (unaudited) for Vanguard Growth and Income Fund
This information for the fiscal year ended September 30, 2016, is included pursuant to provisions
of the Internal Revenue Code.
The fund distributed $284,987,000 as capital gain dividends (20% rate gain distributions) to
shareholders during the fiscal year.
For nonresident alien shareholders, 100% of short-term capital gain dividends distributed by the fund
are qualified short-term capital gains.
The fund distributed $131,874,000 of qualified dividend income to shareholders during the fiscal year.
For corporate shareholders, 92.7% of investment income (dividend income plus short-term gains,
if any) qualifies for the dividends-received deduction.
37
Your Fund’s After-Tax Returns
This table presents returns for your fund both before and after taxes. The after-tax returns are shown in two ways: (1) assuming that an investor owned the fund during the entire period and paid taxes on the fund’s distributions, and (2) assuming that an investor paid taxes on the fund’s distributions and sold all shares at the end of each period.
Calculations are based on the highest individual federal income tax and capital gains tax rates in effect at the times of the distributions and the hypothetical sales. State and local taxes were not considered. After-tax returns reflect any qualified dividend income, using actual prior-year figures and estimates for 2016. (In the example, returns after the sale of fund shares may be higher than those assuming no sale. This occurs when the sale would have produced a capital loss. The calculation assumes that the investor received a tax deduction for the loss.)
The table shows returns for Investor Shares only; returns for other share classes will differ. Please note that your actual after-tax returns will depend on your tax situation and may differ from those shown. Also note that if you own the fund in a tax-deferred account, such as an individual retirement account or a 401(k) plan, this information does not apply to you. Such accounts are not subject to current taxes.
Finally, keep in mind that a fund’s performance—whether before or after taxes—does not guarantee future results.
| Average Annual Total Returns: Growth and Income Fund Investor Shares | |||
| Periods Ended September 30, 2016 | |||
| One | Five | Ten | |
| Year | Years | Years | |
| Returns Before Taxes | 14.79% | 16.80% | 6.64% |
| Returns After Taxes on Distributions | 12.62 | 15.70 | 5.78 |
| Returns After Taxes on Distributions and Sale of Fund Shares | 9.63 | 13.49 | 5.27 |
38
About Your Fund’s Expenses
As a shareholder of the fund, you incur ongoing costs, which include costs for portfolio management, administrative services, and shareholder reports (like this one), among others. Operating expenses, which are deducted from a fund’s gross income, directly reduce the investment return of the fund.
A fund’s expenses are expressed as a percentage of its average net assets. This figure is known as the expense ratio. The following examples are intended to help you understand the ongoing costs (in dollars) of investing in your fund and to compare these costs with those of other mutual funds. The examples are based on an investment of $1,000 made at the beginning of the period shown and held for the entire period.
The accompanying table illustrates your fund’s costs in two ways:
• Based on actual fund return. This section helps you to estimate the actual expenses that you paid over the period. The ”Ending Account Value“ shown is derived from the fund‘s actual return, and the third column shows the dollar amount that would have been paid by an investor who started with $1,000 in the fund. You may use the information here, together with the amount you invested, to estimate the expenses that you paid over the period.
To do so, simply divide your account value by $1,000 (for example, an $8,600 account value divided by $1,000 = 8.6), then multiply the result by the number given for your fund under the heading ”Expenses Paid During Period.“
• Based on hypothetical 5% yearly return. This section is intended to help you compare your fund‘s costs with those of other mutual funds. It assumes that the fund had a yearly return of 5% before expenses, but that the expense ratio is unchanged. In this case—because the return used is not the fund’s actual return—the results do not apply to your investment. The example is useful in making comparisons because the Securities and Exchange Commission requires all mutual funds to calculate expenses based on a 5% return. You can assess your fund’s costs by comparing this hypothetical example with the hypothetical examples that appear in shareholder reports of other funds.
Note that the expenses shown in the table are meant to highlight and help you compare ongoing costs only and do not reflect transaction costs incurred by the fund for buying and selling securities. Further, the expenses do not include any purchase, redemption, or account service fees described in the fund prospectus. If such fees were applied to your account, your costs would be higher. Your fund does not carry a “sales load.”
The calculations assume no shares were bought or sold during the period. Your actual costs may have been higher or lower, depending on the amount of your investment and the timing of any purchases or redemptions.
You can find more information about the fund’s expenses, including annual expense ratios, in the Financial Statements section of this report. For additional information on operating expenses and other shareholder costs, please refer to your fund’s current prospectus.
39
| Six Months Ended September 30, 2016 | |||
| Beginning | Ending | Expenses | |
| Account Value | Account Value | Paid During | |
| Growth and Income Fund | 3/31/2016 | 9/30/2016 | Period |
| Based on Actual Fund Return | |||
| Investor Shares | $1,000.00 | $1,062.16 | $1.86 |
| Admiral Shares | 1,000.00 | 1,062.81 | 1.29 |
| Based on Hypothetical 5% Yearly Return | |||
| Investor Shares | $1,000.00 | $1,023.20 | $1.82 |
| Admiral Shares | 1,000.00 | 1,023.75 | 1.26 |
The calculations are based on expenses incurred in the most recent six-month period. The fund’s annualized six-month expense ratios for that
period are 0.36% for Investor Shares and 0.25% for Admiral Shares. The dollar amounts shown as “Expenses Paid” are equal to the
annualized expense ratio multiplied by the average account value over the period, multiplied by the number of days in the most recent
six-month period, then divided by the number of days in the most recent 12-month period (183/366).
40
Trustees Approve Advisory Arrangements
The board of trustees of Vanguard Growth and Income Fund has renewed the fund’s investment advisory arrangements with D. E. Shaw Investment Management, L.L.C. (DESIM), Los Angeles Capital Management and Equity Research, Inc. (LA Capital), and The Vanguard Group, Inc. (Vanguard), through its Quantitative Equity Group. The board determined that renewing the fund’s advisory arrangements was in the best interest of the fund and its shareholders.
The board based its decision upon an evaluation of each advisor’s investment staff, portfolio management process, and performance. This evaluation included information provided to the board by Vanguard’s Portfolio Review Department, which is responsible for fund and advisor oversight and product management. The Portfolio Review Department met regularly with the advisors and made monthly presentations to the board during the fiscal year directing the board’s focus to relevant information and topics.
The board, or an investment committee made up of board members, also received information throughout the year during advisor presentations. For each advisor presentation, the board was provided with letters and reports that included information about, among other things, the advisory firm and the advisor’s assessment of the investment environment, portfolio performance, and portfolio characteristics.
In addition, the board received monthly reports, which included a Market and Economic Report, a Fund Dashboard Monthly Summary, and a Fund Performance Report.
Prior to their meeting, the trustees were provided with a memo and materials that summarized the information they received over the course of the year. They also considered the factors discussed below, among others. However, no single factor determined whether the board approved the arrangements. Rather, it was the totality of the circumstances that drove the board’s decision.
Nature, extent, and quality of services
The board reviewed the quality of each advisor’s investment management services provided to the fund since 2011, and took into account the organizational depth and stability of each advisor. The board considered the following:
DESIM. Founded in 2005, DESIM is a global investment management and technology development firm. The firm employs quantitative models that seek to capture predominantly “bottom-up” stock-specific return opportunities while aiming to control overall portfolio risk and characteristics, such as size, sector weights, and style, to be similar to those of the benchmark. The firm focuses on return drivers that it considers “idiosyncratic,” or those that other quantitative managers tend to overlook, and de-emphasizes the use of traditional factors such as value, growth, and momentum, as these factors are more subject to crowding from other quantitative managers. DESIM has managed a portion of the fund since 2011.
LA Capital. LA Capital was formed in 2002 from the equity portion of Wilshire Asset Management. The firm employs a controlled, dynamic investment model, gradually assigning new prices to key equity risks as market conditions evolve and investor preferences shift. The price of factor risk evolves over time in a way that can be captured in a model, similar to changes in cost of capital. The model uses more than 50 factors to actively weight stocks, including value, momentum, quality, sector, and market capitalization. The team applies statistical techniques to reduce noise in the factor returns and it looks for velocity and acceleration of the cleansed factor performance over the prior six months. LA Capital has managed a portion of the fund since 2011.
41
Vanguard. Vanguard has been managing investments for more than three decades. The Quantitative Equity Group adheres to a sound, disciplined investment management process; the team has considerable experience, stability, and depth. Vanguard has managed a portion of the fund since 2011.
The board concluded that each advisor’s experience, stability, depth, and performance, among other factors, warranted continuation of the advisory arrangements.
Investment performance
The board considered the fund’s investment performance since each advisor began managing the fund in 2011, including any periods of outperformance or underperformance compared with a relevant benchmark index and peer group. The board concluded that the performance was such that the advisory arrangements should continue. Information about the fund’s most recent performance can be found in the Performance Summary section of this report.
Cost
The board concluded that the fund’s expense ratio was well below the average expense ratio charged by funds in its peer group and that the fund’s advisory expense rate was also well below its peer-group average. Information about the fund’s expense ratio appears in the About Your Fund’s Expenses section of this report as well as in the Financial Statements section, which also includes information about the fund’s advisory expense rate.
The board did not consider profitability of DESIM and LA Capital in determining whether to approve the advisory fees, because the firms are independent of Vanguard, and the advisory fees are the result of arm’s-length negotiations. The board does not conduct a profitability analysis of Vanguard because of Vanguard’s unique “at-cost” structure. Unlike most other mutual fund management companies, Vanguard is owned by the funds it oversees and produces “profits” only in the form of reduced expenses for fund shareholders.
The benefit of economies of scale
The board concluded that the fund’s shareholders benefit from economies of scale because of breakpoints in the advisory fee schedules for DESIM and LA Capital. The breakpoints reduce the effective rate of the fee as the fund’s assets managed by each advisor increase. The board also concluded that the fund’s at-cost arrangement with Vanguard ensures that the fund will realize economies of scale as it grows, with the cost to shareholders declining as the fund’s assets managed by Vanguard increase.
The board will consider whether to renew the advisory arrangements again after a one-year period.
42
Glossary
30-Day SEC Yield. A fund’s 30-day SEC yield is derived using a formula specified by the U.S. Securities and Exchange Commission. Under the formula, data related to the fund’s security holdings in the previous 30 days are used to calculate the fund’s hypothetical net income for that period, which is then annualized and divided by the fund’s estimated average net assets over the calculation period. For the purposes of this calculation, a security’s income is based on its current market yield to maturity (for bonds), its actual income (for asset-backed securities), or its projected dividend yield (for stocks). Because the SEC yield represents hypothetical annualized income, it will differ—at times significantly—from the fund’s actual experience. As a result, the fund’s income distributions may be higher or lower than implied by the SEC yield.
Beta. A measure of the magnitude of a fund’s past share-price fluctuations in relation to the ups and downs of a given market index. The index is assigned a beta of 1.00. Compared with a given index, a fund with a beta of 1.20 typically would have seen its share price rise or fall by 12% when the index rose or fell by 10%. For this report, beta is based on returns over the past 36 months for both the fund and the index. Note that a fund’s beta should be reviewed in conjunction with its R-squared (see definition). The lower the R-squared, the less correlation there is between the fund and the index, and the less reliable beta is as an indicator of volatility.
Dividend Yield. Dividend income earned by stocks, expressed as a percentage of the aggregate market value (or of net asset value, for a fund). The yield is determined by dividing the amount of the annual dividends by the aggregate value (or net asset value) at the end of the period. For a fund, the dividend yield is based solely on stock holdings and does not include any income produced by other investments.
Earnings Growth Rate. The average annual rate of growth in earnings over the past five years for the stocks now in a fund.
Equity Exposure. A measure that reflects a fund’s investments in stocks and stock futures. Any holdings in short-term reserves are excluded.
Expense Ratio. A fund’s total annual operating expenses expressed as a percentage of the fund’s average net assets. The expense ratio includes management and administrative expenses, but does not include the transaction costs of buying and selling portfolio securities.
Foreign Holdings. The percentage of a fund represented by securities or depositary receipts of companies based outside the United States.
Inception Date. The date on which the assets of a fund (or one of its share classes) are first invested in accordance with the fund’s investment objective. For funds with a subscription period, the inception date is the day after that period ends. Investment performance is measured from the inception date.
Median Market Cap. An indicator of the size of companies in which a fund invests; the midpoint of market capitalization (market price x shares outstanding) of a fund’s stocks, weighted by the proportion of the fund’s assets invested in each stock. Stocks representing half of the fund’s assets have market capitalizations above the median, and the rest are below it.
Price/Book Ratio. The share price of a stock divided by its net worth, or book value, per share. For a fund, the weighted average price/book ratio of the stocks it holds.
43
Price/Earnings Ratio. The ratio of a stock’s current price to its per-share earnings over the past year. For a fund, the weighted average P/E of the stocks it holds. P/E is an indicator of market expectations about corporate prospects; the higher the P/E, the greater the expectations for a company’s future growth.
R-Squared. A measure of how much of a fund’s past returns can be explained by the returns from the market in general, as measured by a given index. If a fund’s total returns were precisely synchronized with an index’s returns, its R-squared would be 1.00. If the fund’s returns bore no relationship to the index’s returns, its R-squared would be 0. For this report, R-squared is based on returns over the past 36 months for both the fund and the index.
Return on Equity. The annual average rate of return generated by a company during the past five years for each dollar of shareholder’s equity (net income divided by shareholder’s equity). For a fund, the weighted average return on equity for the companies whose stocks it holds.
Short-Term Reserves. The percentage of a fund invested in highly liquid, short-term securities that can be readily converted to cash.
Turnover Rate. An indication of the fund’s trading activity. Funds with high turnover rates incur higher transaction costs and may be more likely to distribute capital gains (which may be taxable to investors). The turnover rate excludes in-kind transactions, which have minimal impact on costs.
44
This page intentionally left blank.
This page intentionally left blank.
This page intentionally left blank.
The People Who Govern Your Fund
The trustees of your mutual fund are there to see that the fund is operated and managed in your best interests since, as a shareholder, you are a part owner of the fund. Your fund’s trustees also serve on the board of directors of The Vanguard Group, Inc., which is owned by the Vanguard funds and provides services to them on an at-cost basis.
A majority of Vanguard’s board members are independent, meaning that they have no affiliation with Vanguard or the funds they oversee, apart from the sizable personal investments they have made as private individuals. The independent board members have distinguished backgrounds in business, academia, and public service. Each of the trustees and executive officers oversees 198 Vanguard funds.
The following table provides information for each trustee and executive officer of the fund. The mailing address of the trustees and officers is P.O. Box 876, Valley Forge, PA 19482. More information about the trustees is in the Statement of Additional Information, which can be obtained, without charge, by contacting Vanguard at 800-662-7447, or online at vanguard.com.
| InterestedTrustee1 |
| F. William McNabb III |
| Born 1957. Trustee Since July 2009. Chairman of |
| the Board. Principal Occupation(s) During the Past |
| Five Years and Other Experience: Chairman of the |
| Board of The Vanguard Group, Inc., and of each of |
| the investment companies served by The Vanguard |
| Group, since January 2010; Director of The Vanguard |
| Group since 2008; Chief Executive Officer and |
| President of The Vanguard Group, and of each of |
| the investment companies served by The Vanguard |
| Group, since 2008; Director of Vanguard Marketing |
| Corporation; Managing Director of The Vanguard |
| Group (1995–2008). |
| IndependentTrustees |
| Emerson U. Fullwood |
| Born 1948. Trustee Since January 2008. Principal |
| Occupation(s) During the Past Five Years and Other |
| Experience: Executive Chief Staff and Marketing |
| Officer for North America and Corporate Vice President |
| (retired 2008) of Xerox Corporation (document manage- |
| ment products and services); Executive in Residence |
| and 2009–2010 Distinguished Minett Professor at |
| the Rochester Institute of Technology; Lead Director |
| of SPX FLOW, Inc. (multi-industry manufacturing); |
| Director of the United Way of Rochester, the University |
| of Rochester Medical Center, Monroe Community |
| College Foundation, North Carolina A&T University, |
| and Roberts Wesleyan College. |
| Rajiv L. Gupta |
| Born 1945. Trustee Since December 2001.2 Principal |
| Occupation(s) During the Past Five Years and Other |
| Experience: Chairman and Chief Executive Officer |
| (retired 2009) and President (2006–2008) of |
| Rohm and Haas Co. (chemicals); Director of Tyco |
| International plc (diversified manufacturing and |
| services), HP Inc. (printer and personal computer |
| manufacturing), and Delphi Automotive plc |
| (automotive components); Senior Advisor at |
| New Mountain Capital. |
Amy Gutmann |
| Born 1949. Trustee Since June 2006. Principal |
| Occupation(s) During the Past Five Years and |
| Other Experience: President of the University of |
| Pennsylvania; Christopher H. Browne Distinguished |
| Professor of Political Science, School of Arts and |
| Sciences, and Professor of Communication, Annenberg |
| School for Communication, with secondary faculty |
| appointments in the Department of Philosophy, School |
| of Arts and Sciences, and at the Graduate School of |
| Education, University of Pennsylvania; Trustee of the |
| National Constitution Center; Chair of the Presidential |
| Commission for the Study of Bioethical Issues. |
JoAnn Heffernan Heisen |
| Born 1950. Trustee Since July 1998. Principal |
| Occupation(s) During the Past Five Years and |
| Other Experience: Corporate Vice President and |
| Chief Global Diversity Officer (retired 2008) and |
| Member of the Executive Committee (1997–2008) |
| of Johnson & Johnson (pharmaceuticals/medical |
| devices/consumer products); Director of Skytop |
| Lodge Corporation (hotels) and the Robert Wood |
| Johnson Foundation; Member of the Advisory |
| Board of the Institute for Women’s Leadership |
| at Rutgers University. |
| F. Joseph Loughrey |
| Born 1949. Trustee Since October 2009. Principal |
| Occupation(s) During the Past Five Years and Other |
| Experience: President and Chief Operating Officer |
| (retired 2009) of Cummins Inc. (industrial machinery); |
| Chairman of the Board of Hillenbrand, Inc. (specialized |
| consumer services), and of Oxfam America; Director |
| of SKF AB (industrial machinery), Hyster-Yale Materials |
| Handling, Inc. (forklift trucks), the Lumina Foundation |
| for Education, and the V Foundation for Cancer |
| Research; Member of the Advisory Council for the |
| College of Arts and Letters and of the Advisory Board |
| to the Kellogg Institute for International Studies, both |
| at the University of Notre Dame. |
Mark Loughridge |
| Born 1953. Trustee Since March 2012. Principal |
| Occupation(s) During the Past Five Years and Other |
| Experience: Senior Vice President and Chief Financial |
| Officer (retired 2013) at IBM (information technology |
| services); Fiduciary Member of IBM’s Retirement Plan |
| Committee (2004–2013); Director of the Dow Chemical |
| Company; Member of the Council on Chicago Booth. |
Scott C. Malpass |
| Born 1962. Trustee Since March 2012. Principal |
| Occupation(s) During the Past Five Years and Other |
| Experience: Chief Investment Officer and Vice |
| President at the University of Notre Dame; Assistant |
| Professor of Finance at the Mendoza College of |
| Business at Notre Dame; Member of the Notre Dame |
| 403(b) Investment Committee, the Board of Advisors |
| for Spruceview Capital Partners, and the Investment |
| Advisory Committee of Major League Baseball; Board |
| Member of TIFF Advisory Services, Inc., and Catholic |
| Investment Services, Inc. (investment advisors). |
André F. Perold |
| Born 1952. Trustee Since December 2004. Principal |
| Occupation(s) During the Past Five Years and Other |
| Experience: George Gund Professor of Finance and |
| Banking, Emeritus at the Harvard Business School |
| (retired 2011); Chief Investment Officer and Managing |
| Partner of HighVista Strategies LLC (private investment |
| firm); Director of Rand Merchant Bank; Overseer of |
| the Museum of Fine Arts Boston. |
Peter F. Volanakis |
| Born 1955. Trustee Since July 2009. Principal |
| Occupation(s) During the Past Five Years and |
| Other Experience: President and Chief Operating |
| Officer (retired 2010) of Corning Incorporated |
| (communications equipment); Chairman of the |
| Board of Trustees of Colby-Sawyer College; |
| Member of the Advisory Board of the Norris |
| Cotton Cancer Center. |
| Executive Officers | |
| Glenn Booraem | |
| Born 1967. Treasurer Since May 2015. Principal | |
| Occupation(s) During the Past Five Years and | |
| Other Experience: Principal of The Vanguard Group, | |
| Inc.; Treasurer of each of the investment companies | |
| served by The Vanguard Group; Controller of each of | |
| the investment companies served by The Vanguard | |
| Group (2010–2015); Assistant Controller of each of | |
| the investment companies served by The Vanguard | |
| Group (2001–2010). | |
Thomas J. Higgins | |
| Born 1957. Chief Financial Officer Since September | |
| 2008. Principal Occupation(s) During the Past Five | |
| Years and Other Experience: Principal of The Vanguard | |
| Group, Inc.; Chief Financial Officer of each of the | |
| investment companies served by The Vanguard Group; | |
| Treasurer of each of the investment companies served | |
| by The Vanguard Group (1998–2008). | |
Peter Mahoney | |
| Born 1974. Controller Since May 2015. Principal | |
| Occupation(s) During the Past Five Years and Other | |
| Experience: Head of Global Fund Accounting at The | |
| Vanguard Group, Inc.; Controller of each of the invest- | |
| ment companies served by The Vanguard Group; | |
| Head of International Fund Services at The Vanguard | |
| Group (2008–2014). | |
Anne E. Robinson | |
| Born 1970. Secretary Since September 2016. Principal | |
| Occupation(s) During the Past Five Years and Other | |
| Experience: Managing Director of The Vanguard Group, | |
| Inc.; General Counsel of The Vanguard Group; Secretary | |
| of The Vanguard Group and of each of the investment | |
| companies served by The Vanguard Group; Director | |
| and Senior Vice President of Vanguard Marketing | |
| Corporation; Managing Director and General Counsel | |
| of Global Cards and Consumer Services at Citigroup | |
| (2014–2016); Counsel at American Express (2003–2014). | |
| Vanguard Senior ManagementTeam | |
| Mortimer J. Buckley | James M. Norris |
| Kathleen C. Gubanich | Thomas M. Rampulla |
| Martha G. King | Glenn W. Reed |
| John T. Marcante | Karin A. Risi |
| Chris D. McIsaac | Michael Rollings |
| Chairman Emeritus and Senior Advisor | |
| John J. Brennan | |
| Chairman, 1996–2009 | |
| Chief Executive Officer and President, 1996–2008 | |
| Founder | |
| John C. Bogle | |
| Chairman and Chief Executive Officer, 1974–1996 | |
1 Mr. McNabb is considered an “interested person,” as defined in the Investment Company Act of 1940, because he is an officer of the Vanguard funds.
2 December 2002 for Vanguard Equity Income Fund, the Vanguard Municipal Bond Funds, and the Vanguard State Tax-Exempt Funds.
 | |
| P.O. Box 2600 | |
| Valley Forge, PA 19482-2600 | |
| Connect with Vanguard® > vanguard.com | |
| Fund Information > 800-662-7447 | CFA® is a registered trademark owned by CFA Institute. |
| Direct Investor Account Services > 800-662-2739 | |
| Institutional Investor Services > 800-523-1036 | |
| Text Telephone for People | |
| Who Are Deaf or Hard of Hearing> 800-749-7273 | |
| This material may be used in conjunction | |
| with the offering of shares of any Vanguard | |
| fund only if preceded or accompanied by | |
| the fund’s current prospectus. | |
| All comparative mutual fund data are from Lipper, a | |
| Thomson Reuters Company, or Morningstar, Inc., unless | |
| otherwise noted. | |
| You can obtain a free copy of Vanguard’s proxy voting | |
| guidelines by visiting vanguard.com/proxyreporting or by | |
| calling Vanguard at 800-662-2739. The guidelines are | |
| also available from the SEC’s website, sec.gov. In | |
| addition, you may obtain a free report on how your fund | |
| voted the proxies for securities it owned during the 12 | |
| months ended June 30. To get the report, visit either | |
| vanguard.com/proxyreporting or sec.gov. | |
| You can review and copy information about your fund at | |
| the SEC’s Public Reference Room in Washington, D.C. To | |
| find out more about this public service, call the SEC at | |
| 202-551-8090. Information about your fund is also | |
| available on the SEC’s website, and you can receive | |
| copies of this information, for a fee, by sending a | |
| request in either of two ways: via email addressed to | |
| publicinfo@sec.gov or via regular mail addressed to the | |
| Public Reference Section, Securities and Exchange | |
| Commission, Washington, DC 20549-1520. | |
| © 2016 The Vanguard Group, Inc. | |
| All rights reserved. | |
| Vanguard Marketing Corporation, Distributor. | |
| Q930 112016 | |
Annual Report | September 30, 2016
Vanguard Structured Equity Funds
Vanguard Structured Large-Cap Equity Fund
Vanguard Structured Broad Market Fund
A new format, unwavering commitment
As you begin reading this report, you’ll notice that we’ve made some improvements to the opening sections—based on feedback from you, our clients.
Page 1 starts with a new ”Your Fund’s Performance at a Glance,” a concise, handy summary of how your fund performed during the period.
In the renamed ”Chairman’s Perspective,” Bill McNabb will focus on enduring principles and investment insights.
We’ve modified some tables, and eliminated some redundancy, but we haven’t removed any information.
At Vanguard, we’re always looking for better ways to communicate and to help you make sound investment decisions. Thank you for entrusting your assets to us.
| Contents | |
| Your Fund’s Performance at a Glance. | 1 |
| Chairman’s Perspective. | 3 |
| Advisor’s Report. | 6 |
| Structured Large-Cap Equity Fund. | 9 |
| Structured Broad Market Fund. | 25 |
| About Your Fund’s Expenses. | 43 |
| Glossary. | 45 |
Please note: The opinions expressed in this report are just that—informed opinions. They should not be considered promises or advice.
Also, please keep in mind that the information and opinions cover the period through the date on the front of this report. Of course, the
risks of investing in your fund are spelled out in the prospectus.
See the Glossary for definitions of investment terms used in this report.
About the cover: No matter what language you speak, Vanguard has one consistent message and set of principles. Our primary
focus is on you, our clients. We conduct our business with integrity as a faithful steward of your assets. This message is shown
translated into seven languages, reflecting our expanding global presence.
Your Fund’s Performance at a Glance
• The Vanguard Structured Equity Funds trailed their benchmark returns for the 12 months ended September 30, 2016, but outperformed the average returns of their peer groups.
• Vanguard Structured Large-Cap Equity Fund returned more than 14%. It lagged its benchmark, the S&P 500 Index, by about 1 percentage point.
• Vanguard Structured Broad Market Fund returned nearly 12%, about 3 percentage points less than its benchmark, the Russell 3000 Index.
• In most cases, sector performance was positive in both funds but below that of the corresponding benchmark sectors. Information technology and real estate companies were among the funds’ strongest performers. Energy and health care were among both funds’ biggest relative detractors.
• On November 17, 2016, the board of trustees for the Structured Broad Market Fund and the Structured Large-Cap Equity Fund approved liquidation of each fund effective February 22, 2017. The funds are closed to new investors and new investments. See the Notes to Financial Statements for more information.
| Total Returns: Fiscal Year Ended September 30, 2016 | |
| Total | |
| Returns | |
| Vanguard Structured Large-Cap Equity Fund | |
| Institutional Shares | 14.36% |
| Institutional Plus Shares | 14.42 |
| S&P 500 Index | 15.43 |
| Large-Cap Core Funds Average | 12.38 |
| Large-Cap Core Funds Average: Derived from data provided by Lipper, a Thomson Reuters Company. |
| Vanguard Structured Broad Market Fund | |
| Institutional Shares | 11.60% |
| Institutional Plus Shares | 11.66 |
| Russell 3000 Index | 14.96 |
| Multi-Cap Core Funds Average | 10.97 |
| Multi-Cap Core Funds Average: Derived from data provided by Lipper, a Thomson Reuters Company. | |
| Institutional Shares and Institutional Plus Shares are available to certain institutional investors who meet specific administrative, service, and account-size criteria. | |
1
| Total Returns: Ten Years Ended September 30, 2016 | |
| Average | |
| Annual Return | |
| Structured Large-Cap Equity Fund Institutional Shares | 7.41% |
| S&P 500 Index | 7.24 |
| Large-Cap Core Funds Average | 5.89 |
| Large-Cap Core Funds Average: Derived from data provided by Lipper, a Thomson Reuters Company. | |
| Structured Broad Market Fund Institutional Shares (Returns since inception: 11/30/2006) | 7.00% |
| Russell 3000 Index | 6.88 |
| Multi-Cap Core Funds Average | 5.32 |
| Multi-Cap Core Funds Average: Derived from data provided by Lipper, a Thomson Reuters Company. | |
The figures shown represent past performance, which is not a guarantee of future results. (Current performance may be
lower or higher than the performance data cited. For performance data current to the most recent month-end, visit our
website at vanguard.com/performance.) Note, too, that both investment returns and principal value can fluctuate widely, so
an investor’s shares, when sold, could be worth more or less than their original cost.
2
Chairman’s Perspective

Bill McNabb
Chairman and Chief Executive Officer
Dear Shareholder,
If you think you’ve had reason to feel uneasy about the investment environment lately, you’re not imagining things. In just the past few months, we’ve seen economic uncertainty, intense political polarization, and super-low bond yields. Yet at the same time, the stock market kept pushing higher.
In this confusing and sometimes contradictory climate, you may be asking yourself a question that I hear often: How do I make sense of all this, keep investing, and still get a good night’s sleep?
As with any problem, there are multiple ways to go at it. But there’s one approach in particular that is simple, straightforward, and nearly foolproof: Save more money. Not only can saving more give you a greater sense of control over your investment plan, it can help compensate for long-term returns that, in our estimation, could fall short of historical averages.
I love the way one of our investment pros put it. Fran Kinniry this summer told The Wall Street Journal, “Investing is always a partnership between you and the markets.” He explained that the markets carried more than their fair share of the weight for a couple of decades, through the 1990s, providing outsized returns that made the investor’s half of the partnership relatively light work. “But now you are going to have to be the majority partner.”
Sobering? Sure. Hopeless? Definitely not.
3
Over the 12 months since last September, U.S. stocks returned 15%, though the rise has not been a one-way ticket straight up. International markets have also posted strong returns, but lower than those of the broad U.S. market. The decision by United Kingdom voters in June to exit the European Union came as a surprise but caused market heartburn for only a few days.
In fixed income, yields remained extremely low—about 1.60% on the 10-year U.S. Treasury note at the end of September, after dipping below 1.40% over the summer. And bond yields in some international markets were negative.
Even this relatively small window of time illustrates a truism of the financial markets: There will always be segments that perform well and others that don’t. Saving more saves you from trying to control the uncontrollable—how economies and the markets perform. And it keeps you in control of one of the most vital parts of your investment program.
Although the “save more” logic is easy to grasp, it’s not always easy to follow. Bills, illness, the loss of a job—these can affect any of us.
But whatever our circumstances, figuring out how to save more is worth the effort. It requires that we make difficult decisions to forgo some consumption today to increase the likelihood of consuming (or consuming more) in the future. This is the very heart of investing. Sacrifices are never fun, so consider carrying them out systematically and in doses that you
| Market Barometer | |||
| Average Annual Total Returns | |||
| Periods Ended September 30, 2016 | |||
| One | Three | Five | |
| Year | Years | Years | |
| Stocks | |||
| Russell 1000 Index (Large-caps) | 14.93% | 10.78% | 16.41% |
| Russell 2000 Index (Small-caps) | 15.47 | 6.71 | 15.82 |
| Russell 3000 Index (Broad U.S. market) | 14.96 | 10.44 | 16.36 |
| FTSE All-World ex US Index (International) | 9.62 | 0.71 | 6.50 |
| Bonds | |||
| Bloomberg Barclays U.S. Aggregate Bond Index | |||
| (Broad taxable market) | 5.19% | 4.03% | 3.08% |
| Bloomberg Barclays Municipal Bond Index | |||
| (Broad tax-exempt market) | 5.58 | 5.54 | 4.48 |
| Citigroup Three-Month U.S. Treasury Bill Index | 0.20 | 0.06 | 0.06 |
| CPI | |||
| Consumer Price Index | 1.46% | 1.03% | 1.25% |
4
can be comfortable with—for instance, gradually getting up to the max in your IRA, or adding a percentage point or so to the amount you stash in your employer’s retirement plan. As a point of reference, we generally suggest that investors strive for a retirement savings rate of 12%–15%, including any employer contributions.
If you need more convincing about the wisdom of the “save more” course of action, it might be helpful to examine your alternatives. This list is by no means exhaustive, but it hits on a few of the big ones, and none are without risk.
• Reach for yield. With yields so low on many types of bonds, it’s tempting to find the corners of the fixed income market where payouts are juicier. But with the juice comes considerable risk. You need to be aware that you’d be taking on more risk—and how much more.
• Go all-in on a hot-performing asset class or fund. By now, you know better than that, right?
• Sit tight. This approach isn’t a terrible idea; it’s better than panicking and deciding to just “do something,” particularly if that means changing your approach in response to the market’s movements.
Here’s the inescapably challenging part of your partnership with the markets: In the short run, your “partner” is fickle, emotional, and wildly unpredictable. But in the long run, your partner is mostly rational and extremely helpful.
The best way to minimize your vulnerability to the market’s mood swings, and to maximize the benefit of your partner’s longer-term strengths, is to expect less and save more. Maybe the markets will deliver better-than-expected returns. Maybe they’ll be consistent with our more modest expectations. In either case, a higher savings rate can help put you in a better position to reach your goals.
As always, thank you for investing with Vanguard.
Sincerely,

F. William McNabb III
Chairman and Chief Executive Officer
October 18, 2016
5
Advisor’s Report
For the fiscal year ended September 30, 2016, Vanguard Structured Large-Cap Equity Fund returned 14.36% for Institutional Shares, underperforming its benchmark, the S&P 500 Index, by 1.07 percentage points. Vanguard Structured Broad Market Fund returned 11.60% for Institutional Shares, underperforming its benchmark, the Russell 3000 Index, by 3.36 percentage points.
U.S. equities produced strong returns for the 12 months but experienced above-average volatility during the first half of the period. This was reflected in the CBOE Market Volatility Index; the average VIX level was 18.72 during the first half, compared with 14.45 during the second half. The broad U.S. equity market, as represented by the Russell 3000 Index, was up 14.96%, small-capitalization stocks outperformed large-caps by 0.54 percentage point, and value-oriented stocks outpaced their growth counterparts by 2.74 percentage points.
Globally, the U.S. equity market continued to outperform international markets, while emerging markets outpaced developed markets. Within the broad U.S. equity market, all 11 sectors generated positive returns. Information technology, industrial, and consumer staples companies performed the strongest. Although results in telecommunication services, financials, and utilities were still positive, these sectors contributed the least to the broad market return.
Growth around the globe remains subdued. The U.S. economy grew at an annual rate of 0.8% in the first quarter of 2016 and 1.4% in the second. Positive contributions from personal consumption expenditures, exports, and nonresidential fixed investments were partly offset by declines in private inventory investment and residential fixed investment.
The International Monetary Fund estimated that the global economy grew at an annual rate of 2.9% over the first half of 2016, slightly weaker than in the second half of 2015. Brexit is still unfolding, as the long-term arrangements between the United Kingdom and the European Union will remain uncertain for some time.
Commodity prices also partly recovered. After hitting a ten-year low in January 2016, oil prices rallied by 50% to $45 in August, mostly because of production outages. Nonfuel commodity prices also have increased, with metals prices rising 12% and agricultural commodity prices 9%.
Although it’s important to understand how overall performance is affected by these macroeconomic factors, our approach to investing focuses on specific fundamentals—not technical analysis of stock price movements. We compare all stocks in our investment universe within the same industry group to identify those with characteristics that we believe will outperform over the long run.
6
To do this, we use a strict quantitative process that systematically focuses on several key fundamental factors. We believe that attractive stocks exhibit five key characteristics: high quality––healthy balance sheets and steady cash-flow generation; effective use of capital––sound investment policies that favor internal over external funding; consistent earnings growth––the ability to grow earnings year after year; strong market sentiment––market confirmation of our view; and reasonable valuation––avoidance of overpriced stocks.
Using these five themes, we generate a composite rank for all the stocks in our universe each day, seeking to capitalize on investor biases across the market. We monitor our portfolio based on those rankings and adjust when appropriate to maximize expected returns, while minimizing exposure to risks that our research indicates do not improve returns (such as industry selection and other risks relative to our benchmark).
Our portfolio focuses on the attractive stocks from our model that we expect will exhibit future outperformance over time. However, as with any investment management process, there will be periods when our model doesn’t perform as expected. Unfortunately, over the latest fiscal year, the stocks that outperformed had characteristics that our model doesn’t pursue. Although we are disappointed with the performance results, it’s important to remind our investors that we maintain our commitment through different market environments to stocks that have solid fundamentals and that we believe will outperform in the long run.
Among the components of our model, management decisions performed best and sentiment the worst for both the Structured Large-Cap Fund and the Structured Broad Market Fund. We always maintain a positive view on each of our five submodels, but we recently introduced a dynamic weighting process that shifts their relative importance through time. This process successfully underweighted the sentiment component and increased the weight of the management decisions component, which mitigated our under-performance over the period.
Performance was inconsistent across sectors. The Structured Large-Cap Fund produced positive stock selection results in four of the 11 sectors in the benchmark, benefiting the most from strong selection in financials, information technology, and real estate. Our selection was weak in energy, health care, and industrials. The Structured Broad Market Fund produced positive stock selection results in two sectors, real estate and IT; energy, financials, and health care were among the biggest laggards.
7
Structured Large-Cap Fund
At the individual stock level, overweight positions in NVIDIA (+181%) and Navient (+35%) contributed significantly. And relative to the benchmark, we benefited from underweighting or avoiding poorly performing stocks such as Wells Fargo (–11%) and American Express (–12%).
Unfortunately, we were not able to avoid all poor performers. Overweight positions in Gilead Sciences (–18%) and Ensco (–26%) detracted from results. Underweighting companies that the fundamentals in our model did not positively identify, such as Chevron (+36%) and UnitedHealth Group (+23%), hurt overall performance relative to our benchmark.
Structured Broad Market Fund
At the individual stock level, overweight positions in Advanced Micro Devices (+301%), Cirrus Logic (+68%) and CoreSite Realty (+48%) helped significantly. We also benefited from underweighting or avoiding poorly performing stocks such as Cognizant Technology Solutions (–23%) and CVS Health (–6%).
Overweight positions in Teekay Tankers (–60%), Santander Consumer USA Holdings (–40%), and Infinity Pharmaceuticals (–82%) significantly hurt relative results. Underweighting companies that the fundamentals in our model did not positively identify, such as Spectra Energy (+71%) and Medtronic (+32%), further reduced performance relative to our benchmark.
We believe that the Structured Large-Cap Equity and Structured Broad Market Funds offer a strong mix of stocks with attractive valuations and growth characteristics relative to their benchmarks. Although we recognize that risk can reward or punish us in the near term, we continue to believe that constructing a portfolio that emphasizes the key fundamentals within our model will benefit investors over the long term.
We thank you for your investment and look forward to the coming fiscal year.
Portfolio Managers:
James P. Stetler, Principal
Michael R. Roach, CFA
Anatoly Shtekhman, CFA
Binbin Guo, Principal, Head of Equity
Research and Portfolio Strategies
Vanguard Quantitative Equity Group
October 20, 2016
8
Structured Large-Cap Equity Fund
Fund Profile
As of September 30, 2016
| Share-Class Characteristics | ||
| Institutional | Institutional | |
| Shares | Plus Shares | |
| Ticker Symbol | VSLIX | VSLPX |
| Expense Ratio1 | 0.20% | 0.16% |
| 30-Day SEC Yield | 1.85% | 1.89% |
| Portfolio Characteristics | |||
| DJ | |||
| U.S. | |||
| Total | |||
| Market | |||
| S&P 500 | FA | ||
| Fund | Index | Index | |
| Number of Stocks | 171 | 505 | 3,850 |
| Median Market Cap | $30.4B | $81.0B | $51.8B |
| Price/Earnings Ratio | 17.7x | 22.2x | 23.7x |
| Price/Book Ratio | 2.7x | 2.9x | 2.8x |
| Return on Equity | 17.0% | 17.5% | 16.6% |
| Earnings Growth | |||
| Rate | 8.5% | 7.3% | 7.6% |
| Dividend Yield | 2.2% | 2.1% | 2.0% |
| Foreign Holdings | 0.5% | 0.0% | 0.0% |
| Turnover Rate | 67% | — | — |
| Short-Term | |||
| Reserves | -0.1% | — | — |
| Volatility Measures | ||
| DJ | ||
| U.S. Total | ||
| S&P 500 | Market | |
| Index | FA Index | |
| R-Squared | 0.98 | 0.98 |
| Beta | 1.00 | 0.98 |
| These measures show the degree and timing of the fund’s fluctuations compared with the indexes over 36 months. | ||
| Ten Largest Holdings (% of total net assets) | ||
| Apple Inc. | Technology | |
| Hardware, Storage & | ||
| Peripherals | 2.7% | |
| Johnson & Johnson | Pharmaceuticals | 2.2 |
| Alphabet Inc. | Internet Software & | |
| Services | 2.2 | |
| General Electric Co. | Industrial | |
| Conglomerates | 1.9 | |
| Microsoft Corp. | Systems Software | 1.9 |
| Exxon Mobil Corp. | Integrated Oil & Gas | 1.4 |
| JPMorgan Chase & Co. | Diversified Banks | 1.3 |
| Citigroup Inc. | Diversified Banks | 1.3 |
| Verizon Communications Integrated | ||
| Inc. | Telecommunication | |
| Services | 1.2 | |
| Amazon.com Inc. | Internet & Direct | |
| Marketing Retail | 1.2 | |
| Top Ten | 17.3% | |
| The holdings listed exclude any temporary cash investments and equity index products. | ||
Investment Focus
![]()
1 The expense ratios shown are from the prospectus dated January 26, 2016. For the fiscal year ended September 30, 2016, the expense ratios were
0.20% for Institutional Shares and 0.16% for Institutional Plus Shares.
9
Structured Large-Cap Equity Fund
| Sector Diversification (% of equity exposure) | |||
| DJ | |||
| U.S. Total | |||
| S&P 500 | Market | ||
| Fund | Index FA Index | ||
| Consumer | |||
| Discretionary | 12.5% | 12.5% | 12.8% |
| Consumer Staples | 9.8 | 9.9 | 8.7 |
| Energy | 7.3 | 7.3 | 6.7 |
| Financials | 12.9 | 12.8 | 13.3 |
| Health Care | 14.7 | 14.7 | 14.2 |
| Industrials | 9.8 | 9.7 | 10.3 |
| Information | |||
| Technology | 21.3 | 21.2 | 20.7 |
| Materials | 2.9 | 2.9 | 3.3 |
| Real Estate | 3.0 | 3.1 | 4.3 |
| Telecommunication | |||
| Services | 2.6 | 2.6 | 2.4 |
| Utilities | 3.2 | 3.3 | 3.3 |
10
Structured Large-Cap Equity Fund
Performance Summary
All of the returns in this report represent past performance, which is not a guarantee of future results that may be achieved by the fund. (Current performance may be lower or higher than the performance data cited. For performance data current to the most recent month-end, visit our website at vanguard.com/performance.) Note, too, that both investment returns and principal value can fluctuate widely, so an investor’s shares, when sold, could be worth more or less than their original cost. The returns shown do not reflect taxes that a shareholder would pay on fund distributions or on the sale of fund shares.
Cumulative Performance: September 30, 2006, Through September 30, 2016
Initial Investment of $5,000,000
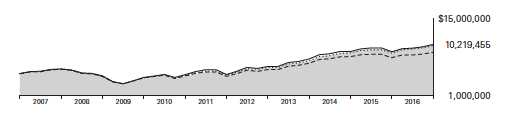
| Average Annual Total Returns | |||||
| Periods Ended September 30, 2016 | |||||
| Final Value | |||||
| One | Five | Ten | of a $5,000,000 | ||
| Year | Years | Years | Investment | ||
| Structured Large-Cap Equity | |||||
| Fund*Institutional Shares | 14.36% | 17.29% | 7.41% | $10,219,455 | |
| •••••••• | S&P 500 Index | 15.43 | 16.37 | 7.24 | 10,056,827 |
| – – – – | Large-Cap Core Funds Average | 12.38 | 14.49 | 5.89 | 8,865,689 |
| Dow Jones U.S. Total Stock Market | |||||
| Float Adjusted Index | 14.93 | 16.30 | 7.49 | 10,296,052 | |
| Large-Cap Core Funds Average: Derived from data provided by Lipper, a Thomson Reuters Company. | |||||
| Final Value | ||||
| One | Five | Ten | of a $200,000,000 | |
| Year | Years | Years | Investment | |
| Structured Large-Cap Equity Fund Institutional | ||||
| Plus Shares | 14.42% | 17.36% | 7.49% | $411,718,229 |
| S&P 500 Index | 15.43 | 16.37 | 7.24 | 354,627,557 |
| Dow Jones U.S. Total Stock Market Float | ||||
| Adjusted Index | 14.93 | 16.30 | 7.49 | 411,842,079 |
See Financial Highlights for dividend and capital gains information.
11
Structured Large-Cap Equity Fund
Fiscal-Year Total Returns (%): September 30, 2006, Through September 30, 2016
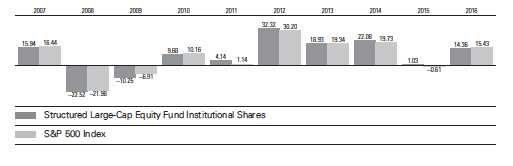
12
Structured Large-Cap Equity Fund
Financial Statements
Statement of Net Assets
As of September 30, 2016
The fund reports a complete list of its holdings in regulatory filings four times in each fiscal year, at the quarter-ends. For the second and fourth fiscal quarters, the lists appear in the fund’s semiannual and annual reports to shareholders. For the first and third fiscal quarters, the fund files the lists with the Securities and Exchange Commission on Form N-Q. Shareholders can look up the fund’s Forms N-Q on the SEC’s website at sec.gov. Forms N-Q may also be reviewed and copied at the SEC’s Public Reference Room (see the back cover of this report for further information).
| Market | |||
| Value• | |||
| Shares | ($000) | ||
| Common Stocks (99.7%)1 | |||
| Consumer Discretionary (12.5%) | |||
| * | Amazon.com Inc. | 7,984 | 6,685 |
| Target Corp. | 58,114 | 3,991 | |
| Omnicom Group Inc. | 41,668 | 3,542 | |
| Ford Motor Co. | 291,975 | 3,524 | |
| Best Buy Co. Inc. | 88,570 | 3,382 | |
| ^ | Nordstrom Inc. | 63,293 | 3,284 |
| Carnival Corp. | 66,953 | 3,269 | |
| Marriott International Inc. | |||
| Class A | 47,108 | 3,172 | |
| * | Discovery Communications | ||
| Inc. Class A | 117,742 | 3,170 | |
| Kohl’s Corp. | 70,400 | 3,080 | |
| TEGNA Inc. | 140,239 | 3,066 | |
| Darden Restaurants Inc. | 49,972 | 3,064 | |
| * | Urban Outfitters Inc. | 87,895 | 3,034 |
| * | O’Reilly Automotive Inc. | 10,799 | 3,025 |
| * | Michael Kors Holdings Ltd. | 62,929 | 2,944 |
| Leggett & Platt Inc. | 62,779 | 2,861 | |
| Gap Inc. | 125,900 | 2,800 | |
| News Corp. Class B | 174,800 | 2,486 | |
| Home Depot Inc. | 17,444 | 2,245 | |
| Whirlpool Corp. | 12,300 | 1,994 | |
| Comcast Corp. Class A | 28,383 | 1,883 | |
| Goodyear Tire & Rubber Co. | 47,911 | 1,547 | |
| Walt Disney Co. | 15,234 | 1,415 | |
| CBS Corp. Class B | 13,039 | 714 | |
| News Corp. Class A | 44,600 | 623 | |
| McDonald’s Corp. | 2,085 | 240 | |
| Foot Locker Inc. | 974 | 66 | |
| 71,106 | |||
| Consumer Staples (9.7%) | |||
| Wal-Mart Stores Inc. | 86,143 | 6,213 | |
| Altria Group Inc. | 89,704 | 5,672 | |
| ^ | Procter & Gamble Co. | 48,779 | 4,378 |
| Kimberly-Clark Corp. | 32,898 | 4,150 | |
| General Mills Inc. | 61,314 | 3,917 | |
| Tyson Foods Inc. Class A | 51,089 | 3,815 | |
| ConAgra Foods Inc. | 77,316 | 3,642 | |
| Sysco Corp. | 70,750 | 3,467 | |
| Colgate-Palmolive Co. | 41,875 | 3,104 | |
| Campbell Soup Co. | 55,947 | 3,060 | |
| JM Smucker Co. | 22,117 | 2,998 | |
| Dr Pepper Snapple | |||
| Group Inc. | 29,167 | 2,663 | |
| Kroger Co. | 77,842 | 2,310 | |
| Coca-Cola Co. | 52,614 | 2,227 | |
| PepsiCo Inc. | 18,192 | 1,979 | |
| Philip Morris | |||
| International Inc. | 17,441 | 1,696 | |
| CVS Health Corp. | 2,002 | 178 | |
| 55,469 | |||
| Energy (7.3%) | |||
| Exxon Mobil Corp. | 92,630 | 8,085 | |
| Apache Corp. | 62,892 | 4,017 | |
| Devon Energy Corp. | 80,382 | 3,546 | |
| ONEOK Inc. | 68,800 | 3,536 | |
| Cimarex Energy Co. | 24,100 | 3,238 | |
| Diamond Offshore | |||
| Drilling Inc. | 180,787 | 3,184 | |
| * | Southwestern Energy Co. | 218,623 | 3,026 |
| * | Newfield Exploration Co. | 69,495 | 3,020 |
| Chevron Corp. | 28,178 | 2,900 | |
| * | Transocean Ltd. | 264,067 | 2,815 |
| Ensco plc Class A | 251,615 | 2,139 | |
| Valero Energy Corp. | 21,949 | 1,163 | |
| Tesoro Corp. | 6,202 | 493 | |
| Schlumberger Ltd. | 4,402 | 346 | |
| 41,508 | |||
| Financials (12.9%) | |||
| JPMorgan Chase & Co. | 113,219 | 7,539 | |
| Citigroup Inc. | 152,705 | 7,212 | |
| * | Berkshire Hathaway Inc. | ||
| Class B | 36,705 | 5,303 | |
| American Express Co. | 67,000 | 4,291 | |
13
Structured Large-Cap Equity Fund
| Market | |||
| Value• | |||
| Shares | ($000) | ||
| Prudential Financial Inc. | 52,106 | 4,254 | |
| Travelers Cos. Inc. | 34,795 | 3,986 | |
| Capital One Financial Corp. | 53,000 | 3,807 | |
| Aflac Inc. | 52,362 | 3,763 | |
| Bank of New York | |||
| Mellon Corp. | 90,609 | 3,613 | |
| Discover Financial Services | 62,575 | 3,539 | |
| Wells Fargo & Co. | 79,782 | 3,533 | |
| Regions Financial Corp. | 349,264 | 3,447 | |
| Ameriprise Financial Inc. | 33,860 | 3,378 | |
| Bank of America Corp. | 215,673 | 3,375 | |
| Navient Corp. | 224,942 | 3,255 | |
| Unum Group | 91,405 | 3,228 | |
| Fifth Third Bancorp | 152,345 | 3,117 | |
| SunTrust Banks Inc. | 59,646 | 2,612 | |
| Assurant Inc. | 646 | 60 | |
| 73,312 | |||
| Health Care (14.7%) | |||
| Johnson & Johnson | 107,502 | 12,699 | |
| Amgen Inc. | 35,850 | 5,980 | |
| Eli Lilly & Co. | 65,287 | 5,240 | |
| Bristol-Myers Squibb Co. | 95,990 | 5,176 | |
| * | Express Scripts Holding Co. | 58,288 | 4,111 |
| Baxter International Inc. | 79,637 | 3,791 | |
| Merck & Co. Inc. | 59,556 | 3,717 | |
| * | HCA Holdings Inc. | 46,370 | 3,507 |
| Anthem Inc. | 27,206 | 3,409 | |
| Zoetis Inc. | 65,272 | 3,395 | |
| * | Hologic Inc. | 86,943 | 3,376 |
| * | Mettler-Toledo | ||
| International Inc. | 8,000 | 3,359 | |
| Pfizer Inc. | 97,712 | 3,309 | |
| Agilent Technologies Inc. | 69,923 | 3,293 | |
| AmerisourceBergen Corp. | |||
| Class A | 40,036 | 3,234 | |
| CR Bard Inc. | 13,812 | 3,098 | |
| PerkinElmer Inc. | 53,617 | 3,008 | |
| McKesson Corp. | 16,397 | 2,734 | |
| Gilead Sciences Inc. | 25,124 | 1,988 | |
| Aetna Inc. | 12,657 | 1,461 | |
| UnitedHealth Group Inc. | 7,680 | 1,075 | |
| Thermo Fisher Scientific Inc. | 6,473 | 1,030 | |
| Medtronic plc | 7,520 | 650 | |
| * | Biogen Inc. | 2,037 | 638 |
| AbbVie Inc. | 3,749 | 236 | |
| 83,514 | |||
| Industrials (9.8%) | |||
| General Electric Co. | 374,822 | 11,102 | |
| Delta Air Lines Inc. | 101,190 | 3,983 | |
| Northrop Grumman Corp. | 17,047 | 3,647 | |
| Ingersoll-Rand plc | 51,800 | 3,519 | |
| * | Quanta Services Inc. | 123,746 | 3,464 |
| Southwest Airlines Co. | 89,030 | 3,462 | |
| Stanley Black & Decker Inc. | 27,891 | 3,430 | |
| L-3 Communications | |||
| Holdings Inc. | 22,096 | 3,331 | |
| * | United Rentals Inc. | 40,921 | 3,212 |
| Masco Corp. | 92,543 | 3,175 | |
| Alaska Air Group Inc. | 48,143 | 3,171 | |
| Dun & Bradstreet Corp. | 22,000 | 3,006 | |
| PACCAR Inc. | 46,800 | 2,751 | |
| Rockwell Automation Inc. | 17,200 | 2,104 | |
| Expeditors International | |||
| of Washington Inc. | 24,600 | 1,267 | |
| Pitney Bowes Inc. | 29,745 | 540 | |
| * | Jacobs Engineering | ||
| Group Inc. | 7,650 | 396 | |
| 3M Co. | 1,400 | 247 | |
| 55,807 | |||
| Information Technology (21.2%) | |||
| Apple Inc. | 137,309 | 15,523 | |
| Microsoft Corp. | 184,842 | 10,647 | |
| * | Alphabet Inc. Class A | 10,509 | 8,450 |
| * | Facebook Inc. Class A | 45,581 | 5,847 |
| Accenture plc Class A | 44,219 | 5,402 | |
| NVIDIA Corp. | 64,802 | 4,440 | |
| Applied Materials Inc. | 137,700 | 4,152 | |
| Texas Instruments Inc. | 59,085 | 4,147 | |
| HP Inc. | 266,990 | 4,146 | |
| * | Alphabet Inc. Class C | 5,135 | 3,991 |
| * | eBay Inc. | 119,000 | 3,915 |
| Intuit Inc. | 35,237 | 3,876 | |
| Seagate Technology plc | 94,401 | 3,639 | |
| Lam Research Corp. | 36,839 | 3,489 | |
| * | Fiserv Inc. | 34,150 | 3,397 |
| * | Citrix Systems Inc. | 39,725 | 3,385 |
| Western Union Co. | 161,793 | 3,369 | |
| Symantec Corp. | 132,000 | 3,313 | |
| * | F5 Networks Inc. | 26,577 | 3,313 |
| Xerox Corp. | 317,278 | 3,214 | |
| * | Teradata Corp. | 102,160 | 3,167 |
| CSRA Inc. | 117,010 | 3,148 | |
| Computer Sciences Corp. | 50,400 | 2,631 | |
| Hewlett Packard | |||
| Enterprise Co. | 97,870 | 2,227 | |
| Intel Corp. | 55,968 | 2,113 | |
| Visa Inc. Class A | 21,512 | 1,779 | |
| Cisco Systems Inc. | 50,378 | 1,598 | |
| International Business | |||
| Machines Corp. | 7,312 | 1,161 | |
| Oracle Corp. | 23,888 | 938 | |
| * | Electronic Arts Inc. | 5,527 | 472 |
| 120,889 | |||
| Materials (2.9%) | |||
| Dow Chemical Co. | 90,421 | 4,687 | |
| LyondellBasell Industries | |||
| NV Class A | 48,629 | 3,922 | |
| Nucor Corp. | 68,900 | 3,407 | |
14
Structured Large-Cap Equity Fund
| Market | |||
| Value• | |||
| Shares | ($000) | ||
| Avery Dennison Corp. | 42,271 | 3,288 | |
| International Paper Co. | 18,934 | 908 | |
| Sherwin-Williams Co. | 1,115 | 309 | |
| 16,521 | |||
| Real Estate (2.9%) | |||
| Crown Castle | |||
| International Corp. | 38,109 | 3,590 | |
| Prologis Inc. | 64,743 | 3,466 | |
| HCP Inc. | 87,000 | 3,302 | |
| Macerich Co. | 39,355 | 3,182 | |
| Host Hotels & Resorts Inc. | 194,134 | 3,023 | |
| Realty Income Corp. | 2,730 | 183 | |
| 16,746 | |||
| Telecommunication Services (2.6%) | |||
| Verizon | |||
| Communications Inc. | 133,662 | 6,948 | |
| AT&T Inc. | 117,056 | 4,753 | |
| CenturyLink Inc. | 116,765 | 3,203 | |
| 14,904 | |||
| Utilities (3.2%) | |||
| PPL Corp. | 95,824 | 3,313 | |
| Entergy Corp. | 41,720 | 3,201 | |
| FirstEnergy Corp. | 96,528 | 3,193 | |
| Edison International | 44,061 | 3,183 | |
| NiSource Inc. | 128,629 | 3,101 | |
| AES Corp. | 186,500 | 2,397 | |
| 18,388 | |||
| Total Common Stocks | |||
| (Cost $471,397) | 568,164 | ||
| Temporary Cash Investments (0.4%)1 | |||
| Money Market Fund (0.3%) | |||
| 2,3 | Vanguard Market | ||
| Liquidity Fund, 0.640% | 17,737 | 1,774 | |
| Face | |||
| Amount | |||
| ($000) | |||
| U.S. Government and Agency Obligations (0.1%) | |||
| 4,5 | Federal Home Loan | ||
| Bank Discount Notes, | |||
| 0.511%, 10/12/16 | 100 | 100 | |
| 4,5 | Federal Home Loan | ||
| Bank Discount Notes, | |||
| 0.471%, 10/19/16 | 100 | 100 | |
| 200 | |||
| Total Temporary Cash Investments | |||
| (Cost $1,973) | 1,974 | ||
| Total Investments (100.1%) | |||
| (Cost $473,370) | 570,138 | ||
| Amount | |
| ($000) | |
| Other Assets and Liabilities (-0.1%) | |
| Other Assets | |
| Investments in Vanguard | 44 |
| Receivables for Investment Securities Sold | 307 |
| Receivables for Accrued Income | 720 |
| Other Assets | 18 |
| Total Other Assets | 1,089 |
| Liabilities | |
| Payables for Investment Securities | |
| Purchased | (1) |
| Collateral for Securities on Loan | (993) |
| Payables for Capital Shares Redeemed | (5) |
| Payables to Vanguard | (512) |
| Other Liabilities | (1) |
| Total Liabilities | (1,512) |
| Net Assets (100%) | 569,715 |
15
Structured Large-Cap Equity Fund
| At September 30, 2016, net assets consisted of: | |
| Amount | |
| ($000) | |
| Paid-in Capital | 443,038 |
| Undistributed Net Investment Income | 7,687 |
| Accumulated Net Realized Gains | 22,214 |
| Unrealized Appreciation (Depreciation) | |
| Investment Securities | 96,768 |
| Futures Contracts | 8 |
| Net Assets | 569,715 |
| Institutional Shares—Net Assets | |
| Applicable to 2,179,041 outstanding | |
| $.001 par value shares of beneficial | |
| interest (unlimited authorization) | 90,367 |
| Net Asset Value Per Share— | |
| Institutional Shares | $41.47 |
| Institutional Plus Shares—Net Assets | |
| Applicable to 5,837,263 outstanding | |
| $.001 par value shares of beneficial | |
| interest (unlimited authorization) | 479,348 |
| Net Asset Value Per Share— | |
| Institutional Plus Shares | $82.12 |
• See Note A in Notes to Financial Statements.
* Non-income-producing security.
^ Includes partial security positions on loan to broker-dealers. The total value of securities on loan is $977,000.
1 The fund invests a portion of its cash reserves in equity markets through the use of index futures contracts. After giving effect to futures
investments, the fund’s effective common stock and temporary cash investment positions represent 100.0% and 0.1%, respectively,
of net assets.
2 Affiliated money market fund available only to Vanguard funds and certain trusts and accounts managed by Vanguard. Rate shown is the
7-day yield.
3 Includes $993,000 of collateral received for securities on loan.
4 The issuer operates under a congressional charter; its securities are generally neither guaranteed by the U.S. Treasury nor backed by the full
faith and credit of the U.S. government.
5 Securities with a value of $200,000 have been segregated as initial margin for open futures contracts.
See accompanying Notes, which are an integral part of the Financial Statements.
16
Structured Large-Cap Equity Fund
Statement of Operations
| Year Ended | |
| September 30, 2016 | |
| ($000) | |
| Investment Income | |
| Income | |
| Dividends | 12,682 |
| Interest1 | 8 |
| Securities Lending—Net | 62 |
| Total Income | 12,752 |
| Expenses | |
| The Vanguard Group—Note B | |
| Investment Advisory Services | 507 |
| Management and Administrative—Institutional Shares | 83 |
| Management and Administrative—Institutional Plus Shares | 276 |
| Marketing and Distribution—Institutional Shares | 3 |
| Marketing and Distribution—Institutional Plus Shares | 5 |
| Custodian Fees | 12 |
| Auditing Fees | 36 |
| Shareholders’ Reports—Institutional Shares | 2 |
| Shareholders’ Reports—Institutional Plus Shares | — |
| Total Expenses | 924 |
| Net Investment Income | 11,828 |
| Realized Net Gain (Loss) | |
| Investment Securities Sold1 | 24,594 |
| Futures Contracts | 183 |
| Realized Net Gain (Loss) | 24,777 |
| Change in Unrealized Appreciation (Depreciation) | |
| Investment Securities | 37,510 |
| Futures Contracts | 24 |
| Change in Unrealized Appreciation (Depreciation) | 37,534 |
| Net Increase (Decrease) in Net Assets Resulting from Operations | 74,139 |
| 1 Interest income and realized net gain (loss) from an affiliated company of the fund were $6,000 and ($1,000), respectively. | |
See accompanying Notes, which are an integral part of the Financial Statements.
17
Structured Large-Cap Equity Fund
Statement of Changes in Net Assets
| Year Ended September 30, | ||
| 2016 | 2015 | |
| ($000) | ($000) | |
| Increase (Decrease) in Net Assets | ||
| Operations | ||
| Net Investment Income | 11,828 | 11,535 |
| Realized Net Gain (Loss) | 24,777 | 101,772 |
| Change in Unrealized Appreciation (Depreciation) | 37,534 | (100,461) |
| Net Increase (Decrease) in Net Assets Resulting from Operations | 74,139 | 12,846 |
| Distributions | ||
| Net Investment Income | ||
| Institutional Shares | (1,885) | (1,797) |
| Institutional Plus Shares | (10,088) | (11,950) |
| Realized Capital Gain | ||
| Institutional Shares | (3,050) | — |
| Institutional Plus Shares | (16,098) | — |
| Total Distributions | (31,121) | (13,747) |
| Capital Share Transactions | ||
| Institutional Shares | (3,614) | 31,286 |
| Institutional Plus Shares | (14,485) | (223,798) |
| Net Increase (Decrease) from Capital Share Transactions | (18,099) | (192,512) |
| Total Increase (Decrease) | 24,919 | (193,413) |
| Net Assets | ||
| Beginning of Period | 544,796 | 738,209 |
| End of Period1 | 569,715 | 544,796 |
| 1 Net Assets—End of Period includes undistributed (overdistributed) net investment income of $7,687,000 and $7,832,000. | ||
See accompanying Notes, which are an integral part of the Financial Statements.
18
Structured Large-Cap Equity Fund
Financial Highlights
| Institutional Shares | |||||
| For a Share Outstanding | Year Ended September 30, | ||||
| Throughout Each Period | 2016 | 2015 | 2014 | 2013 | 2012 |
| Net Asset Value, Beginning of Period | $38.29 | $38.88 | $32.42 | $27.83 | $21.49 |
| Investment Operations | |||||
| Net Investment Income | . 838 | .7731 | .710 | .618 | .531 |
| Net Realized and Unrealized Gain (Loss) | |||||
| on Investments | 4.523 | (.355) | 6.363 | 4.542 | 6.306 |
| Total from Investment Operations | 5.361 | .418 | 7.073 | 5.160 | 6.837 |
| Distributions | |||||
| Dividends from Net Investment Income | (. 833) | (1.008) | (. 613) | (. 570) | (. 497) |
| Distributions from Realized Capital Gains | (1.348) | — | — | — | — |
| Total Distributions | (2.181) | (1.008) | (.613) | (.570) | (.497) |
| Net Asset Value, End of Period | $41.47 | $38.29 | $38.88 | $32.42 | $27.83 |
| Total Return | 14.36% | 1.03% | 22.08% | 18.93% | 32.32% |
| Ratios/Supplemental Data | |||||
| Net Assets, End of Period (Millions) | $90 | $87 | $58 | $52 | $15 |
| Ratio of Total Expenses to Average Net Assets | 0.20% | 0.20% | 0.24% | 0.24% | 0.24% |
| Ratio of Net Investment Income to | |||||
| Average Net Assets | 2.10% | 1.93% | 1.86% | 2.09% | 2.10% |
| Portfolio Turnover Rate | 67% | 73% | 68% | 62% | 64% |
| 1 Calculated based on average shares outstanding. | |||||
See accompanying Notes, which are an integral part of the Financial Statements.
19
Structured Large-Cap Equity Fund
Financial Highlights
| Institutional Plus Shares | |||||
| For a Share Outstanding | Year Ended September 30, | ||||
| Throughout Each Period | 2016 | 2015 | 2014 | 2013 | 2012 |
| Net Asset Value, Beginning of Period | $75.80 | $76.94 | $64.10 | $55.02 | $42.48 |
| Investment Operations | |||||
| Net Investment Income | 1.691 | 1.5501 | 1.455 | 1.207 | 1.084 |
| Net Realized and Unrealized Gain (Loss) | |||||
| on Investments | 8.969 | (.703) | 12.586 | 9.037 | 12.466 |
| Total from Investment Operations | 10.660 | .847 | 14.041 | 10.244 | 13.550 |
| Distributions | |||||
| Dividends from Net Investment Income | (1.672) | (1.987) | (1.201) | (1.164) | (1.010) |
| Distributions from Realized Capital Gains | (2.668) | — | — | — | — |
| Total Distributions | (4.340) | (1.987) | (1.201) | (1.164) | (1.010) |
| Net Asset Value, End of Period | $82.12 | $75.80 | $76.94 | $64.10 | $55.02 |
| Total Return | 14.42% | 1.05% | 22.17% | 19.02% | 32.42% |
| Ratios/Supplemental Data | |||||
| Net Assets, End of Period (Millions) | $479 | $458 | $680 | $612 | $497 |
| Ratio of Total Expenses to Average Net Assets | 0.16% | 0.16% | 0.17% | 0.17% | 0.17% |
| Ratio of Net Investment Income to | |||||
| Average Net Assets | 2.14% | 1.97% | 1.93% | 2.16% | 2.17% |
| Portfolio Turnover Rate | 67% | 73% | 68% | 62% | 64% |
| 1 Calculated based on average shares outstanding. | |||||
See accompanying Notes, which are an integral part of the Financial Statements.
20
Structured Large-Cap Equity Fund
Notes to Financial Statements
Vanguard Structured Large-Cap Equity Fund is registered under the Investment Company Act of 1940 as an open-end investment company, or mutual fund. The fund offers two classes of shares: Institutional Shares and Institutional Plus Shares. Institutional Shares and Institutional Plus Shares are designed for investors who meet certain administrative, service, and account-size criteria.
A. The following significant accounting policies conform to generally accepted accounting principles for U.S. investment companies. The fund consistently follows such policies in preparing its financial statements.
1. Security Valuation: Securities are valued as of the close of trading on the New York Stock Exchange (generally 4 p.m., Eastern time) on the valuation date. Equity securities are valued at the latest quoted sales prices or official closing prices taken from the primary market in which each security trades; such securities not traded on the valuation date are valued at the mean of the latest quoted bid and asked prices. Securities for which market quotations are not readily available, or whose values have been materially affected by events occurring before the fund’s pricing time but after the close of the securities’ primary markets, are valued by methods deemed by the board of trustees to represent fair value. Investments in Vanguard Market Liquidity Fund are valued at that fund’s net asset value. Temporary cash investments acquired over 60 days to maturity are valued using the latest bid prices or using valuations based on a matrix system (which considers such factors as security prices, yields, maturities, and ratings), both as furnished by independent pricing services. Other temporary cash investments are valued at amortized cost, which approximates market value.
2. Futures Contracts: The fund uses index futures contracts to a limited extent, with the objective of maintaining full exposure to the stock market while maintaining liquidity. The fund may purchase or sell futures contracts to achieve a desired level of investment, whether to accommodate portfolio turnover or cash flows from capital share transactions. The primary risks associated with the use of futures contracts are imperfect correlation between changes in market values of stocks held by the fund and the prices of futures contracts, and the possibility of an illiquid market. Counterparty risk involving futures is mitigated because a regulated clearinghouse is the counterparty instead of the clearing broker. To further mitigate counterparty risk, the fund trades futures contracts on an exchange, monitors the financial strength of its clearing brokers and clearinghouse, and has entered into clearing agreements with its clearing brokers. The clearinghouse imposes initial margin requirements to secure the fund’s performance and requires daily settlement of variation margin representing changes in the market value of each contract.
Futures contracts are valued at their quoted daily settlement prices. The aggregate settlement values of the contracts are not recorded in the Statement of Net Assets. Fluctuations in the value of the contracts are recorded in the Statement of Net Assets as an asset (liability) and in the Statement of Operations as unrealized appreciation (depreciation) until the contracts are closed, when they are recorded as realized futures gains (losses).
During the year ended September 30, 2016, the fund’s average investments in long and short futures contracts represented less than 1% and 0% of net assets, respectively, based on the average of aggregate settlement values at each quarter-end during the period.
3. Federal Income Taxes: The fund intends to continue to qualify as a regulated investment company and distribute all of its taxable income. Management has analyzed the fund’s tax positions taken for all open federal income tax years (September 30, 2013–2016), and has concluded that no provision for federal income tax is required in the fund’s financial statements.
21
Structured Large-Cap Equity Fund
4. Distributions: Distributions to shareholders are recorded on the ex-dividend date.
5. Securities Lending: To earn additional income, the fund lends its securities to qualified institutional borrowers. Security loans are subject to termination by the fund at any time, and are required to be secured at all times by collateral in an amount at least equal to the market value of securities loaned. Daily market fluctuations could cause the value of loaned securities to be more or less than the value of the collateral received. When this occurs, the collateral is adjusted and settled on the next business day. The fund further mitigates its counterparty risk by entering into securities lending transactions only with a diverse group of prequalified counterparties, monitoring their financial strength, and entering into master securities lending agreements with its counterparties. The master securities lending agreements provide that, in the event of a counterparty’s default (including bankruptcy), the fund may terminate any loans with that borrower, determine the net amount owed, and sell or retain the collateral up to the net amount owed to the fund; however, such actions may be subject to legal proceedings. While collateral mitigates counterparty risk, in the absence of a default the fund may experience delays and costs in recovering the securities loaned. The fund invests cash collateral received in Vanguard Market Liquidity Fund, and records a liability in the Statement of Net Assets for the return of the collateral, during the period the securities are on loan. Securities lending income represents fees charged to borrowers plus income earned on invested cash collateral, less expenses associated with the loan. During the term of the loan, the fund is entitled to all distributions made on or in respect of the loaned securities.
6. Credit Facility: The fund and certain other funds managed by The Vanguard Group (“Vanguard”) participate in a $3.1 billion committed credit facility provided by a syndicate of lenders pursuant to a credit agreement that may be renewed annually; each fund is individually liable for its borrowings, if any, under the credit facility. Borrowings may be utilized for temporary and emergency purposes, and are subject to the fund’s regulatory and contractual borrowing restrictions. The participating funds are charged administrative fees and an annual commitment fee of 0.10% of the undrawn amount of the facility; these fees are allocated to the funds based on a method approved by the fund’s board of trustees and included in Management and Administrative expenses on the fund’s Statement of Operations. Any borrowings under this facility bear interest at a rate based upon the higher of the one-month London Interbank Offered Rate, federal funds effective rate, or overnight bank funding rate plus an agreed-upon spread.
The fund had no borrowings outstanding at September 30, 2016, or at any time during the period then ended.
7. Other: Dividend income is recorded on the ex-dividend date. Interest income includes income distributions received from Vanguard Market Liquidity Fund and is accrued daily. Premiums and discounts on debt securities purchased are amortized and accreted, respectively, to interest income over the lives of the respective securities. Security transactions are accounted for on the date securities are bought or sold. Costs used to determine realized gains (losses) on the sale of investment securities are those of the specific securities sold.
Each class of shares has equal rights as to assets and earnings, except that each class separately bears certain class-specific expenses related to maintenance of shareholder accounts (included in Management and Administrative expenses) and shareholder reporting. Marketing and distribution expenses are allocated to each class of shares based on a method approved by the board of trustees. Income, other non-class-specific expenses, and gains and losses on investments are allocated to each class of shares based on its relative net assets.
22
Structured Large-Cap Equity Fund
B. In accordance with the terms of a Funds’ Service Agreement (the “FSA”) between Vanguard and the fund, Vanguard furnishes to the fund investment advisory, corporate management, administrative, marketing, and distribution services at Vanguard’s cost of operations (as defined by the FSA). These costs of operations are allocated to the fund based on methods and guidelines approved by the board of trustees. Vanguard does not require reimbursement in the current period for certain costs of operations (such as deferred compensation/benefits and risk/insurance costs); the fund’s liability for these costs of operations is included in Payables to Vanguard on the Statement of Net Assets.
Upon the request of Vanguard, the fund may invest up to 0.40% of its net assets as capital in Vanguard. At September 30, 2016, the fund had contributed to Vanguard capital in the amount of $44,000, representing 0.01% of the fund’s net assets and 0.02% of Vanguard’s capitalization. The fund’s trustees and officers are also directors and employees, respectively, of Vanguard.
C. Various inputs may be used to determine the value of the fund’s investments. These inputs are summarized in three broad levels for financial statement purposes. The inputs or methodologies used to value securities are not necessarily an indication of the risk associated with investing in those securities.
Level 1—Quoted prices in active markets for identical securities.
Level 2—Other significant observable inputs (including quoted prices for similar securities, interest rates, prepayment speeds, credit risk, etc.).
Level 3—Significant unobservable inputs (including the fund’s own assumptions used to determine the fair value of investments).
The following table summarizes the market value of the fund’s investments as of September 30, 2016, based on the inputs used to value them:
| Level 1 | Level 2 | Level 3 | |
| Investments | ($000) | ($000) | ($000) |
| Common Stocks | 568,164 | — | — |
| Temporary Cash Investments | 1,774 | 200 | — |
| Futures Contracts—Assets1 | 9 | — | — |
| Futures Contracts—Liabilities1 | (1) | — | — |
| Total | 569,946 | 200 | — |
| 1 Represents variation margin on the last day of the reporting period. | |||
D. At September 30, 2016, the aggregate settlement value of open futures contracts and the related unrealized appreciation (depreciation) were:
| ($000) | ||||
| Aggregate | ||||
| Number of | Settlement | Unrealized | ||
| Long (Short) | Value | Appreciation | ||
| Futures Contracts | Expiration | Contracts | Long (Short) | (Depreciation) |
| E-mini S&P 500 Index | December 2016 | 14 | 1,512 | 8 |
Unrealized appreciation (depreciation) on open futures contracts is required to be treated as realized gain (loss) for tax purposes.
23
Structured Large-Cap Equity Fund
E. Distributions are determined on a tax basis and may differ from net investment income and realized capital gains for financial reporting purposes. Differences may be permanent or temporary. Permanent differences are reclassified among capital accounts in the financial statements to reflect their tax character. Temporary differences arise when certain items of income, expense, gain, or loss are recognized in different periods for financial statement and tax purposes. These differences will reverse at some time in the future. Differences in classification may also result from the treatment of short-term gains as ordinary income for tax purposes.
For tax purposes, at September 30, 2016, the fund had $8,121,000 of ordinary income and $22,213,000 of long-term capital gains available for distribution.
At September 30, 2016, the cost of investment securities for tax purposes was $473,370,000. Net unrealized appreciation of investment securities for tax purposes was $96,768,000, consisting of unrealized gains of $106,308,000 on securities that had risen in value since their purchase and $9,540,000 in unrealized losses on securities that had fallen in value since their purchase.
F. During the year ended September 30, 2016, the fund purchased $372,615,000 of investment securities and sold $410,392,000 of investment securities, other than temporary cash investments.
G. Capital share transactions for each class of shares were:
| Year Ended September 30, | ||||
| 2016 | 2015 | |||
| Amount | Shares | Amount | Shares | |
| ($000) | (000) | ($000) | (000) | |
| Institutional Shares | ||||
| Issued | 7,965 | 203 | 83,381 | 2,068 |
| Issued in Lieu of Cash Distributions | 3,786 | 97 | 1,272 | 33 |
| Redeemed | (15,365) | (389) | (53,367) | (1,328) |
| Net Increase (Decrease)—Institutional Shares | (3,614) | (89) | 31,286 | 773 |
| Institutional Plus Shares | ||||
| Issued | 828 | 10 | 2,279 | 28 |
| Issued in Lieu of Cash Distributions | 16,131 | 209 | — | — |
| Redeemed | (31,444) | (423) | (226,077) | (2,825) |
| Net Increase (Decrease)—Institutional Plus Shares | (14,485) | (204) | (223,798) | (2,797) |
At September 30, 2016, one shareholder was the record or beneficial owner of 84% of the fund’s net assets. In October 2016, such shareholder redeemed $476,000,000 (84% of the fund’s net assets on the redemption date) from the fund. After the redemption, a separate shareholder became the record or beneficial owner of 43% of the fund’s post redemption net assets. If that shareholder were to redeem its investment in the fund, the redemption may result in an increase in the fund’s expense ratio, cause the fund to incur higher transaction costs, lead to the realization of taxable capital gains, or cause the remaining shareholders to receive distributions representing a disproportionate share of the fund’s ordinary income and long-term capital gains.
H. On November 17, 2016, the board of trustees approved the liquidation and dissolution of the fund. In light of the pending liquidation, the fund intends to declare and pay its calendar-year-end distribution earlier than scheduled; such distribution will consist primarily of the ordinary income and long-term capital gains available for distribution at September 30, 2016 (as discussed in Note E).
Management has determined that no other material events or transactions occurred subsequent to September 30, 2016, that would require recognition or disclosure in these financial statements.
24
Structured Broad Market Fund
Fund Profile
As of September 30, 2016
| Share-Class Characteristics | ||
| Institutional | Institutional | |
| Shares | Plus Shares | |
| Ticker Symbol | VSBMX | VSBPX |
| Expense Ratio1 | 0.20% | 0.16% |
| 30-Day SEC Yield | 1.91% | 1.90% |
| Portfolio Characteristics | |||
| DJ | |||
| U.S. | |||
| Total | |||
| Russell | Market | ||
| 3000 | FA | ||
| Fund | Index | Index | |
| Number of Stocks | 213 | 2,955 | 3,850 |
| Median Market Cap | $23.3B | $53.8B | $51.8B |
| Price/Earnings Ratio | 17.7x | 23.6x | 23.7x |
| Price/Book Ratio | 2.5x | 2.8x | 2.8x |
| Return on Equity | 16.0% | 16.6% | 16.6% |
| Earnings Growth | |||
| Rate | 9.6% | 7.6% | 7.6% |
| Dividend Yield | 2.2% | 2.0% | 2.0% |
| Foreign Holdings | 0.0% | 0.0% | 0.0% |
| Turnover Rate | 78% | — | — |
| Short-Term | |||
| Reserves | 0.0% | — | — |
| Volatility Measures | ||
| DJ | ||
| Russell | U.S. Total | |
| 3000 | Market | |
| Index | FA Index | |
| R-Squared | 0.97 | 0.97 |
| Beta | 0.99 | 0.99 |
| These measures show the degree and timing of the fund’s fluctuations compared with the indexes over 36 months. | ||
| Ten Largest Holdings (% of total net assets) | ||
| Alphabet Inc. | Internet Software & | |
| Services | 2.4% | |
| Apple Inc. | Technology | |
| Hardware, Storage & | ||
| Peripherals | 2.2 | |
| Exxon Mobil Corp. | Integrated Oil & Gas | 2.0 |
| Johnson & Johnson | Pharmaceuticals | 2.0 |
| General Electric Co. | Industrial | |
| Conglomerates | 1.7 | |
| JPMorgan Chase & Co. | Diversified Banks | 1.6 |
| Microsoft Corp. | Systems Software | 1.4 |
| Merck & Co. Inc. | Pharmaceuticals | 1.3 |
| Verizon Communications Integrated | ||
| Inc. | Telecommunication | |
| Services | 1.3 | |
| Bank of America Corp. | Diversified Banks | 1.3 |
| Top Ten | 17.2% | |
| The holdings listed exclude any temporary cash investments and equity index products. | ||
Investment Focus
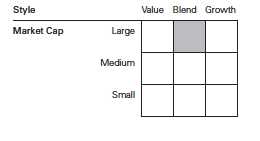
1 The expense ratios shown are from the prospectus dated January 26, 2016. For the fiscal year ended September 30, 2016, the expense ratios were 0.20% for Institutional Shares and 0.16% for Institutional Plus Shares.
25
Structured Broad Market Fund
| Sector Diversification (% of equity exposure) | |||
| DJ | |||
| Russell | U.S. Total | ||
| 3000 | Market | ||
| Fund | Index | FA Index | |
| Consumer | |||
| Discretionary | 12.7% | 12.8% | 12.8% |
| Consumer Staples | 8.8 | 8.8 | 8.7 |
| Energy | 6.8 | 6.7 | 6.7 |
| Financials | 13.4 | 13.4 | 13.3 |
| Health Care | 14.2 | 14.1 | 14.2 |
| Industrials | 10.2 | 10.3 | 10.3 |
| Information | |||
| Technology | 20.6 | 20.6 | 20.7 |
| Materials | 3.3 | 3.3 | 3.3 |
| Real Estate | 4.3 | 4.3 | 4.3 |
| Telecommunication | |||
| Services | 2.4 | 2.4 | 2.4 |
| Utilities | 3.3 | 3.3 | 3.3 |
26
Structured Broad Market Fund
Performance Summary
All of the returns in this report represent past performance, which is not a guarantee of future results that may be achieved by the fund. (Current performance may be lower or higher than the performance data cited. For performance data current to the most recent month-end, visit our website at vanguard.com/performance.) Note, too, that both investment returns and principal value can fluctuate widely, so an investor’s shares, when sold, could be worth more or less than their original cost. The returns shown do not reflect taxes that a shareholder would pay on fund distributions or on the sale of fund shares.
Cumulative Performance: November 30, 2006, Through September 30, 2016
Initial Investment of $5,000,000
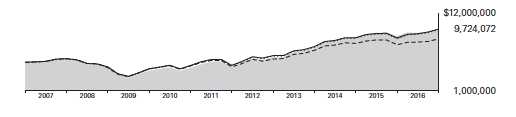
| Average Annual Total Returns | |||||
| Periods Ended September 30, 2016 | |||||
| Since | Final Value | ||||
| One | Five | Inception | of a $5,000,000 | ||
| Year | Years | (11/30/2006) | Investment | ||
| Structured Broad Market | |||||
| Fund*Institutional Shares | 11.60% | 17.54% | 7.00% | $9,724,072 | |
| •••••••• | Russell 3000 Index | 14.96 | 16.36 | 6.88 | 9,618,582 |
| – – – – | Multi-Cap Core Funds Average | 10.97 | 13.82 | 5.32 | 8,324,917 |
| Dow Jones U.S. Total Stock Market | |||||
| Float Adjusted Index | 14.93 | 16.30 | 6.99 | 9,716,287 | |
| Multi-Cap Core Funds Average: Derived from data provided by Lipper, a Thomson Reuters Company. | |||||
| "Since Inception" performance is calculated from the Institutional Shares’ inception date for both the fund and its comparative standards. | |||||
| Final Value | ||||
| One | Five | Ten | of a $200,000,000 | |
| Year | Years | Years | Investment | |
| Structured Broad Market Fund Institutional | ||||
| Plus Shares | 11.66% | 17.61% | 7.58% | $415,359,978 |
| Russell 3000 Index | 14.96 | 16.36 | 7.37 | 352,034,495 |
| Dow Jones U.S. Total Stock Market Float | ||||
| Adjusted Index | 14.93 | 16.30 | 7.49 | 411,842,079 |
The fund commenced operations as a registered investment company on October 3, 2006. The fund's performance includes the performance
of a predecessor trust, Vanguard Fiduciary Trust Company Structured Broad Market Trust, from September 30, 2005, to October 3, 2006.
See Financial Highlights for dividend and capital gains information.
27
Structured Broad Market Fund
Fiscal-Year Total Returns (%): November 30, 2006, Through September 30, 2016
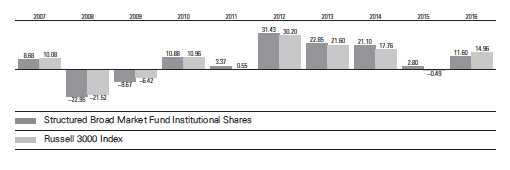
28
Structured Broad Market Fund
Financial Statements
Statement of Net Assets
As of September 30, 2016
The fund reports a complete list of its holdings in regulatory filings four times in each fiscal year, at the quarter-ends. For the second and fourth fiscal quarters, the lists appear in the fund’s semiannual and annual reports to shareholders. For the first and third fiscal quarters, the fund files the lists with the Securities and Exchange Commission on Form N-Q. Shareholders can look up the fund’s Forms N-Q on the SEC’s website at sec.gov. Forms N-Q may also be reviewed and copied at the SEC’s Public Reference Room (see the back cover of this report for further information).
| Market | |||
| Value• | |||
| Shares | ($000) | ||
| Common Stocks (99.4%)1 | |||
| Consumer Discretionary (12.7%) | |||
| Home Depot Inc. | 41,891 | 5,391 | |
| * | Amazon.com Inc. | 5,370 | 4,496 |
| Target Corp. | 45,617 | 3,133 | |
| Lear Corp. | 20,854 | 2,528 | |
| ^ | Nordstrom Inc. | 47,379 | 2,458 |
| Marriott International Inc. | |||
| Class A | 35,834 | 2,413 | |
| Darden Restaurants Inc. | 39,339 | 2,412 | |
| * | Michael Kors Holdings Ltd. | 51,417 | 2,406 |
| * | Liberty SiriusXM Group | ||
| Class A | 70,782 | 2,405 | |
| * | Smith & Wesson | ||
| Holding Corp. | 89,580 | 2,382 | |
| News Corp. Class B | 164,695 | 2,342 | |
| International Game | |||
| Technology plc | 95,562 | 2,330 | |
| Big Lots Inc. | 46,997 | 2,244 | |
| Comcast Corp. Class A | 33,587 | 2,228 | |
| Children’s Place Inc. | 26,600 | 2,125 | |
| Omnicom Group Inc. | 24,568 | 2,088 | |
| Lowe’s Cos. Inc. | 27,712 | 2,001 | |
| Carnival Corp. | 39,689 | 1,938 | |
| Regal Entertainment | |||
| Group Class A | 59,517 | 1,294 | |
| * | Discovery Communications | ||
| Inc. Class A | 42,120 | 1,134 | |
| * | Cooper-Standard Holding Inc. | 8,548 | 845 |
| Ford Motor Co. | 68,992 | 833 | |
| Sturm Ruger & Co. Inc. | 13,039 | 753 | |
| Walt Disney Co. | 7,553 | 701 | |
| Whirlpool Corp. | 2,470 | 401 | |
| * | American Axle | ||
| & Manufacturing | |||
| Holdings Inc. | 20,677 | 356 | |
| PVH Corp. | 3,207 | 354 | |
| Rent-A-Center Inc. | 21,762 | 275 | |
| Leggett & Platt Inc. | 5,539 | 252 | |
| 54,518 | |||
| Consumer Staples (8.8%) | |||
| Altria Group Inc. | 73,593 | 4,653 | |
| Wal-Mart Stores Inc. | 60,842 | 4,388 | |
| ConAgra Foods Inc. | 62,127 | 2,927 | |
| Sysco Corp. | 56,868 | 2,787 | |
| PepsiCo Inc. | 25,569 | 2,781 | |
| Tyson Foods Inc. Class A | 36,054 | 2,692 | |
| Energizer Holdings Inc. | 50,295 | 2,513 | |
| ^ | Procter & Gamble Co. | 26,067 | 2,340 |
| Dean Foods Co. | 142,120 | 2,331 | |
| Philip Morris | |||
| International Inc. | 23,057 | 2,242 | |
| * | Herbalife Ltd. | 35,398 | 2,194 |
| JM Smucker Co. | 16,171 | 2,192 | |
| Coca-Cola Co. | 23,046 | 975 | |
| SpartanNash Co. | 21,408 | 619 | |
| Universal Corp. | 7,338 | 427 | |
| ^ | Natural Health Trends Corp. | 14,014 | 396 |
| Kimberly-Clark Corp. | 2,883 | 364 | |
| Ingles Markets Inc. | |||
| Class A | 8,326 | 329 | |
| * | USANA Health | ||
| Sciences Inc. | 2,235 | 309 | |
| * | National Beverage Corp. | 5,400 | 238 |
| 37,697 | |||
| Energy (6.7%) | |||
| Exxon Mobil Corp. | 100,417 | 8,764 | |
| Apache Corp. | 40,244 | 2,570 | |
| * | Newfield Exploration Co. | 58,648 | 2,549 |
| Rowan Cos. plc | |||
| Class A | 162,224 | 2,459 | |
| ^ | Ship Finance | ||
| International Ltd. | 160,092 | 2,358 | |
| Ensco plc Class A | 244,125 | 2,075 | |
| Tesoro Corp. | 19,133 | 1,522 | |
| Chevron Corp. | 13,976 | 1,439 | |
| Valero Energy Corp. | 26,740 | 1,417 | |
| Energen Corp. | 15,278 | 882 | |
| Devon Energy Corp. | 19,733 | 871 | |
| ^,* | EP Energy Corp. Class A | 177,337 | 777 |
| DHT Holdings Inc. | 105,103 | 440 | |
29
Structured Broad Market Fund
| Market | |||
| Value• | |||
| Shares | ($000) | ||
| * | Denbury Resources Inc. | 88,292 | 285 |
| Baker Hughes Inc. | 5,110 | 258 | |
| Diamond Offshore | |||
| Drilling Inc. | 14,187 | 250 | |
| 28,916 | |||
| Financials (13.3%) | |||
| JPMorgan Chase & Co. | 103,714 | 6,906 | |
| Bank of America Corp. | 347,012 | 5,431 | |
| Citigroup Inc. | 105,772 | 4,996 | |
| American Express Co. | 51,626 | 3,306 | |
| * | Berkshire Hathaway Inc. | ||
| Class B | 20,912 | 3,021 | |
| Travelers Cos. Inc. | 25,852 | 2,961 | |
| Aflac Inc. | 39,776 | 2,859 | |
| Discover Financial Services | 48,619 | 2,749 | |
| Ameriprise Financial Inc. | 26,662 | 2,660 | |
| Navient Corp. | 173,388 | 2,509 | |
| MSCI Inc. Class A | 28,859 | 2,422 | |
| Universal Insurance | |||
| Holdings Inc. | 95,617 | 2,410 | |
| SunTrust Banks Inc. | 51,210 | 2,243 | |
| Prudential Financial Inc. | 26,309 | 2,148 | |
| Wells Fargo & Co. | 46,412 | 2,055 | |
| Assured Guaranty Ltd. | 54,111 | 1,502 | |
| Fifth Third Bancorp | 63,170 | 1,292 | |
| Bank of New York | |||
| Mellon Corp. | 28,307 | 1,129 | |
| * | KCG Holdings Inc. | ||
| Class A | 60,557 | 940 | |
| Regions Financial Corp. | 83,159 | 821 | |
| Nelnet Inc. Class A | 17,728 | 716 | |
| * | Walker & Dunlop Inc. | 22,723 | 574 |
| Ally Financial Inc. | 29,000 | 565 | |
| Capital One Financial Corp. | 5,712 | 410 | |
| * | Flagstar Bancorp Inc. | 9,784 | 272 |
| Marsh & McLennan | |||
| Cos. Inc. | 3,230 | 217 | |
| 57,114 | |||
| Health Care (14.1%) | |||
| Johnson & Johnson | 71,358 | 8,430 | |
| Merck & Co. Inc. | 89,421 | 5,581 | |
| Amgen Inc. | 25,951 | 4,329 | |
| Bristol-Myers Squibb Co. | 73,220 | 3,948 | |
| Eli Lilly & Co. | 47,514 | 3,814 | |
| * | Express Scripts Holding Co. | 44,745 | 3,156 |
| Aetna Inc. | 26,577 | 3,068 | |
| Anthem Inc. | 23,503 | 2,945 | |
| Baxter International Inc. | 58,537 | 2,786 | |
| * | HCA Holdings Inc. | 36,745 | 2,779 |
| AmerisourceBergen Corp. | |||
| Class A | 31,396 | 2,536 | |
| * | WellCare Health Plans Inc. | 21,023 | 2,462 |
| Pfizer Inc. | 71,948 | 2,437 | |
| * | PRA Health Sciences Inc. | 42,331 | 2,392 |
| * | INC Research Holdings Inc. | ||
| Class A | 53,058 | 2,365 | |
| * | Charles River Laboratories | ||
| International Inc. | 25,398 | 2,117 | |
| McKesson Corp. | 9,990 | 1,666 | |
| * | Five Prime Therapeutics Inc. | 23,700 | 1,244 |
| * | Hologic Inc. | 22,278 | 865 |
| * | Quintiles Transnational | ||
| Holdings Inc. | 8,922 | 723 | |
| * | Healthways Inc. | 19,136 | 506 |
| UnitedHealth Group Inc. | 2,516 | 352 | |
| Medtronic plc | 2,617 | 226 | |
| 60,727 | |||
| Industrials (10.1%) | |||
| General Electric Co. | 251,564 | 7,451 | |
| L-3 Communications | |||
| Holdings Inc. | 16,844 | 2,539 | |
| Masco Corp. | 73,831 | 2,533 | |
| Huntington Ingalls | |||
| Industries Inc. | 15,894 | 2,438 | |
| Owens Corning | 45,549 | 2,432 | |
| Global Brass & Copper | |||
| Holdings Inc. | 83,259 | 2,405 | |
| Quad/Graphics Inc. | 89,424 | 2,389 | |
| BWX Technologies Inc. | 61,630 | 2,365 | |
| Insteel Industries Inc. | 65,173 | 2,362 | |
| * | Wabash National Corp. | 164,082 | 2,337 |
| * | Hawaiian Holdings Inc. | 47,506 | 2,309 |
| Delta Air Lines Inc. | 54,472 | 2,144 | |
| SkyWest Inc. | 79,548 | 2,101 | |
| * | United Rentals Inc. | 25,741 | 2,020 |
| Alaska Air Group Inc. | 24,960 | 1,644 | |
| * | Spirit AeroSystems | ||
| Holdings Inc. Class A | 33,187 | 1,478 | |
| * | ACCO Brands Corp. | 65,835 | 635 |
| Southwest Airlines Co. | 11,383 | 443 | |
| Herman Miller Inc. | 12,953 | 370 | |
| Insperity Inc. | 4,482 | 326 | |
| Ennis Inc. | 16,006 | 270 | |
| Briggs & Stratton Corp. | 13,098 | 244 | |
| General Cable Corp. | 14,997 | 225 | |
| 43,460 | |||
| Information Technology (20.5%) | |||
| Apple Inc. | 84,335 | 9,534 | |
| * | Alphabet Inc. Class A | 8,410 | 6,762 |
| Microsoft Corp. | 105,293 | 6,065 | |
| Accenture plc Class A | 32,128 | 3,925 | |
| * | Alphabet Inc. Class C | 4,406 | 3,425 |
| * | Facebook Inc. Class A | 25,606 | 3,284 |
| NVIDIA Corp. | 45,627 | 3,126 | |
| HP Inc. | 187,013 | 2,904 | |
| * | Advanced Micro | ||
| Devices Inc. | 379,453 | 2,622 | |
| Computer Sciences Corp. | 47,614 | 2,486 | |
| Booz Allen Hamilton | |||
| Holding Corp. Class A | 76,569 | 2,420 | |
| * | GoDaddy Inc. Class A | 69,624 | 2,404 |
| * | Manhattan Associates Inc. | 41,514 | 2,392 |
30
Structured Broad Market Fund
| Market | |||
| Value• | |||
| Shares | ($000) | ||
| EarthLink Holdings Corp. | 381,214 | 2,364 | |
| * | Extreme Networks Inc. | 523,510 | 2,351 |
| SYNNEX Corp. | 20,564 | 2,347 | |
| * | Sykes Enterprises Inc. | 82,881 | 2,331 |
| CSG Systems | |||
| International Inc. | 56,351 | 2,329 | |
| * | MaxLinear Inc. | 111,124 | 2,253 |
| International Business | |||
| Machines Corp. | 13,419 | 2,132 | |
| CSRA Inc. | 66,042 | 1,777 | |
| CDW Corp. | 35,867 | 1,640 | |
| Texas Instruments Inc. | 22,906 | 1,608 | |
| * | First Data Corp. Class A | 116,556 | 1,534 |
| * | Aspen Technology Inc. | 32,749 | 1,532 |
| * | Cirrus Logic Inc. | 27,151 | 1,443 |
| ^ | Leidos Holdings Inc. | 30,683 | 1,328 |
| * | Wix.com Ltd. | 26,000 | 1,129 |
| Intel Corp. | 29,439 | 1,111 | |
| * | Teradata Corp. | 35,694 | 1,107 |
| * | Sigma Designs Inc. | 117,383 | 914 |
| * | NCR Corp. | 25,763 | 829 |
| Visa Inc. Class A | 10,025 | 829 | |
| * | TTM Technologies Inc. | 71,883 | 823 |
| Cisco Systems Inc. | 23,383 | 742 | |
| * | Tech Data Corp. | 5,733 | 486 |
| Intuit Inc. | 4,293 | 472 | |
| * | eBay Inc. | 11,927 | 392 |
| * | NeoPhotonics Corp. | 23,471 | 384 |
| Science Applications | |||
| International Corp. | 3,954 | 274 | |
| Oracle Corp. | 5,406 | 212 | |
| 88,022 | |||
| Materials (3.3%) | |||
| Steel Dynamics Inc. | 97,575 | 2,438 | |
| Trinseo SA | 42,682 | 2,414 | |
| Commercial Metals Co. | 146,662 | 2,375 | |
| * | AK Steel Holding Corp. | 462,216 | 2,233 |
| Rayonier Advanced | |||
| Materials Inc. | 114,827 | 1,535 | |
| Dow Chemical Co. | 16,291 | 844 | |
| LyondellBasell Industries | |||
| NV Class A | 9,526 | 768 | |
| * | Coeur Mining Inc. | 60,189 | 712 |
| * | Ryerson Holding Corp. | 44,046 | 497 |
| Cabot Corp. | 6,059 | 318 | |
| 14,134 | |||
| Real Estate (4.3%) | |||
| Hospitality Properties Trust | 81,317 | 2,417 | |
| CBL & Associates | |||
| Properties Inc. | 187,421 | 2,275 | |
| Government Properties | |||
| Income Trust | 99,530 | 2,251 | |
| DuPont Fabros | |||
| Technology Inc. | 54,569 | 2,251 | |
| Select Income REIT | 80,121 | 2,155 |
| Lexington Realty Trust | 156,828 | 1,615 |
| Senior Housing | ||
| Properties Trust | 67,818 | 1,540 |
| Washington Prime | ||
| Group Inc. | 86,496 | 1,071 |
| WP Carey Inc. | 11,744 | 758 |
| Apple Hospitality REIT Inc. | 35,845 | 663 |
| Communications Sales | ||
| & Leasing Inc. | 13,207 | 415 |
| VEREIT Inc. | 38,431 | 399 |
| Care Capital Properties Inc. | 9,703 | 277 |
| Ryman Hospitality | ||
| Properties Inc. | 4,654 | 224 |
| 18,311 | ||
| Telecommunication Services (2.4%) | ||
| Verizon | ||
| Communications Inc. | 105,226 | 5,470 |
| AT&T Inc. | 64,521 | 2,620 |
| CenturyLink Inc. | 52,863 | 1,450 |
| * Cincinnati Bell Inc. | 200,505 | 818 |
| 10,358 | ||
| Utilities (3.2%) | ||
| Edison International | 36,660 | 2,649 |
| FirstEnergy Corp. | 75,103 | 2,485 |
| Entergy Corp. | 32,019 | 2,457 |
| PPL Corp. | 69,492 | 2,402 |
| NiSource Inc. | 98,505 | 2,375 |
| MDU Resources Group Inc. | 40,852 | 1,039 |
| National Fuel Gas Co. | 10,842 | 586 |
| 13,993 | ||
| Total Common Stocks | ||
| (Cost $347,767) | 427,250 | |
| Temporary Cash Investments (1.5%)1 | ||
| Money Market Fund (1.4%) | ||
| 2,3 Vanguard Market | ||
| Liquidity Fund, 0.640% | 62,073 | 6,208 |
| Face | ||
| Amount | ||
| ($000) | ||
| U.S. Government and Agency Obligations (0.1%) | ||
| 4 United States Treasury | ||
| Bill, 0.312%, 12/8/16 | 200 | 200 |
| United States Treasury | ||
| Bill, 0.270%, 12/29/16 | 200 | 200 |
| 400 | ||
| Total Temporary Cash Investments | ||
| (Cost $6,607) | 6,608 | |
| Total Investments (100.9%) | ||
| (Cost $354,374) | 433,858 | |
31
Structured Broad Market Fund
| Amount | |
| ($000) | |
| Other Assets and Liabilities (-0.9%) | |
| Other Assets | |
| Investment in Vanguard | 39 |
| Receivables for Investment Securities Sold | 545 |
| Receivables for Accrued Income | 549 |
| Receivables for Capital Shares Issued | 25 |
| Other Assets 4 | 160 |
| Total Other Assets | 1,318 |
| Liabilities | |
| Payables for Investment Securities | |
| Purchased | (689) |
| Collateral for Securities on Loan | (4,023) |
| Payables to Vanguard | (340) |
| Other Liabilities | (161) |
| Total Liabilities | (5,213) |
| Net Assets (100%) | 429,963 |
| At September 30, 2016, net assets consisted of: | |
| Amount | |
| ($000) | |
| Paid-in Capital | 291,380 |
| Undistributed Net Investment Income | 8,922 |
| Accumulated Net Realized Gains | 50,162 |
| Unrealized Appreciation (Depreciation) | |
| Investment Securities | 79,484 |
| Futures Contracts | 15 |
| Net Assets | 429,963 |
| Institutional Shares—Net Assets | |
| Applicable to 1,198,051 outstanding | |
| $.001 par value shares of beneficial | |
| interest (unlimited authorization) | 40,380 |
| Net Asset Value Per Share— | |
| Institutional Shares | $33.70 |
| Institutional Plus Shares—Net Assets | |
| Applicable to 5,781,842 outstanding | |
| $.001 par value shares of beneficial | |
| interest (unlimited authorization) | 389,583 |
| Net Asset Value Per Share— | |
| Institutional Plus Shares | $67.38 |
• See Note A in Notes to Financial Statements.
^ Includes partial security positions on loan to broker-dealers. The total value of securities on loan is $3,857,000.
* Non-income-producing security.
1 The fund invests a portion of its cash reserves in equity markets through the use of index futures contracts. After giving effect to futures
investments, the fund’s effective common stock and temporary cash investment positions represent 99.9% and 1.0%, respectively,
of net assets.
2 Affiliated money market fund available only to Vanguard funds and certain trusts and accounts managed by Vanguard. Rate shown is the
7-day yield.
3 Includes $4,023,000 of collateral received for securities on loan.
4 Securities with a value of $200,000 and cash of $146,000 have been segregated as initial margin for open futures contracts.
REIT—Real Estate Investment Trust.
See accompanying Notes, which are an integral part of the Financial Statements.
32
Structured Broad Market Fund
Statement of Operations
| Year Ended | |
| September 30, 2016 | |
| ($000) | |
| Investment Income | |
| Income | |
| Dividends | 13,104 |
| Interest1 | 11 |
| Securities Lending—Net | 798 |
| Total Income | 13,913 |
| Expenses | |
| The Vanguard Group—Note B | |
| Investment Advisory Services | 495 |
| Management and Administrative—Institutional Shares | 34 |
| Management and Administrative—Institutional Plus Shares | 308 |
| Marketing and Distribution—Institutional Shares | 1 |
| Marketing and Distribution—Institutional Plus Shares | 6 |
| Custodian Fees | 11 |
| Auditing Fees | 34 |
| Shareholders’ Reports—Institutional Shares | 1 |
| Shareholders’ Reports—Institutional Plus Shares | 1 |
| Total Expenses | 891 |
| Net Investment Income | 13,022 |
| Realized Net Gain (Loss) | |
| Investment Securities Sold1 | 49,849 |
| Futures Contracts | 312 |
| Realized Net Gain (Loss) | 50,161 |
| Change in Unrealized Appreciation (Depreciation) | |
| Investment Securities | (3,724) |
| Futures Contracts | 62 |
| Change in Unrealized Appreciation (Depreciation) | (3,662) |
| Net Increase (Decrease) in Net Assets Resulting from Operations | 59,521 |
| 1 Interest income and realized net gain (loss) from an affiliated company of the fund were $9,000 and $0, respectively. | |
See accompanying Notes, which are an integral part of the Financial Statements.
33
Structured Broad Market Fund
Statement of Changes in Net Assets
| Year Ended September 30, | ||
| 2016 | 2015 | |
| ($000) | ($000) | |
| Increase (Decrease) in Net Assets | ||
| Operations | ||
| Net Investment Income | 13,022 | 10,839 |
| Realized Net Gain (Loss) | 50,161 | 48,798 |
| Change in Unrealized Appreciation (Depreciation) | (3,662) | (44,242) |
| Net Increase (Decrease) in Net Assets Resulting from Operations | 59,521 | 15,395 |
| Distributions | ||
| Net Investment Income | ||
| Institutional Shares | (640) | (434) |
| Institutional Plus Shares | (11,581) | (9,024) |
| Realized Capital Gain1 | ||
| Institutional Shares | (2,234) | (3,078) |
| Institutional Plus Shares | (40,149) | (61,848) |
| Total Distributions | (54,604) | (74,384) |
| Capital Share Transactions | ||
| Institutional Shares | 15,101 | 1,642 |
| Institutional Plus Shares | (140,471) | 65,576 |
| Net Increase (Decrease) from Capital Share Transactions | (125,370) | 67,218 |
| Total Increase (Decrease) | (120,453) | 8,229 |
| Net Assets | ||
| Beginning of Period | 550,416 | 542,187 |
| End of Period2 | 429,963 | 550,416 |
| 1 Includes fiscal 2016 and 2015 short-term gain distributions totaling $251,000 and $16,777,000. Short-term gain distributions are treated as | ||
| ordinary income dividends for tax purposes. | ||
| 2 Net Assets—End of Period includes undistributed (overdistributed) net investment income of $8,922,000 and $8,121,000. | ||
See accompanying Notes, which are an integral part of the Financial Statements.
34
Structured Broad Market Fund
Financial Highlights
| Institutional Shares | |||||
| For a Share Outstanding | Year Ended September 30, | ||||
| Throughout Each Period | 2016 | 2015 | 2014 | 2013 | 2012 |
| Net Asset Value, Beginning of Period | $33.24 | $37.28 | $32.59 | $27.10 | $21.03 |
| Investment Operations | |||||
| Net Investment Income | .7601 | .662 | .632 | . 573 | . 544 |
| Net Realized and Unrealized Gain (Loss) | |||||
| on Investments | 2.965 | .394 | 5.996 | 5.492 | 5.973 |
| Total from Investment Operations | 3.725 | 1.056 | 6.628 | 6.065 | 6.517 |
| Distributions | |||||
| Dividends from Net Investment Income | (.727) | (. 630) | (. 564) | (. 575) | (. 447) |
| Distributions from Realized Capital Gains | (2.538) | (4.466) | (1.374) | — | — |
| Total Distributions | (3.265) | (5.096) | (1.938) | (.575) | (.447) |
| Net Asset Value, End of Period | $33.70 | $33.24 | $37.28 | $32.59 | $27.10 |
| Total Return | 11.60% | 2.80% | 21.10% | 22.85% | 31.43% |
| Ratios/Supplemental Data | |||||
| Net Assets, End of Period (Millions) | $40 | $25 | $26 | $16 | $7 |
| Ratio of Total Expenses to Average Net Assets | 0.20% | 0.20% | 0.24% | 0.24% | 0.24% |
| Ratio of Net Investment Income to | |||||
| Average Net Assets | 2.33% | 1.86% | 1.67% | 1.94% | 2.19% |
| Portfolio Turnover Rate | 78% | 66% | 60% | 63% | 58% |
| 1 Calculated based on average shares outstanding. | |||||
See accompanying Notes, which are an integral part of the Financial Statements.
35
Structured Broad Market Fund
Financial Highlights
| Institutional Plus Shares | |||||
| For a Share Outstanding | Year Ended September 30, | ||||
| Throughout Each Period | 2016 | 2015 | 2014 | 2013 | 2012 |
| Net Asset Value, Beginning of Period | $66.43 | $74.52 | $65.15 | $54.17 | $42.02 |
| Investment Operations | |||||
| Net Investment Income | 1.5621 | 1.355 | 1.303 | 1.186 | 1.122 |
| Net Realized and Unrealized Gain (Loss) | |||||
| on Investments | 5.923 | .781 | 11.981 | 10.980 | 11.951 |
| Total from Investment Operations | 7.485 | 2.136 | 13.284 | 12.166 | 13.073 |
| Distributions | |||||
| Dividends from Net Investment Income | (1.463) | (1.302) | (1.169) | (1.186) | (.923) |
| Distributions from Realized Capital Gains | (5.072) | (8.924) | (2.745) | — | — |
| Total Distributions | (6.535) | (10.226) | (3.914) | (1.186) | (.923) |
| Net Asset Value, End of Period | $67.38 | $66.43 | $74.52 | $65.15 | $54.17 |
| Total Return | 11.66% | 2.84% | 21.16% | 22.95% | 31.56% |
| Ratios/Supplemental Data | |||||
| Net Assets, End of Period (Millions) | $390 | $526 | $516 | $465 | $379 |
| Ratio of Total Expenses to Average Net Assets | 0.16% | 0.16% | 0.17% | 0.17% | 0.17% |
| Ratio of Net Investment Income to | |||||
| Average Net Assets | 2.37% | 1.90% | 1.74% | 2.01% | 2.26% |
| Portfolio Turnover Rate | 78% | 66% | 60% | 63% | 58% |
| 1 Calculated based on average shares outstanding. | |||||
See accompanying Notes, which are an integral part of the Financial Statements.
36
Structured Broad Market Fund
Notes to Financial Statements
Vanguard Structured Broad Market Fund is registered under the Investment Company Act of 1940 as an open-end investment company, or mutual fund. The fund offers two classes of shares: Institutional Shares and Institutional Plus Shares. Institutional Shares and Institutional Plus Shares are designed for investors who meet certain administrative, service, and account-size criteria.
A. The following significant accounting policies conform to generally accepted accounting principles for U.S. investment companies. The fund consistently follows such policies in preparing its financial statements.
1. Security Valuation: Securities are valued as of the close of trading on the New York Stock Exchange (generally 4 p.m., Eastern time) on the valuation date. Equity securities are valued at the latest quoted sales prices or official closing prices taken from the primary market in which each security trades; such securities not traded on the valuation date are valued at the mean of the latest quoted bid and asked prices. Securities for which market quotations are not readily available, or whose values have been materially affected by events occurring before the fund’s pricing time but after the close of the securities’ primary markets, are valued by methods deemed by the board of trustees to represent fair value. Investments in Vanguard Market Liquidity Fund are valued at that fund’s net asset value. Temporary cash investments acquired over 60 days to maturity are valued using the latest bid prices or using valuations based on a matrix system (which considers such factors as security prices, yields, maturities, and ratings), both as furnished by independent pricing services. Other temporary cash investments are valued at amortized cost, which approximates market value.
2. Futures Contracts: The fund uses index futures contracts to a limited extent, with the objective of maintaining full exposure to the stock market while maintaining liquidity. The fund may purchase or sell futures contracts to achieve a desired level of investment, whether to accommodate portfolio turnover or cash flows from capital share transactions. The primary risks associated with the use of futures contracts are imperfect correlation between changes in market values of stocks held by the fund and the prices of futures contracts, and the possibility of an illiquid market. Counterparty risk involving futures is mitigated because a regulated clearinghouse is the counterparty instead of the clearing broker. To further mitigate counterparty risk, the fund trades futures contracts on an exchange, monitors the financial strength of its clearing brokers and clearinghouse, and has entered into clearing agreements with its clearing brokers. The clearinghouse imposes initial margin requirements to secure the fund’s performance and requires daily settlement of variation margin representing changes in the market value of each contract.
Futures contracts are valued at their quoted daily settlement prices. The aggregate settlement values of the contracts are not recorded in the Statement of Net Assets. Fluctuations in the value of the contracts are recorded in the Statement of Net Assets as an asset (liability) and in the Statement of Operations as unrealized appreciation (depreciation) until the contracts are closed, when they are recorded as realized futures gains (losses).
During the year ended September 30, 2016, the fund’s average investments in long and short futures contracts represented less than 1% and 0% of net assets, respectively, based on the average of aggregate settlement values at each quarter-end during the period.
3. Federal Income Taxes: The fund intends to continue to qualify as a regulated investment company and distribute all of its taxable income. Management has analyzed the fund’s tax positions taken for all open federal income tax years (September 30, 2013–2016), and has concluded that no provision for federal income tax is required in the fund’s financial statements.
37
Structured Broad Market Fund
4. Distributions: Distributions to shareholders are recorded on the ex-dividend date.
5. Securities Lending: To earn additional income, the fund lends its securities to qualified institutional borrowers. Security loans are subject to termination by the fund at any time, and are required to be secured at all times by collateral in an amount at least equal to the market value of securities loaned. Daily market fluctuations could cause the value of loaned securities to be more or less than the value of the collateral received. When this occurs, the collateral is adjusted and settled on the next business day. The fund further mitigates its counterparty risk by entering into securities lending transactions only with a diverse group of prequalified counterparties, monitoring their financial strength, and entering into master securities lending agreements with its counterparties. The master securities lending agreements provide that, in the event of a counterparty’s default (including bankruptcy), the fund may terminate any loans with that borrower, determine the net amount owed, and sell or retain the collateral up to the net amount owed to the fund; however, such actions may be subject to legal proceedings. While collateral mitigates counterparty risk, in the absence of a default the fund may experience delays and costs in recovering the securities loaned. The fund invests cash collateral received in Vanguard Market Liquidity Fund, and records a liability in the Statement of Net Assets for the return of the collateral, during the period the securities are on loan. Securities lending income represents fees charged to borrowers plus income earned on invested cash collateral, less expenses associated with the loan. During the term of the loan, the fund is entitled to all distributions made on or in respect of the loaned securities.
6. Credit Facility: The fund and certain other funds managed by The Vanguard Group (“Vanguard”) participate in a $3.1 billion committed credit facility provided by a syndicate of lenders pursuant to a credit agreement that may be renewed annually; each fund is individually liable for its borrowings, if any, under the credit facility. Borrowings may be utilized for temporary and emergency purposes, and are subject to the fund’s regulatory and contractual borrowing restrictions. The participating funds are charged administrative fees and an annual commitment fee of 0.10% of the undrawn amount of the facility; these fees are allocated to the funds based on a method approved by the fund’s board of trustees and included in Management and Administrative expenses on the fund’s Statement of Operations. Any borrowings under this facility bear interest at a rate based upon the higher of the one-month London Interbank Offered Rate, federal funds effective rate, or overnight bank funding rate plus an agreed-upon spread.
The fund had no borrowings outstanding at September 30, 2016, or at any time during the period then ended.
7. Other: Dividend income is recorded on the ex-dividend date. Interest income includes income distributions received from Vanguard Market Liquidity Fund and is accrued daily. Premiums and discounts on debt securities purchased are amortized and accreted, respectively, to interest income over the lives of the respective securities. Security transactions are accounted for on the date securities are bought or sold. Costs used to determine realized gains (losses) on the sale of investment securities are those of the specific securities sold.
Each class of shares has equal rights as to assets and earnings, except that each class separately bears certain class-specific expenses related to maintenance of shareholder accounts (included in Management and Administrative expenses) and shareholder reporting. Marketing and distribution expenses are allocated to each class of shares based on a method approved by the board of trustees. Income, other non-class-specific expenses, and gains and losses on investments are allocated to each class of shares based on its relative net assets.
38
Structured Broad Market Fund
B. In accordance with the terms of a Funds’ Service Agreement (the “FSA”) between Vanguard and the fund, Vanguard furnishes to the fund investment advisory, corporate management, administrative, marketing, and distribution services at Vanguard’s cost of operations (as defined by the FSA). These costs of operations are allocated to the fund based on methods and guidelines approved by the board of trustees. Vanguard does not require reimbursement in the current period for certain costs of operations (such as deferred compensation/benefits and risk/insurance costs); the fund’s liability for these costs of operations is included in Payables to Vanguard on the Statement of Net Assets.
Upon the request of Vanguard, the fund may invest up to 0.40% of its net assets as capital in Vanguard. At September 30, 2016, the fund had contributed to Vanguard capital in the amount of $39,000, representing 0.01% of the fund’s net assets and 0.02% of Vanguard’s capitalization. The fund’s trustees and officers are also directors and employees, respectively, of Vanguard.
C. Various inputs may be used to determine the value of the fund’s investments. These inputs are summarized in three broad levels for financial statement purposes. The inputs or methodologies used to value securities are not necessarily an indication of the risk associated with investing in those securities.
Level 1—Quoted prices in active markets for identical securities.
Level 2—Other significant observable inputs (including quoted prices for similar securities, interest rates, prepayment speeds, credit risk, etc.).
Level 3—Significant unobservable inputs (including the fund’s own assumptions used to determine the fair value of investments).
The following table summarizes the market value of the fund’s investments as of September 30, 2016, based on the inputs used to value them.
| Level 1 | Level 2 | Level 3 | |
| Investments | ($000) | ($000) | ($000) |
| Common Stocks | 427,250 | — | — |
| Temporary Cash Investments | 6,208 | 400 | — |
| Futures Contracts—Assets1 | 14 | — | — |
| Total | 433,472 | 400 | — |
| 1 Represents variation margin on the last day of the reporting period. | |||
D. At September 30, 2016, the aggregate settlement value of open futures contracts and the related unrealized appreciation (depreciation) were:
| ($000) | ||||
| Aggregate | ||||
| Number of | Settlement | Unrealized | ||
| Long (Short) | Value | Appreciation | ||
| Futures Contracts | Expiration | Contracts | Long (Short) | (Depreciation) |
| E-mini S&P 500 Index | December 2016 | 23 | 2,484 | 15 |
Unrealized appreciation (depreciation) on open futures contracts is required to be treated as realized gain (loss) for tax purposes.
39
Structured Broad Market Fund
E. Distributions are determined on a tax basis and may differ from net investment income and realized capital gains for financial reporting purposes. Differences may be permanent or temporary. Permanent differences are reclassified among capital accounts in the financial statements to reflect their tax character. Temporary differences arise when certain items of income, expense, gain, or loss are recognized in different periods for financial statement and tax purposes. These differences will reverse at some time in the future. Differences in classification may also result from the treatment of short-term gains as ordinary income for tax purposes.
For tax purposes, at September 30, 2016, the fund had $9,195,000 of ordinary income and $50,172,000 of long-term capital gains available for distribution.
At September 30, 2016, the cost of investment securities for tax purposes was $354,374,000. Net unrealized appreciation of investment securities for tax purposes was $79,484,000, consisting of unrealized gains of $86,074,000 on securities that had risen in value since their purchase and $6,590,000 in unrealized losses on securities that had fallen in value since their purchase.
F. During the year ended September 30, 2016, the fund purchased $420,489,000 of investment securities and sold $586,651,000 of investment securities, other than temporary cash investments.
G. Capital share transactions for each class of shares were:
| Year Ended September 30, | ||||
| 2016 | 2015 | |||
| Amount | Shares | Amount | Shares | |
| ($000) | (000) | ($000) | (000) | |
| Institutional Shares | ||||
| Issued | 16,991 | 514 | — | — |
| Issued in Lieu of Cash Distributions | 1,675 | 52 | 1,642 | 49 |
| Redeemed | (3,565) | (106) | — | — |
| Net Increase (Decrease)—Institutional Shares | 15,101 | 460 | 1,642 | 49 |
| Institutional Plus Shares | ||||
| Issued | 4,995 | 87 | 3,000 | 45 |
| Issued in Lieu of Cash Distributions | 41,158 | 635 | 62,576 | 940 |
| Redeemed | (186,624) | (2,856) | — | — |
| Net Increase (Decrease)—Institutional Plus Shares | (140,471) | (2,134) | 65,576 | 985 |
At September 30, 2016, one shareholder was the record or beneficial owner of 90% of the fund’s net assets. In October 2016, such shareholder redeemed $219,000,000 (51% of the fund’s net assets on the redemption date) from the fund. If the shareholder were to redeem its remaining investment in the fund, the redemption may result in an increase in the fund’s expense ratio, cause the fund to incur higher transaction costs, lead to the realization of taxable capital gains, or cause the remaining shareholders to receive distributions representing a disproportionate share of the fund’s ordinary income and long-term capital gains.
H. On November 17, 2016, the board of trustees approved the liquidation and dissolution of the fund. In light of the pending liquidation, the fund intends to declare and pay its calendar-year-end distribution earlier than scheduled; such distribution will consist primarily of the ordinary income and long-term capital gains available for distribution at September 30, 2016 (as discussed in Note E).
Management has determined that no other material events or transactions occurred subsequent to September 30, 2016, that would require recognition or disclosure in these financial statements.
40
Report of Independent Registered
Public Accounting Firm
To the Board of Trustees of Vanguard Quantitative Funds and the Shareholders of Vanguard Structured Large-Cap Equity Fund and Vanguard Structured Broad Market Fund: In our opinion, the accompanying statements of net assets and the related statements of operations and of changes in net assets and the financial highlights present fairly, in all material respects, the financial position of Vanguard Structured Large-Cap Equity Fund and Vanguard Structured Broad Market Fund (constituting separate portfolios of Vanguard Quantitative Funds, hereafter referred to as the “Funds”) at September 30, 2016, the results of each of their operations for the year then ended, the changes in each of their net assets for each of the two years in the period then ended, and the financial highlights for each of the five years in the period then ended, in conformity with accounting principles generally accepted in the United States of America. These financial statements and financial highlights (hereafter referred to as “financial statements”) are the responsibility of the Funds’ management. Our responsibility is to express an opinion on these financial statements based on our audits. We conducted our audits of these financial statements in accordance with the standards of the Public Company Accounting Oversight Board (United States). Those standards require that we plan and perform the audit to obtain reasonable assurance about whether the financial statements are free of material misstatement. An audit includes examining, on a test basis, evidence supporting the amounts and disclosures in the financial statements, assessing the accounting principles used and significant estimates made by management, and evaluating the overall financial statement presentation. We believe that our audits, which included confirmation of securities at September 30, 2016 by correspondence with the custodian and brokers and by agreement to the underlying ownership records of the transfer agent, provide a reasonable basis for our opinion.
As discussed in Note H to the financial statements, subsequent to year-end, the Board of Trustees approved a plan of liquidation for the Funds on November 17, 2016.
/s/PricewaterhouseCoopers LLP
Philadelphia, Pennsylvania
November 18, 2016
41

Special 2016 tax information (unaudited) for Vanguard Structured Equity Funds
This information for the fiscal year ended September 30, 2016, is included pursuant to provisions of
the Internal Revenue Code.
For nonresident alien shareholders, 100% of short-term capital gain dividends distributed by the
Structured Broad Market Fund are qualified short-term capital gains.
The funds distributed capital gain dividends (from net long-term capital gains) to shareholders during
the fiscal year as follows:
| Fund | ($000) |
| Structured Large-Cap Equity Fund | 19,148 |
| Structured Broad Market Fund | 42,132 |
The funds distributed qualified dividend income to shareholders during the fiscal year as follows:
| Fund | ($000) |
| Structured Large-Cap Equity Fund | 11,973 |
| Structured Broad Market Fund | 11,658 |
For corporate shareholders, the percentage of investment income (dividend income plus short-term gains, if any) that qualifies for the dividends-received deduction is as follows:
| Fund | Percentage |
| Structured Large-Cap Equity Fund | 96.6% |
| Structured Broad Market Fund | 77.3 |
42
About Your Fund’s Expenses
As a shareholder of the fund, you incur ongoing costs, which include costs for portfolio management, administrative services, and shareholder reports (like this one), among others. Operating expenses, which are deducted from a fund’s gross income, directly reduce the investment return of the fund.
A fund’s expenses are expressed as a percentage of its average net assets. This figure is known as the expense ratio. The following examples are intended to help you understand the ongoing costs (in dollars) of investing in your fund and to compare these costs with those of other mutual funds. The examples are based on an investment of $1,000 made at the beginning of the period shown and held for the entire period.
The accompanying table illustrates your fund’s costs in two ways:
• Based on actual fund return. This section helps you to estimate the actual expenses that you paid over the period. The ”Ending Account Value“ shown is derived from the fund‘s actual return, and the third column shows the dollar amount that would have been paid by an investor who started with $1,000 in the fund. You may use the information here, together with the amount you invested, to estimate the expenses that you paid over the period.
To do so, simply divide your account value by $1,000 (for example, an $8,600 account value divided by $1,000 = 8.6), then multiply the result by the number given for your fund under the heading ”Expenses Paid During Period.“
• Based on hypothetical 5% yearly return. This section is intended to help you compare your fund‘s costs with those of other mutual funds. It assumes that the fund had a yearly return of 5% before expenses, but that the expense ratio is unchanged. In this case—because the return used is not the fund’s actual return—the results do not apply to your investment. The example is useful in making comparisons because the Securities and Exchange Commission requires all mutual funds to calculate expenses based on a 5% return. You can assess your fund’s costs by comparing this hypothetical example with the hypothetical examples that appear in shareholder reports of other funds.
Note that the expenses shown in the table are meant to highlight and help you compare ongoing costs only and do not reflect transaction costs incurred by the fund for buying and selling securities. Further, the expenses do not include any purchase, redemption, or account service fees described in the fund prospectus. If such fees were applied to your account, your costs would be higher. Your fund does not carry a “sales load.”
The calculations assume no shares were bought or sold during the period. Your actual costs may have been higher or lower, depending on the amount of your investment and the timing of any purchases or redemptions.
You can find more information about the fund’s expenses, including annual expense ratios, in the Financial Statements section of this report. For additional information on operating expenses and other shareholder costs, please refer to your fund’s current prospectus.
43
| Six Months Ended September 30, 2016 | |||
| Beginning | Ending | Expenses | |
| Account Value | Account Value | Paid During | |
| 3/31/2016 | 9/30/2016 | Period | |
| Based on Actual Fund Return | |||
| Structured Large-Cap Equity Fund | |||
| Institutional Shares | $1,000.00 | $1,054.95 | $1.13 |
| Institutional Plus Shares | 1,000.00 | 1,055.39 | 0.92 |
| Structured Broad Market Fund | |||
| Institutional Shares | $1,000.00 | $1,060.42 | $1.08 |
| Institutional Plus Shares | 1,000.00 | 1,060.60 | 0.93 |
| Based on Hypothetical 5% Yearly Return | |||
| Structured Large-Cap Equity Fund | |||
| Institutional Shares | $1,000.00 | $1,023.90 | $1.11 |
| Institutional Plus Shares | 1,000.00 | 1,024.10 | 0.91 |
| Structured Broad Market Fund | |||
| Institutional Shares | $1,000.00 | $1,023.95 | $1.06 |
| Institutional Plus Shares | 1,000.00 | 1,024.10 | 0.91 |
The calculations are based on expenses incurred in the most recent six-month period. The funds’ annualized six-month expense ratios for that
period are: for the Structured Large-Cap Equity Fund, 0.22% for Institutional Shares and 0.18% for Institutional Plus Shares; for the Structured
Broad Market Fund, 0.21% for Institutional Shares and 0.18% for Institutional Plus Shares. The dollar amounts shown as “Expenses Paid” are
equal to the annualized expense ratio multiplied by the average account value over the period, multiplied by the number of days in the most
recent six-month period, then divided by the number of days in the most recent 12-month period (183/366).
44
Glossary
30-Day SEC Yield. A fund’s 30-day SEC yield is derived using a formula specified by the U.S. Securities and Exchange Commission. Under the formula, data related to the fund’s security holdings in the previous 30 days are used to calculate the fund’s hypothetical net income for that period, which is then annualized and divided by the fund’s estimated average net assets over the calculation period. For the purposes of this calculation, a security’s income is based on its current market yield to maturity (for bonds), its actual income (for asset-backed securities), or its projected dividend yield (for stocks). Because the SEC yield represents hypothetical annualized income, it will differ—at times significantly—from the fund’s actual experience. As a result, the fund’s income distributions may be higher or lower than implied by the SEC yield.
Beta. A measure of the magnitude of a fund’s past share-price fluctuations in relation to the ups and downs of a given market index. The index is assigned a beta of 1.00. Compared with a given index, a fund with a beta of 1.20 typically would have seen its share price rise or fall by 12% when the index rose or fell by 10%. For this report, beta is based on returns over the past 36 months for both the fund and the index. Note that a fund’s beta should be reviewed in conjunction with its R-squared (see definition). The lower the R-squared, the less correlation there is between the fund and the index, and the less reliable beta is as an indicator of volatility.
Dividend Yield. Dividend income earned by stocks, expressed as a percentage of the aggregate market value (or of net asset value, for a fund). The yield is determined by dividing the amount of the annual dividends by the aggregate value (or net asset value) at the end of the period. For a fund, the dividend yield is based solely on stock holdings and does not include any income produced by other investments.
Earnings Growth Rate. The average annual rate of growth in earnings over the past five years for the stocks now in a fund.
Equity Exposure. A measure that reflects a fund’s investments in stocks and stock futures. Any holdings in short-term reserves are excluded.
Expense Ratio. A fund’s total annual operating expenses expressed as a percentage of the fund’s average net assets. The expense ratio includes management and administrative expenses, but does not include the transaction costs of buying and selling portfolio securities.
Foreign Holdings. The percentage of a fund represented by securities or depositary receipts of companies based outside the United States.
Median Market Cap. An indicator of the size of companies in which a fund invests; the midpoint of market capitalization (market price x shares outstanding) of a fund’s stocks, weighted by the proportion of the fund’s assets invested in each stock. Stocks representing half of the fund’s assets have market capitalizations above the median, and the rest are below it.
Price/Book Ratio. The share price of a stock divided by its net worth, or book value, per share. For a fund, the weighted average price/book ratio of the stocks it holds.
Price/Earnings Ratio. The ratio of a stock’s current price to its per-share earnings over the past year. For a fund, the weighted average P/E of the stocks it holds. P/E is an indicator of market expectations about corporate prospects; the higher the P/E, the greater the expectations for a company’s future growth.
45
R-Squared. A measure of how much of a fund’s past returns can be explained by the returns from the market in general, as measured by a given index. If a fund’s total returns were precisely synchronized with an index’s returns, its R-squared would be 1.00. If the fund’s returns bore no relationship to the index’s returns, its R-squared would be 0. For this report, R-squared is based on returns over the past 36 months for both the fund and the index.
Return on Equity. The annual average rate of return generated by a company during the past five years for each dollar of shareholder’s equity (net income divided by shareholder’s equity). For a fund, the weighted average return on equity for the companies whose stocks it holds.
Short-Term Reserves. The percentage of a fund invested in highly liquid, short-term securities that can be readily converted to cash.
Turnover Rate. An indication of the fund’s trading activity. Funds with high turnover rates incur higher transaction costs and may be more likely to distribute capital gains (which may be taxable to investors). The turnover rate excludes in-kind transactions, which have minimal impact on costs.
46
This page intentionally left blank.
The People Who Govern Your Fund
The trustees of your mutual fund are there to see that the fund is operated and managed in your best interests since, as a shareholder, you are a part owner of the fund. Your fund’s trustees also serve on the board of directors of The Vanguard Group, Inc., which is owned by the Vanguard funds and provides services to them on an at-cost basis.
A majority of Vanguard’s board members are independent, meaning that they have no affiliation with Vanguard or the funds they oversee, apart from the sizable personal investments they have made as private individuals. The independent board members have distinguished backgrounds in business, academia, and public service. Each of the trustees and executive officers oversees 198 Vanguard funds.
The following table provides information for each trustee and executive officer of the fund. The mailing address of the trustees and officers is P.O. Box 876, Valley Forge, PA 19482. More information about the trustees is in the Statement of Additional Information, which can be obtained, without charge, by contacting Vanguard at 800-662-7447, or online at vanguard.com.
| InterestedTrustee1 |
| F. William McNabb III |
| Born 1957. Trustee Since July 2009. Chairman of |
| the Board. Principal Occupation(s) During the Past |
| Five Years and Other Experience: Chairman of the |
| Board of The Vanguard Group, Inc., and of each of |
| the investment companies served by The Vanguard |
| Group, since January 2010; Director of The Vanguard |
| Group since 2008; Chief Executive Officer and |
| President of The Vanguard Group, and of each of |
| the investment companies served by The Vanguard |
| Group, since 2008; Director of Vanguard Marketing |
| Corporation; Managing Director of The Vanguard |
| Group (1995–2008). |
| IndependentTrustees |
| Emerson U. Fullwood |
| Born 1948. Trustee Since January 2008. Principal |
| Occupation(s) During the Past Five Years and Other |
| Experience: Executive Chief Staff and Marketing |
| Officer for North America and Corporate Vice President |
| (retired 2008) of Xerox Corporation (document manage- |
| ment products and services); Executive in Residence |
| and 2009–2010 Distinguished Minett Professor at |
| the Rochester Institute of Technology; Lead Director |
| of SPX FLOW, Inc. (multi-industry manufacturing); |
| Director of the United Way of Rochester, the University |
| of Rochester Medical Center, Monroe Community |
| College Foundation, North Carolina A&T University, |
| and Roberts Wesleyan College. |
| Rajiv L. Gupta |
| Born 1945. Trustee Since December 2001.2 Principal |
| Occupation(s) During the Past Five Years and Other |
| Experience: Chairman and Chief Executive Officer |
| (retired 2009) and President (2006–2008) of |
| Rohm and Haas Co. (chemicals); Director of Tyco |
| International plc (diversified manufacturing and |
| services), HP Inc. (printer and personal computer |
| manufacturing), and Delphi Automotive plc |
| (automotive components); Senior Advisor at |
| New Mountain Capital. |
Amy Gutmann |
| Born 1949. Trustee Since June 2006. Principal |
| Occupation(s) During the Past Five Years and |
| Other Experience: President of the University of |
| Pennsylvania; Christopher H. Browne Distinguished |
| Professor of Political Science, School of Arts and |
| Sciences, and Professor of Communication, Annenberg |
| School for Communication, with secondary faculty |
| appointments in the Department of Philosophy, School |
| of Arts and Sciences, and at the Graduate School of |
| Education, University of Pennsylvania; Trustee of the |
| National Constitution Center; Chair of the Presidential |
| Commission for the Study of Bioethical Issues. |
JoAnn Heffernan Heisen |
| Born 1950. Trustee Since July 1998. Principal |
| Occupation(s) During the Past Five Years and |
| Other Experience: Corporate Vice President and |
| Chief Global Diversity Officer (retired 2008) and |
| Member of the Executive Committee (1997–2008) |
| of Johnson & Johnson (pharmaceuticals/medical |
| devices/consumer products); Director of Skytop |
| Lodge Corporation (hotels) and the Robert Wood |
| Johnson Foundation; Member of the Advisory |
| Board of the Institute for Women’s Leadership |
| at Rutgers University. |
| F. Joseph Loughrey |
| Born 1949. Trustee Since October 2009. Principal |
| Occupation(s) During the Past Five Years and Other |
| Experience: President and Chief Operating Officer |
| (retired 2009) of Cummins Inc. (industrial machinery); |
| Chairman of the Board of Hillenbrand, Inc. (specialized |
| consumer services), and of Oxfam America; Director |
| of SKF AB (industrial machinery), Hyster-Yale Materials |
| Handling, Inc. (forklift trucks), the Lumina Foundation |
| for Education, and the V Foundation for Cancer |
| Research; Member of the Advisory Council for the |
| College of Arts and Letters and of the Advisory Board |
| to the Kellogg Institute for International Studies, both |
| at the University of Notre Dame. |
Mark Loughridge |
| Born 1953. Trustee Since March 2012. Principal |
| Occupation(s) During the Past Five Years and Other |
| Experience: Senior Vice President and Chief Financial |
| Officer (retired 2013) at IBM (information technology |
| services); Fiduciary Member of IBM’s Retirement Plan |
| Committee (2004–2013); Director of the Dow Chemical |
| Company; Member of the Council on Chicago Booth. |
Scott C. Malpass |
| Born 1962. Trustee Since March 2012. Principal |
| Occupation(s) During the Past Five Years and Other |
| Experience: Chief Investment Officer and Vice |
| President at the University of Notre Dame; Assistant |
| Professor of Finance at the Mendoza College of |
| Business at Notre Dame; Member of the Notre Dame |
| 403(b) Investment Committee, the Board of Advisors |
| for Spruceview Capital Partners, and the Investment |
| Advisory Committee of Major League Baseball; Board |
| Member of TIFF Advisory Services, Inc., and Catholic |
| Investment Services, Inc. (investment advisors). |
André F. Perold |
| Born 1952. Trustee Since December 2004. Principal |
| Occupation(s) During the Past Five Years and Other |
| Experience: George Gund Professor of Finance and |
| Banking, Emeritus at the Harvard Business School |
| (retired 2011); Chief Investment Officer and Managing |
| Partner of HighVista Strategies LLC (private investment |
| firm); Director of Rand Merchant Bank; Overseer of |
| the Museum of Fine Arts Boston. |
Peter F. Volanakis |
| Born 1955. Trustee Since July 2009. Principal |
| Occupation(s) During the Past Five Years and |
| Other Experience: President and Chief Operating |
| Officer (retired 2010) of Corning Incorporated |
| (communications equipment); Chairman of the |
| Board of Trustees of Colby-Sawyer College; |
| Member of the Advisory Board of the Norris |
| Cotton Cancer Center. |
| Executive Officers | |
| Glenn Booraem | |
| Born 1967. Treasurer Since May 2015. Principal | |
| Occupation(s) During the Past Five Years and | |
| Other Experience: Principal of The Vanguard Group, | |
| Inc.; Treasurer of each of the investment companies | |
| served by The Vanguard Group; Controller of each of | |
| the investment companies served by The Vanguard | |
| Group (2010–2015); Assistant Controller of each of | |
| the investment companies served by The Vanguard | |
| Group (2001–2010). | |
Thomas J. Higgins | |
| Born 1957. Chief Financial Officer Since September | |
| 2008. Principal Occupation(s) During the Past Five | |
| Years and Other Experience: Principal of The Vanguard | |
| Group, Inc.; Chief Financial Officer of each of the | |
| investment companies served by The Vanguard Group; | |
| Treasurer of each of the investment companies served | |
| by The Vanguard Group (1998–2008). | |
Peter Mahoney | |
| Born 1974. Controller Since May 2015. Principal | |
| Occupation(s) During the Past Five Years and Other | |
| Experience: Head of Global Fund Accounting at The | |
| Vanguard Group, Inc.; Controller of each of the invest- | |
| ment companies served by The Vanguard Group; | |
| Head of International Fund Services at The Vanguard | |
| Group (2008–2014). | |
Anne E. Robinson | |
| Born 1970. Secretary Since September 2016. Principal | |
| Occupation(s) During the Past Five Years and Other | |
| Experience: Managing Director of The Vanguard Group, | |
| Inc.; General Counsel of The Vanguard Group; Secretary | |
| of The Vanguard Group and of each of the investment | |
| companies served by The Vanguard Group; Director | |
| and Senior Vice President of Vanguard Marketing | |
| Corporation; Managing Director and General Counsel | |
| of Global Cards and Consumer Services at Citigroup | |
| (2014–2016); Counsel at American Express (2003–2014). | |
| Vanguard Senior ManagementTeam | |
| Mortimer J. Buckley | James M. Norris |
| Kathleen C. Gubanich | Thomas M. Rampulla |
| Martha G. King | Glenn W. Reed |
| John T. Marcante | Karin A. Risi |
| Chris D. McIsaac | Michael Rollings |
| Chairman Emeritus and Senior Advisor | |
| John J. Brennan | |
| Chairman, 1996–2009 | |
| Chief Executive Officer and President, 1996–2008 | |
| Founder | |
| John C. Bogle | |
| Chairman and Chief Executive Officer, 1974–1996 | |
1 Mr. McNabb is considered an “interested person,” as defined in the Investment Company Act of 1940, because he is an officer of the Vanguard funds.
2 December 2002 for Vanguard Equity Income Fund, the Vanguard Municipal Bond Funds, and the Vanguard State Tax-Exempt Funds.
 | |
| P.O. Box 2600 | |
| Valley Forge, PA 19482-2600 | |
| Connect with Vanguard® > vanguard.com | |
| Fund Information > 800-662-7447 | CFA® is a registered trademark owned by CFA Institute. |
| Direct Investor Account Services > 800-662-2739 | |
| Institutional Investor Services > 800-523-1036 | |
| Text Telephone for People | |
| Who Are Deaf or Hard of Hearing> 800-749-7273 | |
| This material may be used in conjunction | |
| with the offering of shares of any Vanguard | |
| fund only if preceded or accompanied by | |
| the fund’s current prospectus. | |
| All comparative mutual fund data are from Lipper, a | |
| Thomson Reuters Company, or Morningstar, Inc., unless | |
| otherwise noted. | |
| You can obtain a free copy of Vanguard’s proxy voting | |
| guidelines by visiting vanguard.com/proxyreporting or by | |
| calling Vanguard at 800-662-2739. The guidelines are | |
| also available from the SEC’s website, sec.gov. In | |
| addition, you may obtain a free report on how your fund | |
| voted the proxies for securities it owned during the 12 | |
| months ended June 30. To get the report, visit either | |
| vanguard.com/proxyreporting or sec.gov. | |
| You can review and copy information about your fund at | |
| the SEC’s Public Reference Room in Washington, D.C. To | |
| find out more about this public service, call the SEC at | |
| 202-551-8090. Information about your fund is also | |
| available on the SEC’s website, and you can receive | |
| copies of this information, for a fee, by sending a | |
| request in either of two ways: via email addressed to | |
| publicinfo@sec.gov or via regular mail addressed to the | |
| Public Reference Section, Securities and Exchange | |
| Commission, Washington, DC 20549-1520. | |
| © 2016 The Vanguard Group, Inc. | |
| All rights reserved. | |
| Vanguard Marketing Corporation, Distributor. | |
| Q08700 112016 | |
Item 2: Code of Ethics. The Registrant has adopted a code of ethics that applies to the Registrant’s principal executive officer, principal financial officer, principal accounting officer or controller or persons performing similar functions. The Code of Ethics was amended during the reporting period covered by this report to make certain technical, non-material changes.
Item 3: Audit Committee Financial Expert. All members of the Audit Committee have been determined by the Registrant’s Board of Trustees to be Audit Committee Financial Experts and to be independent: Rajiv L. Gupta, JoAnn Heffernan Heisen, F. Joseph Loughrey, Mark Loughridge, and Peter F. Volanakis.
Item 4: Principal Accountant Fees and Services.
(a) Audit Fees.
Audit Fees of the Registrant
Fiscal Year Ended September 30, 2016: $111,000
Fiscal Year Ended September 30, 2015: $101,000
Aggregate Audit Fees of Registered Investment Companies in the Vanguard Group.
Fiscal Year Ended September 30, 2016: $9,629,849
Fiscal Year Ended September 30, 2015: $7,000,200
Includes fees billed in connection with audits of the Registrant, other registered investment companies in the Vanguard complex, The Vanguard Group, Inc. and Vanguard Marketing Corporation.
(b) Audit-Related Fees.
Fiscal Year Ended September 30, 2016: $2,717,627
Fiscal Year Ended September 30, 2015: $2,899,096
Includes fees billed in connection with assurance and related services provided to the Registrant, other registered investment companies in the Vanguard complex, The Vanguard Group, Inc., and Vanguard Marketing Corporation.
(c) Tax Fees.
Fiscal Year Ended September 30, 2016: $254,050
Fiscal Year Ended September 30, 2015: $353,389
Includes fees billed in connection with tax compliance, planning, and advice services provided to the Registrant, other registered investment companies in the Vanguard complex, The Vanguard Group, Inc., and Vanguard Marketing Corporation.
(d) All Other Fees.
Fiscal Year Ended September 30, 2016: $214,225
Fiscal Year Ended September 30, 2015: $202,313
Includes fees billed for services related to tax reported information provided to the Registrant, other registered investment companies in the Vanguard complex, The Vanguard Group, Inc., and Vanguard Marketing Corporation.
(e) (1) Pre-Approval Policies. The policy of the Registrant’s Audit Committee is to consider and, if appropriate, approve before the principal accountant is engaged for such services, all specific audit and non-audit services provided to: the Registrant, other registered investment companies in the Vanguard complex, The Vanguard Group, Inc., and entities controlled by The Vanguard Group, Inc. that provide ongoing services to the Registrant. In making a determination, the Audit Committee considers whether the services are consistent with maintaining the principal accountant’s independence.
In the event of a contingency situation in which the principal accountant is needed to provide services in between scheduled Audit Committee meetings, the Chairman of the Audit Committee would be called on to consider and, if appropriate, pre-approve audit or permitted non-audit services in an amount sufficient to complete services through the next Audit Committee meeting, and to determine if such services would be consistent with maintaining the accountant’s independence. At the next scheduled Audit Committee meeting, services and fees would be presented to the Audit Committee for formal consideration, and, if appropriate, approval by the entire Audit Committee. The Audit Committee would again consider whether such services and fees are consistent with maintaining the principal accountant’s independence.
The Registrant’s Audit Committee is informed at least annually of all audit and non-audit services provided by the principal accountant to the Vanguard complex, whether such services are provided to: the Registrant, other registered investment companies in the Vanguard complex, The Vanguard Group, Inc., or other entities controlled by The Vanguard Group, Inc. that provide ongoing services to the Registrant.
(2) No percentage of the principal accountant’s fees or services were approved pursuant to the waiver provision of paragraph (c)(7)(i)(C) of Rule 2-01 of Regulation S-X.
(f) For the most recent fiscal year, over 50% of the hours worked under the principal accountant’s engagement were not performed by persons other than full-time, permanent employees of the principal accountant.
(g) Aggregate Non-Audit Fees.
Fiscal Year Ended September 30, 2016: $468,275
Fiscal Year Ended September 30, 2015: $555,702
Includes fees billed for non-audit services provided to the Registrant, other registered investment companies in the Vanguard complex, The Vanguard Group, Inc., and Vanguard Marketing Corporation.
(h) For the most recent fiscal year, the Audit Committee has determined that the provision of all non-audit services was consistent with maintaining the principal accountant’s independence.
Item 5: Audit Committee of Listed Registrants.
Not Applicable.
Item 6: Investments.
Not Applicable.
Item 7: Disclosure of Proxy Voting Policies and Procedures for Closed-End Management
Investment Companies.
Not Applicable.
Item 8: Portfolio Managers of Closed-End Management Investment Companies.
Not Applicable.
Item 9: Purchase of Equity Securities by Closed-End Management Investment Company and
Affiliated Purchasers.
Not Applicable.
Item 10: Submission of Matters to a Vote of Security Holders.
Not Applicable.
Item 11: Controls and Procedures.
(a) Disclosure Controls and Procedures. The Principal Executive and Financial Officers concluded that the Registrant’s Disclosure Controls and Procedures are effective based on their evaluation of the Disclosure Controls and Procedures as of a date within 90 days of the filing date of this report.
(b) Internal Control Over Financial Reporting. There were no significant changes in Registrant’s Internal Control Over Financial Reporting or in other factors that could significantly affect this control subsequent to the date of the evaluation, including any corrective actions with regard to significant deficiencies and material weaknesses.
Item 12: Exhibits.
(a) Code of Ethics.
(b) Certifications.
Pursuant to the requirements of the Securities Exchange Act of 1934 and the Investment Company Act of 1940, the registrant has duly caused this report to be signed on its behalf by the undersigned, thereunto duly authorized.
| VANGUARD QUANTITATIVE FUNDS | |
| BY: | /s/ F. WILLIAM MCNABB III* |
| F. WILLIAM MCNABB III | |
| CHIEF EXECUTIVE OFFICER | |
| Date: November 17, 2016 | |
Pursuant to the requirements of the Securities Exchange Act of 1934 and the Investment Company Act of 1940, this report has been signed below by the following persons on behalf of the registrant and in the capacities and on the dates indicated.
| VANGUARD QUANTITATIVE FUNDS | |
| BY: | /s/ F. WILLIAM MCNABB III* |
| F. WILLIAM MCNABB III | |
| CHIEF EXECUTIVE OFFICER | |
Date: November 17, 2016 | |
| VANGUARD QUANTITATIVE FUNDS |
| BY: | /s/ THOMAS J. HIGGINS* |
| THOMAS J. HIGGINS | |
| CHIEF FINANCIAL OFFICER | |
Date: November 17, 2016 | |
* By: /s/ Anne E. Robinson
Anne E. Robinson, pursuant to a Power of Attorney filed on October 4, 2016 see file Number
33-32548, Incorporated by Reference.