UNITED STATES
SECURITIES AND EXCHANGE COMMISSION
Washington, D.C. 20549
FORM N-CSR
CERTIFIED SHAREHOLDER REPORT OF REGISTERED
MANAGEMENT INVESTMENT COMPANIES
Investment Company Act file number 811-4840
The Tocqueville Trust
(Exact name of registrant as specified in charter)
The Tocqueville Trust
40 West 57th Street, 19th Floor
New York, NY 10019
(Address of principal executive offices) (Zip code)
Robert W. Kleinschmidt
The Tocqueville Trust
40 West 57th Street, 19th Floor
New York, NY 10019
(Name and address of agent for service)
(212) 698-0800
Registrant’s telephone number, including area code
Date of fiscal year end: October 31
Date of reporting period: April 30, 2014
Item 1. Reports to Stockholders.
SEMI-ANNUAL REPORT
April 30, 2014
The Tocqueville Trust
Mutual Funds
The Tocqueville Fund
The Tocqueville Opportunity Fund
The Tocqueville International Value Fund
The Tocqueville Gold Fund
The Delafield Fund
The Tocqueville Select Fund

This report is not authorized for distribution to prospective investors unless preceded or accompanied by a currently effective prospectus of The Tocqueville Trust. Please call 1-800-697-FUND (3863) for a free prospectus. Read it carefully before you invest.
You are invited to visit our website @ www.tocqueville.com/mutual-funds
Dear Fellow Shareholder,
After five years of recovery, the global bull market is beginning to exhibit some noticeable internal divergences. For example, the widely followed S&P 500 U.S. Index rose 8.4% to a new record in the six-months ending April 30, 2014; but the broader Russell 2000 Index only gained 3.1%. Britain’s FTSE “Footsie” progressed 2.7% while Japan’s Nikkei gained 0.8%. Korea’s KOSPI and Brazil’s BOVESPA actually declined about 2% and 5%, respectively; and China’s Shanghai lost 5%.
Strangely, this six-month period was one of relative calm for currencies, which contrasted with the previous period, when greater volatility prevailed. The only surprise was the modest reversal of the Chinese Renminbi after a slow but seemingly inexorable ascent.
All in all, however, the financial markets’ apparent calm and almost uninterrupted progress since the spring of 2009 may actually hide the seeds of turmoil. Two concepts come to mind:
| • | Prof. Hyman Minsky’s Financial Instability Hypothesis that prolonged stability leads to instability: “The more comfortable we get with a given condition or trend, the longer it will persist and then when the trend fails, the more dramatic the correction”… [because] the problem with long-term macroeconomic stability is that it tends to produce unstable financial arrangements”. (Mauldin Economics, December 2007) |
| • | The Epsilon Theory argues that understanding the timing of change in market behavior is very similar to understanding the timing of change in fashion behavior, because both are social constructions based on common knowledge, i.e. information that everyone believes everyone else believes. (May 25, 2014) |
These hypotheses are no help in pinpointing the timing of coming market moves. In fact, they could be used to argue that the current situation can last longer. But they should certainly serve as reminders that prudence remains warranted.
Prudence, however, does not mean panic: opportunity often comes along with risk and the keys to successful investment remain first patience and then courage.
Respectfully Yours,

François Sicart
Chairman
| Semi-Annual Report | 1 |
The Tocqueville Fund
Dear Fellow Shareholder,
While equity markets continued to march higher over the six month period ended April 30, 2014, the increase masked some turbulence beneath the surface, as recent investor behavior suggests substantially reduced appetite for risk. Strategies that depend on buying the names and sectors perceived to be fastest growing while shorting slower growing competitors had been successful for some time. Then suddenly, they weren’t. Perhaps this was due to over leverage and concentration on the part of hedge funds, quantitatively driven investors and momentum followers. Perhaps the new Federal Reserve Board Chairperson Janet Yellen’s commentary, the weather, signs of economic weakness in China and geopolitical risk from the Ukraine and elsewhere were the causes. Whatever the catalysts, the rapid switch to more (so called) value oriented parts of the market was clear. As that momentum shifted in early 2014, selling of the (perceived) highly valued names was fierce, with many of the previously high flyers down by 50% or more. Still the equity market made new highs as April came to a close.
Given all the cross winds, it is fair to ask where do we stand with the market so near to its record highs. We believe the macroeconomic environment remains favorable for equities. Inflation is still low, corporate cash flow and balance sheets remain robust and the broader economy is showing signs of picking up after a winter-related hibernation. There also has been a resurgence in mergers and acquisitions in which we have been able to participate; both directly and indirectly through our holdings. Deal activity is typically supportive of stock prices as corporate managements regain confidence and seek to take advantage of still low interest rates, limited organic growth opportunities and reasonable valuations.
Aside from exogenous and unpredictable geopolitical factors, the principal risks remain the likelihood of rapidly rising interest rates and uncertainty over the sustainability of historically high profit margins. Neither appears to be a near-term threat. Even so, it is certainly more difficult for a contrarian value investor to find undervaluation in large swaths of the market. Thus, we have tended to focus our attention on company specific, idiosyncratic situations; although, the extreme falloff in the growth sectors of the market may lead to opportunities if we are selective and stick with our discipline.
Over the recently concluded six month period, the Tocqueville Fund returned 8.22% while the S&P 500, the Fund’s benchmark, gained 8.36%. The top performing sectors of the Fund were information technology, healthcare and industrials while telecommunications, consumer discretionary and financials were the laggards, though only telecommunications was actually negative. The top individual contributors to performance in the portfolio were drug companies, Allergan and Alkermes, and Xerox, while the largest detractors were MUFJ, the largest Japanese bank, Fusion-Io, a technology company, and Ford.
Portfolio activity was relatively balanced between buys and sells, as we selectively added to or initiated positions, on the one hand, while taking advantage of the rising market to monetize some positions that approached our price targets. One of the names added during the period was Qualcomm, the wireless technology company. Qualcomm had underperformed and suffered multiple compressions for several years due to fears of a slowdown in cellular telephone sales, competition for LTE chipsets and fears of declining royalties and margins. However, our belief is that it will continue to dominate wireless chipsets even as LTE and 4G is rolled out worldwide. The company also has substantial amounts of excess cash that could be deployed to the benefit of shareholders. Most importantly, the stock price was attractive relative to our estimates of intrinsic value. Another recent purchase was the retailer Target, which has suffered in the face of a difficult retail environment, coupled with a large scale security breach related to customer credit card and identity data. We developed our own view of the likely cost to the company from the credit card problem and came to the opinion that, even with this uncertainty, the shares were attractively priced in relation to their intrinsic value. The company’s valuable underlying real estate assets support that view. Other names added or initiated during the period include ADT, Allison Transmission, Bill Barrett, Bob Evans, C.H. Robinson, Capital One, EMC, Energy XXI, Fusion-io, McDermott and Perrigo.
Of the names we sold or trimmed, most were the result of approaching or reaching our price targets such as Bank of New York, GE, Google, Isis, Lowes, Mastercard, Steelcase and Xerox. Others such as, Chesapeake, Cisco, FedEx, Intel and Pepsico were sold or trimmed because we believed there were better opportunities elsewhere.
We remain wary as the market moves higher, but we believe that carefully selected equities can continue to outperform alternative investments, even in the face of the eventual normalization of interest rates and the pressure on profit margins when the labor markets finally begin to tighten.
Thank you once again for your continued interest in our Fund.
Sincerely,

Robert W. Kleinschmidt
Portfolio Manager
| 2 | April 30, 2014 |
The Tocqueville Fund
(Unaudited)
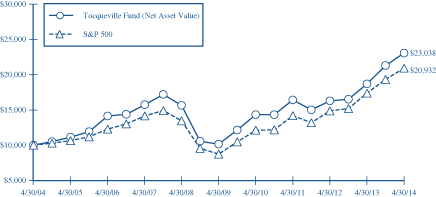
This chart assumes an initial gross investment of $10,000 made on 4/30/04. Returns shown do not reflect the deduction of taxes that a shareholder would pay on fund distributions or the redemption of fund shares. Performance reflects fee waivers in effect. In the absence of fee waivers, total return would be reduced. Returns shown include the reinvestment of all dividends and other distributions. Past performance is not predictive of future performance. Investment return and principal value will fluctuate so that your shares, when redeemed, may be worth more or less than their original cost. The Fund imposes a 2% redemption fee on shares held for 90 days or less.
The Standard & Poor’s 500 Stock Index (S&P 500) is a capital-weighted index, representing the aggregate market value of the common equity of 500 stocks primarily traded on the New York Stock Exchange. Returns assume the reinvestment of all dividends.
AVERAGE ANNUAL RATE OF RETURN (%)
FOR PERIODS ENDED APRIL 30, 2014
| 1 Year | 3 Year | 5 Year | 10 Year | |||||||||||||
The Tocqueville Fund | 23.16% | 11.98% | 17.86% | 8.70% | ||||||||||||
Standard & Poor’s 500 Stock Index | 20.44% | 13.83% | 19.14% | 7.67% | ||||||||||||
| Semi-Annual Report | 3 |
The Tocqueville Opportunity Fund
Dear Fellow Shareholder,
The U.S. market for SMID capitalization equities must be viewed through two different lenses during the first half of the 2014 fiscal year as the price experience was truly a tale of two markets. During the first two thirds of the period, which ran through the end of February, the Tocqueville Opportunity Fund appreciated 14.52% and significantly outperformed its benchmark—the Russell 2500 Growth Index—which gained 9.45%. During this first period, the Fund’s gains were spearheaded by performance of investments in Healthcare and Biotechnology issues. Nevertheless, the Fund experienced relative outperformance in all 12 Russell index sectors except Basic Materials. Investments in the Consumer Discretionary and Financial Services sectors provided the second and third best sector returns. During the latter one third of the period- from the end of February through the end of April—the Fund experienced a dramatic reversal and declined 11.69% and the benchmark declined 5.58%. By the period’s end, the Fund had gained 1.13% versus a benchmark gain of 3.35%. Healthcare, Technology, and Consumer Discretionary investments led the decline, but all sectors, other than Auto/Transportation, went negative in a broad distribution of sector and issue declines.
Volatility in SMID cap investing is not unprecedented. We believe the recent correction is more simply a normal adjustment in valuation and a recurring condition when investing in small cap companies which generate higher rates of growth and inevitably higher valuations. Over the past four years, volatility has been almost commonplace, although it has generally occurred against a backdrop when larger issues were in decline as well. There have been seven corrections of note since the spring of 2010, including the current pullback. On average the corrections have occurred every six to seven months, and lasted up to three months. The current cycle peaked the last week of February and appears to have bottomed during the second week of April with a cycle correction of 14.5%. We expect that upward trending prices will resume after a reasonable period of price consolidation. Moreover, we believe this correction, as those which preceded it, although unsettling will prove to have been a solid opportunity to have invested in the most innovative healthcare and technology issues at one-off prices amidst a sentiment driven sell off. And to the extent that economy sensitive issues were dragged down as well, we expect a recovery with steady, if not exciting, expansion of the economy.
Healthcare investments have continued to increase in prominence over the past two years in the Fund, and provided much of the lift and the subsequent decline over the fiscal period. Over the longer term, Healthcare investments have provided solid appreciation. The historical perspective gained from a review of corrections in the Biotechnology industry is instructive and supportive of ongoing commitments. We believe investments in the industry continue to be attractive.
Investments in the economy sensitive sectors have continued to comprise the cornerstone of the Fund’s exposure. Producer Durables, Auto/Transportation, Materials and Financial Services accounted for over 40% of the Fund’s holdings at the period’s end. However, the weighting masks a significant shift in underlying investments as we increased investments in the Airline industry by nearly half while reducing investment in Materials and Durables. Over the past year, we have been increasingly convinced that we are witnessing a significant investment opportunity as consolidation in the airline industry has led to price and capacity discipline—and that managements are focused on realizing sustained profitability and returns on capital. While investors have been frustrated with the pace of economic growth, we expect that policy will continue to be conducive to expansion. Over the past several months the economy certainly has been dampened by a long, cold winter and declines in confidence, retail activity, and housing have provided little solace from a clouded view. While the top line labor reports have made sunny headlines on the unemployment rate, business decision makers are also keenly focused on the rate of the discouraged, nonparticipating pool of labor. At this point, we still have confidence that there is a greater bias toward economic acceleration and the portfolio is tilted in a direction to participate in such activity.
The top 50 holdings comprised 43% of the Fund at period end, even with the allocation one year ago, but up significantly from 38% at the beginning of the period. During the past two months as the “babies were thrown out with the bathwater” we have increased commitments to core holdings which have been indiscriminately sold without regard to solid execution and attractive valuation—this has required some ongoing restructuring of holdings, but also allowed increased investment in the best positioned names.
As always, we appreciate your confidence in our efforts on the behalf of shareholders of the Opportunity Fund and we remain committed to its success.
Sincerely,

Thomas R. Vandeventer
Portfolio Manager
| 4 | April 30, 2014 |
The Tocqueville Opportunity Fund
(Unaudited)

This chart assumes an initial gross investment of $10,000 made on 4/30/04. Returns shown do not reflect the deduction of taxes that a shareholder would pay on fund distributions or the redemption of fund shares. Performance reflects fee waivers in effect. In the absence of fee waivers, total return would be reduced. Returns shown include the reinvestment of all dividends and other distributions. Past performance is not predictive of future performance. Investment return and principal value will fluctuate so that your shares, when redeemed, may be worth more or less than their original cost. The Fund imposes a 2% redemption fee on shares held for 90 days or less.
The chart and table include The Opportunity Fund’s performance achieved prior to the change effected in 2010 to its investment strategy.
The Russell 2500 Growth Total Return Index is an unmanaged index that measures the performance of the small to mid-cap growth segment of the U.S. equity universe. It includes those Russell 2500 companies with higher price-to-book ratios and higher forcasted growth values. Returns assume the reinvestment of all dividends.
AVERAGE ANNUAL RATE OF RETURN (%)
FOR PERIODS ENDED APRIL 30, 2014
| 1 Year | 3 Year | 5 Year | 10 Year | |||||||||||||
The Tocqueville Opportunity Fund | 19.89% | 9.28% | 18.03% | 4.68% | ||||||||||||
Russell 2500 Growth Total Return Index | 21.77% | 11.30% | 21.51% | 9.72% | ||||||||||||
| Semi-Annual Report | 5 |
The Tocqueville International Value Fund
Dear Fellow Shareholder,
Global equity markets were mixed during the six month period ending April 30, 2014 as investors grappled with the potential impact of the U.S. Fed tapering its quantitative easing, a related decline in emerging markets currencies, weaker than expected manufacturing data from China, and the implications of geopolitical unrest in Ukraine. Markets in the U.S. and Europe had meaningful gains, driven by improving corporate earnings coupled with persistent low interest rates, as well as incrementally positive economic news from peripheral Europe. Japan declined as investors questioned the efficacy of Abenomics in the face of an impending increase in the domestic consumption tax. Emerging markets in Latin America, commodity related markets, and capital importers like Turkey, all declined in connection with concerns about China growth and possible interest rate rises in the U.S. Emerging markets in the Middle East increased in value, while Asia was a mixed bag. The Euro and the British pound increased in value versus the U.S. dollar, as the Eurozone maintained a relatively hawkish stance on monetary policy and U.K. growth exceeded expectations. In contrast, the Yen declined against the U.S. dollar in response to aggressive monetary stimulus there, while most emerging markets currencies declined as foreign investors withdrew capital in response to the prospect of tapering in the U.S. In terms of sectors, advances in Europe were led by energy, travel & leisure, building products, auto parts, and transport, while declines in Japan were led by steel, real estate, electric power and financials.
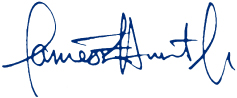
The Tocqueville International Fund’s total U.S. dollar return for the fiscal period was a gain of 7.21%. In the same period, the Morgan Stanley EAFE Net Index, the Fund’s former benchmark, had a total U.S. dollar return of 4.44%. The Morgan Stanley EAFE Gross Index, the Fund’s benchmark, had a total U.S. dollar return of 4.67%. During the period, there was a decrease in the Fund’s exposure to Latin America and Japan and an increase in exposure to Asia and Europe. The Fund began the period and ended the period with approximately 6% in cash reserves. The Fund had meaningful gains in a disparate group of stocks, including U.K. emergency home repair insurer Homeserve, Japanese specialty optics maker Hoya, Norwegian integrated oil & gas concern Statoil, Hong Kong based outdoor advertising company Clear Media, French specialty wire and cable producer Nexans, German integrated circuit maker Infineon, and French construction products producer and distributor Saint Gobain. The Fund had declines in the shares of Dutch oil services company Fugro, UK supermarket company Tesco, Japanese financial Mitsubishi UFJ and industrial products distributor Misumi.
During the period, we exited positions in Telecom Italia and Dutch logistics concern TNT Express, as they approached our estimates of intrinsic value. We sold Fugro, when a new senior management team announced a large capital expenditure program, undercutting the central tenet of our investment thesis, which was based on harvesting free cash flow from prior investments. Also sold was Itau Unibanco, as we came to believe that our fundamental thesis will be overshadowed by deteriorating political circumstances in advance of Brazil’s Presidential election next autumn.
With several of the macro risks associated with the 2008 financial crisis having abated, and with the global economy growing and interest rates at multi-year lows, investors have taken on more risk and committed more funds to equities. As the market becomes more complacent, we become more concerned about potential risks, including multiplying instances of potential geopolitical risk, unprecedented levels of government debt in Japan and elsewhere, the sustainability of corporate profit margins in the U.S., the possibility of inflation, and the impact on equity valuations of a possible rise in interest rates.
That said, we believe there exist multiple pockets of opportunity for a global stock picker. While sentiment towards developed Europe has improved and equity markets there have been re-priced to reflect a low probability of a “black swan” event, they have not discounted a significant multi-year improvement in corporate earnings, particularly among cyclical companies. In Japan, there continue to be opportunities in companies that export to the global marketplace and companies where new and younger management teams are focused on improving profitability and capital allocation. Finally, after several years of poor performance and de-rating, certain emerging markets have become attractively valued. It is in these areas that we are focusing our research efforts.
To protect and grow your capital, we continue to seek out companies that have defensible business franchises, pricing power, limited financial leverage and the ability to return cash to shareholders, and which trade at a discount to intrinsic value based on future cash flows in a conservative economic growth scenario.
Respectfully,
 |
James Hunt
Portfolio Manager
| 6 | April 30, 2014 |
The Tocqueville International Value Fund
(Unaudited)
This chart assumes an initial gross investment of $10,000 made on 4/30/04. Returns shown do not reflect the deduction of taxes that a shareholder would pay on fund distributions or the redemption of fund shares. Performance reflects fee waivers in effect. In the absence of fee waivers, total return would be reduced. Returns shown include the reinvestment of all dividends and other distributions. Past performance is not predictive of future performance. Investment return and principal value will fluctuate so that your shares, when redeemed, may be worth more or less than their original cost. The Fund imposes a 2% redemption fee on shares held 90 days or less.
The MSCI EAFE Index is an unmanaged market-capitalization-weighted index composed of companies representative of the market structure of 21 Developed Market Countries in Europe, Australia, Asia and the Far East.
AVERAGE ANNUAL RATE OF RETURN (%)
FOR PERIODS ENDED APRIL 30, 2014
| 1 Year | 3 Year | 5 Year | 10 Year | |||||||||||||
The Tocqueville International Value Fund | 19.48% | 4.82% | 15.41% | 8.38% | ||||||||||||
MSCI EAFE Net Index | 13.35% | 5.66% | 13.58% | 6.93% | ||||||||||||
MSCI EAFE Gross Index | 13.80% | 6.15% | 14.09% | 7.41% | ||||||||||||
| Semi-Annual Report | 7 |
The Tocqueville Gold Fund
Dear Fellow Shareholder,
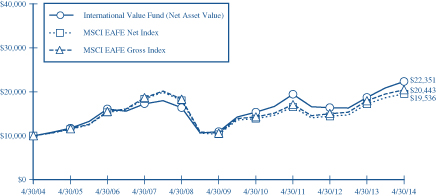
During the six months from the beginning of November through the end of April, the Tocqueville Gold Fund rose 3.6% to $39.96/share from $38.01/share. During the same six month period, the Fund’s benchmark, the Philadelphia Gold and Silver Index, declined 2.2% from 95.07 to 92.26, while the gold price declined 2.1% from $1324/oz. to $1296/oz.
Several of the Fund’s holdings, including Detour Gold, Tahoe Resources, and Randgold successfully completed important new mines, which expanded production and profitability, thereby removing the uncertainties usually associated with new mine startups. In addition, Osisko Mining, one of the Fund’s largest positions, was the target of a hostile takeover bid by Goldcorp. The situation was resolved by a joint takeover by Agnico Eagle and Yamana Gold at a substantial premium to Osisko’s trading price at the beginning of the calendar year. Royalty and streaming companies, including Franco Nevada, Royal Gold, and Silver Wheaton also turned in positive contributions to overall performance. These successful outcomes illustrate the benefits of the extensive due diligence by our research team, and show that not all mine expansions are bad for shareholders, which seems to be the general perception held among investors. We believe that further positive rerating lies ahead for all of these holdings in particular.
In addition, there are other important holdings in the Fund’s portfolio, which illustrate the same characteristics including Torex, Primero, Semafo, MAG Silver and B2 Gold. Over the past few years, we have gradually shifted the portfolio away from large capitalization stocks such as Newmont and Barrick Gold, which are saddled with debt, substantial calls on capital for expansion projects still underway, and unfocussed management, towards mid-tier producers that offer better prospects for value creation. These equities stand a good chance of producing satisfactory returns in the current directionless gold price environment in which the predominant population of gold mining companies find themselves, as opposed to those which are dependent on a rising tide of gold prices to deliver returns.
A few of the key holdings had a disappointing six months including Alamos, Eldorado, and Yamana. While we remain positive on these three holdings, and believe they offer the same characteristics of internal value generation in a difficult gold market as those mentioned in the previous paragraph, gold mining is subject to numerous risks which can represent headwinds during any given period of time. In the case of Alamos and Eldorado, political developments in Turkey adversely impacted share prices. While these companies operate high quality assets in Turkey, and while we believe that Turkey will continue to be a favorable country in which to operate, short-term headlines caused investor worries which we believe will prove to be temporary.
The reputation of the gold mining industry has sunk to new lows during the past two and a half years of a declining gold market. As we have stated during previous commentaries, a good bit of the negative press is well deserved. However, our experience demonstrates that this generalization has important exceptions, including most of the important holdings in the Tocqueville Gold Fund portfolio. On a more general note, the leadership in the mining industry has undergone important changes including substantial turnover among CEO’s, greatly improved financial discipline, and vigorous attention to cost containment. As a result, quarterly earnings reports have exceeded the expectations of brokerage analysts, making it ever more difficult for this rearward focused group to justify their negative tone of commentary.
The gold market appears to be undergoing a protracted base building process since making a low of $1193/oz. at the end of 2013. Market sentiment continues to be deeply negative and characteristic of important bottoms precedent to major trend changes. There are numerous potential catalysts, any one of which, in our opinion, could lead a rally that is surprising both as to timing and magnitude. These include, but are not limited to, the possibility of a trend reversal in the equity market, which has represented a major headwind for capital flows into the gold sector; a reversal of the tapering process by the Fed which, we think, is a good possibility given the increasing evidence that global economic growth is not only stalling but possibly beginning to decline; potential discovery on gold market rigging by bullion banks resulting from numerous legal complaints filed against members of the London Gold Fix in recent months; and, further unfavorable evolution of geopolitical concerns which, in our opinion, are far more serious today than in the past several years.
We appreciate your support as investors in the Tocqueville Gold Fund.
With all best wishes,
|  | |
| John C. Hathaway | Douglas B. Groh | |
| Portfolio Manager | Portfolio Manager |

| 8 | April 30, 2014 |
The Tocqueville Gold Fund
(Unaudited)
This chart assumes an initial gross investment of $10,000 made on 4/30/04. Returns shown do not reflect the deduction of taxes that a shareholder would pay on fund distributions or the redemption of fund shares. Performance reflects fee waivers in effect. In the absence of fee waivers, total return would be reduced. Returns shown include the reinvestment of all dividends and other distributions. Past performance is not predictive of future performance. Investment return and principal value will fluctuate so that your shares, when redeemed, may be worth more or less than their original cost. The Fund imposes a 2% redemption fee on shares held 90 days or less.
In 2006, 2009, and 2010 the performance of The Tocqueville Gold Fund was achieved during a period of unusually favorable market conditions. Such performance may not be sustainable.
The Philadelphia Stock Exchange Gold and Silver Index is an unmanaged capitalization-weighted index which includes the leading companies involved in the mining of gold and silver. Returns include the reinvestment of all dividends.
The Standard & Poor’s 500 Stock Index (S&P 500) is a capital-weighted index, representing the aggregate market value of the common equity of 500 stocks primarily traded on the New York Stock Exchange. Returns include the reinvestment of all dividends.
AVERAGE ANNUAL RATE OF RETURN (%)
FOR PERIODS ENDED APRIL 30, 2014
| 1 Year | 3 Year | 5 Year | 10 Year | |||||||||||||
The Tocqueville Gold Fund | -9.95% | -23.14% | 4.11% | 7.91% | ||||||||||||
Philadelphia Stock Exchange Gold and Silver Index | -13.83% | -23.97% | -3.73% | 2.50% | ||||||||||||
Standard & Poor’s 500 Stock Index | 20.44% | 13.83% | 19.14% | 7.67% | ||||||||||||
| Semi-Annual Report | 9 |
The Delafield Fund
Dear Fellow Shareholder,
For the six months ended April 30, 2014, the Delafield Fund’s net asset value increased 6.38% versus an increase of 3.08% for the Russell 2000 Index (“Russell 2000”) and 8.36% for the Standard & Poor’s 500 Index (“S&P 500”), each on a total return basis. Owing to the smaller average market capitalization of companies in the Russell 2000, we view it as the more appropriate comparative index to the Fund. The Fund’s net asset value as of April 30, 2014 was $38.12 per share. The net asset value amounted to $1,711,324,844 of which 84.1% was invested in equities, and the balance in cash and equivalents and fixed income securities.
Markets were strong for the better part of the first half of the Fund’s current fiscal year. Investors’ vigor was seemingly driven by favorable domestic and mostly stable international economic data. In the U.S., most reports during the period suggested ongoing, albeit modest improvement in the underlying economy. The domestic housing market made some progress, consumer net worth and the employment situation improved, and American manufacturing experienced the start of a renaissance, aided by the availability of cheap domestic natural gas sources. Corporate earnings results were not particularly robust, but were solid enough to also contribute to investor optimism. Potentially negative episodes, such as tapering of the Fed’s quantitative easing program were largely relegated to the background, and resulted in only brief market corrections during the six month period. The international economic picture was more mixed during the first half of the fiscal year, but with expectations set low, overall stability in Europe and slow growth in China was enough to satisfy the markets and offset geopolitical concerns in areas such as the Ukraine.
Our approach remained constant; namely, we continued to actively search for companies that we believed were selling at prices which seemed modest in relation to the company’s intrinsic value and where something could change to alter that company’s future for the better. The portfolio remains composed of companies where managements are taking actions to improve their businesses’ position. However, as some holdings approached full value in our opinion, we were inclined to sell out or trim a number of positions and as a result; we were net sellers during the period. Consequently, the Fund’s performance was tempered somewhat by its cash reserves, but these will serve as the dry powder with which to make new investments as we discover appealing opportunities at compelling valuations.
Stock selection contributed favorably to the Fund’s return during the six month period. Investments in materials, industrials, and information technology stocks, which represented about 70% of the portfolio during the first half of the fiscal year, contributed nearly all of both the absolute and relative performance for the period. With respect to individual stocks, PolyOne Corporation was the largest positive contributor to the portfolio’s performance, followed closely by Weatherford International Ltd. and Flextronics International Ltd. In contrast, Staples Inc., Hercules Offshore Inc. and Ascena Retail Group Inc. were the largest detractors to performance during the period. Sector allocation, which in any event is a coincidental effect of our bottom-up investment approach, had little bearing on the relative performance for the six month period.
With respect to movement within the portfolio over the last six months, the most substantial addition was Jabil Circuit, Inc. Jabil is a leading electronic manufacturing services company and one of the few hybrid players in the space. The shares came under pressure following the company’s fiscal 2014 first quarter earnings report, when management surprised investors with lowered near-term expectations. While near-term visibility is indeed cloudy, we believe that a rebound in business activity with their largest customer is likely, and that coupled with cost savings and bolstered by a $200 million share repurchase, we expect solid core earnings growth over the next several years.
During the first half of the fiscal year we also exited a long-term holding, Acuity Brands, Inc. This was a successful investment, but with shares appearing more fully valued to us, we sold the holdings.
Sincerely,
 |  | |
| J. Dennis Delafield | Vincent Sellecchia | |
| Portfolio Manager | Portfolio Manager | |
| 10 | April 30, 2014 |
The Delafield Fund
(Unaudited)
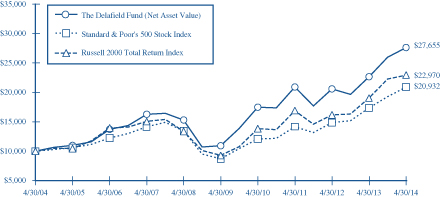
This chart assumes an initial gross investment of $10,000 made on 4/30/04. Since the Delafield Fund did not commence operations until 9/28/09, returns prior to that date are those of the Predecessor Fund. The Delafield Fund assumed the net asset value and performance history of the Predecessor Fund (See Footnote 1 to the Financial Statements). Returns shown do not reflect the deduction of taxes that a shareholder would pay on fund distributions or the redemption of fund shares. Performance reflects fee waivers in effect. In the absence of fee waivers, total return would be reduced. Returns shown include the reinvestment of all dividends and other distributions. Past performance is not predictive of future performance. Investment return and principal value will fluctuate so that your shares, when redeemed, may be worth more or less than their original cost. The Fund imposes a 2% redemption fee on shares held 90 days or less.
The Standard & Poor’s 500 Stock Index (S&P 500) is a capital-weighted index, representing the aggregate market value of the common equity of 500 stocks primarily traded on the New York Stock Exchange. Returns include the reinvestment of all dividends.
The Russell 2000 Total Return Index is an unmanaged index that measures the performance of the 2,000 smallest companies in the Russell 3000 Index, which represent approximately 10% of the total market capitalization of the Russell 3000 Index. Returns include the reinvestment of all dividends.
AVERAGE ANNUAL RATE OF RETURN (%)
FOR PERIODS ENDED APRIL 30, 2014
| 1 Year | 3 Year | 5 Year | 10 Year | |||||||||||||
The Delafield Fund | 21.91% | 9.73% | 20.41% | 10.71% | ||||||||||||
Standard & Poor’s 500 Stock Index | 20.44% | 13.83% | 19.14% | 7.67% | ||||||||||||
Russell 2000 Total Return Index | 20.50% | 10.74% | 19.84% | 8.67% | ||||||||||||
| Semi-Annual Report | 11 |
The Tocqueville Select Fund
Dear Fellow Shareholder,
For the six months ended April 30, 2014, the Tocqueville Select Fund’s net asset value decreased 0.56% versus an increase of 5.20% for the Russell 2500 Index (“Russell 2500”) and 3.08% for the Russell 2000 Index (“Russell 2000”), each on a total return basis. The net asset value as of April 30, 2014 was $13.96 per share. The net asset value amounted to $100,680,686 of which 87.7% was invested in equities, and the balance in cash and equivalents.
Favorable, albeit modestly so, domestic and mostly stable international economic data drove markets up for the better part of the first half of the Fund’s fiscal year. In the U.S., most reports during the period suggested a slowly improving economy. The domestic housing market made some progress, consumer net worth and the employment situation improved, and American manufacturing experienced the start of a renaissance, aided by the availability of cheap domestic natural gas sources. Corporate earnings results were not particularly robust, but were solid enough to also contribute to investor optimism. The international economic picture was more mixed during the first half of the fiscal year, but with expectations set low, overall stability in Europe and slow growth in China was enough to satisfy the markets.
Stock selection was unfavorable to the Fund’s return during the six month period and was the primary reason for the underperformance relative to the Russell 2500. Summer Infant, Inc., Staples, Inc. and EPAM Systems were the largest individual detractors from the six month performance. Together, they represented nearly 200 basis points of negative absolute and relative performance. Alternatively, Acuity Brands, Inc., Flextronics International Ltd. and McDermott International Inc. were the largest contributors to performance.
Sector weighting is a by-product of our company by company investment approach. However, there was no exposure to utilities, telecommunication services or health care stocks during the six month period. This negatively impacted the relative performance, as these categories, in aggregate, represented nearly 15% of the Russell 2500 during the period and were among the top performing sectors.
We remained committed to our investment strategy, where utilizing a strictly bottom-up approach we search for companies that we believe are selling at prices which seem modest in relation to the company’s intrinsic value and where something may change which will alter that company’s future for the better. With that in mind, our largest new investments during the six month period were Jabil Circuit Inc. and Oil States International Inc. Jabil is a leading electronic manufacturing services company and one of the few hybrid players in the space. The shares came under pressure following the company’s fiscal 2014 first quarter earnings report, when management surprised investors with lowered near-term expectations. While near-term visibility is indeed cloudy, we believe that a rebound in business activity with their largest customer is likely, and that coupled with cost savings and bolstered by a $200 million share repurchase, we expect solid core earnings growth over the next several years. Oil States is an oil field services firm consisting of four businesses, including hotels, onshore completion services, offshore products and contract drilling. Management has begun to unwind the existing conglomerate structure, and we believe that the sum of the parts is likely more valuable than the whole. We expect that the next phase of the strategy will be a spin-off of the hotel business, and subsequently conversion of that asset into a REIT structure. Our exit from long held Acuity Brands, Inc. during the period is an example of our sell discipline. While the company had very successfully taken advantage of the growth in LEDs and streamlined its operation to grow earnings, the valuation appeared full to us and we sold our holdings.
Sincerely,
| ||||
| |  | ||
| J. Dennis Delafield | Vincent Sellecchia | Donald Wang | ||
| Portfolio Manager | Portfolio Manager | Portfolio Manager |
| 12 | April 30, 2014 |
The Tocqueville Select Fund
(Unaudited)
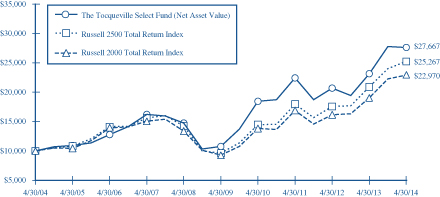
This chart assumes an initial gross investment of $10,000 made on 4/30/04. Since The Tocqueville Select Fund did not commence operations until 9/28/09, returns from the period from September 29, 2008 to September 27, 2009 are those of the Class Y Shares of the Predecessor Fund (See Footnote 1 to the Financial Statements). Prior to that period, returns shown are those of a limited partnership managed by the adviser. Returns shown do not reflect the deduction of taxes that a shareholder would pay on fund distributions or the redemption of fund shares. Performance reflects fee waivers in effect. In the absence of fee waivers, total return would be reduced. Returns shown include the reinvestment of all dividends and other distributions. Past performance is not predictive of future performance. Investment return and principal value will fluctuate so that your shares, when redeemed, may be worth more or less than their original cost. The Fund imposes a 2% redemption fee on shares held 90 days or less.
In 2013 the performance of The Tocqueville Select Fund was achieved during a period of unusually favorable market conditions. Such performance may not be sustainable.
The Russel 2500 Total Return Index is an unmanaged index that measures the performance of the 2,500 smallest companies in the Russell 3000 Index. Returns include the reinvestment of all dividends.
The Russell 2000 Total Return Index is an unmanaged index that measures the performance of the 2,000 smallest companies in the Russell 3000 Index, which represents approximately 10% of the total market capitalization of the Russell 3000 Index. Returns include the reinvestment of all dividends.
AVERAGE ANNUAL RATE OF RETURN (%)
FOR PERIODS ENDED APRIL 30, 2014
| 1 Year | 3 Year | 5 Year | 10 Year | |||||||||||||
The Tocqueville Select Fund | 19.29% | 7.19% | 20.78% | 10.71% | ||||||||||||
Russell 2500 Total Return Index | 20.78% | 12.00% | 21.22% | 9.71% | ||||||||||||
Russell 2000 Total Return Index | 20.50% | 10.74% | 19.84% | 8.67% | ||||||||||||
| Semi-Annual Report | 13 |
Expense Example—April 30, 2014 (Unaudited)
As a shareholder of The Tocqueville Trust (the “Funds”), you incur two types of costs (1) transaction costs, including redemption fees; and (2) ongoing costs, including management fees; distribution (12b-1) fees; and other Fund expenses. This example is intended to help you understand your ongoing costs (in dollars) of investing in the Funds and to compare costs with the ongoing costs of investing in other mutual funds.
The Example is based on an investment of $1,000 invested at the beginning of the period and held the entire period (November 1, 2013-April 30, 2014).
Actual Expenses
The first line of the table below provides information about actual account values and actual expenses. You may use the information in this line, together with the amount you invested, to estimate the expenses that you paid over the period. Simply divide your account value by $1,000 (for example, an $8,600 account value divided by $1,000 = 8.6), then multiply the result by the number in the first line under the heading entitled “Expenses Paid During Period” to estimate the expenses you paid on your account during this period.
Hypothetical Example for Comparison Purposes
The second line of the table below provides information about hypothetical account values and hypothetical expenses based on the Funds’ actual expense ratios and an assumed rate of return of 5% per year before expenses, which is not the Funds’ actual return. The hypothetical account values and expenses may not be used to estimate the actual ending account balance or expenses you paid for the period. You may use this information to compare the ongoing costs of investing in the Funds and other funds. To do so, compare this 5% hypothetical example with the 5% hypothetical examples that appear in the shareholder reports of the other funds.
Please note that the expenses shown in the table are meant to highlight your ongoing costs only and do not reflect any transactional costs, such as sales charges (loads), redemption fees, or exchange fees. Therefore, the second line of the table is useful in comparing ongoing costs only, and will not help you determine the relative costs of owning different funds. In addition, if these transactional costs were included, your costs would have been higher.
| 14 | April 30, 2014 |
Expense Example Tables (Unaudited)
| The Tocqueville Fund | Beginning Account Value November 1, 2013 | Ending Account Value April 30, 2014 | Expenses Paid During Period* November 1, 2013 - April 30, 2014 | |||||||||
Actual | $ | 1,000.00 | $ | 1,082.20 | $ | 6.45 | ||||||
Hypothetical (5% return before expenses) | 1,000.00 | 1,018.60 | 6.26 | |||||||||
| The Tocqueville Opportunity Fund | ||||||||||||
Actual | $ | 1,000.00 | $ | 1,011.30 | $ | 6.38 | ||||||
Hypothetical (5% return before expenses) | 1,000.00 | 1,018.45 | 6.41 | |||||||||
| The Tocqueville International Value Fund | ||||||||||||
Actual | $ | 1,000.00 | $ | 1,072.10 | $ | 6.42 | ||||||
Hypothetical (5% return before expenses) | 1,000.00 | 1,018.60 | 6.26 | |||||||||
| The Tocqueville Gold Fund | ||||||||||||
Actual | $ | 1,000.00 | $ | 1,035.50 | $ | 7.12 | ||||||
Hypothetical (5% return before expenses) | 1,000.00 | 1,017.80 | 7.05 | |||||||||
| The Delafield Fund | ||||||||||||
Actual | $ | 1,000.00 | $ | 1,063.80 | $ | 6.14 | ||||||
Hypothetical (5% return before expenses) | 1,000.00 | 1,018.84 | 6.01 | |||||||||
| The Tocqueville Select Fund | ||||||||||||
Actual | $ | 1,000.00 | $ | 994.40 | $ | 6.53 | ||||||
Hypothetical (5% return before expenses) | 1,000.00 | 1,018.25 | 6.61 | |||||||||
| * | Expenses are equal to the Fund’s annualized six-month expense ratio (including extraordinary expenses) of 1.25%, 1.28%, 1.25%, 1.41%, 1.20% and 1.32% for The Tocqueville Fund, Opportunity Fund, International Value Fund, Gold Fund, Delafield Fund, and Select Fund, respectively, multiplied by the average account value over the period, multiplied by 181/365 to reflect the one-half year period. |
| Semi-Annual Report | 15 |
The Tocqueville Fund
Financial Highlights
| Per share operating performance (For a share outstanding throughout the period) | Six Months Ended April 30, 2014 | Years Ended October 31, | ||||||||||||||||||||||
| 2013 | 2012 | 2011 | 2010 | 2009 | ||||||||||||||||||||
| (Unaudited) | ||||||||||||||||||||||||
Net asset value, beginning of period | $ | 30.67 | $ | 24.11 | $ | 22.23 | $ | 21.53 | $ | 18.47 | $ | 16.39 | ||||||||||||
|
|
|
|
|
|
|
|
|
|
|
| |||||||||||||
Operations: | ||||||||||||||||||||||||
Net investment income (1) | 0.14 | 0.40 | 0.40 | 0.23 | 0.32 | 0.28 | ||||||||||||||||||
Net realized and unrealized gain | 2.35 | 6.51 | 1.81 | 0.80 | 2.97 | 2.09 | ||||||||||||||||||
|
|
|
|
|
|
|
|
|
|
|
| |||||||||||||
Total from investment operations * | 2.49 | 6.91 | 2.21 | 1.03 | 3.29 | 2.37 | ||||||||||||||||||
|
|
|
|
|
|
|
|
|
|
|
| |||||||||||||
Distributions to shareholders: | ||||||||||||||||||||||||
Dividends from net investment income | (0.30 | ) | (0.35 | ) | (0.33 | ) | (0.33 | ) | (0.23 | ) | (0.29 | ) | ||||||||||||
Distributions from net realized gains | (0.25 | ) | — | — | — | — | — | |||||||||||||||||
|
|
|
|
|
|
|
|
|
|
|
| |||||||||||||
Total distributions | (0.55 | ) | (0.35 | ) | (0.33 | ) | (0.33 | ) | (0.23 | ) | (0.29 | ) | ||||||||||||
|
|
|
|
|
|
|
|
|
|
|
| |||||||||||||
Change in net asset value for the period | 1.94 | 6.56 | 1.88 | 0.70 | 3.06 | 2.08 | ||||||||||||||||||
|
|
|
|
|
|
|
|
|
|
|
| |||||||||||||
Net asset value, end of period | $ | 32.61 | $ | 30.67 | $ | 24.11 | $ | 22.23 | $ | 21.53 | $ | 18.47 | ||||||||||||
|
|
|
|
|
|
|
|
|
|
|
| |||||||||||||
* Includes redemption fees per share of | $ | 0.00 | (2) | $ | 0.00 | (2) | $ | 0.00 | (2) | $ | 0.00 | (2) | $ | 0.00 | (2) | $ | 0.01 | |||||||
Total Return | 8.2 | %(4) | 29.0 | % | 10.1 | % | 4.8 | % | 18.0 | % | 14.8 | % | ||||||||||||
Ratios/supplemental data | ||||||||||||||||||||||||
Net assets, end of period (000) | $ | 377,845 | $ | 348,269 | $ | 366,025 | $ | 491,541 | $ | 489,670 | $ | 383,470 | ||||||||||||
Ratio to average net assets: | ||||||||||||||||||||||||
Expenses before waiver/reimbursement | 1.25 | %(5) | 1.28 | % | 1.29 | % | 1.26 | % | 1.26 | % | 1.33 | % | ||||||||||||
Expenses after waiver/reimbursement | 1.25 | %(5) | 1.26 | %(3) | 1.26 | %(3) | 1.25 | % | 1.25 | % | 1.25 | % | ||||||||||||
Net investment income before waiver/reimbursement | 0.88 | %(5) | 1.33 | % | 1.30 | % | 0.97 | % | 1.65 | % | 1.60 | % | ||||||||||||
Net investment income after waiver/reimbursement | 0.88 | %(5) | 1.35 | % | 1.33 | % | 0.98 | % | 1.66 | % | 1.68 | % | ||||||||||||
Portfolio turnover rate | 12 | %(4) | 16 | % | 17 | % | 28 | % | 23 | % | 32 | % | ||||||||||||
| (1) | Net investment income per share is calculated using the ending balance prior to consideration or adjustment for permanent book-to-tax differences. |
| (2) | Represents less than $0.01. |
| (3) | Includes 0.01% of interest expense which is not included in the Fund’s operating expense cap. |
| (4) | Not Annualized. |
| (5) | Annualized. |
The Accompanying Notes are an Integral Part of these Financial Statements.
| 16 | April 30, 2014 |
The Tocqueville Opportunity Fund
Financial Highlights
| Per share operating performance (For a share outstanding throughout the period) | Six Months Ended April 30, 2014 | Years Ended October 31, | ||||||||||||||||||||||
| 2013 | 2012 | 2011 | 2010 | 2009 | ||||||||||||||||||||
| (Unaudited) | ||||||||||||||||||||||||
Net asset value, beginning of period | $ | 21.29 | $ | 15.76 | $ | 14.96 | $ | 13.20 | $ | 10.78 | $ | 9.77 | ||||||||||||
|
|
|
|
|
|
|
|
|
|
|
| |||||||||||||
Operations: | ||||||||||||||||||||||||
Net investment loss (1) | (0.07 | ) | (0.13 | ) | (0.11 | ) | (0.13 | ) | (0.12 | ) | (0.11 | ) | ||||||||||||
Net realized and unrealized gain | 0.34 | 5.66 | 0.91 | 1.89 | 2.54 | 1.23 | ||||||||||||||||||
|
|
|
|
|
|
|
|
|
|
|
| |||||||||||||
Total from investment operations * | 0.27 | 5.53 | 0.80 | 1.76 | 2.42 | 1.12 | ||||||||||||||||||
|
|
|
|
|
|
|
|
|
|
|
| |||||||||||||
Distributions to shareholders: | ||||||||||||||||||||||||
Dividends from net investment income | — | — | — | — | — | (0.01 | ) | |||||||||||||||||
Distributions from net realized gains | (1.09 | ) | — | — | — | — | (0.10 | ) | ||||||||||||||||
|
|
|
|
|
|
|
|
|
|
|
| |||||||||||||
Total distributions | (1.09 | ) | — | — | — | — | (0.11 | ) | ||||||||||||||||
|
|
|
|
|
|
|
|
|
|
|
| |||||||||||||
Change in net asset value for the period | (0.82 | ) | 5.53 | 0.80 | 1.76 | 2.42 | 1.01 | |||||||||||||||||
|
|
|
|
|
|
|
|
|
|
|
| |||||||||||||
Net asset value, end of period | $ | 20.47 | $ | 21.29 | $ | 15.76 | $ | 14.96 | $ | 13.20 | $ | 10.78 | ||||||||||||
|
|
|
|
|
|
|
|
|
|
|
| |||||||||||||
* Includes redemption fees per share of | $ | 0.00 | (2) | $ | 0.00 | (2) | $ | 0.00 | (2) | $ | 0.00 | (2) | $ | 0.00 | (2) | $ | 0.00 | (2) | ||||||
Total Return | 1.1 | %(3) | 35.1 | % | 5.4 | % | 13.3 | % | 22.6 | % | 11.7 | % | ||||||||||||
Ratios/supplemental data | ||||||||||||||||||||||||
Net assets, end of period (000) | $ | 81,819 | $ | 80,609 | $ | 65,455 | $ | 46,963 | $ | 32,863 | $ | 30,498 | ||||||||||||
Ratio to average net assets: | ||||||||||||||||||||||||
Expense | 1.28 | %(4) | 1.30 | % | 1.32 | % | 1.36 | % | 1.41 | % | 1.41 | % | ||||||||||||
Net investment loss | (0.75 | )%(4) | (0.64 | )% | (0.76 | )% | (1.04 | )% | (1.08 | )% | (0.97 | )% | ||||||||||||
Portfolio turnover rate | 43 | %(3) | 100 | % | 77 | % | 110 | % | 104 | % | 62 | % | ||||||||||||
| (1) | Net investment loss per share is calculated using the ending balance prior to consideration or adjustment for permanent book-to-tax differences. |
| (2) | Represents less than $0.01. |
| (3) | Not Annualized. |
| (4) | Annualized. |
The Accompanying Notes are an Integral Part of these Financial Statements.
| Semi-Annual Report | 17 |
The Tocqueville International Value Fund
Financial Highlights
| Per share operating performance (For a share outstanding throughout the period) | Six Months Ended April 30, 2014 | Years Ended October 31, | ||||||||||||||||||||||
| 2013 | 2012 | 2011 | 2010 | 2009 | ||||||||||||||||||||
| (Unaudited) | ||||||||||||||||||||||||
Net asset value, beginning of period | $ | 14.71 | $ | 11.68 | $ | 12.00 | $ | 12.12 | $ | 10.48 | $ | 8.49 | ||||||||||||
|
|
|
|
|
|
|
|
|
|
|
| |||||||||||||
Operations: | ||||||||||||||||||||||||
Net investment income (1) | 0.06 | 0.24 | 0.17 | 0.11 | 0.11 | 0.10 | ||||||||||||||||||
Net realized and unrealized gain (loss) | 0.99 | 2.97 | (0.37 | ) | (0.16 | ) | 1.65 | 2.59 | ||||||||||||||||
|
|
|
|
|
|
|
|
|
|
|
| |||||||||||||
Total from investment operations * | 1.05 | 3.21 | (0.20 | ) | (0.05 | ) | 1.76 | 2.69 | ||||||||||||||||
|
|
|
|
|
|
|
|
|
|
|
| |||||||||||||
Distributions to shareholders: | ||||||||||||||||||||||||
Dividends from net investment income | (0.23 | ) | (0.18 | ) | (0.12 | ) | (0.07 | ) | (0.12 | ) | (0.20 | ) | ||||||||||||
Distributions from net realized gains | — | — | — | — | — | (0.50 | ) | |||||||||||||||||
|
|
|
|
|
|
|
|
|
|
|
| |||||||||||||
Total distributions | (0.23 | ) | (0.18 | ) | (0.12 | ) | (0.07 | ) | (0.12 | ) | (0.70 | ) | ||||||||||||
|
|
|
|
|
|
|
|
|
|
|
| |||||||||||||
Change in net asset value for the period | 0.82 | 3.03 | (0.32 | ) | (0.12 | ) | 1.64 | 1.99 | ||||||||||||||||
|
|
|
|
|
|
|
|
|
|
|
| |||||||||||||
Net asset value, end of period | $ | 15.53 | $ | 14.71 | $ | 11.68 | $ | 12.00 | $ | 12.12 | $ | 10.48 | ||||||||||||
|
|
|
|
|
|
|
|
|
|
|
| |||||||||||||
* Includes redemption fees of | $ | 0.00 | (2) | $ | 0.00 | (2) | $ | 0.00 | (2) | $ | 0.01 | $ | 0.00 | (2) | $ | 0.00 | (2) | |||||||
Total Return | 7.2 | %(4) | 27.8 | % | (1.6 | )% | (0.5 | )% | 17.0 | % | 34.0 | % | ||||||||||||
Ratios/supplemental data | ||||||||||||||||||||||||
Net assets, end of period (000) | $ | 273,017 | $ | 262,981 | $ | 218,793 | $ | 199,848 | $ | 150,103 | $ | 131,613 | ||||||||||||
Ratio to average net assets: | ||||||||||||||||||||||||
Expenses before waiver/reimbursement | 1.53 | %(5) | 1.55 | % | 1.56 | % | 1.56 | % | 1.56 | % | 1.62 | % | ||||||||||||
Expenses after waiver/reimbursement | 1.25 | %(5) | 1.30 | %(3) | 1.56 | % | 1.56 | % | 1.56 | % | 1.62 | % | ||||||||||||
Net investment income before waiver/reimbursement | 0.49 | %(5) | 1.55 | % | 1.53 | % | 0.99 | % | 1.03 | % | 0.96 | % | ||||||||||||
Net investment income after waiver/reimbursement | 0.77 | %(5) | 1.80 | %(3) | 1.53 | % | 0.99 | % | 1.03 | % | 0.96 | % | ||||||||||||
Portfolio turnover rate | 17 | %(4) | 37 | % | 38 | % | 30 | % | 27 | % | 27 | % | ||||||||||||
| (1) | Net investment income per share is calculated using the ending balance prior to consideration or adjustment for permanent book-to-tax differences. |
| (2) | Represents less than $0.01. |
| (3) | Expense limitation agreement of 1.25% was implemented on January 1, 2014. |
| (4) | Not Annualized. |
| (5) | Annualized. |
The Accompanying Notes are an Integral Part of these Financial Statements.
| 18 | April 30, 2014 |
The Tocqueville Gold Fund
Financial Highlights
| Per share operating performance (For a share outstanding throughout the period) | Six Months Ended April 30, 2014 | Years Ended October 31, | ||||||||||||||||||||||
| 2013 | 2012 | 2011 | 2010 | 2009 | ||||||||||||||||||||
| (Unaudited) | ||||||||||||||||||||||||
Net asset value, beginning of period | $ | 38.01 | $ | 72.82 | $ | 81.97 | $ | 82.00 | $ | 49.71 | $ | 21.77 | ||||||||||||
|
|
|
|
|
|
|
|
|
|
|
| |||||||||||||
Operations: | ||||||||||||||||||||||||
Net investment loss (1) | (0.01 | ) | (0.26 | ) | (0.35 | ) | (0.67 | ) | (0.58 | ) | (0.45 | ) | ||||||||||||
Net realized and unrealized gain (loss) | 1.36 | (32.93 | ) | (7.47 | ) | 2.25 | 32.96 | 29.28 | ||||||||||||||||
|
|
|
|
|
|
|
|
|
|
|
| |||||||||||||
Total from investment operations * | 1.35 | (33.19 | ) | (7.82 | ) | 1.58 | 32.38 | 28.83 | ||||||||||||||||
|
|
|
|
|
|
|
|
|
|
|
| |||||||||||||
Distributions to shareholders: | ||||||||||||||||||||||||
Dividends from net investment income | — | — | — | — | — | — | ||||||||||||||||||
Distributions from net realized gains | — | (1.62 | ) | (1.33 | ) | (1.61 | ) | (0.09 | ) | (0.89 | ) | |||||||||||||
|
|
|
|
|
|
|
|
|
|
|
| |||||||||||||
Total distributions | — | (1.62 | ) | (1.33 | ) | (1.61 | ) | (0.09 | ) | (0.89 | ) | |||||||||||||
|
|
|
|
|
|
|
|
|
|
|
| |||||||||||||
Change in net asset value for the period | 1.35 | (34.81 | ) | (9.15 | ) | (0.03 | ) | 32.29 | 27.94 | |||||||||||||||
|
|
|
|
|
|
|
|
|
|
|
| |||||||||||||
Net asset value, end of period | $ | 39.36 | $ | 38.01 | $ | 72.82 | $ | 81.97 | $ | 82.00 | $ | 49.71 | ||||||||||||
|
|
|
|
|
|
|
|
|
|
|
| |||||||||||||
* Includes redemption fees per share of | $ | 0.01 | $ | 0.02 | $ | 0.02 | $ | 0.10 | $ | 0.06 | $ | 0.03 | ||||||||||||
Total Return | 3.6 | %(2) | (46.4 | )% | (9.5 | )% | 1.8 | % | 65.2 | % | 135.2 | % | ||||||||||||
Ratios/supplemental data | ||||||||||||||||||||||||
Net assets, end of period (000) | $ | 1,373,935 | $ | 1,215,081 | $ | 2,445,913 | $ | 2,647,078 | $ | 2,199,603 | $ | 937,492 | ||||||||||||
Ratio to average net assets: | ||||||||||||||||||||||||
Expense | 1.41 | %(3) | 1.34 | % | 1.28 | % | 1.25 | % | 1.34 | % | 1.50 | % | ||||||||||||
Net investment loss | (0.71 | )%(3) | (0.41 | )% | (0.56 | )% | (0.86 | )% | (1.11 | )% | (1.25 | )% | ||||||||||||
Portfolio turnover rate | 1 | %(2) | 14 | % | 11 | % | 3 | % | 9 | % | 9 | % | ||||||||||||
| (1) | Net investment loss per share is calculated using the ending balance prior to consideration or adjustment for permanent book-to-tax differences. |
| (2) | Not Annualized. |
| (3) | Annualized. |
The Accompanying Notes are an Integral Part of these Financial Statements.
| Semi-Annual Report | 19 |
The Delafield Fund
Financial Highlights
| Per share operating performance (For a share outstanding throughout the period) | Six Months Ended April 30, 2014 | Years Ended October 31, | January 1, 2009 through October 31, 2009 | |||||||||||||||||||||
| 2013 | 2012 | 2011 | 2010 | |||||||||||||||||||||
| (Unaudited) | ||||||||||||||||||||||||
Net asset value, beginning of period | $ | 37.13 | $ | 29.79 | $ | 27.21 | $ | 26.65 | $ | 21.35 | $ | 15.10 | ||||||||||||
|
|
|
|
|
|
|
|
|
|
|
| |||||||||||||
Operations: | ||||||||||||||||||||||||
Net investment income (loss) (1) | (0.04 | ) | (0.05 | ) | (0.04 | ) | (0.08 | ) | (0.00 | )(2) | 0.03 | |||||||||||||
Net realized and unrealized gain (loss) | 2.36 | 9.19 | 2.99 | 0.64 | 5.32 | 6.25 | ||||||||||||||||||
|
|
|
|
|
|
|
|
|
|
|
| |||||||||||||
Total from investment operations * | 2.32 | 9.14 | 2.95 | 0.56 | 5.32 | 6.28 | ||||||||||||||||||
|
|
|
|
|
|
|
|
|
|
|
| |||||||||||||
Distributions to shareholders: | ||||||||||||||||||||||||
Dividends from net investment income | — | — | — | — | — | (0.03 | ) | |||||||||||||||||
Distributions from net realized gains | (1.33 | ) | (1.80 | ) | (0.37 | ) | — | — | — | |||||||||||||||
Return of capital | — | — | — | — | (0.02 | ) | (0.00 | )(2) | ||||||||||||||||
|
|
|
|
|
|
|
|
|
|
|
| |||||||||||||
Total distributions | (1.33 | ) | (1.80 | ) | (0.37 | ) | — | (0.02 | ) | (0.03 | ) | |||||||||||||
|
|
|
|
|
|
|
|
|
|
|
| |||||||||||||
Change in net asset value for the period | 0.99 | 7.34 | 2.58 | 0.56 | 5.30 | 6.25 | ||||||||||||||||||
|
|
|
|
|
|
|
|
|
|
|
| |||||||||||||
Net asset value, end of period | $ | 38.12 | $ | 37.13 | $ | 29.79 | $ | 27.21 | $ | 26.65 | $ | 21.35 | ||||||||||||
|
|
|
|
|
|
|
|
|
|
|
| |||||||||||||
* Includes redemption fees of | $ | 0.00 | (2) | $ | 0.00 | (2) | $ | 0.00 | (2) | $ | 0.01 | $ | 0.01 | $ | 0.01 | |||||||||
Total Return | 6.4 | %(3) | 32.1 | % | 11.0 | % | 2.1 | % | 25.0 | % | 41.6 | %(3) | ||||||||||||
Ratios/supplemental data | ||||||||||||||||||||||||
Net assets, end of period (000) | $ | 1,711,325 | $ | 1,759,341 | $ | 1,346,273 | $ | 1,262,876 | $ | 933,674 | $ | 636,548 | ||||||||||||
Ratio to average net assets: | ||||||||||||||||||||||||
Expenses before waiver/reimbursement | 1.20 | %(4) | 1.21 | % | 1.23 | % | 1.23 | % | 1.27 | % | 1.38 | %(4) | ||||||||||||
Expenses after waiver/reimbursement | 1.20 | %(4) | 1.21 | % | 1.23 | % | 1.23 | % | 1.27 | % | 1.38 | %(4) | ||||||||||||
Net investment income (loss) before waiver/reimbursement | (0.20 | )%(4) | (0.15 | )% | (0.13 | )% | (0.30 | )% | (0.02 | )% | 0.21 | %(4) | ||||||||||||
Net investment income (loss) after waiver/reimbursement | (0.20 | )%(4) | (0.15 | )% | (0.13 | )% | (0.30 | )% | (0.02 | )% | 0.21 | %(4) | ||||||||||||
Portfolio turnover rate | 17 | %(3) | 34 | % | 49 | % | 38 | % | 30 | % | 46 | %(3) | ||||||||||||
| (1) | Net investment income (loss) per share is calculated using the ending balance prior to consideration or adjustment for permanent book-to-tax differences. |
| (2) | Represents less than $0.01. |
| (3) | Not annualized. |
| (4) | Annualized. |
The Accompanying Notes are an Integral Part of these Financial Statements.
| 20 | April 30, 2014 |
The Tocqueville Select Fund
Financial Highlights
| Per share operating performance (For a share outstanding throughout the period) | Six Months Ended April 30, 2014 | Years Ended October 31, | January 1, 2009 through October 31, 2009 | |||||||||||||||||||||
| 2013 | 2012 | 2011 | 2010 | |||||||||||||||||||||
| (Unaudited) | ||||||||||||||||||||||||
Net asset value, beginning of period | $ | 15.57 | $ | 11.35 | $ | 11.06 | $ | 11.54 | $ | 8.46 | $ | 5.77 | ||||||||||||
|
|
|
|
|
|
|
|
|
|
|
| |||||||||||||
Operations: | ||||||||||||||||||||||||
Net investment income (loss) (1) | (0.03 | ) | (0.06 | ) | (0.04 | ) | (0.07 | ) | (0.03 | ) | (0.00 | )(4) | ||||||||||||
Net realized and unrealized gain (loss) | (0.04 | ) | 4.79 | 0.44 | 0.12 | 3.12 | 2.70 | |||||||||||||||||
|
|
|
|
|
|
|
|
|
|
|
| |||||||||||||
Total from investment operations * | (0.07 | ) | 4.73 | 0.40 | 0.05 | 3.09 | 2.70 | |||||||||||||||||
|
|
|
|
|
|
|
|
|
|
|
| |||||||||||||
Distributions to shareholders: | ||||||||||||||||||||||||
Dividends from net investment income | — | — | — | — | (0.01 | ) | (0.00 | )(4) | ||||||||||||||||
Distributions from net realized gains | (1.54 | ) | (0.51 | ) | (0.11 | ) | (0.53 | ) | — | — | ||||||||||||||
Return of capital | — | — | — | — | — | (0.01 | ) | |||||||||||||||||
|
|
|
|
|
|
|
|
|
|
|
| |||||||||||||
Total distributions | (1.54 | ) | (0.51 | ) | (0.11 | ) | (0.53 | ) | (0.01 | ) | (0.01 | ) | ||||||||||||
|
|
|
|
|
|
|
|
|
|
|
| |||||||||||||
Change in net asset value for the period | (1.61 | ) | 4.22 | 0.29 | (0.48 | ) | 3.08 | 2.69 | ||||||||||||||||
|
|
|
|
|
|
|
|
|
|
|
| |||||||||||||
Net asset value, end of period | $ | 13.96 | $ | 15.57 | $ | 11.35 | $ | 11.06 | $ | 11.54 | $ | 8.46 | ||||||||||||
|
|
|
|
|
|
|
|
|
|
|
| |||||||||||||
* Includes redemption fees of | $ | 0.00 | (2) | $ | 0.00 | (2) | $ | 0.00 | (2) | $ | 0.01 | $ | 0.01 | $ | 0.00 | |||||||||
Total Return | (0.6 | )%(3) | 43.2 | % | 3.7 | % | (0.1 | )% | 36.6 | % | 46.7 | %(3) | ||||||||||||
Ratios/supplemental data | ||||||||||||||||||||||||
Net assets, end of period (000) | $ | 100,681 | $ | 99,888 | $ | 84,549 | $ | 71,554 | $ | 41,788 | $ | 24,681 | ||||||||||||
Ratio to average net assets: | ||||||||||||||||||||||||
Expenses before waiver/reimbursement | 1.32 | %(4) | 1.34 | % | 1.37 | % | 1.36 | % | 1.38 | % | 2.03 | %(4) | ||||||||||||
Expenses after waiver/reimbursement | 1.32 | %(4) | 1.34 | % | 1.37 | % | 1.36 | % | 1.38 | % | 1.26 | %(4) | ||||||||||||
Net investment loss before waiver/reimbursement | (0.55 | )%(4) | (0.39 | )% | (0.36 | )% | (0.67 | )% | (0.43 | )% | (0.93 | )%(4) | ||||||||||||
Net investment income (loss) after waiver/reimbursement | (0.55 | )%(4) | (0.39 | )% | (0.36 | )% | (0.67 | )% | (0.43 | )% | (0.16 | )%(4) | ||||||||||||
Portfolio turnover rate | 17 | %(3) | 28 | % | 31 | % | 28 | % | 40 | % | 24 | %(3) | ||||||||||||
| (1) | Net investment income (loss) per share is calculated using the ending balance prior to consideration or adjustment for permanent book-to-tax differences. |
| (2) | Represents less than $0.01. |
| (3) | Not annualized. |
| (4) | Annualized. |
The Accompanying Notes are an Integral Part of these Financial Statements.
| Semi-Annual Report | 21 |
The Tocqueville Fund
Schedule of Investments as of April 30, 2014
(Unaudited)
| Common Stocks—95.8% | Shares | Value | ||||||
Automobiles & Components—2.5% |
| |||||||
Allison Transmission Holdings, Inc. | 100,000 | $ | 2,984,000 | |||||
Ford Motor Co. | 400,000 | 6,460,000 | ||||||
| 9,444,000 | ||||||||
Banks—1.4% |
| |||||||
M&T Bank Corp. | 20,000 | 2,440,200 | ||||||
Mitsubishi UFJ Financial Group, Inc.—ADR | 500,000 | 2,675,000 | ||||||
| 5,115,200 | ||||||||
Capital Goods—6.0% |
| |||||||
General Electric Co. | 450,000 | 12,100,500 | ||||||
Illinois Tool Works, Inc. | 50,000 | 4,261,500 | ||||||
The Boeing Co. | 50,000 | 6,451,000 | ||||||
| 22,813,000 | ||||||||
Commercial & Professional Services—3.7% |
| |||||||
Steelcase, Inc. | 250,000 | 4,120,000 | ||||||
The ADT Corp. | 100,000 | 3,024,000 | ||||||
Pitney Bowes, Inc. | 250,000 | 6,700,000 | ||||||
| 13,844,000 | ||||||||
Consumer Services—2.7% |
| |||||||
Bob Evans Farms, Inc. | 75,000 | 3,515,250 | ||||||
DeVry Education Group, Inc. | 150,000 | 6,754,500 | ||||||
| 10,269,750 | ||||||||
Diversified Financials—4.8% |
| |||||||
Capital One Financial Corp. | 90,000 | 6,651,000 | ||||||
Lazard Ltd.(a) | 100,000 | 4,705,000 | ||||||
The Bank of New York Mellon Corp. | 200,000 | 6,774,000 | ||||||
| 18,130,000 | ||||||||
Energy—12.2% |
| |||||||
Bill Barrett Corp.(b) | 100,000 | 2,368,000 | ||||||
Cameco Corp.(a) | 200,000 | 4,258,000 | ||||||
Energen Corp. | 100,000 | 7,791,000 | ||||||
Energy XXI Bermuda Ltd. (a) | 120,000 | 2,871,600 | ||||||
Exxon Mobil Corp. | 100,000 | 10,241,000 | ||||||
McDermott International, Inc.(a)(b) | 300,000 | 2,169,000 | ||||||
Murphy Oil Corp. | 100,000 | 6,343,000 | ||||||
Schlumberger Ltd.(a) | 100,000 | 10,155,000 | ||||||
| 46,196,600 | ||||||||
Food & Staples Retailing—2.1% |
| |||||||
Wal-Mart Stores, Inc. | 100,000 | 7,971,000 | ||||||
Food, Beverage & Tobacco—3.7% |
| |||||||
Campbell Soup Co. | 125,000 | 5,686,250 | ||||||
The Coca-Cola Co. | 200,000 | 8,158,000 | ||||||
| 13,844,250 | ||||||||
Household & Personal Products—4.0% |
| |||||||
Colgate-Palmolive Co. | 100,000 | 6,730,000 | ||||||
The Procter & Gamble Co. | 100,000 | 8,255,000 | ||||||
| 14,985,000 | ||||||||
Insurance—2.9% |
| |||||||
Aflac, Inc. | 100,000 | 6,272,000 | ||||||
XL Group PLC(a) | 150,000 | 4,702,500 | ||||||
| 10,974,500 | ||||||||
Materials—7.5% |
| |||||||
BHP Billiton Ltd.(a) | 75,000 | 5,290,500 | ||||||
El du Pont de Nemours & Co. | 150,000 | 10,098,000 | ||||||
Goldcorp, Inc.(a) | 265,000 | 6,550,800 | ||||||
Sonoco Products Co. | 150,000 | 6,312,000 | ||||||
| 28,251,300 | ||||||||
Pharmaceuticals, Biotechnology & Life Sciences—14.0% |
| |||||||
Alkermes PLC(a)(b) | 200,000 | 9,252,000 | ||||||
Allergan, Inc. | 40,000 | 6,633,600 | ||||||
Isis Pharmaceuticals, Inc.(b) | 200,000 | 5,322,000 | ||||||
Johnson & Johnson | 100,000 | 10,129,000 | ||||||
Merck & Co., Inc. | 150,000 | 8,784,000 | ||||||
Omeros Corp.(b) | 175,000 | 2,166,500 | ||||||
Perrigo Co. PLC(a) | 20,000 | 2,897,200 | ||||||
Pfizer, Inc. | 250,000 | 7,820,000 | ||||||
| 53,004,300 | ||||||||
Retailing—0.7% |
| |||||||
Target Corp. | 40,000 | 2,470,000 | ||||||
Semiconductors & Semiconductor Equipment—4.1% |
| |||||||
Applied Materials, Inc. | 400,000 | 7,624,000 | ||||||
Intel Corp. | 300,000 | 8,007,000 | ||||||
| 15,631,000 | ||||||||
Software & Services—9.2% |
| |||||||
Automatic Data Processing, Inc. | 100,000 | 7,796,000 | ||||||
Facebook, Inc.(b) | 75,000 | 4,483,500 | ||||||
Google, Inc.(b) | 7,000 | 3,686,620 | ||||||
Google, Inc.(b) | 7,000 | 3,744,160 | ||||||
Microsoft Corp. | 300,000 | 12,120,000 | ||||||
Oracle Corp. | 75,000 | 3,066,000 | ||||||
| 34,896,280 | ||||||||
Technology Hardware & Equipment—7.6% |
| |||||||
Apple, Inc. | 10,000 | 5,900,900 | ||||||
Bio-key International, Inc.(b)(c)(d)(e)(Originally acquired 04/16/05, Cost $0) | 47,090 | — | ||||||
EMC Corp. | 300,000 | 7,740,000 | ||||||
Fusion-io, Inc.(b) | 400,000 | 3,452,000 | ||||||
QUALCOMM, Inc. | 30,000 | 2,361,300 | ||||||
Xerox Corp. | 750,000 | 9,067,500 | ||||||
| 28,521,700 | ||||||||
The Accompanying Footnotes are an Integral Part of these Schedule of Investments.
| 22 | April 30, 2014 |
The Tocqueville Fund
Schedule of Investments as of April 30, 2014
(Unaudited)
| Common Stocks (continued) | Shares | Value | ||||||
Telecommunication Services—1.2% |
| |||||||
Verizon Communications, Inc. | 100,000 | $ | 4,673,000 | |||||
Transportation—2.9% |
| |||||||
CH Robinson Worldwide, Inc. | 60,000 | 3,534,000 | ||||||
Delta Air Lines, Inc. | 200,000 | 7,366,000 | ||||||
| 10,900,000 | ||||||||
Utilities—2.6% | ||||||||
NextEra Energy, Inc. | 100,000 | 9,985,000 | ||||||
Total Common Stocks (Cost $245,798,781) | 361,919,880 | |||||||
Real Estate Investment Trust (REIT)—2.0% |
| |||||||
Real Estate—2.0% | ||||||||
Weyerhaeuser Co. | 250,000 | 7,462,500 | ||||||
Total Real Estate Investment Trust (Cost $4,426,162) | 7,462,500 | |||||||
Short-Term Investment—2.2% | ||||||||
Money Market Fund—2.2% | ||||||||
STIT-Treasury Portfolio, 0.01%(f) | 8,590,924 | 8,590,924 | ||||||
Total Short-Term Investment (Cost $8,590,924) | 8,590,924 | |||||||
Total Investments (Cost $258,815,867)—100.0% | 377,973,304 | |||||||
Liabilities in Excess of Other Assets—0.0% |
| (128,215 | ) | |||||
Total Net Assets—100.0% | $ | 377,845,089 | ||||||
|
| |||||||
Percentages are stated as a percent of net assets.
ADR American Depository Receipt
| (a) | Foreign issued security. Foreign concentration (including ADR’s) was as follows: Australia 1.4%; Bermuda 2.0%; Canada 2.9%; Curacao 2.7%; Ireland 4.5%; Japan 0.7%; Panama 0.6%. |
| (b) | Non-income producing security. |
| (c) | Denotes a security that is either fully or partially restricted to resale. The aggregate value of restricted securities as of April 30, 2014 was $0 which represented 0.0% of net assets. |
| (d) | Security is fair valued using procedures approved by the Board of Trustees. The aggregate value of fair valued securites as of April 30, 2014 was $0 which represented 0.0% of net assets. |
| (e) | Security is considered illiquid and may be difficult to sell. |
| (f) | Rate listed is the 7-day effective yield. |
The Global Industry Classification Standard (GICS®) was developed by and/or is the exclusive property of MSCI, Inc. and Standard & Poor Financial Services LLC (“S&P”). GICS is a service mark of MSCI and S&P and has been licensed for use by U.S. Bancorp Fund Services, LLC.
The Accompanying Footnotes are an Integral Part of these Schedule of Investments.
| Semi-Annual Report | 23 |
The Tocqueville Opportunity Fund
Schedule of Investments as of April 30, 2014
(Unaudited)
| Common Stocks—99.4% | Shares | Value | ||||||
Automobiles & Components—3.5% | ||||||||
Allison Transmission Holdings, Inc. | 14,500 | $ | 432,680 | |||||
BorgWarner, Inc. | 6,400 | 397,696 | ||||||
Delphi Automotive PLC(a) | 2,000 | 133,680 | ||||||
Tesla Motors, Inc.(b) | 5,300 | 1,101,817 | ||||||
The Goodyear Tire & Rubber Co. | 12,500 | 315,000 | ||||||
TRW Automotive Holdings Corp.(b) | 3,200 | 257,120 | ||||||
Visteon Corp.(b) | 2,500 | 217,025 | ||||||
| 2,855,018 | ||||||||
Banks—4.4% | ||||||||
Bank of the Ozarks, Inc. | 9,100 | 545,090 | ||||||
City National Corp. | 1,200 | 87,084 | ||||||
First Financial Holdings, Inc. | 7,800 | 448,266 | ||||||
First Republic Bank | 4,900 | 248,724 | ||||||
Ocwen Financial Corp.(b) | 3,300 | 125,070 | ||||||
Pinnacle Financial Partners, Inc. | 23,700 | 819,309 | ||||||
Regions Financial Corp. | 16,000 | 162,240 | ||||||
Signature Bank(b) | 5,000 | 594,100 | ||||||
Talmer Bancorp, Inc.(b) | 3,000 | 40,230 | ||||||
Texas Capital Bancshares, Inc.(b) | 8,100 | 455,139 | ||||||
Umpqua Holdings Corp. | 2,500 | 41,575 | ||||||
| 3,566,827 | ||||||||
Capital Goods—13.0% | ||||||||
Acuity Brands, Inc. | 3,300 | 411,081 | ||||||
AerCap Holdings NV(a)(b) | 1,000 | 41,730 | ||||||
AMETEK, Inc. | 8,500 | 448,120 | ||||||
AO Smith Corp. | 10,500 | 490,980 | ||||||
Astronics Corp.(b) | 3,600 | 205,632 | ||||||
B/E Aerospace, Inc.(b) | 8,000 | 702,160 | ||||||
Belden, Inc. | 2,800 | 206,668 | ||||||
Chicago Bridge & Iron Co. NV(a) | 4,500 | 360,315 | ||||||
Colfax Corp.(b) | 4,100 | 295,118 | ||||||
Donaldson Co., Inc. | 6,100 | 256,749 | ||||||
Fortune Brands Home & Security, Inc. | 8,000 | 318,800 | ||||||
Generac Holdings, Inc. | 3,600 | 211,968 | ||||||
Graco, Inc. | 1,700 | 123,250 | ||||||
HD Supply Holdings, Inc.(b) | 3,500 | 90,230 | ||||||
HEICO Corp. | 5,000 | 276,600 | ||||||
Hexcel Corp.(b) | 7,300 | 304,337 | ||||||
Hubbell, Inc. | 3,700 | 435,564 | ||||||
IDEX Corp. | 3,200 | 238,624 | ||||||
Lennox International, Inc. | 2,800 | 234,724 | ||||||
Lincoln Electric Holdings, Inc. | 3,700 | 247,197 | ||||||
MasTec, Inc.(b) | 2,400 | 94,992 | ||||||
The Middleby Corp.(b) | 2,100 | 530,208 | ||||||
Navistar International Corp.(b) | 3,500 | 132,755 | ||||||
Nordson Corp. | 4,700 | 349,445 | ||||||
PGT, Inc.(b) | 40,000 | 398,000 | ||||||
Proto Labs, Inc.(b) | 2,750 | 166,485 | ||||||
The Toro Co. | 2,100 | 133,434 | ||||||
TransDigm Group, Inc. | 4,200 | 747,054 | ||||||
United Rentals, Inc.(b) | 7,000 | $ | 656,810 | |||||
WABCO Holdings, Inc.(b) | 4,800 | 513,648 | ||||||
Wabtec Corp. | 6,800 | 506,940 | ||||||
Watsco, Inc. | 4,600 | 473,386 | ||||||
| 10,603,004 | ||||||||
Commercial & Professional Services—1.3% |
| |||||||
Copart, Inc.(b) | 3,400 | 123,318 | ||||||
Equifax, Inc. | 7,500 | 531,075 | ||||||
Robert Half International, Inc. | 5,100 | 228,480 | ||||||
WageWorks, Inc.(b) | 3,700 | 156,769 | ||||||
| 1,039,642 | ||||||||
Consumer Durables & Apparel—5.1% |
| |||||||
Cie Financiere Richemont SA(a) | 1,000 | 101,466 | ||||||
Fossil Group, Inc.(b) | 3,000 | 319,950 | ||||||
Haier Electronics Group Co., Ltd.(a) | 36,000 | 88,410 | ||||||
Hanesbrands, Inc. | 9,300 | 763,437 | ||||||
Harman International Industries, Inc. | 1,200 | 131,532 | ||||||
Jarden Corp.(b) | 3,500 | 200,025 | ||||||
Michael Kors Holdings Ltd.(a)(b) | 4,000 | 364,800 | ||||||
Mohawk Industries, Inc.(b) | 2,000 | 264,820 | ||||||
Polaris Industries, Inc. | 4,900 | 658,217 | ||||||
Prada SpA(a) | 6,000 | 47,904 | ||||||
Steven Madden Ltd.(b) | 3,000 | 106,830 | ||||||
Tempur Sealy International, Inc.(b) | 3,400 | 170,612 | ||||||
The Ryland Group, Inc. | 3,400 | 130,526 | ||||||
Tupperware Brands Corp. | 2,500 | 212,275 | ||||||
Under Armour, Inc.(b) | 8,600 | 420,454 | ||||||
Whirlpool Corp. | 1,300 | 199,394 | ||||||
| 4,180,652 | ||||||||
Consumer Services—3.1% | ||||||||
Bob Evans Farms, Inc. | 500 | 23,435 | ||||||
Domino’s Pizza, Inc. | 6,800 | 505,784 | ||||||
Dunkin’ Brands Group, Inc. | 10,900 | 496,059 | ||||||
Jack in the Box, Inc.(b) | 5,600 | 299,824 | ||||||
Panera Bread Co.(b) | 2,100 | 321,237 | ||||||
Starbucks Corp. | 3,500 | 247,170 | ||||||
Starwood Hotels & Resorts Worldwide, Inc. | 3,100 | 237,615 | ||||||
Wyndham Worldwide Corp. | 3,000 | 214,020 | ||||||
Wynn Resorts Ltd. | 1,000 | 203,890 | ||||||
| 2,549,034 | ||||||||
Diversified Financials—3.9% | ||||||||
Affiliated Managers Group, Inc.(b) | 1,900 | 376,580 | ||||||
Blackstone Group LP | 19,000 | 561,070 | ||||||
CBOE Holdings, Inc. | 3,400 | 181,424 | ||||||
Financial Engines, Inc. | 2,500 | 110,625 | ||||||
KKR & Co. LP | 12,700 | 288,417 | ||||||
Lazard Ltd.(a) | 6,800 | 319,940 | ||||||
MSCI, Inc.(b) | 2,100 | 85,134 | ||||||
The Accompanying Footnotes are an Integral Part of these Schedule of Investments.
| 24 | April 30, 2014 |
The Tocqueville Opportunity Fund
Schedule of Investments as of April 30, 2014
(Unaudited)
| Common Stocks (continued) | Shares | Value | ||||||
Portfolio Recovery Associates, Inc.(b) | 5,700 | $ | 325,755 | |||||
T. Rowe Price Group, Inc. | 3,200 | 262,816 | ||||||
The Charles Schwab Corp. | 14,000 | 371,700 | ||||||
Waddell & Reed Financial, Inc. | 4,600 | 310,270 | ||||||
| 3,193,731 | ||||||||
Energy—2.8% | ||||||||
Antero Resources Corp.(b) | 700 | 45,969 | ||||||
Cabot Oil & Gas Corp. | 1,500 | 58,920 | ||||||
Cheniere Energy, Inc.(b) | 13,700 | 773,365 | ||||||
Concho Resources, Inc.(b) | 800 | 104,360 | ||||||
Core Laboratories NV(a) | 800 | 150,144 | ||||||
Dril-Quip, Inc.(b) | 1,200 | 135,744 | ||||||
FMC Technologies, Inc.(b) | 1,000 | 56,700 | ||||||
Halcon Resources Corp.(b) | 47,500 | 262,200 | ||||||
Oceaneering International, Inc. | 4,700 | 344,416 | ||||||
Pioneer Natural Resources Co. | 1,000 | 193,270 | ||||||
SM Energy Co. | 2,000 | 148,260 | ||||||
| 2,273,348 | ||||||||
Food, Beverage & Tobacco—2.2% | ||||||||
Constellation Brands, Inc.(b) | 7,400 | 590,816 | ||||||
Monster Beverage Corp.(b) | 1,000 | 66,960 | ||||||
The Boston Beer Co., Inc.(b) | 1,600 | 393,664 | ||||||
The Hain Celestial Group, Inc.(b) | 5,100 | 438,702 | ||||||
The WhiteWave Foods Co.(b) | 11,000 | 304,590 | ||||||
| 1,794,732 | ||||||||
Health Care Equipment & Services—4.3% |
| |||||||
Align Technology, Inc.(b) | 5,500 | 277,145 | ||||||
athenahealth, Inc.(b) | 2,100 | 259,644 | ||||||
DexCom, Inc.(b) | 9,200 | 298,448 | ||||||
HeartWare International, Inc.(b) | 1,000 | 84,960 | ||||||
IDEXX Laboratories, Inc.(b) | 3,700 | 467,828 | ||||||
Insulet Corp.(b) | 6,900 | 259,647 | ||||||
Medidata Solutions, Inc.(b) | 4,200 | 152,502 | ||||||
MWI Veterinary Supply, Inc.(b) | 1,100 | 172,304 | ||||||
ResMed, Inc. | 6,700 | 333,995 | ||||||
Sirona Dental Systems, Inc.(b) | 2,700 | 203,094 | ||||||
Teleflex, Inc. | 2,100 | 214,389 | ||||||
Tenet Healthcare Corp.(b) | 5,200 | 234,416 | ||||||
The Cooper Cos., Inc. | 1,300 | 171,483 | ||||||
Tornier NV(a)(b) | 10,300 | 174,791 | ||||||
Universal Health Services, Inc. | 2,900 | 237,191 | ||||||
| 3,541,837 | ||||||||
Household & Personal Products—0.7% |
| |||||||
Church & Dwight Co., Inc. | 2,800 | 193,228 | ||||||
Herbalife Ltd.(a) | 3,000 | 179,940 | ||||||
Nu Skin Enterprises, Inc. | 2,400 | 208,800 | ||||||
| 581,968 | ||||||||
Insurance—0.5% | ||||||||
Arthur J. Gallagher & Co. | 4,200 | $ | 189,084 | |||||
RenaissanceRe Holdings Ltd.(a) | 2,000 | 202,420 | ||||||
| 391,504 | ||||||||
Materials—5.3% | ||||||||
Airgas, Inc. | 900 | 95,634 | ||||||
AptarGroup, Inc. | 2,600 | 175,292 | ||||||
Ball Corp. | 5,100 | 286,569 | ||||||
Caesarstone Sdot-Yam Ltd.(a) | 7,000 | 365,260 | ||||||
Crown Holdings, Inc.(b) | 4,500 | 212,265 | ||||||
Eagle Materials, Inc. | 3,000 | 249,990 | ||||||
Eastman Chemical Co. | 1,600 | 139,472 | ||||||
Ecolab, Inc. | 2,600 | 272,064 | ||||||
HB Fuller Co. | 2,200 | 101,926 | ||||||
International Flavors & Fragrances, Inc. | 3,700 | 364,524 | ||||||
Owens-Illinois, Inc.(b) | 6,500 | 206,570 | ||||||
Packaging Corp. of America | 6,200 | 413,106 | ||||||
Rock-Tenn Co. | 2,400 | 229,464 | ||||||
Schweitzer-Mauduit International, Inc. | 500 | 21,820 | ||||||
Sealed Air Corp. | 9,500 | 325,945 | ||||||
The Sherwin-Williams Co. | 900 | 179,856 | ||||||
The Valspar Corp. | 4,200 | 306,768 | ||||||
WR Grace & Co.(b) | 4,000 | 368,400 | ||||||
| 4,314,925 | ||||||||
Media—0.8% | ||||||||
Discovery Communications, Inc.(b) | 2,500 | 189,750 | ||||||
Lions Gate Entertainment Corp.(a) | 5,000 | 132,650 | ||||||
Morningstar, Inc. | 4,200 | 307,986 | ||||||
| 630,386 | ||||||||
Pharmaceuticals, Biotechnology & Life Sciences—22.4% |
| |||||||
Acceleron Pharma, Inc.(b) | 7,000 | 240,450 | ||||||
Actavis plc(a)(b) | 7,106 | 1,451,969 | ||||||
Aegerion Pharmaceuticals, Inc.(b) | 3,900 | 172,614 | ||||||
Alexion Pharmaceuticals, Inc.(b) | 3,700 | 585,340 | ||||||
Alkermes PLC(a)(b) | 10,500 | 485,730 | ||||||
Allergan, Inc. | 2,900 | 480,936 | ||||||
Alnylam Pharmaceuticals, Inc.(b) | 15,800 | 782,574 | ||||||
Auspex Pharmaceuticals, Inc.(b) | 5,000 | 107,200 | ||||||
Auxilium Pharmaceuticals, Inc.(b) | 3,500 | 78,785 | ||||||
BioMarin Pharmaceutical, Inc.(b) | 6,500 | 378,495 | ||||||
Bluebird Bio, Inc.(b) | 500 | 9,900 | ||||||
Celldex Therapeutics, Inc.(b) | 5,500 | 82,500 | ||||||
Cepheid, Inc.(b) | 3,500 | 152,180 | ||||||
Clovis Oncology, Inc.(b) | 6,000 | 324,420 | ||||||
Cubist Pharmaceuticals, Inc.(b) | 5,000 | 350,300 | ||||||
Dicerna Pharmaceuticals, Inc.(b) | 3,500 | 65,695 | ||||||
Endo International PLC(a)(b) | 3,900 | 245,486 | ||||||
Endocyte, Inc. (b) | 2,500 | 45,275 | ||||||
Five Prime Therapeutics, Inc.(b) | 22,000 | 307,340 | ||||||
Genfit(a)(b) | 2,000 | 57,991 | ||||||
The Accompanying Footnotes are an Integral Part of these Schedule of Investments.
| Semi-Annual Report | 25 |
The Tocqueville Opportunity Fund
Schedule of Investments as of April 30, 2014
(Unaudited)
| Common Stocks (continued) | Shares | Value | ||||||
Genmab A/S(a)(b) | 8,500 | $ | 315,827 | |||||
Incyte Corp., Ltd.(b) | 11,000 | 534,160 | ||||||
Infinity Pharmaceuticals, Inc.(b) | 500 | 4,885 | ||||||
Innate Pharma SA(a)(b) | 5,000 | 42,245 | ||||||
Inovio Pharmaceuticals, Inc.(b) | 67,500 | 159,975 | ||||||
Intercept Pharmaceuticals, Inc.(b) | 3,300 | 871,596 | ||||||
Intrexon Corp.(b) | 4,000 | 75,520 | ||||||
Isis Pharmaceuticals, Inc.(b) | 11,000 | 292,710 | ||||||
Jazz Pharmaceuticals Plc(a)(b) | 2,800 | 377,720 | ||||||
KYTHERA Biopharmaceuticals, Inc.(b) | 2,500 | 81,525 | ||||||
La Jolla Pharmaceutical Co.(b) | 18,500 | 169,090 | ||||||
Medivation, Inc.(b) | 7,100 | 427,491 | ||||||
Mettler-Toledo International, Inc.(b) | 1,350 | 314,712 | ||||||
Mylan, Inc.(b) | 5,500 | 279,290 | ||||||
NewLink Genetics Corp.(b) | 2,000 | 44,000 | ||||||
NPS Pharmaceuticals, Inc.(b) | 39,000 | 1,038,180 | ||||||
Omeros Corp.(b) | 12,000 | 148,560 | ||||||
OncoGenex Pharmaceutical, Inc.(b) | 12,100 | 46,948 | ||||||
OncoMed Pharmaceuticals, Inc.(b) | 8,600 | 226,524 | ||||||
PAREXEL International Corp.(b) | 3,200 | 145,120 | ||||||
PerkinElmer, Inc. | 1,500 | 62,955 | ||||||
Perrigo Co. PLC(a) | 2,700 | 391,122 | ||||||
Pharmacyclics, Inc.(b) | 11,000 | 1,040,380 | ||||||
Prosensa Holding NV(a)(b) | 27,000 | 188,730 | ||||||
PTC Therapeutics, Inc.(b) | 10,800 | 211,032 | ||||||
Puma Biotechnology, Inc.(b) | 500 | 37,770 | ||||||
Regeneron Pharmaceuticals, Inc.(b) | 3,500 | 1,039,115 | ||||||
Regulus Therapeutics, Inc.(b) | 18,000 | 128,340 | ||||||
Salix Pharmaceuticals Ltd.(b) | 8,400 | 924,000 | ||||||
Sangamo BioSciences, Inc.(b) | 9,000 | 124,560 | ||||||
Seattle Genetics, Inc.(b) | 17,000 | 654,160 | ||||||
Stemline Therapeutics, Inc.(b) | 7,000 | 107,170 | ||||||
Supernus Pharmaceuticals, Inc.(b) | 15,000 | 123,150 | ||||||
Swedish Orphan Biovitrum AB(a)(b) | 8,000 | 87,847 | ||||||
Synageva BioPharma Corp.(b) | 3,700 | 319,569 | ||||||
United Therapeutics Corp.(b) | 2,200 | 220,022 | ||||||
Valeant Pharmaceuticals International, Inc.(a)(b) | 2,100 | 280,791 | ||||||
Vertex Pharmaceuticals, Inc.(b) | 5,500 | 372,350 | ||||||
| 18,314,321 | ||||||||
Retailing—4.8% | ||||||||
Dick’s Sporting Goods, Inc. | 5,300 | 279,098 | ||||||
Francesca’s Holdings Corp.(b) | 2,100 | 34,356 | ||||||
GNC Holdings, Inc. | 6,000 | 270,000 | ||||||
Groupon, Inc.(b) | 1,000 | 6,990 | ||||||
L Brands, Inc. | 3,500 | 189,700 | ||||||
Liberty Ventures(b) | 3,000 | 174,120 | ||||||
Lithia Motors, Inc. | 1,700 | 126,276 | ||||||
The Priceline Group, Inc.(b) | 1,300 | 1,505,075 | ||||||
Sally Beauty Holdings, Inc.(b) | 8,000 | 219,280 | ||||||
TripAdvisor, Inc.(b) | 3,200 | 258,368 | ||||||
Ulta Salon Cosmetics & Fragrance, Inc.(b) | 4,900 | $ | 429,779 | |||||
Urban Outfitters, Inc.(b) | �� | 9,500 | 338,722 | |||||
Williams-Sonoma, Inc. | 1,800 | 113,076 | ||||||
| 3,944,840 | ||||||||
Semiconductors & Semiconductor Equipment—1.3% |
| |||||||
ARM Holdings PLC—ADR | 6,500 | 295,880 | ||||||
Cavium, Inc.(b) | 6,800 | 288,116 | ||||||
Cree, Inc.(b) | 4,100 | 193,397 | ||||||
Skyworks Solutions, Inc. | 8,000 | 328,400 | ||||||
| 1,105,793 | ||||||||
Software & Services—11.7% | ||||||||
Alliance Data Systems Corp.(b) | 450 | 108,855 | ||||||
ANSYS, Inc.(b) | 4,800 | 366,288 | ||||||
Aspen Technology, Inc.(b) | 11,700 | 502,983 | ||||||
Broadridge Financial Solutions, Inc. | 5,500 | 210,870 | ||||||
Cadence Design Systems, Inc.(b) | 14,500 | 225,620 | ||||||
CommVault Systems, Inc.(b) | 2,100 | 101,640 | ||||||
Concur Technologies, Inc.(b) | 6,800 | 547,196 | ||||||
CoreLogic, Inc.(b) | 5,700 | 159,771 | ||||||
Cornerstone OnDemand, Inc.(b) | 1,500 | 55,140 | ||||||
CoStar Group, Inc.(b) | 1,450 | 233,291 | ||||||
Equinix, Inc.(b) | 500 | 93,905 | ||||||
FactSet Research Systems, Inc. | 2,500 | 266,250 | ||||||
FleetCor Technologies, Inc.(b) | 4,000 | 456,520 | ||||||
Gartner, Inc.(b) | 5,200 | 358,488 | ||||||
Guidewire Software, Inc.(b) | 2,500 | 94,400 | ||||||
LinkedIn Corp.(b) | 400 | 61,388 | ||||||
Manhattan Associates, Inc.(b) | 26,000 | 819,780 | ||||||
NetSuite, Inc.(b) | 8,300 | 641,673 | ||||||
OpenTable, Inc.(b) | 1,700 | 114,172 | ||||||
Pandora Media, Inc.(b) | 7,500 | 175,650 | ||||||
PTC, Inc.(b) | 8,500 | 300,645 | ||||||
Qlik Technologies, Inc.(b) | 6,000 | 131,880 | ||||||
Red Hat, Inc.(b) | 4,500 | 218,925 | ||||||
Salesforce.com, Inc.(b) | 4,000 | 206,600 | ||||||
ServiceNow, Inc.(b) | 9,000 | 447,480 | ||||||
SolarWinds, Inc.(b) | 4,500 | 181,440 | ||||||
Solera Holdings, Inc. | 7,400 | 479,372 | ||||||
Splunk, Inc.(b) | 8,500 | 463,845 | ||||||
SS&C Technologies Holdings, Inc.(b) | 4,100 | 159,572 | ||||||
Teradata Corp.(b) | 2,000 | 90,920 | ||||||
The Ultimate Software Group, Inc.(b) | 3,800 | 454,594 | ||||||
Workday, Inc.(b) | 6,400 | 467,648 | ||||||
Yelp, Inc.(b) | 6,500 | 379,080 | ||||||
| 9,575,881 | ||||||||
Technology Hardware & Equipment—2.6% |
| |||||||
3D Systems Corp.(b) | 4,000 | 189,360 | ||||||
FEI Co. | 2,300 | 182,896 | ||||||
The Accompanying Footnotes are an Integral Part of these Schedule of Investments.
| 26 | April 30, 2014 |
The Tocqueville Opportunity Fund
Schedule of Investments as of April 30, 2014
(Unaudited)
| Common Stocks (continued) | Shares | Value | ||||||
FLIR Systems, Inc. | 5,200 | $ | 177,008 | |||||
InvenSense, Inc.(b) | 7,000 | 150,710 | ||||||
IPG Photonics Corp.(b) | 1,900 | 122,797 | ||||||
NCR Corp.(b) | 8,300 | 253,233 | ||||||
Palo Alto Networks, Inc.(b) | 8,000 | 508,640 | ||||||
Stratasys Ltd.(a)(b) | 1,000 | 96,870 | ||||||
Trimble Navigation Ltd.(b) | 11,500 | 441,945 | ||||||
| 2,123,459 | ||||||||
Transportation—5.7% | ||||||||
American Airlines Group, Inc.(b) | 32,000 | 1,122,240 | ||||||
Delta Air Lines, Inc. | 48,000 | 1,767,840 | ||||||
Genesee & Wyoming, Inc.(b) | 1,800 | 178,218 | ||||||
Kirby Corp.(b) | 1,600 | 160,992 | ||||||
Old Dominion Freight Line, Inc.(b) | 4,500 | 272,835 | ||||||
Spirit Airlines, Inc.(b) | 10,500 | 596,820 | ||||||
United Continental Holdings, Inc.(b) | 15,000 | 613,050 | ||||||
| 4,711,995 | ||||||||
Total Common Stocks | 81,292,897 | |||||||
Real Estate Investment Trust (REIT)—0.3% |
| |||||||
Real Estate—0.3% | ||||||||
Extra Space Storage, Inc. | 4,050 | 211,936 | ||||||
Total Real Estate Investment Trust | 211,936 | |||||||
Purchased Call Options—0.3% | Contracts | |||||||
|
| |||||||
Capital Goods—0.0% | ||||||||
Ametek, Inc. | 40 | 7,000 | ||||||
Food, Beverage & Tobacco—0.0% | ||||||||
Constellation Brands, Inc. | 20 | 5,000 | ||||||
Pharmaceuticals, Biotechnology & Life Sciences—0.2% |
| |||||||
Endocyte, Inc. | 100 | 64,000 | ||||||
Gilead Sciences, Inc. | 100 | 36,500 | ||||||
Gilead Sciences, Inc. | 80 | 40,000 | ||||||
Merrimack Pharmaceuticals, Inc. Expiration: June 2014, | 200 | 11,000 | ||||||
| 151,500 | ||||||||
Retailing—0.0% |
| |||||||
American Eagle Outfitters, Inc. Expiration: August 2014, | 100 | $ | 4,000 | |||||
Software & Services—0.0% |
| |||||||
Facebook, Inc. | 60 | 6,000 | ||||||
Transportation—0.1% |
| |||||||
Copa Holdings SA | 50 | 40,000 | ||||||
Kansas City Southern | 100 | 65,000 | ||||||
| 105,000 | ||||||||
Total Purchased Call Options | 278,500 | |||||||
Short-Term Investment—0.1% | Shares | |||||||
|
| |||||||
Money Market Fund—0.1% | ||||||||
STIT-Treasury Portfolio, 0.01%(c) | 97,089 | 97,089 | ||||||
Total Short-Term Investment | 97,089 | |||||||
Total Investments | 81,880,422 | |||||||
Liabilities in Excess of Other Assets—(0.1)% |
| (61,236 | ) | |||||
Total Net Assets—100.0% | $ | 81,819,186 | ||||||
|
| |||||||
Percentages are stated as a percent of net assets.
ADR American Depository Receipt
| (a) | Foreign issued security. Foreign concentration (including ADR’s) was as follows: Bermuda 0.7%; Canada 0.5%; Cayman Islands 0.2%; Denmark 0.4%; France 0.1%; Ireland 3.6%; Israel 0.6%; Italy 0.1%; Jersey 0.2%; Netherlands 1.1%; Sweden 0.1%; Switzerland 0.1%; United Kingdom 0.4%; Virgin Islands 0.4%. |
| (b) | Non-income producing security. |
| (c) | Rate listed is the 7-day effective yield. |
The Accompanying Footnotes are an Integral Part of these Schedule of Investments.
| Semi-Annual Report | 27 |
The Tocqueville International Value Fund
Schedule of Investments as of April 30, 2014
(Unaudited)
| Common Stocks—93.7% | Shares | Value | ||||||
Australia—1.3% | ||||||||
Incitec Pivot Ltd. | 1,340,429 | $ | 3,586,332 | |||||
Belgium—4.1% | ||||||||
Groupe Bruxelles Lambert SA | 58,000 | 5,863,568 | ||||||
NV Bekaert SA | 129,600 | 5,273,541 | ||||||
| 11,137,109 | ||||||||
Canada—1.9% | ||||||||
Cameco Corp. | 101,430 | 2,159,444 | ||||||
Superior Plus Corp. | 240,000 | 2,892,569 | ||||||
| 5,052,013 | ||||||||
Cayman Islands—1.3% | ||||||||
Greatview Aseptic Packaging Co., Ltd. | 5,804,600 | 3,541,330 | ||||||
France—14.0% | ||||||||
Bollore SA | 10,420 | 6,639,714 | ||||||
Cie de St-Gobain | 112,425 | 6,865,911 | ||||||
Dassault Systemes | 30,210 | 3,714,640 | ||||||
Metropole Television SA | 161,689 | 3,463,482 | ||||||
Nexans SA | 107,500 | 6,046,875 | ||||||
Sanofi | 63,200 | 6,840,821 | ||||||
Vallourec SA | 78,600 | 4,645,884 | ||||||
| 38,217,327 | ||||||||
Germany—5.7% | ||||||||
Infineon Technologies AG | 526,125 | 6,115,984 | ||||||
Siemens AG—ADR | 40,000 | 5,273,200 | ||||||
Wacker Neuson SE | 225,000 | 4,271,816 | ||||||
| 15,661,000 | ||||||||
Hong Kong—5.1% | ||||||||
Chow Tai Fook Jewellery Group Ltd. | 1,938,200 | 2,719,947 | ||||||
Clear Media Ltd. | 3,813,000 | 3,811,549 | ||||||
Hopewell Holdings Ltd. | 1,139,250 | 3,923,407 | ||||||
Television Broadcasts Ltd. | 569,500 | 3,551,593 | ||||||
| 14,006,496 | ||||||||
Ireland—4.5% | ||||||||
Actavis plc(a) | 6,400 | 1,307,712 | ||||||
CRH PLC | 163,173 | 4,733,556 | ||||||
DCC PLC | 122,500 | 6,273,089 | ||||||
| 12,314,357 | ||||||||
Italy—1.2% | ||||||||
Sogefi SpA(a) | 519,701 | 3,292,113 | ||||||
Japan—23.2% | ||||||||
Asics Corp. | 219,900 | 4,278,193 | ||||||
Disco Corp. | 73,400 | 4,458,493 | ||||||
FUJIFILM Holdings Corp. | 180,500 | 4,661,026 | ||||||
Hitachi Ltd. | 1,113,500 | 7,918,174 | ||||||
Horiba Ltd. | 74,900 | 2,582,506 | ||||||
Hoya Corp. | 220,000 | 6,485,841 | ||||||
Kao Corp. | 136,500 | $ | 5,136,357 | |||||
Kyoto Kimono Yuzen Co., Ltd. | 185,800 | 1,839,190 | ||||||
MISUMI Group, Inc. | 137,500 | 3,343,522 | ||||||
Mitsubishi UFJ Financial Group, Inc. | 1,000,000 | 5,301,511 | ||||||
Miura Co., Ltd. | 40,000 | 1,137,380 | ||||||
Omron Corp. | 64,100 | 2,263,423 | ||||||
Shiseido Co., Ltd. | 337,500 | 6,021,421 | ||||||
SMC Corp. | 21,200 | 5,033,795 | ||||||
Toho Co., Ltd. | 145,100 | 2,794,561 | ||||||
| 63,255,393 | ||||||||
Luxembourg—1.6% | ||||||||
SAF-Holland SA | 298,800 | 4,462,517 | ||||||
Netherlands—5.4% | ||||||||
Akzo Nobel NV | 58,000 | 4,465,066 | ||||||
Koninklijke Ten Cate NV | 167,700 | 4,991,681 | ||||||
Unilever NV—ADR | 121,600 | 5,206,912 | ||||||
| 14,663,659 | ||||||||
Norway—5.9% | ||||||||
Orkla ASA | 800,000 | 6,606,665 | ||||||
Statoil ASA—ADR | 205,700 | 6,267,679 | ||||||
Stolt-Nielsen Ltd. | 121,441 | 3,278,987 | ||||||
| 16,153,331 | ||||||||
Singapore—1.8% | ||||||||
Singapore Post Ltd. | 4,345,000 | 4,904,024 | ||||||
South Korea—2.4% | ||||||||
Samsung Electronics Co., Ltd. | 6,500 | 6,523,275 | ||||||
Sweden—1.6% | ||||||||
Lindab International AB(a) | 340,000 | 4,235,490 | ||||||
Switzerland—2.7% | ||||||||
Novartis AG—ADR | 85,000 | 7,389,900 | ||||||
United Kingdom—3.6% | ||||||||
HomeServe PLC | 705,000 | 4,020,886 | ||||||
Stobart Group Ltd. | 464,789 | 1,075,101 | ||||||
Tesco PLC | 970,800 | 4,801,713 | ||||||
| 9,897,700 | ||||||||
United States—6.4% | ||||||||
Aflac, Inc. | 86,000 | 5,393,920 | ||||||
Freeport-McMoRan Copper & Gold, Inc. | 142,000 | 4,880,540 | ||||||
Schlumberger Ltd. | 72,000 | 7,311,600 | ||||||
| 17,586,060 | ||||||||
Total Common Stocks | 255,879,426 | |||||||
The Accompanying Footnotes are an Integral Part of these Schedule of Investments.
| 28 | April 30, 2014 |
The Tocqueville International Value Fund
Schedule of Investments as of April 30, 2014
(Unaudited)
| Short-Term Investments—5.8% | Shares | Value | ||||||
Money Market Fund—4.6% |
| |||||||
STIT-Treasury Portfolio, 0.01%(b) | 12,459,990 | $ | 12,459,990 | |||||
| Commercial Paper—1.2% | | Principal Amount | | |||||
U.S. Bank | $ | 3,350,000 | 3,350,000 | |||||
Total Short-Term Investments (Cost $15,809,990) | 15,809,990 | |||||||
Total Investments |
| 271,689,416 | ||||||
Other Assets in Excess of Liabilities—0.5% |
| 1,327,467 | ||||||
Total Net Assets—100.0% | $ | 273,016,883 | ||||||
|
| |||||||
Percentages are stated as a percent of net assets.
ADR American Depository Receipt
| (a) | Non-income producing security. |
| (b) | Rate listed is the 7-day effective yield. |
Schedule of Open Forward Currency Contracts
April 30, 2014
(Unaudited)
| Counterparties of Contracts | Forward Expiration Date | Currency to be Received | Currency to be Delivered | Amount of Currency to be Delivered | Amount of Currency to be Received | Unrealized Depreciation | ||||||||||||||||
U.S. Bank N.A. | 5/2/2014 | U.S. Dollars | Euro | 9,900,000 | 13,625,370 | $ | (109,369 | ) | ||||||||||||||
U.S. Bank N.A. | 5/2/2014 | U.S. Dollars | British Pound | 4,790,000 | 7,984,451 | $ | (102,823 | ) | ||||||||||||||
|
| |||||||||||||||||||||
| $ | (212,192 | ) | ||||||||||||||||||||
|
| |||||||||||||||||||||
The Accompanying Footnotes are an Integral Part of these Schedule of Investments.
| Semi-Annual Report | 29 |
The Tocqueville Gold Fund
Schedule of Investments as of April 30, 2014
(Unaudited)
| Common Stocks—83.3% | Shares | Value | ||||||
Gold Related Securities—72.8% |
| |||||||
Canada—59.3% | ||||||||
Agnico Eagle Mines Ltd. | 993,000 | $ | 29,353,080 | |||||
Agnico Eagle Mines Ltd.(a) | 210,837 | 6,226,717 | ||||||
Alacer Gold Corp. | 2,626,800 | 6,279,108 | ||||||
Alamos Gold, Inc. | 2,710,000 | 25,257,200 | ||||||
Anthem United, Inc.(b)(c)(d)(e)(f) (Originally acquired 04/03/2014, Cost $905,961) | 5,000,000 | 1,788,240 | ||||||
Argonaut Gold, Inc.(b) | 2,687,000 | 9,928,699 | ||||||
ATAC Resources Ltd.(b)(c) | 10,963,700 | 13,103,825 | ||||||
ATAC Resources Ltd.(b)(c)(d)(e)(f) (Originally acquired 03/26/2014, Cost $703,748) | 553,191 | 647,951 | ||||||
B2Gold Corp.(b) | 11,927,100 | 34,469,319 | ||||||
Barisan Gold Corp.(b) | 877,100 | 100,030 | ||||||
Brazil Resources, Inc.(b) | 202,392 | 171,730 | ||||||
Continental Gold Ltd.(b) | 1,839,900 | 6,546,791 | ||||||
Corvus Gold, Inc.(b)(c) | 2,079,901 | 2,978,626 | ||||||
Corvus Gold, Inc.(a)(b)(c) | | 7,100,000 | | | 10,429,269 | | ||
Dalradian Resources, Inc.(b) | 850,000 | 697,961 | ||||||
Detour Gold Corp.(b)(c) | 5,296,600 | 52,721,961 | ||||||
East Asia Minerals Corp.(b)(c) | 10,544,400 | 384,814 | ||||||
Eldorado Gold Corp. | 8,189,885 | 49,958,299 | ||||||
Eldorado Gold Corp.(a) | 1,000,000 | 6,094,612 | ||||||
Franco-Nevada Corp. | 1,364,300 | 65,759,745 | ||||||
GoGold Resources, Inc.(b)(c) | 8,100,000 | 12,489,394 | ||||||
Goldcorp, Inc. | 580,850 | 14,358,612 | ||||||
Goldcorp, Inc.(a) | 2,138,010 | 52,804,097 | ||||||
IAMGOLD Corp. | 2,083,396 | 7,271,052 | ||||||
International Tower Hill Mines Ltd.(b)(c) | 5,738,836 | 3,787,632 | ||||||
International Tower Hill Mines Ltd.(a)(b)(c) | 7,589,744 | 5,124,228 | ||||||
New Gold, Inc.(b) | 6,091,640 | 30,884,615 | ||||||
Novagold Resources, Inc.(b) | 4,181,300 | 14,759,989 | ||||||
Osisko Mining Corp.(b) | 7,407,400 | 53,481,428 | ||||||
Osisko Mining Corp.(a)(b) | 4,545,000 | 32,551,663 | ||||||
Osisko Spinco(b)(d)(e)(f) (Originally acquired 04/23/2014, Cost $3,039,867) | 2,732,500 | 3,390,539 | ||||||
Pan American Silver Corp. | 2,248,098 | 29,135,350 | ||||||
Primero Mining Corp.(b)(c) | 8,218,800 | 51,965,041 | ||||||
Rockhaven Resources Ltd.(b)(c) | 5,000,000 | 912,367 | ||||||
Rockhaven Resources Ltd.(b)(c)(d)(e)(f) (Originally acquired 04/03/2014, Cost $190,252) | 1,400,000 | 225,318 | ||||||
Romarco Minerals, Inc.(b) | 17,387,800 | 13,917,195 | ||||||
Rubicon Minerals Corp.(b)(c) | 10,230,000 | 10,920,214 | ||||||
SEMAFO, Inc.(c) | 8,614,200 | 32,044,824 | ||||||
Silver Wheaton Corp. | 1,884,875 | 41,844,225 | ||||||
| Common Stocks (continued) | Shares | Value | ||||||
Strategic Metals Ltd.(b)(c) | 10,926,900 | $ | 3,838,198 | |||||
Sunward Resources Ltd.(b) | 660,800 | 102,492 | ||||||
Torex Gold Resources, Inc.(b)(c) | 31,735,500 | 35,324,401 | ||||||
Turquoise Hill Resources Ltd.(b) | 271,032 | 1,057,025 | ||||||
Turquoise Hill Resources Ltd.(a)(b) | 100,000 | 388,668 | ||||||
Yamana Gold, Inc. | 5,046,600 | 37,748,568 | ||||||
Yamana Gold, Inc.(a) | 148,800 | 1,114,591 | ||||||
| 814,339,703 | ||||||||
Peru—0.5% | ||||||||
Cia de Minas Buenaventura SAA—ADR | 553,600 | 7,196,800 | ||||||
South Africa—1.2% | ||||||||
Gold Fields Ltd.—ADR | 3,641,950 | 15,405,449 | ||||||
Gold Fields Ltd.(a) | 166,249 | 697,043 | ||||||
| 16,102,492 | ||||||||
United Kingdom—4.8% | ||||||||
Fresnillo PLC | 940,000 | 13,514,048 | ||||||
Randgold Resources Ltd.—ADR | 652,900 | 52,277,703 | ||||||
| 65,791,751 | ||||||||
United States—7.0% | ||||||||
Electrum Ltd.(b)(d)(e)(f) (Originally acquired 12/21/07, Cost $13,065,361) | 2,127,287 | 1,489,101 | ||||||
Gold Resource Corp. | 1,017,847 | 4,692,275 | ||||||
Newmont Mining Corp. | 635,300 | 15,774,499 | ||||||
Royal Gold, Inc. | 1,118,965 | 74,075,483 | ||||||
| 96,031,358 | ||||||||
Total Gold Related Securities | 999,462,104 | |||||||
Other Precious Metals Related Securities—10.1% |
| |||||||
Canada—8.3% | ||||||||
Bear Creek Mining Corp.(b)(c) | 7,413,200 | 9,874,798 | ||||||
Ivanhoe Mines Ltd.—Class A(b) | 9,152,965 | 15,115,065 | ||||||
Ivanhoe Mines Ltd.—Class B(b)(d)(e)(f)(g) (Originally acquired 08/15/01, Cost $5,300,973) | 3,465,250 | 5,436,337 | ||||||
MAG Silver Corp.(b)(c) | 2,960,700 | 22,530,927 | ||||||
Oban Mining(b) | 530,786 | 130,753 | ||||||
Plata Latina Minerals Corp.(b) | 2,000,000 | 200,721 | ||||||
Scorpio Mining Corp.(b)(c) | 25,668,419 | 6,155,287 | ||||||
Scorpio Mining Corp.(a)(b)(c) | 522,400 | 123,921 | ||||||
Silver Range Resources Ltd.(b)(c) | 3,450,000 | 377,720 | ||||||
Silvercrest Mines, Inc.(b) | 755,600 | 1,302,937 | ||||||
Tahoe Resources, Inc.(b) | 2,350,000 | 52,293,690 | ||||||
| 113,542,156 | ||||||||
United States—1.8% | ||||||||
Stillwater Mining Co.(b) | 1,010,900 | 15,952,002 | ||||||
The Accompanying Footnotes are an Integral Part of these Schedule of Investments.
| 30 | April 30, 2014 |
The Tocqueville Gold Fund
Schedule of Investments as of April 30, 2014
(Unaudited)
| Common Stocks (continued) | Shares | Value | ||||||
Sunshine Mining & Refining(b)(d)(e)(f) (Originally acquired 03/15/11, Cost $18,353,107) | 1,633,545 | $ | 8,984,498 | |||||
| 24,936,500 | ||||||||
Total Other Precious Metals Related Securities | 138,478,656 | |||||||
Other Securities—0.4% | ||||||||
United States—0.4% | ||||||||
Gold Bullion International LLC(b)(c)(d)(e)(f) (Originally acquired 05/12/10, Cost $5,000,000) | 5,000,000 | 5,837,000 | ||||||
GoviEx Uranium, Inc.(b)(d)(e)(f) (Originally acquired 10/09/07, Cost $3,428,821) | 1,750,000 | 175,000 | ||||||
I-Pulse, Inc.(b)(d)(e)(f) (Originally acquired 10/09/07, Cost $175,524) | 74,532 | 256,390 | ||||||
| 6,268,390 | ||||||||
Total Other Securities | 6,268,390 | |||||||
Total Common Stocks | 1,144,209,150 | |||||||
Private Fund—1.2% | ||||||||
Gold Related Securities—1.2% |
| |||||||
United States—1.2% | ||||||||
Tocqueville Bullion Reserve LP(b)(c)(d)(e)(f) (Orignally acquired 11/28/11, Cost $25,000,000) | 13,806 | 17,361,297 | ||||||
Total Private Fund | 17,361,297 | |||||||
| Gold Bullion—9.4% | Ounces | |||||||
Gold Bullion(b) | 99,645 | 128,697,033 | ||||||
Total Gold Bullion | 128,697,033 | |||||||
| Warrants—0.3% | Shares | |||||||
Gold Related Securities—0.3% |
| |||||||
Canada—0.3% | ||||||||
Anthem United, Inc. | 1,250,000 | 154,646 | ||||||
ATAC Resources Ltd. | 276,595 | $ | 41,513 | |||||
East Asia Minerals Corp. | 6,500,000 | 83,618 | ||||||
GoGold Resources, Inc. | 4,050,000 | 1,626,208 | ||||||
Pan American Silver Corp. | 133,333 | 183 | ||||||
Primero Mining Corp. | 1,848,400 | 1,551,506 | ||||||
Rockhaven Resources Ltd. | 700,000 | – | ||||||
Rubicon Minerals Corp.(b)(c) | 3,064,000 | 279,549 | ||||||
Torex Gold Resources, Inc. | 2,950,000 | 134,574 | ||||||
Total Gold Related Securities | 3,871,797 | |||||||
Other Precious Metals Related Securities—0.0% |
| |||||||
Canada—0.0% | ||||||||
Plata Latina Minerals Corp. Expiration: 02/12/2015, Exercise Price: CAD $0.65(b)(d)(e)(f) (Originally acquired 02/08/13, Cost $0) | 1,000,000 | — | ||||||
Total Other Precious Metals Related Securities | — | |||||||
Total Warrants (Cost $0) | 3,871,797 | |||||||
Short-Term Investments—5.9% |
| |||||||
Money Market Fund—4.7% | ||||||||
STIT—Treasury Portfolio, 0.01%(h) | 64,865,088 | 64,865,088 | ||||||
The Accompanying Footnotes are an Integral Part of these Schedule of Investments.
| Semi-Annual Report | 31 |
The Tocqueville Gold Fund
Schedule of Investments as of April 30, 2014
(Unaudited)
| Short-Term Investments (continued) | Principal Amount | Value | ||||||
| Commercial Paper—1.2% | ||||||||
U.S. Bank | $ | 16,310,000 | $ | 16,310,000 | ||||
Convertible Note—0.0% | ||||||||
Gold Bullion International LLC | 211,019 | 211,019 | ||||||
Total Short-Term Investments (Cost $81,386,107) | 81,386,107 | |||||||
Total Investments |
| 1,375,525,384 | ||||||
Liabilities in Excess of Other Assets—(0.1)% |
| (1,590,369 | ) | |||||
Total Net Assets—100.0% | $ | 1,373,935,015 | ||||||
|
| |||||||
Percentages are stated as a percent of net assets.
ADR American Depository Receipt
| (a) | Denotes an issue that is traded on a foreign exchange when a company is listed more than once. |
| (b) | Non-income producing security. |
| (c) | Affiliated Company. See Footnote 8. |
| (d) | Denotes a security is either fully or partially resticted to resale. The aggregate value of resticted securities as of April 30, 2014 was $47,708,858, which represented 3.5% of net assets. |
| (e) | Securities are fair valued using procedures approved by the Board of Trustees. The aggregate value of fair valued securities as of April 30, 2014 was $47,708,858, which represented 3.5% of net assets. |
| (f) | Security is considered illiquid and may be difficult to sell. |
| (g) | Convertible into Ivanplats Ltd.—Class A shares. |
| (h) | Rate listed is the 7-day effective yield. |
The Accompanying Footnotes are an Integral Part of these Schedule of Investments.
| 32 | April 30, 2014 |
The Delafield Fund
Schedule of Investments as of April 30, 2014
(Unaudited)
| Common Stocks—84.1% | Shares | Value | ||||||
Aerospace & Defense—3.0% |
| |||||||
Honeywell International, Inc. | 550,000 | $ | 51,095,000 | |||||
Chemicals—14.4% |
| |||||||
American Vanguard Corp. | 225,000 | 4,007,250 | ||||||
Ashland, Inc. | 200,000 | 19,320,000 | ||||||
Cabot Corp. | 350,000 | 20,230,000 | ||||||
Chemtura Corp.(a) | 875,000 | 19,512,500 | ||||||
Eastman Chemical Co. | 725,000 | 63,198,250 | ||||||
HB Fuller Co. | 400,000 | 18,532,000 | ||||||
LyondellBasell Industries NV(b) | 200,000 | 18,500,000 | ||||||
Minerals Technologies, Inc. | 550,000 | 32,719,500 | ||||||
PolyOne Corp. | 1,325,000 | 49,647,750 | ||||||
| 245,667,250 | ||||||||
Commercial Services & Supplies—3.1% |
| |||||||
ACCO Brands Corp.(a) | 3,000,000 | 18,390,000 | ||||||
Avery Dennison Corp. | 725,000 | 35,278,500 | ||||||
| 53,668,500 | ||||||||
Computers & Peripherals—1.6% |
| |||||||
Diebold, Inc. | 300,000 | 11,283,000 | ||||||
Hewlett-Packard Co. | 475,000 | 15,703,500 | ||||||
| 26,986,500 | ||||||||
Construction & Engineering—1.6% |
| |||||||
Aegion Corp.(a) | 900,000 | 22,941,000 | ||||||
URS Corp. | 100,000 | 4,712,000 | ||||||
| 27,653,000 | ||||||||
Containers & Packaging—4.2% |
| |||||||
Owens-Illinois, Inc.(a) | 1,000,000 | 31,780,000 | ||||||
Sealed Air Corp. | 800,000 | 27,448,000 | ||||||
Sonoco Products Co. | 300,000 | 12,624,000 | ||||||
| 71,852,000 | ||||||||
Electrical Equipment—1.6% |
| |||||||
Brady Corp. | 575,000 | 14,829,250 | ||||||
Hubbell, Inc. | 100,000 | 11,772,000 | ||||||
| 26,601,250 | ||||||||
Electronic Equipment, Instruments & Components—9.0% |
| |||||||
Checkpoint Systems, Inc.(a) | 601,500 | 7,681,155 | ||||||
Flextronics International Ltd.(a)(b) | 6,465,000 | 58,120,350 | ||||||
Ingram Micro, Inc.(a) | 950,000 | 25,612,000 | ||||||
Jabil Circuit, Inc. | 1,700,000 | 29,342,000 | ||||||
Kemet Corp.(a)(c) | 2,275,000 | 11,397,750 | ||||||
Plexus Corp.(a) | 525,000 | 22,008,000 | ||||||
| 154,161,255 | ||||||||
Energy Equipment & Services—4.5% |
| |||||||
Dresser-Rand Group, Inc.(a) | 50,000 | 3,022,000 | ||||||
Hercules Offshore, Inc.(a) | 4,000,000 | 17,880,000 | ||||||
McDermott International, Inc.(a)(b) | 2,500,000 | 18,075,000 | ||||||
Oil States International, Inc.(a) | 175,000 | $ | 16,999,500 | |||||
Weatherford International Ltd.(a)(b) | 1,000,000 | 21,000,000 | ||||||
| 76,976,500 | ||||||||
Industrial Conglomerates—1.4% |
| |||||||
Carlisle Cos., Inc. | 300,000 | 24,675,000 | ||||||
Insurance—1.3% |
| |||||||
XL Group PLC(b) | 725,000 | 22,728,750 | ||||||
Machinery—12.6% |
| |||||||
Crane Co. | 425,000 | 30,910,250 | ||||||
Dover Corp. | 700,000 | 60,480,000 | ||||||
Harsco Corp. | 1,200,000 | 28,716,000 | ||||||
Kennametal, Inc. | 975,000 | 45,561,750 | ||||||
Stanley Black & Decker, Inc. | 475,000 | 40,797,750 | ||||||
Xerium Technologies, Inc.(a)(c) | 620,400 | 8,375,400 | ||||||
| 214,841,150 | ||||||||
Marine—0.2% |
| |||||||
Baltic Trading Ltd.(b) | 500,000 | 2,995,000 | ||||||
Metals & Mining—6.4% |
| |||||||
Allegheny Technologies, Inc. | 350,000 | 14,420,000 | ||||||
AM Castle & Co.(a) | 900,000 | 11,052,000 | ||||||
Carpenter Technology Corp. | 650,000 | 40,820,000 | ||||||
Horsehead Holding Corp.(a) | 950,000 | 14,810,500 | ||||||
Molycorp, Inc.(a) | 3,075,000 | 14,606,250 | ||||||
Universal Stainless & Alloy Products, Inc.(a)(c) | 400,000 | 14,356,000 | ||||||
| 110,064,750 | ||||||||
Oil, Gas & Consumable Fuels—3.5% |
| |||||||
Bill Barrett Corp.(a) | 600,000 | 14,208,000 | ||||||
Boardwalk Pipeline Partners LP | 1,200,000 | 19,164,000 | ||||||
CONSOL Energy, Inc. | 600,000 | 26,706,000 | ||||||
| 60,078,000 | ||||||||
Professional Services—1.9% |
| |||||||
TrueBlue, Inc.(a) | 1,225,000 | 32,768,750 | ||||||
Semiconductors & Semiconductor Equipment—4.9% |
| |||||||
Fairchild Semiconductor International, Inc.(a) | 3,500,000 | 44,555,000 | ||||||
Infineon Technologies AG(b) | 800,000 | 9,299,667 | ||||||
Teradyne, Inc. | 1,675,000 | 29,597,250 | ||||||
| 83,451,917 | ||||||||
Specialty Retail—5.6% |
| |||||||
Ascena Retail Group, Inc.(a) | 1,250,000 | 21,500,000 | ||||||
Stage Stores, Inc. | 500,000 | 9,590,000 | ||||||
Staples, Inc. | 3,000,000 | 37,500,000 | ||||||
The Finish Line, Inc. | 975,000 | 26,841,750 | ||||||
| 95,431,750 | ||||||||
Textiles, Apparel & Luxury Goods—0.5% |
| |||||||
Perry Ellis International, Inc.(a)(c) | 600,000 | 9,060,000 | ||||||
The Accompanying Footnotes are an Integral Part of these Schedule of Investments.
| Semi-Annual Report | 33 |
The Delafield Fund
Schedule of Investments as of April 30, 2014
(Unaudited)
| Common Stocks (continued) | Shares | Value | ||||||
Trading Companies & Distributors—2.8% |
| |||||||
Rush Enterprises, Inc.(a) | 400,000 | $ | 12,840,000 | |||||
WESCO International, Inc.(a) | 400,000 | 35,112,000 | ||||||
| 47,952,000 | ||||||||
Total Common Stocks (Cost $967,270,731) | 1,438,708,322 | |||||||
| Corporate Bonds—2.6% | | Principal Amount | | |||||
Banks—0.3% |
| |||||||
Royal Bank of Canada 0.460%, 01/06/2015(b)(d) | $ | 5,000,000 | 5,008,515 | |||||
Capital Markets—0.3% |
| |||||||
The Goldman Sachs Group, Inc. | 5,000,000 | 4,996,185 | ||||||
Consumer Finance—0.3% |
| |||||||
American Express Credit Corp. | 5,000,000 | 5,034,285 | ||||||
Diversified Financial Services—1.3% |
| |||||||
Canadian Imperial Bank of Commerce 0.337%, 10/10/2014(b)(d) | 5,000,000 | 5,003,525 | ||||||
General Electric Capital Corp. 0.609%, 01/09/2015(d) | 14,000,000 | 14,040,544 | ||||||
Wells Fargo Bank N.A. 0.446%, 05/16/2016(d) | 4,000,000 | 3,988,596 | ||||||
| 23,032,665 | ||||||||
Pharmaceuticals—0.4% |
| |||||||
Merck & Co., Inc. 0.426%, 05/18/2016(d) | 7,200,000 | 7,222,493 | ||||||
Total Corporate Bonds (Cost $45,276,710) | 45,294,143 | |||||||
| Short-Term Investments—13.6% | Shares | |||||||
Money Market Fund—4.8% |
| |||||||
STIT-Treasury | 82,195,734 | 82,195,734 | ||||||
| U.S. Treasury Bills—8.8% | | Principal Amount | | Value | ||||
0.040%, 05/22/2014(f) | $ | 75,000,000 | $ | 74,998,272 | ||||
0.020%, 06/12/2014(f) | 50,000,000 | 49,998,850 | ||||||
0.027%, 07/10/2014(f) | 25,000,000 | 24,999,200 | ||||||
| 149,996,322 | ||||||||
Total Short-Term Investments (Cost $232,191,563) |
| 232,192,056 | ||||||
Total Investments |
| 1,716,194,521 | ||||||
Liabilities in Excess of Other Assets—(0.3)% |
| (4,869,677 | ) | |||||
Total Net Assets—100.0% | $ | 1,711,324,844 | ||||||
|
| |||||||
Percentages are stated as a percent of net assets.
| (a) | Non-income producing security. |
| (b) | Foreign issued security. Foreign concentration was as follows: Canada 0.6%; Germany 0.5%; Ireland 1.3%; Marshall Islands 0.2%; Netherlands 1.1%; Panama 1.1%; Singapore 3.4%; Switzerland 1.2%. |
| (c) | Affiliated company. See Footnote 8. |
| (d) | Variable rate security. The rate shown is as of 04/30/2014. |
| (e) | Rate listed is the 7-day effective yield. |
| (f) | Rate listed is the effective yield based on purchase price. The calculation assumes the security is held to maturity. |
The Accompanying Footnotes are an Integral Part of these Schedule of Investments.
| 34 | April 30, 2014 |
The Tocqueville Select Fund
Schedule of Investments as of April 30, 2014
(Unaudited)
| Common Stocks—87.7% | Shares | Value | ||||||
Chemicals—7.1% |
| |||||||
Ashland, Inc. | 31,100 | $ | 3,004,260 | |||||
Minerals Technologies, Inc. | 70,000 | 4,164,300 | ||||||
| 7,168,560 | ||||||||
Commercial Services & Supplies—6.6% |
| |||||||
ACCO Brands Corp.(a) | 539,400 | 3,306,522 | ||||||
Avery Dennison Corp. | 67,600 | 3,289,416 | ||||||
| 6,595,938 | ||||||||
Containers & Packaging—6.3% |
| |||||||
Owens-Illinois, Inc.(a) | 97,000 | 3,082,660 | ||||||
Sonoco Products Co. | 77,400 | 3,256,992 | ||||||
| 6,339,652 | ||||||||
Electronic Equipment, Instruments & Components—9.7% |
| |||||||
Checkpoint Systems, Inc.(a) | 109,000 | 1,391,930 | ||||||
Flextronics International Ltd.(a)(b) | 498,200 | 4,478,818 | ||||||
Jabil Circuit, Inc. | 227,400 | 3,924,924 | ||||||
| 9,795,672 | ||||||||
Energy Equipment & Services—3.1% |
| |||||||
Oil States International, Inc.(a) | 32,000 | 3,108,480 | ||||||
Household Durables—3.7% |
| |||||||
Universal Electronics, Inc.(a) | 99,292 | 3,708,556 | ||||||
Industrial Conglomerates—2.7% |
| |||||||
Carlisle Cos., Inc. | 33,500 | 2,755,375 | ||||||
Internet Software & Services—5.1% |
| |||||||
Conversant, Inc.(a) | 95,000 | 2,321,800 | ||||||
j2 Global, Inc. | 61,400 | 2,846,504 | ||||||
| 5,168,304 | ||||||||
IT Services—4.5% |
| |||||||
EPAM Systems, Inc.(a) | 145,900 | 4,541,867 | ||||||
Leisure Equipment & Products—1.5% |
| |||||||
Summer Infant, Inc.(a)(c) | 814,933 | 1,548,373 | ||||||
Machinery—14.8% |
| |||||||
Harsco Corp. | 142,000 | 3,398,060 | ||||||
Kennametal, Inc. | 96,000 | 4,486,080 | ||||||
Stanley Black & Decker, Inc. | 39,900 | 3,427,011 | ||||||
Xerium Technologies, Inc.(a)(c) | 265,000 | 3,577,500 | ||||||
| 14,888,651 | ||||||||
Metals & Mining—4.4% |
| |||||||
AM Castle & Co.(a) | 50,000 | 614,000 | ||||||
Carpenter Technology Corp. | 60,000 | 3,768,000 | ||||||
| 4,382,000 | ||||||||
Professional Services—7.3% |
| |||||||
RPX Corp.(a) | 205,000 | 3,357,900 | ||||||
Stantec, Inc.(b) | 67,600 | 4,006,652 | ||||||
| 7,364,552 | ||||||||
Semiconductors & Semiconductor Equipment—3.6% |
| |||||||
Fairchild Semiconductor International, Inc.(a) | 285,000 | $ | 3,628,050 | |||||
Specialty Retail—7.3% |
| |||||||
Ascena Retail Group, Inc.(a) | 195,000 | 3,354,000 | ||||||
Staples, Inc. | 316,000 | 3,950,000 | ||||||
| 7,304,000 | ||||||||
Total Common Stocks (Cost $69,869,685) | 88,298,030 | |||||||
Short-Term Investments—12.6% |
| |||||||
Money Market Fund—3.2% |
| |||||||
STIT-Treasury Portfolio, 0.01%(d) | 3,237,035 | 3,237,035 | ||||||
| U.S. Treasury Bills—9.4% | | Principal Amount | | |||||
0.030%, 05/15/2014(e) | $ | 2,000,000 | 1,999,977 | |||||
0.035%, 06/19/2014(e) | 5,000,000 | 4,999,765 | ||||||
0.022%, 07/10/2014(e) | 2,000,000 | 1,999,936 | ||||||
0.00%, 08/21/2014(e) | 500,000 | 499,959 | ||||||
| 9,499,637 | ||||||||
Total Short-Term Investments (Cost $12,736,698) |
| 12,736,672 | ||||||
Total Investments (Cost $82,606,383)—100.3% | 101,034,702 | |||||||
Liabilities in Excess of Other Assets—(0.3)% |
| (354,016 | ) | |||||
Total Net Assets—100.0% | $ | 100,680,686 | ||||||
|
| |||||||
Percentages are stated as a percent of net assets.
| (a) | Non-income producing security. |
| (b) | Foreign issued security. Foreign concentration was as follows: Canada 4.0%; Singapore 4.4%. |
| (c) | Affiliated company. See Footnote 8. |
| (d) | Rate listed is the 7-day effective yield. |
| (e) | Rate listed is the effective yield based on the purchase price. The calculation assumes the security is held to maturity. |
The Accompanying Footnotes are an Integral Part of these Schedule of Investments.
| Semi-Annual Report | 35 |
Percent of Total Investments
The Tocqueville Fund
Allocation of Portfolio Holdings
April 30, 2014 (Unaudited)
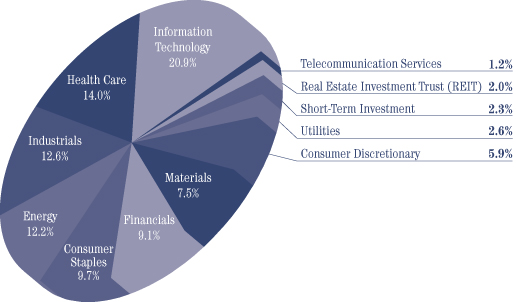
The Tocqueville Opportunity Fund
Allocation of Portfolio Holdings
April 30, 2014 (Unaudited)
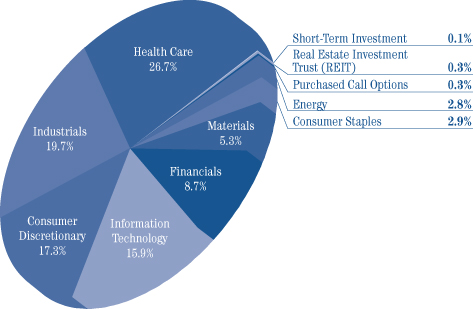
| 36 | April 30, 2014 |
Percent of Total Investments
The Tocqueville International Value Fund
Allocation of Portfolio Holdings
April 30, 2014 (Unaudited)
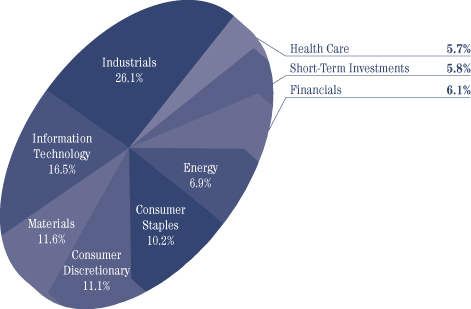
The Tocqueville Gold Fund
Allocation of Portfolio Holdings
April 30, 2014 (Unaudited)
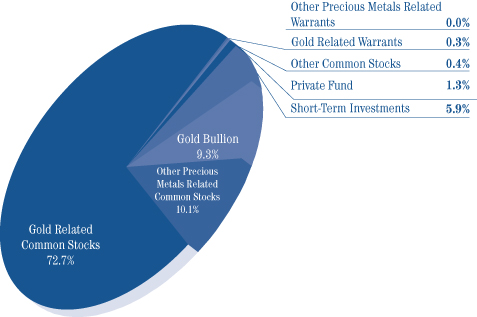
| Semi-Annual Report | 37 |
Percent of Total Investments
The Delafield Fund
Allocation of Portfolio Holdings
April 30, 2014 (Unaudited)
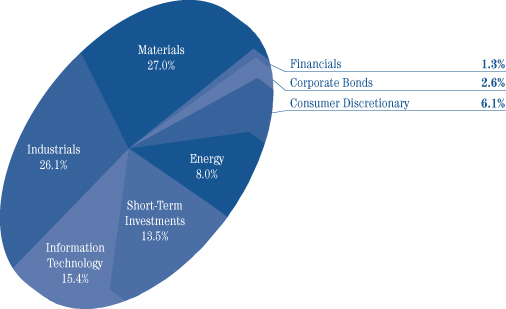
The Tocqueville Select Fund
Allocation of Portfolio Holdings
April 30, 2014 (Unaudited)
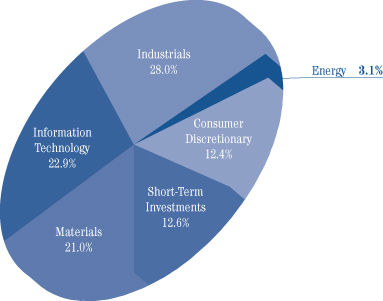
| 38 | April 30, 2014 |
The Toqueville Trust
Statements of Assets & Liabilities
April 30, 2014
(Unaudited)
| The Tocqueville Fund | The Tocqueville Opportunity Fund | The Tocqueville International Value Fund | The Tocqueville Gold Fund | The Delafield Fund | The Tocqueville Select Fund | |||||||||||||||||||
Assets: | ||||||||||||||||||||||||
Investments, at value (1) | ||||||||||||||||||||||||
Unaffiliated Issuers | $ | 377,973,304 | $ | 81,880,422 | $ | 271,689,416 | $ | 1,070,495,498 | $ | 1,654,615,371 | $ | 92,602,307 | ||||||||||||
Affiliated Issuers | — | — | — | 305,029,886 | 61,579,150 | 8,432,395 | ||||||||||||||||||
Foreign currencies, at value (2) | — | — | 842,983 | 993,745 | — | — | ||||||||||||||||||
Cash | — | — | — | 230,350 | 11 | — | ||||||||||||||||||
Receivable for investments sold | — | 1,327,938 | 1,469,846 | — | 10,103,558 | — | ||||||||||||||||||
Receivable for fund shares sold | 2,652,963 | 54,622 | 550,437 | 2,627,789 | 1,152,499 | 361,353 | ||||||||||||||||||
Dividends, interest and other receivables | 257,395 | 10,675 | 1,349,959 | 396,614 | 553,543 | 29,144 | ||||||||||||||||||
Prepaid assets | 16,034 | 12,503 | 27,109 | 30,453 | 56,434 | 10,835 | ||||||||||||||||||
Return of capital receivable | — | 6,650 | — | — | — | — | ||||||||||||||||||
|
|
|
|
|
|
|
|
|
|
|
| |||||||||||||
Total Assets | 380,899,696 | 83,292,810 | 275,929,750 | 1,379,804,335 | 1,728,060,566 | 101,436,034 | ||||||||||||||||||
|
|
|
|
|
|
|
|
|
|
|
| |||||||||||||
Liabilities: | ||||||||||||||||||||||||
Payable for investments purchased | 2,143,768 | 1,337,825 | 2,396,636 | 3,377,709 | 12,934,010 | 620,695 | ||||||||||||||||||
Unrealized depreciation on forward currency contracts | — | — | 212,192 | — | — | — | ||||||||||||||||||
Due to Custodian | — | — | 1,086 | — | 8,515 | — | ||||||||||||||||||
Payable for fund shares redeemed | 499,395 | 39,414 | 27,330 | 870,005 | 2,144,607 | 19,979 | ||||||||||||||||||
Payable to Adviser (See Note 10) | 227,708 | 52,043 | 160,006 | 895,180 | 1,007,650 | 66,973 | ||||||||||||||||||
Payable to Administrator | 51,262 | 11,693 | 35,738 | 175,033 | 251,549 | 14,594 | ||||||||||||||||||
Payable to Trustees | 10,897 | 3,149 | 5,761 | 73,524 | 38,991 | 2,178 | ||||||||||||||||||
Accrued distribution fee | 41,606 | 13,507 | 26,925 | 15,092 | 79,966 | 9,821 | ||||||||||||||||||
Accrued expenses and other liabilities | 79,971 | 15,993 | 47,193 | 462,777 | 270,434 | 21,108 | ||||||||||||||||||
|
|
|
|
|
|
|
|
|
|
|
| |||||||||||||
Total Liabilities | 3,054,607 | 1,473,624 | 2,912,867 | 5,869,320 | 16,735,722 | 755,348 | ||||||||||||||||||
|
|
|
|
|
|
|
|
|
|
|
| |||||||||||||
Net Assets | $ | 377,845,089 | $ | 81,819,186 | $ | 273,016,883 | $ | 1,373,935,015 | $ | 1,711,324,844 | $ | 100,680,686 | ||||||||||||
|
|
|
|
|
|
|
|
|
|
|
| |||||||||||||
Net assets consist of: | ||||||||||||||||||||||||
Paid in capital | $ | 240,038,202 | $ | 60,605,336 | $ | 208,810,287 | $ | 1,744,549,425 | $ | 1,106,043,288 | $ | 76,432,912 | ||||||||||||
Accumulated net investment income (loss) | 980,432 | (746,581 | ) | 142,654 | (46,775,222 | ) | (1,777,488 | ) | (664,559 | ) | ||||||||||||||
Accumulated net realized gain (loss) | 17,669,018 | 6,118,839 | 3,198,016 | (34,173,571 | ) | 135,601,193 | 6,484,014 | |||||||||||||||||
Net unrealized appreciation (depreciation) on: | ||||||||||||||||||||||||
Investments and foreign currency related items | 119,157,437 | 15,841,592 | 60,865,926 | (289,665,617 | ) | 471,457,851 | 18,428,319 | |||||||||||||||||
|
|
|
|
|
|
|
|
|
|
|
| |||||||||||||
Net assets | $ | 377,845,089 | $ | 81,819,186 | $ | 273,016,883 | $ | 1,373,935,015 | $ | 1,711,324,844 | $ | 100,680,686 | ||||||||||||
|
|
|
|
|
|
|
|
|
|
|
| |||||||||||||
Shares of beneficial interest outstanding (unlimited shares of $0.01 par value autorized) | 11,588,294 | 3,996,288 | 17,581,035 | 34,904,307 | 44,890,233 | 7,211,887 | ||||||||||||||||||
Net asset value, offering and redemption price per share | $ | 32.61 | $ | 20.47 | $ | 15.53 | $ | 39.36 | $ | 38.12 | $ | 13.96 | ||||||||||||
|
|
|
|
|
|
|
|
|
|
|
| |||||||||||||
(1) Cost of investments | ||||||||||||||||||||||||
Unafilliated issuers | $ | 258,815,867 | $ | 66,038,869 | $ | 210,620,749 | $ | 1,148,906,269 | $ | 1,186,000,296 | $ | 71,216,315 | ||||||||||||
Affiliated issuers | $ | — | $ | — | $ | — | $ | 516,270,503 | $ | 58,738,708 | $ | 11,390,068 | ||||||||||||
(2) Cost of foreign currencies | $ | — | $ | — | $ | 839,399 | $ | 988,469 | $ | — | $ | — | ||||||||||||
The Accompanying Notes are an Integral Part of these Financial Statements.
| Semi-Annual Report | 39 |
The Tocqueville Trust
Statements of Operations
For the Period Ended April 30, 2014
(Unaudited)
| The Tocqueville Fund | The Tocqueville Opportunity Fund | The Tocqueville International Value Fund | The Tocqueville Gold Fund | The Delafield Fund | The Tocqueville Select Fund | |||||||||||||||||||
Investment Income: | ||||||||||||||||||||||||
Dividends * | ||||||||||||||||||||||||
Unaffiliated issuers | $ | 3,800,475 | $ | 225,055 | $ | 2,671,141 | $ | 4,115,776 | $ | 8,539,243 | $ | 381,706 | ||||||||||||
Interest | ||||||||||||||||||||||||
Unaffiliated issuers | 226 | 6 | 1,210 | 3,940 | 136,461 | 1,912 | ||||||||||||||||||
Affiliated issuers | — | — | — | 29 | — | — | ||||||||||||||||||
|
|
|
|
|
|
|
|
|
|
|
| |||||||||||||
Total investment income | 3,800,701 | 225,061 | 2,672,351 | 4,119,745 | 8,675,704 | 383,618 | ||||||||||||||||||
|
|
|
|
|
|
|
|
|
|
|
| |||||||||||||
Expenses: | ||||||||||||||||||||||||
Investment Adviser’s fee (See Note 4) | 1,336,264 | 317,790 | 1,324,638 | 4,979,724 | 6,094,730 | 399,787 | ||||||||||||||||||
Distribution fees (See Note 4) | 445,421 | 105,930 | 331,159 | 1,486,272 | 2,177,241 | 124,933 | ||||||||||||||||||
Administration fees (See Note 4) | 267,253 | 63,558 | 198,696 | 891,763 | 1,306,345 | 74,960 | ||||||||||||||||||
Transfer agent and shareholder services fees | 67,959 | 8,087 | 38,112 | 475,949 | 344,404 | 18,627 | ||||||||||||||||||
Trustee fees and expenses | 25,906 | 6,522 | 18,926 | 85,529 | 126,376 | 7,151 | ||||||||||||||||||
Professional fees | 23,111 | 6,849 | 17,650 | 88,406 | 104,567 | 7,606 | ||||||||||||||||||
Printing and mailing expense | 17,552 | 3,117 | 11,716 | 95,940 | 87,620 | 4,133 | ||||||||||||||||||
Fund accounting fees | 15,088 | 11,791 | 22,936 | 49,242 | 69,350 | 4,987 | ||||||||||||||||||
Registration fees | 14,314 | 10,987 | 11,844 | 50,112 | 31,498 | 12,689 | ||||||||||||||||||
Custody fees | 9,420 | 5,321 | 32,728 | 118,923 | 55,082 | 2,720 | ||||||||||||||||||
Other expenses (See Note 10) | 8,091 | 3,564 | 16,343 | 26,083 | 38,843 | 2,382 | ||||||||||||||||||
Insurance expense | 2,822 | 828 | 2,311 | 8,013 | 17,136 | 867 | ||||||||||||||||||
|
|
|
|
|
|
|
|
|
|
|
| |||||||||||||
Total expenses before waiver | 2,233,201 | 544,344 | 2,027,059 | 8,355,956 | 10,453,192 | 660,842 | ||||||||||||||||||
Less: Fees waived (See Note 4) | (14,240 | ) | — | (371,262 | ) | — | — | — | ||||||||||||||||
|
|
|
|
|
|
|
|
|
|
|
| |||||||||||||
Net expenses | 2,218,961 | 544,344 | 1,655,797 | 8,355,956 | 10,453,192 | 660,842 | ||||||||||||||||||
|
|
|
|
|
|
|
|
|
|
|
| |||||||||||||
Net Investment Income (Loss) | 1,581,740 | (319,283 | ) | 1,016,554 | (4,236,211 | ) | (1,777,488 | ) | (277,224 | ) | ||||||||||||||
|
|
|
|
|
|
|
|
|
|
|
| |||||||||||||
Realized and Unrealized Gain (Loss): | ||||||||||||||||||||||||
Net realized gain (loss) on: | ||||||||||||||||||||||||
Investments | ||||||||||||||||||||||||
Unaffiliated issuers | 17,776,764 | 6,204,142 | 7,706,185 | (28,548,156 | ) | 140,707,341 | 6,714,024 | |||||||||||||||||
Affiliated issuers | — | — | — | — | (4,280,589 | ) | — | |||||||||||||||||
Forward currency contracts | — | — | 1,184,308 | — | — | — | ||||||||||||||||||
Foreign currency translation | (291 | ) | (1,800 | ) | (108,433 | ) | (97,282 | ) | (21,412 | ) | (119 | ) | ||||||||||||
|
|
|
|
|
|
|
|
|
|
|
| |||||||||||||
| 17,776,473 | 6,202,342 | 8,782,060 | (28,645,438 | ) | 136,405,340 | 6,713,905 | ||||||||||||||||||
Net change in unrealized appreciation (depreciation) on: | ||||||||||||||||||||||||
Investments | 9,060,133 | (5,169,127 | ) | 8,183,473 | 100,849,788 | (25,723,684 | ) | (6,999,999 | ) | |||||||||||||||
Forward currency contracts | — | — | (371,918 | ) | — | — | — | |||||||||||||||||
Foreign currency translation | — | (19,559 | ) | 869,667 | (24,196,650 | ) | (421,371 | ) | — | |||||||||||||||
|
|
|
|
|
|
|
|
|
|
|
| |||||||||||||
| 9,060,133 | (5,188,686 | ) | 8,681,222 | 76,653,138 | (26,145,055 | ) | (6,999,999 | ) | ||||||||||||||||
Net gain (loss) on investments and foreign currency | 26,836,606 | 1,013,656 | 17,463,282 | 48,007,700 | 110,260,285 | (286,094 | ) | |||||||||||||||||
|
|
|
|
|
|
|
|
|
|
|
| |||||||||||||
Net Increase (Decrease) in Net Assets Resulting from Operations | $ | 28,418,346 | $ | 694,373 | $ | 18,479,836 | $ | 43,771,489 | $ | 108,482,797 | $ | (563,318 | ) | |||||||||||
|
|
|
|
|
|
|
|
|
|
|
| |||||||||||||
* Net of foreign taxes withheld of: | $ | 19,882 | $ | 1,266 | $ | 338,421 | $ | 511,890 | $ | — | $ | 3,254 | ||||||||||||
|
|
|
|
|
|
|
|
|
|
|
| |||||||||||||
The Accompanying Notes are an Integral Part of these Financial Statements.
| 40 | April 30, 2014 |
[This page intentionally left blank]
| Semi-Annual Report | 41 |
The Tocqueville Trust
Statements of Changes in Net Assets
| The Tocqueville Fund | The Tocqueville Opportunity Fund | |||||||||||||||
| For the Period Ended April 30, 2014 | For the Year Ended October 31, 2013 | For the Period Ended April 30, 2014 | For the Year Ended October 31, 2013 | |||||||||||||
| (Unaudited) | (Unaudited) | |||||||||||||||
Operations: | ||||||||||||||||
Net investment income (loss) | $ | 1,581,740 | $ | 4,778,719 | $ | (319,283 | ) | $ | (461,498 | ) | ||||||
Net realized gain (loss) on sale of investments and foreign currency | 17,776,473 | 26,838,214 | 6,202,342 | 9,380,542 | ||||||||||||
Net change in unrealized appreciation (depreciation) | 9,060,133 | 58,949,325 | (5,188,686 | ) | 12,734,576 | |||||||||||
|
|
|
|
|
|
|
| |||||||||
Net increase (decrease) in net assets resulting from operations | 28,418,346 | 90,566,258 | 694,373 | 21,653,620 | ||||||||||||
|
|
|
|
|
|
|
| |||||||||
Dividends and distributions to shareholders: | ||||||||||||||||
Net investment income | (3,425,837 | ) | (5,030,132 | ) | — | — | ||||||||||
Net realized gains | (2,781,747 | ) | — | (4,131,999 | ) | — | ||||||||||
|
|
|
|
|
|
|
| |||||||||
Total dividends and distributions | (6,207,584 | ) | (5,030,132 | ) | (4,131,999 | ) | — | |||||||||
Fund share transactions: | ||||||||||||||||
Shares sold | 28,428,026 | 29,776,783 | 6,543,094 | 4,767,903 | ||||||||||||
Shares issued to holders in reinvestment of dividends | 5,727,081 | 4,132,373 | 3,947,515 | — | ||||||||||||
Shares redeemed * | (26,789,877 | ) | (137,200,773 | ) | (5,842,767 | ) | (11,267,163 | ) | ||||||||
|
|
|
|
|
|
|
| |||||||||
Net increase (decrease) | 7,365,230 | (103,291,617 | ) | 4,647,842 | (6,499,260 | ) | ||||||||||
|
|
|
|
|
|
|
| |||||||||
Net increase (decrease) in net assets | 29,575,992 | (17,755,491 | ) | 1,210,216 | 15,154,360 | |||||||||||
Net Assets: | ||||||||||||||||
Beginning of period | 348,269,097 | 366,024,588 | 80,608,970 | 65,454,610 | ||||||||||||
|
|
|
|
|
|
|
| |||||||||
End of period ** | $ | 377,845,089 | $ | 348,269,097 | $ | 81,819,186 | $ | 80,608,970 | ||||||||
|
|
|
|
|
|
|
| |||||||||
* Net of redemption fees of: | $ | 2,295 | $ | 22,305 | $ | 3,811 | $ | 931 | ||||||||
|
|
|
|
|
|
|
| |||||||||
** Including undistributed net investment income (loss) of: | $ | 980,432 | $ | 2,824,529 | $ | (746,581 | ) | $ | (427,298 | ) | ||||||
|
|
|
|
|
|
|
| |||||||||
The Accompanying Notes are an Integral Part of these Financial Statements.
| 42 | April 30, 2014 |
The Tocqueville Trust
Statements of Changes in Net Assets
| The Tocqueville International Value Fund | The Tocqueville Gold Fund | The Delafield Fund | The Tocqueville Select Fund | |||||||||||||||||||||||||||
| For the Period Ended April 30, 2014 | For the Year Ended October 31, 2013 | For the Period Ended April 30, 2014 | For the Year Ended October 31, 2013 | For the Period Ended April 30, 2014 | For the Year Ended October 31, 2013 | For the Period Ended April 30, 2014 | For the Year Ended October 31, 2013 | |||||||||||||||||||||||
| (Unaudited) | (Unaudited) | (Unaudited) | (Unaudited) | |||||||||||||||||||||||||||
| $ | 1,016,554 | $ | 4,250,455 | $ | (4,236,211 | ) | $ | (6,540,749 | ) | $ | (1,777,488 | ) | $ | (2,462,497 | ) | $ | (277,224 | ) | $ | (348,436 | ) | |||||||||
| 8,782,060 |
| 10,347,619 | (28,645,438 | ) | 388,787 | 136,405,340 | 71,422,904 | 6,713,905 | 11,110,235 | ||||||||||||||||||||
| 8,681,222 | 43,468,248 | 76,653,138 | (1,099,579,672 | ) | (26,145,055 | ) | 357,151,669 | (6,999,999 | ) | 21,132,838 | ||||||||||||||||||||
|
|
|
|
|
|
|
|
|
|
|
|
|
|
|
| |||||||||||||||
| 18,479,836 |
| 58,066,322 | 43,771,489 | (1,105,731,634 | ) | 108,482,797 | 426,112,076 | (563,318 | ) | 31,894,637 | |||||||||||||||||||
|
|
|
|
|
|
|
|
|
|
|
|
|
|
|
| |||||||||||||||
| (4,005,675 | ) | (3,270,330 | ) | — | — | — | — | — | — | |||||||||||||||||||||
| — | — | — | (53,161,749 | ) | (61,841,266 | ) | (80,537,788 | ) | (9,932,816 | ) | (3,451,599 | ) | ||||||||||||||||||
|
|
|
|
|
|
|
|
|
|
|
|
|
|
|
| |||||||||||||||
| (4,005,675 | ) | (3,270,330 | ) | — | (53,161,749 | ) | (61,841,266 | ) | (80,537,788 | ) | (9,932,816 | ) | (3,451,599 | ) | ||||||||||||||||
| 30,142,151 | 41,933,095 | 378,165,329 | 689,958,884 | 121,835,554 | 424,376,572 | 9,054,969 | 13,020,097 | |||||||||||||||||||||||
| 3,955,731 | 2,452,030 | — | 48,734,410 | 58,365,399 | 75,042,452 | 9,680,740 | 3,271,889 | |||||||||||||||||||||||
| (38,536,546 | ) | (54,992,275 | ) | (263,083,198 | ) | (810,631,326 | ) | (274,858,915 | ) | (431,925,473 | ) | (7,446,497 | ) | (29,395,929 | ) | |||||||||||||||
|
|
|
|
|
|
|
|
|
|
|
|
|
|
|
| |||||||||||||||
| (4,438,664 | ) | (10,607,150 | ) | 115,082,131 | (71,938,032 | ) | (94,657,962 | ) | 67,493,551 | 11,289,212 | (13,103,943 | ) | ||||||||||||||||||
|
|
|
|
|
|
|
|
|
|
|
|
|
|
|
| |||||||||||||||
| 10,035,497 | 44,188,842 | 158,853,620 | (1,230,831,415 | ) | (48,016,431 | ) | 413,067,839 | 793,078 | 15,339,095 | |||||||||||||||||||||
| 262,981,386 | 218,792,544 | 1,215,081,395 | 2,445,912,810 | 1,759,341,275 | 1,346,273,436 | 99,887,608 | 84,548,513 | |||||||||||||||||||||||
|
|
|
|
|
|
|
|
|
|
|
|
|
|
|
| |||||||||||||||
| $ | 273,016,883 | $ | 262,981,386 | $ | 1,373,935,015 | $ | 1,215,081,395 | $ | 1,711,324,844 | $ | 1,759,341,275 | $ | 100,680,686 | $ | 99,887,608 | |||||||||||||||
|
|
|
|
|
|
|
|
|
|
|
|
|
|
|
| |||||||||||||||
| $ | 5,734 | $ | 16,794 | $ | 383,527 | $ | 714,261 | $ | 28,465 | $ | 103,101 | $ | 599 | $ | 2,935 | |||||||||||||||
|
|
|
|
|
|
|
|
|
|
|
|
|
|
|
| |||||||||||||||
| $ | 142,654 | $ | 3,131,775 | $ | (46,775,222 | ) | $ | (42,539,011 | ) | $ | (1,777,488 | ) | $ | — | $ | (664,559 | ) | $ | (387,335 | ) | ||||||||||
|
|
|
|
|
|
|
|
|
|
|
|
|
|
|
| |||||||||||||||
The Accompanying Notes are an Integral Part of these Financial Statements.
| Semi-Annual Report | 43 |
The Tocqueville Trust
The Tocqueville Fund
The Tocqueville Opportunity Fund
The Tocqueville International Value Fund
The Tocqueville Gold Fund
The Delafield Fund
The Tocqueville Select Fund
Notes to Financial Statements
1. ORGANIZATION
The Tocqueville Trust (the “Trust”) is a Massachusetts business trust registered under the Investment Company Act of 1940 and organized on September 17, 1986, currently consisting of six separate funds (each, a “Fund” or, collectively, the “Funds”). Each Fund is an open-end management investment company with a different investment objective. The Tocqueville Fund, The Tocqueville Opportunity Fund (the “Opportunity Fund”), The Tocqueville International Value Fund (the “International Fund”), and The Delafield Fund are classified as diversified investment companies. The Tocqueville Gold Fund (the “Gold Fund”) and The Tocqueville Select Fund (the “Select Fund”) are classified as non-diversified investment companies. The Tocqueville Fund’s investment objective is long-term capital appreciation which it seeks to achieve by investing primarily in securities of United States issuers. The Opportunity Fund’s investment objective is to achieve long-term capital appreciation which it seeks to achieve by investing in the common stocks of small and mid cap companies which have the potential to deliver superior long term earnings growth. The International Fund’s investment objective is long-term capital appreciation consistent with preservation of capital which it seeks to achieve by investing primarily in securities of non-U.S. issuers. The Gold Fund’s investment objective is long-term capital appreciation which it seeks to achieve by investing in gold, securities of companies located throughout the world that are engaged in mining or processing gold (“gold related securities”), other precious metals and securities of companies located throughout the world that are engaged in mining or processing such other precious metals (“other precious metal securities”). The Delafield Fund’s investment objectives are to seek long-term preservation of capital (sufficient growth to outpace inflation over an extended period of time) and growth of capital which it seeks to achieve by investing primarily in the equity securities of domestic companies. The Tocqueville Select Fund’s investment objective is to achieve long-term capital appreciation by investing in a focused group of common stocks issued primarily by small and mid-sized U.S. companies. Current income is a secondary objective for The Tocqueville Select Fund.
On June 22, 2009, the Board of Directors of Delafield Fund, Inc. approved an Agreement and Plan of Reorganization providing for, among other things, the transfer of the assets and liabilities of Delafield Fund, Inc. into The Delafield Fund, a series of The Tocqueville Trust. On September 24, 2009, the shareholders of Delafield Fund, Inc. approved the Agreement and Plan of Reorganization. On July 9, 2009, the Board of Trustees of Delafield Select Fund, a series of Natixis Funds Trust II, approved an Agreement and Plan of Reorganization providing for, among other things, the transfer of the assets and liabilities of Delafield Select Fund into the sole share class of The Select Fund (now The Tocqueville Select Fund), a series of The Tocqueville Trust. On September 24, 2009, the shareholders of Delafield Select Fund approved the Agreement and Plan of Reorganization. The effective date of both reorganizations was September 28, 2009. Transfers into The Delafield Fund and The Select Fund from their predecessor funds amounted to $649,892,191 and $25,888,388, respectively.
The Delafield Fund, a series of the Trust, commenced operations on September 28, 2009 as successor to Delafield Fund, Inc. The predecessor Delafield Fund, Inc. commenced operations on November 19, 1993.
The Tocqueville Select Fund, a series of the Trust, commenced operations on September 28, 2009 as successor to the Delafield Select Fund, a series of Natixis Funds Trust II. The predecessor Delafield Select Fund commenced operations on September 29, 2008 for Class A and Class C shares and on September 26, 2008 for Class Y shares. Prior to September 29, 2008, the predecessor Delafield Select Fund operated as a Delaware limited partnership using substantially the same investment objectives and investment policies as the predecessor fund. The limited partnership was incepted in July 1998.
| 44 | April 30, 2014 |
2. SIGNIFICANT ACCOUNTING POLICIES
The following is a summary of significant accounting principles followed by the Trust in the preparation of its financial statements.
a) Security valuation and security transactions
Investments in securities, including foreign securities, traded on an exchange or quoted on the over-the-counter market are valued at the last sale price or, if no sale occurred during the day, at the mean between closing bid and asked prices, as last reported by a pricing service approved by the Trustees. Securities that are principally traded on the National Association of Securities Dealers Automated Quotation National Market (“NASDAQ”) are generally valued at the NASDAQ Official Closing Price (“NOCP”). Investments in gold and silver are valued on the basis of the respective closing spot prices of the New York Commodity Exchange. Investments in other precious metals are valued at their respective market values determined on the basis of the mean between the last current bid and asked prices based on dealer or exchange quotations. When market quotations are not readily available, or when restricted securities or other assets are being valued, such assets are valued at fair value as determined in good faith by or under procedures approved by the Trustees. Short-term securities maturing within 60 days are valued on an amortized cost basis. Fixed income securities with maturities greater than 60 days are valued at market price. Debt securities, such as corporate bonds, convertible bonds and U.S. government agency issues for which market quotations are not readily available may be valued based on information supplied by independent pricing services using matrix pricing formulas and/or independent broker bid quotations. Debt securities with remaining maturities of 60 days or less may be valued on an amortized cost basis, which involves valuing an instrument at its cost and thereafter assuming a constant amortization to maturity of any discount or premium, regardless of the impact of fluctuating rates on the fair value of the instrument.
Trading in securities on European and Far Eastern securities exchanges normally is completed before the calculation of the Funds’ net asset value. Trading on these foreign exchanges may not take place on all days on which there is regular trading on the New York Stock Exchange (“NYSE”), or may take place on days on which there is no regular trading on the NYSE. Similarly, the Funds may hold securities traded in domestic markets where the market may close early on a given day prior to calculation of the Funds’ net asset value. Events affecting the value of such securities held by the Funds that occur between the close of trading in the security and the close of trading on the NYSE normally will not be reflected in the Funds’ calculation of the net asset value. Significant events will be closely monitored, and where it is determined that an adjustment should be made to the security’s value because significant interim events may materially affect the value of the security, the security will be priced at its fair value in accordance with the procedures approved by the Trustees.
Investment and shareholder transactions are recorded on trade date. Dividend income is recognized on the ex-dividend date. Interest income is recognized on an accrual basis and includes, where applicable, the amortization of premiums and accretion of discounts. Net realized gains and losses from sales of securities are determined on the specific identification cost method.
b) Restricted and illiquid securities
The Funds may invest in securities that are subject to legal or contractual restrictions on resale or are illiquid. A security may be considered illiquid if it lacks a readily available market or if its valuation has not changed for a certain
| Semi-Annual Report | 45 |
period of time. Disposal of these securities may involve time consuming negotiations and expense, and a prompt sale at the current valuation may be difficult.
c) Fair valuation measurements
The Trust has adopted authoritative fair valuation accounting standards which establish an authoritative definition of fair value and set out a hierarchy for measuring fair value. These standards require additional disclosures about the various inputs and valuation techniques used to develop the measurements of fair value and a discussion in changes in valuation techniques and related inputs during the period. These inputs are summarized in the three broad levels listed below.
| Level 1 - | Quoted prices in active markets for identical securities. |
| Level 2 - | Other significant observable inputs (including quoted prices for similar securities, interest rates, prepayment speeds, credit risk, etc.). |
| Level 3 - | Significant unobservable inputs (including the Fund’s own assumptions in determining the fair value of investments). |
Equity investments, including common stocks, foreign issued common stocks, exchange-traded funds, closed end mutual funds and real estate investments trusts, which are traded on an exchange are valued at the last sale price reported by the exchange on which the securities are primarily traded on the day of valuation. If there are no sales on a given day for securities traded on an exchange, the mean between the latest bid and ask price will be used. If there is no Nasdaq Official Closing Price for a Nasdaq-listed security or sale price available for an over-the-counter security, the mean of the latest bid and asked quotations from Nasdaq will be used. When using the market quotations or closing price provided by the pricing service and when the market is considered active, the security will be classified as a Level 1 security. When using the mean between the latest bid and ask price, the security will be classified as Level 2. On days when the closing price of the S&P 500 moves more than 1% from its previous close, common stocks of the International Value Fund which are traded on non-North American exchanges may be valued using matrix pricing formulas provided by an independent pricing service. These securities will generally be classified as Level 2 securities. Gold bullion is valued at the mean of the closing bid and ask prices from the New York Mercantile Exchange and is classified as a Level 1.
Investment in mutual funds, including money market funds, are generally priced at the ending net asset value (NAV) provided by the service agent of the funds and will be classified as Level 1 securities.
Debt securities, such as corporate bonds, convertible bonds, bank loan obligations and U.S. government agency issues for which market quotations are not readily available may be valued based on information supplied by independent pricing services using matrix pricing formulas and/or independent broker bid quotations and are classified as Level 2. Debt securities with remaining maturities of 60 days or less may be valued on an amortized cost basis, which involves valuing an instrument at its cost and thereafter assuming a constant amortization to maturity of any discount or premium, regardless of the impact of fluctuating rates on the fair value of the instrument and are classified as Level 2. Warrants for which the underlying security is registered and equities which are subject to a required holding period, but have a comparable public issue, are valued in good faith by the Adviser pursuant to procedures established under the general supervision and responsibility of the Funds’ Board of Trustees. These securities will generally be classified as Level 2 securities. Forward currency contracts derive their value from the underlying currency prices. These are valued by a pricing service using pricing models. The models use inputs that are observed from active markets, such as exchange
| 46 | April 30, 2014 |
rates. These contracts are classified as Level 2. Options can diverge from the prices of their underlying instruments. These are valued at the composite last price reported by the exchange on which the options are primarily traded on the day of the valuation. If there is no composite last price on a given day the mean between the latest bid and ask price will be used. These contracts are classified as Level 2.
Any securities or other assets for which market quotations are not readily available are valued at fair value as determined in good faith by the Adviser pursuant to procedures established under the general supervision and responsibility of the Funds’ Board of Trustees and will be classified as Level 3 securities. In determining fair value, a Fund will seek to assign a value to the security which it believes represents the amount that the Fund could reasonably expect to receive upon its current sale. With respect to securities that are actively traded on U.S. exchanges, the Funds expect that market quotations will generally be available and that fair value might be used only in limited circumstances, such as when trading for a security is halted during the trading day.
The Gold Fund currently invests in a private fund that primarily invests in physical gold and is subject to redemption restrictions. This private fund investment can only be disposed of with notice given 24 hours in advance of redemption. This investment is currently valued at $17,361,297 which represents 1.2% of the Gold Fund’s net assets and is classified as Level 3.
For securities traded principally on foreign exchanges, the Funds may use fair value pricing if an event occurs after the close of trading of the principal foreign exchange on which a security is traded, but before calculation of a Fund’s NAV, which a Fund believes affects the value of the security since its last market quotation. Such events may involve situations relating to a single issuer (such as news related to the issuer announced after the close of the principal foreign exchange), or situations relating to sectors of the market or the markets in general (such as significant fluctuations in the U.S. or foreign markets or significant changes in exchange rates, natural disasters, armed conflicts, or governmental actions).
In determining whether a significant event has occurred with respect to securities traded principally in foreign markets, the Funds may engage a third party fair value service provider to systematically recommend the adjustment of closing market prices of non-U.S. securities based upon changes in a designated U.S. securities market index occurring from the time of close of the relevant foreign market and the close of the NYSE. Fair value pricing may also be used to value restricted securities held by the Funds or securities with little or no trading activity for extended periods of time. Fair value pricing involves judgements that are inherently subjective and inexact and it is not possible to determine with certainty when, and to what extent, an event will affect a market price. As a result, there can be no assurance that fair value pricing will reflect actual market value and it is possible that the fair value determined for a security may differ materially from the value that could be realized upon the sale of the security.
| Semi-Annual Report | 47 |
The following is a summary of the inputs used, as of April 30, 2014, involving the Funds’ assets carried at fair value. The inputs of methodology used for valuing securities may not be an indication of the risk associated with investing in those securities.
| Description | Level 1 | Level 2 | Level 3 | Total | ||||||||||||
The Tocqueville Fund | ||||||||||||||||
Common Stocks * | $ | 361,919,880 | $ | — | $ | — | $ | 361,919,880 | ||||||||
Real Estate Investment Trust (REIT) * | 7,462,500 | — | — | 7,462,500 | ||||||||||||
Money Market Fund | 8,590,924 | — | — | 8,590,924 | ||||||||||||
|
|
|
|
|
|
|
| |||||||||
Total Fund | $ | 377,973,304 | $ | — | $ | — | $ | 377,973,304 | ||||||||
|
|
|
|
|
|
|
| |||||||||
| The Tocqueville Opportunity Fund | Level 1 | Level 2 | Level 3 | Total | ||||||||||||
Common Stocks * | $ | 81,292,897 | $ | — | $ | — | $ | 81,292,897 | ||||||||
Real Estate Investment Trust (REIT) * | 211,936 | — | — | 211,936 | ||||||||||||
Purchased Call Options * | — | 278,500 | — | 278,500 | ||||||||||||
Money Market Fund | 97,089 | — | — | 97,089 | ||||||||||||
|
|
|
|
|
|
|
| |||||||||
Total Fund | $ | 81,601,922 | $ | 278,500 | $ | — | $ | 81,880,422 | ||||||||
|
|
|
|
|
|
|
| |||||||||
| The Tocqueville International Value Fund | Level 1 | Level 2 | Level 3 | Total | ||||||||||||
Common Stocks * | $ | 255,879,426 | $ | — | $ | — | $ | 255,879,426 | ||||||||
Money Market Fund | 12,459,990 | — | — | 12,459,990 | ||||||||||||
Commercial Paper | — | 3,350,000 | — | 3,350,000 | ||||||||||||
|
|
|
|
|
|
|
| |||||||||
Total Fund | $ | 268,339,416 | $ | 3,350,000 | $ | — | $ | 271,689,416 | ||||||||
|
|
|
|
|
|
|
| |||||||||
Other Financial Instruments ** | ||||||||||||||||
Total Forward Currency Contracts | $ | — | $ | (212,192 | ) | $ | — | $ | (212,192 | ) | ||||||
|
|
|
|
|
|
|
| |||||||||
| The Tocqueville Gold Fund | Level 1 | Level 2 | Level 3 | Total | ||||||||||||
Common Stocks | ||||||||||||||||
Gold Related | $ | 991,008,588 | $ | 3,573,876 | $ | 4,879,640 | $ | 999,462,104 | ||||||||
Other Precious Metals Related | 123,857,100 | 5,637,058 | 8,984,498 | 138,478,656 | ||||||||||||
Other | — | — | 6,268,390 | 6,268,390 | ||||||||||||
|
|
|
|
|
|
|
| |||||||||
Total Common Stocks | 1,114,865,688 | 9,210,934 | 20,132,528 | 1,144,209,150 | ||||||||||||
Private Fund * | — | — | 17,361,297 | 17,361,297 | ||||||||||||
Warrants * | — | 3,871,797 | — | 3,871,797 | ||||||||||||
Gold Bullion | 128,697,033 | — | — | 128,697,033 | ||||||||||||
Money Market Fund | 64,865,088 | — | — | 64,865,088 | ||||||||||||
Commercial Paper | — | 16,310,000 | — | 16,310,000 | ||||||||||||
Convertible Note | — | — | 211,019 | 211,019 | ||||||||||||
|
|
|
|
|
|
|
| |||||||||
Total Fund | $ | 1,308,427,809 | $ | 29,392,731 | $ | 37,704,844 | $ | 1,375,525,384 | ||||||||
|
|
|
|
|
|
|
| |||||||||
| 48 | April 30, 2014 |
| The Delafield Fund | Level 1 | Level 2 | Level 3 | Total | ||||||||||||
Common Stocks * | $ | 1,438,708,322 | $ | — | $ | — | $ | 1,438,708,322 | ||||||||
Corporate Bonds * | — | 45,294,143 | — | 45,294,143 | ||||||||||||
Money Market Fund | 82,195,734 | — | — | 82,195,734 | ||||||||||||
U.S. Treasury Bills | — | 149,996,322 | — | 149,996,322 | ||||||||||||
|
|
|
|
|
|
|
| |||||||||
Total Fund | $ | 1,520,904,056 | $ | 195,290,465 | $ | — | $ | 1,716,194,521 | ||||||||
|
|
|
|
|
|
|
| |||||||||
| The Tocqueville Select Fund | Level 1 | Level 2 | Level 3 | Total | ||||||||||||
Common Stocks * | $ | 88,298,030 | $ | — | $ | — | $ | 88,298,030 | ||||||||
Money Market Fund | 3,237,035 | — | — | 3,237,035 | ||||||||||||
U.S. Treasury Bills | — | 9,499,637 | — | 9,499,637 | ||||||||||||
|
|
|
|
|
|
|
| |||||||||
Total Fund | $ | 91,535,065 | $ | 9,499,637 | $ | — | $ | 101,034,702 | ||||||||
|
|
|
|
|
|
|
| |||||||||
| * | For further information regarding portfolio characteristics, please see the accompanying Schedules of Investments. |
| ** | Other financial instruments are derivative instruments not reflected in the Schedule of Investments, such as forward currency contracts, which are reflected at the unrealized appreciation (depreciation) on the instrument. |
Below is a reconciliation that details the transfer of securities between Level 1 and Level 2 during the reporting period.
| The Tocqueville Fund | The Tocqueville Opportunity Fund | The Tocqueville International Value Fund | The Tocqueville Gold Fund | The Delafield Fund | The Tocqueville Select Fund | |||||||||||||||||||
Transfers Into Level 1 | $ | — | $ | — | $ | — | $ | 28,933,184 | $ | — | $ | — | ||||||||||||
Transfers Out of Level 1 | — | — | — | (1,113,088 | ) | — | — | |||||||||||||||||
|
|
|
|
|
|
|
|
|
|
|
| |||||||||||||
Net Transfers Into/(Out of ) Level 1 | — | — | — | 27,820,096 | — | — | ||||||||||||||||||
|
|
|
|
|
|
|
|
|
|
|
| |||||||||||||
Transfers Into Level 2 | — | — | — | 1,113,088 | — | — | ||||||||||||||||||
Transfers Out of Level 2 | — | — | — | (28,933,184 | ) | — | — | |||||||||||||||||
|
|
|
|
|
|
|
|
|
|
|
| |||||||||||||
Net Transfers Into/(Out of ) Level 2 | $ | — | $ | — | $ | — | $ | (27,820,096 | ) | $ | — | $ | — | |||||||||||
|
|
|
|
|
|
|
|
|
|
|
| |||||||||||||
| Semi-Annual Report | 49 |
Below is a reconciliation that details the activity of securities in Level 3 during the current fiscal period:
| The Tocqueville Fund | The Tocqueville Opportunity Fund | The Tocqueville International Value Fund | The Tocqueville Gold Fund | The Delafield Fund | The Tocqueville Select Fund | |||||||||||||||||||
Beginning Balance—November 1, 2013 | $ | — | $ | — | $ | — | $ | 37,883,131 | $ | — | $ | — | ||||||||||||
Purchases | — | — | — | 3,569,222 | — | — | ||||||||||||||||||
Sales | — | — | — | — | — | — | ||||||||||||||||||
Realized gains | — | — | — | — | — | — | ||||||||||||||||||
Realized losses | — | — | — | — | — | — | ||||||||||||||||||
Change in unrealized depreciation | — | — | — | (3,747,509 | ) | — | — | |||||||||||||||||
Transfers in/(out) of Level 3 | — | — | — | — | — | — | ||||||||||||||||||
|
|
|
|
|
|
|
|
|
|
|
| |||||||||||||
Ending Balance—April 30, 2014 | $ | — | $ | — | $ | — | $ | 37,704,844 | $ | — | $ | — | ||||||||||||
|
|
|
|
|
|
|
|
|
|
|
| |||||||||||||
The movement from Level 2 to Level 1 in the Gold Fund was due to the use of market quotations or closing prices provided by the pricing service because the market was considered active. The movement from Level 1 to Level 2 in the Gold Fund was from the securities being priced using the mean of the bid and ask price due to the lack of trading volume on April 30, 2014. Transfers between levels are recognized at the end of the reporting period.
The Tocqueville Gold Fund
Type of Security | Industry | Fair Value at 04/30/2014 | Valuation Techniques | Unobservable Inputs | Range | |||||
Common Stock | ||||||||||
Gold Related | $1,489,101 | Latest company financing price adjusted for comparable index fluctuations | Financing prices Discount to index | N/A 45% | ||||||
| 3,390,539 | Latest company sell price provided by broker | Broker price | N/A | |||||||
Other Precious Metals Related | 8,984,498 | Discounted cash flow and net asset value of resources adjusted for comparable index fluctuations | Discount to cash flows Discount to market value of resource Discount to index | 5% 25%-65% 40% | ||||||
Other | 431,390 | Latest company financing price adjusted for comparable index fluctuations | Financing prices Discount to index | N/A 33% | ||||||
| 5,837,000 | Latest company financing price | Financing prices | N/A | |||||||
Private Fund | Gold Related | 17,361,297 | NAV from custodian discounted by Adviser | Illiquidity discount | 2% | |||||
Convertible Note | Other | 211,019 | Latest company financing price | Financing prices | N/A |
| 50 | April 30, 2014 |
The significant unobservable inputs used in the fair value measurement of the Gold Fund’s common stocks are the most recent financing prices of the portfolio company, which approximates the companies’ value in the market place; net asset value of resources and the discounted cash flows from the sale of the mineral resources, which approximates what the company could receive selling its mineral deposits once mined. The significant unobservable inputs for the private fund is the discount for illiquidity applied to the net asset value per share determined by the private fund’s custodian. If comparable indices fluctuate significantly, additional discounts are applied.
Significant changes in the companies’ ability to receive financing for new projects in the future would be an indication of the companies’ financial position and market value. An increase in the discount applied to the value of resources, future expected cash flows, or to account for illiquidity would decrease the value of the portfolio security. If comparable indices fluctuate significantly and additional discounts are applied the value of the security would decrease.
Significant Unobservable Inputs for Level 3 Portfolio Company Securities
The Trust’s valuation procedures have been adopted by the Trust’s Board of Trustees, which has established a Valuation Committee to oversee the valuation process. The Valuation Committee meets on an as needed basis to evaluate changes in the valuation of portfolio securities. The full findings and valuations are then reviewed quarterly by the Independent Trustees.
d) Derivative instruments and hedging activities
The Funds’ Adviser may use derivative instruments, such as purchased call options and forward currency contracts, as a means to manage exposure to different types of risk, including market risk and exchange rate risk, and to gain exposure to underlying securities. The Trust has adopted disclosure standards in order to enable the investor to understand how and why an entity used derivatives, how derivatives are accounted for, and how derivatives affect an entity’s results of operations and financial position.
In the Opportunity Fund, the Adviser used purchased call options to gain exposure to the underlying equity security. In the International Value Fund, the Adviser used forward currency contracts to adjust exposure to foreign exchange rate risk.
Balance Sheet—Values of Derivative Instruments as of April 30, 2014.
The Tocqueville Opportunity Fund
| Asset Derivatives | Liability Derivatives | |||||||||||
| Derivatives not accounted for as hedging instruments | Balance Sheet Location | Value | Balance Sheet Location | Value | ||||||||
Purchased Call Options | Investments, at Value | $ | 278,500 | $ | — | |||||||
|
|
|
| |||||||||
Total | $ | 278,500 | $ | — | ||||||||
|
|
|
| |||||||||
| Semi-Annual Report | 51 |
The Tocqueville International Value Fund
| Asset Derivatives | Liability Derivatives | |||||||||||
| Derivatives not accounted for as hedging instruments | Balance Sheet Location | Value | Balance Sheet Location | Value | ||||||||
Forward Currency Contracts | $ | — | Depreciation on forward currency contracts | $ | (212,192 | ) | ||||||
|
|
|
| |||||||||
Total | $ | — | $ | (212,192 | ) | |||||||
|
|
|
| |||||||||
The Effect of Derivative Instruments on the Statement of Operations for the period ended April 30, 2014.
The Tocqueville Opportunity Fund
| Net Realized Gain on Investments | Net Change in Unrealized Depreciation on Investments | |||||||
Purchased Call Options | $ | 62,270 | $ | (178,691 | ) | |||
|
|
|
| |||||
Total | $ | 62,270 | $ | (178,691 | ) | |||
|
|
|
| |||||
The Tocqueville International Value Fund
| Net Realized Gain on Forward Currency Contracts | Net Change in Unrealized Depreciation on Forward Currency Contracts | |||||||
Foreign Currency Forward Contract | $ | 1,184,308 | $ | (371,918 | ) | |||
|
|
|
| |||||
Total | $ | 1,184,308 | $ | (371,918 | ) | |||
|
|
|
| |||||
Derivatives Risk
The risks of using the types of derivatives in which the Funds may engage include the risk that movements in the value of the derivative may not fully offset or complement instruments currently held in the Funds in the manner intended by the Adviser; the risk that the counterparty to a derivative contract may fail to comply with their obligations to the Fund; the risk that the derivative may not possess a liquid secondary market at a time when the Fund would look to disengage the position; the risk that additional capital from the Fund may be called upon to fulfill the conditions of the derivative contract; and the risk that the cost of the derivative contracts may reduce the overall returns experienced by the Funds. The measurement of risks associated with these instruments is meaningful only when all related offsetting transactions are considered. The use of purchased call options create leverage in the Fund. The use of forward currency contracts do not create leverage in the Funds.
| 52 | April 30, 2014 |
The average monthly value of purchased call options in the Opportunity Fund during the period ended April 30, 2014 was $326,585.
Transactions in purchased options in the Opportunity Fund during the period ended April 30, 2014 were as follows:
| Notional Amount | Contracts | |||||||
Outstanding, beginning of period: | $ | 2,592,500 | 340 | |||||
Options purchased | 5,622,750 | 1025 | ||||||
Options terminated in closing transactions | (2,080,000 | ) | (285 | ) | ||||
Options exercised | (380,000 | ) | (60 | ) | ||||
Options expired | (1,396,250 | ) | (170 | ) | ||||
|
|
|
| |||||
Outstanding, end of period: | $ | 4,359,000 | 850 | |||||
The average monthly notional amount of forward currency contracts during the period ended April 30, 2014 was as follows:
| International Value Fund | ||||
Long Positions Forward currency contracts | $ | — | ||
Short Positions Forward currency contracts | $ | 13,485,353 | ||
e) Foreign currency translation
Investments and other assets and liabilities denominated in foreign currencies are translated to U.S. dollars at the prevailing rates of exchange, in accordance with the Trust’s Portfolio Securities Valuation and Foreign Exchange Contracts Procedures. The Tocqueville Fund, The Tocqueville Opportunity Fund, The Tocqueville International Value Fund, The Tocqueville Gold Fund, The Delafield Fund and The Tocqueville Select Fund have engaged in transactions in securities denominated in foreign currencies and, as a result, entered into foreign exchange contracts. These Funds are exposed to additional market risk as a result of changes in the value of the underlying currency in relation to the U.S. dollar. Risks include potential inability of counterparties to meet the terms of their contracts. The value of foreign currency contracts are marked-to-market on a daily basis, which reflects the changes in the market value of the contract at the close of each day’s trading, resulting in daily unrealized gains and/or losses. When the contracts are closed, the Funds recognize a realized gain or loss.
The Funds isolate that portion of the results of operations resulting from changes in foreign exchange rates on investments from the fluctuations arising from changes in market prices of securities held. Such fluctuations reflected as net realized and unrealized gain or loss on foreign currency translation.
Reported net realized foreign exchange gains or losses arise from sales of foreign currencies, currency gains or losses realized between the trade and settlement dates on securities transactions, the differences between the amounts of dividends, interest, and foreign withholding taxes recorded on the Fund’s books, and the U.S. dollar equivalent of the amounts actually received or paid. Net unrealized foreign exchange gains and losses arise from changes in the value of assets and liabilities other than investments in securities at the end of the fiscal period, resulting from changes in the exchange rates.
| Semi-Annual Report | 53 |
f) Dividends and distributions to shareholders
Dividends to shareholders are recorded on the ex-dividend date. Dividends from net investment income are declared and paid annually by the Funds. Distributions of net realized capital gains, if any, will be declared and paid at least annually. Income and capital gain distributions are determined in accordance with income tax regulations which may differ from generally accepted accounting principles. Permanent differences between financial and tax reporting may result in reclassification to capital stock.
g) Use of estimates
The preparation of financial statements in conformity with accounting principles generally accepted in the United States of America requires management to make estimates and assumptions that affect the reported amounts of assets and liabilities and disclosure of contingent assets and liabilities at the date of the financial statements and the reported amounts of revenues and expenses during the reporting period. Actual results could differ from those estimates.
h) Indemnification
In the normal course of business the Funds enter into contracts that contain general indemnification clauses. The Funds’ maximum exposure under these arrangements is unknown, as this would involve future claims against a Fund that have not yet occurred. Based on experience, the Funds expect the risk of loss to be remote.
i) Subsequent events evaluation
On April 15, 2014, the Board of Trustees of the Bridgehampton Value Strategies Fund, a series of Investment Management Series Trust, approved an Agreement and Plan of Reorganization providing for, among other things, the transfer of the assets and liabilities of the Bridgehampton Value Strategies Fund into the sole share class of The Tocqueville Alternative Strategies Fund, a newly-created series of The Tocqueville Trust. On June 20, 2014, the shareholders of the Bridgehampton Value Strategies Fund approved the Agreement and Plan of Reorganization. The effective date of the reorganization was June 27, 2014. The Tocqueville Alternative Strategies Fund, a series of the Trust, commenced operations after the close of business on June 27, 2014 as successor to the Bridgehampton Value Strategies Fund.
In preparing these financial statements, the Trust has evaluated events and transactions for potential recognition or disclosure resulting from subsequent events through the date financial statements were available to be issued.
3. FEDERAL INCOME TAX
There is no tax liability resulting from unrecognized tax benefits relating to uncertain income tax positions taken or expected to be taken on the tax return for the fiscal year-end October 31, 2013, or for any other tax years which are open for exam. As of October 31, 2013, open tax years include the tax years ended October 31, 2010 through 2013. The Trust is also not aware of any tax positions for which it is reasonably possible that the total amounts of unrecognized tax benefits will significantly change in the next six months. The Funds recognize interest and penalties, if any, related to unrecognized tax benefits as income tax expense in the Statement of Operations. During the period, the Funds did not incur any interest or penalties.
Provision for federal income taxes or excise taxes has not been made since the Funds have elected to be taxed as Regulated Investment Companies and intend to distribute substantially all taxable income to shareholders and otherwise
| 54 | April 30, 2014 |
comply with the provisions of the Internal Revenue Code applicable to Regulated Investment Companies. Distributions from net realized gains for book purposes may include short-term capital gains which are included as ordinary income to shareholders for tax purposes. Additionally, U.S. generally accepted accounting principles require that certain components of net assets relating to permanent differences be reclassified between financial and tax reporting. These reclassifications have no effect on net assets or net asset value per share. For the period ended October 31, 2013, the following table shows the reclassifications made:
| Undistributed Net Investment Income/(Loss) | Accumulated Net Realized Gain/(Loss) | Paid In Capital | ||||||||||
Tocqueville Fund | $ | (347,035 | ) | $ | (70,512 | ) | $ | 417,547 | ||||
Opportunity Fund | 447,959 | (142,391 | ) | (305,568 | ) | |||||||
International Value Fund | (289,294 | ) | 289,294 | — | ||||||||
Gold Fund | 2,733,056 | (822,023 | ) | (1,911,033 | ) | |||||||
Delafield Fund | 3,942,814 | (9,686,332 | ) | 5,743,518 | ||||||||
Select Fund | 243,105 | (1,108,752 | ) | 865,647 | ||||||||
The permanent differences primarily relate to net operating losses, foreign currency reclasses and usage of tax equalization.
As of October 31, 2013, the components of accumulated earnings (losses) for income tax purposes were as follows:
| Tocqueville Fund | Opportunity Fund | International Value Fund | Gold Fund | Delafield Fund | Select Fund | |||||||||||||||||||
Tax cost of investments | $ | 236,119,360 | $ | 59,713,015 | $ | 209,721,561 | $ | 1,578,496,934 | $ | 1,272,357,240 | $ | 74,996,723 | ||||||||||||
|
|
|
|
|
|
|
|
|
|
|
| |||||||||||||
Unrealized appreciation | 114,574,385 | 22,179,664 | 54,723,247 | 244,249,211 | 517,467,741 | 28,203,603 | ||||||||||||||||||
Unrealized depreciation | (4,584,489 | ) | (1,232,879 | ) | (3,694,123 | ) | (610,567,312 | ) | (20,668,322 | ) | (3,005,144 | ) | ||||||||||||
|
|
|
|
|
|
|
|
|
|
|
| |||||||||||||
Net unrealized appreciation/(depreciation) | 109,989,896 | 20,946,785 | 51,029,124 | (366,318,101 | ) | 496,799,419 | 25,198,459 | |||||||||||||||||
|
|
|
|
|
|
|
|
|
|
|
| |||||||||||||
Undistibuted operating income | 2,824,529 | — | 3,898,125 | — | 2,044,735 | — | ||||||||||||||||||
Undistibuted long-term gains/(loss) | 2,781,700 | 4,131,972 | — | — | 59,795,871 | 9,932,784 | ||||||||||||||||||
|
|
|
|
|
|
|
|
|
|
|
| |||||||||||||
Distibutable earnings | 5,606,229 | 4,131,972 | 3,898,125 | — | 61,840,606 | 9,932,784 | ||||||||||||||||||
|
|
|
|
|
|
|
|
|
|
|
| |||||||||||||
Other accumulated gain/(loss) | — | (427,281 | ) | (5,194,814 | ) | (48,067,798 | ) | — | (387,335 | ) | ||||||||||||||
|
|
|
|
|
|
|
|
|
|
|
| |||||||||||||
Total accumulated gain/(loss) | $ | 115,596,125 | $ | 24,651,476 | $ | 49,732,435 | $ | (414,385,899 | ) | $ | 558,640,025 | $ | 34,743,908 | |||||||||||
|
|
|
|
|
|
|
|
|
|
|
| |||||||||||||
The difference between book-basis and tax-basis unrealized appreciation is attributable primarily to wash sale deferrals and passive foreign investment companies (PFIC’s).
| Semi-Annual Report | 55 |
The tax character of distributions paid during the periods ended October 31, 2013 and 2012 was as follows:
| October 31, 2013 | ||||||||||||
| Ordinary Income | Long Term Capital Gain | Total | ||||||||||
Tocqueville Fund | $ | 5,030,132 | $ | — | $ | 5,030,132 | ||||||
Opportunity Fund | — | — | — | |||||||||
International Value Fund | 3,270,330 | — | 3,270,330 | |||||||||
Gold Fund | — | 53,161,749 | 53,161,749 | |||||||||
Delafield Fund | — | 80,537,788 | 80,537,788 | |||||||||
Select Fund | — | 3,451,599 | 3,451,599 | |||||||||
| October 31, 2012 | ||||||||||||
| Ordinary Income | Long Term Capital Gain | Total | ||||||||||
Tocqueville Fund | $ | 5,526,502 | $ | — | $ | 5,526,502 | ||||||
Opportunity Fund | — | — | — | |||||||||
International Value Fund | 2,105,224 | — | 2,105,224 | |||||||||
Gold Fund | 15,486,206 | 26,796,483 | 42,282,689 | |||||||||
Delafield Fund | — | 16,542,579 | 16,542,579 | |||||||||
Select Fund | — | 766,158 | 766,158 | |||||||||
The Funds designated as long-term capital gain dividend, pursuant to Internal Revenue Code Section 852(b)(3), the amount necessary to reduce the earnings and profits of the Funds related to net capital gain to zero for the tax years ended October 31, 2013 and 2012.
For the fiscal year ended October 31, 2013 the Opportunity Fund, Gold Fund, and Select Fund had late year losses of $427,298, $41,733,637, and $378,538, respectively.
At October 31, 2013 certain Funds had tax basis capital losses which may be carried forward to offset future capital gains as shown below.
| Capital losses Expiring | ||||||||||||
| 10/31/2017 | Indefinite ST | Indefinite LT | ||||||||||
International Value Fund | 5,188,654 | — | — | |||||||||
Gold Fund | — | 5,528,133 | — | |||||||||
To the extent that Funds listed above may realize future net capital gains, those gains will be offset by any of their unused respective capital loss carryforwards
| 56 | April 30, 2014 |
4. INVESTMENT ADVISORY AND OTHER AGREEMENTS
Tocqueville Asset Management L.P. (“Tocqueville”) is the investment adviser (the “Adviser”) to the Trust under Investment Advisory Agreements approved by shareholders. For its services, Tocqueville receives fees from The Tocqueville Fund, calculated daily and payable monthly, at an annual rate of 0.75% on the first $1 billion of the average daily net assets of the Fund, and 0.65% of the average daily net assets in excess of $1 billion. Tocqueville receives fees from The Tocqueville Opportunity Fund, calculated daily and payable monthly, at an annual rate of 0.75% on the first $500 million of the average daily net assets of the Fund, and 0.65% of the average daily net assets in excess of $500 million. Tocqueville receives fees from The Tocqueville International Value Fund, calculated daily and payable monthly, at an annual rate of 1.00% on the first $1 billion of the average daily net assets of the Fund, and 0.75% of the average daily net assets in excess of $1 billion. Tocqueville receives fees from The Tocqueville Gold Fund, calculated daily and payable monthly, at an annual rate of 1.00% on the first $500 million of the average daily net assets of the Fund, 0.75% of the average daily net assets in excess of $500 million but not exceeding $1 billion, and 0.65% of the average daily net assets in excess of $1 billion. Tocqueville receives fees from The Delafield Fund, calculated daily and payable monthly, at an annual rate of 0.80% on the first $250 million of net assets of the Fund; 0.75% on the next $250 million of net assets of the Fund; 0.70% on the next $500 million of net assets of the Fund; and 0.65% on all net assets of the Fund over $1 billion. Tocqueville receives fees from The Tocqueville Select Fund, calculated daily and payable monthly, at an annual rate of 0.80% on all net assets of the Fund.
With respect to The Tocqueville Fund, effective March 1, 2013, the Adviser has contractually agreed to waive its advisory fees and/or reimburse expenses in order to ensure that The Tocqueville Fund’s total annual operating expenses do not exceed 1.25% of its average daily net assets (excluding taxes, interest expense, acquired fund fees and expenses, or extraordinary expenses such as litigation). The Expense Limitation Agreement will remain in effect until March 1, 2015. For the six months ended April 30, 2014, the Adviser waived $14,240 of the advisory fee. Such amount is not subject to recoupment by the Adviser.
With respect to The Tocqueville International Value Fund, the Adviser has contractually agreed to waive its advisory fees and/or reimburse expenses in order to ensure that The Tocqueville International Value Fund’s total annual operating expenses do not exceed 1.25% of its average daily net assets (excluding taxes, interest expense, acquired fund fees and expenses, or extraordinary expenses such as litigation). The Expense Limitation Agreement will remain in effect until March 1, 2015. For the six months ended April 30, 2014, the Adviser waived $371,262 of the advisory fee. Such amount is not subject to recoupment by the Adviser.
Pursuant to an Administrative Services Agreement, each Fund pays to the Adviser a fee computed and paid monthly at an annual rate of 0.15% of the average daily net assets of the Fund. For the six months ended April 30, 2014, the Adviser has made payments of $44,513, $10,586, $33,094, $148,638, $217,534, and $12,485 to U.S. Bancorp Fund Services, LLC for services provided under a Sub-Administration Agreement for The Tocqueville Fund, The Tocqueville Opportunity Fund, The Tocqueville International Value Fund, The Tocqueville Gold Fund, The Delafield Fund and The Tocqueville Select Fund, respectively.
Tocqueville Securities, L.P. (the “Distributor”), an affiliate of Tocqueville, acts as distributor for shares of the Trust. Each Fund has adopted a distribution and service plan pursuant to Rule 12b-1 of the 1940 Act. Pursuant to the plans, each Fund pays to the Distributor distribution and service fees of 0.25% per annum of its average daily net assets.
| Semi-Annual Report | 57 |
Commissions earned by the Distributor for services rendered as a registered broker-dealer in securities transactions for The Tocqueville Fund, The Tocqueville Opportunity Fund, The Tocqueville International Value Fund, The
Tocqueville Gold Fund, The Delafield Fund and The Tocqueville Select Fund for the six months ended April 30, 2014, were $32,663, $6,754, $135, $0, $4,861, and $5,757, respectively.
5. CAPITAL SHARE TRANSACTIONS.
Transactions in capital shares for each Fund were as follows:
| For the Six-Months Ended April 30, 2014 (Unaudited) | For the Year Ended October 31, 2013 | |||||||
| The Tocqueville Fund | Shares | Shares | ||||||
Shares sold | 896,205 | 1,122,567 | ||||||
Shares issued to holders in reinvestment dividends | 185,944 | 171,255 | ||||||
Shares redeemed | (847,857 | ) | (5,121,252 | ) | ||||
|
|
|
| |||||
Net increase (decrease) | 234,292 | (3,827,430 | ) | |||||
| The Tocqueville Opportunity Fund | ||||||||
Shares sold | 294,300 | 269,202 | ||||||
Shares issued to holders in reinvestment dividends | 188,786 | — | ||||||
Shares redeemed | (273,730 | ) | (636,699 | ) | ||||
|
|
|
| |||||
Net increase (decrease) | 209,356 | (367,497 | ) | |||||
| The Tocqueville International Value Fund | ||||||||
Shares sold | 2,006,486 | 3,191,672 | ||||||
Shares issued to holders in reinvestment dividends | 272,246 | 197,585 | ||||||
Shares redeemed | (2,571,833 | ) | (4,243,896 | ) | ||||
|
|
|
| |||||
Net decrease | (293,101 | ) | (855,239 | ) | ||||
| The Tocqueville Gold Fund | ||||||||
Shares sold | 10,316,898 | 14,396,666 | ||||||
Shares issued to holders in reinvestment dividends | — | 783,134 | ||||||
Shares redeemed | (7,379,821 | ) | (16,801,311 | ) | ||||
|
|
|
| |||||
Net increase (decrease) | 2,937,077 | (1,621,511 | ) | |||||
| 58 | April 30, 2014 |
| For the Six-Months Ended April 30, 2014 (Unaudited) | For the Year Ended October 31, 2013 | |||||||
| The Delafield Fund | Shares | Shares | ||||||
Shares sold | 3,241,794 | 12,682,948 | ||||||
Shares issued to holders in reinvestment dividends | 1,587,742 | 2,479,103 | ||||||
Shares redeemed | (7,321,509 | ) | (12,970,111 | ) | ||||
|
|
|
| |||||
Net increase (decrease) | (2,491,973 | ) | 2,191,940 | |||||
| The Tocqueville Select Fund | ||||||||
Shares sold | 631,400 | 975,053 | ||||||
Shares issued to holders in reinvestment dividends | 684,635 | 280,128 | ||||||
Shares redeemed | ( 521,472 | ) | (2,288,027 | ) | ||||
|
|
|
| |||||
Net increase (decrease) | 794,563 | (1,032,846 | ) | |||||
6. FUND SHARE TRANSACTIONS
The Funds currently offer only one class of shares of beneficial interest. A redemption fee of 2.00% is imposed on redemptions of shares held 90 days or less. This fee is retained by each Fund and is credited to paid in capital. Redemptions to which the fee applies include redemptions of shares resulting from an exchange made pursuant to the Exchange Privilege, as defined in the Trust’s Prospectus dated February 28, 2014. For a more detailed description of when the redemption fee does not apply, please see the Trust’s Prospectus.
7. INVESTMENT TRANSACTIONS
Purchases and sales of investment securities (excluding short-term instruments) for the period ended April 30, 2014 are summarized below.
| Tocqueville Fund | Opportunity Fund | International Value Fund | Gold Fund | Delafield Fund | Select Fund | |||||||||||||||||||
Purchases: | $ | 42,952,722 | $ | 36,571,113 | $ | 43,757,101 | $ | 122,879,657 | $ | 261,226,269 | $ | 18,406,706 | ||||||||||||
|
|
|
|
|
|
|
|
|
|
|
| |||||||||||||
Sales: | $ | 44,447,768 | $ | 36,520,209 | $ | 53,849,610 | $ | 15,810,279 | $ | 406,189,138 | $ | 14,022,357 | ||||||||||||
|
|
|
|
|
|
|
|
|
|
|
| |||||||||||||
U.S. Government Security Purchases: | $ | — | $ | — | $ | — | $ | — | $ | — | $ | — | ||||||||||||
|
|
|
|
|
|
|
|
|
|
|
| |||||||||||||
U.S. Government Security Sales: | $ | — | $ | — | $ | — | $ | — | $ | — | $ | — | ||||||||||||
|
|
|
|
|
|
|
|
|
|
|
| |||||||||||||
| Semi-Annual Report | 59 |
8. TRANSACTIONS WITH AFFILIATES
The following issuers are affiliated with the Funds; that is, the Adviser had control of 5% or more of the outstanding voting securities during the period from November 1, 2013 through April 30, 2014. As defined in Section (2)(a)(3) of the Investment Company Act of 1940; such issues are:
| November 1, 2013 | Additions | Reductions | Share Balance/ Face Value($) at April 30, 2014 | Interest Income | Dividend Income | Realized Gain/(Loss) | Value at April 30, 2014 | Cost at April 30, 2014 | ||||||||||||||||||||||||||||||||||||||||
Issuer Name | Share Balance/ Face Value($) | Cost | Share Balance/ Face Value($) | Cost | Share Balance/ Face Value($) | Cost | ||||||||||||||||||||||||||||||||||||||||||
The Tocqueville Gold Fund |
| |||||||||||||||||||||||||||||||||||||||||||||||
Anthem United, Inc. | — | $ | — | 5,000,000 | $ | 905,961 | — | $ | — | 5,000,000 | $ | — | $ | — | $ | — | $ | 1,788,240 | $ | 905,961 | ||||||||||||||||||||||||||||
Anthem United, Inc. Warrants | — | — | 1,250,000 | — | — | — | 1,250,000 | — | — | — | 154,646 | — | ||||||||||||||||||||||||||||||||||||
ATAC Resources Ltd. | 10,963,700 | 39,089,734 | — | — | — | — | 10,963,700 | — | — | — | 13,103,825 | 39,089,734 | ||||||||||||||||||||||||||||||||||||
ATAC Resources Ltd. | — | — | 553,191 | 703,748 | 553,191 | — | 647,951 | 703,748 | ||||||||||||||||||||||||||||||||||||||||
ATAC Resources Ltd. Warrants | — | — | 276,595 | — | — | — | 276,595 | — | — | — | 41,513 | — | ||||||||||||||||||||||||||||||||||||
Bear Creek Mining Corp. | 7,413,200 | 28,761,181 | — | — | — | — | 7,413,200 | — | — | — | 9,874,798 | 28,761,181 | ||||||||||||||||||||||||||||||||||||
Corvus Gold, Inc. | 2,079,901 | 1,617,492 | — | — | — | — | 2,079,901 | — | — | — | 2,978,626 | 1,617,492 | ||||||||||||||||||||||||||||||||||||
Corvus Gold, Inc. | 6,100,000 | 4,939,377 | 1,000,000 | 955,840 | — | — | 7,100,000 | — | — | — | 10,429,269 | 5,895,217 | ||||||||||||||||||||||||||||||||||||
Corvus Gold, Inc. (a) | — | — | 1,000,000 | 955,840 | (1,000,000 | ) | (955,840 | ) | — | — | — | — | — | — | ||||||||||||||||||||||||||||||||||
Detour Gold Corp. | 3,704,200 | 85,931,681 | 1,592,400 | 9,527,580 | — | — | 5,296,600 | — | — | — | 52,721,961 | 95,459,261 | ||||||||||||||||||||||||||||||||||||
East Asia Minerals Corp. | 10,544,400 | 21,793,116 | — | — | — | — | 10,544,400 | — | — | — | 384,814 | 21,793,116 | ||||||||||||||||||||||||||||||||||||
East Asia Minerals Corp. Warrants | 6,500,000 | — | — | — | — | — | 6,500,000 | — | — | — | 83,618 | — | ||||||||||||||||||||||||||||||||||||
GoGold Resources, Inc. | 8,100,000 | 9,990,010 | — | — | — | — | 8,100,000 | — | — | — | 12,489,394 | 9,990,010 | ||||||||||||||||||||||||||||||||||||
GoGold Resources, Inc. Warrants | 4,050,000 | — | — | — | — | — | 4,050,000 | — | — | — | 1,626,208 | — | ||||||||||||||||||||||||||||||||||||
Gold Bullion International LLC | 5,000,000 | 5,000,000 | — | — | — | — | 5,000,000 | — | — | — | 5,837,000 | 5,000,000 | ||||||||||||||||||||||||||||||||||||
International Tower Hill Mines Ltd. | 5,738,836 | 20,953,121 | — | — | — | — | 5,738,836 | — | — | — | 3,787,632 | 20,953,121 | ||||||||||||||||||||||||||||||||||||
International Tower Hill Mines Ltd. | 7,589,744 | 38,630,898 | — | — | — | — | 7,589,744 | — | — | — | 5,124,228 | 38,630,898 | ||||||||||||||||||||||||||||||||||||
MAG Silver Corp. | 2,960,700 | 31,563,819 | — | — | — | — | 2,960,700 | — | — | — | 22,530,927 | 31,563,819 | ||||||||||||||||||||||||||||||||||||
Primero Mining Corp. | 4,840,700 | 24,573,319 | 3,378,100 | 24,399,147 | — | — | 8,218,800 | — | — | — | 51,965,041 | 48,972,466 | ||||||||||||||||||||||||||||||||||||
Primero Mining Corp. Warrants | 1,848,400 | — | — | — | — | — | 1,848,400 | — | — | — | 1,551,506 | — | ||||||||||||||||||||||||||||||||||||
Rockhaven Resources Ltd. | 5,000,000 | 6,265,337 | — | — | — | — | 5,000,000 | — | — | — | 912,367 | 6,265,337 | ||||||||||||||||||||||||||||||||||||
Rockhaven Resources Ltd. | — | — | 1,400,000 | 190,252 | 1,400,000 | — | — | — | 225,318 | 190,252 | ||||||||||||||||||||||||||||||||||||||
Rockhaven Resources Ltd. Warrants | — | — | 700,000 | — | — | — | 700,000 | — | — | — | — | — | ||||||||||||||||||||||||||||||||||||
Rubicon Minerals Corp. | — | — | 10,230,000 | 14,130,757 | — | — | 10,230,000 | — | — | — | 10,920,214 | 14,130,757 | ||||||||||||||||||||||||||||||||||||
Rubicon Minerals Corp. Warrants | — | — | 3,064,000 | — | — | — | 3,064,000 | — | — | — | 279,549 | — | ||||||||||||||||||||||||||||||||||||
Scorpio Mining Corp. | 25,668,419 | 23,975,473 | — | — | — | — | 25,668,419 | — | — | — | 6,155,287 | 23,975,473 | ||||||||||||||||||||||||||||||||||||
| 60 | April 30, 2014 |
| November 1, 2013 | Additions | Reductions | Share Balance/ Face Value($) at April 30, 2014 | Interest Income | Dividend Income | Realized Gain/(Loss) | Value at April 30, 2014 | Cost at April 30, 2014 | ||||||||||||||||||||||||||||||||||||||||
Issuer Name | Share Balance/ Face Value($) | Cost | Share Balance/ Face Value($) | Cost | Share Balance/ Face Value($) | Cost | ||||||||||||||||||||||||||||||||||||||||||
Scorpio Mining Corp. | 522,400 | $ | 984,285 | — | $ | — | — | $ | — | 522,400 | $ | — | $ | — | $ | — | $ | 123,921 | $ | 984,285 | ||||||||||||||||||||||||||||
SEMAFO, Inc. | 7,676,200 | 28,072,966 | 938,000 | 3,143,119 | — | — | 8,614,200 | — | — | — | 32,044,824 | 31,216,085 | ||||||||||||||||||||||||||||||||||||
Silver Range Resources Ltd. | 3,450,000 | — | — | — | — | — | 3,450,000 | — | — | — | 377,720 | — | ||||||||||||||||||||||||||||||||||||
Strategic Metals Ltd. | 10,926,900 | 15,810,172 | — | — | — | — | 10,926,900 | — | — | — | 3,838,198 | 15,810,172 | ||||||||||||||||||||||||||||||||||||
Tocqueville Bullion Reserve LP | — | — | 13,806 | 25,000,000 | — | — | 13,806 | — | — | — | 17,361,297 | 25,000,000 | ||||||||||||||||||||||||||||||||||||
Torex Gold Resources, Inc. | 25,260,500 | 42,073,692 | 6,475,000 | 7,077,407 | — | — | 31,735,500 | — | — | — | 35,324,401 | 49,151,099 | ||||||||||||||||||||||||||||||||||||
Torex Gold Resources, Inc. Warrants | — | — | 2,950,000 | — | — | — | 2,950,000 | — | — | — | 134,574 | — | ||||||||||||||||||||||||||||||||||||
Gold Bullion International LLC Convertible Note | — | — | $ | 211,019 | 211,019 | — | — | $ | 211,019 | 29 | — | — | 211,019 | 211,019 | ||||||||||||||||||||||||||||||||||
|
|
|
|
|
|
|
|
|
|
|
|
|
|
|
| |||||||||||||||||||||||||||||||||
| $ | 430,025,673 | $ | 87,200,670 | $ | (955,840 | ) | $ | 29 | $ | — | $ | — | $ | 305,029,886 | $ | 516,270,503 | ||||||||||||||||||||||||||||||||
The Delafield Fund |
| |||||||||||||||||||||||||||||||||||||||||||||||
ACCO Brands Corp. (b) | 4,000,000 | $ | 31,935,099 | 1,000,000 | $ | 6,052,160 | (2,000,000 | ) | $ | (18,419,541 | ) | 3,000,000 | $ | — | $ | — | $ | (6,366,835 | ) | $ | 18,390,000 | $ | 19,567,718 | |||||||||||||||||||||||||
Kemet Corp. | 2,625,000 | 13,419,471 | — | — | (350,000 | ) | (2,295,065 | ) | 2,275,000 | — | — | (222,798 | ) | 11,397,750 | 11,124,406 | |||||||||||||||||||||||||||||||||
LTX-Credence Corp. (b) | 2,000,000 | 14,057,657 | — | — | (2,000,000 | ) | (14,057,657 | ) | — | — | — | 2,418,780 | — | — | ||||||||||||||||||||||||||||||||||
Perry Ellis International | — | — | 600,000 | 8,948,026 | — | — | 600,000 | — | — | — | 9,060,000 | 8,948,026 | ||||||||||||||||||||||||||||||||||||
Universal Stainless & Alloy | 451,000 | 13,213,349 | — | — | (51,000 | ) | (1,906,296 | ) | 400,000 | — | — | (109,736 | ) | 14,356,000 | 11,307,053 | |||||||||||||||||||||||||||||||||
Xerium Technologies, Inc. | 600,000 | 7,522,500 | 20,400 | 269,005 | — | — | 620,400 | — | — | — | 8,375,400 | 7,791,505 | ||||||||||||||||||||||||||||||||||||
|
|
|
|
|
|
|
|
|
|
|
|
|
|
|
| |||||||||||||||||||||||||||||||||
| $ | 80,148,076 | $ | 15,269,191 | $ | (36,678,559 | ) | $ | — | $ | — | $ | (4,280,589 | ) | $ | 61,579,150 | $ | 58,738,708 | |||||||||||||||||||||||||||||||
The Tocqueville Select Fund |
| |||||||||||||||||||||||||||||||||||||||||||||||
ACCO Brands Corp. (b) | 524,500 | $ | 3,958,205 | 14,900 | $ | 85,814 | — | $ | — | 539,400 | $ | — | $ | — | $ | — | $ | 3,306,522 | 4,044,019 | |||||||||||||||||||||||||||||
Summer Infant, Inc. | 814,933 | 3,971,441 | — | — | — | — | 814,933 | — | — | — | 1,548,373 | 3,971,441 | ||||||||||||||||||||||||||||||||||||
Xerium Technologies, Inc. | 200,000 | 2,507,500 | 65,000 | 867,108 | — | — | 265,000 | — | — | — | 3,577,500 | 3,374,608 | ||||||||||||||||||||||||||||||||||||
|
|
|
|
|
|
|
|
|
|
|
|
|
|
|
| |||||||||||||||||||||||||||||||||
| $ | 10,437,146 | $ | 952,922 | $ | — | $ | — | $ | — | $ | — | $ | 8,432,395 | $ | 11,390,068 | |||||||||||||||||||||||||||||||||
|
|
|
|
|
|
|
|
|
|
|
|
|
|
|
| |||||||||||||||||||||||||||||||||
| (a) | Private security restrictions lifted during period and combined with other non-restricted securities. |
| (b) | Security is no longer an affiliated company at April 30, 2014. |
| Semi-Annual Report | 61 |
9. LINE OF CREDIT
The Tocqueville Trust has a $300,000,000 line of credit (the “Line”), which is uncommitted, with U.S. Bank NA. The Line is for temporary emergency or extraordinary purposes, including the meeting of redemption requests that otherwise might require the untimely disposition of securities. The Line is secured by the Trust’s assets. The Line has a one year term and is reviewed annually by the Board of Trustees. The current agreement runs through May 31, 2014. The interest rate as of April 30, 2014 was 2.75%. During the six months ended April 30, 2014, the Tocqueville Fund’s maximum borrowing was $949,000 and average borrowing was $11,789 and the Opportunity Fund’s maximum borrowing was $2,440,000 and average borrowing was $147,114. This borrowing resulted in interest expenses of $278 and $1,612, respectively. These amounts are included in Other Expenses on the Funds’ Statement of Operations. The International Value Fund, Gold Fund, Delafield Fund and Select Fund did not use the Line.
10. CHIEF COMPLIANCE OFFICER
Other expenses include reimbursement to the Adviser for compensation of the Trust’s Chief Compliance Officer. For the six months ended April 30, 2014, reimbursement to the Adviser for compensation of the Trust’s Chief Compliance Officer from the Funds amounted to $7,155, $1,701, $5,320, $23,834, $34,983, $2,007 for the Tocqueville Fund, Opportunity Fund, International Value Fund, Gold Fund, Delafield Fund, and Select Fund, respectively.
Payable to Adviser includes amounts due to the Adviser for reimbursement of costs of Chief Compliance Officer compensation in the amounts of $1,035, $278, $774, $4,271, $5,836 and $371 for the Tocqueville Fund, Opportunity Fund, International Value Fund, Gold Fund, Delafield Fund and Select Fund, respectively.
| 62 | April 30, 2014 |
ADDITIONAL INFORMATION (UNAUDITED)
1. ADDITIONAL DISCLOSURE REGARDING FUND TRUSTEES AND OFFICERS
Independent Trustees
Name, Age and Address | Position(s) Held with the Trust | Term of Office and Length of Time Served (1) | Principal Occupation(s) During Past Five Years | # of Portfolios in Fund Complex Overseen By Trustee | Other Held by Trustee | |||||||
Guy A. Main (77) 40 W. 57th St., 19th Floor New York, NY 10019 | Trustee | Indefinite Term, Since 2000 | Retired. Formerly, Executive Vice President, Amwest Insurance Group, Inc. from April 1996 to January 2001. | 6 | Director, Amwest Insurance Group, Inc. from April 1996 to January 2001; Chairman, Association of California Insurance Companies from January 1996 to January 1998. | |||||||
Charles W. Caulkins (57) 40 W. 57th St., 19th Floor New York, NY 10019 | Trustee | Indefinite Term, Since 2003 | Private Investor from January 2012 – present; Partner, Chora Capital, LLC from June 2010 – December 2011; Director of Marketing, L.R. Global Partners from January 2008 – May 2010; President, Arbor Marketing, Inc. from October 1994 to December 2007. | 6 | Director, Stepping Stones from January 2012- present; Director, Phoenix House from January 2001 to 2007. | |||||||
James W. Gerard (53) 40 W. 57th St., 19th Floor New York, NY 10019 | Trustee | Indefinite Term, Since 2001 | Managing Director, North Sea Partners, from January 2010-present; Principal, Juniper Capital Group, LLC (formerly known as Argus Advisors International, LLC) from August 2003 to December 2009; Managing Director, The Chart Group from January 2001 to present. | 6 | Director and Treasurer, American Overseas Memorial Day Association, 1998 to present; Director and Treasurer ASPCA, 1998 to 2008; Trustee, Salisbury School, 2005 to present; Director, American Friends of Bleraucourt, 1992 to present. | |||||||
| Semi-Annual Report | 63 |
Independent Trustees
Name, Age and Address | Position(s) Held with the Trust | Term of Office and Length of Time Served (1) | Principal Occupation(s) During Past Five Years | # of Portfolios in Fund Complex Overseen By Trustee | Other Held by Trustee | |||||||
William F. Indoe (72) 40 W. 57th St., 19th Floor New York, NY 10019 | Trustee | Indefinite Term, Since 2006 | Senior Counsel, Sullivan & Cromwell LLP (attorneys- at-law). 1968 – present. | 6 | Director, Rho Capital Partners, Inc. | |||||||
William J. Nolan III (66) 40 W. 57th St., 19th Floor New York, NY 10019 | Trustee | Indefinite Term, Since 2006 | Retired. Executive Vice President & Treasurer PaineWebber Inc. 1997 – 2001. | 6 | Trustee, Adirondack Museum, Blue Mt. Lake, NY 1996 to present (Treasurer, 2000 to 2013; Chair of the Investment Committee, 2009 – present). | |||||||
Alexander Douglas (66) 40 W. 57th St., 19th Floor New York, NY 10019 | Trustee | Indefinite Term, Since 2010 | President, CEO and owner of Spaulding Law Printing, Inc. | 6 | None | |||||||
Interested Trustees (and Officers)*
Name, Age and Address | Position(s) Held with the Trust | Term of Office and Length of Time Served (1) | Principal Occupation(s) During Past Five Years | # of Portfolios in Fund Complex Overseen By Trustee | Other Held by Trustee | |||||||
Francois D. Sicart (70) 40 W. 57th St., 19th Floor New York, NY 10019 | Chairman and Trustee | Indefinite Term, Since 1987 | Chairman, Tocqueville Management Corporation, the General Partner of Tocqueville Asset Management L.P. and Tocqueville Securities L.P. from January 1990 to present; Chairman and Founder, Tocqueville Asset Management Corporation from December 1985 to January 1990; Vice Chairman of Tucker Anthony Management Corporation from 1981 to October 1986; Vice President (formerly general partner) among other positions with Tucker Anthony, Inc. from 1969 to January 1990. | 6 | Chairman and Director, Tocqueville Management Corporation, the General Partner of Tocqueville Asset Management L.P. and Tocqueville Securities L.P. from January 1990 to present. | |||||||
| 64 | April 30, 2014 |
Interested Trustees (and Officers)*
Name, Age and Address | Position(s) Held with the Trust | Term of Office and Length of Time Served (1) | Principal Occupation(s) During Past Five Years | # of Portfolios in Fund Complex Overseen By Trustee | Other Held by Trustee | |||||||
Robert W. Kleinschmidt (64) 40 W. 57th St., 19th Floor New York, NY 10019 | President and Trustee | Indefinite Term, Since 1991 | President and Chief Investment Officer of Tocqueville Asset Management; Director, Tocqueville Management Corporation, the General Partner of Tocqueville Asset Management L.P. and Tocqueville Securities L.P. from January 1994 to present; and Managing Director from July 1991 to January 1994; Partner, David J. Greene & Co. from May 1978 to July 1991. | 6 | President and Director, Tocqueville Management Corporation, the General Partner of Tocqueville Asset Management L.P. and Tocqueville Securities L.P. | |||||||
Cleo Kotis (38) 40 W. 57th St., 19th Floor New York, NY 10019 | Secretary | Indefinite Term, Since 2010 | Director of Operations, the Delafield Group of Tocqueville Asset Management L.P., 2009 to present; Vice President and Chief Operations Officer, the Delafield Fund, Inc. from 2005-2009; Vice President and Chief Operations Officer, Delafield Asset Management from 2005- 2009; Vice President, Reich & Tang Asset Management, LLC from 2002-2009. | N/A | N/A | |||||||
Helen Balk (41) 40 W. 57th St., 19th Floor New York, NY 10019 | Treasurer | Indefinite Term, Since 2014 | Controller / Treasurer of Tocqueville Asset Management from January 2014 to present; Manager / Staff Accountant at Pegg & Pegg LLP from August 1995 to January 2014. | N/A | N/A | |||||||
| Semi-Annual Report | 65 |
Interested Trustees (and Officers)*
Name, Age and Address | Position(s) Held with the Trust | Term of Office and Length of Time Served (1) | Principal Occupation(s) During Past Five Years | # of Portfolios in Fund Complex Overseen By Trustee | Other Held by Trustee | |||||||
Elizabeth Bosco (65) 40 W. 57th St., 19th Floor | Anti-Money Laundering Compliance Officer | Indefinite Term, Since 2009 | Chief Compliance Officer of Tocqueville Securities, L.P. from January 2009 to present; Compliance Officer, Tocqueville Securities L.P. and Tocqueville Asset Management from January 1997 to January 2009. | N/A | N/A | |||||||
Thomas Pandick (67) 40 W. 57th St., 19th Floor New York, NY 10019 | Chief Compliance Officer | Indefinite Term, Since 2004 | Chief Compliance Officer (October 2004-present) Tocqueville Asset Management L.P. | N/A | N/A | |||||||
| * | “Interested person” of the Trust is defined in the 1940 Act. Mr. Sicart and Mr. Kleinschmidt are considered “interested persons” because of their affiliation with the Adviser. |
| (1) | Each Trustee will hold office for an indefinite term until the earliest of (i) the next meeting of shareholders, if any, called for the purpose of considering the election or re-election of such Trustee and until the election and qualification of his or her successor, if any, elected at such meeting, or (ii) the date a Trustee resigns or retires, or a Trustee is removed by the Board of Trustees or shareholders, in accordance with the Trust’s By-Laws, as amended, and Agreement and Declaration of Trust, as amended. Each officer will hold office for an indefinite term until the date he or she resigns or retires or until his or her successor is elected and qualified. |
2. PROXY VOTING POLICIES AND PROCEDURES
A description of the policies and procedures that The Tocqueville Trust uses to determine how to vote proxies relating to portfolio securities is available without charge upon request by calling 1-800-355-7307. Information regarding how The Tocqueville Trust voted proxies relating to portfolio securities during the most recent 12-month period ended June 30 is available by calling 1-800-355-7307 and it is also available on the SEC’s web site at http://www.sec.gov.
3. SHAREHOLDER REPORTS AND QUARTERLY PORTFOLIO DISCLOSURE
The Tocqueville Trust is required to file its complete schedule of portfolio holdings with the SEC for its first and third fiscal quarters on Form N-Q. The Trust’s Form N-Q will be available without charge, upon request on the SEC’s website (http://www.sec.gov) and may be available by calling 1-800-697-3863. You can also obtain copies of Form N-Q by (i) visiting the SEC’s Public Reference Room in Washington, DC (information on the operation of the Public
| 66 | April 30, 2014 |
Reference Room may be obtained by calling 1-202-551-8090); (ii) sending your request and a duplicating fee to the SEC’s Public Reference Room, Washington, DC 20549-1520; or (iii) sending your request electronically to publicinfosec.gov. Quarterly portfolio holdings are also available on the website of The Tocqueville Funds, www.tocqueville.com/mutual-funds.
4. SHAREHOLDER NOTIFICATION OF FEDERAL TAX STATUS
For the fiscal period ended October 31, 2013, certain dividends paid by the Funds may be subject to a maximum tax rate of 15%, as provided for by the Jobs and Growth Tax Relief Reconciliation Act of 2003. The percentage of dividends declared from ordinary income designated as qualified dividend income was as follows:
Tocqueville Fund | 100.00 | % | ||
Opportunity Fund | 0.00 | % | ||
International Value Fund | 100.00 | % | ||
Gold Fund | 0.00 | % | ||
Delafield Fund | 0.00 | % | ||
Select Fund | 0.00 | % |
For corporate shareholders, the percent of ordinary income distributions qualifying for the corporate dividends received deduction for the fiscal period ended October 31, 2013 was as follows:
Tocqueville Fund | 100.00 | % | ||
Opportunity Fund | 0.00 | % | ||
International Value Fund | 5.65 | % | ||
Gold Fund | 0.00 | % | ||
Delafield Fund | 0.00 | % | ||
Select Fund | 0.00 | % |
For the period ended October 31, 2013, the funds designate the following percent of ordinary distributions paid as interest-related dividends under the Internal Revenue Code Section 871(k)(1)(c):
Tocqueville Fund | 0.00 | % | ||
Opportunity Fund | 0.00 | % | ||
International Value Fund | 0.02 | % | ||
Gold Fund | 0.00 | % | ||
Delafield Fund | 0.00 | % | ||
Select Fund | 0.00 | % |
The percentage of taxable ordinary income distributions that are designated as short-term capital gain distributions under Internal Revenue Section 871(k)(2)(C) for each Fund were as follows.
Tocqueville Fund | 0.00 | % | ||
Opportunity Fund | 0.00 | % | ||
International Value Fund | 0.00 | % | ||
Gold Fund | 0.00 | % | ||
Delafield Fund | 0.00 | % | ||
Select Fund | 0.00 | % |
| Semi-Annual Report | 67 |
5. FOREIGN TAX CREDIT
For the year ended October 31, 2013, the Tocqueville International Value Fund earned foreign source income and paid foreign taxes which they intend to pass through to their shareholders pursuant to Section 853 of the Internal Revenue Code as follows:
Country | Gross Dividend Per Share | Taxes Withheld Per Share | ||||||
Netherlands Antilles | 0.00155 | 0.00000 | ||||||
Belgium | 0.01820 | 0.00273 | ||||||
Bermuda | 0.00460 | 0.00000 | ||||||
Brazil | 0.00688 | 0.00088 | ||||||
Canada | 0.00500 | 0.00075 | ||||||
Switzerland | 0.02147 | 0.00322 | ||||||
Germany | 0.02055 | 0.00352 | ||||||
France | 0.07432 | 0.01106 | ||||||
Hong Kong | 0.05413 | 0.00000 | ||||||
Indonesia | 0.00343 | 0.00054 | ||||||
Ireland | 0.01217 | 0.00193 | ||||||
Italy | 0.02085 | 0.00000 | ||||||
Japan | 0.06441 | 0.00460 | ||||||
Netherlands | 0.03034 | 0.00455 | ||||||
Norway | 0.03089 | 0.00604 | ||||||
British Virgin Islands | 0.00008 | 0.00000 | ||||||
|
|
|
| |||||
| 0.36886 | 0.03981 | |||||||
|
|
|
| |||||
| 68 | April 30, 2014 |
Investment Adviser
Tocqueville Asset Management L.P.
40 W. 57th St., 19th Floor
New York, NY 10019
(212) 698-0800
www.tocqueville.com
Distributor
Tocqueville Securities, L.P.
40 W. 57th St., 19th Floor
New York, NY 10019
(212) 698-0800
Shareholders’ Servicing and Transfer Agent
U.S. Bancorp Fund Services, LLC
P.O. Box 701
Milwaukee, WI 53201-0701
(800) 697-3863
Custodian
U.S. Bank, N.A.
Custody Operations
1555 River Center Drive, Suite 302
Milwaukee, WI 53212
Board of Trustees
François D. Sicart—Chairman
Charles W. Caulkins
Alexander Douglas
James W. Gerard
William F. Indoe
Robert W. Kleinschmidt
Guy A. Main
William J. Nolan III

Tocqueville Funds
c/o US Bancorp Fund Services, LLC
P.O. Box 701
Milwaukee, WI 53201-0701
www.tocqueville.com/mutual-funds
TQRPSEMI 14
Item 2. Code of Ethics.
Not applicable for semi-annual reports.
Item 3. Audit Committee Financial Expert.
Not applicable for semi-annual reports.
Item 4. Principal Accountant Fees and Services.
Not applicable for semi-annual reports.
Item 5. Audit Committee of Listed Registrants.
Not applicable to registrants who are not listed issuers (as defined in Rule 10A-3 under the Securities Exchange Act of 1934).
Item 6. Investments.
Schedule of Investments is included as part of the report to shareholders filed under Item 1 of this Form.
Item 7. Disclosure of Proxy Voting Policies and Procedures for Closed-End Management Investment Companies.
Not applicable to open-end investment companies.
Item 8. Portfolio Managers of Closed-End Management Investment Companies.
Not applicable to open-end investment companies.
Item 9. Purchases of Equity Securities by Closed-End Management Investment Company and Affiliated Purchasers.
Not applicable to open-end investment companies.
Item 10. Submission of Matters to a Vote of Security Holders.
There have been no material changes to the procedures by which shareholders may recommend nominees to the registrant’s board of trustees.
Item 11. Controls and Procedures.
| (a) | The Registrant’s President and Treasurer have reviewed the Registrant’s disclosure controls and procedures (as defined in Rule 30a-3(c) under the Investment Company Act of 1940 |
| (the “Act”)) as of a date within 90 days of the filing of this report, as required by Rule 30a-3(b) under the Act and Rules 13a-15(b) or 15d-15(b) under the Securities Exchange Act of 1934. Based on their review, such officers have concluded that the disclosure controls and procedures are effective in ensuring that information required to be disclosed in this report is appropriately recorded, processed, summarized and reported and made known to them by others within the Registrant and by the Registrant’s service provider. |
| (b) | There were no changes in the Registrant’s internal control over financial reporting (as defined in Rule 30a-3(d) under the Act) that occurred during the second fiscal quarter of the period covered by this report that has materially affected, or is reasonably likely to materially affect, the Registrant’s internal control over financial reporting. |
Item 12. Exhibits.
| (a) | (1) Any code of ethics or amendment thereto, that is the subject of the disclosure required by Item 2, to the extent that the registrant intends to satisfy Item 2 requirements through filing an exhibit. Not Applicable. |
(2) A separate certification for each principal executive and principal financial officer pursuant to Section 302 of the Sarbanes-Oxley Act of 2002. Filed herewith.
(3) Any written solicitation to purchase securities under Rule 23c-1 under the Act sent or given during the period covered by the report by or on behalf of the registrant to 10 or more persons. Not applicable to open-end investment companies.
| (b) | Certifications pursuant to Section 906 of the Sarbanes-Oxley Act of 2002. Furnished herewith. |
SIGNATURES
Pursuant to the requirements of the Securities Exchange Act of 1934 and the Investment Company Act of 1940, the registrant has duly caused this report to be signed on its behalf by the undersigned, thereunto duly authorized.
| (Registrant) The Tocqueville Trust |
| By (Signature and Title)* /s/ ROBERT W. KLEINSCHMIDT |
| Robert W. Kleinschmidt, President |
| Date July 2, 2014 |
Pursuant to the requirements of the Securities Exchange Act of 1934 and the Investment Company Act of 1940, this report has been signed below by the following persons on behalf of the registrant and in the capacities and on the dates indicated.
| By (Signature and Title)* /S/ ROBERT W. KLEINSCHMIDT |
| Robert W. Kleinschmidt, President |
| Date July 2, 2014 |
| By (Signature and Title)* /s/ HELEN BALK |
| Helen Balk, Treasurer |
| Date July 2, 2014 |
| * | Print the name and title of each signing officer under his or her signature. |