UNITED STATES
SECURITIES AND EXCHANGE COMMISSION
Washington, D.C. 20549
FORM N-CSR
CERTIFIED SHAREHOLDER REPORT OF REGISTERED
MANAGEMENT INVESTMENT COMPANIES
Investment Company Act file number 811-4840
The Tocqueville Trust
(Exact name of registrant as specified in charter)
The Tocqueville Trust
40 West 57th Street, 19th Floor
New York, NY 10019
(Address of principal executive offices) (Zip code)
Robert W. Kleinschmidt
The Tocqueville Trust
40 West 57th Street, 19th Floor
New York, NY 10019
(Name and address of agent for service)
Registrant’s telephone number, including area code (212) 698-0800
Date of fiscal year end: October 31, 2018
Date of reporting period: April 30, 2018
Item 1. Reports to Stockholders.

The Tocqueville Trust
Mutual Funds
Semi-Annual Report
April 30, 2018
The Tocqueville Fund
The Tocqueville Opportunity Fund
The Tocqueville International Value Fund
The Tocqueville Gold Fund
The Delafield Fund
The Tocqueville Select Fund

This report is not authorized for distribution to prospective investors unless preceded or accompanied by a currently effective prospectus of The Tocqueville Trust. Please call 1-800-697-FUND (3863) for a free prospectus. Read it carefully before you invest.
You are invited to visit our website @ www.tocquevillefunds.com
Chairman’s Letter
Dear Fellow Shareholder,
The six-month period ended April 30, 2018 was dominated by events in Washington D.C., as it has been the case since the most recent Presidential election. Passage of a pro-growth tax reform bill that lowered corporate taxes, lowered middle class taxes, and raised taxes for the top one per cent, or at least those of them who live (and most do) in high-tax Blue states like New York, New Jersey, Connecticut and California, provided fuel to the ongoing market rally at the beginning of the period. Before long, however, the Trump Administration’s controversial trade policy emerged, which introduced great uncertainty and greater volatility in the markets. The heightened volatility was something of a return to normal after an extraordinarily stable 2017, but investor memories are short, and the volatility seemed extreme.
Adding to the uncertainty caused by the international trade agenda, which includes renegotiating NAFTA, tariffs on washing machines, steel and aluminum, and a Mexican standoff with China, were a rising dollar and slowly rising interest rates, the latter of which was exacerbated by a spending bill that eviscerated the former sequester rules that had kept government spending under some measure of control during the final years of the Obama Administration. Of all the recently introduced agents of uncertainty, we continue to watch interest rates the most closely. The dollar has appeared to be chronically undervalued for years, and trade, we believe will work itself out, possibly even to the U.S. advantage. We have been surprised (we might even say stunned) by the unexpected effectiveness of the Trump Administration’s unorthodox approach to foreign policy, so we are in no position to predict that these trade initiatives will be utter failures. We do believe, however, that whatever gains may be had from these trade renegotiations will be more political than economic.
United States’ trade “imbalance” is a function of its capital account surplus, which, coupled with the reserve currency status, allows Americans to borrow abroad in U.S. dollars at (up till now) exceedingly low rates. Lowering the amount of goods and services that foreigners are willing to supply in exchange for pieces of paper that will never (functionally) have to be redeemed, is not a salutary economic development. But, it is the fulfillment of a campaign pledge—and this President, for good or ill, has been unique in his commitment to honoring those pledges—and it may be smart politically. The upcoming mid-term elections are currently handicapped to produce a major victory for the minority party. These trade machinations seem designed, at least in part, to frustrate those expectations.
Interest rate increases, on the other hand, are determined by the markets, regardless of what the Fed and Fed watchers think, and if Mr. Market has decided to take rates higher, the carrying costs of massive amounts of sovereign debt will present a huge challenge to policy makers and governments, both here and abroad. It will also present a
| Semi-Annual Report | 1 |
challenge to the equity markets. If rates are rising for the right reasons, i.e., a stronger economy and higher level of demand for commercial credit, we believe that continued strength in corporate earnings can more than offset the rise in rates. A stronger economy can also have a salutary effect on government revenues, as has been the case already, but whether this will be enough to offset a sharply higher cost of debt financing bears very close watching. Pro-growth tax cuts and regulatory reforms, the signature economic achievements of the Trump Administration, are among the casualties that could follow an out of control budget spiral. For the present, however, because of the strength in the economy and corporate profits, along with relatively benign inflationary indications, the equity markets should continue to be a rewarding place for careful and watchful investors.
We thank you for investing with us.
Sincerely,

Robert W. Kleinschmidt
Chairman
| 2 | April 30, 2018 |
The Tocqueville Fund
Dear Fellow Shareholder,
After reaching new highs in January, the market swooned and became more volatile in February and March only to recover somewhat as the period came to a close. Alarm bells seemed to go off for investors with ten-year treasury bonds approaching 3%, corporate earnings growth being impacted by cost inflation and the strengthening dollar possibly hurting exports, non-U.S. dollar based earnings of multinationals and emerging market economies. Despite all the gyrations, the market, as measured by the S&P 500 gained 3.82%, led, as has been the case for many quarters now, by large capitalization Information Technology names. While most sectors of the market generated positive returns, there was evidence of sector rotation, as Consumer Discretionary led the pack, followed by Information Technology and Energy. The weakest sectors in the overall market were Consumer Staples, where secular challenges and rising rates seem to be catching up to what normally seem like stable businesses, as well as Real Estate and Materials, which were impacted by rising rates and strengthening dollar, respectively.
During the same period, the Tocqueville Fund registered a 0.98% gain, more in line with the value indices, as represented by the Russell 2000® Value Index. Overall, Amazon was the Fund’s strongest individual performer, but Boeing, Microsoft, Intel and Alcoa also provided meaningful contributions to the Fund’s performance. The weakest performing sectors were Consumer Staples, Industrials and Healthcare. Biggest individual detractors were GE, Procter & Gamble, Ionis, Arconic and Applied Materials. The top sectors were Consumer Discretionary, Financials and Energy.
We initiated or added to a variety of positions throughout the period during bouts of market uncertainty or when opportunities presented themselves. Positions were sold or reduced when valuation objectives were met, better ideas arose, circumstances changed that impacted our investment thesis or in response to needs for investor liquidity.
One name purchased was Coherent, a leading manufacturer of lasers used in the manufacture of OLED screens. Shares had fallen out of favor due to weaker than expected smartphone sales, particularly the iPhone X, but our view was that OLED technology is likely to become industry standard, as manufacturers switch from LCD to OLED, which, in our point of view, is a superior technology. Looking out through additional product cycles and our estimate of the time it would take for the industry to complete its transition, we concluded that the shares were trading below our estimate of intrinsic value.
Another purchase was Arconic, the supplier of metallic components to the aerospace and other industrial sectors that was spun off from Alcoa. Arconic shares were out of favor due to poor capital allocation, perceived mismanagement and below peer group performance on a variety of metrics. Our interest was triggered by the removal of the prior leadership and installation of well-regarded new management following an activist
| Semi-Annual Report | 3 |
campaign by Elliott Management. While we believed the case for improvement in performance was likely to be more difficult than the activist suggested, our analysis showed that achieving part of those objectives made the shares significantly undervalued.
During the period, we also purchased or added to positions in Apple, Baker Hughes, Biogen, GE, Juno Therapeutics, Las Vegas Sands, Metlife, Newell Brands, Noble Energy, Overstock.com, PG&E, Walt Disney and Wells Fargo.
Most sales or reductions were conducted to provide liquidity to investors or to make room for other ideas. Of the sales related to fundamental changes, Juno Therapeutics was sold as it was the recipient of a takeover offer from Celgene. Newell Brands was sold as we came to believe that changes in the retail sales channel were going to make the prospects of recovery more difficult than we originally believed. Other sales and reductions included Alcoa, Alkermes, Amazon, Applied Materials, Boeing, Delta Airlines, Facebook, Intel, Lazard, Microsoft, Overstock.com, Palo Alto Networks, Qualcomm, Wells Fargo and Williams Sonoma.
Despite markets being near all-time highs, we still are of the view that there is no better alternative to equities given the macroeconomic backdrop and the continued negative reaction of fixed income securities to signals of inflation and rising rates. We may also be reaching the upper limit on the U.S. Dollar as other central banks consider removing stimulus efforts so that headwind for domestic equities might be less of an issue going forward in the near term. As always, we focus on the fundamentals of individual companies when looking for opportunities to generate returns for our shareholders.
Sincerely,
|  | |
| Robert W. Kleinschmidt | Peter D. Shawn | |
| Portfolio Manager | Director of Research | |
| 4 | April 30, 2018 |
The Tocqueville Fund
(Unaudited)
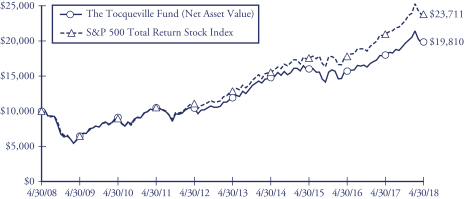
This chart assumes an initial gross investment of $10,000 made on 4/30/08. Returns shown do not reflect the deduction of taxes that a shareholder would pay on fund distributions or the redemption of fund shares. Performance reflects fee waivers in effect. In the absence of fee waivers, total return would be reduced. Returns shown include the reinvestment of all dividends and other distributions. Past performance is not predictive of future performance. Investment return and principal value will fluctuate so that your shares, when redeemed, may be worth more or less than their original cost.
The Standard & Poor’s 500 Total Return Stock Index (S&P 500) is a capital-weighted index, representing the aggregate market value of the common equity of 500 stocks primarily traded on the New York Stock Exchange. Returns assume the reinvestment of all dividends.
AVERAGE ANNUAL RATE OF RETURN (%)
FOR YEARS ENDED APRIL 30, 2018
| 1 Year | 3 Year | 5 Year | 10 Year | |||||||||||||
The Tocqueville Fund | 10.14% | 7.50% | 10.62% | 7.08% | ||||||||||||
Standard & Poor’s 500 Total Return Stock Index | 13.27% | 10.57% | 12.96% | 9.02% | ||||||||||||
| Semi-Annual Report | 5 |
The Tocqueville Opportunity Fund
Dear Fellow Shareholder,
We are pleased to provide this investment overview for the first six-month period of fiscal year 2018 for the Tocqueville Opportunity Fund. During the six-month period ended April 30, 2018, the Fund appreciated 6.72%, and outperformed the SMID cap growth benchmark, the Russell 2500® Growth Index, which gained 5.37%. The past six months’ outperformance comes on the heels of fiscal year 2017, during which the Fund outperformed its SMID growth benchmark 36.47% versus 30.07%. The past eighteen months have been a particularly rewarding period for the Fund with a cumulative performance of 45.64% versus the SMID cap growth benchmark which appreciated 35.26%.
As we had written in our last fiscal year 2017 letter, a considerable degree of the solid performance was likely driven by underperformance in calendar year 2016. Investors will recall that the 2016 investment experience was dominated by an onslaught of macro-economic risks which threatened markets in a series of fits and starts and included: a weakening Chinese economy, Chinese currency devaluations, EU bank credit, oil price collapse, drug price regulation, Brexit, monetary tightening, and Presidential threats to Silicon Valley. During the past six months, we believe the Fund has benefitted from a continued rerating of many of its investment holdings which became unjustifiably undervalued in 2016. In addition, we believe the Tax Cuts and Jobs Act of 2017 which became law in late 2017, marked the beginning of a more benign and friendly atmosphere toward business. The prospect of considerably lowered corporate taxation, deregulation, and accelerated capital investment incentives underlie our continued favorable outlook for economic expansion and support an increased rate of business investment which should particularly benefit rapidly growing sectors and companies. Moreover, the new Tax Act outlined new rules which would guide future decisions for those U.S. companies which have amassed extensive offshore cash balances—we expect that a considerable amount of those offshore balances will find their way back to the U.S. over the next several years to be used for both new capital investments and for the benefit of shareholders in the form of dividends, repurchases, and acquisitions.
Over the past six months, investments in Technology and Healthcare have provided the leading contributions to the Fund’s absolute performance, with Technology investments in the lead. Relative to the benchmark, Information Technology and Healthcare investments dominated outperformance as well. Investments in the Industrials and Financial Services sectors also provided positive contributions, on an absolute basis. Both sectors were underweighted relative to the benchmark throughout the past six-month period, but Industrials outperformance nearly fully offset the relative underperformance of the Financial Services sector, +0.13% versus -0.21%, for a basically insignificant net give-up of -0.08%. At the end of the period, the Fund held no direct Energy sector investments—on an absolute basis, this underweighted exposure had zero
| 6 | April 30, 2018 |
impact to the Fund’s performance while relative to the benchmark the impact was a negligible -0.02%! Relative performance for the remaining sectors was no more significant, with Staples (-0.20%) and Consumer Discretionary (-0.24%) basically offset by Real Estate (+0.28%) and Materials (+0.17%).
Despite the clear and leading collective contributions of the Fund’s Technology investments to performance over the past six months, Biotechnology investments were the “kings of the mountain” in the performance derby—the top ten absolute leaders in price gains were all Biotechnology holdings—probably the first and last time ever that the top ten gainers all came from the same industry! Of the bottom ten performers, seven were Healthcare issues and three were Technology issues. SAGE Therapeutics (+127.4%), AveXis (+102.7%), and Juno Therapeutics (+91.5%) were the three best performers; Dermira (-66.0%), Forward Pharma (-65.3%), and Impinj, Inc (-64%) were the three worst performers—the three best added +4.79% to the Fund while the three worst detracted only -0.14%, due to very small weightings. Analyzing the Fund on an absolute and relative contribution basis, paints a different picture…from this perspective, five of the top 10 absolute contributors were Technology issues, four were Healthcare and one was a Financial…on a relative basis, six were Technology, three were Healthcare and one was a Financial. The worst on an absolute basis were TESARO, Lumentum, Incyte, Clovis, Spark, Aerie, and Alnylam Pharmaceuticals. Ironically, five of the six worst were among the top 10 performers in fiscal 2017 (Aerie, Clovis, Spark, Lumentum, and Alnylam)—we continue to have a favorable opinion of each.
We are pleased to write that the Fund participated in five takeovers during the past six months: AveXis by Novartis, Juno by Celgene, Cavium by Marvell Technology, Oclaro by Lumentum, and Callidus Software by SAP. The addition of these five brings the total number of takeovers in the Fund since we began managing the investments in June 2010 to nearly 90! The acquisitions of AveXis and Juno follow the purchase of Kite Pharmaceuticals by Gilead Sciences in 2017 (Kite was the leading absolute and relative performer for the Fund in fiscal 2017) and support the Fund’s expanding investments in gene editing and gene therapy sciences. Callidus Software was the fourth takeover of a Fund investment over the past years by SAP; SAP had previously purchased: Ariba, SuccessFactors, and Concur Technologies. We have anticipated an increasing volume of merger and acquisition activity due to passage of the Tax Act of 2017, and the rapidly changing landscapes of technology and healthcare. And as we have written before, we continue to expect that technology consolidation will continue to be driven by disruptive new technologies, and the ongoing migration to the cloud and hybrid cloud.
At the close of the first six months of fiscal 2018, the Fund maintained its largest commitments in Technology holdings, followed by Biotechnology investments. While there were no marked increases or decreases in investments in other sectors, the takeovers of Juno and AveXis combined with the significant appreciation of the Fund’s Technology investments, have served to decrease the Fund’s Healthcare allocation by nearly one-fifth. We have increased commitments to the Consumer Discretionary and Industrials sectors, while reduced commitments to the Materials and Financials sectors. At the end of the period, the Fund held no investments in the Staples, Energy, Telecommunications and
| Semi-Annual Report | 7 |
Utilities sectors—this was unchanged from the beginning of the fiscal period. Looking forward, we expect that index reconstruction will have some impact on the Fund’s sector allocation due to the addition of a new sector definition—we expect that S&P will redefine the current Telecommunications sector to include certain technology and consumer discretionary names that are classified as “communications related”. In practice, this is expected to include a wide number of issues, including: cable, media, internet, entertainment, and streaming companies. In terms of the larger capitalization benchmarks, the new Communications sector should be the third largest in market capitalization and exceed the Healthcare, Industrials and Consumer/Consumer Discretionary sectors in size. We expect the changes to most significantly impact the Fund’s current Technology weighting which may decline significantly simply due to a reclassification of Internet related investments to a new Communications classification.
The Top 10, Top 25 and Top 50 positions comprised approximately 35%, 56%, and 71% respectively at the period end. More than 88% of the Fund’s holdings were invested in the Top 100 positions. Smaller investments continue to serve a critical role in the Fund’s investment strategy a bit akin to pawns on a chessboard—their loss is hopefully of little impact, but their influence and power can expand massively…so it can pay immeasurably to follow them! Many of those takeovers over the past eight years had at one time started out as pawns.
We remain confident that the Fund’s investments are well placed in competitively advantaged companies which, in our opinion, are led by smart, vested and visionary management. We continue to invest in a steady and unchanged approach and seek to identify strategic and leading investments—we are investors and not traders who succumb to rapid shifts in market sentiment or a need to play a short game only. As always, we appreciate your continued confidence in our efforts.
Sincerely,

Thomas R. Vandeventer
Portfolio Manager
| 8 | April 30, 2018 |
The Tocqueville Opportunity Fund
(Unaudited)
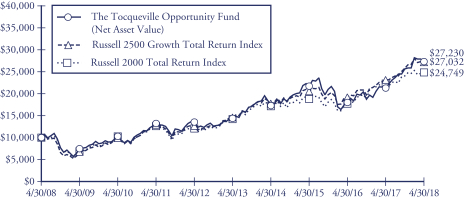
This chart assumes an initial gross investment of $10,000 made on 4/30/08. Returns shown do not reflect the deduction of taxes that a shareholder would pay on fund distributions or the redemption of fund shares. Returns shown include the reinvestment of all dividends and other distributions. Past performance is not predictive of future performance. Investment return and principal value will fluctuate so that your shares, when redeemed, may be worth more or less than their original cost.
The chart and table reflect The Opportunity Fund’s performance achieved prior to the changes effected in 2010 to its investment strategy.
The Russell 2500 Growth Total Return Index is an unmanaged index that measures the performance of the small to mid-cap growth segment of the U.S. equity universe. It includes those Russell 2500 companies with higher price-to-book ratios and higher forecasted growth values. Returns assume the reinvestment of all dividends
The Russell 2000 Total Return Index is an unmanaged index that measures the performance of the 2,000 smallest companies in the Russell 3000 Index. Returns include the reinvestment of all dividends.
AVERAGE ANNUAL RATE OF RETURN (%)
FOR YEARS ENDED APRIL 30, 2018
| 1 Year | 3 Year | 5 Year | 10 Year | |||||||||||||
The Tocqueville Opportunity Fund | 28.22% | 7.92% | 13.63% | 10.54% | ||||||||||||
Russell 2500 Growth Total Return Index | 17.10% | 9.64% | 13.15% | 10.46% | ||||||||||||
Russell 2000 Total Return Index | 11.54% | 9.64% | 11.74% | 9.49% | ||||||||||||
| Semi-Annual Report | 9 |
The Tocqueville International Value Fund
Dear Fellow Shareholder,
Global equity markets rose to multi-year highs in January, and then declined, as investor sentiment soured in response to global trade tensions, disappointing PMI figures from Europe and Japan, rising interest rates and hints of cost inflation. Volatility increased from low levels, as did spreads on corporate debt. The U.S. dollar weakened and commodity prices generally increased, with oil making large gains. Europe was down marginally, Japan up low single digits and commodity linked emerging markets performed well. In this context, oil & gas, paper, telecom equipment, miners and real estate led gains while defensive industries like tobacco, electric utilities, food & beverage performed poorly.
The Fund’s total U.S. dollar return for the six-month period was a gain of 0.26% on a net basis. This compares with a gain of 3.41% in the Morgan Stanley EAFE® Net Index against which the Fund’s international strategy is most often compared.
During the period, the Fund benefited from its exposure to Oil & Gas and Information Technology related shares, as well as security selection in the Information Technology area. This was more than offset by results in the Health Care, Consumer Discretionary and Industrials sectors. During the period, the Fund had meaningful contributions from software concern Aveva Group, waste management concern Estre Ambiental, IT consulting firm Sopra Steria Group, athletic wear maker Asics, and telecom equipment supplier Ericsson. Strong results in these shares were largely offset by declines in outdoor advertiser Clear Media, drugmaker Sanofi, payment processer Cielo, business services concern ISS, and medical equipment maker Miraca.
The Fund eliminated its positions in DCC and Misumi, as their respective share prices approached our estimates of intrinsic value. We sold shares of Travis Perkins, when results from competitors indicated that consumer spending in Travis’ markets had declined more than expected, causing us to believe we will have a better entry point in the future. We sold Countrywide, when incremental negative operating data undercut our investment thesis. Tender offers for Fund holdings in Zodiac and Global Logistics Properties were completed, and Potash Corp became Nutrien following its merger with Agrium.
During the period, the Fund purchased a position in sporting goods maker Asics, which trades at a multi-year low valuation due to a decline in profit margins in the U.S. and European operations. We believe management has a credible plan to improve margins, meanwhile, its business is experiencing profitable growth in China and the rest of Asia. The Fund purchased shares of megabank Mitsubishi UFJ, which trades at a discount to book value and whose return on equity is improving. We purchased a position in software concern Micro Focus International, when the shares sold off in response to weaker than expected operating results, allowing us to acquire a largely
| 10 | April 30, 2018 |
recurring stream of free cash flows at a low multiple. Finally, we took a position in shares of specialty chemical maker Johnson Matthey, which were under pressure due to concerns about the future of its catalytic converter business in a world of electric cars. We added to positions in BHP Billiton, Schlumberger, Smiths Group, Siemens, ISS, CRH, Bayer, Schlumberger, and Sanofi, inter alia.
At the outset of the year, we expressed concern that investor sentiment had begun to show signs of complacency and excessive risk tolerance. Since then, hints of inflation combined with unpredictable behavior by politicians has produced increased volatility, lower valuations, and investor skittishness. We do not expect a return to the abnormally low volatility of the last several years, and this and inflation should lead to some multiple compression. This should be more than compensated for by earnings growth during the foreseeable future. Further, increased investor skepticism should lead to a sharper focus on stock fundamentals and provide a healthier context for decision-making. We remain focused on individual company fundamentals and valuations.
Our investment objective remains to generate positive absolute returns and to exceed the returns of the major indices over the course of an economic cycle. To protect and grow your capital, we continue to seek out compelling long-term investment opportunities in companies that have defensible business franchises, are out of favor or misunderstood, and trade at a substantial discount to intrinsic value.
Sincerely,
James Hunt
Portfolio Manager
| Semi-Annual Report | 11 |
The Tocqueville International Value Fund
(Unaudited)
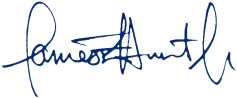
This chart assumes an initial gross investment of $10,000 made on 4/30/08. Returns shown do not reflect the deduction of taxes that a shareholder would pay on fund distributions or the redemption of fund shares. Performance reflects fee waivers in effect. In the absence of fee waivers, total return would be reduced. Returns shown include the reinvestment of all dividends and other distributions. Past performance is not predictive of future performance. Investment return and principal value will fluctuate so that your shares, when redeemed, may be worth more or less than their original cost.
The MSCI EAFE Net Index is an unmanaged market-capitalization-weighted index composed of companies representative of the market structure of 21 Developed Market Countries in Europe, Australia, Asia and the Far East.
The Standard & Poor’s 500 Total Return Stock Index (S&P 500) is a capital-weighted index, representing the aggregate market value of the common equity of 500 stocks primarily traded on the New York Stock Exchange. Returns include the reinvestment of all dividends.
AVERAGE ANNUAL RATE OF RETURN (%)
FOR YEARS ENDED APRIL 30, 2018
| 1 Year | 3 Year | 5 Year | 10 Year | |||||||||||||
The Tocqueville International Value Fund | 9.89% | 6.68% | 8.59% | 5.60% | ||||||||||||
MSCI EAFE Net Index | 14.51% | 4.94% | 5.90% | 2.43% | ||||||||||||
Standard & Poor’s 500 Total Return Stock Index | 13.27% | 10.57% | 12.96% | 9.02% | ||||||||||||
| 12 | April 30, 2018 |
The Tocqueville Gold Fund
Dear Fellow Shareholder,
Over the past half-year, precious metals markets have been affected by geopolitical developments, increasing market volatility, trade war rhetoric and rising commodity prices. Valuations of U.S. financial assets remain at historically high levels, while the U.S. fiscal position steadily worsens. Trillion-dollar budget deficits now appear to becoming commonplace, an unsustainable situation in our opinion. The gold price rose 3.8% during the period—November 2017 through April 2018; while the Philadelphia Stock Exchange Gold and Silver Index was basically flat and the Tocqueville Gold Fund was down 2.2%.
In our quarterly letters, we have discussed the investment thesis for precious metal exposure. The main idea is that consumer-based economies, with growth insufficient to cover the massive credit expansion that fuels those economies, will ultimately end up with debased currencies. Though markets are often thought to be forward looking, market participants living in the day are reluctant to recognize the diminished valuations that will result. When obligations overwhelm asset values on the other side of the ledger, the long-term impact to the real economy is the loss of values on which those economies were built. We expect the precious metals complex to weather the storm as an alternative to destroyed value and as a standard that endures, as it has throughout millennia.
The Fund invests in gold bullion and precious metal mining companies that create value in ways that are not dependent on rising gold and silver prices. It may be through exploration and discovery or mine development and production enhancement. Corporate strategies such as mergers and acquisitions or joint ventures can also enhance value. We are constantly monitoring activities and developments in the precious metals sector for underappreciated value creation opportunities in which to invest.
The largest single position in the Fund is the 119,680 ounces of gold bullion that makes up about 15% of the Fund’s assets. That gold is stored outside the financial system in a secure vault that is monitored and audited on a regular basis. The direct ownership and exposure to physical gold reduced the volatility of the Fund during the period. It acts as ballast in a stormy sea and did just that as market volatility reappeared in early 2018.
Exposure to various stages of resource development and mining activity allows the Fund to diversify risk but also capture different elements of value enhancement. Approximately 70% of the Fund’s assets are mining equities focused on gold discovery or production, while approximately 15% of the Fund is exposed to silver mining stocks. Silver has many industrial applications; however, it is also considered a monetary metal similar to gold and often occurs with gold in multi-metallic orebodies, enhancing the value of those metal deposits.
The precious metal mining stocks that contributed the most during the period included Corvus Gold Inc., Evolution Mining Ltd., Northern Star Resources Ltd.,
| Semi-Annual Report | 13 |
Semafo Inc., B2Gold Corporation and Aurico Metals Inc. Corvus Gold Inc. is currently discovering gold on its Nevada property and has yet to determine the extent of gold mineralization from its drilling campaign. Evolution Mining Ltd. and Northern Star Resources Ltd. are two Australian based companies that are benefiting from well-executed acquisition strategies and improved operating costs due to a weaker Australian dollar in recent months. Semafo Inc. will be adding gold production from the mine it is building; while B2Gold Corporation is ramping up production ahead of market expectations from a new mine it completed during the period. Aurico Metals Inc. was acquired in a friendly acquisition at a premium to its average market price.
Franco-Nevada Corporation, Osisko Gold Royalties Ltd., Ivanhoe Mines Ltd., Detour Gold Corporation, and Torex Gold Resources Inc. declined during the period. Franco-Nevada Corporation and Osisko Gold Royalties Ltd. corrected from much stronger performance during 2017. Ivanhoe Mines Ltd. corrected from the market’s concern surrounding resource nationalism. Detour Gold Corporation changed its mine plan which delayed some mining activity and reduced gold production this year, while Torex Gold Resources Inc. faced a labor disruption which is now resolved.
During the period, the Fund established new positions in Cia de Minas Buenaventura, Yamana Gold Inc. and Gold Standard Ventures Corp. Buenaventura is growing cash flow from its current and new operating mines, while Yamana Gold Inc. is improving on its financial condition. Gold Standard Ventures Corp. has been developing gold deposits on its Nevada properties, which are likely to be attractive to a major mining company looking for U.S. based gold resources. Several positions were eliminated because they were either fully valued or presented limited value creation opportunities, such as Almadex Minerals and Independence Group.
For the moment, precious metals and related mining stocks remain in a holding pattern, as the gains of the past two years consolidate. For the remainder of 2018, we expect inflationary pressures to build, real interest rates to remain low and market volatility to intensify. Investor interest in precious metals and mining stocks should awaken as these macroeconomic fundamentals become more apparent. We believe investors should increase exposure to precious metals and related mining stocks in order to take advantage of, what we see as, momentary quiet period ahead of the coming storm.
Sincerely,
 |  |  | ||
| John C. Hathaway | Douglas B. Groh | Ryan McIntyre | ||
| Portfolio Manager | Portfolio Manager | Portfolio Manager |
| 14 | April 30, 2018 |
The Tocqueville Gold Fund
(Unaudited)
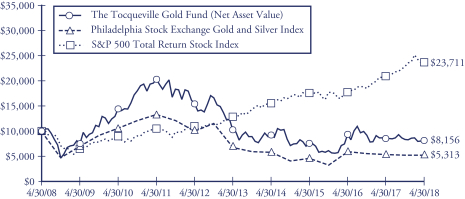
This chart assumes an initial gross investment of $10,000 made on 4/30/08. Returns shown do not reflect the deduction of taxes that a shareholder would pay on fund distributions or the redemption of fund shares. Returns shown include the reinvestment of all dividends and other distributions. Past performance is not predictive of future performance. Investment return and principal value will fluctuate so that your shares, when redeemed, may be worth more or less than their original cost. The Fund imposes a 2% redemption fee on shares held 90 days or less.
In 2009, 2010, and 2016 the performance of The Tocqueville Gold Fund was achieved during a period of unusually favorable market conditions. Such performance may not be sustainable.
The Philadelphia Stock Exchange Gold and Silver Index is an unmanaged capitalization-weighted index which includes the leading companies involved in the mining of gold and silver. Returns include the reinvestment of all dividends.
The Standard & Poor’s 500 Total Return Stock Index (S&P 500) is a capital-weighted index, representing the aggregate market value of the common equity of 500 stocks primarily traded on the New York Stock Exchange. Returns include the reinvestment of all dividends.
AVERAGE ANNUAL RATE OF RETURN (%)
FOR YEARS ENDED APRIL 30, 2018
| 1 Year | 3 Year | 5 Year | 10 Year | |||||||||||||
The Tocqueville Gold Fund | -4.42% | 2.46% | -4.43% | -2.02% | ||||||||||||
Philadelphia Stock Exchange Gold and Silver Index | -1.73% | 4.37% | -4.79% | -6.13% | ||||||||||||
Standard & Poor’s 500 Total Return Stock Index | 13.27% | 10.57% | 12.96% | 9.02% | ||||||||||||
| Semi-Annual Report | 15 |
The Delafield Fund
Dear Fellow Shareholder,
For the six months ended April 30, 2018, the Fund’s net asset value decreased 3.88% versus an increase of 3.27% for the Russell 2000® Index (“Russell 2000”) and an increase of 3.82% for the Standard & Poor’s 500® Total Return Stock Index (“S&P 500”), each on a total return basis. Owing to the smaller average market capitalization of companies in the Russell 2000, we view it as the more appropriately comparative index to the Fund. The Fund’s net asset value as of April 30, 2018 was $21.72 per share. The net asset value amounted to $292,543,953 of which 73.5% was invested in equities, and the balance in cash and equivalents.
From November 2017 through January 2018, U.S small cap stocks, and equity markets overall, continued their upward trajectory, aided by continued solid domestic economic data and low market volatility. Despite a modest decline in December 2017 caused by worries that tax reform would not come to pass and year-end tax loss selling, the three-month period was strong, with stocks rallying in November 2017 and January 2018 on favorable corporate earnings results, solid labor market data and an improved outlook for prospects of continued U.S. economic growth. The Russell 2000 posted a 5.14% increase for that three-month period, while the S&P 500 advanced in excess of 10%. Volatility then came roaring back beginning in February 2018. Investors seemed to suddenly focus on the threat of a tax cut fueled economy overheating and the possibility of spiking inflation and interest rates. For the first time in quite a while, the market was also unwilling to ignore the tumultuous political environment. President Trump prompted worries over a possible trade war with China and raised concerns over his agenda with respect to a possible meeting with North Korea’s Kim Jong-un, while record staff turnover in the White House further unsettled investors. From February 2018 through April 2018, the Russell 2000 declined 1.79%, while the S&P 500 dropped 5.77%.
Directionally, the Fund’s performance mirrored that of the market, with the Fund generating a positive return in the first half of the period, and an offsetting decline in the second half. A number of the holdings experienced operational challenges, albeit largely temporary in nature in our opinion, and associated outsized declines. Relative performance was also negatively impacted by the value bias in the portfolio. Value stocks underperformed growth stocks during the six-month period, as evidenced by the dichotomy in returns for the value constituents of the Russell 2000 versus the growth subset. The former managed to eke out a 0.95% gain for the period, while the latter generated a 5.46% increase. The Fund’s cash reserves also cost the Fund nearly 100 basis points of relative performance.
For the entire six-month period, top contributors included G-III Apparel Group, Ltd., Korn Ferry, Eastman Chemical Company, and Team Inc. G-III benefited from solid earnings results and indications of progress in both the repositioning of the DKNY
| 16 | April 30, 2018 |
brand and the restructuring of their two owned retail concepts. Korn Ferry met earnings expectations and gained from the more optimistic outlook for growth under the Trump Administration. Eastman initially experienced declines following their in-line but unexciting fourth quarter earnings report, but finished the period with a boost following an upbeat investor day meeting in early February. Team shareholders gained primarily from two developments during the period, first, the hiring of a permanent CEO, who hinted at the likelihood of additional cost savings and then, an agreement with their lenders on covenant relief.
In contrast, Horizon Global Corporation, U.S. Concrete Inc. and Diebold Nixdorf were the largest detractors from the Fund’s performance. Horizon reported a substantial earnings miss, and that, coupled with investor’s queasiness over an impending acquisition and related balance sheet implications drove a major selloff in the shares. U.S. Concrete shares came under significant selling pressure as wet weather conditions plagued New York and Dallas, the President’s infrastructure plan stalled, and worries over a peak in the construction cycle in New York resurfaced. Diebold shares were impacted by the unexpected departure of both the CEO in December 2017, followed by the COO in March of this year. Diebold shares also reacted poorly to continued weakness in the ATM hardware segment of their business and lowered core earnings expectations for calendar 2018.
We added a number of new positions to the portfolio during the six-month period, the largest of which included Apogee Enterprises Inc, Commercial Metals Company, Cooper Tire & Rubber Co., and Newell Brands Inc. In contrast, the largest portfolio deletions included Acacia Communications Inc, G-III Apparel Group, Ltd., Invacare Corp., KBR Inc., and Schnitzer Steel Industries.
Sincerely,
 |  | |
J. Dennis Delafield Portfolio Manager | Vincent Sellecchia Portfolio Manager |
 |  | |
Joshua Kaufthal Portfolio Manager | James Maxwell Portfolio Manager |
| Semi-Annual Report | 17 |
The Delafield Fund
(Unaudited)
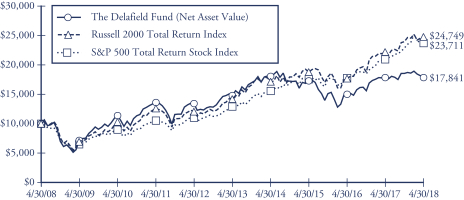
This chart assumes an initial gross investment of $10,000 made on 4/30/08. Since the Delafield Fund did not commence operations until 9/28/09, returns prior to that date are those of the Predecessor Fund. The Delafield Fund assumed the net asset value and performance history of the Predecessor Fund (See Footnote 1 to the Financial Statements). Returns shown do not reflect the deduction of taxes that a shareholder would pay on fund distributions or the redemption of fund shares. Performance reflects fee waivers in effect. In the absence of fee waivers, total return would be reduced. Returns shown include the reinvestment of all dividends and other distributions. Past performance is not predictive of future performance. Investment return and principal value will fluctuate so that your shares, when redeemed, may be worth more or less than their original cost.
The Russell 2000 Total Return Index is an unmanaged index that measures the performance of the 2,000 smallest companies in the Russell 3000 Index, which represent approximately 10% of the total market capitalization of the Russell 3000 Index. Returns include the reinvestment of all dividends.
The Standard & Poor’s 500 Total Return Stock Index (S&P 500) is a capital-weighted index, representing the aggregate market value of the common equity of 500 stocks primarily traded on the New York Stock Exchange. Returns include the reinvestment of all dividends.
AVERAGE ANNUAL RATE OF RETURN (%)
FOR YEARS ENDED APRIL 30, 2018
| 1 Year | 3 Year | 5 Year | 10 Year | |||||||||||||
The Delafield Fund | -0.09% | 1.01% | 3.82% | 5.96% | ||||||||||||
Russell 2000 Total Return Index | 11.54% | 9.64% | 11.74% | 9.49% | ||||||||||||
Standard & Poor’s 500 Total Return Stock Index | 13.27% | 10.57% | 12.96% | 9.02% | ||||||||||||
| 18 | April 30, 2018 |
The Tocqueville Select Fund
Dear Fellow Shareholder,
For the six months ended April 30, 2018, the Fund’s net asset value decreased 2.10% versus increases of 3.63% for the Russell 2500® Index (“Russell 2500”) and 3.27% for the Russell 2000® Index (“Russell 2000”), each on a total return basis. The net asset value as of April 30, 2018 was $11.40 per share. The net asset value amounted to $41,475,574 of which 96.9% was invested in equities, and the balance in cash and equivalents.
During the first half of the period, small cap stocks, and equity markets overall, continued their upward trajectory, aided by continued solid domestic economic data and low market volatility. Stocks rallied strongly in November 2017 and January 2018 on favorable corporate earnings results, solid labor market data and an improving outlook for economic growth. Solid market performance during both months was more than enough to offset a temporary blip in December 2017, when equity markets wavered over worries that tax reform would not come to pass. The Russell 2500 posted a 6.79% increase for that three-month period, while the Russell 2000 advanced in excess of 5%. Volatility returned to the market in February 2018. Investors seemed to suddenly focus on the threat of a tax cut fueled economy overheating and the possibility of spiking inflation and interest rates. For the first time in quite a while, the market was also unwilling to ignore the tumultuous political environment. President Trump prompted worries over a possible trade war with China and raised concerns over his agenda with respect to a possible meeting with North Korea’s Kim Jong-un, while record staff turnover in the White House further unsettled investors. From February 2018 through April 2018, the Russell 2500 declined 2.96%, while the Russell 2000 dropped 1.79%.
Directionally, the Fund’s performance mirrored that of the market. The Fund generated a positive return in the first half of the period, and an offsetting decline in the second half. A couple of the holdings experienced operational challenges, and owing to the concentrated nature of the Fund, the associated price declines had an outsized impact on the total return. Relative performance was also negatively impacted by the value bias in the portfolio.
For the entire six-month period, top contributors included Team Inc., EPAM Systems Inc., and G-III Apparel Group. Team shareholders gained primarily from two developments during the period, first, the hiring of a permanent CEO who hinted at the likelihood of additional cost savings and then, an agreement with their lenders on covenant relief. EPAM reported consecutive quarters of better than expected earnings and also issued encouraging 2018 guidance which highlighted its strong growth profile. G-III benefited from solid earnings results and indications of progress in both the repositioning of the DKNY brand and the restructuring of their two owned retail concepts. In contrast, Horizon Global Corporation and Real Industry Inc. were the largest detractors from the
| Semi-Annual Report | 19 |
Fund’s performance. Horizon reported a substantial earnings miss, and that, coupled with investors’ queasiness over an impending acquisition and related balance sheet implications, drove a major selloff in the shares. Real Industry’s financial woes scared off suppliers, and we sold out of the position, but only after sustaining a substantial loss on the investment.
We added several new positions to the portfolio during the six-month period, the largest of which included TTM Technologies Inc., Tile Shop Holdings Inc, and Fabrinet. In contrast, the largest portfolio deletions included Dover Corporation, Carlisle Companies Inc, and Ralph Lauren Corporation.
Sincerely,
| | | ||
J. Dennis Delafield | Vincent Sellecchia | Joshua Kaufthal | ||
Portfolio Manager | Portfolio Manager | Portfolio Manager |
| | |
Donald Wang | James Maxwell | |
Portfolio Manager | Portfolio Manager |

| 20 | April 30, 2018 |
The Tocqueville Select Fund
(Unaudited)

This chart assumes an initial gross investment of $10,000 made on 4/30/08. Since The Tocqueville Select Fund did not commence operations until 9/28/09, returns from the period from September 29, 2008 to September 27, 2009 are those of the Class Y Shares of the Predecessor Fund (See Footnote 1 to the Financial Statements). Prior to that period, returns shown are those of a limited partnership managed by the adviser. Returns shown do not reflect the deduction of taxes that a shareholder would pay on fund distributions or the redemption of fund shares. Performance reflects fee waivers in effect. In the absence of fee waivers, total return would be reduced. Returns shown include the reinvestment of all dividends and other distributions. Past performance is not predictive of future performance. Investment return and principal value will fluctuate so that your shares, when redeemed, may be worth more or less than their original cost.
In 2013 the performance of The Tocqueville Select Fund was achieved during a period of unusually favorable market conditions. Such performance may not be sustainable.
The Russell 2500 Total Return Index is an unmanaged index that measures the performance of the 2,500 smallest companies in the Russell 3000 Index. Returns include the reinvestment of all dividends.
The Russell 2000 Total Return Index is an unmanaged index that measures the performance of the 2,000 smallest companies in the Russell 3000 Index. Returns include the reinvestment of all dividends.
AVERAGE ANNUAL RATE OF RETURN (%)
FOR YEARS ENDED APRIL 30, 2018
| 1 Year | 3 Year | 5 Year | 10 Year | |||||||||||||
The Tocqueville Select Fund | -3.96% | -2.40% | 4.15% | 6.76% | ||||||||||||
Russell 2500 Total Return Index | 11.72% | 8.88% | 11.53% | 9.73% | ||||||||||||
Russell 2000 Total Return Index | 11.54% | 9.64% | 11.74% | 9.49% | ||||||||||||
| Semi-Annual Report | 21 |
Expense Example—April 30, 2018 (Unaudited)
As a shareholder of The Tocqueville Trust (the “Funds”), you incur ongoing costs, including management fees; distribution fees; and other Fund expenses. This example is intended to help you understand your ongoing costs (in dollars) of investing in the Funds and to compare costs with the ongoing costs of investing in other mutual funds.
The Example is based on an investment of $1,000 invested at the beginning of the period and held the entire period (November 1, 2017-April 30, 2018).
Actual Expenses
The first line of the table below provides information about actual account values and actual expenses. You may use the information in this line, together with the amount you invested, to estimate the expenses that you paid over the period. Simply divide your account value by $1,000 (for example, an $8,600 account value divided by $1,000 = 8.6), then multiply the result by the number in the first line under the heading entitled “Expenses Paid During Period” to estimate the expenses you paid on your account during this period.
Hypothetical Example for Comparison Purposes
The second line of the table below provides information about hypothetical account values and hypothetical expenses based on the Funds’ actual expense ratios and an assumed rate of return of 5% per year before expenses, which is not the Funds’ actual return. The hypothetical account values and expenses may not be used to estimate the actual ending account balance or expenses you paid for the period. You may use this information to compare the ongoing costs of investing in the Funds and other funds. To do so, compare this 5% hypothetical example with the 5% hypothetical examples that appear in the shareholder reports of the other funds.
Please note that the expenses shown in the table are meant to highlight your ongoing costs only and do not reflect any transactional costs, such as sales charges (loads), redemption fees, or exchange fees. Therefore, the second line of the table is useful in comparing ongoing costs only, and will not help you determine the relative costs of owning different funds. In addition, if these transactional costs were included, your costs would have been higher.
| 22 | April 30, 2018 |
Expense Example Tables (Unaudited)
The Tocqueville Fund
| Beginning Account Value November 1, 2017 | Ending Account Value April 30, 2018 | Expenses Paid During Period* November 1, 2017 - April 30, 2018 | ||||||||||
Actual | $ | 1,000.00 | $ | 1,009.80 | $ | 6.23 | ||||||
Hypothetical (5% return before expenses) | 1,000.00 | 1,018.60 | 6.26 | |||||||||
| * | Expenses are equal to the Fund’s annualized six-month expense ratio (including interest expense) of 1.25% for The Tocqueville Fund, multiplied by the average account value over the period, multiplied by 181/365 to reflect the one-half year period. |
The Tocqueville Opportunity Fund
| Beginning Account Value November 1, 2017 | Ending Account Value April 30, 2018 | Expenses Paid During Period* November 1, 2017 - April 30, 2018 | ||||||||||
Actual | $ | 1,000.00 | $ | 1,067.20 | $ | 6.51 | ||||||
Hypothetical (5% return before expenses) | 1,000.00 | 1,018.50 | 6.36 | |||||||||
| * | Expenses are equal to the Fund’s annualized six-month expense ratio (including interest expense) of 1.27% for The Tocqueville Opportunity Fund, multiplied by the average account value over the period, multiplied by 181/365 to reflect the one-half year period. |
The Tocqueville International Value Fund
| Beginning Account Value November 1, 2017 | Ending Account Value April 30, 2018 | Expenses Paid During Period* November 1, 2017 - April 30, 2018 | ||||||||||
Actual | $ | 1,000.00 | $ | 1,002.60 | $ | 6.21 | ||||||
Hypothetical (5% return before expenses) | 1,000.00 | 1,018.60 | 6.26 | |||||||||
| * | Expenses are equal to the Fund’s annualized six-month expense ratio of 1.25% for The Tocqueville International Value Fund, multiplied by the average account value over the period, multiplied by 181/365 to reflect the one-half year period. |
The Tocqueville Gold Fund
| Beginning Account Value November 1, 2017 | Ending Account Value April 30, 2018 | Expenses Paid During Period* November 1, 2017 - April 30, 2018 | ||||||||||
Actual | $ | 1,000.00 | $ | 977.80 | $ | 6.87 | ||||||
Hypothetical (5% return before expenses) | 1,000.00 | 1,017.85 | 7.00 | |||||||||
| * | Expenses are equal to the Fund’s annualized six-month expense ratio (including interest expense) of 1.40% for The Tocqueville Gold Fund, multiplied by the average account value over the period, multiplied by 181/365 to reflect the one-half year period. |
| Semi-Annual Report | 23 |
The Delafield Fund
| Beginning Account Value November 1, 2017 | Ending Account Value April 30, 2018 | Expenses Paid During Period* November 1, 2017 - April 30, 2018 | ||||||||||
Actual | $ | 1,000.00 | $ | 961.20 | $ | 6.08 | ||||||
Hypothetical (5% return before expenses) | 1,000.00 | 1,018.60 | 6.26 | |||||||||
| * | Expenses are equal to the Fund’s annualized six-month expense ratio of 1.25% for The Delafield Fund, multiplied by the average account value over the period, multiplied by 181/365 to reflect the one-half year period. |
The Tocqueville Select Fund
| Beginning Account Value November 1, 2017 | Ending Account Value April 30, 2018 | Expenses Paid During Period* November 1, 2017 - April 30, 2018 | ||||||||||
Actual | $ | 1,000.00 | $ | 979.00 | $ | 6.13 | ||||||
Hypothetical (5% return before expenses) | 1,000.00 | 1,018.60 | 6.26 | |||||||||
| * | Expenses are equal to the Fund’s annualized six-month expense ratio of 1.25% for The Tocqueville Select Fund, multiplied by the average account value over the period, multiplied by 181/365 to reflect the one-half year period. |
| 24 | April 30, 2018 |
The Tocqueville Fund
Financial Highlights
| Per share operating performance (For a share outstanding throughout the period) | Six Months Ended April 30, 2018 | Years Ended October 31, | ||||||||||||||||||||||
| 2017 | 2016 | 2015 | 2014 | 2013 | ||||||||||||||||||||
Net asset value, beginning of period | $ | 38.60 | $ | 33.72 | $ | 32.91 | $ | 34.18 | $ | 30.67 | $ | 24.11 | ||||||||||||
|
|
|
|
|
|
|
|
|
|
|
| |||||||||||||
Operations: | ||||||||||||||||||||||||
Net investment income (1) | 0.14 | 0.37 | 0.42 | 0.37 | 0.28 | 0.40 | ||||||||||||||||||
Net realized and unrealized gain (loss) | 0.30 | 6.40 | 1.07 | (0.19 | ) | 3.78 | 6.51 | |||||||||||||||||
|
|
|
|
|
|
|
|
|
|
|
| |||||||||||||
Total from investment operations * | 0.44 | 6.77 | 1.49 | 0.18 | 4.06 | 6.91 | ||||||||||||||||||
|
|
|
|
|
|
|
|
|
|
|
| |||||||||||||
Distributions to shareholders: | ||||||||||||||||||||||||
Dividends from net investment income | (0.33 | ) | (0.39 | ) | (0.35 | ) | (0.25 | ) | (0.30 | ) | (0.35 | ) | ||||||||||||
Distributions from net realized gains | (3.23 | ) | (1.50 | ) | (0.33 | ) | (1.20 | ) | (0.25 | ) | — | |||||||||||||
|
|
|
|
|
|
|
|
|
|
|
| |||||||||||||
Total distributions | (3.56 | ) | (1.89 | ) | (0.68 | ) | (1.45 | ) | (0.55 | ) | (0.35 | ) | ||||||||||||
|
|
|
|
|
|
|
|
|
|
|
| |||||||||||||
Change in net asset value for the period | (3.12 | ) | 4.88 | 0.81 | (1.27 | ) | 3.51 | 6.56 | ||||||||||||||||
|
|
|
|
|
|
|
|
|
|
|
| |||||||||||||
Net asset value, end of period | $ | 35.48 | $ | 38.60 | $ | 33.72 | $ | 32.91 | $ | 34.18 | $ | 30.67 | ||||||||||||
|
|
|
|
|
|
|
|
|
|
|
| |||||||||||||
* Includes redemption fees per share of | N/A | N/A | N/A | 0.00 | (2) | 0.00 | (2) | 0.00 | (2) | |||||||||||||||
Total Return | 1.0 | %(4) | 20.9 | % | 4.6 | % | 0.5 | % | 13.4 | % | 29.0 | % | ||||||||||||
Ratios/supplemental data | ||||||||||||||||||||||||
Net assets, end of period (000) | $ | 284,913 | $ | 293,637 | $ | 283,126 | $ | 309,267 | $ | 380,561 | $ | 348,269 | ||||||||||||
Ratio to average net assets: | ||||||||||||||||||||||||
Expenses before waiver/reimbursement | 1.25 | %(5) | 1.27 | % | 1.27 | % | 1.29 | % | 1.25 | % | 1.28 | % | ||||||||||||
Expenses after waiver/reimbursement | 1.25 | %(5) | 1.26 | %(3) | 1.24 | %(3) | 1.25 | % | 1.24 | % | 1.26 | %(3) | ||||||||||||
Net investment income before waiver/reimbursement | 0.72 | %(5) | 0.97 | % | 1.18 | % | 0.91 | % | 0.84 | % | 1.33 | % | ||||||||||||
Net investment income after waiver/reimbursement | 0.72 | %(5) | 0.98 | % | 1.21 | % | 0.95 | % | 0.85 | % | 1.35 | % | ||||||||||||
Portfolio turnover rate | 8 | %(4) | 10 | % | 12 | % | 15 | % | 19 | % | 16 | % | ||||||||||||
| (1) | Net investment income per share is calculated using the ending balance prior to consideration or adjustment for permanent book-to-tax differences. |
| (2) | Represents less than $0.01. |
| (3) | Includes 0.01% of interest expense which is not included in the Fund’s operating expense cap. |
| (4) | Not Annualized. |
| (5) | Annualized. |
The Accompanying Notes are an Integral Part of these Financial Statements.
| Semi-Annual Report | 25 |
The Tocqueville Opportunity Fund
Financial Highlights
| Per share operating performance (For a share outstanding throughout the period) | Six Months Ended April 30, 2018 | Years Ended October 31, | ||||||||||||||||||||||
| 2017 | 2016 | 2015 | 2014 | 2013 | ||||||||||||||||||||
Net asset value, beginning of period | $ | 26.12 | $ | 19.14 | $ | 21.41 | $ | 22.78 | $ | 21.29 | $ | 15.76 | ||||||||||||
|
|
|
|
|
|
|
|
|
|
|
| |||||||||||||
Operations: | ||||||||||||||||||||||||
Net investment loss (1) | (0.13 | ) | (0.37 | ) | (0.29 | ) | (0.15 | ) | (0.22 | ) | (0.13 | ) | ||||||||||||
Net realized and unrealized gain (loss) | 1.83 | 7.35 | (1.98 | ) | 1.98 | 2.80 | 5.66 | |||||||||||||||||
|
|
|
|
|
|
|
|
|
|
|
| |||||||||||||
Total from investment operations * | 1.70 | 6.98 | (2.27 | ) | 1.83 | 2.58 | 5.53 | |||||||||||||||||
|
|
|
|
|
|
|
|
|
|
|
| |||||||||||||
Distributions to shareholders: | ||||||||||||||||||||||||
Dividends from net investment income | — | — | — | — | — | — | ||||||||||||||||||
Distributions from net realized gains | (0.86 | ) | — | — | (3.20 | ) | (1.09 | ) | — | |||||||||||||||
|
|
|
|
|
|
|
|
|
|
|
| |||||||||||||
Total distributions | (0.86 | ) | — | — | (3.20 | ) | (1.09 | ) | — | |||||||||||||||
|
|
|
|
|
|
|
|
|
|
|
| |||||||||||||
Change in net asset value for the period | 0.84 | 6.98 | (2.27 | ) | (1.37 | ) | 1.49 | 5.53 | ||||||||||||||||
|
|
|
|
|
|
|
|
|
|
|
| |||||||||||||
Net asset value, end of period | $ | 26.96 | $ | 26.12 | $ | 19.14 | $ | 21.41 | $ | 22.78 | $ | 21.29 | ||||||||||||
|
|
|
|
|
|
|
|
|
|
|
| |||||||||||||
* Includes redemption fees per share of | N/A | N/A | N/A | 0.00 | (2) | 0.00 | (2) | 0.00 | (2) | |||||||||||||||
Total Return | 6.7 | %(5) | 36.5 | % | (10.6 | )% | 9.1 | % | 12.6 | % | 35.1 | % | ||||||||||||
Ratios/supplemental data | ||||||||||||||||||||||||
Net assets, end of period (000) | $ | 82,787 | $ | 77,773 | $ | 92,958 | $ | 153,456 | $ | 80,324 | $ | 80,609 | ||||||||||||
Ratio to average net assets: | ||||||||||||||||||||||||
Expenses before waiver/reimbursement | 1.33 | %(6) | 1.38 | % | 1.38 | % | 1.31 | % | 1.30 | % | 1.30 | % | ||||||||||||
Expenses after waiver/reimbursement | 1.27 | %(3)(6) | 1.30 | %(3)(4) | 1.38 | % | 1.31 | % | 1.30 | % | 1.30 | % | ||||||||||||
Net investment income before waiver/reimbursement | (1.11 | )%(6) | (1.05 | )% | (0.94 | )% | (0.95 | )% | (0.90 | )% | (0.64 | )% | ||||||||||||
Net investment income after waiver/reimbursement | (1.05 | )%(6) | (0.97 | )%(4) | (0.94 | )% | (0.95 | )% | (0.90 | )% | (0.64 | )% | ||||||||||||
Portfolio turnover rate | 72 | %(5) | 133 | % | 108 | % | 101 | % | 92 | % | 100 | % | ||||||||||||
| (1) | Net investment loss per share is calculated using the ending balance prior to consideration or adjustment for permanent book-to-tax differences. |
| (2) | Represents less than $0.01. |
| (3) | Includes interest expense of 0.02% for the six months ended April 30, 2018 and 0.05% for the year ended October 31, 2017. Interest expense is not included in the Fund’s operating expense cap. |
| (4) | Expense waiver of 1.25% was implemented on November 1, 2016. |
| (5) | Not Annualized. |
| (6) | Annualized. |
The Accompanying Notes are an Integral Part of these Financial Statements.
| 26 | April 30, 2018 |
The Tocqueville International Value Fund
Financial Highlights
| Per share operating performance (For a share outstanding throughout the period) | Six Months Ended April 30, 2018 | Years Ended October 31, | ||||||||||||||||||||||
| 2017 | 2016 | 2015 | 2014 | 2013 | ||||||||||||||||||||
Net asset value, beginning of period | $ | 17.58 | $ | 14.44 | $ | 14.59 | $ | 14.48 | $ | 14.71 | $ | 11.68 | ||||||||||||
|
|
|
|
|
|
|
|
|
|
|
| |||||||||||||
Operations: | ||||||||||||||||||||||||
Net investment income (1) | 0.09 | 0.14 | 0.14 | 0.15 | 0.15 | 0.24 | ||||||||||||||||||
Net realized and unrealized gain (loss) | (0.04 | ) | 3.23 | 0.14 | 0.80 | (0.15 | ) | 2.97 | ||||||||||||||||
|
|
|
|
|
|
|
|
|
|
|
| |||||||||||||
Total from investment operations * | 0.05 | 3.37 | 0.28 | 0.95 | — | 3.21 | ||||||||||||||||||
|
|
|
|
|
|
|
|
|
|
|
| |||||||||||||
Distributions to shareholders: | ||||||||||||||||||||||||
Dividends from net investment income | (0.17 | ) | (0.15 | ) | (0.25 | ) | (0.32 | ) | (0.23 | ) | (0.18 | ) | ||||||||||||
Distributions from net realized gains | (0.06 | ) | (0.08 | ) | (0.18 | ) | (0.52 | ) | — | — | ||||||||||||||
|
|
|
|
|
|
|
|
|
|
|
| |||||||||||||
Total distributions | (0.23 | ) | (0.23 | ) | (0.43 | ) | (0.84 | ) | (0.23 | ) | (0.18 | ) | ||||||||||||
|
|
|
|
|
|
|
|
|
|
|
| |||||||||||||
Change in net asset value for the period | (0.18 | ) | 3.14 | (0.15 | ) | 0.11 | (0.23 | ) | 3.03 | |||||||||||||||
|
|
|
|
|
|
|
|
|
|
|
| |||||||||||||
Net asset value, end of period | $ | 17.40 | $ | 17.58 | $ | 14.44 | $ | 14.59 | $ | 14.48 | $ | 14.71 | ||||||||||||
|
|
|
|
|
|
|
|
|
|
|
| |||||||||||||
* Includes redemption fees per share of | N/A | N/A | N/A | 0.00 | (2) | 0.00 | (2) | 0.00 | (2) | |||||||||||||||
Total Return | 0.3 | %(4) | 23.7 | % | 2.0 | % | 7.2 | % | (0.0 | )% | 27.8 | % | ||||||||||||
Ratios/supplemental data | ||||||||||||||||||||||||
Net assets, end of period (000) | $ | 1,329,479 | $ | 1,120,994 | $ | 525,808 | $ | 333,762 | $ | 237,051 | $ | 262,981 | ||||||||||||
Ratio to average net assets: | ||||||||||||||||||||||||
Expenses before waiver/reimbursement | 1.45 | %(5) | 1.53 | % | 1.58 | % | 1.57 | % | 1.54 | % | 1.55 | % | ||||||||||||
Expenses after waiver/reimbursement | 1.25 | %(5) | 1.25 | % | 1.25 | % | 1.25 | % | 1.25 | % | 1.30 | %(3) | ||||||||||||
Net investment income before waiver/reimbursement | 0.83 | %(5) | 0.73 | % | 0.90 | % | 0.71 | % | 0.62 | % | 1.55 | % | ||||||||||||
Net investment income after waiver/reimbursement | 1.03 | %(5) | 1.01 | % | 1.23 | % | 1.03 | % | 0.91 | % | 1.80 | %(3) | ||||||||||||
Portfolio turnover rate | 8 | %(4) | 22 | % | 26 | % | 42 | % | 31 | % | 37 | % | ||||||||||||
| (1) | Net investment income per share is calculated using the ending balance prior to consideration or adjustment for permanent book-to-tax differences. |
| (2) | Represents less than $0.01. |
| (3) | Expense waiver of 1.25% was implemented on January 1, 2013. |
| (4) | Not Annualized. |
| (5) | Annualized. |
The Accompanying Notes are an Integral Part of these Financial Statements.
| Semi-Annual Report | 27 |
The Tocqueville Gold Fund
Financial Highlights
| Per share operating performance (For a share outstanding throughout the period) | Six Months Ended April 30, 2018 | Years Ended October 31, | ||||||||||||||||||||||
| 2017 | 2016 | 2015 | 2014 | 2013 | ||||||||||||||||||||
Net asset value, beginning of period | $ | 35.64 | $ | 39.32 | $ | 26.04 | $ | 30.38 | $ | 38.01 | $ | 72.82 | ||||||||||||
|
|
|
|
|
|
|
|
|
|
|
| |||||||||||||
Operations: | ||||||||||||||||||||||||
Net investment loss (1) | (0.21 | ) | (0.39 | ) | (0.33 | ) | (0.27 | ) | (0.08 | ) | (0.26 | ) | ||||||||||||
Net realized and unrealized gain (loss) | (0.58 | ) | (3.29 | ) | 13.61 | (4.07 | ) | (7.55 | ) | (32.93 | ) | |||||||||||||
|
|
|
|
|
|
|
|
|
|
|
| |||||||||||||
Total from investment operations * | (0.79 | ) | (3.68 | ) | 13.28 | (4.34 | ) | (7.63 | ) | (33.19 | ) | |||||||||||||
|
|
|
|
|
|
|
|
|
|
|
| |||||||||||||
Distributions to shareholders: | ||||||||||||||||||||||||
Dividends from net investment income | — | — | — | — | — | — | ||||||||||||||||||
Distributions from net realized gains | — | — | — | — | — | (1.62 | ) | |||||||||||||||||
|
|
|
|
|
|
|
|
|
|
|
| |||||||||||||
Total distributions | — | — | — | — | — | (1.62 | ) | |||||||||||||||||
|
|
|
|
|
|
|
|
|
|
|
| |||||||||||||
Change in net asset value for the period | (0.79 | ) | (3.68 | ) | 13.28 | (4.34 | ) | (7.63 | ) | (34.81 | ) | |||||||||||||
|
|
|
|
|
|
|
|
|
|
|
| |||||||||||||
Net asset value, end of period | $ | 34.85 | $ | 35.64 | $ | 39.32 | $ | 26.04 | $ | 30.38 | $ | 38.01 | ||||||||||||
|
|
|
|
|
|
|
|
|
|
|
| |||||||||||||
* Includes redemption fees per share of | 0.00 | (2) | 0.01 | 0.01 | 0.01 | 0.02 | 0.02 | |||||||||||||||||
Total Return | (2.2 | )%(3) | (9.4 | )% | 51.0 | % | (14.3 | )% | (20.1 | )% | (46.4 | )% | ||||||||||||
Ratios/supplemental data | ||||||||||||||||||||||||
Net assets, end of period (000) | $ | 1,045,979 | $ | 1,153,287 | $ | 1,365,282 | $ | 947,367 | $ | 1,138,557 | $ | 1,215,081 | ||||||||||||
Ratio to average net assets: | ||||||||||||||||||||||||
Expense | 1.40 | %(4) | 1.38 | % | 1.39 | % | 1.43 | % | 1.36 | % | 1.34 | % | ||||||||||||
Net investment loss | (0.81 | )%(4) | (0.95 | )% | (0.91 | )% | (0.84 | )% | (0.78 | )% | (0.41 | )% | ||||||||||||
Portfolio turnover rate | 8 | %(3) | 14 | % | 15 | % | 11 | % | 10 | % | 14 | % | ||||||||||||
| (1) | Net investment loss per share is calculated using the ending balance prior to consideration or adjustment for permanent book-to-tax differences. |
| (2) | Represents less than $0.01. |
| (3) | Not Annualized. |
| (4) | Annualized. |
The Accompanying Notes are an Integral Part of these Financial Statements.
| 28 | April 30, 2018 |
The Delafield Fund
Financial Highlights
| Per share operating performance (For a share outstanding throughout the period) | Six Months Ended April 30, 2018 | Years Ended October 31, | ||||||||||||||||||||||
| 2017 | 2016 | 2015 | 2014 | 2013 | ||||||||||||||||||||
Net asset value, beginning of period | $ | 26.40 | $ | 26.47 | $ | 28.64 | $ | 36.40 | $ | 37.13 | $ | 29.79 | ||||||||||||
|
|
|
|
|
|
|
|
|
|
|
| |||||||||||||
Operations: | ||||||||||||||||||||||||
Net investment loss (1) | (0.08 | ) | (0.15 | ) | (0.15 | ) | (0.14 | ) | (0.10 | ) | (0.05 | ) | ||||||||||||
Net realized and unrealized gain (loss) | (0.81 | ) | 4.91 | 0.78 | (3.99 | ) | 0.70 | 9.19 | ||||||||||||||||
|
|
|
|
|
|
|
|
|
|
|
| |||||||||||||
Total from investment operations * | (0.89 | ) | 4.76 | 0.63 | (4.13 | ) | 0.60 | 9.14 | ||||||||||||||||
|
|
|
|
|
|
|
|
|
|
|
| |||||||||||||
Distributions to shareholders: | ||||||||||||||||||||||||
Dividends from net investment income | — | — | — | — | — | — | ||||||||||||||||||
Distributions from net realized gains | (3.79 | ) | (4.83 | ) | (2.80 | ) | (3.63 | ) | (1.33 | ) | (1.80 | ) | ||||||||||||
|
|
|
|
|
|
|
|
|
|
|
| |||||||||||||
Total distributions | (3.79 | ) | (4.83 | ) | (2.80 | ) | (3.63 | ) | (1.33 | ) | (1.80 | ) | ||||||||||||
|
|
|
|
|
|
|
|
|
|
|
| |||||||||||||
Change in net asset value for the period | (4.68 | ) | (0.07 | ) | (2.17 | ) | (7.76 | ) | (0.73 | ) | 7.34 | |||||||||||||
|
|
|
|
|
|
|
|
|
|
|
| |||||||||||||
Net asset value, end of period | $ | 21.72 | $ | 26.40 | $ | 26.47 | $ | 28.64 | $ | 36.40 | $ | 37.13 | ||||||||||||
|
|
|
|
|
|
|
|
|
|
|
| |||||||||||||
* Includes redemption fees per share of | N/A | N/A | N/A | 0.00 | (2) | 0.00 | (2) | 0.00 | (2) | |||||||||||||||
Total Return | (3.9 | )%(4) | 19.0 | % | 3.3 | % | (12.3 | )% | 1.6 | % | 32.1 | % | ||||||||||||
Ratios/supplemental data | ||||||||||||||||||||||||
Net assets, end of period (000) | $ | 292,544 | $ | 373,353 | $ | 400,827 | $ | 674,525 | $ | 1,475,139 | $ | 1,759,341 | ||||||||||||
Ratio to average net assets: | ||||||||||||||||||||||||
Expenses before waiver/reimbursement | 1.33 | %(5) | 1.31 | % | 1.29 | % | 1.25 | % | 1.21 | % | 1.21 | % | ||||||||||||
Expenses after waiver/reimbursement | 1.25 | %(5) | 1.25 | %(3) | 1.29 | % | 1.25 | % | 1.21 | % | 1.21 | % | ||||||||||||
Net investment income before waiver/reimbursement | (0.68 | )%(5) | (0.55 | )% | (0.33 | )% | (0.15 | )% | (0.24 | )% | (0.15 | )% | ||||||||||||
Net investment income after waiver/reimbursement | (0.60 | )%(5) | (0.49 | )%(3) | (0.33 | )% | (0.15 | )% | (0.24 | )% | (0.15 | )% | ||||||||||||
Portfolio turnover rate | 18 | %(4) | 36 | % | 39 | % | 19 | % | 34 | % | 34 | % | ||||||||||||
| (1) | Net investment loss per share is calculated using the ending balance prior to consideration or adjustment for permanent book-to-tax differences. |
| (2) | Represents less than $0.01. |
| (3) | Expense waiver of 1.25% was implemented on November 1, 2016. |
| (4) | Not Annualized. |
| (5) | Annualized. |
The Accompanying Notes are an Integral Part of these Financial Statements.
| Semi-Annual Report | 29 |
The Tocqueville Select Fund
Financial Highlights
| Per share operating performance (For a share outstanding throughout the period) | Six Months Ended April 30, 2018 | Years Ended October 31, | ||||||||||||||||||||||
| 2017 | 2016 | 2015 | 2014 | 2013 | ||||||||||||||||||||
Net asset value, beginning of period | $ | 11.87 | $ | 11.43 | $ | 12.08 | $ | 14.90 | $ | 15.57 | $ | 11.35 | ||||||||||||
|
|
|
|
|
|
|
|
|
|
|
| |||||||||||||
Operations: | ||||||||||||||||||||||||
Net investment loss (1) | (0.03 | ) | (0.06 | ) | (0.07 | ) | (0.08 | ) | (0.07 | ) | (0.06 | ) | ||||||||||||
Net realized and unrealized gain (loss) | (0.22 | ) | 1.12 | (0.18 | ) | (1.00 | ) | 0.94 | 4.79 | |||||||||||||||
|
|
|
|
|
|
|
|
|
|
|
| |||||||||||||
Total from investment operations * | (0.25 | ) | 1.06 | (0.25 | ) | (1.08 | ) | 0.87 | 4.73 | |||||||||||||||
|
|
|
|
|
|
|
|
|
|
|
| |||||||||||||
Distributions to shareholders: | ||||||||||||||||||||||||
Dividends from net investment income | — | — | — | — | — | — | ||||||||||||||||||
Distributions from net realized gains | (0.22 | ) | (0.62 | ) | (0.40 | ) | (1.74 | ) | (1.54 | ) | (0.51 | ) | ||||||||||||
|
|
|
|
|
|
|
|
|
|
|
| |||||||||||||
Total distributions | (0.22 | ) | (0.62 | ) | (0.40 | ) | (1.74 | ) | (1.54 | ) | (0.51 | ) | ||||||||||||
|
|
|
|
|
|
|
|
|
|
|
| |||||||||||||
Change in net asset value for the period | (0.47 | ) | 0.44 | (0.65 | ) | (2.82 | ) | (0.67 | ) | 4.22 | ||||||||||||||
|
|
|
|
|
|
|
|
|
|
|
| |||||||||||||
Net asset value, end of period | $ | 11.40 | $ | 11.87 | $ | 11.43 | $ | 12.08 | $ | 14.90 | $ | 15.57 | ||||||||||||
|
|
|
|
|
|
|
|
|
|
|
| |||||||||||||
* Includes redemption fees per share of | N/A | N/A | N/A | 0.00 | (2) | 0.00 | (2) | 0.00 | (2) | |||||||||||||||
Total Return | (2.1 | )%(4) | 8.9 | % | (1.9 | )% | (8.0 | )% | 6.1 | % | 43.2 | % | ||||||||||||
Ratios/supplemental data | ||||||||||||||||||||||||
Net assets, end of period (000) | $ | 41,476 | $ | 49,453 | $ | 63,812 | $ | 81,813 | $ | 108,060 | $ | 99,888 | ||||||||||||
Ratio to average net assets: | ||||||||||||||||||||||||
Expenses before waiver/reimbursement | 1.38 | %(5) | 1.37 | % | 1.37 | % | 1.36 | % | 1.32 | % | 1.34 | % | ||||||||||||
Expenses after waiver/reimbursement | 1.25 | %(5) | 1.25 | %(3) | 1.37 | % | 1.36 | % | 1.32 | % | 1.34 | % | ||||||||||||
Net investment income before waiver/reimbursement | (0.54 | )%(5) | (0.47 | )% | (0.45 | )% | (0.52 | )% | (0.50 | )% | (0.39 | )% | ||||||||||||
Net investment income after waiver/reimbursement | (0.41 | )%(5) | (0.35 | )%(3) | (0.45 | )% | (0.52 | )% | (0.50 | )% | (0.39 | )% | ||||||||||||
Portfolio turnover rate | 11 | % (4) | 24 | % | 32 | % | 43 | % | 32 | % | 28 | % | ||||||||||||
| (1) | Net investment loss per share is calculated using the ending balance prior to consideration or adjustment for permanent book-to-tax differences. |
| (2) | Represents less than $0.01. |
| (3) | Expense waiver of 1.25% was implemented on November 1, 2016. |
| (4) | Not Annualized. |
| (5) | Annualized. |
The Accompanying Notes are an Integral Part of these Financial Statements.
| 30 | April 30, 2018 |
The Tocqueville Fund
Schedule of Investments as of April 30, 2018
(Unaudited)
| Common Stocks—94.8% | Shares | Value | ||||||
Automobiles & Components—1.4% |
| |||||||
Ford Motor Co. | 350,000 | $ | 3,934,000 | |||||
Banks—1.9% | ||||||||
Bank of America Corp. | 100,000 | 2,992,000 | ||||||
Wells Fargo & Co. | 45,000 | 2,338,200 | ||||||
| 5,330,200 | ||||||||
Capital Goods—9.3% | ||||||||
Arconic, Inc. | 175,000 | 3,116,750 | ||||||
Caterpillar, Inc. | 25,000 | 3,609,000 | ||||||
General Electric Co. | 400,000 | 5,628,000 | ||||||
Illinois Tool Works, Inc. | 40,000 | 5,680,800 | ||||||
The Boeing Co. | 25,000 | 8,339,000 | ||||||
| 26,373,550 | ||||||||
Commercial & Professional Services—0.9% |
| |||||||
Steelcase, Inc.—Class A | 200,000 | 2,650,000 | ||||||
Consumer Services—3.4% | ||||||||
Las Vegas Sands Corp. | 40,000 | 2,933,200 | ||||||
McDonald’s Corp. | 40,000 | 6,697,600 | ||||||
| 9,630,800 | ||||||||
Diversified Financials—3.0% |
| |||||||
Synchrony Financial | 50,000 | 1,658,500 | ||||||
The Bank of New York Mellon Corp. | 125,000 | 6,813,750 | ||||||
| 8,472,250 | ||||||||
Energy—7.6% | ||||||||
Baker Hughes a GE Co. | 100,000 | 3,611,000 | ||||||
Exxon Mobil Corp. | 100,000 | 7,775,000 | ||||||
Noble Energy, Inc. | 100,000 | 3,383,000 | ||||||
Schlumberger Ltd.(a) | 100,000 | 6,856,000 | ||||||
| 21,625,000 | ||||||||
Food & Staples Retailing—3.1% |
| |||||||
Walmart, Inc. | 100,000 | 8,846,000 | ||||||
Food, Beverage & Tobacco—3.3% |
| |||||||
Campbell Soup Co. | 75,000 | 3,058,500 | ||||||
The Coca-Cola Co. | 150,000 | 6,481,500 | ||||||
| 9,540,000 | ||||||||
Health Care Equipment & Services—1.0% |
| |||||||
Abbott Laboratories | 50,000 | 2,906,500 | ||||||
Household & Personal Products—4.8% |
| |||||||
Colgate-Palmolive Co. | 100,000 | 6,523,000 | ||||||
The Procter & Gamble Co. | 100,000 | $ | 7,234,000 | |||||
| 13,757,000 | ||||||||
Insurance—2.9% | ||||||||
Aflac, Inc. | 100,000 | 4,557,000 | ||||||
Brighthouse Financial, Inc.(b) | 25,000 | 1,269,500 | ||||||
MetLife, Inc. | 50,000 | 2,383,500 | ||||||
| 8,210,000 | ||||||||
Materials—6.2% | ||||||||
BHP Billiton Ltd.—ADR(a) | 50,000 | 2,337,500 | ||||||
DowDuPont, Inc. | 125,000 | 7,905,000 | ||||||
Nutrien Ltd.(a) | 40,000 | 1,821,200 | ||||||
Sonoco Products Co. | 75,000 | 3,852,000 | ||||||
U.S. Concrete, Inc.(b) | 30,000 | 1,753,500 | ||||||
| 17,669,200 | ||||||||
Media—1.4% | ||||||||
The Walt Disney Co. | 40,000 | 4,013,200 | ||||||
Pharmaceuticals, Biotechnology & Life Sciences—10.3% |
| |||||||
Biogen, Inc.(b) | 10,000 | 2,736,000 | ||||||
Ionis Pharmaceuticals, Inc.(b) | 75,000 | 3,227,250 | ||||||
Johnson & Johnson | 70,000 | 8,854,300 | ||||||
Merck & Co., Inc. | 125,000 | 7,358,750 | ||||||
Pfizer, Inc. | 200,000 | 7,322,000 | ||||||
| 29,498,300 | ||||||||
Retailing—4.1% | ||||||||
Amazon.com, Inc.(b) | 6,500 | 10,179,845 | ||||||
JD.com, Inc.—ADR(a)(b) | 20,000 | 730,200 | ||||||
Overstock.com, Inc.(b) | 20,000 | 762,000 | ||||||
| 11,672,045 | ||||||||
Semiconductors & Semiconductor Equipment—6.7% |
| |||||||
Applied Materials, Inc. | 175,000 | 8,692,250 | ||||||
Intel Corp. | 150,000 | 7,743,000 | ||||||
QUALCOMM, Inc. | 50,000 | 2,550,500 | ||||||
| 18,985,750 | ||||||||
Software & Services—11.2% |
| |||||||
Alphabet, Inc.—Class A(b) | 7,000 | 7,130,060 | ||||||
Automatic Data Processing, Inc. | 75,000 | 8,856,000 | ||||||
Facebook, Inc.—Class A(b) | 37,500 | 6,450,000 | ||||||
The Accompanying Footnotes are an Integral Part of these Financial Statements.
| Semi-Annual Report | 31 |
The Tocqueville Fund
Schedule of Investments as of April 30, 2018
(Unaudited)
| Common Stocks—94.8% | Shares | Value | ||||||
Microsoft Corp. | 100,000 | $ | 9,352,000 | |||||
| 31,788,060 | ||||||||
Technology Hardware & Equipment—3.5% |
| |||||||
Apple, Inc. | 50,000 | 8,263,000 | ||||||
Bio-key International, Inc.(b)(c)(d) | 1,963 | — | ||||||
Coherent, Inc.(b) | 10,000 | 1,682,200 | ||||||
| 9,945,200 | ||||||||
Telecommunication Services—1.7% |
| |||||||
Verizon Communications, Inc. | 100,000 | 4,935,000 | ||||||
Transportation—2.4% | ||||||||
Delta Air Lines, Inc. | 100,000 | 5,222,000 | ||||||
Kansas City Southern | 15,000 | 1,599,450 | ||||||
| 6,821,450 | ||||||||
Utilities—4.7% | ||||||||
NextEra Energy, Inc. | 75,000 | 12,293,250 | ||||||
PG&E Corp. | 25,000 | 1,152,500 | ||||||
| 13,445,750 | ||||||||
Total Common Stocks | 270,049,255 | |||||||
Preferred Stock—0.0% | ||||||||
Health Care Equipment & Supplies—0.0% |
| |||||||
Zymequest, Inc.(b)(c)(d) (Originally acquired 10/13/16, Cost $0) | 400,000 | 1,600 | ||||||
Total Preferred Stock | 1,600 | |||||||
Real Estate Investment Trust (REIT)—2.6% |
| |||||||
Real Estate—2.6% | ||||||||
Weyerhaeuser Co. | 200,000 | 7,356,000 | ||||||
Total Real Estate Investment Trust |
| 7,356,000 | ||||||
Exchange-Traded Fund (ETF)—1.2% |
| |||||||
Metals and Mining—1.2% | ||||||||
SPDR S&P Metals & Mining ETF | 100,000 | 3,497,000 | ||||||
Total Exchange-Traded Fund |
| 3,497,000 | ||||||
Banks—0.4% | ||||||||
Federal National Mortgage Association, 8.250%(e)(f) | 200,000 | $ | 1,280,000 | |||||
Total Government Security |
| 1,280,000 | ||||||
Short-Term Investment—0.8% |
| |||||||
Money Market Fund—0.8% |
| |||||||
STIT-Treasury Portfolio—Institutional Class, 1.600%(g) | 2,174,266 | 2,174,266 | ||||||
Total Short-Term Investment |
| 2,174,266 | ||||||
Total Investments |
| 284,358,121 | ||||||
Other Assets in Excess of Liabilities—0.2% |
| 554,409 | ||||||
Total Net Assets—100.0% |
| $ | 284,912,530 | |||||
|
| |||||||
Percentages are stated as a percent of net assets.
ADR American Depository Receipt
| (a) | Foreign issued Security. Foreign Concentration (including ADR’s) was as follows: Australia 0.8%; Canada 0.6%; Cayman Islands 0.3%; Curacao 2.4%. |
| (b) | Non-income producing security. |
| (c) | Denotes a security that is either fully or partially restricted to resale. The aggregate value of restricted securities as of April 30, 2018 was $1,600 which represented 0.0% of net assets. |
| (d) | Security is fair valued using procedures approved by the Board of Trustees which includes significant unobservable inputs and is deemed a Level 3 security. See Footnote 2. The aggregate value of fair valued securities as of April 30, 2018 was $1,600 which represented 0.0% of net assets. |
| (e) | Variable rate security. The rate shown is as of 4/30/2018. |
| (f) | Callable Security. |
| (g) | Rate listed is the 7-day effective yield. |
The Global Industry Classification Standard (GICS®) was developed by and/or is the exclusive property of MSCI, Inc. and Standard & Poor Financial Services LLC (“S&P”). GICS is a service mark of MSCI and S&P and has been licensed for use by U.S. Bancorp Fund Services, LLC.
The Accompanying Footnotes are an Integral Part of these Financial Statements.
| 32 | April 30, 2018 |
The Tocqueville Opportunity Fund
Schedule of Investments as of April 30, 2018
(Unaudited)
| Common Stocks—99.5% | Shares | Value | ||||||
Automobiles & Components—0.0% |
| |||||||
Delphi Technologies PLC(a) | 166 | $ | 8,036 | |||||
Banks—0.0% | ||||||||
LendingTree, Inc.(b) | 100 | 23,840 | ||||||
Capital Goods—5.5% | ||||||||
Beacon Roofing Supply, Inc.(b) | 3,500 | 171,325 | ||||||
Builders FirstSource, Inc.(b) | 7,500 | 136,725 | ||||||
Donaldson Co., Inc. | 500 | 22,130 | ||||||
Esterline Technologies Corp.(b) | 500 | 35,925 | ||||||
Fortune Brands Home & Security, Inc. | 500 | 27,345 | ||||||
Granite Construction, Inc. | 1,500 | 78,570 | ||||||
HD Supply Holdings, Inc.(b) | 500 | 19,355 | ||||||
HEICO Corp. | 1,875 | 164,719 | ||||||
Hexcel Corp. | 3,600 | 239,292 | ||||||
Hubbell, Inc. | 500 | 51,930 | ||||||
Huntington Ingalls Industries, Inc. | 800 | 194,568 | ||||||
IDEX Corp. | 2,500 | 334,150 | ||||||
Lennox International, Inc. | 2,500 | 483,425 | ||||||
Lincoln Electric Holdings, Inc. | 2,000 | 165,740 | ||||||
Masco Corp. | 1,000 | 37,870 | ||||||
Masonite International Corp.(a)(b) | 500 | 30,350 | ||||||
MasTec, Inc.(b) | 1,000 | 44,000 | ||||||
Nordson Corp. | 2,500 | 321,500 | ||||||
Owens Corning | 1,000 | 65,490 | ||||||
PGT Innovations, Inc.(b) | 500 | 8,725 | ||||||
RBC Bearings, Inc.(b) | 1,000 | 116,380 | ||||||
Rockwell Automation, Inc. | 500 | 82,265 | ||||||
SiteOne Landscape Supply, Inc.(b) | 3,000 | 205,500 | ||||||
Spirit AeroSystems Holdings, Inc.—Class A | 500 | 40,185 | ||||||
Terex Corp. | 4,500 | 164,340 | ||||||
TransDigm Group, Inc. | 100 | 32,057 | ||||||
Trex Co., Inc.(b) | 1,000 | 103,880 | ||||||
United Rentals, Inc.(b) | 3,500 | 525,000 | ||||||
Universal Forest Products, Inc. | 3,000 | 95,640 | ||||||
WABCO Holdings, Inc.(b) | 500 | 64,495 | ||||||
Watsco, Inc. | 2,500 | 418,550 | ||||||
Welbilt, Inc.(b) | 1,500 | 28,740 | ||||||
Woodward, Inc. | 1,000 | 71,940 | ||||||
| 4,582,106 | ||||||||
Commercial & Professional Services—1.5% |
| |||||||
Copart, Inc.(b) | 5,400 | $ | 275,832 | |||||
Costar Group, Inc.(b) | 1,000 | 366,660 | ||||||
Robert Half International, Inc. | 1,000 | 60,750 | ||||||
TransUnion(b) | 8,500 | 551,735 | ||||||
| 1,254,977 | ||||||||
Consumer Durables & Apparel—0.4% |
| |||||||
Cavco Industries, Inc.(b) | 500 | 85,175 | ||||||
Leggett & Platt, Inc. | 3,000 | 121,650 | ||||||
Mohawk Industries, Inc.(b) | 500 | 104,940 | ||||||
| 311,765 | ||||||||
Consumer Services—0.2% | ||||||||
Domino’s Pizza, Inc. | 500 | 120,865 | ||||||
Restaurant Brands International LP(b) | 37 | 1,895 | ||||||
| 122,760 | ||||||||
Diversified Financials—1.3% | ||||||||
CME Group, Inc. | 200 | 31,536 | ||||||
FactSet Research Systems, Inc. | 400 | 75,644 | ||||||
MarketAxess Holdings, Inc. | 200 | 39,726 | ||||||
MSCI, Inc. | 1,500 | 224,745 | ||||||
S&P Global, Inc. | 3,500 | 660,100 | ||||||
SEI Investments Co. | 500 | 31,615 | ||||||
| 1,063,366 | ||||||||
Health Care Equipment & Services—2.2% |
| |||||||
ABIOMED, Inc.(b) | 500 | 150,475 | ||||||
Align Technology, Inc.(b) | 800 | 199,880 | ||||||
Glaukos Corp.(b) | 500 | 16,840 | ||||||
IDEXX Laboratories, Inc.(b) | 900 | 175,041 | ||||||
Intuitive Surgical, Inc.(b) | 500 | 220,390 | ||||||
iRhythm Technologies, Inc.(b) | 3,500 | 203,525 | ||||||
K2M Group Holdings, Inc.(b) | 500 | 9,550 | ||||||
Medidata Solutions, Inc.(b) | 3,500 | 249,760 | ||||||
Pulse Biosciences, Inc.(b) | 1,000 | 17,590 | ||||||
Teleflex, Inc. | 1,000 | 267,880 | ||||||
Veeva Systems, Inc.—Class A(b) | 4,000 | 280,520 | ||||||
| 1,791,451 | ||||||||
Materials—1.3% | ||||||||
Berry Global Group, Inc.(b) | 1,500 | 82,500 | ||||||
The Chemours Co. | 6,000 | 290,460 | ||||||
Eagle Materials, Inc. | 500 | 49,480 | ||||||
Martin Marietta Materials, Inc. | 1,000 | 194,770 | ||||||
Packaging Corp. of America | 1,500 | 173,535 | ||||||
The Accompanying Footnotes are an Integral Part of these Financial Statements.
| Semi-Annual Report | 33 |
The Tocqueville Opportunity Fund
Schedule of Investments as of April 30, 2018
(Unaudited)
| Common Stocks—99.5% | Shares | Value | ||||||
The Sherwin-Williams Co. | 100 | $ | 36,766 | |||||
Vulcan Materials Co. | 1,500 | 167,535 | ||||||
Worthington Industries, Inc. | 1,500 | 66,795 | ||||||
| 1,061,841 | ||||||||
Pharmaceuticals, Biotechnology & Life Sciences—26.0% |
| |||||||
Abeona Therapeutics, Inc.(b) | 7,500 | 130,875 | ||||||
Aclaris Therapeutics, Inc.(b) | 500 | 8,875 | ||||||
Adaptimmune Therapeutics PLC—ADR(a)(b) | 18,000 | 228,780 | ||||||
Aerie Pharmaceuticals, Inc.(b) | 7,000 | 358,400 | ||||||
Alkermes PLC(a)(b) | 500 | 22,135 | ||||||
Alnylam Pharmaceuticals, Inc.(b) | 10,000 | 945,300 | ||||||
Array BioPharma, Inc.(b) | 15,500 | 210,180 | ||||||
Atara Biotherapeutics, Inc.(b) | 6,500 | 262,275 | ||||||
Audentes Therapeutics, Inc.(b) | 7,500 | 280,200 | ||||||
BeiGene Ltd.—ADR(a)(b) | 1,500 | 254,370 | ||||||
Bellicum Pharmaceuticals, Inc.(b) | 1,000 | 6,690 | ||||||
BioMarin Pharmaceutical, Inc.(b) | 1,000 | 83,510 | ||||||
Bluebird Bio, Inc.(b) | 18,500 | 3,147,775 | ||||||
Blueprint Medicines Corp.(b) | 1,500 | 115,080 | ||||||
Cellectis SA—ADR(a)(b) | 500 | 14,350 | ||||||
Clovis Oncology, Inc.(b) | 9,000 | 390,420 | ||||||
CRISPR Therapeutics AG(a)(b) | 13,000 | 609,180 | ||||||
Dermira, Inc.(b) | 500 | 4,555 | ||||||
Editas Medicine, Inc.(b) | 11,000 | 345,400 | ||||||
Esperion Therapeutics, Inc.(b) | 1,500 | 105,015 | ||||||
Five Prime Therapeutics, Inc.(b) | 3,000 | 50,250 | ||||||
Forward Pharma A/S—ADR(a) | 1,000 | 1,960 | ||||||
Genfit(a)(b) | 500 | 14,189 | ||||||
Genmab A/S(a)(b) | 2,500 | 507,318 | ||||||
Global Blood Therapeutics, Inc.(b) | 8,000 | 353,200 | ||||||
Immunomedics, Inc.(b) | 24,000 | 437,040 | ||||||
Incyte Corp.(b) | 1,000 | 61,940 | ||||||
Inovio Pharmaceuticals, Inc.(b) | 1,000 | 4,390 | ||||||
Intellia Therapeutics, Inc.(b) | 13,500 | 270,270 | ||||||
Intra-Cellular Therapies, Inc.(b) | 3,500 | 60,970 | ||||||
Iovance Biotherapeutics, Inc.(b) | 16,500 | 239,250 | ||||||
Jounce Therapeutics, Inc.(b) | 25,000 | 514,750 | ||||||
La Jolla Pharmaceutical Co.(b) | 4,000 | 116,080 | ||||||
Loxo Oncology, Inc.(b) | 4,000 | $ | 503,640 | |||||
Madrigal Pharmaceuticals, Inc.(b) | 3,000 | 339,480 | ||||||
Nektar Therapeutics(b) | 10,500 | 878,430 | ||||||
Neurocrine Biosciences, Inc.(b) | 4,500 | 364,860 | ||||||
Portola Pharmaceuticals, Inc.(b) | 3,500 | 126,455 | ||||||
REGENXBIO, Inc.(b) | 8,500 | 317,475 | ||||||
Sage Therapeutics, Inc.(b) | 25,000 | 3,598,000 | ||||||
Sangamo Therapeutics, Inc.(b) | 21,000 | 331,800 | ||||||
Sarepta Therapeutics, Inc.(b) | 21,000 | 1,603,560 | ||||||
Seattle Genetics, Inc.(b) | 2,500 | 127,975 | ||||||
Spark Therapeutics, Inc.(b) | 23,500 | 1,793,520 | ||||||
TESARO, Inc.(b) | 11,000 | 560,010 | ||||||
Ultragenyx Pharmaceutical, Inc.(b) | 500 | 25,420 | ||||||
Vertex Pharmaceuticals, Inc.(b) | 2,500 | 382,900 | ||||||
Voyager Therapeutics, Inc.(b) | 20,000 | 363,200 | ||||||
Xencor, Inc.(b) | 1,500 | 43,485 | ||||||
| 21,515,182 | ||||||||
Retailing—4.3% | ||||||||
Booking Holdings, Inc.(b) | 800 | 1,742,400 | ||||||
Netflix, Inc.(b) | 5,000 | 1,562,300 | ||||||
Pool Corp. | 2,000 | 277,620 | ||||||
| 3,582,320 | ||||||||
Semiconductors & Semiconductor Equipment—12.4% |
| |||||||
ams AG(a) | 16,500 | 1,371,615 | ||||||
ASML Holding NV(a) | 2,200 | 414,590 | ||||||
Impinj, Inc.(b) | 1,000 | 12,290 | ||||||
Integrated Device Technology, Inc.(b) | 10,000 | 278,300 | ||||||
MACOM Technology Solutions Holdings, Inc.(b) | 500 | 8,310 | ||||||
Marvell Technology Group Ltd.(a) | 22,500 | 451,350 | ||||||
MKS Instruments, Inc. | 3,000 | 307,200 | ||||||
NVIDIA Corp. | 23,500 | 5,285,150 | ||||||
NXP Semiconductors NV(a)(b) | 2,000 | 209,800 | ||||||
Silicon Laboratories, Inc.(b) | 2,000 | 185,800 | ||||||
Texas Instruments, Inc. | 7,500 | 760,725 | ||||||
Universal Display Corp. | 5,500 | 484,275 | ||||||
Xilinx, Inc. | 7,500 | 481,800 | ||||||
| 10,251,205 | ||||||||
The Accompanying Footnotes are an Integral Part of these Financial Statements.
| 34 | April 30, 2018 |
The Tocqueville Opportunity Fund
Schedule of Investments as of April 30, 2018
(Unaudited)
| Common Stocks—99.5% | Shares | Value | ||||||
Software & Services—41.2% | ||||||||
Activision Blizzard, Inc. | 1,000 | $ | 66,350 | |||||
Adobe Systems, Inc.(b) | 5,500 | 1,218,800 | ||||||
Alliance Data Systems Corp. | 200 | 40,610 | ||||||
Alphabet, Inc.—Class C(b) | 600 | 610,398 | ||||||
ANSYS, Inc.(b) | 1,000 | 161,660 | ||||||
Appian Corp.(b) | 10,000 | 271,100 | ||||||
Apptio, Inc.—Class A(b) | 7,000 | 206,570 | ||||||
Aspen Technology, Inc.(b) | 3,000 | 263,250 | ||||||
Atlassian Corp PLC—Class A(a)(b) | 7,000 | 391,860 | ||||||
Autodesk, Inc.(b) | 2,500 | 314,750 | ||||||
Broadridge Financial Solutions, Inc. | 3,000 | 321,630 | ||||||
Cadence Design Systems, Inc.(b) | 5,000 | 200,300 | ||||||
Cloudera, Inc.(b) | 7,500 | 106,875 | ||||||
Coupa Software, Inc.(b) | 20,000 | 927,400 | ||||||
EPAM Systems, Inc.(b) | 2,000 | 228,700 | ||||||
Euronet Worldwide, Inc.(b) | 2,000 | 156,220 | ||||||
Fair Isaac Corp.(b) | 2,500 | 432,950 | ||||||
Fidelity National Information Services, Inc. | 500 | 47,485 | ||||||
Fiserv, Inc.(b) | 3,000 | 212,580 | ||||||
FleetCor Technologies, Inc.(b) | 800 | 165,824 | ||||||
Fortinet, Inc.(b) | 3,500 | 193,760 | ||||||
Gartner, Inc.(b) | 1,000 | 121,290 | ||||||
Global Payments, Inc. | 3,500 | 395,675 | ||||||
GoDaddy, Inc.—Class A(b) | 4,500 | 290,520 | ||||||
GrubHub, Inc.(b) | 1,700 | 171,938 | ||||||
Guidewire Software, Inc.(b) | 3,000 | 253,860 | ||||||
HubSpot, Inc.(b) | 2,000 | 211,800 | ||||||
New Relic, Inc.(b) | 38,500 | 2,690,765 | ||||||
Nutanix, Inc.—Class A(b) | 31,000 | 1,568,290 | ||||||
Okta, Inc.(b) | 5,000 | 214,050 | ||||||
Paycom Software, Inc.(b) | 15,000 | 1,713,150 | ||||||
Paylocity Holding Corp.(b) | 17,500 | 956,025 | ||||||
PayPal Holdings, Inc.(b) | 8,500 | 634,185 | ||||||
Pegasystems, Inc. | 4,500 | 274,725 | ||||||
Proofpoint, Inc.(b) | 11,500 | 1,356,310 | ||||||
PTC, Inc.(b) | 1,500 | 123,525 | ||||||
RealPage, Inc.(b) | 3,500 | 187,250 | ||||||
Red Hat, Inc.(b) | 4,500 | 733,770 | ||||||
salesforce.com, Inc.(b) | 13,000 | 1,572,870 | ||||||
ServiceNow, Inc.(b) | 26,000 | $ | 4,319,640 | |||||
Shopify, Inc.—Class A(a)(b) | 15,000 | 2,004,450 | ||||||
Splunk, Inc.(b) | 11,000 | 1,129,150 | ||||||
Square, Inc.—Class A(b) | 8,500 | 402,390 | ||||||
SS&C Technologies Holdings, Inc. | 2,000 | 99,300 | ||||||
Tableau Software, Inc.—Class A(b) | 8,000 | 680,400 | ||||||
Tencent Holdings Ltd.(a) | 2,000 | 99,635 | ||||||
The Ultimate Software Group, Inc.(b) | 1,550 | 371,876 | ||||||
Total System Services, Inc. | 2,000 | 168,120 | ||||||
Twitter, Inc.(b) | 5,000 | 151,550 | ||||||
Tyler Technologies, Inc.(b) | 1,500 | 328,380 | ||||||
WEX, Inc.(b) | 1,000 | 161,920 | ||||||
Wirecard AG(a) | 2,500 | 341,448 | ||||||
Workday, Inc.—Class A(b) | 22,000 | 2,746,480 | ||||||
Worldpay, Inc.—Class A(b) | 6,500 | 527,930 | ||||||
Zendesk, Inc.(b) | 12,000 | 585,000 | ||||||
| 34,126,739 | ||||||||
Technology Hardware & Equipment—1.8% |
| |||||||
Fabrinet(a)(b) | 500 | 14,105 | ||||||
II-VI, Inc.(b) | 1,000 | 38,100 | ||||||
Lumentum Holdings, Inc.(b) | 4,000 | 201,800 | ||||||
Palo Alto Networks, Inc.(b) | 3,500 | 673,785 | ||||||
Samsung Electronics Co Ltd.—GDR(a) | 400 | 394,800 | ||||||
Viavi Solutions, Inc.(b) | 15,000 | 141,750 | ||||||
| 1,464,340 | ||||||||
Transportation—1.4% | ||||||||
JB Hunt Transport Services, Inc. | 800 | 93,944 | ||||||
Knight-Swift Transportation Holdings, Inc. | 4,500 | 175,545 | ||||||
Old Dominion Freight Line, Inc. | 2,000 | 267,720 | ||||||
Union Pacific Corp. | 1,500 | 200,445 | ||||||
Werner Enterprises, Inc. | 3,000 | 102,900 | ||||||
XPO Logistics, Inc.(b) | 3,500 | 340,060 | ||||||
| 1,180,614 | ||||||||
Total Common Stocks (Cost $58,794,260) | 82,340,542 | |||||||
The Accompanying Footnotes are an Integral Part of these Financial Statements.
| Semi-Annual Report | 35 |
The Tocqueville Opportunity Fund
Schedule of Investments as of April 30, 2018
(Unaudited)
| Real Estate Investment Trusts (REITS)—0.0% | Shares | Value | ||||||
Real Estate—0.0% | ||||||||
Digital Realty Trust, Inc. | 272 | $ | 28,747 | |||||
Equinix, Inc. | 1 | 421 | ||||||
Total Real Estate Investment Trusts |
| 29,168 | ||||||
Purchased Call Options—0.6% | Contracts | |||||||
Banks—0.0% | ||||||||
Bank of the Ozarks | 400 | 6,000 | ||||||
Capital Goods—0.0% | ||||||||
Caterpillar, Inc. | 150 | 750 | ||||||
Parker-Hannifin Corp. | 150 | 1,875 | ||||||
Rockwell Automation, Inc. | 200 | 2,500 | ||||||
| 5,125 | ||||||||
Pharmaceuticals, Biotechnology & Life Sciences—0.2% |
| |||||||
BioMarin Pharmaceutical, Inc. | 100 | 54,000 | ||||||
Clovis Oncology, Inc. | 125 | 10,125 | ||||||
Incyte Corp. | 100 | 1,250 | ||||||
Intra-Cellular Therapies, Inc. | 350 | 55,125 | ||||||
| 120,500 | ||||||||
Semiconductors & Semiconductor Equipment—0.3% |
| |||||||
Broadcom Ltd. | 125 | $ | 40,625 | |||||
Intel Corp. | 500 | 240,000 | ||||||
| 280,625 | ||||||||
Software & Services—0.1% | ||||||||
Alphabet, Inc.—Class C | 25 | 89,500 | ||||||
Total Purchased Call Options |
| 501,750 | ||||||
| Short-Term Investment—0.1% | Shares | |||||||
Money Market Fund—0.1% | ||||||||
STIT-Treasury Portfolio—Institutional Class, 1.600%(c) | 66,846 | 66,846 | ||||||
Total Short-Term Investment (Cost $66,846) | 66,846 | |||||||
Total Investments |
| 82,938,306 | ||||||
Liabilities in Excess of Other Assets—(0.2)% |
| (151,000 | ) | |||||
Total Net Assets—100.0% |
| $ | 82,787,306 | |||||
|
| |||||||
Percentages are stated as a percent of net assets.
ADR American Depository Receipt
GDR Global Depository Receipt
| (a) | Foreign issued Security. Foreign Concentration (including ADR’s and GDR’s) was as follows: Austria 1.7%, Bermuda 0.5%; Canada 2.5%; Cayman Islands 0.4%, Denmark 0.6%; France 0.0%; Germany 0.4%; Ireland 0.0%; Jersey 0.0%, Republic of Korea 0.5%; Netherlands 0.8%; Switzerland 0.7%; United Kingdom 0.7%. |
| (b) | Non-income producing security. |
| (c) | Rate listed is the 7-day effective yield. |
The Accompanying Footnotes are an Integral Part of these Financial Statements.
| 36 | April 30, 2018 |
The Tocqueville International Value Fund
Schedule of Investments as of April 30, 2018
(Unaudited)
| Common Stocks—87.9% | Shares | Value | ||||||
Australia—1.9% | ||||||||
BHP Billiton Ltd.—ADR | 534,300 | $ | 24,978,525 | |||||
Belgium—2.2% | ||||||||
Groupe Bruxelles Lambert SA | 257,987 | 29,489,668 | ||||||
Brazil—2.1% | ||||||||
Ambev SA—ADR | 2,735,000 | 18,105,700 | ||||||
Cielo SA | 1,731,900 | 9,506,862 | ||||||
| 27,612,562 | ||||||||
Canada—1.4% | ||||||||
Nutrien Ltd. | 422,304 | 19,227,501 | ||||||
Denmark—2.2% | ||||||||
ISS A/S | 825,900 | 28,802,560 | ||||||
Finland—1.3% | ||||||||
Nokia OYJ—ADR | 2,950,900 | 17,734,909 | ||||||
France—14.1% | ||||||||
Atos SE | 32,231 | 4,351,183 | ||||||
Bollore SA | 5,580,429 | 27,735,390 | ||||||
Bureau Veritas SA | 1,064,948 | 27,846,028 | ||||||
Cie de Saint-Gobain | 497,748 | 26,042,665 | ||||||
IPSOS | 333,656 | 12,702,604 | ||||||
Publicis Groupe SA | 327,750 | 24,509,089 | ||||||
Sanofi | 385,666 | 30,491,605 | ||||||
Sopra Steria Group | 156,782 | 33,466,300 | ||||||
| 187,144,864 | ||||||||
Germany—8.0% | ||||||||
Bayer AG | 278,750 | 33,316,042 | ||||||
Infineon Technologies AG | 1,034,069 | 26,478,039 | ||||||
Siemens AG—ADR | 512,900 | 32,538,376 | ||||||
Wacker Neuson SE | 443,119 | 14,255,448 | ||||||
| 106,587,905 | ||||||||
Hong Kong—1.1% | ||||||||
Clear Media Ltd.(a) (Originally acquired 10/08/2009, Cost $14,895,581) | 15,955,100 | 12,197,079 | ||||||
Kerry Logistics Network Ltd. | 2,009,500 | 3,068,572 | ||||||
| 15,265,651 | ||||||||
Ireland—2.2% | ||||||||
CRH PLC | 837,163 | $ | 29,728,801 | |||||
Japan—18.4% | ||||||||
Amano Corp. | 1,044,400 | 25,886,384 | ||||||
Asics Corp. | 1,446,600 | 27,335,786 | ||||||
FANUC Corp. | 131,370 | 28,140,851 | ||||||
Hitachi Ltd. | 3,726,840 | 27,200,560 | ||||||
Hoya Corp. | 316,600 | 16,914,307 | ||||||
Kao Corp. | 340,900 | 24,505,951 | ||||||
Makita Corp. | 530,000 | 23,746,422 | ||||||
Miraca Holdings, Inc. | 587,000 | 22,851,868 | ||||||
Mitsubishi UFJ Financial Group, Inc. | 4,003,000 | 26,825,478 | ||||||
SMC Corp. | 29,515 | 11,215,492 | ||||||
Toho Co. Ltd. | 286,380 | 9,552,566 | ||||||
| 244,175,665 | ||||||||
Netherlands—3.0% | ||||||||
Akzo Nobel NV | 213,900 | 19,370,402 | ||||||
Unilever NV—ADR | 358,000 | 20,448,960 | ||||||
| 39,819,362 | ||||||||
Netherlands Antilles—2.0% |
| |||||||
Schlumberger Ltd. | 385,200 | 26,409,312 | ||||||
Republic of Korea—1.2% |
| |||||||
KT&G Corp. | 178,400 | 16,313,313 | ||||||
Spain—3.8% | ||||||||
Applus Services SA | 2,174,830 | 29,387,737 | ||||||
Banco Santander SA | 3,200,400 | 20,677,516 | ||||||
| 50,065,253 | ||||||||
Sweden—1.0% | ||||||||
Telefonaktiebolaget LM Ericsson—Class B | 1,686,288 | 12,855,367 | ||||||
Switzerland—5.4% | ||||||||
Credit Suisse Group AG—ADR | 1,360,678 | 22,818,570 | ||||||
Novartis AG—ADR | 341,600 | 26,197,304 | ||||||
UBS Group AG | 1,379,113 | 23,169,098 | ||||||
| 72,184,972 | ||||||||
United Kingdom—13.0% |
| |||||||
AVEVA Group PLC | 660,423 | 19,497,072 | ||||||
British American Tobacco PLC—ADR | 351,500 | 19,198,930 | ||||||
The Accompanying Footnotes are an Integral Part of these Financial Statements.
| Semi-Annual Report | 37 |
The Tocqueville International Value Fund
Schedule of Investments as of April 30, 2018
(Unaudited)
| Common Stocks—87.9% | Shares | Value | ||||||
Diageo PLC—ADR | 186,400 | $ | 26,461,344 | |||||
Johnson Matthey PLC | 220,500 | 9,965,430 | ||||||
Lloyds Banking Group PLC | 24,243,812 | 21,503,120 | ||||||
Micro Focus International PLC | 940,800 | 16,222,442 | ||||||
Royal Dutch Shell PLC—Class B—ADR | 457,658 | 33,143,592 | ||||||
Smiths Group PLC | 1,200,764 | 26,310,436 | ||||||
| 172,302,366 | ||||||||
United States—3.6% | ||||||||
Aflac, Inc. | 684,300 | 31,183,551 | ||||||
Estre Ambiental SA(b) | 1,440,000 | 17,280,000 | ||||||
| 48,463,551 | ||||||||
Total Common Stocks | 1,169,162,107 | |||||||
Preferred Stocks—4.0% |
| |||||||
Brazil—1.4% | ||||||||
Telefonica Brasil SA—ADR | 1,294,500 | 18,278,340 | ||||||
Republic of Korea—2.6% |
| |||||||
Samsung Electronics Co. Ltd. | 17,700 | 35,194,591 | ||||||
Total Preferred Stocks | 53,472,931 | |||||||
Real Estate Investment Trust (REIT)—0.8% |
| |||||||
Mexico—0.8% | ||||||||
Fibra Uno Administracion SA de CV | 5,982,556 | 9,906,922 | ||||||
Total Real Estate Investment Trust |
| 9,906,922 | ||||||
Short-Term Investments—6.7% |
| |||||||
Money Market Fund—4.9% |
| |||||||
STIT-Treasury Portfolio—Institutional Class, 1.600%(c) | 65,362,000 | 65,362,000 | ||||||
| Money Market Deposit Account—1.8% | Principal Amount | Value | ||||||
U.S. Bank Money Market Deposit Account, 0.300%(d) | $ | 23,720,871 | $ | 23,720,871 | ||||
Total Short-Term Investments |
| 89,082,871 | ||||||
Total Investments |
| 1,321,624,831 | ||||||
Other Assets in Excess of Liabilities—0.6% |
| 7,853,732 | ||||||
Total Net Assets—100.0% |
| $ | 1,329,478,563 | |||||
|
| |||||||
Percentages are stated as a percent of net assets.
ADR American Depository Receipt
| (a) | Denotes a security that is either fully or partially restricted to resale. The value of restricted securities as of April 30, 2018 was $12,197,079, which represented 0.9% of net assets. |
| (b) | Non-income producing security. |
| (c) | Rate listed is the 7-day effective yield. |
| (d) | Variable rate security. The rate listed is as of 4/30/2018. |
The Accompanying Footnotes are an Integral Part of these Financial Statements.
| 38 | April 30, 2018 |
The Tocqueville Gold Fund
Schedule of Investments as of April 30, 2018
(Unaudited)
| Common Stocks—83.0% | Shares | Value | ||||||
Gold Related Securities—74.0% |
| |||||||
Australia—6.3% | ||||||||
Evolution Mining Ltd. | 12,386,774 | $ | 29,934,385 | |||||
Newcrest Mining Ltd. | 1,308,700 | 20,838,074 | ||||||
Northern Star Resources Ltd. | 3,187,500 | 15,334,095 | ||||||
| 66,106,554 | ||||||||
Canada—55.3% | ||||||||
Agnico Eagle Mines Ltd. | 236,200 | 9,941,658 | ||||||
Agnico Eagle Mines Ltd.(a) | 526,485 | 22,155,056 | ||||||
Alacer Gold Corp.(b) | 4,091,800 | 6,788,063 | ||||||
Alamos Gold, Inc.—Class A | 2,469,500 | 13,335,300 | ||||||
Almaden Minerals Ltd.—Class B(b)(c) | 5,607,319 | 4,585,603 | ||||||
Argonaut Gold, Inc.(b)(c) | 2,837,000 | 5,457,681 | ||||||
ATAC Resources Ltd.(b)(c) | 9,784,891 | 4,267,720 | ||||||
B2Gold Corp.(b) | 11,579,700 | 33,233,739 | ||||||
Barkerville Gold Mines Ltd.(b) | 7,110,000 | 3,599,439 | ||||||
Corvus Gold, Inc.(b)(c) | 3,226,901 | 6,711,954 | ||||||
Corvus Gold, Inc.(a)(b)(c) | 13,030,000 | 27,096,149 | ||||||
Corvus Gold, Inc.(b)(c)(d)(e) (Originally acquired 11/29/17, Cost $1,561,600) | 1,739,130 | 3,544,225 | ||||||
Dalradian Resources, Inc.(b) | 8,154,000 | 6,477,729 | ||||||
Detour Gold Corp.(b) | 4,470,100 | 32,308,523 | ||||||
East Asia Minerals Corp.(b)(c) | 13,290,993 | 543,462 | ||||||
Falco Resources Ltd.(b)(c) | 16,222,300 | 8,212,544 | ||||||
Franco-Nevada Corp. | 605,900 | 42,976,216 | ||||||
GoGold Resources, Inc.(b) | 4,455,000 | 1,491,997 | ||||||
Goldcorp, Inc. | 1,935,910 | 25,692,516 | ||||||
Gold Standard Ventures Corp.(b) | 7,011,700 | 10,922,076 | ||||||
IAMGOLD Corp.(b) | 3,880,500 | 21,187,530 | ||||||
International Tower Hill Mines Ltd.(b)(c) | 5,738,836 | 3,558,078 | ||||||
International Tower Hill Mines Ltd.(a)(b)(c) | 20,331,298 | $ | 12,351,270 | |||||
Jaguar Mining, Inc.(b)(c) | 64,330,707 | 17,035,274 | ||||||
Kinross Gold Corp.(b) | 5,401,200 | 20,956,656 | ||||||
Novagold Resources, Inc.(b) | 2,831,300 | 13,533,614 | ||||||
NuLegacy Gold Corp.(b)(c) | 28,556,090 | 4,003,346 | ||||||
OceanaGold Corp. | 4,431,459 | 11,876,310 | ||||||
OceanaGold Corp.(a) | 3,645,600 | 9,824,196 | ||||||
Osisko Gold Royalties Ltd. | 24,340 | 237,558 | ||||||
Osisko Gold Royalties Ltd.(a) | 2,014,400 | 19,658,423 | ||||||
Osisko Mining, Inc.(b)(c) | 7,704,239 | 15,961,117 | ||||||
Pan American Silver Corp. | 2,755,798 | 44,423,464 | ||||||
Premier Gold Mines Ltd.(b)(c) | 8,630,160 | 18,282,671 | ||||||
Rockhaven Resources Ltd.(b) | 4,631,500 | 505,012 | ||||||
SEMAFO, Inc.(b)(c) | 11,300,000 | 35,135,090 | ||||||
Strategic Metals Ltd.(b)(c) | 10,113,400 | 3,268,867 | ||||||
Torex Gold Resources, Inc.(b) | 1,597,000 | 16,418,396 | ||||||
Trifecta Gold Ltd.(b)(c) | 2,325,199 | 181,097 | ||||||
Wheaton Precious Metals Corp. | 1,491,675 | 31,011,923 | ||||||
Yamana Gold, Inc. | 3,524,000 | 10,113,880 | ||||||
| 578,865,422 | ||||||||
Jersey—1.6% | ||||||||
Randgold Resources Ltd.—ADR | 201,400 | 16,333,540 | ||||||
Peru—1.2% | ||||||||
Cia de Minas Buenaventura SAA—ADR | 798,100 | 12,729,695 | ||||||
United Kingdom—2.9% | ||||||||
Fresnillo PLC | 1,742,300 | 30,582,658 | ||||||
United States—6.7% | ||||||||
Contango ORE, Inc.(b) | 263,200 | 6,416,816 | ||||||
The Accompanying Footnotes are an Integral Part of these Financial Statements.
| Semi-Annual Report | 39 |
The Tocqueville Gold Fund
Schedule of Investments as of April 30, 2018
(Unaudited)
| Common Stocks—83.0% | Shares | Value | ||||||
Electrum Ltd.(b)(d)(e) (Originally acquired 12/21/07, Cost $13,065,361) | 2,127,287 | $ | 702,005 | |||||
Newmont Mining Corp. | 861,700 | 33,856,193 | ||||||
Royal Gold, Inc. | 323,700 | 28,744,560 | ||||||
| 69,719,574 | ||||||||
Total Gold Related Securities |
| 774,337,443 | ||||||
Other Precious Metals Related Securities—8.3% |
| |||||||
Canada—7.3% | ||||||||
Bear Creek Mining Corp.(b)(c) | 7,413,200 | 11,720,703 | ||||||
Ivanhoe Mines Ltd.—Class A(b) | 7,882,379 | 16,268,783 | ||||||
MAG Silver Corp.(b)(c) | 1,432,665 | 15,922,839 | ||||||
MAG Silver Corp.(b)(c) | 2,661,600 | 29,623,608 | ||||||
Nickel Creek Platinum Ltd.(b)(c) | 12,379,201 | 2,554,997 | ||||||
| 76,090,930 | ||||||||
United States—1.0% | ||||||||
Sunshine Mining & Refining(b)(d)(e) (Originally acquired 03/15/11, Cost $21,353,108) | 2,300,212 | 10,350,954 | ||||||
Total Other Precious Metals Related Securities |
| 86,441,884 | ||||||
Other Securities—0.7% | ||||||||
United States—0.7% | ||||||||
Gold Bullion International LLC(b)(c)(d)(e) (Originally acquired 05/12/10, Cost $5,000,000) | 5,000,000 | 6,893,000 | ||||||
I-Pulse, Inc.(b)(d)(e) (Originally acquired 10/09/07, Cost $175,524) | 74,532 | 640,975 | ||||||
Total Other Securities | 7,533,975 | |||||||
Total Common Stocks |
| 868,313,302 | ||||||
Gold Related Security—1.7% |
| |||||||
Tocqueville Bullion Reserve LP(b)(c)(d)(e) (Originally acquired 11/28/11, Cost $25,000,000) | 13,806 | $ | 17,510,192 | |||||
Total Private Fund | 17,510,192 | |||||||
| Gold Bullion—15.1% | Ounces | |||||||
Gold Bullion(b) | 119,680 | 157,420,484 | ||||||
Total Gold Bullion | 157,420,484 | |||||||
| Warrants—0.1% | Shares | |||||||
Gold Related Securities—0.0% |
| |||||||
Canada—0.0% | ||||||||
Almaden Minerals Ltd. | 79,585 | 10,339 | ||||||
Almaden Minerals Ltd. | 740,741 | 18,116 | ||||||
Barkerville Gold Mines Ltd. | 3,555,000 | 20,212 | ||||||
East Asia Minerals Corp. | 3,321,250 | 142,271 | ||||||
The Accompanying Footnotes are an Integral Part of these Financial Statements.
| 40 | April 30, 2018 |
The Tocqueville Gold Fund
Schedule of Investments as of April 30, 2018
(Unaudited)
| Warrants—0.1% | Shares | Value | ||||||
East Asia Minerals Corp. | 4,617,560 | $ | 196,362 | |||||
East Asia Minerals Corp. | 976,493 | — | ||||||
Equinox Gold Corp. | 150,000 | 152 | ||||||
Falco Resources Ltd. | 7,000,000 | — | ||||||
Osisko Gold Royalties Ltd. | 274,000 | 278,492 | ||||||
Total Gold Related Securities |
| 665,944 | ||||||
Other Precious Metals Related Security—0.1% |
| |||||||
Canada—0.1% | ||||||||
Nickel Creek Platinum Ltd. | 6,189,601 | 729,379 | ||||||
Total Warrants | 1,395,323 | |||||||
Money Market Fund—0.2% |
| |||||||
STIT—Treasury Portfolio—Institutional Class, 1.600%(f) | 2,449,417 | $ | 2,449,417 | |||||
Total Short-Term Investment |
| 2,449,417 | ||||||
Total Investments |
| 1,047,088,718 | ||||||
Liabilities in Excess of Other Assets—(0.1)% |
| (1,109,268 | ) | |||||
Total Net Assets—100.0% |
| $ | 1,045,979,450 | |||||
|
| |||||||
| Percentages | are stated as a percent of net assets. |
| ADR | American Depository Receipt |
| (a) | Denotes an issue that is traded on a foreign exchange when a company is listed more than once. |
| (b) | Non-income producing security. |
| (c) | Affiliated company. See Footnote 8. |
| (d) | Denotes a security that is either fully or partially restricted to resale. The value of restricted securities as of April 30, 2018 was $40,758,182, which represented 3.9% of net assets. |
| (e) | Security is fair valued using procedures approved by the Board of Trustees which includes significant unobservable inputs and is deemed a Level 3 security. See Footnote 2. The aggregate value of fair valued securities as of April 30, 2018 was $40,758,182, which represented 3.9% of net assets. |
| (f) | Rate listed is the 7-day effective yield. |
The Accompanying Footnotes are an Integral Part of these Financial Statements.
| Semi-Annual Report | 41 |
The Delafield Fund
Schedule of Investments as of April 30, 2018
(Unaudited)
| Common Stocks—73.5% | Shares | Value | ||||||
Aerospace & Defense—2.0% |
| |||||||
Ducommun, Inc.(a) | 200,000 | $ | 5,818,000 | |||||
Auto Components—3.2% | ||||||||
Cooper Tire & Rubber Co. | 100,000 | 2,445,000 | ||||||
Gentex Corp. | 145,000 | 3,297,300 | ||||||
Horizon Global Corp.(a) | 475,000 | 3,548,250 | ||||||
| 9,290,550 | ||||||||
Building Products—1.1% | ||||||||
Apogee Enterprises, Inc. | 79,000 | 3,247,690 | ||||||
Chemicals—13.3% | ||||||||
Eastman Chemical Co. | 100,000 | 10,208,000 | ||||||
GCP Applied Technologies, Inc.(a) | 120,000 | 3,438,000 | ||||||
HB Fuller Co. | 140,000 | 6,925,800 | ||||||
Minerals Technologies, Inc. | 85,000 | 5,869,250 | ||||||
PolyOne Corp. | 175,000 | 7,323,750 | ||||||
WR Grace & Co. | 75,000 | 5,133,000 | ||||||
| 38,897,800 | ||||||||
Commercial Services & Supplies—1.9% |
| |||||||
Pitney Bowes, Inc. | 100,000 | 1,022,000 | ||||||
Team, Inc.(a) | 273,705 | 4,639,300 | ||||||
| 5,661,300 | ||||||||
Construction and Engineering—1.6% |
| |||||||
Aegion Corp.(a) | 200,000 | 4,538,000 | ||||||
Construction Materials—3.5% |
| |||||||
U.S. Concrete, Inc.(a) | 175,000 | 10,228,750 | ||||||
Electrical Equipment—0.5% |
| |||||||
Acuity Brands, Inc. | 12,500 | 1,497,125 | ||||||
Electronic Equipment, Instruments & Components—11.6% |
| |||||||
Avnet, Inc. | 75,000 | 2,942,250 | ||||||
Fabrinet(a)(b) | 240,000 | 6,770,400 | ||||||
Flex Ltd.(a)(b) | 450,000 | 5,850,000 | ||||||
Plexus Corp.(a) | 65,000 | 3,564,600 | ||||||
TTM Technologies, Inc.(a) | 1,060,000 | 14,776,400 | ||||||
| 33,903,650 | ||||||||
Energy Equipment & Services—3.2% |
| |||||||
Aspen Aerogels, Inc.(a) | 600,000 | 2,700,000 | ||||||
McDermott International, Inc.(a)(b) | 1,000,000 | 6,600,000 | ||||||
| 9,300,000 | ||||||||
Household Durables—0.7% |
| |||||||
Newell Brands, Inc. | 70,000 | $ | 1,934,100 | |||||
Internet Software & Services—1.2% |
| |||||||
Cars.com, Inc.(a) | 125,000 | 3,560,000 | ||||||
Machinery—7.2% | ||||||||
Barnes Group, Inc. | 90,000 | 4,997,700 | ||||||
Crane Co. | 75,000 | 6,273,000 | ||||||
Harsco Corp.(a) | 300,000 | 6,135,000 | ||||||
Xerium Technologies, Inc.(a)(c) | 550,000 | 3,602,500 | ||||||
| 21,008,200 | ||||||||
Media—1.5% | ||||||||
TEGNA, Inc. | 425,000 | 4,492,250 | ||||||
Oil, Gas & Consumable Fuels—1.8% |
| |||||||
Boardwalk Pipeline Partners LP | 475,000 | 5,400,750 | ||||||
Metals & Mining—1.0% |
| |||||||
Commercial Metals Co. | 135,000 | 2,836,350 | ||||||
Professional Services—4.8% |
| |||||||
Korn/Ferry International | 115,000 | 6,147,900 | ||||||
TrueBlue, Inc.(a) | 300,000 | 7,995,000 | ||||||
| 14,142,900 | ||||||||
Specialty Retail—0.5% | ||||||||
Ascena Retail Group, Inc.(a) | 725,000 | 1,609,500 | ||||||
Technology Hardware, Storage & Peripherals—4.7% |
| |||||||
Diebold Nixdorf, Inc. | 555,000 | 8,519,250 | ||||||
Hewlett Packard Enterprise Co. | 300,000 | 5,115,000 | ||||||
| 13,634,250 | ||||||||
Textiles, Apparel & Luxury Goods—4.0% |
| |||||||
Hanesbrands, Inc. | 210,000 | 3,878,700 | ||||||
PVH Corp. | 40,000 | 6,386,800 | ||||||
Sequential Brands Group, Inc.(a) | 815,000 | 1,572,950 | ||||||
| 11,838,450 | ||||||||
Trading Companies & Distributors—4.2% |
| |||||||
Rush Enterprises, Inc.—Class A(a) | 115,000 | 4,695,450 | ||||||
The Accompanying Footnotes are an Integral Part of these Financial Statements.
| 42 | April 30, 2018 |
The Delafield Fund
Schedule of Investments as of April 30, 2018
(Unaudited)
| Common Stocks—73.5% | Shares | Value | ||||||
WESCO International, Inc.(a) | 125,000 | $ | 7,443,750 | |||||
| 12,139,200 | ||||||||
Total Common Stocks |
| 214,978,815 | ||||||
Short-Term Investments—27.7% |
| |||||||
Money Market Fund—5.0% |
| |||||||
STIT-Treasury Portfolio—Institutional Class, 1.600%(d) | 14,800,000 | 14,800,000 | ||||||
| Money Market Deposit Account—22.7% | Principal Amount | |||||||
U.S. Bank Money Market Deposit Account, 0.300%(e) | $ | 66,312,074 | 66,312,074 | |||||
Total Short-Term Investments | 81,112,074 | |||||||
Total Investments |
| 296,090,889 | ||||||
Liabilities in Excess of Other Assets—(1.2)% |
| (3,546,936 | ) | |||||
Total Net Assets—100.0% |
| $ | 292,543,953 | |||||
|
| |||||||
| Percentages | are stated as a percent of net assets. |
| (a) | Non-income producing security. |
| (b) | Foreign issued Security. Foreign Concentration (including ADR’s) was as follows: Cayman Islands: 2.3%, Panama: 2.3%; Singapore: 2.0%. |
| (c) | Affiliated company. See Footnote 8. |
| (d) | Rate listed is the 7-day effective yield. |
| (e) | Variable rate security. The rate shown is as of 4/30/2018. |
The Accompanying Footnotes are an Integral Part of these Financial Statements.
| Semi-Annual Report | 43 |
The Tocqueville Select Fund
Schedule of Investments as of April 30, 2018
(Unaudited)
| Common Stocks—96.9% | Shares | Value | ||||||
Auto Components—8.8% |
| |||||||
Gentex Corp. | 108,000 | $ | 2,455,920 | |||||
Horizon Global Corp.(a) | 162,000 | 1,210,140 | ||||||
| 3,666,060 | ||||||||
Chemicals—14.1% |
| |||||||
Eastman Chemical Co. | 21,500 | 2,194,720 | ||||||
Minerals Technologies, Inc. | 28,900 | 1,995,545 | ||||||
WR Grace & Co. | 24,200 | 1,656,248 | ||||||
| 5,846,513 | ||||||||
Commercial Services & Supplies—5.8% |
| |||||||
Team, Inc.(a) | 140,900 | 2,388,255 | ||||||
Computers & Peripherals—2.9% |
| |||||||
Diebold Nixdorf, Inc. | 77,000 | 1,181,950 | ||||||
Electronic Equipment, Instruments & Components—12.1% |
| |||||||
Fabrinet(a)(b) | 51,000 | 1,438,710 | ||||||
Flex Ltd.(a)(b) | 118,500 | 1,540,500 | ||||||
TTM Technologies, Inc.(a) | 147,000 | 2,049,180 | ||||||
| 5,028,390 | ||||||||
Internet Software & Services—9.9% |
| |||||||
Cars.com, Inc.(a) | 65,733 | 1,872,076 | ||||||
j2 Global, Inc. | 28,400 | 2,254,392 | ||||||
| 4,126,468 | ||||||||
IT Services—5.3% | ||||||||
EPAM Systems, Inc.(a) | 19,400 | 2,218,390 | ||||||
Machinery—11.4% | ||||||||
Harsco Corp.(a) | 95,500 | 1,952,975 | ||||||
Stanley Black & Decker, Inc. | 11,900 | 1,684,921 | ||||||
Xerium Technologies, Inc.(a)(c) | 165,000 | 1,080,750 | ||||||
| 4,718,646 | ||||||||
Media—3.5% | ||||||||
TEGNA, Inc. | 136,000 | 1,437,520 | ||||||
Professional Services—12.2% |
| |||||||
ICF International, Inc. | 42,400 | $ | 2,845,040 | |||||
TrueBlue, Inc.(a) | 82,891 | 2,209,045 | ||||||
| 5,054,085 | ||||||||
Specialty Retail—5.1% |
| |||||||
Pier 1 Imports, Inc. | 255,200 | 569,096 | ||||||
Tile Shop Holdings, Inc. | 225,000 | 1,541,250 | ||||||
| 2,110,346 | ||||||||
Trading Companies & Distributors—5.8% |
| |||||||
WESCO International, Inc.(a) | 40,300 | 2,399,865 | ||||||
Total Common Stocks | 40,176,488 | |||||||
Short-Term Investment—3.3% |
| |||||||
Money Market Fund—3.3% |
| |||||||
STIT-Treasury Portfolio—Institutional Class, 1.600%(d) | 1,373,342 | 1,373,342 | ||||||
Total Short-Term Investment | 1,373,342 | |||||||
Total Investments (Cost $35,180,564)—100.2% |
| 41,549,830 | ||||||
Liabilities in Excess of Other Assets—(0.2)% |
| (74,256 | ) | |||||
Total Net Assets—100.0% |
| $ | 41,475,574 | |||||
|
| |||||||
Percentages are stated as a percent of net assets.
| (a) | Non-income producing security. |
| (b) | Foreign issued security. Foreign concentration was as follows: Cayman Islands 3.5%; Singapore 3.7%. |
| (c) | Affiliated Company. See Footnote 8. |
| (d) | Rate listed is the 7-day effective yield. |
The Accompanying Footnotes are an Integral Part of these Financial Statements.
| 44 | April 30, 2018 |
Percent of Total Investments
The Tocqueville Fund
Allocation of Portfolio Holdings
April 30, 2018
(Unaudited)
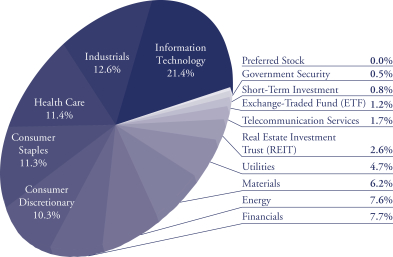
The Tocqueville Opportunity Fund
Allocation of Portfolio Holdings
April 30, 2018
(Unaudited)
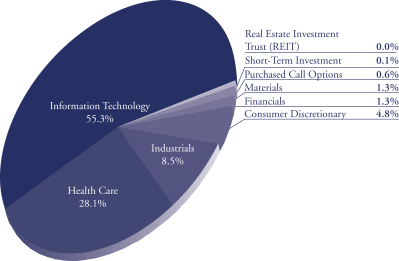
| Annual Report | 45 |
Percent of Total Investments
The Tocqueville International Value Fund
Allocation of Portfolio Holdings
April 30, 2018
(Unaudited)
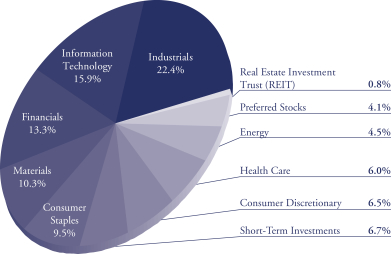
The Tocqueville Gold Fund
Allocation of Portfolio Holdings
April 30, 2018
(Unaudited)
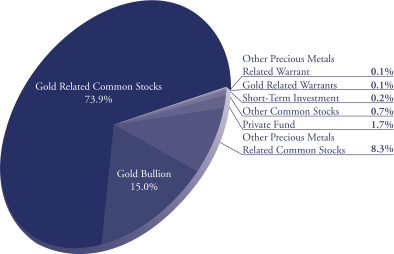
| 46 | April 30, 2018 |
Percent of Total Investments
The Delafield Fund
Allocation of Portfolio Holdings
April 30, 2018
(Unaudited)
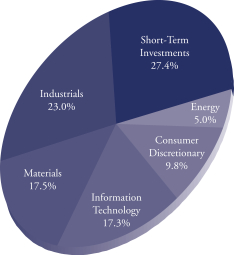
The Tocqueville Select Fund
Allocation of Portfolio Holdings
April 30, 2018
(Unaudited)
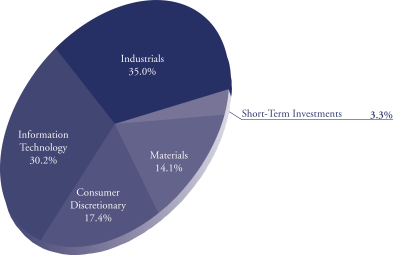
| Annual Report | 47 |
The Tocqueville Trust
Statements of Assets & Liabilities
April 30, 2018
| The Tocqueville Fund | The Tocqueville Opportunity Fund | The Tocqueville International Value Fund | ||||||||||
Assets: | ||||||||||||
Investments, at value (1) | $ | 284,358,121 | $ | 82,938,306 | $ | 1,321,624,831 | ||||||
Foreign currencies, at value (2) | — | — | 590,602 | |||||||||
Receivable for investments sold | — | 80,381 | — | |||||||||
Receivable for Fund shares sold | 1,133,679 | 53,329 | 5,626,978 | |||||||||
Dividends, interest and other receivables | 291,420 | 4,385 | 6,649,637 | |||||||||
Other assets | 18,546 | 17,851 | 110,032 | |||||||||
|
|
|
|
|
| |||||||
Total Assets | 285,801,766 | 83,094,252 | 1,334,602,080 | |||||||||
|
|
|
|
|
| |||||||
Liabilities: | ||||||||||||
Payable for investments purchased | 458,100 | — | 2,617,421 | |||||||||
Payable for foreign currencies purchased | — | — | 3,505 | |||||||||
Payable for Fund shares redeemed | 96,670 | 211,809 | 1,203,042 | |||||||||
Payable to Adviser (see Note 10) | 177,330 | 48,967 | 814,995 | |||||||||
Payable to Administrator | 37,807 | 2,604 | 167,740 | |||||||||
Payable to Trustees | 15,032 | 5,136 | 28,845 | |||||||||
Accrued distribution fee | 53,652 | 15,427 | 157,522 | |||||||||
Accrued expenses and other liabilities | 50,645 | 23,003 | 130,447 | |||||||||
|
|
|
|
|
| |||||||
Total Liabilities | 889,236 | 306,946 | 5,123,517 | |||||||||
|
|
|
|
|
| |||||||
Net Assets | $ | 284,912,530 | $ | 82,787,306 | $ | 1,329,478,563 | ||||||
|
|
|
|
|
| |||||||
Net assets consist of: | ||||||||||||
Paid in capital | $ | 135,957,682 | $ | 54,538,254 | $ | 1,150,616,785 | ||||||
Accumulated net investment income (loss) | 751,406 | (1,061,721 | ) | 1,036,433 | ||||||||
Accumulated net realized gain | 21,423,064 | 6,386,652 | 2,679,792 | |||||||||
Net unrealized appreciation on: | ||||||||||||
Investments and foreign currency related items | 126,780,378 | 22,924,121 | 175,145,553 | |||||||||
|
|
|
|
|
| |||||||
Net assets | $ | 284,912,530 | $ | 82,787,306 | $ | 1,329,478,563 | ||||||
|
|
|
|
|
| |||||||
Shares of beneficial interest outstanding (unlimited shares of $0.01 par value authorized) | 8,030,203 | 3,070,310 | 76,393,258 | |||||||||
Net asset value, offering and redemption price per share | $ | 35.48 | $ | 26.96 | $ | 17.40 | ||||||
|
|
|
|
|
| |||||||
(1) Cost of investments | $ | 157,577,793 | $ | 60,014,194 | $ | 1,146,443,584 | ||||||
(2) Cost of foreign currencies | $ | — | $ | — | $ | 598,161 | ||||||
The Accompanying Notes are an Integral Part of these Financial Statements.
| 48 | April 30, 2018 |
The Tocqueville Trust
Statements of Assets & Liabilities
April 30, 2018
| The Tocqueville Gold Fund | The Delafield Fund | The Tocqueville Select Fund | ||||||||||
Assets: | ||||||||||||
Investments, at value (1) | ||||||||||||
Unaffiliated issuers | $ | 791,570,764 | $ | 292,488,389 | $ | 40,469,080 | ||||||
Affiliated issuers | 255,517,954 | 3,602,500 | 1,080,750 | |||||||||
Receivable for Fund shares sold | 932,053 | 15,164 | 4,419 | |||||||||
Dividends, interest and other receivables | 1,094,561 | 58,587 | 14,080 | |||||||||
Other assets | 39,971 | 20,737 | 10,554 | |||||||||
|
|
|
|
|
| |||||||
Total Assets | 1,049,155,303 | 296,185,377 | 41,578,883 | |||||||||
|
|
|
|
|
| |||||||
Liabilities: | ||||||||||||
Payable for investments purchased | 510,580 | 2,421,510 | — | |||||||||
Payable for foreign currencies purchased | 884 | — | — | |||||||||
Payable for Fund shares redeemed | 1,227,170 | 823,546 | 41,218 | |||||||||
Payable to Adviser (see Note 10) | 764,560 | 178,323 | 25,061 | |||||||||
Payable to Administrator | 123,547 | 43,029 | 5,294 | |||||||||
Payable to Trustees | 65,218 | 23,212 | 3,484 | |||||||||
Accrued distribution fee | 148,704 | 46,949 | 7,619 | |||||||||
Accrued expenses and other liabilities | 335,190 | 104,855 | 20,633 | |||||||||
|
|
|
|
|
| |||||||
Total Liabilities | 3,175,853 | 3,641,424 | 103,309 | |||||||||
|
|
|
|
|
| |||||||
Net Assets | $ | 1,045,979,450 | $ | 292,543,953 | $ | 41,475,574 | ||||||
|
|
|
|
|
| |||||||
Net assets consist of: | ||||||||||||
Paid in capital | $ | 1,528,514,780 | $ | 239,958,431 | $ | 36,654,880 | ||||||
Accumulated net investment loss | (30,405,993 | ) | (1,616,267 | ) | (108,024 | ) | ||||||
Accumulated net realized gain (loss) | (387,165,003 | ) | 19,058,471 | (1,440,548 | ) | |||||||
Net unrealized appreciation (depreciation) on: | ||||||||||||
Investments and foreign currency related items | (64,964,334 | ) | 35,143,318 | 6,369,266 | ||||||||
|
|
|
|
|
| |||||||
Net assets | $ | 1,045,979,450 | $ | 292,543,953 | $ | 41,475,574 | ||||||
|
|
|
|
|
| |||||||
Shares of beneficial interest outstanding (unlimited shares of $0.01 par value authorized) | 30,015,091 | 13,468,033 | 3,637,075 | |||||||||
Net asset value, offering and redemption price per share | $ | 34.85 | $ | 21.72 | $ | 11.40 | ||||||
|
|
|
|
|
| |||||||
(1) Cost of investments | ||||||||||||
Unafilliated issuers | $ | 733,945,932 | $ | 253,750,206 | $ | 33,059,706 | ||||||
Affiliated issuers | $ | 378,106,574 | $ | 7,197,365 | $ | 2,120,858 | ||||||
The Accompanying Notes are an Integral Part of these Financial Statements.
| Semi-Annual Report | 49 |
The Tocqueville Trust
Statements of Operations
| The Tocqueville Fund | The Tocqueville Opportunity Fund | The Tocqueville International Value Fund | ||||||||||
Investment Income: | ||||||||||||
Dividends* | $ | 2,880,592 | $ | 88,560 | $ | 13,592,202 | ||||||
Interest | 3,809 | 322 | 425,531 | |||||||||
|
|
|
|
|
| |||||||
Total investment income | 2,884,401 | 88,882 | 14,017,733 | |||||||||
|
|
|
|
|
| |||||||
Expenses: | ||||||||||||
Investment Adviser’s fee (See Note 4) | 1,095,787 | 302,177 | 5,852,659 | |||||||||
Distribution fees (See Note 4) | 365,262 | 100,726 | 1,537,644 | |||||||||
Administration fees (See Note 4) | 219,157 | 60,435 | 827,330 | |||||||||
Transfer agent and shareholder services fees | 31,048 | 10,045 | 191,227 | |||||||||
Trustee fees and expenses | 25,505 | 7,436 | 90,955 | |||||||||
Legal fees | 21,652 | 5,573 | 62,978 | |||||||||
Fund accounting fees | 13,643 | 9,593 | 58,986 | |||||||||
Blue sky fees | 12,836 | 12,504 | 44,858 | |||||||||
Audit fees | 11,230 | 3,529 | 42,507 | |||||||||
Printing and mailing expense | 9,276 | 3,107 | 34,149 | |||||||||
Other expenses (See Note 10) | 8,296 | 2,421 | 43,073 | |||||||||
Interest expense | 4,345 | 8,786 | — | |||||||||
Custody fees | 7,501 | 8,108 | 94,506 | |||||||||
Insurance expense | 3,899 | 1,199 | 11,254 | |||||||||
Registration fees | 1,403 | 1,056 | 2,293 | |||||||||
|
|
|
|
|
| |||||||
Total expenses before waiver | 1,830,840 | 536,695 | 8,894,419 | |||||||||
Less: Fees waived (See Note 4) | (1,464 | ) | (24,281 | ) | (1,206,197 | ) | ||||||
|
|
|
|
|
| |||||||
Net expenses | 1,829,376 | 512,414 | 7,688,222 | |||||||||
|
|
|
|
|
| |||||||
Net Investment Income (Loss) | 1,055,025 | (423,532 | ) | 6,329,511 | ||||||||
|
|
|
|
|
| |||||||
The Accompanying Notes are an Integral Part of these Financial Statements.
| 50 | April 30, 2018 |
The Tocqueville Trust
Statements of Operations
| The Tocqueville Fund | The Tocqueville Opportunity Fund | The Tocqueville International Value Fund | ||||||||||
Realized and Unrealized Gain (Loss): | ||||||||||||
Net realized gain (loss) on: | ||||||||||||
Investments | 21,481,328 | 7,337,261 | 3,857,724 | |||||||||
Foreign currency translation | — | (7,158 | ) | (770,021 | ) | |||||||
Written option | — | (2,771 | ) | — | ||||||||
|
|
|
|
|
| |||||||
| 21,481,328 | 7,327,332 | 3,087,703 | ||||||||||
Net change in unrealized appreciation (depreciation) on: | ||||||||||||
Investments | (19,507,377 | ) | (1,979,462 | ) | (25,604,861 | ) | ||||||
Foreign currency translation | 9 | 2,813 | 14,492,166 | |||||||||
|
|
|
|
|
| |||||||
| (19,507,368 | ) | (1,976,649 | ) | (11,112,695 | ) | |||||||
Net gain (loss) on investments and foreign currency | 1,973,960 | 5,350,683 | (8,024,992 | ) | ||||||||
|
|
|
|
|
| |||||||
Net Increase (Decrease) in Net Assets Resulting from Operations | $ | 3,028,985 | $ | 4,927,151 | $ | (1,695,481 | ) | |||||
|
|
|
|
|
| |||||||
* Net of foreign taxes withheld of: | $ | 3,900 | $ | 558 | $ | 1,442,542 | ||||||
|
|
|
|
|
| |||||||
The Accompanying Notes are an Integral Part of these Financial Statements.
| Semi-Annual Report | 51 |
The Tocqueville Trust
Statements of Operations
| The Tocqueville Gold Fund | The Delafield Fund | The Tocqueville Select Fund | ||||||||||
Investment Income: | ||||||||||||
Dividends* | $ | 3,194,901 | $ | 852,112 | $ | 173,667 | ||||||
Interest | 22,143 | 215,605 | 15,062 | |||||||||
|
|
|
|
|
| |||||||
Total investment income | 3,217,044 | 1,067,717 | 188,729 | |||||||||
|
|
|
|
|
| |||||||
Expenses: | ||||||||||||
Investment Adviser’s fee (See Note 4) | 4,656,704 | 1,300,609 | 178,919 | |||||||||
Distribution fees (See Note 4) | 1,361,904 | 412,874 | 55,912 | |||||||||
Administration fees (See Note 4) | 742,975 | 247,724 | 33,548 | |||||||||
Transfer agent and shareholder services fees | 317,567 | 67,035 | 8,325 | |||||||||
Custody fees | 108,150 | 17,156 | 1,397 | |||||||||
Trustee fees and expenses | 102,461 | 32,630 | 4,449 | |||||||||
Legal fees | 93,318 | 29,736 | 4,193 | |||||||||
Printing and mailing expense | 65,845 | 23,341 | 2,398 | |||||||||
Fund accounting fees | 50,007 | 17,157 | 2,647 | |||||||||
Audit fees | 41,655 | 13,824 | 2,473 | |||||||||
Other expenses (See Note 10) | 33,831 | 10,332 | 1,448 | |||||||||
Blue sky fees | 25,777 | 15,777 | 12,112 | |||||||||
Insurance expense | 16,613 | 5,060 | 739 | |||||||||
Interest expense | 14,550 | — | — | |||||||||
Registration fees | 3,364 | 1,192 | — | |||||||||
|
|
|
|
|
| |||||||
Total expenses before waiver | 7,634,721 | 2,194,447 | 308,560 | |||||||||
Less: Fees waived (See Note 4) | — | (130,077 | ) | (28,999 | ) | |||||||
|
|
|
|
|
| |||||||
Net expenses | 7,634,721 | 2,064,370 | 279,561 | |||||||||
|
|
|
|
|
| |||||||
Net Investment Loss | (4,417,677 | ) | (996,653 | ) | (90,832 | ) | ||||||
|
|
|
|
|
| |||||||
The Accompanying Notes are an Integral Part of these Financial Statements.
| 52 | April 30, 2018 |
The Tocqueville Trust
Statements of Operations
| The Tocqueville Gold Fund | The Delafield Fund | The Tocqueville Select Fund | ||||||||||
Realized and Unrealized Gain (Loss): | ||||||||||||
Net realized gain (loss) on: | ||||||||||||
Investments | ||||||||||||
Unaffiliated issuers | (3,848,654 | ) | 20,725,544 | (640,250 | ) | |||||||
Affiliated issuers | 605,548 | (1,685,429 | ) | (800,261 | ) | |||||||
Foreign currency translation | (408,276 | ) | — | — | ||||||||
|
|
|
|
|
| |||||||
| (3,651,382 | ) | 19,040,115 | (1,440,511 | ) | ||||||||
Net change in unrealized appreciation (depreciation) on: | ||||||||||||
Investments | (29,618,204 | ) | (29,467,980 | ) | 662,501 | |||||||
Foreign currency translation | 14,190,551 | — | — | |||||||||
|
|
|
|
|
| |||||||
| (15,427,653 | ) | (29,467,980 | ) | 662,501 | ||||||||
Net loss on investments and foreign currency | (19,079,035 | ) | (10,427,865 | ) | (778,010 | ) | ||||||
|
|
|
|
|
| |||||||
Net Decrease in Net Assets Resulting from Operations | $ | (23,496,712 | ) | $ | (11,424,518 | ) | $ | (868,842 | ) | |||
|
|
|
|
|
| |||||||
* Net of foreign taxes withheld of: | $ | 227,712 | $ | $ | — | |||||||
|
|
|
|
|
| |||||||
The Accompanying Notes are an Integral Part of these Financial Statements.
| Semi-Annual Report | 53 |
The Tocqueville Trust
Statements of Changes in Net Assets
| The Tocqueville Fund | The Tocqueville Opportunity Fund | The Tocqueville International Value Fund | ||||||||||||||||||||||
| For the Period Ended April 30, 2018 | For the Year Ended October 31, 2017 | For the Period Ended April 30, 2018 | For the Year Ended October 31, 2017 | For the Period Ended April 30, 2018 | For the Year Ended October 31, 2017 | |||||||||||||||||||
Operations: | ||||||||||||||||||||||||
Net investment income (loss) | $ | 1,055,025 | $ | 2,798,964 | $ | (423,532 | ) | $ | (766,582 | ) | $ | 6,329,511 | $ | 7,808,075 | ||||||||||
Net realized gain on sale of | ||||||||||||||||||||||||
Investments and foreign currency | 21,481,328 | 27,750,358 | 7,330,103 | 7,318,004 | 3,087,703 | 4,954,445 | ||||||||||||||||||
Written options | — | — | (2,771 | ) | — | — | — | |||||||||||||||||
Net change in unrealized appreciation (depreciation) | (19,507,368 | ) | 23,747,091 | (1,976,649 | ) | 18,157,916 | (11,112,695 | ) | 150,926,517 | |||||||||||||||
|
|
|
|
|
|
|
|
|
|
|
| |||||||||||||
Net increase (decrease) in net assets resulting from operations | 3,028,985 | 54,296,413 | 4,927,151 | 24,709,338 | (1,695,481 | ) | 163,689,037 | |||||||||||||||||
|
|
|
|
|
|
|
|
|
|
|
| |||||||||||||
Dividends and distributions to shareholders: | ||||||||||||||||||||||||
Net investment income | (2,493,282 | ) | (3,191,286 | ) | — | — | (11,212,269 | ) | (5,348,368 | ) | ||||||||||||||
Net realized gains | (24,335,053 | ) | (12,245,533 | ) | (2,589,302 | ) | — | (3,668,465 | ) | (2,913,833 | ) | |||||||||||||
|
|
|
|
|
|
|
|
|
|
|
| |||||||||||||
Total dividends and distributions | (26,828,335 | ) | (15,436,819 | ) | (2,589,302 | ) | — | (14,880,734 | ) | (8,262,201 | ) | |||||||||||||
Fund share transactions: | ||||||||||||||||||||||||
Shares sold | 12,108,163 | 20,393,861 | 9,112,960 | 7,604,183 | 337,550,944 | 603,434,286 | ||||||||||||||||||
Shares issued to holders in reinvestment of dividends | 25,480,630 | 14,742,846 | 2,468,524 | — | 13,265,360 | 7,212,804 | ||||||||||||||||||
Shares redeemed* | (22,514,093 | ) | (63,484,870 | ) | (8,905,509 | ) | (47,498,497 | ) | (125,755,321 | ) | (170,888,189 | ) | ||||||||||||
|
|
|
|
|
|
|
|
|
|
|
| |||||||||||||
Net increase (decrease) | 15,074,700 | (28,348,163 | ) | 2,675,975 | (39,894,314 | ) | 225,060,983 | 439,758,901 | ||||||||||||||||
|
|
|
|
|
|
|
|
|
|
|
| |||||||||||||
Net increase (decrease) in net assets | (8,724,650 | ) | 10,511,431 | 5,013,824 | (15,184,976 | ) | 208,484,768 | 595,185,737 | ||||||||||||||||
The Accompanying Notes are an Integral Part of these Financial Statements.
| 54 | April 30, 2018 |
The Tocqueville Trust
Statements of Changes in Net Assets
| The Tocqueville Fund | The Tocqueville Opportunity Fund | The Tocqueville International Value Fund | ||||||||||||||||||||||
| For the Period Ended April 30, 2018 | For the Year Ended October 31, 2017 | For the Period Ended April 30, 2018 | For the Year Ended October 31, 2017 | For the Period Ended April 30, 2018 | For the Year Ended October 31, 2017 | |||||||||||||||||||
Net Assets: | ||||||||||||||||||||||||
Beginning of period | 293,637,180 | 283,125,749 | 77,773,482 | 92,958,458 | 1,120,993,795 | 525,808,058 | ||||||||||||||||||
|
|
|
|
|
|
|
|
|
|
|
| |||||||||||||
End of period** | $ | 284,912,530 | $ | 293,637,180 | $ | 82,787,306 | $ | 77,773,482 | $ | 1,329,478,563 | $ | 1,120,993,795 | ||||||||||||
|
|
|
|
|
|
|
|
|
|
|
| |||||||||||||
** Including undistributed net investment income (loss) of: | $ | 751,406 | $ | 2,189,663 | $ | (1,061,721 | ) | $ | (638,189 | ) | $ | 1,036,433 | $ | 5,919,191 | ||||||||||
|
|
|
|
|
|
|
|
|
|
|
| |||||||||||||
The Accompanying Notes are an Integral Part of these Financial Statements.
| Semi-Annual Report | 55 |
The Tocqueville Trust
Statements of Changes in Net Assets
| The Tocqueville Gold Fund | The Delafield Fund | The Tocqueville Select Fund | ||||||||||||||||||||||
| For the Period Ended April 30, 2018 | For the Year Ended October 31, 2017 | For the Period Ended April 30, 2018 | For the Year Ended October 31, 2017 | For the Period Ended April 30, 2018 | For the Year Ended October 31, 2017 | |||||||||||||||||||
Operations: | ||||||||||||||||||||||||
Net investment loss | $ | (4,417,677 | ) | $ | (11,627,847 | ) | $ | (996,653 | ) | $ | (1,941,535 | ) | $ | (90,832 | ) | $ | (198,971 | ) | ||||||
Net realized gain (loss) on sale of investments and foreign currency | (3,651,382 | ) | (62,949,271 | ) | 19,040,115 | 63,482,709 | (1,440,511 | ) | 1,808,514 | |||||||||||||||
Net change in unrealized appreciation (depreciation) | (15,427,653 | ) | (57,383,526 | ) | (29,467,980 | ) | 9,477,267 | 662,501 | 3,581,268 | |||||||||||||||
|
|
|
|
|
|
|
|
|
|
|
| |||||||||||||
Net increase (decrease) in net assets resulting from operations | (23,496,712 | ) | (131,960,644 | ) | (11,424,518 | ) | 71,018,441 | (868,842 | ) | 5,190,811 | ||||||||||||||
|
|
|
|
|
|
|
|
|
|
|
| |||||||||||||
Dividends and distributions to shareholders: | ||||||||||||||||||||||||
Net investment income | — | — | — | — | — | — | ||||||||||||||||||
Net realized gains | — | — | (51,947,188 | ) | (71,259,512 | ) | (903,728 | ) | (3,023,170 | ) | ||||||||||||||
|
|
|
|
|
|
|
|
|
|
|
| |||||||||||||
Total dividends and distributions | — | — | (51,947,188 | ) | (71,259,512 | ) | (903,728 | ) | (3,023,170 | ) | ||||||||||||||
Fund share transactions: | ||||||||||||||||||||||||
Shares sold | 88,600,882 | 273,496,683 | 10,993,135 | 18,861,894 | 1,330,887 | 4,133,895 | ||||||||||||||||||
Shares issued to holders in reinvestment of dividends | — | — | 50,048,422 | 68,515,995 | 890,838 | 2,918,410 | ||||||||||||||||||
Shares redeemed* | (172,411,956 | ) | (353,530,850 | ) | (78,478,940 | ) | (114,610,738 | ) | (8,426,109 | ) | (23,579,503 | ) | ||||||||||||
|
|
|
|
|
|
|
|
|
|
|
| |||||||||||||
Net decrease | (83,811,074 | ) | (80,034,167 | ) | (17,437,383 | ) | (27,232,849 | ) | (6,204,384 | ) | (16,527,198 | ) | ||||||||||||
|
|
|
|
|
|
|
|
|
|
|
| |||||||||||||
Net decrease in net assets | (107,307,786 | ) | (211,994,811 | ) | (80,809,089 | ) | (27,473,920 | ) | (7,976,954 | ) | (14,359,557 | ) | ||||||||||||
The Accompanying Notes are an Integral Part of these Financial Statements.
| 56 | April 30, 2018 |
The Tocqueville Trust
Statements of Changes in Net Assets
| The Tocqueville Gold Fund | The Delafield Fund | The Tocqueville Select Fund | ||||||||||||||||||||||
| For the Period Ended April 30, 2018 | For the Year Ended October 31, 2017 | For the Period Ended April 30, 2018 | For the Year Ended October 31, 2017 | For the Period Ended April 30, 2018 | For the Year Ended October 31, 2017 | |||||||||||||||||||
Net Assets: | ||||||||||||||||||||||||
Beginning of period | 1,153,287,236 | 1,365,282,047 | 373,353,042 | 400,826,962 | 49,452,528 | 63,812,085 | ||||||||||||||||||
|
|
|
|
|
|
|
|
|
|
|
| |||||||||||||
End of period** | $ | 1,045,979,450 | $ | 1,153,287,236 | $ | 292,543,953 | $ | 373,353,042 | $ | 41,475,574 | $ | 49,452,528 | ||||||||||||
|
|
|
|
|
|
|
|
|
|
|
| |||||||||||||
* Net of redemption fees of: | $ | 38,516 | $ | 228,731 | $ | — | $ | — | $ | — | $ | — | ||||||||||||
|
|
|
|
|
|
|
|
|
|
|
| |||||||||||||
** Including undistributed net investment loss of: | $ | (30,405,993 | ) | $ | (25,988,316 | ) | $ | (1,616,267 | ) | $ | (619,614 | ) | $ | (108,024 | ) | $ | (17,192 | ) | ||||||
|
|
|
|
|
|
|
|
|
|
|
| |||||||||||||
The Accompanying Notes are an Integral Part of these Financial Statements.
| Semi-Annual Report | 57 |
The Tocqueville Trust
Notes to Financial Statements
1. ORGANIZATION
The Tocqueville Trust (the “Trust”) is a Massachusetts business trust registered under the Investment Company Act of 1940 and organized on September 17, 1986, consisting of six separate funds (each, a “Fund” or, collectively, the “Funds”). Each Fund is an open-end management investment company with a different investment objective. The Tocqueville Fund, The Tocqueville Opportunity Fund (the “Opportunity Fund”), The Tocqueville International Value Fund (the “International Fund”), The Delafield Fund and The Tocqueville Select Fund (the “Select Fund”) are classified as diversified investment companies. The Tocqueville Gold Fund (the “Gold Fund”) is classified as a non-diversified investment company. The Tocqueville Fund’s investment objective is long-term capital appreciation which it seeks to achieve by investing primarily in securities of United States issuers. The Opportunity Fund’s investment objective is to achieve long-term capital appreciation which it seeks to achieve by investing in the common stocks of small and mid-cap companies which have the potential to deliver superior long term earnings growth. The International Fund’s investment objective is long-term capital appreciation consistent with preservation of capital which it seeks to achieve by investing primarily in securities of non-U.S. issuers. The Gold Fund’s investment objective is long-term capital appreciation which it seeks to achieve by investing in gold, securities of companies located throughout the world that are engaged in mining or processing gold (“gold related securities”), other precious metals and securities of companies located throughout the world that are engaged in mining or processing such other precious metals (“other precious metal securities”). The Delafield Fund’s investment objectives are to seek long-term preservation of capital (sufficient growth to outpace inflation over an extended period of time) and growth of capital which it seeks to achieve by investing primarily in the equity securities of domestic companies. The Tocqueville Select Fund’s investment objective is to achieve long-term capital appreciation by investing in a focused group of common stocks issued primarily by small and mid-sized U.S. companies. Current income is a secondary objective for The Tocqueville Select Fund.
The Delafield Fund, a series of the Trust, commenced operations on September 28, 2009 as successor to Delafield Fund, Inc. The predecessor Delafield Fund, Inc. commenced operations on November 19, 1993.
The Tocqueville Select Fund, a series of the Trust, commenced operations on September 28, 2009 as successor to the Delafield Select Fund, a series of Natixis Funds Trust II. The predecessor Delafield Select Fund commenced operations on September 29, 2008 for Class A and Class C shares and on September 26, 2008 for Class Y shares. Prior to September 29, 2008, the predecessor Delafield Select Fund operated as a Delaware limited partnership using substantially the same investment objectives and investment policies as the predecessor fund. The limited partnership was incepted in July 1998.
| 58 | April 30, 2018 |
2. SIGNIFICANT ACCOUNTING POLICIES
The following is a summary of significant accounting principles followed by the Trust in the preparation of its financial statements.
a) Security valuation and security transactions
Investments in securities, including foreign securities, traded on an exchange or quoted on the over-the-counter market are valued at the last sale price or, if no sale occurred during the day, at the mean between closing bid and asked prices, as last reported by a pricing service approved by the Trustees. Securities that are principally traded on the National Association of Securities Dealers Automated Quotation National Market (“NASDAQ”) are generally valued at the NASDAQ Official Closing Price (“NOCP”). If there is no NASDAQ Official Closing Price for a NASDAQ-listed security or sale price available for an over-the-counter security, the mean of the latest bid and asked quotations from NASDAQ will be used. Investments in gold will be valued at the spot price of gold determined based on the mean of the last bid and asked price at the close of the New York Commodity Exchange. When market quotations for securities are not readily available, or when restricted securities or other assets are being valued, such assets are valued at fair value as determined in good faith by or under procedures approved by the Trustees. Money market funds are valued at market price. Money market deposit accounts are reflected at cost as this is a cash instrument. Fixed income securities are valued at market price. Fixed Income securities, such as corporate bonds, convertible bonds and U.S. government agency issues for which market quotations are not readily available may be valued based on information supplied by independent pricing services using matrix pricing formulas and/or independent broker bid quotations.
Trading in securities on foreign securities exchanges normally is completed before the calculation of the Funds’ net asset value. Trading on these foreign exchanges may not take place on all days on which there is regular trading on the New York Stock Exchange (“NYSE”), or may take place on days on which there is no regular trading on the NYSE. Similarly, the Funds may hold securities traded in domestic markets where the market may close early on a given day prior to calculation of the Funds’ net asset value. Events affecting the value of such securities held by the Funds that occur between the close of trading in the security and the close of trading on the NYSE normally will not be reflected in the Funds’ calculation of the net asset value. However, significant events will be closely monitored, and where it is determined that an adjustment should be made to the security’s value because significant interim events may materially affect the value of the security, the security will be priced at its fair value in accordance with the procedures approved by the Trustees.
Investment and shareholder transactions are recorded on trade date. Dividend income is recognized on the ex-dividend date. Interest income is recognized on an accrual basis and includes, where applicable, the amortization of premiums and accretion of discounts. Net realized gains and losses from sales of securities are determined on the specific identification cost method.
| Semi-Annual Report | 59 |
b) Restricted and illiquid securities
The Funds may invest in securities that are subject to legal or contractual restrictions on resale or are illiquid. A security may be considered illiquid if it lacks a readily available market or if its valuation has not changed for a certain period of time. Disposal of these securities may involve time consuming negotiations and expense, and a prompt sale at the current valuation may be difficult.
c) Fair Valuation Measurements
The Trust has adopted authoritative fair valuation accounting standards which establish an authoritative definition of fair value and set out a hierarchy for measuring fair value. These standards require additional disclosures about the various inputs and valuation techniques used to develop the measurements of fair value and a discussion in changes in valuation techniques and related inputs during the period. These inputs are summarized in the three broad levels listed below.
| Level 1 - | Quoted prices in active markets for identical securities. |
| Level 2 - | Other significant observable inputs (including quoted prices for similar securities, interest rates, prepayment speeds, credit risk, etc.). |
| Level 3 - | Significant unobservable inputs (including the Fund’s own assumptions in determining the fair value of investments). |
When using the market quotations or closing price provided by the pricing service for equity investments, including common stocks, preferred stocks, foreign issued common stocks, exchange-traded funds, closed end mutual funds and real estate investment trusts, which are traded on an exchange are valued at the last sale price reported by the exchange on which the securities are primarily traded on the day of valuation and when the market is considered active, the security will be classified as a Level 1 security. When using the mean between the latest bid and ask price, the security will be classified as Level 2. Common stocks of the International Value Fund that are traded on non-North American exchanges are valued using matrix pricing formulas provided by an independent pricing service. These securities will be classified as Level 2 securities. When matrix pricing formulas are not available and fair valuation is not applied, the use of closing prices provided by the primary source of the funds will be used. These will be classified as Level 1 securities. Gold bullion is valued at the mean of the closing bid and ask prices from the New York Mercantile Exchange and is classified as a Level 2.
Investment in mutual funds, including money market funds, are generally priced at the ending net asset value (NAV) provided by the service agent of the funds and will be classified as Level 1 securities.
Debt securities, such as corporate bonds, convertible bonds, commercial paper, money market deposit accounts and U.S. government agency issues for which market quotations are not readily available may be valued based on information supplied by
| 60 | April 30, 2018 |
independent pricing services using matrix pricing formulas and/or independent broker bid quotations and are classified as Level 2. Warrants and rights for which the underlying security is registered and equities which are subject to a required holding period, but have a comparable public issue, are valued in good faith by the adviser pursuant to procedures established under the general supervision and responsibility of the Funds’ Board of Trustees. These securities will generally be classified as Level 2 securities. If the warrant or right is exchange traded and the official closing price of the exchange is used, these instruments are classified as Level 1 securities. Forward currency contracts derive their value from the underlying currency prices. These are valued by a pricing service using pricing models. The models use inputs that are observed from active markets, such as exchange rates. These contracts are classified as Level 2. Options can diverge from the prices of their underlying instruments. These are valued at the composite last price reported by the exchange on which the options are primarily traded on the day of the valuation and are classified as Level 1. If there is no composite last price on a given day the mean between the latest bid and ask price will be used. These contracts are classified as Level 2.
Any securities or other assets for which market quotations are not readily available are valued at fair value as determined in good faith by the Adviser pursuant to procedures established under the general supervision and responsibility of the Funds’ Board of Trustees and will be classified as Level 3 securities. In determining fair value, a Fund will seek to assign a value to the security which it believes represents the amount that the Fund could reasonably expect to receive upon its current sale. With respect to securities that are actively traded on U.S. exchanges, the Funds expect that market quotations will generally be available and that fair value might be used only in limited circumstances, such as when trading for a security is halted during the trading day.
For securities traded principally on foreign exchanges, the Funds may use fair value pricing if an event occurs after the close of trading of the principal foreign exchange on which a security is traded, but before calculation of a Fund’s NAV, which a Fund believes affects the value of the security since its last market quotation. Such events may involve situations relating to a single issuer (such as news related to the issuer announced after the close of the principal foreign exchange), or situations relating to sectors of the market or the markets in general (such as significant fluctuations in the U.S. or foreign markets or significant changes in exchange rates, natural disasters, armed conflicts, or governmental actions).
In determining whether a significant event has occurred with respect to securities traded principally in foreign markets, the Funds may engage a third party fair value service provider to systematically recommend the adjustment of closing market prices of non-U.S. securities based upon changes in a designated U.S. securities market index occurring from the time of close of the relevant foreign market and the close of the NYSE. Fair value pricing may also be used to value restricted securities held by the Funds or securities with little or no trading activity for extended periods of time. Fair value pricing involves judgments that are inherently subjective and inexact and it is not possible to determine with certainty when, and to what extent, an event will affect a market price. As
| Semi-Annual Report | 61 |
a result, there can be no assurance that fair value pricing will reflect actual market value and it is possible that the fair value determined for a security may differ materially from the value that could be realized upon the sale of the security.
The following is a summary of the inputs used, as of April 30, 2018, involving the Funds’ assets and liabilities carried at fair value. The inputs of methodology used for valuing securities may not be an indication of the risk associated with investing in those securities.
| Description | Level 1 | Level 2 | Level 3 | Total | ||||||||||||
The Tocqueville Fund | ||||||||||||||||
Assets | ||||||||||||||||
Common Stocks* | $ | 270,049,255 | $ | — | $ | — | $ | 270,049,255 | ||||||||
Preferred Stock* | — | — | 1,600 | 1,600 | ||||||||||||
Real Estate Investment Trust (REIT)* | 7,356,000 | — | — | 7,356,000 | ||||||||||||
Exchange-Traded Fund (ETF)* | 3,497,000 | — | — | 3,497,000 | ||||||||||||
Government Security* | 1,280,000 | — | — | 1,280,000 | ||||||||||||
Money Market Fund | 2,174,266 | — | — | 2,174,266 | ||||||||||||
|
|
|
|
|
|
|
| |||||||||
Total Assets | $ | 284,356,521 | $ | — | $ | 1,600 | $ | 284,358,121 | ||||||||
|
|
|
|
|
|
|
| |||||||||
| The Tocqueville Opportunity Fund | Level 1 | Level 2 | Level 3 | Total | ||||||||||||
Assets | ||||||||||||||||
Common Stocks | ||||||||||||||||
Automobiles & Components | $ | 8,036 | $ | — | $ | — | $ | 8,036 | ||||||||
Banks | 23,840 | — | — | 23,840 | ||||||||||||
Capital Goods | 4,582,106 | — | — | 4,582,106 | ||||||||||||
Commercial & Professional Services | 888,317 | — | — | 888,317 | ||||||||||||
Consumer Durables & Apparel | 311,765 | — | — | 311,765 | ||||||||||||
Consumer Services | 120,865 | 1,895 | — | 122,760 | ||||||||||||
Diversified Financials | 1,063,366 | — | — | 1,063,366 | ||||||||||||
Health Care Equipment & Services | 1,791,451 | — | — | 1,791,451 | ||||||||||||
Materials | 1,061,841 | — | — | 1,061,841 | ||||||||||||
Pharmaceuticals, Biotechnology & Life Sciences | 21,515,182 | — | — | 21,515,182 | ||||||||||||
Retailing | 3,582,320 | — | — | 3,582,320 | ||||||||||||
Semiconductors & Semiconductor Equipment | 9,766,930 | — | — | 9,766,930 | ||||||||||||
Software & Services | 34,493,399 | — | — | 34,493,399 | ||||||||||||
Technology Hardware & Equipment | 1,948,615 | — | — | 1,948,615 | ||||||||||||
Transportation | 1,180,614 | — | — | 1,180,614 | ||||||||||||
|
|
|
|
|
|
|
| |||||||||
Total Common Stocks | 82,338,647 | 1,895 | — | 82,340,542 | ||||||||||||
Real Estate Investment Trusts (REITs)* | 29,168 | — | — | 29,168 | ||||||||||||
Purchased Call Options | ||||||||||||||||
Banks | — | 6,000 | — | 6,000 | ||||||||||||
Capital Goods | 750 | 4,375 | — | 5,125 | ||||||||||||
Pharmaceuticals, Biotechnology & Life Sciences | 10,125 | 110,375 | — | 120,500 | ||||||||||||
Semiconductors & Semiconductor Equipment | 280,625 | — | — | 280,625 | ||||||||||||
Software & Services | 89,500 | — | — | 89,500 | ||||||||||||
|
|
|
|
|
|
|
| |||||||||
Total Purchased Call Options | 381,000 | 120,750 | — | 501,750 | ||||||||||||
Money Market Fund | 66,846 | — | — | 66,846 | ||||||||||||
|
|
|
|
|
|
|
| |||||||||
Total Assets | $ | 82,815,661 | $ | 122,645 | $ | — | $ | 82,938,306 | ||||||||
|
|
|
|
|
|
|
| |||||||||
| 62 | April 30, 2018 |
| The Tocqueville International Value Fund | Level 1 | Level 2 | Level 3 | Total | ||||||||||||
Assets | ||||||||||||||||
Common Stocks | ||||||||||||||||
Australia | $ | 24,978,525 | $ | — | $ | — | $ | 24,978,525 | ||||||||
Belgium | — | 29,489,668 | — | 29,489,668 | ||||||||||||
Brazil | 27,612,562 | — | — | 27,612,562 | ||||||||||||
Canada | 19,227,501 | — | — | 19,227,501 | ||||||||||||
Denmark | — | 28,802,560 | — | 28,802,560 | ||||||||||||
Finland | 17,734,909 | — | — | 17,734,909 | ||||||||||||
France | — | 187,144,864 | — | 187,144,864 | ||||||||||||
Germany | 32,538,376 | 74,049,529 | — | 106,587,905 | ||||||||||||
Hong Kong | 12,197,079 | 3,068,572 | — | 15,265,651 | ||||||||||||
Ireland | — | 29,728,801 | — | 29,728,801 | ||||||||||||
Japan | — | 244,175,665 | — | 244,175,665 | ||||||||||||
Netherlands | 20,448,960 | 19,370,402 | — | 39,819,362 | ||||||||||||
Netherlands Antilles | 26,409,312 | — | — | 26,409,312 | ||||||||||||
Republic of Korea | — | 16,313,313 | — | 16,313,313 | ||||||||||||
Spain | — | 50,065,253 | — | 50,065,253 | ||||||||||||
Sweden | — | 12,855,367 | — | 12,855,367 | ||||||||||||
Switzerland | 72,184,972 | — | — | 72,184,972 | ||||||||||||
United Kingdom | 78,803,866 | 93,498,500 | — | 172,302,366 | ||||||||||||
United States | 48,463,551 | — | — | 48,463,551 | ||||||||||||
|
|
|
|
|
|
|
| |||||||||
Total Common Stocks | 380,599,613 | 788,562,494 | — | 1,169,162,107 | ||||||||||||
Preferred Stocks | ||||||||||||||||
Brazil | 18,278,340 | — | — | 18,278,340 | ||||||||||||
Republic of Korea | — | 35,194,591 | — | 35,194,591 | ||||||||||||
|
|
|
|
|
|
|
| |||||||||
Total Preferred Stocks | 18,278,340 | 35,194,591 | — | 53,472,931 | ||||||||||||
Real Estate Investment Trust (REIT)* | 9,906,922 | — | — | 9,906,922 | ||||||||||||
Money Market Fund | 65,362,000 | — | — | 65,362,000 | ||||||||||||
Money Market Deposit Account | — | 23,720,871 | — | 23,720,871 | ||||||||||||
|
|
|
|
|
|
|
| |||||||||
Total Assets | $ | 474,146,875 | $ | 847,477,956 | $ | — | $ | 1,321,624,831 | ||||||||
|
|
|
|
|
|
|
| |||||||||
| The Tocqueville Gold Fund | Level 1 | Level 2 | Level 3 | Total | ||||||||||||
Assets | ||||||||||||||||
Common Stocks | ||||||||||||||||
Gold Related | $ | 763,130,935 | $ | 10,504,503 | $ | 702,005 | $ | 774,337,443 | ||||||||
Other Precious Metals Related | 76,090,930 | — | 10,350,954 | 86,441,884 | ||||||||||||
Other | — | — | 7,533,975 | 7,533,975 | ||||||||||||
|
|
|
|
|
|
|
| |||||||||
Total Common Stocks | 839,221,865 | 10,504,503 | 18,586,934 | 868,313,302 | ||||||||||||
Private Fund** ^ | — | — | — | 17,510,192 | ||||||||||||
Gold Bullion* | — | 157,420,484 | — | 157,420,484 | ||||||||||||
Warrants* | — | 1,395,323 | — | 1,395,323 | ||||||||||||
Money Market Fund | 2,449,417 | — | — | 2,449,417 | ||||||||||||
|
|
|
|
|
|
|
| |||||||||
Total Assets | $ | 841,671,282 | $ | 169,320,310 | $ | 18,586,934 | $ | 1,047,088,718 | ||||||||
|
|
|
|
|
|
|
| |||||||||
| Semi-Annual Report | 63 |
| The Delafield Fund | Level 1 | Level 2 | Level 3 | Total | ||||||||||||
Assets | ||||||||||||||||
Common Stocks* | $ | 214,978,815 | $ | — | $ | — | $ | 214,978,815 | ||||||||
Money Market Fund | 14,800,000 | — | — | 14,800,000 | ||||||||||||
Money Market Deposit Account | — | 66,312,074 | — | 66,312,074 | ||||||||||||
|
|
|
|
|
|
|
| |||||||||
Total Assets | $ | 229,778,815 | $ | 66,312,074 | $ | — | $ | 296,090,889 | ||||||||
|
|
|
|
|
|
|
| |||||||||
| The Tocqueville Select Fund | Level 1 | Level 2 | Level 3 | Total | ||||||||||||
Assets | ||||||||||||||||
Common Stocks* | $ | 40,176,488 | $ | — | $ | — | $ | 40,176,488 | ||||||||
Money Market Fund | 1,373,342 | — | — | 1,373,342 | ||||||||||||
|
|
|
|
|
|
|
| |||||||||
Total Assets | $ | 41,549,830 | $ | — | $ | — | $ | 41,549,830 | ||||||||
|
|
|
|
|
|
|
| |||||||||
| * | For further information regarding portfolio characteristics, please see the accompanying Schedules of Investments. |
| ** | Certain investments that are measured at fair value using the net asset value per share (or its equivalent) practical expedient have not been categorized in the fair value hierarchy. The fair value amounts presented in the table are intended to permit reconciliation of the fair value hierarchy to the amounts presented in the Statement of Assets and Liabilities. |
| ^ | The Gold Fund currently invests in a private fund that primarily invests in physical gold and is subject to redemption restrictions. This private fund investment can only be disposed of with notice given 24 hours in advance of redemption. |
| 64 | April 30, 2018 |
Below is a reconciliation that details the transfer of securities between Level 1 and Level 2 during the reporting period:
| The Tocqueville Opportunity Fund | The Tocqueville International Value Fund | The Tocqueville Gold Fund | ||||||||||
Transfers Into Level 1 | $ | — | $ | — | $ | — | ||||||
Transfers Out of Level 1 | (1,895 | ) | (29,944,250 | ) | (821,953 | ) | ||||||
|
|
|
|
|
| |||||||
Net Transfers Into/(Out of ) Level 1 | (1,895 | ) | (29,944,250 | ) | (821,953 | ) | ||||||
|
|
|
|
|
| |||||||
Transfers Into Level 2 | 1,895 | 29,944,250 | 821,953 | |||||||||
Transfers Out of Level 2 | — | — | — | |||||||||
|
|
|
|
|
| |||||||
Net Transfers Into/(Out of ) Level 2 | $ | 1,895 | $ | 29,944,250 | $ | 821,953 | ||||||
|
|
|
|
|
| |||||||
Below is a reconciliation that details the activity of securities in Level 3 during the current fiscal period:
| The Tocqueville Fund | The Tocqueville Gold Fund | |||||||
Beginning Balance—November 1, 2017 | $ | 1,600 | $ | 18,586,934 | ||||
Purchases | — | — | ||||||
Sales | — | — | ||||||
Realized gains | — | — | ||||||
Realized losses | — | — | ||||||
Change in unrealized appreciation | — | — | ||||||
Transfers in/(out) of Level 3 | — | — | ||||||
|
|
|
| |||||
Ending Balance—April 30, 2018 | $ | 1,600 | $ | 18,586,934 | ||||
|
|
|
| |||||
| Semi-Annual Report | 65 |
The movement from Level 1 to Level 2 in the Opportunity Fund and the Gold Fund was from the securities being priced using the mean of the bid and ask price due to the lack of trading volume on April 30, 2018. The movement from Level 1 to Level 2 in the International Value Fund was from the securities being priced using matrix pricing formulas provided by an independent pricing service. There were no transfers between levels in The Tocqueville Fund, The Delafield Fund or The Select Fund. Transfers between levels are recognized at the end of the reporting period.
Fund | Type of | Industry | Fair | Valuation | Unobservable Inputs | Range | ||||||
The Tocqueville Fund | Preferred Stock | Health Care Equipment & Supplies | $ 1,600 | Latest company valuation | Financing prices | $0.004 | ||||||
The Tocqueville Gold Fund | Common Stock | Gold Related | $ 702,005 | Latest company valuation | Financing prices | $0.33 | ||||||
| Other Precious Metals Related | 10,350,954 | Latest company financing price | Financing prices | $4.50 | ||||||||
| Other | 7,533,975 | Latest company financing price | Financing prices | $1.38-$8.60 |
The significant unobservable inputs used in the fair value measurement of the Tocqueville Fund’s preferred stock and the Gold Fund’s common stocks are the most recent financing prices of the portfolio company, which approximate the companies’ value in the market place.
Significant changes in the companies’ ability to receive financing for new projects in the future would be an indication of the companies’ financial position and market value.
The Trust’s valuation procedures have been adopted by the Trust’s Board of Trustees, which has established a Valuation Committee to oversee the valuation process. The Valuation Committee meets on an as needed basis to evaluate changes in the valuation of portfolio securities. The full findings and valuations are then reviewed quarterly by the Independent Trustees.
Derivative Instruments and Hedging Activities
The Funds’ Adviser may use derivative instruments, such as options, as a means to manage exposure to different types of risk, including market risk and exchange rate risk, and to gain exposure to underlying securities. The Trust has adopted disclosure standards in order to enable the investor to understand how and why an entity used derivatives, how derivatives are accounted for, and how derivatives affect an entity’s results of operations and financial position.
| 66 | April 30, 2018 |
In the Opportunity Fund, the Adviser used options to gain exposure to the underlying equity security and to earn premium income.
Balance Sheet—Values of Derivative Instruments as of April 30, 2018.
The Tocqueville Opportunity Fund
| Asset Derivatives | Liability Derivatives | |||||||||||||
| Derivatives not accounted for as hedging instruments | Balance Sheet Location | Value | Balance Sheet Location | Value | ||||||||||
Purchased Options | Investments, at Value | $ | 501,750 | $ | — | |||||||||
|
|
|
|
|
| |||||||||
Total | $ | 501,750 | $ | — | ||||||||||
|
|
|
|
|
| |||||||||
The Effect of Derivative Instruments on the Statement of Operations for the period ended April 30, 2018.
The Tocqueville Opportunity Fund
| Purchased Options | Written Options | Total | ||||||||||
Equity contracts net realized gain (loss) | $ | 736,023 | $ | (2,771 | ) | $ | 733,252 | |||||
Equity contracts change in unrealized depreciation | (1,209,345 | ) | — | (1,209,345 | ) | |||||||
Derivatives Risk
The risks of using the types of derivatives in which the Funds may engage include the risk that movements in the value of the derivative may not fully offset or complement instruments currently held in the Funds in the manner intended by the Adviser; the risk that the counterparty to a derivative contract may fail to comply with their obligations to the Fund; the risk that the derivative may not possess a liquid secondary market at a time when the Fund would look to disengage the position; the risk that additional capital from the Fund may be called upon to fulfill the conditions of the derivative contract; and the risk that the cost of the derivative contracts may reduce the overall returns experienced by the Funds. The measurement of risks associated with these instruments is meaningful only when all related offsetting transactions are considered. The Fund may enter into written call options to hedge against changes in the value of equities. The Fund’s option component of the overall investment strategy is often referred to as a “buy-write” strategy (also called a “covered call” strategy), in which the Adviser (as defined below) writes (sells) a call option contract while at the same time owning an equivalent number of shares of the underlying stock to generate moderate current income. The writing of call options is intended to reduce the volatility of the portfolio and to earn premium income. Written call options expose the Fund to minimal counterparty credit risk since they are exchange traded and the exchange’s clearing house guarantees the options against default. As the writer of a call option, the Fund has the obligation to sell the security at the exercise price during the exercise period in the event the option is exercised. The use of options do not create leverage in the Funds.
| Semi-Annual Report | 67 |
The average monthly value of purchased options in the Opportunity Fund during the period ended April 30, 2018 was $988,638.
The average monthly value of written options in the Opportunity Fund during the period ended April 30, 2018 was $20,250
Transactions in purchased options in the Opportunity Fund during the period ended April 30, 2018 were as follows:
| Notional Amount | Contracts | |||||||
Outstanding, beginning of period: | $ | 29,757,500 | 7,925 | |||||
Options purchased | 69,901,250 | 7,100 | ||||||
Options terminated in closing transactions | (50,711,250 | ) | (9,125 | ) | ||||
Options exercised | — | — | ||||||
Options expired | (26,310,000 | ) | (3,675 | ) | ||||
|
|
|
| |||||
Outstanding, end of period: | $ | 22,637,500 | 2,225 | |||||
|
|
|
| |||||
e) Foreign currency translation
Investments and other assets and liabilities denominated in foreign currencies are translated to U.S. dollars at the prevailing rates of exchange, in accordance with the Trust’s Portfolio Securities Valuation and Foreign Exchange Contracts Procedures. The Tocqueville Fund, The Tocqueville Opportunity Fund, The Tocqueville International Value Fund and The Tocqueville Gold Fund have engaged in transactions in securities denominated in foreign currencies and, as a result, entered into foreign exchange transactions. These Funds are exposed to additional market risk as a result of changes in the value of the underlying currency in relation to the U.S. dollar. Risks include potential inability of counterparties to meet the terms of their obligations. The value of foreign currencies are marked-to-market on a daily basis, which reflects the changes in the market value of the contract at the close of each day’s trading, resulting in daily unrealized gains and/or losses. When the transactions are settled or the contracts are closed, the Funds recognize a realized gain or loss.
The Funds isolate that portion of the results of operations resulting from changes in foreign exchange rates on investments from the fluctuations arising from changes in market prices of securities held. Such fluctuations are reflected as net realized and unrealized gain or loss on foreign currency translation.
Reported net realized foreign exchange gains or losses arise from sales of foreign currencies, currency gains or losses realized between the trade and settlement dates on securities transactions, the differences between the amounts of dividends, interest, and foreign withholding taxes recorded on the Fund’s books, and the U.S. dollar equivalent of the amounts actually received or paid. Net unrealized foreign exchange gains and losses arise from changes in the value of assets and liabilities other than investments in securities at the end of the fiscal year, resulting from changes in the exchange rates.
| 68 | April 30, 2018 |
f) Dividends and distributions to shareholders
Dividends to shareholders are recorded on the ex-dividend date. Dividends from net investment income are declared and paid annually by the Funds. Distributions of net realized capital gains, if any, will be declared and paid at least annually. Income and capital gain distributions are determined in accordance with income tax regulations which may differ from generally accepted accounting principles. Permanent differences between financial and tax reporting may result in reclassification to capital stock.
g) Use of estimates
The preparation of financial statements in conformity with accounting principles generally accepted in the United States of America requires management to make estimates and assumptions that affect the reported amounts of assets and liabilities and disclosure of contingent assets and liabilities at the date of the financial statements and the reported amounts of revenues and expenses during the reporting year. Actual results could differ from those estimates.
h) Indemnification
In the normal course of business the Funds enter into contracts that contain general indemnification clauses. The Funds’ maximum exposure under these arrangements is unknown, as this would involve future claims against a Fund that have not yet occurred. Based on experience, the Funds expect the risk of loss to be remote.
i) Subsequent events evaluation
On May 25, 2018, the Tocqueville Trust filed a post-effective amendment, 485A, for the registration of Class I shares for The Tocqueville Fund, The Tocqueville Opportunity Fund, The Tocqueville International Value Fund, The Tocqueville Gold Fund, The Delafield Fund and The Tocqueville Select Fund. The effective date of the Funds’ Class I shares is to be determined.
In preparing these financial statements, the Trust has evaluated events and transactions for potential recognition or disclosure resulting from subsequent events through the date financial statements were available to be issued. This evaluation did not result in any subsequent events, other than those noted above, that necessitated disclosure and/or adjustments.
3. FEDERAL INCOME TAX
There is no tax liability resulting from unrecognized tax benefits relating to uncertain income tax positions taken or expected to be taken on the tax return for the fiscal year-end October 31, 2017, or for any other tax years which are open for exam. As of October 31, 2017, open tax years include the tax years ended October 31, 2014 through 2017. The Trust is also not aware of any tax positions for which it is reasonably possible that the total amounts of
| Semi-Annual Report | 69 |
unrecognized tax benefits will significantly change in the next six months. The Funds recognize interest and penalties, if any, related to unrecognized tax benefits as income tax expense in the Statement of Operations. During the year, the Funds did not incur any interest or penalties.
Provision for federal income taxes or excise taxes has not been made since the Funds have elected to be taxed as Regulated Investment Companies and intend to distribute substantially all taxable income to shareholders and otherwise comply with the provisions of the Internal Revenue Code applicable to Regulated Investment Companies. Distributions from net realized gains for book purposes may include short-term capital gains which are included as ordinary income to shareholders for tax purposes. Additionally, accounting principles generally accepted in the United States of America require that certain components of net assets relating to permanent differences be reclassified between financial and tax reporting. These reclassifications have no effect on net assets or net asset value per share. For the year ended October 31, 2017, the following table shows the reclassifications made:
| Undistributed Net Investment Income/(Loss) | Accumulated Net Realized Gain/(Loss) | Paid In Capital | ||||||||||
Tocqueville Fund | $ | (186,000 | ) | $ | (3,366,126 | ) | $ | 3,552,126 | ||||
Opportunity Fund | 997,247 | (115,888 | ) | (881,359 | ) | |||||||
International Value Fund | (610,363 | ) | (847,698 | ) | 1,458,061 | |||||||
Gold Fund | 2,041,321 | (175,860 | ) | (1,865,461 | ) | |||||||
Delafield Fund | 3,452,972 | (10,947,146 | ) | 7,494,174 | ||||||||
Select Fund | 435,346 | (904,807 | ) | 469,461 | ||||||||
The permanent differences primarily relate to net operating losses, foreign currency reclasses, the usage of tax equalization, Partnerships, and PFICs.
| 70 | April 30, 2018 |
As of October 31, 2017, the components of accumulated earnings (losses) for income tax purposes were as follows:
| Tocqueville Fund | Opportunity Fund | International Value Fund | Gold Fund | Delafield Fund | Select Fund | |||||||||||||||||||
Tax cost of Investments | $ | 147,409,223 | $ | 54,648,145 | $ | 944,848,997 | $ | 1,218,772,797 | $ | 309,119,744 | $ | 43,529,455 | ||||||||||||
|
|
|
|
|
|
|
|
|
|
|
| |||||||||||||
Unrealized Appreciation | 146,567,564 | 25,238,532 | 205,547,198 | 275,703,993 | 88,483,278 | 13,178,624 | ||||||||||||||||||
Unrealized Depreciation | (338,031 | ) | (1,284,648 | ) | (21,424,604 | ) | (341,257,340 | ) | (24,474,504 | ) | (7,480,656 | ) | ||||||||||||
|
|
|
|
|
|
|
|
|
|
|
| |||||||||||||
Net unrealized appreciation (depreciation) | 146,229,533 | 23,953,884 | 181,122,594 | (65,553,347 | ) | 64,008,774 | 5,697,968 | |||||||||||||||||
|
|
|
|
|
|
|
|
|
|
|
| |||||||||||||
Undistributed operating income | 2,189,663 | — | 10,633,274 | — | 2,432,971 | — | ||||||||||||||||||
Undistributed long-term gains | 24,335,002 | 2,589,292 | 3,668,445 | — | 49,515,483 | 903,691 | ||||||||||||||||||
|
|
|
|
|
|
|
|
|
|
|
| |||||||||||||
Distributable earnings | 26,524,665 | 2,589,292 | 14,301,719 | — | 51,948,454 | 903,691 | ||||||||||||||||||
|
|
|
|
|
|
|
|
|
|
|
| |||||||||||||
Other accumulated loss | — | (631,973 | ) | — | (393,467,089 | ) | — | (8,395 | ) | |||||||||||||||
|
|
|
|
|
|
|
|
|
|
|
| |||||||||||||
Total accumulated gain/(loss) | $ | 172,754,198 | $ | 25,913,899 | $ | 195,437,993 | $ | (459,038,618 | ) | $ | 115,957,228 | $ | 6,593,264 | |||||||||||
|
|
|
|
|
|
|
|
|
|
|
| |||||||||||||
| Semi-Annual Report | 71 |
The difference between book-basis and tax-basis unrealized appreciation is attributable primarily to wash sale deferrals and passive foreign investment companies (PFIC’s).
The tax character of distributions paid during the years ended October 31, 2017 and 2016 was as follows:
| October 31, 2017 | ||||||||||||
| Ordinary Income | Long Term Capital Gain | Total | ||||||||||
Tocqueville Fund | 3,191,286 | 12,245,533 | 15,436,819 | |||||||||
Opportunity Fund | — | — | — | |||||||||
International Value Fund | 5,348,368 | 2,913,833 | 8,262,201 | |||||||||
Gold Fund | — | — | — | |||||||||
Delafield Fund | — | 71,259,512 | 71,259,512 | |||||||||
Select Fund | — | 3,023,170 | 3,023,170 | |||||||||
| October 31, 2016 | ||||||||||||
| Ordinary Income | Long Term Capital Gain | Total | ||||||||||
Tocqueville Fund | $ | 3,200,195 | $ | 3,072,752 | $ | 6,272,947 | ||||||
Opportunity Fund | — | — | — | |||||||||
International Value Fund | 5,967,776 | 4,247,573 | 10,215,349 | |||||||||
Gold Fund | — | — | — | |||||||||
Delafield Fund | — | 62,285,610 | 62,285,610 | |||||||||
Select Fund | — | 2,573,589 | 2,573,589 | |||||||||
The Fund designated as long-term capital gain dividend, pursuant to Internal Revenue Code Section 852(b)(3), the amount necessary to reduce the earnings and profits of the Funds related to net capital gain to zero for the tax years ended October 31, 2017 and 2016.
For the fiscal year ended October 31, 2017 the Opportunity Fund, Gold Fund, and Select Fund had late year losses of $631,973, $12,607,883 and $8,395, respectively.
At October 31, 2017 certain Funds had tax basis capital losses which may be carried forward to offset future capital gains as shown below.
| Capital Losses Expiring | ||||
| Indefinite Long Term | ||||
Gold Fund | $ | 380,859,206 | ||
To the extent that Funds listed above may realize future net capital gains, those gains will be offset by any of their unused respective capital loss carryforwards
4. INVESTMENT ADVISORY AND OTHER AGREEMENTS
Tocqueville Asset Management L.P. (“Tocqueville”) is the investment adviser (the “Adviser”) to the Trust under Investment Advisory Agreements approved by shareholders. For its services, Tocqueville receives fees from The Tocqueville Fund, calculated daily and payable monthly, at an annual rate of 0.75% on the first $1 billion of the average daily
| 72 | April 30, 2018 |
net assets of the Fund, and 0.65% of the average daily net assets in excess of $1 billion. Tocqueville receives fees from The Tocqueville Opportunity Fund, calculated daily and payable monthly, at an annual rate of 0.75% on the first $500 million of the average daily net assets of the Fund, and 0.65% of the average daily net assets in excess of $500 million. Tocqueville receives fees from The Tocqueville International Value Fund, calculated daily and payable monthly, at an annual rate of 1.00% on the first $1 billion of the average daily net assets of the Fund, and 0.75% of the average daily net assets in excess of $1 billion. Tocqueville receives fees from The Tocqueville Gold Fund, calculated daily and payable monthly, at an annual rate of 1.00% on the first $500 million of the average daily net assets of the Fund, 0.75% of the average daily net assets in excess of $500 million but not exceeding $1 billion, and 0.65% of the average daily net assets in excess of $1 billion. Tocqueville receives fees from The Delafield Fund, calculated daily and payable monthly, at an annual rate of 0.80% on the first $250 million of net assets of the Fund; 0.75% on the next $250 million of net assets of the Fund; 0.70% on the next $500 million of net assets of the Fund; and 0.65% on all net assets of the Fund over $1 billion. Tocqueville receives fees from The Tocqueville Select Fund, calculated daily and payable monthly, at an annual rate of 0.80% on all net assets of the Fund.
With respect to The Tocqueville Fund, The Tocqueville Opportunity Fund, The Tocqueville International Value Fund, The Delafield Fund and The Tocqueville Select Fund, the Adviser has contractually agreed to waive its advisory fees and/or reimburse expenses in order to ensure that The Tocqueville Fund’s and The Tocqueville International Value Fund’s total annual operating expenses do not exceed 1.25% of its average daily net assets (excluding taxes, interest expense, acquired fund fees and expenses, or extraordinary expenses such as litigation). The Expense Limitation Agreements will remain in effect until March 1, 2019 for each fund. For the six months ended April 30, 2018, the Adviser waived $1,464, $24,281, $1,206,197, $130,077, and $28,999 of the advisory fee for The Tocqueville Fund, The Tocqueville Opportunity Fund, The Tocqueville International Fund, The Delafield Fund, and The Tocqueville Select Fund respectively. Such amounts are not subject to recoupment by the Adviser.
Pursuant to an Administrative Services Agreement, each Fund pays to the Adviser a fee computed and paid monthly at an annual rate of 0.15% on the first $400 million of the average daily net assets of each fund; 0.13% on the next $600 million of the average daily net assets of each fund; and 0.12% on all the average daily net assets of each fund over $1 billion. For the six months ended April 30, 2018, the Adviser has made payments of $38,030, $10,487, $160,189, $141,802, $42,966, and $5,819, to U.S. Bancorp Fund Services, LLC for services provided under a Sub-Administration Agreement for The Tocqueville Fund, The Tocqueville Opportunity Fund, The Tocqueville International Value Fund, The Tocqueville Gold Fund, The Delafield Fund and The Tocqueville Select Fund, respectively.
Tocqueville Securities, L.P. (the “Distributor”), an affiliate of Tocqueville, acts as distributor for shares of the Trust. Each Fund adopted a distribution and service plan pursuant to Rule 12b-1 of the 1940 Act. Pursuant to the plans, each Fund pays to the Distributor distribution and service fees of 0.25% per annum of its average daily net assets.
| Semi-Annual Report | 73 |
Commissions earned by the Distributor for services rendered as a registered broker-dealer in securities transactions for The Tocqueville Fund, The Tocqueville Opportunity Fund, The Tocqueville Gold Fund, The Delafield Fund and The Tocqueville Select Fund for the six months ended April 30, 2018, were $3,075, $62,820, $9,150, $5,868, $2,033, respectively.
5. CAPITAL SHARE TRANSACTIONS.
Transactions in capital shares for each Fund were as follows:
| For the Six Months Ended April 30, 2018 (unaudited) | For the Year Ended October 31, 2017 | |||||||
| The Tocqueville Fund | Shares | Shares | ||||||
Shares sold | 330,062 | 588,202 | ||||||
Shares issued to holders in reinvestment dividends | 705,639 | 435,792 | ||||||
Shares redeemed | (612,570 | ) | (1,813,017 | ) | ||||
|
|
|
| |||||
Net increase (decrease) | 423,131 | (789,023 | ) | |||||
| The Tocqueville Opportunity Fund | ||||||||
Shares sold | 334,698 | 344,287 | ||||||
Shares issued to holders in reinvestment dividends | 97,416 | — | ||||||
Shares redeemed | (339,203 | ) | (2,224,181 | ) | ||||
|
|
|
| |||||
Net increase (decrease) | 92,911 | (1,879,894 | ) | |||||
| The Tocqueville International Value Fund | ||||||||
Shares sold | 18,978,358 | 37,730,215 | ||||||
Shares issued to holders in reinvestment dividends | 766,784 | 509,379 | ||||||
Shares redeemed | (7,124,240 | ) | (10,870,395 | ) | ||||
|
|
|
| |||||
Net increase | 12,620,902 | 27,369,199 | ||||||
| The Tocqueville Gold Fund | ||||||||
Shares sold | 2,487,317 | 7,433,508 | ||||||
Shares issued to holders in reinvestment dividends | — | — | ||||||
Shares redeemed | (4,384,868 | ) | (9,794,433 | ) | ||||
|
|
|
| |||||
Net decrease | (2,347,551 | ) | (2,360,925 | ) | ||||
| The Delafield Fund | ||||||||
Shares sold | 473,816 | 735,499 | ||||||
Shares issued to holders in reinvestment dividends | 2,222,399 | 2,739,544 | ||||||
Shares redeemed | (3,367,742 | ) | (4,475,349 | ) | ||||
|
|
|
| |||||
Net decrease | (671,527 | ) | (1,000,306 | ) | ||||
| The Tocqueville Select Fund | ||||||||
Shares sold | 113,689 | 341,500 | ||||||
Shares issued to holders in reinvestment dividends | 76,796 | 231,253 | ||||||
Shares redeemed | (718,791 | ) | (1,991,554 | ) | ||||
|
|
|
| |||||
Net decrease | (528,306 | ) | (1,418,801 | ) | ||||
| 74 | April 30, 2018 |
6. FUND SHARE TRANSACTIONS
Each Fund currently offers only one class of shares of beneficial interest. A redemption fee of 2.00% is imposed on redemptions of shares held 90 days or fewer for The Tocqueville Gold Fund. This fee is retained by the Fund and is credited to paid in capital. Redemptions to which the fee applies include redemptions of shares resulting from an exchange made pursuant to the Exchange Privilege, as defined in the Trust’s Prospectus dated February 28, 2018. For a more detailed description of when the redemption fee does not apply, please see the Trust’s Prospectus.
| Semi-Annual Report | 75 |
7. INVESTMENT TRANSACTIONS
Purchases and sales of investment securities (excluding short-term instruments) for the year ended April 30, 2018 are summarized below.
| Tocqueville Fund | Opportunity Fund | International Value Fund | Gold Fund | Delafield Fund | Select Fund | |||||||||||||||||||
Purchases: | $ | 24,537,970 | $ | 57,596,988 | $ | 322,099,066 | $ | 83,142,705 | $ | 42,461,169 | $ | 4,424,467 | ||||||||||||
|
|
|
|
|
|
|
|
|
|
|
| |||||||||||||
Sales: | $ | 37,506,319 | $ | 57,817,266 | $ | 90,547,249 | $ | 172,998,709 | $ | 85,339,643 | $ | 9,718,113 | ||||||||||||
|
|
|
|
|
|
|
|
|
|
|
| |||||||||||||
U.S. Government Security Purchases: | $ | — | $ | — | $ | — | $ | — | $ | — | $ | — | ||||||||||||
|
|
|
|
|
|
|
|
|
|
|
| |||||||||||||
U.S. Government Security Sales: | $ | — | $ | — | $ | — | $ | — | $ | — | $ | — | ||||||||||||
|
|
|
|
|
|
|
|
|
|
|
| |||||||||||||
| 76 | April 30, 2018 |
8. TRANSACTIONS WITH AFFILIATES (Unaudited)
The following issuers are affiliated with the Funds; that is, the Adviser had control of 5% or more of the outstanding voting securities during the period from November 1, 2017 through April 30, 2018. As defined in Section (2)(a)(3) of the Investment Company Act of 1940; such issues are:
| November 1, 2017 | Additions | Reductions | April 30, 2018 | Dividend Income | Realized Gain/(Loss) | Change in Gross Unrealized Appreciation/ (Depreciation) | April 30, 2018 | |||||||||||||||||||||||||||||||||||||||||
Issuer Name | Share Balance | Cost | Share Balance | Cost | Share Balance | Cost | Share Balance | Value | Cost | |||||||||||||||||||||||||||||||||||||||
The Tocqueville Gold Fund | ||||||||||||||||||||||||||||||||||||||||||||||||
Almaden Minerals Ltd. | 5,607,319 | $ | 5,045,196 | 875,000 | $ | 685,388 | (875,000 | ) | $ | (1,073,235 | ) | 5,607,319 | $ | — | $ | (258,036 | ) | $ | (720,363 | ) | $ | 4,585,603 | $ | 4,657,349 | ||||||||||||||||||||||||
Almaden Minerals Ltd. Warrant | 740,741 | — | — | — | — | — | 740,741 | — | — | (86,442 | ) | 18,116 | — | |||||||||||||||||||||||||||||||||||
Almaden Minerals Ltd. Warrant | 875,000 | — | — | — | (875,000 | ) | — | — | — | — | — | — | — | |||||||||||||||||||||||||||||||||||
Almaden Minerals Ltd. Warrant | 79,585 | — | — | — | — | — | 79,585 | — | — | (12,548 | ) | 10,339 | — | |||||||||||||||||||||||||||||||||||
Argonaut Gold, Inc. | 2,837,000 | 12,710,613 | — | — | — | — | 2,837,000 | — | — | 333,885 | 5,457,681 | 12,710,613 | ||||||||||||||||||||||||||||||||||||
ATAC Resources Ltd. | 9,784,891 | 31,231,836 | — | — | — | — | 9,784,891 | — | — | 172,037 | 4,267,720 | 31,231,836 | ||||||||||||||||||||||||||||||||||||
AuRico Metals, Inc.(a) | 7,411,437 | 4,616,358 | — | — | (7,411,437 | ) | (4,616,358 | ) | — | — | 5,632,300 | (2,851,953 | ) | — | — | |||||||||||||||||||||||||||||||||
Bear Creek Mining Corp. | 7,413,200 | 28,761,181 | — | — | — | — | 7,413,200 | — | — | 515,571 | 11,720,703 | 28,761,181 | ||||||||||||||||||||||||||||||||||||
Contango ORE, Inc.(a) | 263,200 | 5,000,800 | — | — | — | — | 263,200 | — | — | 1,185,716 | 6,416,816 | 5,000,800 | ||||||||||||||||||||||||||||||||||||
Corvus Gold, Inc. | 3,226,901 | 2,212,904 | — | — | — | — | 3,226,901 | — | — | 3,599,608 | 6,711,954 | 2,212,904 | ||||||||||||||||||||||||||||||||||||
Corvus Gold, Inc. | 13,030,000 | 10,588,821 | — | — | — | — | 13,030,000 | — | — | 14,370,158 | 27,096,149 | 10,588,821 | ||||||||||||||||||||||||||||||||||||
Corvus Gold, Inc. | — | — | 1,739,130 | 1,561,600 | — | — | 1,739,130 | — | — | 1,982,625 | 3,544,225 | 1,561,600 | ||||||||||||||||||||||||||||||||||||
East Asia Minerals Corp. | 13,290,993 | 22,796,021 | — | — | — | — | 13,290,993 | — | — | (538,280 | ) | 543,462 | 22,796,021 | |||||||||||||||||||||||||||||||||||
East Asia Minerals Corp. Warrant | 976,493 | — | — | — | — | — | 976,493 | — | — | — | — | — | ||||||||||||||||||||||||||||||||||||
East Asia Minerals Corp. Warrant | 3,321,250 | — | — | — | — | — | 3,321,250 | — | — | (128,042 | ) | 142,271 | — | |||||||||||||||||||||||||||||||||||
East Asia Minerals Corp. Warrant | 4,617,560 | — | — | — | — | — | 4,617,560 | — | — | (179,099 | ) | 196,362 | — | |||||||||||||||||||||||||||||||||||
Falco Resources Ltd. | 16,222,300 | �� | 11,973,054 | — | — | — | — | 16,222,300 | — | — | (4,361,908 | ) | 8,212,544 | 11,973,054 | ||||||||||||||||||||||||||||||||||
Falco Resources Ltd. Warrant | 7,000,000 | — | — | — | — | — | 7,000,000 | — | — | (475,855 | ) | — | — | |||||||||||||||||||||||||||||||||||
GoGold Resources, Inc.(a) | 13,668,000 | 17,067,345 | 4,455,000 | 5,552,910 | (13,668,000 | ) | (17,067,345 | ) | 4,455,000 | — | (8,729,202 | ) | 8,450,786 | 1,491,997 | 5,552,910 | |||||||||||||||||||||||||||||||||
Gold Bullion International LLC | 5,000,000 | 5,000,000 | — | — | — | — | 5,000,000 | — | — | — | 6,893,000 | 5,000,000 | ||||||||||||||||||||||||||||||||||||
| Semi-Annual Report | 77 |
| November 1, 2017 | Additions | Reductions | April 30, 2018 | Dividend Income | Realized Gain/(Loss) | Change in Gross Unrealized Appreciation/ (Depreciation) | April 30, 2018 | |||||||||||||||||||||||||||||||||||||||||
Issuer Name | Share Balance | Cost | Share Balance | Cost | Share Balance | Cost | Share Balance | Value | Cost | |||||||||||||||||||||||||||||||||||||||
International Tower Hill Mines Ltd. | 5,738,836 | $ | 20,953,121 | — | $ | — | — | $ | — | 5,738,836 | $ | — | $ | — | $ | 1,118,499 | $ | 3,558,078 | $ | 20,953,121 | ||||||||||||||||||||||||||||
International Tower Hill Mines Ltd. | 20,331,298 | 44,453,358 | — | — | — | — | 20,331,298 | — | — | (23,493,807 | ) | 12,351,270 | 44,453,358 | |||||||||||||||||||||||||||||||||||
Jaguar Mining, Inc. | 64,330,707 | 8,127,887 | — | — | — | — | 64,330,707 | — | — | 1,078,506 | 17,035,274 | 8,127,887 | ||||||||||||||||||||||||||||||||||||
MAG Silver Corp. | 2,827,100 | 31,221,184 | — | — | (165,500 | ) | (1,684,479 | ) | 2,661,600 | — | 333,107 | 1,284,285 | 29,623,608 | 29,536,705 | ||||||||||||||||||||||||||||||||||
MAG Silver Corp. | — | — | 1,432,665 | 15,000,003 | — | — | 1,432,665 | — | — | 922,837 | 15,922,839 | 15,000,003 | ||||||||||||||||||||||||||||||||||||
Nickel Creek Platinum | 12,379,201 | 2,544,342 | — | — | — | — | 12,379,201 | — | — | (266,091 | ) | 2,554,997 | 2,544,342 | |||||||||||||||||||||||||||||||||||
Nickel Creek Platinum Warrant | 6,189,601 | — | — | — | — | — | 6,189,601 | — | — | (163,485 | ) | 729,379 | — | |||||||||||||||||||||||||||||||||||
NuLegacy Gold Corp. | 28,556,090 | 6,158,205 | — | — | — | — | 28,556,090 | — | — | 19,084 | 4,003,346 | 6,158,205 | ||||||||||||||||||||||||||||||||||||
NuLegacy Gold Corp. Warrant | 9,020,590 | — | — | — | (9,020,590 | ) | — | — | — | — | (2,797 | ) | — | — | ||||||||||||||||||||||||||||||||||
Osisko Mining, Inc. | 5,704,239 | 14,650,796 | 2,000,000 | 6,732,118 | — | — | 7,704,239 | — | — | (7,415,290 | ) | 15,961,117 | 21,382,914 | |||||||||||||||||||||||||||||||||||
Osisko Mining, Inc.(b) | 2,000,000 | 6,732,118 | — | — | (2,000,000 | ) | (6,732,118 | ) | — | — | — | — | — | — | ||||||||||||||||||||||||||||||||||
Premier Gold Mines Ltd. | 9,643,160 | 18,374,832 | — | — | (1,013,000 | ) | (2,592,311 | ) | 8,630,160 | — | 264,709 | (4,763,370 | ) | 18,282,671 | 15,782,521 | |||||||||||||||||||||||||||||||||
SEMAFO, Inc. | 11,467,000 | 43,362,142 | — | — | (167,000 | ) | (245,312 | ) | 11,300,000 | — | 265,768 | 7,101,634 | 35,135,090 | 43,116,830 | ||||||||||||||||||||||||||||||||||
Strategic Metals Ltd. | 10,113,400 | 14,557,309 | — | — | — | — | 10,113,400 | — | — | (180,398 | ) | 3,268,867 | 14,557,309 | |||||||||||||||||||||||||||||||||||
Tocqueville Bullion Reserve LP—Class G(c) | 13,806 | 25,000,000 | — | — | — | — | 13,806 | — | — | 532,016 | 17,510,192 | 25,000,000 | ||||||||||||||||||||||||||||||||||||
Torex Gold Resources, Inc.(a) | 2,366,950 | 34,206,758 | — | — | (769,950 | ) | (14,952,225 | ) | 1,597,000 | — | (7,905,551 | ) | (1,268,740 | ) | 16,418,396 | 19,254,533 | ||||||||||||||||||||||||||||||||
Trifecta Gold Ltd. | 2,325,199 | — | — | — | — | — | 2,325,199 | — | — | (53,207 | ) | 181,097 | — | |||||||||||||||||||||||||||||||||||
|
|
|
|
|
|
|
|
|
|
|
|
|
|
|
| |||||||||||||||||||||||||||||||||
| $ | 427,346,181 | $ | 29,532,019 | $ | (48,963,383 | ) | $ | — | $ | (10,396,905 | ) | $ | (4,335,055 | ) | $ | 279,845,163 | $ | 407,914,817 | ||||||||||||||||||||||||||||||
| 78 | April 30, 2018 |
| November 1, 2017 | Additions | Reductions | April 30, 2018 | Dividend Income | Realized Loss | Change in Gross Unrealized Appreciation | April 30, 2018 | |||||||||||||||||||||||||||||||||||||||||
Issuer Name | Share Balance | Cost | Share Balance | Cost | Share Balance | Cost | Share Balance | Value | Cost | |||||||||||||||||||||||||||||||||||||||
The Delafield Fund | ||||||||||||||||||||||||||||||||||||||||||||||||
Real Industry, Inc.(a) | 225,000 | $ | 1,102,089 | — | $ | — | (225,000 | ) | $ | (1,102,089 | ) | — | $ | — | $ | (1,023,642 | ) | $ | 708,338 | $ | — | $ | — | |||||||||||||||||||||||||
Xerium Technologies, Inc. | 700,000 | 9,534,818 | — | — | (150,000 | ) | (2,337,453 | ) | 550,000 | — | (1,658,429 | ) | 2,649,953 | 3,602,500 | 7,197,365 | |||||||||||||||||||||||||||||||||
|
|
|
|
|
|
|
|
|
|
|
|
|
|
|
| |||||||||||||||||||||||||||||||||
| $ | 10,636,907 | $ | — | $ | (3,439,542 | ) | $ | — | $ | (2,682,071 | ) | $ | 3,358,291 | $ | 3,602,500 | $ | 7,197,365 | |||||||||||||||||||||||||||||||
The Tocqueville Select Fund | ||||||||||||||||||||||||||||||||||||||||||||||||
Real Industry, Inc.(a) | 890,281 | 3,561,317 | — | — | (890,281 | ) | (3,561,317 | ) | — | — | (3,250,727 | ) | 2,003,325 | — | — | |||||||||||||||||||||||||||||||||
Xerium Technologies, Inc. | 265,000 | 3,374,608 | — | — | (100,000 | ) | (1,253,750 | ) | 165,000 | — | (800,261 | ) | 1,089,000 | 1,080,750 | 2,120,858 | |||||||||||||||||||||||||||||||||
|
|
|
|
|
|
|
|
|
|
|
|
|
|
|
| |||||||||||||||||||||||||||||||||
| $ | 6,935,925 | $ | — | $ | (4,815,067 | ) | $ | — | $ | (4,050,988 | ) | $ | 3,092,325 | $ | 1,080,750 | $ | 2,120,858 | |||||||||||||||||||||||||||||||
| (a) | Security is no longer an affiliated company at April 30, 2018. |
| (b) | Private security restrictions lifted during period and combined with other non-restricted securities |
| (c) | Tocqueville Bullion Reserve (“TBR”) is a Delaware Limited Partnership created for the purpose of owning physical gold. The General Partner of TBR is TERA Management LLC (“Tera”), a Delaware Limited Liability Company, which is equally owned and managed by Tocqueville Partners II LLC (“TP2”), a Delaware Limited Liability Company, and Eidesis Real Assets LLC (“Eidesis”), a Delaware Limited Liability Company. The Managing Member of TP2 is Robert Kleinschmidt, President of the Trust, who has a 51% participating percentage in TP2 and the sole Non-Managing Member is John Hathaway, co-portfolio manager of the Tocqueville Gold Fund, who has a 49% participating percentage. |
| Semi-Annual Report | 79 |
9. LINE OF CREDIT
The Tocqueville Trust has a $300,000,000 line of credit (the “Line”), which is uncommitted, with U.S. Bank NA. The Line is for temporary emergency or extraordinary purposes, including the meeting of redemption requests that otherwise might require the untimely disposition of securities. The Line is secured by the Trust’s assets. The Line has a one year term and is reviewed annually by the Board of Trustees. The current agreement runs through May 25, 2019. The interest rate as of April 30, 2018 was 4.25%. During the period ended April 30, 2018, the Tocqueville Fund’s maximum borrowing was $4,132,000 and average borrowing was $225,610, the Opportunity Fund’s maximum borrowing was $2,309,000 and average borrowing was $413,236, and the Gold Fund’s maximum borrowing was $14,418,000 and average borrowing was $775,333. This borrowing resulted in interest expenses of $4,345, $8,786 and $14,550, respectively. The International Value Fund, The Delafield Fund and The Select Fund did not use the Line.
10. OTHER EXPENSES
Other expenses include reimbursement to the Adviser for compensation of the Trust’s Chief Compliance Officer. For the period ended April 30, 2018, reimbursement to the Adviser for compensation of the Trust’s Chief Compliance Officer from the Funds amounted to $7,143, $1,970, $30,085, $26,636, $8,073, $1,093 for the Tocqueville Fund, Opportunity Fund, International Value Fund, Gold Fund, Delafield Fund, and Select Fund respectively.
| 80 | April 30, 2018 |
ADDITIONAL INFORMATION (UNAUDITED)
1. ADDITIONAL DISCLOSURE REGARDING FUND TRUSTEES AND OFFICERS
Independent Trustees
Name and Age | Position(s) Held | Term of Office | Principal Occupation(s) During Past Five Years | Number of Funds in Fund Complex Overseen By Trustee | Other Directorships Held by Trustee | |||||||
Charles W. Caulkins Year of Birth: 1956 | Trustee; Member of Audit Committee; Member of Governance and Nominating Committee | Indefinite Term, Since 2003 | Private Investor dba Plan B Partners from January 2012 – present. | 6 | None | |||||||
Alexander Douglas Year of Birth: 1947 | Trustee; Member of Audit Committee; Member of Governance and Nominating Committee | Indefinite Term, Since 2010 | Retired. Formerly, President, CEO and owner of Spaulding Law Printing, Inc. from 1992 to November 2014. | 6 | None | |||||||
| Semi-Annual Report | 81 |
ADDITIONAL INFORMATION (UNAUDITED)
Independent Trustees
Name and Age | Position(s) Held | Term of Office | Principal Occupation(s) During Past Five Years | Number of Funds in Fund Complex Overseen By Trustee | Other Directorships Held by Trustee | |||||||
Charles F. Gauvin Year of Birth: 1956 | Trustee; Member of Audit Committee; Member of Governance and Nominating Committee | Indefinite Term, Since February 2015 | Chief Development Officer, Woods Hole Oceanographic Institution, from February 2016 – present; Executive Director, Maine Audubon, from August 2014 – January 2016; Chief Development Officer, Carnegie Endowment for International Peace, from September 2011 – May 2014; Partner, The Riparian Fund/Legacy Ranch Partners (private equity real estate fund), from February 2010 – December 2012. | 6 | Director, Bioqual, Inc., July 1992 – present. | |||||||
James W. Gerard Year of Birth: 1961 | Trustee; Member of Audit Committee; Member of Governance and Nominating Committee | Indefinite Term, Since 2001 | Managing Director, Hycroft Advisors, from January 2010-present; Managing Director, deVisscher & Co., LLC from January 2013 to present; The Chart Group from January 2001 to present. | 6 | President, American Overseas Memorial Day Association, 1998 to present; Trustee, Salisbury School, 2005 to present; Director, American Friends of Bleraucourt, 1992 to present; President, Little Baby Face Foundation, March 2015 to present. | |||||||
| 82 | April 30, 2018 |
ADDITIONAL INFORMATION (UNAUDITED)
Independent Trustees
Name and Age | Position(s) Held | Term of Office | Principal Occupation(s) During Past Five Years | Number of Funds in Fund Complex Overseen By Trustee | Other Directorships Held by Trustee | |||||||
William F. Indoe Year of Birth: 1942 | Trustee; Member of Audit Committee; Member of Governance and Nominating Committee | Indefinite Term, Since December 2006 | Retired. Formerly, Sullivan & Cromwell LLP (attorneys-at-law). 1968 – 2011. | 6 | Director, Rho Capital Partners, Inc. | |||||||
William J. Nolan III Year of Birth: 1947 | Trustee; Chair of Audit Committee; Member of Governance and Nominating Committee | Indefinite Term, Since December 2006 | Retired. Executive Vice President & Treasurer PaineWebber Inc. 1997 – 2001. | 6 | Trustee, Adirondack Museum, Blue Mt. Lake, NY 1996 to present (Treasurer, 2000 to 2013; Executive Committee, 2000 – present). | |||||||
| Semi-Annual Report | 83 |
ADDITIONAL INFORMATION (UNAUDITED)
Interested Trustees(2) and Officers
Name and Age | Position(s) Held | Term of Office | Principal Occupation(s) During Past Five Years | Number of Funds in Fund Complex Overseen By Trustee | Other Directorships Held by Trustee | |||||
Helen Balk Year of Birth:1972 | Treasurer | Indefinite Term, Since 2014 | Controller / Treasurer of Tocqueville Asset Management from January 2014 to present; Manager / Staff Accountant at Pegg & Pegg LLP from August 1995 to January 2014. | N/A | N/A | |||||
Elizabeth Bosco (3) Year of Birth: 1947 | Anti-Money Laundering Compliance Officer | Indefinite Term, Since 2009 | Chief Compliance Officer of Tocqueville Securities, L.P. from January 2009 to present; Compliance Officer, Tocqueville Asset Management from January 2009 to present. | N/A | N/A | |||||
Robert W. Kleinschmidt Year of Birth: 1949 | Chairman, President, and Trustee | Indefinite Term, Chairman Since 2016, and President and Trustee Since 1991 | President and Chief Investment Officer of Tocqueville Asset Management; Director, Tocqueville Management Corporation, the General Partner of Tocqueville Asset Management L.P. and Tocqueville Securities L.P. from January 1994 to present. | 6 | President and Director, Tocqueville Management Corporation, the General Partner of Tocqueville Asset Management L.P. and Tocqueville Securities L.P. | |||||
Cleo Kotis Year of Birth: 1975 | Secretary | Indefinite Term, Since 2010 | Director of Operations, the Delafield Group of Tocqueville Asset Management L.P., 2009 to present. | N/A | N/A | |||||
Thomas Pandick Year of Birth: 1947 | Chief Compliance Officer | Indefinite Term, Since 2004 | Chief Compliance Officer (October 2004 – present) Tocqueville Asset Management L.P. | N/A | N/A | |||||
| 84 | April 30, 2018 |
| (1) | Each Trustee will hold office for an indefinite term until the earliest of (i) the next meeting of shareholders, if any, called for the purpose of considering the election or re-election of such Trustee and until the election and qualification of his or her successor, if any, elected at such meeting, or (ii) the date a Trustee resigns or retires, or a Trustee is removed by the Board of Trustees or shareholders, in accordance with the Trust’s By-Laws, as amended, and Agreement and Declaration of Trust, as amended. Each officer will hold office for an indefinite term until the date he or she resigns or retires or until his or her successor is elected and qualifies. |
| (2) | “Interested person” of the Trust as defined in the 1940 Act. Mr. Kleinschmidt is considered “interested person” because of his affiliation with the Advisor. |
The Statement of Additional Information includes additional information about the Trustees and is available free of charge by calling the Funds toll free at 1-800-355-7307.
| (3) | Mr. Steven Yevak replaced Ms. Bosco as the Trust’s Anti-Money Laundering Compliance Officer on June 14, 2018. |
| Semi-Annual Report | 85 |
2. PROXY VOTING POLICIES AND PROCEDURES
A description of the policies and procedures that The Tocqueville Trust uses to determine how to vote proxies relating to portfolio securities is available without charge upon request by calling 1-800-355-7307. Information regarding how The Tocqueville Trust voted proxies relating to portfolio securities during the most recent 12-month period ended June 30 is available by calling 1-800-355-7307 and it is also available on the SEC’s web site at http://www.sec.gov.
3. SHAREHOLDER REPORTS AND QUARTERLY PORTFOLIO DISCLOSURE
The Tocqueville Trust is required to file its complete schedule of portfolio holdings with the SEC for its first and third fiscal quarters on Form N-Q. The Trust’s Form N-Q will be available without charge, upon request on the SEC’s website (http://www.sec.gov) and may be available by calling 1-800-697-3863. You can also obtain copies of Form N-Q by (i) visiting the SEC’s Public Reference Room in Washington, DC (information on the operation of the Public Reference Room may be obtained by calling 1-202-551-8090); (ii) sending your request and a duplicating fee to the SEC’s Public Reference Room, Washington, DC 20549-1520; or (iii) sending your request electronically to publicinfosec.gov. Quarterly portfolio holdings are also available on the website of The Tocqueville Funds, www.tocquevillefunds.com.
4. SHAREHOLDER NOTIFICATION OF FEDERAL TAX STATUS
For the fiscal year ended October 31, 2017, certain dividends paid by the Funds may be subject to a maximum tax rate of 15%, as provided for by the Jobs and Growth Tax Relief Reconciliation Act of 2003. The percentage of dividends declared from ordinary income designated as qualified dividend income was as follows:
Tocqueville Fund | 100.00 | % | ||
Opportunity Fund | 0.00 | % | ||
International Value Fund | 100.00 | % | ||
Gold Fund | 0.00 | % | ||
Delafield Fund | 0.00 | % | ||
Select Fund | 0.00 | % |
For corporate shareholders, the percent of ordinary income distributions qualifying for the corporate dividends received deduction for the fiscal year ended October 31, 2017 was as follows:
Tocqueville Fund | 100.00 | % | ||
Opportunity Fund | 0.00 | % | ||
International Value Fund | 3.90 | % | ||
Gold Fund | 0.00 | % | ||
Delafield Fund | 0.00 | % | ||
Select Fund | 0.00 | % |
| 86 | April 30, 2018 |
For the year ended October 31, 2017, the funds designate the following percent of ordinary distributions paid as interest-related dividends under the Internal Revenue Code Section 871(k)(1)(c):
Tocqueville Fund | 0.01 | % | ||
Opportunity Fund | 0.00 | % | ||
International Value Fund | 0.75 | % | ||
Gold Fund | 0.00 | % | ||
Delafield Fund | 0.00 | % | ||
Select Fund | 0.00 | % |
The percentage of taxable ordinary income distributions that are designated as short-term capital gain distributions under Internal Revenue Section 871(k)(2)(C) for each Fund were as follows.
Tocqueville Fund | 0.00 | % | ||
Opportunity Fund | 0.00 | % | ||
International Value Fund | 0.00 | % | ||
Gold Fund | 0.00 | % | ||
Delafield Fund | 0.00 | % | ||
Select Fund | 0.00 | % |
5. FOREIGN TAX CREDIT
For the year ended October 31, 2017, the Tocqueville International Value Fund earned foreign source income and paid foreign taxes which they intend to pass through to their shareholders pursuant to Section 853 of the Internal Revenue Code as follows:
Country | Gross Dividend Per Share | Taxes Withheld Per Share | ||||||
Australia | 0.0097 | 0.0003 | ||||||
Belgium | 0.0087 | 0.0013 | ||||||
Brazil | 0.0074 | 0.0003 | ||||||
Canada | 0.0060 | 0.0009 | ||||||
Denmark | 0.0094 | 0.0014 | ||||||
Finland | 0.0062 | 0.0009 | ||||||
France | 0.0466 | 0.0070 | ||||||
Germany | 0.0201 | 0.0027 | ||||||
Hong Kong | 0.0096 | — | ||||||
Japan | 0.0328 | 0.0033 | ||||||
Netherlands Antilles | 0.0068 | — | ||||||
Netherlands | 0.0099 | 0.0015 | ||||||
Mexico | 0.0056 | 0.0015 | ||||||
South Korea | 0.0082 | 0.0014 | ||||||
Spain | 0.0105 | 0.0016 | ||||||
Switzerland | 0.0255 | 0.0012 | ||||||
|
|
|
| |||||
| 0.2230 | 0.0253 | |||||||
|
|
|
| |||||
| Semi-Annual Report | 87 |
Investment Adviser
Tocqueville Asset Management L.P.
40 W. 57th St., 19th Floor
New York, NY 10019
(212) 698-0800
www.tocqueville.com
Distributor
Tocqueville Securities, L.P.
40 W. 57th St., 19th Floor
New York, NY 10019
(212) 698-0800
Shareholders’ Servicing and Transfer Agent
U.S. Bancorp Fund Services, LLC
P.O. Box 701
Milwaukee, WI 53201-0701
(800) 697-3863
Custodian
U.S. Bank, N.A.
Custody Operations
1555 River Center Drive, Suite 302
Milwaukee, WI 53212
Board of Trustees
Robert W. Kleinschmidt—Chairman
Charles W. Caulkins
Alexander Douglas
Charles F. Gauvin
James W. Gerard
William F. Indoe
William J. Nolan III
Tocqueville Funds
c/o US Bancorp Fund Services, LLC
P.O. Box 701
Milwaukee, WI 53201-0701
www.tocquevillefunds.com
TQ-SEMI Tocqueville Semi-Annual Report 4/30/2018
Item 2. Code of Ethics.
Not applicable for semi-annual reports.
Item 3. Audit Committee Financial Expert.
Not applicable for semi-annual reports.
Item 4. Principal Accountant Fees and Services.
Not applicable for semi-annual reports.
Item 5. Audit Committee of Listed Registrants.
Not applicable to registrants who are not listed issuers (as defined in Rule 10A-3 under the Securities Exchange Act of 1934).
Item 6. Investments.
Schedule of Investments is included as part of the report to shareholders filed under Item 1 of this Form.
Item 7. Disclosure of Proxy Voting Policies and Procedures for Closed-End Management Investment Companies.
Not applicable to open-end investment companies.
Item 8. Portfolio Managers of Closed-End Management Investment Companies.
Not applicable to open-end investment companies.
Item 9. Purchases of Equity Securities by Closed-End Management Investment Company and Affiliated Purchasers.
Not applicable to open-end investment companies.
Item 10. Submission of Matters to a Vote of Security Holders.
There have been no material changes to the procedures by which shareholders may recommend nominees to the registrant’s board of trustees.
1
Item 11. Controls and Procedures.
| (a) | The Registrant’s President and Treasurer have reviewed the Registrant’s disclosure controls and procedures (as defined in Rule 30a-3(c) under the Investment Company Act of 1940 (the “Act”)) as of a date within 90 days of the filing of this report, as required by Rule 30a-3(b) under the Act and Rules 13a-15(b) or 15d-15(b) under the Securities Exchange Act of 1934. Based on their review, such officers have concluded that the disclosure controls and procedures are effective in ensuring that information required to be disclosed in this report is appropriately recorded, processed, summarized and reported and made known to them by others within the Registrant and by the Registrant’s service provider. |
| (b) | There were no changes in the Registrant’s internal control over financial reporting (as defined in Rule 30a-3(d) under the Act) that occurred during the second fiscal quarter of the period covered by this report that has materially affected, or is reasonably likely to materially affect, the Registrant’s internal control over financial reporting. |
Item 12. Disclosure of Securities Lending Activities for Closed-End Management Investment Companies
Not applicable to open-end investment companies.
Item 13. Exhibits.
(a) | (1) Any code of ethics or amendment thereto, that is the subject of the disclosure required by Item 2, to the extent that the registrant intends to satisfy Item 2 requirements through filing an exhibit. Not Applicable. | |||
| (2) A separate certification for each principal executive and principal financial officer pursuant to Section 302 of the Sarbanes-Oxley Act of 2002. Filed herewith. | ||||
| (3) Any written solicitation to purchase securities under Rule 23c-1 under the Act sent or given during the period covered by the report by or on behalf of the registrant to 10 or more persons. Not applicable to open-end investment companies. | ||||
(b) | Certifications pursuant to Section 906 of the Sarbanes-Oxley Act of 2002. Furnished herewith. | |||
2
SIGNATURES
Pursuant to the requirements of the Securities Exchange Act of 1934 and the Investment Company Act of 1940, the registrant has duly caused this report to be signed on its behalf by the undersigned, thereunto duly authorized.
| (Registrant) | The Tocqueville Trust |
| By (Signature and Title)* | /s/ Robert W. Kleinschmidt | |||||||
| Robert W. Kleinschmidt, President | ||||||||
| Date | July 6, 2018 | |||||||
Pursuant to the requirements of the Securities Exchange Act of 1934 and the Investment Company Act of 1940, this report has been signed below by the following persons on behalf of the registrant and in the capacities and on the dates indicated.
| By (Signature and Title)* | /s/ Robert W. Kleinschmidt | |||||||
| Robert W. Kleinschmidt, President |
| Date | July 6, 2018 | |||||||
| By (Signature and Title)* | /s/ Helen Balk | |||||||
| Helen Balk, Treasurer | ||||||||
| Date | July 6, 2018 | |||||||
* Print the name and title of each signing officer under his or her signature.
3