Exhibit 13
Commission File No. 0-15261
SECURITIES AND EXCHANGE COMMISSION
Washington, DC 20549
FORM 10-K
ANNUAL REPORT PURSUANT TO SECTION 13 OR 15(d) OF
THE SECURITIES AND EXCHANGE ACT OF 1934
For the Year Ended December 31, 2005
BRYN MAWR BANK CORPORATION
ANNUAL MEETING
The Annual Meeting of Shareholders of Bryn Mawr Bank Corporation will be held in The Gregg Conference Center at The American College, Bryn Mawr, Pennsylvania, on Tuesday, April 25, 2006, at 2:00 p.m.
STOCK LISTING
Bryn Mawr Bank Corporation common stock is traded over-the-counter and is listed on the NASDAQ National Market System under the symbol BMTC.
FORM 10-K
A copy of the Corporation’s Form 10-K, including financial statement schedules as filed with the Securities and Exchange Commission, is available without charge to shareholders upon written request to Robert J. Ricciardi, Secretary, Bryn Mawr Bank Corporation, 801 Lancaster Avenue, Bryn Mawr, Pennsylvania 19010-3396, or via e-mail to bricciardi@bmtc.com.
EQUAL EMPLOYMENT OPPORTUNITY
The Corporation continues its commitment to equal opportunity employment and does not discriminate against minorities or women with respect to recruitment, hiring, training, or promotion. It is the policy of the Corporation to comply voluntarily with the practices of Affirmative Action.
BRYN MAWR BANK CORPORATION

By expanding our network of branches and reaching out to new markets, our goal is to position Bryn MawrTrust as the dominant community bank and wealth management group in the region.
LETTER FROM THE CHAIRMAN
Dear Fellow Shareholders:
It is a pleasure to write to you this year and to report on the excellent progress of the Corporation in 2005. Earnings were up 29.4%, when adjusted for the one-time sale of “mortgage servicing rights” in 2004, and our return-on-equity and return-on-assets ratios of 15.44% and 1.66% respectively, put us among the top banks in the nation in terms of financial performance.
Leading the way was a tremendous performance by our Wealth Management Group, which in 2005 increased its assets under management and administration to $2.25 billion, up 16.0% over 2004. Similarly, our Business Banking group, led by Marty Gallagher, had another strong year as we continued to attract clients who are tired of the large, out-of-town banks that unfortunately dominate the Philadelphia banking scene.
Our strategy of concentrating on our core competencies is working.
Our strategy of sticking to the basics, on executing our straightforward and uncomplicated business plan, and of concentrating on our core competencies is working!
In March of 2005, we opened our eighth full-service office in Exton, which is in the heart of fast-growing Chester County. Annette McNee is heading up our efforts in that region and we are on target to meet our initial year’s projections. In addition, we are currently negotiating the construction of a regional Chester County office in the West Chester area. This large facility would house a Business Banking team as well as Wealth Management personnel, along with a full-service retail branch. To be successful in Chester County, we must have a meaningful presence there.
Furthermore, we will be building a new facility in Ardmore at a superb site providing good access and egress, excellent visibility, and a very high traffic-count. The projected completion date is November 2006. The full-service banking operation that we conduct from our Wynnewood office, which suffers from poor visibility and access, will be relocated to the Ardmore facility.
Accompanying all this good news are some serious challenges for 2006 and beyond. Attracting quality deposits to fund our loan growth is becoming more and more difficult. This is my 30th year in the banking industry and I have never seen deposit generation as competitive as it is now. A second serious challenge is protecting our balance sheet against the time when interest rates begin to fall. As our balance sheet is currently structured, rising interest rates benefit Bryn Mawr Trust because we re-price loans upward at a faster pace than we re-price deposits. In a falling rate environment, the opposite is true, resulting in a decline in net interest income. Not
PAGE TWO
BRYN MAWR BANK CORPORATION
only are we attempting to book more fixed rate loans to help correct this imbalance, but we are also examining other solutions such as interest rate swaps and floors.

Like you, I have been disappointed that despite our outstanding results, we have not seen a commensurate increase in the price of our shares. While the value of the stock has gone up 105% over the past five years, it has not done much of anything the last two years. To help address this problem, we have engaged an investor relations firm, Gregory FCA Communications, to enable us to tell our story better to the investment community. This is the same firm that has given our Wealth Management Group national visibility on television and in the print media.
I would like to note the retirement of Bill Harral from the Board of Directors after a decade of extraordinary service. Bill has been a major contributor to the success of this institution in many ways, but especially in the areas of corporate governance and organizational effectiveness. He will be missed.
As always, thank you for being a shareholder of the Corporation. Please call me on my direct line at 610-581-4800 if I can help you in any way.
Sincerely, |
 |
Ted Peters |
Chairman and Chief Executive Officer |
PAGE THREE
FINANCIAL HIGHLIGHTS 2005
Consolidated Financial Highlights
(Dollars in thousands, except per share amounts)
| 2005 | 2004 | CHANGE | |||||||||||||
FOR THE YEAR | |||||||||||||||
Net interest income | $ | 31,368 | $ | 26,828 | $ | 4,540 | 16.9 | % | |||||||
Net interest income after loan loss provision | 30,606 | 25,928 | 4,678 | 18.0 | |||||||||||
Other income | 18,245 | 19,794 | (1,549 | ) | -7.8 | ||||||||||
Other expenses | 31,573 | 31,625 | (52 | ) | -0.2 | ||||||||||
Income taxes | 5,928 | 4,752 | 1,176 | 24.7 | |||||||||||
Net income | 11,350 | 9,345 | 2,005 | 21.5 | |||||||||||
AT YEAR-END | |||||||||||||||
Total assets | $ | 727,226 | $ | 682,946 | $ | 44,280 | 6.5 | % | |||||||
Total loans | 597,930 | 564,597 | 33,333 | 5.9 | |||||||||||
Total deposits | 636,260 | 600,965 | 35,295 | 5.9 | |||||||||||
Shareholders’ equity | 77,513 | 71,238 | 6,275 | 8.8 | |||||||||||
Wealth assets under management and administration | 2,248,000 | 1,938,000 | 310,000 | 16.0 | |||||||||||
PER COMMON SHARE | |||||||||||||||
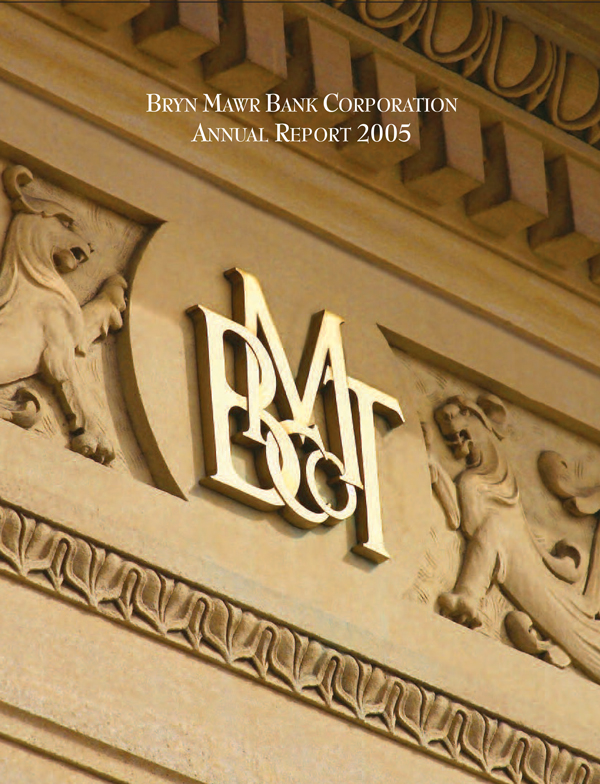
Basic earnings per common share | $ | 1.33 | $ | 1.09 | $ | 0.24 | 22.0 | % | |||||||
Diluted earnings per common share | 1.31 | 1.07 | 0.24 | 22.4 | |||||||||||
Dividends declared | 0.42 | 0.40 | 0.02 | 5.0 | |||||||||||
Book value | 9.06 | 8.29 | 0.77 | 9.3 | |||||||||||
Closing price | 21.66 | 21.99 | (0.33 | ) | -1.5 | ||||||||||
SELECTED RATIOS | |||||||||||||||
Return on average assets | 1.66 | % | 1.45 | % | |||||||||||
Return on average shareholders’ equity | 15.44 | 13.67 | |||||||||||||
Net interest margin | 5.00 | 4.57 | |||||||||||||
Efficiency ratio | 63.64 | 64.97 | |||||||||||||
Note: Net income, earnings per share and selected ratios are from net income from continuing operations.
See Note 14, earnings per share, in the Notes to the Consolidated Financial Statements.
Primary Corporate Strategies
| • | Expand our footprint in targeted communities |
| • | Concentrate on our core competencies: business banking, wealth management, mortgage services and value-added retail banking |
| • | Maintain obsessive client service |
| • | Cultivate aggressive sales culture |
| • | Exercise diligent control of expenses |
PAGE FOUR
BRYN MAWR BANK CORPORATION
SHAREHOLDERS’ EQUITY | DILUTED EARNINGS PER SHARE FROM CONTINUING OPERATIONS | ASSETS UNDER MANAGEMENT AND ADMINISTRATION | ||
| (Dollars in millions) | (Dollars) | (Dollars in billions) | ||
 | 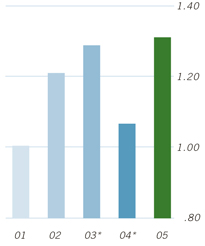 |  | ||
| TOTAL ASSETS | TOTAL LOANS | TOTAL DEPOSITS | ||
| (Dollars in millions) | (Dollars in millions) | (Dollars in millions) | ||
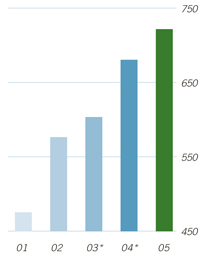 | 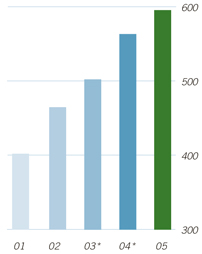 |  | ||
| * | Reclassified for comparative purposes |
PAGE FIVE
THE YEAR IN REVIEW 2005
Repositioning for Growth Based on a Foundation of Superior Client Service
Bryn Mawr Bank Corporation’s principal subsidiary, The Bryn Mawr Trust Company, was founded in 1889. Its eight full-service branches serve residents and businesses in the affluent

Executive Vice President and Chief Financial Officer
J. Duncan Smith oversees the Corporation’s financial well-being.
Net Interest Income shows a 16.9% increase in 2005.
“Main Line” suburbs of Philadelphia. It also maintains seven limited service offices located in upscale adult communities throughout the region. Bryn Mawr Trust has an extremely attractive clientele, including high-net-worth individuals, successful small businesses, and active adults who value the Bank’s long-standing tradition of providing excellent personal service.
In an effort to maximize the effectiveness of the organization, the responsibilities of the executive management team were realigned.
Community Banking now reports to Alison Gers in order to leverage her extensive retail and marketing experience. Marketing, Information Services and Banking & Trust Operations continue to report to her. Loan Operations now reports to Chief Financial Officer Duncan Smith to consolidate accounting resources, streamline processes, and to enable Chief Lending Officer Joe Keefer to concentrate all his efforts on developing new credit business. Bob Ricciardi continues as Corporate Secretary and Chief Credit Policy Officer. In addition, Human Resources and Facilities now report to him as well as Risk Management and Insurance Counsellors, the Corporation’s full-service insurance agency. His special focus is on managing new branch construction.
PAGE SIX
BRYN MAWR BANK CORPORATION
Growth Strategies Identified for Expanding the Footprint of our Branch Network
The Corporation’s growth strategy, which guides the selection of potential branch sites, targets two entirely different types of neighborhoods:
| • | Older, established neighborhoods that share similar demographic characteristics as established Bryn Mawr Trust branches. A good example of this type of target market is Newtown Square, where we opened a branch in 2004. |
| • | Newer neighborhoods that provide exposure to growing communities with a high concentration of businesses. Our Exton Office, which opened in 2005, fits this profile. |

Executive Vice President Robert J. Ricciardi focuses on managing
new branch construction for the Corporation.
New Exton branch deposits and loans are on target.
There are two branch initiatives expected to be announced in 2006. A handsome new building is to be constructed in Ardmore, which will be the new home for our Wynnewood office. Estimated completion date for this project is November of 2006. The other new branch location will involve a site in Chester County.
Construction of our new Exton Branch on Route 100 was completed in early 2005. The Branch began doing business in March with an official ribbon-cutting ceremony and a public grand opening in April. A reception for the business community followed in May. All these activities were well attended.
PAGE SEVEN
THE YEAR IN REVIEW 2005
A Myriad of Promotional Initiatives Foster the Development of an Aggressive Sales Culture
Throughout 2005, many initiatives were held to promote the Exton Branch. There were several direct mail campaigns supported by media blitzes, sweepstakes drawings, and special product offers. The Bank sponsored a free public summer concert, had free ice cream Saturdays, gave away bottled water at the train station, participated in Exton’s Little League Opening Day, and exhibited at the Exton Chamber of Commerce’s Business Expo.

Senior Vice President June M. Falcone discusses bank operations
with Executive Vice President Alison E. Gers who is responsible for
Community Banking, including Operations.
Positioning to meet the challenge of attracting quality deposits.
All of these efforts are designed to spotlight Bryn Mawr Trust as an integral part of the community. Special public events are planned for 2006. First on the docket is an open house to introduce our Wealth Management professionals and the services they provide to the Chester County business community.
Proven to be a successful initiative, the Share-the-Client Program started in 2001 is still going strong. This program rewards the efforts of staff members for making referrals to services provided by business units other than the one where they work. During 2005, there were 2,336 employee referrals generated — about the same number of referrals that were generated in 2004. The amount of revenue produced by the referrals in 2005 showed a 38% increase over revenues resulting from 2004 referrals.
PAGE EIGHT
BRYN MAWR BANK CORPORATION
High-touch Lending Services: the Hallmark of a Bryn Mawr Trust Lender
Our lending professionals continue to base all business development efforts on building banking relationships with privately-owned businesses, non-profits, quality residential builders and owners of commercial real estate. In addition, Bryn Mawr Trust continues to provide high-touch retail lending services to individuals throughout the Delaware Valley. For our lenders, whether commercial or retail, their ultimate overriding goal is establishing long-lasting relationships with individuals and businesses.

Executive Vice President and Chief Lending Officer Joseph G. Keefer
with Senior Vice President Martin F. Gallagher, Jr., who is in charge of
Commercial Lending.
Average loans increase by 8.1% in 2005.
The small business package of services, which was introduced in 2004, still gaining acceptance in the small business community. It has also provided our team small business lenders with a perfect entrée into the Exton Area business community.
Our Residential Mortgage business is still an important segment of the financial services that we provide for our customers, despite the effect of rising mortgage interest rates and the possible impending slowdown of residential construction. There are many efforts in place to heighten the awareness for this part of our business, primarily via newspaper and other forms of print advertising.
Based on the theory that an educated consumer is an excellent prospect for future business, plans were set in motion to present free homeownership seminars to the public. These seminars will provide, firsthand: information concerning real estate financing, homeowners insurance, home warranties, inspections and other important aspects of the ever-changing real estate market. The first program in this series is scheduled to be held in March of 2006.
PAGE NINE
THE YEAR IN REVIEW 2005
Wealth Management Professionals Continue to Gain Prominence in Financial Industry
Our Wealth Management Division provides comprehensive trust & estate services, investment management, retirement planning, brokerage, custody and philanthropic services, and tax planning & preparation. During the year 2005, the assets managed and administered by this Division surpassed the two billion-dollar mark.

Gilbert B. Mateer, Senior Vice President Wealth Management and
President of Retirement Services, with John Pickering, Executive
Vice President and Head of Wealth Management.
2005 Wealth Management assets up 16%.
Wealth Management staff members belong to a variety of professional, civic and philanthropic organizations. Many serve as board members. By doing so, they come in contact with many community leaders and high-net-worth individuals. The group sponsored special events and seminars to win referrals from financial intermediaries and sources of influence. The topics addressed in 2005 included:A New Framework for Tax Advisors, What’s New in Tax Planning, Enhancing the Advisor/Client Relationship, and Intervention Tips for Families in Crisis.
In September 2005, Gilbert B. Mateer joined Bryn Mawr Trust Wealth Management Group as President of Bryn Mawr Retirement Services and Senior Vice President of Business Development. He is responsible for acquiring new business with an emphasis on corporate executives, and family business owners with complex wealth management requirements.
Retirement Services manages 401k and qualified retirement plans on behalf of corporations and other entities. The demand for these services is expected to rise as more companies discontinue traditional pension plans.
PAGE TEN
BRYN MAWR BANK CORPORATION
Our Investment Managers and Wealth Consultants are Nationally Recognized for Their Expertise
During 2005, Bryn Mawr Trust wealth management professionals continued to be sought after for their opinions on current and future market conditions. Their views have been aired on CNBC, Bloomberg Radio and Television, and Fox News. They have been quoted inBarron’s, Forbes, SmartMoney, Buyside Magazine,theNew York Times,theChicago Tribuneand other publications.

Miguel L. Biamon, Vice President and Chief Fixed Income Manager with
F. Peter Brodie, Senior Vice President and Director of Investments.
John M. Grib, Senior Vice President and Portfolio Manager, has been heard on KYW NewsRadio Market Reports for over five years. With his holiday stock report, broadcast on January 2, 2006, he achieved the milestone of having provided 1,000 market updates to KYW listeners.
Wealth professionals gain nationwide visibility.

In addition to its comprehensive menu of financial services, Wealth Management also brings the latest in financial information to our clients, referral sources, prospects and the public at large.The Economic Forecast & Market Reviewis issued quarterly and provides a handy synopsis of current market conditions.BMT in The Newsis a quarterly newsletter providing highlights of media appearances by our Wealth Management professionals.Wealth Watch,issued twice a year, provides general financial information, industry updates and the latest developments and news from the Wealth Management Division.
PAGE ELEVEN
THE YEAR IN REVIEW 2005
Corporate Information
CORPORATE HEADQUARTERS
801 Lancaster Avenue
Bryn Mawr, Pennsylvania 19010-3396
610-525-1700
www.bmtc.com
DIRECTORS
Andrea F. Gilbert
President, Bryn Mawr Hospital
William Harral, III
Chairman, C&D Technologies, Inc.; President,
The Barra Foundation
Wendell F. Holland
Chairman, Pennsylvania Public Utilities Commission
David E. Lees
Senior Partner, myCIO Wealth Partners
Francis J. Leto
Partner, Celli and Leto, LLP, Attorneys at Law;
President, The Brandywine Abstract Companies
Frederick C. “Ted” Peters II
Chairman, President and Chief Executive Officer,
Bryn Mawr Bank Corporation and
The Bryn Mawr Trust Company
B. Loyall Taylor, Jr.
President, Taylor Gifts, Inc.
Nancy J. Vickers
President, Bryn Mawr College
Thomas A. Williams
Retired, formerly Vice President,
Secretary/Treasurer,
Houghton International, Inc.
MARKET MAKERS
Boenning & Scattergood
Citigroup Global Markets
Goldman, Sachs & Co.
Janney Montgomery LLC
Keefe, Bruyette & Woods Inc.
Knight Equity Markets, L.P.
Lehman Brothers Inc.
McConnell Budd & Romano, Inc.
Morgan Stanley & Co., Inc.
Ryan Beck &Co., Inc.
UBS Capital Markets L.P.
UBS Securities LLC
AUDITORS
KPMG LLP
1601 Market Street
Philadelphia, Pennsylvania 19103-2499
REGISTRAR & TRANSFER AGENT
Mellon Investor Services L.L.C.
P.O. Box 3315
South Hackensack, NJ 07606
www.mellon-investor.com
PRINCIPAL SUBSIDIARY
The Bryn Mawr Trust Company
A Subsidiary of Bryn Mawr Bank Corporation
EXECUTIVE MANAGEMENT
Frederick C. “Ted” Peters II*
Chairman, President and Chief Executive Officer
Alison E. Gers
Executive Vice President, Retail Banking,
Marketing, Information Systems & Operations
Joseph G. Keefer
Executive Vice President and Chief Lending Officer
John Pickering
Executive Vice President, Wealth Management
Robert J. Ricciardi*
Executive Vice President, Chief Credit Policy Officer and Corporate Secretary
J. Duncan Smith*
Executive Vice President and Chief Financial Officer
| * | Also officer of the Corporation |
BRANCH OFFICES
801 Lancaster Avenue
Bryn Mawr, Pennsylvania 19010
237 North Pottstown Pike
Exton, Pennsylvania 19341
18 West Eagle Road
Havertown, Pennsylvania 19083
3601 West Chester Pike
Newtown Square, PA 19073
39 West Lancaster Avenue
Paoli, Pennsylvania 19301
330 East Lancaster Avenue
Wayne, Pennsylvania 19087
One Tower Bridge
West Conshohocken,
Pennsylvania 19428
312 East Lancaster Avenue
Wynnewood, Pennsylvania 19096
WEALTH MANAGEMENT DIVISION
10 South Bryn Mawr Avenue
Bryn Mawr, Pennsylvania 19010
LIMITED SERVICE OFFICES
Beaumont at Bryn Mawr Retirement Community
Bryn Mawr, Pennsylvania
Bellingham Retirement Living
West Chester, Pennsylvania
Martins Run Life Care Community
Media, Pennsylvania
Rosemont Presbyterian Village
Rosemont, Pennsylvania
The Quadrangle
Haverford, Pennsylvania
Waverly Heights
Gladwyne, Pennsylvania
White Horse Village
Newtown Square, Pennsylvania
OTHER SUBSIDIARIES AND FINANCIAL SERVICES
BMT Mortgage Company
A Department of The Bryn Mawr Trust Company
Bryn Mawr, Pennsylvania
Myron H. Headen, President
BMT Mortgage Services, Inc.
A Subsidiary of The Bryn Mawr Trust Company
Bryn Mawr, Pennsylvania
Joseph G. Keefer, Chairman
Myron H. Headen, President
Bryn Mawr Retirement Services
A Department of The Bryn Mawr Trust
Company’s Wealth Management Division
Bryn Mawr, Pennsylvania
Gilbert B. Mateer, President
BMT Settlement Services, Inc.
A Subsidiary of The Bryn Mawr Trust Company
Bryn Mawr, Pennsylvania
Joseph G. Keefer, Chairman
Myron H. Headen, President
Insurance Counsellors of Bryn Mawr, Inc.
A Subsidiary of The Bryn Mawr Trust Company
Bryn Mawr, Pennsylvania
Thomas F. Drennan, President
LEGAL COUNSEL
Monteverde, McAlee & Hurd,P.C.
One Penn Center at Suburban Station
1617 John F. Kennedy Boulevard Suite 1500
Philadelnhia Pennsylvania 19103-1815
PAGE TWELVE
BRYN MAWR BANK CORPORATION ANNUAL REPORT 2005
Selected Financial Data 1
Management’s Discussion and Analysis of Financial Condition and Results of Operations 2
Management’s Report on Internal Control over Financial Reporting 15
Report of Independent Registered Public Accounting Firm on Management’s Report on Internal Control over Financial Reporting 16
Report of Independent Registered Public Accounting Firm 17
Consolidated Balance Sheets 18
Consolidated Statements of Income 19
Consolidated Statements of Cash Flows 20
Consolidated Statements of Changes in Shareholders’ Equity 21
Consolidated Statement of Comprehensive Income 21
Notes to Consolidated Financial Statements 22
Price Range of Shares 37
Selected Financial Data
| For the years ended December 31, | 2005 | 2004 | 2003 | 2002 | 2001 | |||||||||||||||
| (dollars in thousands, except for share and per share data) | ||||||||||||||||||||
Interest income | $ | 37,968 | $ | 31,381 | $ | 29,261 | $ | 29,412 | 30,311 | |||||||||||
Interest expense | 6,600 | 4,553 | 4,330 | 4,484 | 6,302 | |||||||||||||||
Net interest income | 31,368 | 26,828 | 24,931 | 24,928 | 24,009 | |||||||||||||||
Loan loss provision | 762 | 900 | 750 | 1,000 | 1,200 | |||||||||||||||
Net interest income after loan loss provision | 30,606 | 25,928 | 24,181 | 23,928 | 22,809 | |||||||||||||||
Non-interest income | 18,245 | 19,794 | 26,577 | 23,899 | 18,846 | |||||||||||||||
Non-interest expense | 31,573 | 31,625 | 33,437 | 31,642 | 28,199 | |||||||||||||||
Income before income taxes and discontinued operations | 17,278 | 14,097 | 17,321 | 16,185 | 13,456 | |||||||||||||||
Applicable income taxes | 5,928 | 4,752 | 6,049 | 5,543 | 4,524 | |||||||||||||||
Income from continuing operations | 11,350 | 9,345 | 11,272 | 10,642 | 8,932 | |||||||||||||||
(Loss) income from discontinued operations | — | — | (1,916 | ) | (435 | ) | 194 | |||||||||||||
Net Income | $ | 11,350 | $ | 9,345 | $ | 9,356 | $ | 10,207 | $ | 9,126 | ||||||||||
Per share data | ||||||||||||||||||||
Earnings per common share from continuing operations: | ||||||||||||||||||||
Basic | $ | 1.33 | $ | 1.09 | $ | 1.30 | $ | 1.22 | $ | 1.03 | ||||||||||
Diluted * | $ | 1.31 | $ | 1.07 | $ | 1.29 | $ | 1.21 | $ | 1.01 | ||||||||||
Earnings per common share | ||||||||||||||||||||
Basic | $ | 1.33 | $ | 1.09 | $ | 1.08 | $ | 1.17 | $ | 1.05 | ||||||||||
Diluted * | $ | 1.31 | $ | 1.07 | $ | 1.07 | $ | 1.16 | $ | 1.04 | ||||||||||
Dividends declared | $ | .42 | $ | 0.40 | $ | 0.40 | $ | 0.38 | $ | 0.36 | ||||||||||
Weighted-average shares outstanding | 8,563,027 | 8,610,171 | 8,657,527 | 8,706,390 | 8,651,040 | |||||||||||||||
Dilutive potential common shares * | 101,200 | 110,854 | 103,107 | 84,606 | 165,216 | |||||||||||||||
Adjusted weighted-average shares | 8,664,227 | 8,721,025 | 8,760,634 | 8,790,996 | 8,816,256 | |||||||||||||||
| At December 31, | 2005 | 2004 | 2003 | 2002 | 2001 | |||||||||||||||
| (dollars in thousands) | ||||||||||||||||||||
Total assets | $ | 727,226 | $ | 682,946 | $ | 604,848 | $ | 577,242 | $ | 476,823 | ||||||||||
Earning assets | 665,667 | 628,754 | 547,637 | 520,562 | 427,805 | |||||||||||||||
Total loans | 597,930 | 564,597 | 502,416 | 466,975 | 400,849 | |||||||||||||||
Deposits | 636,260 | 600,965 | 527,139 | 483,620 | 391,059 | |||||||||||||||
Shareholders’ equity | 77,513 | 71,238 | 67,382 | 62,607 | 57,307 | |||||||||||||||
Ratio of equity to assets | 10.66 | % | 10.43 | % | 11.14 | % | 10.85 | % | 12.02 | % | ||||||||||
Loans serviced for others | 417,649 | 507,421 | 797,326 | 631,105 | 442,373 | |||||||||||||||
Wealth assets under management & administration | 2,248,000 | 1,938,000 | 1,752,000 | 1,551,000 | 1,708,000 | |||||||||||||||
| For the years ended December 31, | 2005 | 2004 | 2003 | 2002 | 2001 | |||||||||||||||
Selected financial ratios: | ||||||||||||||||||||
Net interest margin | 5.00 | % | 4.57 | % | 4.83 | % | 5.47 | % | 5.99 | % | ||||||||||
Income from continuing operations to: | ||||||||||||||||||||
Average total assets | 1.66 | % | 1.45 | % | 1.98 | % | 2.01 | % | 2.05 | % | ||||||||||
Average shareholders’ equity | 15.44 | % | 13.67 | % | 17.76 | % | 17.26 | % | 16.95 | % | ||||||||||
Average shareholders’ equity to average total assets | 10.76 | % | 10.64 | % | 11.13 | % | 11.67 | % | 12.09 | % | ||||||||||
Dividends declared per share to net income per basic common share | 31.58 | % | 36.70 | % | 37.04 | % | 32.48 | % | 34.29 | % | ||||||||||
| * | See Note 14, Earnings Per Share, in the Notes to the Consolidated Financial Statements. |
1
Management’s Discussion and Analysis of Financial Condition and Results of Operations
SPECIAL CAUTIONARY NOTICE REGARDING FORWARD LOOKING STATEMENTS
Certain of the statements contained in this report and the documents incorporated by reference herein, may constitute forward-looking statements for the purposes of the Securities Act of 1933, as amended and the Securities Exchange Act of 1934, as amended, and may involve known and unknown risks, uncertainties and other factors which may cause actual results, performance or achievements of the Corporation to be materially different from future results, performance or achievements expressed or implied by such forward-looking statements. These forward-looking statements include statements with respect to the Corporation’s financial goals, business plans, business prospects, credit quality, credit risk, reserve adequacy, liquidity, origination and sale of residential mortgage loans, impairment of goodwill, the effect of changes in accounting standards, and market and pricing trends. The words “expect,” “anticipate,” “intended,” “plan,” “believe,” “seek,” “estimate,” and similar expressions are intended to identify such forward-looking statements. The Corporation’s actual results may differ materially from the results anticipated by the forward-looking statement due to a variety of factors, including without limitation:
| • | the effect of future economic conditions on the Corporation and its customers, including economic factors which affect consumer confidence in the securities markets, wealth creation, investment and savings patterns, and the Corporation’s interest rate risk exposure and credit risk; |
| • | changes in the securities markets with respect to the market values of financial assets and the stability of particular securities markets; |
| • | governmental monetary and fiscal policies, as well as legislation and regulatory changes; |
| • | changes in accounting requirements or interpretations; |
| • | the risks of changes in interest rates on the level and composition of deposits, loan demand, and the value of loan collateral and securities, as well as interest rate risk; |
| • | the effects of competition from other commercial banks, thrifts, mortgage companies, finance companies, credit unions, securities brokerage firms, insurance companies, money-market and mutual funds and other institutions operating in the Corporation’s trade market area and elsewhere including institutions operating locally, regionally, nationally and internationally together with such competitors offering banking products and services by mail, telephone, computer and the Internet; |
| • | any extraordinary event (such as the September 11, 2001 events, the war on terrorism and the U.S. Government’s response to those events including the war in Iraq); |
| • | the Corporation’s success in continuing to generate new business in its existing markets, as well as its success in identifying and penetrating targeted markets and generating a profit in those markets in a reasonable time; |
| • | the Corporation’s ability to continue to generate investment results for customers and the ability to continue to develop investment products in a manner that meets customer’s needs; |
| • | the Corporation’s timely development of competitive new products and services in a changing environment and the acceptance of such products and services by customers; |
| • | the Corporation’s ability to originate, sell and service residential mortgage loans; |
| • | the accuracy of assumptions underlying the establishment of reserves for loan losses and estimates in the value of collateral, the market value of mortgage servicing rights and various financial assets and liabilities; |
| • | technological changes being more difficult or expensive than anticipated; |
| • | the Corporation’s success in managing the risks involved in the foregoing. |
All written or oral forward-looking statements attributed to the Corporation are expressly qualified in their entirety by use of the foregoing cautionary statements. All forward-looking statements included in this Report are based upon information presently available, and the Corporation assumes no obligation to update any forward-looking statement.
2
BRIEF HISTORYOFTHE CORPORATION
The Bryn Mawr Trust Company (the “Bank”) received its Pennsylvania banking charter in 1889 and is a member of the Federal Reserve System. In 1986, Bryn Mawr Bank Corporation (the “Corporation”) was formed and on January 2, 1987, the Bank became a wholly-owned subsidiary of the Corporation. The Bank and Corporation are headquartered in Bryn Mawr, PA, a western suburb of Philadelphia, PA. The Corporation and its subsidiaries provide wealth management, community banking, residential mortgage lending, insurance and business banking services to its customers through eight full service branches and seven retirement community offices throughout Montgomery, Delaware and Chester counties. The Corporation trades on the NASDAQ National Market under the symbol BMTC.
The goal of the Corporation is to become the preeminent community bank and wealth management organization in the Philadelphia area.
The Corporation operates in a highly competitive market area that includes local, national and regional banks as competitors along with savings banks, credit unions, insurance companies, trust companies, registered investment advisors and mutual fund families. The Corporation and its subsidiaries are regulated by many regulatory agencies including the SEC, NASD, FDIC, the Federal Reserve and the Pennsylvania Department of Banking.
RESULTSOF OPERATIONS
The following is Management’s discussion and analysis of the significant changes in the results of operations, capital resources and liquidity presented in its accompanying consolidated financial statements for the Corporation. The Corporation’s consolidated financial condition and results of operations consist almost entirely of the Bank’s financial condition and results of operations. Current performance does not guarantee, and may not be indicative of similar performance in the future.
CRITICAL ACCOUNTING POLICIES, JUDGMENTSAND ESTIMATES
The accounting and reporting policies of the Corporation and its subsidiaries conform with accounting principles generally accepted in the United States of America applicable to the financial services industry. All significant inter-company transactions are eliminated in consolidation and certain reclassifications are made when necessary to conform the previous year’s financial statements to the current year’s presentation. In preparing the consolidated financial statements, Management is required to make estimates and assumptions that affect the reported amount of assets and liabilities as of the dates of the balance sheets and revenues and expenditures for the periods presented. Therefore, actual results could differ from these estimates.
The allowance for loan losses involves a higher degree of judgment and complexity than other significant accounting policies. The allowance for loan losses is calculated with the objective of maintaining a reserve level believed by Management to be sufficient to absorb estimated probable credit losses. Management’s determination of the adequacy of the allowance is based on periodic evaluations of the loan portfolio and other relevant factors. However, this evaluation is inherently subjective as it requires significant estimates by Management. Consideration is given to a variety of factors in establishing these estimates, including, specific terms and conditions of loans, underwriting standards, delinquency statistics, industry concentration, overall exposure to a single customer, adequacy of collateral, the dependence on collateral, and results of internal loan review, including borrowers perceived financial and management strengths, the amounts and timing of the present value of future cash flows, and access to additional funds. The evaluation process also considers the impact of competition, current and expected economic conditions, national and international events, the regulatory and legislative environment and inherent risks in the loan portfolio. All of these factors may be susceptible to significant change. To the extent actual outcomes differ from Management estimates, additional provisions for loan losses may be required that might adversely affect the Corporation’s results of operations in future periods.
The Corporation recognizes deferred tax assets and liabilities for the future tax effects of temporary differences, net of operating loss carry forwards and tax credits. Deferred tax assets are subject to Management’s judgment based upon available evidence that future realization is more likely than not. If Management determines that the Corporation may be unable to realize all or part of net deferred tax assets in the future, a direct charge to income tax expense may be required to reduce the recorded value of the net deferred tax asset to the expected realizable amount.
The valuation of mortgage servicing rights (“MSRs”) is a critical accounting policy due to the complexity of the quarterly valuation process which is performed by an outside consultant based on data provided by Management. Changes in market interest rates, consumer behavior, demographic trends and other factors influence the value of MSRs. See Note 6 in the accompanying financial statements for additional information.
Other significant accounting policies are presented in Note 1 in the accompanying financial statements. The Corporation has not substantively changed any aspect of its overall approach in the application of the foregoing policies. There have been no material changes in assumptions or estimation techniques utilized as compared to prior periods.
3
EXECUTIVE OVERVIEW
2005 Compared to 2004
The Corporation had net income of $11.350 million for the year ended December 31, 2005, an increase of 21.5% or $2.005 million compared with $9.345 million in 2004. Diluted earnings per share for 2005 were $1.31, an increase of $0.24 or 22.4% compared with $1.07 in 2004. Return on Average Equity (ROE) and Return on Average Assets (ROA) for 2005 were 15.44% and 1.66%, respectively. ROE was 13.67% and ROA was 1.45% in 2004. Management attributes part of this year’s success to a focus on the Corporation’s core competencies which include Wealth, Business Banking, “High Touch” Retail Banking and Mortgage Banking, along with an obsession on client service, close control over expenses and the development of a more assertive sales culture.
The major factor contributing to the increase in earnings for 2005 compared to 2004 was a 43 basis point or 9.4% increase in the Corporation’s net interest margin to 5.00% from 4.57% as the Corporation’s asset sensitive loan portfolio continued to benefit from a series of Federal Reserve interest rate increases. Net interest income for 2005 increased $4.540 million or 16.9%, to $31.368 million from $26.828 million in the same period last year. Additionally, fees for Wealth Management services increased 12.0% or $1.236 million to $11.539 million in 2005 versus $10.303 million in 2004, partially offsetting declines in residential mortgage-related revenues.
In 2004, the Corporation sold mortgage-servicing rights (“MSRs”) that contributed $572 thousand to after tax income and increased diluted earnings per share $0.07. There were no sales of MSRs in 2005. Net income and diluted earnings per share for 2004, excluding the after tax impact of the MSRs sale, would have been $8.773 million and $1.01 per share, respectively. Excluding the impact of the MSRs sale, 2005 net income increased $2.577 million or 29.4% and diluted earnings per share increased $0.30 or 29.7% over the same period last year. (See accompanying reconcilement of GAAP net income and diluted earnings per share to net income and diluted earnings per share that exclude the MSRs sale).
Total loans increased $33.3 million or 5.9% to $597.9 million from $564.6 million over the past 12 months and average loans for 2005 increased $43.6 million or 8.1% to $582.4 million compared to $538.8 million in 2004. The Corporation’s asset quality remains strong as non-performing loans as a percent of total loans was 0.07% at December 31, 2005. The Corporation continues its business development efforts on building banking relationships with privately held businesses, non-profits, quality residential builders and owners of commercial real estate. In addition, the Corporation continues to provide high-touch retail lending services to consumers in the Philadelphia area.
Total deposits grew $35.3 million or 5.9% over the past 12 months to $636.3 million at December 31, 2005 from $601.0 million at December 31, 2004. Average deposits for 2005 increased $32.7 million or 5.8% to $596.4 million compared to $563.7 million in 2004. Deposit balances typically spike near year end as evidenced by an increase in deposits of $31.6 million at December 31, 2005 compared to September 30, 2005. Average deposits for the fourth quarter of 2005 were $600.6 million compared to third quarter 2005 average deposits of $603.3 million reflecting the competitive nature of the deposit gathering business in our market area.
The Corporation will continue with the expansion of its retail banking footprint with controlledde novo expansion in the suburban Philadelphia market. Management anticipates relocating the Wynnewood, PA branch to a new branch in Ardmore, PA in late 2006. Management also plans a new regional office in West Chester, PA some time in 2007 to complement the recently opened Exton, PA and Newtown Square, PA retail branch locations.
Non-interest income for 2005, excluding the $1.145 million gain on MSR sales in 2004, decreased $404 thousand or 2.2% to $18.245 million from $18.649 million in the same period last year. Non-interest income was negatively impacted by the slowdown in residential mortgage activity, as residential mortgage originations and sales declined 7.2% or $15.0 million and $13.3 million or 9.1%, respectively in 2005 compared to 2004. This decline in residential mortgage activity along with very competitive pricing resulted in a reduction in the gain on sale of loans of 44.5% or $1.298 million to $1.622 million in 2005 from $2.920 million in 2004. Non-interest income was also negatively impacted by a $234 thousand or 12.8% decrease in service charges on deposit accounts reflecting the impact of higher earnings credits on commercial checking accounts and the industry’s trend toward “free” checking.
Partially offsetting this decrease in non-interest income was a 2005 increase of $1.236 million or 12.0% in fees for Wealth Management services compared to 2004. Wealth assets under management and administration increased $310 million or 16.0% to $2.248 billion at December 31, 2005, compared to $1.938 billion at December 31, 2004. The increase in assets under management and administration is partly a result of a business acquisition by a significant client in the third quarter of 2005.
Non-interest expense for 2005, excluding $266 thousand of expenses related to the sale of the MSRs, increased $214 thousand or 0.7% to $31.573 million when compared to $31.359 million in the same period last year. The increase is a combination of many factors including increased medical benefit costs, staff merit raises, incentive compensation, and occupancy and furniture and fixture expenses related to the
4
new Exton, PA branch. Partially offsetting these increases were reduced levels of professional fees, lower amortization of mortgage servicing rights, and reduced residential mortgage staffing levels.
2004 Compared to 2003
The Corporation had net income from continuing operations of $9.345 million for the year ended December 31, 2004, a decrease of 17.1% or $1.927 million compared with $11.272 million in 2003. Diluted earnings per share from continuing operations for 2004 were $1.07, a decrease of $0.22 or 17.1% from $1.29 in 2003. ROE and ROA for 2004 on continuing operations were 13.67% and 1.45%, respectively. ROE and ROA for continuing operations in 2003 were 17.76% and 1.98%, respectively.
The major factors contributing to the decline in earnings from continuing operations in 2004 compared to 2003 were a significant drop in residential mortgage related activity, a decline in the Corporation’s net interest margin and compliance costs associated with the implementation of Sarbanes Oxley legislation. Partially offsetting these declines was a gain on the sale of mortgage servicing rights (there were no such sales in 2003) and improved Wealth Division performance (revenues and expense control).
During 2003, the Corporation sold the assets of its family office subsidiary, Joseph W. Roskos & Company (“JWR & Co.”) to its former owners. In accordance with SFAS No. 144 – Accounting for the Impairment or Disposal of Long Lived Assets, the Corporation classified all revenues, expenses, goodwill writedowns, related disposal expenses and applicable income taxes as a loss from discontinued operations. The disposal of the JWR & Co. subsidiary resulted in a loss, net of applicable income taxes, of $1.916 million or $0.22 per share (basic and diluted) in 2003. Additional details related to the disposal of JWR & Co.’s assets are included in Note 20 in the Notes to the Consolidated Financial Statements.
Key Performance Ratios
Key financial performance ratios for the years and years ended December 31, 2005, 2004 and 2003 are shown in the tables below. Ratios are from continuing operations unless noted otherwise.
| 2005 | 2004 | 2003 | ||||||||||
Return on Average Equity (ROE) | 15.44 | % | 13.67 | % | 17.76 | % | ||||||
Return on Average Assets (ROA) | 1.66 | % | 1.45 | % | 1.98 | % | ||||||
Efficiency Ratio* | 63.64 | % | 67.83 | % | 64.34 | % | ||||||
Net Interest Margin | 5.00 | % | 4.57 | % | 4.83 | % | ||||||
Total Diluted Earnings Per Share (including discontinued operations) | $ | 1.31 | $ | 1.07 | $ | 1.07 | ||||||
Dividend Per Share | $ | .42 | $ | 0.40 | $ | 0.40 | ||||||
Diluted Earnings Per Share** | $ | 1.31 | $ | 1.07 | $ | 1.29 | ||||||
| December 31, | ||||||||||||
| 2005 | 2004 | 2003 | ||||||||||
Book Value Per Share | $ | 9.06 | $ | 8.29 | $ | 7.77 | ||||||
Allowance for Loan Losses as a Percentage of Loans | 1.24 | % | 1.23 | % | 1.25 | % | ||||||
Wealth assets under management and administration (in billions) | $ | 2.248 | $ | 1.938 | $ | 1.752 | ||||||
| * | Efficiency ratio is calculated by dividing non-interest expense by the sum of net interest income and non-interest income. |
| ** | See Note 14, Earnings Per Share, in the Notes to Consolidated Financial Statements |
Reconcilement of Non-GAAP Information
See the table below for a reconcilement of GAAP net income, diluted earnings per share, non-interest income and non-interest expense to comparable data that excludes the MSRs sale. Management believes that the presentation excluding the impact of the sale of MSRs in 2004 provides useful supplemental information essential to the proper understanding of the operating results of the Corporation’s core business. These disclosures should not be viewed as a substitute for operating results determined in accordance with GAAP, nor are they necessarily comparable to non-GAAP performance measures, which may be presented by other companies.
Net Income From Continuing Operations | Diluted Earnings Per Share From Continuing Operations | |||||||||||||||||||
| Year Ended December 31, | ||||||||||||||||||||
| 2005 | 2004 | 2003 | 2005 | 2004 | 2003 | |||||||||||||||
| (dollars in thousands except per share data) | ||||||||||||||||||||
As reported2 | $ | 11,350 | $ | 9,345 | $ | 11,272 | 1.31 | $ | 1.07 | 1.29 | ||||||||||
After tax effect of MSR sale1,2 | — | (572 | ) | — | — | (0.07 | ) | |||||||||||||
Adjusted for sale2 | $ | 11,350 | $ | 8,773 | $ | 11,272 | 1.31 | $ | 1.01 | 1.29 | ||||||||||
| Non-Interest Income | Non-Interest Expense | |||||||||||||||||||
| 2005 | 2004 | 2003 | 2005 | 2004 | 2003 | |||||||||||||||
As reported | $ | 18,245 | $ | 19,794 | $ | 26,577 | $ | 31,573 | $ | 31,625 | $ | 33,437 | ||||||||
MSR sale income | — | 1,145 | — | — | — | — | ||||||||||||||
MSR sale expenses | — | — | — | — | 266 | — | ||||||||||||||
Adjusted for sale | $ | 18,245 | $ | 18,649 | $ | 26,577 | $ | 31,573 | $ | 31,359 | $ | 33,437 | ||||||||
| 1 | MSR gain consists of revenues of $1.145 million, direct expenses of $266 thousand and allocated income taxes of $307 thousand netting to $572 thousand of net income. |
| 2 | Dilutive potential shares have been adjusted to reflect the tax benefit of non-qualified stock options. This resulted in an increase to diluted earnings per share from continuing operations for the year 2004 and year 2003 of $0.01 per share. The difference in diluted earnings per share from continuing operations adjusted for the MSR sale is due to rounding. |
5
COMPONENTSOF NET INCOME
Net income is affected by five major elements:Net Interest Income, or the difference between interest income and loan fees earned on loans and investments and interest expense paid on deposits and borrowed funds; The Provision For Loan Losses, or the amount added to the allowance for loan losses to provide reserves for estimated inherent losses on loans;Non-Interest Income which is made up primarily of certain fees, wealth revenue, residential mortgage activities and gains and losses from the sale of securities;Non-Interest Expense, which consists primarily of salaries, employee benefits and other operating expenses; andIncome Taxes. Each of these major elements will be reviewed in more detail in the following discussion.
NET INTEREST INCOME
Rate/Volume Analyses
The rate volume analysis in the table below analyzes changes in net interest income for the year ended December 31, 2005 over December 31, 2004 and December 31, 2004 over December 31, 2003 by its rate and volume components. The change in interest income/expense due to both volume and rate has been allocated to changes in volume.
| Year Ended December 31, | ||||||||||||||||||||||
| (dollars in thousands) | 2005 Compared to 2004 | 2004 Compared to 2003 | ||||||||||||||||||||
| Increase/(decrease) | Volume | Rate | Total | Volume | Rate | Total | ||||||||||||||||
Interest Income: | ||||||||||||||||||||||
Interest-bearing deposits with other banks | $ | (11 | ) | $ | 39 | $ | 28 | $ | (8 | ) | $ | 19 | $ | 11 | ||||||||
Federal funds sold | (99 | ) | 118 | 19 | 25 | 56 | 81 | |||||||||||||||
Investment securities available for sale, taxable | 122 | 42 | 164 | 209 | (135 | ) | 74 | |||||||||||||||
Investment securities available for sale, tax-exempt | — | — | — | 82 | (3 | ) | 79 | |||||||||||||||
Loans | 2,729 | 3,647 | 6,376 | 3,383 | (1,508 | ) | 1,875 | |||||||||||||||
Total interest income | 2,741 | 3,846 | 6,587 | 3,691 | (1,571 | ) | 2,120 | |||||||||||||||
Interest expense: | ||||||||||||||||||||||
Savings, NOW and market rate | (59 | ) | 804 | 745 | 341 | 0 | 341 | |||||||||||||||
Time deposits | 825 | 430 | 1,255 | 115 | (235 | ) | (120 | ) | ||||||||||||||
Short term borrowings | 29 | 18 | 47 | 4 | (2 | ) | 2 | |||||||||||||||
Total interest expense | 795 | 1,252 | 2,047 | 460 | (237 | ) | 223 | |||||||||||||||
Interest differential | $ | 1,946 | $ | 2,594 | $ | 4,540 | $ | 3,231 | $ | (1,334 | ) | $ | 1,897 | |||||||||
Analyses of Interest Rates and Interest Differential
The table below presents the major asset and liability categories on an average daily basis for the periods presented, along with interest income and expense and key rates and yields. The following table shows an analysis of the composition of net interest income for each of the last three years. Interest income on loans includes fees on loans of $645,000, $677,000 and $620,000 in 2004, 2003 and 2002 respectively. The average loan balances include non-accrual loans. All average balances are calculated on a daily basis. Yields on investment securities are not calculated on a tax-equivalent basis.
| For the Year Ended December 31 | 2005 | 2004 | 2003 | |||||||||||||||||||||||||||
| (dollars in thousands) | Average Balance | Interest Income/ Expense | Average Rates Earned/ Paid | Average Balance | Interest Income/ Expense | Average Rates Earned/ Paid | Average Balance | Interest Income/ Expense | Average Rates Earned/ Paid | |||||||||||||||||||||
Assets: | ||||||||||||||||||||||||||||||
Interest-bearing deposits with other banks | $ | 2,398 | $ | 76 | 3.17 | % | $ | 3,079 | $ | 48 | 1.56 | % | $ | 3,737 | $ | 37 | 0.99 | % | ||||||||||||
Federal funds sold | 6,281 | 210 | 3.34 | % | 13,052 | 191 | 1.46 | % | 10,638 | 110 | 1.03 | % | ||||||||||||||||||
Investment securities available for sale: | ||||||||||||||||||||||||||||||
Taxable | 30,848 | 1,018 | 3.30 | % | 27,173 | 854 | 3.14 | % | 21,087 | 780 | 3.70 | % | ||||||||||||||||||
Tax –Exempt | 5,069 | 165 | 3.26 | % | 5,071 | 165 | 3.25 | % | 2,499 | 86 | 3.44 | % | ||||||||||||||||||
Total investment securities | 35,917 | 1,183 | 3.29 | % | 32,244 | 1,019 | 3.16 | % | 23,586 | 866 | 3.67 | % | ||||||||||||||||||
Loans(1) | 582,386 | 36,499 | 6.27 | % | 538,775 | 30,123 | 5.59 | % | 478,397 | 28,248 | 5.90 | % | ||||||||||||||||||
Total interest earning assets | 626,982 | 37,968 | 6.06 | % | 587,150 | 31,381 | 5.34 | % | 516,358 | 29,261 | 5.67 | % | ||||||||||||||||||
Cash and due from banks | 29,918 | 32,774 | 33,005 | |||||||||||||||||||||||||||
Allowance for loan losses | (7,283 | ) | (6,957 | ) | (6,519 | ) | ||||||||||||||||||||||||
Other assets | 33,312 | 29,827 | 27,557 | |||||||||||||||||||||||||||
Total assets | $ | 682,929 | $ | 642,794 | $ | 570,401 | ||||||||||||||||||||||||
Liabilities: | ||||||||||||||||||||||||||||||
Savings, NOW and market rate | $ | 317,205 | $ | 2,744 | .87 | % | $ | 323,972 | $ | 1,999 | 0.62 | % | $ | 263,646 | $ | 1,658 | 0.63 | % | ||||||||||||
Time deposits | 130,667 | 3,799 | 2.91 | % | 102,369 | 2,544 | 2.49 | % | 96,996 | 2,664 | 2.75 | % | ||||||||||||||||||
Total interest-bearing deposits | 447,872 | 6,543 | 1.46 | % | 426,341 | 4,543 | 1.07 | % | 360,642 | 4,322 | 1.20 | % | ||||||||||||||||||
Short term borrowings | 1,700 | 57 | 3.35 | % | 850 | 10 | 1.18 | % | 496 | 8 | 1.61 | % | ||||||||||||||||||
Total interest-bearing liabilities | 449,572 | 6,600 | 1.47 | % | 427,190 | 4,553 | 1.07 | % | 361,138 | 4,330 | 1.20 | % | ||||||||||||||||||
Demand deposits, non-interest-bearing | 148,495 | 137,336 | 135,335 | |||||||||||||||||||||||||||
Other liabilities | 11,370 | 9,900 | 10,454 | |||||||||||||||||||||||||||
Total non-interest-bearing liabilities | 159,865 | 147,236 | 145,789 | |||||||||||||||||||||||||||
Total liabilities | 609,437 | 574,426 | 506,927 | |||||||||||||||||||||||||||
Shareholder’s equity | 73,492 | 68,367 | 63,474 | |||||||||||||||||||||||||||
Total liabilities and shareholders’ equity | $ | 682,929 | $ | 642,794 | $ | 570,401 | ||||||||||||||||||||||||
Net interest spread | 4.59 | % | 4.27 | % | 4.47 | % | ||||||||||||||||||||||||
Effect of non-interest-bearing sources | .41 | % | 0.30 | % | 0.36 | % | ||||||||||||||||||||||||
Net interest income/margin on earning assets | $ | 31,368 | 5.00 | % | $ | 26,828 | 4.57 | % | $ | 24,931 | 4.83 | % | ||||||||||||||||||
| (1) | Non-accrual loans have been included in average loan balances, but interest on non-accrual loans has not been included for purposes of determining interest income. |
6
Net Interest Margin 2005 Compared to 2004 Commentary
Net interest income for the year ended December 31, 2005 of $31.368 million was $4.540 million or 16.9% higher than the net interest income for the same period in 2004 of $26.828 million. The analyses above indicate that both increased loan volume and an increase in rates contributed to the increase in net interest income. Average earning assets increased $39.8 million or 6.8% in 2005 compared to the same period in 2004. Average total loans grew $43.6 million or 8.1% in 2005 compared to 2004.
The average earning asset yield during 2005 of 6.06% was 72 basis points higher than the 5.34% during the same period in 2004. The rate paid on average interest bearing liabilities of 1.47% in 2005 was 40 basis points higher than the 1.07% in 2004. Average non-interest-bearing demand deposits grew 8.1%, while savings decreased 2.1% and time deposits increased 27.6% in 2005 compared to 2004.
Net Interest Margin 2004 Compared to 2003 Commentary
Net interest income for the year ended December 31, 2004 of $26.828 million was $1.897 million or 7.6% higher than the net interest income for the same period in 2003 of $24.931 million. The rate volume analysis and average balance sheet data above clearly show that the increase in interest earning assets, particularly loans, more than offset the decline in interest rates. Average earning assets increased $70.792 million or 13.7% for 2004 compared to the same period in 2003. Average total loans grew $60.378 million or 12.6% while investments increased $8.658 million or 36.7% in 2004 over 2003.
The average earning asset yield during 2004 of 5.34% was 33 basis points lower than the 5.67% in 2003. The rate paid on average interest bearing liabilities of 1.07% in 2004 was 13 basis points lower than the 1.20% in 2003. Average non-interest-bearing demand deposits grew 1.5%, while savings and time deposits increased 22.9% and 5.5%, respectively, in 2004 compared to 2003.
Net Interest Margin
The Corporation’s net interest margin increased 51 basis points to 5.15% in the fourth quarter of 2005 from 4.64% in the same period last year. The net interest margin and related components for the past five linked quarters are shown in the table below. The Corporation anticipates that continued increases in interest rates will have a positive effect on the Corporation’s net interest margin in the first half of 2006. However, factors such as competitive market conditions for deposits and competitive share driven loan pricing could impact the net interest margin in the second half of 2006 and beyond. The Corporation’s net interest margin was 5.00% in 2005 compared with 4.57% in 2004 and 4.83% in 2003. These results reflect the decline in interest rates during 2003 and the first half of 2004. Rates started to rise in 2004 as reflected in the five quarter and three year analyses below.
| Year | Earning Asset Yield | Interest Bearing Liability Cost | Net Interest Spread | Effect of Non-Interest Bearing Sources | Net Interest Margin | ||||||||||||
Net Interest Margin Last Five Quarters |
| ||||||||||||||||
4thQuarter | 2005 | 6.37 | % | 1.73 | % | 4.64 | % | 0.51 | % | 5.15 | % | ||||||
3rdQuarter | 2005 | 6.13 | % | 1.57 | % | 4.56 | % | 0.45 | % | 5.01 | % | ||||||
2ndQuarter | 2005 | 5.94 | % | 1.37 | % | 4.57 | % | 0.37 | % | 4.94 | % | ||||||
1stQuarter | 2005 | 5.76 | % | 1.19 | % | 4.57 | % | 0.32 | % | 4.89 | % | ||||||
4thQuarter | 2004 | 5.45 | % | 1.10 | % | 4.35 | % | 0.29 | % | 4.64 | % | ||||||
Net Interest Margin Last Three Years | |||||||||||||||||
| 2005 | 6.06 | % | 1.47 | % | 4.59 | % | 0.41 | % | 5.00 | % | |||||||
| 2004 | 5.34 | % | 1.07 | % | 4.27 | % | 0.30 | % | 4.57 | % | |||||||
| 2003 | 5.67 | % | 1.20 | % | 4.47 | % | 0.36 | % | 4.83 | % | |||||||
Interest Rate Sensitivity
The Corporation actively manages its interest rate sensitivity position. The objectives of interest rate risk management are to control exposure of net interest income to risks associated with interest rate movements and to achieve sustainable growth in net interest income. Management’s Asset Liability Committee (“ALCO”), using policies and procedures approved by the Corporation’s Board of Directors, is responsible for managing the interest rate sensitivity position. The Corporation manages interest rate sensitivity by changing the mix, pricing and repricing characteristics of its assets and liabilities, through the management of its investment portfolio, its offering of loan and selected deposit terms and through borrowings from the Federal Home Loan Bank of Pittsburgh (“FHLB”). The ALCO is presently evaluating various strategies including interest rate swaps and floors to mitigate the impact of future changes in interest rates on its net interest income.
The Corporation uses several tools to manage its interest rate risk including interest rate sensitivity analysis (aka “GAP Analysis”), market value of portfolio equity analysis, interest rate simulations under various rate scenarios and net interest margin reports. The results of these reports are compared to limits established by the Corporation’s Asset Liability Management Policies and appropriate adjustments are made if the results are outside of established limits.
7
The following table demonstrates the annualized result of an interest rate simulation and the estimated effect that a parallel interest rate shift in the yield curve and subjective adjustments in deposit pricing might have on the Corporation’s projected net interest income over the next 12 months.
Summary of Interest Rate Simulation
| December 31, 2005 | |||||||
| (dollars in thousands) | Estimated Change Next 12 Months | ||||||
Change in Interest Rates | |||||||
+200 basis points | $ | 2,086 | 6.10 | % | |||
+100 basis points | $ | 1,235 | 3.61 | % | |||
-100 basis points | $ | (1,496 | ) | (4.37 | )% | ||
-200 basis points | $ | (3,684 | ) | (10.76 | )% | ||
The interest rate simulation above indicates that the Corporation’s balance sheet as of December 31, 2005 is asset sensitive meaning that an increase in interest rates should increase net interest income and a decline in interest rates will cause a decline in net interest income over the next 12 months when compared to projected net income under a flat or stable rate scenario.
GAP Report
The following table presents the Corporation’s interest rate sensitivity position or GAP Analysis as of December 31, 2005:
| (dollars in thousands) | 0 to 90 Days | 90 to 365 Days | 1 - 5 Years | Over 5 Years | Non- Rate | Total | ||||||||||||||||
Assets: | ||||||||||||||||||||||
Interest-bearing deposits with other banks | $ | 405 | $ | — | $ | — | $ | — | $ | — | $ | 405 | ||||||||||
Federal Funds Sold | 32,341 | — | — | — | — | 32,341 | ||||||||||||||||
Investment securities | 221 | 13,052 | 16,434 | 5,284 | 34,991 | |||||||||||||||||
Loans, net of allowance | 265,199 | 36,961 | 210,559 | 77,809 | 590,528 | |||||||||||||||||
Cash and due from banks | — | — | — | — | 33,896 | 33,896 | ||||||||||||||||
Other assets | — | — | — | — | 35,065 | 35,065 | ||||||||||||||||
Total assets | $ | 298,166 | $ | 50,013 | $ | 226,993 | $ | 83,093 | $ | 68,961 | $ | 727,226 | ||||||||||
Liabilities and shareholders’ equity: | ||||||||||||||||||||||
Non-interest- bearing demand | $ | 47,707 | $ | 18,429 | $ | 98,290 | $ | — | $ | 3,616 | $ | 168,042 | ||||||||||
Savings, NOW and market rate | 51,318 | 43,222 | 166,806 | 51,550 | — | 312,896 | ||||||||||||||||
Time deposits | 74,302 | 55,651 | 25,233 | 136 | — | 155,322 | ||||||||||||||||
Other liabilities | — | — | — | — | 13,453 | 13,453 | ||||||||||||||||
Shareholders’ equity | 2,768 | 8,305 | 44,294 | 22,146 | — | 77,513 | ||||||||||||||||
Total liabilities and shareholders’ equity | $ | 176,095 | $ | 125,607 | $ | 334,623 | $ | 73,832 | $ | 17,069 | $ | 727,226 | ||||||||||
GAP | $ | 122,071 | $ | (75,594 | ) | $ | (107,630 | ) | $ | 9,261 | $ | 51,892 | $ | — | ||||||||
Cumulative GAP | $ | 122,071 | $ | 46,477 | $ | (61,153 | ) | $ | (51,892 | ) | $ | — | $ | — | ||||||||
Cumulative earning assets as a % of cumulative interest bearing liabilities | 238 | % | 155 | % | 138 | % | 141 | % | — | — | ||||||||||||
The table above indicates that the Corporation is asset sensitive in the immediate to 90 day time frame and should experience an increase in net interest income in the near term if interest rates rise. The converse is also true.
Maturity of Certificates of Deposit of $100,000 or Greater
| (dollars in thousands) | |||
Three months or less | $ | 61,148 | |
Three to six months | 8,424 | ||
Six to twelve months | 12,567 | ||
Greater than twelve months | 5,642 | ||
Total | $ | 87,781 | |
PROVISIONFOR LOAN LOSSES
General Discussion of the Allowance for Loan Losses
The Corporation uses the allowance method of accounting for credit losses. The balance in the allowance for loan losses is determined based on Management’s review and evaluation of the loan portfolio in relation to past loss experience, the size and composition of the portfolio, current economic events and conditions, and other pertinent factors, including Management’s assumptions as to future delinquencies, recoveries and losses.
Increases to the allowance for loan losses are implemented through a corresponding provision (expense) in the Corporation’s statement of income. Loans deemed uncollectible are charged against the allowance for loan losses. Recoveries of previously charged-off amounts are credited to the allowance for loan losses.
While Management considers the allowance for loan losses to be adequate based on information currently available, future additions to the allowance may be necessary due to changes in economic conditions or Management’s assumptions as to future delinquencies, recoveries and losses and Management’s intent with regard to the disposition of loans. In addition, the Pennsylvania Department of Banking and the Federal Reserve Bank of Philadelphia, as an integral part of their examination process, periodically review the Corporation’s allowance for loan losses.
The Corporation’s allowance for loan losses is the accumulation of four components that are calculated based on various independent methodologies. All components of the allowance for loan losses are estimations. Management discusses these estimates earlier in this document under the heading of “Critical Accounting Policies, Judgments and Estimates”. The four components are as follows:
| • | Specific Loan Evaluation Component – Includes the specific evaluation of larger classified loans |
8
| • | Historical Charge-Off Component – Applies a five year historical charge-off rate to pools of non-classified loans |
| • | Additional Factors Component – The loan portfolio is broken down into multiple homogenous subclassifications upon which multiple factors (such as delinquency trends, economic conditions, loan terms, and regulatory environment) are evaluated resulting in an allowance amount for each of the subclassifications. The sum of these amounts equals the Additional Factors Component. |
| • | Unallocated Component – This amount represents a general reserve against all loans. |
The Corporation has a material portion of its loans in real estate related loans. A predominant percentage of the Corporation’s real estate exposure, both commercial and residential, is in the Corporation’s primary trade area which includes portions of Delaware, Chester, Montgomery and Philadelphia counties in Southeastern Pennsylvania.
Management is aware of this concentration and mitigates this risk to the extent possible in many ways, including the underwriting and assessment of the borrower’s capacity to repay.
Asset Quality and Analysis of Credit Risk
Asset quality remains strong at December 31, 2005 as non-performing loans as a percentage of total loans were 7 basis points. This compares with 24 basis points at December 31, 2004 and 9 basis points at December 31, 2003. The allowance for loan losses as a percentage of total loans was 1.24% at December 31, 2005 compared with 1.23% at December 31, 2004 and 1.33% at December 31, 2003. The provision for loan losses in 2005 was $762 thousand compared to $900 thousand in 2004. The lower provision is reflective of the high credit quality of the Corporation’s loan portfolio. The provision of $900 thousand in 2004 was higher than the $750 thousand in 2003 due to strong loan growth in 2004 and net charge-offs of $643 thousand. See table below for additional details.
Non-Performing Assets and Related Ratios
| December 31, | ||||||||||||||||||||
| (dollars in thousands) | 2005 | 2004 | 2003 | 2002 | 2001 | |||||||||||||||
Non-accrual loans | $ | 261 | $ | 1,353 | $ | 371 | $ | 209 | $ | 21 | ||||||||||
Loans 90 days or more past due | 129 | 22 | 62 | 45 | 43 | |||||||||||||||
Total non-performing loans | 390 | 1,375 | 433 | 254 | 64 | |||||||||||||||
Other real estate owned (“OREO”) | 25 | 357 | — | — | — | |||||||||||||||
Total non-performing assets | $ | 415 | $ | 1,732 | $ | 433 | $ | 254 | $ | 64 | ||||||||||
Allowance for loan losses to non-performing assets | 1,783.6 | % | 399.9 | % | 1,540.4 | % | 2,407.1 | % | 7,700.0 | % | ||||||||||
Allowance for loan losses to non-performing loans | 1,897.9 | % | 503.8 | % | 1,540.4 | % | 2,407.1 | % | 7,700.0 | % | ||||||||||
Non-performing loans to total loans | 0.07 | % | 0.24 | % | 0.09 | % | 0.05 | % | 0.02 | % | ||||||||||
Allowance for loan losses to total loans | 1.24 | % | 1.23 | % | 1.33 | % | 1.31 | % | 1.23 | % | ||||||||||
Non-performing assets to total assets | 0.06 | % | 0.25 | % | 0.07 | % | 0.04 | % | 0.01 | % | ||||||||||
Period end loans | $ | 597,930 | $ | 564,597 | $ | 502,416 | $ | 466,975 | $ | 400,868 | ||||||||||
Average loans (average for year) | $ | 582,386 | $ | 538,775 | $ | 478,397 | $ | 421,904 | $ | 367,571 | ||||||||||
Allowance for loan losses | $ | 7,402 | $ | 6,927 | $ | 6,670 | $ | 6,114 | $ | 4,928 | ||||||||||
Summary of Changes in the Allowance for Loan Losses
| (dollars in thousands) | 2005 | 2004 | 2003 | 2002 | 2001 | |||||||||||||||
Balance, beginning of period | $ | 6,927 | $ | 6,670 | $ | 6,114 | $ | 4,928 | $ | 4,320 | ||||||||||
Charge-offs: | ||||||||||||||||||||
Consumer | (158 | ) | (94 | ) | (102 | ) | (68 | ) | (178 | ) | ||||||||||
Commercial and industrial | — | (167 | ) | (112 | ) | — | (940 | ) | ||||||||||||
Real estate | (156 | ) | (431 | ) | (13 | ) | — | (51 | ) | |||||||||||
Total charge-offs | (314 | ) | (692 | ) | (227 | ) | (68 | ) | (1,169 | ) | ||||||||||
Recoveries: | ||||||||||||||||||||
Consumer | 11 | 47 | 32 | 24 | 38 | |||||||||||||||
Commercial and industrial | 12 | 2 | — | 220 | 63 | |||||||||||||||
Real estate | 4 | — | 1 | 10 | 476 | |||||||||||||||
Total Recoveries | 27 | 49 | 33 | 254 | 577 | |||||||||||||||
Net (charge-offs) / recoveries | (287 | ) | (643 | ) | (194 | ) | 186 | (592 | ) | |||||||||||
Provision for loan losses | 762 | 900 | 750 | 1,000 | 1,200 | |||||||||||||||
Balance, end of period | $ | 7,402 | $ | 6,927 | $ | 6,670 | $ | 6,114 | $ | 4,928 | ||||||||||
9
Allocation of Allowance for Loan Losses
The following table sets forth an allocation of the allowance for loan losses by loan category. The specific allocations in any particular category may be changed in the future to reflect then current conditions. Accordingly, Management considers the entire allowance to be available to absorb losses in any category.
| December 31, | ||||||||||||||||||||||||||||||
| 2005 | 2004 | 2003 | 2002 | 2001 | ||||||||||||||||||||||||||
| (dollars in thousands) | % Loans to Total Loans | % Loans to Total Loans | % Loans to Total Loans | % Loans to Total Loans | % Loans to Total Loans | |||||||||||||||||||||||||
Balance at end of period applicable to: | ||||||||||||||||||||||||||||||
Commercial and industrial | $ | 2,191 | 28.5 | % | $ | 3,575 | 33.1 | % | $ | 3,656 | 35.7 | % | $ | 2,940 | 36.4 | % | $ | 2,729 | 39.1 | % | ||||||||||
Real estate – construction | 569 | 7.6 | % | 741 | 6.6 | 558 | 7.2 | 494 | 5.9 | 214 | 5.1 | |||||||||||||||||||
Real estate – mortgage | 4,141 | 62.3 | % | 806 | 58.5 | 1,089 | 53.4 | 1,107 | 52.4 | 1,019 | 45.0 | |||||||||||||||||||
Consumer | 143 | 1.6 | % | 1,174 | 1.8 | 906 | 3.7 | 907 | 5.3 | 316 | 10.8 | |||||||||||||||||||
Unallocated | 358 | — | 631 | — | 461 | — | 666 | — | 650 | — | ||||||||||||||||||||
Total | $ | 7,402 | 100.0 | % | $ | 6,927 | 100.0 | % | $ | 6,670 | 100.0 | % | $ | 6,114 | 100.0 | % | $ | 4,928 | 100.0 | % | ||||||||||
NON-INTEREST INCOME
2005 Compared to 2004
Non-Interest Income for 2005 was down $1.549 million or 7.8% compared to 2004 which included a gain related to the sale of mortgage servicing rights (MSR’s) in March 2004. Exclusive of the gain on the sale of MSR’s, Total Non-Interest Income decreased $404 thousand or 2.2%. The most significant decline was in gain on sale of loans, down $1.298 million or 44.5% compared to 2004 as a result of the slow down in the mortgage refinance activity compounded by very competitive pricing pressures which also contributed to the reduction in the gain from year to year. Other fees and service charges were down $337 thousand or 17.9% also as a result of the MSR sale in March 2004 and a decline in volume of loans sold servicing retained from year to year. Service charges on deposit accounts decreased $234 thousand or 12.8% compared to 2004 as a result of higher earnings credits on commercial checking accounts and the industry trend toward “free” checking. Partially offsetting these decreases was an increase in fees for Wealth Management services of $1.236 million or 12.0% compared to the same time last year. The growth in Wealth Management services revenue was primarily the result of new business development, estate revenue and a fee increase in the second quarter of 2005. Wealth Management assets under management and administration increased $310 million or 16.0% to $2.248 billion at December 31, 2005 compared to $1.938 billion at December 31, 2004, partly a result of a business acquisition by a significant client in the third quarter of 2005.
2004 Compared to 2003
Non-Interest Income for 2004 was down $6.783 million or 25.5% compared to 2003. The largest decline was in gain on loan sales, down $7.730 million or 72.6% as a result of the slow down in the mortgage refinance market from 2003 to 2004. Loan sale volume was down $483.136 million or 76.9% to $144.916 million in 2004 from $628.052 million in 2003. Partially offsetting this decrease was an increase of $1.145 million in 2004 related to the sale of MSR’s in 2004. Also contributing to the overall decrease in Total Non-Interest Income in 2004 were other fees and service charges, down $541 thousand or 22.4% directly related to the decline in mortgage activity. Fees for Wealth Management services increased $567 thousand or 5.8% in 2004 compared to 2003. The growth in Wealth Management services revenue was primarily the result of new business fees and an increase in the market value of assets under management and administration in 2004. Wealth assets under management and administration increased $186 million or 10.6% from $1.752 billion at December 31, 2003 to $1.938 billion at December 31, 2004.
NON-INTEREST EXPENSE
2005 Compared to 2004
Non-Interest Expense for 2005 remained level compared to 2004, down $52 thousand or 0.2%. Exclusive of expenses associated with the sale of MSR’s in March 2004, Total Non-Interest Expenses increased $214 thousand or 0.7%. The largest growth was in salaries, up $849 thousand or 56.6% as a result of increased incentive compensation based on overall corporate profitability. Other increases included occupancy expense, up $111 thousand and furniture, fixtures and equipment expense, up $156 thousand both related to the Newtown Square branch added in 2004 and the new Exton branch added in 2005. Partially offsetting these increases were decreases in employee benefits primarily related to pension and post-retirement medical benefit expenses, professional fees, lower amortization of MSR’s and reduced residential mortgage staffing levels.
10
2004 Compared to 2003
Non-Interest Expense decreased $1.812 million or 5.4% in 2004 compared to 2003. The most significant decline was in amortization of MSR’s, down $1.975 million or 70.2% as well as other operating expenses, down $995 thousand or 17.0%. These decreases were both directly attributable to the 76.9% decline in volume of residential mortgage loans sold from year to year discussed above. The largest increase, partially offsetting these decreases, was professional fees, up $862 thousand in 2004 compared to 2003 as a result of increased fees associated with the required Sarbanes Oxley Act Section 404 compliance. Other significant increases included advertising expense, up $205 thousand or 30.4% and occupancy expense, up $200 thousand or 10.2% as a result of the new Newtown Square branch opened in 2004.
INCOME TAXES
Income taxes from operations for the year ended December 31, 2005 were $5.928 million compared to $4.752 million for the same period in 2004. This represents an effective tax rate for the year ended December 31, 2005 of 34.3% and an effective tax rate of 33.7% for the same period in 2004.
Income taxes from continuing operations for 2004 were $4.752 million compared to $6.049 million in 2003. This represents an effective tax rate of 33.7% for the year ended December 31, 2004 and an effective tax rate of 34.9% for the same period in 2003.
BALANCE SHEET ANALYSIS
Total assets increased $44.3 million or 6.5% from $682.9 million as of December 31, 2004 to $727.2 million as December 31, 2005. Total loans increased $33.3 million or 5.9% over the same time period from $564.6 million at December 31, 2004 to $597.9 million at December 31, 2005. Average assets increased $40.1 million or 6.2% to $682.9 million and average loans increased $43.6 million or 8.1% to $582.4 million, in 2005 compared to 2004. Although not reflected in quarter end totals (during the 2nd half of 2005), loan balances grew steadily during the year, as average quarterly loans outstanding was $549.2, $567.8, $578.1, $588.7 and $594.4 million during the 4th quarter of 2004, and the 1st, 2nd, 3rd and 4th quarters of 2005, respectively.
Federal Funds sold spiked at year end 2005 to $32.3 million compared to a 2005 average of $6.3 million at year end as clients temporarily moved deposits into the Bank from external sources. This spike also occurred at the end of 2004. Total deposits during 2005 averaged $596.4 million compared to an average of $563.7 million in 2004. At year end 2005 deposits grew $35.3 million or 5.9% to $636.3 million compared to $601.0 million at December 31, 2004. A more accurate reflection of stable deposit balances is the 4th quarter 2005 average of $600.6 million compared with the 4th quarter 2004 average deposits of $583.2 million, a growth of $17.4 million or 2.9%
Deposit trends during 2005 included a decrease in average Savings, Now and Market Rate accounts of $6.8 million or 2.1%, a large increase in average time deposit accounts of $28.3 million or 27.6%, and a $11.2 million or 8.1% increase in non-interest-bearing demand deposits. The decrease in Savings, Now and Market Rate accounts reflects the competitive nature of the Philadelphia regional banking market place. The combination of rising interest rates, aggressive and innovative marketing from new and established competitors, a more educated and commodity driven consumer, and the Corporation’s reluctance to compete on rate alone contributed to the decline in Savings, Now and Market Rate accounts.
The growth in Certificates of Deposit in 2005 is indicative of customers’ appetite for higher rates and the Corporation’s desire to retain these customers without negatively impacting lower rate “core” deposit accounts. The Corporation is evaluating the deposit market and is developing several new initiatives that are designed to grow “core” deposits.
Non-interest-bearing deposits grew nicely during 2005 ($11.2 million or 8.1% to an average of $148.5 million in 2005 from $137.3 million in 2004) correlating to the 8.1% growth in average loans during the same time period. As mentioned in the Executive Summary, the Corporation continues its business development efforts building banking relationships (loan, deposit and wealth management) with privately held businesses, non-profits, quality residential builders, and owners of commercial real estate. The Corporation anticipates that growth of “core” deposits will be one of its most difficult challenges for the foreseeable future.
Average borrowings over the past three years (2005, 2004 and 2003) have not averaged more than $2.0 million in any one year, as the Corporation has been able to fund earning asset growth through deposit growth. However, the average loan to deposit ratio has increased from 96.5% and 95.6% in 2003 and 2004 to 97.7% in 2005. The Corporation has significant capacity to borrow from the FHLB as discussed later in this document under the section titled “Liquidity”. The Corporation is evaluating other funding mechanisms, including the use of wholesale funding sources.
11
Investment Portfolio
A maturity breakout of the investment portfolio by investment type at December 31, 2005 is as follows:
| (dollars in thousands) | Maturing During 2006 | Maturing From 2007 Through 2010 | Maturing From 2011 Through 2015 | Maturing After 2015 | Total | |||||||||||||||
Obligations of the U.S. Government and agencies: | ||||||||||||||||||||
Book value | $ | 5,431 | $ | 20,562 | $ | — | — | $ | 25,993 | |||||||||||
Weighted average yield | 2.96 | % | 3.58 | % | — | — | 3.45 | % | ||||||||||||
State and political subdivisions: | ||||||||||||||||||||
Book value | — | $ | 990 | $ | 4,024 | — | $ | 5,014 | ||||||||||||
Weighted average yield | — | 3.32 | % | 3.16 | % | — | 3.19 | % | ||||||||||||
Other investment securities: | ||||||||||||||||||||
Book value | $ | 115 | $ | 246 | $ | 412 | $ | 1,182 | $ | 1,955 | ||||||||||
Weighted average yield | 3.36 | % | 4.25 | % | 2.45 | % | 3.32 | % | 3.26 | % | ||||||||||
Subtotal book value | $ | 5,546 | $ | 21,798 | $ | 4,436 | $ | 1,182 | $ | 32,962 | ||||||||||
Weighted average yield | 2.96 | % | 3.57 | % | 3.10 | % | 3.32 | % | 3.36 | % | ||||||||||
Mortgage backed securities | ||||||||||||||||||||
Book value | — | — | — | — | $ | 2,029 | ||||||||||||||
Weighted average yield | — | — | — | — | 4.44 | % | ||||||||||||||
Total book value | $ | 5,546 | $ | 21,798 | $ | 4,436 | $ | 1,182 | $ | 34,991 | ||||||||||
Weighted average yield | 2.96 | % | 3.57 | % | 3.10 | % | 3.32 | % | 3.60 | % | ||||||||||
Loan Portfolio
A breakdown of the loan portfolio by major categories at December 31 for each of the last five years is as follows:
| December 31 | |||||||||||||||
| (dollars in thousands) | 2005 | 2004 | 2003 | 2002 | 2001 | ||||||||||
Consumer | $ | 9,437 | $ | 10,291 | $ | 18,580 | $ | 24,537 | $ | 35,692 | |||||
Commercial & Industrial | 170,283 | 186,923 | 178,382 | 170,286 | 167,452 | ||||||||||
Commercial Mortgage | 162,621 | 137,141 | 119,811 | 103,972 | 67,906 | ||||||||||
Construction | 45,523 | 36,941 | 36,235 | 27,514 | 20,416 | ||||||||||
Residential Mortgage | 99,602 | 75,081 | 59,714 | 51,096 | 45,483 | ||||||||||
Home Equity Lines & Loans | 107,699 | 109,512 | 86,004 | 61,544 | 47,344 | ||||||||||
Total Portfolio Loans | 595,165 | 555,889 | 498,726 | 438,949 | 384,293 | ||||||||||
Loans held for sale | 2,765 | 8,708 | 3,690 | 28,026 | 16,556 | ||||||||||
| $ | 597,930 | $ | 564,597 | $ | 502,416 | $ | 466,975 | $ | 400,849 | ||||||
Loan Portfolio Maturity and Interest Rate Sensitivity
The loan maturity distribution and interest rate sensitivity table below excludes loans secured by one to four family residential properties and consumer loans as of December 31, 2005:
| (dollars in thousands) | Maturing During 2006 | Maturing From 2007 Through 2010 | Maturing 2010 | Total | ||||||||
Loan Portfolio Maturity: | ||||||||||||
Commercial, financial, and agricultural | $ | 75,501 | $ | 51,999 | $ | 18,450 | $ | 145,950 | ||||
Real estate – construction | 23,671 | 17,015 | 4,837 | 45,523 | ||||||||
Real estate – other | 2,391 | 15,238 | 144,992 | 162,621 | ||||||||
Total | $ | 101,563 | $ | 84,252 | $ | 168,279 | $ | 354,094 | ||||
Interest sensitivity on the above loans: | ||||||||||||
Loans with predetermined rates | $ | 9,739 | $ | 62,857 | $ | 43,334 | $ | 115,930 | ||||
Loans with adjustable or floating rates | 127,480 | 92,292 | 18,392 | 238,164 | ||||||||
Total | $ | 137,219 | $ | 155,149 | $ | 61,726 | $ | 354,094 | ||||
DISCUSSIONOF SEGMENTS
The Corporation has three principal segments (Residential Mortgage, Wealth Management, and Banking segments) as defined by SFAS No. 131 “Segment Reporting”. These segments are discussed below. The Detail segment information appears in Note 24 in the Notes to the Consolidated Financial Statements.
Residential Mortgage Segment Activity
All activity is for the year unless noted otherwise:
| (dollars in thousands) | 2005 | 2004 | 2003 | |||||||||
Residential loans held in portfolio* | $ | 99,602 | $ | 75,081 | $ | 59,714 | ||||||
Mortgage originations | 193,324 | 208,252 | 678,560 | |||||||||
Mortgage loans sold: | ||||||||||||
Servicing retained | 41,664 | 111,173 | 546,350 | |||||||||
Servicing released | 78,537 | 33,743 | 81,702 | |||||||||
Servicing retained % | 34.7 | % | 76.7 | % | 87.0 | % | ||||||
Servicing released % | 65.3 | % | 23.3 | % | 13.0 | % | ||||||
Loans serviced for other* | 417,649 | 507,421 | 797,326 | |||||||||
Mortgage servicing rights* | 2,982 | 3,172 | 4,390 | |||||||||
Gain on sale of loans | 1,622 | 2,920 | 10,637 | |||||||||
Loans servicing & late fees | 1,303 | 1,632 | 1,794 | |||||||||
Gain on sale of MSRs | — | 1,145 | — | |||||||||
Amortization of MSRs | 606 | 839 | 2,814 | |||||||||
Basis point yield on loans sold | 135 | 201 | 169 | |||||||||
| * | Period end balance |
12
The Corporation’s mortgage banking segment had a record year in 2003 with the mortgage originations and refinancings totaling $678.6 million. The increased volume of originations and refinancings was due to interest rates being at 30 year lows. During 2004 and 2005 increasing rates resulted in a slow down in mortgage refinancing activity and a decline in mortgage originations to $208.2 million and $193.3 million, respectively. Management anticipates lower volume in 2006.
Loans serviced for others have decreased from $797.3 million in 2003 to $507.4 million in 2004, with a further reduction to $417.6 million in 2005. The decline in loans serviced for others is due to a 2004 sale of $245 million in MSR’s and a 2005 decision by management to sell a higher percentage of loans servicing released. The increase in sale of loans servicing released provided the Corporation the ability to price mortgages more competitively and increase the gain on sale of loans. Competitive pricing pressures during 2005 combined with a smaller gain on sale on loans sold servicing retained resulted in reduced gains on the sale of servicing retained loans. Overall, the gain on sale of loans sold resulted in a gain per loan sold of 135 basis points, 201 basis points, and 169 basis points in 2005, 2004 and 2003, respectively.
Wealth Segment Activity
The Wealth Management segment reported a 34.3% increase in net operating profits for 2005 compared to 2004. This performance is attributed to an increase in Wealth revenues of 12.0% from 2004, while expenses decreased 1.4% from 2004.
The increase in wealth revenues is concentrated in investment management and special needs trusts and estates. Increased investment management fees are the result of new business development, as well as the conversion of custody accounts to investment management accounts. Special needs trust is a specialty niche that continues to expand due to the expertise of the wealth management staff.
Wealth Management assets under management and administration have grown to $2.248 billion as of December 31, 2005 from $1.938 billion at December 31, 2004 or 16.0%. This growth is a combination of a business acquisition by a significant client, along with an increase in other new wealth business, and an increase in the market value of existing accounts.
Banking Segment Activity
Bank segment data as presented in Note 24 of the Notes to Consolidated Financial Statements indicates a pretax segment profit of $11.359 million in 2005, $7.780 million in 2004 and $8.425 million in 2003. See Components of Net Income earlier in this documentation for a discussion of the Banking segment.
CAPITAL
Consolidated shareholder’s equity of the Corporation was $77.5 million or 10.7% of total assets, as of December 31, 2005, compared to $71.2 million or 10.4% of total assets, as of December 31, 2004. The Corporation’s and Bank’s regulatory capital ratios and the minimum capital requirements to be considered “Well Capitalized” by regulators as of December 31, 2005 and December 31, 2004 are displayed in Note 21 in the accompanying Notes to Consolidated Financial Statements for this information.
Both the Corporation and the Bank exceed the required capital levels to be considered “Well Capitalized” by their respective regulators at the end of each period presented.
Neither the Corporation nor the Bank are under any agreement with regulatory authorities, nor is Management aware of any current recommendations by the regulatory authorities, which, if such recommendations were implemented, would have a material effect on liquidity, capital resources or operations of the Corporation.
LIQUIDITY
The Corporation manages its liquidity position on a daily basis as part of the daily settlement function and monthly as part of the asset liability management process. The Bank’s liquidity is maintained by managing its core deposits as the primary source, and purchasing federal funds, selling loans in the secondary market, borrowing from the FHLB and selling securities as its secondary sources. Availability with the FHLB was approximately $232 million as of December 31, 2005. Overnight Fed Funds lines consist of lines from six banks totaling $48.0 million. Quarterly, ALCO reviews the Corporation’s liquidity needs and reports its findings to the Risk Management Committee of the Bank’s Board of Directors. There were no outstanding overnight borrowings at December 31, 2005.
OFF BALANCE SHEET RISK
The following chart presents the off-balance sheet commitments of the Bank as of December 31, 2005, listed by dates of funding or payment:
| (dollars in thousands) | Total | Within 1 Year | 2 - 3 years | 4 - 5 years | After 5 years | ||||||||||
Unfunded loan commitments | $ | 316,869 | $ | 178,836 | $ | 67,866 | $ | 67,477 | $ | 2,690 | |||||
Standby letters of credit | 11,200 | 8,326 | 820 | 2,025 | 29 | ||||||||||
Total | $ | 328,069 | $ | 187,162 | $ | 68,686 | $ | 69,502 | $ | 2,719 | |||||
13
The Corporation becomes party to financial instruments in the normal course of business to meet the financing needs of its customers. These financial instruments include commitments to extend credit and standby letters of credit and create off-balance sheet risk.
Commitments to extend credit are agreements to lend to a customer as long as there is no violation of any condition established in the loan agreement. Total commitments to extend credit at December 31, 2005 were $316.9 million.
Standby letters of credit are conditional commitments issued by the Bank to a customer for a third party. Such standby letters of credit are issued to support private borrowing arrangements. The credit risk involved in issuing standby letters of credit is similar to that involved in granting loan facilities to customers. The Corporation’s obligation under standby letters of credit at December 31, 2005 amounted to $11.2 million.
Estimated fair values of the Corporation’s off-balance sheet instruments are based on fees and rates currently charged to enter into similar loan agreements, taking into account the remaining terms of the agreements and the counterparties’ credit standing. Since fees and rates charged for off-balance sheet items are at market levels when set, there is no material difference between the stated amount and the estimated fair value of off-balance sheet instruments.
CONTRACTUAL CASH OBLIGATIONSOFTHE CORPORATIONASOF DECEMBER 31, 2005
| (dollars in thousands) | Total | Within 1 Year | 2 - 3 Years | 4 - 5 Years | After 5 Years | ||||||||||
Deposits without a stated maturity | $ | 480,938 | $ | 480,938 | $ | — | $ | — | $ | — | |||||
Consumer certificates of deposit | 155,322 | 129,953 | 24,782 | 451 | 136 | ||||||||||
Operating leases | 20,367 | 967 | 1,658 | 1,487 | 16,255 | ||||||||||
Purchase obligations | 1,981 | 1,083 | 678 | 220 | — | ||||||||||
Non-discretionary pension contributions | 131 | 131 | — | — | — | ||||||||||
Total | $ | 658,739 | $ | 613,072 | $ | 27,118 | $ | 2,158 | $ | 16,391 | |||||
SECTION 404OF SARBANES OXLEY ACTOF 2002
The Corporation and its Management completed compliance procedures relating to Section 404 of the Sarbanes Oxley Act of 2002 for the fiscal year ended December 31, 2005 as documented in the Corporation’s Form 10-K.
OTHER INFORMATION
Branch Office Expansion
During the first quarter of 2004 and the second quarter of 2005, the Corporation opened new full service branch bank offices in Newtown Square, PA, and Exton, PA, respectively. At December 31, 2005, the Newtown Square and Exton branches had deposits of approximately $22.3 and $6.0 million, respectively. During the third quarter of 2005, the Corporation entered into a ground lease in Ardmore, PA, with the goal of constructing a branch office and relocating the Wynnewood, PA office, with an expected opening in late 2006. The Corporation anticipates measured expansion of its branch footprint over the next few years including plans to enter the West Chester, PA market in 2007.
Regulatory Matters and Pending Legislation
Management is not aware of any other current specific recommendations by regulatory authorities or proposed legislation which, if they were implemented, would have a material adverse effect upon the liquidity, capital resources, or results of operations, although the general cost of compliance with numerous and multiple federal and state laws and regulations does have, and in the future may have, an impact on the Corporation’s results of operations.
In February, 2006, Congress passed the Federal Deposit Insurance Reform Act of 2005. This legislation will merge the Bank Insurance Fund and the Savings Association Insurance Fund into one fund, increase insurance coverage for retirement accounts to $250,000, adjust the maximum deposit insurance for inflation after March 31, 2010 and give the FDIC greater flexibility in setting insurance assessments.
Effects of Inflation
Inflation has some impact on the Corporation’s operating costs. Unlike many industrial companies, however, substantially all of the Corporation’s assets and liabilities are monetary in nature. As a result, interest rates have a more significant impact on the Corporation’s performance than the general level of inflation. Over short periods of time, interest rates may not necessarily move in the same direction or in the same magnitude as prices of goods and services.
Effect of Government Monetary Policies
The earnings of the Corporation are and will be affected by domestic economic conditions and the monetary and fiscal policies of the United States government and its agencies. An important function of the Federal Reserve Board is to regulate the money supply and interest rates. Among the instruments used to implement those objectives are open market operations in United States government securities and changes in reserve requirements against member bank deposits. These instruments are used in varying combinations to influence overall growth and distribution of bank loans, investments, and deposits, and their use may also affect rates charged on loans or paid for deposits.
The Corporation is a member of the Federal Reserve System and, therefore, the policies and regulations of the Federal Reserve Board have a significant effect on its deposits, loans and investment growth, as well as the rate of interest earned
14
and paid, and are expected to affect the Corporation’s operations in the future. The effect of such policies and regulations upon the future business and earnings of the Corporation cannot be predicted.
QUANTITATIVE AND QUALITATIVE DISCLOSURES ABOUT MARKET RISKS
The quantitative and qualitative disclosures about market risks are included in the Management Discussion and Analysis, in various sections beginning with “Net Interest Income” through “Contractual Cash Obligations of the Corporation”.
Management’s Report on Internal Control over Financial Reporting
Corporation Management is responsible for both establishing and maintaining adequate internal controls over financial reporting. As of December 31, 2005, Management conducted an assessment of the effectiveness of the Corporation’s internal controls over financial reporting and concluded that such internal controls are effective and found no material weaknesses. The assessment was accomplished using the criteria set forth by the Committee of Sponsoring Organizations of the Treadway Commission (“COSO”) in Internal Control-Integrated Framework. Management has concluded that, as of December 31, 2005, the Corporation’s internal control over financial reporting is effective, based on the COSO criteria.
Management’s assessment of the effectiveness of the Corporation’s internal control over financial reporting as of December 31, 2005 has been audited by KPMG LLP, (“KPMG”) the Corporation’s independent registered public accounting firm, having responsibility for auditing the Corporation’s financial statements. KPMG has expressed unqualified opinions on Management’s assessment and on the effectiveness of the Corporation’s internal control over financial reporting as of December 31, 2005 and has issued an attestation report on the Corporation’s management assessment of the Corporation’s internal controls over financial reporting as of December 31, 2005.
15
Report of Independent Registered Public Accounting Firm
The Board of Directors and Shareholders
Bryn Mawr Bank Corporation:
We have audited management’s assessment, included in the accompanying Management’s Report on Internal Control Over Financial Reporting appearing under Item 9A, that Bryn Mawr Bank Corporation and subsidiaries (the “Corporation”) maintained effective internal control over financial reporting as of December 31, 2005, based on criteria established in Internal Control—Integrated Framework issued by the Committee of Sponsoring Organizations of the Treadway Commission (COSO). Corporation management is responsible for maintaining effective internal control over financial reporting and for its assessment of the effectiveness of internal control over financial reporting. Our responsibility is to express an opinion on management’s assessment and an opinion on the effectiveness of the Corporation’s internal control over financial reporting based on our audit.
We conducted our audit in accordance with the standards of the Public Company Accounting Oversight Board (United States). Those standards require that we plan and perform the audit to obtain reasonable assurance about whether effective internal control over financial reporting was maintained in all material respects. Our audit included obtaining an understanding of internal control over financial reporting, evaluating management’s assessment, testing and evaluating the design and operating effectiveness of internal control, and performing such other procedures as we considered necessary in the circumstances. We believe that our audit provides a reasonable basis for our opinion.
A company’s internal control over financial reporting is a process designed to provide reasonable assurance regarding the reliability of financial reporting and the preparation of financial statements for external purposes in accordance with generally accepted accounting principles. A company’s internal control over financial reporting includes those policies and procedures that (1) pertain to the maintenance of records that, in reasonable detail, accurately and fairly reflect the transactions and dispositions of the assets of the company; (2) provide reasonable assurance that transactions are recorded as necessary to permit preparation of financial statements in accordance with generally accepted accounting principles, and that receipts and expenditures of the company are being made only in accordance with authorizations of management and directors of the company; and (3) provide reasonable assurance regarding prevention or timely detection of unauthorized acquisition, use, or disposition of the company’s assets that could have a material effect on the financial statements.
Because of its inherent limitations, internal control over financial reporting may not prevent or detect misstatements. Also, projections of any evaluation of effectiveness to future periods are subject to the risk that controls may become inadequate because of changes in conditions, or that the degree of compliance with the policies or procedures may deteriorate.
In our opinion, management’s assessment that the Corporation maintained effective internal control over financial reporting as of December 31, 2005, is fairly stated, in all material respects, based on criteria established in Internal Control— Integrated Framework issued by the Committee of Sponsoring Organizations of the Treadway Commission (COSO). Also, in our opinion, the Corporation maintained, in all material respects, effective internal control over financial reporting as of December 31, 2005, based on criteria established in Internal Control—Integrated Framework issued by the Committee of Sponsoring Organizations of the Treadway Commission (COSO).
We also have audited, in accordance with the standards of the Public Company Accounting Oversight Board (United States), the consolidated balance sheets of the Corporation as of December 31, 2005 and 2004, and the related consolidated statements of income, shareholders’ equity, comprehensive income and cash flows for each of the years in the two-year period ended December 31, 2005, and our report dated March 8, 2006 expressed an unqualified opinion on those consolidated financial statements. The accompanying consolidated financial statements of the Corporation for the year ended December 31, 2003, were audited by other auditors whose report thereon dated February 27, 2004, expressed an unqualified opinion on those statements.
 |
Philadelphia, Pennsylvania |
March 8, 2006 |
16
Report of Independent Registered Public Accounting Firm
The Board of Directors
Bryn Mawr Bank Corporation:
We have audited the accompanying consolidated balance sheets of Bryn Mawr Bank Corporation and subsidiaries (the “Corporation”) as of December 31, 2005 and 2004, and the related consolidated statements of income, changes in shareholders’ equity, comprehensive income, and cash flows for each of the years in the two-year period ended December 31, 2005. These consolidated financial statements are the responsibility of the Corporation’s management. Our responsibility is to express an opinion on these consolidated financial statements based on our audits. The accompanying consolidated financial statements of the Corporation for the year ended December 31, 2003 were audited by other auditors whose report thereon dated February 27, 2004, expressed an unqualified opinion on those statements.
We conducted our audits in accordance with the standards of the Public Company Accounting Oversight Board (United States). Those standards require that we plan and perform the audit to obtain reasonable assurance about whether the financial statements are free of material misstatement. An audit includes examining, on a test basis, evidence supporting the amounts and disclosures in the financial statements. An audit also includes assessing the accounting principles used and significant estimates made by management, as well as evaluating the overall financial statement presentation. We believe that our audits provide a reasonable basis for our opinion.
In our opinion, the consolidated financial statements referred to above present fairly, in all material respects, the financial position of the Corporation as of December 31, 2005 and 2004, and the results of their operations and their cash flows for each of the years in the two-year period ended December 31, 2005, in conformity with U.S. generally accepted accounting principles.
We also have audited, in accordance with the standards of the Public Company Accounting Oversight Board (United States), the effectiveness of the Corporation’s internal control over financial reporting as of December 31, 2005, based on criteria established in Internal Control—Integrated Framework issued by the Committee of Sponsoring Organizations of the Treadway Commission (COSO), and our report dated March 8, 2006 expressed an unqualified opinion on management’s assessment of, and the effective operation of, internal control over financial reporting.
|
March 8, 2006 |
Philadelphia, Pennsylvania |
17
Consolidated Balance Sheets
| As of December 31, | 2005 | 2004 | ||||||
| (dollars in thousands) | ||||||||
Assets | ||||||||
Cash and due from banks | $ | 33,896 | $ | 26,526 | ||||
Interest bearing deposits with banks | 405 | 15,293 | ||||||
Federal funds sold | 32,341 | 13,423 | ||||||
Investment securities available for sale, at market (amortized cost of $35,608 and $35,654 as of December 31, 2005 and 2004 respectively) | 34,991 | 35,441 | ||||||
Loans: | ||||||||
Portfolio Loans | 595,165 | 555,889 | ||||||
Loans held for sale | 2,765 | 8,708 | ||||||
Total loans | 597,930 | 564,597 | ||||||
Less: Allowance for loan losses | (7,402 | ) | (6,927 | ) | ||||
Net loans | 590,528 | 557,670 | ||||||
Premises and equipment, net | 14,622 | 14,162 | ||||||
Accrued interest receivable | 3,265 | 2,579 | ||||||
Deferred federal income taxes | 709 | — | ||||||
Mortgage servicing rights | 2,982 | 3,172 | ||||||
Other assets | 13,487 | 14,680 | ||||||
Total assets | $ | 727,226 | $ | 682,946 | ||||
Liabilities | ||||||||
Deposits: | ||||||||
Non-interest-bearing demand | $ | 168,042 | $ | 147,236 | ||||
Savings, NOW and market rate accounts | 312,896 | 343,259 | ||||||
Time deposits | 155,322 | 110,470 | ||||||
Total deposits | 636,260 | 600,965 | ||||||
Accrued interest payable | 2,143 | 2,878 | ||||||
Other liabilities | 11,310 | 7,865 | ||||||
Total liabilities | 649,713 | 611,708 | ||||||
Shareholders’ equity | ||||||||
Common stock, par value $1; authorized 25,000,000 shares; issued 11,221,899 and 11,172,582 shares as of December 31, 2005 and 2004 respectively and outstanding of 8,556,255 and 8,597,958 shares as of December 31, 2005 and 2004, respectively | 11,222 | 11,172 | ||||||
Paid-in capital in excess of par value | 7,888 | 7,112 | ||||||
Accumulated other comprehensive income, net of taxes | (643 | ) | (288 | ) | ||||
Retained earnings | 82,930 | 75,179 | ||||||
| 101,397 | 93,175 | |||||||
Less: Common stock in treasury at cost – 2,665,644, and 2,574,624 shares as of December 31, 2005 and 2004 respectively | (23,884 | ) | (21,937 | ) | ||||
Total shareholders’ equity | 77,513 | 71,238 | ||||||
Total liabilities and shareholders’ equity | $ | 727,226 | $ | 682,946 | ||||
Book Value per Share | $ | 9.06 | $ | 8.29 | ||||
The accompanying notes are an integral part of the consolidated financial statements.
18
Consolidated Statements of Income
| For the years ended December 31, | 2005 | 2004 | 2003 | |||||||
| (dollars in thousands, except per share data) | ||||||||||
Net interest income: | ||||||||||
Interest income: | ||||||||||
Interest and fees on loans | $ | 36,499 | $ | 30,123 | $ | 28,248 | ||||
Interest on federal funds sold | 210 | 191 | 110 | |||||||
Interest on deposits with other banks | 76 | 48 | 37 | |||||||
Interest and dividends on investment securities – taxable | 1,018 | 854 | 780 | |||||||
Interest on investment securities – tax exempt | 165 | 165 | 86 | |||||||
Total interest income | 37,968 | 31,381 | 29,261 | |||||||
Interest expense on savings, NOW and market rate accounts | 2,744 | 1,999 | 1,658 | |||||||
Interest expense on time deposits | 3,799 | 2,544 | 2,664 | |||||||
Interest expense on other borrowings | 57 | 10 | 8 | |||||||
Total interest expense | 6,600 | 4,553 | 4,330 | |||||||
Net interest income | 31,368 | 26,828 | 24,931 | |||||||
Loan loss provision | 762 | 900 | 750 | |||||||
Net interest income after loan loss provision | 30,606 | 25,928 | 24,181 | |||||||
Non-interest income: | ||||||||||
Fees for Wealth management services | 11,539 | 10,303 | 9,736 | |||||||
Service charges on deposit accounts | 1,593 | 1,827 | 1,896 | |||||||
Other fees and service charges | 1,542 | 1,879 | 2,420 | |||||||
Net gain on sale of loans | 1,622 | 2,920 | 10,650 | |||||||
Net gain on sale of mortgage servicing rights | — | 1,145 | — | |||||||
Other operating income | 1,949 | 1,720 | 1,875 | |||||||
Total non-interest income | 18,245 | 19,794 | 26,577 | |||||||
Non-interest expenses: | ||||||||||
Salaries | 15,862 | 15,013 | 15,034 | |||||||
Employee benefits | 4,075 | 4,297 | 4,353 | |||||||
Occupancy expense | 2,272 | 2,161 | 1,961 | |||||||
Furniture, fixtures, and equipment | 1,941 | 1,785 | 1,806 | |||||||
Advertising | 960 | 879 | 674 | |||||||
Professional fees | 1,292 | 1,808 | 957 | |||||||
Amortization of MSRs | 606 | 839 | 2,814 | |||||||
Other operating expense | 4,565 | 4,843 | 5,838 | |||||||
Total non-interest expenses | 31,573 | 31,625 | 33,437 | |||||||
Income before income taxes and discontinued operations | 17,278 | 14,097 | 17,321 | |||||||
Applicable income taxes | 5,928 | 4,752 | 6,049 | |||||||
Income from continuing operations | 11,350 | 9,345 | 11,272 | |||||||
Loss from discontinued operations, net of income tax benefit of ($200,000) in 2003 | — | — | (1,916 | ) | ||||||
Net income | $ | 11,350 | $ | 9,345 | $ | 9,356 | ||||
Basic earnings per common share: | ||||||||||
Income from continuing operations | $ | 1.33 | $ | 1.09 | $ | 1.30 | ||||
Loss from discontinued operations | $ | 0.00 | $ | 0.00 | $ | (0.22 | ) | |||
Total basic earnings per common share | $ | 1.33 | $ | 1.09 | $ | 1.08 | ||||
Diluted earnings per common share:* | ||||||||||
Income from continuing operations | $ | 1.31 | $ | 1.07 | $ | 1.29 | ||||
Loss from discontinued operations | $ | 0.00 | $ | 0.00 | $ | (0.22 | ) | |||
Total diluted earnings per common share | $ | 1.31 | $ | 1.07 | $ | 1.07 | ||||
Dividends per share | $ | 0.42 | $ | 0.40 | $ | 0.40 | ||||
Weighted-average shares outstanding | 8,563,027 | 8,610,171 | 8,657,527 | |||||||
Dilutive potential common shares* | 101,200 | 110,854 | 103,107 | |||||||
Adjusted weighted-average shares | 8,664,227 | 8,721,025 | 8,760,634 | |||||||
| * | See Note 14, Earnings Per Share, in the Notes to the Consolidated Financial Statements. |
The accompanying notes are an integral part of the consolidated financial statements.
19
Consolidated Statements of Cash Flows
| For the years ended December 31, | 2005 | 2004 | Revised 2003* | |||||||||
| (dollars in thousands) | ||||||||||||
Operating activities: | ||||||||||||
Income from continuing operations | $ | 11,350 | $ | 9,345 | $ | 11,272 | ||||||
Income from discontinued operations | — | — | (1,916 | ) | ||||||||
Net Income | 11,350 | 9,345 | 9,356 | |||||||||
Adjustments to reconcile income from continuing operations net cash provided by operating activities: | ||||||||||||
Provision for loan losses | 762 | 900 | 750 | |||||||||
Provision for depreciation and amortization | 1,516 | 1,310 | 1,290 | |||||||||
Impairment of goodwill | — | — | 2,405 | |||||||||
Loans originated for resale | (137,485 | ) | (144,916 | ) | (603,678 | ) | ||||||
Proceeds from sale of loans | 132,653 | 148,981 | 638,703 | |||||||||
Net gain on sale of loans | (1,622 | ) | (2,920 | ) | (10,650 | ) | ||||||
Net gain on sale of mortgage servicing rights | — | (1,145 | ) | — | ||||||||
Provision for deferred income taxes | (521 | ) | 38 | 1,004 | ||||||||
Change in income taxes payable/refundable | (354 | ) | (511 | ) | (1,189 | ) | ||||||
Change in accrued interest receivable | (686 | ) | (305 | ) | (156 | ) | ||||||
Change in accrued interest payable | (735 | ) | 550 | 889 | ||||||||
Change in mortgage servicing rights | 190 | 1,219 | (435 | ) | ||||||||
Other | 4,343 | (3,235 | ) | (628 | ) | |||||||
Net cash provided (used) by operating activities | 9,411 | 9,311 | 37,661 | |||||||||
Investing activities: | ||||||||||||
Purchases of investment securities | (9,004 | ) | (17,568 | ) | (31,984 | ) | ||||||
Proceeds from maturities of investment securities | 3,500 | — | 1,000 | |||||||||
Proceeds from sales of investment securities available for sale | 1,586 | 204 | 1,039 | |||||||||
Proceeds from calls of investment securities | 4,000 | 13,147 | 20,440 | |||||||||
Net repayments (originations) of notes receivable | 387 | 435 | (1,603 | ) | ||||||||
Net loan originations | (27,553 | ) | (63,258 | ) | (61,765 | ) | ||||||
Sale of OREO | 377 | — | — | |||||||||
OREO Charge-off | (20 | ) | — | — | ||||||||
Purchases of premises and equipment | (1,859 | ) | (1,716 | ) | (2,886 | ) | ||||||
Net cash used in investing activities | (28,586 | ) | (68,756 | ) | (75,759 | ) | ||||||
Financing activities: | ||||||||||||
Change in demand and savings deposits | (9,558 | ) | 60,547 | 42,197 | ||||||||
Change in time deposits | 44,852 | 13,279 | 1,322 | |||||||||
Dividends paid | (3,599 | ) | (3,446 | ) | (3,465 | ) | ||||||
Repayment of mortgage debt | — | — | (513 | ) | ||||||||
Proceeds from issuance of common stock | 827 | 555 | 838 | |||||||||
Change in borrowed funds | — | — | (20,000 | ) | ||||||||
Retirement of treasury stock | 43 | 31 | 39 | |||||||||
Purchase of treasury stock | (1,990 | ) | (2,574 | ) | (1,826 | ) | ||||||
Net cash provided by financing activities | 30,575 | 68,392 | 18,592 | |||||||||
Change in cash and cash equivalents | 11,400 | 8,947 | (19,506 | ) | ||||||||
Cash and cash equivalents at beginning of year | 55,242 | 46,295 | 65,801 | |||||||||
Cash and cash equivalents at end of year | $ | 66,642 | $ | 55,242 | $ | 46,295 | ||||||
Supplemental cash flow information: | ||||||||||||
Cash paid during the year for: | ||||||||||||
Income taxes | $ | 4,646 | $ | 5,476 | $ | 6,595 | ||||||
Interest | 7,335 | 4,003 | 3,454 | |||||||||
| * | See Note 1, Summary of Significant Accounting Policies – Statement of Cash Flows in the Notes to Consolidated Financial Statements |
The accompanying notes are an integral part of the consolidated financial statements.
20
Consolidated Statements of Changes in Shareholders’ Equity
| For the years ended December 31, 2005, 2004 and 2003 | Shares of Common Stock Issued | Common Stock | Paid-in Capital | Retained Earnings | Accumulated Other Comprehensive Income (Loss) | Treasury Stock | Total Shareholder’s Equity | ||||||||||||||||||||
| (dollars in thousands, except for shares of common stock) | |||||||||||||||||||||||||||
Balance, December 31, 2002 | 5,541,108 | $ | 5,541 | $ | 11,243 | $ | 63,389 | $ | 41 | $ | (17,607 | ) | $ | 62,607 | |||||||||||||
Net income | — | — | — | 9,356 | — | — | 9,356 | ||||||||||||||||||||
Dividends declared, $0.40 per share | — | — | — | (3,465 | ) | — | — | (3,465 | ) | ||||||||||||||||||
Accumulated other comprehensive (loss) income, net of income taxes Of ($90,000) | — | — | — | — | (167 | ) | — | (167 | ) | ||||||||||||||||||
2-for-l stock split | 5,563,816 | 5,564 | (5,564 | ) | — | — | — | — | |||||||||||||||||||
Tax benefit from gains on stock option exercise | — | — | 168 | — | — | — | 168 | ||||||||||||||||||||
Purchase of treasury stock | — | — | — | — | (1,826 | ) | (1,826 | ) | |||||||||||||||||||
Retirement of treasury stock | (2,005 | ) | (2 | ) | (37 | ) | — | — | 39 | — | |||||||||||||||||
Common stock issued | 32,313 | 32 | 677 | — | — | — | 709 | ||||||||||||||||||||
Balance, December 31, 2003 | 11,135,232 | $ | 11,135 | $ | 6,487 | $ | 69,280 | $ | (126 | ) | $ | (19,394 | ) | $ | 67,382 | ||||||||||||
Net income | — | — | — | 9,345 | — | — | 9,345 | ||||||||||||||||||||
Dividends declared, $0.40 per share | — | — | — | (3,446 | ) | — | — | (3,446 | ) | ||||||||||||||||||
Accumulated other comprehensive (loss) income, net of income taxes of ($88,000) | — | — | — | — | (162 | ) | — | (162 | ) | ||||||||||||||||||
Tax benefit from gains on stock option exercise | — | — | 107 | — | — | — | 107 | ||||||||||||||||||||
Purchase of treasury stock | — | — | — | — | — | (2,574 | ) | (2,574 | ) | ||||||||||||||||||
Retirement of treasury stock | (4,234 | ) | (4 | ) | (38 | ) | — | — | 31 | (11 | ) | ||||||||||||||||
Common stock issued | 41,584 | 41 | 556 | — | — | — | 597 | ||||||||||||||||||||
Balance, December 31, 2004 | 11,172,582 | $ | 11,172 | $ | 7,112 | $ | 75,179 | $ | (288 | ) | $ | (21,937 | ) | $ | 71,238 | ||||||||||||
Net income | — | — | — | 11,350 | — | — | 11,350 | ||||||||||||||||||||
Dividends declared, $0.42 per share | — | — | — | (3,599 | ) | — | — | (3,599 | ) | ||||||||||||||||||
Accumulated other comprehensive (loss) income, net of income taxes of ($191,000) | — | — | — | — | (355 | ) | — | (355 | ) | ||||||||||||||||||
Tax benefit from gains on stock option exercise | — | — | 139 | — | — | — | 139 | ||||||||||||||||||||
Purchase of treasury stock | — | — | — | — | — | (1,990 | ) | (1,990 | ) | ||||||||||||||||||
Retirement of treasury stock | (4,480 | ) | (4 | ) | (39 | ) | — | — | 43 | — | |||||||||||||||||
Common stock issued | 53,797 | 54 | 676 | — | — | — | 730 | ||||||||||||||||||||
Balance, December 31, 2005 | 11,221,899 | $ | 11,222 | $ | 7,888 | $ | 82,930 | $ | (643 | ) | $ | (23,884 | ) | $ | 77,513 | ||||||||||||
Consolidated Statement of Comprehensive Income
| For the years ended December 31, | 2005 | 2004 | 2003 | |||||||||
| (dollars in thousands) | ||||||||||||
Net income | $ | 11,350 | $ | 9,345 | $ | 9,356 | ||||||
Other comprehensive income: | ||||||||||||
Unrealized investment portfolio losses arising during the period | (404 | ) | (199 | ) | (362 | ) | ||||||
Change in unfunded pension liability, net of tax | (92 | ) | (33 | ) | 68 | |||||||
Deferred income tax benefit on unrealized investment portfolio losses arising during the period | 141 | 70 | 127 | |||||||||
Comprehensive net income | $ | 10,995 | $ | 9,183 | $ | 9,189 | ||||||
The accompanying notes are an integral part of the consolidated financial statements.
21
Notes to Consolidated Financial Statements
| 1. | SUMMARYOF SIGNIFICANT ACCOUNTING POLICIES: |
Nature of Business:
The Bryn Mawr Trust Company (the “Bank”) received its Pennsylvania banking charter in 1889 and is a member of the Federal Reserve System. In 1986, Bryn Mawr Bank Corporation (the “Corporation”) was formed and on January 2, 1987, the Bank became a wholly-owned subsidiary of the Corporation. The Bank and Corporation are headquartered in Bryn Mawr, PA, a western suburb of Philadelphia, PA. The Corporation and its subsidiaries provide wealth management, community banking, residential mortgage lending, insurance and business banking services to its customers through eight full service branches and seven retirement community offices throughout Montgomery, Delaware and Chester counties. The Corporation trades on the NASDAQ National Market under the symbol BMTC.
The goal of the Corporation is to become the preeminent community bank and wealth management organization in the Philadelphia area.
The Corporation operates in a highly competitive market area that includes local, national and regional banks as competitors along with savings banks, credit unions, insurance companies, trust companies, registered investment advisors and mutual fund families. The Corporation and its subsidiaries are regulated by many regulatory agencies including the SEC, NASD, FDIC, the Federal Reserve and the Pennsylvania Department of Banking.
Basis of Presentation:
The accounting policies of the Corporation conform with accounting principles generally accepted in the United States of America (“GAAP”) and predominate practice with the banking industry.
The Consolidated Financial Statements include the accounts of the Corporation and its wholly owned subsidiaries. The Corporation’s consolidated financial condition and results of operations consist almost entirely of the Bank’s financial condition and results of operations. All material inter-company transactions and balances have been eliminated.
In preparing the Financial Statements, management is required to make estimates and assumptions that affect the reported amounts of assets and liabilities, the disclosure of contingent assets and liabilities at the date of the balance sheets, and the reported amounts of revenues and expenses during the reporting period. Actual results could differ from these estimates.
Cash and cash equivalents:
Cash and cash equivalents include cash and due from banks, federal funds sold, and interest-bearing deposits with other banks with original maturities of three months or less. Cash balances required to meet regulatory reserve requirements of the Federal Reserve Board amounted to $1.175 and $10.400 million at December 31, 2005 and 2004, respectively.
Investment securities:
Investment securities which are held for indefinite periods of time, which management intends to use as part of its asset/liability strategy, or which may be sold in response to changes in interest rates, changes in prepayment risk, increases in capital requirements, or other similar factors, are classified as available for sale and are carried at fair value. Net unrealized gains and losses for such securities, net of tax, are required to be recognized as a separate component of shareholders’ equity and excluded from determination of net income. Gains or losses on disposition are based on the net proceeds and cost of the securities sold, adjusted for amortization of premiums and accretion of discounts, using the specific identification method.
Certain investment securities are classified as held to maturity. The Company has the positive intent and ability to hold these securities to maturity. Held-to-maturity securities are classified at amortized cost.
Mortgage Loans Held for Sale:
Loans originated and intended for sale in the secondary market are carried at the lower of cost or estimated fair market value in the aggregate. Net unrealized losses, if any, are recognized through a valuation allowance by charges to income.
Loans:
The Corporation grants construction, commercial, residential mortgage and consumer loans to customers primarily in Southeastern Pennsylvania. Although the Corporation has a diversified loan portfolio, its debtors’ ability to honor their contracts is substantially dependent upon the real estate and general economic conditions of the region.
Loans that the Corporation has the intent and ability to hold for the foreseeable future or until maturity or pay-off, generally are reported at their outstanding principal balance adjusted for charge-offs, the allowance for loan losses and any deferred fees or costs on originated loans. Interest income is accrued on the unpaid principal balance.
Loan origination fees and loan origination costs are deferred and recognized as an adjustment of the related loan yield using the interest method.
22
The accrual of interest on loans is generally discontinued at the time the loan is 90 days delinquent unless the credit is well secured and in the process of collection. Loans are placed on non-accrual status or charged-off at an earlier date if collection of principal or interest is considered doubtful. All interest accrued, but not collected for loans that are placed on non-accrual status or charged-off is reversed against interest income. The interest received on these loans is applied to reduce the carrying value of the loan or, if principal is considered fully collectible, recognized as interest income until qualifying for return to accrual status. Loans are returned to accrual status when all the principal and interest amounts contractually due are brought current and future payments are reasonably assured.
Allowance for Loan Losses:
The allowance for loan losses is established through a provision for loan losses charged as an expense. Loans are charged against the allowance for loan losses when Management believes that the collectibility of principal is unlikely. The allowance for loan losses is maintained at a level that Management believes is sufficient to absorb estimated probable credit losses.
Management’s determination of the adequacy of the allowance is based on periodic evaluations of the loan portfolio and other relevant factors. However, this evaluation is inherently subjective as it requires significant estimates by Management. Consideration is given to a variety of factors in establishing these estimates including specific terms and conditions of loans, underwriting standards, delinquency statistics, industry concentration, overall exposure to a single customer, adequacy of collateral, the dependence on collateral, and results of internal loan review, including borrowers perceived financial and management strengths, the amounts and timing of the present value of future cash flows, and access to additional funds. The evaluation process also considers the impact of competition, current and expected economic conditions, national and international events, the regulatory and legislative environment and inherent risks in the loan portfolio. All of these factors may be susceptible to significant change. To the extent actual outcomes differ from Management estimates, additional provisions for loan losses may be required that might adversely affect the Corporation’s results of operations in future periods. In addition, various regulatory agencies, as an integral part of their examination process, periodically review the allowance for loan losses. Such agencies may require the Corporation to recognize additions to the allowance based on their judgment of information available to them at the time of their examination.
Impaired Loans:
A loan is considered impaired when, based on current information and events, it is probable that the Corporation will be unable to collect the scheduled payments of principal or interest when due according to the contractual terms of the loan agreement. Factors considered by management in determining impairment include payment status, collateral value, and the probability of collecting scheduled principal and interest payments when due. Loans that experience insignificant payment delays and payment shortfalls generally are not classified as impaired. Management determines the significance of payment delays and payment shortfalls on a case-by-case basis, taking into consideration all of the circumstances surrounding the loan and the borrower, including the length of the delay, the reasons for the delay, the borrower’s prior payment record, and the amount of the shortfall in relation to the principal and interest owed. Impairment is measured on a loan-by-loan basis for commercial and construction loans by either the present value of expected future cash flows discounted at the loan’s effective interest rate, the loan’s obtainable market price, or the fair value of the collateral if the loan is collateral dependent.
Other Real Estate Owned:
Other real estate owned (“OREO”) consists of assets that the Corporation has acquired through foreclosure, by accepting a deed in lieu of foreclosure, or by taking possession of assets that were used as loan collateral. The Corporation reports OREO as a component of “Other Assets” on the balance sheet at the lower of cost or estimated fair value less cost to sell, adjusted periodically based on current appraisals.
Premises and Equipment:
Premises and equipment are stated at cost less accumulated depreciation. Depreciation is recorded using the straight-line method over the estimated useful lives of the assets. Leasehold improvements are amortized over the non-cancelable lease term or the estimated useful lives, whichever is shorter.
Pension and Postretirement Benefit Plans:
The Corporation has two defined benefit pension plans and one postretirement benefit plan as discussed in Note 11, Pension and Postretirement Benefit Plans, in the Notes to Consolidated Financial Statements. The Corporation follows the disclosure provisions of SFAS No. 132R, Employer’s Disclosure About Pensions and Other Postretirement Benefits. Net pension expense consists of service cost, interest cost, return on plan assets, amortization of prior service cost, amortization of transition obligations and amortization of net actuarial gains and losses. The Corporation accrues pension costs as incurred.
Accounting for Stock-Based Compensation:
The Corporation has one Stock Option Plan (the “SOP”) that accounts for stock-based employee compensation under the “intrinsic value” approach in accordance with the provisions of APB Opinion No. 25, rather than under the “fair value” approach prescribed in the Statement of Accounting Standards (“SFAS”) No. 123R, “Accounting for Stock-based Compensation.” The “intrinsic value” approach limits compensation expense to the excess of a stock option’s market
23
price on the grant date over the option’s exercise price. Since the Corporation’s SOP has exercise prices equal to market values on grant date, no compensation expense is recognized in the financial statements. The “fair value” approach under SFAS No. 123R takes into account the time value of the option and will generally result in compensation expense being recorded over the option’s vesting period.
In May of 2005, the FASB issued a second revision to SFAS 123R, which will disallow use of the “intrinsic value” approach beginning in the first quarter of 2006 and requires the Corporation to recognize in the income statement the expenses associated with the value of all stock options granted but not yet fully vested.
In June 2005, the Corporation accelerated the vesting of 83,916 out-of-the-money options, issued to employees, executive management and directors, which resulted in a proforma after-tax expense of $280,000 included in the stock based compensation cost in the table below. The purpose of this transaction was to avoid the expense treatment of SFAS No. 123R in 2006 and 2007.
Had the Corporation accounted for stock-based compensation using SFAS No. 123R, net income would have been as shown in the following pro forma disclosure.
| (dollars in thousands) | 2005 | 2004 | 2003 | ||||||
Net income – as reported | $ | 11,350 | $ | 9,345 | $ | 9,356 | |||
Stock-based compensation cost, net of related taxes | 1,388 | 94 | 79 | ||||||
Net income – proforma | $ | 9,962 | $ | 9,251 | $ | 9,277 | |||
Basic earnings per share – as reported | 1.33 | 1.09 | 1.08 | ||||||
Diluted earnings per share – as reported | 1.31 | 1.07 | 1.07 | ||||||
Basic earnings per share – proforma | 1.16 | 1.07 | 1.07 | ||||||
Diluted earnings per share – proforma | 1.15 | 1.06 | 1.06 | ||||||
See Note 14, Earnings Per Share, and Note 13, Stock Option Plan, in these Consolidated Financial Statements for additional information regarding equity based compensation and earnings per share, respectively.
Earnings Per Common Share:
The Corporation follows the provisions of SFAS No. 128, “Earnings Per Share”. Basic earnings per common share excludes dilution and is computed by dividing income available to common shareholders by the weighted-average common shares outstanding during this period. Diluted earnings per common share takes into account the potential dilution that could occur if stock options were exercised and converted into common stock. Proceeds assumed to have been received on such exercise are assumed to be used to purchase shares of the Corporation’s common stock at the average market price during the period, as required by the “treasury stock method” of accounting. The effects of stock options are excluded from the computation of diluted earnings per share in periods in which the effect would be antidilutive. All weighted average shares, actual shares and per share information in the financial statements have been adjusted retroactively for the effect of stock dividends and splits.
Income Taxes:
The Corporation files a consolidated Federal income tax return with its subsidiaries. Certain items of income and expense are reported in different periods for tax purposes. Deferred taxes are provided on such temporary differences existing between financial and income tax reporting, subject to the deferred tax asset realization criteria required under SFAS No. 109, “Accounting for Income Taxes” (“SFAS No. 109”).
Revenue Recognition:
With the exception of non-accrual loans, the Corporation recognizes all sources of income on the accrual basis. The Corporation recognizes interest income from non-accrual loans on a cash basis.
Mortgage Servicing:
The Corporation performs various servicing functions on loans owned by others. A fee, usually based on a percentage of the outstanding principal balance of the loan, is received for these services.
Mortgage servicing rights (MSRs) are recognized as separate assets when rights are retained through the sale of financial assets. Capitalized servicing rights are reported in other assets and are amortized into non-interest income in proportion to, and over the period of, the estimated future net servicing income of the underlying financial assets.
Servicing assets are evaluated quarterly for impairment based upon the fair value of the rights as compared to amortized cost. Impairment is determined by stratifying rights by predominant characteristics, such as interest rate and terms. Fair value is determined based upon discounted cash flows using market-based assumptions. Impairment is recognized on the income statement to the extent the fair value is less than the capitalized amount for the stratum. A valuation allowance is utilized to record temporary impairment in MSRs. Temporary impairment is defined as impairment that is not deemed permanent. Permanent impairment is recorded as a reduction of the MSR and will not be reversed. There was no net impairment in mortgage servicing rights for the year ended December 31, 2005, 2004 and 2003. See Note 6, Mortgage Servicing Rights, for additional information including temporary impairment and subsequent recovery during 2005, 2004 and 2003.
Recently Issued Accounting Standards:
FASB Staff Position 13-1 (“FSP 13-1”), Accounting for Rental Costs Incurred during a Construction Period, was issued on October 6, 2005. FSP 13-1 states that a lessee may not capitalize rental costs associated with either ground or building operating leases during the construction period and is
24
effective for reporting periods starting after December 15, 2005. The corporation has adopted FSP 13-1 beginning January 1, 2006. Adoption of FSP 13-1 is expected to increase the Corporation’s rent expense by $150,000 in 2006.
Statement of Cash Flows:
In 2003 the Corporation has combined cash flows from discontinued operations with cash flows from continuing operations for each category which in prior periods were reported on a combined basis as a single amount.
Reclassifications:
Certain prior year amounts have been reclassified to conform to the current year presentation.
| 2. | INVESTMENT SECURITIES: |
The amortized cost and estimated market value of investments, all of which were classified as available for sale, are as follows:
As of December 31, 2005:
| (dollars in thousands) | Amortized Cost | Gross Unrealized Gains | Gross Unrealized Losses | Estimated Market Value | |||||||||
Obligations of the U.S. Government and agencies | $ | 26,440 | $ | — | $ | (447 | ) | $ | 25,993 | ||||
State & political subdivisions | 5,185 | — | (171 | ) | 5,014 | ||||||||
FNMA Mortgage Backed Securities | 2,035 | — | (6 | ) | 2,029 | ||||||||
Other securities* | 1,948 | 11 | (4 | ) | 1,955 | ||||||||
Total | $ | 35,608 | $ | 11 | $ | (628 | ) | $ | 34,991 | ||||
As of December 31, 2004:
| (dollars in thousands) | Amortized Cost | Gross Unrealized Gains | Gross Unrealized Losses | Estimated Market Value | |||||||||
Obligations of the U.S. Government and agencies | $ | 28,939 | $ | 8 | $ | (156 | ) | $ | 28,791 | ||||
State & political subdivisions | 5,181 | 18 | (100 | ) | 5,099 | ||||||||
Other securities* | 1,534 | 17 | — | 1,551 | |||||||||
Total | $ | 35,654 | $ | 43 | $ | (256 | ) | $ | 35,441 | ||||
| * | Included in other securities are the following restricted stocks; Federal Reserve Bank, Federal Home Loan Bank of Pittsburgh and the Atlantic Central Banker’s Bank. |
The following table shows the amount of securities that were in an unrealized loss position at December 31, 2005:
| Less than 12 Months | 12 Months or Longer | Total | |||||||||||||||||||
| Fair Value | Unrealized Losses | Fair Value | Unrealized Losses | Fair Value | Unrealized Losses | ||||||||||||||||
US Treasury obligations and direct obligations of US Government Agencies | $ | 7,422 | $ | (78 | ) | $ | 18,571 | $ | (369 | ) | $ | 25,993 | $ | (447 | ) | ||||||
State and political subdivisions | 1,486 | (11 | ) | 3,528 | (160 | ) | 5,014 | (171 | ) | ||||||||||||
Federal agency mortgage-backed securities | 2,029 | (6 | ) | — | — | 2,029 | (6 | ) | |||||||||||||
Other | 246 | (4 | ) | — | — | 246 | (4 | ) | |||||||||||||
Total temporarily impaired securities | $ | 11,183 | $ | (99 | ) | $ | 22,099 | $ | (529 | ) | $ | 33,282 | $ | (628 | ) | ||||||
The Corporation has concluded that the unrealized losses presented in the table above are temporary in nature as they are primarily related to market interest rates and are not related to the underlying credit quality of the issuers. None of the investments are believed to be other-than-temporarily impaired.
The Corporation has the ability and intent to hold the securities until maturity to recover the entire value.
At December 31, 2005, securities having a book value of $15.959 million were pledged as collateral for public funds, trust deposits, and other purposes.
The amortized cost and estimated market value of investment securities at December 31, 2005, by contractual maturity, are shown below. Expected maturities will differ from contractual maturities because borrowers may have the right to call or prepay obligations with or without call or prepayment penalties.
| 2005 | ||||||
| (dollars in thousands) | Amortized Cost | Estimated Market Value | ||||
Due in one year or less | $ | 5,615 | $ | 5,546 | ||
Due after one year through five years | 22,188 | 21,798 | ||||
Due after five years through ten years | 4,599 | 4,436 | ||||
Due after ten years | — | — | ||||
Other securities | 1,171 | 1,182 | ||||
Subtotal | $ | 33,573 | $ | 32,962 | ||
Mortgage backed securities | 2,035 | 2,029 | ||||
Total | $ | 35,608 | $ | 34,991 | ||
There were no sales of debt securities during 2005, 2004 or 2003.
25
| 3. | LOANS: |
Loans outstanding at December 31 are detailed by category as follows:
| (dollars in thousands) | 2005 | 2004 | ||||||
Loans held for sale | $ | 2,765 | $ | 8,708 | ||||
Real estate loans: | ||||||||
Commercial mortgage loans | 162,621 | 137,141 | ||||||
Home equity lines and loans | 107,699 | 109,512 | ||||||
Residential mortgage loans | 99,602 | 75,081 | ||||||
Construction loans | 45,523 | 36,941 | ||||||
Commercial and industrial loans | 170,283 | 186,923 | ||||||
Consumer Loans | 9,437 | 10,291 | ||||||
Total Portfolio Loans | 595,165 | 555,889 | ||||||
Total Loans | $ | 597,930 | $ | 564,597 | ||||
Loans with predetermined rates | 393,782 | 265,041 | ||||||
Loans with adjustable or floating rates | 204,148 | 299,556 | ||||||
Total Loans | $ | 597,930 | $ | 564,597 | ||||
Total deferred loan origination cost and fees included in the above loan numbers | $ | (594 | ) | $ | (502 | ) | ||
Non-accrual loans amounted to $261,000 and $1.353 million at December 31, 2005 and 2004, respectively. Loans past due 90 days or more and still accruing were $129,000 and $22,000 at December 31, 2005 and 2004, respectively. Forgone interest on non-accrual loans was $54,000, $88,000, and $1,000 in 2005, 2004, and 2003, respectively.
Information regarding impaired loans is as follows:
| December 31, | ||||||||||||
| (dollars in thousands) | 2005 | 2004 | 2003 | |||||||||
Impaired Loans | $ | 261 | $ | 1,353 | $ | 371 | ||||||
Allowance for impaired loans | ||||||||||||
Balance January 1 | $ | 5 | $ | 1 | $ | — | ||||||
Provision | 200 | 600 | 125 | |||||||||
Charge-offs | (156 | ) | (598 | ) | (125 | ) | ||||||
Recoveries | 17 | 2 | 1 | |||||||||
Balance December 31 | $ | 66 | $ | 5 | $ | 1 | ||||||
Cash received | $ | 1,356 | $ | 142 | $ | 277 | ||||||
Income recognized | $ | 22 | $ | 5 | $ | 23 | ||||||
| 4. | ALLOWANCEFOR LOAN LOSSES: |
The summary of the changes in the allowance for loan losses is as follows:
| (dollars in thousands) | 2005 | 2004 | 2003 | |||||||||
Balance, January 1 | $ | 6,927 | $ | 6,670 | $ | 6,114 | ||||||
Charge-offs | (314 | ) | (692 | ) | (227 | ) | ||||||
Recoveries | 27 | 49 | 33 | |||||||||
Provision for loan loss | 762 | 900 | 750 | |||||||||
Balance, December 31 | $ | 7,402 | $ | 6,927 | $ | 6,670 | ||||||
| 5. | PREMISESAND EQUIPMENT: |
A summary of premises and equipment at December 31 is as follows:
| (dollars in thousands) | 2005 | 2004 | ||||||
Land | $ | 2,974 | $ | 2,974 | ||||
Buildings | 13,749 | 15,226 | ||||||
Furniture and equipment | 15,642 | 14,996 | ||||||
Leasehold improvements | 4,211 | 1,552 | ||||||
Less: accumulated depreciation | (21,954 | ) | (20,586 | ) | ||||
Total | $ | 14,622 | $ | 14,162 | ||||
Depreciation expense for the years ended December 31, 2005, 2004 and 2003 amounted to $1.398, $1.310 and $1.291 million respectively.
Future minimum rent commitments under various operating leases as of December 31, 2005 are as follows:
| (dollars in thousands) | |||
2006 | $ | 968 | |
2007 | $ | 861 | |
2008 | $ | 797 | |
2009 | $ | 737 | |
2010 | $ | 750 | |
Thereafter | $ | 16,255 | |
| 6. | MORTGAGE SERVICING: |
The following summarizes the Corporation’s activity related to MSRs for the years ended December 31, 2005 and 2004:
| (dollars in thousands) | 2005 | 2004 | ||||||
Balance, January 1 | $ | 3,172 | $ | 4,391 | ||||
Additions | 416 | 1,019 | ||||||
Amortization | (606 | ) | (839 | ) | ||||
Impairment | — | — | ||||||
Sales | — | (1,399 | ) | |||||
Balance, December 31 | $ | 2,982 | $ | 3,172 | ||||
Fair Value | $ | 4,843 | $ | 4,132 | ||||
26
The following summarizes the Corporation’s activity related to changes in the valuation allowance impairment of MSRs for the years ended December 31, 2005 and 2004:
| 2005 | 2004 | ||||||
Balance, January 1 | $ | — | $ | — | |||
Impairment | 42 | — | |||||
Recovery | (42 | ) | — | ||||
Balance, December 31 | $ | — | $ | — | |||
At December 31, 2005, key economic assumptions and the sensitivity of the current fair value of MSRs to immediate 10 and 20 percent adverse changes in those assumptions are as follows:
| (dollars in thousands) | December 31, 2005 | |||
Fair value amount of MSRs | $ | 4,843 | ||
Weighted average life (in years) | 7.0 | |||
Prepayment speeds (constant prepayment rate)* | 11.3 | % | ||
Impact on fair value: | ||||
10% adverse change | (139 | ) | ||
20% adverse change | (1,363 | ) | ||
Discount rate: | 9.5 | % | ||
Impact on fair value: | ||||
10% adverse change | (135 | ) | ||
20% adverse change | (212 | ) | ||
| * | Represents the weighted average prepayment rate for the life of the MSR asset. |
These assumptions and sensitivities are hypothetical and should be used with caution. As the figures indicate, changes in fair value based on a 10% variation in assumptions generally cannot be extrapolated because the relationship of the change in assumptions to the change in fair value may not be linear. Also, the effect of a variation in a particular assumption on the fair value of the MSRs is calculated without changing any other assumption. In realty, changes in one factor may result in changes in another, which could magnify or counteract the sensitivities.
| 7. | DEPOSITS: |
Following is a summary of deposits as of December 31,
| (dollars in thousands) | 2005 | 2004 | ||||
Regular savings | 46,258 | $ | 50,300 | |||
NOW accounts | 154,319 | 166,901 | ||||
Market rate accounts | 112,319 | 126,058 | ||||
Time deposits (less than $100,000) | 67,541 | 70,820 | ||||
Time deposits, $100,000 or more | 87,781 | 39,650 | ||||
Total interest-bearing deposits | 468,218 | 453,729 | ||||
Non-interest-bearing deposits | 168,042 | 147,236 | ||||
Total deposits | $ | 636,260 | $ | 600,965 | ||
The aggregate amount of deposit overdrafts included as loans as of December 31, 2005 and 2004 were $1.870 million and $393,000, respectively.
Maturity of certificates of deposit:
| (dollars in thousands) | $100,000 or more | Less than $100,000 | ||||
Maturing during: | ||||||
2006 | $ | 82,139 | $ | 47,814 | ||
2007 | 5,432 | 17,932 | ||||
2008 | 100 | 1,318 | ||||
2009 | 110 | 246 | ||||
2010 | — | 94 | ||||
2011 and Thereafter | — | 137 | ||||
Total | $ | 87,781 | $ | 67,541 | ||
| 8. | SHORT TERM BORROWINGS: |
Short term borrowings are presented below:
| (dollars in thousands) | 2005 | 2004 | 2003 | |||||||||
Average balance during the year | $ | 1,700 | $ | 849 | $ | 496 | ||||||
Year end balance | — | — | — | |||||||||
Highest month end balance | 12,385 | 13,100 | 8,000 | |||||||||
Weighted-average interest rate during the year | 3.34 | % | 1.17 | % | 1.90 | % | ||||||
Weighted-average interest rate at year end | — | — | — | |||||||||
| 9. | DISCLOSUREABOUT FAIR VALUEOF FINANCIAL INSTRUMENTS: |
Statement of Financial Accounting Standards No. 107, “Disclosures about Fair Value of Financial Instruments” (“SFAS No. 107”), requires disclosure of the fair value information about financial instruments, whether or not recognized in the balance sheet, for which it is practicable to estimate such value. In cases where quoted market prices are not available, fair values are based on estimates using present value or other market value techniques. Those techniques are significantly affected by the assumptions used, including the discount rate and estimates of future cash flows. In that regard the derived fair value estimates cannot be substantiated by comparison to independent markets and, in many cases, could not be realized in immediate settlement of the instrument. SFAS No. 107 excludes certain financial instruments and all non-financial instruments from its disclosure requirements. Accordingly, the aggregate fair value amounts presented do not represent the underlying value of the Corporation.
The following methods and assumptions were used to estimate the fair value of each class of financial instruments for which it is practicable to estimate that value:
Cash and Cash Equivalents:
The carrying amounts reported in the balance sheet for cash and cash equivalents approximate their fair values.
Investment securities:
Estimated fair values for investment securities are based on quoted market price, where available.
27
Loans:
For variable rate loans that reprice frequently and which have no significant change in credit risk, estimated fair values are based on carrying values. Fair values of certain mortgage loans and consumer loans are estimated using discounted cash flow analyses, using interest rates currently being offered for loans with similar terms to borrowers of similar credit quality. The estimated fair value of nonperforming loans is based on discounted estimated cash flows as determined by the internal loan review of the Bank or the appraised market value of the underlying collateral, as determined by independent third party appraisers.
Deposits:
The estimated fair values disclosed for noninterest-bearing demand deposits, NOW accounts, and Market Rate accounts are, by definition, equal to the amounts payable on demand at the reporting date (i.e., their carrying amounts). Fair values for certificates of deposit are estimated using a discounted cash flow calculation that applies interest rates currently being offered on certificates to a schedule of expected monthly maturities on the certificate of deposit. SFAS No. 107 defines the fair value of demand deposits as the amount payable on demand and prohibits adjusting estimated fair value from any value derived from retaining those deposits for an expected future period of time.
Short Term Borrowings:
Due to the short term nature of the maturities the carrying amount of the borrowings approximates the fair value. There were no short term borrowings at December 31, 2005 and 2004.
Other liabilities:
The carrying amounts of accrued interest payable, accrued taxes payable and other accrued payables approximates fair value.
Off-balance sheet instruments:
Estimated fair values of the Corporation’s off-balance sheet instruments (standby letters of credit and loan commitments) are based on fees and rates currently charged to enter into similar loan agreements, taking into account the remaining terms of the agreements and the counterparties’ credit standing. Since fees and rates charged for off-balance sheet items are at market levels when set, there is no material difference between the stated amount and estimated fair values of off-balance sheet instruments.
The carrying amount and estimated fair value of the Corporation’s financial instruments as of December 31, are as follows:
| 2005 | 2004 | |||||||||||
| (dollars in thousands) | Carrying Amount | Estimated Fair Value | Carrying Amount | Estimated Fair Value | ||||||||
Financial assets: | ||||||||||||
Cash and due from banks | $ | 33,896 | $ | 33,896 | $ | 26,526 | $ | 26,526 | ||||
Interest-bearing deposits with other banks | 405 | 405 | 15,293 | 15,293 | ||||||||
Federal funds sold | 32,341 | 32,341 | 13,423 | 13,423 | ||||||||
Investment securities | 34,991 | 34,991 | 35,441 | 35,441 | ||||||||
Mortgage servicing rights | 2,982 | 4,843 | 3,172 | 4,132 | ||||||||
Net loans | 590,528 | 583,135 | 557,670 | 554,515 | ||||||||
Total financial assets | $ | 695,143 | $ | 689,611 | $ | 651,525 | $ | 649,330 | ||||
Financial liabilities: | ||||||||||||
Deposits | $ | 636,260 | $ | 635,443 | $ | 600,965 | $ | 601,109 | ||||
Other liabilities | 2,143 | 2,143 | 2,878 | 2,878 | ||||||||
Total financial liabilities | $ | 638,403 | $ | 637,586 | $ | 603,843 | $ | 603,987 | ||||
Off-balance sheet instruments | $ | 328,069 | $ | 328,069 | $ | 277,839 | $ | 277,839 | ||||
| 10. | APPLICABLE INCOME TAXES: |
The components of the net deferred tax asset (liabilities) as of December 31 are as follows:
| (dollars in thousands) | 2005 | 2004 | ||||||
Deferred tax assets: | ||||||||
Loan loss reserve | $ | 2,591 | $ | 2,270 | ||||
Other reserves | 1,288 | 699 | ||||||
Unrealized depreciation on investment securities | 346 | 155 | ||||||
Total deferred tax asset | 4,225 | 3,124 | ||||||
Deferred tax liabilities: | ||||||||
Depreciation | (268 | ) | (261 | ) | ||||
Other reserves | (314 | ) | (399 | ) | ||||
Pension and other postretirement benefits | (1,890 | ) | (1,417 | ) | ||||
Originated mortgage servicing rights | (1,044 | ) | (1,110 | ) | ||||
Total deferred tax liability | (3,516 | ) | (3,127 | ) | ||||
Total net deferred tax assets (liabilities) | $ | 709 | $ | (3 | ) | |||
There was no valuation allowance as of December 31, 2005 and 2004; since management believes that it is more likely than not that the net deferred tax asset will be realized.
The provision for income taxes consists of the following:
| (dollars in thousands) | 2005 | 2004 | 2003 | |||||||
Currently payable | $ | 6,449 | $ | 4,714 | $ | 5,245 | ||||
Deferred | (521 | ) | 38 | 1,004 | ||||||
Total | $ | 5,928 | $ | 4,752 | $ | 6,249 | ||||
28
Applicable income taxes differed from the amount derived by applying the statutory federal tax rate to income as follows:
| (dollars in thousands) | 2005 | 2004 | 2003 | |||||||||
Computed | ||||||||||||
Tax expense at statutory federal rate | $ | 6,047 | $ | 4,934 | $ | 6,062 | ||||||
Tax-exempt income | (187 | ) | (140 | ) | (103 | ) | ||||||
Other, net | 68 | (42 | ) | 90 | ||||||||
Tax expense from continuing operations | 5,928 | 4,752 | 6,049 | |||||||||
Tax expense (benefit) from discontinued operations | — | — | 200 | |||||||||
Total income tax expense | $ | 5,928 | $ | 4,752 | $ | 6,249 | ||||||
| 11. | PENSIONAND POSTRETIREMENT BENEFIT PLANS: |
The Corporation has two defined benefit pension plans. The qualified defined benefit plan (“QDBP”) covers all employees over age 20 1/2 who meet certain service requirements. The non-qualified defined benefit pension plan (“SERP”) is restricted to certain executive officers of the Corporation as discussed in the Corporation’s Proxy Statement to Shareholders. The Corporation also has a postretirement benefit plan (“PRBP”) that covers certain retired employees and a group of current employees. The PRBP was closed to new participants in 1994. The following tables provide a reconciliation of the changes in the plans’ three benefits obligation and fair value of assets over the two-year period ending December 31, 2005, and a statement of funded status as of December 31 of both years:
Reconciliation of Benefit Obligation and Plan Assets
| Defined Benefit Pension Plan | Postretirement Benefit Plan | |||||||||||||||
| (dollars in thousands) | 2005 | 2004 | 2005 | 2004 | ||||||||||||
Change in benefit obligation | ||||||||||||||||
Benefit obligation at January 1 | $ | 28,406 | $ | 25,149 | $ | 3,152 | $ | 2,375 | ||||||||
Service cost | 1,167 | 1,134 | 12 | 21 | ||||||||||||
Interest cost | 1,650 | 1,573 | 143 | 188 | ||||||||||||
Amendments | — | — | (860 | ) | — | |||||||||||
Actuarial (gain) loss | 571 | 1,517 | 214 | 793 | ||||||||||||
Benefits paid | (1,034 | ) | (967 | ) | (213 | ) | (225 | ) | ||||||||
Benefit obligation at December 31 | $ | 30,760 | $ | 28,406 | $ | 2,448 | $ | 3,152 | ||||||||
Change in plan assets | ||||||||||||||||
Fair value of plan assets at January 1 | $ | 25,838 | $ | 22,615 | $ | — | $ | — | ||||||||
Actual return on plan assets | 902 | 1,441 | — | |||||||||||||
Employer contribution | 1,070 | 2,807 | 193 | 225 | ||||||||||||
Plan participants’ contribution | — | — | 20 | — | ||||||||||||
Administrative expense | (50 | ) | (58 | ) | ||||||||||||
Benefits paid | (1,034 | ) | (967 | ) | (213 | ) | (225 | ) | ||||||||
Fair value of plan assets at December 31 | $ | 26,726 | $ | 25,838 | $ | — | $ | — | ||||||||
Funded Status Reconciliation and Key Assumptions
| Defined Benefit Pension Plans | Postretirement Benefit Plan | |||||||||||||||
| (dollars in thousands) | 2005 | 2004 | 2005 | 2004 | ||||||||||||
Reconciliation of funded status | ||||||||||||||||
Funded Status | $ | (4,033 | ) | $ | (2,568 | ) | $ | (2,448 | ) | $ | (3,152 | ) | ||||
Unrecognized net actuarial (gain) loss | 7,610 | 6,112 | 1,747 | 1,737 | ||||||||||||
Unrecognized prior service cost | 369 | 499 | (742 | ) | — | |||||||||||
Unrecognized transition obligation (asset) | — | — | 181 | 207 | ||||||||||||
Prepaid accrued (benefit) cost | $ | 3,946 | $ | 4,043 | $ | (1,262 | ) | $ | (1,208 | ) | ||||||
Amounts recognized in financial statements consists of: | ||||||||||||||||
Prepaid benefit cost/ (Accrued benefit liability) | $ | 3,400 | $ | 3,612 | (1,262 | ) | (1,208 | ) | ||||||||
Intangible asset prior service cost | 174 | 222 | — | — | ||||||||||||
Accumulated other comprehensive income (loss) | 372 | 209 | — | — | ||||||||||||
Net amount recognized | $ | 3,946 | $ | 4,043 | $ | (1,262 | ) | $ | (1,208 | ) | ||||||
The SERP was the only plan with an accumulated benefit obligation in excess of plan assets. The SERP’s accumulated benefit obligation was $2.000 million as of December 31, 2005 and $1.788 million as of December 31, 2004. There are no plan assets in the SERP due to the nature of the SERP. The PRBP also has no plan assets.
Key Assumptions
The assumptions used in the measurement of the Corporation’s benefit obligation are shown in the following table:
| Defined Benefit Pension Plan | Postretirement Benefit Plan | |||||||||||
| 2005 | 2004 | 2005 | 2004 | |||||||||
Weighted-average assumptions as of end of year | ||||||||||||
Discount rate | 5.75 | % | 6.00 | % | 5.75 | % | 6.00 | % | ||||
Expected rate of return on plan assets | 8.50 | % | 8.75 | % | N/A | N/A | ||||||
Rate of compensation increase | 4.00 | % | 4.00 | % | 4.00 | % | 4.00 | % | ||||
The expected rate of return on plan assets was selected by Management after consultation with the Corporation’s actuary, and is based in part on long term historical rates of return and various actuarial assumptions. The discount rate was also selected by Management after consultation with the Corporation’s actuary, and is based in part upon the current yield of a basket of long term investment grade securities.
29
The following table presents expected future benefit payments which reflect an expected future service requirement:
Expected Future Benefit Payments
| (dollars in thousands) | Defined Benefit Pension Plans | Postretirement Benefit Plan | ||||
For the Fiscal Year Ending: | ||||||
2006 | $ | 1,204 | $ | 289 | ||
2007 | 1,393 | 298 | ||||
2008 | 1,519 | 286 | ||||
2009 | 1,646 | 270 | ||||
2010 | 1,740 | 255 | ||||
Years 2011 – 2015 | 10,531 | 970 | ||||
| $ | 18,033 | $ | 2,368 | |||
Assumed health care cost trend rates at end of year
| 2005 | 2004 | |||||
Health care cost trend rate assumed for next year | 8.10 | % | 11 | % | ||
Rate to which the cost trend rate is assumed to decline (the ultimate trend rate) | 0 | % | 6 | % | ||
Year that the rate reaches the ultimate trend rate | 2006 | 2010 |
In 2005 the Corporation capped the maximum payment under the PRBP at 120% of the 2005 benefit.
The following table provides the components of net periodic cost (income) for the plans for years ended December 31, 2005, 2004 and 2003:
Defined Benefit Pension Plans | Postretirement Benefit Plan | |||||||||||||||||||||
| (dollars in thousands) | 2005 | 2004 | 2003 | 2005 | 2004 | 2003 | ||||||||||||||||
Service cost | $ | 1,167 | $ | 1,134 | $ | 923 | $ | 12 | $ | 21 | $ | 17 | ||||||||||
Interest cost | 1,650 | 1,573 | 1,455 | 143 | 188 | 151 | ||||||||||||||||
Expected return on plan assets | (2,153 | ) | (1,937 | ) | (1,493 | ) | — | — | — | |||||||||||||
Amortization of prior service cost | 130 | 130 | 181 | (138 | ) | — | — | |||||||||||||||
Amortization of transition obligation (asset) | — | — | — | 26 | 26 | 26 | ||||||||||||||||
Amortization of net actuarial (gain) loss | 373 | 285 | 285 | 203 | 185 | 107 | ||||||||||||||||
Net periodic (benefit) cost | $ | 1,167 | $ | 1,185 | $ | 1,351 | $ | 246 | $ | 420 | $ | 301 | ||||||||||
Plan Assets
| Defined Benefit Pension Plan (QDBP) | ||||||
| Target Allocation year ending | Percentage of plan assets at December 31 | |||||
| Dec. 31, 2005 | 2005 | 2004 | ||||
Asset Category | ||||||
Equity Securities* | 40% -60% | 61% | 60% | |||
Debt Securities | 25% -40% | 31% | 29% | |||
Real Estate | 5% - 15% | 0% | 0% | |||
Other | 5% - 15% | 8% | 11% | |||
Total | 100% | 100% | ||||
| * | Includes Bryn Mawr Bank Corporation common stock in the amount of $661,000 (2%) and $600,000 (2%) at December 31, 2005 and 2004, respectively. |
The investment strategy of the Plan is to maintain the investment ranges listed above. The target ranges are to be periodically reviewed based on the prevailing market conditions. Any modification to the current investment strategy must be ratified by the Executive Committee of the Corporation’s Board of Directors. The Plan will retain approximately 2.5% of Bryn Mawr Bank Corporation common stock.
Measurement Date
The measurement date used to determine pension and other postretirement benefit measures for the pension plan and other postretirement benefits plan was December 31st for all respective years presented.
Expected contribution to be Paid in the Next Fiscal Year
Based on the status of the Corporation’s QDBP at December 31, 2005 no minimum funding requirement is anticipated for 2006. The 2006 expected contribution for the SERP is $131,000.
Health Care Cost
In 2005 the Corporation capped the maximum payment under the post retirement benefit plan at 120% of the 2005 benefit. The current trend of 10% will achieve the cap in two years. Long term the impact of the cap will have an immaterial impact on the change in the trend.
| 12. | THRIFTAND SAVINGS PLAN (“THRIFT PLAN”): |
The Corporation has a qualified defined contribution plan for all eligible employees under which the Corporation contributes $1.00 for each $1.00 that an employee contributes up to a maximum of 3.00% of the employee’s base salary. The Corporation’s expenses for the Thrift Plan were $339,000, $347,000 and $335,000 in 2005, 2004 and 2003 respectively.
30
| 13. | STOCK OPTION PLAN: |
The Corporation’s Stock Option Plan ( the “SOP”) permits the issuance of options to key employees and Directors to purchase shares of the Corporation’s common stock. The option price is set at the last sale price for the stock on the day proceeding issuance of grants as determined by the Corporation’s Board of Directors. Options granted may either be “incentive stock options” within the meaning of the Internal Revenue Service code, or non-qualified options. The stock options are exercisable over a period determined by the Board of Directors; however, the option period will not be longer than ten years from the date of the grant. The SOP provides that the option price at the date of the grant will not be less than the fair market value of the corporation’s common stock. The following is a summary of transactions under the SOP:
| (dollars in thousands) | Shares Under Option | Available for Option | Price per Share | Weighted Average Exercise Price | ||||||||
Balance at January 1, 2003 | 511,234 | 152,678 | $ | 4.00 – $18.32 | ||||||||
Options granted | 142,500 | (142,500 | ) | $ | 17.85 – $21.68 | $ | 18.02 | |||||
Options exercised | (53,016 | ) | — | $ | 4.00 – $18.32 | $ | 11.72 | |||||
Options cancelled | (6,334 | ) | 6,334 | $ | 15.15 – $18.32 | $ | 17.06 | |||||
Balance at December 31, 2003 | 594,384 | 16,512 | $ | 4.34 – $21.68 | $ | 14.66 | ||||||
Options authorized | — | 431,143 | — | — | ||||||||
Options granted | 138,750 | (138,750 | ) | $ | 20.47 – $22.68 | $ | 20.51 | |||||
Options exercised | (37,350 | ) | — | $ | 10.50 – $18.46 | $ | 13.11 | |||||
Options cancelled | (43,000 | ) | 43,000 | $ | 14.49 – $20.47 | $ | 17.80 | |||||
Balance at December 31, 2004 | 652,784 | 351,905 | $ | 4.34 – $22.68 | $ | 14.66 | ||||||
Options granted | 342,175 | (342,175 | ) | $ | 18.91 – $21.21 | 19.97 | ||||||
Options exercised | (49,317 | ) | — | $ | 12.25 – $18.91 | 13.09 | ||||||
Options cancelled | (11,334 | ) | 11,334 | $ | 15.15 –$20.47 | 18.21 | ||||||
Balance at December 31, 2005 | 934,308 | 21,064 | $ | 6.25 – $22.68 | $ | 17.44 | ||||||
Information pertaining to options outstanding at December 31, 2005 is as follows:
Price range of shares under option at December 31, 2005:
| (dollars in thousands) | Shares Under Option | Price per Share | Weighted Average Remaining Contractual Life | Weighted Average Exercise Price | Number Exercisable | Weighted Average Exercise Price | |||||||||
| 67,200 | $ | 6.25 – $10.75 | 3.18 | $ | 9.55 | 67,200 | $ | 9.55 | |||||||
| 194,350 | $ | 12.25 – $15.15 | 3.98 | 13.22 | 194,350 | 13.22 | |||||||||
| 377,333 | $ | 16.25 – $18.91 | 8.13 | 18.33 | 343,999 | 18.36 | |||||||||
| 295,425 | $ | 19.11 – $22.68 | 9.23 | 20.87 | 295,425 | 20.87 | |||||||||
Balance at December 31, 2005 | 934,308 | $ | 6.25 –$22.68 | 7.26 | $ | 17.44 | 900,974 | $ | 17.42 | ||||||
The weighted-average fair value of options granted during 2005, 2004 and 2003 were $4.42, $4.61 and $3.98, respectively.
The number of exercisable shares at December 31, 2005, 2004 and 2003 were 900,974, 412,479 and 336,551 respectively, with respective weighted average exercise prices of $17.42, $13.58 and $7.09.
The fair value of each option granted is estimated on the date of the grant using the Black-Scholes option pricing model with the following weighted-average assumptions used for grants in 2005, 2004 and 2003 as follows:
| 2005 | 2004 | 2003 | |||||||
Dividend | 2.07 | % | 1.76 | % | 1.78 | % | |||
Volatility | 20.5 | % | 21.1 | % | 21.0 | % | |||
Risk-free Interest Rate | 4.5 | % | 3.9 | % | 3.5 | % | |||
Expected Life in Years | 6 | 6 | 6 |
Stock appreciation rights may be granted in tandem with non-qualified stock options. No stock appreciation rights have been granted under the SOP.
| 14. | EARNINGS PER SHARE: |
The calculation of basic earnings per share and diluted earnings per share is presented below. All weighted average shares, actual shares and per share information in the financial statements have been adjusted retroactively for the effect of stock dividends and splits. See Note 1 of the consolidated financial statements for a discussion on the calculation of earnings per share.
Earnings Per Share Including Discontinued Operations:
| Year Ended December 31, | |||||||||
| (dollars in thousands, except number of shares and per share date) | 2005 | 2004 | 2003 | ||||||
Numerator: | |||||||||
Net income available to common shareholders | $ | 11,350 | $ | 9,345 | $ | 9,356 | |||
Denominator for basic earnings per share – Weighted average shares outstanding | 8,563,027 | 8,610,171 | 8,657,527 | ||||||
Effect of dilutive potential common shares | 101,200 | 110,854 | 103,107 | ||||||
Denominator for diluted earnings per share – Adjusted weighted average shares outstanding | 8,664,227 | 8,721,025 | 8,760,634 | ||||||
Basic earnings per share | $ | 1.33 | $ | 1.09 | $ | 1.08 | |||
Diluted earnings per share | $ | 1.31 | $ | 1.07 | $ | 1.07 | |||
31
Earnings Per Share From Continuing Operations:
| Year Ended December 31, | |||||||||
| (dollars in thousands, except number of shares and per share date) | 2005 | 2004 | 2003 | ||||||
Numerator: | |||||||||
Net income available to common shareholders | $ | 11,350 | $ | 9,345 | $ | 11,272 | |||
Denominator for basic earnings per share – Weighted average shares outstanding | 8,563,027 | 8,610,171 | 8,657,527 | ||||||
Effect of dilutive potential common shares | 101,200 | 110,854 | 103,107 | ||||||
Denominator for diluted earnings per share – Adjusted weighted average shares outstanding | 8,664,227 | 8,721,025 | 8,760,634 | ||||||
Basic earnings per share | $ | 1.33 | $ | 1.09 | $ | 1.30 | |||
Diluted earnings per share | $ | 1.31 | $ | 1.07 | $ | 1.29 | |||
For 2005, 2004, and 2003 options to purchase 161,300, 3,250 and 1,000 shares of common stock at the weighted average price of $21.23, $22.37 and $21.68 per share respectively have been excluded in the computation of diluted earnings per share because the options’ exercise price was greater than the average market price of the common stock.
Dilutive potential common shares have been adjusted to reflect the tax benefit of non-qualified stock options in 2004, 2003, 2002 and 2001 resulting in lower dilutive shares of 59,691, 55,436, 45,414, and 88,964 in 2004, 2003, 2002 and 2001, respectively. This resulted in an increase to previously reported diluted earnings per share of $.01 in 2004, 2003 and 2002 and $.02 in 2001. This adjustment also resulted in an increase in previously reported diluted earnings per share from continuing operations of $.01 in 2004, 2003, 2002, and 2001.
| 15. | OTHER OPERATING INCOME: |
Components of other operating income for the years ended December 31 include:
| (dollars in thousands) | 2005 | 2004 | 2003 | ||||||
Cash management fees | $ | 476 | $ | 518 | $ | 501 | |||
Safe deposit | 339 | 321 | 321 | ||||||
Insurance commission | 318 | 299 | 268 | ||||||
Rent Income | 306 | 246 | 154 | ||||||
Title insurance income | 153 | 112 | 454 | ||||||
Miscellaneous income | 357 | 224 | 177 | ||||||
Other operating income | $ | 1,949 | $ | 1,720 | $ | 1,875 | |||
| 16. | OTHER OPERATING EXPENSE: |
Components of other operating expense for the years ended December 31 include:
| (dollars in thousands) | 2005 | 2004 | 2003 | ||||||
Computer processing | $ | 463 | $ | 531 | $ | 562 | |||
Stationery & supplies | 295 | 336 | 368 | ||||||
Taxes (shares, sales & use) | 622 | 466 | 554 | ||||||
Telephone | 302 | 284 | 297 | ||||||
Loan processing and closing | 489 | 799 | 1,759 | ||||||
Extra help & hiring | 365 | 285 | 396 | ||||||
Travel and entertainment | 317 | 348 | 305 | ||||||
Miscellaneous | 1,712 | 1,794 | 1,597 | ||||||
Other operating expenses | $ | 4,565 | $ | 4,843 | $ | 5,838 | |||
| 17. | RELATED PARTY TRANSACTIONS: |
In the ordinary course of business, the Bank granted loans to principal officers, directors and their affiliates. Loan activity during 2005 and 2004 was as follows:
Following is a summary of these transactions:
| (dollars in thousands) | 2005 | 2004 | ||||||
Balance, beginning of year | $ | 6,255 | $ | 5,150 | ||||
Additions | 2,473 | 2,009 | ||||||
Amounts collected | (1,508 | ) | (904 | ) | ||||
Balance, end of year | $ | 7,220 | $ | 6,255 | ||||
Related party deposits amounted to $3.230 million and $1.968 million at December 31, 2005 and 2004, respectively.
| 18. | FINANCIAL INSTRUMENTSWITH OFF-BALANCE SHEET RISKAND CONCENTRATIONOF CREDIT RISK: |
The Corporation is a party to financial instruments with off-balance sheet risk in the normal course of business to meet the financing needs of its customers. These financial instruments include commitments to extend credit and standby letters of credit. Those instruments involve, to varying degrees, elements of credit risk in excess of the amount recognized in the consolidated statements of financial condition. The contractual amounts of those instruments reflect the extent of involvement the Corporation has in particular classes of financial instruments.
The Corporation’s exposure to credit loss in the event of nonperformance by the counterparty to the financial instrument of commitments to extend credit and standby letters of credit is represented by the contractual amount of those instruments. The Corporation uses the same credit policies in making commitments and conditional obligations as it does for on-balance sheet financial instruments.
32
Commitments to extend credit are agreements to lend to a customer as long as there is no violation of any condition established in the agreement. Commitments generally have fixed expiration dates or other termination clauses and may require payment of a fee. Some of the commitments are expected to expire without being drawn upon, and the total commitment amounts do not necessarily represent future cash requirements. Total commitments to extend credit at December 31, 2005 are $316.9 million. The Corporation evaluates each customer’s creditworthiness on a case-by-case basis. The amount of collateral obtained, if deemed necessary by the Corporation upon extension of credit, is based on management’s credit evaluation of the counterparty. Collateral varies but may include accounts receivable, marketable securities, inventory, property, plant and equipment, residential real estate, and income-producing commercial properties.
Standby letters of credit are conditional commitments issued by the Bank to a customer for a third party. Such standby letters of credits are issued to support private borrowing arrangements. The credit risk involved in issuing standby letters of credit is similar to that involved in extending loan facilities to customers. The collateral varies, but may include accounts receivable, marketable securities, inventory, property, plant and equipment, and residential real estate for those commitments for which collateral is deemed necessary. The Corporation’s obligation under standby letters of credit as of December 31, 2005 amounted to $11.2 million. There were no outstanding bankers’ acceptances as of December 31, 2005.
The Corporation has a material portion of its loans in real estate related loans. A predominant percentage of the Corporation’s real estate exposure, both commercial and residential, is in the Corporation’s primary trade area which includes portions of Delaware, Chester, Montgomery and Philadelphia counties in Southeastern Pennsylvania. Management is aware of this concentration and mitigates this risk to the extent possible in many ways, including the underwriting and assessment of borrower’s capacity to repay.
As of December 31, 2005, the Corporation had no loans sold with recourse outstanding.
| 19. | DIVIDEND RESTRICTIONS: |
The Bank is subject to the Pennsylvania Banking Code of 1965 (the “Code”), as amended, and is restricted in the amount of dividends that can be paid to its shareholder, the Corporation. The Code restricts the payment of dividends by the Bank to the amount of its retained earnings which was $64.294 million as of December 31, 2005. However, the amount of dividends paid by the Bank cannot reduce capital levels below levels that would cause the Bank to be less than adequately capitalized as detailed in Note 21, Regulatory Capital Requirements.
| 20. | DISCONTINUED OPERATIONS: |
During 2003, the Corporation sold the assets of its family office subsidiary, Joseph W. Roskos & Company (“JWR & Co.”) to a former owner. In accordance with SFAS No. 144 – Accounting for the Impairment or Disposal of Long Lived Assets, the Corporation classified all revenues, expenses, goodwill write downs, related disposal expenses and applicable income taxes as a loss from discontinued operations. The disposal of the JWR & Co. subsidiary resulted in a loss, net of applicable income taxes, of $1.916 million or $0.22 per share (basic and diluted) in 2003.
The table below presents the discontinued operations and related asset sale of JWR & Co. in 2003. There were no JWR & Co. related expenses in 2004 and 2005.
| (dollars in thousands) | 2003 | |||
Revenues of JWR & Co. | $ | 773 | ||
Expenses of JWR & Co. | (1,091 | ) | ||
Pre-tax (loss) income | (318 | ) | ||
Applicable income (tax) benefit | 108 | |||
(Loss) Income | (210 | ) | ||
Non-recurring transactions: | ||||
Write-down of Goodwill | (1,005 | ) | ||
Accounts receivable change-off | (148 | ) | ||
Other | (245 | ) | ||
Income (tax) benefit | (308 | )* | ||
Total of non-recurring transactions | (1,706 | ) | ||
Loss from discontinued operations | $ | (1,916 | ) | |
| * | Includes $444,000 of income tax expense on the sale of JWR & Co.’s assets. |
As of December 31, 2005, the Corporation held notes receivable totaling $954,000 from the purchase of the assets of JWR & Co. These notes bear interest at 6.00% and have various payments and due dates through 2013. The balance of these notes was $1.287 million and $1.671 million at December 31, 2004 and 2003 respectively. These notes were paid in full on February 17, 2006. These notes are included in the Corporation’s consolidated balance sheet as commercial loans.
| 21. | REGULATORY CAPITAL REQUIREMENTS: |
Both the Corporation and the Bank are subject to various regulatory capital requirements, administered by the federal banking agencies. Failure to meet minimum capital requirements can initiate certain mandatory and possibly additional discretionary actions by regulators that, if taken, could have a direct material effect on the Corporation’s and the Bank’s financial statements. Under capital adequacy guidelines and the regulatory framework for prompt corrective action, the Corporation and the Bank must meet specific capital guidelines that involve quantitative measures of their assets, liabilities and certain off-balance-sheet items as
33
calculated under regulatory accounting practices. The capital amounts and classifications are also subject to qualitative judgments by the regulators about components, risk weightings and other factors. Prompt corrective action provisions are not applicable to bank holding companies.
As set forth in the following table, quantitative measures have been established to ensure capital adequacy ratios required of both the Corporation and Bank. Both the Corporation’s and the Bank’s Tier II capital ratios are calculated by adding back a portion of the loan loss reserve to the Tier I capital. Management believes, as of December 31, 2005 and 2004 that the Corporation and the Bank have met all capital adequacy requirements to which they are subject. Federal banking regulators have defined specific capital categories, and categories range from a best of “well capitalized “to a worst of “critically under capitalized”. Both the Corporation and the Bank are classified as “well capitalized” as of December 31, 2005 and 2004.
The Corporation’s and the Bank’s actual capital amounts and ratios as of December 31, 2005 and 2004 are presented in the following table:
| Actual | Minimum to be Adequately Capitalized | Minimum to be Well Capitalized | ||||||||||||||||
| (dollars in thousands) | Amount | Ratio | Amount | Ratio | Amount | Ratio | ||||||||||||
December 31, 2005 | ||||||||||||||||||
Total (Tier II) Capital to Risk Weighted Assets: | ||||||||||||||||||
Corporation | $ | 85,322 | 12.46 | % | — | 8.0 | % | N/A | N/A | |||||||||
Bank | 78,048 | 11.47 | % | $ | 54,424 | 8.0 | % | $ | 68,030 | 10.0 | % | |||||||
Tier I Capital to Risk Weighted Assets: | ||||||||||||||||||
Corporation | 77,915 | 11.38 | % | — | 4.0 | % | N/A | NA | ||||||||||
Bank | 70,641 | 10.38 | % | 27,212 | 4.0 | % | 40,818 | 6.0 | % | |||||||||
Tier I Capital to Quarterly Average Assets: | ||||||||||||||||||
Corporation | 77,915 | 11.25 | % | — | 4.0 | % | N/A | N/A | ||||||||||
Bank | 70,641 | 10.26 | % | 27,529 | 4.0 | % | 34,412 | 5.0 | % | |||||||||
December 31, 2004 | ||||||||||||||||||
Total (Tier II) Capital to Risk Weighted Assets: | ||||||||||||||||||
Corporation | $ | 78,312 | 12.33 | % | — | 8.0 | % | N/A | N/A | |||||||||
Bank | 69,886 | 11.09 | % | 50,417 | 8.0 | % | 63,021 | 10.0 | % | |||||||||
Tier I Capital to Risk Weighted Assets: | ||||||||||||||||||
Corporation | 71,378 | 11.24 | % | — | 4.0 | % | N/A | N/A | ||||||||||
Bank | 62,952 | 9.99 | % | 25,209 | 4.0 | % | 37,813 | 6.0 | % | |||||||||
Tier I Capital to Quarterly Average Assets: | ||||||||||||||||||
Corporation | 71,378 | 10.76 | % | — | 4.0 | % | N/A | N/A | ||||||||||
Bank | 62,952 | 9.56 | % | 26,333 | 4.0 | % | 32,916 | 5.0 | % | |||||||||
| 22. | SELECTED QUARTERLY FINANCIAL DATA (UNAUDITED): |
| Quarters Ending 2005 | ||||||||||||
| (dollars in thousands, except per share data) | 3/31 | 6/30 | 9/30 | 12/31 | ||||||||
Interest income | $ | 8,671 | $ | 9,186 | $ | 9,834 | $ | 10,277 | ||||
Interest expense | 1,303 | 1,544 | 1,788 | 1,965 | ||||||||
Net interest income | 7,368 | 7,642 | 8,046 | 8,312 | ||||||||
Provision for loan losses | 187 | 193 | 209 | 173 | ||||||||
Income before income taxes | 4,211 | 4,305 | 4,375 | 4,387 | ||||||||
Net income | $ | 2,802 | $ | 2,788 | $ | 2,876 | $ | 2,884 | ||||
Basic earnings per common share: | ||||||||||||
Total basic earnings per common share | $ | 0.33 | $ | 0.33 | $ | 0.34 | $ | 0.34 | ||||
Diluted earnings per common share: | ||||||||||||
Total diluted earnings per common share | $ | 0.32 | $ | 0.32 | $ | 0.33 | $ | 0.33 | ||||
| Quarters Ending 2004 | ||||||||||||
| (dollars in thousands, except per share data) | 03/31 | 6/30 | 9/30 | 12/31 | ||||||||
Interest income | $ | 7,452 | $ | 7,632 | $ | 7,969 | $ | 8,328 | ||||
Interest expense | 1,083 | 1,083 | 1,155 | 1,232 | ||||||||
Net interest income | 6,369 | 6,549 | 6,814 | 7,096 | ||||||||
Provision for loan losses | 187 | 188 | 187 | 338 | ||||||||
Income before income taxes | 4,635 | 3,239 | 3,159 | 3,064 | ||||||||
Net income | $ | 3,020 | $ | 2,129 | $ | 2,109 | $ | 2,087 | ||||
Basic earnings per common share: | ||||||||||||
Total basic earnings per common share | $ | 0.35 | $ | 0.25 | $ | 0.25 | $ | 0.24 | ||||
Diluted earnings per common share: | ||||||||||||
Total diluted earnings per common share | $ | 0.34 | $ | 0.24 | $ | 0.24 | 0.24 | |||||
34
| 23. | CONDENSED FINANCIAL STATEMENTS: |
The condensed financial statements of the Corporation (parent company only) as of December 31, 2005 and 2004, and for each of the three years in the period ended December 31, 2005, are as follows:
Condensed Balance Sheets
| (dollars in thousands) | 2005 | 2004 | ||||||
Assets: | ||||||||
Cash | $ | 3,135 | $ | 1,174 | ||||
Investments in subsidiaries, at equity in net assets | 71,095 | 66,665 | ||||||
Premises and equipment, net | 3,368 | 3,467 | ||||||
Other assets | 582 | 543 | ||||||
Total assets | $ | 78,180 | $ | 71,849 | ||||
Liabilities and shareholders’ equity: | ||||||||
Other liabilities | $ | 667 | $ | 611 | ||||
Total liabilities | 667 | 611 | ||||||
Common stock, par value $1, authorized 25,000,000 shares as of December 31, 2005 and 2004, respectively, issued 11,172,582 shares and 11,172,582 shares as of December 31, 2005 and 2004, respectively and outstanding 8,597,958 shares and 8,597,958 shares as of December 31, 2005 and 2004, respectively | 11,222 | 11,172 | ||||||
Paid-in capital in excess of par value | 7,888 | 7,112 | ||||||
Accumulated other comprehensive income, net of deferred income taxes | (643 | ) | (288 | ) | ||||
Retained earnings | 82,930 | 75,179 | ||||||
Less common stock in treasury, at cost - 2,574,624 shares and 2,574,624 shares as of December 31, 2005 and 2004 | (23,884 | ) | (21,937 | ) | ||||
Total shareholders’ equity | 77,513 | 71,238 | ||||||
Total liabilities and shareholders’ equity | $ | 78,180 | $ | 71,849 | ||||
Condensed Statements of Income
| (dollars in thousands) | 2005 | 2004 | 2003 | |||||||
Dividends from The Bryn Mawr Trust Company | $ | 3,599 | $ | 3,446 | $ | 3,465 | ||||
Interest and other income | 326 | 236 | 236 | |||||||
Total operating income | 3,925 | 3,682 | 3,701 | |||||||
Expenses | 503 | 472 | 459 | |||||||
Income before equity in undistributed income of subsidiaries | 3,422 | 3,210 | 3,242 | |||||||
Equity in undistributed income of subsidiaries | 7,868 | 6,055 | 7,954 | |||||||
Income before income taxes and discontinued operations | 11,290 | 9,265 | 11,196 | |||||||
Federal income tax benefit | 60 | 80 | 76 | |||||||
Income from continuing operations | 11,350 | 9,345 | 11,272 | |||||||
(Loss) income from discontinued operations | — | — | (1,916 | ) | ||||||
Net income | $ | 11,350 | $ | 9,345 | $ | 9,356 | ||||
Condensed Statements of Cash Flows
| (in thousands) | 2005 | 2004 | Revised 2003* | |||||||||
Operating activities: | ||||||||||||
Income from continuing operations | $ | 11,350 | $ | 9,345 | $ | 11,272 | ||||||
Loss from discontinued operations | — | — | (1,916 | ) | ||||||||
Net Income | 11,350 | 9,345 | 9,356 | |||||||||
Adjustments to reconcile net income to net cash provided by operating activities: | ||||||||||||
Equity in undistributed income (losses) of subsidiaries | (7,868 | ) | (6,054 | ) | (7,954 | ) | ||||||
Impairment of goodwill | — | — | 2,405 | |||||||||
Depreciation and amortization | 99 | 98 | 98 | |||||||||
Other | 642 | (19 | ) | (53 | ) | |||||||
Net cash provided by operating activities | 4,223 | 3,370 | 3,852 | |||||||||
Investing Activities: | ||||||||||||
Investment in Subsidiaries | 2,597 | 162 | 1,313 | |||||||||
Net cash provided by investing activities | 2,597 | 162 | 1,313 | |||||||||
Financing activities: | ||||||||||||
Dividends paid | (3,599 | ) | (3,446 | ) | (3,465 | ) | ||||||
Repayment of mortgage debt | — | — | (513 | ) | ||||||||
Repurchase of treasury stock | (1,990 | ) | (2,585 | ) | (1,826 | ) | ||||||
Proceeds from issuance of common stock | 730 | 597 | 709 | |||||||||
Net cash used by financing activities | (4,859 | ) | (5,434 | ) | (5,095 | ) | ||||||
Change in cash and cash equivalents | 1,961 | (1,902 | ) | 70 | ||||||||
Cash and cash equivalents at beginning of year | 1,174 | 3,076 | 3,006 | |||||||||
Cash and cash equivalents at end of year | $ | 3,135 | $ | 1,174 | $ | 3,076 | ||||||
These statements should be read in conjunction with the Notes to the Consolidated Financial Statements.
| * | See Note 1, Summary of Significant Accounting Policies – Statement of Cash Flows, in the Notes to the Consolidated Financial Statements. |
| 24. | SEGMENT INFORMATION: |
SFAS No. 131, “Segment Reporting”, identifies operating segments as components of an enterprise which are evaluated regularly by the Corporation’s Chief Executive Officer in deciding how to allocate resources and assess performance. The Corporation has applied the aggregation criterion set forth in SFAS No. 131 to the results of its operations.
The Corporation’s Banking segment consists of commercial and retail banking. The Banking segment is managed as a single strategic unit which generates revenues from a variety of products and services. The Banking segment generates interest income from its lending and investing activities and is dependent on the gathering of lower cost deposits from its branch network or borrowed funds from other sources for funding its loans, resulting in the generation of net interest income. The Banking segment also derives revenues from other sources including service charges on deposit accounts; cash sweep fees, overdraft fees and interchange revenue associated with its Visa Check Card offering.
35
The Wealth Management segment has responsibility for all fiduciary activities within the Corporation, including investment management, trust administration, brokerage, employee benefit administration, tax services and custodial services. This segment includes revenues and related expenses from an investment management agreement with another community bank.
The Mortgage Banking segment includes the origination of residential mortgage loans and the sale and servicing of such loans to the secondary mortgage market. This segment also includes the Corporation’s title insurance and joint mortgage origination activity with a real estate brokerage organization.
The “All Other” segment includes activities and expenses that do not fit into the other three segments including general corporate activities such as shareholder relations costs, NASDAQ fees and the annual meeting of shareholders. This segment also includes revenues and expenses from the Corporation’s insurance agency activities and interest income from the JWR notes receivable.
The banking, wealth management and mortgage banking segments consolidate and roll-up through the Bank.
Segment information for the years ended December 31, 2005, 2004, and 2003, from continuing operations, is as follows:
| 2005 | 2004 | 2003 | ||||||||||||||||||||||||||||||||||||||||||||||||||||||||||
| (dollars in thousands) | Banking | Wealth Management | Mortgage Banking | All Other | Consolidated | Banking | Wealth Management | Mortgage Banking | All Other | Consolidated | Banking | Wealth Management | Mortgage Banking | All Other | Consolidated | |||||||||||||||||||||||||||||||||||||||||||||
Net interest income | $ | 31,200 | $ | — | $ | 92 | $ | 76 | $ | 31,368 | $ | 26,487 | $ | — | $ | 255 | $ | 86 | $ | 26,828 | $ | 24,707 | $ | — | $ | 160 | $ | 64 | $ | 24,931 | ||||||||||||||||||||||||||||||
Less loan loss provision | 762 | — | — | — | 762 | 900 | — | — | — | 900 | 750 | — | — | — | 750 | |||||||||||||||||||||||||||||||||||||||||||||
Net interest income after loan loss provision | 30,438 | — | 92 | 76 | 30,606 | 25,587 | — | 255 | 86 | 25,928 | 23,957 | — | 160 | 64 | 24,181 | |||||||||||||||||||||||||||||||||||||||||||||
Other income: | ||||||||||||||||||||||||||||||||||||||||||||||||||||||||||||
Fees for investment management and trust services | — | 11,539 | — | — | 11,539 | — | 10,303 | — | — | 10,303 | — | 9,736 | — | — | 9,736 | |||||||||||||||||||||||||||||||||||||||||||||
Service charges on deposit accounts | 1,593 | — | — | — | 1,593 | 1,827 | — | — | — | 1,827 | 1,896 | — | — | — | 1,896 | |||||||||||||||||||||||||||||||||||||||||||||
Other fees and service charges | 191 | — | 1,351 | — | 1,542 | 209 | — | 1,670 | — | 1,879 | 199 | — | 2,221 | — | 2,420 | |||||||||||||||||||||||||||||||||||||||||||||
Net gain on sale of loans | — | — | 1,622 | — | 1,622 | 34 | — | 2,886 | — | 2,920 | 13 | — | 10,637 | — | 10,650 | |||||||||||||||||||||||||||||||||||||||||||||
Net gain on sale of mortgage servicing rights | — | — | — | — | — | — | — | 1,145 | — | 1,145 | — | — | — | — | — | |||||||||||||||||||||||||||||||||||||||||||||
Other operating income | 1,408 | 3 | 242 | 296 | 1,949 | 1,331 | — | 112 | 667 | 2,110 | 1,244 | — | 454 | 637 | 2,335 | |||||||||||||||||||||||||||||||||||||||||||||
Total other income | 3,192 | 11,542 | 3,215 | 296 | 18,245 | 3,401 | 10,303 | 5,813 | 667 | 20,184 | 3,352 | 9,736 | 13,312 | 637 | 27,037 | |||||||||||||||||||||||||||||||||||||||||||||
Other expenses: | ||||||||||||||||||||||||||||||||||||||||||||||||||||||||||||
Salaries-regular | 9,006 | 3,620 | 624 | 195 | 13,445 | 8,727 | 3,736 | 904 | 200 | 13,567 | 8,220 | 3,719 | 1,343 | 314 | 13,596 | |||||||||||||||||||||||||||||||||||||||||||||
Salaries-other | 1,879 | 359 | 157 | 22 | 2,417 | 878 | 386 | 171 | 11 | 1,446 | 394 | 198 | 833 | 13 | 1,438 | |||||||||||||||||||||||||||||||||||||||||||||
Fringe benefits | 3,041 | 857 | 129 | 48 | 4,075 | 3,245 | 835 | 165 | 52 | 4,297 | 3,254 | 852 | 195 | 52 | 4,353 | |||||||||||||||||||||||||||||||||||||||||||||
Occupancy | 3,453 | 641 | 242 | (123 | ) | 4,213 | 3,232 | 586 | 249 | 131 | 4,198 | 2,982 | 629 | 258 | 216 | 4,085 | ||||||||||||||||||||||||||||||||||||||||||||
Other operating expenses | 5,093 | 1,082 | 1,105 | 143 | 7,423 | 5,292 | 1,097 | 1,678 | 440 | 8,507 | 4,145 | 1,039 | 4,855 | 386 | 10,425 | |||||||||||||||||||||||||||||||||||||||||||||
Total other expenses | 22,472 | 6,559 | 2,257 | 285 | 31,573 | 21,374 | 6,640 | 3,167 | 834 | 32,015 | 18,995 | 6,437 | 7,484 | 981 | 33,897 | |||||||||||||||||||||||||||||||||||||||||||||
Segment profit (loss) | 11,158 | 4,983 | 1,050 | 87 | 17,278 | 7,614 | 3,663 | 2,901 | (81 | ) | 14,097 | 8,314 | 3,299 | 5,988 | (280 | ) | 17,321 | |||||||||||||||||||||||||||||||||||||||||||
Intersegment (revenues) expenses | 201 | 181 | — | (382 | ) | — | 166 | 181 | — | (347 | ) | — | 111 | 181 | — | (292 | ) | — | ||||||||||||||||||||||||||||||||||||||||||
Segment profit after eliminations | $ | 11,359 | $ | 5,164 | $ | 1,050 | $ | (295 | ) | $ | 17,278 | $ | 7,780 | $ | 3,844 | $ | 2,901 | $ | (428 | ) | $ | 14,097 | $ | 8,425 | $ | 3,480 | $ | 5,988 | $ | (572 | ) | $ | 17,321 | |||||||||||||||||||||||||||
% of segment profit (loss) | 65.7 | % | 29.9 | % | 6.1 | % | (1.7 | )% | 100.0 | % | 55.2 | % | 27.3 | % | 20.6 | % | (3.1 | )% | 100.0 | % | 48.6 | % | 20.1 | % | 34.6 | % | (3.3 | )% | 100.0 | % | ||||||||||||||||||||||||||||||
36
Price Range of Shares
BRYN MAWR BANK CORPORATION
(NASDAQ: BMTC)
| High Bid | Low Bid | Dividend Declared | |||||||
2005 HIGH-LOW QUOTATIONS | |||||||||
First Quarter | $ | 22.86 | $ | 20.00 | $ | 0.10 | |||
Second Quarter | 21.18 | 17.98 | 0.10 | ||||||
Third Quarter | 22.06 | 19.05 | 0.11 | ||||||
Fourth Quarter | 22.00 | 20.75 | 0.11 | ||||||
2004 HIGH-LOW QUOTATIONS | |||||||||
First Quarter | $ | 24.26 | $ | 21.50 | $ | 0.10 | |||
Second Quarter | 23.73 | 19.30 | 0.10 | ||||||
Third Quarter | 22.82 | 19.67 | 0.10 | ||||||
Fourth Quarter | 22.55 | 19.10 | 0.10 | ||||||
The approximate number of registered holders of record of common stock as of December 31, 2005 was 347.
The shares are traded on the NASDAQ National Market System under the symbol BMTC. The price information was obtained from The National Association of Securities Dealers (NASD).
37