UNITED STATES
SECURITIES AND EXCHANGE COMMISSION
Washington, D.C. 20549
FORM N-CSR
CERTIFIED SHAREHOLDER REPORT OF REGISTERED
MANAGEMENT INVESTMENT COMPANIES
Investment Company Act file number: | 811-04864 | |
Exact name of registrant as specified in charter: | Prudential Investment Portfolios 7 | |
Address of principal executive offices: | Gateway Center 3, | |
100 Mulberry Street, | ||
Newark, New Jersey 07102 | ||
Name and address of agent for service: | Deborah A. Docs | |
Gateway Center 3, | ||
100 Mulberry Street, | ||
Newark, New Jersey 07102 | ||
Registrant’s telephone number, including area code: | 800-225-1852 | |
Date of fiscal year end: | 8/31/2013 | |
Date of reporting period: | 8/31/2013 | |
Item 1 – Reports to Stockholders

PRUDENTIAL INVESTMENTS»MUTUAL FUNDS
PRUDENTIAL JENNISON VALUE FUND
ANNUAL REPORT · AUGUST 31, 2013
Fund Type
Large Cap Stock
Objective
Capital appreciation
This report is not authorized for distribution to prospective investors unless preceded or accompanied by a current prospectus.
The views expressed in this report and information about the Fund’s portfolio holdings are for the period covered by this report and are subject to change thereafter.
Mutual funds are distributed by Prudential Investment Management Services LLC (PIMS). Jennison Associates is a registered investment adviser. Both are Prudential Financial companies. © 2013 Prudential Financial, Inc., and its related entities. Prudential Investments, Prudential, Jennison Associates, Jennison, the Prudential logo, Bring Your Challenges, and the Rock symbol are service marks of Prudential Financial, Inc., and its related entities, registered in many jurisdictions worldwide.

|  |

October 15, 2013
Dear Shareholder:
We hope you find the annual report for the Prudential Jennison Value Fund informative and useful. The report covers performance for the 12-month period that ended August 31, 2013.
We recognize that ongoing market volatility may make it a difficult time to be an investor. We continue to believe a prudent response to uncertainty is to maintain a diversified portfolio of funds consistent with your tolerance for risk, time horizon, and financial goals.
Your financial advisor can help you create a diversified investment plan that may include funds covering all the basic asset classes and that reflects your personal investor profile and risk tolerance. Keep in mind, however, that diversification and asset allocation strategies do not assure a profit or protect against loss in declining markets.
Prudential Investments® is dedicated to helping you solve your toughest investment challenges—whether it’s capital growth, reliable income, or protection from market volatility and other risks. We offer the expertise of Prudential Financial’s affiliated asset managers* that strive to be leaders in a broad range of funds to help you stay on course to the future you envision. They also manage money for major corporations and pension funds around the world, which means you benefit from the same expertise, innovation, and attention to risk demanded by today’s most sophisticated investors.
Thank you for choosing the Prudential Investments family of funds.
Sincerely,

Stuart S. Parker, President
Prudential Jennison Value Fund
*Most of Prudential Investments’ equity funds are advised by Jennison Associates LLC, Quantitative Management Associates LLC (QMA), or Prudential Real Estate Investors. Prudential Investments’ fixed income and money market funds are advised by Prudential Investment Management, Inc. (PIM) through its Prudential Fixed Income unit. Jennison Associates, QMA, and PIM are registered investment advisers and Prudential Financial companies. Prudential Real Estate Investors is a unit of PIM.
| Prudential Jennison Value Fund | 1 |
Your Fund’s Performance (Unaudited)
Performance data quoted represent past performance. Past performance does not guarantee future results. The investment return and principal value of an investment will fluctuate, so that an investor’s shares, when redeemed, may be worth more or less than their original cost. Current performance may be lower or higher than the past performance data quoted. An investor may obtain performance data as of the most recent month-end by visiting our website at www.prudentialfunds.com or by calling (800) 225-1852.
Cumulative Total Returns (Without Sales Charges) as of 8/31/13 |
| |||||||||||||||
| One Year | Five Years | Ten Years | Since Inception | |||||||||||||
Class A | 27.71 | % | 28.96 | % | 114.72 | % | — | |||||||||
Class B | 26.85 | 24.64 | 99.83 | — | ||||||||||||
Class C | 26.78 | 24.57 | 99.70 | — | ||||||||||||
Class Q | 28.23 | N/A | N/A | 34.42% (10/31/11) | ||||||||||||
Class R | 27.47 | 27.64 | N/A | 59.89 (6/3/05) | ||||||||||||
Class X | 27.73 | 30.17 | N/A | 22.53 (3/16/07) | ||||||||||||
Class Z | 28.11 | 30.90 | 120.60 | — | ||||||||||||
Russell 1000® Value Index | 23.10 | 38.21 | 108.30 | — | ||||||||||||
S&P 500 Index | 18.70 | 42.33 | 98.86 | — | ||||||||||||
Lipper Large-Cap Value Funds Average | 22.12 | 34.37 | 92.22 | — | ||||||||||||
Lipper Multi-Cap Core Funds Average | 21.19 | 37.25 | 102.20 | — | ||||||||||||
Average Annual Total Returns (With Sales Charges) as of 9/30/13 |
| |||||||||||||||
| One Year | Five Years | Ten Years | Since Inception | |||||||||||||
Class A | 19.74 | % | 8.28 | % | 7.81 | % | — | |||||||||
Class B | 20.87 | 8.62 | 7.65 | — | ||||||||||||
Class C | 24.80 | 8.75 | 7.64 | — | ||||||||||||
Class Q | 27.22 | N/A | N/A | 18.38% (10/31/11) | ||||||||||||
Class R | 26.47 | 9.28 | N/A | 6.15 (6/3/05) | ||||||||||||
Class X | 20.73 | 9.26 | N/A | 3.36 (3/16/07) | ||||||||||||
Class Z | 27.09 | 9.85 | 8.72 | — | ||||||||||||
Russell 1000 Value Index | 22.30 | 8.86 | 7.99 | — | ||||||||||||
S&P 500 Index | | 19.34 | | 10.01 | 7.56 | — | ||||||||||
Lipper Large-Cap Value Funds Average | 22.13 | 8.54 | 7.10 | — | ||||||||||||
Lipper Multi-Cap Core Funds Average | 23.24 | 9.70 | 7.71 | — | ||||||||||||
| 2 | Visit our website at www.prudentialfunds.com |
Average Annual Total Returns (With Sales Charges) as of 8/31/13 | ||||||||||||||
| One Year | Five Years | Ten Years | Since Inception | |||||||||||
Class A | 20.68 | % | 4.04 | % | 7.33 | % | — | |||||||
Class B | 21.85 | 4.34 | 7.17 | — | ||||||||||
Class C | 25.78 | 4.49 | 7.16 | — | ||||||||||
Class Q | 28.23 | N/A | N/A | 17.47% (10/31/11) | ||||||||||
Class R | 27.47 | 5.00 | N/A | 5.86 (6/3/05) | ||||||||||
Class X | 21.73 | 4.92 | N/A | 2.96 (3/16/07) | ||||||||||
Class Z | 28.11 | 5.53 | 8.23 | — | ||||||||||
Average Annual Total Returns (Without Sales Charges) as of 8/31/13 | ||||||||||||||
| One Year | Five Years | Ten Years | Since Inception | |||||||||||
Class A | 27.71 | % | 5.22 | % | 7.94 | % | — | |||||||
Class B | 26.85 | 4.50 | 7.17 | — | ||||||||||
Class C | 26.78 | 4.49 | 7.16 | — | ||||||||||
Class Q | 28.23 | N/A | N/A | 17.47% (10/31/11) | ||||||||||
Class R | 27.47 | 5.00 | N/A | 5.86 (6/3/05) | ||||||||||
Class X | 27.73 | 5.42 | N/A | 3.20 (3/16/07) | ||||||||||
Class Z | 28.11 | 5.53 | 8.23 | — | ||||||||||
Growth of a $10,000 Investment
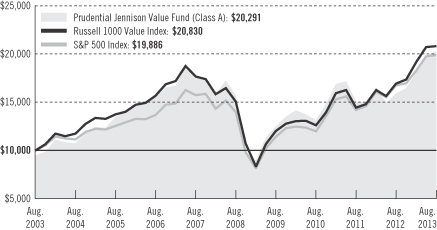
The graph compares a $10,000 investment in the Fund’s Class A shares with a similar investment in the Russell 1000 Value Index and the S&P 500 Index by portraying the initial account values at the beginning of the 10-year period for Class A shares (August 31, 2003) and the account values at the end of the current fiscal year
| Prudential Jennison Value Fund | 3 |
Your Fund’s Performance (continued)
(August 31, 2013) as measured on a quarterly basis. For purposes of the graph, and unless otherwise indicated, it has been assumed that (a) the maximum applicable front-end sales charge was deducted from the initial $10,000 investment in Class A shares; (b) all recurring fees (including management fees) were deducted; and (c) all dividends and distributions were reinvested. The line graph provides information for Class A shares only. As indicated in the tables provided earlier, performance for Class B, Class C, Class Q, Class R, Class X, and Class Z shares will vary due to the differing charges and expenses applicable to each share class (as indicated in the following paragraphs). Without waiver of fees and/or expense reimbursement, if any, the returns would have been lower.
Source: Prudential Investments LLC and Lipper Inc.
Past performance does not predict future performance. Total returns and the ending account values in the graphs include changes in share price and reinvestment of dividends and capital gains distributions in a hypothetical investment for the periods shown. The Fund’s total returns do not reflect the deduction of income taxes on an individual’s investment. Taxes may reduce your actual investment returns on income or gains paid by the Fund or any gains you may realize if you sell your shares.
Inception returns are provided for any share class with less than 10 calendar years. The returns in the tables reflect the share class expense structure in effect at the close of the fiscal period.
The average annual total returns take into account applicable sales charges, which are described for each share class in the table below.
| Class A | Class B | Class C | Class Q | Class R | Class X | Class Z | ||||||||
Maximum initial sales charge | 5.50% of the public offering price | None | None | None | None | None | None | |||||||
Contingent deferred sales charge (CDSC) (as a percentage of the lower of original purchase price or sale proceeds) | 1% on sales of $1 million or more made within 12 months of purchase | 5% (Yr. 1) 4% (Yr. 2) 3% (Yr. 3) 2% (Yr. 4) 1% (Yr. 5) 1% (Yr. 6) 0% (Yr. 7) | 1% on sales made within 12 months of purchase | None | None | 6% (Yr. 1) 5% (Yr. 2) 4% (Yr. 3) 4% (Yr. 4) 3% (Yr. 5) 2% (Yr. 6) | None | |||||||
Annual distribution and service (12b-1) fees (shown as a percentage of average daily net assets) | .30% | 1% | 1% | None | .75% (.50% currently) | 1% | None |
Class X shares are closed to new initial purchases. Class X shares are only available through exchanges from the same class of shares of certain other Prudential Investments funds.
| 4 | Visit our website at www.prudentialfunds.com |
Benchmark Definitions
Russell 1000 Value Index
The Russell 1000 Value Index is an unmanaged index comprising those securities in the Russell 1000 Index with a less-than-average growth orientation. Companies in this index generally have low price-to-book and price-to-earnings ratios, higher dividend yields, and lower forecasted growth values. Russell 1000 Value Index Closest Month-End to Inception cumulative total returns as of 8/31/13 are 40.16% for Class Q; 57.09% for Class R; and 19.35% for Class X. Russell 1000 Value Index Closest Month-End to Inception average annual total returns as of 9/30/13 are 20.81% for Class Q; 5.88% for Class R; and 3.15% for Class X.
S&P 500 Index
The S&P 500 Index is an unmanaged index of 500 stocks of large U.S. public companies. It gives an indication of how U.S. stock prices have performed. S&P 500 Index Closest Month-End to Inception cumulative total returns as of 8/31/13 are 35.79% for Class Q; 63.16% for Class R; and 32.21% for Class X. S&P 500 Index Closest Month-End to Inception average annual total returns as of 9/30/13 are 19.21% for Class Q; 6.44% for Class R; and 4.89% for Class X.
Lipper Large-Cap Value Funds Average
The Lipper Large-Cap Value Funds Average represents returns based on the average return of all funds in the Lipper Large-Cap Value Funds category for the periods noted. Funds in the Lipper Large-Cap Value Funds Average invest at least 75% of their equity assets in companies with market capitalizations (on a three-year weighted basis) greater than 300% of the dollar-weighted median market capitalization of the middle 1,000 securities of the S&P SuperComposite 1500 Index. Large-cap value funds typically have a lower-than-average price-to-earnings ratio, price-to-book ratio, and three-year sales-per-share growth value compared with the S&P 500 Index. Although Lipper classifies the Fund in the Lipper Multi-Cap Value Funds Category, the returns for the Lipper Large-Cap Value Funds Average are also shown, as the Fund’s investment manager believes that the Lipper Large-Cap Value Funds Average is more consistent with the management of the Fund. Lipper Large-Cap Value Funds Average Closest Month-End to Inception cumulative total returns as of 8/31/13 are 36.33% for Class Q; 49.97% for Class R; and 18.24% for Class X. Lipper Large-Cap Value Funds Average Closest Month-End to Inception average annual total returns as of 9/30/13 are 19.17% for Class Q; 5.27% for Class R; and 2.98% for Class X.
Lipper Multi-Cap Core Funds Average
Funds in the Lipper Multi-Cap Core Funds Average are funds that, by portfolio practice, invest in a variety of market capitalization ranges without concentrating 75% of their equity assets in any one market capitalization range over an extended period of time. Multi-cap core funds typically have an average price-to-earnings ratio, price-to-book ratio, and three-year sales-per-share growth value, compared to the S&P SuperComposite 1500 Index. Lipper Multi-Cap Core Funds Average Closest Month-End to Inception cumulative total returns as of 8/31/13 are 33.09% for Class Q; 61.40% for Class R; and 27.61% for Class X. Lipper Multi-Cap Core Funds Average Closest Month-End to Inception average annual total returns as of 9/30/13 are 18.47% for Class Q; 6.31% for Class R; and 4.35% for Class X.
Investors cannot invest directly in an index or average. The returns for the Indexes would be lower if they included the effects of sales charges, operating expenses of a mutual fund, or taxes. Returns for the Lipper Averages reflect the deduction of operating expenses, but not sales charges or taxes.
| Prudential Jennison Value Fund | 5 |
Your Fund’s Performance (continued)
Five Largest Holdings expressed as a percentage of net assets as of 8/31/13 | ||||
Flextronics International Ltd., Electronic Equipment & Instruments | 3.3 | % | ||
Wells Fargo & Co., Commercial Banks | 2.9 | |||
Morgan Stanley, Capital Markets | 2.7 | |||
Liberty Global PLC (Class C Stock), Media | 2.5 | |||
Mylan, Inc., Pharmaceuticals | 2.3 |
Holdings reflect only long-term investments and are subject to change.
Five Largest Industries expressed as a percentage of net assets as of 8/31/13 | ||||
Oil, Gas, & Consumable Fuels | 13.1 | % | ||
Pharmaceuticals | 7.9 | |||
Healthcare Providers & Services | 7.2 | |||
Diversified Financial Services | 5.2 | |||
Capital Markets | 5.0 |
Industry weightings reflect only long-term investments and are subject to change.
| 6 | Visit our website at www.prudentialfunds.com |
Strategy and Performance Overview
How did the Fund perform?
The Prudential Jennison Value Fund’s Class A shares rose 27.71% in the 12-months ended August 31, 2013, outperforming the 23.10% gain of the Russell 1000 Value Index (the Index), the 18.70% gain of the style-neutral S&P 500 Index, and the 22.12% gain of the Lipper Large-Cap Value Funds Average.
| • | All sectors in the Index advanced except telecommunication services. Consumer discretionary and information technology had the most robust performances. Of the advancing sectors, utilities had the weakest returns. |
| • | The Fund outperformed the Index, with stock selection in financials, industrials, and energy contributing most to outperformance. An overweight in consumer discretionary and underweights in utilities and energy further contributed to relative performance. |
| • | Stock selection in information technology and materials had the largest negative impact on relative performance. An underweight position in financials was also detrimental. |
What was the market environment like for U.S. stocks?
| • | The U.S. equity market advanced strongly in the reporting period, but not without bouts of volatility, as sentiment vacillated between optimism and pessimism, often based on short-term data. |
| • | Europe’s lingering economic malaise and political inertia before the U.S. presidential election in November contributed to a downturn earlier in the period, as did subsequent concerns about the reinstatement of the payroll tax; increased tax rates on higher incomes; and sequestration, the across-the-board federal spending cuts that took effect in March. |
| • | Investors seemed to shrug off these fears, however, instead focusing on improving housing and employment data, rising consumer confidence, and continued strength in corporate profits. |
| • | Later in the period, global economic events, most notably China’s slowdown and Europe’s economic issues, which led to moderating global growth, contributed to market volatility, as did concerns that the Federal Reserve would begin scaling back its quantitative easing program. |
Which holdings made the largest positive contributions to the Fund’s return?
| • | Liberty Global outperformed throughout the period. In Jennison’s view, it is well-positioned, given consumers’ desire for faster broadband and digital television. Jennison also believes that Liberty’s growth should accelerate as |
| Prudential Jennison Value Fund | 7 |
Strategy and Performance Overview (continued)
there appears to be room for expansion of Liberty Global’s services in key European markets, most notably Germany. |
| • | Lear exceeded earnings expectations throughout the period. Performance in its electrical segment was a major contributor. Shares also reacted favorably to an unexpected dividend increase and an accelerated share buyback. As production in the European Union recovers, Jennison believes that Lear will be on an attractive growth trajectory. |
| • | Mylan has grown, in Jennison’s view, into one of the most attractive global generic drug companies with exposure to attractive high-growth regions outside of the U.S. Mylan also has a stable and diversified business model with the potential to offer high earnings and growth. During the reporting period, it announced that it would acquire Agila Specialties, an injectable generic pharmaceuticals business. This move makes strategic sense and may significantly increase Mylan’s presence in a higher-growth segment of the generic industry with significant barriers to entry. |
| • | In June Cigna announced a 10-year strategic pharmacy benefits management partnership with Catamaran. The two companies should be able to combine their economies of scale to gain more leverage when purchasing pharmaceutical drugs to help increase earnings. Jennison believes the deal will be a plus for earnings, and that Cigna is better insulated from the potential risks related to healthcare reform. |
| • | Tyson Foods reported several strong quarters during the period. Tyson’s beef segment got a boost from Japan’s decision to ease restrictions on the import of U.S. beef. Jennison continues to have a favorable view of protein producers in general, and Tyson in particular, as feed costs are starting to come down. |
Which holdings detracted most from the Fund’s return?
| • | Shares of Newmont Mining declined as gold prices plummeted. Low nominal interest rates coupled with positive real interest rates, the strengthening of the U.S. dollar, and bearish outlooks on gold from big investment banks have all contributed to the fall in gold prices. Despite the short-term decline, Jennison believes that gold will have a new bullish run as some member countries in the Organization for Economic Cooperation and Development (OECD) may implement inflationary measures to address their high debt levels. Jennison believes Newmont should be able to benefit from tremendous operating leverage when gold prices recover. |
| • | Apple has been hurt by slowing revenue growth, resulting in lowered earnings projections. Jennison finds Apple shares attractively valued as the market is |
| 8 | Visit our website at www.prudentialfunds.com |
projecting flat to declining earnings, and believes the company’s product innovation for the rapidly evolving communications environment will revive earnings growth. |
| • | As with Newmont Mining, shares of Goldcorp declined as gold prices plummeted. However, Jennison believes Goldcorp, like Newmont, will benefit from another bullish run of gold when countries implement inflationary measures to address high debt levels. Like Newmont, Goldcorp should be able to get its costs under control, giving it strong operating leverage when gold prices recover. In addition, Goldcorp has key development projects in Argentina and Mexico that should deliver strong gold production growth. |
| • | Shares of JCPenney fell toward the end of the period. Earlier in the period, shares were off on an unexpectedly large sales decline and disappointing margins. While the company continues to implement its turnaround initiative, Jennison sees a favorable risk/return profile. Jennison’s expectation that the retailer will make slow but steady improvements in sales productivity remains intact. |
| • | Marvell Technology Group declined due to continued weakness in both its mobile and wireless and storage segments. Management said that a slowing economy hurt demand for Marvell’s chips for storage systems (mostly hard disk drives that go into PCs) and cell phones, particularly in China. Jennison’s investment did not play out as anticipated and it closed the position. |
Were there significant changes to the portfolio?
During the reporting period, Jennison increased exposure to the healthcare, energy, and financials sectors. Conversely, the Fund reduced the weight of its holdings in the materials, telecommunication services, and information technology sectors. New positions were established in Microsoft, Marathon Oil, Hertz Global Holdings, and Avon Products. Positions in Smithfield Foods, American Express, and Exelon were eliminated.
| Prudential Jennison Value Fund | 9 |
Comments on Largest Holdings
| 3.3% | Flextronics International Ltd., Electronic Equipment & Instruments |
Flextronics International, the second largest electronics manufacturing services company worldwide, has been showing signs of internal improvements that Jennison expects to continue, further contributing to Flextronics’ attractive valuation. Strong quarterly results late in the reporting period were also driven by anticipation of the launch this fall of Google’s new smartphone, the MotoX. Flextronics is likely to see an acceleration of sales of its Xbox game console and other devices.
| 2.9% | Wells Fargo & Co., Commercial Banks |
In Jennison’s view, Wells Fargo is the best managed of the traditional banks, with numerous avenues for growth. As mortgage lending is likely to slow in the rising interest-rate environment, Wells Fargo is well-positioned since it has demonstrated expertise in managing costs. Although its shares are no longer inexpensive, the bank’s balance sheet and earnings appear likely to strengthen over time.
| 2.7% | Morgan Stanley, Capital Markets |
Morgan Stanley recently announced an unexpected share buyback and has enjoyed steady growth in its wealth management division. It also reported that it is on track to lower costs. In Jennison’s opinion, the stock trades at a very attractive valuation and the company can take advantage of rising interest rates and improving markets.
| 2.5% | Liberty Global PLC, Media |
Please see Fund Activity section for Liberty Global.
| 2.3% | Mylan, Inc., Pharmaceuticals |
Please see Fund Activity section for Mylan.
| 10 | Visit our website at www.prudentialfunds.com |
Fees and Expenses (Unaudited)
As a shareholder of the Fund, you incur two types of costs: (1) transaction costs, including sales charges (loads) on purchase payments and redemptions, as applicable, and (2) ongoing costs, including management fees, distribution and/or service (12b-1) fees, and other Fund expenses, as applicable. This example is intended to help you understand your ongoing costs (in dollars) of investing in the Fund and to compare these costs with the ongoing costs of investing in other mutual funds.
The example is based on an investment of $1,000 invested on March 1, 2013, at the beginning of the period, and held through the six-month period ended August 31, 2013. The example is for illustrative purposes only; you should consult the Prospectus for information on initial and subsequent minimum investment requirements.
Actual Expenses
The first line for each share class in the table on the following page provides information about actual account values and actual expenses. You may use the information on this line, together with the amount you invested, to estimate the expenses that you paid over the period. Simply divide your account value by $1,000 (for example, an $8,600 account value ÷ $1,000 = 8.6), then multiply the result by the number on the first line under the heading “Expenses Paid During the Six-Month Period” to estimate the expenses you paid on your account during this period.
Hypothetical Example for Comparison Purposes
The second line for each share class in the table on the following page provides information about hypothetical account values and hypothetical expenses based on the Fund’s actual expense ratio and an assumed rate of return of 5% per year before expenses, which is not the Fund’s actual return. The hypothetical account values and expenses may not be used to estimate the actual ending account balance or expenses you paid for the period. You may use this information to compare the ongoing costs of investing in the Fund and other funds. To do so, compare this 5% hypothetical example with the 5% hypothetical examples that appear in the shareholder reports of the other funds.
The Fund’s transfer agent may charge additional fees to holders of certain accounts that are not included in the expenses shown in the table on the following page. These fees apply to individual retirement accounts (IRAs) and Section 403(b) accounts. As of the close of the six-month period covered by the table, IRA fees included an annual maintenance fee of $15 per account (subject to a maximum annual maintenance fee of $25 for all accounts held by the same shareholder). Section 403(b) accounts are charged an annual $25 fiduciary maintenance fee. Some of the fees may vary in amount, or may be waived, based on your total account balance or the number of Prudential Investments funds, including the Fund, that you own. You should consider
| Prudential Jennison Value Fund | 11 |
Fees and Expenses (continued)
the additional fees that were charged to your Fund account over the six-month period when you estimate the total ongoing expenses paid over the period and the impact of these fees on your ending account value, as these additional expenses are not reflected in the information provided in the expense table. Additional fees have the effect of reducing investment returns.
Please note that the expenses shown in the table are meant to highlight your ongoing costs only and do not reflect any transactional costs such as sales charges (loads). Therefore, the second line for each share class in the table is useful in comparing ongoing costs only and will not help you determine the relative total costs of owning different funds. In addition, if these transactional costs were included, your costs would have been higher.
| Prudential Jennison Value Fund | Beginning Account March 1, 2013 | Ending Account Value August 31, 2013 | Annualized Expense Ratio Based on the Six-Month Period | Expenses Paid During the Six-Month Period* | ||||||||||||||
| Class A | Actual | $ | 1,000.00 | $ | 1,126.20 | 1.05 | % | $ | 5.63 | |||||||||
| Hypothetical | $ | 1,000.00 | $ | 1,019.91 | 1.05 | % | $ | 5.35 | ||||||||||
| Class B | Actual | $ | 1,000.00 | $ | 1,122.10 | 1.75 | % | $ | 9.36 | |||||||||
| Hypothetical | $ | 1,000.00 | $ | 1,016.38 | 1.75 | % | $ | 8.89 | ||||||||||
| Class C | Actual | $ | 1,000.00 | $ | 1,122.20 | 1.75 | % | $ | 9.36 | |||||||||
| Hypothetical | $ | 1,000.00 | $ | 1,016.38 | 1.75 | % | $ | 8.89 | ||||||||||
| Class Q | Actual | $ | 1,000.00 | $ | 1,128.70 | 0.64 | % | $ | 3.43 | |||||||||
| Hypothetical | $ | 1,000.00 | $ | 1,021.98 | 0.64 | % | $ | 3.26 | ||||||||||
| Class R | Actual | $ | 1,000.00 | $ | 1,124.50 | 1.25 | % | $ | 6.69 | |||||||||
| Hypothetical | $ | 1,000.00 | $ | 1,018.90 | 1.25 | % | $ | 6.36 | ||||||||||
| Class X | Actual | $ | 1,000.00 | $ | 1,126.10 | 1.00 | % | $ | 5.36 | |||||||||
| Hypothetical | $ | 1,000.00 | $ | 1,020.16 | 1.00 | % | $ | 5.09 | ||||||||||
| Class Z | Actual | $ | 1,000.00 | $ | 1,127.90 | 0.75 | % | $ | 4.02 | |||||||||
| Hypothetical | $ | 1,000.00 | $ | 1,021.42 | 0.75 | % | $ | 3.82 | ||||||||||
*Fund expenses (net of fee waivers or subsidies, if any) for each share class are equal to the annualized expense ratio for each share class (provided in the table), multiplied by the average account value over the period, multiplied by the 184 days in the six-month period ended August 31, 2013, and divided by the 365 days in the fund’s fiscal year ended August 31, 2013 (to reflect the six-month period). Expenses presented in the table include the expenses of any underlying portfolios in which the Fund may invest.
| 12 | Visit our website at www.prudentialfunds.com |
The Fund’s annual expense ratios for the year ended August 31, 2013 are as follows:
Class | Gross Operating Expenses | Net Operating Expenses | ||
A | 1.09% | 1.09% | ||
B | 1.79% | 1.79% | ||
C | 1.79% | 1.79% | ||
Q | 0.64% | 0.64% | ||
R | 1.54% | 1.29% | ||
X | 1.79% | 1.04% | ||
Z | 0.79% | 0.79% |
Net operating expenses shown above reflect fee waivers and/or expense reimbursements. Additional information on Fund expenses and any fee waivers and/or expense reimbursements can be found in the “Financial Highlights” tables in this report and in the Notes to the Financial Statements in this report.
| Prudential Jennison Value Fund | 13 |
Portfolio of Investments
as of August 31, 2013
| Shares | Description | Value (Note 1) | ||||
LONG-TERM INVESTMENTS 98.1% | ||||||
COMMON STOCKS | ||||||
Aerospace & Defense 2.2% | ||||||
| 140,451 | Boeing Co. (The) | $ | 14,595,668 | |||
Air Freight & Logistics 0.7% | ||||||
| 43,460 | FedEx Corp. | 4,665,866 | ||||
Airlines 2.2% | ||||||
| 331,394 | Delta Air Lines, Inc. | 6,538,404 | ||||
| 278,236 | United Continental Holdings, Inc.* | 7,918,596 | ||||
|
| |||||
| 14,457,000 | ||||||
Auto Components 2.0% | ||||||
| 191,494 | Lear Corp.(a) | 13,165,212 | ||||
Automobiles 0.8% | ||||||
| 148,488 | General Motors Co.* | 5,060,471 | ||||
Capital Markets 5.0% |
| |||||
| 99,433 | Goldman Sachs Group, Inc. (The) | 15,126,742 | ||||
| 677,884 | Morgan Stanley | 17,462,292 | ||||
|
| |||||
| 32,589,034 | ||||||
Commercial Banks 4.5% |
| |||||
| 142,266 | PNC Financial Services Group, Inc. (The) | 10,281,564 | ||||
| 470,869 | Wells Fargo & Co. | 19,343,298 | ||||
|
| |||||
| 29,624,862 | ||||||
Communications Equipment 1.3% |
| |||||
| 680,084 | JDS Uniphase Corp.* | 8,725,478 | ||||
Computers & Peripherals 1.4% |
| |||||
| 19,114 | Apple, Inc. | 9,309,474 | ||||
Consumer Finance 2.8% |
| |||||
| 125,000 | Capital One Financial Corp. | 8,068,750 | ||||
| 431,677 | SLM Corp. | 10,355,931 | ||||
|
| |||||
| 18,424,681 | ||||||
Diversified Financial Services 5.2% |
| |||||
| 247,455 | Citigroup, Inc. | 11,959,500 | ||||
| 303,894 | ING US, Inc. | 8,752,147 | ||||
See Notes to Financial Statements.
| Prudential Jennison Value Fund | 15 |
Portfolio of Investments
as of August 31, 2013 continued
| Shares | Description | Value (Note 1) | ||||
COMMON STOCKS (Continued) | ||||||
Diversified Financial Services (cont’d.) | ||||||
| 269,896 | JPMorgan Chase & Co. | $ | 13,637,845 | |||
|
| |||||
| 34,349,492 | ||||||
Diversified Telecommunication Services 1.3% | ||||||
| 438,056 | Vivendi SA (France) | 8,885,826 | ||||
Electric Utilities 1.3% |
| |||||
| 236,602 | EDP - Energias de Portugal SA (Portugal), ADR | 8,318,926 | ||||
Electronic Equipment & Instruments 3.3% |
| |||||
| 2,389,511 | Flextronics International Ltd. (Singapore)* | 21,457,809 | ||||
Energy Equipment & Services 1.5% |
| |||||
| 202,382 | Halliburton Co. | 9,714,336 | ||||
Food & Staples Retailing 1.7% |
| |||||
| 109,903 | CVS Caremark Corp. | 6,379,869 | ||||
| 67,352 | Wal-Mart Stores, Inc. | 4,915,349 | ||||
|
| |||||
| 11,295,218 | ||||||
Food Products 4.4% |
| |||||
| 157,897 | Bunge Ltd. | 11,965,434 | ||||
| 337,449 | Mondelez International, Inc. (Class A Stock) | 10,349,561 | ||||
| 234,323 | Tyson Foods, Inc. (Class A Stock) | 6,783,651 | ||||
|
| |||||
| 29,098,646 | ||||||
Healthcare Providers & Services 7.2% |
| |||||
| 176,365 | Cigna Corp. | 13,878,162 | ||||
| 152,611 | Express Scripts Holding Co.* | 9,748,791 | ||||
| 297,423 | HCA Holdings, Inc. | 11,358,584 | ||||
| 167,973 | UnitedHealth Group, Inc. | 12,050,383 | ||||
|
| |||||
| 47,035,920 | ||||||
Hotels, Restaurants & Leisure 4.0% |
| |||||
| 249,388 | Carnival Corp. | 9,000,413 | ||||
| 161,209 | Hyatt Hotels Corp. (Class A Stock)* | 6,996,471 | ||||
| 537,088 | International Game Technology | 10,145,592 | ||||
|
| |||||
| 26,142,476 | ||||||
Independent Power Producers & Energy Traders 1.5% |
| |||||
| 497,953 | Calpine Corp.* | 9,625,431 | ||||
See Notes to Financial Statements.
| 16 |
| Shares | Description | Value (Note 1) | ||||
COMMON STOCKS (Continued) | ||||||
Insurance 4.8% | ||||||
| 139,346 | Axis Capital Holdings Ltd. (Bermuda) | $ | 5,990,484 | |||
| 284,142 | MetLife, Inc. | 13,124,519 | ||||
| 82,010 | Travelers Cos., Inc. (The) | 6,552,599 | ||||
| 208,553 | XL Group PLC (Ireland) | 6,164,827 | ||||
|
| |||||
| 31,832,429 | ||||||
Internet Software & Services 1.7% |
| |||||
| 13,029 | Google, Inc. (Class A Stock)* | 11,034,260 | ||||
Machinery 1.0% |
| |||||
| 87,675 | SPX Corp. | 6,491,457 | ||||
Media 4.0% |
| |||||
| 235,553 | Comcast Corp. (Class A Stock) | 9,914,426 | ||||
| 223,674 | Liberty Global PLC (United Kingdom) (Class C Stock)* | 16,446,749 | ||||
|
| |||||
| 26,361,175 | ||||||
Metals & Mining 2.3% |
| |||||
| 316,599 | Goldcorp, Inc. (Canada) | 9,339,671 | ||||
| 192,917 | Newmont Mining Corp.(a) | 6,128,973 | ||||
|
| |||||
| 15,468,644 | ||||||
Multiline Retail 0.6% |
| |||||
| 327,952 | J.C. Penney Co., Inc.*(a) | 4,092,841 | ||||
Oil, Gas & Consumable Fuels 13.1% |
| |||||
| 128,184 | Anadarko Petroleum Corp. | 11,718,581 | ||||
| 434,195 | Denbury Resources, Inc.* | 7,507,232 | ||||
| 78,447 | EOG Resources, Inc. | 12,320,101 | ||||
| 333,976 | Marathon Oil Corp. | 11,498,794 | ||||
| 139,996 | Newfield Exploration Co.* | 3,334,705 | ||||
| 241,030 | Noble Energy, Inc. | 14,806,473 | ||||
| 107,301 | Occidental Petroleum Corp. | 9,465,021 | ||||
| 276,429 | Suncor Energy, Inc. (Canada) | 9,362,650 | ||||
| 173,562 | Williams Cos., Inc. (The) | 6,289,887 | ||||
|
| |||||
| 86,303,444 | ||||||
Personal Products 1.2% |
| |||||
| 407,971 | Avon Products, Inc. | 8,065,587 | ||||
See Notes to Financial Statements.
| Prudential Jennison Value Fund | 17 |
Portfolio of Investments
as of August 31, 2013 continued
| Shares | Description | Value (Note 1) | ||||
COMMON STOCKS (Continued) | ||||||
Pharmaceuticals 7.9% |
| |||||
| 89,337 | Actavis, Inc.* | $ | 12,076,576 | |||
| 433,523 | Mylan, Inc.* | 15,320,703 | ||||
| 405,787 | Pfizer, Inc. | 11,447,251 | ||||
| 161,900 | Sanofi (France), ADR | 7,735,582 | ||||
| 135,795 | Teva Pharmaceutical Industries Ltd. (Israel), ADR | 5,190,085 | ||||
|
| |||||
| 51,770,197 | ||||||
Road & Rail 2.9% |
| |||||
| 373,059 | Hertz Global Holdings, Inc.* | 8,964,608 | ||||
| 64,704 | Union Pacific Corp. | 9,934,652 | ||||
|
| |||||
| 18,899,260 | ||||||
Software 3.2% |
| |||||
| 270,073 | CA, Inc. | 7,899,635 | ||||
| 389,155 | Microsoft Corp. | 12,997,777 | ||||
|
| |||||
| 20,897,412 | ||||||
Specialty Retail 0.5% |
| |||||
| 44,348 | Bed Bath & Beyond, Inc.* | 3,270,222 | ||||
Wireless Telecommunication Services 0.6% |
| |||||
| 639,416 | NII Holdings, Inc.* | 3,823,708 | ||||
|
| |||||
TOTAL LONG-TERM INVESTMENTS | 644,852,462 | |||||
|
| |||||
SHORT-TERM INVESTMENT 3.2% |
| |||||
AFFILIATED MONEY MARKET MUTUAL FUND |
| |||||
| 21,351,226 | Prudential Investment Portfolios 2 - Prudential Core Taxable Money Market Fund | 21,351,226 | ||||
|
| |||||
TOTAL INVESTMENTS 101.3% | 666,203,688 | |||||
Liabilities in excess of other assets (1.3%) | (8,640,211 | ) | ||||
|
| |||||
NET ASSETS 100.0% | $ | 657,563,477 | ||||
|
| |||||
The following abbreviation is used in the Portfolio descriptions:
ADR—American Depositary Receipt
| * | Non-income producing security. |
See Notes to Financial Statements.
| 18 |
| (a) | All or a portion of security is on loan. The aggregate market value of such securities, including those sold and pending settlement, is $5,572,145; cash collateral of $5,696,546 (included with liabilities) was received with which the Fund purchased highly liquid short-term investments. |
| (b) | Prudential Investments LLC, the manager of the Fund, also serves as manager of the Prudential Investment Portfolios 2 - Prudential Core Taxable Money Market Fund. |
| (c) | Represents security, or a portion thereof, purchased with cash collateral received for securities on loan. |
Various inputs are used in determining the value of the Fund’s investments. These inputs are summarized in the three broad levels listed below.
Level 1—quoted prices generally in active markets for identical securities.
Level 2—other significant observable inputs including, but not limited to, quoted prices for similar securities, interest rates and yield curves, prepayment speeds, foreign currency exchange rates, and amortized cost.
Level 3—significant unobservable inputs for securities valued in accordance with Board approved fair valuation procedures.
The following is a summary of the inputs used as of August 31, 2013 in valuing such portfolio securities:
| Level 1 | Level 2 | Level 3 | ||||||||||
Investments in Securities | ||||||||||||
Common Stocks | $ | 635,966,636 | $ | 8,885,826 | $ | — | ||||||
Affiliated Money Market Mutual Fund | 21,351,226 | — | — | |||||||||
|
|
|
|
|
| |||||||
Total | $ | 657,317,862 | $ | 8,885,826 | $ | — | ||||||
|
|
|
|
|
| |||||||
See Notes to Financial Statements.
| Prudential Jennison Value Fund | 19 |
Portfolio of Investments
as of August 31, 2013 continued
The industry classification of portfolio holdings and liabilities in excess of other assets shown as a percentage of net assets as of August 31, 2013 was as follows:
Oil, Gas & Consumable Fuels | 13.1 | % | ||
Pharmaceuticals | 7.9 | |||
Healthcare Providers & Services | 7.2 | |||
Diversified Financial Services | 5.2 | |||
Capital Markets | 5.0 | |||
Insurance | 4.8 | |||
Commercial Banks | 4.5 | |||
Food Products | 4.4 | |||
Media | 4.0 | |||
Hotels, Restaurants & Leisure | 4.0 | |||
Electronic Equipment & Instruments | 3.3 | |||
Affiliated Money Market Mutual Funds (including 0.9% of collateral received for securities on loan) | 3.2 | |||
Software | 3.2 | |||
Road & Rail | 2.9 | |||
Consumer Finance | 2.8 | |||
Metals & Mining | 2.3 | |||
Aerospace & Defense | 2.2 | |||
Airlines | 2.2 | |||
Auto Components | 2.0 | |||
Food & Staples Retailing | 1.7 | % | ||
Internet Software & Services | 1.7 | |||
Energy Equipment & Services | 1.5 | |||
Independent Power Producers & Energy Traders | 1.5 | |||
Computers & Peripherals | 1.4 | |||
Diversified Telecommunication Services | 1.3 | |||
Communications Equipment | 1.3 | |||
Electric Utilities | 1.3 | |||
Personal Products | 1.2 | |||
Machinery | 1.0 | |||
Automobiles | 0.8 | |||
Air Freight & Logistics | 0.7 | |||
Multiline Retail | 0.6 | |||
Wireless Telecommunication Services | 0.6 | |||
Specialty Retail | 0.5 | |||
|
| |||
| 101.3 | ||||
Liabilities in excess of other assets | (1.3 | ) | ||
|
| |||
| 100.0 | % | |||
|
|
See Notes to Financial Statements.
| 20 |
PRUDENTIAL INVESTMENTS»MUTUAL FUNDS
FINANCIAL STATEMENTS
ANNUAL REPORT · AUGUST 31, 2013
Prudential Jennison Value Fund
Statement of Assets & Liabilities
as of August 31, 2013
Assets | ||||
Investments at value, including securities on loan of $5,572,145: | ||||
Unaffiliated investments (cost $465,219,491) | $ | 644,852,462 | ||
Affiliated investments (cost $21,351,226) | 21,351,226 | |||
Dividends receivable | 1,010,946 | |||
Receivable for Fund shares sold | 339,218 | |||
Tax reclaim receivable | 56,509 | |||
Prepaid expenses | 9,104 | |||
|
| |||
Total assets | 667,619,465 | |||
|
| |||
Liabilities | ||||
Payable to broker for collateral for securities on loan (Note 3) | 5,696,546 | |||
Payable for investments purchased | 2,891,583 | |||
Payable for Fund shares reacquired | 619,047 | |||
Management fee payable | 329,589 | |||
Accrued expenses | 265,316 | |||
Distribution fee payable | 175,920 | |||
Affiliated transfer agent fee payable | 76,685 | |||
Deferred trustees’ fees | 1,302 | |||
|
| |||
Total liabilities | 10,055,988 | |||
|
| |||
Net Assets | $ | 657,563,477 | ||
|
| |||
Net assets were comprised of: | ||||
Shares of beneficial interest, at par | $ | 353,066 | ||
Paid-in capital in excess of par | 519,065,292 | |||
|
| |||
| 519,418,358 | ||||
Undistributed net investment income | 3,455,142 | |||
Accumulated net realized loss on investment and foreign currency transactions | (44,942,994 | ) | ||
Net unrealized appreciation on investments and foreign currencies | 179,632,971 | |||
|
| |||
Net assets, August 31, 2013 | $ | 657,563,477 | ||
|
| |||
See Notes to Financial Statements.
| 22 |
Class A | ||||
Net asset value and redemption price per share | $ | 18.65 | ||
Maximum sales charge (5.50% of offering price) | 1.09 | |||
|
| |||
Maximum offering price to public | $ | 19.74 | ||
|
| |||
Class B | ||||
Net asset value, offering price and redemption price per share | $ | 18.19 | ||
|
| |||
Class C | ||||
Net asset value, offering price and redemption price per share | $ | 18.18 | ||
|
| |||
Class Q | ||||
Net asset value, offering price and redemption price per share | $ | 18.68 | ||
|
| |||
Class R | ||||
Net asset value, offering price and redemption price per share | $ | 18.60 | ||
|
| |||
Class X | ||||
Net asset value, offering price and redemption price per share | $ | 18.58 | ||
|
| |||
Class Z | ||||
Net asset value, offering price and redemption price per share | $ | 18.69 | ||
|
| |||
See Notes to Financial Statements.
| Prudential Jennison Value Fund | 23 |
Statement of Operations
Year Ended August 31, 2013
Net Income | ||||
Income | ||||
Unaffiliated dividend income (net of foreign withholding taxes of $277,728) | $ | 11,880,819 | ||
Affiliated income from securities loaned, net | 86,909 | |||
Affiliated dividend income | 24,418 | |||
|
| |||
Total income | 11,992,146 | |||
|
| |||
Expenses | ||||
Management fee | 3,796,936 | |||
Distribution fee—Class A | 1,489,772 | |||
Distribution fee—Class B | 129,496 | |||
Distribution fee—Class C | 265,541 | |||
Distribution fee—Class R | 54,924 | |||
Distribution fee—Class X | 279 | |||
Transfer agent’s fees and expenses (including affiliated expense of $343,000) (Note 3) | 943,000 | |||
Custodian’s fees and expenses | 115,000 | |||
Shareholders’ reports | 112,000 | |||
Registration fees | 100,000 | |||
Legal fees and expenses | 29,000 | |||
Trustees’ fees | 23,000 | |||
Audit fee | 22,000 | |||
Insurance | 15,000 | |||
Loan interest expense (Note 7) | 371 | |||
Miscellaneous | 20,544 | |||
|
| |||
Total expenses | 7,116,863 | |||
|
| |||
Net investment income | 4,875,283 | |||
|
| |||
Realized And Unrealized Gain (Loss) On Investment And Foreign Currency Transactions | ||||
Net realized gain on: | ||||
Investment transactions | 87,801,087 | |||
Foreign currency transactions | 6,041 | |||
|
| |||
| 87,807,128 | ||||
|
| |||
Net change in unrealized appreciation (depreciation) on: | ||||
Investments | 70,460,559 | |||
Foreign currencies | (3,468 | ) | ||
|
| |||
| 70,457,091 | ||||
|
| |||
Net gain on investment and foreign currency transactions | 158,264,219 | |||
|
| |||
Net Increase In Net Assets Resulting From Operations | $ | 163,139,502 | ||
|
| |||
See Notes to Financial Statements.
| 24 |
Statement of Changes in Net Assets
| Year Ended August 31, | ||||||||
| 2013 | 2012 | |||||||
Increase (Decrease) In Net Assets | ||||||||
Operations | ||||||||
Net investment income | $ | 4,875,283 | $ | 4,914,658 | ||||
Net realized gain on investment and foreign currency transactions | 87,807,128 | 28,632,586 | ||||||
Net change in unrealized appreciation (depreciation) on investments and foreign currencies | 70,457,091 | 22,923,257 | ||||||
|
|
|
| |||||
Net increase in net assets resulting from operations | 163,139,502 | 56,470,501 | ||||||
|
|
|
| |||||
Dividends from net investment income (Note 1) | ||||||||
Class A | (4,261,131 | ) | (1,697,277 | ) | ||||
Class B | (34,986 | ) | — | |||||
Class C | (68,234 | ) | — | |||||
Class L | — | (1,486 | ) | |||||
Class M | — | (800 | ) | |||||
Class Q | (233,667 | ) | (203,679 | ) | ||||
Class R | (73,289 | ) | (12,536 | ) | ||||
Class X | (1,213 | ) | (1,061 | ) | ||||
Class Z | (932,449 | ) | (2,096,859 | ) | ||||
|
|
|
| |||||
| (5,604,969 | ) | (4,013,698 | ) | |||||
|
|
|
| |||||
Capital Contributions (Note 2) | ||||||||
Class X | — | 43 | ||||||
|
|
|
| |||||
Fund share transactions (Net of share conversions) (Note 6) | ||||||||
Net proceeds from shares sold | 60,872,533 | 137,285,561 | ||||||
Net asset value of shares issued in reinvestment of dividends | 5,106,872 | 2,224,831 | ||||||
Cost of shares reacquired | (357,581,722 | ) | (360,004,066 | ) | ||||
|
|
|
| |||||
Net decrease in net assets from Fund share transactions | (291,602,317 | ) | (220,493,674 | ) | ||||
|
|
|
| |||||
Total decrease | (134,067,784 | ) | (168,036,828 | ) | ||||
Net Assets: | ||||||||
Beginning of year | 791,631,261 | 959,668,089 | ||||||
|
|
|
| |||||
End of year(a) | $ | 657,563,477 | $ | 791,631,261 | ||||
|
|
|
| |||||
(a) Includes undistributed net investment income of: | $ | 3,455,142 | $ | 4,436,286 | ||||
|
|
|
| |||||
See Notes to Financial Statements.
| Prudential Jennison Value Fund | 25 |
Notes to Financial Statements
Prudential Investment Portfolios 7 (the “Portfolios”) is registered under the Investment Company Act of 1940, as amended (the “1940 Act”), as a diversified, open-end, management investment company and currently consists of Prudential Jennison Value Fund (the “Fund”). The investment objective of the Fund is capital appreciation.
Note 1. Accounting Policies
The following is a summary of significant accounting policies followed by the Fund in the preparation of the financial statements.
Securities Valuation: The Fund holds portfolio securities and other assets that are fair valued at the close of each day the New York Stock Exchange (“NYSE”) is open for trading. Fair value is the price that would be received to sell an asset or paid to transfer a liability in an orderly transaction between market participants on the measurement date. The Board of Trustees (the “Board”) has delegated fair valuation responsibilities to Prudential Investments LLC (“PI” or “Manager”) through the adoption of Valuation Procedures for valuation of the Fund’s securities. Under the current Valuation Procedures, a Valuation Committee is established and responsible for supervising the valuation of portfolio securities and other assets. The Valuation Procedures allow the Fund to utilize independent pricing vendor services, quotations from market makers and other valuation methods in events when market quotations are not readily available or not representative of the fair value of the securities. A record of the Valuation Committee’s actions is subject to review, approval and ratification by the Board at its next regularly scheduled quarterly meeting.
Various inputs are used in determining the value of the Fund’s investments, which are summarized in the three broad level hierarchies based on any observable inputs used as described in the table following the Portfolio of Investments. The valuation methodologies and significant inputs used in determining the fair value of securities and other assets classified as Level 1, Level 2 and Level 3 of the hierarchy are as follows:
Common stocks, exchange-traded funds and financial derivative instruments (including futures contracts and certain options and swap contracts on securities), that are traded on a national securities exchange are valued at the last sale price as of the close of trading on the applicable exchange. Securities traded via NASDAQ are valued at the NASDAQ official closing price. To the extent these securities are valued at the last sale price or NASDAQ official closing price, they are classified as Level 1 of the fair value hierarchy.
| 26 |
In the event there is no sale or official closing price on such day, these securities are valued at the mean between the last reported bid and asked prices, or at the last bid price in absence of an asked price. These securities are classified as Level 2 of the fair value hierarchy as these inputs are considered as significant other observable inputs to the valuation.
Common stocks traded on foreign securities exchanges are valued using pricing vendor services that provide model prices derived using adjustment factors based on information such as local closing price, relevant general and sector indices, currency fluctuations, depositary receipts, and futures, as applicable. Securities valued using such model prices are classified as Level 2 in the fair value hierarchy, as the adjustment factors are observable and considered to be significant to the valuation.
Investments in open-end, non-exchange-traded mutual funds are valued at their net asset value as of the close of the NYSE on the date of valuation. These securities are classified as Level 1 as they have the ability to be purchased or sold at their net asset value on the date of valuation.
Fixed income securities traded in the over-the-counter market, such as corporate bonds, municipal bonds, U.S. Government agencies issues and guaranteed obligations, U.S. Treasury obligations and sovereign issues are usually valued at prices provided by approved independent pricing vendors. The pricing vendors provide these prices usually after evaluating observable inputs including yield curves, credit rating, yield spreads, default rates, cash flows as well as broker/dealer quotations and reported trades. Securities valued using such vendor prices are classified as Level 2 of the fair value hierarchy.
Asset-backed and mortgage-related securities are usually valued by approved independent pricing vendors. The pricing vendors provide the prices using their internal pricing models with inputs from deal terms, tranche level attributes, yield curves, prepayment speeds, default rates and broker/dealer quotes. Securities valued using such vendor prices are classified as Level 2 of the fair value hierarchy.
Over-the-counter financial derivative instruments, such as option contracts, foreign currency contracts and swaps agreements, are usually valued using pricing vendor services, which derive the valuation based on underlying asset prices, indices, spreads, interest rates, exchange rates and other inputs. These instruments are categorized as Level 2 of the fair value hierarchy.
Securities and other assets that cannot be priced using the methods described above are valued with pricing methodologies approved by the Board of Trustees. In the
| Prudential Jennison Value Fund | 27 |
Notes to Financial Statements
continued
event there are unobservable inputs used when determining such valuations, the securities will be classified as Level 3 of the fair value hierarchy.
When determining the fair value of securities, some of the factors influencing the valuation include: the nature of any restrictions on disposition of the securities; assessment of the general liquidity of the securities; the issuer’s financial condition and the markets in which it does business; the cost of the investment; the size of the holding and the capitalization of the issuer; the prices of any recent transactions or bids/offers for such securities or any comparable securities; any available analyst media or other reports or information deemed reliable by the investment adviser regarding the issuer or the markets or industry in which it operates. Using fair value to price securities may result in a value that is different from a security’s most recent closing price and from the price used by other mutual funds to calculate their net asset values.
Foreign Currency Translation: The books and records of the Fund are maintained in U.S. dollars. Foreign currency amounts are translated into U.S. dollars on the following basis:
(i) market value of investment securities, other assets and liabilities at the current rates of exchange;
(ii) purchases and sales of investment securities, income and expenses at the rates of exchange prevailing on the respective dates of such transactions.
Although the net assets of the Fund are presented at the foreign exchange rates and market values at the close of the period, the Fund does not isolate that portion of the results of operations arising as a result of changes in the foreign exchange rates from the fluctuations arising from changes in the market prices of long-term portfolio securities held at the end of the period. Similarly, the Fund does not isolate the effect of changes in foreign exchange rates from the fluctuations arising from changes in the market prices of long-term portfolio securities sold during the period. Accordingly, these realized foreign currency gains or losses are included in the reported net realized gains or losses on investment transactions.
Net realized gains or losses on foreign currency transactions represent net foreign exchange gains or losses from holdings of foreign currencies, currency gains or losses realized between the trade and settlement dates of security transactions, and the
| 28 |
difference between the amounts of dividends, interest and foreign withholding taxes recorded on the Fund’s books and the U.S. dollar equivalent amounts actually received or paid. Net unrealized currency gains or losses from valuing foreign currency denominated assets and liabilities (other than investments) at period end exchange rates are reflected as a component of unrealized appreciation (depreciation) on foreign currencies.
Foreign security and currency transactions may involve certain considerations and risks not typically associated with those of domestic origin as a result of, among other factors, the possibility of political and economic instability, or the level of governmental supervision and regulation of foreign securities markets.
Securities Lending: The Fund may lend its portfolio securities to banks and broker-dealers. The loans are secured by collateral at least equal to the market value of the securities loaned. Collateral pledged by each borrower is invested in a highly liquid short-term money market fund and is marked to market daily, based on the previous day’s market value, such that the value of the collateral exceeds the value of the loaned securities. Loans are subject to termination at the option of the borrower or the Fund. Upon termination of the loan, the borrower will return to the Fund securities identical to the loaned securities. Should the borrower of the securities fail financially, the Fund has the right to repurchase the securities using the collateral in the open market. The Fund recognizes income, net of any rebate and securities lending agent fees, for lending its securities, and any interest on the investment of cash received as collateral. The Fund also continues to receive interest and dividends or amounts equivalent thereto, on the securities loaned and recognizes any unrealized gain or loss in the market price of the securities loaned that may occur during the term of the loan.
Securities Transactions and Net Investment Income: Securities transactions are recorded on the trade date. Realized gains or losses from investment and currency transactions are calculated on the identified cost basis. Dividend income is recorded on the ex-dividend date. Interest income, including amortization of premium and accretion of discount on debt securities, as required, is recorded on the accrual basis. Expenses are recorded on the accrual basis, which may require the use of certain estimates by management, that may differ from actual.
Net investment income or loss, (other than distribution fees, which are charged directly to the respective class) and unrealized and realized gains or losses are allocated daily to each class of shares based upon the relative proportion of adjusted net assets of each class at the beginning of the day.
| Prudential Jennison Value Fund | 29 |
Notes to Financial Statements
continued
Dividends and Distributions: The Fund expects to pay dividends from net investment income and distributions from net realized capital gains, if any, at least annually. Dividends and distributions to shareholders, which are determined in accordance with federal income tax regulations and which may differ from generally accepted accounting principles, are recorded on the ex-dividend date. Permanent book/tax differences relating to income and gains are reclassified amongst undistributed net investment income, accumulated net realized gain or loss and paid-in capital in excess of par, as appropriate.
Taxes: It is the Fund’s policy to continue to meet the requirements of the Internal Revenue Code applicable to regulated investment companies and to distribute all of its taxable net investment income and capital gains, if any, to its shareholders. Therefore, no federal income tax provision is required.
Withholding taxes on foreign dividends are recorded, net of reclaimable amounts, at the time the related income is earned.
Estimates: The preparation of the financial statements requires management to make estimates and assumptions that affect the reported amounts and disclosures in the financial statements. Actual results could differ from those amounts.
Note 2. Agreements
The Fund has a management agreement with PI. Pursuant to this agreement, PI has responsibility for all investment advisory services and supervises the subadvisor’s performance of such services. PI has entered into a subadvisory agreement with Jennison Associates LLC (“Jennison”). The subadvisory agreement provides that Jennison furnishes investment advisory services in connection with the management of the Fund. In connection therewith, Jennison is obligated to keep certain books and records of the Fund. PI pays for the services of Jennison, the cost of compensation of officers, occupancy and certain clerical and bookkeeping costs of the Fund. The Fund bears all other costs and expenses.
The management fee paid to PI is accrued daily and payable monthly at an annual rate of .60% of the Fund’s average daily net assets up to $500 million, .50% of the next $500 million, .475% of the next $500 million and .45% of the average daily net assets in excess of $1.5 billion. The effective management fee rate was .58% of the Fund’s average daily net assets for the year ended August 31, 2013.
| 30 |
The Fund has a distribution agreement with Prudential Investment Management Services LLC (“PIMS”), which acts as the distributor of the Class A, Class B, Class C, Class Q, Class R, Class X and Class Z shares. In addition, the Fund has a distribution agreement with Prudential Annuities Distributors, Inc. (“PAD”), which, together with PIMS, serves as co-distributor of the Class X shares of the Fund. The Fund compensates PIMS and PAD, as applicable, for distributing and servicing the Fund’s Class A, Class B, Class C, Class R and Class X shares, pursuant to plans of distribution (the “Distribution Plans”), regardless of expenses actually incurred by PIMS or PAD. The distribution fees are accrued daily and payable monthly. No distribution or service fees are paid to PIMS as distributor of the Class Q and Class Z shares of the Fund.
Pursuant to the Distribution Plans, the Fund compensates PIMS and PAD, as applicable, for distribution related activities at an annual rate of up to .30%, 1%, 1%, .75% and 1% of the average daily net assets of the Class A, B, C, R and X shares, respectively. PIMS has contractually agreed through December 31, 2014 to limit such expenses to .50% of the average daily net assets of the Class R shares. Management has received the maximum allowable amount of sales charges for Class X shares in accordance with regulatory limits. As such, any contingent deferred sales charges received by the Manager are contributed back into the Fund and included in the Statement of Changes in Net Assets and Financial Highlights as a contribution to capital.
PIMS has advised the Fund that it has received $141,114 in front-end sales charges resulting from sales of Class A shares, during the year ended August 31, 2013. From these fees, PIMS paid such sales charges to affiliated broker-dealers, which in turn paid commissions to salespersons and incurred other distribution costs.
PIMS has advised the Fund that for the year ended August 31, 2013, it received $99, $18,900 and $2,387 in contingent deferred sales charges imposed upon certain redemptions by Class A, Class B and Class C shareholders, respectively.
PI, PIMS, PAD and Jennison are indirect, wholly-owned subsidiaries of Prudential Financial, Inc. (“Prudential”).
Note 3. Other Transactions with Affiliates
Prudential Mutual Fund Services LLC (“PMFS”), an affiliate of PI and an indirect, wholly-owned subsidiary of Prudential, serves as the Fund’s transfer agent. Transfer agent’s fees and expenses in the Statement of Operations include certain out-of-pocket expenses paid to non-affiliates, where applicable.
| Prudential Jennison Value Fund | 31 |
Notes to Financial Statements
continued
Prudential Investment Management (“PIM”), an indirect, wholly-owned subsidiary of Prudential, is the Fund’s securities lending agent. For the year ended August 31, 2013, PIM has been compensated $25,960 for these services.
The Fund invests in the Prudential Core Taxable Money Market Fund (the “Core Fund”), a portfolio of Prudential Investment Portfolios 2, registered under the 1940 Act and managed by PI. Earnings from the Core Fund are disclosed on the Statement of Operations as affiliated dividend income.
Note 4. Portfolio Securities
Purchases and sales of portfolio securities, excluding short-term investments, for the year ended August 31, 2013, were $194,650,242 and $492,003,659, respectively.
Note 5. Tax Information
Distributions to shareholders, which are determined in accordance with federal income tax regulations and which may differ from generally accepted accounting principles, are recorded on the ex-dividend date. In order to present undistributed net investment income, accumulated net realized loss on investment and foreign currency transactions and paid-in capital in excess of par on the Statement of Assets and Liabilities that more closely represent their tax character, certain adjustments have been made to undistributed net investment income and accumulated net realized loss on investment and foreign currency transactions. For the year ended August 31, 2013, the adjustments were to decrease undistributed net investment income and decrease accumulated net realized loss on investment and foreign currency transactions by $251,458 due to the reclassification of net foreign currency gains and other book to tax differences. Net investment income, net realized gain on investment and foreign currency transactions and net assets were not affected by this change.
For the years ended August 31, 2013 and August 31, 2012, the tax character of dividends paid by the Fund were $5,604,969 and $4,013,698 of ordinary income, respectively.
As of August 31, 2013, the accumulated undistributed earnings on a tax basis was $3,456,442 of ordinary income. This differs from the amount shown on the Statement of Assets and Liabilities primarily due to cumulative timing differences between financial and tax reporting.
| 32 |
The United States federal income tax basis of the Fund’s investments and the net unrealized appreciation as of August 31, 2013 were as follows:
Tax Basis | Appreciation | Depreciation | Net | |||
| $491,045,190 | $193,322,205 | $(18,163,707) | $175,158,498 |
The difference between book basis and tax basis is primarily attributable to deferred losses on wash sales.
Under the Regulated Investment Company Modernization Act of 2010 (the “Act”), the Fund is permitted to carryforward capital losses incurred in the fiscal year ended August 31, 2012 and August 31, 2013 (“post-enactment losses”) for an unlimited period. Post-enactment losses are required to be utilized before the utilization of losses incurred prior to the effective date of the Act. As a result of this ordering rule, capital loss carryforwards related to taxable years ending before August 31, 2012 (“pre-enactment losses”) may have an increased likelihood to expire unused. The Fund utilized approximately $80,854,000 of its pre-enactment losses to offset net taxable gains realized in the fiscal year ended August 31, 2013. No capital gains distributions are expected to be paid to shareholders until net gains have been realized in excess of such losses. As of August 31, 2013, the pre and post-enactment losses were approximately:
Post-Enactment Losses: | $ | 0 | ||
|
| |||
Pre-Enactment Losses: | ||||
Expiring 2018 | $ | 40,469,000 | ||
|
|
Management has analyzed the Fund’s tax positions taken on federal income tax returns for all open tax years and has concluded that no provision for income tax is required in the Fund’s financial statements for the current reporting period. The Fund’s federal and state income and federal excise tax returns for tax years for which the applicable statutes of limitations have not expired are subject to examination by the Internal Revenue Service and state departments of revenue.
Note 6. Capital
The Fund offers Class A, Class B, Class C, Class Q, Class R, Class X and Class Z shares. Class A shares are subject to a maximum front-end sales charge of 5.50%. Investors who purchase Class A shares in an amount of $1 million or more do not pay a front-end sales charge, but are subject to a contingent deferred sales charge
| Prudential Jennison Value Fund | 33 |
Notes to Financial Statements
continued
(“CDSC”) of 1% for shares sold within 12 months of purchase. The Class A CDSC is waived for purchases by certain retirement or benefit plans. Class B shares are subject to a CDSC of 5%, which decreases by 1% annually to 1% in the fifth and six years and 0% in the seventh year. Class B shares automatically convert to Class A shares on a quarterly basis approximately seven years after purchase. Class C shares are subject to a CDSC of 1% on shares redeemed within the first 12 months after purchase. Class X shares are subject to a CDSC of 6%, which decreases by 1% annually to 4% in the third and fourth years, by 1% annually to 2% in the sixth and seventh years, and 1% in the eighth year. Class X shares automatically convert to Class A shares on a monthly basis approximately ten years after purchase. The last conversion of Class M shares and Class L shares to Class A shares was completed as of April 13, 2012 and August 24, 2012, respectively. There are no Class M shares and Class L shares outstanding and Class M shares and Class L shares are no longer being offered for sale. A special exchange privilege is also available for shareholders who qualified to purchase Class A shares at net asset value. Class X shares are closed to new initial purchases. Class X shares are only available through exchanges from the same class of shares of certain other funds. Class Q, Class R and Class Z shares are not subject to any sales or redemption charge and are offered exclusively for sale to a limited group of investors.
Under certain circumstances, an exchange may be made from specified share classes of the Fund to one or more other share classes of the Fund as presented in the table of transactions in shares of beneficial interest.
The Fund has authorized an unlimited number of shares of beneficial interest at $.01 par value divided into seven classes, designated Class A, Class B, Class C, Class Q, Class R, Class X and Class Z.
| 34 |
Transactions in shares of beneficial interest were as follows:
Class A | Shares | Amount | ||||||
Year ended August 31, 2013: | ||||||||
Shares sold | 1,078,961 | $ | 18,251,198 | |||||
Shares issued in reinvestment of dividends | 272,807 | 4,133,018 | ||||||
Shares reacquired | (6,541,375 | ) | (107,101,145 | ) | ||||
|
|
|
| |||||
Net increase (decrease) in shares outstanding before conversion | (5,189,607 | ) | (84,716,929 | ) | ||||
Shares issued upon conversion from Class B, Class X and Class Z | 177,038 | 2,969,088 | ||||||
Shares reacquired upon conversion into Class Z | (26,356 | ) | (440,184 | ) | ||||
|
|
|
| |||||
Net increase (decrease) in shares outstanding | (5,038,925 | ) | $ | (82,188,025 | ) | |||
|
|
|
| |||||
Year ended August 31, 2012: | ||||||||
Shares sold | 1,643,532 | $ | 23,465,235 | |||||
Shares issued in reinvestment of dividends | 124,718 | 1,648,724 | ||||||
Shares reacquired | (8,006,909 | ) | (114,529,777 | ) | ||||
|
|
|
| |||||
Net increase (decrease) in shares outstanding before conversion | (6,238,659 | ) | (89,415,818 | ) | ||||
Shares issued upon conversion from Class B, Class M, Class X and Class Z | 365,755 | 5,197,780 | ||||||
Shares reacquired upon conversion into Class Z | (18,417 | ) | (256,894 | ) | ||||
|
|
|
| |||||
Net increase (decrease) in shares outstanding | (5,891,321 | ) | $ | (84,474,932 | ) | |||
|
|
|
| |||||
Class B | ||||||||
Year ended August 31, 2013: | ||||||||
Shares sold | 122,577 | $ | 2,045,243 | |||||
Shares issued in reinvestment of dividends | 2,324 | 34,506 | ||||||
Shares reacquired | (158,681 | ) | (2,617,042 | ) | ||||
|
|
|
| |||||
Net increase (decrease) in shares outstanding before conversion | (33,780 | ) | (537,293 | ) | ||||
Shares reacquired upon conversion into Class A | (172,445 | ) | (2,831,254 | ) | ||||
|
|
|
| |||||
Net increase (decrease) in shares outstanding | (206,225 | ) | $ | (3,368,547 | ) | |||
|
|
|
| |||||
Year ended August 31, 2012: | ||||||||
Shares sold | 100,807 | $ | 1,416,488 | |||||
Shares reacquired | (204,492 | ) | (2,845,532 | ) | ||||
|
|
|
| |||||
Net increase (decrease) in shares outstanding before conversion | (103,685 | ) | (1,429,044 | ) | ||||
Shares reacquired upon conversion into Class A | (338,272 | ) | (4,698,552 | ) | ||||
|
|
|
| |||||
Net increase (decrease) in shares outstanding | (441,957 | ) | $ | (6,127,596 | ) | |||
|
|
|
| |||||
| Prudential Jennison Value Fund | 35 |
Notes to Financial Statements
continued
Class C | Shares | Amount | ||||||
Year ended August 31, 2013: | ||||||||
Shares sold | 233,003 | $ | 3,931,562 | |||||
Shares issued in reinvestment of dividends | 3,589 | 53,269 | ||||||
Shares reacquired | (392,514 | ) | (6,444,287 | ) | ||||
|
|
|
| |||||
Net increase (decrease) in shares outstanding before conversion | (155,922 | ) | (2,459,456 | ) | ||||
Shares reacquired upon conversion into Class Z | (2,877 | ) | (50,377 | ) | ||||
|
|
|
| |||||
Net increase (decrease) in shares outstanding | (158,799 | ) | $ | (2,509,833 | ) | |||
|
|
|
| |||||
Year ended August 31, 2012: | ||||||||
Shares sold | 181,065 | $ | 2,491,318 | |||||
Shares reacquired | (531,899 | ) | (7,420,890 | ) | ||||
|
|
|
| |||||
Net increase (decrease) in shares outstanding before conversion | (350,834 | ) | (4,929,572 | ) | ||||
Shares reacquired upon conversion into Class Z | (1,969 | ) | (29,968 | ) | ||||
|
|
|
| |||||
Net increase (decrease) in shares outstanding | (352,803 | ) | $ | (4,959,540 | ) | |||
|
|
|
| |||||
Class L | ||||||||
Period ended August 24, 2012*: | ||||||||
Shares sold | 580 | $ | 8,358 | |||||
Shares issued in reinvestment of dividends | 107 | 1,415 | ||||||
Shares reacquired | (95,628 | ) | (1,400,506 | ) | ||||
|
|
|
| |||||
Net increase (decrease) in shares outstanding | (94,941 | ) | $ | (1,390,733 | ) | |||
|
|
|
| |||||
Class M | ||||||||
Period ended April 13, 2012**: | ||||||||
Shares issued in reinvestment of dividends | 61 | $ | 798 | |||||
Shares reacquired | (1,905 | ) | (26,140 | ) | ||||
|
|
|
| |||||
Net increase (decrease) in shares outstanding before conversion | (1,844 | ) | (25,342 | ) | ||||
Shares reacquired upon conversion into Class A | (21,299 | ) | (305,824 | ) | ||||
|
|
|
| |||||
Net increase (decrease) in shares outstanding | (23,143 | ) | $ | (331,166 | ) | |||
|
|
|
| |||||
| 36 |
Class Q | Shares | Amount | ||||||
Year ended August 31, 2013: | ||||||||
Shares sold | 103,485 | $ | 1,675,170 | |||||
Shares issued in reinvestment of dividends | 15,444 | 233,667 | ||||||
Shares reacquired | (188,951 | ) | (3,226,296 | ) | ||||
|
|
|
| |||||
Net increase (decrease) in shares outstanding | (70,022 | ) | $ | (1,317,459 | ) | |||
|
|
|
| |||||
Period ended August 31, 2012***: | ||||||||
Shares sold | 339,398 | $ | 5,137,936 | |||||
Shares issued in reinvestment of dividends | 15,430 | 203,679 | ||||||
Shares reacquired | (1,045,691 | ) | (15,659,419 | ) | ||||
|
|
|
| |||||
Net increase (decrease) in shares outstanding before conversion | (690,863 | ) | (10,317,804 | ) | ||||
Shares issued upon conversion from Class Z | 1,808,802 | 25,703,074 | ||||||
|
|
|
| |||||
Net increase (decrease) in shares outstanding | 1,117,939 | $ | 15,385,270 | |||||
|
|
|
| |||||
Class R | ||||||||
Year ended August 31, 2013 | ||||||||
Shares sold | 215,952 | $ | 3,715,924 | |||||
Shares issued in reinvestment of dividends | 4,462 | 67,509 | ||||||
Shares reacquired | (256,317 | ) | (4,410,221 | ) | ||||
|
|
|
| |||||
Net increase (decrease) in shares outstanding | (35,903 | ) | $ | (626,788 | ) | |||
|
|
|
| |||||
Year ended August 31, 2012: | ||||||||
Shares sold | 234,601 | $ | 3,326,409 | |||||
Shares issued in reinvestment of dividends | 890 | 11,758 | ||||||
Shares reacquired | (316,954 | ) | (4,513,032 | ) | ||||
|
|
|
| |||||
Net increase (decrease) in shares outstanding | (81,463 | ) | $ | (1,174,865 | ) | |||
|
|
|
| |||||
Class X | ||||||||
Year ended August 31, 2013: | ||||||||
Shares issued in reinvestment of dividends | 75 | $ | 1,130 | |||||
Shares reacquired | (754 | ) | (12,908 | ) | ||||
|
|
|
| |||||
Net increase (decrease) in shares outstanding before conversion | (679 | ) | (11,778 | ) | ||||
Shares reacquired upon conversion into Class A | (4,451 | ) | (75,448 | ) | ||||
|
|
|
| |||||
Net increase (decrease) in shares outstanding | (5,130 | ) | $ | (87,226 | ) | |||
|
|
|
| |||||
Year ended August 31, 2012: | ||||||||
Shares sold | — | $ | 3 | |||||
Shares issued in reinvestment of dividends | 78 | 1,031 | ||||||
Shares reacquired | (4,740 | ) | (68,087 | ) | ||||
|
|
|
| |||||
Net increase (decrease) in shares outstanding before conversion | (4,662 | ) | (67,053 | ) | ||||
Shares reacquired upon conversion into Class A | (8,665 | ) | (125,529 | ) | ||||
|
|
|
| |||||
Net increase (decrease) in shares outstanding | (13,327 | ) | $ | (192,582 | ) | |||
|
|
|
| |||||
| Prudential Jennison Value Fund | 37 |
Notes to Financial Statements
continued
Class Z | Shares | Amount | ||||||
Year ended August 31, 2013: | ||||||||
Shares sold | 1,872,692 | $ | 31,253,436 | |||||
Shares issued in reinvestment of dividends | 38,533 | 583,773 | ||||||
Shares reacquired | (14,846,274 | ) | (233,769,823 | ) | ||||
|
|
|
| |||||
Net increase (decrease) in shares outstanding before conversion | (12,935,049 | ) | (201,932,614 | ) | ||||
Shares issued upon conversion from Class A and Class C | 29,118 | 490,561 | ||||||
Shares reacquired upon conversion into Class A | (3,989 | ) | (62,386 | ) | ||||
|
|
|
| |||||
Net increase (decrease) in shares outstanding | (12,909,920 | ) | $ | (201,504,439 | ) | |||
|
|
|
| |||||
Year ended August 31, 2012: | ||||||||
Shares sold | 7,166,898 | $ | 101,439,814 | |||||
Shares issued in reinvestment of dividends | 27,037 | 357,426 | ||||||
Shares reacquired | (14,387,682 | ) | (213,540,683 | ) | ||||
|
|
|
| |||||
Net increase (decrease) in shares outstanding before conversion | (7,193,747 | ) | (111,743,443 | ) | ||||
Shares issued upon conversion from Class A and Class C | 20,309 | 286,862 | ||||||
Shares reacquired upon conversion into Class A and Class Q | (1,813,719 | ) | (25,770,949 | ) | ||||
|
|
|
| |||||
Net increase (decrease) in shares outstanding | (8,987,157 | ) | $ | (137,227,530 | ) | |||
|
|
|
| |||||
| * | As of August 24, 2012, the last conversion of Class L shares to Class A shares was completed. There are no Class L shares outstanding and Class L shares are no longer being offered for sale. |
| ** | As of April 13, 2012, the last conversion of Class M shares to Class A shares was completed. There are no Class M shares outstanding and Class M shares are no longer being offered for sale. |
| *** | Commencement of offering was October 31, 2011. |
Note 7. Borrowing
The Fund, along with other affiliated registered investment companies (the “Funds”), is a party to a Syndicated Credit Agreement (“SCA”) with a group of banks. The purpose of the SCA is to provide an alternative source of temporary funding for capital share redemptions. The SCA provides for a commitment of $900 million for the period November 15, 2012 through November 14, 2013. The Funds pay an annualized commitment fee of 0.08% on the unused portion of the SCA. Prior to November 15, 2012, the Funds had another SCA with substantially similar terms. Interest on any borrowings under the SCA is paid at contracted market rates. The commitment fee for the unused amount is accrued daily and paid quarterly.
The Fund utilized the SCA during the year ended August 31, 2013. The Fund had an average outstanding balance of $1,831,800 for five days at an average interest rate of 1.46%. At August 31, 2013, the Fund did not have an outstanding loan amount.
| 38 |
Note 8. New Accounting Pronouncement
In January 2013, the Financial Accounting Standards Board (“FASB”) issued Accounting Standards Update (“ASU”) No. 2013-01 “Clarifying the Scope of Disclosures about Offsetting Assets and Liabilities” which replaced ASU No. 2011-11 “Disclosures about Offsetting Assets and Liabilities”. The updates create new disclosure requirements requiring entities to disclose both gross and net information for derivatives and other financial instruments that are either offset in the Statement of Assets and Liabilities or subject to an enforceable master netting arrangement or similar agreement. The disclosure requirements are effective for annual reporting periods beginning on or after January 1, 2013 and interim periods within those annual periods. Management is currently evaluating the application of ASU No. 2013-01 and its impact, if any, on the Fund’s financial statements.
| Prudential Jennison Value Fund | 39 |
Financial Highlights
| Class A Shares | ||||||||||||||||||||
| Year Ended August 31, | ||||||||||||||||||||
| 2013 | 2012 | 2011 | 2010 | 2009 | ||||||||||||||||
| Per Share Operating Performance(a): | ||||||||||||||||||||
| Net Asset Value, Beginning Of Year | $14.74 | $14.01 | $12.27 | $11.67 | $16.55 | |||||||||||||||
| Income (loss) from investment operations: | ||||||||||||||||||||
| Net investment income | .12 | .07 | .05 | .05 | .07 | |||||||||||||||
| Net realized and unrealized gain (loss) on investment transactions | 3.93 | .71 | 1.73 | .59 | (3.87 | ) | ||||||||||||||
| Total from investment operations | 4.05 | .78 | 1.78 | .64 | (3.80 | ) | ||||||||||||||
| Less Dividends and Distributions: | ||||||||||||||||||||
| Dividends from net investment income | (.14 | ) | (.05 | ) | (.04 | ) | (.04 | ) | (.12 | ) | ||||||||||
| Distributions from net realized gains | - | - | - | - | (.96 | ) | ||||||||||||||
| Total dividends and distributions | (.14 | ) | (.05 | ) | (.04 | ) | (.04 | ) | (1.08 | ) | ||||||||||
| Net asset value, end of year | $18.65 | $14.74 | $14.01 | $12.27 | $11.67 | |||||||||||||||
| Total Return(b): | 27.71% | 5.57% | 14.48% | 5.44% | (20.76)% | |||||||||||||||
| Ratios/Supplemental Data: | ||||||||||||||||||||
| Net assets, end of year (000) | $516,600 | $482,632 | $541,305 | $543,424 | $565,420 | |||||||||||||||
| Average net assets (000) | $496,591 | $511,257 | $614,287 | $608,797 | $518,332 | |||||||||||||||
| Ratios to average net assets(c): | ||||||||||||||||||||
| Expenses | 1.09% | 1.07% | 1.04% | 1.07% | 1.14% | |||||||||||||||
| Net investment income | .74% | .48% | .33% | .36% | .68% | |||||||||||||||
| Portfolio turnover rate | 30% | 31% | 56% | 56% | 60% | |||||||||||||||
(a) Calculated based on average shares outstanding during the year.
(b) Total return does not consider the effects of sales loads. Total return is calculated assuming a purchase of a share on the first day and a sale on the last day of each year reported, and includes reinvestment of dividends and distributions. Total returns may reflect adjustments to conform to generally accepted accounting principles.
(c) Does not include expenses of the underlying portfolio in which the Fund invests.
See Notes to Financial Statements.
| 40 |
| Class B Shares | ||||||||||||||||||||
| Year Ended August 31, | ||||||||||||||||||||
| 2013 | 2012 | 2011 | 2010 | 2009 | ||||||||||||||||
| Per Share Operating Performance(a): | ||||||||||||||||||||
| Net Asset Value, Beginning Of Year | $14.38 | $13.72 | $12.07 | $11.52 | $16.28 | |||||||||||||||
| Income (loss) from investment operations: | ||||||||||||||||||||
| Net investment income (loss) | .01 | (.03 | ) | (.05 | ) | (.04 | ) | - | (d) | |||||||||||
| Net realized and unrealized gain (loss) on investment transactions | 3.84 | .69 | 1.70 | .59 | (3.79 | ) | ||||||||||||||
| Total from investment operations | 3.85 | .66 | 1.65 | .55 | (3.79 | ) | ||||||||||||||
| Less Dividends and Distributions: | ||||||||||||||||||||
| Dividends from net investment income | (.04 | ) | - | - | - | (d) | (.01 | ) | ||||||||||||
| Distributions from net realized gains | - | - | - | - | (.96 | ) | ||||||||||||||
| Total dividends and distributions | (.04 | ) | - | - | - | (d) | (.97 | ) | ||||||||||||
| Net asset value, end of year | $18.19 | $14.38 | $13.72 | $12.07 | $11.52 | |||||||||||||||
| Total Return(b): | 26.85% | 4.81% | 13.67% | 4.78% | (21.28)% | |||||||||||||||
| Ratios/Supplemental Data: | ||||||||||||||||||||
| Net assets, end of year (000) | $12,727 | $13,030 | $18,493 | $23,813 | $30,905 | |||||||||||||||
| Average net assets (000) | $12,950 | $15,355 | $23,534 | $29,060 | $33,718 | |||||||||||||||
| Ratios to average net assets(c): | ||||||||||||||||||||
| Expenses | 1.79% | 1.77% | 1.74% | 1.77% | 1.84% | |||||||||||||||
| Net investment income (loss) | .06% | (.21)% | (.36)% | (.33)% | -% | (e) | ||||||||||||||
| Portfolio turnover rate | 30% | 31% | 56% | 56% | 60% | |||||||||||||||
(a) Calculated based on average shares outstanding during the year.
(b) Total return does not consider the effects of sales loads. Total return is calculated assuming a purchase of a share on the first day and a sale on the last day of each year reported, and includes reinvestment of dividends and distributions. Total returns may reflect adjustments to conform to generally accepted accounting principles.
(c) Does not include expenses of the underlying portfolio in which the Fund invests.
(d) Less than $.005 per share.
(e) Less than .005%.
See Notes to Financial Statements.
| Prudential Jennison Value Fund | 41 |
Financial Highlights
continued
| Class C Shares | ||||||||||||||||||||
| Year Ended August 31, | ||||||||||||||||||||
| 2013 | 2012 | 2011 | 2010 | 2009 | ||||||||||||||||
| Per Share Operating Performance(a): | ||||||||||||||||||||
| Net Asset Value, Beginning Of Year | $14.38 | $13.72 | $12.06 | $11.52 | $16.29 | |||||||||||||||
| Income (loss) from investment operations: | ||||||||||||||||||||
| Net investment income (loss) | .01 | (.03 | ) | (.05 | ) | (.04 | ) | - | (d) | |||||||||||
| Net realized and unrealized gain (loss) on investment transactions | 3.83 | .69 | 1.71 | .58 | (3.80 | ) | ||||||||||||||
| Total from investment operations | 3.84 | .66 | 1.66 | .54 | (3.80 | ) | ||||||||||||||
| Less Dividends and Distributions: | ||||||||||||||||||||
| Dividends from net investment income | (.04 | ) | - | - | - | (d) | (.01 | ) | ||||||||||||
| Distributions from net realized gains | - | - | - | - | (.96 | ) | ||||||||||||||
| Total dividends and distributions | (.04 | ) | - | - | - | (d) | (.97 | ) | ||||||||||||
| Net asset value, end of year | $18.18 | $14.38 | $13.72 | $12.06 | $11.52 | |||||||||||||||
| Total Return(b): | 26.78% | 4.81% | 13.76% | 4.69% | (21.33)% | |||||||||||||||
| Ratios/Supplemental Data: | ||||||||||||||||||||
| Net assets, end of year (000) | $28,284 | $24,651 | $28,355 | $28,713 | $28,205 | |||||||||||||||
| Average net assets (000) | $26,554 | $26,779 | $32,039 | $31,259 | $27,260 | |||||||||||||||
| Ratios to average net assets(c): | ||||||||||||||||||||
| Expenses | 1.79% | 1.77% | 1.74% | 1.77% | 1.84% | |||||||||||||||
| Net investment income (loss) | .05% | (.22)% | (.37)% | (.33)% | (.02)% | |||||||||||||||
| Portfolio turnover rate | 30% | 31% | 56% | 56% | 60% | |||||||||||||||
(a) Calculated based on average shares outstanding during the year.
(b) Total return does not consider the effects of sales loads. Total return is calculated assuming a purchase of a share on the first day and a sale on the last day of each year reported, and includes reinvestment of dividends and distributions. Total returns may reflect adjustments to conform to generally accepted accounting principles.
(c) Does not include expenses of the underlying portfolio in which the Fund invests.
(d) Less than $.005 per share.
See Notes to Financial Statements.
| 42 |
| Class L Shares | ||||||||||||||||||||||
| Period Ended August 24, | Year Ended August 31, | |||||||||||||||||||||
| 2012(d) | 2011 | 2010 | 2009 | 2008 | ||||||||||||||||||
| Per Share Operating Performance(a): | ||||||||||||||||||||||
| Net Asset Value, Beginning Of Period | $13.96 | $12.23 | $11.63 | $16.48 | $21.74 | |||||||||||||||||
| Income (loss) from investment operations: | ||||||||||||||||||||||
| Net investment income | .04 | .02 | .02 | .05 | .11 | |||||||||||||||||
| Net realized and unrealized gain (loss) on investment transactions | .76 | 1.72 | .59 | (3.85 | ) | (2.01 | ) | |||||||||||||||
| Total from investment operations | .80 | 1.74 | .61 | (3.80 | ) | (1.90 | ) | |||||||||||||||
| Less Dividends and Distributions: | ||||||||||||||||||||||
| Dividends from net investment income | (.02 | ) | (.01 | ) | (.01 | ) | (.09 | ) | (.16 | ) | ||||||||||||
| Distributions from net realized gains | - | - | - | (.96 | ) | (3.20 | ) | |||||||||||||||
| Total dividends and distributions | (.02 | ) | (.01 | ) | (.01 | ) | (1.05 | ) | (3.36 | ) | ||||||||||||
| Net asset value, end of period | $14.74 | $13.96 | $12.23 | $11.63 | $16.48 | |||||||||||||||||
| Total Return(b): | 5.72% | 14.23% | 5.28% | (20.97)% | (10.17)% | |||||||||||||||||
| Ratios/Supplemental Data: | ||||||||||||||||||||||
| Net assets, end of period (000) | $1,132 | $1,326 | $1,550 | $1,796 | $2,896 | |||||||||||||||||
| Average net assets (000) | $1,250 | $1,529 | $1,816 | $1,707 | $4,100 | |||||||||||||||||
| Ratios to average net assets(c): | ||||||||||||||||||||||
| Expenses | 1.27% | (e) | 1.24% | 1.27% | 1.34% | 1.23% | ||||||||||||||||
| Net investment income | .27% | (e) | .14% | .16% | .48% | .61% | ||||||||||||||||
| Portfolio turnover rate | 31% | (f) | 56% | 56% | 60% | 51% | ||||||||||||||||
(a) Calculated based on average shares outstanding during the period.
(b) Total return does not consider the effects of sales loads. Total return is calculated assuming a purchase of a share on the first day and a sale on the last day of each period reported, and includes reinvestment of dividends and distributions. Total returns may reflect adjustments to conform to generally accepted accounting principles. Total returns for periods less than one full year are not annualized.
(c) Does not include expenses of the underlying portfolio in which the Fund invests.
(d) As of August 24, 2012, the last conversion of Class L shares to Class A shares was completed. There are no Class L
shares outstanding and Class L shares are no longer being offered for sale.
(e) Annualized.
(f) Calculated as of August 31, 2012.
See Notes to Financial Statements.
| Prudential Jennison Value Fund | 43 |
Financial Highlights
continued
| Class M Shares | ||||||||||||||||||||||
| Period Ended April 13, | Year Ended August 31, | |||||||||||||||||||||
| 2012(e) | 2011 | 2010 | 2009 | 2008 | ||||||||||||||||||
| Per Share Operating Performance(a): | ||||||||||||||||||||||
| Net Asset Value, Beginning Of Period | $13.93 | $12.20 | $11.58 | $16.30 | $21.53 | |||||||||||||||||
| Income (loss) from investment operations: | ||||||||||||||||||||||
| Net investment income | .03 | .06 | .05 | .03 | .02 | |||||||||||||||||
| Net realized and unrealized gain (loss) on investment transactions | .95 | 1.71 | .59 | (3.78 | ) | (1.99 | ) | |||||||||||||||
| Total from investment operations | .98 | 1.77 | .64 | (3.75 | ) | (1.97 | ) | |||||||||||||||
| Less Dividends and Distributions: | ||||||||||||||||||||||
| Dividends from net investment income | (.05 | ) | (.04 | ) | (.03 | ) | (.01 | ) | (.06 | ) | ||||||||||||
| Distributions from net realized gains | - | - | - | (.96 | ) | (3.20 | ) | |||||||||||||||
| Total dividends and distributions | (.05 | ) | (.04 | ) | (.03 | ) | (.97 | ) | (3.26 | ) | ||||||||||||
| Capital Contributions (Note 2): | - | - | (c) | .01 | - | (c) | - | |||||||||||||||
| Net asset value, end of period | $14.86 | $13.93 | $12.20 | $11.58 | $16.30 | |||||||||||||||||
| Total Return(b): | 7.10% | 14.54% | 5.58% | (20.98)% | (10.59)% | |||||||||||||||||
| Ratios/Supplemental Data: | ||||||||||||||||||||||
| Net assets, end of period (000) | $11 | $322 | $1,186 | $2,480 | $5,898 | |||||||||||||||||
| Average net assets (000) | $165 | $844 | $1,977 | $3,046 | $9,964 | |||||||||||||||||
| Ratios to average net assets(d): | ||||||||||||||||||||||
| Expenses | 1.02% | (f) | .99% | 1.02% | 1.52% | 1.73% | ||||||||||||||||
| Net investment income | .38% | (f) | .40% | .39% | .31% | .11% | ||||||||||||||||
| Portfolio turnover rate | 31% | (g) | 56% | 56% | 60% | 51% | ||||||||||||||||
(a) Calculated based on average shares outstanding during the period.
(b) Total return does not consider the effects of sales loads. Total return is calculated assuming a purchase of a share on the first day and a sale on the last day of each period reported, and includes reinvestment of dividends and distributions. Total returns may reflect adjustments to conform to generally accepted accounting principles. Total returns for periods less than one full year are not annualized.
(c) Less than $.005 per share.
(d) Does not include expenses of the underlying portfolio in which the Fund invests.
(e) As of April 13, 2012, the last conversion of Class M shares to Class A shares was completed. There are no Class M
shares outstanding and Class M shares are no longer being offered for sale.
(f) Annualized.
(g) Calculated as of August 31, 2012.
See Notes to Financial Statements.
| 44 |
| Class Q Shares | ||||||||||
| Year Ended August 31, 2013 | October 31, 2011(b) through August 31, 2012 | |||||||||
| Per Share Operating Performance(a): | ||||||||||
| Net Asset Value, Beginning Of Period | $14.77 | $14.21 | ||||||||
| Income (loss) from investment operations: | ||||||||||
| Net investment income | .20 | .15 | ||||||||
| Net realized and unrealized gain on investment transactions | 3.92 | .52 | ||||||||
| Total from investment operations | 4.12 | .67 | ||||||||
| Less Dividends: | ||||||||||
| Dividends from net investment income | (.21 | ) | (.11 | ) | ||||||
| Net asset value, end of period | $18.68 | $14.77 | ||||||||
| Total Return(c): | 28.23% | 4.83% | ||||||||
| Ratios/Supplemental Data: | ||||||||||
| Net assets, end of period (000) | $19,577 | $16,509 | ||||||||
| Average net assets (000) | $18,609 | $22,334 | ||||||||
| Ratios to average net assets(f): | ||||||||||
| Expenses | .64% | .62% | (d) | |||||||
| Net investment income | 1.18% | 1.06% | (d) | |||||||
| Portfolio turnover rate | 30% | 31% | (e) | |||||||
(a) Calculated based on average shares outstanding during the period.
(b) Commencement of offering.
(c) Total return is calculated assuming a purchase of a share on the first day and a sale on the last day of each period reported and includes reinvestment of dividends and distributions. Total returns may reflect adjustments to conform to generally accepted accounting principles. Total returns for periods less than one full year are not annualized.
(d) Annualized.
(e) Not Annualized.
(f) Does not include expenses of the underlying portfolio in which the Fund invests.
See Notes to Financial Statements.
| Prudential Jennison Value Fund | 45 |
Financial Highlights
continued
| Class R Shares | ||||||||||||||||||||
| Year Ended August 31, | ||||||||||||||||||||
| 2013 | 2012 | 2011 | 2010 | 2009 | ||||||||||||||||
| Per Share Operating Performance(a): | ||||||||||||||||||||
| Net Asset Value, Beginning Of Year | $14.71 | $13.98 | $12.24 | $11.64 | $16.49 | |||||||||||||||
| Income (loss) from investment operations: | ||||||||||||||||||||
| Net investment income | .09 | .04 | .02 | .02 | .05 | |||||||||||||||
| Net realized and unrealized gain (loss) on investment transactions | 3.91 | .71 | 1.73 | .59 | (3.85 | ) | ||||||||||||||
| Total from investment operations | 4.00 | .75 | 1.75 | .61 | (3.80 | ) | ||||||||||||||
| Less Dividends and Distributions: | ||||||||||||||||||||
| Dividends from net investment income | (.11 | ) | (.02 | ) | (.01 | ) | (.01 | ) | (.09 | ) | ||||||||||
| Distributions from net realized gains | - | - | - | - | (.96 | ) | ||||||||||||||
| Total dividends and distributions | (.11 | ) | (.02 | ) | (.01 | ) | (.01 | ) | (1.05 | ) | ||||||||||
| Net asset value, end of year | $18.60 | $14.71 | $13.98 | $12.24 | $11.64 | |||||||||||||||
| Total Return(b): | 27.38% | 5.35% | 14.30% | 5.27% | (20.95)% | |||||||||||||||
| Ratios/Supplemental Data: | ||||||||||||||||||||
| Net assets, end of year (000) | $11,721 | $9,794 | $10,446 | $9,583 | $5,582 | |||||||||||||||
| Average net assets (000) | $10,985 | $10,660 | $11,461 | $8,448 | $4,424 | |||||||||||||||
| Ratios to average net assets(c): | ||||||||||||||||||||
| Expenses(d) | 1.29% | 1.27% | 1.24% | 1.27% | 1.34% | |||||||||||||||
| Net investment income | .53% | .28% | .13% | .18% | .47% | |||||||||||||||
| Portfolio turnover rate | 30% | 31% | 56% | 56% | 60% | |||||||||||||||
(a) Calculated based on average shares outstanding during the year.
(b) Total return is calculated assuming a purchase of a share on the first day and a sale on the last day of each year reported, and includes reinvestment of dividends and distributions. Total returns may reflect adjustments to conform to generally accepted accounting principles.
(c) Does not include expenses of the underlying portfolio in which the Fund invests.
(d) The distributor of the Fund contractually agreed to limit its distribution and service (12b-1) fees to .50% of the average daily net assets of the Class R Shares.
See Notes to Financial Statements.
| 46 |
| Class X Shares | ||||||||||||||||||||
| Year Ended August 31, | ||||||||||||||||||||
| 2013 | 2012 | 2011 | 2010 | 2009 | ||||||||||||||||
| Per Share Operating Performance(a): | ||||||||||||||||||||
| Net Asset Value, Beginning Of Year | $14.69 | $13.96 | $12.22 | $11.62 | $16.37 | |||||||||||||||
| Income (loss) from investment operations: | ||||||||||||||||||||
| Net investment income | .14 | .07 | .06 | .05 | .08 | |||||||||||||||
| Net realized and unrealized gain (loss) on investment transactions | 3.90 | .71 | 1.72 | .58 | (3.81 | ) | ||||||||||||||
| Total from investment operations | 4.04 | .78 | 1.78 | .63 | (3.73 | ) | ||||||||||||||
| Less Dividends and Distributions: | ||||||||||||||||||||
| Dividends from net investment income | (.15 | ) | (.05 | ) | (.04 | ) | (.04 | ) | (.09 | ) | ||||||||||
| Distributions from net realized gains | - | - | - | - | (.96 | ) | ||||||||||||||
| Total dividends and distributions | (.15 | ) | (.05 | ) | (.04 | ) | (.04 | ) | (1.05 | ) | ||||||||||
| Capital Contributions (Note 2): | - | - | (d) | - | (d) | .01 | .03 | |||||||||||||
| Net asset value, end of year | $18.58 | $14.69 | $13.96 | $12.22 | $11.62 | |||||||||||||||
| Total Return(b): | 27.73% | 5.65% | 14.60% | 5.51% | (20.42)% | |||||||||||||||
| Ratios/Supplemental Data: | ||||||||||||||||||||
| Net assets, end of year (000) | $76 | $135 | $314 | $572 | $1,032 | |||||||||||||||
| Average net assets (000) | $112 | $232 | $505 | $909 | $1,175 | |||||||||||||||
| Ratios to average net assets(c): | ||||||||||||||||||||
| Expenses | 1.04% | 1.02% | .99% | 1.02% | 1.09% | |||||||||||||||
| Net investment income | .82% | .52% | .39% | .40% | .80% | |||||||||||||||
| Portfolio turnover rate | 30% | 31% | 56% | 56% | 60% | |||||||||||||||
(a) Calculated based on average shares outstanding during the year.
(b) Total return does not consider the effects of sales loads. Total return is calculated assuming a purchase of a share on the first day and a sale on the last day of each year reported, and includes reinvestment of dividends and distributions. Total returns may reflect adjustments to conform to generally accepted accounting principles.
(c) Does not include expenses of the underlying portfolio in which the Fund invests.
(d) Less than $.005 per share.
See Notes to Financial Statements.
| Prudential Jennison Value Fund | 47 |
Financial Highlights
continued
| Class Z Shares | ||||||||||||||||||||
| Year Ended August 31, | ||||||||||||||||||||
| 2013 | 2012 | 2011 | 2010 | 2009 | ||||||||||||||||
| Per Share Operating Performance(a): | ||||||||||||||||||||
| Net Asset Value, Beginning Of Year | $14.77 | $14.05 | $12.30 | $11.69 | $16.61 | |||||||||||||||
| Income (loss) from investment operations: | ||||||||||||||||||||
| Net investment income | .16 | .11 | .09 | .09 | .10 | |||||||||||||||
| Net realized and unrealized gain (loss) on investment transactions | 3.95 | .70 | 1.74 | .59 | (3.89 | ) | ||||||||||||||
| Total from investment operations | 4.11 | .81 | 1.83 | .68 | (3.79 | ) | ||||||||||||||
| Less Dividends and Distributions: | ||||||||||||||||||||
| Dividends from net investment income | (.19 | ) | (.09 | ) | (.08 | ) | (.07 | ) | (.17 | ) | ||||||||||
| Distributions from net realized gains | - | - | - | - | (.96 | ) | ||||||||||||||
| Total dividends and distributions | (.19 | ) | (.09 | ) | (.08 | ) | (.07 | ) | (1.13 | ) | ||||||||||
| Net asset value, end of year | $18.69 | $14.77 | $14.05 | $12.30 | $11.69 | |||||||||||||||
| Total Return(b): | 28.11% | 5.83% | 14.86% | 5.78% | (20.54)% | |||||||||||||||
| Ratios/Supplemental Data: | ||||||||||||||||||||
| Net assets, end of year (000) | $68,579 | $244,881 | $359,107 | $303,166 | $87,194 | |||||||||||||||
| Average net assets (000) | $93,588 | $295,370 | $403,570 | $259,824 | $80,680 | |||||||||||||||
| Ratios to average net assets(c): | ||||||||||||||||||||
| Expenses | .79% | .77% | .74% | .77% | .84% | |||||||||||||||
| Net investment income | .95% | .78% | .64% | .69% | .98% | |||||||||||||||
| Portfolio turnover rate | 30% | 31% | 56% | 56% | 60% | |||||||||||||||
(a) Calculated based on average shares outstanding during the year.
(b) Total return is calculated assuming a purchase of a share on the first day and a sale on the last day of each year reported, and includes reinvestment of dividends and distributions. Total returns may reflect adjustments to conform to generally accepted accounting principles.
(c) Does not include expenses of the underlying portfolio in which the Fund invests.
See Notes to Financial Statements.
| 48 |
Report of Independent Registered Public
Accounting Firm
The Board of Trustees and Shareholders
Prudential Investment Portfolios 7:
We have audited the accompanying statement of assets and liabilities of the Prudential Jennison Value Fund of Prudential Investment Portfolios 7 (hereafter referred to as the “Fund”), including the portfolio of investments, as of August 31, 2013, and the related statement of operations for the year then ended, the statement of changes in net assets for each of the years in the two-year period then ended and the financial highlights for each of the years in the five-year period then ended. These financial statements and financial highlights are the responsibility of the Fund’s management. Our responsibility is to express an opinion on these financial statements and financial highlights based on our audit.
We conducted our audit in accordance with the standards of the Public Company Accounting Oversight Board (United States). Those standards require that we plan and perform the audit to obtain reasonable assurance about whether the financial statements and financial highlights are free of material misstatement. An audit includes examining, on a test basis, evidence supporting the amounts and disclosures in the financial statements. Our procedures included confirmation of securities owned as of August 31, 2013, by correspondence with the custodian, transfer agent and brokers or by other appropriate auditing procedures when replies from brokers were not received. An audit also includes assessing the accounting principles used and significant estimates made by management, as well as evaluating the overall financial statement presentation. We believe that our audit provides a reasonable basis for our opinion.
In our opinion, the financial statements and financial highlights referred to above present fairly, in all material respects, the financial position of the Fund as of August 31, 2013, and the results of its operations for the year then ended, the changes in its net assets for each of the years in the two-year period then ended and the financial highlights for each of the years in the five-year period then ended, in conformity with U.S. generally accepted accounting principles.

New York, New York
October 25, 2013
| Prudential Jennison Value Fund | 49 |
Tax Information
(Unaudited)
For the year ended August 31, 2013, the Fund reports, in accordance with Section 854 of the Internal Revenue Code, the following percentages of the ordinary income dividends paid as 1) qualified dividend income (QDI); and 2) eligible for corporate dividends received deduction (DRD):
| QDI | DRD | |||||||
Prudential Jennison Value Fund | 100.00 | % | 100.00 | % | ||||
In January 2014, you will be advised on IRS Form 1099-DIV or substitute 1099-DIV, as to the federal tax status of the dividends received by you in calendar year 2013.
| 50 |
INFORMATION ABOUT BOARD MEMBERS AND OFFICERS
(Unaudited)
Information about Board Members and Officers of the Fund is set forth below. Board Members who are not deemed to be “interested persons” of the Fund, as defined in the 1940 Act, are referred to as “Independent Board Members.” Board Members who are deemed to be “interested persons” of the Fund are referred to as “Interested Board Members.” The Board Members are responsible for the overall supervision of the operations of the Fund and perform the various duties imposed on the directors of investment companies by the 1940 Act. The Board in turn elects the Officers, who are responsible for administering the day-to-day operations of the Fund.
Independent Board Members(1) | ||||
Name, Address, Age Position(s) Portfolios Overseen | Principal Occupation(s) During Past Five Years | Other Directorships Held | ||
Ellen S. Alberding (55) Board Member Portfolios Overseen: 64 | President and Board Member, The Joyce Foundation (charitable foundation) (since 2002); Vice Chair, City Colleges of Chicago (community college system) (since 2011); Trustee, Skills for America’s Future (national initiative to connect employers to community colleges) (since 2011); Trustee, National Park Foundation (charitable foundation for national park system) (since 2009); Trustee, Economic Club of Chicago (since 2009). | None. | ||
Kevin J. Bannon (61) Board Member Portfolios Overseen: 64 | Managing Director (since April 2008) and Chief Investment Officer (since October 2008) of Highmount Capital LLC (registered investment adviser); formerly Executive Vice President and Chief Investment Officer (April 1993-August 2007) of Bank of New York Company; President (May 2003-May 2007) of BNY Hamilton Family of Mutual Funds. | Director of Urstadt Biddle Properties (since September 2008). | ||
Linda W. Bynoe (61) Board Member Portfolios Overseen: 64 | President and Chief Executive Officer (since March 1995) and formerly Chief Operating Officer (December 1989-February 1995) of Telemat Ltd. (management consulting); formerly Vice President (January 1985-June 1989) at Morgan Stanley & Co (broker-dealer). | Director of Simon Property Group, Inc. (retail real estate) (May 2003-May 2012); Director of Anixter International, Inc. (communication products distributor) (since January 2006); Director of Northern Trust Corporation (financial services) (since April 2006); Trustee of Equity Residential (residential real estate) (since December 2009). | ||
Prudential Jennison Value Fund
Independent Board Members(1) | ||||
Name, Address, Age Position(s) Portfolios Overseen | Principal Occupation(s) During Past Five Years | Other Directorships Held | ||
Keith F. Hartstein (57) Board Member Portfolios Overseen: 64 | Formerly President and Chief Executive Officer (2005-2012), Senior Vice President (2004-2005), Senior Vice President of Sales and Marketing (1997-2004), and various executive management positions (1990-1997), John Hancock Funds, LLC (asset management); Chairman, Investment Company Institute’s Sales Force Marketing Committee (2003-2008). | None. | ||
Michael S. Hyland, CFA (68) Board Member Portfolios Overseen: 64 | Independent Consultant (since February 2005); formerly Senior Managing Director (July 2001-February 2005) of Bear Stearns & Co, Inc.; Global Partner, INVESCO (1999-2001); Managing Director and President of Salomon Brothers Asset Management (1989-1999). | None. | ||
Douglas H. McCorkindale (74) Board Member Portfolios Overseen: 64 | Formerly Chairman (February 2001-June 2006), Chief Executive Officer (June 2000-July 2005), President (September 1997-July 2005) and Vice Chairman (March 1984-May 2000) of Gannett Co. Inc. (publishing and media). | Director of Lockheed Martin Corp. (aerospace and defense) (since May 2001). | ||
Stephen P. Munn (71) Board Member Portfolios Overseen: 64 | Lead Director (since 2007) and formerly Chairman (1993-2007) of Carlisle Companies Incorporated (manufacturer of industrial products). | Lead Director (since 2007) of Carlisle Companies Incorporated (manufacturer of industrial products). | ||
James E. Quinn (61) Board Member Portfolios Overseen: 64 | Formerly President (2003-2012) and Director (2003-2008), and Vice Chairman and Director (1998-2003), Tiffany & Company (jewelry retailing); Director, Mutual of America Capital Management Corporation (asset management) (since 1996); Director, Hofstra University (since 2008); Vice Chairman, Museum of the City of New York (since 1984). | Director of Deckers Outdoor Corporation (footwear manufacturer) (since 2011). | ||
Richard A. Redeker (70) Board Member & Independent Chair Portfolios Overseen: 64 | Retired Mutual Fund Senior Executive (44 years); Management Consultant; Independent Directors Council (organization of 2,800 Independent Mutual Fund Directors)-Executive Committee, Chair of Policy Steering Committee, Governing Council. | None. | ||
Visit our website at www.prudentialfunds.com
Independent Board Members(1) | ||||
Name, Address, Age Position(s) Portfolios Overseen | Principal Occupation(s) During Past Five Years | Other Directorships Held | ||
Robin B. Smith (74) Board Member Portfolios Overseen: 64 | Chairman of the Board (since January 2003) of Publishers Clearing House (direct marketing); Member of the Board of Directors of ADLPartner (marketing) (since December 2010); formerly Chairman and Chief Executive Officer (August 1996-January 2003) of Publishers Clearing House. | Formerly Director of BellSouth Corporation (telecommunications) (1992-2006). | ||
Stephen G. Stoneburn (70) Board Member Portfolios Overseen: 64 | Chairman, (since July 2011), President and Chief Executive Officer (since June 1996) of Quadrant Media Corp. (publishing company); formerly President (June 1995-June 1996) of Argus Integrated Media, Inc.; Senior Vice President and Managing Director (January 1993-1995) of Cowles Business Media; Senior Vice President of Fairchild Publications, Inc. (1975-1989). | None. | ||
Interested Board Members(1) | ||||
Name, Address, Age Position(s) Portfolios Overseen | Principal Occupation(s) During Past Five Years | Other Directorships Held | ||
Stuart S. Parker (51) Board Member & President Portfolios Overseen: 59 | President of Prudential Investments LLC (since January 2012); Executive Vice President of Prudential Investment Management Services LLC (since December 2012); Executive Vice President of Jennison Associates LLC and Head of Retail Distribution of Prudential Investments LLC (June 2005 - December 2011). | None. | ||
Scott E. Benjamin (40) Board Member & Vice President Portfolios Overseen: 64 | Executive Vice President (since June 2009) of Prudential Investments LLC; Executive Vice President (June 2009-June 2012) and Vice President (since June 2012) of Prudential Investment Management Services LLC; Executive Vice President (since September 2009) of AST Investment Services, Inc.; Senior Vice President of Product Development and Marketing, Prudential Investments (since February 2006); Vice President of Product Development and Product Management, Prudential Investments (2003-2006). | None. | ||
Prudential Jennison Value Fund
| (1) | The year that each individual joined the Fund’s Board is as follows: |
Ellen S. Alberding, 2013; Kevin J. Bannon, 2008; Linda W. Bynoe, 2005; Keith F. Hartstein, 2013; Michael S. Hyland, 2008; Douglas H. McCorkindale, 2000; Stephen P. Munn, 2008; James Quinn, 2013; Richard A. Redeker, 1993; Robin B. Smith, 1996; Stephen G. Stoneburn, 2003; Stuart S. Parker, Board Member and President since 2012; Scott E. Benjamin, Board Member since 2010 and Vice President since 2009.
Fund Officers(a) | ||||
Name, Address and Age Position with Fund | Principal Occupation(s) During Past Five Years | Length of Service as Fund Officer | ||
Raymond A. O’Hara (58) Chief Legal Officer | Vice President and Corporate Counsel (since July 2010) of Prudential Insurance Company of America (Prudential); Vice President (March 2011-Present) of Pruco Life Insurance Company and Pruco Life Insurance Company of New Jersey; Vice President and Corporate Counsel (March 2011-Present) of Prudential Annuities Life Assurance Corporation; Chief Legal Officer of Prudential Investments LLC (since June 2012); Chief Legal Officer of Prudential Mutual Fund Services LLC (since June 2012) and Corporate Counsel of AST Investment Services, Inc. (since June 2012); formerly Assistant Vice President and Corporate Counsel (September 2008-July 2010) of The Hartford Financial Services Group, Inc.; formerly Associate (September 1980-December 1987) and Partner (January 1988–August 2008) of Blazzard & Hasenauer, P.C. (formerly, Blazzard, Grodd & Hasenauer, P.C.). | Since 2012 | ||
Deborah A. Docs (55) Secretary | Vice President and Corporate Counsel (since January 2001) of Prudential; Vice President (since December 1996) and Assistant Secretary (since March 1999) of Prudential Investments LLC; formerly Vice President and Assistant Secretary (May 2003-June 2005) of AST Investment Services, Inc. | Since 2004 | ||
Jonathan D. Shain (55) Assistant Secretary | Vice President and Corporate Counsel (since August 1998) of Prudential; Vice President and Assistant Secretary (since May 2001) of Prudential Investments LLC; Vice President and Assistant Secretary (since February 2001) of Prudential Mutual Fund Services LLC; formerly Vice President and Assistant Secretary (May 2003-June 2005) of AST Investment Services, Inc. | Since 2005 | ||
Claudia DiGiacomo (39) Assistant Secretary | Vice President and Corporate Counsel (since January 2005) of Prudential; Vice President and Assistant Secretary of Prudential Investments LLC (since December 2005); Associate at Sidley Austin Brown & Wood LLP (1999-2004). | Since 2005 | ||
Andrew R. French (50) Assistant Secretary | Vice President and Corporate Counsel (since February 2010) of Prudential; formerly Director and Corporate Counsel (2006-2010) of Prudential; Vice President and Assistant Secretary (since January 2007) of Prudential Investments LLC; Vice President and Assistant Secretary (since January 2007) of Prudential Mutual Fund Services LLC. | Since 2006 | ||
Visit our website at www.prudentialfunds.com
Fund Officers(a) | ||||
Name, Address and Age Position with Fund | Principal Occupation(s) During Past Five Years | Length of Service as Fund Officer | ||
Amanda S. Ryan (35) Assistant Secretary | Director and Corporate Counsel (since March 2012) of Prudential; Director and Assistant Secretary (since June 2012) of Prudential Investments LLC; Associate at Ropes & Gray LLP (2008-2012). | Since 2012 | ||
Bruce Karpati (43) Chief Compliance Officer | Chief Compliance Officer of the Prudential Investments Funds, Target Funds, Advanced Series Trust, the Prudential Series Fund and Prudential’s Gibraltar Fund, Inc. (May 2013 - Present); formerly National Chief (May 2012 - May 2013) and Co-Chief (January 2010 - May 2012) of the Asset Management Unit, Division of Enforcement, of the U.S. Securities and Exchange Commission; Assistant Regional Director (January 2005 - January 2010) of the U.S. Securities and Exchange Commission. | Since 2013 | ||
Theresa C. Thompson (51) Deputy Chief Compliance Officer | Vice President, Compliance, Prudential Investments LLC (since April 2004); and Director, Compliance, Prudential Investments LLC (2001-2004). | Since 2008 | ||
Richard W. Kinville (45) Anti-Money Laundering Compliance Officer | Vice President, Corporate Compliance, Anti-Money Laundering Unit (since January 2005) of Prudential; committee member of the American Council of Life Insurers Anti-Money Laundering and Critical Infrastructure Committee (since January 2007); formerly Investigator and Supervisor in the Special Investigations Unit for the New York Central Mutual Fire Insurance Company (August 1994-January 1999); Investigator in AXA Financial’s Internal Audit Department and Manager in AXA’s Anti-Money Laundering Office (January 1999-January 2005); first chair of the American Council of Life Insurers Anti-Money Laundering and Critical Infrastructure Committee (June 2007-December 2009). | Since 2011 | ||
Grace C. Torres (54) Treasurer and Principal Financial and Accounting Officer | Assistant Treasurer (since March 1999) and Senior Vice President (since September 1999) of Prudential Investments LLC; Assistant Treasurer (since May 2003) and Vice President (since June 2005) of AST Investment Services, Inc.; Senior Vice President and Assistant Treasurer (since May 2003) of Prudential Annuities Advisory Services, Inc.; formerly Senior Vice President (May 2003-June 2005) of AST Investment Services, Inc. | Since 1998 | ||
M. Sadiq Peshimam (49) Assistant Treasurer | Vice President (since 2005) of Prudential Investments LLC. | Since 2006 | ||
Peter Parrella (55) Assistant Treasurer | Vice President (since 2007) and Director (2004-2007) within Prudential Mutual Fund Administration; formerly Tax Manager at SSB Citi Fund Management LLC (1997-2004). | Since 2007 |
| (a) | Excludes Mr. Parker and Mr. Benjamin, interested Board Members who also serve as President and Vice President, respectively. |
Prudential Jennison Value Fund
| (1) | The year that each individual became an Officer of the Fund is as follows: |
Raymond A. O’Hara, 2012; Deborah A. Docs, 2005; Jonathan D. Shain, 2005; Claudia DiGiacomo, 2005; Andrew R. French, 2006; Amanda S. Ryan, 2012; Timothy J. Knierim, 2007; Valerie M. Simpson, 2007; Theresa C. Thompson, 2008; Grace C. Torres, 1997; Peter Parrella, 2007; M. Sadiq Peshimam, 2006; Richard W. Kinville, 2011.
Explanatory Notes to Tables:
| • | Board Members are deemed to be “Interested,” as defined in the 1940 Act, by reason of their affiliation with Prudential Investments LLC and/or an affiliate of Prudential Investments LLC. |
| • | Unless otherwise noted, the address of all Board Members and Officers is c/o Prudential Investments LLC, Gateway Center Three, 100 Mulberry Street, Newark, New Jersey 07102-4077. |
| • | There is no set term of office for Board Members or Officers. The Board Members have adopted a retirement policy, which calls for the retirement of Board Members on December 31 of the year in which they reach the age of 75. |
| • | “Other Directorships Held” includes only directorships of companies required to register or file reports with the SEC under the 1934 Act (that is, “public companies”) or other investment companies registered under the 1940 Act. |
| • | “Portfolios Overseen” includes all investment companies managed by Prudential Investments LLC. The investment companies for which Prudential Investments LLC serves as manager include the Prudential Investments Mutual Funds, The Prudential Variable Contract Accounts, Target Mutual Funds, Prudential Short Duration High Yield Fund, Inc., Prudential Global Short Duration High Yield Fund, Inc., The Prudential Series Fund, Prudential’s Gibraltar Fund, Inc. and the Advanced Series Trust. |
Visit our website at www.prudentialfunds.com
Approval of Advisory Agreements
The Fund’s Board of Trustees
The Board of Trustees (the “Board”) of Prudential Jennison Value Fund (the “Fund”)1 consists of ten individuals, eight of whom are not “interested persons” of the Fund, as defined in the Investment Company Act of 1940, as amended (the “1940 Act”) (the “Independent Trustees”).2 The Board is responsible for the oversight of the Fund and its operations, and performs the various duties imposed on the directors of investment companies by the 1940 Act. The Independent Trustees have retained independent legal counsel to assist them in connection with their duties. The Chair of the Board is an Independent Trustee. The Board has established three standing committees: the Audit Committee, the Nominating and Governance Committee, and the Investment Committee. Each committee is chaired by, and composed of, Independent Trustees.
Annual Approval of the Fund’s Advisory Agreements
As required under the 1940 Act, the Board determines annually whether to renew the Fund’s management agreement with Prudential Investments LLC (“PI”) and the Fund’s subadvisory agreement with Jennison Associates LLC (“Jennison”). In considering the renewal of the agreements, the Board, including all of the Independent Trustees, met on June 4-6, 2013 and approved the renewal of the agreements through July 31, 2014, after concluding that the renewal of the agreements was in the best interests of the Fund and its shareholders.
In advance of the meetings, the Board requested and received materials relating to the agreements, and had the opportunity to ask questions and request further information in connection with its consideration. Among other things, the Board considered comparative fee information from PI and Jennison. Also, the Board considered comparisons with other mutual funds in relevant Peer Universes and Peer Groups, as is further discussed below.
In approving the agreements, the Board, including the Independent Trustees advised by independent legal counsel, considered the factors it deemed relevant, including the nature, quality and extent of services provided by PI and the subadviser, the performance of the Fund, the profitability of PI and its affiliates, expenses and fees, and the potential for economies of scale that may be shared with the Fund and its shareholders as the Fund’s assets grow. In their deliberations, the Trustees did not identify any single factor which alone was responsible for the Board’s decision to approve the agreements with respect to the Fund. In connection with its deliberations, the Board considered information provided by PI throughout the year at regular Board
| 1 | Prudential Jennison Value Fund is a series of Prudential Investment Portfolios 7. |
| 2 | Ms. Alberding and Messrs. Hartstein and Quinn were elected to the Board effective September 1, 2013. |
Prudential Jennison Value Fund
Approval of Advisory Agreements (continued)
meetings, presentations from portfolio managers and other information, as well as information furnished at or in advance of the meetings on June 4-6, 2013.
The Trustees determined that the overall arrangements between the Fund and PI, which serves as the Fund’s investment manager pursuant to a management agreement, and between PI and Jennison, which serves as the Fund’s subadviser pursuant to the terms of a subadvisory agreement with PI, are in the best interests of the Fund and its shareholders in light of the services performed, fees charged and such other matters as the Trustees considered relevant in the exercise of their business judgment.
The material factors and conclusions that formed the basis for the Trustees’ reaching their determinations to approve the continuance of the agreements are separately discussed below.
Nature, Quality and Extent of Services
The Board received and considered information regarding the nature, quality and extent of services provided to the Fund by PI and Jennison. The Board considered the services provided by PI, including but not limited to the oversight of the subadviser for the Fund, as well as the provision of fund recordkeeping, compliance, and other services to the Fund. With respect to PI’s oversight of the subadviser, the Board noted that PI’s Strategic Investment Research Group (“SIRG”), which is a business unit of PI, is responsible for monitoring and reporting to PI’s senior management on the performance and operations of the subadviser. The Board also considered that PI pays the salaries of all of the officers and non-independent Trustees of the Fund. The Board also considered the investment subadvisory services provided by Jennison, as well as adherence to the Fund’s investment restrictions and compliance with applicable Fund policies and procedures. The Board considered PI’s evaluation of the subadviser as well as PI’s recommendation, based on its review of the subadviser, to renew the subadvisory agreement.
The Board considered the qualifications, backgrounds and responsibilities of PI’s senior management responsible for the oversight of the Fund and Jennison, and also considered the qualifications, backgrounds and responsibilities of Jennison’s portfolio managers who are responsible for the day-to-day management of the Fund’s portfolio. The Board was provided with information pertaining to PI’s and Jennison’s organizational structure, senior management, investment operations, and other relevant information pertaining to both PI and Jennison. The Board also noted that it received favorable compliance reports from the Fund’s Chief Compliance Officer (“CCO”) as to both PI and Jennison. The Board noted that Jennison is affiliated with PI.
Visit our website at www.prudentialfunds.com
The Board concluded that it was satisfied with the nature, extent and quality of the investment management services provided by PI and the subadvisory services provided to the Fund by Jennison, and that there was a reasonable basis on which to conclude that the Fund benefits from the services provided by PI and Jennison under the management and subadvisory agreements.
Costs of Services and Profits Realized by PI
The Board was provided with information on the profitability of PI and its affiliates in serving as the Fund’s investment manager. The Board discussed with PI the methodology utilized in assembling the information regarding profitability and considered its reasonableness. The Board recognized that it is difficult to make comparisons of profitability from fund management contracts because comparative information is not generally publicly available and is affected by numerous factors, including the structure of the particular adviser, the types of funds it manages, its business mix, numerous assumptions regarding allocations and the adviser’s capital structure and cost of capital. The Board separately considered information regarding the profitability of the subadviser, an affiliate of PI. Taking these factors into account, the Board concluded that the profitability of PI and its affiliates in relation to the services rendered was not unreasonable.
Economies of Scale
The Board noted that the management fee schedule for the Fund includes breakpoints, which have the effect of decreasing the fee rate as assets increase, and that at its current level of assets the Fund’s effective fee rate reflected some of those rate reductions. The Board received and discussed information concerning whether PI realizes economies of scale as the Fund’s assets grow beyond current levels. The Board took note that the Fund’s fee structure currently results in benefits to Fund shareholders whether or not PI realizes any economies of scale. The Board recognized the inherent limitations of any analysis of economies of scale, stemming largely from the Board’s understanding that most of PI’s costs are not specific to individual funds, but rather are incurred across a variety of products and services.
Other Benefits to PI and Jennison
The Board considered potential ancillary benefits that might be received by PI and Jennison and their affiliates as a result of their relationship with the Fund. The Board concluded that potential benefits to be derived by PI included fees received by affiliates of PI for serving as the Fund’s securities lending agent, transfer agency fees received by the Fund’s transfer agent (which is affiliated with PI), as well as benefits to its reputation or other intangible benefits resulting from PI’s association with the Fund. The Board concluded that the potential benefits to be derived by Jennison included its ability to
Prudential Jennison Value Fund
Approval of Advisory Agreements (continued)
use soft dollar credits, as well as the potential benefits consistent with those generally resulting from an increase in assets under management, specifically, potential access to additional research resources and benefits to its reputation. The Board concluded that the benefits derived by PI and Jennison were consistent with the types of benefits generally derived by investment managers and subadvisers to mutual funds.
Performance of the Fund/Fees and Expenses
The Board considered certain additional specific factors and made related conclusions relating to the historical performance of the Fund for the one-, three-, five- and ten-year periods ended December 31, 2012.
The Board also considered the Fund’s actual management fee, as well as the Fund’s net total expense ratio, for the fiscal year ended August 31, 2012. The Board considered the management fee for the Fund as compared to the management fee charged by PI to other funds and the fee charged by other advisers to comparable mutual funds in a Peer Group. The actual management fee represents the fee rate actually paid by Fund shareholders and includes any fee waivers or reimbursements. The net total expense ratio for the Fund represents the actual expense ratio incurred by Fund shareholders.
The mutual funds included in the Peer Universe (the Lipper Large-Cap Value Funds Performance Universe)3 and the Peer Group were objectively determined by Lipper Inc. (“Lipper”), an independent provider of mutual fund data. To the extent that PI deemed appropriate, and for reasons addressed in detail with the Board, PI may have provided supplemental data compiled by Lipper for the Board’s consideration. The comparisons placed the Fund in various quartiles, with the first quartile being the best 25% of the mutual funds (for performance, the best performing mutual funds and, for expenses, the lowest cost mutual funds).
The section below summarizes key factors considered by the Board and the Board’s conclusions regarding the Fund’s performance, fees and overall expenses. The table sets forth gross performance comparisons (which do not reflect the impact on performance of fund expenses, or any subsidies, expense caps or waivers that may be applicable) with the Peer Universe, actual management fees with the Peer Group (which reflect the impact of any subsidies or fee waivers), and net total expenses with the Peer Group, each of which were key factors considered by the Board.
| 3 | The Fund was compared to the Lipper Large-Cap Value Funds Performance Universe, although Lipper classifies the Fund in the Multi-Cap Core Funds Performance Universe. The Fund was compared to the Lipper Large-Cap Value Funds Performance Universe because PI believes that the funds included in this Universe provide a more appropriate basis for Fund performance comparisons. |
Visit our website at www.prudentialfunds.com
| Performance | 1 Year | 3 Years | 5 Years | 10 Years | ||||
3rd Quartile | 4th Quartile | 3rd Quartile | 1st Quartile | |||||
| Actual Management Fees: 2nd Quartile | ||||||||
| Net Total Expenses: 2nd Quartile | ||||||||
| • | The Board noted that the Fund outperformed its benchmark index over the five- and ten-year periods, although it underperformed its benchmark index over the one- and three-year periods. |
| • | The Board noted PI’s assertion that underperformance was related, in part, to a thematic shift toward mega-caps and high dividend-yielding securities. |
| • | The Board noted that, in light of the Fund’s disappointing performance versus its Lipper Peer Universe, the Board and PI intend to closely monitor the Fund’s performance. |
| • | The Board concluded that it was reasonable to continue to monitor the Fund’s performance, and that it would be in the best interests of the Fund and its shareholders to renew the agreements. |
| • | The Board concluded that the management fees (including subadvisory fees) and total expenses were reasonable in light of the services provided. |
* * *
After full consideration of these factors, the Board concluded that the approval of the agreements was in the best interests of the Fund and its shareholders.
Prudential Jennison Value Fund
| n MAIL | n TELEPHONE | n WEBSITE | ||
Gateway Center Three 100 Mulberry Street Newark, NJ 07102 | (800) 225-1852 | www.prudentialfunds.com |
| PROXY VOTING |
| The Board of Trustees of the Fund has delegated to the Fund’s investment subadviser the responsibility for voting any proxies and maintaining proxy recordkeeping with respect to the Fund. A description of these proxy voting policies and procedures is available without charge, upon request, by calling (800) 225-1852. Information regarding how the Fund voted proxies relating to portfolio securities during the most recent 12-month period ended June 30 is available on the Fund’s website and on the Securities and Exchange Commission’s website. |
| TRUSTEES |
| Ellen S. Alberding • Kevin J. Bannon • Scott E. Benjamin • Linda W. Bynoe • Keith F. Hartstein • Michael S. Hyland • Douglas H. McCorkindale • Stephen P. Munn • Stuart S. Parker • James E. Quinn • Richard A. Redeker • Robin B. Smith • Stephen G. Stoneburn |
| OFFICERS |
| Stuart S. Parker, President • Scott E. Benjamin, Vice President • Grace C. Torres, Treasurer and Principal Financial and Accounting Officer • Raymond A. O’Hara, Chief Legal Officer • Deborah A. Docs, Secretary • Bruce Karpati, Chief Compliance Officer • Theresa C. Thompson, Deputy Chief Compliance Officer • Richard W. Kinville, Anti-Money Laundering Compliance Officer • Jonathan D. Shain, Assistant Secretary • Claudia DiGiacomo, Assistant Secretary • Amanda S. Ryan, Assistant Secretary • Andrew R. French, Assistant Secretary • M. Sadiq Peshimam, Assistant Treasurer • Peter Parrella, Assistant Treasurer |
| MANAGER | Prudential Investments LLC | Gateway Center Three 100 Mulberry Street Newark, NJ 07102 | ||
| ||||
| INVESTMENT SUBADVISER | Jennison Associates LLC | 466 Lexington Avenue New York, NY 10017 | ||
| ||||
| DISTRIBUTOR | Prudential Investment Management Services LLC | Gateway Center Three 100 Mulberry Street | ||
| ||||
| CUSTODIAN | The Bank of New York Mellon | One Wall Street New York, NY 10286 | ||
| ||||
| TRANSFER AGENT | Prudential Mutual Fund Services LLC | PO Box 9658 Providence, RI 02940 | ||
| ||||
| INDEPENDENT REGISTERED PUBLIC ACCOUNTING FIRM | KPMG LLP | 345 Park Avenue New York, NY 10154 | ||
| ||||
| FUND COUNSEL | Willkie Farr & Gallagher LLP | 787 Seventh Avenue New York, NY 10019 | ||
| An investor should consider the investment objectives, risks, charges, and expenses of the Fund carefully before investing. The prospectus and summary prospectus contain this and other information about the Fund. An investor may obtain a prospectus and summary prospectus by visiting our website at www.prudentialfunds.com or by calling (800) 225-1852. The prospectus and summary prospectus should be read carefully before investing. |
| E-DELIVERY |
| To receive your mutual fund documents online, go to www.prudentialfunds.com/edelivery and enroll. Instead of receiving printed documents by mail, you will receive notification via email when new materials are available. You can cancel your enrollment or change your email address at any time by visiting the website address above. |
| SHAREHOLDER COMMUNICATIONS WITH TRUSTEES |
| Shareholders can communicate directly with the Board of Trustees by writing to the Chair of the Board, Prudential Jennison Value Fund, Prudential Investments, Attn: Board of Trustees, 100 Mulberry Street, Gateway Center Three, Newark, NJ 07102. Shareholders can communicate directly with an individual Trustee by writing to the same address. Communications are not screened before being delivered to the addressee. |
| AVAILABILITY OF PORTFOLIO SCHEDULE |
| The Fund files its complete schedule of portfolio holdings with the Securities and Exchange Commission for the first and third quarters of each fiscal year on Form N-Q. The Fund’s Forms N-Q are available on the Commission’s website at www.sec.gov. The Fund’s Forms N-Q may also be reviewed and copied at the Commission’s Public Reference Room in Washington, D.C. Information on the operation and location of the Public Reference Room may be obtained by calling 1-800-SEC-0330. The Fund’s schedule of portfolio holdings is also available on the Fund’s website as of the end of each month. |
| The Fund’s Statement of Additional Information contains additional information about the Fund’s Trustees and is available without charge, upon request, by calling (800) 225-1852. |
Mutual Funds:
| ARE NOT INSURED BY THE FDIC OR ANY FEDERAL GOVERNMENT AGENCY | MAY LOSE VALUE | ARE NOT A DEPOSIT OF OR GUARANTEED BY ANY BANK OR ANY BANK AFFILIATE |
PRUDENTIAL JENNISON VALUE FUND
| SHARE CLASS | A | B | C | Q | R | X | Z | |||||||
| NASDAQ | PBEAX | PBQIX | PEICX | PJVQX | JDVRX | N/A | PEIZX | |||||||
| CUSIP | 74440N102 | 74440N201 | 74440N300 | 74440N888 | 74440N607 | 74440N706 | 74440N805 |
MF131E 0252499-00001-00
Item 2 – Code of Ethics — See Exhibit (a)
As of the end of the period covered by this report, the registrant has adopted a code of ethics (the “Section 406 Standards for Investment Companies – Ethical Standards for Principal Executive and Financial Officers”) that applies to the registrant’s Principal Executive Officer and Principal Financial Officer; the registrant’s Principal Financial Officer also serves as the Principal Accounting Officer.
The registrant hereby undertakes to provide any person, without charge, upon request, a copy of the code of ethics. To request a copy of the code of ethics, contact the registrant 800-225-1852, and ask for a copy of the Section 406 Standards for Investment Companies - Ethical Standards for Principal Executive and Financial Officers.
Item 3 – Audit Committee Financial Expert –
The registrant’s Board has determined that Mr. Stephen P. Munn, member of the Board’s Audit Committee is an “audit committee financial expert,” and that he is “independent,” for purposes of this Item.
Item 4 – Principal Accountant Fees and Services –
(a) Audit Fees
For the fiscal years ended August 31, 2013 and August 31, 2012, KPMG LLP (“KPMG”), the Registrant’s principal accountant, billed the Registrant $22,000 and $22,000, respectively, for professional services rendered for the audit of the Registrant’s annual financial statements or services that are normally provided in connection with statutory and regulatory filings.
(b) Audit-Related Fees
None.
(c) Tax Fees
None.
(d) All Other Fees
None.
(e) (1) Audit Committee Pre-Approval Policies and Procedures
THE PRUDENTIAL MUTUAL FUNDS
AUDIT COMMITTEE POLICY
on
Pre-Approval of Services Provided by the Independent Accountants
The Audit Committee of each Prudential Mutual Fund is charged with the responsibility to monitor the independence of the Fund’s independent accountants. As part of this responsibility, the Audit Committee must pre-approve any independent accounting firm’s engagement to render audit and/or permissible non-audit services, as required by law. In evaluating a proposed engagement of the independent accountants, the Audit Committee will assess the effect that the engagement might reasonably be expected to have on the accountant’s independence. The Committee’s evaluation will be based on:
| • | a review of the nature of the professional services expected to be provided, |
| • | a review of the safeguards put into place by the accounting firm to safeguard independence, and |
| • | periodic meetings with the accounting firm. |
Policy for Audit and Non-Audit Services Provided to the Funds
On an annual basis, the scope of audits for each Fund, audit fees and expenses, and audit-related and non-audit services (and fees proposed in respect thereof) proposed to be performed by the Fund’s independent accountants will be presented by the Treasurer and the independent accountants to the Audit Committee for review and, as appropriate, approval prior to the initiation of such services. Such presentation shall be accompanied by confirmation by both the Treasurer and the independent accountants that the proposed services will not adversely affect the independence of the independent accountants. Proposed services shall be described in sufficient detail to enable the Audit Committee to assess the appropriateness of such services and fees, and the compatibility of the provision of such services with the auditor’s independence. The Committee shall receive periodic reports on the progress of the audit and other services which are approved by the Committee or by the Committee Chair pursuant to authority delegated in this Policy.
The categories of services enumerated under “Audit Services”, “Audit-related Services”, and “Tax Services” are intended to provide guidance to the Treasurer and the independent accountants as to those categories of services which the Committee believes are generally consistent with the independence of the independent accountants and which the Committee (or the Committee Chair) would expect upon the presentation of specific proposals to pre-approve. The enumerated categories are not intended as an exclusive list of audit, audit-related or tax services, which the Committee (or the Committee Chair) would consider for pre-approval.
Audit Services
The following categories of audit services are considered to be consistent with the role of the Fund’s independent accountants:
| • | Annual Fund financial statement audits |
| • | Seed audits (related to new product filings, as required) |
| • | SEC and regulatory filings and consents |
Audit-related Services
The following categories of audit-related services are considered to be consistent with the role of the Fund’s independent accountants:
| • | Accounting consultations |
| • | Fund merger support services |
| • | Agreed Upon Procedure Reports |
| • | Attestation Reports |
| • | Other Internal Control Reports |
Individual audit-related services that fall within one of these categories and are not presented to the Audit Committee as part of the annual pre-approval process will be subject to pre-approval by the Committee Chair (or any other Committee member on whom this responsibility has been delegated) so long as the estimated fee for those services does not exceed $50,000.
Tax Services
The following categories of tax services are considered to be consistent with the role of the Fund’s independent accountants:
| • | Tax compliance services related to the filing or amendment of the following: |
| • | Federal, state and local income tax compliance; and, |
| • | Sales and use tax compliance |
| • | Timely RIC qualification reviews |
| • | Tax distribution analysis and planning |
| • | Tax authority examination services |
| • | Tax appeals support services |
| • | Accounting methods studies |
| • | Fund merger support services |
| • | Tax consulting services and related projects |
Individual tax services that fall within one of these categories and are not presented to the Audit Committee as part of the annual pre-approval process will be subject to pre-approval by the Committee Chair (or any other Committee member on whom this responsibility has been delegated) so long as the estimated fee for those services does not exceed $50,000.
Other Non-audit Services
Certain non-audit services that the independent accountants are legally permitted to render will be subject to pre-approval by the Committee or by one or more Committee members to whom the Committee has delegated this authority and who will report to the full Committee any pre-approval decisions made pursuant to this Policy. Non-audit services presented for pre-approval pursuant to this paragraph will be accompanied by a confirmation from both the Treasurer and the independent accountants that the proposed services will not adversely affect the independence of the independent accountants.
Proscribed Services
The Fund’s independent accountants will not render services in the following categories of non-audit services:
| • | Bookkeeping or other services related to the accounting records or financial statements of the Fund |
| • | Financial information systems design and implementation |
| • | Appraisal or valuation services, fairness opinions, or contribution-in-kind reports |
| • | Actuarial services |
| • | Internal audit outsourcing services |
| • | Management functions or human resources |
| • | Broker or dealer, investment adviser, or investment banking services |
| • | Legal services and expert services unrelated to the audit |
| • | Any other service that the Public Company Accounting Oversight Board determines, by regulation, is impermissible. |
Pre-approval of Non-Audit Services Provided to Other Entities Within the Prudential Fund Complex
Certain non-audit services provided to Prudential Investments LLC or any of its affiliates that also provide ongoing services to the Prudential Mutual Funds will be subject to pre-approval by the Audit Committee. The only non-audit services provided to these entities that will require pre-approval are those related directly to the operations and financial reporting of the Funds. Individual projects that are not presented to the Audit Committee as part of the annual pre-approval process will be subject to pre-approval by the Committee Chair (or any other Committee member on whom this responsibility has been delegated) so long as the estimated fee for those services does not exceed $50,000. Services presented for pre-approval pursuant to this paragraph will be accompanied by a confirmation from both the Treasurer and the independent accountants that the proposed services will not adversely affect the independence of the independent accountants.
Although the Audit Committee will not pre-approve all services provided to Prudential Investments LLC and its affiliates, the Committee will receive an annual report from the Fund’s independent accounting firm showing the aggregate fees for all services provided to Prudential Investments and its affiliates.
(e)(2) Percentage of services referred to in 4(b) – 4(d) that were approved by the audit committee –
Not applicable.
| (f) | Percentage of hours expended attributable to work performed by other than full time employees of principal accountant if greater than 50%. |
The percentage of hours expended on the principal accountant’s engagement to audit the registrant’s financial statements for the most recent fiscal year that were attributed to work performed by persons other than the principal accountant’s full-time, permanent employees was 0%.
(g) Non-Audit Fees
Not applicable to Registrant for the fiscal years 2013 and 2012. The aggregate non-audit fees billed by KPMG for services rendered to the registrant’s investment adviser and any entity controlling, controlled by, or under common control with the investment adviser that provides ongoing services to the registrant for the fiscal years 2013 and 2012 was $0 and $0, respectively.
(h) Principal Accountant’s Independence
Not applicable as KPMG has not provided non-audit services to the registrant’s investment adviser and any entity controlling, controlled by, or under common control with the investment adviser that provides ongoing services to the registrant that were not pre-approved pursuant to Rule 2-01(c)(7)(ii) of Regulation S-X.
Item 5 – Audit Committee of Listed Registrants – Not applicable.
Item 6 – Schedule of Investments – The schedule is included as part of the report to shareholders filed under Item 1 of this Form.
Item 7 – Disclosure of Proxy Voting Policies and Procedures for Closed-End Management Investment Companies – Not
| applicable. |
Item 8 – Portfolio Managers of Closed-End Management Investment Companies – Not applicable.
Item 9 – Purchases of Equity Securities by Closed-End Management Investment Company and Affiliated Purchasers – Not
| applicable. |
Item 10 – Submission of Matters to a Vote of Security Holders – Not applicable.
Item 11 – Controls and Procedures
| (a) | It is the conclusion of the registrant’s principal executive officer and principal financial officer that the effectiveness of the registrant’s current disclosure controls and procedures (such disclosure controls and procedures having been evaluated within 90 days of the date of this filing) provide reasonable assurance that the information required to be disclosed by the registrant has been recorded, processed, summarized and reported within the time period specified in the Commission’s rules and forms and that the information required to be disclosed by the registrant has been accumulated and communicated to the registrant’s principal executive officer and principal financial officer in order to allow timely decisions regarding required disclosure. |
| (b) | There has been no significant change in the registrant’s internal control over financial reporting that occurred during the registrant’s most recent fiscal quarter of the period covered by this report that has materially affected, or is likely to materially affect, the registrant’s internal control over financial reporting. |
Item 12 – Exhibits
| (a) (1) | Code of Ethics – Attached hereto as Exhibit EX-99.CODE-ETH |
| (2) | Certifications pursuant to Section 302 of the Sarbanes-Oxley Act – Attached hereto as Exhibit EX-99.CERT. |
| (3) | Any written solicitation to purchase securities under Rule 23c-1. – Not applicable. |
| (b) | Certifications pursuant to Section 906 of the Sarbanes-Oxley Act – Attached hereto as Exhibit EX-99.906CERT. |
SIGNATURES
Pursuant to the requirements of the Securities Exchange Act of 1934 and the Investment Company Act of 1940, the registrant has duly caused this report to be signed on its behalf by the undersigned, thereunto duly authorized.
Registrant: Prudential Investment Portfolios 7
| By: | /s/ Deborah A. Docs | |
| Deborah A. Docs | ||
| Secretary | ||
| Date: | October 21, 2013 | |
Pursuant to the requirements of the Securities Exchange Act of 1934 and the Investment Company Act of 1940, this report has been signed below by the following persons on behalf of the registrant and in the capacities and on the dates indicated.
| By: | /s/ Stuart S. Parker | |
| Stuart S. Parker | ||
| President and Principal Executive Officer | ||
| Date: | October 21, 2013 | |
| By: | /s/ Grace C. Torres | |
| Grace C. Torres | ||
| Treasurer and Principal Financial Officer | ||
| Date: | October 21, 2013 | |