UNITED STATES
SECURITIES AND EXCHANGE COMMISSION
Washington, D.C. 20549
FORM N-CSR
CERTIFIED SHAREHOLDER REPORT OF REGISTERED MANAGEMENT
INVESTMENT COMPANIES
Investment Company Act file number 811-04878
SEI Institutional Managed Trust
(Exact name of registrant as specified in charter)
SEI Investments
One Freedom Valley Drive
Oaks, PA 19456
(Address of principal executive offices) (Zip code)
CT Corporation
155 Federal Street
Boston, MA 02110
(Name and address of agent for service)
Registrant’s telephone number, including area code: 1-800-342-5734
Date of fiscal year end: September 30, 2016
Date of reporting period: September 30, 2016
Item 1. Reports to Stockholders.

SEI New ways.
New ansers.®
September 30, 2016
ANNUAL REPORT
SEI Institutional Managed Trust
Large Cap Fund
Large Cap Value Fund
Large Cap Growth Fund
Tax-Managed Large Cap Fund
S&P 500 Index Fund
Small Cap Fund
Small Cap Value Fund
Small Cap Growth Fund
Tax-Managed Small/Mid Cap Fund
Mid-Cap Fund
U.S. Managed Volatility Fund
Global Managed Volatility Fund
Tax-Managed Managed Volatility Fund
Real Estate Fund
Enhanced Income Fund
Core Fixed Income Fund
U.S. Fixed Income Fund
High Yield Bond Fund
Conservative Income Fund
Tax-Free Conservative Income Fund
Real Return Fund
Dynamic Asset Allocation Fund
Multi-Strategy Alternative Fund
Multi-Asset Accumulation Fund
Multi-Asset Income Fund
Multi-Asset Inflation Managed Fund
Multi-Asset Capital Stability Fund
Long/Short Alternative Fund
seic.com
The Trust files its complete schedule of portfolio holdings with the Securities and Exchange Commission for the first and third quarter of each fiscal year on Form N-Q within sixty days after the end of the period. The Trust’s Forms N-Q are available on the Commission’s website at http://www.sec.gov, and may be reviewed and copied at the Commission’s Public Reference Room in Washington, DC. Information on the operation of the Public Reference Room may be obtained by calling 1-800-SEC-0330.
A description of the policies and procedures that the Trust uses to determine how to vote proxies relating to portfolio securities, as well as information relating to how a Fund voted proxies relating to portfolio securities during the most recent 12-month period ended June 30, is available (i) without charge, upon request, by calling 1-800-DIAL-SEI; and (ii) on the Commission’s website at http://www.sec.gov.
September 30, 2016 (Unaudited)
To Our Shareholders
The Funds’ fiscal year — October 1, 2015 through September 30, 2016 — was notable for several key themes: energy-sector volatility spread to other areas of the market; major central-bank policies diverged, with the Federal Reserve (“Fed”) commencing rate increases while the European Central Bank (“ECB”), Bank of Japan (“BOJ”), Bank of England (“BOE”) and People’s Bank of China (“PBOC”) deepened their commitments to monetary accommodation; and, as a result of the diverging policies, major developed-market sovereign-bond yields continued to fall, with some edging into negative-rate territory. A vote (“Brexit”) by U.K. citizens in favor of leaving the European Union (“EU”) took place during the final third of the reporting period, briefly upending global financial markets and presenting major questions about how the relationship will be dissolved.
Geopolitical events
Severe unrest continued in certain areas of the Middle East, driven by the sometimes-opposing and sometimes-overlapping interests of Islamic State, the Syrian regime, Syrian nationalists, Kurdish forces and the Iraqi military. Regional superpowers Iran, Saudi Arabia and Turkey also applied varying degrees of indirect influence. Broader involvement escalated at the beginning of the period, with Russia’s airpower commitment and a redoubled coalition of Western powers targeting Islamic State after a series of attacks by religious extremists across the globe. Iraqi forces, supported by U.S. air and ground resources, began to make notable progress in reversing Islamic State gains as the reporting period progressed; at the same time, incidences of terrorism appeared to increase in Africa, Asia, Europe, the Middle East and North America. The latest Syrian ceasefire, established in mid-September 2016 and backed by U.S. and Russia to allow for humanitarian aid, only held for a few days, resulting in deteriorating cooperation between the U.S. and Russia. While the conflict that originated in Syria and Iraq appears to have influenced destabilizing events elsewhere around the globe, and taken a terrible human toll, it has not had a significant impact on global markets or the economy at this point.
It will be interesting, however, to see the ultimate effects of the ensuing Syrian migrant crisis on the EU. Immigration served as one of the key points of contention leading up to Great Britain’s Brexit vote in late June. U.K. Prime Minister David Cameron tendered his resignation as a result, Theresa May was appointed to the office, and a litany of questions entered the public dialogue on topics ranging from when the government would commence the formal withdrawal process to how negotiations would fare regarding trade agreements, and whether the immigration goals espoused by the Leave campaign would come to pass.
Immigration-driven ballot-box uncertainty has also taken center stage in the U.S. presidential election, where the leading primary candidates of the two major political parties — Hillary Clinton (Democrat) and Donald Trump (Republican) — faced off in their first televised debate just before the end of the reporting period.
Despite the considerable aforementioned instability in the Middle East, the price of oil remained mostly insulated from regional developments. Oil-price weakness, which persisted for the first third of the reporting period, remained primarily attributable to oversupply. Energy-export-dependent Venezuela succumbed to the economically depressive effects of low oil prices during the fiscal year. Food shortages and a breakdown of the rule of law appeared to worsen over the course of the fiscal year, despite a rebound in the price of oil. Brazil’s prospects also paled, and then recovered partially during the period, as a corruption investigation centering on its lead state-run oil company enveloped a cross-section of political leaders — culminating in the impeachment of President Dilma Rousseff. The Organization of Petroleum Exporting Countries (“OPEC”) reached an agreement in the weeks leading up to the end of the reporting period on the need for production cuts and cooperation from non-OPEC producers to effect a balanced market.
Economic performance
U.S. economic growth began to decelerate in the third quarter of 2015 (prior to the start of the reporting period), continuing into the fourth-quarter as industrial production and manufacturing came under pressure from the effects of U.S. dollar strength, and slowing further still during the first quarter of 2016. The second quarter saw a pickup, albeit a disappointing one relative to the same period in 2015. The labor market improved during the fiscal year; the unemployment rate started and finished the period at 5.0%, falling as low as 4.7% in May 2016, while the labor force participation rate increased from 62.5% to 62.9%. Average hourly earnings and real personal incomes gained with relative steadiness, bouncing around a rough mean of about 0.2% per month over the reporting period. The Fed raised its target interest rate in mid-December 2015 for the first time since 2006, leaving behind a near-zero rate that had been in place since late 2008.
| SEI Institutional Managed Trust / Annual Report / September 30, 2016 | 1 |
LETTER TO SHAREHOLDERS (Continued)
September 30, 2016 (Unaudited)
Europe’s economic expansion continued along a steady, but modest, trajectory leading up to the reporting period and through the second quarter of 2016 (the latest available information), save for an uptick in the growth rate during the first quarter. The ECB’s introduction of a negative deposit rate and expansion of its asset-purchase program in early 2015 (prior to the start of the Funds’ fiscal year) was followed in March 2016 by a deeper foray into negative-rate territory and additional asset-purchase commitments. Despite concerns as the Brexit vote approached in late June 2016, second-quarter U.K. economic growth was the highest in some time, albeit by a small margin. Much of the U.K.’s economic data showed worsening conditions in the immediate aftermath of the vote, followed by a recovery. Sterling depreciated substantially in the vote’s immediate wake, and then again as the reporting period concluded. The BOE delivered a rate cut coupled with asset-purchase and term-funding programs at its early-August meeting.
In the Asia-Pacific region, Japan started the fiscal year with an economic contraction in the fourth quarter of 2015, followed by a convincing recovery in the first quarter of 2016 and slow growth in the second quarter. The yen began strengthening relative to the U.S. dollar in December 2015, and continued through late June 2016. The BOJ adopted a negative benchmark interest rate and expanded its asset-purchase program, while the government introduced a sizeable fiscal reform proposal focused on government spending. As the end of the period approached the BOJ announced its latest policy endeavor: keeping the 10-year Japanese government bond yield at 0% with a commitment to alter its bond-buying pace as needed to meet this goal. The BOJ also expressed its intention not only to achieve, but temporarily exceed, its target inflation level (currently 2%) to increase inflation expectations. China’s economic growth mostly held firm during the period; while the pace of growth was below that of recent years, it remained considerably higher than most other economies. The PBOC loosened its monetary-policy stance, reducing benchmark interest rates and bank-reserve requirements during the reporting period. The government’s decision to peg its currency (the renminbi) to a basket of currencies instead of just the U.S. dollar had significant global repercussions — especially given the implications for a potential rebalancing of global trade and uncertainty about potential future actions. The renminbi was set for addition to the International Monetary Fund’s special drawing rights currency basket immediately following the end of the reporting period.
Market developments
Risk assets advanced from the start of the fiscal year following severe declines in summer 2015, when China moderately devalued its currency. As 2015 came to a close, the questionable health of U.S. energy companies (which was caused by a persistent multi-year oil-price decline) raised concerns among high-yield bond investors. This resulted in a selloff that likely discouraged investor risk appetite, keeping a lid on performance at year end. The beginning of 2016 was marked by a global flight to quality, benefitting safe-haven assets and driving risk assets to their low points for the period.
A trend reversal took place in mid-February, with risk assets rallying into April, followed by mixed performance until late June. The price of oil (and commodities in general) also advanced sharply from mid-February into June. The Brexit vote caused a major spike in global stock-market volatility, yields were driven downward to record levels on perceived safe-haven investments like developed-market government bonds, and the currencies at the center of the developments — sterling and the euro — weakened substantially relative to the U.S. dollar and yen. Most of the stock-market losses, however, were recovered within a week’s time. A general sideways trend defined the last few months of the period, barring a selloff in anticipation of the Fed’s September policy announcement, which was followed by a recovery.
The U.S. dollar ended the fiscal year 2.5% lower against a trade-weighted basket of major currencies, having been as much as 3.75% higher in late January, and 5% lower in early May. The dollar finished the reporting period about 0.8% higher versus a broad trade-weighted basket, however, with advances and declines that mirrored those against major currencies.
Second-quarter 2016 earnings declined for companies in the S&P 500 Index; although a large majority fared better than analysts’ late-quarter average estimates. The consumer discretionary sector delivered the highest year-over-year earnings growth for the second quarter, while the energy sector continued to lag with deep losses.
| 2 | SEI Institutional Managed Trust / Annual Report / September 30, 2016 |
For the full reporting period, the MSCI All-Country World Index, a proxy for global equities, advanced 11.96% in U.S. dollar terms. The MSCI All-Country World ex USA Index rose by 9.26%, less than its U.S.-inclusive counterpart. Emerging-market equity returns were elevated in U.S. dollar terms, with the MSCI Emerging Markets Index increasing by 16.78%.
U.S. equity returns were strong; the S&P 500 Index returned 15.43% during the fiscal year. U.S. large caps (represented by the Russell 1000 Index) lagged small caps (represented by the Russell 2000 Index) by a bit, returning 14.93% and 15.47%, respectively. While U.S. large-cap performance trailed U.S. small caps and emerging markets over the one-year period, their outperformance relative to these equity markets as well as those in Europe, Japan and globally remained intact when annualized over three, five and ten years through the end of the reporting period.
Technology and materials were among the best-performing sectors in the U.S. and globally. Industrials rounded out the top three worldwide, while telecommunications matched technology’s top performance in the U.S. The poorest-performing sectors were identical both globally and within the U.S.: financials were universally the worst (the only global sector to produce a loss, and were positive in the U.S.), followed by healthcare and consumer discretionary.
Global fixed income, as measured by the Bloomberg Barclays Global Aggregate Bond Index, advanced 8.83% in U.S. dollar terms during the fiscal year. Interest rates generally declined during the reporting period, as major central banks outside of the U.S. guided benchmark rates downward (into negative territory in some cases) and expanded their asset-purchase programs.
U.S. Treasurys generally performed well as the yield curve flattened (bond yields move inversely to prices) and rates fell across most maturities, with only the yields on Treasurys with maturities shorter than three years increasing during the full reporting period.
U.S. investment-grade corporate debt performed well, but was outpaced by the high-yield market. The BofA Merrill Lynch US High Yield Constrained Index increased by 12.82% during the full fiscal year. Mortgage- and asset-backed securities also delivered positive returns during the reporting period.
Emerging-market debt delivered strong returns universally. The J.P. Morgan GBI Emerging Markets Global Diversified Index, which tracks local-currency-denominated emerging-market bonds, increased by 17.06% in U.S. dollar terms during the reporting period. The J.P. Morgan EMBI Global Diversified Index, which tracks emerging-market debt denominated in external currencies (such as the U.S. dollar), advanced by 16.20%.
A combination of subdued inflation and dollar strength began to ease during the reporting period, reducing headwinds to the performance of inflation-sensitive assets such as Treasury inflation-protected securities and commodities. The former outpaced comparable Treasurys over the full period, while the latter — which had dropped by almost 20% through mid-February, according to the TR/CC CRB Commodities Total Return Index — staged a steep recovery to end the fiscal year with a 3.6% decline.
Our view
There are many things over which investors can lose sleep, but as long as central banks pursue aggressively easy policies in a world mostly characterized by slow economic growth and mild inflation pressures, any pullback in the price of riskier assets should be limited.
In general (and especially as it pertains to the U.S.), we continue to view equity-market corrections as buy-on-the-dip opportunities. One reason for maintaining this point of view is our belief that the U.S. economy is on fairly solid ground. It’s true that growth in overall business activity continues to disappoint, but household finances are in good shape as a result of expanding employment and incomes as well as the bull market in stocks, bonds and home values. There is little reason to expect a serious slowing in consumer spending.
We also expect the change in business inventories — the most volatile part of gross domestic product (“GDP”), which has slowed in recent quarters — to rebound in the quarters ahead, supporting a reacceleration in overall U.S. GDP into the 2.5%-to-3.0% range.
Our main concern for the U.S. is weakness in business investment, which has negative implications for productivity. Slowing labor productivity growth and an acceleration in labor compensation growth is a bad combination. Since
| SEI Institutional Managed Trust / Annual Report / September 30, 2016 | 3 |
LETTER TO SHAREHOLDERS (Concluded)
September 30, 2016 (Unaudited)
companies have been unable to raise prices sufficiently, the downward pressure on profit margins appears chronic. As this pressure intensifies, we expect companies will become more aggressive in their attempts to push through price increases.
This uptick in inflation, combined with the tightening labor market and slow-but-steady pace of economic growth, seems to have tipped the balance in favor of a hike in the federal funds rate, probably in December. At their latest meeting, Fed policymakers finally conceded that interest-rate normalization will take years to accomplish, leaving little room to cut rates aggressively in the event of a recession. Investors remain skeptical that the central bank will even achieve its stated objective of pushing its policy rate to the upside. As a result, risk assets should continue to be well supported. Although equity valuations remain elevated, they still appear reasonable relative to those of high-quality bonds.
With regard to the U.K., many observers have been surprised by the resiliency of its economy, although it is way too soon to sound the all-clear. The BOE has pre-emptively cut its base rate to the lowest level in the multi-century history of the central bank, and restarted its quantitative-easing program and previously successful funding-for-lending scheme. On the fiscal policy side, the new Chancellor of the Exchequer scrapped his predecessor’s austerity plans and is expected to introduce a new budget that abandons any notion of achieving a budgetary surplus by the end of the current parliament. In all, U.K. economic policy has shifted dramatically toward easing well before the negative effects of Brexit can be felt. However, while no one knows what a final Brexit agreement will look like, we suspect it will be nowhere near the position being pushed forward by various U.K. leaders. Given this uncertainty, we think investment is likely to slow in the months ahead.
Eurozone exports and imports are in decline. Household spending is growing faster than other areas of the economy, as is the case in the U.S. and the U.K., but Europe’s consumer rebound remains considerably less robust in comparison with these two countries. Although the labor market has certainly improved over the past three years, the country-by-country levels remain wildly disparate. This is especially so for the youth unemployment rate.
We’re concerned that it’s just a matter time before another crisis tests the cohesion of the eurozone. ECB President Draghi knows he has a potential problem on his hands. He continues to reassure investors that the central bank has the will, the tools and the ability to improve the eurozone’s fortunes.
The Japanese economy still lacks momentum despite fiscal stimulus packages, structural reforms and extremely aggressive monetary-policy initiatives. Industrial output has trended lower over the past three years, hurt by the slowdown in global trade, and although the country’s merchandise trade balance has turned positive, this is merely the result of imports falling faster than exports.
On the positive side, housing construction is running near a cyclical high. The unemployment rate, which is structurally much lower than in other developed countries, dipped to 3.1%. Nominal wages remain stuck near zero, however, and inflation expectations have been nearly impossible to nudge to the upside. Our Asia-focused portfolio managers are heartened by improvements in corporate governance and the use of capital. Additionally, the latest fiscal-policy initiative is a significant one, with new spending amounting to ¥7.5 trillion. In the current fiscal year, stimulus is expected to reach 4.5% of GDP.
We think China’s economy will continue to reaccelerate in the near term. Although the country’s growth rate remains below trend, we are beginning to see an improving trajectory following two-and-a-half years of slowdown. The renminbi has depreciated steadily in the year to date, falling 7% against a basket of currencies and less than 3% against the greenback. While the depreciation of the renminbi has not reinvigorated exports, it appears to have stopped its two-year decline. Domestic economic growth in China has been relatively stable this year, with retail sales growing around 10% on a year-over-year basis and industrial output running at a 6% rate. Importantly, the country continues to evolve into a services-oriented economy, with that sector now accounting for more than half of GDP. Housing activity also has picked up. The question now becomes whether government economic policy flips back toward structural reform and economic rationalization and away from stimulus, given that business activity looks to be in a less fragile state than a year ago.
Before the global financial crisis, the U.S. and China were the primary growth engines of the world. Those engines are sputtering when compared to their pre-crisis performance. We think it’s possible that India eventually will become a third major engine of global growth. In the past year, its GDP growth was greater than China’s. While its population is nearly as large, India is growing faster and is much younger. As India institutes economic, financial and legal reforms, it has the potential to grow rapidly for a long time.
| 4 | SEI Institutional Managed Trust / Annual Report / September 30, 2016 |
On behalf of SEI Investments, I want to thank you for your continued confidence. We are working every day to maintain that confidence, and we look forward to serving your investment needs in the future.
Sincerely,

William Lawrence, CFA
Managing Director, Portfolio Management Team
| SEI Institutional Managed Trust / Annual Report / September 30, 2016 | 5 |
MANAGEMENT’S DISCUSSION AND ANALYSIS OF FUND PERFORMANCE
September 30, 2016 (Unaudited)
Large Cap Fund
I. Objective
The Large Cap Fund (the “Fund”) seeks to provide long-term growth of capital and income.
II. Investment Approach
The Fund uses a multi-manager approach, relying on a number of sub-advisers with differing investment philosophies and strategies to manage portions of the Fund’s portfolio, under the general supervision of SEI Investments Management Corporation (“SIMC”). Assets of the Fund not allocated to sub-advisers are managed directly by SIMC. During the fiscal year ended September 30, 2016, the Fund utilized the following sub-advisers: AQR Capital Management, LLC, BlackRock Investment Management, LLC, Brandywine Global Investment Management, LLC, Coho Partners, Ltd., Jackson Square Partners, LLC, LSV Asset Management, Parametric Portfolio Associates LLC and Snow Capital Management, L.P. No manager changes were made during the Fund’s fiscal year.
III. Returns
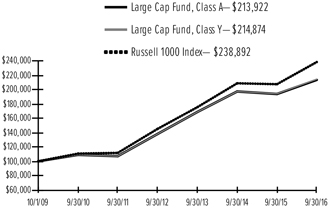
For the fiscal year ended September 30, 2016, the Large Cap Fund, Class A, returned 10.15%. The Fund’s benchmark — the Russell 1000® Index — returned 14.93%.
IV. Performance Discussion
The U.S. equity market began the reporting period with a short rally, led by cyclical stocks driven by decreasing concerns around a slowdown in emerging markets. The upbeat performance quickly turned into a nosedive at the turn of the New Year, as noted in the shareholder letter, after the Federal Reserve (“Fed”) raised rates for the first time in a decade. Despite the Fed’s interest-rate hike, the combination of renewed fears around a hard landing in the Chinese economy, commodity prices dropping to 30-year lows and falling rates in other developed markets pushed investors into low-volatility bond-proxy stocks in a global search for yield. As defensive and low-volatility stocks in the U.S. reached historically high valuations in February, government stimulus in China helped ease emerging-market growth concerns while oil prices found a floor. This was enough to restore investor confidence and spark a rally in cyclical stocks and commodity prices. Despite periods of volatility over the summer from Britain’s unexpected vote to leave the European Union and a moderation in commodity prices during the summer, the rally lasted through the rest of the period. From a sector perspective, technology and utilities were
the best-performing sectors. Technology benefited from increased earnings estimates and prospects of renewed growth late in the period and utilities benefited from a largely stability- and safety-oriented mindset for much of the period.
Losses stemmed from poor stock selection, which was concentrated in two sectors and most severe in healthcare. Within the healthcare sector, the portfolio was overweight the weakest industries (biotech) while underweight the best-performing industries (healthcare equipment and supplies). Biotech stocks sold off due to political pressure on the entire healthcare sector as well as sector-wide scandals. The portfolio’s consumer discretionary stocks also had very poor performance, with losses stemming from retailing sectors. The portfolio’s heavy overweight to airline stocks (from value managers) also detracted from performance as the industry sold off.
From a sub-adviser perspective, stability-oriented value manager Coho benefited from the aforementioned stability- and safety-oriented environment, which created a large tailwind for its process. Snow, our concentrated deep-value manager, struggled as mean-reversion value had a very tough cyclical headwind early in the period. Because value stocks suffered for much of the period, Snow’s selection was poor in multiple sectors. The manager’s overweight to consumer discretionary and financial stocks also detracted as both sectors sold off due to poor outlook and sentiment during the period. It is worth noting that these cyclical trends in the market reversed in the past few months, with Coho’s performance fading while Snow’s recovered materially. Brandywine, another fundamental deep-value manager, also suffered notably due to the same stylistic preferences that hurt Snow. Selection drove losses and was spread across multiple sectors while an overweight to airlines and consumer discretionary stocks further detracted. LSV faced similar headwinds, with poor selection across multiple sectors and an overweight to airlines. SIMC’s factor-based allocation also struggled for the period as its traditional leanings to value and momentum faced stylistic headwinds. AQR also underperformed the benchmark as the manager had value tilts during the period, exposing the manager to similar headwinds as the value managers. Jackson Square Partners, our concentrated quality-growth manager, struggled the most due not only to having stylistic growth headwinds in the stability-led market, but a few costly stock-specific calls, notably with Valeant Pharmaceuticals, which represented a large portion of its losses for the period. Blackrock
| 6 | SEI Institutional Managed Trust / Annual Report / September 30, 2016 |
underperformed due to poor results within healthcare stocks, which underperformed throughout the year as industry scandals involving over-the-top drug pricing and research scares gave investors an excuse to sell out of the sector. Poor selection within the technology and retail sectors also dragged down the manager’s performance.
AVERAGE ANNUAL TOTAL RETURN1 |
| |||||||||||||||
| ||||||||||||||||
One Year Return | Average Annual 3-Year Return | Average Annual 5-Year Return | Annualized Inception to Date | |||||||||||||
| ||||||||||||||||
| Large Cap Fund, Class A | 10.15% | 8.18% | 14.83% | 11.48% | ||||||||||||
| ||||||||||||||||
| Large Cap Fund, Class Y | 10.50% | 8.34% | 14.94% | 11.55% | ||||||||||||
| ||||||||||||||||
| Russell 1000® Index | 14.93% | 10.78% | 16.41% | 13.24% | ||||||||||||
| ||||||||||||||||
Comparison of Change in the Value of a $100,000 Investment in the Large Cap Fund, Class A and Class Y, versus the Russell 1000® Index
| 1 | For the period ended 9/30/16. Past performance is no indication of future performance. Class A shares were offered beginning 9/30/09. Class Y shares were offered beginning 12/31/14. Class Y shares performance for the period prior to 12/31/14 is derived from the performance of Class A shares. Returns for Class Y shares are substantially similar to those of Class A shares and differ only to the extent that Class Y shares have lower total annual fund operating expenses than Class A shares. Returns for Class Y shares are substantially similar to those of Class A shares and differ only to the extent that Class Y shares have lower total annual fund operating expenses than Class A shares. Returns shown do not reflect the deduction of taxes that a shareholder would pay on fund distributions or the redemption of fund shares. The returns for the period reflect fee waivers and/or reimbursements in effect for the period; absent fee waivers and reimbursements, performance would have been lower. |
| SEI Institutional Managed Trust / Annual Report / September 30, 2016 | 7 |
MANAGEMENT’S DISCUSSION AND ANALYSIS OF FUND PERFORMANCE
September 30, 2016 (Unaudited)
Large Cap Value Fund
I. Objective
The Large Cap Value Fund (the “Fund”) seeks to provide long-term growth of capital and income.
II. Investment Approach
The Fund uses a multi-manager approach, relying on a number of sub-advisers with differing investment philosophies and strategies to manage portions of the Fund’s portfolio, under the general supervision of SEI Investments Management Corporation (“SIMC”). Assets of the Fund not allocated to sub-advisers are managed directly by SIMC. The Fund utilized the following sub-advisers during the fiscal year ended September 30, 2016: AQR Capital Management, LLC, Brandywine Global Investment Management, LLC, Coho Partners, Ltd., LSV Asset Management, Parametric Portfolio Associates LLC and Snow Capital Management L.P.
Sub-adviser AJO L.P. was removed from the Fund during the period, while AQR Capital Management, LLC was added.
III. Returns
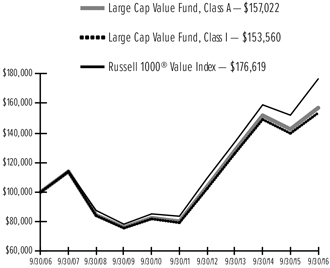
For the fiscal year ended September 30, 2016, the Large Cap Value Fund, Class A, returned 10.16%. The Fund’s benchmark — the Russell 1000® Value Index — returned 16.20%.
IV. Performance Discussion
The U.S. equity market began the reporting period with a short rally, led by cyclical stocks driven by decreasing concerns around a slowdown in emerging markets. The upbeat performance quickly turned into a nosedive during the turn of the New Year, as noted in the shareholder letter, after the Federal Reserve (“Fed”) raised rates for the first time in a decade. Despite the Fed’s interest-rate hike, the combination of renewed fears around a hard landing in the Chinese economy, commodity prices dropping to 30-year lows and falling rates in other developed markets pushed investors into low-volatility bond-proxy stocks in a global search for yield. As defensive and low-volatility stocks in the U.S. reached historically high valuations in February, government stimulus in China helped ease emerging-market growth concerns while oil prices found a floor. This was enough to restore investor confidence and spark a rally in cyclical stocks and commodity prices. Despite periods of volatility over the summer from Britain’s unexpected vote to leave the European Union and a moderation in commodity prices during the summer, the rally lasted through the rest of the period.
From a sector perspective, technology and utilities were the best-performing sectors. Technology benefited from increased earnings estimates and prospects of renewed growth late in the period and utilities benefited from a largely stability- and safety-oriented mindset for much of the period.
Stock selection was poor in all sectors. Within industrials, an overweight to a weak airlines industry took a significant toll on performance. Within healthcare, an overweight to biotechs and an underweight to healthcare equipment stocks detracted from performance. Biotech stocks sold off due to political pressure on the sector and multiple sector-wide scandals. Consumer discretionary was also a major detractor given the portfolio’s overweight to a slowing automotive industry and poor selection in retail stocks. The portfolio’s overweight to banks was also a big detractor. Banks continued to suffer from weak growth and a low-rate environment that progressively worsened throughout the period.
From a sub-adviser perspective, stability-oriented value manager Coho benefited from the aforementioned stability- and safety-oriented environment, which created a large tailwind for its process. Coho was the only manager to outperform the benchmark during the period. Snow, our concentrated deep-value manager, struggled the most as mean-reversion value had a very tough cyclical headwind early in the period. Because value stocks suffered for much of the period, Snow’s selection was poor in multiple sectors. The manager’s overweight to consumer discretionary and financial stocks also detracted as both sectors sold off due to poor outlook and sentiment during the period. It is worth noting that these cyclical trends in the market reversed in the past few months, with Coho’s performance fading while Snow’s recovered materially. Brandywine, another fundamental deep-value manager, also suffered notably due to the same stylistic preferences that hurt Snow. Selection drove losses that were spread across multiple sectors, while an overweight to airlines and consumer discretionary stocks further detracted. SIMC’s factor-based allocation was affected by value headwinds during the period as well. Selection was poor in the energy and information technology sectors, and an underweight to energy stocks also detracted a bit when the sector rebounded during the period. AJO and LSV had poor selection across multiple sectors and were both overweight airlines. The two managers, along with AQR Momentum, also underperformed in energy stocks.
| 8 | SEI Institutional Managed Trust / Annual Report / September 30, 2016 |
| AVERAGE ANNUAL TOTAL RETURN1 | ||||||||||||||||||||
| ||||||||||||||||||||
One Year Return | Average Annual 3-Year Return | Average Annual 5-Year Return | Average Annual 10-Year Return | Annualized Inception to Date | ||||||||||||||||
| ||||||||||||||||||||
| Large Cap Value Fund, Class A† | 10.16% | 7.02% | 14.42% | 4.62% | 8.08% | |||||||||||||||
| ||||||||||||||||||||
| Large Cap Value Fund, Class I† | 9.93% | 6.77% | 14.17% | 4.38% | 8.32% | |||||||||||||||
| ||||||||||||||||||||
| Large Cap Value Fund, Class Y | N/A | N/A | N/A | N/A | 2.88%* | |||||||||||||||
| ||||||||||||||||||||
| Russell 1000® Value Index | 16.20% | 9.70% | 16.15% | 5.85% | 9.73% | |||||||||||||||
| ||||||||||||||||||||
Comparison of Change in the Value of a $100,000 Investment in the Large Cap Value Fund, Class A and Class I, versus the Russell 1000® Index
| 1 | For the period ended 9/30/16. Past performance is no indication of future performance. Class A Shares were offered beginning 10/3/94 and Class I Shares were offered beginning 8/6/01. The performance of Class I Shares prior to 8/6/01 is calculated using the performance of the fund’s Class A Shares adjusted for the higher expenses of the Class I Shares. Class Y shares were offered beginning 10/3/15 and therefore do not have performance history for a full year. Returns shown do not reflect the deduction of taxes that a shareholder would pay on fund distributions or the redemption of fund shares. The returns for certain periods reflect fee waivers and/or reimbursements in effect for that period; absent fee waivers and reimbursements, performance would have been lower. |
† The graph is based on only Class A and Class I Shares; Returns for Class Y shares are substantially similar to those of Class A shares and differ only to the extent that Class Y shares have lower total annual fund operating expenses than Class A shares.
* Cumulative inception to date as of September 30, 2016.
N/A — Not available
| SEI Institutional Managed Trust / Annual Report / September 30, 2016 | 9 |
MANAGEMENT’S DISCUSSION AND ANALYSIS OF FUND PERFORMANCE
September 30, 2016 (Unaudited)
Large Cap Growth Fund
I. Objective
The Large Cap Growth Fund (the “Fund”) seeks to provide capital appreciation.
II. Investment Approach
The Fund uses a multi-manager approach, relying on a number of sub-advisers with differing investment philosophies and strategies to manage portions of the Fund’s portfolio, under the general supervision of SEI Investments Management Corporation (“SIMC”). Assets of the Fund not allocated to sub-advisers are managed directly by SIMC. The Fund utilized the following sub-advisers during the fiscal year ended September 30, 2016: BlackRock Investment Managers, LLC, Jackson Square Partners, LLC and Parametric Portfolio Associates LLC. No manager changes were made during the Fund’s fiscal year.
III. Returns
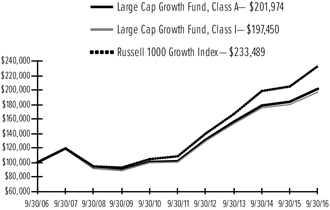
For the fiscal year ended September 30, 2016, the Large Cap Growth Fund, Class A, returned 9.77%. The Fund’s benchmark — the Russell 1000® Growth Index — returned 13.76%.
IV. Performance Discussion
The U.S. equity market began the reporting period with a short rally, led by cyclical stocks driven by decreasing concerns around a slowdown in emerging markets. The upbeat performance quickly turned into a nosedive at the turn of the New Year, as noted in the shareholder letter, after the Federal Reserve (“Fed”) raised rates for the first time in a decade. Despite the Fed’s interest-rate hike, the combination of renewed fears around a hard landing in the Chinese economy, commodity prices dropping to 30-year lows and falling rates in other developed markets pushed investors into low-volatility bond-proxy stocks in a global search for yield. As defensive and low-volatility stocks in the U.S. reached historically high valuations in February, government stimulus in China helped ease emerging-market growth concerns while oil prices found a floor. This was enough to restore investor confidence and spark a rally in cyclical stocks and commodity prices. Despite periods of volatility over the summer from Britain’s unexpected vote to leave the European Union and a moderation in commodity prices during the summer, the rally lasted through the rest of the period. From a sector perspective, technology and utilities were the best-performing sectors. Technology benefited from increased earnings estimates and prospects of renewed growth late in the period and utilities benefited from a
largely stability- and safety-oriented mindset for much of the period.
The Fund was prominently overweight technology stocks as the sector presented higher-growth opportunities with some of the fastest-growing stocks; the overweight was beneficial as technology was one of the best-performing sectors during the period. Stock selection within the sector was positive mainly due to Jackson Square, which preferred the largest and fastest-growing technology stocks such as Facebook and Google, which saw double-digit returns over the period as internet usage and reliance from the general population grew. Selection within tech was dragged down by selection within other sectors. Selection within healthcare was weak due to negative sentiment within the sector from political pressure and poor mergers and acquisition results in some portfolio holdings. Selection within consumer discretionary stocks was poor in retail sectors.
From a sub-adviser perspective, all of the managers underperformed for the period, facing strong stylistic headwinds to earnings revisions, momentum and forward-looking growth prospects. SIMC’s factor-based allocation lagged by the least, benefiting from its risk-managed process and broader diversification relative to the other managers. Jackson Square Partners, our concentrated quality-growth manager, struggled due not only to stylistic headwinds to growth in the stability-led market, but also a few costly stock-specific calls, notably with Valeant Pharmaceuticals, which represented a large portion of its losses for the period. Blackrock also underperformed due to poor results within healthcare stocks, which underperformed throughout the year as industry scandals involving over-the-top drug pricing and research scares gave investors an excuse to sell out of the sector. Poor selection within the technology and retail sectors also dragged down the manager’s performance.
| 10 | SEI Institutional Managed Trust / Annual Report / September 30, 2016 |
| AVERAGE ANNUAL TOTAL RETURN1 | ||||||||||||||||||||
| ||||||||||||||||||||
One Year Return | Average Annual 3-Year Return | Average Annual 5-Year Return | Average Annual 10-Year Return | Annualized Inception to Date | ||||||||||||||||
| ||||||||||||||||||||
| Large Cap Growth Fund, Class A† | 9.77% | 8.95% | 14.76% | 7.28% | 7.84% | |||||||||||||||
| ||||||||||||||||||||
| Large Cap Growth Fund, Class I† | 9.54% | 8.72% | 14.51% | 7.04% | 7.52% | |||||||||||||||
| ||||||||||||||||||||
| Large Cap Growth Fund, Class Y | N/A | N/A | N/A | N/A | 1.58%* | |||||||||||||||
| ||||||||||||||||||||
| Russell 1000® Growth Index | 13.76% | 11.83% | 16.60% | 8.85% | 8.89% | |||||||||||||||
| ||||||||||||||||||||
Comparison of Change in the Value of a $100,000 Investment in the Large Cap Growth Fund, Class A and Class I, versus the Russell 1000® Index
| 1 | For the period ended 9/30/16. Past performance is no indication of future performance. Class A Shares were offered beginning 12/20/94 and Class I Shares were offered beginning 8/6/01. The performance of Class I Shares prior to 8/6/01 is calculated using the performance of the fund’s Class A Shares adjusted for the higher expenses of the Class I Shares. Class Y shares were offered beginning 10/30/15 and therefore do not have performance history for a full year. Returns shown do not reflect the deduction of taxes that a shareholder would pay on fund distributions or the redemption of fund shares. The returns for certain periods reflect fee waivers and/or reimbursements in effect for that period; absent fee waivers and reimbursements, performance would have been lower. |
† The graph is based on only Class A and Class I Shares. Returns for Class Y shares are substantially similar to those of Class A shares and differ only to the extent that Class Y shares have lower total annual fund operating expenses than Class A shares.
* Cumulative inception to date as of September 30, 2016.
N/A — Not available
| SEI Institutional Managed Trust / Annual Report / September 30, 2016 | 11 |
MANAGEMENT’S DISCUSSION AND ANALYSIS OF FUND PERFORMANCE
September 30, 2016 (Unaudited)
Tax-Managed Large Cap Fund
I. Objective
The Tax-Managed Large Cap Fund (the “Fund”) seeks to provide high, long-term after-tax returns.
II. Investment Approach
The Fund uses a multi-manager approach, relying on a number of sub-advisers with differing investment approaches to manage portions of the Fund’s portfolio, under the general supervision of SEI Investments Management Corporation (“SIMC”). Assets of the Fund not allocated to sub-advisers are managed directly by SIMC. The Fund utilized the following sub-advisers during the fiscal year ended September 30, 2016: AQR Capital Management, LLC, BlackRock Investment Management LLC, Brandywine Global Investment Management, LLC, Coho Partners, Ltd., Jackson Square Partners, LLC, LSV Asset Management, Parametric Portfolio Associates LLC and Snow Capital Management, LP. No manager changes were made during the Fund’s fiscal year.
III. Returns
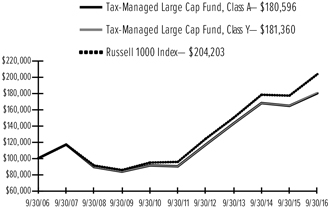
For the fiscal year ended September 30, 2016, the Tax-Managed Large Cap Fund, Class A, returned 9.42%. The Fund’s benchmark — the Russell 1000® Index — returned 14.93%.
IV. Performance Discussion
The U.S. equity market began the reporting period with a short rally, led by cyclical stocks driven by decreasing concerns around a slowdown in emerging markets. The upbeat performance quickly turned into a nosedive at the turn of the New Year, as noted in the shareholder letter, after the Federal Reserve (“Fed”) raised rates for the first time in a decade. Despite the Fed’s interest-rate hike, the combination of renewed fears around a hard landing in the Chinese economy, commodity prices dropping to 30-year lows and falling rates in other developed markets pushed investors into low-volatility bond-proxy stocks in a global search for yield. As defensive and low-volatility stocks in the U.S. reached historically high valuations in February, government stimulus in China helped ease emerging-market growth concerns while oil prices found a floor. This was enough to restore investor confidence and spark a rally in cyclical stocks and commodity prices. Despite periods of volatility over the summer from Britain’s unexpected vote to leave the European Union and a moderation in commodity prices during the summer, the rally lasted through the rest of the period. Technology and utilities
performed well during the period. Technology benefited from increased earnings estimates and prospects of renewed growth late in the period, while utilities benefited from what a largely stability- and safety-oriented mindset for much of the period.
Losses stemmed from poor stock selection, which was concentrated in two sectors and most severe in healthcare. Within the healthcare sector, the portfolio was overweight the weakest industries (biotech) while underweight the best-performing industries (healthcare equipment and supplies). Biotech stocks sold off due to political pressure on the entire healthcare sector and sector-wide scandals. The portfolio’s consumer discretionary stocks also had very poor performance, with losses stemming from retailing sectors. The portfolio’s heavy overweight to airline stocks (from value managers) also detracted from performance as the industry sold off.
From a sub-adviser perspective, stability-oriented value manager Coho did best due to the aforementioned stability- and safety-oriented environment that created a large tailwind for its process. Snow, our concentrated deep-value manager, struggled as mean-reversion value had a very tough cyclical headwind early in the period. Because value stocks suffered for much of the period, Snow’s selection was poor in multiple sectors. The manager’s overweight to financial stocks also detracted as the sector sold off due to poor outlook and sentiment during the period. It is worth noting that these cyclical trends in the market reversed in the past few months, with Coho’s performance fading while Snow’s recovered materially. Brandywine, another fundamental deep-value manager, also suffered notably due to the same stylistic preferences that hurt Snow. Selection drove losses that were spread across multiple sectors, while overweights to airlines and financial stocks further detracted. LSV faced similar headwinds, with poor selection across multiple sectors and an overweight to airlines. SIMC’s factor-based allocation also struggled for the period as its traditional leanings to value and momentum faced stylistic headwinds. AQR also underperformed the benchmark as the manager had value tilts during the period, exposing the manager to similar headwinds as value managers. Jackson Square Partners, our concentrated quality-growth manager, struggled the most due not only to having stylistic headwinds to growth in the stability-led market, but also a few costly stock-specific calls, notably with Valeant Pharmaceuticals, which represented a large portion of its losses for the period. Blackrock underperformed due to poor results within healthcare
| 12 | SEI Institutional Managed Trust / Annual Report / September 30, 2016 |
stocks, which underperformed throughout the year as industry scandals involving over-the top-drug pricing and research scares gave investors an excuse to sell out of the sector. Poor selection within the technology and retail sectors also dragged down the manager’s performance.
AVERAGE ANNUAL TOTAL RETURN1
| ||||||||||||||||||||
| One Year Return | Average 3-Year Return | Average 5-Year Return | Average 10-Year | Annualized to Date | ||||||||||||||||
| ||||||||||||||||||||
| Tax-Managed Large Cap Fund, Class A | 9.42% | 8.05% | 14.91% | 6.09% | 4.94% | |||||||||||||||
| ||||||||||||||||||||
| Tax-Managed Large Cap Fund, Class Y | 9.75% | 8.21% | 15.01% | 6.13% | 4.96% | |||||||||||||||
| ||||||||||||||||||||
| Russell 1000® Index | 14.93% | 10.78% | 16.41% | 7.40% | 6.26% | |||||||||||||||
| ||||||||||||||||||||
Comparison of Change in the Value of a $100,000 Investment in the Tax-Managed Large Cap Fund, Class A and Class Y, versus the Russell 1000® Index
| 1 | For the period ended 9/30/16. Past performance is no indication of future performance. Class A Shares were offered beginning 3/5/98. Class Y shares were offered beginning 12/31/14. Class Y shares performance for the period prior to 12/31/14 is derived from the performance of Class A shares. Returns for Class Y shares are substantially similar to those of Class A shares and differ only to the extent that Class Y shares have lower total annual fund operating expenses than Class A shares. Returns shown do not reflect the deduction of taxes that a shareholder would pay on fund distributions or the redemption of fund shares. The returns for certain periods reflect fee waivers and/or reimbursements in effect for that period; absent fee waivers and reimbursements, performance would have been lower. |
| SEI Institutional Managed Trust / Annual Report / September 30, 2016 | 13 |
MANAGEMENT’S DISCUSSION AND ANALYSIS OF FUND PERFORMANCE
September 30, 2016 (Unaudited)
S&P 500 Index Fund
I. Objective
The S&P 500 Index Fund (the “Fund”) seeks to provide investment results that correspond to the aggregate price and dividend performance of the securities in the S&P 500 Index.
II. Investment Approach
During the fiscal year ended September 30, 2016, the Fund used a single sub-adviser, State Street Global Advisors (“SSgA”), under the general supervision of SEI Investments Management Corporation (SIMC). No manager changes were made during the Fund’s fiscal year.
III. Returns
For the fiscal year ended September 30, 2016, the S&P 500 Index Fund, Class A, returned 14.93%. The Fund’s benchmark — the S&P 500 Index — returned 15.43%.
IV. Performance Discussion
The Fund achieved its objective of tracking, before fees and expenses, the performance of the S&P 500 Index.
The U.S. equity market began the reporting period with a short rally, led by cyclical stocks driven by decreasing concerns around a slowdown in emerging markets. The upbeat performance quickly turned into a nosedive at the turn of the New Year, as noted in the shareholder letter, after the Federal Reserve (“Fed”) raised rates for the first time in a decade. Despite the Fed’s interest-rate hike, the combination of renewed fears around a hard landing in the Chinese economy, commodity prices dropping to 30-year lows and falling rates in other developed markets pushed investors into low-volatility bond-proxy stocks in a global search for yield. As defensive and low-volatility stocks in the U.S. reached historically high valuations in February, government stimulus in China helped ease emerging-market growth concerns while oil prices found a floor. This was enough to restore investor confidence and spark a rally in cyclical stocks and commodity prices. Despite periods of volatility over the summer from Britain’s unexpected vote to leave the European Union and a moderation in commodity prices during the summer, the rally lasted through the rest of the period. From a sector perspective, technology and utilities were the best-performing sectors. Technology benefited from increased earnings estimates and prospects of renewed growth late in the period and utilities benefited from
what was a largely stability- and safety-oriented mindset for much of the period.
Derivatives may be used within the Fund to provide increased efficiency at handling cash flows for replicating the Fund’s benchmark exposures. They are not used for speculation purposes.
AVERAGE ANNUAL TOTAL RETURN1
| ||||||||||||||||||||
| One Year Return | Average 3-Year Return | Average 5-Year Return | Average 10-Year | Annualized to Date | ||||||||||||||||
| ||||||||||||||||||||
| S&P 500 Index Fund, Class A† | 14.93% | 10.71% | 15.91% | 6.83% | 7.65% | |||||||||||||||
| ||||||||||||||||||||
| S&P 500 Index Fund, Class E† | 15.14% | 10.91% | 16.13% | 7.02% | 10.31% | |||||||||||||||
| ||||||||||||||||||||
| S&P 500 Index Fund, Class I† | 14.67% | 10.46% | 15.66% | 6.59% | 7.17% | |||||||||||||||
| ||||||||||||||||||||
| S&P 500 Index Fund, Class Y | N/A | N/A | N/A | N/A | 6.19%* | |||||||||||||||
| ||||||||||||||||||||
| S&P 500 Index | 15.43% | 11.16% | 16.37% | 7.24% | 8.09% | |||||||||||||||
| ||||||||||||||||||||
Comparison of Change in the Value of a $100,000 Investment in the S&P 500 Index Fund, Class A and Class I, versus the S&P 500 Index

| 14 | SEI Institutional Managed Trust / Annual Report / September 30, 2016 |
Comparison of Change in the Value of a $5,000,000 Investment in the S&P 500 Index Fund, Class E, versus the S&P 500 Index
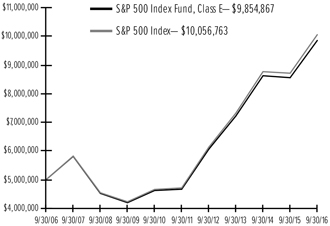
| 1 | For the year ended September 30, 2016. Past performance is not an indication of future performance. Class A shares were offered beginning 2/28/96. Class E Shares were offered beginning 7/31/85. Class I Shares were offered beginning 6/28/02. Class Y shares were offered beginning 10/30/15 and therefore do not have performance history for a full year. The performance of Class I Shares prior to 6/28/02 is calculated using the performance of the fund’s Class A Shares adjusted for the higher expenses of the Class I Shares. Effective 7/31/97, the Board of Trustees approved the renaming of Class A and Class E shares to Class E and Class A shares, respectively. Returns shown do not reflect the deduction of taxes that a shareholder would pay on fund distributions or the redemption of fund shares. The returns for certain periods reflect fee waivers and reimbursements, performance would have been lower. |
† The graph is based on only Class A, Class E and Class I Shares. Returns for Class Y shares are substantially similar to those of Class A shares and differ only to the extent that Class Y shares have lower total annual fund operating expenses than Class A shares.
* Cumulative return as of inception date, which was October 30, 2015.
N/A — Not available
| SEI Institutional Managed Trust / Annual Report / September 30, 2016 | 15 |
MANAGEMENT’S DISCUSSION AND ANALYSIS OF FUND PERFORMANCE
September 30, 2016 (Unaudited)
Small Cap Fund
I. Objective
The Small Cap Fund (the “Fund”) seeks to provide capital appreciation.
II. Investment Approach
The Fund uses a multi-manager approach, relying on a number of sub-advisers with differing investment approaches to manage portions of the Fund’s portfolio, under the general supervision of SEI Investments Management Corporation (“SIMC”). Assets of the Fund not allocated to sub-advisers are managed directly by SIMC. The Fund utilized the following sub-advisers during the fiscal year ended September 30, 2016: AllianceBernstein, L.P., AQR Capital Management, LLC, EAM Investors, LLC, Falcon Point Capital, LLC, Integrity Asset Management, LLC, Mesirow Financial Equity Management, Parametric Portfolio Associates LLC, Robeco Investment Management, Inc., Snow Capital Management, LP and State Street Global Advisors.
Mesirow Financial Equity Management changed its name from Fiduciary Management Associates, LLC following an acquisition by Mesirow Financial Investment Management, Inc. during the period.
Sub-advisers Integrity Asset Management, LLC and State Street Global Advisors were terminated from the Fund, while Falcon Point Capital, LLC and SIMC were added during the period.
III. Returns
For the fiscal year ended September 30, 2016, the Small Cap Fund, Class A, returned 7.76%. The Fund’s benchmark — the Russell 2000 Index — returned 15.47%.
IV. Performance Discussion
The U.S. equity market began the reporting period with a short rally, led by cyclical stocks driven by decreasing concerns around a slowdown in emerging markets. The upbeat performance quickly turned into a nosedive at the turn of the New Year, as noted in the shareholder letter, after the Federal Reserve (“Fed”) raised rates for the first time in a decade. Despite the Fed’s interest-rate hike, the combination of renewed fears around a hard landing in the Chinese economy, commodity prices dropping to 30-year lows, and falling rates in other developed markets pushed investors into low-volatility bond-proxy stocks in a global search for yield. As defensive and low-volatility stocks in the U.S. reached historically high valuations in February, government stimulus in China helped ease emerging-market growth concerns while oil prices found a floor. This was enough
to restore investor confidence and spark a rally in cyclical stocks and commodity prices. Despite periods of volatility over the summer from Britain’s unexpected vote to leave the European Union and a moderation in commodity prices during the summer, the rally lasted through the rest of the period.
From a sector perspective, materials, utilities and technology were the best performers; utilities did well during the first half of the period and materials and technology rebounded during the second half. Other yield-producing sectors (including real estate and telecommunications) performed well during the beginning of the period, but faded in the second half as other cyclical sectors (energy and industrials) picked up. All four sectors remained in the middle of the pack in terms of performance at the end of the period. Consumer discretionary was the worst-performing sector as traditional retailers, facing a challenge from online shopping, came under increased pressure.
The Fund’s underweight to healthcare in February and underweight to a poorly-performing consumer discretionary sector helped, while selection within technology, industrials and healthcare hurt. Information technology and industrials were the greatest detractors due to poor stock selection within both sectors. Within industrials, machinery was the most significant detractor while software was the largest detractor for tech stocks.
AQR Stability and SEISIMC’s factor-based allocation were the best performing managers during the period, although both managers were added only in the first quarter of the year, along with Falcon Point. SIMC’s factor-based allocation outperformed the benchmark in materials and financials stocks but underperformed in energy and healthcare stocks. Overall, the strategy underperformed the benchmark during the period. Snow was the weakest performer due to poor selection in industrials, healthcare and energy. Performance for other managers was mixed. Despite the value tailwind during much of 2016, value managers FMA and Robeco generally struggled, mostly due to selection.
| AVERAGE ANNUAL TOTAL RETURN1 | ||||||||
| ||||||||
| Annualized | Annualized | Annualized | ||||||
| 1 Year Return | 3 Year Return | 5 Year Return | Inception to Date | |||||
| ||||||||
| Small Cap Fund, Class A | 7.76% | 3.91% | 14.06% | 10.52% | ||||
| ||||||||
| Small Cap Fund, Class Y | 8.08% | 4.07% | 14.16% | 10.59% | ||||
| ||||||||
| Russell 2000 Index | 15.47% | 6.71% | 15.82% | 12.48% | ||||
| ||||||||
| 16 | SEI Institutional Managed Trust / Annual Report / September 30, 2016 |
Comparison of Change in the Value of a $100,000 Investment in the Small Cap Fund, Class A and Class Y, versus the Russell 1000® Index
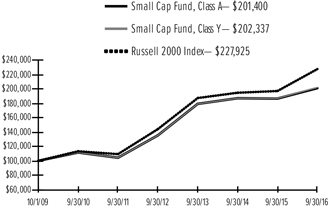
| 1 | For the year ended May 31, 2016. Past performance is not an indication of future performance. Class A shares were offered beginning 6/14/96. Class Y shares were offered beginning 12/31/14. Class Y shares performance for the period prior to 12/31/14 is derived from the performance of Class A shares adjusted for the lower expenses of the Class Y shares. Returns shown do not reflect the deduction of taxes that a shareholder would pay on fund distributions or the redemption of fund shares. The returns for certain periods reflect fee waivers and reimbursements, performance would have been lower. |
| SEI Institutional Managed Trust / Annual Report / September 30, 2016 | 17 |
MANAGEMENT’S DISCUSSION AND ANALYSIS OF FUND PERFORMANCE
September 30, 2016 (Unaudited)
Small Cap Value Fund
I. Objective
The Small Cap Value Fund (the “Fund”) seeks to provide capital appreciation.
II. Investment Approach
The Fund uses a multi-manager approach, relying on a number of sub-advisers with differing investment approaches to manage portions of the Fund’s portfolio, under the general supervision of SEI Investments Management Corporation (“SIMC”). Assets of the Fund not allocated to sub-advisers are managed directly by SIMC. The Fund utilized the following sub-advisers during the fiscal year ending September 30, 2016: AQR Capital Management, LLC, Cardinal Capital Management LLC, LMCG Investments, LLC, LSV Asset Management, Martingale Asset Management, L.P., Mesirow Financial Equity Management, Inc., Parametric Portfolio Associates LLC, Robeco Investment Management, Inc., Security Capital Research + Management Incorporated, Snow Capital Management, L.P. and William Blair + Company, LLC.
Mesirow Financial Equity Management changed its name from Fiduciary Management Associates, LLC following an acquisition by Mesirow Financial Investment Management, Inc. during the period.
Sub-advisers LMCG Investments, LLC, Martingale Asset Management, L.P., Security Capital Research + Management Incorporated and William Blair + Company, LLC were terminated from the Fund during the period, while AQR Capital Management, LLC, Cardinal Capital Management LLC, Snow Capital Management, LP and SIMC were added during the period.
III. Returns
For the fiscal year ended September 30, 2016, the Small Cap Value Fund, Class A, returned 11.60%. The Fund’s benchmark — the Russell 2000® Value Index — returned 18.81%.
IV. Performance Discussion
The U.S. equity market began the reporting period with a short rally, led by cyclical stocks driven by decreasing concerns around a slowdown in emerging markets. The upbeat performance quickly turned into a nosedive at the turn of the New Year, as noted in the shareholder letter, after the Federal Reserve (“Fed”) raised rates for the first time in a decade. Despite the Fed’s interest-rate hike, the combination of renewed fears around a hard landing in the Chinese economy, commodity prices dropping to 30-year lows and falling rates in
other developed markets pushed investors into low-volatility bond-proxy stocks in a global search for yield. As defensive and low-volatility stocks in the U.S. reached historically high valuations in February, government stimulus in China helped ease emerging-market growth concerns while oil prices found a floor. This was enough to restore investor confidence and spark a rally in cyclical stocks and commodity prices. Despite periods of volatility over the summer from Britain’s unexpected vote to leave the European Union and a moderation in commodity prices during the summer, the rally lasted through the rest of the period.
Materials, technology and industrials were the best-performing sectors as the risk-on rally during the second half of the period helped propel them to the top of the list. Consumer discretionary was the worst-performing sector as consumer confidence wavered and traditional retailers came under pressure from the increasing use of online retailers
From a sector perspective, the Fund outperformed the benchmark in financials but underperformed in all other sectors. Within financials, an underweight to banks and an overweight to consumer financials helped drive portfolio performance. An overweight to cyclical sectors including industrials, materials and energy helped, but poor selection led to large losses within those sectors. Within industrials and materials, selection was extremely poor in machinery and metals and mining stocks. Healthcare was a large detractor due to poor selection in healthcare providers and services. Selection was also poor across the entire technology sector.
All managers underperformed the benchmark due mostly to poor stock selection. LSV was the best-performing manager during the period. Both Snow and FMA suffered from weak selection despite the value tailwind that emerged during the second half of the period. Quantitative-value managers LSV and SIMC’s factor-based allocation fared better, as they were able to capture more of the value tailwind with their strategies. SIMC underperformed due to poor selection within healthcare, industrials and materials stocks. Within industrials, poor performance stemmed from selection within aerospace, machinery and professional services companies. During the first quarter, LMCG, William Blair, Security and Martingale were removed and replaced with Snow Capital, SIMC’s factor-based allocation, AQR Stability and Cardinal.
| 18 | SEI Institutional Managed Trust / Annual Report / September 30, 2016 |
| AVERAGE ANNUAL TOTAL RETURN1 | ||||||||||
| ||||||||||
| Average | Average | Average | ||||||||
| Annual | Annual | Annual | Annualized | |||||||
| One Year | 3-Year | 5-Year | 10-Year | Inception | ||||||
| Return | Return | Return | Return | to Date | ||||||
| ||||||||||
| Small Cap Value Fund, Class A† | 11.60% | 5.01% | 13.97% | 5.54% | 9.90% | |||||
| ||||||||||
| Small Cap Value Fund, Class I† | 11.34% | 4.76% | 13.73% | 5.30% | 9.58% | |||||
| ||||||||||
| Small Cap Value Fund, Class Y | N/A | N/A | N/A | N/A | 6.04%* | |||||
| ||||||||||
| Russell 2000® Value Index | 18.81% | 6.77% | 15.45% | 5.78% | 10.51% | |||||
| ||||||||||
Comparison of Change in the Value of a $100,000 Investment in the Small Cap Value Fund, Class A and Class I, versus the Russell 2000® Index
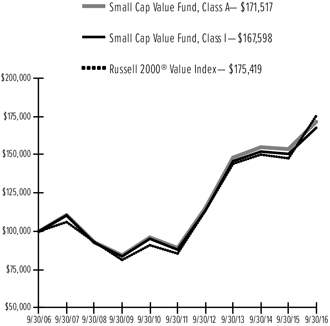
| 1 | For the period ended 9/30/16. Past performance is no indication of future performance. Class A Shares were offered beginning 12/20/94 and Class I Shares were offered beginning 2/11/02. The performance of Class I Shares prior to 2/11/02 is calculated using the performance of the fund’s Class A Shares adjusted for the higher expenses of the Class I Shares. Class Y shares were offered beginning 10/30/15 and therefore do not have performance history for a full year. Returns shown do not reflect the deduction of taxes that a shareholder would pay on fund distributions or the redemption of fund shares. The returns for certain periods reflect fee waivers and/or reimbursements in effect for that period; absent fee waivers and reimbursements, performance would have been lower. |
† The graph is based on only Class A and Class I Shares. Class Y shares were offered beginning 10/30/15 and therefore do not have performance history for a full year. |
* Cumulative inception to date as of September 30, 2016.
N/A — Not available
| SEI Institutional Managed Trust / Annual Report / September 30, 2016 | 19 |
MANAGEMENT’S DISCUSSION AND ANALYSIS OF FUND PERFORMANCE
September 30, 2016 (Unaudited)
Small Cap Growth Fund
I. Objective
The Small Cap Growth Fund (the “Fund”) seeks to provide long-term capital appreciation.
II. Investment Approach
The Fund uses a multi-manager approach, relying on a number of sub-advisers with differing investment approaches to manage portions of the Fund’s portfolio, under the general supervision of SEI Investments Management Corporation (“SIMC”). Assets of the Fund not allocated to sub-advisers are managed directly by SIMC. The Fund utilized the following sub-advisers during the fiscal year ending September 30, 2016: AllianceBernstein, L.P., AQR Capital Management, LLC, Arrowpoint Asset Management, LLC, Axiom International Investors LLC, EAM Investors LLC, Falcon Point Capital, LLC, J.P. Morgan Investment Management Inc., Parametric Portfolio Associates LLC, and State Street Global Advisors.
Sub-advisers AQR Capital Management, LLC, J.P. Morgan Investment Management Inc., and State Street Global Advisors were terminated from the Fund, while Axiom International Investors LLC, Falcon Point Capital, LLC and SIMC were added to the Fund during the period.
III. Returns
For the fiscal year ended September 30, 2016, the Small Cap Growth Fund, Class A, returned 8.50%. The Fund’s benchmark — the Russell 2000® Growth Index — returned 12.12%.
IV. Performance Discussion
The U.S. equity market began the reporting period with a short rally, led by cyclical stocks driven by decreasing concerns around a slowdown in emerging markets. The upbeat performance quickly turned into a nosedive at the turn of the New Year, as noted in the shareholder letter, after the Federal Reserve (Fed) raised rates for the first time in a decade. Despite the Fed’s interest-rate hike, the combination of renewed fears around a hard landing in the Chinese economy, commodity prices dropping to 30-year lows and falling rates in other developed markets pushed investors into low-volatility bond-proxy stocks in a global search for yield. As defensive and low-volatility stocks in the U.S. reached historically high valuations in February, government stimulus in China helped ease emerging-market growth concerns while oil prices found a floor. This was enough to restore investor confidence and spark a rally in cyclical stocks and commodity prices. Despite periods
of volatility over the summer from Britain’s unexpected vote to leave the European Union and a moderation in commodity prices during the summer, the rally lasted through the rest of the period.
From a sector perspective, materials, technology and the new real estate sector (which was previously a subset of the financial sector) were the best performers. The risk-on rally during the second half of the period helped propel technology and materials to the top of the list, while real estate benefited from the market’s thirst for yield and safety, as well as strong fundamentals in the U.S. housing. Consumer discretionary was the worst-performing sector as traditional retailers, facing a challenge from online shopping, came under increased pressure.
The Fund underperformed the benchmark primarily due to stock selection across consumer discretionary, technology and healthcare. Technology was the largest detractor due to poor stock selection lagging strong returns in the software industry. Within healthcare, an underweight to biotech stocks helped, but poor selection more than offset the contributions from the weighting effects.
All managers except Arrowpoint underperformed the benchmark. Axiom was the worst-performing manager due to poor selection and its momentum orientation, which exposed the portfolio to defensive (but expensive) portions of the market that were left behind when cyclicals rallied. EAM, the Fund’s other momentum manager, also underperformed due to momentum exposure and poor selection in technology and healthcare stocks. Arrowpoint outperformed the benchmark due to an underweight to healthcare and selection within healthcare and technology. Arrowpoint was also underweight the highest-momentum stocks, which contributed to performance. SIMC’s factor-based allocation underperformed due primarily to poor selection, especially within healthcare exposures to technology and biotech stocks. Performance in other sectors was also generally poor as a result of selection. Only the materials sector contributed to performance due to strong selection in chemicals stocks.
| 20 | SEI Institutional Managed Trust / Annual Report / September 30, 2016 |
| AVERAGE ANNUAL TOTAL RETURN1 | ||||||||||
| ||||||||||
| Annualized | Annualized | Annualized | Annualized | |||||||
| 1 Year | 3 Year | 5 Year | 10 Year | Inception | ||||||
| Return | Return | Return | Return | to Date | ||||||
| ||||||||||
| Small Cap Growth Fund, Class A† | 8.50% | 5.43% | 15.34% | 5.48% | 8.89% | |||||
| ||||||||||
| Small Cap Growth Fund, Class I† | 8.25% | 5.16% | 15.06% | 5.21% | 8.57% | |||||
| ||||||||||
| Small Cap Growth Fund, Class Y | N/A | N/A | N/A | N/A | 4.37%* | |||||
| ||||||||||
| Russell 2000® Growth Index | 12.12% | 6.58% | 16.15% | 8.29% | 7.53% | |||||
| ||||||||||
Comparison of Change in the Value of a $100,000 Investment in the Small Cap Growth Fund, Class A and Class I, versus the Russell 2000® Growth Index.
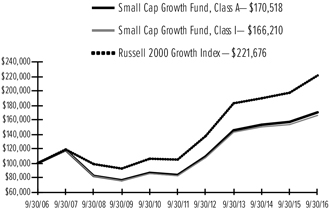
| 1 | For the period ended 9/30/16. Past performance is not an indication of future performance. Class A shares were offered beginning 4/20/92 and Class I shares were offered beginning 8/6/01. Class I shares performance for the period prior to 8/6/01 is derived from the performance of Class A shares adjusted for the higher expenses of Class I shares. Class Y shares were offered beginning 10/30/15 and therefore do not have performance history for a full year. Returns shown do not reflect the deduction of taxes that a shareholder would pay on fund distributions or the redemption of fund shares. The returns for certain periods reflect fee waivers and/or reimbursements in effect for that period; absent fee waivers and/ or reimbursements, performance would have been lower. |
| † | The graph is based on only Class A and Class I Shares. Returns for Class Y shares are substantially similar to those of Class A shares and differ only to the extent that Class Y shares have lower total annual fund operating expenses than Class A shares. |
| * | Cumulative inception to date as of October 30, 2015. |
N/A — Not available
| SEI Institutional Managed Trust / Annual Report / September 30, 2016 | 21 |
MANAGEMENT’S DISCUSSION AND ANALYSIS OF FUND PERFORMANCE
September 30, 2016 (Unaudited)
Tax-Managed Small/Mid Cap Fund
I. Objective
The Tax-Managed Small/Mid Cap Fund (the “Fund”) seeks to provide high, long-term after-tax returns.
II. Investment Approach
The Fund uses a multi-manager approach, relying on a number of sub-advisers with differing investment approaches to manage portions of the Fund’s portfolio, under the general supervision of SEI Investments Management Corporation (“SIMC”). Assets of the Fund not allocated to sub-advisers are managed directly by SIMC. The Fund utilized the following sub-advisers during the fiscal year ending September 30, 2016: AllianceBernstein, L.P., AQR Capital Management, LLC, Cardinal Capital Management LLC, CastleArk Management, LLC, LMCG Investments, LLC, Mesirow Financial Investment Management, Inc., Parametric Portfolio Associates LLC, Snow Capital Management LP and William Blair + Company, LLC.
Mesirow Financial Equity Management changed its name from Fiduciary Management Associates, LLC following an acquisition by Mesirow Financial Investment Management, Inc. during the year.
Sub-advisers LMCG Investments, LLC and William Blair + Company, LLC were terminated from the Fund, while sub-advisers AQR Capital Management, LLC and Cardinal Capital Management LLC were added to the Fund during the year.
III. Returns
For the fiscal year ended September 30, 2016, the Tax-Managed Small/ Mid Cap Fund, Class A, returned 8.55%. The Fund’s benchmark — the Russell 2500® Index — returned 14.44%.
IV. Performance Discussion
The U.S. equity market began the reporting period with a short rally, led by cyclical stocks driven by decreasing concerns around a slowdown in emerging markets. The upbeat performance quickly turned into a nosedive at the turn of the New Year, as noted in the shareholder letter, after the Federal Reserve (the “Fed”) raised rates for the first time in a decade. Despite the Fed’s interest-rate hike, the combination of renewed fears around a hard landing in the Chinese economy, commodity prices dropping to 30-year lows and falling rates in other developed markets pushed investors into low-volatility bond-proxy stocks in a global search for yield. As defensive and low-volatility stocks in the U.S. reached historically high valuations in February, government
stimulus in China helped ease emerging-market growth concerns while oil prices found a floor. This was enough to restore investor confidence and spark a rally in cyclical stocks and commodity prices. Despite periods of volatility over the summer from Britain’s unexpected vote to leave the European Union and a moderation in commodity prices during the summer, the rally lasted through the rest of the period.
Materials, utilities and real estate performed well during the period. Materials rebounded along with the commodity rally, while the dividend-yielding sectors utilities and real estate benefited from the global search for yield. Consumer discretionary was the weakest-performing sector due to headwinds from a decrease in consumer confidence and increasing competition from online retailers.
Relative to the benchmark, the portfolio outperformed in both consumer sectors by being underweight consumer discretionary and overweight consumer staples. However, the Fund underperformed mostly due to stock selection in multiple sectors, including healthcare, industrials, information technology, materials and energy. Within healthcare, overweights to providers and services were primarily responsible for underperformance within the sector. Within industrials, selection was poor across most industries.
The Fund’s value managers detracted most. Snow Capital suffered due to poor stock selection. FMA also underperformed its value benchmark due to a combination of stock selection and an overweight to momentum stocks, which largely consisted of dividend-paying stocks that sold off as defensives fell out of favor. Growth managers detracted less on a relative basis, underperforming primarily due to stock-specific reasons. Similar to Mesirow, the same headwinds that caused momentum stocks to sell off also detracted from CastleArk’s performance, as CastleArk has more exposure to dividend-paying stocks. The SIMC’s factor-based allocation was the worst performing strategy, with losses from selection spread across multiple factors. The strategy’s value-based tilts detracted from performance.
| AVERAGE ANNUAL TOTAL RETURN1 | ||||||||||
| ||||||||||
| Average | Average | Average | ||||||||
| Annual | Annual | Annual | Annualized | |||||||
| One Year | 3-Year | 5-Year | 10-Year | Inception | ||||||
| Return | Return | Return | Return | to Date | ||||||
| ||||||||||
| Tax-Managed Small/Mid Cap Fund, Class A | 8.55% | 5.79% | 14.46% | 6.10% | 6.39% | |||||
| ||||||||||
| Tax-Managed Small/Mid Cap Fund, Class Y | 8.79% | 5.92% | 14.55% | 6.14% | 6.42% | |||||
| ||||||||||
| Russell 2500® Index | 14.44% | 7.77% | 16.30% | 7.94% | 8.22% | |||||
| ||||||||||
| 22 | SEI Institutional Managed Trust / Annual Report / September 30, 2016 |
Comparison of Change in the Value of a $100,000 Investment in the Tax-Managed Small/Mid Cap Fund, Class A and Class Y, versus the Russell 2500® Index
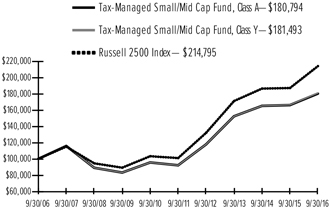
| 1 | For the period ended 9/30/16. Past performance is no indication of future performance. Class A shares were offered beginning 10/31/00. Class Y shares were offered beginning 12/31/14. Class Y shares performance for the period prior to 12/31/14 is derived from the performance of Class A shares adjusted for the lower expenses of Class Y shares. Returns shown do not reflect the deduction of taxes that a shareholder would pay on fund distributions or the redemption of fund shares. The returns for the period reflect fee waivers and/or reimbursements in effect for the period; absent fee waivers and reimbursements, performance would have been lower. |
| SEI Institutional Managed Trust / Annual Report / September 30, 2016 | 23 |
MANAGEMENT’S DISCUSSION AND ANALYSIS OF FUND PERFORMANCE
September 30, 2016 (Unaudited)
Mid-Cap Fund
I. Objective
The Mid-Cap Fund (the “Fund”) seeks to provide long-term capital appreciation.
II. Investment Approach
The Fund used a single sub-adviser, Quantitative Management Associates LLC (“QMA”) under the general supervision of SEI Investments Management Corporation (“SIMC”) during the fiscal year ending September 30, 2016. No manager changes were made during the Fund’s fiscal year.
III. Returns
For the fiscal year ended September 30, 2016, the Mid-Cap Fund, Class A, returned 14.10%. The Fund’s benchmark — the Russell Midcap Index — returned 14.25%.
IV. Performance Discussion
The U.S. equity market began the reporting period with a short rally, led by cyclical stocks driven by decreasing concerns around a slowdown in emerging markets. The upbeat performance quickly turned into a nosedive at the turn of the New Year, as noted in the shareholder letter, after the Federal Reserve (the “Fed”) raised rates for the first time in a decade. Despite the Fed’s interest-rate hike, the combination of renewed fears around a hard landing in the Chinese economy, commodity prices dropping to 30-year lows, and falling rates in other developed markets pushed investors into low-volatility bond-proxy stocks in a global search for yield. As defensive and low-volatility stocks in the U.S. reached historically high valuations in February, government stimulus in China helped ease emerging-market growth concerns while oil prices found a floor. This was enough to restore investor confidence and spark a rally in cyclical stocks and commodity prices. Despite periods of volatility over the summer from Britain’s unexpected vote to leave the European Union and a moderation in commodity prices during the summer, the rally lasted through the rest of the period.
From a sector perspective, materials and technology were the best performers, as both sectors benefited from the market rally during the second half of the period. Defensive sectors (including utilities, consumer staples and real estate) were the next best-performing sectors as investors searched for low-volatility dividend-yielding names. Consumer discretionary was the weakest performer as the sector faced headwinds from
decreased consumer spending and competition from online retailers.
Performance for QMA, the Fund’s only sub-adviser, came mostly from stock selection. QMA benefited from selection in healthcare equipment (driven by strong earnings reports), consumer retailing and software and services. An underweight to the weak consumer-discretionary sector and an overweight to the utilities sector also helped from an allocation standpoint. The portfolio’s losses were concentrated in real estate and energy stocks due to poor selection. Within energy, the cheapest stocks were the worst performers, which presented a headwind to the manager’s value preference and tilt within the sector. Within real estate, the portfolio’s tactical underweight to REITs and overweight to development companies detracted, as REITs benefitted from the market’s search for yield.
AVERAGE ANNUAL TOTAL RETURN1
| ||||||||||||||||||||
| One Year Return | Average Annual 3-Year Return | Average 5-Year | Average Annual 10-Year Return | Annualized to Date | ||||||||||||||||
| ||||||||||||||||||||
| Mid-Cap Fund, Class A | 14.10% | 9.81% | 17.12% | 7.11% | 9.95% | |||||||||||||||
| ||||||||||||||||||||
| Mid-Cap Fund, Class I | 13.84% | 9.56% | 16.85% | 6.86% | 9.65% | |||||||||||||||
| ||||||||||||||||||||
| Mid-Cap Fund, Class Y† | N/A | N/A | N/A | N/A | 7.56%* | |||||||||||||||
| ||||||||||||||||||||
| Russell Midcap Index | 14.25% | 9.70% | 16.67% | 8.32% | 10.97% | |||||||||||||||
| ||||||||||||||||||||
Comparison of Change in the Value of a $100,000 Investment in the Mid-Cap Fund, Class A and Class I, versus the Russell Midcap Index
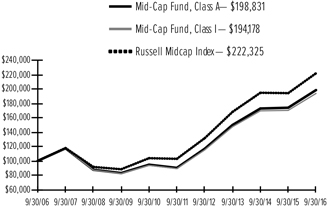
| 1 | For the period ended 09/30/16. Past performance is not indication of future performance. Class A shares were offered beginning 2/16/93 and Class I shares were offered beginning 10/01/07. Class I shares performance for the period prior to 10/01/07 is derived from the performance of Class A shares adjusted for the higher expenses of the Class I Shares. Class Y shares were offered beginning 10/30/15 and therefore do not have performance history for a full year. Returns shown do not reflect the deduction of taxes that a shareholder would pay on fund distributions or the redemption of fund shares. The returns for the period reflect fee waivers and/or reimbursements in effect for the period; absent fee waivers and reimbursements, performance would have been lower. |
| 24 | SEI Institutional Managed Trust / Annual Report / September 30, 2016 |
† The graph is based on only Class A and Class I shares. Returns for Class Y shares are substantially similar to those of Class A shares and differ only to the extent that Class Y shares have lower total annual fund operating expenses than Class A shares.
* Cumulative inception to date as of October 30, 2015.
N/A — Not available
| SEI Institutional Managed Trust / Annual Report / September 30, 2016 | 25 |
MANAGEMENT’S DISCUSSION AND ANALYSIS OF FUND PERFORMANCE
September 30, 2016 (Unaudited)
U.S. Managed Volatility Fund
I. Objective
The U.S. Managed Volatility Fund (the “Fund”) seeks to provide capital appreciation with less volatility than the broad U.S. equity markets.
II. Investment Approach
The Fund uses a multi-manager approach, relying on a number of sub-advisers with differing investment approaches to manage portions of the Fund’s portfolio under the general supervision of SEI Investments Management Corp. (“SIMC”). The Fund utilized the following sub-advisers during the fiscal year ending September 30, 2016: AJO, LLC, Analytic Investors, LLC, and LSV Asset Management. No manager changes were made during the Fund’s fiscal year.
III. Returns
For the fiscal year ended September 30, 2016, the U.S. Managed Volatility Fund, Class A, returned 12.01%. The Fund’s benchmark — the Russell 3000® Index —returned 14.96%.
IV. Performance Discussion
The Fund lagged the broad market during the period, particularly during the first two quarters of 2016 as high-beta names, in which the Fund is underweight by construction, outperformed. Low-volatility investing was overall favored in global markets due to concerns noted in the shareholder letter, such as China, negative- and zero-interest-rate policies across the globe, the Brexit vote outcome and the Federal Reserve’s decision to implement just one interest-rate increase. However, the picture looked the opposite in the U.S. given the outperformance of high-beta information technology names, which comprise the largest portion of the index; thus, low-beta names lagged.
Generally, the Fund is likely to underperform in a steeply rising market environment, but seeks to mitigate losses in a falling market environment by targeting a lower volatility compared to the broad market. In times of stress, low volatility and defensiveness usually translate into better performance. However, the Fund’s underweight to cyclical names within information technology and materials detracted, as did its overweight to momentum.
LSV outperformed while AJO and Analytic lagged. LSV’s exposures to telecommunications and utilities helped, as these sectors rallied. Although AJO had an overweight to utilities, stock selection within consumer discretionary
offset that. Analytic’s selection within small-cap industrials offset its beneficial overweight to utilities.
AVERAGE ANNUAL TOTAL RETURN1
| ||||||||||||||||||||
| One Year Return | Average Annual 3-Year Return | Average Annual 5-Year Return | Average Annual 10-Year Return | Annualized Inception to Date | ||||||||||||||||
| ||||||||||||||||||||
| U.S. Managed Volatility Fund, Class A | 12.01% | 11.62% | 15.23% | 8.21% | 8.77% | |||||||||||||||
| ||||||||||||||||||||
| U.S. Managed Volatility Fund, Class I | 11.76% | 11.37% | 14.96% | 7.92% | 8.45% | |||||||||||||||
| ||||||||||||||||||||
| U.S. Managed Volatility Fund, Class Y | 12.28% | 11.78% | 15.33% | 8.26% | 8.81% | |||||||||||||||
| ||||||||||||||||||||
| Russell 3000® Index | 14.96% | 10.44% | 16.36% | 7.37% | 8.11% | |||||||||||||||
| ||||||||||||||||||||
Comparison of Change in the Value of a $100,000 Investment in the U.S. Managed Volatility Fund, Class A, Class I and Class Y versus the Russell 3000® Index

| 1 | For the period ended 9/30/16. Past performance is no indication of future performance. Class A shares were offered beginning 10/28/04 and Class I shares were offered beginning 6/29/07. Class I shares performance for the period prior to 06/29/07 is derived from the performance of Class A shares adjusted for the higher expenses of the Class I shares. Class Y shares were offered beginning 12/31/14. Class Y shares performance for the period prior to 12/31/14 is derived from the performance of Class A shares adjusted for the lower expenses of the Class Y shares. Returns shown do not reflect the deduction of taxes that a shareholder would pay on fund distributions or the redemption of fund shares. The returns for the period reflect fee waivers and/or reimbursements in effect for the period; absent fee waivers and reimbursements, performance would have been lower. |
| 26 | SEI Institutional Managed Trust / Annual Report / September 30, 2016 |
MANAGEMENT’S DISCUSSION AND ANALYSIS OF FUND PERFORMANCE
September 30, 2016 (Unaudited)
Global Managed Volatility Fund
I. Objective
The Global Managed Volatility Fund (the “Fund”) seeks to provide capital appreciation with less volatility than the broad global equity markets.
II. Investment Approach
The Fund uses a multi-manager approach, relying on a number of sub-advisers with differing investment philosophies to manage portions of the Fund’s portfolio under the general supervision of SEI Investments Management Corp. (“SIMC”). The Fund utilized the following sub-advisers during the fiscal year ending September 30, 2016: Acadian Asset Management LLC and Analytic Investors, LLC. No manager changes were made during the Fund’s fiscal year.
III. Returns
For the fiscal year ended September 30, 2016, the Global Managed Volatility Fund, Class A, returned 13.08%. The Fund’s benchmark — the MSCI World Index — returned 11.36%.
IV. Performance Discussion
For the year ended September 30, 2016, the Fund performed above the broad market, particularly during the first two quarters of 2016 amid investor nervousness as a result of ongoing uncertainty due to concerns on China, negative- and zero-interest-rate policies across the globe, the Brexit vote outcome and the Federal Reserve’s decision to implement just one interest-rate increase. Although the “risk-off” theme dominated the whole year, materials and energy names rebounded sharply from their previous lows amid the recovery in oil and other commodity prices, as the shareholder letter addressed. During the final quarter of the reporting period, we observed an increase in interest rates as the pessimistic post-Brexit sentiment was more or less overdone, which spurred a rally in risky names at the expense of low volatility.
Generally, the Fund is likely to underperform in a steeply rising environment, but seeks to mitigate losses in a falling market environment by targeting a lower volatility compared to the broad market. In times of stress, low volatility and defensiveness usually translate into better performance. Hence, the focus on low-risk names and defensive sectors almost entirely explained the Fund’s outperformance for the period. From a sector standpoint, this translated into benefiting from overweights to consumer staples and telecommunications and underweights to volatile financial names that severely
underperformed. However, leaning away from the information technology, energy and materials sectors detracted from performance, as these sectors also rallied strongly. The Fund’s security selection added value through holding non-bank names, in addition to names within the consumer-staples sector. Selection was also strong in small-cap stocks.
Both managers outperformed for the year. Analytic Investors, LLC led performance, benefiting from an allocation to commodity-based countries (Canada and Australia) that rebounded with commodity prices. Both managers focused on low-volatility sectors and names in a period when investors were seeking safety, which contributed to Fund performance.
For the year ended September 30, 2016, the Fund used currency forwards to hedge currency risk, which detracted modestly. The Fund had exposures to the U.K. and Sweden, whose currencies depreciated against the U.S. dollar. Thus, hedging back to the U.S. dollar from local currency somewhat suppressed performance.
AVERAGE ANNUAL TOTAL RETURN1
| ||||||||||||||||||||
| One Year Return | Average Annual 3-Year Return | Average Annual 5-Year Return | Average Annual 10-Year Return | Annualized Inception to Date | ||||||||||||||||
| ||||||||||||||||||||
| Global Managed Volatility Fund, Class A | 13.08% | 10.91% | 12.53% | 4.56% | 4.86% | |||||||||||||||
| ||||||||||||||||||||
| Global Managed Volatility Fund, Class I | 12.97% | 10.66% | 12.25% | 4.28% | 4.57% | |||||||||||||||
| ||||||||||||||||||||
| Global Managed Volatility Fund, Class Y | 13.49% | 11.11% | 12.65% | 4.62% | 4.91% | |||||||||||||||
| ||||||||||||||||||||
| MSCI World Index | 11.36% | 5.84% | 11.63% | 4.47% | 4.88% | |||||||||||||||
| ||||||||||||||||||||
| SEI Institutional Managed Trust / Annual Report / September 30, 2016 | 27 |
MANAGEMENT’S DISCUSSION AND ANALYSIS OF FUND PERFORMANCE
September 30, 2016 (Unaudited)
Global Managed Volatility Fund (Concluded)
Comparison of Change in the Value of a $100,000 Investment in the Global Managed Volatility Fund, Class A, Class I and Class Y, versus the MSCI World Index
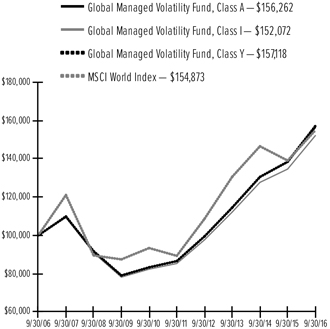
| 1 | For the period ended 9/30/16. Past performance is no indication of future performance. Class A shares were offered beginning 7/27/06 and Class I shares were offered beginning 6/29/07. Class I shares performance for the period prior to 06/29/07 is derived from the performance of Class A shares adjusted for the higher expenses of the Class I shares. Class Y shares were offered beginning 12/31/14. Class Y shares performance for the period prior to 12/31/14 is derived from the performance of Class A shares adjusted for the lower expenses of the Class Y shares. Returns shown do not reflect the deduction of taxes that a shareholder would pay on fund distributions or the redemption of fund shares. The returns for the period reflect fee waivers and/or reimbursements in effect for the period; absent fee waivers and reimbursements, performance would have been lower. |
| 28 | SEI Institutional Managed Trust / Annual Report / September 30, 2016 |
MANAGEMENT’S DISCUSSION AND ANALYSIS OF FUND PERFORMANCE
September 30, 2016 (Unaudited)
Tax-Managed Managed Volatility Fund
I. Objective
The Tax-Managed Managed Volatility Fund (the “Fund”) seeks to maximize after-tax returns, but with a lower level of volatility than the broad U.S. equity markets.
II. Investment Approach
The Fund uses a multi-manager approach, relying on a number of sub-advisers with differing investment approaches to manage portions of the Fund’s portfolio under the general supervision of SEI Investments Management Corp. (“SIMC”). The Fund utilized the following sub-advisers during the fiscal year ending September 30, 2016: AJO, L.P., Analytic Investors LLC, and LSV Asset Management. No manager changes were made during the Fund’s fiscal year.
III. Returns
For the fiscal year ended September 30, 2016, the Tax-Managed Managed Volatility Fund, Class A, returned 12.24%. The Fund’s benchmark — the Russell 3000® Index — returned 14.96%.
IV. Performance Discussion
The Fund lagged the broad market during the period, particularly during the first two quarters of 2016 as high-beta names, in which the Fund is underweight, outperformed. Low-volatility investing was overall favored in global markets due to concerns noted in the shareholder letter, such as China, negative- and zero-interest-rate policies across the globe, the Brexit vote outcome and the Federal Reserve’s decision to implement just one interest-rate increase. However, the picture looked the opposite in the U.S. given the outperformance of high-beta information technology names, which comprise the largest portion of the index; thus, low-beta names lagged.
Generally, the Fund is likely to underperform in a steeply rising market environment, but seeks to mitigate losses in a falling market environment by targeting a lower volatility compared to the broad market. In times of stress, low volatility and defensiveness usually translate into better performance. However, the Fund’s underweight to cyclical names within information technology and materials detracted, as did its overweight to momentum.
LSV outperformed while AJO and Analytic lagged. LSV’s exposures to telecommunications and utilities helped, as these sectors rallied. AJO also had an overweight to utilities, but selection within consumer discretionary
offset it. Analytic’s selection within small-cap industrials offset its beneficial overweight to utilities.
AVERAGE ANNUAL TOTAL RETURN1
| ||||||||||||||||
| 1 Year Return | Annualized 3 Year Return | Annualized 5 Year Return | Annualized Inception to Date | |||||||||||||
| ||||||||||||||||
| Tax-Managed Managed Volatility Fund, Class A | 12.24% | 11.73% | 14.95% | 8.59% | ||||||||||||
| ||||||||||||||||
| Tax-Managed Managed Volatility Fund, Class Y | 12.42% | 11.84% | 15.02% | 8.63% | ||||||||||||
| ||||||||||||||||
| Russell 3000® Index | 14.96% | 10.44% | 16.36% | 7.04% | ||||||||||||
| ||||||||||||||||
Comparison of Change in the Value of a $100,000 Investment in the Tax-Managed Managed Volatility Fund, Class A and Class Y, versus the Russell 3000® Index.
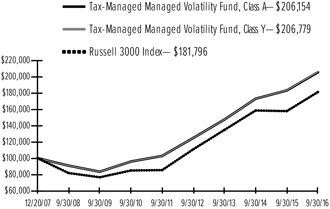
| 1 | For the period ended 9/30/16. Past performance is not an indication of future performance. Class A shares were offered beginning 12/20/07 and Class Y shares were offered beginning 4/30/15. Class Y shares performance for the period prior to 4/30/15 is derived from the performance of Class A shares adjusted for the lower expenses of Class Y shares. Returns shown do not reflect the deduction of taxes that a shareholder would pay on fund distributions or the redemption of fund shares. The returns for certain periods reflect fee waivers and/or reimbursements in effect for that period; absent fee waivers and/or reimbursements, performance would have been lower. |
| SEI Institutional Managed Trust / Annual Report / September 30, 2016 | 29 |
MANAGEMENT’S DISCUSSION AND ANALYSIS OF FUND PERFORMANCE
September 30, 2016 (Unaudited)
Real Estate Fund
I. Objective
The Real Estate Fund (the “Fund”) seeks to provide total return including current income and capital appreciation.
II. Investment Approach
The Fund uses a multi-manager approach, relying on a number of sub-advisers with differing investment approaches to manage portions of the Fund’s portfolio, under the general supervision of SEI Investments Management Corporation (“SIMC”). The Fund utilized the following sub-advisers during the fiscal year ending of September 30, 2016: Center Square Investment Management and Security Capital Research and Management, Inc. No manager changes were made during the Fund’s fiscal year.
III. Returns
For the fiscal year ended September 30, 2016, the Real Estate Fund, Class A, returned 17.13%. The Fund’s benchmark — Wilshire U.S. Real Estate Securities Index — returned 18.45%.
IV. Performance Discussion
For the 12 months ending September 30, 2016, the real-estate market saw double-digit appreciation. The slowdown in emerging markets and continued free fall in commodity prices noted in the shareholder letter resulted in slowing growth across the globe and forced major central banks to lower their rates in an effort to stimulate growth. The result was interest rates that dipped below zero and an increased appetite for dividend-yielding defensive stocks that were treated as bond proxies. Dividend-yielding sectors including utilities and real estate were heavily sought after as investors chased after yield. The eventual stabilization of emerging-market economies and commodity prices helped spark a cyclical rally that persisted throughout the rest of the period. The rally reduced the appetite for yield-producing portions of the market, including real estate, but valuations for these parts of the market remained elevated at the end of the reporting period. U.S. real estate fared better than international real estate, reflecting the better fundamentals of the U.S. housing market.
The Fund’s performance was driven primarily by selection within diversified and office real-estate investment trusts (“REITs”), while the lack of exposure and poor stock selection in specialized REITs hurt performance. Security Capital struggled with specialized
REITs, which were by far the biggest detractor, while Center Square contributed.
AVERAGE ANNUAL TOTAL RETURN1
| ||||||||||||||||||||
| 1 Year Return | Annualized 3 Year Return | Annualized 5 Year Return | Annualized 10 Year Return | Annualized to Date | ||||||||||||||||
| ||||||||||||||||||||
| Real Estate Fund, Class A | 17.13% | 13.70% | 14.69% | 4.90% | 9.73% | |||||||||||||||
| ||||||||||||||||||||
| Real Estate Fund, Class I | 16.90% | 13.44% | 14.44% | 4.67% | 9.47% | |||||||||||||||
| ||||||||||||||||||||
| Real Estate Fund, Class Y | 17.49% | 13.87% | 14.79% | 4.95% | 9.76% | |||||||||||||||
| ||||||||||||||||||||
| Wilshire U.S. Real Estate Securities Index | 18.45% | 14.61% | 16.02% | 5.93% | 10.29% | |||||||||||||||
| ||||||||||||||||||||
Comparison of Change in the Value of a $100,000 Investment in the Real Estate Fund, Class A, Class I and Class Y, versus the Wilshire U.S. Real Estate Securities Index.
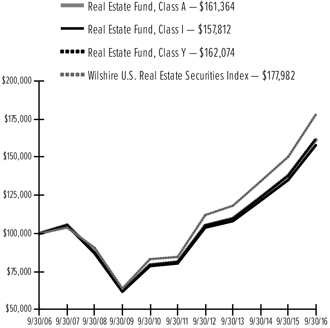
| 1 | For the period ended 9/30/16. Past performance is not an indication of future performance. Class A shares were offered beginning 11/13/03 and Class I shares were offered beginning 10/01/07. Class I shares performance for the period prior to 10/01/07 is derived from the performance of Class A shares adjusted for the higher expenses of Class I shares. Class Y shares were offered beginning 12/31/14. Class Y shares performance for the period prior to 12/31/14 is derived from the performance of Class A shares adjusted for the lower expenses of Class Y shares. Returns shown do not reflect the deduction of taxes that a shareholder would pay on fund distributions or the redemption of fund shares. The returns for certain periods reflect fee waivers and/or reimbursements in effect for that period; absent fee waivers and/or reimbursements, performance would have been lower. |
| 30 | SEI Institutional Managed Trust / Annual Report / September 30, 2016 |
MANAGEMENT’S DISCUSSION AND ANALYSIS OF FUND PERFORMANCE
September 30, 2016 (Unaudited)
Enhanced Income Fund
I. Objective
The Enhanced Income Fund (the “Fund”) seeks to provide capital appreciation and income.
II. Investment Approach
The Fund uses a multi-manager approach, relying on a number of sub-advisers with differing investment approaches to manage portions of the Fund’s portfolio, under the general supervision of SEI Investments Management Corp (“SIMC”). The Fund utilized the following sub-advisers during the one-year period ending September 30, 2016: Ares Management LLC and Wellington Management Company, LLP. No manager changes were made during the Fund’s fiscal year.
III. Returns
For the fiscal year ended September 30, 2016, the Enhanced Income Fund, Class A, returned 2.60%. The Fund’s benchmark — BofA Merrill Lynch 3-Month LIBOR Constant Maturity Index — returned 0.49%.
IV. Performance Discussion
The Fund benefited from spread tightening in both the bank-loan market as well as the investment-grade short-duration space. Bank loans were the biggest contributor to both absolute and benchmark-relative return in the period. Loans benefited from a recovery in credit after a risk-off environment in the beginning of 2016, as addressed in the shareholder letter. Short-duration bonds in the financial sector, especially banks and insurance companies, were also a big contributor to performance. The financial sector experienced positive performance as increased regulation resulted in more conservative capital management by financial institutions, which is favorable to bondholders. Holdings in the securitized space also contributed positively to performance, specifically auto asset-backed securities (“ABS”) and collateralized-loan obligations.
From a sub-adviser perspective, Wellington Management Company, LLP, which manages the Fund’s exposure to ABS and financial-sector bonds, contributed to both absolute and relative performance. Ares Management LLC, which manages the Fund’s bank-loan allocation, contributed to absolute and benchmark-relative performance.
AVERAGE ANNUAL TOTAL RETURN1
| ||||||||||||||||||||
| One Year Return | Average 3-Year | Average 5-Year | Average 10-Year | Annualized Inception to Date | ||||||||||||||||
| ||||||||||||||||||||
| Enhanced Income Fund, Class A | 2.60% | 1.45% | 2.42% | -0.11% | 0.00% | |||||||||||||||
| ||||||||||||||||||||
| Enhanced Income Fund, Class I | 2.20% | 1.19% | 2.12% | -0.42% | -0.31% | |||||||||||||||
| ||||||||||||||||||||
| Enhanced Income Fund, Class Y | 2.61% | 1.48% | 2.44% | -0.10% | 0.01% | |||||||||||||||
| ||||||||||||||||||||
| BofA Merrill Lynch 3-Month LIBOR Constant Maturity Index | 0.49% | 0.33% | 0.35% | 1.39% | 1.47% | |||||||||||||||
| ||||||||||||||||||||
Comparison of Change in the Value of a $100,000 Investment in the Enhanced Income Fund, Class A, Class I and Class Y versus the BofA Merrill Lynch 3-Month LIBOR Constant Maturity Index
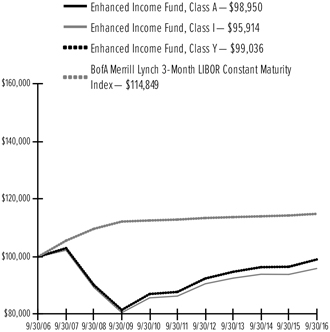
| 1 | For the period ended 9/30/16. Past performance is no indication of future performance. Class A shares were offered beginning 6/14/96 and Class I shares were offered beginning 6/29/07. Class I shares performance for the period prior to 06/29/07 is derived from the performance of Class A shares adjusted for the higher expenses of the Class I shares. Class Y shares were offered beginning 12/31/14. Class Y shares performance for the period prior to 12/31/14 is derived from the performance of Class A shares adjusted for the lower expenses of the Class Y shares. Returns shown do not reflect the deduction of taxes that a shareholder would pay on fund distributions or the redemption of fund shares. The returns for the period reflect fee waivers and/or reimbursements in effect for the period; absent fee waivers and reimbursements, performance would have been lower. |
| SEI Institutional Managed Trust / Annual Report / September 30, 2016 | 31 |
MANAGEMENT’S DISCUSSION AND ANALYSIS OF FUND PERFORMANCE
September 30, 2016 (Unaudited)
Core Fixed Income Fund
I. Objective
The Core Fixed Income Fund (the” Fund”) seeks to provide current income consistent with the preservation of capital.
II. Investment Approach
The Fund uses a multi-manager approach, relying on a number of sub-advisers with differing investment approaches to manage portions of the Fund’s portfolio, under the general supervision of SEI Investments Management Corporation (“SIMC”). The Fund utilized the following sub-advisers during the fiscal year ending September 30, 2016: Jennison Associates LLC, Metropolitan West Asset Management LLC, Wells Capital Management Incorporated, Western Asset Management Company and Western Asset Management Company Limited. There were no manager changes during the year.
III. Returns
For the fiscal year ended September 30, 2016, the Core Fixed Income Fund, Class A, returned 5.64%, while the Fund’s benchmark — the Bloomberg Barclays U.S. Aggregate Bond Index — returned 5.19%.
IV. Performance Discussion
U.S. Treasury yields moved in different patterns during the year; short-term yields rose while long-term yields declined. Long-term yields fell due to muted inflation expectations and global demand from low or negative rates in other developed government-bond markets. As the shareholder letter addressed, short-term yields rose as the Federal funds rate was increased by the Federal Reserve (the “Fed”) in December 2015 by 25 basis points. The Fund’s yield-curve flattening bias was additive as an overweight to 30-year bonds enhanced returns. A slightly shorter-duration posture was a modest drag, but was offset by the yield-curve positioning.
The Fund maintains a small allocation to below-investment-grade credit and emerging-market sovereign bonds, which added to returns as these two markets benefited from the demand for yield and improving oil prices. Despite record new issuance, investment-grade corporate bonds outperformed comparable U.S. Treasury bonds and the Fund’s overweight was additive. The Fund maintains an allocation to non-agency mortgage-backed securities (“MBS”), which benefited from the durable recovery of the housing market over the last several years, mortgage principal paydowns and a shrinking supply of these securities. The Fund’s
overweight to commercial MBS was positive as the demand for and fundamentals of commercial properties improved in line with modest U.S. economic growth, leading to outperformance. Lastly, the Fund’s overweight to asset-backed securities (“ABS”) contributed to performance as the declining unemployment rate and wage growth noted in the shareholder letter improved the debt profile of the U.S. consumer, enabling these securities to outperform. Agency MBS performed well during the period, so the Fund’s underweight detracted from relative performance.
Over the full reporting period, all four sub-advisers outperformed the benchmark, with Western Asset Management Company producing the best returns through its yield-curve flattening posture and corporate overweight. Wells Capital Management, Inc. was the next best performer and benefited from security selection in both ABS and MBS. Jennison Associates LLC also outperformed primarily due to its yield-curve flattening posture. Metropolitan West Asset Management LLC’s returns were slightly ahead of the benchmark, but were held back by more conservative positioning within the corporate sector and, to a lesser degree, by a shorter-duration posture.
Treasury futures and interest-rate swaps were utilized to help manage the Fund’s duration and yield-curve exposure. These exposures performed as described earlier. To a limited extent, the Fund utilized currency-forward contracts to manage currency exposure, which was a modest detractor.
AVERAGE ANNUAL TOTAL RETURN1
| ||||||||||||||||||||
| One Year Return | Average 3-Year | Average 5-Year | Average 10-Year | Annualized to Date | ||||||||||||||||
| ||||||||||||||||||||
| Core Fixed Income Fund, Class A | 5.64% | 4.37% | 4.09% | 5.24% | 6.41% | |||||||||||||||
| ||||||||||||||||||||
| Core Fixed Income Fund, Class I | 5.41% | 4.14% | 3.86% | 5.00% | 6.02% | |||||||||||||||
| ||||||||||||||||||||
| Core Fixed Income Fund, Class Y | 5.90% | 4.48% | 4.16% | 5.28% | 6.42% | |||||||||||||||
| ||||||||||||||||||||
| Bloomberg Barclays U.S. Aggregate Bond Index | 5.19% | 4.03% | 3.08% | 4.79% | 6.61% | |||||||||||||||
| ||||||||||||||||||||
| 32 | SEI Institutional Managed Trust / Annual Report / September 30, 2016 |
Comparison of Change in the Value of a $100,000 Investment in the Core Fixed Income Fund, Class A, Class I and Class Y, versus the Bloomberg Barclays U.S. Aggregate Bond Index
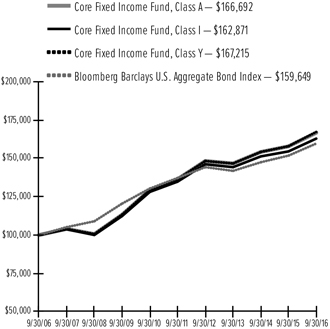
| 1 | For the period ended 9/30/16. Past performance is no indication of future performance. Class A shares were offered beginning 5/1/87 and Class I shares were offered beginning 8/06/01. Class I shares performance for the period prior to 06/29/07 is derived from the performance of Class A shares adjusted for the higher expenses of the Class I shares. Class Y shares were offered beginning 06/30/15. Class Y shares performance for the period prior to 06/30/15 is derived from the performance of Class A shares adjusted for the lower expenses of the Class Y shares. Returns shown do not reflect the deduction of taxes that a shareholder would pay on fund distributions or the redemption of fund shares. The returns for the period reflect fee waivers and/or reimbursements in effect for the period; absent fee waivers and reimbursements, performance would have been lower. |
| SEI Institutional Managed Trust / Annual Report / September 30, 2016 | 33 |
MANAGEMENT’S DISCUSSION AND ANALYSIS OF FUND PERFORMANCE
September 30, 2016 (Unaudited)
U.S. Fixed Income Fund
I. Objective
The U.S. Fixed Income Fund (the “Fund”) seeks to provide current income consistent with the preservation of capital.
II. Investment Approach
The Fund uses a multi-manager approach, relying on a number of sub-advisers with differing investment approaches to manage portions of the Fund’s portfolio, under the general supervision of SEI Investments Management Corporation (“SIMC”). The Fund utilized the following sub-advisers during the fiscal year ending September 30, 2016: J.P. Morgan Investment Management, Inc., Jennison Associates LLC, Metropolitan West Asset Management LLC, Wells Capital Management, Inc. and Western Asset Management Company.
Sub-adviser J.P. Morgan Investment Management, Inc. was terminated from the Fund during the period.
III. Returns
For the fiscal year ended September 30, 2016, the U.S. Fixed Income Fund, Class A, returned 4.94%, while the Fund’s benchmark — the Bloomberg Barclays U.S. Aggregate Bond Index — returned 5.19%.
IV. Performance Discussion
U.S. Treasury yields moved in different patterns during the year, as short-term yields rose and long-term yields declined. Long-term yields fell due to muted inflation expectations and global demand from low or negative rates in other developed government-bond markets. As the shareholder letter addressed, short-term yields rose as the Federal funds rate was increased by the Federal Reserve (“Fed”) in December 2015 by 25 basis points. The Fund’s yield-curve flattening bias was additive as an overweight to 30-year bonds enhanced returns. A slightly shorter-duration posture was a modest drag, but was offset by the yield-curve positioning.
Despite record new issuance, investment-grade corporate bonds outperformed comparable U.S. Treasury bonds and the Fund’s overweight was additive. The Fund maintained an allocation to non-agency mortgage-backed securities (“MBS”), which benefited from the recovery of the housing market over the last several years, mortgage principal paydowns and a shrinking supply of these securities. The Fund’s overweight to commercial MBS was positive as the demand for and fundamentals of commercial properties improved in line with modest U.S. economic growth, leading to
outperformance. Lastly, the Fund’s overweight to asset-backed securities (“ABS”) contributed to performance as the declining unemployment rate and wage growth noted in the shareholder letter improved the debt profile of the U.S. consumer. Agency MBS performed well during the period, so the Fund’s underweight detracted from relative performance.
Three of the four sub-advisers outperformed the benchmark during the period, with Western Asset Management Company producing the best returns through its yield-curve flattening posture and corporate overweight. Wells Capital Management, Inc. benefited from security selection in both ABS and MBS. Jennison Associates LLC also outperformed primarily due to its yield-curve flattening posture. Metropolitan West Asset Management LLC’s returns were held back by more conservative positioning within the corporate sector and, to a lesser degree, by a shorter-duration posture.
Treasury futures and interest-rate swaps were utilized to help manage the Fund’s duration and yield-curve exposure. These exposures performed as described earlier.
AVERAGE ANNUAL TOTAL RETURN1
| ||||||||||||||||
1 Year Return | Annualized 3 Year Return | Annualized 5 Year Return | Annualized Inception to Date | |||||||||||||
| ||||||||||||||||
| U.S. Fixed Income Fund, Class A | 4.94% | 3.83% | 3.28% | 4.77% | ||||||||||||
| ||||||||||||||||
| U.S. Fixed Income Fund, Class Y | 5.20% | 3.98% | 3.36% | 4.83% | ||||||||||||
| ||||||||||||||||
| Bloomberg Barclays U.S. Aggregate Bond Index | 5.19% | 4.03% | 3.08% | 4.44% | ||||||||||||
| ||||||||||||||||
| 34 | SEI Institutional Managed Trust / Annual Report / September 30, 2016 |
Comparison of Change in the Value of a $100,000 Investment in the U.S. Fixed Income Fund, Class A and Class Y, versus the Bloomberg Barclays U.S. Aggregate Bond Index.
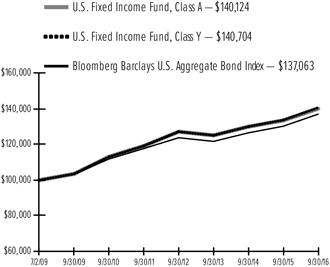
| 1 | For the period ended 9/30/16. Past performance is not an indication of future performance. Class A shares were offered beginning 7/2/09 and Class Y shares were offered beginning 12/31/14. Class Y shares performance for the period prior to 12/31/14 is derived from the performance of Class A shares adjusted for the lower expenses of Class Y shares. Returns shown do not reflect the deduction of taxes that a shareholder would pay on fund distributions or the redemption of fund shares. The returns for certain periods reflect fee waivers and/or reimbursements in effect for that period; absent fee waivers and/or reimbursements, performance would have been lower. |
| SEI Institutional Managed Trust / Annual Report / September 30, 2016 | 35 |
MANAGEMENT’S DISCUSSION AND ANALYSIS OF FUND PERFORMANCE
September 30, 2016 (Unaudited)
High Yield Bond Fund
I. Objective
The High Yield Bond Fund (the “Fund”) seeks total return.
II. Investment Approach
The Fund uses a multi-manager approach, relying on a number of sub-advisers with differing investment approaches to manage portions of the Fund’s portfolio, under the general supervision of SEI Investments Management Corporation (“SIMC”). Assets of the Fund not allocated to sub-advisers are managed directly by SIMC. The Fund utilized the following sub-advisers during the fiscal year ending September 30, 2016: Ares Management LLC, Benefit Street Partners, LLC, Brigade Capital Management, LLC, Delaware Investments Fund Advisers, a series of Delaware Management Business Trust, and J.P. Morgan Investment Management, Inc.
Sub-adviser Delaware Investments Fund Advisers was terminated from the Fund during the period.
III. Returns
For the fiscal year ended September 30, 2016, the High Yield Bond Fund, Class A, returned 10.44%. The Fund’s benchmark — the BofA Merrill Lynch U.S. High Yield Constrained Index — returned 12.82%.
IV. Performance Discussion
The high-yield market advanced nearly 13% during the period, but it was hardly a smooth ride. The period began on a positive note, as the high-yield market was up about 3% from September 30 to November 4, with the energy sector up more than 4%. However, as the shareholder letter addressed, the market took a turn for the worse as oil-price volatility remained a primary concern for the high-yield market, of which energy is the largest sector. From November 4 to February 11, the high-yield market fell nearly 10%, with the energy sector falling more than 30%. February 11 was the low point for the year in terms of performance. The high-yield market began to rally the following day as buyers emerged, and the market returned in excess of 20% from that point through the end of the period, with energy surging by more than 60%. The market yield began the period at 8.08%, hit a period high of 10.10% on February 11, and finished the period at 6.25%. The market spread followed a similar path, beginning the period at 662 basis points, reaching its period high of 887 basis points on February 11, and finishing the period at 497 basis points.
Overweights to and security selection within leisure (primarily gaming) and electronics contributed to the Fund’s relative performance, as did an underweight to and selection within banking. Underweights to and selection within basic industry (primarily metals and mining, excluding steel) and energy (primarily exploration and production, and field equipment and services) detracted. An allocation to collateralized loan obligations (CLOs) also weighed on relative returns. CLOs saw significant markdowns in the five-month period from October 2015 to February 2016 due to declining energy-loan prices, global economic-growth concerns and technical pressures emanating from credit-fund outflows. However, they staged a strong rally over the second half of the period to end the fiscal year in positive territory, but still lagged the 13% return of the high-yield bond market.
Brigade Capital Management, LLC was the only manager to outperform the benchmark during the period. Positioning in technology and electronics, leisure and energy were additive and only partially offset exposures in utilities, retail and basic industry. Ares Management LLC was the chief detractor, due primarily to positioning in energy, basic industry and telecommunications, which was mitigated in part by exposure to consumer goods, banking and retail. Benefit Street Partners, LLC also detracted on positioning in energy, consumer goods and basic industry, offset partially by the merits of exposure to media, utilities and leisure. J.P. Morgan Investment Management, Inc. detracted modestly via positioning in energy and basic industry, as well as technology and electronics, but benefited from exposures to telecommunications, leisure and banking.
The Fund used derivatives throughout the period to help manage duration, yield-curve positioning and spread duration more efficiently. High-yield CDX and total-return swaps were used for this purpose, which had a negligible impact on overall Fund performance.
AVERAGE ANNUAL TOTAL RETURN1
| ||||||||||||||||||||
1 Year Return | Annualized 3 Year Return | Annualized 5 Year Return | Annualized 10 Year Return | Annualized Inception to Date | ||||||||||||||||
| ||||||||||||||||||||
| High Yield Bond Fund, Class A | 10.44% | 4.41% | 7.61% | 6.64% | 7.24% | |||||||||||||||
| ||||||||||||||||||||
| High Yield Bond Fund, Class I | 9.95% | 3.78% | 6.91% | 6.04% | 6.91% | |||||||||||||||
| ||||||||||||||||||||
| High Yield Bond Fund, Class Y | 10.72% | 4.55% | 7.69% | 6.68% | 7.26% | |||||||||||||||
| ||||||||||||||||||||
| BofA Merrill Lynch U.S. High Yield Constrained Index | 12.82% | 5.28% | 8.24% | 7.68% | N/A | |||||||||||||||
| ||||||||||||||||||||
| 36 | SEI Institutional Managed Trust / Annual Report / September 30, 2016 |
Comparison of Change in the Value of a $100,000 Investment in the High Yield Bond Fund, Class A, Class I and Class Y, versus the BofA Merrill Lynch U.S. High Yield Constrained Index.
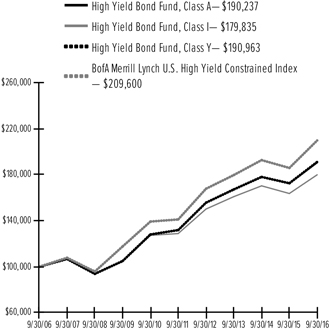
| 1 | For the period ended 9/30/16. Past performance is not an indication of future performance. Class A shares were offered beginning 1/11/95 and Class I shares were offered beginning 10/1/07. Class I shares performance for the period prior to 10/1/07 is derived from the performance of Class A shares adjusted for the higher expenses of the Class I shares. Class Y shares were offered beginning 12/31/14. Class Y shares performance for the period prior to 12/31/14 is derived from the performance of Class A shares adjusted for the lower expenses of the Class Y shares. Returns shown do not reflect the deduction of taxes that a shareholder would pay on fund distributions or the redemption of fund shares. The returns for certain periods reflect fee waivers and/or reimbursements in effect for that period; absent fee waivers and/or reimbursements, performance would have been lower. |
N/A — Not available
| SEI Institutional Managed Trust / Annual Report / September 30, 2016 | 37 |
MANAGEMENT’S DISCUSSION AND ANALYSIS OF FUND PERFORMANCE
September 30, 2016 (Unaudited)
Real Return Fund
I. Objective
The Real Return Fund (the “Fund”) seeks to provide total return exceeding the rate of inflation.
II. Investment Approach
During the one-year period ending September 30, 2016, the Fund was managed by the SEI Fixed Income Portfolio Management Team under the supervision of SEI Investments Management Corporation (“SIMC”).
III. Returns
For the fiscal year ended September 30, 2016, the Real Return Fund, Class A, returned 2.32%. The Fund’s benchmark — Bloomberg Barclays 1-5 Year U.S. TIPS Index — returned 2.88%.
IV. Performance Discussion
The Treasury Inflation-Protected Securities (“TIPS”) market was positively impacted by increased expectations for price increases (inflation) during the Fund’s fiscal year, as noted in the shareholder letter. Higher commodity prices flowed through U.S. inflation calculations, resulting in higher TIPS prices. The market’s expectations, as measured by the TIPS breakeven rate, indicates low inflation expectations over the next five years.
The increase in breakeven rates over the time period benefited the Fund as inflation expectations have increased.
AVERAGE ANNUAL TOTAL RETURN1
| ||||||||||||||||
One Year Return | Average Annual 3-Year Return | Average Annual 5-Year Return | Annualized Inception to Date | |||||||||||||
| ||||||||||||||||
| Real Return Fund, Class A | 2.32% | 0.14% | 0.26% | 1.77% | ||||||||||||
| ||||||||||||||||
| Real Return Fund, Class Y | 2.52% | 0.24% | 0.32% | 1.81% | ||||||||||||
| ||||||||||||||||
| Bloomberg Barclays 1-5 Year U.S. TIPS Index | 2.88% | 0.61% | 0.72% | 2.20% | ||||||||||||
| ||||||||||||||||
Comparison of Change in the Value of a $100,000 Investment in the Real Return Fund, Class A and Class Y, versus the Bloomberg Barclays 1-5 Year U.S. TIPS Index
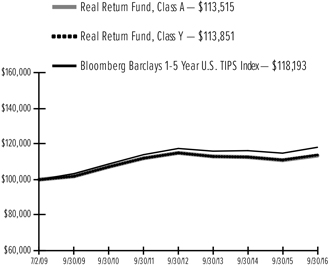
| 1 | For the year ended 9/30/16. Past performance is no indication of future performance. Class A shares were offered beginning 7/2/09 and Class Y shares were offered beginning 12/31/14. Class Y shares performance for the period prior to 12/31/14 is derived from the performance of Class A shares adjusted for the lower expenses of the Class Y shares. Returns shown do not reflect the deduction of taxes that a shareholder would pay on fund distributions or the redemption of fund shares. The returns for the period reflect fee waivers and/or reimbursements in effect for the period; absent fee waivers and reimbursements, performance would have been lower. |
| 38 | SEI Institutional Managed Trust / Annual Report / September 30, 2016 |
MANAGEMENT’S DISCUSSION AND ANALYSIS OF FUND PERFORMANCE
September 30, 2016 (Unaudited)
Dynamic Asset Allocation Fund
I. Objective
The Dynamic Asset Allocation Fund (the “Fund”) seeks long-term total return.
II. Investment Approach
During the one-year period ending September 30, 2016, the Fund used a single sub-adviser, SSgA Funds Management, Inc. (“SSgA”), under the general supervision of SEI Investments Management Corporation (“SIMC”). No manager changes were made during the Fund’s fiscal year.
III. Returns
For the fiscal year ended September 30, 2016, the Dynamic Asset Allocation Fund, Class A, returned 12.39%, and the S&P 500 Index returned 15.43%.
IV. Performance Discussion
The majority of the Fund’s volatility is driven by the underlying beta, or the S&P 500. As such, the largest driver of return in the Fund was the S&P 500. Still, negative performance from the Fund’s tactical trades did cause the Fund to lag the S&P 500.
The U.S. equity market began the reporting period with a short rally, led by cyclical stocks driven by decreasing concerns around a slowdown in emerging markets. The upbeat performance quickly turned into a nosedive at the turn of the New Year, as noted in the shareholder letter, after the Federal Reserve (Fed) raised rates for the first time in a decade. Despite the Fed’s interest-rate hike, the combination of renewed fears around a hard landing in the Chinese economy, commodity prices dropping to 30-year lows and falling rates in other developed markets pushed investors into low-volatility bond-proxy stocks in a global search for yield. As defensive and low-volatility stocks in the U.S. reached historically high valuations in February, government stimulus in China helped ease emerging-market growth concerns while oil prices found a floor. This was enough to restore investor confidence and spark a rally in cyclical stocks and commodity prices. Despite periods of volatility over the summer from Britain’s unexpected vote to leave the European Union and a moderation in commodity prices during the summer, the rally lasted through the rest of the period. From a sector perspective, technology and utilities were the best-performing sectors. Technology benefited from increased earnings estimates and prospects of renewed growth late in the period and utilities benefited from
what was a largely stability- and safety-oriented mindset for much of the period.
The three largest positive contributors to relative performance were a long U.S. inflation versus short U.K. inflation trade implemented late in 2015, a long U.S. large cap versus short U.S. Treasurys trade implemented in the first quarter of 2016, and an outright long U.S. inflation trade implemented in the summer of 2016.
The three largest detractors from relative performance were a long Indian rupee versus short Korean won currency trade, a long Japanese equity (foreign-currency hedged) versus short S&P 500 trade that was reduced in January and closed in April, and a long U.S. dollar versus short Korean won/Singapore dollar/Taiwan dollar foreign-currency basket trade that was both implemented and closed in the first quarter of 2016. Also detracting from performance was a long U.S. large cap versus short European ex-U.K. equity (foreign-exchange hedged) trade that was closed in January of 2016. A long U.S. dollar versus short Saudi riyal foreign-currency trade has also detracted a nominal amount from the portfolio.
Several long option trades — on the VIX and S&P 500 — had been entered as hedges in the portfolio. They have all expired worthless, detracting a nominal amount from performance. A long U.S. dollar versus short Saudi riyal foreign-currency trade, predicated on the latter country’s weakened financial position as a result of low oil prices, also detracted a nominal amount from the portfolio since oil has rallied over the last year, as the shareholder letter addressed.
Derivatives are used to obtain the Fund’s tactical exposures. In the past year, these have included futures, foreign-currency forward contracts, options and total-return swaps. The use of derivatives had a material impact on performance, since all active trades are implemented through their use.
AVERAGE ANNUAL TOTAL RETURN1
| ||||||||
One Year Return | Annualized Inception to Date | |||||||
| ||||||||
| Dynamic Asset Allocation Fund, Class A | 12.39% | 1.85% | ||||||
| ||||||||
| Dynamic Asset Allocation Fund, Class Y | 12.67% | 2.07% | ||||||
| ||||||||
S&P 500 Index | 15.43% | 4.71% | ||||||
| ||||||||
| SEI Institutional Managed Trust / Annual Report / September 30, 2016 | 39 |
MANAGEMENT’S DISCUSSION AND ANALYSIS OF FUND PERFORMANCE
September 30, 2016 (Unaudited)
Dynamic Asset Allocation Fund (Concluded)
Comparison of Change in the Value of a $100,000 Investment in the Dynamic Asset Allocation Fund, Class A and Class Y, versus the S&P 500 Index
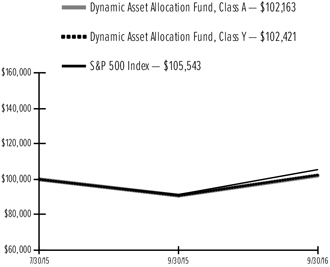
| 1 | For the period ended 9/30/16. Past performance is no indication of future performance. Class A Shares and Class Y Shares were offered beginning 7/30/15. Returns shown do not reflect the deduction of taxes that a shareholder would pay on fund distributions or the redemption of fund shares. The returns for the period reflect fee waivers and/or reimbursements in effect for the period; absent fee waivers and reimbursements, performance would have been lower. |
| 40 | SEI Institutional Managed Trust / Annual Report / September 30, 2016 |
MANAGEMENT’S DISCUSSION AND ANALYSIS OF FUND PERFORMANCE
September 30, 2016 (Unaudited)
Multi-Strategy Alternative Fund
I. Objective
The Multi-Strategy Alternative Fund (the “Fund”) allocates its assets among a variety of investment strategies to seek to generate an absolute return with reduced correlation to the stock and bond markets.
II. Investment Approach
The Fund’s assets are managed under the direction of SEI Investments Management Corporation (“SIMC”), which manages the Fund’s assets in a way that it believes will achieve the Fund’s investment objective. In order to achieve its investment objective, the Fund may allocate its assets among a variety of investment strategies through the use of: (i) affiliated and unaffiliated funds, including open-end funds, closed-end funds and exchange traded funds (underlying funds); and (ii) one or more investment sub-advisers. During the fiscal year ending September 30, 2016, the Fund allocated its assets among unaffiliated funds and one affiliated fund. During the one-year period ending September 30, 2016, sub-advisers Acadian Asset Management, EMSO Partners Ltd., Kettle Hill Capital Management, LLC, Mountaineer Partners Management, LLC, and Ramius Advisors, LLC were added to the Fund.
III. Return vs. Benchmark
For the fiscal year ended September 30, 2016, the Multi-Strategy Alternative Fund, Class A, returned 3.51%. The Fund’s benchmark — BofA Merrill Lynch 3-Month U.S. Treasury Bills Index — returned 0.27%.
Although the Fund’s performance is benchmarked against the return of the BofA Merrill Lynch 3-Month U.S. Treasury Bills Index, an investment in the Fund is substantially different from an investment in U.S. Treasury Bills. Among other things, Treasury bills are backed by the full faith and credit of the U.S. government and have a fixed rate of return. Treasury bill investors do not risk losing their investment, whereas loss of money is a risk of investing in the Fund. Further, an investment in the Fund is expected to be substantially more volatile than an investment in Treasury bills because of the breadth and types of securities and other instruments in which the Fund may invest.
IV. Performance Discussion
The Fund performed well in the full year ended September 30, 2016, outperforming the 3-Month U.S. Treasury Bills Index. Three of the Fund’s four investment strategies delivered positive returns; only the global macro strategy detracted.
The fourth quarter of 2015 saw equity markets rally, only to be followed by a broad selloff, hitting multi-year lows in mid-February of 2016. As the shareholder letter addressed, equity markets then increased off of these lows in the second half of the first quarter of 2016 and most of the second quarter until Brexit occurred in late June. After a very short-lived Brexit selloff, markets continued to rally, making new highs for the year. Sovereign yields fell throughout 2016, especially in the first and second quarters, given continued easing across central banks and no moves toward tightening by Federal Reserve since December 2015. Additionally in 2016, high yield corporate bonds were one of the best performing asset classes as investors searched for yield. In currencies, sterling has depreciated significantly against the U.S. dollar post-Brexit and yen has continued to appreciate against the dollar in 2016.
During the period, the makeup of the Fund changed significantly. A number of third-party mutual fund investments were replaced with separate accounts managed by the sub-advisers listed in Section II. We believe this change will improve investment outcomes over time and it certainly contributed over the period. The event strategy contributed most, and especially the segment sub-advised by Mountaineer Partners. It benefited from a focus on undervalued mid-cap equities coupled with an emphasis on catalysts. The balance of the event strategy was invested in merger arbitrage, which also posted moderate gains. The equity hedge strategy also helped, within which the recently added sub-adviser Kettle Hill performed especially well. Kettle Hill’s focus is on small-cap companies experiencing upward inflections in growth. All investments within the relative value strategy delivered positive returns. EMSO, an emerging-markets debt specialist, led the way, benefiting from debt restructuring and timely investments in Argentina, Greece, Brazil and Russia, as well as short positions in South Africa. The balance of the strategy, which is invested in corporate credit, also contributed. The sole detractor for the period was the global macro strategy, which is also the smallest allocation in the Fund. This category consists of investments in trend-following strategies, which struggled over the period with several trend reversals in the currency, commodity and fixed-income markets. While the strategy struggled overall, it illustrated its important diversification properties by performing strongly during difficult periods, such as the first quarter of 2016, as noted in the shareholder letter.
Derivatives used in the Fund consist primarily of currency futures and forwards, interest-rate swaps,
| SEI Institutional Managed Trust / Annual Report / September 30, 2016 | 41 |
MANAGEMENT’S DISCUSSION AND ANALYSIS OF FUND PERFORMANCE
September 30, 2016 (Unaudited)
Multi-Strategy Alternative Fund (Concluded)
credit default swaps (CDS) and equity and equity-index options. Derivatives in the Fund were primarily used by subadvisors for hedging and risk management. Derivatives performance did not have a material impact on Fund returns over the period.
AVERAGE ANNUAL TOTAL RETURN1
| ||||||||||||||||
| One Year Return | Average 3-Year | Average 5-Year | Annualized to Date | |||||||||||||
| ||||||||||||||||
| Multi-Strategy Alternative Fund, Class A | 3.51% | 1.28% | 1.73% | 0.88% | ||||||||||||
| ||||||||||||||||
| Multi-Strategy Alternative Fund, Class Y | 3.77% | 1.37% | 1.78% | 0.92% | ||||||||||||
| ||||||||||||||||
| BofA Merrill Lynch 3-Month U.S. Treasury Bills Index | 0.27% | 0.11% | 0.10% | 0.11% | ||||||||||||
| ||||||||||||||||
Comparison of Change in the Value of a $100,000 Investment in the Multi-Strategy Alternative Fund, Class A and Class Y, versus the BofA Merrill Lynch 3-Month U.S. Treasury Bills Index
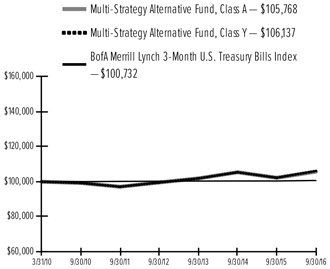
| 1 | For the period ended 9/30/15. Past performance is no indication of future performance. Class A Shares were offered beginning 3/31/10 and Class Y shares were offered beginning 4/30/15. Class Y shares performance for the period prior to 4/30/15 is derived from the performance of Class A shares adjusted for the lower expenses of the Class Y shares. Returns shown do not reflect the deduction of taxes that a shareholder would pay on fund distributions or the redemption of fund shares. The returns for the period reflect fee waivers and/or reimbursements in effect for the period; absent fee waivers and reimbursements, performance would have been lower. Although the Fund’s performance is benchmarked against the return of the BofA Merrill Lynch 3-Month U.S. Treasury Bill Index, an investment in the Fund is substantially different from an investment in U.S. Treasury bills. Among other things, Treasury bills are backed by the full faith and credit of the U.S. Government and have a fixed rate of return. Investors in Treasury bills do not risk losing their investment, whereas loss of money is a risk of investing in the Fund. Further, an investment in the Fund is expected to be substantially more volatile than an investment in Treasury bills because of the breadth and types of securities and other instruments in which the Fund may invest. |
| 42 | SEI Institutional Managed Trust / Annual Report / September 30, 2016 |
MANAGEMENT’S DISCUSSION AND ANALYSIS OF FUND PERFORMANCE
September 30, 2016 (Unaudited)
Multi-Asset Accumulation Fund
I. Objective
The Multi-Asset Accumulation Fund (the “Fund”) seeks to provide total return, including capital appreciation and income.
II. Investment Approach
The Fund uses a multi-manager approach, relying on a number of sub-advisers with differing investment strategies to manage portions of the Fund’s portfolio, under the general supervision of SEI Investments Management Corporation (“SIMC”). The Fund utilized the following sub-advisers during the one-year period ending September 30, 2016: AQR Capital Management, LLC and PanAgora Asset Management Inc. No manager changes were made during the Fund’s fiscal year.
III. Returns
For the fiscal year ended September 30, 2016 the Multi-Asset Accumulation Fund, Class A, returned 11.36%. The Fund’s blended benchmark — MSCI World Index (Net) (Hedged) (USD) Index (60%) and Bloomberg Barclays Global Aggregate Index, Hedged (USD) (40%) — returned 9.30%.
IV. Performance Discussion
Most major asset classes had positive performance during the Fund’s fiscal year. Both developed- and emerging-market equities did well during the period, as the shareholder letter addressed. Developed-market bonds performed reasonably well with mid-single digit returns (when hedged back to the U.S. dollar). Commodities were modestly negative over the past year; however, their performance stabilized in 2016, with positive performance from the beginning of 2016 through the end of the reporting period. The Fund’s exposure to developed- and emerging-market equities contributed to absolute performance as both asset types performed well during the period. However, the Fund’s lower-than-benchmark exposure to equities detracted from relative performance.
Sub-adviser performance was mixed depending upon market performance and the portfolio’s level of exposure to the asset classes. AQR Capital Management, LLC and PanAgora Asset Management Inc.’s greater-than-benchmark exposures to developed-market bonds contributed to relative performance and were the main drivers of outperformance in the period. Conversely, both AQR Capital Management LLC and PanAgora Asset Management Inc.’s exposures to commodity futures detracted from both absolute and benchmark-relative
performance, as commodities experienced negative performance in the period. Additionally, AQR Capital Management LLC’s exposure to emerging-market currencies contributed to relative performance as most major emerging-market currencies appreciated against the U.S. dollar.
The Fund used equity-index futures, bond-index futures, interest-rate swaps, commodity futures, total-return swaps and currency forwards in order to provide cost-effective exposures to the desired asset classes. Derivatives had a meaningful impact on Fund performance during the period. Sovereign bond-index futures, interest-rate swaps and, to a lesser extent, sovereign bond total-return swaps (used for market exposure) contributed to performance, as interest rates declined modestly (on average) over the period. The greater capital weight to sovereign bonds contributed to outperformance during the period. Global-equity futures (used for market exposure), were a meaningful contributor to performance. While equity futures had a positive impact on total returns, a lower notional exposure to equities detracted from to relative performance. The Fund has a controlled foreign corporation designed to provide commodity exposure, primarily through commodity futures and, to a lesser extent, commodity total-return swaps, as commodities are a key part of the Fund’s strategy. The commodity futures provide strategic exposure to a diversified mix of underlying commodities. However, this exposure detracted from total returns over the period. Forward-currency contracts on emerging-market currencies (used for market exposure) were a positive contributor to both total- and benchmark-relative returns. Forward currency contracts on developed-market currencies were principally used to hedge foreign-currency risk relative to the U.S. dollar. These exposures have slightly added to performance over the Fund’s fiscal year.
AVERAGE ANNUAL TOTAL RETURN1
| ||||||||||||
| One Year Return | Average Annual 3-Year Return | Annualized Inception to Date | ||||||||||
| ||||||||||||
| Multi-Asset Accumulation Fund, Class A | 11.36% | 5.27% | 5.01% | |||||||||
| ||||||||||||
| Multi-Asset Accumulation Fund, Class Y | 11.66% | 5.44% | 5.13% | |||||||||
| ||||||||||||
| MSCI World Index (Net) (Hedged) (USD) | 10.83% | 8.16% | 11.03% | |||||||||
| ||||||||||||
| Bloomberg Barclays Global Aggregate Index, (Hedged) (USD) | 6.54% | 5.05% | 4.24% | |||||||||
| ||||||||||||
| 60/40 Hybrid consisting of the MSCI World Index (Net) (Hedged) (USD) and Bloomberg Barclays Global Aggregate Index, Hedged (USD) | 9.30% | 7.05% | 8.41% | |||||||||
| ||||||||||||
| SEI Institutional Managed Trust / Annual Report / September 30, 2016 | 43 |
MANAGEMENT’S DISCUSSION AND ANALYSIS OF FUND PERFORMANCE
September 30, 2016 (Unaudited)
Multi-Asset Accumulation Fund (Concluded)
Comparison of Change in the Value of a $100,000 Investment in the Multi-Asset Accumulation Fund, Class A and Class Y, versus the 60/40 Hybrid consisting of the MSCI World Index (Net) (Hedged) (USD) and Barclays Global Aggregate Index, (Hedged) (USD), the MSCI World Index (Net) (Hedged) (USD), and the Bloomberg Barclays Global Aggregate Index (Hedged) (USD)
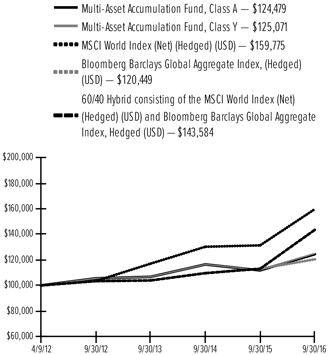
| 1 | For the period ended 9/30/16. Past performance is no indication of future performance. Class A shares were offered beginning 4/09/12 and Class Y shares were offered beginning 12/31/14. Class Y shares performance for the period prior to 12/31/14 is derived from the performance of Class A shares adjusted for the lower expenses of the Class Y shares. Returns shown do not reflect the deduction of taxes that a shareholder would pay on fund distributions or the redemption of fund shares. The returns for the period reflect fee waivers and/or reimbursements in effect for the period; absent fee waivers and reimbursements, performance would have been lower. |
| 44 | SEI Institutional Managed Trust / Annual Report / September 30, 2016 |
MANAGEMENT’S DISCUSSION AND ANALYSIS OF FUND PERFORMANCE
September 30, 2016 (Unaudited)
Multi-Asset Income Fund
I. Objective
The Multi-Asset Income Fund (the “Fund”) seeks to provide total return with an emphasis on current income.
II. Investment Approach
The Fund uses a multi-manager approach, relying on a number of sub-advisers with differing investment strategies to manage portions of the Fund’s portfolio, under the general supervision of SEI Investments Management Corporation (“SIMC”). The Fund used the following sub-advisers during the one-year period ending September 30, 2016: Goldman Sachs Asset Management, L.P. (“Goldman”), Guggenheim Partners Investment Management, LLC (“Guggenheim”) and SSGA Funds Management, Inc.
Sub-adviser Goldman Sachs Asset Management, L.P. was added to the Fund during the period.
III. Returns
For the fiscal year ended September 30, 2016, the Multi-Asset Income Fund, Class A, returned 7.38%. The Fund’s blended benchmark — Bloomberg Barclays U.S. Aggregate Bond Index (45%), the BofA Merrill Lynch U.S. High Yield Constrained Index (40%) and the S&P 500 Index (15%) — returned 9.84%.
IV. Performance Discussion
Credit markets rallied during the Fund’s fiscal year, and credit spreads tightened across the board, but were most pronounced in the below-investment-grade credit market, which includes high-yield bonds and bank loans. Investment-grade corporate credit also performed well during the year as spreads tightened in those sectors. Securitized assets such as asset backed securities (“ABS”), non-agency mortgage-backed securities (“MBS”) and commercial mortgage-backed securities (“CMBS”) performed relatively well, as they benefited from favorable supply and demand dynamics and improving collateral. Non-agency MBS also performed well as the U.S. housing market continued to improve, while collateralized loan obligations (“CLOs”) benefited from strong demand over the past year, which supported the underlying collateral in bank loans. Emerging-market debt, as noted in the shareholder letter, has also enjoyed strong performance over the past year, especially in 2016, as commodity markets have stabilized and outlooks for certain countries have improved. While the Fund’s exposure to high-yield bonds contributed to
absolute returns, their lower-than-benchmark weight detracted on a benchmark-relative basis. The Fund’s off-benchmark exposure to emerging-market debt contributed to both absolute and benchmark-relative performance.
All three sub-advisers contributed to total return. Guggenheim’s meaningful exposure to CLOs, bank loans and ABS helped. Goldman Sachs was added to the Fund in February 2016 and has contributed, principally through exposures to high-yield bonds and emerging-markets debt. Despite its relatively low weight, the covered-call strategy implemented by SSgA provided above-average performance in the period, contributing to relative performance.
The Fund used total-return swaps on equity indexes, interest-rate swaps and futures and options on exchange-traded funds, and equity indices and currency forwards. Derivatives were employed for various reasons, including equity-market exposure to specific sectors, to generate option income and interest-rate risk hedging. Derivatives had a modest impact on Fund performance. Interest-rate futures used to manage duration helped as rates fell during the period. Options used as part of the covered-call strategy contributed, as did a small position in U.S.-equity futures. Currency forwards had a slightly positive impact on performance.
AVERAGE ANNUAL TOTAL RETURN1
| ||||||||||||
| One Year Return | Average Annual 3-Year Return | Annualized Inception to Date | ||||||||||
| ||||||||||||
| Multi-Asset Income Fund, Class A | 7.38% | 5.62% | 6.83% | |||||||||
| ||||||||||||
| Multi-Asset Income Fund, Class Y | 7.49% | 5.68% | 6.87% | |||||||||
| ||||||||||||
| Bloomberg Barclays U.S. Aggregate Bond Index 3 | 5.19% | 4.03% | 2.98% | |||||||||
| ||||||||||||
| BofA Merrill Lunch U.S. High Yield Constrained Index 3 | 12.82% | 5.28% | 6.64% | |||||||||
| ||||||||||||
| S&P 500 Index 3 | 15.43% | 11.16% | 12.96% | |||||||||
| ||||||||||||
| 45/40/15 Hybrid consisting of the Bloomberg Barclays U.S. Aggregate Bond Index, BofA Merrill Lynch U.S. High Yield Constrained Index and S&P 500 Index 3 | 9.84% | 5.67% | 5.98% | |||||||||
| ||||||||||||
| SEI Institutional Managed Trust / Annual Report / September 30, 2016 | 45 |
MANAGEMENT’S DISCUSSION AND ANALYSIS OF FUND PERFORMANCE
September 30, 2016 (Unaudited)
Multi-Asset Income Fund (Concluded)
Comparison of Change in the Value of a $100,000 Investment in the Multi-Asset Income Fund, Class A and Class Y, versus the 45/40/15 Hybrid consisting of the Barclays U.S. Aggregate Bond Index, BofA Merrill Lynch U.S. High Yield Constrained Index, and S&P 500 Index, the Barclays U.S. Aggregate Bond Index, the BofA Merrill Lynch U.S. High Yield Constrained Index, and the S&P 500 Index
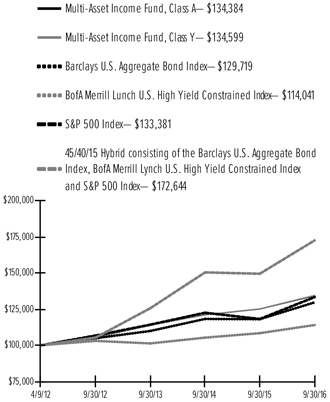
| 1 | For the year ended September 30, 2016. Past performance is not an indication of future performance. Class A shares were offered beginning 4/9/12. Class Y shares performance for the period prior to 12/31/14 is derived from the performance of Class A shares. Returns for Class Y shares are substantially similar to those of Class A shares and differ only to the extent that Class Y shares have lower total annual fund operating expenses than Class A shares. Returns shown do not reflect the deduction of taxes that a shareholder would pay on fund distributions or the redemption of fund shares. The returns for certain periods reflect fee waivers and reimbursements, performance would have been lower. |
| 46 | SEI Institutional Managed Trust / Annual Report / September 30, 2016 |
MANAGEMENT’S DISCUSSION AND ANALYSIS OF FUND PERFORMANCE
September 30, 2016 (Unaudited)
Multi-Asset Inflation Managed Fund
I. Objective
The Multi-Asset Inflation-Managed Fund (the “Fund”) seeks to provide total return exceeding the rate of inflation.
II. Investment Approach
The Fund uses a multi-manager approach, relying on a number of sub-advisers with differing investment strategies to manage portions of the Fund’s portfolio, under the general supervision of SEI Investments Management Corporation (“SIMC”). The Fund utilized the following sub-advisers during the one-year period ending September 30, 2016: AllianceBernstein, L.P, Cohen & Steers and QS Investors, LLC. No manager changes were made during the Fund’s fiscal year.
III. Returns
For the fiscal year ended September 30, 2016, the Multi-Asset Inflation Managed Fund, Class A, returned 1.06%. The Fund’s blended benchmark — the Bloomberg Barclays 1-5 Year U.S. TIPS Total Return Index (70%), the Bloomberg Commodity Total Return Index (20%) and the Russell 1000 Low Volatility Total Return Index (10%) — returned 3.42%.
IV. Performance Discussion
The real-assets market stabilized during the latest completed fiscal year after a difficult period. While commodities had a negative return over the one-year period, recent performance has been favorable, as noted in the shareholder letter, especially in 2016. The main driver of performance was a recovery in oil prices and better fundamentals in certain markets. In addition to commodities, U.S. Treasury Inflation-Protected Securities (TIPS) also performed well with the full TIPS index, measured by the Bloomberg Barclays U.S. TIPS Index, returning 6.5% over the past year. For the Fund’s exposures, TIPS and inflation-linked credit contributed. Commodities had a negligible impact on absolute performance in the period. The long-short equity strategy detracted.
Sub-adviser performance was mixed. Cohen & Steers’ favorable security selection within the commodities sector contributed to relative performance during the period. AllianceBernstein, L.P.’s U.S. TIPS allocation contributed to both absolute and relative performance. Outperformance for AllianceBernstein, L.P. was largely due to an overweight to credit spread sectors. QS Investors’ inflation-sensitive equity long/short strategy
detracted from absolute and blended-benchmark relative performance.
The Fund used commodity futures, bond-index futures, equity-index futures and interest-rate swaps during the period. The use of derivatives had a meaningful impact on Fund performance. A short position in U.S. Treasury futures and interest-rate swaps was used to hedge duration risk for a portion of the Fund’s corporate-bond exposure. This hedge detracted from total returns as interest rates fell. A short position in global equity total-return swaps was used to hedge equity-market risk for a portion of the Fund’s long-equity positions. This hedge detracted from total returns, as equity-market returns were positive. Within the Fund, a controlled foreign corporation has been established to provide additional exposure to commodities, including commodity futures. The commodity futures exposure, used to provide a strategic exposure to a diversified mix of underlying commodities, detracted from total returns. Forward-currency contracts on developed-market currencies were principally used to hedge foreign-currency risk relative to the U.S. dollar and had a slightly positive effect on performance.
AVERAGE ANNUAL TOTAL RETURN1
| ||||||||||||
| One Year Return | Average 3-Year | Annualized to Date | ||||||||||
| ||||||||||||
| Multi-Asset Inflation Managed Fund, Class A | 1.06% | -2.09% | -2.49% | |||||||||
| ||||||||||||
| Multi-Asset Inflation Managed Fund, Class Y | 1.30% | -1.93% | -2.39% | |||||||||
| ||||||||||||
| Bloomberg Barclays 1-5 Year U.S. TIPS Total Return Index | 2.88% | 0.61% | 0.29% | |||||||||
| ||||||||||||
| Bloomberg Commodity Index Total Return Index | -2.58% | -12.34% | -10.54% | |||||||||
| ||||||||||||
| Russell 1000 Low Volatility Total Return Index | 18.45% | 12.73% | 13.64% | |||||||||
| ||||||||||||
| 70/20/10 Hybrid consisting of the Bloomberg Barclays 1-5 Year U.S. TIPS Total Return Index, Bloomberg Commodity Index Total Return Index and Russell 1000 Low Volatility Total Return Index | 3.42% | -1.13% | -0.86% | |||||||||
| ||||||||||||
| SEI Institutional Managed Trust / Annual Report / September 30, 2016 | 47 |
MANAGEMENT’S DISCUSSION AND ANALYSIS OF FUND PERFORMANCE
September 30, 2016 (Unaudited)
Multi-Asset Inflation Managed Fund (Concluded)
Comparison of Change in the Value of a $100,000 Investment in the Multi-Asset Inflation Managed Fund, Class A and Class Y, versus a 70/20/10 Hybrid of the following Indexes: the Bloomberg Barclays 1-5 Year U.S. TIPS Index, Bloomberg Commodity Index Total Return Index and the Russell 1000 Low Volatility Index
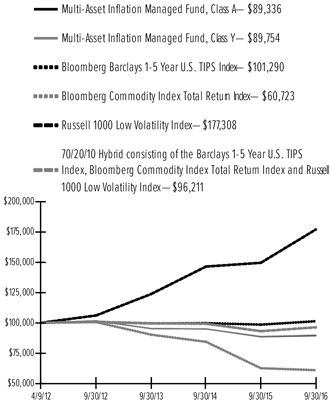
| 1 | For the period ended 9/30/16. Past performance is no indication of future performance. Class A Shares were offered beginning 4/09/12 and Class Y shares were offered beginning 12/31/14. Class Y shares performance for the period prior to 12/31/14 is derived from the performance of Class A shares adjusted for the lower expenses of the Class Y shares. Returns shown do not reflect the deduction of taxes that a shareholder would pay on fund distributions or the redemption of fund shares. The returns for the period reflect fee waivers and/or reimbursements in effect for the period; absent fee waivers and reimbursements, performance would have been lower. |
| 48 | SEI Institutional Managed Trust / Annual Report / September 30, 2016 |
MANAGEMENT’S DISCUSSION AND ANALYSIS OF FUND PERFORMANCE
September 30, 2016 (Unaudited)
Multi-Asset Capital Stability Fund
I. Objective
The Multi-Asset Capital Stability Fund (the “Fund”) seeks to manage the risk of a loss while providing current income and an opportunity for capital appreciation.
II. Investment Approach
During the one-year period ending September 30, 2016, the Fund used a single sub-adviser, AllianceBernstein, L.P., under the general supervision of SEI Investments Management Corporation (“SIMC”). No manager changes were made during the Fund’s fiscal year.
III. Returns
For the fiscal year ended September 30, 2016, the Multi-Asset Capital Stability Fund, Class A, returned 1.47%. The Fund’s blended benchmark — the Bloomberg Barclays 1-3 Year U.S. Government/Credit Index (95%) and S&P 500 Index (5%) — returned 2.01%.
IV. Performance Discussion
Most major asset classes had positive performance during the Fund’s fiscal year. Both developed- and emerging-market equities experienced strong positive performance in the period, as the shareholder letter addressed. Developed-market bonds performed reasonably well with mid-single-digit returns (when hedged back to the U.S. dollar).
The Fund had positive absolute performance, but underperformed relative to its blended benchmark. A greater-than-average exposure to duration contributed. Greater-than-benchmark exposures to equity and credit, on average, helped both absolute and relative performance. Trading effects, or shifting allocations based on risk estimates, detracted from relative returns over the period.
The Fund used credit-default swaps, equity-index futures, bond-index futures, interest-rate swaps, equity options and currency forwards. Derivatives are primarily used to provide cost-effective exposures to the desired asset classes, and had a meaningful impact on Fund performance in the period. Stock-index futures, primarily developed-market equities used for market exposure, resulted in positive performance during the Fund’s fiscal year. Interest-rate futures and swaps were meaningful contributors to performance as interest rates fell on average during the period. Small positions in credit-default swaps, used to gain exposure to high-yield and investment-grade credit, contributed modestly to total return. Forward-currency contracts on developed-market currencies were principally used to hedge foreign-
currency risk relative to the U.S. dollar. The effect of these hedges on performance was largely neutral.
AVERAGE ANNUAL TOTAL RETURN1
| ||||||||||||
| 1 Year Return | Annualized 3 Year Return | Annualized Inception to Date | ||||||||||
| ||||||||||||
| Multi-Asset Capital Stability Fund, Class A | 1.47% | 1.80% | 1.24% | |||||||||
| ||||||||||||
| Multi-Asset Capital Stability Fund, Class Y | 1.57% | 1.86% | 1.28% | |||||||||
| ||||||||||||
| Bloomberg Barclays 1-3 year U.S. Government/Credit Index | 1.31% | 1.09% | 1.03% | |||||||||
| ||||||||||||
| S&P 500 Index | 15.43% | 11.16% | 12.96% | |||||||||
| ||||||||||||
| 95/5 Hybrid consisting of Bloomberg Barclays 1-3 Year U.S. Government/Credit Index and S&P 500 Index | 2.01% | 1.60% | 1.62% | |||||||||
| ||||||||||||
Comparison of Change in the Value of a $100,000 Investment in the Multi-Asset Capital Stability Fund, Class A and Class Y, versus a 95/5 Hybrid of the following indexes: the Bloomberg Barclays 1-3 Year U.S. Government/Credit Index, and the S&P 500 Index.
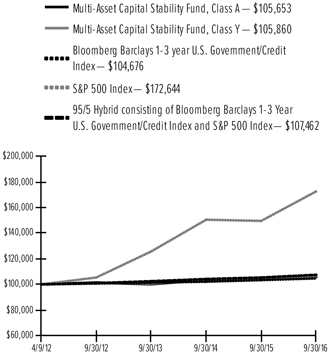
| 1 | For the period ended 9/30/16. Past performance is not an indication of future performance. Class A shares were offered beginning 4/9/12 and Class Y shares were offered beginning 12/31/14. Class Y shares performance for the period prior to 12/31/14 is derived from the performance of Class A shares adjusted for the lower expenses of the Class Y shares. Returns shown do not reflect the deduction of taxes that a shareholder would pay on fund distributions or the redemption of fund shares. The returns for certain periods reflect fee waivers and/or reimbursements in effect for that period; absent fee waivers and/or reimbursements, performance would have been lower. |
| SEI Institutional Managed Trust / Annual Report / September 30, 2016 | 49 |
MANAGEMENT’S DISCUSSION AND ANALYSIS OF FUND PERFORMANCE
September 30, 2016 (Unaudited)
Long/Short Alternative Fund
I. Objective
The Long/Short Alternative Fund (“the Fund”) seeks to provide long term capital appreciation.
II. Investment Approach
During the one-year period ending September 30, 2016, the Fund used a single sub-adviser, Beachhead Capital Management LLC, under the general supervision of SEI Investments Management Corporation (“SIMC”). No manager changes were made during the Fund’s fiscal year.
III. Returns
For the fiscal year ended September 30, 2016 the Long/ Short Alternative Fund, Class A returned 1.45%. The Fund’s benchmark — HFRX Equity Hedge Index — returned 0.13%.
IV. Performance Discussion
During the Fund’s fiscal year, performance was driven mainly by the Fund’s long exposure to U.S. and developed-market equities. The fourth quarter of 2015 saw equity markets rally following challenged performance over the previous quarter. However, some of these gains were given back in the first quarter of 2016 with broad selloffs in developed-market equities and the U.S. dollar. Additionally, investors were rotating into safety-oriented assets, as the shareholder letter addressed, a key driver of the gains in U.S. Treasury bonds over the quarter. The third quarter of 2016 saw rallies in both developed and emerging-equity markets, as well as in high-yield corporate bonds. The Fund’s short position in emerging-markets equities was the largest detractor for the fiscal year and the short position in 30-year Treasury bonds was the second-largest detractor, primarily due to the strong first-quarter performance seen in both asset classes. Long positions in U.S. equity markets contributed, with both the S&P 400 and NASDAQ Composite indexes posting strong returns, especially during the third quarter of 2016. As of the end of the reporting period, the Fund retains its long developed-market equity positioning, short exposure to emerging-market equities and smaller shorts to long-term U.S. Treasuries and the U.S. dollar index.
The Fund achieved the foregoing exposure and related performance primarily through the use of index futures to obtain broad exposure to global financial markets including U.S. and international equities, U.S. government bonds, and currencies.
AVERAGE ANNUAL TOTAL RETURN1
| ||||||||
| One Year Return | Annualized Inception to Date | |||||||
| ||||||||
| Long/Short Alternative Fund, Class A | 1.24% | -1.18% | ||||||
| ||||||||
| Long/Short Alternative Fund, Class Y | 1.45% | -1.07% | ||||||
| ||||||||
| BofA Merrill Lynch 3-Month U.S. Treasury Bill Index | 0.27% | 0.17% | ||||||
| ||||||||
| HFRX Equity Hedge Index | 0.13% | -1.48% | ||||||
| ||||||||
Comparison of Change in the Value of a $100,000 Investment in the Long/Short Alternative Fund, Class A and Class Y, versus the BofA Merrill Lynch 3-Month U.S. Treasury Bill Index and the HFRX Equity Hedge Index
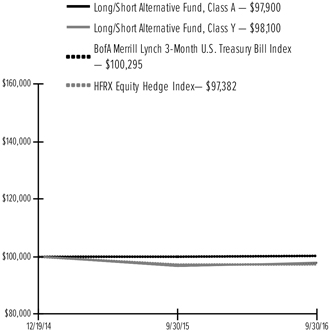
| 1 | For the period ended 9/30/16. Past performance is no indication of future performance. Class A Shares were offered beginning 12/19/14 and Class Y shares were offered beginning 4/30/15. Class Y shares performance for the period prior to 4/30/15 is derived from the performance of Class A shares adjusted for the lower expenses of the Class Y shares. Returns shown do not reflect the deduction of taxes that a shareholder would pay on fund distributions or the redemption of fund shares. The returns for the period reflect fee waivers and/or reimbursements in effect for the period; absent fee waivers and reimbursements, performance would have been lower. |
| 50 | SEI Institutional Managed Trust / Annual Report / September 30, 2016 |
SUMMARY SCHEDULE OF INVESTMENTS
September 30, 2016
Large Cap Fund
Sector Weightings (Unaudited)†:
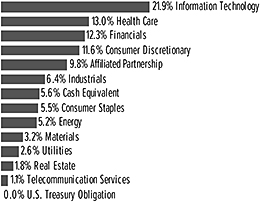
†Percentages are based on total investments. Includes investments held as collateral for securities held on loan (see Note 10).
| ||||||||||
| Description | Percentage of Net Assets (%) | Shares | Market Value ($ Thousands) | |||||||
| ||||||||||
COMMON STOCK — 94.0% |
| |||||||||
Consumer Discretionary — 12.9% |
| |||||||||
Amazon.com, Cl A* | 0.8% | 23,995 | $ | 20,091 | ||||||
General Motors | 1.1 | 810,729 | 25,757 | |||||||
L Brands | 0.8 | 254,873 | 18,037 | |||||||
Liberty Interactive QVC Group, Cl A* | 0.8 | 1,002,388 | 20,058 | |||||||
Macy’s(A) | 0.6 | 378,298 | 14,016 | |||||||
TripAdvisor*(A) | 0.8 | 284,685 | 17,986 | |||||||
Other Securities(A) | 8.0 | 192,987 | ||||||||
|
| |||||||||
| 308,932 | ||||||||||
|
| |||||||||
Consumer Staples — 6.1% |
| |||||||||
Tyson Foods, Cl A(A) | 0.6 | 183,742 | 13,720 | |||||||
Walgreens Boots Alliance | 0.7 | 199,741 | 16,103 | |||||||
Wal-Mart Stores | 0.7 | 225,593 | 16,270 | |||||||
Other Securities(A) | 4.1 | 100,024 | ||||||||
|
| |||||||||
| 146,117 | ||||||||||
|
| |||||||||
Energy — 5.7% |
| |||||||||
BP ADR(A) | 0.5 | 374,541 | 13,169 | |||||||
Other Securities(A) | 5.2 | 124,330 | ||||||||
|
| |||||||||
| 137,499 | ||||||||||
|
| |||||||||
Financials — 13.6% |
| |||||||||
Aflac(A) | 0.7 | 243,578 | 17,506 | |||||||
Bank of America | 1.5 | 2,327,751 | 36,429 | |||||||
Berkshire Hathaway, Cl B* | 0.9 | 153,865 | 22,229 | |||||||
Citigroup | 0.6 | 288,601 | 13,631 | |||||||
Intercontinental Exchange | 0.7 | 66,011 | 17,781 | |||||||
JPMorgan Chase | 1.7 | 605,802 | 40,340 | |||||||
MetLife(A) | 1.1 | 569,914 | 25,321 | |||||||
Travelers(A) | 0.7 | 139,971 | 16,034 | |||||||
Voya Financial | 0.6 | 500,527 | 14,425 | |||||||
Other Securities‡(A)(B) | 5.1 | 124,100 | ||||||||
|
| |||||||||
| 327,796 | ||||||||||
|
| |||||||||
Health Care — 14.5% |
| |||||||||
Allergan* | 0.9 | 94,418 | 21,745 | |||||||
| ||||||||||
| Description | Percentage of Net Assets (%) | Shares | Market Value ($ Thousands) | |||||||
| ||||||||||
COMMON STOCK (continued) |
| |||||||||
Biogen* | 1.7% | 133,814 | $ | 41,888 | ||||||
Celgene, Cl A* | 1.0 | 224,141 | 23,429 | |||||||
Gilead Sciences | 0.7 | 210,954 | 16,691 | |||||||
Johnson & Johnson | 1.0 | 197,492 | 23,330 | |||||||
Merck(A) | 0.7 | 285,564 | 17,822 | |||||||
Pfizer | 0.6 | 417,434 | 14,138 | |||||||
UnitedHealth Group | 0.9 | 159,382 | 22,313 | |||||||
Other Securities(A) | 7.0 | 166,018 | ||||||||
|
| |||||||||
| 347,374 | ||||||||||
|
| |||||||||
Industrials — 7.1% |
| |||||||||
Delta Air Lines, Cl A | 0.8 | 505,767 | 19,907 | |||||||
Nielsen Holdings(A) | 0.6 | 262,822 | 14,079 | |||||||
Other Securities(A) | 5.7 | 137,937 | ||||||||
|
| |||||||||
| 171,923 | ||||||||||
|
| |||||||||
Information Technology — 24.4% |
| |||||||||
Alphabet, Cl A* | 2.0 | 60,511 | 48,654 | |||||||
Alphabet, Cl C* | 0.5 | 14,792 | 11,498 | |||||||
Apple | 0.6 | 136,529 | 15,435 | |||||||
Cisco Systems | 0.8 | 604,482 | 19,174 | |||||||
eBay* | 1.4 | 982,539 | 32,325 | |||||||
Electronic Arts*(A) | 1.0 | 280,385 | 23,945 | |||||||
Facebook, Cl A* | 1.6 | 302,143 | 38,756 | |||||||
Hewlett Packard Enterprise | 0.8 | 867,045 | 19,725 | |||||||
Intel(A) | 0.7 | 473,298 | 17,867 | |||||||
Intuit | 0.8 | 171,815 | 18,901 | |||||||
MasterCard, Cl A | 0.7 | 174,423 | 17,751 | |||||||
Microsoft(A) | 1.9 | 782,927 | 45,097 | |||||||
PayPal Holdings* | 0.9 | 511,919 | 20,973 | |||||||
Qualcomm | 2.1 | 727,763 | 49,852 | |||||||
Visa, Cl A(A) | 1.9 | 563,482 | 46,600 | |||||||
Other Securities(A) | 6.7 | 159,091 | ||||||||
|
| |||||||||
| 585,644 | ||||||||||
|
| |||||||||
Materials — 3.5% |
| |||||||||
International Paper(A) | 0.6 | 276,851 | 13,283 | |||||||
Other Securities(A) | 2.9 | 72,114 | ||||||||
|
| |||||||||
| 85,397 | ||||||||||
|
| |||||||||
Real Estate — 2.0% |
| |||||||||
Crown Castle International‡(A) | 1.3 | 326,330 | 30,744 | |||||||
Equinix‡ | 0.6 | 39,653 | 14,285 | |||||||
Other Securities‡(A) | 0.1 | 2,143 | ||||||||
|
| |||||||||
| 47,172 | ||||||||||
|
| |||||||||
Telecommunication Services — 1.3% |
| |||||||||
Verizon Communications(A) | 1.0 | 444,984 | 23,130 | |||||||
Other Securities | 0.3 | 7,391 | ||||||||
|
| |||||||||
| 30,521 | ||||||||||
|
| |||||||||
Utilities — 2.9% |
| |||||||||
Entergy | 0.7 | 205,126 | 15,739 | |||||||
Exelon | 0.7 | 518,548 | 17,263 | |||||||
Public Service Enterprise Group | 0.8 | 456,756 | 19,124 | |||||||
Other Securities | 0.7 | 16,537 | ||||||||
|
| |||||||||
| 68,663 | ||||||||||
|
| |||||||||
| SEI Institutional Managed Trust / Annual Report / September 30, 2016 | 51 |
SUMMARY SCHEDULE OF INVESTMENTS
September 30, 2016
Large Cap Fund (Concluded)
| ||||||||||
| Description | Percentage of Net Assets (%) | Shares | Market Value ($ Thousands) | |||||||
| ||||||||||
COMMON STOCK (continued) |
| |||||||||
Total Common Stock | $ | 2,257,038 | ||||||||
|
| |||||||||
U.S. TREASURY OBLIGATION — 0.0% |
| |||||||||
Other Securities (C) | 0.0% | 925 | ||||||||
|
| |||||||||
Total U.S. Treasury Obligation | 925 | |||||||||
|
| |||||||||
AFFILIATED PARTNERSHIP — 10.9% |
| |||||||||
SEI Liquidity Fund, L.P. | 10.9 | 261,550,929 | 261,551 | |||||||
|
| |||||||||
Total Affiliated Partnership | 261,551 | |||||||||
|
| |||||||||
CASH EQUIVALENT — 6.2% |
| |||||||||
SEI Daily Income Trust, Government Fund, Cl A | 6.2 | 149,114,835 | 149,115 | |||||||
|
| |||||||||
Total Cash Equivalent | 149,115 | |||||||||
|
| |||||||||
Total Investments — 111.1% | $ | 2,668,629 | ||||||||
|
| |||||||||
A list of the open futures contracts held by the Fund at September 30, 2016 is as follows:
| ||||||||||||
| Type of Contract | Number of Contracts Long | Expiration Date | Unrealized Depreciation ($ Thousands) | |||||||||
| ||||||||||||
S&P 500 Index E-MINI | 149 | Dec-2016 | $(24) | |||||||||
S&P Mid Cap 400 Index E-MINI | 12 | Dec-2016 | (4) | |||||||||
|
| |||||||||||
| $(28) | ||||||||||||
|
| |||||||||||
For the year ended September 30, 2016 the total amount of all open futures contracts, as presented in the table above, are represented of the volume of activity for this derivative type during the year.
Percentages are based on a Net Assets of $2,402,274 ($ Thousands).
| * | Non-income producing security. |
| ** | The rate reported is the 7-day effective yield as of September 30, 2016. |
| ‡ | Real Estate Investment Trust. |
| † | Investment in Affiliated Security (see Note 6). |
| (A) | Certain securities or partial positions of certain securities are on loan at September 30, 2016, (see Note 10). The total market value of securities on loan at September 30, 2016, was $258,188 ($ Thousands). |
| (B) | Security is a Master Limited Partnership. At September 30, 2016, such securities amounted to $9,918 ($ Thousands), or 0.41% of Net Assets (see Note 2). |
| (C) | Security, or portion thereof, has been pledged as collateral on open futures contracts. |
| (D) | This security was purchased with cash collateral held from securities on loan (see Note 10). The total value of such securities as of September 30, 2016 was $261,551 ($ Thousands). |
ADR — American Depositary Receipt
Cl — Class
L.P. —Limited Partnership
S&P — Standards & Poor’s
The Summary Schedule of Investments does not reflect the complete portfolio holdings. It includes the Fund’s 50 largest holdings and each investment of any issuer that exceeds 1% of the Fund’s net assets. “Other Securities” represent all issues not required to be disclosed under the rules adopted by the U.S. Securities and Exchange Commission (“SEC”). In certain instances, securities for which footnotes listed above may otherwise apply are included in the Other Securities caption. The complete schedule of portfolio holdings is available (i) without charge, upon request, by calling (800) 342-5734; and (ii) on the SEC’s website at http://www.sec.gov.
The following is a list of the level of inputs used as of September 30, 2016, in valuing the Fund’s investments and other financial instruments carried at value ($ Thousands):
| ||||||||||||||||
| Investments in Securities | Level 1 | Level 2 | Level 3 | Total | ||||||||||||
| ||||||||||||||||
Common Stock | $ | 2,257,038 | $ | – | $ | – | $ | 2,257,038 | ||||||||
U.S. Treasury Obligation | – | 925 | – | 925 | ||||||||||||
Affiliated Partnership | – | 261,551 | – | 261,551 | ||||||||||||
Cash Equivalent | 149,115 | – | – | 149,115 | ||||||||||||
|
|
|
|
|
|
|
| |||||||||
Total Investments in Securities | $ | 2,406,153 | $ | 262,476 | $ | – | $ | 2,668,629 | ||||||||
|
|
|
|
|
|
|
| |||||||||
| ||||||||||||||||
| Other Financial Instruments | Level 1 | Level 2 | Level 3 | Total | ||||||||||||
| ||||||||||||||||
Futures Contracts * | ||||||||||||||||
Unrealized Depreciation | $ | (28) | $ | — | $ | — | $ | (28) | ||||||||
|
|
|
|
|
|
|
| |||||||||
Total Other Financial Instruments | $ | (28) | $ | — | $ | — | $ | (28) | ||||||||
|
|
|
|
|
|
|
| |||||||||
| * | Futures contracts are valued at the unrealized depreciation on the instrument. |
For the year ended September 30, 2016, there were no transfers between Level 1 and Level 2 assets and liabilities.
For the year ended September 30, 2016, there were no transfers between Level 2 and Level 3 assets and liabilities.
For more information on valuation inputs, see Note 2 — Significant Accounting Policies in Notes to Financial Statements.
Amounts designated as “–” are either $0 or have been rounded to $0.
The accompanying notes are an integral part of the financial statements.
| 52 | SEI Institutional Managed Trust / Annual Report / September 30, 2016 |
SUMMARY SCHEDULE OF INVESTMENTS
September 30, 2016
Large Cap Value Fund
Sector Weightings (Unaudited)†:
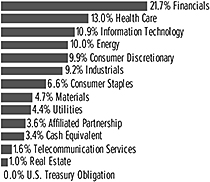
†Percentages are based on total investments. Includes investments held as collateral for securities held on loan (see Note 10).
| ||||||||||
| Description | Percentage of Net Assets (%) | Shares | Market Value ($ Thousands) | |||||||
| ||||||||||
COMMON STOCK — 96.5% |
| |||||||||
Consumer Discretionary — 10.2% |
| |||||||||
General Motors | 1.5% | 632,729 | $ | 20,102 | ||||||
Goodyear Tire & Rubber | 0.9 | 369,058 | 11,921 | |||||||
Kohl’s | 0.7 | 204,750 | 8,958 | |||||||
Macy’s | 0.7 | 249,240 | 9,234 | |||||||
Omnicom Group | 0.7 | 106,508 | 9,053 | |||||||
Other Securities(A) | 5.7 | 76,690 | ||||||||
|
| |||||||||
| 135,958 | ||||||||||
|
| |||||||||
Consumer Staples — 6.9% |
| |||||||||
CVS Health | 0.7 | 111,992 | 9,966 | |||||||
Kroger | 0.7 | 310,514 | 9,216 | |||||||
Philip Morris International | 1.0 | 133,028 | 12,933 | |||||||
Tyson Foods, Cl A | 0.9 | 152,753 | 11,406 | |||||||
Other Securities | 3.6 | 47,459 | ||||||||
|
| |||||||||
| 90,980 | ||||||||||
|
| |||||||||
Energy — 10.4% |
| |||||||||
BP ADR(A) | 0.9 | 352,110 | 12,380 | |||||||
Chevron | 0.9 | 115,452 | 11,882 | |||||||
Devon Energy | 0.7 | 204,395 | 9,016 | |||||||
Exxon Mobil | 1.1 | 166,057 | 14,494 | |||||||
Occidental Petroleum | 0.8 | 146,728 | 10,699 | |||||||
Phillips 66 | 0.7 | 121,518 | 9,788 | |||||||
Valero Energy | 0.7 | 170,168 | 9,019 | |||||||
Other Securities(A) | 4.6 | 60,884 | ||||||||
|
| |||||||||
| 138,162 | ||||||||||
|
| |||||||||
Financials — 22.5% |
| |||||||||
Aflac | 0.9 | 173,489 | 12,469 | |||||||
Bank of America | 2.4 | 2,036,175 | 31,866 | |||||||
Berkshire Hathaway, Cl B* | 0.7 | 60,939 | 8,804 | |||||||
Citigroup | 1.4 | 378,272 | 17,866 | |||||||
JPMorgan Chase | 2.6 | 510,041 | 33,964 | |||||||
MetLife | 2.0 | 588,502 | 26,147 | |||||||
PNC Financial Services Group | 0.9 | 130,000 | 11,712 | |||||||
State Street | 0.9 | 172,944 | 12,042 | |||||||
Voya Financial | 1.1 | 496,151 | 14,299 | |||||||
Other Securities‡(A)(B) | 9.6 | 129,251 | ||||||||
| ||||||||||
| Description | Percentage of Net Assets (%) | Shares | Market Value ($ Thousands) | |||||||
| ||||||||||
COMMON STOCK (continued) |
| |||||||||
|
| |||||||||
| $ | 298,420 | |||||||||
|
| |||||||||
Health Care — 13.5% | ||||||||||
Amgen, Cl A | 1.0% | 77,482 | 12,925 | |||||||
Anthem | 0.7 | 73,740 | 9,240 | |||||||
Gilead Sciences | 0.8 | 125,409 | 9,922 | |||||||
Johnson & Johnson | 2.2 | 243,250 | 28,735 | |||||||
Merck | 1.0 | 216,717 | 13,525 | |||||||
Pfizer | 1.1 | 449,009 | 15,208 | |||||||
UnitedHealth Group | 0.7 | 70,482 | 9,867 | |||||||
Other Securities | 6.0 | 80,250 | ||||||||
|
| |||||||||
| 179,672 | ||||||||||
|
| |||||||||
Industrials — 9.5% |
| |||||||||
American Airlines Group | 0.7 | 241,287 | 8,834 | |||||||
Delta Air Lines, Cl A | 1.1 | 363,710 | 14,316 | |||||||
Illinois Tool Works | 0.8 | 87,772 | 10,519 | |||||||
WW Grainger(A) | 0.7 | 38,001 | 8,544 | |||||||
Other Securities | 6.2 | 83,923 | ||||||||
|
| |||||||||
| 126,136 | ||||||||||
|
| |||||||||
Information Technology — 11.3% |
| |||||||||
Automatic Data Processing | 0.7 | 103,513 | 9,130 | |||||||
Cisco Systems | 1.0 | 427,709 | 13,567 | |||||||
Hewlett Packard Enterprise | 1.0 | 580,558 | 13,208 | |||||||
Intel | 1.2 | 435,126 | 16,426 | |||||||
Microchip Technology(A) | 0.7 | 148,088 | 9,202 | |||||||
Micron Technology* | 0.7 | 498,716 | 8,867 | |||||||
Qualcomm | 1.2 | 229,873 | 15,746 | |||||||
Other Securities(A) | 4.8 | 64,234 | ||||||||
|
| |||||||||
| 150,380 | ||||||||||
|
| |||||||||
Materials — 4.9% |
| |||||||||
Eastman Chemical | 0.6 | 126,251 | 8,545 | |||||||
International Paper | 0.8 | 210,607 | 10,105 | |||||||
Reliance Steel & Aluminum | 0.6 | 120,206 | 8,658 | |||||||
Other Securities | 2.9 | 37,406 | ||||||||
|
| |||||||||
| 64,714 | ||||||||||
|
| |||||||||
Real Estate — 1.0% |
| |||||||||
Other Securities‡ | 1.0 | 13,891 | ||||||||
|
| |||||||||
Telecommunication Services — 1.7% |
| |||||||||
Verizon Communications | 0.9 | 214,992 | 11,175 | |||||||
Other Securities | 0.8 | 11,266 | ||||||||
|
| |||||||||
| 22,441 | ||||||||||
|
| |||||||||
Utilities — 4.6% |
| |||||||||
Entergy | 0.7 | 127,953 | 9,818 | |||||||
Exelon | 1.1 | 452,364 | 15,059 | |||||||
Public Service Enterprise Group | 1.0 | 307,492 | 12,875 | |||||||
Other Securities | 1.8 | 23,417 | ||||||||
|
| |||||||||
| 61,169 | ||||||||||
|
| |||||||||
Total Common Stock |
| 1,281,923 | ||||||||
|
| |||||||||
| SEI Institutional Managed Trust / Annual Report / September 30, 2016 | 53 |
SUMMARY SCHEDULE OF INVESTMENTS
September 30, 2016
Large Cap Value Fund (Concluded)
| ||||||||||
| Description | Percentage of Net Assets (%) | Shares | Market Value ($ Thousands) | |||||||
| ||||||||||
U.S. TREASURY OBLIGATION — 0.0% |
| |||||||||
Other Securities | 0.0% | $ | 25 | |||||||
|
| |||||||||
Total U.S. Treasury Obligation |
| 25 | ||||||||
|
| |||||||||
AFFILIATED PARTNERSHIP — 3.7% |
| |||||||||
SEI Liquidity Fund, L.P. | 3.7 | 49,706,717 | 49,707 | |||||||
|
| |||||||||
Total Affiliated Partnership | 49,707 | |||||||||
|
| |||||||||
CASH EQUIVALENT — 3.6% |
| |||||||||
SEI Daily Income Trust, Government Fund, Cl A | 3.6 | 47,204,335 | 47,204 | |||||||
|
| |||||||||
Total Cash Equivalent |
| 47,204 | ||||||||
|
| |||||||||
Total Investments — 103.8% |
| $ | 1,378,859 | |||||||
|
| |||||||||
| Percentages are based on a Net Assets of $1,328,198 ($ Thousands). |
| * | Non-income producing security. |
| ** | The rate reported is the 7-day effective yield as of September 30, 2016. |
| ‡ | Real Estate Investment Trust. |
| † | Investment in Affiliated Security (see Note 6). |
| (A) | Certain securities or partial positions of certain securities are on loan at September 30, 2016, (see Note 10). The total market value of securities on loan at September 30, 2016, was $49,352 ($ Thousands). |
| (B) | Security is a Master Limited Partnership. At September 30, 2016, such securities amounted to $9,714 ($ Thousands), or 0.73% of Net Assets (see Note 2). |
| (C) | This security was purchased with cash collateral held from securities on loan (see Note 10). The total value of such securities as of September 30, 2016 was $49,707 ($ Thousands). |
ADR — American Depositary Receipt
Cl — Class
L.P. — Limited Partnership
The Summary Schedule of Investments does not reflect the complete portfolio holdings. It includes the Fund’s 50 largest holdings and each investment of any issuer that exceeds 1% of the Fund’s net assets. “Other Securities” represent all issues not required to be disclosed under the rules adopted by the U.S. Securities and Exchange Commission (“SEC”). In certain instances, securities for which footnotes listed above may otherwise apply are included in the Other Securities caption. The complete schedule of portfolio holdings is available (i) without charge, upon request, by calling (800) 342-5734; and (ii) on the SEC’s website at http://www.sec.gov.
The following is a list of the level of inputs used as of September 30, 2016, in valuing the Fund’s investments carried at value ($ Thousands):
| ||||||||||||||||
| Investments in Securities | Level 1 | Level 2 | Level 3 | Total | ||||||||||||
| ||||||||||||||||
Common Stock | $ | 1,281,923 | $ | – | $ | – | $ | 1,281,923 | ||||||||
U.S. Treasury Obligation | – | 25 | – | 25 | ||||||||||||
Affiliated Partnership | – | 49,707 | – | 49,707 | ||||||||||||
Cash Equivalent | 47,204 | – | – | 47,204 | ||||||||||||
|
|
|
|
|
|
|
| |||||||||
Total Investments in Securities | $ | 1,329,127 | $ | 49,732 | $ | – | $ | 1,378,859 | ||||||||
|
|
|
|
|
|
|
| |||||||||
For the year ended September 30, 2016, there were no transfers between Level 1 and Level 2 assets and liabilities.
For the year ended September 30, 2016, there were no transfers between Level 2 and Level 3 assets and liabilities.
For more information on valuation inputs, see Note 2 — Significant Accounting Policies in Notes to Financial Statements.
Amounts designated as “–” are either $0 or have been rounded to $0.
The accompanying notes are an integral part of the financial statements.
| 54 | SEI Institutional Managed Trust / Annual Report / September 30, 2016 |
SUMMARY SCHEDULE OF INVESTMENTS
September 30, 2016
Large Cap Growth Fund
Sector Weightings †:
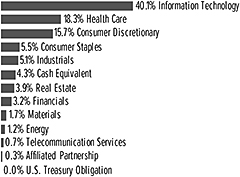
†Percentages are based on total investments. Includes investments held as collateral for securities held on loan (see Note 10).
| ||||||||||
| Description | Percentage of Net Assets (%) | Shares | Market Value ($ Thousands) | |||||||
| ||||||||||
COMMON STOCK†† — 95.9% |
| |||||||||
Consumer Discretionary — 15.8% |
| |||||||||
Amazon.com, Cl A* | 2.7% | 46,767 | $ | 39,159 | ||||||
Dollar General | 0.9 | 181,933 | 12,734 | |||||||
Home Depot | 0.8 | 92,651 | 11,922 | |||||||
L Brands | 1.7 | 344,343 | 24,369 | |||||||
Liberty Global, Cl A* | 0.6 | 263,697 | 9,013 | |||||||
Liberty Global, Cl C* | 0.7 | 323,698 | 10,695 | |||||||
Liberty Interactive QVC Group, Cl A* | 2.2 | 1,566,328 | 31,342 | |||||||
NetFlix* | 0.8 | 120,124 | 11,838 | |||||||
Nike, Cl B | 0.8 | 219,690 | 11,567 | |||||||
Priceline Group* | 0.8 | 7,892 | 11,613 | |||||||
TripAdvisor* | 1.8 | 419,085 | 26,478 | |||||||
Other Securities(A) | 2.0 | 27,375 | ||||||||
|
| |||||||||
| 228,105 | ||||||||||
|
| |||||||||
Consumer Staples — 5.5% | ||||||||||
Anheuser-Busch InBev ADR | 0.8 | 87,507 | 11,499 | |||||||
Constellation Brands, Cl A | 1.2 | 104,035 | 17,321 | |||||||
Costco Wholesale | 0.6 | 60,557 | 9,235 | |||||||
Walgreens Boots Alliance | 1.1 | 205,556 | 16,572 | |||||||
Other Securities | 1.8 | 25,574 | ||||||||
|
| |||||||||
| 80,201 | ||||||||||
|
| |||||||||
Energy — 1.2% | ||||||||||
Other Securities | 1.2 | 17,318 | ||||||||
|
| |||||||||
Financials — 3.2% | ||||||||||
Berkshire Hathaway, Cl B* | 1.1 | 104,419 | 15,085 | |||||||
Intercontinental Exchange | 1.9 | 102,706 | 27,665 | |||||||
Other Securities | 0.2 | 3,363 | ||||||||
|
| |||||||||
| 46,113 | ||||||||||
|
| |||||||||
Health Care — 18.4% | ||||||||||
Alexion Pharmaceuticals* | 0.9 | 113,605 | 13,921 | |||||||
Allergan* | 2.2 | 136,819 | 31,511 | |||||||
Becton Dickinson | 1.0 | 81,304 | 14,613 | |||||||
Biogen* | 2.9 | 133,179 | 41,689 | |||||||
Celgene, Cl A* | 2.4 | 328,873 | 34,377 | |||||||
| ||||||||||
| Description | Percentage of Net Assets (%) | Shares | Market Value ($ Thousands) | |||||||
| ||||||||||
COMMON STOCK (continued) | ||||||||||
DENTSPLY SIRONA | 1.2% | 298,269 | $ | 17,726 | ||||||
Illumina* | 0.8 | 61,671 | 11,203 | |||||||
Novo Nordisk ADR | 0.7 | 260,343 | 10,828 | |||||||
Quintiles Transnational* | 1.3 | 226,064 | 18,325 | |||||||
Regeneron Pharmaceuticals* | 0.8 | 28,149 | 11,316 | |||||||
UnitedHealth Group | 2.3 | 238,659 | 33,412 | |||||||
Other Securities(A) | 1.9 | 27,098 | ||||||||
|
| |||||||||
| 266,019 | ||||||||||
|
| |||||||||
Industrials — 5.1% | ||||||||||
Nielsen Holdings | 1.5 | 397,806 | 21,311 | |||||||
TransDigm Group* | 0.7 | 35,540 | 10,275 | |||||||
Other Securities | 2.9 | 42,644 | ||||||||
|
| |||||||||
| 74,230 | ||||||||||
|
| |||||||||
Information Technology — 40.3% |
| |||||||||
Activision Blizzard | 0.8 | 270,819 | 11,997 | |||||||
Alphabet, Cl A* | 4.7 | 83,962 | 67,510 | |||||||
Alphabet, Cl C* | 1.6 | 28,869 | 22,440 | |||||||
Apple | 1.0 | 133,029 | 15,039 | |||||||
eBay* | 2.1 | 935,848 | 30,789 | |||||||
Electronic Arts* | 2.4 | 405,875 | 34,662 | |||||||
Facebook, Cl A* | 4.1 | 465,968 | 59,770 | |||||||
Fiserv, Cl A* | 0.6 | 93,185 | 9,269 | |||||||
FleetCor Technologies* | 0.8 | 65,197 | 11,327 | |||||||
Global Payments | 0.6 | 119,098 | 9,142 | |||||||
Intuit | 1.5 | 191,540 | 21,071 | |||||||
MasterCard, Cl A | 2.1 | 293,441 | 29,863 | |||||||
Microsoft | 3.9 | 977,374 | 56,297 | |||||||
PayPal Holdings* | 2.5 | 874,367 | 35,823 | |||||||
Qualcomm | 3.0 | 623,798 | 42,730 | |||||||
Symantec, Cl A | 1.0 | 596,567 | 14,974 | |||||||
Tencent Holdings ADR | 0.8 | 436,761 | 12,175 | |||||||
Visa, Cl A | 4.6 | 799,040 | 66,081 | |||||||
Other Securities | 2.2 | 32,210 | ||||||||
|
| |||||||||
| 583,169 | ||||||||||
|
| |||||||||
Materials — 1.8% | ||||||||||
Sherwin-Williams, Cl A | 1.0 | 53,333 | 14,755 | |||||||
Other Securities | 0.8 | 10,866 | ||||||||
|
| |||||||||
| 25,621 | ||||||||||
|
| |||||||||
Real Estate — 3.9% | ||||||||||
Crown Castle International‡ | 2.7 | 410,045 | 38,630 | |||||||
Equinix‡ | 1.2 | 49,967 | 18,001 | |||||||
|
| |||||||||
| 56,631 | ||||||||||
|
| |||||||||
Telecommunication Services — 0.7% |
| |||||||||
Other Securities | 0.7 | 10,586 | ||||||||
|
| |||||||||
Total Common Stock |
| 1,387,993 | ||||||||
|
| |||||||||
| SEI Institutional Managed Trust / Annual Report / September 30, 2016 | 55 |
SUMMARY SCHEDULE OF INVESTMENTS
September 30, 2016
Large Cap Growth Fund (Concluded)
| ||||||||||
| Description | Percentage of Net Assets (%) | Shares | Market Value ($ Thousands) | |||||||
| ||||||||||
U.S. TREASURY OBLIGATION — 0.0% |
| |||||||||
Other Securities | 0.0% | $ | 25 | |||||||
|
| |||||||||
Total U.S. Treasury Obligation |
| 25 | ||||||||
|
| |||||||||
AFFILIATED PARTNERSHIP — 0.3% |
| |||||||||
SEI Liquidity Fund, L.P. | 0.3 | 4,044,105 | 4,044 | |||||||
|
| |||||||||
Total Affiliated Partnership | 4,044 | |||||||||
|
| |||||||||
CASH EQUIVALENT — 4.3% |
| |||||||||
SEI Daily Income Trust, Government Fund, Cl A | 4.3 | 62,625,698 | 62,626 | |||||||
|
| |||||||||
Total Cash Equivalent | 62,626 | |||||||||
|
| |||||||||
Total Investments — 100.5% | $ | 1,454,688 | ||||||||
|
| |||||||||
| Percentages are based on a Net Assets of $1,446,920 ($ Thousands). |
| * | Non-income producing security. |
| ** | The rate reported is the 7-day effective yield as of September 30, 2016. |
| ‡ | Real Estate Investment Trust. |
| † | Investment in Affiliated Security (see Note 6). |
| †† | Narrow Industries are utilized for compliance purposes, whereas broad sectors are utilized for reporting. |
| (A) | Certain securities or partial positions of certain securities are on loan at September 30, 2016, (see Note 10). The total market value of securities on loan at September 30, 2016, was $3,948 ($ Thousands). |
| (B) | This security was purchased with cash collateral held from securities on loan (see Note 10). The total value of such securities as of September 30, 2016 was $4,044 ($ Thousands). |
ADR — American Depositary Receipt
Cl — Class
L.P. — Limited Partnership
The Summary Schedule of Investments does not reflect the complete portfolio holdings. It includes the Fund’s 50 largest holdings and each investment of any issuer that exceeds 1% of the Fund’s net assets. “Other Securities” represent all issues not required to be disclosed under the rules adopted by the U.S. Securities and Exchange Commission (“SEC”). In certain instances, securities for which footnotes listed above may otherwise apply are included in the Other Securities caption. The complete schedule of portfolio holdings is available (i) without charge, upon request, by calling (800) 342-5734; and (ii) on the SEC’s website at http://www.sec.gov.
The following is a list of the level of inputs used as of September 30, 2016, in valuing the Fund’s investments carried at value ($ Thousands):
| ||||||||||||||||
| Investments in Securities | Level 1 | Level 2 | Level 3 | Total | ||||||||||||
| ||||||||||||||||
Common Stock | $ | 1,387,993 | $ | – | $ | – | $ | 1,387,993 | ||||||||
U.S. Treasury Obligation | – | 25 | – | 25 | ||||||||||||
Affiliated Partnership | – | 4,044 | – | 4,044 | ||||||||||||
Cash Equivalent | 62,626 | – | – | 62,626 | ||||||||||||
|
|
|
|
|
|
|
| |||||||||
Total Investments in Securities | $ | 1,450,619 | $ | 4,069 | $ | – | $ | 1,454,688 | ||||||||
|
|
|
|
|
|
|
| |||||||||
For the year ended September 30, 2016, there were no transfers between Level 1 and Level 2 assets and liabilities.
For the year ended September 30, 2016, there were no transfers between Level 2 and Level 3 assets and liabilities.
For more information on valuation inputs, see Note 2 — Significant Accounting Policies in Notes to Financial Statements.
Amounts designated as “–” are either $0 or have been rounded to $0.
The accompanying notes are an integral part of the financial statements.
| 56 | SEI Institutional Managed Trust / Annual Report / September 30, 2016 |
SUMMARY SCHEDULE OF INVESTMENTS
September 30, 2016
Tax-Managed Large Cap Fund
Sector Weightings (Unaudited)†:
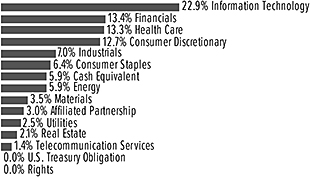
†Percentages are based on total investments. Includes investments held as collateral for securities held on loan (see Note 10).
| ||||||||||
| Description | Percentage of Net Assets (%) | Shares | Market Value ($ Thousands) | |||||||
| ||||||||||
COMMON STOCK — 93.8% |
| |||||||||
Consumer Discretionary — 13.1% |
| |||||||||
Amazon.com, Cl A* | 1.1% | 49,176 | $ | 41,176 | ||||||
General Motors | 0.7 | 839,917 | 26,684 | |||||||
L Brands | 0.7 | 364,619 | 25,804 | |||||||
Liberty Interactive QVC Group, Cl A* | 0.7 | 1,198,119 | 23,974 | |||||||
TripAdvisor* | 0.6 | 326,096 | 20,603 | |||||||
Other Securities(A) | 9.3 | 335,612 | ||||||||
|
| |||||||||
| 473,853 | ||||||||||
|
| |||||||||
Consumer Staples — 6.6% |
| |||||||||
Tyson Foods, Cl A | 0.7 | 359,376 | 26,835 | |||||||
Walgreens Boots Alliance | 0.6 | 289,947 | 23,376 | |||||||
Wal-Mart Stores | 0.6 | 276,893 | 19,969 | |||||||
Other Securities | 4.7 | 168,348 | ||||||||
|
| |||||||||
| 238,528 | ||||||||||
|
| |||||||||
Energy — 6.1% |
| |||||||||
BP ADR(A) | 0.6 | 639,751 | 22,494 | |||||||
Chevron | 0.6 | 213,036 | 21,926 | |||||||
Devon Energy | 0.7 | 606,496 | 26,752 | |||||||
Other Securities(A) | 4.2 | 148,481 | ||||||||
|
| |||||||||
| 219,653 | ||||||||||
|
| |||||||||
Financials — 13.8% |
| |||||||||
Aflac | 0.5 | 255,654 | 18,374 | |||||||
Bank of America | 1.0 | 2,378,236 | 37,219 | |||||||
Berkshire Hathaway, Cl B* | 0.6 | 148,096 | 21,395 | |||||||
Citigroup | 0.5 | 379,987 | 17,947 | |||||||
Intercontinental Exchange | 0.5 | 72,626 | 19,563 | |||||||
JPMorgan Chase | 1.2 | 651,575 | 43,388 | |||||||
MetLife | 0.7 | 591,627 | 26,286 | |||||||
Voya Financial | 0.5 | 615,401 | 17,736 | |||||||
Wells Fargo | 0.5 | 427,725 | 18,940 | |||||||
Other Securities‡(A)(B) | 7.8 | 279,502 | ||||||||
|
| |||||||||
| 500,350 | ||||||||||
|
| |||||||||
Health Care — 13.7% |
| |||||||||
Allergan* | 0.6 | 89,650 | 20,647 | |||||||
| ||||||||||
| Description | Percentage of Net Assets (%) | Shares | Market Value ($ Thousands) | |||||||
| ||||||||||
COMMON STOCK (continued) |
| |||||||||
Amgen, Cl A | 0.6% | 120,417 | $ | 20,087 | ||||||
Biogen* | 1.5 | 176,222 | 55,163 | |||||||
Celgene, Cl A* | 1.0 | 340,478 | 35,590 | |||||||
Johnson & Johnson | 0.7 | 224,386 | 26,507 | |||||||
Merck | 0.5 | 290,561 | 18,134 | |||||||
Pfizer | 0.7 | 706,138 | 23,917 | |||||||
UnitedHealth Group | 0.5 | 127,790 | 17,891 | |||||||
Other Securities(A) | 7.6 | 278,782 | ||||||||
|
| |||||||||
| 496,718 | ||||||||||
|
| |||||||||
Industrials — 7.3% |
| |||||||||
Delta Air Lines, Cl A | 0.5 | 448,474 | 17,652 | |||||||
Northrop Grumman | 0.5 | 88,312 | 18,894 | |||||||
Raytheon | 0.5 | 135,818 | 18,489 | |||||||
Other Securities(A) | 5.8 | 207,947 | ||||||||
|
| |||||||||
| 262,982 | ||||||||||
|
| |||||||||
Information Technology — 23.6% |
| |||||||||
Alphabet, Cl A* | 1.6 | 72,514 | 58,306 | |||||||
Alphabet, Cl C* | 0.7 | 31,880 | 24,780 | |||||||
Apple | 1.0 | 329,490 | 37,249 | |||||||
eBay* | 0.9 | 1,003,808 | 33,025 | |||||||
Electronic Arts* | 0.9 | 396,259 | 33,841 | |||||||
Facebook, Cl A* | 1.5 | 430,310 | 55,196 | |||||||
Hewlett Packard Enterprise | 0.8 | 1,248,924 | 28,413 | |||||||
Intel | 0.6 | 570,596 | 21,540 | |||||||
MasterCard, Cl A | 1.1 | 394,592 | 40,158 | |||||||
Micron Technology* | 0.8 | 1,497,104 | 26,619 | |||||||
Microsoft | 1.3 | 834,465 | 48,065 | |||||||
PayPal Holdings* | 0.8 | 706,306 | 28,937 | |||||||
Qualcomm | 1.5 | 809,951 | 55,482 | |||||||
Visa, Cl A | 1.3 | 556,476 | 46,021 | |||||||
Other Securities(A) | 8.8 | 316,526 | ||||||||
|
| |||||||||
| 854,158 | ||||||||||
|
| |||||||||
Materials — 3.6% |
| |||||||||
International Paper | 0.5 | 408,052 | 19,578 | |||||||
Other Securities(A) | 3.1 | 111,675 | ||||||||
|
| |||||||||
| 131,253 | ||||||||||
|
| |||||||||
Real Estate — 2.1% |
| |||||||||
Crown Castle International‡ | 0.8 | 320,212 | 30,167 | |||||||
Equinix‡ | 0.5 | 48,540 | 17,486 | |||||||
Other Securities‡ | 0.8 | 30,233 | ||||||||
|
| |||||||||
| 77,886 | ||||||||||
|
| |||||||||
Telecommunication Services — 1.4% |
| |||||||||
Verizon Communications | 0.7 | 483,896 | 25,153 | |||||||
Other Securities | 0.7 | 26,603 | ||||||||
|
| |||||||||
| 51,756 | ||||||||||
|
| |||||||||
Utilities — 2.5% |
| |||||||||
Exelon | 0.6 | 612,172 | 20,379 | |||||||
Other Securities | 1.9 | 71,825 | ||||||||
|
| |||||||||
| 92,204 | ||||||||||
|
| |||||||||
| SEI Institutional Managed Trust / Annual Report / September 30, 2016 | 57 |
SUMMARY SCHEDULE OF INVESTMENTS
September 30, 2016
Tax-Managed Large Cap Fund (Concluded)
| ||||||||||
| Description | Percentage of Net Assets (%) | Shares | Market Value ($ Thousands) | |||||||
| ||||||||||
COMMON STOCK (continued) |
| |||||||||
Total Common Stock | $ | 3,399,341 | ||||||||
|
| |||||||||
RIGHTS — 0.0% | ||||||||||
United States — 0.0% |
| |||||||||
Other Securities | 0.0% | 115 | ||||||||
|
| |||||||||
Total Rights | 115 | |||||||||
|
| |||||||||
U.S. TREASURY OBLIGATION — 0.0% |
| |||||||||
Other Securities (C) | 0.0 | 1,005 | ||||||||
|
| |||||||||
Total U.S. Treasury Obligation | 1,005 | |||||||||
|
| |||||||||
AFFILIATED PARTNERSHIP — 3.1% |
| |||||||||
SEI Liquidity Fund, L.P. | 3.1 | 111,916,706 | 111,917 | |||||||
|
| |||||||||
Total Affiliated Partnership |
| 111,917 | ||||||||
|
| |||||||||
CASH EQUIVALENT — 6.1% |
| |||||||||
SEI Daily Income Trust, Government Fund, Cl A | 6.1 | 222,381,770 | 222,382 | |||||||
|
| |||||||||
Total Cash Equivalent |
| 222,382 | ||||||||
|
| |||||||||
Total Investments — 103.0% |
| $ | 3,734,760 | |||||||
|
| |||||||||
A list of the open futures contracts held by the Fund at September 30, 2016 is as follows:
| ||||||||||||
| Type of Contract | Number of Contracts Long | Expiration Date | Unrealized Appreciation ($ Thousands) | |||||||||
| ||||||||||||
S&P 500 Index E-MINI | 146 | Dec-2016 | $23 | |||||||||
S&P Mid Cap 400 Index E-MINI | 12 | Dec-2016 | – | |||||||||
|
| |||||||||||
| $23 | ||||||||||||
|
| |||||||||||
For the year ended September 30, 2016 the total amount of all open futures contracts, as presented in the table above, are represented of the volume of activity for this derivative type during the year.
Percentages are based on a Net Assets of $3,625,346 ($ Thousands).
| * | Non-income producing security. |
| ** | The rate reported is the 7-day effective yield as of September 30, 2016. |
| ‡ | Real Estate Investment Trust. |
| † | Investment in Affiliated Security (see Note 6). |
| (A) | Certain securities or partial positions of certain securities are on loan at September 30, 2016, (see Note 10). The total market value of securities on loan at September 30, 2016, was $110,925 ($ Thousands). |
| (B) | Security is a Master Limited Partnership. At September 30, 2016, such securities amounted to $11,422 ($ Thousands), or 0.32% of Net Assets (see Note 2). |
| (C) | Security, or portion thereof, has been pledged as collateral on open futures contracts. |
| (D) | This security was purchased with cash collateral held from securities on loan (see Note 10). The total value of such securities as of September 30, 2016 was $111,917 ($ Thousands). |
ADR — American Depositary Receipt
Cl — Class
L.P. — Limited Partnership
S&P— Standard & Poor’s
The Summary Schedule of Investments does not reflect the complete portfolio holdings. It includes the Fund’s 50 largest holdings and each investment of any issuer that exceeds 1% of the Fund’s net assets. “Other Securities” represent all issues not required to be disclosed under the rules adopted by the U.S. Securities and Exchange Commission (“SEC”). In certain instances, securities for which footnotes listed above may otherwise apply are included in the Other Securities caption. The complete schedule of portfolio holdings is available (i) without charge, upon request, by calling (800) 342-5734; and (ii) on the SEC’s website at http://www.sec.gov.
The following is a list of the level of inputs used as of September 30, 2016, in valuing the Fund’s investments and other financial instruments carried at value ($ Thousands):
| ||||||||||||||||
| Investments in Securities | Level 1 | Level 2 | Level 3 | Total | ||||||||||||
| ||||||||||||||||
Common Stock | $ | 3,399,341 | $ | – | $ | – | $ | 3,399,341 | ||||||||
Rights | – | 115 | – | 115 | ||||||||||||
U.S. Treasury Obligation | – | 1,005 | – | 1,005 | ||||||||||||
Affiliated Partnership | – | 111,917 | – | 111,917 | ||||||||||||
Cash Equivalent | 222,382 | – | – | 222,382 | ||||||||||||
|
|
|
|
|
|
|
| |||||||||
Total Investments in Securities | $ | 3,621,723 | $ | 113,037 | $ | – | $ | 3,734,760 | ||||||||
|
|
|
|
|
|
|
| |||||||||
| ||||||||||||||||
| Other Financial Instruments | Level 1 | Level 2 | Level 3 | Total | ||||||||||||
| ||||||||||||||||
Futures Contracts * | ||||||||||||||||
Unrealized Appreciation | $ | 23 | $ | — | $ | — | $ | 23 | ||||||||
|
|
|
|
|
|
|
| |||||||||
Total Other Financial Instruments | $ | 23 | $ | — | $ | — | $ | 23 | ||||||||
|
|
|
|
|
|
|
| |||||||||
| * | Future contracts are valued at the unrealized appreciation on the instrument. |
For the year ended September 30, 2016, there were no transfers between Level 1 and Level 2 assets and liabilities.
For the year ended September 30, 2016, there were no transfers between Level 2 and Level 3 assets and liabilities.
For more information on valuation inputs, see Note 2 — Significant Accounting Policies in Notes to Financial Statements.
Amounts designated as “—” are either $0 or have been rounded to $0.
The accompanying notes are an integral part of the financial statements.
| 58 | SEI Institutional Managed Trust / Annual Report / September 30, 2016 |
SUMMARY SCHEDULE OF INVESTMENTS
September 30, 2016
S&P 500 Index Fund
Sector Weightings (Unaudited)†:
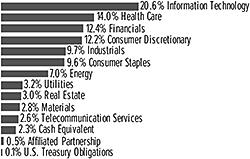
†Percentages are based on total investments. Includes investments held as collateral for securities held on loan (see Note 10).
| ||||||||||
| Description | Percentage of Net Assets (%) | Shares | Market Value ($ Thousands) | |||||||
| ||||||||||
COMMON STOCK — 96.0% |
| |||||||||
Consumer Discretionary — 12.0% |
| |||||||||
Amazon.com, Cl A* | 1.7% | 13,504 | $ | 11,307 | ||||||
Comcast, Cl A | 0.8 | 82,348 | 5,463 | |||||||
Home Depot | 0.8 | 42,409 | 5,457 | |||||||
McDonald’s | 0.5 | 29,483 | 3,401 | |||||||
Starbucks | 0.4 | 50,634 | 2,741 | |||||||
Walt Disney | 0.7 | 50,644 | 4,703 | |||||||
Other Securities(A) | 7.1 | 47,649 | ||||||||
|
| |||||||||
| 80,721 | ||||||||||
|
| |||||||||
Consumer Staples — 9.5% |
| |||||||||
Altria Group | 0.6 | 66,973 | 4,235 | |||||||
Coca-Cola | 0.8 | 133,949 | 5,669 | |||||||
CVS Health | 0.5 | 36,852 | 3,279 | |||||||
PepsiCo | 0.8 | 49,307 | 5,363 | |||||||
Philip Morris International | 0.8 | 53,387 | 5,190 | |||||||
Procter & Gamble | 1.2 | 92,231 | 8,278 | |||||||
Wal-Mart Stores | 0.6 | 51,861 | 3,740 | |||||||
Other Securities | 4.2 | 28,032 | ||||||||
|
| |||||||||
| 63,786 | ||||||||||
|
| |||||||||
Energy — 6.9% |
| |||||||||
Chevron | 1.0 | 64,800 | 6,669 | |||||||
Exxon Mobil | 1.9 | 142,846 | 12,468 | |||||||
Schlumberger, Cl A | 0.6 | 48,000 | 3,775 | |||||||
Other Securities(A) | 3.4 | 23,773 | ||||||||
|
| |||||||||
| 46,685 | ||||||||||
|
| |||||||||
Financials — 12.3% |
| |||||||||
Bank of America | 0.8 | 349,945 | 5,477 | |||||||
Berkshire Hathaway, Cl B* | 1.4 | 65,169 | 9,415 | |||||||
Citigroup | 0.7 | 99,551 | 4,702 | |||||||
JPMorgan Chase | 1.2 | 124,000 | 8,257 | |||||||
Wells Fargo | 1.0 | 155,815 | 6,900 | |||||||
Other Securities | 7.2 | 47,631 | ||||||||
|
| |||||||||
| 82,382 | ||||||||||
|
| |||||||||
Health Care — 13.9% |
| |||||||||
AbbVie | 0.5 | 55,868 | 3,524 | |||||||
Allergan* | 0.5 | 13,653 | 3,144 | |||||||
Amgen, Cl A | 0.6 | 25,864 | 4,314 | |||||||
| ||||||||||
| Description | Percentage of Net Assets (%) | Shares | Market Value ($ Thousands) | |||||||
| ||||||||||
COMMON STOCK (continued) |
| |||||||||
Bristol-Myers Squibb | 0.5% | 57,692 | $ | 3,111 | ||||||
Celgene, Cl A* | 0.4 | 26,513 | 2,771 | |||||||
Gilead Sciences | 0.5 | 45,166 | 3,573 | |||||||
Johnson & Johnson | 1.7 | 94,012 | 11,106 | |||||||
Medtronic | 0.6 | 47,772 | 4,127 | |||||||
Merck | 0.9 | 95,174 | 5,940 | |||||||
Pfizer | 1.1 | 208,656 | 7,067 | |||||||
UnitedHealth Group | 0.7 | 32,660 | 4,572 | |||||||
Other Securities | 5.9 | 39,753 | ||||||||
|
| |||||||||
| 93,002 | ||||||||||
|
| |||||||||
Industrials — 9.6% |
| |||||||||
3M | 0.5 | 20,791 | 3,664 | |||||||
General Electric | 1.4 | 307,709 | 9,114 | |||||||
Honeywell International | 0.5 | 26,168 | 3,051 | |||||||
Union Pacific | 0.4 | 28,801 | 2,809 | |||||||
Other Securities(A) | 6.8 | 45,724 | ||||||||
|
| |||||||||
| 64,362 | ||||||||||
|
| |||||||||
Information Technology — 20.4% |
| |||||||||
Alphabet, Cl A* | 1.2 | 10,167 | 8,175 | |||||||
Alphabet, Cl C* | 1.2 | 10,095 | 7,847 | |||||||
Apple | 3.1 | 185,182 | 20,935 | |||||||
Cisco Systems | 0.8 | 172,861 | 5,483 | |||||||
Facebook, Cl A* | 1.5 | 79,822 | 10,239 | |||||||
Intel | 0.9 | 162,363 | 6,129 | |||||||
International Business Machines | 0.7 | 29,846 | 4,741 | |||||||
MasterCard, Cl A | 0.5 | 32,813 | 3,339 | |||||||
Microsoft | 2.3 | 267,789 | 15,425 | |||||||
Oracle, Cl B | 0.6 | 104,023 | 4,086 | |||||||
Qualcomm | 0.5 | 50,754 | 3,477 | |||||||
Visa, Cl A | 0.8 | 64,718 | 5,352 | |||||||
Other Securities(A) | 6.3 | 41,622 | ||||||||
|
| |||||||||
| 136,850 | ||||||||||
|
| |||||||||
Materials — 2.8% |
| |||||||||
Other Securities | 2.8 | 18,805 | ||||||||
|
| |||||||||
Real Estate — 2.9% |
| |||||||||
Other Securities‡ | 2.9 | 19,674 | ||||||||
|
| |||||||||
Telecommunication Services — 2.5% |
| |||||||||
AT&T | 1.3 | 211,959 | 8,608 | |||||||
Verizon Communications | 1.1 | 140,296 | 7,292 | |||||||
Other Securities | 0.1 | 1,152 | ||||||||
|
| |||||||||
| 17,052 | ||||||||||
|
| |||||||||
Utilities — 3.2% |
| |||||||||
Other Securities | 3.2 | 21,191 | ||||||||
|
| |||||||||
Total Common Stock |
| 644,510 | ||||||||
|
| |||||||||
| SEI Institutional Managed Trust / Annual Report / September 30, 2016 | 59 |
SUMMARY SCHEDULE OF INVESTMENTS
September 30, 2016
S&P 500 Index Fund (Concluded)
| ||||||||||
| Description | Percentage of Net Assets (%) | Shares | Market Value ($ Thousands) | |||||||
| ||||||||||
U.S. TREASURY OBLIGATIONS — 0.1% |
| |||||||||
Other Securities (B) | 0.1% | $ | 804 | |||||||
|
| |||||||||
Total U.S. Treasury Obligations |
| 804 | ||||||||
|
| |||||||||
AFFILIATED PARTNERSHIP — 0.5% | ||||||||||
SEI Liquidity Fund, L.P. | 0.5 | 3,172,128 | 3,172 | |||||||
|
| |||||||||
Total Affiliated Partnership |
| 3,172 | ||||||||
|
| |||||||||
CASH EQUIVALENT — 2.3% |
| |||||||||
SEI Daily Income Trust, Government Fund, Cl A | 2.3 | 15,140,528 | 15,141 | |||||||
|
| |||||||||
Total Cash Equivalent |
| 15,141 | ||||||||
|
| |||||||||
Total Investments — 98.9% |
| $ | 663,627 | |||||||
|
| |||||||||
A list of the open futures contracts held by the Fund at September 30, 2016 is as follows:
| ||||||||||||
| Type of Contract | Number of Contracts Long | Expiration Date | Unrealized Appreciation) ($ Thousands) | |||||||||
| ||||||||||||
S&P 500 Index E-MINI | 160 | Dec-2016 | $304 | |||||||||
|
| |||||||||||
For the year ended September 30, 2016, the total amount of all open futures contracts, as presented in the table above, are representative of the volume of activity for this derivative type during the year.
| Percentages are based on a Net Assets of $670,972 ($ Thousands). |
| * | Non-income producing security. |
| ** | The rate reported is the 7-day effective yield as of September 30, 2016. |
| ‡ | Real Estate Investment Trust. |
| † | Investment in Affiliated Security (see Note 6). |
| (A) | Certain securities or partial positions of certain securities are on loan at September 30, 2016, (see Note 10). The total market value of securities on loan at September 30, 2016, was $3,131 ($ Thousands). |
| (B) | This security was purchased with cash collateral held from securities on loan (see Note 10). The total value of such securities as of September 30, 2016 was $3,172 ($ Thousands). |
| (C) | Security, or portion thereof, has been pledged as collateral on open futures contracts. |
Cl — Class
L.P.— Limited Partnership
S&P— Standard & Poor’s
The Summary Schedule of Investments does not reflect the complete portfolio holdings. It includes the Fund’s 50 largest holdings and each investment of any issuer that exceeds 1% of the Fund’s net assets. “Other Securities” represent all issues not required to be disclosed under the rules adopted by the U.S. Securities and Exchange Commission (“SEC”). In certain instances, securities for which footnotes listed above may otherwise apply are included in the Other Securities caption. The complete schedule of portfolio holdings is available (i) without charge, upon request, by calling (800) 342-5734; and (ii) on the SEC’s website at http://www.sec.gov.
The following is a list of the level of inputs used as of September 30, 2016, in valuing the Fund’s investments and other financial instruments carried at value ($ Thousands):
| ||||||||||||||||
| Investments in Securities | Level 1 | Level 2 | Level 3 | Total | ||||||||||||
| ||||||||||||||||
Common Stock | $ | 644,510 | $ | – | $ | – | $ | 644,510 | ||||||||
U.S. Treasury Obligations | – | 804 | – | 804 | ||||||||||||
Affiliated Partnership | – | 3,172 | – | 3,172 | ||||||||||||
Cash Equivalent | 15,141 | – | – | 15,141 | ||||||||||||
|
|
|
|
|
|
|
| |||||||||
Total Investments in Securities | $ | 659,651 | $ | 3,976 | $ | – | $ | 663,627 | ||||||||
|
|
|
|
|
|
|
| |||||||||
| ||||||||||||||||
| Other Financial Instruments | Level 1 | Level 2 | Level 3 | Total | ||||||||||||
| ||||||||||||||||
Futures Contracts * | ||||||||||||||||
Unrealized Appreciation | $ | 304 | $ | — | $ | — | $ | 304 | ||||||||
|
|
|
|
|
|
|
| |||||||||
Total Other Financial Instruments | $ | 304 | $ | — | $ | — | $ | 304 | ||||||||
|
|
|
|
|
|
|
| |||||||||
* Futures contracts are valued at the unrealized appreciation on the instrument.
For the year ended September 30, 2016, there were no transfers between Level 1 and Level 2 assets and liabilities.
For the year ended September 30, 2016, there were no transfers between Level 2 and Level 3 assets and liabilities.
For more information on valuation inputs, see Note 2 — Significant Accounting Policies in Notes to Financial Statements.
Amounts designated as “–” are either $0 or have been rounded to $0.
The accompanying notes are an integral part of the financial statements.
| 60 | SEI Institutional Managed Trust / Annual Report / September 30, 2016 |
SUMMARY SCHEDULE OF INVESTMENTS
September 30, 2016
Small Cap Fund
Sector Weightings (Unaudited)†:
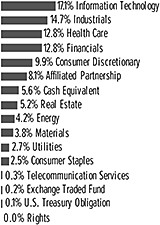
†Percentages are based on total investments. Includes investments held as collateral for securities held on loan (see Note 10).
| ||||||||||
| Description | Percentage of Net Assets (%) | Shares | Market Value ($ Thousands) | |||||||
| ||||||||||
COMMON STOCK — 93.8% | ||||||||||
Consumer Discretionary — 10.9% | ||||||||||
Big Lots | 0.5% | 64,093 | $ | 3,060 | ||||||
Bright Horizons Family Solutions* | 0.5 | 42,498 | 2,843 | |||||||
Fiesta Restaurant Group* | 0.6 | 147,779 | 3,547 | |||||||
Jack in the Box | 0.6 | 37,181 | 3,567 | |||||||
MDC Partners, Cl A(A) | 0.6 | 353,676 | 3,791 | |||||||
Steven Madden* | 0.5 | 83,077 | 2,871 | |||||||
Other Securities(A) | 7.6 | 44,206 | ||||||||
|
| |||||||||
| 63,885 | ||||||||||
|
| |||||||||
Consumer Staples — 2.8% | ||||||||||
Other Securities(A) | 2.8 | 16,323 | ||||||||
|
| |||||||||
Energy — 4.5% | ||||||||||
PBF Energy, Cl A | 0.5 | 126,720 | 2,869 | |||||||
Other Securities(A) | 4.0 | 23,831 | ||||||||
|
| |||||||||
| 26,700 | ||||||||||
|
| |||||||||
Financials — 14.0% | ||||||||||
Argo Group International Holdings | 0.5 | 53,181 | 3,000 | |||||||
FNB (Pennsylvania) | 0.5 | 257,388 | 3,166 | |||||||
Green Dot, Cl A* | 0.6 | 161,841 | 3,732 | |||||||
Hanover Insurance Group, Cl A | 0.5 | 39,334 | 2,967 | |||||||
Investors Bancorp | 0.5 | 260,858 | 3,133 | |||||||
OFG Bancorp | 0.5 | 302,636 | 3,060 | |||||||
Wintrust Financial | 0.8 | 79,383 | 4,411 | |||||||
Other Securities‡(A) | 10.1 | 58,652 | ||||||||
|
| |||||||||
| 82,121 | ||||||||||
|
| |||||||||
Health Care — 14.0% | ||||||||||
AMAG Pharmaceuticals*(A) | 0.6 | 136,710 | 3,351 | |||||||
AMN Healthcare Services* | 0.5 | 91,839 | 2,927 | |||||||
Analogic | 0.4 | 29,849 | 2,645 | |||||||
| ||||||||||
| Description | Percentage of Net Assets (%) | Shares | Market Value ($ Thousands) | |||||||
| ||||||||||
COMMON STOCK (continued) | ||||||||||
Cynosure, Cl A* | 0.7% | 76,795 | $ | 3,912 | ||||||
Globus Medical, Cl A*(A) | 0.5 | 122,619 | 2,767 | |||||||
Integra LifeSciences Holdings* | 1.3 | 89,949 | 7,425 | |||||||
Lannett*(A) | 0.5 | 110,280 | 2,930 | |||||||
Ligand Pharmaceuticals* | 0.7 | 39,138 | 3,994 | |||||||
Molina Healthcare*(A) | 0.6 | 61,824 | 3,606 | |||||||
Prestige Brands Holdings, Cl A* | 0.8 | 96,657 | 4,666 | |||||||
Other Securities(A) | 7.4 | 43,917 | ||||||||
|
| |||||||||
| 82,140 | ||||||||||
|
| |||||||||
Industrials — 16.0% | ||||||||||
Apogee Enterprises | 0.5 | 70,919 | 3,169 | |||||||
Atlas Air Worldwide Holdings* | 0.6 | 80,224 | 3,435 | |||||||
EMCOR Group | 0.5 | 52,082 | 3,105 | |||||||
ICF International, Cl A* | 0.5 | 71,884 | 3,186 | |||||||
On Assignment* | 0.6 | 92,090 | 3,342 | |||||||
WageWorks* | 0.6 | 55,317 | 3,369 | |||||||
Wesco Aircraft Holdings* | 0.5 | 201,182 | 2,702 | |||||||
Other Securities(A) | 12.2 | 72,160 | ||||||||
|
| |||||||||
| 94,468 | ||||||||||
|
| |||||||||
Information Technology — 18.6% |
| |||||||||
Acxiom* | 0.6 | 125,840 | 3,354 | |||||||
CalAmp* | 0.5 | 219,948 | 3,068 | |||||||
Callidus Software* | 0.5 | 173,491 | 3,184 | |||||||
Cavium* | 0.7 | 70,945 | 4,129 | |||||||
Cornerstone OnDemand* | 0.5 | 63,107 | 2,900 | |||||||
Exar* | 0.5 | 313,097 | 2,915 | |||||||
FireEye* | 0.5 | 194,618 | 2,867 | |||||||
Lumentum Holdings*(A) | 0.5 | 72,414 | 3,025 | |||||||
Monolithic Power Systems | 0.5 | 34,129 | 2,747 | |||||||
Open Text(A) | 0.5 | 48,434 | 3,141 | |||||||
Proofpoint* | 0.7 | 52,098 | 3,900 | |||||||
Take-Two Interactive Software, Cl A* | 0.5 | 58,922 | 2,656 | |||||||
Other Securities(A) | 12.1 | 71,734 | ||||||||
|
| |||||||||
| 109,620 | ||||||||||
|
| |||||||||
Materials — 4.1% | ||||||||||
Berry Plastics Group* | 0.6 | 81,534 | 3,575 | |||||||
Other Securities(A) | 3.5 | 20,830 | ||||||||
|
| |||||||||
| 24,405 | ||||||||||
|
| |||||||||
Real Estate — 5.7% | ||||||||||
Agree Realty‡ | 0.4 | 53,294 | 2,635 | |||||||
Colony Starwood Homes‡(A) | 0.7 | 137,395 | 3,943 | |||||||
Gramercy Property Trust‡ | 0.5 | 278,764 | 2,687 | |||||||
Other Securities‡(A) | 4.1 | 24,333 | ||||||||
|
| |||||||||
| 33,598 | ||||||||||
|
| |||||||||
Telecommunication Services — 0.3% |
| |||||||||
Other Securities(A) | 0.3 | 1,860 | ||||||||
|
| |||||||||
Utilities — 2.9% | ||||||||||
PNM Resources | 0.6 | 114,941 | 3,761 | |||||||
Portland General Electric | 0.5 | 70,881 | 3,019 | |||||||
Spire | 0.5 | 48,138 | 3,068 | |||||||
| SEI Institutional Managed Trust / Annual Report / September 30, 2016 | 61 |
SUMMARY SCHEDULE OF INVESTMENTS
September 30, 2016
Small Cap Fund (Concluded)
| ||||||||||
| Description | Percentage of Net Assets (%) | Shares | Market Value ($ Thousands) | |||||||
| ||||||||||
COMMON STOCK (continued) | ||||||||||
Other Securities(A) | 1.3% | $ | 7,328 | |||||||
|
| |||||||||
| 17,176 | ||||||||||
|
| |||||||||
Total Common Stock |
| 552,296 | ||||||||
|
| |||||||||
EXCHANGE TRADED FUND — 0.2% |
| |||||||||
Other Securities | 0.2 | 1,000 | ||||||||
|
| |||||||||
Total Exchange Traded Fund |
| 1,000 | ||||||||
|
| |||||||||
RIGHTS — 0.0% | ||||||||||
United States — 0.0% | ||||||||||
Other Securities | 0.0% | — | ||||||||
|
| |||||||||
Total Rights |
| — | ||||||||
|
| |||||||||
U.S. TREASURY OBLIGATION — 0.1% |
| |||||||||
Other Securities (B) | 0.1 | 550 | ||||||||
|
| |||||||||
Total U.S. Treasury Obligation |
| 550 | ||||||||
|
| |||||||||
AFFILIATED PARTNERSHIP — 8.9% |
| |||||||||
SEI Liquidity Fund, L.P. | 8.9 | 52,352,212 | 52,352 | |||||||
|
| |||||||||
Total Affiliated Partnership |
| 52,352 | ||||||||
|
| |||||||||
CASH EQUIVALENT — 6.1% |
| |||||||||
SEI Daily Income Trust, Government Fund, Cl A | 6.1 | 35,775,093 | 35,775 | |||||||
|
| |||||||||
Total Cash Equivalent |
| 35,775 | ||||||||
|
| |||||||||
Total Investments — 109.1% |
| $ | 641,973 | |||||||
|
| |||||||||
A list of the open futures contracts held by the Fund at September 30, 2016 is as follows:
| ||||||||||||
| Type of Contract | Number of Contracts Long | Expiration Date | Unrealized Depreciation ($ Thousands) | |||||||||
| ||||||||||||
Russell 2000 Index E-MINI | 91 | Dec-2016 | $(38) | |||||||||
|
| |||||||||||
For the year ended September 30, 2016, the total amount of all open futures contracts, as presented in the table above, are representative of the volume of activity for this derivative type during the year.
| Percentages are based on a Net Assets of $588,415 ($ Thousands). |
| * | Non-income producing security. |
| ** | The rate reported is the 7-day effective yield as of September 30, 2016. |
| ‡ | Real Estate Investment Trust. |
| † | Investment in Affiliated Security (see Note 6). |
| (A) | Certain securities or partial positions of certain securities are on loan at September 30, 2016, (see Note 10). The total market value of securities on loan at September 30, 2016, was $51,461 ($ Thousands). |
| (B) | This security was purchased with cash collateral held from securities on loan (see Note 10). The total value of such securities as of September 30, 2016 was $52,352 ($ Thousands). |
| (C) | Security, or portion thereof, has been pledged as collateral on open futures contracts. |
Cl — Class
L.P. — Limited Partnership
The Summary Schedule of Investments does not reflect the complete portfolio holdings. It includes the Fund’s 50 largest holdings and each investment of any issuer that exceeds 1% of the Fund’s net assets. “Other Securities” represent all issues not required to be disclosed under the rules adopted by the U.S. Securities and Exchange Commission (“SEC”). In certain instances, securities for which footnotes listed above may otherwise apply are included in the Other Securities caption. The complete schedule of portfolio holdings is available (i) without charge, upon request, by calling (800) 342-5734; and (ii) on the SEC’s website at http://www.sec.gov.
The following is a list of the level of inputs used as of September 30, 2016, in valuing the Fund’s investments and other financial instruments carried at value ($ Thousands):
| ||||||||||||||||
| Investments in Securities | Level 1 | Level 2 | Level 3 | Total | ||||||||||||
| ||||||||||||||||
Common Stock | $ | 552,296 | $ | – | $ | – | $ | 552,296 | ||||||||
Exchange Traded Fund | 1,000 | – | – | 1,000 | ||||||||||||
Rights | – | – | – | – | ||||||||||||
U.S. Treasury Obligation | – | 550 | – | 550 | ||||||||||||
Affiliated Partnership | – | 52,352 | – | 52,352 | ||||||||||||
Cash Equivalent | 35,775 | – | – | 35,775 | ||||||||||||
|
|
|
|
|
|
|
| |||||||||
Total Investments in Securities | $ | 589,071 | $ | 52,902 | $ | – | $ | 641,973 | ||||||||
|
|
|
|
|
|
|
| |||||||||
| ||||||||||||||||
| Other Financial Instruments | Level 1 | Level 2 | Level 3 | Total | ||||||||||||
| ||||||||||||||||
Futures Contracts * | ||||||||||||||||
Unrealized Depreciation | $ | (38) | $ | — | $ | — | $ | (38) | ||||||||
|
|
|
|
|
|
|
| |||||||||
Total Other Financial Instruments | $ | (38) | $ | — | $ | — | $ | (38) | ||||||||
|
|
|
|
|
|
|
| |||||||||
* Futures contracts are valued at the unrealized depreciation on the instrument.
For the year ended September 30, 2016, there were no transfers between Level 1 and Level 2 assets and liabilities.
For the year ended September 30, 2016, there were no transfers between Level 2 and Level 3 assets and liabilities.
For more information on valuation inputs, see Note 2 — Significant Accounting Policies in Notes to Financial Statements.
Amounts designated as “—” are either $0 or have been rounded to $0.
The accompanying notes are an integral part of the financial statements.
| 62 | SEI Institutional Managed Trust / Annual Report / September 30, 2016 |
SUMMARY SCHEDULE OF INVESTMENTS
September 30, 2016
Small Cap Value Fund
Sector Weightings (Unaudited)†:
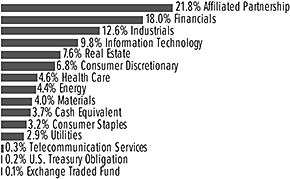
†Percentages are based on total investments. Includes investments held as collateral for securities held on loan (see Note 10).
| ||||||||||
| Description | Percentage of Net Assets (%) | Shares | Market Value ($ Thousands) | |||||||
| ||||||||||
COMMON STOCK — 94.9% |
| |||||||||
Consumer Discretionary — 8.7% |
| |||||||||
Big Lots(A) | 0.4% | 34,258 | $ | 1,636 | ||||||
Libbey | 0.5 | 113,055 | 2,018 | |||||||
Matthews International, Cl A(A) | 0.4 | 27,020 | 1,642 | |||||||
Other Securities(A) | 7.4 | 27,098 | ||||||||
|
| |||||||||
| 32,394 | ||||||||||
|
| |||||||||
Consumer Staples — 4.0% |
| |||||||||
Sanderson Farms(A) | 0.5 | 20,031 | 1,930 | |||||||
Other Securities(A) | 3.5 | 13,125 | ||||||||
|
| |||||||||
| 15,055 | ||||||||||
|
| |||||||||
Energy — 5.7% | ||||||||||
PBF Energy, Cl A(A) | 0.6 | 100,508 | 2,276 | |||||||
Other Securities(A) | 5.1 | 18,825 | ||||||||
|
| |||||||||
| 21,101 | ||||||||||
|
| |||||||||
Financials — 23.0% | ||||||||||
Central Pacific Financial | 0.5 | 72,803 | 1,834 | |||||||
CNO Financial Group | 0.4 | 106,871 | 1,632 | |||||||
Customers Bancorp*(A) | 0.4 | 64,300 | 1,618 | |||||||
First Commonwealth Financial | 0.5 | 182,254 | 1,839 | |||||||
Fulton Financial(A) | 0.7 | 167,050 | 2,426 | |||||||
Green Dot, Cl A* | 0.5 | 80,924 | 1,866 | |||||||
Hanover Insurance Group, Cl A | 0.6 | 30,346 | 2,289 | |||||||
Investors Bancorp | 0.5 | 167,160 | 2,008 | |||||||
Kemper, Cl A(A) | 0.5 | 44,447 | 1,748 | |||||||
Maiden Holdings(A) | 0.6 | 175,865 | 2,232 | |||||||
Meridian Bancorp | 0.6 | 134,614 | 2,096 | |||||||
National Bank Holdings, Cl A(A) | 0.5 | 71,890 | 1,680 | |||||||
Northfield Bancorp | 0.7 | 150,091 | 2,416 | |||||||
OFG Bancorp(A) | 0.6 | 219,525 | 2,219 | |||||||
PacWest Bancorp | 0.4 | 38,520 | 1,653 | |||||||
Popular | 0.6 | 62,900 | 2,404 | |||||||
Starwood Property Trust‡ | 0.5 | 79,897 | 1,799 | |||||||
State Bank Financial | 0.5 | 85,600 | 1,953 | |||||||
Other Securities‡(A) | 13.4 | 50,000 | ||||||||
|
| |||||||||
| 85,712 | ||||||||||
|
| |||||||||
| ||||||||||
| Description | Percentage of Net Assets (%) | Shares | Market Value ($ Thousands) | |||||||
| ||||||||||
COMMON STOCK (continued) |
| |||||||||
Health Care — 5.9% | ||||||||||
Accuray* | 0.6% | 331,209 | $ | 2,110 | ||||||
Integra LifeSciences Holdings* | 0.7 | 29,273 | 2,416 | |||||||
Lannett*(A) | 0.5 | 74,604 | 1,982 | |||||||
Ligand Pharmaceuticals*(A) | 0.5 | 18,870 | 1,926 | |||||||
Trinity Biotech ADR* | 0.5 | 125,200 | 1,655 | |||||||
Other Securities(A) | 3.1 | 11,794 | ||||||||
|
| |||||||||
| 21,883 | ||||||||||
|
| |||||||||
Industrials — 16.1% | ||||||||||
ACCO Brands* | 0.6 | 214,480 | 2,068 | |||||||
Atlas Air Worldwide Holdings* | 0.6 | 56,390 | 2,415 | |||||||
BWX Technologies, Cl W | 0.5 | 47,148 | 1,809 | |||||||
EMCOR Group | 0.6 | 34,990 | 2,086 | |||||||
ICF International, Cl A* | 0.6 | 54,664 | 2,423 | |||||||
KAR Auction Services | 0.5 | 39,486 | 1,704 | |||||||
Triumph Group(A) | 0.5 | 67,821 | 1,891 | |||||||
Other Securities(A) | 12.2 | 45,750 | ||||||||
|
| |||||||||
| 60,146 | ||||||||||
|
| |||||||||
Information Technology — 12.6% |
| |||||||||
Exar* | 0.5 | 208,974 | 1,945 | |||||||
NETGEAR* | 0.5 | 31,721 | 1,919 | |||||||
Open Text | 0.5 | 30,677 | 1,990 | |||||||
Sanmina* | 0.7 | 89,010 | 2,534 | |||||||
SYNNEX | 0.5 | 15,760 | 1,798 | |||||||
Other Securities(A) | 9.9 | 36,713 | ||||||||
|
| |||||||||
| 46,899 | ||||||||||
|
| |||||||||
Materials — 5.1% | ||||||||||
Innospec | 0.5 | 29,911 | 1,819 | |||||||
Schweitzer-Mauduit International | 0.4 | 42,088 | 1,623 | |||||||
Other Securities(A) | 4.2 | 15,664 | ||||||||
|
| |||||||||
| 19,106 | ||||||||||
|
| |||||||||
Real Estate — 9.7% | ||||||||||
Colony Starwood Homes‡(A) | 0.9 | 114,777 | 3,294 | |||||||
EPR Properties, Cl A‡ | 0.4 | 20,515 | 1,615 | |||||||
Equity Commonwealth*‡ | 0.6 | 71,225 | 2,152 | |||||||
GEO Group‡(A) | 0.4 | 69,447 | 1,652 | |||||||
Gramercy Property Trust‡(A) | 0.4 | 168,979 | 1,629 | |||||||
Other Securities‡(A) | 7.0 | 25,725 | ||||||||
|
| |||||||||
| 36,067 | ||||||||||
|
| |||||||||
Telecommunication Services — 0.4% |
| |||||||||
Other Securities(A) | 0.4 | 1,366 | ||||||||
|
| |||||||||
Utilities — 3.7% | ||||||||||
PNM Resources | 0.7 | 77,025 | 2,520 | |||||||
Portland General Electric | 0.8 | 66,477 | 2,831 | |||||||
Spire | 0.5 | 27,070 | 1,725 | |||||||
Other Securities(A) | 1.7 | 6,724 | ||||||||
|
| |||||||||
| 13,800 | ||||||||||
|
| |||||||||
Total Common Stock | 353,529 | |||||||||
|
| |||||||||
| SEI Institutional Managed Trust / Annual Report / September 30, 2016 | 63 |
SUMMARY SCHEDULE OF INVESTMENTS
September 30, 2016
Small Cap Value Fund (Concluded)
| ||||||||||
| Description | Percentage of Net Assets (%) | Shares | Market Value ($ Thousands) | |||||||
| ||||||||||
EXCHANGE TRADED FUND — 0.2% |
| |||||||||
Other Securities | 0.2% | $ | 749 | |||||||
|
| |||||||||
Total Exchange Traded Fund | 749 | |||||||||
|
| |||||||||
U.S. TREASURY OBLIGATION — 0.2% |
| |||||||||
Other Securities (B) | 0.2 | 805 | ||||||||
|
| |||||||||
Total U.S. Treasury Obligation |
| 805 | ||||||||
|
| |||||||||
AFFILIATED PARTNERSHIP — 27.9% |
| |||||||||
SEI Liquidity Fund, L.P. | 27.9 | 104,012,713 | 104,013 | |||||||
|
| |||||||||
Total Affiliated Partnership |
| 104,013 | ||||||||
|
| |||||||||
CASH EQUIVALENT — 4.8% |
| |||||||||
SEI Daily Income Trust, Government Fund, Cl A | 4.8 | 17,700,145 | 17,700 | |||||||
|
| |||||||||
Total Cash Equivalent |
| 17,700 | ||||||||
|
| |||||||||
Total Investments — 128.0% |
| $ | 476,796 | |||||||
|
| |||||||||
A list of the open futures contracts held by the Fund at September 30, 2016 is as follows:
| ||||||||||||
| Type of Contract | Number of Contracts Long | Expiration Date | Unrealized Depreciation ($ Thousands) | |||||||||
| ||||||||||||
Russell 2000 Index E-MINI | 19 | Dec-2016 | $(3) | |||||||||
|
| |||||||||||
For the year ended September 30, 2016 the total amount of all open futures contracts, as presented in the table above, are represented of the volume of activity for this derivative type during the year.
Percentages are based on a Net Assets of $372,465 ($ Thousands).
| * | Non-income producing security. |
| ** | The rate reported is the 7-day effective yield as of September 30, 2016. |
| ‡ | Real Estate Investment Trust. |
| † | Investment in Affiliated Security (see Note 6). |
| (A) | Certain securities or partial positions of certain securities are on loan at September 30, 2016, (see Note 10). The total market value of securities on loan at September 30, 2016, was $102,682 ($ Thousands). |
| (B) | Security, or portion thereof, has been pledged as collateral on open futures contracts. |
| (C) | This security was purchased with cash collateral held from securities on loan (see Note 10). The total value of such securities as of September 30, 2016 was $104,013 ($ Thousands). |
ADR — American Depositary Receipt
Cl — Class
L.P. — Limited Partnership
The Summary Schedule of Investments does not reflect the complete portfolio holdings. It includes the Fund’s 50 largest holdings and each investment of any issuer that exceeds 1% of the Fund’s net assets. “Other Securities” represent all issues not required to be disclosed under the rules adopted by the U.S. Securities and Exchange Commission (“SEC”). In certain instances, securities for which footnotes listed above may otherwise apply are included in the Other Securities caption. The complete schedule of portfolio holdings is available (i) without charge, upon request, by calling (800) 342-5734; and (ii) on the SEC’s website at http://www.sec.gov.
The following is a list of the level of inputs used as of September 30, 2016, in valuing the Fund’s investments and other financial instruments carried at value ($ Thousands):
| ||||||||||||||||
| Investments in Securities | Level 1 | Level 2 | Level 3 | Total | ||||||||||||
| ||||||||||||||||
Common Stock | $ | 353,529 | $ | – | $ | – | $ | 353,529 | ||||||||
Exchange Traded Fund | 749 | – | – | 749 | ||||||||||||
U.S. Treasury Obligation | – | 805 | – | 805 | ||||||||||||
Affiliated Partnership | – | 104,013 | – | 104,013 | ||||||||||||
Cash Equivalent | 17,700 | – | – | 17,700 | ||||||||||||
|
|
|
|
|
|
|
| |||||||||
Total Investments in Securities | $ | 371,978 | $ | 104,818 | $ | – | $ | 476,796 | ||||||||
|
|
|
|
|
|
|
| |||||||||
| ||||||||||||||||
| Other Financial Instruments | Level 1 | Level 2 | Level 3 | Total | ||||||||||||
| ||||||||||||||||
Futures Contracts * | ||||||||||||||||
Unrealized Depreciation | $ | (3) | $ | — | $ | — | $ | (3) | ||||||||
|
|
|
|
|
|
|
| |||||||||
Total Other Financial Instruments | $ | (3) | $ | — | $ | — | $ | (3) | ||||||||
|
|
|
|
|
|
|
| |||||||||
| * | Futures contracts are valued at the unrealized depreciation on the instrument. |
For the year ended September 30, 2016, there were no transfers between Level 1 and Level 2 assets and liabilities.
For the year ended September 30, 2016, there were no transfers between Level 2 and Level 3 assets and liabilities.
For more information on valuation inputs, see Note 2 — Significant Accounting Policies in Notes to Financial Statements.
Amounts designated as “—” are either $0 or have been rounded to $0.
The accompanying notes are an integral part of the financial statements.
| 64 | SEI Institutional Managed Trust / Annual Report / September 30, 2016 |
SUMMARY SCHEDULE OF INVESTMENTS
September 30, 2016
Small Cap Growth Fund
Sector Weightings (Unaudited)†:
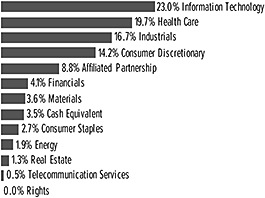
†Percentages are based on total investments. Includes investments held as collateral for securities held on loan (see Note 10).
| ||||||||||
| Description | Percentage of Net Assets (%) | Shares | Market Value ($ Thousands) | |||||||
| ||||||||||
COMMON STOCK†† — 96.1% | ||||||||||
Consumer Discretionary — 15.6% |
| |||||||||
2U*(A) | 0.8% | 64,602 | $ | 2,474 | ||||||
Bright Horizons Family Solutions* | 0.9 | 45,102 | 3,017 | |||||||
Core-Mark Holding, Cl A | 0.6 | 57,387 | 2,054 | |||||||
Fiesta Restaurant Group* | 0.7 | 88,056 | 2,113 | |||||||
Jack in the Box | 0.8 | 26,199 | 2,513 | |||||||
MDC Partners, Cl A(A) | 0.5 | 154,346 | 1,655 | |||||||
Monro Muffler | 0.6 | 30,140 | 1,844 | |||||||
National CineMedia | 0.7 | 151,530 | 2,230 | |||||||
Planet Fitness, Cl A* | 0.6 | 91,915 | 1,845 | |||||||
Other Securities(A) | 9.4 | 30,390 | ||||||||
|
| |||||||||
| 50,135 | ||||||||||
|
| |||||||||
Consumer Staples — 3.0% | ||||||||||
Spectrum Brands Holdings(A) | 0.9 | 21,998 | 3,029 | |||||||
Other Securities(A) | 2.1 | 6,578 | ||||||||
|
| |||||||||
| 9,607 | ||||||||||
|
| |||||||||
Energy — 2.0% | ||||||||||
Other Securities(A) | 2.0 | 6,577 | ||||||||
|
| |||||||||
Financials — 4.5% | ||||||||||
Other Securities(A)(B)(C) | 4.5 | 14,522 | ||||||||
|
| |||||||||
Health Care — 21.6% | ||||||||||
AMAG Pharmaceuticals*(A) | 0.7 | 89,156 | 2,185 | |||||||
AMN Healthcare Services* | 1.0 | 98,966 | 3,154 | |||||||
Cynosure, Cl A* | 0.8 | 51,780 | 2,638 | |||||||
INC Research Holdings, Cl A* | 0.6 | 44,901 | 2,002 | |||||||
Integra LifeSciences Holdings* | 0.8 | 31,756 | 2,621 | |||||||
Ligand Pharmaceuticals* | 0.9 | 27,700 | 2,827 | |||||||
Medidata Solutions* | 0.5 | 31,396 | 1,751 | |||||||
Molina Healthcare* | 0.7 | 37,932 | 2,212 | |||||||
Nevro* | 0.6 | 17,370 | 1,813 | |||||||
Prestige Brands Holdings, Cl A* | 1.0 | 67,487 | 3,258 | |||||||
| ||||||||||
| Description | Percentage of Net Assets (%) | Shares | Market Value ($ Thousands) | |||||||
| ||||||||||
COMMON STOCK (continued) | ||||||||||
Supernus Pharmaceuticals* | 0.5% | 67,751 | $ | 1,675 | ||||||
Other Securities(A) | 13.5 | 43,258 | ||||||||
|
| |||||||||
| 69,394 | ||||||||||
|
| |||||||||
Industrials — 18.3% | ||||||||||
Apogee Enterprises | 0.8 | 56,608 | 2,530 | |||||||
Deluxe | 1.2 | 59,800 | 3,996 | |||||||
Heritage-Crystal Clean* | 0.5 | 123,630 | 1,642 | |||||||
Huron Consulting Group*(A) | 0.6 | 29,411 | 1,758 | |||||||
John Bean Technologies, Cl A | 0.6 | 27,265 | 1,923 | |||||||
MasTec* | 0.5 | 57,929 | 1,723 | |||||||
On Assignment* | 0.6 | 51,585 | 1,872 | |||||||
Swift Transportation, Cl A* | 0.6 | 93,151 | 2,000 | |||||||
Tennant(A) | 0.5 | 25,937 | 1,681 | |||||||
WageWorks* | 0.6 | 33,063 | 2,014 | |||||||
Other Securities(A) | 11.8 | 37,925 | ||||||||
|
| |||||||||
| 59,064 | ||||||||||
|
| |||||||||
Information Technology — 25.2% |
| |||||||||
Acxiom* | 0.6 | 78,734 | 2,098 | |||||||
Blackbaud, Cl A | 0.6 | 28,948 | 1,920 | |||||||
CalAmp* | 0.6 | 150,093 | 2,094 | |||||||
Callidus Software* | 0.9 | 153,824 | 2,823 | |||||||
Cavium* | 0.8 | 43,795 | 2,549 | |||||||
Cornerstone OnDemand* | 0.6 | 39,136 | 1,798 | |||||||
Euronet Worldwide* | 0.6 | 22,470 | 1,839 | |||||||
FireEye* | 0.6 | 122,884 | 1,810 | |||||||
Guidewire Software, Cl Z* | 0.5 | 27,349 | 1,640 | |||||||
Littelfuse | 0.9 | 21,395 | 2,756 | |||||||
LogMeIn* | 0.5 | 18,204 | 1,645 | |||||||
Lumentum Holdings* | 0.9 | 68,350 | 2,855 | |||||||
Monolithic Power Systems | 1.0 | 39,791 | 3,203 | |||||||
Perficient* | 0.5 | 88,245 | 1,778 | |||||||
Proofpoint* | 0.9 | 40,412 | 3,025 | |||||||
Other Securities(A) | 14.7 | 47,224 | ||||||||
|
| |||||||||
| 81,057 | ||||||||||
|
| |||||||||
Materials — 4.0% | ||||||||||
Berry Plastics Group* | 1.2 | 86,692 | 3,801 | |||||||
Sensient Technologies | 0.6 | 25,375 | 1,923 | |||||||
Other Securities(A) | 2.2 | 7,027 | ||||||||
|
| |||||||||
| 12,751 | ||||||||||
|
| |||||||||
Real Estate — 1.4% | ||||||||||
National Storage Affiliates Trust‡ | 0.6 | 91,120 | 1,908 | |||||||
Other Securities‡(A) | 0.8 | 2,520 | ||||||||
|
| |||||||||
| 4,428 | ||||||||||
|
| |||||||||
Telecommunication Services — 0.5% |
| |||||||||
8x8* | 0.5 | 110,207 | 1,700 | |||||||
|
| |||||||||
| SEI Institutional Managed Trust / Annual Report / September 30, 2016 | 65 |
SUMMARY SCHEDULE OF INVESTMENTS
September 30, 2016
Small Cap Growth Fund (Concluded)
| ||||||||||
| Description | Percentage of Net Assets (%) | Shares | Market Value ($ Thousands) | |||||||
| ||||||||||
COMMON STOCK (continued) | ||||||||||
Total Common Stock | $ | 309,235 | ||||||||
|
| |||||||||
RIGHTS — 0.0% | ||||||||||
United States — 0.0% | ||||||||||
Other Securities | 0.0% | — | ||||||||
|
| |||||||||
Total Rights | — | |||||||||
|
| |||||||||
AFFILIATED PARTNERSHIP — 9.7% |
| |||||||||
SEI Liquidity Fund, L.P. | 9.7 | 31,160,567 | 31,161 | |||||||
|
| |||||||||
Total Affiliated Partnership | 31,161 | |||||||||
|
| |||||||||
CASH EQUIVALENT — 3.9% |
| |||||||||
SEI Daily Income Trust, Government Fund, Cl A | 3.9 | 12,401,264 | 12,401 | |||||||
|
| |||||||||
Total Cash Equivalent | 12,401 | |||||||||
|
| |||||||||
Total Investments — 109.7% |
| $ | 352,797 | |||||||
|
| |||||||||
| Percentages are based on a Net Assets of $321,736 ($ Thousands). |
| * | Non-income producing security. |
| ** | The rate reported is the 7-day effective yield as of September 30, 2016. |
| ‡ | Real Estate Investment Trust. |
| † | Investment in Affiliated Security (see Note 6). |
| †† | Narrow industries are utilized for compliance purposes, whereas broad sectors are utilized for reporting. |
| (A) | Certain securities or partial positions of certain securities are on loan at September 30, 2016 (see Note 10). The total market value of securities on loan at September 30, 2016, was $30,880 ($ Thousands). |
| (B) | Certain securities considered illiquid. The total value of such certain securities as of September 30, 2016 was $58 ($ Thousands) and represented 0.0% of Net Assets (Unaudited). |
| (C) | Certain securities considered restricted. The total market value of such certain securities as of September 30, 2016 was $58 ($ Thousands) and represented 0.0% of Net Assets. |
| (D) | This security was purchased with cash collateral held from securities on loan (see Note 10). The total value of such securities as of September 30, 2016 was $31,161 ($ Thousands). |
Cl — Class
L.P. — Limited Partnership
The Summary Schedule of Investments does not reflect the complete portfolio holdings. It includes the Fund’s 50 largest holdings and each investment of any issuer that exceeds 1% of the Fund’s net assets. “Other Securities” represent all issues not required to be disclosed under the rules adopted by the U.S. Securities and Exchange Commission (“SEC”). In certain instances, securities for which footnotes listed above may otherwise apply are included in the Other Securities caption. The complete schedule of portfolio holdings is available (i) without charge, upon request, by calling (800) 342-5734; and (ii) on the SEC’s website at http://www.sec.gov.
The following is a list of the level of inputs used as of September 30, 2016, in valuing the Fund’s investments carried at value ($ Thousands):
| ||||||||||||||||
| Investments in Securities | Level 1 | Level 2 | Level 3 (1) | Total | ||||||||||||
| ||||||||||||||||
Common Stock | $ | 309,177 | $ | – | $ | 58 | $ | 309,235 | ||||||||
Rights | – | – | – | – | ||||||||||||
Affiliated Partnership | – | 31,161 | – | 31,161 | ||||||||||||
Cash Equivalent | 12,401 | – | – | 12,401 | ||||||||||||
|
|
|
|
|
|
|
| |||||||||
Total Investments in Securities | $ | 321,578 | $ | 31,161 | $ | 58 | $ | 352,797 | ||||||||
|
|
|
|
|
|
|
| |||||||||
(1) A reconciliation of Level 3 investments is presented when the Fund has a significant amount of Level 3 investments at the beginning and/or end of the period in relation to the net assets. Management has concluded that Level 3 investments are not material in relation to net assets.
For the year ended September 30, 2016, there were no transfers between Level 1 and Level 2 assets and liabilities.
For the year ended September 30, 2016, there were no transfers between Level 2 and Level 3 assets and liabilities.
For more information on valuation inputs, see Note 2 — Significant Accounting Policies in Notes to Financial Statements.
Amounts designated as “—” are either $0 or have been rounded to $0.
The accompanying notes are an integral part of the financial statements.
| 66 | SEI Institutional Managed Trust / Annual Report / September 30, 2016 |
SUMMARY SCHEDULE OF INVESTMENTS
September 30, 2016
Tax-Managed Small/Mid Cap Fund
Sector Weightings (Unaudited)†:

†Percentages are based on total investments. Includes investments held as collateral for securities held on loan (see Note 10).
| ||||||||||
| Description | Percentage of Net Assets (%) | Shares | Market Value ($ Thousands) | |||||||
| ||||||||||
COMMON STOCK — 95.1% |
| |||||||||
Consumer Discretionary — 10.8% |
| |||||||||
Aramark | 0.4% | 66,097 | $ | 2,514 | ||||||
Big Lots(A) | 0.4 | 60,114 | 2,870 | |||||||
Lithia Motors, Cl A | 0.6 | 43,282 | 4,134 | |||||||
Pool | 0.4 | 32,128 | 3,037 | |||||||
Other Securities(A) | 9.0 | 61,735 | ||||||||
|
| |||||||||
| 74,290 | ||||||||||
|
| |||||||||
Consumer Staples — 3.4% |
| |||||||||
Ingredion | 0.5 | 27,141 | 3,611 | |||||||
Other Securities(A) | 2.9 | 19,720 | ||||||||
|
| |||||||||
| 23,331 | ||||||||||
|
| |||||||||
Energy — 5.0% |
| |||||||||
Concho Resources* | 0.4 | 20,638 | 2,835 | |||||||
Parsley Energy, Cl A* | 0.3 | 70,099 | 2,349 | |||||||
World Fuel Services | 0.4 | 59,253 | 2,741 | |||||||
Other Securities(A) | 3.9 | 26,926 | ||||||||
|
| |||||||||
| 34,851 | ||||||||||
|
| |||||||||
Financials — 13.6% |
| |||||||||
BGC Partners, Cl A | 0.5 | 398,000 | 3,483 | |||||||
Green Dot, Cl A* | 0.6 | 181,408 | 4,183 | |||||||
Hanover Insurance Group, Cl A | 0.4 | 38,140 | 2,877 | |||||||
MB Financial | 0.3 | 63,446 | 2,413 | |||||||
OFG Bancorp | 0.6 | 426,661 | 4,314 | |||||||
PacWest Bancorp(A) | 0.6 | 98,114 | 4,210 | |||||||
Starwood Property Trust‡ | 0.5 | 138,635 | 3,122 | |||||||
Western Alliance Bancorp* | 0.4 | 71,507 | 2,684 | |||||||
Other Securities‡(A) | 9.7 | 66,626 | ||||||||
|
| |||||||||
| 93,912 | ||||||||||
|
| |||||||||
Health Care — 12.0% |
| |||||||||
Akorn*(A) | 0.4 | 92,909 | 2,533 | |||||||
Align Technology* | 0.4 | 26,782 | 2,511 | |||||||
Community Health Systems*(A) | 0.4 | 210,131 | 2,425 | |||||||
DexCom*(A) | 0.3 | 26,872 | 2,356 | |||||||
Integra LifeSciences Holdings* | 0.6 | 50,072 | 4,133 | |||||||
| ||||||||||
| Description | Percentage of Net Assets (%) | Shares | Market Value ($ Thousands) | |||||||
| ||||||||||
COMMON STOCK (continued) |
| |||||||||
Lannett*(A) | 0.5% | 130,610 | $ | 3,470 | ||||||
Ligand Pharmaceuticals*(A) | 0.8 | 55,043 | 5,618 | |||||||
Quintiles Transnational* | 0.4 | 31,043 | 2,516 | |||||||
Other Securities(A) | 8.2 | 57,240 | ||||||||
|
| |||||||||
| 82,802 | ||||||||||
|
| |||||||||
Industrials — 16.9% |
| |||||||||
Acacia Research* | 0.4 | 425,615 | 2,775 | |||||||
ACCO Brands* | 0.4 | 285,499 | 2,752 | |||||||
Atlas Air Worldwide Holdings*(A) | 0.6 | 98,024 | 4,197 | |||||||
BWX Technologies, Cl W | 0.8 | 142,775 | 5,478 | |||||||
Carlisle | 0.5 | 34,980 | 3,588 | |||||||
Crane, Cl A | 0.5 | 51,163 | 3,224 | |||||||
Dycom Industries*(A) | 0.3 | 28,929 | 2,366 | |||||||
Genesee & Wyoming, Cl A*(A) | 0.6 | 58,031 | 4,001 | |||||||
KAR Auction Services | 0.5 | 85,739 | 3,700 | |||||||
Wesco Aircraft Holdings*(A) | 0.4 | 209,569 | 2,815 | |||||||
Other Securities(A) | 11.9 | 81,901 | ||||||||
|
| |||||||||
| 116,797 | ||||||||||
|
| |||||||||
Information Technology — 17.3% |
| |||||||||
Cirrus Logic* | 0.3 | 44,230 | 2,351 | |||||||
Convergys | 0.4 | 84,081 | 2,558 | |||||||
CoStar Group* | 0.4 | 11,236 | 2,433 | |||||||
IAC* | 0.5 | 49,937 | 3,120 | |||||||
InterDigital | 0.4 | 32,257 | 2,555 | |||||||
Open Text | 0.5 | 52,506 | 3,406 | |||||||
OSI Systems* | 0.4 | 37,509 | 2,452 | |||||||
Zebra Technologies, Cl A*(A) | 0.4 | 38,075 | 2,650 | |||||||
Other Securities(A) | 14.0 | 97,737 | ||||||||
|
| |||||||||
| 119,262 | ||||||||||
|
| |||||||||
Materials — 6.2% |
| |||||||||
Avery Dennison | 0.3 | 30,430 | 2,367 | |||||||
FMC | 0.4 | 62,794 | 3,035 | |||||||
Silgan Holdings(A) | 0.4 | 50,049 | 2,532 | |||||||
Other Securities(A) | 5.1 | 34,810 | ||||||||
|
| |||||||||
| 42,744 | ||||||||||
|
| |||||||||
Real Estate — 7.2% |
| |||||||||
EPR Properties, Cl A‡ | 0.4 | 33,739 | 2,657 | |||||||
Forest City Realty Trust, Cl A‡ | 0.3 | 104,433 | 2,416 | |||||||
Highwoods Properties‡ | 0.5 | 65,492 | 3,413 | |||||||
Howard Hughes*(A) | 0.6 | 34,536 | 3,954 | |||||||
Medical Properties Trust‡(A) | 0.4 | 190,106 | 2,808 | |||||||
Other Securities‡(A) | 5.0 | 34,646 | ||||||||
|
| |||||||||
| 49,894 | ||||||||||
|
| |||||||||
Telecommunication Services — 0.4% |
| |||||||||
Other Securities(A) | 0.4 | 2,826 | ||||||||
|
| |||||||||
Utilities — 2.3% | ||||||||||
Other Securities(A) | 2.3 | 16,105 | ||||||||
|
| |||||||||
| SEI Institutional Managed Trust / Annual Report / September 30, 2016 | 67 |
SUMMARY SCHEDULE OF INVESTMENTS
September 30, 2016
Tax-Managed Small/Mid Cap Fund (Concluded)
| ||||||||||
| Description | Percentage of Net Assets (%) | Shares | Market Value ($ Thousands) | |||||||
| ||||||||||
COMMON STOCK (continued) |
| |||||||||
Total Common Stock | $ | 656,814 | ||||||||
|
| |||||||||
RIGHTS — 0.0% |
| |||||||||
United States — 0.0% |
| |||||||||
Other Securities | 0.0% | 12 | ||||||||
|
| |||||||||
Total Rights |
| 12 | ||||||||
|
| |||||||||
U.S. TREASURY OBLIGATION — 0.0% |
| |||||||||
Other Securities (B) | 0.0 | 320 | ||||||||
|
| |||||||||
Total U.S. Treasury Obligation |
| 320 | ||||||||
|
| |||||||||
AFFILIATED PARTNERSHIP — 26.2% |
| |||||||||
SEI Liquidity Fund, L.P. | 26.2 | 180,708,367 | 180,708 | |||||||
|
| |||||||||
Total Affiliated Partnership |
| 180,708 | ||||||||
|
| |||||||||
CASH EQUIVALENT — 4.9% |
| |||||||||
SEI Daily Income Trust, Government Fund, Cl A | 4.9 | 33,688,560 | 33,689 | |||||||
|
| |||||||||
Total Cash Equivalent |
| 33,689 | ||||||||
|
| |||||||||
Total Investments — 126.2% |
| $ | 871,543 | |||||||
|
| |||||||||
A list of the open futures contracts held by the Fund at September 30, 2016, are as follows:
| ||||||||||||
| Type of Contract | Number of Long | Expiration Date | Unrealized Appreciation (Depreciation) ($ Thousands) | |||||||||
| ||||||||||||
Russell 2000 Index E-MINI | 24 | Dec-2016 | $5 | |||||||||
S&P Mid Cap 400 Index E-MINI | 20 | Dec-2016 | (3) | |||||||||
|
| |||||||||||
| $2 | ||||||||||||
|
| |||||||||||
For the year ended September 30, 2016, the total amount of all open futures contracts, as presented in the table above, are representative of the volume of activity for the derivative type during the year.
| Percentages are based on a Net Assets of $690,473 ($ Thousands). |
| * | Non-income producing security. |
| ** | The rate reported is the 7-day effective yield as of September 30, 2016. |
| ‡ | Real Estate Investment Trust. |
| † | Investment in Affiliated Security (see Note 6). |
| (A) | Certain securities or partial positions of certain securities are on loan at September 30, 2016, (see Note 10). The total market value of securities on loan at September 30, 2016, was $178,774 ($ Thousands). |
| (B) | Security, or portion thereof, has been pledged as collateral on open futures contracts. |
| (C) | This security was purchased with cash collateral held from securities on loan (see Note 10). The total value of such securities as of September 30, 2016 was $180,708 ($ Thousands). |
Cl — Class
L.P. — Limited Partnership
S&P — Standard & Poor’s
The Summary Schedule of Investments does not reflect the complete portfolio holdings. It includes the Fund’s 50 largest holdings and each investment of any issuer that exceeds 1% of the Fund’s net assets. “Other Securities” represent all issues not required to be disclosed under the rules adopted by the U.S. Securities and Exchange Commission (“SEC”). In certain instances, securities for which footnotes listed above may otherwise apply are included in the Other Securities caption. The complete schedule of portfolio holdings is available (i) without charge, upon request, by calling (800) 342-5734; and (ii) on the SEC’s website at http://www.sec.gov.
The following is a list of the level of inputs used as of September 30, 2016, in valuing the Fund’s investments and other financial instruments carried at value ($ Thousands):
| ||||||||||||||||
| Investments in Securities | Level 1 | Level 2 | Level 3 | Total | ||||||||||||
| ||||||||||||||||
Common Stock | $ | 656,814 | $ | – | $ | – | $ | 656,814 | ||||||||
Rights | – | 12 | – | 12 | ||||||||||||
U.S. Treasury Obligation | – | 320 | – | 320 | ||||||||||||
Affiliated Partnership | – | 180,708 | – | 180,708 | ||||||||||||
Cash Equivalent | 33,689 | – | – | 33,689 | ||||||||||||
|
|
|
|
|
|
|
| |||||||||
Total Investments in Securities | $ | 690,503 | $ | 181,040 | $ | – | $ | 871,543 | ||||||||
|
|
|
|
|
|
|
| |||||||||
| ||||||||||||||||
| Other Financial Instruments | Level 1 | Level 2 | Level 3 | Total | ||||||||||||
| ||||||||||||||||
Futures Contracts * | ||||||||||||||||
Unrealized Appreciation | $ | 5 | $ | — | $ | — | $ | 5 | ||||||||
Unrealized Depreciation | (3) | — | — | (3) | ||||||||||||
|
|
|
|
|
|
|
| |||||||||
Total Other Financial Instruments | $ | 2 | $ | — | $ | — | $ | 2 | ||||||||
|
|
|
|
|
|
|
| |||||||||
| * | Futures contracts are valued at unrealized appreciation (depreciation) on the instrument. |
For the year ended September 30, 2016, there were no transfers between Level 1 and Level 2 assets and liabilities.
For the year ended September 30, 2016, there were no transfers between Level 2 and Level 3 assets and liabilities.
For more information on valuation inputs, see Note 2 — Significant Accounting Policies in Notes to Financial Statements.
Amounts designated as “—” are either $0 or have been rounded to $0.
The accompanying notes are an integral part of the financial statements.
| 68 | SEI Institutional Managed Trust / Annual Report / September 30, 2016 |
SUMMARY SCHEDULE OF INVESTMENTS
September 30, 2016
Mid-Cap Fund
Sector Weightings (Unaudited)†:
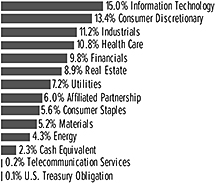
†Percentages are based on total investments. Includes investments held as collateral for securities held on loan (see Note 10).
| ||||||||||
| Description | Percentage of Net Assets (%) | Shares | Market Value ($ Thousands) | |||||||
| ||||||||||
COMMON STOCK — 97.3% |
| |||||||||
Consumer Discretionary — 14.2% |
| |||||||||
Best Buy | 0.8% | 18,400 | $ | 702 | ||||||
Genuine Parts | 0.8 | 6,700 | 673 | |||||||
Lear | 0.7 | 5,300 | 642 | |||||||
Macy’s | 0.8 | 18,200 | 674 | |||||||
PVH | 0.7 | 5,700 | 630 | |||||||
Royal Caribbean Cruises(A) | 0.7 | 8,600 | 645 | |||||||
Other Securities(A) | 9.7 | 8,720 | ||||||||
|
| |||||||||
| 12,686 | ||||||||||
|
| |||||||||
Consumer Staples — 6.0% |
| |||||||||
Clorox | 0.7 | 5,300 | 663 | |||||||
ConAgra Foods | 0.8 | 15,900 | 749 | |||||||
Dr Pepper Snapple Group | 0.8 | 7,500 | 685 | |||||||
JM Smucker | 0.7 | 4,600 | 623 | |||||||
Tyson Foods, Cl A | 1.0 | 11,600 | 866 | |||||||
Other Securities(A) | 2.0 | 1,767 | ||||||||
|
| |||||||||
| 5,353 | ||||||||||
|
| |||||||||
Energy — 4.5% |
| |||||||||
Marathon Petroleum | 0.9 | 19,200 | 779 | |||||||
Tesoro | 0.7 | 7,800 | 621 | |||||||
Other Securities(A) | 2.9 | 2,643 | ||||||||
|
| |||||||||
| 4,043 | ||||||||||
|
| |||||||||
Financials — 10.4% |
| |||||||||
Ally Financial | 0.7 | 32,800 | 639 | |||||||
Ameriprise Financial | 0.8 | 6,900 | 688 | |||||||
Raymond James Financial | 0.7 | 10,600 | 617 | |||||||
Regions Financial | 0.7 | 62,300 | 615 | |||||||
SunTrust Banks | 0.9 | 18,200 | 797 | |||||||
Other Securities‡(A) | 6.6 | 5,945 | ||||||||
|
| |||||||||
| 9,301 | ||||||||||
|
| |||||||||
Health Care — 11.4% |
| |||||||||
C.R. Bard | 0.8 | 3,300 | 740 | |||||||
Cerner*(A) | 0.8 | 11,200 | 692 | |||||||
Edwards Lifesciences, Cl A* | 1.1 | 8,400 | 1,013 | |||||||
Hologic* | 0.7 | 16,600 | 644 | |||||||
Incyte* | 0.8 | 7,700 | 726 | |||||||
| ||||||||||
| Description | Percentage of Net Assets (%) | Shares | Market Value ($ Thousands) | |||||||
| ||||||||||
COMMON STOCK (continued) |
| |||||||||
Intuitive Surgical* | 0.9% | 1,150 | $ | 833 | ||||||
Mallinckrodt* | 0.7 | 9,000 | 628 | |||||||
Other Securities | 5.6 | 4,914 | ||||||||
|
| |||||||||
| 10,190 | ||||||||||
|
| |||||||||
Industrials — 11.9% |
| |||||||||
Cummins | 0.9 | 5,800 | 743 | |||||||
Huntington Ingalls Industries, Cl A | 0.7 | 4,200 | 644 | |||||||
Ingersoll-Rand | 0.8 | 10,800 | 734 | |||||||
PACCAR | 0.8 | 12,100 | 711 | |||||||
Stanley Black & Decker | 0.8 | 6,000 | 738 | |||||||
Textron | 0.7 | 15,900 | 632 | |||||||
United Continental Holdings* | 0.9 | 15,700 | 824 | |||||||
Other Securities(A) | 6.3 | 5,550 | ||||||||
|
| |||||||||
| 10,576 | ||||||||||
|
| |||||||||
Information Technology — 16.0% |
| |||||||||
Citrix Systems* | 0.7 | 7,600 | 648 | |||||||
IAC* | 0.7 | 10,000 | 625 | |||||||
Linear Technology | 0.7 | 10,800 | 640 | |||||||
Symantec, Cl A | 0.9 | 31,600 | 793 | |||||||
Synopsys* | 0.7 | 10,500 | 623 | |||||||
Other Securities(A) | 12.3 | 10,913 | ||||||||
|
| |||||||||
| 14,242 | ||||||||||
|
| |||||||||
Materials — 5.5% |
| |||||||||
Celanese, Ser A | 0.7 | 9,300 | 619 | |||||||
Newmont Mining | 1.0 | 21,700 | 853 | |||||||
Nucor | 0.7 | 13,500 | 667 | |||||||
Other Securities(A) | 3.1 | 2,776 | ||||||||
|
| |||||||||
| 4,915 | ||||||||||
|
| |||||||||
Real Estate — 9.5% |
| |||||||||
General Growth Properties‡ | 0.7 | 22,300 | 616 | |||||||
HCP‡ | 0.8 | 18,900 | 717 | |||||||
ProLogis‡ | 0.9 | 14,600 | 782 | |||||||
Other Securities‡(A) | 7.1 | 6,340 | ||||||||
|
| |||||||||
| 8,455 | ||||||||||
|
| |||||||||
Telecommunication Services — 0.3% |
| |||||||||
Other Securities | 0.3 | 215 | ||||||||
|
| |||||||||
Utilities — 7.6% |
| |||||||||
AES | 0.7 | 51,200 | 658 | |||||||
DTE Energy | 0.8 | 7,500 | 703 | |||||||
Entergy | 0.8 | 8,500 | 652 | |||||||
Eversource Energy | 0.7 | 11,600 | 629 | |||||||
PPL | 0.9 | 22,300 | 771 | |||||||
Public Service Enterprise Group | 0.8 | 17,500 | 733 | |||||||
UGI | 0.7 | 14,100 | 638 | |||||||
Other Securities | 2.2 | 1,994 | ||||||||
|
| |||||||||
| 6,778 | ||||||||||
|
| |||||||||
Total Common Stock |
| 86,754 | ||||||||
|
| |||||||||
| SEI Institutional Managed Trust / Annual Report / September 30, 2016 | 69 |
SUMMARY SCHEDULE OF INVESTMENTS
September 30, 2016
Mid-Cap Fund (Concluded)
| ||||||||||
| Description | Percentage of Net Assets (%) | Shares | Market Value ($ Thousands) | |||||||
| ||||||||||
U.S. TREASURY OBLIGATION — 0.1% |
| |||||||||
Other Securities (B) | 0.1% | $ | 50 | |||||||
|
| |||||||||
Total U.S. Treasury Obligation |
| 50 | ||||||||
|
| |||||||||
AFFILIATED PARTNERSHIP — 6.4% |
| |||||||||
SEI Liquidity Fund, L.P. | ||||||||||
0.440% **†(C) | 6.4 | 5,714,002 | 5,714 | |||||||
|
| |||||||||
Total Affiliated Partnership (Cost $5,714) ($ Thousands) | 5,714 | |||||||||
|
| |||||||||
CASH EQUIVALENT — 2.5% |
| |||||||||
SEI Daily Income Trust, Government Fund, Cl A | ||||||||||
0.220% **† | 2.5 | 2,188,571 | 2,189 | |||||||
|
| |||||||||
Total Cash Equivalent |
| 2,189 | ||||||||
|
| |||||||||
Total Investments — 106.3% |
| $ | 94,707 | |||||||
|
| |||||||||
| Percentages are based on a Net Assets of $89,130 ($ Thousands). |
| * | Non-income producing security. |
| ** | The rate reported is the 7-day effective yield as of September 30, 2016. |
| ‡ | Real Estate Investment Trust. |
| † | Investment in Affiliated Security (see Note 6). |
| (A) | Certain securities or partial positions of certain securities are on loan at September 30, 2016, (see Note 10). The total market value of securities on loan at September 30, 2016, was $5,670 ($ Thousands). |
| (B) | Security, or portion thereof, has been pledged as collateral on open futures contracts. |
| (C) | This security was purchased with cash collateral held from securities on loan (see Note 10). The total value of such securities as of September 30, 2016 was $5,714 ($ Thousands). |
Cl — Class
L.P. — Limited Partnership
The Summary Schedule of Investments does not reflect the complete portfolio holdings. It includes the Fund’s 50 largest holdings and each investment of any issuer that exceeds 1% of the Fund’s net assets. “Other Securities” represent all issues not required to be disclosed under the rules adopted by the U.S. Securities and Exchange Commission (“SEC”). In certain instances, securities for which footnotes listed above may otherwise apply are included in the Other Securities caption. The complete schedule of portfolio holdings is available (i) without charge, upon request, by calling (800) 342-5734; and (ii) on the SEC’s website at http://www.sec.gov.
The following is a list of the level of inputs used as of September 30, 2016, in valuing the Fund’s investments carried at value ($ Thousands):
| ||||||||||||||||
| Investments in Securities | Level 1 | Level 2 | Level 3 | Total | ||||||||||||
| ||||||||||||||||
Common Stock | $ | 86,754 | $ | – | $ | – | $ | 86,754 | ||||||||
U.S. Treasury Obligation | – | 50 | – | 50 | ||||||||||||
Affiliated Partnership | – | 5,714 | – | 5,714 | ||||||||||||
Cash Equivalent | 2,189 | – | – | 2,189 | ||||||||||||
|
|
|
|
|
|
|
| |||||||||
Total Investments in Securities | $ | 88,943 | $ | 5,764 | $ | – | $ | 94,707 | ||||||||
|
|
|
|
|
|
|
| |||||||||
For the year ended September 30, 2016, there were no transfers between Level 1 and Level 2 assets and liabilities.
For the year ended September 30, 2016, there were no transfers between Level 2 and Level 3 assets and liabilities.
For more information on valuation inputs, see Note 2 — Significant Accounting Policies in Notes to Financial Statements.
Amounts designated as “—” are either $0 or have been rounded to $0.
The accompanying notes are an integral part of the financial statements.
| 70 | SEI Institutional Managed Trust / Annual Report / September 30, 2016 |
SUMMARY SCHEDULE OF INVESTMENTS
September 30, 2016
U.S. Managed Volatility Fund
Sector Weightings (Unaudited)†:
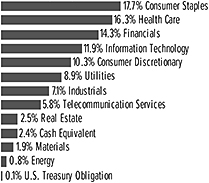
†Percentages are based on total investments.
| ||||||||||
| Description | Percentage of Net Assets (%) | Shares | Market Value ($ Thousands) | |||||||
| ||||||||||
COMMON STOCK — 97.4% |
| |||||||||
Consumer Discretionary — 10.3% |
| |||||||||
Aramark | 0.6% | 242,246 | $ | 9,213 | ||||||
Cheesecake Factory | 0.6 | 178,130 | 8,917 | |||||||
McDonald’s | 0.9 | 124,799 | 14,397 | |||||||
Michael Kors Holdings* | 0.6 | 200,786 | 9,395 | |||||||
Target, Cl A | 1.3 | 301,008 | 20,673 | |||||||
Other Securities | 6.3 | 103,176 | ||||||||
|
| |||||||||
| 165,771 | ||||||||||
|
| |||||||||
Consumer Staples — 17.7% |
| |||||||||
Altria Group | 1.3 | 329,611 | 20,841 | |||||||
Clorox | 0.6 | 83,056 | 10,397 | |||||||
Costco Wholesale | 0.7 | 74,318 | 11,334 | |||||||
Dr Pepper Snapple Group | 1.6 | 287,944 | 26,292 | |||||||
General Mills | 0.7 | 168,008 | 10,732 | |||||||
Kimberly-Clark | 0.8 | 96,029 | 12,113 | |||||||
Kroger | 0.6 | 316,876 | 9,405 | |||||||
McCormick | 0.7 | 111,502 | 11,141 | |||||||
PepsiCo | 1.1 | 157,328 | 17,113 | |||||||
Philip Morris International | 1.0 | 165,454 | 16,085 | |||||||
SYSCO, Cl A | 1.0 | 325,257 | 15,941 | |||||||
Tyson Foods, Cl A | 0.8 | 166,658 | 12,444 | |||||||
Wal-Mart Stores | 2.0 | 441,835 | 31,865 | |||||||
Other Securities | 4.8 | 79,792 | ||||||||
|
| |||||||||
| 285,495 | ||||||||||
|
| |||||||||
Energy — 0.8% |
| |||||||||
Exxon Mobil | 0.6 | 111,500 | 9,732 | |||||||
Other Securities | 0.2 | 2,404 | ||||||||
|
| |||||||||
| 12,136 | ||||||||||
|
| |||||||||
Financials — 14.3% |
| |||||||||
Axis Capital Holdings | 0.8 | 228,855 | 12,434 | |||||||
Berkshire Hathaway, Cl B* | 0.7 | 75,500 | 10,908 | |||||||
CBOE Holdings | 0.8 | 210,763 | 13,668 | |||||||
Everest Re Group | 1.2 | 98,136 | 18,643 | |||||||
RenaissanceRe Holdings | 0.7 | 96,068 | 11,543 | |||||||
Travelers | 1.0 | 136,430 | 15,628 | |||||||
Validus Holdings | 1.0 | 309,657 | 15,427 | |||||||
| ||||||||||
| Description | Percentage of Net Assets (%) | Shares | Market Value ($ Thousands) | |||||||
| ||||||||||
COMMON STOCK (continued) |
| |||||||||
Other Securities‡ | 8.1% | $ | 132,748 | |||||||
|
| |||||||||
| 230,999 | ||||||||||
|
| |||||||||
Health Care — 16.2% |
| |||||||||
Bristol-Myers Squibb | 0.6 | 175,186 | 9,446 | |||||||
Cardinal Health | 1.0 | 198,143 | 15,396 | |||||||
Johnson & Johnson | 2.2 | 299,129 | 35,336 | |||||||
McKesson | 0.7 | 69,018 | 11,509 | |||||||
Merck | 1.4 | 366,497 | 22,873 | |||||||
Pfizer | 1.3 | 638,521 | 21,627 | |||||||
Quest Diagnostics | 0.6 | 118,057 | 9,991 | |||||||
Teleflex | 0.6 | 55,217 | 9,279 | |||||||
Other Securities | 7.8 | 126,916 | ||||||||
|
| |||||||||
| 262,373 | ||||||||||
|
| |||||||||
Industrials — 7.1% |
| |||||||||
Lockheed Martin | 0.8 | 54,845 | 13,147 | |||||||
Northrop Grumman | 0.6 | 47,300 | 10,120 | |||||||
Raytheon | 0.6 | 66,945 | 9,113 | |||||||
Waste Management | 0.7 | 180,423 | 11,504 | |||||||
Other Securities | 4.4 | 70,415 | ||||||||
|
| |||||||||
| 114,299 | ||||||||||
|
| |||||||||
Information Technology — 11.9% |
| |||||||||
Amdocs | 1.5 | 427,486 | 24,730 | |||||||
Cisco Systems | 0.6 | 293,400 | 9,307 | |||||||
Intel | 0.6 | 264,400 | 9,981 | |||||||
International Business Machines | 0.8 | 76,760 | 12,193 | |||||||
Symantec, Cl A | 0.9 | 590,040 | 14,810 | |||||||
Other Securities | 7.5 | 120,949 | ||||||||
|
| |||||||||
| 191,970 | ||||||||||
|
| |||||||||
Materials — 1.9% |
| |||||||||
Other Securities | 1.9 | 31,211 | ||||||||
|
| |||||||||
Real Estate — 2.5% |
| |||||||||
Other Securities‡ | 2.5 | 40,848 | ||||||||
|
| |||||||||
Telecommunication Services — 5.8% |
| |||||||||
AT&T | 2.1 | 843,923 | 34,272 | |||||||
Verizon Communications | 2.1 | 649,368 | 33,754 | |||||||
Other Securities | 1.6 | 25,686 | ||||||||
|
| |||||||||
| 93,712 | ||||||||||
|
| |||||||||
Utilities — 8.9% |
| |||||||||
American Electric Power | 0.8 | 203,085 | 13,040 | |||||||
Edison International | 0.7 | 153,245 | 11,072 | |||||||
Entergy | 0.8 | 177,552 | 13,623 | |||||||
Public Service Enterprise Group | 0.7 | 284,103 | 11,895 | |||||||
Southern | 0.7 | 217,141 | 11,139 | |||||||
Other Securities | 5.2 | 83,048 | ||||||||
|
| |||||||||
| 143,817 | ||||||||||
|
| |||||||||
Total Common Stock | 1,572,631 | |||||||||
|
| |||||||||
| SEI Institutional Managed Trust / Annual Report / September 30, 2016 | 71 |
SUMMARY SCHEDULE OF INVESTMENTS
September 30, 2016
U.S. Managed Volatility Fund (Concluded)
| ||||||||||
| Description | Percentage of Net Assets (%) | Shares | Market Value ($ Thousands) | |||||||
| ||||||||||
U.S. TREASURY OBLIGATION — 0.0% |
| |||||||||
Other Securities (A) | 0.0% | $ | 965 | |||||||
|
| |||||||||
Total U.S. Treasury Obligation | 965 | |||||||||
|
| |||||||||
CASH EQUIVALENT — 2.4% |
| |||||||||
SEI Daily Income Trust, Government Fund, Cl A | ||||||||||
0.220% **† | 2.4 | 39,118,496 | 39,118 | |||||||
|
| |||||||||
Total Cash Equivalent | 39,118 | |||||||||
|
| |||||||||
Total Investments — 99.8% | $ | 1,612,714 | ||||||||
|
| |||||||||
A list of the open futures contracts held by the Fund at September 30, 2016, is as follows:
| ||||||||||||||||
| Type of Contract | Number of Contracts Long | Expiration Date | Unrealized Depreciation ($ Thousands) | |||||||||||||
| ||||||||||||||||
S&P 500 Index E-MINI | 238 | Dec-2016 | $(102) | |||||||||||||
|
| |||||||||||||||
For the year ended September 30, 2016, the total amount of all open futures contracts, as presented in the table above, are representative of the volume of activity for the derivative type during the year.
| Percentages are based on a Net Assets of $1,615,168 ($ Thousands). |
| * | Non-income producing security. |
| ** | The rate reported is the 7-day effective yield as of September 30, 2016. |
| ‡ | Real Estate Investment Trust. |
| † | Investment in Affiliated Security (see Note 6). |
| (A) | Security, or portion thereof, has been pledged as collateral on open futures contracts. |
CI — Class
S&P — Standard & Poor’s
The Summary Schedule of Investments does not reflect the complete portfolio holdings. It includes the Fund’s 50 largest holdings and each investment of any issuer that exceeds 1% of the Fund’s net assets. “Other Securities” represent all issues not required to be disclosed under the rules adopted by the U.S. Securities and Exchange Commission (“SEC”). In certain instances, securities for which footnotes listed above may otherwise apply are included in the Other Securities caption. The complete schedule of portfolio holdings is available (i) without charge, upon request, by calling (800) 342-5734; and (ii) on the SEC’s website at http://www.sec.gov.
The following is a list of the level of inputs used as of September 30, 2016, in valuing the Fund’s investments and other financial instruments carried at value ($ Thousands):
| ||||||||||||||||
| Investments in Securities | Level 1 | Level 2 | Level 3 | Total | ||||||||||||
| ||||||||||||||||
Common Stock | $ | 1,572,631 | $ | – | $ | – | $ | 1,572,631 | ||||||||
U.S. Treasury Obligation | – | 965 | – | 965 | ||||||||||||
Cash Equivalent | 39,118 | – | – | 39,118 | ||||||||||||
|
|
|
|
|
|
|
| |||||||||
Total Investments in Securities | $ | 1,611,749 | $ | 965 | $ | – | $ | 1,612,714 | ||||||||
|
|
|
|
|
|
|
| |||||||||
| ||||||||||||||||
| Other Financial Instruments | Level 1 | Level 2 | Level 3 | Total | ||||||||||||
| ||||||||||||||||
Futures Contracts * | ||||||||||||||||
Unrealized Depreciation | $ | (102) | $ | — | $ | — | $ | (102) | ||||||||
|
|
|
|
|
|
|
| |||||||||
Total Other Financial Instruments | $ | (102) | $ | — | $ | — | $ | (102) | ||||||||
|
|
|
|
|
|
|
| |||||||||
| * | Futures Contracts are valued at the unrealized depreciation on the instrument. |
For the year ended September 30, 2016, there were no transfers between Level 1 and Level 2 assets and liabilities.
For the year ended September 30, 2016, there were no transfers between Level 2 and Level 3 assets and liabilities.
For more information on valuation inputs, see Note 2 — Significant Accounting Policies in Notes to Financial Statements.
Amounts designated as “—” are either $0 or have been rounded to $0.
The accompanying notes are an integral part of the financial statements.
| 72 | SEI Institutional Managed Trust / Annual Report / September 30, 2016 |
SUMMARY SCHEDULE OF INVESTMENTS
September 30, 2016
Global Managed Volatility Fund
Sector Weightings (Unaudited)†:

†Percentages are based on total investments.
| ||||||||||
| Description | Percentage of Net Assets (%) | Shares | Market Value ($ Thousands) | |||||||
| ||||||||||
COMMON STOCK — 93.6% |
| |||||||||
Australia — 4.3% |
| |||||||||
Wesfarmers | 0.8% | 400,112 | $ | 13,565 | ||||||
Other Securities ‡ | 3.5% | 60,358 | ||||||||
|
| |||||||||
| 73,923 | ||||||||||
|
| |||||||||
Austria — 0.9% |
| |||||||||
Other Securities | 0.9 | 16,361 | ||||||||
|
| |||||||||
Belgium — 0.3% |
| |||||||||
Other Securities ‡ | 0.3 | 5,896 | ||||||||
|
| |||||||||
Canada — 9.2% |
| |||||||||
Bank of Montreal | 0.6 | 162,917 | 10,657 | |||||||
BCE | 0.7 | 250,039 | 11,547 | |||||||
Rogers Communications, Cl B | 1.1 | 428,024 | 18,127 | |||||||
Other Securities ‡ | 6.8 | 118,027 | ||||||||
|
| |||||||||
| 158,358 | ||||||||||
|
| |||||||||
Denmark — 0.8% |
| |||||||||
Other Securities | 0.8 | 14,427 | ||||||||
|
| |||||||||
Finland — 0.0% |
| |||||||||
Other Securities | 0.0 | 429 | ||||||||
|
| |||||||||
France — 0.2% |
| |||||||||
Other Securities | 0.2 | 3,003 | ||||||||
|
| |||||||||
Germany — 1.1% |
| |||||||||
Other Securities (A) | 1.1 | 18,905 | ||||||||
|
| |||||||||
Guernsey — 0.6% |
| |||||||||
Amdocs | 0.6 | 174,841 | 10,115 | |||||||
|
| |||||||||
Hong Kong — 3.2% |
| |||||||||
CLP Holdings, Cl B | 1.2 | 1,939,046 | 20,115 | |||||||
Other Securities ‡(A) | 2.0 | 34,823 | ||||||||
|
| |||||||||
| 54,938 | ||||||||||
|
| |||||||||
Ireland — 0.1% |
| |||||||||
Other Securities ‡ | 0.1 | 1,376 | ||||||||
|
| |||||||||
| ||||||||||
| Description | Percentage of Net Assets (%) | Shares | Market Value ($ Thousands) | |||||||
| ||||||||||
COMMON STOCK (continued) |
| |||||||||
Israel — 1.4% |
| |||||||||
Bank Hapoalim | 0.7% | 2,047,460 | $ | 11,613 | ||||||
Other Securities | 0.7 | 12,611 | ||||||||
|
| |||||||||
| 24,224 | ||||||||||
|
| |||||||||
Italy — 1.0% |
| |||||||||
Other Securities | 1.0 | 17,482 | ||||||||
|
| |||||||||
Japan — 7.4% |
| |||||||||
NTT DOCOMO | 0.6 | 400,492 | 10,193 | |||||||
Other Securities ‡ | 6.8 | 117,844 | ||||||||
|
| |||||||||
| 128,037 | ||||||||||
|
| |||||||||
Luxembourg — 0.1% |
| |||||||||
Other Securities | 0.1 | 1,245 | ||||||||
|
| |||||||||
Netherlands — 0.3% |
| |||||||||
Other Securities | 0.3 | 4,493 | ||||||||
|
| |||||||||
New Zealand — 2.4% |
| |||||||||
Other Securities ‡ | 2.4 | 40,937 | ||||||||
|
| |||||||||
Norway — 2.4% |
| |||||||||
Norsk Hydro | 0.6 | 2,572,894 | 11,090 | |||||||
Orkla | 0.7 | 1,248,316 | 12,908 | |||||||
Telenor | 0.7 | 652,264 | 11,195 | |||||||
Other Securities | 0.4 | 6,527 | ||||||||
|
| |||||||||
| 41,720 | ||||||||||
|
| |||||||||
Portugal — 0.1% |
| |||||||||
Other Securities | 0.1 | 2,113 | ||||||||
|
| |||||||||
Singapore — 1.1% |
| |||||||||
Other Securities ‡ | 1.1 | 18,887 | ||||||||
|
| |||||||||
Spain — 1.8% |
| |||||||||
Red Electrica | 0.6 | 481,326 | 10,388 | |||||||
Other Securities | 1.2 | 21,274 | ||||||||
|
| |||||||||
| 31,662 | ||||||||||
|
| |||||||||
Sweden — 1.2% |
| |||||||||
Swedish Match | 0.8 | 360,153 | 13,241 | |||||||
Other Securities | 0.4 | 7,469 | ||||||||
|
| |||||||||
| 20,710 | ||||||||||
|
| |||||||||
Switzerland — 4.3% |
| |||||||||
Nestle | 1.3 | 271,140 | 21,411 | |||||||
Other Securities | 3.0 | 51,951 | ||||||||
|
| |||||||||
| 73,362 | ||||||||||
|
| |||||||||
United Kingdom — 4.9% |
| |||||||||
British American Tobacco | 0.6 | 165,864 | 10,635 | |||||||
Imperial Brands | 0.9 | 288,753 | 14,923 | |||||||
Other Securities ‡ | 3.4 | 58,451 | ||||||||
|
| |||||||||
| 84,009 | ||||||||||
|
| |||||||||
United States — 44.5% |
| |||||||||
Altria Group | 0.8 | 221,141 | 13,983 | |||||||
AmerisourceBergen | 0.7 | 140,293 | 11,333 | |||||||
| SEI Institutional Managed Trust / Annual Report / September 30, 2016 | 73 |
SUMMARY SCHEDULE OF INVESTMENTS
September 30, 2016
Global Managed Volatility Fund (Continued)
| ||||||||||
| Description | Percentage of Net Assets (%) | Shares | Market Value ($ Thousands) | |||||||
| ||||||||||
COMMON STOCK (continued) |
| |||||||||
AT&T | 1.1% | 483,387 | $ | 19,630 | ||||||
C.R. Bard | 0.7 | 51,707 | 11,597 | |||||||
Cardinal Health | 0.6 | 134,707 | 10,467 | |||||||
Church & Dwight | 0.6 | 227,952 | 10,923 | |||||||
Clorox | 1.2 | 168,546 | 21,099 | |||||||
Coca-Cola | 0.6 | 258,267 | 10,930 | |||||||
Colgate-Palmolive | 0.6 | 145,431 | 10,782 | |||||||
DaVita HealthCare Partners * | 0.7 | 171,636 | 11,340 | |||||||
Estee Lauder, Cl A | 0.6 | 115,533 | 10,232 | |||||||
Fresh Del Monte Produce | 0.7 | 196,100 | 11,746 | |||||||
General Mills | 1.0 | 275,123 | 17,575 | |||||||
Henry Schein * | 0.6 | 63,568 | 10,360 | |||||||
Johnson & Johnson | 0.9 | 126,488 | 14,942 | |||||||
Kellogg | 0.6 | 133,497 | 10,342 | |||||||
Kimberly-Clark | 1.2 | 162,723 | 20,526 | |||||||
McCormick | 0.6 | 103,839 | 10,376 | |||||||
McDonald’s | 0.7 | 110,050 | 12,695 | |||||||
Merck | 0.6 | 168,977 | 10,546 | |||||||
PepsiCo | 0.8 | 125,828 | 13,686 | |||||||
Pfizer | 0.6 | 300,268 | 10,170 | |||||||
Philip Morris International | 0.6 | 109,808 | 10,676 | |||||||
Procter & Gamble | 1.1 | 200,966 | 18,037 | |||||||
Quest Diagnostics | 0.7 | 132,457 | 11,210 | |||||||
Reliance Steel & Aluminum | 0.6 | 148,601 | 10,704 | |||||||
Republic Services | 0.7 | 221,347 | 11,167 | |||||||
Southern | 0.6 | 215,618 | 11,061 | |||||||
Spectrum Brands Holdings | 0.7 | 85,005 | 11,704 | |||||||
SYSCO, Cl A | 1.3 | 462,691 | 22,677 | |||||||
Teleflex | 0.6 | 64,954 | 10,916 | |||||||
United Parcel Service, Cl B | 0.6 | 100,910 | 11,036 | |||||||
Wal-Mart Stores | 1.2 | 287,665 | 20,746 | |||||||
Waste Management | 0.7 | 180,447 | 11,505 | |||||||
Other Securities ‡ | 18.6 | 320,170 | ||||||||
|
| |||||||||
| 766,889 | ||||||||||
|
| |||||||||
Total Common Stock |
| 1,613,501 | ||||||||
|
| |||||||||
PREFERRED STOCK — 0.3% |
| |||||||||
Germany — 0.3% |
| |||||||||
Other Securities | 0.3 | 4,218 | ||||||||
|
| |||||||||
Sweden — 0.0% |
| |||||||||
Other Securities | 0.0 | 546 | ||||||||
|
| |||||||||
Total Preferred Stock |
| 4,764 | ||||||||
|
| |||||||||
RIGHT — 0.0% |
| |||||||||
United Kingdom — 0.0% |
| |||||||||
Other Securities | 0.0% | 2 | ||||||||
|
| |||||||||
Total Right |
| 2 | ||||||||
|
| |||||||||
| ||||||||||
| Description | Percentage of Net Assets (%) | Shares | Market Value ($ Thousands) | |||||||
| ||||||||||
U.S. TREASURY OBLIGATION — 0.3% |
| |||||||||
Other Securities (B) | 0.% | $ | 4,300 | |||||||
|
| |||||||||
Total U.S. Treasury Obligation |
| 4,300 | ||||||||
|
| |||||||||
CASH EQUIVALENT — 4.8% |
| |||||||||
SEI Daily Income Trust, Government Fund, Cl A | ||||||||||
0.220% **† | 4.8 | 83,471,339 | 83,471 | |||||||
|
| |||||||||
Total Cash Equivalent |
| 83,471 | ||||||||
|
| |||||||||
Total Investments — 99.0% |
| $ | 1,706,038 | |||||||
|
| |||||||||
A list of the open futures contracts held by the Fund at September 30, 2016, is as follows:
| ||||||||||||||||
| Type of Contract | Number of Contracts Long | Expiration Date | Unrealized (Depreciation) ($ Thousands) | |||||||||||||
| ||||||||||||||||
DJ Euro Stoxx 50 Index | 238 | Dec-2016 | $72 | |||||||||||||
FTSE 100 Index | 61 | Dec-2016 | 149 | |||||||||||||
Hang Seng Index | 8 | Oct-2016 | (6) | |||||||||||||
S&P 500 Index E-MINI | 358 | Dec-2016 | (199) | |||||||||||||
SPI 200 Index | 27 | Dec-2016 | 71 | |||||||||||||
Topix Index | 41 | Dec-2016 | (11) | |||||||||||||
|
| |||||||||||||||
| $76 | ||||||||||||||||
|
| |||||||||||||||
For the year ended September 30, 2016, the total amount of all open futures contracts, as presented in the table above, are representative of the volume of activity for the derivative type during the year.
| 74 | SEI Institutional Managed Trust / Annual Report / September 30, 2016 |
A list of the open forward foreign currency contracts held by the Fund at September 30, 2016, is as follows:
| ||||||||||||
Settlement Date | Currency to Deliver (Thousands) | Currency To Receive (Thousands) | Unrealized Appreciation | |||||||||
| ||||||||||||
10/28/16 | USD | 30 | DKK | 201 | $— | |||||||
10/28/16 | USD | 35 | DKK | 232 | — | |||||||
10/28/16 | USD | 3 | SEK | 28 | — | |||||||
10/28/16 | USD | 139 | SEK | 1,190 | — | |||||||
10/28/16 | USD | 194 | SGD | 264 | — | |||||||
10/28/16 | USD | 487 | HKD | 3,779 | — | |||||||
10/28/16 | USD | 192 | AUD | 251 | — | |||||||
10/28/16 | USD | 409 | AUD | 535 | — | |||||||
10/28/16 | USD | 356 | NOK | 2,878 | 4 | |||||||
10/28/16 | USD | 251 | NOK | 2,007 | — | |||||||
10/28/16 | USD | 133 | CHF | 129 | — | |||||||
10/28/16 | USD | 477 | CHF | 461 | (1) | |||||||
10/28/16 | USD | 617 | NZD | 848 | (1) | |||||||
10/28/16 | USD | 389 | GBP | 300 | — | |||||||
10/28/16 | USD | 441 | GBP | 339 | — | |||||||
10/28/16 | USD | 471 | EUR | 419 | — | |||||||
10/28/16 | USD | 616 | EUR | 547 | (1) | |||||||
10/28/16 | USD | 316 | CAD | 418 | 2 | |||||||
10/28/16 | USD | 1,003 | CAD | 1,315 | (2) | |||||||
10/28/16 | USD | 1,695 | JPY | 170,242 | (12) | |||||||
10/28/16 | SGD | 16,987 | USD | 12,492 | 26 | |||||||
10/28/16 | DKK | 25,951 | USD | 3,928 | 6 | |||||||
10/28/16 | DKK | 84 | USD | 13 | — | |||||||
10/28/16 | NZD | 36,376 | USD | 26,406 | (13) | |||||||
10/28/16 | GBP | 37,259 | USD | 48,367 | (52) | |||||||
10/28/16 | CHF | 38,264 | USD | 39,611 | 71 | |||||||
10/28/16 | CHF | 109 | USD | 113 | — | |||||||
10/28/16 | AUD | 88 | USD | 68 | — | |||||||
10/28/16 | AUD | 43,193 | USD | 32,973 | (57) | |||||||
10/28/16 | EUR | 62,735 | USD | 70,780 | 201 | |||||||
10/28/16 | EUR | 192 | USD | 215 | (1) | |||||||
10/28/16 | SEK | 106,124 | USD | 12,463 | 58 | |||||||
10/28/16 | SEK | 245 | USD | 28 | — | |||||||
10/28/16 | CAD | 108,544 | USD | 82,421 | (195) | |||||||
10/28/16 | NOK | 172,764 | USD | 21,315 | (309) | |||||||
10/28/16 | HKD | 670 | USD | 86 | — | |||||||
10/28/16 | HKD | 224,627 | USD | 28,969 | (1) | |||||||
10/28/16 | JPY | 6,491,083 | USD | 64,722 | 548 | |||||||
10/28/16 | JPY | 79,048 | USD | 778 | (3) | |||||||
|
| |||||||||||
| $268 | ||||||||||||
|
| |||||||||||
A list of the counterparties for the outstanding forward foreign currency contracts held by the Fund at September 30, 2016, is as follows:
| ||||||||||||
| Counterparty | Currency to Deliver ($ Thousands) | Currency to ($ Thousands) | Unrealized Appreciation ($ Thousands) | |||||||||
| ||||||||||||
Brown Brothers Harriman | $(453,727) | $453,995 | $268 | |||||||||
|
| |||||||||||
For the year ended September 30, 2016, the total amount of all open forward foreign currency contracts, as presented in the table above, are representative of the volume of activity for the derivative type during the year.
| Percentages are based on a Net Assets of $1,723,671 ($ Thousands). |
| * | Non-income producing security. |
| ** | The rate reported is the 7-day effective yield as of September 30, 2016. |
| ‡ | Real Estate Investment Trust. |
| † | Investment in Affiliated Security (see Note 6). |
| (A) | Security exempt from registration under Rule 144A of the Securities Act of 1933. These securities may be resold in transactions exempt from registration normally to qualified institutions. On September 30, 2016, the value of these securities amounted to $5,233 ($ Thousands), representing 0.3% of the net assets of the Fund. |
| (B) | Security, or portion thereof, has been pledged as collateral on open futures contracts. |
AUD — Australian Dollar
CAD — Canadian Dollar
CHF — Swiss Franc
CI — Class
DJ — Dow Jones
DKK — Danish Krone
EUR — Euro
FTSE — Financial Times and the London Stock Exchange
GBP — British Pound Sterling
HKD — Hong Kong Dollar
JPY — Japanese Yen
NOK — Norwegian Krone
NZD — New Zealand Dollar
S&P — Standard & Poor’s
SEK — Swedish Krona
SGD — Singapore Dollar
SPI — Share Price Index
USD — United States Dollar
The Summary Schedule of Investments does not reflect the complete portfolio holdings. It includes the Fund’s 50 largest holdings and each investment of any issuer that exceeds 1% of the Fund’s net assets. “Other Securities” represent all issues not required to be disclosed under the rules adopted by the U.S. Securities and Exchange Commission (“SEC”). In certain instances, securities for which footnotes listed above may otherwise apply are included in the Other Securities caption. The complete schedule of portfolio holdings is available (i) without charge, upon request, by calling (800) 342-5734; and (ii) on the SEC’s website at http://www.sec.gov.
The following is a list of the level of inputs used as of September 30, 2016, in valuing the Fund’s investments and other financial instruments carried at value ($ Thousands):
| ||||||||||||||||
| Investments in Securities | Level 1 | Level 2 | Level 3 | Total | ||||||||||||
| ||||||||||||||||
Common Stock | $ | 1,606,477 | $ | 7,024 | $ | – | $ | 1,613,501 | ||||||||
Preferred Stock | 4,764 | – | – | 4,764 | ||||||||||||
Rights | 2 | – | – | 2 | ||||||||||||
U.S. Treasury Obligation | – | 4,300 | – | 4,300 | ||||||||||||
Cash Equivalent | 83,471 | – | – | 83,471 | ||||||||||||
|
|
|
|
|
|
|
| |||||||||
Total Investments in Securities | $ | 1,694,714 | $ | 11,324 | $ | – | $ | 1,706,038 | ||||||||
|
|
|
|
|
|
|
| |||||||||
| ||||||||||||||||
| Other Financial Instruments | Level 1 | Level 2 | Level 3 | Total | ||||||||||||
| ||||||||||||||||
Futures Contracts * | ||||||||||||||||
Unrealized Appreciation | $ | 292 | $ | — | $ | — | $ | 292 | ||||||||
Unrealized Depreciation | (216) | — | — | (216) | ||||||||||||
Forwards Contracts * | ||||||||||||||||
Unrealized Appreciation | — | 916 | — | 916 | ||||||||||||
Unrealized Depreciation | — | (648) | — | (648) | ||||||||||||
|
|
|
|
|
|
|
| |||||||||
Total Other Financial Instruments | $ | 76 | $ | 268 | $ | — | $ | 344 | ||||||||
|
|
|
|
|
|
|
| |||||||||
| SEI Institutional Managed Trust / Annual Report / September 30, 2016 | 75 |
SUMMARY SCHEDULE OF INVESTMENTS
September 30, 2016
Global Managed Volatility Fund (Concluded)
* Futures contracts and forwards contracts are valued at unrealized appreciation (depreciation) on the instrument.
For the year ended September 30, 2016, there were no transfers between Level 1 and Level 2 assets and liabilities.
For the year ended September 30, 2016, there were no transfers between Level 2 and Level 3 assets and liabilities.
For more information on valuation inputs, see Note 2 — Significant Accounting Policies in Notes to Financial Statements.
Amounts designated as “—” are either $0 or have been rounded to $0.
The accompanying notes are an integral part of the financial statements.
| 76 | SEI Institutional Managed Trust / Annual Report / September 30, 2016 |
SUMMARY SCHEDULE OF INVESTMENTS
September 30, 2016
Tax-Managed Managed Volatility Fund
|
Sector Weightings (Unaudited)†:
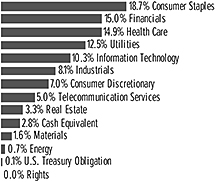
†Percentages are based on total investments.
| ||||||||||||
| Description | Percentage of Net Assets (%) | Shares | Market Value ($ Thousands) | |||||||||
| ||||||||||||
COMMON STOCK — 97.0% |
| |||||||||||
Consumer Discretionary — 7.0% |
| |||||||||||
McDonald’s | 0.6% | 62,343 | $ | 7,192 | ||||||||
Target, Cl A | 1.0 | 167,437 | 11,500 | |||||||||
Other Securities | 5.4 | 65,652 | ||||||||||
|
| |||||||||||
| 84,344 | ||||||||||||
|
| |||||||||||
Consumer Staples — 18.6% |
| |||||||||||
Altria Group | 1.4 | 261,314 | 16,523 | |||||||||
Clorox | 0.7 | 66,941 | 8,380 | |||||||||
Colgate-Palmolive | 0.7 | 108,720 | 8,060 | |||||||||
Costco Wholesale | 0.6 | 46,833 | 7,142 | |||||||||
Dr Pepper Snapple Group | 1.0 | 126,030 | 11,508 | |||||||||
Kellogg | 0.7 | 109,824 | 8,508 | |||||||||
McCormick | 0.6 | 77,336 | 7,727 | |||||||||
PepsiCo | 0.8 | 92,067 | 10,014 | |||||||||
Philip Morris International | 0.8 | 103,617 | 10,074 | |||||||||
Procter & Gamble | 0.7 | 93,908 | 8,428 | |||||||||
SYSCO, Cl A | 0.8 | 207,100 | 10,150 | |||||||||
Tyson Foods, Cl A | 0.8 | 129,190 | 9,647 | |||||||||
Wal-Mart Stores | 1.6 | 262,663 | 18,943 | |||||||||
Other Securities | 7.4 | 88,452 | ||||||||||
|
| |||||||||||
| 223,556 | ||||||||||||
|
| |||||||||||
Energy — 0.7% |
| |||||||||||
Exxon Mobil | 0.7 | 94,000 | 8,204 | |||||||||
|
| |||||||||||
Financials — 15.0% |
| |||||||||||
Axis Capital Holdings | 1.0 | 205,917 | 11,187 | |||||||||
Berkshire Hathaway, Cl B* | 0.7 | 59,100 | 8,538 | |||||||||
CBOE Holdings | 0.8 | 148,665 | 9,641 | |||||||||
Everest Re Group | 1.0 | 63,442 | 12,052 | |||||||||
RenaissanceRe Holdings | 1.1 | 113,370 | 13,623 | |||||||||
Travelers | 1.0 | 97,150 | 11,129 | |||||||||
Validus Holdings | 1.2 | 295,336 | 14,714 | |||||||||
Other Securities‡ | 8.2 | 98,604 | ||||||||||
|
| |||||||||||
| 179,488 | ||||||||||||
|
| |||||||||||
Health Care — 14.9% |
| |||||||||||
Aetna, Cl A | 0.6 | 63,300 | 7,308 | |||||||||
| ||||||||||||
| Description | Percentage of Net Assets (%) | Shares | Market Value ($ Thousands) | |||||||||
| ||||||||||||
COMMON STOCK (continued) |
| |||||||||||
Cardinal Health | 0.7% | 112,500 | $ | 8,741 | ||||||||
Johnson & Johnson | 2.2 | 221,361 | 26,149 | |||||||||
Laboratory Corp of America Holdings* | 0.6 | 53,374 | 7,338 | |||||||||
Merck | 1.3 | 252,680 | 15,770 | |||||||||
Pfizer | 1.9 | 659,915 | 22,351 | |||||||||
Quest Diagnostics | 0.6 | 88,320 | 7,475 | |||||||||
UnitedHealth Group | 0.7 | 61,650 | 8,631 | |||||||||
Other Securities | 6.3 | 74,478 | ||||||||||
|
| |||||||||||
| 178,241 | ||||||||||||
|
| |||||||||||
Industrials — 8.1% |
| |||||||||||
Lockheed Martin | 0.7 | 35,667 | 8,550 | |||||||||
Northrop Grumman | 0.9 | 49,100 | 10,505 | |||||||||
Raytheon | 0.8 | 66,100 | 8,998 | |||||||||
Waste Management | 0.6 | 116,082 | 7,401 | |||||||||
Other Securities | 5.1 | 62,123 | ||||||||||
|
| |||||||||||
| 97,577 | ||||||||||||
|
| |||||||||||
Information Technology — 10.3% |
| |||||||||||
Amdocs | 1.0 | 202,640 | 11,723 | |||||||||
Cisco Systems | 0.6 | 242,600 | 7,695 | |||||||||
Intel | 0.7 | 210,500 | 7,946 | |||||||||
International Business Machines | 0.8 | 59,400 | 9,436 | |||||||||
Symantec, Cl A | 1.0 | 460,474 | 11,558 | |||||||||
Other Securities | 6.2 | 74,945 | ||||||||||
|
| |||||||||||
| 123,303 | ||||||||||||
|
| |||||||||||
Materials — 1.6% |
| |||||||||||
Other Securities | 1.6 | 19,306 | ||||||||||
|
| |||||||||||
Real Estate — 3.3% |
| |||||||||||
Other Securities‡ | 3.3 | 39,378 | ||||||||||
|
| |||||||||||
Telecommunication Services — 5.0% |
| |||||||||||
AT&T | 2.0 | 586,491 | 23,817 | |||||||||
Verizon Communications | 1.5 | 353,624 | 18,381 | |||||||||
Other Securities | 1.5 | 18,210 | ||||||||||
|
| |||||||||||
| 60,408 | ||||||||||||
|
| |||||||||||
Utilities — 12.5% |
| |||||||||||
American Electric Power | 0.9 | 162,970 | 10,464 | |||||||||
Consolidated Edison | 1.1 | 165,942 | 12,495 | |||||||||
Edison International | 0.9 | 155,510 | 11,236 | |||||||||
Entergy | 0.9 | 144,460 | 11,084 | |||||||||
PG&E | 0.9 | 171,750 | 10,506 | |||||||||
Public Service Enterprise Group | 0.8 | 239,620 | 10,033 | |||||||||
Southern | 0.7 | 162,833 | 8,353 | |||||||||
WEC Energy Group | 0.6 | 121,631 | 7,283 | |||||||||
Other Securities | 5.7 | 67,756 | ||||||||||
|
| |||||||||||
| 149,210 | ||||||||||||
|
| |||||||||||
| SEI Institutional Managed Trust / Annual Report / September 30, 2016 | 77 |
SUMMARY SCHEDULE OF INVESTMENTS
September 30, 2016
Tax-Managed Managed Volatility Fund (Concluded)
| ||||||||||||
| Description | Percentage of Net Assets (%) | Shares | Market Value ($ Thousands) | |||||||||
| ||||||||||||
COMMON STOCK (continued) |
| |||||||||||
Total Common Stock |
| $ | 1,163,015 | |||||||||
|
| |||||||||||
RIGHTS — 0.0% |
| |||||||||||
United States — 0.0% |
| |||||||||||
Other Securities | 0.0% | 91 | ||||||||||
|
| |||||||||||
Total Rights |
| 91 | ||||||||||
|
| |||||||||||
U.S. TREASURY OBLIGATION — 0.1% |
| |||||||||||
Other Securities (A) | 0.1 | 1,220 | ||||||||||
|
| |||||||||||
Total U.S. Treasury Obligation |
| 1,220 | ||||||||||
|
| |||||||||||
CASH EQUIVALENT — 2.8% |
| |||||||||||
SEI Daily Income Trust, Government Fund, Cl A 0.220% **† | 2.8 | 34,071,775 | 34,072 | |||||||||
|
| |||||||||||
Total Cash Equivalent |
| 34,072 | ||||||||||
|
| |||||||||||
Total Investments — 99.9% |
| $ | 1,198,398 | |||||||||
|
| |||||||||||
A list of the open futures contracts held by the Fund at September 30, 2016, is as follows:
| ||||||||||||
| Type of Contract | Number of Contracts Long | Expiration Date | Unrealized Depreciation ($ Thousands) | |||||||||
| ||||||||||||
S&P 500 Index E-MINI | 196 | Dec-2016 | $(42) | |||||||||
|
| |||||||||||
For the year ended September 30, 2016, the total amount of all open futures contracts, as presented in the table above, are representative of the volume of activity for the derivative type during the year.
| Percentages are based on a Net Assets of $1,199,495 ($ Thousands). |
| * | Non-income producing security. |
| ** | The rate reported is the 7-day effective yield as of September 30, 2016. |
| ‡ | Real Estate Investment Trust. |
| † | Investment in Affiliated Security (see Note 6). |
| (A) | Security, or portion thereof, has been pledged as collateral on open futures contracts. |
CI — Class
S&P— Standard & Poor’s
The Summary Schedule of Investments does not reflect the complete portfolio holdings. It includes the Fund’s 50 largest holdings and each investment of any issuer that exceeds 1% of the Fund’s net assets. “Other Securities” represent all issues not required to be disclosed under the rules adopted by the U.S. Securities and Exchange Commission (“SEC”). In certain instances, securities for which footnotes listed above may otherwise apply are included in the Other Securities caption. The complete schedule of portfolio holdings is available (i) without charge, upon request, by calling (800) 342-5734; and (ii) on the SEC’s website at http://www.sec.gov.
The following is a list of the level of inputs used as of September 30, 2016, in valuing the Fund’s investments and other financial instruments carried at value ($ Thousands):
| ||||||||||||||||
| Investments in Securities | Level 1 | Level 2 | Level 3 | Total | ||||||||||||
| ||||||||||||||||
Common Stock | $ | 1,163,015 | $ | – | $ | – | $ | 1,163,015 | ||||||||
Rights | – | 91 | – | 91 | ||||||||||||
U.S. Treasury Obligation | – | 1,220 | – | 1,220 | ||||||||||||
Cash Equivalent | 34,072 | – | – | 34,072 | ||||||||||||
|
|
|
|
|
|
|
| |||||||||
Total Investments in Securities | $ | 1,197,087 | $ | 1,311 | $ | – | $ | 1,198,398 | ||||||||
|
|
|
|
|
|
|
| |||||||||
| ||||||||||||||||
| Other Financial Instruments | Level 1 | Level 2 | Level 3 | Total | ||||||||||||
| ||||||||||||||||
Futures Contracts * | ||||||||||||||||
Unrealized Depreciation | $ | (42) | $ | — | $ | — | $ | (42) | ||||||||
|
|
|
|
|
|
|
| |||||||||
Total Other Financial Instruments | $ | (42) | $ | — | $ | — | $ | (42) | ||||||||
|
|
|
|
|
|
|
| |||||||||
* Futures contracts are valued at unrealized depreciation on the instrument.
For the year ended September 30, 2016, there were no transfers between Level 1 and Level 2 assets and liabilities.
For the year ended September 30, 2016, there were no transfers between Level 2 and Level 3 assets and liabilities.
For more information on valuation inputs, see Note 2 — Significant Accounting Policies in Notes to Financial Statements.
Amounts designated as “—” are either $0 or have been rounded to $0.
The accompanying notes are an integral part of the financial statements.
| 78 | SEI Institutional Managed Trust / Annual Report / September 30, 2016 |
SCHEDULE OF INVESTMENTS
September 30, 2016
Real Estate Fund
|
Sector Weightings (Unaudited)†:
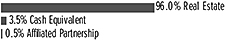
†Percentages are based on total investments. Includes investments held as collateral for securities held on loan (see Note 10).
| ||||||||
| Description | Shares | Market Value ($ Thousands) | ||||||
| ||||||||
COMMON STOCK — 96.9% |
| |||||||
Real Estate — 96.9% |
| |||||||
Alexandria Real Estate Equities ‡ | 25,220 | $ | 2,743 | |||||
American Homes 4 Rent, Cl A ‡ | 135,075 | 2,923 | ||||||
Apartment Investment & Management, Cl A ‡ | 46,361 | 2,128 | ||||||
AvalonBay Communities ‡ | 46,106 | 8,200 | ||||||
Boston Properties ‡ | 25,470 | 3,471 | ||||||
Brixmor Property Group ‡ | 45,150 | 1,255 | ||||||
Camden Property Trust ‡ | 20,590 | 1,724 | ||||||
Care Capital Properties ‡ | 16,223 | 462 | ||||||
CBL & Associates Properties ‡ | 112,125 | 1,361 | ||||||
Chesapeake Lodging Trust ‡ | 47,995 | 1,099 | ||||||
Colony Starwood Homes ‡ | 16,925 | 486 | ||||||
Columbia Property Trust ‡ | 33,790 | 757 | ||||||
CoreSite Realty ‡ | 11,500 | 852 | ||||||
Corporate Office Properties Trust ‡ | 39,510 | 1,120 | ||||||
CubeSmart ‡ | 143,075 | 3,900 | ||||||
CyrusOne ‡ | 62,915 | 2,993 | ||||||
DDR ‡ | 228,955 | 3,991 | ||||||
DiamondRock Hospitality ‡ | 35,290 | 321 | ||||||
Digital Realty Trust, Cl A ‡ | 41,250 | 4,006 | ||||||
Douglas Emmett ‡ | 124,450 | 4,559 | ||||||
Duke Realty ‡ | 118,570 | 3,241 | ||||||
Easterly Government Properties ‡(A) | 14,060 | 268 | ||||||
Education Realty Trust ‡ | 25,250 | 1,089 | ||||||
Equinix ‡ | 21,430 | 7,720 | ||||||
Equity Commonwealth *‡ | 58,925 | 1,781 | ||||||
Equity One, Cl A ‡ | 71,380 | 2,185 | ||||||
Equity Residential ‡ | 135,555 | 8,720 | ||||||
Essex Property Trust ‡ | 18,749 | 4,175 | ||||||
Extra Space Storage ‡ | 16,200 | 1,286 | ||||||
Federal Realty Investment Trust ‡ | 10,250 | 1,578 | ||||||
Forest City Realty Trust, Cl A ‡ | 54,050 | 1,250 | ||||||
General Growth Properties ‡ | 191,444 | 5,284 | ||||||
HCP ‡ | 84,200 | 3,195 | ||||||
Healthcare Realty Trust ‡ | 17,860 | 608 | ||||||
Healthcare Trust of America, Cl A ‡ | 56,610 | 1,847 | ||||||
Highwoods Properties ‡ | 43,730 | 2,279 | ||||||
Hospitality Properties Trust ‡ | 63,315 | 1,882 | ||||||
Host Hotels & Resorts ‡ | 343,224 | 5,344 | ||||||
Hudson Pacific Properties ‡ | 101,740 | 3,344 | ||||||
Kilroy Realty ‡ | 13,175 | 914 | ||||||
Kimco Realty ‡ | 137,810 | 3,990 | ||||||
Kite Realty Group Trust ‡ | 22,990 | 637 | ||||||
Liberty Property Trust ‡ | 94,935 | 3,831 | ||||||
Life Storage ‡ | 31,695 | 2,819 | ||||||
| ||||||||
| Description | Shares | Market Value ($ Thousands) | ||||||
| ||||||||
COMMON STOCK (continued) |
| |||||||
Macerich ‡ | 52,514 | $ | 4,247 | |||||
Mack-Cali Realty ‡ | 13,620 | 371 | ||||||
Medical Properties Trust ‡ | 9,530 | 141 | ||||||
Mid-America Apartment Communities ‡ | 7,900 | 743 | ||||||
Pebblebrook Hotel Trust ‡(A) | 36,175 | 962 | ||||||
Post Properties ‡ | 11,125 | 736 | ||||||
ProLogis ‡ | 167,827 | 8,986 | ||||||
PS Business Parks ‡ | 9,983 | 1,134 | ||||||
Public Storage ‡ | 45,121 | 10,068 | ||||||
QTS Realty Trust, Cl A ‡ | 12,380 | 654 | ||||||
Ramco-Gershenson Properties ‡ | 29,940 | 561 | ||||||
Regency Centers ‡ | 40,290 | 3,122 | ||||||
RLJ Lodging Trust ‡ | 25,900 | 545 | ||||||
Senior Housing Properties Trust ‡ | 173,475 | 3,940 | ||||||
Simon Property Group ‡ | 76,078 | 15,749 | ||||||
SL Green Realty ‡ | 10,260 | 1,109 | ||||||
STAG Industrial ‡ | 30,780 | 754 | ||||||
STORE Capital ‡ | 31,810 | 937 | ||||||
Sun Communities ‡ | 25,050 | 1,966 | ||||||
Sunstone Hotel Investors ‡ | 83,926 | 1,073 | ||||||
UDR ‡ | 78,020 | 2,808 | ||||||
Ventas ‡ | 83,145 | 5,873 | ||||||
Vornado Realty Trust ‡ | 75,965 | 7,688 | ||||||
Washington ‡ | 30,960 | 964 | ||||||
Weingarten Realty Investors ‡ | 80,770 | 3,148 | ||||||
Welltower ‡ | 119,290 | 8,919 | ||||||
|
| |||||||
Total Common Stock |
| 204,816 | ||||||
|
| |||||||
AFFILIATED PARTNERSHIP — 0.5% |
| |||||||
SEI Liquidity Fund, L.P. | 1,023,992 | 1,024 | ||||||
|
| |||||||
Total Affiliated Partnership |
| 1,024 | ||||||
|
| |||||||
CASH EQUIVALENT — 3.5% |
| |||||||
SEI Daily Income Trust, Government Fund, CI A | ||||||||
0.220%**† | 7,522,350 | 7,522 | ||||||
|
| |||||||
Total Cash Equivalent
(Cost $7,522) ($ Thousands) |
| 7,522 | ||||||
|
| |||||||
Total Investments — 100.9% |
| $ | 213,362 | |||||
|
| |||||||
| Percentages are based on Net Assets of $211,420 ($ Thousands). |
| * | Non-income producing security. |
| SEI Institutional Managed Trust / Annual Report / September 30, 2016 | 79 |
SCHEDULE OF INVESTMENTS
September 30, 2016
Real Estate Fund (Concluded)
| ** | Rate shown is the 7-day effective yield as of September 30, 2016. |
| ‡ | Real Estate Investment Trust. |
| † | Investment in Affiliated Security (see Note 6). |
| (A) | This security or a partial position of this security is on loan at September 30, 2016 (see Note 10). The total market value of securities on loan at September 30, 2016 was $1,020 ($ Thousands). |
| (B) | This security was purchased with cash collateral held from securities on loan (see Note 10). The total market value of such securities as of September 30, 2016 was $1,024 ($ Thousands). |
CI — Class
L.P. — Limited Partnership
The following is a list of the level of inputs used as of September 30, 2016, in valuing the Fund’s investments carried at value ($ Thousands):
| ||||||||||||||||
| Investments in Securities | Level 1 | Level 2 | Level 3 | Total | ||||||||||||
| ||||||||||||||||
Common Stock | $ | 204,816 | $ | – | $ | – | $ | 204,816 | ||||||||
Affiliated Partnership | – | 1,024 | – | 1,024 | ||||||||||||
Cash Equivalent | 7,522 | – | – | 7,522 | ||||||||||||
|
|
|
|
|
|
|
| |||||||||
Total Investments in Securities | $ | 212,338 | $ | 1,024 | $ | – | $ | 213,362 | ||||||||
|
|
|
|
|
|
|
| |||||||||
For the year ended September 30, 2016, there were no transfers between Level 1 and Level 2 assets and liabilities.
For the year ended September 30, 2016, there were no transfers between Level 2 and Level 3 assets and liabilities.
For more information on valuation inputs, see Note 2 – Significant Accounting Policies in Notes to Financial Statements.
Amounts designated as “—” are $0 or have been rounded to $0.
The accompanying notes are an integral part of the financial statements.
| 80 | SEI Institutional Managed Trust / Annual Report / September 30, 2016 |
SCHEDULE OF INVESTMENTS
September 30, 2016
Enhanced Income Fund
|
Sector Weightings (Unaudited)†:
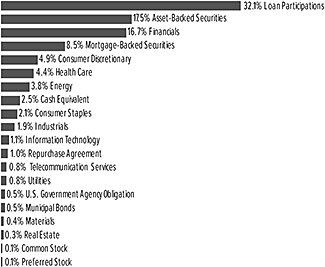
†Percentages are based on total investments.
| ||||||||
| Description | Face Amount (Thousands) | Market Value ($ Thousands) | ||||||
| ||||||||
CORPORATE OBLIGATIONS — 37.8% |
| |||||||
Consumer Discretionary — 4.9% |
| |||||||
American Honda Finance MTN | ||||||||
1.700%, 02/22/2019 | $ | 500 | $ | 504 | ||||
AutoZone | ||||||||
1.625%, 04/21/2019 | 70 | 70 | ||||||
CCO Holdings LLC | ||||||||
5.250%, 09/30/2022 | 250 | 262 | ||||||
Daimler Finance North America LLC | ||||||||
1.650%, 05/18/2018 (A) | 300 | 301 | ||||||
1.500%, 07/05/2019 (A) | 535 | 531 | ||||||
Dollar Tree | ||||||||
5.750%, 03/01/2023 | 125 | 135 | ||||||
Ford Motor Credit LLC | ||||||||
1.897%, 08/12/2019 | 350 | 350 | ||||||
1.724%, 12/06/2017 | 350 | 350 | ||||||
1.675%, 03/12/2019 (B) | 400 | 400 | ||||||
General Motors Financial | ||||||||
2.400%, 04/10/2018 | 750 | 755 | ||||||
Hyundai Capital America MTN | ||||||||
2.000%, 03/19/2018 (A) | 235 | 236 | ||||||
2.000%, 07/01/2019 (A) | 300 | 302 | ||||||
NBCUniversal Enterprise | ||||||||
1.365%, 04/15/2018 (A)(B) | 550 | 554 | ||||||
Nissan Motor Acceptance MTN | ||||||||
1.385%, 03/03/2017 (A)(B) | 310 | 311 | ||||||
Numericable-SFR SAS | ||||||||
7.375%, 05/01/2026 (A) | 300 | 307 | ||||||
Sinclair Television Group | ||||||||
5.625%, 08/01/2024 (A) | 500 | 511 | ||||||
Sirius XM Radio | ||||||||
5.375%, 04/15/2025 (A) | 100 | 103 | ||||||
| ||||||||
| Description | Face Amount (Thousands) | Market Value ($ Thousands) | ||||||
| ||||||||
CORPORATE OBLIGATIONS (continued) |
| |||||||
5.375%, 07/15/2026 (A) | $ | 235 | $ | 243 | ||||
Six Flags Entertainment | ||||||||
4.875%, 07/31/2024 (A) | 100 | 101 | ||||||
Thomson Reuters | ||||||||
1.650%, 09/29/2017 | 345 | 346 | ||||||
Time Warner Cable | ||||||||
5.850%, 05/01/2017 | 450 | 461 | ||||||
Toyota Motor Credit MTN | ||||||||
1.200%, 04/06/2018 | 650 | 650 | ||||||
Tribune Media | ||||||||
5.875%, 07/15/2022 | 185 | 187 | ||||||
Volkswagen Group of America Finance | ||||||||
1.281%, 05/22/2018 (A)(B) | 300 | 298 | ||||||
1.251%, 11/20/2017 (A)(B) | 800 | 797 | ||||||
1.250%, 05/23/2017 (A) | 300 | 299 | ||||||
Whirlpool | ||||||||
1.350%, 03/01/2017 | 440 | 440 | ||||||
|
| |||||||
| 9,804 | ||||||||
|
| |||||||
Consumer Staples — 2.2% |
| |||||||
Anheuser-Busch InBev Finance | ||||||||
1.900%, 02/01/2019 | 320 | 323 | ||||||
1.157%, 02/01/2019 (B) | 650 | 649 | ||||||
CVS Health | ||||||||
1.900%, 07/20/2018 | 350 | 353 | ||||||
JM Smucker | ||||||||
1.750%, 03/15/2018 | 180 | 181 | ||||||
Kroger | ||||||||
2.000%, 01/15/2019 | 220 | 223 | ||||||
Kroger MTN | ||||||||
1.500%, 09/30/2019 | 285 | 285 | ||||||
Molson Coors Brewing | ||||||||
1.450%, 07/15/2019 | 140 | 140 | ||||||
Mondelez International | ||||||||
1.277%, 02/01/2019 (B) | 450 | 450 | ||||||
Reynolds American | ||||||||
2.300%, 06/12/2018 | 445 | 452 | ||||||
SABMiller Holdings | ||||||||
1.447%, 08/01/2018 (A)(B) | 500 | 500 | ||||||
Skandinaviska Enskilda Banken | ||||||||
1.404%, 09/13/2019 (A)(B) | 300 | 300 | ||||||
Walgreens Boots Alliance | ||||||||
1.750%, 05/30/2018 | 450 | 452 | ||||||
|
| |||||||
| 4,308 | ||||||||
|
| |||||||
Energy — 3.9% |
| |||||||
Anadarko Petroleum | ||||||||
6.950%, 06/15/2019 | 235 | 260 | ||||||
Atwood Oceanics | ||||||||
6.500%, 02/01/2020 | 350 | 276 | ||||||
Blue Racer Midstream | ||||||||
6.125%, 11/15/2022 (A) | 107 | 105 | ||||||
| SEI Institutional Managed Trust / Annual Report / September 30, 2016 | 81 |
SCHEDULE OF INVESTMENTS
September 30, 2016
Enhanced Income Fund (Continued)
| ||||||||
| Description | Face Amount (Thousands) | Market Value ($ Thousands) | ||||||
| ||||||||
CORPORATE OBLIGATIONS (continued) |
| |||||||
BP Capital Markets PLC(B) | ||||||||
1.487%, 09/26/2018 | $ | 700 | $ | 703 | ||||
1.242%, 02/13/2018 | 400 | 400 | ||||||
ConocoPhillips | ||||||||
1.500%, 05/15/2018 | 395 | 395 | ||||||
Devon Energy | ||||||||
1.390%, 12/15/2016 (B) | 600 | 599 | ||||||
Enbridge | ||||||||
1.289%, 06/02/2017 (B) | 675 | 674 | ||||||
Energy Transfer Partners | ||||||||
2.500%, 06/15/2018 | 350 | 352 | ||||||
Exxon Mobil | ||||||||
1.439%, 03/01/2018 | 400 | 402 | ||||||
Genesis Energy | ||||||||
6.750%, 08/01/2022 | 162 | 167 | ||||||
6.000%, 05/15/2023 | 95 | 94 | ||||||
Gibson Energy | ||||||||
6.750%, 07/15/2021 (A) | 64 | 66 | ||||||
Halcon Resources | ||||||||
8.625%, 02/01/2020 (A) | 120 | 121 | ||||||
Hess | ||||||||
1.300%, 06/15/2017 | 160 | 160 | ||||||
Kinder Morgan | ||||||||
2.000%, 12/01/2017 | 270 | 270 | ||||||
Noble Energy | ||||||||
8.250%, 03/01/2019 | 250 | 286 | ||||||
Regency Energy Partners | ||||||||
5.000%, 10/01/2022 | 200 | 211 | ||||||
Schlumberger Holdings | ||||||||
1.900%, 12/21/2017 (A) | 550 | 553 | ||||||
Shell International Finance BV | ||||||||
1.375%, 05/10/2019 | 500 | 499 | ||||||
Statoil | ||||||||
1.248%, 11/08/2018 (B) | 300 | 300 | ||||||
Suncor Energy | ||||||||
6.100%, 06/01/2018 | 375 | 403 | ||||||
Total Capital International | ||||||||
1.377%, 08/10/2018 (B) | 450 | 451 | ||||||
|
| |||||||
| 7,747 | ||||||||
|
| |||||||
Financials — 16.9% |
| |||||||
Australia & New Zealand Banking Group(B) | ||||||||
1.377%, 05/15/2018 | 300 | 301 | ||||||
1.045%, 01/10/2017 (A) | 300 | 300 | ||||||
Bank of America | ||||||||
1.610%, 09/15/2036 (B) | 700 | 626 | ||||||
Bank of America MTN | ||||||||
5.650%, 05/01/2018 | 110 | 117 | ||||||
2.000%, 01/11/2018 | 190 | 191 | ||||||
1.700%, 08/25/2017 | 500 | 501 | ||||||
Bank of Montreal MTN | ||||||||
1.265%, 04/09/2018 (B) | 650 | 652 | ||||||
| ||||||||
| Description | Face Amount (Thousands) | Market Value ($ Thousands) | ||||||
| ||||||||
CORPORATE OBLIGATIONS (continued) |
| |||||||
Bank of New York Mellon MTN | ||||||||
1.275%, 03/06/2018 (B) | $ | 650 | $ | 651 | ||||
Bank of Nova Scotia | ||||||||
1.650%, 06/14/2019 | 400 | 400 | ||||||
Bank of Tokyo-Mitsubishi UFJ | ||||||||
1.450%, 09/08/2017 (A) | 400 | 400 | ||||||
1.151%, 09/08/2017 (A)(B) | 400 | 399 | ||||||
Barclays Bank PLC MTN | ||||||||
6.050%, 12/04/2017 (A) | 600 | 627 | ||||||
BB&T MTN | ||||||||
1.417%, 02/01/2019 (B) | 325 | 326 | ||||||
Berkshire Hathaway Finance | ||||||||
1.450%, 03/07/2018 | 500 | 502 | ||||||
BPCE MTN | ||||||||
1.657%, 02/10/2017 (B) | 700 | 701 | ||||||
Branch Banking & Trust | ||||||||
1.450%, 05/10/2019 | 510 | 510 | ||||||
Capital One | ||||||||
1.617%, 09/13/2019 (B) | 400 | 400 | ||||||
Citigroup | ||||||||
1.375%, 08/25/2036 (B) | 1,500 | 1,098 | ||||||
Citizens Bank MTN | ||||||||
1.600%, 12/04/2017 | 800 | 800 | ||||||
Commonwealth Bank of Australia MTN | ||||||||
1.245%, 03/12/2018 (A)(B) | 650 | 649 | ||||||
Credit Agricole MTN | ||||||||
1.815%, 06/10/2020 (A)(B) | 500 | 502 | ||||||
Credit Suisse NY | ||||||||
1.700%, 04/27/2018 | 500 | 500 | ||||||
Credit Suisse NY MTN | ||||||||
1.442%, 01/29/2018 (B) | 500 | 501 | ||||||
Danske Bank | ||||||||
1.409%, 09/06/2019 (A)(B) | 400 | 400 | ||||||
Deutsche Bank | ||||||||
1.497%, 02/13/2018 (B) | 475 | 460 | ||||||
Fifth Third Bank MTN | ||||||||
1.721%, 08/20/2018 (B) | 650 | 654 | ||||||
Goldman Sachs Group(B) | ||||||||
2.023%, 11/15/2021 | 525 | 523 | ||||||
1.875%, 04/23/2020 | 500 | 503 | ||||||
HSBC Bank PLC | ||||||||
1.457%, 05/15/2018 (A)(B) | 600 | 600 | ||||||
Huntington National Bank | ||||||||
1.140%, 04/24/2017 (B) | 350 | 350 | ||||||
ING Bank | ||||||||
1.336%, 10/01/2019 (A)(B) | 400 | 401 | ||||||
Jackson National Life Global Funding | ||||||||
1.875%, 10/15/2018 (A) | 400 | 404 | ||||||
JPMorgan Chase | ||||||||
1.373%, 01/28/2019 (B) | 300 | 300 | ||||||
JPMorgan Chase Capital XXI | ||||||||
1.709%, 02/02/2037 (B) | 1,300 | 1,040 | ||||||
| 82 | SEI Institutional Managed Trust / Annual Report / September 30, 2016 |
| ||||||||
| Description | Face Amount (Thousands) | Market Value ($ Thousands) | ||||||
| ||||||||
CORPORATE OBLIGATIONS (continued) |
| |||||||
KeyBank | ||||||||
2.350%, 03/08/2019 | $ | 250 | $ | 255 | ||||
1.362%, 06/01/2018 (B) | 600 | 599 | ||||||
Lloyds Bank | ||||||||
1.374%, 03/16/2018 (B) | 600 | 599 | ||||||
Macquarie Group | ||||||||
1.759%, 01/31/2017 (A)(B) | 400 | 401 | ||||||
Manufacturers & Traders Trust | ||||||||
1.400%, 07/25/2017 | 475 | 476 | ||||||
Metropolitan Life Global Funding I | ||||||||
1.500%, 01/10/2018 (A) | 220 | 221 | ||||||
1.192%, 09/14/2018 (A)(B) | 400 | 400 | ||||||
Mizuho Bank | ||||||||
1.497%, 03/26/2018 (A)(B) | 550 | 549 | ||||||
Morgan Stanley | ||||||||
1.565%, 01/24/2019 (B) | 450 | 452 | ||||||
Morgan Stanley MTN | ||||||||
5.950%, 12/28/2017 | 140 | 147 | ||||||
MSCI | ||||||||
5.750%, 08/15/2025 (A) | 130 | 139 | ||||||
5.250%, 11/15/2024 (A) | 160 | 169 | ||||||
Nordea Bank MTN | ||||||||
1.473%, 09/30/2019 (A)(B) | 650 | 650 | ||||||
Principal Life Global Funding II | ||||||||
1.500%, 04/18/2019 (A) | 500 | 497 | ||||||
Protective Life Global Funding | ||||||||
1.722%, 04/15/2019 (A) | 435 | 436 | ||||||
Prudential Financial MTN | ||||||||
1.597%, 08/15/2018 (B) | 500 | 499 | ||||||
Royal Bank of Canada MTN | ||||||||
1.545%, 12/10/2018 (B) | 400 | 401 | ||||||
Santander Bank | ||||||||
1.597%, 01/12/2018 (B) | 800 | 796 | ||||||
Santander UK MTN(B) | ||||||||
1.675%, 08/24/2018 | 600 | 600 | ||||||
1.264%, 09/29/2017 | 350 | 349 | ||||||
Societe Generale MTN | ||||||||
1.726%, 10/01/2018 (B) | 550 | 554 | ||||||
Standard Chartered MTN | ||||||||
1.319%, 04/17/2018 (A)(B) | 800 | 796 | ||||||
State Street Capital Trust IV | ||||||||
1.650%, 06/15/2037 (B) | 375 | 323 | ||||||
Svenska Handelsbanken MTN | ||||||||
1.325%, 09/06/2019 (B) | 400 | 401 | ||||||
Synchrony Financial | ||||||||
1.989%, 02/03/2020 (B) | 750 | 734 | ||||||
1.875%, 08/15/2017 | 325 | 325 | ||||||
Toronto-Dominion Bank MTN | ||||||||
1.450%, 08/13/2019 | 750 | 748 | ||||||
UBS MTN | ||||||||
1.457%, 08/14/2019 (B) | 700 | 701 | ||||||
| ||||||||
| Description | Face Amount (Thousands) | Market Value ($ Thousands) | ||||||
| ||||||||
CORPORATE OBLIGATIONS (continued) |
| |||||||
Unitrin | ||||||||
6.000%, 05/15/2017 | $ | 670 | $ | 688 | ||||
US Bancorp MTN | ||||||||
1.115%, 04/25/2019 (B) | 550 | 549 | ||||||
WEA Finance | ||||||||
1.750%, 09/15/2017 (A) | 280 | 281 | ||||||
Wells Fargo MTN | ||||||||
1.650%, 01/22/2018 | 350 | 351 | ||||||
1.432%, 01/30/2020 (B) | 500 | 498 | ||||||
Westpac Banking | ||||||||
1.289%, 01/17/2019 (B) | 400 | 400 | ||||||
1.200%, 05/19/2017 | 300 | 300 | ||||||
|
| |||||||
| 33,573 | ||||||||
|
| |||||||
Health Care — 4.5% |
| |||||||
AbbVie | ||||||||
1.800%, 05/14/2018 | 525 | 527 | ||||||
Actavis Funding SCS | ||||||||
1.925%, 03/12/2018 (B) | 850 | 857 | ||||||
1.300%, 06/15/2017 | 550 | 549 | ||||||
Aetna | ||||||||
1.700%, 06/07/2018 | 700 | 702 | ||||||
Amgen | ||||||||
2.125%, 05/15/2017 | 600 | 604 | ||||||
Baxalta | ||||||||
1.646%, 06/22/2018 (B) | 500 | 498 | ||||||
Bayer US Finance | ||||||||
0.936%, 10/06/2017 (A)(B) | 550 | 549 | ||||||
Becton Dickinson | ||||||||
1.800%, 12/15/2017 | 625 | 628 | ||||||
Celgene | ||||||||
2.125%, 08/15/2018 | 275 | 278 | ||||||
DaVita | ||||||||
5.000%, 05/01/2025 | 310 | 311 | ||||||
McKesson | ||||||||
1.292%, 03/10/2017 | 370 | 371 | ||||||
Medtronic | ||||||||
1.500%, 03/15/2018 | 340 | 342 | ||||||
Mylan | ||||||||
1.350%, 11/29/2016 | 450 | 450 | ||||||
Providence Health & Services Obligated Group | ||||||||
1.446%, 10/01/2016 (B) | 800 | 800 | ||||||
Teva Pharmaceutical Finance Netherlands III BV | ||||||||
1.400%, 07/20/2018 | 625 | 623 | ||||||
Thermo Fisher Scientific | ||||||||
1.300%, 02/01/2017 | 145 | 145 | ||||||
Zimmer Biomet Holdings | ||||||||
1.450%, 04/01/2017 | 625 | 625 | ||||||
|
| |||||||
| 8,859 | ||||||||
|
| |||||||
| SEI Institutional Managed Trust / Annual Report / September 30, 2016 | 83 |
SCHEDULE OF INVESTMENTS
September 30, 2016
Enhanced Income Fund (Continued)
| ||||||||
| Description | Face Amount (Thousands) | Market Value ($ Thousands) | ||||||
| ||||||||
CORPORATE OBLIGATIONS (continued) |
| |||||||
Industrials — 1.9% | ||||||||
Air Lease | ||||||||
2.125%, 01/15/2018 | $ | 310 | $ | 312 | ||||
2.125%, 01/15/2020 | 250 | 249 | ||||||
Catholic Health Initiatives | ||||||||
2.600%, 08/01/2018 | 305 | 311 | ||||||
1.600%, 11/01/2017 | 355 | 355 | ||||||
Fortive | ||||||||
1.800%, 06/15/2019 (A) | 315 | 316 | ||||||
GATX | ||||||||
1.250%, 03/04/2017 | 245 | 245 | ||||||
Hutchison Whampoa International 14 | ||||||||
1.625%, 10/31/2017 (A) | 500 | 500 | ||||||
ILFC E-Capital Trust I | ||||||||
4.000%, 12/21/2065 (A)(B) | 500 | 400 | ||||||
LSC Communications | ||||||||
8.750%, 10/15/2023 (A) | 30 | 30 | ||||||
Nielsen Finance | ||||||||
5.000%, 04/15/2022 (A) | 630 | 651 | ||||||
PACCAR Financial MTN | ||||||||
1.300%, 05/10/2019 | 195 | 195 | ||||||
Sensata Technologies | ||||||||
5.000%, 10/01/2025 (A) | 186 | 190 | ||||||
|
| |||||||
| 3,754 | ||||||||
|
| |||||||
Information Technology — 1.1% |
| |||||||
Bankrate | ||||||||
6.125%, 08/15/2018 (A) | 300 | 303 | ||||||
Cisco Systems | ||||||||
1.194%, 09/20/2019 (B) | 425 | 425 | ||||||
eBay | ||||||||
2.500%, 03/09/2018 | 300 | 304 | ||||||
Fidelity National Information Services | ||||||||
2.850%, 10/15/2018 | 250 | 257 | ||||||
1.450%, 06/05/2017 | 210 | 210 | ||||||
Hewlett Packard Enterprise | ||||||||
2.450%, 10/05/2017 (A) | 650 | 655 | ||||||
|
| |||||||
| 2,154 | ||||||||
|
| |||||||
Materials — 0.4% | ||||||||
Air Liquide Finance | ||||||||
1.375%, 09/27/2019 (A) | 450 | 450 | ||||||
Ball | ||||||||
5.250%, 07/01/2025 | 123 | 133 | ||||||
Boart Longyear Management Properties | ||||||||
10.000%, 10/01/2018 (A) | 350 | 241 | ||||||
|
| |||||||
| 824 | ||||||||
|
| |||||||
Real Estate — 0.3% | ||||||||
Equinix | ||||||||
5.750%, 01/01/2025 | 400 | 425 | ||||||
| ||||||||
| Description | Face Amount (Thousands) | Market Value ($ Thousands) | ||||||
| ||||||||
CORPORATE OBLIGATIONS (continued) |
| |||||||
RHP Hotel Properties | ||||||||
5.000%, 04/15/2023 | $ | 105 | $ | 106 | ||||
Ventas Realty | ||||||||
1.250%, 04/17/2017 | 130 | 130 | ||||||
|
| |||||||
| 661 | ||||||||
|
| |||||||
Telecommunication Services — 0.9% |
| |||||||
AT&T | ||||||||
1.768%, 06/30/2020 (B) | 550 | 555 | ||||||
British Telecommunications PLC | ||||||||
1.250%, 02/14/2017 | 295 | 295 | ||||||
Inmarsat Finance | ||||||||
6.500%, 10/01/2024 (A) | 190 | 190 | ||||||
Verizon Communications | ||||||||
2.606%, 09/14/2018 (B) | 515 | 529 | ||||||
1.375%, 08/15/2019 | 145 | 144 | ||||||
|
| |||||||
| 1,713 | ||||||||
|
| |||||||
Utilities — 0.8% | ||||||||
DTE Energy | ||||||||
1.500%, 10/01/2019 | 260 | 260 | ||||||
Emera US Finance | ||||||||
2.150%, 06/15/2019 (A) | 175 | 177 | ||||||
Exelon | ||||||||
1.550%, 06/09/2017 | 180 | 180 | ||||||
NextEra Energy Capital Holdings | ||||||||
1.649%, 09/01/2018 | 90 | 90 | ||||||
Southern | ||||||||
1.550%, 07/01/2018 | 350 | 352 | ||||||
1.300%, 08/15/2017 | 390 | 390 | ||||||
Talen Energy Supply | ||||||||
4.625%, 07/15/2019 (A) | 210 | 197 | ||||||
|
| |||||||
| 1,646 | ||||||||
|
| |||||||
Total Corporate Obligations |
| 75,043 | ||||||
|
| |||||||
LOAN PARTICIPATIONS — 32.5% |
| |||||||
1011778 B.C. Unlimited Liability Company (New Red Finance, Inc.), Term Loan B2, 1st Lien | ||||||||
3.750%, 12/10/2021 | 66 | 66 | ||||||
Academy Ltd., Term Loan B, 1st Lien | ||||||||
5.000%, 07/01/2022 | 50 | 49 | ||||||
Acadia Healthcare Company, Inc., Term Loan, Tranche B1, 1st Lien | ||||||||
3.750%, 02/11/2022 | 197 | 198 | ||||||
Acadia Healthcare Company, Term Loan, Tranche B2, 1st Lien | ||||||||
4.500%, 02/16/2023 | 199 | 200 | ||||||
Acosta, Term Loan, Tranche B1, 1st Lien | ||||||||
4.250%, 09/26/2021 | 102 | 97 | ||||||
| 84 | SEI Institutional Managed Trust / Annual Report / September 30, 2016 |
| ||||||||
| Description | Face Amount (Thousands) | Market Value ($ Thousands) | ||||||
| ||||||||
LOAN PARTICIPATIONS (continued) |
| |||||||
AdvancePierre Foods, Cov-Lite, Term Loan, 1st Lien | ||||||||
4.750%, 06/02/2023 | $ | 1 | $ | 1 | ||||
AdvancePierre Foods, Inc., Effective Date Loan, 1st Lien | ||||||||
4.500%, 06/02/2023 | 180 | 182 | ||||||
Affinion Group, Term Loan, 2nd Lien | ||||||||
8.500%, 10/31/2018 | 40 | 35 | ||||||
Affinion Group, Term Loan, Tranche B, 1st Lien | ||||||||
6.750%, 04/30/2018 | 369 | 357 | ||||||
Air Medical, Cov-Lite, Initial Term Loan, 1st Lien | ||||||||
4.250%, 04/28/2022 | 818 | 810 | ||||||
Albertson’s LLC, Term Loan B6, 1st Lien | ||||||||
4.750%, 06/22/2023 | 103 | 104 | ||||||
Alere, Term Loan B, 1st Lien | ||||||||
4.250%, 06/20/2022 | 690 | 684 | ||||||
Alinta Energy Finance Pty Limited, Term Loan B, 1st Lien | ||||||||
6.375%, 08/13/2019 | 414 | 413 | ||||||
Allison Transmission, Inc., Term B-3 Loan, 1st Lien | ||||||||
3.500%, 08/23/2019 | 346 | 348 | ||||||
Amber Holdings, Cov-Lite, Delayed Draw, Term Loan, 1st Lien | ||||||||
6.375%, 08/13/2018 | 28 | 27 | ||||||
AMC Entertainment Inc., Initial Term Loan, 1st Lien | ||||||||
4.000%, 12/15/2022 | 495 | 499 | ||||||
American Builders & Contractors Supply Co., Cov-Lite, Term Loan B, 1st Lien | ||||||||
0.000%, 09/23/2023 | 337 | 338 | ||||||
American Builders & Contractors Supply Co., Term Loan B, 1st Lien | ||||||||
3.500%, 04/16/2020 | 505 | 505 | ||||||
American Renal Holdings Inc., Term Loan B, 1st Lien | ||||||||
4.750%, 08/20/2019 | 818 | 817 | ||||||
American Tire Distributors, Cov-Lite, Initial Term Loan, 1st Lien | ||||||||
5.250%, 09/01/2021 | 246 | 243 | ||||||
AmSurg Corp., Initial Term Loan, 1st Lien | ||||||||
3.500%, 07/16/2021 | 295 | 296 | ||||||
Applied Systems, Initial Term Loan, 1st Lien | ||||||||
4.000%, 01/25/2021 | 641 | 641 | ||||||
Aramark Corporation, U.S. Term Loan F, 1st Lien | ||||||||
3.250%, 02/24/2021 (B) | 680 | 684 | ||||||
Ardagh Holdings USA, New Term Loan, 1st Lien | ||||||||
4.000%, 12/17/2019 | 604 | 606 | ||||||
Aricent Technologies, Initial Term Loan, 1st Lien | ||||||||
5.500%, 04/14/2021 | 448 | 403 | ||||||
| ||||||||
| Description | Face Amount (Thousands) | Market Value ($ Thousands) | ||||||
| ||||||||
LOAN PARTICIPATIONS (continued) |
| |||||||
Asurion, LLC, Term Loan, 2nd Lien | ||||||||
8.500%, 03/03/2021 | $ | 680 | $ | 675 | ||||
Asurion, LLC, Term Loan, Incremental Tranche B1, 1st Lien | ||||||||
5.000%, 05/24/2019 | 152 | 152 | ||||||
Asurion, LLC, Term Loan, Incremental Tranche B4 | ||||||||
5.000%, 08/04/2022 | 195 | 196 | ||||||
Auris Luxembourg III S.A R.L., Facility Term Loan B4, 1st Lien | ||||||||
4.250%, 01/17/2022 | 320 | 322 | ||||||
Avago Technologies Cayman Holdings Ltd., Term B-3 Loan, 1st Lien | ||||||||
3.500%, 02/01/2023 | 675 | 682 | ||||||
Avast Software B.V., Term Loan B, 1st Lien | ||||||||
0.000%, 08/03/2022 (C) | 115 | 115 | ||||||
B&G Foods, Term Loan B, 1st Lien | ||||||||
3.839%, 11/02/2022 | 91 | 92 | ||||||
Beacon Roofing Supply, Initial Term Loan, 1st Lien | ||||||||
4.000%, 10/01/2022 | 248 | 248 | ||||||
Berry Plastics Corporation, Term H Loan, 1st Lien | ||||||||
3.800%, 10/01/2022 | 136 | 136 | ||||||
Berry Plastics Corporation, Term Loan H, 1st Lien | ||||||||
3.750%, 10/01/2022 | 121 | 122 | ||||||
Black Knight InfoServ, LLC, Cov-Lite, Term Loan B, 1st Lien | ||||||||
3.750%, 05/27/2022 | 53 | 53 | ||||||
Booz Allen Hamilton, Term Loan B, 1st Lien | ||||||||
3.281%, 06/30/2023 | 117 | 118 | ||||||
Boyd Gaming Corporation, Cov-Lite, Term Loan B, 1st Lien | ||||||||
3.543%, 09/15/2023 | 325 | 327 | ||||||
BPA Laboratories, Initial Term Loan, 2nd Lien | ||||||||
0.000%, 07/03/2017 (C) | 44 | 31 | ||||||
California Resources Corporation, Initial Term Loan, 1st Lien | ||||||||
11.375%, 12/31/2021 | 135 | 142 | ||||||
Calpine Corporation, Term Loan, 1st Lien | ||||||||
3.600%, 05/27/2022 | 357 | 358 | ||||||
Catalent Pharma Solutions, Dollar Term Loan, 1st Lien | ||||||||
4.250%, 05/20/2021 | 489 | 492 | ||||||
Cavium, Cov-Lite, Term Loan B, 1st Lien | ||||||||
3.750%, 08/16/2022 | 93 | 94 | ||||||
CCM Merger, Term Loan, 1st Lien | ||||||||
4.500%, 08/06/2021 | 339 | 339 | ||||||
CDW LLC, Term Loan, 1st Lien | ||||||||
3.000%, 08/17/2023 | 582 | 583 | ||||||
| SEI Institutional Managed Trust / Annual Report / September 30, 2016 | 85 |
SCHEDULE OF INVESTMENTS
September 30, 2016
Enhanced Income Fund (Continued)
| ||||||||
| Description | Face Amount (Thousands) | Market Value ($ Thousands) | ||||||
| ||||||||
LOAN PARTICIPATIONS (continued) |
| |||||||
Ceramtec Acquisition, Dollar Term Loan B1, 1st Lien | ||||||||
4.250%, 08/30/2020 | $ | 185 | $ | 186 | ||||
Ceramtec Acquisition, Dollar Term Loan B3, 1st Lien | ||||||||
4.250%, 08/30/2020 | 56 | 57 | ||||||
Ceramtec Acquisition, Initial Dollar Term Loan B2, 1st Lien | ||||||||
4.250%, 08/30/2020 | 20 | 21 | ||||||
Ceridian HCM Holding, Initial Term Loan, 1st Lien | ||||||||
4.500%, 09/15/2020 | 99 | 97 | ||||||
Charter Communications Operating, Term Loan E, 1st Lien | ||||||||
3.000%, 07/01/2020 | 310 | 310 | ||||||
Chesapeake Energy, Term Loan, 1st Lien | ||||||||
8.500%, 08/23/2021 | 80 | 84 | ||||||
Chief Exploration & Development LLC, Term Loan, 2nd Lien | ||||||||
7.753%, 05/16/2021 | 460 | 428 | ||||||
ClubCorp Club Operations, Term Loan B, 1st Lien | ||||||||
4.250%, 12/15/2022 | 204 | 204 | ||||||
CommScope, Term Loan, Tranche 5, 1st Lien | ||||||||
3.750%, 12/29/2022 | 198 | 200 | ||||||
Communications Sales & Leasing, Term Loan, 1st Lien | ||||||||
5.000%, 10/24/2022 | 381 | 382 | ||||||
Constantia Flexibles Holding, Term Loan B1A, 1st Lien | ||||||||
4.000%, 04/30/2022 | 198 | 198 | ||||||
ConvaTec, Dollar Term Loan, 1st Lien | ||||||||
4.250%, 06/15/2020 | 150 | 151 | ||||||
Coty, Term Loan B, 1st Lien | ||||||||
3.750%, 10/27/2022 | 204 | 206 | ||||||
CSC Holdings, LLC, Term Loan B, 1st Lien | ||||||||
0.000%, 10/11/2024 (C) | 150 | 150 | ||||||
Cumulus Media Holdings, Term Loan, 1st Lien | ||||||||
4.250%, 12/23/2020 | 664 | 461 | ||||||
DaVita HealthCare Partners, Term Loan, Tranche B, 1st Lien | ||||||||
3.500%, 06/24/2021 | 395 | 396 | ||||||
Dell, Cov-Lite, Term Loan B, 1st Lien | ||||||||
4.000%, 09/07/2023 | 364 | 366 | ||||||
Dex Media, Term Loan, 1st Lien | ||||||||
11.000%, 07/29/2021 | 114 | 109 | ||||||
Diebold, Term Loan B, 1st Lien | ||||||||
5.250%, 11/06/2023 | 200 | 202 | ||||||
DigitalGlobe, Term Loan B. 1st Lien | ||||||||
4.750%, 01/25/2020 | 299 | 301 | ||||||
Dollar Tree, Term Loan B, 1st Lien | ||||||||
3.062%, 07/06/2022 | 141 | 142 | ||||||
| ||||||||
| Description | Face Amount (Thousands) | Market Value ($ Thousands) | ||||||
| ||||||||
LOAN PARTICIPATIONS (continued) |
| |||||||
EIG Investors Corp., Term Loan, 1st Lien | ||||||||
6.480%, 11/09/2019 | $ | 391 | $ | 379 | ||||
Emerald Performance Materials, Initial Term Loan, 1st Lien | ||||||||
4.500%, 07/30/2021 | 298 | 299 | ||||||
EMI Music Publishing, Term Loan, 1st Lien | ||||||||
4.000%, 08/19/2022 | 408 | 409 | ||||||
Endo Luxembourg Finance Company I S.à r.l., 2015 Incremental Term B Loan, | ||||||||
3.800%, 09/26/2022 | 199 | 199 | ||||||
Energy & Exploration Partners, Cov-Lite PIK, Term Loan A, 1st Lien | ||||||||
13.000%, 11/12/2021 | 59 | 55 | ||||||
Energy & Exploration Partners, Cov-Lite PIK, Term Loan, 2nd Lien | ||||||||
5.000%, 05/13/2022 (D) | 33 | 22 | ||||||
Energy & Exploration Partners, Term Loan B, 1st Lien | ||||||||
0.500%, 11/12/2021 (C)(E) | 23 | 1 | ||||||
Energy Transfer Equity, Term Loan, 1st Lien | ||||||||
3.292%, 12/02/2019 | 250 | 248 | ||||||
Engility Corporation, Term Loan B2, 1st Lien | ||||||||
5.750%, 08/14/2023 | 151 | 152 | ||||||
Entegris, Term Loan, Tranche B, 1st Lien | ||||||||
3.500%, 04/30/2021 | 217 | 219 | ||||||
Environmental Resources, Cov-Lite, Term Loan B1, 1st Lien | ||||||||
5.000%, 05/14/2021 | 46 | 43 | ||||||
Envision Healthcare Corporation, Initial Term Loan, 1st Lien | ||||||||
4.250%, 05/25/2018 | 437 | 437 | ||||||
Epicor Software Corporation, Term Loan B, 1st Lien | ||||||||
4.750%, 06/01/2022 | 236 | 232 | ||||||
Equinox Holdings Inc., New Initial Term Loan, 1st Lien | ||||||||
5.000%, 01/31/2020 | 724 | 728 | ||||||
ESH Hospitality, Cov-Lite, Term Loan, 1st Lien | ||||||||
3.750%, 08/30/2023 | 425 | 428 | ||||||
Evergreen Skills Lux S.À R.L., Initial Term Loan, 1st Lien | ||||||||
5.750%, 04/28/2021 | 574 | 508 | ||||||
First Data Corporation, 2021 Extended Dollar Term Loan | ||||||||
4.500%, 03/24/2021 | 466 | 470 | ||||||
First Data Corporation, 2022 Dollar Term Loan, 1st Lien | ||||||||
4.275%, 07/08/2022 | 100 | 101 | ||||||
FMG Resources Property, Cov-Lite, Term Loan, 1st Lien | ||||||||
3.750%, 06/30/2019 (B) | 162 | 162 | ||||||
Four Seasons, Term Loan, 1st Lien | ||||||||
3.750%, 06/27/2020 | 635 | 638 | ||||||
| 86 | SEI Institutional Managed Trust / Annual Report / September 30, 2016 |
| ||||||||
| Description | Face Amount (Thousands) | Market Value ($ Thousands) | ||||||
| ||||||||
LOAN PARTICIPATIONS (continued) |
| |||||||
Freeport-McMoran, Extended Term Loan A, 1st Lien | ||||||||
3.280%, 02/28/2020 | $ | 200 | $ | 193 | ||||
Galleria, Term Loan B, 1st Lien | ||||||||
3.750%, 01/26/2023 | 410 | 411 | ||||||
Generac Power Systems, Term Loan B, 1st Lien | ||||||||
3.500%, 05/31/2020 | 599 | 599 | ||||||
General Nutrition Centers, Term Loan, 1st Lien | ||||||||
3.250%, 03/04/2019 | 356 | 355 | ||||||
Genesys Telecom, Dollar Term Loan | ||||||||
4.000%, 02/08/2020 | 881 | 877 | ||||||
Gray Television, Term Loan B, 1st Lien | ||||||||
3.938%, 06/13/2021 | 151 | 152 | ||||||
Grifols Worldwide Operations, Term Loan, Tranche B, 2nd Lien | ||||||||
3.458%, 02/27/2021 | 299 | 302 | ||||||
Gulf Finance, Term Loan B, 1st Lien | ||||||||
6.250%, 08/25/2023 | 45 | 44 | ||||||
Harbor Freight Tools, Cov-Lite, Term Loan, 1st Lien | ||||||||
4.000%, 08/18/2023 | 715 | 718 | ||||||
Headwaters, Term Loan B, 1st Lien | ||||||||
4.000%, 03/24/2022 | 376 | 378 | ||||||
Hilton Worldwide Finance LLC, Initial Term Loan, 1st Lien | ||||||||
3.500%, 10/26/2020 (B) | 35 | 35 | ||||||
Hilton Worldwide Holdings, Term Loan, 1st Lien | ||||||||
3.215%, 10/25/2023 | 219 | 221 | ||||||
3.024%, 10/25/2023 | 134 | 135 | ||||||
Houghton Mifflin Harcourt Publishers, Term Loan, 1st Lien | ||||||||
4.000%, 05/28/2021 | 346 | 342 | ||||||
Hub International Limited, Initial Term Loan, 1st Lien | ||||||||
4.000%, 10/02/2020 | 1,071 | 1,071 | ||||||
Huntsman International LLC, Incremental Term Loan, 1st Lien | ||||||||
3.750%, 10/01/2021 | 299 | 301 | ||||||
Hyperion Insurance Group Limited, Initial Term Loan, 1st Lien | ||||||||
5.500%, 04/29/2022 | 179 | 175 | ||||||
IMS Health Incorporated, Dollar Term Loan B, 1st Lien | ||||||||
3.500%, 03/17/2021 | 567 | 568 | ||||||
Ineos US Finance LLC, Cov-Lite, Dollar Term Loan, 1st Lien | ||||||||
4.250%, 03/31/2022 | 59 | 59 | ||||||
Ineos US Finance LLC, Term Loan, 1st Lien | ||||||||
3.750%, 12/15/2020 | 593 | 594 | ||||||
Informatica Corporation, Dollar Term Loan, 1st Lien | ||||||||
4.500%, 08/05/2022 | 267 | 260 | ||||||
| ||||||||
| Description | Face Amount (Thousands) | Market Value ($ Thousands) | ||||||
| ||||||||
LOAN PARTICIPATIONS (continued) |
| |||||||
Intelsat Jackson Holdings S.A., Term Loan, Tranche B2, 1st Lien | ||||||||
3.750%, 06/30/2019 (B) | $ | 288 | $ | 274 | ||||
ION Trading Technologies S.A.R.L., Dollar Term Loan, Tranche B1 | ||||||||
4.250%, 08/11/2023 | 716 | 715 | ||||||
Jaguar Holding Company I, Initial Term Loan, 1st Lien | ||||||||
4.250%, 08/18/2022 | 695 | 697 | ||||||
Jeld-Wen, Initial Loan, Initial Term Loan, 1st Lien | ||||||||
5.250%, 10/15/2021 | 205 | 206 | ||||||
Jeld-Wen, Term Loan B1, 1st Lien | ||||||||
4.750%, 07/01/2022 | 495 | 498 | ||||||
Kenan Advantage Group Holdings, Delayed Draw, Term Loan, 1st Lien | ||||||||
1.500%, 01/31/2017 | 7 | 7 | ||||||
Kenan Advantage Group Holdings, Delayed Draw, Unfunded Term Loan, 1st Lien | ||||||||
1.500%, 01/31/2017 (C)(E) | 10 | — | ||||||
Kenan Advantage Group Holdings, Initial Canadian Term Loan, 1st Lien | ||||||||
4.000%, 07/29/2022 | 46 | 46 | ||||||
Kenan Advantage Group Holdings, Initial U.S. Term Loan, 1st Lien | ||||||||
4.000%, 07/29/2022 | 145 | 143 | ||||||
KFC Holding, Term Loan B, 1st Lien | ||||||||
3.281%, 06/16/2023 | 20 | 20 | ||||||
Klockner Pentaplast, Initial German Borrower Dollar Term Loan, 1st Lien | ||||||||
5.000%, 04/28/2020 | 32 | 32 | ||||||
Klockner Pentaplast, Initial U.S. Borrower Dollar Term Loan, 1st Lien | ||||||||
5.000%, 04/28/2020 | 75 | 76 | ||||||
Kraton Polymers LLC, Term Loan B, 1st Lien | ||||||||
6.000%, 01/06/2022 | 195 | 196 | ||||||
Kronos Incorporated, Incremental Term Loan, 1st Lien | ||||||||
4.500%, 10/30/2019 | 954 | 956 | ||||||
Landry’s, Cov-Lite, Term Loan B, 1st Lien | ||||||||
0.000%, 09/21/2023 | 60 | 60 | ||||||
LBM Borrower, LLC, Cov-Lite, Term Loan, 1st Lien | ||||||||
0.000%, 08/20/2022 (C) | 37 | 37 | ||||||
Lee Enterprises, Incorporated, Term Loan, 1st Lien | ||||||||
7.250%, 03/31/2019 | 155 | 155 | ||||||
Leslie’s Poolmart, Cov-Lite, Term Loan B, 1st Lien | ||||||||
5.250%, 08/16/2023 | 107 | 107 | ||||||
Level 3 Financing, Term Loan, Tranche B-III, 1st Lien | ||||||||
4.000%, 08/01/2019 | 750 | 753 | ||||||
| SEI Institutional Managed Trust / Annual Report / September 30, 2016 | 87 |
SCHEDULE OF INVESTMENTS
September 30, 2016
Enhanced Income Fund (Continued)
| ||||||||
| Description | Face Amount (Thousands) | Market Value ($ Thousands) | ||||||
| ||||||||
LOAN PARTICIPATIONS (continued) |
| |||||||
Life Time Fitness, Closing Date Term Loan, 1st Lien | ||||||||
4.250%, 06/10/2022 | $ | 453 | $ | 453 | ||||
LTS Buyer LLC, Term Loan B, 1st Lien | ||||||||
4.000%, 04/13/2020 | 194 | 193 | ||||||
MA Financeco., LLC, Term Loan, Initial Tranche B2, 1st Lien | ||||||||
4.502%, 11/19/2021 | 500 | 502 | ||||||
Mallinckrodt International Finance S.A., Initial Term Loan B, 1st Lien | ||||||||
3.250%, 03/19/2021 | 297 | 296 | ||||||
Media General, Cov-Lite, Term Loan B, 1st Lien | ||||||||
4.000%, 07/31/2020 | 146 | 146 | ||||||
MEG Energy Corp., New Term Loan, 1st Lien | ||||||||
3.750%, 03/31/2020 (C) | 618 | 575 | ||||||
MGM Growth Properties Operating Partnership LP, Term B Loan, 1st Lien | ||||||||
4.000%, 04/25/2023 | 127 | 128 | ||||||
Mission Broadcasting, Term Loan B, 1st Lien | ||||||||
0.000%, 09/26/2023 | 23 | 23 | ||||||
MKS Instruments, Term Loan B1, 1st Lien | ||||||||
4.250%, 05/01/2023 | 116 | 117 | ||||||
Mohegan Tribal Gaming Authority, Term Loan B, 1st Lien | ||||||||
5.500%, 06/15/2018 | 616 | 615 | ||||||
0.000%, 09/30/2023 (C) | 296 | 293 | ||||||
MPH Acquisition Holdings LLC, Initial Term Loan, 1st Lien | ||||||||
5.000%, 06/07/2023 | 313 | 316 | ||||||
Mueller Water Products, Initial Term Loan, 1st Lien | ||||||||
4.000%, 11/24/2021 | 96 | 97 | ||||||
Murray Energy Corporation, Term Loan B2, 1st Lien | ||||||||
8.250%, 04/16/2020 | 260 | 220 | ||||||
NBTY, Dollar Term Loan B, 1st Lien | ||||||||
5.000%, 05/05/2023 | 409 | 411 | ||||||
Neiman Marcus Group, Other Term Loan, 1st Lien | ||||||||
4.250%, 10/25/2020 | 116 | 106 | ||||||
Nelson Education Ltd., Term Loan, 1st Lien | ||||||||
12.000%, 10/01/2020 | 160 | 81 | ||||||
New Millennium Holdco, Closing Date Term Loan, 1st Lien | ||||||||
7.500%, 12/21/2020 | 220 | 107 | ||||||
Nexstar Broadcasting, Term Loan B, 1st Lien | ||||||||
0.000%, 09/26/2023 (C) | 253 | 254 | ||||||
Numericable YPSO, Cov-Lite, Term Loan B7, 1st Lien | ||||||||
5.002%, 01/15/2024 | 216 | 218 | ||||||
NXP B.V., Cov-Lite, Term Loan F, 1st Lien | ||||||||
3.750%, 12/07/2020 | 96 | 97 | ||||||
| ||||||||
| Description | Face Amount (Thousands) | Market Value ($ Thousands) | ||||||
| ||||||||
LOAN PARTICIPATIONS (continued) |
| |||||||
ON Semiconductor Corporation, Closing Date Term Loan, 1st Lien | ||||||||
5.250%, 03/31/2023 | $ | 375 | $ | 377 | ||||
Peabody Energy Corporation, Cov-Lite, Term Loan, 1st Lien | ||||||||
4.250%, 09/24/2020 | 127 | 100 | ||||||
Peabody Energy Corporation, Term Loan, 1st Lien | ||||||||
10.000%, 04/18/2017 | 125 | 130 | ||||||
PetSmart, Term Loan, Tranche B1, 1st Lien | ||||||||
4.250%, 03/11/2022 | 99 | 99 | ||||||
Pilot Travel Centers, Term Loan B, 1st Lien | ||||||||
3.274%, 05/25/2023 | 724 | 729 | ||||||
PQ Corp., Term Loan B1, 1st Lien | ||||||||
5.750%, 11/04/2022 | 101 | 102 | ||||||
Press Ganey Holdgins, Cov-Lite, Term Loan, 1st Lien | ||||||||
0.000%, 09/29/2023 (C) | 300 | 299 | ||||||
Quebecor Media, Facility Term Loan, Tranche B1, 1st Lien | ||||||||
3.317%, 08/17/2020 | 116 | 116 | ||||||
Quintiles Transnational, Term Loan B, 1st Lien | ||||||||
3.250%, 05/12/2022 | 296 | 296 | ||||||
RadNet, Term Loan B, 1st Lien | ||||||||
6.250%, 06/30/2023 | 10 | 10 | ||||||
4.750%, 06/30/2023 | 755 | 754 | ||||||
Redtop Acquisitions Limited, Initial Dollar Term Loan, 1st Lien | ||||||||
4.500%, 12/03/2020 | 98 | 97 | ||||||
Regal Cinemas Corporation, Refinancing Term Loan, 1st Lien | ||||||||
3.500%, 04/01/2022 (C) | 271 | 273 | ||||||
Rexnord LLC/ RBS Global, Term B Loan, 1st Lien | ||||||||
4.000%, 08/21/2020 | 274 | 275 | ||||||
Reynolds Group Holdings, U.S. Term Loan, 1st Lien | ||||||||
4.250%, 02/05/2023 | 385 | 386 | ||||||
Royal Holdings, Initial Term Loan, 1st Lien | ||||||||
4.500%, 06/20/2022 | 126 | 126 | ||||||
Samsonite International S.A., Initial Term Loan, Tranche B, 1st Lien | ||||||||
4.000%, 05/15/2023 | 91 | 92 | ||||||
Seadrill Operating, Initial Term Loan, 1st Lien | ||||||||
4.000%, 02/21/2021 | 626 | 310 | ||||||
Seaworld Parks & Entertainment, Term Loan B2, 1st Lien | ||||||||
3.000%, 05/14/2020 | 145 | 141 | ||||||
Seminole Hard Rock Entertainment, Term Loan, 1st Lien | ||||||||
3.500%, 05/14/2020 | 490 | 490 | ||||||
Sensata Technologies B.V., Term Loan B, 1st Lien | ||||||||
3.000%, 10/14/2021 | 299 | 300 | ||||||
| 88 | SEI Institutional Managed Trust / Annual Report / September 30, 2016 |
| ||||||||
| Description | Face Amount (Thousands) | Market Value ($ Thousands) | ||||||
| ||||||||
LOAN PARTICIPATIONS (continued) |
| |||||||
Serta Simmons Holdings, Term Loan, 1st Lien | ||||||||
4.250%, 10/01/2019 | $ | 567 | $ | 568 | ||||
Signode Industrial Group Lux S.A., Initial Term Loan B | ||||||||
3.750%, 05/01/2021 | 258 | 257 | ||||||
Sinclair Television Group, Incremental Term Loan, Tranche B1, 1st Lien | ||||||||
3.500%, 07/30/2021 | 198 | 199 | ||||||
Spectrum Brands, USD Term Loan, 1st Lien | ||||||||
3.500%, 06/23/2022 | 378 | 379 | ||||||
SS&C European Holdings, S.a.r.l, Term Loan B2, 1st Lien | ||||||||
4.083%, 07/08/2022 | 10 | 10 | ||||||
4.000%, 07/08/2022 | 32 | 33 | ||||||
SS&C Technologies, Term Loan B1, 1st Lien | ||||||||
4.083%, 07/08/2022 | 25 | 25 | ||||||
4.002%, 07/08/2022 | 41 | 41 | ||||||
4.000%, 07/08/2022 | 276 | 278 | ||||||
Starwood Property Trust, Term Loan B, 1st Lien | ||||||||
3.500%, 04/17/2020 | 849 | 848 | ||||||
Station Casinos LLC, Facility Term Loan B, 1st Lien | ||||||||
3.750%, 06/08/2023 | 299 | 301 | ||||||
Sterigenics-Nordion Holdings, LLC, Cov-Lite, Initial Term Loan, 1st Lien | ||||||||
4.250%, 05/16/2022 | 267 | 267 | ||||||
Surgical Care Affiliates, Initial Term Loan, 1st Lien | ||||||||
4.250%, 03/17/2022 | 369 | 371 | ||||||
Syncreon Global Finance (US) (Syncreon Group B.V.), Term Loan, 1st Lien | ||||||||
5.250%, 10/28/2020 | 973 | 869 | ||||||
Syniverse Holdings, Term Loan, Tranche B1, 1st Lien | ||||||||
4.000%, 04/23/2019 | 239 | 211 | ||||||
Telesat Canada, U.S., Term Loan, Tranche B2, 1st Lien | ||||||||
3.500%, 03/28/2019 (B) | 385 | 385 | ||||||
Texas Competitive Electric Holdings Co. LLC, Term Loan B, 1st Lien | ||||||||
5.000%, 10/31/2017 | 426 | 429 | ||||||
Texas Competitive Electric Holdings Co. LLC, Term Loan C, 1st Lien | ||||||||
5.000%, 10/31/2017 | 97 | 98 | ||||||
Texas Competitive Electric Holdings Company LLC, 2017 Term Loan, 1st Lien | ||||||||
4.998%, 10/10/2017 (F) | 152 | 44 | ||||||
4.970%, 10/10/2017 (F) | 2 | — | ||||||
Townsquare Media, Cov-Lite, Term Loan B, 1st Lien | ||||||||
4.250%, 04/01/2022 | 185 | 186 | ||||||
| ||||||||
| Description | Face Amount (Thousands) | Market Value ($ Thousands) | ||||||
| ||||||||
LOAN PARTICIPATIONS (continued) |
| |||||||
Trans Union LLC, Incremental Term Loan B2, 1st Lien | ||||||||
3.500%, 04/09/2021 | $ | 676 | $ | 677 | ||||
Transdigm, Term Loan, Tranche D, 1st Lien | ||||||||
3.750%, 06/04/2021 | 500 | 500 | ||||||
Tribune Media Company, Term Loan B, 1st Lien | ||||||||
3.750%, 12/27/2020 | 436 | 439 | ||||||
True Religion Apparel, Cov-Lite, Term Loan, 1st Lien | ||||||||
5.875%, 07/30/2019 | 627 | 147 | ||||||
U.S. Renal Care, Initial Term Loan, 1st Lien | ||||||||
5.250%, 12/30/2022 | 698 | 668 | ||||||
UFC Holdings, Term Loan, 1st Lien | ||||||||
5.000%, 08/18/2023 | 176 | 177 | ||||||
Univar USA Inc., Initial Dollar Term Loan, | ||||||||
4.250%, 07/01/2022 | 90 | 90 | ||||||
Univar, Initial Dollar Term Loan | ||||||||
4.250%, 07/01/2022 | 88 | 88 | ||||||
Univision Communications, Replacement Term Loan, 1st Lien | ||||||||
4.000%, 03/01/2020 | 830 | 832 | ||||||
UPC Financing Partnership, Cov-Lite, Term Loan, 1st Lien | ||||||||
4.080%, 08/31/2024 (C) | 721 | 724 | ||||||
Valeant Pharmaceuticals International, Series D2 Term Loan, Tranche B, 1st Lien | ||||||||
5.000%, 02/13/2019 | 93 | 93 | ||||||
Valeant Pharmaceuticals International, Series E1 Term Loan, Tranche B, 1st Lien | ||||||||
5.250%, 08/05/2020 | 386 | 387 | ||||||
Valeant Pharmaceuticals International, Series F1 Term Loan, Tranche B, 1st Lien | ||||||||
5.500%, 04/01/2022 (C) | 316 | 317 | ||||||
Vantiv LLC, Term Loan B, 1st Lien | ||||||||
3.500%, 06/13/2021 | 241 | 241 | ||||||
Verint Systems Inc., Incremental Term Loan, Tranche B, 1st Lien | ||||||||
3.507%, 09/06/2019 | 389 | 390 | ||||||
Veritas US, Term Loan B1, 1st Lien | ||||||||
6.625%, 01/27/2023 | 40 | 37 | ||||||
Versum Materials, Cov-Lite, Term Loan, 1st Lien | ||||||||
0.000%, 09/21/2023 (C) | 168 | 168 | ||||||
Vertafore Holding, Cov-Lite, Term Loan, 1st Lien | ||||||||
4.750%, 06/30/2023 | 375 | 376 | ||||||
Waste Industries USA, Term Loan B, 1st Lien | ||||||||
3.500%, 02/27/2020 | 394 | 395 | ||||||
WaveDivision Holdings, Initial Term Loan, 1st Lien | ||||||||
4.000%, 10/15/2019 | 401 | �� | 400 | |||||
WCA Waste Systems, Term Loan B, 1st Lien | ||||||||
4.000%, 08/11/2023 | 181 | 181 | ||||||
| SEI Institutional Managed Trust / Annual Report / September 30, 2016 | 89 |
SCHEDULE OF INVESTMENTS
September 30, 2016
Enhanced Income Fund (Continued)
| ||||||||
| Description | Face Amount (Thousands) | Market Value ($ Thousands) | ||||||
| ||||||||
LOAN PARTICIPATIONS (continued) |
| |||||||
Weight Watchers International Inc., Cov-Lite, Term Loan B2, 1st Lien | ||||||||
4.000%, 04/02/2020 | $ | – | $ | — | ||||
Weight Watchers International, Term Loan, Tranche B2, 1st Lien | ||||||||
4.000%, 04/02/2020 | 153 | 116 | ||||||
West Corporation, Term Loan B12, 1st Lien | ||||||||
3.750%, 06/17/2023 | 329 | 330 | ||||||
Western Digital, Cov-Lite, Term Loan B, 1st Lien | ||||||||
4.500%, 04/29/2023 | 108 | 109 | ||||||
WideOpenWest Finance, LLC, Term Loan B, 1st Lien | ||||||||
4.500%, 08/18/2023 | 618 | 616 | ||||||
Wilsonart LLC, Initial Term Loan, 1st Lien | ||||||||
4.000%, 10/31/2019 | 683 | 683 | ||||||
WMG Acquisition Corp., Refinancing Term Loan, Tranche B, 1st Lien | ||||||||
3.750%, 07/01/2020 | 375 | 374 | ||||||
XPO Logistics, Term Loan B, 1st Lien | ||||||||
4.250%, 11/01/2021 | 370 | 371 | ||||||
York Risk Services, Cov-Lite, Term Loan B, 1st Lien | ||||||||
4.750%, 10/01/2021 | 471 | 430 | ||||||
Zekelman Industries, Term Loan B, 1st Lien | ||||||||
6.000%, 06/14/2021 | 115 | 116 | ||||||
Ziggo B.V., US$ B1 Facility, 1st Lien | ||||||||
3.700%, 01/15/2022 | 292 | 292 | ||||||
Ziggo B.V., US$ B2 Facility, 1st Lien | ||||||||
3.700%, 01/15/2022 | 173 | 173 | ||||||
Ziggo B.V., US$ B3 Facility, 1st Lien | ||||||||
3.700%, 01/15/2022 | 54 | 54 | ||||||
|
| |||||||
Total Loan Participations (Cost $66,086) ($ Thousands) | 64,569 | |||||||
|
| |||||||
ASSET-BACKED SECURITIES — 17.7% |
| |||||||
Automotive — 7.9% | ||||||||
Ally Auto Receivables Trust 2015-SN1, Ser 2015-SN1, Cl A3 | ||||||||
1.210%, 12/20/2017 | 593 | 593 | ||||||
Ally Master Owner Trust, Ser 2012-5, Cl A | ||||||||
1.540%, 09/15/2019 | 600 | 602 | ||||||
Ally Master Owner Trust, Ser 2014-5, Cl A2 | ||||||||
1.600%, 10/15/2019 | 800 | 803 | ||||||
AmeriCredit Automobile Receivables Trust, Ser 2014-2, Cl A3 | ||||||||
0.940%, 02/08/2019 | 317 | 317 | ||||||
AmeriCredit Automobile Receivables Trust, Ser 2015-1, Cl A3 | ||||||||
1.260%, 11/08/2019 | 219 | 219 | ||||||
| ||||||||
| Description | Face Amount (Thousands) | Market Value ($ Thousands) | ||||||
| ||||||||
ASSET-BACKED SECURITIES (continued) |
| |||||||
AmeriCredit Automobile Receivables Trust, Ser 2015-4, Cl A2A | ||||||||
1.260%, 04/08/2019 | $ | 287 | $ | 287 | ||||
AmeriCredit Automobile Receivables Trust, Ser 2016-1, Cl A2A | ||||||||
1.520%, 06/10/2019 | 283 | 284 | ||||||
AmeriCredit Automobile Receivables Trust, Ser 2016-2, Cl A3 | ||||||||
1.600%, 11/09/2020 | 205 | 205 | ||||||
Capital Auto Receivables Asset Trust, Ser 2015- 3, Cl A2 | ||||||||
1.720%, 01/22/2019 | 445 | 447 | ||||||
Capital Auto Receivables Asset Trust, Ser 2015- 4, Cl A2 | ||||||||
1.620%, 03/20/2019 | 570 | 570 | ||||||
CarMax Auto Owner Trust, Ser 2012-3, Cl C | ||||||||
1.500%, 08/15/2018 | 115 | 115 | ||||||
Carmax Auto Owner Trust, Ser 2013-2, Cl A4 | ||||||||
0.840%, 11/15/2018 | 681 | 680 | ||||||
CarMax Auto Owner Trust, Ser 2015-4, Cl A2A | ||||||||
1.090%, 04/15/2019 | 358 | 358 | ||||||
CarMax Auto Owner Trust, Ser 2016-2, Cl A2A | ||||||||
1.240%, 06/17/2019 | 650 | 650 | ||||||
Chesapeake Funding LLC, Ser 2013-1A, Cl A | ||||||||
0.948%, 01/07/2025 (A)(B) | 224 | 224 | ||||||
Chesapeake Funding LLC, Ser 2014-1A, Cl A | ||||||||
0.918%, 03/07/2026 (A)(B) | 262 | 263 | ||||||
Chrysler Capital Auto Receivables Trust, Ser 2014-AA, Cl A4 | ||||||||
1.310%, 05/15/2019 (A) | 95 | 95 | ||||||
CPS Auto Receivables Trust, Ser 2013-D, Cl A | ||||||||
1.540%, 07/16/2018 (A) | 17 | 17 | ||||||
CPS Auto Receivables Trust, Ser 2014-A, Cl A | ||||||||
1.210%, 08/15/2018 (A) | 24 | 24 | ||||||
Credit Acceptance Auto Loan Trust, Ser 2014- 1A, Cl A | ||||||||
1.550%, 10/15/2021 (A) | 157 | 157 | ||||||
Enterprise Fleet Financing, Ser 2013-2, Cl A3 | ||||||||
1.510%, 03/20/2019 (A) | 235 | 235 | ||||||
Enterprise Fleet Financing, Ser 2014-1, Cl A2 | ||||||||
0.870%, 09/20/2019 (A) | 32 | 32 | ||||||
Enterprise Fleet Financing, Ser 2016-2, Cl A2 | ||||||||
1.740%, 02/22/2022 (A) | 255 | 254 | ||||||
Fifth Third Auto Trust, Ser 2015-1, Cl A3 | ||||||||
1.420%, 03/16/2020 | 350 | 351 | ||||||
First Investors Auto Owner Trust, Ser 2013-2A, Cl A2 | ||||||||
1.230%, 03/15/2019 (A) | 9 | 9 | ||||||
First Investors Auto Owner Trust, Ser 2014-1A, Cl A3 | ||||||||
1.490%, 01/15/2020 (A) | 312 | 312 | ||||||
| 90 | SEI Institutional Managed Trust / Annual Report / September 30, 2016 |
| ||||||||
| Description | Face Amount (Thousands) | Market Value ($ Thousands) | ||||||
| ||||||||
ASSET-BACKED SECURITIES (continued) |
| |||||||
First Investors Auto Owner Trust, Ser 2016-1A, Cl A1 | ||||||||
1.920%, 05/15/2020 (A) | $ | 267 | $ | 268 | ||||
Ford Credit Auto Lease Trust, Ser 2014-B, Cl A4 | ||||||||
1.100%, 11/15/2017 | 519 | 520 | ||||||
Ford Credit Auto Lease Trust, Ser 2015-B, Cl B | ||||||||
1.920%, 03/15/2019 | 325 | 326 | ||||||
Ford Credit Floorplan Master Owner Trust, Ser 2014-1, Cl A2 | ||||||||
0.908%, 02/15/2019 (B) | 250 | 250 | ||||||
Ford Credit Floorplan Master Owner Trust, Ser 2014-1, Cl B | ||||||||
1.400%, 02/15/2019 | 90 | 90 | ||||||
Ford Credit Floorplan Master Owner Trust, Ser 2014-4, Cl A1 | ||||||||
1.400%, 08/15/2019 | 380 | 381 | ||||||
Ford Credit Floorplan Master Owner Trust, Ser 2016-4, Cl A | ||||||||
1.054%, 07/15/2020 (B) | 290 | 290 | ||||||
GLS Auto Receivables Trust, Ser 2016-1A, Cl A | ||||||||
2.730%, 10/15/2020 (A) | 286 | 285 | ||||||
GM Financial Automobile Leasing Trust, Ser 2015-3, Cl A2A | ||||||||
1.170%, 06/20/2018 | 503 | 503 | ||||||
GM Financial Automobile Leasing Trust, Ser 2016-2, Cl A3 | ||||||||
1.620%, 09/20/2019 | 230 | 231 | ||||||
GMF Floorplan Owner Revolving Trust, Ser 2015-1, Cl A2 | ||||||||
1.024%, 05/15/2020 (A)(B) | 430 | 430 | ||||||
Hyundai Auto Lease Securitization Trust, Ser 2016-B, Cl A3 | ||||||||
1.520%, 10/15/2019 (A) | 200 | 201 | ||||||
Mercedes Benz Auto Lease Trust, Ser 2015-A, Cl A4 | ||||||||
1.210%, 10/15/2020 | 200 | 200 | ||||||
Mercedes Benz Auto Lease Trust, Ser 2015-B, Cl A3 | ||||||||
1.340%, 07/16/2018 | 490 | 491 | ||||||
Nissan Auto Receivables Owner Trust, Ser 2015-C, Cl A2A | ||||||||
0.870%, 11/15/2018 | 274 | 274 | ||||||
Nissan Auto Receivables Owner Trust, Ser 2016-B, Cl A2A | ||||||||
1.050%, 04/15/2019 | 365 | 365 | ||||||
Prestige Auto Receivables Trust, | ||||||||
1.090%, 02/15/2019 (A) | 28 | 28 | ||||||
Prestige Auto Receivables Trust, | ||||||||
1.780%, 08/15/2019 (A) | 312 | 313 | ||||||
| ||||||||
| Description | Face Amount (Thousands) | Market Value ($ Thousands) | ||||||
| ||||||||
ASSET-BACKED SECURITIES (continued) |
| |||||||
Santander Drive Auto Receivables Trust, Ser 2012-3, Cl D | ||||||||
3.640%, 05/15/2018 | $ | 421 | $ | 423 | ||||
Santander Drive Auto Receivables Trust, Ser 2015-5, Cl A3 | ||||||||
1.580%, 09/16/2019 | 345 | 345 | ||||||
Toyota Auto Receivables Owner Trust, Ser 2016-B, Cl A3 | ||||||||
1.300%, 04/15/2020 | 100 | 100 | ||||||
Westlake Automobile Receivables Trust, Ser 2015-1A, Cl A2 | ||||||||
1.170%, 03/15/2018 (A) | 16 | 16 | ||||||
Westlake Automobile Receivables Trust, Ser 2015-2A, Cl A2A | ||||||||
1.280%, 07/16/2018 (A) | 204 | 204 | ||||||
Westlake Automobile Receivables Trust, Ser 2016-2A, Cl A2 | ||||||||
1.570%, 06/17/2019 (A) | 320 | 320 | ||||||
Westlake Automobile Receivables Trust, Ser 2016-2A, Cl B | ||||||||
2.300%, 11/15/2019 (A) | 350 | 354 | ||||||
Wheels SPV 2 LLC, Ser 2014-1A, Cl A2 | ||||||||
0.840%, 03/20/2023 (A) | 94 | 94 | ||||||
World Omni Auto Receivables Trust, Ser 2015-B, Cl A2A | ||||||||
0.960%, 07/15/2019 | 364 | 364 | ||||||
|
| |||||||
| 15,769 | ||||||||
|
| |||||||
Credit Cards — 2.8% | ||||||||
Cabela’s Credit Card Master Note Trust, Ser 2014-1, Cl A | ||||||||
0.874%, 03/16/2020 (B) | 190 | 190 | ||||||
Cabela’s Credit Card Master Note Trust, Ser 2016-1, Cl A1 | ||||||||
1.780%, 06/15/2022 | 355 | 358 | ||||||
Chase Issuance Trust, Ser 2007-B1, Cl B1 | ||||||||
0.774%, 04/15/2019 (B) | 750 | 750 | ||||||
Chase Issuance Trust, Ser 2013-A6, Cl A6 | ||||||||
0.944%, 07/15/2020 (B) | 650 | 652 | ||||||
Chase Issuance Trust, Ser 2014-A1, Cl A1 | ||||||||
1.150%, 01/15/2019 | 490 | 490 | ||||||
Citibank Credit Card Issuance Trust, Ser 2014- A2, Cl A2 | ||||||||
1.020%, 02/22/2019 | 485 | 485 | ||||||
Evergreen Credit Card Trust, Ser 2016-1, Cl A | ||||||||
1.244%, 04/15/2020 (A)(B) | 600 | 602 | ||||||
Synchrony Credit Card Master Note Trust, Ser 2014-1, Cl A | ||||||||
1.610%, 11/15/2020 | 800 | 804 | ||||||
Trillium Credit Card Trust II, Ser 2016-1A, Cl A | ||||||||
1.240%, 05/26/2021 (A)(B) | 710 | 710 | ||||||
| SEI Institutional Managed Trust / Annual Report / September 30, 2016 | 91 |
SCHEDULE OF INVESTMENTS
September 30, 2016
Enhanced Income Fund (Continued)
| ||||||||
| Description | Face Amount (Thousands) | Market Value ($ Thousands) | ||||||
| ||||||||
ASSET-BACKED SECURITIES (continued) |
| |||||||
World Financial Network Credit Card Master Trust, Ser 2015-C, Cl A | ||||||||
1.260%, 03/15/2021 | $ | 640 | $ | 641 | ||||
|
| |||||||
| 5,682 | ||||||||
|
| |||||||
Other Asset-Backed Securities — 7.0% |
| |||||||
Accredited Mortgage Loan Trust, Ser 2004-4, Cl A1A | ||||||||
1.204%, 01/25/2035 (B) | 183 | 180 | ||||||
Aegis Asset-Backed Securities Trust Mortgage Pass-Through Certificates, Ser 2004-3, Cl A2B | ||||||||
1.624%, 09/25/2034 (B) | 96 | 96 | ||||||
Apidos CLO XII, Ser 2013-12A, Cl A | ||||||||
1.780%, 04/15/2025 (A)(B) | 550 | 546 | ||||||
Apidos CLO XVII, Ser 2014-17A, Cl A1A | ||||||||
2.179%, 04/17/2026 (A)(B) | 350 | 350 | ||||||
Cent CLO 20, Ser 2014-20A, Cl A | ||||||||
2.195%, 01/25/2026 (A)(B) | 625 | 625 | ||||||
Cent CLO, Ser 2014-16AR, Cl A1AR | ||||||||
1.887%, 08/01/2024 (A)(B) | 500 | 500 | ||||||
CIFC Funding Ltd., Ser 2013-1A, Cl A1 | ||||||||
1.829%, 04/16/2025 (A)(B) | 485 | 483 | ||||||
CNH Equipment Trust, Ser 2016-B, Cl A2A | ||||||||
1.310%, 10/15/2019 | 255 | 255 | ||||||
Dryden XXXI Senior Loan Fund, Ser 2014-31A, Cl A | ||||||||
2.029%, 04/18/2026 (A)(B) | 510 | 510 | ||||||
First Franklin Mortgage Loan Trust, Ser 2006-FF1, Cl 2A3 | ||||||||
0.764%, 01/25/2036 (B) | 206 | 205 | ||||||
Gramercy Park CLO, Ser 2014-1A, Cl A1R | ||||||||
1.979%, 07/17/2023 (A)(B) | 400 | 400 | ||||||
GreatAmerica Leasing Receivables Funding, Ser 2016-1, Cl A2 | ||||||||
1.570%, 05/21/2018 (A) | 455 | 456 | ||||||
Green Tree Agency Advance Funding Trust I, Ser 2015-T1, Cl AT1 | ||||||||
2.302%, 10/15/2046 (A) | 240 | 240 | ||||||
ING Investment Management CLO, Ser 2014-1A, Cl A1 | ||||||||
2.179%, 04/18/2026 (A)(B) | 510 | 510 | ||||||
Kubota Credit Owner Trust, Ser 2015-1A, Cl A2 | ||||||||
0.940%, 12/15/2017 (A) | 140 | 140 | ||||||
Limerock CLO II, Ser 2014-2A, Cl A | ||||||||
2.179%, 04/18/2026 (A)(B) | 600 | 600 | ||||||
MMAF Equipment Finance, Ser 2014-AA, Cl A3 | ||||||||
0.870%, 01/08/2019 (A) | 615 | 614 | ||||||
Nationstar HECM Loan Trust, Ser 2015-2A, Cl A | ||||||||
2.883%, 11/25/2025 (A) | 89 | 89 | ||||||
Nationstar HECM Loan Trust, Ser 2016-1A, Cl A | ||||||||
2.981%, 02/25/2026 (A) | 96 | 96 | ||||||
| ||||||||
| Description | Face Amount (Thousands) | Market Value ($ Thousands) | ||||||
| ||||||||
ASSET-BACKED SECURITIES (continued) |
| |||||||
Nationstar HECM Loan Trust, Ser 2016-2A, Cl A | ||||||||
2.239%, 06/25/2026 (A) | $ | 188 | $ | 188 | ||||
NRZ Advance Receivables Trust, Ser 2015-T4, Cl AT4 | ||||||||
3.196%, 11/15/2047 (A) | 450 | 452 | ||||||
NYCTL Trust, Ser 2015-A, Cl A | ||||||||
1.340%, 11/10/2028 (A) | 195 | 195 | ||||||
NYCTL Trust, Ser 2016-A, Cl A | ||||||||
1.470%, 11/10/2029 (A) | 181 | 181 | ||||||
Octagon Investment Partners XVI Ltd., Ser 2013-1A, Cl A | ||||||||
1.799%, 07/17/2025 (A)(B) | 550 | 545 | ||||||
OHA Credit Partners VIII Ltd., Ser 2013-8A, Cl A | ||||||||
1.816%, 04/20/2025 (A)(B) | 330 | 328 | ||||||
Race Point VI CLO Ltd., Ser 2014-6A, Cl BR | ||||||||
2.975%, 05/24/2023 (A)(B) | 525 | 525 | ||||||
SLM Student Loan Trust, Ser 2004-1, Cl A3 | ||||||||
0.925%, 04/25/2023 (B) | 466 | 464 | ||||||
SLM Student Loan Trust, Ser 2011-1, Cl A1 | ||||||||
1.044%, 03/25/2026 (B) | 177 | 176 | ||||||
SpringCastle America Funding, Ser 2014-AA, Cl A | ||||||||
2.700%, 05/25/2023 (A) | 497 | 499 | ||||||
Springleaf Funding Trust, Ser 2014-AA, Cl A | ||||||||
2.410%, 12/15/2022 (A) | 261 | 262 | ||||||
SPS Servicer Advance Receivables Trust Advance Receivables Backed Notes, Ser 2015-T2, Cl AT2 | ||||||||
2.620%, 01/15/2047 (A) | 520 | 520 | ||||||
Structured Asset Securities Mortgage Loan Trust, Ser 2006-GEL3, Cl A2 | ||||||||
0.754%, 07/25/2036 (A)(B) | 230 | 230 | ||||||
Structured Asset Securities Mortgage Loan Trust, Ser 2006-WF1, Cl A1 | ||||||||
0.674%, 02/25/2036 (B) | 87 | 87 | ||||||
Symphony CLO Ltd., Ser 2014-8AR, Cl BR | ||||||||
2.367%, 01/09/2023 (A)(B) | 805 | 802 | ||||||
Verizon Owner Trust, Ser 2016-1A, Cl A | ||||||||
1.420%, 01/20/2021 (A) | 600 | 601 | ||||||
Volvo Financial Equipment LLC, Ser 2014-1A, Cl A3 | ||||||||
0.820%, 04/16/2018 (A) | 118 | 118 | ||||||
Voya CLO, Ser 2012-1A, Cl A1R | ||||||||
1.856%, 03/14/2022 (A)(B) | 260 | 260 | ||||||
Voya CLO, Ser 2012-1A, Cl A2R | ||||||||
2.506%, 03/14/2022 (A)(B) | 500 | 500 | ||||||
|
| |||||||
| 13,828 | ||||||||
|
| |||||||
Total Asset-Backed Securities | 35,279 | |||||||
|
| |||||||
| 92 | SEI Institutional Managed Trust / Annual Report / September 30, 2016 |
| ||||||||
| Description | Face Amount (Thousands) | Market Value ($ Thousands) | ||||||
| ||||||||
MORTGAGE-BACKED SECURITIES — 8.6% |
| |||||||
Agency Mortgage-Backed Obligations — 3.0% |
| |||||||
FHLMC | ||||||||
6.000%, 09/01/2026 | $ | 66 | $ | 75 | ||||
FNMA | ||||||||
6.500%, 09/01/2026 | 47 | 54 | ||||||
6.000%, 11/01/2026 to 04/01/2040 | 366 | 419 | ||||||
5.000%, 02/01/2023 to 03/01/2025 | 95 | 103 | ||||||
3.000%, 12/01/2030 | 1,432 | 1,506 | ||||||
FNMA TBA | ||||||||
3.500%, 10/16/2031 | 900 | 949 | ||||||
3.000%, 10/15/2031 to 11/25/2031 | 1,500 | 1,574 | ||||||
FREMF Mortgage Trust, Ser 2013-K502, Cl C | ||||||||
3.196%, 03/25/2045 (A)(B) | 260 | 261 | ||||||
FREMF Mortgage Trust, Ser 2014-K503, Cl C | ||||||||
3.080%, 10/25/2047 (A)(B) | 155 | 151 | ||||||
NCUA Guaranteed Notes, Ser 2010-R1, Cl 1A | ||||||||
0.969%, 10/07/2020 (B) | 262 | 262 | ||||||
NCUA Guaranteed Notes, Ser 2011-R1, Cl 1A | ||||||||
0.975%, 01/08/2020 (B) | 341 | 342 | ||||||
NCUA Guaranteed Notes, Ser 2011-R3, Cl 1A | ||||||||
0.918%, 03/11/2020 (B) | 110 | 110 | ||||||
NCUA Guaranteed Notes, Ser 2011-R4, Cl 1A | ||||||||
0.904%, 03/06/2020 (B) | 50 | 50 | ||||||
|
| |||||||
| 5,856 | ||||||||
|
| |||||||
Non-Agency Mortgage-Backed Obligations — 5.6% |
| |||||||
Adjustable Rate Mortgage Trust, Ser 2005-4, Cl 7A2 | ||||||||
0.984%, 08/25/2035 (B) | 83 | 83 | ||||||
Banc of America Mortgage Securities, Ser 2004-J, Cl 2A1 | ||||||||
2.880%, 11/25/2034 (B) | 63 | 63 | ||||||
Banc of America Mortgage Securities, Ser 2005-C, Cl 2A2 | ||||||||
3.138%, 04/25/2035 (B) | 181 | 167 | ||||||
Banc of America Mortgage Securities, Ser 2005-I, Cl 2A1 | ||||||||
2.912%, 10/25/2035 (B) | 148 | 132 | ||||||
Bear Stearns Commercial Mortgage Securities, Ser 2006-PW14, Cl A4 | ||||||||
5.201%, 12/11/2038 | 138 | 138 | ||||||
Bear Stearns Commercial Mortgage Securities, Ser 2007-PW15, Cl A4 | ||||||||
5.331%, 02/11/2044 | 485 | 488 | ||||||
Citigroup Commercial Mortgage Trust, Ser 2007-C6, Cl A4 | ||||||||
5.901%, 12/10/2049 (B) | 350 | 356 | ||||||
Citigroup Commercial Mortgage Trust, Ser 2008-C7, Cl A4 | ||||||||
6.346%, 12/10/2049 (B) | 432 | 445 | ||||||
| ||||||||
| Description | Face Amount (Thousands) | Market Value ($ Thousands) | ||||||
| ||||||||
MORTGAGE-BACKED SECURITIES (continued) |
| |||||||
Citigroup Commercial Mortgage Trust, Ser 2012-GC8, Cl A1 | ||||||||
0.685%, 09/10/2045 | $ | 65 | $ | 65 | ||||
Citigroup Deutsche Bank Commercial Mortgage, Ser 2007-CD4, Cl A4 | ||||||||
5.322%, 12/11/2049 | 313 | 314 | ||||||
Citigroup Mortgage Loan Trust, Ser 2004-HYB3, Cl 1A | ||||||||
3.087%, 09/25/2034 (B) | 46 | 46 | ||||||
Citigroup/Deutsche Bank Commercial Mortgage Trust, Ser 2007-CD5, Cl A4 | ||||||||
5.886%, 11/15/2044 (B) | 522 | 536 | ||||||
COMM Mortgage Trust, Ser 2012-CR4, Cl A1 | ||||||||
0.704%, 10/15/2045 | 60 | 59 | ||||||
COMM Mortgage Trust, Ser 2013-CR10, Cl A1 | ||||||||
1.278%, 08/10/2046 | 136 | 136 | ||||||
COMM Mortgage Trust, Ser 2014-BBG, Cl A | ||||||||
1.325%, 03/15/2029 (A)(B) | 340 | 337 | ||||||
Connecticut Avenue Securities, Ser 2014-C03, Cl 1M1 | ||||||||
1.724%, 07/25/2024 (B) | 305 | 306 | ||||||
Credit Suisse Commercial Mortgage Trust Series, Ser 2007-C2, Cl A3 | ||||||||
5.542%, 01/15/2049 (B) | 20 | 20 | ||||||
DBUBS Mortgage Trust, Ser 2011-LC1A, Cl A1 | ||||||||
3.742%, 11/10/2046 (A) | 6 | 6 | ||||||
FHLMC Structured Agency Credit Risk Debt Notes, Ser 2013-DN1, Cl M1 | ||||||||
3.925%, 07/25/2023 (B) | 340 | 346 | ||||||
FHLMC Structured Agency Credit Risk Debt Notes, Ser 2014-DN2, Cl M1 | ||||||||
1.375%, 04/25/2024 (B) | 64 | 64 | ||||||
FHLMC Structured Agency Credit Risk Debt Notes, Ser 2015-DN1, Cl M2 | ||||||||
2.924%, 01/25/2025 (B) | 555 | 560 | ||||||
FHLMC Structured Agency Credit Risk Debt Notes, Ser 2015-DNA3, Cl M1 | ||||||||
1.875%, 04/25/2028 (B) | 332 | 333 | ||||||
FNMA Connecticut Avenue Securities, Ser 2014-C02, Cl 2M1 | ||||||||
1.474%, 05/25/2024 (B) | 102 | 102 | ||||||
FNMA Connecticut Avenue Securities, Ser 2014-C02, Cl 1M1 | ||||||||
1.474%, 05/25/2024 (B) | 185 | 185 | ||||||
FNMA Connecticut Avenue Securities, Ser 2015-C02, Cl 1M1 | ||||||||
1.674%, 05/25/2025 (B) | 48 | 48 | ||||||
GS Mortgage Securities II, Ser 2012-GCJ9, Cl A1 | ||||||||
0.662%, 11/10/2045 | 28 | 28 | ||||||
GS Mortgage Securities, Ser 2010-C2, Cl A1 | ||||||||
3.849%, 12/10/2043 (A) | 60 | 63 | ||||||
GS Mortgage Securities, Ser 2013-GC13, Cl A1 | ||||||||
1.206%, 07/10/2046 | 53 | 53 | ||||||
| SEI Institutional Managed Trust / Annual Report / September 30, 2016 | 93 |
SCHEDULE OF INVESTMENTS
September 30, 2016
Enhanced Income Fund (Continued)
| ||||||||
| Description | Face Amount (Thousands) | Market Value ($ Thousands) | ||||||
| ||||||||
MORTGAGE-BACKED SECURITIES (continued) |
| |||||||
Hilton USA, Ser 2013-HLF, Cl AFL | ||||||||
1.523%, 11/05/2030 (A)(B) | $ | 222 | $ | 222 | ||||
Impac CMB Trust, Ser 2005-1, Cl 1A1 | ||||||||
1.044%, 04/25/2035 (B) | 170 | 153 | ||||||
JPMorgan Chase Commercial Mortgage Securities Trust, Ser 2013-C13, Cl A1 | ||||||||
1.303%, 01/15/2046 | 77 | 77 | ||||||
JPMorgan Mortgage Trust, Ser 2006-A6, Cl 4A1 | ||||||||
2.951%, 10/25/2036 (B) | 362 | 339 | ||||||
LB-UBS Commercial Mortgage Trust, Ser 2007-C2, Cl A3 | ||||||||
5.430%, 02/15/2040 | 296 | 298 | ||||||
LB-UBS Commercial Mortgage Trust, Ser 2007-C6, Cl A4 | ||||||||
5.858%, 07/15/2040 (B) | 450 | 456 | ||||||
LB-UBS Commercial Mortgage Trust, Ser 2008-C1, Cl A2 | ||||||||
6.287%, 04/15/2041 (B) | 310 | 323 | ||||||
Merrill Lynch Mortgage Investors, Ser 2005-A1, Cl 1A | ||||||||
3.092%, 12/25/2034 (B) | 118 | 117 | ||||||
Merrill Lynch/Countrywide Commercial Mortgage Trust, Ser 2007-5, Cl A4 | ||||||||
5.378%, 08/12/2048 | 391 | 393 | ||||||
Morgan Stanley Capital I Trust, Ser 2007-T25, Cl A3 | ||||||||
5.514%, 11/12/2049 (B) | 100 | 101 | ||||||
Morgan Stanley Re-REMIC Trust, Ser 2012-IO, Cl AXA | ||||||||
1.000%, 03/27/2051 (A) | 155 | 154 | ||||||
MortgageIT Trust, Ser 2005-5, Cl A1 | ||||||||
0.784%, 12/25/2035 (B) | 523 | 468 | ||||||
Option One Mortgage Loan Trust, Ser 2005-1, Cl A1A | ||||||||
1.024%, 02/25/2035 (B) | 126 | 125 | ||||||
Sequoia Mortgage Trust, Ser 2004-10, Cl A2 | ||||||||
1.152%, 11/20/2034 (B) | 120 | 110 | ||||||
Sequoia Mortgage Trust, Ser 2004-11, Cl A1 | ||||||||
1.112%, 12/20/2034 (B) | 92 | 89 | ||||||
Sequoia Mortgage Trust, Ser 2005-2, Cl A1 | ||||||||
0.732%, 03/20/2035 (B) | 56 | 52 | ||||||
Springleaf Mortgage Loan Trust, Ser 2013-1A, Cl A | ||||||||
1.270%, 06/25/2058 (A)(B) | 325 | 324 | ||||||
Towd Point Mortgage Trust, Ser 2015-4, Cl A1B | ||||||||
2.750%, 04/25/2055 (A)(B) | 147 | 149 | ||||||
Towd Point Mortgage Trust, Ser 2015-5, Cl A1B | ||||||||
2.750%, 05/25/2055 (A)(B) | 152 | 154 | ||||||
Towd Point Mortgage Trust, Ser 2016-1, Cl A1B | ||||||||
2.750%, 02/25/2055 (A)(B) | 161 | 164 | ||||||
Towd Point Mortgage Trust, Ser 2016-3, Cl A1 | ||||||||
2.250%, 08/25/2055 (A)(B) | 316 | 316 | ||||||
| ||||||||
| Description | Face Amount (Thousands) | Market Value ($ Thousands) | ||||||
| ||||||||
MORTGAGE-BACKED SECURITIES (continued) |
| |||||||
Towd Point Mortgage Trust, Ser 2016-4, Cl A1 | ||||||||
2.250%, 07/25/2056 (A)(B) | $ | 480 | $ | 482 | ||||
UBS-Barclays Commercial Mortgage Trust, Ser 2012-C3, Cl A1 | ||||||||
0.726%, 08/10/2049 | 109 | 109 | ||||||
Wachovia Bank Commercial Mortgage Trust, Ser 2006-C26, Cl A3 | ||||||||
6.011%, 06/15/2045 (B) | 11 | 11 | ||||||
Washington Mutual Mortgage Pass-Through Certificates, Ser 2006-AR2, Cl 1A1 | ||||||||
2.515%, 03/25/2036 (B) | 212 | 196 | ||||||
Wells Fargo Commercial Mortgage Trust, Ser 2012-LC5, Cl A1 | ||||||||
0.687%, 10/15/2045 | 87 | 87 | ||||||
Wells Fargo Mortgage-Backed Securities Trust, Ser 2004-BB, Cl A2 | ||||||||
2.855%, 01/25/2035 (B) | 146 | 146 | ||||||
WFRBS Commercial Mortgage Trust, Ser 2012-C9, Cl A1 | ||||||||
0.673%, 11/15/2045 | 96 | 96 | ||||||
|
| |||||||
| 11,190 | ||||||||
|
| |||||||
Total Mortgage-Backed Securities |
| 17,046 | ||||||
|
| |||||||
U.S. GOVERNMENT AGENCY OBLIGATION — 0.5% |
| |||||||
FFCB | ||||||||
0.850%, 10/20/2017 | 1,000 | 1,001 | ||||||
|
| |||||||
Total U.S. Government Agency Obligation |
| 1,001 | ||||||
|
| |||||||
MUNICIPAL BONDS — 0.4% |
| |||||||
California — 0.3% |
| |||||||
University of California, Ser Y-1, RB | ||||||||
Callable 01/01/2017 @ 100 | ||||||||
1.027%, 07/01/2041(B) | 565 | 565 | ||||||
|
| |||||||
Florida — 0.1% |
| |||||||
Florida State, Board of Administration Finance, Ser A, RB | ||||||||
2.163%, 07/01/2019 | 350 | 358 | ||||||
|
| |||||||
Total Municipal Bonds | 923 | |||||||
|
| |||||||
| Shares | ||||||||
COMMON STOCK — 0.1% |
| |||||||
Dex Media * | 23,332 | 46 | ||||||
Energy & Exploration Partners *(D) | 85 | 33 | ||||||
| 94 | SEI Institutional Managed Trust / Annual Report / September 30, 2016 |
| ||||||||
| Description | Shares | Market Value ($ Thousands) | ||||||
| ||||||||
COMMON STOCK (continued) |
| |||||||
Millennium * | 6,490 | $ | 3 | |||||
Nelson Education Ltd. * | 26,098 | — | ||||||
TE Holdcorp * | 11,340 | 77 | ||||||
|
| |||||||
Total Common Stock |
| 159 | ||||||
|
| |||||||
PREFERRED STOCK — 0.1% |
| |||||||
TE Holdcorp, 0.000% * | 16,542 | 153 | ||||||
|
| |||||||
Total Preferred Stock |
| 153 | ||||||
|
| |||||||
CASH EQUIVALENT — 2.6% |
| |||||||
SEI Daily Income Trust, Government Fund, Cl A | 5,121,275 | 5,121 | ||||||
|
| |||||||
Total Cash Equivalent
(Cost $5,121) ($ Thousands) |
| 5,121 | ||||||
|
| |||||||
| Face Amount (Thousands) | ||||||||
REPURCHASE AGREEMENT(G) — 1.0% |
| |||||||
Goldman Sachs | $ 2,000 | 2,000 | ||||||
|
| |||||||
Total Repurchase Agreement | 2,000 | |||||||
|
| |||||||
Total Investments — 101.3% | $ | 201,294 | ||||||
|
| |||||||
A list of the open futures contracts held by the Fund at September 30, 2016, is as follows:
| ||||||||||||
| Type of Contract | Number of Contracts Long (Short) | Expiration Date | Unrealized Appreciation ($ Thousands) | |||||||||
| ||||||||||||
U.S. 10-Year Treasury Note | (8) | Dec-2016 | $1 | |||||||||
U.S. 2-Year Treasury Note | (3) | Dec-2016 | – | |||||||||
U.S. 5-Year Treasury Note | 4 | Dec-2016 | – | |||||||||
|
| |||||||||||
| $1 | ||||||||||||
|
| |||||||||||
For the year ended September 30, 2016, the total amount of all open futures contracts, as presented in the table above, are representative of the volume of activity for the derivative type during the year.
| Percentages are based on Net Assets of $198,624 ($ Thousands). |
| * | Non-income producing security. |
| ** | Rate shown is the 7-day effective yield as of September 30, 2016. |
| † | Investment in Affiliated Security (see Note 6). |
| (A) | Security exempt from registration under Rule 144A of the Securities Act of 1933. These securities may be resold in transactions exempt from registration normally to qualified institutions. On September 30, 2016, the value of these securities amounted to $41,203 ($ Thousands), representing 20.7% of the net assets of the Fund. |
| (B) | Variable Rate Security — The rate reported on the Schedule of Investments is the rate in effect as of September 30, 2016. |
| (C) | Unsettled bank loan. Interest rate not available. |
| (D) | Security fair valued using methods determined in good faith by the Valuation Committee of the Board of Trustees. The total market value of such securities as of September 30, 2016 was $55 ($ Thousands) and represented 0.0% of Net Assets. |
| (E) | Unfunded bank loan. |
| (F) | Security is in default on interest payment. |
| (G) | Tri-Party Repurchase Agreement. |
CI — Class
CLO — Collateralized Loan Obligation
FFCB — Federal Farm Credit Bank
FHLMC — Federal Home Loan Mortgage Corporation
FNMA — Federal National Mortgage Association
LLC — Limited Liability Company
Ltd. — Limited
MTN — Medium Term Note
NCUA — National Credit Union Association
PLC — Public Limited Company
RB — Revenue Bond
Re-REMIC — Resecuritization of Real Estate Mortgage Investment Conduit
Ser — Series
TBA — To Be Announced
The following is a list of the level of inputs used as of September 30, 2016, in valuing the Fund’s investments and other financial instruments carried at value ($ Thousands):
| ||||||||||||||||
| Investments in Securities | Level 1 | Level 2 | Level 3(1) | Total | ||||||||||||
| ||||||||||||||||
Corporate Obligations | $ | – | $ | 75,043 | $ | – | $ | 75,043 | ||||||||
Loan Participations | – | 64,547 | 22 | 64,569 | ||||||||||||
Asset-Backed Securities | – | 35,279 | – | 35,279 | ||||||||||||
Mortgage-Backed Securities | – | 17,046 | – | 17,046 | ||||||||||||
U.S. Government Agency Obligation | – | 1,001 | – | 1,001 | ||||||||||||
Municipal Bonds | – | 923 | – | 923 | ||||||||||||
Common Stock | – | 126 | 33 | 159 | ||||||||||||
Preferred Stock | – | 153 | – | 153 | ||||||||||||
Cash Equivalent | 5,121 | – | – | 5,121 | ||||||||||||
Repurchase Agreement | – | 2,000 | – | 2,000 | ||||||||||||
|
|
|
|
|
|
|
| |||||||||
Total Investments in Securities |
$ |
5,121 |
|
$ |
196,118 |
|
$ |
55 |
|
$ |
201,294 |
| ||||
|
|
|
|
|
|
|
| |||||||||
| SEI Institutional Managed Trust / Annual Report / September 30, 2016 | 95 |
SCHEDULE OF INVESTMENTS
September 30, 2016
Enhanced Income Fund (Concluded)
| ||||||||||||||||
| Other Financial Instruments | Level 1 | Level 2 | Level 3 | Total | ||||||||||||
| ||||||||||||||||
Futures Contracts * | ||||||||||||||||
Unrealized Appreciation | $ | 1 | $ | — | $ | — | $ | 1 | ||||||||
|
|
|
|
|
|
|
| |||||||||
Total Other Financial Instruments
| $
| 1
|
| $
| —
|
| $
| —
|
| $
| 1
|
| ||||
|
|
|
|
|
|
|
| |||||||||
* Futures contracts are valued at the unrealized appreciation on the instrument.
(1) A reconciliation of Level 3 investments is presented when the Fund has a significant amount of Level 3 investments at the beginning and/or end of the period in relation to net assets. Management has concluded that Level 3 investments are not material in relation to net assets.
For the year ended September 30, 2016, there were no transfers between Level 1 and Level 2 assets and liabilities.
For the year ended September 30, 2016, there were no transfers between Level 2 and Level 3 assets and liabilities.
For more information on valuation inputs, see Note 2 – Significant Accounting Policies in Notes to Financial Statements.
Amounts designated as “—” are $0 or have been rounded to $0.
The accompanying notes are an integral part of the financial statements.
| 96 | SEI Institutional Managed Trust / Annual Report / September 30, 2016 |
SCHEDULE OF INVESTMENTS
September 30, 2016
Core Fixed Income Fund
|
Sector Weightings (Unaudited)†:
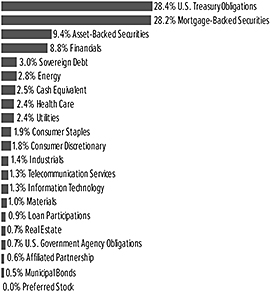
†Percentages are based on total investments. Includes investment held as collateral for securities on loan (see Note 10).
| ||||||||
| Description | Face Amount (Thousands) | Market Value ($ Thousands) | ||||||
| ||||||||
U.S. TREASURY OBLIGATIONS — 30.4% |
| |||||||
U.S. Treasury Bills | ||||||||
0.410%, 02/23/2017 (A) | $ | 29,365 | $ | 29,324 | ||||
0.348%, 01/05/2017 (A) | 6,070 | 6,066 | ||||||
0.318%, 12/08/2016 (A)(B) | 367 | 367 | ||||||
0.311%, 10/20/2016 (A) | 14,330 | 14,329 | ||||||
0.282%, 01/19/2017 (A) | 9,500 | 9,492 | ||||||
U.S. Treasury Bonds | ||||||||
3.750%, 11/15/2043 | 2,470 | 3,215 | ||||||
3.000%, 11/15/2044 | 3,555 | 4,053 | ||||||
3.000%, 05/15/2045 | 18,690 | 21,310 | ||||||
3.000%, 11/15/2045 | 18,036 | 20,579 | ||||||
2.875%, 08/15/2045 | 49,895 | 55,574 | ||||||
2.804%, 08/15/2045 (A) | 2,120 | 1,050 | ||||||
2.750%, 08/15/2042 | 3,570 | 3,890 | ||||||
2.750%, 11/15/2042 | 170 | 185 | ||||||
2.625%, 11/15/2020 | 15,340 | 16,285 | ||||||
2.546%, 05/15/2045 (A) | 3,995 | 1,992 | ||||||
2.500%, 02/15/2045 (B) | 23,905 | 24,704 | ||||||
2.500%, 02/15/2046 | 14,734 | 15,229 | ||||||
2.500%, 05/15/2046 | 13,610 | 14,086 | ||||||
2.250%, 08/15/2046 | 32,936 | 32,339 | ||||||
2.000%, 10/31/2021 | 16,574 | 17,222 | ||||||
U.S. Treasury Inflation Protected Securities | ||||||||
1.750%, 01/15/2028 | 1,252 | 1,465 | ||||||
1.375%, 02/15/2044 | 7,347 | 8,715 | ||||||
1.000%, 02/15/2046 | 4,733 | 5,151 | ||||||
0.750%, 02/15/2042 | 1,342 | 1,383 | ||||||
0.750%, 02/15/2045 | 5,140 | 5,298 | ||||||
0.625%, 01/15/2024 | 2,950 | 3,095 | ||||||
| ||||||||
| Description | Face Amount (Thousands) | Market Value ($ Thousands) | ||||||
| ||||||||
U.S. TREASURY OBLIGATIONS (continued) |
| |||||||
0.625%, 01/15/2026 | $ | 20 | $ | 21 | ||||
0.625%, 02/15/2043 | 1,957 | 1,962 | ||||||
0.375%, 07/15/2023 | 4,271 | 4,426 | ||||||
0.375%, 07/15/2025 | 11,091 | 11,455 | ||||||
U.S. Treasury Notes | ||||||||
3.500%, 05/15/2020 | 6,350 | 6,907 | ||||||
2.125%, 08/31/2020 | 8,220 | 8,552 | ||||||
2.125%, 08/15/2021 | 10,374 | 10,834 | ||||||
2.000%, 09/30/2020 | 1,185 | 1,228 | ||||||
2.000%, 08/31/2021 | 1,973 | 2,049 | ||||||
2.000%, 11/30/2022 | 3,330 | 3,460 | ||||||
1.875%, 08/31/2017 | 10,195 | 10,306 | ||||||
1.875%, 10/31/2017 | 510 | 516 | ||||||
1.750%, 10/31/2020 | 2,090 | 2,145 | ||||||
1.625%, 08/31/2019 | 3,867 | 3,948 | ||||||
1.625%, 11/30/2020 | 7,255 | 7,412 | ||||||
1.625%, 05/15/2026 | 320 | 320 | ||||||
1.500%, 08/15/2026 | 23,980 | 23,747 | ||||||
1.375%, 09/30/2018 | 968 | 979 | ||||||
1.375%, 01/31/2021 | 4,443 | 4,492 | ||||||
1.375%, 04/30/2021 | 11,813 | 11,937 | ||||||
1.375%, 05/31/2021 | 170 | 172 | ||||||
1.375%, 08/31/2023 | 9,888 | 9,857 | ||||||
1.375%, 09/30/2023 | 861 | 858 | ||||||
1.250%, 12/15/2018 | 2,031 | 2,050 | ||||||
1.250%, 07/31/2023 | 9,550 | 9,450 | ||||||
1.125%, 06/15/2018 | 2,189 | 2,203 | ||||||
1.125%, 01/15/2019 | 500 | 503 | ||||||
1.125%, 06/30/2021 | 630 | 629 | ||||||
1.125%, 07/31/2021 | 18,735 | 18,710 | ||||||
1.125%, 08/31/2021 | 4,797 | 4,792 | ||||||
1.125%, 09/30/2021 | 48,820 | 48,755 | ||||||
1.000%, 12/15/2017 | 1,555 | 1,561 | ||||||
1.000%, 05/15/2018 | 3,097 | 3,109 | ||||||
1.000%, 09/15/2018 | 1,058 | 1,062 | ||||||
1.000%, 08/31/2019 | 1,852 | 1,858 | ||||||
0.875%, 10/15/2017 | 1,150 | 1,152 | ||||||
0.875%, 11/15/2017 | 1,840 | 1,844 | ||||||
0.875%, 05/31/2018 | 24,871 | 24,923 | ||||||
0.875%, 07/15/2018 | 1,967 | 1,971 | ||||||
0.875%, 06/15/2019 | 14,786 | 14,790 | ||||||
0.875%, 09/15/2019 | 3,331 | 3,331 | ||||||
0.750%, 10/31/2017 | 28,635 | 28,655 | ||||||
0.750%, 01/31/2018 | 1,095 | 1,095 | ||||||
0.750%, 02/28/2018 | 6,919 | 6,921 | ||||||
0.750%, 07/31/2018 | 8,815 | 8,813 | ||||||
0.750%, 08/31/2018 | 273 | 273 | ||||||
0.750%, 09/30/2018 | 6,393 | 6,391 | ||||||
0.750%, 08/15/2019 | 14,996 | 14,944 | ||||||
|
| |||||||
Total U.S. Treasury Obligations | 653,766 | |||||||
|
| |||||||
| SEI Institutional Managed Trust / Annual Report / September 30, 2016 | 97 |
SCHEDULE OF INVESTMENTS
September 30, 2016
Core Fixed Income Fund (Continued)
| ||||||||
| Description | Face Amount (Thousands) | Market Value ($ Thousands) | ||||||
| ||||||||
MORTGAGE-BACKED SECURITIES — 30.2% |
| |||||||
Agency Mortgage-Backed Obligations — 24.5% |
| |||||||
FHLMC | ||||||||
7.500%, 05/01/2031 to 09/01/2032 | $ | 284 | $ | 308 | ||||
7.000%, 05/01/2024 to 03/01/2039 | 352 | 400 | ||||||
6.500%, 06/01/2017 to 09/01/2039 | 238 | 270 | ||||||
6.000%, 03/01/2020 to 07/01/2037 | 1,191 | 1,296 | ||||||
5.500%, 02/01/2017 to 11/01/2035 | 1,183 | 1,261 | ||||||
5.000%, 10/01/2018 to 06/01/2044 | 5,374 | 5,952 | ||||||
4.500%, 08/01/2020 to 03/01/2044 | 2,412 | 2,588 | ||||||
4.000%, 04/01/2019 to 07/01/2046 | 24,474 | 26,470 | ||||||
3.500%, 11/01/2029 to 08/01/2046 | 64,285 | 68,506 | ||||||
3.000%, 03/01/2030 to 09/01/2046 | 12,900 | 13,442 | ||||||
FHLMC ARM | ||||||||
3.090%, 02/01/2045 (C) | 413 | 430 | ||||||
2.815%, 05/01/2045 (C) | 351 | 364 | ||||||
2.791%, 12/01/2041 (C) | 103 | 107 | ||||||
2.755%, 08/01/2044 (C) | – | – | ||||||
2.540%, 07/01/2042 (C) | 434 | 449 | ||||||
FHLMC CMO, Ser 1988-1, Cl Z | ||||||||
9.300%, 04/15/2019 | 3 | 3 | ||||||
FHLMC CMO, Ser 1997-1983, Cl Z | ||||||||
6.500%, 12/15/2023 | 500 | 549 | ||||||
FHLMC CMO, Ser 2001-2277, Cl B | ||||||||
7.500%, 01/15/2031 | 82 | 96 | ||||||
FHLMC CMO, Ser 2002-2399, Cl XG | ||||||||
6.500%, 01/15/2032 | 562 | 629 | ||||||
FHLMC CMO, Ser 2005-2945, Cl SA | ||||||||
11.350%, 03/15/2020 (C) | 193 | 207 | ||||||
FHLMC CMO, Ser 2006-R007, Cl ZA | ||||||||
6.000%, 05/15/2036 | 1,121 | 1,273 | ||||||
FHLMC CMO, Ser 2007-3294, Cl CB | ||||||||
5.500%, 03/15/2037 | 289 | 314 | ||||||
FHLMC CMO, Ser 2008-3451, Cl SB, IO | ||||||||
5.506%, 05/15/2038 (C) | 90 | 11 | ||||||
FHLMC CMO, Ser 2010-3621, Cl SB, IO | ||||||||
5.706%, 01/15/2040 (C) | 94 | 17 | ||||||
FHLMC CMO, Ser 2011-3947, Cl SG, IO | ||||||||
5.426%, 10/15/2041 (C) | 717 | 115 | ||||||
FHLMC CMO, Ser 2012-4054, Cl SA, IO | ||||||||
5.526%, 08/15/2039 (C) | 1,192 | 191 | ||||||
FHLMC CMO, Ser 2012-4076, Cl SW, IO | ||||||||
5.526%, 07/15/2042 (C) | 66 | 16 | ||||||
FHLMC CMO, Ser 2012-4092, Cl AI, IO | ||||||||
3.000%, 09/15/2031 | 1,207 | 113 | ||||||
FHLMC CMO, Ser 2012-4136, Cl SJ, IO | ||||||||
5.626%, 11/15/2042 (C) | 139 | 25 | ||||||
FHLMC CMO, Ser 2012-4136, Cl SE, IO | ||||||||
5.626%, 11/15/2042 (C) | 127 | 24 | ||||||
FHLMC CMO, Ser 2013-300, Cl 300 | ||||||||
3.000%, 01/15/2043 | 1,305 | 1,359 | ||||||
FHLMC CMO, Ser 2013-4174, Cl SA, IO | ||||||||
5.676%, 05/15/2039 (C) | 395 | 55 | ||||||
| ||||||||
| Description | Face Amount (Thousands) | Market Value ($ Thousands) | ||||||
| ||||||||
MORTGAGE-BACKED SECURITIES (continued) |
| |||||||
FHLMC CMO, Ser 2013-4203, Cl PS, IO | ||||||||
5.726%, 09/15/2042 (C) | $ | 384 | $ | 70 | ||||
FHLMC CMO, Ser 2014-4415, Cl IO, IO | ||||||||
1.948%, 04/15/2041 (C) | 702 | 47 | ||||||
FHLMC CMO, Ser 2015-4425, Cl A | ||||||||
4.000%, 09/15/2040 | 688 | 730 | ||||||
FHLMC Multifamily Structured Pass-Through Certificates, Ser K008, Cl X1, IO | ||||||||
1.782%, 06/25/2020 (C) | 2,782 | 125 | ||||||
FHLMC Multifamily Structured Pass-Through Certificates, Ser K015, Cl X1, IO | ||||||||
1.788%, 07/25/2021 (C) | 1,341 | 88 | ||||||
FHLMC Multifamily Structured Pass-Through Certificates, Ser K016, Cl X1, IO | ||||||||
1.701%, 10/25/2021 (C) | 287 | 19 | ||||||
FHLMC Multifamily Structured Pass-Through Certificates, Ser K151, Cl A3 | ||||||||
3.511%, 04/25/2030 | 1,465 | 1,630 | ||||||
FHLMC TBA | ||||||||
3.500%, 10/01/2046 to 11/01/2046 | 2,500 | �� | 2,634 | |||||
3.000%, 10/15/2042 | 10,375 | 10,781 | ||||||
FNMA | ||||||||
7.000%, 09/01/2026 to 02/01/2039 | 1,301 | 1,503 | ||||||
6.500%, 05/01/2017 to 05/01/2040 | 112 | 121 | ||||||
6.000%, 10/01/2019 to 07/01/2037 | 2,700 | 3,112 | ||||||
5.500%, 12/01/2016 to 08/01/2038 | 389 | 426 | ||||||
5.000%, 01/01/2020 to 02/01/2040 | 6,804 | 7,644 | ||||||
4.500%, 01/01/2020 to 06/01/2046 | 22,204 | 24,570 | ||||||
4.000%, 08/01/2020 to 07/01/2046 | 64,501 | 70,086 | ||||||
3.840%, 08/01/2021 | 2,950 | 3,227 | ||||||
3.762%, 12/01/2020 | 2,769 | 2,989 | ||||||
3.665%, 10/01/2020 | 1,570 | 1,690 | ||||||
3.619%, 12/01/2020 | 1,845 | 1,986 | ||||||
3.500%, 12/01/2029 to 12/31/2050 | 35,373 | 37,795 | ||||||
3.010%, 04/01/2028 | 1,320 | 1,407 | ||||||
3.000%, 04/01/2031 to 09/01/2042 | 9,389 | 9,869 | ||||||
2.830%, 06/01/2022 | 1,170 | 1,237 | ||||||
2.510%, 08/01/2026 | 1,338 | 1,380 | ||||||
2.500%, 10/01/2042 | 807 | 818 | ||||||
FNMA ACES, Ser 2012-M14, Cl X2, IO | ||||||||
0.590%, 09/25/2022 (C) | 18,817 | 441 | ||||||
FNMA ACES, Ser 2014-M12, Cl FA | ||||||||
0.773%, 10/25/2021 (C) | 1,094 | 1,089 | ||||||
FNMA ACES, Ser 2015-M13, Cl A2 | ||||||||
2.801%, 06/25/2025 (C) | 130 | 136 | ||||||
FNMA ACES, Ser 2016-M6, Cl A2 | ||||||||
2.488%, 05/25/2026 | 1,096 | 1,127 | ||||||
FNMA ARM | ||||||||
4.374%, 04/01/2040 (C) | 319 | 339 | ||||||
3.192%, 10/01/2043 (C) | 393 | 410 | ||||||
2.908%, 06/01/2041 (C) | 773 | 816 | ||||||
2.833%, 05/01/2043 (C) | 211 | 220 | ||||||
| 98 | SEI Institutional Managed Trust / Annual Report / September 30, 2016 |
| ||||||||
| Description | Face Amount (Thousands) | Market Value ($ Thousands) | ||||||
| ||||||||
MORTGAGE-BACKED SECURITIES (continued) |
| |||||||
2.753%, 01/01/2045 (C) | $ | 631 | $ | 655 | ||||
2.751%, 01/01/2045 (C) | 523 | 542 | ||||||
2.669%, 01/01/2042 (C) | 527 | 548 | ||||||
2.514%, 02/01/2042 (C) | 987 | 1,034 | ||||||
2.454%, 10/01/2035 (C) | 1,934 | 2,018 | ||||||
2.431%, 06/01/2042 (C) | 400 | 413 | ||||||
2.428%, 11/01/2035 (C) | 283 | 295 | ||||||
2.415%, 11/01/2035 (C) | 1,093 | 1,139 | ||||||
2.409%, 11/01/2035 (C) | 246 | 256 | ||||||
2.395%, 11/01/2035 (C) | 229 | 240 | ||||||
2.392%, 11/01/2035 (C) | 249 | 259 | ||||||
2.354%, 10/01/2035 (C) | 1,239 | 1,289 | ||||||
2.337%, 11/01/2035 (C) | 237 | 246 | ||||||
2.316%, 10/01/2035 (C) | 170 | 177 | ||||||
1.706%, 04/01/2043 (C) | 490 | 504 | ||||||
FNMA CMO STRIPS, Ser 2012-409, Cl C2, IO | ||||||||
3.000%, 04/25/2027 | 880 | 82 | ||||||
FNMA CMO STRIPS, Ser 2012-409, Cl C13, IO | ||||||||
3.500%, 11/25/2041 | �� | 593 | 85 | |||||
FNMA CMO STRIPS, Ser 2012-409, Cl C22, IO | ||||||||
4.500%, 11/25/2039 | 702 | 111 | ||||||
FNMA CMO, Ser 1999-11, Cl Z | ||||||||
5.500%, 03/25/2029 | 231 | 257 | ||||||
FNMA CMO, Ser 2005-117, Cl LC | ||||||||
5.500%, 11/25/2035 | 811 | 877 | ||||||
FNMA CMO, Ser 2005-360, Cl 2, IO | ||||||||
5.000%, 08/01/2035 | 1,916 | 397 | ||||||
FNMA CMO, Ser 2006-112, Cl ST, IO | ||||||||
6.176%, 11/25/2036 (C) | 1,605 | 230 | ||||||
FNMA CMO, Ser 2007-108, Cl AN | ||||||||
8.204%, 11/25/2037 (C) | 127 | 155 | ||||||
FNMA CMO, Ser 2008-22, Cl SI, IO | ||||||||
5.906%, 03/25/2037 (C) | 2,453 | 146 | ||||||
FNMA CMO, Ser 2009-86, Cl BO, PO | ||||||||
0.000%, 03/25/2037 (A) | 2,035 | 1,906 | ||||||
FNMA CMO, Ser 2010-150, Cl SK, IO | ||||||||
6.345%, 01/25/2041 (C) | 594 | 114 | ||||||
FNMA CMO, Ser 2011-59, Cl NZ | ||||||||
5.500%, 07/25/2041 | 2,268 | 2,657 | ||||||
FNMA CMO, Ser 2011-90, Cl QI, IO | ||||||||
5.000%, 05/25/2034 | 808 | 64 | ||||||
FNMA CMO, Ser 2011-96, Cl SA, IO | ||||||||
6.025%, 10/25/2041 (C) | 1,804 | 369 | ||||||
FNMA CMO, Ser 2012-112, Cl DA | ||||||||
3.000%, 10/25/2042 | 1,884 | 1,963 | ||||||
FNMA CMO, Ser 2012-128, Cl SQ, IO | ||||||||
5.626%, 11/25/2042 (C) | 417 | 91 | ||||||
FNMA CMO, Ser 2012-133, Cl CS, IO | ||||||||
5.626%, 12/25/2042 (C) | 515 | 92 | ||||||
FNMA CMO, Ser 2012-133, Cl SA, IO | ||||||||
5.626%, 12/25/2042 (C) | 134 | 26 | ||||||
| ||||||||
| Description | Face Amount (Thousands) | Market Value ($ Thousands) | ||||||
| ||||||||
MORTGAGE-BACKED SECURITIES (continued) |
| |||||||
FNMA CMO, Ser 2012-134, Cl LC | ||||||||
3.000%, 12/25/2042 | $ | 378 | $ | 394 | ||||
FNMA CMO, Ser 2012-28, Cl B | ||||||||
6.500%, 06/25/2039 | 109 | 122 | ||||||
FNMA CMO, Ser 2012-411, Cl A3 | ||||||||
3.000%, 08/25/2042 | 332 | 346 | ||||||
FNMA CMO, Ser 2012-46, Cl BA | ||||||||
6.000%, 05/25/2042 | 484 | 556 | ||||||
FNMA CMO, Ser 2012-70, Cl YS, IO | ||||||||
6.126%, 02/25/2041 (C) | 154 | 20 | ||||||
FNMA CMO, Ser 2012-74, Cl SA, IO | ||||||||
6.126%, 03/25/2042 (C) | 573 | 106 | ||||||
FNMA CMO, Ser 2012-74, Cl OA, PO | ||||||||
0.000%, 03/25/2042 (A) | 44 | 40 | ||||||
FNMA CMO, Ser 2012-75, Cl AO, PO | ||||||||
0.000%, 03/25/2042 (A) | 88 | 80 | ||||||
FNMA CMO, Ser 2013-10, Cl SJ, IO | ||||||||
5.625%, 02/25/2043 (C) | 1,020 | 220 | ||||||
FNMA CMO, Ser 2013-10, Cl JS, IO | ||||||||
5.625%, 02/25/2043 (C) | 958 | 178 | ||||||
FNMA CMO, Ser 2013-35, Cl CL | ||||||||
3.000%, 02/25/2043 | 6,875 | 7,259 | ||||||
FNMA CMO, Ser 2013-9, Cl SA, IO | ||||||||
5.626%, 03/25/2042 (C) | 706 | 122 | ||||||
FNMA CMO, Ser 2013-9, Cl CB | ||||||||
5.500%, 04/25/2042 | 3,961 | 4,459 | ||||||
FNMA CMO, Ser 2013-9, Cl BC | ||||||||
6.500%, 07/25/2042 | 546 | 632 | ||||||
FNMA CMO, Ser 2014-M2, Cl A2 | ||||||||
3.513%, 12/25/2023 (C) | 1,770 | 1,945 | ||||||
FNMA CMO, Ser 2014-M4, Cl A2 | ||||||||
3.346%, 03/25/2024 (C) | 2,795 | 3,037 | ||||||
FNMA CMO, Ser 2015-55, Cl IO, IO | ||||||||
1.741%, 08/25/2055 (C) | 1,343 | 84 | ||||||
FNMA CMO, Ser 2015-M2, Cl A3 | ||||||||
3.150%, 12/25/2024 (C) | 2,582 | 2,770 | ||||||
FNMA CMO, Ser 2015-M7, Cl AB2 | ||||||||
2.502%, 12/25/2024 | 540 | 552 | ||||||
FNMA CMO, Ser 2016-59, Cl CA | ||||||||
3.500%, 09/25/2043 | 1,939 | 2,064 | ||||||
FNMA Multifamily Megas, Ser 141, Cl 1 | ||||||||
2.966%, 05/01/2027 (C) | 2,248 | 2,385 | ||||||
FNMA TBA | ||||||||
5.000%, 11/01/2037 | 1,500 | 1,665 | ||||||
4.500%, 10/15/2042 | 5,435 | 5,952 | ||||||
4.000%, 10/01/2046 to 11/01/2046 | 11,350 | 12,181 | ||||||
3.500%, 10/16/2027 to 11/01/2040 | 17,300 | 18,240 | ||||||
3.000%, 11/25/2026 to 12/15/2044 | 24,790 | 25,754 | ||||||
2.500%, 10/15/2027 | 14,295 | 14,806 | ||||||
0.000%, 10/01/2031 | 1,378 | 1,457 | ||||||
| SEI Institutional Managed Trust / Annual Report / September 30, 2016 | 99 |
SCHEDULE OF INVESTMENTS
September 30, 2016
Core Fixed Income Fund (Continued)
| ||||||||
| Description | Face Amount (Thousands) | Market Value ($ Thousands) | ||||||
| ||||||||
MORTGAGE-BACKED SECURITIES (continued) |
| |||||||
FREMF Mortgage Trust, Ser 2012-K20, Cl X2A, IO | ||||||||
0.200%, 05/25/2045 (D) | $ | 12,707 | $ | 113 | ||||
FREMF Mortgage Trust, Ser 2015-K47, Cl B | ||||||||
3.724%, 06/25/2048 (C)(D) | 160 | 159 | ||||||
GNMA | ||||||||
8.000%, 11/15/2029 to 09/15/2030 | 56 | 62 | ||||||
7.500%, 03/15/2029 | 71 | 87 | ||||||
6.500%, 07/15/2028 to 09/15/2035 | 2,251 | 2,629 | ||||||
6.000%, 10/15/2023 to 10/20/2040 | 4,167 | 4,848 | ||||||
5.000%, 07/20/2040 to 11/20/2045 | 1,042 | 1,159 | ||||||
4.500%, 03/15/2041 to 09/20/2046 | 3,393 | 3,754 | ||||||
4.000%, 10/15/2041 to 08/20/2046 | 8,537 | 9,278 | ||||||
3.500%, 03/20/2046 to 07/15/2046 | 5,504 | 5,855 | ||||||
3.000%, 07/20/2046 to 08/20/2046 | 4,353 | 4,566 | ||||||
GNMA CMO, Ser 2007-17, Cl IB, IO | ||||||||
5.738%, 04/20/2037 (C) | 789 | 158 | ||||||
GNMA CMO, Ser 2010-31, Cl GS, IO | ||||||||
5.988%, 03/20/2039 (C) | 116 | 8 | ||||||
GNMA CMO, Ser 2010-4, Cl NS, IO | ||||||||
5.883%, 01/16/2040 (C) | 6,019 | 1,177 | ||||||
GNMA CMO, Ser 2010-85, Cl HS, IO | ||||||||
6.138%, 01/20/2040 (C) | 114 | 12 | ||||||
GNMA CMO, Ser 2010-H27, Cl FA | ||||||||
0.848%, 12/20/2060 (C) | 1,509 | 1,498 | ||||||
GNMA CMO, Ser 2010-H28, Cl FE | ||||||||
0.868%, 12/20/2060 (C) | 850 | 845 | ||||||
GNMA CMO, Ser 2011-H08, Cl FG | ||||||||
0.948%, 03/20/2061 (C) | 913 | 910 | ||||||
GNMA CMO, Ser 2011-H09, Cl AF | ||||||||
0.968%, 03/20/2061 (C) | 647 | 646 | ||||||
GNMA CMO, Ser 2012-152, Cl IO, IO | ||||||||
0.730%, 01/16/2054 (C) | 9,056 | 493 | ||||||
GNMA CMO, Ser 2012-34, Cl SA, IO | ||||||||
5.538%, 03/20/2042 (C) | 642 | 128 | ||||||
GNMA CMO, Ser 2012-43, Cl SN, IO | ||||||||
6.093%, 04/16/2042 (C) | 52 | 12 | ||||||
GNMA CMO, Ser 2012-66, Cl CI, IO | ||||||||
3.500%, 02/20/2038 | 854 | 69 | ||||||
GNMA CMO, Ser 2012-98, Cl SA, IO | ||||||||
5.666%, 08/16/2042 (C) | 429 | 66 | ||||||
GNMA CMO, Ser 2013-178, Cl IO, IO | ||||||||
0.867%, 06/16/2055 (C) | 1,481 | 67 | ||||||
GNMA CMO, Ser 2015-167, Cl OI, IO | ||||||||
4.000%, 04/16/2045 | 192 | 38 | ||||||
GNMA TBA | ||||||||
3.500%, 10/15/2041 to 11/15/2041 | 16,600 | 17,621 | ||||||
3.000%, 10/01/2042 to 12/01/2042 | 23,165 | 24,229 | ||||||
NCUA Guaranteed Notes, Ser 2010-R2, Cl 1A | ||||||||
0.843%, 11/06/2017 (C) | 978 | 978 | ||||||
|
| |||||||
| 525,530 | ||||||||
|
| |||||||
| ||||||||
| Description | Face Amount (Thousands) | Market Value ($ Thousands) | ||||||
| ||||||||
MORTGAGE-BACKED SECURITIES (continued) |
| |||||||
Non-Agency Mortgage-Backed Obligations — 5.7% |
| |||||||
Adjustable Rate Mortgage Trust, Ser 2004-2, Cl 3A1 | ||||||||
2.575%, 02/25/2035 (C) | $ | 1,834 | $ | 1,737 | ||||
Adjustable Rate Mortgage Trust, Ser 2007-1, Cl 5A31 | ||||||||
0.664%, 03/25/2037 (C) | 2,493 | 1,888 | ||||||
Alternative Loan Trust, Ser 2005-36, Cl 3A1 | ||||||||
2.966%, 08/25/2035 (C) | 2,178 | 1,756 | ||||||
Alternative Loan Trust, Ser 2006-18CB, Cl A6 | ||||||||
26.502%, 07/25/2036 (C) | 371 | 542 | ||||||
Alternative Loan Trust, Ser 2006-OA11, Cl A4 | ||||||||
0.714%, 09/25/2046 (C) | 511 | 388 | ||||||
Alternative Loan Trust, Ser 2007-23CB, Cl A7 | ||||||||
0.925%, 09/25/2037 (C) | 2,793 | 1,492 | ||||||
American Home Mortgage Assets Trust, Ser 2006-6, Cl A1A | ||||||||
0.715%, 12/25/2046 (C) | 1,791 | 1,201 | ||||||
American Home Mortgage Investment Trust, Ser 2005-1, Cl 6A | ||||||||
3.032%, 06/25/2045 (C) | 1,788 | 1,773 | ||||||
American Home Mortgage Investment Trust, Ser 2005-4, Cl 5A | ||||||||
2.842%, 11/25/2045 (C) | 1,824 | 1,378 | ||||||
Avenue of the Americas Trust, Ser 2015-1211, Cl A1A2 | ||||||||
3.901%, 08/10/2035 (D) | 805 | 891 | ||||||
BAMLL Commercial Mortgage Securities Trust, Ser 2014-520M, Cl A | ||||||||
4.185%, 08/15/2034 (C)(D) | 440 | 506 | ||||||
BAMLL Re-REMIC Trust, Ser 2016-RRGG10, Cl AJA | ||||||||
5.988%, 08/10/2045 (C)(D) | 1,812 | 1,236 | ||||||
BCAP Trust, Ser 2015-RR2, Cl 21A1 | ||||||||
0.888%, 03/28/2037 (C)(D) | 1,338 | 1,256 | ||||||
Bear Stearns Adjustable Rate Mortgage Trust, Ser 2004-2, Cl 24A | ||||||||
2.807%, 05/25/2034 (C) | 206 | 195 | ||||||
Bear Stearns Asset-Backed Securities I Trust, Ser 2005-AC6, Cl 1A3 | ||||||||
5.500%, 09/25/2035 (C) | 1,687 | 1,674 | ||||||
Bear Stearns Asset-Backed Securities I Trust, Ser 2005-AC8, Cl A3, IO | ||||||||
7.162%, 11/25/2035 (C) | 5,034 | 1,781 | ||||||
CD Commercial Mortgage Trust, Ser 2006-CD2, Cl AJ | ||||||||
5.563%, 01/15/2046 (C) | 523 | 382 | ||||||
CD Commercial Mortgage Trust, Ser 2006-CD3, Cl AJ | ||||||||
5.688%, 10/15/2048 | 170 | 98 | ||||||
CD Commercial Mortgage Trust, Ser 2007-CD4, Cl AJ | ||||||||
5.398%, 12/11/2049 (C) | 305 | 242 | ||||||
| 100 | SEI Institutional Managed Trust / Annual Report / September 30, 2016 |
| ||||||||
| Description | Face Amount (Thousands) | Market Value ($ Thousands) | ||||||
| ||||||||
MORTGAGE-BACKED SECURITIES (continued) |
| |||||||
CD Commercial Mortgage Trust, Ser 2016-CD1, Cl A1 | ||||||||
1.443%, 08/10/2021 | $ | 186 | $ | 186 | ||||
CD Commercial Mortgage Trust, Ser 2016-CD1, Cl ASB | ||||||||
2.622%, 07/10/2026 | 188 | 193 | ||||||
CFCRE Commercial Mortgage Trust, Ser 2011-C1, Cl A4 | ||||||||
4.961%, 04/15/2044 (C)(D) | 459 | 508 | ||||||
CFCRE Commercial Mortgage Trust, Ser 2016-C3, Cl A1 | ||||||||
1.793%, 01/10/2021 | 323 | 325 | ||||||
CFCRE Commercial Mortgage Trust, Ser 2016-C4, Cl ASB | ||||||||
3.091%, 05/10/2058 | 225 | 236 | ||||||
CGBRAM Commerical Mortgage Trust, Ser 2014-HD, Cl E | ||||||||
3.508%, 02/15/2031 (C)(D) | 640 | 607 | ||||||
CG-CCRE Commercial Mortgage Trust, Ser 2014-FL1, Cl A | ||||||||
1.458%, 06/15/2031 (C)(D) | 483 | 483 | ||||||
Citigroup Commercial Mortgage Trust, Ser 2006-C5, Cl AJ | ||||||||
5.482%, 10/15/2049 | 270 | 252 | ||||||
Citigroup Commercial Mortgage Trust, Ser 20098-C7, Cl AJA | ||||||||
6.333%, 12/10/2049 (C) | 140 | 102 | ||||||
Citigroup Commercial Mortgage Trust, Ser 2013-375P, Cl A | ||||||||
3.251%, 05/10/2035 (D) | 655 | 693 | ||||||
Citigroup Commercial Mortgage Trust, Ser 2013-GC11, Cl A2 | ||||||||
1.987%, 04/10/2046 | 484 | 487 | ||||||
Citigroup Commercial Mortgage Trust, Ser 2014-GC19, Cl E | ||||||||
4.563%, 03/10/2047 (C)(D) | 780 | 548 | ||||||
Citigroup Commercial Mortgage Trust, Ser 2016-GC36, Cl A5 | ||||||||
3.616%, 02/10/2049 | 551 | 599 | ||||||
COMM Mortgage Trust, Ser 2010-C1, Cl A2 | ||||||||
3.830%, 07/10/2046 (D) | 86 | 88 | ||||||
COMM Mortgage Trust, Ser 2010-C1, Cl XWB, IO | ||||||||
0.865%, 07/10/2046 (C)(D) | 13,060 | 367 | ||||||
COMM Mortgage Trust, Ser 2012-CR1, Cl A2 | ||||||||
2.350%, 05/15/2045 | 526 | 528 | ||||||
COMM Mortgage Trust, Ser 2012-CR4, Cl A2 | ||||||||
1.801%, 10/15/2045 | 171 | 172 | ||||||
COMM Mortgage Trust, Ser 2013-300P, Cl A1 | ||||||||
4.353%, 08/10/2030 (D) | 620 | 696 | ||||||
COMM Mortgage Trust, Ser 2013-CR10, Cl A2 | ||||||||
2.972%, 08/10/2046 | 211 | 216 | ||||||
COMM Mortgage Trust, Ser 2013-CR11, Cl A1 | ||||||||
1.468%, 10/10/2046 | 117 | 117 | ||||||
| ||||||||
| Description | Face Amount (Thousands) | Market Value ($ Thousands) | ||||||
| ||||||||
MORTGAGE-BACKED SECURITIES (continued) |
| |||||||
COMM Mortgage Trust, Ser 2013-CR12, Cl A1 | ||||||||
1.295%, 10/10/2046 | $ | 41 | $ | 41 | ||||
COMM Mortgage Trust, Ser 2013-CR12, Cl AM | ||||||||
4.300%, 10/10/2046 | 210 | 232 | ||||||
COMM Mortgage Trust, Ser 2013-CR12, Cl C | ||||||||
5.253%, 10/10/2046 (C) | 40 | 43 | ||||||
COMM Mortgage Trust, Ser 2013-CR12, Cl A4 | ||||||||
4.046%, 10/10/2046 | 57 | 63 | ||||||
COMM Mortgage Trust, Ser 2013-CR12, Cl B | ||||||||
4.762%, 10/10/2046 (C) | 90 | 101 | ||||||
COMM Mortgage Trust, Ser 2013-CR13, Cl A4 | ||||||||
4.194%, 11/10/2023 (C) | 424 | 476 | ||||||
COMM Mortgage Trust, Ser 2013-CR6, Cl A1 | ||||||||
0.719%, 03/10/2046 | 81 | 80 | ||||||
COMM Mortgage Trust, Ser 2013-CR6, Cl A2 | ||||||||
2.122%, 03/10/2046 | 842 | 847 | ||||||
COMM Mortgage Trust, Ser 2013-CR9, Cl E | ||||||||
4.398%, 07/10/2045 (C)(D) | 780 | 581 | ||||||
COMM Mortgage Trust, Ser 2014-CR19, Cl A5 | ||||||||
3.796%, 08/10/2047 | 603 | 660 | ||||||
COMM Mortgage Trust, Ser 2014-SAVA, Cl D | ||||||||
3.608%, 06/15/2034 (C)(D) | 770 | 763 | ||||||
COMM Mortgage Trust, Ser 2014-UBS4, Cl A5 | ||||||||
3.694%, 08/10/2047 | 167 | 181 | ||||||
COMM Mortgage Trust, Ser 2014-UBS5, Cl ASB | ||||||||
3.548%, 09/10/2047 | 191 | 203 | ||||||
COMM Mortgage Trust, Ser 2014-UBS6, Cl ASB | ||||||||
3.387%, 12/10/2047 | 275 | 292 | ||||||
COMM Mortgage Trust, Ser 2014-UBS6, Cl AM | ||||||||
4.048%, 12/10/2047 | 488 | 526 | ||||||
COMM Mortgage Trust, Ser 2015-CR26, Cl ASB | ||||||||
3.373%, 04/10/2025 | 223 | 238 | ||||||
COMM Mortgage Trust, Ser 2016-787S, Cl A | ||||||||
3.545%, 02/10/2036 (D) | 650 | 700 | ||||||
Commercial Mortgage Pass-Through Certificates, Ser 2012-CR3, Cl A3 | ||||||||
2.822%, 11/15/2045 | 60 | 62 | ||||||
Commercial Mortgage Pass-Through Certificates, Ser 2013-WWP, Cl A2 | ||||||||
3.424%, 03/10/2031 (D) | 100 | 107 | ||||||
Connecticut Avenue Securities, Ser 2014-C03, Cl 1M2 | ||||||||
3.524%, 07/25/2024 (C) | 4,810 | 4,815 | ||||||
Core Industrial Trust, Ser 2015-TEXW, Cl E | ||||||||
3.977%, 02/10/2034 (C)(D) | 630 | 612 | ||||||
Credit Suisse Commercial Mortgage Trust, Ser 2006-C3, Cl AJ | ||||||||
6.393%, 06/15/2038 (C) | 378 | 208 | ||||||
Credit Suisse Commercial Mortgage Trust, Ser 2006-C5, Cl AJ | ||||||||
5.373%, 12/15/2039 | 660 | 601 | ||||||
| SEI Institutional Managed Trust / Annual Report / September 30, 2016 | 101 |
SCHEDULE OF INVESTMENTS
September 30, 2016
Core Fixed Income Fund (Continued)
| ||||||||
| Description | Face Amount (Thousands) | Market Value ($ Thousands) | ||||||
| ||||||||
MORTGAGE-BACKED SECURITIES (continued) |
| |||||||
Credit Suisse Commercial Mortgage Trust, Ser 2007-C2, Cl AM | ||||||||
5.615%, 01/15/2049 (C) | $ | 291 | $ | 294 | ||||
Credit Suisse Commercial Mortgage Trust, Ser 2007-C3, Cl AJ | ||||||||
5.889%, 06/15/2039 (C) | 540 | 448 | ||||||
Credit Suisse Commercial Mortgage Trust, Ser 2007-C5, Cl AM | ||||||||
5.869%, 09/15/2040 (C) | 270 | 249 | ||||||
Credit Suisse First Boston Mortgage Securities, Ser 2003-AR24, Cl 2A4 | ||||||||
2.979%, 10/25/2033 (C) | 1,200 | 1,192 | ||||||
Credit Suisse Group Funding Guernsey, Ser 2015-3GNA, Cl A2 | ||||||||
4.273%, 03/12/2017 | 386 | 494 | ||||||
Credit Suisse Group Funding Guernsey, Ser 2015-3GNA, Cl A1 | ||||||||
3.007%, 03/12/2017 | 1,098 | 1,408 | ||||||
Credit Suisse Mortgage Capital Certificates, Ser 2006-C4, Cl AJ | ||||||||
5.538%, 09/15/2039 (C) | 56 | 56 | ||||||
Credit Suisse Mortgage Trust, Ser 2014-USA, Cl E | ||||||||
4.373%, 09/15/2037 (D) | 590 | 508 | ||||||
Credit Suisse Mortgage Trust, Ser 2014-USA, Cl A2 | ||||||||
3.953%, 09/15/2037 (D) | 250 | 270 | ||||||
Credit Suisse Mortgage Trust, Ser 2015-3R, Cl 1A1 | ||||||||
0.712%, 07/29/2037 (C)(D) | 932 | 877 | ||||||
Credit Suisse Mortgage Trust, Ser 2015-4R, Cl 3A1 | ||||||||
0.798%, 10/27/2036 (C)(D) | 1,044 | 1,009 | ||||||
Credit Suisse Mortgage Trust, Ser 2015-SAMZ, Cl MZ | ||||||||
6.244%, 08/15/2022 (C)(D) | 2,500 | 2,388 | ||||||
Credit Suisse Mortgage Trust, Ser 2015-Town, Cl F | ||||||||
5.008%, 03/15/2017 (C)(D) | 650 | 627 | ||||||
CSAIL Commercial Mortgage Trust, Ser 2015-C2, Cl C | ||||||||
4.352%, 06/15/2057 (C) | 635 | 635 | ||||||
CSAIL Commercial Mortgage Trust, Ser 2015-C4, Cl A4 | ||||||||
3.808%, 11/15/2048 | 212 | 233 | ||||||
CSAIL Commercial Mortgage Trust, Ser 2016-C5, Cl ASB | ||||||||
3.533%, 11/15/2048 | 112 | 121 | ||||||
CSMC Trust, Ser 2014-11R, Cl 9A2 | ||||||||
0.628%, 10/27/2036 (C)(D) | 2,620 | 1,539 | ||||||
CSMC Trust, Ser 2014-TIKI, Cl F | ||||||||
4.331%, 09/15/2038 (C)(D) | 1,900 | 1,799 | ||||||
| ||||||||
| Description | Face Amount (Thousands) | Market Value ($ Thousands) | ||||||
| ||||||||
MORTGAGE-BACKED SECURITIES (continued) |
| |||||||
DBUBS Mortgage Trust, Ser 2011-LC1A, Cl A1 | ||||||||
3.742%, 11/10/2046 (D) | $ | 11 | $ | 11 | ||||
Downey Savings & Loan Association Mortgage Loan Trust, Ser 2004-AR2, Cl A2B | ||||||||
1.314%, 11/19/2044 (C) | 1,063 | 926 | ||||||
EQTY Mortgage Trust, Ser 2014-INNS, Cl D | ||||||||
2.849%, 05/08/2031 (C)(D) | 530 | 519 | ||||||
FHLMC Structured Agency Credit Risk Debt Notes, Ser 2014-HQ1, Cl M1 | ||||||||
2.175%, 08/25/2024 (C) | 21 | 21 | ||||||
FHLMC Structured Agency Credit Risk Debt Notes, Ser 2016-DNA2, Cl M3 | ||||||||
5.174%, 10/25/2028 (C) | 1,480 | 1,555 | ||||||
GS Mortgage Securities II, Ser 2015-GC30, Cl B | ||||||||
4.150%, 05/10/2050 (C) | 680 | 703 | ||||||
GS Mortgage Securities Trust, Ser 2006-GG8, Cl AJ | ||||||||
5.622%, 11/10/2039 | 430 | 345 | ||||||
GS Mortgage Securities Trust, Ser 2007-GG10, Cl AM | ||||||||
5.988%, 08/10/2045 (C) | 2,590 | 2,493 | ||||||
GS Mortgage Securities Trust, Ser 2011-GC5, Cl A2 | ||||||||
2.999%, 08/10/2044 | 42 | 42 | ||||||
GS Mortgage Securities Trust, Ser 2011-GC5, Cl XA, IO | ||||||||
1.572%, 08/10/2044 (C)(D) | 752 | 40 | ||||||
GS Mortgage Securities Trust, Ser 2012-GCJ7, Cl A2 | ||||||||
2.318%, 05/10/2045 | 367 | 368 | ||||||
GS Mortgage Securities Trust, Ser 2012-GCJ7, Cl AAB | ||||||||
2.935%, 05/10/2045 | 78 | 80 | ||||||
GS Mortgage Securities Trust, Ser 2013-GC16, Cl A1 | ||||||||
1.264%, 11/10/2046 | 20 | 20 | ||||||
GS Mortgage Securities Trust, Ser 2013-GC16, Cl B | ||||||||
5.161%, 11/10/2046 (C) | 180 | 208 | ||||||
GS Mortgage Securities Trust, Ser 2014-GC18, Cl AAB | ||||||||
3.648%, 01/10/2047 | 311 | 336 | ||||||
GS Mortgage Securities Trust, Ser 2014-GC20, Cl AAB | ||||||||
3.655%, 04/10/2047 | 400 | 433 | ||||||
GS Mortgage Securities Trust, Ser 2014-GC26, Cl B | ||||||||
4.215%, 11/10/2047 (C) | 680 | 741 | ||||||
GS Mortgage Securities Trust, Ser 2015-GC34, Cl AAB | ||||||||
3.278%, 10/10/2048 | 261 | 278 | ||||||
| 102 | SEI Institutional Managed Trust / Annual Report / September 30, 2016 |
| ||||||||
| Description | Face Amount (Thousands) | Market Value ($ Thousands) | ||||||
| ||||||||
MORTGAGE-BACKED SECURITIES (continued) |
| |||||||
GS Mortgage Securities Trust, Ser 2016-GS3, Cl AAB | ||||||||
2.777%, 10/10/2049 | $ | 342 | $ | 352 | ||||
GS Mortgage Securities Trust, Ser 2016-GS3, Cl A4 | ||||||||
2.850%, 10/10/2049 | 808 | 832 | ||||||
GSMPS Mortgage Loan Trust, Ser 1998-1, Cl A | ||||||||
8.000%, 09/19/2027 (C)(D) | 25 | 25 | ||||||
GSR Mortgage Loan Trust, Ser 2003-13, Cl 1A1 | ||||||||
2.797%, 10/25/2033 (C) | 341 | 344 | ||||||
GSR Mortgage Loan Trust, Ser 2005-AR4, Cl 3A5 | ||||||||
3.027%, 07/25/2035 (C) | 4,056 | 3,744 | ||||||
HarborView Mortgage Loan, Ser 2004-3, Cl 1A | ||||||||
2.834%, 05/19/2034 (C) | 1,912 | 1,892 | ||||||
Impac Secured Assets Trust, Ser 2006-5, Cl 2A | ||||||||
0.724%, 12/25/2036 (C) | 1,330 | 1,195 | ||||||
Impact Funding LLC, Ser 2010-1, Cl A1 | ||||||||
5.314%, 01/25/2051 (D) | 1,596 | 1,871 | ||||||
IndyMac IMSC Mortgage Loan Trust, Ser 2007-HOA1, Cl A22 | ||||||||
0.705%, 07/25/2047 (C) | 1,844 | 1,161 | ||||||
IndyMac INDX Mortgage Loan Trust, Ser 2007-AR7, Cl 2A1 | ||||||||
2.654%, 06/25/2037 (C) | 2,707 | 2,057 | ||||||
JPMBB Commercial Mortgage Securities Trust, Ser 2013-C14, Cl ASB | ||||||||
3.761%, 08/15/2046 (C) | 165 | 179 | ||||||
JPMBB Commercial Mortgage Securities Trust, Ser 2013-C15, Cl C | ||||||||
5.215%, 11/15/2045 (C) | 190 | 209 | ||||||
JPMBB Commercial Mortgage Securities Trust, Ser 2013-C15, Cl A2 | ||||||||
2.977%, 11/15/2045 | 214 | 220 | ||||||
JPMBB Commercial Mortgage Securities Trust, Ser 2013-C17, Cl B | ||||||||
5.050%, 01/15/2047 (C) | 100 | 113 | ||||||
JPMBB Commercial Mortgage Securities Trust, Ser 2014-C24, Cl AS | ||||||||
3.914%, 11/15/2047 (C) | 610 | 663 | ||||||
JPMBB Commercial Mortgage Securities Trust, Ser 2015-C28, Cl A3 | ||||||||
2.912%, 10/15/2048 | 774 | 798 | ||||||
JPMBB Commercial Mortgage Securities Trust, Ser 2015-C30, Cl AS | ||||||||
4.226%, 07/15/2048 (C) | 523 | 578 | ||||||
JPMBB Commercial Mortgage Securities Trust, Ser 2015-C31, Cl ASB | ||||||||
3.540%, 08/15/2048 | 177 | 191 | ||||||
JPMBB Commercial Mortgage Securities Trust, Ser 2016-C1, Cl ASB | ||||||||
3.316%, 03/15/2049 | 462 | 491 | ||||||
| ||||||||
| Description | Face Amount (Thousands) | Market Value ($ Thousands) | ||||||
| ||||||||
MORTGAGE-BACKED SECURITIES (continued) |
| |||||||
JPMDB Commercial Mortgage Securities Trust, Ser 2016-C2, Cl ASB | ||||||||
2.954%, 06/15/2049 | $ | 449 | $ | 468 | ||||
JPMorgan Chase Commercial Mortgage Securities Trust, Ser 2004-LN2, Cl A2 | ||||||||
5.115%, 07/15/2041 | 9 | 9 | ||||||
JPMorgan Chase Commercial Mortgage Securities Trust, Ser 2007-CB18, Cl AJ | ||||||||
5.502%, 06/12/2047 (C) | 1,495 | 1,198 | ||||||
JPMorgan Chase Commercial Mortgage Securities Trust, Ser 2007-CB19, Cl AJ | ||||||||
5.882%, 05/12/2017 (C) | 250 | 202 | ||||||
JPMorgan Chase Commercial Mortgage Securities Trust, Ser 2007-LDP12, Cl AJ | ||||||||
6.209%, 02/15/2051 (C) | 45 | 41 | ||||||
JPMorgan Chase Commercial Mortgage Securities Trust, Ser 2010-C2, Cl A2 | ||||||||
3.616%, 11/15/2043 (D) | 177 | 180 | ||||||
JPMorgan Chase Commercial Mortgage Securities Trust, Ser 2010-CNTR, Cl A2 | ||||||||
4.311%, 08/05/2032 (D) | 805 | 866 | ||||||
JPMorgan Chase Commercial Mortgage Securities Trust, Ser 2010-CNTR, Cl A1 | ||||||||
3.300%, 08/05/2032 (D) | 186 | 191 | ||||||
JPMorgan Chase Commercial Mortgage Securities Trust, Ser 2011-C3, Cl A2 | ||||||||
3.673%, 02/15/2046 (D) | 5 | 5 | ||||||
JPMorgan Chase Commercial Mortgage Securities Trust, Ser 2011-C3, Cl A3 | ||||||||
4.388%, 02/15/2046 (D) | 3,025 | 3,133 | ||||||
JPMorgan Chase Commercial Mortgage Securities Trust, Ser 2011-C4, Cl A3 | ||||||||
4.106%, 07/15/2046 (D) | 1,239 | 1,287 | ||||||
JPMorgan Chase Commercial Mortgage Securities Trust, Ser 2012-LC9, Cl A2 | ||||||||
1.677%, 12/15/2047 | 193 | 193 | ||||||
JPMorgan Chase Commercial Mortgage Securities Trust, Ser 2014-C20, Cl C | ||||||||
4.724%, 07/15/2047 (C) | 610 | 631 | ||||||
JPMorgan Chase Commercial Mortgage Securities Trust, Ser 2015-JP1, Cl ASB | ||||||||
3.733%, 01/15/2049 | 125 | 136 | ||||||
JPMorgan Chase Commercial Mortgage Securities Trust, Ser 2016-JP2, Cl ASB | ||||||||
2.713%, 09/15/2025 | 361 | 370 | ||||||
JPMorgan Chase Commercial Mortgage Securities Trust, Ser 2016-JP3, Cl A5 | ||||||||
2.870%, 08/15/2026 | 1,155 | 1,186 | ||||||
JPMorgan Chase Commercial Mortgage Securities, Ser 2013-C13, Cl ASB | ||||||||
3.414%, 01/15/2046 | 333 | 354 | ||||||
Liberty Street Trust, Ser 2016-225L, Cl A | ||||||||
3.597%, 02/10/2036 (D) | 650 | 702 | ||||||
| SEI Institutional Managed Trust / Annual Report / September 30, 2016 | 103 |
SCHEDULE OF INVESTMENTS
September 30, 2016
Core Fixed Income Fund (Continued)
| ||||||||
| Description | Face Amount (Thousands) | Market Value ($ Thousands) | ||||||
| ||||||||
MORTGAGE-BACKED SECURITIES (continued) |
| |||||||
LSTAR Commercial Mortgage Trust, Ser 2015-3, Cl A2 | ||||||||
2.729%, 04/20/2048 (C)(D) | $ | 1,750 | $ | 1,774 | ||||
MASTR Reperforming Loan Trust, Ser 2005-1, Cl 1A1 | ||||||||
6.000%, 08/25/2034 (D) | 1,750 | 1,660 | ||||||
Merrill Lynch Mortgage Investors Trust, Ser 2004-A1, Cl 4A | ||||||||
2.875%, 02/25/2034 (C) | 357 | 358 | ||||||
ML-CFC Commercial Mortgage Trust, Ser 2007-5, Cl AJ | ||||||||
5.450%, 08/12/2048 (C) | 840 | 679 | ||||||
ML-CFC Commercial Mortgage Trust, Ser 2007-5, Cl AJFL | ||||||||
5.450%, 08/12/2048 (C)(D) | 100 | 81 | ||||||
ML-CFC Commercial Mortgage Trust, Ser 2007-9, Cl AJ | ||||||||
6.193%, 09/12/2049 (C) | 1,200 | 912 | ||||||
Morgan Stanley Bank of America Merrill Lynch Trust, Ser 2013-C10, Cl A2 | ||||||||
2.964%, 06/15/2018 | 143 | 146 | ||||||
Morgan Stanley Bank of America Merrill Lynch Trust, Ser 2013-C10, Cl A1 | ||||||||
1.394%, 07/15/2046 | 122 | 123 | ||||||
Morgan Stanley Bank of America Merrill Lynch Trust, Ser 2013-C7, Cl AS | ||||||||
3.214%, 02/15/2046 | 83 | 86 | ||||||
Morgan Stanley Bank of America Merrill Lynch Trust, Ser 2013-C9, Cl A2 | ||||||||
1.970%, 05/15/2046 | 201 | 203 | ||||||
Morgan Stanley Bank of America Merrill Lynch Trust, Ser 2015-C21, Cl E | ||||||||
3.012%, 03/15/2048 (D) | 1,000 | 619 | ||||||
Morgan Stanley Bank of America Merrill Lynch Trust, Ser 2015-C22, Cl C | ||||||||
4.384%, 04/15/2048 (C) | 630 | 639 | ||||||
Morgan Stanley Bank of America Merrill Lynch Trust, Ser 2015-C23, Cl A3 | ||||||||
3.451%, 07/15/2050 | 137 | 148 | ||||||
Morgan Stanley Bank of America Merrill Lynch Trust, Ser 2016-C28, Cl ASB | ||||||||
3.288%, 01/15/2049 | 463 | 490 | ||||||
Morgan Stanley Bank of America Merrill Lynch Trust, Ser 2016-C28, Cl A3 | ||||||||
3.272%, 11/15/2025 | 404 | 430 | ||||||
Morgan Stanley Capital I Trust, Ser 2006-IQ12, Cl AJ | ||||||||
5.399%, 12/15/2043 | 790 | 590 | ||||||
Morgan Stanley Capital I Trust, Ser 2007-IQ16, Cl AJ | ||||||||
6.298%, 12/12/2049 (C) | 1,010 | 917 | ||||||
| ||||||||
| Description | Face Amount (Thousands) | Market Value ($ Thousands) | ||||||
| ||||||||
MORTGAGE-BACKED SECURITIES (continued) |
| |||||||
Morgan Stanley Capital I Trust, Ser 2011-C2, Cl A2 | ||||||||
3.476%, 06/15/2044 (D) | $ | 79 | $ | 79 | ||||
Morgan Stanley Capital I Trust, Ser 2016-UB11, Cl ASB | ||||||||
2.606%, 01/15/2021 | 258 | 264 | ||||||
Morgan Stanley Capital I Trust, Ser 2016-UB11, Cl A1 | ||||||||
1.445%, 04/15/2021 | 576 | 575 | ||||||
Morgan Stanley Capital I Trust, Ser 2016-UBS9, Cl A1 | ||||||||
1.711%, 03/15/2049 | 320 | 320 | ||||||
Motel 6 Trust, Ser 2015-MTL6, Cl F | ||||||||
5.000%, 02/05/2030 (D) | 1,470 | 1,416 | ||||||
Nomura Resecuritization Trust, Ser 2015-6R, Cl 3A5 | ||||||||
0.678%, 05/26/2046 (C)(D) | 3,440 | 2,021 | ||||||
OBP Depositor Trust, Ser 2010-OBP, Cl A | ||||||||
4.646%, 07/15/2045 (D) | 560 | 610 | ||||||
Prime Mortgage Trust, Ser 2006-DR1, Cl 2A1 | ||||||||
5.500%, 05/25/2035 (D) | 1,435 | 1,332 | ||||||
RAMP Trust, Ser 2004-SL1, Cl A8 | ||||||||
6.500%, 11/25/2031 | 129 | 130 | ||||||
RBS Commercial Funding Trust, Ser 2013-1A, Cl A | ||||||||
3.961%, 01/13/2032 (C)(D) | 640 | 701 | ||||||
Residential Asset Securitization Trust, Ser 2004-A6, Cl A1 | ||||||||
5.000%, 08/25/2019 | 57 | 57 | ||||||
Residential Asset Securitization Trust, Ser 2004-IP2, Cl 2A1 | ||||||||
2.989%, 12/25/2034 (C) | 360 | 359 | ||||||
Structured Asset Securities, Ser 2005-17, Cl 5A1 | ||||||||
5.500%, 10/25/2035 | 906 | 736 | ||||||
Trust Company of the West, Ser 1060 | ||||||||
2.600%, 10/28/2031 | 1,370 | 1,374 | ||||||
Trust Company of the West, Ser 1063 | ||||||||
2.610%, 11/28/2028 | 1,355 | 1,379 | ||||||
UBS-Barclays Commercial Mortgage Trust, Ser 2012-C2, Cl A2 | ||||||||
2.113%, 05/10/2063 | 365 | 367 | ||||||
UBS-Barclays Commercial Mortgage Trust, Ser 2012-C4, Cl A2 | ||||||||
1.712%, 12/10/2017 | 362 | 363 | ||||||
UBS-Barclays Commercial Mortgage Trust, Ser 2012-C4, Cl D | ||||||||
4.649%, 12/10/2045 (C)(D) | 670 | 662 | ||||||
VNDO Mortgage Trust, Ser 2012-6AVE, Cl A | ||||||||
2.996%, 11/15/2030 (D) | 110 | 115 | ||||||
WaMu Mortgage Pass-Through Certificates Trust, Ser 2007-OA1, Cl A1A | ||||||||
1.189%, 02/25/2047 (C) | 2,928 | 2,268 | ||||||
| 104 | SEI Institutional Managed Trust / Annual Report / September 30, 2016 |
| ||||||||
| Description | Face Amount (Thousands) | Market Value ($ Thousands) | ||||||
| ||||||||
MORTGAGE-BACKED SECURITIES (continued) |
| |||||||
Washington Mutual Mortgage Pass-Through Certificates Trust, Ser 2007-OA2, Cl 2A | ||||||||
1.189%, 01/25/2047 (C) | $ | 1,784 | $ | 1,286 | ||||
Washington Mutual MSC Mortgage Pass-Through Certificates, Ser 2003-MS1, Cl 1A | ||||||||
5.000%, 02/25/2018 | 17 | 17 | ||||||
Waterfall Commercial Mortgage Trust, Ser 2015-SBC5, Cl A | ||||||||
4.104%, 09/19/2022 (C)(D) | 2,404 | 2,377 | ||||||
Wells Fargo Commercial Mortgage Trust, Ser 2013-LC12, Cl B | ||||||||
4.433%, 07/15/2046 (C) | 20 | 22 | ||||||
Wells Fargo Mortgage-Backed Securities Trust, Ser 2004-H, Cl A1 | ||||||||
3.052%, 06/25/2034 (C) | 701 | 701 | ||||||
WFRBS Commercial Mortgage Trust, Ser 2011-C3, Cl XA, IO | ||||||||
1.542%, 03/15/2044 (C)(D) | 7,580 | 351 | ||||||
WFRBS Commercial Mortgage Trust, Ser 2011-C4, Cl A3 | ||||||||
4.394%, 06/15/2044 (D) | 1,813 | 1,888 | ||||||
WFRBS Commercial Mortgage Trust, Ser 2012-C7, Cl XA, IO | ||||||||
1.661%, 06/15/2045 (C)(D) | 339 | 22 | ||||||
WFRBS Commercial Mortgage Trust, Ser 2014-C19, Cl B | ||||||||
4.723%, 03/15/2047 (C) | 110 | 123 | ||||||
|
| |||||||
| 123,354 | ||||||||
|
| |||||||
Total Mortgage-Backed Securities | 648,884 | |||||||
|
| |||||||
CORPORATE OBLIGATIONS — 27.6% |
| |||||||
Consumer Discretionary — 1.9% |
| |||||||
1011778 BC ULC / New Red Finance | ||||||||
6.000%, 04/01/2022 (D) | 390 | 408 | ||||||
21st Century Fox America | ||||||||
6.650%, 11/15/2037 | 180 | 237 | ||||||
6.200%, 12/15/2034 | 65 | 82 | ||||||
Altice Financing | ||||||||
6.625%, 02/15/2023 (D) | 400 | 410 | ||||||
Amazon.com | ||||||||
4.950%, 12/05/2044 | 360 | 438 | ||||||
American Axle & Manufacturing | ||||||||
6.625%, 10/15/2022 (E) | 380 | 402 | ||||||
American Honda Finance MTN | ||||||||
3.875%, 09/21/2020 (D) | 1,065 | 1,155 | ||||||
BMW US Capital | ||||||||
2.800%, 04/11/2026 (D) | 555 | 566 | ||||||
CCO Holdings | ||||||||
5.875%, 04/01/2024 (D) | 70 | 75 | ||||||
| ||||||||
| Description | Face Amount (Thousands) | Market Value ($ Thousands) | ||||||
| ||||||||
CORPORATE OBLIGATIONS (continued) |
| |||||||
Charter Communications Operating | ||||||||
6.484%, 10/23/2045 (D) | $ | 949 | $ | 1,148 | ||||
6.384%, 10/23/2035 (D) | 100 | 118 | ||||||
4.908%, 07/23/2025 (D) | 40 | 44 | ||||||
4.464%, 07/23/2022 (D) | 1,700 | 1,834 | ||||||
Comcast | ||||||||
6.950%, 08/15/2037 (E) | 450 | 656 | ||||||
6.550%, 07/01/2039 | 270 | 383 | ||||||
6.400%, 03/01/2040 | 150 | 210 | ||||||
4.400%, 08/15/2035 | 315 | 357 | ||||||
4.200%, 08/15/2034 | 200 | 221 | ||||||
3.375%, 02/15/2025 | 310 | 332 | ||||||
Cox Communications | ||||||||
4.800%, 02/01/2035 (D) | 115 | 114 | ||||||
4.700%, 12/15/2042 (D) | 10 | 9 | ||||||
Daimler Finance North America LLC | ||||||||
2.375%, 08/01/2018 (D) | 735 | 746 | ||||||
1.125%, 03/10/2017 (D) | 975 | 975 | ||||||
Discovery Communications | ||||||||
4.900%, 03/11/2026 | 400 | 435 | ||||||
4.875%, 04/01/2043 | 155 | 148 | ||||||
DISH DBS | ||||||||
6.750%, 06/01/2021 | 80 | 86 | ||||||
5.875%, 07/15/2022 | 250 | 257 | ||||||
5.875%, 11/15/2024 | 600 | 593 | ||||||
Dollar Tree | ||||||||
5.750%, 03/01/2023 (E) | 240 | 258 | ||||||
ERAC USA Finance | ||||||||
3.300%, 12/01/2026 (D) | 645 | 664 | ||||||
Fiat Chrysler Automobiles | ||||||||
4.500%, 04/15/2020 (E) | 200 | 206 | ||||||
Ford Motor | ||||||||
4.750%, 01/15/2043 | 260 | 269 | ||||||
Ford Motor Credit | ||||||||
5.875%, 08/02/2021 | 230 | 263 | ||||||
3.200%, 01/15/2021 | 770 | 791 | ||||||
Ford Motor Credit LLC | ||||||||
3.219%, 01/09/2022 | 480 | 493 | ||||||
2.597%, 11/04/2019 | 775 | 787 | ||||||
General Motors | ||||||||
6.600%, 04/01/2036 | 670 | 806 | ||||||
6.250%, 10/02/2043 | 100 | 118 | �� | |||||
5.000%, 04/01/2035 | 305 | 316 | ||||||
General Motors Financial | ||||||||
5.250%, 03/01/2026 | 655 | 719 | ||||||
4.750%, 08/15/2017 | 1,000 | 1,027 | ||||||
4.375%, 09/25/2021 | 180 | 192 | ||||||
4.250%, 05/15/2023 | 110 | 114 | ||||||
4.200%, 03/01/2021 | 1,145 | 1,205 | ||||||
3.700%, 05/09/2023 | 830 | 844 | ||||||
3.450%, 04/10/2022 | 540 | 548 | ||||||
3.250%, 05/15/2018 | 60 | 61 | ||||||
| SEI Institutional Managed Trust / Annual Report / September 30, 2016 | 105 |
SCHEDULE OF INVESTMENTS
September 30, 2016
Core Fixed Income Fund (Continued)
| ||||||||
| Description | Face Amount (Thousands) | Market Value ($ Thousands) | ||||||
| ||||||||
CORPORATE OBLIGATIONS (continued) |
| |||||||
Goodyear Tire & Rubber | ||||||||
5.125%, 11/15/2023 | $ | 300 | $ | 313 | ||||
5.000%, 05/31/2026 | 140 | 144 | ||||||
Grupo Televisa | ||||||||
6.125%, 01/31/2046 | 255 | 279 | ||||||
5.000%, 05/13/2045 | 270 | 258 | ||||||
Hyundai Capital America | ||||||||
2.125%, 10/02/2017 (D) | 270 | 271 | ||||||
L Brands | ||||||||
5.625%, 10/15/2023 | 110 | 123 | ||||||
McDonald’s MTN | ||||||||
4.875%, 12/09/2045 | 630 | 731 | ||||||
3.700%, 01/30/2026 | 324 | 349 | ||||||
2.750%, 12/09/2020 | 285 | 296 | ||||||
NBCUniversal Media | ||||||||
4.375%, 04/01/2021 (E) | 270 | 300 | ||||||
NCL | ||||||||
4.625%, 11/15/2020 (D) | 310 | 310 | ||||||
Netflix | ||||||||
5.875%, 02/15/2025 | 110 | 119 | ||||||
5.500%, 02/15/2022 | 50 | 54 | ||||||
Newell Brands | ||||||||
5.500%, 04/01/2046 | 267 | 324 | ||||||
4.200%, 04/01/2026 | 530 | 577 | ||||||
3.850%, 04/01/2023 | 340 | 362 | ||||||
3.150%, 04/01/2021 | 170 | 177 | ||||||
QVC | ||||||||
5.950%, 03/15/2043 | 20 | 19 | ||||||
Scripps Networks Interactive | ||||||||
3.900%, 11/15/2024 | 225 | 236 | ||||||
3.500%, 06/15/2022 | 255 | 266 | ||||||
2.800%, 06/15/2020 | 290 | 297 | ||||||
SFR Group | ||||||||
7.375%, 05/01/2026 (D) | 600 | 613 | ||||||
Taylor Morrison Communities | ||||||||
5.250%, 04/15/2021 (D)(E) | 460 | 475 | ||||||
Time Warner | ||||||||
7.700%, 05/01/2032 | 1,010 | 1,436 | ||||||
6.250%, 03/29/2041 | 265 | 341 | ||||||
4.750%, 03/29/2021 | 730 | 818 | ||||||
3.550%, 06/01/2024 | 1,365 | 1,450 | ||||||
Time Warner Cable | ||||||||
8.250%, 04/01/2019 | 2,265 | 2,608 | ||||||
7.300%, 07/01/2038 | 190 | 243 | ||||||
6.550%, 05/01/2037 | 635 | 753 | ||||||
5.875%, 11/15/2040 | 370 | 411 | ||||||
Time Warner Entertainment | ||||||||
8.375%, 07/15/2033 | 270 | 368 | ||||||
Toyota Motor Credit MTN | ||||||||
1.250%, 10/05/2017 | 1,150 | 1,151 | ||||||
United Business Media | ||||||||
5.750%, 11/03/2020 (D) | 490 | 531 | ||||||
| ||||||||
| Description | Face Amount (Thousands) | Market Value ($ Thousands) | ||||||
| ||||||||
CORPORATE OBLIGATIONS (continued) |
| |||||||
Viacom | ||||||||
4.850%, 12/15/2034 | $ | 290 | $ | 296 | ||||
4.250%, 09/01/2023 | 100 | 106 | ||||||
3.875%, 04/01/2024 | 100 | 103 | ||||||
3.450%, 10/04/2026 | 230 | 229 | ||||||
2.250%, 02/04/2022 | 350 | 349 | ||||||
Volkswagen International Finance | ||||||||
1.125%, 11/18/2016 (D)
|
| 1,115
|
|
| 1,115
|
| ||
|
| |||||||
| 41,321 | ||||||||
|
| |||||||
Consumer Staples — 2.1% |
| |||||||
Altria Group | ||||||||
9.250%, 08/06/2019 | 1,250 | 1,519 | ||||||
5.375%, 01/31/2044 | 110 | 139 | ||||||
4.750%, 05/05/2021 | 720 | 814 | ||||||
2.850%, 08/09/2022 | 260 | 271 | ||||||
Anheuser-Busch InBev Finance | ||||||||
4.900%, 02/01/2046 | 3,535 | 4,206 | ||||||
3.650%, 02/01/2026 | 4,043 | 4,342 | ||||||
3.300%, 02/01/2023 | 1,830 | 1,932 | ||||||
2.650%, 02/01/2021 | 410 | 423 | ||||||
Anheuser-Busch InBev Worldwide | ||||||||
5.375%, 01/15/2020 | 1,140 | 1,273 | ||||||
5.000%, 04/15/2020 | 430 | 478 | ||||||
2.500%, 07/15/2022 | 330 | 337 | ||||||
Anheuser-Busch LLC | ||||||||
5.050%, 10/15/2016 | 940 | 941 | ||||||
Coca-Cola | ||||||||
1.550%, 09/01/2021 | 375 | 374 | ||||||
Coca-Cola Femsa | ||||||||
2.375%, 11/26/2018 | 680 | 692 | ||||||
CVS Health | ||||||||
5.125%, 07/20/2045 | 1,810 | 2,215 | ||||||
3.875%, 07/20/2025 | 266 | 290 | ||||||
3.500%, 07/20/2022 | 100 | 107 | ||||||
Diageo Capital PLC | ||||||||
4.828%, 07/15/2020 | 1,450 | 1,620 | ||||||
Kraft Heinz Foods | ||||||||
6.500%, 02/09/2040 | 225 | 302 | ||||||
5.375%, 02/10/2020 | 455 | 508 | ||||||
5.200%, 07/15/2045 | 60 | 71 | ||||||
5.000%, 07/15/2035 | 270 | 312 | ||||||
4.375%, 06/01/2046 | 1,080 | 1,143 | ||||||
3.950%, 07/15/2025 | 700 | 757 | ||||||
3.500%, 06/06/2022 | 1,150 | 1,222 | ||||||
3.500%, 07/15/2022 | 500 | 531 | ||||||
3.000%, 06/01/2026 | 540 | 544 | ||||||
2.800%, 07/02/2020 | 875 | 907 | ||||||
1.600%, 06/30/2017 | 1,018 | 1,020 | ||||||
Kroger | ||||||||
2.950%, 11/01/2021 | 375 | 391 | ||||||
| 106 | SEI Institutional Managed Trust / Annual Report / September 30, 2016 |
| ||||||||
| Description | Face Amount (Thousands) | Market Value ($ Thousands) | ||||||
| ||||||||
CORPORATE OBLIGATIONS (continued) |
| |||||||
Molson Coors Brewing | ||||||||
3.500%, 05/01/2022 | $ | 100 | $ | 107 | ||||
3.000%, 07/15/2026 | 775 | 780 | ||||||
Mondelez International | ||||||||
4.000%, 02/01/2024 | 360 | 395 | ||||||
PepsiCo | ||||||||
4.000%, 03/05/2042 | 110 | 120 | ||||||
Pernod Ricard | ||||||||
4.450%, 01/15/2022 (D) | 180 | 199 | ||||||
2.950%, 01/15/2017 (D) | 360 | 361 | ||||||
Philip Morris International | ||||||||
4.500%, 03/20/2042 | 130 | 147 | ||||||
4.250%, 11/10/2044 | 360 | 399 | ||||||
2.900%, 11/15/2021 | 370 | 388 | ||||||
2.500%, 08/22/2022 | 340 | 349 | ||||||
2.125%, 05/10/2023 (E) | 480 | 479 | ||||||
Reynolds American | ||||||||
8.125%, 06/23/2019 | 20 | 23 | ||||||
5.850%, 08/15/2045 | 1,580 | 2,054 | ||||||
5.700%, 08/15/2035 | 275 | 340 | ||||||
3.250%, 06/12/2020 | 162 | 170 | ||||||
Skandinaviska Enskilda Banken | ||||||||
1.875%, 09/13/2021 | 820 | 814 | ||||||
Spectrum Brands | ||||||||
5.750%, 07/15/2025 | 130 | 141 | ||||||
Tyson Foods | ||||||||
5.150%, 08/15/2044 | 130 | 153 | ||||||
Walgreens Boots Alliance | ||||||||
4.800%, 11/18/2044 | 470 | 518 | ||||||
3.450%, 06/01/2026 | 2,530 | 2,626 | ||||||
3.300%, 11/18/2021 | 590 | 624 | ||||||
Wal-Mart Stores | ||||||||
4.300%, 04/22/2044 | 855 | 1,004 | ||||||
Wm Wrigley Jr | ||||||||
3.375%, 10/21/2020 (D) | 765 | 810 | ||||||
2.900%, 10/21/2019 (D) | 1,119 | 1,158 | ||||||
2.400%, 10/21/2018 (D) | 430 | 437 | ||||||
2.000%, 10/20/2017 (D) | 205 | 206 | ||||||
|
| |||||||
| 44,483 | ||||||||
|
| |||||||
Energy — 3.0% |
| |||||||
Anadarko Finance, Ser B | ||||||||
7.500%, 05/01/2031 (E) | 810 | 1,003 | ||||||
Anadarko Petroleum | ||||||||
6.450%, 09/15/2036 | 30 | 35 | ||||||
4.850%, 03/15/2021 | 190 | 204 | ||||||
4.500%, 07/15/2044 | 400 | 367 | ||||||
Apache | ||||||||
5.100%, 09/01/2040 | 80 | 83 | ||||||
4.250%, 01/15/2044 | 950 | 923 | ||||||
BG Energy Capital PLC | ||||||||
4.000%, 10/15/2021 (D) | 910 | 995 | ||||||
| ||||||||
| Description | Face Amount (Thousands) | Market Value ($ Thousands) | ||||||
| ||||||||
CORPORATE OBLIGATIONS (continued) |
| |||||||
BP Capital Markets PLC | ||||||||
3.561%, 11/01/2021 | $ | 50 | $ | 54 | ||||
3.506%, 03/17/2025 | 530 | 562 | ||||||
3.245%, 05/06/2022 (E) | 160 | 169 | ||||||
3.119%, 05/04/2026 | 100 | 102 | ||||||
Chesapeake Energy | ||||||||
5.750%, 03/15/2023 | 70 | 60 | ||||||
Chevron | ||||||||
2.954%, 05/16/2026 | 1,060 | 1,095 | ||||||
2.100%, 05/16/2021 | 1,355 | 1,377 | ||||||
1.561%, 05/16/2019 | 756 | 760 | ||||||
Cimarex Energy | ||||||||
4.375%, 06/01/2024 | 345 | 360 | ||||||
CNOOC Finance | ||||||||
3.500%, 05/05/2025 | 1,370 | 1,410 | ||||||
Concho Resources | ||||||||
5.500%, 10/01/2022 | 130 | 135 | ||||||
5.500%, 04/01/2023 | 60 | 62 | ||||||
Conoco Funding | ||||||||
7.250%, 10/15/2031 | 50 | 66 | ||||||
ConocoPhillips | ||||||||
5.900%, 10/15/2032 | 10 | 12 | ||||||
5.900%, 05/15/2038 | 420 | 503 | ||||||
4.150%, 11/15/2034 | 630 | 629 | ||||||
Devon Energy | ||||||||
5.850%, 12/15/2025 (E) | 450 | 506 | ||||||
5.600%, 07/15/2041 | 380 | 383 | ||||||
5.000%, 06/15/2045 | 580 | 564 | ||||||
3.250%, 05/15/2022 (E) | 270 | 268 | ||||||
Devon Financing LLC | ||||||||
7.875%, 09/30/2031 | 260 | 322 | ||||||
Ecopetrol | ||||||||
5.875%, 05/28/2045 | 1,290 | 1,183 | ||||||
Enbridge Energy Partners | ||||||||
5.875%, 10/15/2025 | 750 | 862 | ||||||
Energy Transfer Partners | ||||||||
8.250%, 11/15/2029 | 1,315 | 1,604 | ||||||
6.125%, 12/15/2045 | 845 | 883 | ||||||
4.750%, 01/15/2026 | 255 | 263 | ||||||
2.500%, 06/15/2018 | 460 | 463 | ||||||
Ensco | ||||||||
4.700%, 03/15/2021 (E) | 170 | 153 | ||||||
Enterprise Products Operating LLC | ||||||||
6.450%, 09/01/2040 | 65 | 79 | ||||||
5.950%, 02/01/2041 | 105 | 122 | ||||||
5.100%, 02/15/2045 | 215 | 231 | ||||||
EOG Resources | ||||||||
4.150%, 01/15/2026 | 399 | 436 | ||||||
Exxon Mobil | ||||||||
4.114%, 03/01/2046 | 476 | 532 | ||||||
3.043%, 03/01/2026 | 500 | 524 | ||||||
| SEI Institutional Managed Trust / Annual Report / September 30, 2016 | 107 |
SCHEDULE OF INVESTMENTS
September 30, 2016
Core Fixed Income Fund (Continued)
| ||||||||
| Description | Face Amount (Thousands) | Market Value ($ Thousands) | ||||||
| ||||||||
CORPORATE OBLIGATIONS (continued) |
| |||||||
Florida Gas Transmission LLC | ||||||||
7.900%, 05/15/2019 (D) | $ | 1,000 | $ | 1,134 | ||||
Gulfstream Natural Gas System | ||||||||
5.950%, 10/15/2045 (D) | 190 | 209 | ||||||
Halliburton | ||||||||
5.000%, 11/15/2045 | 722 | 788 | ||||||
4.850%, 11/15/2035 | 60 | 64 | ||||||
3.800%, 11/15/2025 | 540 | 558 | ||||||
Hess | ||||||||
5.800%, 04/01/2047 | 345 | 353 | ||||||
Kerr-McGee | ||||||||
7.875%, 09/15/2031 | 430 | 533 | ||||||
Kinder Morgan | ||||||||
5.550%, 06/01/2045 | 555 | 569 | ||||||
5.300%, 12/01/2034 | 115 | 115 | ||||||
4.300%, 06/01/2025 | 1,635 | 1,699 | ||||||
Magellan Midstream Partners | ||||||||
5.000%, 03/01/2026 | 185 | 211 | ||||||
Marathon Petroleum | ||||||||
5.850%, 12/15/2045 | 205 | 208 | ||||||
5.000%, 09/15/2054 | 55 | 48 | ||||||
MPLX | ||||||||
5.500%, 02/15/2023 | 320 | 331 | ||||||
4.875%, 12/01/2024 | 320 | 331 | ||||||
4.875%, 06/01/2025 | 110 | 114 | ||||||
Noble Energy | ||||||||
6.000%, 03/01/2041 | 170 | 184 | ||||||
5.250%, 11/15/2043 | 180 | 183 | ||||||
4.150%, 12/15/2021 | 690 | 734 | ||||||
3.900%, 11/15/2024 | 500 | 510 | ||||||
Oasis Petroleum | ||||||||
6.875%, 03/15/2022 | 20 | 19 | ||||||
6.500%, 11/01/2021 | 70 | 67 | ||||||
Occidental Petroleum | ||||||||
4.625%, 06/15/2045 | 150 | 170 | ||||||
3.400%, 04/15/2026 | 270 | 285 | ||||||
3.125%, 02/15/2022 | 330 | 346 | ||||||
Panhandle Eastern Pipeline | ||||||||
8.125%, 06/01/2019 | 2,500 | 2,803 | ||||||
Petrobras Global Finance | ||||||||
6.850%, 06/05/2115 | 620 | 525 | ||||||
6.250%, 03/17/2024 | 720 | 700 | ||||||
5.750%, 01/20/2020 | 574 | 591 | ||||||
Petrobras International Finance | ||||||||
5.375%, 01/27/2021 | 1,090 | 1,078 | ||||||
Petro-Canada | ||||||||
6.800%, 05/15/2038 | 915 | 1,201 | ||||||
Petroleos Mexicanos | ||||||||
6.625%, 06/15/2035 | 1,667 | 1,697 | ||||||
6.375%, 01/23/2045 | 820 | 783 | ||||||
5.500%, 06/27/2044 | 90 | 78 | ||||||
2.460%, 12/15/2025 | 1,121 | 1,151 | ||||||
| ||||||||
| Description | Face Amount (Thousands) | Market Value ($ Thousands) | ||||||
| ||||||||
CORPORATE OBLIGATIONS (continued) |
| |||||||
2.378%, 04/15/2025 | $ | 594 | $ | 608 | ||||
Petroleos Mexicanos MTN | ||||||||
6.875%, 08/04/2026 (D) | 345 | 389 | ||||||
6.750%, 09/21/2047 (D) | 435 | 435 | ||||||
5.625%, 01/23/2046 | 405 | 353 | ||||||
Pride International | ||||||||
8.500%, 06/15/2019 (E) | 170 | 185 | ||||||
6.875%, 08/15/2020 | 80 | 79 | ||||||
QEP Resources | ||||||||
6.875%, 03/01/2021 (E) | 340 | 354 | ||||||
Range Resources | ||||||||
5.000%, 03/15/2023 (D)(E) | 680 | 668 | ||||||
4.875%, 05/15/2025 | 30 | 29 | ||||||
Regency Energy Partners | ||||||||
4.500%, 11/01/2023 | 690 | 695 | ||||||
Sabine Pass Liquefaction | ||||||||
5.750%, 05/15/2024 | 220 | 237 | ||||||
5.000%, 03/15/2027 (D) | 365 | 374 | ||||||
Schlumberger Holdings | ||||||||
4.000%, 12/21/2025 (D) | 330 | 359 | ||||||
3.000%, 12/21/2020 (D) | 1,690 | 1,762 | ||||||
SESI LLC | ||||||||
7.125%, 12/15/2021 | 60 | 59 | ||||||
Shelf Drilling Holdings | ||||||||
8.625%, 11/01/2018 (D) | 40 | 32 | ||||||
Shell International Finance | ||||||||
4.375%, 03/25/2020 | 690 | 753 | ||||||
4.375%, 05/11/2045 | 280 | 302 | ||||||
4.125%, 05/11/2035 | 2,120 | 2,274 | ||||||
4.000%, 05/10/2046 | 637 | 652 | ||||||
3.750%, 09/12/2046 | 310 | 306 | ||||||
3.400%, 08/12/2023 | 595 | 635 | ||||||
2.875%, 05/10/2026 | 1,355 | 1,375 | ||||||
2.500%, 09/12/2026 | 105 | 103 | ||||||
Sinopec Group Overseas Development | ||||||||
4.375%, 04/10/2024 (D) | 860 | 951 | ||||||
2.750%, 05/17/2017 (D) | 490 | 494 | ||||||
SM Energy | ||||||||
5.000%, 01/15/2024 (E) | 70 | 66 | ||||||
Southern Natural Gas LLC | ||||||||
8.000%, 03/01/2032 | 170 | 218 | ||||||
Spectra Energy Partners | ||||||||
4.500%, 03/15/2045 | 800 | 802 | ||||||
Statoil | ||||||||
3.700%, 03/01/2024 | 355 | 386 | ||||||
TC PipeLines | ||||||||
4.650%, 06/15/2021 | 160 | 168 | ||||||
Tennessee Gas Pipeline LLC | ||||||||
8.375%, 06/15/2032 | 1,638 | 2,042 | ||||||
Total Capital International | ||||||||
2.875%, 02/17/2022 | 850 | 892 | ||||||
| 108 | SEI Institutional Managed Trust / Annual Report / September 30, 2016 |
| ||||||||
| Description | Face Amount (Thousands) | Market Value ($ Thousands) | ||||||
| ||||||||
CORPORATE OBLIGATIONS (continued) |
| |||||||
TransCanada PipeLines | ||||||||
4.625%, 03/01/2034 | $ | 815 | $ | 899 | ||||
Transcontinental Gas Pipe Line | ||||||||
7.850%, 02/01/2026 (D) | 1,060 | 1,374 | ||||||
Valero Energy | ||||||||
3.400%, 09/15/2026 | 580 | 576 | ||||||
Williams | ||||||||
7.875%, 09/01/2021 | 495 | 573 | ||||||
7.750%, 06/15/2031 | 861 | 984 | ||||||
Williams Partners | ||||||||
6.125%, 07/15/2022 | 680 | 706 | ||||||
5.100%, 09/15/2045 | 65 | 63 | ||||||
4.875%, 03/15/2024 | 100 | 101 | ||||||
4.000%, 09/15/2025 | 220 | 220 | ||||||
WPX Energy | ||||||||
6.000%, 01/15/2022 | 60 | 60 | ||||||
|
| |||||||
| 65,307 | ||||||||
|
| |||||||
Financials — 9.4% |
| |||||||
ABN AMRO Bank | ||||||||
4.750%, 07/28/2025 (D) | 360 | 378 | ||||||
Allstate | ||||||||
3.150%, 06/15/2023 | 555 | 588 | ||||||
Ally Financial | ||||||||
7.500%, 09/15/2020 | 626 | 712 | ||||||
American Express Credit MTN | ||||||||
2.250%, 08/15/2019 | 1,025 | 1,046 | ||||||
American International Group | ||||||||
6.250%, 05/01/2036 | 335 | 413 | ||||||
6.250%, 03/15/2037 (C) | 1,220 | 1,287 | ||||||
3.900%, 04/01/2026 | 944 | 999 | ||||||
Bank of America | ||||||||
6.250%, 09/29/2049 (C) | 720 | 750 | ||||||
6.000%, 09/01/2017 | 680 | 707 | ||||||
5.750%, 12/01/2017 | 305 | 320 | ||||||
5.700%, 05/02/2017 | 1,300 | 1,331 | ||||||
5.420%, 03/15/2017 | 4,300 | 4,374 | ||||||
3.875%, 03/22/2017 | 280 | 283 | ||||||
Bank of America MTN | ||||||||
8.950%, 05/18/2017 (C) | 1,790 | 1,693 | ||||||
8.680%, 05/02/2017 (C) | 3,160 | 2,981 | ||||||
5.650%, 05/01/2018 | 270 | 286 | ||||||
5.625%, 07/01/2020 | 110 | 123 | ||||||
5.000%, 01/21/2044 | 600 | 706 | ||||||
4.450%, 03/03/2026 | 1,647 | 1,768 | ||||||
4.200%, 08/26/2024 | 830 | 879 | ||||||
4.000%, 04/01/2024 | 3,310 | 3,567 | ||||||
4.000%, 01/22/2025 | 875 | 907 | ||||||
3.875%, 08/01/2025 | 580 | 620 | ||||||
3.500%, 04/19/2026 | 60 | 62 | ||||||
3.300%, 01/11/2023 | 160 | 166 | ||||||
2.625%, 04/19/2021 | 2,365 | 2,403 | ||||||
| ||||||||
| Description | Face Amount (Thousands) | Market Value �� ($ Thousands) | ||||||
| ||||||||
CORPORATE OBLIGATIONS (continued) |
| |||||||
2.600%, 01/15/2019 | $ | 670 | $ | 683 | ||||
Bank of New York Mellon MTN | ||||||||
2.450%, 08/17/2026 | 715 | 711 | ||||||
2.200%, 03/04/2019 | 630 | 642 | ||||||
2.200%, 08/16/2023 | 955 | 952 | ||||||
Bank of New York Mellon | ||||||||
3.400%, 05/15/2024 | 1,865 | 1,996 | ||||||
Barclays Bank PLC MTN | ||||||||
6.050%, 12/04/2017 (D) | 420 | 439 | ||||||
Bear Stearns | ||||||||
6.400%, 10/02/2017 | 70 | 73 | ||||||
4.650%, 07/02/2018 | 995 | 1,049 | ||||||
Berkshire Hathaway | ||||||||
4.500%, 02/11/2043 | 600 | 695 | ||||||
3.125%, 03/15/2026 | 1,805 | 1,897 | ||||||
Berkshire Hathaway Finance | ||||||||
4.400%, 05/15/2042 | 1,000 | 1,135 | ||||||
BNP Paribas MTN | ||||||||
2.375%, 09/14/2017 | 320 | 322 | ||||||
Boeing Capital | ||||||||
4.700%, 10/27/2019 | 490 | 539 | ||||||
BPCE | ||||||||
5.150%, 07/21/2024 (D) | 210 | 221 | ||||||
Capital One Bank USA | ||||||||
1.150%, 11/21/2016 | 1,000 | 1,000 | ||||||
Capital One Financial | ||||||||
4.200%, 10/29/2025 | 526 | 549 | ||||||
3.750%, 07/28/2026 | 365 | 366 | ||||||
Chase Capital VI | ||||||||
1.382%, 08/01/2028 (C) | 1,750 | 1,538 | ||||||
Chubb INA Holdings | ||||||||
4.350%, 11/03/2045 | 405 | 468 | ||||||
3.350%, 05/03/2026 | 734 | 786 | ||||||
2.300%, 11/03/2020 | 160 | 164 | ||||||
CIT Group | ||||||||
5.000%, 08/15/2022 | 120 | 127 | ||||||
5.000%, 08/01/2023 | 450 | 476 | ||||||
Citigroup | ||||||||
8.125%, 07/15/2039 | 69 | 108 | ||||||
6.675%, 09/13/2043 | 70 | 92 | ||||||
6.625%, 06/15/2032 | 100 | 124 | ||||||
6.300%, 12/29/2049 (C) | 520 | 534 | ||||||
5.950%, 12/29/2049 (C) | 360 | 373 | ||||||
5.950%, 12/31/2049 (C) | 1,250 | 1,275 | ||||||
5.900%, 12/29/2049 (C) | 140 | 145 | ||||||
5.500%, 09/13/2025 | 750 | 855 | ||||||
5.350%, 05/29/2049 (C) | 390 | 385 | ||||||
5.300%, 05/06/2044 | 180 | 202 | ||||||
4.650%, 07/30/2045 | 810 | 914 | ||||||
4.600%, 03/09/2026 | 555 | 593 | ||||||
4.450%, 09/29/2027 | 1,915 | 2,004 | ||||||
4.400%, 06/10/2025 | 810 | 858 | ||||||
| SEI Institutional Managed Trust / Annual Report / September 30, 2016 | 109 |
SCHEDULE OF INVESTMENTS
September 30, 2016
Core Fixed Income Fund (Continued)
| ||||||||
| Description | Face Amount (Thousands) | Market Value ($ Thousands) | ||||||
| ||||||||
CORPORATE OBLIGATIONS (continued) |
| |||||||
4.300%, 11/20/2026 | $ | 180 | $ | 189 | ||||
4.050%, 07/30/2022 | 70 | 74 | ||||||
3.700%, 01/12/2026 | 905 | 955 | ||||||
3.500%, 05/15/2023 | 500 | 514 | ||||||
3.400%, 05/01/2026 | 605 | 625 | ||||||
2.500%, 09/26/2018 | 3,330 | 3,383 | ||||||
1.750%, 05/01/2018 | 1,835 | 1,838 | ||||||
1.550%, 08/14/2017 | 980 | 981 | ||||||
Citigroup Capital III | ||||||||
7.625%, 12/01/2036 | 1,500 | 1,904 | ||||||
Commonwealth Bank of Australia MTN | ||||||||
5.000%, 10/15/2019 (D) | 10 | 11 | ||||||
Compass Bank | ||||||||
3.875%, 04/10/2025 | 430 | 421 | ||||||
Cooperatieve Centrale Raiffeisen-Boerenleenbank MTN | ||||||||
4.625%, 12/01/2023 | 1,100 | 1,188 | ||||||
Cooperatieve Centrale Raiffeisen-Boerenleenbank | ||||||||
5.250%, 08/04/2045 | 310 | 353 | ||||||
4.375%, 08/04/2025 | 650 | 686 | ||||||
Cooperatieve Rabobank UA | ||||||||
11.000%, 12/31/2049 (C)(D) | 920 | 1,114 | ||||||
Cooperatieve Rabobank UA MTN | ||||||||
3.750%, 07/21/2026 | 945 | 947 | ||||||
Credit Agricole | ||||||||
8.375%, 12/31/2049 (C)(D) | 1,090 | 1,230 | ||||||
Credit Suisse Group Funding Guernsey | ||||||||
4.875%, 05/15/2045 | 890 | 940 | ||||||
4.550%, 04/17/2026 (D) | 320 | 336 | ||||||
3.800%, 06/09/2023 (D)(E) | 765 | 776 | ||||||
3.450%, 04/16/2021 (D) | 440 | 449 | ||||||
Discover Bank | ||||||||
3.100%, 06/04/2020 | 1,500 | 1,543 | ||||||
Farmers Exchange Capital | ||||||||
7.050%, 07/15/2028 (D) | 1,000 | 1,200 | ||||||
Farmers Exchange Capital II | ||||||||
6.151%, 11/01/2053 (C)(D) | 2,150 | 2,306 | ||||||
Ford Motor Credit LLC | ||||||||
8.125%, 01/15/2020 | 660 | 779 | ||||||
General Electric MTN | ||||||||
4.375%, 09/16/2020 | 30 | 33 | ||||||
Goldman Sachs Capital II | ||||||||
4.000%, 06/01/2043 (C) | 10 | 8 | ||||||
Goldman Sachs Group MTN | ||||||||
7.500%, 02/15/2019 | 950 | 1,074 | ||||||
6.000%, 06/15/2020 | 170 | 193 | ||||||
5.375%, 03/15/2020 | 2,860 | 3,167 | ||||||
4.000%, 03/03/2024 | 490 | 526 | ||||||
3.850%, 07/08/2024 | 830 | 881 | ||||||
Goldman Sachs Group | ||||||||
6.750%, 10/01/2037 (E) | 488 | 621 | ||||||
| ||||||||
| Description | Face Amount (Thousands) | Market Value ($ Thousands) | ||||||
| ||||||||
CORPORATE OBLIGATIONS (continued) |
| |||||||
6.250%, 02/01/2041 | $ | 750 | $ | 981 | ||||
6.150%, 04/01/2018 | 1,780 | 1,896 | ||||||
5.950%, 01/18/2018 | 260 | 274 | ||||||
5.750%, 01/24/2022 | 110 | 128 | ||||||
5.250%, 07/27/2021 | 340 | 384 | ||||||
5.150%, 05/22/2045 | 490 | 534 | ||||||
4.750%, 10/21/2045 | 857 | 962 | ||||||
4.250%, 10/21/2025 | 745 | 784 | ||||||
3.750%, 02/25/2026 | 435 | 457 | ||||||
2.375%, 01/22/2018 | 1,370 | 1,385 | ||||||
2.350%, 11/15/2027 | 1,085 | 1,083 | ||||||
Guardian Life Global Funding MTN | ||||||||
2.000%, 04/26/2021 (D) | 1,000 | 1,010 | ||||||
HBOS PLC MTN | ||||||||
6.750%, 05/21/2018 (D) | 2,100 | 2,244 | ||||||
HSBC Bank PLC | ||||||||
4.750%, 01/19/2021 (D) | 1,760 | 1,943 | ||||||
HSBC Holdings | ||||||||
6.500%, 09/15/2037 | 180 | 231 | ||||||
HSBC Holdings PLC | ||||||||
4.300%, 03/08/2026 | 1,180 | 1,265 | ||||||
4.250%, 03/14/2024 | 985 | 1,016 | ||||||
4.250%, 08/18/2025 | 750 | 770 | ||||||
4.000%, 03/30/2022 | 330 | 351 | ||||||
3.900%, 05/25/2026 | 595 | 616 | ||||||
3.400%, 03/08/2021 | 1,020 | 1,055 | ||||||
2.650%, 01/05/2022 | 1,470 | 1,465 | ||||||
ILFC E-Capital Trust II | ||||||||
4.250%, 12/21/2065 (C)(D) | 400 | 319 | ||||||
ING Bank | ||||||||
5.800%, 09/25/2023 (D) | 920 | 1,028 | ||||||
2.050%, 08/15/2021 (D)(E) | 1,015 | 1,016 | ||||||
International Lease Finance | ||||||||
7.125%, 09/01/2018 (D) | 2,080 | 2,270 | ||||||
Intesa Sanpaolo MTN | ||||||||
5.017%, 06/26/2024 (D) | 1,610 | 1,469 | ||||||
Jackson National Life Global Funding | ||||||||
3.050%, 04/29/2026 (D) | 1,383 | 1,406 | ||||||
John Deere Capital | ||||||||
1.700%, 01/15/2020 (E) | 160 | 161 | ||||||
JPMorgan Chase MTN | ||||||||
2.295%, 08/15/2021 | 1,080 | 1,082 | ||||||
JPMorgan Chase | ||||||||
6.000%, 01/15/2018 | 135 | 143 | ||||||
4.950%, 06/01/2045 | 710 | 795 | ||||||
4.500%, 01/24/2022 | 180 | 199 | ||||||
4.400%, 07/22/2020 | 210 | 229 | ||||||
4.350%, 08/15/2021 | 215 | 236 | ||||||
4.250%, 10/15/2020 | 330 | 358 | ||||||
3.900%, 07/15/2025 | 1,115 | 1,202 | ||||||
3.875%, 09/10/2024 | 620 | 653 | ||||||
2.950%, 10/01/2026 | 1,755 | 1,760 | ||||||
| 110 | SEI Institutional Managed Trust / Annual Report / September 30, 2016 |
| ||||||||
| Description | Face Amount (Thousands) | Market Value ($ Thousands) | ||||||
| ||||||||
CORPORATE OBLIGATIONS (continued) |
| |||||||
2.700%, 05/18/2023 | $ | 1,045 | $ | 1,056 | ||||
2.400%, 06/07/2021 | 680 | 688 | ||||||
2.250%, 01/23/2020 | 1,010 | 1,023 | ||||||
JPMorgan Chase Bank | ||||||||
6.000%, 07/05/2017 | 2,250 | 2,329 | ||||||
6.000%, 10/01/2017 | 1,000 | 1,043 | ||||||
JPMorgan Chase Capital XIII | ||||||||
1.788%, 09/30/2034 (C) | 550 | 451 | ||||||
JPMorgan Chase Capital XXIII | ||||||||
1.817%, 05/15/2047 (C) | 1,900 | 1,439 | ||||||
KFW | ||||||||
1.000%, 07/15/2019 | 1,197 | 1,193 | ||||||
KKR Group Finance II | ||||||||
5.500%, 02/01/2043 (D) | 60 | 63 | ||||||
Lazard Group LLC | ||||||||
4.250%, 11/14/2020 | 490 | 525 | ||||||
3.750%, 02/13/2025 | 825 | 831 | ||||||
M&T Bank | ||||||||
6.875%, 12/29/2049 | 1,740 | 1,750 | ||||||
Macquarie Bank MTN | ||||||||
1.364%, 10/27/2017 (C)(D) | 1,180 | 1,180 | ||||||
Marsh & McLennan | ||||||||
3.750%, 03/14/2026 | 505 | 546 | ||||||
Massachusetts Mutual Life Insurance | ||||||||
8.875%, 06/01/2039 (D) | 605 | 952 | ||||||
MetLife | ||||||||
4.600%, 05/13/2046 | 358 | 387 | ||||||
MetLife Capital Trust IV | ||||||||
7.875%, 12/15/2037 (D) | 800 | 1,004 | ||||||
Metropolitan Life Global Funding I | ||||||||
1.950%, 09/15/2021 (D) | 740 | 739 | ||||||
1.550%, 09/13/2019 (D) | 495 | 493 | ||||||
Metropolitan Life Global Funding I MTN | ||||||||
1.950%, 12/03/2018 (D) | 155 | 157 | ||||||
Mitsubishi UFJ Financial Group | ||||||||
2.757%, 09/13/2026 | 865 | 863 | ||||||
Morgan Stanley MTN | ||||||||
7.300%, 05/13/2019 | 545 | 619 | ||||||
5.500%, 07/24/2020 | 500 | 560 | ||||||
4.750%, 03/22/2017 | 140 | 142 | ||||||
4.000%, 07/23/2025 | 902 | 970 | ||||||
3.125%, 07/27/2026 | 1,440 | 1,449 | ||||||
2.500%, 04/21/2021 | 1,795 | 1,817 | ||||||
1.129%, 10/18/2016 (C) | 5,965 | 5,966 | ||||||
Murray Street Investment Trust I | ||||||||
4.647%, 03/09/2017 (F) | 1,041 | 1,052 | ||||||
Nationwide Mutual Insurance | ||||||||
3.140%, 12/15/2024 (C)(D) | 2,975 | 2,916 | ||||||
New York Life Global Funding | ||||||||
1.550%, 11/02/2018 (D) | 1,000 | 1,005 | ||||||
New York Life Insurance | ||||||||
6.750%, 11/15/2039 (D) | 415 | 575 | ||||||
| ||||||||
| Description | Face Amount (Thousands) | Market Value ($ Thousands) | ||||||
| ||||||||
CORPORATE OBLIGATIONS (continued) |
| |||||||
2.100%, 01/02/2019 (D) | $ | 575 | $ | 584 | ||||
Northwestern Mutual Life Insurance | ||||||||
6.063%, 03/30/2040 (D) | 690 | 893 | ||||||
PNC Bank | ||||||||
2.250%, 07/02/2019 | 545 | 555 | ||||||
PNC Bank MTN | ||||||||
2.400%, 10/18/2019 | 625 | 640 | ||||||
Progressive | ||||||||
2.450%, 01/15/2027 | 315 | 314 | ||||||
Protective Life Global Funding | ||||||||
1.722%, 04/15/2019 (D) | 1,600 | 1,605 | ||||||
Quicken Loans | ||||||||
5.750%, 05/01/2025 (D) | 200 | 198 | ||||||
Royal Bank of Canada | ||||||||
2.300%, 03/22/2021 (E) | 20 | 20 | ||||||
Royal Bank of Scotland | ||||||||
4.650%, 06/04/2018 | 270 | 277 | ||||||
Royal Bank of Scotland Group PLC | ||||||||
6.125%, 12/15/2022 | 390 | 413 | ||||||
6.100%, 06/10/2023 | 550 | 577 | ||||||
6.000%, 12/19/2023 | 860 | 896 | ||||||
5.125%, 05/28/2024 | 490 | 491 | ||||||
3.875%, 09/12/2023 | 710 | 699 | ||||||
Santander UK Group Holdings | ||||||||
2.875%, 08/05/2021 | 1,485 | 1,484 | ||||||
Stadshypotek | ||||||||
1.875%, 10/02/2019 (D) | 640 | 646 | ||||||
Standard Chartered | ||||||||
5.700%, 03/26/2044 (D) | 1,160 | 1,234 | ||||||
State Street | ||||||||
4.956%, 03/15/2018 | 1,300 | 1,357 | ||||||
Svenska Handelsbanken MTN | ||||||||
1.875%, 09/07/2021 | 830 | 826 | ||||||
Synchrony Financial | ||||||||
3.700%, 08/04/2026 | 650 | 645 | ||||||
Teachers Insurance & Annuity Association of America | ||||||||
6.850%, 12/16/2039 (D) | 1,300 | 1,767 | ||||||
4.900%, 09/15/2044 (D) | 85 | 96 | ||||||
Toronto-Dominion Bank | ||||||||
2.250%, 03/15/2021 (D) | 1,415 | 1,445 | ||||||
Trinity Acquisition | ||||||||
4.400%, 03/15/2026 | 160 | 168 | ||||||
UBS MTN | ||||||||
1.375%, 06/01/2017 | 2,000 | 2,001 | ||||||
UBS Group Funding Jersey | ||||||||
4.125%, 09/24/2025 (D) | 510 | 534 | ||||||
4.125%, 04/15/2026 (D) | 450 | 473 | ||||||
2.650%, 02/01/2022 (D) | 1,025 | 1,023 | ||||||
US Bancorp MTN | ||||||||
2.375%, 07/22/2026 | 935 | 923 | ||||||
| SEI Institutional Managed Trust / Annual Report / September 30, 2016 | 111 |
SCHEDULE OF INVESTMENTS
September 30, 2016
Core Fixed Income Fund (Continued)
| ||||||||
| Description | Face Amount (Thousands) | Market Value ($ Thousands) | ||||||
| ||||||||
CORPORATE OBLIGATIONS (continued) |
| |||||||
US Bank | ||||||||
2.125%, 10/28/2019 | $ | 435 | $ | 443 | ||||
Visa | ||||||||
4.300%, 12/14/2045 | 570 | 659 | ||||||
3.150%, 12/14/2025 | 1,050 | 1,109 | ||||||
2.800%, 12/14/2022 | 1,230 | 1,289 | ||||||
Voya Financial | ||||||||
4.800%, 06/15/2046 | 65 | 65 | ||||||
Wachovia Capital Trust III | ||||||||
5.570%, 05/31/2016 (C) | 2,410 | 2,404 | ||||||
WEA Finance | ||||||||
4.750%, 09/17/2044 (D) | 230 | 249 | ||||||
3.750%, 09/17/2024 (D)(E) | 780 | 820 | ||||||
3.250%, 10/05/2020 (D) | 2,290 | 2,386 | ||||||
Wells Fargo | ||||||||
5.875%, 12/31/2049 (C) | 120 | 130 | ||||||
3.000%, 04/22/2026 | 1,935 | 1,953 | ||||||
2.125%, 04/22/2019 | 420 | 426 | ||||||
2.100%, 07/26/2021 | 2,635 | 2,626 | ||||||
Wells Fargo MTN | ||||||||
4.900%, 11/17/2045 | 650 | 716 | ||||||
4.650%, 11/04/2044 | 190 | 200 | ||||||
4.600%, 04/01/2021 | 160 | 177 | ||||||
4.400%, 06/14/2046 | 720 | 733 | ||||||
4.300%, 07/22/2027 | 1,400 | 1,509 | ||||||
3.450%, 02/13/2023 | 430 | 443 | ||||||
3.000%, 01/22/2021 | 1,010 | 1,047 | ||||||
1.650%, 01/22/2018 | 1,670 | 1,675 | ||||||
Wells Fargo Bank | ||||||||
6.000%, 11/15/2017 | 250 | 263 | ||||||
Westpac Banking | ||||||||
2.700%, 08/19/2026 | 425 | 422 | ||||||
2.000%, 08/19/2021 | 1,055 | 1,053 | ||||||
|
| |||||||
| 202,408 | ||||||||
|
| |||||||
Health Care — 2.6% |
| |||||||
AbbVie | ||||||||
4.700%, 05/14/2045 | 1,000 | 1,077 | ||||||
4.500%, 05/14/2035 | 320 | 341 | ||||||
4.450%, 05/14/2046 | 370 | 386 | ||||||
4.400%, 11/06/2042 | 520 | 541 | ||||||
3.600%, 05/14/2025 | 90 | 94 | ||||||
3.200%, 05/14/2026 | 985 | 997 | ||||||
2.500%, 05/14/2020 | 845 | 861 | ||||||
1.800%, 05/14/2018 | 750 | 753 | ||||||
1.750%, 11/06/2017 | 650 | 652 | ||||||
Actavis Funding SCS | ||||||||
4.750%, 03/15/2045 | 2,335 | 2,553 | ||||||
4.550%, 03/15/2035 | 10 | 11 | ||||||
3.800%, 03/15/2025 | 1,636 | 1,732 | ||||||
3.450%, 03/15/2022 | 1,380 | 1,449 | ||||||
| ||||||||
| Description | Face Amount (Thousands) | Market Value ($ Thousands) | ||||||
| ||||||||
CORPORATE OBLIGATIONS (continued) |
| |||||||
Aetna | ||||||||
3.200%, 06/15/2026 | $ | 550 | $ | 559 | ||||
2.800%, 06/15/2023 | 2,965 | 3,028 | ||||||
2.400%, 06/15/2021 | 350 | 354 | ||||||
2.200%, 03/15/2019 | 310 | 315 | ||||||
Amgen | ||||||||
5.150%, 11/15/2041 | 745 | 849 | ||||||
4.663%, 06/15/2051 (D) | 614 | 656 | ||||||
4.400%, 05/01/2045 | 860 | 903 | ||||||
3.625%, 05/22/2024 | 100 | 107 | ||||||
2.600%, 08/19/2026 | 480 | 472 | ||||||
Anthem | ||||||||
5.875%, 06/15/2017 | 1,155 | 1,191 | ||||||
AstraZeneca | ||||||||
3.375%, 11/16/2025 | 500 | 534 | ||||||
Baxalta | ||||||||
3.600%, 06/23/2022 | 920 | 967 | ||||||
Becton Dickinson | ||||||||
4.685%, 12/15/2044 | 120 | 137 | ||||||
3.734%, 12/15/2024 | 350 | 380 | ||||||
2.675%, 12/15/2019 | 455 | 470 | ||||||
Biogen | ||||||||
5.200%, 09/15/2045 | 1,299 | 1,528 | ||||||
3.625%, 09/15/2022 | 260 | 278 | ||||||
Celgene | ||||||||
5.000%, 08/15/2045 | 2,120 | 2,387 | ||||||
3.875%, 08/15/2025 | 415 | 444 | ||||||
3.550%, 08/15/2022 | 300 | 319 | ||||||
2.875%, 08/15/2020 | 335 | 347 | ||||||
Centene | ||||||||
6.125%, 02/15/2024 | 110 | 119 | ||||||
5.625%, 02/15/2021 | 190 | 201 | ||||||
4.750%, 05/15/2022 | 20 | 21 | ||||||
DaVita | ||||||||
5.000%, 05/01/2025 | 80 | 80 | ||||||
EMD Finance | ||||||||
2.400%, 03/19/2020 (D) | 1,045 | 1,063 | ||||||
Express Scripts Holding | ||||||||
4.800%, 07/15/2046 | 329 | 342 | ||||||
3.400%, 03/01/2027 | 1,000 | 1,006 | ||||||
Fresenius Medical Care US Finance II | ||||||||
5.875%, 01/31/2022 (D)(E) | 170 | 193 | ||||||
4.125%, 10/15/2020 (D) | 100 | 105 | ||||||
Gilead Sciences | ||||||||
4.750%, 03/01/2046 | 570 | 637 | ||||||
4.150%, 03/01/2047 | 295 | 302 | ||||||
3.700%, 04/01/2024 | 1,165 | 1,254 | ||||||
3.650%, 03/01/2026 | 460 | 495 | ||||||
3.250%, 09/01/2022 | 405 | 430 | ||||||
2.950%, 03/01/2027 | 1,030 | 1,041 | ||||||
GlaxoSmithKline Capital | ||||||||
5.650%, 05/15/2018 | 810 | 866 | ||||||
| 112 | SEI Institutional Managed Trust / Annual Report / September 30, 2016 |
| ||||||||
| Description | Face Amount (Thousands) | Market Value ($ Thousands) | ||||||
| ||||||||
CORPORATE OBLIGATIONS (continued) |
| |||||||
Humana | ||||||||
7.200%, 06/15/2018 | $ | 1,150 | $ | 1,259 | ||||
4.625%, 12/01/2042 | 130 | 137 | ||||||
3.850%, 10/01/2024 | 790 | 847 | ||||||
3.150%, 12/01/2022 | 170 | 176 | ||||||
Johnson & Johnson | ||||||||
4.500%, 12/05/2043 | 600 | 754 | ||||||
3.550%, 03/01/2036 | 1,000 | 1,109 | ||||||
Medtronic | ||||||||
3.625%, 03/15/2024 | 465 | 506 | ||||||
3.500%, 03/15/2025 | 840 | 904 | ||||||
Merck | ||||||||
2.750%, 02/10/2025 | 400 | 414 | ||||||
2.350%, 02/10/2022 | 685 | 705 | ||||||
Mylan | ||||||||
2.550%, 03/28/2019 | 520 | 526 | ||||||
Northwell Healthcare | ||||||||
3.979%, 11/01/2046 | 1,030 | 1,042 | ||||||
Perrigo Finance Unlimited | ||||||||
4.375%, 03/15/2026 | 830 | 866 | ||||||
Shire Acquisitions Investments Ireland | ||||||||
3.200%, 09/23/2026 | 760 | 764 | ||||||
2.875%, 09/23/2023 | 845 | 850 | ||||||
1.900%, 09/23/2019 | 720 | 720 | ||||||
Tenet Healthcare | ||||||||
8.125%, 04/01/2022 | 60 | 60 | ||||||
Teva Pharmaceutical Finance Netherlands III BV | ||||||||
3.150%, 10/01/2026 (E) | 520 | 523 | ||||||
2.800%, 07/21/2023 | 860 | 862 | ||||||
2.200%, 07/21/2021 | 870 | 867 | ||||||
Thermo Fisher Scientific | ||||||||
3.600%, 08/15/2021 | 350 | 372 | ||||||
3.300%, 02/15/2022 | 270 | 283 | ||||||
2.950%, 09/19/2026 | 670 | 665 | ||||||
UnitedHealth Group | ||||||||
6.000%, 06/15/2017 | 51 | 53 | ||||||
5.800%, 03/15/2036 | 280 | 368 | ||||||
4.625%, 07/15/2035 | 1,010 | 1,173 | ||||||
3.875%, 10/15/2020 | 530 | 574 | ||||||
3.100%, 03/15/2026 | 520 | 543 | ||||||
2.875%, 12/15/2021 | 580 | 611 | ||||||
Valeant Pharmaceuticals International | ||||||||
5.375%, 03/15/2020 (D)(E) | 700 | 647 | ||||||
VPII Escrow | ||||||||
7.500%, 07/15/2021 (D) | 490 | 474 | ||||||
Wyeth LLC | ||||||||
5.950%, 04/01/2037 | 340 | 455 | ||||||
|
| |||||||
| 55,936 | ||||||||
|
| |||||||
| ||||||||
| Description | Face Amount (Thousands) | Market Value ($ Thousands) | ||||||
| ||||||||
CORPORATE OBLIGATIONS (continued) |
| |||||||
Industrials — 1.5% | ||||||||
3M MTN | ||||||||
2.250%, 09/19/2026 | $ | 310 | $ | 310 | ||||
ABB Finance USA | ||||||||
4.375%, 05/08/2042 | 80 | 91 | ||||||
AerCap Ireland Capital | ||||||||
4.625%, 07/01/2022 | 210 | 221 | ||||||
3.750%, 05/15/2019 (E) | 520 | 531 | ||||||
American Airlines Pass-Through Trust, Ser 2013-2 | ||||||||
4.950%, 01/15/2023 | 1,398 | 1,521 | ||||||
AP Moeller - Maersk | ||||||||
3.875%, 09/28/2025 (D) | 467 | 472 | ||||||
BAE Systems | ||||||||
4.750%, 10/11/2021 (D) | 1,350 | 1,501 | ||||||
Burlington Northern Santa Fe | ||||||||
4.150%, 04/01/2045 | 505 | 556 | ||||||
Caterpillar Financial Services MTN | ||||||||
2.750%, 08/20/2021 | 620 | 648 | ||||||
Catholic Health Initiatives | ||||||||
4.350%, 11/01/2042 | 80 | 79 | ||||||
2.950%, 11/01/2022 | 800 | 809 | ||||||
Continental Airlines Pass-Through Trust, Ser 1999-2, Cl C-2 | ||||||||
7.256%, 03/15/2020 | 1,426 | 1,536 | ||||||
Continental Airlines Pass-Through Trust, Ser 2007-1, Cl A | ||||||||
5.983%, 04/19/2022 | 1,313 | 1,480 | ||||||
Delta Air Lines Pass-Through Trust, Ser 2007-1, Cl A | ||||||||
6.821%, 08/10/2022 | 1,002 | 1,185 | ||||||
Eaton | ||||||||
4.150%, 11/02/2042 | 440 | 471 | ||||||
2.750%, 11/02/2022 | 450 | 465 | ||||||
1.500%, 11/02/2017 | 270 | 271 | ||||||
FedEx | ||||||||
4.550%, 04/01/2046 | 545 | 605 | ||||||
Florida East Coast Holdings | ||||||||
6.750%, 05/01/2019 (D) | 460 | 471 | ||||||
GE Capital International Funding | ||||||||
4.418%, 11/15/2035 | 1,410 | 1,583 | ||||||
2.342%, 11/15/2020 (D) | 530 | 544 | ||||||
General Electric | ||||||||
4.500%, 03/11/2044 | 220 | 253 | ||||||
General Electric MTN | ||||||||
6.875%, 01/10/2039 | 171 | 258 | ||||||
5.875%, 01/14/2038 | 197 | 264 | ||||||
5.300%, 02/11/2021 | 184 | 211 | ||||||
1.297%, 08/15/2036 (C) | 1,550 | 1,326 | ||||||
1.158%, 05/05/2026 (C) | 950 | 924 | ||||||
Lockheed Martin | ||||||||
4.700%, 05/15/2046 | 320 | 380 | ||||||
| SEI Institutional Managed Trust / Annual Report / September 30, 2016 | 113 |
SCHEDULE OF INVESTMENTS
September 30, 2016
Core Fixed Income Fund (Continued)
| ||||||||
| Description | Face Amount (Thousands) | Market Value ($ Thousands) | ||||||
| ||||||||
CORPORATE OBLIGATIONS (continued) |
| |||||||
4.500%, 05/15/2036 | $ | 90 | $ | 102 | ||||
3.550%, 01/15/2026 | 1,250 | 1,351 | ||||||
3.350%, 09/15/2021 | 920 | 986 | ||||||
3.100%, 01/15/2023 | 50 | 53 | ||||||
2.500%, 11/23/2020 | 545 | 563 | ||||||
Northrop Grumman | ||||||||
3.850%, 04/15/2045 | 215 | 223 | ||||||
3.250%, 08/01/2023 | 2,660 | 2,842 | ||||||
Penske Truck Leasing L.P. | ||||||||
3.375%, 02/01/2022 (D) | 390 | 406 | ||||||
3.200%, 07/15/2020 (D) | 505 | 523 | ||||||
Raytheon | ||||||||
3.125%, 10/15/2020 | 430 | 456 | ||||||
Siemens Financieringsmaatschappij | ||||||||
2.900%, 05/27/2022 (D) | 825 | 864 | ||||||
2.000%, 09/15/2023 (D) | 1,030 | 1,015 | ||||||
Union Pacific | ||||||||
4.050%, 03/01/2046 | 400 | 440 | ||||||
United Air Lines Pass-Through Trust, Ser 2009-2A | ||||||||
9.750%, 01/15/2017 | 56 | 58 | ||||||
United Rentals North America | ||||||||
5.500%, 07/15/2025 (E) | 310 | 316 | ||||||
United Technologies | ||||||||
4.500%, 06/01/2042 | 200 | 232 | ||||||
US Airways Pass-Through Trust, Ser 2012-2, Cl A | ||||||||
4.625%, 06/03/2025 | 796 | 868 | ||||||
Valmont Industries | ||||||||
5.250%, 10/01/2054 | 315 | 295 | ||||||
Waste Management | ||||||||
7.375%, 05/15/2029 | 330 | 466 | ||||||
3.500%, 05/15/2024 | 280 | 302 | ||||||
West | ||||||||
5.375%, 07/15/2022 (D) | 260 | 255 | ||||||
4.750%, 07/15/2021 (D) | 90 | 92 | ||||||
|
| |||||||
| 31,674 | ||||||||
|
| |||||||
Information Technology — 1.4% |
| |||||||
Activision Blizzard | ||||||||
5.625%, 09/15/2021 (D) | 300 | 313 | ||||||
Apple | ||||||||
4.650%, 02/23/2046 | 565 | 652 | ||||||
4.375%, 05/13/2045 | 1,090 | 1,203 | ||||||
3.850%, 05/04/2043 | 640 | 654 | ||||||
3.850%, 08/04/2046 | 980 | 1,002 | ||||||
2.450%, 08/04/2026 | 1,170 | 1,171 | ||||||
Cisco Systems | ||||||||
2.200%, 09/20/2023 | 1,045 | 1,053 | ||||||
1.850%, 09/20/2021 | 2,355 | 2,369 | ||||||
1.400%, 09/20/2019 | 1,275 | 1,276 | ||||||
| ||||||||
| Description | Face Amount (Thousands) | Market Value ($ Thousands) | ||||||
| ||||||||
CORPORATE OBLIGATIONS (continued) |
| |||||||
Diamond 1 Finance | ||||||||
6.020%, 06/15/2026 (D) | $ | 370 | $ | 406 | ||||
4.420%, 06/15/2021 (D) | 750 | 784 | ||||||
3.480%, 06/01/2019 (D) | 910 | 936 | ||||||
Fidelity National Information Services | ||||||||
4.500%, 08/15/2046 | 409 | 409 | ||||||
3.625%, 10/15/2020 | 505 | 536 | ||||||
2.850%, 10/15/2018 | 635 | 652 | ||||||
2.250%, 08/15/2021 | 362 | 364 | ||||||
Harris | ||||||||
5.054%, 04/27/2045 | 190 | 218 | ||||||
Hewlett Packard Enterprise | ||||||||
6.350%, 10/15/2045 (D) | 710 | 733 | ||||||
4.900%, 10/15/2025 (D) | 285 | 304 | ||||||
Intel | ||||||||
4.900%, 07/29/2045 | 120 | 143 | ||||||
3.700%, 07/29/2025 | 140 | 155 | ||||||
Microsoft | ||||||||
4.200%, 11/03/2035 | 425 | 475 | ||||||
3.950%, 08/08/2056 | 210 | 213 | ||||||
3.750%, 02/12/2045 | 950 | 964 | ||||||
3.700%, 08/08/2046 | 460 | 466 | ||||||
3.500%, 02/12/2035 | 845 | 865 | ||||||
3.450%, 08/08/2036 | 350 | 357 | ||||||
2.400%, 08/08/2026 | 2,685 | 2,687 | ||||||
2.000%, 08/08/2023 | 1,140 | 1,138 | ||||||
National Semiconductor | ||||||||
6.600%, 06/15/2017 | 170 | 177 | ||||||
Oracle | ||||||||
4.000%, 07/15/2046 | 285 | 294 | ||||||
3.900%, 05/15/2035 | 1,195 | 1,235 | ||||||
3.850%, 07/15/2036 | 275 | 286 | ||||||
2.650%, 07/15/2026 | 140 | 140 | ||||||
2.400%, 09/15/2023 | 2,755 | 2,777 | ||||||
1.900%, 09/15/2021 | 630 | 632 | ||||||
1.200%, 10/15/2017 | 1,050 | 1,050 | ||||||
TSMC Global | ||||||||
1.625%, 04/03/2018 (D) | 875 | 876 | ||||||
|
| |||||||
| 29,965 | ||||||||
|
| |||||||
Materials — 1.0% |
| |||||||
Air Liquide Finance | ||||||||
2.500%, 09/27/2026 (D) | 470 | 473 | ||||||
2.250%, 09/27/2023 (D) | 795 | 798 | ||||||
1.750%, 09/27/2021 (D) | 550 | 548 | ||||||
1.375%, 09/27/2019 (D) | 655 | 654 | ||||||
ArcelorMittal(E) | ||||||||
8.000%, 10/15/2039 | 120 | 130 | ||||||
7.250%, 02/25/2022 | 120 | 136 | ||||||
Ardagh Packaging Finance | ||||||||
3.850%, 12/15/2019 (C)(D) | 440 | 446 | ||||||
| 114 | SEI Institutional Managed Trust / Annual Report / September 30, 2016 |
| ||||||||
| Description | Face Amount (Thousands) | Market Value ($ Thousands) | ||||||
| ||||||||
CORPORATE OBLIGATIONS (continued) |
| |||||||
Barrick | ||||||||
5.250%, 04/01/2042 | $ | 230 | $ | 252 | ||||
Barrick Gold | ||||||||
4.100%, 05/01/2023 | 142 | 153 | ||||||
Barrick North America Finance | ||||||||
4.400%, 05/30/2021 | 1,670 | 1,829 | ||||||
BHP Billiton Finance USA | ||||||||
6.750%, 10/19/2075 (C)(D) | 620 | 702 | ||||||
5.000%, 09/30/2043 (E) | 520 | 615 | ||||||
3.250%, 11/21/2021 | 1,330 | 1,423 | ||||||
2.875%, 02/24/2022 | 70 | 73 | ||||||
Celulosa Arauco y Constitucion | ||||||||
4.750%, 01/11/2022 | 520 | 556 | ||||||
Dow Chemical | ||||||||
3.000%, 11/15/2022 | 1,265 | 1,314 | ||||||
Eastman Chemical | ||||||||
2.700%, 01/15/2020 | 695 | 713 | ||||||
Ecolab | ||||||||
4.350%, 12/08/2021 | 220 | 247 | ||||||
Freeport-McMoRan | ||||||||
5.450%, 03/15/2043 | 170 | 136 | ||||||
4.000%, 11/14/2021 (E) | 360 | 341 | ||||||
Freeport-McMoran Oil & Gas | ||||||||
6.875%, 02/15/2023 | 75 | 78 | ||||||
6.500%, 11/15/2020 | 104 | 107 | ||||||
Glencore Finance Canada | ||||||||
2.700%, 10/25/2017 (D)(E) | 1,080 | 1,082 | ||||||
Glencore Funding LLC | ||||||||
2.875%, 04/16/2020 (D) | 940 | 932 | ||||||
International Paper | ||||||||
5.150%, 05/15/2046 | 495 | 549 | ||||||
5.000%, 09/15/2035 | 475 | 522 | ||||||
LyondellBasell Industries | ||||||||
5.750%, 04/15/2024 (E) | 200 | 239 | ||||||
Mosaic | ||||||||
5.625%, 11/15/2043 | 160 | 172 | ||||||
OCP | ||||||||
4.500%, 10/22/2025 (D)(E) | 1,650 | 1,672 | ||||||
Potash Corp of Saskatchewan | ||||||||
4.875%, 03/30/2020 | 280 | 307 | ||||||
Reynolds Group Issuer | ||||||||
6.875%, 02/15/2021 | 180 | 187 | ||||||
5.125%, 07/15/2023 (D) | 170 | 176 | ||||||
Rio Tinto Finance USA | ||||||||
3.750%, 06/15/2025 (E) | 640 | 689 | ||||||
Southern Copper | ||||||||
5.250%, 11/08/2042 | 900 | 851 | ||||||
Steel Dynamics | ||||||||
6.375%, 08/15/2022 | 220 | 232 | ||||||
Vale Overseas | ||||||||
6.875%, 11/21/2036 | 1,510 | 1,468 | ||||||
5.875%, 06/10/2021 (E) | 240 | 251 | ||||||
| ||||||||
| Description | Face Amount (Thousands) | Market Value ($ Thousands) | ||||||
| ||||||||
CORPORATE OBLIGATIONS (continued) |
| |||||||
Westlake Chemical | ||||||||
4.875%, 05/15/2023 (D) | $ | 140 | $ | 146 | ||||
4.625%, 02/15/2021 (D) | 380 | 397 | ||||||
WestRock RKT | ||||||||
4.000%, 03/01/2023 | 70 | 74 | ||||||
3.500%, 03/01/2020 | 320 | 334 | ||||||
|
| |||||||
| 22,004 | ||||||||
|
| |||||||
Real Estate — 0.7% |
| |||||||
Alexandria Real Estate Equities | ||||||||
2.750%, 01/15/2020 | 2,000 | 2,030 | ||||||
American Tower | ||||||||
3.450%, 09/15/2021 | 590 | 621 | ||||||
Boston Properties | ||||||||
3.800%, 02/01/2024 | 1,250 | 1,336 | ||||||
DDR | ||||||||
4.625%, 07/15/2022 | 720 | 781 | ||||||
3.375%, 05/15/2023 | 590 | 595 | ||||||
First Industrial MTN | ||||||||
7.500%, 12/01/2017 | 970 | 1,029 | ||||||
GLP Capital | ||||||||
5.375%, 04/15/2026 | 80 | 86 | ||||||
HCP | ||||||||
4.200%, 03/01/2024 | 765 | 795 | ||||||
3.150%, 08/01/2022 | 1,000 | 1,014 | ||||||
Health Care | ||||||||
5.250%, 01/15/2022 | 900 | 1,020 | ||||||
Highwoods Properties | ||||||||
7.500%, 04/15/2018 | 1,142 | 1,235 | ||||||
Mid-America Apartments | ||||||||
4.300%, 10/15/2023 | 250 | 270 | ||||||
4.000%, 11/15/2025 | 280 | 298 | ||||||
3.750%, 06/15/2024 | 540 | 563 | ||||||
SL Green Realty | ||||||||
7.750%, 03/15/2020 | 1,000 | 1,164 | ||||||
Tanger Properties | ||||||||
3.875%, 12/01/2023 | 305 | 322 | ||||||
3.750%, 12/01/2024 | 265 | 279 | ||||||
Ventas Realty L.P. | ||||||||
2.700%, 04/01/2020 | 1,450 | 1,486 | ||||||
Welltower | ||||||||
4.950%, 01/15/2021 | 820 | 908 | ||||||
|
| |||||||
| 15,832 | ||||||||
|
| |||||||
Telecommunication Services — 1.4% |
| |||||||
America Movil | ||||||||
5.625%, 11/15/2017 | 440 | 461 | ||||||
5.000%, 03/30/2020 (E) | 750 | 824 | ||||||
AT&T | ||||||||
6.000%, 08/15/2040 | 845 | 1,012 | ||||||
4.750%, 05/15/2046 | 1,635 | 1,711 | ||||||
4.500%, 03/09/2048 (D) | 2,038 | 2,049 | ||||||
| SEI Institutional Managed Trust / Annual Report / September 30, 2016 | 115 |
SCHEDULE OF INVESTMENTS
September 30, 2016
Core Fixed Income Fund (Continued)
| ||||||||
| Description | Face Amount (Thousands) | Market Value ($ Thousands) | ||||||
| ||||||||
CORPORATE OBLIGATIONS (continued) |
| |||||||
4.450%, 04/01/2024 | $ | 1,295 | $ | 1,423 | ||||
4.350%, 06/15/2045 | 240 | 236 | ||||||
3.950%, 01/15/2025 | 775 | 823 | ||||||
3.800%, 03/15/2022 | 418 | 448 | ||||||
3.400%, 05/15/2025 | 4,157 | 4,271 | ||||||
3.000%, 06/30/2022 | 990 | 1,018 | ||||||
Bharti Airtel | ||||||||
4.375%, 06/10/2025 (D) | 940 | 973 | ||||||
CenturyLink | ||||||||
5.625%, 04/01/2020 | 80 | 85 | ||||||
5.625%, 04/01/2025 (E) | 180 | 172 | ||||||
Deutsche Telekom International Finance | ||||||||
2.250%, 03/06/2017 (D) | 905 | 908 | ||||||
Sprint | ||||||||
7.875%, 09/15/2023 | 320 | 322 | ||||||
7.625%, 02/15/2025 (E) | 330 | 327 | ||||||
7.250%, 09/15/2021 | 50 | 50 | ||||||
Sprint Capital | ||||||||
8.750%, 03/15/2032 | 380 | 388 | ||||||
Sprint Communications | ||||||||
11.500%, 11/15/2021 | 270 | 308 | ||||||
Telefonica Emisiones SAU | ||||||||
6.221%, 07/03/2017 | 100 | 103 | ||||||
5.877%, 07/15/2019 | 90 | 100 | ||||||
5.134%, 04/27/2020 | 300 | 331 | ||||||
Verizon Communications | ||||||||
6.550%, 09/15/2043 | 733 | 991 | ||||||
6.400%, 09/15/2033 | 1,234 | 1,599 | ||||||
5.150%, 09/15/2023 | 1,920 | 2,237 | ||||||
4.862%, 08/21/2046 | 1,485 | 1,663 | ||||||
4.522%, 09/15/2048 | 435 | 460 | ||||||
4.400%, 11/01/2034 | 2,355 | 2,492 | ||||||
4.272%, 01/15/2036 | 1,335 | 1,391 | ||||||
4.125%, 08/15/2046 | 470 | 470 | ||||||
3.850%, 11/01/2042 | 130 | 124 | ||||||
Vodafone Group PLC | ||||||||
2.950%, 02/19/2023 | 430 | 442 | ||||||
|
| |||||||
| 30,212 | ||||||||
|
| |||||||
Utilities — 2.6% |
| |||||||
AEP Texas Central Transition Funding II | ||||||||
5.170%, 01/01/2018 | 138 | 141 | ||||||
AES | ||||||||
4.875%, 05/15/2023 | 920 | 934 | ||||||
American Electric Power | ||||||||
1.650%, 12/15/2017 | 735 | 736 | ||||||
Arizona Public Service | ||||||||
2.550%, 09/15/2026 | 310 | 312 | ||||||
Berkshire Hathaway Energy | ||||||||
6.500%, 09/15/2037 | 1,160 | 1,595 | ||||||
4.500%, 02/01/2045 | 510 | 570 | ||||||
| ||||||||
| Description | Face Amount (Thousands) | Market Value ($ Thousands) | ||||||
| ||||||||
CORPORATE OBLIGATIONS (continued) |
| |||||||
Commonwealth Edison | ||||||||
3.700%, 03/01/2045 | $ | 120 | $ | 124 | ||||
Consolidated Edison of New York | ||||||||
4.450%, 03/15/2044 | 810 | 928 | ||||||
3.850%, 06/15/2046 | 195 | 204 | ||||||
Dominion Resources | ||||||||
4.700%, 12/01/2044 | 155 | 171 | ||||||
2.962%, 07/01/2019 (F) | 220 | 226 | ||||||
2.850%, 08/15/2026 (E) | 315 | 313 | ||||||
2.500%, 12/01/2019 | 610 | 625 | ||||||
2.000%, 08/15/2021 | 315 | 314 | ||||||
1.600%, 08/15/2019 | 420 | 419 | ||||||
DTE Energy | ||||||||
1.500%, 10/01/2019 | 490 | 489 | ||||||
Duke Energy | ||||||||
4.800%, 12/15/2045 | 110 | 125 | ||||||
3.750%, 09/01/2046 | 260 | 252 | ||||||
2.650%, 09/01/2026 | 600 | 589 | ||||||
1.800%, 09/01/2021 | 480 | 477 | ||||||
Duke Energy Carolinas | ||||||||
4.250%, 12/15/2041 | 600 | 667 | ||||||
4.000%, 09/30/2042 | 1,000 | 1,072 | ||||||
3.875%, 03/15/2046 | 220 | 232 | ||||||
2.500%, 03/15/2023 | 440 | 454 | ||||||
Duke Energy Florida | ||||||||
3.850%, 11/15/2042 | 165 | 172 | ||||||
3.400%, 10/01/2046 | 205 | 200 | ||||||
Duquesne Light Holdings | ||||||||
6.400%, 09/15/2020 (D) | 1,450 | 1,679 | ||||||
Electricite de France | ||||||||
6.000%, 01/22/2114 (D) | 100 | 108 | ||||||
5.250%, 10/13/2055 (D) | 350 | 363 | ||||||
Emera US Finance | ||||||||
2.150%, 06/15/2019 (D) | 2,049 | 2,072 | ||||||
Exelon | ||||||||
5.625%, 06/15/2035 | 880 | 1,052 | ||||||
3.950%, 06/15/2025 (D) | 550 | 593 | ||||||
FirstEnergy | ||||||||
2.750%, 03/15/2018 | 280 | 283 | ||||||
FirstEnergy, Ser C | ||||||||
7.375%, 11/15/2031 | 2,965 | 3,852 | ||||||
Florida Gas Transmission LLC | ||||||||
3.875%, 07/15/2022 (D) | 1,000 | 1,037 | ||||||
Fortis | ||||||||
3.055%, 10/04/2026 (D) | 745 | 742 | ||||||
2.100%, 10/04/2021 (D) | 370 | 369 | ||||||
Indiana Michigan Power | ||||||||
4.550%, 03/15/2046 | 220 | 248 | ||||||
Interstate Power & Light | ||||||||
3.700%, 09/15/2046 | 235 | 239 | ||||||
IPALCO Enterprises | ||||||||
5.000%, 05/01/2018 | 1,200 | 1,251 | ||||||
| 116 | SEI Institutional Managed Trust / Annual Report / September 30, 2016 |
| ||||||||
| Description | Face Amount (Thousands) | Market Value ($ Thousands) | ||||||
| ||||||||
CORPORATE OBLIGATIONS (continued) |
| |||||||
KCP&L Greater Missouri Operations | ||||||||
8.270%, 11/15/2021 | $ | 2,700 | $ | 3,324 | ||||
KeySpan Gas East | ||||||||
5.819%, 04/01/2041 (D) | 1,250 | 1,614 | ||||||
2.742%, 08/15/2026 (D) | 675 | 682 | ||||||
Majapahit Holding BV | ||||||||
7.750%, 01/20/2020 | 420 | 483 | ||||||
Metropolitan Edison | ||||||||
3.500%, 03/15/2023 (D) | 2,425 | 2,493 | ||||||
MidAmerican Energy | ||||||||
4.250%, 05/01/2046 | 805 | 918 | ||||||
3.500%, 10/15/2024 | 305 | 333 | ||||||
NextEra Energy Capital Holdings | ||||||||
2.056%, 09/01/2017 | 2,000 | 2,011 | ||||||
NiSource Finance | ||||||||
6.800%, 01/15/2019 | 2,261 | 2,518 | ||||||
Oncor Electric Delivery LLC | ||||||||
6.800%, 09/01/2018 | 1,075 | 1,182 | ||||||
4.550%, 12/01/2041 | 690 | 805 | ||||||
Pacific Gas & Electric | ||||||||
8.250%, 10/15/2018 | 280 | 318 | ||||||
6.050%, 03/01/2034 | 340 | 453 | ||||||
5.800%, 03/01/2037 | 710 | 934 | ||||||
4.450%, 04/15/2042 | 700 | 794 | ||||||
2.950%, 03/01/2026 | 378 | 394 | ||||||
PECO Energy | ||||||||
4.150%, 10/01/2044 | 625 | 690 | ||||||
3.150%, 10/15/2025 | 560 | 595 | ||||||
PPL Capital Funding | ||||||||
3.100%, 05/15/2026 | 855 | 869 | ||||||
PPL Electric Utilities | ||||||||
4.150%, 10/01/2045 | 370 | 411 | ||||||
Public Service of New Hampshire | ||||||||
3.500%, 11/01/2023 | 310 | 332 | ||||||
Public Service of New Mexico | ||||||||
7.950%, 05/15/2018 | 1,265 | 1,389 | ||||||
Puget Energy | ||||||||
6.000%, 09/01/2021 | 790 | 913 | ||||||
Sierra Pacific Power | ||||||||
2.600%, 05/01/2026 (D) | 485 | 491 | ||||||
Southern | ||||||||
4.400%, 07/01/2046 | 430 | 464 | ||||||
2.150%, 09/01/2019 | 615 | 623 | ||||||
Southern California Gas | ||||||||
2.600%, 06/15/2026 | 615 | 628 | ||||||
Southern Gas Capital | ||||||||
2.450%, 10/01/2023 | 205 | 206 | ||||||
Southwestern Electric Power | ||||||||
3.900%, 04/01/2045 | 315 | 315 | ||||||
Texas-New Mexico Power | ||||||||
6.950%, 04/01/2043 (D) | 457 | 641 | ||||||
| ||||||||
| Description | Face Amount (Thousands) | Market Value ($ Thousands) | ||||||
| ||||||||
CORPORATE OBLIGATIONS (continued) |
| |||||||
Virginia Electric & Power | ||||||||
4.650%, 08/15/2043 | $ | 405 | $ | 475 | ||||
3.150%, 01/15/2026 | 340 | 360 | ||||||
|
| |||||||
| 54,887 | ||||||||
|
| |||||||
Total Corporate Obligations (Cost $561,017) ($ Thousands) |
| 594,029 | ||||||
|
| |||||||
ASSET-BACKED SECURITIES — 10.0% |
| |||||||
Automotive — 2.1% |
| |||||||
Ally Auto Receivables Trust, Ser 2014-1, Cl A4 | ||||||||
1.530%, 04/15/2019 | 507 | 510 | ||||||
Ally Auto Receivables Trust, Ser 2015-1, Cl A3 | ||||||||
1.390%, 09/16/2019 | 610 | 611 | ||||||
Ally Auto Receivables Trust, Ser 2016-1, Cl A2A | ||||||||
1.200%, 08/15/2018 | 301 | 301 | ||||||
Ally Auto Receivables Trust, Ser 2016-3, Cl A2 | ||||||||
1.200%, 12/17/2018 | 355 | 355 | ||||||
Ally Master Owner Trust, Ser 2012-5, Cl A | ||||||||
1.540%, 09/15/2019 | 1,285 | 1,290 | ||||||
Ally Master Owner Trust, Ser 2014-3, Cl A | ||||||||
1.330%, 03/15/2019 | 195 | 195 | ||||||
Ally Master Owner Trust, Ser 2014-4, Cl A2 | ||||||||
1.430%, 06/17/2019 | 1,330 | 1,330 | ||||||
AmeriCredit Automobile Receivables Trust, Ser 2016-3, Cl A2A | ||||||||
1.370%, 11/08/2019 | 354 | 354 | ||||||
Avis Budget Rental Car Funding AESOP, Ser 2012-3A, Cl A | ||||||||
2.100%, 03/20/2019 (D) | 560 | 561 | ||||||
Avis Budget Rental Car Funding AESOP, Ser 2014-1A, Cl A | ||||||||
2.460%, 07/20/2020 (D) | 301 | 304 | ||||||
Avis Budget Rental Car Funding AESOP, Ser 2014-2A, Cl A | ||||||||
2.500%, 02/20/2021 (D) | 639 | 645 | ||||||
Avis Budget Rental Car Funding AESOP, Ser 2016-2A, Cl A | ||||||||
2.720%, 11/20/2022 (D) | 891 | 900 | ||||||
Bank of The West Auto Trust, Ser 2014-1, Cl A3 | ||||||||
1.090%, 03/15/2019 (D) | 268 | 268 | ||||||
California Republic Auto Receivables Trust, Ser 2014-2, Cl A4 | ||||||||
1.570%, 12/16/2019 | 281 | 282 | ||||||
California Republic Auto Receivables Trust, Ser 2015-1, Cl A4 | ||||||||
1.820%, 09/15/2020 | 513 | 516 | ||||||
California Republic Auto Receivables Trust, Ser 2015-2, Cl A3 | ||||||||
1.310%, 08/15/2019 | 317 | 317 | ||||||
| SEI Institutional Managed Trust / Annual Report / September 30, 2016 | 117 |
SCHEDULE OF INVESTMENTS
September 30, 2016
Core Fixed Income Fund (Continued)
| ||||||||
| Description | Face Amount (Thousands) | Market Value ($ Thousands) | ||||||
| ||||||||
ASSET-BACKED SECURITIES (continued) |
| |||||||
California Republic Auto Receivables Trust, Ser 2015-4, Cl A2 | ||||||||
1.600%, 09/17/2018 (D) | $ | 253 | $ | 254 | ||||
California Republic Auto Receivables Trust, Ser 2015-4, Cl A4 | ||||||||
2.580%, 06/15/2021 (D) | 535 | 547 | ||||||
California Republic Auto Receivables Trust, Ser 2016-1, Cl A4 | ||||||||
2.240%, 10/15/2021 | 381 | 386 | ||||||
California Republic Auto Receivables Trust, Ser 2016-1, Cl A3 | ||||||||
1.890%, 05/15/2020 | 685 | 692 | ||||||
California Republic Auto Receivables Trust, Ser 2016-2, Cl A2 | ||||||||
1.340%, 03/15/2019 | 360 | 360 | ||||||
California Republic Auto Receivables Trust, Ser 2016-2, Cl A4 | ||||||||
1.830%, 12/15/2021 | 634 | 636 | ||||||
Capital Auto Receivables Asset Trust, Ser 2013-2, Cl A4 | ||||||||
1.560%, 07/20/2018 | 64 | 64 | ||||||
Capital Auto Receivables Asset Trust, Ser 2013-3, Cl A4 | ||||||||
1.680%, 04/20/2018 | 160 | 160 | ||||||
Capital Auto Receivables Asset Trust, Ser 2013-4, Cl A4 | ||||||||
1.470%, 07/20/2018 | 452 | 453 | ||||||
Capital Auto Receivables Asset Trust, Ser 2014-1, Cl A4 | ||||||||
1.690%, 10/22/2018 | 618 | 618 | ||||||
Capital Auto Receivables Asset Trust, Ser 2015-1, Cl A3 | ||||||||
1.610%, 06/20/2019 | 555 | 557 | ||||||
Capital Auto Receivables Asset Trust, Ser 2015-2, Cl A3 | ||||||||
1.730%, 09/20/2019 | 628 | 629 | ||||||
Capital Auto Receivables Asset Trust, Ser 2015-2, Cl A2 | ||||||||
1.390%, 09/20/2018 | 330 | 330 | ||||||
Capital Auto Receivables Asset Trust, Ser 2015-2, Cl A4 | ||||||||
1.970%, 01/21/2020 | 931 | 932 | ||||||
Capital Auto Receivables Asset Trust, Ser 2015-3, Cl A3 | ||||||||
1.940%, 01/21/2020 | 691 | 694 | ||||||
Capital Auto Receivables Asset Trust, Ser 2015-3, Cl A1A | ||||||||
1.390%, 02/20/2018 (D) | 1,354 | 1,355 | ||||||
Capital Auto Receivables Asset Trust, Ser 2015-4, Cl A4 | ||||||||
2.010%, 07/20/2020 | 349 | 350 | ||||||
| ||||||||
| Description | Face Amount (Thousands) | Market Value ($ Thousands) | ||||||
| ||||||||
ASSET-BACKED SECURITIES (continued) |
| |||||||
Capital Auto Receivables Asset Trust, Ser 2015-4, Cl A3 | ||||||||
1.830%, 03/20/2020 | $ | 701 | $ | 702 | ||||
Capital Auto Receivables Asset Trust, Ser 2015-4, Cl A2 | ||||||||
1.620%, 03/20/2019 | 425 | 425 | ||||||
Capital Auto Receivables Asset Trust, Ser 2016-1, Cl A4 | ||||||||
1.980%, 10/20/2020 | 325 | 327 | ||||||
Capital Auto Receivables Asset Trust, Ser 2016-1, Cl A2A | ||||||||
1.500%, 11/20/2018 | 870 | 870 | ||||||
Capital Auto Receivables Asset Trust, Ser 2016-1, Cl A3 | ||||||||
1.730%, 04/20/2020 | 725 | 723 | ||||||
Capital Auto Receivables Asset Trust, Ser 2016-2, Cl A3 | ||||||||
1.460%, 06/20/2020 | 533 | 532 | ||||||
Capital Auto Receivables Asset Trust, Ser 2016-2, Cl A2A | ||||||||
1.320%, 01/20/2019 | 222 | 222 | ||||||
Capital Auto Receivables Asset Trust, Ser 2016-3, Cl A3 | ||||||||
1.540%, 08/20/2020 | 319 | 319 | ||||||
Capital Auto Receivables Asset Trust, Ser 2016-3, Cl A2A | ||||||||
1.360%, 04/22/2019 | 371 | 371 | ||||||
Capital Auto Receivables Asset Trust, Ser 2016-3, Cl A4 | ||||||||
1.690%, 03/22/2021 | 268 | 269 | ||||||
Chrysler Capital Auto Receivables Trust, Ser 2016-AA, Cl A3 | ||||||||
1.770%, 10/15/2020 (D) | 1,106 | 1,110 | ||||||
Flagship Credit Auto Trust, Ser 2016-3, Cl A2 | ||||||||
2.050%, 11/15/2020 (D) | 365 | 366 | ||||||
Ford Credit Auto Owner Trust, Ser 2014-1, Cl A | ||||||||
2.260%, 11/15/2025 (D) | 2,050 | 2,090 | ||||||
Ford Credit Auto Owner Trust, Ser 2015-1, Cl A | ||||||||
2.120%, 07/15/2026 (D) | 965 | 981 | ||||||
Ford Credit Auto Owner Trust, Ser 2015-2, Cl A | ||||||||
2.440%, 01/15/2027 (D) | 1,456 | 1,498 | ||||||
Ford Credit Auto Owner Trust, Ser 2016-1, Cl A | ||||||||
2.310%, 08/15/2027 (D) | 1,163 | 1,192 | ||||||
Ford Credit Auto Owner Trust, Ser 2016-2, Cl A | ||||||||
2.030%, 12/15/2027 (D) | 1,385 | 1,395 | ||||||
Ford Credit Floorplan Master Owner Trust, Ser 2012-2, Cl A | ||||||||
1.920%, 01/15/2019 | 529 | 531 | ||||||
Ford Credit Floorplan Master Owner Trust, Ser 2014-4, Cl A1 | ||||||||
1.400%, 08/15/2019 | 1,220 | 1,223 | ||||||
Hertz Vehicle Financing, Ser 2013-1A, Cl A2 | ||||||||
1.830%, 08/25/2019 (D) | 299 | 298 | ||||||
| 118 | SEI Institutional Managed Trust / Annual Report / September 30, 2016 |
| ||||||||
| Description | Face Amount (Thousands) | Market Value ($ Thousands) | ||||||
| ||||||||
ASSET-BACKED SECURITIES (continued) |
| |||||||
Hertz Vehicle Financing, Ser 2015-1A, Cl C | ||||||||
4.350%, 03/25/2021 (D) | $ | 650 | $ | 649 | ||||
Hertz Vehicle Financing, Ser 2015-1A, Cl A | ||||||||
2.730%, 03/25/2021 (D) | 988 | 1,001 | ||||||
Hertz Vehicle Financing, Ser 2016-3A, Cl A | ||||||||
2.270%, 07/25/2020 (D) | 716 | 717 | ||||||
Hertz Vehicle Financing, Ser 2016-4A, Cl A | ||||||||
2.650%, 07/15/2022 (D) | 639 | 644 | ||||||
Honda Auto Receivables Owner Trust, Ser 2015-4, Cl A2 | ||||||||
0.820%, 07/23/2018 | 1,287 | 1,286 | ||||||
Honda Auto Receivables Owner Trust, Ser 2016-1, Cl A2 | ||||||||
1.010%, 06/18/2018 | 85 | 85 | ||||||
Honda Auto Receivables Owner Trust, Ser 2016-2, Cl A2 | ||||||||
1.130%, 09/17/2018 | 805 | 805 | ||||||
Mercedes-Benz Auto Receivables Trust, Ser 2016-1, Cl A3 | ||||||||
1.260%, 02/16/2021 | 651 | 651 | ||||||
Nissan Auto Receivables Owner Trust, Ser 2015-C, Cl A2A | ||||||||
0.870%, 11/15/2018 | 1,280 | 1,279 | ||||||
Nissan Auto Receivables Owner Trust, Ser 2016-C, Cl A2A | ||||||||
1.070%, 05/15/2019 | 1,165 | 1,165 | ||||||
Nissan Auto Receivables Owner Trust, Ser 2016-C, Cl A3 | ||||||||
1.180%, 01/15/2021 | 554 | 553 | ||||||
Santander Drive Auto Receivables Trust, Ser 2016-2, Cl A2A | ||||||||
1.380%, 07/15/2019 | 925 | 926 | ||||||
TCF Auto Receivables Owner Trust, Ser 2016-1A, Cl A4 | ||||||||
2.030%, 02/15/2022 (D) | 184 | 184 | ||||||
TCF Auto Receivables Owner Trust, Ser 2016-1A, Cl A2 | ||||||||
1.390%, 11/15/2019 (D) | 619 | 619 | ||||||
TCF Auto Receivables Owner Trust, Ser 2016-1A, Cl A3 | ||||||||
1.710%, 04/15/2021 (D) | 248 | 248 | ||||||
Toyota Auto Receivables, Ser 2016-C, Cl A2A | ||||||||
1.000%, 01/15/2019 | 515 | 514 | ||||||
Toyota Auto Receivables, Ser 2016-C, Cl A3 | ||||||||
1.140%, 08/17/2020 | 686 | 685 | ||||||
World Omni Auto Receivables Trust, Ser 2016-B, Cl A3 | ||||||||
1.570%, 02/15/2022 | 610 | 609 | ||||||
|
| |||||||
| 45,820 | ||||||||
|
| |||||||
| ||||||||
| Description | Face Amount (Thousands) | Market Value ($ Thousands) | ||||||
| ||||||||
ASSET-BACKED SECURITIES (continued) |
| |||||||
Credit Cards — 0.7% |
| |||||||
American Express Credit Account Master Trust, Ser 2014-2, Cl A | ||||||||
1.260%, 01/15/2020 | $ | 360 | $ | 361 | ||||
BA Credit Card Trust, Ser 2007-A1, Cl A1 | ||||||||
5.170%, 06/15/2019 | 235 | 238 | ||||||
Capital One Multi-Asset Execution Trust, Ser 2007-A7, Cl A7 | ||||||||
5.750%, 07/15/2020 | 325 | 339 | ||||||
Capital One Multi-Asset Execution Trust, Ser 2014-A2, Cl A2 | ||||||||
1.260%, 01/15/2020 | 170 | 170 | ||||||
Capital One Multi-Asset Execution Trust, Ser 2014-A5, Cl A5 | ||||||||
1.480%, 07/15/2020 | 1,803 | 1,811 | ||||||
Capital One Multi-Asset Execution Trust, Ser 2015-A1, Cl A1 | ||||||||
1.390%, 01/15/2021 | 65 | 65 | ||||||
Capital One Multi-Asset Execution Trust, Ser 2016-A2, Cl A2 | ||||||||
1.154%, 02/15/2024 (C) | 548 | 551 | ||||||
Capital One Multi-Asset Execution Trust, Ser 2016-A5, Cl A5 | ||||||||
1.660%, 06/17/2024 | 840 | 838 | ||||||
Chase Issuance Trust, Ser 2007-A2, Cl A2 | ||||||||
0.574%, 04/15/2019 (C) | 445 | 445 | ||||||
Chase Issuance Trust, Ser 2012-A2, Cl A2 | ||||||||
0.794%, 05/15/2019 (C) | 1,015 | 1,016 | ||||||
Chase Issuance Trust, Ser 2013-A8, Cl A8 | ||||||||
1.010%, 10/15/2018 | 910 | 910 | ||||||
Chase Issuance Trust, Ser 2014-A1, Cl A1 | ||||||||
1.150%, 01/15/2019 | 470 | 470 | ||||||
Chase Issuance Trust, Ser 2014-A6, Cl A6 | ||||||||
1.260%, 07/15/2019 | 335 | 336 | ||||||
Citibank Credit Card Issuance Trust, Ser 2013-A2, Cl A2 | ||||||||
0.805%, 05/26/2020 (C) | 789 | 790 | ||||||
Citibank Credit Card Issuance Trust, Ser 2014-A2, Cl A2 | ||||||||
1.020%, 02/22/2019 | 1,095 | 1,095 | ||||||
Citibank Credit Card Issuance Trust, Ser 2014-A8, Cl A8 | ||||||||
1.730%, 04/09/2020 | 279 | 282 | ||||||
Discover Card Execution Note Trust, Ser 2016-A2, Cl A2 | ||||||||
1.048%, 09/15/2021 (C) | 258 | 260 | ||||||
Discover Card Execution Note Trust, Ser 2016-A4, Cl A4 | ||||||||
1.390%, 03/15/2022 | 1,832 | 1,833 | ||||||
Synchrony Credit Card Master Note Trust, Ser 2016-2, Cl A | ||||||||
2.210%, 05/15/2024 | 1,244 | 1,270 | ||||||
| SEI Institutional Managed Trust / Annual Report / September 30, 2016 | 119 |
SCHEDULE OF INVESTMENTS
September 30, 2016
Core Fixed Income Fund (Continued)
| ||||||||
| Description | Face Amount (Thousands) | Market Value ($ Thousands) | ||||||
| ||||||||
ASSET-BACKED SECURITIES (continued) |
| |||||||
Synchrony Credit Card Master Note Trust, Ser 2016-3, Cl A | ||||||||
1.580%, 09/15/2022 | $ | 1,117 | $ | 1,119 | ||||
World Financial Network Credit Card Master Trust, Ser 2014-C, Cl A | ||||||||
1.540%, 08/16/2021 | 110 | 110 | ||||||
World Financial Network Credit Card Master Trust, Ser 2016-A, Cl A | ||||||||
2.030%, 04/15/2025 | 169 | 170 | ||||||
World Financial Network Credit Card Master Trust, Ser 2016-B, Cl A | ||||||||
1.440%, 06/15/2022 | 745 | 745 | ||||||
|
| |||||||
| 15,224 | ||||||||
|
| |||||||
Mortgage Related Securities — 0.8% |
| |||||||
AFC Home Equity Loan Trust, Ser 1998-1, Cl 1A2 | ||||||||
1.194%, 04/25/2028 (C) | 7 | 7 | ||||||
Bear Stearns Asset-Backed Securities Trust, Ser 2005-SD1, Cl 1A3 | ||||||||
0.924%, 08/25/2043 (C) | 476 | 471 | ||||||
Centex Home Equity, Ser 2006-A, Cl AV4 | ||||||||
0.775%, 06/25/2036 (C) | 4,546 | 4,420 | ||||||
Citigroup Mortgage Loan Trust, Ser 2006-HE2, Cl A2D | ||||||||
0.764%, 08/25/2036 (C) | 4,200 | 3,706 | ||||||
Contimortgage Home Equity Trust, Ser 1997-2, Cl A9 | ||||||||
7.090%, 04/15/2028 | – | – | ||||||
EMC Mortgage Loan Trust, Ser 2002-AA, Cl A1 | ||||||||
1.465%, 05/25/2039 (C)(D) | 345 | 329 | ||||||
Master Asset-Backed Securities Trust, Ser 2007-HE1, Cl A4 | ||||||||
0.804%, 05/25/2037 (C) | 5,500 | 3,348 | ||||||
New Century Home Equity Loan Trust, Ser 2005-2, Cl M1 | ||||||||
1.169%, 06/25/2035 (C) | 1,063 | 1,056 | ||||||
New Century Home Equity Loan Trust, Ser 2005-3, Cl M2 | ||||||||
1.014%, 07/25/2035 (C) | 3,500 | 3,445 | ||||||
|
| |||||||
| 16,782 | ||||||||
|
| |||||||
Other Asset-Backed Securities — 6.4% |
| |||||||
Academic Loan Funding Trust, Ser 2012-1A, Cl A2 | ||||||||
1.624%, 12/27/2044 (C)(D) | 2,100 | 2,027 | ||||||
Bravo Mortgage Asset Trust, Ser 2006-1A, Cl A2 | ||||||||
0.765%, 07/25/2036 (C)(D) | 1,433 | 1,393 | ||||||
Brazos Higher Education Authority, Ser 2010-1, Cl A2 | ||||||||
2.025%, 02/25/2035 (C) | 2,200 | 2,145 | ||||||
| ||||||||
| Description | Face Amount (Thousands) | Market Value ($ Thousands) | ||||||
| ||||||||
ASSET-BACKED SECURITIES (continued) |
| |||||||
Brazos Higher Education Authority, Ser 2011-2, Cl A3 | ||||||||
1.638%, 10/27/2036 (C) | $ | 1,750 | $ | 1,666 | ||||
Centerpoint Energy Transition Bond III, Ser 2008-A, Cl A1 | ||||||||
4.192%, 02/01/2020 | 1 | 1 | ||||||
CIT Education Loan Trust, Ser 2007-1, Cl A | ||||||||
0.730%, 03/25/2042 (C)(D) | 1,277 | 1,187 | ||||||
Citicorp Residential Mortgage Trust, Ser 2007-1, Cl A5 | ||||||||
6.046%, 03/25/2037 | 1,970 | 2,036 | ||||||
Community Funding CLO, Ser 2015-1A, Cl A | ||||||||
5.750%, 11/01/2027 (D) | 1,510 | 1,481 | ||||||
Conseco Financial, Ser 1993-4, Cl A5 | ||||||||
7.050%, 01/15/2019 | 42 | 43 | ||||||
Consumer Credit Origination Loan Trust, Ser 2015-1, Cl A | ||||||||
2.820%, 03/15/2021 (D) | 106 | 106 | ||||||
Countrywide Asset-Backed Certificates, Ser 2007-13, Cl 2A2 | ||||||||
1.324%, 10/25/2047 (C) | 2,698 | 2,437 | ||||||
Credit-Based Asset Servicing and Securities, Ser 2006-CB3, Cl AV4 | ||||||||
0.784%, 03/25/2036 (C) | 5,000 | 4,193 | ||||||
CWABS Revolving Home Equity Loan Trust, Ser 2004-K, Cl 2A | ||||||||
0.824%, 02/15/2034 (C) | 246 | 226 | ||||||
Educational Funding of the South, Ser 2011-1, Cl A2 | ||||||||
1.288%, 04/25/2035 (C) | 1,471 | 1,450 | ||||||
First Franklin Mortgage Loan Trust, Ser 2005-FF8, Cl M1 | ||||||||
1.014%, 09/25/2035 (C) | 2,397 | 2,356 | ||||||
Flatiron CLO, Ser 2014-1A, Cl A1 | ||||||||
2.059%, 07/17/2026 (C)(D) | 1,600 | 1,602 | ||||||
Ford Credit Floorplan Master Owner Trust, Ser 2014-1, Cl A1 | ||||||||
1.200%, 02/15/2019 | 306 | 306 | ||||||
Ford Credit Floorplan Master Owner Trust, Ser 2015-2, Cl A2 | ||||||||
1.078%, 01/15/2022 (C) | 335 | 335 | ||||||
Global SC Finance II SRL, Ser 2014-1A, Cl A2 | ||||||||
3.090%, 07/17/2029 (D) | 995 | 934 | ||||||
Green Tree, Ser 2008-MH1, Cl A2 | ||||||||
8.970%, 04/25/2038 (C)(D) | 76 | 76 | ||||||
Green Tree, Ser 2008-MH1, Cl A3 | ||||||||
8.970%, 04/25/2038 (C)(D) | 60 | 61 | ||||||
Greenpoint Manufactured Housing, Ser 1999-2, Cl A2 | ||||||||
3.078%, 03/18/2029 (C) | 425 | 374 | ||||||
Greenpoint Manufactured Housing, Ser 1999-3, Cl 1A7 | ||||||||
7.270%, 06/15/2029 | 856 | 852 | ||||||
| 120 | SEI Institutional Managed Trust / Annual Report / September 30, 2016 |
| ||||||||
| Description | Face Amount (Thousands) | Market Value ($ Thousands) | ||||||
| ||||||||
ASSET-BACKED SECURITIES (continued) |
| |||||||
Greenpoint Manufactured Housing, Ser 1999-3, Cl 2A2 | ||||||||
3.813%, 06/19/2029 (C) | $ | 250 | $ | 224 | ||||
Greenpoint Manufactured Housing, Ser 1999-4, Cl A2 | ||||||||
3.990%, 02/20/2030 (C) | 375 | 329 | ||||||
Greenpoint Manufactured Housing, Ser 2001-2, Cl IA2 | ||||||||
3.976%, 02/20/2032 (C) | 100 | 90 | ||||||
Greenpoint Manufactured Housing, Ser 2001-2, Cl IIA2 | ||||||||
4.028%, 03/13/2032 (C) | 300 | 269 | ||||||
GSAMP Trust, Ser 2003-SEA, Cl A1 | ||||||||
0.924%, 02/25/2033 (C) | 1,289 | 1,196 | ||||||
GSAMP Trust, Ser 2006-HE3, Cl A2D | ||||||||
0.774%, 05/25/2046 (C) | 3,300 | 2,457 | ||||||
Higher Education Funding I, Ser 2014-1, Cl A | ||||||||
1.712%, 05/25/2034 (C)(D) | 1,500 | 1,443 | ||||||
HSI Asset Securitization Trust, Ser 2006-OPT3, Cl 3A3 | ||||||||
0.704%, 02/25/2036 (C) | 410 | 394 | ||||||
JGWPT XXX LLC, Ser 2013-3A, Cl A | ||||||||
4.080%, 01/17/2073 (D) | 892 | 951 | ||||||
JGWPT XXXII, Ser 2014-2A, Cl A | ||||||||
3.610%, 01/17/2073 (D) | 1,214 | 1,212 | ||||||
Lehman Manufactured Housing Contract Trust, Ser 2001-B, Cl A4 | ||||||||
5.270%, 09/15/2018 | 461 | 475 | ||||||
Mid-State Trust, Ser 2003-11, Cl A1 | ||||||||
4.864%, 07/15/2038 | 2,242 | 2,386 | ||||||
Morgan Stanley Re-REMIC Trust, Ser 2015-R7, Cl 1BXA | ||||||||
10.683%, 02/26/2036 (C)(D) | 930 | 992 | ||||||
National Collegiate Student Loan Trust, Ser 2005-3, Cl A4 | ||||||||
0.804%, 04/25/2029 (C) | 194 | 192 | ||||||
National Collegiate Student Loan Trust, Ser 2006-3, Cl A4 | ||||||||
0.794%, 03/26/2029 (C) | 1,750 | 1,666 | ||||||
National Collegiate Student Loan Trust, Ser 2007-4, Cl A3L | ||||||||
1.374%, 03/25/2038 (C) | 4,181 | 2,134 | ||||||
Navient Private Education Loan Trust, Ser 2014-AA, Cl A2B | ||||||||
1.758%, 02/15/2029 (C)(D) | 484 | 486 | ||||||
Navient Private Education Loan Trust, Ser 2014-CTA, Cl A | ||||||||
1.208%, 09/16/2024 (C)(D) | 589 | 587 | ||||||
Navient Private Education Loan Trust, Ser 2015-AA, Cl A2A | ||||||||
2.650%, 12/15/2028 (D) | 344 | 352 | ||||||
| ||||||||
| Description | Face Amount (Thousands) | Market Value ($ Thousands) | ||||||
| ||||||||
ASSET-BACKED SECURITIES (continued) |
| |||||||
Navient Private Education Loan Trust, Ser 2015-AA, Cl A2B | ||||||||
1.708%, 12/15/2028 (C)(D) | $ | 216 | $ | 218 | ||||
Navient Private Education Loan Trust, Ser 2015-CA, Cl B | ||||||||
3.250%, 05/15/2040 (D) | 408 | 399 | ||||||
Navient Private Education Loan Trust, Ser 2016-AA, Cl A2A | ||||||||
3.910%, 12/15/2045 (D) | 996 | 1,044 | ||||||
Navient Student Loan Trust, Ser 2014-1, Cl A3 | ||||||||
1.034%, 06/25/2031 (C) | 3,320 | 3,206 | ||||||
Navient Student Loan Trust, Ser 2014-2, Cl A | ||||||||
1.164%, 03/25/2083 (C) | 2,692 | 2,603 | ||||||
Navient Student Loan Trust, Ser 2014-3, Cl A | ||||||||
1.144%, 03/25/2083 (C) | 2,713 | 2,622 | ||||||
Navient Student Loan Trust, Ser 2014-4, Cl A | ||||||||
1.144%, 03/25/2083 (C) | 2,007 | 1,918 | ||||||
Navient Student Loan Trust, Ser 2014-8, Cl A2 | ||||||||
0.964%, 04/25/2023 (C) | 379 | 378 | ||||||
Nelnet Student Loan Trust, Ser 2004-3, Cl A5 | ||||||||
0.818%, 10/27/2036 (C) | 736 | 711 | ||||||
Nelnet Student Loan Trust, Ser 2004-4, Cl A5 | ||||||||
0.798%, 01/25/2037 (C) | 625 | 603 | ||||||
Nelnet Student Loan Trust, Ser 2005-1, Cl A5 | ||||||||
0.748%, 10/25/2033 (C) | 722 | 687 | ||||||
Nelnet Student Loan Trust, Ser 2005-2, Cl A5 | ||||||||
0.747%, 03/23/2037 (C) | 708 | 666 | ||||||
Nelnet Student Loan Trust, Ser 2005-3, Cl A5 | ||||||||
0.767%, 12/24/2035 (C) | 736 | 694 | ||||||
Nelnet Student Loan Trust, Ser 2005-4, Cl A4 | ||||||||
0.827%, 03/22/2032 (C) | 290 | 268 | ||||||
Nelnet Student Loan Trust, Ser 2010-4A, Cl A | ||||||||
1.325%, 04/25/2046 (C)(D) | 232 | 231 | ||||||
Nelnet Student Loan Trust, Ser 2012-5A, Cl A | ||||||||
1.124%, 10/27/2036 (C)(D) | 1,693 | 1,626 | ||||||
Nelnet Student Loan Trust, Ser 2014-4A, Cl A2 | ||||||||
1.475%, 11/25/2043 (C)(D) | 1,655 | 1,529 | ||||||
Nelnet Student Loan Trust, Ser 2015-2A, Cl A2 | ||||||||
1.125%, 09/25/2042 (C)(D) | 2,821 | 2,759 | ||||||
North Carolina State Education Assistance Authority, Ser 2011-2, Cl A2 | ||||||||
1.438%, 07/25/2025 (C) | 774 | 769 | ||||||
Origen Manufactured Housing, Ser 2006-A, Cl A2 | ||||||||
2.379%, 10/15/2037 (C) | 2,503 | 2,146 | ||||||
Park Place Securities, Ser 2004-WCW1, Cl M2 | ||||||||
1.544%, 09/25/2034 (C) | 143 | 145 | ||||||
RAMP Trust, Ser 2003-RS11, Cl MII1 | ||||||||
1.619%, 12/25/2033 (C) | 170 | 157 | ||||||
RAMP Trust, Ser 2006-RZ3, Cl M1 | ||||||||
0.874%, 08/25/2036 (C) | 6,530 | 5,306 | ||||||
RSB BondCo LLC, Ser 2007-A, Cl A3 | ||||||||
5.820%, 06/28/2019 | 527 | 534 | ||||||
| SEI Institutional Managed Trust / Annual Report / September 30, 2016 | 121 |
SCHEDULE OF INVESTMENTS
September 30, 2016
Core Fixed Income Fund (Continued)
| ||||||||
| Description | Face Amount (Thousands) | Market Value ($ Thousands) | ||||||
| ||||||||
ASSET-BACKED SECURITIES (continued) |
| |||||||
SBA Small Business Investment, Ser 2016-10B, Cl 1 | ||||||||
2.051%, 09/10/2026 | $ | 245 | $ | 247 | ||||
Scholar Funding Trust, Ser 2011-A, Cl A | ||||||||
1.643%, 10/28/2043 (C)(D) | 799 | 767 | ||||||
SLC Student Loan Trust, Ser 2007-2, Cl A2 | ||||||||
1.217%, 05/15/2028 (C) | 191 | 189 | ||||||
SLM Private Education Loan Trust, Ser 2012-B, Cl A2 | ||||||||
3.480%, 10/15/2030 (D) | 327 | 334 | ||||||
SLM Private Education Loan Trust, Ser 2012-D, Cl A2 | ||||||||
2.950%, 02/15/2046 (D) | 1,484 | 1,504 | ||||||
SLM Private Education Loan Trust, Ser 2012-E, Cl A2B | ||||||||
2.258%, 06/15/2045 (C)(D) | 344 | 349 | ||||||
SLM Private Education Loan Trust, Ser 2012-E, Cl A1 | ||||||||
1.258%, 10/16/2023 (C)(D) | 60 | 60 | ||||||
SLM Private Education Loan Trust, Ser 2013-1, Cl B | ||||||||
2.324%, 11/25/2043 (C) | 245 | 217 | ||||||
SLM Private Education Loan Trust, Ser 2013-A, Cl A2B | ||||||||
1.558%, 05/17/2027 (C)(D) | 533 | 537 | ||||||
SLM Private Education Loan Trust, Ser 2013-B, Cl A2B | ||||||||
1.608%, 06/17/2030 (C)(D) | 130 | 131 | ||||||
SLM Private Education Loan Trust, Ser 2013-B, Cl A1 | ||||||||
1.158%, 07/15/2022 (C)(D) | 222 | 223 | ||||||
SLM Private Education Loan Trust, Ser 2013-B, Cl A2A | ||||||||
1.850%, 06/17/2030 (D) | 782 | 782 | ||||||
SLM Private Education Loan Trust, Ser 2014-A, Cl A2B | ||||||||
1.658%, 01/15/2026 (C)(D) | 246 | 248 | ||||||
SLM Student Loan Trust, Ser 2003-12, Cl A5 | ||||||||
1.130%, 09/15/2022 (C)(D) | 293 | 292 | ||||||
SLM Student Loan Trust, Ser 2004-10, Cl A6A | ||||||||
1.265%, 04/27/2026 (C)(D) | 1,237 | 1,227 | ||||||
SLM Student Loan Trust, Ser 2004-10, Cl A7A | ||||||||
1.465%, 10/25/2029 (C)(D) | 562 | 538 | ||||||
SLM Student Loan Trust, Ser 2004-3, Cl A5 | ||||||||
0.808%, 07/25/2023 (C) | 744 | 739 | ||||||
SLM Student Loan Trust, Ser 2004-8, Cl B | ||||||||
1.098%, 01/25/2040 (C) | 132 | 114 | ||||||
SLM Student Loan Trust, Ser 2004-8A, Cl A5 | ||||||||
1.138%, 04/25/2024 (C)(D) | 868 | 868 | ||||||
SLM Student Loan Trust, Ser 2005-5, Cl A4 | ||||||||
0.778%, 10/25/2028 (C) | 1,138 | 1,086 | ||||||
SLM Student Loan Trust, Ser 2005-5, Cl A3 | ||||||||
0.738%, 04/25/2025 (C) | 52 | 51 | ||||||
| ||||||||
| Description | Face Amount (Thousands) | Market Value ($ Thousands) | ||||||
| ||||||||
ASSET-BACKED SECURITIES (continued) |
| |||||||
SLM Student Loan Trust, Ser 2005-6, Cl A5B | ||||||||
1.838%, 07/27/2026 (C) | $ | 206 | $ | 207 | ||||
SLM Student Loan Trust, Ser 2005-6, Cl A6 | ||||||||
0.778%, 10/27/2031 (C) | 1,407 | 1,363 | ||||||
SLM Student Loan Trust, Ser 2005-7, Cl A4 | ||||||||
0.788%, 10/25/2029 (C) | 613 | 592 | ||||||
SLM Student Loan Trust, Ser 2005-9, Cl A5 | ||||||||
0.835%, 01/27/2025 (C) | 69 | 69 | ||||||
SLM Student Loan Trust, Ser 2006-2, Cl A6 | ||||||||
0.808%, 01/25/2041 (C) | 1,900 | 1,724 | ||||||
SLM Student Loan Trust, Ser 2006-3, Cl A5 | ||||||||
0.738%, 01/25/2021 (C) | 989 | 945 | ||||||
SLM Student Loan Trust, Ser 2006-8, Cl A6 | ||||||||
0.798%, 01/25/2041 (C) | 1,900 | 1,686 | ||||||
SLM Student Loan Trust, Ser 2007-2, Cl A4 | ||||||||
0.698%, 07/25/2022 (C) | 3,211 | 3,033 | ||||||
SLM Student Loan Trust, Ser 2007-2, Cl B | ||||||||
0.808%, 07/25/2025 (C) | 391 | 313 | ||||||
SLM Student Loan Trust, Ser 2007-3, Cl A3 | ||||||||
0.678%, 04/25/2019 (C) | 1,177 | 1,173 | ||||||
SLM Student Loan Trust, Ser 2007-5, Cl A5 | ||||||||
0.795%, 01/25/2024 (C) | 634 | 631 | ||||||
SLM Student Loan Trust, Ser 2007-6, Cl B | ||||||||
1.488%, 04/27/2043 (C) | 417 | 364 | ||||||
SLM Student Loan Trust, Ser 2008-2, Cl B | ||||||||
1.838%, 01/25/2083 (C) | 525 | 457 | ||||||
SLM Student Loan Trust, Ser 2008-3, Cl B | ||||||||
1.838%, 04/26/2083 (C) | 525 | 445 | ||||||
SLM Student Loan Trust, Ser 2008-4, Cl B | ||||||||
2.488%, 04/25/2029 (C) | 525 | 485 | ||||||
SLM Student Loan Trust, Ser 2008-5, Cl A4 | ||||||||
2.338%, 07/25/2023 (C) | 1,445 | 1,453 | ||||||
SLM Student Loan Trust, Ser 2008-5, Cl B | ||||||||
2.488%, 07/25/2029 (C) | 525 | 487 | ||||||
SLM Student Loan Trust, Ser 2008-6, Cl B | ||||||||
2.488%, 07/26/2083 (C) | 525 | 489 | ||||||
SLM Student Loan Trust, Ser 2008-7, Cl B | ||||||||
2.488%, 07/26/2083 (C) | 525 | 484 | ||||||
SLM Student Loan Trust, Ser 2008-8, Cl B | ||||||||
2.888%, 10/25/2029 (C) | 525 | 502 | ||||||
SLM Student Loan Trust, Ser 2008-9, Cl A | ||||||||
2.138%, 04/25/2023 (C) | 2,078 | 2,083 | ||||||
SLM Student Loan Trust, Ser 2008-9, Cl B | ||||||||
2.888%, 10/25/2083 (C) | 525 | 507 | ||||||
SLM Student Loan Trust, Ser 2010-1, Cl A | ||||||||
0.924%, 03/25/2025 (C) | 495 | 480 | ||||||
SLM Student Loan Trust, Ser 2012-6, Cl B | ||||||||
1.524%, 04/27/2043 (C) | 564 | 485 | ||||||
SLM Student Loan Trust, Ser 2012-6, Cl A3 | ||||||||
1.274%, 05/26/2026 (C) | 385 | 377 | ||||||
SLM Student Loan Trust, Ser 2013-3, Cl B | ||||||||
1.939%, 09/25/2043 (C) | 291 | 249 | ||||||
| 122 | SEI Institutional Managed Trust / Annual Report / September 30, 2016 |
| ||||||||
| Description | Face Amount (Thousands) | Market Value ($ Thousands) | ||||||
| ||||||||
ASSET-BACKED SECURITIES (continued) |
| |||||||
SLM Student Loan Trust, Ser 2013-4, Cl A | ||||||||
1.074%, 06/25/2027 (C) | $ | 947 | $ | 914 | ||||
SLM Student Loan Trust, Ser 2013-6, Cl A3 | ||||||||
1.174%, 06/25/2055 (C) | 985 | 979 | ||||||
SLM Student Loan Trust, Ser 2013-A, Cl A2A | ||||||||
1.770%, 05/17/2027 (D) | 246 | 245 | ||||||
SLM Student Loan Trust, Ser 2013-C, Cl A2A | ||||||||
2.940%, 10/15/2031 (D) | 396 | 404 | ||||||
SLM Student Loan Trust, Ser 2013-M1, Cl M1 | ||||||||
3.500%, 10/28/2029 (D) | 934 | 917 | ||||||
SLM Student Loan Trust, Ser 2014-2, Cl A3 | ||||||||
1.114%, 03/25/2055 (C) | 642 | 633 | ||||||
SLM Student Loan Trust, Ser 2014-A, Cl A2A | ||||||||
2.590%, 01/15/2026 (D) | 421 | 425 | ||||||
SMB Private Education Loan Trust, Ser 2015-A, Cl A1 | ||||||||
1.108%, 07/17/2023 (C)(D) | 131 | 131 | ||||||
SMB Private Education Loan Trust, Ser 2015-A, Cl A2B | ||||||||
1.508%, 06/15/2027 (C)(D) | 776 | 747 | ||||||
SMB Private Education Loan Trust, Ser 2015-A, Cl A2A | ||||||||
2.490%, 06/15/2027 (D) | 1,003 | 1,021 | ||||||
SMB Private Education Loan Trust, Ser 2015-B, Cl A2B | ||||||||
1.708%, 07/15/2027 (C)(D) | 716 | 710 | ||||||
SMB Private Education Loan Trust, Ser 2015-B, Cl A2A | ||||||||
2.980%, 07/15/2027 (D) | 336 | 349 | ||||||
SMB Private Education Loan Trust, Ser 2015-C, Cl A1 | ||||||||
1.408%, 07/15/2022 (C)(D) | 505 | 506 | ||||||
SMB Private Education Loan Trust, Ser 2015-C, Cl A2B | ||||||||
1.908%, 07/15/2027 (C)(D) | 381 | 388 | ||||||
SMB Private Education Loan Trust, Ser 2015-C, Cl A2A | ||||||||
2.750%, 07/15/2027 (D) | 463 | 477 | ||||||
SMB Private Education Loan Trust, Ser 2016-A, Cl A2A | ||||||||
2.700%, 05/15/2031 (D) | 1,339 | 1,348 | ||||||
SMB Private Education Loan Trust, Ser 2016-A, Cl A2B | ||||||||
2.008%, 05/15/2031 (C)(D) | 1,023 | 1,023 | ||||||
SMB Private Education Loan Trust, Ser 2016-A, Cl A1 | ||||||||
1.208%, 05/15/2023 (C)(D) | 581 | 581 | ||||||
SMB Private Education Loan Trust, Ser 2016-B, Cl A1 | ||||||||
1.135%, 11/15/2023 (C)(D) | 834 | 834 | ||||||
SMB Private Education Loan Trust, Ser 2016-B, Cl A2A | ||||||||
2.430%, 02/17/2032 (D) | 1,581 | 1,601 | ||||||
| ||||||||
| Description | Face Amount (Thousands) | Market Value ($ Thousands) | ||||||
| ||||||||
ASSET-BACKED SECURITIES (continued) |
| |||||||
SMB Private Education Loan Trust, Ser 2016-B, Cl A2B | ||||||||
1.935%, 02/17/2032 (C)(D) | $ | 1,002 | $ | 1,002 | ||||
SOFI Consumer Loan Program Trust, Ser 2015, Cl 1A | ||||||||
3.280%, 09/15/2023 | 2,885 | 2,872 | ||||||
SoFi Professional Loan Program, Ser 2016-D, Cl A2A | ||||||||
1.530%, 04/25/2033 (D) | 489 | 489 | ||||||
SoFi Professional Loan Program, Ser 2016-D, Cl A2B | ||||||||
2.340%, 04/25/2033 (D) | 475 | 475 | ||||||
Structured Asset Securities Mortgage Loan Trust, Ser 2008-BC4, Cl A3 | ||||||||
0.774%, 11/25/2037 (C) | 94 | 94 | ||||||
Trade Maps, Ltd., Ser 2013-1A, Cl A | ||||||||
1.218%, 12/10/2018 (C)(D) | 1,400 | 1,398 | ||||||
United States Small Business Administration, Ser 2015-20D, Cl 1 | ||||||||
2.510%, 04/01/2035 | 200 | 206 | ||||||
United States Small Business Administration, Ser 2015-20I, Cl 1 | ||||||||
2.820%, 09/01/2035 | 29 | 30 | ||||||
Verizon Owner Trust, Ser 2016-1A, Cl A | ||||||||
1.420%, 01/20/2021 (D) | 1,619 | 1,622 | ||||||
Voya CLO, Ser 2014-1A, Cl A1 | ||||||||
2.179%, 04/18/2026 (C)(D) | 1,780 | 1,780 | ||||||
Voya CLO, Ser 2014-2A, Cl A1 | ||||||||
2.083%, 07/17/2026 (C)(D) | 1,730 | 1,730 | ||||||
Wells Fargo Home Equity Asset-Backed SecuritiesTrust, Ser 2006-2, Cl A4 | ||||||||
0.774%, 07/25/2036 (C) | 3,469 | 3,392 | ||||||
|
| |||||||
| 137,250 | ||||||||
|
| |||||||
Total Asset-Backed Securities | 215,076 | |||||||
|
| |||||||
SOVEREIGN DEBT — 3.2% | ||||||||
Abu Dhabi Government International Bond | ||||||||
2.125%, 05/03/2021 (D) | 575 | 579 | ||||||
Argentine Republic Government International Bond | ||||||||
7.625%, 04/22/2046 (D) | 180 | 203 | ||||||
7.500%, 04/22/2026 (D) | 280 | 316 | ||||||
6.875%, 04/22/2021 (D) | 420 | 457 | ||||||
Brazil Notas do Tesouro Nacional, Ser F | ||||||||
10.000%, 01/01/2017 | BRL | 2,230 | 680 | |||||
10.000%, 01/01/2021 | 10,399 | 3,043 | ||||||
10.000%, 01/01/2023 | 3,994 | 1,146 | ||||||
Brazilian Government International Bond | ||||||||
5.625%, 01/07/2041 | $ | 1,120 | 1,114 | |||||
5.000%, 01/27/2045 | 560 | 508 | ||||||
2.625%, 01/05/2023 | 200 | 185 | ||||||
| SEI Institutional Managed Trust / Annual Report / September 30, 2016 | 123 |
SCHEDULE OF INVESTMENTS
September 30, 2016
Core Fixed Income Fund (Continued)
| ||||||||
| Description | Face Amount (Thousands) | Market Value ($ Thousands) | ||||||
| ||||||||
SOVEREIGN DEBT (continued) |
| |||||||
China Government Bond | ||||||||
3.390%, 05/21/2025 | CNY | 2,000 | $ | 304 | ||||
3.380%, 11/21/2024 | 1,000 | 152 | ||||||
3.310%, 11/30/2025 | 11,500 | 1,746 | ||||||
Colombia Government International Bond | ||||||||
5.625%, 02/26/2044 | $ | 820 | 949 | |||||
FMS Wertmanagement AoeR | ||||||||
1.000%, 11/21/2017 | 640 | 640 | ||||||
Indonesia Government International Bond MTN | ||||||||
5.875%, 03/13/2020 | 240 | 268 | ||||||
5.875%, 01/15/2024 (D) | 840 | 991 | ||||||
Israel Government International Bond | ||||||||
4.500%, 01/30/2043 | 470 | 536 | ||||||
Japan Finance Organization for Municipalities | ||||||||
4.000%, 01/13/2021 | 1,800 | 1,963 | ||||||
Japan Treasury Discount Bills | ||||||||
-0.247%, 11/14/2016 (A)(G) | JPY | 860,000 | 8,494 | |||||
-0.296%, 12/12/2016 (A)(G) | 970,000 | 9,584 | ||||||
-0.336%, 10/17/2016 (A)(G) | 970,000 | 9,579 | ||||||
Mexico Government International Bond MTN | ||||||||
5.750%, 10/12/2110 | $ | 677 | 716 | |||||
5.550%, 01/21/2045 | 1,110 | 1,286 | ||||||
4.750%, 03/08/2044 | 1,010 | 1,047 | ||||||
4.350%, 01/15/2047 | 295 | 290 | ||||||
4.125%, 01/21/2026 | 928 | 998 | ||||||
3.600%, 01/30/2025 | 780 | 808 | ||||||
Paraguay Government International Bond | ||||||||
6.100%, 08/11/2044 (D) | 325 | 370 | ||||||
Peruvian Government International Bond | ||||||||
6.550%, 03/14/2037 | 90 | 127 | ||||||
5.625%, 11/18/2050 | 580 | 767 | ||||||
Poland Government Bond | ||||||||
3.250%, 07/25/2025 | PLN | 17,180 | 4,629 | |||||
2.500%, 07/25/2026 | 14,470 | 3,647 | ||||||
2.000%, 04/25/2021 | 1,220 | 316 | ||||||
Poland Government International Bond | ||||||||
4.000%, 01/22/2024 | $ | 1,310 | 1,448 | |||||
Portugal Government International Bond MTN | ||||||||
5.125%, 10/15/2024 (D) | 1,100 | 1,096 | ||||||
Province of Ontario Canada | ||||||||
1.625%, 01/18/2019 (E) | 885 | 893 | ||||||
1.250%, 06/17/2019 | 652 | 651 | ||||||
Qatar Government International Bond | ||||||||
3.250%, 06/02/2026 (D) | 465 | 473 | ||||||
2.375%, 06/02/2021 (D) | 765 | 771 | ||||||
Russian Foreign Bond - Eurobond | ||||||||
7.500%, 03/31/2030 | 705 | 854 | ||||||
4.500%, 04/04/2022 | 400 | 431 | ||||||
Russian Government International Bond | ||||||||
7.500%, 03/31/2030 (D) | 311 | 377 | ||||||
Slovenia Government International Bond | ||||||||
5.850%, 05/10/2023 (D) | 525 | 629 | ||||||
| ||||||||
| Description | Face Amount (Thousands) | Market Value ($ Thousands) | ||||||
| ||||||||
SOVEREIGN DEBT (continued) |
| |||||||
5.500%, 10/26/2022 (D) | $ | 528 | $ | 616 | ||||
5.250%, 02/18/2024 (D) | 1,215 | 1,425 | ||||||
South Africa Government International Bond | ||||||||
4.300%, 10/12/2028 | 440 | 440 | ||||||
|
| |||||||
Total Sovereign Debt | 68,542 | |||||||
|
| |||||||
LOAN PARTICIPATIONS — 1.0% |
| |||||||
1011778 BC ULC/ New Red Finance (aka Burger King/Tim Horton’s), Term Loan B2, 1st Lien | ||||||||
3.750%, 12/10/2021 | 601 | 605 | ||||||
Air Medical Group, Cov-Lite, Intial Term Loan, 1st Lien | ||||||||
4.250%, 04/28/2022 | 737 | 730 | ||||||
Albertson’s LLC, Term Loan B4, 1st Lien | ||||||||
4.500%, 08/25/2021 | 450 | 453 | ||||||
Albertson’s LLC, Term Loan B6, 1st Lien | ||||||||
4.750%, 06/22/2023 | 150 | 151 | ||||||
American Airlines, Term Loan, 1st Lien | ||||||||
3.250%, 06/27/2020 | 631 | 631 | ||||||
American Builders & Contractors Supply Co., Inc., Term Loan B, 1st Lien | ||||||||
3.500%, 04/16/2020 | 100 | 100 | ||||||
American Builders & Contractors Supply Co., Term Loan B, 1st Lien | ||||||||
3.500%, 04/16/2020 | 498 | 499 | ||||||
Aramark Corporation, U.S. Term Loan F, 1st Lien | ||||||||
3.250%, 02/24/2021 (C) | 262 | 263 | ||||||
Aristocrat Leisure, Cov-Lite, Term Loan B1, 1st Lien | ||||||||
3.500%, 10/20/2021 | 80 | 80 | ||||||
Berry Plastics Corporation, Term H Loan, 1st Lien | ||||||||
3.800%, 10/01/2022 | 442 | 443 | ||||||
Berry Plastics Corporation, Term Loan H, 1st Lien | ||||||||
3.750%, 10/01/2022 | 150 | 150 | ||||||
Boyd Gaming Corporation, Cov-Lite, Term Loan B, 1st Lien | ||||||||
4.000%, 08/14/2020 | 300 | 302 | ||||||
Charter Communications Operating LLC, Term Loan E | ||||||||
3.000%, 07/01/2020 | 600 | 602 | ||||||
CSC Holdings, LLC (fka CSC Holdings, Inc.), Initial Term Loan, 1st Lien | ||||||||
5.000%, 10/09/2022 | 200 | 200 | ||||||
Dollar Tree, Term Loan B, 1st Lien | ||||||||
3.062%, 07/06/2022 | 393 | 396 | ||||||
| 124 | SEI Institutional Managed Trust / Annual Report / September 30, 2016 |
| ||||||||
| Description | Face Amount (Thousands) | Market Value ($ Thousands) | ||||||
| ||||||||
LOAN PARTICIPATIONS (continued) |
| |||||||
Energy Future Immediate Holding, Term Loan, 1st Lien | ||||||||
4.250%, 12/19/2016 | $ | 2,200 | $ | 2,215 | ||||
First Data Corporation, Extended Term Loan, 1st Lien | ||||||||
4.500%, 03/24/2021 | 1,132 | 1,140 | ||||||
First Data Corporation, Term Loan, 1st Lien | ||||||||
4.275%, 07/08/2022 | 1,000 | 1,005 | ||||||
Gardner Denver, Initial Term Loan, 1st Lien | ||||||||
4.250%, 07/30/2020 (C) | 506 | 489 | ||||||
Hilton Worldwide Holdings, Initial Term Loan, 1st Lien | ||||||||
3.500%, 10/26/2020 (C) | 35 | 36 | ||||||
Hilton Worldwide Holdings, Term Loan, 1st Lien | ||||||||
3.500%, 10/25/2023 (H) | 272 | 274 | ||||||
3.024%, 10/25/2023 (H) | 146 | 147 | ||||||
2.960%, 10/25/2023 (H) | 55 | 55 | ||||||
Intelsat Jackson Holdings S.A., Term Loan, Tranche B2, 1st Lien | ||||||||
3.750%, 06/30/2019 (C) | 671 �� | 638 | ||||||
Jaguar Holding Company I, Initial Term Loan, 1st Lien | ||||||||
4.250%, 08/18/2022 | 170 | 170 | ||||||
Kronos Incorporated, Incremental Term Loan, 1st Lien | ||||||||
4.500%, 10/30/2019 (H) | 90 | 90 | ||||||
Level 3 Financing, Inc., Tranche B-II 2022 Term Loan | ||||||||
3.500%, 05/31/2022 | 600 | 603 | ||||||
Maple Holdings Acquisition Corp., Cov-Lite, Term Loan B, 1st Lien | ||||||||
5.250%, 03/03/2023 | 425 | 430 | ||||||
Michaels Stores, Term Loan B, 1st Lien | ||||||||
3.750%, 01/28/2020 (C)(H) | 564 | 566 | ||||||
MPH Acquisition Holdings LLC, Initial Term Loan, 1st Lien | ||||||||
5.000%, 06/07/2023 | 590 | 597 | ||||||
Murray Energy Corporation, Term Loan B2, 1st Lien | ||||||||
8.250%, 04/16/2020 | 557 | 472 | ||||||
NRG Energy, Term Loan B, 1st Lien | ||||||||
2.750%, 07/01/2018 (C) | 632 | 633 | ||||||
Party City, Term Loan B | ||||||||
4.500%, 08/19/2022 | 562 | 564 | ||||||
4.250%, 08/19/2022 | 15 | 15 | ||||||
PETCO Animal Supplies, Term Loan B1, 1st Lien | ||||||||
5.000%, 01/26/2023 (H) | 360 | 364 | ||||||
PetSmart, Term Loan, Tranche B1, 1st Lien | ||||||||
4.250%, 03/11/2022 | 625 | 625 | ||||||
Reynolds Group Holdings, U.S. Term Loan, 1st Lien | ||||||||
4.250%, 02/05/2023 | 40 | 40 | ||||||
| ||||||||
| Description | Face Amount (Thousands) | Market Value ($ Thousands) | ||||||
| ||||||||
LOAN PARTICIPATIONS (continued) |
| |||||||
RPI Finance Trust, Term Loan B3, 1st Lien | ||||||||
3.250%, 11/09/2018 (H) | $ | 300 | $ | 300 | ||||
Select Medical, Term Loan F, 1st Lien | ||||||||
6.000%, 03/03/2021 | 579 | 582 | ||||||
Servicemaster, Term Loan, 1st Lien | ||||||||
4.250%, 07/01/2021 | 308 | 311 | ||||||
Telesat Canada, U.S., Term Loan, Tranche B2, 1st Lien | ||||||||
3.500%, 03/28/2019 (C) | 480 | 480 | ||||||
T-Mobile USA, Term Loan B, 1st Lien | ||||||||
3.500%, 11/03/2022 (C) | 537 | 541 | ||||||
Univision Communications, Replacement Term Loan, 1st Lien | ||||||||
4.000%, 03/01/2020 | 1,685 | 1,688 | ||||||
Virgin Media Investment Holdings, Term Loan, 1st Lien | ||||||||
3.500%, 06/30/2023 | 498 | 499 | ||||||
XPO Logistics, Term Loan B, 1st Lien | ||||||||
4.250%, 11/01/2021 | 409 | 411 | ||||||
Total Loan Participations |
| |||||||
|
| |||||||
(Cost $21,598) ($ Thousands) |
| 21,585 | ||||||
|
| |||||||
U.S. GOVERNMENT AGENCY OBLIGATIONS — 0.7% |
| |||||||
FHLB | ||||||||
1.250%, 06/28/2030 (F) | 3,405 | 3,406 | ||||||
0.875%, 05/24/2017 | 40 | 40 | ||||||
FICO STRIPS, PO | ||||||||
0.092%, 11/02/2018 (A) | 1,800 | 1,764 | ||||||
0.090%, 04/06/2018 (A) | 1,270 | 1,252 | ||||||
0.000%, 05/11/2018 (A) | 1,910 | 1,883 | ||||||
FNMA | ||||||||
4.852%, 10/09/2019 (A) | 3,025 | 2,904 | ||||||
Tennessee Valley Authority | ||||||||
5.250%, 09/15/2039 | 590 | 815 | ||||||
3.875%, 02/15/2021 | 1,510 | 1,675 | ||||||
2.875%, 09/15/2024 | 1,433 | 1,550 | ||||||
|
| |||||||
Total U.S. Government Agency Obligations |
| 15,289 | ||||||
|
| |||||||
MUNICIPAL BONDS — 0.5% |
| |||||||
California — 0.2% | ||||||||
California State, Build America Project, GO | ||||||||
7.600%, 11/01/2040 | 480 | 781 | ||||||
California State, GO | ||||||||
6.200%, 03/01/2019 | 1,775 | 1,988 | ||||||
| SEI Institutional Managed Trust / Annual Report / September 30, 2016 | 125 |
SCHEDULE OF INVESTMENTS
September 30, 2016
Core Fixed Income Fund (Continued)
| ||||||||
| Description | Face Amount (Thousands) | Market Value ($ Thousands) | ||||||
| ||||||||
MUNICIPAL BONDS (continued) |
| |||||||
Los Angeles, Community College District, Build America Project, GO | ||||||||
6.750%, 08/01/2049 | $ | 520 | $ | 828 | ||||
|
| |||||||
| 3,597 | ||||||||
|
| |||||||
Nevada — 0.1% | ||||||||
Clark County, Department of Aviation, Build America Project, Ser C, RB | ||||||||
6.820%, 07/01/2045 | 770 | 1,198 | ||||||
|
| |||||||
New Jersey — 0.0% | ||||||||
New Jersey State, Turnpike Authority, Build America Project, Ser C, RB | ||||||||
7.102%, 01/01/2041 | 568 | 866 | ||||||
|
| |||||||
New York — 0.1% | ||||||||
New York and New Jersey, Port Authority, RB | ||||||||
4.458%, 10/01/2062 | 715 | 826 | ||||||
New York City, Build America Project, Ser F1, GO | ||||||||
Callable 12/01/2020 @ 100 | ||||||||
6.646%, 12/01/2031 | 900 | 1,066 | ||||||
New York City, Water & Sewer System, Build America Project, RB | ||||||||
5.952%, 06/15/2042 | 750 | 1,084 | ||||||
|
| |||||||
| 2,976 | ||||||||
|
| |||||||
Ohio — 0.0% | ||||||||
Ohio State University, Ser A, RB | ||||||||
4.800%, 06/01/2111 | 212 | 240 | ||||||
|
| |||||||
Texas — 0.1% | ||||||||
Brazos Higher Education Authority, Ser 2006- 2, RB | ||||||||
0.650%, 12/26/2024(C) | 547 | 534 | ||||||
North Texas, Tollway Authority, Build America Project, Ser B, RB | ||||||||
6.718%, 01/01/2049 | 619 | 966 | ||||||
|
| |||||||
| 1,500 | ||||||||
|
| |||||||
Total Municipal Bonds | 10,377 | |||||||
|
| |||||||
| Shares | ||||||||
|
| |||||||
PREFERRED STOCK — 0.0% |
| |||||||
Citigroup Capital XIII, 7.875% (C) | 24,750 | 652 | ||||||
|
| |||||||
Total Preferred Stock | 652 | |||||||
|
| |||||||
| ||||||||
| Description | Shares | Market Value ($ Thousands) | ||||||
| ||||||||
AFFILIATED PARTNERSHIP — 0.7% |
| |||||||
SEI Liquidity Fund, L.P. | ||||||||
0.440% **†(I) | 14,019,829 | $ | 14,020 | |||||
|
| |||||||
Total Affiliated Partnership |
| 14,020 | ||||||
|
| |||||||
CASH EQUIVALENT — 2.6% |
| |||||||
SEI Daily Income Trust, Government Fund, Cl A | ||||||||
0.220%**† | 56,416,046 | 56,416 | ||||||
|
| |||||||
Total Cash Equivalent | ||||||||
(Cost $56,416) ($ Thousands) |
| 56,416 | ||||||
|
| |||||||
Total Investments — 106.9% |
| $ | 2,298,636 | |||||
|
| |||||||
| Contracts | ||||||||
|
| |||||||
PURCHASED OPTIONS(J) — 0.0% |
| |||||||
November 2016, U.S. 10 Year Future Option | 130 | 47 | ||||||
November 2016, U.S. 10 Year Future Option | 113 | 23 | ||||||
November 2016, U.S. 5 Year Future Option | 151 | 28 | ||||||
November 2016, U.S. Long Bond Future Option | 32 | 18 | ||||||
November 2016, U.S. Long Bond Future Option | 64 | 76 | ||||||
November 2016, U.S. Long Bond Future Option | 46 | 16 | ||||||
|
| |||||||
Total Purchased Options | $ | 208 | ||||||
|
| |||||||
WRITTEN OPTIONS(J) — 0.0% |
| |||||||
December 2016, U.S. 10 Year Future Option | (350) | (104) | ||||||
December 2016, U.S. 10 Year Future Option | (129) | (50) | ||||||
December 2016, U.S. Bond Future Option | (44) | (16) | ||||||
| 126 | SEI Institutional Managed Trust / Annual Report / September 30, 2016 |
| ||||||||
| Description | Contracts | Market Value ($ Thousands) | ||||||
| ||||||||
WRITTEN OPTIONS(J) (continued) | ||||||||
December 2016, U.S. Bond Future Option | (97) | $ | (120) | |||||
November 2016, U.S. 5 Year Future Option | (146) | (9) | ||||||
November 2016, U.S. Bond Future Option | (32) | (6) | ||||||
November 2016, U.S. Bond Future Option | (92) | (10) | ||||||
|
| |||||||
Total Written Options | ||||||||
(Premiums Received $468) ($ Thousands) |
| $ | (315) | |||||
|
| |||||||
A list of the open futures contracts held by the Fund at September 30, 2016, is as follows:
| Type of Contract | Number of Contracts Long (Short) | Expiration Date | Unrealized Appreciation (Depreciation) ($ Thousands) | |||||||
90-Day Euro$ | 284 | Dec-2017 | $39 | |||||||
90-Day Euro$ | 120 | Mar-2017 | 9 | |||||||
90-Day Euro$ | (306) | Dec-2019 | (16) | |||||||
Euro | (18) | Dec-2016 | 1 | |||||||
Euro-Bobl | 39 | Dec-2016 | 3 | |||||||
Euro-Bund 10-Year Bond | (90) | Dec-2016 | (120) | |||||||
Euro-Buxl 30-Year Bond | (8) | Dec-2016 | 1 | |||||||
U.S. 10-Year Treasury Note | 692 | Dec-2016 | – | |||||||
U.S. 2-Year Treasury Note | 96 | Dec-2016 | (1) | |||||||
U.S. 5-Year Treasury Note | 1,343 | Dec-2016 | 194 | |||||||
U.S. Long Treasury Bond | (346) | Dec-2016 | 829 | |||||||
U.S. Ultra Long Treasury Bond | (256) | Dec-2016 | 748 | |||||||
U.S. 10-Year Ultra Long Treasury Bond | (132) | Dec-2016 | 7 | |||||||
| ||||||||||
| $1,694 | ||||||||||
| ||||||||||
For the year ended September 30, 2016, the total amount of all open futures contracts, as presented in the table above, are representative of the volume of activity for the derivative type during the year.
A list of the open forward foreign currency contracts held by the Fund at September 30, 2016, is as follows:
Settlement Date | Currency to Deliver (Thousands) | Currency To Receive (Thousands) | Unrealized Appreciation (Depreciation) ($ Thousands) | |||||||||||
10/14/16 | USD | 1,023 | GBP | 789 | $2 | |||||||||
10/14/16 | USD | 1,689 | BRL | 5,408 | (31) | |||||||||
10/14/16 | USD | 2,876 | CNH | 19,240 | 5 | |||||||||
10/14/16 | USD | 4,523 | IDR | 59,300,390 | 22 | |||||||||
10/14/16 | BRL | 5,408 | USD | 1,591 | (67) | |||||||||
10/14/16 | USD | 5,869 | INR | 401,690 | 152 | |||||||||
10/14/16 | USD | 10,817 | CNY | 72,168 | (4) | |||||||||
10/14/16 | PLN | 11,190 | USD | 2,795 | (128) | |||||||||
10/14/16 | USD | 7,726 | EUR | 6,970 | 112 | |||||||||
10/14/16 | USD | 5,839 | EUR | 5,153 | (45) | |||||||||
10/14/16 | INR | 100,340 | USD | 1,505 | 1 | |||||||||
10/14/16-11/10/16 | EUR | 15,564 | USD | 17,430 | (89) | |||||||||
10/14/16-11/14/16 | JPY | 1,768,246 | USD | 17,586 | 101 | |||||||||
10/17/16-12/12/16 | JPY | 1,940,000 | USD | 18,778 | (421) | |||||||||
10/14/16-01/20/17 | CNH | 38,480 | USD | 5,714 | (31) | |||||||||
10/14/16-01/20/17 | CNY | 144,336 | USD | 21,447 | (109) | |||||||||
11/10/16 | GBP | 1,489 | USD | 1,990 | 55 | |||||||||
| ||||||||||||||
| $(475) | ||||||||||||||
| ||||||||||||||
A list of the counterparties for the outstanding forward foreign currency contracts held by the Fund at September 30, 2016, is as follows:
| Counterparty | Currency to Deliver ($ Thousands) | Currency to Receive ($ Thousands) | Unrealized Appreciation (Depreciation) ($ Thousands) | |||||||
Bank of America | $(25,298) | $24,995 | $(303) | |||||||
Barclays PLC | (40,731) | 40,605 | (126) | |||||||
Citigroup | (39,771) | 39,795 | 24 | |||||||
JPMorgan Chase Bank | (18,122) | 18,095 | (27) | |||||||
Morgan Stanley | (3,978) | 3,944 | (34) | |||||||
UBS | (1,984) | 1,975 | (9) | |||||||
| ||||||||||
| $(475) | ||||||||||
| ||||||||||
For the year ended September 30, 2016 the total amount of all open forward foreign currency contracts, as presented in the table above, are representative of the volume of activity for the derivative type during the year.
| SEI Institutional Managed Trust / Annual Report / September 30, 2016 | 127 |
SCHEDULE OF INVESTMENTS
September 30, 2016
Core Fixed Income Fund (Concluded)
A list of the open OTC swap agreements held by the Fund at September 30, 2016 is as follows:
| ||||||||||||||||||||||
| Interest Rate Swaps | ||||||||||||||||||||||
| ||||||||||||||||||||||
| Broker | Fund Pays | Fund Receives | Termination Date | Notional Amount ($ Thousands) | Net Unrealized Depreciation ($ Thousands) | |||||||||||||||||
| ||||||||||||||||||||||
Citigroup | 2.71% | 3 Month USD - LIBOR | 08/15/42 | $ | 3,245 | $ | (676) | |||||||||||||||
|
| |||||||||||||||||||||
| ||||||||||||||||||||
| Credit Default Swaps | ||||||||||||||||||||
| ||||||||||||||||||||
| Counterparty | Reference Entity/Obligation | Buy/Sell Protection | (Pays)/Receives Rate | Termination Date | Notional Amount ($Thousands) | Net Unrealized Depreciation ($ Thousands) | ||||||||||||||
| ||||||||||||||||||||
Goldman Sachs | Metlife Inc. | SELL | 1.00 | 6/20/21 | $ (750) | $ | (10) | |||||||||||||
Goldman Sachs | Metlife Inc. | SELL | 1.00 | 6/20/21 | (840) | (11) | ||||||||||||||
|
| |||||||||||||||||||
| $ | (21) | |||||||||||||||||||
|
| |||||||||||||||||||
A list of the open centrally cleared swap agreements held by the Fund at September 30, 2016 is as follows:
| ||||||||||||||||||||
| Interest Rate Swaps | ||||||||||||||||||||
| ||||||||||||||||||||
| Counterparty | Fund Pays | Fund Receives | Termination Date | Notional Amount ($ Thousands) | Net Unrealized Appreciation (Depreciation) ($ Thousands) | |||||||||||||||
| ||||||||||||||||||||
Citibank | 3.676% | 3 Month USD-LIBOR | 11/15/43 | $ 2,275 | $ | (963) | ||||||||||||||
UBS | 1.27% | 3 Month USD-LIBOR | 05/15/23 | 22,656 | 35 | |||||||||||||||
UBS | 1.90% | 3 Month USD-LIBOR | 11/30/22 | 34,472 | (1,301) | |||||||||||||||
UBS | 3 Month USD-LIBOR | 1.58% | 06/13/26 | 9,520 | (91) | |||||||||||||||
UBS | 3 Month USD-LIBOR | 1.19% | 06/13/21 | 9,530 | 3 | |||||||||||||||
UBS | 1.897% | 3 Month USD-LIBOR | 08/31/22 | 22,800 | (848) | |||||||||||||||
|
| |||||||||||||||||||
| $ | (3,165) | |||||||||||||||||||
|
| |||||||||||||||||||
| ||||||||||||||||
| Credit Default Swaps | ||||||||||||||||
| ||||||||||||||||
| Counterparty | Reference Entity/Obligation | Buy/Sell Protection | (Pays)/Receives Rate | Termination Date | Notional Amount ($Thousands) | Net Unrealized Appreciation ($ Thousands) | ||||||||||
| ||||||||||||||||
UBS | CDX.NA.HY.27 | BUY | 5.00% | 12/20/21 | $ 1,390 | $ 1 | ||||||||||
|
| |||||||||||||||
For the year ended September 30, 2016, the total amount of open swap agreements, as presented in the tables above, are representative of the volume of activity for this derivative type during the year.
| Percentages are based on Net Assets of $2,150,342 ($ Thousands). |
| * | Non-income producing security. |
| ** | Rate shown is the 7-day effective yield as of September 30, 2016. |
| † | Investment in Affiliated Security (see Note 6). |
| (A) | The rate reported is the effective yield at the time of purchase. |
| (B) | Security, or portion thereof, has been pledged as collateral on open futures contracts. |
| (C) | Variable Rate Security — The rate reported on the Schedule of Investments is the rate in effect as of September 30, 2016. |
| (D) | Security exempt from registration under Rule 144A of the Securities Act of 1933. These securities may be resold in transactions exempt from registration normally to qualified institutions. On September 30, 2016, the value of these securities amounted to $228,289 ($ Thousands), representing 10.6% of the Net Assets of the Fund. |
| (E) | This security or a partial position of this security is on loan at September 30, 2016 (see Note 10). The total market value of securities on loan at September 30, 2016 was $13,544 ($ Thousands). |
| (F) | Step Bonds – The rate reflected on the Schedule of Investments is the effective yield on September 30, 2016. The coupon on a step bond changes on a specified date. |
| (G) | Rate is negative due to the decrease in value of the foreign currency against the U.S. Dollar. |
| (H) | Unsettled bank loan. Interest rate not available. |
| (I) | This security was purchased with cash collateral held from securities on loan (see Note 10). The total market value of such securities as of September 30, 2016 was $14,020 ($ Thousands). |
| (J) | For the year ended September 30, 2016, the total amount of open purchased and written options, as presented in the Schedule of Investments, are representative of the volume of activity for these derivative types during the year. |
ACES — Alternative Credit Enhancement Structure
ARM — Adjustable Rate Mortgage
BRL — Brazilian Real
Cl — Class
CLO — Collateralized Loan Obligation
CMO — Collateralized Mortgage Obligation
CNH — Chinese Offshore Yuan
CNY — Chinese Yuan
EUR — Euro
FHLB — Federal Home Loan Bank
FHLMC — Federal Home Loan Mortgage Corporation
FICO — Financing Corporation
FNMA — Federal National Mortgage Association
GBP — British Pound Sterling
GNMA — Government National Mortgage Association
GO — General Obligation
IDR — Indonesian Rupiah
INR — Indian Rupee
IO — Interest Only — face amount represents notional amount.
JPY — Japanese Yen
LIBOR — London Interbank Offered Rate
LLC — Limited Liability Company
L.P. — Limited Partnership
| 128 | SEI Institutional Managed Trust / Annual Report / September 30, 2016 |
Ltd. — Limited
MTN — Medium Term Note
NCUA — National Credit Union Association
OTC — Over the Counter
PLC — Public Limited Company
PLN — Polish Zloty
PO — Principal Only
RB — Revenue Bond
Re-REMIC — Resecuritization of Real Estate Mortgage Investment Conduit
Ser — Series
STRIPS — Separately Traded Registered Interest and Principal Securities
TBA — To Be Announced
ULC — Unlimited Liability Company
USD — United States Dollar
The following is a list of the level of inputs used as of September 30, 2016, in valuing the Fund’s investments and other financial instruments carried at value ($ Thousands):
| ||||||||||||||||
Investments in Securities
|
| Level 1
|
|
| Level 2
|
|
| Level 3
|
|
| Total
|
| ||||
| ||||||||||||||||
U.S. Treasury Obligations | $ | – | $ | 653,766 | $ | – | $ | 653,766 | ||||||||
Mortgage-Backed Securities | – | 648,884 | – | 648,884 | ||||||||||||
Corporate Obligations | – | 594,029 | – | 594,029 | ||||||||||||
Asset-Backed Securities | – | 215,076 | – | 215,076 | ||||||||||||
Sovereign Debt | – | 68,542 | – | 68,542 | ||||||||||||
Loan Participations | – | 21,585 | – | 21,585 | ||||||||||||
U.S. Government Agency Obligations | – | 15,289 | – | 15,289 | ||||||||||||
Municipal Bonds | – | 10,377 | – | 10,377 | ||||||||||||
Preferred Stock | 652 | – | – | 652 | ||||||||||||
Affiliated Partnership | – | 14,020 | – | 14,020 | ||||||||||||
Cash Equivalent | 56,416 | – | – | 56,416 | ||||||||||||
|
|
|
|
|
|
|
| |||||||||
Total Investments in Securities | $ | 57,068 | $ | 2,241,568 | $ | – | $ | 2,298,636 | ||||||||
|
|
|
|
|
|
|
| |||||||||
| ||||||||||||||||
| Other Financial Instruments | Level 1 | Level 2 | Level 3 | Total | ||||||||||||
| ||||||||||||||||
Purchased Options | $ | 208 | $ | — | $ | — | $ | 208 | ||||||||
Written Options | (315) | — | — | (315) | ||||||||||||
Futures Contracts * | ||||||||||||||||
Unrealized Appreciation | 1,831 | — | — | 1,831 | ||||||||||||
Unrealized Depreciation | (137) | — | — | (137) | ||||||||||||
Forwards Contracts * | ||||||||||||||||
Unrealized Appreciation | — | 450 | — | 450 | ||||||||||||
Unrealized Depreciation | — | (925) | — | (925) | ||||||||||||
OTC Swaps | ||||||||||||||||
Interest Rate Swaps * | ||||||||||||||||
Unrealized Depreciation | — | (676) | — | (676) | ||||||||||||
Credit Default Swaps * | ||||||||||||||||
Unrealized Depreciation | — | (21) | — | (21) | ||||||||||||
Centrally Cleared Swaps | ||||||||||||||||
Interest Rate Swaps * | ||||||||||||||||
Unrealized Appreciation | — | 38 | — | 38 | ||||||||||||
Unrealized Depreciation | — | (3,203) | — | (3,203) | ||||||||||||
Credit Default Swaps * | ||||||||||||||||
Unrealized Appreciation | — | 1 | — | 1 | ||||||||||||
|
|
|
|
|
|
|
| |||||||||
Total Other Financial Instruments | $ | 1,587 | $ | (4,336) | $ | — | $ | (2,749) | ||||||||
|
|
|
|
|
|
|
| |||||||||
* Futures contracts, forward contracts and swaps contracts are valued at the unrealized appreciation (depreciation) on the instrument.
For the year ended September 30, 2016, there were no transfers between Level 1 and Level 2 assets and liabilities.
For the year ended September 30, 2016, there were no transfers between Level 2 and Level 3 assets and liabilities.
For more information on valuation inputs, see Note 2 – Significant Accounting Policies in Notes to Financial Statements.
Amounts designated as “—” are $0 or have been rounded to $0.
The accompanying notes are an integral part of the financial statements.
| SEI Institutional Managed Trust / Annual Report / September 30, 2016 | 129 |
SCHEDULE OF INVESTMENTS
September 30, 2016
U.S. Fixed Income Fund
|
Sector Weightings (Unaudited)†:
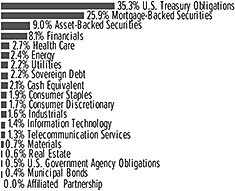
†Percentages are based on total investments. Includes investments held as collateral for securities held on loan (see Note 10).
| ||||||||
| Description | Face Amount (Thousands) | Market Value ($ Thousands) | ||||||
| ||||||||
U.S. TREASURY OBLIGATIONS — 37.9% |
| |||||||
U.S. Treasury Bills | ||||||||
0.443%, 02/23/2017 (A) | $ | 16,060 | $ | 16,038 | ||||
0.436%, 11/25/2016 (A) | 4,695 | 4,694 | ||||||
0.348%, 01/05/2017 (A) | 10,510 | 10,503 | ||||||
0.328%, 12/08/2016 (A) | 190 | 190 | ||||||
0.306%, 10/20/2016 (A) | 4,090 | 4,090 | ||||||
0.286%, 12/15/2016 (A) | 16,970 | 16,964 | ||||||
0.215%, 01/19/2017 (A) | 2,780 | 2,778 | ||||||
U.S. Treasury Bonds | ||||||||
3.750%, 11/15/2043 | 790 | 1,028 | ||||||
3.000%, 11/15/2044 | 670 | 764 | ||||||
3.000%, 05/15/2045 | 18,180 | 20,728 | ||||||
3.000%, 11/15/2045 | 9,065 | 10,343 | ||||||
2.875%, 05/15/2043 | 3,890 | 4,331 | ||||||
2.875%, 08/15/2045 | 8,745 | 9,740 | ||||||
2.763%, 08/15/2045 (A) | 1,725 | 855 | ||||||
2.750%, 08/15/2042 | 915 | 997 | ||||||
2.750%, 11/15/2042 | 2,950 | 3,211 | ||||||
2.734%, 05/15/2045 (A) | 3,100 | 1,546 | ||||||
2.625%, 11/15/2020 | 21,465 | 22,787 | ||||||
2.500%, 02/15/2045 | 14,830 | 15,326 | ||||||
2.500%, 02/15/2046 | 7,835 | 8,098 | ||||||
2.500%, 05/15/2046 | 10,711 | 11,086 | ||||||
2.250%, 08/15/2046 | 19,093 | 18,747 | ||||||
2.000%, 10/31/2021 | 12,624 | 13,118 | ||||||
U.S. Treasury Inflation Protected Securities |
| |||||||
1.750%, 01/15/2028 | 425 | 497 | ||||||
1.375%, 02/15/2044 | 2,628 | 3,117 | ||||||
1.000%, 02/15/2046 | 843 | 918 | ||||||
0.750%, 02/15/2045 | 3,490 | 3,597 | ||||||
0.625%, 01/15/2024 | 155 | 162 | ||||||
0.625%, 02/15/2043 | 3,538 | 3,547 | ||||||
0.375%, 07/15/2025 | 5,586 | 5,769 | ||||||
U.S. Treasury Notes | ||||||||
3.500%, 05/15/2020 | 7,720 | 8,397 | ||||||
| ||||||||
| Description | Face Amount (Thousands) | Market Value ($ Thousands) | ||||||
| ||||||||
U.S. TREASURY OBLIGATIONS (continued) |
| |||||||
2.250%, 11/15/2024 | $ | 3,710 | $ | 3,917 | ||||
2.125%, 08/31/2020 | 8,190 | 8,521 | ||||||
2.125%, 08/15/2021 | 6,282 | 6,560 | ||||||
2.125%, 06/30/2022 | 190 | 199 | ||||||
2.000%, 09/30/2020 | 1,090 | 1,130 | ||||||
2.000%, 08/31/2021 | 1,599 | 1,661 | ||||||
2.000%, 11/30/2022 | 12,570 | 13,061 | ||||||
1.875%, 08/31/2017 | 8,600 | 8,693 | ||||||
1.875%, 09/30/2017 | 30 | 30 | ||||||
1.875%, 10/31/2017 | 800 | 810 | ||||||
1.875%, 05/31/2022 | 2,400 | 2,478 | ||||||
1.750%, 10/31/2020 | 1,697 | 1,742 | ||||||
1.750%, 03/31/2022 | 1,770 | 1,816 | ||||||
1.750%, 05/15/2022 | 775 | 795 | ||||||
1.625%, 08/31/2019 | 3,142 | 3,208 | ||||||
1.625%, 06/30/2020 | 2,390 | 2,442 | ||||||
1.625%, 11/30/2020 | 4,189 | 4,280 | ||||||
1.625%, 05/15/2026 | 260 | 260 | ||||||
1.500%, 02/28/2023 | 4,550 | 4,585 | ||||||
1.500%, 03/31/2023 | 40 | 40 | ||||||
1.500%, 08/15/2026 | 21,243 | 21,036 | ||||||
1.375%, 09/30/2018 | 783 | 792 | ||||||
1.375%, 03/31/2020 | 70 | 71 | ||||||
1.375%, 01/31/2021 | 11,088 | 11,209 | ||||||
1.375%, 04/30/2021 | 12,688 | 12,821 | ||||||
1.375%, 06/30/2023 | 5,300 | 5,291 | ||||||
1.375%, 08/31/2023 | 2,585 | 2,577 | ||||||
1.375%, 09/30/2023 | 701 | 698 | ||||||
1.250%, 12/15/2018 | 1,648 | 1,663 | ||||||
1.250%, 07/31/2023 | 840 | 831 | ||||||
1.125%, 06/15/2018 | 1,783 | 1,794 | ||||||
1.125%, 06/30/2021 | 50 | 50 | ||||||
1.125%, 07/31/2021 | 9,520 | 9,507 | ||||||
1.125%, 08/31/2021 | 11,651 | 11,639 | ||||||
1.125%, 09/30/2021 | 20,694 | 20,667 | ||||||
1.000%, 12/15/2017 | 1,625 | 1,631 | ||||||
1.000%, 12/31/2017 | 3,690 | 3,703 | ||||||
1.000%, 05/15/2018 | 2,462 | 2,472 | ||||||
1.000%, 09/15/2018 | 865 | 869 | ||||||
1.000%, 08/31/2019 | 948 | 951 | ||||||
0.875%, 10/15/2017 | 1,600 | 1,603 | ||||||
0.875%, 11/15/2017 | 5,520 | 5,531 | ||||||
0.875%, 05/31/2018 | 38,402 | 38,481 | ||||||
0.875%, 07/15/2018 | 1,388 | 1,391 | ||||||
0.875%, 09/15/2019 | 3,689 | 3,689 | ||||||
0.750%, 10/31/2017 | 14,110 | 14,120 | ||||||
0.750%, 01/31/2018 | 895 | 895 | ||||||
0.750%, 02/28/2018 | 5,651 | 5,653 | ||||||
0.750%, 07/31/2018 | 7,130 | 7,128 | ||||||
0.750%, 08/31/2018 | 165 | 165 | ||||||
0.750%, 09/30/2018 | 5,182 | 5,180 | ||||||
| 130 | SEI Institutional Managed Trust / Annual Report / September 30, 2016 |
| ||||||||
| Description | Face Amount (Thousands) | Market Value ($ Thousands) | ||||||
| ||||||||
U.S. TREASURY OBLIGATIONS (continued) |
| |||||||
0.750%, 08/15/2019 | $ | 8,904 | $ | 8,873 | ||||
|
| |||||||
Total U.S. Treasury Obligations | 493,175 | |||||||
|
| |||||||
MORTGAGE-BACKED SECURITIES — 27.8% |
| |||||||
Agency Mortgage-Backed Obligations — 24.0% |
| |||||||
FHLMC | ||||||||
10.000%, 03/17/2026 | 101 | 105 | ||||||
7.500%, 01/01/2032 to 02/01/2038 | 381 | 452 | ||||||
6.500%, 10/01/2031 to 09/01/2038 | 421 | 482 | ||||||
6.000%, 02/01/2018 to 09/01/2038 | 567 | 634 | ||||||
5.500%, 06/01/2020 to 08/01/2037 | 829 | 873 | ||||||
5.000%, 03/01/2034 to 06/01/2044 | 1,942 | 2,181 | ||||||
4.500%, 08/01/2020 to 03/01/2044 | 4,395 | 4,844 | ||||||
4.000%, 10/01/2029 to 07/01/2046 | 14,934 | 16,258 | ||||||
3.500%, 11/01/2029 to 08/01/2046 | 41,424 | 44,187 | ||||||
3.000%, 03/01/2030 to 09/01/2046 | 8,354 | 8,702 | ||||||
FHLMC ARM | ||||||||
3.090%, 02/01/2045 (B) | 330 | 343 | ||||||
2.815%, 05/01/2045 (B) | 283 | 294 | ||||||
2.791%, 12/01/2041 (B) | 84 | 87 | ||||||
2.540%, 07/01/2042 (B) | 351 | 362 | ||||||
FHLMC CMO, Ser 2002-2399, Cl XG |
| |||||||
6.500%, 01/15/2032 | 141 | 158 | ||||||
FHLMC CMO, Ser 2005-2945, Cl SA |
| |||||||
11.350%, 03/15/2020 (B) | 10 | 11 | ||||||
FHLMC CMO, Ser 2007-3281, Cl AI, IO |
| |||||||
5.906%, 02/15/2037 (B) | 116 | 22 | ||||||
FHLMC CMO, Ser 2007-3316, Cl JO, PO |
| |||||||
0.000%, 05/15/2037 (A) | 9 | 9 | ||||||
FHLMC CMO, Ser 2011-3804, Cl FN |
| |||||||
0.974%, 03/15/2039 (B) | 150 | 151 | ||||||
FHLMC CMO, Ser 2011-3947, Cl SG, IO |
| |||||||
5.426%, 10/15/2041 (B) | 614 | 99 | ||||||
FHLMC CMO, Ser 2012-283, Cl IO, IO |
| |||||||
3.500%, 10/15/2027 | 1,000 | 106 | ||||||
FHLMC CMO, Ser 2012-4146, Cl DI, IO |
| |||||||
3.000%, 12/15/2031 | 1,192 | 116 | ||||||
FHLMC CMO, Ser 2013-299, Cl 300 |
| |||||||
3.000%, 01/15/2043 | 699 | 729 | ||||||
FHLMC CMO, Ser 2013-300, Cl 300 |
| |||||||
3.000%, 01/15/2043 | 364 | 379 | ||||||
FHLMC CMO, Ser 2013-4194, Cl BI, IO |
| |||||||
3.500%, 04/15/2043 | 535 | 64 | ||||||
FHLMC CMO, Ser 2013-4203, Cl PS, IO |
| |||||||
5.726%, 09/15/2042 (B) | 448 | 82 | ||||||
FHLMC CMO, Ser 2013-4210, Cl Z |
| |||||||
3.000%, 05/15/2043 | 216 | 215 | ||||||
FHLMC CMO, Ser 2013-4239, Cl IO, IO |
| |||||||
3.500%, 06/15/2027 | 757 | 83 | ||||||
| ||||||||
| Description | Face Amount (Thousands) | Market Value ($ Thousands) | ||||||
| ||||||||
MORTGAGE-BACKED SECURITIES (continued) |
| |||||||
FHLMC CMO, Ser 2014-328, Cl S4, IO |
| |||||||
2.051%, 02/15/2038 (B) | $ | 193 | $ | 13 | ||||
FHLMC CMO, Ser 2014-4335, Cl SW, IO |
| |||||||
5.476%, 05/15/2044 (B) | 167 | 31 | ||||||
FHLMC CMO, Ser 2014-4415, Cl IO, IO |
| |||||||
1.948%, 04/15/2041 (B) | 211 | 14 | ||||||
FHLMC CMO, Ser 2015-4425, Cl A |
| |||||||
4.000%, 09/15/2040 | 501 | 532 | ||||||
FHLMC CMO, Ser 2950, Cl JO, PO |
| |||||||
0.000%, 03/15/2020 (A) | 8 | 8 | ||||||
FHLMC CMO, Ser T-76, Cl 2A | ||||||||
1.665%, 10/25/2037 (B) | 192 | 203 | ||||||
FHLMC Multifamily Structured Pass-Through Certificates, Ser K151, Cl A3 | ||||||||
3.511%, 04/25/2030 | 485 | 540 | ||||||
FHLMC Multifamily Structured Pass-Through Certificates, Ser KJ03, Cl A2 | ||||||||
2.328%, 06/25/2021 | 170 | 175 | ||||||
FHLMC TBA | ||||||||
3.500%, 11/15/2046 | 400 | 422 | ||||||
3.000%, 10/15/2046 | 4,975 | 5,170 | ||||||
FNMA | ||||||||
7.500%, 10/01/2037 to 04/01/2039 | 283 | 357 | ||||||
7.000%, 04/01/2032 to 01/01/2039 | 175 | 209 | ||||||
6.500%, 05/01/2027 to 10/01/2038 | 318 | 367 | ||||||
6.000%, 10/01/2019 to 10/01/2040 | 1,404 | 1,599 | ||||||
5.500%, 02/01/2021 to 02/01/2035 | 161 | 181 | ||||||
5.000%, 01/01/2020 to 07/01/2041 | 2,538 | 2,833 | ||||||
4.640%, 01/01/2021 | 466 | 518 | ||||||
4.540%, 01/01/2020 | 453 | 491 | ||||||
4.500%, 01/01/2020 to 06/01/2046 | 10,355 | 11,524 | ||||||
4.410%, 05/01/2021 | 362 | 402 | ||||||
4.360%, 05/01/2021 | 968 | 1,079 | ||||||
4.300%, 04/01/2021 | 238 | 264 | ||||||
4.250%, 04/01/2021 | 250 | 277 | ||||||
4.240%, 06/01/2021 | 956 | 1,058 | ||||||
4.230%, 03/01/2020 | 372 | 401 | ||||||
4.060%, 07/01/2021 | 998 | 1,099 | ||||||
4.000%, 01/01/2029 to 07/01/2046 | 28,393 | 30,844 | ||||||
3.590%, 12/01/2020 | 451 | 486 | ||||||
3.500%, 12/01/2029 to 12/31/2050 | 28,212 | 30,156 | ||||||
3.430%, 10/01/2020 | 910 | 974 | ||||||
3.410%, 10/01/2030 | 839 | 917 | ||||||
3.390%, 01/01/2031 | 700 | 766 | ||||||
3.340%, 07/01/2030 | 600 | 656 | ||||||
3.290%, 10/01/2020 | 333 | 354 | ||||||
3.260%, 10/01/2030 | 739 | 798 | ||||||
3.230%, 11/01/2020 | 327 | 348 | ||||||
3.110%, 02/01/2028 | 465 | 500 | ||||||
3.080%, 04/01/2030 | 500 | 532 | ||||||
3.040%, 04/01/2030 | 500 | 530 | ||||||
3.000%, 04/01/2031 to 01/01/2043 | 4,646 | 4,887 | ||||||
| SEI Institutional Managed Trust / Annual Report / September 30, 2016 | 131 |
SCHEDULE OF INVESTMENTS
September 30, 2016
U.S. Fixed Income Fund (Continued)
| ||||||||
| Description | Face Amount (Thousands) | Market Value ($ Thousands) | ||||||
| ||||||||
MORTGAGE-BACKED SECURITIES (continued) |
| |||||||
2.500%, 10/01/2042 | $ | 294 | $ | 298 | ||||
FNMA ACES, Ser 2014-M12, Cl FA | ||||||||
0.773%, 10/25/2021 (B) | 342 | 341 | ||||||
FNMA ACES, Ser 2016-M6, Cl A2 | ||||||||
2.488%, 05/25/2026 | 878 | 903 | ||||||
FNMA ARM | ||||||||
4.374%, 04/01/2040 (B) | 175 | 186 | ||||||
3.192%, 10/01/2043 (B) | 209 | 218 | ||||||
2.908%, 06/01/2041 (B) | 624 | 658 | ||||||
2.833%, 05/01/2043 (B) | 117 | 122 | ||||||
2.753%, 01/01/2045 (B) | 339 | 352 | ||||||
2.751%, 01/01/2045 (B) | 303 | 314 | ||||||
2.669%, 01/01/2042 (B) | 429 | 445 | ||||||
2.514%, 02/01/2042 (B) | 785 | 823 | ||||||
2.431%, 06/01/2042 (B) | 322 | 333 | ||||||
1.706%, 04/01/2043 (B) | 397 | 408 | ||||||
FNMA CMO, Ser 1999-11, Cl Z | ||||||||
5.500%, 03/25/2029 | 58 | 64 | ||||||
FNMA CMO, Ser 2005-117, Cl LC | ||||||||
5.500%, 11/25/2035 | 315 | 341 | ||||||
FNMA CMO, Ser 2005-29, Cl ZA | ||||||||
5.500%, 04/25/2035 | 311 | 352 | ||||||
FNMA CMO, Ser 2005-360, Cl 2, IO | ||||||||
5.000%, 08/01/2035 | 213 | 44 | ||||||
FNMA CMO, Ser 2007-108, Cl AN | ||||||||
8.204%, 11/25/2037 (B) | 72 | 87 | ||||||
FNMA CMO, Ser 2009-103, Cl MB | ||||||||
2.800%, 12/25/2039 (B) | 165 | 174 | ||||||
FNMA CMO, Ser 2009-86, Cl BO, PO | ||||||||
0.000%, 03/25/2037 (A) | 724 | 678 | ||||||
FNMA CMO, Ser 2011-87, Cl SG, IO | ||||||||
6.025%, 04/25/2040 (B) | 460 | 75 | ||||||
FNMA CMO, Ser 2012-101, Cl AI, IO | ||||||||
3.000%, 06/25/2027 | 736 | 65 | ||||||
FNMA CMO, Ser 2012-112, Cl DA | ||||||||
3.000%, 10/25/2042 | 900 | 937 | ||||||
FNMA CMO, Ser 2012-118, Cl CI, IO | ||||||||
3.500%, 12/25/2039 | 796 | 81 | ||||||
FNMA CMO, Ser 2012-134, Cl LC | ||||||||
3.000%, 12/25/2042 | 157 | 163 | ||||||
FNMA CMO, Ser 2012-411, Cl A3 | ||||||||
3.000%, 08/25/2042 | 179 | 187 | ||||||
FNMA CMO, Ser 2013-126, Cl CS, IO | ||||||||
5.625%, 09/25/2041 (B) | 742 | 102 | ||||||
FNMA CMO, Ser 2013-73, Cl IA, IO | ||||||||
3.000%, 09/25/2032 | 834 | 84 | ||||||
FNMA CMO, Ser 2013-73, Cl IB, IO | ||||||||
3.500%, 07/25/2028 | 208 | 21 | ||||||
FNMA CMO, Ser 2014-47, Cl AI, IO | ||||||||
1.965%, 08/25/2044 (B) | 1,124 | 79 | ||||||
FNMA CMO, Ser 2015-56, Cl AS, IO | ||||||||
5.625%, 08/25/2045 (B) | 91 | 24 | ||||||
| ||||||||
| Description | Face Amount (Thousands) | Market Value ($ Thousands) | ||||||
| ||||||||
MORTGAGE-BACKED SECURITIES (continued) |
| |||||||
FNMA CMO, Ser 2016-59, Cl CA | ||||||||
3.500%, 09/25/2043 | $ | 1,638 | $ | 1,744 | ||||
FNMA TBA | ||||||||
5.000%, 11/01/2046 | 1,500 | 1,665 | ||||||
4.500%, 10/15/2046 | 10,145 | 11,110 | ||||||
4.000%, 10/14/2039 to 11/12/2046 | 9,190 | 9,864 | ||||||
3.500%, 10/01/2040 to 11/01/2046 | 5,520 | 5,819 | ||||||
3.000%, 11/25/2026 to 12/15/2046 | 18,963 | 19,736 | ||||||
2.500%, 10/15/2027 to 11/25/2031 | 8,080 | 8,369 | ||||||
FNMA, Ser 2014-M8, Cl X2, IO | ||||||||
0.535%, 06/25/2024 (B) | 8,763 | 229 | ||||||
FNMA, Ser 2015-M10, Cl A2 | ||||||||
3.092%, 04/25/2027 (B) | 544 | 588 | ||||||
FREMF Mortgage Trust, Ser 2014-K714, Cl C | ||||||||
3.981%, 01/25/2047 (B)(C) | 60 | 59 | ||||||
FREMF Mortgage Trust, Ser 2015-K44, Cl C | ||||||||
3.811%, 01/25/2048 (B)(C) | 180 | 157 | ||||||
GNMA | ||||||||
7.500%, 10/15/2037 | 54 | 61 | ||||||
7.000%, 09/15/2031 | 46 | 57 | ||||||
6.500%, 12/15/2035 | 436 | 524 | ||||||
6.000%, 09/20/2038 | 102 | 117 | ||||||
5.000%, 11/20/2045 | 77 | 87 | ||||||
4.500%, 03/15/2041 to 09/20/2046 | 1,351 | 1,506 | ||||||
4.000%, 10/15/2041 to 08/20/2046 | 9,714 | 10,605 | ||||||
3.500%, 04/20/2046 to 07/15/2046 | 3,009 | 3,200 | ||||||
3.000%, 04/15/2045 to 08/20/2046 | 6,023 | 6,319 | ||||||
2.000%, 02/20/2034 (B) | 342 | 355 | ||||||
GNMA CMO, Ser 2007-78, Cl SA, IO | ||||||||
6.023%, 12/16/2037 (B) | 951 | 167 | ||||||
GNMA CMO, Ser 2009-66, Cl XS, IO | ||||||||
6.293%, 07/16/2039 (B) | 1,187 | 163 | ||||||
GNMA CMO, Ser 2010-4, Cl NS, IO | ||||||||
5.883%, 01/16/2040 (B) | 1,956 | 382 | ||||||
GNMA CMO, Ser 2010-H11, Cl FA | ||||||||
1.524%, 06/20/2060 (B) | 559 | 568 | ||||||
GNMA CMO, Ser 2011-142, Cl IO, IO | ||||||||
0.811%, 09/16/2046 (B) | 4,021 | 129 | ||||||
GNMA CMO, Ser 2011-H08, Cl FD | ||||||||
0.968%, 02/20/2061 (B) | 388 | 387 | ||||||
GNMA CMO, Ser 2012-112, Cl IO, IO | ||||||||
0.364%, 02/16/2053 (B) | 1,186 | 38 | ||||||
GNMA CMO, Ser 2012-34, Cl SA, IO | ||||||||
5.538%, 03/20/2042 (B) | 175 | 35 | ||||||
GNMA CMO, Ser 2012-43, Cl SN, IO | ||||||||
6.093%, 04/16/2042 (B) | 104 | 24 | ||||||
GNMA CMO, Ser 2012-H25, Cl FA | ||||||||
1.168%, 12/20/2061 (B) | 793 | 794 | ||||||
GNMA CMO, Ser 2013-178, Cl IO, IO | ||||||||
0.867%, 06/16/2055 (B) | 907 | 41 | ||||||
GNMA CMO, Ser 2013-63, Cl IO, IO | ||||||||
0.769%, 09/16/2051 (B) | 1,520 | 84 | ||||||
| 132 | SEI Institutional Managed Trust / Annual Report / September 30, 2016 |
| ||||||||
| Description | Face Amount (Thousands) | Market Value ($ Thousands) | ||||||
| ||||||||
MORTGAGE-BACKED SECURITIES (continued) |
| |||||||
GNMA CMO, Ser 2013-69, Cl AI, IO | ||||||||
3.500%, 05/20/2043 | $ | 735 | $ | 99 | ||||
GNMA CMO, Ser 2014-117, Cl SJ, IO | ||||||||
5.088%, 08/20/2044 (B) | 284 | 38 | ||||||
GNMA CMO, Ser 2014-5, Cl SP, IO | ||||||||
5.620%, 06/16/2043 (B) | 730 | 79 | ||||||
GNMA CMO, Ser 2014-H10, Cl TA | ||||||||
1.094%, 04/20/2064 (B) | 785 | 784 | ||||||
GNMA CMO, Ser 2015-167, Cl OI, IO | ||||||||
4.000%, 04/16/2045 | 92 | 18 | ||||||
GNMA CMO, Ser 2015-H10, Cl FC | ||||||||
0.974%, 04/20/2065 (B) | 477 | 473 | ||||||
GNMA CMO, Ser 2015-H18, Cl FA | ||||||||
0.944%, 06/20/2065 (B) | 364 | 361 | ||||||
GNMA CMO, Ser 2015-H20, Cl FA | ||||||||
0.663%, 08/20/2065 (B) | 371 | 368 | ||||||
GNMA TBA | ||||||||
3.500%, 10/15/2041 to 11/15/2046 | 12,805 | 13,591 | ||||||
3.000%, 10/01/2042 to 12/01/2046 | 15,700 | 16,418 | ||||||
GNMA, Ser 2012-27, Cl IO, IO | ||||||||
1.115%, 04/16/2053 (B) | 1,654 | 73 | ||||||
GNMA, Ser 2013-145, Cl IO, IO | ||||||||
1.068%, 09/16/2044 (B) | 1,486 | 89 | ||||||
GNMA, Ser 2013-96, Cl IO, IO | ||||||||
0.531%, 10/16/2054 (B) | 2,069 | 73 | ||||||
GNMA, Ser 2014-47, Cl IA, IO | ||||||||
1.072%, 02/16/2048 (B) | 465 | 23 | ||||||
GNMA, Ser 2014-50, Cl IO, IO | ||||||||
0.948%, 09/16/2055 (B) | 1,370 | 83 | ||||||
GNMA, Ser 2014-92, Cl IX, IO | ||||||||
0.801%, 05/16/2054 (B) | 8,944 | 424 | ||||||
GNMA, Ser 2015-5, Cl IK, IO | ||||||||
0.809%, 11/16/2054 (B) | 7,469 | 421 | ||||||
GNMA, Ser 2015-73, Cl IO, IO | ||||||||
0.869%, 11/16/2055 (B) | 2,157 | 141 | ||||||
|
| |||||||
| 312,041 | ||||||||
|
| |||||||
Non-Agency Mortgage-Backed Obligations — 3.8% |
| |||||||
7 WTC Depositor Trust, Ser 2012-7WTC, Cl A | ||||||||
4.082%, 03/13/2031 (C) | 129 | 130 | ||||||
American Home Mortgage Investment Trust, Ser 2004-4, Cl 4A | ||||||||
3.092%, 02/25/2045 (B) | 571 | 574 | ||||||
ASG Resecuritization Trust, Ser 2009-3, Cl A65 | ||||||||
2.379%, 03/26/2037 (B)(C) | 189 | 188 | ||||||
Banc of America Commercial Mortgage Trust, Ser 2007-2, Cl A4 | ||||||||
5.791%, 04/10/2049 (B) | 580 | 583 | ||||||
Banc of America Funding Trust, Ser 2004-C, Cl 1A1 | ||||||||
3.082%, 12/20/2034 (B) | 24 | 24 | ||||||
| ||||||||
| Description | Face Amount (Thousands) | Market Value ($ Thousands) | ||||||
| ||||||||
MORTGAGE-BACKED SECURITIES (continued) |
| |||||||
Banc of America Funding Trust, Ser 2010-R11A, Cl 1A6 | ||||||||
5.079%, 08/26/2035 (B)(C) | $ | 25 | $ | 25 | ||||
Banc of America Merrill Lynch Commercial Mortgage, Ser 2006-3, Cl A4 | ||||||||
5.889%, 07/10/2044 (B) | 3 | 3 | ||||||
BB-UBS Trust, Ser 2012-SHOW, Cl A | ||||||||
3.430%, 11/05/2036 (C) | 600 | 638 | ||||||
BB-UBS Trust, Ser 2012-TFT, Cl A | ||||||||
2.892%, 06/05/2030 (C) | 150 | 152 | ||||||
BCAP LLC Trust, Ser 2009-RR5, Cl 8A1 | ||||||||
5.500%, 11/26/2034 (C) | 116 | 120 | ||||||
BCAP LLC Trust, Ser 2010-RR7, Cl 1A5 | ||||||||
3.021%, 04/26/2035 (B)(C) | 4 | 4 | ||||||
BCAP LLC Trust, Ser 2011-RR5, Cl 11A3 | ||||||||
0.638%, 05/28/2036 (B)(C) | 17 | 17 | ||||||
Bear Stearns Adjustable Rate Mortgage Trust, Ser 2004-2, Cl 14A | ||||||||
3.344%, 05/25/2034 (B) | 20 | 20 | ||||||
Bear Stearns Adjustable Rate Mortgage Trust, Ser 2005-5, Cl A1 | ||||||||
2.580%, 08/25/2035 (B) | 68 | 69 | ||||||
Bear Stearns ALT-A Trust, Ser 2004-12, Cl 1A3 | ||||||||
1.224%, 01/25/2035 (B) | 214 | 210 | ||||||
Bear Stearns ALT-A Trust, Ser 2004-6, Cl 1A | ||||||||
1.164%, 07/25/2034 (B) | 130 | 128 | ||||||
Bear Stearns ARM Trust, Ser 2003-7, Cl 9A | ||||||||
2.786%, 10/25/2033 (B) | 649 | 643 | ||||||
Bear Stearns Commercial Mortgage Securities, Ser 2005-PWR8, Cl X1, IO | ||||||||
0.393%, 06/11/2041 (B)(C) | 27 | – | ||||||
CD Commercial Mortgage Trust, Ser 2016-CD1, Cl ASB | ||||||||
2.622%, 07/10/2026 | 153 | 157 | ||||||
CD Commercial Mortgage Trust, Ser 2016-CD1, Cl A1 | ||||||||
1.443%, 08/10/2021 | 152 | 151 | ||||||
CFCRE Commercial Mortgage Trust, Ser 2011-C1, Cl A4 | ||||||||
4.961%, 04/15/2044 (B)(C) | 359 | 397 | ||||||
CFCRE Commercial Mortgage Trust, Ser 2016-C3, Cl A1 | ||||||||
1.793%, 01/10/2021 | 263 | 264 | ||||||
CFCRE Commercial Mortgage Trust, Ser 2016-C4, Cl ASB | ||||||||
3.091%, 05/10/2058 | 180 | 188 | ||||||
Chase Mortgage Finance, Ser 2007-A1, Cl 2A1 | ||||||||
3.097%, 02/25/2037 (B) | 44 | 44 | ||||||
Chase Mortgage Finance, Ser 2007-A1, Cl 9A1 | ||||||||
3.000%, 02/25/2037 (B) | 29 | 28 | ||||||
Chase Mortgage Finance, Ser 2007-A2, Cl 1A1 | ||||||||
3.144%, 07/25/2037 (B) | 56 | 56 | ||||||
| SEI Institutional Managed Trust / Annual Report / September 30, 2016 | 133 |
SCHEDULE OF INVESTMENTS
September 30, 2016
U.S. Fixed Income Fund (Continued)
| ||||||||
| Description | Face Amount (Thousands) | Market Value ($ Thousands) | ||||||
| ||||||||
MORTGAGE-BACKED SECURITIES (continued) |
| |||||||
Citigroup Commercial Mortgage Trust, Ser 2013-GC11, Cl A2 | ||||||||
1.987%, 04/10/2046 | $ | 391 | $ | 393 | ||||
Citigroup Commercial Mortgage Trust, Ser 2013-SMP, Cl A | ||||||||
2.110%, 01/12/2030 (C) | 445 | 447 | ||||||
Citigroup Commercial Mortgage Trust, Ser 2014-GC25, Cl AS | ||||||||
4.017%, 10/10/2047 | 140 | 153 | ||||||
Citigroup Commercial Mortgage Trust, Ser 2016-GC36, Cl A5 | ||||||||
3.616%, 02/10/2049 | 441 | 479 | ||||||
Citigroup Global Markets Mortgage Securities VII, Ser 2003-HYB1, Cl A | ||||||||
2.740%, 09/25/2033 (B) | 49 | 48 | ||||||
Citigroup Mortgage Loan Trust, Ser 2008-AR4, Cl 1A1A | ||||||||
2.993%, 11/25/2038 (B)(C) | 65 | 65 | ||||||
Citigroup/Deutsche Bank Commercial Mortgage Trust, Ser 2006-CD2, Cl X, IO | ||||||||
0.023%, 01/15/2046 (B)(C) | 1,236 | – | ||||||
Citigroup/Deutsche Bank Commercial Mortgage Trust, Ser 2007-CD4, Cl XC, IO | ||||||||
0.573%, 12/11/2049 (B)(C) | 5,666 | 4 | ||||||
COMM Mortgage Trust, Ser 2010-C1, Cl A2 | ||||||||
3.830%, 07/10/2046 (C) | 49 | 50 | ||||||
COMM Mortgage Trust, Ser 2012-CR1, Cl A2 | ||||||||
2.350%, 05/15/2045 | 295 | 296 | ||||||
COMM Mortgage Trust, Ser 2012-CR2, Cl XA, IO | ||||||||
1.897%, 08/15/2045 (B) | 665 | 52 | ||||||
COMM Mortgage Trust, Ser 2012-CR4, Cl AM | ||||||||
3.251%, 10/15/2045 | 590 | 616 | ||||||
COMM Mortgage Trust, Ser 2012-CR4, Cl A2 | ||||||||
1.801%, 10/15/2045 | 94 | 94 | ||||||
COMM Mortgage Trust, Ser 2012-LC4, Cl A4 | ||||||||
3.288%, 12/10/2044 | 79 | 84 | ||||||
COMM Mortgage Trust, Ser 2013-300P, Cl A1 | ||||||||
4.353%, 08/10/2030 (C) | 215 | 241 | ||||||
COMM Mortgage Trust, Ser 2013-CR10, Cl A2 | ||||||||
2.972%, 08/10/2046 | 117 | 120 | ||||||
COMM Mortgage Trust, Ser 2013-CR11, Cl A1 | ||||||||
1.468%, 10/10/2046 | 91 | 91 | ||||||
COMM Mortgage Trust, Ser 2013-CR12, Cl A1 | ||||||||
1.295%, 10/10/2046 | 32 | 32 | ||||||
COMM Mortgage Trust, Ser 2013-CR12, Cl C | ||||||||
5.253%, 10/10/2046 (B) | 10 | 11 | ||||||
COMM Mortgage Trust, Ser 2013-CR12, Cl A4 | ||||||||
4.046%, 10/10/2046 | 32 | 36 | ||||||
COMM Mortgage Trust, Ser 2013-CR12, Cl AM | ||||||||
4.300%, 10/10/2046 | 70 | 77 | ||||||
COMM Mortgage Trust, Ser 2013-CR12, Cl B | ||||||||
4.762%, 10/10/2046 (B) | 30 | 34 | ||||||
| ||||||||
| Description | Face Amount (Thousands) | Market Value ($ Thousands) | ||||||
| ||||||||
MORTGAGE-BACKED SECURITIES (continued) |
| |||||||
COMM Mortgage Trust, Ser 2013-CR13, Cl XA, IO | ||||||||
1.124%, 12/10/2023 (B) | $ | 3,984 | $ | 172 | ||||
COMM Mortgage Trust, Ser 2013-CR13, Cl A4 | ||||||||
4.194%, 11/10/2023 (B) | 346 | 388 | ||||||
COMM Mortgage Trust, Ser 2013-CR6, Cl A1 | ||||||||
0.719%, 03/10/2046 | 48 | 47 | ||||||
COMM Mortgage Trust, Ser 2013-CR6, Cl A2 | ||||||||
2.122%, 03/10/2046 | 680 | 684 | ||||||
COMM Mortgage Trust, Ser 2014-CR18, Cl XA, IO | ||||||||
1.428%, 07/15/2047 (B) | 3,739 | 225 | ||||||
COMM Mortgage Trust, Ser 2014-CR19, Cl A5 | ||||||||
3.796%, 08/10/2047 | 489 | 536 | ||||||
COMM Mortgage Trust, Ser 2014-SAVA, Cl D | ||||||||
3.608%, 06/15/2034 (B)(C) | 320 | 317 | ||||||
COMM Mortgage Trust, Ser 2014-UBS4, Cl A5 | ||||||||
3.694%, 08/10/2047 | 133 | 144 | ||||||
COMM Mortgage Trust, Ser 2014-UBS5, Cl ASB | ||||||||
3.548%, 09/10/2047 | 103 | 110 | ||||||
COMM Mortgage Trust, Ser 2015-CR25, Cl A4 | ||||||||
3.759%, 08/10/2048 | 188 | 206 | ||||||
COMM Mortgage Trust, Ser 2015-CR26, Cl ASB | ||||||||
3.373%, 04/10/2025 | 182 | 194 | ||||||
COMM Mortgage Trust, Ser 2016-787S, Cl A | ||||||||
3.545%, 02/10/2036 (C) | 310 | 334 | ||||||
COMM Mortgage Trust, Ser 2016-GCT, Cl A | ||||||||
2.680%, 08/10/2021 | 370 | 382 | ||||||
Commercial Mortgage Pass-Through Certificates, Ser 2014-SAVA, Cl A | ||||||||
1.658%, 06/15/2034 (B)(C) | 259 | 259 | ||||||
Commercial Mortgage Pass-Through Certificates, Ser 2014-UBS2, Cl XA, IO | ||||||||
1.565%, 03/10/2047 (B) | 2,233 | 152 | ||||||
Commercial Mortgage Pass-Through Certificates, Ser 2014-UBS6, Cl ASB | ||||||||
3.387%, 12/10/2047 | 224 | 238 | ||||||
Commercial Mortgage Pass-Through Certificates, Ser 2014-UBS6, Cl AM | ||||||||
4.048%, 12/10/2047 | 372 | 401 | ||||||
Credit Suisse First Boston Mortgage Securities, Ser 2003-27, Cl 5A3 | ||||||||
5.250%, 11/25/2033 | 92 | 93 | ||||||
Credit Suisse First Boston Mortgage Securities, Ser 2003-29, Cl 5A1 | ||||||||
7.000%, 12/25/2033 | 70 | 74 | ||||||
Credit Suisse First Boston Mortgage Securities, Ser 2003-AR24, Cl 2A4 | ||||||||
2.979%, 10/25/2033 (B) | 514 | 511 | ||||||
Credit Suisse Mortgage Capital Certificates, Ser 2011-16R, Cl 7A3 | ||||||||
3.500%, 12/27/2036 (B)(C) | 39 | 39 | ||||||
| 134 | SEI Institutional Managed Trust / Annual Report / September 30, 2016 |
| ||||||||
| Description | Face Amount (Thousands) | Market Value ($ Thousands) | ||||||
| ||||||||
MORTGAGE-BACKED SECURITIES (continued) |
| |||||||
Credit Suisse Mortgage Capital Certificates, Ser 2011-6R, Cl 3A1 | ||||||||
3.210%, 07/28/2036 (B)(C) | $ | 22 | $ | 22 | ||||
CSAIL Commercial Mortgage Trust, Ser 2015-C4, Cl A4 | ||||||||
3.808%, 11/15/2048 | 169 | 185 | ||||||
CSAIL Commercial Mortgage Trust, Ser 2016-C5, Cl ASB | ||||||||
3.533%, 11/15/2048 | 90 | 97 | ||||||
CSMC, Ser 2009-2R, Cl 1A14 | ||||||||
2.989%, 09/26/2034 (B)(C) | 503 | 505 | ||||||
CSMC, Ser 2009-2R, Cl 1A16 | ||||||||
2.989%, 09/26/2034 (B)(C) | 1,000 | 1,012 | ||||||
CSMC, Ser 2010-3R, Cl 2A3 | ||||||||
4.500%, 12/26/2036 (B)(C) | 770 | 786 | ||||||
CSMC, Ser 2014-7R, Cl 8A1 | ||||||||
2.715%, 07/27/2037 (B)(C) | 769 | 766 | ||||||
CSMC, Ser 2015-5R, Cl 1A1 | ||||||||
1.066%, 09/27/2046 (C) | 849 | 820 | ||||||
CSMC, Ser 2016-BDWN, Cl B | ||||||||
5.008%, 02/15/2029 (B)(C) | 370 | 370 | ||||||
DBRR Trust, Ser 2011-LC2, Cl A4A | ||||||||
4.537%, 07/12/2044 (B)(C) | 615 | 671 | ||||||
DBUBS Mortgage Trust, Ser 2011-LC1A, Cl A1 | ||||||||
3.742%, 11/10/2046 (C) | 6 | 6 | ||||||
DBUBS Mortgage Trust, Ser 2011-LC2A, Cl A4 | ||||||||
4.537%, 07/10/2044 (C) | 100 | 110 | ||||||
FHLMC Structured Agency Credit Risk Debt Notes, Ser 2014-DN1, Cl M2 | ||||||||
2.725%, 02/25/2024 (B) | 250 | 257 | ||||||
FHLMC Structured Agency Credit Risk Debt Notes, Ser 2014-DN2, Cl M2 | ||||||||
2.175%, 04/25/2024 (B) | 510 | 514 | ||||||
FHLMC Structured Agency Credit Risk Debt Notes, Ser 2014-HQ1, Cl M1 | ||||||||
2.175%, 08/25/2024 (B) | 12 | 12 | ||||||
FHLMC Structured Agency Credit Risk Debt Notes, Ser 2015-DNA2, Cl M2 | ||||||||
3.125%, 12/25/2027 (B) | 560 | 572 | ||||||
GE Business Loan Trust, Ser 2007-1A, Cl A | ||||||||
0.694%, 04/16/2035 (B)(C) | 162 | 151 | ||||||
GMAC Commercial Mortgage Securities, Ser 2006-C1, Cl AM | ||||||||
5.290%, 11/10/2045 (B) | 129 | 128 | ||||||
Greenwich Capital Commercial Funding, Ser 2007-GG11, Cl A4 | ||||||||
5.736%, 12/10/2049 | 32 | 32 | ||||||
GS Mortgage Securities II, Ser 2013-KING, Cl A | ||||||||
2.706%, 12/10/2027 (C) | 107 | 110 | ||||||
GS Mortgage Securities Trust, Ser 2006-GG8, Cl X, IO | ||||||||
0.748%, 11/10/2039 (B)(C) | 684 | – | ||||||
| ||||||||
| Description | Face Amount (Thousands) | Market Value ($ Thousands) | ||||||
| ||||||||
MORTGAGE-BACKED SECURITIES (continued) |
| |||||||
GS Mortgage Securities Trust, Ser 2011-GC5, Cl A2 | ||||||||
2.999%, 08/10/2044 | $ | 25 | $ | 25 | ||||
GS Mortgage Securities Trust, Ser 2012-GCJ7, Cl AAB | ||||||||
2.935%, 05/10/2045 | 44 | 45 | ||||||
GS Mortgage Securities Trust, Ser 2012-GCJ7, Cl A2 | ||||||||
2.318%, 05/10/2045 | 201 | 202 | ||||||
GS Mortgage Securities Trust, Ser 2013-GC16, Cl B | ||||||||
5.161%, 11/10/2046 (B) | 90 | 104 | ||||||
GS Mortgage Securities Trust, Ser 2013-GC16, Cl A1 | ||||||||
1.264%, 11/10/2046 | 11 | 11 | ||||||
GS Mortgage Securities Trust, Ser 2013-NYC5, Cl A | ||||||||
2.318%, 01/10/2030 (C) | 122 | 123 | ||||||
GS Mortgage Securities Trust, Ser 2014-GC18, Cl AAB | ||||||||
3.648%, 01/10/2047 | 153 | 165 | ||||||
GS Mortgage Securities Trust, Ser 2014-GC20, Cl AAB | ||||||||
3.655%, 04/10/2047 | 220 | 238 | ||||||
GS Mortgage Securities Trust, Ser 2015-GC34, Cl AAB | ||||||||
3.278%, 10/10/2048 | 209 | 222 | ||||||
GS Mortgage Securities Trust, Ser 2016-GS3, Cl AAB | ||||||||
2.777%, 10/10/2049 | 277 | 285 | ||||||
GS Mortgage Securities Trust, Ser 2016-GS3, Cl A4 | ||||||||
2.850%, 10/10/2049 | 185 | 190 | ||||||
GSR Mortgage Loan Trust, Ser 2003-13, Cl 1A1 | ||||||||
2.797%, 10/25/2033 (B) | 114 | 115 | ||||||
GSR Mortgage Loan Trust, Ser 2004-8F, Cl 2A3 | ||||||||
6.000%, 09/25/2034 | 52 | 53 | ||||||
GSR Mortgage Loan Trust, Ser 2007-1F, Cl 2A4 | ||||||||
5.500%, 01/25/2037 | 16 | 15 | ||||||
Hilton USA Trust, Ser 2013-HLF, Cl BFL | ||||||||
2.023%, 11/05/2030 (B)(C) | 227 | 227 | ||||||
Homestar Mortgage Acceptance, Ser 2004-5, Cl A1 | ||||||||
1.388%, 10/25/2034 (B) | 377 | 373 | ||||||
Impac Secured Assets Trust, Ser 2004-3, Cl M1 | ||||||||
1.424%, 11/25/2034 (B) | 1,700 | 1,575 | ||||||
Impac Secured Assets Trust, Ser 2006-2, Cl 2A1 | ||||||||
0.874%, 08/25/2036 (B) | 38 | 38 | ||||||
Impac Secured Assets Trust, Ser 2007-2, Cl 2A | ||||||||
0.774%, 04/25/2037 (B) | 172 | 155 | ||||||
Impac Secured Assets Trust, Ser 2007-A, Cl M1 | ||||||||
0.924%, 05/25/2037 (B)(C) | 467 | 433 | ||||||
| SEI Institutional Managed Trust / Annual Report / September 30, 2016 | 135 |
SCHEDULE OF INVESTMENTS
September 30, 2016
U.S. Fixed Income Fund (Continued)
| ||||||||
| Description | Face Amount (Thousands) | Market Value ($ Thousands) | ||||||
| ||||||||
MORTGAGE-BACKED SECURITIES (continued) |
| |||||||
Impact Funding LLC, Ser 2010-1, Cl A1 | ||||||||
5.314%, 01/25/2051 (C) | $ | 852 | $ | 999 | ||||
JPMBB Commercial Mortgage Securities Trust, Ser 2013-C14, Cl ASB | ||||||||
3.761%, 08/15/2046 (B) | 134 | 145 | ||||||
JPMBB Commercial Mortgage Securities Trust, Ser 2013-C15, Cl C | ||||||||
5.215%, 11/15/2045 (B) | 60 | 66 | ||||||
JPMBB Commercial Mortgage Securities Trust, Ser 2013-C15, Cl A2 | ||||||||
2.977%, 11/15/2045 | 171 | 176 | ||||||
JPMBB Commercial Mortgage Securities Trust, Ser 2013-C17, Cl B | ||||||||
5.050%, 01/15/2047 (B) | 30 | 34 | ||||||
JPMBB Commercial Mortgage Securities Trust, Ser 2014-C22, Cl C | ||||||||
4.712%, 09/15/2047 (B) | 120 | 123 | ||||||
JPMBB Commercial Mortgage Securities Trust, Ser 2015-C28, Cl A3 | ||||||||
2.912%, 10/15/2048 | 629 | 649 | ||||||
JPMBB Commercial Mortgage Securities Trust, Ser 2015-C30, Cl AS | ||||||||
4.226%, 07/15/2048 (B) | 270 | 298 | ||||||
JPMBB Commercial Mortgage Securities Trust, Ser 2015-C31, Cl ASB | ||||||||
3.540%, 08/15/2048 | 141 | 152 | ||||||
JPMBB Commercial Mortgage Securities Trust, Ser 2016-C1, Cl ASB | ||||||||
3.316%, 03/15/2049 | 366 | 389 | ||||||
JPMDB Commercial Mortgage Securities Trust, Ser 2016-C2, Cl ASB | ||||||||
2.954%, 06/15/2049 | 359 | 374 | ||||||
JPMorgan Chase Commercial Mortgage Securities Trust, Ser 2004-LN2, Cl A2 | ||||||||
5.115%, 07/15/2041 | 4 | 5 | ||||||
JPMorgan Chase Commercial Mortgage Securities Trust, Ser 2006-CB15, Cl X1, IO | ||||||||
0.482%, 06/12/2043 (B) | 1,969 | 2 | ||||||
JPMorgan Chase Commercial Mortgage Securities Trust, Ser 2006-LDP9, Cl A3SF | ||||||||
0.679%, 05/15/2047 (B) | 48 | 48 | ||||||
JPMorgan Chase Commercial Mortgage Securities Trust, Ser 2010-C2, Cl A2 | ||||||||
3.616%, 11/15/2043 (C) | 143 | 146 | ||||||
JPMorgan Chase Commercial Mortgage Securities Trust, Ser 2010-CNTR, Cl A2 | ||||||||
4.311%, 08/05/2032 (C) | 655 | 705 | ||||||
JPMorgan Chase Commercial Mortgage Securities Trust, Ser 2010-CNTR, Cl A1 | ||||||||
3.300%, 08/05/2032 (C) | 71 | 73 | ||||||
JPMorgan Chase Commercial Mortgage Securities Trust, Ser 2011-C3, Cl A2 | ||||||||
3.673%, 02/15/2046 (C) | 2 | 2 | ||||||
| ||||||||
| Description | Face Amount (Thousands) | Market Value ($ Thousands) | ||||||
| ||||||||
MORTGAGE-BACKED SECURITIES (continued) |
| |||||||
JPMorgan Chase Commercial Mortgage Securities Trust, Ser 2011-C4, Cl A3 | ||||||||
4.106%, 07/15/2046 (C) | $ | 1,563 | $ | 1,624 | ||||
JPMorgan Chase Commercial Mortgage Securities Trust, Ser 2011-C5, Cl B | ||||||||
5.508%, 08/15/2046 (B)(C) | 296 | 336 | ||||||
JPMorgan Chase Commercial Mortgage Securities Trust, Ser 2012-LC9, Cl A2 | ||||||||
1.677%, 12/15/2047 | 107 | 107 | ||||||
JPMorgan Chase Commercial Mortgage Securities Trust, Ser 2014-C20, Cl A5 | ||||||||
3.805%, 07/15/2047 | 1,502 | 1,644 | ||||||
JPMorgan Chase Commercial Mortgage Securities Trust, Ser 2015-C31, Cl A3 | ||||||||
3.801%, 08/15/2048 | 580 | 636 | ||||||
JPMorgan Chase Commercial Mortgage Securities Trust, Ser 2015-JP1, Cl ASB | ||||||||
3.733%, 01/15/2049 | 74 | 81 | ||||||
JPMorgan Chase Commercial Mortgage Securities Trust, Ser 2016-JP2, Cl ASB | ||||||||
2.713%, 09/15/2025 | 292 | 300 | ||||||
JPMorgan Chase Commercial Mortgage Securities Trust, Ser 2016-JP3, Cl A5 | ||||||||
2.870%, 08/15/2026 | 372 | 382 | ||||||
JPMorgan Chase Commercial Mortgage Securities, Ser 2013-C13, Cl ASB | ||||||||
3.414%, 01/15/2046 | 271 | 288 | ||||||
JPMorgan Mortgage Trust, Ser 2006-A2, Cl 4A1 | ||||||||
3.185%, 08/25/2034 (B) | 165 | 166 | ||||||
JPMorgan Mortgage Trust, Ser 2006-A2, Cl 5A3 | ||||||||
2.783%, 11/25/2033 (B) | 87 | 88 | ||||||
JPMorgan Trust, Ser 2015-5, Cl A9 | ||||||||
2.897%, 05/25/2045 (B)(C) | 416 | 413 | ||||||
LB-UBS Commercial Mortgage Trust, Ser 2006-C1, Cl XCL, IO | ||||||||
0.338%, 02/15/2041 (B)(C) | 1,264 | – | ||||||
Liberty Street Trust, Ser 2016-225L, Cl A | ||||||||
3.597%, 02/10/2036 (C) | 310 | 335 | ||||||
Master Resecuritization Trust, Ser 2005, Cl 3PO, PO | ||||||||
0.000%, 05/28/2035 (A)(C) | 13 | 10 | ||||||
Merrill Lynch Mortgage Investors Trust, Ser 2003-A4, Cl 2A | ||||||||
3.136%, 07/25/2033 (B) | 22 | 21 | ||||||
Merrill Lynch Mortgage Investors Trust, Ser 2004-A1, Cl 4A | ||||||||
2.875%, 02/25/2034 (B) | 119 | 119 | ||||||
Merrill Lynch/Countrywide Commercial Mortgage Trust, Ser 2006-4, Cl XC, IO | ||||||||
0.768%, 12/12/2049 (B)(C) | 600 | – | ||||||
| 136 | SEI Institutional Managed Trust / Annual Report / September 30, 2016 |
| ||||||||
| Description | Face Amount (Thousands) | Market Value ($ Thousands) | ||||||
| ||||||||
MORTGAGE-BACKED SECURITIES (continued) |
| |||||||
Morgan Stanley Bank of America Merrill Lynch Trust, Ser 2012-C6, Cl B | ||||||||
3.930%, 11/15/2045 | $ | 390 | $ | 418 | ||||
Morgan Stanley Bank of America Merrill Lynch Trust, Ser 2013-C10, Cl A2 | ||||||||
2.964%, 06/15/2018 | 116 | 118 | ||||||
Morgan Stanley Bank of America Merrill Lynch Trust, Ser 2013-C10, Cl A1 | ||||||||
1.394%, 07/15/2046 | 71 | 71 | ||||||
Morgan Stanley Bank of America Merrill Lynch Trust, Ser 2013-C7, Cl AS | ||||||||
3.214%, 02/15/2046 | 21 | 22 | ||||||
Morgan Stanley Bank of America Merrill Lynch Trust, Ser 2013-C9, Cl AS | ||||||||
3.456%, 05/15/2046 | 80 | 84 | ||||||
Morgan Stanley Bank of America Merrill Lynch Trust, Ser 2013-C9, Cl A2 | ||||||||
1.970%, 05/15/2046 | 111 | 111 | ||||||
Morgan Stanley Bank of America Merrill Lynch Trust, Ser 2015-C23, Cl A3 | ||||||||
3.451%, 07/15/2050 | 109 | 118 | ||||||
Morgan Stanley Bank of America Merrill Lynch Trust, Ser 2015-C25, Cl A5 | ||||||||
3.635%, 10/15/2048 | 250 | 273 | ||||||
Morgan Stanley Bank of America Merrill Lynch Trust, Ser 2016-C28, Cl A3 | ||||||||
3.272%, 11/15/2025 | 328 | 349 | ||||||
Morgan Stanley Bank of America Merrill Lynch Trust, Ser 2016-C28, Cl ASB | ||||||||
3.288%, 01/15/2049 | 366 | 388 | ||||||
Morgan Stanley Capital I Trust, Ser 2007-HQ11, Cl X, IO | ||||||||
0.379%, 02/12/2044 (B)(C) | 5,051 | 1 | ||||||
Morgan Stanley Capital I Trust, Ser 2007-HQ11, Cl A4FL | ||||||||
0.663%, 02/12/2044 (B) | 723 | 720 | ||||||
Morgan Stanley Capital I Trust, Ser 2011-C2, Cl A2 | ||||||||
3.476%, 06/15/2044 (C) | 42 | 42 | ||||||
Morgan Stanley Capital I Trust, Ser 2016-UB11, Cl A1 | ||||||||
1.445%, 04/15/2021 | 471 | 470 | ||||||
Morgan Stanley Capital I Trust, Ser 2016-UB11, Cl ASB | ||||||||
2.606%, 01/15/2021 | 210 | 215 | ||||||
Morgan Stanley Capital I Trust, Ser 2016-UBS9, Cl A1 | ||||||||
1.711%, 03/15/2049 | 254 | 254 | ||||||
MSCG Trust, Ser 2015-ALDR, Cl A2 | ||||||||
3.577%, 06/07/2035 (B)(C) | 250 | 262 | ||||||
Nomura Asset Acceptance Alternative Loan Trust, Ser 2007-1, Cl 1A4 | ||||||||
6.138%, 03/25/2047 (D) | 119 | 118 | ||||||
| ||||||||
| Description | Face Amount (Thousands) | Market Value ($ Thousands) | ||||||
| ||||||||
MORTGAGE-BACKED SECURITIES (continued) |
| |||||||
Nomura Asset Acceptance Alternative Loan Trust, Ser 2007-1, Cl 1A3 | ||||||||
5.957%, 03/25/2047 (D) | $ | 145 | $ | 144 | ||||
Nomura Resecuritization Trust, Ser 2015-4R, Cl 3A1 | ||||||||
2.475%, 02/26/2036 (B)(C) | 456 | 463 | ||||||
Prime Mortgage Trust, Ser 2004-CL1, Cl 1PO, PO | ||||||||
0.000%, 02/25/2034 (A) | 9 | 7 | ||||||
Prime Mortgage Trust, Ser 2004-CL1, Cl 1A1 | ||||||||
6.000%, 02/25/2034 | 36 | 38 | ||||||
RAMP Trust, Ser 2004-SL1, Cl A8 | ||||||||
6.500%, 11/25/2031 | 239 | 242 | ||||||
RBSCF Trust, Ser 2013-GSP, Cl A | ||||||||
3.961%, 01/13/2032 (B)(C) | 280 | 307 | ||||||
Residential Accredit Loans, Ser 2004-QA7, Cl A4 | ||||||||
5.500%, 05/25/2034 | 210 | 213 | ||||||
Residential Asset Securitization Trust, Ser 2004-IP2, Cl 2A1 | ||||||||
2.989%, 12/25/2034 (B) | 360 | 359 | ||||||
SFAVE Commercial Mortgage Securities Trust, Ser 2015-5AVE, Cl A1 | ||||||||
3.872%, 01/05/2043 (B)(C) | 390 | 404 | ||||||
Springleaf Mortgage Loan Trust, Ser 2013-2A, Cl A | ||||||||
1.780%, 12/25/2065 (B)(C) | 261 | 260 | ||||||
Structured Adjustable Rate Mortgage Loan Trust, Ser 2004-6, Cl 5A4 | ||||||||
2.813%, 06/25/2034 (B) | 2 | 2 | ||||||
Structured Asset Securities Mortgage Pass-Through Certificates, Ser 2002-AL1, Cl A2 | ||||||||
3.450%, 02/25/2032 | 47 | 47 | ||||||
Structured Asset Securities Mortgage Pass-Through Certificates, Ser 2003-24A, Cl 3A2 | ||||||||
2.901%, 07/25/2033 (B) | 123 | 123 | ||||||
Structured Asset Securities Mortgage Pass-Through Certificates, Ser 2003-32, Cl 1A1 | ||||||||
5.221%, 11/25/2033 (B) | 25 | 25 | ||||||
Structured Asset Securities Mortgage Pass-Through Certificates, Ser 2004-5H, Cl A4 | ||||||||
5.540%, 12/25/2033 | 131 | 135 | ||||||
Structured Asset Securities, Ser 2003-37A, Cl 2A | ||||||||
2.675%, 12/25/2033 (B) | 40 | 40 | ||||||
Trust Company of the West, Ser 1060 | ||||||||
2.600%, 10/28/2031 | 735 | 737 | ||||||
Trust Company of the West, Ser 1063 | ||||||||
2.610%, 11/28/2028 | 730 | 743 | ||||||
UBS Commercial Mortgage Trust, Ser 2012-C1, Cl XA, IO | ||||||||
2.275%, 05/10/2045 (B)(C) | 2,751 | 260 | ||||||
| SEI Institutional Managed Trust / Annual Report / September 30, 2016 | 137 |
SCHEDULE OF INVESTMENTS
September 30, 2016
U.S. Fixed Income Fund (Continued)
| ||||||||
| Description | Face Amount (Thousands) | Market Value ($ Thousands) | ||||||
| ||||||||
MORTGAGE-BACKED SECURITIES (continued) |
| |||||||
UBS-Barclays Commercial Mortgage Trust, Ser 2012-C2, Cl A2 | ||||||||
2.113%, 05/10/2063 | $ | 200 | $ | 201 | ||||
UBS-Barclays Commercial Mortgage Trust, Ser 2012-C4, Cl A2 | ||||||||
1.712%, 12/10/2017 | 295 | 296 | ||||||
VNO Mortgage Trust, Ser 2012-6AVE, Cl A | ||||||||
2.996%, 11/15/2030 (C) | 335 | 351 | ||||||
VNO Mortgage Trust, Ser 2013-PENN, Cl A | ||||||||
3.808%, 12/13/2029 (C) | 250 | 268 | ||||||
WaMu Mortgage Pass-Through Certificates, Ser 2003-AR10, Cl A7 | ||||||||
2.537%, 10/25/2033 (B) | 102 | 104 | ||||||
WaMu Mortgage Pass-Through Certificates, Ser 2003-AR7, Cl A7 | ||||||||
2.677%, 08/25/2033 (B) | 53 | 53 | ||||||
WaMu Mortgage Pass-Through Certificates, Ser 2003-AR8, Cl A | ||||||||
2.697%, 08/25/2033 (B) | 28 | 29 | ||||||
WaMu Mortgage Pass-Through Certificates, Ser 2003-AR9, Cl 1A6 | ||||||||
2.631%, 09/25/2033 (B) | 91 | 92 | ||||||
WaMu Mortgage Pass-Through Certificates, Ser 2003-S4, Cl 2A10 | ||||||||
16.018%, 06/25/2033 (B) | 11 | 14 | ||||||
WaMu Mortgage Pass-Through Certificates, Ser 2003-S9, Cl A8 | ||||||||
5.250%, 10/25/2033 | 201 | 209 | ||||||
WaMu Mortgage Pass-Through Certificates, Ser 2004-AR3, Cl A2 | ||||||||
2.783%, 06/25/2034 (B) | 58 | 59 | ||||||
WaMu Mortgage Pass-Through Certificates, Ser 2004-RA4, Cl 3A | ||||||||
7.500%, 07/25/2034 | 175 | 187 | ||||||
WaMu Mortgage Pass-Through Certificates, Ser 2004-S2, Cl 2A4 | ||||||||
5.500%, 06/25/2034 | 5 | 5 | ||||||
WaMu Mortgage Pass-Through Certificates, Ser 2005-AR13, Cl A1A3 | ||||||||
1.304%, 10/25/2045 (B) | 733 | 712 | ||||||
Wells Fargo Commercial Mortgage Trust, Ser 2013-120B, Cl A | ||||||||
2.800%, 03/18/2028 (B)(C) | 200 | 205 | ||||||
Wells Fargo Mortgage-Backed Securities Trust, Ser 2004-E, Cl A2 | ||||||||
3.082%, 05/25/2034 (B) | 14 | 14 | ||||||
Wells Fargo Mortgage-Backed Securities Trust, Ser 2004-EE, Cl 2A1 | ||||||||
2.967%, 12/25/2034 (B) | 74 | 75 | ||||||
Wells Fargo Mortgage-Backed Securities Trust, Ser 2004-H, Cl A1 | ||||||||
3.052%, 06/25/2034 (B) | 154 | 154 | ||||||
| ||||||||
| Description | Face Amount (Thousands) | Market Value ($ Thousands) | ||||||
| ||||||||
MORTGAGE-BACKED SECURITIES (continued) |
| |||||||
Wells Fargo Mortgage-Backed Securities Trust, Ser 2004-I, Cl 1A1 | ||||||||
2.893%, 07/25/2034 (B) | $ | 94 | $ | 95 | ||||
Wells Fargo Mortgage-Backed Securities Trust, Ser 2005-AR8, Cl 2A1 | ||||||||
2.977%, 06/25/2035 (B) | 77 | 79 | ||||||
Wells Fargo Mortgage-Backed Securities Trust, Ser 2006-AR8, Cl 3A1 | ||||||||
2.853%, 04/25/2036 (B) | 787 | 794 | ||||||
WFRBS Commercial Mortgage Trust, Ser 2011-C3, Cl A4 | ||||||||
4.375%, 03/15/2044 (C) | 125 | 137 | ||||||
WFRBS Commercial Mortgage Trust, Ser 2012-C10, Cl XA, IO | ||||||||
1.866%, 12/15/2045 (B)(C) | 1,584 | 117 | ||||||
WFRBS Commercial Mortgage Trust, Ser 2012-C7, Cl XA, IO | ||||||||
1.663%, 06/15/2045 (B)(C) | 363 | 23 | ||||||
WFRBS Commercial Mortgage Trust, Ser 2013-C13, Cl XA, IO | ||||||||
1.534%, 05/15/2045 (B)(C) | 1,100 | 68 | ||||||
WFRBS Commercial Mortgage Trust, Ser 2014-C20, Cl XA, IO | ||||||||
1.170%, 01/15/2024 | 3,081 | 181 | ||||||
WFRBS Commercial Mortgage Trust, Ser 2014-C21, Cl B | ||||||||
4.213%, 08/15/2047 (B) | 300 | 327 | ||||||
|
| |||||||
| 49,830 | ||||||||
|
| |||||||
Total Mortgage-Backed Securities | 361,871 | |||||||
|
| |||||||
CORPORATE OBLIGATIONS — 26.4% |
| |||||||
Consumer Discretionary — 1.8% |
| |||||||
21st Century Fox America | ||||||||
7.250%, 05/18/2018 | 50 | 55 | ||||||
6.900%, 08/15/2039 | 10 | 13 | ||||||
6.750%, 01/09/2038 | 20 | 26 | ||||||
6.650%, 11/15/2037 | 25 | 33 | ||||||
6.150%, 03/01/2037 | 20 | 25 | ||||||
6.150%, 02/15/2041 | 15 | 19 | ||||||
Amazon.com | ||||||||
4.950%, 12/05/2044 | 140 | 171 | ||||||
American Honda Finance MTN | ||||||||
3.875%, 09/21/2020 (C) | 495 | 537 | ||||||
BMW US Capital | ||||||||
2.800%, 04/11/2026 (C) | 450 | 459 | ||||||
CBS | ||||||||
2.900%, 01/15/2027 | 500 | 487 | ||||||
Charter Communications Operating | ||||||||
6.484%, 10/23/2045 (C) | 776 | 938 | ||||||
| 138 | SEI Institutional Managed Trust / Annual Report / September 30, 2016 |
| Description |
Face Amount |
Market Value | ||||||
CORPORATE OBLIGATIONS (continued) |
| |||||||
6.384%, 10/23/2035 (C) | $ | 10 | $ | 12 | ||||
4.908%, 07/23/2025 (C) | 110 | 121 | ||||||
4.464%, 07/23/2022 (C) | 580 | 626 | ||||||
Comcast | ||||||||
7.050%, 03/15/2033 | 90 | 128 | ||||||
6.400%, 03/01/2040 | 60 | 84 | ||||||
4.400%, 08/15/2035 | 875 | 991 | ||||||
4.250%, 01/15/2033 | 60 | 67 | ||||||
4.200%, 08/15/2034 | 30 | 33 | ||||||
3.375%, 02/15/2025 | 70 | 75 | ||||||
Comcast Cable Communications Holdings | ||||||||
9.455%, 11/15/2022 | 180 | 253 | ||||||
Comcast Cable Holdings | ||||||||
10.125%, 04/15/2022 | 45 | 60 | ||||||
Cox Communications | ||||||||
4.800%, 02/01/2035 (C) | 90 | 89 | ||||||
Daimler Finance North America LLC | ||||||||
2.375%, 08/01/2018 (C) | 435 | 442 | ||||||
1.125%, 03/10/2017 (C) | 555 | 555 | ||||||
Discovery Communications | ||||||||
4.900%, 03/11/2026 | 325 | 353 | ||||||
4.875%, 04/01/2043 | 125 | 119 | ||||||
ERAC USA Finance | ||||||||
3.300%, 12/01/2026 (C) | 525 | 540 | ||||||
Ford Motor Credit | ||||||||
5.875%, 08/02/2021 | 550 | 628 | ||||||
3.000%, 06/12/2017 | 500 | 505 | ||||||
2.597%, 11/04/2019 | 480 | 488 | ||||||
1.461%, 03/27/2017 | 500 | 501 | ||||||
Ford Motor Credit LLC | ||||||||
3.219%, 01/09/2022 | 305 | 313 | ||||||
2.375%, 03/12/2019 | 200 | 202 | ||||||
1.684%, 09/08/2017 | 200 | 200 | ||||||
General Motors | ||||||||
6.250%, 10/02/2043 | 160 | 189 | ||||||
5.000%, 04/01/2035 | 245 | 254 | ||||||
4.875%, 10/02/2023 | 315 | 341 | ||||||
General Motors Financial | ||||||||
5.250%, 03/01/2026 | 535 | 588 | ||||||
4.200%, 03/01/2021 | 930 | 979 | ||||||
3.700%, 05/09/2023 | 675 | 686 | ||||||
3.450%, 04/10/2022 | 380 | 385 | ||||||
3.200%, 07/13/2020 | 118 | 121 | ||||||
Grupo Televisa | ||||||||
6.125%, 01/31/2046 | 210 | 230 | ||||||
5.000%, 05/13/2045 | 225 | 215 | ||||||
Home Depot | ||||||||
4.250%, 04/01/2046 | 48 | 55 | ||||||
3.750%, 02/15/2024 | 66 | 73 | ||||||
Hyundai Capital America | ||||||||
2.125%, 10/02/2017 (C) | 60 | 60 | ||||||
| Description |
Face Amount |
Market Value | ||||||
CORPORATE OBLIGATIONS (continued) |
| |||||||
Hyundai Capital America MTN | ||||||||
2.400%, 10/30/2018 (C) | $ | 38 | $ | 39 | ||||
Lowe’s MTN | ||||||||
7.110%, 05/15/2037 | 110 | 156 | ||||||
Lowe’s | ||||||||
5.125%, 11/15/2041 | 11 | 14 | ||||||
McDonald’s MTN | ||||||||
5.350%, 03/01/2018 | 100 | 106 | ||||||
4.875%, 12/09/2045 | 515 | 598 | ||||||
3.700%, 01/30/2026 | 404 | 435 | ||||||
2.750%, 12/09/2020 | 230 | 239 | ||||||
NBCUniversal Enterprise | ||||||||
1.974%, 04/15/2019 (C) | 200 | 203 | ||||||
NBCUniversal Media | ||||||||
5.950%, 04/01/2041 | 50 | 67 | ||||||
4.375%, 04/01/2021 | 120 | 134 | ||||||
Newell Brands | ||||||||
5.500%, 04/01/2046 | 218 | 264 | ||||||
4.200%, 04/01/2026 | 340 | 370 | ||||||
3.850%, 04/01/2023 | 545 | 580 | ||||||
3.150%, 04/01/2021 | 60 | 62 | ||||||
QVC | ||||||||
5.950%, 03/15/2043 | 10 | 9 | ||||||
Scripps Networks Interactive | ||||||||
3.900%, 11/15/2024 | 185 | 194 | ||||||
3.500%, 06/15/2022 | 213 | 222 | ||||||
2.800%, 06/15/2020 | 240 | 246 | ||||||
Time Warner | ||||||||
7.700%, 05/01/2032 | 530 | 754 | ||||||
7.625%, 04/15/2031 | 385 | 546 | ||||||
7.570%, 02/01/2024 | 30 | 39 | ||||||
5.375%, 10/15/2041 | 302 | 357 | ||||||
3.550%, 06/01/2024 | 385 | 409 | ||||||
Time Warner Cable | ||||||||
8.250%, 04/01/2019 | 200 | 230 | ||||||
7.300%, 07/01/2038 | 110 | 141 | ||||||
6.750%, 07/01/2018 | 40 | 43 | ||||||
6.550%, 05/01/2037 | 205 | 243 | ||||||
5.875%, 11/15/2040 | 130 | 144 | ||||||
5.500%, 09/01/2041 | 44 | 47 | ||||||
5.000%, 02/01/2020 | 320 | 347 | ||||||
Toyota Motor Credit MTN | ||||||||
2.100%, 01/17/2019 | 174 | 177 | ||||||
1.250%, 10/05/2017 | 250 | 250 | ||||||
Viacom | ||||||||
4.850%, 12/15/2034 | 239 | 244 | ||||||
4.250%, 09/01/2023 | 30 | 32 | ||||||
3.875%, 04/01/2024 | 30 | 31 | ||||||
3.450%, 10/04/2026 | 190 | 189 | ||||||
2.250%, 02/04/2022 | 280 | 279 | ||||||
Volkswagen International Finance | ||||||||
1.125%, 11/18/2016 (C) | 580 | 580 | ||||||
| SEI Institutional Managed Trust / Annual Report / September 30, 2016 | 139 |
SCHEDULE OF INVESTMENTS
September 30, 2016
U.S. Fixed Income Fund (Continued)
| Description |
Face Amount |
Market Value | ||||||
CORPORATE OBLIGATIONS (continued) |
| |||||||
WPP Finance | ||||||||
5.125%, 09/07/2042
| $
| 60
|
| $
| 67
|
| ||
|
| |||||||
| 23,411 | ||||||||
|
| |||||||
Consumer Staples — 2.1% |
| |||||||
Altria Group | ||||||||
5.375%, 01/31/2044 | 190 | 239 | ||||||
4.750%, 05/05/2021 | 230 | 260 | ||||||
2.850%, 08/09/2022 | 550 | 574 | ||||||
Anheuser-Busch InBev Finance | ||||||||
4.900%, 02/01/2046 | 2,065 | 2,457 | ||||||
3.650%, 02/01/2026 | 2,968 | 3,188 | ||||||
3.300%, 02/01/2023 | 945 | 997 | ||||||
2.650%, 02/01/2021 | 150 | 155 | ||||||
Anheuser-Busch InBev Worldwide | ||||||||
7.750%, 01/15/2019 | 18 | 20 | ||||||
3.750%, 07/15/2042 | 230 | 230 | ||||||
2.500%, 07/15/2022 | 420 | 428 | ||||||
1.375%, 07/15/2017 | 105 | 105 | ||||||
Coca-Cola | ||||||||
1.550%, 09/01/2021 | 305 | 304 | ||||||
Coca-Cola Femsa | ||||||||
2.375%, 11/26/2018 | 400 | 407 | ||||||
Costco Wholesale | ||||||||
2.250%, 02/15/2022 | 56 | 58 | ||||||
CVS Health | ||||||||
5.125%, 07/20/2045 | 535 | 655 | ||||||
3.875%, 07/20/2025 | 89 | 97 | ||||||
3.500%, 07/20/2022 | 110 | 118 | ||||||
2.750%, 12/01/2022 | 510 | 525 | ||||||
CVS Pass-Through Trust | ||||||||
5.926%, 01/10/2034 (C) | 85 | 101 | ||||||
Diageo Investment | ||||||||
2.875%, 05/11/2022 | 580 | 609 | ||||||
Kraft Heinz Foods | ||||||||
6.875%, 01/26/2039 | 49 | 68 | ||||||
6.500%, 02/09/2040 | 140 | 188 | ||||||
6.125%, 08/23/2018 | 225 | 244 | ||||||
5.375%, 02/10/2020 | 16 | 18 | ||||||
5.200%, 07/15/2045 | 450 | 532 | ||||||
5.000%, 07/15/2035 | 100 | 116 | ||||||
5.000%, 06/04/2042 | 35 | 40 | ||||||
4.375%, 06/01/2046 | 455 | 481 | ||||||
3.950%, 07/15/2025 | 370 | 400 | ||||||
3.500%, 06/06/2022 | 820 | 871 | ||||||
3.500%, 07/15/2022 | 325 | 345 | ||||||
3.000%, 06/01/2026 | 440 | 444 | ||||||
2.800%, 07/02/2020 | 710 | 736 | ||||||
Kroger | ||||||||
7.500%, 04/01/2031 | 50 | 71 | ||||||
5.400%, 07/15/2040 | 14 | 17 | ||||||
2.950%, 11/01/2021 | 235 | 245 | ||||||
| Description |
Face Amount |
Market Value | ||||||
CORPORATE OBLIGATIONS (continued) |
| |||||||
2.200%, 01/15/2017 | $ | 40 | $ | 40 | ||||
Molson Coors Brewing | ||||||||
3.000%, 07/15/2026 | 435 | 438 | ||||||
Mondelez International | ||||||||
4.000%, 02/01/2024 | 140 | 154 | ||||||
PepsiCo | ||||||||
7.900%, 11/01/2018 | 11 | 12 | ||||||
4.250%, 10/22/2044 | 100 | 114 | ||||||
4.000%, 03/05/2042 | 50 | 54 | ||||||
3.100%, 07/17/2022 | 59 | 63 | ||||||
3.000%, 08/25/2021 | 31 | 33 | ||||||
1.250%, 08/13/2017 | 72 | 72 | ||||||
Pernod Ricard | ||||||||
4.450%, 01/15/2022 (C) | 370 | 408 | ||||||
2.950%, 01/15/2017 (C) | 825 | 828 | ||||||
Philip Morris International | ||||||||
4.500%, 03/20/2042 | 110 | 124 | ||||||
4.250%, 11/10/2044 | 295 | 327 | ||||||
2.500%, 08/22/2022 | 250 | 257 | ||||||
2.125%, 05/10/2023 | 390 | 389 | ||||||
Reynolds American | ||||||||
8.125%, 06/23/2019 | 370 | 433 | ||||||
5.850%, 08/15/2045 | 625 | 813 | ||||||
5.700%, 08/15/2035 | 220 | 272 | ||||||
3.250%, 06/12/2020 | 54 | 57 | ||||||
Skandinaviska Enskilda Banken | ||||||||
1.875%, 09/13/2021 | 670 | 665 | ||||||
Tyson Foods | ||||||||
5.150%, 08/15/2044 | 210 | 247 | ||||||
3.950%, 08/15/2024 | 60 | 65 | ||||||
Walgreens Boots Alliance | ||||||||
4.800%, 11/18/2044 | 630 | 695 | ||||||
3.450%, 06/01/2026 | 1,070 | 1,111 | ||||||
3.300%, 11/18/2021 | 377 | 399 | ||||||
Wal-Mart Stores | ||||||||
5.625%, 04/15/2041 | 20 | 27 | ||||||
4.750%, 10/02/2043 | 200 | 247 | ||||||
4.300%, 04/22/2044 | 905 | 1,063 | ||||||
3.300%, 04/22/2024 | 60 �� | 65 | ||||||
Wm Wrigley Jr | ||||||||
3.375%, 10/21/2020 (C) | 455 | 482 | ||||||
2.900%, 10/21/2019 (C) | 566 | 586 | ||||||
2.400%, 10/21/2018 (C) | 210 | 213 | ||||||
2.000%, 10/20/2017 (C)
|
| 115
|
|
| 116
|
| ||
|
| |||||||
| 27,212 | ||||||||
|
| |||||||
Energy — 2.5% |
| |||||||
Anadarko Finance, Ser B | ||||||||
7.500%, 05/01/2031 | 60 | 74 | ||||||
Anadarko Petroleum | ||||||||
6.450%, 09/15/2036 | 110 | 129 | ||||||
6.375%, 09/15/2017 | 9 | 9 | ||||||
| 140 | SEI Institutional Managed Trust / Annual Report / September 30, 2016 |
| Description |
Face Amount |
Market Value | ||||||
CORPORATE OBLIGATIONS (continued) |
| |||||||
4.500%, 07/15/2044 | $ | 125 | $ | 115 | ||||
Apache | ||||||||
5.100%, 09/01/2040 | 120 | 124 | ||||||
4.250%, 01/15/2044 | 245 | 238 | ||||||
3.250%, 04/15/2022 | 109 | 112 | ||||||
BG Energy Capital PLC | ||||||||
4.000%, 10/15/2021 (C) | 575 | 629 | ||||||
Boardwalk Pipelines | ||||||||
5.875%, 11/15/2016 | 350 | 352 | ||||||
BP Capital Markets PLC | ||||||||
3.994%, 09/26/2023 | 95 | 104 | ||||||
3.506%, 03/17/2025 | 90 | 95 | ||||||
3.245%, 05/06/2022 | 90 | 95 | ||||||
3.119%, 05/04/2026 | 130 | 133 | ||||||
3.062%, 03/17/2022 | 50 | 52 | ||||||
1.846%, 05/05/2017 | 172 | 173 | ||||||
Canadian Natural Resources | ||||||||
6.450%, 06/30/2033 | 50 | 57 | ||||||
Chevron | ||||||||
3.191%, 06/24/2023 | 22 | 23 | ||||||
2.954%, 05/16/2026 | 550 | 568 | ||||||
2.355%, 12/05/2022 | 15 | 15 | ||||||
2.100%, 05/16/2021 | 1,100 | 1,118 | ||||||
1.561%, 05/16/2019 | 619 | 622 | ||||||
Cimarex Energy | ||||||||
4.375%, 06/01/2024 | 285 | 298 | ||||||
CNOOC Finance | ||||||||
3.500%, 05/05/2025 | 450 | 463 | ||||||
CNOOC Nexen Finance | ||||||||
4.250%, 04/30/2024 | 200 | 216 | ||||||
Conoco Funding | ||||||||
7.250%, 10/15/2031 | 130 | 172 | ||||||
ConocoPhillips | ||||||||
6.000%, 01/15/2020 | 100 | 113 | ||||||
4.150%, 11/15/2034 | 460 | 459 | ||||||
Devon Energy | ||||||||
5.850%, 12/15/2025 | 150 | 169 | ||||||
5.600%, 07/15/2041 | 110 | 111 | ||||||
5.000%, 06/15/2045 | 190 | 185 | ||||||
4.750%, 05/15/2042 | 17 | 16 | ||||||
3.250%, 05/15/2022 | 137 | 136 | ||||||
Devon Financing LLC | ||||||||
7.875%, 09/30/2031 | 40 | 50 | ||||||
Ecopetrol | ||||||||
5.875%, 05/28/2045 | 420 | 385 | ||||||
4.125%, 01/16/2025 | 43 | 42 | ||||||
Enbridge Energy Partners | ||||||||
5.875%, 10/15/2025 (E) | 200 | 230 | ||||||
Energy Transfer Partners | ||||||||
8.250%, 11/15/2029 | 675 | 823 | ||||||
6.125%, 12/15/2045 | 685 | 715 | ||||||
5.150%, 03/15/2045 | 14 | 13 | ||||||
| Description |
Face Amount |
Market Value | ||||||
CORPORATE OBLIGATIONS (continued) |
| |||||||
4.750%, 01/15/2026 | $ | 210 | $ | 217 | ||||
3.600%, 02/01/2023 | 45 | 44 | ||||||
2.500%, 06/15/2018 | 275 | 277 | ||||||
Enterprise Products Operating | ||||||||
6.450%, 09/01/2040 | 50 | 60 | ||||||
5.700%, 02/15/2042 | 40 | 45 | ||||||
Enterprise Products Operating LLC | ||||||||
5.950%, 02/01/2041 | 85 | 98 | ||||||
5.100%, 02/15/2045 | 175 | 188 | ||||||
EOG Resources | ||||||||
4.150%, 01/15/2026 | 225 | 246 | ||||||
Exxon Mobil | ||||||||
4.114%, 03/01/2046 | 426 | 476 | ||||||
3.043%, 03/01/2026 | 220 | 231 | ||||||
2.397%, 03/06/2022 | 100 | 103 | ||||||
Florida Gas Transmission | ||||||||
7.900%, 05/15/2019 (C) | 350 | 397 | ||||||
Gulfstream Natural Gas System | ||||||||
5.950%, 10/15/2045 (C) | 155 | 170 | ||||||
Halliburton | ||||||||
5.000%, 11/15/2045 | 523 | 571 | ||||||
3.800%, 11/15/2025 | 190 | 196 | ||||||
3.500%, 08/01/2023 | 50 | 52 | ||||||
Hess | ||||||||
5.800%, 04/01/2047 | 280 | 286 | ||||||
Kerr-McGee | ||||||||
7.875%, 09/15/2031 | 100 | 124 | ||||||
6.950%, 07/01/2024 | 298 | 358 | ||||||
Kinder Morgan | ||||||||
5.550%, 06/01/2045 | 450 | 462 | ||||||
5.300%, 12/01/2034 | 95 | 95 | ||||||
4.300%, 06/01/2025 | 1,380 | 1,434 | ||||||
Magellan Midstream Partners | ||||||||
5.000%, 03/01/2026 | 155 | 177 | ||||||
Marathon Petroleum | ||||||||
5.850%, 12/15/2045 | 165 | 168 | ||||||
5.000%, 09/15/2054 | 45 | 39 | ||||||
Noble Energy | ||||||||
6.000%, 03/01/2041 | 135 | 146 | ||||||
5.250%, 11/15/2043 | 60 | 61 | ||||||
5.050%, 11/15/2044 | 29 | 29 | ||||||
4.150%, 12/15/2021 | 230 | 245 | ||||||
3.900%, 11/15/2024 | 150 | 153 | ||||||
Occidental Petroleum | ||||||||
4.625%, 06/15/2045 | 130 | 147 | ||||||
3.500%, 06/15/2025 | 45 | 48 | ||||||
2.700%, 02/15/2023 | 129 | 132 | ||||||
Petrobras Global Finance | ||||||||
6.850%, 06/05/2115 | 200 | 169 | ||||||
6.250%, 03/17/2024 | 310 | 301 | ||||||
Petrobras International Finance | ||||||||
5.375%, 01/27/2021 | 1,060 | 1,048 | ||||||
| SEI Institutional Managed Trust / Annual Report / September 30, 2016 | 141 |
SCHEDULE OF INVESTMENTS
September 30, 2016
U.S. Fixed Income Fund (Continued)
| Description |
Face Amount |
Market Value | ||||||
CORPORATE OBLIGATIONS (continued) |
| |||||||
Petro-Canada | ||||||||
6.800%, 05/15/2038 | $ | 475 | $ | 624 | ||||
Petrofac | ||||||||
3.400%, 10/10/2018 (C) | 250 | 251 | ||||||
Petroleos Mexicanos | ||||||||
6.625%, 06/15/2035 | 350 | 356 | ||||||
6.375%, 01/23/2045 | 530 | 506 | ||||||
5.500%, 06/27/2044 | 30 | 26 | ||||||
4.875%, 01/18/2024 | 32 | 32 | ||||||
2.460%, 12/15/2025 | 632 | 649 | ||||||
2.378%, 04/15/2025 | 320 | 327 | ||||||
Petroleos Mexicanos MTN | ||||||||
6.875%, 08/04/2026 (C) | 405 | 457 | ||||||
6.750%, 09/21/2047 (C) | 355 | 355 | ||||||
5.625%, 01/23/2046 | 332 | 290 | ||||||
Phillips 66 | ||||||||
5.875%, 05/01/2042 | 35 | 44 | ||||||
Pride International | ||||||||
6.875%, 08/15/2020 | 30 | 30 | ||||||
Schlumberger Holdings | ||||||||
4.000%, 12/21/2025 (C) | 120 | 131 | ||||||
3.000%, 12/21/2020 (C) | 1,000 | 1,043 | ||||||
Schlumberger Investment | ||||||||
3.650%, 12/01/2023 | 61 | 66 | ||||||
3.300%, 09/14/2021 (C) | 47 | 50 | ||||||
Shell International Finance | ||||||||
4.375%, 03/25/2020 | 140 | 153 | ||||||
4.375%, 05/11/2045 | 515 | 556 | ||||||
4.125%, 05/11/2035 | 2,031 | 2,178 | ||||||
4.000%, 05/10/2046 | 430 | 440 | ||||||
3.750%, 09/12/2046 | 250 | 247 | ||||||
3.400%, 08/12/2023 | 465 | 496 | ||||||
2.875%, 05/10/2026 | 734 | 745 | ||||||
2.500%, 09/12/2026 | 85 | 84 | ||||||
2.125%, 05/11/2020 | 56 | 57 | ||||||
Sinopec Group Overseas Development | ||||||||
4.375%, 04/10/2024 (C) | 380 | 420 | ||||||
Spectra Energy Partners | ||||||||
5.950%, 09/25/2043 | 30 | 35 | ||||||
4.500%, 03/15/2045 | 400 | 401 | ||||||
Statoil | ||||||||
5.250%, 04/15/2019 | 140 | 153 | ||||||
3.700%, 03/01/2024 | 210 | 228 | ||||||
TC PipeLines | ||||||||
4.650%, 06/15/2021 | 85 | 89 | ||||||
Total Capital International | ||||||||
3.700%, 01/15/2024 | 42 | 46 | ||||||
2.875%, 02/17/2022 | 505 | 530 | ||||||
TransCanada Pipelines | ||||||||
4.625%, 03/01/2034 | 470 | 518 | ||||||
Transcontinental Gas Pipe Line | ||||||||
7.850%, 02/01/2026 (C) | 550 | 713 | ||||||
| Description |
Face Amount |
Market Value | ||||||
CORPORATE OBLIGATIONS (continued) |
| |||||||
Transocean | ||||||||
6.800%, 12/15/2016 | $ | 70 | $ | 70 | ||||
3.750%, 10/15/2017 | 260 | 261 | ||||||
Valero Energy | ||||||||
3.400%, 09/15/2026 | 475 | 472 | ||||||
Western Gas Partners | ||||||||
5.375%, 06/01/2021 | 25 | 27 | ||||||
4.000%, 07/01/2022 | 35 | 36 | ||||||
Williams | ||||||||
7.875%, 09/01/2021 | 260 | 301 | ||||||
Williams Partners | ||||||||
5.100%, 09/15/2045 | 55 | 54 | ||||||
4.000%, 09/15/2025
|
| 180
|
|
| 180
|
| ||
|
| |||||||
| 33,153 | ||||||||
|
| |||||||
Financials — 8.7% |
| |||||||
AIG Global Funding MTN | ||||||||
1.650%, 12/15/2017 (C) | 42 | 42 | ||||||
American Express | ||||||||
7.000%, 03/19/2018 | 170 | 183 | ||||||
American Express Credit MTN | ||||||||
2.375%, 05/26/2020 | 64 | 65 | ||||||
2.250%, 08/15/2019 | 625 | 638 | ||||||
1.875%, 11/05/2018 | 44 | 44 | ||||||
1.800%, 07/31/2018 | 65 | 65 | ||||||
American International Group | ||||||||
6.250%, 05/01/2036 | 270 | 333 | ||||||
4.125%, 02/15/2024 | 107 | 115 | ||||||
3.900%, 04/01/2026 | 751 | 795 | ||||||
3.875%, 01/15/2035 | 30 | 29 | ||||||
Aon | ||||||||
6.250%, 09/30/2040 | 19 | 24 | ||||||
3.500%, 06/14/2024 | 65 | 68 | ||||||
Bank of America MTN | ||||||||
6.875%, 04/25/2018 | 175 | 189 | ||||||
6.400%, 08/28/2017 | 150 | 157 | ||||||
5.650%, 05/01/2018 | 1,100 | 1,167 | ||||||
5.625%, 07/01/2020 | 30 | 34 | ||||||
5.000%, 05/13/2021 | 410 | 458 | ||||||
5.000%, 01/21/2044 | 450 | 530 | ||||||
4.450%, 03/03/2026 | 1,329 | 1,426 | ||||||
4.250%, 10/22/2026 | 47 | 50 | ||||||
4.200%, 08/26/2024 | 700 | 741 | ||||||
4.125%, 01/22/2024 | 290 | 315 | ||||||
4.100%, 07/24/2023 | 340 | 368 | ||||||
4.000%, 04/01/2024 | 290 | 313 | ||||||
4.000%, 01/22/2025 | 683 | 708 | ||||||
3.950%, 04/21/2025 | 123 | 127 | ||||||
3.875%, 08/01/2025 | 190 | 203 | ||||||
3.500%, 04/19/2026 | 744 | 773 | ||||||
3.300%, 01/11/2023 | 440 | 455 | ||||||
2.600%, 01/15/2019 | 160 | 163 | ||||||
| 142 | SEI Institutional Managed Trust / Annual Report / September 30, 2016 |
| Description |
Face Amount |
Market Value | ||||||
CORPORATE OBLIGATIONS (continued) |
| |||||||
2.250%, 04/21/2020 | $ | 100 | $ | 101 | ||||
Bank of America | ||||||||
6.100%, 06/15/2017 | 2,600 | 2,684 | ||||||
6.000%, 09/01/2017 | 565 | 588 | ||||||
5.750%, 12/01/2017 | 70 | 73 | ||||||
5.700%, 01/24/2022 | 5 | 6 | ||||||
5.420%, 03/15/2017 | 200 | 203 | ||||||
Bank of Montreal MTN | ||||||||
2.375%, 01/25/2019 | 55 | 56 | ||||||
1.400%, 09/11/2017 | 53 | 53 | ||||||
Bank of New York Mellon MTN | ||||||||
4.600%, 01/15/2020 | 40 | 44 | ||||||
3.250%, 09/11/2024 | 100 | 106 | ||||||
2.500%, 04/15/2021 | 327 | 336 | ||||||
2.450%, 08/17/2026 | 585 | 581 | ||||||
2.200%, 03/04/2019 | 425 | 433 | ||||||
2.200%, 08/16/2023 | 780 | 778 | ||||||
Bank of New York Mellon | ||||||||
3.550%, 09/23/2021 | 34 | 37 | ||||||
3.400%, 05/15/2024 | 1,075 | 1,150 | ||||||
Bank of Nova Scotia | ||||||||
1.850%, 04/14/2020 | 160 | 162 | ||||||
Bank of Tokyo-Mitsubishi | ||||||||
4.100%, 09/09/2023 (C) | 200 | 220 | ||||||
BB&T | ||||||||
5.250%, 11/01/2019 | 200 | 221 | ||||||
Bear Stearns | ||||||||
7.250%, 02/01/2018 | 1,500 | 1,611 | ||||||
Berkshire Hathaway | ||||||||
3.750%, 08/15/2021 | 500 | 547 | ||||||
3.400%, 01/31/2022 | 65 | 70 | ||||||
3.125%, 03/15/2026 | 1,425 | 1,498 | ||||||
Berkshire Hathaway Finance | ||||||||
5.400%, 05/15/2018 | 110 | 117 | ||||||
4.400%, 05/15/2042 | 316 | 359 | ||||||
BNP Paribas MTN | ||||||||
4.375%, 09/28/2025 (C) | 460 | 471 | ||||||
2.700%, 08/20/2018 | 380 | 387 | ||||||
2.375%, 09/14/2017 | 110 | 111 | ||||||
BPCE | ||||||||
5.150%, 07/21/2024 (C) | 200 | 210 | ||||||
Capital One Bank USA | ||||||||
1.200%, 02/13/2017 | 750 | 749 | ||||||
Capital One Financial | ||||||||
4.750%, 07/15/2021 | 50 | 56 | ||||||
4.200%, 10/29/2025 | 429 | 448 | ||||||
3.750%, 07/28/2026 | 300 | 301 | ||||||
Chubb INA Holdings | ||||||||
4.350%, 11/03/2045 | 330 | 381 | ||||||
3.350%, 05/03/2026 | 495 | 530 | ||||||
3.150%, 03/15/2025 | 74 | 78 | ||||||
2.875%, 11/03/2022 | 39 | 41 | ||||||
| Description |
Face Amount |
Market Value | ||||||
CORPORATE OBLIGATIONS (continued) |
| |||||||
2.300%, 11/03/2020 | $ | 50 | $ | 51 | ||||
Citigroup | ||||||||
8.125%, 07/15/2039 | 370 | 582 | ||||||
5.500%, 09/13/2025 | 269 | 307 | ||||||
5.300%, 05/06/2044 | 40 | 45 | ||||||
4.650%, 07/30/2045 | 480 | 542 | ||||||
4.600%, 03/09/2026 | 450 | 481 | ||||||
4.500%, 01/14/2022 | 380 | 420 | ||||||
4.450%, 09/29/2027 | 1,240 | 1,298 | ||||||
4.400%, 06/10/2025 | 270 | 286 | ||||||
4.300%, 11/20/2026 | 60 | 63 | ||||||
3.700%, 01/12/2026 | 595 | 628 | ||||||
3.500%, 05/15/2023 | 130 | 134 | ||||||
3.400%, 05/01/2026 | 260 | 269 | ||||||
3.300%, 04/27/2025 | 120 | 123 | ||||||
2.500%, 09/26/2018 | 990 | 1,006 | ||||||
2.150%, 07/30/2018 | 71 | 72 | ||||||
1.700%, 04/27/2018 | 160 | 160 | ||||||
1.550%, 08/14/2017 | 805 | 806 | ||||||
1.375%, 08/25/2036 (B) | 1,500 | 1,098 | ||||||
CME Group | ||||||||
3.000%, 03/15/2025 | 51 | 54 | ||||||
Commonwealth Bank of Australia | ||||||||
2.250%, 03/16/2017 (C) | 250 | 251 | ||||||
Cooperatieve Rabobank UA MTN | ||||||||
4.625%, 12/01/2023 | 530 | 572 | ||||||
3.875%, 02/08/2022 | 30 | 33 | ||||||
3.750%, 07/21/2026 | 765 | 766 | ||||||
3.375%, 01/19/2017 | 370 | 373 | ||||||
Credit Agricole | ||||||||
8.375%, 12/31/2049 (B)(C) | 170 | 192 | ||||||
Credit Suisse Group Funding Guernsey | ||||||||
4.875%, 05/15/2045 | 280 | 296 | ||||||
4.550%, 04/17/2026 (C) | 405 | 425 | ||||||
3.800%, 06/09/2023 (C) | 600 | 608 | ||||||
3.450%, 04/16/2021 (C) | 330 | 337 | ||||||
Discover Bank | ||||||||
3.100%, 06/04/2020 | 500 | 514 | ||||||
Discover Financial Services | ||||||||
6.450%, 06/12/2017 | 250 | 258 | ||||||
Farmers Exchange Capital | ||||||||
7.200%, 07/15/2048 (C) | 1,021 | 1,204 | ||||||
Fifth Third Bancorp | ||||||||
2.300%, 03/01/2019 | 30 | 30 | ||||||
Fifth Third Bank | ||||||||
2.875%, 10/01/2021 | 200 | 209 | ||||||
Goldman Sachs Group | ||||||||
6.750%, 10/01/2037 | 457 | 582 | ||||||
6.250%, 02/01/2041 | 300 | 392 | ||||||
6.150%, 04/01/2018 | 780 | 831 | ||||||
5.750%, 01/24/2022 | 300 | 348 | ||||||
5.150%, 05/22/2045 | 140 | 153 | ||||||
| SEI Institutional Managed Trust / Annual Report / September 30, 2016 | 143 |
SCHEDULE OF INVESTMENTS
September 30, 2016
U.S. Fixed Income Fund (Continued)
| Description |
Face Amount |
Market Value | ||||||
CORPORATE OBLIGATIONS (continued) |
| |||||||
4.750%, 10/21/2045 | $ | 511 | $ | 573 | ||||
4.250%, 10/21/2025 | 420 | 442 | ||||||
3.750%, 02/25/2026 | 340 | 357 | ||||||
2.900%, 07/19/2018 | 220 | 225 | ||||||
2.750%, 09/15/2020 | 35 | 36 | ||||||
2.625%, 04/25/2021 | 750 | 762 | ||||||
2.375%, 01/22/2018 | 520 | 526 | ||||||
2.350%, 11/15/2027 | 880 | 878 | ||||||
Goldman Sachs Group MTN | ||||||||
7.500%, 02/15/2019 | 710 | 802 | ||||||
6.000%, 06/15/2020 | 880 | 1,001 | ||||||
5.375%, 03/15/2020 | 950 | 1,052 | ||||||
4.000%, 03/03/2024 | 200 | 215 | ||||||
3.850%, 07/08/2024 | 121 | 128 | ||||||
Guardian Life Global Funding MTN | ||||||||
2.000%, 04/26/2021 (C) | 700 | 707 | ||||||
HBOS PLC MTN | ||||||||
6.750%, 05/21/2018 (C) | 200 | 214 | ||||||
HSBC Bank PLC | ||||||||
4.125%, 08/12/2020 (C) | 100 | 107 | ||||||
HSBC Finance | ||||||||
6.676%, 01/15/2021 | 850 | 978 | ||||||
HSBC Holdings PLC | ||||||||
4.875%, 01/14/2022 | 100 | 111 | ||||||
4.300%, 03/08/2026 | 760 | 814 | ||||||
4.250%, 03/14/2024 | 370 | 382 | ||||||
4.250%, 08/18/2025 | 250 | 257 | ||||||
4.000%, 03/30/2022 | 206 | 219 | ||||||
3.900%, 05/25/2026 | 415 | 430 | ||||||
3.400%, 03/08/2021 | 390 | 403 | ||||||
2.650%, 01/05/2022 | 1,220 | 1,216 | ||||||
HSBC USA | ||||||||
2.350%, 03/05/2020 | 100 | 101 | ||||||
ING Bank | ||||||||
5.800%, 09/25/2023 (C) | 430 | 481 | ||||||
2.050%, 08/15/2021 (C) | 830 | 831 | ||||||
Intercontinental Exchange | ||||||||
4.000%, 10/15/2023 | 65 | 71 | ||||||
2.500%, 10/15/2018 | 85 | 87 | ||||||
International Lease Finance | ||||||||
7.125%, 09/01/2018 (C) | 500 | 546 | ||||||
Intesa Sanpaolo MTN | ||||||||
5.017%, 06/26/2024 (C) | 510 | 465 | ||||||
Jackson National Life Global Funding | ||||||||
3.050%, 04/29/2026 (C) | 427 | 434 | ||||||
JPMorgan Chase | ||||||||
4.950%, 06/01/2045 | 240 | 269 | ||||||
4.500%, 01/24/2022 | 660 | 731 | ||||||
4.125%, 12/15/2026 | 520 | 555 | ||||||
3.875%, 09/10/2024 | 20 | 21 | ||||||
3.625%, 05/13/2024 | 230 | 245 | ||||||
3.250%, 09/23/2022 | 240 | 252 | ||||||
| Description |
Face Amount |
Market Value | ||||||
CORPORATE OBLIGATIONS (continued) |
| |||||||
3.200%, 01/25/2023 | $ | 100 | $ | 104 | ||||
2.950%, 10/01/2026 | 1,431 | 1,435 | ||||||
2.700%, 05/18/2023 | 1,285 | 1,298 | ||||||
2.400%, 06/07/2021 | 555 | 561 | ||||||
2.250%, 01/23/2020 | 905 | 917 | ||||||
JPMorgan Chase MTN | ||||||||
2.295%, 08/15/2021 | 880 | 882 | ||||||
JPMorgan Chase Bank | ||||||||
6.000%, 10/01/2017 | 1,927 | 2,010 | ||||||
JPMorgan Chase Capital XIII | ||||||||
1.788%, 09/30/2034 (B) | 500 | 410 | ||||||
KFW | ||||||||
1.000%, 07/15/2019 | 973 | 969 | ||||||
KKR Group Finance II | ||||||||
5.500%, 02/01/2043 (C) | 20 | 21 | ||||||
Lazard Group LLC | ||||||||
4.250%, 11/14/2020 | 345 | 370 | ||||||
3.750%, 02/13/2025 | 675 | 679 | ||||||
Liberty Mutual Insurance | ||||||||
8.500%, 05/15/2025 (C) | 100 | 127 | ||||||
Lloyds Banking Group | ||||||||
3.100%, 07/06/2021 | 490 | 501 | ||||||
Lloyds TSB Bank MTN | ||||||||
5.800%, 01/13/2020 (C) | 310 | 346 | ||||||
Macquarie Bank | ||||||||
5.000%, 02/22/2017 (C) | 170 | 172 | ||||||
Macquarie Group | ||||||||
6.250%, 01/14/2021 (C) | 166 | 189 | ||||||
Marsh & McLennan | ||||||||
3.750%, 03/14/2026 | 415 | 449 | ||||||
Massachusetts Mutual Life Insurance | ||||||||
8.875%, 06/01/2039 (C) | 295 | 464 | ||||||
MetLife | ||||||||
6.400%, 12/15/2036 | 915 | 1,013 | ||||||
5.700%, 06/15/2035 | 15 | 18 | ||||||
4.600%, 05/13/2046 | 292 | 316 | ||||||
Metropolitan Life Global Funding | ||||||||
1.500%, 01/10/2018 (C) | 313 | 314 | ||||||
Metropolitan Life Global Funding I | ||||||||
3.875%, 04/11/2022 (C) | 500 | 543 | ||||||
1.950%, 09/15/2021 (C) | 600 | 599 | ||||||
1.550%, 09/13/2019 (C) | 405 | 404 | ||||||
Mitsubishi UFJ Financial Group | ||||||||
2.757%, 09/13/2026 | 705 | 704 | ||||||
Mizuho Bank | ||||||||
1.800%, 03/26/2018 (C) | 200 | 200 | ||||||
Morgan Stanley MTN | ||||||||
7.300%, 05/13/2019 | 320 | 364 | ||||||
6.625%, 04/01/2018 | 2,050 | 2,197 | ||||||
5.950%, 12/28/2017 | 200 | 211 | ||||||
5.625%, 09/23/2019 | 350 | 388 | ||||||
5.550%, 04/27/2017 | 100 | 102 | ||||||
| 144 | SEI Institutional Managed Trust / Annual Report / September 30, 2016 |
��
| Description |
Face Amount |
Market Value | ||||||
CORPORATE OBLIGATIONS (continued) |
| |||||||
5.450%, 01/09/2017 | $ | 470 | $ | 475 | ||||
4.000%, 07/23/2025 | 732 | 787 | ||||||
3.125%, 07/27/2026 | 1,120 | 1,127 | ||||||
2.500%, 04/21/2021 | 1,443 | 1,461 | ||||||
Murray Street Investment Trust I | ||||||||
4.647%, 03/09/2017 (D) | 612 | 618 | ||||||
National City | ||||||||
6.875%, 05/15/2019 | 50 | 56 | ||||||
National City Bank | ||||||||
1.203%, 06/07/2017 (B) | 600 | 600 | ||||||
Nationwide Mutual Insurance | ||||||||
3.140%, 12/15/2024 (B)(C) | 760 | 745 | ||||||
New York Life Global Funding | ||||||||
2.350%, 07/14/2026 (C) | 700 | 696 | ||||||
2.150%, 06/18/2019 (C) | 73 | 75 | ||||||
New York Life Insurance | ||||||||
6.750%, 11/15/2039 (C) | 255 | 353 | ||||||
2.100%, 01/02/2019 (C) | 330 | 335 | ||||||
Nordea Bank MTN | ||||||||
1.625%, 05/15/2018 (C) | 220 | 221 | ||||||
Nordea Bank | ||||||||
4.875%, 05/13/2021 (C) | 250 | 278 | ||||||
Northwestern Mutual Life Insurance | ||||||||
6.063%, 03/30/2040 (C) | 430 | 556 | ||||||
Pacific Life Global Funding MTN | ||||||||
5.000%, 05/15/2017 (C) | 50 | 51 | ||||||
Pipeline Funding | ||||||||
7.500%, 01/15/2030 (C) | 441 | 521 | ||||||
PNC Bank MTN | ||||||||
2.400%, 10/18/2019 | 400 | 410 | ||||||
PNC Bank | ||||||||
2.250%, 07/02/2019 | 325 | 331 | ||||||
Pricoa Global Funding MTN | ||||||||
1.600%, 05/29/2018 (C) | 150 | 151 | ||||||
Progressive | ||||||||
2.450%, 01/15/2027 | 255 | 254 | ||||||
Protective Life Global Funding | ||||||||
1.722%, 04/15/2019 (C) | 870 | 873 | ||||||
Prudential Financial MTN | ||||||||
5.625%, 05/12/2041 | 10 | 12 | ||||||
Prudential Insurance of America | ||||||||
8.300%, 07/01/2025 (C) | 150 | 201 | ||||||
Royal Bank of Canada MTN | ||||||||
1.200%, 01/23/2017 | 60 | 60 | ||||||
Royal Bank of Canada | ||||||||
2.300%, 03/22/2021 | 15 | 15 | ||||||
2.000%, 10/01/2018 | 183 | 185 | ||||||
1.875%, 02/05/2020 | 180 | 182 | ||||||
1.200%, 09/19/2017 | 140 | 140 | ||||||
Royal Bank of Scotland | ||||||||
4.650%, 06/04/2018 | 350 | 359 | ||||||
| Description |
Face Amount |
Market Value | ||||||
CORPORATE OBLIGATIONS (continued) |
| |||||||
Santander Holdings USA | ||||||||
3.450%, 08/27/2018 | $ | 230 | $ | 236 | ||||
Santander UK Group Holdings | ||||||||
2.875%, 08/05/2021 | 200 | 200 | ||||||
Stadshypotek | ||||||||
1.875%, 10/02/2019 (C) | 520 | 525 | ||||||
Standard Chartered | ||||||||
5.700%, 03/26/2044 (C) | 560 | 596 | ||||||
State Street | ||||||||
4.956%, 03/15/2018 | 270 | 282 | ||||||
3.700%, 11/20/2023 | 138 | 151 | ||||||
3.300%, 12/16/2024 | 70 | 75 | ||||||
Svenska Handelsbanken MTN | ||||||||
1.875%, 09/07/2021 | 675 | 671 | ||||||
Synchrony Financial | ||||||||
3.700%, 08/04/2026 | 530 | 526 | ||||||
Teachers Insurance & Annuity Association of America | ||||||||
6.850%, 12/16/2039 (C) | 150 | 204 | ||||||
4.900%, 09/15/2044 (C) | 305 | 343 | ||||||
Toronto-Dominion Bank MTN | ||||||||
1.750%, 07/23/2018 | 72 | 72 | ||||||
Toronto-Dominion Bank | ||||||||
2.250%, 03/15/2021 (C) | 1,125 | 1,149 | ||||||
Trinity Acquisition | ||||||||
4.400%, 03/15/2026 | 125 | 131 | ||||||
UBS MTN | ||||||||
1.800%, 03/26/2018 | 445 | 446 | ||||||
1.375%, 06/01/2017 | 350 | 350 | ||||||
UBS Group Funding Jersey | ||||||||
4.125%, 04/15/2026 (C) | 345 | 363 | ||||||
2.650%, 02/01/2022 (C) | 825 | 823 | ||||||
US Bancorp MTN | ||||||||
2.950%, 07/15/2022 | 25 | 26 | ||||||
2.375%, 07/22/2026 | 760 | 751 | ||||||
US Bank | ||||||||
2.125%, 10/28/2019 | 260 | 265 | ||||||
Visa | ||||||||
4.300%, 12/14/2045 | 120 | 139 | ||||||
3.150%, 12/14/2025 | 360 | 380 | ||||||
2.800%, 12/14/2022 | 840 | 881 | ||||||
2.200%, 12/14/2020 | 80 | 82 | ||||||
Voya Financial | ||||||||
4.800%, 06/15/2046 | 50 | 50 | ||||||
Wachovia Capital Trust III | ||||||||
5.570%, 12/31/2049 (B) | 450 | 449 | ||||||
WEA Finance | ||||||||
3.750%, 09/17/2024 (C) | 210 | 221 | ||||||
3.250%, 10/05/2020 (C) | 435 | 453 | ||||||
1.750%, 09/15/2017 (C) | 1,250 | 1,252 | ||||||
Wells Fargo MTN | ||||||||
4.900%, 11/17/2045 | 384 | 423 | ||||||
| SEI Institutional Managed Trust / Annual Report / September 30, 2016 | 145 |
SCHEDULE OF INVESTMENTS
September 30, 2016
U.S. Fixed Income Fund (Continued)
| Description |
Face Amount |
Market Value | ||||||
CORPORATE OBLIGATIONS (continued) | ||||||||
4.650%, 11/04/2044 | $ | 121 | $ | 127 | ||||
4.300%, 07/22/2027 | 533 | 574 | ||||||
4.125%, 08/15/2023 | 900 | 963 | ||||||
3.500%, 03/08/2022 | 430�� | 456 | ||||||
3.450%, 02/13/2023 | 230 | 237 | ||||||
3.000%, 01/22/2021 | 575 | 596 | ||||||
2.550%, 12/07/2020 | 46 | 47 | ||||||
2.150%, 01/30/2020 | 70 | 71 | ||||||
1.650%, 01/22/2018 | 585 | 587 | ||||||
Wells Fargo | ||||||||
6.000%, 11/15/2017 | 590 | 620 | ||||||
3.000%, 04/22/2026 | 920 | 929 | ||||||
2.125%, 04/22/2019 | 70 | 71 | ||||||
2.100%, 07/26/2021 | 945 | 942 | ||||||
Westpac Banking | ||||||||
4.875%, 11/19/2019 | 170 | 186 | ||||||
2.700%, 08/19/2026 | 345 | 342 | ||||||
2.450%, 11/28/2016 (C) | 200 | 200 | ||||||
2.000%, 08/19/2021
|
| 860
|
|
| 859
|
| ||
|
| |||||||
| 112,825 | ||||||||
|
| |||||||
Health Care — 2.9% | ||||||||
AbbVie | ||||||||
4.500%, 05/14/2035 | 395 | 421 | ||||||
4.450%, 05/14/2046 | 300 | 313 | ||||||
4.400%, 11/06/2042 | 270 | 281 | ||||||
3.600%, 05/14/2025 | 520 | 544 | ||||||
3.200%, 11/06/2022 | 44 | 46 | ||||||
3.200%, 05/14/2026 | 665 | 673 | ||||||
2.900%, 11/06/2022 | 10 | 10 | ||||||
2.500%, 05/14/2020 | 690 | 703 | ||||||
1.800%, 05/14/2018 | 500 | 502 | ||||||
1.750%, 11/06/2017 | 120 | 120 | ||||||
Actavis | ||||||||
3.250%, 10/01/2022 | 13 | 14 | ||||||
Actavis Funding SCS | ||||||||
4.750%, 03/15/2045 | 610 | 667 | ||||||
4.550%, 03/15/2035 | 260 | 276 | ||||||
3.800%, 03/15/2025 | 1,747 | 1,849 | ||||||
3.450%, 03/15/2022 | 745 | 782 | ||||||
Aetna | ||||||||
3.200%, 06/15/2026 | 210 | 214 | ||||||
2.800%, 06/15/2023 | 1,875 | 1,915 | ||||||
2.400%, 06/15/2021 | 140 | 142 | ||||||
2.200%, 03/15/2019 | 180 | 183 | ||||||
Amgen | ||||||||
5.150%, 11/15/2041 | 760 | 866 | ||||||
4.663%, 06/15/2051 (C) | 564 | 602 | ||||||
4.400%, 05/01/2045 | 557 | 585 | ||||||
3.875%, 11/15/2021 | 150 | 163 | ||||||
3.625%, 05/22/2024 | 30 | 32 | ||||||
2.600%, 08/19/2026 | 390 | 383 | ||||||
| Description |
Face Amount |
Market Value | ||||||
CORPORATE OBLIGATIONS (continued) | ||||||||
2.125%, 05/01/2020 | $ | 22 | $ | 22 | ||||
Anthem | ||||||||
4.625%, 05/15/2042 | 41 | 44 | ||||||
3.500%, 08/15/2024 | 90 | 95 | ||||||
3.125%, 05/15/2022 | 468 | 487 | ||||||
2.300%, 07/15/2018 | 65 | 66 | ||||||
AstraZeneca | ||||||||
3.375%, 11/16/2025 | 500 | 534 | ||||||
Baxalta | ||||||||
3.600%, 06/23/2022 | 627 | 659 | ||||||
2.875%, 06/23/2020 | 500 | 513 | ||||||
Bayer US Finance | ||||||||
3.375%, 10/08/2024 (C) | 200 | 207 | ||||||
Becton Dickinson | ||||||||
4.685%, 12/15/2044 | 110 | 125 | ||||||
3.734%, 12/15/2024 | 166 | 180 | ||||||
2.675%, 12/15/2019 | 297 | 307 | ||||||
Biogen | ||||||||
5.200%, 09/15/2045 | 588 | 692 | ||||||
3.625%, 09/15/2022 | 170 | 182 | ||||||
Celgene | ||||||||
5.250%, 08/15/2043 | 40 | 45 | ||||||
5.000%, 08/15/2045 | 1,072 | 1,207 | ||||||
3.875%, 08/15/2025 | 260 | 278 | ||||||
3.625%, 05/15/2024 | 69 | 73 | ||||||
3.550%, 08/15/2022 | 60 | 64 | ||||||
2.875%, 08/15/2020 | 275 | 285 | ||||||
1.900%, 08/15/2017 | 63 | 63 | ||||||
EMD Finance | ||||||||
2.400%, 03/19/2020 (C) | 670 | 681 | ||||||
Express Scripts Holding | ||||||||
4.800%, 07/15/2046 | 269 | 279 | ||||||
3.400%, 03/01/2027 | 550 | 553 | ||||||
Forest Laboratories | ||||||||
5.000%, 12/15/2021 (C) | 35 | 39 | ||||||
Gilead Sciences | ||||||||
5.650%, 12/01/2041 | 35 | 43 | ||||||
4.750%, 03/01/2046 | 340 | 380 | ||||||
4.500%, 02/01/2045 | 20 | 21 | ||||||
4.150%, 03/01/2047 | 500 | 511 | ||||||
3.700%, 04/01/2024 | 350 | 377 | ||||||
3.650%, 03/01/2026 | 150 | 161 | ||||||
3.250%, 09/01/2022 | 296 | 314 | ||||||
2.950%, 03/01/2027 | 550 | 556 | ||||||
GlaxoSmithKline Capital PLC | ||||||||
2.850%, 05/08/2022 | 170 | 179 | ||||||
1.500%, 05/08/2017 | 160 | 160 | ||||||
Humana | ||||||||
7.200%, 06/15/2018 | 159 | 174 | ||||||
4.625%, 12/01/2042 | 40 | 42 | ||||||
3.850%, 10/01/2024 | 680 | 729 | ||||||
3.150%, 12/01/2022 | 390 | 405 | ||||||
| 146 | SEI Institutional Managed Trust / Annual Report / September 30, 2016 |
| Description |
Face Amount |
Market Value | ||||||
CORPORATE OBLIGATIONS (continued) | ||||||||
Johnson & Johnson | ||||||||
4.500%, 12/05/2043 | $ | 250 | $ | 314 | ||||
3.700%, 03/01/2046 | 170 | 189 | ||||||
3.550%, 03/01/2036 | 410 | 455 | ||||||
2.450%, 03/01/2026 | 109 | 112 | ||||||
Medtronic | ||||||||
4.625%, 03/15/2045 | 60 | 71 | ||||||
4.375%, 03/15/2035 | 76 | 86 | ||||||
3.625%, 03/15/2024 | 170 | 185 | ||||||
3.500%, 03/15/2025 | 270 | 291 | ||||||
3.150%, 03/15/2022 | 65 | 69 | ||||||
Merck | ||||||||
2.750%, 02/10/2025 | 130 | 135 | ||||||
2.400%, 09/15/2022 | 29 | 30 | ||||||
2.350%, 02/10/2022 | 466 | 480 | ||||||
Mylan | ||||||||
2.550%, 03/28/2019 | 305 | 309 | ||||||
2.500%, 06/07/2019 (C) | 900 | 908 | ||||||
New York and Presbyterian Hospital | ||||||||
3.563%, 08/01/2036 | 730 | 764 | ||||||
Northwell Healthcare | ||||||||
3.979%, 11/01/2046 | 550 | 556 | ||||||
Perrigo Finance Unlimited | ||||||||
4.375%, 03/15/2026 | 675 | 704 | ||||||
Pfizer | ||||||||
6.200%, 03/15/2019 | 120 | 134 | ||||||
Shire Acquisitions Investments Ireland | ||||||||
3.200%, 09/23/2026 | 615 | 618 | ||||||
2.875%, 09/23/2023 | 685 | 689 | ||||||
1.900%, 09/23/2019 | 585 | 585 | ||||||
Stryker | ||||||||
4.625%, 03/15/2046 | 675 | 757 | ||||||
Teva Pharmaceutical Finance Netherlands III BV | ||||||||
3.150%, 10/01/2026 | 425 | 427 | ||||||
2.800%, 07/21/2023 | 700 | 702 | ||||||
2.200%, 07/21/2021 | 705 | 702 | ||||||
Thermo Fisher Scientific | ||||||||
3.300%, 02/15/2022 | 465 | 487 | ||||||
2.950%, 09/19/2026 | 540 | 536 | ||||||
UnitedHealth Group | ||||||||
4.625%, 07/15/2035 | 363 | 422 | ||||||
3.875%, 10/15/2020 | 180 | 195 | ||||||
3.750%, 07/15/2025 | 70 | 77 | ||||||
3.375%, 11/15/2021 | 75 | 80 | ||||||
3.350%, 07/15/2022 | 28 | 30 | ||||||
3.100%, 03/15/2026 | 425 | 444 | ||||||
2.875%, 12/15/2021 | 365 | 385 | ||||||
2.875%, 03/15/2023 | 50 | 52 | ||||||
Wyeth LLC | ||||||||
5.950%, 04/01/2037
|
| 130
|
|
| 174
|
| ||
|
| |||||||
| 37,172 | ||||||||
|
| |||||||
| Description |
Face Amount |
Market Value | ||||||
CORPORATE OBLIGATIONS (continued) | ||||||||
Industrials — 1.8% | ||||||||
3M MTN | ||||||||
2.250%, 09/19/2026 | $ | 250 | $ | 250 | ||||
ABB Finance USA | ||||||||
4.375%, 05/08/2042 | 30 | 34 | ||||||
American Airlines Pass-Through Trust, Ser 2013-2 | ||||||||
4.950%, 01/15/2023 | 799 | 869 | ||||||
AP Moeller - Maersk | ||||||||
3.875%, 09/28/2025 (C) | 275 | 278 | ||||||
Aviation Capital Group | ||||||||
6.750%, 04/06/2021 (C) | 180 | 212 | ||||||
BAE Systems | ||||||||
4.750%, 10/11/2021 (C) | 750 | 834 | ||||||
Boeing | ||||||||
4.875%, 02/15/2020 | 210 | 235 | ||||||
Burlington Northern Santa Fe | ||||||||
7.290%, 06/01/2036 | 90 | 132 | ||||||
5.750%, 03/15/2018 | 950 | 1,012 | ||||||
5.400%, 06/01/2041 | 50 | 64 | ||||||
4.150%, 04/01/2045 | 165 | 182 | ||||||
3.450%, 09/15/2021 | 91 | 98 | ||||||
Canadian Pacific Railway | ||||||||
6.125%, 09/15/2115 | 44 | 54 | ||||||
Caterpillar Financial Services MTN | ||||||||
2.750%, 08/20/2021 | 405 | 423 | ||||||
Catholic Health Initiatives | ||||||||
4.350%, 11/01/2042 | 30 | 30 | ||||||
Continental Airlines Pass-Through Trust, Ser 1999-2, Cl A-1 | ||||||||
7.256%, 03/15/2020 | 141 | 152 | ||||||
Continental Airlines Pass-Through Trust, Ser 2000-1, Cl A-1 | ||||||||
8.048%, 11/01/2020 | 191 | 214 | ||||||
Continental Airlines Pass-Through Trust, Ser 2007-1, Cl A | ||||||||
5.983%, 04/19/2022 | 633 | 714 | ||||||
Continental Airlines Pass-Through Trust, Ser 2009-2, Cl A | ||||||||
7.250%, 11/10/2019 | 138 | 158 | ||||||
CSX | ||||||||
6.250%, 03/15/2018 | 155 | 166 | ||||||
3.950%, 05/01/2050 | 21 | 21 | ||||||
Delta Air Lines Pass-Through Trust, Ser 2007-1, Cl A | ||||||||
6.821%, 08/10/2022 | 105 | 125 | ||||||
Delta Air Lines Pass-Through Trust, Ser 2010-1, Cl A | ||||||||
6.200%, 07/02/2018 | 288 | 306 | ||||||
Eaton | ||||||||
7.625%, 04/01/2024 | 75 | 94 | ||||||
4.150%, 11/02/2042 | 110 | 118 | ||||||
| SEI Institutional Managed Trust / Annual Report / September 30, 2016 | 147 |
SCHEDULE OF INVESTMENTS
September 30, 2016
U.S. Fixed Income Fund (Continued)
| Description |
Face Amount |
Market Value | ||||||
CORPORATE OBLIGATIONS (continued) |
| |||||||
2.750%, 11/02/2022 | $ | 450 | $ | 465 | ||||
1.500%, 11/02/2017 | 60 | 60 | ||||||
FedEx | ||||||||
4.550%, 04/01/2046 | 440 | 489 | ||||||
GE Capital International Funding | ||||||||
4.418%, 11/15/2035 | 1,630 | 1,829 | ||||||
2.342%, 11/15/2020 | 695 | 714 | ||||||
General Electric | ||||||||
4.500%, 03/11/2044 | 635 | 731 | ||||||
2.100%, 12/11/2019 | 30 | 31 | ||||||
General Electric MTN | ||||||||
6.875%, 01/10/2039 | 175 | 264 | ||||||
6.150%, 08/07/2037 | 254 | 349 | ||||||
6.000%, 08/07/2019 | 185 | 209 | ||||||
5.875%, 01/14/2038 | 159 | 213 | ||||||
5.625%, 09/15/2017 | 100 | 104 | ||||||
5.500%, 01/08/2020 | 180 | 203 | ||||||
5.400%, 02/15/2017 | 200 | 203 | ||||||
5.300%, 02/11/2021 | 109 | 125 | ||||||
4.650%, 10/17/2021 | 140 | 160 | ||||||
4.625%, 01/07/2021 | 135 | 152 | ||||||
4.375%, 09/16/2020 | 10 | 11 | ||||||
3.100%, 01/09/2023 | 100 | 106 | ||||||
2.300%, 04/27/2017 | 45 | 45 | ||||||
2.200%, 01/09/2020 | 43 | 44 | ||||||
1.297%, 08/15/2036 (B) | 850 | 727 | ||||||
1.158%, 05/05/2026 (B) | 155 | 151 | ||||||
Lockheed Martin | ||||||||
4.700%, 05/15/2046 | 260 | 309 | ||||||
4.070%, 12/15/2042 | 91 | 97 | ||||||
3.550%, 01/15/2026 | 880 | 951 | ||||||
3.350%, 09/15/2021 | 575 | 616 | ||||||
2.500%, 11/23/2020 | 445 | 459 | ||||||
Mexico City Airport Trust | ||||||||
5.500%, 10/31/2046 (C) | 480 | 471 | ||||||
Northrop Grumman | ||||||||
3.850%, 04/15/2045 | 176 | 183 | ||||||
3.250%, 08/01/2023 | 1,930 | 2,062 | ||||||
Penske Truck Leasing L.P. | ||||||||
3.375%, 02/01/2022 (C) | 316 | 329 | ||||||
3.200%, 07/15/2020 (C) | 410 | 424 | ||||||
Siemens Financieringsmaatschappij | ||||||||
2.900%, 05/27/2022 (C) | 760 | 796 | ||||||
2.350%, 10/15/2026 (C) | 555 | 548 | ||||||
Union Pacific | ||||||||
4.050%, 03/01/2046 | 325 | 358 | ||||||
United Technologies | ||||||||
8.875%, 11/15/2019 | 110 | 134 | ||||||
4.150%, 05/15/2045 | 59 | 65 | ||||||
US Airways Pass-Through Trust, Ser 1998-1A | ||||||||
6.850%, 01/30/2018 | 434 | 447 | ||||||
| Description |
Face Amount |
Market Value | ||||||
CORPORATE OBLIGATIONS (continued) |
| |||||||
Valmont Industries | ||||||||
5.250%, 10/01/2054 | $ | 255 | $ | 239 | ||||
Waste Management | ||||||||
4.600%, 03/01/2021 | 90 | 100 | ||||||
3.500%, 05/15/2024
|
| 90
|
|
| 97
|
| ||
|
| |||||||
| 22,845 | ||||||||
|
| |||||||
Information Technology — 1.5% |
| |||||||
Apple | ||||||||
4.650%, 02/23/2046 | 270 | 312 | ||||||
4.375%, 05/13/2045 | 400 | 441 | ||||||
3.850%, 05/04/2043 | 740 | 756 | ||||||
3.850%, 08/04/2046 | 795 | 813 | ||||||
3.450%, 02/09/2045 | 31 | 30 | ||||||
3.200%, 05/13/2025 | 64 | 68 | ||||||
2.850%, 05/06/2021 | 113 | 119 | ||||||
2.450%, 08/04/2026 | 670 | 671 | ||||||
2.150%, 02/09/2022 | 82 | 83 | ||||||
1.009%, 05/03/2018 (B) | 69 | 69 | ||||||
Cisco Systems | �� | |||||||
2.200%, 09/20/2023 | 850 | 857 | ||||||
1.850%, 09/20/2021 | 1,925 | 1,937 | ||||||
1.400%, 09/20/2019 | 1,040 | 1,041 | ||||||
Diamond 1 Finance | ||||||||
6.020%, 06/15/2026 (C) | 300 | 329 | ||||||
4.420%, 06/15/2021 (C) | 280 | 293 | ||||||
3.480%, 06/01/2019 (C) | 350 | 360 | ||||||
Fidelity National Information Services | ||||||||
4.500%, 08/15/2046 | 333 | 333 | ||||||
3.625%, 10/15/2020 | 415 | 440 | ||||||
2.850%, 10/15/2018 | 515 | 529 | ||||||
2.250%, 08/15/2021 | 295 | 297 | ||||||
Harris | ||||||||
5.054%, 04/27/2045 | 60 | 69 | ||||||
Hewlett Packard Enterprise | ||||||||
6.350%, 10/15/2045 (C) | 575 | 593 | ||||||
4.900%, 10/15/2025 (C) | 235 | 251 | ||||||
Intel | ||||||||
3.700%, 07/29/2025 | 83 | 92 | ||||||
3.300%, 10/01/2021 | 35 | 38 | ||||||
3.100%, 07/29/2022 | 35 | 37 | ||||||
KLA-Tencor | ||||||||
4.125%, 11/01/2021 | 370 | 398 | ||||||
Mastercard | ||||||||
3.375%, 04/01/2024 | 250 | 269 | ||||||
Microsoft | ||||||||
4.750%, 11/03/2055 | 43 | 50 | ||||||
4.200%, 11/03/2035 | 301 | 336 | ||||||
4.000%, 02/12/2055 | 24 | 25 | ||||||
3.950%, 08/08/2056 | 170 | 172 | ||||||
3.750%, 02/12/2045 | 330 | 335 | ||||||
3.700%, 08/08/2046 | 370 | 374 | ||||||
| 148 | SEI Institutional Managed Trust / Annual Report / September 30, 2016 |
| ||||||||
| Description | Face Amount (Thousands) | Market Value ($ Thousands) | ||||||
| ||||||||
CORPORATE OBLIGATIONS (continued) |
| |||||||
3.625%, 12/15/2023 | $ | 89 | $ | 98 | ||||
3.500%, 02/12/2035 | 557 | 570 | ||||||
3.450%, 08/08/2036 | 280 | 285 | ||||||
2.400%, 08/08/2026 | 825 | 826 | ||||||
2.375%, 02/12/2022 | 20 | 21 | ||||||
2.375%, 05/01/2023 | 20 | 20 | ||||||
2.000%, 08/08/2023 | 1,115 | 1,113 | ||||||
Oracle | ||||||||
4.000%, 07/15/2046 | 230 | 238 | ||||||
3.900%, 05/15/2035 | 780 | 806 | ||||||
3.850%, 07/15/2036 | 225 | 234 | ||||||
2.650%, 07/15/2026 | 115 | 115 | ||||||
2.400%, 09/15/2023 | 1,850 | 1,865 | ||||||
1.900%, 09/15/2021 | 510 | 511 | ||||||
1.200%, 10/15/2017 | 250 | 250 | ||||||
TSMC Global | ||||||||
1.625%, 04/03/2018 (C)
|
| 460
|
|
| 461
|
| ||
|
| |||||||
| 20,230 | ||||||||
|
| |||||||
Materials — 0.7% |
| |||||||
Air Liquide Finance | ||||||||
2.500%, 09/27/2026 (C) | 385 | 387 | ||||||
2.250%, 09/27/2023 (C) | 650 | 652 | ||||||
1.750%, 09/27/2021 (C) | 450 | 449 | ||||||
1.375%, 09/27/2019 (C) | 530 | 529 | ||||||
Barrick | ||||||||
5.250%, 04/01/2042 | 185 | 203 | ||||||
Barrick Gold | ||||||||
4.100%, 05/01/2023 | 38 | 41 | ||||||
Barrick North America Finance | ||||||||
5.700%, 05/30/2041 | 210 | 239 | ||||||
4.400%, 05/30/2021 | 335 | 367 | ||||||
BHP Billiton Finance USA | ||||||||
6.750%, 10/19/2075 (B)(C) | 210 | 238 | ||||||
6.500%, 04/01/2019 | 125 | 140 | ||||||
5.000%, 09/30/2043 | 365 | 431 | ||||||
4.125%, 02/24/2042 | 40 | 42 | ||||||
3.250%, 11/21/2021 | 330 | 353 | ||||||
2.875%, 02/24/2022 | 30 | 31 | ||||||
2.050%, 09/30/2018 | 44 | 45 | ||||||
Celulosa Arauco y Constitucion | ||||||||
4.750%, 01/11/2022 | 170 | 182 | ||||||
Dow Chemical | ||||||||
5.250%, 11/15/2041 | 25 | 28 | ||||||
3.000%, 11/15/2022 | 1,105 | 1,148 | ||||||
Eastman Chemical | ||||||||
2.700%, 01/15/2020 | 435 | 446 | ||||||
Freeport-McMoRan | ||||||||
6.500%, 11/15/2020 | 23 | 24 | ||||||
4.000%, 11/14/2021 | 280 | 265 | ||||||
Glencore Finance Canada | ||||||||
2.700%, 10/25/2017 (C) | 250 | 250 | ||||||
| ||||||||
| Description | Face Amount (Thousands) | Market Value ($ Thousands) | ||||||
| ||||||||
CORPORATE OBLIGATIONS (continued) |
| |||||||
Glencore Funding LLC | ||||||||
2.875%, 04/16/2020 (C) | $ | 220 | $ | 218 | ||||
2.500%, 01/15/2019 (C) | 190 | 190 | ||||||
International Paper | ||||||||
5.150%, 05/15/2046 | 405 | 449 | ||||||
5.000%, 09/15/2035 | 285 | 313 | ||||||
Mosaic | ||||||||
5.625%, 11/15/2043 | 130 | 140 | ||||||
OCP | ||||||||
4.500%, 10/22/2025 (C) | 290 | 294 | ||||||
Rio Tinto Finance USA | ||||||||
3.750%, 09/20/2021 | 240 | 259 | ||||||
3.750%, 06/15/2025 (E) | 520 | 559 | ||||||
Southern Copper | ||||||||
5.250%, 11/08/2042 | 370 | 350 | ||||||
Teck Resources | ||||||||
6.250%, 07/15/2041 | 5 | 5 | ||||||
Vale Overseas | ||||||||
6.875%, 11/21/2036 | 220 | 214 | ||||||
5.875%, 06/10/2021
|
| 195
|
|
| 204
|
| ||
|
| |||||||
| 9,685 | ||||||||
|
| |||||||
Real Estate — 0.6% |
| |||||||
American Tower | ||||||||
3.450%, 09/15/2021 | 465 | 489 | ||||||
Boston Properties | ||||||||
5.625%, 11/15/2020 | 450 | 511 | ||||||
DDR | ||||||||
4.625%, 07/15/2022 | 425 | 461 | ||||||
3.375%, 05/15/2023 | 355 | 358 | ||||||
Duke Realty | ||||||||
4.375%, 06/15/2022 | 50 | 55 | ||||||
Education Realty Operating Partnership | ||||||||
4.600%, 12/01/2024 | 505 | 526 | ||||||
ERP Operating | ||||||||
5.750%, 06/15/2017 | 125 | 129 | ||||||
4.625%, 12/15/2021 | 64 | 72 | ||||||
HCP | ||||||||
4.250%, 11/15/2023 | 580 | 609 | ||||||
4.000%, 12/01/2022 | 450 | 476 | ||||||
3.400%, 02/01/2025 | 57 | 56 | ||||||
2.625%, 02/01/2020 | 28 | 28 | ||||||
Healthcare Realty Trust | ||||||||
3.875%, 05/01/2025 | 200 | 207 | ||||||
3.750%, 04/15/2023 | 400 | 410 | ||||||
Highwoods Realty | ||||||||
5.850%, 03/15/2017 | 750 | 763 | ||||||
Mid-America Apartments | ||||||||
4.300%, 10/15/2023 | 140 | 151 | ||||||
4.000%, 11/15/2025 | 160 | 170 | ||||||
3.750%, 06/15/2024 | 440 | 459 | ||||||
| SEI Institutional Managed Trust / Annual Report / September 30, 2016 | 149 |
SCHEDULE OF INVESTMENTS
September 30, 2016
U.S. Fixed Income Fund (Continued)
| ||||||||
| Description | Face Amount (Thousands) | Market Value ($ Thousands) | ||||||
| ||||||||
CORPORATE OBLIGATIONS (continued) |
| |||||||
Post Apartment Homes | ||||||||
4.750%, 10/15/2017 | $ | 700 | $ | 722 | ||||
Realty Income | ||||||||
3.250%, 10/15/2022 | 70 | 72 | ||||||
Simon Property Group | ||||||||
4.375%, 03/01/2021 | 38 | 42 | ||||||
2.150%, 09/15/2017 | 125 | 126 | ||||||
Tanger Properties | ||||||||
3.875%, 12/01/2023 | 175 | 185 | ||||||
3.750%, 12/01/2024 | 195 | 205 | ||||||
Ventas Realty | ||||||||
4.125%, 01/15/2026 | 29 | 31 | ||||||
Welltower | ||||||||
6.125%, 04/15/2020 | 525 | 595 | ||||||
4.500%, 01/15/2024
|
| 102
|
|
| 111
|
| ||
|
| |||||||
| 8,019 | ||||||||
|
| |||||||
Telecommunication Services — 1.4% |
| |||||||
America Movil | ||||||||
5.625%, 11/15/2017 | 400 | 419 | ||||||
AT&T | ||||||||
6.000%, 08/15/2040 | 925 | 1,108 | ||||||
5.800%, 02/15/2019 | 210 | 230 | ||||||
5.500%, 02/01/2018 | 100 | 105 | ||||||
5.150%, 03/15/2042 | 25 | 27 | ||||||
4.800%, 06/15/2044 | 240 | 252 | ||||||
4.750%, 05/15/2046 | 535 | 560 | ||||||
4.500%, 03/09/2048 (C) | 345 | 347 | ||||||
4.450%, 04/01/2024 | 1,055 | 1,160 | ||||||
4.350%, 06/15/2045 | 110 | 108 | ||||||
4.300%, 12/15/2042 | 200 | 197 | ||||||
3.950%, 01/15/2025 | 630 | 669 | ||||||
3.875%, 08/15/2021 | 70 | 76 | ||||||
3.800%, 03/15/2022 | 740 | 793 | ||||||
3.400%, 05/15/2025 | 2,099 | 2,157 | ||||||
3.000%, 06/30/2022 | 986 | 1,014 | ||||||
1.600%, 02/15/2017 | 45 | 45 | ||||||
Bharti Airtel | ||||||||
4.375%, 06/10/2025 (C) | 200 | 207 | ||||||
British Telecommunications | ||||||||
5.950%, 01/15/2018 | 200 | 212 | ||||||
CenturyLink | ||||||||
7.650%, 03/15/2042 | 15 | 13 | ||||||
Deutsche Telekom International Finance | ||||||||
2.250%, 03/06/2017 (C) | 770 | 773 | ||||||
Nippon Telegraph & Telephone | ||||||||
1.400%, 07/18/2017 | 65 | 65 | ||||||
Telefonica Emisiones | ||||||||
5.462%, 02/16/2021 | 23 | 26 | ||||||
5.134%, 04/27/2020 | 362 | 399 | ||||||
Verizon Communications | ||||||||
6.550%, 09/15/2043 | 272 | 368 | ||||||
| ||||||||
| Description | Face Amount (Thousands) | Market Value ($ Thousands) | ||||||
| ||||||||
CORPORATE OBLIGATIONS (continued) |
| |||||||
6.400%, 09/15/2033 | $ | 367 | $ | 476 | ||||
5.150%, 09/15/2023 | 900 | 1,048 | ||||||
5.050%, 03/15/2034 | 92 | 103 | ||||||
4.862%, 08/21/2046 | 752 | 842 | ||||||
4.522%, 09/15/2048 | 1,020 | 1,079 | ||||||
4.400%, 11/01/2034 | 1,382 | 1,462 | ||||||
4.272%, 01/15/2036 | 520 | 542 | ||||||
4.125%, 08/15/2046 | 380 | 380 | ||||||
3.850%, 11/01/2042 | 200 | 190 | ||||||
2.450%, 11/01/2022 | 90 | 91 | ||||||
Verizon Global Funding | ||||||||
5.850%, 09/15/2035 | 40 | 49 | ||||||
Vodafone Group PLC | ||||||||
2.950%, 02/19/2023
|
| 215
|
|
| 221
|
| ||
|
| |||||||
| 17,813 | ||||||||
|
| |||||||
Utilities — 2.4% |
| |||||||
AEP Texas Central | ||||||||
6.650%, 02/15/2033 | 500 | 642 | ||||||
AEP Texas Central Transition Funding II | ||||||||
5.170%, 01/01/2018 | 415 | 427 | ||||||
American Electric Power | ||||||||
1.650%, 12/15/2017 | 423 | 424 | ||||||
Arizona Public Service | ||||||||
2.550%, 09/15/2026 | 250 | 252 | ||||||
2.200%, 01/15/2020 | 20 | 20 | ||||||
Berkshire Hathaway Energy | ||||||||
4.500%, 02/01/2045 | 320 | 357 | ||||||
3.750%, 11/15/2023 | 156 | 170 | ||||||
Boston Gas | ||||||||
4.487%, 02/15/2042 (C) | 35 | 39 | ||||||
Carolina Power & Light | ||||||||
5.300%, 01/15/2019 | 175 | 191 | ||||||
3.000%, 09/15/2021 | 194 | 205 | ||||||
2.800%, 05/15/2022 | 25 | 26 | ||||||
Cleco Power | ||||||||
6.000%, 12/01/2040 | 700 | 879 | ||||||
Commonwealth Edison | ||||||||
3.700%, 03/01/2045 | 100 | 103 | ||||||
Consolidated Edison of New York | ||||||||
4.450%, 03/15/2044 | 690 | 791 | ||||||
3.850%, 06/15/2046 | 160 | 168 | ||||||
Dominion Resources | ||||||||
4.700%, 12/01/2044 | 125 | 138 | ||||||
4.104%, 04/01/2021 (D) | 400 | 428 | ||||||
2.962%, 07/01/2019 (D) | 175 | 180 | ||||||
2.850%, 08/15/2026 | 255 | 254 | ||||||
2.500%, 12/01/2019 | 385 | 394 | ||||||
2.000%, 08/15/2021 | 255 | 254 | ||||||
1.600%, 08/15/2019 | 345 | 344 | ||||||
DTE Energy | ||||||||
1.500%, 10/01/2019 | 395 | 395 | ||||||
| 150 | SEI Institutional Managed Trust / Annual Report / September 30, 2016 |
| ||||||||
| Description | Face Amount (Thousands) | Market Value ($ Thousands) | ||||||
| ||||||||
CORPORATE OBLIGATIONS (continued) |
| |||||||
Duke Energy | ||||||||
4.800%, 12/15/2045 | $ | 90 | $ | 102 | ||||
3.750%, 09/01/2046 | 215 | 208 | ||||||
3.550%, 09/15/2021 | 76 | 82 | ||||||
2.650%, 09/01/2026 | 490 | 481 | ||||||
1.800%, 09/01/2021 | 390 | 388 | ||||||
Duke Energy Carolinas | ||||||||
4.300%, 06/15/2020 | 39 | 43 | ||||||
4.250%, 12/15/2041 | 28 | 31 | ||||||
3.875%, 03/15/2046 | 180 | 190 | ||||||
2.500%, 03/15/2023 | 360 | 372 | ||||||
Duke Energy Florida | ||||||||
3.850%, 11/15/2042 | 215 | 224 | ||||||
3.400%, 10/01/2046 | 170 | 166 | ||||||
Duke Energy Indiana | ||||||||
4.200%, 03/15/2042 | 30 | 33 | ||||||
3.750%, 07/15/2020 | 52 | 56 | ||||||
Duke Energy Progress | ||||||||
4.100%, 05/15/2042 | 425 | 462 | ||||||
Duquesne Light Holdings | ||||||||
6.400%, 09/15/2020 (C) | 500 | 579 | ||||||
Electricite de France | ||||||||
6.000%, 01/22/2114 (C) | 80 | 87 | ||||||
5.250%, 10/13/2055 (C) | 285 | 296 | ||||||
Emera US Finance | ||||||||
2.700%, 06/15/2021 (C) | 1,102 | 1,128 | ||||||
Entergy | ||||||||
5.125%, 09/15/2020 | 400 | 444 | ||||||
4.700%, 01/15/2017 | 500 | 503 | ||||||
Exelon | ||||||||
3.950%, 06/15/2025 | 375 | 404 | ||||||
FirstEnergy | ||||||||
4.250%, 03/15/2023 | 340 | 361 | ||||||
2.750%, 03/15/2018 | 70 | 71 | ||||||
FirstEnergy, Ser C | ||||||||
7.375%, 11/15/2031 | 480 | 624 | ||||||
Fortis | ||||||||
3.055%, 10/04/2026 (C) | 605 | 602 | ||||||
2.100%, 10/04/2021 (C) | 300 | 299 | ||||||
Indiana Michigan Power | ||||||||
4.550%, 03/15/2046 | 505 | 568 | ||||||
Interstate Power & Light | ||||||||
3.700%, 09/15/2046 | 195 | 198 | ||||||
ITC Holdings | ||||||||
3.650%, 06/15/2024 | 633 | 666 | ||||||
Jersey Central Power & Light | ||||||||
7.350%, 02/01/2019 | 100 | 111 | ||||||
4.700%, 04/01/2024 (C) | 700 | 766 | ||||||
Kansas City Power & Light | ||||||||
5.300%, 10/01/2041 | 100 | 116 | ||||||
KeySpan Gas East | ||||||||
5.819%, 04/01/2041 (C) | 400 | 516 | ||||||
| ||||||||
| Description | Face Amount (Thousands) | Market Value ($ Thousands) | ||||||
| ||||||||
CORPORATE OBLIGATIONS (continued) |
| |||||||
2.742%, 08/15/2026 (C) | $ | 350 | $ | 354 | ||||
Metropolitan Edison | ||||||||
3.500%, 03/15/2023 (C) | 350 | 360 | ||||||
MidAmerican Energy | ||||||||
4.250%, 05/01/2046 | 440 | 502 | ||||||
3.500%, 10/15/2024 | 240 | 262 | ||||||
MidAmerican Energy Holdings | ||||||||
6.500%, 09/15/2037 | 850 | 1,169 | ||||||
NextEra Energy Capital Holdings | ||||||||
2.300%, 04/01/2019 | 500 | 508 | ||||||
NiSource Finance | ||||||||
5.800%, 02/01/2042 | 149 | 186 | ||||||
Oncor Electric Delivery LLC | ||||||||
6.800%, 09/01/2018 | 460 | 506 | ||||||
5.250%, 09/30/2040 | 250 | 316 | ||||||
Pacific Gas & Electric | ||||||||
8.250%, 10/15/2018 | 180 | 204 | ||||||
6.050%, 03/01/2034 | 230 | 307 | ||||||
5.800%, 03/01/2037 | 70 | 92 | ||||||
5.625%, 11/30/2017 | 525 | 551 | ||||||
5.400%, 01/15/2040 | 42 | 53 | ||||||
4.500%, 12/15/2041 | 48 | 55 | ||||||
3.250%, 09/15/2021 | 12 | 13 | ||||||
2.950%, 03/01/2026 | 305 | 318 | ||||||
PECO Energy | ||||||||
4.150%, 10/01/2044 | 385 | 425 | ||||||
3.150%, 10/15/2025 | 410 | 436 | ||||||
PPL Capital Funding | ||||||||
3.100%, 05/15/2026 | 690 | 701 | ||||||
PPL Electric Utilities | ||||||||
4.150%, 10/01/2045 | 300 | 333 | ||||||
Progress Energy | ||||||||
3.150%, 04/01/2022 | 280 | 293 | ||||||
Public Service of New Hampshire | ||||||||
3.500%, 11/01/2023 | 205 | 219 | ||||||
Puget Energy | ||||||||
6.000%, 09/01/2021 | 470 | 543 | ||||||
Sierra Pacific Power | ||||||||
2.600%, 05/01/2026 (C) | 385 | 390 | ||||||
Southern | ||||||||
4.400%, 07/01/2046 | 350 | 378 | ||||||
2.150%, 09/01/2019 | 375 | 380 | ||||||
Southern California Edison | ||||||||
4.050%, 03/15/2042 | 5 | 5 | ||||||
3.500%, 10/01/2023 | 205 | 223 | ||||||
Southern California Gas | ||||||||
2.600%, 06/15/2026 | 500 | 511 | ||||||
Southern Gas Capital | ||||||||
2.450%, 10/01/2023 | 165 | 166 | ||||||
Southwestern Electric Power | ||||||||
3.900%, 04/01/2045 | 255 | 255 | ||||||
| SEI Institutional Managed Trust / Annual Report / September 30, 2016 | 151 |
SCHEDULE OF INVESTMENTS
September 30, 2016
U.S. Fixed Income Fund (Continued)
| ||||||||
| Description | Face Amount (Thousands) | Market Value ($ Thousands) | ||||||
| ||||||||
CORPORATE OBLIGATIONS (continued) |
| |||||||
Texas-New Mexico Power | ||||||||
9.500%, 04/01/2019 (C) | $ | 1,100 | $ | 1,280 | ||||
Virginia Electric & Power | ||||||||
4.650%, 08/15/2043 | 245 | 287 | ||||||
3.150%, 01/15/2026 | 275 | 291 | ||||||
2.950%, 01/15/2022
|
| 330
|
|
| 346
|
| ||
|
| |||||||
| 31,476 | ||||||||
|
| |||||||
Total Corporate Obligations | 343,841 | |||||||
|
| |||||||
ASSET-BACKED SECURITIES — 9.6% |
| |||||||
Automotive — 2.7% |
| |||||||
Ally Auto Receivables Trust, Ser 2014-1, Cl A4 | ||||||||
1.530%, 04/15/2019 | 297 | 299 | ||||||
Ally Auto Receivables Trust, Ser 2015-1, Cl A3 | ||||||||
1.390%, 09/16/2019 | 400 | 401 | ||||||
Ally Auto Receivables Trust, Ser 2016-1, Cl A2A | ||||||||
1.200%, 08/15/2018 | 205 | 205 | ||||||
Ally Auto Receivables Trust, Ser 2016-3, Cl A2 | ||||||||
1.200%, 12/17/2018 | 585 | 585 | ||||||
Ally Master Owner Trust, Ser 2012-5, Cl A | ||||||||
1.540%, 09/15/2019 | 747 | 750 | ||||||
Ally Master Owner Trust, Ser 2014-3, Cl A | ||||||||
1.330%, 03/15/2019 | 175 | 175 | ||||||
Ally Master Owner Trust, Ser 2014-4, Cl A2 | ||||||||
1.430%, 06/17/2019 | 800 | 800 | ||||||
AmeriCredit Automobile Receivables Trust, Ser 2013-5, Cl A3 | ||||||||
0.900%, 09/10/2018 | 18 | 18 | ||||||
AmeriCredit Automobile Receivables Trust, Ser 2016-3, Cl A2A | ||||||||
1.370%, 11/08/2019 | 288 | 288 | ||||||
Avis Budget Rental Car Funding AESOP, Ser 2012-3A, Cl A | ||||||||
2.100%, 03/20/2019 (C) | 336 | 336 | ||||||
Avis Budget Rental Car Funding AESOP, Ser 2013-2A, Cl A | ||||||||
2.970%, 02/20/2020 (C) | 190 | 194 | ||||||
Avis Budget Rental Car Funding AESOP, Ser 2014-1A, Cl A | ||||||||
2.460%, 07/20/2020 (C) | 246 | 249 | ||||||
Avis Budget Rental Car Funding AESOP, Ser 2014-2A, Cl A | ||||||||
2.500%, 02/20/2021 (C) | 513 | 518 | ||||||
Avis Budget Rental Car Funding AESOP, Ser 2016-2A, Cl A | ||||||||
2.720%, 11/20/2022 (C) | 712 | 719 | ||||||
Bank of The West Auto Trust, Ser 2014-1, Cl A3 | ||||||||
1.090%, 03/15/2019 (C) | 144 | 144 | ||||||
| ||||||||
| Description | Face Amount (Thousands) | Market Value ($ Thousands) | ||||||
| ||||||||
ASSET-BACKED SECURITIES (continued) |
| |||||||
California Republic Auto Receivables Trust, Ser 2014-2, Cl A4 | ||||||||
1.570%, 12/16/2019 | $ | 148 | $ | 148 | ||||
California Republic Auto Receivables Trust, Ser 2015-1, Cl A4 | ||||||||
1.820%, 09/15/2020 | 284 | 285 | ||||||
California Republic Auto Receivables Trust, Ser 2015-2, Cl A3 | ||||||||
1.310%, 08/15/2019 | 325 | 325 | ||||||
California Republic Auto Receivables Trust, Ser 2015-4, Cl A4 | ||||||||
2.580%, 06/15/2021 (C) | 316 | 323 | ||||||
California Republic Auto Receivables Trust, Ser 2015-4, Cl A2 | ||||||||
1.600%, 09/17/2018 (C) | 149 | 150 | ||||||
California Republic Auto Receivables Trust, Ser 2016-1, Cl A3 | ||||||||
1.890%, 05/15/2020 | 544 | 549 | ||||||
California Republic Auto Receivables Trust, Ser 2016-1, Cl A4 | ||||||||
2.240%, 10/15/2021 | 303 | 307 | ||||||
California Republic Auto Receivables Trust, Ser 2016-2, Cl A4 | ||||||||
1.830%, 12/15/2021 | 507 | 509 | ||||||
California Republic Auto Receivables Trust, Ser 2016-2, Cl A2 | ||||||||
1.340%, 03/15/2019 | 289 | 289 | ||||||
Capital Auto Receivables Asset Trust, Ser 2013-2, Cl A4 | ||||||||
1.560%, 07/20/2018 | 31 | 31 | ||||||
Capital Auto Receivables Asset Trust, Ser 2013-3, Cl A4 | ||||||||
1.680%, 04/20/2018 | 82 | 82 | ||||||
Capital Auto Receivables Asset Trust, Ser 2013-4, Cl A4 | ||||||||
1.470%, 07/20/2018 | 358 | 358 | ||||||
Capital Auto Receivables Asset Trust, Ser 2014-1, Cl A4 | ||||||||
1.690%, 10/22/2018 | 343 | 343 | ||||||
Capital Auto Receivables Asset Trust, Ser 2015-1, Cl A3 | ||||||||
1.610%, 06/20/2019 | 432 | 433 | ||||||
Capital Auto Receivables Asset Trust, Ser 2015-2, Cl A3 | ||||||||
1.730%, 09/20/2019 | 343 | 344 | ||||||
Capital Auto Receivables Asset Trust, Ser 2015-2, Cl A2 | ||||||||
1.390%, 09/20/2018 | 237 | 237 | ||||||
Capital Auto Receivables Asset Trust, Ser 2015-2, Cl A4 | ||||||||
1.970%, 01/21/2020 | 509 | 510 | ||||||
| 152 | SEI Institutional Managed Trust / Annual Report / September 30, 2016 |
| ||||||||
| Description | Face Amount (Thousands) | Market Value ($ Thousands) | ||||||
| ||||||||
ASSET-BACKED SECURITIES (continued) |
| |||||||
Capital Auto Receivables Asset Trust, Ser 2015-3, Cl A3 | ||||||||
1.940%, 01/21/2020 | $ | 383 | $ | 385 �� | ||||
Capital Auto Receivables Asset Trust, Ser 2015-3, Cl A1A | ||||||||
1.390%, 02/20/2018 (C) | 799 | 799 | ||||||
Capital Auto Receivables Asset Trust, Ser 2015-4, Cl A3 | ||||||||
1.830%, 03/20/2020 | 558 | 559 | ||||||
Capital Auto Receivables Asset Trust, Ser 2015-4, Cl A4 | ||||||||
2.010%, 07/20/2020 | 201 | 201 | ||||||
Capital Auto Receivables Asset Trust, Ser 2015-4, Cl A2 | ||||||||
1.620%, 03/20/2019 | 244 | 244 | ||||||
Capital Auto Receivables Asset Trust, Ser 2016-1, Cl A4 | ||||||||
1.980%, 10/20/2020 | 260 | 261 | ||||||
Capital Auto Receivables Asset Trust, Ser 2016-1, Cl A2A | ||||||||
1.500%, 11/20/2018 | 689 | 689 | ||||||
Capital Auto Receivables Asset Trust, Ser 2016-1, Cl A3 | ||||||||
1.730%, 04/20/2020 | 575 | 574 | ||||||
Capital Auto Receivables Asset Trust, Ser 2016-2, Cl A2A | ||||||||
1.320%, 01/20/2019 | 179 | 179 | ||||||
Capital Auto Receivables Asset Trust, Ser 2016-2, Cl A3 | ||||||||
1.460%, 06/20/2020 | 430 | 429 | ||||||
Capital Auto Receivables Asset Trust, Ser 2016-3, Cl A4 | ||||||||
1.690%, 03/22/2021 | 218 | 219 | ||||||
Capital Auto Receivables Asset Trust, Ser 2016-3, Cl A2A | ||||||||
1.360%, 04/22/2019 | 302 | 302 | ||||||
Capital Auto Receivables Asset Trust, Ser 2016-3, Cl A3 | ||||||||
1.540%, 08/20/2020 | 260 | 260 | ||||||
CarFinance Capital Auto Trust, Ser 2014-1A, Cl A | ||||||||
1.460%, 12/17/2018 (C) | 7 | 7 | ||||||
CarFinance Capital Auto Trust, Ser 2015-1A, Cl A | ||||||||
1.750%, 06/15/2021 (C) | 44 | 44 | ||||||
Chrysler Capital Auto Receivables Trust, Ser 2016-AA, Cl A3 | ||||||||
1.770%, 10/15/2020 (C) | 882 | 885 | ||||||
Flagship Credit Auto Trust, Ser 2016-3, Cl A2 | ||||||||
2.050%, 11/15/2020 (C) | 295 | 296 | ||||||
Ford Credit Auto Lease Trust, Ser 2014-B, Cl A4 | ||||||||
1.100%, 11/15/2017 | 20 | 20 | ||||||
| ||||||||
| Description | Face Amount (Thousands) | Market Value ($ Thousands) | ||||||
| ||||||||
ASSET-BACKED SECURITIES (continued) |
| |||||||
Ford Credit Auto Owner Trust, Ser 2014-1, Cl A | ||||||||
2.260%, 11/15/2025 (C) | $ | 1,430 | $ | 1,458 | ||||
Ford Credit Auto Owner Trust, Ser 2015-1, Cl A | ||||||||
2.120%, 07/15/2026 (C) | 675 | 686 | ||||||
Ford Credit Auto Owner Trust, Ser 2015-2, Cl A | ||||||||
2.440%, 01/15/2027 (C) | 798 | 821 | ||||||
Ford Credit Auto Owner Trust, Ser 2016-1, Cl A | ||||||||
2.310%, 08/15/2027 (C) | 1,286 | 1,318 | ||||||
Ford Credit Auto Owner Trust, Ser 2016-2, Cl A | ||||||||
2.030%, 12/15/2027 (C) | 1,114 | 1,122 | ||||||
Ford Credit Floorplan Master Owner Trust, Ser 2012-2, Cl A | ||||||||
1.920%, 01/15/2019 | 421 | 422 | ||||||
Ford Credit Floorplan Master Owner Trust, Ser 2014-4, Cl A1 | ||||||||
1.400%, 08/15/2019 | 640 | 642 | ||||||
Hertz Vehicle Financing II, Ser 2015-1A, Cl A | ||||||||
2.730%, 03/25/2021 (C) | 269 | 273 | ||||||
Hertz Vehicle Financing, Ser 2013-1A, Cl A2 | ||||||||
1.830%, 08/25/2019 (C) | 869 | 866 | ||||||
Hertz Vehicle Financing, Ser 2016-3A, Cl A | ||||||||
2.270%, 07/25/2020 (C) | 573 | 574 | ||||||
Hertz Vehicle Financing, Ser 2016-4A, Cl A | ||||||||
2.650%, 07/15/2022 (C) | 518 | 522 | ||||||
Honda Auto Receivables Owner Trust, Ser 2014-3, Cl A3 | ||||||||
0.880%, 06/15/2018 | 324 | 324 | ||||||
Honda Auto Receivables Owner Trust, Ser 2015-4, Cl A2 | ||||||||
0.820%, 07/23/2018 | 438 | 438 | ||||||
Honda Auto Receivables Owner Trust, Ser 2016-1, Cl A2 | ||||||||
1.010%, 06/18/2018 | 70 | 70 | ||||||
Honda Auto Receivables Owner Trust, Ser 2016-2, Cl A2 | ||||||||
1.130%, 09/17/2018 | 640 | 640 | ||||||
Honda Auto Receivables Owner Trust, Ser 2016-3, Cl A3 | ||||||||
1.160%, 05/18/2020 | 1,647 | 1,646 | ||||||
Honda Auto Receivables Owner Trust, Ser 2016-3, Cl A4 | ||||||||
1.330%, 11/18/2022 | 1,356 | 1,354 | ||||||
Mercedes-Benz Auto Receivables Trust, Ser 2016-1, Cl A3 | ||||||||
1.260%, 02/16/2021 | 530 | 530 | ||||||
Nissan Auto Receivables Owner Trust, Ser 2015-C, Cl A2A | ||||||||
0.870%, 11/15/2018 | 432 | 431 | ||||||
Nissan Auto Receivables Owner Trust, Ser 2016-C, Cl A3 | ||||||||
1.180%, 01/15/2021 | 450 | 449 | ||||||
| SEI Institutional Managed Trust / Annual Report / September 30, 2016 | 153 |
SCHEDULE OF INVESTMENTS
September 30, 2016
U.S. Fixed Income Fund (Continued)
| Description | Face Amount (Thousands) | Market Value ($ Thousands) | ||||||
ASSET-BACKED SECURITIES (continued) |
| |||||||
Nissan Auto Receivables Owner Trust, Ser 2016-C, Cl A2A | ||||||||
1.070%, 05/15/2019 | $ | 950 | $ | 950 | ||||
Santander Drive Auto Receivables Trust, Ser 2016-2, Cl A2A | ||||||||
1.380%, 07/15/2019 | 739 | 740 | ||||||
TCF Auto Receivables Owner Trust, Ser 2016-1A, Cl A3 | ||||||||
1.710%, 04/15/2021 (C) | 201 | 201 | ||||||
TCF Auto Receivables Owner Trust, Ser 2016-1A, Cl A2 | ||||||||
1.390%, 11/15/2019 (C) | 503 | 503 | ||||||
TCF Auto Receivables Owner Trust, Ser 2016-1A, Cl A4 | ||||||||
2.030%, 02/15/2022 (C) | 150 | 150 | ||||||
Toyota Auto Receivables, Ser 2016-C, Cl A2A | ||||||||
1.000%, 01/15/2019 | 418 | 417 | ||||||
Toyota Auto Receivables, Ser 2016-C, Cl A3 | ||||||||
1.140%, 08/17/2020 | 558 | 557 | ||||||
World Omni Auto Receivables Trust, Ser 2016-B, Cl A3 | ||||||||
1.570%, 02/15/2022
|
| 497
|
|
| 497
|
| ||
|
| |||||||
| 35,858 | ||||||||
|
| |||||||
Credit Cards — 1.1% | ||||||||
American Express Credit Account Master Trust, Ser 2014-2, Cl A | ||||||||
1.260%, 01/15/2020 | 411 | 412 | ||||||
BA Credit Card Trust, Ser 2007-A1, Cl A1 | ||||||||
5.170%, 06/15/2019 | 195 | 197 | ||||||
BA Credit Card Trust, Ser 2014-A3, Cl A | ||||||||
0.798%, 01/15/2020 (B) | 585 | 586 | ||||||
BA Credit Card Trust, Ser 2015-A1, Cl A | ||||||||
0.854%, 06/15/2020 (B) | 295 | 296 | ||||||
Capital One Multi-Asset Execution Trust, Ser 2007-A7, Cl A7 | ||||||||
5.750%, 07/15/2020 | 265 | 277 | ||||||
Capital One Multi-Asset Execution Trust, Ser 2014-A2, Cl A2 | ||||||||
1.260%, 01/15/2020 | 705 | 706 | ||||||
Capital One Multi-Asset Execution Trust, Ser 2014-A5, Cl A5 | ||||||||
1.480%, 07/15/2020 | 1,460 | 1,466 | ||||||
Capital One Multi-Asset Execution Trust, Ser 2015-A1, Cl A1 | ||||||||
1.390%, 01/15/2021 | 52 | 52 | ||||||
Capital One Multi-Asset Execution Trust, Ser 2016-A2, Cl A2 | ||||||||
1.154%, 02/15/2024 (B) | 445 | 448 | ||||||
Capital One Multi-Asset Execution Trust, Ser 2016-A5, Cl A5 | ||||||||
1.660%, 06/17/2024 | 707 | 706 | ||||||
| Description | Face Amount (Thousands) | Market Value ($ Thousands) | ||||||
ASSET-BACKED SECURITIES (continued) |
| |||||||
Chase Issuance Trust, Ser 2012-A2, Cl A2 | ||||||||
0.794%, 05/15/2019 (B) | $ | 570 | $ | 571 | ||||
Chase Issuance Trust, Ser 2013-A8, Cl A8 | ||||||||
1.010%, 10/15/2018 | 745 | 745 | ||||||
Chase Issuance Trust, Ser 2014-A1, Cl A1 | ||||||||
1.150%, 01/15/2019 | 875 | 875 | ||||||
Chase Issuance Trust, Ser 2014-A6, Cl A6 | ||||||||
1.260%, 07/15/2019 | 295 | 295 | ||||||
Citibank Credit Card Issuance Trust, Ser 2013-A2, Cl A2 | ||||||||
0.805%, 05/26/2020 (B) | 641 | 642 | ||||||
Citibank Credit Card Issuance Trust, Ser 2014-A2, Cl A2 | ||||||||
1.020%, 02/22/2019 | 635 | 635 | ||||||
Citibank Credit Card Issuance Trust, Ser 2014-A4, Cl A4 | ||||||||
1.230%, 04/24/2019 | 195 | 195 | ||||||
Citibank Credit Card Issuance Trust, Ser 2014-A8, Cl A8 | ||||||||
1.730%, 04/09/2020 | 228 | 230 | ||||||
Discover Card Execution Note Trust, Ser 2016-A2, Cl A2 | ||||||||
1.048%, 09/15/2021 (B) | 210 | 212 | ||||||
Discover Card Execution Note Trust, Ser 2016-A4, Cl A4 | ||||||||
1.390%, 03/15/2022 | 1,491 | 1,491 | ||||||
Synchrony Credit Card Master Note Trust, Ser 2016-2, Cl A | ||||||||
2.210%, 05/15/2024 | 1,013 | 1,035 | ||||||
Synchrony Credit Card Master Note Trust, Ser 2016-3, Cl A | ||||||||
1.580%, 09/15/2022 | 908 | 910 | ||||||
World Financial Network Credit Card Master Trust, Ser 2014-C, Cl A | ||||||||
1.540%, 08/16/2021 | 87 | 87 | ||||||
World Financial Network Credit Card Master Trust, Ser 2016-A, Cl A | ||||||||
2.030%, 04/15/2025 | 137 | 138 | ||||||
World Financial Network Credit Card Master Trust, Ser 2016-B, Cl A | ||||||||
1.440%, 06/15/2022
|
| 606
|
|
| 606
|
| ||
|
| |||||||
| 13,813 | ||||||||
|
| |||||||
Mortgage Related Securities — 0.7% | ||||||||
ACE Securities Home Equity Loan Trust, Ser 2006-NC1, Cl A1 | ||||||||
0.745%, 12/25/2035 (B) | 1,791 | 1,655 | ||||||
Aegis Asset-Backed Securities Trust, Ser 2003-3, Cl M1 | ||||||||
1.574%, 01/25/2034 (B) | 505 | 460 | ||||||
Aegis Asset-Backed Securities Trust, Ser 2004-5, Cl M1 | ||||||||
1.499%, 12/25/2034 (B) | 103 | 103 | ||||||
| 154 | SEI Institutional Managed Trust / Annual Report / September 30, 2016 |
| Description | Face Amount (Thousands) | Market Value ($ Thousands) | ||||||
ASSET-BACKED SECURITIES (continued) |
| |||||||
Aegis Asset-Backed Securities Trust, Ser 2005-5, Cl 2A | ||||||||
0.775%, 12/25/2035 (B) | $ | 1,822 | $ | 1,790 | ||||
Ameriquest Mortgage Security Asset-Backed Pass-Through Certificates, Ser 2003-9, Cl AV1 | ||||||||
1.284%, 09/25/2033 (B) | 149 | 138 | ||||||
Argent Securities, Ser 2003-W5, Cl M1 | ||||||||
1.574%, 10/25/2033 (B) | 354 | 333 | ||||||
Bear Stearns Asset-Backed Securities Trust, Ser 2004-HE10, Cl M1 | ||||||||
1.499%, 12/25/2034 (B) | 429 | 409 | ||||||
Bear Stearns Asset-Backed Securities Trust, Ser 2005-SD1, Cl 1A3 | ||||||||
0.924%, 08/25/2043 (B) | 191 | 189 | ||||||
Citifinancial Mortgage Securities, Ser 2004-1, Cl AF4 | ||||||||
5.070%, 04/25/2034 (D) | 370 | 383 | ||||||
Citigroup Global Markets Mortgage Securities VII, Ser 2003-UP1, Cl A | ||||||||
3.950%, 04/25/2032 (C)(D) | 22 | 22 | ||||||
HSBC Home Equity Loan Trust, Ser 2007-1, Cl M2 | ||||||||
0.992%, 03/20/2036 (B) | 2,000 | 1,916 | ||||||
HSBC Home Equity Loan Trust, Ser 2007-1, Cl AS | ||||||||
0.712%, 03/20/2036 (B) | 19 | 19 | ||||||
HSBC Home Equity Loan Trust, Ser 2007-3, Cl APT | ||||||||
1.712%, 11/20/2036 (B) | 198 | 197 | ||||||
Morgan Stanley Capital I Trust, Ser 2005-HE5, Cl M1 | ||||||||
1.154%, 09/25/2035 (B) | 189 | 189 | ||||||
Morgan Stanley Capital I Trust, Ser 2005-HE6, Cl A2C | ||||||||
0.844%, 11/25/2035 (B) | 110 | 110 | ||||||
New Century Home Equity Loan Trust, Ser 2003-A, Cl A | ||||||||
1.244%, 10/25/2033 (B)(C) | 147 | 136 | ||||||
New Century Home Equity Loan Trust, Ser 2005-3, Cl M1 | ||||||||
1.004%, 07/25/2035 (B) | 39 | 39 | ||||||
Nomura Home Equity Loan Home Equity Loan Trust, Ser 2006-HE1, Cl A4 | ||||||||
0.814%, 02/25/2036 (B) | 552 | 551 | ||||||
NovaStar Mortgage Funding Trust, Ser 2004-4, Cl M4 | ||||||||
2.175%, 03/25/2035 (B) | 356 | 353 | ||||||
Saxon Asset Securities Trust, Ser 2003-1, Cl AF6 | ||||||||
4.795%, 06/25/2033 (D) | 18 | 19 | ||||||
|
| |||||||
| 9,011 | ||||||||
|
| |||||||
| Description | Face Amount (Thousands) | Market Value ($ Thousands) | ||||||
ASSET-BACKED SECURITIES (continued) |
| |||||||
Other Asset-Backed Securities — 5.1% |
| |||||||
Academic Loan Funding Trust, Ser 2012-1A, Cl A1 | ||||||||
1.324%, 12/27/2022 (B)(C) | $ | 47 | $ | 47 | ||||
Academic Loan Funding Trust, Ser 2013-1A, Cl A | ||||||||
1.324%, 12/26/2044 (B)(C) | 147 | 145 | ||||||
Airspeed, Ser 2007-1A, Cl G2 | ||||||||
0.770%, 06/15/2032 (B)(C) | 384 | 313 | ||||||
Ballyrock CLO, Ser 2014-1A, Cl A1 | ||||||||
2.114%, 10/20/2026 (B)(C) | 150 | 150 | ||||||
Brazos Higher Education Authority, Ser 2010-1, Cl A2 | ||||||||
2.025%, 02/25/2035 (B) | 850 | 829 | ||||||
Brazos Higher Education Authority, Ser 2011-2, Cl A3 | ||||||||
1.638%, 10/27/2036 (B) | 400 | 381 | ||||||
Business Loan Express Business Loan Trust, Ser 2004-A, Cl A | ||||||||
0.955%, 02/25/2031 (B)(C) | 134 | 127 | ||||||
Carlyle Global Market Strategies Commodities Funding, Ser 2014-1A, Cl A | ||||||||
2.528%, 10/15/2021 (B)(C) | 122 | 110 | ||||||
Cent 18, Ser 2013-18A, Cl A | ||||||||
1.835%, 07/23/2025 (B)(C) | 500 | 497 | ||||||
Chase Funding Mortgage Loan Asset-Backed Certificates, Ser 2003-6, Cl 1A5 | ||||||||
5.164%, 11/25/2034 (D) | 88 | 92 | ||||||
CIT Education Loan Trust, Ser 2007-1, Cl A | ||||||||
0.730%, 03/25/2042 (B)(C) | 515 | 479 | ||||||
Consumer Credit Origination Loan Trust, Ser 2015-1, Cl A | ||||||||
2.820%, 03/15/2021 (C) | 41 | 41 | ||||||
Countrywide Asset-Backed Certificates, Ser 2004-5, Cl 1A | ||||||||
1.024%, 10/25/2034 (B) | 614 | 576 | ||||||
Countrywide Asset-Backed Certificates, Ser 2004-6, Cl 1A1 | ||||||||
1.065%, 12/25/2034 (B) | 499 | 473 | ||||||
Countrywide Asset-Backed Certificates, Ser 2007-4, Cl A4W | ||||||||
5.231%, 04/25/2047 | 482 | 467 | ||||||
Countrywide Home Equity Loan Trust, Ser 2006-F, Cl 2A1A | ||||||||
0.664%, 07/15/2036 (B) | 879 | 784 | ||||||
CWHEQ Revolving Home Equity Loan Trust, Ser 2005-D, Cl 2A | ||||||||
0.714%, 11/15/2035 (B) | 389 | 341 | ||||||
DRB Prime Student Loan Trust, Ser 2015-B, Cl A2 | ||||||||
3.170%, 07/25/2031 (C) | 283 | 290 | ||||||
| SEI Institutional Managed Trust / Annual Report / September 30, 2016 | 155 |
SCHEDULE OF INVESTMENTS
September 30, 2016
U.S. Fixed Income Fund (Continued)
| Description | Face Amount (Thousands) | Market Value ($ Thousands) | ||||||
ASSET-BACKED SECURITIES (continued) |
| |||||||
Educational Funding of the South, Ser 2011-1, Cl A2 | ||||||||
1.288%, 04/25/2035 (B) | $ | 322 | $ | 318 | ||||
First Franklin Mortgage Loan Asset-Backed Certificates, Ser 2004-FF5, Cl A3C | ||||||||
1.524%, 08/25/2034 (B) | 890 | 841 | ||||||
First Franklin Mortgage Loan Asset-Backed Certificates, Ser 2005-FF4, Cl M1 | ||||||||
1.169%, 05/25/2035 (B) | 25 | 25 | ||||||
Flatiron CLO, Ser 2014-1A, Cl A1 | ||||||||
2.059%, 07/17/2026 (B)(C) | 500 | 500 | ||||||
Ford Credit Floorplan Master Owner Trust, Ser 2014-1, Cl A1 | ||||||||
1.200%, 02/15/2019 | 170 | 170 | ||||||
Ford Credit Floorplan Master Owner Trust, Ser 2015-2, Cl A2 | ||||||||
1.078%, 01/15/2022 (B) | 274 | 274 | ||||||
Global SC Finance, Ser 2014-1A, Cl A2 | ||||||||
3.090%, 07/17/2029 (C) | 329 | 309 | ||||||
GSAMP Trust, Ser 2005-HE4, Cl M1 | ||||||||
0.975%, 07/25/2045 (B) | 95 | 95 | ||||||
Higher Education Funding, Ser 2014-1, Cl A | ||||||||
1.712%, 05/25/2034 (B)(C) | 455 | 437 | ||||||
JGWPT XXX LLC, Ser 2013-3A, Cl A | ||||||||
4.080%, 01/17/2073 (C) | 276 | 295 | ||||||
JGWPT XXXI LLC, Ser 2014-1A, Cl A | ||||||||
3.960%, 03/15/2063 (C) | 261 | 276 | ||||||
JGWPT XXXII, Ser 2014-2A, Cl A | ||||||||
3.610%, 01/17/2073 (C) | 373 | 372 | ||||||
JGWPT XXXIII, Ser 2014-3A, Cl A | ||||||||
3.500%, 06/15/2077 (C) | 183 | 180 | ||||||
JPMorgan Chase Acquisition, Ser 2005-OPT1, Cl M1 | ||||||||
0.974%, 06/25/2035 (B) | 442 | 441 | ||||||
Lehman Manufactured Housing Contract Trust, Ser 2001-B, Cl A4 | ||||||||
5.270%, 04/15/2040 | 168 | 173 | ||||||
Magnetite XII, Ser 2015-12A, Cl A | ||||||||
2.128%, 04/15/2027 (B)(C) | 200 | 200 | ||||||
Mid-State Trust, Ser 2003-11, Cl A1 | ||||||||
4.864%, 07/15/2038 | 731 | 778 | ||||||
Navient Private Education Loan Trust, Ser 2014-AA, Cl A2B | ||||||||
1.758%, 02/15/2029 (B)(C) | 388 | 389 | ||||||
Navient Private Education Loan Trust, Ser 2014-CTA, Cl A | ||||||||
1.208%, 09/16/2024 (B)(C) | 476 | 475 | ||||||
Navient Private Education Loan Trust, Ser 2015-AA, Cl A2A | ||||||||
2.650%, 12/15/2028 (C) | 178 | 182 | ||||||
Navient Private Education Loan Trust, Ser 2015-AA, Cl A2B | ||||||||
1.708%, 12/15/2028 (B)(C) | 128 | 129 | ||||||
| Description | Face Amount (Thousands) | Market Value ($ Thousands) | ||||||
ASSET-BACKED SECURITIES (continued) |
| |||||||
Navient Private Education Loan Trust, Ser 2015-CA, Cl B | ||||||||
3.250%, 05/15/2040 (C) | $ | 239 | $ | 234 | ||||
Navient Private Education Loan Trust, Ser 2016-AA, Cl A2A | ||||||||
3.910%, 12/15/2045 (C) | 809 | 848 | ||||||
Navient Student Loan Trust, Ser 2014-1, Cl A3 | ||||||||
1.034%, 06/25/2031 (B) | 1,005 | 971 | ||||||
Navient Student Loan Trust, Ser 2014-2, Cl A | ||||||||
1.164%, 03/25/2083 (B) | 835 | 807 | ||||||
Navient Student Loan Trust, Ser 2014-3, Cl A | ||||||||
1.144%, 03/25/2083 (B) | 842 | 813 | ||||||
Navient Student Loan Trust, Ser 2014-4, Cl A | ||||||||
1.144%, 03/25/2083 (B) | 478 | 457 | ||||||
Navient Student Loan Trust, Ser 2014-8, Cl A2 | ||||||||
0.964%, 04/25/2023 (B) | 274 | 273 | ||||||
Navient Student Loan Trust, Ser 2014-8, Cl B | ||||||||
2.024%, 07/26/2049 (B) | 54 | 48 | ||||||
Navient Student Loan Trust, Ser 2016-2, Cl A3 | ||||||||
2.024%, 06/25/2065 (B)(C) | 870 | 895 | ||||||
Nelnet Student Loan Trust, Ser 2004-3, Cl A5 | ||||||||
0.818%, 10/27/2036 (B) | 412 | 398 | ||||||
Nelnet Student Loan Trust, Ser 2004-4, Cl A5 | ||||||||
0.798%, 01/25/2037 (B) | 337 | 325 | ||||||
Nelnet Student Loan Trust, Ser 2005-1, Cl A5 | ||||||||
0.748%, 10/25/2033 (B) | 476 | 453 | ||||||
Nelnet Student Loan Trust, Ser 2005-2, Cl A5 | ||||||||
0.747%, 03/23/2037 (B) | 393 | 370 | ||||||
Nelnet Student Loan Trust, Ser 2005-3, Cl A5 | ||||||||
0.767%, 12/24/2035 (B) | 1,573 | 1,484 | ||||||
Nelnet Student Loan Trust, Ser 2005-4, Cl A4 | ||||||||
0.827%, 03/22/2032 (B) | 161 | 149 | ||||||
Nelnet Student Loan Trust, Ser 2007-2A, Cl A3L | ||||||||
0.990%, 03/25/2026 (B)(C) | 124 | 120 | ||||||
Nelnet Student Loan Trust, Ser 2008-3, Cl A4 | ||||||||
2.312%, 11/25/2024 (B) | 630 | 628 | ||||||
Nelnet Student Loan Trust, Ser 2010-4A, Cl A | ||||||||
1.325%, 04/25/2046 (B)(C) | 107 | 106 | ||||||
Nelnet Student Loan Trust, Ser 2011-1A, Cl A | ||||||||
1.375%, 02/25/2043 (B)(C) | 632 | 633 | ||||||
Nelnet Student Loan Trust, Ser 2013-5A, Cl A | ||||||||
1.155%, 01/25/2037 (B)(C) | 570 | 558 | ||||||
Nelnet Student Loan Trust, Ser 2014-2A, Cl A3 | ||||||||
1.375%, 07/27/2037 (B)(C) | 950 | 883 | ||||||
Nelnet Student Loan Trust, Ser 2014-4A, Cl A2 | ||||||||
1.475%, 11/25/2043 (B)(C) | 500 | 462 | ||||||
Nelnet Student Loan Trust, Ser 2015-2A, Cl A2 | ||||||||
1.125%, 09/25/2042 (B)(C) | 920 | 899 | ||||||
North Carolina State Education Assistance Authority, Ser 2011-2, Cl A2 | ||||||||
1.438%, 07/25/2025 (B) | 348 | 346 | ||||||
| 156 | SEI Institutional Managed Trust / Annual Report / September 30, 2016 |
| ||||||||
| Description |
Face Amount |
Market Value | ||||||
| ||||||||
ASSET-BACKED SECURITIES (continued) |
| |||||||
OneMain Financial Issuance Trust, Ser 2016-2A, Cl A | ||||||||
4.100%, 03/20/2028 (C) | $ | 290 | $ | 298 | ||||
Ownit Mortgage Loan Trust, Ser 2005-3, Cl A3 | ||||||||
1.525%, 06/25/2036 (B) | 1,289 | 1,277 | ||||||
Park Place Securities, Ser 2004-WCW1, Cl M2 | ||||||||
1.544%, 09/25/2034 (B) | 56 | 57 | ||||||
People’s Choice Home Loan Securities Trust, Ser 2004-1, Cl M1 | ||||||||
1.410%, 06/25/2034 (B) | 650 | 596 | ||||||
RAMP Trust, Ser 2005-EFC5, Cl M1 | ||||||||
0.925%, 10/25/2035 (B) | 328 | 327 | ||||||
RAMP Trust, Ser 2005-RZ3, Cl A3 | ||||||||
0.925%, 09/25/2035 (B) | 38 | 38 | ||||||
RAMP Trust, Ser 2006-RZ1, Cl M1 | ||||||||
0.925%, 03/25/2036 (B) | 1,700 | 1,656 | ||||||
RAMP Trust, Ser 2006-RZ1, Cl A3 | ||||||||
0.825%, 03/25/2036 (B) | 77 | 76 | ||||||
RSB BondCo LLC, Ser 2007-A, Cl A3 | ||||||||
5.820%, 06/28/2019 | 276 | 279 | ||||||
SBA Small Business Investment, Ser 2016-10B, Cl 1 | ||||||||
2.051%, 09/10/2026 | 100 | 101 | ||||||
Scholar Funding Trust, Ser 2011-A, Cl A | ||||||||
1.643%, 10/28/2043 (B)(C) | 246 | 236 | ||||||
SLC Student Loan Trust, Ser 2007-2, Cl A2 | ||||||||
1.217%, 05/15/2028 (B) | 86 | 85 | ||||||
SLM Private Education Loan Trust, Ser 2012-D, Cl A2 | ||||||||
2.950%, 02/15/2046 (C) | 906 | 918 | ||||||
SLM Private Education Loan Trust, Ser 2012-E, Cl A2B | ||||||||
2.258%, 06/15/2045 (B)(C) | 274 | 278 | ||||||
SLM Private Education Loan Trust, Ser 2012-E, Cl A1 | ||||||||
1.258%, 10/16/2023 (B)(C) | 10 | 10 | ||||||
SLM Private Education Loan Trust, Ser 2013-1, Cl B | ||||||||
2.324%, 11/25/2043 (B) | 180 | 160 | ||||||
SLM Private Education Loan Trust, Ser 2013-A, Cl A2B | ||||||||
1.558%, 05/17/2027 (B)(C) | 314 | 317 | ||||||
SLM Private Education Loan Trust, Ser 2013-A, Cl A1 | ||||||||
1.108%, 08/15/2022 (B)(C) | 64 | 64 | ||||||
SLM Private Education Loan Trust, Ser 2013-B, Cl A2A | ||||||||
1.850%, 06/17/2030 (C) | 617 | 617 | ||||||
SLM Private Education Loan Trust, Ser 2013-B, Cl A1 | ||||||||
1.158%, 07/15/2022 (B)(C) | 103 | 103 | ||||||
| ||||||||
| Description |
Face Amount |
Market Value | ||||||
| ||||||||
ASSET-BACKED SECURITIES (continued) |
| |||||||
SLM Private Education Loan Trust, Ser 2013-B, Cl A2B | ||||||||
1.608%, 06/17/2030 (B)(C) | $ | 118 | $ | 119 | ||||
SLM Private Education Loan Trust, Ser 2014-A, Cl A2B | ||||||||
1.658%, 01/15/2026 (B)(C) | 199 | 200 | ||||||
SLM Student Loan Trust, Ser 2003-11, Cl A6 | ||||||||
1.403%, 12/15/2025 (B)(C) | 350 | 344 | ||||||
SLM Student Loan Trust, Ser 2004-10, Cl A6A | ||||||||
1.265%, 04/27/2026 (B)(C) | 676 | 671 | ||||||
SLM Student Loan Trust, Ser 2004-10, Cl A7A | ||||||||
1.465%, 10/25/2029 (B)(C) | 456 | 437 | ||||||
SLM Student Loan Trust, Ser 2004-3, Cl A5 | ||||||||
0.808%, 07/25/2023 (B) | 413 | 410 | ||||||
SLM Student Loan Trust, Ser 2004-8, Cl B | ||||||||
1.098%, 01/25/2040 (B) | 109 | 94 | ||||||
SLM Student Loan Trust, Ser 2005-5, Cl A3 | ||||||||
0.815%, 04/25/2025 (B) | 42 | 42 | ||||||
SLM Student Loan Trust, Ser 2005-5, Cl A4 | ||||||||
0.778%, 10/25/2028 (B) | 574 | 548 | ||||||
SLM Student Loan Trust, Ser 2005-6, Cl A5B | ||||||||
1.838%, 07/27/2026 (B) | 99 | 100 | ||||||
SLM Student Loan Trust, Ser 2005-6, Cl A6 | ||||||||
0.778%, 10/27/2031 (B) | 1,119 | 1,084 | ||||||
SLM Student Loan Trust, Ser 2005-7, Cl A4 | ||||||||
0.788%, 10/25/2029 (B) | 337 | 326 | ||||||
SLM Student Loan Trust, Ser 2005-9, Cl A5 | ||||||||
0.835%, 01/27/2025 (B) | 86 | 85 | ||||||
SLM Student Loan Trust, Ser 2006-2, Cl A6 | ||||||||
0.808%, 01/25/2041 (B) | 540 | 490 | ||||||
SLM Student Loan Trust, Ser 2006-3, Cl A5 | ||||||||
0.738%, 01/25/2021 (B) | 531 | 507 | ||||||
SLM Student Loan Trust, Ser 2006-8, Cl A6 | ||||||||
0.798%, 01/25/2041 (B) | 540 | 479 | ||||||
SLM Student Loan Trust, Ser 2007-2, Cl B | ||||||||
0.808%, 07/25/2025 (B) | 178 | 142 | ||||||
SLM Student Loan Trust, Ser 2007-2, Cl A4 | ||||||||
0.698%, 07/25/2022 (B) | 618 | 584 | ||||||
SLM Student Loan Trust, Ser 2007-2, Cl A3 | ||||||||
0.755%, 01/25/2019 (B) | 471 | 465 | ||||||
SLM Student Loan Trust, Ser 2007-3, Cl A3 | ||||||||
0.678%, 04/25/2019 (B) | 656 | 654 | ||||||
SLM Student Loan Trust, Ser 2007-5, Cl A5 | ||||||||
0.795%, 01/25/2024 (B) | 515 | 512 | ||||||
SLM Student Loan Trust, Ser 2007-6, Cl A4 | ||||||||
1.095%, 10/25/2024 (B) | 980 | 965 | ||||||
SLM Student Loan Trust, Ser 2007-6, Cl B | ||||||||
1.488%, 04/27/2043 (B) | 127 | 111 | ||||||
SLM Student Loan Trust, Ser 2007-7, Cl B | ||||||||
1.465%, 10/27/2070 (B) | 250 | 201 | ||||||
SLM Student Loan Trust, Ser 2008-2, Cl B | ||||||||
1.838%, 01/25/2083 (B) | 160 | 139 | ||||||
| SEI Institutional Managed Trust / Annual Report / September 30, 2016 | 157 |
SCHEDULE OF INVESTMENTS
September 30, 2016
U.S. Fixed Income Fund (Continued)
| ||||||||
| Description |
Face Amount |
Market Value | ||||||
| ||||||||
ASSET-BACKED SECURITIES (continued) |
| |||||||
SLM Student Loan Trust, Ser 2008-3, Cl B | ||||||||
1.838%, 04/26/2083 (B) | $ | 160 | $ | 136 | ||||
SLM Student Loan Trust, Ser 2008-4, Cl A4 | ||||||||
2.288%, 07/25/2022 (B) | 1,292 | 1,296 | ||||||
SLM Student Loan Trust, Ser 2008-4, Cl B | ||||||||
2.488%, 04/25/2029 (B) | 160 | 148 | ||||||
SLM Student Loan Trust, Ser 2008-5, Cl B | ||||||||
2.488%, 07/25/2029 (B) | 160 | 148 | ||||||
SLM Student Loan Trust, Ser 2008-5, Cl A4 | ||||||||
2.338%, 07/25/2023 (B) | 864 | 869 | ||||||
SLM Student Loan Trust, Ser 2008-6, Cl B | ||||||||
2.488%, 07/26/2083 (B) | 160 | 149 | ||||||
SLM Student Loan Trust, Ser 2008-7, Cl B | ||||||||
2.488%, 07/26/2083 (B) | 160 | 148 | ||||||
SLM Student Loan Trust, Ser 2008-8, Cl B | ||||||||
2.888%, 10/25/2029 (B) | 160 | 153 | ||||||
SLM Student Loan Trust, Ser 2008-9, Cl B | ||||||||
2.888%, 10/25/2083 (B) | 160 | 155 | ||||||
SLM Student Loan Trust, Ser 2008-9, Cl A | ||||||||
2.138%, 04/25/2023 (B) | 719 | 721 | ||||||
SLM Student Loan Trust, Ser 2009-3, Cl A | ||||||||
1.275%, 01/25/2045 (B)(C) | 905 | 882 | ||||||
SLM Student Loan Trust, Ser 2010-1, Cl A | ||||||||
0.925%, 03/25/2025 (B) | 218 | 211 | ||||||
SLM Student Loan Trust, Ser 2012-6, Cl B | ||||||||
1.524%, 04/27/2043 (B) | 249 | 214 | ||||||
SLM Student Loan Trust, Ser 2012-6, Cl A3 | ||||||||
1.274%, 05/26/2026 (B) | 211 | 207 | ||||||
SLM Student Loan Trust, Ser 2012-B, Cl A2 | ||||||||
3.480%, 10/15/2030 (C) | 116 | 118 | ||||||
SLM Student Loan Trust, Ser 2013-3, Cl B | ||||||||
1.939%, 09/25/2043 (B) | 136 | 117 | ||||||
SLM Student Loan Trust, Ser 2013-4, Cl A | ||||||||
1.074%, 06/25/2027 (B) | 282 | 272 | ||||||
SLM Student Loan Trust, Ser 2013-6, Cl A3 | ||||||||
1.174%, 06/25/2055 (B) | 785 | 780 | ||||||
SLM Student Loan Trust, Ser 2013-A, Cl A2A | ||||||||
1.770%, 05/17/2027 (C) | 145 | 144 | ||||||
SLM Student Loan Trust, Ser 2013-C, Cl A2A | ||||||||
2.940%, 10/15/2031 (C) | 319 | 325 | ||||||
SLM Student Loan Trust, Ser 2013-M1, Cl M1 | ||||||||
3.500%, 10/28/2029 (C) | 374 | 368 | ||||||
SLM Student Loan Trust, Ser 2014-2, Cl A3 | ||||||||
1.114%, 03/25/2055 (B) | 524 | 517 | ||||||
SLM Student Loan Trust, Ser 2014-A, Cl A2A | ||||||||
2.590%, 01/15/2026 (C) | 225 | 227 | ||||||
Small Business Administration, Ser 2013-20L, Cl 1 | ||||||||
3.380%, 12/01/2033 | 149 | 159 | ||||||
SMB Private Education Loan Trust, Ser 2015-A, Cl A1 | ||||||||
1.108%, 07/17/2023 (B)(C) | 74 | 74 | ||||||
| ||||||||
| Description |
Face Amount |
Market Value | ||||||
| ||||||||
ASSET-BACKED SECURITIES (continued) |
| |||||||
SMB Private Education Loan Trust, Ser 2015-A, Cl A2A | ||||||||
2.490%, 06/15/2027 (C) | $ | 593 | $ | 603 | ||||
SMB Private Education Loan Trust, Ser 2015-A, Cl A2B | ||||||||
1.508%, 06/15/2027 (B)(C) | 634 | 610 | ||||||
SMB Private Education Loan Trust, Ser 2015-B, Cl A2B | ||||||||
1.708%, 07/15/2027 (B)(C) | 637 | 632 | ||||||
SMB Private Education Loan Trust, Ser 2015-B, Cl A2A | ||||||||
2.980%, 07/15/2027 (C) | 450 | 467 | ||||||
SMB Private Education Loan Trust, Ser 2015-B, Cl A1 | ||||||||
1.208%, 02/15/2023 (B)(C) | 127 | 127 | ||||||
SMB Private Education Loan Trust, Ser 2015-C, Cl A2B | ||||||||
1.908%, 07/15/2027 (B)(C) | 220 | 224 | ||||||
SMB Private Education Loan Trust, Ser 2015-C, Cl A1 | ||||||||
1.408%, 07/15/2022 (B)(C) | 292 | 292 | ||||||
SMB Private Education Loan Trust, Ser 2015-C, Cl A2A | ||||||||
2.750%, 07/15/2027 (C) | 357 | 367 | ||||||
SMB Private Education Loan Trust, Ser 2016-A, Cl A2A | ||||||||
2.700%, 05/15/2031 (C) | 1,072 | 1,079 | ||||||
SMB Private Education Loan Trust, Ser 2016-A, Cl A2B | ||||||||
2.008%, 05/15/2031 (B)(C) | 818 | 818 | ||||||
SMB Private Education Loan Trust, Ser 2016-A, Cl A1 | ||||||||
1.208%, 05/15/2023 (B)(C) | 465 | 465 | ||||||
SMB Private Education Loan Trust, Ser 2016-B, Cl A1 | ||||||||
1.135%, 11/15/2023 (B)(C) | 706 | 706 | ||||||
SMB Private Education Loan Trust, Ser 2016-B, Cl A2A | ||||||||
2.430%, 02/17/2032 (C) | 1,363 | 1,380 | ||||||
SMB Private Education Loan Trust, Ser 2016-B, Cl A2B | ||||||||
1.935%, 02/17/2032 (B)(C) | 840 | 840 | ||||||
SoFi Professional Loan Program, Ser 2016-D, Cl A2B | ||||||||
2.340%, 04/25/2033 (C) | 386 | 386 | ||||||
SoFi Professional Loan Program, Ser 2016-D, Cl A2A | ||||||||
1.530%, 04/25/2033 (C) | 398 | 398 | ||||||
Structured Asset Investment Loan Trust, Ser 2004-8, Cl A2 | ||||||||
1.075%, 09/25/2034 (B) | 495 | 456 | ||||||
| 158 | SEI Institutional Managed Trust / Annual Report / September 30, 2016 |
| ||||||||
| Description |
Face Amount |
Market Value | ||||||
| ||||||||
ASSET-BACKED SECURITIES (continued) |
| |||||||
Structured Asset Securities Mortgage Loan Trust, Ser 2005-WF2, Cl A3 | ||||||||
1.124%, 05/25/2035 (B) | $ | 575 | $ | 575 | ||||
Structured Asset Securities Mortgage Loan Trust, Ser 2005-WF4, Cl M2 | ||||||||
0.955%, 11/25/2035 (B) | 1,165 | 1,143 | ||||||
Trade MAPS 1 Ltd, Ser 2013-1A, Cl A | ||||||||
1.218%, 12/10/2018 (B)(C) | 737 | 736 | ||||||
United States Small Business Administration, Ser 2015-20D, Cl 1 | ||||||||
2.510%, 04/01/2035 | 67 | 69 | ||||||
Verizon Owner Trust, Ser 2016-1A, Cl A | ||||||||
1.420%, 01/20/2021 (C) | 1,328 | 1,330 | ||||||
VOLT XL LLC, Ser 2015-NP14, Cl A1 | ||||||||
4.375%, 11/27/2045 (C)(D) | 183 | 185 | ||||||
Voya CLO, Ser 2014-2A, Cl A1 | ||||||||
2.083%, 07/17/2026 (B)(C) | 500 | 500 | ||||||
Voya, Ser 2014-1A, Cl A1 | ||||||||
2.179%, 04/18/2026 (B)(C) | 540 | 540 | ||||||
|
| |||||||
| 66,829 | ||||||||
|
| |||||||
Total Asset-Backed Securities | 125,511 | |||||||
|
| |||||||
SOVEREIGN DEBT — 2.4% | ||||||||
Abu Dhabi Government International Bond | ||||||||
2.125%, 05/03/2021 (C) | 460 | 463 | ||||||
Colombia Government International Bond | ||||||||
5.625%, 02/26/2044 | 1,070 | 1,239 | ||||||
FMS Wertmanagement AoeR | ||||||||
1.000%, 11/21/2017 | 200 | 200 | ||||||
Indonesia Government International Bond MTN | ||||||||
3.750%, 04/25/2022 (C) | 470 | 495 | ||||||
Israel Government International Bond | ||||||||
4.500%, 01/30/2043 | 365 | 416 | ||||||
Japan Treasury Discount Bills | ||||||||
-0.237%, 11/14/2016 (A)(F) | JPY | 510,000 | 5,037 | |||||
-0.296%, 12/12/2016 (A)(F) | 630,000 | 6,225 | ||||||
-0.336%, 10/17/2016 (A)(F) | 360,000 | 3,555 | ||||||
Mexico Government International Bond MTN | ||||||||
6.050%, 01/11/2040 | $ | 100 | 122 | |||||
5.750%, 10/12/2110 | 545 | 576 | ||||||
5.550%, 01/21/2045 | 3,052 | 3,536 | ||||||
4.750%, 03/08/2044 | 60 | 62 | ||||||
4.350%, 01/15/2047 | 240 | 236 | ||||||
4.125%, 01/21/2026 | 709 | 763 | ||||||
3.600%, 01/30/2025 | 520 | 539 | ||||||
Peruvian Government International Bond | ||||||||
6.550%, 03/14/2037 | 50 | 71 | ||||||
5.625%, 11/18/2050 | 414 | 547 | ||||||
Poland Government International Bond | ||||||||
5.000%, 03/23/2022 | 100 | 114 | ||||||
| ||||||||
| Description |
Face Amount |
Market Value | ||||||
| ||||||||
SOVEREIGN DEBT (continued) |
| |||||||
4.000%, 01/22/2024 | $ | 1,257 | $ | 1,389 | ||||
Province of Ontario Canada | ||||||||
1.625%, 01/18/2019 | 520 | 525 | ||||||
1.250%, 06/17/2019 | 532 | 531 | ||||||
Province of Quebec Canada | ||||||||
2.625%, 02/13/2023 | 620 | 649 | ||||||
Qatar Government International Bond | ||||||||
3.250%, 06/02/2026 (C) | 345 | 351 | ||||||
2.375%, 06/02/2021 (C) | 615 | 620 | ||||||
Slovenia Government International Bond | ||||||||
5.850%, 05/10/2023 (C) | 422 | 505 | ||||||
5.500%, 10/26/2022 (C) | 400 | 467 | ||||||
5.250%, 02/18/2024 (C) | 1,040 | 1,220 | ||||||
South Africa Government International Bond | ||||||||
4.300%, 10/12/2028 | 360 | 360 | ||||||
|
| |||||||
Total Sovereign Debt |
| 30,813 | ||||||
|
| |||||||
U.S. GOVERNMENT AGENCY OBLIGATIONS — 0.6% |
| |||||||
FHLB | ||||||||
1.250%, 06/28/2030 (D) | 1,110 | 1,110 | ||||||
0.875%, 05/24/2017 | 10 | 10 | ||||||
FICO STRIPS, PO | ||||||||
0.000%, 05/11/2018 (A) | 460 | 454 | ||||||
FNMA | ||||||||
2.628%, 10/09/2019 (A) | 5,270 | 5,059 | ||||||
Tennessee Valley Authority | ||||||||
2.875%, 09/15/2024 | 775 | 838 | ||||||
|
| |||||||
Total U.S. Government Agency Obligations |
| 7,471 | ||||||
|
| |||||||
MUNICIPAL BONDS — 0.4% | ||||||||
California — 0.1% | ||||||||
California State, Build America Project, GO | ||||||||
7.600%, 11/01/2040 | 390 | 635 | ||||||
6.650%, 03/01/2022 | 250 | 307 | ||||||
California State, GO | ||||||||
6.200%, 03/01/2019 | 300 | 336 | ||||||
Los Angeles, Community College District, Build America Project, GO | ||||||||
6.750%, 08/01/2049 | 430 | 685 | ||||||
|
| |||||||
| 1,963 | ||||||||
|
| |||||||
Nevada — 0.1% | ||||||||
Clark County, Airport System Revenue, Build America Project, Ser C, RB | ||||||||
6.820%, 07/01/2045 | 590 | 918 | ||||||
|
| |||||||
| SEI Institutional Managed Trust / Annual Report / September 30, 2016 | 159 |
SCHEDULE OF INVESTMENTS
September 30, 2016
U.S. Fixed Income Fund (Continued)
| ||||||||
| Description |
Face Amount |
Market Value | ||||||
| ||||||||
MUNICIPAL BONDS (continued) | ||||||||
New Jersey — 0.1% | ||||||||
New Jersey State, Turnpike Authority, Build America Project, Ser C, RB | ||||||||
7.102%, 01/01/2041 | $ | 475 | $ | 724 | ||||
|
| |||||||
New York — 0.0% | ||||||||
New York and New Jersey, Port Authority, RB | ||||||||
4.458%, 10/01/2062 | 585 | 676 | ||||||
New York City, Transitional Finance Authority, Future Tax Secured, RB | ||||||||
5.508%, 08/01/2037 | 275 | 362 | ||||||
|
| |||||||
| 1,038 | ||||||||
|
| |||||||
Ohio — 0.0% | ||||||||
Ohio State University, Ser A, RB | ||||||||
4.800%, 06/01/2111 | 171 | 193 | ||||||
|
| |||||||
Texas — 0.1% | ||||||||
North Texas, Tollway Authority, Build America Project, Ser B, RB | ||||||||
6.718%, 01/01/2049 | 501 | 782 | ||||||
|
| |||||||
Total Municipal Bonds | 5,618 | |||||||
|
| |||||||
| Shares | ||||||||
AFFILIATED PARTNERSHIP — 0.0% | ||||||||
SEI Liquidity Fund, L.P. | ||||||||
0.440% **†(G) | 628,708 | 629 | ||||||
|
| |||||||
Total Affiliated Partnership | 629 | |||||||
|
| |||||||
CASH EQUIVALENT — 2.2% | ||||||||
SEI Daily Income Trust, Government Fund, Cl A | ||||||||
0.220%**† | 31,642,038 | 31,642 | ||||||
|
| |||||||
Total Cash Equivalent
(Cost $31,642) ($ Thousands) | 31,642 | |||||||
|
| |||||||
Total Investments — 107.3% | $ | 1,400,571 | ||||||
|
| |||||||
| Contracts | ||||||||
PURCHASED OPTIONS(H) — 0.0% | ||||||||
November 2016, U.S. 10-Year Treasury Note Call, Expires 10/22/2016, | 51 | 18 | ||||||
November 2016, U.S. 10-Year Treasury Note Call, Expires 10/22/2016, | 46 | 9 | ||||||
| ||||||||
| Description | Contracts |
Market Value | ||||||
| ||||||||
PURCHASED OPTIONS(H) (continued) | ||||||||
November 2016, U.S. 5-Year Treasury Note Call, Expires 10/22/2016, | 59 | $ | 11 | |||||
November 2016, U.S. Long Treasury Bond Future Call, Expires 10/22/2016, | 13 | 7 | ||||||
November 2016, U.S. Long Treasury Bond Future Call, Expires 10/22/2016, | 25 | 30 | ||||||
November 2016, U.S. Long Treasury Bond Future Put, Expires 10/22/2016, | 18 | 6 | ||||||
|
| |||||||
Total Purchased Options | $ | 81 | ||||||
|
| |||||||
WRITTEN OPTIONS(H) — 0.0% | ||||||||
December 2016, U.S. 10-Year Treasury Note Call, Expires 11/19/2016 | (138) | (41) | ||||||
December 2016, U.S. 10-Year Treasury Note Call, Expires 11/19/2016 | (51) | (20) | ||||||
December 2016, U.S. Short Treasury Bond Future Call, Expires 11/19/2016 | (17) | (6) | ||||||
December 2016, U.S. Short Treasury Bond Future Call, Expires 11/19/2016 | (38) | (47) | ||||||
November 2016, U.S. 5-Year Treasury Note Call, Expires 10/22/2016 | (57) | (3) | ||||||
November 2016, U.S. Short Treasury Note Call, Expires 10/22/2016 | (13) | (2) | ||||||
November 2016, U.S. Short Treasury Note Put, Expires 10/22/2016 | (36) | (4) | ||||||
|
| |||||||
Total Written Options
(Premiums Received ($184)) ($ Thousands) |
| $ | (123) | |||||
|
| |||||||
| 160 | SEI Institutional Managed Trust / Annual Report / September 30, 2016 |
A list of the open futures contracts held by the Fund at September 30, 2016, is as follows:
| ||||||||||||
| Type of Contract | Number of Contracts Long (Short) | Expiration Date | Unrealized Appreciation (Depreciation) ($ Thousands) | |||||||||
| ||||||||||||
90-Day Euro$ | 113 | Dec-2017 | $14 | |||||||||
90-Day Euro$ | 47 | Mar-2017 | 3 | |||||||||
90-Day Euro$ | (121) | Dec-2019 | (6) | |||||||||
U.S. 10-Year Treasury Note | (60) | Dec-2016 | 30 | |||||||||
U.S. 2-Year Treasury Note | 67 | Dec-2016 | 6 | |||||||||
U.S. 5-Year Treasury Note | 661 | Dec-2016 | 69 | |||||||||
U.S. Long Treasury Bond | (187) | Dec-2016 | 450 | |||||||||
U.S. Ultra Long Treasury Bond | (136) | Dec-2016 | 409 | |||||||||
U.S. Ultra Long Treasury Bond | (74) | Dec-2016 | (4) | |||||||||
|
| |||||||||||
| $971 | ||||||||||||
|
| |||||||||||
For the year ended September 30, 2016, the total amount of all open futures contracts, as presented in the table above, are representative of the volume of activity for the derivative type during the year.
A list of the open forward foreign currency contracts held by the Fund at September 30, 2016, is as follows:
| ||||||||||||||||||||
Settlement Date | Currency to Deliver (Thousands) | Currency To Receive (Thousands) | Unrealized Appreciation (Depreciation) ($ Thousands) | |||||||||||||||||
| ||||||||||||||||||||
11/14/16 | JPY | 510,000 | USD | 5,056 | $9 | |||||||||||||||
10/17/16-12/12/16 | JPY | 990,000 | USD | 9,633 | (168) | |||||||||||||||
|
| |||||||||||||||||||
| $(159) | ||||||||||||||||||||
|
| |||||||||||||||||||
A list of the counterparties for the outstanding forward foreign currency contracts held by the Fund at September 30, 2016, is as follows:
| ||||||||||||
| Counterparty | Currency to Deliver ($ Thousands) | Currency to Receive ($ Thousands) | Unrealized Depreciation ($ Thousands) | |||||||||
| ||||||||||||
Bank of America | $(3,558) | $3,417 | $(141) | |||||||||
JPMorgan Chase Bank | (11,289) | 11,271 | (18) | |||||||||
|
| |||||||||||
| $(159) | ||||||||||||
|
| |||||||||||
For the year ended September 30, 2016 the total amount of all open forward foreign currency contracts, as presented in the table above, are representative of the volume of activity for the derivative type during the year.
A list of the open OTC swap agreements held by the Fund at September 30, 2016 is as follows:
| ||||||||||||||||||||||
| Interest Rate Swaps | ||||||||||||||||||||||
| ||||||||||||||||||||||
| Counterparty | Fund Pays | Fund Receives | Termination Date | Notional Amount ($Thousands) | Net Unrealized Depreciation ($Thousands) | |||||||||||||||||
| ||||||||||||||||||||||
Citigroup | 2.71% | 3 Month USD - LIBOR | 08/15/42 | $830 | $(173) | |||||||||||||||||
|
| |||||||||||||||||||||
A list of the open centrally cleared swap agreements held by the Fund at September 30, 2016 is as follows:
|
| |||||||||||||||||||||
| ||||||||||||||||||||||
| Interest Rate Swaps | ||||||||||||||||||||||
| ||||||||||||||||||||||
| Counterparty | Fund Pays | Fund Receives | Termination Date | Notional Amount ($Thousands) | Net Unrealized Appreciation (Depreciation) ($Thousands) | |||||||||||||||||
| ||||||||||||||||||||||
Citigroup | 3.68% | 3 Month USD - LIBOR | 11/15/43 | $725 | $(307) | |||||||||||||||||
Merrill Lynch | 1.27% | 3 Month USD - LIBOR | 05/15/23 | 8,960 | 13 | |||||||||||||||||
|
| |||||||||||||||||||||
| $(294) | ||||||||||||||||||||||
|
| |||||||||||||||||||||
For the year ended September 30, 2016, the total amount of open swap agreements, as presented in the tables above, are representative of the volume of activity for this derivative type during the year.
| Percentages are based on Net Assets of $1,302,394 ($ Thousands). |
| * | Non-income producing security. |
| ** | Rate shown is the 7-day effective yield as of September 30, 2016. |
| † | Investment in Affiliated Security (see Note 6). |
| (A) | The rate reported is the effective yield at the time of purchase. |
| (B) | Variable Rate Security — The rate reported on the Schedule of Investments is the rate in effect as of September 30, 2016. |
| (C) | Security exempt from registration under Rule 144A of the Securities Act of 1933. These securities may be resold in transactions exempt from registration normally to qualified institutions. On September 30, 2016, the value of these securities amounted to $120,725 ($ Thousands), representing 9.3% of the Net Assets of the Fund. |
| (D) | Step Bonds – The rate reflected on the Schedule of Investments is the effective yield on September 30, 2016. The coupon on a step bond changes on a specified date. |
| (E) | This security or a partial position of this security is on loan at September 30, 2016 (see Note 10). The total market value of securities on loan at September 30, 2016 was $599 ($ Thousands). |
| (F) | Rate is negative due to the decrease in value of the foreign currency against the U.S. Dollar. |
| (G) | This security was purchased with cash collateral held from securities on loan (see Note 10). The total market value of such securities as of September 30, 2016 was $629 ($ Thousands). |
| (H) | For the year ended September 30, 2016, the total amount of open purchased options and written options, as presented in the Schedule of Investments, are representative of the volume of activity for these derivative types during the period. |
ACES — Alternative Credit Enhancement Structure
ARM — Adjustable Rate Mortgage
Cl — Class
CLO — Collateralized Loan Obligation
CMO — Collateralized Mortgage Obligation
FHLB — Federal Home Loan Bank
FHLMC — Federal Home Loan Mortgage Corporation
FICO — Financing Corporation
FNMA — Federal National Mortgage Association
GNMA — Government National Mortgage Association
GO — General Obligation
| SEI Institutional Managed Trust / Annual Report / September 30, 2016 | 161 |
SCHEDULE OF INVESTMENTS
September 30, 2016
U.S. Fixed Income Fund (Concluded)
IO — Interest Only — face amount represents notional amount.
JPY — Japanese Yen
LIBOR — London Interbank Offered Rate
LLC — Limited Liability Company
Ltd — Limited
L.P. — Limited Partnership
MTN — Medium Term Note
OTC — Over the counter
PLC — Public Limited Company
PO — Principle Only
RB — Revenue Bond
Ser — Series
STRIPS — Separately Traded Registered Interest and Principal Securities
TBA — To Be Announced
USD — United States Dollar
The following is a list of the level of inputs used as of September 30, 2016, in valuing the Fund’s investments and other financial instruments carried at value ($ Thousands):
Investments in Securities | Level 1 | Level 2 | Level 3 | Total | ||||||||||||
U.S. Treasury Obligations | $ | – | $ | 493,175 | $ | – | $ | 493,175 | ||||||||
Mortgage-Backed Securities | – | 361,871 | – | 361,871 | ||||||||||||
Corporate Obligations | – | 343,841 | – | 343,841 | ||||||||||||
Asset-Backed Securities | – | 125,511 | – | 125,511 | ||||||||||||
Sovereign Debt | – | 30,813 | – | 30,813 | ||||||||||||
U.S. Government Agency Obligations | – | 7,471 | – | 7,471 | ||||||||||||
Municipal Bonds | – | 5,618 | – | 5,618 | ||||||||||||
Affiliated Partnership | – | 629 | – | 629 | ||||||||||||
Cash Equivalent | 31,642 | – | – | 31,642 | ||||||||||||
|
|
|
|
|
|
|
| |||||||||
Total Investments in Securities | $ | 31,642 | $ | 1,368,929 | $ | – | $ | 1,400,571 | ||||||||
|
|
|
|
|
|
|
| |||||||||
Other Financial Instruments | Level 1 | Level 2 | Level 3 | Total | ||||||||||||
Purchased Options | $ | 81 | $ | – | $ | – | $ | 81 | ||||||||
Written Options | (123) | – | – | (123) | ||||||||||||
Futures Contracts * | ||||||||||||||||
Unrealized Appreciation | 981 | – | – | 981 | ||||||||||||
Unrealized Depreciation | (10) | – | – | (10) | ||||||||||||
Forwards Contracts * | ||||||||||||||||
Unrealized Appreciation | – | 9 | – | 9 | ||||||||||||
Unrealized Depreciation | – | (168) | – | (168) | ||||||||||||
OTC Swaps | ||||||||||||||||
Interest Rate Swaps * | ||||||||||||||||
Unrealized Depreciation | – | (173) | – | (173) | ||||||||||||
Centrally Cleared Swaps | ||||||||||||||||
Interest Rate Swaps * | ||||||||||||||||
Unrealized Appreciation | – | 13 | – | 13 | ||||||||||||
Unrealized Depreciation | – | (307) | – | (307) | ||||||||||||
|
|
|
|
|
|
|
| |||||||||
Total Other Financial Instruments | $ | 929 | $ | (626) | $ | – | $ | 303 | ||||||||
|
|
|
|
|
|
|
| |||||||||
* Futures contracts, forward contracts and swap contracts are valued at the unrealized appreciation (depreciation) on the instrument.
For the year ended September 30, 2016, there were no transfers between Level 1 and Level 2 assets and liabilities.
For the year ended September 30, 2016, there were no transfers between Level 2 and Level 3 assets and liabilities.
For more information on valuation inputs, see Note 2 – Significant Accounting Policies in Notes to Financial Statements.
Amounts designated as “—” are $0 or have been rounded to $0.
The accompanying notes are an integral part of the financial statements.
| 162 | SEI Institutional Managed Trust / Annual Report / September 30, 2016 |
SCHEDULE OF INVESTMENTS
September 30, 2016
High Yield Bond Fund
Sector Weightings (Unaudited)†:
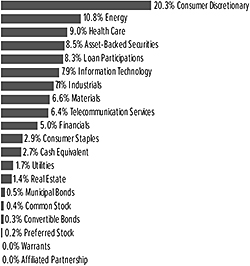
†Percentages are based on total investments. Includes investments held as collateral for securities held on loan (see Note 10).
| ||||||||
| Description |
Face Amount | Market Value ($ Thousands) | ||||||
| ||||||||
CORPORATE OBLIGATIONS — 78.3% | ||||||||
Consumer Discretionary — 20.1% | ||||||||
Adelphia Communications (Escrow Security)(A) | ||||||||
0.000%, 02/15/2004 | $ | 25 | $ | – | ||||
0.000%, 01/15/2009 | 225 | – | ||||||
0.000%, 06/15/2011 | 150 | 1 | ||||||
Adient Global Holdings | ||||||||
4.875%, 08/15/2026 (B) | 2,411 | 2,414 | ||||||
Altice | ||||||||
7.750%, 05/15/2022 (B) | 6,057 | 6,466 | ||||||
7.625%, 02/15/2025 (B) | 470 | 482 | ||||||
Altice Financing | ||||||||
7.500%, 05/15/2026 (B) | 5,562 | 5,791 | ||||||
6.625%, 02/15/2023 (B) | 345 | 354 | ||||||
6.500%, 01/15/2022 (B) | 700 | 738 | ||||||
Altice Finco | ||||||||
8.125%, 01/15/2024 (B) | 610 | 631 | ||||||
Altice Finco MTN | ||||||||
7.625%, 02/15/2025 (B) | 205 | 206 | ||||||
Altice US Finance | ||||||||
5.375%, 07/15/2023 (B) | 3,929 | 4,062 | ||||||
AMC Entertainment | ||||||||
5.750%, 06/15/2025 | 2,500 | 2,525 | ||||||
AMC Networks | ||||||||
5.000%, 04/01/2024 | 1,773 | 1,784 | ||||||
4.750%, 12/15/2022 | 2,210 | 2,238 | ||||||
American Axle & Manufacturing | ||||||||
6.625%, 10/15/2022 | 440 | 465 | ||||||
6.250%, 03/15/2021 | 405 | 423 | ||||||
Apex Tool Group | ||||||||
7.000%, 02/01/2021 (B) | 1,830 | 1,750 | ||||||
| ||||||||
| Description |
Face Amount | Market Value ($ Thousands) | ||||||
| ||||||||
CORPORATE OBLIGATIONS (continued) | ||||||||
Ashtead Capital | ||||||||
6.500%, 07/15/2022 (B) | $ | 3,055 | $ | 3,212 | ||||
Aventine (Escrow Security) | ||||||||
0.000%, 10/15/2049 (A)(C)(D) | 2,750 | – | ||||||
Beazer Homes USA | ||||||||
5.750%, 06/15/2019 | 1,560 | 1,627 | ||||||
Belo | ||||||||
7.750%, 06/01/2027 | 1,675 | 1,809 | ||||||
Bon-Ton Department Stores | ||||||||
8.000%, 06/15/2021 | 8,885 | 4,931 | ||||||
Boyd Gaming | ||||||||
6.875%, 05/15/2023 | 970 | 1,050 | ||||||
6.375%, 04/01/2026 (B) | 2,728 | 2,926 | ||||||
Brinker International | ||||||||
5.000%, 10/01/2024 (B) | 281 | 285 | ||||||
Brookfield Residential Properties | ||||||||
6.375%, 05/15/2025 (B) | 458 | 457 | ||||||
Burger King Worldwide | ||||||||
6.000%, 04/01/2022 (B) | 2,026 | 2,122 | ||||||
Cablevision Systems | ||||||||
7.750%, 04/15/2018 | 500 | 529 | ||||||
5.875%, 09/15/2022 | 1,917 | 1,744 | ||||||
Caesars Entertainment Operating(A) | ||||||||
9.000%, 02/15/2020 | 4,310 | 4,455 | ||||||
8.500%, 02/15/2020 | 1,260 | 1,317 | ||||||
Caesars Entertainment Resort Properties | ||||||||
8.000%, 10/01/2020 | 3,259 | 3,369 | ||||||
Caleres | ||||||||
6.250%, 08/15/2023 | 845 | 877 | ||||||
CCO Holdings | ||||||||
5.875%, 04/01/2024 (B) | 1,500 | 1,600 | ||||||
5.750%, 02/15/2026 (B) | 2,340 | 2,480 | ||||||
5.500%, 05/01/2026 (B) | 800 | 834 | ||||||
5.375%, 05/01/2025 (B) | 865 | 907 | ||||||
5.125%, 02/15/2023 | 2,000 | 2,085 | ||||||
5.125%, 05/01/2023 (B) | 485 | 506 | ||||||
CEC Entertainment | ||||||||
8.000%, 02/15/2022 | 1,283 | 1,278 | ||||||
Cedar Fair | ||||||||
5.375%, 06/01/2024 | 1,174 | 1,239 | ||||||
Cengage Learning | ||||||||
9.500%, 06/15/2024 (B) | 2,835 | 2,885 | ||||||
Century Communities | ||||||||
6.875%, 05/15/2022 | 1,830 | 1,848 | ||||||
Cequel Communications Holdings I | ||||||||
7.750%, 07/15/2025 (B) | 1,430 | 1,544 | ||||||
5.125%, 12/15/2021 (B) | 620 | 618 | ||||||
Charter Communications Operating | ||||||||
6.384%, 10/23/2035 (B) | 315 | 371 | ||||||
4.908%, 07/23/2025 (B) | 250 | 276 | ||||||
Chester Downs & Marina | ||||||||
9.250%, 02/01/2020 (B) | 5,110 | 4,714 | ||||||
| SEI Institutional Managed Trust / Annual Report / September 30, 2016 | 163 |
SCHEDULE OF INVESTMENTS
September 30, 2016
High Yield Bond Fund (Continued)
| ||||||||
| Description |
Face Amount | Market Value ($ Thousands) | ||||||
| ||||||||
CORPORATE OBLIGATIONS (continued) | ||||||||
Chinos Intermediate Holdings | ||||||||
7.750%, 05/01/2019 (B) | $ | 2,048 | $ | 768 | ||||
Cinemark USA | ||||||||
5.125%, 12/15/2022 | 1,390 | 1,425 | ||||||
4.875%, 06/01/2023 | 800 | 804 | ||||||
Claire’s Stores | ||||||||
9.000%, 03/15/2019 (B) | 1,590 | 867 | ||||||
8.875%, 03/15/2019 (C) | 406 | 69 | ||||||
Clear Channel Worldwide Holdings | ||||||||
7.625%, 03/15/2020 | 3,549 | 3,503 | ||||||
6.500%, 11/15/2022 | 3,875 | 4,005 | ||||||
ClubCorp Club Operations | ||||||||
8.250%, 12/15/2023 (B) | 1,520 | 1,634 | ||||||
Cogeco Communications | ||||||||
4.875%, 05/01/2020 (B) | 1,050 | 1,084 | ||||||
CSC Holdings | ||||||||
10.875%, 10/15/2025 (B) | 4,902 | 5,735 | ||||||
10.125%, 01/15/2023 (B) | 5,537 | 6,381 | ||||||
8.625%, 02/15/2019 | 2,125 | 2,372 | ||||||
6.750%, 11/15/2021 | 1,250 | 1,322 | ||||||
6.625%, 10/15/2025 (B) | 420 | 456 | ||||||
5.250%, 06/01/2024 | 1,849 | 1,757 | ||||||
Cumulus Media Holdings | ||||||||
7.750%, 05/01/2019 | 3,970 | 1,608 | ||||||
Dana | ||||||||
5.500%, 12/15/2024 | 465 | 474 | ||||||
Dana Holding | ||||||||
6.000%, 09/15/2023 | 1,385 | 1,440 | ||||||
Deck Chassis Acquisition | ||||||||
10.000%, 06/15/2023 (B) | 915 | 961 | ||||||
DISH DBS | ||||||||
7.750%, 07/01/2026 (B) | 270 | 287 | ||||||
6.750%, 06/01/2021 | 1,030 | 1,112 | ||||||
5.875%, 07/15/2022 | 1,616 | 1,661 | ||||||
5.875%, 11/15/2024 | 6,105 | 6,029 | ||||||
5.000%, 03/15/2023 | 5,025 | 4,887 | ||||||
Dollar Tree | ||||||||
5.750%, 03/01/2023 | 565 | 608 | ||||||
Eldorado Resorts | ||||||||
7.000%, 08/01/2023 | 1,495 | 1,587 | ||||||
Emerald Expositions Holding | ||||||||
9.000%, 06/15/2021 (B) | 1,950 | 2,026 | ||||||
Empire Today | ||||||||
11.375%, 02/01/2017 (B) | 2,000 | 2,002 | ||||||
ESH Hospitality | ||||||||
5.250%, 05/01/2025 (B) | 4,185 | 4,180 | ||||||
Fiat Chrysler Automobiles | ||||||||
5.250%, 04/15/2023 | 410 | 422 | ||||||
Fontainebleau Las Vegas Holdings | ||||||||
0.000%, 06/15/2015 (A)(B) | 3,108 | – | ||||||
Gannett | ||||||||
5.500%, 09/15/2024 (B) | 336 | 347 | ||||||
| ||||||||
| Description |
Face Amount | Market Value ($ Thousands) | ||||||
| ||||||||
CORPORATE OBLIGATIONS (continued) | ||||||||
4.875%, 09/15/2021 (B) | $ | 160 | $ | 166 | ||||
General Motors | ||||||||
4.875%, 10/02/2023 | 1,180 | 1,278 | ||||||
Goodyear Tire & Rubber | ||||||||
8.750%, 08/15/2020 | 155 | 185 | ||||||
5.125%, 11/15/2023 | 225 | 235 | ||||||
5.000%, 05/31/2026 | 275 | 283 | ||||||
Gray Television | ||||||||
5.125%, 10/15/2024 (B)(C) | 981 | 963 | ||||||
Group 1 Automotive | ||||||||
5.250%, 12/15/2023 (B) | 775 | 778 | ||||||
Guitar Center | ||||||||
9.625%, 04/15/2020 (B) | 6,432 | 4,752 | ||||||
6.500%, 04/15/2019 (B) | 3,719 | 3,273 | ||||||
Hanesbrands | ||||||||
4.875%, 05/15/2026 (B) | 310 | 317 | ||||||
4.625%, 05/15/2024 (B) | 310 | 318 | ||||||
Harrah’s Operating | ||||||||
11.250%, 06/01/2017 (A) | 530 | 546 | ||||||
Herc Rentals | ||||||||
7.750%, 06/01/2024 (B) | 830 | 853 | ||||||
7.500%, 06/01/2022 (B) | 430 | 445 | ||||||
Hillman Group | ||||||||
6.375%, 07/15/2022 (B) | 2,765 | 2,592 | ||||||
Hilton Domestic Operating | ||||||||
4.250%, 09/01/2024 (B) | 3,475 | 3,544 | ||||||
Hilton Worldwide Finance | ||||||||
5.625%, 10/15/2021 | 290 | 299 | ||||||
iHeartCommunications | ||||||||
10.625%, 03/15/2023 | 951 | 708 | ||||||
9.000%, 12/15/2019 | 2,409 | 1,906 | ||||||
9.000%, 03/01/2021 | 425 | 317 | ||||||
9.000%, 09/15/2022 | 2,748 | 1,999 | ||||||
iHeartCommunications PIK | ||||||||
14.000%, 02/01/2021 | 3,515 | 1,371 | ||||||
IHO Verwaltungs GmbH PIK | ||||||||
4.500%, 09/15/2023 (B) | 260 | 262 | ||||||
Inn of the Mountain Gods Resort & Casino | ||||||||
9.250%, 11/30/2020 (B)(E) | 4,420 | 4,022 | ||||||
International Game Technology | ||||||||
6.500%, 02/15/2025 (B) | 875 | 943 | ||||||
6.250%, 02/15/2022 (B) | 720 | 763 | ||||||
Interval Acquisition | ||||||||
5.625%, 04/15/2023 | 3,620 | 3,738 | ||||||
Isle of Capri Casinos | ||||||||
5.875%, 03/15/2021 | 535 | 558 | ||||||
JC Penney | ||||||||
6.375%, 10/15/2036 | 840 | 722 | ||||||
5.875%, 07/01/2023 (B) | 1,184 | 1,233 | ||||||
KFC Holding | ||||||||
5.250%, 06/01/2026 (B) | 795 | 841 | ||||||
5.000%, 06/01/2024 (B) | 795 | 831 | ||||||
| 164 | SEI Institutional Managed Trust / Annual Report / September 30, 2016 |
| ||||||||
| Description |
Face Amount | Market Value ($ Thousands) | ||||||
| ||||||||
CORPORATE OBLIGATIONS (continued) | ||||||||
Kosmos Energy | ||||||||
7.875%, 08/01/2021 | $ | 3,195 | $ | 3,099 | ||||
L Brands | ||||||||
6.950%, 03/01/2033 | 1,146 | 1,200 | ||||||
6.875%, 11/01/2035 | 2,225 | 2,425 | ||||||
6.750%, 07/01/2036 | 2,760 | 2,969 | ||||||
5.625%, 02/15/2022 | 1,175 | 1,313 | ||||||
Landry’s | ||||||||
6.750%, 10/15/2024 (B)(C) | 911 | 927 | ||||||
Laureate Education | ||||||||
10.000%, 09/01/2019 (B) | 2,196 | 2,092 | ||||||
Lear | ||||||||
5.250%, 01/15/2025 | 345 | 373 | ||||||
Lee Enterprises | ||||||||
9.500%, 03/15/2022 (B) | 1,300 | 1,342 | ||||||
Liberty Media LLC | ||||||||
8.250%, 02/01/2030 | 3,205 | 3,445 | ||||||
LIN Television | ||||||||
5.875%, 11/15/2022 | 1,332 | 1,395 | ||||||
LKQ | ||||||||
4.750%, 05/15/2023 | 530 | 545 | ||||||
LTF Merger | ||||||||
8.500%, 06/15/2023 (B) | 3,141 | 3,235 | ||||||
Lynx I | ||||||||
5.375%, 04/15/2021 (B) | 1,787 | 1,862 | ||||||
M/I Homes | ||||||||
6.750%, 01/15/2021 | 1,235 | 1,294 | ||||||
McClatchy | ||||||||
9.000%, 12/15/2022 | 2,425 | 2,498 | ||||||
McGraw-Hill Global Education Holdings | ||||||||
7.875%, 05/15/2024 (B) | 162 | 175 | ||||||
MGM Resorts International | ||||||||
7.750%, 03/15/2022 | 2,090 | 2,424 | ||||||
6.750%, 10/01/2020 | 265 | 297 | ||||||
6.625%, 12/15/2021 | 2,900 | 3,262 | ||||||
6.000%, 03/15/2023 | 3,950 | 4,286 | ||||||
5.250%, 03/31/2020 | 885 | 943 | ||||||
4.625%, 09/01/2026 | 300 | 292 | ||||||
Midcontinent Communications | ||||||||
6.250%, 08/01/2021 (B) | 400 | 419 | ||||||
Midcontinent Communications & Midcontinent Finance | ||||||||
6.875%, 08/15/2023 (B) | 3,005 | 3,200 | ||||||
Millennium (Escrow Security) | ||||||||
7.625%, 11/15/2026 (A) | 175 | – | ||||||
Mohegan Tribal Gaming Authority | ||||||||
9.750%, 09/01/2021 | 3,410 | 3,679 | ||||||
7.875%, 10/15/2024 (B)(C) | 2,944 | 2,937 | ||||||
Monitronics International | ||||||||
9.125%, 04/01/2020 | 7,200 | 6,768 | ||||||
Neiman Marcus Group | ||||||||
8.000%, 10/15/2021 (B) | 1,240 | 1,035 | ||||||
| ||||||||
| Description |
Face Amount | Market Value ($ Thousands) | ||||||
| ||||||||
CORPORATE OBLIGATIONS (continued) | ||||||||
Neiman Marcus Group PIK | ||||||||
8.750%, 10/15/2021 (B) | $ | 675 | $ | 530 | ||||
Netflix | ||||||||
5.875%, 02/15/2025 | 1,684 | 1,819 | ||||||
5.500%, 02/15/2022 | 405 | 436 | ||||||
Newell Brands | ||||||||
5.000%, 11/15/2023 (B) | 1,800 | 1,916 | ||||||
Nexstar Broadcasting | ||||||||
6.875%, 11/15/2020 | 2,900 | 3,012 | ||||||
6.125%, 02/15/2022 (B) | 380 | 392 | ||||||
Nexstar Escrow | ||||||||
5.625%, 08/01/2024 (B) | 1,846 | 1,851 | ||||||
Nine West Holdings | ||||||||
8.250%, 03/15/2019 (B) | 5,289 | 793 | ||||||
Numericable-SFR SAS | ||||||||
7.375%, 05/01/2026 (B) | 7,934 | 8,110 | ||||||
Outfront Media Capital | ||||||||
5.875%, 03/15/2025 | 1,485 | 1,559 | ||||||
5.250%, 02/15/2022 | 390 | 406 | ||||||
PetSmart | ||||||||
7.125%, 03/15/2023 (B) | 1,790 | 1,875 | ||||||
PF Chang’s China Bistro | ||||||||
10.250%, 06/30/2020 (B) | 1,361 | 1,283 | ||||||
Pinnacle Entertainment | ||||||||
5.625%, 05/01/2024 (B) | 950 | 955 | ||||||
PulteGroup | ||||||||
5.000%, 01/15/2027 | 987 | 991 | ||||||
Quebecor Media | ||||||||
5.750%, 01/15/2023 | 2,285 | 2,376 | ||||||
Quebecor Media (Escrow Security)(A) | ||||||||
0.000%, 11/15/2013 (F) | 1,725 | 2 | ||||||
0.000%, 03/15/2016 | 1,915 | 2 | ||||||
Radio One | ||||||||
9.250%, 02/15/2020 (B) | 3,221 | 3,004 | ||||||
7.375%, 04/15/2022 (B) | 5,147 | 5,173 | ||||||
Radio Systems | ||||||||
8.375%, 11/01/2019 (B) | 910 | 950 | ||||||
RCN Telecom Services | ||||||||
8.500%, 08/15/2020 (B) | 920 | 981 | ||||||
Regal Entertainment Group | ||||||||
5.750%, 03/15/2022 | 480 | 496 | ||||||
5.750%, 06/15/2023 | 280 | 284 | ||||||
Rivers Pittsburgh Borrower | ||||||||
6.125%, 08/15/2021 (B) | 338 | 349 | ||||||
RSI Home Products | ||||||||
6.500%, 03/15/2023 (B) | 1,040 | 1,097 | ||||||
Sally Holdings | ||||||||
5.625%, 12/01/2025 | 1,415 | 1,523 | ||||||
Schaeffler Finance | ||||||||
4.750%, 05/15/2021 (B) | 265 | 274 | ||||||
4.750%, 05/15/2023 (B) | 250 | 259 | ||||||
| SEI Institutional Managed Trust / Annual Report / September 30, 2016 | 165 |
SCHEDULE OF INVESTMENTS
September 30, 2016
High Yield Bond Fund (Continued)
| ||||||||
| Description | Face Amount (Thousands) | Market Value ($ Thousands) | ||||||
| ||||||||
CORPORATE OBLIGATIONS (continued) |
| |||||||
Schaeffler Finance PIK | ||||||||
6.750%, 11/15/2022 (B) | $ | 374 | $ | 427 | ||||
Schaeffler Finance MTN | ||||||||
4.250%, 05/15/2021 (B) | 1,000 | 1,025 | ||||||
Scientific Games | ||||||||
8.125%, 09/15/2018 | 235 | 236 | ||||||
Scientific Games International | ||||||||
10.000%, 12/01/2022 | 5,142 | 4,743 | ||||||
Seminole Tribe of Florida | ||||||||
6.535%, 10/01/2020 (B) | 380 | 382 | ||||||
Serta Simmons Bedding | ||||||||
8.125%, 10/01/2020 (B) | 1,920 | 2,006 | ||||||
Service International | ||||||||
7.500%, 04/01/2027 | 1,295 | 1,522 | ||||||
SFR Group | ||||||||
6.250%, 05/15/2024 (B) | 4,701 | 4,670 | ||||||
6.000%, 05/15/2022 (B) | 3,105 | 3,167 | ||||||
Sinclair Television Group | ||||||||
6.125%, 10/01/2022 | 995 | 1,050 | ||||||
5.625%, 08/01/2024 (B) | 2,080 | 2,127 | ||||||
5.375%, 04/01/2021 | 3,500 | 3,631 | ||||||
5.125%, 02/15/2027 (B) | 955 | 934 | ||||||
Sirius XM Radio | ||||||||
6.000%, 07/15/2024 (B) | 748 | 798 | ||||||
5.750%, 08/01/2021 (B) | 270 | 283 | ||||||
5.375%, 04/15/2025 (B) | 5,120 | 5,286 | ||||||
5.375%, 07/15/2026 (B) | 1,875 | 1,936 | ||||||
4.625%, 05/15/2023 (B) | 1,000 | 1,000 | ||||||
Six Flags Entertainment | ||||||||
5.250%, 01/15/2021 (B) | 3,200 | 3,304 | ||||||
4.875%, 07/31/2024 (B) | 625 | 631 | ||||||
Spanish Broadcasting System | ||||||||
12.500%, 04/15/2017 (B) | 1,603 | 1,603 | ||||||
Taylor Morrison Communities | ||||||||
5.625%, 03/01/2024 (B) | 1,755 | 1,808 | ||||||
TEGNA | ||||||||
6.375%, 10/15/2023 | 65 | 70 | ||||||
Tempur Sealy International | ||||||||
5.625%, 10/15/2023 | 695 | 731 | ||||||
5.500%, 06/15/2026 (B) | 455 | 469 | ||||||
Tenneco | ||||||||
5.000%, 07/15/2026 | 340 | 344 | ||||||
TI Group Automotive Systems | ||||||||
8.750%, 07/15/2023 (B) | 4,509 | 4,904 | ||||||
Time | ||||||||
5.750%, 04/15/2022 (B) | 740 | 727 | ||||||
Time Warner Cable | ||||||||
6.750%, 06/15/2039 | 525 | 639 | ||||||
5.500%, 09/01/2041 | 710 | 758 | ||||||
Townsquare Media | ||||||||
6.500%, 04/01/2023 (B) | 2,681 | 2,721 | ||||||
| ||||||||
| Description | Face Amount (Thousands) | Market Value ($ Thousands) | ||||||
| ||||||||
CORPORATE OBLIGATIONS (continued) |
| |||||||
Tribune Media | ||||||||
5.875%, 07/15/2022 | $ | 2,555 | $ | 2,585 | ||||
TRU Taj | ||||||||
12.000%, 08/15/2021 (B) | 2,410 | 2,428 | ||||||
UCI International | ||||||||
8.625%, 02/15/2019 (A) | 1,165 | 245 | ||||||
Unitymedia GmbH | ||||||||
6.125%, 01/15/2025 (B) | 795 | 834 | ||||||
Unitymedia Hessen GmbH & KG | ||||||||
5.500%, 01/15/2023 (B) | 2,480 | 2,573 | ||||||
5.000%, 01/15/2025 (B) | 1,100 | 1,114 | ||||||
Univision Communications | ||||||||
8.500%, 05/15/2021 (B) | 1,056 | 1,093 | ||||||
5.125%, 02/15/2025 (B) | 3,015 | 3,034 | ||||||
UPCB Finance IV | ||||||||
5.375%, 01/15/2025 (B) | 1,630 | 1,638 | ||||||
Videotron | ||||||||
5.375%, 06/15/2024 (B) | 635 | 660 | ||||||
5.000%, 07/15/2022 | 1,975 | 2,061 | ||||||
Viking Cruises | ||||||||
8.500%, 10/15/2022 (B) | 1,490 | 1,527 | ||||||
6.250%, 05/15/2025 (B) | 4,215 | 3,941 | ||||||
Virgin Media Finance | ||||||||
5.750%, 01/15/2025 (B) | 397 | 402 | ||||||
Virgin Media Secured Finance | ||||||||
5.500%, 01/15/2025 (B) | 200 | 204 | ||||||
5.500%, 08/15/2026 (B) | 480 | 490 | ||||||
5.250%, 01/15/2026 (B) | 3,335 | 3,385 | ||||||
Vista Outdoor | ||||||||
5.875%, 10/01/2023 (B) | 770 | 805 | ||||||
VTR Finance | ||||||||
6.875%, 01/15/2024 (B) | 1,665 | 1,739 | ||||||
Wave Holdco PIK | ||||||||
8.250%, 07/15/2019 (B) | 416 | 418 | ||||||
WideOpenWest Finance | ||||||||
10.250%, 07/15/2019 | 1,375 | 1,447 | ||||||
WMG Acquisition | ||||||||
6.000%, 01/15/2021 (B) | 851 | 883 | ||||||
5.625%, 04/15/2022 (B) | 65 | 67 | ||||||
5.000%, 08/01/2023 (B) | 420 | 426 | ||||||
Wynn Las Vegas | ||||||||
5.500%, 03/01/2025 (B) | 2,565 | 2,597 | ||||||
4.250%, 05/30/2023 (B) | 479 | 460 | ||||||
Yum! Brands | ||||||||
6.875%, 11/15/2037 | 3,420 | 3,506 | ||||||
5.350%, 11/01/2043 | 130 | 112 | ||||||
ZF North America Capital | ||||||||
4.750%, 04/29/2025 (B) | 1,055 | 1,108 | ||||||
4.500%, 04/29/2022 (B) | 425 | 451 | ||||||
Ziggo Bond Finance BV | ||||||||
5.875%, 01/15/2025 (B) | 926 | 926 | ||||||
| 166 | SEI Institutional Managed Trust / Annual Report / September 30, 2016 |
| ||||||||
| Description | Face Amount (Thousands) | Market Value ($ Thousands) | ||||||
| ||||||||
CORPORATE OBLIGATIONS (continued) |
| |||||||
Ziggo Secured Finance BV | ||||||||
5.500%, 01/15/2027 (B) | $ | 3,065 | $ | 3,061 | ||||
|
| |||||||
| 389,660 | ||||||||
|
| |||||||
Consumer Staples — 2.9% |
| |||||||
Albertsons | ||||||||
6.625%, 06/15/2024 (B) | 990 | 1,030 | ||||||
5.750%, 03/15/2025 (B) | 1,525 | 1,521 | ||||||
Bumble Bee Holdco PIK | ||||||||
9.625%, 03/15/2018 (B) | 2,092 | 2,076 | ||||||
Bumble Bee Holdings | ||||||||
9.000%, 12/15/2017 (B) | 1,106 | 1,112 | ||||||
Central Garden & Pet | ||||||||
6.125%, 11/15/2023 | 680 | 728 | ||||||
Cott Beverages | ||||||||
5.375%, 07/01/2022 | 1,315 | 1,354 | ||||||
CVS Health | ||||||||
5.000%, 12/01/2024 | 1,000 | 1,158 | ||||||
Darling Ingredients | ||||||||
5.375%, 01/15/2022 | 125 | 130 | ||||||
Elizabeth Arden | ||||||||
7.375%, 03/15/2021 | 2,359 | 2,444 | ||||||
Energizer Holdings | ||||||||
5.500%, 06/15/2025 (B) | 775 | 798 | ||||||
Fresh Market | ||||||||
9.750%, 05/01/2023 (B) | 2,105 | 1,879 | ||||||
HRG Group | ||||||||
7.750%, 01/15/2022 | 2,062 | 2,137 | ||||||
KeHE Distributors | ||||||||
7.625%, 08/15/2021 (B) | 1,900 | 1,886 | ||||||
NBTY | ||||||||
7.625%, 05/15/2021 (B) | 1,300 | 1,329 | ||||||
New Albertsons | ||||||||
8.700%, 05/01/2030 | 360 | 365 | ||||||
8.000%, 05/01/2031 | 9,435 | 9,411 | ||||||
7.750%, 06/15/2026 | 160 | 160 | ||||||
7.450%, 08/01/2029 | 1,605 | 1,573 | ||||||
Post Holdings | ||||||||
8.000%, 07/15/2025 (B) | 420 | 481 | ||||||
7.750%, 03/15/2024 (B) | 2,590 | 2,901 | ||||||
6.000%, 12/15/2022 (B) | 270 | 285 | ||||||
5.000%, 08/15/2026 (B)(C) | 5,328 | 5,301 | ||||||
Rite Aid | ||||||||
7.700%, 02/15/2027 | 2,550 | 3,264 | ||||||
6.125%, 04/01/2023 (B)(C) | 4,446 | 4,798 | ||||||
Spectrum Brands | ||||||||
6.625%, 11/15/2022 | 990 | 1,069 | ||||||
6.125%, 12/15/2024 | 1,455 | 1,576 | ||||||
5.750%, 07/15/2025 | 926 | 1,000 | ||||||
SUPERVALU | ||||||||
6.750%, 06/01/2021 | 3,545 | 3,315 | ||||||
| ||||||||
| Description | Face Amount (Thousands) | Market Value ($ Thousands) | ||||||
| ||||||||
CORPORATE OBLIGATIONS (continued) |
| |||||||
TreeHouse Foods | ||||||||
6.000%, 02/15/2024 (B) | $ | 275 | $ | 296 | ||||
|
| |||||||
| 55,377 | ||||||||
|
| |||||||
Energy — 10.7% |
| |||||||
Alberta Energy | ||||||||
8.125%, 09/15/2030 | 135 | 160 | ||||||
7.375%, 11/01/2031 | 110 | 121 | ||||||
American Greetings | ||||||||
7.375%, 12/01/2021 | 555 | 577 | ||||||
Anadarko Petroleum | ||||||||
4.500%, 07/15/2044 | 1,857 | 1,704 | ||||||
Antero Midstream Partners | ||||||||
5.375%, 09/15/2024 (B)(C) | 609 | 617 | ||||||
Antero Resources | ||||||||
6.000%, 12/01/2020 | 700 | 723 | ||||||
5.625%, 06/01/2023 | 2,085 | 2,124 | ||||||
5.375%, 11/01/2021 | 505 | 511 | ||||||
5.125%, 12/01/2022 | 1,654 | 1,666 | ||||||
Archrock Partners | ||||||||
6.000%, 04/01/2021 | 475 | 445 | ||||||
Atwood Oceanics | ||||||||
6.500%, 02/01/2020 | 350 | 276 | ||||||
Basic Energy Services | ||||||||
7.750%, 02/15/2019 (A) | 2,680 | 992 | ||||||
7.750%, 10/15/2022 | 865 | 320 | ||||||
Bellatrix Exploration | ||||||||
8.500%, 05/15/2020 (B) | 1,606 | 1,494 | ||||||
Berry Petroleum(A) | ||||||||
6.750%, 11/01/2020 | 1,060 | 604 | ||||||
6.375%, 09/15/2022 | 2,218 | 1,253 | ||||||
Blue Racer Midstream | ||||||||
6.125%, 11/15/2022 (B) | 4,410 | 4,311 | ||||||
Boardwalk Pipelines | ||||||||
5.950%, 06/01/2026 | 425 | 470 | ||||||
Calfrac Holdings | ||||||||
7.500%, 12/01/2020 (B) | 1,883 | 1,257 | ||||||
California Resources | ||||||||
8.000%, 12/15/2022 (B) | 1,185 | 788 | ||||||
Callon Petroleum | ||||||||
6.125%, 10/01/2024 (B)(C) | 2,334 | 2,416 | ||||||
Calumet Specialty Products Partners | ||||||||
7.625%, 01/15/2022 | 1,615 | 1,304 | ||||||
Carrizo Oil & Gas | ||||||||
6.250%, 04/15/2023 | 195 | 193 | ||||||
CHC Helicopter | ||||||||
9.250%, 10/15/2020 (A) | 139 | 67 | ||||||
Chesapeake Energy | ||||||||
8.000%, 12/15/2022 (B) | 4,697 | 4,762 | ||||||
7.250%, 12/15/2018 | 628 | 637 | ||||||
6.875%, 11/15/2020 (C) | 160 | 150 | ||||||
6.500%, 08/15/2017 (C) | 1,879 | 1,907 | ||||||
| SEI Institutional Managed Trust / Annual Report / September 30, 2016 | 167 |
SCHEDULE OF INVESTMENTS
September 30, 2016
High Yield Bond Fund (Continued)
| ||||||||
| Description | Face Amount (Thousands) | Market Value ($ Thousands) | ||||||
| ||||||||
CORPORATE OBLIGATIONS (continued) |
| |||||||
6.125%, 02/15/2021 | $ | 785 | $ | 720 | ||||
Cloud Peak Energy Resources | ||||||||
8.500%, 12/15/2019 (C) | 887 | 710 | ||||||
Concho Resources | ||||||||
5.500%, 10/01/2022 | 550 | 571 | ||||||
5.500%, 04/01/2023 | 1,610 | 1,660 | ||||||
CONSOL Energy | ||||||||
5.875%, 04/15/2022 | 1,521 | 1,399 | ||||||
Continental Resources | ||||||||
5.000%, 09/15/2022 | 2,213 | 2,207 | ||||||
4.500%, 04/15/2023 | 1,556 | 1,494 | ||||||
Contura Energy | ||||||||
10.000%, 08/01/2021 (B) | 926 | 954 | ||||||
Crestwood Midstream Partners | ||||||||
6.250%, 04/01/2023 | 365 | 370 | ||||||
CSI Compressco | ||||||||
7.250%, 08/15/2022 | 195 | 184 | ||||||
DCP Midstream | ||||||||
5.850%, 05/21/2043 (B)(G) | 646 | 536 | ||||||
5.350%, 03/15/2020 (B) | 1,856 | 1,902 | ||||||
Denbury Resources | ||||||||
5.500%, 05/01/2022 | 815 | 585 | ||||||
4.625%, 07/15/2023 | 1,484 | 987 | ||||||
Enable Midstream Partners | ||||||||
3.900%, 05/15/2024 | 1,560 | 1,455 | ||||||
Encana | ||||||||
7.200%, 11/01/2031 | 215 | 239 | ||||||
6.625%, 08/15/2037 | 410 | 430 | ||||||
6.500%, 08/15/2034 | 1,869 | 1,959 | ||||||
Endeavor Energy Resources | ||||||||
7.000%, 08/15/2021 (B) | 1,611 | 1,655 | ||||||
Energy Transfer Equity | ||||||||
7.500%, 10/15/2020 | 1,019 | 1,118 | ||||||
5.875%, 01/15/2024 | 3,631 | 3,767 | ||||||
5.500%, 06/01/2027 | 1,050 | 1,045 | ||||||
Energy Transfer Partners | ||||||||
6.625%, 10/15/2036 | 440 | 479 | ||||||
6.500%, 02/01/2042 | 95 | 99 | ||||||
6.125%, 12/15/2045 | 1,100 | 1,149 | ||||||
6.050%, 06/01/2041 | 110 | 111 | ||||||
5.150%, 02/01/2043 | 175 | 161 | ||||||
4.900%, 03/15/2035 | 800 | 738 | ||||||
EnLink Midstream Partners | ||||||||
5.050%, 04/01/2045 | 1,558 | 1,379 | ||||||
4.400%, 04/01/2024 | 560 | 547 | ||||||
4.150%, 06/01/2025 | 1,533 | 1,468 | ||||||
2.700%, 04/01/2019 | 805 | 800 | ||||||
EP Energy | ||||||||
9.375%, 05/01/2020 | 1,685 | 1,192 | ||||||
7.750%, 09/01/2022 | 435 | 259 | ||||||
Extraction Oil & Gas Holdings | ||||||||
7.875%, 07/15/2021 (B) | 2,235 | 2,324 | ||||||
| ||||||||
| Description | Face Amount (Thousands) | Market Value ($ Thousands) | ||||||
| ||||||||
CORPORATE OBLIGATIONS (continued) |
| |||||||
FTS International | ||||||||
8.350%, 06/15/2020 (B)(G) | $ | 1,098 | $ | 933 | ||||
Genesis Energy | ||||||||
6.750%, 08/01/2022 | 2,470 | 2,545 | ||||||
6.000%, 05/15/2023 | 1,733 | 1,720 | ||||||
5.750%, 02/15/2021 | 105 | 105 | ||||||
Gibson Energy | ||||||||
6.750%, 07/15/2021 (B) | 5,050 | 5,164 | ||||||
Halcon Resources | ||||||||
8.625%, 02/01/2020 (B) | 1,709 | 1,718 | ||||||
Hiland Partners Holdings | ||||||||
7.250%, 10/01/2020 (B) | 2,634 | 2,729 | ||||||
5.500%, 05/15/2022 (B) | 975 | 1,014 | ||||||
Hilcorp Energy I | ||||||||
5.750%, 10/01/2025 (B) | 621 | 618 | ||||||
5.000%, 12/01/2024 (B) | 667 | 639 | ||||||
IronGate Energy Services | ||||||||
11.000%, 07/01/2018 (A)(B) | 400 | 96 | ||||||
Jupiter Resources | ||||||||
8.500%, 10/01/2022 (B) | 5,490 | 4,612 | ||||||
Kinder Morgan | ||||||||
5.000%, 02/15/2021 (B) | 441 | 477 | ||||||
Laredo Petroleum | ||||||||
7.375%, 05/01/2022 | 450 | 465 | ||||||
Legacy Reserves | ||||||||
8.000%, 12/01/2020 | 794 | 429 | ||||||
Linn Energy | ||||||||
6.250%, 11/01/2019 (A)(C) | 4,035 | 1,016 | ||||||
MEG Energy | ||||||||
7.000%, 03/31/2024 (B) | 4,520 | 3,571 | ||||||
6.500%, 03/15/2021 (B) | 1,016 | 829 | ||||||
6.375%, 01/30/2023 (B) | 1,140 | 902 | ||||||
Memorial Production Partners | ||||||||
7.625%, 05/01/2021 | 3,100 | 1,565 | ||||||
6.875%, 08/01/2022 | 4,630 | 2,234 | ||||||
Midstates Petroleum(A) | ||||||||
10.750%, 10/01/2020 (C) | 2,540 | 25 | ||||||
10.000%, 06/01/2020 | 720 | 482 | ||||||
9.250%, 06/01/2021 | 360 | 4 | ||||||
Milagro Oil & Gas | ||||||||
10.500%, 05/15/2016 (A)(C) | 1,700 | 599 | ||||||
MPLX | ||||||||
5.500%, 02/15/2023 | 280 | 289 | ||||||
4.875%, 12/01/2024 | 3,184 | 3,293 | ||||||
4.875%, 06/01/2025 | 1,685 | 1,741 | ||||||
Murphy Oil | ||||||||
6.875%, 08/15/2024 | 420 | 434 | ||||||
Murray Energy | ||||||||
11.250%, 04/15/2021 (B) | 1,440 | 810 | ||||||
Newfield Exploration | ||||||||
5.750%, 01/30/2022 | 680 | 702 | ||||||
5.625%, 07/01/2024 | 905 | 928 | ||||||
| 168 | SEI Institutional Managed Trust / Annual Report / September 30, 2016 |
| ||||||||
| Description | Face Amount (Thousands) | Market Value ($ Thousands) | ||||||
| ||||||||
CORPORATE OBLIGATIONS (continued) |
| |||||||
5.375%, 01/01/2026 | $ | 1,820 | $ | 1,825 | ||||
Noble Holding International | ||||||||
5.000%, 03/16/2018 | 2,210 | 2,177 | ||||||
Northern Oil & Gas | ||||||||
8.000%, 06/01/2020 | 1,255 | 954 | ||||||
NuStar Logistics | ||||||||
6.750%, 02/01/2021 | 1,110 | 1,196 | ||||||
Oasis Petroleum | ||||||||
6.875%, 03/15/2022 | 1,585 | 1,518 | ||||||
6.875%, 01/15/2023 | 605 | 578 | ||||||
6.500%, 11/01/2021 | 285 | 272 | ||||||
ONEOK | ||||||||
7.500%, 09/01/2023 | 1,400 | 1,568 | ||||||
Parker Drilling | ||||||||
6.750%, 07/15/2022 | 6,215 | 4,848 | ||||||
Parsley Energy | ||||||||
6.250%, 06/01/2024 (B)(C) | 110 | 114 | ||||||
PBF Holding | ||||||||
7.000%, 11/15/2023 (B) | 805 | 759 | ||||||
PDC Energy | ||||||||
6.125%, 09/15/2024 (B)(C) | 246 | 255 | ||||||
Peabody Energy | ||||||||
6.250%, 11/15/2021 (A)(C) | 420 | 101 | ||||||
Permian Resources | ||||||||
8.000%, 06/15/2020 (B) | 1,911 | 1,901 | ||||||
Pride International | ||||||||
8.500%, 06/15/2019 | 923 | 1,004 | ||||||
Range Resources | ||||||||
4.875%, 05/15/2025 | 435 | 418 | ||||||
Regency Energy Partners | ||||||||
5.875%, 03/01/2022 | 2,715 | 2,994 | ||||||
5.500%, 04/15/2023 | 510 | 526 | ||||||
5.000%, 10/01/2022 | 325 | 343 | ||||||
Rice Energy | ||||||||
7.250%, 05/01/2023 | 1,140 | 1,220 | ||||||
Rose Rock Midstream | ||||||||
5.625%, 07/15/2022 | 4,085 | 3,758 | ||||||
5.625%, 11/15/2023 | 1,425 | 1,297 | ||||||
Rowan | ||||||||
5.850%, 01/15/2044 | 1,129 | 782 | ||||||
RSP Permian | ||||||||
6.625%, 10/01/2022 | 250 | 262 | ||||||
Sabine Pass Liquefaction | ||||||||
6.250%, 03/15/2022 | 2,160 | 2,360 | ||||||
5.875%, 06/30/2026 (B) | 1,435 | 1,560 | ||||||
5.750%, 05/15/2024 | 3,325 | 3,578 | ||||||
5.625%, 02/01/2021 | 3,395 | 3,586 | ||||||
5.625%, 04/15/2023 | 1,845 | 1,970 | ||||||
5.625%, 03/01/2025 | 928 | 998 | ||||||
5.000%, 03/15/2027 (B)(C) | 1,015 | 1,040 | ||||||
Sanchez Energy | ||||||||
7.750%, 06/15/2021 | 120 | 106 | ||||||
| ||||||||
| Description | Face Amount (Thousands) | Market Value ($ Thousands) | ||||||
| ||||||||
CORPORATE OBLIGATIONS (continued) |
| |||||||
6.125%, 01/15/2023 | $ | 575 | $ | 461 | ||||
SandRidge Energy(A) | ||||||||
8.750%, 01/15/2020 | 212 | 12 | ||||||
8.750%, 06/01/2020 (B)(C) | 2,485 | 895 | ||||||
8.125%, 10/15/2022 | 26 | 1 | ||||||
7.500%, 02/15/2023 | 3,515 | 202 | ||||||
SemGroup | ||||||||
7.500%, 06/15/2021 | 305 | 305 | ||||||
SESI LLC | ||||||||
7.125%, 12/15/2021 | 5,327 | 5,207 | ||||||
Seventy Seven Energy | ||||||||
6.500%, 07/15/2022 (A) | 305 | – | ||||||
Seventy Seven Operating | ||||||||
6.625%, 11/15/2019 (A) | 1,869 | – | ||||||
SM Energy | ||||||||
6.750%, 09/15/2026 | 1,448 | 1,462 | ||||||
6.500%, 01/01/2023 | 180 | 182 | ||||||
6.125%, 11/15/2022 | 465 | 465 | ||||||
5.625%, 06/01/2025 | 295 | 277 | ||||||
Southwestern Energy | ||||||||
6.700%, 01/23/2025 | 1,235 | 1,235 | ||||||
4.100%, 03/15/2022 | 932 | 846 | ||||||
Summit Midstream Holdings | ||||||||
5.500%, 08/15/2022 | 1,548 | 1,474 | ||||||
Tallgrass Energy Partners | ||||||||
5.500%, 09/15/2024 (B)(C) | 1,154 | 1,163 | ||||||
Targa Resources Partners | ||||||||
6.875%, 02/01/2021 | 1,084 | 1,119 | ||||||
6.750%, 03/15/2024 | 2,385 | 2,552 | ||||||
6.625%, 10/01/2020 | 1,869 | 1,932 | ||||||
5.250%, 05/01/2023 | 40 | 40 | ||||||
5.125%, 02/01/2025 (B)(C) | 160 | 160 | ||||||
4.250%, 11/15/2023 | 3,200 | 3,092 | ||||||
Tesoro Logistics | ||||||||
6.375%, 05/01/2024 | 250 | 268 | ||||||
6.250%, 10/15/2022 | 255 | 272 | ||||||
6.125%, 10/15/2021 | 535 | 559 | ||||||
5.875%, 10/01/2020 | 783 | 806 | ||||||
Transocean | ||||||||
6.000%, 03/15/2018 | 2,173 | 2,184 | ||||||
Tullow Oil | ||||||||
6.250%, 04/15/2022 (B) | 1,274 | 1,140 | ||||||
6.000%, 11/01/2020 (B) | 651 | 587 | ||||||
Unit | ||||||||
6.625%, 05/15/2021 | 2,130 | 1,797 | ||||||
Walter Energy | ||||||||
8.500%, 04/15/2021 (A) | 1,455 | – | ||||||
Weatherford International | ||||||||
8.250%, 06/15/2023 | 1,662 | 1,641 | ||||||
6.750%, 09/15/2040 | 2,230 | 1,594 | ||||||
5.950%, 04/15/2042 | 4,110 | 2,815 | ||||||
| SEI Institutional Managed Trust / Annual Report / September 30, 2016 | 169 |
SCHEDULE OF INVESTMENTS
September 30, 2016
High Yield Bond Fund (Continued)
| ||||||||
| Description | Face Amount (Thousands) | Market Value ($ Thousands) | ||||||
| ||||||||
CORPORATE OBLIGATIONS (continued) |
| |||||||
Western Refining | ||||||||
6.250%, 04/01/2021 | $ | 624 | $ | 616 | ||||
Western Refining Logistics | ||||||||
7.500%, 02/15/2023 | 1,135 | 1,163 | ||||||
Whiting Petroleum | ||||||||
6.500%, 10/01/2018 | 400 | 394 | ||||||
6.250%, 04/01/2023 | 2,260 | 2,062 | ||||||
5.750%, 03/15/2021 | 1,099 | 1,028 | ||||||
Williams | ||||||||
4.550%, 06/24/2024 | 802 | 818 | ||||||
Williams Partners | ||||||||
6.300%, 04/15/2040 | 365 | 401 | ||||||
6.125%, 07/15/2022 | 620 | 644 | ||||||
5.800%, 11/15/2043 | 460 | 479 | ||||||
5.400%, 03/04/2044 | 290 | 289 | ||||||
4.900%, 01/15/2045 | 815 | 775 | ||||||
4.875%, 05/15/2023 | 75 | 76 | ||||||
4.875%, 03/15/2024 | 1,527 | 1,543 | ||||||
4.000%, 09/15/2025 | 335 | 335 | ||||||
3.900%, 01/15/2025 | 505 | 504 | ||||||
Williams, Ser A | ||||||||
7.500%, 01/15/2031 | 176 | 201 | ||||||
WPX Energy | ||||||||
8.250%, 08/01/2023 | 1,241 | 1,334 | ||||||
6.000%, 01/15/2022 | 1,365 | 1,362 | ||||||
5.250%, 09/15/2024
|
| 140
|
|
| 132
|
| ||
|
| |||||||
| 207,959 | ||||||||
|
| |||||||
Financials — 4.9% |
| |||||||
AAF Holdings PIK | ||||||||
12.000%, 07/01/2019 (B) | 1,082 | 1,109 | ||||||
Ally Financial | ||||||||
8.000%, 03/15/2020 | 375 | 428 | ||||||
5.750%, 11/20/2025 | 4,105 | 4,295 | ||||||
5.125%, 09/30/2024 | 7,618 | 8,075 | ||||||
4.625%, 05/19/2022 | 805 | 829 | ||||||
4.625%, 03/30/2025 | 1,450 | 1,486 | ||||||
4.250%, 04/15/2021 | 145 | 148 | ||||||
4.125%, 03/30/2020 | 595 | 605 | ||||||
3.500%, 01/27/2019 | 1,480 | 1,493 | ||||||
American Equity Investment Life Holding | ||||||||
6.625%, 07/15/2021 | 1,900 | 1,980 | ||||||
Bank of America(G) | ||||||||
8.000%, 12/29/2049 | 1,580 | 1,612 | ||||||
6.500%, 12/31/2049 | 2,280 | 2,470 | ||||||
5.125%, 12/31/2049 | 1,917 | 1,883 | ||||||
BCD Acquisition | ||||||||
9.625%, 09/15/2023 (B) | 1,335 | 1,395 | ||||||
Care Capital Properties | ||||||||
5.125%, 08/15/2026 (B) | 3,301 | 3,300 | ||||||
CIT Group | ||||||||
6.625%, 04/01/2018 (B) | 250 | 265 | ||||||
| ||||||||
| Description | Face Amount (Thousands) | Market Value ($ Thousands) | ||||||
| ||||||||
CORPORATE OBLIGATIONS (continued) |
| |||||||
5.500%, 02/15/2019 (B) | $ | 2,940 | $ | 3,113 | ||||
3.875%, 02/19/2019 | 940 | 960 | ||||||
Citigroup(G) | ||||||||
6.250%, 12/29/2049 | 840 | 904 | ||||||
5.950%, 12/29/2049 | 1,950 | 2,020 | ||||||
City National Bank | ||||||||
9.000%, 08/12/2019 | 3,384 | 3,984 | ||||||
Credit Acceptance | ||||||||
7.375%, 03/15/2023 | 3,935 | 4,073 | ||||||
6.125%, 02/15/2021 | 345 | 347 | ||||||
Credit Suisse Group | ||||||||
7.500%, 12/11/2048 (B)(G) | 1,365 | 1,389 | ||||||
CTR Partnership | ||||||||
5.875%, 06/01/2021 | 1,970 | 2,039 | ||||||
Double Eagle Acquisition Sub | ||||||||
7.500%, 10/01/2024 (B)(C) | 838 | 853 | ||||||
FBM Finance | ||||||||
8.250%, 08/15/2021 (B)(C) | 707 | 739 | ||||||
HUB International | ||||||||
9.250%, 02/15/2021 (B) | 350 | 364 | ||||||
7.875%, 10/01/2021 (B) | 4,510 | 4,600 | ||||||
Infinity Acquisition | ||||||||
7.250%, 08/01/2022 (B) | 585 | 509 | ||||||
Jefferies Finance | ||||||||
6.875%, 04/15/2022 (B) | 2,645 | 2,460 | ||||||
JPMorgan Chase(G) | ||||||||
7.900%, 04/29/2049 | 1,967 | 2,021 | ||||||
6.750%, 08/29/2049 | 2,385 | 2,632 | ||||||
6.000%, 12/29/2049 | 3,525 | 3,679 | ||||||
Lloyds Banking Group | ||||||||
7.500%, 12/01/2099 (G) | 2,665 | 2,752 | ||||||
Mattamy Group | ||||||||
6.500%, 11/15/2020 (B) | 1,105 | 1,102 | ||||||
MGIC Investment | ||||||||
5.750%, 08/15/2023 | 2,070 | 2,153 | ||||||
MSCI | ||||||||
5.750%, 08/15/2025 (B) | 566 | 604 | ||||||
5.250%, 11/15/2024 (B) | 1,310 | 1,387 | ||||||
4.750%, 08/01/2026 (B) | 955 | 967 | ||||||
National Life Insurance | ||||||||
10.500%, 09/15/2039 (B) | 990 | 1,518 | ||||||
Nationstar Mortgage | ||||||||
6.500%, 08/01/2018 | 1,350 | 1,372 | ||||||
6.500%, 07/01/2021 | 1,525 | 1,494 | ||||||
Navient | ||||||||
7.250%, 09/25/2023 | 1,380 | 1,380 | ||||||
6.625%, 07/26/2021 | 2,200 | 2,216 | ||||||
NSG Holdings | ||||||||
7.750%, 12/15/2025 (B) | 1,765 | 1,898 | ||||||
Popular | ||||||||
7.000%, 07/01/2019 | 2,488 | 2,563 | ||||||
| 170 | SEI Institutional Managed Trust / Annual Report / September 30, 2016 |
| ||||||||
| Description | Face Amount (Thousands) | Market Value ($ Thousands) | ||||||
| ||||||||
CORPORATE OBLIGATIONS (continued) |
| |||||||
Royal Bank of Scotland Group PLC | ||||||||
8.000%, 12/29/2049 (G) | $ | 1,340 | $ | 1,260 | ||||
5.125%, 05/28/2024 | 780 | 781 | ||||||
USI | ||||||||
7.750%, 01/15/2021 (B) | 1,240 | 1,259 | ||||||
Walter Investment Management | ||||||||
4.500%, 11/01/2019 | 521 | 299 | ||||||
Wells Fargo | ||||||||
7.980%, 03/15/2018 (G) | 950 | 993 | ||||||
York Risk Services Holding | ||||||||
8.500%, 10/01/2022 (B)
|
| 2,250
|
|
| 1,749
|
| ||
|
| |||||||
| 95,806 | ||||||||
|
| |||||||
Health Care — 8.9% |
| |||||||
21st Century Oncology | ||||||||
11.000%, 05/01/2023 (B) | 605 | 515 | ||||||
Acadia Healthcare | ||||||||
6.500%, 03/01/2024 | 611 | 640 | ||||||
5.625%, 02/15/2023 | 1,170 | 1,188 | ||||||
5.125%, 07/01/2022 | 1,600 | 1,584 | ||||||
Alere | ||||||||
6.500%, 06/15/2020 | 215 | 215 | ||||||
6.375%, 07/01/2023 (B) | 1,819 | 1,855 | ||||||
AMN Healthcare | ||||||||
5.125%, 10/01/2024 (B)(C) | 2,569 | 2,595 | ||||||
Amsurg | ||||||||
5.625%, 07/15/2022 | 3,975 | 4,064 | ||||||
Aurora Diagnostics Holdings | ||||||||
10.750%, 01/15/2018 | 4,535 | 3,401 | ||||||
BioScrip | ||||||||
8.875%, 02/15/2021 | 500 | 467 | ||||||
Centene | ||||||||
6.125%, 02/15/2024 | 660 | 716 | ||||||
5.625%, 02/15/2021 | 660 | 700 | ||||||
CHS | ||||||||
8.000%, 11/15/2019 | 1,474 | 1,445 | ||||||
5.125%, 08/01/2021 | 700 | 695 | ||||||
Concordia International | ||||||||
9.500%, 10/21/2022 (B) | 1,953 | 1,352 | ||||||
Crimson Merger | ||||||||
6.625%, 05/15/2022 (B) | 4,320 | 3,812 | ||||||
DaVita HealthCare Partners | ||||||||
5.125%, 07/15/2024 | 2,465 | 2,514 | ||||||
5.000%, 05/01/2025 | 5,720 | 5,741 | ||||||
DJO Finco | ||||||||
8.125%, 06/15/2021 (B) | 2,255 | 2,092 | ||||||
DPx Holdings | ||||||||
7.500%, 02/01/2022 (B) | 530 | 560 | ||||||
Endo | ||||||||
6.000%, 07/15/2023 (B) | 2,618 | 2,382 | ||||||
Fresenius Medical Care US Finance II | ||||||||
4.750%, 10/15/2024 (B) | 800 | 840 | ||||||
| ||||||||
| Description | Face Amount (Thousands) | Market Value ($ Thousands) | ||||||
| ||||||||
CORPORATE OBLIGATIONS (continued) |
| |||||||
4.125%, 10/15/2020 (B) | $ | 2,250 | $ | 2,369 | ||||
Gates Global | ||||||||
6.000%, 07/15/2022 (B) | 545 | 518 | ||||||
Grifols Worldwide Operations | ||||||||
5.250%, 04/01/2022 | 2,845 | 2,945 | ||||||
HCA | ||||||||
7.500%, 02/15/2022 | 3,720 | 4,269 | ||||||
5.875%, 05/01/2023 | 4,660 | 4,963 | ||||||
5.875%, 02/15/2026 | 3,115 | 3,321 | ||||||
5.375%, 02/01/2025 | 6,325 | 6,531 | ||||||
5.250%, 04/15/2025 | 2,495 | 2,660 | ||||||
5.250%, 06/15/2026 | 2,253 | 2,394 | ||||||
5.000%, 03/15/2024 | 488 | 515 | ||||||
HealthSouth | ||||||||
5.750%, 11/01/2024 | 1,900 | 1,968 | ||||||
5.750%, 09/15/2025 | 2,037 | 2,124 | ||||||
5.125%, 03/15/2023 | 463 | 462 | ||||||
Hill-Rom Holdings | ||||||||
5.750%, 09/01/2023 (B) | 2,360 | 2,519 | ||||||
Hologic | ||||||||
5.250%, 07/15/2022 (B) | 705 | 748 | ||||||
IASIS Healthcare | ||||||||
8.375%, 05/15/2019 | 4,572 | 4,138 | ||||||
IMS Health | ||||||||
6.000%, 11/01/2020 (B) | 685 | 695 | ||||||
5.000%, 10/15/2026 (B) | 4,945 | 5,143 | ||||||
inVentiv Health PIK | ||||||||
10.000%, 08/15/2018 (B)(C) | 640 | 657 | ||||||
inVentiv Health | ||||||||
10.000%, 08/15/2018 | 388 | 388 | ||||||
9.000%, 01/15/2018 (B) | 980 | 1,006 | ||||||
Ironwood Pharmaceuticals | ||||||||
11.000%, 06/15/2024 (B) | 2,279 | 2,313 | ||||||
Jaguar Holding II | ||||||||
6.375%, 08/01/2023 (B) | 530 | 551 | ||||||
Kindred Healthcare | ||||||||
8.750%, 01/15/2023 | 1,160 | 1,160 | ||||||
8.000%, 01/15/2020 | 1,060 | 1,079 | ||||||
6.375%, 04/15/2022 | 3,975 | 3,766 | ||||||
Kinetic Concepts | ||||||||
12.500%, 11/01/2019 | 430 | 428 | ||||||
10.500%, 11/01/2018 | 1,510 | 1,587 | ||||||
9.625%, 10/01/2021 (B)(C) | 3,470 | 3,470 | ||||||
7.875%, 02/15/2021 (B) | 1,946 | 2,107 | ||||||
LifePoint Hospitals | ||||||||
5.500%, 12/01/2021 | 2,940 | 3,065 | ||||||
Mallinckrodt International Finance | ||||||||
5.750%, 08/01/2022 (B) | 1,965 | 1,938 | ||||||
5.625%, 10/15/2023 (B) | 690 | 661 | ||||||
5.500%, 04/15/2025 (B) | 2,346 | 2,229 | ||||||
4.875%, 04/15/2020 (B) | 205 | 209 | ||||||
4.750%, 04/15/2023 | 4,751 | 4,276 | ||||||
| SEI Institutional Managed Trust / Annual Report / September 30, 2016 | 171 |
SCHEDULE OF INVESTMENTS
September 30, 2016
High Yield Bond Fund (Continued)
| ||||||||
| Description | Face Amount (Thousands) | Market Value ($ Thousands) | ||||||
| ||||||||
CORPORATE OBLIGATIONS (continued) |
| |||||||
Molina Healthcare | ||||||||
5.375%, 11/15/2022 | $ | 406 | $ | 419 | ||||
MPH Acquisition Holdings | ||||||||
7.125%, 06/01/2024 (B) | 649 | 698 | ||||||
Opal Acquisition | ||||||||
8.875%, 12/15/2021 (B) | 2,678 | 2,196 | ||||||
Prestige Brands | ||||||||
6.375%, 03/01/2024 (B) | 220 | 234 | ||||||
5.375%, 12/15/2021 (B) | 1,225 | 1,268 | ||||||
Quintiles Transnational | ||||||||
4.875%, 05/15/2023 (B) | 1,980 | 2,034 | ||||||
Quorum Health | ||||||||
11.625%, 04/15/2023 (B) | 1,193 | 990 | ||||||
RegionalCare Hospital Partners Holdings | ||||||||
8.250%, 05/01/2023 (B) | 784 | 809 | ||||||
Select Medical | ||||||||
6.375%, 06/01/2021 | 2,690 | 2,646 | ||||||
Sterigenics-Nordion Holdings | ||||||||
6.500%, 05/15/2023 (B) | 1,300 | 1,352 | ||||||
Surgical Care Affiliates | ||||||||
6.000%, 04/01/2023 (B) | 667 | 700 | ||||||
Tenet Healthcare | ||||||||
8.125%, 04/01/2022 | 3,160 | 3,160 | ||||||
8.000%, 08/01/2020 | 660 | 667 | ||||||
6.750%, 02/01/2020 | 1,861 | 1,828 | ||||||
6.750%, 06/15/2023 | 7,636 | 7,101 | ||||||
6.000%, 10/01/2020 | 455 | 481 | ||||||
5.500%, 03/01/2019 | 1,323 | 1,300 | ||||||
4.750%, 06/01/2020 | 115 | 117 | ||||||
4.500%, 04/01/2021 | 260 | 262 | ||||||
4.350%, 06/15/2020 (G) | 545 | 548 | ||||||
Valeant Pharmaceuticals International | ||||||||
7.250%, 07/15/2022 (B) | 1,220 | 1,132 | ||||||
7.000%, 10/01/2020 (B) | 2,770 | 2,687 | ||||||
6.750%, 08/15/2021 (B) | 905 | 851 | ||||||
6.125%, 04/15/2025 (B) | 6,494 | 5,593 | ||||||
5.875%, 05/15/2023 (B) | 2,231 | 1,924 | ||||||
5.500%, 03/01/2023 (B) | 3,193 | 2,730 | ||||||
5.375%, 03/15/2020 (B) | 701 | 648 | ||||||
Valeant Pharmaceuticals International Escrow | ||||||||
7.500%, 07/15/2021 (B) | 8,615 | 8,340 | ||||||
6.750%, 08/15/2018 (B) | 235 | 236 | ||||||
Vizient | ||||||||
10.375%, 03/01/2024 (B)
|
| 910
|
|
| 1,044
|
| ||
|
| |||||||
| 172,540 | ||||||||
|
| |||||||
Industrials — 7.0% |
| |||||||
ACCO Brands | ||||||||
6.750%, 04/30/2020 | 785 | 828 | ||||||
Actuant | ||||||||
5.625%, 06/15/2022 | 3,000 | 3,126 | ||||||
| ||||||||
| Description | Face Amount (Thousands) | Market Value ($ Thousands) | ||||||
| ||||||||
CORPORATE OBLIGATIONS (continued) |
| |||||||
ADT | ||||||||
3.500%, 07/15/2022 | $ | 1,025 | $ | 987 | ||||
Advanced Disposal Services | ||||||||
8.250%, 10/01/2020 | 3,055 | 3,208 | ||||||
AECOM | ||||||||
5.875%, 10/15/2024 | 330 | 352 | ||||||
5.750%, 10/15/2022 | 135 | 142 | ||||||
AerCap Ireland Capital | ||||||||
4.625%, 10/30/2020 | 310 | 325 | ||||||
4.625%, 07/01/2022 | 275 | 289 | ||||||
4.500%, 05/15/2021 | 2,637 | 2,759 | ||||||
Air Medical Merger | ||||||||
6.375%, 05/15/2023 (B) | 3,305 | 3,198 | ||||||
Aircastle | ||||||||
7.625%, 04/15/2020 | 210 | 239 | ||||||
5.125%, 03/15/2021 | 110 | 118 | ||||||
5.000%, 04/01/2023 | 525 | 550 | ||||||
Algeco Scotsman Global Finance | ||||||||
8.500%, 10/15/2018 (B) | 1,565 | 1,416 | ||||||
Allegion | ||||||||
5.875%, 09/15/2023 | 435 | 469 | ||||||
Allegion US Holding | ||||||||
5.750%, 10/01/2021 | 340 | 355 | ||||||
Allison Transmission | ||||||||
5.000%, 10/01/2024 (B) | 1,118 | 1,146 | ||||||
American Builders & Contractors Supply | ||||||||
5.750%, 12/15/2023 (B) | 665 | 694 | ||||||
5.625%, 04/15/2021 (B) | 700 | 724 | ||||||
APX Group | ||||||||
8.750%, 12/01/2020 | 3,765 | 3,690 | ||||||
Associated Materials | ||||||||
9.125%, 11/01/2017 | 190 | 179 | ||||||
Avis Budget Car Rental | ||||||||
6.375%, 04/01/2024 (B) | 730 | 745 | ||||||
5.500%, 04/01/2023 | 825 | 832 | ||||||
5.125%, 06/01/2022 (B) | 75 | 75 | ||||||
Beacon Roofing Supply | ||||||||
6.375%, 10/01/2023 | 895 | 967 | ||||||
BMC East | ||||||||
5.500%, 10/01/2024 (B)(C) | 1,495 | 1,495 | ||||||
Bombardier | ||||||||
7.500%, 03/15/2025 (B) | 1,195 | 1,101 | ||||||
6.000%, 10/15/2022 (B) | 4,411 | 3,992 | ||||||
Builders FirstSource | ||||||||
5.625%, 09/01/2024 (B) | 2,705 | 2,773 | ||||||
CDW | ||||||||
5.000%, 09/01/2023 | 1,750 | 1,807 | ||||||
CEB | ||||||||
5.625%, 06/15/2023 (B) | 460 | 453 | ||||||
Cenveo | ||||||||
8.500%, 09/15/2022 (B) | 5,325 | 3,834 | ||||||
6.000%, 08/01/2019 (B) | 4,380 | 3,887 | ||||||
| 172 | SEI Institutional Managed Trust / Annual Report / September 30, 2016 |
| Description | Face Amount (Thousands) | Market Value ($ Thousands) | ||||||
CORPORATE OBLIGATIONS (continued) |
| |||||||
Ceridian HCM Holding | ||||||||
11.000%, 03/15/2021 (B) | $ | 827 | $ | 875 | ||||
CEVA Group | ||||||||
7.000%, 03/01/2021 (B) | 950 | 769 | ||||||
Clean Harbors | ||||||||
5.250%, 08/01/2020 | 1,755 | 1,803 | ||||||
5.125%, 06/01/2021 | 260 | 266 | ||||||
Cloud Crane | ||||||||
10.125%, 08/01/2024 (B) | 3,086 | 3,194 | ||||||
CNH Industrial Capital | ||||||||
4.875%, 04/01/2021 | 730 | 776 | ||||||
4.375%, 11/06/2020 | 565 | 590 | ||||||
Cortes NP Acquisition | ||||||||
9.250%, 10/15/2024 (B) | 82 | 82 | ||||||
DigitalGlobe | ||||||||
5.250%, 02/01/2021 (B) | 5,468 | 5,427 | ||||||
FGI Operating | ||||||||
7.875%, 05/01/2020 | 910 | 755 | ||||||
Florida East Coast Holdings | ||||||||
6.750%, 05/01/2019 (B) | 2,139 | 2,192 | ||||||
Gardner Denver | ||||||||
6.875%, 08/15/2021 (B) | 1,827 | 1,713 | ||||||
General Cable | ||||||||
5.750%, 10/01/2022 | 1,035 | 983 | ||||||
Global A&T Electronics | ||||||||
10.000%, 02/01/2019 (B) | 400 | 316 | ||||||
Great Lakes Dredge & Dock | ||||||||
7.375%, 02/01/2019 | 1,087 | 1,065 | ||||||
H&E Equipment Services | ||||||||
7.000%, 09/01/2022 | 835 | 881 | ||||||
HD Supply | ||||||||
5.750%, 04/15/2024 (B) | 1,225 | 1,286 | ||||||
5.250%, 12/15/2021 (B) | 375 | 397 | ||||||
Hertz | ||||||||
7.375%, 01/15/2021 | 365 | 379 | ||||||
6.250%, 10/15/2022 | 1,500 | 1,545 | ||||||
5.875%, 10/15/2020 | 280 | 289 | ||||||
5.500%, 10/15/2024 (B)(C) | 440 | 438 | ||||||
Huntington Ingalls Industries | ||||||||
5.000%, 11/15/2025 (B) | 1,251 | 1,323 | ||||||
Icahn Enterprises | ||||||||
5.875%, 02/01/2022 | 1,915 | 1,838 | ||||||
4.875%, 03/15/2019 | 1,632 | 1,640 | ||||||
International Lease Finance | ||||||||
6.250%, 05/15/2019 | 800 | 867 | ||||||
5.875%, 04/01/2019 | 655 | 702 | ||||||
4.625%, 04/15/2021 | 35 | 37 | ||||||
Jack Cooper Enterprises PIK | ||||||||
10.500%, 03/15/2019 (B) | 445 | 116 | ||||||
Jack Cooper Holdings | ||||||||
9.250%, 06/01/2020 | 1,095 | 745 | ||||||
| Description | Face Amount (Thousands) | Market Value ($ Thousands) | ||||||
CORPORATE OBLIGATIONS (continued) |
| |||||||
James Hardie International Finance | ||||||||
5.875%, 02/15/2023 (B) | $ | 610 | $ | 647 | ||||
KLX | ||||||||
5.875%, 12/01/2022 (B) | 2,075 | 2,148 | ||||||
Kratos Defense & Security Solutions | ||||||||
7.000%, 05/15/2019 | 731 | 680 | ||||||
LSC Communications | ||||||||
8.750%, 10/15/2023 (B) | 340 | 339 | ||||||
Manitowoc Foodservice | ||||||||
9.500%, 02/15/2024 | 240 | 275 | ||||||
Masonite International | ||||||||
5.625%, 03/15/2023 (B) | 475 | 501 | ||||||
NCI Building Systems | ||||||||
8.250%, 01/15/2023 (B) | 1,095 | 1,191 | ||||||
Nielsen Finance | ||||||||
5.000%, 04/15/2022 (B) | 4,369 | 4,511 | ||||||
Nielsen Luxembourg | ||||||||
5.500%, 10/01/2021 (B) | 205 | 214 | ||||||
Novelis | ||||||||
6.250%, 08/15/2024 (B) | 230 | 244 | ||||||
5.875%, 09/30/2026 (B) | 775 | 793 | ||||||
Oshkosh | ||||||||
5.375%, 03/01/2022 | 420 | 442 | ||||||
5.375%, 03/01/2025 | 170 | 178 | ||||||
Prime Security Services Borrower | ||||||||
9.250%, 05/15/2023 (B) | 6,869 | 7,487 | ||||||
RR Donnelley & Sons | ||||||||
7.625%, 06/15/2020 | 953 | 1,032 | ||||||
Sensata Technologies | ||||||||
5.625%, 11/01/2024 (B) | 395 | 417 | ||||||
5.000%, 10/01/2025 (B) | 1,039 | 1,062 | ||||||
4.875%, 10/15/2023 (B) | 2,015 | 2,096 | ||||||
Sensata Technologies UK Financing | ||||||||
6.250%, 02/15/2026 (B) | 2,235 | 2,419 | ||||||
SPX FLOW | ||||||||
5.875%, 08/15/2026 (B) | 701 | 709 | ||||||
5.625%, 08/15/2024 (B)(C) | 631 | 640 | ||||||
Standard Industries | ||||||||
6.000%, 10/15/2025 (B) | 345 | 369 | ||||||
5.500%, 02/15/2023 (B) | 410 | 428 | ||||||
StandardAero Aviation Holdings | ||||||||
10.000%, 07/15/2023 (B) | 5,800 | 6,224 | ||||||
Terex | ||||||||
6.500%, 04/01/2020 | 480 | 492 | ||||||
6.000%, 05/15/2021 | 3,140 | 3,211 | ||||||
TransDigm | ||||||||
6.500%, 07/15/2024 | 620 | 652 | ||||||
6.500%, 05/15/2025 | 850 | 885 | ||||||
6.375%, 06/15/2026 (B) | 623 | 643 | ||||||
Triumph Group | ||||||||
4.875%, 04/01/2021 | 925 | 886 | ||||||
| SEI Institutional Managed Trust / Annual Report / September 30, 2016 | 173 |
SCHEDULE OF INVESTMENTS
September 30, 2016
High Yield Bond Fund (Continued)
| Description | Face Amount (Thousands) | Market Value ($ Thousands) | ||||||
CORPORATE OBLIGATIONS (continued) |
| |||||||
United Rentals North America | ||||||||
7.625%, 04/15/2022 | $ | 680 | $ | 724 | ||||
6.125%, 06/15/2023 | 680 | 713 | ||||||
5.875%, 09/15/2026 | 2,355 | 2,426 | ||||||
5.750%, 11/15/2024 | 1,305 | 1,354 | ||||||
5.500%, 07/15/2025 | 1,245 | 1,270 | ||||||
Univar | ||||||||
6.750%, 07/15/2023 (B) | 396 | 408 | ||||||
West | ||||||||
5.375%, 07/15/2022 (B) | 650 | 637 | ||||||
Xerium Technologies | ||||||||
9.500%, 08/15/2021 (B) | 2,380 | 2,410 | ||||||
XPO Logistics | ||||||||
6.500%, 06/15/2022 (B) | 790 | 824 | ||||||
6.125%, 09/01/2023 (B) | 800 | 820 | ||||||
Zekelman Industries | ||||||||
9.875%, 06/15/2023 (B) | 2,427 | 2,560 | ||||||
|
| |||||||
| 136,005 | ||||||||
|
| |||||||
Information Technology — 7.8% |
| |||||||
ACI Worldwide | ||||||||
6.375%, 08/15/2020 (B) | 510 | 527 | ||||||
Activision Blizzard | ||||||||
5.625%, 09/15/2021 (B) | 3,500 | 3,652 | ||||||
Advanced Micro Devices | ||||||||
7.500%, 08/15/2022 | 1,540 | 1,580 | ||||||
7.000%, 07/01/2024 | 1,395 | 1,371 | ||||||
Aegis Merger | ||||||||
10.250%, 02/15/2023 (B) | 5,353 | 5,861 | ||||||
Alliance Data Systems | ||||||||
5.375%, 08/01/2022 (B) | 1,058 | 1,032 | ||||||
Amkor Technology | ||||||||
6.625%, 06/01/2021 | 616 | 634 | ||||||
6.375%, 10/01/2022 | 1,720 | 1,776 | ||||||
Anixter | ||||||||
5.500%, 03/01/2023 | 1,675 | 1,755 | ||||||
Aspect Software | ||||||||
3.000%, 05/23/2023 (H) | 273 | 273 | ||||||
Avaya | ||||||||
10.500%, 03/01/2021 (B) | 699 | 154 | ||||||
9.000%, 04/01/2019 (B) | 1,760 | 1,316 | ||||||
7.000%, 04/01/2019 (B) | 1,959 | 1,445 | ||||||
Bankrate | ||||||||
6.125%, 08/15/2018 (B) | 2,296 | 2,319 | ||||||
Belden | ||||||||
5.500%, 09/01/2022 (B) | 845 | 881 | ||||||
BMC Software Finance | ||||||||
8.125%, 07/15/2021 (B) | 6,238 | 5,661 | ||||||
Boxer Parent PIK | ||||||||
9.000%, 10/15/2019 (B) | 3,070 | 2,778 | ||||||
Camelot Finance | ||||||||
7.875%, 10/15/2024 (B)(C) | 64 | 66 | ||||||
| Description | Face Amount (Thousands) | Market Value ($ Thousands) | ||||||
CORPORATE OBLIGATIONS (continued) |
| |||||||
Cardtronics | ||||||||
5.125%, 08/01/2022 | $ | 2,350 | $ | 2,403 | ||||
Cimpress | ||||||||
7.000%, 04/01/2022 (B) | 237 | 247 | ||||||
CommScope | ||||||||
5.500%, 06/15/2024 (B) | 2,436 | 2,558 | ||||||
CommScope Technologies Finance | ||||||||
6.000%, 06/15/2025 (B) | 2,747 | 2,929 | ||||||
Diamond 1 Finance | ||||||||
8.350%, 07/15/2046 (B) | 2,365 | 2,832 | ||||||
8.100%, 07/15/2036 (B) | 1,970 | 2,316 | ||||||
7.125%, 06/15/2024 (B) | 4,133 | 4,546 | ||||||
6.020%, 06/15/2026 (B) | 2,281 | 2,501 | ||||||
5.875%, 06/15/2021 (B) | 1,017 | 1,080 | ||||||
5.450%, 06/15/2023 (B) | 915 | 980 | ||||||
Donnelley Financial Solutions | ||||||||
8.250%, 10/15/2024 (B)(C) | 1,206 | 1,221 | ||||||
EarthLink Holdings | ||||||||
7.375%, 06/01/2020 | 1,950 | 2,050 | ||||||
Entegris | ||||||||
6.000%, 04/01/2022 (B) | 1,655 | 1,713 | ||||||
First Data | ||||||||
7.000%, 12/01/2023 (B) | 3,319 | 3,510 | ||||||
5.750%, 01/15/2024 (B) | 5,043 | 5,182 | ||||||
5.375%, 08/15/2023 (B) | 2,424 | 2,497 | ||||||
5.000%, 01/15/2024 (B) | 5,167 | 5,244 | ||||||
Harland Clarke Holdings | ||||||||
9.750%, 08/01/2018 (B) | 865 | 889 | ||||||
9.250%, 03/01/2021 (B) | 8,273 | 7,032 | ||||||
Hughes Satellite Systems | ||||||||
7.625%, 06/15/2021 | 2,100 | 2,239 | ||||||
6.625%, 08/01/2026 (B) | 140 | 135 | ||||||
5.250%, 08/01/2026 (B)(C) | 900 | 889 | ||||||
Infor Software Parent PIK | ||||||||
7.125%, 05/01/2021 (B)(C) | 1,180 | 1,145 | ||||||
Infor US | ||||||||
6.500%, 05/15/2022 | 2,040 | 2,065 | ||||||
Informatica | ||||||||
7.125%, 07/15/2023 (B) | 2,354 | 2,201 | ||||||
JDA Escrow | ||||||||
7.375%, 10/15/2024 (B)(C) | 268 | 275 | ||||||
Magnachip Semiconductor | ||||||||
6.625%, 07/15/2021 | 915 | 817 | ||||||
Micron Technology | ||||||||
7.500%, 09/15/2023 (B) | 3,620 | 4,021 | ||||||
5.875%, 02/15/2022 | 1,740 | 1,775 | ||||||
5.250%, 08/01/2023 (B) | 2,655 | 2,622 | ||||||
5.250%, 01/15/2024 (B) | 1,285 | 1,234 | ||||||
Microsemi | ||||||||
9.125%, 04/15/2023 (B) | 765 | 872 | ||||||
NCR | ||||||||
5.000%, 07/15/2022 | 2,015 | 2,060 | ||||||
| 174 | SEI Institutional Managed Trust / Annual Report / September 30, 2016 |
| Description | Face Amount (Thousands) | Market Value ($ Thousands) | ||||||
CORPORATE OBLIGATIONS (continued) |
| |||||||
NeuStar | ||||||||
4.500%, 01/15/2023 | $ | 1,985 | $ | 1,777 | ||||
Nortel Networks | ||||||||
0.000%, 07/15/2011 (A) | 1,605 | 1,485 | ||||||
NXP BV | ||||||||
4.625%, 06/01/2023 (B) | 1,761 | 1,926 | ||||||
4.125%, 06/01/2021 (B) | 1,068 | 1,144 | ||||||
3.875%, 09/01/2022 (B) | 1,000 | 1,047 | ||||||
NXP Funding | ||||||||
5.750%, 02/15/2021 (B) | 780 | 811 | ||||||
5.750%, 03/15/2023 (B) | 685 | 735 | ||||||
Open Text | ||||||||
5.875%, 06/01/2026 (B) | 1,588 | 1,661 | ||||||
Plantronics | ||||||||
5.500%, 05/31/2023 (B) | 3,210 | 3,306 | ||||||
PTC | ||||||||
6.000%, 05/15/2024 | 670 | 715 | ||||||
Qorvo | ||||||||
7.000%, 12/01/2025 | 1,340 | 1,454 | ||||||
6.750%, 12/01/2023 | 1,072 | 1,156 | ||||||
Riverbed Technology | ||||||||
8.875%, 03/01/2023 (B) | 1,060 | 1,133 | ||||||
Sabre | ||||||||
5.375%, 04/15/2023 (B) | 1,650 | 1,695 | ||||||
5.250%, 11/15/2023 (B) | 3,305 | 3,363 | ||||||
VeriSign | ||||||||
5.250%, 04/01/2025 | 500 | 525 | ||||||
4.625%, 05/01/2023 | 1,300 | 1,318 | ||||||
Veritas US | ||||||||
7.500%, 02/01/2023 (B) | 1,729 | 1,664 | ||||||
Western Digital | ||||||||
10.500%, 04/01/2024 (B) | 6,111 | 7,089 | ||||||
7.375%, 04/01/2023 (B) | 1,143 | 1,257 | ||||||
WEX | ||||||||
4.750%, 02/01/2023 (B) | 2,230 | 2,199 | ||||||
Zayo Group | ||||||||
6.375%, 05/15/2025 | 555 | 588 | ||||||
6.000%, 04/01/2023 | 4,255 | 4,468 | ||||||
Zebra Technologies | ||||||||
7.250%, 10/15/2022 | 1,545 | 1,674 | ||||||
|
| |||||||
| 151,351 | ||||||||
|
| |||||||
Materials — 6.5% | ||||||||
AK Steel | ||||||||
7.500%, 07/15/2023 | 1,237 | 1,317 | ||||||
Albea Beauty Holdings | ||||||||
8.375%, 11/01/2019 (B) | 940 | 982 | ||||||
Alcoa Nederland Holding BV | ||||||||
7.000%, 09/30/2026 (B)(C) | 2,723 | 2,815 | ||||||
6.750%, 09/30/2024 (B) | 1,753 | 1,821 | ||||||
Aleris International | ||||||||
9.500%, 04/01/2021 (B) | 1,164 | 1,254 | ||||||
| Description | Face Amount (Thousands) | Market Value ($ Thousands) | ||||||
CORPORATE OBLIGATIONS (continued) |
| |||||||
7.875%, 11/01/2020 | $ | 308 | $ | 312 | ||||
Allegheny Technologies | ||||||||
9.375%, 06/01/2019 | 1,445 | 1,552 | ||||||
7.875%, 08/15/2023 | 675 | 650 | ||||||
ARD Finance PIK | ||||||||
7.125%, 09/15/2023 (B)(C) | 587 | 584 | ||||||
Ardagh Packaging Finance | ||||||||
7.250%, 05/15/2024 (B) | 3,464 | 3,689 | ||||||
7.000%, 11/15/2020 (B) | 77 | 79 | ||||||
6.750%, 01/31/2021 (B) | 225 | 232 | ||||||
6.000%, 06/30/2021 (B) | 2,383 | 2,449 | ||||||
3.850%, 12/15/2019 (B)(G) | 695 | 705 | ||||||
Ashland | ||||||||
6.875%, 05/15/2043 | 330 | 360 | ||||||
4.750%, 08/15/2022 | 1,460 | 1,518 | ||||||
Axalta Coating Systems | ||||||||
4.875%, 08/15/2024 (B) | 290 | 297 | ||||||
Ball | ||||||||
5.250%, 07/01/2025 | 3,427 | 3,693 | ||||||
5.000%, 03/15/2022 | 1,150 | 1,239 | ||||||
Berry Plastics | ||||||||
6.000%, 10/15/2022 | 190 | 200 | ||||||
5.125%, 07/15/2023 | 55 | 56 | ||||||
Blue Cube Spinco | ||||||||
10.000%, 10/15/2025 (B) | 880 | 1,038 | ||||||
9.750%, 10/15/2023 (B) | 4,423 | 5,197 | ||||||
BlueScope Steel Finance | ||||||||
6.500%, 05/15/2021 (B) | 636 | 673 | ||||||
Boart Longyear Management Properties | ||||||||
10.000%, 10/01/2018 (B) | 2,000 | 1,380 | ||||||
7.000%, 04/01/2021 (B) | 4,090 | 491 | ||||||
Boise Cascade | ||||||||
5.625%, 09/01/2024 (B) | 511 | 519 | ||||||
Chemours | ||||||||
7.000%, 05/15/2025 | 195 | 192 | ||||||
6.625%, 05/15/2023 | 1,110 | 1,082 | ||||||
Compass Minerals International | ||||||||
4.875%, 07/15/2024 (B) | 1,314 | 1,242 | ||||||
Constellium | ||||||||
7.875%, 04/01/2021 (B) | 1,890 | 2,018 | ||||||
5.750%, 05/15/2024 (B) | 710 | 657 | ||||||
Cornerstone Chemical | ||||||||
9.375%, 03/15/2018 (B) | 5,745 | 5,716 | ||||||
CVR Partners | ||||||||
9.250%, 06/15/2023 (B) | 1,317 | 1,274 | ||||||
First Quantum Minerals | ||||||||
7.250%, 10/15/2019 (B) | 3,022 | 2,871 | ||||||
7.000%, 02/15/2021 (B) | 1,257 | 1,125 | ||||||
6.750%, 02/15/2020 (B) | 2,505 | 2,317 | ||||||
FMG Resources (August 2006) Property Limited | ||||||||
9.750%, 03/01/2022 (B) | 1,839 | 2,133 | ||||||
| SEI Institutional Managed Trust / Annual Report / September 30, 2016 | 175 |
SCHEDULE OF INVESTMENTS
September 30, 2016
High Yield Bond Fund (Continued)
| ||||||||
| Description |
Face Amount | Market Value ($ Thousands) | ||||||
| ||||||||
CORPORATE OBLIGATIONS (continued) |
| |||||||
Freeport-McMoRan | ||||||||
6.500%, 11/15/2020 | $ | 392 | $ | 402 | ||||
5.450%, 03/15/2043 | 3,535 | 2,837 | ||||||
5.400%, 11/14/2034 | 950 | 788 | ||||||
4.550%, 11/14/2024 | 140 | 127 | ||||||
3.875%, 03/15/2023 | 588 | 528 | ||||||
3.550%, 03/01/2022 | 165 | 150 | ||||||
GCP Applied Technologies | ||||||||
9.500%, 02/01/2023 (B) | 1,445 | 1,651 | ||||||
Glencore Funding | ||||||||
4.125%, 05/30/2023 (B) | 1,103 | 1,097 | ||||||
Graphic Packaging International | ||||||||
4.750%, 04/15/2021 | 1,067 | 1,139 | ||||||
Hecla Mining | ||||||||
6.875%, 05/01/2021 | 2,013 | 2,021 | ||||||
Hexion | ||||||||
10.000%, 04/15/2020 | 4,084 | 4,023 | ||||||
Hexion US Finance | ||||||||
8.875%, 02/01/2018 | 635 | 605 | ||||||
6.625%, 04/15/2020 | 4,695 | 4,132 | ||||||
HudBay Minerals | ||||||||
9.500%, 10/01/2020 | 941 | 944 | ||||||
Huntsman International | ||||||||
5.125%, 11/15/2022 | 1,505 | 1,565 | ||||||
4.875%, 11/15/2020 | 100 | 104 | ||||||
INEOS Group Holdings | ||||||||
5.875%, 02/15/2019 (B) | 1,775 | 1,810 | ||||||
5.625%, 08/01/2024 (B) | 1,080 | 1,060 | ||||||
Kaiser Aluminum | ||||||||
5.875%, 05/15/2024 | 1,055 | 1,102 | ||||||
Kraton Polymers | ||||||||
10.500%, 04/15/2023 (B) | 600 | 681 | ||||||
LSB Industries | ||||||||
0.000%, 08/01/2019 (E) | 1,080 | 1,085 | ||||||
Mirabela Nickel | ||||||||
1.000%, 07/31/2044 | 31 | – | ||||||
New Gold | ||||||||
7.000%, 04/15/2020 (B) | 1,055 | 1,084 | ||||||
6.250%, 11/15/2022 (B) | 1,777 | 1,817 | ||||||
Noranda Aluminum Acquisition | ||||||||
11.000%, 06/01/2019 (A) | 355 | 4 | ||||||
NOVA Chemicals | ||||||||
5.000%, 05/01/2025 (B) | 1,611 | 1,631 | ||||||
Owens-Brockway Glass Container | ||||||||
6.375%, 08/15/2025 (B) | 600 | 661 | ||||||
5.875%, 08/15/2023 (B) | 460 | 494 | ||||||
PaperWorks Industries | ||||||||
9.500%, 08/15/2019 (B) | 2,618 | 2,454 | ||||||
Platform Specialty Products | ||||||||
10.375%, 05/01/2021 (B) | 1,364 | 1,470 | ||||||
6.500%, 02/01/2022 (B) | 1,840 | 1,789 | ||||||
| ||||||||
| Description |
Face Amount | Market Value ($ Thousands) | ||||||
| ||||||||
CORPORATE OBLIGATIONS (continued) |
| |||||||
PQ | ||||||||
6.750%, 11/15/2022 (B) | $ | 1,539 | $ | 1,631 | ||||
Rain CII Carbon | ||||||||
8.250%, 01/15/2021 (B) | 6,620 | 6,455 | ||||||
8.000%, 12/01/2018 (B) | 1,555 | 1,521 | ||||||
Reichhold Holdings | ||||||||
12.000%, 03/31/2017 (H) | 821 | 821 | ||||||
Reichhold Industries | ||||||||
15.000%, 03/13/2017 (H) | 466 | 466 | ||||||
12.000%, 03/31/2017 (H) | 290 | 290 | ||||||
9.000%, 05/08/2017 (A)(B) | 859 | – | ||||||
Reynolds Group | ||||||||
9.875%, 08/15/2019 | 378 | 389 | ||||||
8.250%, 02/15/2021 | 1,710 | 1,783 | ||||||
6.875%, 02/15/2021 | 280 | 291 | ||||||
5.750%, 10/15/2020 | 1,045 | 1,078 | ||||||
Reynolds Group Issuer | ||||||||
7.000%, 07/15/2024 (B) | 1,496 | 1,604 | ||||||
Sappi Papier Holdings | ||||||||
7.750%, 07/15/2017 (B) | 300 | 307 | ||||||
Scotts Miracle-Gro | ||||||||
6.000%, 10/15/2023 (B) | 635 | 676 | ||||||
Signode Industrial Group | ||||||||
6.375%, 05/01/2022 (B) | 2,370 | 2,400 | ||||||
Teck Resources | ||||||||
8.500%, 06/01/2024 (B) | 3,560 | 4,076 | ||||||
8.000%, 06/01/2021 (B) | 174 | 189 | ||||||
TPC Group | ||||||||
8.750%, 12/15/2020 (B) | 809 | 627 | ||||||
Trinseo Materials Operating | ||||||||
6.750%, 05/01/2022 (B) | 400 | 423 | ||||||
Unifrax I | ||||||||
7.500%, 02/15/2019 (B) | 600 | 561 | ||||||
United States Steel | ||||||||
8.375%, 07/01/2021 (B) | 1,536 | 1,680 | ||||||
US Concrete | ||||||||
6.375%, 06/01/2024 | 297 | 308 | ||||||
Valvoline | ||||||||
5.500%, 07/15/2024 (B) | 75 | 79 | ||||||
Versum Materials | ||||||||
5.500%, 09/30/2024 (B)(C) | 3,200 | 3,288 | ||||||
WR Grace & Co. | ||||||||
5.625%, 10/01/2024 (B) | 80 | 87 | ||||||
|
| |||||||
| 126,014 | ||||||||
|
| |||||||
Real Estate — 1.4% | ||||||||
Communications Sales & Leasing | ||||||||
8.250%, 10/15/2023 | 2,785 | 2,923 | ||||||
6.000%, 04/15/2023 (B) | 1,510 | 1,567 | ||||||
Corrections Corp of America | ||||||||
5.000%, 10/15/2022 | 245 | 222 | ||||||
4.625%, 05/01/2023 | 1,465 | 1,286 | ||||||
| 176 | SEI Institutional Managed Trust / Annual Report / September 30, 2016 |
| ||||||||
| Description |
Face Amount | Market Value ($ Thousands) | ||||||
| ||||||||
CORPORATE OBLIGATIONS (continued) |
| |||||||
Equinix | ||||||||
5.875%, 01/15/2026 | $ | 1,470 | $ | 1,580 | ||||
5.750%, 01/01/2025 | 710 | 754 | ||||||
5.375%, 01/01/2022 | 200 | 211 | ||||||
FelCor Lodging | ||||||||
6.000%, 06/01/2025 | 108 | 112 | ||||||
GEO Group | ||||||||
6.000%, 04/15/2026 | 2,290 | 1,947 | ||||||
5.875%, 01/15/2022 | 1,370 | 1,233 | ||||||
5.125%, 04/01/2023 | 35 | 30 | ||||||
GLP Capital | ||||||||
5.375%, 04/15/2026 | 590 | 634 | ||||||
4.875%, 11/01/2020 | 643 | 693 | ||||||
Kennedy-Wilson | ||||||||
5.875%, 04/01/2024 | 700 | 705 | ||||||
Lamar Media | ||||||||
5.750%, 02/01/2026 | 1,125 | 1,212 | ||||||
MGM Growth Properties Operating Partnership | ||||||||
5.625%, 05/01/2024 (B) | 3,470 | 3,764 | ||||||
4.500%, 09/01/2026 (B)(C) | 1,415 | 1,415 | ||||||
MPT Operating Partnership | ||||||||
5.250%, 08/01/2026 | 234 | 243 | ||||||
Realogy Group | ||||||||
4.875%, 06/01/2023 (B) | 2,334 | 2,372 | ||||||
RHP Hotel Properties | ||||||||
5.000%, 04/15/2021 | 2,508 | 2,583 | ||||||
5.000%, 04/15/2023 | 1,120 | 1,137 | ||||||
|
| |||||||
| 26,623 | ||||||||
|
| |||||||
Telecommunication Services — 6.4% |
| |||||||
CenturyLink | ||||||||
7.500%, 04/01/2024 | 1,672 | 1,785 | ||||||
6.750%, 12/01/2023 | 3,685 | 3,832 | ||||||
5.800%, 03/15/2022 | 930 | 953 | ||||||
5.625%, 04/01/2020 | 1,120 | 1,184 | ||||||
5.625%, 04/01/2025 | 1,369 | 1,311 | ||||||
Clearwire Communications | ||||||||
8.250%, 12/01/2040 (B) | 516 | 536 | ||||||
Cogent Communications Finance | ||||||||
5.625%, 04/15/2021 (B) | 1,880 | 1,908 | ||||||
Cogent Communications Group | ||||||||
5.375%, 03/01/2022 (B) | 1,113 | 1,146 | ||||||
Columbus Cable Barbados | ||||||||
7.375%, 03/30/2021 (B) | 595 | 631 | ||||||
Digicel | ||||||||
6.000%, 04/15/2021 (B) | 2,000 | 1,767 | ||||||
Digicel Group | ||||||||
8.250%, 09/30/2020 (B)(C) | 4,085 | 3,549 | ||||||
6.750%, 03/01/2023 (B) | 3,365 | 2,970 | ||||||
Frontier Communications | ||||||||
11.000%, 09/15/2025 | 10,414 | 10,870 | ||||||
10.500%, 09/15/2022 | 4,182 | 4,433 | ||||||
| ||||||||
| Description |
Face Amount | Market Value ($ Thousands) | ||||||
| ||||||||
CORPORATE OBLIGATIONS (continued) |
| |||||||
8.875%, 09/15/2020 | $ | 975 | $ | 1,052 | ||||
7.625%, 04/15/2024 | 1,881 | 1,759 | ||||||
7.125%, 01/15/2023 | 950 | 886 | ||||||
6.875%, 01/15/2025 | 315 | 279 | ||||||
GCI | ||||||||
6.750%, 06/01/2021 | 625 | 642 | ||||||
Inmarsat Finance | ||||||||
6.500%, 10/01/2024 (B) | 2,190 | 2,195 | ||||||
4.875%, 05/15/2022 (B) | 1,080 | 1,026 | ||||||
Intelsat Jackson Holdings | ||||||||
8.000%, 02/15/2024 (B) | 2,556 | 2,562 | ||||||
7.500%, 04/01/2021 | 2,912 | 2,199 | ||||||
7.250%, 04/01/2019 | 445 | 358 | ||||||
7.250%, 10/15/2020 | 5,270 | 4,084 | ||||||
5.500%, 08/01/2023 | 2,445 | 1,693 | ||||||
Intelsat Luxembourg | ||||||||
7.750%, 06/01/2021 | 3,820 | 1,280 | ||||||
Level 3 Communications | ||||||||
5.750%, 12/01/2022 | 505 | 528 | ||||||
Level 3 Financing | ||||||||
5.625%, 02/01/2023 | 65 | 68 | ||||||
5.375%, 01/15/2024 | 570 | 594 | ||||||
5.375%, 05/01/2025 | 4,385 | 4,571 | ||||||
5.125%, 05/01/2023 | 1,430 | 1,473 | ||||||
Qwest Capital Funding | ||||||||
7.750%, 02/15/2031 | 615 | 597 | ||||||
Sable International Finance | ||||||||
6.875%, 08/01/2022 (B) | 650 | 674 | ||||||
SBA Communications | ||||||||
4.875%, 09/01/2024 (B) | 585 | 589 | ||||||
SoftBank Group | ||||||||
6.000%, 07/30/2025 | 375 | 407 | ||||||
5.375%, 07/30/2022 | 265 | 279 | ||||||
4.500%, 04/15/2020 (B)(C) | 2,951 | 3,062 | ||||||
Sprint | ||||||||
7.875%, 09/15/2023 | 11,553 | 11,625 | ||||||
7.625%, 02/15/2025 | 8,897 | 8,808 | ||||||
7.250%, 09/15/2021 | 2,356 | 2,365 | ||||||
7.125%, 06/15/2024 | 860 | 838 | ||||||
Sprint Capital | ||||||||
8.750%, 03/15/2032 | 3,745 | 3,820 | ||||||
6.900%, 05/01/2019 | 370 | 382 | ||||||
6.875%, 11/15/2028 | 4,289 | 4,026 | ||||||
Sprint Communications | ||||||||
9.000%, 11/15/2018 (B)(C) | 715 | 789 | ||||||
7.000%, 03/01/2020 (B) | 445 | 477 | ||||||
Telecom Italia | ||||||||
5.303%, 05/30/2024 (B) | 860 | 879 | ||||||
T-Mobile USA | ||||||||
6.731%, 04/28/2022 | 2,020 | 2,121 | ||||||
6.633%, 04/28/2021 | 330 | 347 | ||||||
6.625%, 04/01/2023 | 2,000 | 2,148 | ||||||
| SEI Institutional Managed Trust / Annual Report / September 30, 2016 | 177 |
SCHEDULE OF INVESTMENTS
September 30, 2016
High Yield Bond Fund (Continued)
| ||||||||
| Description |
Face Amount | Market Value ($ Thousands) | ||||||
| ||||||||
CORPORATE OBLIGATIONS (continued) |
| |||||||
6.500%, 01/15/2024 | $ | 100 | $ | 108 | ||||
6.500%, 01/15/2026 | 3,476 | 3,845 | ||||||
6.375%, 03/01/2025 | 1,280 | 1,392 | ||||||
6.000%, 03/01/2023 | 885 | 945 | ||||||
6.000%, 04/15/2024 | 1,930 | 2,065 | ||||||
United States Cellular | ||||||||
6.700%, 12/15/2033 | 820 | 824 | ||||||
Wind Acquisition Finance | ||||||||
7.375%, 04/23/2021 (B) | 1,885 | 1,970 | ||||||
4.750%, 07/15/2020 (B) | 340 | 343 | ||||||
Windstream | ||||||||
7.750%, 10/01/2021 | 1,800 | 1,796 | ||||||
7.500%, 06/01/2022 | 1,450 | 1,392 | ||||||
Windstream Services | ||||||||
6.375%, 08/01/2023
|
| 225
|
|
| 204
|
| ||
|
| |||||||
| 123,241 | ||||||||
|
| |||||||
Utilities — 1.7% |
| |||||||
AES | ||||||||
7.375%, 07/01/2021 | 605 | 694 | ||||||
6.000%, 05/15/2026 | 335 | 354 | ||||||
AmeriGas Finance | ||||||||
7.000%, 05/20/2022 | 2,063 | 2,182 | ||||||
Calpine | ||||||||
5.750%, 01/15/2025 | 616 | 608 | ||||||
5.500%, 02/01/2024 | 600 | 592 | ||||||
5.375%, 01/15/2023 | 580 | 578 | ||||||
5.250%, 06/01/2026 (B) | 457 | 460 | ||||||
Dynegy | ||||||||
7.625%, 11/01/2024 | 4,025 | 3,953 | ||||||
7.375%, 11/01/2022 | 915 | 904 | ||||||
5.875%, 06/01/2023 | 967 | 878 | ||||||
Enel | ||||||||
8.750%, 09/24/2073 (B)(G) | 728 | 851 | ||||||
Ferrellgas | ||||||||
6.500%, 05/01/2021 | 1,285 | 1,176 | ||||||
GenOn Americas Generation | ||||||||
9.125%, 05/01/2031 | 434 | 351 | ||||||
GenOn Energy | ||||||||
7.875%, 06/15/2017 | 2,181 | 1,805 | ||||||
LBC Tank Terminals Holding Netherlands | ||||||||
6.875%, 05/15/2023 (B) | 2,800 | 2,786 | ||||||
Mirant Americas Generation LLC | ||||||||
8.500%, 10/01/2021 | 3,850 | 3,272 | ||||||
NRG Energy | ||||||||
7.875%, 05/15/2021 | 59 | 62 | ||||||
7.250%, 05/15/2026 (B) | 221 | 225 | ||||||
6.625%, 01/15/2027 (B) | 1,431 | 1,402 | ||||||
6.250%, 07/15/2022 | 615 | 624 | ||||||
6.250%, 05/01/2024 | 1,913 | 1,942 | ||||||
RJS Power Holdings | ||||||||
4.625%, 07/15/2019 (B) | 1,965 | 1,847 | ||||||
| ||||||||
| Description |
Face Amount | Market Value ($ Thousands) | ||||||
| ||||||||
CORPORATE OBLIGATIONS (continued) |
| |||||||
Talen Energy Supply | ||||||||
6.500%, 06/01/2025 | $ | 161 | $ | 129 | ||||
TerraForm Power Operating(E) | ||||||||
6.625%, 12/06/2016 (B) | 2,103 | 2,208 | ||||||
6.375%, 12/06/2016 (B) | 2,096 |
| 2,154
|
| ||||
|
| |||||||
| 32,037 | ||||||||
|
| |||||||
Total Corporate Obligations |
| 1,516,613 | ||||||
|
| |||||||
ASSET-BACKED SECURITIES — 8.4% |
| |||||||
Other Asset-Backed Securities — 8.4% |
| |||||||
Airplanes Pass-Through Trust, | ||||||||
1.074%, 03/15/2019 (B)(G) | 1,062 | 350 | ||||||
B&M CLO, Ser 2014-1A, Cl C | ||||||||
4.429%, 04/16/2026 (B)(G) | 2,108 | 1,951 | ||||||
B&M CLO, Ser 2014-1A, Cl D | ||||||||
5.429%, 04/16/2026 (B)(G) | 3,471 | 2,709 | ||||||
B&M CLO, Ser 2014-1A, Cl E | ||||||||
6.429%, 04/16/2026 (B)(G) | 2,480 | 1,333 | ||||||
Battalion CLO IV, Ser 2013-4A | ||||||||
0.000%, 10/22/2025 (B) | 5,640 | 1,861 | ||||||
Battalion CLO V, Ser 2014-5A | ||||||||
0.000%, 04/17/2026 (B) | 3,274 | 1,048 | ||||||
Battalion CLO VII, Ser 2014-7A | ||||||||
0.000%, 10/17/2026 (B) | 4,007 | 2,284 | ||||||
Battalion CLO VII, Ser 2014-7A, Cl D | ||||||||
5.979%, 10/17/2026 (B)(G) | 2,260 | 1,784 | ||||||
Battalion CLO VIII, Ser 2015-8A | ||||||||
0.000%, 04/18/2027 (B)(H) | 3,655 | 3,034 | ||||||
Battalion CLO VIII, Ser 2015-8A, Cl D | ||||||||
6.129%, 04/18/2027 (B)(G) | 982 | 830 | ||||||
Battalion CLO Warehouse Note | ||||||||
0.000% (I) | 25 | 2,479 | ||||||
Battalion CLO, Ser 2012-3A | ||||||||
0.000%, 01/18/2025 (B) | 2,303 | 1,285 | ||||||
Benefit Street Partners CLO III, Ser 2013-IIIA | ||||||||
0.000%, 01/20/2026 (B)(H) | 2,999 | 1,739 | ||||||
Benefit Street Partners CLO IV | ||||||||
0.000%, 07/20/2026 (B)(J) | 3 | 2,464 | ||||||
Benefit Street Partners CLO IX | ||||||||
0.000%, 07/20/2025 (B)(J) | 21 | 1,987 | ||||||
Benefit Street Partners CLO V | ||||||||
0.000%, 10/20/2026 (B)(J) | 6,387 | 3,995 | ||||||
Benefit Street Partners CLO VII, Ser 2015-VIII | ||||||||
0.000%, 07/18/2027 | 6,715 | 5,778 | ||||||
Benefit Street Partners CLO VIII | ||||||||
0.000%, 01/20/2028 (B)(H) | 67 | 6,384 | ||||||
Benefit Street Partners CLO, Ser 2015-VIA | ||||||||
0.000%, 04/18/2027 | 7,502 | 6,287 | ||||||
| 178 | SEI Institutional Managed Trust / Annual Report / September 30, 2016 |
| ||||||||
| Description |
Face Amount | Market Value ($ Thousands) | ||||||
| ||||||||
ASSET-BACKED SECURITIES (continued) |
| |||||||
Benefit Street Partners Warehouse Note | ||||||||
0.000% (I) | $ | 18 | $ | 1,894 | ||||
Carlyle Global Market Strategies CLO, Ser 2014-3A | ||||||||
0.000%, 07/27/2026 (B) | 2,947 | 2,255 | ||||||
Cathedral Lake CLO, Ser 2015-3A, Cl E | ||||||||
8.230%, 01/15/2026 (B)(G) | 1,175 | 1,175 | ||||||
Cathedral Lake III Equity Tranche | ||||||||
0.000%, 01/15/2026 (B) | 1,869 | 1,598 | ||||||
Cedar Funding V CLO, Ser 2016-5A | ||||||||
0.000%, 07/17/2028 (B)(G) | 19 | 1,711 | ||||||
CIFC Funding II, Ser 2012-2A | ||||||||
0.000%, 12/05/2024 (B) | 17 | 890 | ||||||
CVP Cascade CLO, Ser 2014-2A, Cl D | ||||||||
5.479%, 07/18/2026 (B)(G) | 1,709 | 1,293 | ||||||
CVP Cascade CLO, Ser 2014-2A, Cl E | ||||||||
6.479%, 07/18/2026 (B)(G) | 2,469 | 1,365 | ||||||
Fifth Street Senior Loan Fund, Ser 2015-1A, Cl E | ||||||||
7.896%, 01/20/2027 (B)(G) | 3,890 | 3,394 | ||||||
Fifth Street Senior Loan Fund, Ser 2015-2A | ||||||||
0.000%, 09/29/2027 (B) | 5,483 | 4,918 | ||||||
Figueroa CLO, Ser 2013-1I | ||||||||
0.000%, 03/21/2024 | 18,856 | 7,756 | ||||||
Figueroa CLO, Ser 2013-2A | ||||||||
0.000%, 12/15/2025 (B) | 2,930 | 1,686 | ||||||
Fortress Credit Opportunities III CLO, Ser 2014-3A, Cl E | ||||||||
6.907%, 04/28/2026 (B)(G) | 3,482 | 3,129 | ||||||
Fortress Credit Opportunities VI CLO, Ser 2015-6A, Cl F | ||||||||
7.595%, 10/10/2026 (B)(G) | 1,730 | 1,595 | ||||||
Great Lakes CLO, Ser 2012-1A | ||||||||
0.000%, 01/15/2023 (B) | 2,457 | 1,700 | ||||||
Great Lakes CLO, Ser 2012-1A, Cl E | ||||||||
6.180%, 01/15/2023 (B)(G) | 2,811 | 2,403 | ||||||
Great Lakes CLO, Ser 2014-1A | ||||||||
0.000%, 04/15/2025 (B)(G) | 6,943 | 5,041 | ||||||
Great Lakes CLO, Ser 2014-1A, Cl F | ||||||||
6.680%, 04/15/2025 (B)(G) | 2,480 | 1,575 | ||||||
Great Lakes CLO, Ser 2015-1A | ||||||||
0.000%, 07/15/2026 (B)(G) | 4,202 | 3,244 | ||||||
Great Lakes CLO, Ser 2015-1A, Cl E | ||||||||
7.380%, 07/15/2026 (B)(G) | 2,896 | 2,433 | ||||||
Great Lakes CLO, Ser 2015-1A, Cl F | ||||||||
8.180%, 07/15/2026 (B)(G) | 1,319 | 864 | ||||||
Hildene CLO II, Ser 2014-2A, Cl D | ||||||||
4.388%, 07/19/2026 (B)(G) | 1,987 | 1,899 | ||||||
Hildene CLO II, Ser 2014-2A, Cl E | ||||||||
5.788%, 07/19/2026 (B)(G) | 1,987 | 1,737 | ||||||
Ivy Hill Middle Market Credit Fund VII, Ser 2013-7A | ||||||||
0.000%, 10/20/2025 (B) | 3,198 | 2,606 | ||||||
| ||||||||
| Description |
Face Amount | Market Value ($ Thousands) | ||||||
| ||||||||
ASSET-BACKED SECURITIES (continued) |
| |||||||
Jamestown CLO VII, Ser 2015-7A, Cl D | ||||||||
6.215%, 07/25/2027 (B)(G) | $ | 1,709 | $ | 1,465 | ||||
Jamestown CLO VII, Ser 2015-7A, Cl E | ||||||||
7.465%, 07/25/2027 (B)(G) | 1,709 | 1,327 | ||||||
JFIN Revolver CLO, Ser 2013-1A, Cl B | ||||||||
2.696%, 01/20/2021 (B)(G) | 1,990 | 1,990 | ||||||
JFIN Revolver CLO, Ser 2014-2A, Cl C | ||||||||
3.561%, 02/20/2022 (B)(G) | 1,951 | 1,888 | ||||||
KVK CLO, Ser 2012-2A | ||||||||
0.000%, 02/10/2025 (B) | 2,471 | 877 | ||||||
Lockwood Grove CLO, Ser 2014-1A | ||||||||
0.000%, 01/25/2024 (B) | 3,797 | 2,810 | ||||||
Nelder Grove CLO, Ser 2014-1A, Cl D1 | ||||||||
5.349%, 08/28/2026 (B)(G) | 1,756 | 1,712 | ||||||
Nelder Grove CLO, Ser 2014-1A, Cl E | ||||||||
7.579%, 08/28/2026 (B)(G) | 2,926 | 2,487 | ||||||
Neuberger Berman CLO XIII, Ser 2012-13A | ||||||||
0.000%, 01/23/2024 (B) | 447 | 143 | ||||||
Neuberger Berman CLO XVI, Ser 2014-16A | ||||||||
0.000%, 04/15/2026 to 04/15/2026 (B) | 2,613 | 1,362 | ||||||
Neuberger Berman CLO XXII, Ser 2016-22A | ||||||||
0.000%, 10/17/2027 to 10/17/2027 (B)(G) | 38 | 3,085 | ||||||
NewStar Arlington Senior Loan Program, Ser 2014-1A, Cl E | ||||||||
6.815%, 07/25/2025 (B)(G) | 1,974 | 1,663 | ||||||
NewStar Clarendon Fund CLO, Ser 2015-1A, Cl E | ||||||||
6.765%, 01/25/2027 (B)(G) | 3,439 | 2,816 | ||||||
NXT Capital CLO, Ser 2012-1A, Cl E | ||||||||
8.196%, 07/20/2022 (B)(G) | 2,417 | 2,399 | ||||||
OCP CLO, Ser 2012-2A | ||||||||
0.000%, 11/22/2023 (B) | 2,615 | 1,124 | ||||||
Peaks CLO, Ser 2014-1A, Cl D | ||||||||
5.180%, 06/15/2026 (B)(G) | 985 | 872 | ||||||
Shackleton CLO, Ser 2014-6A | ||||||||
0.000%, 07/17/2026 (B)(G) | 7,935 | 3,491 | ||||||
TCP III CLO Warehouse Note | ||||||||
0.000% (I) | 82 | 8,183 | ||||||
Trinitas CLO II, Ser 2014-2A, Cl D | ||||||||
4.480%, 07/15/2026 (B)(G) | 1,184 | 1,006 | ||||||
Venture CDO, Ser 2012-10A | ||||||||
0.000%, 07/20/2022 (B) | 5,284 | 2,748 | ||||||
Venture XI CLO, Ser 2012-11A | ||||||||
0.000%, 11/14/2022 (B) | 5,403 | 2,323 | ||||||
Venture XIV CLO, Ser 2013-14A | ||||||||
0.000%, 08/25/2025 to 08/25/2025 (B) | 1,833 | 895 | ||||||
Venture XV CLO, Ser 2013-15A | ||||||||
0.000%, 07/15/2025 (B) | 1,022 | 557 | ||||||
Venture XXII CLO, Ser 2016-22A | ||||||||
0.000%, 01/15/2028 (B)(G) | 21 | 1,785 | ||||||
Venture XXII CLO, Ser 2016-22A, Cl F | ||||||||
8.530%, 01/15/2028 (B)(G) | 792 | 697 | ||||||
| SEI Institutional Managed Trust / Annual Report / September 30, 2016 | 179 |
SCHEDULE OF INVESTMENTS
September 30, 2016
High Yield Bond Fund (Continued)
| ||||||||
| Description |
Face Amount | Market Value ($ Thousands) | ||||||
| ||||||||
ASSET-BACKED SECURITIES (continued) |
| |||||||
Venture XXIV CLO, Ser 2016-24A | ||||||||
0.000%, 10/20/2028 (B)(G) | $ | 28 | $ | 2,546 | ||||
Venture XXV CLO Warehouse Note | ||||||||
0.000% (I) | 24 | 2,384 | ||||||
|
| |||||||
Total Asset-Backed Securities | 162,378 | |||||||
|
| |||||||
LOAN PARTICIPATIONS — 8.2% |
| |||||||
21st Century Oncology Holdings, Term Loan B, 1st Lien | ||||||||
7.125%, 04/30/2022 | 921 | 863 | ||||||
682534 N.B. Inc., Initial Term Loan, 1st Lien | ||||||||
12.000%, 10/01/2020 | 700 | 356 | ||||||
Academy Ltd., Term Loan B, 1st Lien | ||||||||
5.000%, 07/01/2022 | 679 | 663 | ||||||
Accudyne Industries LLC, Refinancing Term Loan, 1st Lien | ||||||||
4.000%, 12/13/2019 (G) | 845 | 789 | ||||||
Affinion Group, Term Loan, 2nd Lien | ||||||||
8.500%, 10/31/2018 | 520 | 457 | ||||||
Affinion Group, Term Loan, Tranche B, 1st Lien | ||||||||
6.800%, 04/30/2018 | 1,239 | 1,201 | ||||||
Air Medical Group, Cov-Lite, Intial Term Loan, 1st Lien | ||||||||
4.250%, 04/28/2022 | 996 | 985 | ||||||
Albertson’s LLC, Term Loan B4, 1st Lien | ||||||||
4.500%, 08/25/2021 | 1,040 | 1,047 | ||||||
Alinta Energy Finance Property Limited, Delayed Draw Term Loan, 1st Lien | ||||||||
6.400%, 08/13/2018 | 165 | 165 | ||||||
Alinta Energy Finance Property Limited, Term Loan B, 1st Lien | ||||||||
6.400%, 08/13/2019 | 2,483 | 2,477 | ||||||
American Renal Holdings Inc., Term Loan B, 1st Lien | ||||||||
4.750%, 08/20/2019 | 3,165 | 3,160 | ||||||
American Tire Distributors, Inc., Initial Term Loan, 1st Lien | ||||||||
5.300%, 09/01/2021 | 985 | 971 | ||||||
Amplify Snack Brands Inc., Initial Term Loan, 1st Lien | ||||||||
6.500%, 09/02/2023 | 941 | 932 | ||||||
ANVC Merger Corp., Initial Term Loan, 1st Lien | ||||||||
5.500%, 02/18/2021 | 1,783 | 1,716 | ||||||
Applied Systems Inc., Initial Term Loan, 2nd Lien | ||||||||
7.500%, 01/24/2022 | 1,187 | 1,195 | ||||||
Ascena Retail Group Inc., Term Loan B, 1st Lien | ||||||||
5.300%, 08/21/2022 | 1,580 | 1,521 | ||||||
Aspect Software, Inc., Term Loan, 1st Lien | ||||||||
10.500%, 05/25/2020 | 1,000 | 973 | ||||||
| ||||||||
| Description |
Face Amount | Market Value ($ Thousands) | ||||||
| ||||||||
LOAN PARTICIPATIONS (continued) |
| |||||||
Asurion LLC, Initial Term Loan, 2nd Lien | ||||||||
8.500%, 03/03/2021 | $ | 3,120 | $ | 3,099 | ||||
Asurion LLC, Term Loan B4, 1st Lien | ||||||||
5.000%, 08/04/2022 | 1,468 | 1,475 | ||||||
Atlas America Finance Inc., Term Loan B, 1st Lien | ||||||||
5.580%, 5/06/2021 | 304 | 137 | ||||||
Blount International Inc., Initial Term Loan, 1st Lien | ||||||||
8.750%, 04/12/2023 | 3 | 3 | ||||||
7.250%, 04/12/2023 | 1,227 | 1,242 | ||||||
Blue Ribbon LLC, Initial Term Loan, 1st Lien | ||||||||
5.000%, 11/15/2021 | 677 | 680 | ||||||
BMC Foreign Holding Company, Initial Term Loan, 1st Lien | ||||||||
5.000%, 09/10/2020 | 1,003 | 968 | ||||||
BPA Laboratories, Initial Term Loan, 2nd Lien | ||||||||
0.000%, 07/03/2017 (K) | 181 | 126 | ||||||
BWay Intermediate Company, Inc., Initial Term Loan, 1st Lien | ||||||||
5.500%, 08/14/2020 | 520 | 522 | ||||||
California Resources Corporation, Initial Term Loan, 1st Lien | ||||||||
11.375%, 12/31/2021 | 3,768 | 3,954 | ||||||
0.000%, 09/24/2019 (K) | 1,103 | 1,049 | ||||||
Carestream Health Inc., Initial Term Loan, 2nd Lien | ||||||||
9.500%, 12/07/2019 | 5,008 | 4,519 | ||||||
CD&R Millennium HolcCo 6 S.A.R.L., Initial Term Loan, 2nd Lien | ||||||||
8.800%, 07/31/2022 | 680 | 669 | ||||||
Cengage Learning Inc., 2016 Refinancing Term Loan B, 1st Lien | ||||||||
5.300%, 06/07/2023 | 1,591 | 1,589 | ||||||
Ceva Group PLC (fka Louis No.1 PLC/TNT Logistics), Pre-Funded L/C Loan, 1st Lien | ||||||||
0.007%, 03/19/2021 | 203 | 163 | ||||||
Ceva Intercompany B.V., Initial Term Loan, 1st Lien | ||||||||
6.500%, 03/19/2021 | 209 | 167 | ||||||
Ceva Logistics Canada ULC, Initial Term Loan, 1st Lien | ||||||||
6.500%, 03/19/2021 | 36 | 29 | ||||||
Ceva Logistics U.S. Holdings Inc., Initial Term Loan, 1st Lien | ||||||||
6.500%, 03/19/2021 | 288 | 230 | ||||||
Chesapeake Energy, Term Loan, 1st Lien | ||||||||
8.500%, 08/23/2021 | 4,098 | 4,299 | ||||||
Clear Channel Communications Inc., Extended Term Loan D, 1st Lien | ||||||||
7.274%, 01/30/2019 | 5,436 | 4,176 | ||||||
| 180 | SEI Institutional Managed Trust / Annual Report / September 30, 2016 |
| ||||||||
| Description |
Face Amount | Market Value ($ Thousands) | ||||||
| ||||||||
LOAN PARTICIPATIONS (continued) |
| |||||||
ClubCorp Club Operations Inc., Initial Term Loan, 1st Lien | ||||||||
4.250%, 12/15/2022 | $ | 275 | $ | 276 | ||||
Cowlitz Tribal Gaming Authority, Initial Term Loan, 1st Lien | ||||||||
11.500%, 12/04/2020 (G) | 3,000 | 3,180 | ||||||
CTI Foods, Initial Term Loan, 2nd Lien | ||||||||
8.300%, 06/28/2021 | 1,190 | 1,059 | ||||||
Cumulus Media Holdings Inc., Initial Term Loan, 1st Lien | ||||||||
4.250%, 12/23/2020 | 4,543 | 3,152 | ||||||
Dex Media, Term Loan, 1st Lien | ||||||||
11.000%, 07/29/2021 | 402 | 383 | ||||||
Diebold, Term Loan B, 1st Lien | ||||||||
5.250%, 11/06/2023 | 840 | 848 | ||||||
Dollar Tree Inc., Term Loan B2, 1st Lien | ||||||||
4.300%, 07/06/2022 | 248 | 250 | ||||||
Drillships Ocean Ventures Inc., Term Loan B, 1st Lien | ||||||||
5.500%, 07/25/2021 | 1,909 | 1,315 | ||||||
Empire Generating Co. LLC, Term Loan B, 1st Lien | ||||||||
5.300%, 03/12/2021 | 1,513 | 1,286 | ||||||
Empire Generating Co. LLC, Term Loan C, 1st Lien | ||||||||
5.300%, 03/12/2021 | 120 | 102 | ||||||
Energy & Exploration Partners, Cov-Lite PIK, Term Loan A, 1st Lien | ||||||||
13.000%, 11/12/2021 | 129 | 122 | ||||||
Energy & Exploration Partners, Cov-Lite PIK, Term Loan, 2nd Lien | ||||||||
5.000%, 05/13/2022 | 72 | 48 | ||||||
Energy & Exploration Partners, Term Loan B, 1st Lien | ||||||||
5.000%, 11/12/2021 (L) | 50 | 3 | ||||||
Engility Corporation, Term Loan B2, 1st Lien | ||||||||
5.750%, 08/14/2023 | 908 | 917 | ||||||
EP Energy, Cov-Lite, Initial Term Loan, 1st Lien | ||||||||
9.750%, 06/30/2021 | 420 | 412 | ||||||
Evergreen Skills Lux S.À R.L., Initial Term Loan, 1st Lien | ||||||||
5.750%, 04/28/2021 | 2,278 | 2,014 | ||||||
Evergreen Skills Lux S.À R.L., Initial Term Loan, 2nd Lien | ||||||||
9.250%, 04/28/2022 | 915 | 549 | ||||||
FMG Resources (August 2006) Property Limited, Initial Term Loan, 1st Lien | ||||||||
3.750%, 06/30/2019 (G) | 457 | 457 | ||||||
Gardner Denver, Initial Term Loan, 1st Lien | ||||||||
4.250%, 07/30/2020 (G) | 241 | 233 | ||||||
Gulf Finance, Term Loan B, 1st Lien | ||||||||
6.250%, 08/25/2023 | 623 | 605 | ||||||
| ||||||||
| Description |
Face Amount | Market Value ($ Thousands) | ||||||
| ||||||||
LOAN PARTICIPATIONS (continued) |
| |||||||
Gymboree Corporation, Initial Term Loan, 1st Lien | ||||||||
5.000%, 02/23/2018 | $ | 4,452 | $ | 3,523 | ||||
Hercules Achievement Inc., Initial Term Loan, 1st Lien | ||||||||
5.000%, 12/10/2021 | 1,061 | 1,064 | ||||||
Hillman Companies Inc., Term Loan B, 1st Lien | ||||||||
4.500%, 06/30/2021 | 299 | 300 | ||||||
Indivior Finance S.A.R.L., Initial Term Loan, 1st Lien | ||||||||
7.000%, 12/19/2019 | 1,523 | 1,519 | ||||||
Integra Telecom Inc., Term Loan B, 1st Lien | ||||||||
5.300%, 08/14/2020 | 869 | 862 | ||||||
Intelsat Jackson Holdings Ltd., Term Loan B2, 1st Lien | ||||||||
3.750%, 06/30/2019 (G) | 620 | 589 | ||||||
J.Crew Group Inc., Initial Term Loan, 1st Lien | ||||||||
4.000%, 03/05/2021 | 2,007 | 1,588 | ||||||
KCA Deutag US Finance LLC, Term Loan B, 1st Lien | ||||||||
6.250%, 05/15/2020 | 1,012 | 846 | ||||||
Kraton Polymers LLC, Term Loan B, 1st Lien | ||||||||
6.000%, 01/06/2022 | 240 | 242 | ||||||
Laureate Education Inc., Extended Term Loan, 1st Lien | ||||||||
5.000%, 06/15/2018 | 293 | 291 | ||||||
Lions Gate, Bridge Loan | ||||||||
0.000%, 03/27/2017 | 822 | 822 | ||||||
0.000%, 06/27/2017 | 2,913 | 2,913 | ||||||
Loanstar Intermediate Super Holdings, Unsecured Term Loan B, Other | ||||||||
10.000%, 08/31/2021 | 760 | 753 | ||||||
Magic Newco LLC, Initial Term Loan, 1st Lien | ||||||||
5.000%, 12/12/2018 | 1,164 | 1,165 | ||||||
Magic Newco, LLC, Term Loan, 2nd Lien | ||||||||
12.000%, 06/12/2019 | 1,250 | 1,312 | ||||||
Maple Holdings Acquisition Corp., Cov-Lite, Term Loan B, 1st Lien | ||||||||
5.250%, 03/03/2023 | 2,216 | 2,242 | ||||||
Mashantucket Pequot, Term Loan A, 1st Lien | ||||||||
5.000%, 07/01/2018 | 1,936 | 1,735 | ||||||
Mashantucket Pequot, Term Loan B, 1st Lien | ||||||||
9.400%, 06/30/2020 | 7,188 | 6,344 | ||||||
Mast Global, Initial Term Loan, 1st Lien | ||||||||
7.750%, 09/12/2019 (H) | 13 | 12 | ||||||
Mast Global, Initital Term Loan, 1st Lien | ||||||||
7.750%, 09/12/2019 (H) | 850 | 846 | ||||||
Medical Card System, Initial Term Loan, 1st Lien | ||||||||
1.500%, 05/31/2019 (H) | 1,421 | 908 | ||||||
Metroflag, 2nd Lien | ||||||||
0.000% (A)(I) | 300 | — | ||||||
| SEI Institutional Managed Trust / Annual Report / September 30, 2016 | 181 |
SCHEDULE OF INVESTMENTS
September 30, 2016
High Yield Bond Fund (Continued)
| ||||||||
| Description |
Face Amount | Market Value ($ Thousands) | ||||||
| ||||||||
LOAN PARTICIPATIONS (continued) |
| |||||||
MKS Instruments, Term Loan B1, 1st Lien | ||||||||
4.250%, 05/01/2023 | $ | 489 | $ | 495 | ||||
Mohegan Tribal Gaming Authority, Term Loan B, 1st Lien | ||||||||
5.500%, 06/15/2018 | 2,357 | 2,355 | ||||||
Moneygram International Inc., Initial Term Loan, 1st Lien | ||||||||
4.250%, 03/26/2020 | 1,247 | 1,206 | ||||||
Moxie Liberty LLC, Term Loan B1, 1st Lien | ||||||||
7.500%, 08/21/2020 | 1,953 | 1,916 | ||||||
Murray Energy Corporation, Term Loan B2, 1st Lien | ||||||||
8.250%, 04/16/2020 | 1,158 | 981 | ||||||
NaNa Development Corporation, Initial Term Loan, 1st Lien | ||||||||
8.000%, 03/15/2018 | 188 | 176 | ||||||
Neiman Marcus Group Inc., Initial Term Loan, 1st Lien | ||||||||
4.300%, 10/25/2020 | 1,296 | 1,191 | ||||||
New LightSquared LLC, Initial Term Loan, 1st Lien | ||||||||
9.750%, 06/15/2020 | 2,049 | 1,859 | ||||||
New LightSquared LLC, Initial Term Loan, 2nd Lien | ||||||||
13.500%, 12/07/2020 | 2,351 | 1,516 | ||||||
New Millennium Holdco, Closing Date Term Loan, 1st Lien | ||||||||
7.500%, 12/21/2020 | 724 | 353 | ||||||
New MMI Inc., Initial Term Loan, 1st Lien | ||||||||
9.000%, 01/31/2020 | 3,007 | 2,732 | ||||||
Nine West Holdings Inc., Cov-Lite Unsecured, Initial Term Loan | ||||||||
6.300%, 01/08/2020 | 5,775 | 809 | ||||||
Ocean Rig ASA, Term Loan B1, 1st Lien | ||||||||
6.000%, 03/31/2021 | 2,164 | 1,077 | ||||||
ON Semiconductor Corp., Closing Date Term Loan, 1st Lien | ||||||||
5.250%, 03/31/2023 | 1,590 | 1,597 | ||||||
Onex York Acquisition Corp., Term Loan B, 1st Lien | ||||||||
4.750%, 10/01/2021 | 691 | 632 | ||||||
Ortho-Clinical Diagnostics Inc., Initial Term Loan, 1st Lien | ||||||||
4.750%, 06/30/2021 | 777 | 759 | ||||||
Oxbow Carbon LLC, Initial Term Loan, 2nd Lien | ||||||||
8.000%, 01/17/2020 | 2,394 | 2,326 | ||||||
P2 Upstream Acquisition Co., Initial Term Loan, 1st Lien | ||||||||
5.000%, 10/30/2020 | 732 | 684 | ||||||
Peabody Energy Corp., 1st Lien | ||||||||
0.000%, 09/24/2018 (K) | 4,688 | 3,682 | ||||||
Peak 10 Inc., Initial Term Loan, 2nd Lien | ||||||||
8.250%, 06/17/2022 | 2,300 | 2,105 | ||||||
| ||||||||
| Description |
Face Amount | Market Value ($ Thousands) | ||||||
| ||||||||
LOAN PARTICIPATIONS (continued) |
| |||||||
Penton Media Inc., Initial Term Loan, 2nd Lien | ||||||||
9.000%, 10/02/2020 | $ | 1,970 | $ | 1,963 | ||||
PETCO Animal Supplies, Term Loan B-1, 1st Lien | ||||||||
5.000%, 01/26/2023 | 2,050 | 2,070 | ||||||
PQ Corp., Term Loan B1, 1st Lien | ||||||||
5.750%, 11/04/2022 | 422 | 425 | ||||||
Quorum Health Corp., Term Loan B, 1st Lien | ||||||||
6.750%, 04/29/2022 | 989 | 958 | ||||||
Revlon Consumer Products, Cov-Lite, Term Loan B, 1st Lien | ||||||||
4.250%, 09/07/2023 | 679 | 680 | ||||||
Riverbed Technology Inc., Initial Term Loan, 1st Lien | ||||||||
5.000%, 04/25/2022 | 678 | 684 | ||||||
Royal Holdings Inc., Initial Term Loan, 2nd Lien | ||||||||
8.500%, 06/19/2023 | 319 | 314 | ||||||
Rue 21 Inc., Term Loan B, 1st Lien | ||||||||
5.600%, 10/09/2020 | 1,498 | 746 | ||||||
Seadrill Partners Finco LLC, Initial Term Loan, 1st Lien | ||||||||
4.000%, 02/21/2021 | 345 | 171 | ||||||
SolarWinds Holdings Inc., Initial Term Loan, 1st Lien | ||||||||
5.500%, 02/03/2023 | 1,297 | 1,308 | ||||||
Stardust Finance Holdings Inc., Initial Term Loan, 1st Lien | ||||||||
6.500%, 03/13/2022 | 925 | 919 | ||||||
Steinway Musical Instruments Inc., Initial Term Loan, 1st Lien | ||||||||
4.800%, 09/19/2019 | 941 | 917 | ||||||
Syncreon Global Finance (US) Inc., Initial Term Loan, 1st Lien | ||||||||
5.300%, 10/28/2020 | 891 | 796 | ||||||
Syniverse Holdings Inc., Incremental Term Loan B, 1st Lien | ||||||||
4.000%, 04/23/2019 | 166 | 146 | ||||||
Syniverse Holdings Inc., Initial Term Loan, 1st Lien | ||||||||
4.000%, 04/23/2019 | 1,336 | 1,179 | ||||||
Texas Competitive Electric Holdings Co. LLC, Extended Term Loan, 1st Lien | ||||||||
4.998%, 10/10/2017 (A) | 10,279 | 2,957 | ||||||
4.970%, 10/10/2017 (A) | 17 | 5 | ||||||
Texas Competitive Electric Holdings Co. LLC, Non-Extending Term Loan B, 1st Lien | ||||||||
4.998%, 10/31/2016 (A) | 11,452 | 3,262 | ||||||
4.917%, 10/31/2016 (A) | 93 | 26 | ||||||
Texas Competitive Electric Holdings Co. LLC, Term Loan B, 1st Lien | ||||||||
5.000%, 10/31/2017 | 882 | 888 | ||||||
Texas Competitive Electric Holdings Co. LLC, Term Loan C, 1st Lien | ||||||||
5.000%, 10/31/2017 | 201 | 203 | ||||||
| 182 | SEI Institutional Managed Trust / Annual Report / September 30, 2016 |
| ||||||||
| Description |
Face Amount | Market Value ($ Thousands) | ||||||
| ||||||||
LOAN PARTICIPATIONS (continued) | ||||||||
True Religion Apparel Inc., Initial Term Loan, 1st Lien | ||||||||
5.875%, 07/30/2019 | $ | 759 | $ | 178 | ||||
U.S. Renal Care, Inc., Initial Term Loan, | ||||||||
5.250%, 12/30/2022 | 2,071 | 1,984 | ||||||
UFC Holdings, Term Loan, 1st Lien | ||||||||
5.000%, 08/18/2023 | 940 | 948 | ||||||
Valeant Pharmaceuticals International Inc., Delayed Draw F-1, Term Loan B, 1st Lien | ||||||||
5.500%, 04/01/2022 | 950 | 953 | ||||||
Veritas US, Term Loan B1, 1st Lien | ||||||||
6.625%, 01/27/2023 | 2,608 | 2,429 | ||||||
Vitera Healthcare Solutions LLC, Initial Term Loan, 2nd Lien | ||||||||
9.300%, 11/04/2021 | 900 | 830 | ||||||
Vizient Inc., Initial Term Loan, 1st Lien | ||||||||
6.250%, 02/13/2023 | 1,047 | 1,058 | ||||||
Walter Investment Management Corp., Initial Term Loan, 1st Lien | ||||||||
4.800%, 12/18/2020 | 956 | 873 | ||||||
Weight Watchers International Inc., Cov-Lite, Term Loan B2, 1st Lien | ||||||||
4.000%, 04/02/2020 | 455 | 344 | ||||||
Western Digital, Cov-Lite, Term Loan B, 1st Lien | ||||||||
4.500%, 04/29/2023 | 1,688 | 1,704 | ||||||
Wilton Brands Inc., Initial Term Loan, 1st Lien | ||||||||
8.500%, 08/30/2018 | 2,899 | 2,384 | ||||||
Zekelman Industries, Term Loan B, 1st Lien | ||||||||
6.000%, 06/14/2021 | 648 | 653 | ||||||
|
| |||||||
Total Loan Participations | 159,060 | |||||||
|
| |||||||
MUNICIPAL BONDS — 0.5% | ||||||||
Connecticut — 0.2% | ||||||||
Mohegan Tribal, Finance Authority, RB | ||||||||
Callable 02/01/2023 @ 100 | ||||||||
7.000%, 02/01/2045(B) | 3,625 | 3,785 | ||||||
|
| |||||||
Puerto Rico — 0.1% | ||||||||
Commonwealth of Puerto Rico, Ser A, GO | ||||||||
8.000%, 07/01/2035(A) | 1,700 | 1,113 | ||||||
5.250%, 07/01/2037(A) | 130 | 81 | ||||||
5.125%, 07/01/2037(A) | 775 | 480 | ||||||
5.000%, 07/01/2041(A) | 705 | 433 | ||||||
|
| |||||||
| 2,107 | ||||||||
|
| |||||||
| ||||||||
| Description |
Face Amount | Market Value ($ Thousands) | ||||||
| ||||||||
MUNICIPAL BONDS (continued) | ||||||||
Texas — 0.2% | ||||||||
Texas State, Public Finance Authority, RB | ||||||||
Callable 07/01/2019 @ 100 | ||||||||
8.250%, 07/01/2024 | $ | 3,970 | $ | 4,161 | ||||
|
| |||||||
Total Municipal Bonds | 10,053 | |||||||
|
| |||||||
| Shares | ||||||||
COMMON STOCK — 0.4% | ||||||||
Aspect Software, Cl CR1 *(H) | 27,500 | 217 | ||||||
Aspect Software, Cl CR2 *(H) | 1,526 | 12 | ||||||
Cengage Learning Holdings II * | 2,408 | 52 | ||||||
Ceva Holdings *(H) | 561 | 196 | ||||||
CUI Acquisition *(H) | 3 | 251 | ||||||
Dana Holding | 112,964 | 1,761 | ||||||
Dex Media * | 82,018 | 163 | ||||||
Energy & Exploration Partners *(H) | 185 | 72 | ||||||
Global Aviation Holdings, Cl A * | 97,655 | — | ||||||
Halcon Resources * | 68,040 | 638 | ||||||
Medical Card Systems * | 265 | — | ||||||
Millennium * | 21,260 | 11 | ||||||
Mirabela Nickel *(H) | 5,869,596 | 1 | ||||||
Mmodal *(H) | 42,430 | 679 | ||||||
Nelson Education Ltd. * | 115,452 | — | ||||||
NII Holdings * | 51,236 | 171 | ||||||
Quad Graphics | 35 | 1 | ||||||
Reichhold Industries *(H) | 1,427 | 910 | ||||||
Seventy Seven Energy * | 61,686 | 1,163 | ||||||
TE Holdcorp * | 50,160 | 339 | ||||||
Titan Energy * | 22,243 | 656 | ||||||
|
| |||||||
Total Common Stock | 7,293 | |||||||
|
| |||||||
| Face Amount (Thousands) | ||||||||
CONVERTIBLE BONDS — 0.3% | ||||||||
Advanced Micro Devices CV to 125.0031 | ||||||||
2.125%, 09/01/2026 | 100 | 109 | ||||||
Cheniere Energy CV to 7.2265 | ||||||||
4.250%, 03/15/2045 | 615 | 390 | ||||||
Liberty Media CV to 16.7764 | ||||||||
3.750%, 02/15/2030 | 4,078 | 2,450 | ||||||
Liberty Media CV to 22.94686 | ||||||||
4.000%, 11/15/2029 | 1,661 | 1,025 | ||||||
MGIC Investment CV to 74.0741 | ||||||||
9.000%, 04/01/2063 (B) | 825 | 1,019 | ||||||
Mirabela Nickel | ||||||||
9.500%, 06/24/2019 (A)(B)(C)(H) | 1,541 | 432 | ||||||
| SEI Institutional Managed Trust / Annual Report / September 30, 2016 | 183 |
SCHEDULE OF INVESTMENTS
September 30, 2016
High Yield Bond Fund (Concluded)
| ||||||||
| Description |
Face Amount | Market Value ($ Thousands) | ||||||
| ||||||||
CONVERTIBLE BONDS (continued) | ||||||||
Mirant CV to 14.7167 | ||||||||
0.000%, 06/15/2021 (A) | $ | 2,200 | $ | – | ||||
|
| |||||||
Total Convertible Bonds | 5,425 | |||||||
|
| |||||||
| Shares | ||||||||
PREFERRED STOCK — 0.2% | ||||||||
Aspen Insurance Holdings, 5.950% (G) | 86,000 | 2,507 | ||||||
Ceva Holdings, 0.000% *(H) | 1,214 | 425 | ||||||
SLM, 1.934% (G) | 20,597 | 1,018 | ||||||
TE Holdcorp, 0.000% * | 73,170 | 677 | ||||||
|
| |||||||
Total Preferred Stock | 4,627 | |||||||
|
| |||||||
| Number of Warrants | ||||||||
WARRANTS — 0.0% | ||||||||
Mmodal, Expires 07/31/2017 Strike Price $48 * (H) | 19,978 | 1 | ||||||
Mmodal, Expires 07/31/2017 Strike Price $40 * (H) | 15,150 | 4 | ||||||
| ||||||||
| Description |
Number of Warrants | Market Value ($ Thousands) | ||||||
| ||||||||
WARRANTS (continued) | ||||||||
Seventy Seven Energy, Expires 08/21/2021 | 2,631 | $ | 13 | |||||
|
| |||||||
Total Warrants | 18 | |||||||
|
| |||||||
| Shares | ||||||||
AFFILIATED PARTNERSHIP — 0.0% | ||||||||
SEI Liquidity Fund, L.P. | ||||||||
0.440% **†(M) | 6,089 | 6 | ||||||
|
| |||||||
Total Affiliated Partnership | 6 | |||||||
|
| |||||||
CASH EQUIVALENT — 2.6% | ||||||||
SEI Daily Income Trust, Government Fund, Cl A | ||||||||
0.220%**† | 51,073,621 | 51,074 | ||||||
|
| |||||||
Total Cash Equivalent
(Cost $51,074) ($ Thousands) | 51,074 | |||||||
|
| |||||||
Total Investments — 98.9% | $ | 1,916,547 | ||||||
|
| |||||||
A list of the open centrally cleared swap agreements held by the Fund at September 30, 2016 is as follows:
| ||||||||||||||||
| Credit Default Swaps | ||||||||||||||||
| ||||||||||||||||
| Counterparty | Reference Entity/Obligation | Buy/Sell Protection | (Pays)/Receives Rate | Termination Date | Notional Amount ($Thousands) | Net Unrealized Appreciation ($Thousands) | ||||||||||
| ||||||||||||||||
JPMorgan Chase Bank | CDX.NA.HY SERIES 26 | SELL | 5.00% | 06/20/2021 | $(9,000) | $193 | ||||||||||
|
| |||||||||||||||
For the year ended September 30, 2016, the total amount of open swap agreements, as presented in the table above, are representative of the volume of activity for the derivative type during the year.
| Percentages are based on Net Assets of $1,938,000 ($ Thousands). |
| * | Non-income producing security. |
| ** | Rate shown is the 7-day effective yield as of September 30, 2016. |
| † | Investment in Affiliated Security (see Note 6). |
| (A) | Security is in default on interest payment. |
| (B) | Security exempt from registration under Rule 144A of the Securities Act of 1933. These securities may be resold in transactions exempt from registration normally to qualified institutions. On September 30, 2016, the value of these securities amounted to $884,953 ($ Thousands), representing 45.7% of the net assets of the Fund. |
| (C) | Securities considered illiquid. The total value of such securities as of September 30, 2016 was $976 ($ Thousands) and represented 0.0% of Net Assets (Unaudited). |
| (D) | Securities considered restricted. The total market value of such securities as of September 30, 2016 was $0 ($ Thousands) and represented 0.0% of Net Assets. |
| (E) | Step Bonds – The rate reflected on the Schedule of Investments is the effective yield on September 30, 2016. The coupon on a step bond changes on a specified date. |
| (F) | This security or a partial position of this security is on loan at September 30, 2016 (see Note 10). The total market value of securities on loan at September 30, 2016 was $1 ($ Thousands). |
| (G) | Variable Rate Security — The rate reported on the Schedule of Investments is the rate in effect as of September 30, 2016. |
| (H) | Security fair valued using methods determined in good faith by the Valuation Committee of the Board of Trustees. The total market value of such securities as of September 30, 2016 was $17,973 ($ Thousands) and represented 0.9% of Net Assets. |
| (I) | Maturity date is unavailable. |
| (J) | The rate reported is the effective yield at the time of purchase. |
| (K) | Unsettled bank loan. Interest rate not available. |
| (L) | Unfunded bank loan. |
| (M) | This security was purchased with cash collateral held from securities on loan (see Note 10). The total market value of such securities as of September 30, 2016 was $6 ($ Thousands). |
CDO — Collateralized Debt Obligation
Cl — Class
CLO — Collateralized Loan Obligation
CV — Convertible Security
GO — General Obligation
L.P. — Limited Partnership
| 184 | SEI Institutional Managed Trust / Annual Report / September 30, 2016 |
LLC — Limited Liability Company
MTN — Medium Term Note
PIK — Payment-in-Kind
PLC — Public Limited Company
RB — Revenue Bond
Ser — Series
ULC — Unlimited Liability Company
The following is a list of the level of inputs used as of September 30, 2016, in valuing the Fund’s investments and other financial instruments carried at value ($ Thousands):
| ||||||||||||||||
Investments in Securities | Level 1 | Level 2 | Level 3(1) | Total | ||||||||||||
| ||||||||||||||||
Corporate Obligations | $ | – | $ | 1,511,047 | $ | 5,566 | $ | 1,516,613 | ||||||||
Asset-Backed Securities | – | 350 | 162,028 | 162,378 | ||||||||||||
Loan Participations | – | 145,526 | 13,534 | 159,060 | ||||||||||||
Municipal Bonds | – | 2,107 | 7,946 | 10,053 | ||||||||||||
Common Stock | 4,442 | 513 | 2,338 | 7,293 | ||||||||||||
| ||||||||||||||||
Investments in Securities | Level 1 | Level 2 | Level 3(1) | Total | ||||||||||||
| ||||||||||||||||
Convertible Bonds | $ | – | $ | 4,993 | $ | 432 | $ | 5,425 | ||||||||
Preferred Stock | 2,507 | 1,695 | 425 | 4,627 | ||||||||||||
Warrants | – | 13 | 5 | 18 | ||||||||||||
Affiliated Partnership | – | 6 | – | 6 | ||||||||||||
Cash Equivalent | 51,074 | – | – | 51,074 | ||||||||||||
|
|
|
|
|
|
|
| |||||||||
Total Investments in Securities | $ | 58,023 | $ | 1,666,250 | $ | 192,274 | $ | 1,916,547 | ||||||||
|
|
|
|
|
|
|
| |||||||||
| ||||||||||||||||
| Other Financial Instruments | Level 1 | Level 2 | Level 3 | Total | ||||||||||||
| ||||||||||||||||
Centrally Cleared Swap | ||||||||||||||||
Credit Default Swap *
| ||||||||||||||||
Unrealized Appreciation | $ | — | $ | 193 | $ | — | $ | 193 | ||||||||
|
|
|
|
|
|
|
| |||||||||
Total Other Financial Instruments
| $
| —
|
| $
| 193
|
| $
| —
|
| $
| 193
|
| ||||
|
|
|
|
|
|
|
| |||||||||
| * | Swap contracts are valued at the unrealized appreciation on the instrument. |
The following is a reconciliation of the investments in which significant unobservable inputs (Level 3) were used in determining value ($ Thousands):
| ||||||||||||||||||||||||||||||||
Investments Obligations | Investments Securities | Investments in Loan Participations | Investments in Municipal Bonds | Investments in Common Stock | Investments in Convertible Bonds | Investments in Preferred Stock | Investments in Warrants | |||||||||||||||||||||||||
| ||||||||||||||||||||||||||||||||
Balance as of October 1, 2015 | $ | 5,626 | $ | 167,799 | $ | 6,047 | $ | — | $ | 1,569 | $ | 435 | $ | — | $ | 9 | ||||||||||||||||
Accrued discounts/premiums | 42 | (187) | (107) | — | — | (3) | — | — | ||||||||||||||||||||||||
Realized gain/(loss) | (13) | 2,224 | (1,050) | — | 296 | — | — | — | ||||||||||||||||||||||||
Change in unrealized appreciation/depreciation | (164) | 5,906 | 752 | — | 41 | (137) | — | (4) | ||||||||||||||||||||||||
Purchases | 79 | 38,141 | 859 | — | 269 | 137 | — | — | ||||||||||||||||||||||||
Sales | (5) | (51,855) | (1,007) | — | (33) | — | — | — | ||||||||||||||||||||||||
Net transfer into Level 3 | 1 | — | 10,337 | 7,946 | 196 | — | 425 | — | ||||||||||||||||||||||||
Net transfer out of Level 3 | — | — | (2,297) | — | — | — | — | — | ||||||||||||||||||||||||
|
| |||||||||||||||||||||||||||||||
Ending Balance as of September 30, 2016 | $ | 5,566 | $ | 162,028 | $ | 13,534 | $ | 7,946 | $ | 2,338 | $ | 432 | $ | 425 | $ | 5 | ||||||||||||||||
|
| |||||||||||||||||||||||||||||||
Changes in unrealized gains/(losses) included in earnings related to securities still held at reporting date | $ | (3,084) | $ | 7,601 | $ | (2,384) | $ | 401 | $ | (200) | $ | (176) | $ | (668) | $ | (4) | ||||||||||||||||
|
| |||||||||||||||||||||||||||||||
(1) Of the $192,274 ($ Thousands) in Level 3 securities as of September 30, 2016, $17,973 ($ Thousands) or 0.9% of Net Assets are not valued via third party pricing vendors and broker quotes. If significant, the disclosure of the unobservable inputs and the interrelationships and sensitivity between these inputs are required for those Level 3 securities that are not valued by third party pricing vendors or broker quotes. The value of these securities is immaterial and no further disclosure is required.
For the year ended September 30, 2016, there were no transfers between Level 1 and Level 2 assets and liabilities.
For the year ended September 30, 2016, there were transfers between Level 2 and Level 3 assets and liabilities due to the availability of observable inputs to determine fair value.
For more information on valuation inputs, see Note 2 – Significant Accounting Policies in Notes to Financial Statements.
Amounts designated as “—” are $0 or have been rounded to $0.
The accompanying notes are an integral part of the financial statements.
| SEI Institutional Managed Trust / Annual Report / September 30, 2016 | 185 |
SCHEDULE OF INVESTMENTS
September 30, 2016
Conservative Income Fund
Sector Weightings (Unaudited)†:
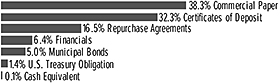
†Percentages are based on total investments.
| ||||||||
| Description |
Face Amount | Market Value ($ Thousands) | ||||||
| ||||||||
COMMERCIAL PAPER (E) — 30.8% |
| |||||||
AutoZone | ||||||||
0.690%, 10/06/2016 (A) | $ | 620 | $ | 620 | ||||
Bedford Row Funding | ||||||||
0.854%, 10/26/2016 (A) | 1,500 | 1,499 | ||||||
BNZ International Funding | ||||||||
0.685%, 11/18/2016 (A) | 700 | 700 | ||||||
Caisse Centrale Desjardins | ||||||||
0.500%, 10/14/2016 (A) | 1,200 | 1,200 | ||||||
Charta | ||||||||
0.882%, 11/29/2016 (A) | 1,000 | 999 | ||||||
Coca Cola | ||||||||
0.975%, 03/01/2017 (A) | 500 | 498 | ||||||
Collateralized Commercial Paper | ||||||||
0.580%, 10/06/2016 | 1,000 | 1,000 | ||||||
Collateralized Commercial Paper II | ||||||||
0.821%, 10/31/2016 (A) | 1,200 | 1,199 | ||||||
Commonwealth Bank of Australia | ||||||||
1.137%, 03/29/2017 (A)(B) | 500 | 500 | ||||||
0.814%, 11/04/2016 (A) | 1,750 | 1,750 | ||||||
DBS Bank | ||||||||
0.747%, 11/07/2016 (A) | 1,000 | 1,000 | ||||||
Enterprise Products Operating | ||||||||
0.780%, 10/06/2016 (A) | 600 | 600 | ||||||
Ford Motor Credit Company | ||||||||
0.750%, 10/05/2016 | 600 | 600 | ||||||
Gotham Funding | ||||||||
1.032%, 12/12/2016 (A) | 600 | 599 | ||||||
0.801%, 11/16/2016 (A) | 700 | 699 | ||||||
Hyundai Capital America | ||||||||
0.740%, 10/17/2016 (A) | 620 | 620 | ||||||
Manhattan Asset Funding | ||||||||
0.932%, 11/16/2016 (A) | 500 | 500 | ||||||
National Australia Bank | ||||||||
0.824%, 11/15/2016 (A) | 1,000 | 999 | ||||||
NBCUniversal Enterprise | ||||||||
0.701%, 10/17/2016 (A) | 620 | 620 | ||||||
Norinchukin Bank | ||||||||
1.256%, 03/21/2017 (B) | 600 | 600 | ||||||
Ontario Teacher Financial Trust | ||||||||
0.956%, 12/16/2016 (A) | 1,000 | 998 | ||||||
0.919%, 11/10/2016 (A) | 750 | 749 | ||||||
Oversea-Chinese Banking | ||||||||
0.721%, 10/13/2016 | 1,200 | 1,200 | ||||||
| ||||||||
| Description |
Face Amount | Market Value ($ Thousands) | ||||||
| ||||||||
COMMERCIAL PAPER (continued) |
| |||||||
Regency Markets No. 1 | ||||||||
0.650%, 10/14/2016 (A) | $ | 1,000 | $ | 1,000 | ||||
0.600%, 10/06/2016 (A) | 1,567 | 1,567 | ||||||
Toyota Motor Credit | ||||||||
0.943%, 01/13/2017 | 1,000 | 998 | ||||||
0.763%, 10/25/2016 | 1,000 | 1,000 | ||||||
UnitedHealth Group | ||||||||
0.630%, 10/03/2016 (A) | 600 | 600 | ||||||
Victory Receivables | ||||||||
1.022%, 12/12/2016 (A) | 600 | 599 | ||||||
0.400%, 10/03/2016 (A) | 2,000 | 2,001 | ||||||
Westpac Banking | ||||||||
1.007%, 01/13/2017 (A) | 750 | 748 | ||||||
|
| |||||||
Total Commercial Paper |
| 28,262 | ||||||
|
| |||||||
CORPORATE OBLIGATIONS — 4.8% |
| |||||||
Financials — 4.8% |
| |||||||
Australia & New Zealand Banking Group | ||||||||
1.045%, 01/10/2017 (A)(B) | 1,000 | 1,001 | ||||||
DNB Bank | ||||||||
1.088%, 02/13/2017 (B) | 1,000 | 1,001 | ||||||
Macquarie Bank | ||||||||
5.000%, 02/22/2017 (A) | 1,100 | 1,114 | ||||||
Toronto-Dominion Bank MTN | ||||||||
0.916%, 01/06/2017 (B) | 1,300 | 1,300 | ||||||
|
| |||||||
| 4,416 | ||||||||
|
| |||||||
Total Corporate Obligations |
| 4,416 | ||||||
|
| |||||||
MUNICIPAL BONDS — 3.8% |
| |||||||
California — 0.5% |
| |||||||
California State, GO | ||||||||
Callable 10/03/2016 @ 100 | ||||||||
0.810%, 05/01/2040(B)(C) | 500 | 500 | ||||||
|
| |||||||
Connecticut — 1.1% |
| |||||||
Connecticut State Development Authority, AMT, RB | ||||||||
Callable 10/03/2016 @ 100 | ||||||||
0.870%, 08/01/2023(B)(C) | 1,000 | 1,000 | ||||||
|
| |||||||
Texas — 1.1% |
| |||||||
North Texas Tollway Authority, RB | ||||||||
Callable 04/01/2017 @ 100 | ||||||||
0.820%, 01/01/2049(B)(C) | 1,000 | 1,000 | ||||||
|
| |||||||
| 186 | SEI Institutional Managed Trust / Annual Report / September 30, 2016 |
| Description |
Face Amount | Market Value ($ Thousands) | ||||||
MUNICIPAL BONDS (continued) |
| |||||||
Wyoming — 1.1% |
| |||||||
Sweetwater County Wyoming, RB | ||||||||
Callable 10/03/2016 @ 100 | ||||||||
0.830%, 11/01/2024(B)(C) | $ | 1,000 | $ | 1,000 | ||||
|
| |||||||
Total Municipal Bonds |
| 3,500 | ||||||
|
| |||||||
U.S. TREASURY OBLIGATION — 1.1% |
| |||||||
U.S. Treasury Note | ||||||||
2.750%, 11/30/2016
|
| 1,000
|
|
| 1,004
|
| ||
|
| |||||||
Total U.S. Treasury Obligation |
| 1,004 | ||||||
|
| |||||||
CERTIFICATES OF DEPOSIT — 22.5% |
| |||||||
Bank of Montreal | ||||||||
1.139%, 05/02/2017 | 500 | 500 | ||||||
0.930%, 12/14/2016 | 500 | 500 | ||||||
0.690%, 10/05/2016 | 1,000 | 1,000 | ||||||
Bank of Nova Scotia | ||||||||
1.115%, 04/25/2017 | 1,750 | 1,750 | ||||||
1.067%, 04/12/2017 | 300 | 300 | ||||||
0.968%, 11/07/2016 | 500 | 500 | ||||||
Caisse Centrale Desjardins | ||||||||
1.253%, 03/27/2017 | 500 | 500 | ||||||
Canadian Imperial Bank of Commerce | ||||||||
1.159%, 05/02/2017 | 1,750 | 1,750 | ||||||
1.155%, 12/05/2016 | 650 | 650 | ||||||
Citibank | ||||||||
0.800%, 11/01/2016 | 1,200 | 1,200 | ||||||
Kookmin Bank | ||||||||
0.440%, 10/05/2016 | 2,000 | 2,000 | ||||||
Mitsubishi UFJ Trust & Banking | ||||||||
1.254%, 04/03/2017 | 700 | 700 | ||||||
National Australia Bank | ||||||||
1.114%, 04/27/2017 | 1,000 | 1,000 | ||||||
Norinchukin Bank | ||||||||
0.950%, 12/20/2016 | 500 | 500 | ||||||
0.900%, 11/16/2016 | 1,200 | 1,200 | ||||||
Sumitomo Mitsui Trust Bank Limited | ||||||||
1.281%, 03/13/2017 | 600 | 600 | ||||||
1.251%, 02/17/2017 | 1,000 | 1,000 | ||||||
1.213%, 02/09/2017 | 1,000 | 1,000 | ||||||
0.925%, 10/26/2016 | 1,500 | 1,500 | ||||||
UBS | ||||||||
0.926%, 11/03/2016 | 1,000 | 1,000 | ||||||
Westpac Banking | ||||||||
1.032%, 01/23/2017 | 750 | 750 | ||||||
| Description |
Face Amount | Market Value ($ Thousands) | ||||||
CERTIFICATES OF DEPOSIT (continued) |
| |||||||
0.947%, 10/21/2016 | $ | 750 | $ | 750 | ||||
|
| |||||||
Total Certificates of Deposit |
| 20,650 | ||||||
|
| |||||||
| Shares | ||||||||
CASH EQUIVALENT — 0.1% |
| |||||||
SEI Daily Income Trust, Government Fund, Cl A | ||||||||
0.220%**† | 50,695 | 51 | ||||||
|
| |||||||
Total Cash Equivalent
(Cost $51) ($ Thousands) |
| 51 | ||||||
|
| |||||||
| Face Amount (Thousands) | ||||||||
REPURCHASE AGREEMENTS(D) — 12.4% |
| |||||||
Bank of Montreal | ||||||||
0.420%, dated 09/30/2016, to be repurchased on 10/03/2016, repurchase price $3,500,123 (collateralized by various FMAC, FNMA and GNMA obligations, ranging in par value $11,249 - $2,580,522, 1.650% - 4.500%, 05/14/2021 - 05/01/2046; total market value $3,599,905) | 3,500 | 3,500 | ||||||
Goldman Sachs | ||||||||
0.500%, dated 09/30/2016, to be repurchased on 10/03/2016, repurchase price $3,500,146 (collateralized by a FNMA obligation, par value $3,844,963, 3.000%, 12/01/2035; total market value $3,605,000) | 3,500 | 3,500 | ||||||
Toronto Dominion Bank | ||||||||
0.520%, dated 09/30/2016, to be repurchased on 10/03/2016, repurchase price $4,400,191 (collateralized by a U.S. Treasury Note, par value $3,848,300, 3.000%, 11/15/2045; total market value $4,488,080)
|
| 4,400
|
|
| 4,400
|
| ||
|
| |||||||
Total Repurchase Agreements |
| 11,400 | ||||||
|
| |||||||
Total Investments — 75.5% |
| $ | 69,283 | |||||
|
| |||||||
| Percentages are based on Net Assets of $91,807 ($ Thousands). |
| ** | Rate shown is the 7-day effective yield as of September 30, 2016. |
| † | Investment in Affiliated Security (see Note 6). |
| (A) | Security exempt from registration under Rule 144A of the Securities Act of 1933. These securities may be resold in transactions exempt from registration normally to qualified institutions. On September 30, 2016, the value of these securities amounted to $24,979 ($ Thousands), representing 27.2% of the Net Assets of the Fund. |
| (B) | Variable Rate Security — The rate reported on the Schedule of Investments is the rate in effect as of September 30, 2016. |
| SEI Institutional Managed Trust / Annual Report / September 30, 2016 | 187 |
SCHEDULE OF INVESTMENTS
September 30, 2016
Conservative Income Fund (Concluded)
| (C) | Securities are held in connection with a letter of credit issued by a major bank. |
| (D) | Tri-Party Repurchase Agreement. |
| (E) | The rate reported is the effective yield at time of purchase. |
AMT — Alternative Minimum Tax
Cl — Class
FMAC — Freddie Mac
FNMA — Federal National Mortgage Association
GNMA — Government National Mortgage Association
GO — General Obligation
MTN — Medium Term Note
RB — Revenue Bond
The following is a list of the level of inputs used as of September 30, 2016, in valuing the Fund’s investments carried at value ($ Thousands):
| ||||||||||||||||
| Investments in Securities | Level 1 | Level 2 | Level 3 | Total | ||||||||||||
| ||||||||||||||||
Commercial Paper | $ | – | $ | 28,262 | $ | – | $ | 28,262 | ||||||||
Corporate Obligations | – | 4,416 | – | 4,416 | ||||||||||||
Municipal Bonds | – | 3,500 | – | 3,500 | ||||||||||||
U.S. Treasury Obligation | – | 1,004 | – | 1,004 | ||||||||||||
Certificates of Deposit | – | 20,650 | – | 20,650 | ||||||||||||
Cash Equivalent | 51 | – | – | 51 | ||||||||||||
Repurchase Agreements | – | 11,400 | – | 11,400 | ||||||||||||
|
|
|
|
|
|
|
| |||||||||
Total Investments in Securities | $ | 51 | $ | 69,232 | $ | – | $ | 69,283 | ||||||||
|
|
|
|
|
|
|
| |||||||||
For the year ended September 30, 2016, there were no transfers between Level 1 and Level 2 assets and liabilities.
For the year ended September 30, 2016, there were no transfers between Level 2 and Level 3 assets and liabilities.
For more information on valuation inputs, see Note 2 – Significant Accounting Policies in Notes to Financial Statements.
Amounts designated as “—” are $0 or have been rounded to $0.
The accompanying notes are an integral part of the financial statements.
| 188 | SEI Institutional Managed Trust / Annual Report / September 30, 2016 |
SCHEDULE OF INVESTMENTS
September 30, 2016
Tax-Free Conservative Income Fund
Sector Weightings (Unaudited)†:

†Percentages are based on total investments.
| Description |
Face Amount |
Market Value | ||||||
MUNICIPAL BONDS — 99.6% |
| |||||||
California — 5.6% | ||||||||
Los Angeles County, Schools Pooled Financing Program, Ser A-3, RB | ||||||||
2.000%, 06/30/2017 | $ | 1,000 | $ | 1,009 | ||||
Orange County, Housing Authority, Oasis Martinique Project, Ser I, RB, FNMA | ||||||||
Callable 10/15/2016 @ 100 | ||||||||
0.920%, 06/15/2028(A) | 1,500 | 1,500 | ||||||
|
| |||||||
| 2,509 | ||||||||
|
| |||||||
Colorado — 4.2% | ||||||||
Colorado State, Ser A, RB | ||||||||
2.000%, 06/27/2017 | 1,000 | 1,008 | ||||||
Colorado State, University of Colorado Denver Fitzsimmons Academic Project, COP | ||||||||
5.000%, 11/01/2016 | 905 | 908 | ||||||
|
| |||||||
| 1,916 | ||||||||
|
| |||||||
Connecticut — 4.5% | ||||||||
Capital City Economic Development Authority, Ser B, RB | ||||||||
Callable 10/03/2016 @ 100 | ||||||||
0.850%, 06/15/2024(A) | 2,000 | 2,000 | ||||||
|
| |||||||
Florida — 1.8% | ||||||||
Escambia County, Health Facilities Authority, Azalea Trace Project, RB, AGC | ||||||||
Callable 11/01/2016 @ 100 | ||||||||
1.000%, 11/15/2029(A) | 800 | 800 | ||||||
|
| |||||||
Idaho — 2.9% | ||||||||
Idaho State, TAN, GO | ||||||||
2.000%, 06/30/2017 | 1,250 | 1,260 | ||||||
|
| |||||||
Illinois — 5.4% | ||||||||
Elmhurst, Industrial Development Revenue Authority, Randall Manufacturing Production Project, AMT, RB | ||||||||
Callable 10/03/2016 @ 100 | ||||||||
1.290%, 02/01/2027(A)(B) | 1,715 | 1,715 | ||||||
Illinois State, Finance Authority, Unity Point Health Project, Ser D, RB | ||||||||
4.000%, 02/15/2017 | 720 | 728 | ||||||
|
| |||||||
| 2,443 | ||||||||
|
| |||||||
| Description |
Face Amount |
Market Value | ||||||
MUNICIPAL BONDS (continued) |
| |||||||
Iowa — 7.8% | ||||||||
Iowa State, Finance Authority, Midwestern Disaster Area Economic Development, CJ Bio America Project, RB | ||||||||
Callable 10/03/2016 @ 100 | ||||||||
1.160%, 04/01/2022(A)(B) | $ | 2,000 | $ | 2,000 | ||||
Iowa State, Finance Authority, Pollution Control Facilities, Mid-American Energy Project, RB | ||||||||
Callable 11/01/2016 @ 100 | ||||||||
0.850%, 09/01/2036(A) | 1,500 | 1,500 | ||||||
|
| |||||||
| 3,500 | ||||||||
|
| |||||||
Louisiana — 4.5% | ||||||||
Ascension Parish, Industrial Development Board, BASF Project, RB | ||||||||
Callable 11/01/2016 @ 100 | ||||||||
1.000%, 10/01/2039(A) | 2,000 | 2,000 | ||||||
|
| |||||||
Massachusetts — 5.1% | ||||||||
Massachusetts State, Educational Financing Authority, Ser A, RB | ||||||||
5.500%, 01/01/2017 | 500 | 505 | ||||||
Salisbury, BAN, GO | ||||||||
2.000%, 09/15/2017 | 1,000 | 1,012 | ||||||
Worcester, Municipal Purpose Loan, GO | ||||||||
4.000%, 11/01/2016 | 750 | 752 | ||||||
|
| |||||||
| 2,269 | ||||||||
|
| |||||||
Michigan — 7.0% | ||||||||
Michigan State, Finance Authority, Higher Education Facilities, University of Detroit Mercy Project, RB | ||||||||
Callable 10/03/2016 @ 100 | ||||||||
0.910%, 11/01/2040(A)(B) | 2,000 | 2,000 | ||||||
Michigan State, Strategic Fund, Kay Screen Printing Project, AMT, RB | ||||||||
Callable 10/03/2016 @ 100 | ||||||||
1.110%, 05/01/2020(A)(B) | 1,100 | 1,100 | ||||||
|
| |||||||
| 3,100 | ||||||||
|
| |||||||
Missouri — 2.2% | ||||||||
Kansas City, Special Obligation, H Roe Bartle Project, Ser E, RB | ||||||||
Callable 10/03/2016 @ 100 | ||||||||
0.870%, 04/15/2034(A)(B) | 1,000 | 1,000 | ||||||
|
| |||||||
Nebraska — 0.3% | ||||||||
Nebraska State, Public Power District, Ser C, RB | ||||||||
5.000%, 01/01/2017 | 150 | 152 | ||||||
|
| |||||||
| SEI Institutional Managed Trust / Annual Report / September 30, 2016 | 189 |
SCHEDULE OF INVESTMENTS
September 30, 2016
Tax-Free Conservative Income Fund (Concluded)
| Description |
Face Amount |
Market Value | ||||||
MUNICIPAL BONDS (continued) |
| |||||||
New Hampshire — 3.3% | ||||||||
Cheshire County, TAN, GO | ||||||||
2.000%, 12/29/2016 | $ | 1,500 | $ | 1,503 | ||||
|
| |||||||
New Jersey — 4.4% | ||||||||
Hudson County, Improvement Authority, RB | ||||||||
2.000%, 06/27/2017 | 500 | 504 | ||||||
New Jersey State, Health Care Facilities Financing Authority, AHS Hospital Project, RB | ||||||||
5.000%, 07/01/2017 | 500 | 515 | ||||||
Wayne Township, BAN, GO | ||||||||
2.000%, 07/14/2017 | 1,000 | 1,008 | ||||||
|
| |||||||
| 2,027 | ||||||||
|
| |||||||
New York — 16.7% | ||||||||
Broome County, BAN, GO | ||||||||
2.000%, 05/05/2017 | 1,500 | 1,508 | ||||||
Corning City, School District, BAN, GO | ||||||||
2.000%, 06/22/2017 | 1,000 | 1,006 | ||||||
New York City, Housing Development Authority, Hewitt House Apartments Project, Ser A, RB | ||||||||
Callable 10/03/2016 @ 100 | ||||||||
0.880%, 11/01/2048(A)(B) | 2,000 | 2,000 | ||||||
New York State, Dormitory Authority, Rockefeller University Project, Ser B, RB | ||||||||
Callable 10/03/2016 @ 100 | ||||||||
0.850%, 07/01/2040(A) | 1,500 | 1,500 | ||||||
Oswego County, Industrial Development Agency, O.H. Properties Project, Ser A, RB | ||||||||
Callable 10/03/2016 @ 100 | ||||||||
1.090%, 06/01/2024(A)(B) | 935 | 935 | ||||||
Phelps-Clifton Springs, Central School District, BAN, GO | ||||||||
1.500%, 06/30/2017 | 500 | 501 | ||||||
|
| |||||||
| 7,450 | ||||||||
|
| |||||||
Ohio — 10.4% | ||||||||
American Municipal Power, Electric System Improvement Authority, Village of Holiday City Project, RB | ||||||||
1.250%, 05/02/2017 | 1,000 | 1,002 | ||||||
Elyria, BAN, GO | ||||||||
1.125%, 05/25/2017 | 600 | 601 | ||||||
Franklin County, Health Care Facilities Refunding and Improvement Authority, Ohio Presbyterian Retirement Services Project, RB | ||||||||
Callable 10/06/2016 @ 100 | ||||||||
0.890%, 07/01/2035(A)(B) | 400 | 400 | ||||||
| Description |
Face Amount |
Market Value | ||||||
MUNICIPAL BONDS (continued) |
| |||||||
Hamilton County, Health Care Facilities Authority, Children’s Home Project, RB | ||||||||
Callable 10/03/2016 @ 100 | ||||||||
0.880%, 03/01/2033(A)(B) | $ | 1,000 | $ | 1,000 | ||||
Hamilton, Multi-Family Housing Authority, Affordable Housing Project, Ser B, RB | ||||||||
Callable 10/03/2016 @ 100 | ||||||||
1.020%, 01/01/2035(A)(B) | 1,726 | 1,726 | ||||||
|
| |||||||
| 4,729 | ||||||||
|
| |||||||
Pennsylvania — 6.9% | ||||||||
Bucks County, Water & Sewer Authority, RB, BAM | ||||||||
1.500%, 06/01/2017 | 470 | 472 | ||||||
Lancaster County, Hospital Authority, Luthercare Project, RB | ||||||||
Callable 10/03/2016 @ 100 | ||||||||
0.890%, 02/15/2029(A)(B) | 2,000 | 2,000 | ||||||
Philadelphia, Gas Works Authority, Ser D, RB | ||||||||
Callable 11/01/2016 @ 100 | ||||||||
0.860%, 08/01/2031(A)(B) | 600 | 600 | ||||||
|
| |||||||
| 3,072 | ||||||||
|
| |||||||
Texas — 0.2% | ||||||||
Harris County, Health Facilities Development Authority, Methodist Hospital System Project, RB | ||||||||
Callable 10/03/2016 @ 100 | ||||||||
0.870%, 12/01/2041(A) | 100 | 100 | ||||||
|
| |||||||
Virginia — 4.5% | ||||||||
Albemarle County, Industrial Development Authority, Jefferson Scholars Foundation Project, RB | ||||||||
Callable 10/03/2016 @ 100 | ||||||||
0.900%, 10/01/2037(A)(B) | 2,000 | 2,000 | ||||||
|
| |||||||
Wisconsin — 1.9% | ||||||||
Oshkosh, Industrial Development Authority, Oshkosh Coil Spring Project, Ser A, AMT, RB | ||||||||
Callable 10/03/2016 @ 100 | ||||||||
1.110%, 12/01/2020(A)(B) | 840 | 840 | ||||||
|
| |||||||
Total Municipal Bonds (Cost $44,684) ($ Thousands) | 44,670 | |||||||
|
| |||||||
Total Investments — 99.6% (Cost $44,684) ($ Thousands) | $ | 44,670 | ||||||
|
| |||||||
| Percentages are based on Net Assets of $44,868 ($ Thousands). |
| (A) | Variable Rate Security — The rate reported on the Schedule of Investments is the rate in effect as of September 30, 2016. |
| (B) | Securities are held in connection with a letter of credit issued by a major bank. |
| 190 | SEI Institutional Managed Trust / Annual Report / September 30, 2016 |
AGC — Assured Guaranty Corporation
AMT — Alternative Minimum Tax
BAM — Build America Mutual
BAN — Bond Anticipation Note
COP— Certificate of Participation
FNMA — Federal National Mortgage Association
GO — General Obligation
RB — Revenue Bond
Ser — Series
TAN — Tax Anticipation Note
As of September 30, 2016, all of the Fund’s investments were considered Level 2, in accordance with the authoritative guidance on fair value measurements and disclosure under U.S. GAAP.
For the year ended September 30, 2016, there were no transfers between Level 1 and Level 2 assets and liabilities.
For the year ended September 30, 2016, there were no transfers between Level 2 and Level 3 assets and liabilities.
For more information on valuation inputs, see Note 2 – Significant Accounting Policies in Notes to Financial Statements.
Amounts designated as “–” are $0 or have been rounded to $0.
The accompanying notes are an integral part of the financial statements.
| SEI Institutional Managed Trust / Annual Report / September 30, 2016 | 191 |
SCHEDULE OF INVESTMENTS
September 30, 2016
Real Return Fund
|
Sector Weightings (Unaudited)†:

†Percentages are based on total investments.
| ||||||||
| Description | Face Amount ($ Thousands) | Market Value ($ Thousands) | ||||||
| ||||||||
U.S. TREASURY OBLIGATIONS — 99.5% |
| |||||||
U.S. Treasury Inflation Protected Securities | ||||||||
2.125%, 01/15/2019 | $ | 11,803 | $ | 12,570 | ||||
1.875%, 07/15/2019 | 13,426 | 14,418 | ||||||
1.625%, 01/15/2018 | 12,865 | 13,261 | ||||||
1.375%, 07/15/2018 | 12,689 | 13,225 | ||||||
1.375%, 01/15/2020 | 17,761 | 18,859 | ||||||
1.250%, 07/15/2020 | 25,151 | 26,873 | ||||||
1.125%, 01/15/2021 | 28,788 | 30,638 | ||||||
0.625%, 07/15/2021 | 31,994 | 33,596 | ||||||
0.125%, 04/15/2018 | 42,452 | 42,914 | ||||||
0.125%, 04/15/2019 | 43,078 | 43,811 | ||||||
0.125%, 04/15/2020 | 42,087 | 42,908 | ||||||
0.125%, 04/15/2021 |
| 24,903
|
|
| 25,423
|
| ||
|
| |||||||
Total U.S. Treasury Obligations | 318,496 | |||||||
|
| |||||||
| Shares | ||||||||
CASH EQUIVALENT — 1.7% |
| |||||||
SEI Daily Income Trust, Government Fund, Cl A | ||||||||
0.220% **† | 5,455,515 | 5,456 | ||||||
|
| |||||||
Total Cash Equivalent | 5,456 | |||||||
|
| |||||||
Total Investments — 101.2% | $ | 323,952 | ||||||
|
| |||||||
| Percentages are based on Net Assets of $320,215 ($ Thousands). |
| ** | Rate shown is the 7-day effective yield as of September 30, 2016. |
| † | Investment in Affiliated Security (see Note 6). |
Cl — Class
The following is a list of the level of inputs used as of September 30, 2016, in valuing the Fund’s investments carried at value ($ Thousands):
| ||||||||||||||||
| Investments in Securities | Level 1 | Level 2 | Level 3 | Total | ||||||||||||
| ||||||||||||||||
U.S. Treasury Obligations | $ | – | $ | 318,496 | $ | – | $ | 318,496 | ||||||||
Cash Equivalent | 5,456 | – | – | 5,456 | ||||||||||||
|
|
|
|
|
|
|
| |||||||||
Total Investments in Securities | $ | 5,456 | $ | 318,496 | $ | – | $ | 323,952 | ||||||||
|
|
|
|
|
|
|
| |||||||||
For the year ended September 30, 2016, there were no transfers between Level 1 and Level 2 assets and liabilities.
For the year ended September 30, 2016, there were no transfers between Level 2 and Level 3 assets and liabilities.
For more information on valuation inputs, see Note 2 – Significant Accounting Policies in Notes to Financial Statements.
Amounts designated as “–” are $0 or have been rounded to $0.
The accompanying notes are an integral part of the financial statements.
| 192 | SEI Institutional Managed Trust / Annual Report / September 30, 2016 |
SUMMARY SCHEDULE OF INVESTMENTS
September 30, 2016
Dynamic Asset Allocation Fund
|
Sector Weightings (Unaudited)†:
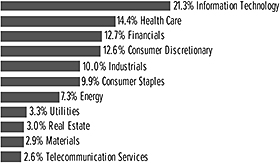
†Percentages are based on total investments.
| ||||||||||||
| Description | Percentage of Net Assets (%) | Shares | Market Value ($ Thousands) | |||||||||
| ||||||||||||
COMMON STOCK — 97.3% |
| |||||||||||
Consumer Discretionary — 12.2% |
| |||||||||||
Amazon.com, Cl A* | 1.7% | 11,036 | $ | 9,241 | ||||||||
Comcast, Cl A | 0.8 | 67,390 | 4,471 | |||||||||
Home Depot | 0.8 | 34,682 | 4,463 | |||||||||
McDonald’s | 0.5 | 23,907 | 2,758 | |||||||||
Starbucks | 0.4 | 40,957 | 2,217 | |||||||||
Walt Disney | 0.7 | 41,581 | 3,861 | |||||||||
Other Securities | 7.3 | 38,799 | ||||||||||
|
| |||||||||||
| 65,810 | ||||||||||||
|
| |||||||||||
Consumer Staples — 9.6% |
| |||||||||||
Altria Group | 0.6 | 54,469 | 3,444 | |||||||||
Coca-Cola | 0.9 | 107,882 | 4,566 | |||||||||
CVS Health | 0.5 | 29,799 | 2,652 | |||||||||
PepsiCo | 0.8 | 40,140 | 4,366 | |||||||||
Philip Morris International | 0.8 | 43,137 | 4,194 | |||||||||
Procter & Gamble | 1.2 | 74,609 | 6,696 | |||||||||
Wal-Mart Stores | 0.6 | 42,376 | 3,056 | |||||||||
Other Securities | 4.2 | 22,742 | ||||||||||
|
| |||||||||||
| 51,716 | ||||||||||||
|
| |||||||||||
Energy — 7.1% |
| |||||||||||
Chevron | 1.0 | 52,726 | 5,427 | |||||||||
Exxon Mobil | 1.9 | 115,900 | 10,116 | |||||||||
Schlumberger, Cl A | 0.6 | 38,737 | 3,046 | |||||||||
Other Securities | 3.6 | 19,336 | ||||||||||
|
| |||||||||||
| 37,925 | ||||||||||||
|
| |||||||||||
Financials — 12.4% |
| |||||||||||
Bank of America | 0.8 | 285,545 | 4,469 | |||||||||
Berkshire Hathaway, Cl B* | 1.4 | 53,130 | 7,676 | |||||||||
Citigroup | 0.7 | 81,345 | 3,842 | |||||||||
JPMorgan Chase | 1.3 | 101,017 | 6,727 | |||||||||
Wells Fargo | 1.0 | 127,033 | 5,625 | |||||||||
Other Securities | 7.2 | 38,140 | ||||||||||
|
| |||||||||||
| 66,479 | ||||||||||||
|
| |||||||||||
Health Care — 14.0% |
| |||||||||||
AbbVie | 0.5 | 45,125 | 2,846 | |||||||||
Allergan* | 0.5 | 10,980 | 2,529 | |||||||||
Amgen, Cl A | 0.6 | 20,863 | 3,480 | |||||||||
| ||||||||||||
| Description | Percentage of Net Assets (%) | Shares | Market Value ($ Thousands) | |||||||||
| ||||||||||||
COMMON STOCK (continued) |
| |||||||||||
Bristol-Myers Squibb | 0.5% | 46,538 | $ | 2,509 | ||||||||
Celgene, Cl A* | 0.4 | 21,394 | 2,236 | |||||||||
Gilead Sciences | 0.5 | 37,013 | 2,928 | |||||||||
Johnson & Johnson | 1.7 | 76,544 | 9,042 | |||||||||
Medtronic | 0.6 | 39,141 | 3,382 | |||||||||
Merck | 0.9 | 76,966 | 4,803 | |||||||||
Pfizer | 1.1 | 168,857 | 5,719 | |||||||||
UnitedHealth Group | 0.7 | 26,411 | 3,698 | |||||||||
Other Securities | 6.0 | 32,217 | ||||||||||
|
| |||||||||||
| 75,389 | ||||||||||||
|
| |||||||||||
Industrials — 9.7% |
| |||||||||||
3M | 0.6 | 16,926 | 2,983 | |||||||||
General Electric | 1.4 | 250,493 | 7,420 | |||||||||
Honeywell International | 0.5 | 21,252 | 2,478 | |||||||||
Union Pacific | 0.4 | 23,419 | 2,284 | |||||||||
Other Securities | 6.8 | 37,219 | ||||||||||
|
| |||||||||||
| 52,384 | ||||||||||||
|
| |||||||||||
Information Technology — 20.7% |
| |||||||||||
Alphabet, Cl A* | 1.2 | 8,269 | 6,649 | |||||||||
Alphabet, Cl C* | 1.2 | 8,293 | 6,446 | |||||||||
Apple | 3.2 | 150,530 | 17,017 | |||||||||
Cisco Systems | 0.8 | 140,072 | 4,443 | |||||||||
Facebook, Cl A* | 1.5 | 64,971 | 8,334 | |||||||||
Intel | 0.9 | 131,297 | 4,956 | |||||||||
International Business Machines | 0.7 | 24,468 | 3,887 | |||||||||
MasterCard, Cl A | 0.5 | 26,982 | 2,746 | |||||||||
Microsoft | 2.3 | 218,096 | 12,562 | |||||||||
Oracle, Cl B | 0.6 | 84,233 | 3,309 | |||||||||
Qualcomm | 0.5 | 40,968 | 2,806 | |||||||||
Visa, Cl A | 0.8 | 53,032 | 4,386 | |||||||||
Other Securities | 6.5 | 33,625 | ||||||||||
|
| |||||||||||
| 111,166 | ||||||||||||
|
| |||||||||||
Materials — 2.8% |
| |||||||||||
Other Securities | 2.8 | 15,120 | ||||||||||
|
| |||||||||||
Real Estate — 3.0% | ||||||||||||
Other Securities‡ | 3.0 | 15,918 | ||||||||||
|
| |||||||||||
Telecommunication Services — 2.6% |
| |||||||||||
AT&T | 1.3 | 171,003 | 6,945 | |||||||||
Verizon Communications | 1.1 | 113,498 | 5,900 | |||||||||
Other Securities | 0.2 | 913 | ||||||||||
|
| |||||||||||
| 13,758 | ||||||||||||
|
| |||||||||||
Utilities — 3.2% |
| |||||||||||
Other Securities | 3.2 | 17,008 | ||||||||||
|
| |||||||||||
Total Common Stock | 522,673 | |||||||||||
|
| |||||||||||
Total Investments — 97.3% | $ | 522,673 | ||||||||||
|
| |||||||||||
| SEI Institutional Managed Trust / Annual Report / September 30, 2016 | 193 |
SUMMARY SCHEDULE OF INVESTMENTS
September 30, 2016
Dynamic Asset Allocation Fund (Concluded)
| ||||||||||
| Description |
Percentage of | Contracts | Market Value ($ Thousands) | |||||||
| ||||||||||
PURCHASED OPTION (A) — 0.1% |
| |||||||||
January 2017 EUR Put, USD Call, Expires 01/21/2017, Strike Price $1.07* | 0.1% | 92,284,855 | $ | 415 | ||||||
|
| |||||||||
Total Purchased Option | $ | 415 | ||||||||
|
| |||||||||
A list of the open futures contracts held by the Fund at September 30, 2016, is as follows:
| ||||||||||||
| Type of Contract | Number of Contracts Long | Expiration Date | Unrealized Appreciation ($ Thousands) | |||||||||
| ||||||||||||
S&P 500 Index E-MINI | 102 | Dec-2016 | $22 | |||||||||
|
| |||||||||||
For the year ended September 30, 2016, the total amount of all open futures contracts, as presented in the table above, are representative of the volume of activity for this derivative type during the year.
A list of the open forward foreign currency contracts held by the Fund at September 30, 2016, is as follows:
| ||||||||||||||||||||
Settlement Date | Currency to Deliver | Currency To Receive | Unrealized Appreciation (Depreciation) ($ Thousands) | |||||||||||||||||
| ||||||||||||||||||||
10/19/16 | USD | 496 | EUR | 441 | $— | |||||||||||||||
10/19/16 | USD | 1,147 | KRW | 1,260,000 | (3) | |||||||||||||||
10/19/16 | INR | 17,400 | USD | 261 | — | |||||||||||||||
10/19/16 | EUR | 48,113 | USD | 53,506 | (611) | |||||||||||||||
10/19/16 | USD | 52,969 | INR | 3,597,822 | 926 | |||||||||||||||
10/19/16 | KRW | 60,086,360 | USD | 52,582 | (1,979) | |||||||||||||||
01/09/17 | USD | 928 | SAR | 3,533 | 12 | |||||||||||||||
01/09/17-01/19/17 | SAR | 104,069 | USD | 27,050 | (642) | |||||||||||||||
|
| |||||||||||||||||||
| $(2,297) | ||||||||||||||||||||
|
| |||||||||||||||||||
A list of the counterparties for the outstanding forward foreign currency contracts held by the Fund at September 30, 2016, is as follows:
| ||||||||||||
| Counterparty | Currency to ($ Thousands) | Currency to ($ Thousands) | Unrealized Appreciation (Depreciation) ($ Thousands) | |||||||||
| ||||||||||||
BNP Paribas | $(1,192) | $1,183 | $(9) | |||||||||
Bank of America | (81,849) | 82,145 | 296 | |||||||||
Goldman Sachs | (2,557) | 2,549 | (8) | |||||||||
Societe Generale | (50,864) | 50,270 | (594) | |||||||||
Standard Chartered | (55,709) | 53,727 | (1,982) | |||||||||
|
| |||||||||||
| $(2,297) | ||||||||||||
|
| |||||||||||
For the year ended September 30, 2016 the total amount of all open forward foreign currency contracts, as presented in the table above, are representative of the volume of activity for the derivative type during the year.
A list of outstanding OTC swap contracts held by the Fund at September 30, 2016, is as follows:
| ||||||||||||||||||||||
| Interest Rate Swaps | ||||||||||||||||||||||
| ||||||||||||||||||||||
| Counterparty | Fund Pays | Fund Receives | Termination Date | Notional Amount ($ Thousands) | Net Unrealized Appreciation ($ Thousands) | |||||||||||||||||
| ||||||||||||||||||||||
| Bank of America | 1.74% | US CPI URBAN CONSUMERS NSA | 08/24/2026 | $ 8,471 | $108 | |||||||||||||||||
| BNP Paribas | 1.76% | US CPI URBAN CONSUMERS NSA | 08/26/2026 | 18,741 | 198 | |||||||||||||||||
| BNP Paribas | 1.76% | US CPI URBAN CONSUMERS NSA | 08/25/2026 | 25,413 | 270 | |||||||||||||||||
|
| |||||||||||||||||||||
| $576 | ||||||||||||||||||||||
|
| |||||||||||||||||||||
For the year ended September 30, 2016, the total amount of all open swap contracts, as presented in the table above, are representative of the volume of activity for the derivative type during the year.
| Percentages are based on a Net Assets of $537,301 ($ Thousands). |
| * | Non-income producing security. |
| ‡ | Real Estate Investment Trust. |
| (A) | For the year ended September 30, 2016, the total amount of open purchased options, as presented in the Schedule of Investments, are representative of the volume of activity for these derivative types during the year. |
Cl — Class
CPI — Consumer Price Index
EUR — Euro
INR — Indian Rupee
KRW — Korean Won
NSA — Not seasonally adjusted
OTC — Over the Counter
S&P— Standard & Poor’s
SAR— Saudi Riyal
USD — United States Dollar
The Summary Schedule of Investments does not reflect the complete portfolio holdings. It includes the Fund’s 50 largest holdings and each investment of any issuer that exceeds 1% of the Fund’s net assets. “Other Securities” represent all issues not required to be disclosed under the rules adopted by the U.S. Securities and Exchange Commission (“SEC”). In certain instances, securities for which footnotes listed above may otherwise apply are included in the Other Securities caption. The complete schedule of portfolio holdings is available (i) without charge, upon request, by calling (800) 342-5734; and (ii) on the SEC’s website at http://www.sec.gov.
| 194 | SEI Institutional Managed Trust / Annual Report / September 30, 2016 |
The following is a list of the level of inputs used as of September 30, 2016, in valuing the Fund’s investments and other financial instruments carried at value ($ Thousands):
| ||||||||||||||||
| Investments in Securities | Level 1 | Level 2 | Level 3 | Total | ||||||||||||
| ||||||||||||||||
Common Stock | $ | 522,673 | $ | – | $ | – | $ | 522,673 | ||||||||
|
|
|
|
|
|
|
| |||||||||
Total Investments in Securities | $ | 522,673 | $ | – | $ | – | $ | 522,673 | ||||||||
|
|
|
|
|
|
|
| |||||||||
| ||||||||||||||||
| Other Financial Instruments | Level 1 | Level 2 | Level 3 | Total | ||||||||||||
| ||||||||||||||||
Purchased Option | $ | 415 | $ | — | $ | — | $ | 415 | ||||||||
Futures Contracts * | ||||||||||||||||
Unrealized Appreciation | 22 | — | — | 22 | ||||||||||||
Forwards Contracts * | ||||||||||||||||
Unrealized Appreciation | — | 938 | — | 938 | ||||||||||||
Unrealized Depreciation | — | (3,235) | — | (3,235) | ||||||||||||
OTC Swaps | ||||||||||||||||
Interest Rate Swaps * | ||||||||||||||||
Unrealized Appreciation | — | 576 | — | 576 | ||||||||||||
|
|
|
|
|
|
|
| |||||||||
Total Other Financial Instruments | $ | 437 | $ | (1,721) | $ | — | $ | (1,284) | ||||||||
|
|
|
|
|
|
|
| |||||||||
* Futures contracts, forward contracts and swap contracts are valued at the unrealized appreciation (depreciation) on the instruments.
For the year ended September 30, 2016, there were no transfers between Level 1 and Level 2 assets and liabilities.
For the year ended September 30, 2016, there were no transfers between Level 2 and Level 3 assets and liabilities.
For more information on valuation inputs, see Note 2 — Significant Accounting Policies in Notes to Financial Statements.
Amounts designated as “—” are either $0 or have been rounded to $0.
The accompanying notes are an integral part of the financial statements.
| SEI Institutional Managed Trust / Annual Report / September 30, 2016 | 195 |
SCHEDULE OF INVESTMENTS
September 30, 2016
Multi-Strategy Alternative Fund
|
| Sector Weightings (Unaudited)†: |
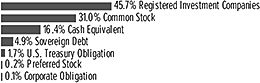 |
†Percentages are based on total investments.
| ||||||||
| Description | Shares |
Market Value | ||||||
| ||||||||
REGISTERED INVESTMENT COMPANIES — 45.7% |
| |||||||
AQR Managed Futures Strategy Fund, Cl I | 364,086 | $ | 3,688 | |||||
AQR Managed Futures Strategy HV Fund, Cl I | 1,611,374 | 16,936 | ||||||
ASG Managed Futures Strategy Fund, Cl Y | 2,194,489 | 22,537 | ||||||
Blackrock Global Long/Short Credit Fund, Cl I | 5,788,156 | 57,766 | ||||||
Driehaus Active Income Fund, Cl I | 4,486,047 | 44,726 | ||||||
Merger Fund, Cl I | 3,940,301 | 61,153 | ||||||
Robeco Boston Partners Long/Short Research Fund, Cl I | 943,164 | 14,261 | ||||||
SEI Institutional Managed Trust Long/Short Alternative Fund, Cl Y †
|
| 4,257,580
|
|
| 41,767
|
| ||
|
| |||||||
Total Registered Investment Companies | 262,834 | |||||||
|
| |||||||
COMMON STOCK — 31.0% | ||||||||
Consumer Discretionary — 4.2% |
| |||||||
adidas | 2,337 | 406 | ||||||
American Eagle Outfitters | 30,001 | 536 | ||||||
Bandai Namco Holdings | 10,900 | 331 | ||||||
Brembo | 9,110 | 544 | ||||||
Carnival | 12,543 | 612 | ||||||
Comcast, Cl A | 8,747 | 580 | ||||||
Continental | 1,831 | 385 | ||||||
Dollarama | 3,700 | 288 | ||||||
Ferrari | 8,394 | 435 | ||||||
Foot Locker, Cl A | 7,813 | 529 | ||||||
Gap | 24,727 | 550 | ||||||
Hennes & Mauritz, Cl B | 17,902 | 506 | ||||||
Home Depot | 4,175 | 537 | ||||||
HUGO BOSS | 9,775 | 541 | ||||||
John Wiley & Sons, Cl A | 9,755 | 504 | ||||||
Kohl’s | 8,874 | 388 | ||||||
L Brands | 8,158 | 577 | ||||||
Lear | 5,206 | 631 | ||||||
Lions Gate Entertainment | 14,125 | 282 | ||||||
Live Nation * | 21,696 | 596 | ||||||
Madison Square Garden * | 7,781 | 1,318 | ||||||
Magna International, Cl A | 21,317 | 916 | ||||||
McDonald’s | 4,483 | 517 | ||||||
Media General * | 34,370 | 634 | ||||||
Mediaset Espana Comunicacion | 48,040 | 570 | ||||||
Nitori Holdings | 2,200 | 262 | ||||||
| ||||||||
| Description | Shares |
Market Value | ||||||
| ||||||||
COMMON STOCK (continued) | ||||||||
Nordstrom | 14,691 | $ | 762 | |||||
Pinnacle Entertainment * | 38,144 | 471 | ||||||
Ralph Lauren, Cl A | 5,389 | 545 | ||||||
Shimamura | 2,300 | 279 | ||||||
Sotheby’s | 2,693 | 102 | ||||||
Start Today | 29,400 | 502 | ||||||
Starz - Liberty Capital * | 16,319 | 509 | ||||||
Tenneco * | 5,042 | 294 | ||||||
Tesla Motors * | 661 | 135 | ||||||
Urban Outfitters * | 15,014 | 518 | ||||||
Walt Disney | 5,570 | 517 | ||||||
WCI Communities * | 100,223 | 2,377 | ||||||
William Lyon Homes, Cl A * | 146,791 | 2,723 | ||||||
Williams-Sonoma | 10,329 | 528 | ||||||
|
| |||||||
| 24,237 | ||||||||
|
| |||||||
Consumer Staples — 1.8% | ||||||||
Axfood | 18,328 | 324 | ||||||
Campbell Soup | 8,916 | 488 | ||||||
Coca-Cola | 12,029 | 509 | ||||||
General Mills | 8,424 | 538 | ||||||
Herbalife * | 9,486 | 588 | ||||||
Hershey | 4,444 | 425 | ||||||
Jeronimo Martins | 33,432 | 580 | ||||||
Lancaster Colony | 4,409 | 582 | ||||||
Lion | 36,000 | 580 | ||||||
Nestle | 7,272 | 574 | ||||||
Nu Skin Enterprises, Cl A | 8,780 | 569 | ||||||
PepsiCo | 5,364 | 583 | ||||||
Philip Morris International | 4,718 | 459 | ||||||
Pilgrim’s Pride | 22,000 | 465 | ||||||
Procter & Gamble | 6,669 | 598 | ||||||
Rite Aid * | 25,057 | 193 | ||||||
Swedish Match | 15,936 | 585 | ||||||
SYSCO, Cl A | 8,857 | 434 | ||||||
Wal-Mart Stores | 7,761 | 560 | ||||||
Wesfarmers | 18,431 | 622 | ||||||
|
| |||||||
| 10,256 | ||||||||
|
| |||||||
Energy — 0.9% | ||||||||
Bristow Group | 72,959 | 1,023 | ||||||
Cenovus Energy | 1,200 | 17 | ||||||
Chevron | 2,027 | 209 | ||||||
Exxon Mobil | 6,102 | 533 | ||||||
Frank’s International | 27,000 | 351 | ||||||
Galp Energia SGPS | 39,207 | 536 | ||||||
Gran Tierra Energy * | 311,694 | 938 | ||||||
RELX | 32,111 | 577 | ||||||
Spectra Energy | 4,744 | 203 | ||||||
TonenGeneral Sekiyu | 62,000 | 624 | ||||||
Ultra Petroleum * | 13,183 | 66 | ||||||
|
| |||||||
| 5,077 | ||||||||
|
| |||||||
| 196 | SEI Institutional Managed Trust / Annual Report / September 30, 2016 |
| ||||||||
| Description | Shares |
Market Value | ||||||
| ||||||||
COMMON STOCK (continued) | ||||||||
Financials — 1.5% | ||||||||
American Capital * | 154,763 | $ | 2,617 | |||||
Bancorp * | 5,713 | 37 | ||||||
Bank of Montreal | 8,800 | 576 | ||||||
Bats Global Markets | 2,026 | 61 | ||||||
Berkshire Hathaway, Cl B * | 3,870 | 559 | ||||||
CIMIC Group ‡ | 9,636 | 212 | ||||||
NorthStar Asset Management Group | 34,222 | 442 | ||||||
SLM * | 336,258 | 2,512 | ||||||
Synchrony Financial | 19,832 | 555 | ||||||
Toronto-Dominion Bank | 13,300 | 589 | ||||||
Zions Bancorporation | 20,211 | 627 | ||||||
|
| |||||||
| 8,787 | ||||||||
|
| |||||||
Health Care — 4.7% | ||||||||
ABIOMED * | 4,591 | 590 | ||||||
Agilent Technologies | 11,806 | 556 | ||||||
Akorn * | 19,950 | 544 | ||||||
Align Technology * | 7,015 | 658 | ||||||
Astellas Pharma | 39,400 | 612 | ||||||
Biogen * | 1,772 | 555 | ||||||
Bristol-Myers Squibb | 9,619 | 519 | ||||||
Bruker BioSciences | 24,900 | 564 | ||||||
Cerner * | 8,728 | 539 | ||||||
Charles River Laboratories International * | 6,789 | 566 | ||||||
Cigna | 1,413 | 184 | ||||||
Coloplast, Cl B | 2,851 | 221 | ||||||
Cynapsus Therapeutics * | 5,579 | 224 | ||||||
DiaSorin | 5,616 | 361 | ||||||
Durect * | 30,100 | 42 | ||||||
Envision Healthcare Holdings * | 42,897 | 955 | ||||||
Galenica | 415 | 441 | ||||||
Hisamitsu Pharmaceutical | 6,300 | 338 | ||||||
Hoya | 12,200 | 487 | ||||||
Humana | 682 | 121 | ||||||
Idexx Laboratories * | 5,062 | 571 | ||||||
Illumina * | 3,927 | 713 | ||||||
Incyte * | 6,128 | 578 | ||||||
Jazz Pharmaceuticals * | 4,485 | 545 | ||||||
Mallinckrodt * | 7,057 | 492 | ||||||
Medidata Solutions * | 9,882 | 551 | ||||||
Mettler Toledo International * | 1,508 | 633 | ||||||
Mylan * | 9,080 | 346 | ||||||
Natera * | 15,593 | 173 | ||||||
Novo Nordisk, Cl B | 11,584 | 482 | ||||||
PerkinElmer | 10,139 | 569 | ||||||
Quintiles Transnational * | 8,614 | 698 | ||||||
Ramsay Health Care | 1,084 | 66 | ||||||
Sanofi | 6,121 | 465 | ||||||
St. Jude Medical | 89,782 | 7,161 | ||||||
Straumann Holding | 1,442 | 565 | ||||||
Taisho Pharmaceutical Holdings | 1,200 | 122 | ||||||
| ||||||||
| Description | Shares |
Market Value | ||||||
| ||||||||
COMMON STOCK (continued) | ||||||||
United Therapeutics * | 4,898 | $ | 578 | |||||
Universal Health Services, Cl B | 4,486 | 553 | ||||||
Valeant Pharmaceuticals International * | 10,700 | 262 | ||||||
Veeva Systems, Cl A * | 13,262 | 547 | ||||||
VWR * | 6,387 | 181 | ||||||
Waters * | 3,975 | 630 | ||||||
WellCare Health Plans * | 5,342 | 626 | ||||||
|
| |||||||
| 27,184 | ||||||||
|
| |||||||
Industrials — 3.6% | ||||||||
3M | 134 | 24 | ||||||
ACS Actividades de Construccion y Servicios | 16,753 | 506 | ||||||
Aena (A) | 9,950 | 1,468 | ||||||
ANA Holdings | 8,000 | 22 | ||||||
BWX Technologies, Cl W | 66,300 | 2,544 | ||||||
Central Japan Railway | 3,100 | 527 | ||||||
Commercial Vehicle Group * | 37,971 | 219 | ||||||
Curtiss-Wright | 6,788 | 618 | ||||||
Delta Air Lines, Cl A | 66,486 | 2,617 | ||||||
Deutsche Lufthansa | 40,588 | 452 | ||||||
Fortive | 10,481 | 533 | ||||||
General Electric | 600 | 18 | ||||||
Herc Holdings * | 10,537 | 355 | ||||||
Hitachi Construction Machinery | 8,400 | 166 | ||||||
HOCHTIEF | 4,524 | 638 | ||||||
Huntington Ingalls Industries, Cl A | 3,361 | 516 | ||||||
Japan Airlines | 15,500 | 453 | ||||||
Joy Global | 8,489 | 236 | ||||||
Kone, Cl B | 11,791 | 599 | ||||||
Kuehne & Nagel International | 230 | 33 | ||||||
ManpowerGroup | 2,967 | 214 | ||||||
Mitsubishi Electric | 34,000 | 431 | ||||||
NCI Building Systems * | 80,179 | 1,170 | ||||||
Park24 | 8,400 | 272 | ||||||
PGT * | 49,941 | 533 | ||||||
Quanta Services * | 8,382 | 235 | ||||||
Robert Half International | 14,774 | 559 | ||||||
Spirit AeroSystems Holdings, Cl A * | 476 | 21 | ||||||
Swift Transportation, Cl A * | 15,845 | 340 | ||||||
United Continental Holdings * | 47,635 | 2,499 | ||||||
United Parcel Service, Cl B | 5,244 | 574 | ||||||
United Rentals * | 6,208 | 487 | ||||||
Waste Management | 8,790 | 560 | ||||||
|
| |||||||
| 20,439 | ||||||||
|
| |||||||
Information Technology — 9.0% | ||||||||
Acacia Communications * | 2,531 | 261 | ||||||
Accenture, Cl A | 2,181 | 266 | ||||||
Akamai Technologies * | 10,247 | 543 | ||||||
Amdocs | 9,579 | 554 | ||||||
Applied Micro Circuits * | 1,309 | 9 | ||||||
Aspen Technology * | 11,981 | 561 | ||||||
| SEI Institutional Managed Trust / Annual Report / September 30, 2016 | 197 |
SCHEDULE OF INVESTMENTS
September 30, 2016
Multi-Strategy Alternative Fund (Continued)
| ||||||||
| Description | Shares |
Market Value | ||||||
| ||||||||
COMMON STOCK (continued) | ||||||||
Axcelis Technologies * | 79,095 | $ | 1,050 | |||||
Canon | 18,900 | 546 | ||||||
Care.com * | 37,499 | 373 | ||||||
CDK Global | 30,445 | 1,746 | ||||||
Citrix Systems * | 6,772 | 577 | ||||||
CommerceHub * | 46,238 | 731 | ||||||
Dell Technologies - VMware, Cl V * | 1 | — | ||||||
Exar * | 92,561 | 862 | ||||||
F5 Networks, Cl A * | 4,810 | 600 | ||||||
Fair Isaac | 920 | 115 | ||||||
Fingerprint Cards, Cl B * | 27,683 | 325 | ||||||
Five9 * | 40,966 | 642 | ||||||
GrubHub * | 10,739 | 462 | ||||||
Harmonic, Cl A * | 179,185 | 1,063 | ||||||
Immersion * | 76,132 | 621 | ||||||
Imperva * | 15,703 | 843 | ||||||
inContact * | 123,527 | 1,727 | ||||||
Infinera * | 16,172 | 146 | ||||||
Infoblox * | 1,568 | 41 | ||||||
Ingram Micro, Cl A | 26,832 | 957 | ||||||
Intersil, Cl A | 26,411 | 579 | ||||||
Intuit | 5,119 | 563 | ||||||
Lexmark International, Cl A | 8,789 | 351 | ||||||
Linear Technology | 61,117 | 3,624 | ||||||
LinkedIn, Cl A * | 45,827 | 8,758 | ||||||
Manhattan Associates * | 9,279 | 535 | ||||||
Marvell Technology Group | 93,472 | 1,240 | ||||||
Match Group * | 16,743 | 298 | ||||||
Maxim Integrated Products | 14,538 | 580 | ||||||
MercadoLibre | 3,072 | 568 | ||||||
Micron Technology * | 150,455 | 2,675 | ||||||
NetApp | 8,899 | 319 | ||||||
Nexon | 36,700 | 571 | ||||||
Nintendo | 2,097 | 551 | ||||||
Oracle Japan | 7,000 | 393 | ||||||
PayPal Holdings * | 7,285 | 298 | ||||||
Rackspace Hosting * | 16,839 | 534 | ||||||
Radisys * | 30,002 | 160 | ||||||
Rightmove | 6,903 | 379 | ||||||
Stamps.com * | 3,085 | 292 | ||||||
SunEdison Semiconductor * | 135,261 | 1,541 | ||||||
Symantec, Cl A | 31,866 | 800 | ||||||
SYNNEX | 5,927 | 676 | ||||||
Take-Two Interactive Software, Cl A * | 25,141 | 1,133 | ||||||
Telefonaktiebolaget LM Ericsson, Cl B | 71,805 | 519 | ||||||
Teradata * | 20,726 | 643 | ||||||
Teradyne | 28,709 | 620 | ||||||
Twitter * | 3,746 | 86 | ||||||
VeriSign * | 6,859 | 537 | ||||||
VMware, Cl A * | 8,859 | 650 | ||||||
Western Union | 7,246 | 151 | ||||||
XO Group * | 47,652 | 921 | ||||||
| ||||||||
| Description | Shares |
Market Value | ||||||
| ||||||||
COMMON STOCK (continued) | ||||||||
Yahoo! * | 75,367 | $ | 3,248 | |||||
Zynga, Cl A * | 547,616 | 1,594 | ||||||
|
| |||||||
| 52,008 | ||||||||
|
| |||||||
Materials — 3.3% | ||||||||
Avery Dennison | 6,982 | 543 | ||||||
Cabot | 10,280 | 539 | ||||||
Cemex ADR * | 182,697 | 1,451 | ||||||
Chemours | 8,161 | 131 | ||||||
Constellium, Cl A * | 343,144 | 2,471 | ||||||
Dow Chemical, Cl A | 1,550 | 80 | ||||||
Evonik Industries | 3,382 | 115 | ||||||
Fortescue Metals Group | 91,621 | 347 | ||||||
Ingevity * | 57,057 | 2,630 | ||||||
Monsanto | 4,415 | 451 | ||||||
Newcrest Mining | 27,647 | 470 | ||||||
Norbord | 104,557 | 2,681 | ||||||
Nucor | 11,026 | 545 | ||||||
Reliance Steel & Aluminum | 7,222 | 520 | ||||||
Steel Dynamics | 22,624 | 565 | ||||||
Syngenta ADR | 51,997 | 4,555 | ||||||
TimkenSteel | 55,145 | 576 | ||||||
|
| |||||||
| 18,670 | ||||||||
|
| |||||||
Telecommunication Services — 1.5% | ||||||||
AT&T | 14,027 | 570 | ||||||
BCE | 15,950 | 736 | ||||||
CenturyTel | 7,793 | 214 | ||||||
Cincinnati Bell, Cl A * | 232,593 | 949 | ||||||
Deutsche Telekom | 31,001 | 520 | ||||||
Globalstar * | 92,594 | 112 | ||||||
Level 3 Communications * | 41,200 | 1,911 | ||||||
Lumos Networks * | 32,175 | 450 | ||||||
Nippon Telegraph & Telephone | 11,500 | 524 | ||||||
NTT DOCOMO | 21,100 | 534 | ||||||
Spark New Zealand | 185,751 | 488 | ||||||
Zayo Group Holdings * | 59,828 | 1,777 | ||||||
|
| |||||||
| 8,785 | ||||||||
|
| |||||||
Utilities — 0.5% | ||||||||
Centerpoint Energy | 17,839 | 414 | ||||||
Chubu Electric Power | 5,600 | 81 | ||||||
CLP Holdings, Cl B | 56,000 | 579 | ||||||
Red Electrica | 24,492 | 529 | ||||||
Toho Gas | 64,000 | 596 | ||||||
Tokyo Gas | 105,000 | 464 | ||||||
|
| |||||||
| 2,663 | ||||||||
|
| |||||||
Total Common Stock | 178,106 | |||||||
|
| |||||||
| 198 | SEI Institutional Managed Trust / Annual Report / September 30, 2016 |
| ||||||||
| Description | Face Amount (Thousands) |
Market Value | ||||||
| ||||||||
SOVEREIGN DEBT — 4.9% | ||||||||
Argentine Republic Government International Bond | ||||||||
8.750%, 06/02/2017 | $ | 1,489 | $ | 1,550 | ||||
7.820%, 12/31/2033 | EUR | 1,288 | 1,600 | |||||
7.820%, 12/31/2033 | 157 | 197 | ||||||
6.875%, 04/22/2021 | $ | 747 | 813 | |||||
3.380%, 03/31/2019 (B) | EUR | 1,426 | 1,052 | |||||
3.380%, 12/31/2038 (B) | 228 | 165 | ||||||
Cyprus Government International Bond MTN | ||||||||
3.875%, 05/06/2022 | 601 | 703 | ||||||
Ecuador Government International Bond | ||||||||
10.750%, 03/28/2022 | $ | 291 | 297 | |||||
EP PetroEcuador via Noble Sovereign Funding I | ||||||||
6.487%, 09/24/2019 (C) | 306 | 296 | ||||||
GTH Finance BV | ||||||||
6.250%, 04/26/2020 | 424 | 446 | ||||||
Hellenic Republic Government Bond | ||||||||
4.750%, 04/17/2019 (A) | EUR | 1,638 | 1,672 | |||||
3.650%, 02/24/2023 (B) | 44 | 37 | ||||||
3.650%, 02/24/2024 (B) | 44 | 36 | ||||||
3.650%, 02/24/2025 (B) | 44 | 35 | ||||||
3.650%, 02/24/2026 (B) | 44 | 35 | ||||||
3.650%, 02/24/2027 (B) | 44 | 34 | ||||||
3.650%, 02/24/2028 (B) | 44 | 33 | ||||||
3.650%, 02/24/2029 (B) | 44 | 32 | ||||||
3.650%, 02/24/2030 (B) | 44 | 32 | ||||||
3.650%, 02/24/2031 (B) | 44 | 31 | ||||||
3.650%, 02/24/2032 (B) | 44 | 31 | ||||||
3.650%, 02/24/2033 (B) | 44 | 30 | ||||||
3.650%, 02/24/2034 (B) | 44 | 30 | ||||||
3.650%, 02/24/2035 (B) | 44 | 29 | ||||||
3.650%, 02/24/2036 (B) | 44 | 29 | ||||||
3.650%, 02/24/2037 (B) | 44 | 29 | ||||||
3.650%, 02/24/2038 (B) | 44 | 29 | ||||||
3.650%, 02/24/2039 (B) | 44 | 29 | ||||||
3.650%, 02/24/2040 (B) | 44 | 29 | ||||||
3.650%, 02/24/2041 (B) | 44 | 29 | ||||||
3.650%, 02/24/2042 (B) | 44 | 29 | ||||||
3.375%, 07/17/2017 (A) | 2,601 | 2,858 | �� | |||||
Iraq International Bond | ||||||||
5.800%, 01/15/2028 | $ | 701 | 571 | |||||
Letras del Banco Central de la Republica Argentina | ||||||||
26.284%, 01/04/2017 (D) | ARS | 3,306 | 204 | |||||
24.966%, 12/07/2016 (D) | 3,027 | 189 | ||||||
24.519%, 12/28/2016 (D) | 5,111 | 317 | ||||||
24.144%, 01/25/2017 (D) | 2,973 | 181 | ||||||
23.940%, 01/18/2017 (D) | 15,938 | 974 | ||||||
Mexico City Airport Trust | ||||||||
5.500%, 10/31/2046 | $ | 200 | 196 | |||||
Mexico Government International Bond | ||||||||
4.000%, 10/02/2023 | 116 | 124 | ||||||
| ||||||||
| Description | Face Amount (Thousands) |
Market Value | ||||||
| ||||||||
SOVEREIGN DEBT (continued) | ||||||||
Oman Government International Bond | ||||||||
3.625%, 06/15/2021 | $ | 291 | $ | 294 | ||||
Pakistan Government International Bond | ||||||||
6.750%, 12/03/2019 | 321 | 338 | ||||||
Paraguay Government International Bond | ||||||||
4.625%, 01/25/2023 | 533 | 565 | ||||||
4.625%, 01/25/2023 | 200 | 212 | ||||||
Peruvian Government International Bond | ||||||||
6.350%, 08/12/2028 | PEN | 518 | 152 | |||||
Petrobras Global Finance | ||||||||
8.750%, 05/23/2026 | $ | 458 | 506 | |||||
8.375%, 05/23/2021 | 729 | 797 | ||||||
5.750%, 01/20/2020 | 268 | 276 | ||||||
4.875%, 03/17/2020 | 1,707 | 1,711 | ||||||
3.250%, 04/01/2019 | EUR | 252 | 284 | |||||
3.000%, 01/15/2019 | $ | 1,079 | 1,057 | |||||
Petroleos de Venezuela | ||||||||
6.000%, 05/16/2024 | 1,545 | 660 | ||||||
6.000%, 05/16/2024 | 277 | 118 | ||||||
6.000%, 11/15/2026 | 964 | 405 | ||||||
Petroleos Mexicanos MTN | ||||||||
6.875%, 08/04/2026 | 805 | 908 | ||||||
4.250%, 01/15/2025 | 420 | 405 | ||||||
Russian Federal Bond - OFZ | ||||||||
6.400%, 05/27/2020 | RUB | 76,570 | 1,142 | |||||
Russian Foreign Bond - Eurobond | ||||||||
4.750%, 05/27/2026 | $ | 1,800 | 1,941 | |||||
Ukraine Government International Bond | ||||||||
7.750%, 09/01/2019 | 1,291 | 1,274 | ||||||
7.750%, 09/01/2020 | 275 | 269 | ||||||
|
| |||||||
Total Sovereign Debt | 28,347 | |||||||
|
| |||||||
| Shares | ||||||||
|
| |||||||
PREFERRED STOCK — 0.2% | ||||||||
Financials — 0.2% | ||||||||
FHLMC, 8.375% *(C) | 132,779 | 462 | ||||||
FNMA, 8.250% *(B)(C) | 114,003 | 400 | ||||||
|
| |||||||
Total Preferred Stock | 862 | |||||||
|
| |||||||
| SEI Institutional Managed Trust / Annual Report / September 30, 2016 | 199 |
SCHEDULE OF INVESTMENTS
September 30, 2016
Multi-Strategy Alternative Fund (Continued)
| ||||||||
| Description | Face Amount (Thousands) |
Market Value | ||||||
| ||||||||
CORPORATE OBLIGATION — 0.1% | ||||||||
Information Technology — 0.1% | ||||||||
Rackspace Hosting | ||||||||
6.500%, 01/15/2024 (A) | $ | 754 | $ | 827 | ||||
|
| |||||||
Total Corporate Obligation | 827 | |||||||
|
| |||||||
U.S. TREASURY OBLIGATION — 1.7% | ||||||||
U.S. Treasury Bills | ||||||||
0.416%, 12/08/2016 (D) |
| 10,000
|
|
| 9,997
|
| ||
|
| |||||||
Total U.S. Treasury Obligation | 9,997 | |||||||
|
| |||||||
| Shares | ||||||||
|
| |||||||
CASH EQUIVALENT — 16.4% | ||||||||
SEI Daily Income Trust, Government Fund, Cl A | ||||||||
0.220%**† | 94,331,651 | 94,332 | ||||||
|
| |||||||
Total Cash Equivalent | 94,332 | |||||||
|
| |||||||
Total Investments — 100.0% | $ | 575,305 | ||||||
|
| |||||||
COMMON STOCK SOLD SHORT— (15.5)% | ||||||||
Consumer Discretionary — (2.6)% | ||||||||
Cabela’s * | (6,531) | (359) | ||||||
Charter Communications, Cl A * | (2,469) | (667) | ||||||
Daimler | (8,543) | (602) | ||||||
Fossil Group * | (17,642) | (490) | ||||||
GameStop, Cl A | (26,661) | (736) | ||||||
Garmin | (11,793) | (567) | ||||||
Groupon, Cl A * | (70,455) | (363) | ||||||
Hanesbrands | (13,398) | (338) | ||||||
Isuzu Motors | (31,200) | (363) | ||||||
Izumi | (1,600) | (68) | ||||||
Liberty Broadband, Cl C * | (8,030) | (574) | ||||||
Liberty Global, Cl A * | (815) | (28) | ||||||
Liberty Global, Cl C * | (320) | (11) | ||||||
Liberty Global LiLAC, Cl C * | (17,735) | (497) | ||||||
Liberty Global LiLAC, Cl A * | (1,763) | (49) | ||||||
Liberty Media - Interactive, Cl A * | (25,464) | (510) | ||||||
Lions Gate Entertainment | (11,089) | (222) | ||||||
lululemon athletica * | (7,402) | (451) | ||||||
Marui Group | (39,100) | (513) | ||||||
MSG Networks * | (39,874) | (742) | ||||||
NetFlix * | (11,485) | (1,132) | ||||||
| ||||||||
| Description | Shares |
Market Value | ||||||
| ||||||||
COMMON STOCK SOLD SHORT (continued) | ||||||||
Nexstar Broadcasting Group, Cl A | (4,312) | $ | (249) | |||||
NGK Spark Plug | (24,600) | (429) | ||||||
Nissan Motor | (7,500) | (73) | ||||||
Norwegian Cruise Line Holdings * | (11,827) | (446) | ||||||
Penske Auto Group, Cl A | (1,357) | (65) | ||||||
PulteGroup | (25,628) | (514) | ||||||
Restaurant Brands International | (4,900) | (218) | ||||||
Select Comfort * | (28,296) | (611) | ||||||
Smith & Wesson Holding * | (15,313) | (407) | ||||||
Sony | (12,800) | (416) | ||||||
Tesla Motors * | (5,441) | (1,110) | ||||||
Toyota Motor | (200) | (11) | ||||||
Universal Electronics * | (8,917) | (664) | ||||||
Vince Holding * | (25,022) | (141) | ||||||
Yamaha Motor | (7,500) | (150) | ||||||
|
| |||||||
| (14,786) | ||||||||
|
| |||||||
Consumer Staples — (0.3)% | ||||||||
Dr Pepper Snapple Group | (4,835) | (442) | ||||||
Edgewell Personal Care | (6,720) | (534) | ||||||
Fresh Del Monte Produce | (7,473) | (448) | ||||||
Molson Coors Brewing, Cl B | (76) | (8) | ||||||
Sanderson Farms | (5,921) | (570) | ||||||
|
| |||||||
| (2,002) | ||||||||
|
| |||||||
Energy — (1.0)% | ||||||||
Apache | (7,304) | (466) | ||||||
BP ADR | (6,399) | (225) | ||||||
Cameco | (54,500) | (465) | ||||||
Cheniere Energy * | (12,149) | (530) | ||||||
Enbridge | (4,669) | (207) | ||||||
Encana | (43,100) | (450) | ||||||
HollyFrontier | (5,446) | (133) | ||||||
Lundin Petroleum * | (7,177) | (131) | ||||||
Marathon Oil | (25,115) | (397) | ||||||
Parsley Energy, Cl A * | (17,334) | (581) | ||||||
PrairieSky Royalty | (9,100) | (185) | ||||||
Royal Dutch Shell, Cl A | (21,094) | (526) | ||||||
SBM Offshore | (33,782) | (480) | ||||||
Targa Resources | (9,127) | (448) | ||||||
Weatherford International * | (64,503) | (362) | ||||||
|
| |||||||
| (5,586) | ||||||||
|
| |||||||
Financials — (1.1)% | ||||||||
Aegon | (92,740) | (356) | ||||||
American Express | (8,948) | (573) | ||||||
Ares Capital | (74,746) | (1,159) | ||||||
Banco Popular Espanol | (293,098) | (363) | ||||||
Banco Santander | (102,003) | (452) | ||||||
CaixaBank | (189,054) | (478) | ||||||
CBOE Holdings | (650) | (42) | ||||||
| 200 | SEI Institutional Managed Trust / Annual Report / September 30, 2016 |
| Description | Shares | Market Value ($ Thousands) | ||||||
COMMON STOCK SOLD SHORT (continued) |
| |||||||
Colony Capital, Cl A | (23,349) | $ | (426) | |||||
Element Financial | (54,300) | (678) | ||||||
ING Groep | (19,405) | (240) | ||||||
Mitsubishi UFJ Financial Group | (72,100) | (360) | ||||||
Nordea Bank | (18,454) | (183) | ||||||
Skandinaviska Enskilda Banken, Cl A | (55,070) | (554) | ||||||
Thomson Reuters | (10,567) | (437) | ||||||
UBS Group | (3,691) | (50) | ||||||
|
| |||||||
| (6,351) | ||||||||
|
| |||||||
Health Care — (1.5)% | ||||||||
Abbott Laboratories | (78,352) | (3,314) | ||||||
Acadia Healthcare, Cl A * | (9,842) | (488) | ||||||
ACADIA Pharmaceuticals * | (12,337) | (392) | ||||||
Aceto | (12,575) | (239) | ||||||
Aetna, Cl A | (567) | (65) | ||||||
Alnylam Pharmaceuticals * | (5,461) | (370) | ||||||
Amgen, Cl A | (1,267) | (211) | ||||||
Amsurg * | (14,328) | (961) | ||||||
Anthem | (730) | (91) | ||||||
Mylan * | (13,823) | (527) | ||||||
Neogen, Cl B * | (8,057) | (451) | ||||||
Novartis | (6,811) | (537) | ||||||
Ono Pharmaceutical | (6,600) | (183) | ||||||
ResMed | (4,540) | (294) | ||||||
Sarepta Therapeutics * | (1,586) | (97) | ||||||
Team Health Holdings * | (12,629) | (411) | ||||||
|
| |||||||
| (8,631) | ||||||||
|
| |||||||
Industrials — (2.0)% | ||||||||
Abertis Infraestructuras | (36,146) | (563) | ||||||
Airbus Group | (7,219) | (437) | ||||||
American Airlines Group | (10,442) | (382) | ||||||
Argan | (19,195) | (1,136) | ||||||
Bollore | (87,436) | (304) | ||||||
Bombardier, Cl B * | (370,000) | (507) | ||||||
FANUC | (3,500) | (588) | ||||||
Fastenal, Cl A | (11,700) | (489) | ||||||
Ferrovial | (27,734) | (590) | ||||||
Keihan Holdings | (29,000) | (202) | ||||||
Keppel | (133,100) | (526) | ||||||
Kubota | (34,800) | (520) | ||||||
Manitowoc Foodservice * | (35,691) | (579) | ||||||
Middleby * | (4,366) | (540) | ||||||
MonotaRO | (10,500) | (280) | ||||||
Seibu Holdings | (14,700) | (241) | ||||||
Sembcorp Industries | (241,500) | (459) | ||||||
Sensata Technologies Holding * | (15,027) | (583) | ||||||
Siemens | (1,501) | (176) | ||||||
Stericycle, Cl A * | (6,561) | (526) | ||||||
Supreme Industries, Cl A | (23,253) | (449) | ||||||
Volvo, Cl B | (43,465) | (497) | ||||||
| Description | Shares | Market Value ($ Thousands) | ||||||
COMMON STOCK SOLD SHORT (continued) |
| |||||||
Wartsila Abp | (12,668) | $ | (570) | |||||
XPO Logistics * | (10,013) | (367) | ||||||
|
| |||||||
| (11,511) | ||||||||
|
| |||||||
Information Technology — (4.8)% | ||||||||
Activision Blizzard | (27,877) | (1,235) | ||||||
Advanced Micro Devices * | (62,673) | (433) | ||||||
Alibaba Group Holding ADR * | (27,485) | (2,908) | ||||||
Analog Devices | (11,563) | (745) | ||||||
Apple | (5,617) | (635) | ||||||
Avid Technology * | (51,641) | (410) | ||||||
Blackbaud, Cl A | (8,619) | (572) | ||||||
BlackBerry * | (50,439) | (402) | ||||||
Broadcom | (3,668) | (633) | ||||||
CSRA | (7,630) | (205) | ||||||
Cvent * | (122) | (4) | ||||||
Cypress Semiconductor | (51,013) | (620) | ||||||
Echo Global Logistics * | (7,227) | (167) | ||||||
Electronic Arts * | (7,135) | (609) | ||||||
EPAM Systems * | (7,613) | (528) | ||||||
Facebook, Cl A * | (3,516) | (451) | ||||||
First Data, Cl A * | (40,163) | (528) | ||||||
First Solar * | (12,515) | (494) | ||||||
FleetCor Technologies * | (3,233) | (562) | ||||||
Global Payments | (7,406) | (568) | ||||||
Gogo * | (40,920) | (452) | ||||||
GrubHub * | (12,693) | (546) | ||||||
InterDigital | (14,908) | (1,181) | ||||||
j2 Global | (6,691) | (446) | ||||||
Juniper Networks | (37,721) | (908) | ||||||
Just Eat * | (96,910) | (675) | ||||||
Keyence | (900) | (653) | ||||||
LivePerson * | (80,412) | (676) | ||||||
Marvell Technology Group | (40,107) | (532) | ||||||
Micron Technology * | (30,373) | (540) | ||||||
Microsoft | (10,063) | (580) | ||||||
Mobileye * | (33,527) | (1,427) | ||||||
NeuStar, Cl A * | (56,602) | (1,505) | ||||||
New Relic * | (12,419) | (476) | ||||||
Palo Alto Networks * | (3,614) | (576) | ||||||
Pandora Media * | (36,090) | (517) | ||||||
Rofin-Sinar Technologies * | (1,884) | (61) | ||||||
Rosetta Stone * | (47,380) | (402) | ||||||
SS&C Technologies Holdings | (18,897) | (607) | ||||||
Twitter * | (28,459) | (656) | ||||||
Tyler Technologies * | (3,552) | (608) | ||||||
United Internet | (4,452) | (197) | ||||||
Versum Materials * | (19,313) | (438) | ||||||
|
| |||||||
| (27,368) | ||||||||
|
| |||||||
Materials — (1.7)% | ||||||||
Anglo American | (30,373) | (382) | ||||||
| SEI Institutional Managed Trust / Annual Report / September 30, 2016 | 201 |
SCHEDULE OF INVESTMENTS
September 30, 2016
Multi-Strategy Alternative Fund (Continued)
| Description | Shares | Market Value ($ Thousands) | ||||||
COMMON STOCK SOLD SHORT (continued) |
| |||||||
Antofagasta | (60,839) | $ | (414) | |||||
ArcelorMittal | (69,447) | (425) | ||||||
BHP Billiton | (35,592) | (610) | ||||||
Cabot | (14,907) | (781) | ||||||
CF Industries Holdings | (17,266) | (420) | ||||||
E.I. Du Pont de Nemours | (1,209) | (81) | ||||||
FMC | (12,089) | (584) | ||||||
Franco-Nevada | (7,600) | (530) | ||||||
Freeport-McMoRan, Cl B | (34,865) | (379) | ||||||
Goldcorp | (19,200) | (316) | ||||||
K+S | (11,705) | (222) | ||||||
LafargeHolcim | (11,231) | (608) | ||||||
LyondellBasell Industries, Cl A | (3,081) | (249) | ||||||
Orica | (40,550) | (472) | ||||||
Randgold Resources ADR | (4,450) | (445) | ||||||
Rio Tinto | (15,344) | (606) | ||||||
Royal Gold, Cl A | (6,510) | (504) | ||||||
RPC Group | (22,435) | (280) | ||||||
Shin-Etsu Chemical, Cl A | (7,300) | (505) | ||||||
Silver Wheaton | (19,737) | (532) | ||||||
Sumitomo Metal Mining | (21,000) | (288) | ||||||
|
| |||||||
| (9,633) | ||||||||
|
| |||||||
Telecommunication Services — (0.4)% |
| |||||||
Boingo Wireless * | (58,286) | (599) | ||||||
CenturyTel | (22,013) | (604) | ||||||
Freenet | (2,847) | (83) | ||||||
Frontier Communications | (114,465) | (476) | ||||||
KDDI | (3,700) | (114) | ||||||
Manitoba Telecom Services | (11,644) | (334) | ||||||
SoftBank Group | (5,900) | (380) | ||||||
|
| |||||||
| (2,590) | ||||||||
|
| |||||||
Utilities — (0.1)% |
| |||||||
Spark Energy, Cl A | (23,034) | (671) | ||||||
|
| |||||||
Total Common Stock Sold Short | ||||||||
(Proceeds $86,031) ($ Thousands) | (89,129) | |||||||
|
| |||||||
EXCHANGE TRADED FUNDS SOLD SHORT— (0.4)% |
| |||||||
CurrencyShares Japanese Yen Trust | (4,393) | (418) | ||||||
iShares iBoxx USD High Yield Corporate Bond ETF | (13,375) | (1,167) | ||||||
SPDR S&P 500 ETF Trust | (3,790) | (820) | ||||||
|
| |||||||
Total Exchange Traded Funds Sold Short | ||||||||
(Proceeds $2,287) ($ Thousands) | (2,405) | |||||||
|
| |||||||
| Description | Shares | Market Value ($ Thousands) | ||||||
PREFERRED STOCK SOLD SHORT— (0.2)% |
| |||||||
Consumer Discretionary — (0.2)% |
| |||||||
Porsche Automobil Holding, 0.000% | (10,979) | $ | (561) | |||||
Volkswagen, 0.000% | (4,268) | (561) | ||||||
|
| |||||||
Total Preferred Stock Sold Short | ||||||||
(Proceeds $1,236) ($ Thousands) |
| (1,122) | ||||||
|
| |||||||
Total Investments Sold Short — (16.1)% |
| |||||||
(Proceeds $89,554) ($ Thousands) |
| $ | (92,656) | |||||
|
| |||||||
| Contracts | ||||||||
|
| |||||||
PURCHASED OPTIONS (E) — 0.0% |
| |||||||
Abbott Laboratories, Expires 11/19/2016, Strike Price $45.00* | 25 | $ | 1 | |||||
Alibaba Group Holding, Expires 10/22/2016, Strike Price $110.00* | 82 | 9 | ||||||
Apollo Education Group, Expires 01/21/2017, Strike Price $8.00* | 139 | 14 | ||||||
Apollo Education Group Put, Expires 01/21/2017, Strike Price $5.00* | 97 | 4 | ||||||
CBOE Holdings, Expires 01/21/2017, Strike Price $72.50* | 56 | 3 | ||||||
CBOE Holdings, Expires 01/21/2017, Strike Price $70.00* | 37 | 3 | ||||||
CBOE Holdings, Expires 12/17/2016, Strike Price $72.50* | 75 | 2 | ||||||
EI du Pont de Nemours, Expires 10/22/2016, Strike Price $60.00* | 22 | – | ||||||
EI du Pont de Nemours, Expires 10/22/2016, Strike Price $62.50* | 9 | – | ||||||
Imperva, Expires 10/22/2016, Strike Price $45.00* | 112 | 3 | ||||||
Imperva, Expires 10/22/2016, Strike Price $55.00* | 131 | 20 | ||||||
Intersil, Expires 01/21/2017, Strike Price $20.00* | 75 | 13 | ||||||
Intersil, Expires 10/22/2016, Strike Price $21.00* | 56 | 5 | ||||||
Lexmark International, Expires 10/22/2016, Strike Price $30.00* | 76 | – | ||||||
Lexmark International, Expires 10/22/2016, Strike Price $29.00* | 85 | – | ||||||
LinkedIn, Expires 01/20/2018, Strike Price $200.00* | 2 | – | ||||||
Lions Gate Entertainment, Expires 12/17/2016, Strike Price $23.00* | 72 | 3 | ||||||
Lions Gate Entertainment, Expires 12/17/2016, Strike Price $22.00* | 36 | 3 | ||||||
Lions Gate Entertainment, Expires 10/22/2016, Strike Price $23.00* | 30 | – | ||||||
Medivation, Expires 10/22/2016, Strike Price $50.00* | 7 | – | ||||||
| 202 | SEI Institutional Managed Trust / Annual Report / September 30, 2016 |
| Description | Contracts | Market Value ($ Thousands) | ||||||
PURCHASED OPTIONS (E) (continued) | ||||||||
Medivation, Expires 10/22/2016, Strike Price $55.00* | 3 | $ | – | |||||
Medivation, Expires 10/22/2016, Strike Price $45.00* | 1 | – | ||||||
Monsanto, Expires 01/21/2017, Strike Price $110.00* | 78 | 7 | ||||||
NorthStar Realty Finance, Expires 12/17/2016, Strike Price $11.00* | 75 | 1 | ||||||
October 16 Puts on SPX, Expires 10/22/2016, Strike Price $1,980.00* | 32 | 4 | ||||||
October 16 Puts on SPX, Expires 10/22/2016, Strike Price $2,150.00* | 2 | 4 | ||||||
October 16 Puts on SPX, Expires 10/22/2016, Strike Price $1,990.00* | 2 | – | ||||||
October 16 Puts on SPX, Expires 10/22/2016, Strike Price $2,140.00* | 32 | 47 | ||||||
Valspar, Expires 10/22/2016, Strike Price $100.00* | 29 | 1 | ||||||
WhiteWave Foods, Expires 01/21/2017, Strike Price $55.00* | 113 | 11 | ||||||
WhiteWave Foods, Expires 01/21/2017, Strike Price $52.50* | 21 | 2 | ||||||
WhiteWave Foods, Expires 10/22/2016, Strike Price $52.50* | 40 | – | ||||||
|
| |||||||
Total Purchased Options | $ | 160 | ||||||
|
| |||||||
WRITTEN OPTIONS (E) — 0.0% | ||||||||
Alibaba Group Holding, Expires 10/22/2016 Strike Price $115.00* | (6) | $ | – | |||||
October 16 Puts on SPX, Expires 10/22/2016 Strike Price $2,070.00* | (4) | (2) | ||||||
October 16 Puts on SPX, Expires 10/22/2016 Strike Price $2,060.00* | (64) | (26) | ||||||
WhiteWave Foods, Expires 01/21/2017 Strike Price $50.00* | (113) | (64) | ||||||
|
| |||||||
Total Written Options
(Premiums Received $117) ($ Thousands) | $ | (92) | ||||||
|
| |||||||
A list of the open futures contracts held by the Fund at September 30, 2016, is as follows:
| ||||||||||||
| Type of Contract | Number of Contracts Short | Expiration Date | Unrealized Appreciation (Depreciation) ($ Thousands) | |||||||||
| ||||||||||||
90-Day Euro$ | (12) | Dec-2017 | $(3) | |||||||||
Euro-BTP | (10) | Dec-2016 | (5) | |||||||||
S&P 500 Index E-MINI | (17) | Dec-2016 | 5 | |||||||||
U.S. 10-Year Treasury Note | (6) | Dec-2016 | (1) | |||||||||
U.S. Long Treasury Bond | (6) | Dec-2016 | 13 | |||||||||
|
| |||||||||||
| $9 | ||||||||||||
|
| |||||||||||
For the year ended September 30, 2016, the total amount of all open futures contracts, as presented in the table above, are representative of the volume of activity for the derivative type during the year.
A list of the open forward foreign currency contracts held by the Fund at September 30, 2016, is as follows:
| ||||||||||||||||||||
Settlement Date | Currency to Deliver (Thousands) | Currency To Receive (Thousands) | Unrealized Appreciation (Depreciation) ($ Thousands) | |||||||||||||||||
| ||||||||||||||||||||
10/07/16 | USD | 153 | PEN | 517 | $(2) | |||||||||||||||
12/20/16-12/21/16 | USD | 1,618 | MXN | 32,122 | 27 | |||||||||||||||
12/21/16 | USD | 14 | EUR | 13 | — | |||||||||||||||
12/21/16 | USD | 529 | MXN | 10,274 | (3) | |||||||||||||||
12/21/16 | USD | 1,251 | RUB | 82,939 | 38 | |||||||||||||||
12/21/16 | TRY | 3,785 | USD | 1,248 | 8 | |||||||||||||||
12/21/16 | EUR | 8,071 | USD | 9,061 | (45) | |||||||||||||||
12/21/16 | MXN | 11,438 | USD | 573 | (13) | |||||||||||||||
12/21/16 | CNH | 19,760 | USD | 2,934 | (12) | |||||||||||||||
12/21/16 | RUB | 82,939 | USD | 1,262 | (27) | |||||||||||||||
12/21/16 | JPY | 102,946 | USD | 1,017 | (4) | |||||||||||||||
01/19/17 | USD | 2,476 | SAR | 9,333 | 7 | |||||||||||||||
01/19/17 | SAR | 9,333 | USD | 2,431 | (52) | |||||||||||||||
|
| |||||||||||||||||||
| (78) | ||||||||||||||||||||
|
| |||||||||||||||||||
A list of the counterparties for the outstanding forward foreign currency contracts held by the Fund at September 30, 2016, is as follows:
| ||||||||||||
| Counterparty | Currency to Deliver ($ Thousands) | Currency to Receive ($ Thousands) | Unrealized Appreciation (Depreciation) ($ Thousands) | |||||||||
| ||||||||||||
Bank of America | $(572) | $585 | $13 | |||||||||
Credit Suisse First Boston | (2,946) | 2,934 | (12) | |||||||||
Merrill Lynch | (1,936) | 1,939 | 3 | |||||||||
Morgan Stanley | (19,258) | 19,176 | (82) | |||||||||
|
| |||||||||||
| $(78) | ||||||||||||
|
| |||||||||||
For the year ended September 30, 2016 the total amount of all open forward foreign currency contracts, as presented in the table above, are representative of the volume of activity for the derivative type during the year.
| SEI Institutional Managed Trust / Annual Report / September 30, 2016 | 203 |
SCHEDULE OF INVESTMENTS
September 30, 2016
Multi-Strategy Alternative Fund (Concluded)
A list of the open OTC swap agreements held by the Fund at September 30, 2016 is as follows:
| Interest Rate Swaps | ||||||||||||||||
| Counterparty | Fund Pays | Fund Receives | Termination Date | Currency | Notional Amount ($Thousands) | Net Unrealized Appreciation ($Thousands) | ||||||||||
Morgan Stanley | 1.0 X BRLCDI | 12.05% | 01/02/2020 | BRL | $2,594 | $11 | ||||||||||
| ||||||||||||||||
| Credit Default Swaps | ||||||||||||||||||||||||
| Counterparty | Reference Entity/Obligation | Buy/Sell Protection | (Pays)/Receives Rate | Termination Date | Notional Amount ($ Thousands) | Net Unrealized Appreciation ($ Thousands) | ||||||||||||||||||
Morgan Stanley | Argent | BUY | 5.00% | 06/20/2017 | $1,526 | $ 57 | ||||||||||||||||||
| ||||||||||||||||||||||||
| ||||||||||||||||||||||||
| Total Return Swaps | ||||||||||||||||||||||||
| Counterparty | Reference Entity/Obligation | Fund Pays | Fund Receives | Termination Date | Notional Amount ($ Thousands) | Net Unrealized Appreciation ($ Thousands) | ||||||||||||||||||
Morgan Stanley | Sabmiller PLC | 1-Month GBP – LIBOR | Asset Return | 12/12/2017 | $(5,922) | $ 131 | ||||||||||||||||||
| ||||||||||||||||||||||||
A list of the open centrally cleared swap agreements held by the Fund at September 30, 2016 is as follows:
| ||||||||||||||||||||||||
| Credit Default Swaps | ||||||||||||||||||||||||
| Counterparty | Reference Entity/Obligation | Buy/Sell Protection | (Pays)/Receives Rate | Termination Date | Notional Amount ($ Thousands) | Net Unrealized Appreciation (Depreciation) ($Thousands) | ||||||||||||||||||
Citigroup | Brazil | �� | SELL | 1.00% | 06/20/2021 | $ (2,856) | $70 | |||||||||||||||||
Citigroup | ITRAXX.XO.VER.Series 25, Version 1 | SELL | 5.00% | 06/20/2021 | (1,000) | (7) | ||||||||||||||||||
Citigroup | Republic Of Turkey | BUY | 1.00% | 06/20/2021 | 514 | 1 | ||||||||||||||||||
Citigroup | Republic Of Turkey | BUY | 1.00% | 06/20/2021 | 3,117 | (26) | ||||||||||||||||||
Citigroup | Republic Of Turkey | SELL | 1.00% | 06/20/2021 | (2,169) | 23 | ||||||||||||||||||
Citigroup | Republic Of Turkey | BUY | 1.00% | 12/20/2020 | 2,696 | (71) | ||||||||||||||||||
Citigroup | Russia | SELL | 1.00% | 06/20/2021 | (2,345) | 51 | ||||||||||||||||||
| ||||||||||||||||||||||||
| $41 | ||||||||||||||||||||||||
| ||||||||||||||||||||||||
For the year ended September 30, 2016, the total amount of open swap agreements, as presented in the tables above, are representative of the volume of activity for this derivative type during the year.
| Percentages are based on Net Assets of $575,104 ($ Thousands). |
| * | Non-income producing security. |
| ** | Rate shown is the 7-day effective yield as of September 30, 2016. |
| ‡ | Real Estate Investment Trust. |
| † | Investment in Affiliated Security (see Note6) |
| (A) | Security exempt from registration under Rule 144A of the Securities Act of 1933. These securities may be resold in transactions exempt from registration normally to qualified institutions. On September 30, 2016, the value of these securities amounted to $6,825 ($ Thousands), representing 1.2% of the net assets of the Fund. |
| (B) | Step Bonds – The rate reflected on the Schedule of Investments is the effective yield on September 30, 2016. The coupon on a step bond changes on a specified date. |
| (C) | Variable Rate Security — The rate reported on the Schedule of Investments is the rate in effect as of September 30, 2016. |
| (D) | The rate reported is the effective yield at the time of purchase. |
| (E) | For the year ended September 30, 2016, the total amount of open purchased options and written options, as presented in the Schedule of Investments, are representative of the volume of activity for these derivative types during the year. |
ADR — American Depositary Receipt
ARS — Argentine Peso
BRL — Brazilian Real
Cl — Class
CNH — Chinese Offshore Yuan
EUR — Euro
FHLMC — Federal Home Loan Mortgage Corporation
FNMA — Federal National Mortgage Association
GBP — British Pound
JPY — Japanese Yen
MTN — Medium Term Note
MXN — Mexican Peso
OTC — Over the Counter
PEN — Peruvian Nuevo Sol
RUB — Russian Ruble
S&P— Standard & Poor’s
SAR— Saudi Riyal
TRY — Turkish Lira
USD — United States Dollar
| 204 | SEI Institutional Managed Trust / Annual Report / September 30, 2016 |
The following is a list of the level of inputs used as of September 30, 2016, in valuing the Fund’s investments and other financial instruments carried at value ($ Thousands):
| ||||||||||||||||
| Investments in Securities | Level 1 | Level 2 |
Level 3 | Total | ||||||||||||
| ||||||||||||||||
Registered Investment Companies | $ | 262,834 | $ | – | $ | – | $ | 262,834 | ||||||||
Common Stock | 178,106 | – | – | 178,106 | ||||||||||||
Sovereign Debt | – | 28,347 | – | 28,347 | ||||||||||||
Preferred Stock | 862 | – | – | 862 | ||||||||||||
Corporate Obligations | – | 827 | – | 827 | ||||||||||||
U.S. Treasury Obligation | – | 9,997 | – | 9,997 | ||||||||||||
Cash Equivalent | 94,332 | – | – | 94,332 | ||||||||||||
|
|
|
|
|
|
|
| |||||||||
Total Investments in Securities | $ | 536,134 | $ | 39,171 | $ | – | $ | 575,305 | ||||||||
|
|
|
|
|
|
|
| |||||||||
| ||||||||||||||||
| Securities Sold Short | Level 1 | Level 2 | Level 3 | Total | ||||||||||||
| ||||||||||||||||
Common Stock | $ | (89,129) | $ | – | $ | – | $ | (89,129) | ||||||||
Exchange Traded Funds | (2,405) | – | – | (2,405) | ||||||||||||
Preferred Stock | (1,122) | – | – | (1,122) | ||||||||||||
|
|
|
|
|
|
|
| |||||||||
Total Securities Sold Short | $ | (92,656) | $ | – | $ | – | $ | (92,656) | ||||||||
|
|
|
|
|
|
|
| |||||||||
| ||||||||||||||||
| Other Financial Instruments | Level 1 | Level 2 | Level 3 | Total | ||||||||||||
| ||||||||||||||||
Purchased Options | $ | 160 | $ | — | $ | — | $ | 160 | ||||||||
Written Options | (92) | — | — | (92) | ||||||||||||
Futures Contracts * | ||||||||||||||||
Unrealized Appreciation | 18 | — | — | 18 | ||||||||||||
Unrealized Depreciation | (9) | — | — | (9) | ||||||||||||
Forwards Contracts * | ||||||||||||||||
Unrealized Appreciation | — | 80 | — | 80 | ||||||||||||
Unrealized Depreciation | — | (158) | — | (158) | ||||||||||||
OTC Swaps | ||||||||||||||||
Interest Rate Swaps * | ||||||||||||||||
Unrealized Appreciation | — | 11 | — | 11 | ||||||||||||
Credit Default Swaps * | ||||||||||||||||
Unrealized Appreciation | — | 57 | — | 57 | ||||||||||||
Total Return Swaps * | ||||||||||||||||
Unrealized Appreciation | — | 131 | — | 131 | ||||||||||||
Centrally Cleared Swaps | ||||||||||||||||
Credit Default Swaps * | ||||||||||||||||
Unrealized Appreciation | — | 145 | — | �� | 145 | |||||||||||
Unrealized Depreciation | — | (104) | — | (104) | ||||||||||||
|
|
|
|
|
|
|
| |||||||||
Total Other Financial Instruments | $ | 77 | $ | 162 | $ | — | $ | 239 | ||||||||
|
|
|
|
|
|
|
| |||||||||
* Futures contracts, forward contracts and swap contracts are valued at the unrealized appreciation (depreciation) on the instrument.
For the year ended September 30, 2016, there were no transfers between Level 1 and Level 2 assets and liabilities.
For the year ended September 30, 2016, there were no transfers between Level 2 and Level 3 assets and liabilities.
For more information on valuation inputs, see Note 2 – Significant Accounting Policies in Notes to Financial Statements.
Amounts designated as “—” are $0 or have been rounded to $0.
The accompanying notes are an integral part of the financial statements.
| SEI Institutional Managed Trust / Annual Report / September 30, 2016 | 205 |
CONSOLIDATED SCHEDULE OF INVESTMENTS
September 30, 2016
Multi-Asset Accumulation Fund
Sector Weightings (Unaudited)†:
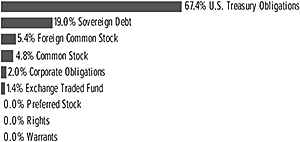
†Percentages are based on total investments.
| Description | Face Amount (Thousands) | Market Value ($ Thousands) | ||||||||||
U.S. TREASURY OBLIGATIONS — 55.6% |
| |||||||||||
U.S. Treasury Bills | ||||||||||||
0.541%, 03/16/2017 (A) | $ | 3,994 | $ | 3,986 | ||||||||
0.480%, 11/25/2016 (A)(B) | 41,108 | 41,098 | ||||||||||
0.477%, 12/01/2016 (A)(B) | 43,790 | 43,777 | ||||||||||
0.451%, 02/23/2017 (A)(B) | 7,347 | 7,337 | ||||||||||
0.446%, 02/16/2017 (A)(B) | 3,623 | 3,618 | ||||||||||
0.431%, 01/19/2017 (A)(B) | 488,464 | 488,077 | ||||||||||
0.420%, 03/30/2017 (A) | 1,068 | 1,066 | ||||||||||
0.401%, 10/27/2016 (A)(B) | 1,599 | 1,599 | ||||||||||
0.395%, 02/02/2017 (A)(B) | 97,276 | 97,167 | ||||||||||
0.370%, 11/17/2016 (A)(B) | 31,481 | 31,474 | ||||||||||
0.310%, 10/20/2016 (A)(B) | 150,000 | 149,991 | ||||||||||
0.266%, 10/06/2016 (A)(B) | 36,500 | 36,500 | ||||||||||
U.S. Treasury Inflation Protected Securities | ||||||||||||
3.875%, 04/15/2029 | 2,079 | 2,995 | ||||||||||
3.625%, 04/15/2028 | 838 | 1,157 | ||||||||||
3.375%, 04/15/2032 | 2,034 | 2,984 | ||||||||||
2.625%, 07/15/2017 | 697 | 718 | ||||||||||
2.500%, 01/15/2029 | 2,080 | 2,641 | ||||||||||
2.375%, 01/15/2017 | 239 | 241 | ||||||||||
2.375%, 01/15/2025 | 3,152 | 3,756 | ||||||||||
2.375%, 01/15/2027 | 776 | 951 | ||||||||||
2.125%, 01/15/2019 | 2,018 | 2,149 | ||||||||||
2.125%, 02/15/2041 | 1,171 | 1,573 | ||||||||||
2.000%, 01/15/2026 | 2,528 | 2,969 | ||||||||||
1.875%, 07/15/2019 | 3,949 | 4,241 | ||||||||||
1.750%, 01/15/2028 | 1,119 | 1,310 | ||||||||||
1.375%, 07/15/2018 | 3,236 | 3,373 | ||||||||||
1.375%, 01/15/2020 | 972 | 1,032 | ||||||||||
1.375%, 02/15/2044 | 1,033 | 1,225 | ||||||||||
1.250%, 07/15/2020 | 3,149 | 3,365 | ||||||||||
1.125%, 01/15/2021 | 2,015 | 2,145 | ||||||||||
1.000%, 02/15/2046 | 5,078 | 5,527 | ||||||||||
0.750%, 02/15/2042 | 1,544 | 1,591 | ||||||||||
0.750%, 02/15/2045 | 766 | 790 | ||||||||||
0.625%, 07/15/2021 | 2,328 | 2,444 | ||||||||||
0.625%, 01/15/2024 | 4,435 | 4,653 | ||||||||||
0.625%, 01/15/2026 | 2,532 | 2,629 | ||||||||||
0.625%, 02/15/2043 | 785 | 787 | ||||||||||
| Description | Face Amount (Thousands) | Market Value ($ Thousands) | ||||||
U.S. TREASURY OBLIGATIONS (continued) |
| |||||||
0.375%, 07/15/2023 | $ 2,533 | $ | 2,625 | |||||
0.375%, 07/15/2025 | 43,800 | 45,231 | ||||||
0.250%, 01/15/2025 | 39,911 | 40,649 | ||||||
0.125%, 04/15/2017 | 424 | 425 | ||||||
0.125%, 04/15/2018 | 1,510 | 1,526 | ||||||
0.125%, 04/15/2019 | 82,452 | 83,851 | ||||||
0.125%, 04/15/2020 | 86,510 | 88,198 | ||||||
0.125%, 04/15/2021 | 5,077 | 5,183 | ||||||
0.125%, 01/15/2022 | 1,807 | 1,845 | ||||||
0.125%, 07/15/2022 | 2,041 | 2,089 | ||||||
0.125%, 01/15/2023 | 1,720 | 1,747 | ||||||
0.125%, 07/15/2024 | 30,954 | 31,404 | ||||||
|
| |||||||
Total U.S. Treasury Obligations | 1,267,709 | |||||||
|
| |||||||
SOVEREIGN DEBT — 15.6% |
| |||||||
African Development Bank MTN | ||||||||
2.375%, 09/23/2021 (B) | 1,000 | 1,043 | ||||||
1.375%, 02/12/2020 (B) | 1,000 | 1,005 | ||||||
1.125%, 03/15/2017 (B) | 200 | 200 | ||||||
0.875%, 03/15/2018 (B) | 500 | 499 | ||||||
Andina de Fomento | ||||||||
4.375%, 06/15/2022 (B) | 250 | 277 | ||||||
Asian Development Bank MTN | ||||||||
5.593%, 07/16/2018 (B) | 250 | 269 | ||||||
1.625%, 08/26/2020 (B) | 2,000 | 2,028 | ||||||
1.375%, 01/15/2019 (B) | 1,000 | 1,008 | ||||||
1.125%, 03/15/2017 (B) | 150 | 150 | ||||||
Bundesrepublik Deutschland Bundesobligation Inflation Linked Bond | ||||||||
0.750%, 04/15/2018 | EUR 4,074 | 4,699 | ||||||
0.750%, 04/15/2018 | 336 | 387 | ||||||
Canada Government International Bond | ||||||||
1.625%, 02/27/2019 (B) | $ 1,500 | 1,523 | ||||||
0.875%, 02/14/2017 (B) | 1,200 | 1,201 | ||||||
Chile Government International Bond | ||||||||
3.875%, 08/05/2020 (B) | 250 | 272 | ||||||
Council of Europe Development Bank | ||||||||
1.750%, 11/14/2019 (B) | 1,000 | 1,017 | ||||||
1.500%, 02/22/2017 (B) | 850 | 852 | ||||||
Deutsche Bundesrepublik Inflation Linked Bond | ||||||||
1.750%, 04/15/2020 | EUR 7,867 | 9,819 | ||||||
1.750%, 04/15/2020 | 16,077 | 20,067 | ||||||
0.500%, 04/15/2030 | 4,960 | 6,799 | ||||||
0.100%, 04/15/2023 | 12,588 | 15,504 | ||||||
0.100%, 04/15/2026 | 23,947 | 30,465 | ||||||
0.100%, 04/15/2026 | 3,044 | 3,853 | ||||||
0.100%, 04/15/2046 | 719 | 1,045 | ||||||
Development Bank of Japan | ||||||||
5.125%, 02/01/2017 (B) | $ 200 | 203 | ||||||
| 206 | SEI Institutional Managed Trust / Annual Report / September 30, 2016 |
| Description | Face Amount (Thousands) | Market Value ($ Thousands) | ||||||
SOVEREIGN DEBT (continued) |
| |||||||
European Bank for Reconstruction & Development MTN | ||||||||
1.750%, 11/26/2019 (B) | $ 2,500 | $ | 2,543 | |||||
1.500%, 03/16/2020 (B) | 250 | 253 | ||||||
1.000%, 02/16/2017 (B) | 600 | 601 | ||||||
0.750%, 09/01/2017 (B) | 200 | 200 | ||||||
European Investment Bank | ||||||||
4.875%, 02/15/2036 (B) | 250 | 346 | ||||||
4.000%, 02/16/2021 (B) | 1,000 | 1,111 | ||||||
2.125%, 10/15/2021 (B) | 1,000 | 1,032 | ||||||
1.625%, 12/15/2020 (B) | 1,000 | 1,012 | ||||||
1.000%, 12/15/2017 (B) | 150 | 150 | ||||||
Export Development Canada | ||||||||
1.750%, 08/19/2019 (B) | 500 | 509 | ||||||
1.750%, 07/21/2020 (B) | 1,000 | 1,021 | ||||||
0.750%, 12/15/2017 (B) | 750 | 749 | ||||||
FMS Wertmanagement AoeR | ||||||||
1.750%, 03/17/2020 (B) | 500 | 508 | ||||||
1.250%, 07/30/2018 (B) | 1,000 | 1,006 | ||||||
1.000%, 11/21/2017 (B) | 950 | 950 | ||||||
France Government Bond OAT | ||||||||
3.400%, 07/25/2029 | EUR 873 | 1,555 | ||||||
3.150%, 07/25/2032 | 713 | 1,319 | ||||||
2.250%, 07/25/2020 | 17,920 | 23,064 | ||||||
2.100%, 07/25/2023 | 1,400 | 1,941 | ||||||
2.100%, 07/25/2023 | 1,084 | 1,502 | ||||||
1.850%, 07/25/2027 | 6,350 | 9,389 | ||||||
1.800%, 07/25/2040 | 2,382 | 4,216 | ||||||
1.300%, 07/25/2019 | 243 | 294 | ||||||
1.100%, 07/25/2022 | 1,231 | 1,582 | ||||||
1.100%, 07/25/2022 | 7,410 | 8,467 | ||||||
1.000%, 07/25/2017 | 1,087 | 1,246 | ||||||
0.700%, 07/25/2030 (C) | 203 | 276 | ||||||
0.250%, 07/25/2018 | 1,579 | 1,836 | ||||||
0.250%, 07/25/2024 | 1,234 | 2,055 | ||||||
0.250%, 07/25/2024 | 8,225 | 10,278 | ||||||
0.100%, 03/01/2021 | 3,000 | 3,590 | ||||||
0.100%, 07/25/2021 | 6,629 | 7,955 | ||||||
0.100%, 03/01/2025 | 9,303 | 11,459 | ||||||
Hydro-Quebec | ||||||||
1.375%, 06/19/2017 (B) | $ 150 | 150 | ||||||
Inter-American Development Bank | ||||||||
7.000%, 06/15/2025 (B) | 500 | 688 | ||||||
3.875%, 09/17/2019 (B) | 350 | 377 | ||||||
1.125%, 03/15/2017 (B) | 300 | 301 | ||||||
International Bank for Reconstruction & Development | ||||||||
4.750%, 02/15/2035 (B) | 250 | 335 | ||||||
2.250%, 06/24/2021 (B) | 1,000 | 1,040 | ||||||
1.625%, 03/09/2021 (B) | 1,000 | 1,014 | ||||||
0.875%, 04/17/2017 (B) | 450 | 450 | ||||||
| Description | Face Amount (Thousands) | Market Value ($ Thousands) | ||||||
SOVEREIGN DEBT (continued) |
| |||||||
International Finance MTN | ||||||||
2.125%, 11/17/2017 (B) | $ 750 | $ | 761 | |||||
1.750%, 09/04/2018 (B) | 200 | 203 | ||||||
1.625%, 07/16/2020 (B) | 2,000 | 2,030 | ||||||
1.125%, 11/23/2016 (B) | 750 | 750 | ||||||
1.000%, 04/24/2017 (B) | 300 | 300 | ||||||
0.875%, 06/15/2018 (B) | 1,000 | 1,000 | ||||||
Italy Buoni Poliennali Del Tesoro | ||||||||
3.100%, 09/15/2026 | EUR 2,254 | 3,208 | ||||||
2.600%, 09/15/2023 | 2,969 | 3,971 | ||||||
2.550%, 09/15/2041 | 968 | 1,466 | ||||||
2.350%, 09/15/2019 | 560 | 686 | ||||||
2.350%, 09/15/2024 (C) | 2,136 | 2,813 | ||||||
2.350%, 09/15/2035 | 2,426 | 3,539 | ||||||
2.100%, 09/15/2017 | 1,000 | 1,159 | ||||||
2.100%, 09/15/2021 | 1,480 | 1,870 | ||||||
1.700%, 09/15/2018 | 921 | 1,085 | ||||||
1.700%, 09/15/2018 | 102 | 121 | ||||||
Korea Development Bank | ||||||||
4.625%, 11/16/2021 (B) | $ 250 | 285 | ||||||
Nordic Investment Bank MTN | ||||||||
1.500%, 09/29/2020 (B) | 1,000 | 1,009 | ||||||
1.125%, 03/19/2018 (B) | 1,000 | 1,003 | ||||||
1.000%, 03/07/2017 (B) | 750 | 751 | ||||||
0.750%, 01/17/2018 (B) | 200 | 200 | ||||||
North American Development Bank | ||||||||
2.400%, 10/26/2022 (B) | 200 | 203 | ||||||
Province of British Columbia Canada | ||||||||
6.500%, 01/15/2026 (B) | 250 | 338 | ||||||
2.000%, 10/23/2022 (B) | 250 | 254 | ||||||
Province of Manitoba Canada | ||||||||
3.050%, 05/14/2024 (B) | 250 | 270 | ||||||
Province of Ontario Canada | ||||||||
4.000%, 10/07/2019 (B) | 500 | 539 | ||||||
2.450%, 06/29/2022 (B) | 250 | 260 | ||||||
2.000%, 01/30/2019 (B) | 500 | 508 | ||||||
Province of Quebec Canada | ||||||||
7.500%, 09/15/2029 (B) | 200 | 301 | ||||||
Svensk Exportkredit MTN | ||||||||
5.125%, 03/01/2017 (B) | 150 | 153 | ||||||
1.750%, 03/10/2021 (B) | 1,000 | 1,012 | ||||||
United Kingdom Gilt Inflation Linked | ||||||||
4.125%, 07/22/2030 | GBP 1,000 | 4,904 | ||||||
2.500%, 04/16/2020 | 429 | 2,060 | ||||||
2.500%, 07/17/2024 | 340 | 1,632 | ||||||
2.000%, 01/26/2035 | 432 | 1,544 | ||||||
1.875%, 11/22/2022 | 4,098 | 6,773 | ||||||
1.250%, 11/22/2017 | 204 | 276 | ||||||
1.250%, 11/22/2027 | 1,222 | 2,227 | ||||||
1.250%, 11/22/2032 | 696 | 1,446 | ||||||
1.250%, 11/22/2055 | 1,560 | 5,407 | ||||||
1.125%, 11/22/2037 | 1,016 | 2,325 | ||||||
| SEI Institutional Managed Trust / Annual Report / September 30, 2016 | 207 |
CONSOLIDATED SCHEDULE OF INVESTMENTS
September 30, 2016
Multi-Asset Accumulation Fund (Continued)
| Description | Face Amount (Thousands) | Market Value ($ Thousands) | ||||||||||
SOVEREIGN DEBT (continued) |
| |||||||||||
0.750%, 03/22/2034 | GBP 964 | $ | 1,922 | |||||||||
0.750%, 11/22/2047 | 824 | 2,165 | ||||||||||
0.625%, 03/22/2040 | 1,788 | 3,981 | ||||||||||
0.625%, 11/22/2042 | 1,023 | 2,387 | ||||||||||
0.500%, 03/22/2050 | 2,407 | 6,273 | ||||||||||
0.375%, 03/22/2062 | 495 | 1,577 | ||||||||||
0.250%, 03/22/2052 | 653 | 1,667 | ||||||||||
0.125%, 03/22/2024 | 19,721 | 30,391 | ||||||||||
0.125%, 03/22/2026 | 13,668 | 21,750 | ||||||||||
0.125%, 03/22/2029 | 111 | 186 | ||||||||||
0.125%, 03/22/2044 | 1,847 | 3,970 | ||||||||||
0.125%, 03/22/2058 | 1,235 | 3,409 | ||||||||||
0.125%, 11/22/2065 | 750 | 2,384 | ||||||||||
0.125%, 03/22/2068 | 422 | 1,408 | ||||||||||
|
| |||||||||||
Total Sovereign Debt | 356,667 | |||||||||||
|
| |||||||||||
| Shares | ||||||||||||
FOREIGN COMMON STOCK — 4.4% |
| |||||||||||
Australia — 0.3% | ||||||||||||
AGL Energy | 25,712 | 375 | ||||||||||
Amcor | 3,900 | 45 | ||||||||||
APA Group | 38,075 | 248 | ||||||||||
Aristocrat Leisure | 14,947 | 181 | ||||||||||
ASX | 2,472 | 91 | ||||||||||
Aurizon Holdings | 21,309 | 77 | ||||||||||
AusNet Services | 264,595 | 332 | ||||||||||
BHP Billiton | 5,561 | 95 | ||||||||||
Brambles | 9,655 | 89 | ||||||||||
Caltex Australia | 6,748 | 177 | ||||||||||
CIMIC Group ‡ | 4,686 | 103 | ||||||||||
Coca-Cola Amatil | 19,358 | 152 | ||||||||||
Cochlear | 2,349 | 253 | ||||||||||
Computershare | 58,392 | 461 | ||||||||||
Crown Resorts | 10,576 | 106 | ||||||||||
CSL | 3,596 | 294 | ||||||||||
DUET Group | 92,883 | 178 | ||||||||||
Fortescue Metals Group | 27,506 | 104 | ||||||||||
Harvey Norman Holdings | 38,002 | 151 | ||||||||||
Healthscope | 82,236 | 193 | ||||||||||
Incitec Pivot | 29,314 | 63 | ||||||||||
Insurance Australia Group | 17,664 | 74 | ||||||||||
LendLease Group | 3,959 | 43 | ||||||||||
Origin Energy | 40,531 | 168 | ||||||||||
Qantas Airways | 25,771 | 62 | ||||||||||
Ramsay Health Care | 5,073 | 307 | ||||||||||
REA Group | 2,602 | 113 | ||||||||||
Rio Tinto | 2,745 | 109 | ||||||||||
Santos | 26,897 | 74 | ||||||||||
Scentre Group ‡ | 11,668 | 42 | ||||||||||
SEEK | 7,445 | 89 | ||||||||||
| Description | Shares | Market Value ($ Thousands) | ||||||||||
FOREIGN COMMON STOCK (continued) |
| |||||||||||
Sonic Healthcare | 16,500 | $ | 278 | |||||||||
South32 | 36,210 | 67 | ||||||||||
Sydney Airport | 20,066 | 107 | ||||||||||
Tabcorp Holdings | 34,462 | 131 | ||||||||||
Tatts Group | 44,420 | 124 | ||||||||||
Telstra, Cl B | 88,932 | 352 | ||||||||||
TPG Telecom | 28,076 | 185 | ||||||||||
Transurban Group | 13,849 | 121 | ||||||||||
Treasury Wine Estates | 30,987 | 262 | ||||||||||
Vicinity Centres ‡ | 28,772 | 70 | ||||||||||
Vocus Communications | 16,502 | 79 | ||||||||||
Wesfarmers | 4,028 | 136 | ||||||||||
Westfield | 9,207 | 69 | ||||||||||
Westpac Banking | 2,441 | 55 | ||||||||||
Woodside Petroleum | 6,856 | 150 | ||||||||||
Woolworths | 9,620 | 171 | ||||||||||
|
| |||||||||||
| 7,206 | ||||||||||||
|
| |||||||||||
Austria — 0.0% | ||||||||||||
Andritz | 4,304 | 234 | ||||||||||
Erste Group Bank | 4,076 | 121 | ||||||||||
OMV | 9,074 | 261 | ||||||||||
Raiffeisen Bank International | 8,262 | 126 | �� | |||||||||
voestalpine | 5,195 | 180 | ||||||||||
|
| |||||||||||
| 922 | ||||||||||||
|
| |||||||||||
Belgium — 0.1% | ||||||||||||
Ageas | 2,714 | 99 | ||||||||||
Anheuser-Busch InBev | 1,572 | 206 | ||||||||||
Colruyt | 6,336 | 351 | ||||||||||
Groupe Bruxelles Lambert | 357 | 32 | ||||||||||
KBC Group | 1,942 | 113 | ||||||||||
Proximus | 13,839 | 413 | ||||||||||
Solvay | 1,290 | 149 | ||||||||||
Telenet Group Holding * | 7,685 | 401 | ||||||||||
UCB, Cl A | 6,939 | 537 | ||||||||||
Umicore | 4,213 | 265 | ||||||||||
|
| |||||||||||
| 2,566 | ||||||||||||
|
| |||||||||||
Canada — 0.4% | ||||||||||||
Alimentation Couche-Tard, Cl B | 5,390 | 261 | ||||||||||
Atco, Cl I | 9,853 | 350 | ||||||||||
Bank of Montreal | 518 | 34 | ||||||||||
Bank of Nova Scotia, Cl C | 1,590 | 84 | ||||||||||
BCE | 8,954 | 413 | ||||||||||
BlackBerry * | 20,413 | 163 | ||||||||||
Bombardier, Cl B * | 74,372 | 102 | ||||||||||
CAE | 9,180 | 130 | ||||||||||
Canadian National Railway | 2,192 | 143 | ||||||||||
Canadian Natural Resources | 4,257 | 136 | ||||||||||
Canadian Pacific Railway | 641 | 98 | ||||||||||
Canadian Tire, Cl A | 1,352 | 135 | ||||||||||
Canadian Utilities, Cl A | 11,446 | 322 | ||||||||||
CGI Group, Cl A * | 6,993 | 333 | ||||||||||
| 208 | SEI Institutional Managed Trust / Annual Report / September 30, 2016 |
| Description | Shares | Market Value ($ Thousands) | ||||||||||
FOREIGN COMMON STOCK (continued) |
| |||||||||||
CI Financial | 3,354 | $ | 64 | |||||||||
Constellation Software | 636 | 286 | ||||||||||
Crescent Point Energy, Cl F | 4,916 | 65 | ||||||||||
Dollarama | 3,044 | 237 | ||||||||||
Empire, Cl A | 8,607 | 128 | ||||||||||
Enbridge | 913 | 40 | ||||||||||
Encana | 8,974 | 94 | ||||||||||
Fairfax Financial Holdings | 200 | 117 | ||||||||||
First Capital Realty | 4,150 | 69 | ||||||||||
First Quantum Minerals (Canada) | 2,143 | 18 | ||||||||||
Fortis | 11,351 | 364 | ||||||||||
Franco-Nevada | 1,000 | 70 | ||||||||||
George Weston | 2,265 | 189 | ||||||||||
Gildan Activewear | 4,096 | 114 | ||||||||||
H&R ‡ | 4,787 | 82 | ||||||||||
Husky Energy | 5,232 | 64 | ||||||||||
Imperial Oil | 2,707 | 84 | ||||||||||
Intact Financial | 1,580 | 114 | ||||||||||
Jean Coutu Group PJC, Cl A | 11,072 | 169 | ||||||||||
Loblaw | 4,092 | 210 | ||||||||||
Magna International, Cl A | 2,438 | 105 | ||||||||||
Methanex | 1,070 | 38 | ||||||||||
Metro, Cl A | 7,776 | 255 | ||||||||||
National Bank of Canada | 870 | 31 | ||||||||||
Open Text | 4,874 | 315 | ||||||||||
Potash Corp of Saskatchewan | 2,157 | 35 | ||||||||||
PrairieSky Royalty | 2,615 | 53 | ||||||||||
Restaurant Brands International | 2,608 | 116 | ||||||||||
RioCan ‡ | 3,430 | 71 | ||||||||||
Rogers Communications, Cl B | 8,565 | 363 | ||||||||||
Royal Bank of Canada | 1,066 | 66 | ||||||||||
Saputo | 5,318 | 185 | ||||||||||
Shaw Communications, Cl B | 7,879 | 161 | ||||||||||
Silver Wheaton | 3,032 | 82 | ||||||||||
SNC-Lavalin Group | 1,669 | 65 | ||||||||||
Suncor Energy | 1,464 | 40 | ||||||||||
Teck Resources, Cl B | 2,423 | 43 | ||||||||||
TELUS | 9,642 | 317 | ||||||||||
Thomson Reuters, Cl B | 4,373 | 181 | ||||||||||
Toronto-Dominion Bank | 1,857 | 82 | ||||||||||
TransCanada | 2,000 | 95 | ||||||||||
Turquoise Hill Resources * | 6,748 | 20 | ||||||||||
Valeant Pharmaceuticals International * | 10,021 | 245 | ||||||||||
Vermilion Energy | 2,483 | 96 | ||||||||||
|
| |||||||||||
| 8,342 | ||||||||||||
|
| |||||||||||
Chile — 0.0% | ||||||||||||
Antofagasta | 8,667 | 59 | ||||||||||
|
| |||||||||||
China — 0.0% | ||||||||||||
Sands China | 18,800 | 82 | ||||||||||
Yangzijiang Shipbuilding Holdings | 175,548 | 96 | ||||||||||
|
| |||||||||||
| 178 | ||||||||||||
|
| |||||||||||
| Description | Shares | Market Value ($ Thousands) | ||||||||||
FOREIGN COMMON STOCK (continued) |
| |||||||||||
Denmark — 0.2% | ||||||||||||
AP Moeller - Maersk, Cl A | 102 | $ | 143 | |||||||||
AP Moeller - Maersk, Cl B | 99 | 145 | ||||||||||
Carlsberg, Cl B | 3,116 | 297 | ||||||||||
Chr Hansen Holding | 4,349 | 259 | ||||||||||
Coloplast, Cl B | 4,159 | 323 | ||||||||||
Danske Bank | 6,879 | 201 | ||||||||||
Genmab * | 996 | 170 | ||||||||||
Novo Nordisk, Cl B | 5,821 | 242 | ||||||||||
Novozymes, Cl B | 7,255 | 319 | ||||||||||
Pandora | 1,416 | 171 | ||||||||||
TDC | 68,288 | 402 | ||||||||||
Tryg | 10,215 | 205 | ||||||||||
Vestas Wind Systems | 1,356 | 112 | ||||||||||
William Demant Holding * | 18,776 | 383 | ||||||||||
|
| |||||||||||
| 3,372 | ||||||||||||
|
| |||||||||||
Finland — 0.1% | ||||||||||||
Elisa | 10,422 | 384 | ||||||||||
Fortum | 21,754 | 352 | ||||||||||
Kone, Cl B | 2,993 | 152 | ||||||||||
Metso | 2,878 | 84 | ||||||||||
Neste | 13,857 | 591 | ||||||||||
Nokia | 58,083 | 337 | ||||||||||
Nokian Renkaat | 5,363 | 196 | ||||||||||
Orion, Cl B | 11,412 | 450 | ||||||||||
Sampo, Cl A | 3,627 | 161 | ||||||||||
Stora Enso, Cl R | 16,819 | 150 | ||||||||||
UPM-Kymmene, Cl V | 9,046 | 191 | ||||||||||
Wartsila Abp | 2,318 | 104 | ||||||||||
|
| |||||||||||
| 3,152 | ||||||||||||
|
| |||||||||||
France — 0.3% | ||||||||||||
Accor | 875 | 35 | ||||||||||
Aeroports de Paris, Cl A | 373 | 37 | ||||||||||
Air Liquide | 1,030 | 110 | ||||||||||
Arkema | 1,313 | 122 | ||||||||||
Atos | 2,646 | 285 | ||||||||||
AXA | 1,932 | 41 | ||||||||||
Bouygues | 892 | 29 | ||||||||||
Bureau Veritas | 900 | 19 | ||||||||||
Capgemini | 2,596 | 254 | ||||||||||
Carrefour | 1,443 | 37 | ||||||||||
Christian Dior, Cl B | 506 | 91 | ||||||||||
CNP Assurances | 1,903 | 32 | ||||||||||
Credit Agricole | 5,388 | 53 | ||||||||||
Danone | 1,646 | 122 | ||||||||||
Dassault Systemes | 3,513 | 305 | ||||||||||
Electricite de France | 11,810 | 144 | ||||||||||
Engie | 8,471 | 131 | ||||||||||
Essilor International | 3,685 | 475 | ||||||||||
Eutelsat Communications | 1,501 | 31 | ||||||||||
Fonciere Des Regions ‡ | 434 | 41 | ||||||||||
Gecina ‡ | 699 | 110 | ||||||||||
| SEI Institutional Managed Trust / Annual Report / September 30, 2016 | 209 |
CONSOLIDATED SCHEDULE OF INVESTMENTS
September 30, 2016
Multi-Asset Accumulation Fund (Continued)
| Description | Shares | Market Value ($ Thousands) | ||||||||||
FOREIGN COMMON STOCK (continued) |
| |||||||||||
Groupe Eurotunnel | 4,624 | $ | 50 | |||||||||
Hermes International | 26 | 11 | ||||||||||
ICADE ‡ | 512 | 40 | ||||||||||
Iliad | 1,128 | 237 | ||||||||||
Ingenico Group | 1,988 | 174 | ||||||||||
JCDecaux | 1,173 | 38 | ||||||||||
Kering | 389 | 78 | ||||||||||
Klepierre ‡ | 1,965 | 90 | ||||||||||
L’Oreal | 607 | 115 | ||||||||||
LVMH Moet Hennessy Louis Vuitton | 241 | 41 | ||||||||||
Natixis | 5,679 | 26 | ||||||||||
Orange | 12,973 | 203 | ||||||||||
Pernod Ricard | 1,010 | 120 | ||||||||||
Remy Cointreau | 1,323 | 113 | ||||||||||
Renault | 450 | 37 | ||||||||||
Rexel | 3,641 | 56 | ||||||||||
Sanofi | 4,184 | 318 | ||||||||||
Schneider Electric | 577 | 40 | ||||||||||
SCOR | 1,457 | 45 | ||||||||||
SES, Cl A | 1,713 | 42 | ||||||||||
SFR Group | 6,317 | 186 | ||||||||||
Societe BIC | 289 | 43 | ||||||||||
Societe Generale | 2,531 | 88 | ||||||||||
STMicroelectronics | 30,387 | 248 | ||||||||||
Suez | 13,641 | 225 | ||||||||||
Technip | 5,328 | 327 | ||||||||||
Thales, Cl A | 1,344 | 124 | ||||||||||
TOTAL | 5,406 | 256 | ||||||||||
Valeo | 527 | 31 | ||||||||||
Veolia Environnement | 8,189 | 189 | ||||||||||
Vinci | 822 | 63 | ||||||||||
Vivendi | 5,328 | 108 | ||||||||||
Wendel | 681 | 80 | ||||||||||
|
| |||||||||||
| 6,346 | ||||||||||||
|
| |||||||||||
Germany — 0.3% | ||||||||||||
adidas | 861 | 150 | ||||||||||
Allianz | 347 | 52 | ||||||||||
BASF | 1,028 | 88 | ||||||||||
Bayer | 1,449 | 145 | ||||||||||
Beiersdorf | 1,696 | 160 | ||||||||||
Brenntag | 527 | 29 | ||||||||||
Commerzbank | 5,497 | 35 | ||||||||||
Continental | 286 | 60 | ||||||||||
Covestro (C) | 1,507 | 89 | ||||||||||
Deutsche Bank | 2,043 | 26 | ||||||||||
Deutsche Boerse * | 283 | 23 | ||||||||||
Deutsche Lufthansa | 5,273 | 59 | ||||||||||
Deutsche Post | 2,302 | 72 | ||||||||||
Deutsche Telekom | 20,670 | 347 | ||||||||||
Deutsche Wohnen | 1,750 | 64 | ||||||||||
E.ON | 26,305 | 187 | ||||||||||
Fraport Frankfurt Airport Services Worldwide | 1,521 | 83 | ||||||||||
| Description | Shares | Market Value ($ Thousands) | ||||||||||
FOREIGN COMMON STOCK (continued) |
| |||||||||||
Fresenius | 4,273 | $ | 341 | |||||||||
Fresenius Medical Care | 3,975 | 347 | ||||||||||
GEA Group | 1,568 | 87 | ||||||||||
Hannover Rueck | 619 | 66 | ||||||||||
HeidelbergCement | 879 | 83 | ||||||||||
Henkel & KGaA | 1,543 | 180 | ||||||||||
HUGO BOSS | 2,069 | 114 | ||||||||||
Infineon Technologies | 20,066 | 358 | ||||||||||
K+S | 2,963 | 56 | ||||||||||
LANXESS | 1,587 | 99 | ||||||||||
Linde | 488 | 83 | ||||||||||
MAN | 398 | 42 | ||||||||||
Merck KGaA | 2,187 | 236 | ||||||||||
Metro | 4,277 | 127 | ||||||||||
Muenchener Rueckversicherungs-Gesellschaft in Muenchen | 274 | 51 | ||||||||||
OSRAM Licht | 1,575 | 92 | ||||||||||
QIAGEN * | 7,992 | 220 | ||||||||||
RWE | 17,258 | 297 | ||||||||||
SAP | 4,196 | 382 | ||||||||||
Siemens | 850 | 100 | ||||||||||
Symrise | 2,361 | 173 | ||||||||||
Telefonica Deutschland Holding | 49,505 | 199 | ||||||||||
thyssenkrupp | 3,604 | 86 | ||||||||||
TUI | 3,217 | 46 | ||||||||||
Uniper * | 2,630 | 32 | ||||||||||
United Internet | 6,170 | 273 | ||||||||||
Volkswagen | 135 | 20 | ||||||||||
|
| |||||||||||
| 5,859 | ||||||||||||
|
| |||||||||||
Hong Kong — 0.2% | ||||||||||||
AIA Group | 13,800 | 92 | ||||||||||
ASM Pacific Technology | 63,400 | 522 | ||||||||||
BOC Hong Kong Holdings | 15,500 | 52 | ||||||||||
Cathay Pacific Airways | 77,000 | 107 | ||||||||||
Cheung Kong Infrastructure Holdings | 43,438 | 373 | ||||||||||
Cheung Kong Property Holdings | 5,708 | 42 | ||||||||||
CK Hutchison Holdings | 8,208 | 105 | ||||||||||
CLP Holdings, Cl B | 58,000 | 599 | ||||||||||
Galaxy Entertainment Group | 6,000 | 22 | ||||||||||
HK Electric Investments & HK Electric Investments (C) | 290,500 | 285 | ||||||||||
HKT Trust and HKT | 283,920 | 400 | ||||||||||
Hong Kong & China Gas | 200,158 | 378 | ||||||||||
Kerry Properties | 13,000 | 42 | ||||||||||
Li & Fung | 154,000 | 79 | ||||||||||
Link ‡ | 13,500 | 99 | ||||||||||
MGM China Holdings | 30,000 | 52 | ||||||||||
MTR | 39,500 | 218 | ||||||||||
NWS Holdings | 90,000 | 150 | ||||||||||
PCCW | 686,000 | 421 | ||||||||||
Power Assets Holdings | 44,602 | 435 | ||||||||||
Shangri-La Asia | 82,000 | 90 | ||||||||||
| 210 | SEI Institutional Managed Trust / Annual Report / September 30, 2016 |
| Description | Shares | Market Value ($ Thousands) | ||||||||||
FOREIGN COMMON STOCK (continued) |
| |||||||||||
SJM Holdings | 52,000 | $ | 38 | |||||||||
Swire Pacific, Cl A | 4,000 | 43 | ||||||||||
Swire Properties | 18,400 | 54 | ||||||||||
Techtronic Industries | 31,500 | 123 | ||||||||||
WH Group (C) | 469,000 | 377 | ||||||||||
Wynn Macau | 27,600 | 46 | ||||||||||
Yue Yuen Industrial Holdings | 30,500 | 126 | ||||||||||
|
| |||||||||||
| 5,370 | ||||||||||||
|
| |||||||||||
Ireland — 0.1% | ||||||||||||
Accenture, Cl A | 1,413 | 173 | ||||||||||
Bank of Ireland * | 430,737 | 90 | ||||||||||
CRH | 8,888 | 297 | ||||||||||
Eaton | 2,114 | 139 | ||||||||||
Kerry Group, Cl A | 4,069 | 339 | ||||||||||
Paddy Power Betfair | 3,752 | 424 | ||||||||||
Ryanair Holdings ADR | 4,036 | 303 | ||||||||||
|
| |||||||||||
| 1,765 | ||||||||||||
|
| |||||||||||
Israel — 0.1% | ||||||||||||
Azrieli Group | 2,954 | 130 | ||||||||||
Bank Hapoalim | 29,177 | 165 | ||||||||||
Bank Leumi Le-Israel * | 39,720 | 151 | ||||||||||
Bezeq The Israeli Telecommunication | 203,497 | 383 | ||||||||||
Check Point Software Technologies * | 3,321 | 258 | ||||||||||
Israel Chemicals | 66,305 | 258 | ||||||||||
Mizrahi Tefahot Bank | 12,761 | 162 | ||||||||||
NICE-Systems | 6,857 | 458 | ||||||||||
Teva Pharmaceutical Industries | 8,087 | 388 | ||||||||||
|
| |||||||||||
| 2,353 | ||||||||||||
|
| |||||||||||
Italy — 0.1% | ||||||||||||
Assicurazioni Generali | 2,134 | 26 | ||||||||||
Atlantia | 3,095 | 79 | ||||||||||
CNH Industrial | 12,849 | 92 | ||||||||||
Enel | 67,914 | 303 | ||||||||||
Eni | 16,512 | 238 | ||||||||||
EXOR | 1,900 | 77 | ||||||||||
Ferrari | 3,250 | 169 | ||||||||||
Fiat Chrysler Automobiles | 18,029 | 114 | ||||||||||
Leonardo-Finmeccanica * | 10,324 | 117 | ||||||||||
Luxottica Group | 2,908 | 139 | ||||||||||
Mediobanca | 8,384 | 55 | ||||||||||
Prysmian | 5,661 | 148 | ||||||||||
Saipem | 451,982 | 191 | ||||||||||
Snam Rete Gas | 39,115 | 217 | ||||||||||
Telecom Italia | 511,570 | 380 | ||||||||||
Tenaris | 15,473 | 221 | ||||||||||
Terna Rete Elettrica Nazionale | 44,057 | 227 | ||||||||||
UnipolSai | 31,346 | 51 | ||||||||||
|
| |||||||||||
| 2,844 | ||||||||||||
|
| |||||||||||
Japan — 0.7% | ||||||||||||
Aeon, Cl H | 5,800 | 85 | ||||||||||
AEON Financial Service | 4,700 | 81 | ||||||||||
| Description | Shares | Market Value ($ Thousands) | ||||||||||
FOREIGN COMMON STOCK (continued) |
| |||||||||||
Air Water | 5,000 | $ | 94 | |||||||||
Aisin Seiki | 800 | 36 | ||||||||||
Ajinomoto | 7,000 | 155 | ||||||||||
Alfresa Holdings | 6,800 | 143 | ||||||||||
ANA Holdings | 20,000 | 54 | ||||||||||
Aozora Bank | 31,000 | 106 | ||||||||||
Asahi Group Holdings | 2,800 | 101 | ||||||||||
Asahi Kasei | 9,000 | 71 | ||||||||||
Astellas Pharma | 8,000 | 124 | ||||||||||
Bank of Kyoto | 12,000 | 87 | ||||||||||
Benesse, Cl A | 2,700 | 69 | ||||||||||
Bridgestone | 2,000 | 73 | ||||||||||
Calbee | 2,000 | 75 | ||||||||||
Canon | 2,600 | 75 | ||||||||||
Central Japan Railway | 400 | 68 | ||||||||||
Chiba Bank, Cl B | 21,000 | 118 | ||||||||||
Chubu Electric Power | 11,300 | 164 | ||||||||||
Chugai Pharmaceutical | 2,500 | 90 | ||||||||||
Chugoku Bank | 7,600 | 92 | ||||||||||
Chugoku Electric Power | 12,200 | 153 | ||||||||||
Concordia Financial Group | 24,000 | 104 | ||||||||||
Credit Saison | 5,700 | 94 | ||||||||||
Daicel | 3,800 | 48 | ||||||||||
Daito Trust Construction | 500 | 80 | ||||||||||
Daiwa House Industry | 3,000 | 82 | ||||||||||
Daiwa Securities Group | 18,000 | 100 | ||||||||||
Dentsu | 1,000 | 50 | ||||||||||
Eisai | 2,000 | 124 | ||||||||||
Electric Power Development | 6,100 | 146 | ||||||||||
FamilyMart UNY Holdings, Cl H | 2,600 | 173 | ||||||||||
Fast Retailing | 100 | 32 | ||||||||||
Fuji Heavy Industries | 900 | 33 | ||||||||||
FUJIFILM Holdings | 2,200 | 81 | ||||||||||
Fukuoka Financial Group | 29,000 | 120 | ||||||||||
Hachijuni Bank | 23,000 | 119 | ||||||||||
Hankyu Hanshin Holdings | 1,400 | 48 | ||||||||||
Hino Motors | 3,600 | 38 | ||||||||||
Hirose Electric | 840 | 110 | ||||||||||
Hiroshima Bank | 31,000 | 127 | ||||||||||
Hisamitsu Pharmaceutical | 2,500 | 134 | ||||||||||
Hitachi Chemical | 3,039 | 69 | ||||||||||
Hitachi Metals | 5,000 | 61 | ||||||||||
Hokuriku Electric Power | 11,100 | 134 | ||||||||||
Idemitsu Kosan | 13,100 | 269 | ||||||||||
Inpex | 21,000 | 189 | ||||||||||
Iyo Bank | 13,500 | 81 | ||||||||||
J Front Retailing | 3,000 | 39 | ||||||||||
Japan Prime Realty Investment, Cl A ‡ | 24 | 109 | ||||||||||
Japan Real Estate Investment ‡ | 16 | 96 | ||||||||||
Japan Retail Fund Investment, Cl A ‡ | 32 | 79 | ||||||||||
JX Holdings | 56,400 | 227 | ||||||||||
Kajima | 7,000 | 49 | ||||||||||
| SEI Institutional Managed Trust / Annual Report / September 30, 2016 | 211 |
CONSOLIDATED SCHEDULE OF INVESTMENTS
September 30, 2016
Multi-Asset Accumulation Fund (Continued)
| Description | Shares | Market Value ($ Thousands) | ||||||||||
FOREIGN COMMON STOCK (continued) |
| |||||||||||
Kamigumi | 8,000 | $ | 69 | |||||||||
Kaneka | 12,000 | 94 | ||||||||||
Kansai Electric Power * | 10,800 | 98 | ||||||||||
Kansai Paint | 3,000 | 65 | ||||||||||
Kao | 1,800 | 101 | ||||||||||
KDDI | 10,900 | 335 | ||||||||||
Keikyu | 4,000 | 42 | ||||||||||
Keio | 3,000 | 26 | ||||||||||
Keyence | 200 | 145 | ||||||||||
Kikkoman | 4,000 | 127 | ||||||||||
Kintetsu Group Holdings | 15,000 | 63 | ||||||||||
Kirin Holdings | 6,100 | 101 | ||||||||||
Konami Holdings | 3,656 | 141 | ||||||||||
Kyocera | 900 | 43 | ||||||||||
Kyowa Hakko Kirin | 6,400 | 100 | ||||||||||
Kyushu Electric Power | 9,400 | 88 | ||||||||||
Lawson | 1,600 | 126 | ||||||||||
LIXIL Group | 3,000 | 64 | ||||||||||
M3 | 3,600 | 122 | ||||||||||
Marubeni | 15,700 | 80 | ||||||||||
Maruichi Steel Tube | 3,200 | 110 | ||||||||||
McDonald’s Holdings Japan | 1,623 | 48 | ||||||||||
Mebuki Financial Group | 33,930 | 120 | ||||||||||
Medipal Holdings | 6,500 | 112 | ||||||||||
MEIJI Holdings | 2,000 | 197 | ||||||||||
Miraca Holdings | 2,800 | 139 | ||||||||||
Mitsubishi Chemical Holdings, Cl B | 4,700 | 29 | ||||||||||
Mitsubishi Motors | 4,200 | 20 | ||||||||||
Mitsubishi Tanabe Pharma | 7,400 | 157 | ||||||||||
Mitsui Chemicals | 9,000 | 43 | ||||||||||
Mizuho Financial Group | 45,700 | 76 | ||||||||||
Murata Manufacturing | 500 | 64 | ||||||||||
NEC | 12,000 | 30 | ||||||||||
NGK Spark Plug | 2,600 | 45 | ||||||||||
NH Foods | 4,000 | 96 | ||||||||||
NHK Spring | 3,000 | 29 | ||||||||||
Nintendo | 500 | 131 | ||||||||||
Nippon Building Fund ‡ | 13 | 82 | ||||||||||
Nippon Express | 13,000 | 60 | ||||||||||
Nippon Prologis ‡ | 36 | 91 | ||||||||||
Nippon Steel & Sumitomo Metal | 2,855 | 58 | ||||||||||
Nippon Telegraph & Telephone | 9,600 | 437 | ||||||||||
Nisshin Seifun Group | 9,415 | 143 | ||||||||||
Nissin Food Products | 2,000 | 121 | ||||||||||
Nitori Holdings | 400 | 47 | ||||||||||
NOK | 1,500 | 33 | ||||||||||
Nomura Research Institute | 1,980 | 68 | ||||||||||
NTT Data | 2,000 | 99 | ||||||||||
NTT DOCOMO | 16,300 | 413 | ||||||||||
Odakyu Electric Railway | 1,500 | 33 | ||||||||||
Oji Holdings | 22,000 | 87 | ||||||||||
Ono Pharmaceutical | 2,400 | 67 | ||||||||||
| Description | Shares | Market Value ($ Thousands) | ||||||||||
FOREIGN COMMON STOCK (continued) |
| |||||||||||
Oracle Japan | 1,900 | $ | 107 | |||||||||
Osaka Gas | 78,000 | 325 | ||||||||||
Otsuka Holdings | 3,400 | 154 | ||||||||||
Resona Holdings | 27,900 | 116 | ||||||||||
Rohm | 800 | 42 | ||||||||||
Ryohin Keikaku | 200 | 40 | ||||||||||
Sankyo | 1,100 | 37 | ||||||||||
Santen Pharmaceutical | 7,500 | 110 | ||||||||||
Sekisui Chemical | 3,000 | 43 | ||||||||||
Seven & i Holdings | 2,100 | 99 | ||||||||||
Seven Bank | 30,200 | 96 | ||||||||||
Shikoku Electric Power | 9,400 | 92 | ||||||||||
Shimadzu | 6,000 | 91 | ||||||||||
Shimizu | 3,000 | 27 | ||||||||||
Shin-Etsu Chemical, Cl A | 1,100 | 76 | ||||||||||
Shiseido | 3,900 | 103 | ||||||||||
Shizuoka Bank | 12,000 | 95 | ||||||||||
Showa Shell Sekiyu | 29,300 | 270 | ||||||||||
SoftBank | 4,800 | 309 | ||||||||||
Sumitomo | 6,500 | 72 | ||||||||||
Sumitomo Metal Mining | 8,000 | 109 | ||||||||||
Sumitomo Rubber Industries | 100 | 2 | ||||||||||
Suntory Beverage & Food | 2,800 | 120 | ||||||||||
Suzuken | 2,760 | 90 | ||||||||||
Sysmex | 1,700 | 125 | ||||||||||
Taisei | 5,000 | 37 | ||||||||||
Taisho Pharmaceutical Holdings | 1,000 | 102 | ||||||||||
Takeda Pharmaceutical | 2,600 | 124 | ||||||||||
Teijin | 4,800 | 92 | ||||||||||
Terumo | 4,000 | 153 | ||||||||||
Tobu Railway | 17,000 | 86 | ||||||||||
Toho | 1,600 | 53 | ||||||||||
Toho Gas | 42,063 | 392 | ||||||||||
Tohoku Electric Power | 8,400 | 109 | ||||||||||
Tokyo Electric Power Holdings * | 4,200 | 18 | ||||||||||
Tokyo Gas | 62,000 | 274 | ||||||||||
Tokyu | 4,000 | 30 | ||||||||||
TonenGeneral Sekiyu | 32,000 | 322 | ||||||||||
Toray Industries | 10,000 | 97 | ||||||||||
TOTO | 1,000 | 37 | ||||||||||
Toyo Seikan Group Holdings | 1,900 | 33 | ||||||||||
Toyo Suisan Kaisha | 3,000 | 127 | ||||||||||
Toyota Industries | 1,900 | 87 | ||||||||||
Toyota Motor | 1,700 | 97 | ||||||||||
Unicharm | 4,900 | 126 | ||||||||||
United Urban Investment ‡ | 66 | 120 | ||||||||||
USS | 5,600 | 94 | ||||||||||
Yakult Honsha | 1,800 | 81 | ||||||||||
Yamaguchi Financial Group | 9,000 | 96 | ||||||||||
Yamato Holdings | 1,400 | 32 | ||||||||||
Yamazaki Baking | 5,000 | 122 | ||||||||||
|
| |||||||||||
| 16,365 | ||||||||||||
|
| |||||||||||
| 212 | SEI Institutional Managed Trust / Annual Report / September 30, 2016 |
| Description | Shares | Market Value ($ Thousands) | ||||||||||
FOREIGN COMMON STOCK (continued) |
| |||||||||||
Luxembourg — 0.0% | ||||||||||||
RTL Group | 682 | $ | 57 | |||||||||
|
| |||||||||||
Netherlands — 0.2% | ||||||||||||
Aegon | 27,244 | 105 | ||||||||||
Akzo Nobel | 2,588 | 176 | ||||||||||
Altice * | 7,879 | 141 | ||||||||||
Altice, Cl B * | 11,055 | 199 | ||||||||||
ArcelorMittal | 29,025 | 178 | ||||||||||
ASML Holding | 3,148 | 346 | ||||||||||
Coca-Cola European Partners | 2,967 | 118 | ||||||||||
Gemalto | 4,556 | 292 | ||||||||||
Heineken | 1,925 | 170 | ||||||||||
ING Groep | 10,046 | 124 | ||||||||||
Koninklijke Ahold Delhaize | 20,056 | 457 | ||||||||||
Koninklijke Boskalis Westminster | 1,861 | 66 | ||||||||||
Koninklijke DSM | 3,445 | 233 | ||||||||||
Koninklijke Philips | 3,383 | 100 | ||||||||||
Koninklijke Vopak | 10,682 | 561 | ||||||||||
LyondellBasell Industries, Cl A | 3,347 | 270 | ||||||||||
NN Group | 3,780 | 116 | ||||||||||
NXP Semiconductors * | 2,141 | 218 | ||||||||||
OCI * | 4,290 | 63 | ||||||||||
Randstad Holding | 1,641 | 75 | ||||||||||
RELX | 10,973 | 197 | ||||||||||
Royal KPN | 91,067 | 302 | ||||||||||
Unibail-Rodamco ‡ | 139 | 38 | ||||||||||
Unilever | 3,312 | 153 | ||||||||||
Wolters Kluwer | 4,597 | 197 | ||||||||||
|
| |||||||||||
| 4,895 | ||||||||||||
|
| |||||||||||
New Zealand — 0.1% | ||||||||||||
Auckland International Airport | 70,442 | 377 | ||||||||||
Contact Energy | 79,201 | 290 | ||||||||||
Fletcher Building | 46,704 | 364 | ||||||||||
Mercury NZ | 112,969 | 250 | ||||||||||
Meridian Energy | 170,649 | 323 | ||||||||||
Ryman Healthcare | 45,110 | 316 | ||||||||||
Spark New Zealand | 147,825 | 388 | ||||||||||
|
| |||||||||||
| 2,308 | ||||||||||||
|
| |||||||||||
Norway — 0.1% | ||||||||||||
DNB, Cl A | 9,226 | 121 | ||||||||||
Gjensidige Forsikring | 10,608 | 198 | ||||||||||
Marine Harvest | 9,931 | 178 | ||||||||||
Norsk Hydro | 51,688 | 223 | ||||||||||
Orkla | 30,555 | 316 | ||||||||||
Schibsted, Cl B | 4,860 | 130 | ||||||||||
Statoil | 26,354 | 441 | ||||||||||
Telenor | 17,631 | 302 | ||||||||||
Yara International | 3,178 | 106 | ||||||||||
|
| |||||||||||
| 2,015 | ||||||||||||
|
| |||||||||||
| Description | Shares | Market Value ($ Thousands) | ||||||||||
FOREIGN COMMON STOCK (continued) |
| |||||||||||
Panama — 0.0% | ||||||||||||
Carnival | 2,195 | $ | 107 | |||||||||
|
| |||||||||||
Portugal — 0.0% | ||||||||||||
Banco Espirito Santo * | 50,830 | – | ||||||||||
EDP - Energias de Portugal | 85,324 | 287 | ||||||||||
Galp Energia SGPS | 20,070 | 274 | ||||||||||
Jeronimo Martins | 16,644 | 289 | ||||||||||
|
| |||||||||||
| 850 | ||||||||||||
|
| |||||||||||
Singapore — 0.1% | ||||||||||||
CapitaLand | 33,800 | 79 | ||||||||||
CapitaLand Commercial Trust ‡ | 53,667 | 63 | ||||||||||
DBS Group Holdings | 7,800 | 88 | ||||||||||
Genting Singapore | 238,600 | 131 | ||||||||||
Global Logistic Properties | 42,000 | 58 | ||||||||||
Golden Agri-Resources | 928,100 | 241 | ||||||||||
Hutchison Port Holdings, Cl U | 150,126 | 67 | ||||||||||
Jardine Cycle & Carriage | 6,200 | 195 | ||||||||||
Keppel | 16,600 | 66 | ||||||||||
Noble Group | 170,100 | 19 | ||||||||||
Oversea-Chinese Banking | 12,800 | 81 | ||||||||||
Sembcorp Industries | 31,300 | 59 | ||||||||||
Sembcorp Marine | 42,000 | 40 | ||||||||||
Singapore Airlines | 21,300 | 164 | ||||||||||
Singapore Exchange | 22,900 | 125 | ||||||||||
Singapore Press Holdings | 97,800 | 273 | ||||||||||
Singapore Technologies Engineering | 25,400 | 60 | ||||||||||
Singapore Telecommunications | 116,700 | 340 | ||||||||||
StarHub | 141,300 | 356 | ||||||||||
United Overseas Bank | 5,300 | 73 | ||||||||||
UOL Group | 7,072 | 29 | ||||||||||
Wilmar International | 89,200 | 211 | ||||||||||
|
| |||||||||||
| 2,818 | ||||||||||||
|
| |||||||||||
Spain — 0.2% | ||||||||||||
Abertis Infraestructuras | 5,513 | 86 | ||||||||||
ACS Actividades de Construccion y Servicios | 2,833 | 86 | ||||||||||
Aena (C) | 765 | 113 | ||||||||||
Amadeus IT Group, Cl A | 11,484 | 574 | ||||||||||
Banco Bilbao Vizcaya Argentaria | 10,923 | 66 | ||||||||||
Banco Santander | 24,737 | 110 | ||||||||||
Bankia | 80,911 | 66 | ||||||||||
CaixaBank | 30,255 | 76 | ||||||||||
Distribuidora Internacional de Alimentacion | 38,251 | 237 | ||||||||||
Enagas | 5,493 | 165 | ||||||||||
Endesa | 4,836 | 104 | ||||||||||
Ferrovial | 4,529 | 96 | ||||||||||
Gas Natural SDG | 6,561 | 135 | ||||||||||
Grifols | 14,620 | 315 | ||||||||||
Iberdrola | 26,058 | 177 | ||||||||||
Industria de Diseno Textil | 9,200 | 341 | ||||||||||
International Consolidated Airlines Group | 7,033 | 36 | ||||||||||
Red Electrica | 8,320 | 180 | ||||||||||
| SEI Institutional Managed Trust / Annual Report / September 30, 2016 | 213 |
CONSOLIDATED SCHEDULE OF INVESTMENTS
September 30, 2016
Multi-Asset Accumulation Fund (Continued)
| Description | Shares | Market Value ($ Thousands) | ||||||||||
FOREIGN COMMON STOCK (continued) |
| |||||||||||
Repsol, Cl A | 25,262 | $ | 343 | |||||||||
Telefonica | 18,046 | 183 | ||||||||||
Zardoya Otis | 7,495 | 72 | ||||||||||
|
| |||||||||||
| 3,561 | ||||||||||||
|
| |||||||||||
Sweden — 0.2% | ||||||||||||
Alfa Laval | 3,670 | 57 | ||||||||||
Atlas Copco, Cl A | 1,818 | 55 | ||||||||||
Atlas Copco, Cl B | 1,891 | 52 | ||||||||||
Boliden | 12,111 | 285 | ||||||||||
Electrolux | 4,260 | 107 | ||||||||||
Getinge, Cl B | 16,980 | 330 | ||||||||||
Hennes & Mauritz, Cl B | 4,059 | 115 | ||||||||||
Hexagon, Cl B | 8,618 | 377 | ||||||||||
Husqvarna, Cl B | 17,924 | 156 | ||||||||||
ICA Gruppen | 6,378 | 211 | ||||||||||
Industrivarden, Cl C | 4,865 | 90 | ||||||||||
Kinnevik | 1,565 | 40 | ||||||||||
Lundin Petroleum * | 24,445 | 448 | ||||||||||
Millicom International Cellular | 2,887 | 150 | ||||||||||
Nordea Bank | 6,982 | 69 | ||||||||||
Skandinaviska Enskilda Banken, Cl A | 7,936 | 80 | ||||||||||
SKF, Cl B | 8,542 | 147 | ||||||||||
Svenska Cellulosa SCA, Cl B | 6,221 | 185 | ||||||||||
Svenska Handelsbanken, Cl A | 2,082 | 29 | ||||||||||
Swedbank, Cl A | 2,347 | 55 | ||||||||||
Swedish Match | 5,303 | 195 | ||||||||||
Tele2, Cl B | 24,845 | 215 | ||||||||||
Telefonaktiebolaget LM Ericsson, Cl B | 53,405 | 386 | ||||||||||
Telia | 44,427 | 199 | ||||||||||
Volvo, Cl B | 6,277 | 72 | ||||||||||
|
| |||||||||||
| 4,105 | ||||||||||||
|
| |||||||||||
Switzerland — 0.2% | ||||||||||||
ABB | 4,545 | 102 | ||||||||||
Actelion | 1,191 | 207 | ||||||||||
Adecco Group | 1,187 | 67 | ||||||||||
Aryzta | 3,114 | 139 | ||||||||||
Baloise Holding | 496 | 60 | ||||||||||
Barry Callebaut | 121 | 161 | ||||||||||
Chocoladefabriken Lindt & Spruengli | 31 | 305 | ||||||||||
Cie Financiere Richemont | 1,741 | 106 | ||||||||||
Coca-Cola HBC | 3,429 | 80 | ||||||||||
Dufry * | 1,505 | 189 | ||||||||||
EMS-Chemie Holding | 353 | 190 | ||||||||||
Galenica | 161 | 171 | ||||||||||
Geberit | 215 | 94 | ||||||||||
Givaudan | 89 | 181 | ||||||||||
Kuehne & Nagel International | 661 | 96 | ||||||||||
LafargeHolcim | 843 | 46 | ||||||||||
Lonza Group | 1,178 | 226 | ||||||||||
Nestle | 1,850 | 146 | ||||||||||
Novartis | 2,503 | 197 | ||||||||||
Partners Group Holding | 322 | 163 | ||||||||||
| Description | Shares | Market Value ($ Thousands) | ||||||||||
FOREIGN COMMON STOCK (continued) |
| |||||||||||
Roche Holding | 773 | $ | 192 | |||||||||
Schindler Holding | 1,164 | 220 | ||||||||||
SGS, Cl B | 41 | 92 | ||||||||||
Sika | 37 | 180 | ||||||||||
Sonova Holding | 1,666 | 236 | ||||||||||
Swatch Group, Cl B | 331 | 94 | ||||||||||
Swatch Group | 1,778 | 99 | ||||||||||
Swiss Life Holding | 254 | 66 | ||||||||||
Swisscom | 1,049 | 500 | ||||||||||
Syngenta * | 280 | 123 | ||||||||||
TE Connectivity | 2,040 | 131 | ||||||||||
Transocean | 13,803 | 147 | ||||||||||
|
| |||||||||||
| 5,006 | ||||||||||||
|
| |||||||||||
United Kingdom — 0.4% | ||||||||||||
Aberdeen Asset Management | 4,451 | 19 | ||||||||||
Admiral Group | 3,076 | 82 | ||||||||||
Anglo American | 12,831 | 161 | ||||||||||
Associated British Foods | 2,191 | 74 | ||||||||||
AstraZeneca | 3,801 | 247 | ||||||||||
Auto Trader Group (C) | 48,359 | 255 | ||||||||||
Aviva | 4,112 | 24 | ||||||||||
Barratt Developments | 14,410 | 93 | ||||||||||
BHP Billiton | 4,135 | 62 | ||||||||||
BP | 50,616 | 296 | ||||||||||
British American Tobacco | 1,681 | 107 | ||||||||||
BT Group, Cl A | 59,549 | 301 | ||||||||||
Bunzl | 3,000 | 89 | ||||||||||
Burberry Group | 1,376 | 25 | ||||||||||
Capita | 2,265 | 20 | ||||||||||
Centrica | 91,279 | 271 | ||||||||||
Cobham | 76,406 | 166 | ||||||||||
Compass Group | 5,292 | 103 | ||||||||||
Croda International | 2,513 | 114 | ||||||||||
Delphi Automotive | 1,026 | 73 | ||||||||||
Diageo | 2,888 | 83 | ||||||||||
Dixons Carphone | 10,596 | 51 | ||||||||||
easyJet | 3,512 | 46 | ||||||||||
Experian | 2,610 | 52 | ||||||||||
G4S | 16,567 | 49 | ||||||||||
GlaxoSmithKline | 14,130 | 302 | ||||||||||
Glencore | 35,516 | 98 | ||||||||||
IMI | 1,574 | 22 | ||||||||||
Imperial Brands | 2,202 | 114 | ||||||||||
Inmarsat | 34,123 | 312 | ||||||||||
InterContinental Hotels Group | 1,274 | 52 | ||||||||||
Intertek Group | 544 | 25 | ||||||||||
ITV | 11,950 | 29 | ||||||||||
J Sainsbury | 21,670 | 69 | ||||||||||
Johnson Matthey | 1,866 | 80 | ||||||||||
Marks & Spencer Group | 10,789 | 46 | ||||||||||
Mediclinic International | 9,495 | 114 | ||||||||||
National Grid | 20,542 | 291 | ||||||||||
| 214 | SEI Institutional Managed Trust / Annual Report / September 30, 2016 |
| Description | Shares | Market Value ($ Thousands) | ||||||||||
FOREIGN COMMON STOCK (continued) |
| |||||||||||
Next, Cl A | 560 | $ | 35 | |||||||||
Pearson | 7,800 | 76 | ||||||||||
Petrofac | 15,865 | 184 | ||||||||||
Reckitt Benckiser Group | 1,075 | 101 | ||||||||||
RELX | 3,034 | 58 | ||||||||||
Rio Tinto | 1,309 | 44 | ||||||||||
Royal Dutch Shell, Cl A | 9,648 | 240 | ||||||||||
Royal Dutch Shell, Cl B | 9,779 | 253 | ||||||||||
Royal Mail | 6,924 | 44 | ||||||||||
RSA Insurance Group | 7,664 | 54 | ||||||||||
SABMiller | 1,731 | 101 | ||||||||||
Sage Group | 34,684 | 333 | ||||||||||
Severn Trent | 8,989 | 292 | ||||||||||
Shire | 3,125 | 203 | ||||||||||
Sky | 5,534 | 64 | ||||||||||
Smith & Nephew | 15,129 | 244 | ||||||||||
Smiths Group | 4,570 | 87 | ||||||||||
SSE | 11,470 | 234 | ||||||||||
Tate & Lyle | 7,790 | 76 | ||||||||||
Travis Perkins | 3,353 | 67 | ||||||||||
Unilever | 2,107 | 100 | ||||||||||
United Utilities Group, Cl B | 17,772 | 232 | ||||||||||
Vodafone Group | 121,674 | 350 | ||||||||||
Whitbread | 1,095 | 56 | ||||||||||
Wm Morrison Supermarkets | 34,659 | 98 | ||||||||||
Worldpay Group (C) | 57,601 | 222 | ||||||||||
WPP | 2,771 | 65 | ||||||||||
|
| |||||||||||
| 8,330 | ||||||||||||
|
| |||||||||||
Total Foreign Common Stock | 100,751 | |||||||||||
|
| |||||||||||
COMMON STOCK — 3.9% |
| |||||||||||
Consumer Discretionary — 0.4% | ||||||||||||
Advance Auto Parts | 730 | 109 | ||||||||||
Amazon.com, Cl A * | 164 | 137 | ||||||||||
Autonation * | 1,850 | 90 | ||||||||||
Autozone * | 115 | 88 | ||||||||||
Bed Bath & Beyond | 2,455 | 106 | ||||||||||
Best Buy | 2,195 | 84 | ||||||||||
BorgWarner | 3,275 | 115 | ||||||||||
CarMax * | 1,714 | 91 | ||||||||||
CBS, Cl B | 891 | 49 | ||||||||||
Chipotle Mexican Grill, Cl A * | 282 | 119 | ||||||||||
Coach | 5,184 | 190 | ||||||||||
Comcast, Cl A | 1,221 | 81 | ||||||||||
Darden Restaurants | 2,025 | 124 | ||||||||||
Discovery Communications, Cl A * | 1,971 | 53 | ||||||||||
Discovery Communications, Cl C * | 3,273 | 86 | ||||||||||
Dollar General | 1,154 | 81 | ||||||||||
Dollar Tree * | 1,039 | 82 | ||||||||||
DR Horton | 2,237 | 68 | ||||||||||
| Description | Shares | Market Value ($ Thousands) | ||||||||||
COMMON STOCK (continued) |
| |||||||||||
Expedia | 1,058 | $ | 123 | |||||||||
Foot Locker, Cl A | 2,052 | 139 | ||||||||||
Ford Motor | 8,016 | 97 | ||||||||||
Gap | 3,519 | 78 | ||||||||||
Garmin | 1,579 | 76 | ||||||||||
General Motors | 2,216 | 70 | ||||||||||
Genuine Parts | 684 | 69 | ||||||||||
Goodyear Tire & Rubber | 1,985 | 64 | ||||||||||
H&R Block | 4,738 | 110 | ||||||||||
Hanesbrands | 3,911 | 99 | ||||||||||
Harley-Davidson, Cl A | 2,718 | 143 | ||||||||||
Harman International Industries, Cl A | 559 | 47 | ||||||||||
Hasbro | 950 | 76 | ||||||||||
Home Depot | 660 | 85 | ||||||||||
Interpublic Group | 2,930 | 65 | ||||||||||
Johnson Controls International | 6,450 | 300 | ||||||||||
Kohl’s | 2,633 | 115 | ||||||||||
L Brands | 1,688 | 119 | ||||||||||
Leggett & Platt | 1,629 | 74 | ||||||||||
Lennar, Cl A | 2,151 | 91 | ||||||||||
LKQ * | 1,870 | 66 | ||||||||||
Lowe’s | 1,189 | 86 | ||||||||||
Macy’s | 2,465 | 91 | ||||||||||
Marriott International, Cl A | 3,129 | 211 | ||||||||||
Mattel | 3,641 | 110 | ||||||||||
McDonald’s | 1,006 | 116 | ||||||||||
Michael Kors Holdings * | 1,898 | 89 | ||||||||||
Mohawk Industries * | 603 | 121 | ||||||||||
NetFlix * | 798 | 79 | ||||||||||
Newell Brands, Cl B | 1,797 | 95 | ||||||||||
News, Cl A | 10,261 | 143 | ||||||||||
News, Cl B | 6,800 | 97 | ||||||||||
Nike, Cl B | 2,242 | 118 | ||||||||||
Nordstrom | 1,762 | 92 | ||||||||||
Omnicom Group | 2,049 | 174 | ||||||||||
O’Reilly Automotive * | 309 | 87 | ||||||||||
Priceline Group * | 50 | 74 | ||||||||||
PulteGroup | 2,869 | 57 | ||||||||||
PVH | 977 | 108 | ||||||||||
Ralph Lauren, Cl A | 721 | 73 | ||||||||||
Ross Stores | 2,214 | 142 | ||||||||||
Royal Caribbean Cruises | 1,209 | 91 | ||||||||||
Scripps Networks Interactive, Cl A | 899 | 57 | ||||||||||
Signet Jewelers | 1,118 | 83 | ||||||||||
Staples | 8,000 | 68 | ||||||||||
Starbucks | 1,667 | 90 | ||||||||||
Target, Cl A | 1,487 | 102 | ||||||||||
TEGNA | 3,155 | 69 | ||||||||||
Tiffany | 1,689 | 123 | ||||||||||
Time Warner | 1,132 | 90 | ||||||||||
TJX | 1,183 | 89 | ||||||||||
Tractor Supply | 1,391 | 94 | ||||||||||
| SEI Institutional Managed Trust / Annual Report / September 30, 2016 | 215 |
CONSOLIDATED SCHEDULE OF INVESTMENTS
September 30, 2016
Multi-Asset Accumulation Fund (Continued)
| Description | Shares | Market Value ($ Thousands) | ||||||||||
COMMON STOCK (continued) |
| |||||||||||
TripAdvisor * | 1,460 | $ | 92 | |||||||||
Twenty-First Century Fox ADR, Cl A | 2,526 | 61 | ||||||||||
Twenty-First Century Fox, Cl B | 3,644 | 90 | ||||||||||
Ulta Salon Cosmetics & Fragrance * | 470 | 112 | ||||||||||
Under Armour, Cl A * | 2,392 | 92 | ||||||||||
Under Armour, Cl C * | 3,047 | 103 | ||||||||||
Urban Outfitters * | 3,420 | 118 | ||||||||||
VF | 1,799 | 101 | ||||||||||
Viacom, Cl B | 1,904 | 73 | ||||||||||
Walt Disney | 1,190 | 111 | ||||||||||
Whirlpool | 397 | 64 | ||||||||||
Wyndham Worldwide | 1,075 | 72 | ||||||||||
Wynn Resorts | 1,014 | 99 | ||||||||||
Yum! Brands | 1,420 | 129 | ||||||||||
|
| |||||||||||
| 8,295 | ||||||||||||
|
| |||||||||||
Consumer Staples — 0.5% | ||||||||||||
Altria Group | 3,905 | 247 | ||||||||||
Archer-Daniels-Midland | 8,119 | 342 | ||||||||||
Brown-Forman, Cl B | 5,136 | 244 | ||||||||||
Campbell Soup | 4,237 | 232 | ||||||||||
Church & Dwight | 7,552 | 362 | ||||||||||
Clorox | 1,950 | 244 | ||||||||||
Coca-Cola | 5,902 | 250 | ||||||||||
Colgate-Palmolive | 5,396 | 400 | ||||||||||
ConAgra Foods | 6,299 | 297 | ||||||||||
Constellation Brands, Cl A | 1,639 | 273 | ||||||||||
Costco Wholesale | 2,243 | 342 | ||||||||||
CVS Health | 2,823 | 251 | ||||||||||
Dr Pepper Snapple Group | 2,934 | 268 | ||||||||||
Estee Lauder, Cl A | 3,029 | 268 | ||||||||||
General Mills | 4,478 | 286 | ||||||||||
Hershey | 4,539 | 434 | ||||||||||
Hormel Foods | 10,103 | 383 | ||||||||||
JM Smucker | 2,365 | 321 | ||||||||||
Kellogg | 3,168 | 245 | ||||||||||
Kimberly-Clark | 2,375 | 299 | ||||||||||
Kraft Heinz | 4,045 | 362 | ||||||||||
Kroger | 7,623 | 226 | ||||||||||
McCormick | 3,299 | 330 | ||||||||||
Mead Johnson Nutrition, Cl A | 3,862 | 305 | ||||||||||
Molson Coors Brewing, Cl B | 3,046 | 334 | ||||||||||
Mondelez International, Cl A | 5,619 | 247 | ||||||||||
Monster Beverage * | 2,190 | 321 | ||||||||||
PepsiCo | 2,423 | 264 | ||||||||||
Philip Morris International | 2,328 | 226 | ||||||||||
Procter & Gamble | 2,984 | 268 | ||||||||||
Reynolds American | 4,913 | 232 | ||||||||||
SYSCO, Cl A | 5,177 | 254 | ||||||||||
Tyson Foods, Cl A | 3,419 | 255 | ||||||||||
Walgreens Boots Alliance | 3,532 | 285 | ||||||||||
Wal-Mart Stores | 4,991 | 360 | ||||||||||
| Description | Shares | Market Value ($ Thousands) | ||||||||||
COMMON STOCK (continued) |
| |||||||||||
Whole Foods Market | 9,948 | $ | 282 | |||||||||
|
| |||||||||||
| 10,539 | ||||||||||||
|
| |||||||||||
Energy — 0.3% | ||||||||||||
Anadarko Petroleum, Cl A | 2,311 | 146 | ||||||||||
Apache | 3,437 | 220 | ||||||||||
Baker Hughes | 4,278 | 216 | ||||||||||
Cabot Oil & Gas | 6,882 | 178 | ||||||||||
Chesapeake Energy * | 26,966 | 169 | ||||||||||
Chevron | 2,251 | 232 | ||||||||||
Cimarex Energy | 1,622 | 218 | ||||||||||
Concho Resources * | 1,972 | 271 | ||||||||||
ConocoPhillips | 4,596 | 200 | ||||||||||
Devon Energy | 4,496 | 198 | ||||||||||
Diamond Offshore Drilling | 8,978 | 158 | ||||||||||
EOG Resources | 2,565 | 248 | ||||||||||
EQT | 3,315 | 241 | ||||||||||
Exxon Mobil | 2,881 | 252 | ||||||||||
FMC Technologies * | 7,037 | 209 | ||||||||||
Halliburton | 5,364 | 241 | ||||||||||
Helmerich & Payne | 3,032 | 204 | ||||||||||
Hess | 3,644 | 195 | ||||||||||
Kinder Morgan | 8,493 | 197 | ||||||||||
Marathon Oil | 10,683 | 169 | ||||||||||
Marathon Petroleum | 4,014 | 163 | ||||||||||
Murphy Oil | 5,767 | 175 | ||||||||||
National Oilwell Varco, Cl A | 6,758 | 248 | ||||||||||
Newfield Exploration * | 4,105 | 178 | ||||||||||
Noble Energy | 5,104 | 182 | ||||||||||
Occidental Petroleum | 3,639 | 265 | ||||||||||
Oneok | 6,107 | 314 | ||||||||||
Phillips 66 | 3,313 | 267 | ||||||||||
Pioneer Natural Resources | 1,390 | 258 | ||||||||||
Range Resources | 3,619 | 140 | ||||||||||
Schlumberger, Cl A | 3,885 | 305 | ||||||||||
Southwestern Energy * | 7,514 | 104 | ||||||||||
Spectra Energy | 8,561 | 366 | ||||||||||
Tesoro | 2,422 | 193 | ||||||||||
Valero Energy | 3,835 | 203 | ||||||||||
Williams | 7,626 | 234 | ||||||||||
|
| |||||||||||
| 7,757 | ||||||||||||
|
| |||||||||||
Financials — 0.2% | ||||||||||||
Affiliated Managers Group * | 586 | 85 | ||||||||||
Aflac | 669 | 48 | ||||||||||
Allstate | 963 | 67 | ||||||||||
American Express | 1,241 | 79 | ||||||||||
American International Group | 2,014 | 119 | ||||||||||
Ameriprise Financial | 614 | 61 | ||||||||||
Aon | 1,040 | 117 | ||||||||||
Arthur J. Gallagher | 2,093 | 106 | ||||||||||
Assurant | 976 | 90 | ||||||||||
Bank of America | 3,043 | 48 | ||||||||||
| 216 | SEI Institutional Managed Trust / Annual Report / September 30, 2016 |
| Description | Shares | Market Value ($ Thousands) | ||||||||||
COMMON STOCK (continued) |
| |||||||||||
Bank of New York Mellon | 1,559 | $ | 62 | |||||||||
BB&T | 1,795 | 68 | ||||||||||
Berkshire Hathaway, Cl B * | 698 | 101 | ||||||||||
BlackRock | 151 | 55 | ||||||||||
Capital One Financial | 700 | 50 | ||||||||||
Charles Schwab | 2,369 | 75 | ||||||||||
Chubb | 1,185 | 149 | ||||||||||
Cincinnati Financial | 2,017 | 152 | ||||||||||
Citigroup | 1,388 | 66 | ||||||||||
Citizens Financial Group | 3,013 | 74 | ||||||||||
CME Group | 1,198 | 125 | ||||||||||
Comerica | 1,055 | 50 | ||||||||||
Discover Financial Services | 1,159 | 66 | ||||||||||
E*Trade Financial * | 4,160 | 121 | ||||||||||
Fifth Third Bancorp | 5,885 | 120 | ||||||||||
Franklin Resources | 1,671 | 59 | ||||||||||
Goldman Sachs Group | 268 | 43 | ||||||||||
Hartford Financial Services Group | 2,184 | 94 | ||||||||||
Huntington Bancshares | 5,352 | 53 | ||||||||||
Intercontinental Exchange | 310 | 84 | ||||||||||
Invesco | 1,903 | 60 | ||||||||||
JPMorgan Chase | 873 | 58 | ||||||||||
KeyCorp | 3,605 | 44 | ||||||||||
Legg Mason | 1,384 | 46 | ||||||||||
Leucadia National | 7,057 | 134 | ||||||||||
Lincoln National | 1,000 | 47 | ||||||||||
Loews | 1,145 | 47 | ||||||||||
M&T Bank | 901 | 105 | ||||||||||
Marsh & McLennan | 1,756 | 118 | ||||||||||
MetLife | 2,745 | 122 | ||||||||||
Moody’s | 673 | 73 | ||||||||||
Morgan Stanley | 3,723 | 119 | ||||||||||
Nasdaq, Cl A | 1,585 | 107 | ||||||||||
Navient | 5,548 | 80 | ||||||||||
Northern Trust | 1,046 | 71 | ||||||||||
People’s United Financial | 4,631 | 73 | ||||||||||
PNC Financial Services Group | 968 | 87 | ||||||||||
Principal Financial Group, Cl A | 2,672 | 138 | ||||||||||
Progressive | 2,974 | 94 | ||||||||||
Prudential Financial | 1,201 | 98 | ||||||||||
Regions Financial | 10,217 | 101 | ||||||||||
S&P Global | 1,004 | 127 | ||||||||||
State Street | 770 | 54 | ||||||||||
SunTrust Banks | 1,338 | 59 | ||||||||||
Synchrony Financial | 3,561 | 100 | ||||||||||
T. Rowe Price Group | 1,457 | 97 | ||||||||||
Torchmark, Cl A | 2,083 | 133 | ||||||||||
Travelers | 849 | 97 | ||||||||||
Unum Group | 1,475 | 52 | ||||||||||
US Bancorp | 2,336 | 100 | ||||||||||
Wells Fargo | 3,144 | 139 | ||||||||||
Willis Towers Watson | 432 | 57 | ||||||||||
| Description | Shares | Market Value ($ Thousands) | ||||||||||
COMMON STOCK (continued) |
| |||||||||||
XL Group | 2,550 | $ | 86 | |||||||||
Zions Bancorporation | 2,651 | 82 | ||||||||||
|
| |||||||||||
| 5,492 | ||||||||||||
|
| |||||||||||
Health Care — 0.4% | ||||||||||||
Abbott Laboratories | 3,250 | 137 | ||||||||||
AbbVie | 2,438 | 154 | ||||||||||
Aetna, Cl A | 1,342 | 155 | ||||||||||
Agilent Technologies | 4,929 | 232 | ||||||||||
Alexion Pharmaceuticals * | 963 | 118 | ||||||||||
Allergan * | 620 | 143 | ||||||||||
AmerisourceBergen | 1,376 | 111 | ||||||||||
Amgen, Cl A | 840 | 140 | ||||||||||
Anthem | 1,304 | 164 | ||||||||||
Baxter International | 4,092 | 195 | ||||||||||
Becton Dickinson | 1,426 | 256 | ||||||||||
Biogen * | 478 | 150 | ||||||||||
Boston Scientific * | 9,145 | 218 | ||||||||||
Bristol-Myers Squibb | 2,001 | 108 | ||||||||||
C.R. Bard | 1,046 | 235 | ||||||||||
Cardinal Health | 1,831 | 142 | ||||||||||
Celgene, Cl A * | 1,304 | 136 | ||||||||||
Centene * | 1,976 | 132 | ||||||||||
Cerner * | 3,217 | 199 | ||||||||||
Cigna | 1,350 | 176 | ||||||||||
DaVita HealthCare Partners * | 2,885 | 191 | ||||||||||
DENTSPLY SIRONA | 2,721 | 162 | ||||||||||
Edwards Lifesciences, Cl A * | 1,836 | 221 | ||||||||||
Eli Lilly | 1,884 | 151 | ||||||||||
Endo International * | 6,159 | 124 | ||||||||||
Express Scripts Holding * | 2,680 | 189 | ||||||||||
Gilead Sciences | 1,480 | 117 | ||||||||||
HCA Holdings * | 1,960 | 148 | ||||||||||
Henry Schein * | 830 | 135 | ||||||||||
Hologic * | 5,088 | 198 | ||||||||||
Humana | 1,000 | 177 | ||||||||||
Illumina * | 1,071 | 195 | ||||||||||
Intuitive Surgical * | 262 | 190 | ||||||||||
Johnson & Johnson | 2,358 | 279 | ||||||||||
Laboratory Corp of America Holdings * | 1,602 | 220 | ||||||||||
Mallinckrodt * | 1,409 | 98 | ||||||||||
McKesson | 792 | 132 | ||||||||||
Medtronic | 2,224 | 192 | ||||||||||
Merck | 2,621 | 164 | ||||||||||
Mylan * | 2,967 | 113 | ||||||||||
Patterson | 4,669 | 215 | ||||||||||
PerkinElmer | 2,942 | 165 | ||||||||||
Perrigo | 1,103 | 102 | ||||||||||
Pfizer | 6,421 | 217 | ||||||||||
Quest Diagnostics | 2,313 | 196 | ||||||||||
Regeneron Pharmaceuticals * | 338 | 136 | ||||||||||
St. Jude Medical | 2,411 | 192 | ||||||||||
Stryker | 1,505 | 175 | ||||||||||
| SEI Institutional Managed Trust / Annual Report / September 30, 2016 | 217 |
CONSOLIDATED SCHEDULE OF INVESTMENTS
September 30, 2016
Multi-Asset Accumulation Fund (Continued)
| Description | Shares | Market Value ($ Thousands) | ||||||||||
COMMON STOCK (continued) |
| |||||||||||
Taro Pharmaceutical Industries * | 3,157 | $ | 349 | |||||||||
Thermo Fisher Scientific | 1,047 | 166 | ||||||||||
UnitedHealth Group | 1,173 | 164 | ||||||||||
Universal Health Services, Cl B | 1,166 | 144 | ||||||||||
Varian Medical Systems * | 2,224 | 221 | ||||||||||
Vertex Pharmaceuticals * | 1,215 | 106 | ||||||||||
Waters * | 1,193 | 189 | ||||||||||
Zimmer Biomet Holdings | 1,594 | 207 | ||||||||||
Zoetis, Cl A | 2,648 | 138 | ||||||||||
|
| |||||||||||
| 9,779 | ||||||||||||
|
| |||||||||||
Industrials — 0.4% | ||||||||||||
3M | 1,244 | 219 | ||||||||||
Acuity Brands | 340 | 90 | ||||||||||
Alaska Air Group | 478 | 31 | ||||||||||
Allegion | 2,213 | 153 | ||||||||||
American Airlines Group | 2,945 | 108 | ||||||||||
Ametek | 1,885 | 90 | ||||||||||
Boeing | 1,037 | 137 | ||||||||||
C.H. Robinson Worldwide | 2,024 | 143 | ||||||||||
Caterpillar, Cl A | 1,117 | 99 | ||||||||||
Cintas | 1,885 | 212 | ||||||||||
CSX | 4,880 | 149 | ||||||||||
Cummins | 1,302 | 167 | ||||||||||
Danaher, Cl A | 1,081 | 85 | ||||||||||
Deere | 1,562 | 133 | ||||||||||
Delta Air Lines, Cl A | 3,091 | 122 | ||||||||||
Dover | 1,286 | 95 | ||||||||||
Dun & Bradstreet | 1,003 | 137 | ||||||||||
Emerson Electric | 3,514 | 192 | ||||||||||
Equifax | 1,030 | 139 | ||||||||||
Expeditors International of Washington | 3,505 | 180 | ||||||||||
Fastenal, Cl A | 2,002 | 83 | ||||||||||
FedEx | 581 | 101 | ||||||||||
Flowserve | 1,736 | 84 | ||||||||||
Fluor | 1,781 | 91 | ||||||||||
Fortive | 540 | 27 | ||||||||||
Fortune Brands Home & Security | 1,500 | 87 | ||||||||||
General Dynamics | 849 | 132 | ||||||||||
General Electric | 3,393 | 101 | ||||||||||
Honeywell International | 835 | 97 | ||||||||||
Illinois Tool Works | 945 | 113 | ||||||||||
Ingersoll-Rand | 1,653 | 112 | ||||||||||
Jacobs Engineering Group * | 2,905 | 150 | ||||||||||
JB Hunt Transport Services | 1,502 | 122 | ||||||||||
Kansas City Southern | 1,143 | 107 | ||||||||||
L-3 Communications Holdings | 1,255 | 189 | ||||||||||
Lockheed Martin | 518 | 124 | ||||||||||
Masco | 3,446 | 118 | ||||||||||
Nielsen Holdings | 2,902 | 155 | ||||||||||
Norfolk Southern | 1,519 | 147 | ||||||||||
Northrop Grumman | 759 | 162 | ||||||||||
PACCAR | 1,691 | 99 | ||||||||||
| Description | Shares | Market Value ($ Thousands) | ||||||||||
COMMON STOCK (continued) |
| |||||||||||
Parker-Hannifin, Cl A | 653 | $ | 82 | |||||||||
Pentair | 2,268 | 146 | ||||||||||
Pitney Bowes | 4,588 | 83 | ||||||||||
Quanta Services * | 3,494 | 98 | ||||||||||
Raytheon | 872 | 119 | ||||||||||
Republic Services | 3,860 | 195 | ||||||||||
Robert Half International | 3,077 | 117 | ||||||||||
Rockwell Automation | 1,359 | 166 | ||||||||||
Rockwell Collins | 1,112 | 94 | ||||||||||
Roper Technologies | 466 | 85 | ||||||||||
Ryder System | 1,472 | 97 | ||||||||||
Snap-on | 801 | 122 | ||||||||||
Southwest Airlines, Cl A | 3,040 | 118 | ||||||||||
Stanley Black & Decker | 854 | 105 | ||||||||||
Stericycle, Cl A * | 1,394 | 112 | ||||||||||
Textron | 2,415 | 96 | ||||||||||
TransDigm Group * | 200 | 58 | ||||||||||
Union Pacific | 1,324 | 129 | ||||||||||
United Continental Holdings * | 2,649 | 139 | ||||||||||
United Parcel Service, Cl B | 975 | 107 | ||||||||||
United Rentals * | 1,181 | 93 | ||||||||||
United Technologies | 1,125 | 114 | ||||||||||
Verisk Analytics, Cl A * | 1,825 | 148 | ||||||||||
Waste Management | 3,332 | 212 | ||||||||||
WW Grainger | 632 | 142 | ||||||||||
Xylem | 3,160 | 166 | ||||||||||
|
| |||||||||||
| 8,225 | ||||||||||||
|
| |||||||||||
Information Technology — 0.4% |
| |||||||||||
Activision Blizzard | 3,303 | 146 | ||||||||||
Adobe Systems * | 1,333 | 145 | ||||||||||
Akamai Technologies * | 2,138 | 113 | ||||||||||
Alliance Data Systems * | 672 | 144 | ||||||||||
Alphabet, Cl A * | 135 | 109 | ||||||||||
Alphabet, Cl C * | 158 | 123 | ||||||||||
Amphenol, Cl A | 1,661 | 108 | ||||||||||
Analog Devices | 1,682 | 108 | ||||||||||
Apple | 1,192 | 135 | ||||||||||
Applied Materials | 5,515 | 166 | ||||||||||
Autodesk, Cl A * | 2,022 | 146 | ||||||||||
Automatic Data Processing | 1,236 | 109 | ||||||||||
Broadcom | 770 | 133 | ||||||||||
CA | 4,037 | 134 | ||||||||||
Cisco Systems | 3,423 | 109 | ||||||||||
Citrix Systems * | 1,207 | 103 | ||||||||||
Cognizant Technology Solutions, Cl A * | 1,460 | 70 | ||||||||||
Corning, Cl B | 6,188 | 146 | ||||||||||
CSRA | 4,599 | 124 | ||||||||||
Dell Technologies - VMware, Cl V * | 647 | 31 | ||||||||||
eBay * | 4,896 | 161 | ||||||||||
Electronic Arts * | 1,819 | 155 | ||||||||||
F5 Networks, Cl A * | 1,077 | 134 | ||||||||||
Facebook, Cl A * | 855 | 110 | ||||||||||
| 218 | SEI Institutional Managed Trust / Annual Report / September 30, 2016 |
| Description | Shares | Market Value ($ Thousands) | ||||||||||
COMMON STOCK (continued) |
| |||||||||||
Fidelity National Information Services, Cl B | 1,370 | $ | 105 | |||||||||
First Solar * | 1,938 | 77 | ||||||||||
Fiserv, Cl A * | 1,220 | 121 | ||||||||||
Flir Systems | 3,188 | 100 | ||||||||||
Global Payments | 1,650 | 127 | ||||||||||
Harris | 1,630 | 149 | ||||||||||
Hewlett Packard Enterprise | 5,885 | 134 | ||||||||||
HP | 8,533 | 132 | ||||||||||
Intel | 4,494 | 170 | ||||||||||
International Business Machines | 793 | 126 | ||||||||||
Intuit | 1,158 | 127 | ||||||||||
Juniper Networks | 4,939 | 119 | ||||||||||
KLA-Tencor | 1,572 | 110 | ||||||||||
Lam Research | 1,568 | 148 | ||||||||||
Linear Technology | 2,768 | 164 | ||||||||||
MasterCard, Cl A | 1,158 | 118 | ||||||||||
Microchip Technology | 2,532 | 157 | ||||||||||
Micron Technology * | 7,551 | 134 | ||||||||||
Microsoft | 2,267 | 131 | ||||||||||
Mobileye * | 5,790 | 247 | ||||||||||
Motorola Solutions | 1,647 | 126 | ||||||||||
NetApp | 5,224 | 187 | ||||||||||
Nvidia | 1,767 | 121 | ||||||||||
Oracle, Cl B | 2,124 | 83 | ||||||||||
Paychex | 2,240 | 130 | ||||||||||
PayPal Holdings * | 3,253 | 133 | ||||||||||
Qorvo * | 1,591 | 89 | ||||||||||
Qualcomm | 2,828 | 194 | ||||||||||
Red Hat * | 1,732 | 140 | ||||||||||
salesforce.com * | 1,252 | 89 | ||||||||||
Seagate Technology | 4,322 | 167 | ||||||||||
Skyworks Solutions | 1,430 | 109 | ||||||||||
Symantec, Cl A | 7,725 | 194 | ||||||||||
Teradata * | 3,726 | 115 | ||||||||||
Texas Instruments | 1,935 | 136 | ||||||||||
Total System Services | 1,926 | 91 | ||||||||||
VeriSign * | 1,436 | 112 | ||||||||||
Visa, Cl A | 1,380 | 114 | ||||||||||
Western Digital | 2,038 | 119 | ||||||||||
Western Union | 7,451 | 155 | ||||||||||
Xerox | 11,605 | 118 | ||||||||||
Xilinx | 2,202 | 120 | ||||||||||
Yahoo! * | 3,036 | 131 | ||||||||||
|
| |||||||||||
| 8,631 | ||||||||||||
|
| |||||||||||
Materials — 0.3% | ||||||||||||
Air Products & Chemicals | 1,914 | 288 | ||||||||||
Albemarle | 2,600 | 222 | ||||||||||
Alcoa | 21,544 | 218 | ||||||||||
Avery Dennison | 3,753 | 292 | ||||||||||
Ball | 3,476 | 285 | ||||||||||
CF Industries Holdings | 9,010 | 219 | ||||||||||
Dow Chemical, Cl A | 3,819 | 198 | ||||||||||
| Description | Shares | Market Value ($ Thousands) | ||||||||||
COMMON STOCK (continued) |
| |||||||||||
E.I. Du Pont de Nemours | 3,495 | $ | 234 | |||||||||
Eastman Chemical | 3,217 | 218 | ||||||||||
Ecolab | 3,373 | 411 | ||||||||||
FMC | 4,986 | 241 | ||||||||||
Freeport-McMoRan, Cl B | 15,519 | 169 | ||||||||||
International Flavors & Fragrances | 3,064 | 438 | ||||||||||
International Paper | 5,522 | 265 | ||||||||||
Martin Marietta Materials, Cl A | 1,465 | 262 | ||||||||||
Monsanto | 3,480 | 356 | ||||||||||
Mosaic | 8,234 | 202 | ||||||||||
Newmont Mining | 8,759 | 344 | ||||||||||
Nucor | 5,150 | 255 | ||||||||||
Owens-Illinois * | 13,803 | 254 | ||||||||||
PPG Industries | 2,411 | 249 | ||||||||||
Praxair | 3,536 | 427 | ||||||||||
Sealed Air | 6,166 | 282 | ||||||||||
Sherwin-Williams, Cl A | 861 | 238 | ||||||||||
Vulcan Materials | 2,659 | 303 | ||||||||||
WestRock | 5,916 | 287 | ||||||||||
|
| |||||||||||
| 7,157 | ||||||||||||
|
| |||||||||||
Real Estate — 0.1% | ||||||||||||
American Tower, Cl A ‡ | 1,449 | 164 | ||||||||||
Apartment Investment & Management, Cl A ‡ | 2,812 | 129 | ||||||||||
AvalonBay Communities ‡ | 979 | 174 | ||||||||||
Boston Properties ‡ | 488 | 67 | ||||||||||
CBRE Group, Cl A * | 3,263 | 91 | ||||||||||
Crown Castle International ‡ | 1,247 | 118 | ||||||||||
Digital Realty Trust, Cl A ‡ | 1,000 | 97 | ||||||||||
Equinix ‡ | 391 | 141 | ||||||||||
Equity Residential ‡ | 941 | 61 | ||||||||||
Essex Property Trust ‡ | 534 | 119 | ||||||||||
Extra Space Storage ‡ | 1,522 | 121 | ||||||||||
Federal Realty Investment Trust ‡ | 625 | 96 | ||||||||||
General Growth Properties ‡ | 3,887 | 107 | ||||||||||
HCP ‡ | 4,241 | 161 | ||||||||||
Host Hotels & Resorts ‡ | 7,223 | 112 | ||||||||||
Iron Mountain ‡ | 3,207 | 120 | ||||||||||
Kimco Realty ‡ | 2,593 | 75 | ||||||||||
Macerich ‡ | 1,104 | 89 | ||||||||||
ProLogis ‡ | 2,009 | 108 | ||||||||||
Public Storage ‡ | 541 | 121 | ||||||||||
Realty Income ‡ | 1,430 | 96 | ||||||||||
Simon Property Group ‡ | 730 | 151 | ||||||||||
SL Green Realty ‡ | 1,090 | 118 | ||||||||||
UDR ‡ | 2,944 | 106 | ||||||||||
Ventas ‡ | 1,347 | 95 | ||||||||||
Vornado Realty Trust ‡ | 1,108 | 112 | ||||||||||
Welltower ‡ | 1,515 | 113 | ||||||||||
Weyerhaeuser ‡ | 4,633 | 148 | ||||||||||
|
| |||||||||||
| 3,210 | ||||||||||||
|
| |||||||||||
| SEI Institutional Managed Trust / Annual Report / September 30, 2016 | 219 |
CONSOLIDATED SCHEDULE OF INVESTMENTS
September 30, 2016
Multi-Asset Accumulation Fund (Continued)
| Description | Shares | Market Value ($ Thousands) | ||||||
COMMON STOCK (continued) |
| |||||||
Telecommunication Services — 0.4% |
| |||||||
AT&T | 58,821 | $ | 2,389 | |||||
CenturyTel | 79,156 | 2,171 | ||||||
Frontier Communications | 297,551 | 1,238 | ||||||
Level 3 Communications * | 26,693 | 1,238 | ||||||
Verizon Communications | 43,437 | 2,258 | ||||||
|
| |||||||
| 9,294 | ||||||||
|
| |||||||
Utilities — 0.5% | ||||||||
AES | 42,041 | 540 | ||||||
Alliant Energy | 8,000 | 306 | ||||||
Ameren | 8,493 | 418 | ||||||
American Electric Power | 5,845 | 375 | ||||||
American Water Works | 5,181 | 388 | ||||||
Centerpoint Energy | 18,582 | 432 | ||||||
CMS Energy | 9,350 | 393 | ||||||
Consolidated Edison | 5,188 | 391 | ||||||
Dominion Resources | 5,265 | 391 | ||||||
DTE Energy | 4,990 | 467 | ||||||
Duke Energy | 4,270 | 342 | ||||||
Edison International | 5,948 | 430 | ||||||
Entergy | 5,069 | 389 | ||||||
Eversource Energy | 8,691 | 471 | ||||||
Exelon | 12,325 | 410 | ||||||
FirstEnergy | 11,636 | 385 | ||||||
NextEra Energy | 3,446 | 422 | ||||||
NiSource | 16,382 | 395 | ||||||
NRG Energy | 24,004 | 269 | ||||||
PG&E | 7,506 | 459 | ||||||
Pinnacle West Capital | 5,992 | 455 | ||||||
PPL | 9,870 | 341 | ||||||
Public Service Enterprise Group | 8,502 | 356 | ||||||
SCANA | 5,783 | 418 | ||||||
Sempra Energy | 4,307 | 462 | ||||||
Southern | 6,218 | 319 | ||||||
WEC Energy Group | 6,517 | 390 | ||||||
Xcel Energy | 10,425 | 429 | ||||||
|
| |||||||
| 11,243 | ||||||||
|
| |||||||
Total Common Stock (Cost $73,775) ($ Thousands) | 89,622 | |||||||
|
| |||||||
| Face Amount (Thousands) | ||||||||
CORPORATE OBLIGATIONS — 1.7% |
| |||||||
Consumer Discretionary — 0.0% |
| |||||||
Toyota Motor Credit MTN | ||||||||
3.400%, 09/15/2021 (B) | $ | 150 | 162 | |||||
Trustees of Dartmouth College | ||||||||
4.750%, 06/01/2019 (B) | 150 | 164 | ||||||
| Description | Face Amount (Thousands) | Market Value ($ Thousands) | ||||||
CORPORATE OBLIGATIONS (continued) |
| |||||||
University of Southern California | ||||||||
5.250%, 10/01/2111 (B) | $ | 100 | $ | 131 | ||||
|
| |||||||
| 457 | ||||||||
|
| |||||||
Consumer Staples — 0.1% |
| |||||||
Coca-Cola | ||||||||
1.150%, 04/01/2018 (B) | 1,000 | 1,001 | ||||||
Colgate-Palmolive MTN | ||||||||
2.300%, 05/03/2022 (B) | 250 | 258 | ||||||
Wal-Mart Stores | ||||||||
5.250%, 09/01/2035 (B) | 1,000 | 1,328 | ||||||
|
| |||||||
| 2,587 | ||||||||
|
| |||||||
Energy — 0.2% | ||||||||
Chevron | ||||||||
4.950%, 03/03/2019 (B) | 150 | 163 | ||||||
Exxon Mobil | ||||||||
3.176%, 03/15/2024 (B) | 500 | 532 | ||||||
Nexen Energy ULC | ||||||||
5.875%, 03/10/2035 (B) | 100 | 124 | ||||||
Shell International Finance | ||||||||
4.375%, 03/25/2020 (B) | 1,000 | 1,091 | ||||||
Statoil | ||||||||
2.450%, 01/17/2023 (B) | 250 | 255 | ||||||
Total Capital International | ||||||||
2.100%, 06/19/2019 (B) | 1,000 | 1,020 | ||||||
XTO Energy | ||||||||
6.750%, 08/01/2037 (B) | 300 | 440 | ||||||
6.500%, 12/15/2018 (B) | 750 | 833 | ||||||
|
| |||||||
| 4,458 | ||||||||
|
| |||||||
Financials — 1.0% | ||||||||
Australia & New Zealand Banking Group NY MTN | ||||||||
2.250%, 06/13/2019 (B) | 300 | 305 | ||||||
1.875%, 10/06/2017 (B) | 250 | 252 | ||||||
Bank of Montreal MTN | ||||||||
2.550%, 11/06/2022 (B) | 250 | 256 | ||||||
1.400%, 09/11/2017 (B) | 200 | 200 | ||||||
Bank of New York Mellon | ||||||||
3.550%, 09/23/2021 (B) | 200 | 215 | ||||||
Bank of Nova Scotia | ||||||||
2.800%, 07/21/2021 (B) | 1,000 | 1,042 | ||||||
2.050%, 10/30/2018 (B) | 250 | 253 | ||||||
Berkshire Hathaway | ||||||||
3.400%, 01/31/2022 (B) | 150 | 162 | ||||||
2.750%, 03/15/2023 (B) | 1,000 | 1,039 | ||||||
Berkshire Hathaway Finance | ||||||||
5.400%, 05/15/2018 (B) | 250 | 267 | ||||||
Canadian Imperial Bank of Commerce | ||||||||
1.550%, 01/23/2018 (B) | 500 | 501 | ||||||
CME Group | ||||||||
3.000%, 09/15/2022 (B) | 100 | 106 | ||||||
| 220 | SEI Institutional Managed Trust / Annual Report / September 30, 2016 |
| Description | Face Amount (Thousands) | Market Value ($ Thousands) | ||||||||
CORPORATE OBLIGATIONS (continued) |
| |||||||||
3.000%, 03/15/2025 (B) | $ | 1,000 | $ | 1,050 | ||||||
Commonwealth Bank of Australia NY MTN | ||||||||||
1.900%, 09/18/2017 (B) | 150 | 151 | ||||||||
Commonwealth Bank of Australia NY | ||||||||||
2.300%, 09/06/2019 (B) | 250 | 254 | ||||||||
2.250%, 03/13/2019 (B) | 250 | 254 | ||||||||
Cooperatieve Rabobank UA MTN | ||||||||||
3.375%, 01/19/2017 (B) | 250 | 252 | ||||||||
HSBC Holdings | ||||||||||
5.100%, 04/05/2021 (B) | 250 | 276 | ||||||||
KFW MTN | ||||||||||
2.750%, 09/08/2020 (B) | 1,000 | 1,056 | ||||||||
KFW(B) | ||||||||||
2.375%, 08/25/2021 | 1,500 | 1,569 | ||||||||
1.875%, 06/30/2020 | 1,000 | 1,021 | ||||||||
1.875%, 11/30/2020 | 1,000 | 1,023 | ||||||||
0.875%, 09/05/2017 | 200 | 200 | ||||||||
Landwirtschaftliche Rentenbank | ||||||||||
2.250%, 10/01/2021 (B) | 2,000 | 2,076 | ||||||||
1.875%, 09/17/2018 (B) | 550 | 560 | ||||||||
1.750%, 04/15/2019 (B) | 200 | 203 | ||||||||
1.375%, 10/23/2019 (B) | 500 | 503 | ||||||||
1.000%, 04/04/2018 (B) | 200 | 200 | ||||||||
0.875%, 09/12/2017 (B) | 300 | 300 | ||||||||
National Australia Bank | ||||||||||
3.000%, 01/20/2023 (B) | 200 | 208 | ||||||||
Oesterreichische Kontrollbank | ||||||||||
1.875%, 01/20/2021 (B) | 1,000 | 1,021 | ||||||||
1.625%, 03/12/2019 (B) | 1,000 | 1,011 | ||||||||
Royal Bank of Canada MTN | ||||||||||
2.200%, 07/27/2018 (B) | 250 | 254 | ||||||||
2.150%, 03/15/2019 (B) | 200 | 203 | ||||||||
1.800%, 07/30/2018 (B) | 200 | 202 | ||||||||
1.500%, 01/16/2018 (B) | 500 | 501 | ||||||||
Svenska Handelsbanken | ||||||||||
2.875%, 04/04/2017 (B) | 200 | 202 | ||||||||
2.500%, 01/25/2019 (B) | 200 | 204 | ||||||||
Svenska Handelsbanken MTN | ||||||||||
2.250%, 06/17/2019 (B) | 300 | 305 | ||||||||
Toronto-Dominion Bank MTN | ||||||||||
2.125%, 07/02/2019 (B) | 250 | 254 | ||||||||
Toronto-Dominion Bank | ||||||||||
2.375%, 10/19/2016 (B) | 250 | 250 | ||||||||
US Bank | ||||||||||
2.125%, 10/28/2019 (B) | 400 | 407 | ||||||||
Wells Fargo MTN | ||||||||||
1.650%, 01/22/2018 (B) | 1,000 | 1,003 | ||||||||
Westpac Banking | ||||||||||
4.875%, 11/19/2019 (B) | 200 | 219 | ||||||||
2.600%, 11/23/2020 (B) | 1,000 | 1,028 | ||||||||
|
| |||||||||
| 22,818 | ||||||||||
|
| |||||||||
| Description | Face Amount (Thousands) | Market Value ($ Thousands) | ||||||||||
CORPORATE OBLIGATIONS (continued) |
| |||||||||||
Health Care — 0.1% | ||||||||||||
Johns Hopkins University | ||||||||||||
5.250%, 07/01/2019 (B) | $ | 18 | $ | 20 | ||||||||
Johnson & Johnson | ||||||||||||
5.950%, 08/15/2037 (B) | 300 | 438 | ||||||||||
3.375%, 12/05/2023 (B) | 500 | 552 | ||||||||||
Novartis Securities Investment | ||||||||||||
5.125%, 02/10/2019 (B) | 150 | 163 | ||||||||||
Sanofi | ||||||||||||
4.000%, 03/29/2021 (B) | 150 | 165 | ||||||||||
|
| |||||||||||
| 1,338 | ||||||||||||
|
| |||||||||||
Industrials — 0.0% | ||||||||||||
3M MTN | ||||||||||||
5.700%, 03/15/2037 (B) | 150 | 206 | ||||||||||
|
| |||||||||||
Information Technology — 0.3% |
| |||||||||||
Alphabet | ||||||||||||
3.625%, 05/19/2021 (B) | 150 | 165 | ||||||||||
Apple | ||||||||||||
4.650%, 02/23/2046 (B) | 1,000 | 1,154 | ||||||||||
3.250%, 02/23/2026 (B) | 1,000 | 1,063 | ||||||||||
2.850%, 02/23/2023 (B) | 1,000 | 1,053 | ||||||||||
2.400%, 05/03/2023 (B) | 250 | 254 | ||||||||||
Microsoft | ||||||||||||
2.125%, 11/15/2022 (B) | 500 | 506 | ||||||||||
0.875%, 11/15/2017 (B) | 1,500 | 1,500 | ||||||||||
|
| |||||||||||
| 5,695 | ||||||||||||
|
| |||||||||||
Telecommunication Services — 0.0% |
| |||||||||||
Nippon Telegraph & Telephone | ||||||||||||
1.400%, 07/18/2017 (B) | 200 | 200 | ||||||||||
|
| |||||||||||
Utilities — 0.0% |
| |||||||||||
Southern California Gas | ||||||||||||
5.125%, 11/15/2040 (B) | 150 | 189 | ||||||||||
|
| |||||||||||
Total Corporate Obligations (Cost $37,435) ($ Thousands) | 37,948 | |||||||||||
|
| |||||||||||
| Shares | ||||||||||||
EXCHANGE TRADED FUND — 1.2% |
| |||||||||||
United States — 1.2% | ||||||||||||
iShares iBoxx Investment Grade Corporate Bond Fund | 217,571 | 26,800 | ||||||||||
|
| |||||||||||
Total Exchange Traded Fund (Cost $25,644) ($ Thousands) | 26,800 | |||||||||||
|
| |||||||||||
| SEI Institutional Managed Trust / Annual Report / September 30, 2016 | 221 |
CONSOLIDATED SCHEDULE OF INVESTMENTS
September 30, 2016
Multi-Asset Accumulation Fund (Continued)
| Description | Shares | Market Value ($ Thousands) | ||||||||||
PREFERRED STOCK — 0.0% |
| |||||||||||
Germany — 0.0% | ||||||||||||
Fuchs Petrolub | 1,520 | $ | 70 | |||||||||
Henkel & KGaA | 1,296 | 176 | ||||||||||
Porsche Automobil Holding | 342 | 17 | ||||||||||
Volkswagen | 65 | 9 | ||||||||||
|
| |||||||||||
Total Preferred Stock | 272 | |||||||||||
|
| |||||||||||
Number of | ||||||||||||
RIGHTS — 0.0% | ||||||||||||
Safeway CVR - Casa Ley *‡‡ | 2,823 | 3 | ||||||||||
Safeway CVR - PDC *‡‡ | 2,823 | – | ||||||||||
|
| |||||||||||
Total Rights | 3 | |||||||||||
|
| |||||||||||
Total Investments — 82.4% | $ | 1,879,772 | ||||||||||
|
| |||||||||||
A list of the open futures contracts held by the Fund at September 30, 2016, is as follows:
| Type of Contract | Number of Contracts Long (Short) | Expiration Date | Unrealized Appreciation (Depreciation) ($ Thousands) | |||||||||
Australian 10-Year Bond | 1,348 | Dec-2016 | $1,649 | |||||||||
Amsterdam Index | 20 | Oct-2016 | (27) | |||||||||
CAC40 10 Euro Index | 279 | Oct-2016 | 53 | |||||||||
Canadian 10-Year Bond | 1,579 | Dec-2016 | 494 | |||||||||
CBT 10-Year T-Bonds | 765 | Dec-2016 | 488 | |||||||||
Dax Index | 79 | Dec-2016 | 181 | |||||||||
DJ Euro Stoxx 50 Index | 1,315 | Dec-2016 | 476 | |||||||||
Dow Jones-UBS Commodity Index | 988 | Dec-2016 | 244 | |||||||||
Euro-Bob | 530 | Dec-2016 | 200 | |||||||||
Euro-BTP | 674 | Dec-2016 | (828) | |||||||||
Euro-Bund Index | 241 | Dec-2016 | 200 | |||||||||
Euro-Bund Index | 1,690 | Dec-2016 | 2,115 | |||||||||
Euro-Buxl Index | 101 | Dec-2016 | 100 | |||||||||
FTSE 100 Index | 567 | Dec-2016 | 1,163 | |||||||||
FTSE/JSE Top 40 Index | 220 | Dec-2016 | (176) | |||||||||
H-Shares | 90 | Oct-2016 | (70) | |||||||||
Hang Seng Index | 51 | Oct-2016 | (59) | |||||||||
IBEX 35 Plus Index | 42 | Oct-2016 | (6) | |||||||||
Japanese 10-Year Bond | 70 | Dec-2016 | 316 | |||||||||
Japanese 10-Year Bond E-MINI | 1,485 | Dec-2016 | 989 | |||||||||
KOSPI 200 Index | 14 | Dec-2016 | (22) | |||||||||
Long Gilt 10-Year Bond | 387 | Dec-2016 | (540) | |||||||||
MSCI Emerging Markets E-MINI | 1,927 | Dec-2016 | (1,411) | |||||||||
OMX Index | (73) | Oct-2016 | (22) | |||||||||
Russell 2000 Index E-MINI | 814 | Dec-2016 | 1,348 | |||||||||
S&P 500 Index E-MINI | 3,320 | Dec-2016 | 2,573 | |||||||||
S&P Composite Index | 29 | Dec-2016 | 61 | |||||||||
S&P Mid Cap 400 Index E-MINI | 227 | Dec-2016 | 157 | |||||||||
S&P TSE 60 Index | 81 | Dec-2016 | 58 | |||||||||
SGX S&P CNX Nifty Index | 368 | Oct-2016 | (97) | |||||||||
SPI 200 Index | 153 | Dec-2016 | 420 | |||||||||
Taiwan Index | 155 | Oct-2016 | (72) | |||||||||
Topix Index | 441 | Dec-2016 | (555) | |||||||||
U.S. 10-Year Treasury Note | 2,477 | Dec-2016 | (249) | |||||||||
U.S. 2-Year Treasury Note | 5 | Dec-2016 | 1 | |||||||||
U.S. Long Treasury Bond | 464 | Dec-2016 | (740) | |||||||||
Brent Crude Penultimate** | 262 | Jan-2017 | 625 | |||||||||
Coffee** | 134 | Dec-2016 | 97 | |||||||||
Corn** | 429 | Dec-2016 | (610) | |||||||||
Cotton No. 2** | 169 | Dec-2016 | 400 | |||||||||
Cotton No. 2** | 44 | Mar-2017 | (23) | |||||||||
Crude Oil** | 162 | Dec-2016 | 428 | |||||||||
Feeder Cattle** | 32 | Jan-2017 | (145) | |||||||||
Feeder Cattle** | 119 | Nov-2016 | (552) | |||||||||
Gasoil** | 119 | Dec-2016 | 483 | |||||||||
Gasoline RBOB ** | 269 | Dec-2016 | 861 | |||||||||
Gold** | 112 | Oct-2016 | 243 | |||||||||
Gold** | 386 | Dec-2016 | (959) | |||||||||
Heating Oil** | 79 | Dec-2016 | 273 | |||||||||
ICE Brent Crude* | 109 | Dec-2016 | 417 | |||||||||
Lean Hogs** | 134 | Feb-2017 | (630) | |||||||||
Lean Hogs** | 362 | Dec-2016 | (1,790) | |||||||||
Live Cattle** | 102 | Feb-2017 | (247) | |||||||||
Live Cattle** | 566 | Dec-2016 | (1,943) | |||||||||
LME Copper** | 123 | Dec-2016 | 114 | |||||||||
| 222 | SEI Institutional Managed Trust / Annual Report / September 30, 2016 |
| Type of Contract | Number of Contracts Long (Short) | Expiration Date | Unrealized Appreciation (Depreciation) ($ Thousands) | |||||||||
LME Copper** | 92 | Dec-2016 | $99 | |||||||||
LME Lead** | 56 | Dec-2016 | 366 | |||||||||
LME Nickel** | 183 | Dec-2016 | 462 | |||||||||
LME Primary Aluminum ** | 714 | Dec-2016 | (77) | |||||||||
LME Zinc** | 214 | Dec-2016 | 565 | |||||||||
Natural Gas** | 64 | Nov-2016 | (32) | |||||||||
Natural Gas** | 127 | Jan-2017 | 14 | |||||||||
NYMEX Cocoa** | 205 | Mar-2017 | (218) | |||||||||
NYMEX Cocoa** | 16 | Dec-2016 | (51) | |||||||||
Silver** | 275 | Dec-2016 | (1,491) | |||||||||
Soybean** | 194 | Jan-2017 | (124) | |||||||||
Soybean Meal** | 165 | Dec-2016 | (1,387) | |||||||||
Soybean Oil** | 385 | Jan-2017 | (123) | |||||||||
Soybean Oil** | 47 | Dec-2016 | 76 | |||||||||
Sugar No. 11** | 705 | Mar-2017 | 1,923 | |||||||||
Wheat** | 13 | Dec-2016 | (19) | |||||||||
Wheat** | 159 | Dec-2016 | (301) | |||||||||
|
| |||||||||||
| $5,136 | ||||||||||||
|
| |||||||||||
For the year ended September 30, 2016, the total amount of all open futures contracts, as presented in the table above, are representative of the volume of activity for the derivative type during the year.
A list of the open forward foreign currency contracts held by the Fund at September 30, 2016, is as follows:
| Settlement Date | Currency to Deliver (Thousands) | Currency To Receive (Thousands) | Unrealized Appreciation (Depreciation) ($ Thousands) | |||||||||||||||||
10/11/16-12/21/16 | USD | 11,286 | CNH | 75,800 | $19 | |||||||||||||||
10/11/16-12/21/16 | CNH | 8,100 | USD | 1,212 | 1 | |||||||||||||||
12/21/16 | CNH | 16,900 | USD | 2,513 | (6) | |||||||||||||||
10/28/16-12/21/16 | GBP | 47,116 | USD | 61,832 | 536 | |||||||||||||||
10/27/16-10/28/16 | GBP | 48,369 | USD | 62,739 | (120) | |||||||||||||||
12/21/16 | EUR | 138,079 | USD | 156,104 | 322 | |||||||||||||||
10/27/16-12/21/16 | EUR | 191,795 | USD | 214,903 | (1,175) | |||||||||||||||
12/21/16 | CHF | 185 | USD | 192 | — | |||||||||||||||
10/28/16-12/21/16 | CHF | 5,172 | USD | 5,335 | (14) | |||||||||||||||
10/28/16 | AUD | 9,400 | USD | 7,191 | 4 | |||||||||||||||
10/28/16 | CAD | 11,000 | USD | 8,310 | (63) | |||||||||||||||
10/28/16-12/21/16 | HKD | 54,907 | USD | 7,083 | — | |||||||||||||||
12/21/16 | HKD | 21,510 | USD | 2,775 | (1) | |||||||||||||||
10/28/16 | JPY | 1,678,200 | USD | 16,737 | 143 | |||||||||||||||
12/21/16 | JPY | 31,148 | USD | 305 | (4) | |||||||||||||||
12/21/16 | USD | 144 | JPY | 14,668 | 1 | |||||||||||||||
12/21/16 | USD | 7 | JPY | 681 | — | |||||||||||||||
12/21/16 | USD | 192 | CAD | 249 | (2) | |||||||||||||||
12/21/16 | USD | 635 | CHF | 615 | 3 | |||||||||||||||
12/21/16 | USD | 361 | HKD | 2,801 | — | |||||||||||||||
12/21/16 | USD | 2,303 | HKD | 17,840 | — | |||||||||||||||
12/21/16 | USD | 1,825 | GBP | 1,406 | 4 | |||||||||||||||
12/21/16 | USD | 3,381 | GBP | 2,540 | (75) | |||||||||||||||
12/21/16 | ZAR | 5,800 | USD | 394 | (21) | |||||||||||||||
12/21/16 | BRL | 8,500 | USD | 2,572 | 19 | |||||||||||||||
12/21/16 | USD | 15,128 | EUR | 13,431 | 25 | |||||||||||||||
| Settlement Date | Currency to Deliver (Thousands) | Currency To Receive (Thousands) | Unrealized Appreciation (Depreciation) ($ Thousands) | |||||||||||||||||
12/21/16 | USD | 3,013 | EUR | 2,670 | $(1) | |||||||||||||||
12/21/16 | USD | 21,736 | ZAR | 315,100 | 817 | |||||||||||||||
12/21/16 | USD | 646 | ZAR | 8,900 | (10) | |||||||||||||||
12/21/16 | TRY | 18,300 | USD | 6,029 | 30 | |||||||||||||||
12/21/16 | TRY | 5,500 | USD | 1,803 | — | |||||||||||||||
12/21/16 | USD | 20,800 | INR | 1,415,111 | 199 | |||||||||||||||
12/21/16 | USD | 6,531 | INR | 439,289 | (12) | |||||||||||||||
12/21/16 | PLN | 28,300 | USD | 7,303 | (83) | |||||||||||||||
12/21/16 | USD | 24,298 | HUF | 6,724,985 | 188 | |||||||||||||||
12/21/16 | USD | 4,186 | HUF | 1,142,415 | (26) | |||||||||||||||
12/21/16 | USD | 28,831 | BRL | 97,033 | 321 | |||||||||||||||
12/21/16 | USD | 5,036 | BRL | 16,567 | (59) | |||||||||||||||
12/21/16 | USD | 34,871 | PLN | 134,600 | 258 | |||||||||||||||
12/21/16 | USD | 127 | MXN | 2,500 | — | |||||||||||||||
12/21/16 | USD | 36,879 | MXN | 701,900 | (936) | |||||||||||||||
12/21/16 | USD | 27,293 | KRW | 30,499,269 | 395 | |||||||||||||||
12/21/16 | USD | 15,266 | KRW | 16,714,731 | (92) | |||||||||||||||
12/21/16 | USD | 44,652 | TRY | 134,400 | (593) | |||||||||||||||
12/21/16 | INR | 80,800 | USD | 1,201 | 2 | |||||||||||||||
12/21/16 | MXN | 131,800 | USD | 6,865 | 115 | |||||||||||||||
12/21/16 | MXN | 107,900 | USD | 5,484 | (41) | |||||||||||||||
12/21/16 | HUF | 145,000 | USD | 529 | — | |||||||||||||||
12/21/16 | HUF | 137,500 | USD | 499 | (1) | |||||||||||||||
12/21/16 | KRW | 2,790,500 | USD | 2,544 | 10 | |||||||||||||||
12/21/16 | KRW | 5,552,000 | USD | 4,982 | (58) | |||||||||||||||
|
| |||||||||||||||||||
| $19 | ||||||||||||||||||||
|
| |||||||||||||||||||
A list of the counterparties for the outstanding forward foreign currency contracts held by the Fund at September 30, 2016, is as follows:
| Counterparty | Currency to Deliver ($ Thousands) | Currency to Receive ($ Thousands) | Unrealized Appreciation (Depreciation) ($ Thousands) | |||||||||
Brown Brothers Harriman | $(62,769) | $62,649 | $(120) | |||||||||
Citigroup | (668,945) | 669,495 | 550 | |||||||||
JPMorgan Chase Bank | (91) | 91 | — | |||||||||
State Street | (83,270) | 82,830 | (440) | |||||||||
U.S. Bancorp | (82,194) | 82,223 | 29 | |||||||||
|
| |||||||||||
| $19 | ||||||||||||
|
| |||||||||||
For the year ended September 30, 2016 the total amount of all open forward foreign currency contracts, as presented in the table above, are representative of the volume of activity for the derivative type during the year.
| SEI Institutional Managed Trust / Annual Report / September 30, 2016 | 223 |
CONSOLIDATED SCHEDULE OF INVESTMENTS
September 30, 2016
Multi-Asset Accumulation Fund (Concluded)
A list of the open OTC swap agreements held by the Fund at September 30, 2016 is as follows:
| Total Return Swaps | ||||||||||||||||||||
| Counterparty | Reference Entity/Obligation | Fund Pays | Fund Receives | Termination Date | Currency | Notional Amount (Thousands) | Net Unrealized Appreciation (Depreciation) ($Thousands) | |||||||||||||
| JPMorgan Chase Bank | Bovaspa Index | Negative Price Return | Positive Price Return | 10/19/2016 | BRL | 16,970 | $(665) | |||||||||||||
| Bank of America | Taiwan Index | Negative Price Return | Positive Price Return | 10/20/2016 | USD | 3,204 | 18 | |||||||||||||
| Bank of America | H-Shares Index | Negative Price Return | Positive Price Return | 10/31/2016 | HKD | 31,315 | (319) | |||||||||||||
| JPMorgan Chase Bank | H-Shares Index | Negative Price Return | Positive Price Return | 10/31/2016 | HKD | 13,863 | (218) | |||||||||||||
| Bank of America | Hang Seng Index | Negative Price Return | Positive Price Return | 10/31/2016 | HKD | 1,202 | (8) | |||||||||||||
| JPMorgan Chase Bank | Hang Seng Index | Negative Price Return | Positive Price Return | 10/31/2016 | HKD | 3,908 | (23) | |||||||||||||
| Bank of America | SGX S&P CNX Nifty Index | Negative Price Return | Positive Price Return | 10/31/2016 | USD | 3,616 | (86) | |||||||||||||
| JPMorgan Chase Bank | SGX S&P CNX Nifty Index | Negative Price Return | Positive Price Return | 10/31/2016 | USD | 1,938 | (22) | |||||||||||||
| Bank of America | Taiwan Index | Negative Price Return | Positive Price Return | 10/31/2016 | USD | 13,087 | (79) | |||||||||||||
| JPMorgan Chase Bank | Taiwan Index | Negative Price Return | Positive Price Return | 10/31/2016 | USD | 12,062 | (106) | |||||||||||||
| Bank of America | Japanese 10-Year Bond | Negative Price Return | Positive Price Return | 12/09/2016 | JPY | 21,061 | 177 | |||||||||||||
| Bank of America | KOSPI 200 Index | Negative Price Return | Positive Price Return | 12/09/2016 | KRW | 9,378 | 49 | |||||||||||||
| JPMorgan Chase Bank | KOSPI 200 Index | Negative Price Return | Positive Price Return | 12/09/2016 | KRW | 16,411 | (144) | |||||||||||||
| Bank of America | Euro-Bund | Negative Price Return | Positive Price Return | 12/11/2016 | EUR | 124,390 | 1,507 | |||||||||||||
| JPMorgan Chase Bank | Swiss Market Index | Negative Price Return | Positive Price Return | 12/16/2016 | CHF | 17,914 | (40) | |||||||||||||
| Bank of America | Canadian 10-Year Bond | Negative Price Return | Positive Price Return | 12/30/2016 | CAD | 1,789 | (35) | |||||||||||||
| Bank of America | U.S. Treasury 10-Year Note | Negative Price Return | Positive Price Return | 12/30/2016 | USD | 440,318 | (534) | |||||||||||||
| Citigroup | Soybean Oil ** | Negative Price Return | Positive Price Return | 12/15/2016 | USD | 3,672 | 92 | |||||||||||||
| Deutsche Bank | Soybean Oil ** | Negative Price Return | Positive Price Return | 12/15/2016 | USD | 100 | (3) | |||||||||||||
| BoA Merrill Lynch | Soybean Oil ** | Negative Price Return | Positive Price Return | 12/15/2016 | USD | 3,250 | 44 | |||||||||||||
| Citigroup | Corn ** | Negative Price Return | Positive Price Return | 12/16/2016 | USD | 5,388 | (354) | |||||||||||||
| Deutsche Bank | Corn ** | Negative Price Return | Positive Price Return | 12/16/2016 | USD | 3,738 | (263) | |||||||||||||
| BoA Merrill Lynch | Corn ** | Negative Price Return | Positive Price Return | 12/16/2016 | USD | 2,071 | (92) | |||||||||||||
| Deutsche Bank | Lean Hogs ** | Negative Price Return | Positive Price Return | 12/16/2016 | USD | 774 | (214) | |||||||||||||
| BoA Merrill Lynch | Lean Hogs ** | Negative Price Return | Positive Price Return | 12/16/2016 | USD | 1,865 | (509) | |||||||||||||
| Citigroup | Soybean Meal ** | Negative Price Return | Positive Price Return | 12/16/2016 | USD | 689 | (86) | |||||||||||||
| BoA Merrill Lynch | Soybean Meal ** | Negative Price Return | Positive Price Return | 12/16/2016 | USD | 210 | (26) | |||||||||||||
| Citibank | Wheat ** | Negative Price Return | Positive Price Return | 12/16/2016 | USD | 281 | (39) | |||||||||||||
| Deutsche Bank | Wheat ** | Negative Price Return | Positive Price Return | 12/16/2016 | USD | 623 | (3) | |||||||||||||
| BoA Merrill Lynch | Wheat ** | Negative Price Return | Positive Price Return | 12/16/2016 | USD | 583 | (15) | |||||||||||||
| Citibank | Coffee ‘C’ ** | Negative Price Return | Positive Price Return | 12/20/2016 | USD | 2,501 | 104 | |||||||||||||
| Deutsche Bank | Coffee ‘C’ ** | Negative Price Return | Positive Price Return | 12/20/2016 | USD | 909 | 45 | |||||||||||||
| Citigroup | Cotton No.2 ** | Negative Price Return | Positive Price Return | 12/21/2016 | USD | 2,213 | 144 | |||||||||||||
| Deutsche Bank | Cotton No.2 ** | Negative Price Return | Positive Price Return | 12/21/2016 | USD | 2,485 | 57 | |||||||||||||
| Citibank | LME Lead ** | Negative Price Return | Positive Price Return | 12/21/2016 | USD | 53 | 6 | |||||||||||||
| Citigroup | Cocoa ** | Negative Price Return | Positive Price Return | 12/30/2016 | USD | 55 | (6) | |||||||||||||
| Citibank | WTI Crude ** | Negative Price Return | Positive Price Return | 12/30/2016 | USD | 8,592 | 7 | |||||||||||||
| Deutsche Bank | Gold 100 Oz ** | Negative Price Return | Positive Price Return | 12/30/2016 | USD | 1,581 | (36) | |||||||||||||
| Deutsche Bank | Heating Oil ** | Negative Price Return | Positive Price Return | 12/30/2016 | �� | USD | 2,276 | 81 | ||||||||||||
| Citigroup | Wheat ** | Negative Price Return | Positive Price Return | 12/30/2016 | USD | 249 | (19) | |||||||||||||
| Citigroup | Natural Gas ** | Negative Price Return | Positive Price Return | 12/30/2016 | USD | 1,597 | (5) | |||||||||||||
| Deutsche Bank | Gas Oil Future (100Mt) ** | Negative Price Return | Positive Price Return | 12/30/2016 | USD | 314 | 9 | |||||||||||||
| BoA Merrill Lynch | Gas Oil Future (100Mt) ** | Negative Price Return | Positive Price Return | 12/30/2016 | USD | 2,690 | 30 | |||||||||||||
| Deutsche Bank | Unleaded Gas Rbob ** | Negative Price Return | Positive Price Return | 12/30/2016 | USD | 2,169 | 111 | |||||||||||||
| Deutsche Bank | Live Cattle ** | Negative Price Return | Positive Price Return | 12/31/2016 | USD | 441 | (21) | |||||||||||||
| BoA Merrill Lynch | Live Cattle ** | Negative Price Return | Positive Price Return | 12/31/2016 | USD | 3,885 | (178) | |||||||||||||
| Citibank | Soybean ** | Negative Price Return | Positive Price Return | 01/16/2017 | USD | 3,501 | (26) | |||||||||||||
| BoA Merrill Lynch | Soybean ** | Negative Price Return | Positive Price Return | 01/16/2017 | USD | 4,221 | (31) | |||||||||||||
| Citigroup | Brent Crude ** | Negative Price Return | Positive Price Return | 01/28/2017 | USD | 9,338 | 4 | |||||||||||||
|
| |||||||||||||||||||
| $(1,720) | ||||||||||||||||||||
|
| |||||||||||||||||||
A list of the open centrally cleared swap agreements held by the Fund at September 30, 2016 is as follows:
| Interest Rate Swaps | ||||||||||||
| Counterparty | Fund Pays | Fund Receives | Termination Date | Notional Amount ($ Thousands) | Net Unrealized Appreciation (Depreciation) ($ Thousands) | |||||||
| JPMorgan Chase Bank | 3-Month USD - LIBOR | 1.50% | 12/21/2021 | $136,507 | $277 | |||||||
| JPMorgan Chase Bank | 3-Month USD - LIBOR | 1.25% | 12/21/2018 | 361,231 | (83) | |||||||
|
| |||||||||||
| $194 | ||||||||||||
|
| |||||||||||
For the year ended September 30, 2016, the total amount of open swap agreements, as presented in the tables above, are representative of the volume of activity for this derivative type during the year.
| 224 | SEI Institutional Managed Trust / Annual Report / September 30, 2016 |
| Percentages are based on Net Assets of $2,279,105 ($ Thousands). |
| * | Non-income producing security. |
| ** | Futures and swap contracts held by Accumulation Commodity Strategy Subsidiary, Ltd. as of September 30, 2016. |
| ‡ | Real Estate Investment Trust. |
| ‡‡ | Expiration date unavailable. |
| (A) | The rate reported is the effective yield at the time of purchase. |
| (B) | Security, or a portion thereof, is held by the Accumulation Commodity Strategy Subsidiary, Ltd. as of September 30, 2016. |
| (C) | Security exempt from registration under Rule 144A of the Securities Act of 1933. These securities may be resold in transactions exempt from registration normally to qualified institutions. On September 30, 2016, the value of these securities amounted to $4,430 ($ Thousands), representing 0.2% of the Net Assets of the Fund. |
ADR — American Depositary Receipt
AUD — Australian Dollar
BRL — Brazilian Real
CAD — Canadian Dollar
CHF — Swiss Franc
Cl — Class
CNH — Chinese Offshore Yuan
DJ — Dow Jones
EUR — Euro
FTSE— Financial Times and the London Stock Exchange
GBP — British Pound Sterling
HKD — Hong Kong Dollar
HUF — Hungarian Forint
INR — Indian Rupee
JPY — Japanese Yen
JSE — Johannesburg Stock Exchange
KOSPI — Korea Composite Stock Price Index
KRW — Korean Won
LIBOR — London Interbank Offered Rate
LME — London Metal Exchange
MSCI — Morgan Stanley Capital International
MTN — Medium Term Note
MXN — Mexican Peso
OTC — Over the Counter
PLN — Polish Zloty
S&P— Standard & Poor’s
SGX — Singapore Exchange
SPI — Share Price Index
TRY — Turkish Lira
TSE — Tokyo Stock Exchange
USD — United States Dollar
ZAR — South African Rand
The following is a list of the level of inputs used as of September 30, 2016, in valuing the Fund’s investments and other financial instruments carried at value ($ Thousands):
| Investments in Securities | Level 1 | Level 2 | Level 3 | Total | ||||||||||||
U.S. Treasury Obligations | $ | – | $ | 1,267,709 | $ | – | $ | 1,267,709 | ||||||||
Sovereign Debt | – | 356,667 | – | 356,667 | ||||||||||||
Foreign Common Stock | 100,751 | – | – | 100,751 | ||||||||||||
Common Stock | 89,622 | – | – | 89,622 | ||||||||||||
Corporate Obligations | – | 37,948 | – | 37,948 | ||||||||||||
Exchange Traded Fund | 26,800 | – | – | 26,800 | ||||||||||||
Preferred Stock | 272 | – | – | 272 | ||||||||||||
Rights | – | 3 | – | 3 | ||||||||||||
|
|
|
|
|
|
|
| |||||||||
Total Investments in Securities | $ | 217,445 | $ | 1,662,327 | $ | – | $ | 1,879,772 | ||||||||
|
|
|
|
|
|
|
| |||||||||
| Other Financial Instruments | Level 1 | Level 2 | Level 3 | Total | ||||||||||||
Futures Contracts * | ||||||||||||||||
Unrealized Appreciation | $ | 20,732 | $ | — | $ | — | $ | 20,732 | ||||||||
Unrealized Depreciation | (15,596) | — | — | (15,596) | ||||||||||||
Forwards Contracts * | ||||||||||||||||
Unrealized Appreciation | — | 3,412 | — | 3,412 | ||||||||||||
Unrealized Depreciation | — | (3,393) | — | (3,393) | ||||||||||||
OTC Swaps | ||||||||||||||||
Total Return Swaps * | ||||||||||||||||
Unrealized Appreciation | — | 2,485 | — | 2,485 | ||||||||||||
Unrealized Depreciation | — | (4,205) | — | (4,205) | ||||||||||||
Centrally Cleared Swaps | ||||||||||||||||
Interest Rate Swaps * | ||||||||||||||||
Unrealized Appreciation | — | 277 | — | 277 | ||||||||||||
Unrealized Depreciation | — | (83) | — | (83) | ||||||||||||
|
|
|
|
|
|
|
| |||||||||
Total Other Financial Instruments | $ | 5,136 | $ | (1,507) | $ | — | $ | 3,629 | ||||||||
|
|
|
|
|
|
|
| |||||||||
* Futures contracts, forward contracts and swap contracts are valued at the unrealized appreciation (depreciation) on the instrument.
For the year ended September 30, 2016, there were no transfers between Level 1 and Level 2 assets and liabilities.
For the year ended September 30, 2016, there were no transfers between Level 2 and Level 3 assets and liabilities.
For more information on valuation inputs, see Note 2 – Significant Accounting Policies in Notes to Financial Statements.
Amounts designated as “—” are $0 or have been rounded to $0.
The accompanying notes are an integral part of the financial statements.
| SEI Institutional Managed Trust / Annual Report / September 30, 2016 | 225 |
SCHEDULE OF INVESTMENTS
September 30, 2016
Multi-Asset Income Fund
Sector Weightings (Unaudited)†:
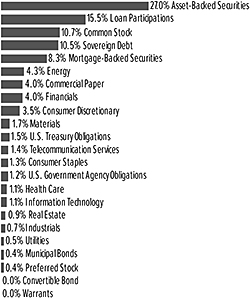
†Percentages are based on total investments.
| Description | Face Amount
(Thousands) | Market Value
($ Thousands) | ||||||||||
ASSET-BACKED SECURITIES — 25.6% | ||||||||||||
Credit Cards — 0.0% | ||||||||||||
Citi Holdings Liquidating Unrated Performing Assets, Ser 2012-BIZ,Cl A | ||||||||||||
0.128%, 12/15/2049 (A)
| $
|
|
|
| 113
|
| $
| 91
| ||||
| ||||||||||||
Mortgage Related Securities — 0.0% |
| |||||||||||
GSAA Home Equity Trust, Ser 2006-14, Cl A3A | ||||||||||||
0.775%, 09/25/2036 (B)
|
| 542
|
| 334
| ||||||||
| ||||||||||||
Other Asset-Backed Securities —25.6% | ||||||||||||
ACAS CLO, Ser 2013-1A, Cl C | ||||||||||||
3.446%, 04/20/2025 (A)(B) | 1,000 | 1,000 | ||||||||||
ACAS CLO, Ser 2015-1A, Cl F | ||||||||||||
7.329%, 04/18/2027 (A)(B) | 1,000 | 801 | ||||||||||
ACIS CLO, Ser 2013-1A, Cl ACOM | ||||||||||||
1.860%, 04/18/2024 (A)(B) | 1,000 | 966 | ||||||||||
ACIS CLO, Ser 2013-1A, Cl D | ||||||||||||
5.179%, 04/18/2024 (A)(B) | 800 | 781 | ||||||||||
ACIS CLO, Ser 2013-2A, Cl A | ||||||||||||
1.130%, 10/14/2022 (A)(B) | 348 | 345 | ||||||||||
ACIS CLO, Ser 2013-2A, Cl D | ||||||||||||
4.523%, 10/14/2022 (A)(B) | 1,100 | 1,082 | ||||||||||
ACIS CLO, Ser 2014-4A, Cl A | ||||||||||||
2.057%, 05/01/2026 (A)(B) | 500 | 499 | ||||||||||
AIM Aviation Finance, Ser 2015-1A, Cl B1 | ||||||||||||
5.072%, 02/15/2040 (A) | 887 | 854 | ||||||||||
| Description |
Face Amount
(Thousands) | Market Value
($ Thousands) | ||||||||||||
ASSET-BACKED SECURITIES (continued) | ||||||||||||||
Airplanes Pass-Through Trust, Ser 2001-1A, Cl A9 | ||||||||||||||
1.074%, 03/15/2019 (A)(B) | $ | 1,341 | $ | 443 | ||||||||||
ALM VII, Ser 2013-7RA, Cl C | ||||||||||||||
4.165%, 04/24/2024 (A)(B) | 1,250 | 1,237 | ||||||||||||
ALM XIV, Ser 2014-14A, Cl B | ||||||||||||||
3.693%, 07/28/2026 (A)(B) | 1,000 | 1,004 | ||||||||||||
ALM XIV, Ser 2014-14A, Cl C | ||||||||||||||
4.193%, 07/28/2026 (A)(B) | 1,250 | 1,219 | ||||||||||||
AMMC CLO XI, Ser 2012-11A | ||||||||||||||
0.000%, 10/30/2023 (A) | 2,100 | 1,040 | ||||||||||||
AMMC CLO XIV, Ser 2014-14A, Cl A3L | ||||||||||||||
3.515%, 07/27/2026 (A)(B) | 1,000 | 995 | ||||||||||||
Anchorage Capital CLO 4, Ser 2014-4A, Cl A1A | ||||||||||||||
2.084%, 07/28/2026 (A)(B) | 300 | 299 | ||||||||||||
Anchorage Capital CLO 6, Ser 2015-6A, Cl A1 | ||||||||||||||
2.168%, 04/15/2027 (A)(B) | 750 | 749 | ||||||||||||
Apidos CLO X, Ser 2012-10A, Cl A | ||||||||||||||
2.177%, 10/30/2022 (A)(B) | 2,350 | 2,348 | ||||||||||||
Apollo Aviation Securitization Equity Trust, Ser 2014-1, Cl A | ||||||||||||||
5.125%, 12/15/2029 (B) | 4,760 | 4,633 | ||||||||||||
Apollo Aviation Securitization Equity Trust, Ser 2014-1, Cl B | ||||||||||||||
7.500%, 12/15/2029 (B) | 4,543 | 4,509 | ||||||||||||
ARES XXV CLO, Ser 2012-3A | ||||||||||||||
0.000%, 01/17/2024 (A) | 750 | 411 | ||||||||||||
ARES XXVI CLO, Ser 2013-1A | ||||||||||||||
0.000%, 04/15/2025 (A) | 2,400 | 1,162 | ||||||||||||
ARES XXVI CLO, Ser 2013-1A, Cl C | ||||||||||||||
3.430%, 04/15/2025 (A)(B) | 750 | 750 | ||||||||||||
ARES XXVI CLO, Ser 2013-1X | ||||||||||||||
0.000%, 04/15/2025 | 500 | 242 | ||||||||||||
Atlas Senior Loan Fund II, Ser 2012-2A | ||||||||||||||
0.000%, 01/30/2024 (A) | 950 | 501 | ||||||||||||
Atlas Senior Loan Fund, Ser 2013-2A, Cl A3L | ||||||||||||||
3.517%, 02/17/2026 | 1,350 | 1,350 | ||||||||||||
Avery Point III CLO, Ser 2013-3X, Cl COM | ||||||||||||||
0.701%, 01/18/2025 (I) | 3,000 | 2,413 | ||||||||||||
B&M CLO, Ser 2014-1A, Cl A2 | ||||||||||||||
2.629%, 04/16/2026 (A)(B) | 450 | 436 | ||||||||||||
Babson CLO, Ser 2012-2A | ||||||||||||||
0.000%, 05/15/2023 (A) | 3,000 | 1,831 | ||||||||||||
Babson CLO, Ser 2014-3A, Cl F | ||||||||||||||
6.680%, 01/15/2026 (A)(B) | 2,000 | 1,556 | ||||||||||||
Babson CLO, Ser 2014-IA | ||||||||||||||
0.797%, 07/20/2025 (A) | 2,400 | 1,460 | ||||||||||||
Bank of America Student Loan Trust, Ser 2010- 1A, Cl A | ||||||||||||||
1.515%, 02/25/2043 (A)(B) | 322 | 317 | ||||||||||||
Black Diamond CLO 2006-1 Luxembourg, Ser 2007-1A, Cl AD | ||||||||||||||
1.002%, 04/29/2019 (A)(B) | 2,826 | 2,810 | ||||||||||||
| 226 | SEI Institutional Managed Trust / Annual Report / September 30, 2016 |
| Description |
Face Amount (Thousands) | Market Value ($ Thousands) | ||||||
ASSET-BACKED SECURITIES (continued) | ||||||||
Brad, Ser 2014-1, Cl B | ||||||||
5.438%, 03/12/2026 (C) | 877 | $ | 879 | |||||
Brentwood CLO, Ser 2006-1A, Cl A1A | ||||||||
1.027%, 02/01/2022 (A)(B) | 234 | 232 | ||||||
Burr Ridge CLO Plus, Ser 2006-1A, Cl A1T | ||||||||
0.900%, 03/27/2023 (A)(B) | 338 | 336 | ||||||
Carlyle Global Market Strategies CLO, Ser 2012-3A | ||||||||
0.000%, 10/14/2024 (A) | 750 | 593 | ||||||
Carlyle Global Market Strategies CLO, Ser 2014-2A, Cl DR | ||||||||
4.596%, 07/20/2023 (A)(B) | 1,000 | 996 | ||||||
Castlelake Aircraft Securitization Trust, Ser 2014-1, Cl B | ||||||||
7.500%, 02/15/2029 | 912 | 905 | ||||||
Catamaran CLO, Ser 2012-1A, Cl F | ||||||||
7.107%, 12/20/2023 (A)(B) | 1,500 | 1,108 | ||||||
Cedar Funding V CLO, Ser 2016-5A, Cl A1 | ||||||||
2.243%, 07/17/2028 (A)(B) | 2,000 | 2,005 | ||||||
Cent CLO 21, Ser 2014-21A, Cl A1B | ||||||||
2.124%, 07/27/2026 (A)(B) | 500 | 498 | ||||||
Cerberus Onshore II CLO, Ser 2014-1A, Cl C | ||||||||
4.180%, 10/15/2023 (A)(B) | 250 | 249 | ||||||
3.978%, 10/15/2023 (A)(B) | 750 | 748 | ||||||
Cerberus Onshore II CLO, Ser 2014-1A, Cl D | ||||||||
4.778%, 10/15/2023 (A)(B) | 750 | 741 | ||||||
4.680%, 10/15/2023 (A)(B) | 250 | 247 | ||||||
CIFC Funding, Ser 2014-1A, Cl A3R | ||||||||
3.887%, 08/14/2024 (A)(B) | 1,000 | 1,000 | ||||||
CIFC Funding, Ser 2014-1A, Cl C | ||||||||
3.479%, 04/18/2025 (A)(B) | 750 | 750 | ||||||
CIFC Funding, Ser 2014-3A, Cl E | ||||||||
5.452%, 07/22/2026 (A)(B) | 500 | 427 | ||||||
CIFC Funding, Ser 2014-3X | ||||||||
0.000%, 07/22/2026 | 2,000 | 1,253 | ||||||
CIT Education Loan Trust, Ser 2005-1, Cl A3 | ||||||||
0.970%, 03/15/2026 (B) | 890 | 877 | ||||||
Citigroup Mortgage Loan Trust, Ser 2005- OPT4, Cl M5 | ||||||||
1.144%, 07/25/2035 (B) | 500 | 461 | ||||||
COA Summit CLO, Ser 2014-1A, Cl C | ||||||||
4.546%, 04/20/2023 (A)(B) | 500 | 495 | ||||||
Copper River CLO, Ser 2007-1A, Cl INC | ||||||||
0.000%, 01/20/2021 (A)(B) | 3,000 | 667 | ||||||
Covenant Credit Partners CLO I, Ser 2014-1A, Cl C | ||||||||
3.616%, 07/20/2026 (A)(B) | 500 | 500 | ||||||
DIVCORE CLO, Ser 2013-1A, Cl B | ||||||||
4.381%, 11/15/2032 | 750 | 735 | ||||||
Dryden 37 Senior Loan Fund, Ser 2015-37A, Cl Q | ||||||||
0.211%, 04/15/2027 (A) | 1,000 | 930 | ||||||
| Description |
Face Amount (Thousands) | Market Value ($ Thousands) | ||||||||||
ASSET-BACKED SECURITIES (continued) |
| |||||||||||
Dryden 41 Senior Loan Fund, Ser 2015-41A | ||||||||||||
1.315%, 01/15/2028 (A) | $ | 1,600 | $ | 1,296 | ||||||||
Duane Street CLO IV, Ser 2007-4A, Cl A1R | ||||||||||||
1.077%, 11/14/2021 (A)(B) | 757 | 748 | ||||||||||
ECAF I, Ser 2015-1A, Cl B1 | ||||||||||||
5.802%, 06/15/2040 (A) | 4,402 | 4,314 | ||||||||||
ECMC Group Student Loan Trust 2016-1, Ser 2016-1A, Cl A | ||||||||||||
1.864%, 07/26/2066 (A)(B) | 1,300 | 1,300 | ||||||||||
Educational Funding of the South, Ser 2011-1, Cl A2 | ||||||||||||
1.365%, 04/25/2035 (B) | 560 | 552 | ||||||||||
Emerald Aviation Finance, Ser 2013-1, Cl B | ||||||||||||
6.350%, 10/15/2038 (A) | 1,150 | 1,152 | ||||||||||
Fifth Street SLF II, Ser 2015-2A, Cl A2 | ||||||||||||
3.448%, 09/29/2027 (A)(B) | 1,000 | 990 | ||||||||||
Finn Square CLO, Ser 2012-1A | ||||||||||||
0.000%, 12/24/2023 (A) | 1,000 | 455 | ||||||||||
Fortress Credit Funding V, Ser 2015-5A, Cl BR | ||||||||||||
4.468%, 08/15/2022 (A)(B) | 2,000 | 1,965 | ||||||||||
Fortress Credit Investments IV, Ser 2015-4A, Cl D | ||||||||||||
4.179%, 07/17/2023 (A)(B) | 1,000 | 968 | ||||||||||
Fortress Credit Opportunities III CLO, Ser 2014- 3A, Cl C | ||||||||||||
3.907%, 04/28/2026 (A)(B) | 2,500 | 2,353 | ||||||||||
Fortress Credit Opportunities V CLO, Ser 2014-5A, Cl C | ||||||||||||
4.215%, 10/15/2026 (A)(B) | 2,250 | 2,216 | ||||||||||
Fortress Credit Opportunities V CLO, Ser 2014- 5A, Cl D | ||||||||||||
5.165%, 10/15/2026 (A)(B) | 1,000 | 933 | ||||||||||
Fortress Credit Opportunities VI CLO, Ser 2015- 6A, Cl D | ||||||||||||
5.845%, 10/10/2026 (A)(B) | 1,000 | 955 | ||||||||||
Galaxy XIX CLO, Ser 2015-19A, Cl COMB | ||||||||||||
0.307%, 01/24/2027 (A) | 1,000 | 885 | ||||||||||
Gale Force 3 Clo, Ser 2007-3A, Cl B1 | ||||||||||||
1.078%, 04/19/2021 (A)(B) | 1,550 | 1,512 | ||||||||||
Gallatin CLO VII, Ser 2014-1A, Cl D | ||||||||||||
4.388%, 07/15/2023 (A)(B) | 500 | 476 | ||||||||||
Garrison Funding 2016-2, Ser 2016-2A, Cl B | ||||||||||||
4.856%, 09/29/2027 (A)(B)(C) | 1,000 | 989 | ||||||||||
GCAT, Ser 2015-1, Cl A1 | ||||||||||||
3.625%, 05/26/2020 (A) | 1,047 | 1,049 | ||||||||||
Golub Capital Partners CLO, Ser 2014-18A, Cl C | ||||||||||||
4.215%, 04/25/2026 (A)(B) | 600 | 594 | ||||||||||
Golub Capital Partners CLO, Ser 2014-18A, Cl D | ||||||||||||
4.715%, 04/25/2026 (A)(B) | 300 | 270 �� | ||||||||||
Golub Capital Partners CLO, Ser 2014-21A, Cl C | ||||||||||||
4.015%, 10/25/2026 (A)(B) | 1,200 | 1,157 | ||||||||||
Golub Capital Partners CLO, Ser 2015-24A, Cl C | ||||||||||||
4.528%, 02/05/2027 (A)(B) | 2,000 | 1,990 | ||||||||||
| SEI Institutional Managed Trust / Annual Report / September 30, 2016 | 227 |
SCHEDULE OF INVESTMENTS
September 30, 2016
Multi-Asset Income Fund (Continued)
| Description |
Face Amount
(Thousands) | Market Value
($ Thousands) | ||||||
ASSET-BACKED SECURITIES (continued) | ||||||||
Golub Capital Partners CLO, Ser 2015-25A, Cl C | ||||||||
4.428%, 08/05/2027 (A)(B) | $ | 1,000 | $ | 953 | ||||
Gramercy Park CLO, Ser 2012-1A | ||||||||
2.122%, 07/17/2023 (A) | 1,100 | 610 | ||||||
Gramercy Park CLO, Ser 2014-1A, Cl CR | ||||||||
4.729%, 07/17/2023 (A)(B) | 600 | 596 | ||||||
Gramercy Real Estate, Ser 2007-1A, Cl A1 | ||||||||
1.097%, 08/15/2056 (A)(B) | 3,017 | 2,849 | ||||||
Grayson CLO, Ser 2006-1A, Cl A2 | ||||||||
1.167%, 11/01/2021 (A)(B) | 700 | 675 | ||||||
Great Lakes CLO, Ser 2012-1A | ||||||||
0.000%, 01/15/2023 (A) | 1,000 | 692 | ||||||
Great Lakes CLO, Ser 2014-1A, Cl C | ||||||||
4.380%, 04/15/2025 (A)(B) | 2,500 | 2,428 | ||||||
Great Lakes CLO, Ser 2014-1A, Cl D | ||||||||
4.880%, 04/15/2025 (A)(B) | 500 | 455 | ||||||
Greywolf CLO III, Ser 2014-1A, Cl B | ||||||||
3.552%, 04/22/2026 (A)(B) | 750 | 750 | ||||||
Halcyon Loan Advisors Funding, Ser 2012-1A, Cl B | ||||||||
0.382%, 08/15/2023 (A)(B) | 500 | 481 | ||||||
Halcyon Loan Advisors Funding, Ser 2012-2A, Cl C | ||||||||
3.707%, 12/20/2024 (A)(B) | 500 | 478 | ||||||
Halcyon Loan Advisors Funding, Ser 2013-1A, Cl A1 | ||||||||
1.778%, 04/15/2025 (A)(B) | 500 | 496 | ||||||
Halcyon Loan Advisors Funding, Ser 2014-1A, Cl A1 | ||||||||
2.163%, 04/18/2026 (A)(B) | 650 | 649 | ||||||
Halcyon Loan Investors CLO II, Ser 2007-2A, Cl C | ||||||||
2.115%, 04/24/2021 (A)(B) | 500 | 487 | ||||||
Helios Series I Multi Asset, Ser 2001-1A, Cl B | ||||||||
1.794%, 12/13/2036 (A)(B) | 35 | 34 | ||||||
JP Morgan Mortgage Acquisition Trust, Ser 2007-CH5, Cl A5 | ||||||||
0.784%, 05/25/2037 (B) | 1,400 | 1,156 | ||||||
Kingsland IV, Ser 2007-4A, Cl D | ||||||||
2.129%, 04/16/2021 (A)(B) | 500 | 473 | ||||||
KKR CLO 12, Ser 2015-12, Cl C | ||||||||
3.680%, 07/15/2027 (A)(B) | 1,000 | 999 | ||||||
KVK CLO, Ser 2013-1A | ||||||||
0.000%, 04/14/2025 (A) | 3,500 | 1,326 | ||||||
KVK CLO, Ser 2014-1A, Cl C | ||||||||
3.717%, 05/15/2026 (A)(B) | 1,000 | 967 | ||||||
KVK CLO, Ser 2014-2A, Cl C | ||||||||
3.680%, 07/15/2026 (A)(B) | 1,000 | 979 | ||||||
LCM X, Ser 2014-10A, Cl DR | ||||||||
4.430%, 04/15/2022 (A)(B) | 1,000 | 1,000 | ||||||
Lime Street CLO, Ser 2007-1A, Cl D | ||||||||
3.357%, 06/20/2021 (A)(B) | 750 | 706 | ||||||
| Description |
Face Amount
(Thousands) | Market Value
($ Thousands) | ||||||
ASSET-BACKED SECURITIES (continued) | ||||||||
Long Beach Mortgage Loan Trust, Ser 2006-5, Cl 2A3 | ||||||||
0.675%, 06/25/2036 (B) | $ | 3,007 | $ | 1,529 | ||||
Marathon CLO II, Ser 2005-2A, Cl INC | ||||||||
0.000%, 12/20/2019 (A)(B) | 750 | – | ||||||
Marathon CLO VI, Ser 2014-6A, Cl B | ||||||||
3.667%, 05/13/2025 (A)(B) | 1,000 | 971 | ||||||
MCF CLO III, Ser 2014-3A, Cl D | ||||||||
3.417%, 01/20/2024 (A)(B) | 250 | 213 | ||||||
MCF CLO IV, Ser 2014-1A, Cl E | ||||||||
6.580%, 10/15/2025 (A)(B) | 500 | 429 | ||||||
Mountain Hawk II CLO, Ser 2013-2A, Cl C | ||||||||
3.296%, 07/22/2024 (A)(B) | 1,000 | 935 | ||||||
Mountain Hawk II CLO, Ser 2013-2A, Cl D | ||||||||
3.846%, 07/22/2024 (A)(B) | 1,000 | 820 | ||||||
MT Wilson CLO II, Ser 2007-2A, Cl D | ||||||||
3.415%, 07/11/2020 (A)(B) | 3,000 | 2,892 | ||||||
Navient Student Loan Trust, Ser 2016-2, Cl A2 | ||||||||
1.574%, 06/25/2065 (A)(B) | 750 | 757 | ||||||
Navient Student Loan Trust, Ser 2016-5A, Cl A | ||||||||
1.737%, 06/25/2065 (A)(B) | 2,370 | 2,370 | ||||||
Neuberger Berman CLO, Ser 2012-12A | ||||||||
0.000%, 07/25/2023 (A) | 3,200 | 1,630 | ||||||
NewMark Capital Funding CLO, Ser 2014-2A, Cl E | ||||||||
5.431%, 06/30/2026 (A)(B) | 3,000 | 2,332 | ||||||
NewStar Arlington Senior Loan Program, Ser 2014-1A, Cl C1 | ||||||||
4.015%, 07/25/2025 (A)(B) | 1,000 | 969 | ||||||
NewStar Arlington Senior Loan Program, Ser 2014-1A, Cl D | ||||||||
4.965%, 07/25/2025 (A)(B) | 750 | 692 | ||||||
Newstar Commercial Loan Funding, Ser 2013- 1A, Cl D | ||||||||
5.407%, 09/20/2023 (A)(B) | 600 | 559 | ||||||
Newstar Commercial Loan Funding, Ser 2013- 1A, Cl E | ||||||||
6.157%, 09/20/2023 (A)(B) | 250 | 227 | ||||||
Newstar Commercial Loan Funding, Ser 2014- 1A, Cl C | ||||||||
4.296%, 04/20/2025 (A)(B) | 1,500 | 1,474 | ||||||
Newstar Commercial Loan Funding, Ser 2014- 1A, Cl D | ||||||||
5.446%, 04/20/2025 (A)(B) | 750 | 683 | ||||||
Newstar Commercial Loan Funding, Ser 2015- 1A, Cl C | ||||||||
4.484%, 01/20/2027 (A)(B) | 1,000 | 999 | ||||||
Newstar Commercial Loan Trust, Ser 2007-1A, Cl C | ||||||||
2.129%, 09/30/2022 (A)(B) | 500 | 483 | ||||||
Newstar Trust, Ser 2012-2A, Cl D | ||||||||
6.946%, 01/20/2023 (A)(B) | 500 | 487 | ||||||
| 228 | SEI Institutional Managed Trust / Annual Report / September 30, 2016 |
| ||||||||
Face Amount |
Market Value | |||||||
| Description |
(Thousands) |
($ Thousands) | ||||||
| ||||||||
ASSET-BACKED SECURITIES (continued) | ||||||||
Northwoods Capital XIV, Ser 2014-14A, Cl C | ||||||||
4.168%, 11/12/2025 (A)(B) | $ | 1,500 | $ | 1,501 | ||||
NRPL Trust, Ser 2014-2A, Cl A1 | ||||||||
3.750%, 10/25/2057 (A)(B) | 877 | 872 | ||||||
NRPL Trust, Ser 2015-1A, Cl A1 | ||||||||
3.875%, 11/01/2054 (A) | 2,289 | 2,274 | ||||||
N-Star Reak Estate CDO VIII, Ser 2006-8A, Cl A2 | ||||||||
0.883%, 02/01/2041 (A)(B) | 1,000 | 971 | ||||||
Oak Hill Advisors Residential Loan Trust, Ser 2015-NPL2, Cl A1 | ||||||||
3.721%, 07/25/2055 (A)(D) | 1,876 | 1,860 | ||||||
Oaktree EIF II, Ser 2014-A2, Cl C | ||||||||
4.017%, 11/15/2025 (A)(B) | 1,000 | 1,000 | ||||||
OCP CLO, Ser 2014-6A, Cl B | ||||||||
3.779%, 07/17/2026 (A)(B) | 1,000 | 1,000 | ||||||
OCP CLO, Ser 2016-12A, Cl A1 | ||||||||
2.426%, 10/18/2028 (A)(B) | 1,400 | 1,399 | ||||||
Octagon Investment Partners XV, Ser 2013-1A, Cl C | ||||||||
3.538%, 01/19/2025 (A)(B) | 500 | 499 | ||||||
Octagon Investment Partners XX, Ser 2014-1A, Cl E | ||||||||
6.068%, 08/12/2026 (A)(B) | 2,750 | 2,323 | ||||||
Octagon Loan Funding, Ser 2014-1A | ||||||||
0.000%, 11/18/2026 (A) | 1,000 | 575 | ||||||
OFSI Fund VI, Ser 2014-6A, Cl A1 | ||||||||
1.658%, 03/20/2025 (A)(B) | 650 | 641 | ||||||
OFSI Fund VII, Ser 2014-7A, Cl A | ||||||||
1.973%, 10/18/2026 (A)(B) | 601 | 596 | ||||||
OHA Credit Partners IX, Ser 2013-9A, Cl ACOM | ||||||||
0.476%, 10/20/2025 (A) | 2,000 | 1,751 | ||||||
OHA Credit Partners VII, Ser 2012-7A, Cl D | ||||||||
4.811%, 11/20/2023 (A)(B) | 1,000 | 1,000 | ||||||
OZLM Funding V, Ser 2013-5A, Cl B | ||||||||
3.679%, 01/17/2026 (A)(B) | 750 | 750 | ||||||
Palmer Square CLO, Ser 2014-1A, Cl B | ||||||||
3.229%, 10/17/2022 (A)(B) | 1,000 | 991 | ||||||
Palmer Square CLO, Ser 2014-1A, Cl C | ||||||||
4.529%, 10/17/2022 (A)(B) | 2,000 | 1,998 | ||||||
Panhandle-Plains Higher Education Authority, Ser 2011-1, Cl A2 | ||||||||
1.596%, 07/01/2024 (B) | 1,227 | 1,226 | ||||||
PHEAA Student Loan Trust, Ser 2016-1A, Cl A | ||||||||
1.728%, 09/25/2065 (A)(B) | 1,400 | 1,400 | ||||||
Primus CLO II, Ser 2007-2A, Cl C | ||||||||
1.630%, 07/15/2021 (A)(B) | 1,500 | 1,445 | ||||||
Putnam Structured Product Funding, Ser 2003- 1A, Cl A2 | ||||||||
1.524%, 10/15/2038 (A)(B) | 2,000 | 1,820 | ||||||
Race Point CLO, Ser 2014-5A, Cl DR | ||||||||
4.600%, 12/15/2022 (A)(B) | 1,600 | 1,599 | ||||||
| ||||||||
Face Amount |
Market Value | |||||||
| Description |
(Thousands) |
($ Thousands) | ||||||
| ||||||||
ASSET-BACKED SECURITIES (continued) | ||||||||
RAIT CRE CDO I, Ser 2006-1X, Cl A1B | ||||||||
0.862%, 11/20/2046 (B) | $ | 1,104 | $ | 1,068 | ||||
Scholar Funding Trust, Ser 2011-A, Cl A | ||||||||
1.643%, 10/28/2043 (A)(B) | 1,660 | 1,593 | ||||||
Scholar Funding Trust, Ser 2012-B, Cl A2 | ||||||||
1.624%, 03/28/2046 (A)(B) | 1,650 | 1,600 | ||||||
Shackleton CLO, Ser 2012-2A, Cl D | ||||||||
4.746%, 10/20/2023 (A)(B) | 1,000 | 991 | ||||||
Sound Point CLO VI, Ser 2014-2A, Cl A1 | ||||||||
1.994%, 10/20/2026 (A)(B) | 400 | 399 | ||||||
Sound Point CLO XI, Ser 2016-1A, Cl A | ||||||||
2.285%, 07/20/2028 (A)(B) | 2,800 | 2,807 | ||||||
Sound Point CLO XI, Ser 2016-1A, Cl B1 | ||||||||
2.925%, 07/20/2028 (A)(B) | 800 | 807 | ||||||
Steele Creek CLO, Ser 2014-1A, Cl C | ||||||||
4.011%, 08/21/2026 (A)(B) | 500 | 500 | ||||||
Symphony CLO XI, Ser 2013-11A, Cl D | ||||||||
4.679%, 01/17/2025 (A)(B) | 1,000 | 996 | ||||||
Telos CLO, Ser 2013-3A, Cl D | ||||||||
4.929%, 01/17/2024 (A)(B) | 1,050 | 1,010 | ||||||
Telos CLO, Ser 2014-6A, Cl C | ||||||||
3.679%, 01/17/2027 (A)(B) | 3,000 | 2,962 | ||||||
TICP CLO I, Ser 2015-1A, Cl E | ||||||||
6.196%, 07/20/2027 (A)(B) | 1,500 | 1,294 | ||||||
TICP CLO II, Ser 2014-2A, Cl B | ||||||||
3.696%, 07/20/2026 (A)(B) | 600 | 593 | ||||||
Treman Park CLO, Ser 2015-1A, Cl COM | ||||||||
0.459%, 04/20/2027 (A)(I) | 3,000 | 2,667 | ||||||
Triaxx Prime, Ser 2006-2A, Cl A1A | ||||||||
0.785%, 10/02/2039 (A)(B) | 5,106 | 4,897 | ||||||
Turbine Engines Securitization, Ser 2013-1A, Cl A | ||||||||
5.125%, 12/13/2048 (A) | 933 | 924 | ||||||
Turbine Engines Securitization, Ser 2013-1A, Cl B | ||||||||
6.375%, 12/13/2048 (A) | 600 | 552 | ||||||
Venture XV CLO, Ser 2013-15A, Cl C | ||||||||
3.780%, 07/15/2025 (A)(B) | 250 | 250 | ||||||
Wachovia Asset Securitization Issuance II, Ser 2007-HE1, Cl A | ||||||||
0.665%, 07/25/2037 (A)(B) | 728 | 606 | ||||||
West CLO, Ser 2013-1A | ||||||||
0.000%, 11/07/2025 (A) | 1,350 | 442 | ||||||
West CLO, Ser 2013-1A, Cl B | ||||||||
3.688%, 11/07/2025 (A)(B) | 1,000 | 963 | ||||||
WhiteHorse VIII, Ser 2014-1A, Cl C | ||||||||
3.507%, 05/01/2026 (A)(B) | 1,000 | 952 | ||||||
Willis Engine Securitization Trust II, Ser 2012-A, Cl A | ||||||||
5.500%, 09/15/2037 (A) | 1,459 | 1,427 | ||||||
| SEI Institutional Managed Trust / Annual Report / September 30, 2016 | 229 |
SCHEDULE OF INVESTMENTS
September 30, 2016
Multi-Asset Income Fund (Continued)
| ||||||||
Face Amount |
Market Value | |||||||
| Description |
(Thousands) |
($ Thousands) | ||||||
| ||||||||
ASSET-BACKED SECURITIES (continued) | ||||||||
Zais CLO 4, Ser 2016-1A, Cl A | ||||||||
2.183%, 05/10/2025 (A)(B) | $ | 750 | $ | 747 | ||||
| ||||||||
| 189,022 | ||||||||
| ||||||||
Total Asset-Backed Securities | 189,447 | |||||||
| ||||||||
CORPORATE OBLIGATIONS — 19.3% | ||||||||
Consumer Discretionary — 3.3% | ||||||||
21st Century Fox America | ||||||||
4.950%, 10/15/2045 | 250 | 283 | ||||||
Ahern Rentals | ||||||||
7.375%, 05/15/2023 (A) | 550 | 356 | ||||||
Altice Financing | ||||||||
7.500%, 05/15/2026 (A) | 1,075 | 1,119 | ||||||
6.625%, 02/15/2023 (A) | 500 | 513 | ||||||
Altice Financing MTN | ||||||||
5.250%, 02/15/2023 | EUR | 300 | 350 | |||||
Altice US Finance I | ||||||||
5.500%, 05/15/2026 (A) | $ | 200 | 206 | |||||
AMC Networks | ||||||||
5.000%, 04/01/2024 | 400 | 403 | ||||||
Burger King Worldwide | ||||||||
6.000%, 04/01/2022 (A) | 625 | 655 | ||||||
Cablevision | ||||||||
6.500%, 06/15/2021 (A) | 150 | 156 | ||||||
CCO Holdings | ||||||||
5.750%, 02/15/2026 (A) | 1,000 | 1,060 | ||||||
Charter Communications Operating | ||||||||
6.484%, 10/23/2045 (A) | 50 | 61 | ||||||
4.908%, 07/23/2025 (A) | 250 | 276 | ||||||
3.579%, 07/23/2020 (A) | 450 | 470 | ||||||
Clear Channel Worldwide Holdings | ||||||||
6.500%, 11/15/2022 | 550 | 554 | ||||||
Comcast | ||||||||
3.375%, 08/15/2025 | 300 | 322 | ||||||
DISH DBS | ||||||||
7.750%, 07/01/2026 (A) | 600 | 638 | ||||||
5.875%, 07/15/2022 | 300 | 308 | ||||||
5.875%, 11/15/2024 | 2,150 | 2,123 | ||||||
Ford Motor Credit | ||||||||
5.875%, 08/02/2021 | 350 | 399 | ||||||
General Motors | ||||||||
3.500%, 10/02/2018 | 250 | 258 | ||||||
Gray Television | ||||||||
5.125%, 10/15/2024 (A)(E) | 250 | 245 | ||||||
IHO Verwaltungs GmbH PIK | ||||||||
4.500%, 09/15/2023 (A) | 550 | 555 | ||||||
KFC Holding | ||||||||
5.250%, 06/01/2026 (A) | 150 | 159 | ||||||
5.000%, 06/01/2024 (A) | 100 | 104 | ||||||
Face Amount |
Market Value | |||||||
| Description |
(Thousands) |
($ Thousands) | ||||||
CORPORATE OBLIGATIONS (continued) | ||||||||
MDC Partners | ||||||||
6.500%, 05/01/2024 (A) | $ | 550 | $ | 509 | ||||
MGM Resorts International | ||||||||
6.750%, 10/01/2020 | 600 | 672 | ||||||
Midcontinent Communications & Midcontinent Finance | ||||||||
6.875%, 08/15/2023 (A) | 1,200 | 1,278 | ||||||
Nexstar Escrow | ||||||||
5.625%, 08/01/2024 (A) | 200 | 201 | ||||||
Schaeffler Finance | ||||||||
4.750%, 05/15/2023 (A) | 275 | 285 | ||||||
Scientific Games International | ||||||||
10.000%, 12/01/2022 | 825 | 761 | ||||||
Seminole Hard Rock Entertainment | ||||||||
5.875%, 05/15/2021 (A) | 300 | 303 | ||||||
SFR Group | ||||||||
6.250%, 05/15/2024 (A) | 700 | 695 | ||||||
6.000%, 05/15/2022 (A) | 1,750 | 1,785 | ||||||
Sirius XM Radio | ||||||||
5.375%, 04/15/2025 (A) | 400 | 413 | ||||||
4.625%, 05/15/2023 (A) | 250 | 250 | ||||||
Unitymedia GmbH | ||||||||
6.125%, 01/15/2025 (A) | 1,050 | 1,101 | ||||||
Univision Communications | ||||||||
5.125%, 02/15/2025 (A) | 800 | 805 | ||||||
UPC Holding BV | ||||||||
6.750%, 03/15/2023 | EUR | 350 | 422 | |||||
UPCB Finance IV | ||||||||
5.375%, 01/15/2025 (A) | $ | 200 | 201 | |||||
4.000%, 01/15/2027 | EUR | 350 | 389 | |||||
Virgin Media Secured Finance | ||||||||
5.500%, 01/15/2025 (A) | $ | 1,050 | 1,074 | |||||
4.875%, 01/15/2027 | GBP | 100 | 130 | |||||
WMG Acquisition | ||||||||
6.750%, 04/15/2022 (A) | $ | 705 | 746 | |||||
5.625%, 04/15/2022 (A) | 250 | 259 | ||||||
Wynn Las Vegas | ||||||||
5.500%, 03/01/2025 (A) | 845 | 855 | ||||||
| ||||||||
| 24,707 | ||||||||
| ||||||||
Consumer Staples — 1.2% | ||||||||
Anheuser-Busch InBev Finance | ||||||||
4.900%, 02/01/2046 | 725 | 863 | ||||||
BAT International Finance | ||||||||
3.950%, 06/15/2025 (A) | 425 | 470 | ||||||
2.750%, 06/15/2020 (A) | 350 | 362 | ||||||
Bumble Bee Holdings | ||||||||
9.000%, 12/15/2017 (A) | 3,216 | 3,232 | ||||||
CVS Health | ||||||||
5.125%, 07/20/2045 | 150 | 184 | ||||||
3.875%, 07/20/2025 | 332 | 361 | ||||||
| 230 | SEI Institutional Managed Trust / Annual Report / September 30, 2016 |
Face Amount
| Market Value
| |||||||
| Description | (Thousands) | ($ Thousands) | ||||||
CORPORATE OBLIGATIONS (continued) | ||||||||
KeHE Distributors | ||||||||
7.625%, 08/15/2021 (A) | $ | 550 | $ | 546 | ||||
Kraft Heinz Foods | ||||||||
3.500%, 07/15/2022 | 350 | 372 | ||||||
Lindley | ||||||||
4.625%, 04/12/2023 | 190 | 195 | ||||||
Performance Food Group | ||||||||
5.500%, 06/01/2024 (A) | 250 | 258 | ||||||
Reynolds American | ||||||||
5.850%, 08/15/2045 | 250 | 325 | ||||||
4.450%, 06/12/2025 | 425 | 474 | ||||||
SABMiller Holdings | ||||||||
4.950%, 01/15/2042 (A) | 300 | 350 | ||||||
Sigma Alimentos | ||||||||
4.125%, 05/02/2026 (A) | 430 | 431 | ||||||
Sysco | ||||||||
4.850%, 10/01/2045 | 150 | 171 | ||||||
3.750%, 10/01/2025
| 350
| 377
| ||||||
| ||||||||
| 8,971 | ||||||||
| ||||||||
Energy — 4.0% | ||||||||
Anadarko Petroleum | ||||||||
6.450%, 09/15/2036 | 775 | 905 | ||||||
3.450%, 07/15/2024 | 150 | 148 | ||||||
Antero Resources | ||||||||
6.000%, 12/01/2020 | 325 | 336 | ||||||
5.625%, 06/01/2023 | 100 | 102 | ||||||
5.125%, 12/01/2022 | 1,275 | 1,285 | ||||||
Apache | ||||||||
4.750%, 04/15/2043 | 150 | 153 | ||||||
4.250%, 01/15/2044 | 150 | 146 | ||||||
Approach Resources | ||||||||
7.000%, 06/15/2021 | 1,000 | 800 | ||||||
BreitBurn Energy Partners | ||||||||
9.250%, 05/18/2020 (C)(F) | 813 | 569 | ||||||
Cheniere Corpus Christi Holdings | ||||||||
7.000%, 06/30/2024 (A) | 300 | 324 | ||||||
Comstock Resources | ||||||||
10.000%, 03/15/2020 | 675 | 624 | ||||||
ConocoPhillips | ||||||||
4.950%, 03/15/2026 | 500 | 564 | ||||||
3.350%, 11/15/2024 | 350 | 358 | ||||||
CONSOL Energy | ||||||||
8.000%, 04/01/2023 | 1,000 | 970 | ||||||
Crestwood Midstream Partners | ||||||||
6.125%, 03/01/2022 | 450 | 455 | ||||||
Devon Energy | ||||||||
5.850%, 12/15/2025 | 800 | 900 | ||||||
3.250%, 05/15/2022 | 200 | 199 | ||||||
Dolphin Energy | ||||||||
5.500%, 12/15/2021 | 220 | 252 | ||||||
Face Amount
| Market Value
| |||||||
| Description | (Thousands) | ($ Thousands) | ||||||
CORPORATE OBLIGATIONS (continued) | ||||||||
Dynagas LNG Partners | ||||||||
6.250%, 10/30/2019 (E) | $ | 1,800 | $ | 1,669 | ||||
Enterprise Products Operating | ||||||||
3.750%, 02/15/2025 | 500 | 518 | ||||||
3.700%, 02/15/2026 | 300 | 309 | ||||||
Gazprom Neft OAO Via GPN Capital | ||||||||
6.000%, 11/27/2023 | 920 | 992 | ||||||
Gazprom OAO Via Gaz Capital MTN | ||||||||
7.288%, 08/16/2037 | 610 | 719 | ||||||
Gazprom OAO Via Gaz Capital | ||||||||
9.250%, 04/23/2019 | 310 | 357 | ||||||
Gibson Energy | ||||||||
6.750%, 07/15/2021 (A) | 634 | 648 | ||||||
GNL Quintero | ||||||||
4.634%, 07/31/2029 | 400 | 420 | ||||||
Halcon Resources | ||||||||
8.625%, 02/01/2020 (A) | 185 | 186 | ||||||
Hess | ||||||||
7.300%, 08/15/2031 | 350 | 415 | ||||||
KazMunayGas National JSC MTN | ||||||||
9.125%, 07/02/2018 | 600 | 662 | ||||||
Kinder Morgan | ||||||||
5.050%, 02/15/2046 | 175 | 167 | ||||||
Laredo Petroleum | ||||||||
7.375%, 05/01/2022 | 575 | 594 | ||||||
6.250%, 03/15/2023 | 300 | 294 | ||||||
Oasis Petroleum | ||||||||
6.875%, 03/15/2022 | 475 | 455 | ||||||
6.875%, 01/15/2023 | 400 | 382 | ||||||
Petroleos de Venezuela | ||||||||
6.000%, 05/16/2024 | 1,950 | 833 | ||||||
6.000%, 11/15/2026 | 790 | 332 | ||||||
5.500%, 04/12/2037 | 30 | 12 | ||||||
5.375%, 04/12/2027 | 560 | 234 | ||||||
Petroleos Mexicanos | ||||||||
8.000%, 05/03/2019 | 160 | 180 | ||||||
6.625%, 06/15/2035 | 120 | 122 | ||||||
6.375%, 02/04/2021 | 220 | 240 | ||||||
5.750%, 03/01/2018 | 310 | 325 | ||||||
4.875%, 01/24/2022 | 10 | 10 | ||||||
Petroleos Mexicanos MTN | ||||||||
6.875%, 08/04/2026 (A)(E) | 710 | 801 | ||||||
6.750%, 09/21/2047 (A) | 110 | 110 | ||||||
5.500%, 02/04/2019 | 90 | 95 | ||||||
5.125%, 03/15/2023 | EUR | 880 | 1,106 | |||||
4.500%, 01/23/2026 | $ | 10 | 10 | |||||
3.500%, 07/23/2020 | 100 | 101 | ||||||
Rice Energy | ||||||||
6.250%, 05/01/2022 | 425 | 439 | ||||||
Sabine Pass Liquefaction | ||||||||
5.750%, 05/15/2024 | 400 | 431 | ||||||
| SEI Institutional Managed Trust / Annual Report / September 30, 2016 | 231 |
SCHEDULE OF INVESTMENTS
September 30, 2016
Multi-Asset Income Fund (Continued)
Face Amount |
Market Value | |||||||
| Description |
(Thousands) |
($ Thousands) | ||||||
CORPORATE OBLIGATIONS (continued) | ||||||||
SandRidge Energy | ||||||||
8.750%, 06/01/2020 (A)(E)(F) | $ | 2,750 | $ | 990 | ||||
Schahin II Finance | ||||||||
5.875%, 09/25/2022 (A)(F) | 1,737 | 208 | ||||||
SM Energy | ||||||||
6.750%, 09/15/2026 | 200 | 202 | ||||||
Sunoco Logistics Partners Operations | ||||||||
5.950%, 12/01/2025 | 1,500 | 1,738 | ||||||
TOTAL MTN | ||||||||
2.625%, 12/29/2049 (B) | EUR | 800 | 868 | |||||
Unit | ||||||||
6.625%, 05/15/2021 | $ | 420 | 354 | |||||
Weatherford International | ||||||||
6.500%, 08/01/2036 | 150 | 107 | ||||||
Western Gas Partners | ||||||||
4.000%, 07/01/2022 | 200 | 205 | ||||||
Whiting Petroleum | ||||||||
5.750%, 03/15/2021 | 200 | 187 | ||||||
5.000%, 03/15/2019 | 425 | 411 | ||||||
Williams Partners | ||||||||
3.600%, 03/15/2022 | 800 | 814 | ||||||
WPX Energy | ||||||||
6.000%, 01/15/2022 | 400 | 399 | ||||||
YPF | ||||||||
8.875%, 12/19/2018
| 130 ��
| 144
| ||||||
| 29,885 | ||||||||
Financials — 3.8% | ||||||||
Abe Investment Holdings | ||||||||
10.500%, 10/16/2020 (A) | 1,000 | 950 | ||||||
Banco do Brasil | ||||||||
9.000%, 06/29/2049 (B) | 360 | 310 | ||||||
Banco Regional SAECA | ||||||||
8.125%, 01/24/2019 | 290 | 312 | ||||||
Bank of America MTN | ||||||||
4.000%, 04/01/2024 | 650 | 701 | ||||||
Bank of America(B) | ||||||||
6.300%, 12/31/2049 | 700 | 760 | ||||||
6.250%, 09/29/2049 | 150 | 156 | ||||||
6.100%, 12/29/2049 | 2,000 | 2,085 | ||||||
BPCE MTN | ||||||||
4.875%, 04/01/2026 (A) | 200 | 208 | ||||||
CIC Receivables Master Trust | ||||||||
4.890%, 10/07/2021 (C) | 2,688 | 2,712 | ||||||
Citigroup(B) | ||||||||
5.950%, 12/29/2049 | 1,820 | 1,853 | ||||||
5.950%, 12/31/2049 | 350 | 357 | ||||||
5.875%, 12/29/2049 | 2,595 | 2,604 | ||||||
CoBank ACB | ||||||||
6.250%, 12/29/2049 (B) | 250 | 273 | ||||||
Credit Suisse Group | ||||||||
6.250%, 12/29/2049 (A)(B) | 200 | 190 | ||||||
Face Amount |
Market Value | |||||||
| Description |
(Thousands) |
($ Thousands) | ||||||
CORPORATE OBLIGATIONS (continued) | ||||||||
Deutsche Bank | ||||||||
2.500%, 02/13/2019 | $ | 125 | $ | 121 | ||||
FBM Finance | ||||||||
8.250%, 08/15/2021 (A)(E) | 150 | 157 | ||||||
Fifth Third Bancorp | ||||||||
4.900%, 12/29/2049 (B) | 1,200 | 1,163 | ||||||
Greystar Real Estate Partners | ||||||||
8.250%, 12/01/2022 (A) | 375 | 397 | ||||||
International Lease Finance | ||||||||
7.125%, 09/01/2018 (A) | 500 | 546 | ||||||
Intesa Sanpaolo MTN | ||||||||
5.017%, 06/26/2024 (A) | 475 | 433 | ||||||
Itau CorpBanca | ||||||||
3.875%, 09/22/2019 | 250 | 261 | ||||||
Jefferies Finance | ||||||||
7.375%, 04/01/2020 (A) | 2,000 | 1,950 | ||||||
Jefferies LoanCore | ||||||||
6.875%, 06/01/2020 (A) | 300 | 273 | ||||||
JPMorgan Chase(B) | ||||||||
5.300%, 12/29/2049 | 800 | 811 | ||||||
5.000%, 12/29/2049 | 900 | 887 | ||||||
Lloyds Banking Group | ||||||||
6.375%, 06/27/2049 (B) | EUR | 475 | 536 | |||||
4.500%, 11/04/2024 | $ | 200 | 207 | |||||
Morgan Stanley MTN | ||||||||
4.000%, 07/23/2025 | 750 | 806 | ||||||
3.700%, 10/23/2024 | 300 | 317 | ||||||
Nationstar Mortgage | ||||||||
6.500%, 08/01/2018 | 225 | 229 | ||||||
Navient MTN | ||||||||
5.500%, 01/15/2019 | 600 | 609 | ||||||
NFP | ||||||||
9.000%, 07/15/2021 (A) | 400 | 411 | ||||||
Oxford Finance | ||||||||
7.250%, 01/15/2018 (A) | 2,250 | 2,250 | ||||||
Royal Bank of Scotland Group | ||||||||
8.625%, 12/31/2049 (B) | 525 | 514 | ||||||
Speedy Cash Intermediate Holdings | ||||||||
10.750%, 05/15/2018 (A) | 275 | 198 | ||||||
Trust F | ||||||||
5.250%, 01/30/2026 (A) | 200 | 207 | ||||||
UBS Group(B) | ||||||||
7.000%, 12/29/2049 | 200 | 211 | ||||||
6.875%, 12/29/2049 | 400 | 392 | ||||||
Wells Fargo MTN | ||||||||
3.000%, 02/19/2025
| 400
| 406
| ||||||
| 27,763 | ||||||||
Health Care — 1.0% | ||||||||
Actavis Funding SCS | ||||||||
3.800%, 03/15/2025 | 925 | 979 | ||||||
| 232 | SEI Institutional Managed Trust / Annual Report / September 30, 2016 |
| Description |
Face Amount
(Thousands) |
Market Value
($ Thousands) | ||||||
CORPORATE OBLIGATIONS (continued) | ||||||||
CHS | ||||||||
5.125%, 08/15/2018 | $ | 101 | $ | 102 | ||||
Concordia International | ||||||||
7.000%, 04/15/2023 (A) | 100 | 64 | ||||||
DaVita HealthCare Partners | ||||||||
5.125%, 07/15/2024 | 1,125 | 1,147 | ||||||
5.000%, 05/01/2025 | 200 | 201 | ||||||
Endo | ||||||||
6.000%, 07/15/2023 (A) | 400 | 364 | ||||||
Endo Finance | ||||||||
6.500%, 02/01/2025 (A) | 400 | 354 | ||||||
Fresenius Medical Care US Finance II | ||||||||
4.750%, 10/15/2024 (A) | 200 | 210 | ||||||
HCA | ||||||||
6.500%, 02/15/2020 | 250 | 277 | ||||||
5.000%, 03/15/2024 | 1,250 | 1,319 | ||||||
Kinetic Concepts | ||||||||
7.875%, 02/15/2021 (A) | 400 | 433 | ||||||
Merck KGaA(B) | ||||||||
3.375%, 12/12/2074 | EUR | 400 | 479 | |||||
2.625%, 12/12/2074 | 250 | 290 | ||||||
Opal Acquisition | ||||||||
8.875%, 12/15/2021 (A) | $ | 400 | 328 | |||||
Tenet Healthcare | ||||||||
4.350%, 06/15/2020 (B) | 725 | 728 | ||||||
UnitedHealth Group | ||||||||
4.750%, 07/15/2045
| 200
| 240
| ||||||
| ||||||||
| 7,515 | ||||||||
| ||||||||
Industrials — 0.7% | ||||||||
Air Canada 2013-1 Class C Pass Through Trust | ||||||||
6.625%, 05/15/2018 (A) | 725 | 754 | ||||||
HD Supply | ||||||||
5.750%, 04/15/2024 (A) | 290 | 305 | ||||||
LMI Aerospace | ||||||||
7.375%, 07/15/2019 | 250 | 251 | ||||||
Novelis | ||||||||
5.875%, 09/30/2026 (A) | 1,100 | 1,126 | ||||||
Princess Juliana International Airport Operating | ||||||||
5.500%, 12/20/2027 (A) | 923 | 907 | ||||||
Standard Life | ||||||||
6.546%, 11/29/2049 (B) | GBP | 100 | 139 | |||||
StandardAero Aviation Holdings | ||||||||
10.000%, 07/15/2023 (A) | $ | 900 | 966 | |||||
United Rentals North America | ||||||||
4.625%, 07/15/2023 | 375 | 384 | ||||||
Wharf Finance MTN | ||||||||
4.625%, 02/08/2017
| 210
| 212
| ||||||
| ||||||||
| 5,044 | ||||||||
| ||||||||
| Description |
Face Amount
(Thousands) |
Market Value
($ Thousands) | ||||||
CORPORATE OBLIGATIONS (continued) | ||||||||
Information Technology — 1.0% | ||||||||
Apple | ||||||||
4.650%, 02/23/2046 | $ | 25 | $ | 29 | ||||
3.850%, 05/04/2043 | 400 | 408 | ||||||
Avaya | ||||||||
7.000%, 04/01/2019 (A) | 1,250 | 922 | ||||||
EIG Investors | ||||||||
10.875%, 02/01/2024 (A)(C) | 200 | 166 | ||||||
Fidelity National Information Services | ||||||||
5.000%, 10/15/2025 | 300 | 342 | ||||||
First Data | ||||||||
5.750%, 01/15/2024 (A) | 600 | 617 | ||||||
5.000%, 01/15/2024 (A) | 150 | 152 | ||||||
Infor US | ||||||||
6.500%, 05/15/2022 | 1,000 | 1,012 | ||||||
Micron Technology | ||||||||
7.500%, 09/15/2023 (A) | 1,475 | 1,638 | ||||||
5.250%, 08/01/2023 (A) | 1,150 | 1,136 | ||||||
NXP BV | ||||||||
3.750%, 06/01/2018 (A) | 250 | 257 | ||||||
Qorvo | ||||||||
6.750%, 12/01/2023 | 250 | 270 | ||||||
VeriSign | ||||||||
5.250%, 04/01/2025 | 150 | 158 | ||||||
Western Digital | ||||||||
7.375%, 04/01/2023 (A)
| 250
| 275
| ||||||
| ||||||||
| 7,382 | ||||||||
| ||||||||
Materials — 1.6% | ||||||||
Advanced Disposal Services | ||||||||
8.250%, 10/01/2020 | 800 | 840 | ||||||
Alcoa Nederland Holding BV | ||||||||
7.000%, 09/30/2026 (A)(E) | 250 | 258 | ||||||
Axalta Coating Systems Dutch Holding B BV | ||||||||
3.750%, 01/15/2025 | EUR | 550 | 607 | |||||
Berry Plastics | ||||||||
5.500%, 05/15/2022 | $ | 500 | 517 | |||||
BHP Billiton Finance USA | ||||||||
6.750%, 10/19/2075 (A)(B) | 1,500 | 1,699 | ||||||
Brazil Minas SPE via State of Minas Gerais | ||||||||
5.333%, 02/15/2028 | 800 | 788 | ||||||
BWAY Holding | ||||||||
9.125%, 08/15/2021 (A) | 850 | 882 | ||||||
Cemex Finance | ||||||||
4.625%, 06/15/2024 | EUR | 300 | 345 | |||||
Constellium | ||||||||
7.875%, 04/01/2021 (A) | $ | 400 | 427 | |||||
Crown European Holdings | ||||||||
3.375%, 05/15/2025 | EUR | 200 | 230 | |||||
Eldorado | ||||||||
6.125%, 12/15/2020 (A) | $ | 850 | 856 | |||||
| SEI Institutional Managed Trust / Annual Report / September 30, 2016 | 233 |
SCHEDULE OF INVESTMENTS
September 30, 2016
Multi-Asset Income Fund (Continued)
Face Amount
|
Market Value
| |||||||
| Description | (Thousands) | ($ Thousands) | ||||||
CORPORATE OBLIGATIONS (continued) | ||||||||
Glencore Funding | ||||||||
4.000%, 04/16/2025 (A) | $ | 300 | $ | 293 | ||||
Mirabela Nickel | ||||||||
1.000%, 07/31/2044 | 3 | – | ||||||
Reynolds Group Issuer | ||||||||
5.125%, 07/15/2023 (A) | 1,000 | 1,033 | ||||||
Severstal OAO Via Steel Capital | ||||||||
6.700%, 10/25/2017 | 200 | 209 | ||||||
Sociedad Quimica y Minera de Chile | ||||||||
4.375%, 01/28/2025 | 220 | 222 | ||||||
Versum Materials | ||||||||
5.500%, 09/30/2024 (A)(E) | 410 | 421 | ||||||
WR Grace & Co. | ||||||||
5.125%, 10/01/2021 (A) | 300 | 319 | ||||||
Yamana | ||||||||
4.950%, 07/15/2024
| 1,900
| 1,963
| ||||||
| ||||||||
| 11,909 | ||||||||
| ||||||||
Real Estate — 0.9% | ||||||||
American Tower | ||||||||
3.300%, 02/15/2021 | 350 | 366 | ||||||
Communications Sales & Leasing | ||||||||
6.000%, 04/15/2023 (A) | 825 | 856 | ||||||
DuPont Fabros Technology | ||||||||
5.875%, 09/15/2021 | 250 | 262 | ||||||
5.625%, 06/15/2023 | 200 | 210 | ||||||
Equinix | ||||||||
5.875%, 01/15/2026 | 1,000 | 1,075 | ||||||
GEO Group | ||||||||
6.000%, 04/15/2026 | 750 | 637 | ||||||
5.875%, 01/15/2022 | 250 | 225 | ||||||
5.875%, 10/15/2024 | 450 | 387 | ||||||
Iron Mountain Europe | ||||||||
6.125%, 09/15/2022 | GBP | 150 | 203 | |||||
Kennedy-Wilson | ||||||||
5.875%, 04/01/2024 | $ | 1,100 | 1,108 | |||||
Lamar Media | ||||||||
5.750%, 02/01/2026 | 200 | 216 | ||||||
MGM Growth Properties Operating Partnership | ||||||||
5.625%, 05/01/2024 (A)
| 1,025
| 1,112
| ||||||
| ||||||||
| 6,657 | ||||||||
| ||||||||
Telecommunication Services — 1.3% | ||||||||
Comcel Trust via Comunicaciones Celulares | ||||||||
6.875%, 02/06/2024 | 200 | 206 | ||||||
Digicel | ||||||||
6.000%, 04/15/2021 | 400 | 353 | ||||||
Digicel Group | ||||||||
6.750%, 03/01/2023 (A) | 320 | 282 | ||||||
Intelsat Jackson Holdings | ||||||||
5.500%, 08/01/2023 | 125 | 87 | ||||||
Face Amount
|
Market Value
| |||||||||
| Description | (Thousands) | ($ Thousands) | ||||||||
CORPORATE OBLIGATIONS (continued) | ||||||||||
Intelsat Luxembourg | ||||||||||
8.125%, 06/01/2023 | $ | 50 | $ | 17 | ||||||
Millicom International Cellular | ||||||||||
4.750%, 05/22/2020 | 350 | 354 | ||||||||
SoftBank Group | ||||||||||
4.500%, 04/15/2020 (A)(E) | 945 | 980 | ||||||||
Sprint | ||||||||||
7.875%, 09/15/2023 | 950 | 956 | ||||||||
7.625%, 02/15/2025 | 500 | 495 | ||||||||
7.125%, 06/15/2024 | 300 | 293 | ||||||||
Sprint Communications | ||||||||||
11.500%, 11/15/2021 | 650 | 743 | ||||||||
7.000%, 03/01/2020 (A) | 600 | 643 | ||||||||
7.000%, 08/15/2020 | 500 | 502 | ||||||||
Telecom Italia | ||||||||||
5.303%, 05/30/2024 (A) | 750 | 767 | ||||||||
Telefonica Europe BV | ||||||||||
5.875%, 03/31/2049 (B) | EUR | 100 | 121 | |||||||
T-Mobile USA | ||||||||||
6.500%, 01/15/2026 | $ | 250 | 277 | |||||||
Verizon Communications | ||||||||||
5.150%, 09/15/2023 | 525 | 612 | ||||||||
4.862%, 08/21/2046 | 275 | 308 | ||||||||
Wind Acquisition Finance | ||||||||||
7.375%, 04/23/2021 | 422 | 441 | ||||||||
7.000%, 04/23/2021 | EUR | 130 | 153 | |||||||
4.750%, 07/15/2020 (A) | $ | 450 | 453 | |||||||
Windstream | ||||||||||
7.750%, 10/01/2021
| 650
| 648
| ||||||||
| ||||||||||
| 9,691 | ||||||||||
| ||||||||||
Utilities — 0.5% | ||||||||||
Calpine | ||||||||||
7.875%, 01/15/2023 (A) | 200 | 211 | ||||||||
Dynegy | ||||||||||
6.750%, 11/01/2019 | 650 | 666 | ||||||||
Electricite de France MTN | ||||||||||
4.125%, 01/29/2049 (B) | EUR | 400 | 446 | |||||||
Enel(B) | ||||||||||
8.750%, 09/24/2073 (A) | $ | 200 | 234 | |||||||
7.750%, 09/10/2075 | GBP | 200 | 288 | |||||||
Ferrellgas | ||||||||||
6.750%, 06/15/2023 | $ | 900 | 792 | |||||||
Greenko Investment | ||||||||||
4.875%, 08/16/2023 (A) | 410 | 401 | ||||||||
Listrindo Capital BV | ||||||||||
4.950%, 09/14/2026 (A) | 200 | 201 | ||||||||
| 234 | SEI Institutional Managed Trust / Annual Report / September 30, 2016 |
Face Amount |
Market Value | |||||||
| Description |
(Thousands) |
($ Thousands) | ||||||
CORPORATE OBLIGATIONS (continued) | ||||||||
Terraform Global Operating | ||||||||
13.750%, 08/15/2022 (A) | $ | 225 | $ | 232 | ||||
| 3,471 | ||||||||
Total Corporate Obligations | ||||||||
(Cost $138,020) ($ Thousands) | 142,995 | |||||||
LOAN PARTICIPATIONS — 14.7% | ||||||||
AABS, Bridge Term Loan | ||||||||
4.875%, 01/15/2038 | 562 | 559 | ||||||
ABB/Con-Cise Optical Group LLC, Initial Term Loan, | ||||||||
6.000%, 06/15/2023 | 600 | 605 | ||||||
Acosta, Revolving Credit Term Loans 1st Lien | ||||||||
0.500%, 09/26/2019 (G) | 2,000 | (162) | ||||||
Acrisure, LLC, Term B Loan, 1st Lien | ||||||||
6.500%, 05/19/2022 | 1,237 | 1,239 | ||||||
ADS Waste Holdings, Inc., Initial Tranche B-2 Term Loan, 1st Lien | ||||||||
3.750%, 10/09/2019 (B) | 275 | 275 | ||||||
AdvancePierre Foods, Inc., Effective Date Loan, 1st Lien | ||||||||
4.500%, 06/02/2023 | 274 | 276 | ||||||
Advantage Sales & Marketing, Revolver Loan | ||||||||
3.250%, 07/25/2019 (G) | 102 | 7 | ||||||
0.500%, 07/25/2019 (G) | 361 | 33 | ||||||
Advantage Sales & Marketing, Revolving Loan 1st Lien | ||||||||
3.770%, 07/25/2019 | 38 | 33 | ||||||
Affordable Care Holding Corp., Term B Loan | ||||||||
5.750%, 10/24/2022 | 993 | 992 | ||||||
Air Newco LLC, Initial Term Loan, 2nd Lien | ||||||||
10.500%, 01/31/2023 | 750 | 690 | ||||||
American Renal Holdings Inc., Term Loan B, 1st Lien | ||||||||
4.750%, 08/20/2019 | 223 | 223 | ||||||
American Seafoods Group LLC, Term Loan, 1st Lien | ||||||||
6.000%, 08/19/2021 | 963 | 954 | ||||||
American Tire Distributors, Inc., Initial Term Loan, 1st Lien | ||||||||
5.250%, 09/01/2021 | 249 | 246 | ||||||
Americold Realty Operating Partnership, L.P., Initial Term Loan, 1st Lien | ||||||||
5.750%, 12/01/2022 | 848 | 855 | ||||||
Anaren, Inc., Term Loan, 1st Lien | ||||||||
5.500%, 02/18/2021 | 469 | 452 | ||||||
Anaren, Inc., Term Loan, 2nd Lien | ||||||||
9.250%, 08/18/2021 | 500 | 445 | ||||||
Arctic Glacier U.S.A., Inc., 2014 Term Loan, 1st Lien | ||||||||
6.000%, 05/10/2019 | 306 | 302 | ||||||
Face Amount |
Market Value | |||||||||
| Description |
(Thousands) |
($ Thousands) | ||||||||
LOAN PARTICIPATIONS (continued) | ||||||||||
Aspect Software, Inc., Term Loan, 1st Lien | ||||||||||
10.500%, 05/25/2020 | $ | 518 | $ | 504 | ||||||
Asurion, LLC (fka Asurion Corporation), Incremental Tranche B-4 Term Loan, | ||||||||||
5.000%, 08/04/2022 | 270 | 271 | ||||||||
Asurion, LLC (fka Asurion Corporation), Term Loan, 2nd Lien | ||||||||||
8.500%, 03/03/2021 | 2,500 | 2,483 | ||||||||
Atkore International, Inc., Initial Term Loan, 1st Lien | ||||||||||
4.500%, 04/09/2021 | 274 | 274 | ||||||||
Atkore International, Inc., Initial Term Loan, 2nd Lien | ||||||||||
7.750%, 10/09/2021 | 350 | 350 | ||||||||
Atlas, 1st Lien Term Loan | ||||||||||
4.875%, 12/15/2039 | 1,120 | 1,109 | ||||||||
Authentic Brands, Cov-Lite, Term Loan, 1st Lien | ||||||||||
5.500%, 05/27/2021 | 661 | 659 | ||||||||
Avago Technologies Cayman Holdings Ltd., Term B-3 Loan, 1st Lien | ||||||||||
3.520%, 02/01/2023 | 439 | 443 | ||||||||
Avaya Inc., Term B-7 Loan, 1st Lien | ||||||||||
6.250%, 05/29/2020 | 985 | 725 | ||||||||
Axalta Coating Systems Dutch Holding B B.V. (Axalta Coating Systems U.S. Holdings, Inc.), Refinanced Term B Loan, 1st Lien | ||||||||||
3.750%, 02/01/2020 | 306 | 308 | ||||||||
Belk, Inc., Closing Date Term Loan, 1st Lien | ||||||||||
5.750%, 12/12/2022 | 249 | 226 | ||||||||
Berry Plastics Corporation, Term Loan H, 1st Lien | ||||||||||
3.750%, 10/01/2022 | 231 | 232 | ||||||||
Bioplan USA, Inc. (Tripolis US LLC), Initial Term Loan, | ||||||||||
5.750%, 09/23/2021 | 398 | 370 | ||||||||
BJ’s Wholesale Club, Inc., 2013 (November) Replacement Loan, 2nd Lien | ||||||||||
8.500%, 03/26/2020 (H) | 1,225 | 1,229 | ||||||||
BJ’s Wholesale Club, Inc., New 2013 (November) Replacement Loan, 1st Lien | ||||||||||
4.500%, 09/26/2019 | 317 | 317 | ||||||||
BMC Software Finance, Inc., Initial US Term Loan, 1st Lien | ||||||||||
5.000%, 09/10/2020 | 546 | 525 | ||||||||
BWay Intermediate Company, Inc., Initial Term Loan, 1st Lien | ||||||||||
5.500%, 08/14/2020 | 646 | 649 | ||||||||
Calpine Corporation, Term Loan, 1st Lien | ||||||||||
3.590%, 05/27/2022 | 2,537 | 2,543 | ||||||||
Capital Automotive L.P., Term Loan, 2nd Lien | ||||||||||
6.000%, 04/30/2020 | 210 | 211 | ||||||||
Carecore National, LLC, Term Loan, 1st Lien | ||||||||||
5.500%, 03/05/2021 | 1,673 | 1,639 | ||||||||
| SEI Institutional Managed Trust / Annual Report / September 30, 2016 | 235 |
SCHEDULE OF INVESTMENTS
September 30, 2016
Multi-Asset Income Fund (Continued)
Face Amount |
Market Value | |||||||
| Description |
(Thousands) |
($ Thousands) | ||||||
LOAN PARTICIPATIONS (continued) | ||||||||
Cengage Learning Inc., 2016 Refinancing Term Loan B, 1st Lien | ||||||||
5.250%, 06/07/2023 | $ | 1,691 | $ | 1,688 | ||||
Ceridian HCM Holding Inc., Initial Term Loan, 1st Lien | ||||||||
4.500%, 09/15/2020 | 841 | 821 | ||||||
Ceva Group PLC (fka Louis No.1 PLC/TNT Logistics), Pre-Funded L/C Loan, 1st Lien | ||||||||
6.500%, 03/19/2021 | 73 | 58 | ||||||
Charter Communications Operating, LLC (aka CCO Safari LLC), Term H Loan (2016), 1st Lien | ||||||||
3.250%, 08/24/2021 | 647 | 649 | ||||||
Checkout Holding Corp., Term B Loan, 1st Lien | ||||||||
4.500%, 04/09/2021 | 1,021 | 927 | ||||||
Chobani, Term Loan B | ||||||||
0.000%, 10/09/2023 (H) | 1,000 | 1,000 | ||||||
CHS/Community Health Systems, Inc., Incremental 2021 Term H Loan | ||||||||
4.000%, 01/27/2021 | 273 | 268 | ||||||
CompuCom Systems, Inc., Term Loan, 1st Lien | ||||||||
4.250%, 05/09/2020 | 900 | 637 | ||||||
CPI Acquisition, Inc., Term Loan, 1st Lien | ||||||||
5.500%, 08/17/2022 | 314 | 306 | ||||||
CSC Holdings, LLC (fka CSC Holdings, Inc.), Initial Term Loan, 1st Lien | ||||||||
5.000%, 10/09/2022 | 873 | 874 | ||||||
CTI Foods Holding Co., LLC, Term Loan, 1st Lien | ||||||||
4.500%, 06/29/2020 | 188 | 182 | ||||||
CTI Foods Holding Co., LLC, Term Loan, 2nd Lien | ||||||||
8.250%, 06/28/2021 | 350 | 312 | ||||||
Cunningham Lindsey U.S. Inc., Initial Term Loan, 1st Lien | ||||||||
5.000%, 12/10/2019 | 189 | 158 | ||||||
CVS Holdings I, LP, Tranche B-1 Term Loan, 1st Lien | ||||||||
7.250%, 08/16/2021 (C) | 495 | 491 | ||||||
Cyan Blue Holdco 2 Limited, Initial Term Loan, 1st Lien | ||||||||
6.250%, 02/25/2022 | 650 | 848 | ||||||
DAE Aviation Holdings, Inc., Initial Term Loan, 1st Lien | ||||||||
5.250%, 07/07/2022 | 990 | 995 | ||||||
Deltek, Inc., Term Loan, 1st Lien | ||||||||
5.000%, 06/25/2022 | 419 | 420 | ||||||
DJO Finance LLC, Initial Term Loan, 1st Lien | ||||||||
4.250%, 06/08/2020 | 241 | 237 | ||||||
Doncasters US Finance LLC (Doncasters US LLC), Second-Lien Term Loans, 2nd Lien | ||||||||
9.500%, 10/09/2020 | 84 | 80 | ||||||
Dynegy Finance IV, Inc., Term Loan, 1st Lien | ||||||||
5.000%, 06/27/2023 | 700 | 705 | ||||||
Face Amount |
Market Value | |||||||
| Description |
(Thousands) |
($ Thousands) | ||||||
LOAN PARTICIPATIONS (continued) | ||||||||
Eastern Power, LLC (Eastern Covert Midco, LLC), Term Loan, 1st Lien | ||||||||
5.000%, 10/02/2021 | $ | 690 | $ | 697 | ||||
EFS Cogen Holdings I LLC, Term B Advance, 1st Lien | ||||||||
5.250%, 06/28/2023 | 1,179 | 1,190 | ||||||
EIG Investors Corp., Incremental Term Loan, 1st Lien | ||||||||
6.000%, 02/09/2023 | 1,633 | 1,519 | ||||||
EIG Investors Corp., Term Loan, 1st Lien | ||||||||
6.480%, 11/09/2019 | 754 | 731 | ||||||
Endo Luxembourg Finance Company I S.à r.l., 2015 Incremental Term B Loan, | ||||||||
3.750%, 09/26/2022 | 323 | 322 | ||||||
EnergySolutions, LLC (aka Envirocare of Utah, LLC), Term Advance, 1st Lien | ||||||||
6.750%, 05/29/2020 | 2,306 | 2,294 | ||||||
Epicor Software Corporation (fka Eagle Parent Inc.), Term B Loan, 1st Lien | ||||||||
4.750%, 06/01/2022 | 599 | 590 | ||||||
Equinox Holdings Inc., New Initial Term Loan, 1st Lien | ||||||||
5.000%, 01/31/2020 | 661 | 665 | ||||||
EWT Holdings III Corp. (fka WTG Holdings III Corp.), Incremental 2016 Term Loan, 1st Lien | ||||||||
5.500%, 01/15/2021 | 199 | 200 | ||||||
Eyemart Express LLC, Term Loan, 1st Lien | ||||||||
5.000%, 12/18/2021 | 925 | 927 | ||||||
EZE Software Group LLC, New Loan, 2nd Lien | ||||||||
7.250%, 04/05/2021 | 150 | 145 | ||||||
Fender Musical Instruments Corporation, Initial Loan, 1st Lien | ||||||||
5.750%, 04/03/2019 | 149 | 148 | ||||||
First Data Corporation, 2021 Extended Dollar Term Loan | ||||||||
4.530%, 03/24/2021 | 94 | 95 | ||||||
Fitness International, LLC, Term B Loan, 1st Lien | ||||||||
6.000%, 07/01/2020 | 675 | 674 | ||||||
Flakt Woods Group, Term Loan | ||||||||
0.000%, 03/20/2017 | 284 | 281 | ||||||
Flakt Woods, 2nd Lien Term Loan | ||||||||
4.750%, 03/20/2017 (C) | 376 | 418 | ||||||
Flexera Software LLC (fka Flexera Software, Inc.), Term Loan, 2nd Lien | ||||||||
8.000%, 04/02/2021 | 150 | 147 | ||||||
Gates Global LLC, Initial Dollar Term Loan, 1st Lien | ||||||||
4.250%, 07/06/2021 (H) | 1,185 | 1,167 | ||||||
Getty Images, Inc., Initial Term Loan, 1st Lien | ||||||||
4.750%, 10/18/2019 | 2,664 | 2,222 |
| 236 | SEI Institutional Managed Trust / Annual Report / September 30, 2016 |
| Description |
Face Amount |
Market Value ($ Thousands) | ||||||||
LOAN PARTICIPATIONS (continued) |
| |||||||||
Global Payments Inc., Heartland Incremental Term B Loan, | ||||||||||
4.020%, 04/22/2023 (B) | $ | 125 | $ | 126 | ||||||
Globallogic Holdings Inc., Term Loan, 1st Lien | ||||||||||
6.250%, 06/02/2019 | 292 | 291 | ||||||||
GOBP Holdings Inc., Initial Term Loan, 1st Lien | ||||||||||
5.000%, 10/21/2021 | 995 | 992 | ||||||||
Greenway Health, LLC (fka Vitera Healthcare Solutions, LLC), Term Loan, 1st Lien | ||||||||||
6.000%, 11/04/2020 | 875 | 851 | ||||||||
Greenway Health, LLC (fka Vitera Healthcare Solutions, LLC), Term Loan, 2nd Lien | ||||||||||
9.250%, 11/04/2021 | 100 | 92 | ||||||||
Gypsum Holdings III Corp., Term Loan Retired 09/27/2016, 1st Lien | ||||||||||
4.750%, 04/01/2021 | 1,104 | 1,100 | ||||||||
Hardware Holdings, Cov-Lite, 1st Lien Term Loan | ||||||||||
6.750%, 03/30/2020 (E) | 980 | 956 | ||||||||
Hi-Crush Partners, LP, 1st Lien | ||||||||||
4.750%, 04/28/2021 | 597 | 541 | ||||||||
Hoffmaster Group, Inc., Initial Term Loan, 1st Lien | ||||||||||
5.250%, 05/09/2020 | 733 | 733 | ||||||||
Hyperion Insurance Group Limited, Initial Term Loan, 1st Lien | ||||||||||
5.500%, 04/29/2022 | 300 | 293 | ||||||||
IHC Holding, Term Loan, 1st Lien | ||||||||||
7.000%, 04/30/2021 (C) | 1,234 | 1,220 | ||||||||
Implus Footcare, Term Loan | ||||||||||
7.250%, 04/30/2021 (C) | 239 | 237 | ||||||||
Infor (US), Inc. (fka Lawson Software Inc.) , Tranche B-5 Term Loan, 1st Lien | ||||||||||
3.750%, 06/03/2020 | 268 | 266 | ||||||||
Insight Fourth Hospitality, Term Loan, 1st Lien | ||||||||||
7.250%, 07/15/2021 (C) | 1,000 | 1,282 | ||||||||
Intelsat Jackson Holdings S.A., Term Loan, Tranche B-2, 1st Lien | ||||||||||
3.750%, 06/30/2019 (B) | 975 | 926 | ||||||||
Intrawest Holdings | ||||||||||
4.500%, 12/10/2018 (C)(G) | 157 | – | ||||||||
0.375%, 12/10/2018 (C)(G) | 43 | – | ||||||||
Invenergy Thermal Opearting I LLC, Term Loan, 1st Lien | ||||||||||
6.500%, 10/19/2022 | 1,450 | 1,384 | ||||||||
iStar Inc., Term Loan, 1st Lien | ||||||||||
5.500%, 07/01/2020 | 1,000 | 1,009 | ||||||||
J. Crew Group, Inc., Initial Loan, 1st Lien | ||||||||||
4.000%, 03/05/2021 | 2,474 | 1,959 | ||||||||
Jacobs Entertainment, Inc., Replacement Tranche B Loan, 1st Lien | ||||||||||
5.250%, 10/29/2018 | 371 | 371 | ||||||||
| Description |
Face Amount |
Market Value | ||||||||||
LOAN PARTICIPATIONS (continued) |
| |||||||||||
Jazz Acquisition, Inc., Revolving Loan, 1st Lien | ||||||||||||
4.040%, 06/19/2019 | $ | 90 | $ | 80 | ||||||||
Landesk Software, Term Loan | ||||||||||||
5.500%, 09/16/2022 | 550 | 554 | ||||||||||
Lanyon Solutions, Inc. (Lanyon, Inc.), Term Loan, 1st Lien | ||||||||||||
5.500%, 11/13/2020 | 463 | 460 | ||||||||||
Learning Care Group (US) No. 2 Inc., Term Loan, 1st Lien | ||||||||||||
5.000%, 05/05/2021 | 1,435 | 1,432 | ||||||||||
Level 3 Financing, Inc. Term Loan, Tranche B-II 2022 | ||||||||||||
3.500%, 05/31/2022 | 250 | 251 | ||||||||||
Lineage Logistics, LLC, Term Loan, 1st Lien | ||||||||||||
4.500%, 04/07/2021 | 2,126 | 2,099 | ||||||||||
Lions Gate Entertainment Corp., Term Loan, 2nd Lien | ||||||||||||
5.000%, 03/17/2022 | 550 | 559 | ||||||||||
LPL Holdings, Inc., Term Loan, 2022 Tranche B | ||||||||||||
4.750%, 11/21/2022 | 794 | 798 | ||||||||||
Magic Newco, LLC, Term Loan, 2nd Lien | ||||||||||||
12.000%, 06/12/2019 | 350 | 368 | ||||||||||
Match Group, Inc. (fka The Match Group, Inc.), Term B-1 Loan, 1st Lien | ||||||||||||
5.500%, 11/16/2022 | 512 | 514 | ||||||||||
Mavis Tire Supply, Term Loan | ||||||||||||
6.250%, 11/02/2020 (C)(E) | 1,481 | 1,464 | ||||||||||
McGraw-Hill Global Education Holdings, LLC, Term B Loan | ||||||||||||
5.000%, 05/04/2022 | 154 | 155 | ||||||||||
MEG Energy Corp., New Term Loan, 1st Lien | ||||||||||||
3.750%, 03/31/2020 (H) | 1,317 | 1,226 | ||||||||||
Men’s Wearhouse, Inc., Term Loan, Tranche B, 1st Lien | ||||||||||||
4.500%, 06/18/2021 (H) | 501 | 496 | ||||||||||
Mergermarket USA, Inc., 2014 Incremental Term Loan, 1st Lien | ||||||||||||
4.500%, 02/04/2021 | 731 | 720 | ||||||||||
MGM Growth Properties Operating Partnership L.P., Term B Loan, 1st Lien | ||||||||||||
4.000%, 04/25/2023 | 398 | 401 | ||||||||||
Micron Technology, Inc., Term Loan, 1st Lien | ||||||||||||
6.530%, 04/26/2022 | 1,172 | 1,184 | ||||||||||
Milacron LLC, Term Loan, 1st Lien | ||||||||||||
4.250%, 09/28/2020 | 150 | 151 | ||||||||||
MRP Generation Holdings, LLC (TPF), Term Loan B (2016) | ||||||||||||
7.000%, 10/18/2022 (H) | 500 | 470 | ||||||||||
NaNa Development Corporation, Term Loan, 1st Lien | ||||||||||||
8.000%, 03/15/2018 | 108 | 101 | ||||||||||
Navistar, Inc., Term Loan, Tranche B 1st Lien | ||||||||||||
6.500%, 08/07/2020 | 993 | 994 | ||||||||||
| SEI Institutional Managed Trust / Annual Report / September 30, 2016 | 237 |
SCHEDULE OF INVESTMENTS
September 30, 2016
Multi-Asset Income Fund (Continued)
| Description |
Face Amount |
Market Value | ||||||
LOAN PARTICIPATIONS (continued) | ||||||||
Neiman Marcus Group Inc., Other Term Loan, 1st Lien | ||||||||
4.250%, 10/25/2020 | $ | 2,557 | $ | 2,349 | ||||
NEP/NCP Holdco, Inc., Amendment No. 4 Incremental Term Loan | ||||||||
4.250%, 01/22/2020 | 1,218 | 1,212 | ||||||
NEP/NCP Holdco, Inc., Term Loan, 2nd Lien | ||||||||
10.000%, 07/22/2020 | 575 | 576 | ||||||
NES Global Talent Finance US LLC, Term Loan, 1st Lien | ||||||||
6.500%, 10/03/2019 | 941 | 837 | ||||||
NVA Holdings, Inc., Incremental Term Loan, B-1 | ||||||||
5.500%, 08/14/2021 | 119 | 120 | ||||||
NVA Holdings, Inc., Term Loan, 1st Lien | ||||||||
4.750%, 08/14/2021 | 898 | 897 | ||||||
Opal Acquisition, Inc., Term Loan B, 1st Lien | ||||||||
5.000%, 11/27/2020 | 853 | 797 | ||||||
Packers Holdings, LLC, Initial Term Loan, 1st Lien | ||||||||
4.750%, 12/02/2021 | 983 | 985 | ||||||
Panda Hummel Station, Term Loan B, 1st Lien | ||||||||
7.000%, 10/27/2022 | 200 | 192 | ||||||
Panda Temple Power II, LLC, Construction Term Loan Advance, 1st Lien | ||||||||
7.250%, 04/03/2019 | 347 | 317 | ||||||
Party City Holdings Inc. (Party City Corporation), Term Loan, 1st Lien | ||||||||
4.490%, 08/19/2022 | 99 | 100 | ||||||
Pelican Products, Inc., Term Loan, 1st Lien | ||||||||
5.250%, 04/10/2020 | 250 | 245 | ||||||
Pelican Products, Inc., Term Loan, 2nd Lien | ||||||||
9.250%, 04/09/2021 | 1,000 | 890 | ||||||
Phillips-Medisize Corporation, Initial Term Loan, 1st Lien | ||||||||
4.750%, 06/16/2021 | 489 | 488 | ||||||
Project Alpha Intermediate, Term Loan, 1st Lien | ||||||||
9.250%, 08/22/2022 (C) | 900 | 883 | ||||||
Prolampac Intermediate Inc., Initial Term Loan, | ||||||||
5.750%, 08/18/2022 | 495 | 497 | ||||||
Prowler Acquisition Corp., Term Loan, 1st Lien | ||||||||
5.500%, 01/28/2020 | 267 | 195 | ||||||
Reddy Ice Corporation, Term Loan B, 1st Lien | ||||||||
6.750%, 05/01/2019 | 338 | 309 | ||||||
Reddy Ice Corporation, Term Loan B, 2nd Lien | ||||||||
10.750%, 11/01/2019 | 225 | 175 | ||||||
Rise Term Loan A | ||||||||
4.750%, 02/12/2039 | 2,516 | 2,485 | ||||||
Ryan, LLC, Term Loan, Tranche B , 1st Lien | ||||||||
6.750%, 08/07/2020 | 469 | 463 |
| Description |
Face Amount |
Market Value | ||||||||
LOAN PARTICIPATIONS (continued) | ||||||||||
SBA Senior Finance II LLC, Incremental Term Loan, Tranche B-1, 1st Lien | ||||||||||
3.340%, 03/24/2021 | $ | 248 | $ | 248 | ||||||
Scientific Games International, Inc., Initial Term Loan B-2 | ||||||||||
6.000%, 10/01/2021 | 129 | 129 | ||||||||
Scientific Games International, Inc., Initial Term Loan B-2, 1st Lien | ||||||||||
6.000%, 10/01/2021 | 270 | 270 | ||||||||
Sears Roebuck Acceptance Corp. (Kmart Corporation), Term Loan (2015), 1st Lien | ||||||||||
5.500%, 06/30/2018 | 586 | 574 | ||||||||
Sedgwick Claims Management Services, Inc., Initial Term Loan, 1st Lien | ||||||||||
3.750%, 03/01/2021 | 273 | 271 | ||||||||
Sedgwick Claims Management Services, Inc., New Loan | ||||||||||
6.750%, 02/28/2022 | 125 | 123 | ||||||||
Shearer’s Foods, LLC, Term Loan, 1st Lien | ||||||||||
4.940%, 06/30/2021 | 273 | 271 | ||||||||
Shearer’s Foods, LLC, Term Loan, 2nd Lien | ||||||||||
7.750%, 06/30/2022 | 150 | 136 | ||||||||
SIG Combibloc Holdings S.C.A. (fka Onex Wizard Acquisition Company II S.C.A.), Initial Dollar Term Loan, 1st Lien | ||||||||||
4.000%, 03/11/2022 | 248 | 248 | ||||||||
SIRVA Worldwide, Inc., Term Loan, 1st Lien | ||||||||||
7.500%, 03/27/2019 | 662 | 655 | ||||||||
Solera, LLC (Solera Finance, Inc.), Dollar Term Loan, 1st Lien | ||||||||||
5.750%, 03/03/2023 | 846 | 854 | ||||||||
Sparta Systems | ||||||||||
6.500%, 07/28/2020 (C) | 669 | 664 | ||||||||
Spring Industries, Term Loan, 1st Lien | ||||||||||
7.500%, 06/01/2021 (C) | 600 | 587 | ||||||||
SRS Distribution Inc., Loan, Tranche B-1, 1st Lien | ||||||||||
5.250%, 08/25/2022 | 1,008 | 1,016 | ||||||||
Stromboli Investissements, Second Lien 1 Facility, 2nd Lien | ||||||||||
0.500%, 03/20/2017 (C) | – | 35 | ||||||||
Thermasys Corporation, Term Loan, 1st Lien | ||||||||||
5.250%, 05/03/2019 | 345 | 277 | ||||||||
TIBCO Software Inc., Term Loan, 1st Lien | ||||||||||
6.500%, 12/04/2020 (E) | 1,970 | 1,939 | ||||||||
TMS International Corp., Term B Loan, 1st Lien | ||||||||||
4.500%, 10/16/2020 | 383 | 375 | ||||||||
Transdigm Inc., Term Loan, Tranche E, 1st Lien | ||||||||||
3.750%, 05/14/2022 | 670 | 671 | ||||||||
Travelport Finance (Luxembourg) S.à r.l., Term Loan B, 1st Lien | ||||||||||
5.000%, 09/02/2021 | 1,923 | 1,931 | ||||||||
| 238 | SEI Institutional Managed Trust / Annual Report / September 30, 2016 |
| Description |
Face Amount | Market Value ($ Thousands) | ||||||||
LOAN PARTICIPATIONS (continued) | ||||||||||
TSAM Delaware | ||||||||||
7.750%, 09/12/2019 (C) | $ | 421 | $ | 419 | ||||||
U.S. Renal Care, Inc., Initial Term Loan | ||||||||||
5.250%, 12/30/2022 | 372 | 357 | ||||||||
Univar USA Inc., Initial Dollar Term Loan | ||||||||||
4.250%, 07/01/2022 | 347 | 348 | ||||||||
US Foods, Inc. (aka U.S. Foodservice, Inc.), Initial Term Loan, 1st Lien | ||||||||||
4.000%, 06/27/2023 | 621 | 626 | ||||||||
Valeant Pharmaceuticals International Inc., Delayed Draw F-1, Term Loan B, 1st Lien | ||||||||||
5.500%, 04/01/2022 (H) | 1,115 | 1,118 | ||||||||
Vencore, Inc. (fka SI Organization, Inc., The), Initial Term Loan, 1st Lien | ||||||||||
5.750%, 11/23/2019 | 804 | 807 | ||||||||
Violin Finco S.A.R.L., Term Loan, 1st Lien | ||||||||||
5.750%, 12/20/2019 | 283 | 278 | ||||||||
Vouvray US Finance LLC, Initial Term Loan, 1st Lien | ||||||||||
4.750%, 06/25/2021 | 491 | 491 | ||||||||
Wencor, Cov-Lite, Revolving Credit 1st Lien Term Loan | ||||||||||
0.500%, 06/19/2019 (G) | 346 | 38 | ||||||||
Ziggo B.V., US$ B1 Facility, 1st Lien | ||||||||||
3.650%, 01/15/2022 | 148 | 148 | ||||||||
Ziggo B.V., US$ B2 Facility, 1st Lien | ||||||||||
3.650%, 01/15/2022 | 80 | 80 | ||||||||
Ziggo B.V., US$ B3 Facility, 1st Lien | ||||||||||
3.700%, 01/15/2022 | 27 | 27 | ||||||||
Ziggo, Term Loan B1, 1st Lien | ||||||||||
3.650%, 01/15/2022 | 8 | 8 | ||||||||
| ||||||||||
Total Loan Participations (Cost $109,790) ($ Thousands) | 109,316 | |||||||||
| ||||||||||
Shares | ||||||||||
COMMON STOCK — 10.2% | ||||||||||
Consumer Discretionary — 1.2% | ||||||||||
Advance Auto Parts | 294 | 44 | ||||||||
Amazon.com, Cl A * | 1,537 | 1,287 | ||||||||
Autonation * | 202 | 10 | ||||||||
Autozone * | 117 | 90 | ||||||||
Bed Bath & Beyond | 469 | 20 | ||||||||
Best Buy | 921 | 35 | ||||||||
BorgWarner | 699 | 25 | ||||||||
CarMax * | 775 | 41 | ||||||||
Carnival | 1,728 | 84 | ||||||||
CBS, Cl B | 1,635 | 90 | ||||||||
Cengage Learning Holdings II * | 5,114 | 111 | ||||||||
Charter Communications, Cl A * | 852 | 230 | ||||||||
Chipotle Mexican Grill, Cl A * | 117 | 50 | ||||||||
Coach | 1,113 | 41 | ||||||||
Comcast, Cl A | 9,377 | 622 | ||||||||
| Description | Shares |
Market Value | ||||||
COMMON STOCK (continued) | ||||||||
Darden Restaurants | 465 | $ | 28 | |||||
Delphi Automotive | 1,079 | 77 | ||||||
Discovery Communications, Cl A * | 406 | 11 | ||||||
Discovery Communications, Cl C * | 778 | 20 | ||||||
Dollar General | 1,114 | 78 | ||||||
Dollar Tree * | 927 | 73 | ||||||
DR Horton | 1,323 | 40 | ||||||
Expedia | 466 | 54 | ||||||
Foot Locker, Cl A | 551 | 37 | ||||||
Ford Motor | 15,217 | 184 | ||||||
Gap | 712 | 16 | ||||||
Garmin | 386 | 19 | ||||||
General Motors | 5,468 | 174 | ||||||
Genuine Parts | 593 | 60 | ||||||
Goodyear Tire & Rubber | 836 | 27 | ||||||
H&R Block | 703 | 16 | ||||||
Hanesbrands | 1,219 | 31 | ||||||
Harley-Davidson, Cl A | 728 | 38 | ||||||
Harman International Industries, Cl A | 228 | 19 | ||||||
Hasbro | 463 | 37 | ||||||
Home Depot | 4,825 | 621 | ||||||
Interpublic Group | 1,621 | 36 | ||||||
Johnson Controls International | 3,728 | 173 | ||||||
Kohl’s | 589 | 26 | ||||||
L Brands | 999 | 71 | ||||||
Leggett & Platt | 439 | 20 | ||||||
Lennar, Cl A | 608 | 26 | ||||||
LKQ * | 1,228 | 43 | ||||||
Lowe’s | 3,448 | 249 | ||||||
Macy’s | 1,230 | 46 | ||||||
Marriott International, Cl A | 1,294 | 87 | ||||||
Mattel | 1,361 | 41 | ||||||
McDonald’s | 3,343 | 386 | ||||||
Michael Kors Holdings * | 713 | 33 | ||||||
Mohawk Industries * | 254 | 51 | ||||||
NetFlix * | 1,673 | 165 | ||||||
Newell Brands, Cl B | 1,794 | 94 | ||||||
News, Cl A | 1,254 | 18 | ||||||
News, Cl B | 450 | 6 | ||||||
Nike, Cl B | 5,178 | 273 | ||||||
Nordstrom | 377 | 19 | ||||||
Omnicom Group | 937 | 80 | ||||||
O’Reilly Automotive * | 378 | 106 | ||||||
Priceline Group * | 193 | 284 | ||||||
PulteGroup | 1,032 | 21 | ||||||
PVH | 263 | 29 | ||||||
Ralph Lauren, Cl A | 168 | 17 | ||||||
Ross Stores | 1,578 | 101 | ||||||
Royal Caribbean Cruises | 670 | 50 | ||||||
Scripps Networks Interactive, Cl A | 303 | 19 | ||||||
Signet Jewelers | 231 | 17 | ||||||
Staples | 2,024 | 17 | ||||||
| SEI Institutional Managed Trust / Annual Report / September 30, 2016 | 239 |
SCHEDULE OF INVESTMENTS
September 30, 2016
Multi-Asset Income Fund (Continued)
| Description | Shares |
Market Value
($ Thousands) | ||||
COMMON STOCK (continued) | ||||||
Starbucks | 5,695 | $ | 308 | |||
Target, Cl A | 2,301 | 158 | ||||
TEGNA | 592 | 13 | ||||
Tiffany | 358 | 26 | ||||
Time Warner | 3,061 | 244 | ||||
TJX | 2,577 | 193 | ||||
Tractor Supply | 534 | 36 | ||||
TripAdvisor * | 361 | 23 | ||||
Twenty-First Century Fox ADR, Cl A | 4,297 | 104 | ||||
Twenty-First Century Fox, Cl B | 1,724 | 43 | ||||
Ulta Salon Cosmetics & Fragrance * | 247 | 59 | ||||
Under Armour, Cl A * | 544 | 21 | ||||
Under Armour, Cl C * | 547 | 18 | ||||
Urban Outfitters * | 276 | 10 | ||||
VF | 1,314 | 74 | ||||
Viacom, Cl B | 1,375 | 52 | ||||
Walt Disney | 5,791 | 538 | ||||
Whirlpool | 302 | 49 | ||||
Wyndham Worldwide | 454 | 31 | ||||
Wynn Resorts | 258 | 25 | ||||
Yum! Brands | 1,465 | 133 | ||||
9,202 | ||||||
Consumer Staples — 1.0% | ||||||
Altria Group | 7,593 | 480 | ||||
Archer-Daniels-Midland | 2,307 | 97 | ||||
Brown-Forman, Cl B | 808 | 38 | ||||
Campbell Soup | 718 | 39 | ||||
Church & Dwight | 1,022 | 49 | ||||
Clorox | 512 | 64 | ||||
Coca-Cola | 15,100 | 639 | ||||
Colgate-Palmolive | 3,475 | 258 | ||||
ConAgra Foods | 1,720 | 81 | ||||
Constellation Brands, Cl A | 691 | 115 | ||||
Costco Wholesale | 1,704 | 260 | ||||
CVS Health | 4,171 | 371 | ||||
Dr Pepper Snapple Group | 734 | 67 | ||||
Estee Lauder, Cl A | 877 | 78 | ||||
General Mills | 2,321 | 148 | ||||
Hershey | 557 | 53 | ||||
Hormel Foods | 1,086 | 41 | ||||
JM Smucker | 473 | 64 | ||||
Kellogg | 993 | 77 | ||||
Kimberly-Clark | 1,405 | 177 | ||||
Kraft Heinz | 2,322 | 208 | ||||
Kroger | 3,737 | 111 | ||||
McCormick | 461 | 46 | ||||
Mead Johnson Nutrition, Cl A | 739 | 59 | ||||
Molson Coors Brewing, Cl B | 727 | 80 | ||||
Mondelez International, Cl A | 6,040 | 265 | ||||
Monster Beverage * | 554 | 81 | ||||
PepsiCo | 5,603 | 610 | ||||
| Description | Shares |
Market Value
($ Thousands) | ||||
COMMON STOCK (continued) | ||||||
Philip Morris International | 6,017 | $ | 585 | |||
Procter & Gamble | 10,428 | 936 | ||||
Reynolds American | 3,232 | 152 | ||||
SYSCO, Cl A | 2,056 | 101 | ||||
Tyson Foods, Cl A | 1,183 | 89 | ||||
Walgreens Boots Alliance | 3,362 | 271 | ||||
Wal-Mart Stores | 5,929 | 428 | ||||
Whole Foods Market | 1,039 | 29 | ||||
7,247 | ||||||
Energy — 0.8% | ||||||
Anadarko Petroleum, Cl A | 2,002 | 127 | ||||
Apache | 1,493 | 95 | ||||
Baker Hughes | 1,723 | 87 | ||||
Breitburn Energy Partners *(C) | 62,847 | 10 | ||||
Cabot Oil & Gas | 1,858 | 48 | ||||
Chesapeake Energy * | 2,296 | 14 | ||||
Chevron | 7,307 | 752 | ||||
Cimarex Energy | 378 | 51 | ||||
Concho Resources * | 550 | 76 | ||||
ConocoPhillips | 4,826 | 210 | ||||
Devon Energy | 2,061 | 91 | ||||
EOG Resources | 2,146 | 208 | ||||
EQT | 690 | 50 | ||||
Exxon Mobil | 16,192 | 1,413 | ||||
FMC Technologies * | 945 | 28 | ||||
Halliburton | 3,357 | 150 | ||||
Helmerich & Payne | 337 | 23 | ||||
Hess | 1,046 | 56 | ||||
Kinder Morgan | 7,570 | 175 | ||||
Marathon Oil | 3,373 | 53 | ||||
Marathon Petroleum | 2,085 | 85 | ||||
Murphy Oil | 473 | 14 | ||||
National Oilwell Varco, Cl A | 1,501 | 55 | ||||
Newfield Exploration * | 630 | 27 | ||||
Noble Energy | 1,700 | 61 | ||||
Occidental Petroleum | 2,974 | 217 | ||||
Oneok | 859 | 44 | ||||
Phillips 66 | 1,756 | 141 | ||||
Pioneer Natural Resources | 641 | 119 | ||||
Range Resources | 779 | 30 | ||||
Schlumberger, Cl A | 5,395 | 424 | ||||
Southwestern Energy * | 1,617 | 22 | ||||
Spectra Energy | 2,688 | 115 | ||||
Tesoro | 385 | 31 | ||||
Titan Energy * | 13,743 | 406 | ||||
Transocean | 908 | 10 | ||||
Valero Energy | 1,844 | 98 | ||||
Williams | 2,699 | 83 | ||||
5,699 | ||||||
| 240 | SEI Institutional Managed Trust / Annual Report / September 30, 2016 |
| Description | Shares |
Market Value
($ Thousands) | ||||||
COMMON STOCK (continued) |
| |||||||
Financials — 1.5% | ||||||||
Affiliated Managers Group * | 219 | $ | 32 | |||||
Aflac | 1,622 | 117 | ||||||
Allstate | 1,470 | 102 | ||||||
American Express | 3,054 | 195 | ||||||
American International Group | 3,997 | 237 | ||||||
Ameriprise Financial | 657 | 66 | ||||||
Aon | 1,038 | 117 | ||||||
Arthur J. Gallagher | 570 | 29 | ||||||
Assurant | 193 | 18 | ||||||
Bank of America | 39,844 | 624 | ||||||
Bank of New York Mellon | 4,204 | 168 | ||||||
BB&T | 3,215 | 121 | ||||||
Berkshire Hathaway, Cl B * | 7,416 | 1,072 | ||||||
BlackRock | 491 | 178 | ||||||
California Republic Bancorp * | 48,000 | 1,784 | ||||||
Capital One Financial | 2,003 | 144 | ||||||
Charles Schwab | 4,703 | 148 | ||||||
Chubb | 1,809 | 227 | ||||||
Cincinnati Financial | 592 | 45 | ||||||
Citigroup | 11,388 | 538 | ||||||
Citizens Financial Group | 2,109 | 52 | ||||||
CME Group | 1,324 | 138 | ||||||
Comerica | 566 | 27 | ||||||
Discover Financial Services | 1,620 | 92 | ||||||
E*Trade Financial * | 923 | 27 | ||||||
Fifth Third Bancorp | 3,046 | 62 | ||||||
Franklin Resources | 1,466 | 52 | ||||||
Goldman Sachs Group | 1,504 | 243 | ||||||
Hartford Financial Services Group | 1,559 | 67 | ||||||
Huntington Bancshares | 4,418 | 44 | ||||||
Intercontinental Exchange | 466 | 126 | ||||||
Invesco | 1,664 | 52 | ||||||
JPMorgan Chase | 14,172 | 944 | ||||||
KeyCorp | 4,310 | 52 | ||||||
Legg Mason | 369 | 12 | ||||||
Leucadia National | 1,070 | 20 | ||||||
Lincoln National | 957 | 45 | ||||||
Loews | 1,072 | 44 | ||||||
M&T Bank | 628 | 73 | ||||||
Marsh & McLennan | 2,039 | 137 | ||||||
MetLife | 4,288 | 190 | ||||||
Moody’s | 668 | 72 | ||||||
Morgan Stanley | 5,895 | 189 | ||||||
Nasdaq, Cl A | 354 | 24 | ||||||
Navient | 961 | 14 | ||||||
Northern Trust | 851 | 58 | ||||||
People’s United Financial | 856 | 13 | ||||||
PNC Financial Services Group | 1,949 | 176 | ||||||
Principal Financial Group, Cl A | 1,074 | 55 | ||||||
Progressive | 2,300 | 72 | ||||||
Prudential Financial | 1,729 | 141 | ||||||
| Description | Shares |
Market Value
($ Thousands) | ||||||
COMMON STOCK (continued) |
| |||||||
Regions Financial | 5,055 | $ | 50 | |||||
S&P Global | 1,036 | 131 | ||||||
State Street | 1,455 | 101 | ||||||
SunTrust Banks | 1,974 | 86 | ||||||
Synchrony Financial | 3,280 | 92 | ||||||
T. Rowe Price Group | 982 | 65 | ||||||
Torchmark, Cl A | 340 | 22 | ||||||
Travelers | 1,144 | 131 | ||||||
Unum Group | 963 | 34 | ||||||
US Bancorp | 6,313 | 271 | ||||||
Wells Fargo | 17,748 | 786 | ||||||
Willis Towers Watson | 548 | 73 | ||||||
XL Group | 1,145 | 38 | ||||||
Zions Bancorporation | 859 | 27 | ||||||
| ||||||||
| 11,182 | ||||||||
| ||||||||
Health Care — 1.4% | ||||||||
Abbott Laboratories | 5,718 | 242 | ||||||
AbbVie | 6,280 | 396 | ||||||
Aetna, Cl A | 1,369 | 158 | ||||||
Agilent Technologies | 1,299 | 61 | ||||||
Alexion Pharmaceuticals * | 878 | 107 | ||||||
Allergan * | 1,536 | 354 | ||||||
AmerisourceBergen | 726 | 59 | ||||||
Amgen, Cl A | 2,915 | 486 | ||||||
Anthem | 1,029 | 129 | ||||||
Baxter International | 1,947 | 93 | ||||||
Becton Dickinson | 830 | 149 | ||||||
Biogen * | 852 | 267 | ||||||
Boston Scientific * | 5,312 | 127 | ||||||
Bristol-Myers Squibb | 6,485 | 350 | ||||||
C.R. Bard | 290 | 65 | ||||||
Cardinal Health | 1,278 | 99 | ||||||
Celgene, Cl A * | 3,010 | 315 | ||||||
Centene * | 681 | 46 | ||||||
Cerner * | 1,187 | 73 | ||||||
Cigna | 1,004 | 131 | ||||||
Cooper, Cl A | 190 | 34 | ||||||
DaVita HealthCare Partners * | 653 | 43 | ||||||
DENTSPLY SIRONA | 931 | 55 | ||||||
Edwards Lifesciences, Cl A * | 832 | 100 | ||||||
Eli Lilly | 3,777 | 303 | ||||||
Endo International * | 597 | 12 | ||||||
Express Scripts Holding * | 2,468 | 174 | ||||||
Gilead Sciences | 5,172 | 409 | ||||||
HCA Holdings * | 1,185 | 90 | ||||||
Henry Schein * | 327 | 53 | ||||||
Hologic * | 977 | 38 | ||||||
Humana | 585 | 103 | ||||||
Illumina * | 578 | 105 | ||||||
Intuitive Surgical * | 149 | 108 | ||||||
Johnson & Johnson | 10,656 | 1,259 | ||||||
| SEI Institutional Managed Trust / Annual Report / September 30, 2016 | 241 |
SCHEDULE OF INVESTMENTS
September 30, 2016
Multi-Asset Income Fund (Continued)
| Description | Shares |
Market Value
($ Thousands) | ||||
COMMON STOCK (continued) | ||||||
Laboratory Corp of America Holdings * | 407 | $ | 56 | |||
Mallinckrodt * | 347 | 24 | ||||
McKesson | 878 | 146 | ||||
Medtronic | 5,458 | 472 | ||||
Merck | 10,734 | 670 | ||||
Mettler Toledo International * | 100 | 42 | ||||
Mylan * | 1,774 | 67 | ||||
Patterson | 243 | 11 | ||||
PerkinElmer | 309 | 17 | ||||
Perrigo | 571 | 53 | ||||
Pfizer | 23,510 | 796 | ||||
Quest Diagnostics | 565 | 48 | ||||
Regeneron Pharmaceuticals * | 305 | 123 | ||||
St. Jude Medical | 1,118 | 89 | ||||
Stryker | 1,229 | 143 | ||||
Thermo Fisher Scientific | 1,532 | 244 | ||||
UnitedHealth Group | 3,690 | 517 | ||||
Universal Health Services, Cl B | 359 | 44 | ||||
Varian Medical Systems * | 384 | 38 | ||||
Vertex Pharmaceuticals * | 972 | 85 | ||||
Waters * | 322 | 51 | ||||
Zimmer Biomet Holdings | 782 | 102 | ||||
Zoetis, Cl A | 1,966 | 102 | ||||
10,533 | ||||||
Industrials — 1.0% | ||||||
3M | 2,355 | 415 | ||||
Acuity Brands | 175 | 46 | ||||
Alaska Air Group | 400 | 26 | ||||
Allegion | 276 | 19 | ||||
American Airlines Group | 2,091 | 77 | ||||
Ametek | 933 | 45 | ||||
Boeing | 2,277 | 300 | ||||
C.H. Robinson Worldwide | 573 | 40 | ||||
Caterpillar, Cl A | 2,277 | 202 | ||||
Cintas | 348 | 39 | ||||
CSX | 3,751 | 114 | ||||
Cummins | 625 | 80 | ||||
Danaher, Cl A | 2,337 | 183 | ||||
Deere | 1,174 | 100 | ||||
Delta Air Lines, Cl A | 3,025 | 119 | ||||
Dover | 620 | 46 | ||||
Dun & Bradstreet | 101 | 14 | ||||
Eaton | 1,794 | 118 | ||||
Emerson Electric | 2,516 | 137 | ||||
Equifax | 472 | 64 | ||||
Expeditors International of Washington | 733 | 38 | ||||
Fastenal, Cl A | 1,151 | 48 | ||||
FedEx | 975 | 170 | ||||
Flowserve | 405 | 20 | ||||
Fluor | 446 | 23 | ||||
Fortive | 1,187 | 60 | ||||
| Description | Shares |
Market Value
($ Thousands) | ||||
COMMON STOCK (continued) | ||||||
Fortune Brands Home & Security | 500 | $ | 29 | |||
General Dynamics | 1,121 | 174 | ||||
General Electric | 35,007 | 1,037 | ||||
Honeywell International | 2,962 | 345 | ||||
Illinois Tool Works | 1,264 | 152 | ||||
Ingersoll-Rand | 1,018 | 69 | ||||
Jacobs Engineering Group * | 348 | 18 | ||||
JB Hunt Transport Services | 362 | 29 | ||||
Kansas City Southern | 433 | 40 | ||||
L-3 Communications Holdings | 308 | 46 | ||||
Lockheed Martin | 988 | 237 | ||||
Masco | 1,329 | 46 | ||||
Nielsen Holdings | 1,424 | 76 | ||||
Norfolk Southern | 1,161 | 113 | ||||
Northrop Grumman | 705 | 151 | ||||
PACCAR | 1,381 | 81 | ||||
Parker-Hannifin, Cl A | 533 | 67 | ||||
Pentair | 721 | 46 | ||||
Pitney Bowes | 554 | 10 | ||||
Quanta Services * | 532 | 15 | ||||
Raytheon | 1,159 | 158 | ||||
Republic Services | 947 | 48 | ||||
Robert Half International | 380 | 14 | ||||
Rockwell Automation | 516 | 63 | ||||
Rockwell Collins | 521 | 44 | ||||
Roper Technologies | 400 | 73 | ||||
Ryder System | 144 | 10 | ||||
Snap-on | 187 | 28 | ||||
Southwest Airlines, Cl A | 2,511 | 98 | ||||
Stanley Black & Decker | 593 | 73 | ||||
Stericycle, Cl A * | 250 | 20 | ||||
Textron | 1,076 | 43 | ||||
TransDigm Group * | 210 | 61 | ||||
Union Pacific | 3,270 | 319 | ||||
United Continental Holdings * | 1,179 | 62 | ||||
United Parcel Service, Cl B | 2,685 | 294 | ||||
United Rentals * | 302 | 24 | ||||
United Technologies | 3,025 | 307 | ||||
Verisk Analytics, Cl A * | 617 | 50 | ||||
Waste Management | 1,621 | 103 | ||||
WW Grainger | 225 | 50 | ||||
Xylem | 564 | 30 | ||||
7,296 | ||||||
Information Technology — 2.1% | ||||||
Accenture, Cl A | 2,427 | 297 | ||||
Activision Blizzard | 2,701 | 120 | ||||
Adobe Systems * | 1,950 | 212 | ||||
Akamai Technologies * | 717 | 38 | ||||
Alliance Data Systems | 235 | 50 | ||||
Alphabet, Cl A * | 1,152 | 927 | ||||
Alphabet, Cl C * | 1,145 | 890 | ||||
| 242 | SEI Institutional Managed Trust / Annual Report / September 30, 2016 |
| Description | Shares |
Market Value
($ Thousands) | ||||||
COMMON STOCK (continued) | ||||||||
Amphenol, Cl A | 1,216 | $ | 79 | |||||
Analog Devices | 1,212 | 78 | ||||||
Apple | 21,029 | 2,377 | ||||||
Applied Materials | 4,268 | 129 | ||||||
Autodesk, Cl A * | 788 | 57 | ||||||
Automatic Data Processing | 1,779 | 157 | ||||||
Broadcom | 1,553 | 268 | ||||||
CA | 1,188 | 39 | ||||||
Cisco Systems | 19,510 | 619 | ||||||
Citrix Systems * | 617 | 53 | ||||||
Cognizant Technology Solutions, Cl A * | 2,370 | 113 | ||||||
Corning, Cl B | 4,226 | 100 | ||||||
CSRA | 385 | 10 | ||||||
eBay * | 4,138 | 136 | ||||||
Electronic Arts * | 1,185 | 101 | ||||||
F5 Networks, Cl A * | 271 | 34 | ||||||
Facebook, Cl A * | 9,073 | 1,164 | ||||||
Fidelity National Information Services, Cl B | 1,302 | 100 | ||||||
First Solar * | 218 | 9 | ||||||
Fiserv, Cl A * | 875 | 87 | ||||||
Flir Systems | 394 | 12 | ||||||
Global Payments | 616 | 47 | ||||||
Harris | 499 | 46 | ||||||
Hewlett Packard Enterprise | 6,498 | 148 | ||||||
HP | 6,720 | 104 | ||||||
Intel | 18,314 | 691 | ||||||
International Business Machines | 3,427 | 544 | ||||||
Intuit | 1,003 | 110 | ||||||
Juniper Networks | 1,430 | 34 | ||||||
KLA-Tencor | 624 | 44 | ||||||
Lam Research | 634 | 60 | ||||||
Linear Technology | 950 | 56 | ||||||
MasterCard, Cl A | 3,772 | 384 | ||||||
Microchip Technology | 855 | 53 | ||||||
Micron Technology * | 4,107 | 73 | ||||||
Microsoft | 30,442 | 1,753 | ||||||
Motorola Solutions | 634 | 48 | ||||||
NetApp | 936 | 33 | ||||||
Nvidia | 1,987 | 136 | ||||||
Oracle, Cl B | 11,781 | 463 | ||||||
Paychex | 1,265 | 73 | ||||||
PayPal Holdings * | 4,306 | 177 | ||||||
Qlik *(C) | 3,600 | 4 | ||||||
Qlik, Cl A *(C) | 56 | 56 | ||||||
Qlik, Cl B *(C) | 13,812 | — | ||||||
Qorvo * | 400 | 22 | ||||||
Qualcomm | 5,708 | 391 | ||||||
Red Hat * | 722 | 58 | ||||||
salesforce.com * | 2,484 | 177 | ||||||
Seagate Technology | 1,214 | 47 | ||||||
Skyworks Solutions | 757 | 58 | ||||||
Symantec, Cl A | 2,433 | 61 | ||||||
| Description | Shares |
Market Value
($ Thousands) | ||||||
COMMON STOCK (continued) | ||||||||
TE Connectivity | 1,408 | $ | 91 | |||||
Teradata * | 402 | 13 | ||||||
Texas Instruments | 3,907 | 274 | ||||||
Total System Services | 530 | 25 | ||||||
VeriSign * | 283 | 22 | ||||||
Visa, Cl A | 7,389 | 611 | ||||||
Western Digital | 1,122 | 66 | ||||||
Western Union | 1,566 | 33 | ||||||
Xerox | 3,050 | 31 | ||||||
Xilinx | 1,010 | 55 | ||||||
Yahoo! * | 3,416 | 147 | ||||||
| ||||||||
15,575 | ||||||||
| ||||||||
Materials — 0.3% | ||||||||
Air Products & Chemicals | 857 | 129 | ||||||
Albemarle | 370 | 32 | ||||||
Alcoa | 5,230 | 53 | ||||||
Avery Dennison | 291 | 23 | ||||||
Ball | 691 | 56 | ||||||
CF Industries Holdings | 718 | 17 | ||||||
Dow Chemical, Cl A | 4,373 | 227 | ||||||
E.I. Du Pont de Nemours | 3,401 | 228 | ||||||
Eastman Chemical | 598 | 40 | ||||||
Ecolab | 1,033 | 126 | ||||||
FMC | 378 | 18 | ||||||
Freeport-McMoRan, Cl B | 5,269 | 57 | ||||||
International Flavors & Fragrances | 319 | 46 | ||||||
International Paper | 1,622 | 78 | ||||||
LyondellBasell Industries, Cl A | 1,340 | 108 | ||||||
Martin Marietta Materials, Cl A | 253 | 45 | ||||||
Mirabela Nickel *(C) | 597,236 | — | ||||||
Monsanto | 1,704 | 174 | ||||||
Mosaic | 1,406 | 34 | ||||||
Newmont Mining | 2,086 | 82 | ||||||
Nucor | 1,259 | 63 | ||||||
Owens-Illinois * | 471 | 9 | ||||||
PPG Industries | 1,044 | 108 | ||||||
Praxair | 1,116 | 135 | ||||||
Sealed Air | 794 | 36 | ||||||
Sherwin-Williams, Cl A | 309 | 85 | ||||||
Vulcan Materials | 528 | 60 | ||||||
WestRock | 1,010 | 49 | ||||||
| ||||||||
2,118 | ||||||||
| ||||||||
Real Estate — 0.3% | ||||||||
American Tower, Cl A ‡ | 1,656 | 188 | ||||||
Apartment Investment & Management, Cl A ‡ | 493 | 23 | ||||||
AvalonBay Communities ‡ | 539 | 96 | ||||||
Boston Properties ‡ | 605 | 82 | ||||||
CBRE Group, Cl A * | 1,180 | 33 | ||||||
Crown Castle International ‡ | 1,319 | 124 | ||||||
Digital Realty Trust, Cl A ‡ | 583 | 57 | ||||||
| SEI Institutional Managed Trust / Annual Report / September 30, 2016 | 243 |
SCHEDULE OF INVESTMENTS
September 30, 2016
Multi-Asset Income Fund (Continued)
| Description | Shares | Market Value ($ Thousands) | ||||||
COMMON STOCK (continued) | ||||||||
Equinix ‡ | 273 | $ | 98 | |||||
Equity Residential ‡ | 1,436 | 92 | ||||||
Essex Property Trust ‡ | 260 | 58 | ||||||
Extra Space Storage ‡ | 502 | 40 | ||||||
Federal Realty Investment Trust ‡ | 284 | 44 | ||||||
General Growth Properties ‡ | 2,305 | 63 | ||||||
HCP ‡ | 1,844 | 70 | ||||||
Host Hotels & Resorts ‡ | 2,973 | 46 | ||||||
Iron Mountain ‡ | 1,005 | 38 | ||||||
Kimco Realty ‡ | 1,673 | 48 | ||||||
Macerich ‡ | 506 | 41 | ||||||
ProLogis ‡ | 2,060 | 110 | ||||||
Public Storage ‡ | 577 | 129 | ||||||
Realty Income ‡ | 1,019 | 68 | ||||||
Simon Property Group ‡ | 1,204 | 249 | ||||||
SL Green Realty ‡ | 400 | 43 | ||||||
UDR ‡ | 1,074 | 39 | ||||||
Ventas ‡ | 1,328 | 94 | ||||||
Vornado Realty Trust ‡ | 701 | 71 | ||||||
Welltower ‡ | 1,400 | 105 | ||||||
Weyerhaeuser ‡ | 2,937 | 94 | ||||||
| ||||||||
2,243 | ||||||||
| ||||||||
Telecommunication Services — 0.3% | ||||||||
AT&T | 23,856 | 969 | ||||||
CenturyTel | 2,163 | 59 | ||||||
Frontier Communications | 3,318 | 14 | ||||||
Level 3 Communications * | 1,152 | 54 | ||||||
Verizon Communications | 15,801 | 821 | ||||||
| ||||||||
1,917 | ||||||||
| ||||||||
Utilities — 0.3% | ||||||||
AES | 2,134 | 27 | ||||||
Alliant Energy | 934 | 36 | ||||||
Ameren | 968 | 48 | ||||||
American Electric Power | 1,923 | 123 | ||||||
American Water Works | 707 | 53 | ||||||
Centerpoint Energy | 1,731 | 40 | ||||||
CMS Energy | 1,114 | 47 | ||||||
Consolidated Edison | 1,196 | 90 | ||||||
Dominion Resources | 2,404 | 179 | ||||||
DTE Energy | 710 | 66 | ||||||
Duke Energy | 2,684 | 215 | ||||||
Edison International | 1,280 | 93 | ||||||
Entergy | 710 | 54 | ||||||
Eversource Energy | 1,254 | 68 | ||||||
Exelon | 3,609 | 120 | ||||||
FirstEnergy | 1,688 | 56 | ||||||
NextEra Energy | 1,797 | 220 | ||||||
NiSource | 1,333 | 32 | ||||||
NRG Energy | 935 | 11 | ||||||
PG&E | 1,942 | 119 | ||||||
| Description | Shares | Market Value ($ Thousands) | ||||||
COMMON STOCK (continued) | ||||||||
Pinnacle West Capital | 449 | $ | 34 | |||||
PPL | 2,661 | 92 | ||||||
Public Service Enterprise Group | 1,991 | 83 | ||||||
SCANA | 573 | 41 | ||||||
Sempra Energy | 931 | 100 | ||||||
Southern | 3,852 | 198 | ||||||
WEC Energy Group | 1,245 | 75 | ||||||
Xcel Energy | 2,000 | 82 | ||||||
| ||||||||
2,402 | ||||||||
| ||||||||
Total Common Stock (Cost $70,121) ($ Thousands) | 75,414 | |||||||
| ||||||||
Face Amount | ||||||||
SOVEREIGN DEBT — 9.9% | ||||||||
Abu Dhabi Government International Bond | ||||||||
3.125%, 05/03/2026 | 850 | 888 | ||||||
2.125%, 05/03/2021 | 200 | 201 | ||||||
Angolan Government International Bond | ||||||||
9.500%, 11/12/2025 | 420 | 417 | ||||||
Argentine Republic Government International Bond | ||||||||
8.280%, 12/31/2033 | 112 | 125 | ||||||
7.820%, 12/31/2033 | EUR | 199 | 247 | |||||
7.500%, 04/22/2026 (A) | $ | 1,160 | 1,308 | |||||
7.125%, 07/06/2036 (A) | 400 | 424 | ||||||
6.875%, 04/22/2021 (A) | 260 | 283 | ||||||
6.625%, 07/06/2028 (A) | 150 | 159 | ||||||
2.500%, 12/31/2038 (D) | 320 | 227 | ||||||
0.000%, 12/15/2035 (B) | EUR | 1,060 | 124 | |||||
Armenia International Bond | ||||||||
7.150%, 03/26/2025 | $ | 200 | 213 | |||||
Brazilian Government International Bond | ||||||||
4.250%, 01/07/2025 | 210 | 209 | ||||||
2.625%, 01/05/2023 | 1,390 | 1,286 | ||||||
Bulgaria Government International Bond | ||||||||
3.125%, 03/26/2035 | EUR | 170 | 199 | |||||
3.000%, 03/21/2028 | 360 | 442 | ||||||
2.950%, 09/03/2024 | 830 | 1,038 | ||||||
2.625%, 03/26/2027 | 100 | 121 | ||||||
Chile Government International Bond | ||||||||
3.125%, 01/21/2026 | $ | 1,220 | 1,295 | |||||
Colombia Government International Bond | ||||||||
4.500%, 01/28/2026 | 1,810 | 1,996 | ||||||
3.875%, 03/22/2026 | EUR | 530 | 674 | |||||
2.625%, 03/15/2023 | $ | 860 | 848 | |||||
Costa Rica Government International Bond | ||||||||
7.158%, 03/12/2045 | 880 | 948 | ||||||
7.000%, 04/04/2044 | 400 | 427 | ||||||
5.625%, 04/30/2043 | 400 | 366 | ||||||
Croatia Government International Bond | ||||||||
3.000%, 03/11/2025 | EUR | 190 | 218 | |||||
| 244 | SEI Institutional Managed Trust / Annual Report / September 30, 2016 |
| Description |
Face Amount
(Thousands) | Market Value
($ Thousands) | ||||||
SOVEREIGN DEBT (continued) | ||||||||
Dominican Republic International Bond | ||||||||
6.875%, 01/29/2026 | $ | 1,060 | $ | 1,227 | ||||
6.850%, 01/27/2045 (A) | 2,450 | 2,744 | ||||||
6.850%, 01/27/2045 | 760 | 851 | ||||||
6.600%, 01/28/2024 | 300 | 338 | ||||||
5.875%, 04/18/2024 | 3,090 | 3,360 | ||||||
5.500%, 01/27/2025 | 220 | 233 | ||||||
Ecuador Government International Bond | ||||||||
10.750%, 03/28/2022 | 440 | 449 | ||||||
7.950%, 06/20/2024 | 690 | 618 | ||||||
El Salvador Government International Bond | ||||||||
7.650%, 06/15/2035 | 1,000 | 1,046 | ||||||
Gabon Government International Bond | ||||||||
6.950%, 06/16/2025 | 530 | 487 | ||||||
Ghana Government International Bond | ||||||||
8.125%, 01/18/2026 | 370 | 344 | ||||||
Guatemala Government Bond | ||||||||
5.750%, 06/06/2022 | 700 | 786 | ||||||
4.875%, 02/13/2028 | 210 | 227 | ||||||
4.500%, 05/03/2026 (A) | 970 | 1,010 | ||||||
Honduras Government International Bond | ||||||||
7.500%, 03/15/2024 | 860 | 976 | ||||||
Hungary Government International Bond | ||||||||
7.625%, 03/29/2041 | 80 | 125 | ||||||
6.375%, 03/29/2021 | 540 | 626 | ||||||
6.250%, 01/29/2020 | 2,310 | 2,596 | ||||||
5.750%, 11/22/2023 | 750 | 883 | ||||||
5.375%, 02/21/2023 | 250 | 287 | ||||||
5.375%, 03/25/2024 | 80 | 93 | ||||||
4.125%, 02/19/2018 | 70 | 72 | ||||||
4.000%, 03/25/2019 | 30 | 31 | ||||||
Indonesia Government International Bond MTN | ||||||||
5.950%, 01/08/2046 | 211 | 267 | ||||||
5.875%, 01/15/2024 | 1,130 | 1,333 | ||||||
4.750%, 01/08/2026 | 2,270 | 2,535 | ||||||
4.625%, 04/15/2043 | 230 | 245 | ||||||
4.125%, 01/15/2025 | 300 | 320 | ||||||
3.750%, 06/14/2028 (A) | EUR | 200 | 246 | |||||
3.375%, 04/15/2023 | $ | 310 | 319 | |||||
3.375%, 07/30/2025 | EUR | 900 | 1,094 | |||||
2.625%, 06/14/2023 (A) | 300 | 354 | ||||||
Ivory Coast Government International Bond | ||||||||
5.750%, 12/31/2032 | $ | 198 | 195 | |||||
Kazakhstan Government International Bond MTN | ||||||||
6.500%, 07/21/2045 | 250 | 312 | ||||||
5.125%, 07/21/2025 | 770 | 866 | ||||||
Kenya Government International Bond | ||||||||
6.875%, 06/24/2024 (A) | 2,850 | 2,793 | ||||||
6.875%, 06/24/2024 | 300 | 294 | ||||||
Macedonia Government International Bond | ||||||||
5.625%, 07/26/2023 (A) | EUR | 350 | 423 | |||||
| Description |
Face Amount
(Thousands) | Market Value
($ Thousands) | ||||||
SOVEREIGN DEBT (continued) | ||||||||
5.625%, 07/26/2023 | EUR | 350 | $ | 422 | ||||
Mexican Bonos | ||||||||
7.750%, 11/23/2034 | MXN | 3,222 | 189 | |||||
Mexico Cetes | ||||||||
4.397%, 10/20/2016 (I) | 652,689 | 3,364 | ||||||
Mexico Government International Bond | ||||||||
4.000%, 10/02/2023 | $ | 2,670 | 2,853 | |||||
3.625%, 03/15/2022 | 70 | 74 | ||||||
Mongolia Government International Bond MTN | ||||||||
5.125%, 12/05/2022 | 401 | 352 | ||||||
Nigeria Government International Bond | ||||||||
6.750%, 01/28/2021 | 207 | 209 | ||||||
6.375%, 07/12/2023 | 200 | 197 | ||||||
Oman Government International Bond | ||||||||
4.750%, 06/15/2026 | 200 | 201 | ||||||
Pakistan Government International Bond | ||||||||
8.250%, 09/30/2025 | 570 | 633 | ||||||
7.875%, 03/31/2036 | 130 | 128 | ||||||
Paraguay Government International Bond | ||||||||
6.100%, 08/11/2044 | 350 | 398 | ||||||
5.000%, 04/15/2026 (A) | 440 | 476 | ||||||
4.625%, 01/25/2023 | 550 | 583 | ||||||
Perusahaan Penerbit SBSN Indonesia III | ||||||||
4.550%, 03/29/2026 (A) | 330 | 358 | ||||||
Petrobras Global Finance | ||||||||
5.750%, 01/20/2020 | 320 | 330 | ||||||
4.875%, 03/17/2020 | 640 | 641 | ||||||
Petroleos Mexicanos MTN | ||||||||
6.875%, 08/04/2026 | 860 | 970 | ||||||
Philippine Government International Bond | ||||||||
5.500%, 03/30/2026 | 200 | 252 | ||||||
Romanian Government International Bond MTN | ||||||||
2.875%, 05/26/2028 | EUR | 230 | 280 | |||||
Russian Foreign Bond - Eurobond | ||||||||
4.875%, 09/16/2023 (A) | $ | 400 | 440 | |||||
4.750%, 05/27/2026 | 1,600 | 1,725 | ||||||
4.500%, 04/04/2022 (A) | 200 | 216 | ||||||
Sberbank of Russia Via SB Capital | ||||||||
5.500%, 02/26/2024 (B) | 400 | 404 | ||||||
Serbia International Bond | ||||||||
7.250%, 09/28/2021 | 210 | 244 | ||||||
South Africa Government International Bond | ||||||||
5.875%, 05/30/2022 | 100 | 113 | ||||||
5.875%, 09/16/2025 | 760 | 861 | ||||||
5.500%, 03/09/2020 | 180 | 196 | ||||||
5.000%, 10/12/2046 | 240 | 240 | ||||||
4.875%, 04/14/2026 | 490 | 515 | ||||||
4.665%, 01/17/2024 | 190 | 201 | ||||||
Sri Lanka Government International Bond | ||||||||
6.850%, 11/03/2025 | 390 | 418 | ||||||
6.825%, 07/18/2026 (A) | 450 | 484 | ||||||
| SEI Institutional Managed Trust / Annual Report / September 30, 2016 | 245 |
SCHEDULE OF INVESTMENTS
September 30, 2016
Multi-Asset Income Fund (Continued)
Face Amount |
Market Value | |||||||
| Description |
(Thousands) |
($ Thousands) | ||||||
SOVEREIGN DEBT (continued) | ||||||||
6.125%, 06/03/2025 | $ | 200 | $ | 204 | ||||
5.875%, 07/25/2022 | 470 | 483 | ||||||
5.750%, 01/18/2022 (A) | 200 | 204 | ||||||
Turkey Government International Bond | ||||||||
7.375%, 02/05/2025 | 560 | 662 | ||||||
7.000%, 06/05/2020 | 220 | 243 | ||||||
6.250%, 09/26/2022 | 1,271 | 1,395 | ||||||
5.750%, 03/22/2024 | 616 | 663 | ||||||
5.125%, 03/25/2022 | 200 | 208 | ||||||
4.875%, 10/09/2026 | 570 | 580 | ||||||
4.250%, 04/14/2026 | 200 | 196 | ||||||
Venezuela Government International Bond | ||||||||
7.750%, 10/13/2019 | 3,080 | 1,893 | ||||||
Vietnam Government International Bond | ||||||||
4.800%, 11/19/2024 | 200 | 212 | ||||||
Zambia Government International Bond | ||||||||
8.970%, 07/30/2027 | 1,350 | 1,332 | ||||||
8.970%, 07/30/2027 | 200 | 197 | ||||||
8.500%, 04/14/2024 | 400 | 393 | ||||||
5.375%, 09/20/2022 | 280 | 246 | ||||||
| ||||||||
Total Sovereign Debt | 73,766 | |||||||
| ||||||||
MORTGAGE-BACKED SECURITIES — 7.9% | ||||||||
Non-Agency Mortgage-Backed Obligations — 7.9% | ||||||||
Alliance Bancorp Trust, Ser 2007-OA1, Cl A1 | ||||||||
0.764%, 07/25/2037 (B) | 1,127 | 822 | ||||||
Alternative Loan Trust, Ser 2007-J2, Cl 1A1 | ||||||||
6.500%, 07/25/2037 | 660 | 308 | ||||||
American Home Mortgage Assets Trust, Ser 2006-6, Cl A1A | ||||||||
0.715%, 12/25/2046 (B) | 15 | 10 | ||||||
American Home Mortgage Assets Trust, Ser 2007-1, Cl A1 | ||||||||
1.207%, 02/25/2047 (B) | 4,841 | 2,869 | ||||||
American Home Mortgage Investment Trust, Ser 2006-1, Cl 12A1 | ||||||||
0.924%, 03/25/2046 (B) | 1,557 | 1,290 | ||||||
Bank of America Funding, Ser 2013-R1, Cl A5 | ||||||||
0.714%, 11/03/2041 (A)(B) | 4,500 | 4,100 | ||||||
BCAP Trust 2006-AA2, Ser 2006-AA2, Cl A1 | ||||||||
0.695%, 01/25/2037 (B) | 939 | 789 | ||||||
BCAP Trust 2007-AA2, Ser 2007-AA2, Cl 2A7 | ||||||||
6.000%, 04/25/2037 | 1,092 | 958 | ||||||
Capmark Military Housing Trust, Ser 2007-AET2, Cl A | ||||||||
6.063%, 10/10/2052 (A) | 975 | 984 | ||||||
CDGJ Commercial Mortgage Trust, Ser 2014-BXCH, Cl EPA | ||||||||
4.774%, 12/15/2027 (A)(B) | 3,742 | 3,707 | ||||||
Face Amount |
Market Value | |||||||
| Description |
(Thousands) |
($ Thousands) | ||||||
MORTGAGE-BACKED SECURITIES (continued) | ||||||||
Chase Mortgage Finance Trust Series, Ser 2007-S5, Cl 1A3 | ||||||||
6.000%, 07/25/2037 | $ | 1,632 | $ | 1,358 | ||||
FHLMC Structured Agency Credit Risk Debt Notes, Ser 2015-DN1, Cl M3 | ||||||||
4.674%, 01/25/2025 (B) | 700 | 741 | ||||||
FHLMC Structured Agency Credit Risk Debt Notes, Ser 2016-DNA3, Cl M3 | ||||||||
5.525%, 12/25/2028 (B) | 250 | 267 | ||||||
FHLMC Structured Agency Credit Risk Debt Notes, Ser 2016-DNA4, Cl M3 | ||||||||
4.324%, 03/25/2029 (B) | 300 | 302 | ||||||
FNMA Connecticut Avenue Securities, Ser 2016-C04, Cl 1M2 | ||||||||
4.775%, 01/25/2029 (B) | 300 | 307 | ||||||
GE Business Loan Trust, Ser 2007-1, Cl C | ||||||||
0.974%, 04/16/2035 (A)(B) | 1,475 | 1,295 | ||||||
GreenPoint Mortgage Funding Trust, Ser 2006-AR1, Cl A1A | ||||||||
0.814%, 02/25/2036 (B) | 1,661 | 1,415 | ||||||
GreenPoint Mortgage Funding Trust, Ser 2007-AR1, Cl 1A1A | ||||||||
0.604%, 02/25/2047 (B) | 82 | 82 | ||||||
GS Mortgage Securities Trust, Ser 2016-ICE2, Cl E | ||||||||
9.024%, 02/15/2033 (A)(B) | 3,300 | 3,293 | ||||||
Lehman XS Trust, Ser 2006-10N, Cl 1A3A | ||||||||
0.734%, 07/25/2046 (B) | 1,175 | 936 | ||||||
Lehman XS Trust, Ser 2006-16N, Cl A4A | ||||||||
0.714%, 11/25/2046 (B) | 3,279 | 2,702 | ||||||
LSTAR Securities Investment Trust, Ser 2015-1, Cl A | ||||||||
2.494%, 01/01/2020 (A)(B) | 3,612 | 3,566 | ||||||
LSTAR Securities Investment, Ser 2016-3, Cl A | ||||||||
2.528%, 09/01/2021 (A)(B)(C) | 1,800 | 1,777 | ||||||
Luminent Mortgage Trust, Ser 2006-2, Cl A1A | ||||||||
0.725%, 02/25/2046 (B) | 4,268 | 2,924 | ||||||
Morgan Stanley Re-REMIC Trust, Ser 2010-R5, Cl 4B | ||||||||
1.053%, 06/26/2036 (A)(B) | 814 | 568 | ||||||
Mortgage Repurchase Agreement Financing Trust, Ser 2016-1, Cl A | ||||||||
1.618%, 09/10/2018 (A)(B) | 1,150 | 1,150 | ||||||
Mortgage Repurchase Agreement Financing Trust, Ser 2016-2, Cl A | ||||||||
1.818%, 03/10/2019 (A)(B) | 1,150 | 1,150 | ||||||
Motel 6 Trust, Ser 2015-MTL6, Cl E | ||||||||
5.279%, 02/05/2030 (A) | 3,800 | 3,804 | ||||||
Nomura Resecuritization Trust, Ser 2012-1R, Cl A | ||||||||
0.964%, 08/27/2047 (A)(B) | 1,772 | 1,735 | ||||||
| 246 | SEI Institutional Managed Trust / Annual Report / September 30, 2016 |
| Description |
Face Amount
(Thousands) | Market Value
($ Thousands) | ||||||||||||||
MORTGAGE-BACKED SECURITIES (continued) |
| |||||||||||||||
Nomura Resecuritization Trust, Ser 2015-4R, Cl 5A1 | ||||||||||||||||
1.313%, 03/26/2036 (A)(B) | $ | 1,010 | $ | 958 | ||||||||||||
RALI Series Trust, Ser 2006-QO2, Cl A2 | ||||||||||||||||
0.795%, 02/25/2046 (B) | 1,940 | 874 | ||||||||||||||
RALI Series Trust, Ser 2007-QO2, Cl A1 | ||||||||||||||||
0.674%, 02/25/2047 (B) | 1,558 | 886 | ||||||||||||||
Resource Capital, Ser 2015-CRE3, Cl D | ||||||||||||||||
4.530%, 03/15/2032 (A)(B) | 1,000 | 967 | ||||||||||||||
Resource Capital, Ser 2015-CRE4, Cl B | ||||||||||||||||
3.530%, 08/15/2032 (A)(B) | 1,000 | 893 | ||||||||||||||
SRERS Funding, Ser 2011-RS, Cl A1B1 | ||||||||||||||||
0.763%, 05/09/2046 (A)(B) | 1,066 | 1,047 | ||||||||||||||
SRERS Funding, Ser 2011-RS, Cl A1B2 | ||||||||||||||||
0.763%, 05/09/2046 (A)(B) | 1,500 | 898 | ||||||||||||||
Structured Adjustable Rate Mortgage Loan Trust, Ser 2005-19XS, Cl 2A1 | ||||||||||||||||
0.824%, 10/25/2035 (B) | 1,303 | 1,232 | ||||||||||||||
Washington Mutual Mortgage Pass-Through Certificates, Ser 2006-AR9, Cl 2A | ||||||||||||||||
1.347%, 11/25/2046 (B) | 6,858 | 4,920 | ||||||||||||||
Wells Fargo Mortgage-Backed Securities Trust, Ser 2005-AR12, Cl 2A5 | ||||||||||||||||
2.929%, 06/25/2035 (B) | 568 | 581 | ||||||||||||||
|
| |||||||||||||||
|
58,465 |
| ||||||||||||||
|
| |||||||||||||||
Total Mortgage-Backed Securities | 58,465 | |||||||||||||||
|
| |||||||||||||||
COMMERCIAL PAPER (I) — 3.8% | ||||||||||||||||
American Water Capital | ||||||||||||||||
0.690%, 10/03/2016 (A) | 5,000 | 5,000 | ||||||||||||||
BAT International Finance | ||||||||||||||||
0.801%, 10/20/2016 (A) | 4,500 | 4,498 | ||||||||||||||
General Mills | ||||||||||||||||
0.630%, 10/12/2016 (A) | 5,000 | 4,999 | ||||||||||||||
Harley-Davidson Financial Services | ||||||||||||||||
0.671%, 10/19/2016 (A) | 6,000 | 5,997 | ||||||||||||||
Nissan Motor Acceptance | ||||||||||||||||
0.660%, 10/17/2016 (A) | 2,500 | 2,499 | ||||||||||||||
VF | ||||||||||||||||
0.650%, 10/27/2016 (A) | 5,000 | 4,997 | ||||||||||||||
|
| |||||||||||||||
Total Commercial Paper | 27,990 | |||||||||||||||
|
| |||||||||||||||
U.S. TREASURY OBLIGATIONS — 1.5% |
| |||||||||||||||
U.S. Treasury Bonds | ||||||||||||||||
2.250%, 08/15/2046 | 390 | 383 | ||||||||||||||
| Description |
Face Amount
(Thousands) | Market Value
($ Thousands) | ||||||||||||||
U.S. TREASURY OBLIGATIONS (continued) |
| |||||||||||||||
U.S. Treasury Notes | ||||||||||||||||
1.625%, 06/30/2020 | $ | 10,200 | $
| 10,422
|
| |||||||||||
|
| |||||||||||||||
Total U.S. Treasury Obligations | 10,805 | |||||||||||||||
|
| |||||||||||||||
U.S. GOVERNMENT AGENCY OBLIGATIONS — 1.1% |
| |||||||||||||||
FHLB DN | ||||||||||||||||
0.240%, 10/04/2016 (I) | 3,500 | 3,500 | ||||||||||||||
0.210%, 10/21/2016 (I) | 5,000 | 5,000 | ||||||||||||||
|
| |||||||||||||||
Total U.S. Government Agency Obligations | 8,500 | |||||||||||||||
|
| |||||||||||||||
MUNICIPAL BONDS — 0.4% | ||||||||||||||||
North Carolina — 0.2% | ||||||||||||||||
North Carolina State Education Assistance Authority, Ser A-3, RB | ||||||||||||||||
1.615%, 10/25/2041(B) | 1,250 | 1,209 | ||||||||||||||
|
| |||||||||||||||
Puerto Rico — 0.2% | ||||||||||||||||
Commonwealth of Puerto Rico, Ser A, GO | ||||||||||||||||
8.000%, 07/01/2035(F) | 410 | 268 | ||||||||||||||
Commonwealth of Puerto Rico, Ser B, GO | ||||||||||||||||
6.000%, 07/01/2039(F) | 35 | 22 | ||||||||||||||
Puerto Rico Commonwealth Aqueduct & Sewer Authority, Ser Senior A, RB | ||||||||||||||||
6.000%, 07/01/2038 | 55 | 42 | ||||||||||||||
5.000%, 07/01/2033 | 25 | 19 | ||||||||||||||
Puerto Rico Sales Tax Financing Sales Tax Revenue, Sub-Ser A, RB | ||||||||||||||||
6.500%, 08/01/2044 | 1,020 | 561 | ||||||||||||||
6.000%, 08/01/2042 | 105 | 56 | ||||||||||||||
5.750%, 08/01/2037 | 510 | 270 | ||||||||||||||
5.500%, 08/01/2028 | 35 | 18 | ||||||||||||||
5.500%, 08/01/2037 | 90 | 48 | ||||||||||||||
5.375%, 08/01/2039 | 960 | 504 | ||||||||||||||
Puerto Rico Sales Tax Financing Sales Tax Revenue, Sub-Ser A-1, RB | ||||||||||||||||
5.000%, 08/01/2043 | 40 | 21 | ||||||||||||||
| SEI Institutional Managed Trust / Annual Report / September 30, 2016 | 247 |
SCHEDULE OF INVESTMENTS
September 30, 2016
Multi-Asset Income Fund (Continued)
| Description | Face Amount
(Thousands) |
Market Value
($ Thousands) | ||||||||||||
MUNICIPAL BONDS (continued) |
| |||||||||||||
Puerto Rico Sales Tax Financing Sales Tax | ||||||||||||||
5.250%, 08/01/2041 | $ | 30 | $ | 16 | ||||||||||
|
| |||||||||||||
1,845 | ||||||||||||||
|
| |||||||||||||
Total Municipal Bonds | 3,054 | |||||||||||||
|
| |||||||||||||
| Shares | ||||||||||||||
|
| |||||||||||||
PREFERRED STOCK — 0.4% |
| |||||||||||||
Industrials — 0.4% |
| |||||||||||||
Seaspan, 6.375% | 107,439 | 2,729 | ||||||||||||
|
| |||||||||||||
Other Asset-Backed Securities — 0.0% |
| |||||||||||||
GSC Partners Fund V, Ser 2004-5A, | 1,800 | — | ||||||||||||
GSC Partners Fund V, Ser 2004-5I, 0.000% *(B) | 100 | — | ||||||||||||
|
| |||||||||||||
Total Preferred Stock | 2,729 | |||||||||||||
|
| |||||||||||||
| Face Amount (Thousands) | ||||||||||||||
|
| |||||||||||||
CONVERTIBLE BOND — 0.0% |
| |||||||||||||
Mirabela Nickel | ||||||||||||||
9.500%, 06/24/2019 | 167 | 47 | ||||||||||||
|
| |||||||||||||
Total Convertible Bond | 47 | |||||||||||||
|
| |||||||||||||
| Number of Warrants | ||||||||||||||
|
| |||||||||||||
WARRANT — 0.0% |
| |||||||||||||
Comstock Resources, Expires 06/15/2020 Strike Price $– * | 1,857 | 14 | ||||||||||||
|
| |||||||||||||
Total Warrant | 14 | |||||||||||||
|
| |||||||||||||
Total Investments — 94.8% | $ | 702,542 | ||||||||||||
|
| |||||||||||||
| Contracts | ||||||||||||||
|
| |||||||||||||
WRITTEN OPTIONS(J) — (0.3)% | ||||||||||||||
October 16 Calls on SPX, Expires 10/21/2016 Strike Price $2,155.00* | (124) | (413) | ||||||||||||
October 16 Calls on SPX, Expires 10/21/2016 Strike Price $2,120.00* | (124) | (749) | ||||||||||||
| Description | Contracts |
Market Value
($ Thousands) | ||||||||||||
WRITTEN OPTIONS(J) (continued) |
| |||||||||||||
October 16 Calls on SPX, Expires 10/21/2016 Strike Price $2,125.00* | (186) | $ | (1,060) | |||||||||||
|
| |||||||||||||
Total Written Options | ||||||||||||||
(Premiums Received $1,800) ($ Thousands) | $ | (2,222) | ||||||||||||
|
| |||||||||||||
A list of the open futures contracts held by the Fund at September 30, 2016, is as follows:
| Type of Contract | Number of Contracts Long | Expiration Date | Unrealized Appreciation ($ Thousands) | |||||||
S&P 500 Index E-MINI | 209 | Dec-2016 | $68 | |||||||
U.S. 10-Year Treasury Note | 60 | Dec-2016 | 30 | |||||||
U.S. 2-Year Treasury Note | 73 | Dec-2016 | 9 | |||||||
U.S. 5-Year Treasury Note | 285 | Dec-2016 | 106 | |||||||
U.S. Long Treasury Bond | 19 | Dec-2016 | (28) | |||||||
U.S. Ultra Long Treasury Bond | 14 | Dec-2016 | (44) | |||||||
U.S. Ultra Long Treasury Bond | 18 | Dec-2016 | (9) | |||||||
| ||||||||||
| $132 | ||||||||||
| ||||||||||
For the year ended September 30, 2016, the total amount of all open futures contracts, as presented in the table above, are representative of the volume of activity for the derivative type during the year.
A list of the open forward foreign currency contracts held by the Fund at September 30, 2016, is as follows:
Settlement Date | Currency to Deliver (Thousands) | Currency To Receive (Thousands) | Unrealized Appreciation (Depreciation) ($ Thousands) | |||||||||||||||
10/13/16-11/16/16 | GBP | 2,240 | USD | 2,973 | $62 | |||||||||||||
11/10/16-11/10/16 | EUR | 10,219 | USD | 11,525 | 20 | |||||||||||||
10/13/16-11/10/16 | EUR | 1,302 | USD | 1,463 | (3) | |||||||||||||
10/13/16-10/20/16 | MXN | 69,134 | USD | 3,697 | 132 | |||||||||||||
12/21/16 | USD | 1,280 | MXN | 25,463 | 24 | |||||||||||||
| ||||||||||||||||||
| $235 | ||||||||||||||||||
| ||||||||||||||||||
A list of the counterparties for the outstanding forward foreign currency contracts held by the Fund at September 30, 2016, is as follows:
| Counterparty | Currency to Deliver ($ Thousands) | Currency to Receive ($ Thousands) | Unrealized Appreciation ($ Thousands) | |||||||
Bank of America | $(3,508 | ) | $3,551 | $43 | ||||||
Barclays PLC | (3,328 | ) | 3,446 | 118 | ||||||
Brown Brothers Harriman | (12,643 | ) | 12,686 | 43 | ||||||
Citigroup | (143 | ) | 143 | — | ||||||
Credit Suisse First Boston | (114 | ) | 114 | — | ||||||
JPMorgan Chase Bank | (991 | ) | 1,022 | 31 | ||||||
| ||||||||||
| $235 | ||||||||||
| ||||||||||
For the year ended September 30, 2016 the total amount of all open forward foreign currency contracts, as presented in the table above, are representative of the volume of activity for the derivative type during the period.
| 248 | SEI Institutional Managed Trust / Annual Report / September 30, 2016 |
A list of the open OTC swap agreements held by the Fund at September 30, 2016 is as follows:
| Total Return Swaps | ||||||||||||||||||||
| Counterparty | Reference Entity/Obligation | Fund Pays | Fund Receives | Termination Date | Notional ($ Thousands) | Net Unrealized Appreciation (Depreciation) ($Thousands) | ||||||||||||||
| Bank of America | U.S. Treasury Note 1.500% | 0.20% | Asset Return | 12/08/16 | $307 | $30,414 | ||||||||||||||
| Bank of America | U.S. Treasury Note 1.500% | 0.20% | Asset Return | 12/08/16 | (30,569) | (30,573) | ||||||||||||||
| Goldman Sachs | German Bund 8/15/26 | -1.25% | Asset Return | 12/08/16 | 24,854 | 27,909 | ||||||||||||||
| Goldman Sachs | German Bund 8/15/26 | -1.25% | Asset Return | 12/08/16 | (246) | (27,989) | ||||||||||||||
|
| |||||||||||||||||||
| $(239) | ||||||||||||||||||||
|
| |||||||||||||||||||
A list of the open centrally cleared swap agreements held by the Fund at September 30, 2016 is as follows:
| Interest Rate Swaps | ||||||||||||||||
| Counterparty | Fund Pays | Fund Receives | Termination Date | Notional Amount ($ Thousands) | Net Unrealized Appreciation ($Thousands) | |||||||||||
| Bank of America | 2.70% | 3 Month USD - LIBOR | 07/18/23 | $600 | $(62) | |||||||||||
| Bank of America | 1.56% | 3 Month USD - LIBOR | 07/03/18 | 7,150 | (133) | |||||||||||
| Barclays Bank PLC | 1.50% | 6 Month USD - LIBOR | 12/21/26 | 170 | (1) | |||||||||||
| Barclays Bank PLC | 0.25% | 6 Month EUR -LIBOR | 12/21/21 | 1,720 | (5) | |||||||||||
| BNP Paribas | 0.50% | 6 Month EUR -LIBOR | 12/21/23 | 4,300 | (22) | |||||||||||
| Credit Suisse | 1.75% | 3 Month USD - LIBOR | 12/21/26 | 1,300 | (11) | |||||||||||
| Deutsche Bank | 28-Day MXN - TIIE | 6.0% | 03/03/27 | 26,230 | (16) | |||||||||||
| Deutsche Bank | 0.00% | 6 Month EUR -LIBOR | 12/21/18 | 1,880 | (1) | |||||||||||
| Goldman Sachs | 0.61% | 1-DAY FED FUNDS | 01/31/18 | 188,500 | 22 | |||||||||||
| Merrill Lynch | 0.60% | 1-DAY FED FUNDS | 01/31/18 | 188,500 | 45 | |||||||||||
| Morgan Stanley | 0.75% | 6 Month EUR -LIBOR | 12/21/26 | 2,540 | (33) | |||||||||||
| Morgan Stanley | 6 Month PZL - WIBOR | 1.61% | 09/21/18 | 19,360 | (10) | |||||||||||
|
| |||||||||||||||
| $(227) | ||||||||||||||||
|
| |||||||||||||||
For the year ended September 30, 2016, the total amount of open swap agreements, as presented in the tables above, are representative of the volume of activity for this derivative type during the year.
Percentages are based on Net Assets of $741,420 ($ Thousands).
| * | Non-income producing security. |
| ‡ | Real Estate Investment Trust. |
| (A) | Security exempt from registration under Rule 144A of the Securities Act of 1933. These securities may be resold in transactions exempt from registration normally to qualified institutions. On September 30, 2016, the value of these securities amounted to $295,129 ($ Thousands), representing 39.8% of the net assets of the Fund. |
| (B) | Variable Rate Security — The rate reported on the Schedule of Investments is the rate in effect as of September 30, 2016. |
| (C) | Security fair valued using methods determined in good faith by the Valuation Committee of the Board of Trustees. The total market value of such securities as of September 30, 2016 was $14,909 ($ Thousands) and represented 2.0% of Net Assets. |
| (D) | Step Bonds – The rate reflected on the Schedule of Investments is the effective yield on September 30, 2016. The coupon on a step bond changes on a specified date. |
| (E) | Securities considered illiquid. The total value of such securities as of September 30, 2016 was $9,928 ($ Thousands) and represented 1.3% of Net Assets (Unaudited). |
| (F) | Security is in default on interest payment. |
| (G) | Unfunded bank loan. |
| (H) | Unsettled bank loan. Interest rate not available. |
| (I) | The rate reported is the effective yield at the time of purchase. |
| (J) | For the year ended September 30, 2016, the total amount of open purchased swaptions, written options and written swaptions, as presented in the Schedule of Investments, are representative of the volume of activity for these derivative types during the period. |
ADR — American Depositary Receipt
CDO — Collateralized Debt Obligation
Cl — Class
CLO — Collateralized Loan Obligation
EUR — Euro
EURIBOR — Euro InterBank Rate
FHLB — Federal Home Loan Bank
FHLMC — Federal Home Loan Mortgage Corporation
FNMA — Federal National Mortgage Association
GBP — British Pound
GO — General Obligation
LIBOR — London Interbank Offered Rate
LLC — Limited Liability Company
LP — Limited Partnership
MTN — Medium Term Note
MXN — Mexican Peso
OTC — Over the Counter
PIK — Payment-in-Kind
PLC — Public Limited Company
PLN — Polish Zloty
RB — Revenue Bond
RE-REMIC — Resecuritization of Real Estate Mortgage Investment Conduit
S&P— Standard & Poor’s
Ser — Series
TIIE — Interbank Equilibrium Interest Rate
USD — U.S. Dollar
WIBOR — Warsaw Interbank Offered Rate
| SEI Institutional Managed Trust / Annual Report / September 30, 2016 | 249 |
SCHEDULE OF INVESTMENTS
September 30, 2016
Multi-Asset Income Fund (Concluded)
The following is a list of the level of inputs used as of September 30, 2016, in valuing the Fund’s investments and other financial instruments carried at value ($ Thousands):
Investments in Securities | Level 1 | Level 2 | Level 3 | Total | ||||||||||||
Asset-Backed Securities | $ | – | $ | 186,887 | $ | 2,560 | $ | 189,447 | ||||||||
Corporate Obligations | – | 139,548 | 3,447 | 142,995 | ||||||||||||
Loan Participations | – | 101,160 | 8,156 | 109,316 | ||||||||||||
Common Stock | 75,343 | – | 71 | 75,414 | ||||||||||||
Sovereign Debt | – | 73,766 | – | 73,766 | ||||||||||||
Mortgage-Backed Securities | – | 56,688 | 1,777 | 58,465 | ||||||||||||
Commercial Paper | – | 27,990 | – | 27,990 | ||||||||||||
U.S. Treasury Obligations | – | 10,805 | – | 10,805 | ||||||||||||
U.S. Government Agency Obligations | – | 8,500 | – | 8,500 | ||||||||||||
Municipal Bonds | – | 3,054 | – | 3,054 | ||||||||||||
Preferred Stock | 2,729 | – | – | 2,729 | ||||||||||||
Convertible Bond | – | – | 47 | 47 | ||||||||||||
Warrant | – | – | 14 | 14 | ||||||||||||
|
|
|
| |||||||||||||
Total Investments in Securities | $ | 78,072 | $ | 608,398 | $ | 16,072 | $ | 702,542 | ||||||||
|
|
|
| |||||||||||||
| Other Financial Instruments | �� | Level 1 | Level 2 | Level 3 | Total | |||||||||||
Written Options | $ | (2,222) | $ | — | $ | — | $ | (2,222) | ||||||||
Futures Contracts * | ||||||||||||||||
Unrealized Appreciation | 213 | — | — | 213 | ||||||||||||
Unrealized Depreciation | (81) | — | — | (81) | ||||||||||||
Forwards Contracts * | ||||||||||||||||
Unrealized Appreciation | — | 238 | — | 238 | ||||||||||||
Unrealized Appreciation | — | (3) | — | (3) | ||||||||||||
OTC Swaps | ||||||||||||||||
Total Return Swaps * | ||||||||||||||||
Unrealized Appreciation | — | 58,323 | — | 58,323 | ||||||||||||
Unrealized Depreciation | — | (58,562) | — | (58,562) | ||||||||||||
Centrally Cleared Swaps | ||||||||||||||||
Interest Rate Swaps * | ||||||||||||||||
Unrealized Appreciation | — | 67 | — | 67 | ||||||||||||
Unrealized Depreciation | — | (294) | — | (294) | ||||||||||||
|
|
|
| |||||||||||||
Total Other Financial Instruments | $ | (2,090) | $ | (231) | $ | — | $ | (2,321) | ||||||||
|
|
|
| |||||||||||||
* Futures contracts, forward contracts and swap contracts are valued at the unrealized appreciation (depreciation) on the instrument.
The following is a reconciliation of the investments in which significant unobservable inputs (Level 3) were used in determining value ($ Thousands):
| Investments in Asset- Backed Securities | Investments in Corporate Obligations | Investments in | Investments in Common Stock | Investments in Mortgage-Backed Securities | Investments in Convertible Bonds | Investments in Warrants | ||||||||||||||||||||||||||||||||||||||
Balance as of September 30, 2015 | $ | 2,970 | $ | 4,185 | $ | 8,925 | $ | 315 | $ | – | $ | 47 | $ | – | ||||||||||||||||||||||||||||||
Accrued discounts/premiums | – | (3) | 27 | – | – | – | – | |||||||||||||||||||||||||||||||||||||
Realized gain/(loss) | – | (186) | 273 | – | – | – | – | |||||||||||||||||||||||||||||||||||||
Change in unrealized appreciation/ depreciation | 53 | (70) | (260) | (323) | 3 | (15) | – | |||||||||||||||||||||||||||||||||||||
Purchases | 989 | – | 2,150 | 79 | 1,774 | 15 | 14 | |||||||||||||||||||||||||||||||||||||
Sales | (72) | (645) | (816) | – | – | – | – | |||||||||||||||||||||||||||||||||||||
Net transfer into Level 3 | – | 166 | 36 | – | – | – | – | |||||||||||||||||||||||||||||||||||||
Net transfer out of Level 3 | (1,380) | – | (2,179) | – | – | – | – | |||||||||||||||||||||||||||||||||||||
| ||||||||||||||||||||||||||||||||||||||||||||
Ending Balance as of September 30, 2016 | $ | 2,560 | $ | 3,447 | $ | 8,156 | $ | 71 | $ | 1,777 | $ | 47 | $ | 14 | ||||||||||||||||||||||||||||||
| ||||||||||||||||||||||||||||||||||||||||||||
Changes in unrealized gains/(losses) included in earnings related to securities still held at reporting date | $ | (601) | $ | (171) | $ | (56) | $ | (324) | $ | 3 | $ | (15) | $ | 14 | ||||||||||||||||||||||||||||||
| ||||||||||||||||||||||||||||||||||||||||||||
For the year ended September 30, 2016, there were no transfers between Level 1 and Level 2 assets and liabilities.
For the year ended September 30, 2016, there were no transfers between Level 2 and Level 3 assets and liabilities.
For more information on valuation inputs, see Note 2 – Significant Accounting Policies in Notes to Financial Statements.
Amounts designated as “—” are $0 or have been rounded to $0.
The accompanying notes are an integral part of the financial statements.
| 250 | SEI Institutional Managed Trust / Annual Report / September 30, 2016 |
CONSOLIDATED SCHEDULE OF INVESTMENTS
September 30, 2016
Multi-Asset Inflation Managed Fund
|
Sector Weightings (Unaudited)†:
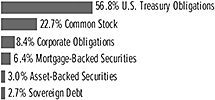
†Percentages are based on total investments.
| ||||||||
| Description | Face Amount (Thousands) | Market Value ($ Thousands) | ||||||
| ||||||||
U.S. TREASURY OBLIGATIONS — 67.7% |
| |||||||
U.S. Treasury Bill | ||||||||
0.456%, 12/01/2016 (A)(B)(I) | $ | 96,500 | $ | 96,471 | ||||
0.348%, 11/10/2016 (A)(B)(I) | 54,400 | 54,389 | ||||||
0.306%, 10/20/2016 (A)(B)(I) | 38,000 | 37,998 | ||||||
U.S. Treasury Inflation Protected Securities | ||||||||
2.125%, 01/15/2019 (H) | 39,183 | 41,730 | ||||||
1.375%, 01/15/2020 (H) | 60,817 | 64,577 | ||||||
1.250%, 07/15/2020 | 59,355 | 63,420 | ||||||
0.625%, 07/15/2021 | 140,695 | 147,737 | ||||||
0.125%, 04/15/2018 (H) | 27,142 | 27,438 | ||||||
0.125%, 04/15/2019 (H) | 111,378 | 113,274 | ||||||
0.125%, 04/15/2020 (H)(J) | 82,948 | 84,580 | ||||||
|
| |||||||
Total U.S. Treasury Obligations | 731,614 | |||||||
|
| |||||||
| Shares | ||||||||
|
| |||||||
COMMON STOCK — 27.1% |
| |||||||
Consumer Discretionary — 0.0% |
| |||||||
Scholastic, Cl B | 800 | 31 | ||||||
|
| |||||||
Consumer Staples — 4.3% | ||||||||
Altria Group (K) | 104,500 | 6,608 | ||||||
Campbell Soup (K) | 49,700 | 2,719 | ||||||
Clorox | 5,500 | 689 | ||||||
Coca-Cola | 13,400 | 567 | ||||||
CVS Health (K) | 31,400 | 2,794 | ||||||
Dean Foods | 316,700 | 5,194 | ||||||
Dr Pepper Snapple Group (K) | 25,900 | 2,365 | ||||||
Energizer Holdings | 1,900 | 95 | ||||||
Fresh Del Monte Produce | 8,000 | 479 | ||||||
Herbalife * | 12,400 | 769 | ||||||
Ingredion | 2,900 | 386 | ||||||
Medifast | 10,800 | 408 | ||||||
Mondelez International, Cl A | 51,700 | 2,270 | ||||||
Natural Health Trends | 1,800 | 51 | ||||||
Nu Skin Enterprises, Cl A | 20,300 | 1,315 | ||||||
Omega Protein * | 19,000 | 444 | ||||||
PepsiCo | 20,400 | 2,219 | ||||||
Philip Morris International | 600 | 58 | ||||||
Post Holdings * | 10,900 | 841 | ||||||
Procter & Gamble | 39,400 | 3,536 | ||||||
Sanderson Farms | 9,600 | 925 | ||||||
| ||||||||
| Description | Shares | Market Value ($ Thousands) | ||||||
| ||||||||
COMMON STOCK (continued) |
| |||||||
SpartanNash | 3,400 | $ | 99 | |||||
SYSCO, Cl A | 38,900 | 1,907 | ||||||
Tyson Foods, Cl A | 87,600 | 6,541 | ||||||
Universal | 18,600 | 1,083 | ||||||
Walgreens Boots Alliance | 1,800 | 145 | ||||||
Wal-Mart Stores | 30,800 | 2,221 | ||||||
|
| |||||||
| 46,728 | ||||||||
|
| |||||||
Energy — 7.1% |
| |||||||
Antero Resources * | 70,000 | 1,886 | ||||||
Atwood Oceanics, Cl A | 22,900 | 199 | ||||||
Cabot Oil & Gas | 39,600 | 1,022 | ||||||
Chesapeake Energy * | 179,500 | 1,125 | ||||||
Chevron (K) | 44,290 | 4,558 | ||||||
Contango Oil & Gas * | 21,800 | 223 | ||||||
DHT Holdings | 504,900 | 2,115 | ||||||
Diamond Offshore Drilling (K) | 155,700 | 2,742 | ||||||
Energen | 8,200 | 473 | ||||||
Exxon Mobil (K) | 180,530 | 15,757 | ||||||
Gener8 Maritime * | 39,600 | 203 | ||||||
Hallador Energy | 43,600 | 344 | ||||||
McDermott International * | 188,000 | 942 | ||||||
Natural Gas Services Group * | 1,800 | 44 | ||||||
PDC Energy, Cl A * | 600 | 40 | ||||||
PHI * | 9,700 | 176 | ||||||
Pioneer Natural Resources | 27,900 | 5,180 | ||||||
REX American Resources * | 13,400 | 1,136 | ||||||
Rowan, Cl A | 307,400 | 4,660 | ||||||
Schlumberger, Cl A (K) | 49,000 | 3,853 | ||||||
Southwestern Energy * | 418,300 | 5,789 | ||||||
Tesoro (K) | 75,400 | 5,999 | ||||||
Transocean (K) | 635,600 | 6,776 | ||||||
Valero Energy (K) | 115,900 | 6,143 | ||||||
Western Refining | 205,700 | 5,443 | ||||||
|
| |||||||
| 76,828 | ||||||||
|
| |||||||
Financials — 1.9% |
| |||||||
Ambac Financial Group * | 53,600 | 986 | ||||||
Annaly Capital Management ‡(K) | 330,300 | 3,468 | ||||||
Ares Commercial Real Estate ‡ | 5,500 | 69 | ||||||
Assurant | 6,900 | 637 | ||||||
Chimera Investment ‡ | 154,000 | 2,456 | ||||||
Citigroup | 10,100 | 477 | ||||||
Dynex Capital ‡ | 29,500 | 219 | ||||||
Heartland Financial USA | 6,500 | 234 | ||||||
Markel * | 631 | 586 | ||||||
MFA Financial ‡ | 365,900 | 2,737 | ||||||
MGIC Investment * | 141,900 | 1,135 | ||||||
Old Republic International | 39,400 | 694 | ||||||
Popular (K) | 146,900 | 5,615 | ||||||
Two Harbors Investment ‡ | 175,100 | 1,494 | ||||||
|
| |||||||
| 20,807 | ||||||||
|
| |||||||
| SEI Institutional Managed Trust / Annual Report / September 30, 2016 | 251 |
CONSOLIDATED SCHEDULE OF INVESTMENTS
September 30, 2016
Multi-Asset Inflation Managed Fund (Continued)
| ||||||||
| Description | Shares | Market Value ($ Thousands) | ||||||
| ||||||||
COMMON STOCK (continued) |
| |||||||
Health Care — 7.0% |
| |||||||
Aetna, Cl A | 29,700 | $ | 3,429 | |||||
AMAG Pharmaceuticals * | 33,400 | 819 | ||||||
Amedisys * | 31,100 | 1,475 | ||||||
Amgen, Cl A (K) | 34,800 | 5,805 | ||||||
Anthem | 30,700 | 3,847 | ||||||
Baxter International | 128,100 | 6,097 | ||||||
Centene *(K) | 28,636 | 1,918 | ||||||
Charles River Laboratories International * | 25,600 | 2,133 | ||||||
Cigna | 300 | 39 | ||||||
Exactech * | 2,700 | 73 | ||||||
Express Scripts Holding * | 8,400 | 592 | ||||||
Five Prime Therapeutics * | 32,200 | 1,690 | ||||||
Gilead Sciences (K) | 93,700 | 7,414 | ||||||
Healthways * | 98,400 | 2,604 | ||||||
Hologic * | 24,700 | 959 | ||||||
INC Research Holdings, Cl A * | 6,800 | 303 | ||||||
Johnson & Johnson (K) | 68,400 | 8,080 | ||||||
LeMaitre Vascular | 7,600 | 151 | ||||||
Magellan Health * | 19,400 | 1,042 | ||||||
Merck | 22,800 | 1,423 | ||||||
Mettler Toledo International * | 9,640 | 4,047 | ||||||
PDL BioPharma | 353,500 | 1,184 | ||||||
Pfizer | 129,600 | 4,390 | ||||||
Quintiles Transnational * | 7,400 | 600 | ||||||
ResMed | 18,000 | 1,166 | ||||||
United Therapeutics * | 17,000 | 2,007 | ||||||
UnitedHealth Group | 19,900 | 2,786 | ||||||
Waters * | 27,700 | 4,390 | ||||||
WellCare Health Plans * | 40,000 | 4,684 | ||||||
|
| |||||||
| 75,147 | ||||||||
|
| |||||||
Industrials — 1.1% |
| |||||||
Argan | 15,500 | 917 | ||||||
Greenbrier | 107,150 | 3,783 | ||||||
Hawaiian Holdings *(K) | 34,700 | 1,686 | ||||||
Heritage-Crystal Clean * | 4,100 | 54 | ||||||
Insteel Industries | 6,700 | 243 | ||||||
United Continental Holdings * | 89,400 | 4,691 | ||||||
Universal Forest Products | 1,100 | 108 | ||||||
Wabash National * | 28,600 | 407 | ||||||
|
| |||||||
| 11,889 | ||||||||
|
| |||||||
Information Technology — 2.8% |
| |||||||
Accenture, Cl A | 20,600 | 2,517 | ||||||
EarthLink Holdings | 138,100 | 856 | ||||||
Electronic Arts *(K) | 36,700 | 3,134 | ||||||
ExlService Holdings * | 1,200 | 60 | ||||||
Hackett Group | 29,100 | 481 | ||||||
International Business Machines | 45,000 | 7,148 | ||||||
Leidos Holdings | 71,400 | 3,090 | ||||||
Microsoft | 53,600 | 3,087 | ||||||
NeuStar, Cl A * | 133,500 | 3,550 | ||||||
| ||||||||
| Description | Shares | Market Value ($ Thousands) | ||||||
| ||||||||
COMMON STOCK (continued) |
| |||||||
Symantec, Cl A | 237,800 | $ | 5,969 | |||||
Xerox | 10,500 | 106 | ||||||
Zix * | 44,400 | 182 | ||||||
|
| |||||||
| 30,180 | ||||||||
|
| |||||||
Real Estate — 1.8% |
| |||||||
Altisource Portfolio Solutions * | 96,800 | 3,136 | ||||||
CorEnergy Infrastructure Trust ‡ | 7,400 | 217 | ||||||
CoreSite Realty ‡ | 19,300 | 1,429 | ||||||
DuPont Fabros Technology ‡ | 50,800 | 2,096 | ||||||
Equity Commonwealth *‡ | 44,900 | 1,357 | ||||||
Equity LifeStyle Properties ‡ | 8,500 | 656 | ||||||
Equity Residential ‡ | 41,100 | 2,644 | ||||||
Gaming and Leisure Properties ‡ | 67,400 | 2,255 | ||||||
Getty Realty ‡ | 3,443 | 82 | ||||||
Hudson Pacific Properties ‡ | 1,400 | 46 | ||||||
Macerich ‡ | 18,400 | 1,488 | ||||||
Monmouth Real Estate Investment, Cl A ‡ | 20,200 | 288 | ||||||
PS Business Parks ‡ | 4,400 | 500 | ||||||
Public Storage ‡ | 2,200 | 491 | ||||||
Retail Opportunity Investments ‡ | 38,500 | 845 | ||||||
RMR Group | 4,500 | 171 | ||||||
Ryman Hospitality Properties | 26,900 | 1,296 | ||||||
Simon Property Group ‡ | 1,600 | 331 | ||||||
SL Green Realty ‡ | 400 | 43 | ||||||
|
| |||||||
| 19,371 | ||||||||
|
| |||||||
Telecommunication Services — 0.5% |
| |||||||
AT&T | 20,900 | 849 | ||||||
FairPoint Communications * | 29,800 | 448 | ||||||
IDT, Cl B | 23,100 | 398 | ||||||
Telephone & Data Systems | 107,500 | 2,922 | ||||||
Verizon Communications | 24,400 | 1,268 | ||||||
|
| |||||||
| 5,885 | ||||||||
|
| |||||||
Utilities — 0.6% |
| |||||||
Entergy | 16,800 | 1,289 | ||||||
Exelon | 55,100 | 1,834 | ||||||
MDU Resources Group | 52,400 | 1,333 | ||||||
NiSource | 69,500 | 1,676 | ||||||
|
| |||||||
| 6,132 | ||||||||
|
| |||||||
Total Common Stock |
| 292,998 | ||||||
|
| |||||||
| Face Amount (Thousands) | ||||||||
|
| |||||||
CORPORATE OBLIGATIONS — 10.1% |
| |||||||
Consumer Discretionary — 1.4% |
| |||||||
21st Century Fox America | ||||||||
6.150%, 02/15/2041 | $ | 165 | 209 | |||||
4.500%, 02/15/2021 | 260 | 288 | ||||||
4.000%, 10/01/2023 | 185 | 203 | ||||||
3.000%, 09/15/2022 | 405 | 422 | ||||||
| 252 | SEI Institutional Managed Trust / Annual Report / September 30, 2016 |
| ||||||||
| Description | Face Amount (Thousands) | Market Value ($ Thousands) | ||||||
| ||||||||
CORPORATE OBLIGATIONS (continued) |
| |||||||
Adient Global Holdings | ||||||||
4.875%, 08/15/2026 (C) | $ | 238 | $ | 238 | ||||
CBS | ||||||||
3.500%, 01/15/2025 | 835 | 859 | ||||||
Comcast | ||||||||
6.450%, 03/15/2037 | 185 | 255 | ||||||
Cox Communications | ||||||||
2.950%, 06/30/2023 (C) | 240 | 237 | ||||||
CSC Holdings | ||||||||
6.750%, 11/15/2021 | 160 | 169 | ||||||
Dana Holding | ||||||||
6.000%, 09/15/2023 | 148 | 154 | ||||||
Discovery Communications | ||||||||
3.450%, 03/15/2025 | 450 | 445 | ||||||
Ford Motor Credit | ||||||||
5.875%, 08/02/2021 | 695 | 794 | ||||||
2.597%, 11/04/2019 | 1,152 | 1,170 | ||||||
General Motors | ||||||||
3.500%, 10/02/2018 | 465 | 479 | ||||||
Hanesbrands | ||||||||
4.625%, 05/15/2024 (C) | 338 | 347 | ||||||
International Game Technology | ||||||||
6.500%, 02/15/2025 (C) | 785 | 846 | ||||||
6.250%, 02/15/2022 (C) | 560 | 594 | ||||||
KB Home | ||||||||
4.750%, 05/15/2019 | 382 | 390 | ||||||
Kohl’s | ||||||||
5.550%, 07/17/2045 | 710 | 696 | ||||||
MCE Finance | ||||||||
5.000%, 02/15/2021 (C) | 405 | 407 | ||||||
Newell Brands | ||||||||
3.850%, 04/01/2023 | 395 | 420 | ||||||
3.150%, 04/01/2021 | 1,351 | 1,408 | ||||||
RELX Capital | ||||||||
8.625%, 01/15/2019 | 475 | 547 | ||||||
SFR Group | ||||||||
5.375%, 05/15/2022 (C) | EUR | 235 | 273 | |||||
Time Warner | ||||||||
3.550%, 06/01/2024 | $ | 745 | 792 | |||||
Time Warner Cable | ||||||||
4.500%, 09/15/2042 | 330 | 315 | ||||||
Viacom | ||||||||
4.375%, 03/15/2043 | 569 | 522 | ||||||
Virgin Media Finance | ||||||||
5.250%, 02/15/2022 | 200 | 173 | ||||||
Ziggo Secured Finance BV | ||||||||
5.500%, 01/15/2027 (C) | 835 | 834 | ||||||
|
| |||||||
| 14,486 | ||||||||
|
| |||||||
Consumer Staples — 0.7% |
| |||||||
Altria Group | ||||||||
4.750%, 05/05/2021 | 210 | 237 | ||||||
| ||||||||
| Description | Face Amount (Thousands) | Market Value ($ Thousands) | ||||||
| ||||||||
CORPORATE OBLIGATIONS (continued) |
| |||||||
2.625%, 01/14/2020 | $ | 1,160 | $ | 1,200 | ||||
Bunge Finance | ||||||||
8.500%, 06/15/2019 | 9 | 10 | ||||||
CVS Health | ||||||||
3.875%, 07/20/2025 | 925 | 1,007 | ||||||
Grupo Bimbo | ||||||||
3.875%, 06/27/2024 (C) | 703 | 728 | ||||||
Kraft Heinz Foods | ||||||||
3.500%, 07/15/2022 | 664 | 706 | ||||||
2.800%, 07/02/2020 | 520 | 539 | ||||||
Minerva Luxembourg | ||||||||
6.500%, 09/20/2026 (C) | 286 | 281 | ||||||
Reynolds American | ||||||||
4.000%, 06/12/2022 | 908 | 987 | ||||||
Tyson Foods | ||||||||
3.950%, 08/15/2024 | 715 | 772 | ||||||
2.650%, 08/15/2019 | 219 | 224 | ||||||
Virgolino de Oliveira Finance | ||||||||
10.500%, 01/28/2018 (C)(D) | 660 | 43 | ||||||
Walgreens Boots Alliance | ||||||||
3.800%, 11/18/2024 | 1,160 | 1,245 | ||||||
|
| |||||||
| 7,979 | ||||||||
|
| |||||||
Energy — 1.3% |
| |||||||
Cenovus Energy | ||||||||
5.700%, 10/15/2019 | 261 | 280 | ||||||
3.000%, 08/15/2022 | 52 | 50 | ||||||
Diamond Offshore Drilling | ||||||||
4.875%, 11/01/2043 | 370 | 257 | ||||||
Ecopetrol | ||||||||
5.875%, 05/28/2045 | 309 | 284 | ||||||
Energy Transfer Partners | ||||||||
6.125%, 02/15/2017 | 200 | 203 | ||||||
5.200%, 02/01/2022 | 465 | 504 | ||||||
EnLink Midstream Partners | ||||||||
5.050%, 04/01/2045 | 507 | 449 | ||||||
Enterprise Products Operating | ||||||||
5.200%, 09/01/2020 | 340 | 380 | ||||||
3.700%, 02/15/2026 | 1,103 | 1,135 | ||||||
Hess | ||||||||
4.300%, 04/01/2027 | 966 | 973 | ||||||
Kinder Morgan Energy Partners | ||||||||
3.950%, 09/01/2022 | 990 | 1,034 | ||||||
Korea National Oil | ||||||||
3.125%, 04/03/2017 (C) | 465 | 469 | ||||||
Marathon Petroleum | ||||||||
5.125%, 03/01/2021 | 196 | 217 | ||||||
Noble Energy | ||||||||
8.250%, 03/01/2019 | 153 | 175 | ||||||
4.150%, 12/15/2021 | 475 | 505 | ||||||
3.900%, 11/15/2024 | 606 | 618 | ||||||
| SEI Institutional Managed Trust / Annual Report / September 30, 2016 | 253 |
CONSOLIDATED SCHEDULE OF INVESTMENTS
September 30, 2016
Multi-Asset Inflation Managed Fund (Continued)
| ||||||||
| Description | Face Amount (Thousands) | Market Value ($ Thousands) | ||||||
| ||||||||
CORPORATE OBLIGATIONS (continued) |
| |||||||
Petrobras Global Finance | ||||||||
5.750%, 01/20/2020 | $ | 888 | $ | 915 | ||||
Petroleos Mexicanos MTN | ||||||||
4.625%, 09/21/2023 (C) | 1,126 | 1,128 | ||||||
Plains All American Pipeline | ||||||||
3.600%, 11/01/2024 | 902 | 874 | ||||||
Regency Energy Partners | ||||||||
4.500%, 11/01/2023 | 114 | 115 | ||||||
Sabine Pass Liquefaction | ||||||||
5.000%, 03/15/2027 (C) | 720 | 738 | ||||||
Schlumberger Holdings | ||||||||
3.000%, 12/21/2020 (C) | 1,345 | 1,402 | ||||||
SM Energy | ||||||||
6.500%, 01/01/2023 | 43 | 43 | ||||||
Ultrapar International | ||||||||
5.250%, 10/06/2026 (C) | 562 | 558 | ||||||
Valero Energy | ||||||||
6.125%, 02/01/2020 | 480 | 542 | ||||||
Williams Partners | ||||||||
3.900%, 01/15/2025 | 217 | 217 | ||||||
|
| |||||||
| 14,065 | ||||||||
|
| |||||||
Financials — 2.1% |
| |||||||
American International Group | ||||||||
4.875%, 06/01/2022 | 520 | 585 | ||||||
Bank of America | ||||||||
6.500%, 12/31/2049 (E) | 292 | 317 | ||||||
Barclays | ||||||||
3.650%, 03/16/2025 | 330 | 326 | ||||||
Barclays Bank | ||||||||
7.750%, 04/10/2023 (E) | 393 | 412 | ||||||
7.625%, 11/21/2022 | 207 | 230 | ||||||
6.860%, 09/29/2049 (C)(E) | 131 | 151 | ||||||
Barclays Bank MTN | ||||||||
6.625%, 03/30/2022 | EUR | 103 | 142 | |||||
BNP Paribas MTN | ||||||||
4.375%, 05/12/2026 (C) | $ | 541 | 559 | |||||
Citigroup | ||||||||
3.875%, 03/26/2025 | 905 | 934 | ||||||
Cooperatieve Rabobank UA | ||||||||
4.375%, 08/04/2025 | 657 | 693 | ||||||
Credit Agricole | ||||||||
8.125%, 12/31/2049 (C)(E) | 260 | 276 | ||||||
4.375%, 03/17/2025 (C) | 546 | 558 | ||||||
Credit Suisse Group Funding Guernsey | ||||||||
4.550%, 04/17/2026 (C) | 567 | 595 | ||||||
Goldman Sachs Group MTN | ||||||||
2.429%, 11/29/2023 (E) | 900 | 915 | ||||||
Goldman Sachs Group | ||||||||
2.350%, 11/15/2027 | 847 | 845 | ||||||
Hartford Financial Services Group | ||||||||
5.125%, 04/15/2022 | 655 | 744 | ||||||
| ||||||||
| Description | Face Amount (Thousands) | Market Value ($ Thousands) | ||||||
| ||||||||
CORPORATE OBLIGATIONS (continued) |
| |||||||
Intesa Sanpaolo MTN | ||||||||
5.017%, 06/26/2024 (C) | $ | 746 | $ | 681 | ||||
JPMorgan Chase | ||||||||
5.400%, 01/06/2042 | 175 | 219 | ||||||
JPMorgan Chase MTN | ||||||||
2.295%, 08/15/2021 | 551 | 552 | ||||||
Lincoln National | ||||||||
4.200%, 03/15/2022 | 355 | 384 | ||||||
Lloyds Banking Group | ||||||||
3.100%, 07/06/2021 | 400 | 409 | ||||||
MetLife | ||||||||
5.700%, 06/15/2035 | 80 | 97 | ||||||
Metropolitan Life Global Funding I | ||||||||
3.875%, 04/11/2022 (C) | 275 | 299 | ||||||
Mitsubishi UFJ Financial Group | ||||||||
2.722%, 03/01/2021 (E) | 1,361 | 1,411 | ||||||
Mizuho Financial Group Cayman 3 | ||||||||
4.600%, 03/27/2024 (C) | 840 | 927 | ||||||
Morgan Stanley MTN | ||||||||
5.500%, 07/28/2021 | 585 | 667 | ||||||
Murray Street Investment Trust I | ||||||||
4.647%, 03/09/2017 (F) | 55 | 56 | ||||||
Nationwide Building Society | ||||||||
4.000%, 09/14/2026 (C) | 1,390 | 1,385 | ||||||
Nationwide Financial Services | ||||||||
5.375%, 03/25/2021 (C) | 470 | 527 | ||||||
Navient | ||||||||
6.625%, 07/26/2021 | 770 | 776 | ||||||
Navient MTN | ||||||||
7.250%, 01/25/2022 | 52 | 53 | ||||||
PNC Bank | ||||||||
3.800%, 07/25/2023 | 960 | 1,044 | ||||||
Rabobank Capital Funding Trust III | ||||||||
5.254%, 10/21/2016 (C)(E) | 380 | 380 | ||||||
Royal Bank of Scotland MTN | ||||||||
9.500%, 03/16/2022 (E) | 32 | 33 | ||||||
Royal Bank of Scotland Group(E) | ||||||||
8.625%, 12/31/2049 | 825 | 807 | ||||||
7.500%, 12/29/2049 | 525 | 482 | ||||||
Royal Bank of Scotland Group PLC | ||||||||
7.640%, 09/29/2017 (E) | 100 | 97 | ||||||
Santander Issuances | ||||||||
5.179%, 11/19/2025 | 600 | 611 | ||||||
Santander UK | ||||||||
5.000%, 11/07/2023 (C) | 700 | 729 | ||||||
Societe Generale | ||||||||
5.922%, 04/05/2017 (C)(E) | 115 | 116 | ||||||
4.250%, 08/19/2026 (C) | 560 | 563 | ||||||
Standard Chartered | ||||||||
6.409%, 01/30/2049 (C)(E) | 400 | 388 | ||||||
UBS Group Funding Jersey | ||||||||
4.125%, 09/24/2025 (C) | 689 | 722 | ||||||
| 254 | SEI Institutional Managed Trust / Annual Report / September 30, 2016 |
| Description | Face Amount (Thousands) | Market Value ($ Thousands) | ||||||
CORPORATE OBLIGATIONS (continued) |
| |||||||
XLIT | ||||||||
5.500%, 03/31/2045 | $ | 225 | $ | 220 | ||||
|
| |||||||
| 22,917 | ||||||||
|
| |||||||
Health Care — 1.2% |
| |||||||
AbbVie | ||||||||
3.600%, 05/14/2025 | 1,744 | 1,823 | ||||||
Actavis Funding SCS | ||||||||
3.850%, 06/15/2024 | 297 | 316 | ||||||
3.800%, 03/15/2025 | 1,096 | 1,160 | ||||||
Baxalta | ||||||||
3.600%, 06/23/2022 | 1,040 | 1,093 | ||||||
Bayer US Finance | ||||||||
3.375%, 10/08/2024 (C) | 405 | 418 | ||||||
Becton Dickinson | ||||||||
3.734%, 12/15/2024 | 513 | 556 | ||||||
Biogen | ||||||||
3.625%, 09/15/2022 | 647 | 693 | ||||||
Celgene | ||||||||
3.875%, 08/15/2025 | 785 | 839 | ||||||
Gilead Sciences | ||||||||
3.650%, 03/01/2026 | 500 | 538 | ||||||
Laboratory Corp of America Holdings | ||||||||
3.600%, 02/01/2025 | 385 | 404 | ||||||
Medtronic | ||||||||
3.500%, 03/15/2025 | 1,170 | 1,260 | ||||||
Perrigo Finance Unlimited | ||||||||
3.900%, 12/15/2024 | 430 | 436 | ||||||
3.500%, 12/15/2021 | 227 | 235 | ||||||
Teva Pharmaceutical Finance Netherlands III BV | ||||||||
3.150%, 10/01/2026 | 674 | 677 | ||||||
2.800%, 07/21/2023 | 1,016 | 1,019 | ||||||
Thermo Fisher Scientific | ||||||||
4.150%, 02/01/2024 | 365 | 397 | ||||||
Valeant Pharmaceuticals International | ||||||||
6.125%, 04/15/2025 (C) | 600 | 517 | ||||||
|
| |||||||
| 12,381 | ||||||||
|
| |||||||
Industrials — 0.3% |
| |||||||
AerCap Aviation Solutions BV | ||||||||
6.375%, 05/30/2017 | 234 | 240 | ||||||
Allison Transmission | ||||||||
5.000%, 10/01/2024 (C) | 286 | 293 | ||||||
Avis Budget Car Rental | ||||||||
5.250%, 03/15/2025 (C) | 467 | 448 | ||||||
Empresa de Transporte de Pasajeros Metro | ||||||||
4.750%, 02/04/2024 (C) | 360 | 394 | ||||||
General Electric | ||||||||
5.000%, 12/29/2049 (E) | 300 | 317 | ||||||
International Lease Finance | ||||||||
5.875%, 04/01/2019 | 325 | 348 | ||||||
| Description | Face Amount (Thousands) | Market Value ($ Thousands) | ||||||
CORPORATE OBLIGATIONS (continued) |
| |||||||
Odebrecht Finance | ||||||||
7.125%, 06/26/2042 (C) | $ | 844 | $ | 338 | ||||
5.250%, 06/27/2029 (C) | 457 | 164 | ||||||
SPX FLOW | ||||||||
5.875%, 08/15/2026 (C) | 182 | 184 | ||||||
5.625%, 08/15/2024 (C) | 183 | 186 | ||||||
|
| |||||||
| 2,912 | ||||||||
|
| |||||||
Information Technology — 0.7% |
| |||||||
Diamond 1 Finance | ||||||||
7.125%, 06/15/2024 (C) | 558 | 614 | ||||||
4.420%, 06/15/2021 (C) | 1,375 | 1,437 | ||||||
eBay | ||||||||
3.800%, 03/09/2022 | 357 | 382 | ||||||
Fidelity National Information Services | ||||||||
5.000%, 10/15/2025 | 3 | 4 | ||||||
3.500%, 04/15/2023 | 188 | 197 | ||||||
KLA-Tencor | ||||||||
4.650%, 11/01/2024 | 894 | 982 | ||||||
Lam Research | ||||||||
2.800%, 06/15/2021 | 640 | 657 | ||||||
Micron Technology | ||||||||
7.500%, 09/15/2023 (C) | 350 | 389 | ||||||
NXP BV | ||||||||
4.125%, 06/01/2021 (C) | 550 | 589 | ||||||
Seagate HDD Cayman | ||||||||
4.750%, 01/01/2025 | 427 | 404 | ||||||
Tencent Holdings MTN | ||||||||
3.375%, 05/02/2019 (C) | 676 | 700 | ||||||
Total System Services | ||||||||
2.375%, 06/01/2018 | 262 | 264 | ||||||
Western Digital | ||||||||
7.375%, 04/01/2023 (C) | 762 | 838 | ||||||
|
| |||||||
| 7,457 | ||||||||
|
| |||||||
Materials — 0.6% |
| |||||||
Barrick Gold | ||||||||
4.100%, 05/01/2023 | 64 | 69 | ||||||
Basell Finance BV | ||||||||
8.100%, 03/15/2027 (C) | 220 | 296 | ||||||
Dow Chemical | ||||||||
4.250%, 11/15/2020 | 131 | 142 | ||||||
Eastman Chemical | ||||||||
3.800%, 03/15/2025 | 420 | 445 | ||||||
Glencore Funding | ||||||||
3.125%, 04/29/2019 (C) | 1,840 | 1,847 | ||||||
International Paper | ||||||||
4.750%, 02/15/2022 | 361 | 402 | ||||||
LyondellBasell Industries | ||||||||
5.750%, 04/15/2024 | 1,100 | 1,312 | ||||||
Minsur | ||||||||
6.250%, 02/07/2024 (C) | 168 | 175 | ||||||
| SEI Institutional Managed Trust / Annual Report / September 30, 2016 | 255 |
CONSOLIDATED SCHEDULE OF INVESTMENTS
September 30, 2016
Multi-Asset Inflation Managed Fund (Continued)
| Description | Face Amount (Thousands) | Market Value ($ Thousands) | ||||||
CORPORATE OBLIGATIONS (continued) |
| |||||||
NOVA Chemicals | ||||||||
5.250%, 08/01/2023 (C) | $ | 420 | $ | 429 | ||||
Reynolds Group | ||||||||
5.750%, 10/15/2020 | 300 | 309 | ||||||
Sociedad Quimica y Minera de Chile | ||||||||
3.625%, 04/03/2023 (C) | 408 | 398 | ||||||
Yamana | ||||||||
4.950%, 07/15/2024 | 462 | 477 | ||||||
|
| |||||||
| 6,301 | ||||||||
|
| |||||||
Real Estate — 0.2% |
| |||||||
American Tower | ||||||||
4.700%, 03/15/2022 | 365 | 406 | ||||||
3.500%, 01/31/2023 | 485 | 506 | ||||||
Healthcare Realty Trust | ||||||||
5.750%, 01/15/2021 | 285 | 324 | ||||||
Host Hotels & Resorts | ||||||||
5.250%, 03/15/2022 | 190 | 210 | ||||||
3.750%, 10/15/2023 | 16 | 16 | ||||||
Welltower | ||||||||
5.250%, 01/15/2022 | 695 | 787 | ||||||
|
| |||||||
| 2,249 | ||||||||
|
| |||||||
Telecommunication Services — 1.0% |
| |||||||
America Movil | ||||||||
3.125%, 07/16/2022 | 1,355 | 1,388 | ||||||
AT&T | ||||||||
4.750%, 05/15/2046 | 360 | 377 | ||||||
3.800%, 03/15/2022 | 262 | 281 | ||||||
3.400%, 05/15/2025 | 1,905 | 1,957 | ||||||
3.000%, 02/15/2022 | 465 | 480 | ||||||
CenturyLink | ||||||||
7.500%, 04/01/2024 | 364 | 389 | ||||||
6.450%, 06/15/2021 | 397 | 425 | ||||||
Rogers Communications | ||||||||
4.000%, 06/06/2022 | CAD | 60 | 50 | |||||
SBA Tower Trust | ||||||||
3.156%, 10/15/2020 (C) | $ | 950 | 959 | |||||
Sprint Capital | ||||||||
6.900%, 05/01/2019 | 1,485 | 1,531 | ||||||
Telefonica Emisiones | ||||||||
5.462%, 02/16/2021 | 200 | 227 | ||||||
Verizon Communications | ||||||||
4.600%, 04/01/2021 | 1,160 | 1,291 | ||||||
4.272%, 01/15/2036 | 1,170 | 1,219 | ||||||
Wind Acquisition Finance | ||||||||
4.750%, 07/15/2020 (C) | 535 | 539 | ||||||
|
| |||||||
| 11,113 | ||||||||
|
| |||||||
Utilities — 0.6% |
| |||||||
Berkshire Hathaway Energy | ||||||||
6.125%, 04/01/2036 | 390 | 518 | ||||||
| Description | Face Amount (Thousands) | Market Value ($ Thousands) | ||||||
CORPORATE OBLIGATIONS (continued) |
| |||||||
CMS Energy | ||||||||
5.050%, 03/15/2022 | $ | 185 | $ | 211 | ||||
Constellation Energy Group | ||||||||
5.150%, 12/01/2020 | 70 | 78 | ||||||
Entergy | ||||||||
4.000%, 07/15/2022 | 907 | 984 | ||||||
Exelon | ||||||||
2.850%, 06/15/2020 | 1,695 | 1,757 | ||||||
Exelon Generation | ||||||||
4.250%, 06/15/2022 | 460 | 494 | ||||||
Israel Electric | ||||||||
5.000%, 11/12/2024 (C) | 792 | 869 | ||||||
NRG Energy | ||||||||
6.250%, 05/01/2024 | 315 | 320 | ||||||
Talent Yield Investments | ||||||||
4.500%, 04/25/2022 (C) | 1,301 | 1,428 | ||||||
|
| |||||||
| 6,659 | ||||||||
|
| |||||||
Total Corporate Obligations (Cost $105,542) ($ Thousands) |
| 108,519 | ||||||
|
| |||||||
MORTGAGE-BACKED SECURITIES — 7.7% |
| |||||||
Agency Mortgage-Backed Obligations — 0.7% |
| |||||||
FHLMC CMO, Ser 2007-3311, Cl IE, IO | ||||||||
5.886%, 05/15/2037 (E) | 2,852 | 618 | ||||||
FNMA CMO, Ser 2011-15, Cl SA | ||||||||
6.536%, 03/25/2041 (E) | 3,101 | 783 | ||||||
FNMA CMO, Ser 2013-130, Cl SN, IO | ||||||||
6.125%, 10/25/2042 (E) | 3,805 | 743 | ||||||
FNMA CMO, Ser 2015-33, Cl AI, IO | ||||||||
5.000%, 06/25/2045 | 4,289 | 767 | ||||||
FNMA CMO, Ser 2015-66, Cl AS, IO | ||||||||
5.725%, 09/25/2045 (E) | 3,839 | 790 | ||||||
FNMA CMO, Ser 2016-11, Cl SG, IO | ||||||||
5.625%, 03/25/2046 (E) | 4,033 | 771 | ||||||
FNMA CMO, Ser 2016-19, Cl SA, IO | ||||||||
5.575%, 04/25/2046 (E) | 4,945 | 913 | ||||||
FNMA CMO, Ser 2016-22, Cl ST, IO | ||||||||
5.575%, 04/25/2046 (E) | 4,088 | 796 | ||||||
GNMA CMO, Ser 2016-108, Cl SM, IO | ||||||||
5.568%, 08/20/2046 (E) | 3,193 | 881 | ||||||
|
| |||||||
| 7,062 | ||||||||
|
| |||||||
Non-Agency Mortgage-Backed Obligations — 7.0% |
| |||||||
Alternative Loan Trust, Ser 2005-20CB, Cl 3A6 | ||||||||
5.500%, 07/25/2035 | 137 | 126 | ||||||
Alternative Loan Trust, Ser 2005-57CB, Cl 4A3 | ||||||||
5.500%, 12/25/2035 | 333 | 284 | ||||||
Alternative Loan Trust, Ser 2006-23CB, Cl 1A7 | ||||||||
6.000%, 08/25/2036 | 215 | 196 | ||||||
| 256 | SEI Institutional Managed Trust / Annual Report / September 30, 2016 |
| Description | Face Amount (Thousands) | Market Value ($ Thousands) | ||||||
MORTGAGE-BACKED SECURITIES (continued) |
| |||||||
Alternative Loan Trust, Ser 2006-24CB, Cl A16 | ||||||||
5.750%, 06/25/2036 | $ | 548 | $ | 464 | ||||
Alternative Loan Trust, Ser 2006-28CB, Cl A14 | ||||||||
6.250%, 10/25/2036 | 379 | 314 | ||||||
Alternative Loan Trust, Ser 2006-9T1, Cl A1 | ||||||||
5.750%, 05/25/2036 | 241 | 187 | ||||||
Alternative Loan Trust, Ser 2006-J1, Cl 1A13 | ||||||||
5.500%, 02/25/2036 | 319 | 271 | ||||||
Banc of America Commercial Mortgage Trust, Ser 2007-4, Cl A1A | ||||||||
5.774%, 02/10/2051 (E) | 1,540 | 1,575 | ||||||
Banc of America Commercial Mortgage Trust, Ser 2007-5, Cl AM | ||||||||
5.772%, 02/10/2051 (E) | 262 | 269 | ||||||
Bear Stearns Commercial Mortgage Securities Trust, Ser 2006-PW13, Cl AJ | ||||||||
5.611%, 09/11/2041 (E) | 161 | 161 | ||||||
Bellemeade Re II, Ser 2016-1A, Cl M2B | ||||||||
7.025%, 04/25/2026 (C)(E) | 487 | 488 | ||||||
Bellemeade Re, Ser 2015-1A, Cl M1 | ||||||||
3.025%, 07/25/2025 (C)(E) | 195 | 193 | ||||||
BHMS Mortgage Trust, Ser 2014-ATLS, Cl AFX | ||||||||
3.600%, 07/05/2033 (C) | 1,180 | 1,222 | ||||||
CGRBS Commercial Mortgage Trust, Ser 2013- VN05, Cl A | ||||||||
3.187%, 03/13/2035 (C) | 915 | 971 | ||||||
Chase Mortgage Finance Trust Series, Ser 2007-S5, Cl 1A17 | ||||||||
6.000%, 07/25/2037 | 180 | 150 | ||||||
CHL Mortgage Pass-Through Trust, Ser 2006- 10, Cl 1A8 | ||||||||
6.000%, 05/25/2036 | 310 | 267 | ||||||
CHL Mortgage Pass-Through Trust, Ser 2006- 13, Cl 1A19 | ||||||||
6.250%, 09/25/2036 | 154 | 133 | ||||||
CHL Mortgage Pass-Through Trust, Ser 2007- HYB2, Cl 3A1 | ||||||||
2.971%, 02/25/2047 (E) | 445 | 365 | ||||||
Citigroup Commercial Mortgage Trust, Ser 2012-GC8, Cl D | ||||||||
5.039%, 09/10/2045 (C)(E) | 807 | 763 | ||||||
Citigroup Commercial Mortgage Trust, Ser 2013-GC11, Cl D | ||||||||
4.603%, 04/10/2046 (C)(E) | 784 | 754 | ||||||
Citigroup Commercial Mortgage Trust, Ser 2015-GC27, Cl A5 | ||||||||
3.137%, 02/10/2048 | 980 | 1,027 | ||||||
Citigroup Commercial Mortgage Trust, Ser 2016-C1, Cl A4 | ||||||||
3.209%, 05/10/2049 | 1,099 | 1,158 | ||||||
COBALT Commercial Mortgage Trust, Ser 2007- C3, Cl A4 | ||||||||
5.958%, 05/15/2046 (E) | 459 | 468 | ||||||
| Description | Face Amount (Thousands) | Market Value ($ Thousands) | ||||||
MORTGAGE-BACKED SECURITIES (continued) |
| |||||||
COMM Mortgage Trust, Ser 2015-CR25, Cl A4 | ||||||||
3.759%, 08/10/2048 | $ | 1,000 | $ | 1,097 | ||||
Commercial Mortgage Loan Trust, Ser 2008- LS1, Cl A1A | ||||||||
6.296%, 12/10/2049 (E) | 1,563 | 1,618 | ||||||
Commercial Mortgage Pass-Through Certificates, Ser 2013-SFS, Cl A1 | ||||||||
1.873%, 04/12/2035 (C) | 331 | 331 | ||||||
Commercial Mortgage Pass-Through Certificates, Ser 2014-SAVA, Cl A | ||||||||
1.658%, 06/15/2034 (C)(E) | 380 | 381 | ||||||
Commercial Mortgage Trust, Ser 2006-C8, Cl A1A | ||||||||
5.292%, 12/10/2046 | 109 | 109 | ||||||
Commercial Mortgage Trust, Ser 2007-GG9, Cl A4 | ||||||||
5.444%, 03/10/2039 | 459 | 459 | ||||||
Commercial Mortgage Trust, Ser 2007-GG9, Cl AM | ||||||||
5.475%, 03/10/2039 | 613 | 618 | ||||||
Credit Suisse Commercial Mortgage Trust Series, Ser 2007-C2, Cl A3 | ||||||||
5.542%, 01/15/2049 (E) | 26 | 26 | ||||||
Credit Suisse Commercial Mortgage Trust Series, Ser 2007-C3, Cl AM | ||||||||
5.889%, 06/15/2039 (E) | 581 | 585 | ||||||
CSAIL Commercial Mortgage Trust, Ser 2014- C3, Cl A4 | ||||||||
3.691%, 08/15/2048 | 959 | 1,052 | ||||||
CSMC, Ser 2010-6R, Cl 3A2 | ||||||||
5.875%, 01/26/2038 (C) | 628 | 497 | ||||||
Deutsche Alt-A Securities Mortgage Loan Trust, Ser 2006-AR4, Cl A2 | ||||||||
2.059%, 04/10/2031 (E) | 570 | 562 | ||||||
0.715%, 12/25/2036 (E) | 666 | 418 | ||||||
FHLMC Structured Agency Credit Risk Debt Notes, Ser 2013-DN2, Cl M2 | ||||||||
4.775%, 11/25/2023 (E) | 1,035 | 1,097 | ||||||
FHLMC Structured Agency Credit Risk Debt Notes, Ser 2014-DN3, Cl M3 | ||||||||
4.525%, 08/25/2024 (E) | 1,165 | 1,219 | ||||||
FHLMC Structured Agency Credit Risk Debt Notes, Ser 2014-DN4, Cl M3 | ||||||||
5.074%, 10/25/2024 (E) | 250 | 265 | ||||||
FHLMC Structured Agency Credit Risk Debt Notes, Ser 2014-HQ3, Cl M3 | ||||||||
5.275%, 10/25/2024 (E) | 1,052 | 1,124 | ||||||
FHLMC Structured Agency Credit Risk Debt Notes, Ser 2015-DNA1, Cl M3 | ||||||||
3.824%, 10/25/2027 (E) | 280 | 290 | ||||||
FHLMC Structured Agency Credit Risk Debt Notes, Ser 2015-DNA2, Cl M2 | ||||||||
3.125%, 12/25/2027 (E) | 1,489 | 1,522 | ||||||
| SEI Institutional Managed Trust / Annual Report / September 30, 2016 | 257 |
CONSOLIDATED SCHEDULE OF INVESTMENTS
September 30, 2016
Multi-Asset Inflation Managed Fund (Continued)
| Description | Face Amount (Thousands) | Market Value ($ Thousands) | ||||||
MORTGAGE-BACKED SECURITIES (continued) |
| |||||||
FHLMC Structured Agency Credit Risk Debt Notes, Ser 2015-DNA3, Cl M3 | ||||||||
5.224%, 04/25/2028 (E) | $ | 354 | $ | 377 | ||||
FHLMC Structured Agency Credit Risk Debt Notes, Ser 2016-DNA4, Cl M3 | ||||||||
4.324%, 03/25/2029 (E) | 363 | 365 | ||||||
FHLMC Structured Agency Credit Risk Debt Notes, Ser 2015-HQ1, Cl M2 | ||||||||
2.724%, 03/25/2025 (E) | 530 | 536 | ||||||
FHLMC Structured Agency Credit Risk Debt Notes, Ser 2015-HQA1, Cl M2 | ||||||||
3.174%, 03/25/2028 (E) | 1,290 | 1,320 | ||||||
FHLMC Structured Agency Credit Risk Debt Notes, Ser 2015-HQA2, Cl M3 | ||||||||
5.324%, 05/25/2028 (E) | 316 | 338 | ||||||
FHLMC Structured Agency Credit Risk Debt Notes, Ser 2015-HQA2, Cl M2 | ||||||||
3.325%, 05/25/2028 (E) | 476 | 491 | ||||||
FHLMC Structured Agency Credit Risk Debt Notes, Ser 2016-DNA1, Cl M3 | ||||||||
5.975%, 07/25/2028 (E) | 513 | 562 | ||||||
FHLMC Structured Agency Credit Risk Debt Notes, Ser 2016-DNA2, Cl M3 | ||||||||
5.174%, 10/25/2028 (E) | 396 | 416 | ||||||
FHLMC Structured Agency Credit Risk Debt Notes, Ser 2016-DNA3, Cl M3 | ||||||||
5.525%, 12/25/2028 (E) | 1,095 | 1,169 | ||||||
FHLMC Structured Agency Credit Risk Debt Notes, Ser 2016-HQA1, Cl M3 | ||||||||
6.874%, 09/25/2028 (E) | 976 | 1,095 | ||||||
First Horizon Alternative Mortgage Securities Trust, Ser 2006-FA3, Cl A9 | ||||||||
6.000%, 07/25/2036 | 336 | 275 | ||||||
FNMA Connecticut Avenue Securities, Ser 2014- C03, Cl 1M1 | ||||||||
1.724%, 07/25/2024 (E) | 175 | 176 | ||||||
FNMA Connecticut Avenue Securities, Ser 2014- C04, Cl 1M2 | ||||||||
5.424%, 11/25/2024 (E) | 678 | 734 | ||||||
FNMA Connecticut Avenue Securities, Ser 2014- C04, Cl 2M2 | ||||||||
5.524%, 11/25/2024 (E) | 255 | 273 | ||||||
FNMA Connecticut Avenue Securities, Ser 2015-C01, Cl 2M2 | ||||||||
5.074%, 02/25/2025 (E) | 1,321 | 1,377 | ||||||
FNMA Connecticut Avenue Securities, Ser 2015-C01, Cl 1M2 | ||||||||
4.825%, 02/25/2025 (E) | 530 | 556 | ||||||
FNMA Connecticut Avenue Securities, Ser 2015-C02, Cl 2M2 | ||||||||
4.524%, 05/25/2025 (E) | 620 | 644 | ||||||
| Description | Face Amount (Thousands) | Market Value ($ Thousands) | ||||||
MORTGAGE-BACKED SECURITIES (continued) |
| |||||||
FNMA Connecticut Avenue Securities, Ser 2015-C02, Cl 1M2 | ||||||||
4.524%, 05/25/2025 (E) | $ | 945 | $ | 983 | ||||
FNMA Connecticut Avenue Securities, Ser 2015-C03, Cl 1M2 | ||||||||
5.524%, 07/25/2025 (E) | 1,021 | 1,089 | ||||||
FNMA Connecticut Avenue Securities, Ser 2015-C03, Cl 1M1 | ||||||||
2.024%, 07/25/2025 (E) | 331 | 332 | ||||||
FNMA Connecticut Avenue Securities, Ser 2015-C03, Cl 2M2 | ||||||||
5.524%, 07/25/2025 (E) | 1,129 | 1,216 | ||||||
FNMA Connecticut Avenue Securities, Ser 2015-C04, Cl 1M2 | ||||||||
5.894%, 04/25/2028 (E) | 312 | 338 | ||||||
FNMA Connecticut Avenue Securities, Ser 2015-C04, Cl 2M2 | ||||||||
6.075%, 04/25/2028 (E) | 980 | 1,056 | ||||||
FNMA Connecticut Avenue Securities, Ser 2016-C01, Cl 1M2 | ||||||||
7.275%, 08/25/2028 (E) | 978 | 1,109 | ||||||
FNMA Connecticut Avenue Securities, Ser 2016-C01, Cl 2M2 | ||||||||
7.438%, 08/25/2028 (E) | 731 | 829 | ||||||
FNMA Connecticut Avenue Securities, Ser 2016-C02, Cl 1M2 | ||||||||
6.525%, 09/25/2028 (E) | 814 | 899 | ||||||
FNMA Connecticut Avenue Securities, Ser 2016-C03, Cl 1M2 | ||||||||
5.824%, 10/25/2028 (E) | 178 | 192 | ||||||
FNMA Connecticut Avenue Securities, Ser 2016-C03, Cl 2M2 | ||||||||
6.424%, 10/25/2028 (E) | 1,025 | 1,120 | ||||||
FNMA Connecticut Avenue Securities, Ser 2016-C04, Cl 1M2 | ||||||||
4.775%, 01/25/2029 (E) | 261 | 267 | ||||||
FNMA Connecticut Avenue Securities, Ser 2016-C05, Cl 2M2 | ||||||||
4.975%, 01/25/2029 (E) | 357 | 370 | ||||||
GS Mortgage Securities II, Ser 2007-GG10, Cl A4 | ||||||||
5.988%, 08/10/2045 (E) | 756 | 767 | ||||||
GS Mortgage Securities II, Ser 2013-KING, Cl A | ||||||||
2.706%, 12/10/2027 (C) | 785 | 802 | ||||||
GS Mortgage Securities Trust, Ser 2012-GC6, Cl D | ||||||||
5.847%, 01/10/2045 (C)(E) | 716 | 713 | ||||||
GS Mortgage Securities Trust, Ser 2013-G1, Cl A2 | ||||||||
3.557%, 04/10/2031 (C)(E) | 1,426 | 1,473 | ||||||
GS Mortgage Securities Trust, Ser 2014-GC18, Cl D | ||||||||
5.107%, 01/10/2047 (C)(E) | 955 | 811 | ||||||
| 258 | SEI Institutional Managed Trust / Annual Report / September 30, 2016 |
| Description | Face Amount (Thousands) | Market Value ($ Thousands) | ||||||
MORTGAGE-BACKED SECURITIES (continued) |
| |||||||
H/2 Asset Funding, Ser 2015-1A | ||||||||
2.102%, 06/24/2049 | $ | 972 | $ | 962 | ||||
HomeBanc Mortgage Trust, Ser 2005-1, Cl A1 | ||||||||
0.775%, 03/25/2035 (E) | 280 | 235 | ||||||
JPMBB Commercial Mortgage Securities Trust, Ser 2015-C32, Cl C | ||||||||
4.819%, 11/15/2048 (E) | 849 | 808 | ||||||
JPMorgan Chase Commercial Mortgage Securities Trust, Ser 2004-LN2, Cl A1A | ||||||||
4.838%, 07/15/2041 (C)(E) | 254 | 254 | ||||||
JPMorgan Chase Commercial Mortgage Securities Trust, Ser 2006-LDP8, Cl AJ | ||||||||
5.480%, 05/15/2045 (E) | 84 | 84 | ||||||
JPMorgan Chase Commercial Mortgage Securities Trust, Ser 2006-LDP9, Cl AM | ||||||||
5.372%, 05/15/2047 | 548 | 549 | ||||||
JPMorgan Chase Commercial Mortgage Securities Trust, Ser 2007-CB19, Cl AM | ||||||||
5.882%, 02/12/2049 (E) | 300 | 305 | ||||||
JPMorgan Chase Commercial Mortgage Securities Trust, Ser 2007-LD12, Cl AM | ||||||||
6.209%, 02/15/2051 (E) | 254 | 261 | ||||||
JPMorgan Chase Commercial Mortgage Securities Trust, Ser 2007-LDPX, Cl A3 | ||||||||
5.420%, 01/15/2049 | 434 | 437 | ||||||
JPMorgan Chase Commercial Mortgage Securities Trust, Ser 2007-LDPX, Cl A1A | ||||||||
5.439%, 01/15/2049 | 1,645 | 1,660 | ||||||
JPMorgan Chase Commercial Mortgage Securities Trust, Ser 2014-INN, Cl A | ||||||||
1.444%, 06/15/2029 (C)(E) | 1,145 | 1,140 | ||||||
JPMorgan Chase Commercial Mortgage Securities Trust, Ser 2015-C31, Cl A3 | ||||||||
3.801%, 08/15/2048 | 889 | 975 | ||||||
JPMorgan Chase Commercial Mortgage Securities Trust, Ser 2015-SGP, Cl A | ||||||||
2.208%, 07/15/2036 (C)(E) | 1,283 | 1,290 | ||||||
JPMorgan Mortgage Trust, Ser 2007-S3, Cl 1A8 | ||||||||
6.000%, 08/25/2037 | 262 | 233 | ||||||
LB-UBS Commercial Mortgage Trust, Ser 2006- C6, Cl AJ | ||||||||
5.452%, 09/15/2039 (E) | 462 | 430 | ||||||
LB-UBS Commercial Mortgage Trust, Ser C1, Cl AM | ||||||||
5.455%, 02/15/2040 | 395 | 398 | ||||||
LSTAR Commercial Mortgage Trust, Ser 2014-2, Cl A2 | ||||||||
2.767%, 01/20/2041 (C) | 561 | 563 | ||||||
LSTAR Commercial Mortgage Trust, Ser 2015-3, Cl A2 | ||||||||
2.729%, 04/20/2048 (C)(E) | 1,028 | 1,042 | ||||||
| Description | Face Amount (Thousands) | Market Value ($ Thousands) | ||||||
MORTGAGE-BACKED SECURITIES (continued) |
| |||||||
LSTAR Commercial Mortgage Trust, Ser 2016-4, Cl A2 | ||||||||
2.458%, 03/10/2049 (C)(E) | $ | 971 | $ | 972 | ||||
Merrill Lynch Mortgage Trust, Ser 2006-C2, Cl AJ | ||||||||
5.802%, 08/12/2043 (E) | 39 | 39 | ||||||
ML-CFC Commercial Mortgage Trust, Ser 2007- 9, Cl A4 | ||||||||
5.700%, 09/12/2049 | 1,066 | 1,099 | ||||||
Morgan Stanley Capital I Trust, Ser 2005-IQ9, Cl D | ||||||||
5.000%, 07/15/2056 | 545 | 553 | ||||||
Morgan Stanley Capital I Trust, Ser 2015-XLF2, Cl AFSA | ||||||||
2.458%, 08/15/2026 (C)(E) | 270 | 269 | ||||||
Morgan Stanley Capital I Trust, Ser 2015-XLF2, Cl SNMA | ||||||||
2.458%, 11/15/2026 (C)(E) | 270 | 271 | ||||||
RBSSP Resecuritization Trust, Ser 2009-7, Cl 10A3 | ||||||||
6.000%, 08/26/2037 (C) | 825 | 708 | ||||||
RBSSP Resecuritization Trust, Ser 2010-9, Cl 7A6 | ||||||||
6.289%, 05/26/2037 (C)(E) | 771 | 589 | ||||||
Resource Capital, Ser 2014-CRE2, Cl A | ||||||||
1.580%, 04/15/2032 (C)(E) | 246 | 244 | ||||||
SG Commercial Mortgage Securities Trust, Ser 2016-C5, Cl A4 | ||||||||
3.055%, 10/10/2048 | 644 | 664 | ||||||
Starwood Retail Property Trust, Ser 2014, Cl A | ||||||||
1.744%, 11/15/2027 (C)(E) | 1,818 | 1,799 | ||||||
UBS-Barclays Commercial Mortgage Trust, Ser 2012-C4, Cl A5 | ||||||||
2.850%, 12/10/2045 | 596 | 621 | ||||||
UBS-Barclays Commercial Mortgage Trust, Ser 2014-C3, Cl A4 | ||||||||
3.091%, 08/10/2049 | 297 | 314 | ||||||
UBS-Citigroup Commercial Mortgage Trust, Ser 2011-C1, Cl E | ||||||||
6.266%, 01/10/2045 (C)(E) | 361 | 395 | ||||||
Wachovia Bank Commercial Mortgage Trust, Ser 2006-C26, Cl A1A | ||||||||
6.009%, 06/15/2045 (E) | 65 | 65 | ||||||
Wells Fargo Commercial Mortgage Trust, Ser 2015-SG1, Cl C | ||||||||
4.620%, 12/15/2047 (E) | 794 | 796 | ||||||
Wells Fargo Commercial Mortgage Trust, Ser 2015-SG1, Cl A4 | ||||||||
3.789%, 12/15/2047 | 485 | 530 | ||||||
Wells Fargo Commercial Mortgage Trust, Ser 2016-NXS6, Cl C | ||||||||
4.452%, 11/15/2049 | 925 | 926 | ||||||
SEI Institutional Managed Trust / Annual Report / September 30, 2016 | 259 |
CONSOLIDATED SCHEDULE OF INVESTMENTS
September 30, 2016
Multi-Asset Inflation Managed Fund (Continued)
| ||||||||
| Description | Face Amount (Thousands) | Market Value ($ Thousands) | ||||||
| ||||||||
MORTGAGE-BACKED SECURITIES (continued) |
| |||||||
Wells Fargo Credit Risk Transfer Securities Trust, Ser 2015-WF1, Cl 2M2 | ||||||||
6.025%, 11/25/2025 (C)(E) | $ | 163 | $ | 163 | ||||
Wells Fargo Credit Risk Transfer Securities Trust, Ser 2015-WF1, Cl 1M2 | ||||||||
5.775%, 11/25/2025 (C)(E) | 613 | 614 | ||||||
Wells Fargo Mortgage Backed Securities Trust, Ser 2007-8, Cl 2A5 | ||||||||
5.750%, 07/25/2037 | 187 | 185 | ||||||
WFRBS Commercial Mortgage Trust, Ser 2012-C9, Cl D | ||||||||
4.961%, 11/15/2045 (C)(E) | 517 | 510 | ||||||
WFRBS Commercial Mortgage Trust, Ser 2013-C14, Cl A5 | ||||||||
3.337%, 06/15/2046 | 856 | 911 | ||||||
WFRBS Commercial Mortgage Trust, Ser 2014-C20, Cl A2 | ||||||||
3.036%, 05/15/2047 | 701 | 727 | ||||||
|
| |||||||
| 75,736 | ||||||||
|
| |||||||
Total Mortgage-Backed Securities | 82,798 | |||||||
|
| |||||||
ASSET-BACKED SECURITIES — 3.5% |
| |||||||
Automotive — 1.7% |
| |||||||
Ally Auto Receivables Trust, Ser 2015-2, Cl A3 | ||||||||
1.490%, 11/15/2019 | 509 | 511 | ||||||
AmeriCredit Automobile Receivables Trust, Ser 2014-1, Cl A3 | ||||||||
0.900%, 02/08/2019 | 137 | 137 | ||||||
ARI Fleet Lease Trust, Ser 2014-A, Cl A2 | ||||||||
0.810%, 11/15/2022 (C) | 67 | 67 | ||||||
Avis Budget Rental Car Funding AESOP, Ser 2012-3A, Cl A | ||||||||
2.100%, 03/20/2019 (C) | 435 | 436 | ||||||
Avis Budget Rental Car Funding AESOP, Ser 2013-2A, Cl A | ||||||||
2.970%, 02/20/2020 (C) | 594 | 606 | ||||||
Avis Budget Rental Car Funding AESOP, Ser 2016-1A, Cl A | ||||||||
2.990%, 06/20/2022 (C) | 646 | 663 | ||||||
Bank of The West Auto Trust, Ser 2015-1, Cl A3 | ||||||||
1.310%, 10/15/2019 (C) | 1,025 | 1,026 | ||||||
California Republic Auto Receivables Trust, Ser 2014-2, Cl A4 | ||||||||
1.570%, 12/16/2019 | 907 | 910 | ||||||
California Republic Auto Receivables Trust, Ser 2015-2, Cl A3 | ||||||||
1.310%, 08/15/2019 | 771 | 771 | ||||||
| ||||||||
| Description | Face Amount (Thousands) | Market Value ($ Thousands) | ||||||
| ||||||||
ASSET-BACKED SECURITIES (continued) |
| |||||||
Capital Auto Receivables Asset Trust, Ser 2014-1, Cl B | ||||||||
2.220%, 01/22/2019 | $ | 200 | $ | 201 | ||||
Chrysler Capital Auto Receivables Trust, Ser 2016-AA, Cl A3 | ||||||||
1.770%, 10/15/2020 (C) | 1,380 | 1,385 | ||||||
CPS Auto Receivables Trust, Ser 2013-B, Cl A | ||||||||
1.820%, 09/15/2020 (C) | 241 | 240 | ||||||
CPS Auto Receivables Trust, Ser 2014-B, Cl A | ||||||||
1.110%, 11/15/2018 (C) | 119 | 118 | ||||||
Drive Auto Receivables Trust, Ser 2016-AA, Cl A2A | ||||||||
1.500%, 03/15/2018 (C) | 15 | 15 | ||||||
Drive Auto Receivables Trust, Ser 2016-BA, Cl A2 | ||||||||
1.380%, 08/15/2018 (C) | 1,263 | 1,263 | ||||||
Enterprise Fleet Financing, Ser 2014-1, Cl A2 | ||||||||
0.870%, 09/20/2019 (C) | 65 | 65 | ||||||
Enterprise Fleet Financing, Ser 2015-1, Cl A2 | ||||||||
1.300%, 09/20/2020 (C) | 604 | 603 | ||||||
Exeter Automobile Receivables Trust, Ser 2016- 1A, Cl D | ||||||||
8.200%, 02/15/2023 (C) | 440 | 471 | ||||||
First Investors Auto Owner Trust, Ser 2016-2A, Cl A1 | ||||||||
1.530%, 11/16/2020 (C) | 989 | 989 | ||||||
Flagship Credit Auto Trust, Ser 2016-2, Cl D | ||||||||
8.560%, 11/15/2023 (C) | 545 | 580 | ||||||
Ford Credit Auto Owner Trust, Ser 2012-D, Cl B | ||||||||
1.010%, 05/15/2018 | 240 | 240 | ||||||
Ford Credit Auto Owner Trust, Ser 2014-2, Cl A | ||||||||
2.310%, 04/15/2026 (C) | 816 | 836 | ||||||
Harley-Davidson Motorcycle Trust, Ser 2014-1, Cl A3 | ||||||||
1.100%, 09/15/2019 | 320 | 320 | ||||||
Harley-Davidson Motorcycle Trust, Ser 2015-2, Cl A3 | ||||||||
1.300%, 03/16/2020 | 1,025 | 1,026 | ||||||
Hertz Fleet Lease Funding, Ser 2013-3, Cl A | ||||||||
1.068%, 12/10/2027 (C)(E) | 299 | 299 | ||||||
Hertz Vehicle Financing II, Ser 2015-2A, Cl A | ||||||||
2.020%, 09/25/2019 (C) | 700 | 699 | ||||||
Hertz Vehicle Financing, | ||||||||
2.480%, 08/25/2019 (C) | 579 | 568 | ||||||
Hertz Vehicle Financing, | ||||||||
2.320%, 03/25/2020 (C) | 524 | 527 | ||||||
Hyundai Auto Lease Securitization Trust, Ser 2015-A, Cl A2 | ||||||||
1.000%, 10/16/2017 (C) | 124 | 124 | ||||||
Mercedes Benz Auto Lease Trust, Ser 2015-B, Cl A3 | ||||||||
1.340%, 07/16/2018 | 495 | 496 | ||||||
| 260 | SEI Institutional Managed Trust / Annual Report / September 30, 2016 |
| ||||||||
| Description | Face Amount (Thousands) | Market Value ($ Thousands) | ||||||
| ||||||||
ASSET-BACKED SECURITIES (continued) |
| |||||||
Porsche Innovative Lease Owner Trust, Ser 2015-1, Cl A4 | ||||||||
1.430%, 05/21/2021 (C) | $ | 1,021 | $ | 1,024 | ||||
Santander Drive Auto Receivables Trust, Ser 2013-2, Cl E | ||||||||
2.980%, 04/15/2020 (C) | 1,095 | 1,109 | ||||||
Santander Drive Auto Receivables Trust, Ser 2015-3, Cl A2A | ||||||||
1.020%, 09/17/2018 | 78 | 78 | ||||||
Santander Drive Auto Receivables Trust, Ser 2015-4, Cl A2A | ||||||||
1.200%, 12/17/2018 | 133 | 133 | ||||||
TCF Auto Receivables Owner Trust, Ser 2015-1A, Cl A2 | ||||||||
1.020%, 08/15/2018 (C) | 129 | 129 | ||||||
Westlake Automobile Receivables Trust, Ser 2015-3A, Cl A2A | ||||||||
1.420%, 05/17/2021 (C) | 251 | 251 | ||||||
|
| |||||||
| 18,916 | ||||||||
|
| |||||||
Credit Cards — 0.4% |
| |||||||
Cabela’s Credit Card Master Note Trust, Ser 2014-1, Cl A | ||||||||
0.874%, 03/16/2020 (E) | 500 | 500 | ||||||
First National Master Note Trust, Ser 2013-2, Cl A | ||||||||
1.054%, 10/15/2019 (E) | 794 | 794 | ||||||
Synchrony Credit Card Master Note Trust, Ser 2012-2, Cl A | ||||||||
2.220%, 01/15/2022 | 1,389 | 1,413 | ||||||
Synchrony Credit Card Master Note Trust, Ser 2016-1, Cl A | ||||||||
2.040%, 03/15/2022 | 401 | 406 | ||||||
World Financial Network Credit Card Master Trust, Ser 2013-A, Cl A | ||||||||
1.610%, 12/15/2021 | 385 | 387 | ||||||
World Financial Network Credit Card Master Trust, Ser 2015-A, Cl A | ||||||||
1.004%, 02/15/2022 (E) | 571 | 572 | ||||||
|
| |||||||
| 4,072 | ||||||||
|
| |||||||
Other Asset-Backed Securities — 1.4% |
| |||||||
Ally Master Owner Trust, | ||||||||
1.290%, 01/15/2019 | 1,405 | 1,405 | ||||||
Ally Master Owner Trust, | ||||||||
1.630%, 05/15/2020 | 1,079 | 1,083 | ||||||
BMW Floorplan Master Owner Trust, Ser 2015-1A, Cl A | ||||||||
1.008%, 07/15/2020 (C)(E) | 1,565 | 1,566 | ||||||
Citi Held for Asset Issuance, Ser 2016-PM1, Cl A | ||||||||
4.650%, 04/15/2025 (C) | 482 | 490 | ||||||
CNH Equipment Trust, Ser 2015-A, Cl A4 | ||||||||
1.850%, 04/15/2021 | 673 | 681 | ||||||
| ||||||||
| Description | Face Amount (Thousands) | Market Value ($ Thousands) | ||||||
| ||||||||
ASSET-BACKED SECURITIES (continued) |
| |||||||
Dell Equipment Finance Trust, Ser 2015-1, Cl A3 | ||||||||
1.300%, 03/23/2020 (C) | $ | 333 | $ | 333 | ||||
Dell Equipment Finance Trust, Ser 2015-2, Cl A2A | ||||||||
1.420%, 12/22/2017 (C) | 375 | 375 | ||||||
Ford Credit Floorplan Master Owner Trust, Ser 2014-1, Cl A1 | ||||||||
1.200%, 02/15/2019 | 999 | 999 | ||||||
Ford Credit Floorplan Master Owner Trust, Ser 2015-2, Cl A2 | ||||||||
1.078%, 01/15/2022 (E) | 954 | 955 | ||||||
GMF Floorplan Owner Revolving Trust, Ser 2015-1, Cl A1 | ||||||||
1.650%, 05/15/2020 (C) | 496 | 493 | ||||||
GMF Floorplan Owner Revolving Trust, Ser 2016-1, Cl A1 | ||||||||
1.960%, 05/17/2021 (C) | 986 | 993 | ||||||
Marlette Funding Trust, Ser 2016-1A, Cl A | ||||||||
3.060%, 01/17/2023 (C) | 494 | 494 | ||||||
Navistar Financial Dealer Note Master Trust, Ser 2014-1, Cl A | ||||||||
1.274%, 10/25/2019 (C)(E) | 768 | 768 | ||||||
SoFi Consumer Loan Program, Ser 2016-2A, Cl A | ||||||||
3.090%, 10/27/2025 (C) | 713 | 716 | ||||||
Taco Bell Funding, Ser 2016-1A, Cl A2I | ||||||||
3.832%, 05/25/2046 (C) | 810 | 823 | ||||||
Volkswagen Credit Auto Master Trust, Ser 2014-1A, Cl A1 | ||||||||
0.862%, 07/22/2019 (C)(E) | 500 | 499 | ||||||
Volvo Financial Equipment, Ser 2015-1A, Cl A3 | ||||||||
1.510%, 06/17/2019 (C) | 986 | 988 | ||||||
Wells Fargo Dealer Floorplan Master Note Trust, | ||||||||
0.892%, 07/20/2019 (E) | 579 | 578 | ||||||
Wells Fargo Dealer Floorplan Master Note Trust, | ||||||||
1.012%, 01/20/2020 (E) | 856 | 856 | ||||||
|
| |||||||
| 15,095 | ||||||||
|
| |||||||
Total Asset-Backed Securities | 38,083 | |||||||
|
| |||||||
SOVEREIGN DEBT — 3.2% |
| |||||||
Brazil Notas do Tesouro Nacional, Ser F | ||||||||
10.000%, 01/01/2017 | BRL | 6,145 | 1,873 | |||||
10.000%, 01/01/2027 | 9,305 | 2,592 | ||||||
Japan Treasury Discount Bill | ||||||||
(0.081)%, | JPY | 2,920,000 | 28,837 | |||||
Mexico Government International Bond MTN | ||||||||
5.950%, 03/19/2019 | $ | 164 | 182 | |||||
| SEI Institutional Managed Trust / Annual Report / September 30, 2016 | 261 |
CONSOLIDATED SCHEDULE OF INVESTMENTS
September 30, 2016
Multi-Asset Inflation Managed Fund (Continued)
| ||||||||
| Description | Face Amount (Thousands) | Market Value ($ Thousands) | ||||||
| ||||||||
SOVEREIGN DEBT (continued) |
| |||||||
Qatar Government International Bond | ||||||||
2.375%, 06/02/2021 (E) | $ | 1,027 | $ | 1,035 | ||||
|
| |||||||
Total Sovereign Debt (Cost $33,097) ($ Thousands) | 34,519 | |||||||
|
| |||||||
Total Investments — 119.3% |
| $ | 1,288,531 | |||||
|
| |||||||
| Shares | ||||||||
|
| |||||||
COMMON STOCK SOLD SHORT— (13.5)% |
| |||||||
Consumer Discretionary — (7.3)% |
| |||||||
1-800-Flowers.com, Cl A * | (48,500 | ) | $ | (445 | ) | |||
Amazon.com, Cl A * | (180 | ) | (151 | ) | ||||
America’s Car-Mart * | (13,400 | ) | (488 | ) | ||||
Arctic Cat | (36,200 | ) | (561 | ) | ||||
Ascena Retail Group * | (528,400 | ) | (2,954 | ) | ||||
Ascent Capital Group, Cl A * | (25,800 | ) | (598 | ) | ||||
Beazer Homes USA, Cl A * | (191,400 | ) | (2,232 | ) | ||||
Belmond, Cl A * | (13,100 | ) | (166 | ) | ||||
Boot Barn Holdings * | (9,100 | ) | (104 | ) | ||||
BorgWarner | (113,200 | ) | (3,982 | ) | ||||
Bridgepoint Education * | (14,800 | ) | (102 | ) | ||||
CarMax * | (65,500 | ) | (3,494 | ) | ||||
Cherokee * | (7,100 | ) | (73 | ) | ||||
Chipotle Mexican Grill, Cl A * | (10,174 | ) | (4,309 | ) | ||||
ClubCorp Holdings | (33,400 | ) | (483 | ) | ||||
CROCS * | (219,600 | ) | (1,823 | ) | ||||
Del Frisco’s Restaurant Group * | (16,300 | ) | (220 | ) | ||||
Delphi Automotive | (4,500 | ) | (321 | ) | ||||
Destination XL Group * | (15,500 | ) | (67 | ) | ||||
Dollar Tree * | (16,900 | ) | (1,334 | ) | ||||
EW Scripps, Cl A * | (76,500 | ) | (1,216 | ) | ||||
Federal-Mogul Holdings, Cl A * | (9,200 | ) | (89 | ) | ||||
Fiesta Restaurant Group * | (54,700 | ) | (1,313 | ) | ||||
Fox Factory Holding * | (29,900 | ) | (687 | ) | ||||
Fred’s, Cl A | (46,300 | ) | (419 | ) | ||||
Gentherm * | (24,100 | ) | (757 | ) | ||||
G-III Apparel Group * | (43,500 | ) | (1,268 | ) | ||||
Global Eagle Entertainment * | (30,000 | ) | (249 | ) | ||||
Gray Television * | (45,600 | ) | (472 | ) | ||||
Groupon, Cl A * | (222,500 | ) | (1,146 | ) | ||||
H&R Block | (20,600 | ) | (477 | ) | ||||
Hanesbrands | (136,400 | ) | (3,444 | ) | ||||
Harley-Davidson, Cl A | (124,200 | ) | (6,532 | ) | ||||
Harman International Industries, Cl A | (5,300 | ) | (447 | ) | ||||
Houghton Mifflin Harcourt * | (83,700 | ) | (1,122 | ) | ||||
Kate Spade * | (102,000 | ) | (1,747 | ) | ||||
Kona Grill * | (22,700 | ) | (285 | ) | ||||
La Quinta Holdings * | (17,400 | ) | (195 | ) | ||||
Liberty Global, Cl A * | (38,000 | ) | (1,299 | ) | ||||
Liberty Global LiLAC * | (19,907 | ) | (549 | ) | ||||
Liberty Media – Interactive, Cl A * | (38,000 | ) | (760 | ) | ||||
| ||||||||
| Description | Shares | Market Value ($ Thousands) | ||||||
| ||||||||
COMMON STOCK SOLD SHORT (continued) |
| |||||||
Liberty Ventures, Ser A * | (147,300 | ) | $ | (5,873 | ) | |||
Malibu Boats, Cl A * | (12,700 | ) | (189 | ) | ||||
Media General * | (61,500 | ) | (1,134 | ) | ||||
MGM Mirage * | (2,500 | ) | (65 | ) | ||||
Modine Manufacturing * | (6,300 | ) | (75 | ) | ||||
Monro Muffler | (10,000 | ) | (612 | ) | ||||
Motorcar Parts of America * | (42,500 | ) | (1,223 | ) | ||||
Nautilus * | (15,000 | ) | (341 | ) | ||||
NetFlix * | (67,700 | ) | (6,672 | ) | ||||
New Home * | (15,900 | ) | (170 | ) | ||||
Norwegian Cruise Line Holdings * | (6,900 | ) | (260 | ) | ||||
Penn National Gaming * | (130,600 | ) | (1,772 | ) | ||||
Ruby Tuesday * | (195,700 | ) | (489 | ) | ||||
Signet Jewelers | (16,200 | ) | (1,207 | ) | ||||
Skechers U.S.A., Cl A * | (40,700 | ) | (932 | ) | ||||
Sotheby’s | (41,000 | ) | (1,559 | ) | ||||
Taylor Morrison Home, Cl A * | (45,900 | ) | (808 | ) | ||||
Time | (239,300 | ) | (3,465 | ) | ||||
TripAdvisor * | (46,100 | ) | (2,912 | ) | ||||
Tuesday Morning * | (55,300 | ) | (331 | ) | ||||
Vince Holding * | (25,600 | ) | (145 | ) | ||||
William Lyon Homes, Cl A * | (26,700 | ) | (495 | ) | ||||
ZAGG * | (22,200 | ) | (180 | ) | ||||
|
| |||||||
| (79,289 | ) | |||||||
|
| |||||||
Financials — (0.5)% |
| |||||||
Genworth Financial, Cl A * | (42,200 | ) | (209 | ) | ||||
Greenlight Capital Re, Cl A * | (27,300 | ) | (558 | ) | ||||
Home BancShares | (26,600 | ) | (554 | ) | ||||
Moody’s | (7,500 | ) | (812 | ) | ||||
OneMain Holdings, Cl A * | (6,500 | ) | (201 | ) | ||||
PHH * | (115,000 | ) | (1,662 | ) | ||||
Safeguard Scientifics * | (6,700 | ) | (87 | ) | ||||
TFS Financial | (55,400 | ) | (986 | ) | ||||
Yadkin Financial | (19,400 | ) | (510 | ) | ||||
|
| |||||||
| (5,579 | ) | |||||||
|
| |||||||
Industrials — (1.3)% |
| |||||||
Acacia Research | (57,545 | ) | (375 | ) | ||||
Aerovironment * | (8,400 | ) | (205 | ) | ||||
Builders FirstSource * | (149,100 | ) | (1,716 | ) | ||||
CDI | (19,900 | ) | (113 | ) | ||||
Celadon Group | (12,300 | ) | (107 | ) | ||||
Chart Industries * | (46,400 | ) | (1,523 | ) | ||||
DXP Enterprises * | (25,300 | ) | (713 | ) | ||||
Engility Holdings * | (12,000 | ) | (378 | ) | ||||
Kirby * | (3,900 | ) | (242 | ) | ||||
KLX * | (13,400 | ) | (472 | ) | ||||
Kratos Defense & Security Solutions * | (12,000 | ) | (83 | ) | ||||
LB Foster, Cl A | (13,500 | ) | (162 | ) | ||||
LMI Aerospace * | (5,200 | ) | (37 | ) | ||||
MRC Global * | (131,300 | ) | (2,158 | ) | ||||
| 262 | SEI Institutional Managed Trust / Annual Report / September 30, 2016 |
| ||||||||
| Description | Shares | Market Value ($ Thousands) | ||||||
| ||||||||
COMMON STOCK SOLD SHORT (continued) |
| |||||||
NN, Cl A | (8,000 | ) | $ | (146 | ) | |||
Northwest Pipe * | (7,500 | ) | (89 | ) | ||||
NOW * | (112,700 | ) | (2,415 | ) | ||||
Sparton * | (4,900 | ) | (128 | ) | ||||
SPX * | (14,300 | ) | (288 | ) | ||||
SPX FLOW * | (3,500 | ) | (108 | ) | ||||
Team * | (1,900 | ) | (62 | ) | ||||
Triumph Group | (64,300 | ) | (1,793 | ) | ||||
Twin Disc | (3,400 | ) | (41 | ) | ||||
Wesco Aircraft Holdings * | (46,000 | ) | (618 | ) | ||||
YRC Worldwide * | (30,400 | ) | (375 | ) | ||||
|
| |||||||
| (14,347 | ) | |||||||
|
| |||||||
Information Technology — (2.4)% |
| |||||||
Apple | (13,800 | ) | (1,560 | ) | ||||
Applied Micro Circuits * | (105,500 | ) | (733 | ) | ||||
Applied Optoelectronics * | (8,100 | ) | (180 | ) | ||||
Bel Fuse, Cl B | (3,900 | ) | (94 | ) | ||||
Black Box | (20,900 | ) | (291 | ) | ||||
Cabot Microelectronics | (1,500 | ) | (79 | ) | ||||
Calix * | (35,800 | ) | (263 | ) | ||||
Cavium * | (15,500 | ) | (902 | ) | ||||
CUI Global * | (11,700 | ) | (68 | ) | ||||
Cypress Semiconductor | (466,200 | ) | (5,669 | ) | ||||
Electro Scientific Industries * | (23,300 | ) | (132 | ) | ||||
Exar * | (7,100 | ) | (66 | ) | ||||
Harmonic, Cl A * | (98,200 | ) | (582 | ) | ||||
Immersion * | (58,600 | ) | (478 | ) | ||||
Infinera * | (551,500 | ) | (4,980 | ) | ||||
Lattice Semiconductor * | (318,100 | ) | (2,065 | ) | ||||
MACOM Technology Solutions Holdings * | (12,800 | ) | (542 | ) | ||||
PDF Solutions * | (3,900 | ) | (71 | ) | ||||
Sonus Networks * | (33,800 | ) | (263 | ) | ||||
Synaptics * | (1,800 | ) | (105 | ) | ||||
Veeco Instruments * | (38,000 | ) | (746 | ) | ||||
VeriFone Holdings * | (154,100 | ) | (2,425 | ) | ||||
Viasat * | (17,800 | ) | (1,329 | ) | ||||
Zebra Technologies, Cl A * | (27,800 | ) | (1,935 | ) | ||||
|
| |||||||
| (25,558 | ) | |||||||
|
| |||||||
Materials — (1.9)% |
| |||||||
Balchem | (2,900 | ) | (225 | ) | ||||
Century Aluminum * | (485,200 | ) | (3,372 | ) | ||||
CF Industries Holdings | (102,000 | ) | (2,484 | ) | ||||
Compass Minerals International, Cl A | (21,100 | ) | (1,555 | ) | ||||
Deltic Timber | (2,500 | ) | (169 | ) | ||||
Freeport-McMoRan, Cl B | (564,100 | ) | (6,126 | ) | ||||
KapStone Paper and Packaging | (28,300 | ) | (536 | ) | ||||
LSB Industries * | (160,680 | ) | (1,378 | ) | ||||
Olin | (33,300 | ) | (683 | ) | ||||
Real Industry * | (18,700 | ) | (114 | ) | ||||
Rentech * | (10,900 | ) | (32 | ) | ||||
| ||||||||
| Description | Shares | Market Value ($ Thousands) | ||||||
| ||||||||
COMMON STOCK SOLD SHORT (continued) |
| |||||||
TimkenSteel | (147,800 | ) | $ | (1,545 | ) | |||
WestRock | (45,600 | ) | (2,211 | ) | ||||
|
| |||||||
| (20,430 | ) | |||||||
|
| |||||||
Real Estate — (0.1)% |
| |||||||
Forestar Group * | (51,800 | ) | (607 | ) | ||||
Kennedy-Wilson Holdings | (6,000 | ) | (135 | ) | ||||
|
| |||||||
| (742 | ) | |||||||
|
| |||||||
Total Common Stock Sold Short | $ | (145,945 | ) | |||||
|
| |||||||
A list of the open futures contracts held by the Fund at September 30, 2016, is as follows:
| ||||||||||||
| Type of Contract | Number of Contracts Long (Short) | Expiration Date | Unrealized Appreciation (Depreciation) ($ Thousands) | |||||||||
| ||||||||||||
| Euro-Bobl | (118) | Dec-2016 | $(30) | |||||||||
| MSCI EAFE Index E-MINI | (177) | Dec-2016 | (29) | |||||||||
| S&P 500 Index E-MINI | (149) | Dec-2016 | (64) | |||||||||
| U.S. 10-Year Treasury Note | (217) | Dec-2016 | (153) | |||||||||
| U.S. 5-Year Treasury Note | 9 | Dec-2016 | – | |||||||||
| U.S. Ultra Long Treasury Bond | 15 | Dec-2016 | (26) | |||||||||
| Brent Crude Penultimate ** | 396 | Jan-2017 | 1,014 | |||||||||
| Coffee** | (10) | Dec-2016 | (24) | |||||||||
| Coffee Robusta** | 56 | Nov-2016 | 10 | |||||||||
| Corn** | 692 | Dec-2016 | 211 | |||||||||
| Corn** | (58) | Dec-2017 | (2) | |||||||||
| Cotton No. 2** | 80 | Mar-2017 | 70 | |||||||||
| Cotton No. 2** | 101 | Dec-2016 | 7 | |||||||||
| Crude Oil** | (83) | Dec-2017 | (21) | |||||||||
| Crude Oil** | 338 | Nov-2017 | 1,432 | |||||||||
| Feeder Cattle** | (79) | Oct-2016 | 487 | |||||||||
| Feeder Cattle** | (18) | Nov-2016 | 45 | |||||||||
| Gold** | 157 | Dec-2016 | (431) | |||||||||
| Heating Oil** | 141 | Nov-2016 | 705 | |||||||||
| Heating Oil** | 35 | Jan-2017 | 185 | |||||||||
| ICE Brent Crude** | 142 | Dec-2017 | 57 | |||||||||
| Lean Hogs** | 165 | Dec-2016 | (443) | |||||||||
| Live Cattle** | 185 | Dec-2016 | (417) | |||||||||
| LME Copper** | 209 | Dec-2016 | 224 | |||||||||
| LME Nickel** | (82) | Dec-2016 | (1,005) | |||||||||
| LME Nickel** | 243 | Nov-2016 | 55 | |||||||||
| LME Primary Aluminum ** | 198 | Nov-2016 | 93 | |||||||||
| LME Zinc** | (44) | Dec-2016 | (624) | |||||||||
| LME Zinc** | 203 | Nov-2016 | 498 | |||||||||
| Natural Gas** | 392 | Nov-2016 | 343 | |||||||||
| Natural Gas** | 355 | Jan-2017 | (104) | |||||||||
| RBOB Gasoline** | 162 | Nov-2016 | 999 | |||||||||
| SGX Iron Ore ** | (801) | Nov-2016 | (20) | |||||||||
| Silver** | 107 | Dec-2016 | (451) | |||||||||
| Soybean** | 44 | Nov-2017 | 14 | |||||||||
| Soybean** | 285 | Nov-2016 | (928) | |||||||||
| Soybean Meal** | 195 | Dec-2016 | (2,031) | |||||||||
| SEI Institutional Managed Trust / Annual Report / September 30, 2016 | 263 |
CONSOLIDATED SCHEDULE OF INVESTMENTS
September 30, 2016
Multi-Asset Inflation Managed Fund (Continued)
| Type of Contract | Number of Contracts Long (Short) | Expiration Date | Unrealized Appreciation (Depreciation) ($ Thousands) | |||||||||
| Soybean Oil** | 293 | Dec-2016 | $63 | |||||||||
| Sugar No. 11** | 723 | Mar-2017 | 2,297 | |||||||||
| Sugar No. 11** | (331) | May-2017 | (1,588) | |||||||||
| Wheat** | 405 | Dec-2016 | (712) | |||||||||
| Wheat** | (137) | Mar-2017 | 235 | |||||||||
| Wheat** | 86 | Dec-2016 | (93) | |||||||||
|
| |||||||||||
| $(152) | ||||||||||||
|
| |||||||||||
For the year ended September 30, 2016, the total amount of all open futures contracts, as presented in the table above, are representative of the volume of activity for the derivative type during the year.
A list of the open forward foreign currency contracts held by the Fund at September 30, 2016, is as follows:
| Settlement Date | Currency to Deliver (Thousands) | Currency To Receive (Thousands) | Unrealized Appreciation (Depreciation) ($ Thousands) | |||||||||||||||||
| 10/04/16 | USD | 1,346 | BRL | 4,304 | $(23) | |||||||||||||||
| 11/03/16 | BRL | 3,982 | USD | 1,217 | 4 | |||||||||||||||
| 10/04/16-01/04/17 | BRL | 14,738 | USD | �� | 3,929 | (549) | ||||||||||||||
| 10/06/16 | USD | 1,225 | EUR | 1,098 | 9 | |||||||||||||||
| 10/06/16 | USD | 4,082 | TWD | 128,738 | 29 | |||||||||||||||
| 10/06/16-10/06/16 | EUR | 6,550 | USD | 7,284 | (78) | |||||||||||||||
| 10/06/16 | TWD | 128,002 | USD | 4,041 | (46) | |||||||||||||||
| 10/21/16 | USD | 2,818 | JPY | 282,400 | (27) | |||||||||||||||
| 10/21/16-10/27/16 | JPY | 3,197,666 | USD | 30,377 | (1,240) | |||||||||||||||
| 10/28/16 | AUD | 466 | USD | 359 | 3 | |||||||||||||||
| 11/10/16 | CAD | 9,733 | USD | 7,581 | 172 | |||||||||||||||
| 11/16/16 | GBP | 148 | USD | 192 | — | |||||||||||||||
| 11/22/16 | USD | 3,943 | MXN | 77,205 | 23 | |||||||||||||||
| 12/14/16 | SGD | 7,524 | USD | 5,525 | 3 | |||||||||||||||
| 12/15/16 | USD | 2,455 | INR | 166,251 | 14 | |||||||||||||||
|
| |||||||||||||||||||
| $(1,706) | ||||||||||||||||||||
|
| |||||||||||||||||||
A list of the counterparties for the outstanding forward foreign currency contracts held by the Fund at September 30, 2016, is as follows:
| Counterparty | Currency to Deliver ($ Thousands) | Currency to Receive ($ Thousands) | Unrealized Appreciation (Depreciation) ($ Thousands) | |||||||||
| Barclays PLC | $(35,436) | $34,214 | $(1,222) | |||||||||
| BNP Paribas | (6,891) | 6,813 | (78) | |||||||||
| Brown Brothers Harriman | (1,773) | 1,785 | 12 | |||||||||
| Citigroup | (3,943) | 3,966 | 23 | |||||||||
| Goldman Sachs | (3,276) | 2,726 | (550) | |||||||||
| HSBC | (4,082) | 4,112 | 30 | |||||||||
| JPMorgan Chase Bank | (6,015) | 5,937 | (78) | |||||||||
| Standard Chartered | (16,692) | 16,851 | 157 | |||||||||
|
| |||||||||||
| $(1,706) | ||||||||||||
|
| |||||||||||
For the year ended September 30, 2016 the total amount of all open forward foreign currency contracts, as presented in the table above, are representative of the volume of activity for the derivative type during the year.
A list of the open OTC swap agreements held by the Fund at September 30, 2016 is as follows:
| Interest Rate Swaps | ||||||||||||||
| Counterparty | Fund Pays | Fund Receives | Termination Date | Notional Amount ($ Thousands) | Net Unrealized Depreciation ($ Thousands) | |||||||||
| JPMorgan Chase Bank | 2.83% | 3 Month USD – LIBOR | 04/12/2042 | $2,790 | $(678) | |||||||||
|
| |||||||||||||
| Credit Default Swaps | ||||||||||||||||
| Counterparty | Reference Entity/Obligation | Buy/Sell Protection | (Pays)/Receives Rate | Termination Date | Notional Amount ($ Thousands) | Net Unrealized Appreciation (Depreciation) ($ Thousands) | ||||||||||
| Bank of America | Societe Generale | SELL | 3.00% | 12/20/2017 | $(550) | $12 | ||||||||||
| Citibank | Advanced Micro Devices Inc | BUY | 5.00% | 03/20/2019 | 416 | (53) | ||||||||||
| Citibank | Sprint Communications Inc | BUY | 5.00% | 06/20/2019 | 692 | 4 | ||||||||||
| Citibank | Sprint Communications Inc | BUY | 5.00% | 06/20/2019 | 793 | 5 | ||||||||||
| Deutsche Bank AG London | Anadarko Petroleum Corporation | SELL | 1.00% | 09/20/2017 | (500) | 6 | ||||||||||
| Deutsche Bank AG London | CMBX.NA.BBB-.9 | SELL | 3.00% | 12/31/2049 | (1,093) | (16) | ||||||||||
| Deutsche Bank AG London | CMBX.NA.BBB-.9 | SELL | 3.00% | 12/31/2049 | (227) | (3) | ||||||||||
| Deutsche Bank AG London | CMBX.NA.BBB-.9 | SELL | 3.00% | 12/31/2049 | (42) | (1) | ||||||||||
| Deutsche Bank AG London | CMBX.NA.BBB-.9 | SELL | 3.00% | 05/11/2063 | (812) | (16) | ||||||||||
| 264 | SEI Institutional Managed Trust / Annual Report / September 30, 2016 |
| Credit Default Swaps | ||||||||||||||||||||
| Counterparty | Reference Entity/Obligation | Buy/Sell Protection | (Pays)/Receives Rate | Termination Date | Notional Amount ($ Thousands) | Net Unrealized Appreciation (Depreciation) ($ Thousands) | ||||||||||||||
| Goldman Sachs International | CMBX.NA.BBB-.9 | SELL | 3.00% | 12/31/2049 | $(1,324) | $(117) | ||||||||||||||
| Goldman Sachs International | CMBX.NA.BBB-.9 | SELL | 3.00% | 05/11/2063 | (1,105) | (4) | ||||||||||||||
|
| |||||||||||||||||||
| $(183) | ||||||||||||||||||||
|
| |||||||||||||||||||
A list of the open centrally cleared swap agreements held by the Fund at September 30, 2016 is as follows:
| Interest Rate Swaps | ||||||||||||||||
| Counterparty | Fund Pays | Fund Receives | Termination Date | Currency | Notional Amount (Thousands) | Net Unrealized Appreciation (Depreciation) ($ Thousands) | ||||||||||
| Morgan Stanley | 2.63% | 3-Month USD – LIBOR | 11/10/2035 | USD | 2,970 | $(473) | ||||||||||
| Morgan Stanley | USD 3 Month LIBOR | 3.31% | 05/06/2034 | USD | 1,510 | 399 | ||||||||||
| Morgan Stanley | 1.49% | 3-Month USD – LIBOR | 10/04/2026 | USD | 10,480 | – | ||||||||||
| Morgan Stanley | 0.96% | 6-Month NOK – BBR | 08/01/2018 | NOK | 73,130 | 40 | ||||||||||
| Morgan Stanley | 3-Month NZD – BKBM | 2.47% | 07/28/2026 | NZD | 7,620 | 22 | ||||||||||
| Morgan Stanley | 2.29% | 3-Month USD – LIBOR | 08/04/2025 | USD | 2,717 | (205) | ||||||||||
| Morgan Stanley | 6-Month AUD – BBR | 3.38% | 06/09/2025 | AUD | 3,130 | 271 | ||||||||||
| Morgan Stanley | 2.49% | 3-Month USD – LIBOR | 06/09/2025 | USD | 1,710 | (164) | ||||||||||
| Morgan Stanley | 2.31% | 3-Month USD – LIBOR | 05/18/2025 | USD | 2,820 | (229) | ||||||||||
| Morgan Stanley | 1.99% | 3-Month USD – LIBOR | 04/21/2025 | USD | 2,760 | (151) | ||||||||||
| Morgan Stanley | 6-Month AUD – BBR | 2.97% | 03/11/2025 | AUD | 4,780 | 275 | ||||||||||
| Morgan Stanley | 3-Month USD – LIBOR | 2.67% | 07/18/2024 | USD | 2,060 | 209 | ||||||||||
| Morgan Stanley | 2.67% | 3-Month USD – LIBOR | 07/10/2024 | USD | 2,570 | (263) | ||||||||||
| Morgan Stanley | 3-Month USD – LIBOR | 2.63% | 05/29/2024 | USD | 1,990 | 202 | ||||||||||
| Morgan Stanley | 2.63% | 3-Month USD – LIBOR | 05/23/2024 | USD | 3,980 | (405) | ||||||||||
| Morgan Stanley | 2.82% | 3-Month USD – LIBOR | 04/28/2024 | USD | 3,520 | (413) | ||||||||||
| Morgan Stanley | 2.89% | 3-Month USD – LIBOR | 02/14/2024 | USD | 2,310 | (260) | ||||||||||
| Morgan Stanley | 2.98% | 3-Month USD – LIBOR | 01/14/2024 | USD | 2,630 | (317) | ||||||||||
| Morgan Stanley | 1.26% | 3-Month USD – LIBOR | 08/31/2021 | USD | 11,420 | (40) | ||||||||||
| Morgan Stanley | 2.24% | 3-Month USD – LIBOR | 06/25/2021 | USD | 2,100 | (116) | ||||||||||
| Morgan Stanley | 1.69% | 3-Month USD – LIBOR | 08/06/2020 | USD | 10,830 | (245) | ||||||||||
| Morgan Stanley | 6-Month GBP – LIBOR | 1.65% | 06/05/2020 | GBP | 3,757 | 229 | ||||||||||
| Morgan Stanley | 1.57% | 3-Month USD – LIBOR | 04/01/2020 | USD | 5,135 | (83) | ||||||||||
| Morgan Stanley | 3-Month USD – LIBOR | 1.75% | 10/31/2019 | USD | 4,860 | 129 | ||||||||||
| Morgan Stanley | 3-Month USD – LIBOR | 1.70% | 07/02/2019 | USD | 1,900 | 41 | ||||||||||
| Morgan Stanley | 1.71% | 3-Month AUD – BBR | 09/24/2018 | AUD | 60,300 | (38) | ||||||||||
| Morgan Stanley | 1.13% | 6-Month NOK – NIBOR | 08/13/2018 | NOK | 54,170 | 11 | ||||||||||
| Morgan Stanley | 1.08% | 6-Month NOK – NIBOR | 08/13/2018 | NOK | 81,260 | 25 | ||||||||||
| Morgan Stanley | 1.01% | 6-Month NOK – NIBOR | 08/06/2018 | NOK | 18,960 | 9 | ||||||||||
| Morgan Stanley | 2.05% | 3-Month NZD – BKBM | 07/28/2018 | NZD | 70,620 | (12) | ||||||||||
| Morgan Stanley | 1.01% | 3-Month NOK – NIBOR | 05/19/2018 | NOK | 107,030 | 55 | ||||||||||
| Morgan Stanley | 0.95% | 3-Month NOK – NIBOR | 05/12/2018 | NOK | 321,850 | 201 | ||||||||||
| Morgan Stanley | 2.21% | 3-Month AUD – BBR | 04/27/2018 | AUD | 18,540 | (129) | ||||||||||
| Morgan Stanley | 0.81% | 3-Month USD – LIBOR | 05/18/2017 | USD | 18,010 | (25) | ||||||||||
|
| |||||||||||||||
| $(1,450) | ||||||||||||||||
|
| |||||||||||||||
For the year ended September 30, 2016, the total amount of open swap agreements, as presented in the tables above, are representative of the volume of activity for this derivative type during the year.
Percentages are based on Net Assets of $1,080,192 ($ Thousands).
| * | Non-income producing security. |
| ** | Future is held by Inflation Commodity Strategy Subsidiary, Ltd. As of September 30, 2016. |
| ‡ | Real Estate Investment Trust. |
| (A) | Security, or a portion thereof, is held by the Commodity Strategy Subsidiary, Ltd. As of September 30, 2016. |
| (B) | The rate reported is the effective yield at the time of purchase. |
| (C) | Security exempt from registration under Rule 144A of the Securities Act of 1933. These securities may be resold in transactions exempt from registration normally to qualified institutions. On September 30, 2016, the value of these securities amounted to $75,281 ($ Thousands), representing 7.0% of the Net Assets of the Fund. |
| (D) | Security is in default on interest payment. |
| (E) | Variable Rate Security — The rate reported on the Schedule of Investments is the rate in effect as of September 30, 2016. |
| (F) | Step Bonds – The rate reflected on the Schedule of Investments is the effective yield on September 30, 2016. The coupon on a step bond changes on a specified date. |
| (G) | Rate is negative due to the decrease in value of the foreign currency against the U.S. Dollar. |
| (H) | Security, or a portion thereof, has been pledged as collateral on reverse repurchase agreements. |
| (I) | Security, or a portion thereof, has been pledged as collateral on open futures contracts. |
| (J) | Security, or a portion thereof, has been pledged as collateral on open centrally cleared swap contracts. |
| (K) | Security, or a portion thereof, has been pledged as collateral on securities sold short. |
| SEI Institutional Managed Trust / Annual Report / September 30, 2016 | 265 |
CONSOLIDATED SCHEDULE OF INVESTMENTS
September 30, 2016
Multi-Asset Inflation Managed Fund (Concluded)
AUD — Australian Dollar
BBR — Australian Bank Bill Rate
BKBM — Bank Bill Reference Rate
BRL — Brazilian Real
CAD — Canadian Dollar
Cl — Class
CMBX — A series of indices designed to reflect the creditworthiness of commercial mortgage-backed securities.
CMO — Collateralized Mortgage Obligation
EAFE — Europe, Australasia and Far East
EUR — Euro
FHLMC — Federal Home Loan Mortgage Corporation
FNMA — Federal National Mortgage Association
GBP — British Pound Sterling
GNMA — Government National Mortgage Association
INR — Indian Rupee
IO — Interest Only — face amount represents notional amount.
JPY — Japanese Yen
LIBOR — London Interbank Offered Rate
MSCI —Morgan Stanley Capital International
MTN — Medium Term Note
MXN — Mexican Peso
NIBOR — Norwegian Interbank Offered Rate
NOK — Norwegian Krone
NZD — New Zealand Dollar
OTC — Over the Counter
PLC — Public Limited Company
S&P— Standard & Poor’s
Ser — Series
SGD — Singapore Dollar
SPX — Standard & Poor’s 500 Index
TWD — Taiwanese Dollar
USD — United States Dollar
The following is a list of the level of inputs used as of September 30, 2016, in valuing the Fund’s investments and other financial instruments carried at value ($ Thousands):
| Investments in Securities | Level 1 | Level 2 | Level 3 | Total | ||||||||||||
U.S. Treasury Obligations | $ | – | $ | 731,614 | $ | – | $ | 731,614 | ||||||||
Common Stock | 292,998 | – | – | 292,998 | ||||||||||||
Corporate Obligations | – | 108,519 | – | 108,519 | ||||||||||||
Mortgage-Backed Securities | – | 82,798 | – | 82,798 | ||||||||||||
Asset-Backed Securities | – | 38,083 | – | 38,083 | ||||||||||||
Sovereign Debt | – | 34,519 | – | 34,519 | ||||||||||||
|
|
|
|
|
|
|
| |||||||||
| Total Investments in Securities | $ | 292,998 | $ | 995,533 | $ | – | $ | 1,288,531 | ||||||||
|
|
|
|
|
|
|
| |||||||||
Securities Sold Short | Level 1 | Level 2 | Level 3 | Total | ||||||||||||
Common Stock | $ | (145,945) | $ | — | $ | — | $ | (145,945) | ||||||||
|
|
|
|
|
|
|
| |||||||||
Total Securities Sold Short | $ | (145,945) | $ | — | $ | — | $ | (145,945) | ||||||||
|
|
|
|
|
|
|
| |||||||||
Other Financial Instruments | Level 1 | Level 2 | Level 3 | Total | ||||||||||||
Futures Contracts * | ||||||||||||||||
Unrealized Appreciation | $ | 9,044 | $ | — | $ | — | $ | 9,044 | ||||||||
Unrealized Depreciation | (9,196) | — | — | (9,196) | ||||||||||||
Forwards Contracts * | ||||||||||||||||
Unrealized Appreciation | — | 257 | — | 257 | ||||||||||||
Unrealized Depreciation | — | (1,963) | — | (1,963) | ||||||||||||
OTC Swaps | ||||||||||||||||
Interest Rate Swaps * | ||||||||||||||||
Unrealized Depreciation | — | (678) | — | (678) | ||||||||||||
Credit Default Swaps * | ||||||||||||||||
Unrealized Appreciation | — | 27 | — | 27 | ||||||||||||
Unrealized Depreciation | — | (210) | — | (210) | ||||||||||||
Centrally Cleared Swaps | ||||||||||||||||
Interest Rate Swaps * | ||||||||||||||||
Unrealized Appreciation | — | 2,118 | — | 2,118 | ||||||||||||
Unrealized Depreciation | — | (3,568) | — | (3,568) | ||||||||||||
Reverse Repurchase Agreements** | — | (244,323) | — | (244,323) | ||||||||||||
|
|
|
|
|
|
|
| |||||||||
Total Other Financial Instruments | $ | (152) | $ | (248,340) | $ | — | $ | (248,492) | ||||||||
|
|
|
|
|
|
|
| |||||||||
* Futures contracts, forward contracts and swaps are valued at the unrealized appreciation (depreciation) on the instrument.
** See Note 2 for more information on the reverse repurchase agreements.
For the year ended September 30, 2016, there were no transfers between Level 1 and Level 2 assets and liabilities.
For the year ended September 30, 2016, there were no transfers between Level 2 and Level 3 assets and liabilities.
For more information on valuation inputs, see Note 2 – Significant Accounting Policies in Notes to Financial Statements.
Amounts designated as “—” are $0 or have been rounded to $0.
The accompanying notes are an integral part of the financial statements.
| 266 | SEI Institutional Managed Trust / Annual Report / September 30, 2016 |
SCHEDULE OF INVESTMENTS
September 30, 2016
Multi-Asset Capital Stability Fund
|
Sector Weightings (Unaudited)†:
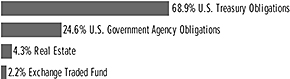
†Percentages are based on total investments.
| Description | Face Amount (Thousands) | Market Value ($ Thousands) | ||||||
U.S. TREASURY OBLIGATIONS — 12.0% |
| |||||||
U.S. Treasury Inflation Protected Securities | ||||||||
3.875%, 04/15/2029 | $ | 1,589 | $ | 2,289 | ||||
3.625%, 04/15/2028 | 227 | 313 | ||||||
3.375%, 04/15/2032 | 540 | 793 | ||||||
2.500%, 01/15/2029 | 1,496 | 1,899 | ||||||
2.375%, 01/15/2025 | 2,638 | 3,144 | ||||||
2.375%, 01/15/2027 | 1,548 | 1,899 | ||||||
2.125%, 01/15/2019 | 1,401 | 1,492 | ||||||
2.125%, 02/15/2041 | 1,040 | 1,397 | ||||||
2.000%, 01/15/2026 | 1,922 | 2,258 | ||||||
1.875%, 07/15/2019 | 1,592 | 1,710 | ||||||
1.750%, 01/15/2028 | 1,546 | 1,809 | ||||||
1.625%, 01/15/2018 | 1,481 | 1,527 | ||||||
1.375%, 07/15/2018 | 1,503 | 1,567 | ||||||
1.375%, 01/15/2020 | 1,932 | 2,052 | ||||||
1.375%, 02/15/2044 | 2,044 | 2,425 | ||||||
1.250%, 07/15/2020 | 5,797 | 6,194 | ||||||
1.125%, 01/15/2021 | 3,395 | 3,613 | ||||||
1.000%, 02/15/2046 | 662 | 721 | ||||||
0.750%, 02/15/2042 | 1,832 | 1,887 | ||||||
0.750%, 02/15/2045 | 2,378 | 2,451 | ||||||
0.625%, 01/15/2024 | 2,807 | 2,945 | ||||||
0.625%, 01/15/2026 | 275 | 285 | ||||||
0.625%, 02/15/2043 | 844 | 846 | ||||||
0.375%, 07/15/2023 | 6,187 | 6,411 | ||||||
0.375%, 07/15/2025 | 4,013 | 4,144 | ||||||
0.250%, 01/15/2025 | 4,018 | 4,093 | ||||||
0.125%, 04/15/2018 | 3,218 | 3,253 | ||||||
0.125%, 04/15/2020 | 4,954 | 5,051 | ||||||
0.125%, 04/15/2021 | 2,937 | 2,999 | ||||||
0.125%, 01/15/2022 (A) | 3,977 | 4,059 | ||||||
0.125%, 07/15/2022 | 121 | 124 | ||||||
0.125%, 01/15/2023 | 4,123 | 4,188 | ||||||
0.125%, 07/15/2024 | 4,009 | 4,067 | ||||||
0.125%, 07/15/2026 | 1,382 | 1,398 | ||||||
|
| |||||||
Total U.S. Treasury Obligations | 85,303 | |||||||
|
| |||||||
| Description | Face Amount (Thousands) | Market Value ($ Thousands) | ||||||
U.S. GOVERNMENT AGENCY OBLIGATIONS — 4.3% |
| |||||||
FHLMC | ||||||||
1.375%, 05/01/2020 | $ | 16,120 | $ | 16,295 | ||||
FNMA | ||||||||
5.000%, 05/11/2017 | 13,860 | 14,234 | ||||||
|
| |||||||
Total U.S. Government Agency Obligations (Cost $30,295) ($ Thousands) |
| 30,529 | ||||||
|
| |||||||
| Shares | ||||||||
PREFERRED STOCK — 0.8% |
| |||||||
United States — 0.8% | ||||||||
Apartment Investment & Management ‡ | 51,000 | 1,433 | ||||||
Hersha Hospitality Trust ‡ | 49,075 | 1,276 | ||||||
Pebblebrook Hotel Trust ‡ | 54,050 | 1,400 | ||||||
Sabra Health Care ‡ | 43,875 | 1,162 | ||||||
|
| |||||||
Total Preferred Stock (Cost $4,950) ($ Thousands) | 5,271 | |||||||
|
| |||||||
EXCHANGE TRADED FUND — 0.4% |
| |||||||
United States — 0.4% | ||||||||
iShares MSCI Emerging Markets ETF | 73,650 | 2,758 | ||||||
|
| |||||||
Total Exchange Traded Fund (Cost $2,513) ($ Thousands) | 2,758 | |||||||
|
| |||||||
Total Investments — 17.5% | $ | 123,861 | ||||||
|
| |||||||
| Contracts | ||||||||
PURCHASED OPTIONS(B) — 0.0% |
| |||||||
iShares MSCI Emerging Markets ETF, Expires 10/22/2016, | ||||||||
Strike Price $38.50* | 762 | $ | 21 | |||||
November 2016, MXN Call, USD Put, Expires 11/19/2016, | ||||||||
Strike Price $19.13* | 3,200,000 | 44 | ||||||
|
| |||||||
Total Purchased Options (Cost $53) ($ Thousands) | 65 | |||||||
|
| |||||||
WRITTEN OPTIONS(B) — 0.0% |
| |||||||
December 2016, CNH Put, USD Call, Expires 12/17/2016 | ||||||||
Strike Price $6.92* | (6,870,000 | ) | (11 | ) | ||||
December 2016, CNH Put, USD Call, Expires 12/17/2016 | ||||||||
Strike Price $6.92* | (6,930,000 | ) | (11 | ) | ||||
December 2016, EUR Call, TRY Put, Expires 12/17/2016 | ||||||||
Strike Price $0.27* | (17,131,000 | ) | (16 | ) | ||||
| SEI Institutional Management Trust / Annual Report / September 30, 2016 | 267 |
SCHEDULE OF INVESTMENTS
September 30, 2016
Multi-Asset Capital Stability Fund (Continued)
| Description | Contracts | Market Value ($ Thousands) | ||||||
WRITTEN OPTIONS(B) (continued) | ||||||||
December 2016, TRY Put, EUR Call, Expires 12/17/2016 | ||||||||
Strike Price $3.70* | (2,500,000 | ) | $ | (9 | ) | |||
iShares MSCI Emerging Markets ETF, Expires 10/22/2016 | ||||||||
Strike Price $35.50* | (762 | ) | (14 | ) | ||||
November 2016, MXN Put, USD Call, Expires 11/19/2016 | ||||||||
Strike Price $21.05* | (3,200,000 | ) | (10 | ) | ||||
|
| |||||||
Total Written Options
| ||||||||
(Premiums Received ($272)) ($ Thousands) | $ | (71 | ) | |||||
|
| |||||||
A list of the open futures contracts held by the Fund at September 30, 2016, is as follows:
| Type of Contract | Number of Contracts Long | Expiration Date | Unrealized Appreciation (Depreciation) ($ Thousands) | |||||||||
| Canadian 10-Year Bond | 169 | Dec-2016 | $10 | |||||||||
| H-shares Index | 22 | Oct-2016 | (13) | |||||||||
| Long Gilt 10-Year Bond | 102 | Dec-2016 | (125) | |||||||||
| MSCI EAFE Index E-MINI | 449 | Dec-2016 | 281 | |||||||||
| S&P 500 Index E-MINI | 431 | Dec-2016 | (298) | |||||||||
| S&P TSX 60 Index | 32 | Dec-2016 | 5 | |||||||||
| U.S. 10-Year Treasury Note | 301 | Dec-2016 | (23) | |||||||||
| U.S. 2-Year Treasury Note | 193 | Dec-2016 | 30 | |||||||||
| U.S. 5-Year Treasury Note | 239 | Dec-2016 | 1 | |||||||||
| U.S. Ultra Long Treasury Bond | 28 | Dec-2016 | (38) | |||||||||
|
| |||||||||||
| $(170) | ||||||||||||
|
| |||||||||||
For the year ended September 30, 2016, the total amount of all open futures contracts, as presented in the table above, are representative of the volume of activity for the derivative type during the year.
A list of the open forward foreign currency contracts held by the Fund at September 30, 2016, is as follows:
Settlement Date | Currency to Deliver (Thousands) | Currency To Receive (Thousands) | Unrealized Appreciation (Depreciation) ($ Thousands) | |||||||||||||||||
| 11/03/16-12/15/16 | USD | 4,113 | BRL | 13,856 | $75 | |||||||||||||||
| 12/02/16 | USD | 347 | BRL | 1,136 | (4) | |||||||||||||||
| 11/09/16-01/17/17 | USD | 1,617 | MXN | 31,952 | 21 | |||||||||||||||
| 11/16/16-12/15/16 | USD | 4,718 | MXN | 87,998 | (208) | |||||||||||||||
| 11/16/16-12/15/16 | MXN | 59,608 | USD | 3,151 | 91 | |||||||||||||||
| 11/09/16 | MXN | 32,156 | USD | 1,614 | (40) | |||||||||||||||
| 11/16/16 | USD | 1,584 | COP | 4,746,210 | 50 | |||||||||||||||
| 11/16/16 | USD | 1,763 | CZK | 42,357 | 3 | |||||||||||||||
| 11/16/16-12/15/16 | TRY | 3,387 | USD | 1,124 | 9 | |||||||||||||||
| 11/16/16 | USD | 1,750 | MYR | 7,241 | 2 | |||||||||||||||
| 11/16/16 | USD | 1,760 | MYR | 7,275 | — | |||||||||||||||
| 11/16/16-05/10/21 | GBP | 2,818 | USD | 3,746 | 81 | |||||||||||||||
| 12/15/16 | GBP | 817 | USD | 1,061 | (2) | |||||||||||||||
| 11/16/16-12/15/16 | USD | 3,354 | AUD | 4,422 | 26 | |||||||||||||||
| 12/15/16 | USD | 352 | AUD | 460 | (1) | |||||||||||||||
Settlement Date | Currency to Deliver (Thousands) | Currency To Receive (Thousands) | Unrealized Appreciation (Depreciation) ($ Thousands) | |||||||||||||||||
| 11/16/16-12/15/16 | USD | 2,434 | INR | 164,556 | $18 | |||||||||||||||
| 12/15/16 | USD | 3,733 | INR | 251,092 | (4) | |||||||||||||||
| 11/16/16-01/17/17 | USD | 4,460 | KRW | 4,961,518 | 44 | |||||||||||||||
| 12/15/16-12/15/16 | USD | 1,814 | KRW | 1,981,642 | (15) | |||||||||||||||
| 12/15/16-12/15/16 | USD | 4,350 | NZD | 6,097 | 69 | |||||||||||||||
| 11/16/16-01/17/17 | USD | 1,962 | NZD | 2,685 | (16) | |||||||||||||||
| 11/16/16-01/17/17 | AUD | 7,199 | USD | 5,450 | (49) | |||||||||||||||
| 11/16/16-01/17/17 | USD | 4,795 | TWD | 149,688 | 20 | |||||||||||||||
| 12/15/16 | USD | 2,832 | TWD | 87,791 | (9) | |||||||||||||||
| 11/16/16-01/17/17 | NZD | 7,519 | USD | 5,472 | 22 | |||||||||||||||
| 12/15/16 | NZD | 1,215 | USD | 879 | (1) | |||||||||||||||
| 11/16/16-11/16/16 | USD | 2,814 | JPY | 286,150 | 18 | |||||||||||||||
| 12/15/16-01/17/17 | USD | 6,302 | JPY | 630,985 | (47) | |||||||||||||||
| 12/15/16-12/15/16 | CAD | 7,885 | USD | 6,082 | 78 | |||||||||||||||
| 11/16/16-12/15/16 | CAD | 4,957 | USD | 3,761 | (12) | |||||||||||||||
| 11/16/16-12/15/16 | RUB | 62,076 | USD | 938 | (31) | |||||||||||||||
| 11/16/16-12/15/16 | TWD | 100,248 | USD | 3,166 | (55) | |||||||||||||||
| 12/15/16 | INR | 1,943 | USD | 29 | — | |||||||||||||||
| 11/16/16 | INR | 117,381 | USD | 1,751 | — | |||||||||||||||
| 11/16/16-01/17/17 | JPY | 392,386 | USD | 3,919 | 32 | |||||||||||||||
| 12/15/16-12/15/16 | JPY | 524,749 | USD | 5,126 | (75) | |||||||||||||||
| 11/16/16-01/17/17 | KRW | 2,207,977 | USD | 2,005 | 1 | |||||||||||||||
| 12/15/16-12/15/16 | KRW | 4,735,183 | USD | 4,231 | (68) | |||||||||||||||
| 12/02/16 | BRL | 4,033 | USD | 1,228 | 10 | |||||||||||||||
| 12/15/16 | BRL | 1,175 | USD | 350 | (4) | |||||||||||||||
| 12/07/16 | TRY | 1,821 | EUR | 535 | 5 | |||||||||||||||
| 12/09/16 | TRY | 1,200 | EUR | 340 | (11) | |||||||||||||||
| 12/15/16 | USD | 1,011 | ZAR | 14,333 | 16 | |||||||||||||||
| 12/15/16 | USD | 2,084 | CLP | 1,418,448 | 56 | |||||||||||||||
| 12/15/16 | USD | 2,126 | TRY | 6,372 | (35) | |||||||||||||||
| 12/15/16-12/15/16 | USD | 3,006 | RUB | 197,142 | 62 | |||||||||||||||
| 12/15/16-12/15/16 | USD | 3,169 | PEN | 10,734 | (42) | |||||||||||||||
| 12/15/16 | USD | 3,557 | EUR | 3,129 | (28) | |||||||||||||||
| 12/15/16 | PEN | 3,631 | USD | 1,059 | 1 | |||||||||||||||
| 12/15/16 | PLN | 4,091 | USD | 1,056 | (12) | |||||||||||||||
| 12/15/16 | USD | 4,117 | HUF | 1,125,298 | (21) | |||||||||||||||
| 12/15/16 | USD | 4,365 | PLN | 16,666 | (15) | |||||||||||||||
| 12/15/16 | USD | 5,046 | NOK | 41,148 | 105 | |||||||||||||||
| 12/15/16 | USD | 1,887 | GBP | 1,463 | 16 | |||||||||||||||
| 12/15/16-12/15/16 | USD | 3,509 | GBP | 2,682 | (20) | |||||||||||||||
| 01/17/17 | CHF | 4,126 | EUR | 3,801 | 7 | |||||||||||||||
| 12/15/16 | CHF | 1,691 | EUR | 1,549 | (7) | |||||||||||||||
| 12/15/16-01/17/17 | EUR | 5,983 | CHF | 6,523 | 17 | |||||||||||||||
| 12/15/16 | USD | 7,693 | SEK | 64,239 | (163) | |||||||||||||||
| 12/15/16 | USD | 1,045 | CAD | 1,377 | 3 | |||||||||||||||
| 12/15/16-01/17/17 | USD | 8,627 | CAD | 11,202 | (96) | |||||||||||||||
| 12/15/16 | CHF | 10,099 | USD | 10,496 | 26 | |||||||||||||||
| 12/15/16-01/17/17 | USD | 7,421 | CHF | 7,173 | 28 | |||||||||||||||
| 12/15/16-12/15/16 | USD | 2,829 | CHF | 2,697 | (32) | |||||||||||||||
| 12/15/16 | NOK | 12,191 | USD | 1,480 | (47) | |||||||||||||||
| 12/15/16 | EUR | 9,386 | USD | 10,615 | 30 | |||||||||||||||
| 12/15/16 | EUR | 3,160 | USD | 3,541 | (23) | |||||||||||||||
| 268 | SEI Institutional Management Trust / Annual Report / September 30, 2016 |
Settlement Date | Currency to Deliver (Thousands) | Currency To Receive (Thousands) | Unrealized Appreciation (Depreciation) ($ Thousands) | |||||||||||||||||
| 12/15/16-01/17/17 | USD | 17,555 | CNH | 117,909 | $24 | |||||||||||||||
| 12/15/16 | SEK | 19,035 | USD | 2,263 | 31 | |||||||||||||||
| 01/17/17 | SEK | 15,047 | USD | 1,759 | (8) | |||||||||||||||
| 12/15/16-01/17/17 | ZAR | 38,502 | USD | 2,758 | 10 | |||||||||||||||
| 12/15/16-01/17/17 | CNH | 179,161 | USD | 26,656 | (59) | |||||||||||||||
| 12/15/16 | HUF | 292,568 | USD | 1,054 | (11) | |||||||||||||||
| 12/15/16 | CLP | 1,418,448 | USD | 2,088 | (51) | |||||||||||||||
| 01/17/17-01/17/17 | EUR | 1,740 | NOK | 15,829 | 16 | |||||||||||||||
| 01/17/17 | MYR | 7,314 | USD | 1,763 | (4) | |||||||||||||||
| 01/17/17 | COP | 2,706,406 | USD | 905 | (18) | |||||||||||||||
| 03/16/17 | EUR | 3,151 | CZK | 84,626 | (6) | |||||||||||||||
|
| |||||||||||||||||||
| $(227) | ||||||||||||||||||||
|
| |||||||||||||||||||
A list of the counterparties for the outstanding forward foreign currency contracts held by the Fund at September 30, 2016, is as follows:
| Counterparty | Currency to Deliver ($ Thousands) | Currency to Receive ($ Thousands) | Unrealized Appreciation (Depreciation) ($ Thousands) | |||||||||
| Bank of America | $(3,786) | $3,806 | $20 | |||||||||
| Barclays PLC | (11,919) | 11,765 | (154) | |||||||||
| BNP Paribas | (13,600) | 13,593 | (7) | |||||||||
| Brown Brothers Harriman | (48,105) | 48,023 | (82) | |||||||||
| Citigroup | (100,988) | 101,042 | 54 | |||||||||
| Deutsche Bank | (6,433) | 6,386 | (47) | |||||||||
| Goldman Sachs | (5,813) | 5,864 | 51 | |||||||||
| HSBC | (2,699) | 2,703 | 4 | |||||||||
| JPMorgan Chase Bank | (23,722) | 23,599 | (123) | |||||||||
| Montgomery/Bank of America | (2,466) | 2,467 | 1 | |||||||||
| Morgan Stanley | (16,266) | 16,277 | 11 | |||||||||
| Nomura Securities International | (11,818) | 11,801 | (17) | |||||||||
| Royal Bank of Scotland | (17,118) | 17,146 | 28 | |||||||||
| Standard Chartered | (13,216) | 13,250 | 34 | |||||||||
|
| |||||||||||
| $(227) | ||||||||||||
|
| |||||||||||
For the year ended September 30, 2016 the total amount of all open forward foreign currency contracts, as presented in the tables above, are representative of the volume of activity for the derivative type during the year.
A list of the open centrally cleared swap agreements held by the Fund at September 30, 2016 is as follows:
| Credit Default Swaps | ||||||||||||||||
| Counterparty | Reference Entity/Obligation | Buy/Sell Protection | (Pays)/Receives Rate | Termination Date | Notional Amount ($Thousands) | Net Unrealized Appreciation (Depreciation) ($Thousands) | ||||||||||
| Morgan Stanley | CDX.HY.IG, SERIES 26, VERSION 1 | SELL | 5.00 | 06/20/21 | $(1,400) | $(8) | ||||||||||
| Morgan Stanley | CDX.HY.IG, SERIES 26, VERSION 1 | SELL | 5.00 | 06/20/21 | (3,300) | 9 | ||||||||||
| Morgan Stanley | CDX.NA.IG, SERIES 26, VERSION 1 | SELL | 1.00 | 06/20/21 | (140) | — | ||||||||||
| Morgan Stanley | CDX.NA.IG, SERIES 26, VERSION 1 | SELL | 1.00 | 06/20/21 | (690) | 2 | ||||||||||
| Morgan Stanley | CDX.NA.IG, SERIES 26, VERSION 1 | SELL | 1.00 | 06/20/21 | (1,310) | 1 | ||||||||||
| Morgan Stanley | CDX.NA.IG, SERIES 26, VERSION 1 | SELL | 1.00 | 06/20/21 | (900) | — | ||||||||||
| Morgan Stanley | CDX.NA.IG, SERIES 26, VERSION 1 | SELL | 1.00 | 06/20/21 | (550) | — | ||||||||||
| Morgan Stanley | CDX.NA.IG, SERIES 26, VERSION 1 | SELL | 1.00 | 06/20/21 | (1,370) | — | ||||||||||
| Morgan Stanley | CDX.NA.IG, SERIES 26, VERSION 1 | SELL | 1.00 | 06/20/21 | (1,130) | (1) | ||||||||||
| Morgan Stanley | CDX.NA.IG, SERIES 26, VERSION 1 | SELL | 1.00 | 06/20/21 | (1,320) | (1) | ||||||||||
| Morgan Stanley | CDX.NA.IG, SERIES 27, VERSION 1 | SELL | 1.00 | 12/20/21 | (2,480) | 2 | ||||||||||
| Morgan Stanley | ITRAXX.XO.VER.SERIES 25, VERSION 1 | SELL | 5.00 | 06/20/21 | (40) | — | ||||||||||
| Morgan Stanley | ITRAXX.XO.VER.SERIES 25, VERSION 1 | SELL | 5.00 | 06/20/21 | (620) | (11) | ||||||||||
| Morgan Stanley | ITRAXX.XO.VER.SERIES 26, VERSION 1 | SELL | 5.00 | 12/20/21 | (1,450) | — | ||||||||||
|
| |||||||||||||||
| $(7) | ||||||||||||||||
|
| |||||||||||||||
| ||||||||||||||||
| Interest Rate Swaps | ||||||||||||||||
| Counterparty | Fund Pays | Fund Receives | Termination Date | Currency | Notional Amount (Thousands) | Net Unrealized Appreciation (Depreciation) ($ Thousands) | ||||||||||
| Morgan Stanley | 6-Month AUD - BBSW | 2.15% | 09/30/2026 | AUD | 5,830 | $ | 20 | |||||||||
| Morgan Stanley | 6-Month AUD - BBSW | 2.15% | 09/27/2026 | AUD | 1,230 | 4 | ||||||||||
| Morgan Stanley | 6-Month AUD - BBSW | 2.11% | 09/09/2026 | AUD | 1,390 | 2 | ||||||||||
| Morgan Stanley | 6-Month AUD - BBSW | 2.08% | 07/12/2026 | AUD | 2,960 | (4) | ||||||||||
| Morgan Stanley | 6-Month AUD - BBSW | 2.18% | 07/04/2026 | AUD | 1,390 | 9 | ||||||||||
| Morgan Stanley | 6-Month AUD - BBSW | 2.34% | 06/09/2026 | AUD | 2,080 | 38 | ||||||||||
| Morgan Stanley | 6-Month AUD - BBSW | 2.40% | 05/30/2026 | AUD | 3,180 | 70 | ||||||||||
| Morgan Stanley | 6-Month AUD - BBSW | 2.42% | 05/24/2026 | AUD | 5,110 | 122 | ||||||||||
|
| |||||||||||||||
| $ | 261 | |||||||||||||||
|
| |||||||||||||||
For the year ended September 30, 2016, the total amount of open swap agreements, as presented in the tables above, are representative of the volume of activity for this derivative type during the year.
| SEI Institutional Management Trust / Annual Report / September 30, 2016 | 269 |
SCHEDULE OF INVESTMENTS
September 30, 2016
Multi-Asset Capital Stability Fund (Concluded)
| Percentages are based on Net Assets of $709,681 ($ Thousands). |
| * | Non-income producing security. |
| ‡ | Real Estate Investment Trust. |
| (A) | Security, or portion thereof, has been pledged as collateral on open options contracts. |
| (B) | For the year ended September 30, 2016, the total amount of open purchased options and written options, as presented in the Schedule of Investments, are representative of the volume of activity for these derivative types during the period. |
AUD — Australian Dollar
BBSW — Bank Bill Swap Reference Rate
BRL — Brazilian Real
CAD — Canadian Dollar
CHF — Swiss Franc
CLP — Chilean Peso
CNH — Chinese Offshore Yuan
COP — Colombian Peso
CZK — Czech Koruna
EAFE — Europe, Australasia and Far East
ETF — Exchange Traded Fund
EUR — Euro
FHLMC — Federal Home Loan Mortgage Corporation
FNMA — Federal National Mortgage Association
GBP — British Pound Sterling
HUF — Hungarian Forint
INR — Indian Rupee
JPY — Japanese Yen
KRW — Korean Won
MSCI —Morgan Stanley Capital International
MXN — Mexican Peso
MYR — Malaysian Ringgit
NOK — Norwegian Krone
NZD — New Zealand Dollar
PEN — Peruvian Nuevo Sol
PLN — Polish Zloty
RUB — Russian Ruble
S&P— Standard & Poor’s
SEK — Swedish Krona
TRY — Turkish Lira
TSX — Toronto Stock Exchange
TWD — Taiwan Dollar
USD — United States Dollar
ZAR — South African Rand
The following is a list of the level of inputs used as of September 30, 2016, in valuing the Fund’s investments and other financial instruments carried at value ($ Thousands):
| Investments in Securities | Level 1 | Level 2 | Level 3 | Total | ||||||||||||
U.S. Treasury Obligations | $ | – | $ | 85,303 | $ | – | $ | 85,303 | ||||||||
U.S. Government Agency Obligations | – | 30,529 | – | 30,529 | ||||||||||||
Preferred Stock | – | 5,271 | – | 5,271 | ||||||||||||
Exchange Traded Fund | 2,758 | – | – | 2,758 | ||||||||||||
|
|
|
|
|
|
|
| |||||||||
Total Investments in Securities | $ | 2,758 | $ | 121,103 | $ | – | $ | 123,861 | ||||||||
|
|
|
|
|
|
|
| |||||||||
| Other Financial Instruments | Level 1 | Level 2 | Level 3 | Total | ||||||||||||
Purchased Options | $ | 65 | $ | — | $ | — | $ | 65 | ||||||||
Written Options | (71) | — | — | (71) | ||||||||||||
Futures Contracts * | ||||||||||||||||
Unrealized Appreciation | 327 | — | — | 327 | ||||||||||||
Unrealized Depreciation | (497) | — | — | (497) | ||||||||||||
Forwards Contracts * | ||||||||||||||||
Unrealized Appreciation | — | 1,123 | — | 1,123 | ||||||||||||
Unrealized Depreciation | — | (1,350) | — | (1,350) | ||||||||||||
Centrally Cleared Swaps | ||||||||||||||||
Credit Default Swaps * | ||||||||||||||||
Unrealized Appreciation | — | 14 | — | 14 | ||||||||||||
Unrealized Depreciation | — | (21) | — | (21) | ||||||||||||
Interest Rate Swaps * | ||||||||||||||||
Unrealized Appreciation | — | 265 | — | 265 | ||||||||||||
Unrealized Depreciation | — | (4) | — | (4) | ||||||||||||
|
|
|
|
|
|
|
| |||||||||
Total Other Financial Instruments | $ | (176) | $ | 27 | $ | — | $ | (149) | ||||||||
|
|
|
|
|
|
|
| |||||||||
* Futures contracts, forward contracts and swap contracts are valued at the unrealized appreciation (depreciation) on the instrument.
For the year ended September 30, 2016, there were no transfers between Level 1 and Level 2 assets and liabilities.
For the year ended September 30, 2016, there were no transfers between Level 2 and Level 3 assets and liabilities.
For more information on valuation inputs, see Note 2 – Significant Accounting Policies in Notes to Financial Statements.
Amounts designated as “—” are $0 or have been rounded to $0.
The accompanying notes are an integral part of the financial statements.
| 270 | SEI Institutional Management Trust / Annual Report / September 30, 2016 |
SCHEDULE OF INVESTMENTS
September 30, 2016
Long/Short Alternative Fund
Sector Weightings (Unaudited)†:
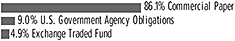
†Percentages are based on total investments.
| Description | Face Amount (Thousands) | Market Value ($ Thousands) | ||||||
COMMERCIAL PAPER (A) — 83.8% |
| |||||||
Banks — 28.6% |
| |||||||
Australia & New Zealand Banking Group |
| |||||||
0.450%, 10/24/2016 (B) | $ | 1,500 | $ | 1,499 | ||||
Bank of Nova Scotia | ||||||||
0.550%, 11/02/2016 (B) | 1,500 | 1,499 | ||||||
DNB Bank | ||||||||
0.651%, 11/14/2016 (B) | 605 | 605 | ||||||
0.480%, 10/03/2016 (B) | 1,000 | 1,000 | ||||||
Nordea Bank | ||||||||
0.561%, 11/23/2016 (B) | 1,454 | 1,453 | ||||||
Skandinaviska Enskilda Banken | ||||||||
0.601%, 10/26/2016 (B) | 1,414 | 1,413 | ||||||
Svenska Handelsbanken | ||||||||
33.428%, 10/13/2016 (B) | 1,274 | 1,274 | ||||||
0.500%, 10/18/2016 (B) | 470 | 470 | ||||||
Toronto-Dominion Holdings USA | ||||||||
0.630%, 10/06/2016 (B) | 1,250 | 1,250 | ||||||
Westpac Banking | ||||||||
0.852%, 12/13/2016 (B) | 1,500 | 1,498 | ||||||
|
| |||||||
| 11,961 | ||||||||
|
| |||||||
Financial — 3.6% | ||||||||
Novartis Finance | ||||||||
0.450%, 11/08/2016 (B) | 1,500 | 1,499 | ||||||
|
| |||||||
Industrial & Other Commercial Paper — 51.6% |
| |||||||
American Honda Finance | ||||||||
0.601%, 11/07/2016 | 1,608 | 1,607 | ||||||
BASF | ||||||||
0.500%, 10/12/2016 (B) | 834 | 834 | ||||||
BMW US Capital | ||||||||
0.430%, 10/20/2016 (B) | 557 | 557 | ||||||
Exxon Mobil | ||||||||
0.400%, 10/19/2016 | 1,500 | 1,500 | ||||||
Illinois Tool Works | ||||||||
0.380%, 10/05/2016 (B) | 1,821 | 1,821 | ||||||
Microsoft | ||||||||
0.400%, 10/25/2016 (B) | 1,500 | 1,499 | ||||||
Nestle Finance International | ||||||||
0.591%, 12/05/2012 | 1,500 | 1,499 | ||||||
PepsiCo | ||||||||
0.370%, 10/07/2016 (B) | 1,500 | 1,500 | ||||||
Pfizer | ||||||||
0.480%, 10/03/2016 (B) | 1,615 | 1,615 | ||||||
Roche Holdings | ||||||||
0.430%, 10/04/2016 (B) | 1,544 | 1,544 | ||||||
| Description | Face Amount (Thousands) | Market Value ($ Thousands) | ||||||
COMMERCIAL PAPER (continued) |
| |||||||
Sanofi | ||||||||
0.430%, 10/14/2016 (B) | $ | 1,632 | $ | 1,632 | ||||
Toyota Motor Credit | ||||||||
0.611%, 10/31/2016 | 1,829 | 1,828 | ||||||
Unilever Capital | ||||||||
0.420%, 10/11/2016 (B) | 1,494 | 1,494 | ||||||
United Parcel Service | ||||||||
0.400%, 10/04/2016 (B) | 1,000 | 1,000 | ||||||
Wal-Mart Stores | ||||||||
0.400%, 10/12/2016 (B) | 1,125 | 1,125 | ||||||
0.310%, 10/11/2016 (B) | 504 | 504 | ||||||
|
| |||||||
| 21,559 | ||||||||
|
| |||||||
Total Commercial Paper | 35,019 | |||||||
|
| |||||||
U.S. GOVERNMENT AGENCY OBLIGATIONS (A) — 8.8% |
| |||||||
FHLB | ||||||||
0.260%, 11/18/2016 | 1,666 | 1,665 | ||||||
FHLMC | ||||||||
0.160%, 10/06/2016 | 2,000 | 2,000 | ||||||
|
| |||||||
Total U.S. Government Agency Obligations |
| 3,665 | ||||||
|
| |||||||
| Shares | ||||||||
EXCHANGE TRADED FUND — 4.7% |
| |||||||
iShares iBoxx USD High Yield Corporate Bond ETF | 22,609 | 1,973 | ||||||
|
| |||||||
Total Exchange Traded Fund | 1,973 | |||||||
|
| |||||||
Total Investments — 97.3% | $ | 40,657 | ||||||
|
| |||||||
| SEI Institutional Managed Trust / Annual Report / September 30, 2016 | 271 |
SCHEDULE OF INVESTMENTS
September 30, 2016
Long/Short Alternative Fund (Concluded)
A list of the open futures contracts held by the Fund at September 30, 2016, is as follows:
| Type of Contract | Number of Contracts Long (Short) | Expiration Date | Unrealized Appreciation (Depreciation) ($ Thousands) | |||||||
MSCI EAFE Index E-MINI | 95 | Dec-2016 | $(95) | |||||||
MSCI Emerging Markets E-MINI | (153) | Dec-2016 | 112 | |||||||
NASDAQ 100 Index E-MINI | 76 | Dec-2016 | 68 | |||||||
S&P Mid Cap 400 Index E-MINI | 57 | Dec-2016 | (163) | |||||||
U.S. Dollar Index | (43) | Dec-2016 | 8 | |||||||
U.S. Long Treasury Bond | 7 | Dec-2016 | (6) | |||||||
|
| |||||||||
| $(76) | ||||||||||
|
| |||||||||
For the year ended September 30, 2016, the total amount of all open futures contracts, as presented in the table above, are representative of the volume of activity for this derivative type during the year.
| Percentages are based on Net Assets of $41,794 ($ Thousands). |
| (A) | The rate reported is the effective yield at the time of purchase. |
| (B) | The rate reported is the effective yield at time of purchase. |
| (C) | Security exempt from registration under Rule 144A of the Securities Act of 1933. These securities may be resold in transactions exempt from registration normally to qualified institutions. On September 30, 2016, the value of these securities amounted to $28,585 ($ Thousands), representing 68.4% of the Net Assets of the Fund. |
EAFE — Europe, Australasia and Far East
ETF — Exchange Traded Fund
FHLB — Federal Home Loan Bank
FHLMC — Federal Home Loan Mortgage Corporation
MSCI — Morgan Stanley Capital International
NASDAQ — National Association of Securities Dealers and Automated Quotations
S&P — Standard & Poor’s
USD — U.S. Dollar
The following is a list of the level of inputs used as of September 30, 2016, in valuing the Fund’s investments and other financial instruments carried at value ($ Thousands):
Investments in Securities
| Level 1
| Level 2
| Level 3
| Total
| ||||||||||||
Commercial Paper | $ | – | $ | 35,019 | $ | – | $ | 35,019 | ||||||||
U.S. Government Agency Obligations | – | 3,665 | – | 3,665 | ||||||||||||
Exchange Traded Fund | 1,973 | – | – | 1,973 | ||||||||||||
|
|
|
|
|
|
|
| |||||||||
Total Investments in Securities | $ | 1,973 | $ | 38,684 | $ | – | $ | 40,657 | ||||||||
|
|
|
|
|
|
|
| |||||||||
| Other Financial Instruments | Level 1 | Level 2 | Level 3 | Total | ||||||||||||
Futures Contracts * | ||||||||||||||||
Unrealized Appreciation | $ | 188 | $ | — | $ | — | $ | 188 | ||||||||
Unrealized Depreciation | (264) | — | — | (264) | ||||||||||||
|
|
|
|
|
|
|
| |||||||||
Total Other Financial Instruments | $ | (76) | $ | — | $ | — | $ | (76) | ||||||||
|
|
|
|
|
|
|
| |||||||||
* Futures contracts are valued at the unrealized appreciation (depreciation) on the instrument.
For the year ended September 30, 2016, there were no transfers between Level 1 and Level 2 assets and liabilities.
For the year ended September 30, 2016, there were no transfers between Level 2 and Level 3 assets and liabilities.
For more information on valuation inputs, see Note 2 – Significant Accounting Policies in Notes to Financial Statements.
Amounts designated as “—” are $0 or have been rounded to $0.
The accompanying notes are an integral part of the financial statements.
| 272 | SEI Institutional Managed Trust / Annual Report / September 30, 2016 |
(This page intentionally left blank)
STATEMENTS OF ASSETS AND LIABILITIES ($ Thousands)
September 30, 2016
Large Cap Fund | Large Cap Value Fund | |||||||
Assets: | ||||||||
Investments, at value † | $ | 2,257,963* | $ | 1,281,948* | ||||
Affiliated investments, at value †† | 410,666 | 96,911 | ||||||
Cash and cash equivalents | 21 | – | ||||||
Foreign currency, at value ††† | – | – | ||||||
Receivable for fund shares sold | 1,112 | 228 | ||||||
Receivable for investment securities sold | 5,750 | 1,438 | ||||||
Dividends and Interest receivable | 1,827 | 1,860 | ||||||
Receivable for variation margin | 100 | – | ||||||
Foreign tax reclaim receivable | 1 | 1 | ||||||
Receivable from investment adviser | – | – | ||||||
Other receivables | – | 1 | ||||||
Prepaid expenses | 41 | 26 | ||||||
Total Assets | 2,677,481 | 1,382,413 | ||||||
Liabilities: | ||||||||
Payable upon return on securities loaned | 261,551 | 49,707 | ||||||
Payable for investment securities purchased | 9,494 | 2,090 | ||||||
Payable for fund shares redeemed | 2,473 | 1,460 | ||||||
Administration fees payable | 588 | 327 | ||||||
Shareholder servicing fees payable Class A | 456 | 266 | ||||||
Shareholder servicing fees payable Class E | – | – | ||||||
Shareholder servicing fees payable Class I | – | – | ||||||
Payable to custodian | – | 1 | ||||||
Payable for variation margin | – | – | ||||||
Investment advisory fees payable | 542 | 300 | ||||||
Chief Compliance Officer fees payable | 3 | 1 | ||||||
Trustees fees payable | 1 | – | ||||||
Administration servicing fees payable Class I | – | 1 | ||||||
Accrued expense payable | 99 | 62 | ||||||
Total Liabilities | 275,207 | 54,215 | ||||||
Net Assets | $ | 2,402,274 | $ | 1,328,198 | ||||
† Cost of investments and repurchase agreements | $ | 1,864,769 | $ | 1,110,102 | ||||
†† Cost of affiliated investments | 410,666 | 96,911 | ||||||
††† Cost of foreign currency | – | – | ||||||
* Includes market value of securities on loan | 258,188 | 49,352 | ||||||
Amounts designated as “—” are $0 or have been rounded to $0.
The accompanying notes are an integral part of the financial statements.
| 274 | SEI Institutional Managed Trust / Annual Report / September 30, 2016 |
| Large Cap Growth Fund | Tax-Managed Large Cap Fund | S&P 500 Index Fund | Small Cap Fund | Small Cap Value Fund | Small Cap Growth Fund | Tax-Managed Small/ Mid Cap Fund | Mid-Cap Fund | |||||||||||||||||||||
| $ | 1,388,018* | $ | 3,400,461* | $ | 645,314* | $ | 553,846* | $ | 355,083* | $ | 309,235* | $ | 657,146* | $ 86,804* | ||||||||||||||
| 66,670 | 334,299 | 18,313 | 88,127 | 121,713 | 43,562 | 214,397 | 7,903 | |||||||||||||||||||||
| – | 28 | – | 3 | 20 | – | 24 | 25 | |||||||||||||||||||||
| – | 129 | – | – | – | – | – | – | |||||||||||||||||||||
| 120 | 2,460 | 10,264 | 322 | 82 | 80 | 500 | 47 | |||||||||||||||||||||
| 11,323 | 1,764 | 39 | 4,850 | 3,147 | 657 | 292 | – | |||||||||||||||||||||
| 192 | 2,976 | 731 | 514 | 570 | 107 | 625 | 158 | |||||||||||||||||||||
| – | 1,949 | 95 | 109 | 23 | – | 57 | – | |||||||||||||||||||||
| – | – | – | – | – | – | – | 1 | |||||||||||||||||||||
| – | – | – | – | 1 | – | – | – | |||||||||||||||||||||
| 1 | – | – | – | – | – | – | – | |||||||||||||||||||||
| 25 | 60 | 11 | 10 | 7 | 5 | 11 | 2 | |||||||||||||||||||||
| 1,466,349 | 3,744,126 | 674,767 | 647,781 | 480,646 | 353,646 | 873,052 | 94,940 | |||||||||||||||||||||
| 4,044 | 111,917 | 3,172 | 52,352 | 104,013 | 31,161 | 180,708 | 5,714 | |||||||||||||||||||||
| 12,679 | – | – | 5,918 | 3,477 | 132 | 719 | – | |||||||||||||||||||||
| 1,667 | 2,492 | 402 | 580 | 359 | 330 | 559 | 22 | |||||||||||||||||||||
| 295 | 887 | 119 | 144 | 91 | 79 | 169 | 22 | |||||||||||||||||||||
| 290 | 699 | 48 | 113 | 74 | 64 | 115 | 18 | |||||||||||||||||||||
| – | – | 10 | – | – | – | – | – | |||||||||||||||||||||
| – | – | 1 | – | – | – | – | – | |||||||||||||||||||||
| – | – | 2 | – | – | – | – | – | |||||||||||||||||||||
| – | 1,843 | – | – | – | – | – | – | |||||||||||||||||||||
| 384 | 812 | 16 | 227 | 147 | 129 | 284 | 29 | |||||||||||||||||||||
| 2 | 4 | 1 | 1 | – | – | 1 | – | |||||||||||||||||||||
| – | 1 | – | – | – | – | – | – | |||||||||||||||||||||
| 1 | – | 2 | – | 1 | – | – | – | |||||||||||||||||||||
| 67 | 125 | 22 | 31 | 19 | 15 | 24 | 5 | |||||||||||||||||||||
| 19,429 | 118,780 | 3,795 | 59,366 | 108,181 | 31,910 | 182,579 | 5,810 | |||||||||||||||||||||
| $ | 1,446,920 | $ | 3,625,346 | $ | 670,972 | $ | 588,415 | $ | 372,465 | $ | 321,736 | $ | 690,473 | $ 89,130 | ||||||||||||||
| $ | 1,053,989 | $ | 2,152,815 | $ | 321,849 | $ | 499,148 | $ | 305,587 | $ | 293,595 | $ | 462,373 | $ 80,024 | ||||||||||||||
| 66,670 | 334,299 | 18,313 | 88,127 | 121,713 | 43,562 | 214,397 | 7,903 | |||||||||||||||||||||
| – | 129 | – | – | – | – | – | – | |||||||||||||||||||||
| 3,948 | 110,925 | 3,131 | 51,461 | 102,682 | 30,880 | 178,774 | 5,670 | |||||||||||||||||||||
| SEI Institutional Managed Trust / Annual Report / September 30, 2016 | 275 |
STATEMENTS OF ASSETS AND LIABILITIES ($ Thousands)
September 30, 2016
Large Cap Fund |
Large Cap Value Fund | |||||||
Net Assets: | ||||||||
Paid-in capital — (unlimited authorization — no par value) | $ | 2,088,555 | $ | 1,219,659 | ||||
Undistributed (distributions in excess of) net investment income | 5,051 | 9,711 | ||||||
Accumulated net realized gain (loss) on investments, option contracts, swaptions, futures contracts, securities sold short, swap contracts and foreign currency | (84,498 | ) | (73,018 | ) | ||||
Net unrealized appreciation on investments and securities sold short | 393,194 | 171,846 | ||||||
Net unrealized appreciation (depreciation) on futures contracts | (28 | ) | – | |||||
Net unrealized depreciation on forward foreign currency contracts, foreign currencies and translation of other assets and liabilities denominated in foreign currencies
| – | – | ||||||
Net Assets | $ | 2,402,274 | $ | 1,328,198 | ||||
Net Asset Value, Offering and Redemption Price Per Share — Class A | $
| 12.54 ($2,237,662,894 178,391,154 share | ÷ s) | $
| 21.20 ($1,300,028,797 61,310,604 share | ÷ s) | ||
Net Asset Value, Offering and Redemption Price Per Share — Class E | N/A | N/A | ||||||
Net Asset Value, Offering and Redemption Price Per Share — Class I |
| N/A
|
| $
| 21.21 ($ 6,164,527 290,634 share | ÷ s) | ||
Net Asset Value, Offering and Redemption Price Per Share — Class Y | $
| 12.55 ($164,611,458 13,115,536 share | ÷ s) | $
| 21.21 ($22,004,398 1,037,604 share | ÷ s) | ||
Amounts designated as “—” are $0 or have been rounded to $0.
N/A - Not applicable. Share class currently not offered.
The accompanying notes are an integral part of the financial statements.
| 276 | SEI Institutional Managed Trust / Annual Report / September 30, 2016 |
Large Cap Growth Fund | Tax-Managed Large Cap Fund | S&P 500 Index Fund | Small Cap Fund | Small Cap Value Fund | Small Cap Growth Fund | Tax-Managed Mid Cap Fund | Mid-Cap Fund | |||||||||||||||||||||||
| $ | 1,192,055 | $ | 2,539,463 | $ | 327,989 | $ | 548,305 | $ | 335,274 | $ | 336,749 | $ | 500,508 | $ | 82,663 | |||||||||||||||
| 1,233 | 6,797 | 2,548 | 416 | 1,105 | (901 | ) | 1,093 | 46 | ||||||||||||||||||||||
| (80,397 | ) | (168,583 | ) | 16,666 | (14,966 | ) | (13,407 | ) | (29,752 | ) | (5,902 | ) | (359 | ) | ||||||||||||||||
| 334,029 | 1,247,646 | 323,465 | 54,698 | 49,496 | 15,640 | 194,773 | 6,780 | |||||||||||||||||||||||
| – | 23 | 304 | (38 | ) | (3 | ) | – | 2 | – | |||||||||||||||||||||
|
– |
|
|
– |
| – |
|
– |
|
|
– |
|
|
– |
|
|
(1 |
) |
|
– |
| |||||||||
| $ | 1,446,920 | $ | 3,625,346 | $ | 670,972 | $ | 588,415 | $ | 372,465 | $ | 321,736 | $ | 690,473 | $ | 89,130 | |||||||||||||||
| $
| 29.74 ($1,421,655,602 47,794,785 share | ÷ s) | $
| 20.74 ($3,427,251,372 165,282,645 share | ÷ s) | $
| 53.32 ($386,476,820 7,248,117 share | ÷ s) | $
| 11.61 ($550,555,788 47,412,455 share | ÷ s) | $
| 22.75 ($362,348,337 15,928,742 share | ÷ s) | $
| 28.86 ($312,240,401 10,819,772 share | ÷ s) | $
| 18.97 ($643,288,207 33,916,448 share | ÷ s) | $
| 24.00 ($87,780,766 3,658,038 share | ÷ s) | |||||||
|
| N/A
|
|
| N/A
|
| $
| 53.68 ($277,241,855 5,165,158 share
| ÷ s)
|
| N/A
|
|
| N/A
|
|
| N/A
|
|
| N/A
|
|
| N/A
|
| |||||||
| $
| 29.17 ($4,782,931 163,979 share | ÷ s) |
| N/A
|
| $
| 53.58 ($6,473,537 120,810 share | ÷ s) |
| N/A
|
| $
| 22.57 ($2,910,191 128,930 share | ÷ s) | $
| 27.83 ($2,252,515 80,938 share | ÷ s) |
| N/A
|
| $
| 23.96 ($870,755 36,338 share | ÷ s) | |||||||
| $
| 29.80 ($20,481,065 687,299 share | ÷ s) | $
| 20.75 ($198,094,406 9,547,943 share | ÷ s) | $
| 53.33 ($779,619 14,619 share | ÷ s) | $
| 11.66 ($37,859,579 3,247,872 share | ÷ s) | $
| 22.76 ($7,206,417 316,565 share | ÷ s) | $
| 28.93 ($7,242,900 250,364 share | ÷ s) | $
| 18.98 ($47,184,838 2,486,406 share | ÷ s) | $
| 24.01 ($478,905 19,943 share | ÷ s) | |||||||
| SEI Institutional Managed Trust / Annual Report / September 30, 2016 | 277 |
STATEMENTS OF ASSETS AND LIABILITIES ($ Thousands)
September 30, 2016
U.S. Managed Volatility Fund | Global Managed Volatility Fund | |||||||
Assets: | ||||||||
Investments, at value † | $ | 1,573,596 | $ | 1,622,567 | ||||
Affiliated investments, at value †† | 39,118 | 83,471 | ||||||
Repurchase agreements† | – | – | ||||||
Cash and cash equivalents | 173 | 8,939 | ||||||
Due from Broker | – | – | ||||||
Cash pledged as collateral on swap contracts | – | – | ||||||
Cash pledged as collateral on futures contracts | – | – | ||||||
Foreign currency, at value ††† | 1,177 | 3,444 | ||||||
Receivable for fund shares sold | 1,495 | 792 | ||||||
Receivable for investment securities sold | 4,968 | 3 | ||||||
Dividends and Interest receivable | 2,891 | 4,108 | ||||||
Receivable for variation margin | 135 | 254 | ||||||
Unrealized gain on forward foreign currency contracts | – | 916 | ||||||
Options purchased, at value ††††† | – | – | ||||||
Foreign tax reclaim receivable | – | 2,429 | ||||||
Receivable from investment adviser | – | – | ||||||
Other receivables | – | – | ||||||
Prepaid expenses | 26 | 31 | ||||||
Total Assets | 1,623,579 | 1,726,954 | ||||||
Liabilities: | ||||||||
Payable for investment securities purchased | 5,726 | – | ||||||
Payable for fund shares redeemed | 1,467 | 893 | ||||||
Administration fees payable | 397 | 420 | ||||||
Shareholder servicing fees payable Class A | 231 | 328 | ||||||
Shareholder servicing fees payable Class I | – | 1 | ||||||
Payable upon return on securities loaned | – | – | ||||||
Income distribution payable | – | – | ||||||
OTC Swap contracts, at value †††† | – | – | ||||||
Options written, at value ††††† | – | – | ||||||
Payable to custodian | – | – | ||||||
Payable for variation margin | – | 154 | ||||||
Unrealized loss on forward foreign currency contracts | – | 648 | ||||||
Investment advisory fees payable | 507 | 689 | ||||||
Chief Compliance Officer fees payable | 2 | 2 | ||||||
Trustees fees payable | – | – | ||||||
Administration servicing fees payable Class I | – | 1 | ||||||
Other payables | – | – | ||||||
Accrued expense payable | 81 | 147 | ||||||
Total Liabilities | 8,411 | 3,283 | ||||||
Net Assets | $ | 1,615,168 | $ | 1,723,671 | ||||
† Cost of investments and repurchase agreements | $ | 1,356,352 | $ | 1,415,399 | ||||
†† Cost of affiliated investments | 39,118 | 83,471 | ||||||
††† Cost of foreign currency | 1,173 | 3,442 | ||||||
†††† Cost (premiums received) | – | – | ||||||
††††† Cost (premiums received) | – | – | ||||||
* Includes market value of securities on loan | – | – | ||||||
Amounts designated as “—” are $0 or have been rounded to $0.
The accompanying notes are an integral part of the financial statements.
| 278 | SEI Institutional Managed Trust / Annual Report / September 30, 2016 |
Tax-Managed Managed Volatility Fund | Real Estate Fund | Enhanced Income Fund | Core Fixed Income Fund | U.S. Fixed Income Fund | High Yield Bond Fund | Conservative Income Fund | ||||||||||||||||||||
| $ | 1,164,326 | $ | 204,816* | $ | 194,173 | $ | 2,228,200* | $ | 1,368,300* | $ | 1,865,467* | $ | 57,832 | |||||||||||||
| 34,072 | 8,546 | 5,121 | 70,436 | 32,271 | 51,080 | 51 | ||||||||||||||||||||
| – | – | 2,000 | – | – | – | 11,400 | ||||||||||||||||||||
| 150 | – | 342 | 103 | – | 395 | – | ||||||||||||||||||||
| – | – | – | – | – | 348 | – | ||||||||||||||||||||
| – | – | – | 3,287 | 158 | 893 | – | ||||||||||||||||||||
| – | – | 11 | 1,059 | 943 | – | – | ||||||||||||||||||||
| 758 | – | – | 355 | – | – | – | ||||||||||||||||||||
| 1,531 | 2,124 | 141 | 1,355 | 1,055 | 1,137 | 19,182 | ||||||||||||||||||||
| 1,121 | 3,451 | 2,759 | 95,006 | 68,695 | 18,377 | 3,500 | ||||||||||||||||||||
| 1,830 | 1,040 | 715 | 10,647 | 6,199 | 30,874 | 49 | ||||||||||||||||||||
| 113 | – | 4 | 1,446 | 1,389 | 34 | – | ||||||||||||||||||||
| – | – | – | 450 | 9 | – | – | ||||||||||||||||||||
| – | – | – | 208 | 81 | – | – | ||||||||||||||||||||
| 2 | – | – | 8 | 8 | 13 | – | ||||||||||||||||||||
| – | – | – | 2 | – | – | 11 | ||||||||||||||||||||
| – | – | – | – | – | 400 | – | ||||||||||||||||||||
| 19 | 4 | 4 | 37 | 22 | 31 | 1 | ||||||||||||||||||||
| 1,203,922 | 219,981 | 205,270 | 2,412,599 | 1,479,130 | 1,969,049 | 92,026 | ||||||||||||||||||||
| 2,479 | 7,031 | 6,298 | 241,760 | 172,492 | 26,661 | – | ||||||||||||||||||||
| 977 | 320 | 241 | 2,321 | 1,265 | 2,080 | 166 | ||||||||||||||||||||
| 294 | 52 | 16 | 351 | 213 | 317 | 12 | ||||||||||||||||||||
| 238 | 35 | 21 | 423 | 247 | 355 | 5 | ||||||||||||||||||||
| – | – | – | – | – | – | – | ||||||||||||||||||||
| – | 1,024 | – | 14,020 | 629 | 6 | – | ||||||||||||||||||||
| – | – | – | 353 | 271 | 928 | 20 | ||||||||||||||||||||
| – | – | – | 684 | 173 | – | – | ||||||||||||||||||||
| – | – | – | 315 | 123 | – | – | ||||||||||||||||||||
| – | – | – | – | 45 | – | – | ||||||||||||||||||||
| – | – | 1 | 640 | 839 | – | – | ||||||||||||||||||||
| – | – | – | 925 | 168 | – | – | ||||||||||||||||||||
| 373 | 90 | 43 | 240 | 148 | 575 | 6 | ||||||||||||||||||||
| 1 | – | – | 2 | 1 | 2 | – | ||||||||||||||||||||
| – | – | – | 1 | – | 1 | – | ||||||||||||||||||||
| – | – | – | 2 | – | 1 | – | ||||||||||||||||||||
| – | – | – | 4 | – | – | – | ||||||||||||||||||||
| 65 | 9 | 26 | 216 | 122 | 123 | 10 | ||||||||||||||||||||
| 4,427 | 8,561 | 6,646 | 262,257 | 176,736 | 31,049 | 219 | ||||||||||||||||||||
| $ | 1,199,495 | $ | 211,420 | $ | 198,624 | $ | 2,150,342 | $ | 1,302,394 | $ | 1,938,000 | $ | 91,807 | |||||||||||||
| $ | 910,883 | $ | 159,456 | $ | 199,014 | $ | 2,178,162 | $ | 1,332,901 | $ | 1,885,562 | $ | 69,227 | |||||||||||||
| 34,072 | 8,546 | 5,121 | 70,436 | 32,271 | 51,080 | 51 | ||||||||||||||||||||
| 764 | – | – | 331 | – | – | – | ||||||||||||||||||||
| – | – | – | 13 | – | – | – | ||||||||||||||||||||
| – | – | – | (160 | ) | (62 | ) | – | – | ||||||||||||||||||
| – | 1,020 | – | 13,544 | 599 | 1 | – | ||||||||||||||||||||
| SEI Institutional Managed Trust / Annual Report / September 30, 2016 | 279 |
STATEMENTS OF ASSETS AND LIABILITIES ($ Thousands)
September 30, 2016
| U.S. Managed Volatility Fund | Global Managed Volatility Fund | |||||||
Net Assets: | ||||||||
Paid-in capital — (unlimited authorization — no par value) | $ | 1,350,819 | $ | 1,453,138 | ||||
Undistributed (distributions in excess of) net investment income | 5,726 | 21,778 | ||||||
Accumulated net realized gain (loss) on investments, option contracts, swaptions, futures contracts, securities sold short, swap contracts and foreign currency | 41,478 | 41,376 | ||||||
Net unrealized appreciation (depreciation) on investments and securities sold short | 217,244 | 207,168 | ||||||
Net unrealized appreciation on option contracts | – | – | ||||||
Net unrealized appreciation (depreciation) on futures contracts | (102 | ) | 76 | |||||
Net unrealized appreciation (depreciation) on forward foreign currency contracts, foreign currencies and translation of other assets and liabilities denominated in foreign currencies | 3 | 135 | ||||||
Net unrealized appreciation (depreciation) on swap contracts | – | – | ||||||
Net Assets | $ | 1,615,168 | �� | $ | 1,723,671 | |||
Net Asset Value, Offering and Redemption Price Per Share — Class A | $ | 17.04 | $ | 11.51 | ||||
|
| ($1,126,684,758 66,115,893 share | ÷ s) |
| ($1,618,548,555 140,572,556 share | ÷ s) | |||
Net Asset Value, Offering and Redemption Price Per Share — Class I | $ | 17.03 | $ | 11.29 | ||||
|
| ($1,928,461 113,270 share | ÷ s) |
| ($2,734,462 242,305 share | ÷ s) | |||
Net Asset Value, Offering and Redemption Price Per Share — Class Y | $ | 17.05 | $ | 11.55 | ||||
|
| ($486,555,063 28,537,396 share | ÷ s) |
| ($102,388,311 8,866,795 share | ÷ s) | |||
Amounts designated as “—” are $0 or have been rounded to $0.
N/A - Not applicable. Share class currently not offered.
The accompanying notes are an integral part of the financial statements.
| 280 | SEI Institutional Managed Trust / Annual Report / September 30, 2016 |
| Tax-Managed Managed Volatility Fund | Real Estate Fund | Enhanced Income Fund | Core Fixed Income Fund | U.S. Fixed Income Fund | High Yield Bond Fund | Conservative Income Fund | ||||||||||||||||||||
| $ | 930,260 | $ | 153,133 | $ | 324,462 | $ | 2,089,251 | $ | 1,254,250 | $ | 2,100,479 | $ | 91,801 | |||||||||||||
| 3,919 | 2,193 | 974 | (3,948 | ) | 165 | 16,847 | – | |||||||||||||||||||
|
11,922 |
| 10,734 | (123,972 | ) | 17,556 | 12,215 | (159,424 | ) | 1 | ||||||||||||||||
| 253,443 | 45,360 | (2,841 | ) | 50,038 | 35,399 | (20,095 | ) | 5 | ||||||||||||||||||
| – | – | – | 53 | 20 | – | – | ||||||||||||||||||||
| (42 | ) | – | 1 | 1,694 | 971 | – | – | |||||||||||||||||||
|
(7 |
) | – | – | (441 | ) | (159 | ) | – | – | ||||||||||||||||
| – | – | – | (3,861 | ) | (467 | ) | 193 | – | ||||||||||||||||||
| $ | 1,199,495 | $ | 211,420 | $ | 198,624 | $ | 2,150,342 | $ | 1,302,394 | $ | 1,938,000 | $ | 91,807 | |||||||||||||
| $ | 14.74 | $ | 19.37 | $ | 7.49 | $ | 11.71 | $ | 10.58 | $ | 7.18 | $ | 10.00 | |||||||||||||
|
| ($1,162,477,654 78,889,551 share | ÷ s) |
| ($174,178,580 8,991,371 share | ÷ s) |
| ($181,058,741 24,180,396 share | ÷ s) |
| ($2,070,113,148 176,817,380 share | ÷ s) |
| ($1,205,262,289 113,942,724 share | ÷ s) |
| ($1,737,907,584 241,916,664 share | ÷ s) |
| ($75,010,907 7,500,664 share | ÷ s) | ||||||
| N/A | $ | 19.35 | $ | 7.47 | $ | 11.70 | N/A | $ | 6.93 | N/A | ||||||||||||||||
|
| ($650,929 33,633 share | ÷ s) |
| ($255,237 34,156 share | ÷ s) |
| ($9,313,119 795,866 share | ÷ s) |
| ($1,077,576 155,565 share | ÷ s) | |||||||||||||||
| $ | 14.74 | $ | 19.38 | $ | 7.48 | $ | 11.71 | $ | 10.58 | $ | 7.18 | $ | 10.00 | |||||||||||||
|
| ($37,017,186 2,511,039 share | ÷ s) |
| ($36,590,712 1,888,387 share | ÷ s) |
| ($17,309,952 2,313,851 share | ÷ s) |
| ($70,916,227 6,055,602 share | ÷ s) |
| ($97,131,412 9,184,289 share | ÷ s) |
| ($199,015,009 27,703,642 share | ÷ s) |
| ($16,796,526 1,679,517 share | ÷ s) | ||||||
| SEI Institutional Managed Trust / Annual Report / September 30, 2016 | 281 |
STATEMENTS OF ASSETS AND LIABILITIES/CONSOLIDATED STATEMENT OF ASSETS AND LIABILITIES ($ Thousands)
September 30, 2016
Tax-Free Conservative Income Fund | Real Return Fund | |||||||
Assets: | ||||||||
Investments, at value † | $ | 44,670 | $ | 318,496 | ||||
Affiliated investments, at value †† | – | 5,456 | ||||||
Cash and cash equivalents | 20 | – | ||||||
Due from Broker | – | – | ||||||
Cash pledged as collateral on swap contracts | – | – | ||||||
Cash pledged as collateral on futures contracts | – | – | ||||||
Foreign currency, at value ††† | – | – | ||||||
Receivable for fund shares sold | 183 | 176 | ||||||
Receivable for investment securities sold | 500 | – | ||||||
Dividends and Interest receivable | 124 | 499 | ||||||
Unrealized gain on forward foreign currency contracts | – | – | ||||||
Unrealized gain on foreign spot currency contracts | – | – | ||||||
OTC Swap contracts, at value †††† | – | – | ||||||
Options purchased, at value ††††† | – | – | ||||||
Foreign tax reclaim receivable | – | – | ||||||
Receivable for variation margin | – | – | ||||||
Prepaid expenses | 1 | 5 | ||||||
Total Assets | 45,498 | 324,632 | ||||||
Liabilities: | ||||||||
Payable for investment securities purchased | 515 | 3,820 | ||||||
Payable for fund shares redeemed | 89 | 485 | ||||||
Income distribution payable | 12 | – | ||||||
Shareholder servicing fees payable Class A | 3 | 24 | ||||||
Administration fees payable | 2 | 52 | ||||||
Payable for securities sold short@ | – | – | ||||||
OTC Swap contracts, at value †††† | – | – | ||||||
Options written, at value ††††† | – | – | ||||||
Due to broker | – | – | ||||||
Reverse repurchase agreements | – | – | ||||||
Payable for variation margin | – | – | ||||||
Unrealized loss on foreign currency spot contracts | – | – | ||||||
Unrealized loss on forward foreign currency contracts | – | – | ||||||
Investment advisory fees payable | 4 | 21 | ||||||
Interest payable | – | – | ||||||
Chief Compliance Officer fees payable | – | – | ||||||
Accrued expense payable | 5 | 15 | ||||||
Total Liabilities | 630 | 4,417 | ||||||
Net Assets | $ | 44,868 | $ | 320,215 | ||||
† Cost of investments and repurchase agreements | $ | 44,684 | $ | 315,426 | ||||
†† Cost of affiliated investments | – | 5,456 | ||||||
††† Cost of foreign currency | – | – | ||||||
†††† Cost (premiums received) | – | – | ||||||
††††† Cost (premiums received) | – | – | ||||||
@Proceeds from securities sold short | – | – | ||||||
Amounts designated as “—” are $0 or have been rounded to $0.
The accompanying notes are an integral part of the financial statements.
| 282 | SEI Institutional Managed Trust / Annual Report / September 30, 2016 |
| Dynamic Asset Allocation Fund | Multi-Strategy Alternative Fund | Multi-Asset Accumulation Fund | Multi-Asset Income Fund | Multi-Asset Inflation Managed Fund | Multi-Asset Capital Stability Fund | Long/Short Alternative Fund | ||||||||||||||||||||
| $ | 522,673 | $ | 439,206 | $ | 1,879,772 | $ | 702,542 | $ | 1,288,531 | $ | 123,861 | $ | 40,657 | |||||||||||||
| – | 136,099 | – | – | – | – | – | ||||||||||||||||||||
| 5,231 | 84,480 | 331,237 | 26,068 | 182,745 | 576,479 | 1 | ||||||||||||||||||||
| 9,745 | 523 | 3,586 | – | – | – | – | ||||||||||||||||||||
| – | 3,283 | 7,737 | 22,180 | 967 | 1,159 | – | ||||||||||||||||||||
| 428 | 171 | 60,338 | 1,442 | 1,803 | 5,948 | 1,027 | ||||||||||||||||||||
| – | 131 | 3,993 | 74 | 6 | 2,268 | – | ||||||||||||||||||||
| 547 | 465 | 1,678 | 636 | 1,040 | 546 | – | ||||||||||||||||||||
| 24 | 26,897 | 814 | 2,527 | 10,734 | – | – | ||||||||||||||||||||
| 584 | 517 | 1,668 | 4,627 | 2,886 | 599 | – | ||||||||||||||||||||
| 938 | 80 | 3,412 | 238 | 257 | 1,123 | – | ||||||||||||||||||||
| – | – | 33 | – | 5 | – | – | ||||||||||||||||||||
| 576 | 142 | 2,485 | 58,323 | 22 | – | – | ||||||||||||||||||||
| 415 | 160 | – | – | – | 65 | – | ||||||||||||||||||||
| – | 3 | 136 | 9 | 15 | – | – | ||||||||||||||||||||
| 61 | 28 | 2,514 | 209 | 3,272 | 705 | 192 | ||||||||||||||||||||
| 8 | 10 | 37 | 12 | 20 | 12 | 1 | ||||||||||||||||||||
| 541,230 | 692,195 | 2,299,440 | 818,887 | 1,492,303 | 712,765 | 41,878 | ||||||||||||||||||||
| – | 23,163 | 2,313 | 15,022 | 12,044 | – | – | ||||||||||||||||||||
| 367 | 613 | 1,825 | 612 | 1,185 | 851 | – | ||||||||||||||||||||
| – | – | – | 378 | – | – | – | ||||||||||||||||||||
| 99 | 97 | 421 | 52 | 201 | 54 | – | ||||||||||||||||||||
| 131 | – | 555 | 120 | 219 | 90 | 10 | ||||||||||||||||||||
| – | 92,656 | – | – | 145,945 | – | – | ||||||||||||||||||||
| – | – | 4,205 | 58,562 | 1,160 | – | – | ||||||||||||||||||||
| – | 92 | – | 2,222 | – | 71 | – | ||||||||||||||||||||
| – | – | 2,574 | – | 1,930 | – | – | ||||||||||||||||||||
| – | – | – | – | 244,323 | – | – | ||||||||||||||||||||
| – | 32 | 3,877 | 175 | 2,642 | 460 | 53 | ||||||||||||||||||||
| – | – | 18 | – | 8 | – | – | ||||||||||||||||||||
| 3,235 | 158 | 3,393 | 3 | 1,963 | 1,350 | – | ||||||||||||||||||||
| 43 | 238 | 1,021 | 226 | 282 | 174 | 18 | ||||||||||||||||||||
| – | 11 | – | – | 15 | – | – | ||||||||||||||||||||
| 1 | 1 | 3 | 1 | 1 | 1 | – | ||||||||||||||||||||
| 53 | 30 | 130 | 94 | 193 | 33 | 3 | ||||||||||||||||||||
| 3,929 | 117,091 | 20,335 | 77,467 | 412,111 | 3,084 | 84 | ||||||||||||||||||||
| $ | 537,301 | $ | 575,104 | $ | 2,279,105 | $ | 741,420 | $ | 1,080,192 | $ | 709,681 | $ | 41,794 | |||||||||||||
| $ | 484,206 | $ | 437,563 | $ | 1,835,347 | $ | 699,829 | $ | 1,249,777 | $ | 120,296 | $ | 40,637 | |||||||||||||
| – | 137,027 | – | – | – | – | – | ||||||||||||||||||||
| – | 506 | 3,986 | 71 | 6 | 2,138 | – | ||||||||||||||||||||
| – | (57 | ) | – | – | (277 | ) | – | – | ||||||||||||||||||
| 524 | 97 | – | 1,800 | – | (219 | ) | – | |||||||||||||||||||
| – | (89,554 | ) | – | – | (145,564 | ) | – | – | ||||||||||||||||||
| SEI Institutional Managed Trust / Annual Report / September 30, 2016 | 283 |
STATEMENTS OF ASSETS AND LIABILITIES/CONSOLIDATED STATEMENT OF ASSETS AND LIABILITIESs ($ Thousands)
September 30, 2016
| Tax-Free Conservative Income Fund | Real Return Fund | |||||||
Net Assets: | ||||||||
Paid-in capital — (unlimited authorization — no par value) | $ | 44,882 | $ | 321,573 | ||||
Undistributed (distributions in excess of) net investment income | – | (336) | ||||||
Accumulated net realized gain (loss) on investments, option contracts, swaptions, futures contracts, securities sold short, swap contracts and foreign currency | – | (4,092) | ||||||
Net unrealized appreciation (depreciation) on investments and securities sold short | (14) | 3,070 | ||||||
Net unrealized appreciation (depreciation) on option contracts | – | – | ||||||
Net unrealized appreciation (depreciation) on futures contracts | – | – | ||||||
Net unrealized appreciation (depreciation) on forward foreign currency contracts, foreign currencies and translation of other assets and liabilities denominated in foreign currencies | – | – | ||||||
Net unrealized appreciation (depreciation) on swap contracts
| – | – | ||||||
Net Assets | $ | 44,868 | $ | 320,215 | ||||
Net Asset Value, Offering and Redemption Price Per Share — Class A | $ | 10.00 | $ | 10.14 | ||||
|
| ($30,946,244 3,095,559 share | ÷ s) |
| ($291,379,675 28,723,821 share | ÷ s) | |||
Net Asset Value, Offering and Redemption Price Per Share — Class Y | $ | 10.00 | $ | 10.17 | ||||
|
| ($13,922,107 1,392,631 share | ÷ s) |
| ($28,835,391 2,834,951 share | ÷ s) | |||
Amounts designated as “—” are $0 or have been rounded to $0.
N/A - Not applicable. Share class currently not offered.
The accompanying notes are an integral part of the financial statements.
| 284 | SEI Institutional Managed Trust / Annual Report / September 30, 2016 |
| Dynamic Asset Allocation Fund | Multi-Strategy Alternative Fund | Multi-Asset Accumulation Fund | Multi-Asset Income Fund | Multi-Asset Inflation Managed Fund | Multi-Asset Capital Stability Fund | Long/Short Alternative Fund | ||||||||||||||||||||
| $ | 502,228 | $ | 587,029 | $ | 2,264,641 | $ | 742,710 | $ | 1,170,155 | $ | 703,985 | $ | 42,401 | |||||||||||||
| 1,461 | 415 | (17,755) | (823) | (1,933) | 1,249 | (83) | ||||||||||||||||||||
| (3,047) | (10,095) | (15,473) | (2,648) | (122,200) | 682 | (468) | ||||||||||||||||||||
| 38,467 | (2,387) | 44,425 | 2,713 | 38,373 | 3,565 | 20 | ||||||||||||||||||||
| (109) | (29) | – | (422) | – | 213 | – | ||||||||||||||||||||
| 22 | 9 | 5,136 | 132 | (152) | (170) | (76) | ||||||||||||||||||||
| (2,297) | (78) | (343) | 224 | (1,740) | (97) | – | ||||||||||||||||||||
| 576 | 240 | (1,526) | (466) | (2,311) | 254 | �� | – | |||||||||||||||||||
| $ | 537,301 | $ | 575,104 | $ | 2,279,105 | $ | 741,420 | $ | 1,080,192 | $ | 709,681 | $ | 41,794 | |||||||||||||
| $ | 10.18 | $ | 9.67 | $ | 10.31 | $ | 10.56 | $ | 8.80 | $ | 10.14 | $ | 9.79 | |||||||||||||
|
| ($488,778,343 48,026,702 share | ÷ s) |
| ($573,752,058 59,323,915 share | ÷ s) |
| ($2,076,240,440 201,363,419 share | ÷ s) |
| ($643,477,093 60,946,873 share | ÷ s) |
| ($990,930,949 112,549,375 share | ÷ s) |
| ($658,185,196 64,905,652 share | ÷ s) |
| ($19,365 1,979 share | ÷ s) | ||||||
| $ | 10.20 | $ | 9.68 | $ | 10.36 | $ | 10.56 | $ | 8.82 | $ | 10.16 | $ | 9.81 | |||||||||||||
|
| ($48,523,146 4,758,101 share | ÷ s) |
| ($1,351,547 139,614 share | ÷ s) |
| ($202,864,705 19,589,928 share | ÷ s) |
| ($97,942,762 9,277,346 share | ÷ s) |
| ($89,261,319 10,118,066 share | ÷ s) |
| ($51,495,790 5,068,152 share | ÷ s) |
| ($41,774,801 4,257,589 share | ÷ s) | ||||||
| SEI Institutional Managed Trust / Annual Report / September 30, 2016 | 285 |
STATEMENTS OF OPERATIONS ($ Thousands)
For the year or period ended September 30, 2016
Large Cap Fund |
Large Cap Value Fund |
Large Cap Growth Fund | ||||||||||
Investment Income: | ||||||||||||
Dividends | $ | 44,713 | $ | 32,472 | $ | 14,019 | ||||||
Dividends from affiliated investment company (1) | 201 | 90 | 106 | |||||||||
Interest income | 3 | 1 | 2 | |||||||||
Security lending income — net (1)(2) | 469 | 244 | 36 | |||||||||
Less: foreign taxes withheld | (200 | ) | (160 | ) | (90 | ) | ||||||
Total Investment Income | 45,186 | 32,647 | 14,073 | |||||||||
Expenses: | ||||||||||||
Investment advisory fees | 9,201 | 4,624 | 5,801 | |||||||||
Administration fees | 7,078 | 3,964 | 4,350 | |||||||||
Shareholder servicing fees Class A | 5,486 | 3,252 | 3,579 | |||||||||
Shareholder servicing fees Class I | – | 16 | 13 | |||||||||
Trustees’ fees | 37 | 21 | 23 | |||||||||
Chief compliance officer fees | 13 | 8 | 8 | |||||||||
Administration servicing fees Class I | – | 16 | 13 | |||||||||
Proxy fees | 355 | 221 | 234 | |||||||||
Printing fees | 312 | 174 | 192 | |||||||||
Professional fees | 137 | 77 | 83 | |||||||||
Custodian/Wire agent fees | 107 | 61 | 67 | |||||||||
Registration fees | 69 | 49 | 56 | |||||||||
Pricing fees | – | – | – | |||||||||
Interest expense | – | – | – | |||||||||
Other expenses | 58 | 32 | 35 | |||||||||
Total Expenses | 22,853 | 12,515 | 14,454 | |||||||||
Less: | ||||||||||||
Waiver of investment advisory fees | (1,876 | ) | (531 | ) | (586 | ) | ||||||
Waiver of shareholder servicing fees Class A | – | – | – | |||||||||
Waiver of shareholder servicing fees Class I | – | (2 | ) | (2 | ) | |||||||
Waiver of administration fees | – | – | (725 | ) | ||||||||
Fees paid indirectly(1) | – | – | – | |||||||||
Net Expenses | 20,977 | 11,982 | 13,141 | |||||||||
Net Investment Income (Loss) | 24,209 | 20,665 | 932 | |||||||||
Net Realized Gain (Loss) on: | ||||||||||||
Investments | (42,348 | ) | (39,802 | ) | (71,723 | ) | ||||||
Futures contracts | 1,964 | 1,462 | 1,133 | |||||||||
Foreign currency transactions | – | – | – | |||||||||
Net Change in Unrealized Appreciation (Depreciation) on: | ||||||||||||
Investments | 251,641 | 146,769 | 202,793 | |||||||||
Futures contracts | 1,050 | 222 | 491 | |||||||||
Net Increase in Net Assets Resulting from Operations | $ | 236,516 | $ | 129,316 | $ | 133,626 | ||||||
| (1) | See Note 6 in Notes to Financial Statements. |
| (2) | Income is from the investment of collateral in an affiliated security. |
Amounts designated as “—” are $0 or have been rounded to $0.
The accompanying notes are an integral part of the financial statements.
| 286 | SEI Institutional Managed Trust / Annual Report / September 30, 2016 |
| Tax-Managed Large Cap Fund | S&P 500 Index Fund | Small Cap Fund | Small Cap Value Fund | Small Cap Growth Fund | Tax-Managed Small/Mid Cap Fund | Mid-Cap Fund | ||||||||||||||||||||
| $ | 62,949 | $ | 13,973 | $ | 5,790 | $ | 6,247 | $ | 1,693 | $ | 8,446 | $ | 1,932 | |||||||||||||
| 314 | 22 | 69 | 36 | 28 | 65 | 8 | ||||||||||||||||||||
| 5 | – | 2 | 1 | 1 | 2 | 1 | ||||||||||||||||||||
| 926 | 30 | 800 | 454 | 854 | 1,125 | 19 | ||||||||||||||||||||
| (362 | ) | (1 | ) | (45 | ) | (25 | ) | (14 | ) | (31 | ) | – | ||||||||||||||
| 63,832 | 14,024 | 6,616 | 6,713 | 2,562 | 9,607 | 1,960 | ||||||||||||||||||||
| 13,748 | 196 | 3,623 | 2,428 | 2,018 | 4,223 | 361 | ||||||||||||||||||||
| 10,311 | 1,439 | 1,672 | 1,121 | 932 | 1,949 | 271 | ||||||||||||||||||||
| 8,167 | 985 | 1,301 | 914 | 759 | 1,524 | 223 | ||||||||||||||||||||
| – | 20 | – | 8 | 6 | – | 2 | ||||||||||||||||||||
| 53 | 10 | 9 | 6 | 5 | 10 | 1 | ||||||||||||||||||||
| 20 | 4 | 3 | 2 | 2 | 4 | 1 | ||||||||||||||||||||
| – | 20 | – | 8 | 6 | – | 2 | ||||||||||||||||||||
| 468 | 127 | 99 | 96 | 82 | 104 | 27 | ||||||||||||||||||||
| 449 | 85 | 98 | 62 | 41 | 96 | 12 | ||||||||||||||||||||
| 266 | 38 | 33 | 22 | 18 | 50 | 5 | ||||||||||||||||||||
| 161 | 30 | 26 | 17 | 14 | 30 | 4 | ||||||||||||||||||||
| 107 | 26 | 19 | 12 | 10 | 19 | 3 | ||||||||||||||||||||
| – | – | – | 7 | – | – | – | ||||||||||||||||||||
| – | 121 | – | – | – | – | – | ||||||||||||||||||||
| 80 | 19 | 18 | 5 | 12 | 20 | 4 | ||||||||||||||||||||
| 33,830 | 3,120 | 6,901 | 4,708 | 3,905 | 8,029 | 916 | ||||||||||||||||||||
| (3,079 | ) | – | (530 | ) | (347 | ) | (377 | ) | (597 | ) | (1 | ) | ||||||||||||||
| – | (276 | ) | – | – | – | (183 | ) | – | ||||||||||||||||||
| – | (8 | ) | – | (1 | ) | – | – | – | ||||||||||||||||||
| – | (321 | ) | – | – | – | – | – | |||||||||||||||||||
| – | – | – | (5 | ) | – | – | – | |||||||||||||||||||
| 30,751 | 2,515 | 6,371 | 4,355 | 3,528 | 7,249 | 915 | ||||||||||||||||||||
| 33,081 | 11,509 | 245 | 2,358 | (966 | ) | 2,358 | 1,045 | |||||||||||||||||||
| (30,428 | ) | 21,353 | (7,419 | ) | (1,362 | ) | (9,571 | ) | (3,379 | ) | (218 | ) | ||||||||||||||
| 6,828 | 1,172 | 2,484 | (3,025 | ) | 157 | 1,945 | 206 | |||||||||||||||||||
| (1 | ) | – | – | – | – | – | – | |||||||||||||||||||
| 297,162 | 55,569 | 47,559 | 39,682 | 35,477 | 51,255 | 9,533 | ||||||||||||||||||||
| 655 | 552 | 332 | 33 | 316 | 398 | 37 | ||||||||||||||||||||
| $ | 307,297 | $ | 90,155 | $ | 43,201 | $ | 37,686 | $ | 25,413 | $ | 52,577 | $ | 10,603 | |||||||||||||
| SEI Institutional Managed Trust / Annual Report / September 30, 2016 | 287 |
STATEMENTS OF OPERATIONS ($ Thousands)
For the year or period ended September 30, 2016
| U.S. Managed Volatility Fund | Global Managed Volatility Fund | Tax-Managed Managed Volatility Fund | ||||||||||
Investment Income: | ||||||||||||
Dividends | $ | 38,307 | $ | 53,926 | $ | 27,036 | ||||||
Dividends from affiliated investment company (1) | 97 | 207 | 81 | |||||||||
Interest income | 5 | 18 | 4 | |||||||||
Security lending income — net (1)(2) | – | – | – | |||||||||
Less: foreign taxes withheld | (216 | ) | (2,770 | ) | (142 | ) | ||||||
Total Investment Income | 38,193 | 51,381 | 26,979 | |||||||||
Expenses: | ||||||||||||
Investment advisory fees | 9,737 | 12,677 | 6,914 | |||||||||
Administration fees | 4,494 | 5,851 | 3,191 | |||||||||
Shareholder servicing fees Class A | 2,610 | 4,621 | 2,602 | |||||||||
Shareholder servicing fees Class I | 5 | 5 | – | |||||||||
Trustees’ fees | 23 | 32 | 16 | |||||||||
Chief compliance officer fees | 9 | 11 | 6 | |||||||||
Administration servicing fees Class I | 5 | 5 | – | |||||||||
Proxy fees | 232 | 294 | 149 | |||||||||
Printing fees | 194 | 267 | 136 | |||||||||
Professional fees | 89 | 109 | 64 | |||||||||
Custodian/Wire agent fees | 71 | 202 | 52 | |||||||||
Registration fees | 33 | 58 | 38 | |||||||||
Interest expense | – | – | – | |||||||||
Other expenses | 36 | 63 | 25 | |||||||||
Total Expenses | 17,538 | 24,195 | 13,193 | |||||||||
Less: | ||||||||||||
Waiver of investment advisory fees | (3,428 | ) | (2,463 | ) | (2,448 | ) | ||||||
Waiver of shareholder servicing fees Class A | – | – | – | |||||||||
Waiver of shareholder servicing fees Class I | – | – | – | |||||||||
Waiver of administration fees | – | – | – | |||||||||
Fees paid indirectly | – | – | – | |||||||||
Net Expenses | 14,110 | 21,732 | 10,745 | |||||||||
Net Investment Income | 24,083 | 29,649 | 16,234 | |||||||||
Net Realized Gain (Loss) on: | ||||||||||||
Investments | 42,322 | 22,120 | 10,890 | |||||||||
Futures contracts | 4,200 | 6,390 | 3,047 | |||||||||
Foreign currency transactions | 66 | 880 | (21 | ) | ||||||||
Purchased and written options | – | – | – | |||||||||
Purchased and written swaptions | – | – | – | |||||||||
Swap contracts | – | – | – | |||||||||
Net Change in Unrealized Appreciation (Depreciation) on: | ||||||||||||
Investments | 97,077 | 162,326 | † | 90,197 | ||||||||
Futures contracts | 124 | 1,554 | 245 | |||||||||
Purchased and written options | – | – | – | |||||||||
Purchased and written swaptions | – | – | – | |||||||||
Swap contracts | – | – | – | |||||||||
Foreign currency translation of other assets and liabilities denominated in foreign currencies | 10 | (2,264 | ) | (7 | ) | |||||||
Net Increase in Net Assets Resulting from Operations | $ | 167,882 | $ | 220,655 | $ | 120,585 | ||||||
| (1) | See Note 6 in Notes to Financial Statements. |
| (2) | Income is from the investment of collateral in an affiliated security. |
| (3) | Commenced operations on April 22, 2016. |
† Includes realized losses of $(24,125) ($ Thousands) due to in-kind transactions (See Note 13).
Amounts designated as “—” are $0 or have been rounded to $0.
The accompanying notes are an integral part of the financial statements.
| 288 | SEI Institutional Managed Trust / Annual Report / September 30, 2016 |
| Real Estate Fund | Enhanced Income Fund | Core Fixed Income Fund | U.S. Fixed Income Fund | High Yield Bond Fund | Conservative Income Fund(3) | |||||||||||||||||
| $ | 5,514 | $ | – | $ | 52 | $ | – | $ | 896 | $ | – | |||||||||||
| 14 | 11 | 122 | 96 | 137 | 2 | |||||||||||||||||
| – | 5,234 | 62,176 | 30,783 | 123,153 | 197 | |||||||||||||||||
| 3 | – | 167 | 25 | – | – | |||||||||||||||||
| – | (2 | ) | – | (44 | ) | (60 | ) | – | ||||||||||||||
| 5,531 | 5,243 | 62,517 | 30,860 | 124,126 | 199 | |||||||||||||||||
| 1,343 | 812 | 5,772 | 3,418 | 8,556 | 29 | |||||||||||||||||
| 620 | 609 | 5,877 | 3,480 | 5,265 | 59 | |||||||||||||||||
| 439 | 467 | 5,099 | 2,874 | 3,936 | 55 | |||||||||||||||||
| 2 | 1 | 23 | – | 13 | – | |||||||||||||||||
| 3 | 3 | 33 | 19 | 27 | 1 | |||||||||||||||||
| 1 | 1 | 12 | 7 | 10 | – | |||||||||||||||||
| 2 | 1 | 23 | – | 13 | – | |||||||||||||||||
| 44 | 48 | 325 | 203 | 319 | – | |||||||||||||||||
| 27 | 27 | 275 | 162 | 227 | 4 | |||||||||||||||||
| 12 | 12 | 128 | 73 | 138 | 3 | |||||||||||||||||
| 9 | 10 | 100 | 60 | 82 | 4 | |||||||||||||||||
| 7 | 6 | 63 | 39 | 63 | 5 | |||||||||||||||||
| – | – | – | – | – | – | |||||||||||||||||
| 5 | 76 | 560 | 314 | 247 | 2 | |||||||||||||||||
| 2,514 | 2,073 | 18,290 | 10,649 | 18,896 | 162 | |||||||||||||||||
| (177 | ) | (283 | ) | (2,284 | ) | (1,462 | ) | (1,561 | ) | – | ||||||||||||
| – | (206 | ) | – | – | (2 | ) | (33 | ) | ||||||||||||||
| – | – | (3 | ) | – | – | – | ||||||||||||||||
| – | (336 | ) | (1,679 | ) | (994 | ) | (1,755 | ) | (47 | ) | ||||||||||||
| (10 | ) | – | – | – | – | – | ||||||||||||||||
| 2,327 | 1,248 | 14,324 | 8,193 | 15,578 | 82 | |||||||||||||||||
| 3,204 | 3,995 | 48,193 | 22,667 | 108,548 | 117 | |||||||||||||||||
| 22,656 | (828 | ) | 34,039 | 28,729 | (54,009 | ) | 1 | |||||||||||||||
| – | (64 | ) | 1,197 | (4,093 | ) | – | – | |||||||||||||||
| – | – | (2,737 | ) | 72 | – | – | ||||||||||||||||
| – | – | (1,339 | ) | (455 | ) | – | – | |||||||||||||||
| – | – | 101 | – | – | – | |||||||||||||||||
| – | – | (2,915 | ) | (189 | ) | 1,485 | – | |||||||||||||||
| 6,545 | 1,963 | 39,561 | 12,236 | 129,008 | 5 | |||||||||||||||||
| – | 15 | 1,544 | 1,524 | – | – | |||||||||||||||||
| – | – | 251 | 87 | – | – | |||||||||||||||||
| – | – | (104 | ) | – | – | – | ||||||||||||||||
| – | – | (2,383 | ) | (166 | ) | (708 | ) | – | ||||||||||||||
|
– |
|
|
– |
|
|
388 |
|
|
(111 |
) |
|
– |
|
|
– |
| |||||
| $ | 32,405 | $ | 5,081 | $ | 115,796 | $ | 60,301 | $ | 184,324 | $ | 123 | |||||||||||
| SEI Institutional Managed Trust / Annual Report / September 30, 2016 | 289 |
STATEMENTS OF OPERATIONS/CONSOLIDATED STATEMENTS OF OPERATIONS ($ Thousands)
For the year or period ended September 30, 2016
| Tax-Free Conservative Income Fund(3) | Real Return Fund | Dynamic Asset Allocation Fund | ||||||||||
Investment Income: | ||||||||||||
Dividends | $ | – | $ | – | $ | 10,519 | ||||||
Dividends from Affiliated Investment Company (1) | – | 5 | – | |||||||||
Interest Income | 108 | 1,366 | – | |||||||||
Security Lending Income — net (1)(2) | – | – | – | |||||||||
Less: Foreign Taxes Withheld | – | – | – | |||||||||
Total Investment Income | 108 | 1,371 | 10,519 | |||||||||
Expenses: | ||||||||||||
Administration Fees | 38 | 909 | 1,443 | |||||||||
Shareholder Servicing Fees Class A | 32 | 691 | 1,083 | |||||||||
Investment Advisory Fees | 19 | 667 | 2,886 | |||||||||
Trustees’ Fees | – | 5 | 7 | |||||||||
Chief Compliance Officer Fees | – | 2 | 3 | |||||||||
Registration Fees | 3 | 10 | 33 | |||||||||
Printing Fees | 2 | 39 | 79 | |||||||||
Professional Fees | 2 | 18 | 28 | |||||||||
Custodian/Wire Agent Fees | 1 | 15 | 24 | |||||||||
Dividend Expense on Securities Sold Short | – | – | – | |||||||||
Proxy Fees | – | 60 | 83 | |||||||||
Interest Expense | – | – | – | |||||||||
Other Expenses | 2 | 6 | 13 | |||||||||
Total Expenses | 99 | 2,422 | 5,682 | |||||||||
Less: | ||||||||||||
Waiver of Investment Advisory Fees | – | (303 | ) | (2,104 | ) | |||||||
Waiver of Shareholder Servicing Fees Class A | (19 | ) | (414 | ) | – | |||||||
Waiver of Administration Fees | (29 | ) | (303 | ) | – | |||||||
Net Expenses | 51 | 1,402 | 3,578 | |||||||||
Net Investment Income (Loss) | 57 | (31 | ) | 6,941 | ||||||||
Net Realized Gain (Loss) on: | ||||||||||||
Investments | – | (745 | ) | (516 | ) | |||||||
Securities Sold Short | – | – | – | |||||||||
Futures Contracts | – | – | (2,981 | ) | ||||||||
Foreign Currency Transactions | – | – | (3,995 | ) | ||||||||
Purchased and Written Options | – | – | (195 | ) | ||||||||
Purchased and Written Swaptions | – | – | – | |||||||||
Swap Contracts | – | – | 1,437 | |||||||||
Net Change in Unrealized Appreciation (Depreciation) on: | ||||||||||||
Investments | (14 | ) | 8,054 | 44,680 | ||||||||
Securities Sold Short | – | – | – | |||||||||
Affiliated Investments | – | – | – | |||||||||
Futures Contracts | – | – | 59 | |||||||||
Purchased and Written Options | – | – | (109 | ) | ||||||||
Swap Contracts | – | – | 576 | |||||||||
Foreign Currency Translation of Other Assets and Liabilities Denominated in Foreign Currencies | – | – | (2,358 | ) | ||||||||
Net Increase in Net Assets Resulting from Operations | $ | 43 | $ | 7,278 | $ | 43,539 | ||||||
| (1) | See Note 6 in Notes to Financial Statements. |
| (2) | Income is from the Investment of collateral in an affiliated security. |
| (3) | Commenced operation on April 22, 2016. |
Amounts designated as “—” are $0 or have been rounded to $0.
The accompanying notes are an integral part of the financial statements.
| 290 | SEI Institutional Managed Trust / Annual Report / September 30, 2016 |
| Multi-Strategy Alternative Fund | Multi-Asset Accumulation Fund | Multi-Asset Income Fund | Multi-Asset Inflation Managed Fund | Multi-Asset Capital Stability Fund | Long/Short Alternative Fund | |||||||||||||||||
| $ | 8,348 | $ | 5,562 | $ | 5,015 | $ | 7,176 | $ | 362 | $ | 140 | |||||||||||
| 175 | 1,218 | – | – | – | – | |||||||||||||||||
| 2,866 | 8,128 | 33,375 | 11,839 | 3,401 | 109 | |||||||||||||||||
| – | – | – | – | – | – | |||||||||||||||||
| (65 | ) | (401 | ) | (102 | ) | 10 | – | – | ||||||||||||||
| 11,324 | 14,507 | 38,288 | 19,025 | 3,763 | 249 | |||||||||||||||||
| 1,648 | 6,396 | 2,021 | 3,143 | 1,993 | 124 | |||||||||||||||||
| 1,370 | 4,824 | 1,501 | 2,400 | 1,532 | – | |||||||||||||||||
| 8,238 | 15,990 | 4,043 | 5,762 | 2,658 | 331 | |||||||||||||||||
| 8 | 33 | 10 | 16 | 10 | 1 | |||||||||||||||||
| 3 | 12 | 4 | 6 | 4 | – | |||||||||||||||||
| 17 | 49 | 22 | 29 | 22 | – | |||||||||||||||||
| 166 | 277 | 88 | 137 | 86 | 5 | |||||||||||||||||
| 32 | 128 | 40 | 61 | 39 | 2 | |||||||||||||||||
| 26 | 76 | 29 | 34 | 40 | 2 | |||||||||||||||||
| 1,461 | – | – | 1,586 | – | – | |||||||||||||||||
| 105 | 321 | 115 | 177 | 108 | 7 | |||||||||||||||||
| – | – | 20 | 1,656 | – | – | |||||||||||||||||
| 22 | 108 | 189 | 93 | 18 | 4 | |||||||||||||||||
| 13,096 | 28,214 | 8,082 | 15,100 | 6,510 | 476 | |||||||||||||||||
| (6,040 | ) | (3,418 | ) | (1,452 | ) | (1,936 | ) | (313 | ) | (96 | ) | |||||||||||
| (20 | ) | – | (901 | ) | – | (919 | ) | – | ||||||||||||||
| (894 | ) | – | (264 | ) | (524 | ) | (1,093 | ) | – | |||||||||||||
| 6,142 | 24,796 | 5,465 | 12,640 | 4,185 | 380 | |||||||||||||||||
| 5,182 | (10,289 | ) | 32,823 | 6,385 | (422 | ) | (131 | ) | ||||||||||||||
| (3,722 | ) | 729 | (3,010 | ) | (12,000 | ) | 1,209 | (9 | ) | |||||||||||||
| (4,357 | ) | – | – | 8,534 | – | – | ||||||||||||||||
| (290 | ) | 144,544 | (240 | ) | (5,288 | ) | 3,030 | 206 | ||||||||||||||
| 275 | 10,203 | 597 | (28 | ) | 1,589 | – | ||||||||||||||||
| (1,165 | ) | – | (1,873 | ) | (338 | ) | (587 | ) | – | |||||||||||||
| – | – | – | – | 356 | – | |||||||||||||||||
| 1,030 | 28,352 | (3,517 | ) | (1,218 | ) | (326 | ) | – | ||||||||||||||
| 24,156 | 56,138 | 23,723 | 54,961 | 4,289 | 103 | |||||||||||||||||
| (3,102 | ) | – | – | (41,293 | ) | – | – | |||||||||||||||
| 596 | – | – | – | – | – | |||||||||||||||||
| 9 | 6,227 | 698 | 5,333 | 269 | 442 | |||||||||||||||||
| (29 | ) | – | (1,471 | ) | 11 | 406 | – | |||||||||||||||
| 240 | (1,930 | ) | 1,184 | (391 | ) | 788 | – | |||||||||||||||
|
(78 |
) | (1,282 | ) | 306 | (2,228 | ) | (345 | ) | – | ||||||||||||
| $ | 18,745 | $ | 232,692 | $ | 49,220 | $ | 12,440 | $ | 10,256 | $ | 611 | |||||||||||
| SEI Institutional Managed Trust / Annual Report / September 30, 2016 | 291 |
STATEMENTS OF CHANGES IN NET ASSETS ($ Thousands)
For the years or period ended September 30,
| Large Cap Fund(1) | ||||||||
| 2016 | 2015 | |||||||
Operations: | ||||||||
Net investment income | $ | 24,209 | $ | 20,982 | ||||
Net realized gain (loss) from investments, securities sold short, futures contracts, options, swaptions and swap contracts | (40,384 | ) | 383,661 | |||||
Net realized (Loss) on foreign currency transactions | – | – | ||||||
Net change in unrealized appreciation (depreciation) on investments, securities sold short, futures contracts, options and swap contracts | 252,691 | (452,335 | ) | |||||
Net Increase (Decrease) in Net Assets Resulting from Operations | 236,516 | (47,692 | ) | |||||
Dividends and Distributions to Shareholders: | ||||||||
Net investment income: | ||||||||
Class A | (22,122 | ) | (16,450 | ) | ||||
Class E | N/A | N/A | ||||||
Class I | N/A | N/A | ||||||
Class T | N/A | N/A | ||||||
Class Y | (2,019 | ) | (1,174 | ) | ||||
Net capital gains: | ||||||||
Class A | (369,451 | ) | (207,875 | ) | ||||
Class E | N/A | N/A | ||||||
Class I | N/A | N/A | ||||||
Class T | N/A | N/A | ||||||
Class Y | (25,458 | ) | – | |||||
Total Dividends and Distributions | (419,050 | ) | (225,499 | ) | ||||
Capital Share Transactions:(3) | ||||||||
Class A: | ||||||||
Proceeds from shares issued | 572,117 | 782,487 | ||||||
Reinvestment of dividends & distributions | 355,095 | 203,519 | ||||||
Cost of shares redeemed | (1,000,085 | ) | (818,271 | ) | ||||
Net increase (decrease) from Class A transactions | (72,873 | ) | 167,735 | |||||
Class E: | ||||||||
Proceeds from shares issued | N/A | N/A | ||||||
Reinvestment of dividends & distributions | N/A | N/A | ||||||
Cost of shares redeemed | N/A | N/A | ||||||
Net increase (decrease) from Class E transactions | N/A | N/A | ||||||
Class I: | ||||||||
Proceeds from shares issued | N/A | N/A | ||||||
Reinvestment of dividends & distributions | N/A | N/A | ||||||
Cost of shares redeemed | N/A | N/A | ||||||
Net increase (decrease) from Class I transactions | N/A | N/A | ||||||
Class T: | ||||||||
Proceeds from shares issued | N/A | N/A | ||||||
Reinvestment of dividends & distributions | N/A | N/A | ||||||
Cost of shares redeemed | N/A | N/A | ||||||
Net increase (decrease) from Class T transactions | N/A | N/A | ||||||
Class Y: | ||||||||
Proceeds from shares issued | 35,851 | 243,048 | ||||||
Reinvestment of dividends & distributions | 27,475 | 1,174 | ||||||
Cost of shares redeemed | (45,385 | ) | (80,970 | ) | ||||
Net increase (decrease) from Class Y transactions | 17,941 | 163,252 | ||||||
Increase (Decrease) in Net Assets Derived from Capital Share Transactions | (54,932 | ) | 330,987 | |||||
Net Increase (Decrease) in Net Assets | (237,466 | ) | 57,796 | |||||
Net Assets | ||||||||
Beginning of year or period | 2,639,740 | 2,581,944 | ||||||
End of year or period | $ | 2,402,274 | $ | 2,639,740 | ||||
Undistributed Net Investment Income Included in Net Assets at Year or Period End | $ | 5,051 | $ | 4,590 | ||||
| @ | Includes realized gains of $1,179,815 ($ Thousands) for 2015 due to affiliated and in-kind transactions (see Notes 6 and 12). |
| (1) | Class Y commenced operations on December 31, 2014. |
| (2) | Class Y commenced operations on October 30, 2015. |
| (3) | Class T closed on December 30, 2014. |
| (4) | See Note 7 in Notes to Financial Statements for additional information. |
| (5) | Includes redemptions as a result of affiliated and in-kind transactions (see Notes 6 and 12). |
N/A — Not applicable.
Amounts designated as “—” are $0 or have been rounded to $0.
The accompanying notes are an integral part of the financial statements.
| 292 | SEI Institutional Managed Trust / Annual Report / September 30, 2016 |
| Large Cap Value Fund(2) | Large Cap Growth Fund(2) | Tax-Managed Large Cap Fund(1)(3) | S&P 500 Index Fund(2) | |||||||||||||||||||||||||||
| 2016 | 2015 | 2016 | 2015 | 2016 | 2015 | 2016 | 2015 | |||||||||||||||||||||||
| $ | 20,665 | $ | 19,388 | $ | 932 | $ | 3,767 | $ | 33,081 | $ | 23,526 | $ | 11,509 | $ | 16,255 | |||||||||||||||
| (38,340 | ) | 171,067 | (70,590 | ) | 250,177 | (23,600 | ) | 114,462 | 22,525 | 1,258,319 | @ | |||||||||||||||||||
| – | – | – | – | (1 | ) | – | – | – | ||||||||||||||||||||||
| 146,991 | (271,656 | ) | 203,284 | (203,071 | ) | 297,817 | (213,359 | ) | 56,121 | (1,199,416 | ) | |||||||||||||||||||
| 129,316 | (81,201 | ) | 133,626 | 50,873 | 307,297 | (75,371 | ) | 90,155 | 75,158 | |||||||||||||||||||||
| (18,523 | ) | (14,922 | ) | (440 | ) | (2,496 | ) | (30,096 | ) | (20,052 | ) | (6,553 | ) | (6,880 | ) | |||||||||||||||
| N/A | N/A | N/A | N/A | N/A | N/A | (4,549 | ) | (17,505 | ) | |||||||||||||||||||||
| (79 | ) | (69 | ) | – | (4 | ) | N/A | N/A | (110 | ) | (113 | ) | ||||||||||||||||||
| N/A | N/A | N/A | N/A | – | (1 | ) | N/A | N/A | ||||||||||||||||||||||
| (195 | ) | – | (18 | ) | – | (1,885 | ) | (704 | ) | (9 | ) | – | ||||||||||||||||||
| (170,943 | ) | (100,168 | ) | (247,678 | ) | (116,418 | ) | – | – | (563 | ) | (35,643 | ) | |||||||||||||||||
| N/A | N/A | N/A | N/A | N/A | N/A | (352 | ) | (103,471 | ) | |||||||||||||||||||||
| (838 | ) | (623 | ) | (854 | ) | (538 | ) | N/A | N/A | (10 | ) | (692 | ) | |||||||||||||||||
| N/A | N/A | N/A | N/A | – | – | N/A | N/A | |||||||||||||||||||||||
| (3 | ) | – | (3 | ) | – | – | – | – | – | |||||||||||||||||||||
| (190,581 | ) | (115,782 | ) | (248,993 | ) | (119,456 | ) | (31,981 | ) | (20,757 | ) | (12,146 | ) | (164,304 | ) | |||||||||||||||
| 175,232 | 172,834 | 213,121 | 175,310 | 678,227 | 695,876 | 105,268 | 108,597 | |||||||||||||||||||||||
| 178,150 | 108,520 | 234,095 | 112,489 | 27,092 | 17,867 | 6,660 | 40,147 | |||||||||||||||||||||||
| (289,549 | ) | (312,977 | ) | (351,098 | ) | (327,559 | ) | (609,417 | ) | (642,867 | ) | (158,094 | ) | (112,883 | ) | |||||||||||||||
| 63,833 | (31,623 | ) | 96,118 | (39,760 | ) | 95,902 | 70,876 | (46,166 | ) | 35,861 | ||||||||||||||||||||
| N/A | N/A | N/A | N/A | N/A | N/A | 33,726 | 41,342 | |||||||||||||||||||||||
| N/A | N/A | N/A | N/A | N/A | N/A | 4,442 | 119,019 | |||||||||||||||||||||||
| N/A | N/A | N/A | N/A | N/A | N/A | (33,888 | ) | (1,943,969)(4 | ) | |||||||||||||||||||||
| N/A | N/A | N/A | N/A | N/A | N/A | 4,280 | (1,783,608 | ) | ||||||||||||||||||||||
| 1,924 | 1,079 | 1,555 | 1,138 | N/A | N/A | 5,253 | 2,602 | |||||||||||||||||||||||
| 731 | 583 | 627 | 428 | N/A | N/A | 71 | 487 | |||||||||||||||||||||||
| (3,668 | ) | (2,545 | ) | (2,584 | ) | (2,987 | ) | N/A | N/A | (7,598 | ) | (2,435 | ) | |||||||||||||||||
| (1,013 | ) | (883 | ) | (402 | ) | (1,421 | ) | N/A | N/A | (2,274 | ) | 654 | ||||||||||||||||||
| N/A | N/A | N/A | N/A | N/A | – | N/A | N/A | |||||||||||||||||||||||
| N/A | N/A | N/A | N/A | N/A | 1 | N/A | N/A | |||||||||||||||||||||||
| N/A | N/A | N/A | N/A | N/A | (498 | ) | N/A | N/A | ||||||||||||||||||||||
| N/A | N/A | N/A | N/A | N/A | (497 | ) | N/A | N/A | ||||||||||||||||||||||
| 19,939 | – | 19,291 | – | 69,611 | 153,508 | 1,046 | – | |||||||||||||||||||||||
| 195 | – | 18 | – | 1,857 | 704 | 9 | – | |||||||||||||||||||||||
| (1,001 | ) | – | (942 | ) | – | (20,114 | ) | (16,000 | ) | (411 | ) | – | ||||||||||||||||||
| 19,133 | – | 18,367 | – | 51,354 | 138,212 | 644 | – | |||||||||||||||||||||||
| 81,953 | (32,506 | ) | 114,083 | (41,181 | ) | 147,256 | 208,591 | (43,516 | ) | (1,747,093 | ) | |||||||||||||||||||
| 20,688 | (229,489 | ) | (1,284 | ) | (109,764 | ) | 422,572 | 112,463 | 34,493 | (1,836,239 | ) | |||||||||||||||||||
| 1,307,510 | 1,536,999 | 1,448,204 | 1,557,968 | 3,202,774 | 3,090,311 | 636,479 | 2,472,718 | |||||||||||||||||||||||
| $ | 1,328,198 | $ | 1,307,510 | $ | 1,446,920 | $ | 1,448,204 | $ | 3,625,346 | $ | 3,202,774 | $ | 670,972 | $ | 636,479 | |||||||||||||||
| $ | 9,711 | $ | 7,694 | $ | 1,233 | $ | – | $ | 6,797 | $ | 5,846 | $ | 2,548 | $ | 2,196 | |||||||||||||||
| SEI Institutional Managed Trust / Annual Report / September 30, 2016 | 293 |
STATEMENTS OF CHANGES IN NET ASSETS ($ Thousands)
For the years or period ended September 30,
| Small Cap Fund(1) | Small Cap Value Fund(2) | Small Cap Growth Fund(2) | ||||||||||||||||||||||
| 2016 | 2015 | 2016 | 2015 | 2016 | 2015 | |||||||||||||||||||
Operations: | ||||||||||||||||||||||||
Net investment Income (Loss) | $ | 245 | $ | (520 | ) | $ | 2,358 | $ | 2,129 | $ | (966 | ) | $ | (1,716 | ) | |||||||||
Net realized gain (loss) from investments, securities sold short, futures contracts, options, swaptions and swap contracts | (4,935 | ) | 52,132 | (4,387 | ) | 20,141 | (9,414 | ) | 60,950 | |||||||||||||||
Net realized Gain (Loss) on foreign currency transactions | — | — | — | — | — | — | ||||||||||||||||||
Net change in unrealized appreciation (depreciation) on investments, securities sold short, futures contracts, options and swap contracts | 47,891 | (55,301 | ) | 39,715 | (23,946 | ) | 35,793 | (49,856 | ) | |||||||||||||||
Net change in unrealized appreciation (depreciation) on foreign currency transactions | — | — | — | — | — | — | ||||||||||||||||||
Net Increase (Decrease) in Net Assets Resulting from Operations | 43,201 | (3,689 | ) | 37,686 | (1,676 | ) | 25,413 | 9,378 | ||||||||||||||||
Dividends and Distributions to Shareholders: | ||||||||||||||||||||||||
Net investment income: | ||||||||||||||||||||||||
Class A | (81 | ) | — | (2,620 | ) | (2,503 | ) | — | — | |||||||||||||||
Class I | N/A | N/A | (17 | ) | (18 | ) | — | — | ||||||||||||||||
Class Y | (30 | ) | — | (26 | ) | — | — | — | ||||||||||||||||
Net capital gains: | ||||||||||||||||||||||||
Class A | (53,729 | ) | (40,220 | ) | (23,148 | ) | (29,816 | ) | — | — | ||||||||||||||
Class I | N/A | N/A | (176 | ) | (337 | ) | — | — | ||||||||||||||||
Class Y | (3,378 | ) | — | (1 | ) | — | — | — | ||||||||||||||||
Total Dividends and Distributions | (57,218 | ) | (40,220 | ) | (25,988 | ) | (32,674 | ) | — | — | ||||||||||||||
Capital Share Transactions:(4) | ||||||||||||||||||||||||
Class A: | ||||||||||||||||||||||||
Proceeds from shares issued | 152,199 | 165,162 | 91,045 | 49,533 | 37,779 | 47,183 | ||||||||||||||||||
Reinvestment of dividends & distributions | 47,634 | 35,322 | 24,137 | 29,963 | N/A | N/A | ||||||||||||||||||
Cost of shares redeemed | (130,137 | ) | (146,610 | ) | (108,797 | ) | (74,752 | ) | (74,997 | ) | (67,002 | ) | ||||||||||||
Net increase (decrease) from Class A transactions | 69,696 | 53,874 | 6,385 | 4,744 | (37,218 | ) | (19,819 | ) | ||||||||||||||||
Class I: | ||||||||||||||||||||||||
Proceeds from shares issued | N/A | N/A | 1,365 | 797 | 1,127 | 951 | ||||||||||||||||||
Reinvestment of dividends & distributions | N/A | N/A | 164 | 317 | — | — | ||||||||||||||||||
Cost of shares redeemed | N/A | N/A | (2,458 | ) | (1,185 | ) | (1,807 | ) | (1,200 | ) | ||||||||||||||
Net increase (decrease) from Class I transactions | N/A | N/A | (929 | ) | (71 | ) | (680 | ) | (249 | ) | ||||||||||||||
Class Y: | ||||||||||||||||||||||||
Proceeds from shares issued | 13,098 | 40,512 | 6,260 | — | 6,390 | — | ||||||||||||||||||
Reinvestment of dividends & distributions | 3,408 | — | 26 | — | — | — | ||||||||||||||||||
Cost of shares redeemed | (11,825 | ) | (5,704 | ) | (305 | ) | — | (296 | ) | — | ||||||||||||||
Net increase (decrease) from Class Y transactions | 4,681 | 34,808 | 5,981 | — | 6,094 | — | ||||||||||||||||||
Increase (Decrease) in Net Assets Derived from Capital Share Transactions | 74,377 | 88,682 | 11,437 | 4,673 | (31,804 | ) | (20,068 | ) | ||||||||||||||||
Net Increase (Decrease) in Net Assets | 60,360 | 44,773 | 23,135 | (29,677 | ) | (6,391 | ) | (10,690 | ) | |||||||||||||||
Net Assets | ||||||||||||||||||||||||
Beginning of year or period | 528,055 | 483,282 | 349,330 | 379,007 | 328,127 | 338,817 | ||||||||||||||||||
End of year or period | $ | 588,415 | $ | 528,055 | $ | 372,465 | $ | 349,330 | $ | 321,736 | $ | 328,127 | ||||||||||||
Undistributed (Distributions in Excess of) Net Investment Income Included in Net Assets at Year or Period End | $ | 416 | $ | (29 | ) | $ | 1,105 | $ | 750 | $ | (901 | ) | $ | (1,334 | ) | |||||||||
| (1) | Class Y commenced operations on December 31, 2014. |
| (2) | Class Y commenced operations on October 30, 2015. |
| (3) | Class Y commenced operations on April 30, 2015. |
| (4) | See Note 7 in Notes to Financial Statements for additional information. |
† Includes realized losses of $(24,125) ($ Thousands) due to in-kind transactions (See Note 13).
* Includes redemptions as a result of in-kind transactions (See Note 13).
N/A — Not applicable.
Amounts designated as “—” are $0 or have been rounded to $0.
The accompanying notes are an integral part of the financial statements.
| 294 | SEI Institutional Managed Trust / Annual Report / September 30, 2016 |
Tax-Managed Small/Mid Cap Fund(1) | Mid-Cap Fund(2) | U.S. Managed Volatility Fund(1) | Global Managed Volatility Fund(1) | Tax-Managed Managed Volatility Fund(3) | ||||||||||||||||||||||||||||||||||
| 2016 | 2015 | 2016 | 2015 | 2016 | 2015 | 2016 | 2015 | 2016 | 2015 | |||||||||||||||||||||||||||||
| $ | 2,358 | $ | 813 | $ | 1,045 | $ | 593 | $ | 24,083 | $ | 19,059 | $ | 29,649 | $ | 35,558 | $ | 16,234 | $ | 12,159 | |||||||||||||||||||
| (1,434 | ) | (2,210 | ) | (12 | ) | 15,211 | 46,522 | 78,952 | 28,510 | † | 31,072 | 13,937 | 41,085 | |||||||||||||||||||||||||
| — | — | — | — | 66 | (64 | ) | 880 | 111,849 | (21 | ) | (36 | ) | ||||||||||||||||||||||||||
| 51,653 | 2,088 | 9,570 | (15,787 | ) | 97,201 | (60,314 | ) | 163,880 | (68,468 | ) | 90,442 | (9,817 | ) | |||||||||||||||||||||||||
| — | — | — | — | 10 | 2 | (2,264 | ) | (5,649 | ) | (7 | ) | 8 | ||||||||||||||||||||||||||
| 52,577 | 691 | 10,603 | 17 | 167,882 | 37,635 | 220,655 | 104,362 | 120,585 | 43,399 | |||||||||||||||||||||||||||||
| (1,942 | ) | (492 | ) | (1,316 | ) | (229 | ) | (16,243 | ) | (14,740 | ) | (121,131 | ) | (96,403 | ) | (15,355 | ) | (11,964 | ) | |||||||||||||||||||
| N/A | N/A | (11 | ) | (1 | ) | (22 | ) | (20 | ) | (66 | ) | (54 | ) | N/A | N/A | |||||||||||||||||||||||
| (205 | ) | (24 | ) | (3 | ) | — | (7,953 | ) | (3,149 | ) | (4,789 | ) | — | (291 | ) | — | ||||||||||||||||||||||
| — | (6,161 | ) | (14,310 | ) | (8,477 | ) | (49,368 | ) | (109,056 | ) | (30,756 | ) | (108,330 | ) | (37,938 | ) | (50,428 | ) | ||||||||||||||||||||
| N/A | N/A | (133 | ) | (74 | ) | (78 | ) | (175 | ) | (17 | ) | (69 | ) | N/A | N/A | |||||||||||||||||||||||
| — | — | (3 | ) | — | (19,030 | ) | — | (1,174 | ) | — | (8 | ) | — | |||||||||||||||||||||||||
| (2,147 | ) | (6,677 | ) | (15,776 | ) | (8,781 | ) | (92,694 | ) | (127,140 | ) | (157,933 | ) | (204,856 | ) | (53,592 | ) | (62,392 | ) | |||||||||||||||||||
| 140,278 | 146,045 | 45,846 | 56,163 | 485,649 | 346,255 | 686,309 | 849,169 | 422,637 | 299,438 | |||||||||||||||||||||||||||||
| 1,729 | 5,876 | 13,666 | 7,637 | 57,534 | 108,070 | 142,990 | 190,920 | 45,387 | 52,717 | |||||||||||||||||||||||||||||
| (134,198 | ) | (130,722 | ) | (60,453 | ) | (54,886 | ) | (422,085 | ) | (420,910 | ) | (1,499,613 | ) * | (504,130 | ) | (269,936 | ) | (197,877 | ) | |||||||||||||||||||
| 7,809 | 21,199 | (941 | ) | 8,914 | 121,098 | 33,415 | (670,314 | ) | 535,959 | 198,088 | 154,278 | |||||||||||||||||||||||||||
| N/A | N/A | 104 | 216 | 555 | 1,200 | 1,745 | 356 | N/A | N/A | |||||||||||||||||||||||||||||
| N/A | N/A | 144 | 75 | 100 | 196 | 83 | 123 | N/A | N/A | |||||||||||||||||||||||||||||
| N/A | N/A | (229 | ) | (484 | ) | (298 | ) | (1,046 | ) | (511 | ) | (146 | ) | N/A | N/A | |||||||||||||||||||||||
| N/A | N/A | 19 | (193 | ) | 357 | 350 | 1,317 | 333 | N/A | N/A | ||||||||||||||||||||||||||||
| 20,131 | 33,638 | 517 | — | 183,651 | 473,581 | 60,214 | 106,183 | 36,398 | 320 | |||||||||||||||||||||||||||||
| 201 | 24 | 2 | — | 26,906 | 3,139 | 5,963 | — | 250 | — | |||||||||||||||||||||||||||||
| (5,900 | ) | (4,248 | ) | (100 | ) | — | (144,982 | ) | (70,875 | ) | (66,830 | ) | (12,258 | ) | (3,583 | ) | — | |||||||||||||||||||||
| 14,432 | 29,414 | 419 | — | 65,575 | 405,845 | (653 | ) | 93,925 | 33,065 | 320 | ||||||||||||||||||||||||||||
| 22,241 | 50,613 | (503 | ) | 8,721 | 187,030 | 439,610 | (669,650 | ) | 630,217 | 231,153 | 154,598 | |||||||||||||||||||||||||||
| 72,671 | 44,627 | (5,676 | ) | (43 | ) | 262,218 | 350,105 | (606,928 | ) | 529,723 | 298,146 | 135,605 | ||||||||||||||||||||||||||
| 617,802 | 573,175 | 94,806 | 94,849 | 1,352,950 | 1,002,845 | 2,330,599 | 1,800,876 | 901,349 | 765,744 | |||||||||||||||||||||||||||||
| $ | 690,473 | $ | 617,802 | $ | 89,130 | $ | 94,806 | $ | 1,615,168 | $ | 1,352,950 | $ | 1,723,671 | $ | 2,330,599 | $ | 1,199,495 | $ | 901,349 | |||||||||||||||||||
$ | 1,093 |
| $ | 148 |
| $ | 46 |
| $ | 401 |
| $ | 5,726 | $ | 5,368 | $ | 21,778 | $ | 114,930 | $ | 3,919 | $ | 3,095 | |||||||||||||||
| SEI Institutional Managed Trust / Annual Report / September 30, 2016 | 295 |
STATEMENTS OF CHANGES IN NET ASSETS ($ Thousands)
For the years or period ended September 30,
Real Estate Fund(1) | Enhanced Income Fund(1) | Core Fixed Income Fund(2) | ||||||||||||||||||||||
| 2016 | 2015 | 2016 | 2015 | 2016 | 2015 | |||||||||||||||||||
Operations: | ||||||||||||||||||||||||
Net investment Income (Loss) | $ | 3,204 | $ | 1,079 | $ | 3,995 | $ | 4,023 | $ | 48,193 | $ | 48,651 | ||||||||||||
Net realized gain (loss) from investments, securities sold short, futures contracts, options, swaptions and swap contracts | 22,656 | 13,008 | (892 | ) | (520 | ) | 31,083 | 30,840 | ||||||||||||||||
Net realized Gain (Loss) on foreign currency transactions | – | – | – | – | (2,737 | ) | 2,242 | |||||||||||||||||
Net change in unrealized appreciation (depreciation) on investments, securities sold short, futures contracts, options and swap contracts | 6,545 | 10,977 | 1,978 | (3,013 | ) | 38,869 | (31,800 | ) | ||||||||||||||||
Net change in unrealized appreciation (depreciation) on foreign currency transactions | – | – | – | – | 388 | (2,305 | ) | |||||||||||||||||
Net Increase (Decrease) in Net Assets Resulting from Operations | 32,405 | 25,064 | 5,081 | 490 | 115,796 | 47,628 | ||||||||||||||||||
Dividends and Distributions to Shareholders: | ||||||||||||||||||||||||
Net investment income: | ||||||||||||||||||||||||
Class A | (1,492 | ) | (3,342 | ) | (4,041 | ) | (3,921 | ) | (47,320 | ) | (48,772 | ) | ||||||||||||
Class I | (5 | ) | (8 | ) | (4 | ) | (6 | ) | (196 | ) | (215 | ) | ||||||||||||
Class Y | (289 | ) | (147 | ) | (333 | ) | (366 | ) | (1,281 | ) | (99 | ) | ||||||||||||
Net capital gains: | ||||||||||||||||||||||||
Class A | (13,478 | ) | (9,691 | ) | – | – | (22,282 | ) | – | |||||||||||||||
Class I | (50 | ) | (29 | ) | – | – | (88 | ) | – | |||||||||||||||
Class Y | (2,072 | ) | (355 | ) | – | – | (251 | ) | – | |||||||||||||||
Total Dividends and Distributions | (17,386 | ) | (13,572 | ) | (4,378 | ) | (4,293 | ) | (71,418 | ) | (49,086 | ) | ||||||||||||
Capital Share Transactions:(4) | ||||||||||||||||||||||||
Class A: | ||||||||||||||||||||||||
Proceeds from shares issued | 53,758 | 57,178 | 64,014 | 79,695 | 370,267 | 378,385 | ||||||||||||||||||
Reinvestment of dividends & distributions | 13,986 | 12,341 | 3,328 | 3,219 | 62,831 | 44,243 | ||||||||||||||||||
Cost of shares redeemed | (98,481 | ) | (116,047 | ) | (77,456 | ) | (119,541 | ) | (473,871 | ) | (394,000 | ) | ||||||||||||
Net increase (decrease) from Class A transactions | (30,737 | ) | (46,528 | ) | (10,114 | ) | (36,627 | ) | (40,773 | ) | 28,628 | |||||||||||||
Class I: | ||||||||||||||||||||||||
Proceeds from shares issued | 51 | 53 | 56 | 67 | 7,030 | 5,064 | ||||||||||||||||||
Reinvestment of dividends & distributions | 55 | 38 | 5 | 6 | 181 | 147 | ||||||||||||||||||
Cost of shares redeemed | (224 | ) | (23 | ) | (38 | ) | (213 | ) | (10,645 | ) | (3,212 | ) | ||||||||||||
Net increase (decrease) from Class I transactions | (118 | ) | 68 | 23 | (140 | ) | (3,434 | ) | 1,999 | |||||||||||||||
Class Y: | ||||||||||||||||||||||||
Proceeds from shares issued | 20,904 | 24,117 | 9,533 | 34,988 | 48,188 | 23,516 | ||||||||||||||||||
Reinvestment of dividends & distributions | 2,288 | 502 | 325 | 366 | 1,528 | 99 | ||||||||||||||||||
Cost of shares redeemed | (8,223 | ) | (4,766 | ) | (3,986 | ) | (23,930 | ) | (3,615 | ) | (470 | ) | ||||||||||||
Net increase (decrease) from Class Y transactions | 14,969 | 19,853 | 5,872 | 11,424 | 46,101 | 23,145 | ||||||||||||||||||
Increase (Decrease) in Net Assets Derived from Capital Share Transactions | (15,886 | ) | (26,607 | ) | (4,219 | ) | (25,343 | ) | 1,894 | 53,772 | ||||||||||||||
Net Increase (Decrease) in Net Assets | (867 | ) | (15,115 | ) | (3,516 | ) | (29,146 | ) | 46,272 | 52,314 | ||||||||||||||
Net Assets | ||||||||||||||||||||||||
Beginning of year or period | 212,287 | 227,402 | 202,140 | 231,286 | 2,104,070 | 2,051,756 | ||||||||||||||||||
End of year or period | $ | 211,420 | $ | 212,287 | $ | 198,624 | $ | 202,140 | $ | 2,150,342 | $ | 2,104,070 | ||||||||||||
Undistributed (Distributions in Excess of) Net Investment Income Included in Net Assets at Year or Period End | $ | 2,193 | $ | 88 | $ | 974 | $ | 1,128 | $ | (3,948 | ) | $ | (1,148 | ) | ||||||||||
| (1) | Class Y commenced operations on December 31, 2014. |
| (2) | Class Y commenced operations on June 30, 2015. |
| (3) | Commenced operations on April 22, 2016 |
| (4) | See Note 7 in Notes to Financial Statements for additional information. |
N/A — Not applicable.
Amounts designated as “—” are $0 or have been rounded to $0.
The accompanying notes are an integral part of the financial statements.
| 296 | SEI Institutional Managed Trust / Annual Report / September 30, 2016 |
U.S. Fixed Income Fund(1) | High Yield Bond Fund(1) | Conservative Income Fund(3) | Tax-Free Conservative Income Fund(3) | Real Return Fund(1) | ||||||||||||||||||||||||||
| 2016 | 2015 | 2016 | 2015 | 2016 | 2016 | 2016 | 2015 | |||||||||||||||||||||||
| $ | 22,667 | $ | 22,338 | $ | 108,548 | $ | 99,796 | $ | 117 | $ | 57 | $ | (31 | ) | $ | (2,742) | ||||||||||||||
|
23,992 |
| 12,791 | (52,524 | ) | (17,997 | ) | 1 | – | (745 | ) | (742) | ||||||||||||||||||
| 72 | (2 | ) | – | – | – | – | – | – | ||||||||||||||||||||||
|
13,681 |
| (5,940 | ) | 128,300 | (139,096 | ) | 5 | (14) | 8,054 | (1,056) | |||||||||||||||||||
|
(111 |
) | (48 | ) | – | – | – | – | – | – | ||||||||||||||||||||
|
60,301 |
| 29,139 | 184,324 | (57,297 | ) | 123 | 43 | 7,278 | (4,540) | ||||||||||||||||||||
| (21,692 | ) | (21,502 | ) | (97,388 | ) | (91,740 | ) | (82) | (35) | – | (344) | |||||||||||||||||||
| N/A | N/A | (303 | ) | (373 | ) | N/A | N/A | N/A | N/A | |||||||||||||||||||||
| (1,995 | ) | (1,561 | ) | �� | (11,336 | ) | (6,435 | ) | (35) | (22) | – | – | ||||||||||||||||||
| (11,458 | ) | (1,985 | ) | (20,752 | ) | (9,791 | ) | – | – | – | – | |||||||||||||||||||
| N/A | N/A | (14 | ) | (21 | ) | N/A | N/A | N/A | N/A | |||||||||||||||||||||
| (904 | ) | – | (1,965 | ) | – | – | – | – | – | |||||||||||||||||||||
| (36,049 | ) | (25,048 | ) | (131,758 | ) | (108,360 | ) | (117) | (57) | – | (344) | |||||||||||||||||||
| 341,832 | 325,292 | 557,107 | 585,697 | 79,708 | 34,618 | 101,105 | 90,001 | |||||||||||||||||||||||
| 27,978 | 20,101 | 104,534 | 89,537 | 2 | N/A | – | 294 | |||||||||||||||||||||||
| (300,552 | ) | (335,149 | ) | (516,086 | ) | (677,590 | ) | (4,704) | (3,662) | (80,211 | ) | (106,478) | ||||||||||||||||||
| 69,258 | 10,244 | 145,555 | (2,356 | ) | 75,006 | 30,956 | 20,894 | (16,183) | ||||||||||||||||||||||
| N/A | N/A | 17,111 | 30,476 | N/A | N/A | N/A | N/A | |||||||||||||||||||||||
| N/A | N/A | 257 | 351 | N/A | N/A | N/A | N/A | |||||||||||||||||||||||
| N/A | N/A | (17,757 | ) | (32,994 | ) | N/A | N/A | N/A | N/A | |||||||||||||||||||||
| N/A | N/A | (389 | ) | (2,167 | ) | N/A | N/A | N/A | N/A | |||||||||||||||||||||
| 28,070 | 101,947 | 73,327 | 168,948 | 33,606 | 13,904 | 11,568 | 29,060 | |||||||||||||||||||||||
| 2,884 | 1,581 | 13,277 | 6,525 | 34 | 22 | – | – | |||||||||||||||||||||||
| (24,672 | ) | (13,741 | ) | (39,455 | ) | (23,450 | ) | (16,845) | – | (8,938 | ) | (3,524) | ||||||||||||||||||
| 6,282 | 89,787 | 47,149 | 152,023 | 16,795 | 13,926 | 2,630 | 25,536 | |||||||||||||||||||||||
|
75,540 |
| 100,031 | 192,315 | 147,500 | 91,801 | 44,882 | 23,524 | 9,353 | |||||||||||||||||||||
| 99,792 | 104,122 | 244,881 | (18,157 | ) | 91,807 | 44,868 | 30,802 | 4,469 | ||||||||||||||||||||||
| 1,202,602 | 1,098,480 | 1,693,119 | 1,711,276 | – | – | 289,413 | 284,944 | |||||||||||||||||||||||
| $ | 1,302,394 | $ | 1,202,602 | $ | 1,938,000 | $ | 1,693,119 | $ | 91,807 | $ | 44,868 | $ | 320,215 | $ | 289,413 | |||||||||||||||
$ |
165 |
| $ | 172 | $ | 16,847 | $ | 17,465 | $ | – | $ | – | $ | (336 | ) | $ | (1,766) | |||||||||||||
| SEI Institutional Managed Trust / Annual Report / September 30, 2016 | 297 |
STATEMENTS OF CHANGES IN NET ASSETS/CONSOLIDATED STATEMENTS OF CHANGES IN NET ASSETS ($ Thousands)
For the years or period ended September 30,
| Dynamic Asset Allocation Fund(1) | Multi-Strategy Alternative Fund(2) | Multi-Asset Accumulation Fund(3) | ||||||||||||||||||||||
| 2016 | 2015 | 2016 | 2015 | 2016 | 2015 | |||||||||||||||||||
Operations: | ||||||||||||||||||||||||
Net investment Income (Loss) | $ | 6,941 | $ | 209 | $ | 5,182 | $ | 8,025 | $ | (10,289 | ) | $ | (17,632 | ) | ||||||||||
Net realized gain (loss) from investments, securities sold short, futures contracts, options, swaptions and swap contracts | (2,255 | ) | (742 | ) | (8,504 | ) | 10,930 | 173,625 | (81,069 | ) | ||||||||||||||
Net realized Gain (Loss) on foreign currency transactions | (3,995 | ) | 4 | 275 | – | 10,203 | (8,451 | ) | ||||||||||||||||
Net change in unrealized appreciation (depreciation) on investments, securities sold short, futures contracts, options and swap contracts | 45,206 | (6,250 | ) | 21,870 | (35,082 | ) | 60,435 | 14,046 | ||||||||||||||||
Net change in unrealized appreciation (depreciation) on foreign currency transactions | (2,358 | ) | 61 | (78 | ) | – | (1,282 | ) | 1,263 | |||||||||||||||
Net Increase (Decrease) in Net Assets Resulting from Operations | 43,539 | (6,718 | ) | 18,745 | (16,127 | ) | 232,692 | (91,843 | ) | |||||||||||||||
Dividends and Distributions to Shareholders: | ||||||||||||||||||||||||
Net investment income: | ||||||||||||||||||||||||
Class A | (1,545 | ) | – | (8,678 | ) | (8,032 | ) | – | (21,898 | ) | ||||||||||||||
Class Y | (203 | ) | – | – | * | – | – | – | ||||||||||||||||
Net capital gains: | ||||||||||||||||||||||||
Class A | – | – | (5,493 | ) | – | (52,441 | ) | (155,829 | ) | |||||||||||||||
Class Y | – | – | – | * | – | (5,687 | ) | – | ||||||||||||||||
Total Dividends and Distributions | (1,748 | ) | – | (14,171 | ) | (8,032 | ) | (58,128 | ) | (177,727 | ) | |||||||||||||
Capital Share Transactions:(5) | ||||||||||||||||||||||||
Class A: | ||||||||||||||||||||||||
Proceeds from shares issued | 528,103 | 24,838 | 171,102 | 165,330 | 552,145 | 668,657 | ||||||||||||||||||
Reinvestment of dividends & distributions | 1,436 | – | 12,521 | 7,058 | 48,391 | 161,925 | ||||||||||||||||||
Cost of shares redeemed | (98,390 | ) | (1,318 | ) | (142,145 | ) | (118,528 | ) | (486,245 | ) | (636,334 | ) | ||||||||||||
Net increase (decrease) from Class A transactions | 431,149 | 23,520 | 41,478 | 53,860 | 114,291 | 194,248 | ||||||||||||||||||
Class Y: | ||||||||||||||||||||||||
Proceeds from shares issued | 6,305 | 54,351 | 4,953 | 20 | 27,220 | 233,302 | ||||||||||||||||||
Reinvestment of dividends & distributions | 202 | – | – | – | 5,687 | – | ||||||||||||||||||
Cost of shares redeemed | (11,889 | ) | (1,410 | ) | (3,712 | ) | – | (48,587 | ) | (17,896 | ) | |||||||||||||
Net increase (decrease) from Class Y transactions | (5,382 | ) | 52,941 | 1,241 | 20 | (15,680 | ) | 215,406 | ||||||||||||||||
Increase (Decrease) in Net Assets Derived from Capital Share Transactions | 425,767 | 76,461 | 42,719 | 53,880 | 98,611 | 409,654 | ||||||||||||||||||
Net Increase in Net Assets | 467,558 | 69,743 | 47,293 | 29,721 | 273,175 | 140,084 | ||||||||||||||||||
Net Assets | ||||||||||||||||||||||||
Beginning of year or period | 69,743 | – | 527,811 | 498,090 | 2,005,930 | 1,865,846 | ||||||||||||||||||
End of year or period | $ | 537,301 | $ | 69,743 | $ | 575,104 | $ | 527,811 | $ | 2,279,105 | $ | 2,005,930 | ||||||||||||
Undistributed (Distributions in Excess of) Net Investment Income Included in Net Assets at Year or Period End | $ | 1,461 | $ | 214 | $ | 415 | $ | 2,934 | $ | (17,755 | ) | $ | (16,059 | ) | ||||||||||
| (1) | Commenced operations on July 30, 2015. |
| (2) | Class Y commenced operations on April 30, 2015. |
| (3) | Class Y commenced operations on December 31, 2014. |
| (4) | Commenced operations December 19, 2014. |
| (5) | See Note 7 in Notes to Financial Statements for additional information. |
| * | Includes investment income distributions of $351 and capital gains distributions of $195. |
Amounts designated as “—” are $0 or have been rounded to $0.
The accompanying notes are an integral part of the financial statements.
| 298 | SEI Institutional Managed Trust / Annual Report / September 30, 2016 |
| Multi-Asset Income Fund(3) | Multi-Asset Inflation Managed Fund(3) | Multi-Asset Capital Stability Fund(3) | Long/Short Alternative Fund(2)(4) | |||||||||||||||||||||||||||
| 2016 | 2015 | 2016 | 2015 | 2016 | 2015 | 2016 | 2015 | |||||||||||||||||||||||
| $ | 32,823 | $ | 30,610 | $ | 6,385 | $ | (17 | ) | $ | (422 | ) | $ | (2,202 | ) | $ | (131 | ) | $ | (266 | ) | ||||||||||
| (8,640 | ) | 1,276 | (10,310 | ) | (85,398 | ) | 3,682 | 7,875 | 197 | (665 | ) | |||||||||||||||||||
| 597 | 4,342 | (28 | ) | 2,781 | 1,589 | 1,638 | – | – | ||||||||||||||||||||||
| 24,134 | (17,363 | ) | 18,621 | 15,262 | 5,752 | (4,834 | ) | 545 | (601 | ) | ||||||||||||||||||||
| 306 | (626 | ) | (2,228 | ) | (234 | ) | (345 | ) | 25 | – | – | |||||||||||||||||||
| 49,220 | 18,239 | 12,440 | (67,606 | ) | 10,256 | 2,502 | 611 | (1,532 | ) | |||||||||||||||||||||
| (31,119 | ) | (23,778 | ) | (4,527 | ) | – | – | (254 | ) | – | – | |||||||||||||||||||
| (3,724 | ) | (1,166 | ) | (590 | ) | – | – | – | – | – | ||||||||||||||||||||
| (6,367 | ) | (2,779 | ) | – | – | (6,779 | ) | (10,427 | ) | – | – | |||||||||||||||||||
| (332 | ) | – | – | – | (583 | ) | – | – | – | |||||||||||||||||||||
| (41,542 | ) | (27,723 | ) | (5,117 | ) | – | (7,362 | ) | (10,681 | ) | – | – | ||||||||||||||||||
| 216,121 | 225,257 | 313,191 | 333,123 | 252,346 | 209,534 | – | 36,289 | |||||||||||||||||||||||
| 30,116 | 21,766 | 3,967 | – | 5,291 | 8,724 | – | – | |||||||||||||||||||||||
| (222,050 | ) | (162,300 | ) | (256,694 | ) | (267,036 | ) | (167,823 | ) | (185,686 | ) | – | (36,631 | ) | ||||||||||||||||
| 24,187 | 84,723 | 60,464 | 66,087 | 89,814 | 32,572 | – | (342 | ) | ||||||||||||||||||||||
| 69,963 | 37,444 | 21,292 | 94,894 | 12,540 | 57,966 | – | 43,057 | |||||||||||||||||||||||
| 4,001 | 1,166 | 590 | – | 583 | – | – | – | |||||||||||||||||||||||
| (12,892 | ) | (4,870 | ) | (16,773 | ) | (9,620 | ) | (12,521 | ) | (7,590 | ) | – | – | |||||||||||||||||
| 61,072 | 33,740 | 5,109 | 85,274 | 602 | 50,376 | – | 43,057 | |||||||||||||||||||||||
| 85,259 | 118,463 | 65,573 | 151,361 | 90,416 | 82,948 | – | 42,715 | |||||||||||||||||||||||
| 92,937 | 108,979 | 72,896 | 83,755 | 93,310 | 74,769 | 611 | 41,183 | |||||||||||||||||||||||
| 648,483 | 539,504 | 1,007,296 | 923,541 | 616,371 | 541,602 | 41,183 | – | |||||||||||||||||||||||
| $ | 741,420 | $ | 648,483 | $ | 1,080,192 | $ | 1,007,296 | $ | 709,681 | $ | 616,371 | $ | 41,794 | $ | 41,183 | |||||||||||||||
| $ | (823 | ) | $ | 5,120 | $ | (1,933 | ) | $ | (4,507 | ) | $ | 1,249 | $ | (235 | ) | $ | (83 | ) | $ | (266 | ) | |||||||||
| SEI Institutional Managed Trust / Annual Report / September 30, 2016 | 299 |
CONSOLIDATED STATEMENT OF CASH FLOWS ($ Thousands)
September 30, 2016
| Multi-Asset Inflation Managed Fund | ||||
Cash Flows from Operating Activities: | ||||
Net Increase in net assets from operations | $ | 12,440 | ||
Adjustments to reconcile net increase in net assets resulting from operations to net cash used in operating activities: | ||||
Purchase of Investment Securities | (1,196,714 | ) | ||
Proceeds from disposition of investment securities | 1,217,235 | |||
Proceeds from securities sold short | 264,483 | |||
Purchases to cover securities sold short | (295,924 | ) | ||
Purchased options/purchases to cover written options | (228 | ) | ||
Proceeds from sale of options/expired options | 36 | |||
Amortization (accretion of market discount) | (368 | ) | ||
Net Realized Loss on: | ||||
Investments and securities sold short | 3,466 | |||
Options | 338 | |||
Net Change in Unrealized (Appreciation) Depreciation on: | ||||
Investments and securities sold short | (13,668 | ) | ||
Options | (11 | ) | ||
Changes in Assets: | ||||
Cash collateral on swaps | (548 | ) | ||
Cash collateral on futures | 456 | |||
Foreign currency, at value | 39 | |||
Receivable for investment securities sold | (7,130 | ) | ||
Dividends and interest receivable | (345 | ) | ||
Unrealized gain on foreign currency contracts | 214 | |||
Unrealized gain of foreign spot currency contracts | 9 | |||
OTC swap contracts, at value | 257 | |||
Receivable for variation margin | 254 | |||
Foreign tax reclaim receivable | (2 | ) | ||
Prepaid expenses | (10 | ) | ||
Changes in Liabilities: | ||||
Administration fees payable | 14 | |||
Shareholder servicing fees payable, Class A | 13 | |||
Payable for investment securities purchased | 7,133 | |||
OTC swap contracts, at value | 915 | |||
Payable for variation margin | (783 | ) | ||
Investment advisory fees payable | (9 | ) | ||
Unrealized loss on forward foreign currency contracts | 1,771 | |||
Unrealized loss on foreign currency spot contracts | 5 | |||
Interest payable | 15 | |||
Due to broker | 1,930 | |||
Accrued expenses payable | (20 | ) | ||
Net Cash Used in Operating Activities | (4,737 | ) | ||
Cash Flows from Financing Activities | ||||
Reverse repurchase agreements | (21,967 | ) | ||
Dividends and distributions | (5,117 | ) | ||
Proceeds from shares issued | 335,421 | |||
Reinvestment of dividends and distributions | 4,557 | |||
Cost of shares redeemed | (273,680 | ) | ||
Net Cash Provided by Financing Activities | 39,214 | |||
Net Change in Cash | 34,477 | |||
Cash at Beginning of Year | $ | 148,268 | ||
Cash at End of Year | $ | 182,745 | ||
The accompanying notes are an integral part of the financial statements.
| 300 | SEI Institutional Managed Trust / Annual Report / September 30, 2016 |
For the years or period ended September 30, (unless otherwise indicated)
For a Share Outstanding Throughout the Periods
| ||||||||||||||||||||||||||||||||||||||||||||||||||||||||||||
| Net Asset Value, Beginning of Period | Net Investment Income (Loss)(1) | Net Realized and Unrealized Gains (Losses) on Investments(1) | Total from Operations | Dividends from Net Investment Income | Distributions from Net Realized Capital Gains | Total Dividends and Distributions | Net Asset Value, End of Period | Total Return† | Net Assets End of Period ($ Thousands) | Ratio of Net Expenses to Average Net Assets | Ratio of Expenses to Average Net Assets (Excluding Fees Paid Indirectly and Including Waivers) | Ratio of Expenses to Average Net Assets (Excluding Fees Paid Indirectly and Waivers) | Ratio of Net Investment Income (Loss) to Average Net Assets | Portfolio Turnover Rate† | ||||||||||||||||||||||||||||||||||||||||||||||
| ||||||||||||||||||||||||||||||||||||||||||||||||||||||||||||
Large Cap Fund |
| |||||||||||||||||||||||||||||||||||||||||||||||||||||||||||
Class A | ||||||||||||||||||||||||||||||||||||||||||||||||||||||||||||
2016 | $ | 13.71 | $ | 0.12 | $ | 1.16 | $ | 1.28 | $ | (0.12) | $ | (2.33) | $ | (2.45) | $ | 12.54 | 10.15% | $ | 2,237,663 | 0.91%(2) | 0.91%(2) | 0.99%(2) | 1.01% | 68% | ||||||||||||||||||||||||||||||||||||
2015 | 15.19 | 0.11 | (0.30) | (0.19) | (0.09) | (1.20) | (1.29) | 13.71 | (1.73) | 2,483,582 | 0.89 | 0.89 | 0.97 | 0.74 | 110 | |||||||||||||||||||||||||||||||||||||||||||||
2014 | 13.95 | 0.09 | 2.19 | 2.28 | (0.09) | (0.95) | (1.04) | 15.19 | 16.96 | 2,581,944 | 0.89 | 0.89 | 1.01 | 0.60 | 57 | |||||||||||||||||||||||||||||||||||||||||||||
2013 | 12.15 | 0.12 | 2.43 | 2.55 | (0.13) | (0.62) | (0.75) | 13.95 | 22.23 | 2,107,192 | 0.89 | 0.89 | 1.01 | 0.94 | 49 | |||||||||||||||||||||||||||||||||||||||||||||
2012 | 10.15 | 0.10 | 2.72 | 2.82 | (0.09) | (0.73) | (0.82) | 12.15 | 29.04 | 1,488,259 | 0.89 | 0.89 | 1.02 | 0.89 | 50 | |||||||||||||||||||||||||||||||||||||||||||||
Class Y | ||||||||||||||||||||||||||||||||||||||||||||||||||||||||||||
2016 | $ | 13.71 | $ | 0.16 | $ | 1.16 | $ | 1.32 | $ | (0.15) | $ | (2.33) | $ | (2.48) | $ | 12.55 | 10.50% | $ | 164,611 | 0.66%(2) | 0.66%(2) | 0.74%(2) | 1.26% | 68% | ||||||||||||||||||||||||||||||||||||
2015(3) | 14.62 | 0.11 | (0.94) | (0.83) | (0.08) | — | (0.08) | 13.71 | (5.74) | 156,158 | 0.64 | 0.64 | 0.72 | 1.03 | 110 | |||||||||||||||||||||||||||||||||||||||||||||
Large Cap Value Fund |
| |||||||||||||||||||||||||||||||||||||||||||||||||||||||||||
Class A | ||||||||||||||||||||||||||||||||||||||||||||||||||||||||||||
2016 | $ | 22.35 | $ | 0.32 | $ | 1.78 | $ | 2.10 | $ | (0.30) | $ | (2.95) | $ | (3.25) | $ | 21.20 | 10.16% | $ | 1,300,029 | 0.91%(2) | 0.91%(2) | 0.95%(2) | 1.56% | 70% | ||||||||||||||||||||||||||||||||||||
2015 | 25.71 | 0.32 | (1.72) | (1.40) | (0.25) | (1.71) | (1.96) | 22.35 | (6.15) | 1,300,033 | 0.89 | 0.90 | 0.93 | 1.29 | 96 | |||||||||||||||||||||||||||||||||||||||||||||
2014 | 21.94 | 0.29 | 3.76 | 4.05 | (0.28) | — | (0.28) | 25.71 | 18.55 | 1,527,500 | 0.89 | 0.89 | 0.97 | 1.19 | 58 | |||||||||||||||||||||||||||||||||||||||||||||
2013 | 18.02 | 0.28 | 3.92 | 4.20 | (0.28) | — | (0.28) | 21.94 | 23.55 | 1,444,929 | 0.89 | 0.89 | 0.97 | 1.39 | 55 | |||||||||||||||||||||||||||||||||||||||||||||
2012 | 14.13 | 0.25 | 3.89 | 4.14 | (0.25) | — | (0.25) | 18.02 | 29.54 | 1,344,405 | 0.89 | 0.89 | 0.98 | 1.51 | 37 | |||||||||||||||||||||||||||||||||||||||||||||
Class I | ||||||||||||||||||||||||||||||||||||||||||||||||||||||||||||
2016 | $ | 22.35 | $ | 0.28 | $ | 1.78 | $ | 2.06 | $ | (0.25) | $ | (2.95) | $ | (3.20) | $ | 21.21 | 9.93% | $ | 6,165 | 1.13%(2) | 1.13%(2) | 1.20%(2) | 1.33% | 70% | ||||||||||||||||||||||||||||||||||||
2015 | 25.71 | 0.27 | (1.72) | (1.45) | (0.20) | (1.71) | (1.91) | 22.35 | (6.34) | 7,477 | 1.11 | 1.12 | 1.18 | 1.06 | 96 | |||||||||||||||||||||||||||||||||||||||||||||
2014 | 21.96 | 0.24 | 3.75 | 3.99 | (0.24) | — | (0.24) | 25.71 | 18.22 | 9,499 | 1.11 | 1.11 | 1.22 | 0.97 | 58 | |||||||||||||||||||||||||||||||||||||||||||||
2013 | 18.02 | 0.23 | 3.95 | 4.18 | (0.24) | — | (0.24) | 21.96 | 23.35 | 9,412 | 1.11 | 1.11 | 1.22 | 1.16 | 55 | |||||||||||||||||||||||||||||||||||||||||||||
2012 | 14.13 | 0.21 | 3.89 | 4.10 | (0.21) | — | (0.21) | 18.02 | 29.20 | 7,668 | 1.11 | 1.11 | 1.23 | 1.28 | 37 | |||||||||||||||||||||||||||||||||||||||||||||
Class Y | ||||||||||||||||||||||||||||||||||||||||||||||||||||||||||||
2016(4) | $ | 23.90 | $ | 0.35 | $ | 0.16 | $ | 0.51 | $ | (0.25) | $ | (2.95) | $ | (3.20) | $ | 21.21 | 2.88% | $ | 22,004 | 0.66%(2) | 0.66%(2) | 0.70%(2) | 1.89% | 70% | ||||||||||||||||||||||||||||||||||||
Large Cap Growth Fund |
| |||||||||||||||||||||||||||||||||||||||||||||||||||||||||||
Class A | ||||||||||||||||||||||||||||||||||||||||||||||||||||||||||||
2016 | $ | 32.22 | $ | 0.02 | $ | 3.02 | $ | 3.04 | $ | (0.01) | $ | (5.51) | $ | (5.52) | $ | 29.74 | 9.77% | $ | 1,421,656 | 0.91%(2) | 0.91%(2) | 1.00%(2) | 0.06% | 93% | ||||||||||||||||||||||||||||||||||||
2015 | 33.82 | 0.08 | 0.97 | 1.05 | (0.05) | (2.60) | (2.65) | 32.22 | 2.87 | 1,442,646 | 0.89 | 0.89 | 0.98 | 0.24 | 110 | |||||||||||||||||||||||||||||||||||||||||||||
2014 | 30.28 | 0.09 | 4.25 | 4.34 | (0.09) | (0.71) | (0.80) | 33.82 | 14.51 | 1,550,723 | 0.89 | 0.89 | 1.02 | 0.26 | 61 | |||||||||||||||||||||||||||||||||||||||||||||
2013 | 25.57 | 0.08 | 4.73 | 4.81 | (0.10) | — | (0.10) | 30.28 | 18.89 | 1,433,284 | 0.89 | 0.89 | 1.02 | 0.28 | 69 | |||||||||||||||||||||||||||||||||||||||||||||
2012 | 19.77 | 0.05 | 5.78 | 5.83 | (0.03) | — | (0.03) | 25.57 | 29.47 | 1,354,774 | 0.89 | 0.90 | 1.03 | 0.19 | 88 | |||||||||||||||||||||||||||||||||||||||||||||
Class I | ||||||||||||||||||||||||||||||||||||||||||||||||||||||||||||
2016 | $ | 31.75 | $ | (0.04) | $ | 2.97 | $ | 2.93 | $ | — | $ | (5.51) | $ | (5.51) | $ | 29.17 | 9.54% | $ | 4,783 | 1.13%(2) | 1.13%(2) | 1.25%(2) | (0.15)% | 93% | ||||||||||||||||||||||||||||||||||||
2015 | 33.40 | 0.01 | 0.96 | 0.97 | (0.02) | (2.60) | (2.62) | 31.75 | 2.65 | 5,558 | 1.11 | 1.11 | 1.23 | 0.02 | 110 | |||||||||||||||||||||||||||||||||||||||||||||
2014 | 29.93 | 0.01 | 4.21 | 4.22 | (0.04) | (0.71) | (0.75) | 33.40 | 14.28 | 7,245 | 1.11 | 1.11 | 1.27 | 0.05 | 61 | |||||||||||||||||||||||||||||||||||||||||||||
2013 | 25.28 | 0.02 | 4.68 | 4.70 | (0.05) | — | (0.05) | 29.93 | 18.62 | 8,324 | 1.11 | 1.11 | 1.27 | 0.06 | 69 | |||||||||||||||||||||||||||||||||||||||||||||
2012 | 19.57 | —* | 5.71 | 5.71 | — | — | — | 25.28 | 29.18 | 8,549 | 1.11 | 1.12 | 1.28 | (0.02) | 88 | |||||||||||||||||||||||||||||||||||||||||||||
Class Y | ||||||||||||||||||||||||||||||||||||||||||||||||||||||||||||
2016(4) | $ | 34.91 | $ | 0.07 | $ | 0.36 | $ | 0.43 | $ | (0.03) | $ | (5.51) | $ | (5.54) | $ | 29.80 | 1.58% | $ | 20,481 | 0.66%(2) | 0.66%(2) | 0.75%(2) | 0.25% | 93% | ||||||||||||||||||||||||||||||||||||
| * | Amount represents less than $0.01 per share. |
| † | Returns and portfolio turnover rates are for the period indicated and have not been annualized. Returns do not reflect the deduction of taxes the shareholder would pay on fund distributions or redemption of fund shares. |
| (1) | Per share net investment income and net realized and unrealized gains (losses) calculated using average shares. |
| (2) | The expense ratio includes proxy expenses outside of the cap. |
| (3) | Commenced operations on December 31, 2014. All ratios for the period have been annualized. |
| (4) | Commenced operations on October 30, 2015. All ratios for the period have been annualized. |
| SEI Institutional Managed Trust / Annual Report / September 30, 2016 | 301 |
FINANCIAL HIGHLIGHTS
For the years or period ended September 30, (unless otherwise indicated)
For a Share Outstanding Throughout the Periods
| ||||||||||||||||||||||||||||||||||||||||||||||||||||||||||||
| Net Asset Value, Beginning of Period | Net Investment Income (Loss)(1) | Net Realized and Unrealized Gains (Losses) on Investments(1) | Total from | Dividends from Net Investment Income | Distributions from Net Realized Capital Gains | Total Dividends and Distributions | Net Asset Value, End of Period | Total Return† | Net Assets End of Period ($ Thousands) | Ratio of Net Expenses to Average Net Assets | Ratio of Expenses to Average Net Assets (Excluding Fees Paid Indirectly and Including Waivers) | Ratio of Expenses to Average Net Assets (Excluding Fees Paid Indirectly and Waivers) | Ratio of Net Investment Income (Loss) to Average Net Assets | Portfolio Turnover Rate† | ||||||||||||||||||||||||||||||||||||||||||||||
| ||||||||||||||||||||||||||||||||||||||||||||||||||||||||||||
Tax-Managed Large Cap Fund |
| |||||||||||||||||||||||||||||||||||||||||||||||||||||||||||
Class A | ||||||||||||||||||||||||||||||||||||||||||||||||||||||||||||
2016 | $ | 19.13 | $ | 0.19 | $ | 1.60 | $ | 1.79 | $ | (0.18) | $ | — | $ | (0.18) | $ | 20.74 | 9.42% | $ | 3,427,251 | 0.91%(2) | 0.91%(2) | 1.00%(2) | 0.95% | 89% | ||||||||||||||||||||||||||||||||||||
2015 | 19.64 | 0.14 | (0.52) | (0.38) | (0.13) | — | (0.13) | 19.13 | (1.99) | 3,072,983 | 0.89 | 0.89 | 0.98 | 0.70 | 85 | |||||||||||||||||||||||||||||||||||||||||||||
2014 | 16.81 | 0.12 | 2.84 | 2.96 | (0.13) | — | (0.13) | 19.64 | 17.63 | 3,089,839 | 0.89 | 0.89 | 1.02 | 0.65 | 39 | |||||||||||||||||||||||||||||||||||||||||||||
2013 | 13.88 | 0.15 | 2.94 | 3.09 | (0.16) | — | (0.16) | 16.81 | 22.47 | 2,407,951 | 0.89 | 0.89 | 1.02 | 1.00 | 42 | |||||||||||||||||||||||||||||||||||||||||||||
2012 | 10.80 | 0.12 | 3.07 | 3.19 | (0.11) | — | (0.11) | 13.88 | 29.70 | 1,882,834 | 0.89 | 0.89 | 1.03 | 0.96 | 53 | |||||||||||||||||||||||||||||||||||||||||||||
Class Y | ||||||||||||||||||||||||||||||||||||||||||||||||||||||||||||
2016 | $ | 19.13 | $ | 0.24 | $ | 1.61 | $ | 1.85 | $ | (0.23) | $ | — | $ | (0.23) | $ | 20.75 | 9.75% | $ | 198,095 | 0.66%(2) | 0.66%(2) | 0.75%(2) | 1.20% | 89% | ||||||||||||||||||||||||||||||||||||
2015(3) | 20.46 | 0.15 | (1.38) | (1.23) | (0.10) | — | (0.10) | 19.13 | (6.04) | 129,791 | 0.64 | 0.64 | 0.73 | 1.00 | 85 | |||||||||||||||||||||||||||||||||||||||||||||
S&P 500 Index Fund |
| |||||||||||||||||||||||||||||||||||||||||||||||||||||||||||
Class A | ||||||||||||||||||||||||||||||||||||||||||||||||||||||||||||
2016 | $ | 47.23 | $ | 0.86 | $ | 6.13 | $ | 6.99 | $ | (0.83) | $ | (0.07) | $ | (0.90) | $ | 53.32 | 14.93% | $ | 386,477 | 0.45%(2) | 0.45%(2) | 0.57%(2) | 1.69% | 10% | ||||||||||||||||||||||||||||||||||||
2015 | 53.00 | 0.77 | (0.99) | (0.22) | (0.86) | (4.69) | (5.55) | 47.23 | (0.97) | 385,743 | 0.43 | 0.43 | 0.54 | 1.51 | 12 | |||||||||||||||||||||||||||||||||||||||||||||
2014 | 46.20 | 0.79 | 7.91 | 8.70 | (0.83) | (1.07) | (1.90) | 53.00 | 19.23 | 394,132 | 0.43 | 0.43 | 0.54 | 1.58 | 10 | |||||||||||||||||||||||||||||||||||||||||||||
2013 | 39.60 | 0.76 | 6.61 | 7.37 | (0.77) | — | (0.77) | 46.20 | 18.87 | 352,589 | 0.43 | 0.43 | 0.54 | 1.78 | 6 | |||||||||||||||||||||||||||||||||||||||||||||
2012 | 31.03 | 0.64 | 8.51 | 9.15 | (0.58) | — | (0.58) | 39.60 | 29.74 | 294,234 | 0.43 | 0.43 | 0.54 | 1.76 | 18 | |||||||||||||||||||||||||||||||||||||||||||||
Class E | ||||||||||||||||||||||||||||||||||||||||||||||||||||||||||||
2016 | $ | 47.54 | $ | 0.95 | $ | 6.18 | $ | 7.13 | $ | (0.92) | $ | (0.07) | $ | (0.99) | $ | 53.68 | 15.14% | $ | 277,242 | 0.27%(2) | 0.27%(2) | 0.32%(2) | 1.88% | 10% | ||||||||||||||||||||||||||||||||||||
2015 | 53.30 | 0.87 | (0.99) | (0.12) | (0.95) | (4.69) | (5.64) | 47.54 | (0.77) | 242,962 | 0.25 | 0.25 | 0.29 | 1.67 | 12 | |||||||||||||||||||||||||||||||||||||||||||||
2014 | 46.45 | 0.89 | 7.94 | 8.83 | (0.91) | (1.07) | (1.98) | 53.30 | 19.42 | 2,070,624 | 0.25 | 0.25 | 0.29 | 1.76 | 10 | |||||||||||||||||||||||||||||||||||||||||||||
2013 | 39.79 | 0.85 | 6.65 | 7.50 | (0.84) | — | (0.84) | 46.45 | 19.11 | 2,365,696 | 0.25 | 0.25 | 0.29 | 1.99 | 6 | |||||||||||||||||||||||||||||||||||||||||||||
2012 | 31.17 | 0.71 | 8.54 | 9.25 | (0.63) | — | (0.63) | 39.79 | 29.97 | 2,580,512 | 0.25 | 0.25 | 0.29 | 1.92 | 18 | |||||||||||||||||||||||||||||||||||||||||||||
Class I | ||||||||||||||||||||||||||||||||||||||||||||||||||||||||||||
2016 | $ | 47.46 | $ | 0.76 | $ | 6.15 | $ | 6.91 | $ | (0.72) | $ | (0.07) | $ | (0.79) | $ | 53.58 | 14.67% | $ | 6,473 | 0.67%(2) | 0.67%(2) | 0.82%(2) | 1.49% | 10% | ||||||||||||||||||||||||||||||||||||
2015 | 53.22 | 0.66 | (0.99) | (0.33) | (0.74) | (4.69) | (5.43) | 47.46 | (1.19) | 7,774 | 0.65 | 0.65 | 0.79 | 1.28 | 12 | |||||||||||||||||||||||||||||||||||||||||||||
2014 | 46.38 | 0.68 | 7.94 | 8.62 | (0.71) | (1.07) | (1.78) | 53.22 | 18.95 | 7,962 | 0.65 | 0.65 | 0.79 | 1.35 | 10 | |||||||||||||||||||||||||||||||||||||||||||||
2013 | 39.73 | 0.67 | 6.65 | 7.32 | (0.67) | — | (0.67) | 46.38 | 18.60 | 7,577 | 0.65 | 0.65 | 0.79 | 1.58 | 6 | |||||||||||||||||||||||||||||||||||||||||||||
2012 | 31.12 | 0.56 | 8.54 | 9.10 | (0.49) | — | (0.49) | 39.73 | 29.46 | 8,500 | 0.65 | 0.65 | 0.79 | 1.53 | 18 | |||||||||||||||||||||||||||||||||||||||||||||
Class Y | ||||||||||||||||||||||||||||||||||||||||||||||||||||||||||||
2016(4) | $ | 51.04 | $ | 0.87 | $ | 2.25 | $ | 3.12 | $ | (0.76) | $ | (0.07) | $ | (0.83) | $ | 53.33 | 6.19% | $ | 780 | 0.28%(2) | 0.28%(2) | 0.32%(2) | 1.88% | 10% | ||||||||||||||||||||||||||||||||||||
Small Cap Fund |
| |||||||||||||||||||||||||||||||||||||||||||||||||||||||||||
Class A | ||||||||||||||||||||||||||||||||||||||||||||||||||||||||||||
2016 | $ | 11.99 | $ | — | $ | 0.88 | $ | 0.88 | $ | — | $ | (1.26) | $ | (1.26) | $ | 11.61 | 7.76% | $ | 550,556 | 1.16%(2) | 1.16%(2) | 1.26%(2) | 0.03% | 104% | ||||||||||||||||||||||||||||||||||||
2015 | 13.01 | (0.01) | 0.04 | 0.03 | — | (1.05) | (1.05) | 11.99 | (0.24) | 495,245 | 1.14 | 1.14 | 1.22 | (0.11) | 137 | |||||||||||||||||||||||||||||||||||||||||||||
2014 | 13.32 | (0.03) | 0.61 | 0.58 | —* | (0.89) | (0.89) | 13.01 | 4.38 | 483,282 | 1.14 | 1.14 | 1.28 | (0.24) | 72 | |||||||||||||||||||||||||||||||||||||||||||||
2013 | 10.62 | 0.01 | 3.25 | 3.26 | (0.05) | (0.51) | (0.56) | 13.32 | 32.40 | 410,780 | 1.14 | 1.14 | 1.28 | 0.08 | 72 | |||||||||||||||||||||||||||||||||||||||||||||
2012 | 9.51 | 0.01 | 2.67 | 2.68 | (0.01) | (1.56) | (1.57) | 10.62 | 29.93 | 254,051 | 1.14 | 1.15 | 1.28 | 0.08 | 114 | |||||||||||||||||||||||||||||||||||||||||||||
Class Y | ||||||||||||||||||||||||||||||||||||||||||||||||||||||||||||
2016 | $ | 12.01 | $ | 0.03 | $ | 0.89 | $ | 0.92 | $ | (0.01) | $ | (1.26) | $ | (1.27) | $ | 11.66 | 8.08% | $ | 37,859 | 0.91%(2) | 0.91%(2) | 1.01%(2) | 0.28% | 104% | ||||||||||||||||||||||||||||||||||||
2015(3) | 12.89 | 0.01 | (0.89) | (0.88) | — | — | — | 12.01 | (6.83) | 32,810 | 0.89 | 0.89 | 0.98 | 0.11 | 137 | |||||||||||||||||||||||||||||||||||||||||||||
| * | Amount represents less than $0.01 per share. |
| † | Returns and portfolio turnover rates are for the period indicated and have not been annualized. Returns do not reflect the deduction of taxes the shareholder would pay on fund distributions or redemption of fund shares. |
| (1) | Per share net investment income and net realized and unrealized gains (losses) calculated using average shares. |
| (2) | The expense ratio includes proxy expenses outside of the cap. |
| (3) | Commenced operations on December 31, 2014. All ratios for the period have been annualized. |
| (4) | Commenced operations on October 30, 2015. All ratios for the period have been annualized. |
| 302 | SEI Institutional Managed Trust / Annual Report / September 30, 2016 |
FINANCIAL HIGHLIGHTS
For the years or period ended September 30, (unless otherwise indicated)
For a Share Outstanding Throughout the Periods
| ||||||||||||||||||||||||||||||||||||||||||||||||||||||||||||
| Net Asset Value, Beginning of Period | Net Investment Income (Loss)(1) | Net Realized and Unrealized Gains (Losses) on Investments(1) | Total from | Dividends from Net Investment Income | Distributions from Net Realized Capital Gains | Total Dividends and Distributions | Net of | Total Return† | Net Assets End of Period ($ Thousands) | Ratio of Net Expenses to Average Net Assets | Ratio of Expenses to Average Net Assets (Excluding Fees Paid Indirectly and Including Waivers) | Ratio of Net | Ratio of Net Investment Income (Loss) to Average Net Assets | Portfolio Turnover Rate† | ||||||||||||||||||||||||||||||||||||||||||||||
| ||||||||||||||||||||||||||||||||||||||||||||||||||||||||||||
Small Cap Value Fund |
| |||||||||||||||||||||||||||||||||||||||||||||||||||||||||||
Class A | ||||||||||||||||||||||||||||||||||||||||||||||||||||||||||||
2016 | $ | 21.80 | $ | 0.14 | $ | 2.27 | $ | 2.41 | $ | (0.15) | $ | (1.31) | $ | (1.46) | $ | 22.75 | 11.60% | $ | 362,348 | 1.17%(2) | 1.17%(2) | 1.26%(2) | 0.63% | 87% | ||||||||||||||||||||||||||||||||||||
2015 | 23.97 | 0.13 | (0.19) | (0.06) | (0.15) | (1.96) | (2.11) | 21.80 | (0.76) | 345,594 | 1.14 | 1.14 | 1.23 | 0.56 | 87 | |||||||||||||||||||||||||||||||||||||||||||||
2014 | 23.24 | 0.12 | 0.95 | 1.07 | (0.14) | (0.20) | (0.34) | 23.97 | 4.54 | 374,828 | 1.14 | 1.14 | 1.27 | 0.49 | 52 | |||||||||||||||||||||||||||||||||||||||||||||
2013 | 18.23 | 0.17 | 5.03 | 5.20 | (0.19) | — | (0.19) | 23.24 | 28.73 | 391,113 | 1.14 | 1.14 | 1.28 | 0.84 | 51 | |||||||||||||||||||||||||||||||||||||||||||||
2012 | 14.26 | 0.11 | 4.02 | 4.13 | (0.16) | — | (0.16) | 18.23 | 29.04 | 405,106 | 1.14 | 1.15 | 1.28 | 0.64 | 53 | |||||||||||||||||||||||||||||||||||||||||||||
Class I | ||||||||||||||||||||||||||||||||||||||||||||||||||||||||||||
2016 | $ | 21.64 | $ | 0.09 | $ | 2.25 | $ | 2.34 | $ | (0.10) | $ | (1.31) | $ | (1.41) | $ | 22.57 | 11.34% | $ | 2,910 | 1.39%(2) | 1.39%(2) | 1.51%(2) | 0.40% | 87% | ||||||||||||||||||||||||||||||||||||
2015 | 23.81 | 0.08 | (0.19) | (0.11) | (0.10) | (1.96) | (2.06) | 21.64 | (0.99) | 3,736 | 1.36 | 1.36 | 1.48 | 0.34 | 87 | |||||||||||||||||||||||||||||||||||||||||||||
2014 | 23.09 | 0.07 | 0.93 | 1.00 | (0.08) | (0.20) | (0.28) | 23.81 | 4.29 | 4,179 | 1.36 | 1.36 | 1.52 | 0.27 | 52 | |||||||||||||||||||||||||||||||||||||||||||||
2013 | 18.10 | 0.11 | 5.02 | 5.13 | (0.14) | — | (0.14) | 23.09 | 28.51 | 5,308 | 1.36 | 1.36 | 1.53 | 0.55 | 51 | |||||||||||||||||||||||||||||||||||||||||||||
2012 | 14.15 | 0.07 | 3.99 | 4.06 | (0.11) | — | (0.11) | 18.10 | 28.78 | 4,368 | 1.36 | 1.37 | 1.53 | 0.42 | 53 | |||||||||||||||||||||||||||||||||||||||||||||
Class Y | ||||||||||||||||||||||||||||||||||||||||||||||||||||||||||||
2016(3) | $ | 22.95 | $ | 0.18 | $ | 1.09 | $ | 1.27 | $ | (0.15) | $ | (1.31) | $ | (1.46) | $ | 22.76 | 6.04% | $ | 7,207 | 0.92%(2) | 0.92%(2) | 1.02%(2) | 0.91% | 87% | ||||||||||||||||||||||||||||||||||||
Small Cap Growth Fund |
| |||||||||||||||||||||||||||||||||||||||||||||||||||||||||||
Class A | ||||||||||||||||||||||||||||||||||||||||||||||||||||||||||||
2016 | $ | 26.60 | $ | (0.08) | $ | 2.34 | $ | 2.26 | $ | — | $ | — | $ | — | $ | 28.86 | 8.50% | $ | 312,240 | 1.14%(2) | 1.14%(2) | 1.26%(2) | (0.31)% | 124% | ||||||||||||||||||||||||||||||||||||
2015 | 25.95 | (0.14) | 0.79 | 0.65 | — | — | — | 26.60 | 2.50 | 325,353 | 1.11 | 1.11 | 1.23 | (0.48) | 131 | |||||||||||||||||||||||||||||||||||||||||||||
2014 | 24.63 | (0.15) | 1.47 | 1.32 | —* | — | —* | 25.95 | 5.36 | 335,849 | 1.11 | 1.11 | 1.28 | (0.57) | 70 | |||||||||||||||||||||||||||||||||||||||||||||
2013 | 18.57 | (0.02) | 6.16 | 6.14 | (0.08) | — | (0.08) | 24.63 | 33.21 | 353,097 | 1.11 | 1.11 | 1.28 | (0.08) | 81 | |||||||||||||||||||||||||||||||||||||||||||||
2012 | 14.20 | (0.02) | 4.39 | 4.37 | — | — | — | 18.57 | 30.77 | 300,972 | 1.11 | 1.12 | 1.28 | (0.13) | 110 | |||||||||||||||||||||||||||||||||||||||||||||
Class I | ||||||||||||||||||||||||||||||||||||||||||||||||||||||||||||
2016 | $ | 25.71 | $ | (0.14) | $ | 2.26 | $ | 2.12 | $ | — | $ | — | $ | — | $ | 27.83 | 8.25% | $ | 2,253 | 1.39%(2) | 1.39%(2) | 1.51%(2) | (0.56)% | 124% | ||||||||||||||||||||||||||||||||||||
2015 | 25.15 | (0.20) | 0.76 | 0.56 | — | — | — | 25.71 | 2.23 | 2,774 | 1.36 | 1.36 | 1.48 | (0.73) | 131 | |||||||||||||||||||||||||||||||||||||||||||||
2014 | 23.93 | (0.21) | 1.43 | 1.22 | — | — | — | 25.15 | 5.10 | 2,968 | 1.36 | 1.36 | 1.52 | (0.82) | 70 | |||||||||||||||||||||||||||||||||||||||||||||
2013 | 18.04 | (0.07) | 5.99 | 5.92 | (0.03) | — | (0.03) | 23.93 | 32.86 | 3,384 | 1.36 | 1.36 | 1.53 | (0.35) | 81 | |||||||||||||||||||||||||||||||||||||||||||||
2012 | 13.82 | (0.06) | 4.28 | 4.22 | — | — | — | 18.04 | 30.54 | 2,650 | 1.36 | 1.37 | 1.53 | (0.38) | 110 | |||||||||||||||||||||||||||||||||||||||||||||
Class Y | ||||||||||||||||||||||||||||||||||||||||||||||||||||||||||||
2016(3) | $ | 27.72 | $ | (0.02) | $ | 1.23 | $ | 1.21 | $ | — | $ | — | $ | — | $ | 28.93 | 4.37% | $ | 7,243 | 0.89%(2) | 0.89%(2) | 1.01%(2) | (0.08)% | 124% | ||||||||||||||||||||||||||||||||||||
Tax-Managed Small/Mid Cap Fund |
| |||||||||||||||||||||||||||||||||||||||||||||||||||||||||||
Class A | ||||||||||||||||||||||||||||||||||||||||||||||||||||||||||||
2016 | $ | 17.53 | $ | 0.06 | $ | 1.44 | $ | 1.50 | $ | (0.06) | $ | — | $ | (0.06) | $ | 18.97 | 8.55% | $ | 643,288 | 1.13%(2) | 1.13%(2) | 1.25%(2) | 0.35% | 107% | ||||||||||||||||||||||||||||||||||||
2015 | 17.62 | 0.02 | 0.09 | 0.11 | (0.01) | (0.19) | (0.20) | 17.53 | 0.58 | 589,712 | 1.11 | 1.11 | 1.23 | 0.12 | 98 | |||||||||||||||||||||||||||||||||||||||||||||
2014 | 17.10 | 0.01 | 1.40 | 1.41 | (0.02) | (0.87) | (0.89) | 17.62 | 8.44 | 573,175 | 1.11 | 1.11 | 1.28 | 0.07 | 61 | |||||||||||||||||||||||||||||||||||||||||||||
2013 | 13.26 | 0.04 | 3.86 | 3.90 | (0.06) | — | (0.06) | 17.10 | 29.54 | 486,216 | 1.11 | 1.11 | 1.28 | 0.30 | 67 | |||||||||||||||||||||||||||||||||||||||||||||
2012 | 10.39 | 0.03 | 2.88 | 2.91 | (0.04) | — | (0.04) | 13.26 | 28.09 | 336,339 | 1.11 | 1.12 | 1.28 | 0.24 | 67 | |||||||||||||||||||||||||||||||||||||||||||||
Class Y | ||||||||||||||||||||||||||||||||||||||||||||||||||||||||||||
2016 | $ | 17.55 | $ | 0.10 | $ | 1.44 | $ | 1.54 | $ | (0.11) | $ | — | $ | (0.11) | $ | 18.98 | 8.79% | $ | 47,185 | 0.91%(2) | 0.91%(2) | 1.00%(2) | 0.58% | 107% | ||||||||||||||||||||||||||||||||||||
2015(4) | 18.52 | 0.05 | (1.01) | (0.96) | (0.01) | — | (0.01) | 17.55 | (5.17) | 28,090 | 0.89 | 0.89 | 0.98 | 0.32 | 98 | |||||||||||||||||||||||||||||||||||||||||||||
| * | Amount represents less than $0.01 per share. |
| † | Returns and portfolio turnover rates are for the period indicated and have not been annualized. Returns do not reflect the deduction of taxes the shareholder would pay on fund distributions or redemption of fund shares. |
| (1) | Per share net investment income and net realized and unrealized gains (losses) calculated using average shares. |
| (2) | The expense ratio includes proxy expenses outside of the cap. |
| (3) | Commenced operations on October 30, 2015. All ratios for the period have been annualized. |
| (4) | Commenced operations on December 31, 2014. All ratios for the period have been annualized. |
| SEI Institutional Managed Trust / Annual Report / September 30, 2016 | 303 |
FINANCIAL HIGHLIGHTS
For the years or period ended September 30, (unless otherwise indicated)
For a share outstanding throughout each period
| ||||||||||||||||||||||||||||||||||||||||||||||||||||||||||
| Net Asset Value, Beginning of Period | Net Investment Income (Loss)(1) | Net Realized and Unrealized Gains (Losses) on Investments(1) | Total from | Dividends from Net Investment Income | Distributions from Net Realized Capital Gains | Total Dividends and Distributions | Net Asset Value, End of Period | Total Return† | Net Assets End of Period ($ Thousands) | Ratio of Net Expenses to Average Net Assets | Ratio of Expenses to Average Net Assets (Excluding Fees Paid Indirectly and Including Waivers) | Ratio of Expenses to Average Net Assets (Excluding Fees Paid Indirectly and Waivers) | Ratio of Net Investment Income (Loss) to Average Net Assets | Portfolio Turnover Rate† | ||||||||||||||||||||||||||||||||||||||||||||
| ||||||||||||||||||||||||||||||||||||||||||||||||||||||||||
Mid-Cap Fund | ||||||||||||||||||||||||||||||||||||||||||||||||||||||||||
Class A | ||||||||||||||||||||||||||||||||||||||||||||||||||||||||||
2016 | $ | 25.08 | $ | 0.27 | $ | 2.86 | $ | 3.13 | $ | (0.34) | $ | (3.87) | $ | (4.21) | $ | 24.00 | 14.10% | $ | 87,780 | 1.01%(2) | 1.01%(2) | 1.01%(2) | 1.16% | 115% | ||||||||||||||||||||||||||||||||||
2015 | 27.53 | 0.17 | 0.12 | 0.29 | (0.07) | (2.67) | (2.74) | 25.08 | 0.67 | 93,923 | 0.98 | 0.98 | 0.98 | 0.63 | 175 | |||||||||||||||||||||||||||||||||||||||||||
2014 | 24.64 | 0.04 | 3.65 | 3.69 | (0.06) | (0.74) | (0.80) | 27.53 | 15.28 | 93,705 | 1.02 | 1.02 | 1.03 | 0.16 | 66 | |||||||||||||||||||||||||||||||||||||||||||
2013 | 19.30 | 0.11 | 5.37 | 5.48 | (0.14) | — | (0.14) | 24.64 | 28.52 | 107,487 | 1.02 | 1.02 | 1.03 | 0.52 | 108 | |||||||||||||||||||||||||||||||||||||||||||
2012 | 14.99 | 0.09 | 4.32 | 4.41 | (0.10) | — | (0.10) | 19.30 | 29.50 | 85,119 | 1.02 | 1.02 | 1.04 | 0.53 | 81 | |||||||||||||||||||||||||||||||||||||||||||
Class I | ||||||||||||||||||||||||||||||||||||||||||||||||||||||||||
2016 | $ | 25.04 | $ | 0.22 | $ | 2.85 | $ | 3.07 | $ | (0.28) | $ | (3.87) | $ | (4.15) | $ | 23.96 | 13.84% | $ | 871 | 1.24%(2) | 1.24%(2) | 1.27%(2) | 0.97% | 115% | ||||||||||||||||||||||||||||||||||
2015 | 27.52 | 0.10 | 0.12 | 0.22 | (0.03) | (2.67) | (2.70) | 25.04 | 0.43 | 883 | 1.20 | 1.20 | 1.23 | 0.38 | 175 | |||||||||||||||||||||||||||||||||||||||||||
2014 | 24.64 | (0.02) | 3.65 | 3.63 | (0.01) | (0.74) | (0.75) | 27.52 | 15.01 | 1,144 | 1.26 | 1.26 | 1.28 | (0.08) | 66 | |||||||||||||||||||||||||||||||||||||||||||
2013 | 19.30 | 0.06 | 5.37 | 5.43 | (0.09) | — | (0.09) | 24.64 | 28.20 | 1,558 | 1.26 | 1.26 | 1.28 | 0.27 | 108 | |||||||||||||||||||||||||||||||||||||||||||
2012 | 14.99 | 0.05 | 4.32 | 4.37 | (0.06) | — | (0.06) | 19.30 | 29.21 | 1,088 | 1.26 | 1.26 | 1.29 | 0.28 | 81 | |||||||||||||||||||||||||||||||||||||||||||
Class Y | ||||||||||||||||||||||||||||||||||||||||||||||||||||||||||
2016(3) | $ | 26.61 | $ | 0.30 | $ | 1.29 | $ | 1.59 | $ | (0.32) | $ | (3.87) | $ | (4.19) | $ | 24.01 | 7.56% | $ | 479 | 0.78%(2) | 0.78%(2) | 0.78%(2) | 1.43% | 115% | ||||||||||||||||||||||||||||||||||
U.S. Managed Volatility Fund | ||||||||||||||||||||||||||||||||||||||||||||||||||||||||||
Class A | ||||||||||||||||||||||||||||||||||||||||||||||||||||||||||
2016 | $ | 16.23 | $ | 0.25 | $ | 1.62 | $ | 1.87 | $ | (0.26) | $ | (0.80) | $ | (1.06) | $ | 17.04 | 12.01% | $ | 1,126,685 | 1.02%(2) | 1.02%(2) | 1.25%(2) | 1.53% | 43% | ||||||||||||||||||||||||||||||||||
2015 | 17.50 | 0.25 | 0.60 | 0.85 | (0.25) | (1.87) | (2.12) | 16.23 | 4.61 | 959,241 | 1.00 | 1.00 | 1.23 | 1.47 | 58 | |||||||||||||||||||||||||||||||||||||||||||
2014 | 16.09 | 0.23 | 2.62 | 2.85 | (0.23) | (1.21) | (1.44) | 17.50 | 18.68 | 1,001,565 | 1.00 | 1.00 | 1.27 | 1.38 | 71 | |||||||||||||||||||||||||||||||||||||||||||
2013 | 13.96 | 0.27 | 2.25 | 2.52 | (0.27) | (0.12) | (0.39) | 16.09 | 18.39 | 851,119 | 1.00 | 1.00 | 1.27 | 1.78 | 39 | |||||||||||||||||||||||||||||||||||||||||||
2012 | 11.49 | 0.22 | 2.45 | 2.67 | (0.20) | — | (0.20) | 13.96 | 23.41 | 635,298 | 1.00 | 1.00 | 1.28 | 1.72 | 48 | |||||||||||||||||||||||||||||||||||||||||||
Class I | ||||||||||||||||||||||||||||||||||||||||||||||||||||||||||
2016 | $ | 16.21 | $ | 0.21 | $ | 1.62 | $ | 1.83 | $ | (0.21) | $ | (0.80) | $ | (1.01) | $ | 17.03 | 11.76% | $ | 1,928 | 1.27%(2) | 1.27%(2) | 1.50%(2) | 1.28% | 43% | ||||||||||||||||||||||||||||||||||
2015 | 17.47 | 0.21 | 0.60 | 0.81 | (0.20) | (1.87) | (2.07) | 16.21 | 4.43 | 1,469 | 1.25 | 1.25 | 1.48 | 1.22 | 58 | |||||||||||||||||||||||||||||||||||||||||||
2014 | 16.07 | 0.19 | 2.61 | 2.80 | (0.19) | (1.21) | (1.40) | 17.47 | 18.35 | 1,280 | 1.25 | 1.25 | 1.52 | 1.13 | 71 | |||||||||||||||||||||||||||||||||||||||||||
2013 | 13.93 | 0.23 | 2.25 | 2.48 | (0.22) | (0.12) | (0.34) | 16.07 | 18.10 | 1,230 | 1.25 | 1.25 | 1.52 | 1.52 | 39 | |||||||||||||||||||||||||||||||||||||||||||
2012 | 11.47 | 0.22 | 2.41 | 2.63 | (0.17) | — | (0.17) | 13.93 | 23.08 | 709 | 1.25 | 1.25 | 1.53 | 1.62 | 48 | |||||||||||||||||||||||||||||||||||||||||||
Class Y | ||||||||||||||||||||||||||||||||||||||||||||||||||||||||||
2016 | $ | 16.24 | $ | 0.29 | $ | 1.62 | $ | 1.91 | $ | (0.30) | $ | (0.80) | $ | (1.10) | $ | 17.05 | 12.28% | $ | 486,555 | 0.77%(2) | | 0.77%(2) | | 1.00%(2) | 1.78% | 43% | ||||||||||||||||||||||||||||||||
2015(4) | 16.51 | 0.22 | (0.35) | (0.13) | (0.14) | — | (0.14) | 16.24 | (1.97) | 392,240 | 0.75 | 0.75 | 0.99 | 1.73 | 58 | |||||||||||||||||||||||||||||||||||||||||||
Global Managed Volatility Fund | ||||||||||||||||||||||||||||||||||||||||||||||||||||||||||
Class A | ||||||||||||||||||||||||||||||||||||||||||||||||||||||||||
2016 | $ | 10.83 | $ | 0.17 | $ | 1.20 | $ | 1.37 | $ | (0.55) | $ | (0.14) | $ | (0.69) | $ | 11.51 | 13.08% | $ | 1,618,549 | 1.13%(2) | 1.13%(2) | 1.25%(2) | 1.50% | 58% | ||||||||||||||||||||||||||||||||||
2015 | 11.41 | 0.20 | 0.47 | 0.67 | (0.57) | (0.68) | (1.25) | 10.83 | 5.87 | 2,234,776 | 1.11 | 1.11 | 1.23 | 1.75 | 52 | |||||||||||||||||||||||||||||||||||||||||||
2014 | 11.00 | 0.20 | 1.24 | 1.44 | (0.50) | (0.53) | (1.03) | 11.41 | 13.97 | 1,799,842 | 1.11 | 1.11 | 1.28 | 1.84 | 68 | |||||||||||||||||||||||||||||||||||||||||||
2013 | 9.80 | 0.23 | 1.22 | 1.45 | (0.25) | — | (0.25) | 11.00 | 15.12 | 1,399,316 | 1.11 | 1.11 | 1.28 | 2.09 | 60 | |||||||||||||||||||||||||||||||||||||||||||
2012 | 8.53 | 0.20 | 1.07 | 1.27 | — | — | — | 9.80 | 14.89 | 928,141 | 1.11 | 1.11 | 1.30 | 2.19 | 48 | |||||||||||||||||||||||||||||||||||||||||||
Class I | ||||||||||||||||||||||||||||||||||||||||||||||||||||||||||
2016 | $ | 10.62 | $ | 0.15 | $ | 1.18 | $ | 1.33 | $ | (0.52) | $ | (0.14) | $ | (0.66) | $ | 11.29 | 12.97% | $ | 2,734 | 1.38%(2) | 1.38%(2) | 1.51%(2) | 1.41% | 58% | ||||||||||||||||||||||||||||||||||
2015 | 11.23 | 0.17 | 0.44 | 0.61 | (0.54) | (0.68) | (1.22) | 10.62 | 5.43 | 1,301 | 1.36 | 1.36 | 1.48 | 1.50 | 52 | |||||||||||||||||||||||||||||||||||||||||||
2014 | 10.84 | 0.17 | 1.23 | 1.40 | (0.48) | (0.53) | (1.01) | 11.23 | 13.78 | 1,034 | 1.36 | 1.36 | 1.53 | 1.59 | 68 | |||||||||||||||||||||||||||||||||||||||||||
2013 | 9.66 | 0.20 | 1.21 | 1.41 | (0.23) | — | (0.23) | 10.84 | 14.91 | 954 | 1.36 | 1.36 | 1.54 | 1.85 | 60 | |||||||||||||||||||||||||||||||||||||||||||
2012 | 8.44 | 0.22 | 1.00 | 1.22 | — | — | — | 9.66 | 14.45 | 320 | 1.36 | 1.36 | 1.55 | 2.32 | 48 | |||||||||||||||||||||||||||||||||||||||||||
Class Y | ||||||||||||||||||||||||||||||||||||||||||||||||||||||||||
2016 | $ | 10.85 | $ | 0.21 | $ | 1.20 | $ | 1.41 | $ | (0.57) | $ | (0.14) | $ | (0.71) | $ | 11.55 | 13.49% | $ | 102,388 | 0.88%(2) | 0.88%(2) | 1.01%(2) | 1.86% | 58% | ||||||||||||||||||||||||||||||||||
2015(4) | 10.73 | 0.19 | (0.07) | 0.12 | — | — | — | 10.85 | 1.12 | 94,522 | 0.86 | 0.86 | 0.99 | 2.23 | 52 | |||||||||||||||||||||||||||||||||||||||||||
| † | Returns and portfolio turnover rates are for the period indicated and have not been annualized. Returns do not reflect the deduction of taxes the shareholder would pay on fund distributions or redemption of fund shares. |
| (1) | Per share net investment income and net realized and unrealized gains (losses) calculated using average shares. |
| (2) | The expense ratio includes proxy expenses outside of the cap. |
| (3) | Commenced operations on October 30, 2015. All ratios for the period have been annualized. |
| (4) | Commenced operations on December 31, 2014. All ratios for the period have been annualized. |
| 304 | SEI Institutional Managed Trust / Annual Report / September 30, 2016 |
FINANCIAL HIGHLIGHTS
For the years or period ended September 30, (unless otherwise indicated)
For a share outstanding throughout each period
| ||||||||||||||||||||||||||||||||||||||||||||||||||||||||||
| Net Asset Value, Beginning of Period | Net Investment Income (Loss)(1) | Net Realized and Unrealized Gains (Losses) on Investments(1) | Total from | Dividends from Net Investment Income | Distributions from Net Realized Capital Gains | Total Dividends and Distributions | Net of | Total Return† | Net Assets End of Period ($ Thousands) | Ratio of Net Expenses to Average Net Assets | Ratio of Expenses to Average Net Assets (Excluding Fees Paid Indirectly and Including Waivers) | Ratio of Net | Ratio of Net Investment Income (Loss) to Average Net Assets | Portfolio Turnover Rate† | ||||||||||||||||||||||||||||||||||||||||||||
| ||||||||||||||||||||||||||||||||||||||||||||||||||||||||||
Tax-Managed Managed Volatility Fund | ||||||||||||||||||||||||||||||||||||||||||||||||||||||||||
Class A | ||||||||||||||||||||||||||||||||||||||||||||||||||||||||||
2016 | $ | 13.88 | $ | 0.22 | $ | 1.41 | $ | 1.63 | $ | (0.21) | $ | (0.56) | $ | (0.77) | $ | 14.74 | 12.24% | $ | 1,162,478 | 1.02%(2) | 1.02%(2) | 1.25%(2) | 1.52% | 32% | ||||||||||||||||||||||||||||||||||
2015 | 14.14 | 0.20 | 0.64 | 0.84 | (0.20) | (0.90) | (1.10) | 13.88 | 5.92 | 901,026 | 1.00 | 1.00 | 1.23 | 1.40 | 49 | |||||||||||||||||||||||||||||||||||||||||||
2014 | 12.70 | 0.19 | 1.94 | 2.13 | (0.18) | (0.51) | (0.69) | 14.14 | 17.33 | 765,744 | 1.00 | 1.00 | 1.28 | 1.38 | 58 | |||||||||||||||||||||||||||||||||||||||||||
2013 | 11.28 | 0.22 | 1.75 | 1.97 | (0.22) | (0.33) | (0.55) | 12.70 | 18.24 | 621,530 | 1.00 | 1.00 | 1.27 | 1.86 | 28 | |||||||||||||||||||||||||||||||||||||||||||
2012 | 9.77 | 0.18 | 1.87 | 2.05 | (0.16) | (0.38) | (0.54) | 11.28 | 21.70 | 442,074 | 1.00 | 1.00 | 1.28 | 1.71 | 30 | |||||||||||||||||||||||||||||||||||||||||||
Class Y | ||||||||||||||||||||||||||||||||||||||||||||||||||||||||||
2016 | $ | 13.89 | $ | 0.26 | $ | 1.40 | $ | 1.66 | $ | (0.25) | $ | (0.56) | $ | (0.81) | $ | 14.74 | 12.42% | $ | 37,017 | 0.77%(2) | 0.77%(2) | 1.01%(2) | 1.81% | 32% | ||||||||||||||||||||||||||||||||||
2015(3) | 14.25 | 0.11 | (0.42)(4) | (0.31) | (0.05) | — | (0.05) | 13.89 | (2.17) | 323 | 0.81 | 0.81 | 1.06 | 1.77 | 49 | |||||||||||||||||||||||||||||||||||||||||||
Real Estate Fund | ||||||||||||||||||||||||||||||||||||||||||||||||||||||||||
Class A | ||||||||||||||||||||||||||||||||||||||||||||||||||||||||||
2016 | $ | 17.96 | $ | 0.29 | $ | 2.69 | $ | 2.98 | $ | (0.16) | $ | (1.41) | $ | (1.57) | $ | 19.37 | 17.13% | $ | 174,178 | 1.16%(2) | 1.16%(2) | 1.25%(2) | 1.54% | 84% | ||||||||||||||||||||||||||||||||||
2015 | 17.05 | 0.08 | 1.87 | 1.95 | (0.26) | (0.78) | (1.04) | 17.96 | 11.44 | 193,006 | 1.14 | 1.14 | 1.23 | 0.42 | 51 | |||||||||||||||||||||||||||||||||||||||||||
2014 | 15.42 | 0.29 | 1.64 | 1.93 | (0.30) | — | (0.30) | 17.05 | 12.63 | 226,780 | 1.14 | 1.14 | 1.28 | 1.76 | 57 | |||||||||||||||||||||||||||||||||||||||||||
2013 | 14.97 | 0.14 | 0.50 | 0.64 | (0.19) | — | (0.19) | 15.42 | 4.30 | 207,876 | 1.14 | 1.14 | 1.27 | 0.91 | 74 | |||||||||||||||||||||||||||||||||||||||||||
2012 | 11.67 | 0.08 | 3.34 | 3.42 | (0.12) | — | (0.12) | 14.97 | 29.44 | 191,484 | 1.14 | 1.14 | 1.28 | 0.55 | 68 | |||||||||||||||||||||||||||||||||||||||||||
Class I | ||||||||||||||||||||||||||||||||||||||||||||||||||||||||||
2016 | $ | 17.94 | $ | 0.25 | $ | 2.69 | $ | 2.94 | $ | (0.12) | $ | (1.41) | $ | (1.53) | $ | 19.35 | 16.90% | $ | 651 | 1.38%(2) | 1.38%(2) | 1.50%(2) | 1.33% | 84% | ||||||||||||||||||||||||||||||||||
2015 | 17.03 | 0.03 | 1.87 | 1.90 | (0.21) | (0.78) | (0.99) | 17.94 | 11.16 | 720 | 1.36 | 1.36 | 1.48 | 0.17 | 51 | |||||||||||||||||||||||||||||||||||||||||||
2014 | 15.39 | 0.25 | 1.64 | 1.89 | (0.25) | — | (0.25) | 17.03 | 12.33 | 622 | 1.36 | 1.36 | 1.52 | 1.51 | 57 | |||||||||||||||||||||||||||||||||||||||||||
2013 | 14.93 | 0.10 | 0.51 | 0.61 | (0.15) | — | (0.15) | 15.39 | 4.09 | 565 | 1.36 | 1.36 | 1.52 | 0.65 | 74 | |||||||||||||||||||||||||||||||||||||||||||
2012 | 11.64 | 0.05 | 3.33 | 3.38 | (0.09) | — | (0.09) | 14.93 | 29.16 | 606 | 1.36 | 1.36 | 1.53 | 0.33 | 68 | |||||||||||||||||||||||||||||||||||||||||||
Class Y | ||||||||||||||||||||||||||||||||||||||||||||||||||||||||||
2016 | $ | 17.96 | $ | 0.32 | $ | 2.72 | $ | 3.04 | $ | (0.21) | $ | (1.41) | $ | (1.62) | $ | 19.38 | 17.49% | $ | 36,591 | 0.92%(2) | 0.92%(2) | 1.01%(2) | 1.64% | 84% | ||||||||||||||||||||||||||||||||||
2015(5) | 19.00 | 0.08 | (0.65)(4) | (0.57) | (0.14) | (0.33) | (0.47) | 17.96 | (2.97) | 18,561 | 0.89 | 0.89 | 0.98 | 0.54 | 51 | |||||||||||||||||||||||||||||||||||||||||||
Enhanced Income Fund | ||||||||||||||||||||||||||||||||||||||||||||||||||||||||||
Class A | ||||||||||||||||||||||||||||||||||||||||||||||||||||||||||
2016 | $ | 7.46 | $ | 0.15 | $ | 0.04 | $ | 0.19 | $ | (0.16) | $ | — | $ | (0.16) | $ | 7.49 | 2.60% | $ | 181,059 | 0.63%(2) | 0.63%(2) | 1.04%(2) | 1.96% | 90% | ||||||||||||||||||||||||||||||||||
2015 | 7.60 | 0.14 | (0.13) | 0.01 | (0.15) | — | (0.15) | 7.46 | 0.07 | 190,645 | 0.60 | 0.60 | 1.02 | 1.82 | 89 | |||||||||||||||||||||||||||||||||||||||||||
2014 | 7.61 | 0.14 | (0.01) | 0.13 | (0.14) | — | (0.14) | 7.60 | 1.69 | 230,910 | 0.60 | 0.60 | 1.05 | 1.78 | 106 | |||||||||||||||||||||||||||||||||||||||||||
2013 | 7.57 | 0.16 | 0.03 | 0.19 | (0.15) | — | (0.15) | 7.61 | 2.50 | 194,821 | 0.60 | 0.60 | 1.05 | 2.08 | 170 | |||||||||||||||||||||||||||||||||||||||||||
2012 | 7.36 | 0.18 | 0.20 | 0.38 | (0.17) | — | (0.17) | 7.57 | 5.30 | 161,037 | 0.60 | 0.60 | 1.05 | 2.41 | 198 | |||||||||||||||||||||||||||||||||||||||||||
Class I | ||||||||||||||||||||||||||||||||||||||||||||||||||||||||||
2016 | $ | 7.45 | $ | 0.13 | $ | 0.03 | $ | 0.16 | $ | (0.14) | $ | — | $ | (0.14) | $ | 7.47 | 2.20% | $ | 255 | 0.88%(2) | 0.88%(2) | 1.29%(2) | 1.71% | 90% | ||||||||||||||||||||||||||||||||||
2015 | 7.58 | 0.12 | (0.12) | — | (0.13) | — | (0.13) | 7.45 | (0.06) | 232 | 0.85 | 0.85 | 1.26 | 1.54 | 89 | |||||||||||||||||||||||||||||||||||||||||||
2014 | 7.59 | 0.12 | (0.01) | 0.11 | (0.12) | — | (0.12) | 7.58 | 1.44 | 376 | 0.85 | 0.85 | 1.30 | 1.53 | 106 | |||||||||||||||||||||||||||||||||||||||||||
2013 | 7.56 | 0.14 | 0.02 | 0.16 | (0.13) | — | (0.13) | 7.59 | 2.17 | 368 | 0.85 | 0.85 | 1.30 | 1.85 | 170 | |||||||||||||||||||||||||||||||||||||||||||
2012 | 7.36 | 0.15 | 0.21 | 0.36 | (0.16) | — | (0.16) | 7.56 | 4.93 | 69 | 0.85 | 0.85 | 1.30 | 2.11 | 198 | |||||||||||||||||||||||||||||||||||||||||||
Class Y | ||||||||||||||||||||||||||||||||||||||||||||||||||||||||||
2016 | $ | 7.46 | $ | 0.16 | $ | 0.03 | $ | 0.19 | $ | (0.17) | $ | — | $ | (0.17) | $ | 7.48 | 2.61% | $ | 17,310 | 0.49%(2) | 0.49%(2) | 0.79%(2) | 2.11% | 90% | ||||||||||||||||||||||||||||||||||
2015(5) | 7.51 | 0.11 | (0.08) | 0.03 | (0.08) | — | (0.08) | 7.46 | 0.44 | 11,264 | 0.46 | 0.46 | 0.77 | 1.89 | 89 | |||||||||||||||||||||||||||||||||||||||||||
| † | Returns and portfolio turnover rates are for the period indicated and have not been annualized. Returns do not reflect the deduction of taxes the shareholder would pay on fund distributions or redemption of fund shares. |
| (1) | Per share net investment income and net realized and unrealized gains (losses) calculated using average shares. |
| (2) | The expense ratio includes proxy expenses outside of the cap. |
| (3) | Commenced operations on April 30, 2015. All ratios for the period have been annualized. |
| (4) | The amount shown for a share outstanding throughout the period does not accord with the aggregate net gains on investments for that period because the sales and repurchase of Fund shares in relation to the fluctuating market value of the Fund. |
| (5) | Commenced operations on December 31, 2014. All ratios for the period have been annualized. |
| SEI Institutional Managed Trust / Annual Report / September 30, 2016 | 305 |
FINANCIAL HIGHLIGHTS
For the years or period ended September 30, (unless otherwise indicated)
For a share outstanding throughout each period
| ||||||||||||||||||||||||||||||||||||||||||||||||||||||||||||
Net Asset Value, | Net Investment Income (Loss)(1) | Net Realized and Gains | Total from | Dividends from Net Investment Income | Distributions from Net Realized Capital Gains | Total Dividends and Distributions | Net Asset Value, End of Period | Total Return† | Net Assets End of Period ($ Thousands) | Ratio of Net Expenses to Average Net Assets | Ratio of Expenses to Average Net Assets (Excluding Fees Paid Indirectly and Including Waivers) | Ratio of Expenses to Average Net Assets (Excluding Fees Paid Indirectly and Waivers) | Ratio of Net Investment Income (Loss) to Average Net Assets | Portfolio Turnover Rate† | ||||||||||||||||||||||||||||||||||||||||||||||
| ||||||||||||||||||||||||||||||||||||||||||||||||||||||||||||
Core Fixed Income Fund |
| |||||||||||||||||||||||||||||||||||||||||||||||||||||||||||
Class A | ||||||||||||||||||||||||||||||||||||||||||||||||||||||||||||
2016 | $ | 11.47 | $ | 0.26 | $ | 0.37 | $ | 0.63 | $ | (0.27) | $ | (0.12) | $ | (0.39) | $ | 11.71 | 5.64% | $ | 2,070,113 | 0.69%(2) | 0.69%(2) | 0.88%(2) | 2.29% | 336% | ||||||||||||||||||||||||||||||||||||
2015 | 11.47 | 0.27 | — | 0.27 | (0.27) | — | (0.27) | 11.47 | 2.36 | 2,068,581 | 0.67 | 0.67 | 0.86 | 2.32 | 350 | |||||||||||||||||||||||||||||||||||||||||||||
2014 | 11.20 | 0.29 | 0.28 | 0.57 | (0.30) | — | (0.30) | 11.47 | 5.14 | 2,041,268 | 0.67 | 0.67 | 0.85 | 2.59 | 343 | |||||||||||||||||||||||||||||||||||||||||||||
2013 | 11.64 | 0.30 | (0.42) | (0.12) | (0.32) | — | (0.32) | 11.20 | (1.09) | 1,904,623 | 0.67 | 0.67 | 0.85 | 2.57 | 342 | |||||||||||||||||||||||||||||||||||||||||||||
2012 | 11.14 | 0.33 | 0.61 | 0.94 | (0.35) | (0.09) | (0.44) | 11.64 | 8.67 | 2,172,794 | 0.67 | 0.67 | 0.85 | 2.93 | 349 | |||||||||||||||||||||||||||||||||||||||||||||
Class I | ||||||||||||||||||||||||||||||||||||||||||||||||||||||||||||
2016 | $ | 11.46 | $ | 0.24 | $ | 0.36 | $ | 0.60 | $ | (0.24) | $ | (0.12) | $ | (0.36) | $ | 11.70 | 5.41% | $ | 9,313 | 0.91%(2) | 0.91%(2) | 1.13%(2) | 2.07% | 336% | ||||||||||||||||||||||||||||||||||||
2015 | 11.46 | 0.24 | 0.01 | 0.25 | (0.25) | — | (0.25) | 11.46 | 2.14 | 12,504 | 0.89 | 0.89 | 1.11 | 2.10 | 350 | |||||||||||||||||||||||||||||||||||||||||||||
2014 | 11.19 | 0.27 | 0.27 | 0.54 | (0.27) | — | (0.27) | 11.46 | 4.91 | 10,488 | 0.89 | 0.89 | 1.08 | 2.38 | 343 | |||||||||||||||||||||||||||||||||||||||||||||
2013 | 11.63 | 0.27 | (0.42) | (0.15) | (0.29) | — | (0.29) | 11.19 | (1.31) | 14,128 | 0.89 | 0.89 | 1.10 | 2.34 | 342 | |||||||||||||||||||||||||||||||||||||||||||||
2012 | 11.13 | 0.31 | 0.61 | 0.92 | (0.33) | (0.09) | (0.42) | 11.63 | 8.44 | 14,944 | 0.89 | 0.89 | 1.10 | 2.71 | 349 | |||||||||||||||||||||||||||||||||||||||||||||
Class Y | ||||||||||||||||||||||||||||||||||||||||||||||||||||||||||||
2016 | $ | 11.47 | $ | 0.29 | $ | 0.37 | $ | 0.66 | $ | (0.30) | $ | (0.12) | $ | (0.42) | $ | 11.71 | 5.90% | $ | 70,916 | 0.44%(2) | 0.44%(2) | 0.63%(2) | 2.55% | 336% | ||||||||||||||||||||||||||||||||||||
2015(3) | 11.47 | 0.08 | — | 0.08 | (0.08) | — | (0.08) | 11.47 | 0.69 | 22,985 | 0.42 | 0.42 | 0.63 | 2.66 | 350 | |||||||||||||||||||||||||||||||||||||||||||||
U.S. Fixed Income Fund |
| |||||||||||||||||||||||||||||||||||||||||||||||||||||||||||
Class A | ||||||||||||||||||||||||||||||||||||||||||||||||||||||||||||
2016 | $ | 10.38 | $ | 0.19 | $ | 0.32 | $ | 0.51 | $ | (0.20) | $ | (0.11) | $ | (0.31) | $ | 10.58 | 4.94% | $ | 1,205,262 | 0.68%(2) | 0.68%(2) | 0.88%(2) | 1.81% | 401% | ||||||||||||||||||||||||||||||||||||
2015 | 10.33 | 0.20 | 0.08 | 0.28 | (0.21) | (0.02) | (0.23) | 10.38 | 2.67 | 1,113,602 | 0.66 | 0.66 | 0.86 | 1.92 | 313 | |||||||||||||||||||||||||||||||||||||||||||||
2014 | 10.15 | 0.21 | 0.18 | 0.39 | (0.21) | — | (0.21) | 10.33 | 3.91 | 1,098,480 | 0.66 | 0.66 | 0.86 | 2.02 | 345 | |||||||||||||||||||||||||||||||||||||||||||||
2013 | 10.84 | 0.19 | (0.36) | (0.17) | (0.21) | (0.31) | (0.52) | 10.15 | (1.61) | 1,022,233 | 0.66 | 0.66 | 0.86 | 1.85 | 319 | |||||||||||||||||||||||||||||||||||||||||||||
2012 | 10.70 | 0.25 | 0.44 | 0.69 | (0.27) | (0.28) | (0.55) | 10.84 | 6.68 | 898,450 | 0.66 | 0.66 | 0.87 | 2.34 | 322 | |||||||||||||||||||||||||||||||||||||||||||||
Class Y | ||||||||||||||||||||||||||||||||||||||||||||||||||||||||||||
2016 | $ | 10.38 | $ | 0.21 | $ | 0.32 | $ | 0.53 | $ | (0.22) | $ | (0.11) | $ | (0.33) | $ | 10.58 | 5.20% | $ | 97,132 | 0.43%(2) | 0.43%(2) | 0.63%(2) | 2.06% | 401% | ||||||||||||||||||||||||||||||||||||
2015(4) | 10.44 | 0.17 | (0.06)(5) | 0.11 | (0.17) | — | (0.17) | 10.38 | 1.03 | 89,000 | 0.41 | 0.41 | 0.61 | 2.16 | 313 | |||||||||||||||||||||||||||||||||||||||||||||
High Yield Bond Fund |
| |||||||||||||||||||||||||||||||||||||||||||||||||||||||||||
Class A | ||||||||||||||||||||||||||||||||||||||||||||||||||||||||||||
2016 | $ | 7.01 | $ | 0.42 | $ | 0.26 | $ | 0.68 | $ | (0.42) | $ | (0.09) | $ | (0.51) | $ | 7.18 | 10.44% | $ | 1,737,907 | 0.91%(2) | 0.91%(2) | 1.10%(2) | 6.16% | 56% | ||||||||||||||||||||||||||||||||||||
2015 | 7.70 | 0.42 | (0.65) | (0.23) | (0.42) | (0.04) | (0.46) | 7.01 | (3.21) | 1,548,778 | 0.89 | 0.89 | 1.08 | 5.61 | 56 | |||||||||||||||||||||||||||||||||||||||||||||
2014 | 7.68 | 0.43 | 0.06‡ | 0.49 | (0.43) | (0.04) | (0.47) | 7.70 | 6.49 | 1,707,482 | 0.89 | 0.89 | 1.12 | 5.47 | 73 | |||||||||||||||||||||||||||||||||||||||||||||
2013 | 7.59 | 0.48 | 0.07 | 0.55 | (0.46) | — | (0.46) | 7.68 | 7.39 | 1,989,355 | 0.89 | 0.89 | 1.12 | 6.13 | 74 | |||||||||||||||||||||||||||||||||||||||||||||
2012 | 6.92 | 0.53 | 0.68 | 1.21 | (0.51) | (0.03) | (0.54) | 7.59 | 18.04 | 1,752,357 | 0.89 | 0.89 | 1.12 | 7.23 | 65 | |||||||||||||||||||||||||||||||||||||||||||||
Class I | ||||||||||||||||||||||||||||||||||||||||||||||||||||||||||||
2016 | $ | 6.78 | $ | 0.40 | $ | 0.23 | $ | 0.63 | $ | (0.39) | $ | (0.09) | $ | (0.48) | $ | 6.93 | 9.95% | $ | 1,078 | 1.14%(2) | 1.14%(2) | 1.36%(2) | 6.01% | 56% | ||||||||||||||||||||||||||||||||||||
2015 | 7.48 | 0.39 | (0.67) | (0.28) | (0.38) | (0.04) | (0.42) | 6.78 | (3.91) | 1,026 | 1.11 | 1.11 | 1.32 | 5.31 | 56 | |||||||||||||||||||||||||||||||||||||||||||||
2014 | 7.49 | 0.40 | 0.03 | 0.43 | (0.40) | (0.04) | (0.44) | 7.48 | 5.81 | 3,794 | 1.11 | 1.11 | 1.37 | 5.24 | 73 | |||||||||||||||||||||||||||||||||||||||||||||
2013 | 7.40 | 0.45 | 0.07 | 0.52 | (0.43) | — | (0.43) | 7.49 | 7.19 | 38,849 | 1.11 | 1.11 | 1.38 | 6.07 | 74 | |||||||||||||||||||||||||||||||||||||||||||||
2012 | 6.82 | 0.50 | 0.59 | 1.09 | (0.48) | (0.03) | (0.51) | 7.40 | 16.54 | 14,161 | 1.11 | 1.11 | 1.38 | 6.91 | 65 | |||||||||||||||||||||||||||||||||||||||||||||
Class Y | ||||||||||||||||||||||||||||||||||||||||||||||||||||||||||||
2016 | $ | 7.01 | $ | 0.44 | $ | 0.26 | $ | 0.70 | $ | (0.44) | $ | (0.09) | $ | (0.53) | $ | 7.18 | 10.72% | $ | 199,015 | 0.66%(2) | 0.66%(2) | 0.85%(2) | 6.42% | 56% | ||||||||||||||||||||||||||||||||||||
2015(4) | 7.44 | 0.33 | (0.44) | (0.11) | (0.32) | — | (0.32) | 7.01 | (1.75) | 143,315 | 0.64 | 0.64 | 0.83 | 5.94 | 56 | |||||||||||||||||||||||||||||||||||||||||||||
| † | Returns and portfolio turnover rates are for the period indicated and have not been annualized. Returns do not reflect the deduction of taxes the shareholder would pay on fund distributions or redemption of fund shares. |
| ‡ | Includes redemption fees of $0.03 per share. |
| (1) | Per share net investment income and net realized and unrealized gains (losses) calculated using average shares. |
| (2) | The expense ratio includes proxy expenses outside of the cap. |
| (3) | Commenced operations on June 30, 2015. All ratios for the period have been annualized. |
| (4) | Commenced operations on December 31, 2014. All ratios for the period have been annualized. |
| (5) | The amount shown for a share outstanding throughout the period does not accord with the aggregate net gains on investments for that period because the sales and repurchase of Fund shares in relation to the fluctuating market value of the Fund. |
| 306 | SEI Institutional Managed Trust / Annual Report / September 30, 2016 |
FINANCIAL HIGHLIGHTS
For the years or period ended September 30, (unless otherwise indicated)
For a share outstanding throughout each period
| ||||||||||||||||||||||||||||||||||||||||||||||||||||||||||||
| Net Asset Value, Beginning of Period | Net Investment Income (Loss)(1) | Net Realized and Unrealized Gains (Losses) on Investments(1) | Total from Operations | Dividends from Net Investment Income | Distributions from Net Realized Capital Gains | Total Dividends and Distributions | Net Asset Value, End of Period | Total Return† | Net Assets End of Period ($ Thousands) | Ratio of Net Expenses to Average Net Assets | Ratio of Expenses to Average Net Assets (Excluding Fees Paid Indirectly and Including Waivers) | Ratio of Expenses to Average Net Assets (Excluding Fees Paid Indirectly and Waivers) | Ratio of Net Investment Income (Loss) to Average Net Assets | Portfolio Turnover Rate† | ||||||||||||||||||||||||||||||||||||||||||||||
| ||||||||||||||||||||||||||||||||||||||||||||||||||||||||||||
Conservative Income Fund |
| |||||||||||||||||||||||||||||||||||||||||||||||||||||||||||
Class A | ||||||||||||||||||||||||||||||||||||||||||||||||||||||||||||
2016(2) | $ | 10.00 | $ | 0.02 | $ | — | $ | 0.02 | $ | (0.02) | $ | — | $ | (0.02) | $ | 10.00 | 0.16% | $ | 75,011 | 0.30%(3) | 0.30%(3) | 0.61%(3) | 0.37% | –% | ||||||||||||||||||||||||||||||||||||
Class Y | ||||||||||||||||||||||||||||||||||||||||||||||||||||||||||||
2016(2) | $ | 10.00 | $ | 0.02 | $ | — | $ | 0.02 | $ | (0.02) | $ | — | $ | (0.02) | $ | 10.00 | 0.20% | $ | 16,796 | 0.20%(3) | 0.20%(3) | 0.36%(3) | 0.47% | –% | ||||||||||||||||||||||||||||||||||||
Tax-Free Conservative Income Fund |
| |||||||||||||||||||||||||||||||||||||||||||||||||||||||||||
Class A | ||||||||||||||||||||||||||||||||||||||||||||||||||||||||||||
2016(2) | $ | 10.00 | $ | 0.01 | $ | — | $ | 0.01 | $ | (0.01) | $ | — | $ | (0.01) | $ | 10.00 | 0.12% | $ | 30,946 | 0.30%(3) | 0.30%(3) | 0.60%(3) | 0.27% | –% | ||||||||||||||||||||||||||||||||||||
Class Y | ||||||||||||||||||||||||||||||||||||||||||||||||||||||||||||
2016(2) | $ | 10.00 | $ | 0.02 | $ | — | $ | 0.02 | $ | (0.02) | $ | — | $ | (0.02) | $ | 10.00 | 0.16% | $ | 13,922 | 0.20%(3) | 0.20%(3) | 0.35%(3) | 0.37% | –% | ||||||||||||||||||||||||||||||||||||
Real Return Fund |
| |||||||||||||||||||||||||||||||||||||||||||||||||||||||||||
Class A | ||||||||||||||||||||||||||||||||||||||||||||||||||||||||||||
2016 | $ | 9.91 | $ | — | $ | 0.23 | $ | 0.23 | $ | — | $ | — | $ | — | $ | 10.14 | 2.32% | $ | 291,380 | 0.47%(3) | 0.47%(3) | 0.82%(3) | (0.02)% | 38% | ||||||||||||||||||||||||||||||||||||
2015 | 10.08 | (0.10) | (0.06) | (0.16) | (0.01) | — | (0.01) | 9.91 | (1.57) | 263,888 | 0.45 | 0.45 | 0.80 | (1.01) | 37 | |||||||||||||||||||||||||||||||||||||||||||||
2014 | 10.19 | 0.05 | (0.08) | (0.03) | (0.04) | (0.04) | (0.08) | 10.08 | (0.30) | 284,944 | 0.45 | 0.45 | 0.84 | 0.51 | 34 | |||||||||||||||||||||||||||||||||||||||||||||
2013 | 10.67 | 0.05 | (0.23) | (0.18) | (0.06) | (0.24) | (0.30) | 10.19 | (1.72) | 308,821 | 0.45 | 0.45 | 0.84 | 0.48 | 72 | |||||||||||||||||||||||||||||||||||||||||||||
2012 | 10.60 | 0.05 | 0.23 | 0.28 | (0.14) | (0.07) | (0.21) | 10.67 | 2.66 | 283,646 | 0.45 | 0.45 | 0.85 | 0.48 | 137 | |||||||||||||||||||||||||||||||||||||||||||||
Class Y | ||||||||||||||||||||||||||||||||||||||||||||||||||||||||||||
2016 | $ | 9.92 | $ | 0.01 | $ | 0.24 | $ | 0.25 | $ | — | $ | — | $ | — | $ | 10.17 | 2.52% | $ | 28,835 | 0.37%(3) | 0.37%(3) | 0.57%(3) | 0.07% | 38% | ||||||||||||||||||||||||||||||||||||
2015(4) | 9.91 | (0.02) | 0.03 | 0.01 | — | — | — | 9.92 | 0.10 | 25,525 | 0.35 | 0.35 | 0.55 | (0.27) | 37 | |||||||||||||||||||||||||||||||||||||||||||||
Dynamic Asset Allocation Fund |
| |||||||||||||||||||||||||||||||||||||||||||||||||||||||||||
Class A | ||||||||||||||||||||||||||||||||||||||||||||||||||||||||||||
2016 | $ | 9.09 | $ | 0.14 | $ | 0.99 | $ | 1.13 | $ | (0.04) | $ | — | $ | (0.04) | $ | 10.18 | 12.39% | $ | 488,778 | 0.77%(3) | 0.77%(3) | 1.21%(3) | 1.42% | 7% | ||||||||||||||||||||||||||||||||||||
2015(5) | 10.00 | 0.03 | (0.94) | (0.91) | — | — | — | 9.09 | (9.10) | 21,514 | 0.75 | 0.75 | 1.25 | 1.62 | 2 | |||||||||||||||||||||||||||||||||||||||||||||
Class Y | ||||||||||||||||||||||||||||||||||||||||||||||||||||||||||||
2016 | $ | 9.09 | $ | 0.16 | $ | 0.99 | $ | 1.15 | $ | (0.04) | $ | — | $ | (0.04) | $ | 10.20 | 12.67% | $ | 48,523 | 0.52%(3) | 0.52%(3) | 0.96%(3) | 1.66% | 7% | ||||||||||||||||||||||||||||||||||||
2015(5) | 10.00 | 0.03 | (0.94) | (0.91) | — | — | — | 9.09 | (9.10) | 48,229 | 0.50 | 0.50 | 0.96 | 1.97 | 2 | |||||||||||||||||||||||||||||||||||||||||||||
| † | Returns and portfolio turnover rates are for the period indicated and have not been annualized. Returns do not reflect the deduction of taxes the shareholder would pay on fund distributions or redemption of fund shares. |
| (1) | Per share net investment income and net realized and unrealized gains (losses) calculated using average shares. |
| (2) | Commenced operations on April 22, 2016. All ratios for the period have been annualized. |
| (3) | The expense ratio includes proxy expenses outside of the cap. |
| (4) | Commenced operations on December 31, 2014. All ratios for the period have been annualized. |
| (5) | Commenced operations on July 30, 2015. All ratios for the period have been annualized. |
| SEI Institutional Managed Trust / Annual Report / September 30, 2016 | 307 |
FINANCIAL HIGHLIGHTS/CONSOLIDATED FINANCIAL HIGHLIGHTS
For the years or period ended September 30, (unless otherwise indicated)
For a share outstanding throughout each period
| ||||||||||||||||||||||||||||||||||||||||||||||||||||||||||||
| Net Asset Value, Beginning of Period | Net Investment Income (Loss)(1) | Net Realized and Unrealized Gains (Losses) on Investments(1) | Total from | Dividends from Net Investment Income | Distributions from Net Realized Capital Gains | Total Dividends and Distributions | Net Asset Value, End of Period | Total Return† | Net Assets End of Period ($ Thousands) | Ratio of Net Expenses to Average Net Assets | Ratio of Expenses to Average Net Assets (Excluding Fees Paid Indirectly and Including Waivers) | Ratio of Expenses to Average Net Assets (Excluding Fees Paid Indirectly and Waivers) | Ratio of Net Investment Income (Loss) to Average Net Assets | Portfolio Turnover Rate† | ||||||||||||||||||||||||||||||||||||||||||||||
| ||||||||||||||||||||||||||||||||||||||||||||||||||||||||||||
Multi-Strategy Alternative Fund |
| |||||||||||||||||||||||||||||||||||||||||||||||||||||||||||
Class A | ||||||||||||||||||||||||||||||||||||||||||||||||||||||||||||
2016 | $ | 9.60 | $ | 0.09 | $ | 0.23 | $ | 0.32 | $ | (0.15) | $ | (0.10) | $ | (0.25) | $ | 9.67 | 3.40% | $ | 573,752 | 1.12%(2)(3) | 1.12%(2)(3) | 2.39%(2)(3) | 0.95% | 149% | ||||||||||||||||||||||||||||||||||||
2015 | 10.05 | 0.19 | (0.48) | (0.29) | (0.16) | — | (0.16) | 9.60 | (2.98) | 527,792 | 0.49 | 0.49 | 2.08 | 1.88 | 35 | |||||||||||||||||||||||||||||||||||||||||||||
2014 | 9.79 | 0.06 | 0.28 | 0.34 | (0.08) | — | (0.08) | 10.05 | 3.45 | 498,090 | 0.64(4) | 0.64(4) | 2.19(4) | 0.64 | 72 | |||||||||||||||||||||||||||||||||||||||||||||
2013 | 9.62 | 0.07 | 0.15 | 0.22 | (0.05) | — | (0.05) | 9.79 | 2.33 | 426,733 | 0.73(5) | 0.73(5) | 2.22(5) | 0.71 | 139 | |||||||||||||||||||||||||||||||||||||||||||||
2012 | 9.57 | 0.07 | 0.17 | 0.24 | (0.19) | — | (0.19) | 9.62 | 2.50 | 334,914 | 0.65(6) | 0.65(6) | 2.15(6) | 0.68 | 44 | |||||||||||||||||||||||||||||||||||||||||||||
Class Y | ||||||||||||||||||||||||||||||||||||||||||||||||||||||||||||
2016 | $ | 9.60 | $ | — | $ | 0.36 | $ | 0.36 | $ | (0.18) | $ | (0.10) | $ | (0.28) | $ | 9.68 | 3.77% | $ | 1,352 | 0.96%(2)(7) | 0.96%(2)(7) | 2.18%(2)(7) | –% | 149% | ||||||||||||||||||||||||||||||||||||
2015(8) | 9.97 | 0.04 | (0.41) | (0.37) | — | — | — | 9.60 | (3.71) | 19 | 0.25 | 0.25 | 1.83 | 1.03 | 35 | |||||||||||||||||||||||||||||||||||||||||||||
Multi-Asset Accumulation Fund |
| |||||||||||||||||||||||||||||||||||||||||||||||||||||||||||
Class A | ||||||||||||||||||||||||||||||||||||||||||||||||||||||||||||
2016 | $ | 9.53 | $ | (0.05) | $ | 1.10 | $ | 1.05 | $ | — | $ | (0.27) | $ | (0.27) | $ | 10.31 | 11.36% | $ | 2,076,240 | 1.19%(2) | 1.19%(2) | 1.35%(2) | (0.50)% | 55% | ||||||||||||||||||||||||||||||||||||
2015 | 10.89 | (0.09) | (0.28) | (0.37) | (0.11) | (0.88) | (0.99) | 9.53 | (3.98) | 1,803,619 | 1.17 | 1.17 | 1.33 | (0.85) | 94 | |||||||||||||||||||||||||||||||||||||||||||||
2014 | 10.30 | (0.05) | 0.96 | 0.91 | —* | (0.32) | (0.32) | 10.89 | 9.11 | 1,865,846 | 1.17 | 1.17 | 1.38 | (0.47) | 55 | |||||||||||||||||||||||||||||||||||||||||||||
2013 | 10.51 | (0.05) | 0.17 | 0.12 | (0.01) | (0.32) | (0.33) | 10.30 | 1.12 | 1,414,563 | 1.17 | 1.17 | 1.37 | (0.52) | 104 | |||||||||||||||||||||||||||||||||||||||||||||
2012(9) | 10.00 | (0.02) | 0.57 | 0.55 | (0.04) | — | (0.04) | 10.51 | 5.51 | 959,727 | 1.17 | 1.17 | 1.39 | (0.46) | 38 | |||||||||||||||||||||||||||||||||||||||||||||
Class Y | ||||||||||||||||||||||||||||||||||||||||||||||||||||||||||||
2016 | $ | 9.55 | $ | (0.03) | $ | 1.11 | $ | 1.08 | $ | — | $ | (0.27) | $ | (0.27) | $ | 10.36 | 11.66% | $ | 202,865 | 0.94%(2) | 0.94%(2) | 1.10%(2) | (0.33)% | 55% | ||||||||||||||||||||||||||||||||||||
2015(10) | 10.11 | (0.08) | (0.48) | (0.56) | — | — | — | 9.55 | (5.54) | 202,311 | 0.92 | 0.92 | 1.08 | (1.04) | 94 | |||||||||||||||||||||||||||||||||||||||||||||
Multi-Asset Income Fund |
| |||||||||||||||||||||||||||||||||||||||||||||||||||||||||||
Class A | ||||||||||||||||||||||||||||||||||||||||||||||||||||||||||||
2016 | $ | 10.46 | $ | 0.50 | $ | 0.23 | $ | 0.73 | $ | (0.53) | $ | (0.10) | $ | (0.63) | $ | 10.56 | 7.38% | $ | 643,477 | 0.82%(2)(11) | 0.82%(2)(11) | 1.23%(2)(11) | 4.85% | 72% | ||||||||||||||||||||||||||||||||||||
2015 | 10.60 | 0.54 | (0.19) | 0.35 | (0.44) | (0.05) | (0.49) | 10.46 | 3.33 | 615,259 | 0.85(12) | 0.85(12) | 1.25(12) | 5.06 | 109 | |||||||||||||||||||||||||||||||||||||||||||||
2014 | 10.60 | 0.51 | 0.13(13) | 0.64 | (0.47) | (0.17) | (0.64) | 10.60 | 6.19 | 539,504 | 0.83(14) | 0.83(14) | 1.27(14) | 4.76 | 124 | |||||||||||||||||||||||||||||||||||||||||||||
2013 | 10.35 | 0.67 | 0.17(13) | 0.84 | (0.52) | (0.07) | (0.59) | 10.60 | 8.24 | 230,356 | 0.98(15) | 0.98(15) | 1.40(15) | 6.22 | 89 | |||||||||||||||||||||||||||||||||||||||||||||
2012(9) | 10.00 | 0.23 | 0.30 | 0.53 | (0.18) | — | (0.18) | 10.35 | 5.37 | 84,499 | 0.89(16) | 0.89(16) | 1.36(16) | 4.88 | 25 | |||||||||||||||||||||||||||||||||||||||||||||
Class Y | ||||||||||||||||||||||||||||||||||||||||||||||||||||||||||||
2016 | $ | 10.46 | $ | 0.52 | $ | 0.22 | $ | 0.74 | $ | (0.54) | $ | (0.10) | $ | (0.64) | $ | 10.56 | 7.49% | $ | 97,943 | 0.72%(2)(17) | 0.72%(2)(17) | 0.98%(2)(17) | 5.08% | 72% | ||||||||||||||||||||||||||||||||||||
2015(10) | 10.62 | 0.45 | (0.26) | 0.19 | (0.35) | — | (0.35) | 10.46 | 1.81 | 33,224 | 0.76(18) | 0.76(18) | 1.00(18) | 5.60 | 109 | |||||||||||||||||||||||||||||||||||||||||||||
| * | Amount represents less than $0.01 per share. |
| † | Returns and portfolio turnover rates are for the period indicated and have not been annualized. Returns do not reflect the deduction of taxes the shareholder would pay on fund distributions or redemption of fund shares. |
| (1) | Per share net investment income and net realized and unrealized gains (losses) calculated using average shares. |
| (2) | The expense ratio includes proxy expenses outside of the cap. |
| (3) | The expense ratio includes dividend and interest expense, and other expenses outside the cap. Had this expense been excluded the ratios would have been 0.85%, 0.85%, and 2.12%. |
| (4) | The expense ratio includes dividend expense and other expenses outside the cap. Had this expense been excluded the ratios would have been 0.58%, 0.58%, and 2.13%. |
| (5) | The expense ratio includes dividend expense and other expenses outside the cap. Had this expense been excluded the ratios would have been 0.60%, 0.60%, and 2.09%. |
| (6) | The expense ratio includes dividend expense. Had this expense been excluded the ratios would have been 0.63%, 0.63%, and 2.13%. |
| (7) | The expense ratio includes dividend and interest expense, and other expenses outside the cap. Had this expense been excluded the ratios would have been 0.69%, 0.69%, and 1.91%. |
| (8) | Commenced operations on April 30, 2015. All ratios for the period have been annualized. |
| (9) | Commenced operations on April 9, 2012. All ratios for the period have been annualized. |
| (10) | Commenced operations on December 31, 2014. All ratios for the period have been annualized. |
| (11) | The expense ratio includes interest expense. Had this expense been excluded the ratios would have been 0.80%, 0.80%, and 1.21%. |
| (12) | The expense ratio includes interest expense. Had this expense been excluded the ratios would have been 0.80%, 0.80%, and 1.20%. |
| (13) | The amount shown for a share outstanding throughout the period does not accord with the aggregate net gains on investments for that period because the sales and repurchase of Fund shares in relation to the fluctuating market value of the Fund. |
| (14) | The expense ratio includes interest expense. Had this expense been excluded the ratios would have been 0.80%, 0.80%, and 1.24%. |
| (15) | The expense ratio includes interest expense. Had this expense been excluded the ratios would have been 0.80%, 0.80%, and 1.22%. |
| (16) | The expense ratio includes interest expense. Had this expense been excluded the ratios would have been 0.76%, 0.76%, and 1.23%. |
| (17) | The expense ratio includes interest expense. Had this expense been excluded the ratios would have been 0.70%, 0.70%, and 0.96%. |
| (18) | The expense ratio includes interest expense. Had this expense been excluded the ratios would have been 0.70%, 0.70%, and 0.95%. |
| 308 | SEI Institutional Managed Trust / Annual Report / September 30, 2016 |
FINANCIAL HIGHLIGHTS/CONSOLIDATED FINANCIAL HIGHLIGHTS
For the years or period ended September 30, (unless otherwise indicated)
For a share outstanding throughout each period
| ||||||||||||||||||||||||||||||||||||||||||||||||||||||||||||
| Net Asset Value, Beginning of Period | Net Investment Income (Loss)(1) | Net Realized and Unrealized Gains (Losses) on Investments(1) | Total from | Dividends from Net Investment Income | Distributions from Net Realized Capital Gains | Total Dividends and Distributions | Net Asset Value, End of Period | Total Return† | Net Assets End of Period ($ Thousands) | Ratio of Net Expenses to Average Net Assets | Ratio of Expenses to Average Net Assets (Excluding Fees Paid Indirectly and Including Waivers) | Ratio of Expenses to Average Net Assets (Excluding Fees Paid Indirectly and Waivers) | Ratio of Net Investment Income (Loss) to Average Net Assets | Portfolio Turnover Rate† | ||||||||||||||||||||||||||||||||||||||||||||||
| ||||||||||||||||||||||||||||||||||||||||||||||||||||||||||||
Multi-Asset Inflation Managed Fund |
| |||||||||||||||||||||||||||||||||||||||||||||||||||||||||||
Class A | ||||||||||||||||||||||||||||||||||||||||||||||||||||||||||||
2016 | $ | 8.75 | $ | 0.05 | $ | 0.04 | $ | 0.09 | $ (0.04) | $ | — | $ | (0.04) | $ | 8.80 | 1.06% | $ | 990,931 | 1.23%(2)(3) | 1.23%(2)(3) | 1.46%(2)(3) | 0.59% | 73% | |||||||||||||||||||||||||||||||||||||
2015 | 9.39 | — | (0.64) | (0.64) | — | — | — | 8.75 | (6.82) | 924,048 | 1.11(4) | 1.11(4) | 1.34(4) | (0.05) | 115 | |||||||||||||||||||||||||||||||||||||||||||||
2014 | 9.42 | 0.06 | (0.09) | (0.03) | — | — | — | 9.39 | (0.32) | 923,541 | 1.02(5) | 1.02(5) | 1.30(5) | 0.65 | 119 | |||||||||||||||||||||||||||||||||||||||||||||
2013 | 10.10 | 0.06 | (0.69) | (0.63) | (0.04) | (0.01) | (0.05) | 9.42 | (6.27) | 766,368 | 0.93(6) | 0.93(6) | 1.20(6) | 0.59 | 61 | |||||||||||||||||||||||||||||||||||||||||||||
2012(7) | 10.00 | 0.02 | 0.13 | 0.15 | (0.05)(8) | — | (0.05) | 10.10 | 1.54 | 540,255 | 0.93(9) | 0.93(9) | 1.22(9) | 0.47 | 19 | |||||||||||||||||||||||||||||||||||||||||||||
Class Y | ||||||||||||||||||||||||||||||||||||||||||||||||||||||||||||
2016 | $ | 8.77 | $ | 0.07 | $ | 0.04 | $ | 0.11 | $ (0.06) | $ | — | $ | (0.06) | $ | 8.82 | 1.30% | $ | 89,261 | 0.98%(2)(10) | 0.98%(2)(10) | 1.21%(2)(10) | 0.79% | 73% | |||||||||||||||||||||||||||||||||||||
2015(11) | 8.96 | 0.04 | (0.23) | (0.19) | — | — | — | 8.77 | (2.12) | 83,248 | 0.92(12) | 0.92(12) | 1.15(12) | 0.53 | 115 | |||||||||||||||||||||||||||||||||||||||||||||
Multi-Asset Capital Stability Fund |
| |||||||||||||||||||||||||||||||||||||||||||||||||||||||||||
Class A | ||||||||||||||||||||||||||||||||||||||||||||||||||||||||||||
2016 | $ | 10.11 | $ | (0.01) | $ | 0.16 | $ | 0.15 | $ — | $ | (0.12) | $ | (0.12) | $ | 10.14 | 1.47% | $ | 658,185 | 0.64%(2) | 0.64%(2) | 1.00%(2) | (0.07)% | 234% | |||||||||||||||||||||||||||||||||||||
2015 | 10.25 | (0.04) | 0.09 | 0.05 | — | (0.19) | (0.19) | 10.11 | 0.57 | 565,709 | 0.62 | 0.62 | 0.98 | (0.39) | 227 | |||||||||||||||||||||||||||||||||||||||||||||
2014 | 9.94 | (0.01) | 0.34 | 0.33 | — | (0.02) | (0.02) | 10.25 | 3.37 | 541,602 | 0.62 | 0.62 | 1.02 | (0.12) | 246 | |||||||||||||||||||||||||||||||||||||||||||||
2013 | 10.14 | (0.02) | (0.10) | (0.12) | (0.01) | (0.07) | (0.08) | 9.94 | (1.23) | 486,926 | 0.62 | 0.62 | 1.02 | (0.22) | 410 | |||||||||||||||||||||||||||||||||||||||||||||
2012(7) | 10.00 | (0.01) | 0.15 | 0.14 | —* | — | —* | 10.14 | 1.40 | 347,861 | 0.62 | 0.62 | 1.02 | (0.29) | 180 | |||||||||||||||||||||||||||||||||||||||||||||
Class Y | ||||||||||||||||||||||||||||||||||||||||||||||||||||||||||||
2016 | $ | 10.12 | $ | — | $ | 0.16 | $ | 0.16 | $ — | $ | (0.12) | $ | (0.12) | $ | 10.16 | 1.57% | $ | 51,496 | 0.54%(2) | 0.54%(2) | 0.75%(2) | 0.02% | 234% | |||||||||||||||||||||||||||||||||||||
2015(11) | 10.06 | (0.02) | 0.08 | 0.06 | — | — | — | 10.12 | 0.60 | 50,662 | 0.52 | 0.52 | 0.74 | (0.30) | 227 | |||||||||||||||||||||||||||||||||||||||||||||
Long/Short Alternative Fund |
| |||||||||||||||||||||||||||||||||||||||||||||||||||||||||||
Class A | ||||||||||||||||||||||||||||||||||||||||||||||||||||||||||||
2016 | $ | 9.67 | $ | (0.06) | $ | 0.18 | $ | 0.12 | $ — | $ | — | $ | — | $ | 9.79 | 1.24% | $ | 19 | 1.17%(2) | 1.17%(2) | 1.40%(2) | (0.57)% | 43% | |||||||||||||||||||||||||||||||||||||
2015(13) | 10.00 | (0.08) | (0.25) | (0.33) | — | — | — | 9.67 | (3.30) | 19 | 1.14 | 1.14 | 1.39 | (0.99) | 198 | |||||||||||||||||||||||||||||||||||||||||||||
Class Y | ||||||||||||||||||||||||||||||||||||||||||||||||||||||||||||
2016 | $ | 9.67 | $ | (0.03) | $ | 0.17 | $ | 0.14 | $ — | $ | — | $ | — | $ | 9.81 | 1.45% | $ | 41,775 | 0.92%(2) | 0.92%(2) | 1.15%(2) | (0.32)% | 43% | |||||||||||||||||||||||||||||||||||||
2015(14) | 10.11 | (0.03) | (0.41) | (0.44) | — | — | — | 9.67 | (4.35) | 41,164 | 0.91 | 0.91 | 1.15 | (0.81) | 198 | |||||||||||||||||||||||||||||||||||||||||||||
| * | Amount represents less than $0.01 per share. |
| † | Returns and portfolio turnover rates are for the period indicated and have not been annualized. Returns do not reflect the deduction of taxes the shareholder would pay on fund distributions or redemption of fund shares. |
| (1) | Per share net investment income and net realized and unrealized gains (losses) calculated using average shares. |
| (2) | The expense ratio includes proxy expenses outside of the cap. |
| (3) | The expense ratio includes dividend and interest expense, and other expenses outside the cap. Had this expense been excluded the ratios would have been 0.90%, 0.90%, and 1.14%. |
| (4) | The expense ratio includes interest and dividend expense. Had this expense been excluded the ratios would have been 0.95%, 0.95%, and 1.18%. |
| (5) | The expense ratio includes dividend and interest expense, and other expenses outside the cap. Had this expense been excluded the ratios would have been 0.90%, 0.90%, and 1.18%. |
| (6) | The expense ratio includes interest expense. Had this expense been excluded the ratios would have been 0.90%, 0.90%, and 1.17%. |
| (7) | Commenced operations on April 9, 2012. All ratios for the period have been annualized. |
| (8) | Includes return of capital of $0.04. |
| (9) | The expense ratio includes interest expense. Had this expense been excluded the ratios would have been 0.90%, 0.90%, and 1.19%. |
| (10) | The expense ratio includes dividend and interest expense, and other expenses outside the cap. Had this expense been excluded the ratios would have been 0.65%, 0.65%, and 0.88%. |
| (11) | Commenced operations on December 31, 2014. All ratios for the period have been annualized. |
| (12) | The expense ratio includes dividend and interest expense. Had this expense been excluded the ratios would have been 0.70%, 0.70%, and 0.93%. |
| (13) | Commenced operations on December 19, 2014. All ratios for the period have been annualized. |
| (14) | Commenced operations on April 30, 2015. All ratios for the period have been annualized. |
| SEI Institutional Managed Trust / Annual Report / September 30, 2016 | 309 |
Notes to Financial Statements/Consolidated Notes to Financial Statements
September 30, 2016
1. ORGANIZATION
SEI Institutional Managed Trust (the “Trust”) is organized as a Massachusetts business trust under a Declaration of Trust dated October 20, 1986.
The Trust is registered under the Investment Company Act of 1940, as amended, as an open-end investment company with 29 funds: Large Cap, Large Cap Value, Large Cap Growth, Tax-Managed Large Cap, S&P 500 Index, Small Cap, Small Cap Value, Small Cap Growth, Tax-Managed Small/Mid Cap, Mid-Cap, U.S. Managed Volatility, Global Managed Volatility, Tax-Managed Managed Volatility, Tax-Managed International Managed Volatility, Real Estate, Enhanced Income, Core Fixed Income, U.S. Fixed Income, High Yield Bond, Conservative Income, Tax-Free Conservative Income, Real Return, Dynamic Asset Allocation, Multi-Strategy Alternative, Multi-Asset Accumulation, Multi-Asset Income, Multi-Asset Inflation Managed, Multi-Asset Capital Stability and Long/Short Alternative (each a “Fund,” collectively the “Funds”) each of which are diversified Funds, with the exception of the Real Estate, Multi-Asset Accumulation, Multi-Asset Inflation Managed and Long/Short Alternative Funds.
The Accumulation Commodity Strategy Subsidiary, Ltd. and Inflation Commodity Strategy Subsidiary, Ltd. are both wholly-owned subsidiaries of the Multi-Asset Accumulation and Multi-Asset Inflation Managed Funds, respectively, (each a “Subsidiary”, collectively the “Subsidiaries”). Each Subsidiary is organized under the laws of the Cayman Islands as an exempt limited company. Information regarding the Multi-Asset Accumulation and Multi-Asset Inflation Managed Funds and their respective subsidiaries have been consolidated in the Consolidated Schedule of Investments, Consolidated Statements of Assets and Liabilities, Consolidated Statements of Operations, Consolidated Statements of Changes in Net Assets and Consolidated Statement of Cash Flows.
The Trust is registered to offer: Class A shares of the Funds and Class Y shares of the Funds; Class E shares of the S&P 500 Index Fund; Class I shares of the Large Cap, Large Cap Value, Large Cap Growth, S&P 500 Index, Small Cap, Small Cap Value, Small Cap Growth, Mid-Cap, U.S. Managed Volatility, Global Managed Volatility, Real Estate, Enhanced Income, Core Fixed Income, U.S. Fixed Income, High Yield Bond and Real Return Funds. The assets of each Fund are segregated, and a shareholder’s interest is limited to the Fund in which shares are held. The Funds’ prospectuses provide a description of each Fund’s investment objective and its principal strategies and risks.
As of September 30, 2016, the Tax-Managed International Managed Volatility Fund has not yet commenced operations.
Class T closed on December 30, 2014. Class Y commenced operations on December 31, 2014 in the following Funds: Large Cap, Tax-Managed Large Cap, Small Cap, Tax-Managed Small/Mid Cap, U.S. Managed Volatility, Global Managed Volatility, Real Estate, Enhanced Income, U.S. Fixed Income, High Yield Bond, Real Return, Multi-Asset Accumulation, Multi-Asset Income, Multi-Asset Inflation Managed and Multi-Asset Capital Stability Funds. Class Y commenced operations on April 30, 2015 in the Tax-Managed Managed Volatility, Multi-Strategy Alternative and Long/Short Alternative Funds. Class Y commenced operations on June 30, 2015 in the Core Fixed Income Fund. Class Y commenced operations on October 30, 2015 in the following Funds: Large Cap Value, Large Cap Growth, S&P 500 Index, Small Cap Value, Small Cap Growth and Mid-Cap Funds.
The Conservative Income Fund and Tax-Free Conservative Income Fund each commenced operations on April 22, 2016.
2. SIGNIFICANT ACCOUNTING POLICIES
The following is a summary of significant accounting policies consistently followed by the Funds. The Funds are investment companies in conformity with accounting principles generally accepted in the United States of America (“U.S. GAAP”). Therefore, the Funds follow the accounting and reporting guidelines for investment companies.
Use of Estimates — The preparation of financial statements, in conformity with U.S. GAAP requires management to make estimates and assumptions that affect the reported amounts of assets and liabilities and disclosure of contingent assets and liabilities as of the date of the financial statements and the reported amounts of increases and decreases in net assets from operations during the reporting period. Actual results could differ from those estimates.
Security Valuation — Securities listed on a securities exchange, market or automated quotation system for which quotations are readily available (other than securities traded on National Association of Securities Dealers Automated Quotations (NASDAQ) or as otherwise noted below) at the last quoted sale price on an exchange or market (foreign or domestic) on which the securities are traded, or, if there is no such reported sale, at the most recent quoted bid price. The Funds value securities traded on NASDAQ at the NASDAQ Official Closing Price. If available, debt securities, swaps (which are not centrally cleared), bank loans or collateralized debt obligations (including collateralized
| 310 | SEI Institutional Managed Trust / Annual Report / September 30, 2016 |
loan obligations), such as those held by the Funds, are priced based upon valuations provided by independent, third-party pricing agents. Such values generally reflect the last reported sales price if the security is actively traded. The third-party pricing agents may also value debt securities at an evaluated bid price by employing methodologies that utilize actual market transactions, broker-supplied valuations or other methodologies designed to identify the market value for such securities. Redeemable securities issued by open-end investment companies are valued at the investment company’s applicable net asset value, with the exception of ETFs, which are priced as equity securities. The prices of foreign securities are reported in local currency and converted to U.S. dollars using currency exchange rates. If a security’s price cannot be obtained, as noted above, the Funds will value the securities using a bid price from at least one independent broker. If such prices are not readily available or cannot be valued using the methodologies described above, the Funds will value the security using the Funds’ Fair Value Pricing Policies and Procedures (“Fair Value Procedures”), as described below.
On the first day a new debt security purchase is recorded, if a price is not available from a third-party pricing agent or an independent broker, the security may be valued at its purchase price. Each day thereafter, the debt security will be valued according to the Funds’ Fair Value Procedures until a price from an independent source can be secured. Securities held by a Fund with remaining maturities of 60 days or less may be valued by the amortized cost method, which involves valuing a security at its cost on the date of purchase and thereafter (absent unusual circumstances) assuming a constant amortization to maturity of any discount or premium, regardless of the impact of fluctuations in general market rates of interest on the value of the instrument. While this method provides certainty in valuation, it may result in periods during which value, as determined by this method, is higher or lower than the price a Fund would receive if it sold the instrument. Further, the value of securities in the Fund can be expected to vary inversely with changes in prevailing interest rates. Should existing credit, liquidity or interest rate conditions in the relevant markets and issuer-specific circumstances suggest that amortized cost does not approximate fair value, then the amortized cost method may not be used.
Options are valued at the last quoted sales price. If there is no such reported sale on the valuation date, long positions are valued at the most recent bid price, and short positions are valued at the most recent ask price.
Futures and swaps cleared through a central clearing house (“centrally cleared swaps”) are valued at the settlement price established each day by the board of exchange on which they are traded. The daily settlement prices for financial futures and centrally cleared swaps are provided by an independent source. On days when there is excessive volume, market volatility or the future or centrally cleared swap does not end trading by the time a Fund calculates its NAV, the settlement price may not be available at the time at which the Fund calculates its NAV. On such days, the best available price (which is typically the last sales price) may be used to value a Fund’s futures or centrally cleared swaps position.
Foreign currency forward contracts are valued at the current day’s interpolated foreign exchange rate, as calculated using the current day’s spot rate, and the thirty, sixty, ninety and one-hundred eighty day forward rates provided by an independent source.
Prices for most securities held by a Fund are provided daily by third party independent pricing agents. SEI Investments Management Corporation (“SIMC”) or a Sub-Adviser (“Sub-Adviser”), as applicable, reasonably believes that prices provided by independent pricing agents are reliable. However, there can be no assurance that such pricing service’s prices will be reliable. SIMC or a Sub-Adviser, as applicable, will continuously monitor the reliability of prices obtained from any pricing service and shall promptly notify the Funds’ administrator if it believes that a particular pricing service is no longer a reliable source of prices. The Funds’ administrator, in turn, will notify the Fair Value Pricing Committee (the “Committee”) if it receives such notification from SIMC or a Sub-Adviser, as applicable, or if the Funds’ administrator reasonably believes that a particular pricing service is no longer a reliable source for prices.
The Funds’ Fair Value Procedures provide that any change in a primary pricing agent or a pricing methodology requires prior approval by the Board of Trustees (“Board”) or its designated sub-committee. However, when the change would not materially affect valuation of a Fund’s net assets or involve a material departure in pricing methodology from that of the Fund’s existing pricing agent or pricing methodology, approval may be obtained at the next regularly scheduled meeting of the Board.
Securities for which market prices are not readily available, for which market prices are determined to be unreliable, or which cannot be valued using the methodologies described above are valued in accordance with the Fair Value Procedures established by the Board. The Funds’ Fair Value Procedures are implemented through the Committee designated by the Board. The Committee is currently composed of
| SEI Institutional Managed Trust / Annual Report / September 30, 2016 | 311 |
Notes to Financial Statements/Consolidated Notes to Financial Statements (Continued)
September 30, 2016
two members of the Board, as well as representatives from SIMC and its affiliates. Some of the more common reasons that may necessitate that a security be valued using Fair Value Procedures include: (i) the security’s trading has been halted or suspended, (ii) the security has been delisted from a national exchange, (iii) the security’s primary trading market is temporarily closed at a time when under normal conditions it would be open, or (iv) the security’s primary pricing source is not able or willing to provide a price. When a security is valued in accordance with the Fair Value Procedures, the Committee will determine the value after taking into consideration relevant information reasonably available to the Committee. Examples of factors the Committee may consider include: (i) the facts giving rise to the need to fair value, (ii) the last trade price, (iii) the performance of the market or the issuer’s industry, (iv) the liquidity of the security, (v) the size of the holding in a Fund, or (vi) any other appropriate information.
The determination of a security’s fair value price often involves the consideration of a number of subjective factors, and is therefore subject to the unavoidable risk that the value assigned to a security may be higher or lower than the security’s value would be if a reliable market quotation for the security was readily available.
For securities that principally trade on a foreign market or exchange, a significant gap in time can exist between the time of a particular security’s last trade and the time at which a Fund calculates its Net Asset Value (“NAV”). The closing prices of such securities may no longer reflect their market value at the time a Fund calculates NAV if an event that could materially affect the value of those securities (a “Significant Event”), including substantial fluctuations in domestic or foreign markets or occurrences not tied directly to the securities markets, such as natural disasters, armed conflicts or significant governmental actions, has occurred between the time of the security’s last close and the time that the Fund calculates NAV. A Fund may invest in securities that are primarily listed on foreign exchanges that trade on weekends or other days when the Fund does not price its shares. As a result, the NAV of the Fund’s shares may change on days when shareholders will not be able to purchase or redeem Fund shares.
A Significant Event may relate to a single issuer or to an entire market sector. If SIMC or a Sub-Adviser becomes aware of a Significant Event that has occurred with respect to a security or group of securities after the closing of the exchange or market on which the security or securities principally trade, but before the time at which the Funds calculate NAV, it may request that a Committee meeting be called. In addition, the Funds use several processes, with respect to certain securities to
monitor the pricing data supplied by various sources, including price comparisons and price movements. Any identified discrepancies are researched and subject to the procedures described above.
The Global Managed Volatility Fund also uses a third-party fair valuation vendor. The vendor provides a fair value for foreign securities held by the Fund based on certain factors and methodologies (involving, generally, tracking valuation correlations between the U.S. market and each non-U.S. security). Values from the fair value vendor are applied in the event that there is a movement in the U.S. market that exceeds a specific threshold that has been established by the Committee. The Committee has also established a “confidence interval” which is used to determine the level of historical correlation between the value of a specific foreign security and movements in the U.S. market before a particular security will be fair valued when the threshold is exceeded. In the event that the threshold established by the Committee is exceeded on a specific day, the Global Managed Volatility Fund will value the non-U.S. securities in its portfolio that exceed the applicable “confidence interval” based upon the adjusted prices provided by the fair valuation vendor.
In accordance with U.S. GAAP, fair value is defined as the price that a Fund would receive upon selling an investment in an orderly transaction to an independent buyer in the principal or most advantageous market of the investment. A three-tier hierarchy has been established to maximize the use of observable and minimize the use of unobservable inputs and to establish classification of fair value measurements for disclosure purposes. Inputs refer broadly to the assumptions that market participants would use in pricing an asset. Inputs may be observable or unobservable. Observable inputs are inputs that reflect the assumptions market participants would use in pricing the asset or liability based on market data obtained from sources independent of the reporting entity. Unobservable inputs are inputs that reflect the reporting entity’s own assumptions about the assumptions market participants would use in pricing the asset or liability based on the best information available in the circumstances.
The three-tier hierarchy of inputs is summarized in the three broad Levels listed below:
Level 1 — quoted prices in active markets for identical investments
Level 2 — other significant observable inputs (including quoted prices for similar investments, interest rates, prepayment speeds, credit risks, etc.)
| 312 | SEI Institutional Managed Trust / Annual Report / September 30, 2016 |
Level 3 — significant unobservable inputs (including the Fund’s own assumptions in determining the fair value of investments)
Investments are classified within the level of the lowest significant input considered in determining fair value. Investments classified within Level 3 whose fair value measurement considers several inputs may include Level 1 or Level 2 inputs as components of the overall fair value measurement.
Debt securities are valued in accordance with the evaluated bid price supplied by the pricing service and generally categorized as Level 2 in the hierarchy. Other securities that are categorized as Level 2 in the hierarchy include, but are not limited to, preferred stocks, bank loans, warrants, swaps and forward contracts. The Fund may use a systematic fair valuation model provided by an independent pricing service to value foreign equity securities in order to adjust for stale pricing, which may occur between the close of certain foreign exchanges and the NYSE. These are generally categorized as Level 2 in the hierarchy.
When independent prices are unavailable or unreliable, debt securities and swaps may be valued utilizing pricing matrices which consider similar factors that
would be used by independent pricing services. These are generally categorized as Level 2 in the hierarchy but may be Level 3 depending on the circumstances. For certain collateralized debt obligations, corporate obligations, mortgage backed securities, auction rate preferred securities and loan participations where observable inputs are limited, assumptions about market activity and risk are used and are categorized as Level 3 in the hierarchy.
The valuation techniques used by the Funds to measure fair value during the year ended September 30, 2016, maximized the use of observable inputs and minimized the use of unobservable inputs. For details of the investment classification, reference the Summary Schedules of Investments/Schedules of Investments.
For the year ended September 30, 2016, there have been no significant changes to the Trust’s fair valuation methodologies.
The following table summarizes the quantitative inputs and assumptions used for items categorized as recurring Level 3 assets as of September 30, 2016. The disclosures below also include qualitative information on the sensitivity of the fair value measurements to changes in the significant unobservable inputs.
Multi-Asset Income Fund
| ||||||||||
| Assets | Fair Value (in Thousands) at September 30, 2016 | Valuation Technique(s) | Range (Weighted Unobservable Input Average) | |||||||
| ||||||||||
| Asset-Backed Securities | $ | 879 | OAS off 08/31/2016 Single Broker Price | Indicative Quote | 439 | |||||
| 989 | 9/15/2016 Trade Price | Trade Price | 421 | |||||||
|
| |||||||||
| Total Asset-Backed Securities | 1,868 | |||||||||
|
| |||||||||
| Corporate Obligations | 569 | 08/26/2016 Single Broker Price | Broker Quote | N/A | ||||||
| 2,712 | OAS off 08/31/2016 Single Broker Price | Indicative Quote | 355 | |||||||
| 166 | OAS off 08/31/2016 Single Broker Price | Indicative Quote | 1,229 | |||||||
|
| |||||||||
| Total Corporate Obligations | 3,447 | |||||||||
|
| |||||||||
| Loan Participations | 453 | 09/20/2016 Multiple Broker price | Broker Quote | 500 | ||||||
| 7,247 | Internal Model Price | Indicative Quote | 572-868 | |||||||
|
| |||||||||
| Total Loan Participations | 7,700 | |||||||||
|
| |||||||||
| Common Stock | 71 | Internal Model price | Indicative Quote | N/A | ||||||
|
| |||||||||
| Mortgage-Backed Securities | 1,777 | OAS from 9/14/2016 Trade Price | Indicative Quote | 241 | ||||||
|
| |||||||||
| Convertible Bond | 47 | Internal Model price | Indicative Quote | N/A | ||||||
|
| |||||||||
The unobservable inputs used to determine fair value of reoccurring Level 3 assets may have similar or diverging impacts on valuation. Significant increases and decreases in these inputs in isolation and interrelationships between those inputs could result in significantly higher or lower fair value measurement.
Security Transactions and Investment Income — Security transactions are recorded on the trade date. Costs used in determining net realized capital gains and losses on the sale of securities are on the basis of specific identification. Dividend income is recognized on the ex-dividend date, and interest income is recognized using the accrual basis of accounting. Income from
payment-in-kind securities is recorded daily based on the effective interest method of accrual.
Distributions received on securities that represent a return of capital or capital gain are recorded as a reduction of cost of investments and/or as a realized gain. The Trust estimates the components of distributions received that may be considered nontaxable distributions or capital gain distributions.
| SEI Institutional Managed Trust / Annual Report / September 30, 2016 | 313 |
Notes to Financial Statements/Consolidated Notes to Financial Statements (Continued)
September 30, 2016
Amortization and accretion is calculated using the scientific interest method, which is not materially different from the effective interest method. Amortization of premiums and discounts is included in interest income.
For Treasury Inflation-Protected Securities, the principal amount is adjusted daily to keep pace with inflation. Interest is accrued based on the adjusted principal amount. The adjustments to principal due to inflation are reflected as increases or decreases to interest in the accompanying Statements of Operations. Such adjustments may have a significant impact on a Fund’s distributions.
Repurchase Agreements —Securities pledged as collateral for repurchase agreements are held by each Fund’s custodian bank until the repurchase date of the repurchase agreement. The Funds may also invest in tri-party repurchase agreements. Securities held as collateral for tri-party repurchase agreements are maintained by the broker’s custodian bank in a segregated account until the repurchase date of the repurchase agreement. Provisions of the repurchase agreements and the Trust’s policies require that the market value of the collateral, including accrued interest thereon, is sufficient in the event of default by the counterparty. If the counterparty defaults and the value of the collateral declines, or if the counterparty enters into an insolvency proceeding, realization of the collateral by the Funds may be delayed or limited.
Reverse Repurchase Agreements —To the extent consistent with its Investment Objective and Strategies, a Fund may issue reverse repurchase agreements. A reverse repurchase agreement involves the sale of portfolio assets together with an agreement to repurchase the same assets later at a fixed price. The segregated assets may consist of cash, U.S. Government securities, or other liquid securities at least equal in value to the obligations under the reverse repurchase agreements. In the event the buyer of securities under a reverse repurchase agreement files for bankruptcy or becomes insolvent, a Fund’s use of the proceeds under the agreement may be restricted pending a determination by the other party, or its trustee or receiver, whether to enforce the obligation to repurchase the securities. Reverse repurchase agreements outstanding as of September 30, 2016 were as follows:
|
| |||||||
| MULTI-ASSET INFLATION MANAGED FUND | ||||||||
|
| |||||||
| Principal Amount ($ Thousands) | Counterparty | Value ($ Thousands) | ||||||
|
| |||||||
| $(46,669) | Chase Securities | 0.41% | $(46,669) | |||||
| (35,194) | Chase Securities | 0.57% | (35,194) | |||||
| (35,110) | Chase Securities | 0.59% | (35,110) | |||||
|
| |||||||
| MULTI-ASSET INFLATION MANAGED FUND | ||||||||
|
| |||||||
| Principal Amount ($ Thousands) | Counterparty | Value ($ Thousands) | ||||||
|
| |||||||
| $(31,200) | Chase Securities | 0.41% | $(31,200) | |||||
| (21,576) | Chase Securities | 0.41% | (21,576) | |||||
| (11,258) | Chase Securities | 0.41% | (11,258) | |||||
| (10,802) | Chase Securities | 0.41% | (10,802) | |||||
| (10,363) | Merrill Lynch | 1.50% | (10,363) | |||||
| (10,105) | Merrill Lynch | 1.50% | (10,105) | |||||
| (9,113) | Chase Securities | 0.41% | (9,113) | |||||
| (6,776) | Merrill Lynch | 1.50% | (6,776) | |||||
| (4,755) | Merrill Lynch | 1.50% | (4,755) | |||||
| (4,150) | Chase Securities | 0.46% | (4,150) | |||||
| (4,139) | Chase Securities | 0.57% | (4,139) | |||||
| (3,113) | Chase Securities | 0.46% | (3,113) | |||||
| ||||||||
| $(244,323) | ||||||||
| ||||||||
Classes — Class-specific expenses are borne by that class of shares. Income, realized and unrealized gains/ losses and non class-specific expenses are allocated to the respective class on the basis of relative daily net assets.
Expenses — Expenses that are directly related to a Fund are charged directly to that Fund. Other operating expenses of the Funds are prorated to the Funds on the basis of relative daily net assets.
Commodity-Linked Investments — To the extent consistent with its Investment Objective and Strategies, the Multi-Asset Accumulation Fund and the Multi-Asset Inflation Managed Fund may invest in commodity investments to provide exposure to the investment returns of the commodities markets. Commodity investments include notes with interest payments that are tied to an underlying commodity or commodity index, ETFs or other exchange-traded products that are tied to the performance of a commodity or commodity index or other types of investment vehicles or instruments that provide returns that are tied to commodities or commodity indices. The Multi-Asset Accumulation and Multi-Asset Inflation Managed Funds may also invest in equity securities of issuers in commodity-related industries.
The Multi-Asset Accumulation and Multi-Asset Inflation Managed Funds may also seek to gain exposure to the commodity markets, in whole or in part, through investments in a wholly owned Subsidiary. The Subsidiary, unlike the Fund, may invest to a significant extent directly in commodities and in equity-linked securities and commodity-linked derivative instruments, including options, futures contracts, swaps, options on futures contracts and commodity-linked structured notes. The Subsidiary may also invest in other instruments in which the Fund is permitted to invest, either as investments or to serve as margin or collateral for its derivative positions. A Fund may invest up to 25% of its total assets in its Subsidiary.
| 314 | SEI Institutional Managed Trust / Annual Report / September 30, 2016 |
In order for a Fund to qualify as a regulated investment company under Subchapter M of the Code, the Fund must derive at least 90% of its gross income each taxable year from qualifying income. The status of certain commodity-linked derivative instruments as qualifying income has been addressed in Revenue Ruling 2006-1 and Revenue Ruling 2006-31 which provide that income from certain commodity-linked derivative instruments in which the Fund invests will not be considered qualifying income. To the extent the Multi-Asset Accumulation and the Multi-Asset Inflation Managed Funds invest in such instruments directly, each Fund will seek to restrict its income from commodity-linked derivative instruments that do not generate qualifying income, such as commodity-linked swaps, to a maximum of 10% of its gross income (when combined with its other investments that produce non-qualifying income).
Foreign Currency Translation — The books and records of the Funds are maintained in U.S. dollars on the following basis:
(I) market value of investment securities, assets and liabilities at the current rate of exchange; and
(II) purchases and sales of investment securities, income and expenses at the relevant rates of exchange prevailing on the respective dates of such transactions.
The Funds do not isolate that portion of gains and losses on investments in equity securities that is due to changes in the foreign exchange rates from that which is due to changes in market prices of equity securities.
The Funds report certain foreign-currency-related transactions as components of realized gains for financial reporting purposes, whereas such components are treated as ordinary income for Federal income tax purposes.
Forward Foreign Currency Contracts — To the extent consistent with its Investment Objective and Strategies, a Fund may enter into forward foreign currency contracts as hedges against either specific transactions, fund positions or anticipated fund positions. A Fund may also engage in currency transactions to enhance that Fund’s returns. All commitments are “marked-to-market” daily at the applicable foreign exchange rate, and any resulting unrealized gains or losses are recorded currently. The Funds realize gains and losses at the time forward contracts are extinguished. Unrealized gains or losses on outstanding positions in forward foreign currency contracts held at the close of the period are
recognized as ordinary income or loss for Federal income tax purposes.
The Funds could be exposed to risk if the counterparties to the contracts are unable to meet the terms of the contract and from unanticipated movements in the value of a foreign currency relative to the U.S. dollar.
Finally, the risk exists that losses could exceed amounts disclosed on the Statements of Assets and Liabilities or Consolidated Statements of Assets and Liabilities. Refer to each Fund’s Schedule of Investments, Summary Schedule of Investments or Consolidated Schedule of Investments for details regarding open forward foreign currency contracts as of September 30, 2016, if applicable.
Futures Contracts — To the extent consistent with its Investment Objective and Strategies, a Fund may use futures contracts for tactical hedging purposes as well as to enhance the Fund’s returns. In addition, fixed income funds will utilize futures contracts to help manage duration and yield curve exposure. Initial margin deposits of cash or securities are made upon entering into futures contracts. The contracts are marked to market daily and the resulting changes in value are accounted for as unrealized gains and losses. Variation margin payments are paid or received, depending upon whether unrealized gains or losses are incurred. When the contract is closed, the Funds record a realized gain or loss equal to the difference between the proceeds from (or cost of) the closing transaction and the amount invested in the contract.
Risks of entering into futures contracts include the possibility that there will be an imperfect price correlation between the futures and the underlying securities. Second, it is possible that a lack of liquidity for futures contracts could exist in the secondary market, resulting in an inability to close a position prior to its maturity date. Third, the futures contract involves the risk that the Fund could lose more than the original margin deposit required to initiate a futures transaction.
Finally, the risk exists that losses could exceed amounts disclosed on the Statements of Assets and Liabilities or Consolidated Statements of Assets and Liabilities. Refer to each Fund’s Schedule of Investments, Summary Schedule of Investments or Consolidated Schedule of Investments for details regarding open futures contracts as of September 30, 2016 if applicable.
Inflation-Indexed Bonds — Inflation-indexed bonds are fixed income securities whose principal value is periodically adjusted according to the rate of inflation. If the index measuring inflation rises or falls, the principal value of inflation-indexed bonds will be adjusted upward or downward, and consequently the interest payable on
| SEI Institutional Managed Trust / Annual Report / September 30, 2016 | 315 |
Notes to Financial Statements/Consolidated Notes to Financial Statements (Continued)
September 30, 2016
these securities calculated with respect to a larger or smaller principal amount) will be increased or reduced, respectively. Any upward or downward adjustment in the principal amount of an inflation-indexed bond will be included in interest income in the Statement of Operations, even though investors do not receive their principal until maturity. Repayment of the original bond principal upon maturity (as adjusted for inflation) is guaranteed in the case of U.S. Treasury inflation-indexed bonds. For bonds that do not provide a similar guarantee, the adjusted principal value of the bond repaid at maturity may be less than the original principal.
Master Limited Partnerships — Investments in units of master limited partnerships (“MLPs”) involve risks that differ from an investment in common stock. Holders of the units of master limited partnerships have more limited control and limited rights to vote on matters affecting the partnership. There are also certain tax risks associated with an investment in units of master limited partnerships. In addition, conflicts of interest may exist between common unit holders, subordinated unit holders and the general partner of a master limited partnership, including a conflict arising as a result of incentive distribution payments. The benefit a Fund derives from investment in MLP units is largely dependent on the MLPs being treated as partnerships and not as corporations for federal income tax purposes. If an MLP were classified as a corporation for federal income tax purposes, there would be reduction in the after-tax return to a Fund of distributions from the MLP, likely causing a reduction in the value of a Fund’s shares. MLP entities are typically focused in the energy, natural resources and real estate sectors of the economy. A downturn in the energy, natural resources or real estate sectors of the economy could have an adverse impact on a Fund. At times, the performance of securities of companies in the energy, natural resources and real estate sectors of the economy may lag the performance of other sectors or the broader market as a whole.
Options/Swaptions Writing/Purchasing —To the extent consistent with its Investment Objective and Strategies, a Fund may invest in financial options/swaptions contracts for the purpose of hedging its existing fund securities or to enhance the Fund’s returns. When a Fund writes or purchases an option/swaption, an amount equal to the premium received or paid by the Fund is recorded as a liability or an asset and is subsequently adjusted to the current market value of the option/swaption written or purchased. Premiums received or paid from writing or purchasing options/swaptions which expire unexercised are treated by the Fund on the expiration date as realized gains or losses. The difference between the premium and the amount paid or received on effecting a closing purchase or sale transaction,
including brokerage commissions, is also treated as a realized gain or loss. If an option/swaption is exercised, the premium paid or received is added to the cost of the purchase or proceeds from the sale in determining whether the Fund has realized a gain or a loss on investment transactions.
The risk in writing a call option/swaption is that the Funds give up the opportunity for profit if the market price of the security increases. The risk in writing a put option/swaption is that the Funds may incur a loss if the market price of the security decreases and the option/swaption is exercised. The risk in purchasing an option/swaption is that the Funds pay a premium whether or not the option/swaption is exercised. The Funds also have the additional risk of being unable to enter into a closing transaction at an acceptable price if a liquid secondary market does not exist. Option/swaption contracts also involve the risk that they may not work as intended due to unanticipated developments in market conditions or other causes.
Finally, the risk exists that losses on written options could exceed amounts disclosed on the Statements of Assets and Liabilities. Refer to each Fund’s Schedule of Investments, Summary Schedule of Investments or Consolidated Schedule of Investments for details regarding open option/swaption contracts as of September 30, 2016, if applicable.
Securities Sold Short —To the extent consistent with its Investment Objective and Strategies, a Fund may engage in short sales. Short sales are transactions under which a Fund sells a security it does not own. To complete such a transaction, the Fund must borrow the security to make delivery to the buyer. A Fund then is obligated to replace the security borrowed by purchasing the security at the market price at the time of the replacement. The price at such time may be more or less than the price at which the security was sold by a Fund. Until the security is replaced, a Fund is required to pay the lender amounts equal to any dividends or interest that accrue during the period of the loan. Dividends and interest are shown as an expense for financial reporting purposes. To borrow the security, a Fund also may be required to pay a premium, which would decrease proceeds of the security sold. The proceeds of the short sale are retained by the broker, to the extent necessary to meet margin requirements, until the short position is closed out. A gain, limited to the price at which a Fund sold the security short, or a loss, unlimited in size, will be recognized upon the close of a short sale.
Refer to each Fund’s Schedule of Investments, Summary Schedule of Investments or Consolidated Schedule of Investments for details regarding securities sold short as of September 30, 2016, if applicable.
| 316 | SEI Institutional Managed Trust / Annual Report / September 30, 2016 |
Swap Agreements — To the extent consistent with its Investment Objective and Strategies, a Fund may invest in swap contracts as an efficient means to synthetically obtain exposure to securities or baskets of securities and to manage a Fund’s interest rate duration and yield curve exposure. Swap contracts may also be used to mitigate a Fund’s overall level of risk and/or a Fund’s risk to particular types of securities, currencies or market segments. Interest rate swaps may further be used to manage a Fund’s yield spread sensitivity. A Fund may buy credit default swaps in an attempt to manage credit risk where a Fund has credit exposure to an issuer, and a Fund may sell credit default swaps to more efficiently gain credit exposure to a security or basket of securities. A swap agreement is a two-party contract under which an agreement is made to exchange returns from predetermined investments or instruments, including a particular interest rate, foreign currency, or “basket” of securities representing a particular index. Swap agreements are privately negotiated in the over-the-counter market (“OTC swaps”) or may be executed in a multilateral or other trade facility platform, such as a registered commodities exchange (“Centrally Cleared swaps”). Interest rate swaps involve the exchange by a Fund with another party of their respective commitments to pay or receive interest (e.g., an exchange of floating rate payments for fixed rate payments) with respect to a notional amount of principal. Credit-default swaps involve periodic payments by a Fund or counterparty based on a specified rate multiplied by a notional amount assigned to an underlying debt instrument or group of debt instruments in exchange for the assumption of credit risk on the same instruments. In the event of a credit event, usually in the form of a credit rating downgrade, the party receiving periodic payments (i.e. floating rate payer) must pay the other party (i.e. fixed rate payer) an amount equal to the recovery rate used to settle the contracts. The recovery rate is a function of how many credit default swap investors wish to deliver the security or receive the security. The recovery rate is determined through an auction process. Total return swaps allow an investor to benefit from the cash flow without ever actually owning the underlying security. The receiver must pay any decline in value to the payer at the end of the total return swap. However, the investor does not need to make a payment if there is no decline in price. Payments can be made on various indices, bonds (i.e. mortgage backed securities, bank debt and corporate), loans or commodities. The value of a total return swap is equal to the change in value of the underlying asset versus the accrued income payment based on LIBOR or some other form of indices
on the notional amount. Payments received or made are recorded as realized gains or loss. A Fund could be exposed to credit or market risk due to unfavorable changes in the fluctuation of interest rates or if the counterparty defaults on its obligation to perform. Risk of loss may exceed amounts recognized on the statement of assets and liabilities. Interest rate swap contracts outstanding at year end, if any, are listed after a Fund’s portfolio. In connection with swap agreements securities may be set aside as collateral by a Fund’s custodian.
Swaps are marked-to-market daily based upon quotations from market makers and the resulting changes in market values, if any, are recorded as an unrealized gain or loss in the Statement of Operations or Consolidated Statement of Operations. Centrally cleared swaps are valued at the settlement price established each day by the board of exchange on which they are traded. The daily settlement prices for centrally cleared swaps are provided by an independent source. Net payments of interest are recorded as realized gains or losses. Daily changes in valuation of Centrally Cleared swaps, if any, are recorded as a receivable or payable for the change in value as appropriate (“variation margin”) on the Statements of Assets and Liabilities.
Entering into swap agreements involves, to varying degrees, elements of credit and market risk in excess of the amounts recognized on the Statement of Assets and Liabilities or Consolidated Statement of Assets and Liabilities. Such risks involve the possibility that there will be no liquid market for these agreements, that the counterparty to the agreement may default on its obligation to perform and that there may be unfavorable changes in the fluctuation of interest rates. Risks also arise from potential losses from adverse market movements.
This risk is mitigated by having a master netting arrangement between a Fund and the counterparty and by having the counterparty post collateral to cover a Fund’s exposure to the counterparty. See Note 3 for further details. Refer to each Fund’s Schedule of Investments, Summary Schedule of Investments or Consolidated Schedule of Investments for details regarding open swap agreements as of September 30, 2016, if applicable.
Delayed Delivery Transactions — To the extent consistent with its Investment Objective and Strategies, a Fund may purchase or sell securities on a when-issued or delayed delivery basis. These transactions involve a commitment by the Fund to purchase or sell securities for a predetermined price or yield, with payment and delivery taking place beyond the customary settlement period. When delayed delivery purchases are outstanding, the Fund will set aside liquid assets in
| SEI Institutional Managed Trust / Annual Report / September 30, 2016 | 317 |
Notes to Financial Statements/Consolidated Notes to Financial Statements (Continued)
September 30, 2016
an amount sufficient to meet the purchase price. When purchasing a security on a delayed delivery basis, the Fund assumes the rights and risks of ownership of the security, including the risk of price and yield fluctuations, and takes such fluctuations into account when determining its net asset value. The Fund may dispose of or renegotiate a delayed delivery transaction after it is entered into, and may sell when-issued securities before they are delivered, which may result in a capital gain or loss. When the Fund has sold a security on delayed delivery basis, the Fund does not participate in future gains and losses with respect to the security.
Collateralized Debt Obligations — To the extent consistent with its Investment Objective and Strategies, a Fund may invest in collateralized debt obligations (“CDOs”), which include collateralized loan obligations (“CLOs”) and other similarly structured securities. CLOs are a type of asset-backed securities. A CLO is a trust typically collateralized by a pool of loans, which may include, among others, domestic and foreign senior secured loans, senior unsecured loans, and subordinate corporate loans, including loans that may be rated below investment grade or equivalent unrated loans. CDOs may charge management fees and administrative expenses.
For CDOs, the cash flows from the trust are split into two or more portions, called tranches, varying in risk and yield. The riskiest portion is the “equity” tranche which bears the bulk of defaults from the bonds or loans in the trust and serves to protect the other, more senior tranches from default in all but the most severe circumstances. Since it is partially protected from defaults, a senior tranche from a CDO trust typically has a higher rating and lower yield than its underlying securities, and can be rated investment grade. Despite the protection from the equity tranche, CDO tranches can experience substantial losses due to actual defaults, increased sensitivity to defaults due to collateral default and disappearance of protecting tranches, market anticipation of defaults, as well as aversion to CDO securities as a class.
The risks of an investment in a CDO depend largely on its Class and its collateral securities. Normally, CLOs and other CDOs are privately offered and sold, and thus, are not registered under the securities laws. As a result, investments in CDOs may be characterized by the Funds as illiquid securities; however, an active dealer market may exist for CDOs, allowing a CDO to qualify for Rule 144A transactions. In addition to the normal risks associated with fixed income securities (e.g., interest rate risk and default risk), CDOs carry additional risks including, but not limited to: (i) the possibility that distributions from collateral securities will not be adequate to make interest or other payments; (ii) the quality of the collateral may decline in value or default; (iii) the Funds may invest in CDOs that are subordinate to other classes; and (iv) the complex structure of the security may not be fully understood at the time of investment and may produce disputes with the issuer or unexpected investment results.
Illiquid Securities — A security is considered illiquid if it cannot be sold or disposed of in the ordinary course of business within seven days or less for its approximate carrying value on the books of a Fund. Valuations of illiquid securities may differ significantly from the values that would have been used had an active market value for these securities existed.
Restricted Securities — At September 30, 2016, the following Funds owned private placement investments that were purchased through private offerings or acquired through initial public offerings and cannot be sold without prior registration under the Securities Act of 1933 or pursuant to an exemption therefrom. In addition, the Funds have generally agreed to further restrictions on the disposition of certain holdings as set forth in various agreements entered into in connection with the purchase of these investments. These investments are valued at fair value as determined in accordance with the procedures approved by the Board of Trustees. The acquisition dates of these investments, the enforceable right to acquire these securities, along with their cost and values at September 30, 2016, were as follows:
| ||||||||||||||||||||||
Number of Shares/ ($ Thousands) | Acquisition Date | Right to Acquire Date | Cost ($ Thousands) | Market Value ($ Thousands) | % of Net Assets | |||||||||||||||||
| ||||||||||||||||||||||
Small Cap Growth Fund | ||||||||||||||||||||||
Value Creation | 145,600 | 8/10/06 | 08/10/06 | $ | 1,491 | $ | 58 | 0.02% | ||||||||||||||
|
|
|
|
| ||||||||||||||||||
High Yield Bond Fund | ||||||||||||||||||||||
Aventine (Escrow Security) | $ | 2,750 | 11/30/10 | 11/30/10 | $ | – | $ | – | 0.00% | |||||||||||||
|
|
|
|
| ||||||||||||||||||
Dividends and Distributions to Shareholders — Dividends from net investment income are declared and paid to shareholders quarterly for the Large Cap, Large Cap Value, Large Cap Growth, Tax-Managed Large Cap,
S&P 500 Index, Small Cap, Small Cap Value, Small Cap Growth, Tax-Managed Small/Mid Cap, Mid-Cap, U.S. Managed Volatility, Tax-Managed Managed Volatility, Real Estate, Enhanced Income and Real Return Funds;
| 318 | SEI Institutional Managed Trust / Annual Report / September 30, 2016 |
are declared and paid annually for the Global Managed Volatility, Tax-Managed International Managed Volatility, Multi-Strategy Alternative, Multi-Asset Accumulation, Multi-Asset Inflation Managed, Multi-Asset Capital Stability, Dynamic Asset Allocation and Long/Short Alternative Funds; are declared daily and paid monthly for the Core Fixed Income, U.S. Fixed Income, High Yield Bond, Conservative Income, Tax-Free Conservative Income, Multi-Asset Income and Multi-Asset Capital Stability Funds. Any net realized capital gains on sales of securities are distributed to shareholders at least annually. Dividends and distributions are recorded on the ex-dividend date.
Investments in Real Estate Investment Trust — With respect to the Real Estate Fund, dividend income is recorded based on the income included in distributions received from the Real Estate Investment Trust (“REIT”) investments using published REIT reclassifications including some management estimates when actual amounts are not available. Distributions received in excess of this estimated amount are recorded as a reduction of the cost of investments or reclassified to capital gains. The actual amounts of income, return of capital, and capital gains are only determined by each REIT after its fiscal year end, and may differ from the estimated amounts.
Investment in Subsidiary — Each of the Multi-Asset Accumulation and Multi-Asset Inflation Managed Funds may invest in its own Subsidiary. By investing in a Subsidiary, each Fund is indirectly exposed to the risks associated with such Subsidiary’s investments. The commodity-related instruments held by a Subsidiary are generally similar to those that are permitted to be held by the applicable Fund and are subject to the same risks that apply to similar investments if held directly by the Fund. A Subsidiary, however, is not registered under the 1940 Act and will not be subject to all of the investor protections of the 1940 Act. Thus, the Multi-Asset Accumulation and Multi-Asset Inflation Managed Funds, as investors in their respective Subsidiary, will not have all of the protections offered to investors in registered investment companies.
However, each Fund wholly owns and controls its respective Subsidiary, and the Funds and the Subsidiaries are all managed by SIMC, making it unlikely that a Subsidiary will take action contrary to the interests of the applicable Fund or its shareholders. While a Subsidiary has its own Board of Directors (“Board”) that is responsible for overseeing the operations of such Subsidiary, the respective Fund’s Board has oversight responsibility for the investment activities of the Fund, including its investment in the respective Subsidiary, and the Fund’s role as the sole shareholder of such Subsidiary. It is not currently expected that shares of any
Subsidiary will be sold or offered to investors other than the respective Fund.
Changes in the laws of the United States and/or the Cayman Islands or governmental interpretation of such laws, under which the Funds and the Subsidiaries, respectively, are organized, could result in the inability of a Fund and/or its respective Subsidiary to operate as intended and could negatively affect the Funds and their shareholders. For example, Cayman Islands law does not currently impose any income, corporate or capital gains tax, estate duty, inheritance tax, gift tax or withholding tax on the Subsidiaries. If Cayman Islands law changes such that the Subsidiaries must pay Cayman Islands governmental authority taxes, Fund shareholders would likely suffer decreased investment return.
3. CREDIT DERIVATIVES
A Fund may use credit default swaps to reduce risk where a Fund has exposure to the issuer, or to take an active long or short position with respect to the likelihood of an event of default. The reference obligation of the swap can be a single issuer, a “basket” of issuers, or an index. The underlying referenced assets are corporate debt, sovereign debt and asset backed securities.
The buyer of a credit default swap is generally obligated to pay the seller a periodic stream of payments over the term of the contract in return for a contingent payment upon the occurrence of a credit event with respect to an underlying reference obligation. Generally, a credit event for corporate or sovereign reference obligations means bankruptcy, failure to pay, obligation acceleration, repudiation/moratorium or restructuring. For credit default swaps on asset-backed securities, a credit event may be triggered by events such as failure to pay principal, maturity extension, rating downgrade or write-down.
If a Fund is a seller of protection, and a credit event occurs, as defined under the terms of that particular swap agreement, a Fund will generally either (i) pay to the buyer an amount equal to the notional amount of the swap and take delivery of the referenced obligation, other deliverable obligations, or underlying securities comprising a referenced index or (ii) pay a net settlement amount in the form of cash or securities equal to the notional amount of the swap less the recovery value of the referenced obligation or underlying securities comprising a referenced index.
If a Fund is a buyer of protection and a credit event occurs, as defined under the terms of that particular swap agreement, a Fund will either (i) receive from the seller of protection an amount equal to the notional
| SEI Institutional Managed Trust / Annual Report / September 30, 2016 | 319 |
Notes to Financial Statements/Consolidated Notes to Financial Statements (Continued)
September 30, 2016
amount of the swap and deliver the referenced obligation, other deliverable obligations or underlying securities comprising the referenced index or (ii) receive a net settlement amount in the form of cash or securities equal to the notional amount of the swap less the recovery value of the referenced obligation or underlying securities comprising the referenced index. Recovery values are assumed by market makers considering either industry standard recovery rates or entity specific factors and considerations until a credit event occurs. If a credit event has occurred, the recovery value is determined by a facilitated auction whereby a minimum number of allowable broker bids, together with a specified valuation method, are used to calculate the settlement value.
Certain Funds are party to International Swap Dealers Association, Inc. Master Agreements (“ISDA Master Agreements”). These agreements are with select counterparties and they govern transactions, including certain over-the counter derivative and foreign
exchange contracts, entered into by the Funds and the counterparty.
As of September 30, 2016, Core Fixed Income Fund, Multi-Strategy Alternative Fund and the Multi-Asset Inflation Managed Fund are the buyers (“receiving protection”) on a total notional amount of $1.4 million, $7.9 million and $1.9 million, respectively. As of September 30, 2016, Core Fixed Income Fund, High Yield Bond Fund, Multi-Strategy Alternative Fund, Multi-Asset Inflation Managed Fund and Multi-Asset Capital Stability Fund are the sellers (“providing protection”) on a total notional amount of $1.6 million, $9.0 million, $10.6 million, $5.7 million and $17.0 million, respectively. The notional amounts of the swaps are not recorded in the financial statements. The notional amounts approximate the maximum potential amount of future payments that the Fund could be required to make if the Fund was the seller of protection and a credit event was to occur. Those credit default swaps (“CDS”) for which the Fund is providing protection at the balance sheet date are summarized as follows:
| ||||||||||||||||||||
| CORE FIXED INCOME FUND | ||||||||||||||||||||
| WRITTEN CREDIT DERIVATIVE CONTRACTS | SINGLE NAME CDS | CDS ON AN INDEX | ||||||||||||||||||
| ||||||||||||||||||||
| CORP | SOVERIGN | ABS | CORP | |||||||||||||||||
| REFERENCE ASSET | US$ | US$ | US$ | US$ | Total | |||||||||||||||
| ||||||||||||||||||||
Fair value of written credit derivatives | $(7,746) | $- | $- | $- | $(7,746) | |||||||||||||||
Maximum potential amount of future payments | 1,590,000 | - | - | - | 1,590,000 | |||||||||||||||
Recourse provisions with third parties to recover any amounts paid under the credit derivative (including any purchased credit protection)1 | - | - | - | - | - | |||||||||||||||
Collateral held by the Fund can obtain upon occurrence of triggering event | - | - | - | - | - | |||||||||||||||
| ||||||||||||||||||||
| HIGH YIELD BOND FUND | ||||||||||||||||||||
| WRITTEN CREDIT DERIVATIVE CONTRACTS | SINGLE NAME CDS | CDS ON AN INDEX | ||||||||||||||||||
| ||||||||||||||||||||
| CORP | SOVERIGN | ABS | CORP | |||||||||||||||||
| REFERENCE ASSET | US$ | US$ | US$ | US$ | Total | |||||||||||||||
| ||||||||||||||||||||
Fair value of written credit derivatives | $- | $- | $- | $456,877 | $456,877 | |||||||||||||||
Maximum potential amount of future payments | - | - | - | 9,000,000 | 9,000,000 | |||||||||||||||
Recourse provisions with third parties to recover any amounts paid under the credit derivative (including any purchased credit protection) 1 | - | - | - | - | - | |||||||||||||||
Collateral held by the Fund can obtain upon occurrence of triggering event | - | - | - | - | - | |||||||||||||||
| 320 | SEI Institutional Managed Trust / Annual Report / September 30, 2016 |
| ||||||||||||||||||||
| MULTI-STRATEGY ALTERNATIVE FUND | ||||||||||||||||||||
| WRITTEN CREDIT DERIVATIVE CONTRACTS | SINGLE NAME CDS | CDS ON AN INDEX | ||||||||||||||||||
| ||||||||||||||||||||
| CORP | SOVERIGN | ABS | CORP | |||||||||||||||||
| REFERENCE ASSET | US$ | US$ | US$ | US$ | Total | |||||||||||||||
| ||||||||||||||||||||
Fair value of written credit derivatives | $- | $(181,653) | $- | $88,366 | $(93,287) | |||||||||||||||
Maximum potential amount of future payments | - | 9,463,000 | - | 1,123,798 | 10,586,798 | |||||||||||||||
Recourse provisions with third parties to recover any amounts paid under the credit derivative (including any purchased credit protection) 1 | - | - | - | - | - | |||||||||||||||
Collateral held by the Fund can obtain upon occurrence of triggering event | - | - | - | - | - | |||||||||||||||
| ||||||||||||||||||||
| MULTI-ASSET INFLATION MANAGED FUND | ||||||||||||||||||||
| WRITTEN CREDIT DERIVATIVE CONTRACTS | SINGLE NAME CDS | CDS ON AN INDEX | ||||||||||||||||||
| ||||||||||||||||||||
| CORP | SOVERIGN | ABS | CORP | |||||||||||||||||
| REFERENCE ASSET | US$ | US$ | US$ | US$ | Total | |||||||||||||||
| ||||||||||||||||||||
Fair value of written credit derivatives | $24,503 | $- | $(408,070) | $- | $(383,567) | |||||||||||||||
Maximum potential amount of future payments | 1,118,089 | - | 4,603,000 | - | 5,721,089 | |||||||||||||||
Recourse provisions with third parties to recover any amounts paid under the credit derivative (including any purchased credit protection) 1 | - | - | - | - | - | |||||||||||||||
Collateral held by the Fund can obtain upon occurrence of triggering event | - | - | - | - | - | |||||||||||||||
| ||||||||||||||||||||
| MULTI-ASSET CAPITAL STABILITY FUND | ||||||||||||||||||||
| WRITTEN CREDIT DERIVATIVE CONTRACTS | SINGLE NAME CDS | CDS ON AN INDEX | ||||||||||||||||||
| ||||||||||||||||||||
| CORP | SOVERIGN | ABS | CORP | |||||||||||||||||
| REFERENCE ASSET | US$ | US$ | US$ | US$ | Total | |||||||||||||||
| ||||||||||||||||||||
Fair value of written credit derivatives | $- | $- | $- | $561,247 | $561,247 | |||||||||||||||
Maximum potential amount of future payments | - | - | - | 16,961,212 | 16,961,212 | |||||||||||||||
Recourse provisions with third parties to recover any amounts paid under the credit derivative (including any purchased credit protection) 1 | - | - | - | - | - | |||||||||||||||
Collateral held by the Fund can obtain upon occurrence of triggering event | - | - | - | - | - | |||||||||||||||
| 1 | Potential recoveries would include purchased credit derivatives to the extent they offset written credit derivatives which have an identical underlying, or a netting arrangement or credit support annex with the counterparty. There may be other potential recoveries from recourse provisions where agreements cover multiple derivative arrangements but those amounts have not been included. |
| ||||||||||||||||||||||||
| MAXIMUM POTENTIAL AMOUNT OF FUTURE PAYMENTS BY CONTRACT TERM | ||||||||||||||||||||||||
| ||||||||||||||||||||||||
| CORE FIXED INCOME FUND | 0-6 MONTHS | 6-12 MONTHS | 1-5 YEARS | 5-10 YEARS | > 10 YEARS | Total | ||||||||||||||||||
| ||||||||||||||||||||||||
Current credit spread* on underlying (in basis points) | ||||||||||||||||||||||||
0-100 | $- | $- | $- | $- | $- | $- | ||||||||||||||||||
101-200 | - | - | 1,590,000 | - | - | 1,590,000 | ||||||||||||||||||
201-300 | - | - | - | - | - | - | ||||||||||||||||||
301-400 | - | - | - | - | - | - | ||||||||||||||||||
> than 400 | - | - | - | - | - | - | ||||||||||||||||||
| ||||||||||||||||||||||||
Total | $- | $- | $1,590,000 | $- | $- | $1,590,000 | ||||||||||||||||||
| ||||||||||||||||||||||||
| ||||||||||||||||||||||||
| MAXIMUM POTENTIAL AMOUNT OF FUTURE PAYMENTS BY CONTRACT TERM | ||||||||||||||||||||||||
| ||||||||||||||||||||||||
| HIGH YIELD BOND FUND | 0-6 MONTHS | 6-12 MONTHS | 1-5 YEARS | 5-10 YEARS | > 10 YEARS | Total | ||||||||||||||||||
| ||||||||||||||||||||||||
Current credit spread* on underlying (in basis points) | ||||||||||||||||||||||||
0-100 | $- | $- | $- | $- | $- | $- | ||||||||||||||||||
101-200 | - | - | - | - | - | - | ||||||||||||||||||
201-300 | - | - | - | - | - | - | ||||||||||||||||||
301-400 | - | - | 9,000,000 | - | - | 9,000,000 | ||||||||||||||||||
> than 400 | - | - | - | - | - | - | ||||||||||||||||||
| ||||||||||||||||||||||||
Total | $- | $- | $9,000,000 | $- | $- | $9,000,000 | ||||||||||||||||||
| ||||||||||||||||||||||||
| SEI Institutional Managed Trust / Annual Report / September 30, 2016 | 321 |
Notes to Financial Statements/Consolidated Notes to Financial Statements (Continued)
September 30, 2016
| ||||||||||||||||||||||
| MAXIMUM POTENTIAL AMOUNT OF FUTURE PAYMENTS BY CONTRACT TERM | ||||||||||||||||||||||
| ||||||||||||||||||||||
| MULTI-STRATEGY ALTERNATIVE FUND | 0-6 MONTHS | 6-12 MONTHS | 1-5 YEARS | 5-10 YEARS | > 10 YEARS | Total | ||||||||||||||||
| ||||||||||||||||||||||
Current credit spread* on underlying (in basis points) | ||||||||||||||||||||||
0-100 | $- | $- | $- | $- | $- | $- | ||||||||||||||||
101-200 | - | - | 2,345,000 | - | - | 2,345,000 | ||||||||||||||||
201-300 | - | - | 7,118,000 | - | - | 7,118,000 | ||||||||||||||||
301-400 | - | - | 1,123,798 | - | - | 1,123,798 | ||||||||||||||||
> than 400 | - | - | - | - | - | - | ||||||||||||||||
| ||||||||||||||||||||||
Total | $- | $- | $10,586,798 | $- | $- | $10,586,798 | ||||||||||||||||
| ||||||||||||||||||||||
| ||||||||||||||||||||||
| MAXIMUM POTENTIAL AMOUNT OF FUTURE PAYMENTS BY CONTRACT TERM | ||||||||||||||||||||||
| ||||||||||||||||||||||
| MULTI-ASSET INFLATION MANAGED FUND | 0-6 MONTHS | 6-12 MONTHS | 1-5 YEARS | 5-10 YEARS | > 10 YEARS | Total | ||||||||||||||||
| ||||||||||||||||||||||
Current credit spread* on underlying (in basis points) | ||||||||||||||||||||||
0-100 | $- | $500,000 | $618,089 | $- | $- | $1,118,089 | ||||||||||||||||
101-200 | - | - | - | - | - | - | ||||||||||||||||
201-200 | - | - | - | - | - | - | ||||||||||||||||
301-400 | - | - | - | - | - | |||||||||||||||||
> than 400 | - | - | - | - | 4,603,000 | 4,603,000 | ||||||||||||||||
| ||||||||||||||||||||||
Total | $- | $500,000 | $618,089 | $- | $4,603,000 | $5,721,089 | ||||||||||||||||
| ||||||||||||||||||||||
| ||||||||||||||||||||||
| MAXIMUM POTENTIAL AMOUNT OF FUTURE PAYMENTS BY CONTRACT TERM | ||||||||||||||||||||||
| ||||||||||||||||||||||
| MULTI-ASSET CAPITAL STABILITY FUND | 0-6 MONTHS | 6-12 MONTHS | 1-5 YEARS | 5-10 YEARS | > 10 YEARS | Total | ||||||||||||||||
| ||||||||||||||||||||||
Current credit spread* on underlying (in basis points) | ||||||||||||||||||||||
0-100 | $- | $- | $7,410,000 | $2,480,000 | $- | $9,890,000 | ||||||||||||||||
101-200 | - | - | - | - | - | - | ||||||||||||||||
201-300 | - | - | - | - | - | - | ||||||||||||||||
301-400 | - | - | 5,441,706 | 1,629,506 | - | 7,071,212 | ||||||||||||||||
> than 400 | - | - | - | - | - | - | ||||||||||||||||
| ||||||||||||||||||||||
Total | $- | $- | $12,851,706 | $4,109,506 | $- | $16,961,212 | ||||||||||||||||
| ||||||||||||||||||||||
| * | The credit spread on the underlying asset is generally indicative of the current status of the underlying risk of the Fund having to perform. The spread also reflects the cost of buying/selling protection and may include upfront payments required to be made to enter into a contract. Higher credit spreads with a shorter contract term is indicative of a higher likelihood of performance by the Fund. |
The credit spread disclosed above for each reference obligation where the Fund is the seller of protection is a representation of the current payment/performance risk of the swap.
| 322 | SEI Institutional Managed Trust / Annual Report / September 30, 2016 |
4. DERIVATIVE TRANSACTIONS
The following tables include only Funds that had exposure to more than one type of risk on derivatives held throughout the year. For Funds that held derivatives throughout the year with only one type of risk exposure, additional information can be found on the Summary Schedule of Investments, Schedule of Investments or Consolidated Schedule of Investments and the Statement of Operations or Consolidated Statement of Operations.
The fair value of derivative instruments as of September 30, 2016 was as follows ($ Thousands):
| ||||||||||||
| Asset Derivatives | Liability Derivatives | |||||||||||
| ||||||||||||
| Statement of Assets and Liabilities/ Consolidated | Statement of Assets and Liabilities/ Consolidated | |||||||||||
| Statement of Assets and Liabilities Location | Fair Value | Statement of Assets and Liabilities Location | Fair Value | |||||||||
| ||||||||||||
Derivatives not accounted for as hedging instruments: | ||||||||||||
Global Managed Volatility Fund | ||||||||||||
Equity contracts | Net Assets — Unrealized appreciation on futures contracts | $ 292* | Net Assets — Unrealized depreciation on futures contracts | $ 216* | ||||||||
Foreign exchange contracts | Unrealized gain on forward foreign currency contracts | 916 | Unrealized loss on forward foreign currency contracts | 648 | ||||||||
|
|
|
| |||||||||
Total Derivatives not accounted for as hedging instruments | $1,208 | $864 | ||||||||||
|
|
|
| |||||||||
Core Fixed Income Fund | ||||||||||||
Interest rate contracts | Net Assets — Unrealized appreciation on futures contracts | $ 1,831 * | Net Assets — Unrealized depreciation on futures contracts | $ 137 * | ||||||||
Net Assets — Unrealized appreciation on swap contracts | 38† | Net Assets — Unrealized depreciation on swap contracts | 3,879† | |||||||||
Options purchased, at value | 208 | Options written, at value | 315 | |||||||||
Foreign exchange contracts | Unrealized gain on forward foreign currency contracts | 450 | Unrealized loss on forward foreign currency contracts | 925 | ||||||||
Credit contracts | Net Assets — Unrealized appreciation on swap contracts | 1† | Net Assets — Unrealized depreciation on swap contracts | 21† | ||||||||
|
|
|
| |||||||||
Total Derivatives not accounted for as hedging instruments | $2,528 | $5,277 | ||||||||||
|
|
|
| |||||||||
U.S. Fixed Income Fund | ||||||||||||
Interest rate contracts | Net Assets — Unrealized appreciation on futures contracts | $981 * | Net Assets — Unrealized depreciation on futures contracts | $10 * | ||||||||
Net Assets — Unrealized appreciation on swap contracts | 13† | Net Assets — Unrealized depreciation on swap contracts | 480† | |||||||||
Options purchased, at value | 81 | Options written, at value | 123 | |||||||||
Foreign exchange contracts | Unrealized gain on forward foreign currency contracts | 9 | Unrealized loss on forward foreign currency contracts | 168 | ||||||||
|
|
|
| |||||||||
Total Derivatives not accounted for as hedging instruments | $1,084 | $781 | ||||||||||
|
|
|
| |||||||||
Dynamic Asset Allocation Fund | ||||||||||||
Interest rate contracts | Net Assets — Unrealized appreciation on swap contracts | $576† | Net Assets — Unrealized depreciation on swap contracts | $–† | ||||||||
Equity contracts | Net Assets — Unrealized appreciation on futures contracts | 22* | Net Assets — Unrealized depreciation on futures contracts | –* | ||||||||
Options purchased, at value | 415 | Options written, at value | – | |||||||||
Foreign exchange contracts | Unrealized gain on forward foreign currency contracts | 938 | Unrealized loss on forward foreign currency contracts | 3,235 | ||||||||
|
|
|
| |||||||||
Total Derivatives not accounted for as hedging instruments | $1,951 | $3,235 | ||||||||||
|
|
|
| |||||||||
| SEI Institutional Managed Trust / Annual Report / September 30, 2016 | 323 |
Notes to Financial Statements/Consolidated Notes to Financial Statements (Continued)
September 30, 2016
| ||||||||||||
| Asset Derivatives | Liability Derivatives | |||||||||||
| ||||||||||||
| Statement of Assets and Liabilities/ Consolidated | Statement of Assets and Liabilities/ Consolidated | |||||||||||
| Statement of Assets and Liabilities Location | Fair Value | Statement of Assets and Liabilities Location | Fair Value | |||||||||
| ||||||||||||
Multi-Strategy Alternative Fund | ||||||||||||
Interest rate contracts | Net Assets — Unrealized appreciation on futures contracts | $13* | Net Assets — Unrealized depreciation on futures contracts | $9* | ||||||||
Net Assets — Unrealized appreciation on swap contracts | 11† | Net Assets — Unrealized depreciation on swap contracts | –† | |||||||||
Equity contracts | Options purchased, at value | 160 | Options written, at value | 92 | ||||||||
Net Assets — Unrealized appreciation on futures contracts | 5* | Net Assets — Unrealized depreciation on futures contracts | –* | |||||||||
Net Assets — Unrealized appreciation on swap contracts | 131† | Net Assets — Unrealized depreciation on swap contracts | –† | |||||||||
Foreign exchange contracts | Unrealized gain on forward foreign currency contracts | 80 | Unrealized loss on forward foreign currency contracts | 158 | ||||||||
Credit contracts | Net Assets — Unrealized appreciation on swap contracts | 202† | Net Assets — Unrealized depreciation on swap contracts | 104† | ||||||||
|
|
|
| |||||||||
Total Derivatives not accounted for as hedging instruments | $602 | $363 | ||||||||||
|
|
|
| |||||||||
Multi-Asset Accumulation Fund | ||||||||||||
Interest rate contracts | Net Assets — Unrealized appreciation on futures contracts | $6,552* | Net Assets — Unrealized depreciation on futures contracts | $2,357* | ||||||||
Net Assets — Unrealized appreciation on swap contracts | 1,961† | Net Assets — Unrealized depreciation on swap contracts | 652† | |||||||||
Equity contracts | Net Assets — Unrealized appreciation on futures contracts | 6,490* | Net Assets — Unrealized depreciation on futures contracts | 2,517* | ||||||||
Net Assets — Unrealized appreciation on swap contracts | 67† | Net Assets — Unrealized depreciation on swap contracts | 1,710† | |||||||||
Foreign exchange contracts | Unrealized gain on forward foreign currency contracts | 3,412 | Unrealized loss on forward foreign currency contracts | 3,393 | ||||||||
Commodity contracts | Net Assets — Unrealized appreciation on futures contracts | 7,690* | Net Assets — Unrealized depreciation on futures contracts | 10,722* | ||||||||
Net Assets — Unrealized appreciation on swap contracts | 734† | Net Assets — Unrealized depreciation on swap contracts | 1,926† | |||||||||
|
|
|
| |||||||||
Total Derivatives not accounted for as hedging instruments | $26,906 | $23,277 | ||||||||||
|
|
|
| |||||||||
Multi-Asset Income Fund | ||||||||||||
Interest rate contracts | Net Assets — Unrealized appreciation on futures contracts | $145* | Net Assets — Unrealized depreciation on swap contracts | $81* | ||||||||
Net Assets — Unrealized appreciation on swap contracts | 58,390† | Net Assets — Unrealized depreciation on swap contracts | 58,856† | |||||||||
Equity contracts | Options purchased, at value | – | Options written, at value | 2,222 | ||||||||
Net Assets — Unrealized appreciation on futures contracts | 68* | Net Assets — Unrealized depreciation on futures contracts | –* | |||||||||
Foreign exchange contracts | Unrealized gain on forward foreign currency contracts | 238 | Unrealized loss on forward foreign currency contracts | 3 | ||||||||
|
|
|
| |||||||||
Total Derivatives not accounted for as hedging instruments | $58,841 | $61,162 | ||||||||||
|
|
|
| |||||||||
| 324 | SEI Institutional Managed Trust / Annual Report / September 30, 2016 |
| ||||||||||||
| Asset Derivatives | Liability Derivatives | |||||||||||
| ||||||||||||
| Statement of Assets and Liabilities/ Consolidated | Statement of Assets and Liabilities/ Consolidated | |||||||||||
| Statement of Assets and Liabilities Location | Fair Value | Statement of Assets and Liabilities Location | Fair Value | |||||||||
| ||||||||||||
Multi-Asset Inflation Managed Fund | ||||||||||||
Interest rate contracts | Net Assets — Unrealized appreciation on futures contracts | $ –* | Net Assets — Unrealized depreciation on futures contracts | $ 209* | ||||||||
Net Assets — Unrealized appreciation on swap contracts | 2,118† | Net Assets — Unrealized depreciation on swap contracts | 4,246† | |||||||||
Equity contracts | Net Assets — Unrealized appreciation on futures contracts | –† | Net Assets — Unrealized depreciation on futures contracts | 93† | ||||||||
Foreign exchange contracts | Unrealized gain on forward foreign currency contracts | 257 | Unrealized loss on forward foreign currency contracts | 1,963 | ||||||||
Commodity contracts | Net Assets — Unrealized appreciation on futures contracts | 9,044* | Net Assets — Unrealized depreciation on future contracts | 8,894* | ||||||||
Credit contracts | Net Assets — Unrealized appreciation on swaps contracts | 27† | Net Assets — Unrealized depreciation on swaps contracts | 210† | ||||||||
|
|
|
| |||||||||
Total Derivatives not accounted for as hedging instruments | $11,446 | $15,615 | ||||||||||
|
|
|
| |||||||||
Multi-Asset Capital Stability Fund | ||||||||||||
Interest rate contracts | Net Assets — Unrealized appreciation on futures contracts | $41* | Net Assets — Unrealized depreciation on futures contracts | $ 186* | ||||||||
Net Assets — Unrealized appreciation on swap contracts | 265† | Net Assets — Unrealized depreciation on swap contracts | 4† | |||||||||
Equity contracts | Net Assets — Unrealized appreciation on futures contracts | 286* | Net Assets — Unrealized depreciation on futures contracts | 311* | ||||||||
Options purchased, at value | 21 | Options written, at value | 14 | |||||||||
Foreign exchange contracts | Unrealized gain on forward foreign currency contracts | 1,123 | Unrealized loss on forward foreign currency contracts | 1,350 | ||||||||
Options purchased, at value | 44 | Options written, at value | 57 | |||||||||
Credit contracts | Net Assets — Unrealized appreciation on swap contracts | 14† | Net Assets — Unrealized depreciation on swap contracts | 21† | ||||||||
|
|
|
| |||||||||
Total Derivatives not accounted for as hedging instruments | $1,794 | $1,943 | ||||||||||
|
|
|
| |||||||||
Long/Short Alternative Fund | ||||||||||||
Interest rate contracts | Net Assets — Unrealized appreciation on futures contracts | $8* | Net Assets — Unrealized depreciation on futures contracts | $ 6* | ||||||||
Equity contracts | Net Assets — Unrealized appreciation on futures contracts | 180* | Net Assets — Unrealized depreciation on futures contracts | 258* | ||||||||
|
|
|
| |||||||||
Total Derivatives not accounted for as hedging instruments | $188 | $264 | ||||||||||
|
|
|
| |||||||||
| * | Includes cumulative appreciation/depreciation of futures contracts as reported in the Schedules of Investments. Only current day’s variation margin is reported within the Statements of Assets & Liabilities. |
| † | Includes cumulative appreciation/depreciation of swap contracts as reported in the Schedules of Investments. Market Value is reported within the Statements of Assets & Liabilities for swap contracts that have paid premiums. |
| SEI Institutional Managed Trust / Annual Report / September 30, 2016 | 325 |
Notes to Financial Statements/Consolidated Notes to Financial Statements (Continued)
September 30, 2016
The effect of derivative instruments on the Statements of Operations/Consolidated Statements of Operations for the year ended September 30, 2016.
Amount of realized gain or (loss) on derivatives recognized in income ($ Thousands):
| ||||||||||||||||||||||||
| Derivatives Not Accounted for as Hedging Instruments | Options | Swaptions | Futures | Forward Currency Contracts | Swaps | Total | ||||||||||||||||||
| ||||||||||||||||||||||||
Global Managed Volatility Fund |
| |||||||||||||||||||||||
Equity contracts | $ | — | $ | — | $ | 6,390 | $ | — | $ | — | $ | 6,390 | ||||||||||||
Foreign exchange contracts | — | — | — | (715) | — | (715) | ||||||||||||||||||
| ||||||||||||||||||||||||
Total | $ | — | $ | — | $ | 6,390 | $ | (715) | $ | — | $ | 5,675 | ||||||||||||
| ||||||||||||||||||||||||
Core Fixed Income Fund |
| |||||||||||||||||||||||
Interest rate contracts | $ | (1,236) | $ | 101 | $ | 1,197 | $ | — | $ | (2,899) | $ | (2,837) | ||||||||||||
Foreign exchange contracts | (103) | — | — | (3,315) | — | (3,418) | ||||||||||||||||||
Credit contracts | — | — | — | — | (16) | (16) | ||||||||||||||||||
| ||||||||||||||||||||||||
Total | $ | (1,339) | $ | 101 | $ | 1,197 | $ | (3,315) | $ | (2,915) | $ | (6,271) | ||||||||||||
| ||||||||||||||||||||||||
U.S. Fixed Income Fund |
| |||||||||||||||||||||||
Interest rate contracts | $ | (455) | $ | — | $ | (4,093) | $ | — | $ | (189) | $ | (4,737) | ||||||||||||
Foreign exchange contracts | — | — | — | (1,058) | — | (1,058) | ||||||||||||||||||
| ||||||||||||||||||||||||
Total | $ | (455) | $ | — | $ | (4,093) | $ | (1,058) | $ | (189) | $ | (5,795) | ||||||||||||
| ||||||||||||||||||||||||
Dynamic Asset Allocation Fund |
| |||||||||||||||||||||||
Equity contracts | $ | (195) | $ | — | $ | (2,563) | $ | — | $ | — | $ | (2,758) | ||||||||||||
Interest rate contracts | — | — | (418) | — | 1,437 | 1,019 | ||||||||||||||||||
Foreign exchange contracts | — | — | — | (3,979) | — | (3,979) | ||||||||||||||||||
| ||||||||||||||||||||||||
Total | $ | (195) | $ | — | $ | (2,981) | $ | (3,979) | $ | 1,437 | $ | (5,718) | ||||||||||||
| ||||||||||||||||||||||||
Multi-Strategy Alternative Fund |
| |||||||||||||||||||||||
Credit contracts | $ | — | $ | — | $ | — | $ | — | $ | (89) | $ | (89) | ||||||||||||
Equity contracts | (1,165) | — | (116) | — | 1,119 | (162) | ||||||||||||||||||
Interest rate contracts | — | — | (174) | — | — | (174) | ||||||||||||||||||
Foreign exchange contracts | — | — | — | (79) | — | (79) | ||||||||||||||||||
| ||||||||||||||||||||||||
Total | $ | (1,165) | $ | — | $ | (290) | $ | (79) | $ | 1,030 | $ | (504) | ||||||||||||
| ||||||||||||||||||||||||
Multi-Asset Accumulation Fund |
| |||||||||||||||||||||||
Equity contracts | $ | — | $ | — | $ | 24,530 | $ | — | $ | 2,726 | $ | 27,256 | ||||||||||||
Interest rate contracts | — | — | 106,331 | — | 31,791 | 138,122 | ||||||||||||||||||
Foreign exchange contracts | — | — | — | 20,901 | — | 20,901 | ||||||||||||||||||
Commodity contracts | — | — | 13,683 | — | (6,165) | 7,518 | ||||||||||||||||||
| ||||||||||||||||||||||||
Total | $ | — | $ | — | $ | 144,544 | $ | 20,901 | $ | 28,352 | $ | 193,797 | ||||||||||||
| ||||||||||||||||||||||||
Multi-Asset Income Fund |
| |||||||||||||||||||||||
Credit contracts | $ | — | $ | — | $ | — | $ | — | $ | 432 | $ | 432 | ||||||||||||
Equity contracts | (397) | — | 1,951 | — | — | 1,554 | ||||||||||||||||||
Interest rate contracts | — | — | (2,191) | — | (3,949) | (6,140) | ||||||||||||||||||
Foreign exchange contracts | (1,476) | — | — | 369 | — | (1,107) | ||||||||||||||||||
| ||||||||||||||||||||||||
Total | $ | (1,873) | $ | — | $ | (240) | $ | 369 | $ | (3,517) | $ | (5,261) | ||||||||||||
| ||||||||||||||||||||||||
Multi-Asset Inflation Managed Fund |
| |||||||||||||||||||||||
Credit contracts | $ | — | $ | — | $ | — | $ | — | $ | (41) | $ | (41) | ||||||||||||
Equity contracts | (374) | — | (2,536) | — | — | (2,910) | ||||||||||||||||||
Interest rate contracts | — | — | (1,332) | — | (1,177) | (2,509) | ||||||||||||||||||
Foreign exchange contracts | 36 | — | — | (1,206) | — | (1,170) | ||||||||||||||||||
Commodity contracts | — | — | (1,420) | — | — | (1,420) | ||||||||||||||||||
| ||||||||||||||||||||||||
Total | $ | (338) | $ | — | $ | (5,288) | $ | (1,206) | $ | (1,218) | $ | (8,050) | ||||||||||||
| ||||||||||||||||||||||||
| 326 | SEI Institutional Managed Trust / Annual Report / September 30, 2016 |
| ||||||||||||||||||||||||
| Derivatives Not Accounted for as Hedging Instruments | Options | Swaptions | Futures | Forward Currency Contracts | Swaps | Total | ||||||||||||||||||
| ||||||||||||||||||||||||
Multi-Asset Capital Stability Fund |
| |||||||||||||||||||||||
Credit contracts | $ | — | $ | — | $ | — | $ | — | $ | (383) | $ | (383) | ||||||||||||
Equity contracts | (208) | — | (1,267) | — | — | (1,475) | ||||||||||||||||||
Interest rate contracts | — | 356 | 4,297 | — | 57 | 4,710 | ||||||||||||||||||
Foreign exchange contracts | (379) | — | — | 1,877 | — | 1,498 | ||||||||||||||||||
| ||||||||||||||||||||||||
Total | $ | (587) | $ | 356 | $ | 3,030 | $ | 1,877 | $ | (326) | $ | 4,350 | ||||||||||||
| ||||||||||||||||||||||||
Long/Short Alternative Fund |
| |||||||||||||||||||||||
Equity contracts | $ | — | $ | — | $ | 1,308 | $ | — | $ | — | $ | 1,308 | ||||||||||||
Interest rate contracts | — | — | (1,102) | — | — | (1,102) | ||||||||||||||||||
| ||||||||||||||||||||||||
Total | $ | — | $ | — | $ | 206 | $ | — | $ | — | $ | 206 | ||||||||||||
| ||||||||||||||||||||||||
Change in unrealized appreciation or (depreciation) on derivatives recognized in income ($ Thousands):
| ||||||||||||||||||||||||
| ||||||||||||||||||||||||
| Derivatives Not Accounted for as Hedging Instruments | Options | Swaptions | Futures | Forward Currency Contracts | Swaps | Total | ||||||||||||||||||
| ||||||||||||||||||||||||
Global Managed Volatility Fund |
| |||||||||||||||||||||||
Equity contracts | $ | — | $ | — | $ | 1,554 | $ | — | $ | — | $ | 1,554 | ||||||||||||
Foreign exchange Contracts | — | — | — | (2,235) | — | (2,235) | ||||||||||||||||||
| ||||||||||||||||||||||||
Total | $ | — | $ | — | $ | 1,554 | $ | (2,235) | $ | — | $ | (681) | ||||||||||||
| ||||||||||||||||||||||||
Core Fixed Income Fund |
| |||||||||||||||||||||||
Credit contracts | $ | — | $ | — | $ | — | $ | — | $ | (24) | $ | (24) | ||||||||||||
Interest rate contracts | 251 | (104) | 1,544 | — | (2,359) | (668) | ||||||||||||||||||
Foreign exchange contracts | — | — | — | 364 | — | 364 | ||||||||||||||||||
| ||||||||||||||||||||||||
Total | $ | 251 | $ | (104) | $ | 1,544 | $ | 364 | $ | (2,383) | $ | (328) | ||||||||||||
| ||||||||||||||||||||||||
U.S. Fixed Income Fund |
| |||||||||||||||||||||||
Interest rate contracts | $ | 87 | $ | — | $ | 1,524 | $ | — | $ | (166) | $ | 1,445 | ||||||||||||
Foreign exchange contracts | — | — | — | (111) | — | (111) | ||||||||||||||||||
| ||||||||||||||||||||||||
Total | $ | 87 | $ | — | $ | 1,524 | $ | (111) | $ | (166) | $ | 1,334 | ||||||||||||
| ||||||||||||||||||||||||
Dynamic Asset Allocation Fund |
| |||||||||||||||||||||||
Equity contracts | $ | — | $ | — | $ | 59 | $ | — | $ | — | $ | 59 | ||||||||||||
Interest rate contracts | (109) | — | — | — | 576 | 467 | ||||||||||||||||||
Foreign exchange contracts | — | — | — | (2,358) | — | (2,358) | ||||||||||||||||||
| ||||||||||||||||||||||||
Total | $ | (109) | $ | — | $ | 59 | $ | (2,358) | $ | 576 | $ | (1,832) | ||||||||||||
| ||||||||||||||||||||||||
Multi-Strategy Alternative Fund |
| |||||||||||||||||||||||
Credit contracts | $ | — | $ | — | $ | — | $ | — | $ | 98 | $ | 98 | ||||||||||||
Equity contracts | (29) | — | 5 | — | 131 | 107 | ||||||||||||||||||
Interest rate contracts | — | — | 4 | — | 11 | 15 | ||||||||||||||||||
Foreign exchange contracts | — | — | — | (78) | — | (78) | ||||||||||||||||||
| ||||||||||||||||||||||||
Total | $ | (29) | $ | — | $ | 9 | $ | (78) | $ | 240 | $ | 136 | ||||||||||||
| ||||||||||||||||||||||||
Multi-Asset Accumulation Fund |
| |||||||||||||||||||||||
Equity contracts | $ | — | $ | — | $ | 14,262 | $ | — | $ | (173) | $ | 14,089 | ||||||||||||
Interest rate contracts | — | — | (10,347) | — | (2,521) | (12,868) | ||||||||||||||||||
Foreign exchange contracts | — | — | — | 552 | — | 552 | ||||||||||||||||||
Commodity Contracts | — | — | 2,312 | — | 764 | 3,076 | ||||||||||||||||||
| ||||||||||||||||||||||||
Total | $ | — | $ | — | $ | 6,227 | $ | 552 | $ | (1,930) | $ | 4,849 | ||||||||||||
| ||||||||||||||||||||||||
| SEI Institutional Managed Trust / Annual Report / September 30, 2016 | 327 |
Notes to Financial Statements/Consolidated Notes to Financial Statements (Continued)
September 30, 2016
| ||||||||||||||||||||||||
| Derivatives Not Accounted for as Hedging Instruments | Options | Swaptions | Futures | Forward Currency Contracts | Swaps | Total | ||||||||||||||||||
| ||||||||||||||||||||||||
Multi-Asset Income Fund | ||||||||||||||||||||||||
Equity contracts | $ | (1,586) | $ | — | $ | 634 | $ | — | $ | 2,028 | $ | 1,076 | ||||||||||||
Interest rate contracts | 115 | — | 64 | — | (844) | (665) | ||||||||||||||||||
Foreign exchange contracts | — | — | — | 255 | — | 255 | ||||||||||||||||||
| ||||||||||||||||||||||||
Total | $ | (1,471) | $ | — | $ | 698 | $ | 255 | $ | 1,184 | $ | 666 | ||||||||||||
| ||||||||||||||||||||||||
Multi-Asset Inflation Managed Fund | ||||||||||||||||||||||||
Credit contracts | $ | — | $ | — | $ | — | $ | — | $ | (478) | $ | (478) | ||||||||||||
Equity contracts | — | — | (908) | — | — | (908) | ||||||||||||||||||
Interest rate contracts | — | — | 270 | — | 87 | 357 | ||||||||||||||||||
Foreign exchange contracts | — | — | — | (1,985) | — | (1,985) | ||||||||||||||||||
Commodity Contracts | 11 | — | 5,971 | — | — | 5,982 | ||||||||||||||||||
| ||||||||||||||||||||||||
Total | $ | 11 | $ | — | $ | 5,333 | $ | (1,985) | $ | (391) | $ | 2,968 | ||||||||||||
| ||||||||||||||||||||||||
Multi-Asset Capital Stability Fund | ||||||||||||||||||||||||
Credit contracts | $ | — | $ | — | $ | — | $ | — | $ | 28 | $ | 28 | ||||||||||||
Equity contracts | 202 | — | 823 | — | — | 1,025 | ||||||||||||||||||
Interest rate contracts | 204 | — | (554) | — | 760 | 410 | ||||||||||||||||||
Foreign exchange contracts | — | — | — | (442) | — | (442) | ||||||||||||||||||
| ||||||||||||||||||||||||
Total | $ | 406 | $ | — | $ | 269 | $ | (442) | $ | 788 | $ | 1,021 | ||||||||||||
| ||||||||||||||||||||||||
Long/Short Alternative Fund | ||||||||||||||||||||||||
Equity contracts | $ | — | $ | — | $ | 414 | $ | — | $ | — | $ | 414 | ||||||||||||
Interest rate contracts | — | — | 28 | — | — | 28 | ||||||||||||||||||
| ||||||||||||||||||||||||
Total | $ | — | $ | — | $ | 442 | $ | — | $ | — | $ | 442 | ||||||||||||
| ||||||||||||||||||||||||
A Fund is subject to various netting arrangements with select counterparties (“Master Agreements”). Master Agreements govern the terms of certain transactions, and reduce the counterparty risk associated with relevant transactions by specifying credit protection mechanisms and providing standardization that improves legal certainty. Since different types of transactions have different mechanics and are sometimes traded out of different legal entities of a particular counterparty organization, each type of transaction may be covered by a different Master Agreement, resulting in the need for multiple agreements with a single counterparty. As the Master Agreements are specific to unique operations of different asset types, they allow a Fund to close out and net its total exposure to a specific counterparty entity in the event of a default with respect to all the transactions governed under a single agreement with a specific counterparty entity.
Master Agreements can also help limit counterparty risk by specifying collateral posting arrangements at pre-arranged exposure levels. Under the Master Agreements, collateral is routinely transferred if the total net exposure to certain transactions (net of existing collateral already in place) governed under the relevant Master Agreement with a counterparty in a given account exceeds a specified threshold, which typically ranges from zero to $250,000 depending on
the counterparty and the type of Master Agreement. United States Treasury Securities and U.S. dollar cash are generally the preferred forms of collateral. Securities and cash pledged as collateral are reflected as assets on the Statements of Assets and Liabilities/Consolidated Statements of Assets and Liabilities as either a component of investments at value (securities) or deposits due from counterparties (cash). Cash collateral received is not typically held in a segregated account and as such is reflected as a liability on the Statements of Assets and Liabilities/Consolidated Statements of Assets and Liabilities as deposits due to counterparties. The market value of any securities received as collateral is not reflected as a component of net asset value. A Fund’s overall exposure to counterparty risk can change substantially within a short period, as it is affected by each transaction subject to the relevant Master Agreement.
Customer Account Agreements and related addendums govern exchange traded derivatives transactions such as futures, options on futures, and centrally cleared swaps. Exchange traded derivative transactions require posting of initial margin as determined by each relevant clearing agency which is segregated at a broker account registered with the Commodities Futures Trading Commission (CFTC), or the applicable regulator. In the US, counterparty risk is reduced as placement due to the Fund assets in the segregated account. Additionally, portability of exposure in the event of default further reduces risk to the Funds. Variation margin, or changes in market value, are exchanged daily, but may not be netted between futures and cleared OTC derivatives.
| 328 | SEI Institutional Managed Trust / Annual Report / September 30, 2016 |
The following is a summary of the market value and variation margin of exchange-traded or centrally cleared financial derivative instruments of the Funds as of September 30, 2016 ($ Thousands):
| Financial Derivative Assets | Financial Derivative Liabilities | |||||||||||||||||||||||||||||||
|
|
|
| |||||||||||||||||||||||||||||
| Market Value | Variation Margin Asset | Market Value | Variation Margin Liability | |||||||||||||||||||||||||||||
|
|
|
| |||||||||||||||||||||||||||||
| Purchased | Swap | Written | Swap | |||||||||||||||||||||||||||||
| Fund | Options | Futures | Agreements | Total | Options | Futures | Agreements | Total | ||||||||||||||||||||||||
|
|
| ||||||||||||||||||||||||||||||
Large Cap Fund | $ — | $ 100 | $ — | $ 100 | $ — | $ — | $ — | $ — | ||||||||||||||||||||||||
Tax Managed Large Cap Fund | — | 1,949 | — | 1,949 | — | 1,843 | — | 1,843 | ||||||||||||||||||||||||
S&P 500 Index Fund | — | 95 | — | 95 | — | — | — | — | ||||||||||||||||||||||||
Small Cap Fund | — | 109 | — | 109 | — | — | — | — | ||||||||||||||||||||||||
Small Cap Value Fund | — | 23 | — | 23 | — | — | — | — | ||||||||||||||||||||||||
Small Cap Growth Fund | — | — | — | — | — | — | — | — | ||||||||||||||||||||||||
Tax Managed Small/Mid Cap Fund | — | 57 | — | 57 | — | — | — | — | ||||||||||||||||||||||||
U.S. Managed Volatility Fund | — | 135 | — | 135 | — | — | — | — | ||||||||||||||||||||||||
Global Managed Volatility Fund | — | 254 | — | 254 | — | 154 | — | 154 | ||||||||||||||||||||||||
Tax-Managed Managed Volatility Fund | — | 113 | — | 113 | — | — | — | — | ||||||||||||||||||||||||
Enhanced Income Fund | — | 4 | — | 4 | — | 1 | — | 1 | ||||||||||||||||||||||||
Core Fixed Income Fund | 208 | 1,190 | 256 | 1,654 | 315 | 590 | 50 | 955 | ||||||||||||||||||||||||
U.S. Fixed Income Fund | 81 | 723 | 666 | 1,470 | 123 | 212 | 627 | 962 | ||||||||||||||||||||||||
High Yield Bond Fund | — | — | 34 | 34 | — | — | — | — | ||||||||||||||||||||||||
Dynamic Asset Allocation Fund | — | 61 | — | 61 | — | — | — | — | ||||||||||||||||||||||||
Multi-Strategy Alternative Fund | 160 | 12 | 16 | 188 | 92 | 14 | 18 | 124 | ||||||||||||||||||||||||
Multi-Asset Accumulation Fund | — | 2,333 | 181 | 2,514 | — | 3,435 | 442 | 3,877 | ||||||||||||||||||||||||
Multi-Asset Income Fund | — | 124 | 85 | 209 | 2,222 | 159 | 16 | 2,397 | ||||||||||||||||||||||||
Multi-Asset Inflation Managed Fund | — | 1,989 | 1,283 | 3,272 | — | 1,588 | 1,054 | 2,642 | ||||||||||||||||||||||||
Multi-Asset Capital Stability Fund | 65 | 596 | 109 | 770 | 71 | 460 | — | 531 | ||||||||||||||||||||||||
Long/Short Alternative Fund | — | 192 | — | 192 | — | 53 | — | 53 | ||||||||||||||||||||||||
|
|
|
| |||||||||||||||||||||||||||||
Total Exchange-Traded or Centrally Cleared | $ 514 | $ 10,059 | $ 2,630 | $ 13,203 | $ 2,823 | $ 8,456 | $ 2,207 | $ 13,486 | ||||||||||||||||||||||||
|
|
|
| |||||||||||||||||||||||||||||
Securities with an aggregate market value of $326,185 ($ Thousands) have been pledged and $100,358 in cash has been received as collateral for exchange-traded and centrally cleared derivative instruments as of September 30, 2016.
International Swaps and Derivatives Association, Inc. Master Agreements and Credit Support Annexes (“ISDA Master Agreements”) govern OTC financial derivative transactions entered into by a Fund and select counterparties. ISDA Master Agreements maintain provisions for general obligations, representations, agreements, collateral and events of default or
termination. Events of termination include conditions that may entitle counterparties to elect to terminate early and cause settlement of all outstanding transactions under the applicable ISDA Master Agreement. Any election to terminate early could be material to the financial statements. In limited circumstances, the ISDA Master Agreement may contain additional provisions that add additional counterparty protection beyond coverage of existing daily exposure if the counterparty has a decline in credit quality below a predefined level. These amounts, if any, may be segregated with a third party custodian.
The following is a summary by counterparty of the market value of OTC financial derivative instruments and collateral (received)/pledged as of September 30, 2016 ($ Thousands):
| Financial Derivative Assets | Financial Derivative Liabilities | |||||||||||||||||||||||||||||||||||||||||||||||
|
|
|
| |||||||||||||||||||||||||||||||||||||||||||||
| Forward | Purchased | Forward | Written | Net Market | ||||||||||||||||||||||||||||||||||||||||||||
| Foreign | Options | Total Over | Foreign | Options | Reverse | Total | Value of | Collateral | ||||||||||||||||||||||||||||||||||||||||
| Global Managed Volatility | Currency | and | Swap | the | Currency | and | Swap | Repurchase | Over the | OTC | (Received) | Net | ||||||||||||||||||||||||||||||||||||
| Fund | Contracts | Swaptions | Agreements | Counter | Contracts | Swaptions | Agreements | Agreements | Counter | Derivatives | Pledged | Exposures(1) | ||||||||||||||||||||||||||||||||||||
|
|
|
|
| ||||||||||||||||||||||||||||||||||||||||||||
Brown Brothers Harriman | $ 916 | $ — | $ — | $ 916 | $ 648 | $ — | $ — | $ — | $ 648 | �� | $ 268 | $ — | $ 268 | |||||||||||||||||||||||||||||||||||
|
|
|
| |||||||||||||||||||||||||||||||||||||||||||||
Total Over the Counter | $ 916 | $ — | $ — | $ 916 | $ 648 | $ — | $ — | $ — | $ 648 | |||||||||||||||||||||||||||||||||||||||
| SEI Institutional Managed Trust / Annual Report / September 30, 2016 | 329 |
Notes to Financial Statements/Consolidated Notes to Financial Statements (Continued)
September 30, 2016
| Financial Derivative Assets | Financial Derivative Liabilities | |||||||||||||||||||||||||||||||||||||||||||||||
|
|
|
| |||||||||||||||||||||||||||||||||||||||||||||
| Forward | Purchased | Forward | Written | Net Market | ||||||||||||||||||||||||||||||||||||||||||||
| Foreign | Options | Total Over | Foreign | Options | Reverse | Total | Value of | Collateral | ||||||||||||||||||||||||||||||||||||||||
| Currency | and | Swap | the | Currency | and | Swap | Repurchase | Over the | OTC | (Received) | Net | |||||||||||||||||||||||||||||||||||||
| Core Fixed Income Fund | Contracts | Swaptions | Agreements | Counter | Contracts | Swaptions | Agreements | Agreements | Counter | Derivatives | Pledged | Exposures(1) | ||||||||||||||||||||||||||||||||||||
|
|
|
|
| ||||||||||||||||||||||||||||||||||||||||||||
Bank of America | $ 112 | $ — | $ — | $ 112 | $ 415 | $ — | $ — | $ — | $ 415 | $ (303) | $ 530 | $ 227 | ||||||||||||||||||||||||||||||||||||
Barclays PLC | 112 | — | — | 112 | 238 | — | — | — | 238 | (126) | — | (126) | ||||||||||||||||||||||||||||||||||||
Citigroup | 210 | — | — | 210 | 186 | — | 676 | — | 862 | (652) | 565 | (87) | ||||||||||||||||||||||||||||||||||||
Goldman Sachs | — | — | — | — | — | — | 8 | — | 8 | (8) | — | (8) | ||||||||||||||||||||||||||||||||||||
JPMorgan Chase Bank | 16 | — | — | 16 | 43 | — | — | — | 43 | (27) | — | (27) | ||||||||||||||||||||||||||||||||||||
Morgan Stanley | — | — | — | — | 34 | — | — | — | 34 | (34) | — | (34) | ||||||||||||||||||||||||||||||||||||
UBS | — | — | — | — | 9 | — | — | — | 9 | (9) | — | (9) | ||||||||||||||||||||||||||||||||||||
|
|
|
| |||||||||||||||||||||||||||||||||||||||||||||
Total Over the Counter | $ 450 | $ — | $ — | $ 450 | $ 925 | $ — | $ 684 | $ — | $ 1,609 | |||||||||||||||||||||||||||||||||||||||
| Financial Derivative Assets | Financial Derivative Liabilities | |||||||||||||||||||||||||||||||||||||||||||||||
|
|
|
| |||||||||||||||||||||||||||||||||||||||||||||
| Forward | Purchased | Forward | Written | Net Market | ||||||||||||||||||||||||||||||||||||||||||||
| Foreign | Options | Total Over | Foreign | Options | Reverse | Total | Value of | Collateral | ||||||||||||||||||||||||||||||||||||||||
| Currency | and | Swap | the | Currency | and | Swap | Repurchase | Over the | OTC | (Received) | Net | |||||||||||||||||||||||||||||||||||||
| U.S. Fixed Income Fund | Contracts | Swaptions | Agreements | Counter | Contracts | Swaptions | Agreements | Agreements | Counter | Derivatives | Pledged | Exposures(1) | ||||||||||||||||||||||||||||||||||||
|
|
|
|
| ||||||||||||||||||||||||||||||||||||||||||||
Bank of America | $ — | $ — | $ — | $ — | $ 140 | $ — | $ — | $ — | $ 140 | $ (140) | $ — | $ (140) | ||||||||||||||||||||||||||||||||||||
Citigroup | — | — | — | — | — | — | 173 | — | 173 | (173) | — | (173) | ||||||||||||||||||||||||||||||||||||
JPMorgan Chase Bank | 9 | — | — | 9 | 28 | — | — | — | 28 | (19) | — | (19) | ||||||||||||||||||||||||||||||||||||
|
|
|
| |||||||||||||||||||||||||||||||||||||||||||||
Total Over the Counter | $ 9 | $ — | $ — | $ 9 | $ 168 | $ — | $ 173 | $ — | $ 341 | |||||||||||||||||||||||||||||||||||||||
| Financial Derivative Assets | Financial Derivative Liabilities | |||||||||||||||||||||||||||||||||||||||||||||||
|
|
|
| |||||||||||||||||||||||||||||||||||||||||||||
| Forward | Purchased | Forward | Written | Net Market | ||||||||||||||||||||||||||||||||||||||||||||
| Foreign | Options | Total Over | Foreign | Options | Reverse | Total | Value of | Collateral | ||||||||||||||||||||||||||||||||||||||||
| Dynamic Asset Allocation | Currency | and | Swap | the | Currency | and | Swap | Repurchase | Over the | OTC | (Received) | Net | ||||||||||||||||||||||||||||||||||||
| Fund | Contracts | Swaptions | Agreements | Counter | Contracts | Swaptions | Agreements | Agreements | Counter | Derivatives | Pledged | Exposures(1) | ||||||||||||||||||||||||||||||||||||
|
|
|
|
| ||||||||||||||||||||||||||||||||||||||||||||
Bank of America | $ 938 | $ — | $ 108 | $ 1,046 | $ 642 | $ — | $ — | $ — | $ 642 | $ 404 | $ — | $ 404 | ||||||||||||||||||||||||||||||||||||
BNP Paribas | — | — | 468 | 468 | 9 | — | — | — | 9 | 459 | — | 459 | ||||||||||||||||||||||||||||||||||||
Goldman Sachs | — | — | — | — | 8 | — | — | — | 8 | (8) | — | (8) | ||||||||||||||||||||||||||||||||||||
Societe Generale | — | — | — | — | 594 | — | — | — | 594 | (594) | — | (594) | ||||||||||||||||||||||||||||||||||||
Standard Chartered | — | 415 | — | 415 | 1,982 | — | — | — | 1,982 | (1,567) | — | (1,567) | ||||||||||||||||||||||||||||||||||||
|
|
|
| |||||||||||||||||||||||||||||||||||||||||||||
Total Over the Counter | $ 938 | $ 415 | $ 576 | $ 1,929 | $ 3,235 | $ — | $ — | $ — | $ 3,235 | |||||||||||||||||||||||||||||||||||||||
| Financial Derivative Assets | Financial Derivative Liabilities | |||||||||||||||||||||||||||||||||||||||||||||||
|
|
|
| |||||||||||||||||||||||||||||||||||||||||||||
| Forward | Purchased | Forward | Written | Net Market | ||||||||||||||||||||||||||||||||||||||||||||
| Foreign | Options | Total Over | Foreign | Options | Reverse | Total | Value of | Collateral | ||||||||||||||||||||||||||||||||||||||||
| Multi-Strategy Alternative | Currency | and | Swap | the | Currency | and | Swap | Repurchase | Over the | OTC | (Received) | Net | ||||||||||||||||||||||||||||||||||||
| Fund | Contracts | Swaptions | Agreements | Counter | Contracts | Swaptions | Agreements | Agreements | Counter | Derivatives | Pledged | Exposures(1) | ||||||||||||||||||||||||||||||||||||
|
|
|
|
| ||||||||||||||||||||||||||||||||||||||||||||
Bank of America | $ 13 | $ — | $ — | $ 13 | $ — | $ — | $ — | $ — | $ — | $ 13 | $ — | $ 13 | ||||||||||||||||||||||||||||||||||||
Citibank | — | — | — | — | — | — | — | — | — | — | 2,533 | 2,533 | ||||||||||||||||||||||||||||||||||||
Credit Suisse First Boston | — | — | — | — | 12 | — | — | — | 12 | (12) | — | (12) | ||||||||||||||||||||||||||||||||||||
Merrill Lynch | 8 | — | — | 8 | 5 | — | — | — | 5 | 3 | — | 3 | ||||||||||||||||||||||||||||||||||||
Morgan Stanley | 59 | — | 142 | 201 | 141 | — | — | — | 141 | 60 | 750 | 810 | ||||||||||||||||||||||||||||||||||||
|
|
|
| |||||||||||||||||||||||||||||||||||||||||||||
Total Over the Counter | $ 80 | $ — | $ 142 | $ 222 | $ 158 | $ — | $ — | $ — | $ 158 | |||||||||||||||||||||||||||||||||||||||
| Financial Derivative Assets | Financial Derivative Liabilities | |||||||||||||||||||||||||||||||||||||||||||||||
|
|
|
| |||||||||||||||||||||||||||||||||||||||||||||
| Forward | Purchased | Forward | Written | Net Market | ||||||||||||||||||||||||||||||||||||||||||||
| Foreign | Options | Total Over | Foreign | Options | Reverse | Total | Value of | Collateral | ||||||||||||||||||||||||||||||||||||||||
| Multi-Asset Accumulation | Currency | and | Swap | the | Currency | and | Swap | Repurchase | Over the | OTC | (Received) | Net | ||||||||||||||||||||||||||||||||||||
| Fund | Contracts | Swaptions | Agreements | Counter | Contracts | Swaptions | Agreements | Agreements | Counter | Derivatives | Pledged | Exposures(1) | ||||||||||||||||||||||||||||||||||||
|
|
|
|
| ||||||||||||||||||||||||||||||||||||||||||||
Bank of America | $ — | $ — | $ 1,751 | $ 1,751 | $ — | $ — | $ 1,061 | $ — | $ 1,061 | $ 690 | $ — | $ 690 | ||||||||||||||||||||||||||||||||||||
BoA Merrill Lynch | — | — | 74 | 74 | — | — | 851 | — | 851 | (777) | — | (777) | ||||||||||||||||||||||||||||||||||||
Brown Brothers Harriman | — | — | — | — | 120 | — | — | — | 120 | (120) | — | (120) | ||||||||||||||||||||||||||||||||||||
Citibank | — | — | 117 | 117 | — | — | 65 | — | 65 | 52 | — | 52 | ||||||||||||||||||||||||||||||||||||
Citigroup | 3,247 | — | 240 | 3,487 | 2,697 | — | 470 | — | 3,167 | 320 | — | 320 | ||||||||||||||||||||||||||||||||||||
Deutsche Bank | — | — | 303 | 303 | — | — | 540 | — | 540 | (237) | — | (237) | ||||||||||||||||||||||||||||||||||||
| 330 | SEI Institutional Managed Trust / Annual Report / September 30, 2016 |
| Financial Derivative Assets | Financial Derivative Liabilities | |||||||||||||||||||||||||||||||||||||||||||||||
|
|
|
| |||||||||||||||||||||||||||||||||||||||||||||
| Forward | Purchased | Forward | Written | Net Market | ||||||||||||||||||||||||||||||||||||||||||||
| Multi-Asset | Foreign | Options | Total Over | Foreign | Options | Reverse | Total | Value of | Collateral | |||||||||||||||||||||||||||||||||||||||
| Accumulation | Currency | and | Swap | the | Currency | and | Swap | Repurchase | Over the | OTC | (Received) | Net | ||||||||||||||||||||||||||||||||||||
| Fund | Contracts | Swaptions | Agreements | Counter | Contracts | Swaptions | Agreements | Agreements | Counter | Derivatives | Pledged | Exposures(1) | ||||||||||||||||||||||||||||||||||||
|
|
|
|
| ||||||||||||||||||||||||||||||||||||||||||||
JPMorgan Chase Bank | — | — | — | — | — | — | 1,218 | — | 1,218 | (1,218) | 7,738 | 6,520 | ||||||||||||||||||||||||||||||||||||
State Street | — | — | — | — | 440 | — | — | — | 440 | (440) | — | (440) | ||||||||||||||||||||||||||||||||||||
U.S. Bancorp | 165 | — | — | 165 | 136 | — | — | — | 136 | 29 | — | 29 | ||||||||||||||||||||||||||||||||||||
|
|
|
| |||||||||||||||||||||||||||||||||||||||||||||
Total Over the Counter | $ 3,412 | $ — | $ 2,485 | $ 5,897 | $ 3,393 | $ — | $ 4,205 | $ — | $ 7,598 | |||||||||||||||||||||||||||||||||||||||
| Financial Derivative Assets | Financial Derivative Liabilities | |||||||||||||||||||||||||||||||||||||||||||||||
|
|
|
| |||||||||||||||||||||||||||||||||||||||||||||
| Forward | Purchased | Forward | Written | Net Market | ||||||||||||||||||||||||||||||||||||||||||||
| Multi-Asset | Foreign | Options | Total Over | Foreign | Options | Reverse | Total | Value of | Collateral | |||||||||||||||||||||||||||||||||||||||
| Income | Currency | and | Swap | the | Currency | and | Swap | Repurchase | Over the | OTC | (Received) | Net | ||||||||||||||||||||||||||||||||||||
| Fund | Contracts | Swaptions | Agreements | Counter | Contracts | Swaptions | Agreements | Agreements | Counter | Derivatives | Pledged | Exposures(1) | ||||||||||||||||||||||||||||||||||||
|
|
|
|
| ||||||||||||||||||||||||||||||||||||||||||||
Bank of America | $ 46 | $ — | $ 30,414 | $ 30,460 | $ 3 | $ — | $ 30,573 | $ — | $ 30,576 | $ (116) | $ 981 | $ 865 | ||||||||||||||||||||||||||||||||||||
Barclays PLC | 118 | — | — | 118 | — | — | — | — | — | 118 | — | 118 | ||||||||||||||||||||||||||||||||||||
Brown Brothers Harriman | 43 | — | — | 43 | — | — | — | — | — | 43 | — | 43 | ||||||||||||||||||||||||||||||||||||
Goldman Sachs | — | — | 27,909 | 27,909 | — | — | 27,989 | — | 27,989 | (80) | — | (80) | ||||||||||||||||||||||||||||||||||||
JPMorgan Chase Bank | 31 | — | — | 31 | — | — | — | — | — | 31 | — | 31 | ||||||||||||||||||||||||||||||||||||
|
|
|
| |||||||||||||||||||||||||||||||||||||||||||||
Total Over the Counter | $ 238 | $ — | $ 58,323 | $ 58,561 | $ 3 | $ — | $ 58,562 | $ — | $ 58,565 | |||||||||||||||||||||||||||||||||||||||
| Financial Derivative Assets | Financial Derivative Liabilities | |||||||||||||||||||||||||||||||||||||||||||||||
|
|
|
| |||||||||||||||||||||||||||||||||||||||||||||
| Multi-Asset | Forward | Purchased | Forward | Written | Net Market | |||||||||||||||||||||||||||||||||||||||||||
| Inflation | Foreign | Options | Total Over | Foreign | Options | Reverse | Total | Value of | Collateral | |||||||||||||||||||||||||||||||||||||||
| Managed | Currency | and | Swap | the | Currency | and | Swap | Repurchase | Over the | OTC | (Received) | Net | ||||||||||||||||||||||||||||||||||||
| Fund | Contracts | Swaptions | Agreements | Counter | Contracts | Swaptions | Agreements | Agreements | Counter | Derivatives | Pledged | Exposures(1) | ||||||||||||||||||||||||||||||||||||
|
|
|
|
| ||||||||||||||||||||||||||||||||||||||||||||
Bank of America | $ — | $ — | $ 22 | $ 22 | $ — | $ — | $ — | $ — | $ — | $ 22 | $ — | $ 22 | ||||||||||||||||||||||||||||||||||||
Barclays PLC | 14 | — | — | 14 | 1,236 | — | — | — | 1,236 | (1,222) | — | (1,222) | ||||||||||||||||||||||||||||||||||||
BNP Paribas | — | — | — | — | 78 | — | — | — | 78 | (78) | — | (78) | ||||||||||||||||||||||||||||||||||||
BoA Merill Lynch | — | — | — | — | — | — | — | 31,999 | 31,999 | (31,999) | 32,011 | 12 | ||||||||||||||||||||||||||||||||||||
Brown Brothers Harriman | 12 | — | — | 12 | — | — | — | — | — | 12 | — | 12 | ||||||||||||||||||||||||||||||||||||
Chase Securities | — | — | — | — | — | — | — | 212,324 | 212,324 | (212,324) | — | (212,324) | ||||||||||||||||||||||||||||||||||||
Citibank | — | — | — | — | — | — | 76 | — | 76 | (76) | — | (76) | ||||||||||||||||||||||||||||||||||||
Citigroup | 23 | — | — | 23 | — | — | — | — | — | 23 | — | 23 | ||||||||||||||||||||||||||||||||||||
Deutsche Bank AG London | — | — | — | — | — | — | 192 | — | 192 | (192) | — | (192) | ||||||||||||||||||||||||||||||||||||
Goldman Sachs International | — | — | — | — | 550 | — | 214 | — | 764 | (764) | — | (764) | ||||||||||||||||||||||||||||||||||||
JPMorgan Chase Bank | — | — | — | — | 78 | — | 678 | — | 756 | (756) | 212,864 | 212,108 | ||||||||||||||||||||||||||||||||||||
HSBC | 30 | — | — | 30 | — | — | — | — | — | 30 | — | 30 | ||||||||||||||||||||||||||||||||||||
Standard Chartered | 178 | — | — | 178 | 21 | — | — | — | 21 | 157 | — | 157 | ||||||||||||||||||||||||||||||||||||
|
|
|
| |||||||||||||||||||||||||||||||||||||||||||||
Total Over the Counter | $ 257 | $ — | $ 22 | $ 279 | $ 1,963 | $ — | $ 1,160 | $ 244,323 | $ 247,446 | |||||||||||||||||||||||||||||||||||||||
| Financial Derivative Assets | Financial Derivative Liabilities | |||||||||||||||||||||||||||||||||||||||||||||||
|
|
|
| |||||||||||||||||||||||||||||||||||||||||||||
| Multi-Asset | Forward | Purchased | Forward | Written | Net Market | |||||||||||||||||||||||||||||||||||||||||||
| Capital | Foreign | Options | Total Over | Foreign | Options | Reverse | Total | Value of | Collateral | |||||||||||||||||||||||||||||||||||||||
| Stability | Currency | and | Swap | the | Currency | and | Swap | Repurchase | Over the | OTC | (Received) | Net | ||||||||||||||||||||||||||||||||||||
| Fund | Contracts | Swaptions | Agreements | Counter | Contracts | Swaptions | Agreements | Agreements | Counter | Derivatives | Pledged | Exposures(1) | ||||||||||||||||||||||||||||||||||||
|
|
|
|
| ||||||||||||||||||||||||||||||||||||||||||||
Bank of America | $ 39 | $ — | $ — | $ 39 | $ 19 | $ — | $ — | $ — | $ 19 | $ 20 | $ — | $ 20 | ||||||||||||||||||||||||||||||||||||
Barclays PLC | 21 | — | — | 21 | 175 | — | — | — | 175 | (154) | — | (154) | ||||||||||||||||||||||||||||||||||||
BNP Paribas | 54 | — | — | 54 | 61 | — | — | — | 61 | (7) | — | (7) | ||||||||||||||||||||||||||||||||||||
Brown Brothers Harriman | 28 | — | — | 28 | 110 | — | — | — | 110 | (82) | — | (82) | ||||||||||||||||||||||||||||||||||||
Citigroup | 539 | — | — | 539 | 485 | — | — | — | 485 | 54 | — | 54 | ||||||||||||||||||||||||||||||||||||
Deutsche Bank | 1 | — | — | 1 | 48 | — | — | — | 48 | (47) | — | (47) | ||||||||||||||||||||||||||||||||||||
Goldman Sachs | 58 | — | — | 58 | 7 | — | — | — | 7 | 51 | — | 51 | ||||||||||||||||||||||||||||||||||||
HSBC | 7 | — | — | 7 | 3 | — | — | — | 3 | 4 | — | 4 | ||||||||||||||||||||||||||||||||||||
JPMorgan Chase Bank | 58 | — | — | 58 | 181 | — | — | — | 181 | (123) | — | (123) | ||||||||||||||||||||||||||||||||||||
Montgomery/Bank of America | 3 | — | — | 3 | 2 | — | — | — | 2 | 1 | — | 1 | ||||||||||||||||||||||||||||||||||||
| SEI Institutional Managed Trust / Annual Report / September 30, 2016 | 331 |
Notes to Financial Statements/Consolidated Notes to Financial Statements (Continued)
September 30, 2016
| Financial Derivative Assets | Financial Derivative Liabilities | |||||||||||||||||||||||||||||||||||||||||||||||
|
|
|
| |||||||||||||||||||||||||||||||||||||||||||||
| Multi-Asset Capital Stability Fund | Forward Foreign Currency Contracts | Purchased Options and Swaptions | Swap Agreements | Total Over the Counter | Forward Foreign Currency Contracts | Written Options and Swaptions | Swap Agreements | Reverse Repurchase Agreements | Total Over the | Net Market Value of OTC Derivatives | Collateral (Received) Pledged | Net Exposures(1) | ||||||||||||||||||||||||||||||||||||
|
|
|
|
| ||||||||||||||||||||||||||||||||||||||||||||
Morgan Stanley | 75 | — | — | 75 | 64 | — | — | — | 64 | 11 | — | 11 | ||||||||||||||||||||||||||||||||||||
Nomura Securities International | 21 | — | — | 21 | 38 | — | — | — | 38 | (17) | — | (17) | ||||||||||||||||||||||||||||||||||||
Royal Bank of Scotland | 161 | — | — | 161 | 133 | — | — | — | 133 | 28 | — | 28 | ||||||||||||||||||||||||||||||||||||
Standard Chartered | 58 | — | — | 58 | 24 | — | — | — | 24 | 34 | — | 34 | ||||||||||||||||||||||||||||||||||||
|
|
|
| |||||||||||||||||||||||||||||||||||||||||||||
Total Over the Counter | $ 1,123 | $ | — | $ | — | $ | 1,123 | $ | 1,350 | $ | — | $ | — | $ | — | $ | 1,350 | |||||||||||||||||||||||||||||||
| (1) | Net Exposures represents the net receivable/(payable) that would be due from /to the counterparty in the event of default. Exposure from OTC financial derivative instruments can only be netted across transactions governed under the same master agreement with the same legal entity. |
Securities with an aggregate market value of $0 have been pledged as collateral for financial derivative instruments as governed by International Swaps and Derivatives Association, Inc. master agreements as of September 30, 2016.
Written Options transactions entered into during the year ended September 30, 2016 are summarized as follows:
| ||||
| Core Fixed Income Fund | Number of Contracts | Premium ($ Thousands) | ||
| ||||
Balance at the beginning of year | 1,132 | $ 412 | ||
Written | 4,959 | 1,686 | ||
Expired | (3,344) | (980) | ||
Closing buys
| (1,857) | (650) | ||
| ||||
Balance at the end of year | 890 | $ 468 | ||
| ||||
| ||||
| U.S. Fixed Income Fund | Number of Contracts | Premium ($ Thousands) | ||
| ||||
Balance at the beginning of year | 396 | $ 142 | ||
Written | 1,792 | 619 | ||
Expired | (1,153) | (341) | ||
Closing buys
| (685) | (236) | ||
| ||||
Balance at the end of year | 350 | $ 184 | ||
| ||||
| ||||
| Multi-Strategy Alternative Fund | Number of Contracts | Premium ($ Thousands) | ||
| ||||
Balance at the beginning of year | – | $ – | ||
Written | 8,201 | 3,240 | ||
Exercised | (65) | (6) | ||
Expired | (516) | (39) | ||
Closing buys
| (7,433) | (3,078) | ||
| ||||
Balance at the end of year | 187 | $ 117 | ||
| ||||
| ||||
| Multi-Asset Income Fund | Number of Contracts | Premium ($ Thousands) | ||
| ||||
Balance at the beginning of year | 2,815 | $ 1,870 | ||
Written | 4,476 | 16,998 | ||
Expired | (2,468) | (354) | ||
Closing buys
| (4,389) | (16,714) | ||
| ||||
Balance at the end of year | 434 | $ 1,800 | ||
| ||||
| ||||
| Multi-Asset Capital Stability Fund | Number of Contracts | Premium ($ Thousands) | ||
| ||||
Balance at the beginning of year | 1,929 | $ 362 | ||
Written | 89,147,486 | 902 | ||
Expired | (52,516,863) | (867) | ||
Closing buys
| (790) | (125) | ||
| ||||
Balance at the end of year | 36,631,762 | $ 272 | ||
| ||||
Written Swaptions transactions entered into during the year ended September 30, 2016 are summarized as follows:
| ||||
| Core Fixed Income Fund | Notional Amount ($ Thousands) | Premium ($ Thousands) | ||
| ||||
Balance at the beginning of year | $ 13,905 | $ 360 | ||
Closing buys
| (13,905) | (360) | ||
| ||||
Balance at the end of year | $ – | $ – | ||
| ||||
At September 30, 2016 the Funds had cash and/or securities at least equal to the value of written options/ written swaptions.
5. BASIS FOR CONSOLIDATION FOR THE MULTI-ASSET ACCUMULATION FUND AND MULTI-ASSET INFLATION MANAGED FUND
The consolidated Schedules of Investments, Statements of Assets and Liabilities, Statements of Operations, Statements of Changes in Net Assets, Statement of Cash Flows, and the Financial Highlights of the Multi-Asset Accumulation Fund and Multi-Asset Inflation Managed Fund include the accounts of their respective Subsidiaries. All intercompany accounts and transactions have been eliminated in consolidation for the Funds. Each of the Subsidiaries has a fiscal year end of September 30th for financial statement consolidation purposes and a nonconforming tax year end of August 31.
The Subsidiaries are classified as controlled foreign corporations under the Internal Revenue Code of 1986 (“IRC”). Each Subsidiary’s taxable income is included in the calculation of the relevant Fund’s taxable income. Net losses of the Subsidiaries are not deductible by the Funds either in the current period or carried forward to future periods.
| 332 | SEI Institutional Managed Trust / Annual Report / September 30, 2016 |
The Multi-Asset Accumulation Fund and Multi-Asset
Inflation Managed Fund may each invest up to 25% of
their total assets in its respective Subsidiary.
A summary of the Funds’ investments in the Subsidiaries are as follows:
| ||||||||||||
| Inception Date of Subsidiary | Subsidiary Net Assets at September 30, 2016 ($ Thousands) | % of Total Net Assets at September 30, 2016 | ||||||||||
| ||||||||||||
Accumulation Commodity Strategy Subsidiary, Ltd. | April 9, 2012 | $ 377,829 | 16.6% | |||||||||
Inflation Commodity Strategy Subsidiary Ltd. | April 9, 2012 | 217,407 | 20.1% | |||||||||
Gains and losses attributed to the Funds’ investments in
Subsidiaries are as follows:
| ||||||||
Accumulation Commodity Strategy, Ltd. ($ Thousands) | Inflation Commodity Strategy Subsidiary, Ltd. ($ Thousands) | |||||||
| ||||||||
Investment Income: | ||||||||
Investment Income | $ | 1,235 | $ | 605 | ||||
Net Realized Gain (Loss) on: | ||||||||
Investments | 640 | 227 | ||||||
Futures Contracts | 7,924 | (1,420) | ||||||
Swap Contracts | (6,165) | — | ||||||
Purchased Options | — | (374) | ||||||
Net Change in Unrealized Appreciation (Depreciation) on: | ||||||||
Investments | 794 | 48 | ||||||
Futures Contracts | 2,313 | 5,972 | ||||||
Swap Contracts | 764 | — | ||||||
Purchased Options | — | 11 | ||||||
|
|
|
| |||||
Total gains and losses attributed to the Funds’ investment in Subsidiaries | $ | 7,505 | $ | 5,069 | ||||
|
|
|
| |||||
6. INVESTMENT ADVISORY, ADMINISTRATION AND DISTRIBUTION AGREEMENTS, INVESTMENT SUBADVISORY AGREEMENTS AND OTHER TRANSACTIONS WITH AFFILIATES
Investment Advisory, Administration and Distribution Agreements — SIMC serves as investment adviser (the “Adviser”) to each Fund. In connection with serving as Adviser, SIMC is entitled to a fee, which is calculated daily and paid monthly, based on the average daily net assets of each Fund.
SEI Investments Global Funds Services (the “Administrator”) provides administrative and transfer agency services to the Funds for annual fees, based on the average daily net assets of each Fund.
SEI Investments Distribution Co. “SIDCo.” is the Distributor of the shares of the Funds. The Funds have adopted a shareholder services plan and agreement (the “Service Plan”) with respect to Class A and Class I Shares that allows such shares to pay service providers a fee, based on average daily net assets of each respective Class of Shares, in connection with the
ongoing servicing of shareholder accounts owning such shares. The Funds have also adopted an administrative services plan and agreement (the “Administrative Service Plan”) with respect to Class I Shares that allows such Shares to pay service providers a fee, based on average daily net assets of the Class I Shares, in connection with ongoing administrative services for shareholder accounts owning such Shares.
The Service Plan and Administrative Service Plan provide that shareholder service fees and administrative service fees, respectively, on Class A and Class I Shares will be paid to SIDCo., which may then be used by SIDCo. to compensate financial intermediaries for providing shareholder services and administrative services, as applicable, with respect to the Shares.
The Adviser, Administrator and/or Distributor have voluntarily agreed to waive a portion of their fees in order to keep total direct operating expenses (exclusive of interest from borrowings, brokerage commissions, taxes, Trustee fees, proxy fees, prime broker fees, interest and dividend expenses related to short sales and extraordinary expenses not incurred in the ordinary course of the Funds’ business) at a specified level. The waivers by the Funds’ Adviser, Administrator and/ or Distributor are limited to the Funds’ direct operating expenses and, therefore, do not apply to indirect expenses incurred by the Funds, such as acquired fund fees and expenses. The waivers are voluntarily and the Funds’ Adviser, Administrator and/or Distributor may discontinue all or part of any of these waivers at any time. In addition, some Funds may participate in a commission recapture program where the Funds’ trades may be executed through the Funds’ distributor, and a portion of the commissions paid on those trades are then used to pay the Funds’ expenses.
| SEI Institutional Managed Trust / Annual Report / September 30, 2016 | 333 |
Notes to Financial Statements/Consolidated Notes to Financial Statements (Continued)
September 30, 2016
The following is a summary of annual fees payable to the Adviser, Administrator and Distributor and the voluntary expense limitations for each fund:
| ||||||||||||||||||
| Advisory Fees | Administration Fees | Shareholder Servicing Fee | Administrative Servicing Fee | Voluntary Expense Limitation | ||||||||||||||
| ||||||||||||||||||
Large Cap Fund | ||||||||||||||||||
Class A | 0.3900% | 0.30% | 0.25% | — | 0.89% | |||||||||||||
Class Y | 0.3900% | 0.30% | — | — | 0.64% | |||||||||||||
Large Cap Value Fund | ||||||||||||||||||
Class A | 0.3500% | 0.30% | 0.25% | — | 0.89% | |||||||||||||
Class I | 0.3500% | 0.30% | 0.25% | 0.25% | 1.11% | |||||||||||||
Class Y | 0.3500% | 0.30% | — | — | 0.64% | |||||||||||||
Large Cap Growth Fund | ||||||||||||||||||
Class A | 0.4000% | 0.30% | 0.25% | — | 0.89% | |||||||||||||
Class I | 0.4000% | 0.30% | 0.25% | 0.25% | 1.11% | |||||||||||||
Class Y | 0.4000% | 0.30% | — | — | 0.64% | |||||||||||||
Tax-Managed Large Cap Fund | ||||||||||||||||||
Class A | 0.4000% | 0.30% | 0.25% | — | 0.89% | |||||||||||||
Class Y | 0.4000% | 0.30% | — | — | 0.64% | |||||||||||||
S&P 500 Index Fund | ||||||||||||||||||
Class A | 0.0300% | 0.22% | 0.25% | — | 0.43% | |||||||||||||
Class E | 0.0300% | 0.22% | — | — | 0.25% | |||||||||||||
Class I | 0.0300% | 0.22% | 0.25% | 0.25% | 0.65% | |||||||||||||
Class Y | 0.0300% | 0.22% | — | — | 0.25% | |||||||||||||
Small Cap Fund | ||||||||||||||||||
Class A | 0.6500% | 0.30% | 0.25% | — | 1.14% | |||||||||||||
Class Y | 0.6500% | 0.30% | — | — | 0.89% | |||||||||||||
Small Cap Value Fund | ||||||||||||||||||
Class A | 0.6500% | 0.30% | 0.25% | — | 1.14% | |||||||||||||
Class I | 0.6500% | 0.30% | 0.25% | 0.25% | 1.36% | |||||||||||||
Class Y | 0.6500% | 0.30% | — | — | 0.89% | |||||||||||||
Small Cap Growth Fund | ||||||||||||||||||
Class A | 0.6500% | 0.30% | 0.25% | — | 1.11% | |||||||||||||
Class I | 0.6500% | 0.30% | 0.25% | 0.25% | 1.36% | |||||||||||||
Class Y | 0.6500% | 0.30% | — | — | 0.86% | |||||||||||||
Tax-Managed Small/Mid Cap Fund | ||||||||||||||||||
Class A | 0.6500% | 0.30% | 0.25% | — | 1.11% | |||||||||||||
Class Y | 0.6500% | 0.30% | — | — | 0.89% | |||||||||||||
Mid-Cap Fund | ||||||||||||||||||
Class A | 0.4000% | 0.30% | 0.25% | — | 0.98% | |||||||||||||
Class I | 0.4000% | 0.30% | 0.25% | 0.25% | 1.20% | |||||||||||||
Class Y | 0.4000% | 0.30% | — | — | 0.73% | |||||||||||||
U.S. Managed Volatility Fund | ||||||||||||||||||
Class A | 0.6500% | 0.30% | 0.25% | — | 1.00% | |||||||||||||
Class I | 0.6500% | 0.30% | 0.25% | 0.25% | 1.25% | |||||||||||||
Class Y | 0.6500% | 0.30% | — | — | 0.75% | |||||||||||||
Global Managed Volatility Fund | ||||||||||||||||||
Class A | 0.6500% | 0.30% | 0.25% | — | 1.11% | |||||||||||||
Class I | 0.6500% | 0.30% | 0.25% | 0.25% | 1.36% | |||||||||||||
Class Y | 0.6500% | 0.30% | — | — | 0.86% | |||||||||||||
Tax-Managed Managed Volatility Fund | ||||||||||||||||||
Class A | 0.6500% | 0.30% | 0.25% | — | 1.00% | |||||||||||||
Class Y | 0.6500% | 0.30% | — | — | 0.81% | |||||||||||||
Real Estate Fund | ||||||||||||||||||
Class A | 0.6500% | 0.30% | 0.25% | — | 1.14% | |||||||||||||
Class I | 0.6500% | 0.30% | 0.25% | 0.25% | 1.36% | |||||||||||||
Class Y | 0.6500% | 0.30% | — | — | 0.89% | |||||||||||||
Enhanced Income Fund | ||||||||||||||||||
Class A | 0.4000% | 0.30% | 0.25% | — | 0.60% | |||||||||||||
Class I | 0.4000% | 0.30% | 0.25% | 0.25% | 0.85% | |||||||||||||
Class Y | 0.4000% | 0.30% | — | — | 0.46% | |||||||||||||
| 334 | SEI Institutional Managed Trust / Annual Report / September 30, 2016 |
| ||||||||||||||||||
| Advisory Fees | Administration Fees | Shareholder Servicing Fee | Administrative Servicing Fee | Voluntary Expense Limitation | ||||||||||||||
| ||||||||||||||||||
Core Fixed Income Fund | ||||||||||||||||||
Class A | 0.2750% | 0.28% | 0.25% | — | 0.67% | |||||||||||||
Class I | 0.2750% | 0.28% | 0.25% | 0.25% | 0.89% | |||||||||||||
Class Y | 0.2750% | 0.28% | — | — | 0.42% | |||||||||||||
U.S. Fixed Income Fund | ||||||||||||||||||
Class A | 0.2750% | 0.28% | 0.25% | — | 0.66% | |||||||||||||
Class Y | 0.2750% | 0.28% | — | — | 0.41% | |||||||||||||
High Yield Bond Fund | ||||||||||||||||||
Class A | 0.4875% | 0.30% | 0.25% | — | 0.89% | |||||||||||||
Class I | 0.4875% | 0.30% | 0.25% | 0.25% | 1.11% | |||||||||||||
Class Y | 0.4875% | 0.30% | — | — | 0.64% | |||||||||||||
Conservative Income Fund | ||||||||||||||||||
Class A | 0.1000% | 0.20% | 0.25% | — | 0.30% | |||||||||||||
Class Y | 0.1000% | 0.20% | — | — | 0.20% | |||||||||||||
Tax-Free Conservative Income Fund | ||||||||||||||||||
Class A | 0.1000% | 0.20% | 0.25% | — | 0.30% | |||||||||||||
Class Y | 0.1000% | 0.20% | — | — | 0.20% | |||||||||||||
Real Return Fund | ||||||||||||||||||
Class A | 0.2200% | 0.30% | 0.25% | — | 0.45% | |||||||||||||
Class Y | 0.2200% | 0.30% | — | — | 0.35% | |||||||||||||
Dynamic Asset Allocation Fund | ||||||||||||||||||
Class A | 0.6000% | 0.30% | 0.25% | — | 0.75% | |||||||||||||
Class Y | 0.6000% | 0.30% | — | — | 0.50% | |||||||||||||
Multi-Strategy Alternative Fund | ||||||||||||||||||
Class A | 1.5000% | 0.30% | 0.25% | — | 0.99%* | |||||||||||||
Class Y | 1.5000% | �� | 0.30% | — | — | 0.74%* | ||||||||||||
Multi-Asset Accumulation Fund | ||||||||||||||||||
Class A | 0.7500% | 0.30% | 0.25% | — | 1.17% | |||||||||||||
Class Y | 0.7500% | 0.30% | — | — | 0.92% | |||||||||||||
Multi-Asset Income Fund | ||||||||||||||||||
Class A | 0.6000% | 0.30% | 0.25% | — | 0.80% | |||||||||||||
Class Y | 0.6000% | 0.30% | — | — | 0.70% | |||||||||||||
Multi-Asset Inflation Managed Fund | ||||||||||||||||||
Class A | 0.5500% | 0.30% | 0.25% | — | 0.95% | |||||||||||||
Class Y | 0.5500% | 0.30% | — | — | 0.76% | |||||||||||||
Multi-Asset Capital Stability Fund | ||||||||||||||||||
Class A | 0.4000% | 0.30% | 0.25% | — | 0.62% | |||||||||||||
Class Y | 0.4000% | 0.30% | — | — | 0.52% | |||||||||||||
Long/Short Alternative Fund | ||||||||||||||||||
Class A | 0.8000% | 0.30% | 0.25% | — | 1.14% | |||||||||||||
Class Y | 0.8000% | 0.30% | — | — | 0.91% | |||||||||||||
* Voluntary expense limitations in effect as of June 10, 2016. Prior to June 10, 2016, the voluntary expense limitations were 0.91% for Class A and 0.66% for Class Y. Prior to May 3, 2016, the voluntary expense limitations were 0.81% for Class A and 0.56% for Class Y. Prior to December 31, 2016, the voluntary expense limitations were 0.61% for Class A and 0.36% for Class Y.
As of September 30, 2016, SIMC has entered into investment sub-advisory agreements with the following unaffiliated parties:
|
|
| Investment Sub-Adviser |
|
| Large Cap Fund |
| AQR Capital Management, LLC |
| BlackRock Investment Management, LLC |
| Brandywine Global Investment Management, LLC |
| Coho Partners, Ltd. |
| Jackson Square Partners, LLC |
| LSV Asset Management |
| Parametric Portfolio Associates LLC |
| Snow Capital Management, L.P. |
| Large Cap Value Fund |
| AQR Capital Management, LLC |
| Brandywine Global Investment Management, LLC |
| Coho Partners, Ltd. |
| LSV Asset Management |
| Parametric Portfolio Associates LLC |
| Snow Capital Management, L.P. |
| Large Cap Growth Fund |
| BlackRock Investment Management, LLC |
| Jackson Square Partners, LLC |
| Parametric Portfolio Associates LLC |
| Tax-Managed Large Cap Fund |
| AQR Capital Management, LLC |
| BlackRock Investment Management, LLC |
| Brandywine Global Investment Management, LLC |
| Coho Partners, Ltd. |
| Jackson Square Partners, LLC |
| SEI Institutional Managed Trust / Annual Report / September 30, 2016 | 335 |
Notes to Financial Statements/Consolidated Notes to Financial Statements (Continued)
September 30, 2016
LSV Asset Management
Parametric Portfolio Associates LLC
Snow Capital Management, L.P.
S&P 500 Index Fund
SSgA Funds Management, Inc.
Small Cap Fund
AllianceBernstein, L.P.
AQR Capital Management, LLC
EAM Investors, LLC
Falcon Point Capital, LLC
Mesirow Financial Investment Management, Inc.
Parametric Portfolio Associates LLC
Robeco Investment Management, Inc.
Snow Capital Management L.P.
Small Cap Value Fund
AQR Capital Management, LLC
Cardinal Capital Management, L.L.C.
Mesirow Financial Investment Management, Inc.
LSV Asset Management
Parametric Portfolio Associates LLC
Robeco Investment Management, Inc.
Snow Capital Management, L.P.
Small Cap Growth Fund
AllianceBernstein, L.P.
Arrowpoint Asset Management, LLC
Axiom International Investors LLC
EAM Investors LLC
FalconPoint Capital, LLC
Parametric Portfolio Associates LLC
Tax-Managed Small/Mid Cap Fund
AllianceBernstein, L.P.
AQR Capital Management, LLC
Cardinal Capital Management, L.L.C.
Castle Ark Management, LLC
Mesirow Financial Investment Management, Inc.
Parametric Portfolio Associates LLC
Snow Capital Management L.P.
Mid-Cap Fund
Quantitative Management Associates LLC
U.S. Managed Volatility Fund
AJO, L.P.
Analytic Investors, LLC
LSV Asset Management
Global Managed Volatility Fund
Acadian Asset Management LLC
Analytic Investors, LLC
Tax-Managed Managed Volatility Fund
AJO, L.P.
Analytic Investors LLC
LSV Asset Management
Parametric Portfolio Associates LLC
Real Estate Fund
CenterSquare Investment Management Inc.
Security Capital Research and Management
Incorporated
Enhanced Income Fund
Ares Management LLC
Wellington Management Company, LLP
Core Fixed Income Fund
Jennison Associates LLC
Metropolitan West Asset Management LLC
Wells Capital Management Incorporated
Western Asset Management Company
Western Asset Management Company Limited
U.S. Fixed Income Fund
Jennison Associates LLC
Metropolitan West Asset Management LLC
Wells Capital Management Incorporated
Western Asset Management Company
Western Asset Management Company Limited
High Yield Bond Fund
Ares Management LLC
Benefit Street Partners, LLC
Brigade Capital Management, LLC
J.P. Morgan Investment Management, Inc.
Conservative Income Fund
BlackRock Advisors, LLC
Tax-Free Conservative Income Fund
BlackRock Advisors, LLC
Dynamic Asset Allocation Fund
SSgA Funds Management, Inc.
Multi-Strategy Alternative Fund
Acadian Asset Management LLC
Emso Partners Limited Management, LLC
Kettle Hill Capital Management LLC
Mountaineer Partners Management, LLC
Ramius Advisors, LLC
Multi-Asset Accumulation Fund
AQR Capital Management, LLC
PanAgora Asset Management Inc.
Multi-Asset Income Fund
Goldman Sachs Asset Management, LP
Guggenheim Partners Investment Management,
SSgA Funds Management Inc.
Multi-Asset Inflation Managed Fund
AllianceBernstein, L.P.
QS Investors, LLC
Multi-Asset Capital Stability Fund
AllianceBernstein, L.P.
Long/Short Alternative Fund
Beachhead Capital Management, LLC
Under the investment sub-advisory agreements, each
sub-adviser receives an annual fee paid by SIMC.
Other — The Distribution Agreement between the
Distributor and the Trust provides that the Distributor
may receive compensation on fund transactions
effected for the Trust in accordance with the rules
of the Securities and Exchange Commission (“SEC”).
| 336 | SEI Institutional Managed Trust / Annual Report / September 30, 2016 |
Accordingly, it is expected that fund transactions may result in brokerage commissions being paid to the Distributor. SEC rules require that such commissions not exceed usual and customary commissions.
Such commissions for the year ended September 30, 2016 were as follows ($ Thousands):
Small Cap Value Fund | $ | 5 | ||
Real Estate Fund | 14 | |||
|
| |||
| $ | 19 | |||
|
|
Payments to Affiliates — Certain officers and/or trustees of the Trust are also officers and/or Directors of the Administrator, Adviser and/or Distributor. The Trust pays each unaffiliated Trustee an annual fee for attendance at quarterly, interim and committee meetings. Compensation of officers and affiliated Trustees of the Trust is paid by the Administrator or Distributor.
A portion of the services provided by the Chief Compliance Officer (“CCO”) and his staff, whom are employees of the Administrator, are paid for by the Trust as incurred.
LSV Asset Management (a partially owned indirect subsidiary of SEI Investment Co.) serves as the sub-adviser to the Large Cap, Large Cap Value, Tax-Managed Large Cap, Small Cap Value, U.S. Managed Volatility and Tax-Managed Managed Volatility Funds. For this service LSV Asset Management is entitled to receive a fee from SIMC. Such fees for the year ended September 30, 2016 were as follows ($ Thousands):
Large Cap Fund | $ | 326 | ||
Large Cap Value Fund | 298 | |||
Tax-Managed Large Cap Fund | 481 | |||
Small Cap Value Fund | 332 | |||
U.S. Managed Volatility Fund | 1,413 | |||
Tax-Managed Managed Volatility Fund | 1,117 | |||
|
| |||
| $ | 3,967 | |||
|
|
Fees Paid Indirectly — The Funds may direct certain fund trades to the Distributor who pays a portion of the Funds’ expenses. Accordingly, the expenses reduced, which were used to pay third party expenses, and the effect on the Funds’ expense ratio, as a percentage of the Funds’ average daily net assets for the year ended September 30, 2016, can be found on the Statements of Operations and Financial Highlights, respectively.
Investment in Affiliated Security — The Funds may invest in the SEI Daily Income Trust Government Fund, and prior to July 22, 2016, the SEI Daily Income Trust Prime Obligation Fund, which closed operations, each an affiliated money market fund to manage excess cash or to serve as margin or collateral for derivative positions. Additionally, the Funds may invest the cash
collateral from the securities lending program in the SEI Liquidity Fund, L.P.
The following is a summary of the transactions with affiliates for the year ended September 30, 2016 ($ Thousands):
| ||||||||||
| SEI Liquidity Fund, L.P. | Value 9/30/15 | Purchases at Cost | Proceeds from Sales | Value 9/30/16 | Dividend Income | |||||
| ||||||||||
Large Cap Fund | $36,418 | $2,374,202 | $(2,149,069) | $261,551 | $469 | |||||
Large Cap Value Fund | 33,726 | 347,707 | (331,726) | 49,707 | 244 | |||||
Large Cap Growth Fund | 5,199 | 136,426 | (137,581) | 4,044 | 36 | |||||
Tax-Managed Large Cap Fund | 41,280 | 575,675 | (505,038) | 111,917 | 926 | |||||
S&P 500 Index Fund | 1,328 | 32,900 | (31,056) | 3,172 | 30 | |||||
Small Cap Fund | 30,125 | 236,310 | (214,083) | 52,352 | 800 | |||||
Small Cap Value Fund | 16,899 | 336,325 | (249,211) | 104,013 | 454 | |||||
Small Cap Growth Fund | 25,078 | 180,213 | (174,130) | 31,161 | 854 | |||||
Tax-Managed Small/ Mid Cap Fund | 251,945 | 642,496 | (713,733) | 180,708 | 1,125 | |||||
Mid-Cap Fund | — | 95,197 | (89,483) | 5,714 | 19 | |||||
Real Estate Fund | — | 12,502 | (11,478) | 1,024 | 3 | |||||
Core Fixed Income Fund | 3,456 | 580,593 | (570,029) | 14,020 | 167 | |||||
U.S. Fixed Income Fund | — | 284,162 | (283,533) | 629 | 25 | |||||
High Yield Fund | 6 | — | — | 6 | — | |||||
| ||||||||||
| SDIT Prime Obligation Fund, Cl A | Value 9/30/15 | Purchases at Cost | Proceeds from Sales | Value 9/30/16 | Dividend Income | |||||
| ||||||||||
Large Cap Fund | $189,621 | $327,256 | $(516,877) | $— | $127 | |||||
Large Cap Value Fund | 71,835 | 232,456 | (304,291) | — | 67 | |||||
Large Cap Growth Fund | 78,356 | 330,288 | (408,644) | — | 76 | |||||
Tax-Managed Large Cap Fund | 188,812 | 573,037 | (761,849) | — | 206 | |||||
S&P 500 Index Fund | 9,086 | 119,057 | (128,143) | — | 14 | |||||
Small Cap Fund | 40,025 | 186,625 | (226,650) | — | 51 | |||||
Small Cap Value Fund | 14,504 | 168,261 | (182,765) | — | 26 | |||||
Small Cap Growth Fund | 20,247 | 86,822 | (107,069) | — | 20 | |||||
Tax-Managed Small/ Mid Cap Fund | 31,840 | 110,188 | (142,028) | — | 46 | |||||
Mid-Cap Fund | 4,774 | 52,830 | (57,604) | — | 6 | |||||
U.S. Managed Volatility Fund | 26,035 | 323,168 | (349,203) | — | 76 | |||||
Global Managed Volatility Fund | 108,089 | 512,658 | (620,747) | — | 155 | |||||
Tax-Managed Managed Volatility Fund | 27,260 | 325,141 | (352,401) | — | 61 | |||||
Real Estate Fund | 6,435 | 59,389 | (65,824) | — | 11 | |||||
Enhanced Income Fund | 5,674 | 13,457 | (19,131) | — | 8 | |||||
Core Fixed Income Fund | 85,704 | 880,438 | (966,142) | — | 98 | |||||
U.S. Fixed Income Fund | 55,864 | 726,692 | (782,556) | — | 81 | |||||
| SEI Institutional Managed Trust / Annual Report / September 30, 2016 | 337 |
Notes to Financial Statements/Consolidated Notes to Financial Statements (Continued)
September 30, 2016
| ||||||||||||||||||
SDIT Prime Obligation Fund, Cl A | Value 9/30/15 | Purchases at Cost | Proceeds from Sales | Value 9/30/16 | Dividend Income | |||||||||||||
| ||||||||||||||||||
High Yield Fund | $60,505 | $510,087 | $(570,592) | $— | $96 | |||||||||||||
Real Return Fund | 227 | 29,118 | (29,345) | — | 3 | |||||||||||||
Multi-Strategy Alternative Fund | 22,920 | 582,431 | (605,351) | — | 139 | |||||||||||||
Multi-Asset Accumulation Fund | 765,254 | 1,169 | (766,423) | — | 1,218 | |||||||||||||
| ||||||||||||||||||
SDIT Government Fund, Cl A | Value 9/30/15 | Purchases at Cost | Proceeds from Sales | Value 9/30/16 | Dividend Income | |||||||||||||
| ||||||||||||||||||
Large Cap Fund | $— | $279,580 | $(130,465) | $149,115 | $74 | |||||||||||||
Large Cap Value Fund | — | 141,610 | (94,406) | 47,204 | 23 | |||||||||||||
Large Cap Growth Fund | — | 189,183 | (126,557) | 62,626 | 30 | |||||||||||||
Tax-Managed Large Cap Fund | — | 339,429 | (117,047) | 222,382 | 108 | |||||||||||||
S&P 500 Index Fund | — | 43,339 | (28,198) | 15,141 | 8 | |||||||||||||
Small Cap Fund | — | 74,009 | (38,234) | 35,775 | 18 | |||||||||||||
Small Cap Value Fund | — | 49,002 | (31,302) | 17,700 | 10 | |||||||||||||
Small Cap Growth Fund | — | 42,174 | (29,773) | 12,401 | 8 | |||||||||||||
Tax-Managed Small/Mid Cap Fund | — | 75,674 | (41,985) | 33,689 | 19 | |||||||||||||
Mid-Cap Fund | — | 16,492 | (14,303) | 2,189 | 2 | |||||||||||||
U.S. Managed Volatility Fund | — | 165,229 | (126,111) | 39,118 | 21 | |||||||||||||
Global Managed Volatility Fund | — | 188,686 | (105,215) | 83,471 | 52 | |||||||||||||
Tax-Managed Managed Volatility Fund | — | 134,582 | (100,510) | 34,072 | 20 | |||||||||||||
Real Estate Fund | — | 25,519 | (17,997) | 7,522 | 3 | |||||||||||||
Enhanced Income Fund | — | 11,824 | (6,703) | 5,121 | 3 | |||||||||||||
Core Fixed Income Fund | — | 408,484 | (352,068) | 56,416 | 24 | |||||||||||||
U.S. Fixed Income Fund | — | 262,865 | (234,120) | 28,745 | 15 | |||||||||||||
High Yield Fund | — | 325,837 | (274,763) | 51,074 | 41 | |||||||||||||
Conservative Income Fund | — | 33,757 | (33,706) | 51 | 2 | |||||||||||||
Real Return Fund | — | 14,577 | (9,121) | 5,456 | 2 | |||||||||||||
Multi-Strategy Alternative Fund | — | 183,223 | (88,891) | 94,332 | 36 | |||||||||||||
| ||||||||||||||||||
SEI Institutional Managed Trust Long/Short Alternative Fund | Purchases at Cost | Proceeds from | Value 9/30/16 | Change in Unrealized | Dividend Income | |||||||||||||
| ||||||||||||||||||
Multi-Strategy Alternative Fund | $— | $— | $41,767 | $(596) | $— | |||||||||||||
Interfund Lending — The SEC has granted an exemption that permits the Trust to participate in an interfund lending program (“the Program”) with existing or future investment companies registered under the 1940 Act that are advised by SIMC (the “SEI Funds”). The Program allows the SEI Funds to lend money to and borrow money from each other for temporary or emergency purposes. Participation in the Program is voluntary for both borrowing and lending funds.
Interfund loans may be made only when the rate of interest to be charged is more favorable to the lending fund than an investment in overnight repurchase agreements (“Repo Rate”), and more favorable to the borrowing fund than the rate of interest that would be charged by a bank for short-term borrowings (“Bank Loan Rate”). The Bank Loan Rate will be determined using a formula annually reviewed by the SEI Funds’ Board of Trustees. The interest rate imposed on interfund loans is the average of the Repo Rate and the Bank Loan Rate.
During the year ended September 30, 2016, the Trust borrowed funds from the SEI Liquid Asset Trust, Prime Obligation Fund. The amount borrowed, interest paid on the borrowing and the corresponding interest rate were as follows ($ Thousands):
| ||||||||||||||
| Borrowing Date | Maturity Date | Amount Borrowed | Interest Paid | Interest Rate | ||||||||||
| ||||||||||||||
Mid-Cap Fund | 01/21/16 | 01/22/16 | $ | 6,750 | $– | 0.49% | ||||||||
Mid-Cap Fund | 01/22/16 | 01/25/16 | 6,750 | – | 0.48 | |||||||||
Amounts designated as “—” are $0 or have been rounded to $0.
7. CAPITAL SHARE TRANSACTIONS
Capital share transactions for the Funds were as follows (Thousands):
For the years ended September 30,
| Large Cap Fund(2) | Large Cap Value Fund(7) | Large Cap Growth Fund(7) | Tax-Managed Large Cap Fund(2) (4) | |||||||||||||||||||||||||||||
| ||||||||||||||||||||||||||||||||
| 2016 | 2015 | 2016 | 2015 | 2016 | 2015 | 2016 | 2015 | |||||||||||||||||||||||||
| ||||||||||||||||||||||||||||||||
Class A: | ||||||||||||||||||||||||||||||||
Shares Issued | 45,905 | 52,908 | 8,504 | 6,976 | 7,211 | 5,116 | 34,379 | 34,115 | ||||||||||||||||||||||||
Shares Issued in Lieu of Dividends and Distributions | 29,281 | 13,912 | 8,742 | 4,360 | 8,025 | 3,377 | 1,372 | 872 | ||||||||||||||||||||||||
Shares Redeemed | (77,979) | (55,593) | (14,097) | (12,596) | (12,209) | (9,579) | (31,139) | (31,607) | ||||||||||||||||||||||||
| ||||||||||||||||||||||||||||||||
Total Increase (Decrease) in Net Assets Derived from Class A Transactions | (2,793) | 11,227 | 3,149 | (1,260) | 3,027 | (1,086) | 4,612 | 3,380 | ||||||||||||||||||||||||
| ||||||||||||||||||||||||||||||||
Class I: | ||||||||||||||||||||||||||||||||
| 338 | SEI Institutional Managed Trust / Annual Report / September 30, 2016 |
| Large Cap Fund(2) | Value Fund(7) | Growth Fund(7) | Tax-Managed Large Cap Fund(2) (4) | |||||||||||||||||||||||||||||||||
| ||||||||||||||||||||||||||||||||||||
| 2016 | 2015 | 2016 | 2015 | 2016 | 2015 | 2016 | 2015 | |||||||||||||||||||||||||||||
| ||||||||||||||||||||||||||||||||||||
Shares Issued | N/A | N/A | 92 | 44 | 55 | 33 | N/A | N/A | ||||||||||||||||||||||||||||
Shares Issued in Lieu of Dividends and Distributions | N/A | N/A | 36 | 24 | 22 | 13 | N/A | N/A | ||||||||||||||||||||||||||||
Shares Redeemed | N/A | N/A | (172 | ) | (102 | ) | (88 | ) | (88 | ) | N/A | N/A | ||||||||||||||||||||||||
| ||||||||||||||||||||||||||||||||||||
Total Decrease in Net Assets Derived from Class I Transactions | N/A | N/A | (44 | ) | (34 | ) | (11 | ) | (42 | ) | N/A | N/A | ||||||||||||||||||||||||
| ||||||||||||||||||||||||||||||||||||
Class T: | ||||||||||||||||||||||||||||||||||||
Shares Issued | N/A | N/A | N/A | N/A | N/A | N/A | — | – | ||||||||||||||||||||||||||||
Shares Issued in Lieu of Dividends and Distributions | N/A | N/A | N/A | N/A | N/A | N/A | — | – | ||||||||||||||||||||||||||||
Shares Redeemed | N/A | N/A | N/A | N/A | N/A | N/A | — | (23 | ) | |||||||||||||||||||||||||||
| ||||||||||||||||||||||||||||||||||||
Total Decrease in Net Assets Derived from Class T Transactions | N/A | N/A | N/A | N/A | N/A | N/A | — | (23 | ) | |||||||||||||||||||||||||||
| ||||||||||||||||||||||||||||||||||||
Class Y: | ||||||||||||||||||||||||||||||||||||
Shares Issued | 3,136 | 16,678 | 1,078 | – | 719 | – | 3,695 | 7,528 | ||||||||||||||||||||||||||||
Shares Issued in Lieu of Dividends and Distributions | 2,264 | 79 | 10 | – | 1 | – | 94 | 34 | ||||||||||||||||||||||||||||
Shares Redeemed | (3,671 | ) | (5,369 | ) | (50 | ) | – | (33 | ) | – | (1,024 | ) | (779 | ) | ||||||||||||||||||||||
| ||||||||||||||||||||||||||||||||||||
Total Increase in Net Assets Derived from Class Y Transactions | 1,729 | 11,388 | 1,038 | – | 687 | – | 2,765 | 6,783 | ||||||||||||||||||||||||||||
| ||||||||||||||||||||||||||||||||||||
Increase (Decrease) in Share Transactions | (1,065 | ) | 22,615 | 4,143 | (1,294 | ) | 3,702 | (1,128 | ) | 7,377 | 10,140 | |||||||||||||||||||||||||
| ||||||||||||||||||||||||||||||||||||
S&P 500 Index Fund(7) | Small Cap Fund(2) | Small Cap Value Fund(7) | Small Cap Growth Fund(7) | |||||||||||||||||||||||||||||||||
| ||||||||||||||||||||||||||||||||||||
| 2016 | 2015 | 2016 | 2015 | 2016 | 2015 | 2016 | 2015 | |||||||||||||||||||||||||||||
| ||||||||||||||||||||||||||||||||||||
Class A: | ||||||||||||||||||||||||||||||||||||
Shares Issued | 2,107 | 2,154 | 13,639 | 12,620 | 4,091 | 2,087 | 1,411 | 1,639 | ||||||||||||||||||||||||||||
Shares Issued in Lieu of Dividends and Distributions | 132 | 792 | 4,272 | 2,773 | 1,136 | 1,284 | — | — | ||||||||||||||||||||||||||||
Shares Redeemed | (3,158 | ) | (2,216 | ) | (11,802 | ) | (11,240 | ) | (5,149 | ) | (3,156 | ) | (2,824 | ) | (2,348 | ) | ||||||||||||||||||||
| ||||||||||||||||||||||||||||||||||||
Total Increase (Decrease) in Net Assets Derived from Class A Transactions | (919 | ) | 730 | 6,109 | 4,153 | 78 | 215 | (1,413 | ) | (709 | ) | |||||||||||||||||||||||||
| ||||||||||||||||||||||||||||||||||||
Class E: | ||||||||||||||||||||||||||||||||||||
Shares Issued | 642 | 792 | N/A | N/A | N/A | N/A | N/A | N/A | ||||||||||||||||||||||||||||
Shares Issued in Lieu of Dividends and Distributions | 88 | 2,330 | N/A | N/A | N/A | N/A | N/A | N/A | ||||||||||||||||||||||||||||
Shares Redeemed | (676 | ) | (36,856 | )(1) | N/A | N/A | N/A | N/A | N/A | N/A | ||||||||||||||||||||||||||
| ||||||||||||||||||||||||||||||||||||
Total Increase (Decrease) in Net Assets Derived from Class E Transactions | 54 | (33,734 | ) | N/A | N/A | N/A | N/A | N/A | N/A | |||||||||||||||||||||||||||
| ||||||||||||||||||||||||||||||||||||
Class I: | ||||||||||||||||||||||||||||||||||||
Shares Issued | 103 | 52 | N/A | N/A | 65 | 34 | 44 | 35 | ||||||||||||||||||||||||||||
Shares Issued in Lieu of Dividends and Distributions | 1 | 9 | N/A | N/A | 8 | 14 | — | — | ||||||||||||||||||||||||||||
Shares Redeemed | (147 | ) | (47 | ) | N/A | N/A | (117 | ) | (51 | ) | (71 | ) | (45 | ) | ||||||||||||||||||||||
| ||||||||||||||||||||||||||||||||||||
Total Increase (Decrease) in Net Assets Derived from Class I Transactions | (43 | ) | 14 | N/A | N/A | (44 | ) | (3 | ) | (27 | ) | (10 | ) | |||||||||||||||||||||||
| ||||||||||||||||||||||||||||||||||||
Class Y: | ||||||||||||||||||||||||||||||||||||
Shares Issued | 23 | – | 1,277 | 3,161 | 331 | – | 261 | – | ||||||||||||||||||||||||||||
Shares Issued in Lieu of Dividends and Distributions | — | – | 305 | — | 1 | – | — | – | ||||||||||||||||||||||||||||
Shares Redeemed | (8 | ) | – | (1,066 | ) | (429 | ) | (15 | ) | – | (11 | ) | – | |||||||||||||||||||||||
| ||||||||||||||||||||||||||||||||||||
Total Increase in Net Assets Derived from Class Y Transactions | 15 | – | 516 | 2,732 | 317 | – | 250 | – | ||||||||||||||||||||||||||||
| ||||||||||||||||||||||||||||||||||||
Increase (Decrease) in Share Transactions | (893 | ) | (32,990 | ) | 6,625 | 6,885 | 351 | 212 | (1,190 | ) | (719 | ) | ||||||||||||||||||||||||
| ||||||||||||||||||||||||||||||||||||
Tax-Managed Fund(2) | Mid-Cap Fund(7) | U.S. Managed Volatility Fund(2) | Global Managed Fund(2) | |||||||||||||||||||||||||||||||||
| ||||||||||||||||||||||||||||||||||||
| 2016 | 2015 | 2016 | 2015 | 2016 | 2015 | 2016 | 2015 | |||||||||||||||||||||||||||||
| ||||||||||||||||||||||||||||||||||||
Class A: | ||||||||||||||||||||||||||||||||||||
Shares Issued | 7,880 | 7,830 | 1,997 | 2,089 | 29,644 | 20,272 | 61,728 | 76,701 | ||||||||||||||||||||||||||||
Shares Issued in Lieu of Dividends and Distributions | 95 | 319 | 617 | 293 | 3,601 | 6,453 | 13,170 | 17,258 | ||||||||||||||||||||||||||||
Shares Redeemed | (7,696 | ) | (7,033 | ) | (2,702 | ) | (2,040 | ) | (26,236 | ) | (24,866 | ) | (140,761 | ) * | (45,201 | ) | ||||||||||||||||||||
| ||||||||||||||||||||||||||||||||||||
Total Increase (Decrease) in Net Assets Derived from Class A Transactions | 279 | 1,116 | (88 | ) | 342 | 7,009 | 1,859 | (65,863 | ) | 48,758 | ||||||||||||||||||||||||||
| ||||||||||||||||||||||||||||||||||||
Class I: | ||||||||||||||||||||||||||||||||||||
Shares Issued | N/A | N/A | 4 | 8 | 34 | 70 | 158 | 32 | ||||||||||||||||||||||||||||
Shares Issued in Lieu of Dividends and Distributions | N/A | N/A | 6 | 3 | 6 | 12 | 8 | 11 | ||||||||||||||||||||||||||||
Shares Redeemed | N/A | N/A | (9 | ) | (18 | ) | (18 | ) | (64 | ) | (46 | ) | (13 | ) | ||||||||||||||||||||||
| ||||||||||||||||||||||||||||||||||||
Total Increase (Decrease) in Net Assets Derived from Class I Transactions | N/A | N/A | 1 | (7 | ) | 22 | 18 | 120 | 30 | |||||||||||||||||||||||||||
| ||||||||||||||||||||||||||||||||||||
Class Y: | ||||||||||||||||||||||||||||||||||||
Shares Issued | 1,207 | 1,823 | 24 | – | 11,471 | 28,155 | 5,869 | 9,804 | ||||||||||||||||||||||||||||
Shares Issued in Lieu of Dividends and Distributions | 11 | 1 | — | – | 1,680 | 184 | 549 | — | ||||||||||||||||||||||||||||
Shares Redeemed | (332 | ) | (224 | ) | (4 | ) | – | (8,772 | ) | (4,180 | ) | (6,262 | ) | (1,093 | ) | |||||||||||||||||||||
| ||||||||||||||||||||||||||||||||||||
Total Increase in Net Assets Derived from Class Y Transactions | 886 | 1,600 | 20 | – | 4,379 | 24,159 | 156 | 8,711 | ||||||||||||||||||||||||||||
| ||||||||||||||||||||||||||||||||||||
Increase (Decrease) in Share Transactions | 1,165 | 2,716 | (67 | ) | 335 | 11,410 | 26,036 | (65,587 | ) | 57,499 | ||||||||||||||||||||||||||
| ||||||||||||||||||||||||||||||||||||
| SEI Institutional Managed Trust / Annual Report / September 30, 2016 | 339 |
Notes to Financial Statements/Consolidated Notes to Financial Statements (Continued)
September 30, 2016
| Tax-Managed Managed Volatility Fund(6) | Real Estate Fund(2)
| Enhanced Income Fund(2)
| Core Fixed Income Fund(9)
| |||||||||||||||||||||||||||||||||||||||
| ||||||||||||||||||||||||||||||||||||||||||
| 2016 | 2015 | 2016 | 2015 | 2016 | 2015 | 2016 | 2015 | |||||||||||||||||||||||||||||||||||
| ||||||||||||||||||||||||||||||||||||||||||
Class A: | ||||||||||||||||||||||||||||||||||||||||||
Shares Issued | 29,839 | 20,888 | 2,811 | 3,021 | 8,644 | 10,582 | 32,257 | 32,646 | ||||||||||||||||||||||||||||||||||
Shares Issued in Lieu of Dividends and Distributions | 3,286 | 3,723 | 749 | 674 | 450 | 427 | 5,497 | 3,816 | ||||||||||||||||||||||||||||||||||
Shares Redeemed | (19,159 | ) | (13,858 | ) | (5,318 | ) | (6,249 | ) | (10,461 | ) | (15,851 | ) | (41,340 | ) | (34,049 | ) | ||||||||||||||||||||||||||
| ||||||||||||||||||||||||||||||||||||||||||
Total Increase (Decrease) in Net Assets Derived from Class A Transactions | 13,966 | 10,753 | (1,758 | ) | (2,554 | ) | (1,367 | ) | (4,842 | ) | (3,586 | ) | 2,413 | |||||||||||||||||||||||||||||
| ||||||||||||||||||||||||||||||||||||||||||
Class I: | ||||||||||||||||||||||||||||||||||||||||||
Shares Issued | N/A | N/A | 3 | 3 | 7 | 9 | 623 | 440 | ||||||||||||||||||||||||||||||||||
Shares Issued in Lieu of Dividends and Distributions | N/A | N/A | 3 | 2 | 1 | 1 | 16 | 13 | ||||||||||||||||||||||||||||||||||
Shares Redeemed | N/A | N/A | (12 | ) | (2 | ) | (5 | ) | (29 | ) | (934 | ) | (277 | ) | ||||||||||||||||||||||||||||
| ||||||||||||||||||||||||||||||||||||||||||
Total Increase (Decrease) in Net Assets Derived from Class I Transactions | N/A | N/A | (6 | ) | 3 | 3 | (19 | ) | (295 | ) | 176 | |||||||||||||||||||||||||||||||
| ||||||||||||||||||||||||||||||||||||||||||
Class Y: | ||||||||||||||||||||||||||||||||||||||||||
Shares Issued | 2,723 | 23 | 1,166 | 1,256 | 1,298 | 4,658 | 4,234 | 2,036 | ||||||||||||||||||||||||||||||||||
Shares Issued in Lieu of Dividends and Distributions | 17 | — | 121 | 28 | 44 | 48 | 133 | 9 | ||||||||||||||||||||||||||||||||||
Shares Redeemed | (252 | ) | — | (432 | ) | (251 | ) | (538 | ) | (3,196 | ) | (315 | ) | (41 | ) | |||||||||||||||||||||||||||
| ||||||||||||||||||||||||||||||||||||||||||
Total Increase in Net Assets Derived from Class Y Transactions | 2,488 | 23 | 855 | 1,033 | 804 | 1,510 | 4,052 | 2,004 | ||||||||||||||||||||||||||||||||||
| ||||||||||||||||||||||||||||||||||||||||||
Increase (Decrease) in Share Transactions | 16,454 | 10,776 | (909 | ) | (1,518 | ) | (560 | ) | (3,351 | ) | 171 | 4,593 | ||||||||||||||||||||||||||||||
| ||||||||||||||||||||||||||||||||||||||||||
U.S. Fixed Income Fund(2)
| High Yield Bond Fund(2)
| Conservative
| Tax-Free Conservative Income Fund(8) | Real Return Fund(2)
| ||||||||||||||||||||||||||||||||||||||
| ||||||||||||||||||||||||||||||||||||||||||
| 2016 | 2015 | 2016 | 2015 | 2016 | 2016 | 2016 | 2015 | |||||||||||||||||||||||||||||||||||
| ||||||||||||||||||||||||||||||||||||||||||
Class A: | ||||||||||||||||||||||||||||||||||||||||||
Shares Issued | 32,888 | 31,167 | 81,751 | 77,938 | 7,971 | 3,462 | 10,142 | 9,026 | ||||||||||||||||||||||||||||||||||
Shares Issued in Lieu of Dividends and Distributions | 2,706 | 1,924 | 15,362 | 11,990 | — | — | — | 30 | ||||||||||||||||||||||||||||||||||
Shares Redeemed | (28,955 | ) | (32,075 | ) | (76,133 | ) | (90,628 | ) | (470 | ) | (366 | ) | (8,049 | ) | (10,681 | ) | ||||||||||||||||||||||||||
| ||||||||||||||||||||||||||||||||||||||||||
Total Increase (Decrease) in Net Assets Derived from Class A Transactions | 6,639 | 1,016 | 20,980 | (700 | ) | 7,501 | 3,096 | 2,093 | (1,625 | ) | ||||||||||||||||||||||||||||||||
| ||||||||||||||||||||||||||||||||||||||||||
Class I: | ||||||||||||||||||||||||||||||||||||||||||
Shares Issued | N/A | N/A | 2,636 | 4,129 | N/A | N/A | N/A | N/A | ||||||||||||||||||||||||||||||||||
Shares Issued in Lieu of Dividends and Distributions | N/A | N/A | 39 | 48 | N/A | N/A | N/A | N/A | ||||||||||||||||||||||||||||||||||
Shares Redeemed | N/A | N/A | (2,670 | ) | (4,533 | ) | N/A | N/A | N/A | N/A | ||||||||||||||||||||||||||||||||
| ||||||||||||||||||||||||||||||||||||||||||
Total Increase (Decrease) in Net Assets Derived from Class I Transactions | N/A | N/A | 5 | (356 | ) | N/A | N/A | N/A | N/A | |||||||||||||||||||||||||||||||||
| ||||||||||||||||||||||||||||||||||||||||||
Class Y: | ||||||||||||||||||||||||||||||||||||||||||
Shares Issued | 2,711 | 9,745 | 11,136 | 22,731 | 3,361 | 1,391 | 1,160 | 2,926 | ||||||||||||||||||||||||||||||||||
Shares Issued in Lieu of Dividends and Distributions | 279 | 151 | 1,951 | 879 | 4 | 2 | — | — | ||||||||||||||||||||||||||||||||||
Shares Redeemed | (2,383 | ) | (1,319 | ) | (5,825 | ) | (3,168 | ) | (1,685 | ) | — | (897 | ) | (354 | ) | |||||||||||||||||||||||||||
| ||||||||||||||||||||||||||||||||||||||||||
Total Increase in Net Assets Derived from Class Y Transactions | 607 | 8,577 | 7,262 | 20,442 | 1,680 | 1,393 | 263 | 2,572 | ||||||||||||||||||||||||||||||||||
| ||||||||||||||||||||||||||||||||||||||||||
Increase (Decrease) in Share Transactions | 7,246 | 9,593 | 28,247 | 19,386 | 9,181 | 4,489 | 2,356 | 947 | ||||||||||||||||||||||||||||||||||
| ||||||||||||||||||||||||||||||||||||||||||
| Dynamic Asset Allocation Fund(3) | Multi-Strategy Alternative Fund(6) | Multi-Asset Accumulation Fund(2) | Multi-Asset Income Fund(2)
| |||||||||||||||||||||||||||||||||||||||
| ||||||||||||||||||||||||||||||||||||||||||
| 2016 | 2015 | 2016 | 2015 | 2016 | 2015 | 2016 | 2015 | |||||||||||||||||||||||||||||||||||
| ||||||||||||||||||||||||||||||||||||||||||
Class A: | ||||||||||||||||||||||||||||||||||||||||||
Shares Issued | 55,755 | 2,513 | 18,039 | 16,684 | 57,375 | 64,416 | 21,092 | 21,108 | ||||||||||||||||||||||||||||||||||
Shares Issued in Lieu of Dividends and Distributions | 146 | — | 1,326 | 711 | 5,289 | 15,763 | 2,952 | 2,042 | ||||||||||||||||||||||||||||||||||
Shares Redeemed | (10,242 | ) | (145 | ) | (15,036 | ) | (11,970 | ) | (50,537 | ) | (62,211 | ) | (21,922 | ) | (15,220 | ) | ||||||||||||||||||||||||||
| ||||||||||||||||||||||||||||||||||||||||||
Total Increase in Net Assets Derived from Class A Transactions | 45,659 | 2,368 | 4,329 | 5,425 | 12,127 | 17,968 | 2,122 | 7,930 | ||||||||||||||||||||||||||||||||||
| ||||||||||||||||||||||||||||||||||||||||||
Class Y: | ||||||||||||||||||||||||||||||||||||||||||
Shares Issued | 658 | 5,455 | 539 | 2 | 2,864 | 22,926 | 6,970 | 3,525 | ||||||||||||||||||||||||||||||||||
Shares Issued in Lieu of Dividends and Distributions | 21 | — | — | — | 620 | — | 393 | 109 | ||||||||||||||||||||||||||||||||||
Shares Redeemed | (1,227 | ) | (149 | ) | (401 | ) | — | (5,075 | ) | (1,744 | ) | (1,263 | ) | (457 | ) | |||||||||||||||||||||||||||
| ||||||||||||||||||||||||||||||||||||||||||
Total Increase (Decrease) in Net Assets Derived from Class Y Transactions | (548 | ) | 5,306 | 138 | 2 | (1,591 | ) | 21,182 | 6,100 | 3,177 | ||||||||||||||||||||||||||||||||
| ||||||||||||||||||||||||||||||||||||||||||
Increase (Decrease) in Share Transactions | 45,111 | 7,674 | 4,467 | 5,427 | 10,536 | 39,150 | 8,222 | 11,107 | ||||||||||||||||||||||||||||||||||
| ||||||||||||||||||||||||||||||||||||||||||
| 340 | SEI Institutional Managed Trust / Annual Report / September 30, 2016 |
Multi-Asset Inflation Managed Fund(2) | Multi-Asset Capital Stability Fund(2) | Long/Short Alternative Fund(5)(6) | ||||||||||||||||||||||
| ||||||||||||||||||||||||
2016 | 2015 | 2016 | 2015 | 2016 | 2015 | |||||||||||||||||||
| ||||||||||||||||||||||||
Class A: | ||||||||||||||||||||||||
Shares Issued | 36,085 | 36,915 | 25,115 | 20,564 | — | 3,625 | ||||||||||||||||||
Shares Issued in Lieu of Dividends and Distributions | 463 | — | 531 | 865 | — | — | ||||||||||||||||||
Shares Redeemed | (29,602) | (29,661) | (16,702) | (18,288) | — | (3,623) | ||||||||||||||||||
| ||||||||||||||||||||||||
Total Increase in Net Assets Derived from Class A Transactions | 6,946 | 7,254 | 8,944 | 3,141 | — | 2 | ||||||||||||||||||
| ||||||||||||||||||||||||
Class Y: | ||||||||||||||||||||||||
Shares Issued | 2,485 | 10,575 | 1,248 | 5,752 | — | 4,258 | ||||||||||||||||||
Shares Issued in Lieu of Dividends and Distributions | 69 | — | 58 | — | — | — | ||||||||||||||||||
Shares Redeemed | (1,931) | (1,080) | (1,245) | (745) | — | — | ||||||||||||||||||
| ||||||||||||||||||||||||
Total Increase in Net Assets Derived from Class Y Transactions | 623 | 9,495 | 61 | 5,007 | — | 4,258 | ||||||||||||||||||
| ||||||||||||||||||||||||
Increase (Decrease) in Share Transactions | 7,569 | 16,749 | 9,005 | 8,148 | — | 4,260 | ||||||||||||||||||
| ||||||||||||||||||||||||
(1) Includes redemptions as a result of affiliated and in-kind transactions (See Notes 6 and 13).
(2) Class Y commenced operations on December 31, 2014.
(3) Commenced operations on July 30, 2015.
(4) Class T closed on December 30, 2014.
(5) Commenced operations on December 19, 2014.
(6) Class Y commenced operations on April 30, 2015.
(7) Class Y commenced operations on October 30, 2015.
(8) Commenced operations on April 22, 2016.
(9) Class Y commenced operations on June 30, 2015.
* Includes redemptions as a result of in-kind transactions (See Note 13).
N/A — Not applicable.
Amounts designated as “—” are zero or have been rounded to zero.
8. INVESTMENT TRANSACTIONS
The cost of security purchases and proceeds from the sale of securities, other than temporary cash investments and futures, during the year ended September 30, 2016, were as follows:
| ||||||||||||
| U.S. Gov’t ($ Thousands) | Other ($ Thousands) | Total ($ Thousands) | ||||||||||
| ||||||||||||
Large Cap Fund |
| |||||||||||
Purchases | $ — | $ 1,543,316 | $ 1,543,316 | |||||||||
Sales | — | 1,934,947 | 1,934,947 | |||||||||
Large Cap Value Fund |
| |||||||||||
Purchases | — | 891,363 | 891,363 | |||||||||
Sales | — | 950,822 | 950,822 | |||||||||
Large Cap Growth Fund |
| |||||||||||
Purchases | — | 1,303,037 | 1,303,037 | |||||||||
Sales | — | 1,415,734 | 1,415,734 | |||||||||
Tax-Managed Large Cap Fund |
| |||||||||||
Purchases | — | 3,048,883 | 3,048,883 | |||||||||
Sales | — | 2,915,961 | 2,915,961 | |||||||||
S&P 500 Index Fund |
| |||||||||||
Purchases | — | 65,039 | 65,039 | |||||||||
Sales | — | 123,967 | 123,967 | |||||||||
Small Cap Fund |
| |||||||||||
Purchases | — | 574,333 | 574,333 | |||||||||
Sales | — | 547,380 | 547,380 | |||||||||
Small Cap Value Fund |
| |||||||||||
Purchases | — | 307,855 | 307,855 | |||||||||
Sales | — | 325,986 | 325,986 | |||||||||
Small Cap Growth Fund |
| |||||||||||
Purchases | — | 369,615 | 369,615 | |||||||||
Sales | — | 393,835 | 393,835 | |||||||||
| ||||||||||||
| U.S. Gov’t ($ Thousands) | Other ($ Thousands) | Total ($ Thousands) | ||||||||||
| ||||||||||||
Tax-Managed Small/Mid Cap Fund |
| |||||||||||
Purchases | $ — | $ 684,211 | $ 684,211 | |||||||||
Sales | — | 659,682 | 659,682 | |||||||||
Mid-Cap Fund |
| |||||||||||
Purchases | — | 98,683 | 98,683 | |||||||||
Sales | — | 110,954 | 110,954 | |||||||||
U.S. Managed Volatility Fund |
| |||||||||||
Purchases | — | 745,763 | 745,763 | |||||||||
Sales | — | 627,027 | 627,027 | |||||||||
Global Managed Volatility Fund |
| |||||||||||
Purchases | — | 1,283,946 | 1,283,946 | |||||||||
Sales | — | 1,911,666(1) | 1,911,666 | |||||||||
Tax-Managed Managed Volatility Fund |
| |||||||||||
Purchases | — | 522,657 | 522,657 | |||||||||
Sales | — | 329,658 | 329,658 | |||||||||
Real Estate Fund |
| |||||||||||
Purchases | — | 167,801 | 167,801 | |||||||||
Sales | — | 195,340 | 195,340 | |||||||||
Enhanced Income Fund |
| |||||||||||
Purchases | 43,050 | 42,704 | 85,754 | |||||||||
Sales | 51,120 | 40,155 | 91,275 | |||||||||
Core Fixed Income Fund |
| |||||||||||
Purchases | 6,053,273 | 697,290 | 6,750,563 | |||||||||
Sales | 6,024,537 | 753,119 | 6,777,656 | |||||||||
U.S. Fixed Income Fund |
| |||||||||||
Purchases | 4,208,382 | 685,238 | 4,893,620 | |||||||||
Sales | 4,173,095 | 657,581 | 4,830,676 | |||||||||
High Yield Bond Fund |
| |||||||||||
Purchases | — | 972,560 | 972,560 | |||||||||
Sales | — | 822,196 | 822,196 | |||||||||
| SEI Institutional Managed Trust / Annual Report / September 30, 2016 | 341 |
Notes to Financial Statements/Consolidated Notes to Financial Statements (Continued)
September 30, 2016
| ||||||||||
| U.S. Gov’t ($ Thousands) | Other ($ Thousands) | Total ($ Thousands) | ||||||||
| ||||||||||
Conservative Income Fund | ||||||||||
Purchases | $ | — | $ | — | $ — | |||||
Sales | — | — | — | |||||||
Tax-Free Conservative Income Fund | ||||||||||
Purchases | — | — | — | |||||||
Sales | — | — | — | |||||||
Real Return Fund | ||||||||||
Purchases | 136,512 | — | 136,512 | |||||||
Sales | 113,302 | — | 113,302 | |||||||
Dynamic Asset Allocation Fund | ||||||||||
Purchases | — | 443,097 | 443,097 | |||||||
Sales | — | 32,480 | 32,480 | |||||||
Multi-Strategy Alternative Fund | ||||||||||
Purchases | 5,205 | 692,225 | 697,430 | |||||||
Sales | 4,691 | 730,087 | 734,778 | |||||||
Multi-Asset Accumulation Fund | ||||||||||
Purchases | 329,789 | 385,859 | 715,648 | |||||||
Sales | 212,260 | 215,804 | 428,064 | |||||||
Multi-Asset Income Fund | ||||||||||
Purchases | 73,748 | 286,582 | 360,330 | |||||||
Sales | 51,078 | 230,155 | 281,233 | |||||||
Multi-Asset Inflation Managed Fund | ||||||||||
Purchases | 290,496 | 490,275 | 780,771 | |||||||
Sales | 272,766 | 500,645 | 773,411 | |||||||
Multi-Asset Capital Stability Fund | ||||||||||
Purchases | 302,617 | 34,308 | 336,925 | |||||||
Sales | 255,403 | 38,582 | 293,985 | |||||||
Long/Short Alternative Fund | ||||||||||
Purchases | — | 1,415 | 1,415 | |||||||
Sales | — | 1,438 | 1,438 | |||||||
(1) Includes 17a-7 related party transactions of $843,072 ($ Thousands).
9. FEDERAL TAX INFORMATION
It is each Fund’s intention to continue to qualify as a regulated investment company under Subchapter M of The Internal Revenue Code and distribute all of its taxable income (including net capital gains). Accordingly, no provision for Federal income taxes is required.
The Multi-Asset Accumulation and Multi-Asset Inflation Managed Funds have each requested private letter rulings from the Internal Revenue Service (“IRS”) concluding that the income generated from their investment in their respective Subsidiaries, each of which invests in commodity-linked derivatives, will be “qualifying income” for regulated investment company (“RIC”) qualification purposes, regardless of whether actual distributions are made to the Funds by the respective Subsidiary.
In July 2011, the IRS suspended the issuance of private letter rulings regarding the investment by RICs into controlled foreign corporations which principally invest in commodities, such as the Subsidiaries, indicating that it was reconsidering its policies surrounding the issuance of these rulings. The IRS subsequently stated that it intends to issue public guidance regarding
the use of controlled foreign corporations by RICs to indirectly invest in commodities. It is unclear whether this guidance will continue to permit or somehow restrict the distributions from controlled foreign corporations to be treated as “qualifying income” for purposes of the RIC qualification rules. As a result, there can be no assurance that the IRS will grant the private letter ruling requested by the Funds. The IRS, however, has informally indicated that any guidance regarding the treatment of distributions from controlled foreign corporations will be prospective in application and provide for transition periods for affected RICs. While the private letter ruling request is pending with the IRS, the Multi-Asset Accumulation and Multi-Asset Inflation Managed Funds have secured an opinion of counsel based on customary representations that actual distributions made to the Funds should be treated as “qualifying income.” If the IRS does issue public guidance that results in an adverse determination relating to the treatment of income and gain to the Funds from controlled foreign corporations such as the Subsidiaries, the Funds would likely need to significantly change their investment strategies, which could adversely affect such Funds.
The Real Estate Fund has a tax year that ends on December 31. The following tax disclosures are representative as of September 30, 2016, except for the permanent reclassification and tax character of distributions, which are as of December 31, 2015. Accordingly, the disclosures are for informational use by shareholders and are subject to change attributable to activity through the end of the tax year-ending December 31, 2016.
Dividends from net investment income and distributions from net realized capital gains are determined in accordance with U.S. Federal income tax regulations, which may differ from those amounts determined under U.S. GAAP. These book/tax differences are either temporary or permanent in nature. To the extent these differences are permanent, they are charged or credited to paid-in capital, undistributed net investment income or accumulated net realized gain, as appropriate, in the period that the differences arise.
Accordingly, the following permanent differences, primarily attributable to different treatment for gains and losses on paydowns of mortgage and asset-backed securities for tax purposes, defaulted bond basis adjustments, reclassification of long term capital gain distributions on REIT securities, reclassification of income and expense from swap transactions, Treasury Inflation-Protected Securities and net operating losses, basis adjustments for investments in partnerships, and gains and losses on passive foreign investment companies, collateralized loan
| 342 | SEI Institutional Managed Trust / Annual Report / September 30, 2016 |
obligation basis adjustments, utilization of earnings and profits on shareholder redemptions, certain foreign currency related transactions, and non-taxable in-kind redemptions, have been reclassified to/from the following accounts as of September 30, 2016:
| ||||||||||||
| Undistributed Net Investment Income (Loss) ($ Thousands) | Accumulated Realized Gain (Loss) ($ Thousands) | Paid-in- Capital ($ Thousands) | ||||||||||
| ||||||||||||
Large Cap Fund | $ | 393 | $ | (393) | $ | — | ||||||
Large Cap Value Fund | 149 | (149) | — | |||||||||
Large Cap Growth Fund | 759 | (759) | — | |||||||||
Tax-Managed Large Cap Fund | (149) | 149 | — | |||||||||
S&P 500 Index Fund | 64 | (2,629) | 2,565 | |||||||||
Small Cap Fund | 311 | (311) | — | |||||||||
Small Cap Value Fund | 660 | (660) | — | |||||||||
Small Cap Growth Fund | 1,399 | (41) | (1,358) | |||||||||
Tax-Managed Small/Mid Cap Fund | 734 | (734) | — | |||||||||
Mid-Cap Fund | (70) | 70 | — | |||||||||
U.S. Managed Volatility Fund | 493 | (493) | — | |||||||||
| ||||||||||
| Undistributed Net Investment Income (Loss) ($ Thousands) | Accumulated Realized Gain (Loss) ($ Thousands) | Paid-in- Capital | ||||||||
| ||||||||||
Global Managed Volatility Fund | $ | 3,185 | $ | 20,997 | $ (24,182) | |||||
Tax-Managed Managed Volatility Fund | 236 | (236) | — | |||||||
Real Estate Fund | 687 | (687) | — | |||||||
Enhanced Income Fund | 229 | 3,106 | (3,335) | |||||||
Core Fixed Income Fund | (2,196) | 2,196 | — | |||||||
U.S. Fixed Income Fund | 1,013 | (1,013) | — | |||||||
High Yield Bond Fund | (139) | 139 | — | |||||||
Real Return Fund | 1,461 | (4) | (1,457) | |||||||
Dynamic Asset Allocation Fund | (3,946) | 3,946 | — | |||||||
Multi-Strategy Alternative Fund | 977 | (977) | — | |||||||
Multi-Asset Accumulation Fund | 8,593 | (8,593) | — | |||||||
Multi-Asset Income Fund | (3,923) | 3,923 | — | |||||||
Multi-Asset Inflation Managed Fund | 1,306 | (1,306) | — | |||||||
Multi-Asset Capital Stability Fund | 1,906 | (1,906) | — | |||||||
Long/Short Alternative Fund | 314 | — | (314) | |||||||
These reclassifications have no impact on net assets or net asset value per share.
The tax character of dividends and distributions paid during the fiscal years or periods ended September 30, 2016 or September 30, 2015 (unless otherwise indicated) was as follows:
| ||||||||||||||||||||||
Ordinary Income | Long-term Capital Gain | Return of Capital ($ Thousands) | Tax Exempt Income ($ Thousands) | Total ($ Thousands) | ||||||||||||||||||
| ||||||||||||||||||||||
Large Cap Fund | ||||||||||||||||||||||
| 2016 | $ | 24,693 | $ | 394,357 | $ | — | $ | — | $ 419,050 | |||||||||||||
| 2015 | 48,726 | 176,773 | — | — | 225,499 | |||||||||||||||||
Large Cap Value Fund | ||||||||||||||||||||||
| 2016 | 18,803 | 171,778 | — | — | 190,581 | |||||||||||||||||
| 2015 | 14,991 | 100,791 | — | — | 115,782 | |||||||||||||||||
Large Cap Growth Fund | ||||||||||||||||||||||
| 2016 | 462 | 248,531 | — | — | 248,993 | |||||||||||||||||
| 2015 | 35,374 | 84,082 | — | — | 119,456 | |||||||||||||||||
Tax-Managed Large Cap Fund | ||||||||||||||||||||||
| 2016 | 31,981 | — | — | — | 31,981 | |||||||||||||||||
| 2015 | 20,757 | — | — | — | 20,757 | |||||||||||||||||
S&P 500 Index Fund | ||||||||||||||||||||||
| 2016 | 11,761 | 385 | — | — | 12,146 | |||||||||||||||||
| 2015 | 31,852 | 132,452 | — | — | 164,304 | |||||||||||||||||
Small Cap Fund | ||||||||||||||||||||||
| 2016 | 4,317 | 52,901 | — | — | 57,218 | |||||||||||||||||
| 2015 | 7,427 | 32,793 | — | — | 40,220 | |||||||||||||||||
Small Cap Value Fund | ||||||||||||||||||||||
| 2016 | 2,663 | 23,325 | — | — | 25,988 | |||||||||||||||||
| 2015 | 9,074 | 23,600 | — | — | 32,674 | |||||||||||||||||
Tax-Managed Small/Mid Cap Fund | ||||||||||||||||||||||
| 2016 | 2,147 | — | — | — | 2,147 | |||||||||||||||||
| 2015 | 792 | 5,885 | — | — | 6,677 | |||||||||||||||||
Mid-Cap Fund | ||||||||||||||||||||||
| 2016 | 4,049 | 11,727 | — | — | 15,776 | |||||||||||||||||
| 2015 | 4,125 | 4,656 | — | — | 8,781 | |||||||||||||||||
U.S. Managed Volatility Fund | ||||||||||||||||||||||
| 2016 | 27,826 | 64,868 | — | — | 92,694 | |||||||||||||||||
| 2015 | 44,185 | 82,955 | — | — | 127,140 | |||||||||||||||||
| SEI Institutional Managed Trust / Annual Report / September 30, 2016 | 343 |
Notes to Financial Statements/Consolidated Notes to Financial Statements (Continued)
September 30, 2016
| ||||||||||||||||||||||
Ordinary Income | Long-term Capital Gain | Return of Capital ($ Thousands) | Tax Exempt Income ($ Thousands) | Total ($ Thousands) | ||||||||||||||||||
| ||||||||||||||||||||||
Global Managed Volatility Fund | ||||||||||||||||||||||
| 2016 | $ | 126,506 | $ | 31,427 | $ | — | $ | — | $ 157,933 | |||||||||||||
| 2015 | 126,600 | 78,256 | — | — | 204,856 | |||||||||||||||||
Tax-Managed Managed Volatility Fund | ||||||||||||||||||||||
| 2016 | 15,646 | 37,946 | — | — | 53,592 | |||||||||||||||||
| 2015 | 15,163 | 47,229 | — | — | 62,392 | |||||||||||||||||
Real Estate Fund | ||||||||||||||||||||||
| 2016 | 2,448 | 14,938 | — | — | 17,386 | |||||||||||||||||
| 2015 | 3,497 | 10,075 | — | — | 13,572 | |||||||||||||||||
Enhanced Income Fund | ||||||||||||||||||||||
| 2016 | 4,378 | — | — | — | 4,378 | |||||||||||||||||
| 2015 | 4,293 | — | — | — | 4,293 | |||||||||||||||||
Core Fixed Income Fund | ||||||||||||||||||||||
| 2016 | 71,418 | — | — | — | 71,418 | |||||||||||||||||
| 2015 | 49,086 | — | — | — | 49,086 | |||||||||||||||||
U.S. Fixed Income Fund | ||||||||||||||||||||||
| 2016 | 35,096 | 953 | — | — | 36,049 | |||||||||||||||||
| 2015 | 25,048 | — | — | — | 25,048 | |||||||||||||||||
High Yield Bond Fund | ||||||||||||||||||||||
| 2016 | 131,758 | — | — | — | 131,758 | |||||||||||||||||
| 2015 | 108,360 | — | — | — | 108,360 | |||||||||||||||||
Conservative Income Fund | ||||||||||||||||||||||
| 2016 | 117 | — | — | — | 117 | |||||||||||||||||
Tax-Free Conservative Income Fund | ||||||||||||||||||||||
| 2016 | — | — | — | 57 | 57 | |||||||||||||||||
Real Return Fund | ||||||||||||||||||||||
| 2016 | — | — | — | — | — | |||||||||||||||||
| 2015 | 343 | — | 1 | — | 344 | |||||||||||||||||
Dynamic Asset Allocation Fund | ||||||||||||||||||||||
| 2016 | 1,748 | — | — | — | 1,748 | |||||||||||||||||
| 2015 | — | — | — | — | — | |||||||||||||||||
Multi-Strategy Alternative Fund | ||||||||||||||||||||||
| 2016 | 8,684 | 5,487 | — | — | 14,171 | |||||||||||||||||
| 2015 | 8,032 | — | — | — | 8,032 | |||||||||||||||||
Multi-Asset Accumulation Fund | ||||||||||||||||||||||
| 2016 | 36,119 | 22,009 | — | — | 58,128 | |||||||||||||||||
| 2015 | 113,427 | 64,300 | — | — | 177,727 | |||||||||||||||||
Multi-Asset Income Fund | ||||||||||||||||||||||
| 2016 | 39,477 | 2,065 | — | — | 41,542 | |||||||||||||||||
| 2015 | 26,291 | 1,432 | — | — | 27,723 | |||||||||||||||||
Multi-Asset Inflation Managed Fund | ||||||||||||||||||||||
| 2016 | 5,117 | — | — | — | 5,117 | |||||||||||||||||
| 2015 | — | — | — | — | — | |||||||||||||||||
Multi-Asset Capital Stability Fund | ||||||||||||||||||||||
| 2016 | 5,061 | 2,301 | — | — | 7,362 | |||||||||||||||||
| 2015 | 6,158 | 4,523 | — | — | 10,681 | |||||||||||||||||
| 344 | SEI Institutional Managed Trust / Annual Report / September 30, 2016 |
As of September 30, 2016, the components of Distributable Earnings/(Accumulated Losses) were as follows:
| ||||||||||||||||||||||||||||||||||||
Undistributed Ordinary Income ($ Thousands) | Undistributed Long-Term Capital Gain ($ Thousands) | Undistributed Tax-Exempt Income ($ Thousands) | Capital Loss Carryforwards | Post- October Losses ($ Thousands) | Late Year Losses | Unrealized (Depreciation) | Other Temporary | Total Distributable | ||||||||||||||||||||||||||||
| ||||||||||||||||||||||||||||||||||||
Large Cap Fund | $ | 5,107 | $ | — | $ | — | $ | — | $ | (58,795) | $ | — | $ | 367,437 | $ | (30) | $ | 313,719 | ||||||||||||||||||
Large Cap Value Fund | 9,720 | — | — | (3,230) | (39,300) | — | 141,349 | — | 108,539 | |||||||||||||||||||||||||||
Large Cap Growth Fund | 1,234 | — | — | (61,171) | — | — | 314,804 | (2) | 254,865 | |||||||||||||||||||||||||||
Tax-Managed Large Cap Fund | 6,816 | — | — | (135,370) | — | — | 1,214,477 | (40) | 1,085,883 | |||||||||||||||||||||||||||
S&P 500 Index Fund | 3,736 | 18,525 | — | — | — | — | 321,029 | (307) | 342,983 | |||||||||||||||||||||||||||
Small Cap Fund | 492 | — | — | (6,430) | — | — | 46,012 | 36 | 40,110 | |||||||||||||||||||||||||||
Small Cap Value Fund | 1,161 | 167 | — | — | (10,040) | — | 45,953 | (50) | 37,191 | |||||||||||||||||||||||||||
Small Cap Growth Fund | — | — | — | (28,227) | — | (798) | 14,012 | — | (15,013) | |||||||||||||||||||||||||||
Tax-Managed Small/Mid Cap Fund | 1,367 | — | — | (1,073) | (4,212) | — | 194,009 | (126) | 189,965 | |||||||||||||||||||||||||||
Mid-Cap Fund | 47 | — | — | — | — | — | 6,420 | — | 6,467 | |||||||||||||||||||||||||||
U.S. Managed Volatility Fund | 5,727 | 44,706 | — | — | — | — | 213,815 | 101 | 264,349 | |||||||||||||||||||||||||||
Global Managed Volatility Fund | 31,139 | 45,839 | — | — | — | — | 193,814 | (259) | 270,533 | |||||||||||||||||||||||||||
Tax-Managed Managed Volatility Fund | 3,918 | 13,890 | — | — | — | — | 251,385 | 42 | 269,235 | |||||||||||||||||||||||||||
Real Estate Fund | 2,197 | 14,417 | — | — | — | — | 41,673 | — | 58,287 | |||||||||||||||||||||||||||
Enhanced Income Fund | 1,048 | — | — | (123,972) | — | — | (2,912) | (2) | (125,838) | |||||||||||||||||||||||||||
Core Fixed Income Fund | 33,388 | 7,983 | — | — | — | — | 44,658 | (24,938) | 61,091 | |||||||||||||||||||||||||||
U.S. Fixed Income Fund | 26,001 | 2,612 | — | — | — | — | 33,412 | (13,881) | 48,144 | |||||||||||||||||||||||||||
High Yield Bond Fund | 30,300 | — | — | (105,273) | — | — | (76,514) | (10,992) | (162,479) | |||||||||||||||||||||||||||
Conservative Income Fund | 21 | — | — | — | — | — | 5 | (20) | 6 | |||||||||||||||||||||||||||
Tax-Free Conservative Income Fund | — | — | 12 | — | — | — | (14) | (12) | (14) | |||||||||||||||||||||||||||
Real Return Fund | — | — | — | (2,968) | — | — | 2,530 | (920) | (1,358) | |||||||||||||||||||||||||||
Dynamic Asset Allocation Fund | — | — | — | (1,756) | — | (206) | 35,390 | 1,645 | 35,073 | |||||||||||||||||||||||||||
Multi-Strategy Alternative Fund | 354 | — | — | (6,376) | — | — | (5,936) | 33 | (11,925) | |||||||||||||||||||||||||||
Multi-Asset Accumulation Fund | 92,177 | 61,486 | — | — | — | — | (133,807) | (5,392) | 14,464 | |||||||||||||||||||||||||||
Multi-Asset Income Fund | 1,529 | — | — | (6,024) | — | — | 5,235 | (2,030) | (1,290) | |||||||||||||||||||||||||||
Multi-Asset Inflation Managed Fund | 6,292 | — | — | (25,857) | (6,482) | — | (62,914) | (1,002) | (89,963) | |||||||||||||||||||||||||||
Multi-Asset Capital Stability Fund | 3,410 | 1,615 | — | — | — | — | 3,156 | (2,485) | 5,696 | |||||||||||||||||||||||||||
Long/Short Alternative Fund | — | — | — | (92) | (448) | (83) | (61) | 77 | (607) | |||||||||||||||||||||||||||
Post October losses represent losses realized on investment transactions from November 1, 2015 through September 30, 2016 that, in accordance with Federal income tax regulations, the Funds may defer and treat as having arisen in the following fiscal year. Deferred Late-Year Losses represent ordinary losses realized on investment transactions from January 1, 2016 through September 30, 2016 and specified losses realized on investment transactions from November 1, 2015 through September 30, 2016, that, in accordance with Federal income tax regulations, the Fund defers and treats as having arisen in the following fiscal year.
| SEI Institutional Managed Trust / Annual Report / September 30, 2016 | 345 |
Notes to Financial Statements/Consolidated Notes to Financial Statements (Continued)
September 30, 2016
For Federal income tax purposes, capital loss carryforwards may be carried forward and applied against future capital gains as follows:
| ||||||||||||||||||||||||
| Expires 2020 ($ Thousands) | Expires 2019 ($ Thousands) | Expires 2018 ($ Thousands) | Expires 2017 ($ Thousands) | Expires 2016 ($ Thousands) | Total Capital Loss Carryforwards | |||||||||||||||||||
| ||||||||||||||||||||||||
Tax-Managed Large Cap Fund | $ | — | $ | — | $ | 114,969 | $ | — | $ | — | $ | 114,969 | ||||||||||||
Small Cap Growth Fund | — | — | 17,369 | — | — | 17,369 | ||||||||||||||||||
Enhanced Income Fund | — | 26,775 | 61,656 | 31,834 | — | 120,265 | ||||||||||||||||||
High Yield Bond Fund | — | — | 3,086 | 33,267 | — | 36,353 | ||||||||||||||||||
Under the Regulated Investment Company Modernization Act of 2010, Funds will be permitted to carry forward capital losses incurred in taxable years beginning after December 22, 2010 for an unlimited period. However, any losses incurred during those future taxable years are required to be utilized prior to the losses incurred in pre-enactment taxable years. As a result of this ordering rule, pre-enactment capital loss carryforwards are more likely to expire unused. Additionally, post-enactment capital losses that are carried forward will retain their character as either short-term or long-term capital losses rather than being considered all short-term as under previous law. Losses carried forward under these new provisions are as follows:
| ||||||||||||
Short-Term Loss ($ Thousands) | Long-Term Loss ($ Thousands) | Total * ($ Thousands) | ||||||||||
| ||||||||||||
Large Cap Value Fund | $ | 3,230 | $ | – | $ | 3,230 | ||||||
Large Cap Growth Fund | 61,171 | – | 61,171 | |||||||||
Tax-Managed Large Cap Fund | 20,401 | – | 20,401 | |||||||||
Small Cap Fund | 6,430 | – | 6,430 | |||||||||
Small Cap Growth Fund | 10,858 | – | 10,858 | |||||||||
Tax-Managed Small/Mid Cap Fund | 1,073 | – | 1,073 | |||||||||
Enhanced Income Fund | 60 | 3,647 | 3,707 | |||||||||
High Yield Bond Fund | 9,123 | 59,797 | 68,920 | |||||||||
Real Return Fund | 862 | 2,106 | 2,968 | |||||||||
Dynamic Asset Allocation Fund | 1,756 | – | 1,756 | |||||||||
Multi-Strategy Alternative Fund | – | 6,376 | 6,376 | |||||||||
Multi-Asset Income Fund | 1,404 | 4,620 | 6,024 | |||||||||
Multi-Asset Inflation Managed Fund | 20,588 | 5,269 | 25,857 | |||||||||
Long/Short Alternative Fund | 53 | 39 | 92 | |||||||||
| * | This table should be used in conjunction with the capital loss carryforwards table. |
During the fiscal year ended September 30, 2016, the following Funds utilized capital loss carryforward to offset capital gains:
| ||
Amount Utilized ($ Thousands) | ||
| ||
Enhanced Income Fund | $203 | |
For Federal income tax purposes, the cost of securities owned at September 30, 2016, and the net realized gains or losses on securities sold for the period, were different from amounts reported for financial reporting
purposes primarily due to investments in partnerships that captures losses from other securities, and wash sales which cannot be used for Federal income tax purposes in the current year and have been deferred for use in future years. The Federal tax cost and aggregate gross unrealized appreciation and depreciation on investments held by the Funds at September 30, 2016, were as follows:
| ||||||||||||||||
| Federal Tax Cost ($ Thousands) | Appreciated Securities ($ Thousands) | Depreciated Securities ($ Thousands) | Net Unrealized Appreciation (Depreciation) ($ Thousands) | |||||||||||||
| ||||||||||||||||
Large Cap Fund | $ | 2,301,164 | $ | 437,586 | $ | (70,121) | $ | 367,465 | ||||||||
Large Cap Value Fund | 1,237,509 | 213,986 | (72,636) | 141,350 | ||||||||||||
Large Cap Growth Fund | 1,139,884 | 347,439 | (32,635) | 314,804 | ||||||||||||
Tax-Managed Large Cap Fund | 2,520,306 | 1,250,499 | (36,045) | 1,214,454 | ||||||||||||
S&P 500 Index Fund | 342,902 | 331,348 | (10,623) | 320,725 | ||||||||||||
Small Cap Fund | 595,923 | 83,706 | (37,656) | 46,050 | ||||||||||||
Small Cap Value Fund | 430,839 | 65,258 | (19,301) | 45,957 | ||||||||||||
Small Cap Growth Fund | 338,786 | 35,916 | (21,905) | 14,011 | ||||||||||||
Tax-Managed Small/Mid Cap Fund | 677,536 | 196,002 | (1,995) | 194,007 | ||||||||||||
Mid-Cap Fund | 88,287 | 9,390 | (2,970) | 6,420 | ||||||||||||
U.S. Managed Volatility Fund | 1,398,801 | 253,922 | (40,009) | 213,913 | ||||||||||||
Global Managed Volatility Fund | 1,512,437 | 233,267 | (39,666) | 193,601 | ||||||||||||
Tax-Managed Managed Volatility Fund | 946,963 | 262,771 | (11,336) | 251,435 | ||||||||||||
Real Estate Fund | 171,685 | 45,891 | (4,214) | 41,677 | ||||||||||||
Enhanced Income Fund | 204,208 | 1,144 | (4,058) | (2,914) | ||||||||||||
Core Fixed Income Fund | 2,251,418 | 78,699 | (31,481) | 47,218 | ||||||||||||
U.S. Fixed Income Fund | 1,367,506 | 38,473 | (5,408) | 33,065 | ||||||||||||
High Yield Bond Fund | 1,993,254 | 79,003 | (155,710) | (76,707) | ||||||||||||
Conservative Income Fund | 69,278 | 7 | (2) | 5 | ||||||||||||
Tax-Free Conservative Income Fund | 44,684 | 2 | (16) | (14) | ||||||||||||
Real Return Fund | 321,422 | 3,215 | (685) | 2,530 | ||||||||||||
Dynamic Asset Allocation Fund | 485,474 | 53,267 | (16,068) | 37,199 | ||||||||||||
Multi-Strategy Alternative Fund | 578,281 | 14,993 | (17,969) | (2,976) | ||||||||||||
Multi-Asset Accumulation Fund | 2,005,901 | 60,575 | (186,704) | (126,129) | ||||||||||||
| 346 | SEI Institutional Managed Trust / Annual Report / September 30, 2016 |
| ||||||||||||||||
Federal Tax Cost ($ Thousands) | Appreciated Securities ($ Thousands) | Depreciated Securities ($ Thousands) | Net Unrealized Appreciation (Depreciation) ($ Thousands) | |||||||||||||
| ||||||||||||||||
Multi-Asset Income Fund | $ | 696,775 | $ | 27,417 | $ | (21,650) | $ | 5,767 | ||||||||
Multi-Asset Inflation Managed Fund | 1,346,864 | 46,308 | (104,641) | (58,333) | ||||||||||||
Multi-Asset Capital Stability Fund | 120,906 | 3,565 | (610) | 2,955 | ||||||||||||
Long/Short Alternative Fund | 40,641 | 20 | (4) | 16 | ||||||||||||
Management has analyzed the Funds’ tax positions taken on federal income tax returns for all open tax years and has concluded that as of September 30, 2016, no provision for income tax would be required in the Funds’ financial statements. The Funds’ federal and state income and federal excise tax returns for tax years for which the applicable statutes of limitations have not expired are subject to examination by the Internal Revenue Service and state departments of revenue.
10. SECURITIES LENDING
Each Fund may lend portfolio securities to brokers, dealers and other financial organizations that meet capital and other credit requirements or other criteria established by the Trust’s Board of Trustees. These loans may not exceed 331/3% of the total asset value of the Fund (including the loan collateral). No Fund will lend portfolio securities to its Adviser, sub-adviser or their affiliates unless it has applied for and received specific authority to do so from the SEC. Loans of portfolio securities will be fully collateralized by cash. Collateral will be maintained in an amount equal to at least 100% of the current market value of the loaned securities by marking to market daily, although the borrower will be required to deliver collateral between 102% and 105% of the market value of borrowed securities for domestic and foreign securities, respectively. However, due to market fluctuations during the day, the value of securities loaned on a particular day may, during the course of the day, exceed the value of collateral. On each business day, the amount of collateral is adjusted based on the prior day’s market fluctuations and the current day’s lending activity. Income from lending activity is determined by the amount of interest earned on collateral, less any amounts payable to the borrowers of the securities and the lending agent. Lending securities involves certain risks, including the risk that the Fund may be delayed or prevented from recovering the collateral if the borrower fails to return the securities.
Cash collateral received in connection with securities lending is invested in short-term investments by the lending agent. These investments may include the SEI Liquidity Fund L.P., and the Fund bears all of the gains
and losses on such investment. There is no guarantee that these investments will not lose value.
The following is a summary of securities lending agreements held by certain Funds which would be subject to offset as of September 30, 2016 ($ Thousands):
| ||||||||||||
Securities Loaned at Value | Cash Collateral Received (1) | Net Amount | ||||||||||
| ||||||||||||
Large Cap Fund | $258,188 | $258,188 | $– | |||||||||
Large Cap Value Fund | 49,352 | 49,352 | – | |||||||||
Large Cap Growth Fund | 3,948 | 3,948 | – | |||||||||
Tax-Managed Large Cap Fund | 110,925 | 110,925 | – | |||||||||
S&P 500 Index Fund | 3,131 | 3,131 | – | |||||||||
Small Cap Fund | 51,461 | 51,461 | – | |||||||||
Small Cap Value Fund | 102,682 | 102,682 | – | |||||||||
Small Cap Growth Fund | 30,880 | 30,880 | – | |||||||||
Tax-Managed Small/Mid Cap Fund | 178,774 | 178,774 | – | |||||||||
Mid-Cap Fund | 5,670 | 5,670 | – | |||||||||
Real Estate Fund | 1,020 | 1,020 | – | |||||||||
Core Fixed Income Fund | 13,544 | 13,544 | – | |||||||||
U.S. Fixed Income Fund | 599 | 599 | – | |||||||||
High Yield Bond Fund | 1 | 1 | – | |||||||||
| (1) | Excess collateral received in connection with the above securities lending transactions is not shown for financial reporting purposes. See each Fund’s Summary Schedule of Investments or Schedule of Investments for the total collateral received. |
11. CONCENTRATION/RISKS
In the normal course of business, the Trust enters into contracts that provide general indemnifications by the Trust to the counterparty to the contract. The Trust’s maximum exposure under these arrangements is dependent on future claims that may be made against the Trust and, therefore, cannot be estimated; however, Management believes that, based on experience, the risk of loss from such claims is considered remote.
In the normal course of business, the Multi-Strategy Alternative Fund invests substantially in underlying funds that are comprised of fixed income and equity securities in specific industries and that may engage in short selling activities, writing option contracts, and equity swaps, and therefore, the Fund may be affected by events in these industries. The Fund’s Prospectus provides a description of risks associated with the different investments in the underlying affiliated investment companies.
In the normal course of business, the Global Managed Volatility Fund and the Multi-Asset Funds’ invest in securities of foreign issuers in various countries. These investments may involve certain considerations and risks not typically associated with investments in the United States, as a result of, among other factors, the possibility of future political and economic developments and the level of governmental supervision and regulation
| SEI Institutional Managed Trust / Annual Report / September 30, 2016 | 347 |
Notes to Financial Statements/Consolidated Notes to Financial Statements (Continued)
September 30, 2016
of securities markets in the respective countries. The Funds’ Prospectus provides a description of the risk associated with the different investments.
The market values of the Enhanced Income, Core Fixed Income, U.S. Fixed Income, High Yield Bond, Conservative Income, Tax-Free Conservative Income, Real Return and Multi-Asset Funds’ investments will change in response to interest rate changes and other factors. During periods of falling interest rates, the values of fixed income securities generally rise. Conversely, during periods of rising interest rates, the values of such securities generally decline. Changes by recognized rating agencies in the ratings of any fixed income security and in the ability of an issuer to make payments of interest and principal may also affect the value of these investments.
The following descriptions provide additional information about some of the risks of investing in the Funds:
Asset-Backed Securities Risk — Payment of principal and interest on asset-backed securities is dependent largely on the cash flows generated by the assets backing the securities, and asset-backed securities may not have the benefit of any security interest in the related assets.
Bank Loans Risk—With respect to bank loans, the Fund will assume the credit risk of both the borrower and the lender that is selling the participation. The Fund may also have difficulty disposing of bank loans because, in certain cases, the market for such instruments is not highly liquid.
Commodity Risk — The value of commodity-linked derivative securities may be affected by a variety of factors, including, but not limited to, overall market movements and other factors affecting the value of particular industries or commodities, such as weather, disease, embargoes, acts of war or terrorism or political and regulatory developments. The prices of commodity-linked derivative securities may move in different directions than investments in traditional equity and debt securities when the value of those traditional securities is declining due to adverse economic conditions.
Credit Risk — The risk that the issuer of a security or the counterparty to a contract will default or otherwise become unable to honor a financial obligation.
Currency Risk — Due to a Fund’s active positions in currencies, it will be subject to the risk that currency exchange rates may fluctuate in response to, among other things, changes in interest rates, intervention or failure to intervene) by U.S. or foreign governments, central banks or supranational entities, or by the
imposition of currency controls or other political developments in the United States or abroad.
Fixed Income Market Risk — The prices of a Fund’s fixed income securities respond to economic developments, particularly interest rate changes, as well as to perceptions about the creditworthiness of individual issuers, including governments and their agencies. Generally, the Fund’s fixed income securities will decrease in value if interest rates rise and vice versa. In the case of foreign securities, price fluctuations will reflect international economic and political events, as well as changes in currency valuations relative to the U.S. dollar.
Foreign Investment/Emerging Markets Risk — The risk that non-U.S. securities may be subject to additional risks due to, among other things, political, social and economic developments abroad, currency movements, and different legal, regulatory and tax environments. These additional risks may be heightened with respect to emerging market countries since political turmoil and rapid changes in economic conditions are more likely to occur in these countries.
Interest Rate Risk — The risk that a rise in interest rates will cause a fall in the value of fixed income securities, including U.S. Government Securities, in which the Fund invests. Although U.S. Government securities are considered to be among the safest investments, they are not guaranteed against price movements due to changing interest rates. A low interest rate environment may present greater interest rate risk, because there may be a greater likelihood of rates increasing and rates may increase more rapidly.
Leverage Risk — Certain Fund transactions, such as derivatives or reverse repurchase agreements, may give rise to a form of leverage. The use of leverage can amplify the effects of market volatility on the Funds’ share price and make the Funds’ returns more volatile. This is because leverage tends to exaggerate the effect of any increase or decrease in the value of the Funds’ portfolio securities. The use of leverage may also cause the Funds to liquidate portfolio positions when it would not be advantageous to do so in order to satisfy its obligations.
Mortgage-Backed Securities Risk — Mortgage-backed securities are affected by, among other things, interest rate changes and the possibility of prepayment of the underlying mortgage loans. Mortgagebacked securities are also subject to the risk that underlying borrowers will be unable to meet their obligations.
The foregoing is not intended to be a complete discussion of the risks associated with investing in a Fund. Please review each Fund’s current prospectus for additional disclosures regarding the principal risks associated with investing in a Fund.
| 348 | SEI Institutional Managed Trust / Annual Report / September 30, 2016 |
12. CONCENTRATION OF SHAREHOLDERS
SEI Private Trust Company (“SPTC”) and SIMC are subsidiaries of SEI Investments Company. As of, September 30, 2016, SPTC held of record the following percentage of outstanding shares of each Fund:
| ||||
Fund | % held
| |||
| ||||
Large Cap Fund | ||||
Class A | 98.08% | |||
Class Y | 7.66 | |||
Large Cap Value Fund | ||||
Class A | 95.11% | |||
Class I | 22.21 | |||
Class Y | 100.00 | |||
Large Cap Growth Fund | ||||
Class A | 95.14% | |||
Class I | 28.52 | |||
Class Y | 100.00 | |||
Tax-Managed Large Cap Fund | ||||
Class A | 92.97% | |||
Class Y | 26.21 | |||
S&P 500 Index Fund | ||||
Class A | 84.56% | |||
Class E | 6.53 | |||
Class I | 47.69 | |||
Class Y | 100.00 | |||
Small Cap Fund | ||||
Class A | 98.25% | |||
Class Y | 14.42 | |||
Small Cap Value Fund | ||||
Class A | 85.61% | |||
Class I | 15.15 | |||
Class Y | 100.00 | |||
Small Cap Growth Fund | ||||
Class A | 92.82% | |||
Class I | 20.01 | |||
Class Y | 100.00 | |||
Tax-Managed Small/Mid Cap Fund | ||||
Class A | 94.32% | |||
Class Y | 34.05 | |||
Mid-Cap Fund | ||||
Class A | 81.18% | |||
Class I | 0.00 | |||
Class Y | 96.23 | |||
U.S. Managed Volatility Fund | ||||
Class A | 80.85% | |||
Class I | 0.00 | |||
Class Y | 9.78 | |||
| ||||
Fund | % held
| |||
| ||||
Global Managed Volatility Fund | ||||
Class A | 84.44% | |||
Class I | 3.53 | |||
Class Y | 53.50 | |||
Tax-Managed Managed Volatility Fund | ||||
Class A | 91.30% | |||
Class Y | 81.69 | |||
Real Estate Fund | ||||
Class A | 91.08% | |||
Class I | 1.64 | |||
Class Y | 46.81 | |||
Enhanced Income Fund | ||||
Class A | 96.66% | |||
Class I | 0.00 | |||
Class Y | 36.59 | |||
Core Fixed Income Fund | ||||
Class A | 94.79% | |||
Class I | 38.99 | |||
Class Y | 56.19 | |||
U.S. Fixed Income Fund | ||||
Class A | 98.20% | |||
Class Y | 10.51 | |||
High Yield Bond Fund | ||||
Class A | 95.04% | |||
Class I | 0.00 | |||
Class Y | 23.36 | |||
Conservative Income Fund | ||||
Class A | 99.96% | |||
Class Y | 1.20 | |||
Tax-Free Conservative Income Fund | ||||
Class A | 99.99% | |||
Class Y | 0.00 | |||
Real Return Fund | ||||
Class A | 97.85% | |||
Class Y | 11.27 | |||
Dynamic Asset Allocation Fund | ||||
Class A | 97.10% | |||
Class Y | 0.04 | |||
Multi-Strategy Alternative Fund | ||||
Class A | 97.12% | |||
Class Y | 62.43 | |||
Multi-Asset Accumulation Fund | ||||
Class A | 97.67% | |||
Class Y | 1.19 | |||
Multi-Asset Income Fund | ||||
Class A | 97.41% | |||
Class Y | 63.86 | |||
Multi-Asset Inflation Managed Fund | ||||
Class A | 97.78% | |||
Class Y | 9.51 | |||
| SEI Institutional Managed Trust / Annual Report / September 30, 2016 | 349 |
Notes to Financial Statements/Consolidated Notes to Financial Statements (Concluded)
September 30, 2016
| ||||
Fund | % held
| |||
| ||||
Multi-Asset Capital Stability Fund | ||||
Class A | 97.99% | |||
Class Y | 3.83 | |||
Long/Short Alternative Fund | ||||
Class A | 0.00% | |||
Class Y | 0.00 | |||
SPTC is not a direct service provider to the Funds. However, SPTC performs a key role in the comprehensive investment solution that SEI provides to investors. SPTC holds the vast majority of shares in the Funds as custodian for shareholders that are clients of the advisors and financial planners. SPTC maintains accounts at SEI Institutional Transfer Agency (“SITA”), and operates in an omnibus fund account environment.
13. IN-KIND TRANSACTIONS
During the fiscal year ended September 30, 2016, Global Managed Volatility Fund redeemed shares of beneficial interest in exchange for securities. The securities were redeemed at their current value on the date of the transaction.
| ||||||||||||||||
| Transaction Date | Shares Redeemed (Thousands) | Value ($ Thousands) | Cash ($ Thousands) | Loss ($ Thousands) | ||||||||||||
| ||||||||||||||||
01/29/2016 | 80,677 | $ 843,072 | $ — | $ (24,125) | ||||||||||||
During the fiscal year ended September 30, 2015, the S&P 500 Index Fund redeemed shares of beneficial interest in exchange for securities and cash. The securities were redeemed at their current value on the date of the transaction.
| ||||||||||||||||
| Transaction Date | Shares Redeemed (Thousands) | Value ($ Thousands) | Cash ($ Thousands) | Gain ($ Thousands) | ||||||||||||
| ||||||||||||||||
10/31/2014 | 16,201 | $ 821,276 | $ 59,392 | $ 591,363 | ||||||||||||
12/30/2014 | 14,191 | 806,037 | 78,774 | 534,652 | ||||||||||||
02/27/2015 | 1,639 | 81,779 | 3,461 | 50,889 | ||||||||||||
03/31/2015 | 95 | 4,800 | 69 | 2,911 | ||||||||||||
14. SUBSEQUENT EVENTS
Management has evaluated the need for disclosures and/or adjustments resulting from subsequent events through the date the financial statements were issued. Based on this evaluation, no disclosures and/or adjustments were required to the financial statements as of September 30, 2016.
| 350 | SEI Institutional Managed Trust / Annual Report / September 30, 2016 |
Report of Independent Registered Public Accounting Firm
The Board of Trustees and Shareholders
SEI Institutional Managed Trust:
We have audited the accompanying statements of assets and liabilities, including the schedules of investments and summary schedules of investments, of the Large Cap Fund, Large Cap Value Fund, Large Cap Growth Fund, Tax-Managed Large Cap Fund, S&P 500 Index Fund, Small Cap Fund, Small Cap Value Fund, Small Cap Growth Fund, Tax-Managed Small/Mid Cap Fund, Mid-Cap Fund, U.S. Managed Volatility Fund, Global Managed Volatility Fund, Tax-Managed Managed Volatility Fund, Real Estate Fund, Enhanced Income Fund, Core Fixed Income Fund, U.S. Fixed Income Fund, High Yield Bond Fund, Conservative Income Fund, Tax-Free Conservative Income Fund, Real Return Fund, Dynamic Asset Allocation Fund, Multi-Strategy Alternative Fund, Multi-Asset Income Fund, Multi- Asset Capital Stability Fund, and the Long/Short Alternative Fund (twenty-six of the twenty-eight funds comprising the SEI Institutional Managed Trust (the Trust)), as of September 30, 2016, and the related statements of operations for the year or period then ended, the statements of changes in net assets for each of the years or periods in the two-year period then ended, and the financial highlights for each of the years or periods in the five-year period then ended. We have also audited the accompanying consolidated statements of assets and liabilities, including the consolidated schedules of investments, of the Multi-Asset Accumulation Fund and the Multi-Asset Inflation Managed Fund (two of the twenty-eight funds comprising the Trust), as of September 30, 2016, and the related consolidated statements of operations for the year then ended, the consolidated statements of changes in net assets for each of the years in the two-year period then ended, the consolidated statement of cash flows for the year then ended for the Multi-Asset Inflation Managed Fund, and the consolidated financial highlights for each of the years or periods in the five-year period then ended. These financial statements and consolidated financial statements and financial highlights and consolidated financial highlights are the responsibility of the Trust’s management. Our responsibility is to express an opinion on these financial statements and consolidated financial statements and financial highlights and consolidated financial highlights based on our audits.
We conducted our audits in accordance with the standards of the Public Company Accounting Oversight Board (United States). Those standards require that we plan and perform the audit to obtain reasonable assurance about whether the financial statements and consolidated financial statements and financial highlights and consolidated financial highlights are free of material misstatement. An audit includes examining, on a test basis, evidence supporting the amounts and disclosures in the financial statements. Our procedures included confirmation of securities owned as of September 30, 2016, by correspondence with the custodians, transfer agent, and brokers or other appropriate auditing procedures. An audit also includes assessing the accounting principles used and significant estimates made by management, as well as evaluating the overall financial statement presentation. We believe that our audits provide a reasonable basis for our opinion.
In our opinion, the financial statements and consolidated financial statements and financial highlights and consolidated financial highlights referred to above present fairly, in all material respects, the financial position of each of the funds comprising SEI Institutional Managed Trust as of September 30, 2016, the results of their operations, the changes in their net assets, their cash flows, and the financial highlights for the years or periods described in the first paragraph, in conformity with U.S. generally accepted accounting principles.

Philadelphia, Pennsylvania
November 28, 2016
| SEI Institutional Managed Trust / Annual Report / September 30, 2016 | 351 |
Trustees and Officers of the Trust (Unaudited)
The following chart lists Trustees and Officers as of September 30, 2016.
Set forth below are the names, addresses, ages, position with the Trust, Term of Office and Length of Time Served, the principal occupations for the last five years, number of positions in fund complex overseen by trustee, and other directorships outside the fund complex of each of the persons currently serving as Trustees and Officers of the Trust. The Trust’s Statement of Additional Information (“SAI”) includes additional information about the Trustees and Officers. The SAI may be obtained without charge by calling 1-800-342-5734.
| Name, Address, and Age | Position(s) Held with Trusts | Term of Office and Length of Time Served1 | Principal Occupation(s) During Past Five Years | Number of Portfolios in Fund Complex Overseen by Trustee2 | Other Directorships Held by Trustee | |||||
| INTERESTED TRUSTEES | ||||||||||
| Robert A. Nesher One Freedom Valley Drive Oaks, PA 19456 70 yrs. old | Chairman of the Board of Trustees* | since 1995 | Currently performs various services on behalf of SEI for which Mr. Nesher is compensated. | 104 | Vice Chairman of The Advisors’ Inner Circle Fund III, Winton Series Trust and Winton Diversified Opportunities Fund since 2014. Vice Chairman of Gallery Trust since 2015. President and Director of SEI Structured Credit Fund, LP. Director of SEI Global Master Fund plc, SEI Global Assets Fund plc, SEI Global Investments Fund plc, SEI Investments—Global Funds Services, Limited, SEI Investments Global, Limited, SEI Investments (Europe) Ltd., SEI Multi-Strategy Funds PLC, SEI Global Nominee Ltd and SEI Investments—Unit Trust Management (UK) Limited. Director and President of SEI Opportunity Fund, L.P. to 2010. President, Director and Chief Executive Officer of SEI Alpha Strategy Portfolios, LP from 2007 to 2013. Trustee of The Advisors’ Inner Circle Fund, The Advisors’ Inner Circle Fund II, Bishop Street Funds, SEI Asset Allocation Trust, SEI Daily Income Trust, SEI Institutional Managed Trust, SEI Institutional International Trust, SEI Institutional Investments Trust, SEI Tax Exempt Trust, SEI Insurance Products Trust, Adviser Managed Trust, The KP Funds and SEI Catholic Values Trust. | |||||
William M. Doran One Freedom | Trustee* | since 1995 | Self-employed consultant since 2003.Partner, Morgan, Lewis & Bockius LLP (law firm) from 1976 to 2003, counsel to the Trust, SEI, SIMC, the Administrator and the Distributor. | 104 | Director of SEI since 1974; Secretary of SEI since 1978. Director of SEI Investments Distribution Co. since 2003. Director of SEI Investments—Global Funds Services, Limited, SEI Investments Global, Limited, SEI Investments (Europe), Limited, SEI Investments (Asia) Limited, SEI Global Nominee Ltd. and SEI Investments—Unit Trust Management (UK) Limited. Trustee of SEI Liquid Asset Trust from 1982 to 2016. Trustee of O’Connor EQUUS from 2014 to 2016. Director of SEI Alpha Strategy Portfolios, LP from 2007 to 2013. Trustee of The Advisors’ Inner Circle Fund, The Advisors’ Inner Circle Fund II, The Advisors’ Inner Circle Fund III, Winton Series Trust, Winton Diversified Opportunities Fund, Gallery Trust, Bishop Street Funds, SEI Asset Allocation Trust, SEI Daily Income Trust, SEI Institutional Managed Trust, SEI Institutional International Trust, SEI Institutional Investments Trust, SEI Tax Exempt Trust, SEI Insurance Products Trust, Adviser Managed Trust, The KP Funds and SEI Catholic Values Trust. | |||||
| TRUSTEES | ||||||||||
| George J. Sullivan Jr. One Freedom Valley Drive, Oaks, PA 19456 73 yrs. old | Trustee | since 1996 | Retired since January 2012. Self-Employed Consultant, Newfound Consultants Inc. April 1997-December 2011. | 104 | Member of the independent review committee for SEI’s Canadian-registered mutual funds. Director of SEI Opportunity Fund, L.P. to 2010. Director of SEI Alpha Strategy Portfolios, LP from 2007 to 2013. Trustee of SEI Liquid Asset Trust from 1996 to 2016. Trustee/Director of State Street Navigator Securities Lending Trust, The Advisors’ Inner Circle Fund, The Advisors’ Inner Circle Fund II, Bishop Street Funds, SEI Structured Credit Fund, LP, SEI Asset Allocation Trust, SEI Daily Income Trust, SEI Institutional Managed Trust, SEI Institutional International Trust, SEI Institutional Investments Trust, SEI Tax Exempt Trust, SEI Insurance Products Trust, Adviser Managed Trust, The KP Funds and SEI Catholic Values Trust. | |||||
| * | Messrs. Nesher and Doran are Trustees who may be deemed as “interested” persons of the Trust as that term is defined in the 1940 Act by virtue of their affiliation with SIMC and the Trust’s Distributor. |
| 1 | Each trustee shall hold office during the lifetime of this Trust until the election and qualification of his or her successor, or until he or she sooner dies, resigns or is removed in accordance with the Trust’s Declaration of Trust |
| 2 | The Fund Complex includes the following Trusts: SEI Asset Allocation Trust, SEI Daily Income Trust, SEI Institutional Investments Trust, Adviser Managed Trust, SEI Institutional International Trust, SEI Institutional Managed Trust, SEI Liquid Asset Trust, SEI Tax Exempt Trust, SEI Insurance Products Trust and New Covenant Funds. |
| 352 | SEI Institutional Managed Trust / Annual Report / September 30, 2016 |
| Name Address, and Age | Position(s) Held with Trusts | Term of Office and Length of Time Served1 | Principal Occupation(s) During Past Five Years | Number of Portfolios in Fund Complex Overseen by Trustee2 | Other Directorships Held by Trustee | |||||
| TRUSTEES (continued) | ||||||||||
| Nina Lesavoy One Freedom Valley Drive, Oaks, PA 19456 57 yrs. old | Trustee | since 2003 | Founder and Managing Director, Avec Capital (strategic fundraising firm) since 2008. Managing Director, Cue Capital (strategic fundraising firm) from March 2002-March 2008. | 104 | Director of SEI Opportunity Fund, L.P. to 2010. Director of SEI Alpha Strategy Portfolios, LP from 2007 to 2013. Trustee of SEI Liquid Asset Trust from 2003 to 2016. Trustee/Director of SEI Structured Credit Fund, L.P., SEI Asset Allocation Trust, SEI Daily Income Trust, SEI Institutional Managed Trust, SEI Institutional International Trust, SEI Institutional Investments Trust, SEI Tax Exempt Trust, SEI Insurance Products Trust, Adviser Managed Trust and SEI Catholic Values Trust. | |||||
| James M. Williams One Freedom Valley Drive, Oaks, PA 19456 69 yrs. old | Trustee | since 2004 | Vice President and Chief Investment Officer, J. Paul Getty Trust, Non-Profit Foundation for Visual Arts, since December 2002. President, Harbor Capital Advisors and Harbor Mutual Funds, 2000-2002. Director of SEI Alpha Strategy Portfolios, L.P. from 2007 to 2013. Manager, Pension Asset Management, Ford Motor Company, 1997-1999. | 104 | Director of SEI Opportunity Fund, L.P. to 2010. Director of SEI Alpha Strategy Portfolios, LP from 2007 to 2013, Trustee of SEI Liquid Asset Trust from 2004 to 2016. Trustee/Director of Ariel Mutual Funds, SEI Structured Credit Fund, LP, SEI Asset Allocation Trust, SEI Daily Income Trust, SEI Institutional Managed Trust, SEI Institutional International Trust, SEI Institutional Investments Trust, SEI Tax Exempt Trust, SEI Insurance Products Trust, Adviser Managed Trust and SEI Catholic Values Trust. | |||||
| Mitchell A. Johnson One Freedom Valley Drive, Oaks, PA 19456 74 yrs. old | Trustee | since 2007 | Private Investor since 1994. | 104 | Director, Federal Agricultural Mortgage Corporation (Farmer Mac) since 1997. Director of SEI Alpha Strategy Portfolios, LP from 2007 to 2013. Trustee of SEI Liquid Asset Trust from 2007 to 2016. Trustee of the Advisors’ Inner Circle Fund, The Advisors’ Inner Circle Fund II, SEI Asset Allocation Trust, SEI Daily Income Trust, SEI Institutional Managed Trust, SEI Institutional International Trust, SEI Institutional Investments Trust, SEI Tax Exempt Trust, SEI Insurance Products Trust, Adviser Managed Trust, The KP Funds and SEI Catholic Values Trust. | |||||
| Hubert L. Harris, Jr. One Freedom Valley Drive, Oaks, PA 19456 73 yrs. old | Trustee | since 2008 | Retired since December 2005. Owner of Harris Plantation, Inc. since 1995. Chief Executive Officer of Harris CAPM, a consulting asset and property management entity. Chief Executive Officer, INVESCO North America, August 2003-December 2005. Chief Executive Officer and Chair of the Board of Directors, AMVESCAP Retirement, Inc., January 1998- August 2003. | 104 | Director of AMVESCAP PLC from 1993-2004. Served as a director of a bank holding company, 2003-2009. Director, Aaron’s Inc., 2012-present. Chair of the Board of Trustees, Georgia Tech Foundation, Inc. (nonprofit corporation), 2007-2009, and member of the Executive Committee, 2003-2011; currently emeritus trustee. Member of the advisory board of the Georgia Tech Ivan Allen School of Liberal Arts and the Sam Nunn School of International Affairs, 2009-present. Member of the Board of Councilors of the Carter Center (nonprofit corporation). Director of SEI Alpha Strategy Portfolios, LP from 2008 to 2013. Trustee of SEI Asset Allocation Trust, SEI Daily Income Trust, SEI Institutional Managed Trust, SEI Institutional International Trust, SEI Institutional Investments Trust, SEI Tax Exempt Trust, SEI Insurance Products Trust, Adviser Managed Trust and SEI Catholic Values Trust. | |||||
| Susan C. Cote One Freedom Valley Drive Oaks, PA 19456 61 years old | Trustee | since 2016 | Retired since July 2015. Americas Director of Asset Management, Ernest & Young LLP from 2006-2013. Global Asset Management Assurance Leader, Ernest & Young LLP from 2006-2015. Partner Ernest & Young LLP from 1997-2015. Prudential, 1983-1997. Retirement Investment Committee-Treasurer and Chair of Finance, Investment and Audit Committee of the New York Women’s Foundation. Independent Consultant to SEI Liquid Asset Allocation Trust. | 104 | Trustee of SEI Tax Exempt Trust, SEI Daily Income Trust, SEI Institutional International Trust, SEI Institutional Managed Trust, SEI Asset Allocation Trust, SEI Institutional Investments Trust, SEI Insurance Products Trust, Adviser Managed Trust and SEI Catholic Values Trust. | |||||
| OFFICERS | ||||||||||
| Robert A. Nesher One Freedom Valley Drive, Oaks, PA 19456 70 yrs. Old | President and CEO | since 2005 | Currently performs various services on behalf of SEI for which Mr. Nesher is compensated. | N/A | N/A | |||||
| James J. Hoffmayer One Freedom Valley Drive Oaks, PA 19456 43 yrs. old | Controller and Chief Financial Officer | since 2016 | Senior Director, Funds Accounting and Fund Administration, SEI Investments Global Funds Services (since September 2016); Senior Director of Fund Administration, SEI Investments Global Funds Services (since October 2014). Director of Financial Reporting, SEI Investments Global Funds Services (November 2004 – October 2014). | N/A | N/A | |||||
| 1 | Each trustee shall hold office during the lifetime of this Trust until the election and qualification of his or her successor, or until he or she sooner dies, resigns or is removed in accordance with the Trust’s Declaration of Trust. |
| 2 | The Fund Complex includes the following Trusts: SEI Asset Allocation Trust, SEI Daily Income Trust, SEI Institutional Investments Trust, Adviser Managed Trust, SEI Institutional International Trust, SEI Institutional Managed Trust, SEI Liquid Asset Trust, SEI Tax Exempt Trust, SEI Insurance Products Trust and New Covenant Funds. |
| SEI Institutional Managed Trust / Annual Report / September 30, 2016 | 353 |
Trustees and Officers of the Trust (Unaudited) (Concluded)
| Name Address, and Age | Position(s) Held with Trusts | Term of Office and Length of Time Served1 | Principal Occupation(s) During Past Five Years | Number of Portfolios in Fund Complex Overseen by Trustee2 | Other Directorships Held by Trustee | |||||
| OFFICERS (continued) | ||||||||||
Russell Emery One Freedom Oaks, PA 19456 53 yrs. old | Chief Compliance Officer | since 2006 | Chief Compliance Officer of SEI Institutional Investments Trust, SEI Institutional Managed Trust, SEI Asset Allocation Trust, SEI Institutional International Trust, SEI Tax Exempt Trust, The Advisors’ Inner Circle Fund, The Advisors’ Inner Circle Fund II and Bishop Street Funds since March 2006. Chief Compliance Officer of SEI Liquid Asset Trust from 2006 to 2016. Chief Compliance Officer of SEI Structured Credit Fund, LP June 2007. Chief Compliance Officer of Adviser Managed Trust since December 2010. Chief Compliance Officer of SEI Alpha Strategy Portfolios, LP from 2007 to 2013. Chief Compliance Officer of SEI Insurance Products Trust and The KP Funds since 2013. Chief Compliance Officer of O’Connor EQUUS from 2014 to 2016. Chief Compliance Officer of The Advisors’ Inner Circle Fund III, Winton Series Trust and Winton Diversified Opportunities Fund since 2014. Chief Compliance Officer of SEI Catholic Values Trust and Gallery Trust since 2015. | N/A | N/A | |||||
Timothy D Barto One Freedom Valley Drive Oaks, PA 19456 48 yrs. old | Vice President and Secretary | since 2002 | Vice President and Secretary of SEI Institutional Transfer Agent, Inc. since 2009. General Counsel and Secretary of SIMC and the Administrator since 2004. Vice President of SIMC and the Administrator since 1999. Vice President and Assistant Secretary of SEI since 2001. | N/A | N/A | |||||
Aaron Buser One Freedom Oaks, PA 19456 45 yrs. old | Vice President and Assistant Secretary | since 2008 | Vice President and Assistant Secretary of SEI Institutional Transfer Agent, Inc. since 2009. Vice President and Assistant Secretary of SIMC since 2007. Attorney Stark & Stark (law firm), March 2004-July 2007. | N/A | N/A | |||||
David F. McCann One Freedom Oaks, PA 19456 40 yrs. old | Vice President and Assistant Secretary | since 2009 | Vice President and Assistant Secretary of SEI Institutional Transfer Agent, Inc. since 2009. Vice President and Assistant Secretary of SIMC since 2008. Attorney, Drinker Biddle & Heath, LLP (law firm), May 2005 - October 2008. | N/A | N/A | |||||
Stephen G. MacRae One Freedom Oaks, PA 19456 47 yrs. old | Vice President | since 2012 | Director of Global Investment Product Management January 2004 - to present. Global Funds Services, March 2005 to June 2006. | N/A | N/A | |||||
Bridget E. Sudall One Freedom Oaks, PA 19456 36 yrs. old | Anti-Money Laundering Compliance Officer and Privacy Officer | since 2015 | Anti-Money Laundering Compliance Officer and Privacy Officer (since 2015), Senior Associate and AML Officer, Morgan Stanley Alternative Investment Partners, April 2011-March 2015, Investor Services Team Lead, Morgan Stanley Alternative Investment Partners, July 2007-April 2011. | N/A | N/A | |||||
| 1 | Each trustee shall hold office during the lifetime of this Trust until the election and qualification of his or her successor, or until he or she sooner dies, resigns or is removed in accordance with the Trust’s Declaration of Trust. |
| 2 | The Fund Complex includes the following Trusts: SEI Asset Allocation Trust, SEI Daily Income Trust, SEI Institutional Investments Trust, Adviser Managed Trust, SEI Institutional International Trust, SEI Institutional Managed Trust, SEI Liquid Asset Trust, SEI Tax Exempt Trust, SEI Insurance Products Trust and New Covenant Funds. |
| 354 | SEI Institutional Managed Trust / Annual Report / September 30, 2016 |
Disclosure of Fund Expenses (Unaudited)
September 30, 2016
All mutual funds have operating expenses. As a shareholder of a fund, your investment is affected by these ongoing costs, which include (among others) costs for portfolio management, administrative services, and shareholder reports like this one. It is important for you to understand the impact of these costs on your investment returns.
Operating expenses such as these are deducted from the fund’s gross income and directly reduce your final investment return. These expenses are expressed as a percentage of the fund’s average net assets; this percentage is known as the fund’s expense ratio.
The following examples use the expense ratio and are intended to help you understand the ongoing costs (in dollars) of investing in your fund and to compare these costs with those of other mutual funds. The examples are based on an investment of $1,000 made at the beginning of the period shown and held for the entire period.
The table on this page illustrates your fund’s costs in two ways:
• Actual fund return. This section helps you to estimate the actual expenses after fee waivers that your Fund incurred over the period. The “Expenses Paid During Period” column shows the actual dollar expense cost incurred by a $1,000 investment in the Fund, and the “Ending Account Value” number is derived from deducting that expense cost from the Fund’s gross investment return.
You can use this information, together with the actual amount you invested in the Fund, to estimate the expenses you paid over that period. Simply divide your actual account value by $1,000 to arrive at a ratio (for example, an $8,600 account value divided by $1,000 = 8.6), then multiply that ratio by the number shown for your Fund under “Expenses Paid During Period.”
• Hypothetical 5% return. This section helps you compare your Fund’s costs with those of other mutual funds. It assumes that the fund had an annual 5% return before expenses during the year, but that the expense ratio (Column 3) for the period is unchanged. This example is useful in making comparisons because the Securities and Exchange Commission requires all mutual funds to make this 5% calculation. You can assess your Fund’s comparative cost by comparing the hypothetical result for your Fund in the “Expense Paid During Period” column with those that appear in the same charts in the shareholder reports for other funds.
NOTE: Because the return is set at 5% for comparison purposes — NOT your Fund’s actual return — the account values shown may not apply to your specific investment.
| Beginning Account Value 4/1/16 | Ending Account Value 9/30/16 | Annualized Expense Ratios | Expenses Paid During Period * | |||||||||||||
Large Cap Fund |
| |||||||||||||||
Actual Fund Return |
| |||||||||||||||
Class A Shares | $ | 1,000.00 | $ | 1,055.90 | 0.91 | % | $ | 4.67 | ||||||||
Class Y Shares | 1,000.00 | 1,058.10 | 0.66 | 3.39 | ||||||||||||
Hypothetical 5% Return |
| |||||||||||||||
Class A Shares | $ | 1,000.00 | $ | 1,020.46 | 0.91 | % | $ | 4.59 | ||||||||
Class Y Shares | 1,000.00 | 1,021.71 | 0.66 | 3.33 | ||||||||||||
Large Cap Value Fund |
| |||||||||||||||
Actual Fund Return |
| |||||||||||||||
Class A Shares | $ | 1,000.00 | $ | 1,061.70 | 0.91 | % | $ | 4.68 | ||||||||
Class I Shares | 1,000.00 | 1,060.50 | 1.13 | 5.81 | ||||||||||||
Class Y Shares | 1,000.00 | 1,064.60 | 0.66 | 3.39 | ||||||||||||
Hypothetical 5% Return |
| |||||||||||||||
Class A Shares | $ | 1,000.00 | $ | 1,020.46 | 0.91 | % | $ | 4.59 | ||||||||
Class I Shares | 1,000.00 | 1,019.36 | 1.13 | 5.69 | ||||||||||||
Class Y Shares | 1,000.00 | 1,021.71 | 0.66 | 3.32 | ||||||||||||
| Beginning Account Value 4/1/16 | Ending Account Value 9/30/16 | Annualized Expense Ratios | Expenses Paid During Period * | |||||||||||||
Large Cap Growth Fund |
| |||||||||||||||
Actual Fund Return |
| |||||||||||||||
Class A Shares | $ | 1,000.00 | $ | 1,063.20 | 0.91 | % | $ | 4.70 | ||||||||
Class I Shares | 1,000.00 | 1,062.30 | 1.13 | 5.82 | ||||||||||||
Class Y Shares | 1,000.00 | 1,064.90 | 0.66 | 3.40 | ||||||||||||
Hypothetical 5% Return |
| |||||||||||||||
Class A Shares | $ | 1,000.00 | $ | 1,020.46 | 0.91 | % | $ | 4.60 | ||||||||
Class I Shares | 1,000.00 | 1,019.35 | 1.13 | 5.70 | ||||||||||||
Class Y Shares | 1,000.00 | 1,021.71 | 0.66 | 3.33 | ||||||||||||
Tax-Managed Large Cap Fund |
| |||||||||||||||
Actual Fund Return |
| |||||||||||||||
Class A Shares | $ | 1,000.00 | $ | 1,056.60 | 0.91 | % | $ | 4.69 | ||||||||
Class Y Shares | 1,000.00 | 1,057.90 | 0.66 | 3.40 | ||||||||||||
Hypothetical 5% Return |
| |||||||||||||||
Class A Shares | $ | 1,000.00 | $ | 1,020.44 | 0.91 | % | $ | 4.60 | ||||||||
Class Y Shares | 1,000.00 | 1,021.69 | 0.66 | 3.34 | ||||||||||||
| SEI Institutional Managed Trust / Annual Report / September 30, 2016 | 355 |
Disclosure of Fund Expenses (Unaudited) (Concluded)
September 30, 2016
| Beginning Account Value 4/1/16 | Ending Account Value 9/30/16 | Annualized Expense Ratios | Expenses Paid During Period * | |||||||||||||
S&P 500 Index Fund |
| |||||||||||||||
Actual Fund Return |
| |||||||||||||||
Class A Shares | $ | 1,000.00 | $ | 1,061.60 | 0.17 | % | $ | 0.90 | ||||||||
Class E Shares | 1,000.00 | 1,062.60 | 0.69 | 3.55 | ||||||||||||
Class I Shares | 1,000.00 | 1,060.40 | 0.66 | 3.42 | ||||||||||||
Class Y Shares | 1,000.00 | 1,062.50 | 0.27 | 1.39 | ||||||||||||
Hypothetical 5% Return |
| |||||||||||||||
Class A Shares | $ | 1,000.00 | $ | 1,024.13 | 0.17 | % | $ | 0.88 | ||||||||
Class E Shares | 1,000.00 | 1,021.56 | 0.69 | 3.48 | ||||||||||||
Class I Shares | 1,000.00 | 1,021.68 | 0.66 | 3.36 | ||||||||||||
Class Y Shares | 1,000.00 | 1,023.65 | 0.27 | 1.36 | ||||||||||||
Small Cap Fund |
| |||||||||||||||
Actual Fund Return |
| |||||||||||||||
Class A Shares | $ | 1,000.00 | $ | 1,074.20 | 1.16 | % | $ | 6.00 | ||||||||
Class Y Shares | 1,000.00 | 1,076.50 | 0.91 | 4.71 | ||||||||||||
Hypothetical 5% Return |
| |||||||||||||||
Class A Shares | $ | 1,000.00 | $ | 1,019.21 | 1.16 | % | $ | 5.84 | ||||||||
Class Y Shares | 1,000.00 | 1,020.46 | 0.91 | 4.58 | ||||||||||||
Small Cap Value Fund |
| |||||||||||||||
Actual Fund Return |
| |||||||||||||||
Class A Shares | $ | 1,000.00 | $ | 1,070.80 | 1.16 | % | $ | 5.99 | ||||||||
Class I Shares | 1,000.00 | 1,069.20 | 1.38 | 7.13 | ||||||||||||
Class Y Shares | 1,000.00 | 1,071.70 | 0.91 | 4.70 | ||||||||||||
Hypothetical 5% Return |
| |||||||||||||||
Class A Shares | $ | 1,000.00 | $ | 1,019.21 | 1.16 | % | $ | 5.85 | ||||||||
Class I Shares | 1,000.00 | 1,018.11 | 1.38 | 6.95 | ||||||||||||
Class Y Shares | 1,000.00 | 1,020.46 | 0.91 | 4.59 | ||||||||||||
Small Cap Growth Fund |
| |||||||||||||||
Actual Fund Return |
| |||||||||||||||
Class A Shares | $ | 1,000.00 | $ | 1,111.70 | 1.13 | % | $ | 5.97 | ||||||||
Class I Shares | 1,000.00 | 1,110.10 | 1.38 | 7.28 | ||||||||||||
Class Y Shares | 1,000.00 | 1,113.10 | 0.88 | 4.65 | ||||||||||||
Hypothetical 5% Return |
| |||||||||||||||
Class A Shares | $ | 1,000.00 | $ | 1,019.35 | 1.13 | % | $ | 5.70 | ||||||||
Class I Shares | 1,000.00 | 1,018.10 | 1.38 | 6.96 | ||||||||||||
Class Y Shares | 1,000.00 | 1,020.60 | 0.88 | 4.45 | ||||||||||||
Tax-Managed Small/Mid Cap Fund |
| |||||||||||||||
Actual Fund Return |
| |||||||||||||||
Class A Shares | $ | 1,000.00 | $ | 1,067.30 | 1.13 | % | $ | 5.84 | ||||||||
Class Y Shares | 1,000.00 | 1,068.50 | 0.91 | 4.71 | ||||||||||||
Hypothetical 5% Return |
| |||||||||||||||
Class A Shares | $ | 1,000.00 | $ | 1,019.35 | 1.13 | % | $ | 5.71 | ||||||||
Class Y Shares | 1,000.00 | 1,020.44 | 0.91 | 4.60 | ||||||||||||
Mid-Cap Fund |
| |||||||||||||||
Actual Fund Return |
| |||||||||||||||
Class A Shares | $ | 1,000.00 | $ | 1,067.60 | 1.00 | % | $ | 5.16 | ||||||||
Class I Shares | 1,000.00 | 1,066.00 | 1.22 | 6.30 | ||||||||||||
Class Y Shares | 1,000.00 | 1,068.90 | 0.75 | 3.88 | ||||||||||||
Hypothetical 5% Return |
| |||||||||||||||
Class A Shares | $ | 1,000.00 | $ | 1,020.01 | 1.00 | % | $ | 5.04 | ||||||||
Class I Shares | 1,000.00 | 1,018.90 | 1.22 | 6.16 | ||||||||||||
Class Y Shares | 1,000.00 | 1,021.25 | 0.75 | 3.79 | ||||||||||||
| Beginning Account Value 4/1/16 | Ending Account Value 9/30/16 | Annualized Expense Ratios | Expenses Paid During Period * | |||||||||||||
U.S. Managed Volatility Fund |
| |||||||||||||||
Actual Fund Return |
| |||||||||||||||
Class A Shares | $ | 1,000.00 | $ | 1,034.40 | 1.02 | % | $ | 5.17 | ||||||||
Class I Shares | 1,000.00 | 1,033.80 | 1.27 | 6.44 | ||||||||||||
Class Y Shares | 1,000.00 | 1,036.20 | 0.77 | 3.90 | ||||||||||||
Hypothetical 5% Return |
| |||||||||||||||
Class A Shares | $ | 1,000.00 | $ | 1,019.92 | 1.02 | % | $ | 5.14 | ||||||||
Class I Shares | 1,000.00 | 1,018.66 | 1.27 | 6.40 | ||||||||||||
Class Y Shares | 1,000.00 | 1,021.16 | 0.77 | 3.88 | ||||||||||||
Global Managed Volatility Fund |
| |||||||||||||||
Actual Fund Return |
| |||||||||||||||
Class A Shares | $ | 1,000.00 | $ | 1,040.70 | 1.13 | % | $ | 5.76 | ||||||||
Class I Shares | 1,000.00 | 1,040.60 | 1.38 | 7.02 | ||||||||||||
Class Y Shares | 1,000.00 | 1,042.40 | 0.88 | 4.49 | ||||||||||||
Hypothetical 5% Return |
| |||||||||||||||
Class A Shares | $ | 1,000.00 | $ | 1,019.36 | 1.13 | % | $ | 5.70 | ||||||||
Class I Shares | 1,000.00 | 1,018.12 | 1.38 | 6.95 | ||||||||||||
Class Y Shares | 1,000.00 | 1,020.60 | 0.88 | 4.44 | ||||||||||||
Tax-Managed Managed Volatility Fund |
| |||||||||||||||
Actual Fund Return |
| |||||||||||||||
Class A Shares | $ | 1,000.00 | $ | 1,029.50 | 1.02 | % | $ | 5.18 | ||||||||
Class Y Shares | 1,000.00 | 1,030.00 | 0.77 | 3.91 | ||||||||||||
Hypothetical 5% Return |
| |||||||||||||||
Class A Shares | $ | 1,000.00 | $ | 1,019.90 | 1.02 | % | $ | 5.15 | ||||||||
Class Y Shares | 1,000.00 | 1,021.15 | 0.77 | 3.89 | ||||||||||||
Real Estate Fund |
| |||||||||||||||
Actual Fund Return |
| |||||||||||||||
Class A Shares | $ | 1,000.00 | $ | 1,042.40 | 1.16 | % | $ | 5.92 | ||||||||
Class I Shares | 1,000.00 | 1,041.20 | 1.38 | 7.04 | ||||||||||||
Class Y Shares | 1,000.00 | 1,043.70 | 0.91 | 4.65 | ||||||||||||
Hypothetical 5% Return |
| |||||||||||||||
Class A Shares | $ | 1,000.00 | $ | 1,019.20 | 1.16 | % | $ | 5.86 | ||||||||
Class I Shares | 1,000.00 | 1,018.10 | 1.38 | 6.96 | ||||||||||||
Class Y Shares | 1,000.00 | 1,020.45 | 0.91 | 4.60 | ||||||||||||
Enhanced Income Fund |
| |||||||||||||||
Actual Fund Return |
| |||||||||||||||
Class A Shares | $ | 1,000.00 | $ | 1,023.00 | 0.62 | % | $ | 3.13 | ||||||||
Class I Shares | 1,000.00 | 1,021.70 | 0.87 | 4.39 | ||||||||||||
Class Y Shares | 1,000.00 | 1,023.80 | 0.48 | 2.42 | ||||||||||||
Hypothetical 5% Return |
| |||||||||||||||
Class A Shares | $ | 1,000.00 | $ | 1,021.91 | 0.62 | % | $ | 3.13 | ||||||||
Class I Shares | 1,000.00 | 1,020.66 | 0.87 | 4.39 | ||||||||||||
Class Y Shares | 1,000.00 | 1,022.61 | 0.48 | 2.42 | ||||||||||||
Core Fixed Income Fund |
| |||||||||||||||
Actual Fund Return |
| |||||||||||||||
Class A Shares | $ | 1,000.00 | $ | 1,033.70 | 0.69 | % | $ | 3.50 | ||||||||
Class I Shares | 1,000.00 | 1,032.50 | 0.91 | 4.62 | ||||||||||||
Class Y Shares | 1,000.00 | 1,034.90 | 0.44 | 2.23 | ||||||||||||
Hypothetical 5% Return |
| |||||||||||||||
Class A Shares | $ | 1,000.00 | $ | 1,021.56 | 0.69 | % | $ | 3.48 | ||||||||
Class I Shares | 1,000.00 | 1,020.46 | 0.91 | 4.59 | ||||||||||||
Class Y Shares | 1,000.00 | 1,022.81 | 0.44 | 2.22 | ||||||||||||
| 356 | SEI Institutional Managed Trust / Annual Report / September 30, 2016 |
| Beginning Account Value 4/1/16 | Ending Account Value 9/30/16 | Annualized Expense Ratios | Expenses Paid During Period * | |||||||||||||
U.S. Fixed Income Fund |
| |||||||||||||||
Actual Fund Return |
| |||||||||||||||
Class A Shares | $ | 1,000.00 | $ | 1,027.60 | 0.68 | % | $ | 3.45 | ||||||||
Class Y Shares | 1,000.00 | 1,028.90 | 0.43 | 2.18 | ||||||||||||
Hypothetical 5% Return |
| |||||||||||||||
Class A Shares | $ | 1,000.00 | $ | 1,021.60 | 0.68 | % | $ | 3.44 | ||||||||
Class Y Shares | 1,000.00 | 1,022.85 | 0.43 | 2.17 | ||||||||||||
High Yield Bond Fund |
| |||||||||||||||
Actual Fund Return |
| |||||||||||||||
Class A Shares | $ | 1,000.00 | $ | 1,123.30 | 0.91 | % | $ | 4.83 | ||||||||
Class I Shares | 1,000.00 | 1,119.70 | 1.14 | 6.04 | ||||||||||||
Class Y Shares | 1,000.00 | 1,124.70 | 0.66 | 3.51 | ||||||||||||
Hypothetical 5% Return |
| |||||||||||||||
Class A Shares | $ | 1,000.00 | $ | 1,020.45 | 0.91 | % | $ | 4.60 | ||||||||
Class I Shares | 1,000.00 | 1,019.30 | 1.14 | 5.76 | ||||||||||||
Class Y Shares | 1,000.00 | 1,021.70 | 0.66 | 3.34 | ||||||||||||
Conservative Income Fund |
| |||||||||||||||
Actual Fund Return |
| |||||||||||||||
Class A Shares | $ | 1,000.00 | $ | 1,001.60 | 0.30 | % | $ | 1.32** | ||||||||
Class Y Shares | 1,000.00 | 1,002.00 | 0.20 | 0.88** | ||||||||||||
Hypothetical 5% Return |
| |||||||||||||||
Class A Shares | $ | 1,000.00 | $ | 1,023.50 | 0.30 | % | $ | 1.52 | ||||||||
Class Y Shares | 1,000.00 | 1,024.00 | 0.20 | 1.01 | ||||||||||||
Tax-Free Conservative Income Fund |
| |||||||||||||||
Actual Fund Return |
| |||||||||||||||
Class A Shares | $ | 1,000.00 | $ | 1,001.20 | 0.30 | % | $ | 1.32** | ||||||||
Class Y Shares | 1,000.00 | 1,001.60 | 0.20 | 0.88** | ||||||||||||
Hypothetical 5% Return |
| |||||||||||||||
Class A Shares | $ | 1,000.00 | $ | 1,023.50 | 0.30 | % | $ | 1.52 | ||||||||
Class Y Shares | 1,000.00 | 1,024.00 | 0.20 | 1.01 | ||||||||||||
Real Return Fund |
| |||||||||||||||
Actual Fund Return |
| |||||||||||||||
Class A Shares | $ | 1,000.00 | $ | 1,009.00 | 0.47 | % | $ | 2.36 | ||||||||
Class Y Shares | 1,000.00 | 1,009.90 | 0.37 | 1.86 | ||||||||||||
Hypothetical 5% Return |
| |||||||||||||||
Class A Shares | $ | 1,000.00 | $ | 1,022.65 | 0.47 | % | $ | 2.38 | ||||||||
Class Y Shares | 1,000.00 | 1,023.15 | 0.37 | 1.87 | ||||||||||||
Dynamic Asset Allocation Fund |
| |||||||||||||||
Actual Fund Return |
| |||||||||||||||
Class A Shares | $ | 1,000.00 | $ | 1,061.50 | 0.77 | % | $ | 3.97 | ||||||||
Class Y Shares | 1,000.00 | 1,062.50 | 0.52 | 2.68 | ||||||||||||
Hypothetical 5% Return |
| |||||||||||||||
Class A Shares | $ | 1,000.00 | $ | 1,021.15 | 0.77 | % | $ | 3.89 | ||||||||
Class Y Shares | 1,000.00 | 1,022.40 | 0.52 | 2.63 | ||||||||||||
* Expenses are equal to the Fund’s annualized expense ratio multiplied by the average account value over the period, multiplied by 183/366 (to reflect the one-half year period shown).
| Beginning Account Value 4/1/16 | Ending Account Value 9/30/16 | Annualized Expense Ratios | Expenses Paid During Period * | |||||||||||||
Multi-Strategy Alternative Fund |
| |||||||||||||||
Actual Fund Return |
| |||||||||||||||
Class A Shares | $ | 1,000.00 | $ | 1,029.80 | 1.40 | % | $ | 7.10 | ||||||||
Class Y Shares | 1,000.00 | 1,029.80 | 1.15 | 5.84 | ||||||||||||
Hypothetical 5% Return |
| |||||||||||||||
Class A Shares | $ | 1,000.00 | $ | 1,018.00 | 1.40 | % | $ | 7.06 | ||||||||
Class Y Shares | 1,000.00 | 1,019.25 | 1.15 | 5.81 | ||||||||||||
Multi-Asset Accumulation Fund |
| |||||||||||||||
Actual Fund Return |
| |||||||||||||||
Class A Shares | $ | 1,000.00 | $ | 1,075.10 | 1.19 | % | $ | 6.17 | ||||||||
Class Y Shares | 1,000.00 | 1,076.90 | 0.94 | 4.88 | ||||||||||||
Hypothetical 5% Return |
| |||||||||||||||
Class A Shares | $ | 1,000.00 | $ | 1,019.05 | 1.19 | % | $ | 6.01 | ||||||||
Class Y Shares | 1,000.00 | 1,020.30 | 0.94 | 4.75 | ||||||||||||
Multi-Asset Income Fund |
| |||||||||||||||
Actual Fund Return |
| |||||||||||||||
Class A Shares | $ | 1,000.00 | $ | 1,079.00 | 0.82 | % | $ | 4.25 | ||||||||
Class Y Shares | 1,000.00 | 1,079.60 | 0.72 | 3.73 | ||||||||||||
Hypothetical 5% Return |
| |||||||||||||||
Class A Shares | $ | 1,000.00 | $ | 1,020.91 | 0.82 | % | $ | 4.13 | ||||||||
Class Y Shares | 1,000.00 | 1,021.41 | 0.72 | 3.63 | ||||||||||||
Multi-Asset Inflation Managed Fund |
| |||||||||||||||
Actual Fund Return |
| |||||||||||||||
Class A Shares | $ | 1,000.00 | $ | 1,024.40 | 1.25 | % | $ | 6.33 | ||||||||
Class Y Shares | 1,000.00 | 1,026.80 | 1.00 | 5.07 | ||||||||||||
Hypothetical 5% Return |
| |||||||||||||||
Class A Shares | $ | 1,000.00 | $ | 1,018.75 | 1.25 | % | $ | 6.31 | ||||||||
Class Y Shares | 1,000.00 | 1,020.00 | 1.00 | 5.05 | ||||||||||||
Multi-Asset Capital Stability Fund |
| |||||||||||||||
Actual Fund Return |
| |||||||||||||||
Class A Shares | $ | 1,000.00 | $ | 1,009.00 | 0.64 | % | $ | 3.21 | ||||||||
Class Y Shares | 1,000.00 | 1,008.90 | 0.54 | 2.71 | ||||||||||||
Hypothetical 5% Return |
| |||||||||||||||
Class A Shares | $ | 1,000.00 | $ | 121.80 | 0.64 | % | $ | 3.23 | ||||||||
Class Y Shares | 1,000.00 | 1,022.30 | 0.54 | 2.73 | ||||||||||||
Long/Short Alternative Fund |
| |||||||||||||||
Actual Fund Return |
| |||||||||||||||
Class A Shares | $ | 1,000.00 | $ | 1,023.00 | 2.10 | % | $ | 10.62 | ||||||||
Class Y Shares | 1,000.00 | 1,024.00 | 0.92 | 4.66 | ||||||||||||
Hypothetical 5% Return |
| |||||||||||||||
Class A Shares | $ | 1,000.00 | $ | 1,014.50 | 2.10 | % | $ | 10.58 | ||||||||
Class Y Shares | 1,000.00 | 1,020.40 | 0.92 | 4.65 | ||||||||||||
** Expenses are equal to the Fund’s annualized expense ratio multiplied by the average account value over the period, multiplied by 161/366 (to reflect the period since inception to period end).
| SEI Institutional Managed Trust / Annual Report / September 30, 2016 | 357 |
Board of Trustees Considerations in Approving the Advisory and Sub-Advisory Agreement (Unaudited)
SEI Institutional Managed Trust (the “Trust”) and SEI Investments Management Corporation (“SIMC”) have entered into an investment advisory agreement (the “Advisory Agreement”). Pursuant to the Advisory Agreement, SIMC is responsible for the investment advisory services provided to the series of the Trust (the “Funds”). Pursuant to separate sub-advisory agreements with SIMC (the “Sub-Advisory Agreements” and, together with the Advisory Agreement, the “Investment Advisory Agreements”), and under the supervision of SIMC and the Trust’s Board of Trustees (the “Board”), the sub-advisers (each, a “Sub-Adviser” and collectively, the “Sub-Advisers”) provide security selection and certain other advisory services with respect to all or a discrete portion of the assets of the Funds. The Sub-Advisers are also responsible for managing their employees who provide services to the Funds. The Sub-Advisers are selected based primarily upon the research and recommendations of SIMC, which evaluates quantitatively and qualitatively the Sub-Advisers’ skills and investment results in managing assets for specific asset classes, investment styles and strategies.
The Investment Company Act of 1940, as amended (the “1940 Act”), requires that the initial approval of, as well as the continuation of, the Funds’ Investment Advisory Agreements be specifically approved: (i) by the vote of the Board or by a vote of the shareholders of the Funds; and (ii) by the vote of a majority of the Trustees who are not parties to the Investment Advisory Agreements or “interested persons” of any party (the “Independent Trustees”), cast in person at a meeting called for the purpose of voting on such approval(s). In connection with their consideration of such approval(s), the Funds’ Trustees must request and evaluate, and SIMC and the Sub-Advisers are required to furnish, such information as may be reasonably necessary to evaluate the terms of the Investment Advisory Agreements. In addition, the Securities and Exchange Commission takes the position that, as part of their fiduciary duties with respect to a mutual fund’s fees, mutual fund boards are required to evaluate the material factors applicable to a decision to approve an Investment Advisory Agreement.
Consistent with these responsibilities, the Board calls and holds meetings each year to consider whether to approve new and/or renew existing Investment Advisory Agreements between the Trust and SIMC and SIMC and the Sub-Advisers with respect to the Funds of the Trust. In preparation for these meetings, the Board requests and reviews a wide variety of materials provided by SIMC and the Sub-Advisers, including information about SIMC’s and the Sub-Advisers’ affiliates, personnel and operations and the services provided pursuant to the Investment Advisory Agreements. The Board also receives data from third parties. This information is provided in addition to the detailed information about the Funds that the Board reviews during the course of each year, including information that relates to Fund operations and Fund performance. The Trustees also receive a memorandum from counsel regarding the responsibilities of Trustees in connection with their consideration of whether to approve the Trust’s Investment Advisory Agreements. Finally, the Independent Trustees receive advice from independent counsel to the Independent Trustees, meet in executive sessions outside the presence of Fund management and participate in question and answer sessions with representatives of SIMC and the Sub-Advisers.
Specifically, during the course of the Trust’s fiscal year, the Board requested and received written materials from SIMC and the Sub-Advisers regarding: (i) the quality of SIMC’s and the Sub-Advisers’ investment management and other services; (ii) SIMC’s and the Sub-Advisers’ investment management personnel; (iii) SIMC’s and the Sub-Advisers’ operations and financial condition; (iv) SIMC’s and the Sub-Advisers’ brokerage practices (including any soft dollar arrangements) and investment strategies; (v) the level of the advisory fees that SIMC charges the Funds and the level of the sub-advisory fees that SIMC pays the Sub-Advisers, compared with fees each charge to comparable accounts; (vi) the advisory fees charged by SIMC and the Funds’ overall fees and operating expenses compared with peer groups of mutual funds prepared by Broadridge, an independent provider of investment company data; (vii) the level of SIMC’s and the Sub-Advisers’ profitability from their Fund-related operations; (viii) SIMC’s and the Sub-Advisers’ compliance program, including a description of material compliance matters and material compliance violations; (ix) SIMC’s potential economies of scale; (x) SIMC’s and the Sub-Advisers’ policies on and compliance procedures for personal securities transactions; (xi) SIMC’s and the Sub-Advisers’ expertise and resources in domestic and/or international financial markets; and (xii) the Funds’ performance over various periods of time compared with peer groups of mutual funds prepared by Broadridge and the Funds’ benchmark indices.
At the March 28-30, 2016 meeting of the Board, the Trustees, including a majority of the Independent Trustees, approved the renewal of the Advisory Agreement. Also, each Sub-Advisory Agreement was either initially approved or, if the Sub-Advisory Agreement was already in effect (unless operating under an initial two-year term), renewed at meetings of the Board held during the course of the Trust’s fiscal year on December 7-9, 2015, March 28-30, 2016, June 20-22, 2016 and September 13-14, 2016. In each case, the Board’s approval (or renewal) was based on
| 358 | SEI Institutional Managed Trust / Annual Report / September 30, 2016 |
its consideration and evaluation of the factors described above, as discussed at the meetings and at prior meetings. The following discusses some, but not all, of the factors that were considered by the Board in connection with its assessment of the Investment Advisory Agreements.
Nature, Extent and Quality of Services. The Board considered the nature, extent and quality of the services provided by SIMC and the Sub-Advisers to the Funds and the resources of SIMC and the Sub-Advisers and their affiliates dedicated to the Funds. In this regard, the Trustees evaluated, among other things, SIMC’s and each Sub-Adviser’s personnel, experience, track record and compliance program. Following evaluation, the Board concluded that, within the context of its full deliberations, the nature, extent and quality of services provided by SIMC and the Sub-Advisers to the Funds and the resources of SIMC and the Sub-Advisers and their affiliates dedicated to the Funds were sufficient to support the renewal of the Investment Advisory Agreements. In addition to advisory services, the Board considered the nature and quality of certain administrative, transfer agency and other non-investment advisory services provided to the Funds by SIMC and/or its affiliates.
Performance. In determining whether to renew SIMC’s Advisory Agreement, the Trustees considered the Funds’ performance relative to their peer groups and appropriate indexes/benchmarks. The Trustees reviewed performance information for each Fund, noting that they receive performance reports that permit them to monitor each Fund’s performance at board meetings throughout the year. As part of this review, the Trustees considered the composition of each peer group and selection criteria. In assessing Fund performance, the Trustees considered a report compiled by Broadridge, an independent third-party that was engaged to prepare an assessment of the Funds in connection with the renewal of the Advisory Agreement (the “Broadridge Report”). The Broadridge Report included metrics on risk analysis and volatility versus total return (except when such metric was not available due to a limited operating history), net total return and performance consistency for the Funds and a universe of comparable funds. Based on the materials considered and discussed at the meetings, the Trustees found Fund performance satisfactory, or, where performance was materially below the benchmark and/or peer group, the Trustees were satisfied with the reasons provided to explain such performance. In connection with the approval or renewal of Sub-Advisory Agreements, the Board considered the performance of the Sub-Adviser relative to appropriate indexes/benchmarks. Following evaluation, the Board concluded that, within the context of its full deliberations, the performance of the Funds was sufficient to support renewal of SIMC’s Advisory Agreement, and the performance of each Sub-Adviser was sufficient to support approval or renewal of the Sub-Advisory Agreement.
Fees. With respect to the Funds’ expenses under the Investment Advisory Agreements, the Trustees considered the rate of compensation called for by the Investment Advisory Agreements and the Funds’ net operating expense ratio in comparison to those of the Funds’ respective peer groups. In assessing Fund expenses, the Trustees considered the information in the Broadridge Report, which included various metrics related to fund expenses, including, but not limited to, contractual management fees at various fee levels, actual management fees (including transfer agent expenses), and actual total expenses (including, solely with respect to the Multi-Strategy Alternative Fund, underlying fund expenses) for the Funds and a universe of comparable funds. Based on the materials considered and discussion at the meetings, the Trustees further determined that fees were either shown to be below the peer average in the comparative fee analysis, or that there was a reasonable basis for the fee level. The Trustees also considered the effects of SIMC’s voluntary waiver of management and other fees to prevent total Fund operating expenses from exceeding a specified cap and concluded that SIMC, through waivers, has maintained the Funds’ net operating expenses at competitive levels for its distribution channels. In determining the appropriateness of fees, the Board also took into consideration the impact of fees incurred indirectly by the Funds as a result of investments into underlying funds, including funds from which SIMC or its affiliates earn fees. The Board also took into consideration compensation earned from the Funds by SIMC or its affiliates for non-advisory services, such as administration, transfer agency, shareholder services or brokerage, and considered whether SIMC and its affiliates may have realized other benefits from their relationship with the Funds, such as any research and brokerage services received under soft dollar arrangements. When considering fees paid to Sub-Advisers, the Board took into account the fact that the Sub-Advisers are compensated by SIMC and not by the Funds directly, and that such compensation with respect to any unaffiliated Sub-Adviser reflects an arms-length negotiation between the Sub-Adviser and SIMC. Following evaluation, the Board concluded that, within the context of its full deliberations, the expenses of the Funds are reasonable and supported renewal of the Investment Advisory Agreements. The Board also considered whether the Sub-Advisers and their affiliates may have realized other benefits from their relationship with the Funds, such as any research and brokerage services received under soft dollar arrangements.
| SEI Institutional Managed Trust / Annual Report / September 30, 2016 | 359 |
Board of Trustees Considerations in Approving the Advisory and Sub-Advisory Agreement (Unaudited) (Concluded)
Profitability. With regard to profitability, the Trustees considered compensation flowing to SIMC and the Sub-Advisers and their affiliates, directly or indirectly. The Trustees considered whether the levels of compensation and profitability were reasonable. As with the fee levels, when considering the profitability of the Sub-Advisers, the Board took into account the fact that compensation with respect to any unaffiliated Sub-Adviser reflects an arms-length negotiation between the Sub-Adviser and SIMC. In connection with the approval or renewal of each Sub-Advisory Agreement, the Board also took into consideration the impact that the fees paid to the Sub-Adviser have on SIMC’s advisory fee margin and profitability. Based on this evaluation, the Board concluded that, within the context of its full deliberations, the profitability of each of SIMC and the Sub-Advisers is reasonable and supported renewal of the Investment Advisory Agreements.
Economies of Scale. With respect to the Advisory Agreement, the Trustees considered whether any economies of scale were being realized by SIMC and their affiliates and, if so, whether the benefits of such economies of scale were passed along to the Funds’ shareholders through a graduated investment advisory fee schedule or other means, including any fee waivers by SIMC and its affiliates. The Trustees recognized that economies of scale are difficult to identify and quantify and are rarely identifiable on a fund-by-fund basis. Based on this evaluation, the Board determined that the fees were reasonable in light of the information that was provided by SIMC with respect to economies of scale.
Based on the Trustees’ deliberation and their evaluation of the information described above, the Board, including all of the Independent Trustees, with the assistance of Fund counsel and Independent Trustees’ counsel, unanimously approved the approval or renewal, as applicable, of the Investment Advisory Agreements and concluded that the compensation under the Investment Advisory Agreements is fair and reasonable in light of such services and expenses and such other matters as the Trustees considered to be relevant in the exercise of their reasonable judgment. In the course of its deliberations, the Board did not identify any particular factor (or conclusion with respect thereto) or single piece of information that was all-important, controlling or determinative of its decision, but considered all of the factors together, and each Trustee may have attributed different weights to the various factors (and conclusions with respect thereto) and information.
| 360 | SEI Institutional Managed Trust / Annual Report / September 30, 2016 |
Notice Shareholders (Unaudited)
For shareholders who do not have a September 30, 2016, taxable year end, this notice is for informational purposes only. For shareholders with a September 30, 2016, taxable year end, please consult your tax adviser as to the pertinence of this notice.
For the fiscal year ended September 30, 2016, the Funds are designating long term and qualifying dividend income with regard to distributions paid during the year as follows:
| (A) Tax-Exempt Income Distribution (Tax Basis) | (B) Long Term Capital Gains Distributions (Tax Basis) | (C) Ordinary Income Distributions (Tax Basis) | Total Distributions (Tax Basis) | (D) Dividends Qualifying for Corporate Dividends Rec. Deduction (1) | ||||||||
| Large Cap Fund | 0.00% | 94.11% | 5.89% | 100.00% | 100.00% | |||||||
| Large Cap Value Fund | 0.00% | 90.13% | 9.87% | 100.00% | 100.00% | |||||||
| Large Cap Growth Fund | 0.00% | 99.81% | 0.19% | 100.00% | 100.00% | |||||||
| Tax-Managed Large Cap Fund | 0.00% | 0.00% | 100.00% | 100.00% | 100.00% | |||||||
| S&P 500 Index Fund | 0.00% | 19.01% | 80.99% | 100.00% | 96.29% | |||||||
| Small Cap Fund | 0.00% | 92.45% | 7.55% | 100.00% | 93.76% | |||||||
| Small Cap Value Fund | 0.00% | 89.75% | 10.25% | 100.00% | 100.00% | |||||||
| Small Cap Growth Fund | 0.00% | 0.00% | 0.00% | 0.00% | 0.00% | |||||||
| Tax-Managed Small/Mid Cap Fund | 0.00% | 0.00% | 100.00% | 100.00% | 100.00% | |||||||
| Mid-Cap Fund | 0.00% | 74.33% | 25.67% | 100.00% | 51.63% | |||||||
| U.S. Managed Volatility Fund | 0.00% | 69.98% | 30.02% | 100.00% | 98.50% | |||||||
| Global Managed Volatility Fund | 0.00% | 19.90% | 80.10% | 100.00% | 11.74% | |||||||
| Tax-Managed Managed Volatility Fund | 0.00% | 70.81% | 29.19% | 100.00% | 100.00% | |||||||
| Real Estate Fund | 0.00% | 81.45% | 18.55% | 100.00% | 0.00% | |||||||
| Enhanced Income Fund | 0.00% | 0.00% | 100.00% | 100.00% | 0.00% | |||||||
| Core Fixed Income Fund | 0.00% | 0.00% | 100.00% | 100.00% | 0.00% | |||||||
| U.S. Fixed Income Fund | 0.00% | 2.63% | 97.37% | 100.00% | 0.00% | |||||||
| High Yield Bond Fund | 0.00% | 0.00% | 100.00% | 100.00% | 0.00% | |||||||
| Conservative Income Fund | 0.00% | 0.00% | 100.00% | 100.00% | 0.00% | |||||||
| Tax-Free Conservative Income Fund | 100.00% | 0.00% | 0.00% | 100.00% | 0.00% | |||||||
| Real Return Fund | 0.00% | 0.00% | 0.00% | 0.00% | 0.00% | |||||||
| Dynamic Asset Allocation Fund | 0.00% | 0.00% | 100.00% | 100.00% | 98.55% | |||||||
| Multi-Strategy Alternative Fund | 0.00% | 38.72% | 61.28% | 100.00% | 17.99% | |||||||
| Multi-Asset Accumulation Fund | 0.00% | 37.86% | 62.14% | 100.00% | 3.57% | |||||||
| Multi-Asset Income Fund | 0.00% | 5.00% | 95.00% | 100.00% | 3.98% | |||||||
| Multi-Asset Inflation Managed Fund | 0.00% | 0.00% | 100.00% | 100.00% | 84.11% | |||||||
| Multi-Asset Capital Stability Fund | 0.00% | 31.25% | 68.75% | 100.00% | 10.69% | |||||||
| Long/Short Alternative Fund | 0.00% | 0.00% | 0.00% | 0.00% | 0.00% |
| SEI Institutional Managed Trust / Annual Report / September 30, 2016 | 361 |
Notice Shareholders (Unaudited) (Concluded)
| (E) Qualifying Dividend Income (15% Tax Rate for QDI) (2) | U.S. Government Interest (3) | Interest Related Dividends (4) | Short-Term Capital Gain Dividends (5) | |||||||
| Large Cap Fund | 100.00% | 0.01% | 0.00% | 0.00% | ||||||
| Large Cap Value Fund | 100.00% | 0.00% | 0.00% | 0.00% | ||||||
| Large Cap Growth Fund | 100.00% | 0.05% | 0.01% | 0.00% | ||||||
| Tax-Managed Large Cap Fund | 100.00% | 0.01% | 0.01% | 0.00% | ||||||
| S&P 500 Index Fund | 96.59% | 0.01% | 0.01% | 100.00% | ||||||
| Small Cap Fund | 91.89% | 0.00% | 0.01% | 100.00% | ||||||
| Small Cap Value Fund | 100.00% | 0.02% | 0.01% | 0.00% | ||||||
| Small Cap Growth Fund | 0.00% | 0.00% | 0.00% | 0.00% | ||||||
| Tax-Managed Small/Mid Cap Fund | 100.00% | 0.02% | 0.01% | 0.00% | ||||||
| Mid-Cap Fund | 51.41% | 0.01% | 0.01% | 100.00% | ||||||
| U.S. Managed Volatility Fund | 99.30% | 0.01% | 0.01% | 100.00% | ||||||
| Global Managed Volatility Fund | 36.40% | 0.01% | 0.00% | 0.00% | ||||||
| Tax-Managed Managed Volatility Fund | 100.00% | 0.02% | 0.02% | 0.00% | ||||||
| Real Estate Fund | 0.00% | 0.00% | 0.00% | 0.00% | ||||||
| Enhanced Income Fund | 0.00% | 0.00% | 0.00% | 0.00% | ||||||
| Core Fixed Income Fund | 0.00% | 10.90% | 87.51% | 100.00% | ||||||
| U.S. Fixed Income Fund | 0.00% | 13.65% | 87.98% | 0.00% | ||||||
| High Yield Bond Fund | 0.00% | 0.00% | 82.59% | 0.00% | ||||||
| Conservative Income Fund | 0.00% | 1.46% | 96.10% | 0.00% | ||||||
| Tax-Free Conservative Income Fund | 0.00% | 0.00% | 0.00% | 0.00% | ||||||
| Real Return Fund | 0.00% | 0.00% | 0.00% | 0.00% | ||||||
| Dynamic Asset Allocation Fund | 95.26% | 0.00% | 0.09% | 0.00% | ||||||
| Multi-Strategy Alternative Fund | 18.12% | 0.00% | 0.00% | 0.00% | ||||||
| Multi-Asset Accumulation Fund | 10.91% | 11.00% | 0.11% | 0.00% | ||||||
| Multi-Asset Income Fund | 3.94% | 0.09% | 76.55% | 100.00% | ||||||
| Multi-Asset Inflation Managed Fund | 83.10% | 13.12% | 0.00% | 0.00% | ||||||
| Multi-Asset Capital Stability Fund | 10.25% | 22.53% | 3.07% | 100.00% | ||||||
| Long/Short Alternative Fund | 0.00% | 0.00% | 0.00% | 0.00% |
| (1) | Qualifying dividends represent dividends which qualify for the corporate dividends received deduction. |
| (2) | The percentage in this column represents the amount of “Qualifying Dividend Income” is reflected as a percentage of “Ordinary Income Distributions.” It is the intention of each of the aforementioned funds to designate the maximum amount permitted by the law. The information reported herein may differ from the information and distributions taxable to the shareholders for the calendar year ending December 31, 2016. Complete information will be computed and reported in conjunction with your 2016 Form 1099-DIV. |
| (3) | “U.S. Government Interest” represents the amount of interest that was derived from direct U.S. Government obligations and distributed during the fiscal year. This amount is reflected as a percentage of total ordinary income distributions (the total of short term capital gain and net investment income distributions). Generally, interest from direct U.S. Government obligations is exempt from state income tax. However, for shareholders of the SEI Institutional Trust, who are residents of California, Connecticut and New York, the statutory threshold requirements were not satisfied to permit exemption of these amounts from state income. |
| (4) | The percentage in this column represents the amount of “Interest Related Dividend” is reflected as a percentage of ordinary income distribution. Interest related dividends are exempted from U.S. withholding tax when paid to foreign investors. |
| (5) | The percentage of this column represents the amount of “Short Term Capital Gain Dividend” is reflected as a percentage of short term capital gain distribution that is exempted from U.S. withholding tax when paid to foreign investors. |
Items (A) and (B) are based on the percentage of each Fund’s total distribution.
Items (C) and (D) are based on the percentage of ordinary income distributions of each Fund.
Item (E) is based on the percentage of gross income of each Fund.
Please consult your tax adviser for proper treatment of this information. This notification should be kept with your permanent tax records.
| 362 | SEI Institutional Managed Trust / Annual Report / September 30, 2016 |
(This page intentionally left blank)
SHAREHOLDER VOTING RESULTS (Unaudited)
A Special Meeting of Shareholders of the SEI Institutional Managed Trust (the “Trust”) was held on March 14, 2016 for the purpose of considering the proposal to elect, as a slate of nominees, each of the current Trustees and one new Trustee to the Board of Trustees of the Trust. The proposal was approved with the following voting results:
| Trustee | Shares Voted | |
Robert A. Nesher | ||
For | 1,015,904,420.867 | |
Withheld | 49,893,060.428 | |
William M. Doran | ||
For | 1,016,309,105.947 | |
Withheld | 49,488,375.348 | |
George J. Sullivan, JR. | ||
For | 1,016,538,713.693 | |
Withheld | 49,258,767.602 | |
Nina Lesavoy | ||
For | 1,016,867,926.740 | |
Withheld | 48,929,554.555 | |
James M. Williams | ||
For | 1,016,927,090.157 | |
Withheld | 48,870,391.138 | |
Mitchell A. Johnson | ||
For | 1,016,676,276.127 | |
Withheld | 49,121,205.168 | |
Hubert L. Harris, JR. | ||
For | 1,016,582,512.198 | |
Withheld | 49,214,969.097 | |
Susan C. Cote | ||
For | 1,016,797,597.744 | |
Withheld | 48,999,883.551 |
A Special Meeting of Shareholders of the SEI Institutional Managed Trust (the “Trust”) was held on March 14, 2016 for the purpose of considering the proposal to amend the Agreement and Declaration of Trust for the Trust to reduce the shareholder quorum requirement from a majority to one-third (33 – 1/3%). The proposal was not approved. The voting results were as follows:
| Shares Voted | ||
For | 892,712,362.326 | |
Against | 70,391,667.148 | |
Abstain | 52,267,623.900 | |
Broker Non-Vote | 50,425,827.921 |
| 364 | SEI Institutional Managed Trust / Annual Report / September 30, 2016 |
SEI Institutional Managed Trust / Annual Report / September 30, 2016
Robert A. Nesher, Chairman
Trustees
William M. Doran
George J. Sullivan, Jr.
Nina Lesavoy
James M. Williams
Mitchell A. Johnson
Hubert L. Harris, Jr.
Susan C. Cote
Officers
Robert A. Nesher
President and Chief Executive Officer
James J. Hoffmayer
Controller and Chief Financial Officer
Russell Emery
Chief Compliance Officer
Timothy D. Barto
Vice President, Secretary
Aaron Buser
Vice President, Assistant Secretary
David F. McCann
Vice President, Assistant Secretary
Stephen G. MacRae
Vice President
Bridget E. Sudall
Anti-Money Laundering Compliance Officer
Privacy Officer
Investment Adviser
SEI Investments Management Corporation
Administrator
SEI Investments Global Funds Services
Distributor
SEI Investments Distribution Co.
Legal Counsel
Morgan, Lewis & Bockius LLP
Independent Registered Public Accounting Firm
KPMG LLP
This report and the financial statements contained herein are submitted for the general information of the shareholders of the Trust and must be preceded or accompanied by a current prospectus. Shares of the Funds are not deposits or obligations of, or guaranteed or endorsed by, any bank. The shares are not federally insured by the Federal Deposit Insurance Corporation (FDIC), the Federal Reserve Board, or any other government agency. Investment in the shares involves risk, including the possible loss of principal.
For more information call
1 800 DIAL SEI
(1 800 342 5734)

SEI-F-087 (9/16)
Item 2. Code of Ethics.
The Registrant has adopted a code of ethics that applies to the Registrant’s principal executive officer, principal financial officer, principal accounting officer or controller, or persons performing similar functions.
Item 3. Audit Committee Financial Expert.
(a) (1) The Registrant’s Board of Trustees has determined that the Registrant has at least two audit committee financial experts serving on the audit committee.
(a) (2) The audit committee financial experts are George J. Sullivan, Jr. and Hubert L. Harris, Jr. Messrs. Sullivan and Harris are independent as defined in Form N-CSR Item 3 (a) (2).
Item 4. Principal Accountant Fees and Services.
Fees billed by KPMG LLP (“KPMG”) related to the Registrant.
KPMG billed the Registrant aggregate fees for services rendered to the Registrant for the fiscal years 2016 and 2015 as follows:
| Fiscal 2016 | Fiscal 2015 | |||||||||||||
| All fees and services to the Registrant that were pre- approved | All fees and services to service affiliates that were pre- approved | All other fees and services to service affiliates that did not require pre- approval | All fees and services to the Registrant that were pre- approved | All fees and services to service affiliates that were pre- approved | All other fees and services to service affiliates that did not require pre- approval | |||||||||
(a) | Audit Fees (1) | $868,000 | $0 | N/A | $755,000 | $0 | N/A | |||||||
(b) | Audit-Related Fees | $0 | $0 | $0 | $0 | $0 | $0 | |||||||
(c) | Tax Fees | $0 | $0 | $0 | $0 | $0 | $0 | |||||||
(d) | All Other Fees (2) | $0 | $325,515 | $0 | $0 | $240,350 | $0 | |||||||
Notes:
| (1) | Audit fees include amounts related to the audit of the Registrant’s annual financial statements and services normally provided by the accountant in connection with statutory and regulatory filings. |
| (2) | See Item 4(g) for a description of the services comprising the fees disclosed under this category. |
(e)(1) The Registrant’s Audit Committee has adopted and the Board of Trustees has ratified an Audit and Non-Audit Services Pre-Approval Policy (the “Policy”), which sets forth the procedures and the conditions pursuant to which services proposed to be performed by the independent auditor of the Registrant may be pre-approved.
The Policy provides that all requests or applications for proposed services to be provided by the independent auditor must be submitted to the Registrant’s Chief Financial Officer (“CFO”) and must include a detailed description of the services proposed to be rendered. The CFO will determine whether such services: (1) require specific pre-approval; (2) are included within the list of services that have received the general pre-approval of the Audit Committee pursuant to the Policy; or (3) have been previously pre-approved in connection with the independent auditor’s annual engagement letter for the applicable year or otherwise. In any instance where services require pre-approval, the Audit Committee will consider whether such services are consistent with SEC rules and whether the provision of such services would impair the auditor’s independence.
Requests or applications to provide services that require specific pre-approval by the Audit Committee will be submitted to the Audit Committee by the CFO. The Audit Committee will be informed by the CFO on a quarterly basis of all services rendered by the independent auditor. The Audit Committee has delegated specific pre-approval authority to either the Audit Committee Chair or financial experts, provided that the estimated fee for any such proposed pre-approved service does not exceed $100,000 and any pre-approval decisions are reported to the Audit Committee at its next regularly scheduled meeting.
Services that have received the general pre-approval of the Audit Committee are identified and described in the Policy. In addition, the Policy sets forth a maximum fee per engagement with respect to each identified service that has received general pre-approval.
All services to be provided by the independent auditor shall be provided pursuant to a signed written engagement letter with the Registrant, the investment advisor or applicable control affiliate (except that matters as to which an engagement letter would be impractical because of timing issues or because the matter is small may not be the subject of an engagement letter) that sets forth both the services to be provided by the independent auditor and the total fees to be paid to the independent auditor for those services.
In addition, the Audit Committee has determined to take additional measures on an annual basis to meet its responsibility to oversee the work of the independent auditor and to assure the auditor’s independence from the Registrant, such as reviewing a formal written statement from the independent auditor delineating all relationships between the independent auditor and the Registrant, and discussing with the independent auditor its methods and procedures for ensuring independence.
(e)(2) Percentage of fees billed applicable to non-audit services pursuant to waiver of pre-approval requirement were as follows:
| Fiscal 2016 | Fiscal 2015 | |||
Audit-Related Fees
| 0% | 0% | ||
Tax Fees
| 0% | 0% | ||
All Other Fees
| 0% | 0% |
(f) Not Applicable.
(g)(1) The aggregate non-audit fees and services billed by KPMG for the fiscal years 2016 and 2015 were $325,515 and $240,350, respectively. Non-audit fees consist of SSAE No. 16 review of fund accounting and administration operations, attestation report in accordance with Rule 17 Ad-13.
(h) During the past fiscal year, Registrant’s principal accountant provided certain non-audit services to Registrant’s investment adviser or to entities controlling, controlled by, or under common control with Registrant’s investment adviser that provide ongoing services to Registrant that were not subject to pre-approval pursuant to paragraph (c)(7)(ii) of Rule 2-01 of Regulation S-X. The Audit Committee of Registrant’s Board of Trustees reviewed and considered these non-audit services provided by Registrant’s principal accountant to Registrant’s affiliates, including whether the provision of these non-audit services is compatible with maintaining the principal accountant’s independence.
Item 5. Audit Committee of Listed Registrants.
Not applicable.
Item 6. Schedule of Investments
The Schedules of Investments in securities of unaffiliated issuers as of the close of the reporting period for the Large Cap Fund, Large Cap Value Fund, Large Cap Growth Fund, Tax-Managed Large Cap Fund, S&P 500 Index Fund, Small Cap Fund, Small Cap Value Fund, Small Cap Growth Fund, Tax-Managed Small/Mid Cap Fund, Mid-Cap Fund, U.S. Managed Volatility Fund, Global Managed Volatility Fund, Tax-Managed Managed Volatility Fund and Dynamic Asset Allocation Fund are listed below. The Schedule of Investments in securities of unaffiliated issuers as of the close of the reporting period for the Real Estate Fund, Enhanced Income Fund, Core Fixed Income Fund, U.S. Fixed Income Fund, High Yield Bond Fund, Conservative Income Fund, Tax-Free Conservative Income Fund, Real Return Fund, Multi-Strategy Alternative Fund, Multi-Asset Accumulation Fund, Multi-Asset Income Fund, Multi-Asset Inflation Managed Fund, Multi-Asset Capital Stability Fund and Long/Short Alternative Fund is included as part of the report to shareholders filed under Item 1 of this form.
SCHEDULE OF INVESTMENTS
September 30, 2016
Large Cap Fund
| Description | Shares | Market Value ($ Thousands) | ||||||
COMMON STOCK — 94.0% | ||||||||
Consumer Discretionary — 12.9% | ||||||||
Amazon.com, Cl A * | 23,995 | $ | 20,091 | |||||
Bed Bath & Beyond (A) | 47,030 | 2,027 | ||||||
Best Buy | 147,911 | 5,647 | ||||||
Chipotle Mexican Grill, Cl A *(A) | 12,729 | 5,391 | ||||||
Darden Restaurants | 37,892 | 2,324 | ||||||
Dick's Sporting Goods | 126,233 | 7,160 | ||||||
Dillard's, Cl A (A) | 91,298 | 5,753 | ||||||
Discovery Communications, Cl C *(A) | 189,481 | 4,985 | ||||||
Dollar General | 167,070 | 11,693 | ||||||
Domino's Pizza | 20,961 | 3,183 | ||||||
Ford Motor (A) | 504,488 | 6,089 | ||||||
General Motors | 810,729 | 25,757 | ||||||
Genuine Parts | 40,994 | 4,118 | ||||||
Goodyear Tire & Rubber | 399,199 | 12,894 | ||||||
Home Depot (A) | 61,489 | 7,912 | ||||||
Interpublic Group | 101,740 | 2,274 | ||||||
Kohl's | 213,535 | 9,342 | ||||||
L Brands | 254,873 | 18,037 | ||||||
Lear | 68,325 | 8,282 | ||||||
Liberty Global, Cl A * | 235,985 | 8,066 | ||||||
Liberty Global, Cl C * | 144,008 | 4,758 | ||||||
Liberty Interactive QVC Group, Cl A * | 1,002,388 | 20,058 | ||||||
Lowe's | 26,820 | 1,937 | ||||||
Macy's (A) | 378,298 | 14,016 | ||||||
Marriott International, Cl A (A) | 48,727 | 3,281 | ||||||
Michael Kors Holdings *(A) | 179,921 | 8,419 | ||||||
NetFlix * | 52,392 | 5,163 | ||||||
Nike, Cl B | 121,080 | 6,375 | ||||||
Norwegian Cruise Line Holdings * | 140,155 | 5,284 | ||||||
Omnicom Group | 78,433 | 6,667 | ||||||
Priceline Group * | 1,712 | 2,519 | ||||||
PulteGroup | 277,162 | 5,554 | ||||||
Ross Stores | 67,567 | 4,345 | ||||||
Target, Cl A | 56,344 | 3,870 | ||||||
TJX (A) | 50,220 | 3,755 | ||||||
Toll Brothers * | 75,375 | 2,251 | ||||||
Toyota Motor ADR (A) | 32,746 | 3,801 | ||||||
TripAdvisor *(A) | 284,685 | 17,986 | ||||||
Tupperware Brands (A) | 41,393 | 2,706 | ||||||
Viacom, Cl B | 128,217 | 4,885 | ||||||
Whirlpool (A) | 34,473 | 5,590 | ||||||
Yum! Brands | 51,618 | 4,687 | ||||||
|
|
| ||||||
| 308,932 | ||||||||
|
|
| ||||||
Consumer Staples — 6.1% | ||||||||
Altria Group | 99,811 | 6,311 | ||||||
Anheuser-Busch InBev ADR | 46,686 | 6,135 | ||||||
Archer-Daniels-Midland (A) | 107,617 | 4,538 | ||||||
Bunge (A) | 100,130 | 5,931 | ||||||
Clorox | 34,077 | 4,266 | ||||||
Constellation Brands, Cl A | 78,218 | 13,022 | ||||||
| Description | Shares | Market Value ($ Thousands) | ||||||
COMMON STOCK (continued) | ||||||||
Costco Wholesale | 39,694 | $ | 6,054 | |||||
Dr Pepper Snapple Group | 24,589 | 2,245 | ||||||
General Mills | 90,000 | 5,749 | ||||||
Ingredion | 66,323 | 8,825 | ||||||
JM Smucker | 31,185 | 4,227 | ||||||
Kroger (A) | 395,396 | 11,735 | ||||||
Mead Johnson Nutrition, Cl A (A) | 31,612 | 2,498 | ||||||
PepsiCo | 25,183 | 2,739 | ||||||
Philip Morris International | 64,422 | 6,263 | ||||||
Procter & Gamble | 80,646 | 7,238 | ||||||
Reynolds American | 47,673 | 2,248 | ||||||
Tyson Foods, Cl A (A) | 183,742 | 13,720 | ||||||
Walgreens Boots Alliance | 199,741 | 16,103 | ||||||
Wal-Mart Stores | 225,593 | 16,270 | ||||||
|
|
| ||||||
| 146,117 | ||||||||
|
|
| ||||||
Energy — 5.7% | ||||||||
Anadarko Petroleum, Cl A | 66,201 | 4,195 | ||||||
Apache | 97,302 | 6,215 | ||||||
BP ADR (A) | 374,541 | 13,169 | ||||||
Canadian Natural Resources | 132,778 | 4,254 | ||||||
Chevron | 38,574 | 3,970 | ||||||
Concho Resources * | 21,883 | 3,006 | ||||||
Devon Energy | 242,696 | 10,705 | ||||||
EOG Resources | 50,750 | 4,908 | ||||||
Exxon Mobil | 104,761 | 9,144 | ||||||
Helmerich & Payne (A) | 93,588 | 6,298 | ||||||
Kinder Morgan | 441,231 | 10,206 | ||||||
Marathon Petroleum | 267,580 | 10,861 | ||||||
Occidental Petroleum | 57,720 | 4,209 | ||||||
Oceaneering International, Cl A | 91,088 | 2,506 | ||||||
PBF Energy, Cl A | 310,774 | 7,036 | ||||||
Phillips 66 | 94,915 | 7,645 | ||||||
Royal Dutch Shell ADR, Cl A | 161,764 | 8,100 | ||||||
Southwestern Energy *(A) | 550,795 | 7,623 | ||||||
Tesoro | 29,203 | 2,323 | ||||||
Valero Energy | 209,932 | 11,126 | ||||||
|
|
| ||||||
| 137,499 | ||||||||
|
|
| ||||||
Financials — 13.6% | ||||||||
Aflac (A) | 243,578 | 17,506 | ||||||
Allstate | 114,888 | 7,948 | ||||||
American Financial Group | 32,852 | 2,464 | ||||||
American National Insurance | 2,942 | 359 | ||||||
Ameriprise Financial (A) | 31,220 | 3,115 | ||||||
Annaly Capital Management ‡ | 904,291 | 9,495 | ||||||
Assurant | 54,205 | 5,000 | ||||||
Axis Capital Holdings | 41,630 | 2,262 | ||||||
Bank of America | 2,327,751 | 36,429 | ||||||
Berkshire Hathaway, Cl B * | 153,865 | 22,229 | ||||||
Blackstone Group (B) | 84,851 | 2,166 | ||||||
Capital One Financial | 33,400 | 2,399 | ||||||
SEI Institutional Managed Trust / Annual Report / September 30, 2016 |
1 |
SCHEDULE OF INVESTMENTS
September 30, 2016
Large Cap Fund (Continued)
| Description | Shares | Market Value ($ Thousands) | ||||||
COMMON STOCK (continued) | ||||||||
Citigroup | 288,601 | $ | 13,631 | |||||
Cullen/Frost Bankers (A) | 39,240 | 2,823 | ||||||
Discover Financial Services | 188,260 | 10,646 | ||||||
Everest Re Group | 42,860 | 8,142 | ||||||
Fifth Third Bancorp | 299,873 | 6,135 | ||||||
Intercontinental Exchange | 66,011 | 17,781 | ||||||
JPMorgan Chase | 605,802 | 40,340 | ||||||
KeyCorp (A) | 185,598 | 2,259 | ||||||
KKR (B) | 543,645 | 7,752 | ||||||
Lincoln National | 47,673 | 2,240 | ||||||
MetLife (A) | 569,914 | 25,321 | ||||||
Popular | 104,491 | 3,994 | ||||||
Prudential Financial (A) | 40,530 | 3,309 | ||||||
Radian Group | 184,980 | 2,507 | ||||||
Regions Financial | 409,319 | 4,040 | ||||||
Santander Consumer USA Holdings *(A) | 245,531 | 2,986 | ||||||
State Street | 71,598 | 4,985 | ||||||
SunTrust Banks | 173,071 | 7,581 | ||||||
Synchrony Financial | 275,795 | 7,722 | ||||||
Travelers (A) | 139,971 | 16,034 | ||||||
Two Harbors Investment ‡ | 838,773 | 7,155 | ||||||
Unum Group (A) | 64,466 | 2,276 | ||||||
Validus Holdings | 46,972 | 2,340 | ||||||
Voya Financial | 500,527 | 14,425 | ||||||
|
|
| ||||||
| 327,796 | ||||||||
|
|
| ||||||
Health Care — 14.5% | ||||||||
Abbott Laboratories (A) | 65,397 | 2,766 | ||||||
AbbVie (A) | 153,656 | 9,691 | ||||||
Aetna, Cl A (A) | 46,864 | 5,410 | ||||||
Alexion Pharmaceuticals * | 53,518 | 6,558 | ||||||
Allergan * | 94,418 | 21,745 | ||||||
AmerisourceBergen | 102,993 | 8,320 | ||||||
Amgen, Cl A (A) | 43,295 | 7,222 | ||||||
Anthem | 59,518 | 7,458 | ||||||
Baxter International | 142,750 | 6,795 | ||||||
Becton Dickinson | 58,672 | 10,545 | ||||||
Biogen * | 133,814 | 41,888 | ||||||
C.R. Bard (A) | 39,918 | 8,953 | ||||||
Cardinal Health | 43,556 | 3,384 | ||||||
Celgene, Cl A * | 224,141 | 23,429 | ||||||
Cigna | 18,000 | 2,346 | ||||||
DENTSPLY SIRONA | 196,728 | 11,692 | ||||||
Gilead Sciences | 210,954 | 16,691 | ||||||
HCA Holdings * | 105,452 | 7,975 | ||||||
Horizon Pharma *(A) | 115,275 | 2,090 | ||||||
Humana | 14,000 | 2,476 | ||||||
Illumina * | 41,056 | 7,458 | ||||||
IMS Health Holdings *(A) | 148,265 | 4,647 | ||||||
Intuitive Surgical * | 3,999 | 2,899 | ||||||
Johnson & Johnson | 197,492 | 23,330 | ||||||
Mallinckrodt * | 49,493 | 3,454 | ||||||
| Description | Shares | Market Value ($ Thousands) | ||||||
COMMON STOCK (continued) | ||||||||
Merck (A) | 285,564 | $ | 17,822 | |||||
Mettler Toledo International * | 6,209 | 2,607 | ||||||
Mylan * | 130,843 | 4,988 | ||||||
Novo Nordisk ADR (A) | 141,033 | 5,866 | ||||||
Pfizer | 417,434 | 14,138 | ||||||
Quest Diagnostics | 35,560 | 3,009 | ||||||
Quintiles Transnational * | 89,708 | 7,272 | ||||||
Regeneron Pharmaceuticals *(A) | 16,851 | 6,774 | ||||||
Teva Pharmaceutical Industries ADR | 144,171 | 6,633 | ||||||
UnitedHealth Group | 159,382 | 22,313 | ||||||
Vertex Pharmaceuticals * | 23,215 | 2,025 | ||||||
Zimmer Biomet Holdings | 36,188 | 4,705 | ||||||
|
|
| ||||||
| 347,374 | ||||||||
|
|
| ||||||
Industrials — 7.1% | ||||||||
3M (A) | 13,663 | 2,408 | ||||||
Acuity Brands (A) | 18,195 | 4,814 | ||||||
AECOM *(A) | 93,990 | 2,794 | ||||||
AerCap Holdings * | 137,561 | 5,295 | ||||||
AGCO | 46,758 | 2,306 | ||||||
Alaska Air Group | 70,446 | 4,640 | ||||||
American Airlines Group (A) | 122,191 | 4,473 | ||||||
BE Aerospace | 50,786 | 2,624 | ||||||
Boeing | 55,502 | 7,312 | ||||||
BWX Technologies, Cl W | 69,574 | 2,670 | ||||||
C.H. Robinson Worldwide (A) | 43,889 | 3,092 | ||||||
Carlisle | 37,822 | 3,879 | ||||||
Caterpillar, Cl A | 28,301 | 2,512 | ||||||
Chicago Bridge & Iron (A) | 87,002 | 2,439 | ||||||
Delta Air Lines, Cl A | 505,767 | 19,907 | ||||||
Dover | 31,093 | 2,290 | ||||||
Eaton | 151,484 | 9,954 | ||||||
Fluor | 142,984 | 7,338 | ||||||
Huntington Ingalls Industries, Cl A | 50,310 | 7,719 | ||||||
Masco | 97,863 | 3,358 | ||||||
Nielsen Holdings (A) | 262,822 | 14,079 | ||||||
Norfolk Southern | 40,873 | 3,967 | ||||||
Northrop Grumman | 48,439 | 10,363 | ||||||
Oshkosh Truck | 67,454 | 3,777 | ||||||
Owens Corning | 72,128 | 3,851 | ||||||
Roper Technologies | 19,379 | 3,536 | ||||||
Southwest Airlines, Cl A (A) | 58,970 | 2,293 | ||||||
Spirit AeroSystems Holdings, Cl A * | 49,465 | 2,203 | ||||||
Stanley Black & Decker | 26,548 | 3,265 | ||||||
Terex | 143,870 | 3,656 | ||||||
TransDigm Group *(A) | 25,439 | 7,355 | ||||||
Triumph Group | 257,987 | 7,193 | ||||||
United Continental Holdings * | 86,923 | 4,561 | ||||||
|
|
| ||||||
| 171,923 | ||||||||
|
|
| ||||||
Information Technology — 24.4% | ||||||||
Activision Blizzard (A) | 189,383 | 8,390 | ||||||
2 |
SEI Institutional Managed Trust / Annual Report / September 30, 2016 |
SCHEDULE OF INVESTMENTS
September 30, 2016
Large Cap Fund (Continued)
| Description | Shares | Market Value ($ Thousands) | ||||||
COMMON STOCK (continued) | ||||||||
Akamai Technologies * | 40,217 | $ | 2,131 | |||||
Alphabet, Cl A * | 60,511 | 48,654 | ||||||
Alphabet, Cl C * | 14,792 | 11,498 | ||||||
Amdocs | 132,826 | 7,684 | ||||||
Apple | 136,529 | 15,435 | ||||||
Applied Materials | 422,791 | 12,747 | ||||||
Arrow Electronics, Cl A * | 50,068 | 3,203 | ||||||
Automatic Data Processing | 41,746 | 3,682 | ||||||
Avnet | 72,898 | 2,993 | ||||||
Brocade Communications Systems (A) | 416,344 | 3,843 | ||||||
CA | 43,400 | 1,436 | ||||||
Cisco Systems | 604,482 | 19,174 | ||||||
Citrix Systems * | 30,587 | 2,607 | ||||||
CoreLogic * | 20,500 | 804 | ||||||
Dell Technologies - VMware, Cl V * | 20,273 | 969 | ||||||
eBay * | 982,539 | 32,325 | ||||||
Electronic Arts *(A) | 280,385 | 23,945 | ||||||
Facebook, Cl A * | 302,143 | 38,756 | ||||||
FleetCor Technologies * | 43,054 | 7,480 | ||||||
Global Payments | 47,111 | 3,616 | ||||||
Harris | 24,980 | 2,288 | ||||||
Hewlett Packard Enterprise | 867,045 | 19,725 | ||||||
HP | 506,873 | 7,872 | ||||||
Ingram Micro, Cl A * | 114,531 | 4,084 | ||||||
Intel (A) | 473,298 | 17,867 | ||||||
International Business Machines (A) | 78,683 | 12,499 | ||||||
Intuit | 171,815 | 18,901 | ||||||
Juniper Networks | 95,031 | 2,286 | ||||||
Keysight Technologies * | 207,276 | 6,569 | ||||||
MasterCard, Cl A | 174,423 | 17,751 | ||||||
Microchip Technology (A) | 20,400 | 1,268 | ||||||
Micron Technology *(A) | 624,103 | 11,096 | ||||||
Microsoft (A) | 782,927 | 45,097 | ||||||
Motorola Solutions | 32,457 | 2,476 | ||||||
PayPal Holdings * | 511,919 | 20,973 | ||||||
Qualcomm | 727,763 | 49,852 | ||||||
salesforce.com *(A) | 63,890 | 4,557 | ||||||
Skyworks Solutions | 134,000 | 10,203 | ||||||
Symantec, Cl A | 407,531 | 10,229 | ||||||
Tencent Holdings ADR | 210,661 | 5,872 | ||||||
Texas Instruments (A) | 66,904 | 4,695 | ||||||
Visa, Cl A (A) | 563,482 | 46,600 | ||||||
Western Digital | 53,726 | 3,141 | ||||||
Xerox (A) | 615,102 | 6,231 | ||||||
Zynga, Cl A * | 735,281 | 2,140 | ||||||
|
|
| ||||||
| 585,644 | ||||||||
|
|
| ||||||
Materials — 3.5% | ||||||||
Cabot | 80,518 | 4,220 | ||||||
Cemex ADR * | 907,691 | 7,207 | ||||||
Eastman Chemical | 151,183 | 10,232 | ||||||
Ecolab (A) | 43,203 | 5,259 | ||||||
| Description | Shares | Market Value ($ Thousands) | ||||||
COMMON STOCK (continued) | ||||||||
Huntsman | 143,031 | $ | 2,327 | |||||
International Paper (A) | 276,851 | 13,283 | ||||||
Louisiana-Pacific *(A) | 159,566 | 3,005 | ||||||
LyondellBasell Industries, Cl A | 121,788 | 9,823 | ||||||
Mosaic | 404,371 | 9,891 | ||||||
Reliance Steel & Aluminum | 109,912 | 7,917 | ||||||
Sherwin-Williams, Cl A (A) | 44,215 | 12,233 | ||||||
|
|
| ||||||
| 85,397 | ||||||||
|
|
| ||||||
Real Estate — 2.0% | ||||||||
CBL & Associates Properties ‡(A) | 176,542 | 2,143 | ||||||
Crown Castle International ‡(A) | 326,330 | 30,744 | ||||||
Equinix ‡ | 39,653 | 14,285 | ||||||
|
|
| ||||||
| 47,172 | ||||||||
|
|
| ||||||
Telecommunication Services — 1.3% |
| |||||||
AT&T | 50,618 | 2,056 | ||||||
SBA Communications, Cl A * | 47,570 | 5,335 | ||||||
Verizon Communications (A) | 444,984 | 23,130 | ||||||
|
|
| ||||||
| 30,521 | ||||||||
|
|
| ||||||
Utilities — 2.9% | ||||||||
Ameren | 62,345 | 3,066 | ||||||
American Electric Power | 164,703 | 10,576 | ||||||
Entergy | 205,126 | 15,739 | ||||||
Exelon | 518,548 | 17,263 | ||||||
FirstEnergy | 87,516 | 2,895 | ||||||
Public Service Enterprise Group | 456,756 | 19,124 | ||||||
|
|
| ||||||
| 68,663 | ||||||||
|
|
| ||||||
Total Common Stock |
| 2,257,038 | ||||||
|
|
| ||||||
| Face Amount (Thousands) | ||||||||
U.S. TREASURY OBLIGATION — 0.0% |
| |||||||
U.S. Treasury Bills | ||||||||
0.239%, 10/20/2016 | $ | 925 | 925 | |||||
|
|
| ||||||
Total U.S. Treasury Obligation |
| 925 | ||||||
|
|
| ||||||
| Shares | ||||||||
AFFILIATED PARTNERSHIP — 10.9% |
| |||||||
SEI Liquidity Fund, L.P. | ||||||||
0.440% **†(C) | 261,550,929 | 261,551 | ||||||
|
|
| ||||||
Total Affiliated Partnership |
| 261,551 | ||||||
|
|
| ||||||
SEI Institutional Managed Trust / Annual Report / September 30, 2016 |
3 |
SCHEDULE OF INVESTMENTS
September 30, 2016
Large Cap Fund (Concluded)
| Description | Shares | Market Value ($ Thousands) | ||||||
CASH EQUIVALENT — 6.2% |
| |||||||
SEI Daily Income Trust, Government Fund, Cl A | ||||||||
0.220%**† | 149,114,835 | $ | 149,115 | |||||
|
|
| ||||||
Total Cash Equivalent
(Cost $149,115) ($ Thousands) | 149,115 | |||||||
|
|
| ||||||
Total Investments — 111.1% |
| $ | 2,668,629 | |||||
|
|
| ||||||
A list of the open futures contracts held by the Fund at September 30, 2016, is as follows:
| Type of Contract | Number of Contracts Long | Expiration Date | Unrealized Depreciation ($ Thousands) | |||||||||
S&P 500 Index E-MINI | 149 | Dec-2016 | $(24) | |||||||||
S&P Mid Cap 400 Index E-MINI | 12 | Dec-2016 | (4) | |||||||||
|
| |||||||||||
| $(28) | ||||||||||||
|
| |||||||||||
For the year ended September 30, 2016, the total amount of all open futures contracts, as presented in the table above, are representative of the volume of activity for the derivative type during the year.
| Percentages are based on Net Assets of $2,402,274 ($ Thousands). |
| * | Non-income producing security. |
| ** | Rate shown is the 7-day effective yield as of September 30, 2016. |
| ‡ | Real Estate Investment Trust. |
| † | Investment in Affiliated Security (see Note 6). |
| (A) | This security or a partial position of this security is on loan at September 30, 2016 (see Note 10). The total market value of securities on loan at September 30, 2016 was $258,188 ($ Thousands). |
| (B) | Security is a Master Limited Partnership. At September 30, 2016, such securities amounted to $9,918 ($ Thousands), or 0.41% of Net Assets (see Note 2). |
| (C) | This security was purchased with cash collateral held from securities on loan (see Note 10). The total market value of such securities as of September 30, 2016 was $261,551 ($ Thousands). |
| (D) | The rate reported is the effective yield at time of purchase. |
ADR — American Depositary Receipt
Cl — Class
L.P. — Limited Partnership
S&P — Standards and Poor’s
The following is a list of the level of inputs used as of September 30, 2016, in valuing the Fund’s investments and other financial instruments carried at value ($ Thousands):
Investments in Securities | Level 1 | Level 2 | Level 3 | Total | ||||||||||||
Common Stock | $ | 2,257,038 | $ | – | $ | – | $ | 2,257,038 | ||||||||
U.S. Treasury Obligation | – | 925 | – | 925 | ||||||||||||
Affiliated Partnership | – | 261,551 | – | 261,551 | ||||||||||||
Cash Equivalent | 149,115 | – | – | 149,115 | ||||||||||||
|
|
|
|
|
|
|
| |||||||||
Total Investments in Securities | $ | 2,406,153 | $ | 262,476 | $ | – | $ | 2,668,629 | ||||||||
|
|
|
|
|
|
|
| |||||||||
| Other Financial Instruments | Level 1 | Level 2 | Level 3 | Total | ||||||||||||
Futures Contracts * | ||||||||||||||||
Unrealized Depreciation | $ | (28 | ) | $ | — | $ | — | $ | (28 | ) | ||||||
|
|
|
|
|
|
|
| |||||||||
Total Other Financial Instruments | $ | (28 | ) | $ | — | $ | — | $ | (28 | ) | ||||||
|
|
|
|
|
|
|
| |||||||||
* Futures contracts are valued at the unrealized depreciation on the instrument.
For the year ended September 30, 2016, there were no transfers between Level 1 and Level 2 assets and liabilities.
For the year ended September 30, 2016, there were no transfers between Level 2 and Level 3 assets and liabilities.
For more information on valuation inputs, see Note 2 – Significant Accounting Policies in Notes to Financial Statements.
Amounts designated as “—” are $0 or have been rounded to $0.
The accompanying notes are an integral part of the financial statements.
4 |
SEI Institutional Managed Trust / Annual Report / September 30, 2016 |
SCHEDULE OF INVESTMENTS
September 30, 2016
Large Cap Value Fund
| Description | Shares | Market Value ($ Thousands) | ||||||
COMMON STOCK — 96.5% | ||||||||
Consumer Discretionary — 10.2% | ||||||||
Best Buy | 150,296 | $ | 5,738 | |||||
Brinker International | 71,546 | 3,608 | ||||||
Dick's Sporting Goods | 94,123 | 5,339 | ||||||
Dillard's, Cl A | 75,273 | 4,743 | ||||||
Dollar General | 77,782 | 5,444 | ||||||
Ford Motor | 480,485 | 5,799 | ||||||
GameStop, Cl A (A) | 66,203 | 1,827 | ||||||
General Motors | 632,729 | 20,102 | ||||||
Goodyear Tire & Rubber | 369,058 | 11,921 | ||||||
Harley-Davidson, Cl A | 26,905 | 1,415 | ||||||
Kohl's | 204,750 | 8,958 | ||||||
Lear | 27,271 | 3,306 | ||||||
Lowe's | 29,259 | 2,113 | ||||||
Macy's | 249,240 | 9,234 | ||||||
Michael Kors Holdings * | 114,800 | 5,371 | ||||||
Norwegian Cruise Line Holdings * | 185,734 | 7,002 | ||||||
Omnicom Group | 106,508 | 9,053 | ||||||
PulteGroup | 194,717 | 3,902 | ||||||
Signet Jewelers | 25,423 | 1,895 | ||||||
Staples | 140,647 | 1,203 | ||||||
Target, Cl A | 24,012 | 1,649 | ||||||
Toyota Motor ADR (A) | 33,518 | 3,890 | ||||||
Tupperware Brands | 36,077 | 2,358 | ||||||
Viacom, Cl B | 85,267 | 3,249 | ||||||
Whirlpool | 42,174 | 6,839 | ||||||
|
|
| ||||||
| 135,958 | ||||||||
|
|
| ||||||
Consumer Staples — 6.9% | ||||||||
Archer-Daniels-Midland | 35,965 | 1,517 | ||||||
Bunge | 60,393 | 3,577 | ||||||
CVS Health | 111,992 | 9,966 | ||||||
Ingredion | 55,937 | 7,443 | ||||||
JM Smucker | 52,960 | 7,178 | ||||||
Kimberly-Clark | 30,306 | 3,823 | ||||||
Kroger | 310,514 | 9,216 | ||||||
Philip Morris International | 133,028 | 12,933 | ||||||
Pilgrim's Pride * | 155,207 | 3,278 | ||||||
Procter & Gamble | 86,669 | 7,778 | ||||||
Reynolds American | 103,388 | 4,875 | ||||||
Tyson Foods, Cl A | 152,753 | 11,406 | ||||||
Wal-Mart Stores | 110,785 | 7,990 | ||||||
|
|
| ||||||
| 90,980 | ||||||||
|
|
| ||||||
Energy — 10.4% | ||||||||
Anadarko Petroleum, Cl A | 52,763 | 3,343 | ||||||
Apache | 54,557 | 3,485 | ||||||
BP ADR (A) | 352,110 | 12,380 | ||||||
Canadian Natural Resources | 133,114 | 4,265 | ||||||
Chevron | 115,452 | 11,882 | ||||||
Devon Energy | 204,395 | 9,016 | ||||||
Ensco, Cl A | 200,685 | 1,706 | ||||||
| Description | Shares | Market Value ($ Thousands) | ||||||
COMMON STOCK (continued) | ||||||||
Exxon Mobil | 166,057 | $ | 14,494 | |||||
Helmerich & Payne (A) | 106,797 | 7,187 | ||||||
HollyFrontier | 114,047 | 2,794 | ||||||
Kinder Morgan | 349,638 | 8,087 | ||||||
Marathon Petroleum | 202,420 | 8,216 | ||||||
Occidental Petroleum | 146,728 | 10,699 | ||||||
Oceaneering International, Cl A | 67,066 | 1,845 | ||||||
PBF Energy, Cl A (A) | 228,369 | 5,170 | ||||||
Phillips 66 | 121,518 | 9,788 | ||||||
Royal Dutch Shell ADR, Cl A | 142,157 | 7,118 | ||||||
Southwestern Energy * | 404,468 | 5,598 | ||||||
Tesoro | 26,013 | 2,070 | ||||||
Valero Energy | 170,168 | 9,019 | ||||||
|
|
| ||||||
| 138,162 | ||||||||
|
|
| ||||||
Financials — 22.5% | ||||||||
Aflac | 173,489 | 12,469 | ||||||
Allstate | 107,848 | 7,461 | ||||||
Ally Financial | 70,898 | 1,380 | ||||||
American Capital Agency, Cl A ‡ | 94,520 | 1,847 | ||||||
American Financial Group | 22,794 | 1,709 | ||||||
Ameriprise Financial | 29,033 | 2,897 | ||||||
Annaly Capital Management ‡ | 628,409 | 6,598 | ||||||
Assurant | 19,613 | 1,809 | ||||||
Bank of America | 2,036,175 | 31,866 | ||||||
Berkshire Hathaway, Cl B * | 60,939 | 8,804 | ||||||
Blackstone Group (B) | 119,495 | 3,051 | ||||||
Capital One Financial | 87,452 | 6,282 | ||||||
CIT Group | 58,606 | 2,127 | ||||||
Citigroup | 378,272 | 17,866 | ||||||
Cullen/Frost Bankers (A) | 66,431 | 4,779 | ||||||
Discover Financial Services | 148,304 | 8,387 | ||||||
Everest Re Group | 42,213 | 8,019 | ||||||
Fifth Third Bancorp | 118,530 | 2,425 | ||||||
Goldman Sachs Group | 8,298 | 1,338 | ||||||
Huntington Bancshares | 322,922 | 3,184 | ||||||
JPMorgan Chase | 510,041 | 33,964 | ||||||
KKR (B) | 467,232 | 6,663 | ||||||
Lincoln National | 28,386 | 1,333 | ||||||
Marsh & McLennan | 85,318 | 5,738 | ||||||
MetLife | 588,502 | 26,147 | ||||||
MFA Financial ‡ | 180,592 | 1,351 | ||||||
Morgan Stanley | 43,957 | 1,409 | ||||||
Nasdaq, Cl A | 18,895 | 1,276 | ||||||
PNC Financial Services Group | 130,000 | 11,712 | ||||||
Popular | 108,137 | 4,133 | ||||||
Prudential Financial | 47,585 | 3,885 | ||||||
Radian Group | 103,250 | 1,399 | ||||||
Regions Financial | 276,285 | 2,727 | ||||||
Reinsurance Group of America, Cl A | 47,194 | 5,094 | ||||||
Santander Consumer USA Holdings * | 136,408 | 1,659 | ||||||
State Street | 172,944 | 12,042 | ||||||
SEI Institutional Managed Trust / Annual Report / September 30, 2016 |
1 |
SCHEDULE OF INVESTMENTS
September 30, 2016
Large Cap Value Fund (Continued)
| Description | Shares | Market Value ($ Thousands) | ||||||
COMMON STOCK (continued) | ||||||||
SunTrust Banks | 189,525 | $ | 8,301 | |||||
Synchrony Financial | 284,307 | 7,961 | ||||||
Travelers | 65,347 | 7,485 | ||||||
Two Harbors Investment ‡ | 433,365 | 3,697 | ||||||
Unum Group | 52,306 | 1,847 | ||||||
Voya Financial | 496,151 | 14,299 | ||||||
|
|
| ||||||
| 298,420 | ||||||||
|
|
| ||||||
Health Care — 13.5% | ||||||||
Abbott Laboratories | 118,290 | 5,002 | ||||||
AbbVie | 83,535 | 5,269 | ||||||
Aetna, Cl A | 54,793 | 6,326 | ||||||
AmerisourceBergen | 71,616 | 5,785 | ||||||
Amgen, Cl A | 77,482 | 12,925 | ||||||
Anthem | 73,740 | 9,240 | ||||||
Baxter International | 176,493 | 8,401 | ||||||
Becton Dickinson | 31,741 | 5,705 | ||||||
Biogen * | 22,482 | 7,037 | ||||||
Express Scripts Holding * | 41,792 | 2,948 | ||||||
Gilead Sciences | 125,409 | 9,922 | ||||||
HCA Holdings * | 99,215 | 7,504 | ||||||
Horizon Pharma * | 108,470 | 1,967 | ||||||
Johnson & Johnson | 243,250 | 28,735 | ||||||
Laboratory Corp of America Holdings * | 11,245 | 1,546 | ||||||
Mallinckrodt * | 59,955 | 4,184 | ||||||
Merck | 216,717 | 13,525 | ||||||
Mylan * | 70,384 | 2,683 | ||||||
Pfizer | 449,009 | 15,208 | ||||||
Quest Diagnostics | 53,172 | 4,500 | ||||||
Teva Pharmaceutical Industries ADR | 130,992 | 6,027 | ||||||
UnitedHealth Group | 70,482 | 9,867 | ||||||
Universal Health Services, Cl B | 11,111 | 1,369 | ||||||
Zimmer Biomet Holdings | 30,741 | 3,997 | ||||||
|
|
| ||||||
| 179,672 | ||||||||
|
|
| ||||||
Industrials — 9.5% | ||||||||
3M | 40,100 | 7,067 | ||||||
AECOM * | 50,834 | 1,511 | ||||||
AerCap Holdings * | 93,746 | 3,608 | ||||||
Alaska Air Group | 26,192 | 1,725 | ||||||
American Airlines Group | 241,287 | 8,834 | ||||||
BE Aerospace | 28,696 | 1,482 | ||||||
Boeing | 10,922 | 1,439 | ||||||
Carlisle | 22,997 | 2,359 | ||||||
Caterpillar, Cl A | 57,818 | 5,133 | ||||||
Chicago Bridge & Iron | 91,743 | 2,572 | ||||||
Delta Air Lines, Cl A | 363,710 | 14,316 | ||||||
Eaton | 81,075 | 5,327 | ||||||
FedEx | 30,115 | 5,261 | ||||||
Fluor | 111,063 | 5,700 | ||||||
General Electric | 104,941 | 3,108 | ||||||
Illinois Tool Works | 87,772 | 10,519 | ||||||
| Description | Shares | Market Value ($ Thousands) | ||||||
COMMON STOCK (continued) | ||||||||
JetBlue Airways * | 99,671 | $ | 1,718 | |||||
ManpowerGroup | 16,193 | 1,170 | ||||||
Northrop Grumman | 31,120 | 6,658 | ||||||
Oshkosh Truck | 38,255 | 2,142 | ||||||
Owens Corning | 54,642 | 2,917 | ||||||
Raytheon | 16,580 | 2,257 | ||||||
RR Donnelley & Sons | 79,864 | 1,256 | ||||||
Terex | 146,682 | 3,727 | ||||||
Trinity Industries | 132,146 | 3,195 | ||||||
Triumph Group | 204,175 | 5,692 | ||||||
United Continental Holdings * | 76,630 | 4,021 | ||||||
USG * | 51,700 | 1,336 | ||||||
Waste Management | 24,185 | 1,542 | ||||||
WW Grainger (A) | 38,001 | 8,544 | ||||||
|
|
| ||||||
| 126,136 | ||||||||
|
|
| ||||||
Information Technology — 11.3% | ||||||||
Apple | 20,805 | 2,352 | ||||||
Applied Materials | 143,764 | 4,335 | ||||||
Arrow Electronics, Cl A * | 23,777 | 1,521 | ||||||
Automatic Data Processing | 103,513 | 9,130 | ||||||
Avnet | 48,618 | 1,996 | ||||||
Brocade Communications Systems | 436,293 | 4,027 | ||||||
CA | 43,393 | 1,435 | ||||||
Cisco Systems | 427,709 | 13,567 | ||||||
Dell Technologies - VMware, Cl V * | 25,354 | 1,212 | ||||||
Harris | 30,285 | 2,774 | ||||||
Hewlett Packard Enterprise | 580,558 | 13,208 | ||||||
HP | 503,743 | 7,823 | ||||||
Ingram Micro, Cl A * | 193,966 | 6,917 | ||||||
Intel | 435,126 | 16,426 | ||||||
International Business Machines | 37,199 | 5,909 | ||||||
Juniper Networks | 75,740 | 1,822 | ||||||
Keysight Technologies * | 167,867 | 5,320 | ||||||
Microchip Technology (A) | 148,088 | 9,202 | ||||||
Micron Technology * | 498,716 | 8,867 | ||||||
Nuance Communications * | 67,079 | 973 | ||||||
Qualcomm | 229,873 | 15,746 | ||||||
Seagate Technology (A) | 51,042 | 1,968 | ||||||
Skyworks Solutions | 80,000 | 6,091 | ||||||
Symantec, Cl A | 74,539 | 1,871 | ||||||
Tech Data * | 17,949 | 1,520 | ||||||
Western Digital | 47,670 | 2,787 | ||||||
Xerox | 156,021 | 1,581 | ||||||
|
|
| ||||||
| 150,380 | ||||||||
|
|
| ||||||
Materials — 4.9% | ||||||||
Cabot | 26,288 | 1,378 | ||||||
Cemex ADR * | 747,878 | 5,938 | ||||||
CF Industries Holdings | 48,660 | 1,185 | ||||||
Domtar | 33,526 | 1,245 | ||||||
Dow Chemical, Cl A | 148,129 | 7,677 | ||||||
2 |
SEI Institutional Managed Trust / Annual Report / September 30, 2016 |
SCHEDULE OF INVESTMENTS
September 30, 2016
Large Cap Value Fund (Concluded)
| Description | Shares | Market Value ($ Thousands) | ||||||
COMMON STOCK (continued) | ||||||||
Eastman Chemical | 126,251 | $ | 8,545 | |||||
Huntsman | 157,022 | 2,555 | ||||||
International Paper | 210,607 | 10,105 | ||||||
Louisiana-Pacific * | 107,838 | 2,031 | ||||||
LyondellBasell Industries, Cl A | 61,034 | 4,923 | ||||||
Mosaic | 319,081 | 7,805 | ||||||
Owens-Illinois * | 63,621 | 1,170 | ||||||
Reliance Steel & Aluminum | 120,206 | 8,658 | ||||||
Sonoco Products | 28,379 | 1,499 | ||||||
|
|
| ||||||
| 64,714 | ||||||||
|
|
| ||||||
Real Estate — 1.0% | ||||||||
Brandywine Realty Trust ‡ | 90,795 | 1,418 | ||||||
Healthcare Trust of America, Cl A ‡ | 69,743 | 2,275 | ||||||
Hospitality Properties Trust ‡ | 192,037 | 5,707 | ||||||
Howard Hughes * | 13,280 | 1,521 | ||||||
Senior Housing Properties Trust ‡ | 130,790 | 2,970 | ||||||
|
|
| ||||||
| 13,891 | ||||||||
|
|
| ||||||
Telecommunication Services — 1.7% | ||||||||
AT&T | 172,812 | 7,018 | ||||||
China Mobile ADR | 69,040 | 4,248 | ||||||
Verizon Communications | 214,992 | 11,175 | ||||||
|
|
| ||||||
| 22,441 | ||||||||
|
|
| ||||||
Utilities — 4.6% | ||||||||
Ameren | 89,535 | 4,403 | ||||||
American Electric Power | 55,410 | 3,558 | ||||||
Atmos Energy | 37,934 | 2,825 | ||||||
Edison International | 35,217 | 2,544 | ||||||
Entergy | 127,953 | 9,818 | ||||||
Exelon | 452,364 | 15,059 | ||||||
FirstEnergy | 227,678 | 7,532 | ||||||
Public Service Enterprise Group | 307,492 | 12,875 | ||||||
UGI | 28,205 | 1,276 | ||||||
Vectren | 25,472 | 1,279 | ||||||
|
|
| ||||||
| 61,169 | ||||||||
|
|
| ||||||
Total Common Stock | 1,281,923 | |||||||
|
|
| ||||||
| Face Amount (Thousands) | ||||||||
U.S. TREASURY OBLIGATION — 0.0% | ||||||||
U.S. Treasury Bills | ||||||||
0.216%, 10/20/2016 (C) | $ | 25 | 25 | |||||
|
|
| ||||||
Total U.S. Treasury Obligation | 25 | |||||||
|
|
| ||||||
| Description | Shares | Market Value ($ Thousands) | ||||||
AFFILIATED PARTNERSHIP — 3.7% | ||||||||
SEI Liquidity Fund, L.P. | ||||||||
0.440% **†(D) | 49,706,717 | $ | 49,707 | |||||
|
|
| ||||||
Total Affiliated Partnership | 49,707 | |||||||
|
|
| ||||||
CASH EQUIVALENT — 3.6% | ||||||||
SEI Daily Income Trust, Government Fund, Cl A | ||||||||
0.220%**† | 47,204,335 | 47,204 | ||||||
|
|
| ||||||
Total Cash Equivalent | 47,204 | |||||||
|
|
| ||||||
Total Investments — 103.8% | $ | 1,378,859 | ||||||
|
|
| ||||||
| Percentages are based on Net Assets of $1,328,198 ($ Thousands). |
| * | Non-income producing security. |
| ** | Rate shown is the 7-day effective yield as of September 30, 2016. |
| ‡ | Real Estate Investment Trust. |
| † | Investment in Affiliated Security (see Note 6). |
| (A) | This security or a partial position of this security is on loan at September 30, 2016 (see Note 10). The total market value of securities on loan at September 30, 2016 was $49,352 ($ Thousands). |
| (B) | Security is a Master Limited Partnership. At September 30, 2016, such securities amounted to $9,714 ($ Thousands), or 0.73% of Net Assets (see Note 2). |
| (C) | Security, or portion thereof, has been pledged as collateral on open futures contracts. |
| (D) | This security was purchased with cash collateral held from securities on loan (see Note 10). The total market value of such securities as of September 30, 2016 was $49,707 ($ Thousands). |
ADR — American Depositary Receipt
Cl — Class
L.P. — Limited Partnership
The following is a list of the level of inputs used as of September 30, 2016, in valuing the Fund’s investments carried at value ($ Thousands):
| Investments in Securities | Level 1 | Level 2 | Level 3 | Total | ||||||||||||
Common Stock | $ | 1,281,923 | $ | – | $ | – | $ | 1,281,923 | ||||||||
U.S. Treasury Obligation | – | 25 | – | 25 | ||||||||||||
Affiliated Partnership | – | 49,707 | – | 49,707 | ||||||||||||
Cash Equivalent | 47,204 | – | – | 47,204 | ||||||||||||
|
|
|
|
|
|
|
| |||||||||
Total Investments in Securities | $ | 1,329,127 | $ | 49,732 | $ | – | $ | 1,378,859 | ||||||||
|
|
|
|
|
|
|
| |||||||||
For the year ended September 30, 2016, there were no transfers between Level 1 and Level 2 assets and liabilities.
For the year ended September 30, 2016, there were no transfers between Level 2 and Level 3 assets and liabilities.
For more information on valuation inputs, see Note 2 – Significant Accounting Policies in Notes to Financial Statements.
Amounts designated as “—” are $0 or have been rounded to $0.
The accompanying notes are an integral part of the financial statements.
SEI Institutional Managed Trust / Annual Report / September 30, 2016 |
3 |
SCHEDULE OF INVESTMENTS
September 30, 2016
Large Cap Growth Fund
| Description | Shares | Market Value ($ Thousands) | ||||||
COMMON STOCK — 95.9% | ||||||||
Consumer Discretionary — 15.8% | ||||||||
Amazon.com, Cl A * | 46,767 | $ | 39,159 | |||||
Chipotle Mexican Grill, Cl A * | 19,111 | 8,094 | ||||||
Discovery Communications, Cl C * | 65,613 | 1,726 | ||||||
Dollar General | 181,933 | 12,734 | ||||||
Domino's Pizza | 53,463 | 8,118 | ||||||
Foot Locker, Cl A | 25,602 | 1,734 | ||||||
Home Depot | 92,651 | 11,922 | ||||||
Interpublic Group | 62,328 | 1,393 | ||||||
L Brands | 344,343 | 24,369 | ||||||
Lear | 13,283 | 1,610 | ||||||
Liberty Global, Cl A * | 263,697 | 9,013 | ||||||
Liberty Global, Cl C * | 323,698 | 10,695 | ||||||
Liberty Interactive QVC Group, Cl A * | 1,566,328 | 31,342 | ||||||
Michael Kors Holdings * | 26,171 | 1,225 | ||||||
NetFlix * | 120,124 | 11,838 | ||||||
Nike, Cl B | 219,690 | 11,567 | ||||||
Nordstrom (A) | 26,528 | 1,376 | ||||||
NVR * | 1,280 | 2,099 | ||||||
Priceline Group * | 7,892 | 11,613 | ||||||
TripAdvisor * | 419,085 | 26,478 | ||||||
|
|
| ||||||
| 228,105 | ||||||||
|
|
| ||||||
Consumer Staples — 5.5% | ||||||||
Altria Group | 41,450 | 2,621 | ||||||
Anheuser-Busch InBev ADR | 87,507 | 11,499 | ||||||
Campbell Soup | 42,678 | 2,334 | ||||||
Clorox | 55,344 | 6,928 | ||||||
Constellation Brands, Cl A | 104,035 | 17,321 | ||||||
Costco Wholesale | 60,557 | 9,235 | ||||||
Dr Pepper Snapple Group | 63,439 | 5,793 | ||||||
Hormel Foods | 37,665 | 1,429 | ||||||
Mead Johnson Nutrition, Cl A | 47,023 | 3,715 | ||||||
SYSCO, Cl A | 26,613 | 1,304 | ||||||
Tyson Foods, Cl A | 19,413 | 1,450 | ||||||
Walgreens Boots Alliance | 205,556 | 16,572 | ||||||
|
|
| ||||||
| 80,201 | ||||||||
|
|
| ||||||
Energy — 1.2% | ||||||||
Concho Resources * | 50,838 | 6,982 | ||||||
EOG Resources | 67,924 | 6,569 | ||||||
Pioneer Natural Resources | 20,289 | 3,767 | ||||||
|
|
| ||||||
| 17,318 | ||||||||
|
|
| ||||||
Financials — 3.2% | ||||||||
Berkshire Hathaway, Cl B * | 104,419 | 15,085 | ||||||
CBOE Holdings | 51,860 | 3,363 | ||||||
Intercontinental Exchange | 102,706 | 27,665 | ||||||
|
|
| ||||||
| 46,113 | ||||||||
|
|
| ||||||
Health Care — 18.4% | ||||||||
Alexion Pharmaceuticals * | 113,605 | 13,921 | ||||||
Allergan * | 136,819 | 31,511 | ||||||
| Description | Shares | Market Value ($ Thousands) | ||||||
COMMON STOCK (continued) | ||||||||
Anthem | 10,922 | $ | 1,369 | |||||
AstraZeneca ADR (A) | 78,312 | 2,573 | ||||||
Becton Dickinson | 81,304 | 14,613 | ||||||
Biogen * | 133,179 | 41,689 | ||||||
Boston Scientific * | 228,385 | 5,436 | ||||||
Cardinal Health | 16,126 | 1,253 | ||||||
Celgene, Cl A * | 328,873 | 34,377 | ||||||
DENTSPLY SIRONA | 298,269 | 17,726 | ||||||
Gilead Sciences | 50,142 | 3,967 | ||||||
Illumina * | 61,671 | 11,203 | ||||||
IMS Health Holdings * | 284,475 | 8,915 | ||||||
Intuitive Surgical * | 2,018 | 1,463 | ||||||
Novo Nordisk ADR | 260,343 | 10,828 | ||||||
Quintiles Transnational * | 226,064 | 18,325 | ||||||
Regeneron Pharmaceuticals * | 28,149 | 11,316 | ||||||
UnitedHealth Group | 238,659 | 33,412 | ||||||
Vertex Pharmaceuticals * | 24,333 | 2,122 | ||||||
|
|
| ||||||
| 266,019 | ||||||||
|
|
| ||||||
Industrials — 5.1% | ||||||||
Acuity Brands | 22,249 | 5,887 | ||||||
C.H. Robinson Worldwide | 51,742 | 3,646 | ||||||
Delta Air Lines, Cl A | 106,451 | 4,190 | ||||||
Huntington Ingalls Industries, Cl A | 9,040 | 1,387 | ||||||
JB Hunt Transport Services | 25,548 | 2,073 | ||||||
Lennox International | 19,246 | 3,022 | ||||||
Nielsen Holdings | 397,806 | 21,311 | ||||||
Norfolk Southern | 89,217 | 8,659 | ||||||
Roper Technologies | 40,889 | 7,461 | ||||||
Snap-on | 17,379 | 2,641 | ||||||
Southwest Airlines, Cl A | 44,257 | 1,721 | ||||||
Toro | 41,774 | 1,957 | ||||||
TransDigm Group * | 35,540 | 10,275 | ||||||
|
|
| ||||||
| 74,230 | ||||||||
|
|
| ||||||
Information Technology — 40.3% | ||||||||
Activision Blizzard | 270,819 | 11,997 | ||||||
Alphabet, Cl A * | 83,962 | 67,510 | ||||||
Alphabet, Cl C * | 28,869 | 22,440 | ||||||
Apple | 133,029 | 15,039 | ||||||
Applied Materials | 191,427 | 5,772 | ||||||
ASML Holding, Cl G | 34,819 | 3,815 | ||||||
Broadcom | 15,571 | 2,686 | ||||||
CDW | 62,718 | 2,868 | ||||||
eBay * | 935,848 | 30,789 | ||||||
Electronic Arts * | 405,875 | 34,662 | ||||||
F5 Networks, Cl A * | 11,629 | 1,449 | ||||||
Facebook, Cl A * | 465,968 | 59,770 | ||||||
Fiserv, Cl A * | 93,185 | 9,269 | ||||||
FleetCor Technologies * | 65,197 | 11,327 | ||||||
Global Payments | 119,098 | 9,142 | ||||||
Intuit | 191,540 | 21,071 | ||||||
Jack Henry & Associates | 15,883 | 1,359 | ||||||
SEI Institutional Managed Trust / Annual Report / September 30, 2016 |
1 |
SCHEDULE OF INVESTMENTS
September 30, 2016
Large Cap Growth Fund (Concluded)
| Description | Shares | Market Value ($ Thousands) | ||||||
COMMON STOCK (continued) | ||||||||
MasterCard, Cl A | 293,441 | $ | 29,863 | |||||
Microsoft | 977,374 | 56,297 | ||||||
PayPal Holdings * | 874,367 | 35,823 | ||||||
Qualcomm | 623,798 | 42,730 | ||||||
salesforce.com * | 73,803 | 5,264 | ||||||
Symantec, Cl A | 596,567 | 14,974 | ||||||
Tencent Holdings ADR | 436,761 | 12,175 | ||||||
Texas Instruments | 53,984 | 3,789 | ||||||
Vantiv, Cl A * | 92,552 | 5,208 | ||||||
Visa, Cl A | 799,040 | 66,081 | ||||||
|
|
| ||||||
| 583,169 | ||||||||
|
|
| ||||||
Materials — 1.8% | ||||||||
Ecolab | 70,309 | 8,558 | ||||||
LyondellBasell Industries, Cl A | 28,606 | 2,308 | ||||||
Sherwin-Williams, Cl A | 53,333 | 14,755 | ||||||
|
|
| ||||||
| 25,621 | ||||||||
|
|
| ||||||
Real Estate — 3.9% | ||||||||
Crown Castle International ‡ | 410,045 | 38,630 | ||||||
Equinix ‡ | 49,967 | 18,001 | ||||||
|
|
| ||||||
| 56,631 | ||||||||
|
|
| ||||||
Telecommunication Services — 0.7% |
| |||||||
SBA Communications, Cl A * | 69,653 | 7,812 | ||||||
Verizon Communications | 53,366 | 2,774 | ||||||
|
|
| ||||||
| 10,586 | ||||||||
|
|
| ||||||
Total Common Stock | 1,387,993 | |||||||
|
|
| ||||||
| Face Amount (Thousands) | ||||||||
U.S. TREASURY OBLIGATION — 0.0% | ||||||||
U.S. Treasury Bills | ||||||||
0.216%, 10/20/2016 (B) (C) | $ | 25 | 25 | |||||
|
|
| ||||||
Total U.S. Treasury Obligation | 25 | |||||||
|
|
| ||||||
| Shares | ||||||||
AFFILIATED PARTNERSHIP — 0.3% | ||||||||
SEI Liquidity Fund, L.P. | ||||||||
0.440% **†(D) | 4,044,105 | 4,044 | ||||||
|
|
| ||||||
Total Affiliated Partnership | ||||||||
(Cost $4,044) ($ Thousands) | 4,044 | |||||||
|
|
| ||||||
| Description | Shares | Market Value ($ Thousands) | ||||||
CASH EQUIVALENT — 4.3% | ||||||||
SEI Daily Income Trust, Government Fund, Cl A | ||||||||
0.220%**† | 62,625,698 | $ | 62,626 | |||||
|
|
| ||||||
Total Cash Equivalent | 62,626 | |||||||
|
|
| ||||||
Total Investments — 100.5% | $ | 1,454,688 | ||||||
|
|
| ||||||
| Percentages are based on Net Assets of $1,446,920 ($ Thousands). |
| * | Non-income producing security. |
| ** | Rate shown is the 7-day effective yield as of September 30, 2016. |
| ‡ | Real Estate Investment Trust. |
| † | Investment in Affiliated Security (see Note 6). |
| †† | Narrow industries are utilized for compliance purposes, whereas broad sectors are utilized for reporting. |
| (A) | This security or a partial position of this security is on loan at September 30, 2016 (see Note 10). The total market value of securities on loan at September 30, 2016 was $3,948 ($ Thousands). |
| (B) | Security, or portion thereof, has been pledged as collateral on open futures contracts. |
| (C) | The rate reported is the effective yield at time of purchase. |
| (D) | This security was purchased with cash collateral held from securities on loan (see Note 10). The total market value of such securities as of September 30, 2016 was $4,044 ($ Thousands). |
ADR — American Depositary Receipt
Cl — Class
L.P. — Limited Partnership
The following is a list of the level of inputs used as of September 30, 2016, in valuing the Fund’s investments carried at value ($ Thousands):
| Investments in Securities | Level 1 | Level 2 | Level 3 | Total | ||||||||||||
Common Stock | $ | 1,387,993 | $ | – | $ | – | $ | 1,387,993 | ||||||||
U.S. Treasury Obligation | – | 25 | – | 25 | ||||||||||||
Affiliated Partnership | – | 4,044 | – | 4,044 | ||||||||||||
Cash Equivalent | 62,626 | – | – | 62,626 | ||||||||||||
|
|
|
|
|
|
|
| |||||||||
Total Investments in Securities | $ | 1,450,619 | $ | 4,069 | $ | – | $ | 1,454,688 | ||||||||
|
|
|
|
|
|
|
| |||||||||
For the year ended September 30, 2016, there were no transfers between Level 1 and Level 2 assets and liabilities.
For the year ended September 30, 2016, there were no transfers between Level 2 and Level 3 assets and liabilities.
For more information on valuation inputs, see Note 2 – Significant Accounting Policies in Notes to Financial Statements.
Amounts designated as “—” are $0 or have been rounded to $0.
The accompanying notes are an integral part of the financial statements.
2 |
SEI Institutional Managed Trust / Annual Report / September 30, 2016 |
SCHEDULE OF INVESTMENTS
September 30, 2016
Tax-Managed Large Cap Fund
| Description | Shares | Market Value ($ Thousands) | ||||||
COMMON STOCK — 93.8% | ||||||||
Consumer Discretionary — 13.1% | ||||||||
Amazon.com, Cl A * | 49,176 | $ | 41,176 | |||||
Bed Bath & Beyond | 48,438 | 2,088 | ||||||
Best Buy | 186,465 | 7,119 | ||||||
Brinker International | 22,523 | 1,136 | ||||||
Charter Communications, Cl A * | 29,337 | 7,920 | ||||||
Chipotle Mexican Grill, Cl A * | 13,013 | 5,511 | ||||||
Comcast, Cl A | 81,471 | 5,405 | ||||||
Darden Restaurants | 34,626 | 2,123 | ||||||
Delphi Automotive | 91,343 | 6,515 | ||||||
Dick's Sporting Goods | 202,635 | 11,493 | ||||||
Dollar General | 81,182 | 5,682 | ||||||
Domino's Pizza | 25,114 | 3,814 | ||||||
Ford Motor | 1,028,932 | 12,419 | ||||||
GameStop, Cl A (A) | 89,722 | 2,475 | ||||||
General Motors | 839,917 | 26,684 | ||||||
Genuine Parts | 27,400 | 2,752 | ||||||
Goodyear Tire & Rubber | 179,472 | 5,797 | ||||||
Graham Holdings, Cl B | 809 | 389 | ||||||
Groupon, Cl A *(A) | 347,146 | 1,788 | ||||||
Harley-Davidson, Cl A | 30,157 | 1,586 | ||||||
Home Depot | 118,848 | 15,293 | ||||||
International Game Technology | 79,819 | 1,946 | ||||||
Interpublic Group | 55,709 | 1,245 | ||||||
Kohl's (A) | 256,630 | 11,228 | ||||||
L Brands | 364,619 | 25,804 | ||||||
Las Vegas Sands | 22,879 | 1,316 | ||||||
Lear | 115,549 | 14,007 | ||||||
Liberty Global, Cl A * | 112,201 | 3,835 | ||||||
Liberty Global, Cl C * | 307,545 | 10,161 | ||||||
Liberty Interactive QVC Group, Cl A * | 1,198,119 | 23,974 | ||||||
Lowe's | 45,020 | 3,251 | ||||||
Macy's | 305,845 | 11,332 | ||||||
Magna International, Cl A | 255,130 | 10,958 | ||||||
Marriott International, Cl A | 40,040 | 2,696 | ||||||
Michael Kors Holdings * | 279,901 | 13,097 | ||||||
Murphy USA * | 24,225 | 1,729 | ||||||
NetFlix * | 63,236 | 6,232 | ||||||
Nike, Cl B | 329,743 | 17,361 | ||||||
Norwegian Cruise Line Holdings * | 369,890 | 13,945 | ||||||
Omnicom Group | 191,057 | 16,240 | ||||||
Priceline Group * | 7,673 | 11,291 | ||||||
PulteGroup | 435,000 | 8,717 | ||||||
PVH | 19,211 | 2,123 | ||||||
Ross Stores | 84,479 | 5,432 | ||||||
Scripps Networks Interactive, Cl A | 16,630 | 1,056 | ||||||
Signet Jewelers | 11,777 | 878 | ||||||
Staples | 721,965 | 6,173 | ||||||
Starbucks | 227,286 | 12,305 | ||||||
Target, Cl A | 21,414 | 1,471 | ||||||
TEGNA | 153,973 | 3,366 | ||||||
Time Warner | 41,985 | 3,342 | ||||||
| Description | Shares | Market Value ($ Thousands) | ||||||
COMMON STOCK (continued) | ||||||||
TJX | 44,758 | $ | 3,347 | |||||
TopBuild * | 51,618 | 1,714 | ||||||
Toyota Motor ADR (A) | 49,676 | 5,765 | ||||||
TripAdvisor * | 326,096 | 20,603 | ||||||
Tupperware Brands | 21,691 | 1,418 | ||||||
Urban Outfitters * | 33,167 | 1,145 | ||||||
Walt Disney | 54,000 | 5,014 | ||||||
Whirlpool | 68,064 | 11,037 | ||||||
Yum! Brands | 89,577 | 8,134 | ||||||
|
|
| ||||||
| 473,853 | ||||||||
|
|
| ||||||
Consumer Staples — 6.6% | ||||||||
Altria Group | 127,397 | 8,055 | ||||||
Anheuser-Busch InBev ADR | 85,244 | 11,202 | ||||||
Archer-Daniels-Midland | 148,154 | 6,248 | ||||||
Bunge | 31,232 | 1,850 | ||||||
Clorox | 53,141 | 6,652 | ||||||
Coca-Cola | 84,125 | 3,560 | ||||||
ConAgra Foods | 54,663 | 2,575 | ||||||
Constellation Brands, Cl A | 84,705 | 14,103 | ||||||
Costco Wholesale | 111,223 | 16,963 | ||||||
CVS Health | 185,772 | 16,532 | ||||||
Dr Pepper Snapple Group | 25,908 | 2,366 | ||||||
General Mills | 16,297 | 1,041 | ||||||
Hershey | 3,593 | 343 | ||||||
Hormel Foods | 20,520 | 778 | ||||||
Ingredion | 40,323 | 5,365 | ||||||
JM Smucker | 34,455 | 4,670 | ||||||
Kimberly-Clark | 51,071 | 6,442 | ||||||
Kraft Heinz | 13,143 | 1,176 | ||||||
Kroger | 530,992 | 15,760 | ||||||
Mead Johnson Nutrition, Cl A | 88,188 | 6,968 | ||||||
Mondelez International, Cl A | 122,182 | 5,364 | ||||||
PepsiCo | 3,825 | 416 | ||||||
Philip Morris International | 115,139 | 11,194 | ||||||
Procter & Gamble | 80,986 | 7,268 | ||||||
Reynolds American | 242,984 | 11,457 | ||||||
Tyson Foods, Cl A | 359,376 | 26,835 | ||||||
Walgreens Boots Alliance | 289,947 | 23,376 | ||||||
Wal-Mart Stores | 276,893 | 19,969 | ||||||
|
|
| ||||||
| 238,528 | ||||||||
|
|
| ||||||
Energy — 6.1% | ||||||||
Anadarko Petroleum, Cl A | 53,445 | 3,386 | ||||||
Apache | 141,776 | 9,055 | ||||||
BP ADR (A) | 639,751 | 22,494 | ||||||
Canadian Natural Resources | 311,948 | 9,995 | ||||||
Chevron | 213,036 | 21,926 | ||||||
Concho Resources * | 34,048 | 4,676 | ||||||
Devon Energy | 606,496 | 26,752 | ||||||
Diamond Offshore Drilling * | 284,470 | 5,009 | ||||||
EP Energy, Cl A *(A) | 349,551 | 1,531 | ||||||
SEI Institutional Managed Trust / Annual Report / September 30, 2016 |
1 |
SCHEDULE OF INVESTMENTS
September 30, 2016
Tax-Managed Large Cap Fund (Continued)
| Description | Shares | Market Value ($ Thousands) | ||||||
COMMON STOCK (continued) | ||||||||
Exxon Mobil | 164,776 | $ | 14,382 | |||||
FMC Technologies * | 105,032 | 3,116 | ||||||
Helmerich & Payne (A) | 52,920 | 3,561 | ||||||
Hess | 52,408 | 2,810 | ||||||
HollyFrontier | 163,780 | 4,013 | ||||||
Kinder Morgan | 704,998 | 16,307 | ||||||
Marathon Oil | 290,425 | 4,592 | ||||||
Marathon Petroleum | 270,012 | 10,960 | ||||||
Occidental Petroleum | 33,020 | 2,408 | ||||||
Phillips 66 | 151,255 | 12,184 | ||||||
Royal Dutch Shell ADR, Cl A | 42,286 | 2,117 | ||||||
Southwestern Energy *(A) | 1,163,610 | 16,104 | ||||||
Teekay Shipping (A) | 146,650 | 1,131 | ||||||
Tesoro | 62,488 | 4,972 | ||||||
Valero Energy | 245,630 | 13,018 | ||||||
Williams | 102,633 | 3,154 | ||||||
|
|
| ||||||
| 219,653 | ||||||||
|
|
| ||||||
Financials — 13.8% | ||||||||
Aflac | 255,654 | 18,374 | ||||||
Allstate | 59,438 | 4,112 | ||||||
Ally Financial | 156,993 | 3,057 | ||||||
American Financial Group | 39,790 | 2,984 | ||||||
American International Group | 232,082 | 13,772 | ||||||
Ameriprise Financial | 82,444 | 8,225 | ||||||
Assurant | 132,522 | 12,225 | ||||||
Bank of America | 2,378,236 | 37,219 | ||||||
BB&T | 41,703 | 1,573 | ||||||
Berkshire Hathaway, Cl B * | 148,096 | 21,395 | ||||||
Blackstone Group (B) | 116,035 | 2,962 | ||||||
Capital One Financial | 113,167 | 8,129 | ||||||
CIT Group | 106,074 | 3,850 | ||||||
Citigroup | 379,987 | 17,947 | ||||||
CME Group | 87,815 | 9,178 | ||||||
Cullen/Frost Bankers (A) | 37,402 | 2,691 | ||||||
Discover Financial Services | 241,586 | 13,662 | ||||||
Everest Re Group | 57,218 | 10,870 | ||||||
Fifth Third Bancorp (A) | 478,279 | 9,786 | ||||||
Franklin Resources | 88,854 | 3,161 | ||||||
Goldman Sachs Group | 21,644 | 3,490 | ||||||
Hartford Financial Services Group | 101,910 | 4,364 | ||||||
Huntington Bancshares | 321,477 | 3,170 | ||||||
Intercontinental Exchange | 72,626 | 19,563 | ||||||
Invesco | 126,803 | 3,965 | ||||||
JPMorgan Chase | 651,575 | 43,388 | ||||||
KeyCorp | 816,571 | 9,938 | ||||||
KKR, Cl Miscellaneous (B) | 593,261 | 8,460 | ||||||
Lincoln National | 182,558 | 8,577 | ||||||
Marsh & McLennan | 102,651 | 6,903 | ||||||
MetLife | 591,627 | 26,286 | ||||||
MFA Financial ‡ | 161,550 | 1,208 | ||||||
Morgan Stanley | 311,935 | 10,001 | ||||||
| Description | Shares | Market Value ($ Thousands) | ||||||
COMMON STOCK (continued) | ||||||||
PNC Financial Services Group | 124,968 | $ | 11,258 | |||||
Popular | 193,445 | 7,393 | ||||||
Principal Financial Group, Cl A | 139,391 | 7,180 | ||||||
Progressive | 44,272 | 1,395 | ||||||
Prudential Financial | 125,547 | 10,251 | ||||||
Radian Group | 138,469 | 1,876 | ||||||
Regions Financial | 507,300 | 5,007 | ||||||
Reinsurance Group of America, Cl A | 61,098 | 6,595 | ||||||
S&P Global | 23,272 | 2,945 | ||||||
Santander Consumer USA Holdings * | 691,937 | 8,414 | ||||||
Starwood Property Trust ‡ | 153,603 | 3,459 | ||||||
State Street | 165,424 | 11,518 | ||||||
SunTrust Banks | 142,000 | 6,220 | ||||||
Synchrony Financial | 39,416 | 1,104 | ||||||
Travelers | 120,419 | 13,794 | ||||||
Two Harbors Investment ‡ | 456,366 | 3,893 | ||||||
Unum Group | 155,168 | 5,479 | ||||||
Validus Holdings | 28,272 | 1,408 | ||||||
Voya Financial | 615,401 | 17,736 | ||||||
Wells Fargo | 427,725 | 18,940 | ||||||
|
|
| ||||||
| 500,350 | ||||||||
|
|
| ||||||
Health Care — 13.7% | ||||||||
Abbott Laboratories | 99,343 | 4,201 | ||||||
AbbVie | 206,293 | 13,011 | ||||||
Aetna, Cl A | 79,792 | 9,212 | ||||||
Alexion Pharmaceuticals * | 79,977 | 9,800 | ||||||
Allergan * | 89,650 | 20,647 | ||||||
AmerisourceBergen | 97,471 | 7,874 | ||||||
Amgen, Cl A | 120,417 | 20,087 | ||||||
Anthem | 91,456 | 11,460 | ||||||
AstraZeneca ADR (A) | 146,056 | 4,799 | ||||||
Baxter International | 180,158 | 8,575 | ||||||
Becton Dickinson | 43,917 | 7,893 | ||||||
Biogen * | 176,222 | 55,163 | ||||||
Boston Scientific * | 218,646 | 5,204 | ||||||
Bruker BioSciences | 114,861 | 2,602 | ||||||
C.R. Bard | 30,808 | 6,910 | ||||||
Cardinal Health | 83,112 | 6,458 | ||||||
Celgene, Cl A * | 340,478 | 35,590 | ||||||
Centene * | 39,088 | 2,617 | ||||||
Charles River Laboratories International * | 14,173 | 1,181 | ||||||
Cigna | 68,071 | 8,871 | ||||||
DENTSPLY SIRONA (A) | 153,475 | 9,121 | ||||||
Edwards Lifesciences, Cl A * | 47,124 | 5,681 | ||||||
Endo International * | 86,639 | 1,746 | ||||||
Gilead Sciences | 185,910 | 14,709 | ||||||
HCA Holdings * | 144,187 | 10,905 | ||||||
Hologic * | 34,000 | 1,320 | ||||||
Horizon Pharma *(A) | 196,339 | 3,560 | ||||||
Humana | 44,504 | 7,872 | ||||||
Idexx Laboratories * | 72,356 | 8,157 | ||||||
2 |
SEI Institutional Managed Trust / Annual Report / September 30, 2016 |
SCHEDULE OF INVESTMENTS
September 30, 2016
Tax-Managed Large Cap Fund (Continued)
| Description | Shares | Market Value ($ Thousands) | ||||||
COMMON STOCK (continued) | ||||||||
Illumina * | 55,646 | $ | 10,109 | |||||
IMS Health Holdings * | 79,937 | 2,505 | ||||||
Intuitive Surgical * | 7,226 | 5,238 | ||||||
Ionis Pharmaceuticals * | 109,925 | 4,028 | ||||||
Jazz Pharmaceuticals * | 16,083 | 1,954 | ||||||
Johnson & Johnson | 224,386 | 26,507 | ||||||
Mallinckrodt * | 75,667 | 5,280 | ||||||
McKesson | 33,384 | 5,567 | ||||||
Merck | 290,561 | 18,134 | ||||||
Mettler Toledo International * | 2,765 | 1,161 | ||||||
Mylan * | 89,707 | 3,420 | ||||||
Novo Nordisk ADR | 326,982 | 13,599 | ||||||
Pfizer | 706,138 | 23,917 | ||||||
Quest Diagnostics | 12,728 | 1,077 | ||||||
Quintiles Transnational * | 134,735 | 10,922 | ||||||
Regeneron Pharmaceuticals * | 24,257 | 9,752 | ||||||
Teva Pharmaceutical Industries ADR | 148,926 | 6,852 | ||||||
United Therapeutics * | 47,682 | 5,630 | ||||||
UnitedHealth Group | 127,790 | 17,891 | ||||||
Universal Health Services, Cl B | 10,672 | 1,315 | ||||||
Vertex Pharmaceuticals * | 42,616 | 3,716 | ||||||
Zimmer Biomet Holdings | 82,010 | 10,663 | ||||||
Zoetis, Cl A | 43,368 | 2,255 | ||||||
|
|
| ||||||
| 496,718 | ||||||||
|
|
| ||||||
Industrials — 7.3% | ||||||||
3M | 52,661 | 9,280 | ||||||
Acuity Brands | 17,836 | 4,719 | ||||||
AECOM * | 38,691 | 1,150 | ||||||
AerCap Holdings * | 231,360 | 8,905 | ||||||
AGCO | 52,600 | 2,594 | ||||||
Alaska Air Group | 181,446 | 11,950 | ||||||
American Airlines Group | 251,322 | 9,201 | ||||||
BE Aerospace | 20,939 | 1,082 | ||||||
BWX Technologies, Cl W | 37,080 | 1,423 | ||||||
C.H. Robinson Worldwide | 31,918 | 2,249 | ||||||
Caterpillar, Cl A | 47,565 | 4,222 | ||||||
Deere (A) | 31,142 | 2,658 | ||||||
Delta Air Lines, Cl A | 448,474 | 17,652 | ||||||
Eaton | 239,695 | 15,750 | ||||||
FedEx | 20,626 | 3,603 | ||||||
Fluor | 99,000 | 5,081 | ||||||
General Dynamics | 19,797 | 3,072 | ||||||
General Electric | 224,840 | 6,660 | ||||||
Huntington Ingalls Industries, Cl A | 63,273 | 9,707 | ||||||
Illinois Tool Works (A) | 117,212 | 14,047 | ||||||
Lockheed Martin | 35,370 | 8,479 | ||||||
ManpowerGroup | 18,167 | 1,313 | ||||||
Masco | 39,457 | 1,354 | ||||||
Nielsen Holdings | 171,337 | 9,179 | ||||||
Norfolk Southern | 64,160 | 6,227 | ||||||
Northrop Grumman | 88,312 | 18,894 | ||||||
| Description | Shares | Market Value ($ Thousands) | ||||||
COMMON STOCK (continued) | ||||||||
Oshkosh Truck | 98,940 | $ | 5,541 | |||||
Owens Corning | 28,000 | 1,495 | ||||||
Raytheon | 135,818 | 18,489 | ||||||
Roper Technologies | 24,000 | 4,379 | ||||||
RR Donnelley & Sons | 93,388 | 1,468 | ||||||
Southwest Airlines, Cl A | 233,769 | 9,091 | ||||||
Spirit AeroSystems Holdings, Cl A * | 31,308 | 1,394 | ||||||
SPX * | 206,472 | 4,158 | ||||||
SPX FLOW * | 145,067 | 4,485 | ||||||
Terex | 202,319 | 5,141 | ||||||
Textron | 18,331 | 729 | ||||||
TransDigm Group * | 7,723 | 2,233 | ||||||
Trinity Industries | 142,401 | 3,443 | ||||||
United Continental Holdings * | 219,507 | 11,518 | ||||||
USG * | 38,000 | 982 | ||||||
Waste Management | 18,232 | 1,163 | ||||||
WW Grainger (A) | 30,341 | 6,822 | ||||||
|
|
| ||||||
| 262,982 | ||||||||
|
|
| ||||||
Information Technology — 23.6% | ||||||||
Accenture, Cl A | 96,547 | 11,795 | ||||||
Activision Blizzard | 225,719 | 9,999 | ||||||
Adobe Systems * | 144,353 | 15,668 | ||||||
Alphabet, Cl A * | 72,514 | 58,306 | ||||||
Alphabet, Cl C * | 31,880 | 24,780 | ||||||
Amdocs | 87,071 | 5,037 | ||||||
Apple | 329,490 | 37,249 | ||||||
Applied Materials | 507,844 | 15,311 | ||||||
Automatic Data Processing | 65,350 | 5,764 | ||||||
Broadcom | 35,768 | 6,171 | ||||||
Brocade Communications Systems | 213,029 | 1,966 | ||||||
CA | 81,679 | 2,702 | ||||||
Cisco Systems | 518,629 | 16,451 | ||||||
Citrix Systems * | 61,566 | 5,247 | ||||||
Cognizant Technology Solutions, Cl A * | 90,285 | 4,307 | ||||||
Computer Sciences | 28,981 | 1,513 | ||||||
CoreLogic * | 19,431 | 762 | ||||||
Corning, Cl B | 234,159 | 5,538 | ||||||
Dell Technologies - VMware, Cl V * | 1 | — | ||||||
DST Systems | 11,635 | 1,372 | ||||||
eBay * | 1,003,808 | 33,025 | ||||||
Electronic Arts * | 396,259 | 33,841 | ||||||
Facebook, Cl A * | 430,310 | 55,196 | ||||||
First Solar * | 102,904 | 4,064 | ||||||
FleetCor Technologies * | 41,862 | 7,273 | ||||||
Genpact * | 160,287 | 3,839 | ||||||
Harris | 25,220 | 2,310 | ||||||
Hewlett Packard Enterprise | 1,248,924 | 28,413 | ||||||
HP | 787,986 | 12,237 | ||||||
Ingram Micro, Cl A * | 158,717 | 5,660 | ||||||
Intel | 570,596 | 21,540 | ||||||
International Business Machines | 70,641 | 11,221 | ||||||
SEI Institutional Managed Trust / Annual Report / September 30, 2016 |
3 |
SCHEDULE OF INVESTMENTS
September 30, 2016
Tax-Managed Large Cap Fund (Continued)
| Description | Shares | Market Value ($ Thousands) | ||||||
COMMON STOCK (continued) | ||||||||
Intuit | 156,005 | $ | 17,162 | |||||
Jabil Circuit | 58,700 | 1,281 | ||||||
Juniper Networks | 66,060 | 1,589 | ||||||
Keysight Technologies * | 333,391 | 10,565 | ||||||
Lam Research (A) | 22,006 | 2,084 | ||||||
Lexmark International, Cl A | 59,121 | 2,362 | ||||||
LinkedIn, Cl A * | 10,951 | 2,093 | ||||||
Marvell Technology Group | 578,567 | 7,678 | ||||||
MasterCard, Cl A | 394,592 | 40,158 | ||||||
Microchip Technology (A) | 35,826 | 2,226 | ||||||
Micron Technology * | 1,497,104 | 26,619 | ||||||
Microsoft | 834,465 | 48,065 | ||||||
Motorola Solutions | 25,730 | 1,963 | ||||||
Nuance Communications * | 67,888 | 984 | ||||||
Oracle, Cl B | 334,529 | 13,140 | ||||||
PayPal Holdings * | 706,306 | 28,937 | ||||||
Qualcomm | 809,951 | 55,482 | ||||||
Rackspace Hosting * | 152,258 | 4,825 | ||||||
Red Hat * | 16,812 | 1,359 | ||||||
salesforce.com * | 15,984 | 1,140 | ||||||
Seagate Technology | 112,151 | 4,323 | ||||||
ServiceNow * | 18,268 | 1,446 | ||||||
Skyworks Solutions | 160,949 | 12,255 | ||||||
Symantec, Cl A | 433,589 | 10,883 | ||||||
Tableau Software, Cl A * | 45,010 | 2,488 | ||||||
Tech Data * | 22,300 | 1,889 | ||||||
Tencent Holdings ADR | 508,111 | 14,164 | ||||||
Teradata * | 50,205 | 1,556 | ||||||
Texas Instruments | 211,061 | 14,812 | ||||||
VeriSign *(A) | 91,384 | 7,150 | ||||||
Visa, Cl A | 556,476 | 46,021 | ||||||
Vishay Intertechnology | 88,686 | 1,250 | ||||||
Western Digital | 128,989 | 7,542 | ||||||
Western Union | 109,331 | 2,276 | ||||||
Xerox | 392,593 | 3,977 | ||||||
Yelp, Cl A * | 51,177 | 2,134 | ||||||
Zynga, Cl A * | 591,995 | 1,723 | ||||||
|
|
| ||||||
| 854,158 | ||||||||
|
|
| ||||||
Materials — 3.6% | ||||||||
Cabot | 99,097 | 5,194 | ||||||
Celanese, Ser A | 28,298 | 1,884 | ||||||
Cemex ADR * | 1,944,078 | 15,436 | ||||||
Domtar | 28,000 | 1,040 | ||||||
Dow Chemical, Cl A (A) | 250,839 | 13,001 | ||||||
Eastman Chemical | 133,827 | 9,057 | ||||||
Ecolab | 48,941 | 5,957 | ||||||
Freeport-McMoRan, Cl B * | 229,050 | 2,488 | ||||||
Huntsman | 312,058 | 5,077 | ||||||
Ingevity * | 14,131 | 651 | ||||||
International Paper | 408,052 | 19,578 | ||||||
Louisiana-Pacific * | 240,753 | 4,533 | ||||||
| Description | Shares | Market Value ($ Thousands) | ||||||
COMMON STOCK (continued) | ||||||||
LyondellBasell Industries, Cl A | 171,434 | $ | 13,828 | |||||
Mosaic | 186,525 | 4,562 | ||||||
Nucor | 66,958 | 3,311 | ||||||
Owens-Illinois * | 225,590 | 4,149 | ||||||
Reliance Steel & Aluminum | 65,718 | 4,734 | ||||||
Sealed Air | 22,988 | 1,053 | ||||||
Sherwin-Williams, Cl A | 39,129 | 10,825 | ||||||
Westlake Chemical | 14,664 | 785 | ||||||
WestRock | 84,787 | 4,110 | ||||||
|
|
| ||||||
| 131,253 | ||||||||
|
|
| ||||||
Real Estate — 2.1% | ||||||||
Brandywine Realty Trust ‡ | 185,374 | 2,896 | ||||||
CBL & Associates Properties ‡ | 361,216 | 4,385 | ||||||
CBRE Group, Cl A * | 32,365 | 906 | ||||||
Columbia Property Trust ‡ | 46,664 | 1,045 | ||||||
Corporate Office Properties Trust ‡ | 203,059 | 5,757 | ||||||
Crown Castle International ‡ | 320,212 | 30,167 | ||||||
Equinix ‡ | 48,540 | 17,486 | ||||||
Hospitality Properties Trust ‡ | 97,540 | 2,899 | ||||||
Host Hotels & Resorts ‡ | 135,804 | 2,114 | ||||||
NorthStar Realty Finance ‡ | 260,207 | 3,427 | ||||||
Outfront Media ‡ | 134,267 | 3,175 | ||||||
Public Storage ‡ | 4,106 | 916 | ||||||
Simon Property Group ‡ | 6,723 | 1,392 | ||||||
Weyerhaeuser ‡ | 41,353 | 1,321 | ||||||
|
|
| ||||||
| 77,886 | ||||||||
|
|
| ||||||
Telecommunication Services — 1.4% | ||||||||
AT&T | 348,990 | 14,172 | ||||||
China Mobile ADR | 107,908 | 6,639 | ||||||
SBA Communications, Cl A * | 51,639 | 5,792 | ||||||
Verizon Communications | 483,896 | 25,153 | ||||||
|
|
| ||||||
| 51,756 | ||||||||
|
|
| ||||||
Utilities — 2.5% | ||||||||
Ameren | 113,300 | 5,572 | ||||||
American Electric Power | 179,636 | 11,534 | ||||||
Calpine * | 387,320 | 4,896 | ||||||
Centerpoint Energy | 201,621 | 4,684 | ||||||
Consolidated Edison | 18,914 | 1,424 | ||||||
Edison International | 234,583 | 16,949 | ||||||
Entergy | 131,055 | 10,056 | ||||||
Exelon | 612,172 | 20,379 | ||||||
Public Service Enterprise Group | 316,913 | 13,269 | ||||||
WEC Energy Group | 57,461 | 3,441 | ||||||
|
|
| ||||||
| 92,204 | ||||||||
|
|
| ||||||
Total Common Stock | 3,399,341 | |||||||
|
|
| ||||||
4 |
SEI Institutional Managed Trust / Annual Report / September 30, 2016 |
SCHEDULE OF INVESTMENTS
September 30, 2016
Tax-Managed Large Cap Fund (Concluded)
| Description | Number of Rights | Market Value ($ Thousands) | ||||||
RIGHTS — 0.0% | ||||||||
United States — 0.0% | ||||||||
Safeway CVR - Casa Ley *‡‡ | 107,954 | $ | 110 | |||||
Safeway CVR - PDC *‡‡ | 107,954 | 5 | ||||||
|
|
| ||||||
Total Rights | 115 | |||||||
|
|
| ||||||
| Face Amount (Thousands) | ||||||||
U.S. TREASURY OBLIGATION — 0.0% | ||||||||
U.S. Treasury Bills | ||||||||
0.237%, 10/20/2016 (C) (D) | $ | 1,005 | 1,005 | |||||
|
|
| ||||||
Total U.S. Treasury Obligation | 1,005 | |||||||
|
|
| ||||||
| Shares | ||||||||
AFFILIATED PARTNERSHIP — 3.1% | ||||||||
SEI Liquidity Fund, L.P. | ||||||||
0.440% **†(E) | 111,916,706 | 111,917 | ||||||
|
|
| ||||||
Total Affiliated Partnership | 111,917 | |||||||
|
|
| ||||||
CASH EQUIVALENT — 6.1% | ||||||||
SEI Daily Income Trust, Government Fund, Cl A | ||||||||
0.220%**† | 222,381,770 | 222,382 | ||||||
|
|
| ||||||
Total Cash Equivalent | 222,382 | |||||||
|
|
| ||||||
Total Investments — 103.0% | $ | 3,734,760 | ||||||
|
|
| ||||||
A list of the open futures contracts held by the Fund at September 30, 2016, is as follows:
| Type of Contract | Number of Contracts Long | Expiration Date | Unrealized Appreciation ($ Thousands) | |||||||||
S&P 500 Index E-MINI | 146 | Dec-2016 | $23 | |||||||||
S&P Mid Cap 400 Index E-MINI | 12 | Dec-2016 | – | |||||||||
|
| |||||||||||
| $23 | ||||||||||||
|
| |||||||||||
For the year ended September 30, 2016, the total amount of all open futures contracts, as presented in the table above, are representative of the volume of activity for the derivative type during the year.
| Percentages are based on Net Assets of $3,625,346 ($ Thousands). |
| * | Non-income producing security. |
| ** | Rate shown is the 7-day effective yield as of September 30, 2016. |
| ‡ | Real Estate Investment Trust. |
| ‡‡ | Expiration date unavailable. |
| † | Investment in Affiliated Security (see Note 6). |
| (A) | This security or a partial position of this security is on loan at September 30, 2016 (see Note 10). The total market value of securities on loan at September 30, 2016 was $110,925 ($ Thousands). |
| (B) | Security is a Master Limited Partnership. At September 30, 2016, such securities amounted to $11,422 ($ Thousands), or 0.32% of Net Assets (see Note 2). |
| (C) | Security, or portion thereof, has been pledged as collateral on open futures contracts. |
| (D) | The rate reported is the effective yield at time of purchase. |
| (E) | This security was purchased with cash collateral held from securities on loan (see Note 10). The total market value of such securities as of September 30, 2016 was $111,917 ($ Thousands). |
ADR — American Depositary Receipt
Cl — Class
CVR — Contingent Value Rights
L.P. — Limited Partnership
S&P— Standard & Poor's
The following is a list of the level of inputs used as of September 30, 2016, in valuing the Fund’s investments and other financial instruments carried at value ($ Thousands):
| Investments in Securities | Level 1 | Level 2 | Level 3 | Total | ||||||||||||
Common Stock | $ | 3,399,341 | $ | – | $ | – | $ | 3,399,341 | ||||||||
Rights | – | 115 | – | 115 | ||||||||||||
U.S. Treasury Obligation | – | 1,005 | – | 1,005 | ||||||||||||
Affiliated Partnership | – | 111,917 | – | 111,917 | ||||||||||||
Cash Equivalent | 222,382 | – | – | 222,382 | ||||||||||||
|
|
|
|
|
|
|
| |||||||||
Total Investments in Securities | $ | 3,621,723 | $ | 113,037 | $ | – | $ | 3,734,760 | ||||||||
|
|
|
|
|
|
|
| |||||||||
| Other Financial Instruments | Level 1 | Level 2 | Level 3 | Total | ||||||||||||
Futures Contracts * | ||||||||||||||||
Unrealized Appreciation | $ | 23 | $ | — | $ | — | $ | 23 | ||||||||
|
|
|
|
|
|
|
| |||||||||
Total Other Financial Instruments | $ | 23 | $ | — | $ | — | $ | 23 | ||||||||
|
|
|
|
|
|
|
| |||||||||
* Futures contracts are valued at the unrealized appreciation on the instrument.
For the year ended September 30, 2016, there were no transfers between Level 1 and Level 2 assets and liabilities.
For the year ended September 30, 2016, there were no transfers between Level 2 and Level 3 assets and liabilities.
For more information on valuation inputs, see Note 2 – Significant Accounting Policies in Notes to Financial Statements.
Amounts designated as “—” are $0 or have been rounded to $0.
The accompanying notes are an integral part of the financial statements.
SEI Institutional Managed Trust / Annual Report / September 30, 2016 |
5 |
SCHEDULE OF INVESTMENTS
September 30, 2016
S&P 500 Index Fund
| Description | Shares | Market Value ($ Thousands) | ||||||
COMMON STOCK — 96.0% | ||||||||
Consumer Discretionary — 12.0% | ||||||||
Advance Auto Parts | 2,500 | $ | 373 | |||||
Amazon.com, Cl A * | 13,504 | 11,307 | ||||||
Autonation * | 2,526 | 123 | ||||||
Autozone * | 994 | 764 | ||||||
Bed Bath & Beyond | 5,333 | 230 | ||||||
Best Buy | 9,254 | 353 | ||||||
BorgWarner | 6,500 | 229 | ||||||
CarMax * | 6,800 | 363 | ||||||
Carnival | 15,184 | 741 | ||||||
CBS, Cl B | 14,295 | 782 | ||||||
Charter Communications, Cl A * | 7,500 | 2,025 | ||||||
Chipotle Mexican Grill, Cl A * | 1,004 | 425 | ||||||
Coach | 9,619 | 352 | ||||||
Comcast, Cl A | 82,348 | 5,463 | ||||||
Darden Restaurants | 4,018 | 246 | ||||||
Delphi Automotive | 9,400 | 670 | ||||||
Discovery Communications, Cl A * | 5,300 | 143 | ||||||
Discovery Communications, Cl C * | 7,100 | 187 | ||||||
Dollar General | 9,000 | 630 | ||||||
Dollar Tree * | 8,154 | 644 | ||||||
DR Horton | 11,358 | 343 | ||||||
Expedia | 4,055 | 473 | ||||||
Foot Locker, Cl A | 4,700 | 318 | ||||||
Ford Motor | 134,937 | 1,629 | ||||||
Gap | 8,031 | 179 | ||||||
Garmin | 3,705 | 178 | ||||||
General Motors | 48,413 | 1,538 | ||||||
Genuine Parts | 5,136 | 516 | ||||||
Goodyear Tire & Rubber | 9,393 | 303 | ||||||
H&R Block | 7,713 | 179 | ||||||
Hanesbrands | 13,000 | 328 | ||||||
Harley-Davidson, Cl A | 6,208 | 326 | ||||||
Harman International Industries, Cl A | 2,462 | 208 | ||||||
Hasbro | 3,896 | 309 | ||||||
Home Depot | 42,409 | 5,457 | ||||||
Interpublic Group | 13,801 | 308 | ||||||
Johnson Controls International | 32,809 | 1,527 | ||||||
Kohl's | 6,356 | 278 | ||||||
L Brands | 8,527 | 603 | ||||||
Leggett & Platt | 4,759 | 217 | ||||||
Lennar, Cl A | 6,216 | 263 | ||||||
LKQ * | 10,700 | 379 | ||||||
Lowe's | 29,849 | 2,155 | ||||||
Macy's | 10,664 | 395 | ||||||
Marriott International, Cl A | 11,224 | 756 | ||||||
Mattel | 11,731 | 355 | ||||||
McDonald's | 29,483 | 3,401 | ||||||
Michael Kors Holdings * | 6,200 | 290 | ||||||
Mohawk Industries * | 2,200 | 441 | ||||||
NetFlix * | 14,800 | 1,459 | ||||||
Newell Brands, Cl B | 15,855 | 835 | ||||||
| Description | Shares | Market Value ($ Thousands) | ||||||
COMMON STOCK (continued) | ||||||||
News, Cl A | 13,375 | $ | 187 | |||||
News, Cl B | 4,000 | 57 | ||||||
Nike, Cl B | 45,994 | 2,422 | ||||||
Nordstrom (A) | 4,107 | 213 | ||||||
Omnicom Group | 8,204 | 697 | ||||||
O'Reilly Automotive * | 3,300 | 924 | ||||||
Priceline Group * | 1,657 | 2,438 | ||||||
PulteGroup | 10,999 | 220 | ||||||
PVH | 2,800 | 309 | ||||||
Ralph Lauren, Cl A | 2,005 | 203 | ||||||
Ross Stores | 13,836 | 890 | ||||||
Royal Caribbean Cruises | 5,800 | 435 | ||||||
Scripps Networks Interactive, Cl A | 3,300 | 210 | ||||||
Signet Jewelers | 2,700 | 201 | ||||||
Staples | 22,636 | 194 | ||||||
Starbucks | 50,634 | 2,741 | ||||||
Target, Cl A | 19,528 | 1,341 | ||||||
TEGNA | 7,747 | 169 | ||||||
Tiffany (A) | 3,778 | 274 | ||||||
Time Warner | 26,525 | 2,112 | ||||||
TJX | 22,843 | 1,708 | ||||||
Tractor Supply | 4,600 | 310 | ||||||
TripAdvisor * | 3,955 | 250 | ||||||
Twenty-First Century Fox ADR, Cl A | 35,959 | 871 | ||||||
Twenty-First Century Fox, Cl B | 14,900 | 369 | ||||||
Ulta Salon Cosmetics & Fragrance * | 2,100 | 500 | ||||||
Under Armour, Cl A *(A) | 6,205 | 240 | ||||||
Under Armour, Cl C * | 6,249 | 212 | ||||||
Urban Outfitters * | 3,100 | 107 | ||||||
VF | 11,465 | 643 | ||||||
Viacom, Cl B | 12,001 | 457 | ||||||
Walt Disney | 50,644 | 4,703 | ||||||
Whirlpool | 2,605 | 422 | ||||||
Wyndham Worldwide | 3,902 | 263 | ||||||
Wynn Resorts (A) | 2,800 | 273 | ||||||
Yum! Brands | 12,770 | 1,160 | ||||||
|
|
| ||||||
| 80,721 | ||||||||
|
|
| ||||||
Consumer Staples — 9.5% | ||||||||
Altria Group | 66,973 | 4,235 | ||||||
Archer-Daniels-Midland | 20,275 | 855 | ||||||
Brown-Forman, Cl B | 5,892 | 280 | ||||||
Campbell Soup | 6,184 | 338 | ||||||
Church & Dwight | 8,600 | 412 | ||||||
Clorox | 4,442 | 556 | ||||||
Coca-Cola | 133,949 | 5,669 | ||||||
Colgate-Palmolive | 30,895 | 2,291 | ||||||
ConAgra Foods | 13,965 | 658 | ||||||
Constellation Brands, Cl A | 6,100 | 1,016 | ||||||
Costco Wholesale | 15,118 | 2,306 | ||||||
CVS Health | 36,852 | 3,279 | ||||||
Dr Pepper Snapple Group | 6,400 | 584 | ||||||
SEI Institutional Managed Trust / Annual Report / September 30, 2016 |
1 |
SCHEDULE OF INVESTMENTS
September 30, 2016
S&P 500 Index Fund (Continued)
| Description | Shares | Market Value ($ Thousands) | ||||||
COMMON STOCK (continued) | ||||||||
Estee Lauder, Cl A | 7,700 | $ | 682 | |||||
General Mills | 20,586 | 1,315 | ||||||
Hershey | 4,812 | 460 | ||||||
Hormel Foods | 9,408 | 357 | ||||||
JM Smucker | 4,153 | 563 | ||||||
Kellogg | 8,767 | 679 | ||||||
Kimberly-Clark | 12,403 | 1,565 | ||||||
Kraft Heinz | 20,608 | 1,845 | ||||||
Kroger | 33,036 | 980 | ||||||
McCormick | 3,966 | 396 | ||||||
Mead Johnson Nutrition, Cl A | 6,434 | 508 | ||||||
Molson Coors Brewing, Cl B | 6,351 | 697 | ||||||
Mondelez International, Cl A | 53,620 | 2,354 | ||||||
Monster Beverage * | 4,518 | 663 | ||||||
PepsiCo | 49,307 | 5,363 | ||||||
Philip Morris International | 53,387 | 5,190 | ||||||
Procter & Gamble | 92,231 | 8,278 | ||||||
Reynolds American | 28,642 | 1,350 | ||||||
SYSCO, Cl A | 17,720 | 868 | ||||||
Tyson Foods, Cl A | 10,403 | 777 | ||||||
Walgreens Boots Alliance | 29,257 | 2,359 | ||||||
Wal-Mart Stores | 51,861 | 3,740 | ||||||
Whole Foods Market | 11,209 | 318 | ||||||
|
|
| ||||||
| 63,786 | ||||||||
|
|
| ||||||
Energy — 6.9% | ||||||||
Anadarko Petroleum, Cl A | 17,685 | 1,121 | ||||||
Apache | 13,100 | 837 | ||||||
Baker Hughes | 14,349 | 724 | ||||||
Cabot Oil & Gas | 15,913 | 411 | ||||||
Chesapeake Energy *(A) | 17,822 | 112 | ||||||
Chevron | 64,800 | 6,669 | ||||||
Cimarex Energy | 3,304 | 444 | ||||||
Concho Resources * | 4,500 | 618 | ||||||
ConocoPhillips | 42,760 | 1,859 | ||||||
Devon Energy | 18,113 | 799 | ||||||
EOG Resources | 18,997 | 1,837 | ||||||
EQT | 5,905 | 429 | ||||||
Exxon Mobil | 142,846 | 12,468 | ||||||
FMC Technologies * | 7,900 | 234 | ||||||
Halliburton | 29,742 | 1,335 | ||||||
Helmerich & Payne (A) | 3,805 | 256 | ||||||
Hess | 9,175 | 492 | ||||||
Kinder Morgan | 66,382 | 1,535 | ||||||
Marathon Oil | 29,556 | 467 | ||||||
Marathon Petroleum | 18,364 | 745 | ||||||
Murphy Oil | 5,772 | 175 | ||||||
National Oilwell Varco, Cl A | 12,968 | 476 | ||||||
Newfield Exploration * | 6,900 | 300 | ||||||
Noble Energy | 14,900 | 533 | ||||||
Occidental Petroleum | 26,064 | 1,901 | ||||||
Oneok | 7,309 | 376 | ||||||
| Description | Shares | Market Value ($ Thousands) | ||||||
COMMON STOCK (continued) | ||||||||
Phillips 66 | 15,375 | $ | 1,238 | |||||
Pioneer Natural Resources | 5,604 | 1,040 | ||||||
Range Resources | 6,000 | 232 | ||||||
Schlumberger, Cl A | 48,000 | 3,775 | ||||||
Southwestern Energy * | 16,400 | 227 | ||||||
Spectra Energy | 23,661 | 1,012 | ||||||
Tesoro | 4,100 | 326 | ||||||
Transocean *(A) | 12,000 | 128 | ||||||
Valero Energy | 15,608 | 827 | ||||||
Williams | 23,669 | 727 | ||||||
|
|
| ||||||
| 46,685 | ||||||||
|
|
| ||||||
Financials — 12.3% | ||||||||
Affiliated Managers Group * | 1,900 | 275 | ||||||
Aflac | 14,317 | 1,029 | ||||||
Allstate | 12,959 | 897 | ||||||
American Express | 26,428 | 1,692 | ||||||
American International Group | 35,130 | 2,085 | ||||||
Ameriprise Financial | 5,684 | 567 | ||||||
Aon | 9,129 | 1,027 | ||||||
Arthur J. Gallagher | 6,200 | 315 | ||||||
Assurant | 2,105 | 194 | ||||||
Bank of America | 349,945 | 5,477 | ||||||
Bank of New York Mellon | 37,199 | 1,484 | ||||||
BB&T | 28,306 | 1,068 | ||||||
Berkshire Hathaway, Cl B * | 65,169 | 9,415 | ||||||
BlackRock | 4,161 | 1,508 | ||||||
Capital One Financial | 17,166 | 1,233 | ||||||
Charles Schwab | 40,936 | 1,292 | ||||||
Chubb | 16,034 | 2,015 | ||||||
Cincinnati Financial | 5,183 | 391 | ||||||
Citigroup | 99,551 | 4,702 | ||||||
Citizens Financial Group | 18,300 | 452 | ||||||
CME Group | 11,740 | 1,227 | ||||||
Comerica | 6,092 | 288 | ||||||
Discover Financial Services | 13,630 | 771 | ||||||
E*Trade Financial * | 9,552 | 278 | ||||||
Fifth Third Bancorp | 26,511 | 542 | ||||||
Franklin Resources | 11,650 | 414 | ||||||
Goldman Sachs Group | 13,065 | 2,107 | ||||||
Hartford Financial Services Group | 13,586 | 582 | ||||||
Huntington Bancshares | 37,014 | 365 | ||||||
Intercontinental Exchange | 4,081 | 1,099 | ||||||
Invesco | 14,400 | 450 | ||||||
JPMorgan Chase | 124,000 | 8,257 | ||||||
KeyCorp | 37,283 | 454 | ||||||
Legg Mason | 2,705 | 91 | ||||||
Leucadia National | 11,713 | 223 | ||||||
Lincoln National | 8,298 | 390 | ||||||
Loews | 9,262 | 381 | ||||||
M&T Bank | 5,525 | 641 | ||||||
Marsh & McLennan | 18,059 | 1,214 | ||||||
2 |
SEI Institutional Managed Trust / Annual Report / September 30, 2016 |
SCHEDULE OF INVESTMENTS
September 30, 2016
S&P 500 Index Fund (Continued)
| Description | Shares | Market Value ($ Thousands) | ||||||
COMMON STOCK (continued) | ||||||||
MetLife | 37,939 | $ | 1,686 | |||||
Moody's | 5,708 | 618 | ||||||
Morgan Stanley | 50,161 | 1,608 | ||||||
Nasdaq, Cl A | 3,900 | 263 | ||||||
Navient | 11,343 | 164 | ||||||
Northern Trust | 7,409 | 504 | ||||||
People's United Financial | 11,000 | 174 | ||||||
PNC Financial Services Group | 16,684 | 1,503 | ||||||
Principal Financial Group, Cl A | 9,357 | 482 | ||||||
Progressive | 20,285 | 639 | ||||||
Prudential Financial | 15,266 | 1,247 | ||||||
Regions Financial | 41,963 | 414 | ||||||
S&P Global | 9,121 | 1,154 | ||||||
State Street | 12,691 | 884 | ||||||
SunTrust Banks | 17,296 | 758 | ||||||
Synchrony Financial | 26,663 | 747 | ||||||
T. Rowe Price Group | 8,608 | 572 | ||||||
Torchmark, Cl A | 3,839 | 245 | ||||||
Travelers | 10,056 | 1,152 | ||||||
Unum Group | 8,161 | 288 | ||||||
US Bancorp | 54,923 | 2,356 | ||||||
Wells Fargo | 155,815 | 6,900 | ||||||
Willis Towers Watson | 4,321 | 574 | ||||||
XL Group | 10,005 | 336 | ||||||
Zions Bancorporation | 7,160 | 222 | ||||||
|
|
| ||||||
| 82,382 | ||||||||
|
|
| ||||||
Health Care — 13.9% | ||||||||
Abbott Laboratories | 50,763 | 2,147 | ||||||
AbbVie | 55,868 | 3,524 | ||||||
Aetna, Cl A | 12,107 | 1,398 | ||||||
Agilent Technologies | 11,315 | 533 | ||||||
Alexion Pharmaceuticals * | 7,700 | 944 | ||||||
Allergan * | 13,653 | 3,144 | ||||||
AmerisourceBergen | 6,296 | 509 | ||||||
Amgen, Cl A | 25,864 | 4,314 | ||||||
Anthem | 9,102 | 1,141 | ||||||
Baxter International | 16,935 | 806 | ||||||
Becton Dickinson | 7,358 | 1,322 | ||||||
Biogen * | 7,500 | 2,348 | ||||||
Boston Scientific * | 46,812 | 1,114 | ||||||
Bristol-Myers Squibb | 57,692 | 3,111 | ||||||
C.R. Bard | 2,488 | 558 | ||||||
Cardinal Health | 10,759 | 836 | ||||||
Celgene, Cl A * | 26,513 | 2,771 | ||||||
Centene * | 5,900 | 395 | ||||||
Cerner * | 10,100 | 624 | ||||||
Cigna | 8,871 | 1,156 | ||||||
Cooper, Cl A | 1,700 | 305 | ||||||
DaVita HealthCare Partners * | 5,705 | 377 | ||||||
DENTSPLY SIRONA | 8,109 | 482 | ||||||
Edwards Lifesciences, Cl A * | 7,300 | 880 | ||||||
| Description | Shares | Market Value ($ Thousands) | ||||||
COMMON STOCK (continued) | ||||||||
Eli Lilly | 33,539 | $ | 2,692 | |||||
Endo International * | 7,300 | 147 | ||||||
Express Scripts Holding * | 21,870 | 1,542 | ||||||
Gilead Sciences | 45,166 | 3,573 | ||||||
HCA Holdings * | 10,405 | 787 | ||||||
Henry Schein * | 2,800 | 456 | ||||||
Hologic * | 8,500 | 330 | ||||||
Humana | 5,101 | 902 | ||||||
Illumina * | 5,100 | 926 | ||||||
Intuitive Surgical * | 1,320 | 957 | ||||||
Johnson & Johnson | 94,012 | 11,106 | ||||||
Laboratory Corp of America Holdings * | 3,563 | 490 | ||||||
Mallinckrodt * | 3,804 | 265 | ||||||
McKesson | 7,769 | 1,295 | ||||||
Medtronic | 47,772 | 4,127 | ||||||
Merck | 95,174 | 5,940 | ||||||
Mettler Toledo International * | 900 | 378 | ||||||
Mylan * | 14,915 | 569 | ||||||
Patterson | 2,900 | 133 | ||||||
PerkinElmer | 3,740 | 210 | ||||||
Perrigo | 4,904 | 453 | ||||||
Pfizer | 208,656 | 7,067 | ||||||
Quest Diagnostics | 4,924 | 417 | ||||||
Regeneron Pharmaceuticals * | 2,600 | 1,045 | ||||||
St. Jude Medical | 9,856 | 786 | ||||||
Stryker | 10,846 | 1,263 | ||||||
Thermo Fisher Scientific | 13,552 | 2,156 | ||||||
UnitedHealth Group | 32,660 | 4,572 | ||||||
Universal Health Services, Cl B | 3,100 | 382 | ||||||
Varian Medical Systems * | 3,305 | 329 | ||||||
Vertex Pharmaceuticals * | 8,500 | 741 | ||||||
Waters * | 2,797 | 443 | ||||||
Zimmer Biomet Holdings | 6,860 | 892 | ||||||
Zoetis, Cl A | 17,146 | 892 | ||||||
|
|
| ||||||
| 93,002 | ||||||||
|
|
| ||||||
Industrials — 9.6% | ||||||||
3M | 20,791 | 3,664 | ||||||
Acuity Brands | 1,500 | 397 | ||||||
Alaska Air Group | 4,300 | 283 | ||||||
Allegion | 3,370 | 232 | ||||||
American Airlines Group | 17,809 | 652 | ||||||
Ametek | 7,700 | 368 | ||||||
Boeing | 20,041 | 2,640 | ||||||
C.H. Robinson Worldwide | 5,005 | 353 | ||||||
Caterpillar, Cl A | 20,206 | 1,794 | ||||||
Cintas | 3,012 | 339 | ||||||
CSX | 32,972 | 1,006 | ||||||
Cummins | 5,444 | 698 | ||||||
Danaher, Cl A | 20,696 | 1,622 | ||||||
Deere | 9,806 | 837 | ||||||
Delta Air Lines, Cl A | 25,313 | 996 | ||||||
SEI Institutional Managed Trust / Annual Report / September 30, 2016 |
3 |
SCHEDULE OF INVESTMENTS
September 30, 2016
S&P 500 Index Fund (Continued)
| Description | Shares | Market Value ($ Thousands) | ||||||
COMMON STOCK (continued) | ||||||||
Dover | 5,437 | $ | 400 | |||||
Dun & Bradstreet | 1,205 | 165 | ||||||
Eaton | 15,515 | 1,019 | ||||||
Emerson Electric | 22,315 | 1,216 | ||||||
Equifax | 4,130 | 556 | ||||||
Expeditors International of Washington | 6,409 | 330 | ||||||
Fastenal, Cl A | 10,009 | 418 | ||||||
FedEx | 8,305 | 1,451 | ||||||
Flowserve | 4,500 | 217 | ||||||
Fluor | 4,744 | 243 | ||||||
Fortive | 10,448 | 532 | ||||||
Fortune Brands Home & Security | 5,300 | 308 | ||||||
General Dynamics | 9,930 | 1,541 | ||||||
General Electric | 307,709 | 9,114 | ||||||
Honeywell International | 26,168 | 3,051 | ||||||
Illinois Tool Works | 11,129 | 1,334 | ||||||
Ingersoll-Rand | 8,904 | 605 | ||||||
Jacobs Engineering Group * | 4,304 | 223 | ||||||
JB Hunt Transport Services | 3,100 | 252 | ||||||
Kansas City Southern | 3,600 | 336 | ||||||
L-3 Communications Holdings | 2,623 | 395 | ||||||
Lockheed Martin | 8,636 | 2,070 | ||||||
Masco | 11,568 | 397 | ||||||
Nielsen Holdings | 11,200 | 600 | ||||||
Norfolk Southern | 10,230 | 993 | ||||||
Northrop Grumman | 6,223 | 1,331 | ||||||
PACCAR | 12,191 | 717 | ||||||
Parker-Hannifin, Cl A | 4,671 | 586 | ||||||
Pentair | 5,466 | 351 | ||||||
Pitney Bowes | 6,475 | 118 | ||||||
Quanta Services * | 5,100 | 143 | ||||||
Raytheon | 10,273 | 1,398 | ||||||
Republic Services | 8,283 | 418 | ||||||
Robert Half International | 4,532 | 172 | ||||||
Rockwell Automation | 4,530 | 554 | ||||||
Rockwell Collins | 4,278 | 361 | ||||||
Roper Technologies | 3,500 | 639 | ||||||
Ryder System | 1,859 | 123 | ||||||
Snap-on | 1,953 | 297 | ||||||
Southwest Airlines, Cl A | 20,862 | 811 | ||||||
Stanley Black & Decker | 5,040 | 620 | ||||||
Stericycle, Cl A * | 2,904 | 233 | ||||||
Textron | 9,307 | 370 | ||||||
TransDigm Group * | 1,700 | 491 | ||||||
Union Pacific | 28,801 | 2,809 | ||||||
United Continental Holdings * | 10,100 | 530 | ||||||
United Parcel Service, Cl B | 23,624 | 2,583 | ||||||
United Rentals * | 3,000 | 235 | ||||||
United Technologies | 26,641 | 2,707 | ||||||
Verisk Analytics, Cl A * | 5,400 | 439 | ||||||
Waste Management | 14,228 | 907 | ||||||
WW Grainger (A) | 1,965 | 442 | ||||||
| Description | Shares | Market Value ($ Thousands) | ||||||
COMMON STOCK (continued) | ||||||||
Xylem | 6,300 | $ | 330 | |||||
|
|
| ||||||
| 64,362 | ||||||||
|
|
| ||||||
Information Technology — 20.4% | ||||||||
Accenture, Cl A | 21,404 | 2,615 | ||||||
Activision Blizzard | 23,600 | 1,045 | ||||||
Adobe Systems * | 17,241 | 1,871 | ||||||
Akamai Technologies * | 6,104 | 323 | ||||||
Alliance Data Systems * | 2,000 | 429 | ||||||
Alphabet, Cl A * | 10,167 | 8,175 | ||||||
Alphabet, Cl C * | 10,095 | 7,847 | ||||||
Amphenol, Cl A | 10,709 | 695 | ||||||
Analog Devices | 10,599 | 683 | ||||||
Apple | 185,182 | 20,935 | ||||||
Applied Materials | 37,750 | 1,138 | ||||||
Autodesk, Cl A * | 6,717 | 486 | ||||||
Automatic Data Processing | 15,759 | 1,390 | ||||||
Broadcom | 13,646 | 2,354 | ||||||
CA | 10,340 | 342 | ||||||
Cisco Systems | 172,861 | 5,483 | ||||||
Citrix Systems * | 5,342 | 455 | ||||||
Cognizant Technology Solutions, Cl A * | 20,905 | 997 | ||||||
Corning, Cl B | 35,008 | 828 | ||||||
CSRA | 4,838 | 130 | ||||||
Dell Technologies - VMware, Cl V * | 1 | — | ||||||
eBay * | 36,649 | 1,206 | ||||||
Electronic Arts * | 10,478 | 895 | ||||||
F5 Networks, Cl A * | 2,300 | 287 | ||||||
Facebook, Cl A * | 79,822 | 10,239 | ||||||
Fidelity National Information Services, Cl B | 11,365 | 875 | ||||||
First Solar * | 2,640 | 104 | ||||||
Fiserv, Cl A * | 7,660 | 762 | ||||||
Flir Systems | 4,800 | 151 | ||||||
Global Payments | 5,300 | 407 | ||||||
Harris | 4,300 | 394 | ||||||
Hewlett Packard Enterprise | 57,591 | 1,310 | ||||||
HP | 58,991 | 916 | ||||||
Intel | 162,363 | 6,129 | ||||||
International Business Machines | 29,846 | 4,741 | ||||||
Intuit | 8,286 | 912 | ||||||
Juniper Networks | 12,200 | 294 | ||||||
KLA-Tencor | 5,471 | 381 | ||||||
Lam Research (A) | 5,522 | 523 | ||||||
Linear Technology | 7,998 | 474 | ||||||
MasterCard, Cl A | 32,813 | 3,339 | ||||||
Microchip Technology (A) | 7,304 | 454 | ||||||
Micron Technology * | 35,969 | 640 | ||||||
Microsoft | 267,789 | 15,425 | ||||||
Motorola Solutions | 5,289 | 403 | ||||||
NetApp | 10,185 | 365 | ||||||
Nvidia | 18,465 | 1,265 | ||||||
Oracle, Cl B | 104,023 | 4,086 | ||||||
4 |
SEI Institutional Managed Trust / Annual Report / September 30, 2016 |
SCHEDULE OF INVESTMENTS
September 30, 2016
S&P 500 Index Fund (Continued)
| Description | Shares | Market Value ($ Thousands) | ||||||
COMMON STOCK (continued) | ||||||||
Paychex | 11,169 | $ | 646 | |||||
PayPal Holdings * | 37,649 | 1,542 | ||||||
Qorvo * | 4,500 | 251 | ||||||
Qualcomm | 50,754 | 3,477 | ||||||
Red Hat * | 6,300 | 509 | ||||||
salesforce.com * | 22,009 | 1,570 | ||||||
Seagate Technology | 10,200 | 393 | ||||||
Skyworks Solutions | 6,604 | 503 | ||||||
Symantec, Cl A | 21,147 | 531 | ||||||
TE Connectivity | 12,409 | 799 | ||||||
Teradata * | 4,568 | 142 | ||||||
Texas Instruments | 34,366 | 2,412 | ||||||
Total System Services | 5,889 | 278 | ||||||
VeriSign *(A) | 3,300 | 258 | ||||||
Visa, Cl A | 64,718 | 5,352 | ||||||
Western Digital | 9,674 | 566 | ||||||
Western Union | 17,234 | 359 | ||||||
Xerox | 27,706 | 281 | ||||||
Xilinx | 8,809 | 479 | ||||||
Yahoo! * | 30,247 | 1,304 | ||||||
|
|
| ||||||
| 136,850 | ||||||||
|
|
| ||||||
Materials — 2.8% | ||||||||
Air Products & Chemicals | 7,526 | 1,131 | ||||||
Albemarle | 3,900 | 333 | ||||||
Alcoa | 45,535 | 462 | ||||||
Avery Dennison | 3,115 | 242 | ||||||
Ball | 5,986 | 491 | ||||||
CF Industries Holdings | 8,150 | 198 | ||||||
Dow Chemical, Cl A | 38,792 | 2,011 | ||||||
E.I. Du Pont de Nemours | 30,148 | 2,019 | ||||||
Eastman Chemical | 5,120 | 347 | ||||||
Ecolab | 9,134 | 1,112 | ||||||
FMC | 4,600 | 222 | ||||||
Freeport-McMoRan, Cl B * | 43,336 | 471 | ||||||
International Flavors & Fragrances | 2,794 | 399 | ||||||
International Paper | 14,274 | 685 | ||||||
LyondellBasell Industries, Cl A | 11,804 | 952 | ||||||
Martin Marietta Materials, Cl A | 2,200 | 394 | ||||||
Monsanto | 15,057 | 1,539 | ||||||
Mosaic | 12,009 | 294 | ||||||
Newmont Mining | 18,325 | 720 | ||||||
Nucor | 10,995 | 544 | ||||||
Owens-Illinois * | 5,600 | 103 | ||||||
PPG Industries | 9,190 | 950 | ||||||
Praxair | 9,699 | 1,172 | ||||||
Sealed Air | 6,728 | 308 | ||||||
Sherwin-Williams, Cl A | 2,716 | 751 | ||||||
Vulcan Materials | 4,649 | 529 | ||||||
WestRock | 8,784 | 426 | ||||||
|
|
| ||||||
| 18,805 | ||||||||
|
|
| ||||||
| Description | Shares | Market Value ($ Thousands) | ||||||
COMMON STOCK (continued) | ||||||||
Real Estate — 2.9% | ||||||||
American Tower, Cl A ‡ | 14,700 | $ | 1,666 | |||||
Apartment Investment & Management, Cl A ‡ | 5,539 | 254 | ||||||
AvalonBay Communities ‡ | 4,708 | 837 | ||||||
Boston Properties ‡ | 5,300 | 722 | ||||||
CBRE Group, Cl A * | 10,209 | 286 | ||||||
Crown Castle International ‡ | 11,604 | 1,093 | ||||||
Digital Realty Trust, Cl A ‡ | 5,100 | 495 | ||||||
Equinix ‡ | 2,356 | 849 | ||||||
Equity Residential ‡ | 12,644 | 813 | ||||||
Essex Property Trust ‡ | 2,200 | 490 | ||||||
Extra Space Storage ‡ | 4,400 | 349 | ||||||
Federal Realty Investment Trust ‡ | 2,400 | 370 | ||||||
General Growth Properties ‡ | 20,200 | 558 | ||||||
HCP ‡ | 16,100 | 611 | ||||||
Host Hotels & Resorts ‡ | 26,074 | 406 | ||||||
Iron Mountain ‡ | 8,238 | 309 | ||||||
Kimco Realty ‡ | 14,313 | 414 | ||||||
Macerich ‡ | 4,404 | 356 | ||||||
ProLogis ‡ | 18,200 | 974 | ||||||
Public Storage ‡ | 5,033 | 1,123 | ||||||
Realty Income ‡ | 8,600 | 576 | ||||||
Simon Property Group ‡ | 10,906 | 2,258 | ||||||
SL Green Realty ‡ | 3,500 | 378 | ||||||
UDR ‡ | 9,200 | 331 | ||||||
Ventas ‡ | 11,632 | 822 | ||||||
Vornado Realty Trust ‡ | 5,777 | 585 | ||||||
Welltower ‡ | 12,300 | 920 | ||||||
Weyerhaeuser ‡ | 25,961 | 829 | ||||||
|
|
| ||||||
| 19,674 | ||||||||
|
|
| ||||||
Telecommunication Services — 2.5% | ||||||||
AT&T | 211,959 | 8,608 | ||||||
CenturyTel | 18,870 | 518 | ||||||
Frontier Communications | 40,960 | 170 | ||||||
Level 3 Communications * | 10,000 | 464 | ||||||
Verizon Communications | 140,296 | 7,292 | ||||||
|
|
| ||||||
| 17,052 | ||||||||
|
|
| ||||||
Utilities — 3.2% | ||||||||
AES | 22,790 | 293 | ||||||
Alliant Energy | 7,900 | 303 | ||||||
Ameren | 8,453 | 416 | ||||||
American Electric Power | 17,015 | 1,092 | ||||||
American Water Works | 6,200 | 464 | ||||||
Centerpoint Energy | 14,885 | 346 | ||||||
CMS Energy | 9,601 | 403 | ||||||
Consolidated Edison | 10,533 | 793 | ||||||
Dominion Resources | 21,240 | 1,577 | ||||||
DTE Energy | 6,245 | 585 | ||||||
Duke Energy | 23,816 | 1,906 | ||||||
Edison International | 11,257 | 813 | ||||||
SEI Institutional Managed Trust / Annual Report / September 30, 2016 |
5 |
SCHEDULE OF INVESTMENTS
September 30, 2016
S&P 500 Index Fund (Concluded)
| Description | Shares | Market Value ($ Thousands) | ||||||
COMMON STOCK (continued) | ||||||||
Entergy | 6,164 | $ | 473 | |||||
Eversource Energy | 11,035 | 598 | ||||||
Exelon | 31,955 | 1,064 | ||||||
FirstEnergy | 14,723 | 487 | ||||||
NextEra Energy | 15,920 | 1,947 | ||||||
NiSource | 11,192 | 270 | ||||||
NRG Energy | 11,113 | 125 | ||||||
PG&E | 17,129 | 1,048 | ||||||
Pinnacle West Capital | 3,849 | 292 | ||||||
PPL | 23,371 | 808 | ||||||
Public Service Enterprise Group | 17,530 | 734 | ||||||
SCANA | 5,004 | 362 | ||||||
Sempra Energy | 8,170 | 876 | ||||||
Southern | 33,835 | 1,736 | ||||||
WEC Energy Group | 10,919 | 654 | ||||||
Xcel Energy | 17,636 | 726 | ||||||
|
|
| ||||||
| 21,191 | ||||||||
|
|
| ||||||
Total Common Stock | 644,510 | |||||||
|
|
| ||||||
| Face Amount (Thousands) | ||||||||
U.S. TREASURY OBLIGATIONS — 0.1% |
| |||||||
U.S. Treasury Bills | ||||||||
0.421%, 03/02/2017 (B)(C) | $ | 525 | 524 | |||||
0.292%, 12/08/2016 (B)(C) | 280 | 280 | ||||||
|
|
| ||||||
Total U.S. Treasury Obligations | 804 | |||||||
|
|
| ||||||
| Shares | ||||||||
AFFILIATED PARTNERSHIP — 0.5% | ||||||||
SEI Liquidity Fund, L.P. | ||||||||
0.440% **†(D) | 3,172,128 | 3,172 | ||||||
|
|
| ||||||
Total Affiliated Partnership | 3,172 | |||||||
|
|
| ||||||
CASH EQUIVALENT — 2.3% | ||||||||
SEI Daily Income Trust, Government Fund, Cl A | ||||||||
0.220%**† | 15,140,528 | 15,141 | ||||||
|
|
| ||||||
Total Cash Equivalent | 15,141 | |||||||
|
|
| ||||||
Total Investments — 98.9% | $ | 663,627 | ||||||
|
|
| ||||||
A list of the open futures contracts held by the Fund at September 30, 2016, is as follows:
| Type of Contract | Number of Contracts Long | Expiration Date | Unrealized Appreciation ($ Thousands) | |||||||||
S&P 500 Index E-MINI | 160 | Dec-2016 | $304 | |||||||||
|
| |||||||||||
For the year ended September 30, 2016, the total amount of all open futures contracts, as presented in the table above, are representative of the volume of activity for the derivative type during the year.
| Percentages are based on Net Assets of $670,972 ($ Thousands). |
| * | Non-income producing security. |
| ** | Rate shown is the 7-day effective yield as of September 30, 2016. |
| ‡ | Real Estate Investment Trust. |
| † | Investment in Affiliated Security (see Note 6). |
| (A) | This security or a partial position of this security is on loan at September 30, 2016 (see Note 10). The total market value of securities on loan at September 30, 2016 was $3,131 ($ Thousands). |
| (B) | Security, or portion thereof, has been pledged as collateral on open futures contracts. |
| (C) | The rate reported is the effective yield at time of purchase. |
| (D) | This security was purchased with cash collateral held from securities on loan (see Note 10). The total market value of such securities as of September 30, 2016 was $3,172 ($ Thousands). |
ADR — American Depositary Receipt
Cl — Class
L.P. — Limited Partnership
S&P— Standard & Poor's
The following is a list of the level of inputs used as of September 30, 2016, in valuing the Fund’s investments and other financial instruments carried at value ($ Thousands):
| Investments in Securities | Level 1 | Level 2 | Level 3 | Total | ||||||||||||
Common Stock | $ | 644,510 | $ | – | $ | – | $ | 644,510 | ||||||||
U.S. Treasury Obligations | – | 804 | – | 804 | ||||||||||||
Affiliated Partnership | – | 3,172 | – | 3,172 | ||||||||||||
Cash Equivalent | 15,141 | – | – | 15,141 | ||||||||||||
|
|
|
|
|
|
|
| |||||||||
Total Investments in Securities | $ | 659,651 | $ | 3,976 | $ | – | $ | 663,627 | ||||||||
|
|
|
|
|
|
|
| |||||||||
| Other Financial Instruments | Level 1 | Level 2 | Level 3 | Total | ||||||||||||
Futures Contracts * | ||||||||||||||||
Unrealized Appreciation | $ | 304 | $ | — | $ | — | $ | 304 | ||||||||
|
|
|
|
|
|
|
| |||||||||
Total Other Financial Instruments | $ | 304 | $ | — | $ | — | $ | 304 | ||||||||
|
|
|
|
|
|
|
| |||||||||
* Futures contracts are valued at the unrealized appreciation on the instrument.
For the year ended September 30, 2016, there were no transfers between Level 1 and Level 2 assets and liabilities.
For the year ended September 30, 2016, there were no transfers between Level 2 and Level 3 assets and liabilities.
For more information on valuation inputs, see Note 2 – Significant Accounting Policies in Notes to Financial Statements.
Amounts designated as “—” are $0 or have been rounded to $0.
The accompanying notes are an integral part of the financial statements.
6 |
SEI Institutional Managed Trust / Annual Report / September 30, 2016 |
SCHEDULE OF INVESTMENTS
September 30, 2016
Small Cap Fund
| Description | Shares | Market Value ($ Thousands) | ||||||
COMMON STOCK — 93.8% | ||||||||
Consumer Discretionary — 10.9% | ||||||||
2U * | 30,962 | $ | 1,186 | |||||
American Axle & Manufacturing Holdings * | 40,634 | 700 | ||||||
American Eagle Outfitters (A) | 30,994 | 554 | ||||||
Big Lots | 64,093 | 3,060 | ||||||
Bloomin' Brands | 40,646 | 701 | ||||||
Bright Horizons Family Solutions * | 42,498 | 2,843 | ||||||
Buffalo Wild Wings * | 4,399 | 619 | ||||||
Callaway Golf | 99,851 | 1,159 | ||||||
Carrols Restaurant Group * | 27,658 | 365 | ||||||
Cavco Industries *(A) | 2,934 | 291 | ||||||
Century Communities * | 30,103 | 647 | ||||||
Cooper Tire & Rubber | 24,846 | 945 | ||||||
Cooper-Standard Holding * | 9,897 | 978 | ||||||
Core-Mark Holding, Cl A (A) | 59,294 | 2,123 | ||||||
Cracker Barrel Old Country Store (A) | 1,589 | 210 | ||||||
CROCS * | 51,875 | 431 | ||||||
Dave & Buster's Entertainment * | 17,149 | 672 | ||||||
Del Taco Restaurants *(A) | 52,112 | 621 | ||||||
Destination XL Group * | 41,000 | 178 | ||||||
Express * | 33,947 | 400 | ||||||
Fiesta Restaurant Group * | 147,779 | 3,547 | ||||||
Five Below *(A) | 20,824 | 839 | ||||||
Hooker Furniture | 2,893 | 71 | ||||||
IMAX *(A) | 16,626 | 482 | ||||||
Installed Building Products * | 15,697 | 563 | ||||||
J Alexander's Holdings * | 2,750 | 28 | ||||||
Jack in the Box | 37,181 | 3,567 | ||||||
Libbey | 144,553 | 2,580 | ||||||
Lithia Motors, Cl A (A) | 9,355 | 894 | ||||||
Lumber Liquidators Holdings *(A) | 34,956 | 688 | ||||||
Marriott Vacations Worldwide | 22,611 | 1,658 | ||||||
Matthews International, Cl A | 33,724 | 2,049 | ||||||
MDC Partners, Cl A (A) | 353,676 | 3,791 | ||||||
Monro Muffler | 26,893 | 1,645 | ||||||
NACCO Industries, Cl A | 153 | 10 | ||||||
National CineMedia | 81,267 | 1,196 | ||||||
Nexstar Broadcasting Group, Cl A (A) | 12,480 | 720 | ||||||
Nutrisystem | 22,883 | 679 | ||||||
Ollie's Bargain Outlet Holdings * | 22,442 | 588 | ||||||
Planet Fitness, Cl A *(A) | 71,969 | 1,444 | ||||||
Pool | 19,540 | 1,847 | ||||||
Ruth's Chris Steak House | 47,615 | 672 | ||||||
Select Comfort * | 45,422 | 981 | ||||||
Sequential Brands Group *(A) | 104,870 | 839 | ||||||
Shoe Carnival | 25,419 | 678 | ||||||
SodaStream International *(A) | 38,605 | 1,025 | ||||||
Steven Madden * | 83,077 | 2,871 | ||||||
Strayer Education * | 221 | 10 | ||||||
Superior Industries International | 21,373 | 623 | ||||||
Tempur-Pedic International *(A) | 11,571 | 657 | ||||||
Tenneco * | 9,985 | 582 | ||||||
| Description | Shares | Market Value ($ Thousands) | ||||||
COMMON STOCK (continued) | ||||||||
Texas Roadhouse, Cl A | 51,009 | $ | 1,991 | |||||
Tile Shop Holdings *(A) | 32,638 | 540 | ||||||
Tilly's, Cl A * | 23,604 | 222 | ||||||
Tower International | 6,660 | 160 | ||||||
Visteon * | 15,475 | 1,109 | ||||||
William Lyon Homes, Cl A * | 104,006 | 1,929 | ||||||
Wolverine World Wide | 35,286 | 813 | ||||||
ZAGG * | 32,647 | 264 | ||||||
Zoe's Kitchen *(A) | 15,779 | 350 | ||||||
|
|
| ||||||
| 63,885 | ||||||||
|
|
| ||||||
Consumer Staples — 2.8% | ||||||||
Andersons | 38,760 | 1,402 | ||||||
B&G Foods, Cl A | 37,869 | 1,862 | ||||||
Cal-Maine Foods *(A) | 11,445 | 441 | ||||||
Central Garden & Pet, Cl A * | 61,871 | 1,534 | ||||||
Chefs' Warehouse Holdings * | 46,991 | 524 | ||||||
Dean Foods (A) | 31,055 | 509 | ||||||
Fresh Del Monte Produce | 18,614 | 1,115 | ||||||
Freshpet * | 113,313 | 980 | ||||||
Ingredion | 5,000 | 665 | ||||||
John B Sanfilippo & Son | 12,062 | 619 | ||||||
Landec * | 110,729 | 1,485 | ||||||
Omega Protein * | 81,388 | 1,902 | ||||||
Performance Food Group * | 45,286 | 1,123 | ||||||
Sanderson Farms (A) | 11,435 | 1,102 | ||||||
Snyder's-Lance | 14,520 | 488 | ||||||
SUPERVALU * | 114,535 | 572 | ||||||
|
|
| ||||||
| 16,323 | ||||||||
|
|
| ||||||
Energy — 4.5% | ||||||||
Alberta Oilsands * | 184,500 | 17 | ||||||
Approach Resources, Cl A *(A) | 144,968 | 490 | ||||||
Ardmore Shipping | 71,555 | 504 | ||||||
Atwood Oceanics, Cl A *(A) | 61,558 | 535 | ||||||
Bill Barrett *(A) | 83,827 | 466 | ||||||
CARBO Ceramics *(A) | 108,511 | 1,187 | ||||||
Carrizo Oil & Gas * | 55,373 | 2,249 | ||||||
Clayton Williams Energy *(A) | 7,604 | 650 | ||||||
Dril-Quip *(A) | 7,838 | 437 | ||||||
Eclipse Resources * | 176,317 | 580 | ||||||
Gulfport Energy * | 68,633 | 1,939 | ||||||
Matrix Service * | 56,537 | 1,061 | ||||||
Oil States International * | 45,587 | 1,439 | ||||||
Pacific Ethanol *(A) | 111,576 | 771 | ||||||
Patterson-UTI Energy (A) | 35,463 | 793 | ||||||
PBF Energy, Cl A | 126,720 | 2,869 | ||||||
PDC Energy, Cl A * | 8,195 | 549 | ||||||
Resolute Energy * | 28,961 | 755 | ||||||
Scorpio Tankers (A) | 320,855 | 1,486 | ||||||
Seadrill *(A) | 178,967 | 424 | ||||||
Southwestern Energy * | 91,817 | 1,271 | ||||||
SEI Institutional Managed Trust / Annual Report / September 30, 2016 |
1 |
SCHEDULE OF INVESTMENTS
September 30, 2016
Small Cap Fund (Continued)
| Description | Shares | Market Value ($ Thousands) | ||||||
COMMON STOCK (continued) | ||||||||
StealthGas *(A) | 99,434 | $ | 344 | |||||
Superior Energy Services * | 45,515 | 815 | ||||||
Synergy Resources * | 94,683 | 656 | ||||||
TETRA Technologies * | 241,658 | 1,476 | ||||||
Tidewater, Cl A *(A) | 298,845 | 843 | ||||||
Transocean *(A) | 44,803 | 478 | ||||||
Western Refining | 28,485 | 754 | ||||||
Westmoreland Coal *(A) | 97,326 | 862 | ||||||
|
|
| ||||||
| 26,700 | ||||||||
|
|
| ||||||
Financials — 14.0% | ||||||||
American Capital Agency, Cl A ‡ | 27,927 | 546 | ||||||
American Equity Investment Life Holding | 115,931 | 2,055 | ||||||
Argo Group International Holdings | 53,181 | 3,000 | ||||||
Axis Capital Holdings | 14,697 | 799 | ||||||
Banc of California (A) | 61,674 | 1,077 | ||||||
Bancorp * | 164,563 | 1,057 | ||||||
Capitol Federal Financial | 185,603 | 2,611 | ||||||
Central Pacific Financial | 93,659 | 2,359 | ||||||
Chemical Financial (A) | 17,958 | 793 | ||||||
CNO Financial Group (A) | 85,630 | 1,308 | ||||||
Colony Capital, Cl A ‡ | 3,686 | 67 | ||||||
Customers Bancorp * | 79,837 | 2,009 | ||||||
Employers Holdings | 26,238 | 783 | ||||||
Evercore Partners, Cl A | 12,470 | 642 | ||||||
Everest Re Group | 2,650 | 503 | ||||||
FBL Financial Group, Cl A (A) | 3,392 | 217 | ||||||
FBR | 74,075 | 981 | ||||||
Fidelity Southern | 1,096 | 20 | ||||||
First Commonwealth Financial (A) | 186,262 | 1,879 | ||||||
First Foundation * | 38,156 | 941 | ||||||
First Interstate BancSystem, Cl A | 18,580 | 585 | ||||||
FNB (Pennsylvania) | 257,388 | 3,166 | ||||||
FNFV Group * | 111,737 | 1,394 | ||||||
Fulton Financial | 84,159 | 1,222 | ||||||
Great Western Bancorp | 61,313 | 2,043 | ||||||
Green Dot, Cl A * | 161,841 | 3,732 | ||||||
Hanover Insurance Group, Cl A | 39,334 | 2,967 | ||||||
Houlihan Lokey, Cl A | 38,115 | 955 | ||||||
IBERIABANK | 24,660 | 1,655 | ||||||
Independent Bank | 2,893 | 49 | ||||||
Infinity Property & Casualty (A) | 111 | 9 | ||||||
International. FCStone * | 6,193 | 241 | ||||||
Investors Bancorp | 260,858 | 3,133 | ||||||
KCG Holdings, Cl A * | 55,392 | 860 | ||||||
Kearny Financial | 88,105 | 1,199 | ||||||
Kemper, Cl A | 50,300 | 1,978 | ||||||
Maiden Holdings | 168,927 | 2,144 | ||||||
Meridian Bancorp | 148,390 | 2,310 | ||||||
MGIC Investment * | 63,913 | 511 | ||||||
National Bank Holdings, Cl A | 74,498 | 1,741 | ||||||
Northfield Bancorp | 141,191 | 2,273 | ||||||
| Description | Shares | Market Value ($ Thousands) | ||||||
COMMON STOCK (continued) | ||||||||
OFG Bancorp | 302,636 | $ | 3,060 | |||||
Popular | 68,678 | 2,625 | ||||||
ProAssurance | 10,285 | 540 | ||||||
Selective Insurance Group | 26,441 | 1,054 | ||||||
Signature Bank, Cl B * | 5,568 | 660 | ||||||
State Bank Financial | 96,720 | 2,207 | ||||||
Towne Bank | 1,290 | 31 | ||||||
Two Harbors Investment ‡ | 231,809 | 1,977 | ||||||
United Community Banks | 111,286 | 2,339 | ||||||
United Fire Group | 11,803 | 500 | ||||||
Voya Financial | 36,310 | 1,046 | ||||||
Webster Financial | 39,300 | 1,494 | ||||||
Western Alliance Bancorp * | 48,916 | 1,836 | ||||||
White Mountains Insurance Group | 635 | 527 | ||||||
Wintrust Financial | 79,383 | 4,411 | ||||||
|
|
| ||||||
| 82,121 | ||||||||
|
|
| ||||||
Health Care — 14.0% | ||||||||
ABIOMED * | 4,616 | 593 | ||||||
Acadia Healthcare, Cl A *(A) | 11,337 | 562 | ||||||
Accuray *(A) | 401,988 | 2,561 | ||||||
Adamas Pharmaceuticals * | 31,166 | 511 | ||||||
Advaxis * | 36,936 | 395 | ||||||
Aerie Pharmaceuticals * | 14,114 | 533 | ||||||
Aimmune Therapeutics *(A) | 12,736 | 191 | ||||||
Akorn * | 37,677 | 1,027 | ||||||
Alder Biopharmaceuticals *(A) | 20,909 | 685 | ||||||
Align Technology * | 8,175 | 766 | ||||||
AMAG Pharmaceuticals *(A) | 136,710 | 3,351 | ||||||
Amedisys * | 11,119 | 527 | ||||||
AMN Healthcare Services * | 91,839 | 2,927 | ||||||
Amsurg * | 7,241 | 485 | ||||||
Analogic | 29,849 | 2,645 | ||||||
Audentes Therapeutics * | 30,016 | 535 | ||||||
BioDelivery Sciences International * | 455,902 | 1,231 | ||||||
Cambrex * | 11,193 | 498 | ||||||
Capital Senior Living * | 124,007 | 2,083 | ||||||
CoLucid Pharmaceuticals *(A) | 17,653 | 673 | ||||||
Community Health Systems *(A) | 162,949 | 1,880 | ||||||
Cotiviti Holdings * | 18,007 | 604 | ||||||
Cynosure, Cl A * | 76,795 | 3,912 | ||||||
Dermira * | 16,133 | 546 | ||||||
DexCom * | 5,953 | 522 | ||||||
Diplomat Pharmacy *(A) | 21,000 | 588 | ||||||
Emergent BioSolutions *(A) | 27,301 | 861 | ||||||
Ensign Group (A) | 25,787 | 519 | ||||||
Exelixis *(A) | 37,180 | 476 | ||||||
Five Prime Therapeutics * | 13,593 | 713 | ||||||
Flamel Technologies ADR * | 143,234 | 1,776 | ||||||
Glaukos * | 22,378 | 845 | ||||||
Globus Medical, Cl A *(A) | 122,619 | 2,767 | ||||||
ICON * | 10,548 | 816 | ||||||
2 |
SEI Institutional Managed Trust / Annual Report / September 30, 2016 |
SCHEDULE OF INVESTMENTS
September 30, 2016
Small Cap Fund (Continued)
| Description | Shares | Market Value ($ Thousands) | ||||||
COMMON STOCK (continued) | ||||||||
Integra LifeSciences Holdings * | 89,949 | $ | 7,425 | |||||
Kindred Healthcare | 128,908 | 1,317 | ||||||
Lannett *(A) | 110,280 | 2,930 | ||||||
LHC Group * | 18,889 | 697 | ||||||
Ligand Pharmaceuticals * | 39,138 | 3,994 | ||||||
Masimo * | 9,662 | 575 | ||||||
Medicines *(A) | 8,910 | 336 | ||||||
Molina Healthcare *(A) | 61,824 | 3,606 | ||||||
Myriad Genetics * | 29,658 | 610 | ||||||
NeoGenomics * | 60,484 | 497 | ||||||
Nevro * | 14,684 | 1,533 | ||||||
Omnicell * | 14,633 | 560 | ||||||
PDL BioPharma * | 181,096 | 607 | ||||||
Penumbra * | 13,769 | 1,046 | ||||||
PharMerica * | 27,431 | 770 | ||||||
Premier, Cl A * | 19,004 | 615 | ||||||
Prestige Brands Holdings, Cl A * | 96,657 | 4,666 | ||||||
Puma Biotechnology * | 8,131 | 545 | ||||||
Quality Systems * | 35,978 | 407 | ||||||
Radius Health * | 9,830 | 532 | ||||||
Sage Therapeutics * | 6,962 | 321 | ||||||
Sarepta Therapeutics * | 9,572 | 588 | ||||||
Supernus Pharmaceuticals * | 77,055 | 1,906 | ||||||
Surgical Care Affiliates * | 11,199 | 546 | ||||||
TESARO *(A) | 6,503 | 652 | ||||||
Trinity Biotech ADR * | 130,160 | 1,721 | ||||||
Triple-S Management, Cl B * | 30,403 | 667 | ||||||
Ultragenyx Pharmaceutical *(A) | 6,948 | 493 | ||||||
Vocera Communications * | 61,938 | 1,047 | ||||||
WellCare Health Plans * | 5,101 | 597 | ||||||
Zeltiq Aesthetics * | 18,611 | 730 | ||||||
|
|
| ||||||
| 82,140 | ||||||||
|
|
| ||||||
Industrials — 16.0% | ||||||||
Acacia Research * | 201,045 | 1,311 | ||||||
ACCO Brands * | 231,183 | 2,229 | ||||||
Actuant, Cl A | 12,300 | 286 | ||||||
Air Transport Services Group * | 70,450 | 1,011 | ||||||
Apogee Enterprises | 70,919 | 3,169 | ||||||
ARC Document Solutions * | 136,300 | 510 | ||||||
Astec Industries | 9,372 | 561 | ||||||
Atlas Air Worldwide Holdings * | 80,224 | 3,435 | ||||||
Babcock & Wilcox Enterprises * | 36,887 | 609 | ||||||
Barnes Group | 52,235 | 2,118 | ||||||
BWX Technologies, Cl W | 50,530 | 1,939 | ||||||
Carlisle | 14,061 | 1,442 | ||||||
Celadon Group (A) | 78,429 | 686 | ||||||
CIRCOR International (A) | 19,798 | 1,179 | ||||||
Comfort Systems USA | 19,697 | 577 | ||||||
Covanta Holding | 30,500 | 469 | ||||||
Crane, Cl A | 37,820 | 2,383 | ||||||
Curtiss-Wright | 12,230 | 1,114 | ||||||
| Description | Shares | Market Value ($ Thousands) | ||||||
COMMON STOCK (continued) | ||||||||
Deluxe | 26,389 | $ | 1,763 | |||||
DXP Enterprises * | 28,470 | 803 | ||||||
Dycom Industries * | 8,322 | 681 | ||||||
EMCOR Group | 52,082 | 3,105 | ||||||
Energy Recovery * | 36,809 | 588 | ||||||
Engility Holdings * | 30,135 | 949 | ||||||
Ennis | 29,919 | 504 | ||||||
Essendant | 38,507 | 790 | ||||||
Forward Air | 27,595 | 1,194 | ||||||
Franklin Electric (A) | 30,327 | 1,235 | ||||||
FreightCar America, Cl A (A) | 120,465 | 1,732 | ||||||
Generac Holdings *(A) | 18,000 | 653 | ||||||
Genesee & Wyoming, Cl A * | 10,825 | 746 | ||||||
Gibraltar Industries * | 16,851 | 626 | ||||||
Global Brass & Copper Holdings | 19,424 | 561 | ||||||
Great Lakes Dredge & Dock * | 446,800 | 1,564 | ||||||
Greenbrier (A) | 19,045 | 672 | ||||||
H&E Equipment Services | 42,084 | 705 | ||||||
Hawaiian Holdings * | 17,143 | 833 | ||||||
Hexcel, Cl A | 15,616 | 692 | ||||||
Huron Consulting Group *(A) | 43,691 | 2,611 | ||||||
ICF International, Cl A * | 71,884 | 3,186 | ||||||
IDEX | 12,447 | 1,165 | ||||||
InnerWorkings * | 104,853 | 988 | ||||||
ITT | 34,190 | 1,225 | ||||||
John Bean Technologies, Cl A | 18,338 | 1,294 | ||||||
KBR | 69,839 | 1,057 | ||||||
Keyw Holding, Cl A *(A) | 68,116 | 752 | ||||||
Kirby *(A) | 11,675 | 726 | ||||||
Korn/Ferry International | 38,131 | 801 | ||||||
LB Foster, Cl A | 102,020 | 1,225 | ||||||
Lincoln Electric Holdings | 12,610 | 790 | ||||||
Manitowoc | 99,038 | 474 | ||||||
MasTec * | 78,388 | 2,331 | ||||||
Matson (A) | 15,508 | 619 | ||||||
Middleby * | 5,907 | 730 | ||||||
MRC Global * | 37,325 | 613 | ||||||
MSA Safety | 15,473 | 898 | ||||||
NN, Cl A | 34,894 | 637 | ||||||
On Assignment * | 92,090 | 3,342 | ||||||
Orion Group Holdings *(A) | 172,931 | 1,185 | ||||||
Oshkosh Truck | 18,813 | 1,054 | ||||||
Patrick Industries * | 8,968 | 555 | ||||||
RBC Bearings * | 9,022 | 690 | ||||||
Resources Connection (A) | 8,277 | 124 | ||||||
SiteOne Landscape Supply * | 33,196 | 1,193 | ||||||
Skywest | 29,034 | 767 | ||||||
Spirit Airlines * | 17,868 | 760 | ||||||
Sterling Construction * | 67,876 | 525 | ||||||
Swift Transportation, Cl A * | 114,331 | 2,455 | ||||||
Titan Machinery *(A) | 123,352 | 1,283 | ||||||
Triumph Group (A) | 89,028 | 2,482 | ||||||
SEI Institutional Managed Trust / Annual Report / September 30, 2016 |
3 |
SCHEDULE OF INVESTMENTS
September 30, 2016
Small Cap Fund (Continued)
| Description | Shares | Market Value ($ Thousands) | ||||||
COMMON STOCK (continued) | ||||||||
TrueBlue * | 15,285 | $ | 346 | |||||
Tutor Perini * | 91,730 | 1,969 | ||||||
Universal Forest Products | 1,683 | 166 | ||||||
Wabash National *(A) | 37,371 | 532 | ||||||
WageWorks * | 55,317 | 3,369 | ||||||
Wesco Aircraft Holdings * | 201,182 | 2,702 | ||||||
XPO Logistics *(A) | 38,816 | 1,423 | ||||||
|
|
| ||||||
| 94,468 | ||||||||
|
|
| ||||||
Information Technology — 18.6% | ||||||||
Acxiom * | 125,840 | 3,354 | ||||||
Advanced Energy Industries * | 7,526 | 356 | ||||||
Amkor Technology * | 91,055 | 885 | ||||||
Applied Micro Circuits *(A) | 85,000 | 591 | ||||||
Aspen Technology * | 38,533 | 1,803 | ||||||
Atlassian, Cl A * | 26,356 | 790 | ||||||
AVG Technologies * | 22,458 | 562 | ||||||
Bankrate * | 58,507 | 496 | ||||||
Bazaarvoice * | 97,252 | 575 | ||||||
Black Box (A) | 99,116 | 1,378 | ||||||
Blackbaud, Cl A (A) | 31,522 | 2,091 | ||||||
Blackhawk Network Holdings, Cl A * | 20,358 | 614 | ||||||
Bottomline Technologies * | 32,068 | 747 | ||||||
BroadSoft * | 6,292 | 293 | ||||||
CACI International, Cl A * | 16,125 | 1,627 | ||||||
CalAmp * | 219,948 | 3,068 | ||||||
Callidus Software * | 173,491 | 3,184 | ||||||
Cardtronics * | 12,083 | 539 | ||||||
Cavium * | 70,945 | 4,129 | ||||||
Cimpress *(A) | 10,581 | 1,071 | ||||||
Cirrus Logic * | 17,101 | 909 | ||||||
Coherent *(A) | 2,895 | 320 | ||||||
Cohu | 3,286 | 39 | ||||||
CommVault Systems * | 27,360 | 1,454 | ||||||
Convergys | 25,374 | 772 | ||||||
Cornerstone OnDemand * | 63,107 | 2,900 | ||||||
Cypress Semiconductor | 74,980 | 912 | ||||||
DHI Group * | 9,999 | 79 | ||||||
Digi International * | 99,749 | 1,137 | ||||||
EarthLink Holdings | 6,160 | 38 | ||||||
Electronics For Imaging *(A) | 17,450 | 854 | ||||||
EMCORE * | 17,708 | 101 | ||||||
Exar * | 313,097 | 2,915 | ||||||
ExlService Holdings * | 31,175 | 1,554 | ||||||
Finisar * | 20,814 | 620 | ||||||
FireEye * | 194,618 | 2,867 | ||||||
Five9 * | 41,085 | 644 | ||||||
Guidewire Software, Cl Z * | 17,665 | 1,060 | ||||||
HubSpot * | 13,341 | 769 | ||||||
II-VI * | 12,425 | 302 | ||||||
Inphi * | 31,238 | 1,359 | ||||||
Insight Enterprises * | 19,060 | 620 | ||||||
| Description | Shares | Market Value ($ Thousands) | ||||||
COMMON STOCK (continued) | ||||||||
Ixia * | 46,678 | $ | 583 | |||||
IXYS | 6,111 | 74 | ||||||
Keysight Technologies * | 76,435 | 2,422 | ||||||
Liquidity Services * | 8,846 | 99 | ||||||
Littelfuse | 15,108 | 1,946 | ||||||
LogMeIn * | 7,325 | 662 | ||||||
Lumentum Holdings *(A) | 72,414 | 3,025 | ||||||
MAXIMUS | 38,366 | 2,170 | ||||||
MaxLinear, Cl A * | 47,406 | 961 | ||||||
Mellanox Technologies *(A) | 11,410 | 493 | ||||||
Mentor Graphics | 23,860 | 631 | ||||||
Mercury Systems * | 17,800 | 437 | ||||||
Methode Electronics | 15,950 | 558 | ||||||
Microsemi * | 16,924 | 710 | ||||||
Mitek Systems * | 70,856 | 587 | ||||||
MKS Instruments | 33,215 | 1,652 | ||||||
Monolithic Power Systems | 34,129 | 2,747 | ||||||
NeoPhotonics * | 41,598 | 680 | ||||||
NETGEAR * | 25,138 | 1,521 | ||||||
NeuStar, Cl A * | 21,206 | 564 | ||||||
Oclaro * | 98,978 | 846 | ||||||
Open Text (A) | 48,434 | 3,141 | ||||||
Orbotech * | 39,408 | 1,167 | ||||||
OSI Systems * | 37,807 | 2,472 | ||||||
Pandora Media *(A) | 43,014 | 616 | ||||||
Paylocity Holding *(A) | 17,097 | 760 | ||||||
PDF Solutions * | 129,210 | 2,348 | ||||||
Perficient * | 122,234 | 2,463 | ||||||
Photronics * | 86,838 | 895 | ||||||
Progress Software | 7,668 | 209 | ||||||
Proofpoint * | 52,098 | 3,900 | ||||||
Q2 Holdings * | 21,249 | 609 | ||||||
QAD, Cl A (A) | 32,674 | 731 | ||||||
QuinStreet * | 4,338 | 13 | ||||||
RetailMeNot * | 21,829 | 216 | ||||||
RingCentral, Cl A * | 38,013 | 899 | ||||||
Rudolph Technologies * | 13,643 | 242 | ||||||
Sanmina * | 73,294 | 2,087 | ||||||
Silicon Laboratories * | 19,045 | 1,120 | ||||||
SuperCom * | 79,000 | 271 | ||||||
Sykes Enterprises * | 41,217 | 1,159 | ||||||
Synaptics * | 12,972 | 760 | ||||||
SYNNEX | 7,471 | 852 | ||||||
Take-Two Interactive Software, Cl A * | 58,922 | 2,656 | ||||||
Tech Data * | 15,734 | 1,333 | ||||||
TeleTech Holdings | 2,988 | 87 | ||||||
Ultratech * | 49,192 | 1,135 | ||||||
Viavi Solutions * | 74,953 | 554 | ||||||
Xcerra * | 100,052 | 606 | ||||||
Zebra Technologies, Cl A * | 33,668 | 2,344 | ||||||
Zendesk * | 7,471 | 229 | ||||||
|
|
| ||||||
| 109,620 | ||||||||
|
|
| ||||||
4 |
SEI Institutional Managed Trust / Annual Report / September 30, 2016 |
SCHEDULE OF INVESTMENTS
September 30, 2016
Small Cap Fund (Continued)
| Description | Shares | Market Value ($ Thousands) | ||||||
COMMON STOCK (continued) | ||||||||
Materials — 4.1% | ||||||||
Allegheny Technologies (A) | 35,100 | $ | 634 | |||||
Berry Plastics Group * | 81,534 | 3,575 | ||||||
Cabot (A) | 16,409 | 860 | ||||||
Carpenter Technology (A) | 22,499 | 928 | ||||||
Chemours | 60,106 | 962 | ||||||
Commercial Metals, Cl A | 58,068 | 940 | ||||||
FMC | 11,000 | 532 | ||||||
FutureFuel | 3,082 | 35 | ||||||
Headwaters, Cl A * | 46,759 | 791 | ||||||
Ingevity * | 31,021 | 1,430 | ||||||
Innospec | 21,669 | 1,318 | ||||||
LSB Industries *(A) | 153,709 | 1,319 | ||||||
Neenah Paper, Cl A | 2,857 | 226 | ||||||
Owens-Illinois * | 30,569 | 562 | ||||||
PolyOne | 41,714 | 1,410 | ||||||
Rayonier Advanced Materials (A) | 53,930 | 721 | ||||||
Ryerson Holding * | 40,539 | 458 | ||||||
Schulman A | 66,295 | 1,931 | ||||||
Schweitzer-Mauduit International | 49,849 | 1,922 | ||||||
Sensient Technologies | 7,920 | 600 | ||||||
Stepan | 1,464 | 107 | ||||||
Summit Materials, Cl A * | 34,052 | 632 | ||||||
Trinseo | 11,266 | 637 | ||||||
United States Steel (A) | 67,025 | 1,264 | ||||||
Worthington Industries | 12,727 | 611 | ||||||
|
|
| ||||||
| 24,405 | ||||||||
|
|
| ||||||
Real Estate — 5.7% | ||||||||
Agree Realty ‡ | 53,294 | 2,635 | ||||||
Armada Hoffler Properties ‡ | 47,903 | 642 | ||||||
Brandywine Realty Trust ‡ | 56,167 | 877 | ||||||
CatchMark Timber Trust, Cl A ‡ | 117,916 | 1,378 | ||||||
Cedar Realty Trust ‡ | 294,278 | 2,119 | ||||||
Colony Starwood Homes ‡(A) | 137,395 | 3,943 | ||||||
Columbia Property Trust ‡ | 23,442 | 525 | ||||||
Corporate Office Properties Trust ‡ | 19,353 | 549 | ||||||
Corrections Corp of America ‡(A) | 29,376 | 407 | ||||||
EPR Properties, Cl A ‡ | 11,373 | 896 | ||||||
Equity Commonwealth *‡ | 66,251 | 2,002 | ||||||
FelCor Lodging Trust ‡ | 67,753 | 436 | ||||||
Four Corners Property Trust ‡ | 28,486 | 608 | ||||||
Franklin Street Properties ‡ | 5,316 | 67 | ||||||
GEO Group ‡(A) | 79,666 | 1,894 | ||||||
Gramercy Property Trust ‡ | 278,764 | 2,687 | ||||||
Healthcare Trust of America, Cl A ‡ | 63,815 | 2,082 | ||||||
Highwoods Properties ‡ | 37,300 | 1,944 | ||||||
Kennedy-Wilson Holdings | 88,073 | 1,986 | ||||||
Life Storage | 11,344 | 1,009 | ||||||
Physicians Realty Trust ‡ | 75,311 | 1,622 | ||||||
QTS Realty Trust, Cl A ‡ | 43,390 | 2,293 | ||||||
Saul Centers ‡ | 2,177 | 145 | ||||||
| Description | Shares | Market Value ($ Thousands) | ||||||
COMMON STOCK (continued) | ||||||||
Seritage Growth Properties ‡(A) | 16,803 | $ | 852 | |||||
|
|
| ||||||
| 33,598 | ||||||||
|
|
| ||||||
Telecommunication Services — 0.3% |
| |||||||
8x8 * | 19,315 | 298 | ||||||
Cincinnati Bell, Cl A * | 17,877 | 73 | ||||||
Inteliquent | 25,369 | 410 | ||||||
Telephone & Data Systems | 19,091 | 519 | ||||||
Windstream Holdings (A) | 55,749 | 560 | ||||||
|
|
| ||||||
| 1,860 | ||||||||
|
|
| ||||||
Utilities — 2.9% | ||||||||
ALLETE | 26,260 | 1,565 | ||||||
Cadiz *(A) | 46,300 | 343 | ||||||
Chesapeake Utilities | 24,252 | 1,481 | ||||||
NorthWestern | 12,860 | 740 | ||||||
ONE Gas | 1,098 | 68 | ||||||
PNM Resources | 114,941 | 3,761 | ||||||
Portland General Electric | 70,881 | 3,019 | ||||||
South Jersey Industries, Cl A | 18,702 | 553 | ||||||
Southwest Gas | 20,858 | 1,457 | ||||||
Spire | 48,138 | 3,068 | ||||||
Talen Energy *(A) | 40,716 | 564 | ||||||
UGI | 12,321 | 557 | ||||||
|
|
| ||||||
| 17,176 | ||||||||
|
|
| ||||||
Total Common Stock | ||||||||
(Cost $497,624) ($ Thousands) | 552,296 | |||||||
|
|
| ||||||
EXCHANGE TRADED FUND — 0.2% |
| |||||||
Financials — 0.2% | ||||||||
iShares Russell 2000 Value ETF | 9,550 | 1,000 | ||||||
|
|
| ||||||
Total Exchange Traded Fund | 1,000 | |||||||
|
|
| ||||||
| Number of Rights | ||||||||
RIGHTS — 0.0% | ||||||||
United States — 0.0% | ||||||||
Allos Therapeutics *‡‡ | 45,500 | – | ||||||
|
|
| ||||||
Total Rights | – | |||||||
|
|
| ||||||
SEI Institutional Managed Trust / Annual Report / September 30, 2016 |
5 |
SCHEDULE OF INVESTMENTS
September 30, 2016
Small Cap Fund (Concluded)
| Description | Face Amount (Thousands) | Market Value ($ Thousands) | ||||||
U.S. TREASURY OBLIGATION — 0.1% |
| |||||||
U.S. Treasury Bill | ||||||||
0.240%, 10/20/2016 (B)(C) | $ | 550 | $ | 550 | ||||
|
| |||||||
Total U.S. Treasury Obligation | 550 | |||||||
|
| |||||||
| Shares | ||||||||
AFFILIATED PARTNERSHIP — 8.9% |
| |||||||
SEI Liquidity Fund, L.P. | ||||||||
0.440% **†(D) | 52,352,212 | 52,352 | ||||||
|
| |||||||
Total Affiliated Partnership | 52,352 | |||||||
|
| |||||||
CASH EQUIVALENT — 6.1% |
| |||||||
SEI Daily Income Trust, Government Fund, Cl A | ||||||||
0.220%**† | 35,775,093 | 35,775 | ||||||
|
| |||||||
Total Cash Equivalent | 35,775 | |||||||
|
| |||||||
Total Investments — 109.1% |
| $ | 641,973 | |||||
|
| |||||||
A list of the open futures contracts held by the Fund at September 30, 2016, is as follows:
| Type of Contract | Number of Contracts Long | Expiration Date | Unrealized (Depreciation) ($ Thousands) | |||||||||
Russell 2000 Index E-MINI | 91 | Dec-2016 | $(38) | |||||||||
|
| |||||||||||
For the year ended September 30, 2016, the total amount of all open futures contracts, as presented in the table above, are representative of the volume of activity for the derivative type during the year.
| Percentages are based on Net Assets of $588,415 ($ Thousands). |
| * | Non-income producing security. |
| ** | Rate shown is the 7-day effective yield as of September 30, 2016. |
| ‡ | Real Estate Investment Trust. |
| ‡‡ | Expiration date unavailable. |
| † | Investment in Affiliated Security (see Note 6). |
| (A) | This security or a partial position of this security is on loan at September 30, 2016 (see Note 10). The total market value of securities on loan at September 30, 2016 was $51,461 ($ Thousands). |
| (B) | Security, or portion thereof, has been pledged as collateral on open futures contracts. |
| (C) | The rate reported is the effective yield at time of purchase. |
| (D) | This security was purchased with cash collateral held from securities on loan (see Note 10). The total market value of such securities as of September 30, 2016 was $52,352 ($ Thousands). |
ADR — American Depositary Receipt
Cl — Class
L.P. — Limited Partnership
The following is a list of the level of inputs used as of September 30, 2016, in valuing the Fund’s investments and other financial instruments carried at value ($ Thousands):
| Investments in Securities | Level 1 | Level 2 | Level 3 | Total | ||||||||||||
Common Stock | $ | 552,296 | $ | – | $ | – | $ | 552,296 | ||||||||
Exchange Traded Fund | 1,000 | – | – | 1,000 | ||||||||||||
Rights | – | – | – | – | ||||||||||||
U.S. Treasury Obligation | – | 550 | – | 550 | ||||||||||||
Affiliated Partnership | – | 52,352 | – | 52,352 | ||||||||||||
Cash Equivalent | 35,775 | – | – | 35,775 | ||||||||||||
|
|
|
|
|
|
|
| |||||||||
Total Investments in Securities | $ | 589,071 | $ | 52,902 | $ | – | $ | 641,973 | ||||||||
|
|
|
|
|
|
|
| |||||||||
| Other Financial Instruments | Level 1 | Level 2 | Level 3 | Total | ||||||||||||
Futures Contracts * | ||||||||||||||||
Unrealized Depreciation | $ | (38) | $ | — | $ | — | | $ | (38) | |||||||
|
|
|
|
|
|
|
| |||||||||
Total Other Financial Instruments | $ | (38) | $ | — | $ | — | | $ | (38) | |||||||
|
|
|
|
|
|
|
| |||||||||
* Futures contracts are valued at the unrealized depreciation on the instrument.
For the year ended September 30, 2016, there were no transfers between Level 1 and Level 2 assets and liabilities.
For the year ended September 30, 2016, there were no transfers between Level 2 and Level 3 assets and liabilities.
For more information on valuation inputs, see Note 2 – Significant Accounting Policies in Notes to Financial Statements.
Amounts designated as “—” are $0 or have been rounded to $0.
The accompanying notes are an integral part of the financial statements.
6 |
SEI Institutional Managed Trust / Annual Report / September 30, 2016 |
SCHEDULE OF INVESTMENTS
September 30, 2016
Small Cap Value Fund
| Description | Shares | Market Value ($ Thousands) | ||||||
COMMON STOCK — 94.9% | ||||||||
Consumer Discretionary — 8.7% | ||||||||
Aaron's | 14,761 | $ | 375 | |||||
American Axle & Manufacturing Holdings * | 33,900 | 584 | ||||||
Big 5 Sporting Goods | 25,362 | 345 | ||||||
Big Lots (A) | 34,258 | 1,636 | ||||||
Bloomin' Brands | 16,770 | 289 | ||||||
Bright Horizons Family Solutions * | 9,549 | 639 | ||||||
Brinker International | 13,690 | 690 | ||||||
CalAtlantic Group (A) | 15,234 | 509 | ||||||
Callaway Golf | 48,836 | 567 | ||||||
Century Communities * | 4,300 | 93 | ||||||
Cooper Tire & Rubber | 21,105 | 802 | ||||||
Cooper-Standard Holding * | 16,327 | 1,613 | ||||||
CROCS *(A) | 40,900 | 340 | ||||||
CSS Industries | 19,629 | 502 | ||||||
Dana Holding | 55,391 | 864 | ||||||
Deckers Outdoor * | 3,731 | 222 | ||||||
Del Taco Restaurants *(A) | 37,145 | 443 | ||||||
Destination XL Group *(A) | 44,600 | 193 | ||||||
Express * | 62,553 | 738 | ||||||
Finish Line, Cl A (A) | 21,700 | 501 | ||||||
GameStop, Cl A (A) | 13,391 | 369 | ||||||
Gannett | 23,588 | 275 | ||||||
Group 1 Automotive | 3,600 | 230 | ||||||
Haverty Furniture | 9,400 | 188 | ||||||
Installed Building Products *(A) | 15,459 | 555 | ||||||
Libbey | 113,055 | 2,018 | ||||||
Lithia Motors, Cl A | 9,616 | 919 | ||||||
Lumber Liquidators Holdings *(A) | 24,677 | 485 | ||||||
Marriott Vacations Worldwide (A) | 15,443 | 1,132 | ||||||
Matthews International, Cl A (A) | 27,020 | 1,642 | ||||||
MDC Partners, Cl A (A) | 118,337 | 1,269 | ||||||
Meritage Homes * | 9,962 | 346 | ||||||
Murphy USA * | 6,462 | 461 | ||||||
Nexstar Broadcasting Group, Cl A (A) | 7,731 | 446 | ||||||
Office Depot | 97,283 | 347 | ||||||
Pool | 9,082 | 858 | ||||||
Rent-A-Center (A) | 49,052 | 620 | ||||||
Select Comfort * | 32,811 | 709 | ||||||
Sequential Brands Group *(A) | 89,081 | 713 | ||||||
Shoe Carnival | 7,100 | 189 | ||||||
Six Flags Entertainment (A) | 22,218 | 1,191 | ||||||
Smith & Wesson Holding *(A) | 18,394 | 489 | ||||||
SodaStream International * | 18,835 | 500 | ||||||
Sonic Automotive, Cl A (A) | 14,700 | 276 | ||||||
Steven Madden *(A) | 25,022 | 865 | ||||||
Stoneridge * | �� | 23,900 | 440 | |||||
Texas Roadhouse, Cl A (A) | 21,315 | 832 | ||||||
Vera Bradley * | 21,900 | 332 | ||||||
Visteon * | 4,677 | 335 | ||||||
Wendy's (A) | 84,744 | 915 | ||||||
| Description | Shares | Market Value ($ Thousands) | ||||||
COMMON STOCK (continued) | ||||||||
Wolverine World Wide (A) | 21,841 | $ | 503 | |||||
|
|
| ||||||
| 32,394 | ||||||||
|
|
| ||||||
Consumer Staples — 4.0% | ||||||||
Andersons | 28,606 | 1,035 | ||||||
B&G Foods, Cl A | 19,818 | 975 | ||||||
Central Garden & Pet, Cl A * | 43,936 | 1,090 | ||||||
Dean Foods (A) | 44,650 | 732 | ||||||
Fresh Del Monte Produce | 12,890 | 772 | ||||||
Freshpet *(A) | 49,768 | 430 | ||||||
Ingles Markets, Cl A | 9,983 | 395 | ||||||
John B Sanfilippo & Son (A) | 7,887 | 405 | ||||||
Landec *(A) | 110,629 | 1,483 | ||||||
Omega Protein * | 59,096 | 1,381 | ||||||
Performance Food Group * | 24,715 | 613 | ||||||
Pinnacle Foods | 21,405 | 1,074 | ||||||
Sanderson Farms (A) | 20,031 | 1,930 | ||||||
SpartanNash | 35,478 | 1,026 | ||||||
SUPERVALU * | 118,570 | 592 | ||||||
Universal (A) | 15,000 | 873 | ||||||
Weis Markets | 4,700 | 249 | ||||||
|
|
| ||||||
| 15,055 | ||||||||
|
|
| ||||||
Energy — 5.7% | ||||||||
Ardmore Shipping (A) | 84,361 | 594 | ||||||
Atwood Oceanics, Cl A *(A) | 45,378 | 394 | ||||||
Bill Barrett * | 53,920 | 300 | ||||||
Callon Petroleum * | 54,439 | 855 | ||||||
CARBO Ceramics *(A) | 55,439 | 607 | ||||||
Carrizo Oil & Gas *(A) | 19,221 | 781 | ||||||
Concho Resources * | 10,376 | 1,425 | ||||||
DHT Holdings (A) | 60,347 | 253 | ||||||
Eclipse Resources * | 124,920 | 411 | ||||||
Exterran * | 27,760 | 435 | ||||||
Frontline (A) | 45,603 | 327 | ||||||
Gulfport Energy *(A) | 46,793 | 1,322 | ||||||
Matrix Service * | 46,806 | 878 | ||||||
Oil States International * | 17,885 | 565 | ||||||
Pacific Ethanol *(A) | 66,620 | 460 | ||||||
Parsley Energy, Cl A * | 35,588 | 1,193 | ||||||
Patterson-UTI Energy (A) | 20,263 | 453 | ||||||
PBF Energy, Cl A (A) | 100,508 | 2,276 | ||||||
Scorpio Tankers (A) | 200,671 | 929 | ||||||
Southwestern Energy *(A) | 58,079 | 804 | ||||||
StealthGas * | 108,300 | 375 | ||||||
Superior Energy Services * | 38,258 | 685 | ||||||
Synergy Resources *(A) | 59,495 | 412 | ||||||
TETRA Technologies * | 204,662 | 1,250 | ||||||
Tidewater, Cl A *(A) | 225,301 | 635 | ||||||
Western Refining (A) | 22,519 | 596 | ||||||
Westmoreland Coal * | 57,272 | 507 | ||||||
SEI Institutional Managed Trust / Annual Report / September 30, 2016 |
1 |
SCHEDULE OF INVESTMENTS
September 30, 2016
Small Cap Value Fund (Continued)
| Description | Shares | Market Value ($ Thousands) | ||||||
COMMON STOCK (continued) | ||||||||
World Fuel Services | 29,815 | $ | 1,379 | |||||
|
|
| ||||||
| 21,101 | ||||||||
|
|
| ||||||
Financials — 23.0% | ||||||||
1st Source | 14,280 | 510 | ||||||
AG Mortgage Investment Trust ‡ | 31,051 | 489 | ||||||
American Equity Investment Life Holding | 71,459 | 1,267 | ||||||
AmTrust Financial Services | 11,200 | 300 | ||||||
Apollo Commercial Real Estate Finance ‡ | 19,300 | 316 | ||||||
Argo Group International Holdings | 24,241 | 1,368 | ||||||
Aspen Insurance Holdings | 16,741 | 780 | ||||||
Axis Capital Holdings | 9,760 | 530 | ||||||
Banc of California | 50,845 | 888 | ||||||
Banco Latinoamericano de Exportaciones, Cl E | 31,400 | 885 | ||||||
Bancorp * | 104,278 | 669 | ||||||
Berkshire Hills Bancorp | 19,546 | 542 | ||||||
BGC Partners, Cl A | 122,404 | 1,071 | ||||||
BlackRock Capital Investment | 76,269 | 631 | ||||||
Camden National | 10,400 | 496 | ||||||
Capitol Federal Financial (A) | 71,595 | 1,007 | ||||||
Central Pacific Financial | 72,803 | 1,834 | ||||||
Chemical Financial | 7,985 | 352 | ||||||
CNO Financial Group | 106,871 | 1,632 | ||||||
Columbia Banking System (A) | 42,915 | 1,404 | ||||||
Community Trust Bancorp | 14,480 | 537 | ||||||
Customers Bancorp *(A) | 64,300 | 1,618 | ||||||
CYS Investments ‡ | 45,374 | 396 | ||||||
Dynex Capital ‡ | 47,377 | 352 | ||||||
Employers Holdings | 13,762 | 411 | ||||||
Endurance Specialty Holdings | 20,182 | 1,321 | ||||||
Enterprise Financial Services | 4,550 | 142 | ||||||
Everest Re Group | 2,920 | 555 | ||||||
FBR (A) | 49,200 | 651 | ||||||
Federal Agricultural Mortgage, Cl C | 16,494 | 652 | ||||||
First Busey | 17,533 | 396 | ||||||
First Commonwealth Financial | 182,254 | 1,839 | ||||||
First Community Bancshares | 24,295 | 603 | ||||||
First Foundation * | 27,682 | 683 | ||||||
First Interstate BancSystem, Cl A | 23,250 | 733 | ||||||
First NBC Bank Holding * | 26,075 | 246 | ||||||
FirstCash | 13,938 | 656 | ||||||
Flagstar Bancorp * | 13,823 | 384 | ||||||
Flushing Financial | 29,300 | 695 | ||||||
FNB (Pennsylvania) (A) | 70,473 | 867 | ||||||
FNFV Group * | 61,500 | 768 | ||||||
Fulton Financial (A) | 167,050 | 2,426 | ||||||
Great Western Bancorp | 31,909 | 1,063 | ||||||
Green Dot, Cl A * | 80,924 | 1,866 | ||||||
Hancock Holding, Cl A (A) | 15,536 | 504 | ||||||
Hanover Insurance Group, Cl A | 30,346 | 2,289 | ||||||
Hercules Capital, Cl A | 37,894 | 514 | ||||||
IBERIABANK | 14,325 | 961 | ||||||
| Description | Shares | Market Value ($ Thousands) | ||||||
COMMON STOCK (continued) | ||||||||
Investors Bancorp | 167,160 | $ | 2,008 | |||||
Kearny Financial | 80,707 | 1,098 | ||||||
Kemper, Cl A (A) | 44,447 | 1,748 | ||||||
Maiden Holdings (A) | 175,865 | 2,232 | ||||||
MainSource Financial Group | 32,593 | 813 | ||||||
MB Financial | 24,311 | 925 | ||||||
Meridian Bancorp | 134,614 | 2,096 | ||||||
MFA Financial ‡(A) | 90,161 | 674 | ||||||
MGIC Investment * | 80,884 | 647 | ||||||
National Bank Holdings, Cl A (A) | 71,890 | 1,680 | ||||||
National General Holdings | 16,961 | 377 | ||||||
Nelnet, Cl A | 18,916 | 764 | ||||||
Northfield Bancorp | 150,091 | 2,416 | ||||||
OceanFirst Financial | 33,563 | 646 | ||||||
OFG Bancorp (A) | 219,525 | 2,219 | ||||||
Old National Bancorp, Cl A | 65,505 | 921 | ||||||
PacWest Bancorp | 38,520 | 1,653 | ||||||
PennyMac Mortgage Investment | 31,400 | 489 | ||||||
Piper Jaffray *(A) | 14,622 | 706 | ||||||
Popular | 62,900 | 2,404 | ||||||
Preferred Bank | 4,500 | 161 | ||||||
Radian Group | 30,107 | 408 | ||||||
Republic Bancorp, Cl A | 16,500 | 513 | ||||||
Selective Insurance Group | 18,214 | 726 | ||||||
SLM * | 144,624 | 1,080 | ||||||
Starwood Property Trust ‡ | 79,897 | 1,799 | ||||||
State Bank Financial | 85,600 | 1,953 | ||||||
TCF Financial | 71,902 | 1,043 | ||||||
Two Harbors Investment ‡ | 113,016 | 964 | ||||||
Union Bankshares | 18,400 | 493 | ||||||
United Community Banks | 69,000 | 1,450 | ||||||
United Fire Group | 9,380 | 397 | ||||||
Validus Holdings | 27,291 | 1,360 | ||||||
Voya Financial | 22,783 | 657 | ||||||
Walker & Dunlop * | 12,492 | 316 | ||||||
Webster Financial (A) | 27,435 | 1,043 | ||||||
WesBanco | 10,000 | 329 | ||||||
Western Alliance Bancorp * | 26,912 | 1,010 | ||||||
Western Asset Mortgage Capital ‡(A) | 41,719 | 435 | ||||||
White Mountains Insurance Group | 517 | 429 | ||||||
Wintrust Financial | 19,045 | 1,058 | ||||||
World Acceptance *(A) | 9,653 | 473 | ||||||
|
|
| ||||||
| 85,712 | ||||||||
|
|
| ||||||
Health Care — 5.9% | ||||||||
Accuray * | 331,209 | 2,110 | ||||||
Air Methods *(A) | 32,615 | 1,027 | ||||||
Akorn * | 31,432 | 857 | ||||||
Analogic (A) | 17,166 | 1,521 | ||||||
Community Health Systems *(A) | 131,803 | 1,521 | ||||||
Emergent BioSolutions * | 21,395 | 675 | ||||||
Ensign Group (A) | 18,312 | 369 | ||||||
2 |
SEI Institutional Managed Trust / Annual Report / September 30, 2016 |
SCHEDULE OF INVESTMENTS
September 30, 2016
Small Cap Value Fund (Continued)
| Description | Shares | Market Value ($ Thousands) | ||||||
COMMON STOCK (continued) | ||||||||
Exactech * | 12,600 | $ | 341 | |||||
Five Prime Therapeutics *(A) | 8,015 | 421 | ||||||
Integra LifeSciences Holdings * | 29,273 | 2,416 | ||||||
Kindred Healthcare | 112,270 | 1,147 | ||||||
Lannett *(A) | 74,604 | 1,982 | ||||||
LHC Group * | 9,111 | 336 | ||||||
LifePoint Health *(A) | 8,400 | 497 | ||||||
Ligand Pharmaceuticals *(A) | 18,870 | 1,926 | ||||||
Magellan Health * | 5,464 | 294 | ||||||
Omnicell * | 9,214 | 353 | ||||||
PDL BioPharma * | 112,744 | 378 | ||||||
Prestige Brands Holdings, Cl A * | 12,668 | 611 | ||||||
Sucampo Pharmaceuticals, Cl A * | 33,101 | 407 | ||||||
Trinity Biotech ADR * | 125,200 | 1,655 | ||||||
Triple-S Management, Cl B * | 23,461 | 514 | ||||||
Vocera Communications * | 31,045 | 525 | ||||||
|
|
| ||||||
| 21,883 | ||||||||
|
|
| ||||||
Industrials — 16.1% | ||||||||
AAR | 20,200 | 633 | ||||||
Acacia Research * | 119,793 | 781 | ||||||
ACCO Brands * | 214,480 | 2,068 | ||||||
Actuant, Cl A (A) | 8,427 | 196 | ||||||
Aegion, Cl A * | 23,278 | 444 | ||||||
Air Transport Services Group * | 50,500 | 725 | ||||||
Alamo Group | 5,400 | 356 | ||||||
Alaska Air Group | 4,500 | 296 | ||||||
American Railcar Industries (A) | 10,156 | 421 | ||||||
ARC Document Solutions * | 96,637 | 361 | ||||||
ArcBest | 20,312 | 386 | ||||||
Atlas Air Worldwide Holdings * | 56,390 | 2,415 | ||||||
Babcock & Wilcox Enterprises * | 78,581 | 1,297 | ||||||
Barnes Group | 31,420 | 1,274 | ||||||
Briggs & Stratton | 29,533 | 551 | ||||||
BWX Technologies, Cl W | 47,148 | 1,809 | ||||||
CEB | 5,770 | 314 | ||||||
Celadon Group (A) | 34,195 | 299 | ||||||
CIRCOR International | 8,674 | 517 | ||||||
Covanta Holding (A) | 33,200 | 511 | ||||||
Crane, Cl A | 19,781 | 1,246 | ||||||
Deluxe (A) | 8,100 | 541 | ||||||
DXP Enterprises *(A) | 13,555 | 382 | ||||||
EMCOR Group | 34,990 | 2,086 | ||||||
Engility Holdings * | 20,215 | �� | 637 | |||||
Ennis | 37,091 | 625 | ||||||
Essendant | 6,500 | 133 | ||||||
Federal Signal | 26,789 | 355 | ||||||
Forward Air | 19,163 | 829 | ||||||
Franklin Electric | 16,199 | 659 | ||||||
FreightCar America, Cl A | 82,709 | 1,189 | ||||||
Generac Holdings *(A) | 22,839 | 829 | ||||||
Genesee & Wyoming, Cl A *(A) | 18,271 | 1,260 | ||||||
| Description | Shares | Market Value ($ Thousands) | ||||||
COMMON STOCK (continued) | ||||||||
Great Lakes Dredge & Dock *(A) | 444,813 | $ | 1,557 | |||||
Greenbrier (A) | 11,649 | 411 | ||||||
Hawaiian Holdings * | 18,300 | 889 | ||||||
Hillenbrand (A) | 10,600 | 335 | ||||||
Hyster-Yale Materials Handling | 16,739 | 1,006 | ||||||
ICF International, Cl A * | 54,664 | 2,423 | ||||||
InnerWorkings * | 87,012 | 820 | ||||||
ITT | 27,429 | 983 | ||||||
JetBlue Airways * | 20,636 | 356 | ||||||
John Bean Technologies, Cl A (A) | 10,246 | 723 | ||||||
Kadant | 13,205 | 688 | ||||||
Kaman, Cl A (A) | 35,674 | 1,567 | ||||||
KAR Auction Services | 39,486 | 1,704 | ||||||
KBR | 46,469 | 703 | ||||||
Keyw Holding, Cl A *(A) | 39,645 | 438 | ||||||
Korn/Ferry International | 20,861 | 438 | ||||||
LB Foster, Cl A | 67,001 | 805 | ||||||
Manitowoc (A) | 69,494 | 333 | ||||||
Meritor * | 88,965 | 990 | ||||||
MRC Global * | 26,314 | 432 | ||||||
MSA Safety | 6,542 | 380 | ||||||
Navigant Consulting * | 24,108 | 487 | ||||||
Orion Group Holdings *(A) | 138,349 | 948 | ||||||
Oshkosh Truck | 10,717 | 600 | ||||||
Quad Graphics | 22,979 | 614 | ||||||
Roadrunner Transportation Systems * | 41,310 | 330 | ||||||
RPX * | 45,075 | 482 | ||||||
RR Donnelley & Sons | 18,986 | 298 | ||||||
Skywest | 32,357 | 855 | ||||||
Spirit Airlines * | 12,545 | 533 | ||||||
Sterling Construction * | 39,782 | 308 | ||||||
Teledyne Technologies *(A) | 11,139 | 1,202 | ||||||
Titan Machinery *(A) | 92,675 | 964 | ||||||
Triton International | 22,304 | 294 | ||||||
Triumph Group (A) | 67,821 | 1,891 | ||||||
TrueBlue * | 16,011 | 363 | ||||||
Tutor Perini *(A) | 63,138 | 1,356 | ||||||
Universal Forest Products | 5,120 | 504 | ||||||
VSE | 7,000 | 238 | ||||||
Wabash National *(A) | 65,789 | 937 | ||||||
Wesco Aircraft Holdings *(A) | 120,050 | 1,612 | ||||||
West | 15,758 | 348 | ||||||
XPO Logistics *(A) | 15,697 | 576 | ||||||
|
|
| ||||||
| 60,146 | ||||||||
|
|
| ||||||
Information Technology — 12.6% | ||||||||
ACI Worldwide *(A) | 53,745 | 1,042 | ||||||
Amkor Technology * | 108,249 | 1,052 | ||||||
Applied Micro Circuits * | 94,452 | 656 | ||||||
Aspen Technology * | 8,036 | 376 | ||||||
Bazaarvoice * | 70,495 | 417 | ||||||
Benchmark Electronics *(A) | 53,334 | 1,331 | ||||||
SEI Institutional Managed Trust / Annual Report / September 30, 2016 |
3 |
SCHEDULE OF INVESTMENTS
September 30, 2016
Small Cap Value Fund (Continued)
| Description | Shares | Market Value ($ Thousands) | ||||||
COMMON STOCK (continued) | ||||||||
Black Box | 68,208 | $ | 948 | |||||
Blackbaud, Cl A (A) | 10,035 | 666 | ||||||
Blackhawk Network Holdings, Cl A * | 11,418 | 344 | ||||||
Bottomline Technologies * | 23,198 | 541 | ||||||
CACI International, Cl A * | 9,252 | 933 | ||||||
Cavium *(A) | 5,903 | 344 | ||||||
CommVault Systems * | 17,985 | 955 | ||||||
Convergys | 29,580 | 900 | ||||||
CSG Systems International | 13,339 | 551 | ||||||
Cypress Semiconductor (A) | 33,174 | 403 | ||||||
Digi International * | 98,852 | 1,127 | ||||||
ePlus * | 2,800 | 264 | ||||||
Exar * | 208,974 | 1,945 | ||||||
ExlService Holdings * | 15,714 | 783 | ||||||
Fabrinet * | 7,100 | 317 | ||||||
IAC * | 19,148 | 1,196 | ||||||
Inphi * | 15,139 | 659 | ||||||
Insight Enterprises * | 39,523 | 1,286 | ||||||
InterDigital | 8,068 | 639 | ||||||
j2 Global | 18,530 | 1,234 | ||||||
Keysight Technologies * | 37,453 | 1,187 | ||||||
Kulicke & Soffa Industries * | 29,000 | 375 | ||||||
Littelfuse | 8,494 | 1,094 | ||||||
MaxLinear, Cl A *(A) | 31,723 | 643 | ||||||
Mentor Graphics | 31,691 | 838 | ||||||
Mercury Systems * | 18,642 | 458 | ||||||
MKS Instruments | 8,017 | 399 | ||||||
MoneyGram International * | 26,500 | 188 | ||||||
Monolithic Power Systems | 8,770 | 706 | ||||||
NETGEAR * | 31,721 | 1,919 | ||||||
NeuStar, Cl A *(A) | 15,747 | 419 | ||||||
Open Text | 30,677 | 1,990 | ||||||
Orbotech * | 23,524 | 696 | ||||||
OSI Systems * | 19,656 | 1,285 | ||||||
Pandora Media *(A) | – | — | ||||||
Photronics * | 80,388 | 829 | ||||||
QAD, Cl A | 34,400 | 770 | ||||||
Sanmina * | 89,010 | 2,534 | ||||||
Silicon Motion Technology ADR | 12,438 | 644 | ||||||
SuperCom *(A) | 86,200 | 296 | ||||||
Sykes Enterprises * | 34,045 | 958 | ||||||
SYNNEX | 15,760 | 1,798 | ||||||
Take-Two Interactive Software, Cl A * | 24,532 | 1,106 | ||||||
Tech Data * | 15,103 | 1,279 | ||||||
TeleTech Holdings | 15,517 | 450 | ||||||
Ultratech * | 34,036 | 786 | ||||||
Viavi Solutions * | 53,280 | 394 | ||||||
Xcerra * | 106,900 | 648 | ||||||
Zebra Technologies, Cl A * | 18,684 | 1,301 | ||||||
|
|
| ||||||
| 46,899 | ||||||||
|
|
| ||||||
| Description | Shares | Market Value ($ Thousands) | ||||||
COMMON STOCK (continued) | ||||||||
Materials — 5.1% | ||||||||
AK Steel Holding *(A) | 71,706 | $ | 346 | |||||
Allegheny Technologies (A) | 26,799 | 484 | ||||||
Ashland Global Holdings | 6,442 | 747 | ||||||
Cabot | 27,814 | 1,458 | ||||||
Carpenter Technology (A) | 16,400 | 677 | ||||||
Chemtura * | 8,821 | 289 | ||||||
Clearwater Paper * | 10,489 | 678 | ||||||
Commercial Metals, Cl A | 63,752 | 1,032 | ||||||
Compass Minerals International, Cl A (A) | 7,241 | 533 | ||||||
Domtar | 7,700 | 286 | ||||||
FMC | 29,434 | 1,423 | ||||||
Glatfelter | 14,800 | 321 | ||||||
Headwaters, Cl A * | 34,085 | 577 | ||||||
Huntsman | 24,908 | �� | 405 | |||||
Ingevity * | 23,385 | 1,078 | ||||||
Innospec | 29,911 | 1,819 | ||||||
LSB Industries *(A) | 92,173 | 791 | ||||||
Rayonier Advanced Materials | 37,270 | 498 | ||||||
Ryerson Holding * | 24,949 | 282 | ||||||
Schulman A (A) | 37,687 | 1,097 | ||||||
Schweitzer-Mauduit International | 42,088 | 1,623 | ||||||
Sensient Technologies | 8,348 | 633 | ||||||
Silgan Holdings (A) | 27,729 | 1,403 | ||||||
United States Steel (A) | 33,175 | 626 | ||||||
|
|
| ||||||
| 19,106 | ||||||||
|
|
| ||||||
Real Estate — 9.7% | ||||||||
Agree Realty ‡ | 27,274 | 1,348 | ||||||
Ashford Hospitality Trust ‡ | 64,106 | 378 | ||||||
Brandywine Realty Trust ‡(A) | 61,174 | 956 | ||||||
Camden Property Trust ‡(A) | 475 | 40 | ||||||
CatchMark Timber Trust, Cl A ‡ | 122,726 | 1,435 | ||||||
CBL & Associates Properties ‡ | 28,700 | 348 | ||||||
Cedar Realty Trust ‡ | 165,585 | 1,192 | ||||||
Chatham Lodging Trust ‡ | 24,600 | 474 | ||||||
Colony Starwood Homes ‡(A) | 114,777 | 3,294 | ||||||
Corrections Corp of America ‡ | 17,735 | 246 | ||||||
DiamondRock Hospitality ‡(A) | 35,180 | 320 | ||||||
EPR Properties, Cl A ‡ | 20,515 | 1,615 | ||||||
Equity Commonwealth *‡ | 71,225 | 2,152 | ||||||
FelCor Lodging Trust ‡(A) | 46,824 | 301 | ||||||
Forest City Realty Trust, Cl A ‡ | 46,788 | 1,082 | ||||||
Franklin Street Properties ‡ | 112,407 | 1,416 | ||||||
Gaming and Leisure Properties ‡ | 39,650 | 1,326 | ||||||
GEO Group ‡(A) | 69,447 | 1,652 | ||||||
Gladstone Commercial ‡ | 26,801 | 499 | ||||||
Gramercy Property Trust ‡(A) | 168,979 | 1,629 | ||||||
Healthcare Trust of America, Cl A ‡(A) | 47,778 | 1,559 | ||||||
Hersha Hospitality Trust, Cl A ‡(A) | 62,189 | 1,121 | ||||||
Highwoods Properties ‡ | 21,772 | 1,135 | ||||||
Hospitality Properties Trust ‡(A) | 12,900 | 383 | ||||||
4 |
SEI Institutional Managed Trust / Annual Report / September 30, 2016 |
SCHEDULE OF INVESTMENTS
September 30, 2016
Small Cap Value Fund (Continued)
| Description | Shares | Market Value ($ Thousands) | ||||||
COMMON STOCK (continued) | ||||||||
Howard Hughes * | 13,511 | $ | 1,547 | |||||
Kennedy-Wilson Holdings (A) | 58,951 | 1,329 | ||||||
Mack-Cali Realty ‡(A) | 15,200 | 414 | ||||||
Medical Properties Trust ‡(A) | 74,492 | 1,100 | ||||||
Physicians Realty Trust ‡(A) | 36,002 | 776 | ||||||
Piedmont Office Realty Trust, Cl A ‡(A) | 25,550 | 556 | ||||||
Post Properties ‡ | 550 | 36 | ||||||
QTS Realty Trust, Cl A ‡(A) | 24,135 | 1,276 | ||||||
RLJ Lodging Trust ‡ | 16,665 | 351 | ||||||
Select Income ‡ | 44,514 | 1,197 | ||||||
Seritage Growth Properties ‡(A) | 10,761 | 545 | ||||||
Summit Hotel Properties ‡ | 78,954 | 1,039 | ||||||
|
|
| ||||||
| 36,067 | ||||||||
|
|
| ||||||
Telecommunication Services — 0.4% | ||||||||
Cincinnati Bell, Cl A * | 75,000 | 306 | ||||||
Inteliquent | 24,177 | 390 | ||||||
Iridium Communications *(A) | 82,575 | 670 | ||||||
|
|
| ||||||
| 1,366 | ||||||||
|
|
| ||||||
Utilities — 3.7% | ||||||||
ALLETE (A) | 21,493 | 1,281 | ||||||
Avista | 13,700 | 573 | ||||||
Black Hills, Cl A (A) | 7,100 | 435 | ||||||
Cadiz *(A) | 50,400 | 373 | ||||||
Chesapeake Utilities (A) | 15,748 | 962 | ||||||
Idacorp, Cl A | 4,621 | 362 | ||||||
Pinnacle West Capital | 6,076 | 462 | ||||||
PNM Resources | 77,025 | 2,520 | ||||||
Portland General Electric | 66,477 | 2,831 | ||||||
SJW | 9,485 | 414 | ||||||
South Jersey Industries, Cl A (A) | 19,571 | 578 | ||||||
Southwest Gas | 18,375 | 1,284 | ||||||
Spire | 27,070 | 1,725 | ||||||
|
|
| ||||||
| 13,800 | ||||||||
|
|
| ||||||
Total Common Stock |
| 353,529 | ||||||
|
|
| ||||||
EXCHANGE TRADED FUND — 0.2% | ||||||||
Exchange Traded Fund — 0.2% | ||||||||
iShares Russell 2000 Value ETF | 7,150 | 749 | ||||||
|
|
| ||||||
Total Exchange Traded Fund | 749 | |||||||
|
|
| ||||||
| Description | Face Amount (Thousands) | Market Value ($ Thousands) | ||||||
U.S. TREASURY OBLIGATION — 0.2% |
| |||||||
U.S. Treasury Bills | ||||||||
0.240%, 10/20/2016 (B) (C) | $ | 805 | $ | 805 | ||||
|
|
| ||||||
Total U.S. Treasury Obligation |
| 805 | ||||||
|
|
| ||||||
| Shares | ||||||||
AFFILIATED PARTNERSHIP — 27.9% |
| |||||||
SEI Liquidity Fund, L.P. | ||||||||
0.440% **†(D) | 104,012,713 | 104,013 | ||||||
|
|
| ||||||
Total Affiliated Partnership |
| 104,013 | ||||||
|
|
| ||||||
CASH EQUIVALENT — 4.8% | ||||||||
SEI Daily Income Trust, Government Fund, Cl A | ||||||||
0.220%**† | 17,700,145 | 17,700 | ||||||
|
|
| ||||||
Total Cash Equivalent
(Cost $17,700) ($ Thousands) |
| 17,700 | ||||||
|
|
| ||||||
Total Investments — 128.0% |
| $ | 476,796 | |||||
|
|
| ||||||
SEI Institutional Managed Trust / Annual Report / September 30, 2016 |
5 |
SCHEDULE OF INVESTMENTS
September 30, 2016
Small Cap Value Fund (Concluded)
A list of the open futures contracts held by the Fund at September 30, 2016, is as follows:
| Type of Contract | Number of Contracts Long | Expiration Date | Unrealized Depreciation ($ Thousands) | |||||||||
Russell 2000 Index E-MINI | 19 | Dec-2016 | $(3) | |||||||||
|
| |||||||||||
For the year ended September 30, 2016, the total amount of all open futures contracts, as presented in the table above, are representative of the volume of activity for the derivative type during the year.
| Percentages are based on Net Assets of $372,465 ($ Thousands). |
| * | Non-income producing security. |
| ** | Rate shown is the 7-day effective yield as of September 30, 2016. |
| ‡ | Real Estate Investment Trust. |
| † | Investment in Affiliated Security (see Note 6). |
| (A) | This security or a partial position of this security is on loan at September 30, 2016 (see Note 10). The total market value of securities on loan at September 30, 2016 was $102,682 ($ Thousands). |
| (B) | Security, or portion thereof, has been pledged as collateral on open futures contracts. |
| (C) | The rate reported is the effective yield at time of purchase. |
| (D) | This security was purchased with cash collateral held from securities on loan (see Note 10). The total market value of such securities as of September 30, 2016 was $104,013 ($ Thousands). |
ADR — American Depositary Receipt
Cl — Class
ETF — Exchange Traded Fund
L.P. — Limited Partnership
The following is a list of the level of inputs used as of September 30, 2016, in valuing the Fund’s investments and other financial instruments carried at value ($ Thousands):
| Investments in Securities | Level 1 | Level 2 | Level 3 | Total | ||||||||||||
Common Stock | $ | 353,529 | $ | – | $ | – | $ | 353,529 | ||||||||
Exchange Traded Fund | 749 | – | – | 749 | ||||||||||||
U.S. Treasury Obligation | – | 805 | – | 805 | ||||||||||||
Affiliated Partnership | – | 104,013 | – | 104,013 | ||||||||||||
Cash Equivalent | 17,700 | – | – | 17,700 | ||||||||||||
|
|
|
|
|
|
|
| |||||||||
Total Investments in Securities | $ | 371,978 | $ | 104,818 | $ | – | $ | 476,796 | ||||||||
|
|
|
|
|
|
|
| |||||||||
| Other Financial Instruments | Level 1 | Level 2 | Level 3 | Total | ||||||||||||
Futures Contracts * | ||||||||||||||||
Unrealized Depreciation | $ | (3) | $ | — | $ | — | $ | (3) | ||||||||
|
|
|
|
|
|
|
| |||||||||
Total Other Financial Instruments | $ | (3) | $ | — | $ | — | $ | (3) | ||||||||
|
|
|
|
|
|
|
| |||||||||
* Futures contracts are valued at the unrealized depreciation on the instrument.
For the year ended September 30, 2016, there were no transfers between Level 1 and Level 2 assets and liabilities.
For the year ended September 30, 2016, there were no transfers between Level 2 and Level 3 assets and liabilities.
For more information on valuation inputs, see Note 2 – Significant Accounting Policies in Notes to Financial Statements.
Amounts designated as “—” are $0 or have been rounded to $0.
The accompanying notes are an integral part of the financial statements.
6 |
SEI Institutional Managed Trust / Annual Report / September 30, 2016 |
SCHEDULE OF INVESTMENTS
September 30, 2016
Small Cap Growth Fund
| Description | Shares | Market Value ($ Thousands) | ||||||
COMMON STOCK — 96.1%†† | ||||||||
Consumer Discretionary — 15.6% | ||||||||
2U *(A) | 64,602 | $ | 2,474 | |||||
American Eagle Outfitters (A) | 22,013 | 393 | ||||||
Arctic Cat *(A) | 22,117 | 343 | ||||||
Big Lots | 12,388 | 591 | ||||||
Bloomin' Brands | 16,649 | 287 | ||||||
Boot Barn Holdings *(A) | 28,232 | 321 | ||||||
Bright Horizons Family Solutions * | 45,102 | 3,017 | ||||||
Buffalo Wild Wings * | 4,065 | 572 | ||||||
Callaway Golf | 37,737 | 438 | ||||||
Carriage Services (A) | 42,560 | 1,007 | ||||||
Cavco Industries * | 4,166 | 413 | ||||||
Cooper-Standard Holding * | 7,719 | 763 | ||||||
Core-Mark Holding, Cl A | 57,387 | 2,054 | ||||||
Dave & Buster's Entertainment * | 30,293 | 1,187 | ||||||
Del Frisco's Restaurant Group * | 38,599 | 520 | ||||||
Dorman Products *(A) | 14,162 | 905 | ||||||
Drew Industries | 7,141 | 700 | ||||||
Duluth Holdings, Cl B * | 11,645 | 309 | ||||||
Dunkin' Brands Group | 15,640 | 814 | ||||||
Fenix Parts *(A) | 70,449 | 279 | ||||||
Fiesta Restaurant Group * | 88,056 | 2,113 | ||||||
Five Below * | 33,682 | 1,357 | ||||||
Francesca's Holdings * | 22,005 | 340 | ||||||
GNC Holdings, Cl A | 23,259 | 475 | ||||||
Grand Canyon Education * | 24,742 | 999 | ||||||
Helen of Troy * | 16,836 | 1,451 | ||||||
Hibbett Sports *(A) | 32,092 | 1,280 | ||||||
IMAX *(A) | 34,891 | 1,011 | ||||||
Jack in the Box | 26,199 | 2,513 | ||||||
Lithia Motors, Cl A (A) | 7,805 | 746 | ||||||
Malibu Boats, Cl A * | 42,567 | 634 | ||||||
MarineMax * | 15,433 | 323 | ||||||
MDC Partners, Cl A (A) | 154,346 | 1,655 | ||||||
Monro Muffler | 30,140 | 1,844 | ||||||
Motorcar Parts of America * | 18,655 | 537 | ||||||
National CineMedia | 151,530 | 2,230 | ||||||
Nautilus * | 35,678 | 811 | ||||||
Nutrisystem | 13,973 | 415 | ||||||
Ollie's Bargain Outlet Holdings * | 16,674 | 437 | ||||||
Planet Fitness, Cl A * | 91,915 | 1,845 | ||||||
Pool | 3,974 | 376 | ||||||
Sally Beauty Holdings * | 34,144 | 877 | ||||||
Smith & Wesson Holding *(A) | 10,914 | 290 | ||||||
Spartan Motors | 36,523 | 350 | ||||||
Steven Madden * | 23,096 | 798 | ||||||
Superior Industries International | 11,509 | 336 | ||||||
Tempur-Pedic International *(A) | 9,895 | 561 | ||||||
Tenneco * | 6,872 | 400 | ||||||
Texas Roadhouse, Cl A | 13,402 | 523 | ||||||
Tile Shop Holdings *(A) | 31,951 | 529 | ||||||
Universal Electronics * | 21,168 | 1,576 | ||||||
| Description | Shares | Market Value ($ Thousands) | ||||||
COMMON STOCK (continued) | ||||||||
William Lyon Homes, Cl A * | 52,582 | $ | 975 | |||||
Wingstop, Cl A * | 10,708 | 314 | ||||||
Winmark | 5,247 | 554 | ||||||
Wolverine World Wide | 44,554 | 1,026 | ||||||
Zoe's Kitchen *(A) | 11,144 | 247 | ||||||
|
|
| ||||||
| 50,135 | ||||||||
|
|
| ||||||
Consumer Staples — 3.0% | ||||||||
AdvancePierre Foods Holdings | 20,518 | 565 | ||||||
Amplify Snack Brands *(A) | 22,519 | 365 | ||||||
B&G Foods, Cl A | 6,279 | 309 | ||||||
Cal-Maine Foods *(A) | 5,803 | 224 | ||||||
Central Garden & Pet *(A) | 49,187 | 1,279 | ||||||
Chefs' Warehouse Holdings * | 32,217 | 359 | ||||||
Dean Foods (A) | 16,552 | 271 | ||||||
Freshpet * | 39,134 | 338 | ||||||
MGP Ingredients | 8,955 | 363 | ||||||
Primo Water * | 72,867 | 884 | ||||||
Spectrum Brands Holdings (A) | 21,998 | 3,029 | ||||||
WD-40 (A) | 14,417 | 1,621 | ||||||
|
|
| ||||||
| 9,607 | ||||||||
|
|
| ||||||
Energy — 2.0% | ||||||||
Carrizo Oil & Gas * | 34,390 | 1,397 | ||||||
Clayton Williams Energy *(A) | 6,077 | 519 | ||||||
Dril-Quip * | 7,089 | 395 | ||||||
Evolution Petroleum | 188,027 | 1,181 | ||||||
Matador Resources * | 14,102 | 343 | ||||||
Oil States International * | 11,834 | 374 | ||||||
Pacific Ethanol * | 48,026 | 332 | ||||||
PDC Energy, Cl A * | 4,399 | 295 | ||||||
Resolute Energy * | 15,514 | 404 | ||||||
RigNet, Cl A * | 51,243 | 775 | ||||||
US Silica Holdings (A) | 12,067 | 562 | ||||||
|
|
| ||||||
| 6,577 | ||||||||
|
|
| ||||||
Financials — 4.5% | ||||||||
Amerisafe (A) | 7,877 | 463 | ||||||
Bank of the Ozarks | 9,651 | 371 | ||||||
Bats Global Markets | 40,462 | 1,219 | ||||||
Eagle Bancorp * | 28,835 | 1,422 | ||||||
Financial Engines (A) | 31,406 | 933 | ||||||
Franklin Financial Network * | 16,807 | 628 | ||||||
Houlihan Lokey, Cl A | 19,877 | 498 | ||||||
KCG Holdings, Cl A * | 34,444 | 535 | ||||||
National General Holdings | 65,405 | 1,455 | ||||||
Opus Bank | 22,540 | 797 | ||||||
PennantPark Investment | 124,243 | 934 | ||||||
Signature Bank, Cl B * | 2,673 | 317 | ||||||
Stifel Financial * | 9,366 | 360 | ||||||
Trupanion *(A) | 24,397 | 412 | ||||||
United Community Banks | 62,453 | 1,313 | ||||||
Univest Corp of Pennsylvania | 24,833 | 580 | ||||||
SEI Institutional Managed Trust / Annual Report / September 30, 2016 |
1 |
SCHEDULE OF INVESTMENTS
September 30, 2016
Small Cap Growth Fund (Continued)
| Description | Shares | Market Value ($ Thousands) | ||||||
COMMON STOCK (continued) | ||||||||
Value Creation *(B)(C) | 145,600 | $ | 58 | |||||
Western Alliance Bancorp * | 11,881 | 446 | ||||||
Wintrust Financial | 21,987 | 1,222 | ||||||
WisdomTree Investments (A) | 54,291 | 559 | ||||||
|
|
| ||||||
| 14,522 | ||||||||
|
|
| ||||||
Health Care — 21.6% | ||||||||
ABIOMED * | 2,520 | 324 | ||||||
Acadia Healthcare, Cl A *(A) | 11,583 | 574 | ||||||
Accelerate Diagnostics *(A) | 20,046 | 546 | ||||||
Adamas Pharmaceuticals * | 18,095 | 297 | ||||||
Advaxis * | 19,890 | 213 | ||||||
Aerie Pharmaceuticals * | 18,071 | 682 | ||||||
Aimmune Therapeutics * | 9,003 | 135 | ||||||
Akorn * | 17,419 | 475 | ||||||
Alder Biopharmaceuticals * | 11,687 | 383 | ||||||
Align Technology * | 5,145 | 482 | ||||||
AMAG Pharmaceuticals *(A) | 89,156 | 2,185 | ||||||
AMN Healthcare Services * | 98,966 | 3,154 | ||||||
Amphastar Pharmaceuticals *(A) | 18,712 | 355 | ||||||
Amsurg * | 9,271 | 622 | ||||||
Atara Biotherapeutics * | 13,830 | 296 | ||||||
Atrion | 635 | 271 | ||||||
Audentes Therapeutics * | 28,400 | 506 | ||||||
BioDelivery Sciences International * | 271,200 | 732 | ||||||
BioTelemetry * | 24,355 | 452 | ||||||
Bluebird Bio * | 10,025 | 679 | ||||||
Cambrex * | 25,770 | 1,146 | ||||||
Capital Senior Living * | 83,539 | 1,403 | ||||||
Cardiovascular Systems * | 11,721 | 278 | ||||||
Castlight Health, Cl B *(A) | 102,652 | 427 | ||||||
Chimerix * | 95,801 | 531 | ||||||
CoLucid Pharmaceuticals * | 16,268 | 621 | ||||||
Cotiviti Holdings * | 10,019 | 336 | ||||||
Cynosure, Cl A * | 51,780 | 2,638 | ||||||
DBV Technologies ADR * | 10,805 | 393 | ||||||
Depomed * | 12,458 | 311 | ||||||
Dermira * | 9,475 | 320 | ||||||
DexCom * | 4,215 | 369 | ||||||
Diplomat Pharmacy *(A) | 27,275 | 764 | ||||||
Emergent BioSolutions * | 13,758 | 434 | ||||||
Endologix *(A) | 66,534 | 852 | ||||||
Entellus Medical * | 9,817 | 218 | ||||||
Exact Sciences *(A) | 26,325 | 489 | ||||||
Exelixis *(A) | 33,242 | 425 | ||||||
Flamel Technologies ADR * | 79,933 | 991 | ||||||
Glaukos * | 21,212 | 801 | ||||||
Globus Medical, Cl A *(A) | 72,271 | 1,631 | ||||||
GW Pharmaceuticals ADR *(A) | 3,419 | 454 | ||||||
Heska * | 6,916 | 376 | ||||||
ICON * | 5,561 | 430 | ||||||
INC Research Holdings, Cl A * | 44,901 | 2,002 | ||||||
| Description | Shares | Market Value ($ Thousands) | ||||||
COMMON STOCK (continued) | ||||||||
Inogen *(A) | 9,140 | $ | 547 | |||||
Insulet * | 12,183 | 499 | ||||||
Integra LifeSciences Holdings * | 31,756 | 2,621 | ||||||
LeMaitre Vascular | 30,957 | 614 | ||||||
Ligand Pharmaceuticals * | 27,700 | 2,827 | ||||||
Masimo * | 10,738 | 639 | ||||||
Medicines *(A) | 6,330 | 239 | ||||||
Medidata Solutions * | 31,396 | 1,751 | ||||||
Medpace Holdings * | 16,144 | 482 | ||||||
Merit Medical Systems * | 23,032 | 559 | ||||||
Molina Healthcare * | 37,932 | 2,212 | ||||||
Myriad Genetics * | 14,854 | 306 | ||||||
NeoGenomics * | 106,931 | 879 | ||||||
Neurocrine Biosciences * | 11,354 | 575 | ||||||
Neuroderm * | 23,089 | 427 | ||||||
Nevro * | 17,370 | 1,813 | ||||||
Novadaq Technologies * | 40,323 | 467 | ||||||
Omnicell * | 36,826 | 1,410 | ||||||
OraSure Technologies * | 27,803 | 222 | ||||||
Otonomy *(A) | 17,505 | 318 | ||||||
OvaScience *(A) | 30,802 | 221 | ||||||
Pacific Biosciences of California *(A) | 44,130 | 395 | ||||||
Penumbra * | 9,300 | 707 | ||||||
PRA Health Sciences * | 25,047 | 1,415 | ||||||
Premier, Cl A * | 13,419 | 434 | ||||||
Press Ganey Holdings * | 40,416 | 1,633 | ||||||
Prestige Brands Holdings, Cl A * | 67,487 | 3,258 | ||||||
Puma Biotechnology * | 5,154 | 346 | ||||||
Quidel *(A) | 21,713 | 480 | ||||||
Radius Health * | 8,900 | 481 | ||||||
Repligen * | 10,924 | 330 | ||||||
Revance Therapeutics * | 18,674 | 303 | ||||||
Sarepta Therapeutics *(A) | 5,482 | 337 | ||||||
Spectranetics * | 42,350 | 1,063 | ||||||
Supernus Pharmaceuticals * | 67,751 | 1,675 | ||||||
Surgical Care Affiliates * | 8,149 | 397 | ||||||
Syndax Pharmaceuticals *(A) | 22,131 | 336 | ||||||
TESARO *(A) | 7,710 | 773 | ||||||
Ultragenyx Pharmaceutical *(A) | 5,005 | 355 | ||||||
Vascular Solutions * | 7,405 | 357 | ||||||
Versartis * | 39,463 | 483 | ||||||
Vocera Communications * | 42,301 | 715 | ||||||
Xencor * | 24,590 | 602 | ||||||
Zeltiq Aesthetics * | 22,645 | 888 | ||||||
|
|
| ||||||
| 69,394 | ||||||||
|
|
| ||||||
Industrials — 18.3% | ||||||||
ABM Industries | 31,750 | 1,260 | ||||||
Advisory Board * | 10,568 | 473 | ||||||
Air Transport Services Group * | 79,895 | 1,146 | ||||||
Albany International, Cl A | 10,904 | 462 | ||||||
American Woodmark * | 12,873 | 1,037 | ||||||
2 |
SEI Institutional Managed Trust / Annual Report / September 30, 2016 |
SCHEDULE OF INVESTMENTS
September 30, 2016
Small Cap Growth Fund (Continued)
| Description | Shares | Market Value ($ Thousands) | ||||||
COMMON STOCK (continued) | ||||||||
Apogee Enterprises | 56,608 | $ | 2,530 | |||||
Argan | 6,991 | 414 | ||||||
Astec Industries | 25,754 | 1,542 | ||||||
BWX Technologies, Cl W | 28,462 | 1,092 | ||||||
Carlisle | 6,856 | 703 | ||||||
CEB | 17,584 | 958 | ||||||
Clean Harbors * | 24,308 | 1,166 | ||||||
Deluxe | 59,800 | 3,996 | ||||||
Dycom Industries * | 15,914 | 1,301 | ||||||
Energy Recovery * | 20,658 | 330 | ||||||
Exponent | 24,304 | 1,241 | ||||||
Forward Air | 22,684 | 981 | ||||||
Genesee & Wyoming, Cl A * | 5,942 | 410 | ||||||
Gibraltar Industries * | 9,645 | 358 | ||||||
Global Brass & Copper Holdings | 10,957 | 317 | ||||||
H&E Equipment Services | 24,573 | 412 | ||||||
Hawaiian Holdings * | 7,861 | 382 | ||||||
Healthcare Services Group (A) | 28,473 | 1,127 | ||||||
Heartland Express (A) | 69,741 | 1,317 | ||||||
Heico, Cl A | 19,453 | 1,177 | ||||||
Heritage-Crystal Clean * | 123,630 | 1,642 | ||||||
Hexcel, Cl A | 9,159 | 406 | ||||||
Hudson Technologies * | 56,304 | 374 | ||||||
Huron Consulting Group *(A) | 29,411 | 1,758 | ||||||
IDEX | 9,592 | 897 | ||||||
InnerWorkings * | 82,522 | 777 | ||||||
Insteel Industries | 21,317 | 772 | ||||||
John Bean Technologies, Cl A | 27,265 | 1,923 | ||||||
Kennametal | 22,454 | 652 | ||||||
Keyw Holding, Cl A *(A) | 29,544 | 326 | ||||||
Kirby *(A) | 20,925 | 1,301 | ||||||
Lincoln Electric Holdings | 8,490 | 532 | ||||||
MasTec * | 57,929 | 1,723 | ||||||
Matson | 7,328 | 292 | ||||||
Middleby * | 2,422 | 299 | ||||||
MSC Industrial Direct, Cl A (A) | 10,415 | 765 | ||||||
Nordson | 3,318 | 331 | ||||||
NV5 Global * | 10,497 | 339 | ||||||
On Assignment * | 51,585 | 1,872 | ||||||
Park-Ohio Holdings | 13,851 | 505 | ||||||
Patrick Industries * | 10,383 | 643 | ||||||
Paylocity Holding *(A) | 9,698 | 431 | ||||||
Proto Labs * | 11,514 | 690 | ||||||
RBC Bearings * | 11,730 | 897 | ||||||
Ritchie Bros. Auctioneers | 14,835 | 520 | ||||||
Roadrunner Transportation Systems * | 32,205 | 257 | ||||||
Saia * | 18,157 | 544 | ||||||
SiteOne Landscape Supply * | 25,790 | 927 | ||||||
Skywest | 12,077 | 319 | ||||||
SP Plus * | 57,590 | 1,473 | ||||||
Swift Transportation, Cl A * | 93,151 | 2,000 | ||||||
TASER International *(A) | 16,155 | 462 | ||||||
| Description | Shares | Market Value ($ Thousands) | ||||||
COMMON STOCK (continued) | ||||||||
Tennant (A) | 25,937 | $ | 1,681 | |||||
TriNet Group * | 69,193 | 1,497 | ||||||
TrueBlue * | 20,032 | 454 | ||||||
WageWorks * | 33,063 | 2,014 | ||||||
XPO Logistics *(A) | 17,380 | 637 | ||||||
|
|
| ||||||
| 59,064 | ||||||||
|
|
| ||||||
Information Technology — 25.2% | ||||||||
Acacia Communications *(A) | 2,688 | 278 | ||||||
Acxiom * | 78,734 | 2,098 | ||||||
Advanced Energy Industries * | 10,866 | 514 | ||||||
Advanced Micro Devices * | 51,721 | 357 | ||||||
Alarm.com Holdings *(A) | 33,542 | 968 | ||||||
Aspen Technology * | 24,470 | 1,145 | ||||||
Atlassian, Cl A * | 12,586 | 377 | ||||||
Barracuda Networks * | 28,249 | 720 | ||||||
Blackbaud, Cl A | 28,948 | 1,920 | ||||||
Booz Allen Hamilton Holding, Cl A | 24,244 | 766 | ||||||
BroadSoft * | 8,387 | 390 | ||||||
CalAmp * | 150,093 | 2,094 | ||||||
Callidus Software * | 153,824 | 2,823 | ||||||
Carbonite * | 102,699 | 1,577 | ||||||
Cavium * | 43,795 | 2,549 | ||||||
ChannelAdvisor * | 86,990 | 1,125 | ||||||
Cimpress *(A) | 15,231 | 1,541 | ||||||
Cirrus Logic * | 26,576 | 1,413 | ||||||
Coherent * | 9,862 | 1,090 | ||||||
comScore * | 21,206 | 650 | ||||||
Cornerstone OnDemand * | 39,136 | 1,798 | ||||||
CSG Systems International | 20,603 | 852 | ||||||
Descartes Systems Group * | 15,735 | 339 | ||||||
DST Systems | 11,948 | 1,409 | ||||||
DTS | 22,991 | 978 | ||||||
EarthLink Holdings | 9,903 | 61 | ||||||
Ebix (A) | 5,905 | 336 | ||||||
Envestnet *(A) | 23,826 | 868 | ||||||
EPAM Systems *(A) | 10,976 | 761 | ||||||
Euronet Worldwide * | 22,470 | 1,839 | ||||||
Everbridge * | 21,318 | 359 | ||||||
Exa * | 71,051 | 1,140 | ||||||
ExlService Holdings * | 7,552 | 376 | ||||||
Fabrinet * | 7,648 | 341 | ||||||
Finisar * | 14,470 | 431 | ||||||
FireEye * | 122,884 | 1,810 | ||||||
Five9 * | 30,149 | 473 | ||||||
Fleetmatics Group * | 20,245 | 1,214 | ||||||
Forrester Research (A) | 11,076 | 431 | ||||||
Fortinet * | 9,950 | 367 | ||||||
Gigamon * | 11,381 | 624 | ||||||
Globant *(A) | 10,180 | 429 | ||||||
Guidewire Software, Cl Z * | 27,349 | 1,640 | ||||||
Hackett Group | 39,383 | 651 | ||||||
SEI Institutional Managed Trust / Annual Report / September 30, 2016 |
3 |
SCHEDULE OF INVESTMENTS
September 30, 2016
Small Cap Growth Fund (Continued)
| Description | Shares | Market Value ($ Thousands) | ||||||
COMMON STOCK (continued) |
| |||||||
HubSpot * | 9,608 | $ | 554 | |||||
Infoblox * | 13,291 | 351 | ||||||
Instructure *(A) | 37,108 | 941 | ||||||
Integrated Device Technology * | 15,975 | 369 | ||||||
Littelfuse | 21,395 | 2,756 | ||||||
LivePerson * | 102,571 | 863 | ||||||
LogMeIn * | 18,204 | 1,645 | ||||||
Lumentum Holdings * | 68,350 | 2,855 | ||||||
Manhattan Associates * | 8,644 | 498 | ||||||
MAXIMUS | 21,220 | 1,200 | ||||||
MaxLinear, Cl A * | 18,175 | 368 | ||||||
Mellanox Technologies * | 10,682 | 462 | ||||||
Mercury Systems * | 36,983 | 909 | ||||||
Mesa Laboratories | 3,255 | 372 | ||||||
Microsemi * | 17,508 | 735 | ||||||
Mitek Systems * | 37,179 | 308 | ||||||
Monolithic Power Systems | 39,791 | 3,203 | ||||||
Nanometrics *(A) | 13,953 | 312 | ||||||
NeoPhotonics * | 22,435 | 367 | ||||||
NETGEAR * | 5,609 | 339 | ||||||
New Relic *(A) | 11,587 | 444 | ||||||
Oclaro * | 102,709 | 878 | ||||||
Pandora Media *(A) | 31,159 | 447 | ||||||
Paycom Software *(A) | 7,434 | 373 | ||||||
PDF Solutions * | 89,629 | 1,629 | ||||||
Perficient * | 88,245 | 1,778 | ||||||
Proofpoint * | 40,412 | 3,025 | ||||||
Q2 Holdings * | 49,721 | 1,425 | ||||||
RealPage * | 21,702 | 558 | ||||||
RingCentral, Cl A * | 20,574 | 487 | ||||||
Rudolph Technologies * | 28,959 | 514 | ||||||
Shutterstock *(A) | 10,143 | 646 | ||||||
Silicon Laboratories * | 13,478 | 793 | ||||||
SPS Commerce * | 6,060 | 445 | ||||||
Stratasys *(A) | 16,463 | 397 | ||||||
Synaptics * | 8,080 | 473 | ||||||
Take-Two Interactive Software, Cl A * | 24,943 | 1,124 | ||||||
Tessera Technologies | 8,303 | 319 | ||||||
TTM Technologies * | 29,026 | 332 | ||||||
Tyler Technologies * | 5,937 | 1,017 | ||||||
Virtusa * | 11,781 | 291 | ||||||
Yelp, Cl A * | 7,996 | 333 | ||||||
|
|
| ||||||
| 81,057 | ||||||||
|
|
| ||||||
Materials — 4.0% | ||||||||
AEP Industries | 2,758 | 302 | ||||||
Balchem | 7,544 | 585 | ||||||
Berry Plastics Group * | 86,692 | 3,801 | ||||||
Chemours | 20,825 | 333 | ||||||
Clearwater Paper * | 4,891 | 316 | ||||||
Ingevity * | 23,822 | 1,098 | ||||||
Innospec | 6,783 | 413 | ||||||
| Description | Shares | Market Value ($ Thousands) | ||||||
COMMON STOCK (continued) |
| |||||||
Kraton *(A) | 25,077 | $ | 879 | |||||
Neenah Paper, Cl A | 6,232 | 492 | ||||||
PolyOne | 29,417 | 995 | ||||||
Rayonier Advanced Materials | 24,815 | 332 | ||||||
Sensient Technologies | 25,375 | 1,923 | ||||||
Summit Materials, Cl A * | 51,386 | 953 | ||||||
Trinseo | 5,810 | 329 | ||||||
|
|
| ||||||
| 12,751 | ||||||||
|
|
| ||||||
Real Estate — 1.4% | ||||||||
Agree Realty ‡ | 9,080 | 449 | ||||||
CoreSite Realty ‡ | 8,939 | 662 | ||||||
Four Corners Property Trust ‡ | 21,862 | 466 | ||||||
Jernigan Capital ‡(A) | 35,368 | 678 | ||||||
National Storage Affiliates Trust ‡ | 91,120 | 1,908 | ||||||
STORE Capital ‡ | 8,982 | 265 | ||||||
|
|
| ||||||
| 4,428 | ||||||||
|
|
| ||||||
Telecommunication Services — 0.5% |
| |||||||
8x8 * | 110,207 | 1,700 | ||||||
|
|
| ||||||
Total Common Stock |
| 309,235 | ||||||
|
|
| ||||||
| Number of Rights | ||||||||
RIGHTS — 0.0% | ||||||||
United States — 0.0% | ||||||||
Durata Therapeutics *‡‡ | 8,500 | – | ||||||
Dyax, Expires 12/31/2019 * | 7,184 | – | ||||||
|
|
| ||||||
Total Rights |
| – | ||||||
|
|
| ||||||
| Shares | ||||||||
AFFILIATED PARTNERSHIP — 9.7% |
| |||||||
SEI Liquidity Fund, L.P. | ||||||||
0.440% **†(D) | 31,160,567 | 31,161 | ||||||
|
|
| ||||||
Total Affiliated Partnership |
| 31,161 | ||||||
|
|
| ||||||
4 |
SEI Institutional Managed Trust / Annual Report / September 30, 2016 |
SCHEDULE OF INVESTMENTS
September 30, 2016
Small Cap Growth Fund (Concluded)
| Description | Shares | Market Value ($ Thousands) | ||||||
CASH EQUIVALENT — 3.9% | ||||||||
SEI Daily Income Trust, Government Fund, Cl A | ||||||||
0.220%**† | 12,401,264 | $ | 12,401 | |||||
|
|
| ||||||
Total Cash Equivalent | 12,401 | |||||||
|
|
| ||||||
Total Investments — 109.7% | $ | 352,797 | ||||||
|
|
| ||||||
| Percentages are based on Net Assets of $321,736 ($ Thousands). |
| * | Non-income producing security. |
| ** | Rate shown is the 7-day effective yield as of September 30, 2016. |
| ‡ | Real Estate Investment Trust. |
| ‡‡ | Expiration date unavailable. |
| † | Investment in Affiliated Security (see Note 6). |
| †† | Narrow industries are utilized for compliance purposes, whereas broad sectors are utilized for reporting. |
| (A) | This security or a partial position of this security is on loan at September 30, 2016 (see Note 10). The total market value of securities on loan at September 30, 2016 was $30,880 ($ Thousands). |
| (B) | Securities considered illiquid. The total value of such securities as of September 30, 2016 was $58 ($ Thousands) and represented 0.0% of Net Assets. |
| (C) | Securities considered restricted. The total market value of such securities as of September 30, 2016 was $58 ($ Thousands) and represented 0.0% of Net Assets. |
| (D) | This security was purchased with cash collateral held from securities on loan (see Note 10). The total market value of such securities as of September 30, 2016 was $31,161 ($ Thousands). |
ADR — American Depositary Receipt
Cl — Class
L.P. — Limited Partnership
The following is a list of the level of inputs used as of September 30, 2016, in valuing the Fund’s investments carried at value ($ Thousands):
| Investments in Securities | Level 1 | Level 2 | Level 3(1) | Total | ||||||||||||
Common Stock | $ | 309,177 | $ | – | $ | 58 | $ | 309,235 | ||||||||
Rights | – | – | – | – | ||||||||||||
Affiliated Partnership | – | 31,161 | – | 31,161 | ||||||||||||
Cash Equivalent | 12,401 | – | – | 12,401 | ||||||||||||
|
|
|
|
|
|
|
| |||||||||
Total Investments in Securities | $ | 321,578 | $ | 31,161 | $ | 58 | $ | 352,797 | ||||||||
|
|
|
|
|
|
|
| |||||||||
(1) A reconciliation of Level 3 investments is presented when the Fund has a significant amount of Level 3 investments at the beginning and/or end of the period in relation to net assets. Management has concluded that Level 3 investments are not material in relation to net assets.
For the year ended September 30, 2016, there were no transfers between Level 1 and Level 2 assets and liabilities.
For the year ended September 30, 2016, there were no transfers between Level 2 and Level 3 assets and liabilities.
For more information on valuation inputs, see Note 2 – Significant Accounting Policies in Notes to Financial Statements.
Amounts designated as “—” are $0 or have been rounded to $0.
The accompanying notes are an integral part of the financial statements.
SEI Institutional Managed Trust / Annual Report / September 30, 2016 |
5 |
SCHEDULE OF INVESTMENTS
September 30, 2016
Tax-Managed Small/Mid Cap Fund
| Description | Shares | Market Value ($ Thousands) | ||||||
COMMON STOCK — 95.1% | ||||||||
Consumer Discretionary — 10.8% | ||||||||
2U *(A) | 40,016 | $ | 1,532 | |||||
Aaron's | 41,041 | 1,043 | ||||||
Abercrombie & Fitch, Cl A (A) | 30,971 | 492 | ||||||
American Axle & Manufacturing Holdings * | 49,577 | 854 | ||||||
American Eagle Outfitters (A) | 91,705 | 1,638 | ||||||
Aramark | 66,097 | 2,514 | ||||||
Autoliv (A) | 7,000 | 748 | ||||||
Beazer Homes USA, Cl A *(A) | 95,749 | 1,116 | ||||||
Big 5 Sporting Goods | 33,898 | 462 | ||||||
Big Lots (A) | 60,114 | 2,870 | ||||||
Bloomin' Brands | 51,081 | 881 | ||||||
Bright Horizons Family Solutions * | 31,693 | 2,120 | ||||||
Brinker International | 15,448 | 779 | ||||||
Buffalo Wild Wings * | 8,233 | 1,159 | ||||||
Burlington Stores * | 21,198 | 1,717 | ||||||
Carter's | 2,200 | 191 | ||||||
Cato, Cl A | 9,700 | 319 | ||||||
Cooper Tire & Rubber | 40,319 | 1,533 | ||||||
Cooper-Standard Holding * | 8,000 | 790 | ||||||
Core-Mark Holding, Cl A | 19,658 | 704 | ||||||
Dave & Buster's Entertainment * | 25,145 | 985 | ||||||
Denny's, Cl A * | 32,085 | 343 | ||||||
Dillard's, Cl A (A) | 7,747 | 488 | ||||||
DineEquity | 3,910 | 310 | ||||||
Domino's Pizza | 2,231 | 339 | ||||||
DR Horton | 6,100 | 184 | ||||||
Fiesta Restaurant Group * | 16,434 | 394 | ||||||
Five Below *(A) | 37,142 | 1,496 | ||||||
Foot Locker, Cl A | 4,907 | 332 | ||||||
Francesca's Holdings * | 20,351 | 314 | ||||||
GameStop, Cl A (A) | 23,776 | 656 | ||||||
Gannett (A) | 63,701 | 742 | ||||||
GNC Holdings, Cl A | 31,751 | 648 | ||||||
Goodyear Tire & Rubber | 20,773 | 671 | ||||||
Hasbro | 8,180 | 649 | ||||||
IMAX * | 13,560 | 393 | ||||||
Installed Building Products * | 17,478 | 627 | ||||||
Interpublic Group | 48,781 | 1,090 | ||||||
J.C. Penney *(A) | 45,399 | 419 | ||||||
Jack in the Box | 3,488 | 335 | ||||||
John Wiley & Sons, Cl A | 7,029 | 363 | ||||||
Lear | 15,285 | 1,853 | ||||||
Libbey | 18,365 | 328 | ||||||
Lithia Motors, Cl A | 43,282 | 4,134 | ||||||
LKQ * | 20,430 | 724 | ||||||
Marriott Vacations Worldwide (A) | 16,786 | 1,231 | ||||||
MDC Partners, Cl A (A) | 66,728 | 715 | ||||||
Michaels * | 18,669 | 451 | ||||||
Murphy USA * | 7,798 | 556 | ||||||
National CineMedia | 87,651 | 1,290 | ||||||
Newell Brands, Cl B | 20,677 | 1,089 | ||||||
| Description | Shares | Market Value ($ Thousands) | ||||||
COMMON STOCK (continued) | ||||||||
Nexstar Broadcasting Group, Cl A (A) | 20,328 | $ | 1,173 | |||||
NVR * | 262 | 430 | ||||||
Office Depot | 85,227 | 304 | ||||||
Ollie's Bargain Outlet Holdings *(A) | 40,289 | 1,056 | ||||||
Panera Bread, Cl A *(A) | 2,763 | 538 | ||||||
Planet Fitness, Cl A * | 74,589 | 1,497 | ||||||
Polaris Industries (A) | 1,000 | 77 | ||||||
Pool | 32,128 | 3,037 | ||||||
PVH | 5,832 | 644 | ||||||
RetailMeNot * | 42,858 | 424 | ||||||
Signet Jewelers (A) | 3,000 | 224 | ||||||
Six Flags Entertainment (A) | 20,170 | 1,081 | ||||||
Skechers U.S.A., Cl A * | 19,536 | 447 | ||||||
Smith & Wesson Holding *(A) | 26,801 | 713 | ||||||
SodaStream International * | 74,058 | 1,967 | ||||||
Starz - Liberty Capital * | 13,322 | 416 | ||||||
Tempur Sealy International *(A) | 10,383 | 589 | ||||||
Tenneco *(A) | 28,072 | 1,636 | ||||||
Texas Roadhouse, Cl A (A) | 39,879 | 1,557 | ||||||
Tile Shop Holdings * | 63,059 | 1,044 | ||||||
Tower International | 14,866 | 358 | ||||||
Ulta Salon Cosmetics & Fragrance * | 3,283 | 781 | ||||||
US Foods Holding * | 32,416 | 765 | ||||||
Vail Resorts | 7,682 | 1,205 | ||||||
Vista Outdoor *(A) | 8,030 | 320 | ||||||
Visteon * | 5,986 | 429 | ||||||
Wendy's (A) | 180,995 | 1,955 | ||||||
Whirlpool (A) | 5,200 | 843 | ||||||
Wolverine World Wide (A) | 43,355 | 999 | ||||||
Zoe's Kitchen *(A) | 7,676 | 170 | ||||||
|
|
| ||||||
| 74,290 | ||||||||
|
|
| ||||||
Consumer Staples — 3.4% | ||||||||
Andersons | 48,086 | 1,740 | ||||||
B&G Foods, Cl A | 26,595 | 1,308 | ||||||
Cal-Maine Foods *(A) | 7,066 | 272 | ||||||
Central Garden & Pet, Cl A * | 40,635 | 1,008 | ||||||
Energizer Holdings | 19,026 | 951 | ||||||
Fresh Del Monte Produce | 10,000 | 599 | ||||||
Freshpet *(A) | 114,620 | 992 | ||||||
Ingredion | 27,141 | 3,611 | ||||||
J&J Snack Foods (A) | 7,030 | 837 | ||||||
John B Sanfilippo & Son (A) | 6,294 | 323 | ||||||
Kroger | 19,039 | 565 | ||||||
Molson Coors Brewing, Cl B | 6,535 | 718 | ||||||
Omega Protein * | 78,738 | 1,840 | ||||||
Pilgrim's Pride *(A) | 8,724 | 184 | ||||||
Pinnacle Foods | 21,455 | 1,076 | ||||||
Post Holdings * | 14,734 | 1,137 | ||||||
Sanderson Farms (A) | 13,270 | 1,278 | ||||||
SpartanNash | 14,576 | 422 | ||||||
Spectrum Brands Holdings | 9,521 | 1,311 | ||||||
SEI Institutional Managed Trust / Annual Report / September 30, 2016 |
1 |
SCHEDULE OF INVESTMENTS
September 30, 2016
Tax-Managed Small/Mid Cap Fund (Continued)
| Description | Shares | Market Value ($ Thousands) | ||||||
COMMON STOCK (continued) | ||||||||
SUPERVALU * | 236,895 | $ | 1,182 | |||||
TreeHouse Foods *(A) | 5,261 | 459 | ||||||
USANA Health Sciences * | 3,091 | 428 | ||||||
WhiteWave Foods, Cl A * | 20,031 | 1,090 | ||||||
|
|
| ||||||
| 23,331 | ||||||||
|
|
| ||||||
Energy — 5.0% | ||||||||
Callon Petroleum * | 45,700 | 718 | ||||||
CARBO Ceramics *(A) | 135,932 | 1,487 | ||||||
Carrizo Oil & Gas *(A) | 44,145 | 1,793 | ||||||
Concho Resources * | 20,638 | 2,835 | ||||||
Contango Oil & Gas * | 29,732 | 304 | ||||||
Denbury Resources *(A) | 147,146 | 475 | ||||||
Diamondback Energy, Cl A *(A) | 6,772 | 654 | ||||||
Dril-Quip *(A) | 2,441 | 136 | ||||||
Ensco, Cl A | 105,365 | 896 | ||||||
Forum Energy Technologies *(A) | 31,746 | 630 | ||||||
Frank's International (A) | 24,311 | 316 | ||||||
HollyFrontier (A) | 12,959 | 318 | ||||||
Matador Resources *(A) | 34,174 | 832 | ||||||
Murphy Oil (A) | 5,089 | 155 | ||||||
Newfield Exploration * | 39,763 | 1,728 | ||||||
Noble (A) | 128,907 | 817 | ||||||
Oasis Petroleum *(A) | 62,111 | 712 | ||||||
Oceaneering International, Cl A | 14,038 | 386 | ||||||
Oil States International * | 55,605 | 1,755 | ||||||
Parsley Energy, Cl A * | 70,099 | 2,349 | ||||||
Patterson-UTI Energy (A) | 70,106 | 1,568 | ||||||
PBF Energy, Cl A (A) | 67,075 | 1,519 | ||||||
PDC Energy, Cl A * | 13,281 | 891 | ||||||
Pioneer Natural Resources | 2,474 | 459 | ||||||
Prothena *(A) | 5,294 | 317 | ||||||
Rowan, Cl A *(A) | 106,998 | 1,622 | ||||||
Seadrill *(A) | 273,647 | 649 | ||||||
Ship Finance International (A) | 20,548 | 303 | ||||||
Southwestern Energy *(A) | 102,511 | 1,419 | ||||||
Superior Energy Services * | 54,184 | 970 | ||||||
Tesoro | 7,278 | 579 | ||||||
US Silica Holdings (A) | 26,082 | 1,214 | ||||||
Western Refining (A) | 49,288 | 1,304 | ||||||
World Fuel Services | 59,253 | 2,741 | ||||||
|
|
| ||||||
| 34,851 | ||||||||
|
|
| ||||||
Financials — 13.6% | ||||||||
Affiliated Managers Group * | 12,845 | 1,859 | ||||||
Allied World Assurance Holdings | 12,900 | 521 | ||||||
Allstate | 8,087 | 559 | ||||||
American Equity Investment Life Holding | 118,034 | 2,093 | ||||||
American Financial Group | 13,800 | 1,035 | ||||||
Ameriprise Financial | 4,701 | 469 | ||||||
Amerisafe | 1,639 | 96 | ||||||
AmTrust Financial Services | 11,628 | 312 | ||||||
| Description | Shares | Market Value ($ Thousands) | ||||||
COMMON STOCK (continued) | ||||||||
Arch Capital Group * | 3,676 | $ | 291 | |||||
Argo Group International Holdings | 5,428 | 306 | ||||||
Artisan Partners Asset Management, Cl A | 20,184 | 549 | ||||||
Aspen Insurance Holdings | 8,500 | 396 | ||||||
Assurant | 10,159 | 937 | ||||||
Assured Guaranty | 12,310 | 342 | ||||||
Axis Capital Holdings | 2,535 | 138 | ||||||
Bank of the Ozarks | 26,740 | 1,027 | ||||||
BankUnited | 42,286 | 1,277 | ||||||
Beneficial Bancorp | 71,421 | 1,051 | ||||||
BGC Partners, Cl A | 398,000 | 3,483 | ||||||
Capitol Federal Financial (A) | 104,787 | 1,474 | ||||||
Central Pacific Financial | 15,480 | 390 | ||||||
Chemical Financial (A) | 17,703 | 781 | ||||||
CNO Financial Group | 75,798 | 1,157 | ||||||
Cohen & Steers | 7,006 | 300 | ||||||
Columbia Banking System (A) | 58,121 | 1,902 | ||||||
E*Trade Financial * | 11,727 | 341 | ||||||
Eagle Bancorp *(A) | 33,168 | 1,636 | ||||||
East West Bancorp | 36,967 | 1,357 | ||||||
Employers Holdings | 17,888 | 534 | ||||||
Endurance Specialty Holdings | 18,808 | 1,231 | ||||||
Erie Indemnity, Cl A (A) | 5,598 | 571 | ||||||
EverBank Financial, Cl A | 45,939 | 889 | ||||||
Evercore Partners, Cl A | 15,008 | 773 | ||||||
Everest Re Group | 6,060 | 1,151 | ||||||
FBL Financial Group, Cl A (A) | 3,708 | 237 | ||||||
Federal Agricultural Mortgage, Cl C | 7,433 | 294 | ||||||
Federated Investors, Cl B (A) | 37,377 | 1,107 | ||||||
Fidelity Southern | 20,478 | 377 | ||||||
First American Financial | 8,776 | 345 | ||||||
First Citizens BancShares, Cl A (A) | 1,150 | 338 | ||||||
First Commonwealth Financial | 156,875 | 1,583 | ||||||
First Interstate BancSystem, Cl A (A) | 19,006 | 599 | ||||||
FirstCash | 24,398 | 1,149 | ||||||
FNB (Pennsylvania) (A) | 102,113 | 1,256 | ||||||
FNF Group | 6,136 | 226 | ||||||
FNFV Group * | 32,120 | 401 | ||||||
Green Dot, Cl A * | 181,408 | 4,183 | ||||||
Greenhill | 25,986 | 612 | ||||||
Hanover Insurance Group, Cl A | 38,140 | 2,877 | ||||||
Hilltop Holdings * | 15,949 | 358 | ||||||
Horace Mann Educators, Cl A (A) | 23,303 | 854 | ||||||
Houlihan Lokey, Cl A | 42,219 | 1,058 | ||||||
Huntington Bancshares | 127,744 | 1,260 | ||||||
Infinity Property & Casualty | 6,577 | 543 | ||||||
International Bancshares | 20,180 | 601 | ||||||
International. FCStone * | 11,359 | 441 | ||||||
Investors Bancorp | 57,756 | 694 | ||||||
LendingTree *(A) | 3,685 | 357 | ||||||
LPL Financial Holdings (A) | 51,260 | 1,533 | ||||||
MarketAxess Holdings | 3,601 | 596 | ||||||
2 |
SEI Institutional Managed Trust / Annual Report / September 30, 2016 |
SCHEDULE OF INVESTMENTS
September 30, 2016
Tax-Managed Small/Mid Cap Fund (Continued)
| Description | Shares | Market Value ($ Thousands) | ||||||
COMMON STOCK (continued) | ||||||||
MB Financial | 63,446 | $ | 2,413 | |||||
MGIC Investment * | 183,662 | 1,469 | ||||||
Nasdaq, Cl A | 5,050 | 341 | ||||||
OFG Bancorp | 426,661 | 4,314 | ||||||
PacWest Bancorp (A) | 98,114 | 4,210 | ||||||
PennyMac Mortgage Investment Trust ‡ | 25,807 | 402 | ||||||
Piper Jaffray *(A) | 8,894 | 430 | ||||||
Popular | 47,861 | 1,829 | ||||||
PrivateBancorp, Cl A | 20,103 | 923 | ||||||
ProAssurance (A) | 4,901 | 257 | ||||||
Reinsurance Group of America, Cl A | 13,096 | 1,414 | ||||||
RenaissanceRe Holdings (A) | 1,520 | 183 | ||||||
Santander Consumer USA Holdings * | 48,153 | 586 | ||||||
Selective Insurance Group | 45,314 | 1,806 | ||||||
ServisFirst Bancshares (A) | 7,609 | 395 | ||||||
Signature Bank, Cl B * | 11,813 | 1,399 | ||||||
SLM * | 260,629 | 1,947 | ||||||
Starwood Property Trust ‡ | 138,635 | 3,122 | ||||||
Stifel Financial * | 12,532 | 482 | ||||||
SunTrust Banks | 17,965 | 787 | ||||||
SVB Financial Group, Cl B *(A) | 10,502 | 1,161 | ||||||
Synovus Financial | 17,477 | 569 | ||||||
TCF Financial | 55,027 | 798 | ||||||
Unum Group | 29,327 | 1,036 | ||||||
Validus Holdings | 15,363 | 765 | ||||||
Voya Financial | 40,024 | 1,154 | ||||||
Webster Financial (A) | 7,700 | 293 | ||||||
Western Alliance Bancorp * | 71,507 | 2,684 | ||||||
WSFS Financial | 28,005 | 1,022 | ||||||
Zions Bancorporation | 19,800 | 614 | ||||||
|
|
| ||||||
| 93,912 | ||||||||
|
|
| ||||||
Health Care — 12.0% | ||||||||
ABIOMED * | 8,661 | 1,114 | ||||||
Acadia Healthcare, Cl A *(A) | 34,736 | 1,721 | ||||||
Adamas Pharmaceuticals *(A) | 24,345 | 400 | ||||||
Aerie Pharmaceuticals * | 21,500 | 811 | ||||||
Aimmune Therapeutics *(A) | 26,200 | 393 | ||||||
Akorn *(A) | 92,909 | 2,533 | ||||||
Alder Biopharmaceuticals *(A) | 16,379 | 537 | ||||||
Alere * | 3,176 | 137 | ||||||
Align Technology * | 26,782 | 2,511 | ||||||
Alkermes *(A) | 13,865 | 652 | ||||||
AmerisourceBergen | 6,362 | 514 | ||||||
Amicus Therapeutics *(A) | 48,568 | 359 | ||||||
AMN Healthcare Services * | 20,799 | 663 | ||||||
Amsurg *(A) | 34,469 | 2,311 | ||||||
Analogic (A) | 19,010 | 1,684 | ||||||
C.R. Bard | 1,624 | 364 | ||||||
Centene *(A) | 8,307 | 556 | ||||||
Cepheid * | 22,791 | 1,201 | ||||||
Charles River Laboratories International * | 14,525 | 1,211 | ||||||
| Description | Shares | Market Value ($ Thousands) | ||||||
COMMON STOCK (continued) | ||||||||
Chemed | 7,200 | $ | 1,016 | |||||
Community Health Systems *(A) | 210,131 | 2,425 | ||||||
Cooper, Cl A | 1,915 | 343 | ||||||
Cynosure, Cl A * | 22,740 | 1,158 | ||||||
DBV Technologies ADR * | 4,828 | 175 | ||||||
DENTSPLY SIRONA | 25,057 | 1,489 | ||||||
DexCom *(A) | 26,872 | 2,356 | ||||||
Diplomat Pharmacy *(A) | 11,095 | 311 | ||||||
Emergent BioSolutions * | 22,875 | 721 | ||||||
Ensign Group (A) | 16,233 | 327 | ||||||
Exelixis * | 63,713 | 815 | ||||||
Five Prime Therapeutics *(A) | 11,200 | 588 | ||||||
Glaukos * | 18,293 | 690 | ||||||
GW Pharmaceuticals ADR *(A) | 3,127 | 415 | ||||||
HealthSouth | 50,304 | 2,041 | ||||||
Horizon Pharma *(A) | 29,601 | 537 | ||||||
Humana | 5,500 | 973 | ||||||
ICON *(A) | 20,157 | 1,560 | ||||||
ICU Medical * | 5,669 | 716 | ||||||
Idexx Laboratories * | 6,675 | 752 | ||||||
INC Research Holdings, Cl A * | 8,498 | 379 | ||||||
Incyte * | 3,300 | 311 | ||||||
Insulet * | 10,776 | 441 | ||||||
Integra LifeSciences Holdings * | 50,072 | 4,133 | ||||||
Kindred Healthcare | 113,393 | 1,159 | ||||||
Lannett *(A) | 130,610 | 3,470 | ||||||
LHC Group * | 8,754 | 323 | ||||||
LifePoint Health *(A) | 10,538 | 624 | ||||||
Ligand Pharmaceuticals *(A) | 55,043 | 5,618 | ||||||
Luminex * | 15,633 | 355 | ||||||
Magellan Health * | 8,334 | 448 | ||||||
Masimo * | 15,397 | 916 | ||||||
Medicines *(A) | 16,794 | 634 | ||||||
Medidata Solutions * | 5,534 | 309 | ||||||
MEDNAX *(A) | 14,152 | 938 | ||||||
Mettler Toledo International *(A) | 2,460 | 1,033 | ||||||
MiMedx Group *(A) | 48,064 | 412 | ||||||
Molina Healthcare *(A) | 23,101 | 1,347 | ||||||
Neurocrine Biosciences * | 10,042 | 509 | ||||||
Nevro *(A) | 19,869 | 2,074 | ||||||
NuVasive * | 10,376 | 692 | ||||||
Orthofix International * | 8,084 | 346 | ||||||
Otonomy *(A) | 21,739 | 395 | ||||||
Parexel International * | 15,050 | 1,045 | ||||||
PDL BioPharma * | 245,771 | 823 | ||||||
Penumbra * | 15,074 | 1,145 | ||||||
PerkinElmer | 14,013 | 786 | ||||||
PRA Health Sciences * | 5,799 | 328 | ||||||
Premier, Cl A * | 20,465 | 662 | ||||||
Quintiles Transnational * | 31,043 | 2,516 | ||||||
Radius Health * | 7,937 | 429 | ||||||
Sage Therapeutics *(A) | 15,894 | 732 | ||||||
SEI Institutional Managed Trust / Annual Report / September 30, 2016 |
3 |
SCHEDULE OF INVESTMENTS
September 30, 2016
Tax-Managed Small/Mid Cap Fund (Continued)
| Description | Shares | Market Value ($ Thousands) | ||||||
COMMON STOCK (continued) | ||||||||
STERIS | 4,494 | $ | 329 | |||||
Teleflex | 3,980 | 669 | ||||||
TESARO *(A) | 12,579 | 1,261 | ||||||
Triple-S Management, Cl B * | 13,520 | 297 | ||||||
Ultragenyx Pharmaceutical *(A) | 10,062 | 714 | ||||||
United Therapeutics *(A) | 14,367 | 1,696 | ||||||
VCA * | 7,484 | 524 | ||||||
WellCare Health Plans * | 7,864 | 921 | ||||||
West Pharmaceutical Services | 4,288 | 319 | ||||||
Wright Medical Group * | 12,485 | 306 | ||||||
Zeltiq Aesthetics *(A) | 34,524 | 1,354 | ||||||
|
|
| ||||||
| 82,802 | ||||||||
|
|
| ||||||
Industrials — 16.9% | ||||||||
AAR | 13,157 | 412 | ||||||
Acacia Research * | 425,615 | 2,775 | ||||||
ACCO Brands * | 285,499 | 2,752 | ||||||
Actuant, Cl A (A) | 42,636 | 991 | ||||||
Acuity Brands | 7,636 | 2,020 | ||||||
Aegion, Cl A * | 16,638 | 317 | ||||||
Alaska Air Group | 16,037 | 1,056 | ||||||
Allegiant Travel, Cl A | 2,338 | 309 | ||||||
American Woodmark * | 3,752 | 302 | ||||||
AO Smith | 14,044 | 1,387 | ||||||
Apogee Enterprises (A) | 8,228 | 368 | ||||||
ArcBest | 36,582 | 696 | ||||||
Atlas Air Worldwide Holdings *(A) | 98,024 | 4,197 | ||||||
Babcock & Wilcox Enterprises * | 88,878 | 1,466 | ||||||
Beacon Roofing Supply * | 19,239 | 809 | ||||||
BWX Technologies, Cl W | 142,775 | 5,478 | ||||||
Carlisle | 34,980 | 3,588 | ||||||
CEB | 13,321 | 726 | ||||||
Cintas | 12,501 | 1,408 | ||||||
CIRCOR International (A) | 12,386 | 738 | ||||||
Comfort Systems USA | 6,327 | 185 | ||||||
Copa Holdings, Cl A (A) | 5,789 | 509 | ||||||
Copart * | 6,297 | 337 | ||||||
Crane, Cl A | 51,163 | 3,224 | ||||||
Curtiss-Wright | 15,306 | 1,395 | ||||||
Deluxe (A) | 12,883 | 861 | ||||||
Dun & Bradstreet | 8,152 | 1,114 | ||||||
DXP Enterprises *(A) | 44,495 | 1,254 | ||||||
Dycom Industries *(A) | 28,929 | 2,366 | ||||||
EMCOR Group | 24,206 | 1,443 | ||||||
Engility Holdings * | 23,184 | 730 | ||||||
Equifax | 2,212 | 298 | ||||||
Federal Signal | 26,947 | 357 | ||||||
FreightCar America, Cl A | 20,718 | 298 | ||||||
G&K Services | 16,788 | 1,603 | ||||||
Genesee & Wyoming, Cl A *(A) | 58,031 | 4,001 | ||||||
Global Brass & Copper Holdings | 11,651 | 337 | ||||||
Greenbrier (A) | 22,252 | 785 | ||||||
| Description | Shares | Market Value ($ Thousands) | ||||||
COMMON STOCK (continued) | ||||||||
H&E Equipment Services | 46,602 | $ | 781 | |||||
Hawaiian Holdings * | 26,352 | 1,281 | ||||||
HD Supply Holdings * | 39,572 | 1,266 | ||||||
Herc Holdings * | 9,993 | 337 | ||||||
Hertz Global Holdings * | 23,339 | 937 | ||||||
Hexcel, Cl A (A) | 24,458 | 1,083 | ||||||
HNI | 13,162 | 524 | ||||||
Huntington Ingalls Industries, Cl A | 7,861 | 1,206 | ||||||
Hyster-Yale Materials Handling | 6,202 | 373 | ||||||
IDEX (A) | 18,517 | 1,733 | ||||||
ITT | 31,123 | 1,115 | ||||||
Jacobs Engineering Group * | 6,039 | 312 | ||||||
JetBlue Airways * | 77,930 | 1,344 | ||||||
John Bean Technologies, Cl A (A) | 7,131 | 503 | ||||||
Kadant | 25,142 | 1,310 | ||||||
Kaman, Cl A (A) | 35,491 | 1,559 | ||||||
KAR Auction Services | 85,739 | 3,700 | ||||||
Kirby *(A) | 17,144 | 1,066 | ||||||
L-3 Communications Holdings | 7,300 | 1,100 | ||||||
LB Foster, Cl A | 75,966 | 912 | ||||||
Lennox International (A) | 7,466 | 1,172 | ||||||
Lincoln Electric Holdings (A) | 18,611 | 1,165 | ||||||
ManpowerGroup | 25,113 | 1,815 | ||||||
Masco | 22,855 | 784 | ||||||
MasTec * | 29,249 | 870 | ||||||
Matson (A) | 17,260 | 688 | ||||||
Meritor * | 119,937 | 1,335 | ||||||
Middleby * | 11,790 | 1,457 | ||||||
MRC Global * | 20,993 | 345 | ||||||
MSA Safety | 5,363 | 311 | ||||||
MYR Group * | 12,505 | 376 | ||||||
Old Dominion Freight Line, Cl A *(A) | 25,477 | 1,748 | ||||||
Orbital ATK | 6,990 | 533 | ||||||
Oshkosh Truck | 35,569 | 1,992 | ||||||
Owens Corning | 13,810 | 737 | ||||||
Paylocity Holding *(A) | 21,432 | 953 | ||||||
Quad Graphics | 18,303 | 489 | ||||||
RBC Bearings *(A) | 14,377 | 1,100 | ||||||
Resources Connection | 20,994 | 314 | ||||||
Roadrunner Transportation Systems * | 60,561 | 483 | ||||||
Robert Half International | 35,045 | 1,327 | ||||||
RPX * | 31,949 | 342 | ||||||
Ryder System | 8,900 | 587 | ||||||
Saia *(A) | 9,826 | 294 | ||||||
SiteOne Landscape Supply * | 16,776 | 603 | ||||||
Skywest | 25,407 | 671 | ||||||
Spirit AeroSystems Holdings, Cl A * | 28,103 | 1,252 | ||||||
Spirit Airlines * | 7,026 | 299 | ||||||
SPX FLOW * | 12,449 | 385 | ||||||
TASER International *(A) | 10,881 | 311 | ||||||
Teledyne Technologies * | 20,481 | 2,211 | ||||||
Tetra Tech (A) | 16,037 | 569 | ||||||
4 |
SEI Institutional Managed Trust / Annual Report / September 30, 2016 |
SCHEDULE OF INVESTMENTS
September 30, 2016
Tax-Managed Small/Mid Cap Fund (Continued)
| Description | Shares | Market Value ($ Thousands) | ||||||
COMMON STOCK (continued) | ||||||||
Titan Machinery *(A) | 118,090 | $ | 1,228 | |||||
Toro | 10,348 | 485 | ||||||
TransDigm Group * | 3,700 | 1,070 | ||||||
Trinity Industries (A) | 60,530 | 1,464 | ||||||
Triumph Group (A) | 1,013 | 28 | ||||||
TrueBlue * | 18,524 | 420 | ||||||
Unifirst (A) | 644 | 85 | ||||||
United Rentals * | 9,199 | 722 | ||||||
Universal Forest Products | 8,704 | 857 | ||||||
Wabash National *(A) | 41,485 | 591 | ||||||
Wabtec (A) | 3,600 | 294 | ||||||
WageWorks *(A) | 8,366 | 510 | ||||||
Waste Connections | 4,781 | 357 | ||||||
Watsco (A) | 6,700 | 944 | ||||||
Wesco Aircraft Holdings *(A) | 209,569 | 2,815 | ||||||
XPO Logistics *(A) | 30,205 | 1,108 | ||||||
Xylem | 18,430 | 967 | ||||||
|
|
| ||||||
| 116,797 | ||||||||
|
|
| ||||||
Information Technology — 17.3% | ||||||||
ACI Worldwide *(A) | 61,709 | 1,196 | ||||||
Acxiom *(A) | 29,729 | 792 | ||||||
Advanced Energy Industries * | 1,400 | 66 | ||||||
Alliance Data Systems *(A) | 1,158 | 248 | ||||||
Amkor Technology * | 37,824 | 368 | ||||||
Ansys * | 3,217 | 298 | ||||||
Arista Networks *(A) | 4,501 | 383 | ||||||
Arrow Electronics, Cl A * | 4,925 | 315 | ||||||
Aspen Technology * | 41,409 | 1,938 | ||||||
Atlassian, Cl A * | 23,427 | 702 | ||||||
AVG Technologies * | 17,281 | 432 | ||||||
Avnet | 8,652 | 355 | ||||||
Bankrate * | 39,418 | 334 | ||||||
Belden | 9,618 | 664 | ||||||
Benchmark Electronics *(A) | 25,072 | 626 | ||||||
Black Box | 54,931 | 764 | ||||||
Blackbaud, Cl A (A) | 13,951 | 926 | ||||||
Blackhawk Network Holdings, Cl A * | 22,561 | 681 | ||||||
Bottomline Technologies * | 42,540 | 992 | ||||||
Broadcom | 9,282 | 1,601 | ||||||
Broadridge Financial Solutions | 28,670 | 1,944 | ||||||
BroadSoft * | 8,619 | 401 | ||||||
Brocade Communications Systems | 100,100 | 924 | ||||||
CACI International, Cl A * | 10,545 | 1,064 | ||||||
Cadence Design Systems *(A) | 73,065 | 1,865 | ||||||
CDW | 10,820 | 495 | ||||||
Cimpress *(A) | 10,766 | 1,089 | ||||||
Cirrus Logic * | 44,230 | 2,351 | ||||||
Coherent * | 5,166 | 571 | ||||||
CommScope Holding * | 10,267 | 309 | ||||||
CommVault Systems * | 39,535 | 2,100 | ||||||
Convergys | 84,081 | 2,558 | ||||||
| Description | Shares | Market Value ($ Thousands) | ||||||
COMMON STOCK (continued) | ||||||||
CoStar Group * | 11,236 | $ | 2,433 | |||||
CSG Systems International | 16,700 | 690 | ||||||
Cypress Semiconductor (A) | 123,886 | 1,506 | ||||||
Dolby Laboratories, Cl A | 17,896 | 972 | ||||||
Electronic Arts * | 13,002 | 1,110 | ||||||
Electronics For Imaging *(A) | 9,392 | 459 | ||||||
Ellie Mae * | 4,713 | 496 | ||||||
Entegris * | 26,270 | 458 | ||||||
EPAM Systems *(A) | 7,056 | 489 | ||||||
Euronet Worldwide * | 20,534 | 1,680 | ||||||
ExlService Holdings * | 24,455 | 1,219 | ||||||
Fair Isaac | 6,500 | 810 | ||||||
Fidelity National Information Services, Cl B | 12,644 | 974 | ||||||
First Solar *(A) | 8,716 | 344 | ||||||
Fleetmatics Group * | 9,640 | 578 | ||||||
Fortinet * | 20,199 | 746 | ||||||
Gartner * | 2,600 | 230 | ||||||
Gigamon * | 19,328 | 1,059 | ||||||
Global Payments | 23,656 | 1,816 | ||||||
Guidewire Software, Cl Z * | 28,765 | 1,725 | ||||||
Harris | 11,871 | 1,088 | ||||||
HubSpot *(A) | 20,052 | 1,155 | ||||||
IAC * | 49,937 | 3,120 | ||||||
Ingram Micro, Cl A * | 8,623 | 308 | ||||||
Inphi * | 24,989 | 1,087 | ||||||
Insight Enterprises * | 21,641 | 704 | ||||||
InterDigital | 32,257 | 2,555 | ||||||
Intersil, Cl A | 28,169 | 618 | ||||||
InterXion Holding * | 26,628 | 964 | ||||||
Ixia * | 24,958 | 312 | ||||||
j2 Global | 28,988 | 1,931 | ||||||
Jabil Circuit | 70,363 | 1,535 | ||||||
Keysight Technologies * | 71,100 | 2,253 | ||||||
Leidos Holdings | 7,816 | 338 | ||||||
Littelfuse | 16,324 | 2,103 | ||||||
Lumentum Holdings * | 17,046 | 712 | ||||||
Manhattan Associates * | 10,280 | 592 | ||||||
Marvell Technology Group | 35,377 | 469 | ||||||
MaxLinear, Cl A *(A) | 30,144 | 611 | ||||||
Mellanox Technologies * | 14,590 | 631 | ||||||
Mentor Graphics | 16,556 | 438 | ||||||
Methode Electronics | 11,078 | 387 | ||||||
Microchip Technology (A) | 16,167 | 1,005 | ||||||
Microsemi *(A) | 44,787 | 1,880 | ||||||
MKS Instruments (A) | 14,407 | 716 | ||||||
Monolithic Power Systems | 22,891 | 1,843 | ||||||
NCR * | 10,826 | 348 | ||||||
NETGEAR * | 16,427 | 994 | ||||||
NeuStar, Cl A *(A) | 25,797 | 686 | ||||||
Oclaro * | 120,042 | 1,026 | ||||||
ON Semiconductor * | 42,625 | 525 | ||||||
Open Text | 52,506 | 3,406 | ||||||
SEI Institutional Managed Trust / Annual Report / September 30, 2016 |
5 |
SCHEDULE OF INVESTMENTS
September 30, 2016
Tax-Managed Small/Mid Cap Fund (Continued)
| Description | Shares | Market Value ($ Thousands) | ||||||
COMMON STOCK (continued) | ||||||||
Orbotech * | 53,910 | $ | 1,596 | |||||
OSI Systems * | 37,509 | 2,452 | ||||||
Palo Alto Networks *(A) | 5,733 | 913 | ||||||
Pandora Media *(A) | 54,424 | 780 | ||||||
Paycom Software * | 9,028 | 453 | ||||||
Photronics * | 30,706 | 317 | ||||||
Proofpoint *(A) | 20,816 | 1,558 | ||||||
Q2 Holdings *(A) | 29,886 | 857 | ||||||
Qorvo *(A) | 10,870 | 606 | ||||||
Rackspace Hosting * | 17,788 | 564 | ||||||
RingCentral, Cl A * | 52,403 | 1,240 | ||||||
Rubicon Project * | 30,043 | 249 | ||||||
Sabre (A) | 20,405 | 575 | ||||||
Sanmina * | 39,282 | 1,118 | ||||||
Science Applications International | 11,933 | 828 | ||||||
Shopify, Cl A * | 16,098 | 691 | ||||||
Silicon Graphics International * | 152,937 | 1,178 | ||||||
Silicon Laboratories * | 19,462 | 1,144 | ||||||
Silicon Motion Technology ADR | 21,597 | 1,119 | ||||||
Skyworks Solutions (A) | 4,477 | 341 | ||||||
SS&C Technologies Holdings | 17,556 | 564 | ||||||
Super Micro Computer * | 14,225 | 332 | ||||||
Sykes Enterprises * | 20,228 | 569 | ||||||
Synaptics *(A) | 3,844 | 225 | ||||||
SYNNEX | 9,640 | 1,100 | ||||||
Synopsys * | 20,308 | 1,205 | ||||||
Take-Two Interactive Software, Cl A * | 35,738 | 1,611 | ||||||
Tech Data * | 11,750 | 995 | ||||||
Teradyne | 40,298 | 870 | ||||||
Tessera Technologies | 15,131 | 582 | ||||||
Trimble Navigation * | 28,030 | 801 | ||||||
Tyler Technologies *(A) | 4,765 | 816 | ||||||
Ultimate Software Group *(A) | 10,632 | 2,173 | ||||||
Western Digital | 6,200 | 363 | ||||||
Yelp, Cl A * | 8,179 | 341 | ||||||
Zebra Technologies, Cl A *(A) | 38,075 | 2,650 | ||||||
|
|
| ||||||
| 119,262 | ||||||||
|
|
| ||||||
Materials — 6.2% | ||||||||
Albemarle | 25,763 | 2,202 | ||||||
Ashland Global Holdings | 18,288 | 2,121 | ||||||
Avery Dennison | 30,430 | 2,367 | ||||||
Ball | 9,183 | 753 | ||||||
Bemis (A) | 2,836 | 145 | ||||||
Berry Plastics Group * | 41,193 | 1,806 | ||||||
Boise Cascade * | 20,506 | 521 | ||||||
Cabot | 44,463 | 2,330 | ||||||
Chemtura * | 13,358 | 438 | ||||||
Cliffs Natural Resources *(A) | 48,623 | 284 | ||||||
Commercial Metals, Cl A | 26,650 | 431 | ||||||
Compass Minerals International, Cl A (A) | 13,714 | 1,011 | ||||||
Crown Holdings * | 31,797 | 1,815 | ||||||
| Description | Shares | Market Value ($ Thousands) | ||||||
COMMON STOCK (continued) | ||||||||
Eagle Materials | 4,019 | $ | 311 | |||||
FMC | 62,794 | 3,035 | ||||||
Gold Resource | 24,572 | 182 | ||||||
Graphic Packaging Holding | 53,005 | 742 | ||||||
Headwaters, Cl A * | 66,598 | 1,127 | ||||||
Huntsman | 23,455 | 382 | ||||||
Kaiser Aluminum | 3,573 | 309 | ||||||
LSB Industries *(A) | 189,964 | 1,630 | ||||||
Martin Marietta Materials, Cl A | 420 | 75 | ||||||
Materion | 12,245 | 376 | ||||||
Neenah Paper, Cl A | 14,000 | 1,106 | ||||||
Olympic Steel | 15,772 | 349 | ||||||
Owens-Illinois * | 42,341 | 779 | ||||||
Packaging Corp of America (A) | 10,242 | 832 | ||||||
PolyOne | 61,364 | 2,075 | ||||||
Rayonier Advanced Materials | 43,416 | 580 | ||||||
Reliance Steel & Aluminum | 24,004 | 1,729 | ||||||
Schulman A | 33,230 | 968 | ||||||
Sensient Technologies | 16,062 | 1,218 | ||||||
Silgan Holdings (A) | 50,049 | 2,532 | ||||||
Steel Dynamics | 52,104 | 1,302 | ||||||
Stepan | 6,908 | 502 | ||||||
Summit Materials, Cl A * | 50,034 | 928 | ||||||
SunCoke Energy * | 48,154 | 386 | ||||||
United States Steel (A) | 80,675 | 1,522 | ||||||
Worthington Industries | 20,346 | 977 | ||||||
WR Grace | 7,676 | 566 | ||||||
|
|
| ||||||
| 42,744 | ||||||||
|
|
| ||||||
Real Estate — 7.2% | ||||||||
Acadia Realty Trust ‡ | 50,493 | 1,830 | ||||||
Alexandria Real Estate Equities ‡ | 10,497 | 1,142 | ||||||
American Assets Trust ‡(A) | 28,220 | 1,224 | ||||||
American Campus Communities ‡(A) | 37,670 | 1,916 | ||||||
American Homes 4 Rent, Cl A ‡ | 62,696 | 1,357 | ||||||
Armada Hoffler Properties ‡ | 28,819 | 386 | ||||||
Brixmor Property Group ‡ | 13,478 | 375 | ||||||
CBL & Associates Properties ‡ | 126,782 | 1,539 | ||||||
Cedar Realty Trust ‡ | 44,843 | 323 | ||||||
Chesapeake Lodging Trust ‡(A) | 17,222 | 394 | ||||||
Colony Starwood Homes ‡(A) | 51,237 | 1,471 | ||||||
Columbia Property Trust ‡ | 13,787 | 309 | ||||||
CoreSite Realty ‡(A) | 5,244 | 388 | ||||||
CyrusOne ‡(A) | 25,221 | 1,200 | ||||||
Digital Realty Trust, Cl A ‡(A) | 4,193 | 407 | ||||||
Douglas Emmett ‡(A) | 4,298 | 157 | ||||||
DuPont Fabros Technology ‡ | 28,525 | 1,177 | ||||||
Education Realty Trust ‡ | 46,530 | 2,007 | ||||||
EPR Properties, Cl A ‡ | 33,739 | 2,657 | ||||||
Equity One, Cl A ‡ | 16,882 | 517 | ||||||
First Potomac Realty Trust ‡ | 32,931 | 301 | ||||||
Forest City Realty Trust, Cl A ‡ | 104,433 | 2,416 | ||||||
6 |
SEI Institutional Managed Trust / Annual Report / September 30, 2016 |
SCHEDULE OF INVESTMENTS
September 30, 2016
Tax-Managed Small/Mid Cap Fund (Continued)
| Description | Shares | Market Value ($ Thousands) | ||||||
COMMON STOCK (continued) |
| |||||||
Franklin Street Properties ‡ | 28,037 | $ | 353 | |||||
Gaming and Leisure Properties ‡ | 66,751 | 2,233 | ||||||
GEO Group ‡(A) | 20,515 | 488 | ||||||
Healthcare Trust of America, Cl A ‡(A) | 33,399 | 1,090 | ||||||
Hersha Hospitality Trust, Cl A ‡(A) | 79,289 | 1,429 | ||||||
Highwoods Properties ‡ | 65,492 | 3,413 | ||||||
Hospitality Properties Trust ‡(A) | 46,609 | 1,385 | ||||||
Howard Hughes *(A) | 34,536 | 3,954 | ||||||
InfraREIT ‡ | 17,700 | 321 | ||||||
Jones Lang LaSalle | 10,068 | 1,146 | ||||||
Lamar Advertising, Cl A ‡(A) | 11,919 | 778 | ||||||
Life Storage | 1,800 | 160 | ||||||
Medical Properties Trust ‡(A) | 190,106 | 2,808 | ||||||
Mid-America Apartment Communities ‡ | 8,042 | 756 | ||||||
Omega Healthcare Investors ‡(A) | 19,600 | 695 | ||||||
Parkway Properties ‡ | 43,809 | 745 | ||||||
Pebblebrook Hotel Trust ‡(A) | 25,055 | 666 | ||||||
PS Business Parks ‡ | 8,411 | 955 | ||||||
QTS Realty Trust, Cl A ‡(A) | 13,887 | 734 | ||||||
Ryman Hospitality Properties | 14,227 | 685 | ||||||
Summit Hotel Properties ‡ | 40,648 | 535 | ||||||
Sun Communities ‡ | 1,825 | 143 | ||||||
Sunstone Hotel Investors ‡(A) | 22,405 | 287 | ||||||
Washington Prime Group | 51,848 | 642 | ||||||
|
|
| ||||||
| 49,894 | ||||||||
|
|
| ||||||
Telecommunication Services — 0.4% |
| |||||||
Cincinnati Bell, Cl A * | 97,720 | 399 | ||||||
Cogent Communications Holdings (A) | 21,690 | 798 | ||||||
Level 3 Communications * | 5,076 | 235 | ||||||
SBA Communications, Cl A * | 2,217 | 249 | ||||||
Telephone & Data Systems | 21,150 | 575 | ||||||
Vonage Holdings * | 86,245 | 570 | ||||||
|
|
| ||||||
| 2,826 | ||||||||
|
|
| ||||||
Utilities — 2.3% | ||||||||
Atmos Energy | 20,484 | 1,525 | ||||||
Avista | 21,700 | 907 | ||||||
Black Hills, Cl A (A) | 9,464 | 579 | ||||||
Calpine * | 22,624 | 286 | ||||||
CMS Energy | 17,866 | 751 | ||||||
Edison International | 6,342 | 458 | ||||||
Great Plains Energy | 42,356 | 1,156 | ||||||
Idacorp, Cl A | 10,909 | 854 | ||||||
National Fuel Gas | 19,648 | 1,062 | ||||||
New Jersey Resources (A) | 1,500 | 49 | ||||||
ONE Gas | 9,553 | 591 | ||||||
PNM Resources | 26,970 | 883 | ||||||
Portland General Electric | 43,378 | 1,848 | ||||||
SCANA | 22,344 | 1,617 | ||||||
Southwest Gas | 15,642 | 1,093 | ||||||
Spire | 7,863 | 501 | ||||||
| Description | Shares | Market Value ($ Thousands) | ||||||
COMMON STOCK (continued) |
| |||||||
UGI | 35,168 | $ | 1,591 | |||||
Vectren | 7,055 | 354 | ||||||
|
|
| ||||||
| 16,105 | ||||||||
|
|
| ||||||
Total Common Stock |
| 656,814 | ||||||
|
|
| ||||||
| Number of Rights | ||||||||
RIGHTS — 0.0% | ||||||||
United States — 0.0% | ||||||||
Central European Media Enterprises ‡‡ | 53 | – | ||||||
Chelseea Therapeutics International CVR ‡‡ | 3,004 | – | ||||||
Dyax, Expires 12/31/2019 | 6,884 | – | ||||||
Endo Pharmaceuticals ‡‡ | 1,900 | – | ||||||
Safeway CVR - Casa Ley ‡‡ | 11,400 | 12 | ||||||
Safeway CVR - PDC ‡‡ | 11,400 | – | ||||||
|
|
| ||||||
Total Rights | 12 | |||||||
|
|
| ||||||
| Shares | ||||||||
AFFILIATED PARTNERSHIP — 26.2% |
| |||||||
SEI Liquidity Fund, L.P. | ||||||||
0.440% **†(B) | 180,708,367 | 180,708 | ||||||
|
|
| ||||||
Total Affiliated Partnership |
| 180,708 | ||||||
|
|
| ||||||
| Face Amount (Thousands) | ||||||||
U.S. TREASURY OBLIGATION — 0.0% |
| |||||||
U.S. Treasury Bills | ||||||||
0.241%, 10/20/2016 (C) | $ | 320 | 320 | |||||
|
|
| ||||||
Total U.S. Treasury Obligation |
| 320 | ||||||
|
|
| ||||||
| Shares | ||||||||
CASH EQUIVALENT — 4.9% |
| |||||||
SEI Daily Income Trust, Government Fund, Cl A | ||||||||
0.220%**† | 33,688,560 | 33,689 | ||||||
|
|
| ||||||
Total Cash Equivalent
(Cost $33,689) ($ Thousands) |
| 33,689 | ||||||
|
|
| ||||||
Total Investments — 126.2% |
| $ | 871,543 | |||||
|
|
| ||||||
SEI Institutional Managed Trust / Annual Report / September 30, 2016 |
7 |
SCHEDULE OF INVESTMENTS
September 30, 2016
Tax-Managed Small/Mid Cap Fund (Concluded)
A list of the open futures contracts held by the Fund at September 30, 2016, is as follows:
| Type of Contract | Number of Contracts Long | Expiration Date | Unrealized Appreciation | |||||||||
Russell 2000 Index E-MINI | 24 | Dec-2016 | $5 | |||||||||
S&P Mid Cap 400 Index E-MINI | 20 | Dec-2016 | (3) | |||||||||
|
| |||||||||||
| $2 | ||||||||||||
|
| |||||||||||
For the year ended September 30, 2016, the total amount of all open futures contracts, as presented in the table above, are representative of the volume of activity for the derivative type during the year.
| Percentages are based on Net Assets of $690,473 ($ Thousands). |
| * | Non-income producing security. |
| ** | Rate shown is the 7-day effective yield as of September 30, 2016. |
| ‡ | Real Estate Investment Trust. |
| ‡‡ | Expiration date unavailable. |
| † | Investment in Affiliated Security (see Note 6). |
| (A) | This security or a partial position of this security is on loan at September 30, 2016 (see Note 10). The total market value of securities on loan at September 30, 2016 was $178,774 ($ Thousands). |
| (B) | This security was purchased with cash collateral held from securities on loan (see Note 10). The total market value of such securities as of September 30, 2016 was $180,708 ($ Thousands). |
| (C) | Security, or portion thereof, has been pledged as collateral on open futures contracts. |
ADR — American Depositary Receipt
Cl — Class
L.P.— Limited Partnership
S&P— Standard & Poor's
The following is a list of the level of inputs used as of September 30, 2016, in valuing the Fund’s investments and other financial instruments carried at value ($ Thousands):
| Investments in Securities | Level 1 | Level 2 | Level 3 | Total | ||||||||||||
Common Stock | $ | 656,814 | $ | – | $ | – | $ | 656,814 | ||||||||
Rights | – | 12 | – | 12 | ||||||||||||
Affiliated Partnership | – | 180,708 | – | 180,708 | ||||||||||||
U.S. Treasury Obligation | – | 320 | – | 320 | ||||||||||||
Cash Equivalent | 33,689 | – | – | 33,689 | ||||||||||||
|
|
|
|
|
|
|
| |||||||||
Total Investments in Securities | $ | 690,503 | $ | 181,040 | $ | – | $ | 871,543 | ||||||||
|
|
|
|
|
|
|
| |||||||||
| Other Financial Instruments | Level 1 | Level 2 | Level 3 | Total | ||||||||||||
Forwards Contracts * | ||||||||||||||||
Unrealized Appreciation | $ | 5 | $ | — | $ | — | $ | 5 | ||||||||
Unrealized Depreciation | (3 | ) | — | — | (3 | ) | ||||||||||
|
|
|
|
|
|
|
| |||||||||
Total Other Financial Instruments | $ | 2 | $ | — | $ | — | $ | 2 | ||||||||
|
|
|
|
|
|
|
| |||||||||
* Futures contracts are valued at the unrealized appreciation (depreciation) on the instrument.
For the year ended September 30, 2016, there were no transfers between Level 1 and Level 2 assets and liabilities.
For the year ended September 30, 2016, there were no transfers between Level 2 and Level 3 assets and liabilities.
For more information on valuation inputs, see Note 2 – Significant Accounting Policies in Notes to Financial Statements.
Amounts designated as “—” are $0 or have been rounded to $0.
The accompanying notes are an integral part of the financial statements.
8 |
SEI Institutional Managed Trust / Annual Report / September 30, 2016 |
SCHEDULE OF INVESTMENTS
September 30, 2016
Mid-Cap Fund
| Description | Shares | Market Value ($ Thousands) | ||||||
COMMON STOCK — 97.3% |
| |||||||
Consumer Discretionary — 14.2% |
| |||||||
Bed Bath & Beyond (A) | 12,300 | $ | 530 | |||||
Best Buy | 18,400 | 702 | ||||||
Carter’s | 5,200 | 451 | ||||||
Cooper-Standard Holding * | 2,800 | 277 | ||||||
Dillard’s, Cl A (A) | 2,100 | 133 | ||||||
Discovery Communications, Cl A *(A) | 1,900 | 51 | ||||||
Discovery Communications, Cl C * | 21,200 | 558 | ||||||
Dollar General | 6,500 | 455 | ||||||
DR Horton | 19,100 | 577 | ||||||
Express * | 3,300 | 39 | ||||||
Extended Stay America | 18,300 | 260 | ||||||
Foot Locker, Cl A | 800 | 54 | ||||||
FTD *(A) | 3,100 | 64 | ||||||
Genuine Parts | 6,700 | 673 | ||||||
Kohl’s (A) | 3,183 | 139 | ||||||
Lear | 5,300 | 642 | ||||||
Lennar, Cl A | 2,600 | 110 | ||||||
Lennar, Cl B | 3,000 | 101 | ||||||
Liberty Interactive QVC Group, Cl A * | 29,700 | 594 | ||||||
Macy’s | 18,200 | 674 | ||||||
Murphy USA * | 6,200 | 442 | ||||||
NACCO Industries, Cl A | 3,100 | 211 | ||||||
News, Cl A | 22,400 | 313 | ||||||
NVR * | 100 | 164 | ||||||
Penske Auto Group, Cl A (A) | 8,500 | 410 | ||||||
PVH | 5,700 | 630 | ||||||
Ross Stores | 6,200 | 399 | ||||||
Royal Caribbean Cruises (A) | 8,600 | 645 | ||||||
Staples | 22,800 | 195 | ||||||
TEGNA | 11,100 | 242 | ||||||
Thor Industries | 3,200 | 271 | ||||||
Ulta Salon Cosmetics & Fragrance * | 2,400 | 571 | ||||||
Viacom, Cl B | 14,800 | 564 | ||||||
Wyndham Worldwide | 8,100 | 545 | ||||||
|
|
| ||||||
| 12,686 | ||||||||
|
|
| ||||||
Consumer Staples — 6.0% |
| |||||||
Blue Buffalo Pet Products * | 6,600 | 157 | ||||||
Bunge | 9,600 | 569 | ||||||
Campbell Soup | 6,000 | 328 | ||||||
Clorox | 5,300 | 663 | ||||||
ConAgra Foods | 15,900 | 749 | ||||||
Dr Pepper Snapple Group | 7,500 | 685 | ||||||
Ingredion | 2,500 | 333 | ||||||
JM Smucker | 4,600 | 623 | ||||||
Pilgrim's Pride *(A) | 18,000 | 380 | ||||||
Tyson Foods, Cl A | 11,600 | 866 | ||||||
|
|
| ||||||
| 5,353 | ||||||||
|
|
| ||||||
Energy — 4.5% | ||||||||
Energen * | 7,400 | 427 | ||||||
| Description | Shares | Market Value ($ Thousands) | ||||||
COMMON STOCK (continued) |
| |||||||
Ensco, Cl A | 28,600 | $ | 243 | |||||
Marathon Oil | 3,800 | 60 | ||||||
Marathon Petroleum | 19,200 | 779 | ||||||
Newfield Exploration * | 12,700 | 552 | ||||||
Oneok | 9,800 | 504 | ||||||
PBF Energy, Cl A (A) | 20,100 | 455 | ||||||
Rice Energy * | 15,400 | 402 | ||||||
Tesoro | 7,800 | 621 | ||||||
|
|
| ||||||
| 4,043 | ||||||||
|
|
| ||||||
Financials — 10.4% | ||||||||
Ally Financial | 32,800 | 639 | ||||||
American Financial Group | 6,900 | 517 | ||||||
Ameriprise Financial | 6,900 | 688 | ||||||
Annaly Capital Management ‡ | 54,600 | 574 | ||||||
Assured Guaranty | 2,800 | 78 | ||||||
Chimera Investment ‡ | 30,540 | 487 | ||||||
Citizens Financial Group | 23,300 | 576 | ||||||
East West Bancorp | 14,600 | 536 | ||||||
Fifth Third Bancorp | 11,600 | 237 | ||||||
Genworth Financial, Cl A * | 9,700 | 48 | ||||||
Invesco | 15,800 | 494 | ||||||
Invesco Mortgage Capital ‡ | 3,300 | 50 | ||||||
Lincoln National | 1,500 | 70 | ||||||
Navient (A) | 8,500 | 123 | ||||||
Old Republic International | 27,400 | 483 | ||||||
Progressive | 7,900 | 249 | ||||||
Raymond James Financial | 10,600 | 617 | ||||||
Regions Financial | 62,300 | 615 | ||||||
Reinsurance Group of America, Cl A | 1,500 | 162 | ||||||
Starwood Property Trust ‡ | 4,000 | 90 | ||||||
SunTrust Banks | 18,200 | 797 | ||||||
Unum Group | 17,200 | 607 | ||||||
Voya Financial | 300 | 9 | ||||||
XL Group | 16,500 | 555 | ||||||
|
|
| ||||||
| 9,301 | ||||||||
|
|
| ||||||
Health Care — 11.4% | ||||||||
Alkermes * | 1,300 | 61 | ||||||
AmerisourceBergen | 2,200 | 178 | ||||||
Anthem | 1,200 | 150 | ||||||
Boston Scientific * | 18,900 | 450 | ||||||
Bruker BioSciences | 18,200 | 412 | ||||||
C.R. Bard | 3,300 | 740 | ||||||
Cerner *(A) | 11,200 | 692 | ||||||
DaVita HealthCare Partners * | 900 | 60 | ||||||
Edwards Lifesciences, Cl A * | 8,400 | 1,013 | ||||||
Hill-Rom Holdings | 7,900 | 490 | ||||||
Hologic * | 16,600 | 644 | ||||||
IDEXX Laboratories * | 600 | 68 | ||||||
Incyte * | 7,700 | 726 | ||||||
Intuitive Surgical * | 1,150 | 833 | ||||||
SEI Institutional Managed Trust / Annual Report / September 30, 2016 |
1 |
SCHEDULE OF INVESTMENTS
September 30, 2016
Mid-Cap Fund (Continued)
| Description | Shares | Market Value ($ Thousands) | ||||||
COMMON STOCK (continued) | ||||||||
Jazz Pharmaceuticals * | 3,860 | $ | 469 | |||||
Mallinckrodt * | 9,000 | 628 | ||||||
Quintiles Transnational * | 6,200 | 503 | ||||||
Universal Health Services, Cl B | 4,500 | 555 | ||||||
Vertex Pharmaceuticals * | 800 | 70 | ||||||
VWR * | 16,800 | 476 | ||||||
WellCare Health Plans * | 4,000 | 468 | ||||||
West Pharmaceutical Services | 1,400 | 104 | ||||||
Zimmer Biomet Holdings | 600 | 78 | ||||||
Zoetis, Cl A | 6,200 | 322 | ||||||
|
|
| ||||||
| 10,190 | ||||||||
|
|
| ||||||
Industrials — 11.9% | ||||||||
Alaska Air Group | 700 | 46 | ||||||
Babcock & Wilcox Enterprises * | 19,700 | 325 | ||||||
BWX Technologies, Cl W | 14,600 | 560 | ||||||
Carlisle | 5,400 | 554 | ||||||
Continental Building Products * | 6,300 | 132 | ||||||
Cummins | 5,800 | 743 | ||||||
Global Brass & Copper Holdings | 1,500 | 43 | ||||||
HD Supply Holdings * | 8,800 | 281 | ||||||
Hubbell, Cl B | 900 | 97 | ||||||
Huntington Ingalls Industries, Cl A | 4,200 | 644 | ||||||
Ingersoll-Rand | 10,800 | 734 | ||||||
KBR | 32,600 | 493 | ||||||
L-3 Communications Holdings | 500 | 75 | ||||||
Lennox International (A) | 2,300 | 361 | ||||||
ManpowerGroup | 6,400 | 463 | ||||||
Masco | 8,800 | 302 | ||||||
PACCAR | 12,100 | 711 | ||||||
Parker-Hannifin, Cl A | 4,300 | 540 | ||||||
Republic Services (A) | 1,100 | 56 | ||||||
RR Donnelley & Sons | 3,000 | 47 | ||||||
Southwest Airlines, Cl A | 11,900 | 463 | ||||||
Spirit AeroSystems Holdings, Cl A * | 12,000 | 535 | ||||||
SPX FLOW * | 3,700 | 115 | ||||||
Stanley Black & Decker | 6,000 | 738 | ||||||
Textron | 15,900 | 632 | ||||||
United Continental Holdings * | 15,700 | 824 | ||||||
Wabash National *(A) | 2,100 | 30 | ||||||
Wesco Aircraft Holdings *(A) | 2,400 | 32 | ||||||
|
|
| ||||||
| 10,576 | ||||||||
|
|
| ||||||
Information Technology — 16.0% | ||||||||
Advanced Energy Industries * | 2,400 | 114 | ||||||
Akamai Technologies * | 6,800 | 360 | ||||||
Analog Devices | 4,900 | 316 | ||||||
Ansys * | 1,600 | 148 | ||||||
Applied Materials | 5,100 | 154 | ||||||
Arista Networks *(A) | 5,500 | 468 | ||||||
Arrow Electronics, Cl A * | 4,400 | 281 | ||||||
Avnet | 4,300 | 177 | ||||||
| Description | Shares | Market Value ($ Thousands) | ||||||
COMMON STOCK (continued) | ||||||||
Booz Allen Hamilton Holding, Cl A | 4,700 | $ | 149 | |||||
CA | 1,200 | 40 | ||||||
Cardtronics *(A) | 7,300 | 326 | ||||||
CDK Global | 4,400 | 252 | ||||||
CDW | 13,400 | 613 | ||||||
Citrix Systems * | 7,600 | 648 | ||||||
CommScope Holding * | 17,500 | 527 | ||||||
CoreLogic * | 1,200 | 47 | ||||||
CoStar Group * | 2,700 | 585 | ||||||
eBay * | 18,100 | 595 | ||||||
Electronic Arts * | 4,100 | 350 | ||||||
F5 Networks, Cl A * | 4,600 | 573 | ||||||
First Data, Cl A * | 30,800 | 405 | ||||||
Fiserv, Cl A * | 5,400 | 537 | ||||||
HP | 26,200 | 407 | ||||||
IAC * | 10,000 | 625 | ||||||
Intuit | 1,100 | 121 | ||||||
Juniper Networks | 25,100 | 604 | ||||||
Leidos Holdings | 1,100 | 48 | ||||||
Linear Technology | 10,800 | 640 | ||||||
Manhattan Associates * | 8,200 | 473 | ||||||
Maxim Integrated Products | 6,600 | 263 | ||||||
NCR * | 11,400 | 367 | ||||||
Nuance Communications * | 20,400 | 296 | ||||||
Red Hat * | 6,500 | 525 | ||||||
Seagate Technology (A) | 8,700 | 335 | ||||||
Symantec, Cl A | 31,600 | 793 | ||||||
Synopsys * | 10,500 | 623 | ||||||
Total System Services | 9,700 | 457 | ||||||
|
|
| ||||||
| 14,242 | ||||||||
|
|
| ||||||
Materials — 5.5% | ||||||||
Alcoa (A) | 6,400 | 65 | ||||||
Celanese, Ser A | 9,300 | 619 | ||||||
Crown Holdings * | 10,600 | 605 | ||||||
GCP Applied Technologies * | 4,900 | 139 | ||||||
Newmont Mining | 21,700 | 853 | ||||||
Nucor | 13,500 | 667 | ||||||
Owens-Illinois * | 18,400 | 338 | ||||||
RPM International | 10,100 | 543 | ||||||
Steel Dynamics | 21,200 | 530 | ||||||
Westlake Chemical | 10,400 | 556 | ||||||
|
|
| ||||||
| 4,915 | ||||||||
|
|
| ||||||
Real Estate — 9.5% | ||||||||
American Campus Communities ‡ | 6,800 | 346 | ||||||
Apple Hospitality (A) | 15,100 | 280 | ||||||
Ashford Hospitality Trust ‡ | 13,300 | 78 | ||||||
Boston Properties ‡ | 3,000 | 409 | ||||||
Brixmor Property Group ‡ | 18,200 | 506 | ||||||
CBRE Group, Cl A * | 12,600 | 353 | ||||||
Chesapeake Lodging Trust ‡ | 5,200 | 119 | ||||||
2 |
SEI Institutional Managed Trust / Annual Report / September 30, 2016 |
SCHEDULE OF INVESTMENTS
September 30, 2016
Mid-Cap Fund (Concluded)
| Description | Shares | Market Value ($ Thousands) | ||||||
COMMON STOCK (continued) | ||||||||
Empire State Realty Trust, Cl A ‡ | 7,400 | $ | 155 | |||||
Forest City Realty Trust, Cl A ‡ | 22,500 | 520 | ||||||
Franklin Street Properties ‡ | 22,300 | 281 | ||||||
General Growth Properties ‡ | 22,300 | 616 | ||||||
GEO Group ‡(A) | 19,700 | 468 | ||||||
HCP ‡ | 18,900 | 717 | ||||||
Jones Lang LaSalle | 5,060 | 576 | ||||||
Marcus & Millichap * | 3,500 | 91 | ||||||
NexPoint Residential Trust | 2,100 | 41 | ||||||
NorthStar Realty Finance ‡ | 22,700 | 299 | ||||||
Paramount Group ‡ | 10,000 | 164 | ||||||
ProLogis ‡ | 14,600 | 782 | ||||||
Rayonier ‡ | 4,900 | 130 | ||||||
Ryman Hospitality Properties | 8,500 | 409 | ||||||
VEREIT ‡ | 56,500 | 586 | ||||||
WP Carey ‡ | 8,200 | 529 | ||||||
|
|
| ||||||
| 8,455 | ||||||||
|
|
| ||||||
Telecommunication Services — 0.3% | ||||||||
Telephone & Data Systems | 7,900 | 215 | ||||||
|
|
| ||||||
Utilities — 7.6% | ||||||||
AES | 51,200 | 658 | ||||||
American Electric Power | 4,100 | 263 | ||||||
DTE Energy | 7,500 | 703 | ||||||
Edison International | 4,000 | 289 | ||||||
Entergy | 8,500 | 652 | ||||||
Eversource Energy | 11,600 | 629 | ||||||
FirstEnergy | 16,500 | 546 | ||||||
Hawaiian Electric Industries | 12,600 | 376 | ||||||
MDU Resources Group | 10,900 | 277 | ||||||
National Fuel Gas | 4,500 | 243 | ||||||
PPL | 22,300 | 771 | ||||||
Public Service Enterprise Group | 17,500 | 733 | ||||||
UGI | 14,100 | 638 | ||||||
|
|
| ||||||
| 6,778 | ||||||||
|
|
| ||||||
Total Common Stock | 86,754 | |||||||
|
|
| ||||||
AFFILIATED PARTNERSHIP — 6.4% | ||||||||
SEI Liquidity Fund, L.P. | ||||||||
0.440% **†(B) | 5,714,002 | 5,714 | ||||||
|
|
| ||||||
Total Affiliated Partnership (Cost $5,714) ($ Thousands) | 5,714 | |||||||
|
|
| ||||||
| Description | Face Amount (Thousands) | Market Value ($ Thousands) | ||||||
U.S. TREASURY OBLIGATION — 0.1% | ||||||||
U.S. Treasury Bill | ||||||||
0.238%, 10/20/2016 (C)(D) | $ | 50 | $ | 50 | ||||
|
|
| ||||||
Total U.S. Treasury Obligation (Cost $50) ($ Thousands) | 50 | |||||||
|
|
| ||||||
| Shares | ||||||||
CASH EQUIVALENT — 2.5% | ||||||||
SEI Daily Income Trust, Government Fund, Cl A | ||||||||
0.220%**† | 2,188,571 | 2,189 | ||||||
|
|
| ||||||
Total Cash Equivalent (Cost $2,189) ($ Thousands) | 2,189 | |||||||
|
|
| ||||||
Total Investments — 106.3% | $ | 94,707 | ||||||
|
|
| ||||||
| Percentages are based on Net Assets of $89,130 ($ Thousands). |
| * | Non-income producing security. |
| ** | Rate shown is the 7-day effective yield as of September 30, 2016. |
| ‡ | Real Estate Investment Trust. |
| † | Investment in Affiliated Security (see Note 6). |
| (A) | This security or a partial position of this security is on loan at September 30, 2016 (see Note 10). The total market value of securities on loan at September 30, 2016 was $5,670 ($ Thousands). |
| (B) | This security was purchased with cash collateral held from securities on loan (see Note 10). The total market value of such securities as of September 30, 2016 was $5,714 ($ Thousands). |
| (C) | Security, or portion thereof, has been pledged as collateral on open futures contracts. |
Cl — Class
L.P. — Limited Partnership
Ser — Series
The following is a list of the level of inputs used as of September 30, 2016, in valuing the Fund’s investments carried at value ($ Thousands):
| Investments in Securities | Level 1 | Level 2 | Level 3 | Total | ||||||||||||
Common Stock | $ | 86,754 | $ | – | $ | – | $ | 86,754 | ||||||||
U.S. Treasury Obligation | – | 50 | – | 50 | ||||||||||||
Affiliated Partnership | – | 5,714 | – | 5,714 | ||||||||||||
Cash Equivalent | 2,189 | – | – | 2,189 | ||||||||||||
|
|
|
|
|
|
|
| |||||||||
Total Investments in Securities | $ | 88,943 | $ | 5,764 | $ | – | $ | 94,707 | ||||||||
|
|
|
|
|
|
|
| |||||||||
For the year ended September 30, 2016, there were no transfers between Level 1 and Level 2 assets and liabilities.
For the year ended September 30, 2016, there were no transfers between Level 2 and Level 3 assets and liabilities.
For more information on valuation inputs, see Note 2 – Significant Accounting Policies in Notes to Financial Statements.
Amounts designated as “—” are $0 or have been rounded to $0.
The accompanying notes are an integral part of the financial statements.
SEI Institutional Managed Trust / Annual Report / September 30, 2016 |
3 |
SCHEDULE OF INVESTMENTS
September 30, 2016
U.S. Managed Volatility Fund
| Description | Shares | Market Value ($ Thousands) | ||||||
COMMON STOCK — 97.4% | ||||||||
Consumer Discretionary — 10.3% | ||||||||
American Eagle Outfitters | 182,290 | $ | 3,256 | |||||
Aramark | 242,246 | 9,213 | ||||||
Bed Bath & Beyond | 159,924 | 6,894 | ||||||
Best Buy | 31,153 | 1,189 | ||||||
Big Lots | 129,291 | 6,174 | ||||||
BJ's Restaurants * | 12,392 | 440 | ||||||
Brinker International | 85,406 | 4,307 | ||||||
Canadian Tire, Cl A | 30,700 | 3,069 | ||||||
Carriage Services | 12,539 | 297 | ||||||
Cheesecake Factory | 178,130 | 8,917 | ||||||
Children's Place | 46,400 | 3,706 | ||||||
Comcast, Cl A | 49,100 | 3,257 | ||||||
Cooper Tire & Rubber | 17,450 | 663 | ||||||
Cooper-Standard Holding * | 8,838 | 873 | ||||||
Cracker Barrel Old Country Store | 3,069 | 406 | ||||||
CST Brands | 12,623 | 607 | ||||||
Darden Restaurants | 83,246 | 5,105 | ||||||
Del Frisco's Restaurant Group * | 9,995 | 135 | ||||||
Del Taco Restaurants * | 44,759 | 533 | ||||||
Dillard's, Cl A | 47,256 | 2,977 | ||||||
Discovery Communications, Cl C * | 13,093 | 345 | ||||||
Dollar General | 109,500 | 7,664 | ||||||
Eldorado Resorts * | 39,801 | 559 | ||||||
Escalade | 6,743 | 86 | ||||||
Foot Locker, Cl A | 62,655 | 4,243 | ||||||
GameStop, Cl A | 68,633 | 1,894 | ||||||
General Motors | 9,491 | 301 | ||||||
Genuine Parts | 19,662 | 1,975 | ||||||
Goodyear Tire & Rubber | 14,668 | 474 | ||||||
Graham Holdings, Cl B | 975 | 469 | ||||||
Grand Canyon Education * | 3,784 | 153 | ||||||
Hemisphere Media Group, Cl A * | 12,906 | 165 | ||||||
Hooker Furniture | 5,949 | 146 | ||||||
Kohl's | 89,800 | 3,929 | ||||||
Lear | 15,993 | 1,939 | ||||||
Lindblad Expeditions Holdings * | 27,763 | 250 | ||||||
Macy's | 37,300 | 1,382 | ||||||
Mattel | 277,602 | 8,406 | ||||||
McDonald's | 124,799 | 14,397 | ||||||
Michael Kors Holdings * | 200,786 | 9,395 | ||||||
Murphy USA * | 58,900 | 4,203 | ||||||
National CineMedia | 24,332 | 358 | ||||||
NVR * | 3,342 | 5,480 | ||||||
Panera Bread, Cl A * | 11,286 | 2,198 | ||||||
PetMed Express | 35,402 | 718 | ||||||
Regal Entertainment Group, Cl A | 15,740 | 342 | ||||||
Sally Beauty Holdings * | 142,800 | 3,667 | ||||||
Scripps Networks Interactive, Cl A | 51,600 | 3,276 | ||||||
Staples | 152,215 | 1,301 | ||||||
Superior Uniform Group | 2,724 | 54 | ||||||
Target, Cl A | 301,008 | 20,673 | ||||||
| Description | Shares | Market Value ($ Thousands) | ||||||
COMMON STOCK (continued) | ||||||||
Tenneco * | 15,288 | $ | 891 | |||||
TJX | 7,671 | 574 | ||||||
Viacom, Cl B | 40,400 | 1,539 | ||||||
Wayfair, Cl A * | 1,780 | 70 | ||||||
Yum! Brands | 2,608 | 237 | ||||||
|
|
| ||||||
| 165,771 | ||||||||
|
|
| ||||||
Consumer Staples — 17.7% | ||||||||
Altria Group | 329,611 | 20,841 | ||||||
Amplify Snack Brands * | 20,924 | 339 | ||||||
Brown-Forman, Cl B | 4,684 | 222 | ||||||
Bunge | 85,408 | 5,059 | ||||||
Calavo Growers | 1,988 | 130 | ||||||
Cal-Maine Foods * | 1,241 | 48 | ||||||
Campbell Soup | 46,724 | 2,556 | ||||||
Clorox | 83,056 | 10,397 | ||||||
Coca-Cola | 189,454 | 8,018 | ||||||
Coca-Cola European Partners | 36,600 | 1,460 | ||||||
Costco Wholesale | 74,318 | 11,334 | ||||||
Coty, Cl A | 61,236 | 1,439 | ||||||
CVS Health | 88,800 | 7,902 | ||||||
Dean Foods | 263,002 | 4,313 | ||||||
Dr Pepper Snapple Group | 287,944 | 26,292 | ||||||
Flowers Foods | 320,072 | 4,839 | ||||||
Fresh Del Monte Produce | 94,401 | 5,655 | ||||||
General Mills | 168,008 | 10,732 | ||||||
Hormel Foods | 137,734 | 5,224 | ||||||
Ingredion | 36,252 | 4,824 | ||||||
J&J Snack Foods | 6,446 | 768 | ||||||
John B Sanfilippo & Son | 9,094 | 467 | ||||||
Kellogg | 59,300 | 4,594 | ||||||
Kimberly-Clark | 96,029 | 12,113 | ||||||
Kroger | 316,876 | 9,405 | ||||||
Lancaster Colony | 9,105 | 1,203 | ||||||
McCormick | 111,502 | 11,141 | ||||||
Metro, Cl A | 92,100 | 3,018 | ||||||
National Beverage, Cl A * | 4,077 | 180 | ||||||
Nu Skin Enterprises, Cl A | 55,876 | 3,620 | ||||||
Orchids Paper Products | 8,767 | 239 | ||||||
PepsiCo | 157,328 | 17,113 | ||||||
Philip Morris International | 165,454 | 16,085 | ||||||
Pinnacle Foods | 110,188 | 5,528 | ||||||
Sanderson Farms | 41,900 | 4,036 | ||||||
Snyder's-Lance | 8,820 | 296 | ||||||
SYSCO, Cl A | 325,257 | 15,941 | ||||||
Tyson Foods, Cl A | 166,658 | 12,444 | ||||||
Universal | 36,082 | 2,101 | ||||||
Vector Group | 53,626 | 1,155 | ||||||
Wal-Mart Stores | 441,835 | 31,865 | ||||||
Weis Markets | 10,536 | 559 | ||||||
|
|
| ||||||
| 285,495 | ||||||||
|
|
| ||||||
SEI Institutional Managed Trust / Annual Report / September 30, 2016 |
1 |
SCHEDULE OF INVESTMENTS
September 30, 2016
U.S. Managed Volatility Fund (Continued)
| Description | Shares | Market Value ($ Thousands) | ||||||
COMMON STOCK (continued) |
| |||||||
Energy — 0.8% | ||||||||
Exxon Mobil | 111,500 | $ | 9,732 | |||||
Frank's International | 125,003 | 1,625 | ||||||
Range Resources | 20,117 | 779 | ||||||
|
|
| ||||||
| 12,136 | ||||||||
|
|
| ||||||
Financials — 14.3% | ||||||||
Aflac | 93,600 | 6,727 | ||||||
Allied World Assurance Holdings | 160,971 | 6,506 | ||||||
Allstate | 120,809 | 8,358 | ||||||
American Capital Agency, Cl A ‡ | 55,100 | 1,077 | ||||||
American Capital Mortgage Investment ‡ | 59,245 | 1,018 | ||||||
American Financial Group | 93,497 | 7,012 | ||||||
American National Insurance | 30,666 | 3,740 | ||||||
Amerisafe | 3,186 | 187 | ||||||
Annaly Capital Management ‡ | 516,100 | 5,419 | ||||||
Anworth Mortgage Asset ‡ | 93,474 | 460 | ||||||
Apollo Commercial Real Estate Finance ‡ | 200,248 | 3,278 | ||||||
Arch Capital Group * | 90,931 | 7,207 | ||||||
Ares Commercial Real Estate ‡ | 8,823 | 111 | ||||||
Argo Group International Holdings | 5,484 | 309 | ||||||
Aspen Insurance Holdings | 155,200 | 7,231 | ||||||
Assured Guaranty | 88,885 | 2,467 | ||||||
Atlas Financial Holdings * | 21,013 | 331 | ||||||
Axis Capital Holdings | 228,855 | 12,434 | ||||||
Bank of Marin Bancorp | 2,321 | 115 | ||||||
BankUnited | 29,171 | 881 | ||||||
Berkshire Hathaway, Cl B * | 75,500 | 10,908 | ||||||
BNC Bancorp | 12,825 | 312 | ||||||
BOK Financial | 15,452 | 1,066 | ||||||
Capitol Federal Financial | 64,763 | 911 | ||||||
Capstead Mortgage ‡ | 73,999 | 698 | ||||||
Carolina Financial | 8,605 | 192 | ||||||
CBOE Holdings | 210,763 | 13,668 | ||||||
Charter Financial | 11,684 | 151 | ||||||
Chemical Financial | 4,366 | 193 | ||||||
Chimera Investment ‡ | 92,995 | 1,483 | ||||||
Citigroup | 15,441 | 729 | ||||||
Citizens Financial Group | 21,122 | 522 | ||||||
CME Group | 9,925 | 1,037 | ||||||
CU Bancorp * | 14,194 | 324 | ||||||
Cullen/Frost Bankers | 6,470 | 466 | ||||||
CYS Investments ‡ | 8,834 | 77 | ||||||
Employers Holdings | 8,614 | 257 | ||||||
Endurance Specialty Holdings | 87,833 | 5,749 | ||||||
Enstar Group * | 3,173 | 522 | ||||||
Essent Group * | 5,160 | 137 | ||||||
Everest Re Group | 98,136 | 18,643 | ||||||
Farmers Capital Bank | 3,810 | 113 | ||||||
Fidelity Southern | 18,137 | 334 | ||||||
First Business Financial Services | 8,452 | 199 | ||||||
First Foundation * | 5,967 | 147 | ||||||
| Description | Shares | Market Value ($ Thousands) | ||||||
COMMON STOCK (continued) |
| |||||||
First Interstate BancSystem, Cl A | 3,249 | $ | 102 | |||||
First Mid-Illinois Bancshares | 2,150 | 59 | ||||||
Genworth MI Canada | 71,000 | 1,824 | ||||||
Great Ajax ‡ | 7,494 | 102 | ||||||
Green Dot, Cl A * | 23,086 | 533 | ||||||
Guaranty Bancorp | 5,796 | 103 | ||||||
Heritage Insurance Holdings | 17,876 | 258 | ||||||
Horizon Bancorp | 5,018 | 147 | ||||||
Houlihan Lokey, Cl A | 1,906 | 48 | ||||||
James River Group Holdings | 8,608 | 312 | ||||||
MBT Financial | 4,566 | 41 | ||||||
MFA Financial ‡ | 1,055,596 | 7,896 | ||||||
Middleburg Financial | 1,280 | 36 | ||||||
MidWestOne Financial Group | 3,341 | 102 | ||||||
Morningstar, Cl A | 6,151 | 488 | ||||||
National Bank Holdings, Cl A | 18,485 | 432 | ||||||
National Bank of Canada | 96,800 | 3,426 | ||||||
Northwest Bancshares | 25,491 | 400 | ||||||
Old Line Bancshares | 6,115 | 121 | ||||||
Old Second Bancorp | 15,242 | 127 | ||||||
OneBeacon Insurance Group, Cl A | 8,763 | 125 | ||||||
Opus Bank | 6,870 | 243 | ||||||
Oritani Financial | 4,965 | 78 | ||||||
Pacific Premier Bancorp * | 35,227 | 932 | ||||||
Peoples Financial Services | 3,918 | 160 | ||||||
People's Utah Bancorp | 2,867 | 58 | ||||||
PNC Financial Services Group | 42,000 | 3,784 | ||||||
Popular | 39,866 | 1,524 | ||||||
Preferred Bank | 6,905 | 247 | ||||||
ProAssurance | 19,684 | 1,033 | ||||||
QCR Holdings | 3,057 | 97 | ||||||
Reinsurance Group of America, Cl A | 46,470 | 5,016 | ||||||
RenaissanceRe Holdings | 96,068 | 11,543 | ||||||
RLI | 1,568 | 107 | ||||||
Royal Bank of Canada | 58,700 | 3,629 | ||||||
Santander Consumer USA Holdings * | 132,590 | 1,612 | ||||||
Starwood Property Trust ‡ | 112,600 | 2,536 | ||||||
Stonegate Bank | 22,618 | 763 | ||||||
TFS Financial | 8,105 | 144 | ||||||
Thomson Reuters | 43,256 | 1,790 | ||||||
Travelers | 136,430 | 15,628 | ||||||
Triumph Bancorp * | 2,715 | 54 | ||||||
Two Harbors Investment ‡ | 830,743 | 7,086 | ||||||
United Financial Bancorp | 107,408 | 1,487 | ||||||
United Insurance Holdings | 1,941 | 33 | ||||||
Validus Holdings | 309,657 | 15,427 | ||||||
Virtu Financial, Cl A | 49,065 | 734 | ||||||
Voya Financial | 15,890 | 458 | ||||||
WashingtonFirst Bankshares | 4,516 | 111 | ||||||
Waterstone Financial | 17,315 | 294 | ||||||
Wells Fargo | 90,400 | 4,003 | ||||||
|
|
| ||||||
| 230,999 | ||||||||
|
|
| ||||||
2 |
SEI Institutional Managed Trust / Annual Report / September 30, 2016 |
SCHEDULE OF INVESTMENTS
September 30, 2016
U.S. Managed Volatility Fund (Continued)
| Description | Shares | Market Value ($ Thousands) | ||||||
COMMON STOCK (continued) | ||||||||
Health Care — 16.2% | ||||||||
Abbott Laboratories | 18,093 | $ | 765 | |||||
AbbVie | 71,404 | 4,503 | ||||||
Aetna, Cl A | 57,900 | 6,684 | ||||||
Allscripts Healthcare Solutions * | 188,297 | 2,480 | ||||||
Amgen, Cl A | 51,811 | 8,643 | ||||||
Anthem | 48,900 | 6,128 | ||||||
AxoGen * | 69,759 | 630 | ||||||
Baxter International | 143,424 | 6,827 | ||||||
Biogen * | 6,585 | 2,061 | ||||||
Bristol-Myers Squibb | 175,186 | 9,446 | ||||||
C.R. Bard | 18,334 | 4,112 | ||||||
Cardinal Health | 198,143 | 15,396 | ||||||
Chemed | 5,505 | 777 | ||||||
Computer Programs & Systems | 10,362 | 270 | ||||||
Conmed | 755 | 30 | ||||||
DaVita HealthCare Partners * | 61,084 | 4,036 | ||||||
Eli Lilly | 59,937 | 4,811 | ||||||
Enzo Biochem * | 9,883 | 50 | ||||||
Express Scripts Holding * | 90,388 | 6,375 | ||||||
Gilead Sciences | 58,958 | 4,665 | ||||||
HCA Holdings * | 71,160 | 5,382 | ||||||
Healthways * | 7,631 | 202 | ||||||
Henry Schein * | 10,470 | 1,706 | ||||||
Heska * | 13,256 | 722 | ||||||
Hill-Rom Holdings | 40,928 | 2,537 | ||||||
Humana | 18,500 | 3,272 | ||||||
ICON * | 63,847 | 4,940 | ||||||
ICU Medical * | 6,015 | 760 | ||||||
Johnson & Johnson | 299,129 | 35,336 | ||||||
Laboratory Corp of America Holdings * | 53,172 | 7,310 | ||||||
LeMaitre Vascular | 18,622 | 370 | ||||||
Mallinckrodt * | 4,822 | 336 | ||||||
Masimo * | 5,970 | 355 | ||||||
McKesson | 69,018 | 11,509 | ||||||
Merck | 366,497 | 22,873 | ||||||
Meridian Bioscience | 38,281 | 738 | ||||||
Myriad Genetics * | 31,180 | 642 | ||||||
NeoGenomics * | 48,210 | 396 | ||||||
Owens & Minor | 131,847 | 4,579 | ||||||
Patterson | 95,086 | 4,368 | ||||||
Pfizer | 638,521 | 21,627 | ||||||
PharMerica * | 5,224 | 147 | ||||||
Press Ganey Holdings * | 10,499 | 424 | ||||||
Quality Systems * | 49,408 | 560 | ||||||
Quest Diagnostics | 118,057 | 9,991 | ||||||
Quintiles Transnational * | 18,550 | 1,504 | ||||||
Teleflex | 55,217 | 9,279 | ||||||
United Therapeutics * | 39,432 | 4,656 | ||||||
UnitedHealth Group | 52,700 | 7,378 | ||||||
Utah Medical Products | 6,072 | 363 | ||||||
Varian Medical Systems * | 50,940 | 5,070 | ||||||
| Description | Shares | Market Value ($ Thousands) | ||||||
COMMON STOCK (continued) | ||||||||
Vocera Communications * | 7,111 | $ | 120 | |||||
Waters * | 26,703 | 4,232 | ||||||
|
|
| ||||||
| 262,373 | ||||||||
|
|
| ||||||
Industrials — 7.1% | ||||||||
Alaska Air Group | 8,816 | 581 | ||||||
Babcock & Wilcox Enterprises * | 37,453 | 618 | ||||||
Blue Bird * | 5,409 | 79 | ||||||
Boeing | 23,700 | 3,122 | ||||||
BWX Technologies, Cl W | 122,897 | 4,716 | ||||||
Copa Holdings, Cl A | 11,295 | 993 | ||||||
Danaher, Cl A | 7,462 | 585 | ||||||
Deere | 63,600 | 5,428 | ||||||
Delta Air Lines, Cl A | 94,053 | 3,702 | ||||||
EMCOR Group | 54,410 | 3,244 | ||||||
FedEx | 15,900 | 2,777 | ||||||
General Dynamics | 19,000 | 2,948 | ||||||
Global Brass & Copper Holdings | 18,008 | 520 | ||||||
Huntington Ingalls Industries, Cl A | 43,546 | 6,681 | ||||||
IES Holdings * | 4,298 | 77 | ||||||
Landstar System | 64,949 | 4,422 | ||||||
Lockheed Martin | 54,845 | 13,147 | ||||||
Masonite International * | 11,362 | 707 | ||||||
MSC Industrial Direct, Cl A | 4,187 | 307 | ||||||
Northrop Grumman | 47,300 | 10,120 | ||||||
Owens Corning | 18,717 | 999 | ||||||
Quanta Services * | 185,249 | 5,185 | ||||||
Raytheon | 66,945 | 9,113 | ||||||
Republic Services | 146,000 | 7,365 | ||||||
Southwest Airlines, Cl A | 73,237 | 2,848 | ||||||
Spirit AeroSystems Holdings, Cl A * | 56,104 | 2,499 | ||||||
Supreme Industries, Cl A | 2,519 | 49 | ||||||
United Continental Holdings * | 27,078 | 1,421 | ||||||
United Parcel Service, Cl B | 36,300 | 3,970 | ||||||
United Technologies | 45,000 | 4,572 | ||||||
Waste Management | 180,423 | 11,504 | ||||||
|
|
| ||||||
| 114,299 | ||||||||
|
|
| ||||||
Information Technology — 11.9% | ||||||||
Accenture, Cl A | 37,078 | 4,530 | ||||||
Alphabet, Cl A * | 1,140 | 917 | ||||||
Amdocs | 427,486 | 24,730 | ||||||
Apple | 46,500 | 5,257 | ||||||
Applied Materials | 41,836 | 1,261 | ||||||
Aspen Technology * | 107,933 | 5,050 | ||||||
Atlassian, Cl A * | 44,359 | 1,329 | ||||||
Booz Allen Hamilton Holding, Cl A | 162,751 | 5,145 | ||||||
Broadridge Financial Solutions | 42,956 | 2,912 | ||||||
CA | 109,761 | 3,631 | ||||||
CDW | 56,354 | 2,577 | ||||||
Cisco Systems | 293,400 | 9,307 | ||||||
Citrix Systems * | 37,208 | 3,171 | ||||||
SEI Institutional Managed Trust / Annual Report / September 30, 2016 |
3 |
SCHEDULE OF INVESTMENTS
September 30, 2016
U.S. Managed Volatility Fund (Continued)
| Description | Shares | Market Value ($ Thousands) | ||||||
COMMON STOCK (continued) | ||||||||
Convergys | 136,140 | $ | 4,141 | |||||
CSG Systems International | 18,623 | 770 | ||||||
CSRA | 118,838 | 3,197 | ||||||
Dell Technologies - VMware Inc, Cl V * | 15,147 | 724 | ||||||
DST Systems | 5,054 | 596 | ||||||
eBay * | 158,105 | 5,202 | ||||||
First Data, Cl A * | 163,688 | 2,154 | ||||||
Forrester Research | 24,608 | 957 | ||||||
Genpact * | 31,821 | 762 | ||||||
Harris | 37,426 | 3,429 | ||||||
HP | 85,223 | 1,323 | ||||||
IAC * | 64,938 | 4,057 | ||||||
Ingram Micro, Cl A * | 53,090 | 1,893 | ||||||
Intel | 264,400 | 9,981 | ||||||
International Business Machines | 76,760 | 12,193 | ||||||
Intuit | 40,792 | 4,488 | ||||||
Jack Henry & Associates | 8,732 | 747 | ||||||
Lumentum Holdings * | 14,735 | 615 | ||||||
Microsoft | 33,755 | 1,944 | ||||||
MINDBODY, Cl A * | 38,033 | 748 | ||||||
Motorola Solutions | 57,007 | 4,348 | ||||||
NetApp | 161,994 | 5,803 | ||||||
NIC | 6,108 | 143 | ||||||
Oracle, Cl B | 157,535 | 6,188 | ||||||
Planet Payment * | 71,965 | 267 | ||||||
Qualcomm | 126,000 | 8,631 | ||||||
RealPage * | 10,303 | 265 | ||||||
Reis | 10,586 | 216 | ||||||
Sapiens International | 11,726 | 150 | ||||||
Square, Cl A * | 213,899 | 2,494 | ||||||
Symantec, Cl A | 590,040 | 14,810 | ||||||
Synopsys * | 29,404 | 1,745 | ||||||
Take-Two Interactive Software, Cl A * | 111,719 | 5,036 | ||||||
Tech Data * | 30,000 | 2,542 | ||||||
Teradata * | 11,052 | 343 | ||||||
Teradyne | 57,783 | 1,247 | ||||||
VeriSign * | 61,295 | 4,796 | ||||||
Western Union | 154,100 | 3,208 | ||||||
|
|
| ||||||
| 191,970 | ||||||||
|
|
| ||||||
Materials — 1.9% | ||||||||
Avery Dennison | 44,400 | 3,454 | ||||||
Bemis | 104,603 | 5,336 | ||||||
Cabot | 45,196 | 2,369 | ||||||
Celanese, Ser A | 20,544 | 1,367 | ||||||
Compass Minerals International, Cl A | 42,805 | 3,155 | ||||||
Kaiser Aluminum | 41,600 | 3,598 | ||||||
LyondellBasell Industries, Cl A | 13,970 | 1,127 | ||||||
Reliance Steel & Aluminum | 13,877 | 999 | ||||||
Schweitzer-Mauduit International | 60,500 | 2,333 | ||||||
Scotts Miracle-Gro, Cl A | 16,988 | 1,415 | ||||||
Sonoco Products | 103,900 | 5,489 | ||||||
| Description | Shares | Market Value ($ Thousands) | ||||||
COMMON STOCK (continued) | ||||||||
Steel Dynamics | 9,476 | $ | 237 | |||||
Tahoe Resources | 25,908 | 332 | ||||||
|
|
| ||||||
| 31,211 | ||||||||
|
|
| ||||||
Real Estate — 2.5% | ||||||||
Brixmor Property Group ‡ | 145,800 | 4,052 | ||||||
CBL & Associates Properties ‡ | 143,132 | 1,738 | ||||||
City Office ‡ | 25,978 | 330 | ||||||
CorEnergy Infrastructure Trust ‡ | 11,196 | 328 | ||||||
Easterly Government Properties ‡ | 40,203 | 767 | ||||||
Forest City Realty Trust, Cl A ‡ | 13,199 | 305 | ||||||
Four Corners Property Trust ‡ | 12,509 | 267 | ||||||
Mid-America Apartment Communities ‡ | 34,700 | 3,262 | ||||||
Monogram Residential Trust ‡ | 20,773 | 221 | ||||||
Outfront Media ‡ | 24,779 | 586 | ||||||
Piedmont Office Realty Trust, Cl A ‡ | 377,883 | 8,227 | ||||||
Preferred Apartment Communities, Cl A ‡ | 4,457 | 60 | ||||||
PS Business Parks ‡ | 7,787 | 884 | ||||||
Retail Properties of America, Cl A ‡ | 238,300 | 4,003 | ||||||
Ryman Hospitality Properties | 63,950 | 3,080 | ||||||
Select Income ‡ | 15,967 | 430 | ||||||
Senior Housing Properties Trust ‡ | 156,600 | 3,556 | ||||||
Silver Bay Realty Trust ‡ | 32,418 | 568 | ||||||
Tanger Factory Outlet Centers ‡ | 102,200 | 3,982 | ||||||
Taubman Centers ‡ | 4,824 | 359 | ||||||
Welltower ‡ | 51,400 | 3,843 | ||||||
|
|
| ||||||
| 40,848 | ||||||||
|
|
| ||||||
Telecommunication Services — 5.8% |
| |||||||
AT&T | 843,923 | 34,272 | ||||||
BCE | 82,400 | 3,799 | ||||||
Hawaiian Telcom Holdco * | 12,860 | 288 | ||||||
Nippon Telegraph & Telephone ADR | 86,900 | 3,981 | ||||||
NTT DoCoMo ADR | 260,300 | 6,614 | ||||||
Rogers Communications, Cl B | 47,400 | 2,007 | ||||||
SK Telecom ADR | 191,000 | 4,317 | ||||||
TELUS | 142,100 | 4,680 | ||||||
Verizon Communications | 649,368 | 33,754 | ||||||
|
|
| ||||||
| 93,712 | ||||||||
|
|
| ||||||
Utilities — 8.9% |
| |||||||
AES | 153,916 | 1,978 | ||||||
ALLETE | 10,633 | 634 | ||||||
Ameren | 71,700 | 3,526 | ||||||
American Electric Power | 203,085 | 13,040 | ||||||
Artesian Resources, Cl A | 1,545 | 44 | ||||||
Avista | 57,764 | 2,414 | ||||||
California Water Service Group, Cl A | 11,941 | 383 | ||||||
CMS Energy | 107,255 | 4,506 | ||||||
Consolidated Edison | 107,163 | 8,069 | ||||||
DTE Energy | 24,700 | 2,314 | ||||||
Edison International | 153,245 | 11,072 | ||||||
El Paso Electric, Cl A | 12,081 | 565 | ||||||
4 |
SEI Institutional Managed Trust / Annual Report / September 30, 2016 |
SCHEDULE OF INVESTMENTS
September 30, 2016
U.S. Managed Volatility Fund (Continued)
| Description | Shares | Market Value ($ Thousands) | ||||||
COMMON STOCK (continued) | ||||||||
Entergy | 177,552 | $ | 13,623 | |||||
Exelon | 215,659 | 7,179 | ||||||
FirstEnergy | 131,671 | 4,356 | ||||||
Great Plains Energy | 84,710 | 2,312 | ||||||
Hawaiian Electric Industries | 12,794 | 382 | ||||||
Idacorp, Cl A | 12,298 | 963 | ||||||
Korea Electric Power ADR | 172,200 | 4,198 | ||||||
MGE Energy | 4,670 | 264 | ||||||
NiSource | 16,649 | 402 | ||||||
Northwest Natural Gas | 17,621 | 1,059 | ||||||
NorthWestern | 9,252 | 532 | ||||||
PG&E | 76,491 | 4,679 | ||||||
Pinnacle West Capital | 106,215 | 8,071 | ||||||
PNM Resources | 24,085 | 788 | ||||||
Portland General Electric | 140,939 | 6,003 | ||||||
Public Service Enterprise Group | 284,103 | 11,895 | ||||||
SCANA | 89,200 | 6,455 | ||||||
Southern | 217,141 | 11,139 | ||||||
Southwest Gas | 51,430 | 3,593 | ||||||
Spire | 3,852 | 246 | ||||||
Talen Energy * | 9,517 | 132 | ||||||
UGI | 14,373 | 650 | ||||||
Unitil | 23,422 | 915 | ||||||
Vectren | 9,464 | 475 | ||||||
Xcel Energy | 120,578 | 4,961 | ||||||
|
|
| ||||||
| 143,817 | ||||||||
|
|
| ||||||
Total Common Stock (Cost $1,355,387) ($ Thousands) | 1,572,631 | |||||||
|
|
| ||||||
| Face Amount (Thousands) | ||||||||
U.S. TREASURY OBLIGATION — 0.0% |
| |||||||
U.S. Treasury Bills | ||||||||
0.226%, 10/20/2016 (A) | $ | 965 | 965 | |||||
|
|
| ||||||
Total U.S. Treasury Obligation (Cost $965) ($ Thousands) | 965 | |||||||
|
|
| ||||||
| Shares | ||||||||
CASH EQUIVALENT — 2.4% | ||||||||
SEI Daily Income Trust, Government Fund, Cl A | ||||||||
0.220%**† | 39,118,496 | 39,118 | ||||||
|
|
| ||||||
Total Cash Equivalent (Cost $39,118) ($ Thousands) | 39,118 | |||||||
|
|
| ||||||
Total Investments — 99.8% (Cost $1,395,470) ($ Thousands) | $ | 1,612,714 | ||||||
|
|
| ||||||
A list of the open futures contracts held by the Fund at September 30, 2016, is as follows:
| Type of Contract | Number of Contracts Long | Expiration Date | Unrealized Depreciation ($ Thousands) | |||||||||
S&P 500 Index E-MINI | 238 | Dec-2016 | $(102) | |||||||||
|
| |||||||||||
For the year ended September 30, 2016, the total amount of all open futures contracts, as presented in the table above, are representative of the volume of activity for the derivative type during the year.
| Percentages are based on Net Assets of $1,615,168 ($ Thousands). |
| * | Non-income producing security. |
| ** | Rate shown is the 7-day effective yield as of September 30, 2016. |
| ‡ | Real Estate Investment Trust. |
| † | Investment in Affiliated Security (see Note 6). |
| (A) | Security, or portion thereof, has been pledged as collateral on open futures contracts. |
ADR — American Depositary Receipt
Cl — Class
S&P— Standard & Poor's
Ser — Series
The following is a list of the level of inputs used as of September 30, 2016, in valuing the Fund’s investments and other financial instruments carried at value ($ Thousands):
| Investments in Securities | Level 1 | Level 2 | Level 3 | Total | ||||||||||||
Common Stock | $ | 1,572,631 | $ | – | $ | – | $ | 1,572,631 | ||||||||
U.S. Treasury Obligation | – | 965 | – | 965 | ||||||||||||
Cash Equivalent | 39,118 | – | – | 39,118 | ||||||||||||
|
|
|
|
|
|
|
|
| ||||||||
Total Investments in Securities | $ | 1,611,749 | $ | 965 | $ | – | $ | 1,612,714 | ||||||||
|
|
|
|
|
|
|
|
| ||||||||
| Other Financial Instruments | Level 1 | Level 2 | Level 3 | Total | ||||||||||||
Futures Contracts * | ||||||||||||||||
Unrealized Depreciation | $ | (102 | ) | $ | — | $ | — | $ | (102 | ) | ||||||
|
|
|
|
|
|
|
|
| ||||||||
Total Other Financial Instruments | $ | (102 | ) | $ | — | $ | — | $ | (102 | ) | ||||||
|
|
|
|
|
|
|
|
| ||||||||
| * | Futures contracts are valued at the unrealized depreciation on the instrument. |
For the year ended September 30, 2016, there were no transfers between Level 1 and Level 2 assets and liabilities.
For the year ended September 30, 2016, there were no transfers between Level 2 and Level 3 assets and liabilities.
For more information on valuation inputs, see Note 2 – Significant Accounting Policies in Notes to Financial Statements.
Amounts designated as “—” are $0 or have been rounded to $0.
The accompanying notes are an integral part of the financial statements.
SEI Institutional Managed Trust / Annual Report / September 30, 2016 |
5 |
SCHEDULE OF INVESTMENTS
September 30, 2016
Global Managed Volatility Fund (Continued)
| Description | Shares | Market Value ($ Thousands) | ||||||
COMMON STOCK — 93.6% | ||||||||
Australia — 4.3% | ||||||||
AGL Energy | 648,811 | $ | 9,506 | |||||
Amcor | 376,169 | 4,390 | ||||||
Aristocrat Leisure | 57,568 | 702 | ||||||
ASX | 67,189 | 2,495 | ||||||
Aurizon Holdings | 711,576 | 2,577 | ||||||
Ausdrill * | 221,202 | 246 | ||||||
AusNet Services | 1,796,653 | 2,266 | ||||||
CIMIC Group ‡ | 17,471 | 387 | ||||||
Coca-Cola Amatil | 420,513 | 3,317 | ||||||
Cochlear | 18,795 | 2,040 | ||||||
CSL | 89,529 | 7,364 | ||||||
Flight Centre Travel Group | 72,846 | 2,043 | ||||||
Goodman Group ‡ | 143,577 | 805 | ||||||
GPT Group ‡ | 14,739 | 57 | ||||||
Harvey Norman Holdings | 78,967 | 317 | ||||||
LendLease Group | 244,197 | 2,647 | ||||||
Mirvac Group ‡ | 546,549 | 944 | ||||||
Newcrest Mining | 56,337 | 953 | ||||||
Orica | 124,835 | 1,464 | ||||||
Qantas Airways | 97,093 | 233 | ||||||
Sonic Healthcare | 147,471 | 2,499 | ||||||
South32 | 112,339 | 207 | ||||||
Stockland ‡ | 993,861 | 3,646 | ||||||
Tabcorp Holdings | 551,012 | 2,107 | ||||||
Tatts Group | 1,074,396 | 3,021 | ||||||
Telstra, Cl B | 982,644 | 3,916 | ||||||
Treasury Wine Estates | 24,496 | 209 | ||||||
Wesfarmers | 400,112 | 13,565 | ||||||
|
|
| ||||||
| 73,923 | ||||||||
|
|
| ||||||
Austria — 0.9% | ||||||||
BUWOG * | 125,492 | 3,399 | ||||||
CA Immobilien Anlagen * | 10,733 | 205 | ||||||
Conwert Immobilien Invest * | 114,844 | 2,166 | ||||||
Flughafen Wien | 18,588 | 460 | ||||||
Oesterreichische Post | 63,397 | 2,251 | ||||||
OMV | 20,188 | 582 | ||||||
Telekom Austria, Cl A * | 112,758 | 639 | ||||||
UNIQA Insurance Group | 36,114 | 235 | ||||||
Verbund ‡ | 16,404 | 274 | ||||||
voestalpine | 177,420 | 6,150 | ||||||
|
|
| ||||||
| 16,361 | ||||||||
|
|
| ||||||
Belgium — 0.3% | ||||||||
Befimmo ‡ | 5,970 | 361 | ||||||
Colruyt | 48,798 | 2,708 | ||||||
Elia System Operator | 15,067 | 770 | ||||||
Proximus | 68,756 | 2,057 | ||||||
|
|
| ||||||
| 5,896 | ||||||||
|
|
| ||||||
Canada — 9.2% | ||||||||
Alimentation Couche-Tard, Cl B | 11,051 | 535 | ||||||
Allied Properties, Cl A ‡ | 28,700 | 823 | ||||||
| Description | Shares | Market Value ($ Thousands) | ||||||
COMMON STOCK (continued) | ||||||||
Atco, Cl I | 99,600 | $ | 3,533 | |||||
Bank of Montreal | 162,917 | 10,657 | ||||||
Barrick Gold | 124,800 | 2,206 | ||||||
BCE | 273,694 | 12,638 | ||||||
Canadian Imperial Bank of Commerce | 72,168 | 5,586 | ||||||
Canadian Real Estate Investment Trust ‡ | 13,500 | 483 | ||||||
Canadian Tire, Cl A | 29,578 | 2,957 | ||||||
Canadian Utilities, Cl A | 16,600 | 468 | ||||||
Capital Power, Cl B | 15,500 | 243 | ||||||
CCL Industries, Cl B | 20,148 | 3,873 | ||||||
CI Financial | 20,020 | 383 | ||||||
Cineplex | 5,485 | 211 | ||||||
Constellation Software | 8,952 | 4,028 | ||||||
Dollarama | 85,290 | 6,647 | ||||||
Emera | 215,229 | 7,748 | ||||||
Empire, Cl A | 62,156 | 926 | ||||||
Fairfax Financial Holdings | 3,345 | 1,957 | ||||||
First Capital Realty | 330,680 | 5,530 | ||||||
Fortis | 137,880 | 4,426 | ||||||
George Weston | 90,575 | 7,542 | ||||||
Goldcorp | 43,600 | 718 | ||||||
H&R ‡ | 121,485 | 2,073 | ||||||
Industrial Alliance Insurance & Financial Services | 2,858 | 103 | ||||||
Intact Financial | 61,090 | 4,408 | ||||||
Jean Coutu Group PJC, Cl A | 33,264 | 509 | ||||||
Kinross Gold * | 252,100 | 1,061 | ||||||
Loblaw | 77,700 | 3,991 | ||||||
Manitoba Telecom Services | 109,683 | 3,146 | ||||||
Maple Leaf Foods | 119,227 | 2,732 | ||||||
Masonite International * | 10,658 | 663 | ||||||
Metro, Cl A | 140,200 | 4,595 | ||||||
Morguard ‡ | 18,037 | 216 | ||||||
National Bank of Canada | 92,090 | 3,260 | ||||||
Open Text | 54,407 | 3,518 | ||||||
Power Financial | 10,683 | 247 | ||||||
Pure Industrial Real Estate Trust ‡ | 316,400 | 1,327 | ||||||
RioCan ‡ | 130,658 | 2,706 | ||||||
Rogers Communications, Cl B | 428,024 | 18,127 | ||||||
Royal Bank of Canada | 38,386 | 2,373 | ||||||
Saputo | 119,750 | 4,154 | ||||||
Shaw Communications, Cl B | 388,906 | 7,945 | ||||||
Sienna Senior Living | 22,871 | 295 | ||||||
Smart Real Estate Investment Trust ‡ | 21,458 | 577 | ||||||
Toronto-Dominion Bank | 110,664 | 4,904 | ||||||
Valener | 37,628 | 625 | ||||||
Yamana Gold | 159,400 | 685 | ||||||
|
|
| ||||||
| 158,358 | ||||||||
|
|
| ||||||
Denmark — 0.8% | ||||||||
Carlsberg, Cl B | 14,764 | 1,417 | ||||||
Chr Hansen Holding | 3,084 | 184 | ||||||
Coloplast, Cl B | 6,713 | 524 | ||||||
SEI Institutional Managed Trust / Annual Report / September 30, 2016 |
1 |
SCHEDULE OF INVESTMENTS
September 30, 2016
Global Managed Volatility Fund (Continued)
| Description | Shares | Market Value ($ Thousands) | ||||||
COMMON STOCK (continued) | ||||||||
Novo Nordisk, Cl B | 236,090 | $ | 9,904 | |||||
Schouw | 8,465 | 556 | ||||||
TDC * | 74,362 | 440 | ||||||
William Demant Holding * | 68,675 | 1,402 | ||||||
|
|
| ||||||
| 14,427 | ||||||||
|
|
| ||||||
Finland — 0.0% | ||||||||
Orion, Cl B | 10,874 | 429 | ||||||
|
|
| ||||||
France — 0.2% | ||||||||
Boiron | 3,901 | 397 | ||||||
Dassault Systemes | 1,658 | 144 | ||||||
Eutelsat Communications | 43,633 | 903 | ||||||
Iliad | 2,211 | 465 | ||||||
Ipsen | 4,636 | 326 | ||||||
SES, Cl A | 25,244 | 621 | ||||||
Tessi | 181 | 29 | ||||||
Vilmorin & Cie | 1,799 | 118 | ||||||
|
|
| ||||||
| 3,003 | ||||||||
|
|
| ||||||
Germany — 1.1% | ||||||||
Celesio | 64,013 | 1,856 | ||||||
Commerzbank | 365,719 | 2,366 | ||||||
Merck KGaA | 47,887 | 5,182 | ||||||
RHOEN-KLINIKUM | 122,774 | 3,737 | ||||||
STADA Arzneimittel | 74,071 | 4,124 | ||||||
Suedzucker | 33,817 | 941 | ||||||
Zalando *(A) | 16,752 | 699 | ||||||
|
|
| ||||||
| 18,905 | ||||||||
|
|
| ||||||
Guernsey — 0.6% | ||||||||
Amdocs | 174,841 | 10,115 | ||||||
|
|
| ||||||
Hong Kong — 3.2% | ||||||||
ASM Pacific Technology | 37,500 | 312 | ||||||
Cathay Pacific Airways | 605,626 | 849 | ||||||
Cheung Kong Infrastructure Holdings | 348,215 | 3,010 | ||||||
CLP Holdings, Cl B | 1,939,046 | 20,115 | ||||||
First Pacific | 897,661 | 643 | ||||||
Hang Seng Bank | 82,357 | 1,481 | ||||||
HK Electric Investments & HK Electric Investments (A) | 1,272,197 | 1,248 | ||||||
HKT Trust & HKT | 1,991,483 | 2,811 | ||||||
Hopewell Holdings | 64,500 | 236 | ||||||
Kerry Properties | 204,832 | 673 | ||||||
Link ‡ | 1,145,369 | 8,452 | ||||||
MTR | 225,974 | 1,250 | ||||||
NWS Holdings | 282,436 | 473 | ||||||
PCCW | 2,361,220 | 1,451 | ||||||
Power Assets Holdings | 163,957 | 1,605 | ||||||
Shangri-La Asia | 184,597 | 204 | ||||||
Sunlight ‡ | 378,721 | 242 | ||||||
Swire Pacific, Cl A | 316,181 | 3,435 | ||||||
WH Group (A) | 4,057,773 | 3,286 | ||||||
Wheelock | 76,514 | 455 | ||||||
| Description | Shares | Market Value ($ Thousands) | ||||||
COMMON STOCK (continued) | ||||||||
Yue Yuen Industrial Holdings | 651,756 | $ | 2,707 | |||||
|
|
| ||||||
| 54,938 | ||||||||
|
|
| ||||||
Ireland — 0.1% | ||||||||
Hibernia ‡ | 422,769 | 651 | ||||||
Kerry Group, Cl A | 5,899 | 492 | ||||||
UDG Healthcare | 28,027 | 233 | ||||||
|
|
| ||||||
| 1,376 | ||||||||
|
|
| ||||||
Israel — 1.4% | ||||||||
Amot Investments | 141,941 | 634 | ||||||
Bank Hapoalim | 2,047,460 | 11,613 | ||||||
Bank Leumi Le-Israel * | 1,843,717 | 7,022 | ||||||
First International Bank of Israel | 17,956 | 229 | ||||||
Formula Systems 1985 | 2,472 | 96 | ||||||
Israel Discount Bank, Cl A * | 1,447,292 | 2,663 | ||||||
Teva Pharmaceutical Industries | 42,844 | 1,967 | ||||||
|
|
| ||||||
| 24,224 | ||||||||
|
|
| ||||||
Italy — 1.0% | ||||||||
Amplifon | 46,603 | 479 | ||||||
CSP International Fashion Group | 775 | 1 | ||||||
DiaSorin | 28,303 | 1,821 | ||||||
Hera | 2,042,730 | 5,507 | ||||||
Parmalat | 69,038 | 183 | ||||||
Terna Rete Elettrica Nazionale | 1,839,170 | 9,491 | ||||||
|
|
| ||||||
| 17,482 | ||||||||
|
|
| ||||||
Japan — 7.4% | ||||||||
Alfresa Holdings | 9,400 | 199 | ||||||
Alpen | 35,569 | 642 | ||||||
Amada Holdings | 57,100 | 595 | ||||||
Aozora Bank | 556,555 | 1,923 | ||||||
Asahi Glass | 45,000 | 292 | ||||||
Asahi Group Holdings | 22,100 | 806 | ||||||
Astellas Pharma | 192,800 | 3,017 | ||||||
Can Do | 24,649 | 396 | ||||||
Canon | 175,300 | 5,087 | ||||||
Chubu Electric Power | 11,200 | 164 | ||||||
Coca-Cola West | 179,411 | 5,027 | ||||||
Daiichi Sankyo | 239,179 | 5,758 | ||||||
Daito Trust Construction | 8,300 | 1,332 | ||||||
Dunlop Sports | 9,821 | 99 | ||||||
Dydo Drinco | 45,190 | 2,515 | ||||||
Earth Chemical | 12,781 | 604 | ||||||
Eisai | 52,600 | 3,284 | ||||||
Electric Power Development | 34,700 | 836 | ||||||
GungHo Online Entertainment * | 177,100 | 435 | ||||||
Hisamitsu Pharmaceutical | 5,100 | 276 | ||||||
Hoya * | 58,262 | 2,347 | ||||||
ITOCHU | 177,600 | 2,239 | ||||||
Itochu-Shokuhin | 2,503 | 100 | ||||||
Japan Airlines * | 46,600 | 1,370 | ||||||
Japan Prime Realty Investment, Cl A ‡ | 38 | 172 | ||||||
Japan Tobacco | 215,100 | 8,821 | ||||||
2 |
SEI Institutional Managed Trust / Annual Report / September 30, 2016 |
SCHEDULE OF INVESTMENTS
September 30, 2016
Global Managed Volatility Fund (Continued)
| Description | Shares | Market Value ($ Thousands) | ||||||
COMMON STOCK (continued) | ||||||||
KDDI | 104,275 | $ | 3,221 | |||||
Key Coffee | 10,848 | 204 | ||||||
KFC Holdings Japan | 11,875 | 217 | ||||||
Kohnan Shoji | 60,146 | 1,170 | ||||||
Kuraray | 42,200 | 626 | ||||||
Kurita Water Industries | 6,700 | 159 | ||||||
Kyowa Hakko Kirin | 20,000 | 316 | ||||||
Lawson | 45,324 | 3,584 | ||||||
Lion | 499,526 | 8,092 | ||||||
LIXIL Group | 8,100 | 174 | ||||||
Marudai Food | 52,636 | 257 | ||||||
Maruha Nichiro | 89,673 | 2,424 | ||||||
Maruichi Steel Tube | 16,400 | 567 | ||||||
Matsuya Foods | 17,716 | 552 | ||||||
Maxvalu Tokai | 1,605 | 29 | ||||||
McDonald's Holdings Japan | 36,300 | 1,069 | ||||||
Medipal Holdings | 21,700 | 376 | ||||||
Ministop | 59,055 | 1,022 | ||||||
Mitsubishi Electric | 112,000 | 1,435 | ||||||
Mitsubishi Gas Chemical | 31,500 | 452 | ||||||
Mitsubishi Tanabe Pharma | 146,600 | 3,148 | ||||||
MOS Food Services | 47,958 | 1,526 | ||||||
Mr Max | 94,103 | 300 | ||||||
NEC | 164,000 | 423 | ||||||
Nihon Shokuhin Kako | 1,284 | 5 | ||||||
Nikon | 26,900 | 402 | ||||||
Nippon Building Fund ‡ | 74 | 470 | ||||||
Nippon Express | 177,973 | 833 | ||||||
Nippon Flour Mills | 60,535 | 930 | ||||||
Nisshin Oillio Group | 256,760 | 1,196 | ||||||
Noevir Holdings | 11,757 | 360 | ||||||
NTT DOCOMO | 400,492 | 10,193 | ||||||
Okinawa Electric Power | 10,000 | 226 | ||||||
Oracle Japan * | 50,480 | 2,851 | ||||||
Osaka Gas | 986,356 | 4,142 | ||||||
Otsuka | 5,700 | 270 | ||||||
Otsuka Holdings | 8,800 | 402 | ||||||
Pola Orbis Holdings | 11,100 | 997 | ||||||
Ricoh | 53,400 | 483 | ||||||
Rock Field | 35,562 | 532 | ||||||
Sankyo | 29,373 | 1,004 | ||||||
Santen Pharmaceutical | 20,800 | 307 | ||||||
Sega Sammy Holdings | 53,900 | 770 | ||||||
Shimadzu | 28,000 | 427 | ||||||
Shionogi | 6,800 | 349 | ||||||
Start Today | 42,900 | 740 | ||||||
Starzen | 5,000 | 255 | ||||||
Studio Alice | 21,632 | 475 | ||||||
Sumitomo Dainippon Pharma | 309,100 | 5,999 | ||||||
Suzuken | 37,474 | 1,238 | ||||||
Taisho Pharmaceutical Holdings | 8,100 | 830 | ||||||
Takeda Pharmaceutical | 8,000 | 383 | ||||||
| Description | Shares | Market Value ($ Thousands) | ||||||
COMMON STOCK (continued) | ||||||||
Toho Gas | 53,000 | $ | 496 | |||||
Tokai | 5,905 | 210 | ||||||
Tokyo Gas | 176,000 | 785 | ||||||
Toppan Printing | 13,000 | 117 | ||||||
Trend Micro * | 114,945 | 4,007 | ||||||
Tsuruha Holdings | 900 | 104 | ||||||
Vital KSK Holdings | 73,400 | 778 | ||||||
West Japan Railway | 17,500 | 1,085 | ||||||
Yamada Denki | 182,900 | 908 | ||||||
Yamazaki Baking | 57,700 | 1,420 | ||||||
Yoshinoya Holdings | 95,904 | 1,379 | ||||||
|
|
| ||||||
| 128,037 | ||||||||
|
|
| ||||||
Luxembourg — 0.1% | ||||||||
RTL Group | 14,986 | 1,245 | ||||||
|
|
| ||||||
Netherlands — 0.3% | ||||||||
Heineken Holding | 55,906 | 4,493 | ||||||
|
|
| ||||||
New Zealand — 2.4% | ||||||||
Air New Zealand | 422,867 | 575 | ||||||
Auckland International Airport | 1,550,869 | 8,297 | ||||||
Chorus | 344,587 | 981 | ||||||
Contact Energy | 1,876,343 | 6,897 | ||||||
Fisher & Paykel Healthcare | 769,509 | 5,610 | ||||||
Fletcher Building | 485,797 | 3,802 | ||||||
Genesis Energy | 113,154 | 172 | ||||||
Infratil | 65,956 | 156 | ||||||
Kiwi Property Group ‡ | 614,432 | 670 | ||||||
Mercury NZ | 302,272 | 669 | ||||||
Meridian Energy | 238,261 | 452 | ||||||
Restaurant Brands New Zealand | 13,581 | 57 | ||||||
Ryman Healthcare | 283,731 | 1,988 | ||||||
Sky City Entertainment Group | 953,366 | 3,177 | ||||||
Spark New Zealand | 2,597,479 | 6,825 | ||||||
Summerset Group Holdings | 76,122 | 293 | ||||||
Z Energy | 51,819 | 316 | ||||||
|
|
| ||||||
| 40,937 | ||||||||
|
|
| ||||||
Norway — 2.4% | ||||||||
Austevoll Seafood | 54,975 | 463 | ||||||
DNB, Cl A | 65,490 | 858 | ||||||
Leroy Seafood Group | 49,024 | 2,479 | ||||||
Marine Harvest | 152,602 | 2,727 | ||||||
Norsk Hydro | 2,572,894 | 11,090 | ||||||
Orkla | 1,248,316 | 12,908 | ||||||
Telenor | 652,264 | 11,195 | ||||||
|
|
| ||||||
| 41,720 | ||||||||
|
|
| ||||||
Portugal — 0.1% | ||||||||
EDP - Energias de Portugal | 228,329 | 768 | ||||||
REN - Redes Energeticas Nacionais SGPS | 425,291 | 1,244 | ||||||
Sonaecom - SGPS | 34,299 | 101 | ||||||
|
|
| ||||||
| 2,113 | ||||||||
|
|
| ||||||
SEI Institutional Managed Trust / Annual Report / September 30, 2016 |
3 |
SCHEDULE OF INVESTMENTS
September 30, 2016
Global Managed Volatility Fund (Continued)
| Description | Shares | Market Value ($ Thousands) | ||||||
COMMON STOCK (continued) | ||||||||
Singapore — 1.1% | ||||||||
Ascendas ‡ | 794,114 | $ | 1,471 | |||||
CapitaLand Commercial Trust ‡ | 1,981,321 | 2,321 | ||||||
CapitaLand Mall Trust ‡ | 1,836,125 | 2,932 | ||||||
ComfortDelGro | 866,928 | 1,795 | ||||||
First ‡ | 89,866 | 89 | ||||||
Hutchison Port Holdings, Cl U | 1,397,913 | 624 | ||||||
Metro Holdings | 47,205 | 32 | ||||||
Singapore Airlines | 31,919 | 247 | ||||||
Singapore Press Holdings | 450,716 | 1,265 | ||||||
Singapore Technologies Engineering | 24,300 | 58 | ||||||
StarHub | 2,060,623 | 5,205 | ||||||
Suntec Real Estate Investment Trust ‡ | 62,015 | 78 | ||||||
Venture | 162,459 | 1,076 | ||||||
Wilmar International | 712,259 | 1,694 | ||||||
|
|
| ||||||
| 18,887 | ||||||||
|
|
| ||||||
Spain — 1.8% | ||||||||
Acciona | 5,294 | 401 | ||||||
Ebro Foods | 108,474 | 2,525 | ||||||
Enagas | 51,901 | 1,564 | ||||||
Endesa | 230,788 | 4,952 | ||||||
Gas Natural SDG | 75,176 | 1,550 | ||||||
Grifols | 25,217 | 544 | ||||||
Iberdrola | 1,430,990 | 9,738 | ||||||
Red Electrica | 481,326 | 10,388 | ||||||
|
|
| ||||||
| 31,662 | ||||||||
|
|
| ||||||
Sweden — 1.2% | ||||||||
Axfood | 298,518 | 5,285 | ||||||
ICA Gruppen | 37,069 | 1,226 | ||||||
Swedish Match | 360,153 | 13,241 | ||||||
Tele2, Cl B | 110,785 | 958 | ||||||
|
|
| ||||||
| 20,710 | ||||||||
|
|
| ||||||
Switzerland — 4.3% | ||||||||
ABB | 40,608 | 914 | ||||||
Actelion | 47,346 | 8,222 | ||||||
Allreal Holding, Cl A | 19,927 | 3,032 | ||||||
Alpiq Holding * | 2,696 | 250 | ||||||
Barry Callebaut | 529 | 704 | ||||||
Basler Kantonalbank, Cl H | 592 | 41 | ||||||
Bell | 300 | 131 | ||||||
Chocoladefabriken Lindt & Spruengli | 17 | 1,163 | ||||||
Coca-Cola HBC | 95,820 | 2,232 | ||||||
EMS-Chemie Holding | 748 | 403 | ||||||
Flughafen Zuerich | 11,641 | 2,279 | ||||||
Galenica | 5,643 | 6,003 | ||||||
Kuehne & Nagel International | 898 | 131 | ||||||
Mobilezone Holding | 253 | 4 | ||||||
Mobimo Holding | 8,069 | 2,061 | ||||||
Nestle | 271,140 | 21,411 | ||||||
Orior | 424 | 36 | ||||||
Pargesa Holding | 7,090 | 487 | ||||||
| Description | Shares | Market Value ($ Thousands) | ||||||
COMMON STOCK (continued) | ||||||||
Roche Holding | 5,774 | $ | 1,440 | |||||
Schindler Holding | 6,847 | 1,288 | ||||||
SGS, Cl B | 41 | 92 | ||||||
Siegfried Holding | 1,199 | 262 | ||||||
Sika | 129 | 629 | ||||||
Sonova Holding | 8,965 | 1,272 | ||||||
Swiss Prime Site, Cl H | 106,299 | 9,343 | ||||||
Swisscom | 5,526 | 2,639 | ||||||
Valora Holding | 10,380 | 2,964 | ||||||
Ypsomed Holding AG | 19,104 | 3,929 | ||||||
|
|
| ||||||
| 73,362 | ||||||||
|
|
| ||||||
United Kingdom — 4.9% | ||||||||
BCA Marketplace | 75,693 | 177 | ||||||
British American Tobacco | 165,864 | 10,635 | ||||||
Britvic | 69,576 | 546 | ||||||
BTG * | 89,045 | 734 | ||||||
Cranswick | 39,278 | 1,193 | ||||||
DCC | 30,643 | 2,797 | ||||||
Dechra Pharmaceuticals | 23,823 | 432 | ||||||
Diageo | 175,553 | 5,048 | ||||||
EMIS Group | 34,658 | 424 | ||||||
GlaxoSmithKline | 184,715 | 3,946 | ||||||
Greggs | 261,838 | 3,449 | ||||||
Hill & Smith Holdings | 14,970 | 220 | ||||||
Imperial Brands | 288,753 | 14,923 | ||||||
Inchcape | 247,589 | 2,123 | ||||||
Indivior | 70,783 | 282 | ||||||
J Sainsbury | 340,891 | 1,091 | ||||||
JD Sports Fashion | 1,504 | 29 | ||||||
KCOM Group | 22,026 | 33 | ||||||
Kennedy Wilson Europe Real Estate | 79,097 | 1,032 | ||||||
Kingfisher | 116,173 | 569 | ||||||
LondonMetric Property ‡ | 145,234 | 302 | ||||||
McBride | 72,348 | 176 | ||||||
Melrose Industries | 49,717 | 113 | ||||||
National Grid | 689,472 | 9,763 | ||||||
Next, Cl A | 20,559 | 1,277 | ||||||
QinetiQ Group | 236,942 | 728 | ||||||
Reckitt Benckiser Group | 88,705 | 8,383 | ||||||
Rentokil Initial | 1,108,242 | 3,206 | ||||||
Sage Group | 336,756 | 3,233 | ||||||
Shaftesbury ‡ | 45,239 | 571 | ||||||
Smith & Nephew | 12,366 | 200 | ||||||
Spectris | 11,601 | 297 | ||||||
SSE | 272,778 | 5,568 | ||||||
Tate & Lyle | 9,411 | 92 | ||||||
Tritax Big Box ‡ | 231,224 | 417 | ||||||
|
|
| ||||||
| 84,009 | ||||||||
|
|
| ||||||
United States — 44.5% | ||||||||
AbbVie | 24,208 | 1,527 | ||||||
Activision Blizzard | 84,453 | 3,741 | ||||||
Alleghany * | 1,031 | 541 | ||||||
4 |
SEI Institutional Managed Trust / Annual Report / September 30, 2016 |
SCHEDULE OF INVESTMENTS
September 30, 2016
Global Managed Volatility Fund (Continued)
| Description | Shares | Market Value ($ Thousands) | ||||||
COMMON STOCK (continued) | ||||||||
Allscripts Healthcare Solutions * | 258,189 | $ | 3,400 | |||||
Alphabet, Cl A * | 804 | 646 | ||||||
Altria Group | 221,141 | 13,983 | ||||||
American Capital Agency, Cl A ‡ | 484,030 | 9,458 | ||||||
American Capital Mortgage Investment ‡ | 86,074 | 1,480 | ||||||
American National Insurance | 1,898 | 231 | ||||||
AmerisourceBergen | 140,293 | 11,333 | ||||||
Amgen, Cl A | 32,624 | 5,442 | ||||||
Annaly Capital Management ‡ | 532,036 | 5,586 | ||||||
Apple Hospitality | 78,459 | 1,452 | ||||||
Ares Commercial Real Estate ‡ | 116,798 | 1,472 | ||||||
AT&T | 483,387 | 19,630 | ||||||
Autozone * | 1,048 | 805 | ||||||
Baxter International | 31,785 | 1,513 | ||||||
Beneficial Bancorp | 262,207 | 3,857 | ||||||
Berkshire Hathaway, Cl B * | 48,842 | 7,056 | ||||||
Bio-Rad Laboratories, Cl A * | 18,213 | 2,983 | ||||||
Bristol-Myers Squibb | 126,906 | 6,843 | ||||||
Bunge | 54,774 | 3,244 | ||||||
C.R. Bard | 51,707 | 11,597 | ||||||
CACI International, Cl A * | 77,415 | 7,811 | ||||||
Capitol Federal Financial | 477,092 | 6,713 | ||||||
Capstead Mortgage ‡ | 39,630 | 374 | ||||||
Cardinal Health | 134,707 | 10,467 | ||||||
Chemed | 65,359 | 9,220 | ||||||
Chimera Investment ‡ | 457,623 | 7,299 | ||||||
Church & Dwight | 227,952 | 10,923 | ||||||
Clifton Bancorp | 24,776 | 379 | ||||||
Clorox | 168,546 | 21,099 | ||||||
CME Group | 4,023 | 421 | ||||||
Coca-Cola | 258,267 | 10,930 | ||||||
Colgate-Palmolive | 145,431 | 10,782 | ||||||
Consolidated Edison | 101,783 | 7,664 | ||||||
Costco Wholesale | 52,855 | 8,061 | ||||||
CSG Systems International | 21,071 | 871 | ||||||
Darden Restaurants | 78,344 | 4,804 | ||||||
DaVita HealthCare Partners * | 171,636 | 11,340 | ||||||
Dime Community Bancshares | 30,139 | 505 | ||||||
Dollar General | 57,076 | 3,995 | ||||||
Dr Pepper Snapple Group | 46,790 | 4,272 | ||||||
Duke Energy | 91,047 | 7,287 | ||||||
Ellington Residential Mortgage ‡ | 7,588 | 99 | ||||||
Equity Residential ‡ | 33,029 | 2,125 | ||||||
Estee Lauder, Cl A | 115,533 | 10,232 | ||||||
Exactech * | 5,765 | 156 | ||||||
Expeditors International of Washington | 7,715 | 397 | ||||||
Express Scripts Holding * | 26,101 | 1,841 | ||||||
First Defiance Financial | 4,932 | 220 | ||||||
Flagstar Bancorp * | 7,412 | 206 | ||||||
Fresh Del Monte Produce | 196,100 | 11,746 | ||||||
GameStop, Cl A | 198,032 | 5,464 | ||||||
General Mills | 275,123 | 17,575 | ||||||
| Description | Shares | Market Value ($ Thousands) | ||||||
COMMON STOCK (continued) | ||||||||
Genworth Financial, Cl A * | 161,632 | $ | 802 | |||||
Gilead Sciences | 106,468 | 8,424 | ||||||
Great Plains Energy | 95,508 | 2,606 | ||||||
Henry Schein * | 63,568 | 10,360 | ||||||
Hershey | 22,972 | 2,196 | ||||||
Hill-Rom Holdings | 38,127 | 2,363 | ||||||
Hormel Foods | 40,057 | 1,519 | ||||||
IAC * | 10,927 | 683 | ||||||
Ingredion | 48,221 | 6,416 | ||||||
Intuitive Surgical * | 7,456 | 5,404 | ||||||
J&J Snack Foods | 14,468 | 1,723 | ||||||
Jack Henry & Associates | 100,274 | 8,578 | ||||||
JM Smucker | 46,020 | 6,238 | ||||||
Johnson & Johnson | 126,488 | 14,942 | ||||||
Kaiser Aluminum | 94,256 | 8,152 | ||||||
Kearny Financial | 229,279 | 3,121 | ||||||
Kellogg | 133,497 | 10,342 | ||||||
Kimberly-Clark | 162,723 | 20,526 | ||||||
Kohl's | 33,735 | 1,476 | ||||||
Lancaster Colony | 3,665 | 484 | ||||||
Liberty Media Group, Cl A * | 134,209 | 3,845 | ||||||
LifePoint Health * | 68,811 | 4,076 | ||||||
Lockheed Martin | 4,472 | 1,072 | ||||||
Mantech International, Cl A | 60,927 | 2,296 | ||||||
Masimo * | 27,753 | 1,651 | ||||||
McCormick | 103,839 | 10,376 | ||||||
McDonald's | 110,050 | 12,695 | ||||||
McKesson | 2,603 | 434 | ||||||
Medifast | 10,061 | 380 | ||||||
Merck | 168,977 | 10,546 | ||||||
Meridian Bancorp | 39,255 | 611 | ||||||
Meridian Bioscience | 50,441 | 973 | ||||||
Mettler Toledo International * | 13,057 | 5,482 | ||||||
Michael Kors Holdings * | 17,311 | 810 | ||||||
National HealthCare | 15,961 | 1,053 | ||||||
NETGEAR * | 4,552 | 275 | ||||||
New York Times, Cl A | 50,385 | 602 | ||||||
Newmont Mining | 137,625 | 5,407 | ||||||
NII Holdings * | 346,321 | 1,153 | ||||||
Northfield Bancorp | 61,626 | 992 | ||||||
Northwest Bancshares | 241,552 | 3,795 | ||||||
Nucor | 27,901 | 1,380 | ||||||
Oil-Dri Corp of America | 2,201 | 83 | ||||||
Otter Tail | 6,228 | 215 | ||||||
Owens & Minor | 272,449 | 9,462 | ||||||
PepsiCo | 125,828 | 13,686 | ||||||
Pfizer | 300,268 | 10,170 | ||||||
Philip Morris International | 109,808 | 10,676 | ||||||
Pinnacle West Capital | 23,937 | 1,819 | ||||||
PPL | 31,406 | 1,086 | ||||||
Prestige Brands Holdings, Cl A * | 13,186 | 637 | ||||||
Procter & Gamble | 200,966 | 18,037 | ||||||
SEI Institutional Managed Trust / Annual Report / September 30, 2016 |
5 |
SCHEDULE OF INVESTMENTS
September 30, 2016
Global Managed Volatility Fund (Continued)
Description | Shares | Market Value ($ Thousands) | ||||||
COMMON STOCK (continued) | ||||||||
Progress Software | 13,757 | $ | 374 | |||||
Quality Systems * | 42,611 | 482 | ||||||
Quest Diagnostics | 132,457 | 11,210 | ||||||
Reading International, Cl A * | 10,388 | 139 | ||||||
Reliance Steel & Aluminum | 148,601 | 10,704 | ||||||
Republic Services | 221,347 | 11,167 | ||||||
ResMed | 10,213 | 662 | ||||||
Southern | 215,618 | 11,061 | ||||||
Spectrum Brands Holdings | 85,005 | 11,704 | ||||||
Stryker | 15,654 | 1,822 | ||||||
Sykes Enterprises * | 19,217 | 541 | ||||||
Symantec, Cl A | 184,084 | 4,621 | ||||||
Synopsys * | 31,188 | 1,851 | ||||||
SYSCO, Cl A | 462,691 | 22,677 | ||||||
Target, Cl A | 30,597 | 2,101 | ||||||
Teleflex | 64,954 | 10,916 | ||||||
Telephone & Data Systems | 92,648 | 2,518 | ||||||
Territorial Bancorp | 4,643 | 133 | ||||||
Trustco Bank NY | 50,155 | 356 | ||||||
United Parcel Service, Cl B | 100,910 | 11,036 | ||||||
United Therapeutics * | 37,660 | 4,447 | ||||||
Unitil | 53,025 | 2,071 | ||||||
Universal | 104,464 | 6,082 | ||||||
US Cellular * | 9,756 | 355 | ||||||
Varian Medical Systems * | 87,589 | 8,718 | ||||||
Vector Group | 172,255 | 3,709 | ||||||
VMware, Cl A * | 33,908 | 2,487 | ||||||
Voya Financial | 322,602 | 9,297 | ||||||
Wal-Mart Stores | 287,665 | 20,746 | ||||||
Walt Disney | 84,745 | 7,869 | ||||||
Waste Management | 180,447 | 11,505 | ||||||
Waters * | 8,262 | 1,309 | ||||||
Waterstone Financial | 28,828 | 490 | ||||||
WD-40 | 18,425 | 2,072 | ||||||
Weis Markets | 8,823 | 468 | ||||||
Xcel Energy | 96,284 | 3,961 | ||||||
|
|
| ||||||
| 766,889 | ||||||||
|
|
| ||||||
Total Common Stock (Cost $1,406,520) ($ Thousands) | 1,613,501 | |||||||
|
|
| ||||||
PREFERRED STOCK — 0.3% | ||||||||
Germany — 0.3% | ||||||||
Henkel & KGaA | 30,981 | 4,218 | ||||||
|
|
| ||||||
Sweden — 0.0% | ||||||||
Akelius Residential Property | 14,552 | 546 | ||||||
|
|
| ||||||
Total Preferred Stock (Cost $4,580) ($ Thousands) | 4,764 | |||||||
|
|
| ||||||
| Description | Number of Rights | Market Value ($ Thousands) | ||||||
RIGHTS — 0.0% | ||||||||
United Kingdom — 0.0% | ||||||||
Tritax Big Box, Expires 10/18/2016 * | 21,020 | $ | 2 | |||||
|
|
| ||||||
Total Rights | 2 | |||||||
|
|
| ||||||
| Face Amount (Thousands) | ||||||||
U.S. TREASURY OBLIGATION — 0.3% |
| |||||||
U.S. Treasury Bills |
| |||||||
0.232%, 10/20/2016 (B) | $ | 4,300 | 4,300 | |||||
|
|
| ||||||
Total U.S. Treasury Obligation | 4,300 | |||||||
|
|
| ||||||
| Shares | ||||||||
CASH EQUIVALENT — 4.8% | ||||||||
SEI Daily Income Trust, Government Fund, Cl A | ||||||||
0.220%**† | 83,471,339 | 83,471 | ||||||
|
|
| ||||||
Total Cash Equivalent | 83,471 | |||||||
|
|
| ||||||
Total Investments — 99.0% | $ | 1,706,038 | ||||||
|
|
| ||||||
6 |
SEI Institutional Managed Trust / Annual Report / September 30, 2016 |
SCHEDULE OF INVESTMENTS
September 30, 2016
Global Managed Volatility Fund (Continued)
A list of the open futures contracts held by the Fund at September 30, 2016, is as follows:
| Type of Contract | Number of Contracts Long | Expiration Date | Unrealized Appreciation (Depreciation) ($ Thousands) | |||||||||
DJ Euro Stoxx 50 Index | 238 | Dec-2016 | $72 | |||||||||
FTSE 100 Index | 61 | Dec-2016 | 149 | |||||||||
Hang Seng Index | 8 | Oct-2016 | (6) | |||||||||
S&P 500 Index E-MINI | 358 | Dec-2016 | (199) | |||||||||
SPI 200 Index | 27 | Dec-2016 | 71 | |||||||||
Topix Index | 41 | Dec-2016 | (11) | |||||||||
|
| |||||||||||
| $76 | ||||||||||||
|
| |||||||||||
For the year ended September 30, 2016, the total amount of all open futures contracts, as presented in the table above, are representative of the volume of activity for the derivative type during the year.
A list of the open forward foreign currency contracts held by the Fund at September 30, 2016, is as follows:
Settlement Date | Currency to Deliver (Thousands) | Currency To Receive (Thousands) | Unrealized Appreciation (Depreciation) ($ Thousands) | |||||||||||||||||
10/28/16 | USD | 30 | DKK | 201 | $— | |||||||||||||||
10/28/16 | USD | 35 | DKK | 232 | — | |||||||||||||||
10/28/16 | USD | 3 | SEK | 28 | — | |||||||||||||||
10/28/16 | USD | 139 | SEK | 1,190 | — | |||||||||||||||
10/28/16 | USD | 194 | SGD | 264 | — | |||||||||||||||
10/28/16 | USD | 487 | HKD | 3,779 | — | |||||||||||||||
10/28/16 | USD | 192 | AUD | 251 | — | |||||||||||||||
10/28/16 | USD | 409 | AUD | 535 | — | |||||||||||||||
10/28/16 | USD | 356 | NOK | 2,878 | 4 | |||||||||||||||
10/28/16 | USD | 251 | NOK | 2,007 | — | |||||||||||||||
10/28/16 | USD | 133 | CHF | 129 | — | |||||||||||||||
10/28/16 | USD | 477 | CHF | 461 | (1) | |||||||||||||||
10/28/16 | USD | 617 | NZD | 848 | (1) | |||||||||||||||
10/28/16 | USD | 389 | GBP | 300 | — | |||||||||||||||
10/28/16 | USD | 441 | GBP | 339 | — | |||||||||||||||
10/28/16 | USD | 471 | EUR | 419 | — | |||||||||||||||
10/28/16 | USD | 616 | EUR | 547 | (1) | |||||||||||||||
10/28/16 | USD | 316 | CAD | 418 | 2 | |||||||||||||||
10/28/16 | USD | 1,003 | CAD | 1,315 | (2) | |||||||||||||||
10/28/16 | USD | 1,695 | JPY | 170,242 | (12) | |||||||||||||||
10/28/16 | SGD | 16,987 | USD | 12,492 | 26 | |||||||||||||||
10/28/16 | DKK | 25,951 | USD | 3,928 | 6 | |||||||||||||||
10/28/16 | DKK | 84 | USD | 13 | — | |||||||||||||||
10/28/16 | NZD | 36,376 | USD | 26,406 | (13) | |||||||||||||||
10/28/16 | GBP | 37,259 | USD | 48,367 | (52) | |||||||||||||||
10/28/16 | CHF | 38,264 | USD | 39,611 | 71 | |||||||||||||||
10/28/16 | CHF | 109 | USD | 113 | — | |||||||||||||||
10/28/16 | AUD | 88 | USD | 68 | — | |||||||||||||||
10/28/16 | AUD | 43,193 | USD | 32,973 | (57) | |||||||||||||||
10/28/16 | EUR | 62,735 | USD | 70,780 | 201 | |||||||||||||||
10/28/16 | EUR | 192 | USD | 215 | (1) | |||||||||||||||
10/28/16 | SEK | 106,124 | USD | 12,463 | 58 | |||||||||||||||
10/28/16 | SEK | 245 | USD | 28 | — | |||||||||||||||
Settlement Date | Currency to Deliver (Thousands) | Currency To Receive (Thousands) | Unrealized Appreciation (Depreciation) ($ Thousands) | |||||||||||||||||
10/28/16 | CAD | 108,544 | USD | 82,421 | $(195) | |||||||||||||||
10/28/16 | NOK | 172,764 | USD | 21,315 | (309) | |||||||||||||||
10/28/16 | HKD | 670 | USD | 86 | — | |||||||||||||||
10/28/16 | HKD | 224,627 | USD | 28,969 | (1) | |||||||||||||||
10/28/16 | JPY | 6,491,083 | USD | 64,722 | 548 | |||||||||||||||
10/28/16 | JPY | 79,048 | USD | 778 | (3) | |||||||||||||||
|
| |||||||||||||||||||
| $268 | ||||||||||||||||||||
|
| |||||||||||||||||||
A list of the counterparties for the outstanding forward foreign currency contracts held by the Fund at September 30, 2016, is as follows:
| Counterparty | Currency to Deliver ($ Thousands) | Currency to Receive ($ Thousands) | Unrealized Appreciation ($ Thousands) | |||||||||
Brown Brothers Harriman | $(453,727) | $453,995 | $268 | |||||||||
|
| |||||||||||
For the year ended September 30, 2016 the total amount of all open forward foreign currency contracts, as presented in the table above, are representative of the volume of activity for the derivative type during the year.
| Percentages are based on Net Assets of $1,723,671 ($ Thousands). |
| * | Non-income producing security. |
| ** | Rate shown is the 7-day effective yield as of September 30, 2016. |
| ‡ | Real Estate Investment Trust. |
| † | Investment in Affiliated Security (see Note 6). |
| (A) | Security exempt from registration under Rule 144A of the Securities Act of 1933. These securities may be resold in transactions exempt from registration normally to qualified institutions. On September 30, 2016, the value of these securities amounted to $5,233 ($ Thousands), representing 0.3% of the net assets of the Fund. |
| (B) | Security, or portion thereof, has been pledged as collateral on open futures contracts. |
AUD — Australian Dollar
CAD — Canadian Dollar
CHF — Swiss Franc
Cl — Class
DJ — Dow Jones
DKK — Danish Krone
EUR — Euro
FTSE— Financial Times and Stock Exchange
GBP — British Pound Sterling
HKD — Hong Kong Dollar
JPY — Japanese Yen
NOK — Norwegian Krone
NZD — New Zealand Dollar
S&P— Standard & Poor's
SEK — Swedish Krona
SGD — Singapore Dollar
SPI — Share Price Index
USD — United States Dollar
SEI Institutional Managed Trust / Annual Report / September 30, 2016 |
7 |
SCHEDULE OF INVESTMENTS
September 30, 2016
Global Managed Volatility Fund (Concluded)
The following is a list of the level of inputs used as of September 30, 2016, in valuing the Fund’s investments and other financial instruments carried at value ($ Thousands):
| Investments in Securities | Level 1 | Level 2 | Level 3 | Total | ||||||||||||
Common Stock | $ | 1,606,477 | $ | 7,024 | $ | – | $ | 1,613,501 | ||||||||
Preferred Stock | 4,764 | – | – | 4,764 | ||||||||||||
Rights | 2 | – | – | 2 | ||||||||||||
U.S. Treasury Obligation | – | 4,300 | – | 4,300 | ||||||||||||
Cash Equivalent | 83,471 | – | – | 83,471 | ||||||||||||
|
|
|
|
|
|
|
|
|
|
|
| |||||
Total Investments in Securities | $ | 1,694,714 | $ | 11,324 | $ | – | $ | 1,706,038 | ||||||||
|
|
|
|
|
|
|
|
|
|
|
| |||||
| Other Financial Instruments | Level 1 | Level 2 | Level 3 | Total | ||||||||||||
Futures Contracts * | ||||||||||||||||
Unrealized Appreciation | $ | 292 | $ | — | $ | — | $ | 292 | ||||||||
Unrealized Depreciation | (216) | — | — | (216) | ||||||||||||
Forwards Contracts * | ||||||||||||||||
Unrealized Appreciation | — | 916 | — | 916 | ||||||||||||
Unrealized Depreciation | — | (648) | — | (648) | ||||||||||||
|
|
|
|
|
|
|
|
|
|
|
| |||||
Total Other Financial Instruments | $ | 76 | $ | 268 | $ | — | $ | 344 | ||||||||
|
|
|
|
|
|
|
|
|
|
|
| |||||
* Futures contracts and forward contracts are valued at the unrealized appreciation (depreciation) on the instrument.
For the year ended September 30, 2016, there were no transfers between Level 1 and Level 2 assets and liabilities.
For the year ended September 30, 2016, there were no transfers between Level 2 and Level 3 assets and liabilities.
For more information on valuation inputs, see Note 2 – Significant Accounting Policies in Notes to Financial Statements.
Amounts designated as “—” are $0 or have been rounded to $0.
The accompanying notes are an integral part of the financial statements.
8 |
SEI Institutional Managed Trust / Annual Report / September 30, 2016 |
SCHEDULE OF INVESTMENTS
September 30, 2016
Tax-Managed Managed Volatility Fund
| Description | Shares | Market Value ($ Thousands) | ||||||
COMMON STOCK — 97.0% | ||||||||
Consumer Discretionary — 7.0% | ||||||||
American Eagle Outfitters | 141,410 | $ | 2,526 | |||||
Autozone * | 3,400 | 2,612 | ||||||
Bed Bath & Beyond | 64,070 | 2,762 | ||||||
Best Buy | 13,870 | 530 | ||||||
Big Lots | 90,390 | 4,316 | ||||||
Brinker International | 63,223 | 3,188 | ||||||
Canadian Tire, Cl A | 29,600 | 2,959 | ||||||
Charter Communications, Cl A * | 5,444 | 1,470 | ||||||
Cheesecake Factory | 44,100 | 2,208 | ||||||
Children's Place | 37,800 | 3,019 | ||||||
Cogeco Communications | 10,500 | 517 | ||||||
Comcast, Cl A | 42,900 | 2,846 | ||||||
Darden Restaurants | 34,900 | 2,140 | ||||||
Dillard's, Cl A | 30,212 | 1,904 | ||||||
Dollar General | 18,394 | 1,287 | ||||||
Dunkin' Brands Group | 40,288 | 2,098 | ||||||
Fiat Chrysler Automobiles * | 30,990 | 198 | ||||||
Foot Locker, Cl A | 71,400 | 4,835 | ||||||
Graham Holdings, Cl B | 1,400 | 674 | ||||||
Grand Canyon Education * | 9,070 | 366 | ||||||
Kohl's | 69,100 | 3,023 | ||||||
Lear | 3,680 | 446 | ||||||
McDonald's | 62,343 | 7,192 | ||||||
Michael Kors Holdings * | 56,395 | 2,639 | ||||||
NVR * | 2,250 | 3,690 | ||||||
Panera Bread, Cl A * | 29,875 | 5,817 | ||||||
Sally Beauty Holdings * | 111,200 | 2,856 | ||||||
Scripps Networks Interactive, Cl A | 46,400 | 2,946 | ||||||
Target, Cl A | 167,437 | 11,500 | ||||||
Tenneco * | 8,210 | 478 | ||||||
Urban Outfitters * | 6,130 | 212 | ||||||
Viacom, Cl B | 28,600 | 1,090 | ||||||
|
|
| ||||||
| 84,344 | ||||||||
|
|
| ||||||
Consumer Staples — 18.6% | ||||||||
Altria Group | 261,314 | 16,523 | ||||||
Archer-Daniels-Midland | 45,200 | 1,906 | ||||||
Bunge | 41,700 | 2,470 | ||||||
Cal-Maine Foods * | 68,600 | 2,644 | ||||||
Campbell Soup | 19,049 | 1,042 | ||||||
Church & Dwight | 123,346 | 5,911 | ||||||
Clorox | 66,941 | 8,380 | ||||||
Coca-Cola | 110,792 | 4,689 | ||||||
Coca-Cola European Partners | 49,400 | 1,971 | ||||||
Colgate-Palmolive | 108,720 | 8,060 | ||||||
ConAgra Foods | 123,574 | 5,822 | ||||||
Costco Wholesale | 46,833 | 7,142 | ||||||
CVS Health | 49,900 | 4,441 | ||||||
Dean Foods | 171,136 | 2,807 | ||||||
Dr Pepper Snapple Group | 126,030 | 11,508 | ||||||
General Mills | 87,916 | 5,616 | ||||||
| Description | Shares | Market Value ($ Thousands) | ||||||
COMMON STOCK (continued) | ||||||||
Hershey | 51,971 | $ | 4,968 | |||||
Ingredion | 47,527 | 6,324 | ||||||
JM Smucker | 38,052 | 5,158 | ||||||
Kellogg | 109,824 | 8,508 | ||||||
Kimberly-Clark | 43,939 | 5,542 | ||||||
Kroger | 213,256 | 6,329 | ||||||
McCormick | 77,336 | 7,727 | ||||||
Metro, Cl A | 58,400 | 1,914 | ||||||
Nu Skin Enterprises, Cl A | 58,731 | 3,805 | ||||||
PepsiCo | 92,067 | 10,014 | ||||||
Philip Morris International | 103,617 | 10,074 | ||||||
Pinnacle Foods | 18,100 | 908 | ||||||
Procter & Gamble | 93,908 | 8,428 | ||||||
Reynolds American | 137,289 | 6,473 | ||||||
Sanderson Farms | 28,200 | 2,716 | ||||||
SYSCO, Cl A | 207,100 | 10,150 | ||||||
Tyson Foods, Cl A | 129,190 | 9,647 | ||||||
Universal | 16,000 | 931 | ||||||
Wal-Mart Stores | 262,663 | 18,943 | ||||||
Weis Markets | 43,300 | 2,295 | ||||||
Whole Foods Market | 62,425 | 1,770 | ||||||
|
|
| ||||||
| 223,556 | ||||||||
|
|
| ||||||
Energy — 0.7% | ||||||||
Exxon Mobil | 94,000 | 8,204 | ||||||
|
|
| ||||||
Financials — 15.0% | ||||||||
Aflac | 56,400 | 4,053 | ||||||
Allied World Assurance Holdings | 131,751 | 5,325 | ||||||
Allstate | 86,300 | 5,970 | ||||||
American Capital Agency, Cl A ‡ | 147,233 | 2,877 | ||||||
American Financial Group | 90,130 | 6,760 | ||||||
Arch Capital Group * | 83,237 | 6,597 | ||||||
Aspen Insurance Holdings | 90,015 | 4,194 | ||||||
Assurant | 13,330 | 1,230 | ||||||
Assured Guaranty | 145,920 | 4,049 | ||||||
Axis Capital Holdings | 205,917 | 11,187 | ||||||
Berkshire Hathaway, Cl B * | 59,100 | 8,538 | ||||||
BOK Financial | 52,300 | 3,607 | ||||||
Canadian Imperial Bank of Commerce | 31,000 | 2,400 | ||||||
CBOE Holdings | 148,665 | 9,641 | ||||||
Chubb | 12,399 | 1,558 | ||||||
Endurance Specialty Holdings | 42,200 | 2,762 | ||||||
Everest Re Group | 63,442 | 12,052 | ||||||
Genworth MI Canada | 23,900 | 614 | ||||||
Hanover Insurance Group, Cl A | 22,140 | 1,670 | ||||||
Maiden Holdings | 62,300 | 791 | ||||||
Markel * | 4,220 | 3,919 | ||||||
MFA Financial ‡ | 787,489 | 5,890 | ||||||
Morningstar, Cl A | 57,051 | 4,522 | ||||||
National Bank of Canada | 71,400 | 2,527 | ||||||
Popular | 21,070 | 805 | ||||||
SEI Institutional Managed Trust / Annual Report / September 30, 2016 |
1 |
SCHEDULE OF INVESTMENTS
September 30, 2016
Tax-Managed Managed Volatility Fund (Continued)
| Description | Shares | Market Value ($ Thousands) | ||||||
COMMON STOCK (continued) | ||||||||
ProAssurance | 78,979 | $ | 4,145 | |||||
Progressive | 115,800 | 3,648 | ||||||
Reinsurance Group of America, Cl A | 38,990 | 4,209 | ||||||
RenaissanceRe Holdings | 113,370 | 13,623 | ||||||
Starwood Property Trust ‡ | 113,800 | 2,563 | ||||||
TFS Financial | 173,405 | 3,088 | ||||||
Travelers | 97,150 | 11,129 | ||||||
Two Harbors Investment ‡ | 309,947 | 2,644 | ||||||
Validus Holdings | 295,336 | 14,714 | ||||||
Voya Financial | 13,830 | 399 | ||||||
White Mountains Insurance Group | 5,757 | 4,778 | ||||||
XL Group | 30,035 | 1,010 | ||||||
|
|
| ||||||
| 179,488 | ||||||||
|
|
| ||||||
Health Care — 14.9% | ||||||||
AbbVie | 53,300 | 3,362 | ||||||
Aetna, Cl A | 63,300 | 7,308 | ||||||
AmerisourceBergen | 78,858 | 6,370 | ||||||
Amgen, Cl A | 40,710 | 6,791 | ||||||
Anthem | 56,500 | 7,080 | ||||||
AstraZeneca ADR | 107,200 | 3,523 | ||||||
Baxter International | 18,420 | 877 | ||||||
Biogen * | 5,620 | 1,759 | ||||||
C.R. Bard | 8,000 | 1,794 | ||||||
Cardinal Health | 112,500 | 8,741 | ||||||
DaVita HealthCare Partners * | 51,260 | 3,387 | ||||||
Edwards Lifesciences, Cl A * | 2,820 | 340 | ||||||
Eli Lilly | 48,900 | 3,925 | ||||||
Express Scripts Holding * | 61,100 | 4,309 | ||||||
Gilead Sciences | 48,360 | 3,826 | ||||||
HCA Holdings * | 39,500 | 2,987 | ||||||
Hill-Rom Holdings | 18,200 | 1,128 | ||||||
Hologic * | 62,870 | 2,441 | ||||||
Humana | 11,900 | 2,105 | ||||||
ICON * | 26,640 | 2,061 | ||||||
Johnson & Johnson | 221,361 | 26,149 | ||||||
Laboratory Corp of America Holdings * | 53,374 | 7,338 | ||||||
Mallinckrodt * | 5,080 | 355 | ||||||
Masimo * | 14,010 | 834 | ||||||
McKesson | 11,300 | 1,884 | ||||||
Merck | 252,680 | 15,770 | ||||||
Owens & Minor | 85,370 | 2,965 | ||||||
Patterson | 75,082 | 3,449 | ||||||
Pfizer | 659,915 | 22,351 | ||||||
Quest Diagnostics | 88,320 | 7,475 | ||||||
Stryker | 21,000 | 2,445 | ||||||
United Therapeutics * | 33,320 | 3,934 | ||||||
UnitedHealth Group | 61,650 | 8,631 | ||||||
Varian Medical Systems * | 5,500 | 547 | ||||||
|
|
| ||||||
| 178,241 | ||||||||
|
|
| ||||||
| Description | Shares | Market Value ($ Thousands) | ||||||
COMMON STOCK (continued) | ||||||||
Industrials — 8.1% | ||||||||
3M | 34,896 | $ | 6,150 | |||||
Alaska Air Group | 18,187 | 1,198 | ||||||
Allegiant Travel, Cl A | 3,000 | 396 | ||||||
Boeing | 21,700 | 2,859 | ||||||
BWX Technologies, Cl W | 101,770 | 3,905 | ||||||
Delta Air Lines, Cl A | 12,230 | 481 | ||||||
EMCOR Group | 42,345 | 2,525 | ||||||
Expeditors International of Washington | 104,761 | 5,397 | ||||||
General Dynamics | 8,600 | 1,334 | ||||||
Huntington Ingalls Industries, Cl A | 18,140 | 2,783 | ||||||
Kaman, Cl A | 32,900 | 1,445 | ||||||
L-3 Communications Holdings | 24,400 | 3,678 | ||||||
Landstar System | 88,124 | 6,000 | ||||||
Lockheed Martin | 35,667 | 8,550 | ||||||
Northrop Grumman | 49,100 | 10,505 | ||||||
Orbital ATK | 24,500 | 1,868 | ||||||
Owens Corning | 8,530 | 455 | ||||||
Quanta Services * | 157,569 | 4,410 | ||||||
Raytheon | 66,100 | 8,998 | ||||||
Republic Services | 118,700 | 5,988 | ||||||
Southwest Airlines, Cl A | 38,120 | 1,483 | ||||||
Spirit AeroSystems Holdings, Cl A * | 37,380 | 1,665 | ||||||
United Continental Holdings * | 18,050 | 947 | ||||||
United Parcel Service, Cl B | 26,600 | 2,909 | ||||||
United Technologies | 41,800 | 4,247 | ||||||
Waste Management | 116,082 | 7,401 | ||||||
|
|
| ||||||
| 97,577 | ||||||||
|
|
| ||||||
Information Technology — 10.3% | ||||||||
Amdocs | 202,640 | 11,723 | ||||||
Apple | 22,500 | 2,544 | ||||||
Applied Materials | 22,810 | 688 | ||||||
Aspen Technology * | 90,163 | 4,219 | ||||||
Automatic Data Processing | 41,459 | 3,657 | ||||||
Broadridge Financial Solutions | 44,500 | 3,017 | ||||||
CA | 84,690 | 2,801 | ||||||
Canon ADR | 87,700 | 2,546 | ||||||
Cisco Systems | 242,600 | 7,695 | ||||||
Citrix Systems * | 23,740 | 2,023 | ||||||
Convergys | 85,000 | 2,586 | ||||||
CSG Systems International | 37,600 | 1,554 | ||||||
eBay * | 130,590 | 4,296 | ||||||
Flex * | 16,170 | 220 | ||||||
Harris | 20,200 | 1,850 | ||||||
HP | 26,700 | 415 | ||||||
Intel | 210,500 | 7,946 | ||||||
International Business Machines | 59,400 | 9,436 | ||||||
Intuit | 35,440 | 3,899 | ||||||
Jack Henry & Associates | 13,800 | 1,180 | ||||||
Leidos Holdings | 4,230 | 183 | ||||||
Microsoft | 105,410 | 6,072 | ||||||
2 |
SEI Institutional Managed Trust / Annual Report / September 30, 2016 |
SCHEDULE OF INVESTMENTS
September 30, 2016
Tax-Managed Managed Volatility Fund (Continued)
| Description | Shares | Market Value ($ Thousands) | ||||||
COMMON STOCK (continued) | ||||||||
Motorola Solutions | 48,500 | $ | 3,699 | |||||
NetApp | 68,870 | 2,467 | ||||||
Oracle, Cl B | 105,830 | 4,157 | ||||||
Qualcomm | 51,900 | 3,555 | ||||||
Science Applications International | 14,671 | 1,018 | ||||||
Symantec, Cl A | 460,474 | 11,558 | ||||||
Synopsys * | 58,000 | 3,442 | ||||||
Take-Two Interactive Software, Cl A * | 93,259 | 4,204 | ||||||
Tech Data * | 22,200 | 1,880 | ||||||
Teradyne | 14,264 | 308 | ||||||
VeriSign * | 51,200 | 4,006 | ||||||
Western Union | 118,100 | 2,459 | ||||||
|
|
| ||||||
| 123,303 | ||||||||
|
|
| ||||||
Materials — 1.6% | ||||||||
AptarGroup | 7,900 | 612 | ||||||
Avery Dennison | 31,600 | 2,458 | ||||||
Bemis | 44,400 | 2,265 | ||||||
Cabot | 35,076 | 1,838 | ||||||
Celanese, Ser A | 2,780 | 185 | ||||||
Compass Minerals International, Cl A | 11,576 | 853 | ||||||
Kaiser Aluminum | 33,600 | 2,906 | ||||||
LyondellBasell Industries, Cl A | 7,480 | 603 | ||||||
Pan American Silver | 18,260 | 322 | ||||||
Reliance Steel & Aluminum | 13,741 | 990 | ||||||
Royal Gold, Cl A | 3,538 | 274 | ||||||
Sonoco Products | 74,703 | 3,947 | ||||||
Steel Dynamics | 13,850 | 346 | ||||||
Trinseo | 30,180 | 1,707 | ||||||
|
|
| ||||||
| 19,306 | ||||||||
|
|
| ||||||
Real Estate — 3.3% | ||||||||
Brixmor Property Group ‡ | 118,700 | 3,299 | ||||||
Equity LifeStyle Properties ‡ | 51,170 | 3,949 | ||||||
Mid-America Apartment Communities ‡ | 28,000 | 2,632 | ||||||
National Health Investors ‡ | 26,300 | 2,064 | ||||||
Piedmont Office Realty Trust, Cl A ‡ | 267,330 | 5,820 | ||||||
Post Properties ‡ | 55,654 | 3,680 | ||||||
Retail Properties of America, Cl A ‡ | 193,600 | 3,252 | ||||||
Select Income ‡ | 65,000 | 1,749 | ||||||
Senior Housing Properties Trust ‡ | 132,100 | 3,000 | ||||||
Tanger Factory Outlet Centers ‡ | 156,504 | 6,097 | ||||||
Welltower ‡ | 51,300 | 3,836 | ||||||
|
|
| ||||||
| 39,378 | ||||||||
|
|
| ||||||
Telecommunication Services — 5.0% | ||||||||
AT&T | 586,491 | 23,817 | ||||||
BCE | 67,200 | 3,098 | ||||||
CenturyTel | 105,200 | 2,886 | ||||||
NTT DoCoMo ADR | 130,100 | 3,306 | ||||||
Rogers Communications, Cl B | 38,700 | 1,639 | ||||||
SK Telecom ADR | 129,800 | 2,933 | ||||||
Telephone & Data Systems | 19,850 | 540 | ||||||
| Description | Shares | Market Value ($ Thousands) | ||||||
COMMON STOCK (continued) | ||||||||
TELUS | 115,600 | $ | 3,808 | |||||
Verizon Communications | 353,624 | 18,381 | ||||||
|
|
| ||||||
| 60,408 | ||||||||
|
|
| ||||||
Utilities — 12.5% | ||||||||
AES | 173,305 | 2,227 | ||||||
Alliant Energy | 12,600 | 483 | ||||||
Ameren | 60,200 | 2,961 | ||||||
American Electric Power | 162,970 | 10,464 | ||||||
Atmos Energy | 7,375 | 549 | ||||||
CMS Energy | 89,620 | 3,765 | ||||||
Consolidated Edison | 165,942 | 12,495 | ||||||
DTE Energy | 52,332 | 4,902 | ||||||
Duke Energy | 55,583 | 4,449 | ||||||
Edison International | 155,510 | 11,236 | ||||||
Entergy | 144,460 | 11,084 | ||||||
Eversource Energy | 126,703 | 6,865 | ||||||
Exelon | 161,500 | 5,376 | ||||||
FirstEnergy | 167,080 | 5,527 | ||||||
Great Plains Energy | 23,336 | 637 | ||||||
ITC Holdings | 75,342 | 3,502 | ||||||
Korea Electric Power ADR | 123,300 | 3,006 | ||||||
NRG Energy | 75,200 | 843 | ||||||
PG&E | 171,750 | 10,506 | ||||||
Pinnacle West Capital | 81,212 | 6,171 | ||||||
Portland General Electric | 64,100 | 2,730 | ||||||
PPL | 53,000 | 1,832 | ||||||
Public Service Enterprise Group | 239,620 | 10,033 | ||||||
SCANA | 41,600 | 3,011 | ||||||
Southern | 162,833 | 8,353 | ||||||
Southwest Gas | 37,601 | 2,627 | ||||||
UGI | 57,750 | 2,613 | ||||||
Vectren | 73,315 | 3,680 | ||||||
WEC Energy Group | 121,631 | 7,283 | ||||||
|
|
| ||||||
| 149,210 | ||||||||
|
|
| ||||||
Total Common Stock (Cost $909,663) ($ Thousands) | 1,163,015 | |||||||
|
|
| ||||||
| Number of Rights | ||||||||
RIGHTS — 0.0% | ||||||||
United States — 0.0% | ||||||||
Safeway CVR - Casa Ley *‡‡ | 85,430 | 87 | ||||||
Safeway CVR - PDC *‡‡ | 85,430 | 4 | ||||||
|
|
| ||||||
Total Rights | 91 | |||||||
|
|
| ||||||
SEI Institutional Managed Trust / Annual Report / September 30, 2016 |
3 |
SCHEDULE OF INVESTMENTS
September 30, 2016
Tax-Managed Managed Volatility Fund (Concluded)
| Description | Face Amount (Thousands) | Market Value ($ Thousands) | ||||||
U.S. TREASURY OBLIGATION — 0.1% |
| |||||||
U.S. Treasury Bills | ||||||||
0.306%, 10/20/2016 (A)(B) | $ | 1,220 | $ | 1,220 | ||||
|
|
| ||||||
Total U.S. Treasury Obligation (Cost $1,220) ($ Thousands) | 1,220 | |||||||
|
|
| ||||||
| Shares | ||||||||
CASH EQUIVALENT — 2.8% | ||||||||
SEI Daily Income Trust, Government Fund, Cl A | ||||||||
0.220%**† | 34,071,775 | 34,072 | ||||||
|
|
| ||||||
Total Cash Equivalent (Cost $34,072) ($ Thousands) | 34,072 | |||||||
|
|
| ||||||
Total Investments — 99.9% (Cost $944,955) ($ Thousands) | $ | 1,198,398 | ||||||
|
|
| ||||||
A list of the open futures contracts held by the Fund at September 30, 2016, is as follows:
| Type of Contract | Number of Contracts Long | Expiration Date | Unrealized Depreciation ($ Thousands) | |||||||||
S&P 500 Index E-MINI | 196 | Dec-2016 | $(42) | |||||||||
|
| |||||||||||
For the year ended September 30, 2016, the total amount of all open futures contracts, as presented in the table above, are representative of the volume of activity for the derivative type during the year.
| Percentages are based on Net Assets of $1,199,495 ($ Thousands). |
| * | Non-income producing security. |
| ** | Rate shown is the 7-day effective yield as of September 30, 2016. |
| ‡ | Real Estate Investment Trust. |
| ‡‡ | Expiration date unavailable. |
| † | Investment in Affiliated Security (see Note 6). |
| (A) | Security, or portion thereof, has been pledged as collateral on open futures contracts. |
| (B) | The rate reported is the effective yield at time of purchase. |
ADR — American Depositary Receipt
Cl — Class
S&P— Standard & Poor's
Ser — Series
The following is a list of the level of inputs used as of September 30, 2016, in valuing the Fund’s investments and other financial instruments carried at value ($ Thousands):
| Investments in Securities | Level 1 | Level 2 | Level 3 | Total | ||||||||||||
Common Stock | $ | 1,163,015 | $ | – | $ | – | $ | 1,163,015 | ||||||||
Rights | – | 91 | – | 91 | ||||||||||||
U.S. Treasury Obligation | – | 1,220 | – | 1,220 | ||||||||||||
Cash Equivalent | 34,072 | – | – | 34,072 | ||||||||||||
|
|
|
|
|
|
|
|
|
|
|
| |||||
Total Investments in Securities | $ | 1,197,087 | $ | 1,311 | $ | – | $ | 1,198,398 | ||||||||
|
|
|
|
|
|
|
|
|
|
|
| |||||
| Other Financial Instruments | Level 1 | Level 2 | Level 3 | Total | ||||||||||||
Futures Contracts * | ||||||||||||||||
Unrealized Depreciation | $ | (42) | $ | — | $ | — | $ | (42) | ||||||||
|
|
|
|
|
|
|
|
|
|
|
| |||||
Total Other Financial Instruments | $ | (42) | $ | — | $ | — | $ | (42) | ||||||||
|
|
|
|
|
|
|
|
|
|
|
| |||||
* Futures contracts are valued at the unrealized depreciation on the instrument.
For the year ended September 30, 2016, there were no transfers between Level 1 and Level 2 assets and liabilities.
For the year ended September 30, 2016, there were no transfers between Level 2 and Level 3 assets and liabilities.
For more information on valuation inputs, see Note 2 – Significant Accounting Policies in Notes to Financial Statements.
Amounts designated as “—” are $0 or have been rounded to $0.
The accompanying notes are an integral part of the financial statements.
4 |
SEI Institutional Managed Trust / Annual Report / September 30, 2016 |
SCHEDULE OF INVESTMENTS
September 30, 2016
Dynamic Asset Allocation Fund
| Description | Shares | Market Value ($ Thousands) | ||||||
COMMON STOCK — 97.3% | ||||||||
Consumer Discretionary — 12.2% | ||||||||
Advance Auto Parts | 2,094 | $ | 312 | |||||
Amazon.com, Cl A * | 11,036 | 9,241 | ||||||
Autonation * | 2,116 | 103 | ||||||
Autozone * | 825 | 634 | ||||||
Bed Bath & Beyond | 4,655 | 201 | ||||||
Best Buy | 7,878 | 301 | ||||||
BorgWarner | 5,801 | 204 | ||||||
CarMax * | 5,456 | 291 | ||||||
Carnival | 11,880 | 580 | ||||||
CBS, Cl B | 11,588 | 634 | ||||||
Charter Communications, Cl A * | 6,000 | 1,620 | ||||||
Chipotle Mexican Grill, Cl A * | 823 | 349 | ||||||
Coach | 7,634 | 279 | ||||||
Comcast, Cl A | 67,390 | 4,471 | ||||||
Darden Restaurants | 3,234 | 198 | ||||||
Delphi Automotive | 7,741 | 552 | ||||||
Discovery Communications, Cl A * | 4,029 | 108 | ||||||
Discovery Communications, Cl C * | 6,593 | 173 | ||||||
Dollar General | 7,873 | 551 | ||||||
Dollar Tree * | 6,585 | 520 | ||||||
DR Horton | 9,286 | 280 | ||||||
Expedia | 3,415 | 399 | ||||||
Foot Locker, Cl A | 3,700 | 251 | ||||||
Ford Motor | 107,776 | 1,301 | ||||||
Gap | 6,198 | 138 | ||||||
Garmin | 3,304 | 159 | ||||||
General Motors | 39,977 | 1,270 | ||||||
Genuine Parts | 4,004 | 402 | ||||||
Goodyear Tire & Rubber | 7,416 | 240 | ||||||
H&R Block | 6,610 | 153 | ||||||
Hanesbrands | 10,667 | 269 | ||||||
Harley-Davidson, Cl A | 4,955 | 261 | ||||||
Harman International Industries, Cl A | 1,789 | 151 | ||||||
Hasbro | 3,098 | 246 | ||||||
Home Depot | 34,682 | 4,463 | ||||||
Interpublic Group | 11,197 | 250 | ||||||
Johnson Controls International | 25,938 | 1,207 | ||||||
Kohl's | 4,927 | 216 | ||||||
L Brands | 6,908 | 489 | ||||||
Leggett & Platt | 3,565 | 163 | ||||||
Lennar, Cl A | 4,874 | 206 | ||||||
LKQ * | 8,200 | 291 | ||||||
Lowe's | 24,545 | 1,772 | ||||||
Macy's | 8,430 | 312 | ||||||
Marriott International, Cl A | 9,051 | 609 | ||||||
Mattel | 9,299 | 282 | ||||||
McDonald's | 23,907 | 2,758 | ||||||
Michael Kors Holdings * | 4,828 | 226 | ||||||
Mohawk Industries * | 1,858 | 372 | ||||||
NetFlix * | 11,820 | 1,165 | ||||||
Newell Brands, Cl B | 13,613 | 717 | ||||||
| Description | Shares | Market Value ($ Thousands) | ||||||
COMMON STOCK (continued) | ||||||||
News, Cl A | 9,930 | $ | 139 | |||||
News, Cl B | 2,300 | 33 | ||||||
Nike, Cl B | 37,238 | 1,961 | ||||||
Nordstrom | 3,766 | 195 | ||||||
Omnicom Group | 6,569 | 558 | ||||||
O'Reilly Automotive * | 2,712 | 760 | ||||||
Priceline Group * | 1,409 | 2,073 | ||||||
PulteGroup | 8,243 | 165 | ||||||
PVH | 2,120 | 234 | ||||||
Ralph Lauren, Cl A | 1,660 | 168 | ||||||
Ross Stores | 11,035 | 710 | ||||||
Royal Caribbean Cruises | 4,710 | 353 | ||||||
Scripps Networks Interactive, Cl A | 2,494 | 158 | ||||||
Signet Jewelers | 2,113 | 157 | ||||||
Staples | 19,201 | 164 | ||||||
Starbucks | 40,957 | 2,217 | ||||||
Target, Cl A | 16,484 | 1,132 | ||||||
TEGNA | 5,938 | 130 | ||||||
Tiffany | 3,098 | 225 | ||||||
Time Warner | 22,023 | 1,753 | ||||||
TJX | 18,538 | 1,386 | ||||||
Tractor Supply | 3,546 | 239 | ||||||
TripAdvisor * | 3,097 | 196 | ||||||
Twenty-First Century Fox ADR, Cl A | 30,862 | 747 | ||||||
Twenty-First Century Fox, Cl B | 13,900 | 344 | ||||||
Ulta Salon Cosmetics & Fragrance * | 1,700 | 405 | ||||||
Under Armour, Cl A * | 4,946 | 191 | ||||||
Under Armour, Cl C * | 4,981 | 169 | ||||||
Urban Outfitters * | 2,059 | 71 | ||||||
VF | 9,140 | 512 | ||||||
Viacom, Cl B | 9,330 | 355 | ||||||
Walt Disney | 41,581 | 3,861 | ||||||
Whirlpool | 2,109 | 342 | ||||||
Wyndham Worldwide | 3,219 | 217 | ||||||
Wynn Resorts | 2,117 | 206 | ||||||
Yum! Brands | 10,397 | 944 | ||||||
|
|
| ||||||
| 65,810 | ||||||||
|
|
| ||||||
Consumer Staples — 9.6% | ||||||||
Altria Group | 54,469 | 3,444 | ||||||
Archer-Daniels-Midland | 16,341 | 689 | ||||||
Brown-Forman, Cl B | 5,628 | 267 | ||||||
Campbell Soup | 4,872 | 267 | ||||||
Church & Dwight | 7,400 | 355 | ||||||
Clorox | 3,522 | 441 | ||||||
Coca-Cola | 107,882 | 4,566 | ||||||
Colgate-Palmolive | 24,948 | 1,850 | ||||||
ConAgra Foods | 11,992 | 565 | ||||||
Constellation Brands, Cl A | 4,870 | 811 | ||||||
Costco Wholesale | 12,176 | 1,857 | ||||||
CVS Health | 29,799 | 2,652 | ||||||
Dr Pepper Snapple Group | 5,089 | 465 | ||||||
SEI Institutional Managed Trust / Annual Report / September 30, 2016 |
1 |
SCHEDULE OF INVESTMENTS
September 30, 2016
Dynamic Asset Allocation Fund (Continued)
| Description | Shares | Market Value ($ Thousands) | ||||||
COMMON STOCK (continued) | ||||||||
Estee Lauder, Cl A | 6,044 | $ | 535 | |||||
General Mills | 16,541 | 1,057 | ||||||
Hershey | 3,786 | 362 | ||||||
Hormel Foods | 7,316 | 277 | ||||||
JM Smucker | 3,304 | 448 | ||||||
Kellogg | 7,194 | 557 | ||||||
Kimberly-Clark | 9,977 | 1,259 | ||||||
Kraft Heinz | 16,500 | 1,477 | ||||||
Kroger | 26,248 | 779 | ||||||
McCormick | 3,314 | 331 | ||||||
Mead Johnson Nutrition, Cl A | 5,138 | 406 | ||||||
Molson Coors Brewing, Cl B | 5,224 | 574 | ||||||
Mondelez International, Cl A | 43,053 | 1,890 | ||||||
Monster Beverage * | 4,055 | 595 | ||||||
PepsiCo | 40,140 | 4,366 | ||||||
Philip Morris International | 43,137 | 4,194 | ||||||
Procter & Gamble | 74,609 | 6,696 | ||||||
Reynolds American | 23,064 | 1,087 | ||||||
SYSCO, Cl A | 14,843 | 727 | ||||||
Tyson Foods, Cl A | 8,375 | 625 | ||||||
Walgreens Boots Alliance | 23,907 | 1,927 | ||||||
Wal-Mart Stores | 42,376 | 3,056 | ||||||
Whole Foods Market | 9,251 | 262 | ||||||
|
|
| ||||||
| 51,716 | ||||||||
|
|
| ||||||
Energy — 7.1% | ||||||||
Anadarko Petroleum, Cl A | 14,393 | 912 | ||||||
Apache | 10,701 | 683 | ||||||
Baker Hughes | 12,415 | 627 | ||||||
Cabot Oil & Gas | 12,898 | 333 | ||||||
Chesapeake Energy * | 18,802 | 118 | ||||||
Chevron | 52,726 | 5,427 | ||||||
Cimarex Energy | 2,649 | 356 | ||||||
Concho Resources * | 3,900 | 536 | ||||||
ConocoPhillips | 34,186 | 1,486 | ||||||
Devon Energy | 14,726 | 650 | ||||||
EOG Resources | 15,327 | 1,482 | ||||||
EQT | 4,705 | 342 | ||||||
Exxon Mobil | 115,900 | 10,116 | ||||||
FMC Technologies * | 5,813 | 172 | ||||||
Halliburton | 24,042 | 1,079 | ||||||
Helmerich & Payne | 2,843 | 191 | ||||||
Hess | 7,274 | 390 | ||||||
Kinder Morgan | 54,014 | 1,249 | ||||||
Marathon Oil | 23,892 | 378 | ||||||
Marathon Petroleum | 15,037 | 610 | ||||||
Murphy Oil | 4,295 | 131 | ||||||
National Oilwell Varco, Cl A | 10,530 | 387 | ||||||
Newfield Exploration * | 5,573 | 242 | ||||||
Noble Energy | 11,737 | 419 | ||||||
Occidental Petroleum | 21,100 | 1,539 | ||||||
Oneok | 5,954 | 306 | ||||||
| Description | Shares | Market Value ($ Thousands) | ||||||
COMMON STOCK (continued) | ||||||||
Phillips 66 | 12,799 | $ | 1,031 | |||||
Pioneer Natural Resources | 4,792 | 890 | ||||||
Range Resources | 4,487 | 174 | ||||||
Schlumberger, Cl A | 38,737 | 3,046 | ||||||
Southwestern Energy * | 13,886 | 192 | ||||||
Spectra Energy | 18,957 | 810 | ||||||
Tesoro | 3,203 | 255 | ||||||
Transocean | 9,031 | 96 | ||||||
Valero Energy | 13,097 | 694 | ||||||
Williams | 18,746 | 576 | ||||||
|
|
| ||||||
| 37,925 | ||||||||
|
|
| ||||||
Financials — 12.4% | ||||||||
Affiliated Managers Group * | 1,529 | 221 | ||||||
Aflac | 11,409 | 820 | ||||||
Allstate | 10,312 | 713 | ||||||
American Express | 22,313 | 1,429 | ||||||
American International Group | 28,505 | 1,691 | ||||||
Ameriprise Financial | 4,617 | 461 | ||||||
Aon | 7,409 | 833 | ||||||
Arthur J. Gallagher | 4,700 | 239 | ||||||
Assurant | 1,782 | 164 | ||||||
Bank of America | 285,545 | 4,469 | ||||||
Bank of New York Mellon | 29,843 | 1,190 | ||||||
BB&T | 22,956 | 866 | ||||||
Berkshire Hathaway, Cl B * | 53,130 | 7,676 | ||||||
BlackRock | 3,515 | 1,274 | ||||||
Capital One Financial | 14,215 | 1,021 | ||||||
Charles Schwab | 33,635 | 1,062 | ||||||
Chubb | 12,866 | 1,617 | ||||||
Cincinnati Financial | 4,093 | 309 | ||||||
Citigroup | 81,345 | 3,842 | ||||||
Citizens Financial Group | 15,100 | 373 | ||||||
CME Group | 9,548 | 998 | ||||||
Comerica | 5,073 | 240 | ||||||
Discover Financial Services | 11,446 | 647 | ||||||
E*Trade Financial * | 8,170 | 238 | ||||||
Fifth Third Bancorp | 21,751 | 445 | ||||||
Franklin Resources | 10,436 | 371 | ||||||
Goldman Sachs Group | 10,721 | 1,729 | ||||||
Hartford Financial Services Group | 10,961 | 469 | ||||||
Huntington Bancshares | 29,847 | 294 | ||||||
Intercontinental Exchange | 3,256 | 877 | ||||||
Invesco | 11,212 | 351 | ||||||
JPMorgan Chase | 101,017 | 6,727 | ||||||
KeyCorp | 29,652 | 361 | ||||||
Legg Mason | 3,009 | 101 | ||||||
Leucadia National | 8,640 | 165 | ||||||
Lincoln National | 6,609 | 311 | ||||||
Loews | 7,389 | 304 | ||||||
M&T Bank | 4,508 | 523 | ||||||
Marsh & McLennan | 14,417 | 970 | ||||||
2 |
SEI Institutional Managed Trust / Annual Report / September 30, 2016 |
SCHEDULE OF INVESTMENTS
September 30, 2016
Dynamic Asset Allocation Fund (Continued)
| Description | Shares | Market Value ($ Thousands) | ||||||
COMMON STOCK (continued) | ||||||||
MetLife | 30,812 | $ | 1,369 | |||||
Moody's | 4,704 | 509 | ||||||
Morgan Stanley | 41,717 | 1,337 | ||||||
Nasdaq, Cl A | 2,987 | 202 | ||||||
Navient | 10,409 | 151 | ||||||
Northern Trust | 6,071 | 413 | ||||||
People's United Financial | 8,289 | 131 | ||||||
PNC Financial Services Group | 13,997 | 1,261 | ||||||
Principal Financial Group, Cl A | 7,733 | 398 | ||||||
Progressive | 16,521 | 520 | ||||||
Prudential Financial | 12,377 | 1,011 | ||||||
Regions Financial | 34,660 | 342 | ||||||
S&P Global | 7,278 | 921 | ||||||
SunTrust Banks | 13,839 | 606 | ||||||
Synchrony Financial | 22,801 | 638 | ||||||
T. Rowe Price Group | 6,740 | 448 | ||||||
Torchmark, Cl A | 3,035 | 194 | ||||||
Travelers | 8,052 | 922 | ||||||
Unum Group | 6,163 | 218 | ||||||
US Bancorp | 45,202 | 1,939 | ||||||
Wells Fargo | 127,033 | 5,625 | ||||||
Willis Towers Watson | 3,747 | 497 | ||||||
XL Group | 8,014 | 270 | ||||||
Zions Bancorporation | 5,337 | 166 | ||||||
|
|
| ||||||
| 66,479 | ||||||||
|
|
| ||||||
Health Care — 14.0% | ||||||||
Abbott Laboratories | 40,915 | 1,730 | ||||||
AbbVie | 45,125 | 2,846 | ||||||
Aetna, Cl A | 9,616 | 1,110 | ||||||
Agilent Technologies | 9,285 | 437 | ||||||
Alexion Pharmaceuticals * | 6,208 | 761 | ||||||
Allergan * | 10,980 | 2,529 | ||||||
AmerisourceBergen | 5,154 | 416 | ||||||
Amgen, Cl A | 20,863 | 3,480 | ||||||
Anthem | 7,338 | 920 | ||||||
Baxter International | 13,792 | 657 | ||||||
Becton Dickinson | 5,952 | 1,070 | ||||||
Biogen * | 6,050 | 1,894 | ||||||
Boston Scientific * | 37,592 | 895 | ||||||
Bristol-Myers Squibb | 46,538 | 2,509 | ||||||
C.R. Bard | 1,997 | 448 | ||||||
Cardinal Health | 9,003 | 700 | ||||||
Celgene, Cl A * | 21,394 | 2,236 | ||||||
Centene * | 4,600 | 308 | ||||||
Cerner * | 8,212 | 507 | ||||||
Cigna | 7,010 | 914 | ||||||
Cooper, Cl A | 1,400 | 251 | ||||||
DaVita HealthCare Partners * | 4,357 | 288 | ||||||
DENTSPLY SIRONA | 6,671 | 396 | ||||||
Edwards Lifesciences, Cl A * | 5,872 | 708 | ||||||
Eli Lilly | 26,913 | 2,160 | ||||||
| Description | Shares | Market Value ($ Thousands) | ||||||
COMMON STOCK (continued) | ||||||||
Endo International * | 5,438 | $ | 110 | |||||
Express Scripts Holding * | 17,632 | 1,244 | ||||||
Gilead Sciences | 37,013 | 2,928 | ||||||
HCA Holdings * | 8,343 | 631 | ||||||
Henry Schein * | 2,222 | 362 | ||||||
Hologic * | 8,000 | 311 | ||||||
Humana | 4,090 | 724 | ||||||
Illumina * | 4,100 | 745 | ||||||
Intuitive Surgical * | 1,046 | 758 | ||||||
Johnson & Johnson | 76,544 | 9,042 | ||||||
Laboratory Corp of America Holdings * | 2,917 | 401 | ||||||
Mallinckrodt * | 3,211 | 224 | ||||||
McKesson | 6,237 | 1,040 | ||||||
Medtronic | 39,141 | 3,382 | ||||||
Merck | 76,966 | 4,803 | ||||||
Mettler Toledo International * | 800 | 336 | ||||||
Mylan * | 12,626 | 481 | ||||||
Patterson | 2,462 | 113 | ||||||
PerkinElmer | 2,969 | 167 | ||||||
Perrigo | 4,076 | 376 | ||||||
Pfizer | 168,857 | 5,719 | ||||||
Quest Diagnostics | 4,078 | 345 | ||||||
Regeneron Pharmaceuticals * | 2,215 | 890 | ||||||
St. Jude Medical | 7,909 | 631 | ||||||
Stryker | 8,876 | 1,033 | ||||||
Thermo Fisher Scientific | 11,011 | 1,751 | ||||||
UnitedHealth Group | 26,411 | 3,698 | ||||||
Universal Health Services, Cl B | 2,542 | 313 | ||||||
Varian Medical Systems * | 2,565 | 255 | ||||||
Vertex Pharmaceuticals * | 6,758 | 589 | ||||||
Waters * | 2,320 | 368 | ||||||
Zimmer Biomet Holdings | 5,553 | 722 | ||||||
Zoetis, Cl A | 13,973 | 727 | ||||||
|
|
| ||||||
| 75,389 | ||||||||
|
|
| ||||||
Industrials — 9.7% | ||||||||
3M | 16,926 | 2,983 | ||||||
Acuity Brands | 1,200 | 318 | ||||||
Alaska Air Group | 3,300 | 217 | ||||||
Allegion | 2,494 | 172 | ||||||
American Airlines Group | 15,925 | 583 | ||||||
Ametek | 6,364 | 304 | ||||||
Boeing | 16,509 | 2,175 | ||||||
C.H. Robinson Worldwide | 3,887 | 274 | ||||||
Caterpillar, Cl A | 16,245 | 1,442 | ||||||
Cintas | 2,552 | 287 | ||||||
CSX | 26,188 | 799 | ||||||
Cummins | 4,463 | 572 | ||||||
Danaher, Cl A | 16,791 | 1,316 | ||||||
Deere | 8,313 | 710 | ||||||
Delta Air Lines, Cl A | 21,522 | 847 | ||||||
Dover | 4,246 | 313 | ||||||
SEI Institutional Managed Trust / Annual Report / September 30, 2016 |
3 |
SCHEDULE OF INVESTMENTS
September 30, 2016
Dynamic Asset Allocation Fund (Continued)
| Description | Shares | Market Value ($ Thousands) | ||||||
COMMON STOCK (continued) | ||||||||
Dun & Bradstreet | 952 | $ | 130 | |||||
Eaton | 12,539 | 824 | ||||||
Emerson Electric | 17,926 | 977 | ||||||
Equifax | 3,276 | 441 | ||||||
Expeditors International of Washington | 5,208 | 268 | ||||||
Fastenal, Cl A | 7,722 | 323 | ||||||
FedEx | 6,969 | 1,217 | ||||||
Flowserve | 3,454 | 167 | ||||||
Fluor | 3,692 | 189 | ||||||
Fortive | 8,195 | 417 | ||||||
Fortune Brands Home & Security | 4,200 | 244 | ||||||
General Dynamics | 7,965 | 1,236 | ||||||
General Electric | 250,493 | 7,420 | ||||||
Honeywell International | 21,252 | 2,478 | ||||||
Illinois Tool Works | 8,931 | 1,070 | ||||||
Ingersoll-Rand | 7,103 | 483 | ||||||
Jacobs Engineering Group * | 3,321 | 172 | ||||||
JB Hunt Transport Services | 2,345 | 190 | ||||||
Kansas City Southern | 2,863 | 267 | ||||||
L-3 Communications Holdings | 2,219 | 334 | ||||||
Lockheed Martin | 7,093 | 1,700 | ||||||
Masco | 9,323 | 320 | ||||||
Nielsen Holdings | 9,880 | 529 | ||||||
Norfolk Southern | 8,302 | 806 | ||||||
Northrop Grumman | 4,961 | 1,061 | ||||||
PACCAR | 9,519 | 560 | ||||||
Parker-Hannifin, Cl A | 3,652 | 458 | ||||||
Pentair | 5,077 | 326 | ||||||
Pitney Bowes | 5,551 | 101 | ||||||
Quanta Services * | 4,382 | 123 | ||||||
Raytheon | 8,299 | 1,130 | ||||||
Republic Services | 6,662 | 336 | ||||||
Robert Half International | 3,459 | 131 | ||||||
Rockwell Automation | 3,535 | 432 | ||||||
Rockwell Collins | 3,630 | 306 | ||||||
Roper Technologies | 2,914 | 532 | ||||||
Ryder System | 1,523 | 100 | ||||||
Snap-on | 1,555 | 236 | ||||||
Southwest Airlines, Cl A | 17,433 | 678 | ||||||
Stanley Black & Decker | 4,211 | 518 | ||||||
Stericycle, Cl A * | 2,226 | 178 | ||||||
Textron | 7,737 | 308 | ||||||
TransDigm Group * | 1,500 | 434 | ||||||
Union Pacific | 23,419 | 2,284 | ||||||
United Continental Holdings * | 8,300 | 435 | ||||||
United Parcel Service, Cl B | 19,211 | 2,101 | ||||||
United Rentals * | 2,499 | 196 | ||||||
United Technologies | 21,532 | 2,188 | ||||||
Verisk Analytics, Cl A * | 4,300 | 350 | ||||||
Waste Management | 11,682 | 745 | ||||||
WW Grainger | 1,547 | 348 | ||||||
| Description | Shares | Market Value ($ Thousands) | ||||||
COMMON STOCK (continued) | ||||||||
Xylem | 5,248 | $ | 275 | |||||
|
|
| ||||||
| 52,384 | ||||||||
|
|
| ||||||
Information Technology — 20.7% | ||||||||
Accenture, Cl A | 17,248 | 2,107 | ||||||
Activision Blizzard | 19,200 | 851 | ||||||
Adobe Systems * | 13,864 | 1,505 | ||||||
Akamai Technologies * | 4,774 | 253 | ||||||
Alliance Data Systems * | 1,646 | 353 | ||||||
Alphabet, Cl A * | 8,269 | 6,649 | ||||||
Alphabet, Cl C * | 8,293 | 6,446 | ||||||
Amphenol, Cl A | 8,320 | 540 | ||||||
Analog Devices | 8,443 | 544 | ||||||
Apple | 150,530 | 17,017 | ||||||
Applied Materials | 31,171 | 940 | ||||||
Autodesk, Cl A * | 5,605 | 405 | ||||||
Automatic Data Processing | 12,642 | 1,115 | ||||||
Broadcom | 11,075 | 1,911 | ||||||
CA | 8,433 | 279 | ||||||
Cisco Systems | 140,072 | 4,443 | ||||||
Citrix Systems * | 4,126 | 352 | ||||||
Cognizant Technology Solutions, Cl A * | 16,977 | 810 | ||||||
Corning, Cl B | 29,371 | 695 | ||||||
CSRA | 3,466 | 93 | ||||||
eBay * | 29,347 | 966 | ||||||
Electronic Arts * | 8,428 | 720 | ||||||
F5 Networks, Cl A * | 1,791 | 223 | ||||||
Facebook, Cl A * | 64,971 | 8,334 | ||||||
Fidelity National Information Services, Cl B | 9,253 | 713 | ||||||
First Solar * | 2,122 | 84 | ||||||
Fiserv, Cl A * | 6,182 | 615 | ||||||
Flir Systems | 3,792 | 119 | ||||||
Global Payments | 4,147 | 318 | ||||||
Harris | 3,527 | 323 | ||||||
Hewlett Packard Enterprise | 45,510 | 1,035 | ||||||
HP | 47,710 | 741 | ||||||
Intel | 131,297 | 4,956 | ||||||
International Business Machines | 24,468 | 3,887 | ||||||
Intuit | 6,985 | 768 | ||||||
Juniper Networks | 10,033 | 241 | ||||||
KLA-Tencor | 4,249 | 296 | ||||||
Lam Research | 4,520 | 428 | ||||||
Linear Technology | 6,536 | 388 | ||||||
MasterCard, Cl A | 26,982 | 2,746 | ||||||
Microchip Technology | 6,037 | 375 | ||||||
Micron Technology * | 29,071 | 517 | ||||||
Microsoft | 218,096 | 12,562 | ||||||
Motorola Solutions | 4,302 | 328 | ||||||
NetApp | 8,228 | 295 | ||||||
Nvidia | 15,048 | 1,031 | ||||||
Oracle, Cl B | 84,233 | 3,309 | ||||||
Paychex | 9,100 | 527 | ||||||
4 |
SEI Institutional Managed Trust / Annual Report / September 30, 2016 |
SCHEDULE OF INVESTMENTS
September 30, 2016
Dynamic Asset Allocation Fund (Continued)
| Description | Shares | Market Value ($ Thousands) | ||||||
COMMON STOCK (continued) | ||||||||
PayPal Holdings * | 30,985 | $ | 1,269 | |||||
Qorvo * | 3,805 | 212 | ||||||
Qualcomm | 40,968 | 2,806 | ||||||
Red Hat * | 4,960 | 401 | ||||||
salesforce.com * | 17,572 | 1,253 | ||||||
Seagate Technology | 8,043 | 310 | ||||||
Skyworks Solutions | 5,207 | 396 | ||||||
Symantec, Cl A | 17,208 | 432 | ||||||
TE Connectivity | 9,703 | 625 | ||||||
Teradata * | 3,999 | 124 | ||||||
Texas Instruments | 27,711 | 1,945 | ||||||
Total System Services | 4,667 | 220 | ||||||
VeriSign * | 2,478 | 194 | ||||||
Visa, Cl A | 53,032 | 4,386 | ||||||
Western Digital | 7,638 | 447 | ||||||
Western Union | 13,877 | 289 | ||||||
Xerox | 27,356 | 277 | ||||||
Xilinx | 6,887 | 374 | ||||||
Yahoo! * | 24,432 | 1,053 | ||||||
|
|
| ||||||
| 111,166 | ||||||||
|
|
| ||||||
Materials — 2.8% | ||||||||
Air Products & Chemicals | 6,061 | 911 | ||||||
Albemarle | 3,000 | 256 | ||||||
Alcoa | 37,178 | 377 | ||||||
Avery Dennison | 2,376 | 185 | ||||||
Ball | 4,856 | 398 | ||||||
CF Industries Holdings | 5,937 | 145 | ||||||
Dow Chemical, Cl A | 30,989 | 1,606 | ||||||
E.I. Du Pont de Nemours | 24,165 | 1,618 | ||||||
Eastman Chemical | 4,198 | 284 | ||||||
Ecolab | 7,354 | 895 | ||||||
FMC | 3,549 | 172 | ||||||
Freeport-McMoRan, Cl B | 37,562 | 408 | ||||||
International Flavors & Fragrances | 2,215 | 317 | ||||||
International Paper | 11,273 | 541 | ||||||
LyondellBasell Industries, Cl A | 9,543 | 770 | ||||||
Martin Marietta Materials, Cl A | 1,765 | 316 | ||||||
Monsanto | 12,028 | 1,229 | ||||||
Mosaic | 9,410 | 230 | ||||||
Newmont Mining | 14,604 | 574 | ||||||
Nucor | 8,948 | 443 | ||||||
Owens-Illinois * | 5,128 | 94 | ||||||
PPG Industries | 7,270 | 751 | ||||||
Praxair | 8,033 | 971 | ||||||
Sealed Air | 5,658 | 259 | ||||||
Sherwin-Williams, Cl A | 2,213 | 612 | ||||||
Vulcan Materials | 3,730 | 424 | ||||||
WestRock | 6,892 | 334 | ||||||
|
|
| ||||||
| 15,120 | ||||||||
|
|
| ||||||
| Description | Shares | Market Value ($ Thousands) | ||||||
COMMON STOCK (continued) | ||||||||
Real Estate — 3.0% | ||||||||
American Tower, Cl A ‡ | 11,916 | $ | 1,350 | |||||
Apartment Investment & Management, Cl A ‡ | 4,543 | 209 | ||||||
AvalonBay Communities ‡ | 3,722 | 662 | ||||||
Boston Properties ‡ | 4,308 | 587 | ||||||
CBRE Group, Cl A * | 7,925 | 222 | ||||||
Crown Castle International ‡ | 9,428 | 888 | ||||||
Digital Realty Trust, Cl A ‡ | 4,200 | 408 | ||||||
Equinix ‡ | 1,959 | 706 | ||||||
Equity Residential ‡ | 9,933 | 639 | ||||||
Essex Property Trust ‡ | 1,760 | 392 | ||||||
Extra Space Storage ‡ | 3,500 | 278 | ||||||
Federal Realty Investment Trust ‡ | 2,000 | 308 | ||||||
General Growth Properties ‡ | 15,697 | 433 | ||||||
HCP ‡ | 13,130 | 498 | ||||||
Host Hotels & Resorts ‡ | 21,312 | 332 | ||||||
Iron Mountain ‡ | 6,776 | 254 | ||||||
Kimco Realty ‡ | 11,396 | 330 | ||||||
Macerich ‡ | 3,565 | 288 | ||||||
ProLogis ‡ | 14,671 | 785 | ||||||
Public Storage ‡ | 4,100 | 915 | ||||||
Realty Income ‡ | 7,218 | 483 | ||||||
Simon Property Group ‡ | 8,658 | 1,792 | ||||||
SL Green Realty ‡ | 2,815 | 304 | ||||||
UDR ‡ | 7,000 | 252 | ||||||
Ventas ‡ | 9,910 | 700 | ||||||
Vornado Realty Trust ‡ | 4,831 | 489 | ||||||
Welltower ‡ | 9,907 | 741 | ||||||
Weyerhaeuser ‡ | 21,060 | 673 | ||||||
|
|
| ||||||
| 15,918 | ||||||||
|
|
| ||||||
Telecommunication Services — 2.6% | ||||||||
AT&T | 171,003 | 6,945 | ||||||
CenturyTel | 15,242 | 418 | ||||||
Frontier Communications | 30,139 | 125 | ||||||
Level 3 Communications * | 7,981 | 370 | ||||||
Verizon Communications | 113,498 | 5,900 | ||||||
|
|
| ||||||
| 13,758 | ||||||||
|
|
| ||||||
Utilities — 3.2% | ||||||||
AES | 17,212 | 221 | ||||||
Alliant Energy | 6,200 | 237 | ||||||
Ameren | 6,544 | 322 | ||||||
American Electric Power | 13,729 | 882 | ||||||
American Water Works | 4,800 | 359 | ||||||
Centerpoint Energy | 11,917 | 277 | ||||||
CMS Energy | 7,513 | 316 | ||||||
Consolidated Edison | 8,378 | 631 | ||||||
Dominion Resources | 17,604 | 1,307 | ||||||
DTE Energy | 4,841 | 453 | ||||||
Duke Energy | 18,998 | 1,521 | ||||||
Edison International | 9,190 | 664 | ||||||
SEI Institutional Managed Trust / Annual Report / September 30, 2016 |
5 |
SCHEDULE OF INVESTMENTS
September 30, 2016
Dynamic Asset Allocation Fund (Continued)
| Description | Shares | Market Value ($ Thousands) | ||||||
COMMON STOCK (continued) | ||||||||
Entergy | 4,777 | $ | 367 | |||||
Eversource Energy | 8,544 | 463 | ||||||
Exelon | 25,390 | 845 | ||||||
FirstEnergy | 11,621 | 384 | ||||||
NextEra Energy | 13,098 | 1,602 | ||||||
NiSource | 9,413 | 227 | ||||||
NRG Energy | 8,464 | 95 | ||||||
PG&E | 13,693 | 838 | ||||||
Pinnacle West Capital | 3,094 | 235 | ||||||
PPL | 18,839 | 651 | ||||||
Public Service Enterprise Group | 14,357 | 601 | ||||||
SCANA | 3,980 | 288 | ||||||
Sempra Energy | 6,668 | 715 | ||||||
Southern | 27,482 | 1,410 | ||||||
WEC Energy Group | 8,537 | 511 | ||||||
Xcel Energy | 14,246 | 586 | ||||||
|
| |||||||
| 17,008 | ||||||||
|
| |||||||
Total Common Stock (Cost $484,206) ($ Thousands) | 522,673 | |||||||
|
| |||||||
Total Investments — 97.3% (Cost $484,206) ($ Thousands) | $ | 522,673 | ||||||
|
| |||||||
| Contracts | ||||||||
PURCHASED OPTION (A) — 0.1% |
| |||||||
January 2017 EUR Put, USD Call, | ||||||||
Expires 01/21/2017, | ||||||||
Strike Price $1.07* | 92,284,855 | 415 | ||||||
|
| |||||||
Total Purchased Option (Cost $524) ($ Thousands) | $ | 415 | ||||||
|
| |||||||
A list of the open futures contracts held by the Fund at September 30, 2016, is as follows:
| Type of Contract | Number of Contracts Long | Expiration Date | Unrealized Appreciation ($ Thousands) | |||||||||
S&P 500 Index E-MINI | 102 | Dec-2016 | $22 | |||||||||
|
| |||||||||||
For the year ended September 30, 2016, the total amount of all open futures contracts, as presented in the table above, are representative of the volume of activity for the derivative type during the year.
A list of the open forward foreign currency contracts held by the Fund at September 30, 2016, is as follows:
| Settlement Date | Currency to Deliver (Thousands) | Currency To Receive (Thousands) | Unrealized Appreciation (Depreciation) ($ Thousands) | |||||||||||||||||
10/19/16 | USD | 496 | EUR | 441 | $— | |||||||||||||||
10/19/16 | USD | 1,147 | KRW | 1,260,000 | (3 | ) | ||||||||||||||
10/19/16 | INR | 17,400 | USD | 261 | — | |||||||||||||||
10/19/16-10/19/16 | EUR | 48,113 | USD | 53,506 | (611 | ) | ||||||||||||||
10/19/16 | USD | 52,969 | INR | 3,597,822 | 926 | |||||||||||||||
10/19/16 | KRW | 60,086,360 | USD | 52,582 | (1,979 | ) | ||||||||||||||
01/09/17 | USD | 928 | SAR | 3,533 | 12 | |||||||||||||||
01/09/17-01/19/17 | SAR | 104,069 | USD | 27,050 | (642 | ) | ||||||||||||||
|
| |||||||||||||||||||
| $(2,297) | ||||||||||||||||||||
|
| |||||||||||||||||||
A list of the counterparties for the outstanding forward foreign currency contracts held by the Fund at September 30, 2016, is as follows:
| Counterparty | Currency to Deliver ($ Thousands) | Currency to Receive ($ Thousands) | Unrealized Appreciation (Depreciation) ($ Thousands) | |||||||||
BNP Paribas | $(1,192 | ) | $1,183 | $(9) | ||||||||
Bank of America | (81,849 | ) | 82,145 | 296 | ||||||||
Goldman Sachs | (2,557 | ) | 2,549 | (8) | ||||||||
Societe Generale | (50,864 | ) | 50,270 | (594) | ||||||||
Standard Chartered | (55,709 | ) | 53,727 | (1,982) | ||||||||
|
| |||||||||||
| $(2,297) | ||||||||||||
|
| |||||||||||
For the year ended September 30, 2016 the total amount of all open forward foreign currency contracts, as presented in the table above, are representative of the volume of activity for the derivative type during the year.
6 |
SEI Institutional Managed Trust / Annual Report / September 30, 2016 |
SCHEDULE OF INVESTMENTS
September 30, 2016
Dynamic Asset Allocation Fund (Concluded)
A list of the open OTC swap agreements held by the Fund at September 30, 2016 is as follows:
| Interest Rate Swaps | ||||||||||||||
| Counterparty | Fund Pays | Fund Receives | Termination Date | Notional Amount ($Thousands) | Net Unrealized Appreciation ($ Thousands) | |||||||||
Bank of America | 1.74% | US CPI URBAN CONSUMERS NSA | 08/24/2026 | $8,471 | $108 | |||||||||
BNP Paribas | 1.76% | US CPI URBAN CONSUMERS NSA | 08/26/2026 | 18,741 | 198 | |||||||||
BNP Paribas | 1.76% | US CPI URBAN CONSUMERS NSA | 08/25/2026 | 25,413 | 270 | |||||||||
|
| |||||||||||||
| $576 | ||||||||||||||
|
| |||||||||||||
For the year ended September 30, 2016, the total amount of open swap agreements, as presented in the tables above, are representative of the volume of activity for this derivative type during the year.
| Percentages are based on Net Assets of $537,301 ($ Thousands). |
| * | Non-income producing security. |
| ‡ | Real Estate Investment Trust. |
| (A) | For the year ended September 30, 2016, the total amount of open purchased options, as presented in the Schedule of Investments, are representative of the volume of activity for these derivative types during the year. |
ADR — American Depositary Receipt
Cl — Class
CPI — Consumer Price Index
EUR — Euro
INR — Indian Rupee
KRW — Korean Won
NSA — Not seasonally adjusted
OTC — Over the Counter
S&P— Standard & Poor's
SAR— Saudi Riyal
USD — United States Dollar
The following is a list of the level of inputs used as of September 30, 2016, in valuing the Fund’s investments and other financial instruments carried at value ($ Thousands):
| Investments in Securities | Level 1 | Level 2 | Level 3 | Total | ||||||||||||
Common Stock | $ | 522,673 | $ | – | $ | – | $ | 522,673 | ||||||||
|
|
|
|
|
|
|
|
|
|
|
| |||||
Total Investments in Securities | $ | 522,673 | $ | – | $ | – | $ | 522,673 | ||||||||
|
|
|
|
|
|
|
|
|
|
|
| |||||
| Other Financial Instruments | Level 1 | Level 2 | Level 3 | Total | ||||||||||||
Purchased Options | $ | 415 | $ | — | $ | — | $ | 415 | ||||||||
Futures Contracts * | ||||||||||||||||
Unrealized Appreciation | 22 | — | — | 22 | ||||||||||||
Forwards Contracts * | ||||||||||||||||
Unrealized Appreciation | — | 938 | — | 938 | ||||||||||||
Unrealized Depreciation | — | (3,235 | ) | — | (3,235 | ) | ||||||||||
OTC Swaps | ||||||||||||||||
Interest Rate Swaps * | ||||||||||||||||
Unrealized Appreciation | — | 576 | — | 576 | ||||||||||||
|
|
|
|
|
|
|
|
|
|
|
| |||||
Total Other Financial Instruments | $ | 437 | $ | (1,721 | ) | $ | — | $ | (1,284 | ) | ||||||
|
|
|
|
|
|
|
|
|
|
|
| |||||
* Futures contracts, forward contracts and swap contracts are valued at the unrealized appreciation (depreciation) on the instruments.
For the year ended September 30, 2016, there were no transfers between Level 1 and Level 2 assets and liabilities.
For the year ended September 30, 2016, there were no transfers between Level 2 and Level 3 assets and liabilities.
For more information on valuation inputs, see Note 2 – Significant Accounting Policies in Notes to Financial Statements.
Amounts designated as “—” are $0 or have been rounded to $0.
The accompanying notes are an integral part of the financial statements.
SEI Institutional Managed Trust / Annual Report / September 30, 2016 |
7 |
 | KPMG LLP | |||||
| 1601 Market Street | ||||||
| Philadelphia, PA 19103-2499 |
Report of Independent Registered Public Accounting Firm
The Board of Trustees and Shareholders
SEI Institutional Managed Trust:
We have audited the accompanying statements of assets and liabilities, including the summary schedules of investments, of the Large Cap Fund, Large Cap Value Fund, Large Cap Growth Fund, Tax-Managed Large Cap Fund, S&P 500 Index Fund, Small Cap Fund, Small Cap Value Fund, Small Cap Growth Fund, Tax-Managed Small/Mid Cap Fund, Mid-Cap Fund, U.S. Managed Volatility Fund, Global Managed Volatility Fund, Tax-Managed Managed Volatility Fund, Real Estate Fund, Enhanced Income Fund, Core Fixed Income Fund, U.S. Fixed Income Fund, High Yield Bond Fund, Conservative Income Fund, Tax-Free Conservative Income Fund, Real Return Fund, Dynamic Asset Allocation Fund, Multi-Strategy Alternative Fund, Multi-Asset Income Fund, Multi-Asset Capital Stability Fund, and the Long/Short Alternative Fund (twenty-six of the twenty-eight funds comprising the SEI Institutional Managed Trust (the Trust)), as of September 30, 2016, and the related statements of operations for the year or period then ended, the statements of changes in net assets for each of the years or periods in the two-year period then ended, and the financial highlights for each of the years or periods in the five-year period then ended. We have also audited the accompanying consolidated statements of assets and liabilities, including the consolidated schedules of investments, of the Multi-Asset Accumulation Fund and the Multi-Asset Inflation Managed Fund (two of the twenty-eight funds comprising the Trust), as of September 30, 2016, and the related consolidated statements of operations for the year then ended, the consolidated statements of changes in net assets for each of the years in the two-year period then ended, the consolidated statement of cash flows for the year then ended for the Multi-Asset Inflation Managed Fund, and the consolidated financial highlights for each of the years or periods in the five-year period then ended. The financial statements and consolidated financial statements and financial highlights and consolidated financial highlights, are included in Item 1 of this Form N-CSR and the schedules of investments in securities of the Large Cap Fund, Large Cap Value Fund, Large Cap Growth Fund, Tax-Managed Large Cap Fund, S&P 500 Index Fund, Small Cap Fund, Small Cap Value Fund, Small Cap Growth Fund, Tax-Managed Small/Mid Cap Fund, Mid-Cap Fund, U.S. Managed Volatility Fund, Global Managed Volatility Fund, Tax-Managed Managed Volatility Fund, and the Dynamic Asset Allocation Fund as of September 30, 2016 are included in Item 6 of this Form N-CSR. These financial statements and consolidated financial statements and financial highlights and consolidated financial highlights and the schedules of investments in securities and consolidated schedules of investments in securities are the responsibility of the Trust’s management. Our responsibility is to express an opinion on these financial statements, consolidated financial statements, financial highlights, consolidated financial highlights and schedules of investments in securities and consolidated schedules of investments in securities based on our audits.
We conducted our audits in accordance with the standards of the Public Company Accounting Oversight Board (United States). Those standards require that we plan and perform the audits to obtain reasonable assurance about whether the financial statements and financial highlights are free of material misstatement. An audit includes examining, on a test basis, evidence supporting the amounts and disclosures in the financial statements. Our procedures included confirmation of securities owned as of September 30, 2016, by correspondence with custodians, transfer agent and brokers or other appropriate auditing procedures. An audit also includes assessing the accounting principles used and significant estimates made by management, as well as evaluating the overall financial statement presentation. We believe that our audits provide a reasonable basis for our opinion.
In our opinion, the financial statements and consolidated financial statements and financial highlights and consolidated financial highlights and schedules of investments in securities and consolidated schedules of
.
investments in securities referred to above present fairly, in all material respects, the financial position of each of the funds comprising the SEI Institutional Managed Trust as of September 30, 2016, the results of their operations, the changes in their net assets, their cash flows, and the financial highlights for each of the years or periods described in the first paragraph, in conformity with U.S. generally accepted accounting principles.

Philadelphia, Pennsylvania
November 28, 2016
Item 7. Disclosure of Proxy Voting Policies and Procedures for Closed-End Management Investment Companies.
Not applicable.
Item 8. Portfolio Managers of Closed-End Management Investment Companies
Not applicable.
Item 9. Purchases of Equity Securities by Closed-End Management Company and Affiliated Purchasers.
Not applicable.
Item 10. Submission of Matters to a Vote of Security Holders.
The Registrant has a standing Governance Committee (the “Committee”) currently consisting of the Independent Trustees. The Committee is responsible for evaluating and recommending nominees for election to the Registrant’s Board of Trustees (the “Board”). Pursuant to the Committee’s Charter, adopted on June 18, 2004, as amended, the Committee will review all shareholder recommendations for nominations to fill vacancies on the Board if such recommendations are submitted in writing and addressed to the Committee at the Registrant’s office.
Item 11. Controls and Procedures.
(a) The Registrant’s principal executive and principal financial officers, or persons performing similar functions, have concluded that the Registrant’s disclosure controls and procedures (as defined in Rule 30a-3(c) under the Investment Company Act of 1940 (the “1940 Act”)) are effective, based on the evaluation of these controls and procedures required by Rule 30a-3(b) under the 1940 Act and Rules 13a-15(b) or 15d-15(b) under the Securities Exchange Act of 1934 as of a date within 90 days of the filing date of this report.
(b) There were no changes in the Registrant’s internal control over financial reporting (as defined in Rule 30a-3(d) under the 1940 Act) that occurred during the second fiscal quarter of the period covered by this report that have materially affected, or are reasonably likely to materially affect, the Registrants internal control over financial reporting.
Items 12. Exhibits.
(a)(1) Code of Ethics attached hereto.
(a)(2) A separate certification for the principal executive officer and the principal financial officer of the Registrant as required by Rule 30a-2(a) under the Investment Company Act of 1940, as amended (17 CFR 270.30a-2(a)), are filed herewith.
(b) Officer certifications as required by Rule 30a-2(b) under the Investment Company Act of 1940, as amended (17 CFR 270.30a-2(b)) also accompany this filing as exhibits.
SIGNATURES
Pursuant to the requirements of the Securities Exchange Act of 1934 and the Investment Company Act of 1940, the Registrant has duly caused this report to be signed on its behalf by the undersigned, thereunto duly authorized.
| SEI Institutional Managed Trust | ||||||
| By | /s/ Robert A. Nesher | |||||
| Robert A. Nesher | ||||||
| President & CEO | ||||||
Date: December 8, 2016
Pursuant to the requirements of the Securities Exchange Act of 1934 and the Investment Company Act of 1940, this report has been signed below by the following persons on behalf of the Registrant and in the capacities and on the dates indicated.
| By | /s/ Robert A. Nesher | |||||
| Robert A. Nesher | ||||||
| President & CEO |
Date: December 8, 2016
| By | /s/ James J. Hoffmayer | |||||
| James J. Hoffmayer | ||||||
| Controller & CFO |
Date: December 8, 2016