PROJECT SPARKLE | | CONFIDENTIAL |
|
11.26.03 | | |
Exhibit (c) (i)
VALUATION ANALYSIS
This presentation and its analyses are only for the use of Alan Zimmer, and are not intended to, nor should they be, relied upon by any other party, including shareholders of Reeds Jewelers, Inc. The consent of Capitalink is required prior to the disclosure to any third party of this presentation, its analyses, or of the assessments made by Capitalink. These materials are based solely on information contained in publicly available documents and certain other information provided to Capitalink by management. Capitalink has not attempted to investigate or verify the accuracy or completeness of such publicly available information or other information provided to Capitalink. Capitalink has relied upon the accuracy and completeness of such publicly available information and other information supplied to Capitalink. The preparation of these materials was completed on November 25, 2003 based on information publicly available or supplied to Capitalink through such date. Capitalink is not obligated to its analyses to reflect any information that becomes publicly available or that is provided to Capitalink after such date.
 | |  |
Page 1
PROJECT SPARKLE | | CONFIDENTIAL |
|
TABLE OF CONTENTS | | |
| |
| I | | INTRODUCTION |
| |
| II | | COMPANY OVERVIEW |
| |
| III | | COMPANY FINANCIAL & MARKET PERFORMANCE |
| |
| IV | | VALUATION ANALYSIS |
| |
| V | | APPENDIX |
Page 2
PROJECT SPARKLE | | CONFIDENTIAL |
|
GLOSSARY OF TERMS | | |
| |
| EBIT | | Earnings before interest and taxes |
| |
| EBITDA | | Earnings before interest, taxes, depreciation and amortization |
| |
| EPS | | Earnings per share |
| |
| EV | | Enterprise value |
| |
| FY | | Fiscal year |
| |
| ITM | | In the money |
| |
| LTM | | Latest twelve months |
| |
| MV | | Market value |
| |
| MRQ | | Most recent quarter |
| |
| SEC | | Securities and Exchange Commission |
| |
| TIC | | Total invested capital |
| |
| WACC | | Weighted average cost of capital |
Page 3
PROJECT SPARKLE | | CONFIDENTIAL |
|
INTRODUCTION | | |
| |
| I | | INTRODUCTION |
| |
| II | | COMPANY OVERVIEW |
| |
| III | | COMPANY FINANCIAL & MARKET PERFORMANCE |
| |
| IV | | VALUATION |
| |
| V | | APPENDIX |
Page 4
PROJECT SPARKLE | | CONFIDENTIAL |
|
INTRODUCTION | | |
| | • | Alan Zimmer, a controlling shareholder of Reeds Jewelers, Inc. (“Reeds” or the “Company”) has retained Capitalink, L.C. (“Capitalink”) as financial advisor and to prepare a financial analysis to determine a range of indicated values for the Company (the “Analysis”). |
| | • | The Company’s common stock is publicly traded on the American Stock Exchange market under the symbol “RJI”, and as of November 10, 2003, there were 8,476,372 shares of the Company’s common stock outstanding. |
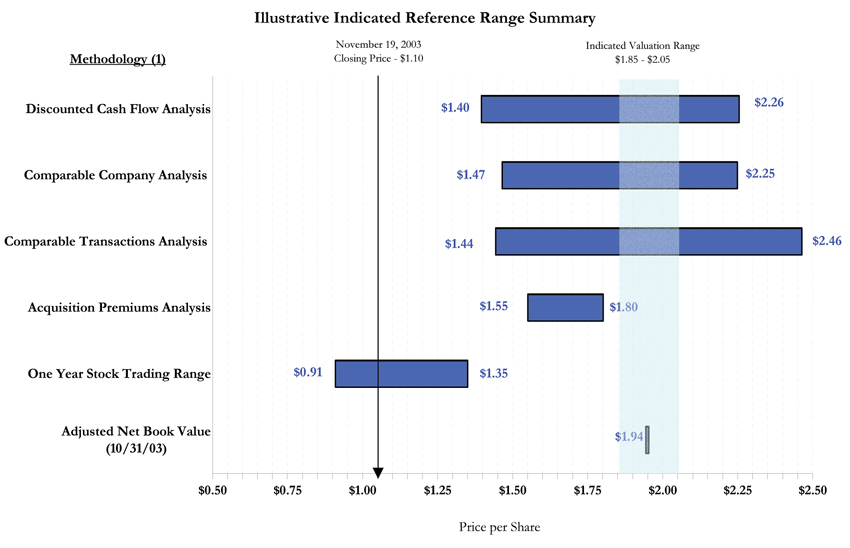
| | • | The closing price of the Company’s stock on November 25, 2003 (date presentation materials completed) was $1.10. |
| | • | Zimmer is the President and Chief Executive Officer of the Company and beneficially owns 2,029,690 shares of common stock or approximately 23.95% of the Company’s issued and outstanding common stock. In addition, Zimmer, combined with the other directors of the Company have a combined holding of 7,461,670 shares or approximately 88.03% of the issued and outstanding common stock. |
Page 5
PROJECT SPARKLE | | CONFIDENTIAL |
|
INTRODUCTION - SCOPE OF ENGAGEMENT | | |
| | • | For purposes of rendering the Analysis, Capitalink has: |
| | • | | Reviewed publicly available financial information and other data with respect to the Company, including the Annual Report on Form 10-K for the fiscal year ended February 28, 2003, the Quarterly Report on Form 10-Q for the six months ended August 31, 2003, and the Proxy Statement filed May 29, 2003 on Schedule 14A. |
| | • | | Reviewed draft financial results for the months ended September and October 2003. |
| | • | | Reviewed certain publicly available information concerning the trading of, and the trading market for, the common stock of the Company. |
| | • | | Reviewed and analyzed the Company’s projected unlevered free cash flows and prepared discounted cash flows. |
| | • | | Reviewed and analyzed certain financial characteristics of companies that were deemed to have characteristics comparable to those of the Company. |
| | • | | Reviewed and analyzed certain financial characteristics of target companies in transactions where such target company was deemed to have characteristics comparable to those of the Company. |
| | • | | Reviewed and analyzed recent acquisition premiums paid in going-private transactions involving a minority stock acquisition. |
| | • | | Reviewed and analyzed the Company’s adjusted net book value. |
| | • | | Reviewed and discussed with representatives of the management of the Company certain financial and operating information furnished by them, including financial analyses with respect to the business, operations and prospects of the Company. |
| | • | | Considered the historical financial results and present financial condition of the Company. |
| | • | | Performed such other analyses and examinations as were deemed appropriate. |
| | • | The Analysis is necessarily based upon market, economic and other conditions, as they exist on, and could be evaluated as of November 25, 2003. Accordingly, although subsequent developments may affect the Analysis, Capitalink does not assume any obligation to update, review or reaffirm the Analysis. |
| | • | Capitalink has relied upon and assumed the accuracy and completeness of all of the financial and other information that was used by it without assuming any responsibility for any independent verification of any such information and has further relied upon the assurances of Company management that it is not aware of |
Page 6
PROJECT SPARKLE | | CONFIDENTIAL |
|
INTRODUCTION - SCOPE OF ENGAGEMENT | | |
| | any facts or circumstances that would make any such information inaccurate or misleading. With respect to the financial projections utilized, Capitalink assumed that such projections have been reasonably prepared on a basis reflecting the best currently available estimates and judgments, and that such projections provide a reasonable basis upon which it could make its analysis. |
| | • | Capitalink has not made a physical inspection of the properties and facilities of the Company and has not made or obtained any evaluations or appraisals of the assets and liabilities (contingent or otherwise) of the Company. |
| | • | The Analysis is based on assumptions regarding future earnings potential and/or certain assets values that may or may not materialize. Therefore, the actual results achieved in the future will vary from the assumptions utilized in the Analysis, and the variations may be material. Adjusted or projected statements may not anticipate the economic, socioeconomic, political, market or legal factors that may impact the operations of the Company. |
| | • | The Analysis is for the use and benefit of the Zimmer and is not intended to be and does not constitute a recommendation to any shareholder of the Company as to whether such shareholder should take any action, such as voting on any matter or tendering any shares, in connection with any possible transaction contemplated. Capitalink does not express any opinion as to the underlying valuation or future performance of the Company or the price at which the Company’s common stock would trade at any time in the future. |
Page 7
PROJECT SPARKLE | | CONFIDENTIAL |
|
| |
I | | INTRODUCTION |
| |
II | | COMPANY OVERVIEW |
| |
III | | COMPANY FINANCIAL & MARKET PERFORMANCE |
| |
IV | | VALUATION |
| |
V | | APPENDIX |
Page 8
PROJECT SPARKLE | | CONFIDENTIAL |
|
COMPANY OVERVIEW | | |
| | • | Reeds operates 91 premier specialty retail jewelry stores in enclosed regional malls located principally in the Southeast and Midwest of the United States, under the names Reeds Jewelers, Mills Jewelers and Reeds Jewelers Outlet. The Company was incorporated in 1984 under the laws of North Carolina as part of a reorganization whereby a number of affiliated corporations under common ownership became subsidiaries of the Company. |
| | • | The Company offers a wide selection of merchandise, including diamond rings and jewelry, gold jewelry and chains, gemstone rings, watches and other fine jewelry. Most of the diamonds sold by the Company are one carat or less in size, while it’s selection of gold jewelry is primarily 14 karat. For the year ended February 28, 2003, the Company’s sales consisted of 59.4% diamonds and precious gems, 15.2% watches, 7.2% semi-precious gems and 6.6% gold jewelry. |
| | • | Approximately 91% of the products sold by the Company are purchased through a centralized merchandising department, which provide a continuing source of product supply, consistent quality control, and competitive pricing. The average price of a piece of merchandise sold from the Company’s basic merchandise mix in FY2003 was $271. |
| | • | The Company’s stores range in size from approximately 500 to 2,100 square feet of selling space with an average of 1,150 per store. The stores are designed to invite customers into a well-lit and attractive setting where typically more than 2,200 items are offered for sale. |
| | • | All of the Company’s stores are located in mall locations. The Company believes consumer shopping patterns are moving away from malls to free-standing mass merchandisers and big box specialty retailers and the internet. In line with these trends, the Company has plans to open up a free-standing store in Mayfaire, a new urban lifestyle community in North Carolina and continue promotion of their website, www.reeds.com. |
| | • | The Company’s business is highly seasonal, with the fourth fiscal quarter (December to February), which includes the major part of the Christmas selling season, producing the highest sales. Over the last three fiscal years, the fourth fiscal quarter generated on average 38.9% of total net sales. |
Page 9
PROJECT SPARKLE | | CONFIDENTIAL |
|
COMPANY OVERVIEW | | |
| | • | The retail jewelry industry is highly competitive and fragmented, with a large number of independent jewelry retailers. According to National Jeweler, a trade publication, the Company is the tenth largest retail jewelry chain in the United States, based on the number of locations. However, other publicly held jewelry chains are substantially larger and compete directly with the Company in a number of markets. The Company competes with Zales in 82% of its locations, with Kay Jewelers in 77%, with Friedman’s in 48% and with Whitehall Jewellers in 40% of its locations. |
| | • | The malls in which the Company has stores have an average of 5.4 specialty retail jewelers, with as few as two and as many as eleven in any single mall. Management estimates that its market share among specialty jewelers in the malls in which it operates to be approximately 14.8%. Although the Company considers its primary competition to be other specialty jewelers in the malls in which it operates, it also competes for customers in various markets with department stores, discount stores, direct mail suppliers, television shopping networks and merchants on the Internet. |
| | • | The Company believes the retail jewelry industry competes primarily on the basis of reputation, value, service, location and fashion. Success is substantially dependent on the experience, training, and enthusiasm of sales personnel and the ability to respond quickly to the level of consumer demand for particular items of merchandise. The Company seeks to maintain and increase its market position by aggressively promoting competitive prices and value, by offering quality products and services and by employing superior inventory replenishment and management information systems. |
| | • | As of February 28, 2003, the Company had approximately 685 full-time equivalent employees of which 117 were employed in the corporate headquarters and the remaining 568 were employed in the stores. Approximately 78.9% of all employees are full time, with the remainder working part-time (required for the holiday shopping seasons). |
| | • | All of the Company’s stores are leased, including the Company’s corporate headquarters. Each store is generally operated under ten year lease agreements with monthly payments of five to seven percent of net sales, subject to minimum payments. The Company does own a property in Wilmington, North Carolina, which is currently marketed for sale. Expected proceeds from the sale range of $400,000 to $600,000. |
Page 10
PROJECT SPARKLE | | CONFIDENTIAL |
|
COMPANY OVERVIEW | | |
| | • | On February 28, 2002, the Company entered into a seven-year agreement with Alliance Data Systems Corporation (“ADS”) to outsource its private label credit card and included the sale of substantially all of the Company’s accounts receivable portfolio for approximately $42.5 million. $6.4 million of the purchase price is contingent on the performance of the portfolio. The Company will be eligible to receive one-third of the contingent portion after February 28, 2005 based on the audited financial performance of the Company. The balance may be received in ten years with the second automatic renewal of the private label credit card program agreement with the purchaser. |
| | • | Capitalink noted several general factors to be considered in connection with the status of Reeds as a publicly traded company: |
| | • | | The Company’s common stock historically has extremely limited trading volume and provided limited liquidity for the Company’s shareholders. |
| | • | | The size of the Company’s float is small (estimated to be 1,014,702 shares). |
| | • | | The Company has not realized the benefits of public company status (i.e., ability to raise capital, use of stock as currency in acquisitions), but incurs the increased expenses necessary to comply with reporting requirements and other public company obligations. |
Page 11
PROJECT SPARKLE | | CONFIDENTIAL |
|
| |
I | | INTRODUCTION |
| |
II | | COMPANY OVERVIEW |
| |
III | | COMPANY FINANCIAL & MARKET PERFORMANCE |
| |
IV | | VALUATION |
| |
V | | APPENDIX |
Page 12
PROJECT SPARKLE | | CONFIDENTIAL |
|
COMPANY FINANCIAL PERFORMANCE | | |
| | • | Capitalink reviewed the Company’s historical financial data as derived from the Company’s public filings for the four years ended February 28, 2002 and the six months ended August 31, 2003. The Company’s financial information was normalized to remove restructuring expenses and discontinued operations, including the sale of their Credit Operations to ADS. By adjusting for these items, Capitalink was able to derive normalized historical revenues and earnings for the Company. |
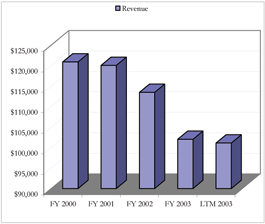
| | • | Revenues for the Company have steadily declined from approximately $120.9 million in FY2000 to approximately $101.0 million for the LTM ended August 31, 2003. The gradual deterioration of the Company’s revenue is due to rising competition in the industry, the closure of underperforming stores, and the decline in the United States economy after the events of 9/11. |
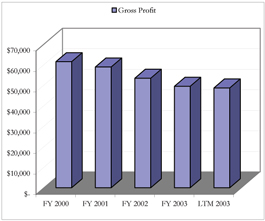
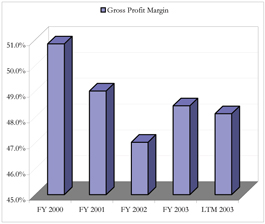
| | • | Over the past four fiscal years, the Company’s gross margin has fallen from approximately 51% in FY2000 to approximately 48% for the LTM ended August 31, 2003. The decline in gross margins reflects the increased promotional activity by the Company due to increased competitive pressures and management’s intent to rapidly mark down slower-moving merchandise to improve inventory turn and free up working capital. |
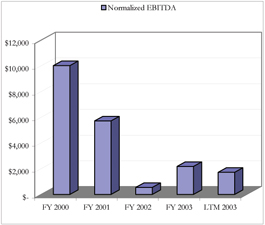
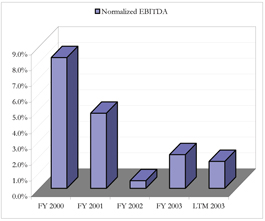
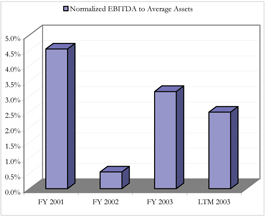
| | • | The Company’s EBITDA fell significantly from a high of approximately $10.0 million in FY2000 to approximately $1.7 million for the LTM period August 31, 2003. As with revenue, the fall in EBITDA was primarily dependent on the United States economy, resulting in falling expenditure on discretionary items such as jewelry, rising bad debt expenses and rising personnel and lease expenses. |
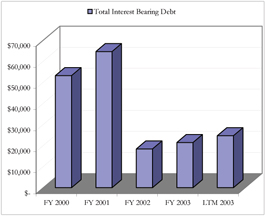
| | • | The sale of the Company’s credit operations and related accounts receivable portfolio to ADS significantly reduced the Company’s working capital requirements from a high of approximately $77.9 million in FY2000 to approximately $33.3 million as of August 31, 2003. With the sale, the Company was able to reduce its interest bearing debt obligations from a high of approximately $64.6 million in FY2001 to approximately $24.7 million as of August 31, 2003. The Company has a revolving credit agreement, which is collateralized by substantially all of the Company’s assets and permits borrowings of up to $30 million through February 28, 2005. |
Page 13
PROJECT SPARKLE | | CONFIDENTIAL |
|
COMPANY FINANCIAL PERFORMANCE | | |
| | • | During FY2002, the Company recorded approximately $6.0 million in restructuring costs related to the closure of 24 under performing stores, costs associated with buying out store leases, store closing costs, and the loss on the sale or abandonment of leasehold improvements and furniture and fixtures. The restructuring charge also includes the severance costs associated with reducing its corporate office personnel by approximately 20% and its store personnel by approximately 17%. |
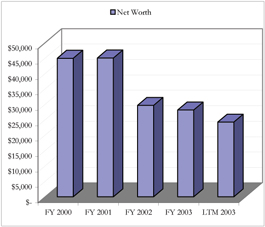
| | • | The Company’s net worth has also fallen significantly in line with the deterioration of the Company’s cash flow and restructuring charges. Over the last four years, the Company’s net book value per share has fallen from a high of $5.31 per share to $2.86 per share as at August 31, 2003. |
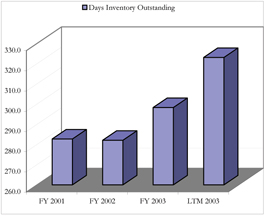
| | • | The rise in the Company’s inventory days outstanding also reflect the level of excess and obsolete inventory on hand, in part due to the significant number of store closures. The inventory days outstanding as of August 31, 2003 is skewed higher due to the build up of inventories for the holiday selling season. |
Page 14
PROJECT SPARKLE | | CONFIDENTIAL |
|
COMPANY FINANCIAL PERFORMANCE | | |
Summary Financial Data
($ in thousands, except per share)
| | | as of & for years ended the last day of February,
| | | LTM
August 31, 2003
| |
| | | 2000
| | | 2001
| | | 2002
| | | 2003
| | |
Financial Data(1) | | | | | | | | | | | | | | | | | | | | |
Revenue | | $ | 120,861 | | | $ | 120,037 | | | $ | 113,449 | | | $ | 102,011 | | | $ | 101,084 | |
Gross Profit | | $ | 61,453 | | | $ | 58,843 | | | $ | 53,358 | | | $ | 49,421 | | | $ | 48,658 | |
Normalized EBIT | | $ | 6,632 | | | $ | 1,849 | | | $ | (3,247 | ) | | $ | (270 | ) | | $ | (727 | ) |
Normalized EBITDA | | $ | 10,023 | | | $ | 5,719 | | | $ | 550 | | | $ | 2,180 | | | $ | 1,729 | |
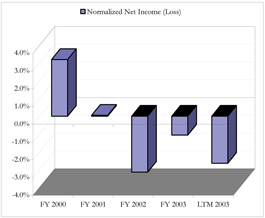
Normalized Net Income (Loss) | | $ | 3,861 | | | $ | 67 | | | $ | (3,570 | ) | | $ | (1,079 | ) | | $ | (2,681 | ) |
Normalized Basic EPS | | $ | 0.46 | | | $ | 0.01 | | | $ | (0.42 | ) | | $ | (0.13 | ) | | $ | (0.32 | ) |
Net Working Capital | | $ | 77,855 | | | $ | 85,181 | | | $ | 30,148 | | | $ | 33,550 | | | $ | 33,383 | |
Total Interest Bearing Debt | | $ | 53,204 | | | $ | 64,606 | | | $ | 18,388 | | | $ | 21,452 | | | $ | 24,667 | |
Total Liabilities | | $ | 76,367 | | | $ | 85,405 | | | $ | 42,292 | | | $ | 37,868 | | | $ | 43,918 | |
Net Worth | | $ | 44,970 | | | $ | 45,032 | | | $ | 29,656 | | | $ | 28,151 | | | $ | 24,220 | |
Net Book Value per Share | | $ | 5.31 | | | $ | 5.31 | | | $ | 3.50 | | | $ | 3.32 | | | $ | 2.86 | |
| | | | | |
Margin Analysis | | | | | | | | | | | | | | | | | | | | |
Gross Profit Margin | | | 50.8 | % | | | 49.0 | % | | | 47.0 | % | | | 48.4 | % | | | 48.1 | % |
Normalized EBIT | | | 5.5 | % | | | 1.5 | % | | | -2.9 | % | | | -0.3 | % | | | -0.7 | % |
Normalized EBITDA | | | 8.3 | % | | | 4.8 | % | | | 0.5 | % | | | 2.1 | % | | | 1.7 | % |
Normalized Net Income (Loss) | | | 3.2 | % | | | 0.1 | % | | | -3.1 | % | | | -1.1 | % | | | -2.7 | % |
| | | | | |
Financial Strength Analysis | | | | | | | | | | | | | | | | | | | | |
Quick Ratio | | | 2.5 | | | | 3.0 | | | | 0.4 | | | | 0.3 | | | | 0.3 | |
Current Ratio | | | 4.6 | | | | 5.7 | | | | 2.3 | | | | 3.7 | | | | 3.1 | |
Total Liabilities to Net Worth | | | 169.8 | % | | | 189.7 | % | | | 142.6 | % | | | 134.5 | % | | | 309.5 | % |
Total Interest Bearing Debt to Total Capitalization | | | 118.3 | % | | | 143.5 | % | | | 62.0 | % | | | 76.2 | % | | | 101.8 | % |
Total Interest Bearing Debt to EBITDA | | | 5.3 | | | | 11.3 | | | | 33.4 | | | | 9.8 | | | | 14.3 | |
| | | | | |
Efficiency and Return Analysis | | | | | | | | | | | | | | | | | | | | |
Days Sales Outstanding | | | na | | | | 151.8 | | | | 81.8 | | | | 3.6 | | | | 6.7 | |
Days Inventory Outstanding | | | na | | | | 282.7 | | | | 282.1 | | | | 298.4 | | | | 323.1 | |
Days Payable Outstanding | | | na | | | | 40.6 | | | | 47.9 | | | | 43.9 | | | | 44.3 | |
Normalized EBIT to Net Worth | | | na | | | | 4.1 | % | | | -8.7 | % | | | -0.9 | % | | | -2.8 | % |
Normalized EBITDA to Average Assets | | | na | | | | 4.5 | % | | | 0.5 | % | | | 3.2 | % | | | 2.5 | % |
Normalized EBITDA to Net Worth | | | na | | | | 12.7 | % | | | 1.5 | % | | | 7.5 | % | | | 6.7 | % |
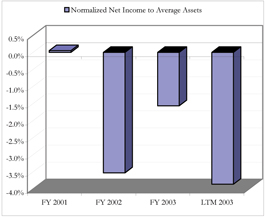
Normalized Net Income to Average Assets | | | na | | | | 0.1 | % | | | -3.5 | % | | | -1.6 | % | | | -3.9 | % |
| (1) | Normalized to remove restructuring expenses and discontinued operations. |
Page 15
PROJECT SPARKLE | | CONFIDENTIAL |
|
COMPANY FINANCIAL PERFORMANCE | | |
Selected Financial Graphs
($ in thousands)
Page 16
PROJECT SPARKLE | | CONFIDENTIAL |
|
COMPANY FINANCIAL PERFORMANCE | | |
Selected Financial Graphs – Continued
($ in thousands)
Page 17
PROJECT SPARKLE | | CONFIDENTIAL |
|
COMPANY MARKET PERFORMANCE | | |
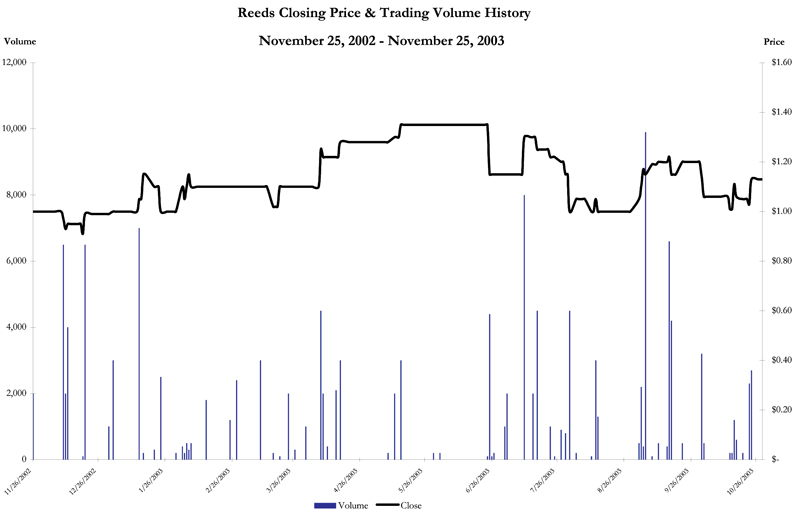
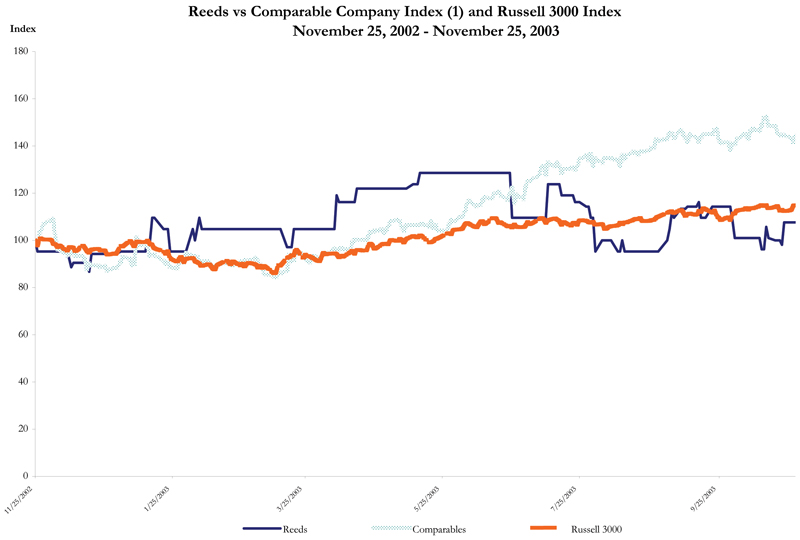
| | • | Capitalink reviewed the daily closing market price and trading volume of the Company’s common stock over the period commencing November 25, 2002 through November 25, 2003. |
| | • | Capitalink compared the daily closing market price performance of the Company’s common stock for such period to both the Comparable Companies (as defined below) and the Russell 3000 Index. |
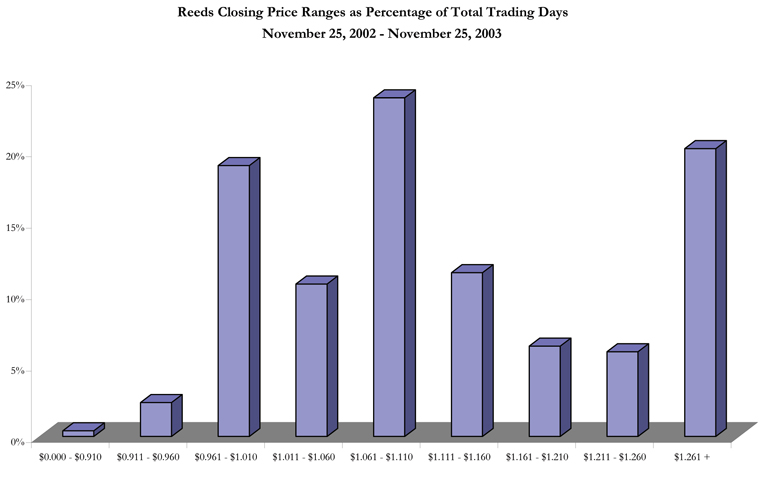
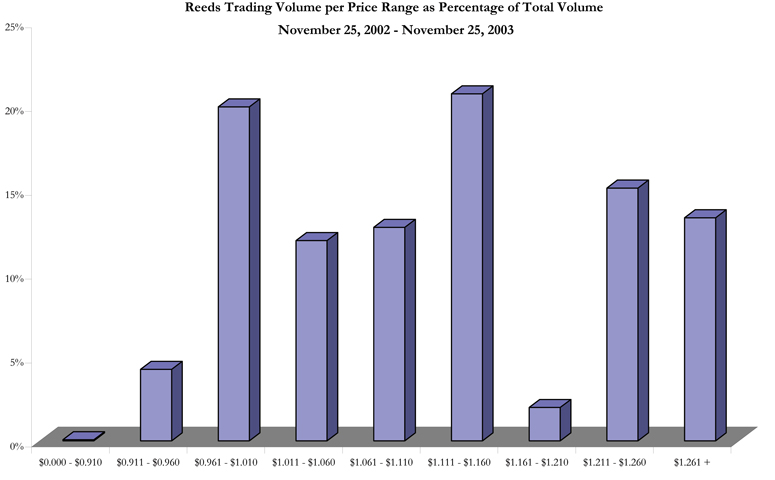
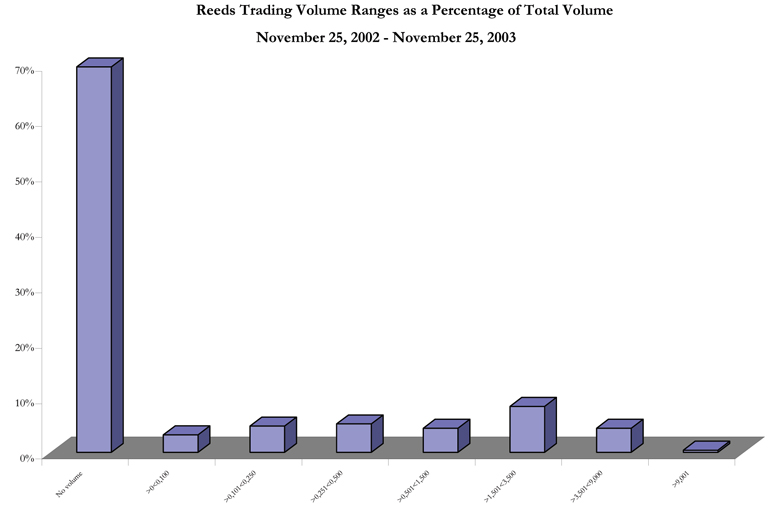
| | • | Capitalink calculated total trading volumes at various closing price ranges of the Company’s common stock. In addition, the number of trading days, and the respective percentages, at certain trading volumes, was set forth. |
| | • | Capitalink noted the following characteristics of the Company’s common stock: |
| | • | | During the twelve months ended November 25, 2003 the Company’s share price has ranged from as high as $1.35 to as low as $0.91. The Company’s common stock closed at $1.10 on November 25, 2003. |
| | • | | The Company’s stock has experienced extremely limited liquidity with the average and median daily number of shares traded equal to 556 and 0 respectively. It was further noted that there was no volume on 176 trading days or approximately 69.6% of the available trading days. The Company’s daily trading volume exceeded 9,000 shares only once over the last twelve months. |
| | • | Capitalink noted that during the twelve months ended November 25, 2003, the Company’s common stock increased 4.8%, while the Comparable Companies index increased 46.3% and the Russell 3000 Index increased 16.0%. |
Page 18
PROJECT SPARKLE | | CONFIDENTIAL |
|
COMPANY MARKET PERFORMANCE | | |
Sources of information: Commodity Systems, Inc.
Page 19
PROJECT SPARKLE | | CONFIDENTIAL |
|
COMPANY MARKET PERFORMANCE | | |
| (1) | Reflects the market cap weighted prices of the comparable companies utilized in the Comparable Company Analysis. |
Sources of information: Commodity Systems, Inc.
Page 20
PROJECT SPARKLE | | CONFIDENTIAL |
|
COMPANY MARKET PERFORMANCE | | |
Sources of information: Commodity Systems, Inc.
Page 21
PROJECT SPARKLE | | CONFIDENTIAL |
|
COMPANY MARKET PERFORMANCE | | |
Sources of information: Commodity Systems, Inc.
Page 22
PROJECT SPARKLE | | CONFIDENTIAL |
|
COMPANY MARKET PERFORMANCE | | |
Sources of information: Commodity Systems, Inc.
Page 23
PROJECT SPARKLE | | CONFIDENTIAL |
| |
I | | INTRODUCTION |
| |
II | | COMPANY OVERVIEW |
| |
III | | COMPANY FINANCIAL & MARKET PERFORMANCE |
| |
IV | | VALUATION |
| |
V | | APPENDIX |
Page 24
PROJECT SPARKLE | | CONFIDENTIAL |
|
VALUATION ANALYSIS - METHODOLOGIES | | |
| | • | Based upon a review of the Company’s historical financial data, projections, and certain other qualitative data, Capitalink utilized several valuation methodologies to determine a range of values for the Company. |
| | • | Capitalink did not form a conclusion as to whether any individual analysis, considered in isolation, supported or failed to support its range of value. |
| | • | Capitalink did not place any particular reliance or weight on any individual analysis, but instead concluded that the analyses, taken as a whole, supported its determination. Accordingly, the analyses must be considered as a whole and selecting portions of analyses or the factors considered, without considering all analyses and factors collectively, could create an incomplete and incorrect view of the process underlying the preparation of the Analysis. |
| | • | The financial reviews and analyses include information presented in tabular format. In order to fully understand Capitalink’s financial review and analyses, the tables must be read together with the text of the presentation. The tables alone are not a complete description of the financial review and analyses and considering the tables alone could create a misleading or incomplete view of Capitalink’s financial review and analyses. |
| | • | The methodologies utilized by Capitalink included: |
| | • | | A review of the historical financial information of the Company. |
| | • | | A review and comparison of the trading of, and the trading market for, the common stock of the Company, the Comparable Companies and a general market index. |
| | • | | A review of a discounted cash flow analysis of the Company, with sensitivity analyses based on a range of assumptions. |
| | • | | A review and comparison of trading multiples for deemed comparable publicly-traded companies for the Company. |
| | • | | A review and comparison of transaction multiples for target companies that are deemed comparable to the Company. |
| | • | | A review and comparison of the premiums paid in recent going private involving minority purchase acquisitions. |
Page 25
PROJECT SPARKLE | | CONFIDENTIAL |
|
VALUATION ANALYSIS - METHODOLOGIES | | |
| | • | | A review and determination of the Company’s adjusted net book value analysis. |
| | • | Instruction 2 to Item 1014 of SEC Regulation MA refers to factors that are important in determining the fairness of a transaction to unaffiliated security holders and the weight, if any, that should be given to them in a particular context will vary. The factors will include, among others, whether the consideration offered to unaffiliated security holders constitutes fair value in relation to: |
| | ii) | Historical market prices |
| | vi) | Purchase prices paid in previous purchases |
| | vii) | Any report, opinion or appraisal |
| | viii) | Firm offers of which the subject company or affiliate is aware made by any unaffiliated persons during the past two years. |
| | • | Capitalink noted that the Analysis addresses factors (i) through (iv). Capitalink has been advised that management is not aware of any relevant information as relates to factors (vi) and (viii). In addition, based upon discussions with management, Capitalink determined that a liquidation analysis (factor (v)) would not derive an indicated value in excess of net book value and therefore such analysis was not warranted. |
Page 26
PROJECT SPARKLE | | CONFIDENTIAL |
|
VALUATION ANALYSIS - SUMMARY | | |
| (1) | Please reference the appropriate analysis for further discussion and sources of information. |
Page 27
PROJECT SPARKLE | | CONFIDENTIAL |
|
VALUATION ANALYSIS - SUMMARY | | |
Indicated Reference Range Summary
($ in thousands, except per share)
Methodology(1)
| | Statistic
| | Selected
Multiple
Range
| | | Indicated EV Value
| | Indicated Equity
Value
| | Indicated
Share Price
|
Discounted Cash Flow Analysis | | | | | | | | | | | | | | | | | | | | | | | | | | | | | | | | | | | |
Revenue Terminal Multiple | | | | | | | | | | | | | $ | 41,999 | | – | | $ | 46,833 | | $ | 13,826 | | – | | $ | 18,660 | | $ | 1.62 | | – | | $ | 2.19 |
EBITDA Terminal Multiple | | | | | | | | | | | | | $ | 40,151 | | – | | $ | 44,946 | | $ | 11,978 | | – | | $ | 16,773 | | $ | 1.41 | | – | | $ | 1.97 |
Perpetual Growth Terminal Value | | | | | | | | | | | | | $ | 38,020 | | – | | $ | 50,324 | | $ | 9,847 | | – | | $ | 22,151 | | $ | 1.16 | | – | | $ | 2.60 |
Indicated Reference Range | | | | | | | | | | | | | | | | | | | | | | | | | | | | | $ | 1.40 | | – | | $ | 2.26 |
Comparable Company Analysis | | | | | | | | | | | | | | | | | | | | | | | | | | | | | | | | | | | |
Market Value as a Multiple of: | | | | | | | | | | | | | | | | | | | | | | | | | | | | | | | | | | | |
Net Tangible Equity (8/31/03) | | $ | 24,220 | | 0.5 | x | | – | | 1.0 | x | | | | | | | | | | $ | 12,110 | | – | | $ | 24,220 | | $ | 1.42 | | – | | $ | 2.85 |
Enterprise Value as Multiple of: | | | | | | | | | | | | | | | | | | | | | | | | | | | | | | | | | | | |
LTM Revenue (8/31/03) | | $ | 101,084 | | 0.40 | x | | – | | 0.45 | x | | $ | 40,434 | | – | | $ | 45,488 | | $ | 16,333 | | – | | $ | 21,387 | | $ | 1.92 | | – | | $ | 2.51 |
NFY Revenue (2/28/04) | | $ | 109,188 | | 0.35 | x | | – | | 0.40 | x | | $ | 38,216 | | – | | $ | 43,675 | | $ | 14,115 | | – | | $ | 19,574 | | $ | 1.66 | | – | | $ | 2.30 |
Average EBITDA (FY2000-LTM Aug 2003) | | $ | 4,040 | | 7.8 | x | | – | | 8.8 | x | | $ | 31,441 | | – | | $ | 35,481 | | $ | 7,340 | | – | | $ | 11,380 | | $ | 0.86 | | – | | $ | 1.34 |
Indicated Reference Range | | | | | | | | | | | | | | | | | | | | | | | | | | | | | $ | 1.47 | | – | | $ | 2.25 |
Comparable Transactions Analysis | | | | | | | | | | | | | | | | | | | | | | | | | | | | | | | | | | | |
Market Value as a Multiple of: | | | | | | | | | | | | | | | | | | �� | | | | | | | | | | | | | | | | | |
Net Common Equity (8/31/03) | | $ | 24,220 | | 0.6 | x | | – | | 1.0 | x | | | | | | | | | | $ | 14,532 | | – | | $ | 24,220 | | $ | 1.71 | | – | | $ | 2.85 |
Enterprise Value as Multiple of: | | | | | | | | | | | | | | | | | | | | | | | | | | | | | | | | | | | |
LTM Revenue (8/31/03) | | $ | 101,084 | | 0.44 | x | | – | | 0.50 | x | | $ | 44,309 | | – | | $ | 50,542 | | $ | 20,208 | | – | | $ | 26,441 | | $ | 2.37 | | – | | $ | 3.11 |
Average EBITDA (FY2000-LTM Aug 2003) | | $ | 4,040 | | 6.5 | x | | – | | 9.0 | x | | $ | 26,228 | | – | | $ | 36,360 | | $ | 2,127 | | – | | $ | 12,259 | | $ | 0.25 | | – | | $ | 1.44 |
Indicated Reference Range | | | | | | | | | | | | | | | | | | | | | | | | | | | | | $ | 1.44 | | – | | $ | 2.46 |
Acquisition Premiums Analysis | | | | | | | | | | | | | | | | | | | | | | | | | | | | | | | | | | | |
Prior One Day | | $ | 1.10 | | 37.3 | % | | – | | 57.2 | % | | | | | | | | | | | | | | | | | | $ | 1.51 | | – | | $ | 1.73 |
Prior Five Day | | $ | 1.10 | | 41.0 | % | | – | | 66.2 | % | | | | | | | | | | | | | | | | | | $ | 1.55 | | – | | $ | 1.83 |
Prior 30 Day | | $ | 1.13 | | 40.8 | % | | – | | 63.5 | % | | | | | | | | | | | | | | | | | | $ | 1.59 | | – | | $ | 1.85 |
Indicated Reference Range | | | | | | | | | | | | | | | | | | | | | | | | | | | | | $ | 1.55 | | – | | $ | 1.80 |
Net Book Value Analysis | | | | | | | | | | | | | | | | | | | | | | | | | | | | | | | | | | | |
Adjusted Net Book Value (10/31/03) | | $ | 1.94 | | | | | | | | | | | | | | | | | | | | | | | | | | | | | | | | |
| (1) | Please reference the appropriate analysis for further discussion and sources of information. |
Page 28
PROJECT SPARKLE | | CONFIDENTIAL |
|
| VALUATION ANALYSIS – DISCOUNTED CASH FLOW ANALYSIS |
| | • | The discounted cash flow analysis estimates value based upon a company’s projected future free cash flow discounted at a rate reflecting risks inherent in its business and capital structure. Unlevered free cash flow represents the amount of cash generated and available for principal, interest and dividend payments after providing for ongoing business operations. |
| | • | While the discounted cash flow analysis is the most scientific of the methodologies, it is dependent on projections and is further dependent on numerous industry-specific and macroeconomic factors. |
| | • | Capitalink utilized the forecasts provided by Company management, which show a gradual increase in revenue between 2004 and 2008 from approximately $101.9 million to approximately $130.2 million. For the forecast period, the Company projects an increase in EBITDA from approximately $3.8 million for FY2004, to approximately $6.5 million for FY2008. This represents an increase in the Company’s EBITDA margin from 3.7% to 5.0%. |
| | • | In order to arrive at a present value, Capitalink utilized discount rates ranging from 17.5% to 18.5%. This was based on an estimated WACC of 18.0% (based on the Company’s 24.9% estimated cost of equity and 5.3% weighted average cost of debt). |
| | • | Capitalink presented a range of terminal values at the end of the forecast period by applying a range of multiples to the FY2008 projected revenue and EBITDA. |
| | • | In addition, Capitalink presented a perpetual growth scenario whereby ranges of growth rates were applied to the FY2008 free cash flow in order to determine a terminal value, rather than multiples. |
| | • | In each of the scenarios noted above, a range of enterprise values was derived for the Company’s business. |
Page 29
PROJECT SPARKLE | | CONFIDENTIAL |
|
| VALUATION ANALYSIS – DISCOUNTED CASH FLOW ANALYSIS |
| | • | The results of the discounted cash flow analysis under the three terminal value scenarios were as follows: |
| | • | | Utilizing the revenue terminal scenario (range of 0.40 times to 0.45 times), Capitalink calculated a range of indicated enterprise values from $42.0 million to $46.8 million. |
| | • | | Utilizing the EBITDA terminal scenario (range of 7.5 times to 8.5 times), Capitalink calculated a range of indicated enterprise values from $40.1 million to $44.9 million. |
| | • | | Utilizing a perpetual growth scenario (growth rates of 11.5% to 12.5%), Capitalink calculated a range of indicated enterprise values from $38.0 million to $50.3 million. |
| | • | The total enterprise values above were then reduced by the Company’s net debt of $28.2 million as of October 31, 2003 (which includes $28.6 million in interest bearing debt and approximately $413,000 in cash on hand and from the assumed exercise of ITM options) to arrive at an equity value range. |
| | • | The equity value range was then divided by the total common stock equivalents of 8.512 million, which includes ITM options, to obtain a range of indicated common stock shares prices of between $1.40 and $2.26. |
Page 30
PROJECT SPARKLE | | CONFIDENTIAL |
|
| VALUATION ANALYSIS – DISCOUNTED CASH FLOW ANALYSIS |
Indicated Reference Range
($ in thousands, except per share)
| | | Selected Range
| | | | | | | |
| | | Low - High
| | | Indicated EV Value
| | Indicated Equity Value (1)
| | Indicated Share Price (2)
|
LTM Revenue Terminal Multiple | | 0.40 | x | | - | | 0.45 | x | | $ | 41,999 | | - | | $ | 46,833 | | $ | 13,826 | | $ | 18,660 | | $ | 1.62 | | - | | $ | 2.19 |
LTM EBITDA Terminal Multiple | | 7.50 | x | | - | | 8.50 | x | | $ | 40,151 | | - | | $ | 44,946 | | $ | 11,978 | | $ | 16,773 | | $ | 1.41 | | - | | $ | 1.97 |
Perpetual Growth Method | | 11.50 | % | | - | | 12.50 | % | | $ | 38,020 | | - | | $ | 50,324 | | $ | 9,847 | | $ | 22,151 | | $ | 1.16 | | - | | $ | 2.60 |
Indicated Reference Range | | | | | | | | | | | | | | | | | | | | | | | | $ | 1.40 | | - | | $ | 2.26 |
| (1) | Adjusted for $28,173 estimated net debt as of October 31, 2003, which includes cash from in the money options/warrants outstanding. |
| (2) | Based upon and assumes 8,512 shares and in the money options/warrants outstanding. |
Page 31
PROJECT SPARKLE | | CONFIDENTIAL |
|
VALUATION ANALYSIS – DISCOUNTED CASH FLOW ANALYSIS |
Estimated Ranges
($ in thousands, except per share)
Discount Rate
| | Estimated Range of Enterprise Values
| | Estimated Range of Equity Values
| | Estimated Range of Equity Values Per
Share
|
Revenue Terminal Value Analysis |
| | | 0.400x
| | 0.413x
| | 0.425x
| | 0.438x
| | 0.450x
| | 0.40x
| | 0.41x
| | 0.43x
| | 0.44x
| | 0.45x
| | 0.40x
| | 0.41x
| | 0.43x
| | 0.44x
| | 0.45x
|
17.5% | | $ | 42,875 | | $ | 43,864 | | $ | 44,854 | | $ | 45,844 | | $ | 46,833 | | $ | 14,702 | | $ | 15,691 | | $ | 16,681 | | $ | 17,671 | | $ | 18,660 | | $ | 1.73 | | $ | 1.84 | | $ | 1.96 | | $ | 2.08 | | $ | 2.19 |
17.8% | | $ | 42,653 | | $ | 43,636 | | $ | 44,619 | | $ | 45,603 | | $ | 46,586 | | $ | 14,480 | | $ | 15,463 | | $ | 16,446 | | $ | 17,430 | | $ | 18,413 | | $ | 1.70 | | $ | 1.82 | | $ | 1.93 | | $ | 2.05 | | $ | 2.16 |
18.0% | | $ | 42,433 | | $ | 43,410 | | $ | 44,387 | | $ | 45,364 | | $ | 46,341 | | $ | 14,260 | | $ | 15,237 | | $ | 16,214 | | $ | 17,191 | | $ | 18,168 | | $ | 1.68 | | $ | 1.79 | | $ | 1.90 | | $ | 2.02 | | $ | 2.13 |
18.3% | | $ | 42,215 | | $ | 43,186 | | $ | 44,156 | | $ | 45,127 | | $ | 46,097 | | $ | 14,042 | | $ | 15,013 | | $ | 15,983 | | $ | 16,954 | | $ | 17,924 | | $ | 1.65 | | $ | 1.76 | | $ | 1.88 | | $ | 1.99 | | $ | 2.11 |
18.5% | | $ | 41,999 | | $ | 42,964 | | $ | 43,928 | | $ | 44,892 | | $ | 45,856 | | $ | 13,826 | | $ | 14,791 | | $ | 15,755 | | $ | 16,719 | | $ | 17,683 | | $ | 1.62 | | $ | 1.74 | | $ | 1.85 | | $ | 1.96 | | $ | 2.08 |
| | | | | | | | |
|
| | | | | | | | | | | | | |
|
| | | | | | | | | | | | | |
|
| | | | | | |
| | | | | | | Average | | $ | 44,389 | | | | | | | | | | | | Average | | $ | 16,216 | | | | | | | | | | | | Average | | $ | 1.91 | | | | | | |
| | | | | | | | |
|
| | | | | | | | | | | | | |
|
| | | | | | | | | | | | | |
|
| | | | | | |
EBITDA Terminal Value Analysis |
| | | 7.50x
| | 7.75x
| | 8.00x
| | 8.25x
| | 8.50x
| | 7.50x
| | 7.75x
| | 8.00x
| | 8.25x
| | 8.50x
| | 7.50x
| | 7.75x
| | 8.00x
| | 8.25x
| | 8.50x
|
17.5% | | $ | 40,977 | | $ | 41,969 | | $ | 42,962 | | $ | 43,954 | | $ | 44,946 | | $ | 12,804 | | $ | 13,796 | | $ | 14,789 | | $ | 15,781 | | $ | 16,773 | | $ | 1.50 | | $ | 1.62 | | $ | 1.74 | | $ | 1.85 | | $ | 1.97 |
17.8% | | $ | 40,768 | | $ | 41,753 | | $ | 42,739 | | $ | 43,725 | | $ | 44,711 | | $ | 12,595 | | $ | 13,580 | | $ | 14,566 | | $ | 15,552 | | $ | 16,538 | | $ | 1.48 | | $ | 1.60 | | $ | 1.71 | | $ | 1.83 | | $ | 1.94 |
18.0% | | $ | 40,560 | | $ | 41,540 | | $ | 42,519 | | $ | 43,499 | | $ | 44,478 | | $ | 12,387 | | $ | 13,367 | | $ | 14,346 | | $ | 15,326 | | $ | 16,305 | | $ | 1.46 | | $ | 1.57 | | $ | 1.69 | | $ | 1.80 | | $ | 1.92 |
18.3% | | $ | 40,354 | | $ | 41,328 | | $ | 42,301 | | $ | 43,274 | | $ | 44,247 | | $ | 12,181 | | $ | 13,155 | | $ | 14,128 | | $ | 15,101 | | $ | 16,074 | | $ | 1.43 | | $ | 1.55 | | $ | 1.66 | | $ | 1.77 | | $ | 1.89 |
18.5% | | $ | 40,151 | | $ | 41,117 | | $ | 42,084 | | $ | 43,051 | | $ | 44,018 | | $ | 11,978 | | $ | 12,944 | | $ | 13,911 | | $ | 14,878 | | $ | 15,845 | | $ | 1.41 | | $ | 1.52 | | $ | 1.63 | | $ | 1.75 | | $ | 1.86 |
| | | | | | | | |
|
| | | | | | | | | | | | | |
|
| | | | | | | | | | | | | |
|
| | | | | | |
| | | | | | | Average | | $ | 42,521 | | | | | | | | | | | | Average | | $ | 14,348 | | | | | | | | | | | | Average | | $ | 1.69 | | | | | | |
| | | | | | | | |
|
| | | | | | | | | | | | | |
|
| | | | | | | | | | | | | |
|
| | | | | | |
Perpetual Growth Terminal Value Analysis |
| | | 11.50%
| | 11.75%
| | 12.00%
| | 12.25%
| | 12.50%
| | 11.50%
| | 11.75%
| | 12.00%
| | 12.25%
| | 12.50%
| | 11.50%
| | 11.75%
| | 12.00%
| | 12.25%
| | 12.50%
|
17.5% | | $ | 43,387 | | $ | 44,895 | | $ | 46,540 | | $ | 48,342 | | $ | 50,324 | | $ | 15,214 | | $ | 16,722 | | $ | 18,367 | | $ | 20,169 | | $ | 22,151 | | $ | 1.79 | | $ | 1.96 | | $ | 2.16 | | $ | 2.37 | | $ | 2.60 |
17.8% | | $ | 41,883 | | $ | 43,266 | | $ | 44,769 | | $ | 46,408 | | $ | 48,203 | | $ | 13,710 | | $ | 15,093 | | $ | 16,596 | | $ | 18,235 | | $ | 20,030 | | $ | 1.61 | | $ | 1.77 | | $ | 1.95 | | $ | 2.14 | | $ | 2.35 |
18.0% | | $ | 40,496 | | $ | 41,767 | | $ | 43,145 | | $ | 44,642 | | $ | 46,276 | | $ | 12,323 | | $ | 13,594 | | $ | 14,972 | | $ | 16,469 | | $ | 18,103 | | $ | 1.45 | | $ | 1.60 | | $ | 1.76 | | $ | 1.93 | | $ | 2.13 |
18.3% | | $ | 39,212 | | $ | 40,385 | | $ | 41,652 | | $ | 43,025 | | $ | 44,517 | | $ | 11,039 | | $ | 12,212 | | $ | 13,479 | | $ | 14,852 | | $ | 16,344 | | $ | 1.30 | | $ | 1.43 | | $ | 1.58 | | $ | 1.74 | | $ | 1.92 |
18.5% | | $ | 38,020 | | $ | 39,105 | | $ | 40,275 | | $ | 41,537 | | $ | 42,905 | | $ | 9,847 | | $ | 10,932 | | $ | 12,102 | | $ | 13,364 | | $ | 14,732 | | $ | 1.16 | | $ | 1.28 | | $ | 1.42 | | $ | 1.57 | | $ | 1.73 |
| | | | | | | | |
|
| | | | | | | | | | | | | |
|
| | | | | | | | | | | | | |
|
| | | | | | |
| | | | | | | Average | | $ | 43,399 | | | | | | | | | | | | Average | | $ | 15,226 | | | | | | | | | | | | Average | | $ | 1.79 | | | | | | |
| | | | | | | | |
|
| | | | | | | | | | | | | |
|
| | | | | | | | | | | | | |
|
| | | | | | |
All Discounted amounts have been calculated utilizing a mid-year convention.
| Sources | of information: Company financials, projections and management. |
Page 32
PROJECT SPARKLE | | CONFIDENTIAL |
|
VALUATION ANALYSIS – DISCOUNTED CASH FLOW ANALYSIS |
Free Cash Flow Projections
($ in thousands)
| | | Actual/Estimated
| | | Projected
| |
| | | FYE
Feb-03
| | | 9 ME Nov-03
| | | 3 ME Feb-04
| | FYE Feb 29
| |
| | | | | | 2004
| | 2005
| | | 2006
| | | 2007
| | | 2008
| |
Free Cash Flows | | | | | | | | | | | | | | | | | | | | | | | | | | | | | | |
Revenue | | $ | 102,011 | | | $ | 60,011 | | | $ | 41,946 | | $ | 101,957 | | $ | 109,188 | | | $ | 115,847 | | | $ | 122,841 | | | $ | 130,182 | |
Cost of Goods Sold | | | 52,590 | | | | 31,454 | | | | 21,555 | | | 53,009 | | | 55,794 | | | | 58,735 | | | | 61,912 | | | | 65,352 | |
| | |
|
|
| |
|
|
| |
|
| |
|
| |
|
|
| |
|
|
| |
|
|
| |
|
|
|
Gross Margin | | | 49,421 | | | | 28,557 | | | | 20,391 | | | 48,948 | | | 53,394 | | | | 57,112 | | | | 60,929 | | | | 64,830 | |
Operating Expenses | | | 47,241 | | | | 31,517 | | | | 13,641 | | | 45,158 | | | 49,345 | | | | 52,581 | | | | 55,387 | | | | 58,303 | |
| | |
|
|
| |
|
|
| |
|
| |
|
| |
|
|
| |
|
|
| |
|
|
| |
|
|
|
EBITDA | | | 2,180 | | | | (2,960 | ) | | | 6,750 | | | 3,790 | | | 4,049 | | | | 4,531 | | | | 5,542 | | | | 6,527 | |
Deprec. & Amort. | | | 2,450 | | | | 1,782 | | | | 568 | | | 2,350 | | | 2,370 | | | | 2,308 | | | | 2,319 | | | | 2,238 | |
| | |
|
|
| |
|
|
| |
|
| |
|
| |
|
|
| |
|
|
| |
|
|
| |
|
|
|
EBIT | | | (270 | ) | | | (4,742 | ) | | | 6,182 | | | 1,440 | | | 1,679 | | | | 2,223 | | | | 3,223 | | | | 4,289 | |
Income Taxes | | | — | | | | — | | | | — | | | — | | | 1,500 | | | | — | | | | 1,169 | | | | 1,587 | |
| | |
|
|
| |
|
|
| |
|
| |
|
| |
|
|
| |
|
|
| |
|
|
| |
|
|
|
Unlevered After-tax Income | | | (270 | ) | | | (4,742 | ) | | | 6,182 | | | 1,440 | | | 179 | | | | 2,223 | | | | 2,054 | | | | 2,702 | |
Add: Deprec. & Amort. | | | 2,450 | | | | 1,782 | | | | 568 | | | 2,350 | | | 2,370 | | | | 2,308 | | | | 2,319 | | | | 2,238 | |
Add: Change in Net WC | | | (3,827 | ) | | | (2,138 | ) | | | 2,538 | | | 400 | | | (1,049 | ) | | | (293 | ) | | | (856 | ) | | | (2,919 | ) |
Less: Capital Expenditures | | | 696 | | | | 500 | | | | 500 | | | 1,000 | | | 1,500 | | | | 2,000 | | | | 2,000 | | | | 2,000 | |
| | |
|
|
| |
|
|
| |
|
| |
|
| |
|
|
| |
|
|
| |
|
|
| |
|
|
|
Unlevered Free Cash Flows | | $ | (2,343 | ) | | $ | (5,598 | ) | | $ | 8,788 | | $ | 3,190 | | $ | — | | | $ | 2,238 | | | $ | 1,517 | | | $ | 21 | |
| | |
|
|
| |
|
|
| |
|
| |
|
| |
|
|
| |
|
|
| |
|
|
| |
|
|
|
| | | Actual
FYE
Feb-03
| | | Projected
| |
| | | | FYE Feb 29
| |
| | | | 2004
| | | 2005
| | | 2006
| | | 2007
| | | 2008
| |
Growth Analysis | | | | | | | | | | | | | | | | | | |
Revenue | | na | | | -0.1 | % | | 7.1 | % | | 6.1 | % | | 6.0 | % | | 6.0 | % |
Cost of Goods Sold | | na | | | 0.8 | % | | 5.3 | % | | 5.3 | % | | 5.4 | % | | 5.6 | % |
Gross Margin | | na | | | -1.0 | % | | 9.1 | % | | 7.0 | % | | 6.7 | % | | 6.4 | % |
Operating Expenses | | na | | | -4.4 | % | | 9.3 | % | | 6.6 | % | | 5.3 | % | | 5.3 | % |
EBITDA | | na | | | 73.9 | % | | 6.8 | % | | 11.9 | % | | 22.3 | % | | 17.8 | % |
Deprec. & Amort. | | na | | | -4.1 | % | | 0.9 | % | | -2.6 | % | | 0.5 | % | | -3.5 | % |
EBIT | | na | | | na | | | 16.6 | % | | 32.4 | % | | 45.0 | % | | 33.1 | % |
Income Taxes | | na | | | na | | | na | | | -100.0 | % | | na | | | 35.7 | % |
Unlevered After-tax Income | | na | | | na | | | -87.6 | % | | 1141.9 | % | | -7.6 | % | | 31.6 | % |
Add: Deprec. & Amort. | | na | | | -4.1 | % | | 0.9 | % | | -2.6 | % | | 0.5 | % | | -3.5 | % |
Add: Change in Net WC | | na | | | na | | | -362.3 | % | | na | | | na | | | na | |
Less: Capital Expenditures | | na | | | 43.7 | % | | 50.0 | % | | 33.3 | % | | 0.0 | % | | 0.0 | % |
Unlevered Free Cash Flows | | na | | | na | | | -100.0 | % | | na | | | -32.2 | % | | -98.6 | % |
| | | | | | |
Profitability Analysis | | | | | | | | | | | | | | | | | | |
Gross Margin | | 48.4 | % | | 48.0 | % | | 48.9 | % | | 49.3 | % | | 49.6 | % | | 49.8 | % |
EBITDA | | 2.1 | % | | 3.7 | % | | 3.7 | % | | 3.9 | % | | 4.5 | % | | 5.0 | % |
EBIT | | -0.3 | % | | 1.4 | % | | 1.5 | % | | 1.9 | % | | 2.6 | % | | 3.3 | % |
Unlevered After-tax Income | | -0.3 | % | | 1.4 | % | | 0.2 | % | | 1.9 | % | | 1.7 | % | | 2.1 | % |
Sources of information: Company financials, projections and management.
Page 33
PROJECT SPARKLE | | CONFIDENTIAL |
|
VALUATION ANALYSIS – DISCOUNTED CASH FLOW ANALYSIS |
Working Capital and Income Tax
($ in thousands)
| | | Actual/ Estimated
| | | Projected
| |
| | | FYE
Feb-03
| | | 9 ME
Nov-03
| | | 3 ME
Feb-04
| | | FYE Feb 29
| |
| | | | | | 2005
| | | 2006
| | | 2007
| | | 2008
| |
Non-Cash Working Capital Assumptions | | | | | | | | | | | | | | | | | | | | | | | | | | | | |
AR Days Outstanding | | | 0 | | | | na | | | | 0 | | | | 0 | | | | 0 | | | | 0 | | | | 0 | |
A/R - % Sales | | | 0.0 | % | | | na | | | | 0.1 | % | | | 0.1 | % | | | 0.1 | % | | | 0.1 | % | | | 0.1 | % |
| | | | | | | |
Days Inventory Outs. | | | 289 | | | | na | | | | 282 | | | | 281 | | | | 273 | | | | 268 | | | | 267 | |
Inv - % CGS | | | 79.2 | % | | | na | | | | 77.3 | % | | | 76.9 | % | | | 74.7 | % | | | 73.4 | % | | | 73.1 | % |
| | | | | | | |
Prepay & Other - % CGS & Op E | | | 3.5 | % | | | na | | | | 3.1 | % | | | 2.9 | % | | | 2.7 | % | | | 2.6 | % | | | 2.5 | % |
| | | | | | | |
AP Days Outstanding | | | 44 | | | | na | | | | 42 | | | | 42 | | | | 42 | | | | 42 | | | | 41 | |
A/P - % CGS & Op Exp | | | 12.0 | % | | | na | | | | 11.6 | % | | | 11.6 | % | | | 11.6 | % | | | 11.6 | % | | | 11.2 | % |
| | | | | | | |
Non-Cash Net Working Capital | | | | | | | | | | | | | | | | | | | | | | | | | | | | |
| | | | | | | |
Accounts Receivable | | $ | 7 | | | $ | 110 | | | $ | 110 | | | $ | 110 | | | $ | 110 | | | $ | 110 | | | $ | 110 | |
Inventory | | | 41,637 | | | | 50,798 | | | | 41,000 | | | | 42,912 | | | | 43,904 | | | | 45,460 | | | | 47,798 | |
Prepayments | | | 3,497 | | | | 4,055 | | | | 3,055 | | | | 3,055 | | | | 3,055 | | | | 3,055 | | | | 3,055 | |
Accounts Payable | | | 11,944 | | | | 19,628 | | | | 11,368 | | | | 12,231 | | | | 12,930 | | | | 13,630 | | | | 13,905 | |
| | |
|
|
| |
|
|
| |
|
|
| |
|
|
| |
|
|
| |
|
|
| |
|
|
|
| | | | | | | |
Non-Cash Net WC | | $ | 33,197 | | | $ | 35,335 | | | $ | 32,797 | | | $ | 33,846 | | | $ | 34,139 | | | $ | 34,995 | | | $ | 37,058 | |
| | |
|
|
| |
|
|
| |
|
|
| |
|
|
| |
|
|
| |
|
|
| |
|
|
|
| | | | | | | |
Change in Non-Cash Net WC | | $ | (3,827 | ) | | $ | (2,138 | ) | | $ | 2,538 | | | $ | (1,049 | ) | | $ | (293 | ) | | $ | (856 | ) | | $ | (2,919 | ) |
| | |
|
|
| |
|
|
| |
|
|
| |
|
|
| |
|
|
| |
|
|
| |
|
|
|
| | | Actual/ Estimated
| | | Projected
| |
| | | FYE
Feb-03
| | | 9 ME
Nov-03
| | | 3 ME
Feb-04
| | | FYE Feb 29
| |
| | | | | | 2005
| | | 2006
| | | 2007
| | | 2008
| |
Income Tax Expense and Assumptions | | | | | | | | | | | | | | | | | | | | | | | | | | | | |
Statutory Tax Rate | | | 37.0 | % | | | 37.0 | % | | | 37.0 | % | | | 37.0 | % | | | 37.0 | % | | | 37.0 | % | | | 37.0 | % |
Effective Tax Rate | | | 0.0 | % | | | 0.0 | % | | | 0.0 | % | | | 89.3 | % | | | 0.0 | % | | | 36.3 | % | | | 37.0 | % |
| | | | | | | |
EBT | | | (270 | ) | | | (4,742 | ) | | | 6,182 | | | | 1,679 | | | | 2,223 | | | | 3,223 | | | | 4,289 | |
| | | | | | | |
Tax Expense | | $ | (100 | ) | | $ | (1,755 | ) | | $ | 2,287 | | | $ | 2,121 | | | $ | 823 | | | $ | 1,193 | | | $ | 1,587 | |
NOL Usage | | | 100 | | | | 1,755 | | | | (2,287 | ) | | | (621 | ) | | | (823 | ) | | | (23 | ) | | | — | |
| | |
|
|
| |
|
|
| |
|
|
| |
|
|
| |
|
|
| |
|
|
| |
|
|
|
Income Tax Expense | | $ | — | | | $ | — | | | $ | — | | | $ | 1,500 | | | $ | — | | | $ | 1,169 | | | $ | 1,587 | |
| | |
|
|
| |
|
|
| |
|
|
| |
|
|
| |
|
|
| |
|
|
| |
|
|
|
| | | | | | | |
Ending NOL Balance | | $ | 3,362 | | | $ | 5,117 | | | $ | 2,829 | | | $ | 846 | | | $ | 23 | | | $ | — | | | $ | — | |
| | |
|
|
| |
|
|
| |
|
|
| |
|
|
| |
|
|
| |
|
|
| |
|
|
|
Sources of information: Company financials, projections and management.
Page 34
PROJECT SPARKLE | | CONFIDENTIAL |
|
| VALUATION ANALYSIS – DISCOUNTED CASH FLOW ANALYSIS |
Cost of Capital, Net Debt & Stock Equivalents
($ in thousands, except per share)
Cost of Equity
Riskless(1) | | | |
20 year treasury coupon (Rf) | | 5.1 | % |
Risk(2) | | | |
Equity risk premium (EP) | | 7.0 | % |
Industry risk premium (IP) | | 1.6 | % |
Size Premium (SP) | | 9.2 | % |
Company Specific | | | |
Poor Historical Track Record | | 2.0 | % |
| | |
|
|
| | | 24.9 | % |
| | |
|
|
Cost of Debt | | | | | | | | | | | | |
| | | | |
Type of Debt
| | Nominal
Rate
| | | Amount
| | % of
Debt
| | | Weighted
Cost of Debt
| |
Revolving Line of Credit | | 5.00 | % | | $ | 26,007 | | 91.0 | % | | 4.5 | % |
Related Party Loan 1 | | 10.00 | % | | | 1,750 | | 6.1 | % | | 0.6 | % |
Related Party Loan 2 | | 4.00 | % | | | 829 | | 2.9 | % | | 0.1 | % |
| | | | | |
|
| |
|
| |
|
|
| | | | | | $ | 28,586 | | 100.0 | % | | 5.3 | % |
| | | | | |
|
| |
|
| |
|
|
Weighted Average Cost of Capital | | | | | | | | | | | | | | | | | | | | | | | | |
| | | | | | | | | |
| | | Shares Outs.
(in thousands)
| | Stock Price
25-Nov-03
| | Market
Value
| | % of
Total Capital
| | | Industry Avg. %
of Total
Capital (3)
| | | Nominal
Rate
| | | Effective
Tax Rate
| | | Cost of
Capital
| | | Weighted
Cost of Capital
| |
Debt | | | | | | | $ | 28,586 | | 75.4 | % | | 32.0 | % | | 5.3 | % | | 37.0 | % | | 3.3 | % | | 1.1 | % |
Equity | | 8,476 | | $ | 1.1000 | | | 9,324 | �� | 24.6 | % | | 68.0 | % | | 24.9 | % | | | | | 24.9 | % | | 16.9 | % |
| | | | | | | |
|
| |
|
| |
|
| | | | | | | | | | |
|
|
| | | | | | | | $ | 37,910 | | 100.0 | % | | 100.0 | % | | | | | | | | | | | 18.0 | % |
| | | | | | | |
|
| |
|
| |
|
| | | | | | | | | | |
|
|
Net Debt
| | | Preliminary
as of
31-Oct-03
|
Debt & Other Obligations | | | |
Interest Bearing Debt | | $ | 28,586 |
Minority Interests | | | — |
Preferred Stock | | | — |
| | |
|
|
| | | | 28,586 |
| | |
|
|
Less Cash | | | |
Cash on Hand | | | 359 |
Assumed cash from exercise of options | | | 54 |
Assumed cash from Other | | | — |
| | |
|
|
| | | | 413 |
| | |
|
|
Net Debt | | $ | 28,173 |
| | |
|
|
Common Stock Equivalents
| | | | | as of
31-Oct-03
|
Common Stock Equivalents (in thousands) | | | | | |
Common Stock Outstanding | | | | | 8,476 |
Stock issued re Other | | | | | — |
| | | | | |
|
| | | | | | 8,476 |
| | | | | |
|
| | | Exercise $ | | | |
Options in the money(4): Plan 1 | | $ | 1.50 | | 36 |
Plan 2 | | $ | — | | — |
| | | | | |
|
| | | | | | 36 |
| | | | | |
|
Total Common Stock Equivalents | | | | | 8,512 |
| | | | | |
|
| (1) | As reported by the Federal Reserve Board on a daily basis as of November 24, 2003. |
| (2) | Sourced from the Ibbotson SBBI Valuation Edition 2003 Yearbook. Industry risk premium based on SIC 5944 (Jewelry Stores). |
| (3) | Sourced from Ibbotson 2003 Cost of Capital Yearbook, based on average composite debt to total capital ratio for SIC 5944 |
| (4) | Options in the money includes all options and warrants with an exercise price less than or equal to $2.00 per share. |
Sources of information: Company financials, projections & management, Ibbotson 2003 SBBI and Federal Reserve Board.
Page 35
PROJECT SPARKLE | | CONFIDENTIAL |
|
| VALUATION ANALYSIS – SELECTED COMPARABLE COMPANY ANALYSIS |
| | • | The selected comparable company analysis compares the trading multiples of the Company with those of other publicly traded companies that are similar with respect to business and revenue model, operating sector, size and target customer base. |
| | • | Capitalink located five companies that it deemed comparable to the Company with respect to their industry sector and market served (the “Comparable Companies”). All are involved in the operation of jewelry stores in the United States and operate under the SIC code 5944. |
| | • | Reeds is significantly smaller than all of the Comparable Companies. As of November 25, 2003, the enterprise values for the Comparable Companies ranged from approximately $3.6 billion to approximately $72.9 million and revenue ranged from approximately $2.5 billion to approximately $111.9 million. In comparison, Reeds had an enterprise value and LTM revenue of approximately $33.5 million and approximately $101.1 million, respectively. |
| | • | In terms of number of stores, average store size, and average sales per store, Reeds is smaller than the average of the Comparable Companies. Reeds has a total of 91 stores compared with the mean and median of the Comparable Companies of 1,000 and 697, respectively. The Company’s stores are also smaller in size with 1,150 square feet, compared with a mean of 1,849 and a store weighted average of 1,319 square feet for the Comparable Companies. Average sales per store and average price per transaction for Reeds is approximately $1.0 million compared with a mean of $1.6 million for the Comparable Companies. However, the average price per transaction of $280 for Reeds is slightly above the median of the Comparable Companies of $263. |
| | • | Capitalink noted that of the Comparable Companies, Friedmans and Whitehall Jewellers were the most comparable in terms of size and operating model. However, Friedmans is currently under-going a SEC fraud investigation that has negatively impacted their share price and has announced it will need to restate its historical results to reflect increases in allowances for doubtful accounts. |
Page 36
PROJECT SPARKLE | | CONFIDENTIAL |
|
| VALUATION ANALYSIS – SELECTED COMPARABLE COMPANY ANALYSIS |
| | • | Multiples utilizing market value and enterprise value were used. The difference between the two is as follows: |
| | • | | Market value equals price per share times number of shares outstanding, |
| | • | | Enterprise value equals market value plus interest bearing debt, preferred stock and minority interest, less cash and equivalents. |
| | • | Market values were used to calculate multiples of EPS, common equity, and net tangible common equity, while enterprise values were used to calculate multiples of LTM revenue, LTM EBIT, LTM EBITDA, and total assets. For comparison purposes, all operating profits including EBITDA were normalized to exclude unusual and extraordinary expenses or income. |
| | • | The comparable company analysis generated a wide range of multiples: |
| | • | | Based on market value, the mean LTM EPS multiple and common equity multiple was 12.8 times and 1.5 times, respectively. |
| | • | | Based on enterprise value, the mean LTM revenue and LTM EBITDA multiple was 0.82 times and 8.0 times respectively, compared with an LTM revenue multiple of 0.33 times and EBITDA multiple of 19.4 times for the Company. The high EBITDA multiple reflects the Company’s historically low LTM EBITDA of $1.7 million. |
| | • | Capitalink noted that the EBITDA margin for the Company of 1.7% for the LTM period ended August 31, 2003 was lower than all of the Comparable Companies, the mean and media of which was 7.9% and 9.6%, respectively. Given the volatility in the Company’s EBITDA, Capitalink also calculated the average EBITDA from FY2000 to LTM August 2003 to be approximately $4.0 million. |
| | • | Capitalink noted that the Company’s debt to total invested capital ratio of 73.7% is higher than any of the Comparable Companies (the mean and median of which was 39.7% and 36.3%, respectively). |
| | • | Capitalink determined a range of indicated values for the Company by selecting a range of valuation multiples based on the Comparable Companies, and applying them to the Company’s net tangible equity, LTM revenue, NFY Revenue and average EBITDA (from FY2000 to LTM August 2003). |
Page 37
PROJECT SPARKLE | | CONFIDENTIAL |
|
| VALUATION ANALYSIS – SELECTED COMPARABLE COMPANY ANALYSIS |
| | • | Capitalink expects the Company’s valuation multiples to be below the average of the Comparable Companies due to the smaller size of the Company (which limits the ability of the Company to gain economies of scale advantages with respect to corporate costs and supply costs) and the poor historical performance of the Company relative to most of the Comparable Companies. |
| | • | Capitalink selected an appropriate multiple range for the Company as follows: |
| | • | | 0.5 times to 1.0 times net tangible equity. |
| | • | | 0.40 times to 0.50 times LTM revenue. |
| | • | | 0.35 times to 0.40 times NFY revenue. |
| | • | | 7.8 times to 8.8 times average EBITDA. |
| | • | Based on the selected multiple ranges, and taking into account net debt of approximately $24.1 million and common stock equivalents of 8.512 million shares as of August 31, 2003, Capitalink calculated a range of indicated equity values per share of between $1.47 and $2.25. |
| | • | An analysis of publicly-traded comparable companies is not mathematical; rather it involves complex consideration and judgments concerning differences in financial and operating characteristics of the Comparable Companies and other factors that could affect the public trading of the Comparable Companies. |
Page 38
PROJECT SPARKLE | | CONFIDENTIAL |
|
| VALUATION ANALYSIS – SELECTED COMPARABLE COMPANY ANALYSIS |
Indicated Reference Range
($ in thousands, except per share)
| | | | | Selected Multiple Range
| | | | | | | |
| | | Statistic
| | Low
| | | - | | High
| | | Indicated EV Value
| | Indicated E quity Value(1)
| | Indicated Share Price(2)
|
Market Value Multiple | | | | | | | | | | | | | | | | | | | | | | | | | | | | | | | | | | | |
Net Tangible Equity (8/31/03) | | $ | 24,220 | | 0.5 | x | | - | | 1.0 | x | | | | | | | | | | $ | 12,110 | | - | | $ | 24,220 | | $ | 1.42 | | - | | $ | 2.85 |
Total Enterprise Value (EV) Multiple | | | | | | | | | | | | | | | | | | | | | | | | | | | | | | | | | | | |
LTM Revenue (8/31/03) | | $ | 101,084 | | 0.40 | x | | - | | 0.45 | x | | $ | 40,434 | | - | | $ | 45,488 | | $ | 16,333 | | - | | $ | 21,387 | | $ | 1.92 | | - | | $ | 2.51 |
NFY Revenue (2/28/04) | | $ | 109,188 | | 0.35 | x | | - | | 0.40 | x | | $ | 38,216 | | - | | $ | 43,675 | | $ | 14,115 | | - | | $ | 19,574 | | $ | 1.66 | | - | | $ | 2.30 |
Average EBITDA (FY2000-LTM Aug 2003) | | $ | 4,040 | | 7.8 | x | | - | | 8.8 | x | | $ | 31,441 | | - | | $ | 35,481 | | $ | 7,340 | | - | | $ | 11,380 | | $ | 0.86 | | - | | $ | 1.34 |
Indicated Reference Range | | | | | | | | | | | | | | | | | | | | | | | | | | | | | $ | 1.47 | | - | | $ | 2.25 |
| (1) | Adjusted for $24,101 net debt as of August 31, 2003, which includes cash from in the money options/warrants outstanding. |
| (2) | Based upon and assumes 8,512 shares and in the money options/warrants outstanding. |
Page 39
PROJECT SPARKLE | | CONFIDENTIAL |
|
| VALUATION ANALYSIS – SELECTED COMPARABLE COMPANY ANALYSIS |
Valuation Multiples
($ in thousands, except per share data)
| | | | | | | | | | | | | | | | MV as a Multiple of
| | | EV as a Multiple of
| | | 5 Yr
EPS Growth
Proj(3)
| |
Company
| | Ticker
| | Stock Price
25-Nov-03
| | % Below/
Above
52-week
High-Low
| | | Market
Value
MV
| | Total
Invested
Capital
TIC(1)
| | Enterprise
Value EV(2)
| | EPS(3)
| | | Common
Equity
| | | Net
Tang
Com
Eq
| | | Revenue(3)
| | | LTM
EBIT
| | | LTM
EBITDA
| | | Total
Assets
| | |
| | | | | | | | LTM
| | | Est
CFY
| | | | | LTM
| | | Est
CFY
| | | | | |
Signet Group PLC | | SIGY | | $ | 53.250 | | 10.3 | % | | – | | 78.7 | % | | $ | 3,050,693 | | $ | 3,686,160 | | $ | 3,636,089 | | 15.0 | x | | 14.0 | x | | 2.6 | x | | 2.7 | x | | 1.43 | x | | na | | | 10.8 | x | | 9.1 | x | | 2.0 | x | | 10.0 | % |
Zale Corp | | ZLC | | | 55.170 | | 1.6 | % | | – | | 94.6 | % | | | 1,512,155 | | | 1,696,555 | | | 1,661,282 | | 18.6 | | | 14.9 | | | 2.3 | | | 2.7 | | | 0.75 | | | 0.73 | | | 10.6 | | | 7.8 | | | 1.3 | | | 13.9 | % |
Friedmans Inc | | FRM | | | 6.390 | | 63.5 | % | | – | | 26.5 | % | | | 120,228 | | | 247,425 | | | 247,139 | | 4.6 | | | 4.6 | | | 0.4 | | | 0.4 | | | 0.53 | | | 0.53 | | | 6.0 | | | 4.6 | | | 0.5 | | | 15.0 | % |
Whitehall Jewellers | | JWL | | | 10.820 | | 18.3 | % | | – | | 37.0 | % | | | 153,806 | | | 240,821 | | | 239,422 | | na | | | 14.1 | | | 1.4 | | | 1.4 | | | 0.72 | | | 0.66 | | | 22.3 | | | 10.7 | | | 0.8 | | | 20.0 | % |
Mayor’s Jewelers | | MYR | | | 0.720 | | 26.5 | % | | – | | 323.5 | % | | | 14,118 | | | 74,019 | | | 72,943 | | na | | | na | | | 0.7 | | | 0.7 | | | 0.65 | | | na | | | na | | | na | | | 0.7 | | | na | |
| | | | | | | | | | | | | | | | | |
| | | | | | | | | | | High | | $ | 3,050,693 | | $ | 3,686,160 | | $ | 3,636,089 | | 18.6 | x | | 14.9 | x | | 2.6 | x | | 2.7 | x | | 1.43 | x | | 0.73 | x | | 22.3 | x | | 10.7 | x | | 2.0 | x | | 20.0 | % |
| | | | | | | | | | | Mean | | | 970,200 | | | 1,188,996 | | | 1,171,375 | | 12.8 | | | 11.9 | | | 1.5 | | | 1.6 | | | 0.82 | | | 0.64 | | | 12.4 | | | 8.0 | | | 1.0 | | | 14.7 | % |
| | | | | | | | | | | Median | | | 153,806 | | | 247,425 | | | 247,139 | | 15.0 | | | 14.0 | | | 1.4 | | | 1.4 | | | 0.72 | | | 0.66 | | | 10.7 | | | 8.5 | | | 0.8 | | | 14.4 | % |
| | | | | | | | | | | Low | | | 14,118 | | | 74,019 | | | 72,943 | | 4.6 | | | 4.6 | | | 0.4 | | | 0.4 | | | 0.53 | | | 0.53 | | | 6.0 | | | 4.6 | | | 0.5 | | | 10.0 | % |
Reeds Jewelers | | RJI | | $ | 1.100 | | 18.5 | % | | – | | 20.9 | % | | $ | 9,324 | | $ | 33,991 | | $ | 33,479 | | na | | | na | | | 0.4 | x | | 0.4 | x | | 0.33 | x | | 0.33 | x | | na | | | 19.4 | x | | 0.5 | x | | na | |
| (1) | Total Invested Capital equals Market Value plus total debt, preferred stock, and minority interests. |
| (2) | Enterprise Value equals Market Value plus total debt, preferred stock, and minority interests, less cash. |
| (3) | Sources of estimates: Multex Estimates and other various securities analysts’ estimates and reports. |
Sources of information: SEC Edgar filings, Multex, Capital IQ, Yahoo and Commodity Systems.
Page 40
PROJECT SPARKLE | | CONFIDENTIAL |
|
| VALUATION ANALYSIS – SELECTED COMPARABLE COMPANY ANALYSIS |
Margin and Other Analyses
($ in thousands)
| | | | | LTM(1)
| | as of Latest Available Filing
| |
Company
| | | | Revenue
| | as Percentage of Revenue
| | | Return on
| | | Accts
Receivable
Turnover
| | | Inventory
Turnover
| | | Days Sales
Outstanding
| | Current
Ratio
| | Total
Debt
to
TIC
| | | Total
Debt to
EBITDA
| | | Latest
FY
Revenue
Growth
| |
| | | | Gross
Margin
| | | S G
& A
| | | Operating
Margin
| | | EBITDA
| | | EBIT
| | | Net
Income
| | | Average
Assets
| | | Average
Common
Eq
| | | | | | | | |
Signet Group PLC | | | | $ | 2,537,866 | | 16.9 | % | | 3.6 | % | | 13.3 | % | | 15.7 | % | | 13.3 | % | | 8.0 | % | | 11.0 | % | | 18.3 | % | | 4.9 | x | | 2.4 | x | | 74.7 | | 4.0 | | 17.5 | % | | 1.6 | x | | 8.3 | % |
Zale Corp | | | | | 2,212,241 | | 50.2 | % | | 40.3 | % | | 7.4 | % | | 9.6 | % | | 7.1 | % | | 4.3 | % | | 6.9 | % | | 12.0 | % | | na | | | 1.4 | | | na | | 2.5 | | 11.1 | % | | 0.9 | | | 0.9 | % |
Friedmans Inc | | | | | 462,758 | | 47.7 | % | | 36.0 | % | | 9.0 | % | | 11.6 | % | | 9.0 | % | | 5.8 | % | | 5.6 | % | | 9.1 | % | | 2.8 | | | 1.7 | | | 128.7 | | 5.7 | | 51.5 | % | | 2.4 | | | 6.1 | % |
Whitehall Jewellers | | | | | 332,087 | | 36.6 | % | | 33.4 | % | | 3.2 | % | | 6.8 | % | | 3.2 | % | | 1.1 | % | | 1.4 | % | | 3.3 | % | | 339.9 | | | 1.0 | | | 1.1 | | 1.3 | | 36.3 | % | | 3.9 | | | 0.6 | % |
Mayor’s Jewelers | | | | | 111,910 | | 38.1 | % | | 42.4 | % | | -7.1 | % | | -4.4 | % | | -7.1 | % | | -10.4 | % | | -10.8 | % | | -49.8 | % | | 18.9 | | | 0.8 | | | 19.4 | | 1.6 | | 82.1 | % | | na | | | -26.3 | % |
| | | | | | | | | | | | | | | | | |
| | | High | | $ | 2,537,866 | | 50.2 | % | | 42.4 | % | | 13.3 | % | | 15.7 | % | | 13.3 | % | | 8.0 | % | | 11.0 | % | | 18.3 | % | | 339.9 | x | | 2.4 | x | | 128.7 | | 5.7 | | 82.1 | % | | 3.9 | x | | 8.3 | % |
| | | Mean | | | 1,131,372 | | 37.9 | % | | 31.2 | % | | 5.1 | % | | 7.9 | % | | 5.1 | % | | 1.8 | % | | 2.8 | % | | -1.4 | % | | 91.6 | | | 1.5 | | | 55.9 | | 3.0 | | 39.7 | % | | 2.2 | | | -2.1 | % |
| | | Median | | | 462,758 | | 38.1 | % | | 36.0 | % | | 7.4 | % | | 9.6 | % | | 7.1 | % | | 4.3 | % | | 5.6 | % | | 9.1 | % | | 11.9 | | | 1.4 | | | 47.0 | | 2.5 | | 36.3 | % | | 2.0 | | | 0.9 | % |
| | | Low | | | 111,910 | | 16.9 | % | | 3.6 | % | | -7.1 | % | | -4.4 | % | | -7.1 | % | | -10.4 | % | | -10.8 | % | | -49.8 | % | | 2.8 | | | 0.8 | | | 1.1 | | 1.3 | | 11.1 | % | | 0.9 | | | -26.3 | % |
Reeds Jewelers | | | | $ | 101,084 | | 48.1 | % | | 46.4 | % | | -0.7 | % | | 1.7 | % | | -0.7 | % | | -2.7 | % | | -4.0 | % | | -10.2 | % | | 53.9 | x | | 1.2 | x | | 6.8 | | 3.1 | | 73.7 | % | | 14.3 | x | | -10.1 | % |
| (1) | May exclude special items, such as extraordinary and non-recurring expenses. See individual company overviews for details of exclusions, if any. |
Sources of information: SEC Edgar filings, Multex, Capital IQ, Yahoo and Commodity Systems.
Page 41
PROJECT SPARKLE | | CONFIDENTIAL |
|
| VALUATION ANALYSIS – SELECTED COMPARABLE COMPANY ANALYSIS |
Store Comparisons
($ in thousands)
Company (1)
| | No. of
Stores
| | Avg. Store
Size (Sq ft)
| | Average Sales Per
Store
| | Average Price Per Transaction
| | Type of Products
|
Signet Group PLC | | | | | | | | | | | | |
US - Kay | | 676 | | 1,444 | | $ | 1,490 | | $ | 242 | | Low end diamonds, gold, gemstones, watches. |
US - Regional | | 307 | | 1,444 | | | 1,558 | | | 265 | | Low to medium end diamonds, gold, gemstones, watches. |
US - Jared | | 67 | | 5,800 | | | 4,310 | | | 558 | | Medium to high end daimonds, golds, watches |
UK - H. Samuels | | 418 | | 1,124 | | | 1,090 | | | 53 | | Low end diamonds, gold, gemstones, watches. |
UK - Ernest Jones | | 192 | | 851 | | | 1,658 | | | 209 | | Low to medium end diamonds, gold, gemstones, watches. |
Total/Average | | 1,660 | | 1,471 | | | 1,535 | | | 208 | | |
| | | | | |
Zale Corporation | | | | | | | | | | | | |
Zales | | 851 | | 1,654 | | | 1,356 | | | 282 | | Low to medium end diamonds, gold, gemstones, watches. |
Gordon’s | | 287 | | 1,444 | | | 1,084 | | | 355 | | Low to High end diamonds, gold, gemstones. |
Bailey Banks Biddle | | 116 | | 3,593 | | | 2,702 | | | 916 | | High end watches, jewelry, gemstones |
People’s Jewelers | | 167 | | 1,586 | | | 878 | | | 177 | | Low end diamonds, gold, gemstones, watches, wedding items. |
Piercing Pagoda | | 813 | | 192 | | | 322 | | | 27 | | Low end gold jewelrey sold through small kiosks. |
Total/Average | | 2234 | | 1,191 | | | 979 | | | 224 | | |
Friedmans Inc | | 697 | | 1,500 | | | 664 | | | na | | Low end diamonds, gold, gemstones, watches. |
Whitehall Jewellers | | 383 | | 870 | | | 929 | | | 302 | | Low to medium end diamonds, gold, gemstones, watches. |
Mayor’s Jewelers | | 28 | | 4,213 | | | 3,997 | | | 1,360 | | High end watches, jewelry and gifts. |
High | | 2,234 | | 4,213 | | $ | 3,997 | | $ | 1,360 | | |
Simple Mean | | 1,000 | | 1,849 | | | 1,621 | | | 523 | | |
Store Weighted Average | | 582 | | 1,319 | | | 1,133 | | | 200 | | |
Median | | 697 | | 1,471 | | | 979 | | | 263 | | |
Low | | 28 | | 870 | | | 664 | | | 208 | | |
Reeds Jewelers | | 92 | | 1,150 | | $ | 1,099 | | $ | 280 | | Low to medium end diamonds, gold, gemstones, watches. |
| (1) | Derived from latest available SEC Edgar filings for each company and management estimates. |
Source: SEC Edgar filings & Company management.
Page 42
PROJECT SPARKLE | | CONFIDENTIAL |
|
| VALUATION ANALYSIS – SELECTED COMPARABLE COMPANY ANALYSIS |
Income Statement Review
($ in thousands, except per share data)
| | | | | Revenue
| | EBITDA (1)
| | | EBIT(1)
| | | Net Income (1)
| | | EPS(1)
| | | Latest Available 10-Q
| | Latest Available 10-K
|
Company
| | | | LTM
| | Latest 10-K
| | LTM
| | | Latest 10-K
| | | LTM
| | | Latest 10-K
| | | LTM
| | | Latest 10-K
| | | LTM
| | | Latest 10-K
| | | |
Signet Group PLC | | | | $ | 2,537,866 | | $ | 2,460,240 | | $ | 398,488 | | | $ | 388,620 | | | $ | 336,827 | | | $ | 330,786 | | | $ | 201,983 | | | $ | 197,217 | | | $ | 3.54 | | | $ | 3.46 | | | 31-Jul-03 | | 1-Feb-03 |
Zale Corp | | | | | 2,212,241 | | | 2,212,241 | | | 213,467 | | | | 213,467 | | | | 157,314 | | | | 157,314 | | | | 95,655 | | | | 95,655 | | | | 2.96 | | | | 2.96 | | | 31-Jul-03 | | 31-Jul-03 |
Friedmans Inc | | | | | 462,758 | | | 436,069 | | | 53,884 | | | | 47,047 | | | | 41,460 | | | | 35,707 | | | | 26,657 | | | | 23,167 | | | | 1.39 | | | | 1.35 | | | 28-Jun-03 | | 28-Sep-02 |
Whitehall Jewellers | | | | | 332,087 | | | 341,037 | | | 22,426 | | | | 31,553 | | | | 10,726 | | | | 20,337 | | | | 3,805 | | | | 9,907 | | | | 0.25 | | | | 0.68 | | | 31-Jul-03 | | 31-Jan-03 |
Mayor’s Jewelers | | | | | 111,910 | | | 118,391 | | | (4,894 | ) | | | (14,068 | ) | | | (7,987 | ) | | | (18,245 | ) | | | (11,591 | ) | | | (23,022 | ) | | | (0.59 | ) | | | (1.18 | ) | | 27-Sep-03 | | 29-Mar-03 |
| | | | | | | | | | | | | |
| | | High | | $ | 2,537,866 | | $ | 2,460,240 | | $ | 398,488 | | | $ | 388,620 | | | $ | 336,827 | | | $ | 330,786 | | | $ | 201,983 | | | $ | 197,217 | | | $ | 3.54 | | | $ | 3.46 | | | | | |
| | | Mean | | | 1,131,372 | | | 1,113,596 | | | 136,674 | | | | 133,324 | | | | 107,668 | | | | 105,180 | | | | 63,302 | | | | 60,585 | | | | 1.51 | | | | 1.45 | | | | | |
| | | Median | | | 462,758 | | | 436,069 | | | 53,884 | | | | 47,047 | | | | 41,460 | | | | 35,707 | | | | 26,657 | | | | 23,167 | | | | 1.39 | | | | 1.35 | | | | | |
| | | Low | | | 111,910 | | | 118,391 | | | (4,894 | ) | | | (14,068 | ) | | | (7,987 | ) | | | (18,245 | ) | | | (11,591 | ) | | | (23,022 | ) | | | (0.59 | ) | | | (1.18 | ) | | | | |
Reeds Jewelers | | | | $ | 101,084 | | $ | 102,011 | | $ | 1,729 | | | $ | 2,180 | | | $ | (727 | ) | | $ | (270 | ) | | $ | (2,681 | ) | | $ | (1,079 | ) | | $ | (0.32 | ) | | $ | (0.13 | ) | | 31-Aug-03 | | 28-Feb-03 |
| (1) | May exclude special items, such as extraordinary and non-recurring expenses. See individual company overviews for details of exclusions, if any. |
Sources of information: SEC Edgar filings, Multex, Capital IQ, Yahoo and Commodity Systems.
Page 43
PROJECT SPARKLE | | CONFIDENTIAL |
|
| ALUATION ANALYSIS – SELECTED COMPARABLE COMPANY ANALYSIS |
Balance Sheet Review
($ in thousands)
| | | | | As of Latest Available Filing
| | Latest
Available
Filing
|
Company
| | | | Cash &
Mrkt Sec
| | Accounts
Receivables
| | Inventory
| | Total
Current
Assets
| | PPE, net
| | Intangibles,
net
| | Total
Assets
| | Total
Current
Liabilities
| | Total
Debt
| | Total
Common
Eq
| | Net
Tangible
Common
Eq
| |
Signet Group PLC | | | | $ | 50,071 | | $ | 508,921 | | $ | 905,464 | | $ | 1,464,456 | | $ | 345,828 | | $ | 31,717 | | $ | 1,842,001 | | $ | 367,724 | | $ | 635,467 | | $ | 1,166,928 | | $ | 1,135,211 | | 31-Jul-03 |
Zale Corp | | | | | 35,273 | | | — | | | 798,761 | | | 886,484 | | | 266,167 | | | 82,199 | | | 1,294,106 | | | 354,041 | | | 184,400 | | | 652,323 | | | 570,124 | | 31-Jul-03 |
Friedmans Inc | | | | | 286 | | | 176,433 | | | 153,134 | | | 346,911 | | | 52,947 | | | 5,022 | | | 496,176 | | | 61,274 | | | 127,197 | | | 305,756 | | | 300,734 | | 28-Jun-03 |
Whitehall Jewellers | | | | | 1,399 | | | 333 | | | 206,149 | | | 216,683 | | | 63,604 | | | 5,662 | | | 286,730 | | | 165,719 | | | 87,015 | | | 113,154 | | | 107,492 | | 31-Jul-03 |
Mayor’s Jewelers | | | | | 1,076 | | | 5,314 | | | 87,386 | | | 95,530 | | | 14,704 | | | — | | | 111,098 | | | 61,160 | | | 59,901 | | | 19,189 | | | 19,189 | | 27-Sep-03 |
| | | High | | $ | 50,071 | | $ | 508,921 | | $ | 905,464 | | $ | 1,464,456 | | $ | 345,828 | | $ | 82,199 | | $ | 1,842,001 | | $ | 367,724 | | $ | 635,467 | | $ | 1,166,928 | | $ | 1,135,211 | | |
| | | Mean | | | 17,621 | | | 138,200 | | | 430,179 | | | 602,013 | | | 148,650 | | | 24,920 | | | 806,022 | | | 201,984 | | | 218,796 | | | 451,470 | | | 426,550 | | |
| | | Median | | | 1,399 | | | 5,314 | | | 206,149 | | | 346,911 | | | 63,604 | | | 5,662 | | | 496,176 | | | 165,719 | | | 127,197 | | | 305,756 | | | 300,734 | | |
| | | Low | | | 286 | | | — | | | 87,386 | | | 95,530 | | | 14,704 | | | — | | | 111,098 | | | 61,160 | | | 59,901 | | | 19,189 | | | 19,189 | | |
Reeds Jewelers | | | | $ | 512 | | $ | 2,332 | | $ | 44,458 | | $ | 49,316 | | $ | 9,844 | | $ | — | | $ | 68,138 | | $ | 15,933 | | $ | 24,667 | | $ | 24,220 | | $ | 24,220 | | 31-Aug-03 |
Sources of information: SEC Edgar filings, Multex, Capital IQ, Yahoo and Commodity Systems.
Page 44
PROJECT SPARKLE | | CONFIDENTIAL |
|
| VALUATION ANALYSIS – COMPARABLE TRANSACTIONS ANALYSIS |
| | • | The comparable transaction analysis involves a review of merger, acquisition and asset purchase transactions involving target companies that are in related industries to the Company. |
| | • | The comparable transaction analysis generally provides the widest range of value due to the varying importance of an acquisition to a buyer (i.e., a strategic buyer willing to pay more than a financial buyer) in addition to the potential differences in the transaction process (i.e., competitiveness among potential buyers). |
| | • | Information is typically not disclosed for transactions involving a private seller, even when the buyer is a public company, unless the acquisition is deemed to be “material” for the acquirer. As a result, the selected comparable transaction analysis is limited to transactions involving the acquisition of a public company, or substantially all of its assets, or the acquisition of a large private company, or substantially all of its assets, by a public company. |
| | • | Capitalink located seven transactions announced since February 2000 involving target companies in related industries to the Company (the “Comparable Transactions”) and for which detail financial information was available. Target companies were involved in the operation of jewelry and/or watch stores and were generally classified under the SIC code 5944. |
| | • | Based on the information disclosed with respect to the targets in the each of the Comparable Transactions, Capitalink calculated and compared enterprise values as multiples of LTM revenue and LTM EBITDA and market value or price paid as a multiple of net common equity. |
| | • | A review of the analysis indicates mean enterprise value multiples to LTM revenue of 0.65 times and price paid to net common equity of 1.5 times. Only one of the transactions provided information on EBITDA of which the multiple was 6.5 times. |
| | • | Capitalink determined a range of indicated equity values for the Company by selecting a range of valuation multiples based on the Comparable Transactions, and applying them to the Company’s net common equity, LTM revenue and average EBITDA (from FY2000 to LTM Aug 2003). |
Page 45
PROJECT SPARKLE | | CONFIDENTIAL |
|
| VALUATION ANALYSIS – COMPARABLE TRANSACTIONS ANALYSIS |
| | • | As with the Comparable Company analysis, the Company’s unique characteristics, smaller size and poor historical performance would suggest Reeds be valued below the average of the Comparable Transaction multiples. |
| | • | Therefore taking into account those factors, Capitalink selected an appropriate multiple range for the Company as follows: |
| | • | | Between 0.60 times and 1.0 times net common equity. |
| | • | | Between 0.44 times and 0.50 times LTM revenue. |
| | • | | Between 6.5 times and 9.0 times average EBITDA. |
| | • | Based on the selected multiple ranges, and taking into account net debt of approximately $24.1 million and common stock equivalents of 8.512 million shares as of August 31, 2003, Capitalink calculated a range of indicated equity values per share of between $1.44 and $2.46. |
| | • | None of the Comparable Transactions are identical to the Proposed Transaction. Accordingly, an analysis of comparable business combinations is not mathematical; rather it involves complex considerations and judgments concerning differences in financial and operating characteristics of the Comparable Transactions and other factors that could affect the respective acquisition values. |
Page 46
PROJECT SPARKLE | | CONFIDENTIAL |
|
VALUATION ANALYSIS – COMPARABLE TRANSACTIONS ANALYSIS |
Indicated Reference Range
($ in thousands, except per share)
| | | | | Selected Multiple Range
| | | | | | | | | | |
| | | Statistic
| | Low
| | - | | High
| | Indicated EV Value
| | Indicated Equity Value(1)
| | Indicated
Share Price (2)
|
Market Value as a Multiple of: | | | | | | | | | | | | | | | | | | | | | | | | | | | | | | | | | |
Net Common Equity (8/31/03) | | $ | 24,220 | | 0.6x | | - | | 1.0x | | | | | | | | | | $ | 14,532 | | - | | $ | 24,220 | | $ | 1.71 | | - | | $ | 2.85 |
Total Enterprise Value (EV) Multiple | | | | | | | | | | | | | | | | | | | | | | | | | | | | | | | | | |
LTM Revenue (8/31/03) | | $ | 101,084 | | 0.44x | | - | | 0.50x | | $ | 44,309 | | - | | $ | 50,542 | | $ | 20,208 | | - | | $ | 26,441 | | $ | 2.37 | | - | | $ | 3.11 |
Average EBITDA (FY2000-LTM Aug 2003) | | $ | 4,040 | | 6.5x | | - | | 9.0x | | $ | 26,228 | | - | | $ | 36,360 | | $ | 2,127 | | - | | $ | 12,259 | | $ | 0.25 | | - | | $ | 1.44 |
Indicated Reference Range | | | | | | | | | | | | | | | | | | | | | | | | | | | $ | 1.44 | | - | | $ | 2.46 |
| (1) | Adjusted for $24,101 net debt as of August 31, 2003, which includes cash from in the money options/warrants outstanding. |
| (2) | Based upon and assumes 8,512 shares and in the money options/warrants outstanding. |
Page 47
PROJECT SPARKLE | | CONFIDENTIAL |
|
| VALUATION ANALYSIS – COMPARABLE TRANSACTIONS ANALYSIS |
Comparable Transaction Review
($ in millions)
| | | | | | | | | | | | | | MRQ Net Common Equity
| | Total Price Paid (1) TPP
| | Total Invested Capital (2) TIC
| | Enterprise Value (2) EV
| | TPP Multiple of Net Common Equity
| | | | | | | |
| | | | | | | | | | | | | | | | | | | | | | | |
Announced Date
| | Closing Date
| | | | | | TTM
| | | | | | | | EV Multiple of
| |
| | | Acquiror
| | Target/Transaction Description
| | Revenue
| | EBITDA
| | | | | | | | Revenue
| | | EBITDA
| |
12-Aug-02 | | 28-Oct-02 | | Tiffany & Co.(NYSE: TIF) | | Little Switzerland Acquired remaining 55% for $22.5M | | $ | 59.62 | | $ | (1.95 | ) | | $ | 1.16 | | $ | 22.52 | | $ | 26.82 | | $ | 47.92 | | na | | | 0.80x | | | na | |
31-Jul-02 | | 20-Aug-02 | | Henry Birks & Sons | | Mayors Jewelers Inc Acquired 72% stake of fine jeweler in SE | | | 155.86 | | | (18.20 | ) | | | 52.72 | | | 15.00 | | | 65.44 | | | 68.32 | | 0.3 | | | 0.44 | | | na | |
10-Apr-01 | | 4-May-01 | | Tiffany & Co. (NYSE: TIF) | | Little Switzerland Acquired 45% stake at $9.0 million. | | | 56.30 | | | (5.20 | ) | | | 17.00 | | | 20.00 | | | 30.20 | | | 29.00 | | 1.2 | | | 0.52 | | | na | |
11-Aug-00 | | 20-Sep-00 | | Zale Corp (NYSE: ZLC) | | Piercing Pagoda, Inc Operates specialty jewelry kiosk stores | | | 280.72 | | | 33.73 | | | | 65.56 | | | 197.55 | | | 220.12 | | | 218.98 | | 3.0 | | | 0.78 | | | 6.5 | |
1-Jun-00 | | 1-Jun-00 | | Signet Group PLC | | Marks & Morgan Jewelers, Inc Retails Jewelry | | | 158.10 | | | — | | | | — | | | 115.00 | | | 160.00 | | | 160.00 | | na | | | 1.01 | | | na | |
4-May-00 | | 7-Jun-00 | | Sunglass Hut International | | Watch World International, Inc Retails Watches | | | 42.00 | | | — | | | | — | | | 30.00 | | | 30.00 | | | 30.00 | | na | | | 0.71 | | | na | |
10-Feb-00 | | 4-Apr-00 | | Finlay Enterprises(NASD: FNLY) | | Jay B. Rudolph 57 fine jewelery stores | | | 84.00 | | | — | | | | — | | | 23.00 | | | 23.00 | | | 23.00 | | na | | | 0.27 | | | na | |
| | | | | | | | | | | | |
| | | | | | | | | | | | | | | | | High | | $ | 197.55 | | $ | 220.12 | | $ | 218.98 | | 3.0 | x | | 1.01 | x | | 6.5 | x |
| | | | | | | | | | | | | | | | | Mean | | | 60.44 | | | 79.37 | | | 82.46 | | 1.5 | | | 0.65 | | | 6.5 | |
| | | | | | | | | | | | | | | | | Median | | | 23.00 | | | 30.20 | | | 47.92 | | 1.2 | | | 0.71 | | | 6.5 | |
| | | | | | | | | | | | | | | | | Low | | | 15.00 | | | 23.00 | | | 23.00 | | 0.3 | | | 0.27 | | | 6.5 | |
| (1) | Total Price Paid equals common equity value of interest acquired, with exception of Little Switzerland, where number is total implied price paid for 100% based on 45% stake acquired for $9.0 million. |
| (2) | Enterprise Value equals Total Price Paid plus total debt, preferred stock, and minority interests, less cash. |
Sources of information: SEC Edgar Filings, Press Releases, CapitalIQ, Multex, Mergerstat, Thomson Financial, & Done Deals.
Page 48
PROJECT SPARKLE | | CONFIDENTIAL |
|
VALUATION ANALYSIS – ACQUISITIONS PREMIUMS PAID ANALYSIS |
| | • | The acquisition premiums analysis involves the examination of the acquisition premiums derived in other transactions where a minority interest of a public company was acquired. Capitalink reviewed the one-day, five-day and 30-day premiums for all minority interest transactions where: |
| | • | | The transaction was announced on or after January 2001, |
| | • | | The transaction value is less than or equal to $25.0 million, |
| | • | | The acquiring party previously had more than 50% shareholding in the target company, and |
| | • | | The target company is based in the United States. |
| | • | Capitalink reviewed approximately 46 transactions that met these criteria and calculated the mean and median of the acquisition premiums. They were 57.2% and 37.3%, for the one day premium, 66.2% and 41.0% for the five day premium and 63.5% and 40.8% for the 30 day premium. |
| | • | Based on the premiums paid in the scenario set forth above, Capitalink derived an indicated range of per share market values for the Company using the prior one-day, five-day and 30-day share price as of November 25, 2003. |
| | • | Based on the selected multiple ranges, Capitalink calculated a range of indicated equity values per share of between $1.55 to $1.80. |
Page 49
PROJECT SPARKLE | | CONFIDENTIAL |
|
VALUATION ANALYSIS – ACQUISITIONS PREMIUMS PAID ANALYSIS |
Indicated Reference Range
| | | | | Selected Range
| | | |
| | | Statistic
| | Low
| | | - | | High
| | | Indicated Share Price
|
Acquisitions Premiums Paid(1) | | | | | | | | | | | | | | | | | | | |
Prior One Day | | $ | 1.10 | | 37.3 | % | | - | | 57.2 | % | | $ | 1.51 | | - | | $ | 1.73 |
Prior 5 Day | | $ | 1.10 | | 41.0 | % | | - | | 66.2 | % | | $ | 1.55 | | - | | $ | 1.83 |
Prior 30 Day | | $ | 1.13 | | 40.8 | % | | - | | 63.5 | % | | $ | 1.59 | | - | | $ | 1.85 |
Indicated Reference Range | | | | | | | | | | | | | $ | 1.55 | | - | | $ | 1.80 |
| (1) | Includes acquisitions by controlling shareholder (>50%) of minority interests from January 2001 with deal value < $25 million. Acquisitions at a discount (negative premiums) have been excluded. |
Sources of information: Commodity Systems, Inc. and Mergerstat, Inc.
Page 50
PROJECT SPARKLE | | CONFIDENTIAL |
|
VALUATION ANALYSIS – ACQUISITIONS PREMIUMS PAID ANALYSIS |
Acquisition Premiums Review(1)
Announc. Date
| | Seller
| | Buyer
| | Previous
Ownership
Percentage
| | | Percentage Sought
| | | Premiums
| |
| | | | | | 1 Day
| | | 5 Day
| | | 30 Day
| |
30-Oct-03 | | Bausch & Lomb Inc (RayBan Sun Optics India Ltd) | | Luxottica Group SpA | | 44.00 | % | | 20.00 | % | | 86.03 | % | | 94.56 | % | | 92.76 | % |
9-Sep-03 | | ON Command Corp | | Liberty Media Corp | | 74.00 | % | | 26.00 | % | | 125.23 | % | | 125.23 | % | | 93.37 | % |
21-Aug-03 | | Joule Inc | | Private Group Led By Wellman | | 72.00 | % | | 28.00 | % | | 3.85 | % | | 3.85 | % | | 25.00 | % |
14-Aug-03 | | TDS Informationstechnologie AG | | General Atlantic Partners LLC | | 26.59 | % | | 44.41 | % | | na | | | na | | | 17.50 | % |
13-Jun-03 | | Atalanta/Sosnoff Capital Corp | | Private Group Led By Management of Atalanta/Sosnof | | 82.69 | % | | 17.31 | % | | 0.36 | % | | 6.65 | % | | 12.50 | % |
29-May-03 | | BCT International Inc | | Phoenix Group of Florida Inc | | 52.50 | % | | 47.50 | % | | 117.39 | % | | 102.02 | % | | 113.90 | % |
16-May-03 | | Wolohan Lumber Co | | Private Group Led By Management of Wolohan Lumber | | 51.20 | % | | 48.80 | % | | 10.41 | % | | 8.75 | % | | 9.57 | % |
5-May-03 | | Westerbeke Corp | | Westerbeke Acquisition Corp | | 56.20 | % | | 43.80 | % | | 65.75 | % | | 65.75 | % | | 71.43 | % |
5-May-03 | | Atlantic Data Services Inc | | Private Group Led by Management of Atlantic Data | | 65.06 | % | | 34.94 | % | | 1.01 | % | | 2.04 | % | | 14.50 | % |
5-May-03 | | Semele Group Inc | | Private Group Led by Management of Semele Group Inc | | 53.08 | % | | 46.92 | % | | 25.00 | % | | 25.00 | % | | 21.21 | % |
29-Apr-03 | | RWD Technologies Inc | | Research Park Acquisition Inc | | 66.00 | % | | 34.00 | % | | 128.26 | % | | 147.06 | % | | 156.10 | % |
27-Mar-03 | | DSI Toys Inc | | DSI Acquisition Inc | | 73.28 | % | | 26.72 | % | | 11.90 | % | | 8.05 | % | | na | |
26-Mar-03 | | InvestorsBancorp Inc | | Private Group Led by Management of InvestorsBancor | | 61.80 | % | | 38.20 | % | | na | | | 4.80 | % | | 9.65 | % |
24-Mar-03 | | Judge Group Inc | | Private Group Led by Management of Judge Group Inc | | 60.00 | % | | 40.00 | % | | 17.14 | % | | 12.33 | % | | 29.13 | % |
6-Feb-03 | | deltathree Inc | | Atarey Hasharon Chevra Lepituach Vehashkaot Benadl | | 71.00 | % | | 29.00 | % | | 37.25 | % | | 27.27 | % | | 48.94 | % |
3-Feb-03 | | 9278 Communications Inc | | NTSE Holding Corp | | 54.20 | % | | 45.80 | % | | 185.71 | % | | 257.14 | % | | 150.00 | % |
29-Jan-03 | | DSI Toys Inc | | Mvii Llc | | 55.20 | % | | 44.80 | % | | na | | | na | | | 15.79 | % |
22-Nov-02 | | Unimark Group Inc (The) | | M&M Nominee LLC | | 62.50 | % | | 37.50 | % | | 132.14 | % | | 160.00 | % | | 66.67 | % |
19-Nov-02 | | MDI Entertainment Inc | | Scientific Games Corp | | 66.00 | % | | 34.00 | % | | 27.27 | % | | 40.00 | % | | 53.85 | % |
13-Nov-02 | | Media Source Inc | | Private Group Led By Davis | | 65.90 | % | | 34.10 | % | | 12.44 | % | | 45.16 | % | | 36.36 | % |
19-Sep-02 | | WJ Communications Inc | | Fox Paine & Co LLC | | 65.50 | % | | 34.50 | % | | 0.92 | % | | na | | | 29.41 | % |
13-Aug-02 | | Oriole Homes Corp | | Levy Group (The) | | 60.10 | % | | 39.90 | % | | 63.33 | % | | 63.33 | % | | 29.29 | % |
13-Aug-02 | | R-B Rubber Products Inc | | Dash Multi-Corp Inc | | 70.00 | % | | 30.00 | % | | 83.01 | % | | 69.70 | % | | 95.80 | % |
5-Aug-02 | | Sandata Technologies Inc | | Sandata Acquisition Corp | | 74.40 | % | | 25.60 | % | | 282.00 | % | | 516.13 | % | | 180.88 | % |
12-Jun-02 | | Swiss Army Brands Inc | | Victorinox AG | | 66.90 | % | | 33.10 | % | | 41.73 | % | | 42.63 | % | | 40.85 | % |
16-May-02 | | Electric Lightwave Inc | | Citizens Communications Co | | 85.00 | % | | 15.00 | % | | 105.88 | % | | 79.49 | % | | 55.56 | % |
16-May-02 | | Balanced Care Corp | | IPC Advisors Sarl | | 53.30 | % | | 46.70 | % | | 150.00 | % | | 177.78 | % | | 127.27 | % |
10-Apr-02 | | PartsBase Inc | | Private Group Led by Robert A Hammond Jr | | 65.00 | % | | 35.00 | % | | 95.83 | % | | 95.83 | % | | 95.83 | % |
3-Apr-02 | | CBNY Investment Services Corp | | Private Group Led By CBNY Investment Services Mgmt | | 73.60 | % | | 26.40 | % | | 1.30 | % | | 1.00 | % | | 1.00 | % |
28-Mar-02 | | Shibazaki Seisakusho Ltd | | Alcoa Inc | | 50.50 | % | | 20.30 | % | | 30.87 | % | | 28.09 | % | | 44.71 | % |
14-Mar-02 | | Konover Property Trust | | Prometheus Southeast Retail Trust | | 66.00 | % | | 34.00 | % | | 20.00 | % | | 20.00 | % | | 24.26 | % |
11-Mar-02 | | Hawker Pacific Aerospace | | Deutsche Lufthansa AG | | 72.70 | % | | 27.30 | % | | 2.20 | % | | 3.50 | % | | 51.16 | % |
6-Mar-02 | | CAA AG | | Harman International Industries Inc | | 78.15 | % | | 21.85 | % | | 0.44 | % | | 27.50 | % | | 12.50 | % |
22-Jan-02 | | Rottlund Co Inc (The) | | Private Group Led by David and Bernard Rotter | | 71.40 | % | | 28.60 | % | | 18.06 | % | | 29.79 | % | | 46.63 | % |
16-Nov-01 | | Ugly Duckling Corp | | Private Group led by Ernest C Garcia II | | 61.00 | % | | 39.00 | % | | 41.77 | % | | 42.91 | % | | 30.74 | % |
18-Sep-01 | | Organic Inc | | Seneca Investments LLC | | 80.90 | % | | 19.10 | % | | 13.79 | % | | 17.86 | % | | 37.50 | % |
22-Aug-01 | | HomeServices.Com Inc | | Berkshire Hathaway Inc | | 83.50 | % | | 16.50 | % | | 38.78 | % | | 40.50 | % | | 66.67 | % |
14-Aug-01 | | National Home Centers Inc | | Private Group Led By Dwain A Newman | | 63.49 | % | | 36.51 | % | | 21.74 | % | | 17.65 | % | | 35.92 | % |
3-Aug-01 | | Lincoln Snacks Co | | Lincoln Snacks Acquisition Corp | | 89.80 | % | | 10.20 | % | | 12.90 | % | | 16.67 | % | | 27.27 | % |
6-Jun-01 | | HIS Sportswear AG | | VF Corp | | 85.00 | % | | 15.00 | % | | 18.48 | % | | 46.72 | % | | 32.09 | % |
30-Apr-01 | | STV Group Inc | | Private Group Led By ESOP Of STV Group Inc | | 62.81 | % | | 37.19 | % | | 97.37 | % | | 110.28 | % | | 80.00 | % |
27-Apr-01 | | Pierre Foods Inc | | PF Management Inc | | 63.00 | % | | 37.00 | % | | 101.61 | % | | 62.34 | % | | 121.24 | % |
2-Apr-01 | | Milestone Properties Inc | | Concord Assets Group Inc | | 68.80 | % | | 31.20 | % | | 40.96 | % | | 40.96 | % | | 40.96 | % |
27-Mar-01 | | Hahn Automotive Warehouse Inc | | Private Group Led By Futerman | | 64.00 | % | | 36.00 | % | | 33.33 | % | | 33.33 | % | | 9.89 | % |
9-Feb-01 | | Marketing Specialists Corp | | Private Group Led By Richmont Capital Partners I | | 83.20 | % | | 16.80 | % | | 98.41 | % | | 66.67 | % | | 468.18 | % |
24-Jan-01 | | Firecom Inc | | Private Group Led By Mendez | | 68.80 | % | | 31.20 | % | | 59.09 | % | | 59.09 | % | | 34.62 | % |
| | | | | | | |
| | | | | | | | | | High | | | 282.0 | % | | 516.1 | % | | 468.2 | % |
| | | | | | | | | | Mean | | | 57.2 | % | | 66.2 | % | | 63.5 | % |
| | | | | | | | | | Median | | | 37.3 | % | | 41.0 | % | | 40.8 | % |
| | | | | | | | | | Low | | | 0.4 | % | | 1.0 | % | | 1.0 | % |
| (1) | Includes acquisitions by controlling shareholder (>50%) of minority interests from January 2001 with deal value < $25 million. Acquisitions at a discount (negative premiums) have been excluded. |
Sources of information: Mergerstat, Inc.
Page 51
PROJECT SPARKLE | | CONFIDENTIAL |
|
VALUATION ANALYSIS – ADJUSTED NET BOOK VALUE ANALYSIS |
| | • | Capitalink performed an adjusted book value analysis, based upon a going concern premise, to determine the value of the Company assuming all of its assets were valued at market value. Under historical cost accounting most assets in the Company’s financial statements are generally not reflected at market value, but reflect historical acquisition costs. |
| | • | For the purposes of this analysis, based upon discussions with Company management and utilizing the Company’s balance sheet as of October 31, 2003, the following adjustments to market value were assumed: |
| | • | | Inventory adjustment to reflect market value of slow moving inventory. |
| | • | | Deferred tax asset adjustment to reflect assumed tax net operating loss adjustment. |
| | • | | Contingent purchase holdback adjustment to reflect the present value of the expected future cash flow. |
| | • | The results of the analysis indicate that as of October 31, 2003, the Company’s net book value per share decreases from $2.67 to an adjusted net book value per share of $1.94. |
Page 52
PROJECT SPARKLE | | CONFIDENTIAL |
|
VALUATION ANALYSIS – ADJUSTED NET BOOK VALUE ANALYSIS |
Adjusted Net Book Value Analysis as of October 31, 2003
($ in thousands)
| | | | | Market Adjusted Value
|
| | | Unadjusted
Book Value
| | Adjs(1)
| | | Notes
| | Adjusted
|
Current Assets: | | | | | | | | | | | | |
Cash & Equivalents | | $ | 359 | | $ | — | | | | | $ | 359 |
Accounts Receivable, net | | | 2,097 | | | — | | | | | | 2,097 |
Inventory | | | 51,448 | | | (900 | ) | | a | | | 50,548 |
Other Current Assets | | | 1,951 | | | — | | | | | | 1,951 |
| | |
|
| |
|
|
| | | |
|
|
Total Current Assets | | | 55,855 | | | (900 | ) | | | | | 54,955 |
| | | | |
Long Term Assets: | | | | | | | | | | | | |
Net Property, Plant & Equipment | | | 9,510 | | | — | | | | | | 9,510 |
Deferred Tax Asset | | | 3,095 | | | (1,500 | ) | | b | | | 1,595 |
Intangible Assets | | | — | | | — | | | | | | — |
Contingent Purchase Holdback | | | 5,474 | | | (3,777 | ) | | c | | | 1,697 |
Other | | | 362 | | | — | | | | | | 362 |
| | |
|
| |
|
|
| | | |
|
|
Total Long Term Assets | | | 18,441 | | | (5,277 | ) | | | | | 13,164 |
| | |
|
| |
|
|
| | | |
|
|
Total Assets | | $ | 74,296 | | $ | (6,177 | ) | | | | $ | 68,119 |
| | |
|
| |
|
|
| | | |
|
|
Explanation of Notes:
| a | Assumed market adjustment for slow-moving inventory. |
| b | Estimated tax adjustment. |
| c | Present value adjustment for payment received in 8 years using Company’s WACC. |
| | | | | Market Adjusted Value
|
| | | Unadjusted
Book Value
| | Adjs(1)
| | | Notes
| | Adjusted
|
Current Liabilities: | | | | | | | | | | | | |
Accounts Payable | | | 15,961 | | | — | | | | | | 15,961 |
Accrued Compensation | | | 1,312 | | | — | | | | | | 1,312 |
Accured Expenses | | | 2,464 | | | — | | | | | | 2,464 |
Current Portion of LT Debt | | | 17 | | | — | | | | | | 17 |
| | |
|
| |
|
|
| | | |
|
|
Total Current Liabilities | | | 19,754 | | | — | | | | | | 19,754 |
| | | | |
Long Term Liabilities | | | | | | | | | | | | |
Revolving Credit Note | | | 25,990 | | | — | | | | | | 25,990 |
Notes Payable to Affiliate | | | 2,579 | | | — | | | | | | 2,579 |
Deferred Income Taxes | | | 3,104 | | | | | | | | | 3,104 |
Other Long Term | | | 216 | | | — | | | | | | 216 |
| | |
|
| |
|
|
| | | |
|
|
Total Long Term Liabilities | | | 31,889 | | | — | | | | | | 31,889 |
| | | | |
Contingent Liabilities Other | | | — | | | — | | | | | | — |
| | |
|
| |
|
|
| | | |
|
|
Total Contingent Liabilities | | | — | | | — | | | | | | — |
| | |
|
| |
|
|
| | | |
|
|
Total Liabilities | | | 51,643 | | | — | | | | | | 51,643 |
| | |
|
| |
|
|
| | | |
|
|
Net Book Value | | $ | 22,653 | | $ | (6,177 | ) | | | | $ | 16,476 |
| | |
|
| |
|
|
| | | |
|
|
Number Outstanding Shares as of October 31, 2003 | | | | | | 8,476 | | | | | | |
Net Book Value Per Share | | $ | 2.67 | | | | | | | | | |
| | |
|
| | | | | | | | | |
Indicated Value, per share | | | | | | | | | | | $ | 1.94 |
| | | | | | | | | | | |
|
|
| (1) | Adjustments determined in discussions with Company Management. |
Sources of information: Company financials and management
Page 53
PROJECT SPARKLE | | CONFIDENTIAL |
|
| APPENDIX | | |
| |
| I | | INTRODUCTION |
| |
| II | | COMPANY OVERVIEW |
| |
| III | | COMPANY FINANCIAL & MARKET PERFORMANCE |
| |
| IV | | VALUATION |
| |
| V | | APPENDIX |
Page 54
PROJECT SPARKLE | | CONFIDENTIAL |
|
APPENDIX TABLE OF CONTENTS | | |
|
COMPANY FINANCIAL DATA |
|
COMPARABLE COMPANY DATA |
Page 55
PROJECT SPARKLE | | CONFIDENTIAL |
|
APPENDIX – COMPANY FINANCIAL DATA | | |
Normalized Comparative Summary Income Statements
($ in thousands except per share)
| | | for years ended the last day of February,
| | | for the 6 months
ended August 31,
| | | LTM
August 31, 2003
| |
| | | 2000
| | | 2001
| | | 2002
| | | 2003
| | | 2002
| | | 2003
| | |
Revenue | | $ | 120,861 | | | $ | 120,037 | | | $ | 113,449 | | | $ | 102,011 | | | $ | 39,972 | | | $ | 39,045 | | | $ | 101,084 | |
Cost of Revenue | | | 59,408 | | | | 61,194 | | | | 60,091 | | | | 52,590 | | | | 20,072 | | | | 19,908 | | | | 52,426 | |
| | |
|
|
| |
|
|
| |
|
|
| |
|
|
| |
|
|
| |
|
|
| |
|
|
|
Gross Profit | | | 61,453 | | | | 58,843 | | | | 53,358 | | | | 49,421 | | | | 19,900 | | | | 19,137 | | | | 48,658 | |
Selling, General & Admin | | | 51,430 | | | | 53,134 | | | | 52,808 | | | | 47,241 | | | | 21,335 | | | | 21,023 | | | | 46,929 | |
Depreciation & Amortization | | | 3,391 | | | | 3,860 | | | | 3,797 | | | | 2,450 | | | | 1,195 | | | | 1,201 | | | | 2,456 | |
| | |
|
|
| |
|
|
| |
|
|
| |
|
|
| |
|
|
| |
|
|
| |
|
|
|
Total Operating Expenses | | | 54,821 | | | | 56,994 | | | | 56,605 | | | | 49,691 | | | | 22,530 | | | | 22,224 | | | | 49,385 | |
| | |
|
|
| |
|
|
| |
|
|
| |
|
|
| |
|
|
| |
|
|
| |
|
|
|
Operating Income (Loss) | | | 6,632 | | | | 1,849 | | | | (3,247 | ) | | | (270 | ) | | | (2,630 | ) | | | (3,087 | ) | | | (727 | ) |
Interest Income (Expense) | | | (966 | ) | | | (1,749 | ) | | | (1,871 | ) | | | (1,443 | ) | | | (711 | ) | | | (620 | ) | | | (1,352 | ) |
| | |
|
|
| |
|
|
| |
|
|
| |
|
|
| |
|
|
| |
|
|
| |
|
|
|
Pre-tax Income (Loss) | | | 5,666 | | | | 100 | | | | (5,118 | ) | | | (1,713 | ) | | | (3,341 | ) | | | (3,707 | ) | | | (2,079 | ) |
Income Tax (Benefit) | | | 1,805 | | | | 33 | | | | (1,548 | ) | | | (634 | ) | | | (1,236 | ) | | | — | | | | 602 | |
| | |
|
|
| |
|
|
| |
|
|
| |
|
|
| |
|
|
| |
|
|
| |
|
|
|
Normalized Net Income | | $ | 3,861 | | | $ | 67 | | | $ | (3,570 | ) | | $ | (1,079 | ) | | $ | (2,105 | ) | | $ | (3,707 | ) | | $ | (2,681 | ) |
| | |
|
|
| |
|
|
| |
|
|
| |
|
|
| |
|
|
| |
|
|
| |
|
|
|
Normalized EBIT | | $ | 6,632 | | | $ | 1,849 | | | $ | (3,247 | ) | | $ | (270 | ) | | $ | (2,630 | ) | | $ | (3,087 | ) | | $ | (727 | ) |
Total Depreciation & Amortization | | $ | 3,391 | | | $ | 3,870 | | | $ | 3,797 | | | $ | 2,450 | | | $ | 1,195 | | | $ | 1,201 | | | $ | 2,456 | |
Normalized EBITDA | | $ | 10,023 | | | $ | 5,719 | | | $ | 550 | | | $ | 2,180 | | | $ | (1,435 | ) | | $ | (1,886 | ) | | $ | 1,729 | |
Capital Expenditures, net of Disposals (CAPEX, net) | | $ | 5,397 | | | $ | 6,967 | | | $ | 2,792 | | | $ | 696 | | | $ | 555 | | | $ | 139 | | | $ | 280 | |
Normalized EBITDA - CAPEX | | $ | 4,626 | | | $ | (1,248 | ) | | $ | (2,242 | ) | | $ | 1,484 | | | $ | (1,990 | ) | | $ | (2,025 | ) | | $ | 1,449 | |
Earnings per Share | | | | | | | | | | | | | | | | | | | | | | | | | | | | |
Basic Normalized EPS | | $ | 0.46 | | | $ | 0.01 | | | $ | (0.42 | ) | | $ | (0.13 | ) | | $ | (0.25 | ) | | $ | (0.44 | ) | | $ | (0.32 | ) |
Basic Reported EPS | | $ | 0.57 | | | $ | 0.01 | | | $ | (1.81 | ) | | $ | (0.18 | ) | | $ | (0.29 | ) | | $ | (0.46 | ) | | $ | (0.35 | ) |
Weighted Average Shares Outstanding (thousands) | | | 8,476 | | | | 8,476 | | | | 8,476 | | | | 8,476 | | | | 8,476 | | | | 8,476 | | | | | |
Diluted Normalized EPS | | $ | 0.46 | | | $ | 0.01 | | | $ | (0.42 | ) | | $ | (0.13 | ) | | $ | (0.25 | ) | | $ | (0.44 | ) | | $ | (0.32 | ) |
Diluted Reported EPS | | $ | 0.57 | | | $ | 0.01 | | | $ | (1.81 | ) | | $ | (0.18 | ) | | $ | (0.29 | ) | | $ | (0.46 | ) | | $ | (0.35 | ) |
Weighted Average Shares Outstanding (thousands) | | | 8,480 | | | | 8,477 | | | | 8,476 | | | | 8,476 | | | | 8,476 | | | | 8,476 | | | | | |
Normalizing Reconciliation | | | | | | | | | | | | | | | | | | | | | | | | | | | | |
Restructuring/Goodwill Impairment | | $ | — | | | $ | — | | | $ | (17,067 | ) | | $ | (270 | ) | | $ | (270 | ) | | $ | — | | | $ | — | |
Other Unusual (Expense) Gain Items | | | — | | | | — | | | | — | | | | — | | | | — | | | | — | | | | — | |
Income Tax Shelter (Charge) from Unusual Items | | | — | | | | — | | | | 5,163 | | | | 100 | | | | 100 | | | | — | | | | — | |
| | |
|
|
| |
|
|
| |
|
|
| |
|
|
| |
|
|
| |
|
|
| |
|
|
|
Unusual (Expense) Gain Items, net of Taxes | | | — | | | | — | | | | (11,904 | ) | | | (170 | ) | | | (170 | ) | | | — | | | | — | |
Accounting Changes, net of Taxes | | | — | | | | — | | | | — | | | | — | | | | — | | | | — | | | | — | |
Discontinued Operations, net of Taxes | | | 941 | | | | (5 | ) | | | 98 | | | | (256 | ) | | | (153 | ) | | | (224 | ) | | | (327 | ) |
Extraordinary Items, net of Taxes | | | — | | | | — | | | | — | | | | — | | | | — | | | | — | | | | — | |
| | |
|
|
| |
|
|
| |
|
|
| |
|
|
| |
|
|
| |
|
|
| |
|
|
|
Total Reconciling Items, net of Taxes | | $ | 941 | | | $ | (5 | ) | | $ | (11,806 | ) | | $ | (426 | ) | | $ | (323 | ) | | $ | (224 | ) | | $ | (327 | ) |
| | |
|
|
| |
|
|
| |
|
|
| |
|
|
| |
|
|
| |
|
|
| |
|
|
|
Reported Income Tax (Benefit) | | $ | 1,805 | | | $ | 33 | | | $ | (6,711 | ) | | $ | (734 | ) | | $ | (1,336 | ) | | $ | — | | | $ | 602 | |
Reported Net Income (Loss) | | $ | 4,802 | | | $ | 62 | | | $ | (15,376 | ) | | $ | (1,505 | ) | | $ | (2,428 | ) | | $ | (3,931 | ) | | $ | (3,008 | ) |
Sources of information: Company financial statements and management
Page 56
PROJECT SPARKLE | | CONFIDENTIAL |
|
| APPENDIX – COMPANY FINANCIAL DATA | | |
Normalized Common Sized Summary Income Statements
| | | for years ended the last day of February,
| | | for the 6 months
ended August 31,
| | | LTM August 31, 2003
| |
| | | 2000
| | | 2001
| | | 2002
| | | 2003
| | | 2002
| | | 2003
| | |
Revenue | | 100.0 | % | | 100.0 | % | | 100.0 | % | | 100.0 | % | | 100.0 | % | | 100.0 | % | | 100.0 | % |
Cost of Revenue | | 49.2 | % | | 51.0 | % | | 53.0 | % | | 51.6 | % | | 50.2 | % | | 51.0 | % | | 51.9 | % |
| | |
|
| |
|
| |
|
| |
|
| |
|
| |
|
| |
|
|
Gross Profit | | 50.8 | % | | 49.0 | % | | 47.0 | % | | 48.4 | % | | 49.8 | % | | 49.0 | % | | 48.1 | % |
Selling, General & Admin | | 42.6 | % | | 44.3 | % | | 46.5 | % | | 46.3 | % | | 53.4 | % | | 53.8 | % | | 46.4 | % |
Depreciation & Amortization | | 2.8 | % | | 3.2 | % | | 3.3 | % | | 2.4 | % | | 3.0 | % | | 3.1 | % | | 2.4 | % |
| | |
|
| |
|
| |
|
| |
|
| |
|
| |
|
| |
|
|
Total Operating Expenses | | 45.4 | % | | 47.5 | % | | 49.9 | % | | 48.7 | % | | 56.4 | % | | 56.9 | % | | 48.9 | % |
| | |
|
| |
|
| |
|
| |
|
| |
|
| |
|
| |
|
|
Operating Income (Loss) | | 5.5 | % | | 1.5 | % | | -2.9 | % | | -0.3 | % | | -6.6 | % | | -7.9 | % | | -0.7 | % |
Interest Income (Expense) | | -0.8 | % | | -1.5 | % | | -1.6 | % | | -1.4 | % | | -1.8 | % | | -1.6 | % | | -1.3 | % |
| | |
|
| |
|
| |
|
| |
|
| |
|
| |
|
| |
|
|
Pre-tax Income (Loss) | | 4.7 | % | | 0.1 | % | | -4.5 | % | | -1.7 | % | | -8.4 | % | | -9.5 | % | | -2.1 | % |
Income Tax (Benefit) | | 1.5 | % | | 0.0 | % | | -1.4 | % | | -0.6 | % | | -3.1 | % | | 0.0 | % | | 0.6 | % |
| | |
|
| |
|
| |
|
| |
|
| |
|
| |
|
| |
|
|
Normalized Net Income | | 3.2 | % | | 0.1 | % | | -3.1 | % | | -1.1 | % | | -5.3 | % | | -9.5 | % | | -2.7 | % |
| | |
|
| |
|
| |
|
| |
|
| |
|
| |
|
| |
|
|
Normalized EBIT | | 5.5 | % | | 1.5 | % | | -2.9 | % | | -0.3 | % | | -6.6 | % | | -7.9 | % | | -0.7 | % |
Total Depreciation & Amortization | | 2.8 | % | | 3.2 | % | | 3.3 | % | | 2.4 | % | | 3.0 | % | | 3.1 | % | | 2.4 | % |
Normalized EBITDA | | 8.3 | % | | 4.8 | % | | 0.5 | % | | 2.1 | % | | -3.6 | % | | -4.8 | % | | 1.7 | % |
Capital Expenditures, net of Disposals (CAPEX, net) | | 4.5 | % | | 5.8 | % | | 2.5 | % | | 0.7 | % | | 1.4 | % | | 0.4 | % | | 0.3 | % |
Normalized EBITDA - CAPEX | | 3.8 | % | | -1.0 | % | | -2.0 | % | | 1.5 | % | | -5.0 | % | | -5.2 | % | | 1.4 | % |
Normalizing Reconciliation | | | | | | | | | | | | | | | | | | | | | |
Restructuring/Goodwill Impairment | | 0.0 | % | | 0.0 | % | | 0.0 | % | | 0.0 | % | | 0.0 | % | | 0.0 | % | | 0.0 | % |
Other Unusual (Expense) Gain Items | | 0.0 | % | | 0.0 | % | | -15.0 | % | | -0.3 | % | | -0.7 | % | | 0.0 | % | | 0.0 | % |
Income Tax Shelter (Charge) from Unusual Items | | 0.0 | % | | 0.0 | % | | 4.6 | % | | 0.1 | % | | 0.2 | % | | 0.0 | % | | 0.0 | % |
| | |
|
| |
|
| |
|
| |
|
| |
|
| |
|
| |
|
|
Unusual (Expense) Gain Items, net of Taxes | | 0.0 | % | | 0.0 | % | | -10.5 | % | | -0.2 | % | | -0.4 | % | | 0.0 | % | | 0.0 | % |
Accounting Changes, net of Taxes | | 0.0 | % | | 0.0 | % | | 0.0 | % | | 0.0 | % | | 0.0 | % | | 0.0 | % | | 0.0 | % |
Discontinued Operations, net of Taxes | | 0.8 | % | | 0.0 | % | | 0.1 | % | | -0.3 | % | | -0.4 | % | | -0.6 | % | | -0.3 | % |
Extraordinary Items, net of Taxes | | 0.0 | % | | 0.0 | % | | 0.0 | % | | 0.0 | % | | 0.0 | % | | 0.0 | % | | 0.0 | % |
| | |
|
| |
|
| |
|
| |
|
| |
|
| |
|
| |
|
|
Total Reconciling Items, net of Taxes | | 0.8 | % | | 0.0 | % | | -10.4 | % | | -0.4 | % | | -0.8 | % | | -0.6 | % | | -0.3 | % |
| | |
|
| |
|
| |
|
| |
|
| |
|
| |
|
| |
|
|
Reported Income Tax (Benefit) | | 1.5 | % | | 0.0 | % | | -5.9 | % | | -0.7 | % | | -3.3 | % | | 0.0 | % | | 0.6 | % |
Reported Net Income (Loss) | | 4.0 | % | | 0.1 | % | | -13.6 | % | | -1.5 | % | | -6.1 | % | | -10.1 | % | | -3.0 | % |
Sources of information: Company financial statements and management
Page 57
PROJECT SPARKLE | | CONFIDENTIAL |
|
| APPENDIX – COMPANY FINANCIAL DATA | | |
Comparative Summary Balance Sheets
($ in thousands, except per share)
| | | as of February 28,
| | | as of August 31,
| |
| Assets | | 2000
| | | 2001
| | | 2002
| | | 2003
| | | 2002
| | | 2003
| |
Current Assets | | | | | | | | | | | | | | | | | | | | | | | | |
Cash & Equivalents | | $ | 895 | | | $ | 685 | | | $ | 809 | | | $ | 384 | | | $ | 353 | | | $ | 512 | |
Accounts Receivable | | | 49,655 | | | | 50,199 | | | | 621 | | | | 1,418 | | | | 1,397 | | | | 2,332 | |
Inventory | | | 46,253 | | | | 48,552 | | | | 44,337 | | | | 41,637 | | | | 48,362 | | | | 44,458 | |
Deferred Income Taxes | | | 2,249 | | | | 2,194 | | | | — | | | | 1,327 | | | | — | | | | 1,181 | |
Prepaid & Other | | | 486 | | | | 1,622 | | | | 7,430 | | | | 1,063 | | | | 2,992 | | | | 833 | |
| | |
|
|
| |
|
|
| |
|
|
| |
|
|
| |
|
|
| |
|
|
|
Total Current Assets | | | 99,538 | | | | 103,252 | | | | 53,197 | | | | 45,829 | | | | 53,104 | | | | 49,316 | |
Property & Equipment | | | 34,349 | | | | 37,840 | | | | 29,919 | | | | 29,285 | | | | 29,437 | | | | 29,527 | |
Less Accumulated Depreciation | | | (19,305 | ) | | | (19,662 | ) | | | (17,765 | ) | | | (18,843 | ) | | | (18,316 | ) | | | (19,683 | ) |
| | |
|
|
| |
|
|
| |
|
|
| |
|
|
| |
|
|
| |
|
|
|
Property & Equipment, net | | | 15,044 | | | | 18,178 | | | | 12,154 | | | | 10,442 | | | | 11,121 | | | | 9,844 | |
Intangible Assets, net | | | 5,849 | | | | 5,403 | | | | — | | | | — | | | | — | | | | — | |
Contingent Purchase Holdback | | | — | | | | — | | | | 5,474 | | | | 5,474 | | | | 5,474 | | | | 5,474 | |
Other Assets | | | 906 | | | | 3,604 | | | | 1,123 | | | | 4,274 | | | | 1,051 | | | | 3,504 | |
| | |
|
|
| |
|
|
| |
|
|
| |
|
|
| |
|
|
| |
|
|
|
| | | $ | 121,337 | | | $ | 130,437 | | | $ | 71,948 | | | $ | 66,019 | | | $ | 70,750 | | | $ | 68,138 | |
| | |
|
|
| |
|
|
| |
|
|
| |
|
|
| |
|
|
| |
|
|
|
Liabilities & Stockholders’ Equity | | | | | | | | | | | | | | | | | | | | | | | | |
Current Liabilities | | | | | | | | | | | | | | | | | | | | | | | | |
Accounts Payable | | $ | 12,855 | | | $ | 13,418 | | | $ | 17,233 | | | $ | 7,385 | | | $ | 12,558 | | | $ | 12,140 | |
Accrued Expenses | | | 2,712 | | | | 2,348 | | | | 3,805 | | | | 3,167 | | | | 2,383 | | | | 2,628 | |
Accrued Compensation | | | 3,569 | | | | 2,305 | | | | 2,011 | | | | 1,727 | | | | 1,267 | | | | 1,165 | |
Other | | | 2,547 | | | | — | | | | — | | | | — | | | | — | | | | — | |
| | |
|
|
| |
|
|
| |
|
|
| |
|
|
| |
|
|
| |
|
|
|
Total Current Liabilities | | | 21,683 | | | | 18,071 | | | | 23,049 | | | | 12,279 | | | | 16,208 | | | | 15,933 | |
Long Term Interest Bearing Debt | | | 52,359 | | | | 63,761 | | | | 15,809 | | | | 18,873 | | | | 23,880 | | | | 22,088 | |
Long Term Interest Bearing Debt, Affiliates | | | 845 | | | | 845 | | | | 2,579 | | | | 2,579 | | | | 2,579 | | | | 2,579 | |
Deferred Income Taxes | | | 1,267 | | | | 2,517 | | | | — | | | | 3,292 | | | | — | | | | 3,105 | |
Other Long Term | | | 213 | | | | 211 | | | | 855 | | | | 845 | | | | 855 | | | | 213 | |
| | |
|
|
| |
|
|
| |
|
|
| |
|
|
| |
|
|
| |
|
|
|
Total Liabilities | | | 76,367 | | | | 85,405 | | | | 42,292 | | | | 37,868 | | | | 43,522 | | | | 43,918 | |
Stockholders’ Equity | | | | | | | | | | | | | | | | | | | | | | | | |
Common Stock | | | 847 | | | | 847 | | | | 847 | | | | 847 | | | | 847 | | | | 847 | |
Paid in Capital | | | 10,560 | | | | 10,560 | | | | 10,560 | | | | 10,560 | | | | 10,560 | | | | 10,560 | |
Accumulated Earnings (Deficit) | | | 33,563 | | | | 33,625 | | | | 18,249 | | | | 16,744 | | | | 15,821 | | | | 12,813 | |
| | |
|
|
| |
|
|
| |
|
|
| |
|
|
| |
|
|
| |
|
|
|
Total Stockholders’ Equity | | | 44,970 | | | | 45,032 | | | | 29,656 | | | | 28,151 | | | | 27,228 | | | | 24,220 | |
| | |
|
|
| |
|
|
| |
|
|
| |
|
|
| |
|
|
| |
|
|
|
| | | $ | 121,337 | | | $ | 130,437 | | | $ | 71,948 | | | $ | 66,019 | | | $ | 70,750 | | | $ | 68,138 | |
| | |
|
|
| |
|
|
| |
|
|
| |
|
|
| |
|
|
| |
|
|
|
Net Working Capital | | $ | 77,855 | | | $ | 85,181 | | | $ | 30,148 | | | $ | 33,550 | | | $ | 36,896 | | | $ | 33,383 | |
Common Shares Outstanding (thousands) | | | 8,476 | | | | 8,476 | | | | 8,476 | | | | 8,476 | | | | 8,476 | | | | 8,476 | |
Book Value per Share | | $ | 5.31 | | | $ | 5.31 | | | $ | 3.50 | | | $ | 3.32 | | | $ | 3.21 | | | $ | 2.86 | |
Tangible Book Value Per Share | | $ | 4.62 | | | $ | 4.68 | | | $ | 3.50 | | | $ | 3.32 | | | $ | 3.21 | | | $ | 2.86 | |
Sources of information: Company financial statements and management
Page 58
PROJECT SPARKLE | | CONFIDENTIAL |
|
| APPENDIX – COMPANY FINANCIAL DATA | | |
Common Sized Summary Balance Sheets
| | | as of February 28,
| | | as of August 31,
| |
| Assets | | 2000
| | | 2001
| | | 2002
| | | 2003
| | | 2002
| | | 2003
| |
Current Assets | | | | | | | | | | | | | | | | | | |
Cash & Equivalents | | 0.7 | % | | 0.5 | % | | 1.1 | % | | 0.6 | % | | 0.5 | % | | 0.8 | % |
Accounts Receivable | | 40.9 | % | | 38.5 | % | | 0.9 | % | | 2.1 | % | | 2.0 | % | | 3.4 | % |
Inventory | | 38.1 | % | | 37.2 | % | | 61.6 | % | | 63.1 | % | | 68.4 | % | | 65.2 | % |
Deferred Income Taxes | | 1.9 | % | | 1.7 | % | | 0.0 | % | | 2.0 | % | | 0.0 | % | | 1.7 | % |
Prepaid & Other | | 0.4 | % | | 1.2 | % | | 10.3 | % | | 1.6 | % | | 4.2 | % | | 1.2 | % |
| | |
|
| |
|
| |
|
| |
|
| |
|
| |
|
|
Total Current Assets | | 82.0 | % | | 79.2 | % | | 73.9 | % | | 69.4 | % | | 75.1 | % | | 72.4 | % |
Property & Equipment | | 28.3 | % | | 29.0 | % | | 41.6 | % | | 44.4 | % | | 41.6 | % | | 43.3 | % |
Less Accumulated Depreciation | | -15.9 | % | | -15.1 | % | | -24.7 | % | | -28.5 | % | | -25.9 | % | | -28.9 | % |
| | |
|
| |
|
| |
|
| |
|
| |
|
| |
|
|
Property & Equipment, net | | 12.4 | % | | 13.9 | % | | 16.9 | % | | 15.8 | % | | 15.7 | % | | 14.4 | % |
Intangible Assets, net | | 4.8 | % | | 4.1 | % | | 0.0 | % | | 0.0 | % | | 0.0 | % | | 0.0 | % |
Contingent Purchase Holdback | | 0.0 | % | | 0.0 | % | | 7.6 | % | | 8.3 | % | | 7.7 | % | | 8.0 | % |
Other Assets | | 0.7 | % | | 2.8 | % | | 1.6 | % | | 6.5 | % | | 1.5 | % | | 5.1 | % |
| | |
|
| |
|
| |
|
| |
|
| |
|
| |
|
|
| | | 100.0 | % | | 100.0 | % | | 100.0 | % | | 100.0 | % | | 100.0 | % | | 100.0 | % |
| | |
|
| |
|
| |
|
| |
|
| |
|
| |
|
|
Liabilities & Stockholders’ Equity | | | | | | | | | | | | | | | | | | |
Current Liabilities | | | | | | | | | | | | | | | | | | |
Accounts Payable | | 10.6 | % | | 10.3 | % | | 24.0 | % | | 11.2 | % | | 17.7 | % | | 17.8 | % |
Accrued Expenses | | 2.2 | % | | 1.8 | % | | 5.3 | % | | 4.8 | % | | 3.4 | % | | 3.9 | % |
Accrued Compensation | | 2.9 | % | | 1.8 | % | | 2.8 | % | | 2.6 | % | | 1.8 | % | | 1.7 | % |
Other | | 2.1 | % | | 0.0 | % | | 0.0 | % | | 0.0 | % | | 0.0 | % | | 0.0 | % |
| | |
|
| |
|
| |
|
| |
|
| |
|
| |
|
|
Total Current Liabilities | | 17.9 | % | | 13.9 | % | | 32.0 | % | | 18.6 | % | | 22.9 | % | | 23.4 | % |
Long Term Interest Bearing Debt | | 43.2 | % | | 48.9 | % | | 22.0 | % | | 28.6 | % | | 33.8 | % | | 32.4 | % |
Long Term Interest Bearing Debt, Affiliates | | 0.7 | % | | 0.6 | % | | 3.6 | % | | 3.9 | % | | 3.6 | % | | 3.8 | % |
Deferred Income Taxes | | 1.0 | % | | 1.9 | % | | 0.0 | % | | 5.0 | % | | 0.0 | % | | 4.6 | % |
Other Long Term | | 0.2 | % | | 0.2 | % | | 1.2 | % | | 1.3 | % | | 1.2 | % | | 0.3 | % |
| | |
|
| |
|
| |
|
| |
|
| |
|
| |
|
|
Total Liabilities | | 62.9 | % | | 65.5 | % | | 58.8 | % | | 57.4 | % | | 61.5 | % | | 64.5 | % |
Stockholders’ Equity | | | | | | | | | | | | | | | | | | |
Common Stock | | 0.7 | % | | 0.6 | % | | 1.2 | % | | 1.3 | % | | 1.2 | % | | 1.2 | % |
Paid in Capital | | 8.7 | % | | 8.1 | % | | 14.7 | % | | 16.0 | % | | 14.9 | % | | 15.5 | % |
Accumulated Earnings (Deficit) | | 27.7 | % | | 25.8 | % | | 25.4 | % | | 25.4 | % | | 22.4 | % | | 18.8 | % |
Treasury Stock & Stock Receivable | | 0.0 | % | | 0.0 | % | | 0.0 | % | | 0.0 | % | | 0.0 | % | | 0.0 | % |
| | |
|
| |
|
| |
|
| |
|
| |
|
| |
|
|
Total Stockholders’ Equity | | 37.1 | % | | 34.5 | % | | 41.2 | % | | 42.6 | % | | 38.5 | % | | 35.5 | % |
| | |
|
| |
|
| |
|
| |
|
| |
|
| |
|
|
| | | 100.0 | % | | 100.0 | % | | 100.0 | % | | 100.0 | % | | 100.0 | % | | 100.0 | % |
| | |
|
| |
|
| |
|
| |
|
| |
|
| |
|
|
Net Working Capital | | 64.2 | % | | 65.3 | % | | 41.9 | % | | 50.8 | % | | 52.1 | % | | 49.0 | % |
Sources of information: Company financial statements and management
Page 59
PROJECT SPARKLE | | CONFIDENTIAL |
|
| APPENDIX – COMPANY FINANCIAL DATA | | |
Comparative Financial Analysis
($ in thousands, except per share)
| | | | | | | | | | | | | | | as of & for the
6 months ended | | | as of & for LTM August 31, 2003
| |
| | | as of & for years ended the last day of February,
| | | August 31,
| | |
| | | 2000
| | | 2001
| | | 2002
| | | 2003
| | | 2002
| | | 2003
| | |
| | | | | | | |
Financial Review | | | | | | | | | | | | | | | | | | | | | | | | | | | | |
Revenue | | $ | 120,861 | | | $ | 120,037 | | | $ | 113,449 | | | $ | 102,011 | | | $ | 39,972 | | | $ | 39,045 | | | $ | 101,084 | |
Gross Profit | | $ | 61,453 | | | $ | 58,843 | | | $ | 53,358 | | | $ | 49,421 | | | $ | 19,900 | | | $ | 19,137 | | | $ | 48,658 | |
Total Operating Expenses | | $ | 54,821 | | | $ | 56,994 | | | $ | 56,605 | | | $ | 49,691 | | | $ | 22,530 | | | $ | 22,224 | | | $ | 49,385 | |
Operating Income | | $ | 6,632 | | | $ | 1,849 | | | $ | (3,247 | ) | | $ | (270 | ) | | $ | (2,630 | ) | | $ | (3,087 | ) | | $ | (727 | ) |
Pre-tax Income (Loss) | | $ | 5,666 | | | $ | 100 | | | $ | (5,118 | ) | | $ | (1,713 | ) | | $ | (3,341 | ) | | $ | (3,707 | ) | | $ | (2,079 | ) |
Normalized Net Income (Loss) | | $ | 3,861 | | | $ | 67 | | | $ | (3,570 | ) | | $ | (1,079 | ) | | $ | (2,105 | ) | | $ | (3,707 | ) | | $ | (2,681 | ) |
Normalized EBIT | | $ | 6,632 | | | $ | 1,849 | | | $ | (3,247 | ) | | $ | (270 | ) | | $ | (2,630 | ) | | $ | (3,087 | ) | | $ | (727 | ) |
Normalized EBITDA | | $ | 10,023 | | | $ | 5,719 | | | $ | 550 | | | $ | 2,180 | | | $ | (1,435 | ) | | $ | (1,886 | ) | | $ | 1,729 | |
Normalized Basic EPS | | $ | 0.46 | | | $ | 0.01 | | | $ | (0.42 | ) | | $ | (0.13 | ) | | $ | (0.25 | ) | | $ | (0.44 | ) | | $ | (0.32 | ) |
Normalized Diluted EPS | | $ | 0.46 | | | $ | 0.01 | | | $ | (0.42 | ) | | $ | (0.13 | ) | | $ | (0.25 | ) | | $ | (0.44 | ) | | $ | (0.32 | ) |
Total Assets | | $ | 121,337 | | | $ | 130,437 | | | $ | 71,948 | | | $ | 66,019 | | | $ | 70,750 | | | $ | 68,138 | | | $ | 68,138 | |
Net Worth | | $ | 44,970 | | | $ | 45,032 | | | $ | 29,656 | | | $ | 28,151 | | | $ | 27,228 | | | $ | 24,220 | | | $ | 24,220 | |
Tangible Net Worth | | $ | 39,121 | | | $ | 39,629 | | | $ | 29,656 | | | $ | 28,151 | | | $ | 27,228 | | | $ | 24,220 | | | $ | 24,220 | |
Total Interest Bearing Debt | | $ | 53,204 | | | $ | 64,606 | | | $ | 18,388 | | | $ | 21,452 | | | $ | 26,459 | | | $ | 24,667 | | | $ | 24,667 | |
Net Interest Bearing Debt | | $ | 52,309 | | | $ | 63,921 | | | $ | 17,579 | | | $ | 21,068 | | | $ | 26,106 | | | $ | 24,155 | | | $ | 24,155 | |
Total Capitalization | | $ | 98,174 | | | $ | 109,638 | | | $ | 48,044 | | | $ | 49,603 | | | $ | 53,687 | | | $ | 48,887 | | | $ | 48,887 | |
| | | | | | | |
Financial Strength | | | | | | | | | | | | | | | | | | | | | | | | | | | | |
Quick Ratio | | | 2.5 | | | | 3.0 | | | | 0.4 | | | | 0.3 | | | | 0.3 | | | | 0.3 | | | | 0.3 | |
Current Ratio | | | 4.6 | | | | 5.7 | | | | 2.3 | | | | 3.7 | | | | 3.3 | | | | 3.1 | | | | 3.1 | |
Total Liabilities to Net Worth | | | 169.8 | % | | | 189.7 | % | | | 142.6 | % | | | 134.5 | % | | | 159.8 | % | | | 181.3 | % | | | 181.3 | % |
Total Interest Bearing Debt to Net Worth | | | 118.3 | % | | | 143.5 | % | | | 62.0 | % | | | 76.2 | % | | | 97.2 | % | | | 101.8 | % | | | 101.8 | % |
Total Interest Bearing Debt to Total Capitalization | | | 54.2 | % | | | 58.9 | % | | | 38.3 | % | | | 43.2 | % | | | 49.3 | % | | | 50.5 | % | | | 50.5 | % |
Net Interest Bearing Debt to Total Capitalization | | | 53.3 | % | | | 58.3 | % | | | 36.6 | % | | | 42.5 | % | | | 48.6 | % | | | 49.4 | % | | | 49.4 | % |
Interest Expense to Interest Bearing Debt | | | 1.8 | % | | | 2.7 | % | | | 10.2 | % | | | 6.7 | % | | | 2.7 | % | | | 2.5 | % | | | 5.5 | % |
Total Interest Bearing Debt to Normalized EBITDA | | | 5.3 | | | | 11.3 | | | | 33.4 | | | | 9.8 | | | | na | | | | na | | | | 14.3 | |
Normalized EBITDA to Interest Expense | | | 10.4 | | | | 3.3 | | | | 0.3 | | | | 1.5 | | | | na | | | | na | | | | 1.3 | |
Normalized EBITDA-CAPEX, net to Interest Exp. | | | 4.8 | | | | (0.7 | ) | | | (1.2 | ) | | | 1.0 | | | | na | | | | na | | | | 1.1 | |
| | | | | | | |
Effectiveness and Efficiency | | | | | | | | | | | | | | | | | | | | | | | | | | | | |
Accounts Receivable Turnover | | | na | | | | 2.4 | | | | 4.5 | | | | 100.1 | | | | 39.6 | | | | 20.8 | | | | 54.2 | |
Inventory Turnover | | | na | | | | 1.3 | | | | 1.3 | | | | 1.2 | | | | 0.4 | | | | 0.5 | | | | 1.1 | |
Asset Turnover | | | na | | | | 1.0 | | | | 1.1 | | | | 1.5 | | | | 0.6 | | | | 0.6 | | | | 1.5 | |
Days Sales Outstanding | | | na | | | | 151.8 | | | | 81.8 | | | | 3.6 | | | | 4.6 | | | | 8.8 | | | | 6.7 | |
Days Inventory Outstanding | | | na | | | | 282.7 | | | | 282.1 | | | | 298.4 | | | | 424.9 | | | | 397.9 | | | | 323.1 | |
Days Payable Outstanding | | | na | | | | 40.6 | | | | 47.9 | | | | 43.9 | | | | 64.3 | | | | 42.6 | | | | 44.3 | |
Normalized EBIT to Average Assets | | | na | | | | 1.5 | % | | | -3.2 | % | | | -0.4 | % | | | na | | | | na | | | | -1.0 | % |
Normalized EBIT to Net Worth | | | na | | | | 4.1 | % | | | -8.7 | % | | | -0.9 | % | | | na | | | | na | | | | -2.8 | % |
Normalized EBITDA to Average Assets | | | na | | | | 4.5 | % | | | 0.5 | % | | | 3.2 | % | | | na | | | | na | | | | 2.5 | % |
Normalized EBITDA to Net Worth | | | na | | | | 12.7 | % | | | 1.5 | % | | | 7.5 | % | | | na | | | | na | | | | 6.7 | % |
Normalized Net Income to Average Assets | | | na | | | | 0.1 | % | | | -3.5 | % | | | -1.6 | % | | | na | | | | na | | | | -3.9 | % |
Normalized Net Income to Net Worth | | | na | | | | 0.1 | % | | | -9.6 | % | | | -3.7 | % | | | na | | | | na | | | | -10.4 | % |
Sources of information: Company financial statements and management
Page 60
PROJECT SPARKLE | | CONFIDENTIAL |
|
| APPENDIX – COMPANY FINANCIAL DATA | | |
Comparative Financial Analysis Continued
($ in thousands, except per share)
| | | as of & for years ended the last day of February,
| | | as of & for the 6 months ended
August 31,
| | | as of & for
LTM
August 31, 2003
| |
| | | 2000
| | | 2001
| | | 2002
| | | 2003
| | | 2002
| | | 2003
| | |
Profitability Ratios (as % of Revenue) | | | | | | | | | | | | | | | | | | | | | |
Gross Profit Margin | | 50.8 | % | | 49.0 | % | | 47.0 | % | | 48.4 | % | | 49.8 | % | | 49.0 | % | | 48.1 | % |
SG&A | | 42.6 | % | | 44.3 | % | | 46.5 | % | | 46.3 | % | | 53.4 | % | | 53.8 | % | | 46.4 | % |
Total Operating Expenses | | 45.4 | % | | 47.5 | % | | 49.9 | % | | 48.7 | % | | 56.4 | % | | 56.9 | % | | 48.9 | % |
Operating Income | | 5.5 | % | | 1.5 | % | | -2.9 | % | | -0.3 | % | | -6.6 | % | | -7.9 | % | | -0.7 | % |
Pre-tax Income (Loss) | | 4.7 | % | | 0.1 | % | | -4.5 | % | | -1.7 | % | | -8.4 | % | | -9.5 | % | | -2.1 | % |
Normalized Net Income (Loss) | | 3.2 | % | | 0.1 | % | | -3.1 | % | | -1.1 | % | | -5.3 | % | | -9.5 | % | | -2.7 | % |
Normalized EBIT | | 5.5 | % | | 1.5 | % | | -2.9 | % | | -0.3 | % | | -6.6 | % | | -7.9 | % | | -0.7 | % |
Normalized EBITDA | | 8.3 | % | | 4.8 | % | | 0.5 | % | | 2.1 | % | | -3.6 | % | | -4.8 | % | | 1.7 | % |
| | | | | | | |
Growth Rates | | | | | | | | | | | | | | | | | | | | | |
Revenue | | na | | | -0.7 | % | | -5.5 | % | | -10.1 | % | | na | | | -2.3 | % | | -0.9 | % |
Gross Profit | | na | | | -4.2 | % | | -9.3 | % | | -7.4 | % | | na | | | -3.8 | % | | -1.5 | % |
Operating Income | | na | | | -72.1 | % | | -275.6 | % | | na | | | na | | | na | | | na | |
Pre-tax Income (Loss) | | na | | | -98.2 | % | | -5218.0 | % | | na | | | na | | | na | | | na | |
Normalized Net Income (Loss) | | na | | | -98.3 | % | | -5428.0 | % | | na | | | na | | | na | | | na | |
Normalized EBIT | | na | | | -72.1 | % | | -275.6 | % | | na | | | na | | | na | | | na | |
Normalized EBITDA | | na | | | -42.9 | % | | -90.4 | % | | 296.4 | % | | na | | | na | | | -20.7 | % |
Normalized Basic EPS | | na | | | -97.8 | % | | -4300.0 | % | | na | | | na | | | na | | | na | |
Normalized Diluted EPS | | na | | | -97.8 | % | | -4300.0 | % | | na | | | na | | | na | | | na | |
Total Assets | | na | | | 7.5 | % | | -44.8 | % | | -8.2 | % | | na | | | -3.7 | % | | 3.2 | % |
Net Worth | | na | | | 0.1 | % | | -34.1 | % | | -5.1 | % | | na | | | -11.0 | % | | -14.0 | % |
Tangible Net Worth | | na | | | 1.3 | % | | -25.2 | % | | -5.1 | % | | na | | | -11.0 | % | | -14.0 | % |
CAPEX, net | | na | | | 29.1 | % | | -59.9 | % | | -75.1 | % | | na | | | -75.0 | % | | -59.8 | % |
| | | | | | | |
Cumulative Average Growth Rate (CAGR) Statistics | | | | | | | | | | | | | | | | | | | | | |
Revenue | | na | | | -0.7 | % | | -3.1 | % | | -5.5 | % | | na | | | na | | | na | |
Gross Profit | | na | | | -4.2 | % | | -6.8 | % | | -7.0 | % | | na | | | na | | | na | |
Operating Income | | na | | | -72.1 | % | | na | | | na | | | na | | | na | | | na | |
Pre-tax Income (Loss) | | na | | | -98.2 | % | | na | | | na | | | na | | | na | | | na | |
Normalized Net Income (Loss) | | na | | | -98.3 | % | | na | | | na | | | na | | | na | | | na | |
Normalized EBIT | | na | | | -72.1 | % | | na | | | na | | | na | | | na | | | na | |
Normalized EBITDA | | na | | | -42.9 | % | | -76.6 | % | | -39.9 | % | | na | | | na | | | na | |
Normalized Basic EPS | | na | | | -97.8 | % | | na | | | na | | | na | | | na | | | na | |
Normalized Diluted EPS | | na | | | -97.8 | % | | na | | | na | | | na | | | na | | | na | |
Total Assets | | na | | | 7.5 | % | | -23.0 | % | | -18.4 | % | | na | | | na | | | na | |
Net Worth | | na | | | 0.1 | % | | -18.8 | % | | -14.5 | % | | na | | | na | | | na | |
Tangible Net Worth | | na | | | 1.3 | % | | -12.9 | % | | -10.4 | % | | na | | | na | | | na | |
CAPEX, net | | na | | | 29.1 | % | | -28.1 | % | | -49.5 | % | | na | | | na | | | na | |
| | | | | | | |
Depreciation & Capital Spending | | | | | | | | | | | | | | | | | | | | | |
Depreciation to CAPEX, net | | 62.8 | % | | 55.5 | % | | 136.0 | % | | 352.0 | % | | 215.3 | % | | 864.0 | % | | 877.1 | % |
CAPEX, net to Revenue | | 4.5 | % | | 5.8 | % | | 2.5 | % | | 0.7 | % | | 1.4 | % | | 0.4 | % | | 0.3 | % |
Sources of information: Company financial statements and management
Page 61
PROJECT SPARKLE | | CONFIDENTIAL |
|
APPENDIX – COMPARABLE COMPANY DATA | | |
Signet Group PLC Overview | | ($ in thousands, except per share) |
Company Information
Name | | Signet Group PLC | | Address | | Zenith House, The Hyde |
Symbol | | SIGY | | City, State Zip | | London, EN NW9 6 |
Latest Fiscal YE | | 1-Feb-03 | | Telephone | | (870) 909-0301 |
Latest Rprt Per | | 31-Jul-03 | | Website | | signetgroupplc.com |
Market Information
As of Date | | | 25-Nov-03 | | Market Cap | | $ | 3,050,693 | |
Exchange | | | NASD | | Total Invested Capital (TIC) | | $ | 3,686,160 | |
Stock Price | | $ | 53.25 | | Enterprise Value (EV) | | $ | 3,636,089 | |
52 Week High | | $ | 59.34 | | | | | | |
52 Week Low | | $ | 29.80 | | Insider Ownership | | | 21.00 | % |
Avg. Daily Volume (000’s) | | | 2 | | Institutional | | | | |
Beta | | | 1.11 | | % Owned | | | na | |
Shares Outstanding (000’s) | | | 57,290 | | Number of Institutions | | | na | |
Valuation Analysis
| | | Multiple of
| |
| | | Market Cap
| | | TIC
| | | EV
| |
Latest Twelve Months | | | | | | | | | |
Revenue | | 1.20 | x | | 1.45 | x | | 1.43 | x |
EBIT | | 9.06 | x | | 10.94 | x | | 10.80 | x |
EBITDA | | 7.66 | x | | 9.25 | x | | 9.12 | x |
Normalized Net Income | | 15.10 | x | | 18.25 | x | | 18.00 | x |
Basic Normalized EPS | | 15.04 | x | | na | | | na | |
Projected | | | | | | | | | |
Feb-04 Mean Revenue | | na | | | na | | | na | |
Jan-05 Mean Revenue | | na | | | na | | | na | |
Feb-04 Mean EBITDA | | na | | | na | | | na | |
Jan-05 Mean EBITDA | | na | | | na | | | na | |
Feb-04 Mean EPS | | 14.01 | x | | na | | | na | |
Jan-05 Mean EPS | | 12.92 | x | | na | | | na | |
Most Recent Filing | | | | | | | | | |
Assets | | 1.66 | x | | 2.00 | x | | 1.97 | x |
Common Equity | | 2.61 | x | | na | | | na | |
Tangible Common Equity | | 2.69 | x | | na | | | na | |
Mean Consensus Estimates
Year Ending
| | # Ests
| | Revenue
| | EBITDA
| | EPS
| |
February-04 | | — | | na | | na | | $ | 3.80 | |
January-05 | | — | | na | | na | | $ | 4.12 | |
LT Growth | | — | | na | | na | | | 10.00 | % |
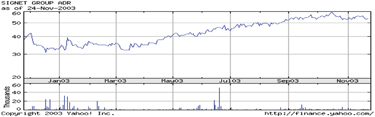
Income and Cashflow Statement Data
| | | LTM Jul-03
| | | Six Months Ended
| | | Fiscal Years Ended
| |
| | | | Jul-03
| | | Jul-02
| | | Feb-03
| | | Feb-02
| |
Revenue | | $ | 2,537,866 | | | $ | 1,074,514 | | | $ | 996,888 | | | $ | 2,460,240 | | | $ | 2,272,464 | |
Cost of Revenue | | | 2,108,933 | | | | 987,735 | | | | 916,150 | | | | 2,037,348 | | | | 1,898,352 | |
| | |
|
|
| |
|
|
| |
|
|
| |
|
|
| |
|
|
|
Gross Profit | | | 428,933 | | | | 86,779 | | | | 80,738 | | | | 422,892 | | | | 374,112 | |
Selling, General & Administrative | | | 92,106 | | | | — | | | | — | | | | 92,106 | | | | 85,104 | |
Depreciation & Amortization | | | — | | | | — | | | | — | | | | — | | | | — | |
| | |
|
|
| |
|
|
| |
|
|
| |
|
|
| |
|
|
|
Operating Income | | | 336,827 | | | | 86,779 | | | | 80,738 | | | | 330,786 | | | | 289,008 | |
Interest Income / (Expense), net | | | (23,824 | ) | | | (9,821 | ) | | | (11,242 | ) | | | (25,245 | ) | | | (25,776 | ) |
Other Income / (Expense), net | | | — | | | | — | | | | — | | | | — | | | | — | |
| | |
|
|
| |
|
|
| |
|
|
| |
|
|
| |
|
|
|
Pre-tax Income | | | 313,003 | | | | 76,958 | | | | 69,496 | | | | 305,541 | | | | 263,232 | |
Taxes | | | 111,020 | | | | 27,370 | | | | 24,674 | | | | 108,324 | | | | 90,864 | |
| | |
|
|
| |
|
|
| |
|
|
| |
|
|
| |
|
|
|
After-tax Income | | | 201,983 | | | | 49,588 | | | | 44,822 | | | | 197,217 | | | | 172,368 | |
Minority Interest | | | — | | | | — | | | | — | | | | — | | | | — | |
Equity in Affiliates | | | — | | | | — | | | | — | | | | — | | | | — | |
| | |
|
|
| |
|
|
| |
|
|
| |
|
|
| |
|
|
|
Normalized Net Income | | | 201,983 | | | | 49,588 | | | | 44,822 | | | | 197,217 | | | | 172,368 | |
Preferred Dividends | | | — | | | | — | | | | — | | | | — | | | | — | |
| | |
|
|
| |
|
|
| |
|
|
| |
|
|
| |
|
|
|
Normalized Net Income to Common | | $ | 201,983 | | | $ | 49,588 | | | $ | 44,822 | | | $ | 197,217 | | | $ | 172,368 | |
| | |
|
|
| |
|
|
| |
|
|
| |
|
|
| |
|
|
|
Normalized EBIT | | $ | 336,827 | | | $ | 86,779 | | | $ | 80,738 | | | $ | 330,786 | | | $ | 289,008 | |
Depreciation & Amortization | | $ | 61,661 | | | $ | 30,107 | | | $ | 26,280 | | | $ | 57,834 | | | $ | 49,968 | |
Normalized EBITDA | | $ | 398,488 | | | $ | 116,886 | | | $ | 107,018 | | | $ | 388,620 | | | $ | 338,976 | |
CAPEX | | $ | 76,747 | | | $ | 38,479 | | | $ | 35,478 | | | $ | 73,746 | | | $ | 87,408 | |
EBITDA - CAPEX | | $ | 321,741 | | | $ | 78,407 | | | $ | 71,540 | | | $ | 314,874 | | | $ | 251,568 | |
GAAP Operating Cash Flow | | $ | 279,844 | | | $ | 116,564 | | | $ | 115,486 | | | $ | 278,766 | | | $ | 270,720 | |
| | | | | |
Basic Reported Weighted Avg Shares Out (000’s) | | | | | | | 57,167 | | | | 56,987 | | | | 57,023 | | | | 56,340 | |
Basic Normalized EPS | | $ | 3.54 | | | $ | 0.87 | | | $ | 0.79 | | | $ | 3.46 | | | $ | 3.06 | |
Basic Reported EPS | | $ | 3.54 | | | $ | 0.87 | | | $ | 0.79 | | | $ | 3.46 | | | $ | 3.06 | |
Diluted Reported Weighted Avg Shares Out (000’s) | | | | | | | 57,563 | | | | 57,633 | | | | 57,570 | | | | 57,357 | |
Diluted Normalized EPS | | $ | 3.51 | | | $ | 0.86 | | | $ | 0.78 | | | $ | 3.43 | | | $ | 3.01 | |
Diluted Reported EPS | | $ | 3.51 | | | $ | 0.86 | | | $ | 0.78 | | | $ | 3.43 | | | $ | 3.01 | |
|
| Normalized Reconciliation |
| | | | | |
Restructuring/Goodwill Impairment | | $ | — | | | $ | — | | | $ | — | | | $ | — | | | $ | — | |
Other Unusual (Expense) Gain Items | | | — | | | | — | | | | — | | | | — | | | | — | |
Tax Shelter (Charge) on Unusual Items | | | — | | | | — | | | | — | | | | — | | | | — | |
| | |
|
|
| |
|
|
| |
|
|
| |
|
|
| |
|
|
|
Unusual (Exp) Gain Items, net of Taxes | | | — | | | | — | | | | — | | | | — | | | | — | |
Accounting Changes, net of Taxes | | | — | | | | — | | | | — | | | | — | | | | — | |
Discontinued Operations, net of Taxes | | | — | | | | — | | | | — | | | | — | | | | — | |
Extraordinary Items, net of Taxes | | | — | | | | — | | | | — | | | | — | | | | — | |
| | |
|
|
| |
|
|
| |
|
|
| |
|
|
| |
|
|
|
Total Reconciling Items, net of Taxes | | $ | — | | | $ | — | | | $ | — | | | $ | — | | | $ | — | |
| | |
|
|
| |
|
|
| |
|
|
| |
|
|
| |
|
|
|
Reported Income Tax (Benefit) | | $ | 111,020 | | | $ | 27,370 | | | $ | 24,674 | | | $ | 108,324 | | | $ | 90,864 | |
Reported Net Income (Loss) | | $ | 201,983 | | | $ | 49,588 | | | $ | 44,822 | | | $ | 197,217 | | | $ | 172,368 | |
|
| Revenue Breakdown |
| | | | | |
Net Sales | | $ | 2,537,866 | | | $ | 1,074,514 | | | $ | 996,888 | | | $ | 2,460,240 | | | $ | 2,272,464 | |
Other | | | — | | | | — | | | | — | | | | — | | | | — | |
| | |
|
|
| |
|
|
| |
|
|
| |
|
|
| |
|
|
|
| | | $ | 2,537,866 | | | $ | 1,074,514 | | | $ | 996,888 | | | $ | 2,460,240 | | | $ | 2,272,464 | |
| | |
|
|
| |
|
|
| |
|
|
| |
|
|
| |
|
|
|
Net Sales | | | 100.0 | % | | | 100.0 | % | | | 100.0 | % | | | 100.0 | % | | | 100.0 | % |
Other | | | 0.0 | % | | | 0.0 | % | | | 0.0 | % | | | 0.0 | % | | | 0.0 | % |
Sources of information: SEC Edgar filings, Multex, Capital IQ, Yahoo and Commodity Systems.
Page 62
PROJECT SPARKLE | | CONFIDENTIAL |
|
| APPENDIX – COMPARABLE COMPANY DATA | | |
| Signet Group PLC Overview (continued) | | ($ in thousands, except per share) |
Balance Sheet Data
| | | Jul-03
| | | Feb-03
| | | Feb-02
| |
Cash & Mkt Securities | | $ | 50,071 | | | $ | 136,476 | | | $ | 95,760 | |
Accounts Receivable | | | 508,921 | | | | 529,227 | | | | 548,208 | |
Inventory | | | 905,464 | | | | 825,435 | | | | 799,920 | |
Other Current Assets | | | — | | | | — | | | | — | |
| | |
|
|
| |
|
|
| |
|
|
|
Total Current Assets | | | 1,464,456 | | | | 1,491,138 | | | | 1,443,888 | |
PPE, net | | | 345,828 | | | | 314,415 | | | | 308,304 | |
Intangibles, net | | | 31,717 | | | | 30,294 | | | | 34,848 | |
Deferred Income Taxes | | | — | | | | — | | | | — | |
Other Assets | | | — | | | | — | | | | — | |
| | |
|
|
| |
|
|
| |
|
|
|
Total Assets | | $ | 1,842,001 | | | $ | 1,835,847 | | | $ | 1,787,040 | |
| | |
|
|
| |
|
|
| |
|
|
|
Accounts Payable | | $ | — | | | $ | — | | | $ | — | |
Accrued Expenses | | | — | | | | — | | | | — | |
Short Term Debt | | | 367,724 | | | | 497,097 | | | | 461,520 | |
Short Term Capital Leases | | | — | | | | — | | | | — | |
Other Current Liabilities | | | — | | | | — | | | | — | |
| | |
|
|
| |
|
|
| |
|
|
|
Total Current Liabilities | | | 367,724 | | | | 497,097 | | | | 461,520 | |
Other LT Liabilities | | | 39,606 | | | | 38,556 | | | | 23,328 | |
Long Term Debt | | | 267,743 | | | | 262,242 | | | | 323,424 | |
Long Term Capital Leases | | | — | | | | — | | | | — | |
Minority Interests | | | — | | | | — | | | | — | |
Pref Stock (Liq Value) | | | — | | | | — | | | | — | |
| | |
|
|
| |
|
|
| |
|
|
|
Total Liabilities & Pref Stock | | | 675,073 | | | | 797,895 | | | | 808,272 | |
| | |
|
|
| |
|
|
| |
|
|
|
Common Equity | | | 1,166,928 | | | | 1,037,952 | | | | 978,768 | |
| | |
|
|
| |
|
|
| |
|
|
|
Total Liabilities & Equity | | $ | 1,842,001 | | | $ | 1,835,847 | | | $ | 1,787,040 | |
| | |
|
|
| |
|
|
| |
|
|
|
Common Shares Outstanding (000’s) | | | 57,290 | | | | 57,126 | | | | 56,867 | |
Cash Value per share | | $ | 0.87 | | | $ | 2.39 | | | $ | 1.68 | |
Common Book Value per share | | $ | 20.37 | | | $ | 18.17 | | | $ | 17.21 | |
Common Tangible Book Value per share | | $ | 19.82 | | | $ | 17.64 | | | $ | 16.60 | |
Total Debt | | $ | 635,467 | | | $ | 759,339 | | | $ | 784,944 | |
Net Debt | | $ | 585,396 | | | $ | 622,863 | | | $ | 689,184 | |
Total Capitalization | | $ | 1,802,395 | | | $ | 1,797,291 | | | $ | 1,763,712 | |
|
| Balance Sheet Analysis |
| | | |
Effectiveness and Efficiency | | | | | | | | | | | | |
A/R Turnover | | | 4.9 | x | | | 4.6 | x | | | 4.1 | x |
Inventory Turnover | | | 2.4 | x | | | 2.5 | x | | | 2.4 | x |
Asset Turnover | | | 1.4 | x | | | 1.4 | x | | | 1.3 | x |
Days Sales Outstanding | | | 74.7 | | | | 79.9 | | | | 88.1 | |
Days Inventory Outstanding | | | 149.8 | | | | 145.6 | | | | 153.8 | |
Days Payable Outstanding | | | na | | | | na | | | | na | |
Normalized Return on Avg Assets | | | 11.0 | % | | | 10.9 | % | | | na | |
Normalized Return on Avg Common Equity | | | 18.3 | % | | | 19.6 | % | | | na | |
Financial Strength | | | | | | | | | | | | |
Current Ratio | | | 4.0 | | | | 3.0 | | | | 3.1 | |
Quick Ratio | | | 1.5 | | | | 1.3 | | | | 1.4 | |
Total Debt/Total Capitalization | | | 35.3 | % | | | 42.2 | % | | | 44.5 | % |
Total Debt/TIC | | | 17.2 | % | | | 20.6 | % | | | 21.3 | % |
Total Debt/EBITDA | | | 1.6 | x | | | 2.0 | x | | | 2.3 | x |
Total Debt/EBITDA-CAPEX | | | 2.0 | x | | | 2.4 | x | | | 3.1 | x |
EBITDA/Interest Expense | | | 16.7 | x | | | 15.4 | x | | | 13.2 | x |
EBITDA-CAPEX/Interest Expense | | | 13.5 | x | | | 12.5 | x | | | 9.8 | x |
Income and Cashflow Analysis
| | | LTM Jul-03
| | | Six Months Ended
| | | Fiscal Years Ended
| |
| | | | Jul-03
| | | Jul-02
| | | Feb-03
| | | Jan-02
| |
Profitability & Cost Ratios (as % of Revenue) | | | | | | | | | | | | | | | |
Gross Margin | | 16.9 | % | | 8.1 | % | | 8.1 | % | | 17.2 | % | | 16.5 | % |
S,G & A | | 3.6 | % | | 0.0 | % | | 0.0 | % | | 3.7 | % | | 3.7 | % |
Operating Income | | 13.3 | % | | 8.1 | % | | 8.1 | % | | 13.4 | % | | 12.7 | % |
Pre-Tax | | 12.3 | % | | 7.2 | % | | 7.0 | % | | 12.4 | % | | 11.6 | % |
EBIT | | 13.3 | % | | 8.1 | % | | 8.1 | % | | 13.4 | % | | 12.7 | % |
EBITDA | | 15.7 | % | | 10.9 | % | | 10.7 | % | | 15.8 | % | | 14.9 | % |
Normalized Net Income to Common | | 8.0 | % | | 4.6 | % | | 4.5 | % | | 8.0 | % | | 7.6 | % |
Reported Net Income | | 8.0 | % | | 4.6 | % | | 4.5 | % | | 8.0 | % | | 7.6 | % |
CAPEX | | 3.0 | % | | 3.6 | % | | 3.6 | % | | 3.0 | % | | 3.8 | % |
| | | | | |
Period Growth Rates | | | | | | | | | | | | | | | |
Revenue | | | | | 7.8 | % | | | | | 8.3 | % | | | |
EBIT | �� | | | | 7.5 | % | | | | | 14.5 | % | | | |
EBITDA | | | | | 9.2 | % | | | | | 14.6 | % | | | |
|
| Notes |
| | | | | |
One ASD share = 30 UK Ordinary Shares | | | | | | | | | | | | | | | |
| | | | | | Six Months Ended
| | | Fiscal Years Ended
| |
| Assumed USD to UKP Exchange Rate: | | | | | Jul-03
| | | Jul-02
| | | Feb-03
| | | Jan-02
| |
P&L (Average) | | | | | 1.61 | | | 1.46 | | | 1.53 | | | 1.44 | |
Bal Sheet (Closing) | | | | | 1.60 | | | 1.57 | | | 1.64 | | | 1.42 | |
Company has own credit operations.
On November 25, Company announced third quarter sales up from aprox $407m to $465m and operating profit up from aprox. $9.8 m to $13.3 m.
Other Analysis
| | | Number
of stores
| | Avg Store
Size (Sq Ft)
| | Avg Sales/
Store ($000)
| | Avg Price
Per Trans ($)
|
US - Kay | | 676 | | 1,444 | | $ | 1,490 | | $ | 242 |
US - Regional | | 307 | | 1,444 | | $ | 1,558 | | $ | 265 |
US - Jared | | 67 | | 5,800 | | $ | 4,310 | | $ | 558 |
UK - H. Samuels | | 418 | | 1,124 | | $ | 1,090 | | $ | 53 |
UK - Ernest Jones | | 192 | | 851 | | $ | 1,658 | | $ | 209 |
Company Description
Signet Group plc is primarily engaged in the retailing of jewelry, watches and gifts. The Company is managed as two operating segments, the United States and United Kingdom divisions. In the United States, Signet is a specialty retail jeweler that operated 1,050 stores in 45 states as of February 1, 2003. As of the same date, the Company operated 983 mall jewelry stores and 67 destination superstores in off-mall shopping centers. Its mall stores trade nationwide as Kay Jewelers, and regionally under a number of well-established and recognized names. The destination superstores trade as Jared The Galleria of Jewelry. In the United Kingdom, Signet is a specialty retailer of fine jewelry with 610 stores as of February 1, 2003. It trades as H.Samuel, targeting the middle market, and Ernest Jones, positioned at the upper end of the middle market. As of February 1, 2003, there were 418 H.Samuel stores and 192 Ernest Jones stores (including 16 Leslie Davis stores).
Sources of information: SEC Edgar filings, Multex, Capital IQ, Yahoo and Commodity Systems.
Page 63
PROJECT SPARKLE | | CONFIDENTIAL |
|
| APPENDIX – COMPARABLE COMPANY DATA | | |
Zale Corp Overview | | ($ | in thousands, except per share | ) |
Company Information
Name | | Zale Corp | | Address | | 901 West Walnut Hill Lane |
Symbol | | ZLC | | City, State Zip | | Irving, TX 75038 |
Latest Fiscal YE | | 31-Jul-03 | | Telephone | | (972) 580-4000 |
Latest Rprt Per | | 31-Jul-03 | | Website | | zales.com |
Market Information
As of Date | | | 25-Nov-03 | | Market Cap | | $ | 1,512,155 | |
Exchange | | | NYSE | | Total Invested Capital (TIC) | | $ | 1,696,555 | |
Stock Price | | $ | 55.17 | | Enterprise Value (EV) | | $ | 1,661,282 | |
52 Week High | | $ | 56.05 | | | | | | |
52 Week Low | | $ | 28.35 | | Insider Ownership | | | 0.03 | % |
Avg. Daily Volume (000’s) | | | 278 | | Institutional | | | | |
Beta | | | 1.65 | | % Owned | | | 95.00 | % |
Shares Outstanding (000’s) | | | 27,409 | | Number of Institutions | | | 10 | |
Valuation Analysis
| | | Multiple of
| |
| | | Market Cap
| | | TIC
| | | EV
| |
| | | |
Latest Twelve Months | | | | | | | | | |
Revenue | | 0.68 | x | | 0.77 | x | | 0.75 | x |
EBIT | | 9.61 | x | | 10.78 | x | | 10.56 | x |
EBITDA | | 7.08 | x | | 7.95 | x | | 7.78 | x |
Normalized Net Income | | 15.81 | x | | 17.74 | x | | 17.37 | x |
Basic Normalized EPS | | 18.64 | x | | na | | | na | |
| | | |
Projected | | | | | | | | | |
Jul-04 Mean Revenue | | 0.66 | x | | 0.74 | x | | 0.73 | x |
Jul-05 Mean Revenue | | 0.63 | x | | 0.71 | x | | 0.69 | x |
Jul-04 Mean EBITDA | | na | | | na | | | na | |
Jul-05 Mean EBITDA | | na | | | na | | | na | |
Jul-04 Mean EPS | | 14.89 | x | | na | | | na | |
Jul-05 Mean EPS | | 13.10 | x | | na | | | na | |
| | | |
Most Recent Filing | | | | | | | | | |
Assets | | 1.17 | x | | 1.31 | x | | 1.28 | x |
Common Equity | | 2.32 | x | | na | | | na | |
Tangible Common Equity | | 2.65 | x | | na | | | na | |
Mean Consensus Estimates
Year Ending
| | # Ests
| | Revenue
| | EBITDA
| | EPS
| |
July-04 | | 9 | | $ | 2,278,260 | | na | | $ | 3.70 | |
July-05 | | 7 | | $ | 2,390,480 | | na | | $ | 4.21 | |
LT Growth | | 7 | | | na | | na | | | 13.86 | % |
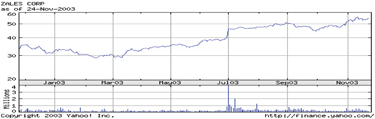
Income and Cashflow Statement Data
| | | LTM Jul-03
| | | Fiscal Year is
LTM
| | Fiscal Years Ended
| |
| | | | Jul-03
| | Jul-02
| | Jul-03
| | | Jul-02
| |
Revenue | | $ | 2,212,241 | | | $ | — | | $ | — | | $ | 2,212,241 | | | $ | 2,191,727 | |
Cost of Revenue | | | 1,101,030 | | | | — | | | — | | | 1,101,030 | | | | 1,083,053 | |
| | |
|
|
| |
|
| |
|
| |
|
|
| |
|
|
|
Gross Profit | | | 1,111,211 | | | | — | | | — | | | 1,111,211 | | | | 1,108,674 | |
Selling, General & Administrative | | | 892,297 | | | | — | | | — | | | 892,297 | | | | 881,885 | |
Depreciation & Amortization | | | 55,690 | | | | — | | | — | | | 55,690 | | | | 58,340 | |
| | |
|
|
| |
|
| |
|
| |
|
|
| |
|
|
|
Operating Income | | | 163,224 | | | | — | | | — | | | 163,224 | | | | 168,449 | |
Interest Income / (Expense), net | | | (6,319 | ) | | | — | | | — | | | (6,319 | ) | | | (7,750 | ) |
Other Income / (Expense), net | | | (5,910 | ) | | | — | | | — | | | (5,910 | ) | | | — | |
| | |
|
|
| |
|
| |
|
| |
|
|
| |
|
|
|
Pre-tax Income | | | 150,995 | | | | — | | | — | | | 150,995 | | | | 160,699 | |
Taxes | | | 55,340 | | | | — | | | — | | | 55,340 | | | | 59,256 | |
| | |
|
|
| |
|
| |
|
| |
|
|
| |
|
|
|
After-tax Income | | | 95,655 | | | | — | | | — | | | 95,655 | | | | 101,443 | |
Minority Interest | | | — | | | | — | | | — | | | — | | | | — | |
Equity in Affiliates | | | — | | | | — | | | — | | | — | | | | — | |
| | |
|
|
| |
|
| |
|
| |
|
|
| |
|
|
|
Normalized Net Income | | | 95,655 | | | | — | | | — | | | 95,655 | | | | 101,443 | |
Preferred Dividends | | | — | | | | — | | | — | | | — | | | | — | |
| | |
|
|
| |
|
| |
|
| |
|
|
| |
|
|
|
Normalized Net Income to Common | | $ | 95,655 | | | $ | — | | $ | — | | $ | 95,655 | | | $ | 101,443 | |
| | |
|
|
| |
|
| |
|
| |
|
|
| |
|
|
|
Normalized EBIT | | $ | 157,314 | | | $ | — | | $ | — | | $ | 157,314 | | | $ | 168,449 | |
Depreciation & Amortization | | $ | 56,153 | | | $ | — | | $ | — | | $ | 56,153 | | | $ | 58,787 | |
Normalized EBITDA | | $ | 213,467 | | | $ | — | | $ | — | | $ | 213,467 | | | $ | 227,236 | |
CAPEX | | $ | 37,385 | | | $ | — | | $ | — | | $ | 37,385 | | | $ | 50,251 | |
EBITDA - CAPEX | | $ | 176,082 | | | $ | — | | $ | — | | $ | 176,082 | | | $ | 176,985 | |
GAAP Operating Cash Flow | | $ | 158,626 | | | $ | — | | $ | — | | $ | 158,626 | | | $ | 175,007 | |
| | | | | |
Basic Reported Weighted Avg Shares Out (000’s) | | | | | | | — | | | — | | | 32,264 | | | | 34,589 | |
Basic Normalized EPS | | $ | 2.96 | | | | na | | | na | | $ | 2.96 | | | $ | 2.93 | |
Basic Reported EPS | | $ | (1.26 | ) | | | na | | | na | | $ | (1.26 | ) | | $ | 4.16 | |
Diluted Reported Weighted Avg Shares Out (000’s) | | | | | | | — | | | — | | | 32,264 | | | | 34,846 | |
Diluted Normalized EPS | | $ | 2.96 | | | | na | | | na | | $ | 2.96 | | | $ | 2.91 | |
Diluted Reported EPS | | $ | (1.26 | ) | | | na | | | na | | $ | (1.26 | ) | | $ | 4.13 | |
|
| Normalized Reconciliation |
| | | | | |
Restructuring/Goodwill Impairment | | $ | (136,300 | ) | | $ | — | | $ | — | | $ | (136,300 | ) | | $ | — | |
Other Unusual (Expense) Gain Items | | | — | | | | — | | | — | | | — | | | | 1,202 | |
Tax Shelter (Charge) on Unusual Items | | | — | | | | — | | | — | | | — | | | | — | |
| | |
|
|
| |
|
| |
|
| |
|
|
| |
|
|
|
Unusual (Exp) Gain Items, net of Taxes | | | (136,300 | ) | | | — | | | — | | | (136,300 | ) | | | 1,202 | |
Accounting Changes, net of Taxes | | | — | | | | — | | | — | | | — | | | | 41,287 | |
Discontinued Operations, net of Taxes | | | — | | | | — | | | — | | | — | | | | — | |
Extraordinary Items, net of Taxes | | | — | | | | — | | | — | | | — | | | | — | |
| | |
|
|
| |
|
| |
|
| |
|
|
| |
|
|
|
Total Reconciling Items, net of Taxes | | $ | (136,300 | ) | | $ | — | | $ | — | | $ | (136,300 | ) | | $ | 42,489 | |
| | |
|
|
| |
|
| |
|
| |
|
|
| |
|
|
|
Reported Income Tax (Benefit) | | $ | 55,340 | | | $ | — | | $ | — | | $ | 55,340 | | | $ | 59,256 | |
Reported Net Income (Loss) | | $ | (40,645 | ) | | $ | — | | $ | — | | $ | (40,645 | ) | | $ | 143,932 | |
|
| Revenue Breakdown |
| | | | | |
Net Sales | | $ | 2,212,241 | | | $ | — | | $ | — | | $ | 2,212,241 | | | $ | 2,191,727 | |
Other | | | — | | | | — | | | — | | | — | | | | — | |
| | |
|
|
| |
|
| |
|
| |
|
|
| |
|
|
|
| | | $ | 2,212,241 | | | $ | — | | $ | — | | $ | 2,212,241 | | | $ | 2,191,727 | |
| | |
|
|
| |
|
| |
|
| |
|
|
| |
|
|
|
Net Sales | | | 100.0 | % | | | na | | | na | | | 100.0 | % | | | 100.0 | % |
Other | | | 0.0 | % | | | na | | | na | | | 0.0 | % | | | vm0.0 | % |
Sources of information: SEC Edgar filings, Multex, Capital IQ, Yahoo and Commodity Systems.
Page 64
PROJECT SPARKLE | | CONFIDENTIAL |
|
| APPENDIX – COMPARABLE COMPANY DATA | | |
| Zale Corp Overview (continued) | | ($ in thousands, except per share) |
Balance Sheet Data
| | | Jul-03
| | | Jul-03
| | | Jul-02
| |
Cash & Mkt Securities | | $ | 35,273 | | | $ | 35,273 | | | $ | 84,887 | |
Accounts Receivable | | | — | | | | — | | | | — | |
Inventory | | | 798,761 | | | | 798,761 | | | | 782,316 | |
Other Current Assets | | | 52,450 | | | | 52,450 | | | | 47,915 | |
| | |
|
|
| |
|
|
| |
|
|
|
Total Current Assets | | | 886,484 | | | | 886,484 | | | | 915,118 | |
PPE, net | | | 266,167 | | | | 266,167 | | | | 284,438 | |
Intangibles, net | | | 82,199 | | | | 82,199 | | | | 212,039 | |
Deferred Income Taxes | | | 21,123 | | | | 21,123 | | | | 43,016 | |
Other Assets | | | 38,133 | | | | 38,133 | | | | 34,654 | |
| | |
|
|
| |
|
|
| |
|
|
|
Total Assets | | $ | 1,294,106 | | | $ | 1,294,106 | | | $ | 1,489,265 | |
| | |
|
|
| |
|
|
| |
|
|
|
Accounts Payable | | $ | 307,775 | | | $ | 307,775 | | | $ | 331,663 | |
Accrued Expenses | | | — | | | | — | | | | — | |
Short Term Debt | | | — | | | | — | | | | — | |
Short Term Capital Leases | | | — | | | | — | | | | — | |
Other Current Liabilities | | | 46,266 | | | | 46,266 | | | | 21,516 | |
| | |
|
|
| |
|
|
| |
|
|
|
Total Current Liabilities | | | 354,041 | | | | 354,041 | | | | 353,179 | |
Other LT Liabilities | | | 103,342 | | | | 103,342 | | | | 109,530 | |
Long Term Debt | | | 184,400 | | | | 184,400 | | | | 86,749 | |
Long Term Capital Leases | | | — | | | | — | | | | — | |
Minority Interests | | | — | | | | — | | | | — | |
Pref Stock (Liq Value) | | | — | | | | — | | | | — | |
| | |
|
|
| |
|
|
| |
|
|
|
Total Liabilities & Pref Stock | | | 641,783 | | | | 641,783 | | | | 549,458 | |
| | |
|
|
| |
|
|
| |
|
|
|
Common Equity | | | 652,323 | | | | 652,323 | | | | 939,807 | |
| | |
|
|
| |
|
|
| |
|
|
|
Total Liabilities & Equity | | $ | 1,294,106 | | | $ | 1,294,106 | | | $ | 1,489,265 | |
| | |
|
|
| |
|
|
| |
|
|
|
Common Shares Outstanding (000’s) | | | 27,611 | | | | 27,611 | | | | 33,569 | |
Cash Value per share | | $ | 1.28 | | | $ | 1.28 | | | $ | 2.53 | |
Common Book Value per share | | $ | 23.63 | | | $ | 23.63 | | | $ | 28.00 | |
Common Tangible Book Value per share | | $ | 20.65 | | | $ | 20.65 | | | $ | 21.68 | |
Total Debt | | $ | 184,400 | | | $ | 184,400 | | | $ | 86,749 | |
Net Debt | | $ | 149,127 | | | $ | 149,127 | | | $ | 1,862 | |
Total Capitalization | | $ | 836,723 | | | $ | 836,723 | | | $ | 1,026,556 | |
|
| Balance Sheet Analysis |
| | | |
Effectiveness and Efficiency | | | | | | | | | | | | |
A/R Turnover | | | na | | | | na | | | | na | |
Inventory Turnover | | | 1.4 | x | | | 1.4 | x | | | 1.4 | x |
Asset Turnover | | | 1.6 | x | | | 1.6 | x | | | 1.5 | x |
Days Sales Outstanding | | | na | | | | na | | | | na | |
Days Inventory Outstanding | | | 262.1 | | | | 262.1 | | | | 263.6 | |
Days Payable Outstanding | | | 57.0 | | | | 57.0 | | | | 59.8 | |
Normalized Return on Avg Assets | | | 6.9 | % | | | 6.9 | % | | | na | |
Normalized Return on Avg Common Equity | | | 12.0 | % | | | 12.0 | % | | | na | |
Financial Strength | | | | | | | | | | | | |
Current Ratio | | | 2.5 | | | | 2.5 | | | | 2.6 | |
Quick Ratio | | | 0.2 | | | | 0.2 | | | | 0.4 | |
Total Debt/Total Capitalization | | | 22.0 | % | | | 22.0 | % | | | 8.5 | % |
Total Debt/TIC | | | 11.1 | % | | | 11.1 | % | | | 5.2 | % |
Total Debt/EBITDA | | | 0.9 | x | | | 0.9 | x | | | 0.4 | x |
Total Debt/EBITDA-CAPEX | | | 1.0 | x | | | 1.0 | x | | | 0.5 | x |
EBITDA/Interest Expense | | | 33.8 | x | | | 33.8 | x | | | 29.3 | x |
EBITDA-CAPEX/Interest Expense | | | 27.9 | x | | | 27.9 | x | | | 22.8 | x |
Income and Cashflow Analysis
| | | LTM
Jul-03
| | | Fiscal Year is
LTM
| | Fiscal Years
Ended
| |
| | | | Jul-03
| | Jul-02
| | Jul-03
| | | Jul-02
| |
Profitability & Cost Ratios (as % of Revenue) | | | | | | | | | | | | | |
Gross Margin | | 50.2 | % | | na | | na | | 50.2 | % | | 50.6 | % |
S,G & A | | 40.3 | % | | na | | na | | 40.3 | % | | 40.2 | % |
Operating Income | | 7.4 | % | | na | | na | | 7.4 | % | | 7.7 | % |
Pre-Tax | | 6.8 | % | | na | | na | | 6.8 | % | | 7.3 | % |
EBIT | | 7.1 | % | | na | | na | | 7.1 | % | | 7.7 | % |
EBITDA | | 9.6 | % | | na | | na | | 9.6 | % | | 10.4 | % |
Normalized Net Income to Common | | 4.3 | % | | na | | na | | 4.3 | % | | 4.6 | % |
Reported Net Income | | -1.8 | % | | na | | na | | -1.8 | % | | 6.6 | % |
CAPEX | | 1.7 | % | | na | | na | | 1.7 | % | | 2.3 | % |
| | | | | |
Period Growth Rates | | | | | | | | | | | | | |
Revenue | | | | | na | | | | 0.9 | % | | | |
EBIT | | | | | na | | | | -6.6 | % | | | |
EBITDA | | | | | na | | | | -6.1 | % | | | |
Notes
$136.3 million impairment reduced the carrying value of the Piercing Pagoda goodwill to approximately $19.4 million
Unusual Items are Executive Transaction and Retiree Medical Curtailment
Other Analysis
| | | Number
of stores
| | Avg Store
Size (Sq Ft)
| | Avg Sales /
Store ($000)
| | Avg Price
Per
Trans ($)
|
Zales | | 851 | | 1654 | | $ | 1,356 | | $ | 282 |
Gordon’s | | 287 | | 1444 | | $ | 1,084 | | $ | 355 |
Bailey Banks Biddle | | 116 | | 3593 | | $ | 2,702 | | $ | 916 |
People’s Jewelers | | 167 | | 1586 | | $ | 878 | | $ | 177 |
Piercing Pagoda | | 813 | | 192 | | $ | 322 | | $ | 27 |
Company Description
Zale Corporation operates as a specialty retailer of fine jewelry in North America. As of July 31, 2003, the Company operated 2,234 specialty retail jewelry stores and kiosks located primarily in shopping malls throughout the United States, Canada and Puerto Rico. Zale primarily operates under six principal brands, each targeted to reach a distinct customer. Its specialty retail jewelry stores operate under brand names including Zales Jewelers (including Zale.com), Zales the Diamond Store Outlet, Gordon’s Jewelers, Bailey Banks & Biddle Fine Jewelers, Peoples Jewellers in Canada and Mappins Jewelers in Canada. In addition, Zale operates mall-based kiosks under the brand name Piercing Pagoda. The Company, through Zale Indemnity Company, Zale Life Insurance Company and Jewel Re-Insurance Ltd., provides insurance and reinsurance facilities for various types of insurance coverage, which typically are marketed to its private-label credit card customers.
Sources of information: SEC Edgar filings, Multex, Capital IQ, Yahoo and Commodity Systems.
Page 65
PROJECT SPARKLE | | CONFIDENTIAL |
|
| APPENDIX – COMPARABLE COMPANY DATA | | |
Friedmans Inc Overview | | ($ in thousands, except per share) |
| Company Information |
| | | |
Name | | Friedmans Inc | | Address | | 171 Crossroads Parkway |
Symbol | | FRM | | City, State Zip | | Savannah, GA 31422 |
Latest Fiscal YE | | 28-Sep-02 | | Telephone | | (912) 233-9333 |
Latest Rprt Per | | 28-Jun-03 | | Website | | friedmans.com |
Market Information
As of Date | | | 25-Nov-03 | | Market Cap | | $ | 120,228 | |
Exchange | | | NYSE | | Total Invested Capital (TIC) | | $ | 247,425 | |
Stock Price | | $ | 6.39 | | Enterprise Value (EV) | | $ | 247,139 | |
52 Week High | | $ | 17.50 | | | | | | |
52 Week Low | | $ | 5.05 | | Insider Ownership | | | 18.15 | % |
Avg. Daily Volume (000’s) | | | 362 | | Institutional | | | | |
Beta | | | 0.84 | | % Owned | | | 78.31 | % |
Shares Outstanding (000’s) | | | 18,815 | | Number of Institutions | | | 64 | |
Valuation Analysis
| | | Multiple of
| |
| | | Market Cap
| | | TIC
| | | EV
| |
Latest Twelve Months | | | | | | | | | |
Revenue | | 0.26 | x | | 0.53 | x | | 0.53 | x |
EBIT | | 2.9 | x | | 6.0 | x | | 6.0 | x |
EBITDA | | 2.2 | x | | 4.6 | x | | 4.6 | x |
Normalized Net Income | | 4.5 | x | | 9.3 | x | | 9.3 | x |
Basic Normalized EPS | | 4.6 | x | | na | | | na | |
Projected | | | | | | | | | |
Sep-03 Mean Revenue | | 0.26 | x | | 0.53 | x | | 0.53 | x |
Sep-04 Mean Revenue | | 0.18 | x | | 0.36 | x | | 0.36 | x |
Sep-03 Mean EBITDA | | na | | | na | | | na | |
Sep-04 Mean EBITDA | | na | | | na | | | na | |
Sep-03 Mean EPS | | 4.6 | x | | na | | | na | |
Sep-04 Mean EPS | | 4.2 | x | | na | | | na | |
Most Recent Filing | | | | | | | | | |
Assets | | 0.2 | x | | 0.5 | x | | 0.5 | x |
Common Equity | | 0.4 | x | | na | | | na | |
Tangible Common Equity | | 0.4 | x | | na | | | na | |
Mean Consensus Estimates
Year Ending
| | # Ests
| | Revenue
| | EBITDA
| | EPS
| |
September-03 | | 5 | | $ | 467,940 | | na | | $ | 1.39 | |
September-04 | | 5 | | $ | 684,270 | | na | | $ | 1.52 | |
LT Growth | | 3 | | | na | | na | | | 15.00 | % |
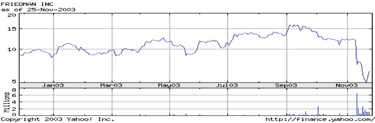
Income and Cashflow Statement Data
| | | LTM Jun-03
| | | Nine Months Ended
| | | Fiscal Years Ended
| |
| | | | Jun-03
| | | Jun-02
| | | Sep-02
| | | Sep-01
| |
Revenue | | $ | 462,758 | | | $ | 393,518 | | | $ | 366,829 | | | $ | 436,069 | | | $ | 411,037 | |
Cost of Revenue | | | 242,076 | | | | 203,512 | | | | 188,922 | | | | 227,486 | | | | 216,265 | |
| | |
|
|
| |
|
|
| |
|
|
| |
|
|
| |
|
|
|
Gross Profit | | | 220,682 | | | | 190,006 | | | | 177,907 | | | | 208,583 | | | | 194,772 | |
Selling, General & Administrative | | | 166,798 | | | | 138,518 | | | | 133,256 | | | | 161,536 | | | | 160,941 | |
Depreciation & Amortization | | | 12,424 | | | | 9,541 | | | | 8,457 | | | | 11,340 | | | | 13,881 | |
| | |
|
|
| |
|
|
| |
|
|
| |
|
|
| |
|
|
|
Operating Income | | | 41,460 | | | | 41,947 | | | | 36,194 | | | | 35,707 | | | | 19,950 | |
Interest Income / (Expense), net | | | (714 | ) | | | (674 | ) | | | (265 | ) | | | (305 | ) | | | (2,511 | ) |
Other Income / (Expense), net | | | — | | | | — | | | | — | | | | — | | | | — | |
| | |
|
|
| |
|
|
| |
|
|
| |
|
|
| |
|
|
|
Pre-tax Income | | | 40,746 | | | | 41,273 | | | | 35,929 | | | | 35,402 | | | | 17,439 | |
Taxes | | | 14,187 | | | | 14,391 | | | | 12,619 | | | | 12,415 | | | | 6,584 | |
| | |
|
|
| |
|
|
| |
|
|
| |
|
|
| |
|
|
|
After-tax Income | | | 26,559 | | | | 26,882 | | | | 23,310 | | | | 22,987 | | | | 10,855 | |
Minority Interest | | | 98 | | | | 44 | | | | 126 | | | | 180 | | | | 1,374 | |
Equity in Affiliates | | | — | | | | — | | | | — | | | | — | | | | — | |
| | |
|
|
| |
|
|
| |
|
|
| |
|
|
| |
|
|
|
Normalized Net Income | | | 26,657 | | | | 26,926 | | | | 23,436 | | | | 23,167 | | | | 12,229 | |
Preferred Dividends | | | — | | | | — | | | | — | | | | — | | | | — | |
| | |
|
|
| |
|
|
| |
|
|
| |
|
|
| |
|
|
|
Normalized Net Income to Common | | $ | 26,657 | | | $ | 26,926 | | | $ | 23,436 | | | $ | 23,167 | | | $ | 12,229 | |
| | |
|
|
| |
|
|
| |
|
|
| |
|
|
| |
|
|
|
Normalized EBIT | | $ | 41,460 | | | $ | 41,947 | | | $ | 36,194 | | | $ | 35,707 | | | $ | 19,950 | |
Depreciation & Amortization | | $ | 12,424 | | | $ | 9,541 | | | $ | 8,457 | | | $ | 11,340 | | | $ | 13,881 | |
Normalized EBITDA | | $ | 53,884 | | | $ | 51,488 | | | $ | 44,651 | | | $ | 47,047 | | | $ | 33,831 | |
CAPEX | | $ | 12,859 | | | $ | 10,948 | | | $ | 5,703 | | | $ | 7,614 | | | $ | 11,473 | |
EBITDA - CAPEX | | $ | 41,025 | | | $ | 40,540 | | | $ | 38,948 | | | $ | 39,433 | | | $ | 22,358 | |
GAAP Operating Cash Flow | | $ | 12,110 | | | $ | 670 | | | $ | (7,047 | ) | | $ | 4,393 | | | $ | 288 | |
Basic Reported Weighted Avg Shares Out (000’s) | | | | | | | 18,630 | | | | 16,604 | | | | 17,108 | | | | 14,501 | |
Basic Normalized EPS | | $ | 1.39 | | | $ | 1.45 | | | $ | 1.41 | | | $ | 1.35 | | | $ | 0.84 | |
Basic Reported EPS | | $ | 1.39 | | | $ | 1.45 | | | $ | 1.41 | | | $ | 1.35 | | | $ | 0.84 | |
Diluted Reported Weighted Avg Shares Out (000’s) | | | | | | | 19,142 | | | | 19,030 | | | | 17,347 | | | | 14,531 | |
Diluted Normalized EPS | | $ | 1.52 | | | $ | 1.41 | | | $ | 1.23 | | | $ | 1.34 | | | $ | 0.84 | |
Diluted Reported EPS | | $ | 1.52 | | | $ | 1.41 | | | $ | 1.23 | | | $ | 1.34 | | | $ | 0.84 | |
|
| Normalized Reconciliation | |
| | | | | |
Restructuring/Goodwill Impairment | | $ | — | | | $ | — | | | $ | — | | | $ | — | | | $ | — | |
Other Unusual (Expense) Gain Items | | | — | | | | — | | | | — | | | | — | | | | — | |
Tax Shelter (Change) on Unusual Items | | | — | | | | — | | | | — | | | | — | | | | — | |
| | |
|
|
| |
|
|
| |
|
|
| |
|
|
| |
|
|
|
Unusual (Exp) Gain Items, net of Taxes | | | — | | | | — | | | | — | | | | — | | | | — | |
Accounting Changes, net of Taxes | | | — | | | | — | | | | — | | | | — | | | | — | |
Discontinued Operations, net of Taxes | | | — | | | | — | | | | — | | | | — | | | | — | |
Extraordinary Items, net of Taxes | | | — | | | | — | | | | — | | | | — | | | | — | |
| | |
|
|
| |
|
|
| |
|
|
| |
|
|
| |
|
|
|
Total Reconciling Items, net of Taxes | | $ | — | | | $ | — | | | $ | — | | | $ | — | | | $ | — | |
| | |
|
|
| |
|
|
| |
|
|
| |
|
|
| |
|
|
|
Reported Income Tax (Benefit) | | $ | 14,187 | | | $ | 14,391 | | | $ | 12,619 | | | $ | 12,415 | | | $ | 6,584 | |
Reported Net Income (Loss) | | $ | 26,657 | | | $ | 26,926 | | | $ | 23,436 | | | $ | 23,167 | | | $ | 12,229 | |
|
| Revenue Breakdown | |
| | | | | |
Net Sales | | $ | 462,758 | | | $ | 393,518 | | | $ | 366,829 | | | $ | 436,069 | | | $ | 411,037 | |
Other | | | — | | | | — | | | | — | | | | — | | | | — | |
| | |
|
|
| |
|
|
| |
|
|
| |
|
|
| |
|
|
|
| | | $ | 462,758 | | | $ | 393,518 | | | $ | 366,829 | | | $ | 436,069 | | | $ | 411,037 | |
| | |
|
|
| |
|
|
| |
|
|
| |
|
|
| |
|
|
|
Net Sales | | | 100.0 | % | | | 100.0 | % | | | 100.0 | % | | | 100.0 | % | | | 100.0 | % |
Other | | | 0.0 | % | | | 0.0 | % | | | 0.0 | % | | | 0.0 | % | | | 0.0 | % |
Sources of information: SEC Edgar filings, Multex, Capital IQ, Yahoo and Commodity Systems.
Page 66
PROJECT SPARKLE | | CONFIDENTIAL |
|
APPENDIX – COMPARABLE COMPANY DATA | | |
| Friedmans Inc Overview (continued) | | ($ in thousands, except per share) |
Balance Sheet Data
| | | Jun-03
| | | Sep-02
| | | Sep-01
| |
Cash & Mkt Securities | | $ | 286 | | | $ | 271 | | | $ | 468 | |
Accounts Receivable | | | 176,433 | | | | 149,868 | | | | 132,695 | |
Inventory | | | 153,134 | | | | 136,606 | | | | 136,520 | |
Other Current Assets | | | 17,058 | | | | 13,396 | | | | 12,000 | |
| | |
|
|
| |
|
|
| |
|
|
|
Total Current Assets | | | 346,911 | | | | 300,141 | | | | 281,683 | |
PPE, net | | | 52,947 | | | | 50,117 | | | | 54,495 | |
Intangibles, net | | | 5,022 | | | | 5,022 | | | | 5,022 | |
Deferred Income Taxes | | | — | | | | — | | | | — | |
Other Assets | | | 91,296 | | | | 92,603 | | | | 111,425 | |
| | |
|
|
| |
|
|
| |
|
|
|
Total Assets | | $ | 496,176 | | | $ | 447,883 | | | $ | 452,625 | |
| | |
|
|
| |
|
|
| |
|
|
|
Accounts Payable | | $ | 41,601 | | | $ | 31,070 | | | $ | 46,680 | |
Accrued Expenses | | | 19,041 | | | | 18,649 | | | | 12,561 | |
Short Term Debt | | | 632 | | | | 590 | | | | 168,814 | |
Short Term Capital Leases | | | — | | | | — | | | | — | |
Other Current Liabilities | | | — | | | | — | | | | — | |
| | |
|
|
| |
|
|
| |
|
|
|
Total Current Liabilities | | | 61,274 | | | | 50,309 | | | | 228,055 | |
Other LT Liabilities | | | 2,581 | | | | 2,581 | | | | 1,314 | |
Long Term Debt | | | 126,565 | | | | 114,808 | | | | — | |
Long Term Capital Leases | | | — | | | | 618 | | | | 685 | |
Minority Interests | | | — | | | | — | | | | — | |
Pref Stock (Liq Value) | | | — | | | | — | | | | — | |
| | |
|
|
| |
|
|
| |
|
|
|
Total Liabilities & Pref Stock | | | 190,420 | | | | 168,316 | | | | 230,054 | |
| | |
|
|
| |
|
|
| |
|
|
|
Common Equity | | | 305,756 | | | | 279,567 | | | | 222,571 | |
| | |
|
|
| |
|
|
| |
|
|
|
Total Liabilities & Equity | | $ | 496,176 | | | $ | 447,883 | | | $ | 452,625 | |
| | |
|
|
| |
|
|
| |
|
|
|
Common Shares Outstanding (000’s) | | | 18,800 | | | | 18,620 | | | | 14,519 | |
Cash Value per share | | $ | 0.02 | | | $ | 0.01 | | | $ | 0.03 | |
Common Book Value per share | | $ | 16.26 | | | $ | 15.01 | | | $ | 15.33 | |
Common Tangible Book Value per share | | $ | 16.00 | | | $ | 14.74 | | | $ | 14.98 | |
Total Debt | | $ | 127,197 | | | $ | 116,016 | | | $ | 169,499 | |
Net Debt | | $ | 126,911 | | | $ | 115,745 | | | $ | 169,031 | |
Total Capitalization | | $ | 432,953 | | | $ | 395,583 | | | $ | 392,070 | |
|
| Balance Sheet Analysis |
| | | |
Effectiveness and Efficiency | | | | | | | | | | | | |
A/R Turnover | | | 2.8 | x | | | 3.1 | x | | | 3.1 | x |
Inventory Turnover | | | 1.7 | x | | | 1.7 | x | | | 1.6 | x |
Asset Turnover | | | 1.0 | x | | | 1.0 | x | | | 0.9 | x |
Days Sales Outstanding | | | 128.7 | | | | 118.3 | | | | 117.8 | |
Days Inventory Outstanding | | | 218.4 | | | | 219.1 | | | | 230.4 | |
Days Payable Outstanding | | | 31.5 | | | | 35.4 | | | | 43.6 | |
Normalized Return on Avg Assets | | | 5.6 | % | | | 5.1 | % | | | na | |
Normalized Return on Avg Common Equity | | | 9.1 | % | | | 9.2 | % | | | na | |
Financial Strength | | | | | | | | | | | | |
Current Ratio | | | 5.7 | | | | 6.0 | | | | 1.2 | |
Quick Ratio | | | 3.2 | | | | 3.3 | | | | 0.6 | |
Total Debt/Total Capitalization | | | 29.4 | % | | | 29.3 | % | | | 43.2 | % |
Total Debt/TIC | | | 54.7 | % | | | 49.9 | % | | | 72.9 | % |
Total Debt/EBITDA | | | 2.4 | x | | | 2.5 | x | | | 5.0 | x |
Total Debt/EBITDA-CAPEX | | | 3.1 | x | | | 2.9 | x | | | 7.6 | x |
EBITDA/Interest Expense | | | 75.5 | x | | | 154.3 | x | | | 13.5 | x |
EBITDA-CAPEX/Interest Expense | | | 57.5 | x | | | 129.3 | x | | | 8.9 | x |
Income and Cashflow Analysis
| | | LTM | | | Nine Months
Ended
| | | Fiscal Years
Ended
| |
| | | Jun-03
| | | Jun-03
| | | Jun-02
| | | Sep-02
| | | Sep-01
| |
Profitability & Cost Ratios (as % of Revenue) | | | | | | | | | | | | | | | |
Gross Margin | | 47.7 | % | | 48.3 | % | | 48.5 | % | | 47.8 | % | | 47.4 | % |
S,G & A | | 36.0 | % | | 35.2 | % | | 36.3 | % | | 37.0 | % | | 39.2 | % |
Operating Income | | 9.0 | % | | 10.7 | % | | 9.9 | % | | 8.2 | % | | 4.9 | % |
Pre-Tax | | 8.8 | % | | 10.5 | % | | 9.8 | % | | 8.1 | % | | 4.2 | % |
EBIT | | 9.0 | % | | 10.7 | % | | 9.9 | % | | 8.2 | % | | 4.9 | % |
EBITDA | | 11.6 | % | | 13.1 | % | | 12.2 | % | | 10.8 | % | | 8.2 | % |
Normalized Net Income to Common | | 5.8 | % | | 6.8 | % | | 6.4 | % | | 5.3 | % | | 3.0 | % |
Reported Net Income | | 5.8 | % | | 6.8 | % | | 6.4 | % | | 5.3 | % | | 3.0 | % |
CAPEX | | 2.8 | % | | 2.8 | % | | 1.6 | % | | 1.7 | % | | 2.8 | % |
Period Growth Rates | | | | | | | | | | | | | | | |
Revenue | | | | | 7.3 | % | | | | | 6.1 | % | | | |
EBIT | | | | | 15.9 | % | | | | | 79.0 | % | | | |
EBITDA | | | | | 15.3 | % | | | | | 39.1 | % | | | |
Notes
The company has their own merchandise credit operations.
Company is undergoing fraud investigations by the SEC. Company CFO is on administrative leave.
Company has announced that they will need to restate financial statements since FY2000 to reflect higher doubtful debt provisions.
Other Analysis
Number
of stores
| | Avg Store
Size (Sq Ft)
| | Avg Sales/
Store ($000)
| | Avg Price
Per Trans ($)
|
| 697 | | 1500 | | $ 664 | | na |
Company Description
Friedman’s, Inc. operates as a specialty retailer of fine jewelry in the United States. As of October 2, 2003, it operated a total of 675 stores in 20 states, of which 449 were located in power strip centers and 226 were located in regional malls. Stores are primarily located in the southeast, midwest, and mid-Atlantic regions. Friedman’s targets low to middle income consumers aged between 18 to 45 years, with its selection of diamonds, gold, gemstones, and wedding-related items. The company’s stores provide various jewelry products, including earrings, rings, necklaces, chains, watches, and other fine jewelry for men and women. These items are made of yellow and white gold, platinum, and silver; and set with diamonds and other fine gemstones. The gold jewelry, which the company sells in its stores, is primarily 10 and 14 karat. Friedman’s stores also offer a range of diamonds up to one carat. Friedman’s affiliate, Crescent Jewelers, a specialty retailer of fine jewelry, operates stores in six western states. The company’s competitors include Zale Corporation; Sterling, Inc.; Whitehall Jewelers, Inc.; and Helzberg’s Diamond Shops, Inc.
Sources of information: SEC Edgar filings, Multex, Capital IQ, Yahoo and Commodity Systems.
Page 67
PROJECT SPARKLE | | CONFIDENTIAL |
|
| APPENDIX – COMPARABLE COMPANY DATA | | |
| Whitehall Jewellers Overview | | ($ in thousands, except per share) |
| Company Information |
Name | | Whitehall Jewellers | | Address | | 155 North Wacker, Suite 500 |
Symbol | | JWL | | City, State Zip | | Chicago, IL 60606 |
Latest Fiscal YE | | 31-Jan-03 | | Telephone | | (312) 782-6800 |
Latest Rprt Per | | 31-Jul-03 | | Website | | whitehalljewellers.com |
Market Information
As of Date | | | 25-Nov-03 | | Market Cap | | $ | 153,806 | |
Exchange | | | NYSE | | Total Invested Capital (TIC) | | $ | 240,821 | |
Stock Price | | $ | 10.82 | | Enterprise Value (EV) | | $ | 239,422 | |
52 Week High | | $ | 13.25 | | | | | | |
52 Week Low | | $ | 7.90 | | Insider Ownership | | | 9.00 | % |
Avg. Daily Volume (000’s) | | | 36 | | Institutional | | | | |
Beta | | | 1.48 | | % Owned | | | 70.00 | % |
Shares Outstanding (000’s) | | | 14,215 | | Number of Institutions | | | 10 | |
Valuation Analysis
| | | Multiple of
| |
| | | Market Cap
| | | TIC
| | | EV
| |
Latest Twelve Months | | | | | | | | | |
Revenue | | 0.46 | x | | 0.73 | x | | 0.72 | x |
EBIT | | 14.34 | x | | 22.45 | x | | 22.32 | x |
EBITDA | | 6.86 | x | | 10.74 | x | | 10.68 | x |
Normalized Net Income | | 40.42 | x | | 63.29 | x | | 62.92 | x |
Basic Normalized EPS | | 43.28 | x | | na | | | na | |
Projected | | | | | | | | | |
Jan-04 Mean Revenue | | 0.43 | x | | 0.67 | x | | 0.66 | x |
Jan-05 Mean Revenue | | 0.45 | x | | 0.71 | x | | 0.70 | x |
Jan-04 Mean EBITDA | | na | | | na | | | na | |
Jan-05 Mean EBITDA | | na | | | na | | | na | |
Jan-04 Mean EPS | | 14.05 | x | | na | | | na | |
Jan-05 Mean EPS | | 20.42 | x | | na | | | na | |
Most Recent Filing | | | | | | | | | |
Assets | | 0.54 | x | | 0.84 | x | | 0.84 | x |
Common Equity | | 1.36 | x | | na | | | na | |
Tangible Common Equity | | 1.43 | x | | na | | | na | |
Mean Consensus Estimates
Year Ending
| | # Ests
| | Revenue
| | EBITDA
| | EPS
| |
January-04 | | 3 | | $ | 360,150 | | na | | $ | 0.77 | |
January-05 | | 3 | | $ | 340,450 | | na | | $ | 0.53 | |
LT Growth | | 1 | | | na | | na | | | 20.00 | % |
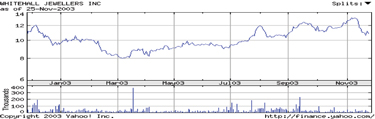
Income and Cashflow Statement Data
| | | LTM
Jul-03
| | | Six Months Ended
| | | Fiscal Years Ended
| |
| | | | Jul-03
| | | Jul-02
| | | Jan-03
| | | Jan-02
| |
Revenue | | $ | 332,087 | | | $ | 141,881 | | | $ | 150,831 | | | $ | 341,037 | | | $ | 338,911 | |
Cost of Revenue | | | 210,506 | | | | 94,675 | | | | 97,079 | | | | 212,910 | | | | 206,574 | |
| | |
|
|
| |
|
|
| |
|
|
| |
|
|
| |
|
|
|
Gross Profit | | | 121,581 | | | | 47,206 | | | | 53,752 | | | | 128,127 | | | | 132,337 | |
Selling, General & Administrative | | | 110,855 | | | | 53,943 | | | | 50,878 | | | | 107,790 | | | | 109,975 | |
Depreciation & Amortization | | | — | | | | — | | | | — | | | | — | | | | — | |
| | |
|
|
| |
|
|
| |
|
|
| |
|
|
| |
|
|
|
Operating Income | | | 10,726 | | | | (6,737 | ) | | | 2,874 | | | | 20,337 | | | | 22,362 | |
Interest Income / (Expense), net | | | (4,690 | ) | | | (2,472 | ) | | | (2,123 | ) | | | (4,341 | ) | | | (6,902 | ) |
Other Income / (Expense), net | | | — | | | | — | | | | — | | | | — | | | | — | |
| | |
|
|
| |
|
|
| |
|
|
| |
|
|
| |
|
|
|
Pre-tax Income | | | 6,036 | | | | (9,209 | ) | | | 751 | | | | 15,996 | | | | 15,460 | |
Taxes | | | 2,231 | | | | (3,590 | ) | | | 268 | | | | 6,089 | | | | 5,380 | |
| | |
|
|
| |
|
|
| |
|
|
| |
|
|
| |
|
|
|
After-tax Income | | | 3,805 | | | | (5,619 | ) | | | 483 | | | | 9,907 | | | | 10,080 | |
Minority Interest | | | — | | | | — | | | | — | | | | — | | | | — | |
Equity in Affiliates | | | — | | | | — | | | | — | | | | — | | | | — | |
| | |
|
|
| |
|
|
| |
|
|
| |
|
|
| |
|
|
|
Normalized Net Income | | | 3,805 | | | | (5,619 | ) | | | 483 | | | | 9,907 | | | | 10,080 | |
Preferred Dividends | | | — | | | | — | | | | — | | | | — | | | | — | |
| | |
|
|
| |
|
|
| |
|
|
| |
|
|
| |
|
|
|
Normalized Net Income to Common | | $ | 3,805 | | | $ | (5,619 | ) | | $ | 483 | | | $ | 9,907 | | | $ | 10,080 | |
| | |
|
|
| |
|
|
| |
|
|
| |
|
|
| |
|
|
|
| | | | | |
Normalized EBIT | | $ | 10,726 | | | $ | (6,737 | ) | | $ | 2,874 | | | $ | 20,337 | | | $ | 22,362 | |
Depreciation & Amortization | | $ | 11,700 | | | $ | 6,028 | | | $ | 5,544 | | | $ | 11,216 | | | $ | 10,715 | |
Normalized EBITDA | | $ | 22,426 | | | $ | (709 | ) | | $ | 8,418 | | | $ | 31,553 | | | $ | 33,077 | |
CAPEX | | $ | 12,357 | | | $ | 8,125 | | | $ | 4,339 | | | $ | 8,571 | | | $ | 12,695 | |
EBITDA - CAPEX | | $ | 10,069 | | | $ | (8,834 | ) | | $ | 4,079 | | | $ | 22,982 | | | $ | 20,382 | |
GAAP Operating Cash Flow | | $ | 8,008 | | | $ | 10,176 | | | $ | (17,898 | ) | | $ | (20,066 | ) | | $ | 45,193 | |
| | | | | |
Basic Reported Weighted Avg Shares Out (000’s) | | | | | | | 14,210 | | | | 14,719 | | | | 14,545 | | | | 14,584 | |
Basic Normalized EPS | | $ | 0.25 | | | $ | (0.40 | ) | | $ | 0.03 | | | $ | 0.68 | | | $ | 0.69 | |
Basic Reported EPS | | $ | 0.25 | | | $ | (0.40 | ) | | $ | 0.03 | | | $ | 0.68 | | | $ | 0.69 | |
Diluted Reported Weighted Avg Shares Out (000’s) | | | | | | | 14,210 | | | | 14,576 | | | | 15,038 | | | | 14,685 | |
Diluted Normalized EPS | | $ | 0.23 | | | $ | (0.40 | ) | | $ | 0.03 | | | $ | 0.66 | | | $ | 0.69 | |
Diluted Reported EPS | | $ | 0.23 | | | $ | (0.40 | ) | | $ | 0.03 | | | $ | 0.66 | | | $ | 0.69 | |
|
| Normalized Reconciliation |
| | | | | |
Restructuring/Goodwill Impairment | | $ | — | | | $ | — | | | $ | — | | | $ | — | | | $ | — | |
Other Unusual (Expense) Gain Items | | | — | | | | — | | | | — | | | | — | | | | — | |
Tax Shelter (Charge) on Unusual Items | | | — | | | | — | | | | — | | | | — | | | | — | |
| | |
|
|
| |
|
|
| |
|
|
| |
|
|
| |
|
|
|
Unusual (Exp) Gain Items, net of Taxes | | | — | | | | — | | | | — | | | | — | | | | — | |
Accounting Changes, net of Taxes | | | — | | | | — | | | | — | | | | — | | | | — | |
Discontinued Operations, net of Taxes | | | — | | | | — | | | | — | | | | — | | | | — | |
Extraordinary Items, net of Taxes | | | — | | | | — | | | | — | | | | — | | | | — | |
| | |
|
|
| |
|
|
| |
|
|
| |
|
|
| |
|
|
|
Total Reconciling Items, net of Taxes | | $ | — | | | $ | — | | | $ | — | | | $ | — | | | $ | — | |
| | |
|
|
| |
|
|
| |
|
|
| |
|
|
| |
|
|
|
Reported Income Tax (Benefit) | | $ | 2,231 | | | $ | (3,590 | ) | | $ | 268 | | | $ | 6,089 | | | $ | 5,380 | |
Reported Net Income (Loss) | | $ | 3,805 | | | $ | (5,619 | ) | | $ | 483 | | | $ | 9,907 | | | $ | 10,080 | |
|
| Revenue Breakdown |
| | | | | |
Net Sales | | $ | 332,087 | | | $ | 141,881 | | | $ | 150,831 | | | $ | 341,037 | | | $ | 338,911 | |
Other | | | — | | | | — | | | | — | | | | — | | | | — | |
| | |
|
|
| |
|
|
| |
|
|
| |
|
|
| |
|
|
|
| | | $ | 332,087 | | | $ | 141,881 | | | $ | 150,831 | | | $ | 341,037 | | | $ | 338,911 | |
| | |
|
|
| |
|
|
| |
|
|
| |
|
|
| |
|
|
|
Net Sales | | | 100.0 | % | | | 100.0 | % | | | 100.0 | % | | | 100.0 | % | | | 100.0 | % |
Other | | | 0.0 | % | | | 0.0 | % | | | 0.0 | % | | | 0.0 | % | | | 0.0 | % |
Sources of information: SEC Edgar filings, Multex, Capital IQ, Yahoo and Commodity Systems.
Page 68
PROJECT SPARKLE | | CONFIDENTIAL |
|
APPENDIX – COMPARABLE COMPANY DATA | | |
| Whitehall Jewellers Overview (continued) | | ($ in thousands, except per share) |
Balance Sheet Data
| | | Jul-03
| | | Jan-03
| | | Jan-02
| |
Cash & Mkt Securities | | $ | 1,399 | | | $ | 2,048 | | | $ | 2,741 | |
Accounts Receivable | | | 333 | | | | 1,621 | | | | 1,189 | |
Inventory | | | 206,149 | | | | 197,859 | | | | 173,931 | |
Other Current Assets | | | 8,802 | | | | 3,921 | | | | 4,188 | |
| | |
|
|
| |
|
|
| |
|
|
|
Total Current Assets | | | 216,683 | | | | 205,449 | | | | 182,049 | |
PPE, net | | | 63,604 | | | | 61,634 | | | | 63,914 | |
Intangibles, net | | | 5,662 | | | | 5,662 | | | | 5,662 | |
Deferred Income Taxes | | | — | | | | — | | | | — | |
Other Assets | | | 781 | | | | 213 | | | | 723 | |
| | |
|
|
| |
|
|
| |
|
|
|
Total Assets | | $ | 286,730 | | | $ | 272,958 | | | $ | 252,348 | |
| | |
|
|
| |
|
|
| |
|
|
|
Accounts Payable | | $ | 57,051 | | | $ | 24,726 | | | $ | 56,695 | |
Accrued Expenses | | | 22,293 | | | | 19,750 | | | | 27,667 | |
Short Term Debt | | | 86,375 | | | | 98,990 | | | | 40,527 | |
Short Term Capital Leases | | | — | | | | — | | | | — | |
Other Current Liabilities | | | — | | | | 3,454 | | | | 3,963 | |
| | |
|
|
| |
|
|
| |
|
|
|
Total Current Liabilities | | | 165,719 | | | | 146,920 | | | | 128,852 | |
Other LT Liabilities | | | 7,217 | | | | 6,745 | | | | 4,672 | |
Long Term Debt | | | 640 | | | | 640 | | | | 5,140 | |
Long Term Capital Leases | | | — | | | | — | | | | — | |
Minority Interests | | | — | | | | — | | | | — | |
Pref Stock (Liq Value) | | | — | | | | — | | | | — | |
| | |
|
|
| |
|
|
| |
|
|
|
Total Liabilities & Pref Stock | | | 173,576 | | | | 154,305 | | | | 138,664 | |
| | |
|
|
| |
|
|
| |
|
|
|
Common Equity | | | 113,154 | | | | 118,653 | | | | 113,684 | |
| | |
|
|
| |
|
|
| |
|
|
|
Total Liabilities & Equity | | $ | 286,730 | | | $ | 272,958 | | | $ | 252,348 | |
| | |
|
|
| |
|
|
| |
|
|
|
Common Shares Outstanding (000’s) | | | 14,206 | | | | 14,198 | | | | 14,610 | |
Cash Value per share | | $ | 0.10 | | | $ | 0.14 | | | $ | 0.19 | |
Common Book Value per share | | $ | 7.97 | | | $ | 8.36 | | | $ | 7.78 | |
Common Tangible Book Value per share | | $ | 7.57 | | | $ | 7.96 | | | $ | 7.39 | |
Total Debt | | $ | 87,015 | | | $ | 99,630 | | | $ | 45,667 | |
Net Debt | | $ | 85,616 | | | $ | 97,582 | | | $ | 42,926 | |
Total Capitalization | | $ | 200,169 | | | $ | 218,283 | | | $ | 159,351 | |
|
| Balance Sheet Analysis |
| | | |
Effectiveness and Efficiency | | | | | | | | | | | | |
A/R Turnover | | | 339.9 | x | | | 242.7 | x | | | 285.0 | x |
Inventory Turnover | | | 1.0 | x | | | 1.1 | x | | | 1.2 | x |
Asset Turnover | | | 1.2 | x | | | 1.3 | x | | | 1.3 | x |
Days Sales Outstanding | | | 1.1 | | | | 1.5 | | | | 1.3 | |
Days Inventory Outstanding | | | 350.3 | | | | 318.7 | | | | 307.3 | |
Days Payable Outstanding | | | 46.4 | | | | 46.3 | | | | 65.4 | |
Normalized Return on Avg Assets | | | 1.4 | % | | | 3.8 | % | | | na | |
Normalized Return on Avg Common Equity | | | 3.3 | % | | | 8.5 | % | | | na | |
Financial Strength | | | | | | | | | | | | |
Current Ratio | | | 1.3 | | | | 1.4 | | | | 1.4 | |
Quick Ratio | | | 0.1 | | | | 0.1 | | | | 0.1 | |
Total Debt/Total Capitalization | | | 43.5 | % | | | 45.6 | % | | | 28.7 | % |
Total Debt/TIC | | | 35.7 | % | | | 40.9 | % | | | 18.7 | % |
Total Debt/EBITDA | | | 3.9 | x | | | 3.2 | x | | | 1.4 | x |
Total Debt/EBITDA-CAPEX | | | 8.6 | x | | | 4.3 | x | | | 2.2 | x |
EBITDA/Interest Expense | | | 4.8 | x | | | 7.3 | x | | | 4.8 | x |
EBITDA-CAPEX/Interest Expense | | | 2.1 | x | | | 5.3 | x | | | 3.0 | x |
Income and Cashflow Analysis
| | | LTM Jul-03
| | | Six Months
Ended
| | | Fiscal Years
Ended
| |
| | | | Jul-03
| | | Jul-02
| | | Jan-03
| | | Jan-02
| |
Profitability & Cost Ratios (as % of Revenue) | | | | | | | | | | | | | | | |
Gross Margin | | 36.6 | % | | 33.3 | % | | 35.6 | % | | 37.6 | % | | 39.0 | % |
S,G & A | | 33.4 | % | | 38.0 | % | | 33.7 | % | | 31.6 | % | | 32.4 | % |
Operating Income | | 3.2 | % | | -4.7 | % | | 1.9 | % | | 6.0 | % | | 6.6 | % |
Pre-Tax | | 1.8 | % | | -6.5 | % | | 0.5 | % | | 4.7 | % | | 4.6 | % |
EBIT | | 3.2 | % | | -4.7 | % | | 1.9 | % | | 6.0 | % | | 6.6 | % |
EBITDA | | 6.8 | % | | -0.5 | % | | 5.6 | % | | 9.3 | % | | 9.8 | % |
Normalized Net Income to Common | | 1.1 | % | | -4.0 | % | | 0.3 | % | | 2.9 | % | | 3.0 | % |
Reported Net Income | | 1.1 | % | | -4.0 | % | | 0.3 | % | | 2.9 | % | | 3.0 | % |
CAPEX | | 3.7 | % | | 5.7 | % | | 2.9 | % | | 2.5 | % | | 3.7 | % |
| | | | | |
Period Growth Rates | | | | | | | | | | | | | | | |
Revenue | | | | | -5.9 | % | | | | | 0.6 | % | | | |
EBIT | | | | | -334.4 | % | | | | | -9.1 | % | | | |
EBITDA | | | | | -108.4 | % | | | | | -4.6 | % | | | |
Notes
Other Analysis
Number of
stores
| | Avg Store
Size (Sq Ft)
| | Avg Sales/
Store ($000)
| | Avg Price
Per Trans ($)
|
383 | | 870 | | $ 929 | | $302 |
Company Description
Whitehall Jewellers, Inc. serves as a national specialty retailer of fine jewelry. It offers jewelry in the following key categories: diamond, such as diamond jewelry, diamond solitaires, and bridal), gold, precious, and semi-precious jewelry. As of August 28, 2003, it operated 384 stores in 38 states. These stores are operated in regional and superregional shopping malls under the names, Whitehall Co. Jewellers, Lundstrom Jewelers, and Marks Bros. Jewelers. On an average, the company’s store offers approximately 2,700 individual items, including approximately 1,450 core jewelry items. Whitehall’s target customers are middle to upper-middle income women over 25 years old. Diamond Trading Company, a marketing arm of DeBeers Consolidated Mines, Ltd., is one of the company’s competitors.
Sources of information: SEC Edgar filings, Multex, Capital IQ, Yahoo and Commodity Systems.
Page 69
PROJECT SPARKLE | | CONFIDENTIAL |
|
| APPENDIX – COMPARABLE COMPANY DATA | | |
| Mayor’s Jewelers Overview | | ($ in thousands, except per share) |
Company Information
Name | | Mayor’s Jewelers | | Address | | 14051 N.W. 14th Street |
Symbol | | MYR | | City, State Zip | | Sunrise, FL 33323 |
Latest Fiscal YE | | 29-Mar-03 | | Telephone | | (954) 846-8000 |
Latest Rprt Per | | 27-Sep-03 | | Website | | mayors.com |
Market Information
As of Date | | | 25-Nov-03 | | Market Cap | | $ | 14,118 | |
Exchange | | | AMEX | | Total Invested Capital (TIC) | | $ | 74,019 | |
Stock Price | | $ | 0.72 | | Enterprise Value (EV) | | $ | 72,943 | |
52 Week High | | $ | 0.98 | | | | | | |
52 Week Low | | $ | 0.17 | | Insider Ownership | | | 16.00 | % |
Avg. Daily Volume (000’s) | | | 39 | | Institutional | | | | |
Beta | | | 1.10 | | % Owned | | | 13.00 | % |
Shares Outstanding (000’s) | | | 19,608 | | Number of Institutions | | | 9 | |
Valuation Analysis
| | | Multiple of
| |
| | | Market Cap
| | | TIC
| | | EV
| |
Latest Twelve Months | | | | | | | | | |
Revenue | | 0.13 | x | | 0.66 | x | | 0.65 | x |
EBIT | | na | | | na | | | na | |
EBITDA | | na | | | na | | | na | |
Normalized Net Income | | na | | | na | | | na | |
Basic Normalized EPS | | na | | | na | | | na | |
Projected | | | | | | | | | |
Dec-03 Mean Revenue | | na | | | na | | | na | |
Dec-04 Mean Revenue | | na | | | na | | | na | |
Dec-03 Mean EBITDA | | na | | | na | | | na | |
Dec-04 Mean EBITDA | | na | | | na | | | na | |
Dec-03 Mean EPS | | na | | | na | | | na | |
Dec-04 Mean EPS | | na | | | na | | | na | |
Most Recent Filing | | | | | | | | | |
Assets | | 0.13 | x | | 0.67 | x | | 0.66 | x |
Common Equity | | 0.74 | x | | na | | | na | |
Tangible Common Equity | | 0.74 | x | | na | | | na | |
Mean Consensus Estimates
Year Ending
| | # Ests
| | Revenue
| | EBITDA
| | EPS
|
December-03 | | na | | na | | na | | na |
December-04 | | na | | na | | na | | na |
LT Growth | | na | | na | | na | | na |
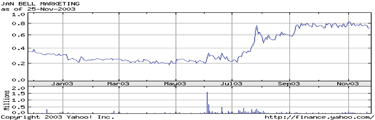
Income and Cashflow Statement Data
| | | LTM
Sep-03
| | | Six Months Ended
| | | Fiscal Years Ended
| |
| | | | Sep-03
| | | Sep-02
| | | Mar-03
| | | Feb-02
| |
Revenue | | $ | 111,910 | | | $ | 48,339 | | | $ | 54,820 | | | $ | 118,391 | | | $ | 160,727 | |
Cost of Revenue | | | 69,310 | | | | 28,934 | | | | 38,364 | | | | 78,740 | | | | 101,179 | |
| | |
|
|
| |
|
|
| |
|
|
| |
|
|
| |
|
|
|
Gross Profit | | | 42,600 | | | | 19,405 | | | | 16,456 | | | | 39,651 | | | | 59,548 | |
Selling, General & Administrative | | | 47,494 | | | | 23,672 | | | | 29,897 | | | | 53,719 | | | | 76,206 | |
Depreciation & Amortization | | | 3,093 | | | | 1,712 | | | | 2,796 | | | | 4,177 | | | | 9,564 | |
| | |
|
|
| |
|
|
| |
|
|
| |
|
|
| |
|
|
|
Operating Income | | | (7,987 | ) | | | (5,979 | ) | | | (16,237 | ) | | | (18,245 | ) | | | (26,222 | ) |
Interest Income / (Expense), net | | | (4,025 | ) | | | (2,209 | ) | | | (3,508 | ) | | | (5,324 | ) | | | (3,614 | ) |
Other Income / (Expense), net | | | — | | | | — | | | | — | | | | — | | | | — | |
| | |
|
|
| |
|
|
| |
|
|
| |
|
|
| |
|
|
|
Pre-tax Income | | | (12,012 | ) | | | (8,188 | ) | | | (19,745 | ) | | | (23,569 | ) | | | (29,836 | ) |
Taxes | | | (1,017 | ) | | | — | | | | 470 | | | | (547 | ) | | | 3,431 | |
| | |
|
|
| |
|
|
| |
|
|
| |
|
|
| |
|
|
|
After-tax Income | | | (10,995 | ) | | | (8,188 | ) | | | (20,215 | ) | | | (23,022 | ) | | | (33,267 | ) |
Minority Interest | | | — | | | | — | | | | — | | | | — | | | | — | |
Equity in Affiliates | | | — | | | | — | | | | — | | | | — | | | | — | |
| | |
|
|
| |
|
|
| |
|
|
| |
|
|
| |
|
|
|
Normalized Net Income | | | (10,995 | ) | | | (8,188 | ) | | | (20,215 | ) | | | (23,022 | ) | | | (33,267 | ) |
Preferred Dividends | | | 596 | | | | 715 | | | | 119 | | | | — | | | | — | |
| | |
|
|
| |
|
|
| |
|
|
| |
|
|
| |
|
|
|
Normalized Net Income to Common | | $ | (11,591 | ) | | $ | (8,903 | ) | | $ | (20,334 | ) | | $ | (23,022 | ) | | $ | (33,267 | ) |
| | |
|
|
| |
|
|
| |
|
|
| |
|
|
| |
|
|
|
| | | | | |
Normalized EBIT | | $ | (7,987 | ) | | $ | (5,979 | ) | | $ | (16,237 | ) | | $ | (18,245 | ) | | $ | (26,222 | ) |
Depreciation & Amortization | | $ | 3,093 | | | $ | 1,712 | | | $ | 2,796 | | | $ | 4,177 | | | $ | 9,771 | |
Normalized EBITDA | | $ | (4,894 | ) | | $ | (4,267 | ) | | $ | (13,441 | ) | | $ | (14,068 | ) | | $ | (16,451 | ) |
CAPEX | | $ | 1,423 | | | $ | 544 | | | $ | (4,412 | ) | | $ | (3,533 | ) | | $ | 6,400 | |
EBITDA - CAPEX | | $ | (6,317 | ) | | $ | (4,811 | ) | | $ | (9,029 | ) | | $ | (10,535 | ) | | $ | (22,851 | ) |
GAAP Operating Cash Flow | | $ | (22,588 | ) | | $ | (8,321 | ) | | $ | (4,540 | ) | | $ | (18,807 | ) | | $ | 330 | |
| | | | | |
Basic Reported Weighted Avg Shares Out (000’s) | | | | | | | 19,608 | | | | 19,548 | | | | 19,568 | | | | 19,416 | |
Basic Normalized EPS | | $ | (0.59 | ) | | $ | (0.45 | ) | | $ | (1.04 | ) | | $ | (1.18 | ) | | $ | (1.71 | ) |
Basic Reported EPS | | $ | (0.61 | ) | | $ | (0.45 | ) | | $ | (1.21 | ) | | $ | (1.37 | ) | | $ | (4.32 | ) |
Diluted Reported Weighted Avg Shares Out (000’s) | | | | | | | 19,608 | | | | 19,548 | | | | 19,568 | | | | 19,416 | |
Diluted Normalized EPS | | $ | (0.59 | ) | | $ | (0.45 | ) | | $ | (1.04 | ) | | $ | (1.18 | ) | | $ | (1.71 | ) |
Diluted Reported EPS | | $ | (0.61 | ) | | $ | (0.45 | ) | | $ | (1.21 | ) | | $ | (1.37 | ) | | $ | (4.32 | ) |
|
| Normalized Reconciliation |
| | | | | |
Restructuring/Goodwill Impairment | | $ | (2,272 | ) | | $ | — | | | $ | — | | | $ | (2,272 | ) | | $ | (50,479 | ) |
Other Unusual (Expense) Gain Items | | | 2,976 | | | | — | | | | (2,976 | ) | | | — | | | | — | |
Tax Shelter (Charge) on Unusual Items | | | — | | | | — | | | | — | | | | — | | | | — | |
| | |
|
|
| |
|
|
| |
|
|
| |
|
|
| |
|
|
|
Unusual (Exp) Gain Items, net of Taxes | | | 704 | | | | — | | | | (2,976 | ) | | | (2,272 | ) | | | (50,479 | ) |
Accounting Changes, net of Taxes | | | — | | | | — | | | | — | | | | — | | | | — | |
Discontinued Operations, net of Taxes | | | (1,354 | ) | | | — | | | | (250 | ) | | | (1,604 | ) | | | (112 | ) |
Extraordinary Items, net of Taxes | | | — | | | | — | | | | — | | | | — | | | | — | |
| | |
|
|
| |
|
|
| |
|
|
| |
|
|
| |
|
|
|
Total Reconciling Items, net of Taxes | | $ | (650 | ) | | $ | — | | | $ | (3,226 | ) | | $ | (3,876 | ) | | $ | (50,591 | ) |
| | |
|
|
| |
|
|
| |
|
|
| |
|
|
| |
|
|
|
Reported Income Tax (Benefit) | | $ | (1,017 | ) | | $ | — | | | $ | 470 | | | $ | (547 | ) | | $ | 3,431 | |
Reported Net Income (Loss) | | $ | (12,241 | ) | | $ | (8,903 | ) | | $ | (23,560 | ) | | $ | (26,898 | ) | | $ | (83,858 | ) |
|
| Revenue Breakdown |
| | | | | |
Net Sales | | $ | 111,910 | | | $ | 48,339 | | | $ | 54,820 | | | $ | 118,391 | | | $ | 160,727 | |
Other | | | — | | | | — | | | | — | | | | — | | | | — | |
| | |
|
|
| |
|
|
| |
|
|
| |
|
|
| |
|
|
|
| | | $ | 111,910 | | | $ | 48,339 | | | $ | 54,820 | | | $ | 118,391 | | | $ | 160,727 | |
| | |
|
|
| |
|
|
| |
|
|
| |
|
|
| |
|
|
|
Net Sales | | | 100.0 | % | | | 100.0 | % | | | 100.0 | % | | | 100.0 | % | | | 100.0 | % |
Other | | | 0.0 | % | | | 0.0 | % | | | 0.0 | % | | | 0.0 | % | | | 0.0 | % |
Sources of information: SEC Edgar filings, Multex, Capital IQ, Yahoo and Commodity Systems.
Page 70
PROJECT SPARKLE | | CONFIDENTIAL |
|
APPENDIX – COMPARABLE COMPANY DATA | | |
| Mayor’s Jewelers Overview (continued) | | ($ in thousands, except per share) |
Balance Sheet Data
| | | Sep-03
| | | Mar-03
| | | Feb-02
| |
Cash & Mkt Securities | | $ | 1,076 | | | $ | 276 | | | $ | 2,886 | |
Accounts Receivable | | | 5,314 | | | | 6,559 | | | | 31,845 | |
Inventory | | | 87,386 | | | | 76,753 | | | | 80,716 | |
Other Current Assets | | | 1,754 | | | | 2,987 | | | | 2,604 | |
| | |
|
|
| |
|
|
| |
|
|
|
Total Current Assets | | | 95,530 | | | | 86,575 | | | | 118,051 | |
PPE, net | | | 14,704 | | | | 15,872 | | | | 25,455 | |
Intangibles, net | | | — | | | | — | | | | — | |
Deferred Income Taxes | | | — | | | | — | | | | — | |
Other Assets | | | 864 | | | | 736 | | | | 1,083 | |
| | |
|
|
| |
|
|
| |
|
|
|
Total Assets | | $ | 111,098 | | | $ | 103,183 | | | $ | 144,589 | |
| | |
|
|
| |
|
|
| |
|
|
|
Accounts Payable | | $ | 19,721 | | | $ | 13,798 | | | $ | 10,769 | |
Accrued Expenses | | | 9,256 | | | | 7,434 | | | | 7,318 | |
Short Term Debt | | | 32,183 | | | | 23,283 | | | | 53,464 | |
Short Term Capital Leases | | | — | | | | — | | | | — | |
Other Current Liabilities | | | — | | | | 527 | | | | 8,574 | |
| | |
|
|
| |
|
|
| |
|
|
|
Total Current Liabilities | | | 61,160 | | | | 45,042 | | | | 80,125 | |
Other LT Liabilities | | | 3,031 | | | | 3,046 | | | | 3,357 | |
Long Term Debt | | | 12,668 | | | | 12,668 | | | | — | |
Long Term Capital Leases | | | — | | | | — | | | | — | |
Minority Interests | | | — | | | | — | | | | — | |
Pref Stock (Liq Value) | | | 15,050 | | | | 15,050 | | | | — | |
| | |
|
|
| |
|
|
| |
|
|
|
Total Liabilities & Pref Stock | | | 91,909 | | | | 75,806 | | | | 83,482 | |
| | |
|
|
| |
|
|
| |
|
|
|
Common Equity | | | 19,189 | | | | 27,377 | | | | 61,107 | |
| | |
|
|
| |
|
|
| |
|
|
|
Total Liabilities & Equity | | $ | 111,098 | | | $ | 103,183 | | | $ | 144,589 | |
| | |
|
|
| |
|
|
| |
|
|
|
Common Shares Outstanding (000’s) | | | 19,608 | | | | 19,608 | | | | 19,526 | |
Cash Value per share | | $ | 0.05 | | | $ | 0.01 | | | $ | 0.15 | |
Common Book Value per share | | $ | 0.98 | | | $ | 1.40 | | | $ | 3.13 | |
Common Tangible Book Value per share | | $ | 0.98 | | | $ | 1.40 | | | $ | 3.13 | |
Total Debt | | $ | 59,901 | | | $ | 51,001 | | | $ | 53,464 | |
Net Debt | | $ | 58,825 | | | $ | 50,725 | | | $ | 50,578 | |
Total Capitalization | | $ | 79,090 | | | $ | 78,378 | | | $ | 114,571 | |
|
| Balance Sheet Analysis |
| | | |
Effectiveness and Efficiency | | | | | | | | | | | | |
A/R Turnover | | | 18.9 | x | | | 6.2 | x | | | 5.0 | x |
Inventory Turnover | | | 0.8 | x | | | 1.0 | x | | | 1.3 | x |
Asset Turnover | | | 1.0 | x | | | 1.0 | x | | | 1.1 | x |
Days Sales Outstanding | | | 19.4 | | | | 59.2 | | | | 72.3 | |
Days Inventory Outstanding | | | 432.2 | | | | 365.0 | | | | 291.2 | |
Days Payable Outstanding | | | 51.0 | | | | 32.8 | | | | 21.0 | |
Normalized Return on Avg Assets | | | -10.8 | % | | | -18.6 | % | | | na | |
Normalized Return on Avg Common Equity | | | -49.8 | % | | | -52.0 | % | | | na | |
Financial Strength | | | | | | | | | | | | |
Current Ratio | | | 1.6 | | | | 1.9 | | | | 1.5 | |
Quick Ratio | | | 0.1 | | | | 0.2 | | | | 0.5 | |
Total Debt/Total Capitalization | | | 75.7 | % | | | 65.1 | % | | | 46.7 | % |
Total Debt/TIC | | | 79.9 | % | | | 68.0 | % | | | 71.3 | % |
Total Debt/EBITDA | | | na | | | | na | | | | na | |
Total Debt/EBITDA-CAPEX | | | na | | | | na | | | | na | |
EBITDA/Interest Expense | | | na | | | | na | | | | na | |
EBITDA-CAPEX/Interest Expense | | | na | | | | na | | | | na | |
Income and Cashflow Analysis
| | | LTM
Sep-03
| | | Six Months
Ended
| | | Fiscal Years
Ended
| |
| | | | Sep-03
| | | Sep-02
| | | Mar-03
| | | Feb-02
| |
Profitability & Cost Ratios (as % of Revenue) | | | | | | | | | | | | | | | |
Gross Margin | | 38.1 | % | | 40.1 | % | | 30.0 | % | | 33.5 | % | | 37.0 | % |
S,G & A | | 42.4 | % | | 49.0 | % | | 54.5 | % | | 45.4 | % | | 47.4 | % |
Operating Income | | -7.1 | % | | -12.4 | % | | -29.6 | % | | -15.4 | % | | -16.3 | % |
Pre-Tax | | -10.7 | % | | -16.9 | % | | -36.0 | % | | -19.9 | % | | -18.6 | % |
EBIT | | -7.1 | % | | -12.4 | % | | -29.6 | % | | -15.4 | % | | -16.3 | % |
EBITDA | | -4.4 | % | | -8.8 | % | | -24.5 | % | | -11.9 | % | | -10.2 | % |
Normalized Net Income to Common | | -10.4 | % | | -18.4 | % | | -37.1 | % | | -19.4 | % | | -20.7 | % |
Reported Net Income | | -10.9 | % | | -18.4 | % | | -43.0 | % | | -22.7 | % | | -52.2 | % |
CAPEX | | 1.3 | % | | 1.1 | % | | -8.0 | % | | -3.0 | % | | 4.0 | % |
| | | | | |
Period Growth Rates | | | | | | | | | | | | | | | |
Revenue | | | | | -11.8 | % | | | | | -26.3 | % | | | |
EBIT | | | | | -63.2 | % | | | | | -30.4 | % | | | |
EBITDA | | | | | -68.3 | % | | | | | -14.5 | % | | | |
Notes
Normalized items: Restructuring plan implementation and the goodwill impairment of $22.3 million is a write off of goodwill associated with the Mayor’s acquisition.
Disc Ops: The Company closed a store outside of its core area
Other Analysis
Number
of stores
| | Avg Store
Size (Sq Ft)
| | Avg Sales/
Store ($000)
| | Avg Price Per Trans ($)
|
| 28 | | 4,213 | | $ 3,997 | | $ 1,360 |
Company Description
Mayor’s Jewelers, Inc. sells jewelry, watches, and giftware in the United States. As of June 28, 2003, it operated 28 locations in south and central Florida; and metropolitan Atlanta, Georgia. The company offers a selection of merchandise that includes designer jewelry, diamond, gemstone, and precious metal jewelry; rings; wedding bands; earrings; bracelets; necklaces; charms; its own private label jewelry that includes baby jewelry; and Swiss timepieces that are often not available from other jewelers in its markets. All of Mayor’s jewelry products are constructed of 18-karat gold, platinum, or sterling silver. Its stores also carry a large selection of brand name watches and giftware.
Sources of information: SEC Edgar filings, Multex, Capital IQ, Yahoo and Commodity Systems.
Page 71
PROJECT SPARKLE | | CONFIDENTIAL |
|
APPENDIX – COMPARABLE COMPANY DATA | | |
| Reeds Jewelers Overview | | ($ in thousands, except per share) |
Company Information
| Name | | Reeds Jewelers | | Address | | 2525 South 17th Street |
Symbol | | RJI | | City, State Zip | | Wilmington, NC 28401 |
Latest Fiscal YE | | 28-Feb-03 | | Telephone | | (910) 350-3100 |
Latest Rprt Per | | 31-Aug-03 | | Website | | www.reeds.com/ |
Market Information
As of Date | | | 25-Nov-03 | | Market Cap | | $ | 9,324 | |
Exchange | | | AMEX | | Total Invested Capital (TIC) | | $ | 33,991 | |
Stock Price | | $ | 1.10 | | Enterprise Value (EV) | | $ | 33,479 | |
52 Week High | | $ | 1.35 | | | | | | |
52 Week Low | | $ | 0.91 | | Insider Ownership | | | 88.00 | % |
Avg. Daily Volume (000’s) | | | 1 | | Institutional | | | | |
Beta | | | 0.46 | | % Owned | | | 2.00 | % |
Shares Outstanding (000’s) | | | 8,476 | | Number of Institutions | | | 4 | |
Valuation Analysis
| | | Multiple of
| |
| | | Market Cap
| | | TIC
| | | EV
| |
Latest Twelve Months | | | | | | | | | |
Revenue | | 0.09 | x | | 0.34 | x | | 0.33 | x |
EBIT | | na | | | na | | | na | |
EBITDA | | 5.39 | x | | 19.66 | x | | 19.36 | x |
Normalized Net Income | | na | | | na | | | na | |
Basic Normalized EPS | | na | | | na | | | na | |
Projected | | | | | | | | | |
Feb-04 Mean Revenue | | 0.09 | x | | 0.33 | x | | 0.33 | x |
Feb-05 Mean Revenue | | 0.09 | x | | 0.31 | x | | 0.31 | x |
Feb-04 Mean EBITDA | | 2.50 | x | | 9.10 | x | | 8.96 | x |
Feb-05 Mean EBITDA | | 2.24 | x | | 8.15 | x | | 8.03 | x |
Feb-04 Mean EPS | | 45.83 | x | | na | | | na | |
Feb-05 Mean EPS | | 11.96 | x | | na | | | na | |
Most Recent Filing | | | | | | | | | |
Assets | | 0.14 | x | | 0.50 | x | | 0.49 | x |
Common Equity | | 0.38 | x | | na | | | na | |
Tangible Common Equity | | 0.38 | x | | na | | | na | |
Mean Consensus Estimates
Year Ending
| | # Ests
| | Revenue
| | EBITDA
| | EPS
|
February-04 | | na | | $ | 101,956 | | $ | 3,735 | | $ | 0.02 |
February-05 | | na | | $ | 109,188 | | $ | 4,169 | | $ | 0.09 |
LT Growth | | na | | | na | | | na | | | na |

Income and Cashflow Statement Data
| | | LTM | | | Six Months Ended
| | | Fiscal Years Ended
| |
| | | Aug-03
| | | Aug-03
| | | Aug-02
| | | Feb-03
| | | Feb-02
| |
Revenue | | $ | 101,084 | | | $ | 39,045 | | | $ | 39,972 | | | $ | 102,011 | | | $ | 113,449 | |
Cost of Revenue | | | 52,426 | | | | 19,908 | | | | 20,072 | | | | 52,590 | | | | 60,091 | |
| | |
|
|
| |
|
|
| |
|
|
| |
|
|
| |
|
|
|
Gross Profit | | | 48,658 | | | | 19,137 | | | | 19,900 | | | | 49,421 | | | | 53,358 | |
Selling, General & Administrative | | | 46,929 | | | | 21,023 | | | | 21,335 | | | | 47,241 | | | | 52,808 | |
Depreciation & Amortization | | | 2,456 | | | | 1,201 | | | | 1,195 | | | | 2,450 | | | | 3,797 | |
| | |
|
|
| |
|
|
| |
|
|
| |
|
|
| |
|
|
|
Operating Income | | | (727 | ) | | | (3,087 | ) | | | (2,630 | ) | | | (270 | ) | | | (3,247 | ) |
Interest Income / (Expense), net | | | (1,352 | ) | | | (620 | ) | | | (711 | ) | | | (1,443 | ) | | | (1,871 | ) |
Other Income / (Expense), net | | | — | | | | — | | | | — | | | | — | | | | — | |
| | |
|
|
| |
|
|
| |
|
|
| |
|
|
| |
|
|
|
Pre-tax Income | | | (2,079 | ) | | | (3,707 | ) | | | (3,341 | ) | | | (1,713 | ) | | | (5,118 | ) |
Taxes | | | 602 | | | | — | | | | (1,236 | ) | | | (634 | ) | | | (1,548 | ) |
| | |
|
|
| |
|
|
| |
|
|
| |
|
|
| |
|
|
|
After-tax Income | | | (2,681 | ) | | | (3,707 | ) | | | (2,105 | ) | | | (1,079 | ) | | | (3,570 | ) |
Minority Interest | | | — | | | | — | | | | — | | | | — | | | | — | |
Equity in Affiliates | | | — | | | | — | | | | — | | | | — | | | | — | |
| | |
|
|
| |
|
|
| |
|
|
| |
|
|
| |
|
|
|
Normalized Net Income | | | (2,681 | ) | | | (3,707 | ) | | | (2,105 | ) | | | (1,079 | ) | | | (3,570 | ) |
Preferred Dividends | | | — | | | | — | | | | — | | | | — | | | | — | |
| | |
|
|
| |
|
|
| |
|
|
| |
|
|
| |
|
|
|
Normalized Net Income to Common | | $ | (2,681 | ) | | $ | (3,707 | ) | | $ | (2,105 | ) | | $ | (1,079 | ) | | $ | (3,570 | ) |
| | |
|
|
| |
|
|
| |
|
|
| |
|
|
| |
|
|
|
Normalized EBIT | | $ | (727 | ) | | $ | (3,087 | ) | | $ | (2,630 | ) | | $ | (270 | ) | | $ | (3,247 | ) |
Depreciation & Amortization | | $ | 2,456 | | | $ | 1,201 | | | $ | 1,195 | | | $ | 2,450 | | | $ | 3,797 | |
Normalized EBITDA | | $ | 1,729 | | | $ | (1,886 | ) | | $ | (1,435 | ) | | $ | 2,180 | | | $ | 550 | |
CAPEX | | $ | 1,112 | | | $ | 555 | | | $ | 139 | | | $ | 696 | | | $ | 2,792 | |
EBITDA - CAPEX | | $ | 617 | | | $ | (2,441 | ) | | $ | (1,574 | ) | | $ | 1,484 | | | $ | (2,242 | ) |
GAAP Operating Cash Flow | | $ | 3,063 | | | $ | (2,532 | ) | | $ | (8,388 | ) | | $ | (2,793 | ) | | $ | 52,028 | |
| | | | | |
Basic Reported Weighted Avg Shares Out (000’s) | | | | | | | 8,476 | | | | 8,476 | | | | 8,476 | | | | 8,476 | |
Basic Normalized EPS | | $ | (0.32 | ) | | $ | (0.44 | ) | | $ | (0.25 | ) | | $ | (0.13 | ) | | $ | (0.42 | ) |
Basic Reported EPS | | $ | (0.35 | ) | | $ | (0.46 | ) | | $ | (0.29 | ) | | $ | (0.18 | ) | | $ | (1.81 | ) |
Diluted Reported Weighted Avg Shares Out (000’s) | | | | | | | 8,476 | | | | 8,476 | | | | 8,476 | | | | 8,476 | |
Diluted Normalized EPS | | $ | (0.32 | ) | | $ | (0.44 | ) | | $ | (0.25 | ) | | $ | (0.13 | ) | | $ | (0.42 | ) |
Diluted Reported EPS | | $ | (0.35 | ) | | $ | (0.46 | ) | | $ | (0.29 | ) | | $ | (0.18 | ) | | $ | (1.81 | ) |
|
| Normalized Reconciliation |
| | | | | |
Restructuring/Goodwill Impairment | | $ | — | | | $ | — | | | $ | (270 | ) | | $ | (270 | ) | | $ | (17,067 | ) |
Other Unusual (Expense) Gain Items | | | — | | | | — | | | | — | | | | — | | | | — | |
Tax Shelter (Charge) on Unusual Items | | | — | | | | — | | | | 100 | | | | 100 | | | | 5,163 | |
| | |
|
|
| |
|
|
| |
|
|
| |
|
|
| |
|
|
|
Unusual (Exp) Gain Items, net of Taxes | | | — | | | | — | | | | (170 | ) | | | (170 | ) | | | (11,904 | ) |
Accounting Changes, net of Taxes | | | — | | | | — | | | | — | | | | — | | | | — | |
Discontinued Operations, net of Taxes | | | (327 | ) | | | (224 | ) | | | (153 | ) | | | (256 | ) | | | 98 | |
Extraordinary Items, net of Taxes | | | — | | | | — | | | | — | | | | — | | | | — | |
| | |
|
|
| |
|
|
| |
|
|
| |
|
|
| |
|
|
|
Total Reconciling Items, net of Taxes | | $ | (327 | ) | | $ | (224 | ) | | $ | (323 | ) | | $ | (426 | ) | | $ | (11,806 | ) |
| | |
|
|
| |
|
|
| |
|
|
| |
|
|
| |
|
|
|
Reported Income Tax (Benefit) | | $ | 602 | | | $ | — | | | $ | (1,336 | ) | | $ | (734 | ) | | $ | (6,711 | ) |
Reported Net Income (Loss) | | $ | (3,008 | ) | | $ | (3,931 | ) | | $ | (2,428 | ) | | $ | (1,505 | ) | | $ | (15,376 | ) |
|
| Revenue Breakdown |
| | | | | |
Net Sales | | $ | 101,084 | | | $ | 39,045 | | | $ | 39,972 | | | $ | 102,011 | | | $ | 113,449 | |
Other | | | — | | | | — | | | | — | | | | — | | | | — | |
| | |
|
|
| |
|
|
| |
|
|
| |
|
|
| |
|
|
|
| | | $ | 101,084 | | | $ | 39,045 | | | $ | 39,972 | | | $ | 102,011 | | | $ | 113,449 | |
| | |
|
|
| |
|
|
| |
|
|
| |
|
|
| |
|
|
|
Net Sales | | | 100.0 | % | | | 100.0 | % | | | 100.0 | % | | | 100.0 | % | | | 100.0 | % |
Other | | | 0.0 | % | | | 0.0 | % | | | 0.0 | % | | | 0.0 | % | | | 0.0 | % |
Sources of information: SEC Edgar filings, Multex, Capital IQ, Yahoo and Commodity Systems.
Page 72
PROJECT SPARKLE | | CONFIDENTIAL |
|
APPENDIX – COMPARABLE COMPANY DATA | | |
| Reeds Jewelers Overview (continued) | | ($ in thousands, except per share) |
Balance Sheet Data
| | | Aug-03
| | | Feb-03
| | | Feb-02
| |
Cash & Mkt Securities | | $ | 512 | | | $ | 384 | | | $ | 809 | |
Accounts Receivable | | | 2,332 | | | | 1,418 | | | | 621 | |
Inventory | | | 44,458 | | | | 41,637 | | | | 44,337 | |
Other Current Assets | | | 2,014 | | | | 2,390 | | | | 7,430 | |
| | |
|
|
| |
|
|
| |
|
|
|
Total Current Assets | | | 49,316 | | | | 45,829 | | | | 53,197 | |
PPE, net | | | 9,844 | | | | 10,442 | | | | 12,154 | |
Intangibles, net | | | — | | | | — | | | | — | |
Deferred Income Taxes | | | 3,091 | | | | 3,132 | | | | — | |
Other Assets | | | 5,887 | | | | 6,616 | | | | 6,597 | |
| | |
|
|
| |
|
|
| |
|
|
|
Total Assets | | $ | 68,138 | | | $ | 66,019 | | | $ | 71,948 | |
| | |
|
|
| |
|
|
| |
|
|
|
Accounts Payable | | $ | 12,140 | | | $ | 7,385 | | | $ | 17,233 | |
Accrued Expenses | | | 3,793 | | | | 4,894 | | | | 5,816 | |
Short Term Debt | | | — | | | | — | | | | — | |
Short Term Capital Leases | | | — | | | | — | | | | — | |
Other Current Liabilities | | | — | | | | — | | | | — | |
| | |
|
|
| |
|
|
| |
|
|
|
Total Current Liabilities | | | 15,933 | | | | 12,279 | | | | 23,049 | |
Other LT Liabilities | | | 3,318 | | | | 4,137 | | | | 855 | |
Long Term Debt | | | 24,667 | | | | 21,452 | | | | 18,388 | |
Long Term Capital Leases | | | — | | | | — | | | | — | |
Minority Interests | | | — | | | | — | | | | — | |
Pref Stock (Liq Value) | | | — | | | | — | | | | — | |
| | |
|
|
| |
|
|
| |
|
|
|
Total Liabilities & Pref Stock | | | 43,918 | | | | 37,868 | | | | 42,292 | |
| | |
|
|
| |
|
|
| |
|
|
|
Common Equity | | | 24,220 | | | | 28,151 | | | | 29,656 | |
| | |
|
|
| |
|
|
| |
|
|
|
Total Liabilities & Equity | | $ | 68,138 | | | $ | 66,019 | | | $ | 71,948 | |
| | |
|
|
| |
|
|
| |
|
|
|
Common Shares Outstanding (000’s) | | | 8,476 | | | | 8,476 | | | | 8,476 | |
Cash Value per share | | $ | 0.06 | | | $ | 0.05 | | | $ | 0.10 | |
Common Book Value per share | | $ | 2.86 | | | $ | 3.32 | | | $ | 3.50 | |
Common Tangible Book Value per share | | $ | 2.86 | | | $ | 3.32 | | | $ | 3.50 | |
Total Debt | | $ | 24,667 | | | $ | 21,452 | | | $ | 18,388 | |
Net Debt | | $ | 24,155 | | | $ | 21,068 | | | $ | 17,579 | |
Total Capitalization | | $ | 48,887 | | | $ | 49,603 | | | $ | 48,044 | |
|
| Balance Sheet Analysis |
| | | |
Effectiveness and Efficiency | | | | | | | | | | | | |
A/R Turnover | | | 53.9 | x | | | 100.1 | x | | | 182.7 | x |
Inventory Turnover | | | 1.2 | x | | | 1.2 | x | | | 1.4 | x |
Asset Turnover | | | 1.5 | x | | | 1.5 | x | | | 1.6 | x |
Days Sales Outstanding | | | 6.8 | | | | 3.6 | | | | 2.0 | |
Days Inventory Outstanding | | | 299.7 | | | | 298.4 | | | | 269.3 | |
Days Payable Outstanding | | | 35.0 | | | | 43.9 | | | | 53.9 | |
Normalized Return on Avg Assets | | | -4.0 | % | | | -1.6 | % | | | na | |
Normalized Return on Avg Common Equity | | | -10.2 | % | | | -3.7 | % | | | na | |
Financial Strength | | | | | | | | | | | | |
Current Ratio | | | 3.1 | | | | 3.7 | | | | 2.3 | |
Quick Ratio | | | 0.3 | | | | 0.3 | | | | 0.4 | |
Total Debt/Total Capitalization | | | 50.5 | % | | | 43.2 | % | | | 38.3 | % |
Total Debt/TIC | | | 72.6 | % | | | 63.1 | % | | | 54.1 | % |
Total Debt/EBITDA | | | 14.3 | x | | | 9.8 | x | | | 33.4 | x |
Total Debt/EBITDA-CAPEX | | | 40.0 | x | | | 14.5 | x | | | na | |
EBITDA/Interest Expense | | | 1.3 | x | | | 1.5 | x | | | 0.3 | x |
EBITDA-CAPEX/Interest Expense | | | 0.5 | x | | | 1.0 | x | | | na | |
Income and Cashflow Analysis
| | | LTM Aug-03
| | | Six Months
Ended
| | | Fiscal Years
Ended
| |
| | | | Aug-03
| | | Aug-02
| | | Feb-03
| | | Feb-02
| |
Profitability & Cost Ratios (as % of Revenue) | | | | | | | | | | | | | | | |
Gross Margin | | 48.1 | % | | 49.0 | % | | 49.8 | % | | 48.4 | % | | 47.0 | % |
S,G & A | | 46.4 | % | | 53.8 | % | | 53.4 | % | | 46.3 | % | | 46.5 | % |
Operating Income | | -0.7 | % | | -7.9 | % | | -6.6 | % | | -0.3 | % | | -2.9 | % |
Pre-Tax | | -2.1 | % | | -9.5 | % | | -8.4 | % | | -1.7 | % | | -4.5 | % |
EBIT | | -0.7 | % | | -7.9 | % | | -6.6 | % | | -0.3 | % | | -2.9 | % |
EBITDA | | 1.7 | % | | -4.8 | % | | -3.6 | % | | 2.1 | % | | 0.5 | % |
Normalized Net Income to Common | | -2.7 | % | | -9.5 | % | | -5.3 | % | | -1.1 | % | | -3.1 | % |
Reported Net Income | | -3.0 | % | | -10.1 | % | | -6.1 | % | | -1.5 | % | | -13.6 | % |
CAPEX | | 1.1 | % | | 1.4 | % | | 0.3 | % | | 0.7 | % | | 2.5 | % |
| | | | | |
Period Growth Rates | | | | | | | | | | | | | | | |
Revenue | | | | | -2.3 | % | | | | | -10.1 | % | | | |
EBIT | | | | | 17.4 | % | | | | | -91.7 | % | | | |
EBITDA | | | | | 31.4 | % | | | | | 296.4 | % | | | |
Notes
Restructuring/Goodwill Impairment: $6,020,000 for restructuring and related costs associated with the Company’s exit from under-performing markets and asset impairment charge of $9,047,000 (including a write-down of goodwill due to the closing of a significant number of stores and a reduction to fair value of the historical cost of assets associated with Reeds.com.)
Other Analysis
Number
of stores
| | Avg Store
Size (Sq Ft)
| | Avg Sales/
Store ($000)
| | Avg Price
Per Trans ($)
|
92 | | 1150 | | $ 1,099 | | $ 280 |
Company Description
Reeds Jewelers, Inc. operates 92 specialty retail jewelry stores in enclosed regional malls located principally in the Southeast and Midwest sections of the United States. The Company has opened 39 new stores and closed 45 under-performing stores since 1998. Reeds operates stores under the names of Reeds Jewelers, Mills Jewelers and Reeds Jewelers Outlet. The Company operates one store with the Mills Jewelers name and two stores with the Reeds Jewelers Outlet name. The Company’s stores range in size from approximately 500 to 2,100 square feet of selling space, and average approximately 1,150 square feet of selling space. The stores are designed to invite customers into a well-lit and attractive setting where typically more than 2,200 items are offered for sale. Reeds has an Internet site, www.reeds.com, which offers consumers the opportunity to buy diamond jewelry, gold jewelry, watches and giftware online. Customers can also apply online for credit.
Sources of information: SEC Edgar filings, Multex, Capital IQ, Yahoo and Commodity Systems.
Page 73