UNITED STATES
SECURITIES AND EXCHANGE COMMISSION
Washington, D.C. 20549
FORM N-CSR
CERTIFIED SHAREHOLDER REPORT OF REGISTERED
MANAGEMENT INVESTMENT COMPANIES
Investment Company Act File Number: 811-04998
| T. Rowe Price Spectrum Fund, Inc. |
| (Exact name of registrant as specified in charter) |
| 100 East Pratt Street, Baltimore, MD 21202 |
| (Address of principal executive offices) |
| David Oestreicher |
| 100 East Pratt Street, Baltimore, MD 21202 |
| (Name and address of agent for service) |
Registrant’s telephone number, including area code: (410) 345-2000
Date of fiscal year end: December 31
Date of reporting period: December 31, 2018
 |
| Spectrum Funds | December 31, 2018 |
Beginning on January 1, 2021, as permitted by SEC regulations, paper copies of the T. Rowe Price funds’ annual and semiannual shareholder reports will no longer be mailed, unless you specifically request them. Instead, shareholder reports will be made available on the funds’ website (troweprice.com/prospectus), and you will be notified by mail with a website link to access the reports each time a report is posted to the site.
If you already elected to receive reports electronically, you will not be affected by this change and need not take any action. At any time, shareholders who invest directly in T. Rowe Price funds may generally elect to receive reports or other communications electronically by enrolling attroweprice.com/paperlessor, if you are a retirement plan sponsor or invest in the funds through a financial intermediary (such as an investment advisor, broker-dealer, insurance company, or bank), by contacting your representative or your financial intermediary.
You may elect to continue receiving paper copies of future shareholder reports free of charge. To do so, if you invest directly with T. Rowe Price, please call T. Rowe Price as follows: IRA, nonretirement account holders, and institutional investors,1-800-225-5132; small business retirement accounts,1-800-492-7670. If you are a retirement plan sponsor or invest in the T. Rowe Price funds through a financial intermediary, please contact your representative or financial intermediary or follow additional instructions if included with this document. Your election to receive paper copies of reports will apply to all funds held in your account with your financial intermediary or, if you invest directly in the T. Rowe Price funds, with T. Rowe Price. Your election can be changed at any time in the future.
| T. ROWE PRICE SPECTRUM FUNDS |
HIGHLIGHTS
| ■ | The Spectrum Funds posted negative returns for the 12-month period ended December 31, 2018. The Spectrum Growth Fund and Spectrum Income Fund both underperformed their respective benchmarks and Lipper peer groups. The Spectrum International Fund lagged its benchmark but outperformed its peer group. |
| ■ | Market volatility was elevated throughout 2018. Global equities pulled back as global trade tensions, slowing growth, and political uncertainty weighed on various markets. Rising interest rates tempered returns in U.S. fixed income markets, while country-specific risks hurt performance in international bond markets. |
| ■ | We took advantage of attractive valuations following sharp market declines to adjust our allocations in several segments. We increased our exposure to emerging markets equities and growth-oriented stocks in the equity portfolios and increased allocations to emerging markets debt within the fixed income portfolio. |
| ■ | We seek value in segments where we feel that market weakness has created attractive risk/reward opportunities. Near-term risks to global markets include repercussions from potential monetary policy missteps and an escalation in trade tensions. |

Log in to your account attroweprice.comfor more information.
*Certain mutual fund accounts that are assessed an annual account service fee can also save money by switching to e-delivery.
CIO Market Commentary
Dear Shareholder
The year 2018 was not one that investors will remember fondly. The major stock indexes recorded their worst declines in a decade, with most falling over 20% from recent peaks and bringing a technical end to the bull market that began in 2009. In direct contrast to 2017, financial assets performed poorly across asset classes and geographies. The broadest measure of domestic bond returns, the Bloomberg Barclays U.S. Aggregate Bond Index, returned exactly nothing (0.0%) for the year, and nearly all overseas bond and equity markets also performed poorly. “Cash was king,” in Wall Street parlance, which never makes for a happy reign.
Many issues were behind the market weakness, but we can point to four primary factors that weighed on sentiment:
Rising interest rates.Wage pressures appeared to be accelerating early in the year, sending longer-term bond yields to multiyear highs and sparking a sell-off in equities in early February. Wage gains soon moderated, but a continued decline in the unemployment rate—which reached a five-decade low of 3.7% in September—kept investors on the lookout for higher inflation ahead. In October, yields returned to their peaks on the back of good economic data and suggestions from Federal Reserve officials that they might keep hiking interest rates more quickly than expected. This was subsequently followed by a decline in long-term rates as investors sought safety late in the year and questioned the pace of future interest rate hikes.
Trade tensions.On March 1, President Donald Trump took markets by surprise in announcing a new series of metal tariffs. His administration quickly adopted a decidedly protectionist stance, with pro-trade advocates leaving and the announcement of plans for a range of new trade restrictions. Many threats never materialized, and the White House announced a renegotiated trade deal with Canada and Mexico. Trade tensions with China only appeared to deepen as the year progressed, however.
Slowing global growth. A global slowdown became apparent in the second half of 2018. Environmental and financial reforms put the brakes on the Chinese economy, as planned, but trade frictions caused growth to slow below official targets. Other emerging markets suffered from a stronger U.S. dollar and higher U.S. interest rates. In Europe, trade worries also hampered business spending, while unresolved Brexit fears and further threats to the eurozone from Italy and elsewhere also took a toll. Plummeting oil prices late in the year seemed to confirm a general weakening in global economic conditions.
Peaking fundamentals.The U.S. economy stood apart by accelerating in 2018, but a moderation in 2019 appears all but inevitable as the effects of fiscal stimulus moderate. Of specific concern to investors is the almost certain slowdown in corporate profits in the coming year. Overall profits for the S&P 500 grew by 25% versus the year before in the first three quarters of 2018—a pace sure to slow as the year-over-year impact of the tax cut fades, wage gains pressure margins, and the global economy cools.
The market’s dramatic pullback in the final weeks of 2018—stocks suffered their worst December since the Great Depression—seemed to reflect fears that a recession might even be imminent. I think such concerns are overblown. The Fed has already completed most of its planned rate hikes, promising less of a headwind for the economy and markets. China and Europe are likely to respond to slowing growth with stimulus, and both will benefit from lower oil prices. As I write, some encouraging signs have also emerged on the trade front, although whether the U.S. and China can resolve their differences remains perhaps the largest uncertainty facing markets.
In terms of stock performance, the painful end to 2018 served to improve valuations, making gains in the coming year less of a hurdle. I would also note that a further stock market “bust” in 2019 seems unlikely given that we never experienced the concentrated “boom” that has preceded past bad bear markets. In the final stages of the dot-com boom of the late 1990s, for example, investors flooded in to telecom shares, and huge amounts of capital and risk flowed in to housing in the mid-2000s. Currently, I simply do not see those sorts of distortions in the financial system.
Of course, opinions about what 2019 holds vary among our investment professionals at T. Rowe Price, and we sharpen each other’s thinking by constantly sharing opinions and insights. Please rest assured that your fund’s manager is drawing on the insights and perspectives across our global organization as he or she charts the course ahead.
Thank you for your continued confidence in T. Rowe Price.
Sincerely,

Robert Sharps
Group Chief Investment Officer
Management’s Discussion of Fund Performance
SPECTRUM GROWTH FUND
INVESTMENT OBJECTIVE
The fund seeks long-term capital appreciation and growth of income with current income a secondary objective.
FUND COMMENTARY
How did the fund perform in the past 12 months?
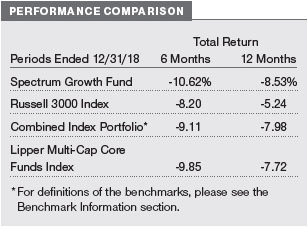
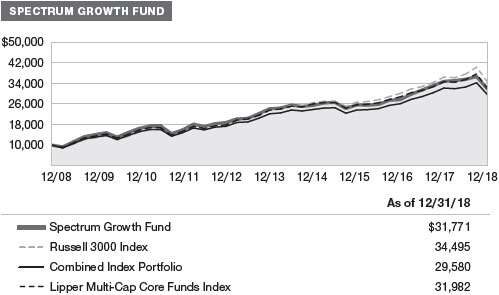
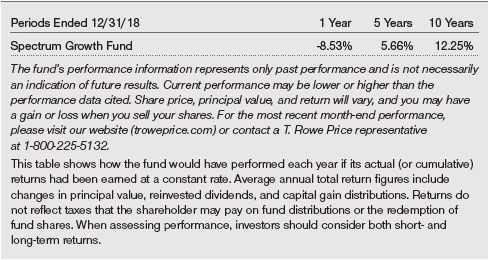
The Spectrum Growth Fund returned -8.53% for the 12-month period ended December 31, 2018, underperforming the Russell 3000 Index. The fund lagged its combined index portfolio—a custom benchmark comprising indexes thatrepresent the asset classes in which the fund invests—and the Lipper Multi-Cap Core Funds Index.
What factors influenced the fund’s performance?
The fund’s benchmark—the Russell 3000 Index—tracks the performance of U.S.-traded stocks, while the Spectrum Growth Fund invests in both U.S. and international equities. Ina year when international markets notably underperformed U.S. markets, the fund’s exposure to international and emerging markets stocks was the top detractor relative to the benchmark. Escalating trade tensions, political uncertainty in some key countries, and slowing economic growth dragged down international equity markets. These markets fared better than U.S. markets during the sharp fourth-quarter global downturn, but it was not enough to offset underperformance for most of the year.
The inclusion of real assets equities hurt relative results, although a tactical underweight allocation to the sector partially mitigated the negative impact. Real assets equities lagged global equities as slowing Chinese economic growth weighed on commodity prices, and global oil oversupply fears plunged crude oil prices from a four-year high in early October into bear market territory.
Tactical decisions to overweight or underweight various asset classes detracted. While an underweight to the challenged real assets sector added value, an overweight to international stocks hurt performance, as they lagged U.S. equities. An overweight to U.S. small-cap equities, which underperformed large-caps, also hampered relative returns.
Overall, security selection in our underlying funds was positive. Results were particularly strong in the New Horizons Fund and Blue Chip Growth Fund, which invest in U.S. small-cap growth and large-cap growth stocks, respectively. Selection in the international and U.S. value equity portfolios detracted from relative results.
How is the fund positioned?
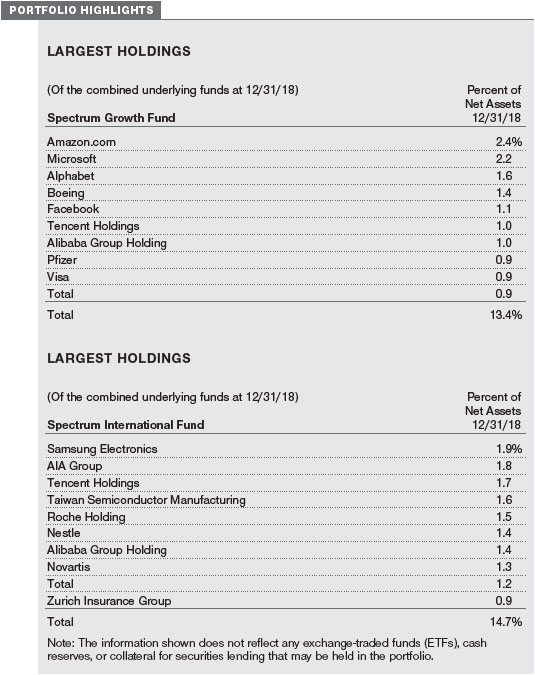
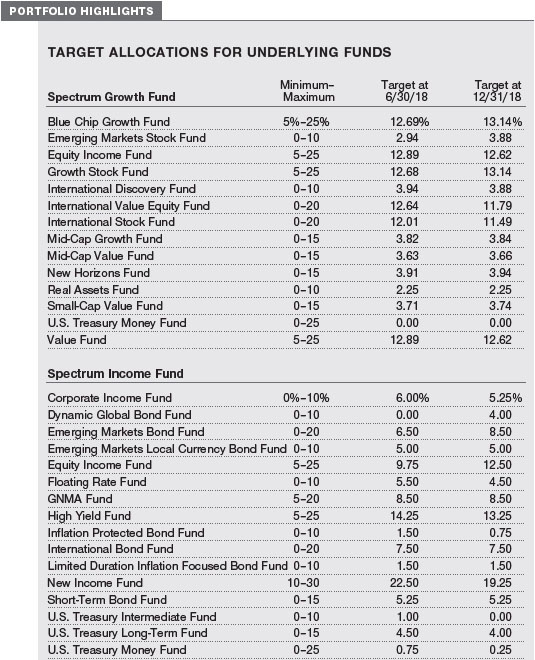
The Spectrum Growth Fund invests in several underlying T. Rowe Price funds that focus on U.S. and international equities across the full range of market capitalizations and style, as well as in emerging markets.
We reduced our underweight to U.S. equities. Market weakness late in the period resulted in more attractive valuations, and while U.S. earnings growth has likely peaked, it is still constructive. Growth expectations have moderated, and rising trade tensions and political uncertainty—including Brexit—could pose significant risk to international equities. We initiated an overweight to U.S. growth stocks, which webelieve are more reasonably priced after the recent downturn. Secular growth stocks tend to be more defensive in a low-growth environment, while value stocks in various sectors face headwinds from moderating growth, the late-stage credit cycle, a flattening Treasury yield curve, and low energy prices.
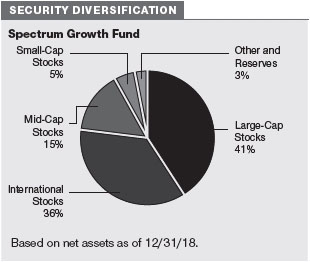
We are overweight U.S. small-cap stocks relative to U.S. large-caps because they offer more compelling valuations after recent weakness. Given their domestic focus, small-cap stocks are less vulnerable to slowing global trade and growth concerns, while large-cap stocks are subject to fading earnings growth potential and trade tensions.
We reduced our overweight to value stocks outside the U.S. Their valuations are still relatively attractive, but cyclical sectors could be challenged by moderating growth expectations and persistent low interest rates.
After a broad sell-off in emerging markets resulted in cheaper valuations, we have continued to increase our overweight. The prospect of a more measured Federal Reserve and a weakening U.S. dollar could be supportive for emerging markets stocks. With many developing countries less reliant on U.S. dollar funding than in the past, idiosyncratic and political risks are unlikely to become systemic.
We continue to underweight inflation-sensitive real assets equities because we expect global growth to slow in the near term and that longer-term imbalances between energy supply and demand will persist.
SPECTRUM INCOME FUND
INVESTMENT OBJECTIVE
The fund seeks a high level of current income with moderate share price fluctuation.
FUND COMMENTARY
How did the fund perform in the past 12 months?
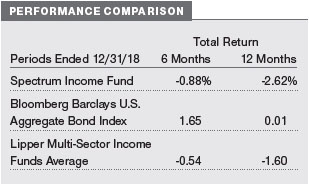
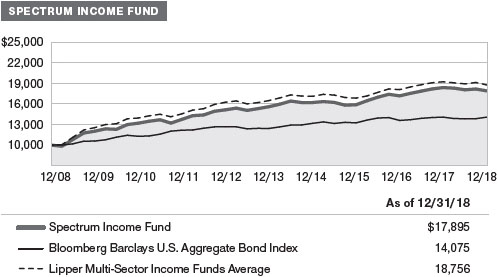
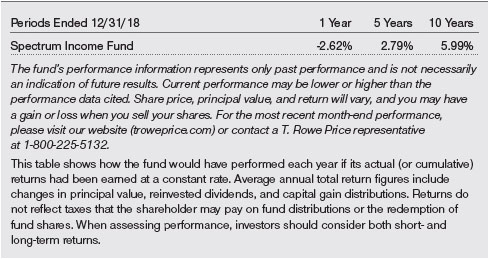
The Spectrum Income Fund returned -2.62% for the 12-month period ended December 31, 2018. The fund underperformed the Bloomberg Barclays U.S. Aggregate Bond Index and the Lipper Multi-Sector Income Funds Average.
What factors influenced the fund’s performance?
The inclusion of U.S. dividend-paying equities, which significantly underperformed fixed income securities, detracted the most for the year. Equity markets pulled back in the fourth quarter as trade tensions, monetary policy developments, and macroeconomic concerns drove stretches of sharp declines. Exposure to emerging markets bonds (dollar-denominated and local currency) and underperformance by the respective funds weighed on relative performance. Emerging markets debt declined due to local currency weakness, pressures from monetary tightening in developed markets, trade tensions, and negative political events impacting several key countries. As discussed in our positioning section below, we took advantage of the cheap valuations following the sell-off to increase our allocation to emerging markets dollar-denominated debt. Decelerating U.S. economic growth coupled with Fed interest rate policy becoming increasingly data dependent as it approaches neutral are likely to provide a headwind to further dollar strength, which could be supportive for developing markets.
An allocation to high yield bonds hurt relative returns, as the sector underperformed U.S. investment-grade issues. The sector struggled due, in part, to heightened risk aversion and weakness in the energy sector, which represents a sizable portion of the high yield universe. Crude oil prices rose to four-year highs in October then plunged into bear market territory amid global oversupply fears. We recently trimmed our underweight to high yield bonds after valuations became more attractive following the market sell-off.
On the positive side, tactical decisions to overweight or underweight underlying asset classes contributed to relative performance. Our overweight to floating rate loans and an underweight allocation to U.S. dividend-paying equities, which underperformed U.S. investment-grade bonds, also added value. However, our preference for emerging markets local currency bonds hurt returns as several local currencies were casualties of the widespread rout in the asset class amid contagion fears.
How is the fund positioned?
The Spectrum Income Fund invests primarily in fixed income securities through a diversified mix of U.S. and international T. Rowe Price mutual funds. Underlying investments also include a fund focused on dividend-paying U.S. large-cap stocks.
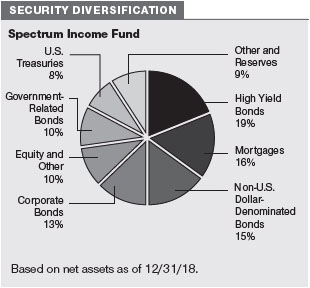
We are currently underweight noninvestment-grade bonds. Within the sector, we have moderated our exposure to floating ratebank loans and added to high yield bonds. Valuations for high yield bonds became more appealing after the late-year sell-off. Despite the late stage of the credit cycle, we believe that high yield bonds present attractive opportunities supported by positive corporate fundamentals and low default expectations. We expect that short-term interest rates are nearing their peak as Fed policy becomes more data dependent and weakening loan terms and liquidity concerns present potential headwinds for floating rate bank loans.
We are underweight international bonds. Developed markets bonds outside the U.S. have a less attractive outlook due to their relatively extended duration (a measure of a bond’s sensitivity to interest rate changes), particularly as the European Central Bank ends its monthly bond purchases and prepares to start raising short-term rates.
We increased our exposure to U.S. dollar-denominated emerging markets sovereign debt and maintained an overweight to emerging markets local currency bonds after the widespread sell-off made valuations more appealing. Many currencies in developing markets have been unduly punished amid fears of contagion, creating compelling opportunities in select areas. While broad emerging markets debt fundamentals remain attractive—and could be supported by a dovish Fed and fading country-specific risks—concerns over global trade, political uncertainty in some countries, rising developed markets interest rates, and U.S. dollar strength have weighed on returns.
We moved from an underweight to a neutral position to dividend-paying equities. Equity valuations are more attractive after the recent downturn; however, risks remain given moderating global growth.
As outlined in our semiannual letter, we initiated an allocation into the Dynamic Global Bond Fund during the fourth quarter of 2018. The strategy has the potential to add value from traditional fixed income sources—such as yield curve positioning, currency management, and credit analysis—but often with less strategic sensitivity to interest rates than a broad bond market index, such as the Bloomberg Barclays Global Aggregate Bond Index.
We expect to initiate an allocation to currency-hedged nondollar bonds in the first quarter of 2019. These hedged bonds are less vulnerable to changes in currency valuations and therefore generally less volatile than unhedged bonds. Depending on the relative interest rate environment, there may be a cost or benefit associated with hedging the currency. These changes are being implemented in the Spectrum Income Fund in an effort to reduce overall portfolio risk and improve the fund’s risk/return profile.
SPECTRUM INTERNATIONAL FUND
INVESTMENT OBJECTIVE
The fund seeks long-term capital appreciation.
FUND COMMENTARY
How did the fund perform in the past 12 months?
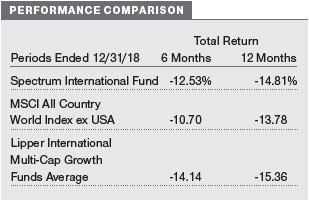
The Spectrum International Fund returned -14.81% for the 12-month period ended December 31, 2018. The fund trailed the MSCI All Country WorldIndex ex USA but outpaced the Lipper International Multi-Cap Growth Funds Average.
What factors influenced the fund’s performance?
Within the fund, security selection among international value equities was a negative contributor to performance for the year. Stocks in the industrials andbusiness services sector, consumer discretionary sector, and newly formed communication services sector weighed on performance. However, the strategy’s underweight to the financials sector added value as financial stocks fared poorly for the year. On a regional basis, holdings in developed Europe were among the worst performers—dragged down by escalating trade tensions, political uncertainty in some countries, and slowing economic growth—while equities in Pacific ex-Japan generated marginal gains.
The Japan Fund outperformed its benchmark and contributed to relative performance. Japanese equities declined for the year as global trade tensions weighed on its export-driven economy. We were, however, able to find select opportunities in companies that are benefiting from reforms seeking to advance shareholder-friendly policies meant to create value for investors and the Bank of Japan’s accommodative monetary policy. The European Stock Fund also outpaced its benchmark and contributed to relative returns.
How is the fund positioned?
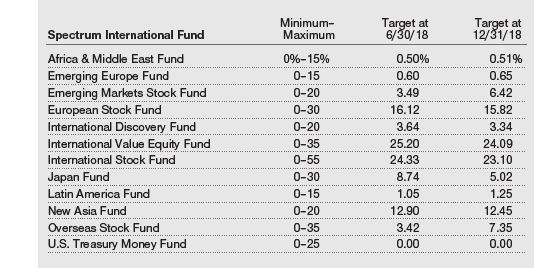
The Spectrum International Fund offers investors broadly diversified exposure to international equities in developed and emerging markets.
Among developed markets, we reduced an overweight allocation and are now neutral to Japanese equities. While valuations remain attractive, Japan’s dependence on global trade poses a headwind as globalgrowth momentum fades and trade tensions remain. We have moderated our overweight to Europe. The region may benefit from still-supportive monetary policies contributing to a stabilization in domestic growth. However, slowing global growth, rising trade protectionism, and political uncertainty—such as Brexit negotiations—pose significant risks.
We reduced our overweight to value stocks outside the U.S. Their valuations are still relatively attractive, but moderating growth expectations and persistent low interest rates may prove challenging for cyclical sectors.
After a broad sell-off in emerging markets resulted in cheaper valuations, we have continued to increase our overweight. The prospect of a more measured Federal Reserve and a weakening U.S. dollar could also be supportive for emerging markets stocks. With many developing countries less reliant on U.S. dollar funding than in the past, idiosyncratic and political risks are unlikely to become systemic. Trade policy and slowing growth in China are key risks.
What is portfolio management’s outlook?
After 2017’s synchronized upswing in global economic activity, growth trajectories worldwide diverged in 2018. Fiscal stimulus and the late-2017 tax overhaul package benefited the U.S. economy, while growth began to waver in a few other markets despite support from long-standing accommodative monetary policies. We expect that the growth differential between the U.S. and the rest of the world will narrow as the tailwind from the U.S. fiscal stimulus starts to fade. Growth in Europe moderated, but will stabilize near potential growth levels. The stronger U.S. dollar and global trade strife haveexacerbated economic imbalances in some emerging markets; however, many developing countries rely less on U.S. dollar funding than they have in the past, lessening the potential for systemic risk. Recent energy price declines should be supportive of more consumer-oriented emerging markets but may prove to be a headwind for their commodity export-dependent peers.
We seek investment opportunities, particularly in instances where fundamental value may not be fully reflected in market prices. Global central banks are in varying stages of winding down accommodative monetary policies, leading to a decrease in global liquidity and the potential for upward pressure on yields. Still, fundamentals for corporate earnings remain broadly supportive in our view, and we do not anticipate a U.S. recession over the next year. Near-term risks to global markets include repercussions from potential monetary policy missteps and an escalation in trade tensions.
With rising geopolitical and monetary policy risks and higher volatility, we have a balanced view on risk-taking within our portfolios. We have, however, selectively added to our positions where we feel that market weakness has created attractive opportunities. Given the many crosscurrents that can influence global financial markets, we believe that the Spectrum Funds’ broad diversification across asset classes, investment styles, and geography, combined with strengths in our strategic investing approach, will help us generate attractive risk-adjusted returns over time.
The views expressed reflect the opinions of T. Rowe Price as of the date of this report and are subject to change based on changes in market, economic, or other conditions. These views are not intended to be a forecast of future events and are no guarantee of future results.
RISKS OF INVESTING
As with all stock and bond mutual funds, each fund’s share price can fall because of weakness in the stock or bond markets, a particular industry, or specific holdings. Stock markets can decline for many reasons, including adverse political or economic developments, changes in investor psychology, or heavy institutional selling. The prospects for an industry or company may deteriorate because of a variety of factors, including disappointing earnings or changes in the competitive environment. In addition, the investment manager’s assessment of companies held in a fund may prove incorrect, resulting in losses or poor performance even in rising markets.
Bonds are subject to interest rate risk, the decline in bond prices that usually accompanies a rise in interest rates, and credit risk, the chance that any fund holding could have its credit rating downgraded or that a bond issuer will default (fail to make timely payments of interest or principal), potentially reducing the fund’s income level and share price. High yield corporate bonds could have greater price declines than funds that invest primarily in high-quality bonds. Companies issuing high yield bonds are not as strong financially as those with higher credit ratings, so the bonds are usually considered speculative investments.
Funds that invest overseas may carry more risk than funds that invest strictly in U.S. assets. Risks can result from varying stages of economic and political development; differing regulatory environments, trading days, and accounting standards; and higher transaction costs of non-U.S. markets. Non-U.S. investments are also subject to currency risk, or a decline in the value of a foreign currency versus the U.S. dollar, which reduces the dollar value of securities denominated in that currency.
BENCHMARK INFORMATION
Combined index portfolio:An unmanaged blended index portfolio created as a custom benchmark for the Spectrum Growth Fund consisting of 70% Russell 3000 Index and 30% MSCI All Country World Index ex USA.
Note: Bloomberg Index Services Ltd. Copyright © 2018, Bloomberg Index Services Ltd. Used with permission.
Note: Information has been obtained from sources believed to be reliable, but J.P. Morgan does not warrant its completeness or accuracy. The index is used with permission. The index may not be copied, used, or distributed without J.P. Morgan’s prior written approval. Copyright 2018, J.P. Morgan Chase & Co. All rights reserved.
Note: MSCI makes no express or implied warranties or representations and shall have no liability whatsoever with respect to any MSCI data contained herein. The MSCI data may not be further redistributed or used as a basis for other indices or any securities or financial products. This report is not approved, reviewed, or produced by MSCI.
Note: Frank Russell Company (Russell) is the source and owner of the Russell index data contained or reflected in these materials and all trademarks andcopyrights related thereto. Russell® is a registered trademark of Russell. Russellis not responsible for the formatting or configuration of these materials or for any inaccuracy in T. Rowe Price Associates’ presentation thereof.
GROWTH OF $10,000
This chart shows the value of a hypothetical $10,000 investment in the fund over the past 10 fiscal year periods or since inception (for funds lacking 10-year records). The result is compared with benchmarks, which include a broad-based market index and may also include a peer group average or index. Market indexes do not include expenses, which are deducted from fund returns as well as mutual fund averages and indexes.
AVERAGE ANNUAL COMPOUND TOTAL RETURN
GROWTH OF $10,000
This chart shows the value of a hypothetical $10,000 investment in the fund over the past 10 fiscal year periods or since inception (for funds lacking 10-year records). The result is compared with benchmarks, which include a broad-based market index and may also include a peer group average or index. Market indexes do not include expenses, which are deducted from fund returns as well as mutual fund averages and indexes.
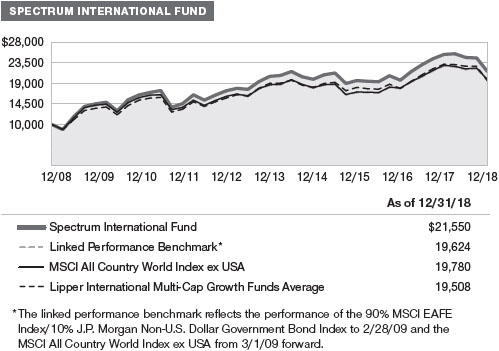
AVERAGE ANNUAL COMPOUND TOTAL RETURN
![]()
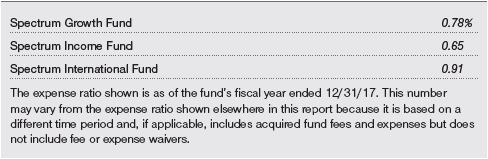
EXPENSE RATIO
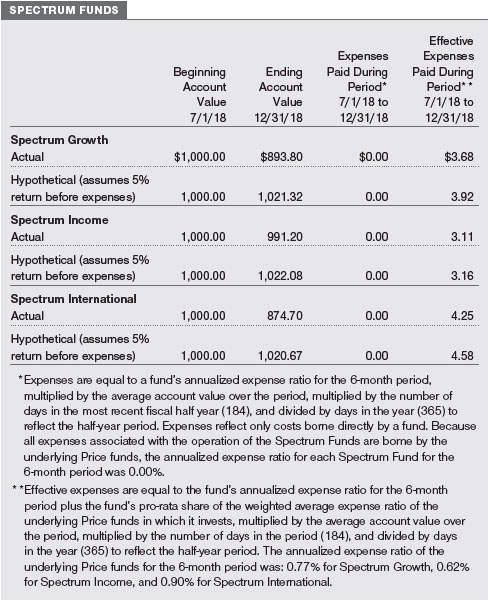
FUND EXPENSE EXAMPLE
As a mutual fund shareholder, you may incur two types of costs: (1) transaction costs, such as redemption fees or sales loads, and (2) ongoing costs, including management fees, distribution and service (12b-1) fees, and other fund expenses. The following example is intended to help you understand your ongoing costs (in dollars) of investing in the fund and to compare these costs with the ongoing costs of investing in other mutual funds. The example is based on an investment of $1,000 invested at the beginning of the most recent six-month period and held for the entire period.
Actual Expenses
The first line of the following table (Actual) provides information about actual account values and expenses based on the fund’s actual returns. You may use the information on this line, together with your account balance, to estimate the expenses that you paid over the period. Simply divide your account value by $1,000 (for example, an $8,600 account value divided by $1,000 = 8.6), then multiply the result by the number on the first line under the heading “Expenses Paid During Period” to estimate the expenses you paid on your account during this period.
Hypothetical Example for Comparison Purposes
The information on the second line of the table (Hypothetical) is based on hypothetical account values and expenses derived from the fund’s actual expense ratio and an assumed 5% per year rate of return before expenses (not the fund’s actual return). You may compare the ongoing costs of investing in the fund with other funds by contrasting this 5% hypothetical example and the 5% hypothetical examples that appear in the shareholder reports of the other funds. The hypothetical account values and expenses may not be used to estimate the actual ending account balance or expenses you paid for the period.
Note:T. Rowe Price charges an annual account service fee of $20, generally for accounts with less than $10,000. The fee is waived for any investor whose T. Rowe Price mutual fund accounts total $50,000 or more; accounts electing to receive electronic delivery of account statements, transaction confirmations, prospectuses, and shareholder reports; or accounts of an investor who is a T. Rowe Price Personal Services or Enhanced Personal Services client (enrollment in these programs generally requires T. Rowe Price assets of at least $250,000). This fee is not included in the accompanying table. If you are subject to the fee, keep it in mind when you are estimating the ongoing expenses of investing in the fund and when comparing the expenses of this fund with other funds.
You should also be aware that the expenses shown in the table highlight only your ongoing costs and do not reflect any transaction costs, such as redemption fees or sales loads. Therefore, the second line of the table is useful in comparing ongoing costs only and will not help you determine the relative total costs of owning different funds. To the extent a fund charges transaction costs, however, the total cost of owning that fund is higher.
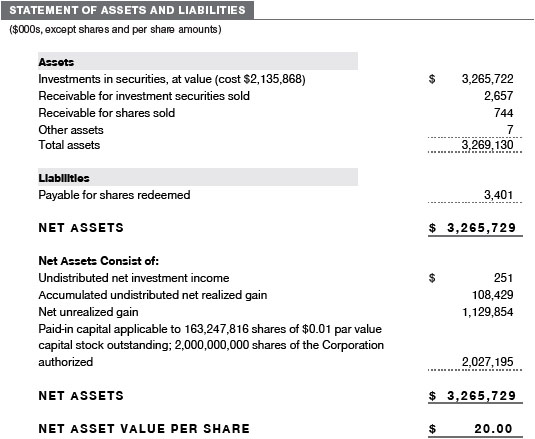
| T. ROWE PRICE SPECTRUM GROWTH FUND |

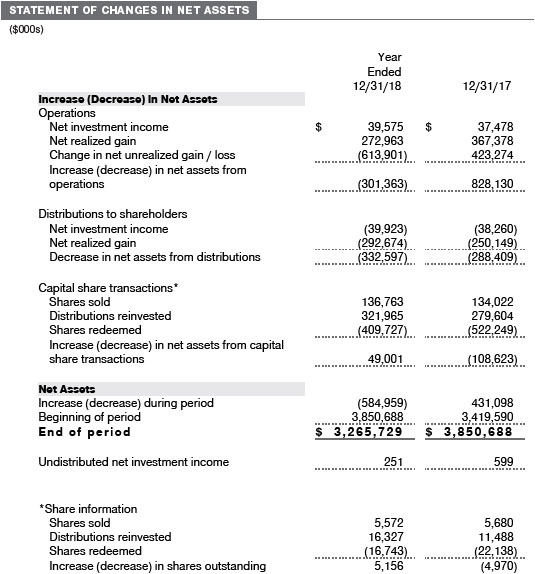
The accompanying notes are an integral part of these financial statements.
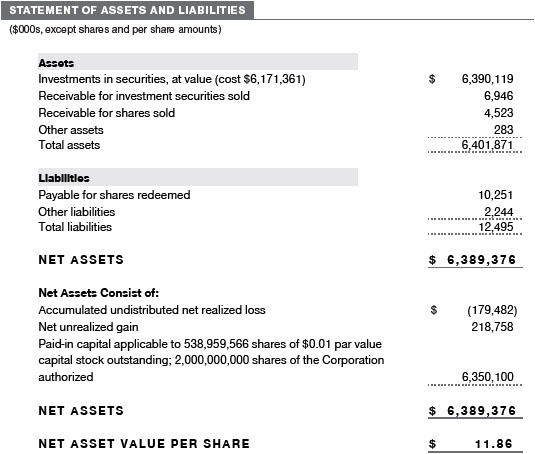
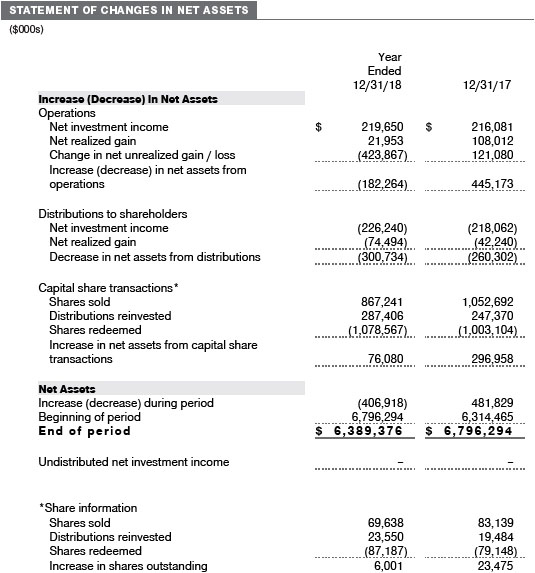
| T. ROWE PRICE SPECTRUM INCOME FUND |

The accompanying notes are an integral part of these financial statements.
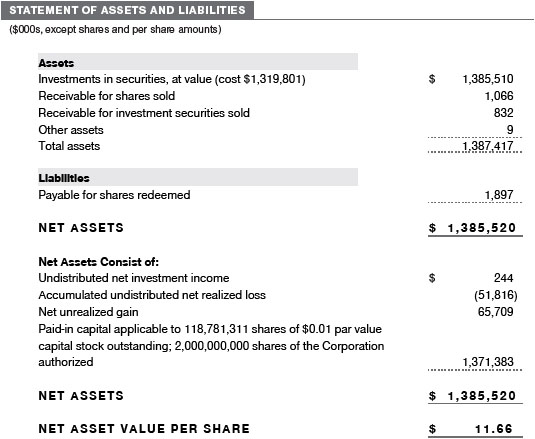
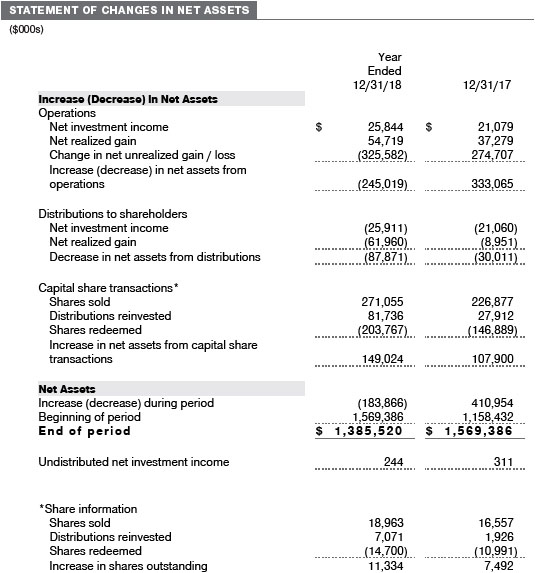
| T. ROWE PRICE SPECTRUM INTERNATIONAL FUND |
The accompanying notes are an integral part of these financial statements.
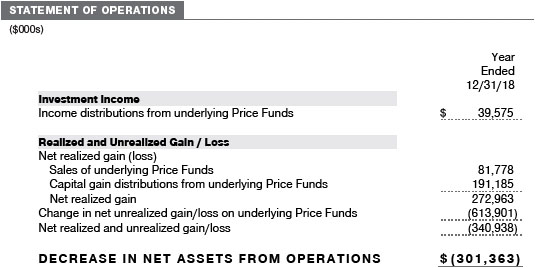
| T. ROWE PRICE SPECTRUM GROWTH FUND |
The accompanying notes are an integral part of these financial statements.
| T. ROWE PRICE SPECTRUM INCOME FUND |
The accompanying notes are an integral part of these financial statements.
| T. ROWE PRICE SPECTRUM INTERNATIONAL FUND |
The accompanying notes are an integral part of these financial statements.
| T. ROWE PRICE SPECTRUM GROWTH FUND |
The accompanying notes are an integral part of these financial statements.
| T. ROWE PRICE SPECTRUM INCOME FUND |

The accompanying notes are an integral part of these financial statements.
| T. ROWE PRICE SPECTRUM INTERNATIONAL FUND |
The accompanying notes are an integral part of these financial statements.
| T. ROWE PRICE SPECTRUM GROWTH FUND |
The accompanying notes are an integral part of these financial statements.
| T. ROWE PRICE SPECTRUM INCOME FUND |
The accompanying notes are an integral part of these financial statements.
| T. ROWE PRICE SPECTRUM INTERNATIONAL FUND |
The accompanying notes are an integral part of these financial statements.
| NOTES TO FINANCIAL STATEMENTS |
T. Rowe Price Spectrum Fund, Inc. (the corporation) is registered under the Investment Company Act of 1940 (the 1940 Act) as an open-end management investment company. Spectrum Growth Fund, Spectrum Income Fund, and Spectrum International Fund (collectively, the Spectrum Funds) are three portfolios established by the corporation.
Each Spectrum Fund diversifies its assets within specified ranges among a set of T. Rowe Price mutual funds (underlying Price Funds) representing specific market segments. Each Spectrum Fund is nondiversified for purposes of the 1940 Act, due to its limited number of investments; however, its investments in underlying Price Funds are selected to provide exposure to a diversified portfolio of securities. Spectrum Growth seeks long-term capital appreciation and growth of income with current income as a secondary objective. Spectrum Income seeks a high level of current income with moderate share price fluctuation. Spectrum International seeks long-term capital appreciation.
NOTE 1 - SIGNIFICANT ACCOUNTING POLICIES
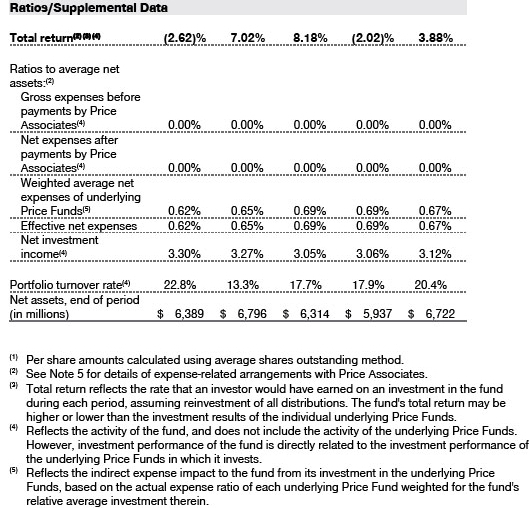
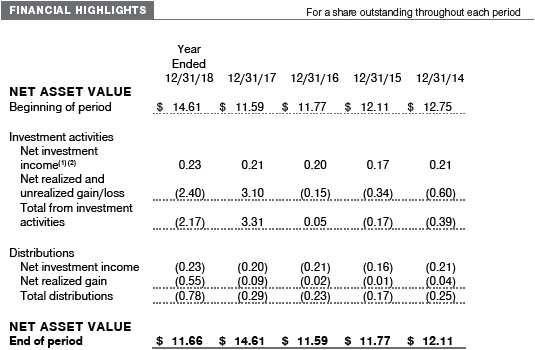
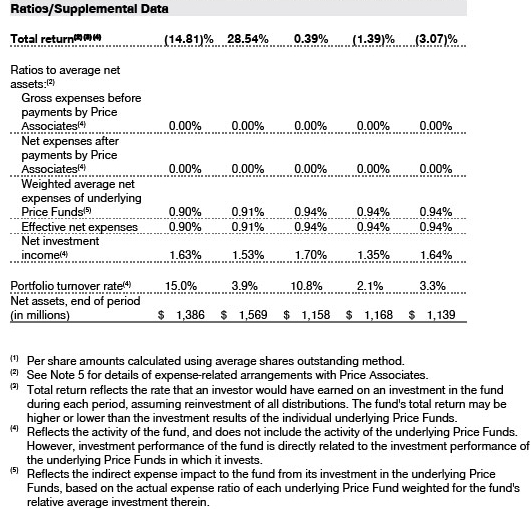
Basis of PreparationEach fund is an investment company and follows accounting and reporting guidance in the Financial Accounting Standards BoardAccounting Standards CodificationTopic 946 (ASC 946). The accompanying financial statements were prepared in accordance with accounting principles generally accepted in the United States of America (GAAP), including, but not limited to, ASC 946. GAAP requires the use of estimates made by management. Management believes that estimates and valuations of the underlying Price Funds are appropriate; however, actual results may differ from those estimates, and the valuations reflected in the accompanying financial statements may differ from the value ultimately realized upon sale of the underlying Price Funds. Certain ratios in the accompanying Financial Highlights have been included to conform to the current year presentation.
Investment Transactions, Investment Income, and DistributionsPurchases and sales of the underlying Price Funds are accounted for on the trade date basis. Income is recorded on the accrual basis. Gains and losses realized on sales of the underlying Price Funds are reported on the identified cost basis. Income tax-related interest and penalties, if incurred, are recorded as income tax expense. Dividends received from underlying Price Fund investments are reflected as dividend income; capital gain distributions are reflected as realized gain/loss. Income and capital gain distributions from the underlying Price Funds are recorded on the ex-dividend date. Distributions to shareholders arerecorded on the ex-dividend date. Income distributions are declared by Spectrum Income daily and paid monthly. Income distributions, if any, are declared and paid by Spectrum Growth and Spectrum International annually. A capital gain distribution may also be declared and paid by each fund annually.
Redemption FeesA 2% fee is assessed on redemptions of Spectrum International shares held for 90 days or less to deter short-term trading and to protect the interests of long-term shareholders. Redemption fees are withheld from proceeds that shareholders receive from the sale or exchange of fund shares and are paid to the fund. Redemption fees received by Spectrum International are allocated to each underlying Price Fund in proportion to the average daily value of its shares owned by the fund. Accordingly, redemption fees have no effect on the net assets of Spectrum International. The fees may cause the redemption price per share to differ from the net asset value per share.
IndemnificationIn the normal course of business, the funds may provide indemnification in connection with their officers and directors, service providers and/or private company investments. Each fund’s maximum exposure under these arrangements is unknown; however, the risk of material loss is currently considered to be remote.
NOTE 2 - VALUATION
Each fund’s financial instruments are valued and its net asset value (NAV) per share is computed at the close of the New York Stock Exchange (NYSE), normally 4 p.m. ET, each day the NYSE is open for business. However, the NAV per share may be calculated at a time other than the normal close of the NYSE if trading on the NYSE is restricted, if the NYSE closes earlier, or as may be permitted by the SEC. Each fund’s financial instruments are reported at fair value, which GAAP defines as the price that would be received to sell an asset or paid to transfer a liability in an orderly transaction between market participants at the measurement date. Investments in the underlying Price Funds are valued at their closing NAV per share on the day of valuation. Assets and liabilities other than financial instruments, including short-term receivables and payables, are carried at cost, or estimated realizable value, if less, which approximates fair value.
The T. Rowe Price Valuation Committee (the Valuation Committee) is an internal committee that has been delegated certain responsibilities by the funds’ Board of Directors (the Board) to ensure that financial instruments are appropriately priced at fair value in accordance with GAAP and the 1940 Act. Subject to oversight by the Board, the Valuation Committee develops and oversees pricing-related policies and proceduresand approves all fair value determinations. Specifically, the Valuation Committee establishes procedures to value securities; determines pricing techniques, sources, and persons eligible to effect fair value pricing actions; oversees the selection, services, and performance of pricing vendors; oversees valuation-related business continuity practices; and provides guidance on internal controls and valuation-related matters. The Valuation Committee reports to the Board and has representation from legal, portfolio management and trading, operations, risk management, and the funds’ treasurer.
Various valuation techniques and inputs are used to determine the fair value of financial instruments. GAAP establishes the following fair value hierarchy that categorizes the inputs used to measure fair value:
Level 1 – quoted prices (unadjusted) in active markets for identical financial instruments that the fund can access at the reporting date
Level 2 – inputs other than Level 1 quoted prices that are observable, either directly or indirectly (including, but not limited to, quoted prices for similar financial instruments in active markets, quoted prices for identical or similar financial instruments in inactive markets, interest rates and yield curves, implied volatilities, and credit spreads)
Level 3 – unobservable inputs
Observable inputs are developed using market data, such as publicly available information about actual events or transactions, and reflect the assumptions that market participants would use to price the financial instrument. Unobservable inputs are those for which market data are not available and are developed using the best information available about the assumptions that market participants would use to price the financial instrument. GAAP requires valuation techniques to maximize the use of relevant observable inputs and minimize the use of unobservable inputs. When multiple inputs are used to derive fair value, the financial instrument is assigned to the level within the fair value hierarchy based on the lowest-level input that is significant to the fair value of the financial instrument. Input levels are not necessarily an indication of the risk or liquidity associated with financial instruments at that level but rather the degree of judgment used in determining those values. On December 31, 2018, all of the investments in underlying Price Funds were classified as Level 1, based on the inputs used to determine their fair values.
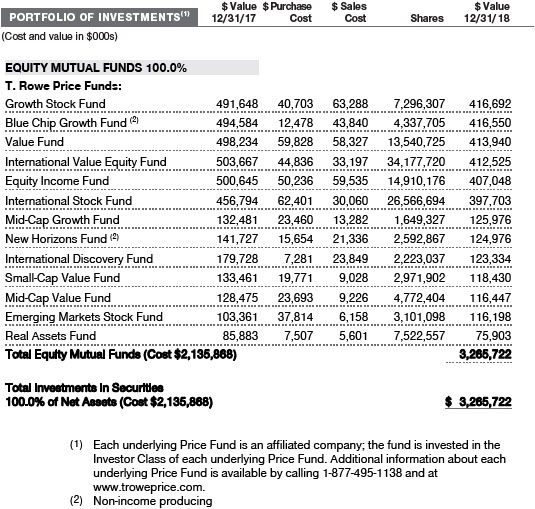
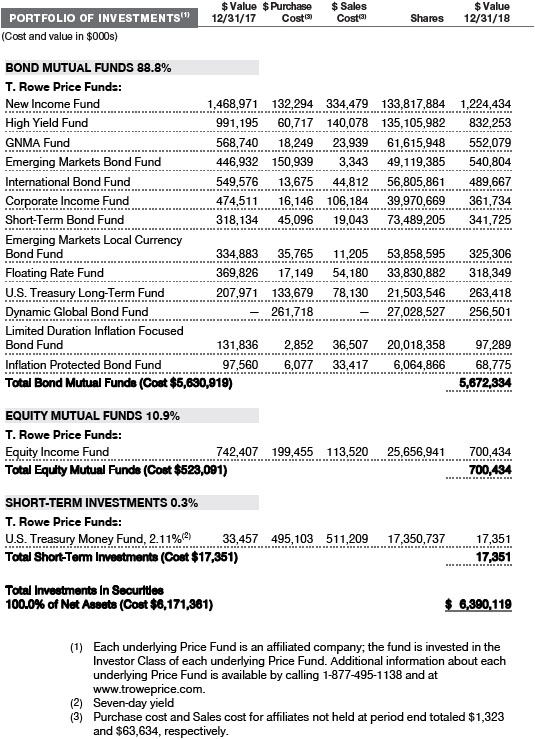
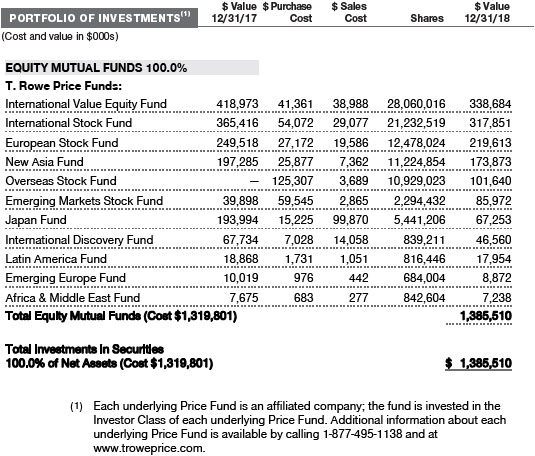
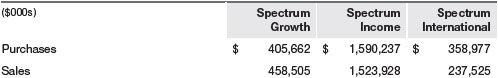
NOTE 3 - INVESTMENTS IN UNDERLYING PRICE FUNDS
Purchases and sales of the underlying Price Funds during the year ended December 31, 2018, were as follows:
NOTE 4 - FEDERAL INCOME TAXES
No provision for federal income taxes is required since each fund intends to continue to qualify as a regulated investment company under Subchapter M of the Internal Revenue Code and distribute to shareholders all of its taxable income and gains. Distributions determined in accordance with federal income tax regulations may differ in amount or character from net investment income and realized gains for financial reporting purposes. Financial reporting records are adjusted for permanent book/tax differences to reflect tax character but are not adjusted for temporary differences.
Each fund files U.S. federal, state, and local tax returns as required. Each fund’s tax returns are subject to examination by the relevant tax authorities until expiration of the applicable statute of limitations, which is generally three years after the filing of the tax return but which can be extended to six years in certain circumstances. Tax returns for open years have incorporated no uncertain tax positions that require a provision for income taxes.
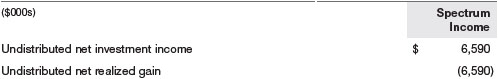
For the Spectrum Income Fund, reclassifications between income and gain relate primarily to the character of distributions from the underlying Price Funds. For the year ended December 31, 2018, the following reclassifications were recorded to reflect tax character; the reclassifications had no impact on results of operations or net assets:
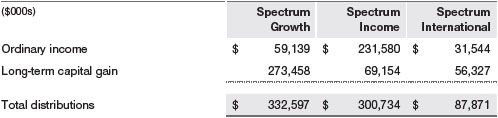
Distributions during the year ended December 31, 2018, were characterized for tax purposes as follows:
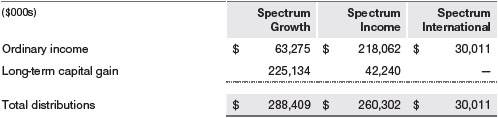
Distributions during the prior year ended December 31, 2017, were characterized for tax purposes as follows:
At December 31, 2018, the tax-basis costs of investments and components of net assets were as follows:
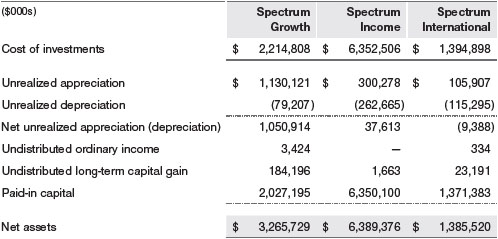
The difference between book-basis and tax-basis net unrealized appreciation (depreciation) is attributable to the deferral of losses from wash sales for tax purposes.
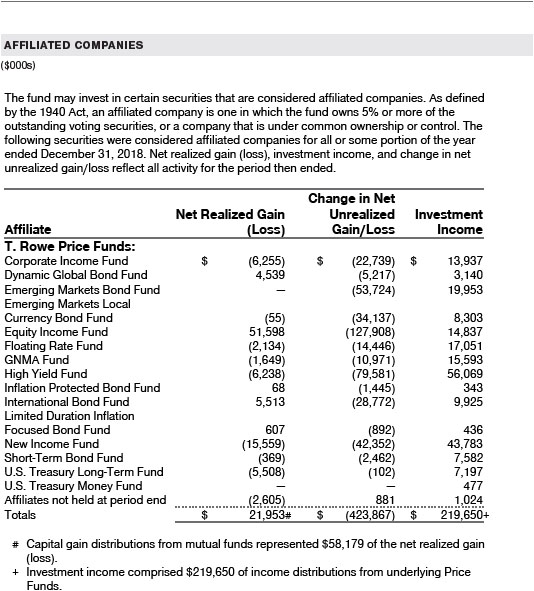
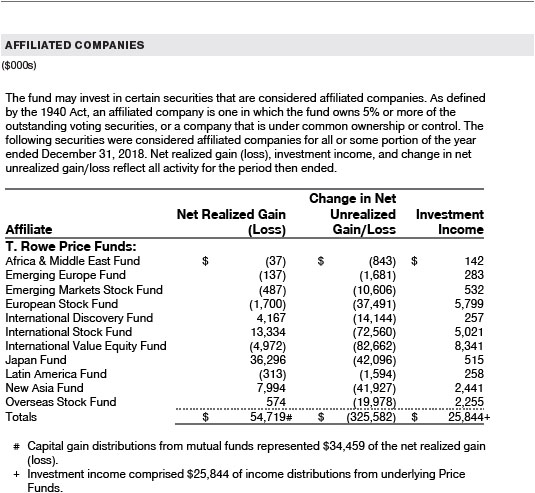
NOTE 5 - RELATED PARTY TRANSACTIONS
The Spectrum Funds are managed by T. Rowe Price Associates, Inc. (Price Associates), a wholly owned subsidiary of T. Rowe Price Group, Inc. Price Associates, directly or through sub-advisory agreements with its wholly owned subsidiaries, also provides investment management services to all the underlying Price Funds. Pursuant to various service agreements, Price Associates and its wholly owned subsidiaries provide shareholder servicing and administrative services as well as certain accounting, marketing, and other services to the Spectrum Funds. Certain officers and directors of the Spectrum Funds are also officers and directors of Price Associates and its subsidiaries and of the underlying Price Funds.
The Spectrum Funds pay no management fees; however, Price Associates receives management fees from the underlying Price Funds. The Spectrum Funds operate in accordance with the investment management and special servicing agreements between and among the corporation, the underlying Price Funds, and Price Associates. Pursuant to these agreements, expenses associated with the operation of the Spectrum Funds are borne by each underlying Price Fund to the extent of estimated savings to it and in proportion to the average daily value of its shares owned by the Spectrum Funds. Therefore, each Spectrum Fund operates at a zero expense ratio. However, each Spectrum Fund indirectly bears its proportionate share of the management fees and operating costs of the underlying Price Funds in which it invests.
The Spectrum Funds do not invest in the underlying Price Funds for the purpose of exercising management or control; however, investments by the Spectrum Funds may represent a significant portion of an underlying Price Fund’s net assets. At December 31, 2018, Spectrum Growth held less than 25% of the outstanding shares of any underlying Price Fund; Spectrum International held approximately 26% of the outstanding shares of the European Stock Fund, and less than 25% of any other underlying Price Fund; and Spectrum Income held approximately 48% of the outstanding shares of the Corporate Income Fund, 83% of the Emerging Markets Local Currency Bond Fund, 44% of the GNMA Fund, 42% of the International Bond Fund, and less than 25% of any other underlying Price Fund.
Additionally, Spectrum Income Fund is one of several mutual funds in which certain college savings plans managed by Price Associates may invest. Shareholder servicing costs associated with each college savings plan are allocated to Spectrum Income Fund in proportion to the average daily value of its shares owned by the college savings plan and, in turn, are borne by the underlying Price Funds in accordance with the terms ofthe investment management and special servicing agreements. At December 31, 2018, approximately 37% of the outstanding shares of Spectrum Income Fund were held by the college savings plans.
As of December 31, 2018, T. Rowe Price Group, Inc., or its wholly owned subsidiaries owned 2,215,330 shares of the Spectrum Growth Fund, representing 1% of the fund’s net assets.
REPORT OF INDEPENDENT REGISTERED PUBLIC ACCOUNTING FIRM
To the Board of Directors of T. Rowe Price Spectrum Funds, Inc. and
Shareholders of T. Rowe Price Spectrum Growth Fund, T. Rowe Price Spectrum
Income Fund, and T. Rowe Price Spectrum International Fund
Opinion on the Financial Statements
We have audited the accompanying statement of assets and liabilities, including the portfolio of investments, of T. Rowe Price Spectrum Growth Fund, T. Rowe Price Spectrum Income Fund, and T. Rowe Price Spectrum International Fund (constituting T. Rowe Price Spectrum Funds, Inc., hereafter referred to as the “Funds”) as of December 31, 2018, the related statement of operations for the year ended December 31, 2018, the statement of changes in net assets for each of the two years in the period ended December 31, 2018, including the related notes, and the financial highlights for each of the five years in the period ended December 31, 2018 (collectively referred to as the “financial statements”). In our opinion, the financial statements present fairly, in all material respects, the financial position of each of the Funds as of December 31, 2018, the results of each of their operations for the year then ended, the changes in each of their net assets for each of the two years in the period ended December 31, 2018 and each of the financial highlights for each of the five years in the period ended December 31, 2018 in conformity with accounting principles generally accepted in the United States of America.
Basis for Opinion
These financial statements are the responsibility of the Funds’ management. Our responsibility is to express an opinion on the Funds’ financial statements based on our audits. We are a public accounting firm registered with the Public Company Accounting Oversight Board (United States) (PCAOB) and are required to be independent with respect to the Funds in accordance with the U.S. federal securities laws and the applicable rules and regulations of the Securities and Exchange Commission and the PCAOB.
We conducted our audits of these financial statements in accordance with the standards of the PCAOB. Those standards require that we plan and perform the audit to obtain reasonable assurance about whether the financial statements are free of material misstatement, whether due to error or fraud.
Our audits included performing procedures to assess the risks of material misstatement of the financial statements, whether due to error or fraud, and performing procedures that respond to those risks. Such procedures included examining, on a test basis, evidence regarding the amounts and disclosures in the financial statements. Our audits also included evaluating the accounting principles used and significant estimates made by management, as well as evaluating the overall presentation of the financial statements. Our procedures included confirmation of securities owned as of December 31, 2018 by correspondence with the transfer agent. We believe that our audits provide a reasonable basis for our opinion.
PricewaterhouseCoopers LLP
Baltimore, Maryland
February 15, 2019
We have served as the auditor of one or more investment companies in the T. Rowe Price group of investment companies since 1973.
TAX INFORMATION (UNAUDITED) FOR THE TAX YEAR ENDED 12/31/18
We are providing this information as required by the Internal Revenue Code. The amounts shown may differ from those elsewhere in this report because of differences between tax and financial reporting requirements.
The funds’ distributions to shareholders included amounts as follows:
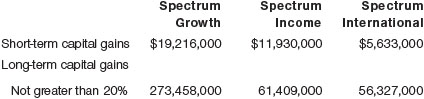
For taxable non-corporate shareholders, income represents qualified dividend income subject to a long-term capital gains tax rate of not greater than 20% as follows:

For corporate shareholders, income qualifies for the dividends-received deduction as follows:

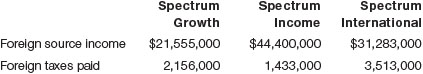
The funds will pass through foreign source income and foreign taxes paid, as follows:
INFORMATION ON PROXY VOTING POLICIES, PROCEDURES, AND RECORDS
A description of the policies and procedures used by T. Rowe Price funds and portfolios to determine how to vote proxies relating to portfolio securities is available in each fund’s Statement of Additional Information. You may request this document by calling 1-800-225-5132 or by accessing the SEC’s website, sec.gov.
The description of our proxy voting policies and procedures is also available on our corporate website. To access it, please visit the following Web page:
https://www3.troweprice.com/usis/corporate/en/utility/policies.html
Scroll down to the section near the bottom of the page that says, “Proxy Voting Policies.” Click on the Proxy Voting Policies link in the shaded box.
Each fund’s most recent annual proxy voting record is available on our website and through the SEC’s website. To access it through T. Rowe Price, visit the website location shown above, and scroll down to the section near the bottom of the page that says, “Proxy Voting Records.” Click on the Proxy Voting Records link in the shaded box.
HOW TO OBTAIN QUARTERLY PORTFOLIO HOLDINGS
Effective for reporting periods on or after March 1, 2019, the fund files a complete schedule of portfolio holdings with the Securities and Exchange Commission (SEC) for the first and third quarters of each fiscal year as an exhibit to its reports on Form N-PORT. Prior to March 1, 2019, the fund filed a complete schedule of portfolio holdings with the SEC for the first and third quarters of each fiscal year on Form N-Q. The fund’s Forms N-PORT and N-Q are available electronically on the SEC’s website (sec.gov).
ABOUT THE FUND’S DIRECTORS AND OFFICERS
Your fund is overseen by a Board of Directors (Board) that meets regularly to review a wide variety of matters affecting or potentially affecting the fund, including performance, investment programs, compliance matters, advisory fees and expenses, service providers, and business and regulatory affairs. The Board elects the fund’s officers, who are listed in the final table. At least 75% of the Board’s members are independent of the Boards of T. Rowe Price Associates, Inc. (T. Rowe Price), and its affiliates; “inside” or “interested” directors are employees or officers of T. Rowe Price. The business address of each director and officer is 100 East Pratt Street, Baltimore, Maryland 21202. The Statement of Additional Information includes additional information about the fund directors and is available without charge by calling a T. Rowe Price representative at 1-800-638-5660.
| INDEPENDENT DIRECTORS(a) | ||
| Name (Year of Birth) Year Elected* [Number of T. Rowe Price Portfolios Overseen] | Principal Occupation(s) and Directorships of Public Companies and Other Investment Companies During the Past Five Years | |
| Teresa Bryce Bazemore(b) (1959) 2018 [189] | President, Radian Guaranty (2008 to 2017); Member, Bazemore Consulting LLC (2018 to present); Member, Chimera Investment Corporation (2017 to present); Member, Federal Home Loan Bank of Pittsburgh (2017 to present) | |
| Ronald J. Daniels(b) (1959) 2018 [189] | President, The Johns Hopkins University(c)and Professor, Political Science Department, The Johns Hopkins University (2009 to present); Director, Lyndhurst Holdings (2015 to present) | |
| Bruce W. Duncan (1951) 2013 [189] | Chief Executive Officer and Director (January 2009 to December 2016), Chairman of the Board (January 2016 to present), and President (January 2009 to September 2016), First Industrial Realty Trust, an owner and operator of industrial properties; Chairman of the Board (2005 to September 2016) and Director (1999 to September 2016), Starwood Hotels & Resorts, a hotel and leisure company; Director, Boston Properties (May 2016 to present); Director, Marriott International, Inc. (September 2016 to present) | |
| Robert J. Gerrard, Jr. (1952) 2012 [189] | Advisory Board Member, Pipeline Crisis/Winning Strategies, a collaborative working to improve opportunities for young African Americans (1997 to present); Chairman of the Board, all funds (since July 2018) | |
| Paul F. McBride (1956) 2013 [189] | Advisory Board Member, Vizzia Technologies (2015 to present); Board Member, Dunbar Armored (2012 to present) | |
| Cecilia E. Rouse, Ph.D. (1963) 2012 [189] | Dean, Woodrow Wilson School (2012 to present); Professor and Researcher, Princeton University (1992 to present); Member of National Academy of Education (2010 to present); Director, MDRC, a nonprofit education and social policy research organization (2011 to present); Research Associate of Labor Studies Program at the National Bureau of Economic Research (2011 to 2015); Board Member of the National Bureau of Economic Research (2011 to present); Chair of Committee on the Status of Minority Groups in the Economic Profession of the American Economic Association (2012 to 2017); Vice President (2015 to 2016), American Economic Association | |
| John G. Schreiber (1946) 2001 [189] | Owner/President, Centaur Capital Partners, Inc., a real estate investment company (1991 to present); Cofounder, Partner, and Cochairman of the Investment Committee, Blackstone Real Estate Advisors, L.P. (1992 to 2015); Director, General Growth Properties, Inc. (2010 to 2013); Director, Blackstone Mortgage Trust, a real estate finance company (2012 to 2016); Director and Chairman of the Board, Brixmor Property Group, Inc. (2013 to present); Director, Hilton Worldwide (2013 to present); Director, Hudson Pacific Properties (2014 to 2016); Director, Invitation Homes (2014 to present) | |
| Mark R. Tercek (1957) 2009 [189] | President and Chief Executive Officer, The Nature Conservancy (2008 to present) | |
| (a)All information about the independent directors was current as of December 31, 2017, except for the information provided for Ms. Bazemore and Mr. Daniels, which is current as of January 1, 2018. | ||
| (b)Effective January 1, 2018, Ms. Bazemore and Mr. Daniels were elected as independent directors of the Price Funds. | ||
| (c)William J. Stromberg, president and chief executive officer of T. Rowe Price Group, Inc., the parent company of the Price Funds’ investment advisor, has served on the Board of Trustees of Johns Hopkins University since 2014 and is a member of the Johns Hopkins University Board’s Compensation Committee. | ||
| INSIDE DIRECTORS | ||
| Name (Year of Birth) Year Elected* [Number of T. Rowe Price Portfolios Overseen] | Principal Occupation(s) and Directorships of Public Companies and Other Investment Companies During the Past Five Years | |
| Edward C. Bernard** (1956) 2006 [0] | Director and Vice President, T. Rowe Price; Vice Chairman of the Board, Director, and Vice President, T. Rowe Price Group, Inc.; Chairman of the Board, Director, and Vice President, T. Rowe Price Investment Services, Inc., and T. Rowe Price Services, Inc.; Chairman of the Board and Director, T. Rowe Price Retirement Plan Services, Inc.; Chairman of the Board, Chief Executive Officer, Director, and President, T. Rowe Price International and T. Rowe Price Trust Company; Chairman of the Board, all funds (2006 to July 2018) | |
| David Oestreicher (1967) 2018 [189] | Chief Legal Officer, Vice President, and Secretary, T. Rowe Price Group, Inc.; Director, Vice President, and Secretary, T. Rowe Price Investment Services, Inc., T. Rowe Price Retirement Plan Services, Inc., T. Rowe Price Services, Inc., and T. Rowe Price Trust Company; Vice President and Secretary, T. Rowe Price, T. Rowe Price Hong Kong, and T. Rowe Price International; Vice President, T. Rowe Price Japan and T. Rowe Price Singapore; Principal Executive Officer and Executive Vice President, all funds | |
| Robert W. Sharps, CFA, CPA (1971) 2017 [135] | Vice President, T. Rowe Price, T. Rowe Price Group, Inc., and T. Rowe Price Trust Company; Vice President, Spectrum Funds | |
| *Each inside director serves until retirement, resignation, or election of a successor. | ||
| **Effective at the conclusion of a meeting of the Boards of the Price Funds held on July 25, 2018, | ||
| Mr. Bernard resigned from his role as a director and chairman of the Boards of all the Price Funds. | ||
| OFFICERS | ||
| Name (Year of Birth) Position Held With Spectrum Funds | Principal Occupation(s) | |
| Christopher D. Alderson (1962) Vice President | Director and Vice President, T. Rowe Price International; Vice President, Price Hong Kong, Price Singapore, and T. Rowe Price Group, Inc. | |
| Darrell N. Braman (1963) Vice President and Secretary | Vice President, Price Hong Kong, Price Singapore, T. Rowe Price, T. Rowe Price Group, Inc., T. Rowe Price International, T. Rowe Price Investment Services, Inc., and T. Rowe Price Services, Inc. | |
| Kimberly E. DeDominicis (1976) Vice President | Vice President, T. Rowe Price, T. Rowe Price Group, Inc., and T. Rowe Price International | |
| John R. Gilner (1961) Chief Compliance Officer | Chief Compliance Officer and Vice President, T. Rowe Price; Vice President, T. Rowe Price Group, Inc., and T. Rowe Price Investment Services, Inc. | |
| David R. Giroux, CFA (1975) Vice President | Vice President, T. Rowe Price, T. Rowe Price Group, Inc., and T. Rowe Price Trust Company | |
| Gary J. Greb (1961) Vice President | Vice President, T. Rowe Price, T. Rowe Price International, and T. Rowe Price Trust Company | |
| Arif Husain, CFA (1972) Vice President | Vice President, T. Rowe Price Group, Inc., and T. Rowe Price International; formerly, Director/Head of UK and Euro Fixed Income, AllianceBernstein (to 2013) | |
| Paul J. Krug, CPA (1964) Vice President | Vice President, T. Rowe Price, T. Rowe Price Group, Inc., and T. Rowe Price Trust Company | |
| Wyatt A. Lee, CFA (1971) Vice President | Vice President, T. Rowe Price, T. Rowe Price Group, Inc., and T. Rowe Price Trust Company | |
| Catherine D. Mathews (1963) Treasurer and Vice President | Vice President, T. Rowe Price, T. Rowe Price Group, Inc., and T. Rowe Price Trust Company | |
| Sebastien Page (1977) Vice President | Vice President, T. Rowe Price and T. Rowe Price Group, Inc. | |
| John W. Ratzesberger (1975) Vice President | Vice President, T. Rowe Price, T. Rowe Price Group, Inc., and T. Rowe Price Trust Company; formerly, North American Head of Listed Derivatives Operation, Morgan Stanley (to 2013) | |
| Shannon H. Rauser (1987) Assistant Secretary | Employee, T. Rowe Price | |
| Daniel O. Shackelford, CFA (1958) Vice President | Vice President, T. Rowe Price, T. Rowe Price Group, Inc., and T. Rowe Price Trust Company | |
| Charles M. Shriver, CFA (1967) President | Vice President, T. Rowe Price, T. Rowe Price Group, Inc., T. Rowe Price International, and T. Rowe Price Trust Company | |
| Guido F. Stubenrauch, CFA (1970) Vice President | Vice President, T. Rowe Price and T. Rowe Price Group, Inc. | |
| Toby M. Thompson, CFA, CAIA (1971) Vice President | Vice President, T. Rowe Price and T. Rowe Price Group, Inc. | |
| Justin Thomson (1968) Vice President | Vice President, T. Rowe Price Group, Inc., and T. Rowe Price | |
| Mark S. Vaselkiv (1958) Vice President | Vice President, T. Rowe Price, T. Rowe Price Group, Inc., and T. Rowe Price Trust Company | |
| Megan Warren (1968) Vice President | Vice President, T. Rowe Price, T. Rowe Price Group, Inc., T. Rowe Price Retirement Plan Services, Inc., T. Rowe Price Services, Inc., and T. Rowe Price Trust Company; formerly, Executive Director, JP Morgan Chase (to 2017) | |
| Unless otherwise noted, officers have been employees of T. Rowe Price or T. Rowe Price International for at least 5 years. | ||
Item 2. Code of Ethics.
The registrant has adopted a code of ethics, as defined in Item 2 of Form N-CSR, applicable to its principal executive officer, principal financial officer, principal accounting officer or controller, or persons performing similar functions. A copy of this code of ethics is filed as an exhibit to this Form N-CSR. No substantive amendments were approved or waivers were granted to this code of ethics during the period covered by this report.
Item 3. Audit Committee Financial Expert.
The registrant’s Board of Directors/Trustees has determined that Mr. Bruce W. Duncan qualifies as an audit committee financial expert, as defined in Item 3 of Form N-CSR. Mr. Duncan is considered independent for purposes of Item 3 of Form N-CSR.
Item 4. Principal Accountant Fees and Services.
(a) – (d) Aggregate fees billed for the last two fiscal years for professional services rendered to, or on behalf of, the registrant by the registrant’s principal accountant were as follows:
Audit fees include amounts related to the audit of the registrant’s annual financial statements and services normally provided by the accountant in connection with statutory and regulatory filings. Audit-related fees include amounts reasonably related to the performance of the audit of the registrant’s financial statements and specifically include the issuance of a report on internal controls and, if applicable, agreed-upon procedures related to fund acquisitions. Tax fees include amounts related to services for tax compliance, tax planning, and tax advice. The nature of these services specifically includes the review of distribution calculations and the preparation of Federal, state, and excise tax returns. All other fees include the registrant’s pro-rata share of amounts for agreed-upon procedures in conjunction with service contract approvals by the registrant’s Board of Directors/Trustees.
(e)(1) The registrant’s audit committee has adopted a policy whereby audit and non-audit services performed by the registrant’s principal accountant for the registrant, its investment adviser, and any entity controlling, controlled by, or under common control with the investment adviser that provides ongoing services to the registrant require pre-approval in advance at regularly scheduled audit committee meetings. If such a service is required between regularly scheduled audit committee meetings, pre-approval may be authorized by one audit committee member with ratification at the next scheduled audit committee meeting. Waiver of pre-approval for audit or non-audit services requiring fees of a de minimis amount is not permitted.
(2) No services included in (b) – (d) above were approved pursuant to paragraph (c)(7)(i)(C) of Rule 2-01 of Regulation S-X.
(f) Less than 50 percent of the hours expended on the principal accountant’s engagement to audit the registrant’s financial statements for the most recent fiscal year were attributed to work performed by persons other than the principal accountant’s full-time, permanent employees.
(g) The aggregate fees billed for the most recent fiscal year and the preceding fiscal year by the registrant’s principal accountant for non-audit services rendered to the registrant, its investment adviser, and any entity controlling, controlled by, or under common control with the investment adviser that provides ongoing services to the registrant were $2,544,000 and $2,169,000, respectively.
(h) All non-audit services rendered in (g) above were pre-approved by the registrant’s audit committee. Accordingly, these services were considered by the registrant’s audit committee in maintaining the principal accountant’s independence.
Item 5. Audit Committee of Listed Registrants.
Not applicable.
Item 6. Investments.
(a) Not applicable. The complete schedule of investments is included in Item 1 of this Form N-CSR.
(b) Not applicable.
Item 7. Disclosure of Proxy Voting Policies and Procedures for Closed-End Management Investment Companies.
Not applicable.
Item 8. Portfolio Managers of Closed-End Management Investment Companies.
Not applicable.
Item 9. Purchases of Equity Securities by Closed-End Management Investment Company and Affiliated Purchasers.
Not applicable.
Item 10. Submission of Matters to a Vote of Security Holders.
Not applicable.
Item 11. Controls and Procedures.
(a) The registrant’s principal executive officer and principal financial officer have evaluated the registrant’s disclosure controls and procedures within 90 days of this filing and have concluded that the registrant’s disclosure controls and procedures were effective, as of that date, in ensuring that information required to be disclosed by the registrant in this Form N-CSR was recorded, processed, summarized, and reported timely.
(b) During the period, the Price Funds’ accounting agent, The Bank of New York Mellon (BNYM), converted the funds’ books and records from a legacy fund accounting system / operating model to a BNYM fund accounting system / operating model.
Item 12. Exhibits.
(a)(1) The registrant’s code of ethics pursuant to Item 2 of Form N-CSR is attached.
(2) Separate certifications by the registrant's principal executive officer and principal financial officer, pursuant to Section 302 of the Sarbanes-Oxley Act of 2002 and required by Rule 30a-2(a) under the Investment Company Act of 1940, are attached.
(3) Written solicitation to repurchase securities issued by closed-end companies: not applicable.
(b) A certification by the registrant's principal executive officer and principal financial officer, pursuant to Section 906 of the Sarbanes-Oxley Act of 2002 and required by Rule 30a-2(b) under the Investment Company Act of 1940, is attached.
SIGNATURES
Pursuant to the requirements of the Securities Exchange Act of 1934 and the Investment Company Act of 1940, the registrant has duly caused this report to be signed on its behalf by the undersigned, thereunto duly authorized.
T. Rowe Price Spectrum Fund, Inc.
| By | /s/ David Oestreicher | |||||
| David Oestreicher | ||||||
| Principal Executive Officer | ||||||
| Date | February 15, 2019 | |||||
Pursuant to the requirements of the Securities Exchange Act of 1934 and the Investment Company Act of 1940, this report has been signed below by the following persons on behalf of the registrant and in the capacities and on the dates indicated.
| By | /s/ David Oestreicher | |||||
| David Oestreicher | ||||||
| Principal Executive Officer | ||||||
| Date | February 15, 2019 | |||||
| By | /s/ Catherine D. Mathews | |||||
| Catherine D. Mathews | ||||||
| Principal Financial Officer | ||||||
| Date | February 15, 2019 | |||||