UNITED STATES
SECURITIES AND EXCHANGE COMMISSION
Washington, D.C. 20549
FORMN-CSR
CERTIFIED SHAREHOLDER REPORT OF REGISTERED
MANAGEMENT INVESTMENT COMPANIES
Investment Company Act file number:811-4984
AMERICAN BEACON FUNDS
(Exact name of registrant as specified in charter)
220 East Las Colinas Boulevard, Suite 1200
Irving, Texas 75039
(Address of principal executive offices)-(Zip code)
GENE L. NEEDLES, JR., PRESIDENT
220 East Las Colinas Boulevard, Suite 1200
Irving, Texas 75039
(Name and address of agent for service)
Registrant’s telephone number, including area code: (817)391-6100
Date of fiscal year end: January 31, 2020
Date of reporting period: January 31, 2020
FormN-CSR is to be used by management investment companies to file reports with the Commission not later than 10 days after the transmission to stockholders of any report that is required to be transmitted to stockholders under Rule30e-1 under the Investment Company Act of 1940 (17 CFR270.30e-1). The Commission may use the information provided on FormN-CSR in its regulatory, disclosure review, inspection, and policymaking roles.
A registrant is required to disclose the information specified by FormN-CSR, and the Commission will make this information public. A registrant is not required to respond to the collection of information contained in FormN-CSR unless the Form displays a currently valid Office of Management and Budget (“OMB”) control number. Please direct comments concerning the accuracy of the information collection burden estimate and any suggestions for reducing the burden to Secretary, Securities and Exchange Commission, 450 Fifth Street, NW, Washington, DC 20549-0609. The OMB has reviewed this collection of information under the clearance requirements of 44 U.S.C. § 3507.
| ITEM 1. | REPORTS TO STOCKHOLDERS. |
About American Beacon Advisors
Since 1986, American Beacon Advisors, Inc. has offered a variety of products and investment advisory services to numerous institutional and retail clients, including a variety of mutual funds, corporate cash management, and separate account management.
Our clients include defined benefit plans, defined contribution plans, foundations, endowments, corporations, financial planners, and other institutional investors. With American Beacon Advisors, you can put the experience of a multi-billion dollar asset management firm to work for your company.
ACADIAN EMERGING MARKETS MANAGED VOLATILITY FUND
Investing inforeign and emerging market securitiesmay involve heightened risk due to currency fluctuations and economic and political risks. Investing inlower volatility securitiesmay produce more modest gains than other stock funds as atrade-off for the potentially lower downside risk. The use offutures contractsfor cash management may subject the Fund to losing more money than invested. The Fund participates in asecurities lendingprogram. Please see the prospectus for a complete discussion of the Fund’s risks. There can be no assurances that the investment objectives of this Fund will be met.
Any opinions herein, including forecasts, reflect our judgment as of the end of the reporting period and are subject to change. Each advisor’s strategies and each Fund’s portfolio composition will change depending on economic and market conditions. This report is not a complete analysis of market conditions, and, therefore, should not be relied upon as investment advice. Although economic and market information has been compiled from reliable sources, American Beacon Advisors, Inc. makes no representation as to the completeness or accuracy of the statements contained herein.
American Beacon Funds | January 31, 2020 |
Contents
| 1 | ||||
| 2 | ||||
| 6 | ||||
| 8 | ||||
Schedules of Investments: | ||||
American Beacon Acadian Emerging Markets Managed Volatility Fund | 9 | |||
| 17 | ||||
| 20 | ||||
Financial Highlights: | ||||
American Beacon Acadian Emerging Markets Managed Volatility Fund | 42 | |||
| 47 | ||||
| 48 | ||||
| 54 | ||||
| Back Cover | ||||
 | Dear Shareholders,
During the 12 months of this reporting period, news reports highlighted multiple disruptive headwinds in the global economy; among them the U.S. trade war with China and its toll on the global economy, Brexit, disruptions in the Middle East and protests in Hong Kong. And although the headlines seemed to be just starting during the period addressed in this report, it’s now undeniable that the global spread of the COVID-19 virus is having an overwhelming effect on the world’s markets, the full impact of which is unknown at this time.
As Peter L. Bernstein said in his treatise on risk,Against the Gods: The Remarkable Story of Risk, published by John Wiley & Sons, Inc. in September 1998, “Volatility is a proxy for uncertainty and must be accommodated in measuring investment risk.”
During times of economic uncertainty and market volatility, fear of loss can be a powerful emotion – one that drives many investors to making short-term decisions subject to a variety of potential error-leading biases. Unfortunately, some short-term investment decisions may create more volatility rather than mitigate it. |
Instead of dwelling on the markets’ short-term reaction to waves of negative global news, we encourage investors to focus on the horizon instead. Long-term investing isn’t about identifying and anticipating the next big market move, it is about identifying the right investment products for riding out those moves. As a long-term investor, you should keep in mind the three Ds:direction,disciplineanddiversification.
| u | Direction: Achieving your long-term financial goals requires an individualized plan of action. You may want your plan to provide some measure of protection against periods of geopolitical turmoil, economic uncertainty, market volatility and job insecurity. Your plan should be reviewed annually and be adjusted in the event your long-range needs change. |
| u | Discipline:Long-term, systematic participation in an investment portfolio requires your resolution to stay the course. Spending time in the market – rather than trying to time the market – may place you in a better position to reach your long-term financial goals. |
| u | Diversification: By investing in different investment styles and asset classes, you may be able to help mitigate financial risks across your investment portfolio. By allocating your investment portfolio according to your risk-tolerance level, you may be better positioned to weather storms and achieve your long-term financial goals. |
Since 1986, American Beacon has endeavored to provide investors with a disciplined approach to realizing long-term financial goals.As a manager of managers, we strive to provide investment products that may enable investors to participate during market upswings while potentially insulating against market downswings.
Many of thesub-advisors to our mutual funds pursue upside capture and/or downside protection using proprietary strategies. The investment teams behind our mutual funds seek to produce consistent, long-term results rather than focus only on short-term movements in the markets. In managing our investment products, we emphasize identifying opportunities that offer the potential for long-term rewards.
Our management approach is more than a concept; it’s the cornerstone of our culture. And we strive to apply it at every turn as we seek to provide a well-diversified line of investment solutions to help our shareholders seek long-term rewards while mitigating volatility and risk.
Thank you for your continued interest in American Beacon. For additional information about our investment products or to access your account information, please visit our website atwww.americanbeaconfunds.com.
Best Regards,

Gene L. Needles, Jr.
President
American Beacon Funds
1
Global Equity and Emerging Markets Overview
January 31, 2020 (Unaudited)
Global equity markets closed with a gain for the12-month period ended January 31, 2020, as evidenced by the MSCI ACWI Index (up 16.0%). In the U.S., the unemployment rate moved slightly up to 3.6%, and gross domestic product growth for 2019 averaged 2.3%. The fiscal year began with global uncertainty stemming from Brexit-related turmoil in the eurozone, as well as the U.S.-China trade war and the effects reverberating from it.
However, as the year went on, markets were emboldened by progress toward a “phase one” trade deal between the U.S. and China, and the uncertainty regarding the eurozone was reduced with a strong electoral win by the Conservative Party and Boris Johnson in the U.K. Investors welcomed the Federal Reserve’s rate cuts and the monetary easing efforts enacted by other central banks. Although these positive trends were well-received, investors maintained a healthy dose of caution given the history of trade rhetoric between U.S. and China, the U.S. entering a presidential election year, and the emergence of a potential pandemic stemming from the newly identifiedCOVID-19 virus.
Emerging Markets delivered positive returns, with the MSCI Emerging Markets Index up 3.8% for the period under review. Following are some country highlights:
| • | Chinese equities rose 5.8% for the period while awaiting the completion of the phase one trade deal with the U.S., which was officially signed in January 2020. Although Beijing’s stimulus measures took root,pro-democracy protests in Hong Kong remained a dark cloud. |
| • | Brazilian equities closed down 0.8%, despite a positive 2020 forecast for economic and domestic demand recovery. |
| • | Mexican equities ticked up 2.8% on the U.S. House of Representatives’ approval of the United States-Mexico-Canada Agreement, a new trade deal seeking to modernize the26-year-old North American Free Trade Agreement, and the resulting diminished threat of new auto tariffs. |
| • | Turkish equities posted a 4.5% loss despite the central bank cutting interest rates in an effort to revive the nation’s economy. |
Ultimately, Emerging Markets lagged developed markets during the period as investors deliberated over the effect of back and forth U.S.-China trade negotiations, which had an outsized impact on performance.
2
American Beacon Acadian Emerging Markets Managed Volatility FundSM
Performance Overview
January 31, 2020 (Unaudited)
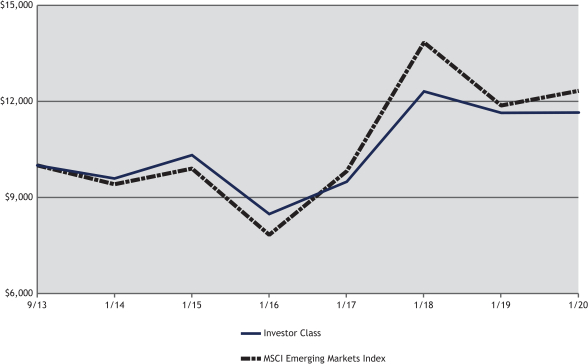
The Investor Class of the American Beacon Acadian Emerging Markets Managed Volatility Fund (the “Fund”) returned 0.06% for the 12 months ended January 31, 2020. The Fund underperformed the MSCI Emerging Markets Index (the “Index”) return of 3.81% for the period.
Comparison of Changes in Value of a $10,000 Investment for the period 9/27/2013 through 1/31/2020
| Total Returns for the Period ended January 31, 2020 |
| |||||||||||||||||||||||||||||||
Ticker | 1 Year | 3 Years | 5 Years | Since Inception | Value of $10,000 1/31/2020 | |||||||||||||||||||||||||||
Institutional Class (1,3) | ACDIX | 0.42 | % | 7.46 | % | 2.82 | % | 2.80 | % | $ | 11,914 | |||||||||||||||||||||
Y Class (1,3) | ACDYX | 0.23 | % | 7.35 | % | 2.73 | % | 2.69 | % | $ | 11,835 | |||||||||||||||||||||
Investor Class (1,3) | ACDPX | 0.06 | % | 7.08 | % | 2.45 | % | 2.43 | % | $ | 11,643 | |||||||||||||||||||||
A without Sales Charge (1,3) | ACDAX | 0.03 | % | 7.06 | % | 2.41 | % | 2.38 | % | $ | 11,611 | |||||||||||||||||||||
A with Sales Charge (1,3) | ACDAX | (5.73 | )% | 4.97 | % | 1.21 | % | 1.43 | % | $ | 10,944 | |||||||||||||||||||||
C without Sales Charge (1,3) | ACDCX | (0.71 | )% | 6.23 | % | 1.66 | % | 1.61 | % | $ | 11,064 | |||||||||||||||||||||
C with Sales Charge (1,3) | ACDCX | (1.71 | )% | 6.23 | % | 1.66 | % | 1.61 | % | $ | 11,064 | |||||||||||||||||||||
MSCI Emerging Markets Index (2) | 3.81 | % | 7.88 | % | 4.48 | % | 3.35 | % | $ | 12,323 | ||||||||||||||||||||||
| 1. | Performance shown is historical and is not indicative of future returns. Investment returns and principal value will vary, and shares may be worth more or less at redemption than at original purchase. Performance shown is calculated based on the published end of day net asset values as of the date indicated and current performance may be lower or higher than the performance data quoted. To obtain performance as of the most recent month end, please visitwww.americanbeaconfunds.com or call1-800-967-9009. Fund performance in the table above does not reflect the deduction of taxes a shareholder would pay on distributions or the redemption of shares. Generally accepted accounting principles require adjustments to be made to the net assets of the Fund at period end for financial reporting purposes only, and as such, the total return based on the unadjusted net asset value per share may differ from the total return reported in the financial highlights. A portion of the fees charged to each Class of the Fund has been waived since Fund inception. Performance prior to waiving fees was lower than the actual returns shown since inception. A Class shares have a maximum sales charge of 5.75%. The maximum contingent deferred sales charge for the C Class is 1.00% for shares redeemed within one year of the date of purchase. |
3
American Beacon Acadian Emerging Markets Managed Volatility FundSM
Performance Overview
January 31, 2020 (Unaudited)
| 2. | The MSCI Emerging Markets Index is a market capitalization weighted index composed of companies that are representative of the market structure of developing countries in Latin America, Asia, Eastern Europe, the Middle East and Africa. The MSCI® information contained herein: (1) is provided “as is,” (2) is proprietary to MSCI and/or its content providers, (3) may not be used to create any financial instruments or products or any indexes and (4) may not be copied or distributed without MSCI’s express written consent. MSCI disclaims all warranties with respect to the information. Neither MSCI nor its content providers are responsible for any damages or losses arising from any use of this information. One cannot directly invest in an index. |
| 3. | The Total Annual Fund Operating Expense ratios set forth in the most recent Fund prospectus for the Institutional, Y, Investor, A and C Class shares were 1.71%, 1.76%, 2.15%, 2.02% and 2.77%, respectively. The expense ratios above may vary from the expense ratios presented in other sections of this report that are based on expenses incurred during the period covered by this report. |
The Fund underperformed the Index over theone-year period primarily due to stock selection. Country allocation was moderately positive.
Stock selections in China and Taiwan detracted from relative performance during the period. The primary detractors in China included China Telecom Corp. Ltd., Class H (down 25.5%) and China Unicom Hong Kong Ltd. (down 25.7%). Detractors in Taiwan included Sitronix Technology Corp. (down 12.3%). Stock selections in Brazil such as Grupo SBF S.A. (up 179.1%) provided positive contribution to relative returns.
Relative contribution from country allocation was positive for the12-month period. Overweighting Egypt (up 31.7%) and Greece (up 28.0%) contributed positively to relative performance. On the other hand, overweighting Chile (down 31.7%) detracted from relative performance during the period.
The Fund’s basic philosophy remains focused on investing in a well-diversified portfolio of low volatility stocks that aims to maximize risk-adjusted returns.
| Top Ten Holdings (% Net Assets) | ||||||||
| Samsung Electronics Co., Ltd. | 3.9 | |||||||
| China Telecom Corp. Ltd., Class H | 1.4 | |||||||
| Foxconn Industrial Internet Co., Ltd., Class A | 1.4 | |||||||
| Gazprom Neft PJSC, Sponsored ADR | 1.4 | |||||||
| Hellenic Telecommunications Organization S.A. | 1.4 | |||||||
| Hindustan Unilever Ltd. | 1.4 | |||||||
| IRB Brasil Resseguros S/A | 1.4 | |||||||
| Magyar Telekom Telecommunications PLC | 1.4 | |||||||
| Oracle Financial Services Software Ltd. | 1.4 | |||||||
| Taiwan Shin Kong Security Co., Ltd. | 1.4 | |||||||
| Total Fund Holdings | 182 | |||||||
| Sector Allocation (% Equities) | ||||||||
| Financials | 24.0 | |||||||
| Information Technology | 18.0 | |||||||
| Communication Services | 17.7 | |||||||
| Utilities | 10.4 | |||||||
| Consumer Staples | 9.6 | |||||||
| Industrials | 6.4 | |||||||
| Energy | 4.7 | |||||||
| Consumer Discretionary | 4.6 | |||||||
| Materials | 2.6 | |||||||
| Health Care | 1.3 | |||||||
| Real Estate | 0.7 | |||||||
4
American Beacon Acadian Emerging Markets Managed Volatility FundSM
Performance Overview
January 31, 2020 (Unaudited)
| Country Allocation (% Equities) | ||||||||
| China | 28.6 | |||||||
| Republic of Korea | 12.8 | |||||||
| Taiwan | 8.6 | |||||||
| India | 8.3 | |||||||
| Brazil | 4.3 | |||||||
| Russia | 4.2 | |||||||
| Malaysia | 3.8 | |||||||
| Thailand | 3.8 | |||||||
| Mexico | 3.6 | |||||||
| Philippines | 3.5 | |||||||
| Egypt | 3.1 | |||||||
| Chile | 2.5 | |||||||
| Czech Republic | 2.3 | |||||||
| South Africa | 2.3 | |||||||
| Greece | 2.1 | |||||||
| Hungary | 2.0 | |||||||
| Poland | 1.6 | |||||||
| Turkey | 0.8 | |||||||
| Peru | 0.7 | |||||||
| Indonesia | 0.5 | |||||||
| United States | 0.5 | |||||||
| Hong Kong | 0.1 |
5
American Beacon FundsSM
January 31, 2020 (Unaudited)
Fund Expense Example
As a shareholder of a Fund, you incur two types of costs: (1) transaction costs, including sales charges (loads) on purchase payments and redemption fees, if applicable, and (2) ongoing costs, including management fees, distribution(12b-1) fees,sub-transfer agent fees, and other Fund expenses. The Examples are intended to help you understand the ongoing cost (in dollars) of investing in the Fund and to compare these costs with the ongoing costs of investing in other mutual funds. The Examples are based on an investment of $1,000 invested at the beginning of the period in each Class and held for the entire period from August 1, 2019 through January 31, 2020.
Actual Expenses
The “Actual” lines of the tables provide information about actual account values and actual expenses. You may use the information on this page, together with the amount you invested, to estimate the expenses that you paid over the period. Simply divide your account value by $1,000 (for example, an $8,600 account value divided by $1,000 = $8.60), then multiply the result by the “Expenses Paid During Period” to estimate the expenses you paid on your account during this period. Shareholders of the Investor and Institutional Classes that invest in the Fund through an IRA or Roth IRA may be subject to a custodial IRA fee of $15 that is typically deducted each December. If your account was subject to a custodial IRA fee during the period, your costs would have been $15 higher.
Hypothetical Example for Comparison Purposes
The “Hypothetical” lines of the tables provide information about hypothetical account values and hypothetical expenses based on the Fund’s actual expense ratio and an assumed 5% per year rate of return before expenses (not the Fund’s actual return). You may compare the ongoing costs of investing in the Fund with other funds by contrasting this 5% hypothetical example and the 5% hypothetical examples that appear in the shareholder reports of the other funds. The hypothetical account values and expenses may not be used to estimate the actual ending account balance or expenses you paid for the period. Shareholders of the Investor and Institutional Classes that invest in the Funds through an IRA or Roth IRA may be subject to a custodial IRA fee of $15 that is typically deducted each December. If your account was subject to a custodial IRA fee during the period, your costs would have been $15 higher.
You should also be aware that the expenses shown in the table highlight only your ongoing costs and do not reflect any transaction costs charged by the Fund, such as sales charges (loads) or redemption fees, as applicable. Similarly, the expense examples for other funds do not reflect any transaction costs charged by those funds, such as sales charges (loads), redemption fees or exchange fees. Therefore, the “Hypothetical” lines of the tables are useful in comparing ongoing costs only and will not help you determine the relative total costs of owning different funds. If you were subject to any transaction costs during the period, your costs would have been higher.
6
American Beacon Acadian Emerging Markets Managed Volatility FundSM
Expense Examples
January 31, 2020 (Unaudited)
| American Beacon Acadian Emerging Markets Managed Volatility Fund |
| ||||||||||||||
| Beginning Account Value 8/1/2019 | Ending Account Value 1/31/2020 | Expenses Paid During Period 8/1/2019-1/31/2020* | |||||||||||||
| Institutional Class | |||||||||||||||
| Actual | $1,000.00 | $1,010.90 | $6.84 | ||||||||||||
| Hypothetical** | $1,000.00 | $1,018.40 | $6.87 | ||||||||||||
| Y Class | |||||||||||||||
| Actual | $1,000.00 | $1,009.90 | $7.35 | ||||||||||||
| Hypothetical** | $1,000.00 | $1,017.90 | $7.38 | ||||||||||||
| Investor Class | |||||||||||||||
| Actual | $1,000.00 | $1,009.30 | $8.76 | ||||||||||||
| Hypothetical** | $1,000.00 | $1,016.48 | $8.79 | ||||||||||||
| A Class | |||||||||||||||
| Actual | $1,000.00 | $1,009.00 | $8.86 | ||||||||||||
| Hypothetical** | $1,000.00 | $1,016.38 | $8.89 | ||||||||||||
| C Class | |||||||||||||||
| Actual | $1,000.00 | $1,004.50 | $12.63 | ||||||||||||
| Hypothetical** | $1,000.00 | $1,012.60 | $12.68 | ||||||||||||
| * | Expenses are equal to the Fund’s annualized expense ratios for the six-month period of 1.35%, 1.45%, 1.73%, 1.75%, and 2.50% for the Institutional, Y, Investor, A, and C Classes, respectively, multiplied by the average account value over the period, multiplied by the number derived by dividing the number of days in the most recent fiscal half-year (184) by days in the year (365) to reflect the half-year period. |
| ** | 5% return before expenses. |
7
American Beacon FundsSM
Report of Independent Registered Public Accounting Firm
To the Board of Trustees of American Beacon Funds and the Shareholders of American Beacon Acadian Emerging Markets Managed Volatility Fund
Opinion on the Financial Statements
We have audited the accompanying statement of assets and liabilities, including the schedule of investments, of American Beacon Acadian Emerging Markets Managed Volatility Fund (one of the series constituting American Beacon Funds, referred to hereafter as the “Fund”) as of January 31, 2020, the related statement of operations for the year ended January 31, 2020, the statement of changes in net assets for each of the two years in the period ended January 31, 2020, including the related notes, and the financial highlights for each of the five years in the period ended January 31, 2020 (collectively referred to as the “financial statements”). In our opinion, the financial statements present fairly, in all material respects, the financial position of the Fund as of January 31, 2020, the results of its operations for the year then ended, the changes in its net assets for each of the two years in the period ended January 31, 2020 and the financial highlights for each of the five years in the period ended January 31, 2020 in conformity with accounting principles generally accepted in the United States of America.
The financial statements of the Fund as of and for the year ended January 31, 2016 and the financial highlights for each of the periods ended on or prior to January 31, 2016 (not presented herein, other than the financial highlights) were audited by other auditors whose report dated March 31, 2016 expressed an unqualified opinion on those financial statements and financial highlights.
Basis for Opinion
These financial statements are the responsibility of the Fund’s management. Our responsibility is to express an opinion on the Fund’s financial statements based on our audits. We are a public accounting firm registered with the Public Company Accounting Oversight Board (United States) (PCAOB) and are required to be independent with respect to the Fund in accordance with the U.S. federal securities laws and the applicable rules and regulations of the Securities and Exchange Commission and the PCAOB.
We conducted our audits of these financial statements in accordance with the standards of the PCAOB. Those standards require that we plan and perform the audit to obtain reasonable assurance about whether the financial statements are free of material misstatement, whether due to error or fraud.
Our audits included performing procedures to assess the risks of material misstatement of the financial statements, whether due to error or fraud, and performing procedures that respond to those risks. Such procedures included examining, on a test basis, evidence regarding the amounts and disclosures in the financial statements. Our audits also included evaluating the accounting principles used and significant estimates made by management, as well as evaluating the overall presentation of the financial statements. Our procedures included confirmation of securities owned as of January 31, 2020 by correspondence with the custodian, transfer agent and brokers; when replies were not received from brokers, we performed other auditing procedures. We believe that our audits provide a reasonable basis for our opinion.
PricewaterhouseCoopers LLP
Dallas, TX
March 30, 2020
We have served as the auditor of one or more investment companies in the American Beacon family of funds since 2016.
8
American Beacon Acadian Emerging Markets Managed Volatility FundSM
Schedule of Investments
January 31, 2020
| Shares | Fair Value | ||||||||||||||
| Brazil - 3.76% | |||||||||||||||
| Common Stocks - 2.30% | |||||||||||||||
| Alupar Investimento S.A.A | 3,700 | $ | 25,556 | ||||||||||||
| CPFL Energia S.A. | 1,000 | 8,936 | |||||||||||||
| Grupo SBF S.A.B | 616 | 5,675 | |||||||||||||
| IRB Brasil Resseguros S/A | 14,900 | 155,972 | |||||||||||||
| Neoenergia S.A. | 5,000 | 30,040 | |||||||||||||
| Telefonica Brasil S.A., ADR | 796 | 11,049 | |||||||||||||
| Transmissora Alianca de Energia Eletrica S.A.A | 2,400 | 17,350 | |||||||||||||
|
| ||||||||||||||
Total Common Stocks | 254,578 | ||||||||||||||
|
| ||||||||||||||
| Preferred Stocks - 1.46% | |||||||||||||||
| Centrais Eletricas Santa Catarina C | 900 | 11,249 | |||||||||||||
| Cia de Transmissao de Energia Eletrica Paulista C | 1,200 | 6,220 | |||||||||||||
| Telefonica Brasil S.A. C | 10,400 | 144,225 | |||||||||||||
|
| ||||||||||||||
Total Preferred Stocks | 161,694 | ||||||||||||||
|
| ||||||||||||||
Total Brazil (Cost $296,034) | 416,272 | ||||||||||||||
|
| ||||||||||||||
| Chile - 2.22% | |||||||||||||||
| Common Stocks - 2.22% | |||||||||||||||
| Banco de Chile | 4,737 | 466 | |||||||||||||
| Blumar S.A. | 25,008 | 8,265 | |||||||||||||
| Cia Cervecerias Unidas S.A. | 1,442 | 12,730 | |||||||||||||
| Embotelladora Andina S.A., Class B, ADR | 2,810 | 43,583 | |||||||||||||
| Empresas COPEC S.A. | 442 | 3,943 | |||||||||||||
| Enel Americas SA | 60,566 | 11,934 | |||||||||||||
| Enel Chile S.A. | 1,495,968 | 141,877 | |||||||||||||
| Inversiones Aguas Metropolitanas S.A. | 6,607 | 6,192 | |||||||||||||
| Minera Valparaiso S.A. | 54 | 905 | |||||||||||||
| Quinenco S.A. | 1,735 | 2,991 | |||||||||||||
| Sigdo Koppers S.A. | 10,378 | 12,838 | |||||||||||||
|
| ||||||||||||||
Total Common Stocks | 245,724 | ||||||||||||||
|
| ||||||||||||||
Total Chile (Cost $277,464) | 245,724 | ||||||||||||||
|
| ||||||||||||||
| China - 25.39% | |||||||||||||||
| Common Stocks - 25.39% | |||||||||||||||
| Agricultural Bank of China Ltd., Class HD | 384,000 | 148,071 | |||||||||||||
| Bank of China Ltd., Class HD | 385,000 | 148,860 | |||||||||||||
| Bank of Communications Co., Ltd., Class HD | 216,000 | 137,680 | |||||||||||||
| Beijing Chunlizhengda Medical Instruments Co., Ltd., Class HD | 11,636 | 83,566 | |||||||||||||
| Beijing Jingkelong Co., Ltd., Class H | 69,000 | 11,549 | |||||||||||||
| Changshouhua Food Co., Ltd.D | 19,000 | 6,549 | |||||||||||||
| China CITIC Bank Corp. Ltd., Class HD | 33,000 | 17,180 | |||||||||||||
| China Construction Bank Corp., Class HD | 189,000 | 143,372 | |||||||||||||
| China Everbright Bank Co., Ltd., Class HD | 239,000 | 95,793 | |||||||||||||
| China Minsheng Banking Corp. Ltd., Class HD | 209,000 | 145,797 | |||||||||||||
| China Mobile Ltd.D | 17,500 | 143,274 | |||||||||||||
| China Petroleum & Chemical Corp., Class HD | 216,000 | 113,972 | |||||||||||||
| China Telecom Corp. Ltd., Class HD | 388,000 | 150,663 | |||||||||||||
| China Unicom Hong Kong Ltd.D | 176,000 | 146,735 | |||||||||||||
| CITIC Ltd.D | 126,000 | 141,465 | |||||||||||||
| CNOOC Ltd.D | 12,000 | 18,179 | |||||||||||||
| COSCO SHIPPING International Hong Kong Co., Ltd.D | 94,000 | 28,083 | |||||||||||||
| Foxconn Industrial Internet Co., Ltd., Class AD | 52,900 | 150,739 | |||||||||||||
| Fuguiniao Co., Ltd., Class HB D E | 28,000 | - | |||||||||||||
| GoerTek, Inc., Class AD | 36,100 | 120,683 | |||||||||||||
| Huishang Bank Corp. Ltd., Class HD | 99,100 | 36,491 | |||||||||||||
See accompanying notes
9
American Beacon Acadian Emerging Markets Managed Volatility FundSM
Schedule of Investments
January 31, 2020
| Shares | Fair Value | ||||||||||||||
| China - 25.39% (continued) | |||||||||||||||
| Common Stocks - 25.39% (continued) | |||||||||||||||
| Industrial & Commercial Bank of China Ltd., Class HD | 219,000 | $ | 145,736 | ||||||||||||
| Lenovo Group Ltd.D | 108,000 | 70,398 | |||||||||||||
| Lens Technology Co., Ltd., Class AD | 15,500 | 45,541 | |||||||||||||
| Luxshare Precision Industry Co., Ltd., Class AD | 3,300 | 21,216 | |||||||||||||
| NVC International Holdings Ltd.D | 949,000 | 28,887 | |||||||||||||
| PetroChina Co., Ltd., Class HD | 326,000 | 143,585 | |||||||||||||
| Ping An Insurance Group Co. of China Ltd., Class HD | 13,000 | 147,071 | |||||||||||||
| Sunac China Holdings Ltd.D | 11,000 | 53,030 | |||||||||||||
| Tencent Holdings Ltd.D | 2,000 | 94,966 | |||||||||||||
| Universal Scientific Industrial Shanghai Co., Ltd., Class AD | 23,745 | 64,972 | |||||||||||||
|
| ||||||||||||||
Total Common Stocks | 2,804,103 | ||||||||||||||
|
| ||||||||||||||
Total China (Cost $2,999,362) | 2,804,103 | ||||||||||||||
|
| ||||||||||||||
| Czech Republic - 2.01% | |||||||||||||||
| Common Stocks - 2.01% | |||||||||||||||
| CEZ A/SD | 6,276 | 137,382 | |||||||||||||
| Kofola CeskoSlovensko A/SD | 1,018 | 11,812 | |||||||||||||
| Komercni banka A/SD | 836 | 28,723 | |||||||||||||
| Philip Morris CR A/SD | 65 | 43,989 | |||||||||||||
|
| ||||||||||||||
Total Common Stocks | 221,906 | ||||||||||||||
|
| ||||||||||||||
Total Czech Republic (Cost $191,900) | 221,906 | ||||||||||||||
|
| ||||||||||||||
| Egypt - 2.79% | |||||||||||||||
| Common Stocks - 2.79% | |||||||||||||||
| Commercial International Bank Egypt SAED | 17,672 | 95,183 | |||||||||||||
| Credit Agricole Egypt SAED | 9,625 | 26,797 | |||||||||||||
| Faisal Islamic Bank of EgyptD | 46,254 | 42,408 | |||||||||||||
| MM Group for Industry & International Trade SAEB D | 90 | 54 | |||||||||||||
| Telecom Egypt Co.D | 184,372 | 143,997 | |||||||||||||
|
| ||||||||||||||
Total Common Stocks | 308,439 | ||||||||||||||
|
| ||||||||||||||
Total Egypt (Cost $251,475) | 308,439 | ||||||||||||||
|
| ||||||||||||||
| Greece - 1.85% | |||||||||||||||
| Common Stocks - 1.85% | |||||||||||||||
| Aegean Airlines S.A.D | 2,427 | 22,469 | |||||||||||||
| European Reliance General Insurance Co. S.A.D | 3,556 | 19,530 | |||||||||||||
| Hellenic Telecommunications Organization S.A.D | 10,293 | 153,848 | |||||||||||||
| Thessaloniki Water Supply & Sewage Co. S.A.D | 1,610 | 8,267 | |||||||||||||
|
| ||||||||||||||
Total Common Stocks | 204,114 | ||||||||||||||
|
| ||||||||||||||
Total Greece (Cost $145,554) | 204,114 | ||||||||||||||
|
| ||||||||||||||
| Hong Kong - 0.12% (Cost $20,109) | |||||||||||||||
| Common Stocks - 0.12% | |||||||||||||||
| Goldlion Holdings Ltd.D | 46,000 | 12,741 | |||||||||||||
|
| ||||||||||||||
| Hungary - 1.79% | |||||||||||||||
| Common Stocks - 1.79% | |||||||||||||||
| Magyar Telekom Telecommunications PLCD | 105,940 | 158,033 | |||||||||||||
| MOL Hungarian Oil & Gas PLCD | 2,320 | 19,616 | |||||||||||||
| OTP Bank NyrtD | 282 | 13,075 | |||||||||||||
| Richter Gedeon NyrtD | 231 | 4,956 | |||||||||||||
| Zwack Unicum RtD | 33 | 1,914 | |||||||||||||
|
| ||||||||||||||
Total Common Stocks | 197,594 | ||||||||||||||
|
| ||||||||||||||
Total Hungary (Cost $189,304) | 197,594 | ||||||||||||||
|
| ||||||||||||||
See accompanying notes
10
American Beacon Acadian Emerging Markets Managed Volatility FundSM
Schedule of Investments
January 31, 2020
| Shares | Fair Value | ||||||||||||||
| India - 7.40% | |||||||||||||||
| Common Stocks - 7.40% | |||||||||||||||
| Accelya Solutions India Ltd.B D | 828 | $ | 12,168 | ||||||||||||
| Dabur India Ltd.D | 3,593 | 24,998 | |||||||||||||
| GlaxoSmithKline Pharmaceuticals Ltd.D | 1,581 | 36,783 | |||||||||||||
| Gujarat Industries Power Co., Ltd.D | 7,676 | 8,660 | |||||||||||||
| Hinduja Global Solutions Ltd.D | 805 | 7,555 | |||||||||||||
| Hindustan Unilever Ltd.D | 5,387 | 153,707 | |||||||||||||
| Infosys Ltd.D | 6,332 | 69,045 | |||||||||||||
| Infosys Ltd., Sponsored ADR | 7,875 | 86,310 | |||||||||||||
| ION Exchange India Ltd.D | 2,845 | 37,682 | |||||||||||||
| Oracle Financial Services Software Ltd.B D | 3,733 | 152,776 | |||||||||||||
| Procter & Gamble Hygiene & Health Care Ltd.D | 426 | 65,972 | |||||||||||||
| SJVN Ltd.D | 34,607 | 12,319 | |||||||||||||
| Wipro Ltd.D | 44,149 | 146,335 | |||||||||||||
| Wipro Ltd., ADR | 810 | 2,940 | |||||||||||||
|
| ||||||||||||||
Total Common Stocks | 817,250 | ||||||||||||||
|
| ||||||||||||||
Total India (Cost $701,331) | 817,250 | ||||||||||||||
|
| ||||||||||||||
| Indonesia - 0.42% | |||||||||||||||
| Common Stocks - 0.42% | |||||||||||||||
| Astra Graphia Tbk PTD | 167,100 | 11,541 | |||||||||||||
| Multipolar Technology Tbk PTD | 558,900 | 14,065 | |||||||||||||
| Telekomunikasi Indonesia Persero Tbk PTD | 75,300 | 20,855 | |||||||||||||
|
| ||||||||||||||
Total Common Stocks | 46,461 | ||||||||||||||
|
| ||||||||||||||
Total Indonesia (Cost $95,880) | 46,461 | ||||||||||||||
|
| ||||||||||||||
| Malaysia - 3.38% | |||||||||||||||
| Common Stocks - 3.38% | |||||||||||||||
| Batu Kawan BhdD | 1,500 | 5,958 | |||||||||||||
| Kuala Lumpur Kepong BhdD | 350 | 1,946 | |||||||||||||
| Malayan Banking BhdD | 10,000 | 20,514 | |||||||||||||
| MISC BhdD | 25,600 | 47,609 | |||||||||||||
| Public Bank BhdD | 32,400 | 146,572 | |||||||||||||
| Tenaga Nasional BhdD | 49,528 | 150,218 | |||||||||||||
|
| ||||||||||||||
Total Common Stocks | 372,817 | ||||||||||||||
|
| ||||||||||||||
Total Malaysia (Cost $378,749) | 372,817 | ||||||||||||||
|
| ||||||||||||||
| Mexico - 3.17% | |||||||||||||||
| Common Stocks - 3.17% | |||||||||||||||
| Coca-Cola Femsa S.A.B. de C.V.A | 23,821 | 145,544 | |||||||||||||
| Coca-Cola Femsa S.A.B. de C.V., Sponsored ADR | 117 | 7,131 | |||||||||||||
| Grupo Industrial Saltillo S.A.B. de C.V. | 1,900 | 2,313 | |||||||||||||
| Industrias Bachoco S.A.B. de C.V., Series B | 17,308 | 69,450 | |||||||||||||
| Invex Controladora S.A.B. de C.V., Class A | 1,177 | 4,411 | |||||||||||||
| Wal-Mart de Mexico S.A.B. de C.V. | 41,394 | 121,123 | |||||||||||||
|
| ||||||||||||||
Total Common Stocks | 349,972 | ||||||||||||||
|
| ||||||||||||||
Total Mexico (Cost $359,278) | 349,972 | ||||||||||||||
|
| ||||||||||||||
| Peru - 0.63% | |||||||||||||||
| Common Stocks - 0.63% | |||||||||||||||
| Corp. Aceros Arequipa S.A. | 90,277 | 24,262 | |||||||||||||
| Enel Generacion Peru S.A.A. | 380 | 267 | |||||||||||||
| Engie Energia Peru S.A. | 2,663 | 6,134 | |||||||||||||
| Intercorp Financial Services, Inc. | 617 | 26,007 | |||||||||||||
See accompanying notes
11
American Beacon Acadian Emerging Markets Managed Volatility FundSM
Schedule of Investments
January 31, 2020
| Shares | Fair Value | ||||||||||||||
| Peru - 0.63% (continued) | |||||||||||||||
| Common Stocks - 0.63% (continued) | |||||||||||||||
| Luz del Sur S.A.A. | 1,768 | $ | 12,532 | ||||||||||||
|
| ||||||||||||||
Total Common Stocks | 69,202 | ||||||||||||||
|
| ||||||||||||||
Total Peru (Cost $61,491) | 69,202 | ||||||||||||||
|
| ||||||||||||||
| Philippines - 3.07% | |||||||||||||||
| Common Stocks - 3.07% | |||||||||||||||
| Asia United Bank Corp.D | 19,880 | 20,391 | |||||||||||||
| China Banking Corp.D | 51,412 | 25,323 | |||||||||||||
| Cosco Capital, Inc.D | 261,300 | 31,238 | |||||||||||||
| Eagle Cement Corp.D | 101,800 | 25,311 | |||||||||||||
| Globe Telecom, Inc.D | 345 | 12,791 | |||||||||||||
| Manila Electric Co.D | 24,380 | 123,075 | |||||||||||||
| Philippine National BankB D | 18,855 | 11,761 | |||||||||||||
| Pilipinas Shell Petroleum Corp.D | 5,480 | 3,225 | |||||||||||||
| RFM Corp.D | 132,000 | 12,990 | |||||||||||||
| San Miguel Corp.D | 12,387 | 33,833 | |||||||||||||
| Top Frontier Investment Holdings, Inc.B D | 3,950 | 14,603 | |||||||||||||
| Union Bank of the PhilippinesD | 19,531 | 24,389 | |||||||||||||
|
| ||||||||||||||
Total Common Stocks | 338,930 | ||||||||||||||
|
| ||||||||||||||
Total Philippines (Cost $394,612) | 338,930 | ||||||||||||||
|
| ||||||||||||||
| Poland - 1.39% | |||||||||||||||
| Common Stocks - 1.39% | |||||||||||||||
| Dom Development S.A.D | 576 | 14,128 | |||||||||||||
| Netia S.A.B D | 10,180 | 11,971 | |||||||||||||
| Stalexport Autostrady S.A.D | 32,382 | 24,732 | |||||||||||||
| TEN Square Games S.A.D | 1,674 | 99,719 | |||||||||||||
| Zespol Elektrocieplowni Wroclawskich Kogeneracja S.A.B D | 373 | 3,330 | |||||||||||||
|
| ||||||||||||||
Total Common Stocks | 153,880 | ||||||||||||||
|
| ||||||||||||||
Total Poland (Cost $139,101) | 153,880 | ||||||||||||||
|
| ||||||||||||||
| Republic of Korea - 11.31% | |||||||||||||||
| Common Stocks - 11.31% | |||||||||||||||
| Busan City Gas Co., Ltd.D | 989 | 28,665 | |||||||||||||
| BYC Co., Ltd.D | 44 | 8,238 | |||||||||||||
| Daesung Energy Co., Ltd.D | 8,294 | 34,975 | |||||||||||||
| ESTec Corp.D | 1,734 | 15,705 | |||||||||||||
| Fursys, Inc.D | 862 | 20,686 | |||||||||||||
| Incheon City Gas Co., Ltd.D | 1,386 | 32,159 | |||||||||||||
| Jinro Distillers Co., Ltd.D | 966 | 24,573 | |||||||||||||
| JLS Co., Ltd.D | 9,573 | 59,946 | |||||||||||||
| Kia Motors Corp.D | 3,648 | 124,243 | |||||||||||||
| KT Corp.B D | 7,015 | 148,899 | |||||||||||||
| RedcapTour Co., Ltd.D | 176 | 2,187 | |||||||||||||
| Samsung Electronics Co., Ltd.D | 9,093 | 425,545 | |||||||||||||
| Samwonsteel Co., Ltd.D | 3,736 | 8,987 | |||||||||||||
| Samyang Tongsang Co., Ltd.D | 602 | 30,911 | |||||||||||||
| SK Hynix, Inc.D | 461 | 35,755 | |||||||||||||
| SK Telecom Co., Ltd.D | 772 | 148,497 | |||||||||||||
| Yesco Holdings Co., Ltd.D | 2,505 | 76,269 | |||||||||||||
| Youngone Holdings Co., Ltd.D | 671 | 23,203 | |||||||||||||
|
| ||||||||||||||
Total Common Stocks | 1,249,443 | ||||||||||||||
|
| ||||||||||||||
Total Republic of Korea (Cost $1,252,264) | 1,249,443 | ||||||||||||||
|
| ||||||||||||||
See accompanying notes
12
American Beacon Acadian Emerging Markets Managed Volatility FundSM
Schedule of Investments
January 31, 2020
| Shares | Fair Value | ||||||||||||||
| Russia - 3.77% | |||||||||||||||
| Common Stocks - 3.77% | |||||||||||||||
| Gazprom Neft PJSC, Sponsored ADRD | 4,321 | $ | 150,267 | ||||||||||||
| MMC Norilsk Nickel PJSC, ADRD | 3,784 | 121,955 | |||||||||||||
| Rostelecom PJSC, Sponsored ADRD | 17,496 | 140,469 | |||||||||||||
| Severstal PJSC, GDRD | 244 | 3,429 | |||||||||||||
|
| ||||||||||||||
Total Common Stocks | 416,120 | ||||||||||||||
|
| ||||||||||||||
Total Russia (Cost $259,226) | 416,120 | ||||||||||||||
|
| ||||||||||||||
| South Africa - 2.07% | |||||||||||||||
| Common Stocks - 1.71% | |||||||||||||||
| Anglo American Platinum Ltd.D | 587 | 46,973 | |||||||||||||
| Combined Motor Holdings Ltd.D | 9,782 | 13,646 | |||||||||||||
| Motus Holdings Ltd.D | 23,788 | 128,111 | |||||||||||||
|
| ||||||||||||||
Total Common Stocks | 188,730 | ||||||||||||||
|
| ||||||||||||||
| Preferred Stocks - 0.36% | |||||||||||||||
| Absa Bank Ltd. C D | 814 | 40,087 | |||||||||||||
|
| ||||||||||||||
Total South Africa (Cost $266,073) | 228,817 | ||||||||||||||
|
| ||||||||||||||
| Taiwan - 7.64% | |||||||||||||||
| Common Stocks - 7.64% | |||||||||||||||
| 104 Corp.D | 3,000 | 14,991 | |||||||||||||
| Dafeng TV Ltd.D | 3,000 | 4,017 | |||||||||||||
| E-LIFE MALL Corp.D | 834 | 1,870 | |||||||||||||
| Great Taipei Gas Co., Ltd.D | 49,000 | 50,985 | |||||||||||||
| Hey Song Corp.D | 9,000 | 9,804 | |||||||||||||
| Hon Hai Precision Industry Co., Ltd.D | 51,000 | 138,506 | |||||||||||||
| Hua Nan Financial Holdings Co., Ltd.D | 209,440 | 149,438 | |||||||||||||
| Kedge Construction Co., Ltd.D | 13,000 | 16,472 | |||||||||||||
| Lian HWA Food Corp.D | 3,363 | 4,560 | |||||||||||||
| Nanya Technology Corp.D | 5,000 | 12,641 | |||||||||||||
| Sinon Corp.D | 12,000 | 7,556 | |||||||||||||
| Sitronix Technology Corp.D | 21,000 | 106,039 | |||||||||||||
| Taichung Commercial Bank Co., Ltd.D | 183,327 | 73,631 | |||||||||||||
| Taiwan Semiconductor Manufacturing Co., Ltd.D | 5,000 | 53,489 | |||||||||||||
| Taiwan Shin Kong Security Co., Ltd.D | 125,170 | 153,465 | |||||||||||||
| Ttet Union Corp.D | 4,000 | 16,153 | |||||||||||||
| Ve Wong Corp.D | 34,000 | 30,030 | |||||||||||||
|
| ||||||||||||||
Total Common Stocks | 843,647 | ||||||||||||||
|
| ||||||||||||||
Total Taiwan (Cost $759,558) | 843,647 | ||||||||||||||
|
| ||||||||||||||
| Thailand - 3.37% | |||||||||||||||
| Common Stocks - 3.37% | |||||||||||||||
| Advanced Information Technology PCL, Class F | 46,100 | 25,734 | |||||||||||||
| Amata B.Grimm Power Plant Infrasture FundA | 135,700 | 20,724 | |||||||||||||
| Bangkok Bank PCLD | 15,400 | 70,928 | |||||||||||||
| Bangkok Insurance PCL, NVDRD | 1,200 | 11,085 | |||||||||||||
| Kang Yong Electric PCL, NVDRD | 100 | 836 | |||||||||||||
| Krung Thai Bank PCL, NVDRD | 289,600 | 149,112 | |||||||||||||
| Prime Office Leasehold Property FundA D | 52,200 | 21,564 | |||||||||||||
| PTT PCL, NVDRD | 7,000 | 9,678 | |||||||||||||
| Siam Cement PCL, NVDRD | 300 | 3,421 | |||||||||||||
| SPCG PCL, NVDRD | 70,400 | 45,038 | |||||||||||||
| Thai Stanley Electric PCL, NVDRD | 1,100 | 5,793 | |||||||||||||
| Thai Vegetable Oil PCL, NVDRD | 1,000 | 938 | |||||||||||||
See accompanying notes
13
American Beacon Acadian Emerging Markets Managed Volatility FundSM
Schedule of Investments
January 31, 2020
| Shares | Fair Value | ||||||||||||||
| Thailand - 3.37% (continued) | |||||||||||||||
| Common Stocks - 3.37% (continued) | |||||||||||||||
| TTW PCL, NVDRD | 17,500 | $ | 7,801 | ||||||||||||
|
| ||||||||||||||
Total Common Stocks | 372,652 | ||||||||||||||
|
| ||||||||||||||
Total Thailand (Cost $415,461) | 372,652 | ||||||||||||||
|
| ||||||||||||||
| Turkey - 0.68% | |||||||||||||||
| Common Stocks - 0.68% | |||||||||||||||
| Anadolu Anonim Turk Sigorta SirketiD | 38,245 | 31,466 | |||||||||||||
| KOC Holding A/SD | 12,206 | 39,449 | |||||||||||||
| Nuh Cimento Sanayi A/SD | 2,088 | 4,072 | |||||||||||||
|
| ||||||||||||||
Total Common Stocks | 74,987 | ||||||||||||||
|
| ||||||||||||||
Total Turkey (Cost $70,320) | 74,987 | ||||||||||||||
|
| ||||||||||||||
| United States - 0.47% (Cost $54,363) | |||||||||||||||
| Common Stocks - 0.47% | |||||||||||||||
| JBS S.A. | 8,119 | 52,286 | |||||||||||||
|
| ||||||||||||||
| SHORT-TERM INVESTMENTS - 2.63% (Cost $290,781) | |||||||||||||||
| Investment Companies - 2.63% | |||||||||||||||
| American Beacon U.S. Government Money Market Select Fund, Select Class, 1.47% F G | 290,781 | 290,781 | |||||||||||||
|
| ||||||||||||||
TOTAL INVESTMENTS - 91.33% (Cost $9,869,690) | 10,088,138 | ||||||||||||||
OTHER ASSETS, NET OF LIABILITIES - 8.67% | 957,088 | ||||||||||||||
|
| ||||||||||||||
TOTAL NET ASSETS - 100.00% | $ | 11,045,226 | |||||||||||||
|
| ||||||||||||||
| Percentages are stated as a percent of net assets. | |||||||||||||||
A Unit - Usually consists of one common stock and/or rights and warrants.
BNon-income producing security.
C A type of Preferred Stock that has no maturity date.
D Fair valued pursuant to procedures approved by the Board of Trustees. At period end, the value of these securities amounted to $8,516,644 or 77.11% of net assets.
E Value was determined using significant unobservable inputs.
F The Fund is affiliated by having the same investment advisor.
G7-day yield.
ADR - American Depositary Receipt.
GDR - Global Depositary Receipt.
NVDR -Non-Voting Depositary Receipt.
PCL - Public Company Limited (Thailand).
PJSC - Private Joint Stock Company.
PLC - Public Limited Company.
| Long Futures Contracts Open on January 31, 2020: |
| |||||||||||||||
| Equity Futures Contracts | ||||||||||||||||
| Description | Number of Contracts | Expiration Date | Notional Amount | Contract Value | Unrealized Appreciation (Depreciation) | |||||||||||
| Mini MSCI Emerging Markets Index Futures | 5 | March 2020 | $ | 266,686 | $ | 262,525 | $ | (4,161 | ) | |||||||
|
|
|
|
|
| |||||||||||
| $ | 266,686 | $ | 262,525 | $ | (4,161 | ) | ||||||||||
|
|
|
|
|
| |||||||||||
See accompanying notes
14
American Beacon Acadian Emerging Markets Managed Volatility FundSM
Schedule of Investments
January 31, 2020
| Glossary: | ||
| Index Abbreviations: | ||
| MSCI | Morgan Stanley Capital International. | |
The Fund’s investments are summarized by level based on the inputs used to determine their values. As of January 31, 2020, the investments were classified as described below:
Acadian Emerging Markets Managed Volatility Fund | Level 1 | Level 2 | Level 3 | Total | ||||||||||||||||||||||||
Assets | ||||||||||||||||||||||||||||
Foreign Common Stocks | ||||||||||||||||||||||||||||
Brazil | $ | 254,578 | $ | - | $ | - | $ | 254,578 | ||||||||||||||||||||
Chile | 245,724 | - | - | 245,724 | ||||||||||||||||||||||||
China | 11,549 | 2,792,554 | 0 | (1) | 2,804,103 | |||||||||||||||||||||||
Czech Republic | - | 221,906 | - | 221,906 | ||||||||||||||||||||||||
Egypt | - | 308,439 | - | 308,439 | ||||||||||||||||||||||||
Greece | - | 204,114 | - | 204,114 | ||||||||||||||||||||||||
Hong Kong | - | 12,741 | - | 12,741 | ||||||||||||||||||||||||
Hungary | - | 197,594 | - | 197,594 | ||||||||||||||||||||||||
India | 89,250 | 728,000 | - | 817,250 | ||||||||||||||||||||||||
Indonesia | - | 46,461 | - | 46,461 | ||||||||||||||||||||||||
Malaysia | - | 372,817 | - | 372,817 | ||||||||||||||||||||||||
Mexico | 349,972 | - | - | 349,972 | ||||||||||||||||||||||||
Peru | 69,202 | - | - | 69,202 | ||||||||||||||||||||||||
Philippines | - | 338,930 | - | 338,930 | ||||||||||||||||||||||||
Poland | - | 153,880 | - | 153,880 | ||||||||||||||||||||||||
Republic of Korea | - | 1,249,443 | - | 1,249,443 | ||||||||||||||||||||||||
Russia | - | 416,120 | - | 416,120 | ||||||||||||||||||||||||
South Africa | - | 188,730 | - | 188,730 | ||||||||||||||||||||||||
Taiwan | - | 843,647 | - | 843,647 | ||||||||||||||||||||||||
Thailand | 20,724 | 351,928 | - | 372,652 | ||||||||||||||||||||||||
Turkey | - | 74,987 | - | 74,987 | ||||||||||||||||||||||||
Foreign Preferred Stocks | ||||||||||||||||||||||||||||
Brazil | 161,694 | - | - | 161,694 | ||||||||||||||||||||||||
South Africa | - | 40,087 | - | 40,087 | ||||||||||||||||||||||||
Common Stocks | ||||||||||||||||||||||||||||
United States | 52,286 | - | - | 52,286 | ||||||||||||||||||||||||
Short-Term Investments | 290,781 | - | - | 290,781 | ||||||||||||||||||||||||
|
|
|
|
|
|
|
| |||||||||||||||||||||
Total Investments in Securities - Assets | $ | 1,545,760 | $ | 8,542,378 | $ | - | $ | 10,088,138 | ||||||||||||||||||||
|
|
|
|
|
|
|
| |||||||||||||||||||||
Financial Derivative Instruments - Liabilities | ||||||||||||||||||||||||||||
Futures Contracts | $ | (4,161 | ) | $ | - | $ | - | $ | (4,161 | ) | ||||||||||||||||||
|
|
|
|
|
|
|
| |||||||||||||||||||||
Total Financial Derivative Instruments - Liabilities | $ | (4,161 | ) | $ | - | $ | - | $ | (4,161 | ) | ||||||||||||||||||
|
|
|
|
|
|
|
| |||||||||||||||||||||
| (1) | Includes investments held in the Fund’s portfolio with $0 fair value. |
U.S. GAAP requires transfers between all levels to/from level 3 be disclosed. During the year ended January 31, 2020, there were no transfers into or out of Level 3.
See accompanying notes
15
American Beacon Acadian Emerging Markets Managed Volatility FundSM
Schedule of Investments
January 31, 2020
The following table is a reconciliation of Level 3 assets within the Fund for which significant unobservable inputs were used to determine fair value. Transfers in or out of Level 3 represent the ending value of any security or instrument where a change in the level has occurred from the beginning to the end of the period:
| Security Type | Balance as of 1/31/2019 | Purchases | Sales | Accrued Discounts (Premiums) | Realized Gain (Loss) | Change in Unrealized Appreciation (Depreciation) | Transfer into Level 3 | Transfer out of Level 3 | Balance as of 1/31/2020 | Unrealized Appreciation (Depreciation) at Period end** | ||||||||||||||||||||||||||
| Foreign Common Stocks | $ 0(1) | $ - | $ | - | $ | - | $ | - | $ | - | $ | - | $ | - | $ | 0 | (1) | $ | (13,361 | ) | ||||||||||||||||
| ** | Change in unrealized appreciation (depreciation) attributable to Level 3 securities held at period end. This balance is included in the change in unrealized appreciation (depreciation) on the Statement of Operations. |
| (1) | Includes investments held in the Fund’s portfolio with $0 fair value. |
The foreign common stock classified as Level 3 was fair valued at a nominal value of 0.00 Hong Kong Dollar (HKD) due to lack of unobservable inputs. The company is in bankruptcy proceedings, therefore the valuation of the common stock has remained priced at 0.00 HKD, written down from 0.10 HKD. There was no impact to the Fund’s NAV.
See accompanying notes
16
American Beacon Acadian Emerging Markets Managed Volatility FundSM
Statement of Assets and Liabilities
January 31, 2020
Assets: | ||||
Investments in unaffiliated securities, at fair value† | $ | 9,797,357 | ||
Investments in affiliated securities, at fair value‡ | 290,781 | |||
Foreign currency, at fair value^ | 147,488 | |||
Dividends and interest receivable | 23,443 | |||
Deposits with broker for futures contracts | 1,516 | |||
Cash collateral at broker | 10,000 | |||
Receivable for investments sold | 100,536 | |||
Receivable for fund shares sold | 780,652 | |||
Receivable for expense reimbursement (Note 2) | 21,045 | |||
Prepaid expenses | 30,101 | |||
|
| |||
Total assets | 11,202,919 | |||
|
| |||
Liabilities: |
| |||
Payable for fund shares redeemed | 19,641 | |||
Payable for variation margin on open futures contacts (Note 5) | 4,101 | |||
Management andsub-advisory fees payable (Note 2) | 13,546 | |||
Service fees payable (Note 2) | 961 | |||
Transfer agent fees payable (Note 2) | 1,279 | |||
Custody and fund accounting fees payable | 16,351 | |||
Professional fees payable | 98,595 | |||
Trustee fees payable (Note 2) | 62 | |||
Payable for prospectus and shareholder reports | 2,725 | |||
Other liabilities | 432 | |||
|
| |||
Total liabilities | 157,693 | |||
|
| |||
Net assets | $ | 11,045,226 | ||
|
| |||
Analysis of net assets: |
| |||
Paid-in-capital | $ | 10,026,553 | ||
Total distributable earnings (deficits)A | 1,018,673 | |||
|
| |||
Net assets | $ | 11,045,226 | ||
|
| |||
Shares outstanding at no par value (unlimited shares authorized): |
| |||
Institutional Class | 424,625 | |||
|
| |||
Y Class | 664,554 | |||
|
| |||
Investor Class | 286,261 | |||
|
| |||
A Class | 37,214 | |||
|
| |||
C Class | 14,380 | |||
|
| |||
Net assets: |
| |||
Institutional Class | $ | 3,318,116 | ||
|
| |||
Y Class | $ | 5,148,222 | ||
|
| |||
Investor Class | $ | 2,181,698 | ||
|
| |||
A Class | $ | 285,259 | ||
|
| |||
C Class | $ | 111,931 | ||
|
| |||
Net asset value, offering and redemption price per share: |
| |||
Institutional Class | $ | 7.81 | ||
|
| |||
Y Class | $ | 7.75 | ||
|
| |||
Investor Class | $ | 7.62 | ||
|
| |||
A Class | $ | 7.67 | ||
|
| |||
A Class (offering price) | $ | 8.14 | ||
|
| |||
C Class | $ | 7.78 | ||
|
| |||
† Cost of investments in unaffiliated securities | $ | 9,578,909 | ||
‡ Cost of investments in affiliated securities | $ | 290,781 | ||
^ Cost of foreign currency | $ | 147,576 | ||
A The Fund’s investments in affiliated securities did not have unrealized appreciation (depreciation) at year end. | ||||
See accompanying notes
17
American Beacon Acadian Emerging Markets Managed Volatility FundSM
Statement of Operations
For the year ended January 31, 2020
Investment income: |
| |||
Dividend income from unaffiliated securities (net of foreign taxes)† | $ | 914,098 | A | |
Dividend income from affiliated securities (Note 8) | 5,576 | |||
Interest income | 291 | |||
Income derived from securities lending (Note 9) | 92 | |||
|
| |||
Total investment income | 920,057 | |||
|
| |||
Expenses: |
| |||
Management andsub-advisory fees (Note 2) | 226,923 | |||
Transfer agent fees: | ||||
Institutional Class (Note 2) | 2,789 | |||
Y Class (Note 2) | 16,625 | |||
Investor Class | 1,689 | |||
A Class | 76 | |||
C Class | 60 | |||
Custody and fund accounting fees | 103,253 | |||
Professional fees | 96,183 | |||
Registration fees and expenses | 68,262 | |||
Service fees (Note 2): | ||||
Investor Class | 7,979 | |||
A Class | 205 | |||
C Class | 256 | |||
Distribution fees (Note 2): | ||||
A Class | 917 | |||
C Class | 1,652 | |||
Prospectus and shareholder report expenses | 17,034 | |||
Trustee fees (Note 2) | 1,709 | |||
Other expenses | 10,256 | |||
|
| |||
Total expenses | 555,868 | |||
|
| |||
Net fees waived and expenses (reimbursed) (Note 2) | (210,287 | ) | ||
|
| |||
Net expenses | 345,581 | |||
|
| |||
Net investment income | 574,476 | |||
|
| |||
Realized and unrealized gain (loss) from investments: |
| |||
Net realized gain (loss) from: | ||||
Investments in unaffiliated securitiesB‡ | 3,702,759 | |||
Commission recapture (Note 1) | 175 | |||
Foreign currency transactions | (46,986 | ) | ||
Futures contracts | (25,408 | ) | ||
Change in net unrealized appreciation (depreciation) of: | ||||
Investments in unaffiliated securitiesC | (4,267,710 | ) | ||
Foreign currency transactions | (3,811 | ) | ||
Futures contracts | (40,840 | ) | ||
|
| |||
Net (loss) from investments | (681,821 | ) | ||
|
| |||
Net (decrease) in net assets resulting from operations | $ | (107,345 | ) | |
|
| |||
† Foreign taxes | $ | 112,518 | ||
‡ Net of foreign withholding taxes on capital gains | $ | 64,171 | ||
A Includes signficant dividends of $109,126. | ||||
B The Fund did not recognize net realized gains (losses) from the sale of investments in affiliated securities. | ||||
C The Fund’s investments in affiliated securities did not have a change in unrealized appreciation (depreciation) at year end. |
| |||
See accompanying notes
18
American Beacon Acadian Emerging Markets Managed Volatility FundSM
Statement of Changes in Net Assets
| Year Ended January 31, 2020 | Year Ended January 31, 2019 | |||||||||||
Increase (decrease) in net assets: |
| |||||||||||
Operations: |
| |||||||||||
Net investment income | $ | 574,476 | $ | 537,809 | ||||||||
Net realized gain from investments in unaffiliated securities, commission recapture, foreign currency transactions, and futures contracts | 3,630,540 | 588,740 | ||||||||||
Change in net unrealized (depreciation) of investments in unaffiliated securities, foreign currency transactions, and futures contracts | (4,312,361 | ) | (3,096,637 | ) | ||||||||
|
|
|
| |||||||||
Net (decrease) in net assets resulting from operations | (107,345 | ) | (1,970,088 | ) | ||||||||
|
|
|
| |||||||||
Distributions to shareholders: |
| |||||||||||
Total retained earnings: | ||||||||||||
Institutional Class | (1,007,287 | ) | (243,835 | ) | ||||||||
Y Class | (1,682,496 | ) | (1,353,535 | ) | ||||||||
Investor Class | (619,971 | ) | (143,418 | ) | ||||||||
A Class | (99,285 | ) | (20,737 | ) | ||||||||
C Class | (32,910 | ) | (9,707 | ) | ||||||||
|
|
|
| |||||||||
Net distributions to shareholders | (3,441,949 | ) | (1,771,232 | ) | ||||||||
|
|
|
| |||||||||
Capital share transactions (Note 11): |
| |||||||||||
Proceeds from sales of shares | 3,626,292 | 9,804,850 | ||||||||||
Reinvestment of dividends and distributions | 3,043,885 | 1,702,819 | ||||||||||
Cost of shares redeemed | (27,232,693 | ) | (10,520,132 | ) | ||||||||
Redemption fees | - | 16,131 | ||||||||||
|
|
|
| |||||||||
Net increase (decrease) in net assets from capital share transactions | (20,562,516 | ) | 1,003,668 | |||||||||
|
|
|
| |||||||||
Net (decrease) in net assets | (24,111,810 | ) | (2,737,652 | ) | ||||||||
|
|
|
| |||||||||
Net assets: |
| |||||||||||
Beginning of period | 35,157,036 | 37,894,688 | ||||||||||
|
|
|
| |||||||||
End of period | $ | 11,045,226 | $ | 35,157,036 | ||||||||
|
|
|
| |||||||||
See accompanying notes
19
American Beacon Acadian Emerging Markets Managed Volatility FundSM
January 31, 2020
1. Organization and Significant Accounting Policies
American Beacon Funds (the “Trust”) is organized as a Massachusetts business trust. The Fund, a series within the Trust, is registered under the Investment Company Act of 1940, as amended (the “Act”), as a diversified,open-end management investment company. As of January 31, 2020, the Trust consists ofthirty-two active series, one of which is presented in this filing: American Beacon Acadian Emerging Markets Managed Volatility Fund (the “Fund”). The remainingthirty-one active series are reported in separate filings.
American Beacon Advisors, Inc. (the “Manager”) is a Delaware corporation and a wholly-owned subsidiary of Resolute Investment Managers, Inc. (“RIM”) organized in 1986 to provide business management, advisory, administrative, and asset management consulting services to the Trust and other investors. The Manager is registered as an investment advisor under the Investment Advisers Act of 1940, as amended (the “Advisers Act”). RIM is, in turn, a wholly-owned subsidiary of Resolute Acquisition, Inc., which is a wholly-owned subsidiary of Resolute Topco, Inc., a wholly-owned subsidiary of Resolute Investment Holdings, LLC (“RIH”). RIH is owned primarily by Kelso Investment Associates VIII, L.P., KEP VI, LLC and Estancia Capital Partners L.P., investment funds affiliated with Kelso & Company, L.P. (“Kelso”) or Estancia Capital Management, LLC (“Estancia”), which are private equity firms.
Recently Adopted Accounting Pronouncements
In March 2017, the Financial Accounting Standards Board (“FASB”) issued Accounting Standards Update (“ASU”)2017-08,Premium Amortization of Purchased Callable Debt Securities. The amendments in the ASU shorten the premium amortization period on a purchased callable debt security from the security’s contractual life to the earliest call date. It is anticipated that this change will enhance disclosures by reducing losses recognized when a security is called on an earlier date. This ASU is effective for fiscal years beginning after December 15, 2018, and has been adopted accordingly with no material impact on the financial statements and other disclosures.
In August 2018, the FASB issued ASU2018-13,Fair Value Measurement (“Topic 820”). The amendments in the ASU impact disclosure requirements for fair value measurement. It is anticipated that this change will enhance the effectiveness of disclosures in the notes to the financial statements. This ASU is effective for fiscal years beginning after December 15, 2019. Early adoption is permitted and can include the entire standard or certain provisions that exclude or amend disclosures. For the year ended January 31, 2020, the Fund has chosen to adopt the standard. The adoption of this ASU guidance did not have a material impact on the financial statements and other disclosures.
Class Disclosure
The Fund has multiple classes of shares designed to meet the needs of different groups of investors. The following table sets forth the differences amongst the classes:
Class | Eligible Investors | Minimum Initial Investments | ||||
| Institutional | Large institutional investors - sold directly or through intermediary channels. | $ | 250,000 | |||
| Y Class | Large institutional retirement plan investors - sold directly or through intermediary channels. | $ | 100,000 | |||
| Investor | All investors using intermediary organizations, such as broker-dealers or retirement plan sponsors. | $ | 2,500 | |||
| A Class | All investors who invest through intermediary organizations, such as broker-dealers or third party administrator. Retail investors who invest directly through a financial intermediary such as a broker, bank, or registered investment advisor which may include afront-end sales charge and a contingent deferred sales charge (“CDSC”). | $ | 2,500 | |||
| C Class | Retail investors who invest directly through a financial intermediary such as a broker or through employee directed benefit plans with applicable sales charges which may include CDSC. | $ | 1,000 | |||
20
American Beacon Acadian Emerging Markets Managed Volatility FundSM
Notes to Financial Statements
January 31, 2020
Each class offered by the Trust has equal rights as to assets and voting privileges. Income andnon-class specific expenses are allocated daily to each class based on the relative net assets. Realized and unrealized capital gains and losses of each class are allocated daily based on the relative net assets of each class of the respective Fund. Class specific expenses, where applicable, currently include service, distribution, transfer agent fees, andsub-transfer agent fees that vary amongst the classes as described more fully in Note 2.
Significant Accounting Policies
The following is a summary of significant accounting policies, consistently followed by the Fund in preparation of the financial statements. The Fund is considered an investment company and accordingly, follows the investment company accounting and reporting guidance of the FASB Accounting Standards Codification Topic 946,Financial Services – Investment Companies,a part of Generally Accepted Accounting Principles (“U.S. GAAP”).
Security Transactions and Investment Income
Security transactions are recorded as of the trade date for financial reporting purposes. Securities purchased or sold on a when-issued or delayed-delivery basis may be settled beyond a standard settlement period for the security after the trade date.
Dividend income, net of foreign taxes, is recorded on theex-dividend date, except certain dividends from foreign securities which are recorded as soon as the information is available to the Fund. Interest income, net of foreign taxes, is earned from settlement date, recorded on the accrual basis, and adjusted, if necessary, for accretion of discounts and amortization of premiums. Realized gains (losses) from securities sold are determined based on specific lot identification.
Commission Recapture
The Fund has established brokerage commission recapture arrangements with certain brokers or dealers. If the Fund’s investment advisor chooses to execute a transaction through a participating broker, the broker rebates a portion of the commission back to the Fund. Any collateral benefit received through participation in the commission recapture program is directed exclusively to the Fund. This amount is reported with the net realized gain (loss) in the Fund’s Statement of Operations, if applicable.
Currency Translation
All assets and liabilities initially expressed in foreign currency values are converted into U.S. dollar values at the mean of the bid and ask prices of such currencies against U.S. dollars as last quoted by a recognized dealer. Income, expenses, and purchases and sales of investments are translated into U.S. dollars at the rate of the exchange prevailing on the respective dates of such transactions. The effect of changes in foreign currency exchange rates on investments is separately identified from the fluctuations arising from changes in market values of securities held and is reported with all other foreign currency gains and losses on the Fund’s Statement of Operations.
Distributions to Shareholders
The Fund distributes most or all of its net earnings and realized gains, if any, each taxable year in the form of dividends from net investment income and distributions of realized net capital gains and net gains from foreign currency transactions on an annual basis. The Fund does not have a fixed dividend rate and does not guarantee that it will pay any distributions in any particular period. Dividends to shareholders are determined in accordance with federal income tax regulations, which may differ in amount and character from net investment income and realized gains recognized for purposes of U.S. GAAP. To the extent necessary to fully distribute capital gains, the Fund may designate earnings and profits distributed to shareholders on the redemption of shares.
21
American Beacon Acadian Emerging Markets Managed Volatility FundSM
Notes to Financial Statements
January 31, 2020
Allocation of Income, Trust Expenses, Gains, and Losses
Investment income, realized and unrealized gains and losses from investments of the Fund is allocated daily to each class of shares based upon the relative proportion of net assets of each class to the total net assets of the Fund. Expenses directly charged or attributable to the Fund will be paid from the assets of the Fund. Generally, expenses of the Trust will be allocated among and charged to the assets of the Fund on a basis that the Trust’s Board of Trustees (the “Board”) deems fair and equitable, which may be based on the relative net assets of the Fund or nature of the services performed and relative applicability to the Fund.
Use of Estimates
The preparation of financial statements in conformity with U.S. GAAP requires management to make estimates and assumptions that affect the amounts reported in the financial statements and accompanying notes. Actual results may differ from those estimated.
Other
Under the Trust’s organizational documents, its officers and trustees are indemnified against certain liabilities arising out of the performance of their duties to the Trust. In the normal course of business, the Trust enters into contracts that provide indemnification to the other party or parties against potential costs or liabilities. The Trust’s maximum exposure under these arrangements is dependent on claims that may be made in the future and, therefore, cannot be estimated. The Trust has had no prior claims or losses pursuant to any such agreement.
2. Transactions with Affiliates
Management and InvestmentSub-Advisory Agreements
The Fund and the Manager are parties to a Management Agreement that obligates the Manager to provide the Fund with investment advisory and administrative services. As compensation for performing the duties under the Management Agreement, the Manager will receive an annualized management fee based on a percentage of the Fund’s average daily net assets that is calculated and accrued daily according to the following schedule:
First $5 billion | 0.35 | % | ||
Next $5 billion | 0.325 | % | ||
Next $10 billion | 0.30 | % | ||
Over $20 billion | 0.275 | % |
The Trust, on behalf of the Fund, and the Manager have entered into an Investment Advisory Agreement with Acadian Asset Management LLC (the“Sub-Advisor”) pursuant to which the Fund has agreed to pay an annualizedsub-advisory fee that is calculated and accrued daily based on the Fund’s average daily net assets according to the following schedule:
Acadian Asset Management LLC
First $500 million | 0.65 | % | ||
Over $500 million | 0.60 | % |
The Management andSub-Advisory Fees paid by the Fund for the year ended January 31, 2020 were as follows:
| Effective Fee Rate | Amount of Fees Paid | |||||||||||
Management Fees | 0.35 | % | $ | 82,230 | ||||||||
Sub-Advisor Fees | 0.65 | % | 144,693 | |||||||||
|
|
|
| |||||||||
Total | 1.00 | % | $ | 226,923 | ||||||||
|
|
|
| |||||||||
22
American Beacon Acadian Emerging Markets Managed Volatility FundSM
Notes to Financial Statements
January 31, 2020
As compensation for services provided by the Manager in connection with securities lending activities conducted by the Fund, the lending Fund pays to the Manager, with respect to cash collateral posted by borrowers, a fee up to 10% of the net monthly interest income (the gross interest income earned by the investment of cash collateral, less the amount paid to borrowers and related expenses) from such activities and, with respect to loan fees paid by borrowers, a fee up to 10% of such loan fees. These fees are included in “Income derived from securities lending” and “Management and investment advisory fees” on the Statement of Operations. During the year ended January 31, 2020, the Manager received securities lending fees of $9 for the securities lending activities of the Fund.
Distribution Plans
Separate Distribution Plans (the “Distribution Plans”) have been adopted pursuant to Rule 12b-1 under the Act for the A and C Classes of the Funds. Under the Distribution Plans, as compensation for distribution and shareholder servicing assistance, the Funds’ Distributor, Resolute Investment Distributors, Inc. (“RID” or “Distributor”), receives an annual fee of 0.25% of the average daily net assets of the A Class and 1.00% of the average daily net assets of the C Class. The fee will be payable without regard to whether the amount of the fee is more or less than the actual expenses incurred in a particular month by the Distributor for distribution assistance.
For all other share classes, the Funds have utilized a “defensive” distribution plan (the “Plan”) pursuant to which no separate fees may be charged to the Funds for distribution purposes. However, the Plan authorizes the use of management fees received by the Manager and/or the investment advisors hired by the Manager for distribution purposes. Under this Plan, the Funds do not intend to compensate the Manager or any other party, either directly or indirectly, for the distribution of Fund shares from these fees.
Service Plans
The Investor, A and C Classes have each adopted a Service Plan (collectively, the “Plans”). The Plans authorize the payment to the Manager an annual fee up to 0.375% of the average daily net assets of the Investor Class, up to 0.25% of the average daily net assets of the A Class and up to 0.25% of the average daily net assets of the C Class. In addition, the Funds may reimburse the Manager for certain non-distribution shareholder services provided by financial intermediaries attributable to Y Class and Institutional Class. The Manager or other approved entities may spend such amounts on any activities or expenses primarily intended to result in or relate to the servicing of A Class, C Class, Y Class, Institutional Class and Investor Class including, but not limited to, payment of shareholder service fees and transfer agency or sub-transfer agency expenses. The fees will be payable monthly in arrears. The primary expenses expected to be incurred under the Plans are shareholder servicing, record keeping fees and servicing fees paid to financial intermediaries such as plan sponsors and broker-dealers.
Sub-Transfer Agent Fees
The Manager has entered into agreements, which include servicing agreements, with financial intermediaries that provide recordkeeping, processing, shareholder communications and other services to customers of the intermediaries that hold positions in the Institutional and Y Classes of the Fund and has agreed to compensate the intermediaries for providing these services. Intermediaries transact with the Fund primarily through the use of omnibus accounts on behalf of its customers who hold positions in the Fund. Certain services would have been provided by the Fund’s transfer agent and other service providers if the shareholders’ accounts were maintained directly by the Fund’s transfer agent. Accordingly, the Fund, pursuant to Board approval, has agreed to reimburse the Manager for certainnon-distribution shareholder services provided by financial intermediaries for the Institutional and Y Classes. The reimbursement amounts(sub-transfer agent fees) paid to the Manager are subject to a fee limit of up to 0.10% of an intermediary’s average net assets in the Institutional and Y Classes on an annual basis. During the year ended January 31, 2020, thesub-transfer agent fees, as reflected in “Transfer agent fees” on the Statement of Operations, were as follows:
Fund | Sub-Transfer Agent Fees | |||
Acadian Emerging Markets Managed Volatility | $ | 17,680 | ||
23
American Beacon Acadian Emerging Markets Managed Volatility FundSM
Notes to Financial Statements
January 31, 2020
As of January 31, 2020, the Fund owed the Manager the following reimbursement ofsub-transfer agent fees, as reflected in “Transfer agent fees payable” on the Statement of Assets and Liabilities:
Fund | Reimbursement Sub-Transfer Agent Fees | |||
Acadian Emerging Markets Managed Volatility | $ | 688 | ||
Investments in Affiliated Funds
The Fund may invest in the American Beacon U.S. Government Money Market Select Fund (the “USG Select Fund”). Cash collateral received by the Fund in connection with securities lending may also be invested in the USG Select Fund. The Fund and the USG Select Fund have the same investment advisor and therefore, are considered to be affiliated. The Manager serves as investment advisor to the USG Select Fund and receives management fees and administrative fees totaling 0.10% of the average daily net assets of the USG Select Fund. During the year ended January 31, 2020, the Manager earned fees on the Fund’s direct investments and securities lending collateral investments in the USG Select Fund as shown below:
Fund | Direct Investments in USG Select Fund | Securities Lending Collateral Investments in USG Select Fund | Total | |||||||||
Acadian Emerging Markets Managed Volatility | $ | 263 | $ | 7 | $ | 270 | ||||||
Interfund Credit Facility
Pursuant to an exemptive order issued by the U.S. Securities and Exchange Commission (“SEC”), the Fund, along with other registered investment companies having management contracts with the Manager, may participate in a credit facility whereby each fund, under certain conditions, is permitted to lend money directly to and borrow directly from other participating funds for temporary purposes. The interfund credit facility is advantageous to the funds because it provides added liquidity and eliminates the need to maintain higher cash balances to meet redemptions. This situation could arise when shareholder redemptions exceed anticipated volumes and certain funds have insufficient cash on hand to satisfy such redemptions or when sales of securities do not settle as expected, resulting in a cash shortfall for a fund. When a fund liquidates portfolio securities to meet redemption requests, they often do not receive payment in settlement for up to two days (or longer for certain foreign transactions). Redemption requests normally are satisfied on the next business day. The credit facility provides a source of immediate, short-term liquidity pending settlement of the sale of portfolio securities. The credit facility is administered by a credit facility team consisting of professionals from the Manager’s asset management, compliance, and accounting areas who report the activities of the credit facility to the Board. During the year ended January 31, 2020, the Fund borrowed on average $586,693 for 36 days at an average interest rate of 2.59% with interest charges of $1,469. These amounts are recorded as “Other expenses” in the Statement of Operations.
Expense Reimbursement Plan
The Manager contractually agreed to reduce fees and/or reimburse expenses for the classes of the Fund to the extent that total operating expenses exceed the Fund’s expense cap. During the year ended January 31, 2020, the Manager waived and/or reimbursed expenses as follows:
| Expense Cap | Expiration of Reimbursed Expenses | |||||||||||||||||
Fund | Class | 2/1/2019 - 1/31/2020 | Reimbursed Expenses | (Recouped) Expenses | ||||||||||||||
Acadian Emerging Markets Managed Volatility | Institutional | 1.35 | % | $ | 47,080 | $ | (2,081 | ) | 2022-2023 | |||||||||
Acadian Emerging Markets Managed Volatility | Y | 1.45 | % | 139,856 | - | 2022-2023 | ||||||||||||
Acadian Emerging Markets Managed Volatility | Investor | 1.73 | % | 22,759 | (1,676 | ) | 2022-2023 | |||||||||||
Acadian Emerging Markets Managed Volatility | A | 1.75 | % | 3,191 | (325 | ) | 2022-2023 | |||||||||||
Acadian Emerging Markets Managed Volatility | C | 2.50 | % | 1,483 | - | 2022-2023 | ||||||||||||
24
American Beacon Acadian Emerging Markets Managed Volatility FundSM
Notes to Financial Statements
January 31, 2020
Of these amounts, $21,045 was disclosed as a receivable from the Manager on the Statement of Assets and Liabilities at January 31, 2020.
The Fund has adopted an Expense Reimbursement Plan whereby the Manager may seek repayment of such fee or voluntary reductions and expense reimbursements. Under the policy, the Manager can be reimbursed by the Fund for any contractual or voluntary fee reductions or expense reimbursements if reimbursement to the Manager (a) occurs within three years after the date of the Manager’s waiver/reimbursement and (b) does not cause the Fund’s annual operating expenses to exceed the lesser of the contractual percentage limit in effect at the time of the waiver/reimbursement or time of recoupment. The reimbursed expenses listed above will expire in 2022 and 2023. The Fund did not record a liability for potential reimbursements due to the current assessment that reimbursements are uncertain. The carryover of excess expenses potentially reimbursable to the Manager, but not recorded as a liability are as follows:
Fund | Recouped Expenses | Excess Expense Carryover | Expired Expense Carryover | Expiration of Reimbursed Expenses | ||||||||||||
Acadian Emerging Markets Managed Volatility | $ | 2,547 | $ | - | $ | 102,522 | 2019-2020 | |||||||||
Acadian Emerging Markets Managed Volatility | 1,536 | 206,434 | - | 2020-2021 | ||||||||||||
Acadian Emerging Markets Managed Volatility | - | 120,396 | - | 2021-2022 | ||||||||||||
Sales Commissions
The Fund’s Distributor, Resolute Investment Distributors, Inc. (“RID” or “Distributor”), may receive a portion of Class A sales charges from broker dealers which may be used to offset distribution related expenses. During the year ended January 31, 2020, there were no fees collected for Class A Shares of the Fund.
A CDSC of 0.50% will be deducted with respect to Class A Shares on certain purchases of $1,000,000 or more that are redeemed in whole or part within 18 months of purchase, unless waived as discussed in the Fund’s Prospectus. Any applicable CDSC will be 0.50% of the lesser of the original purchase price or the value of the redemption of the Class A Shares redeemed. During the year ended January 31, 2020, there were no CDSC fees collected for Class A Shares of the Fund.
A CDSC of 1.00% will be deducted with respect to Class C Shares redeemed within 12 months of purchase, unless waived as discussed in the Fund’s Prospectus. Any applicable CDSC will be 1.00% of the lesser of the original purchase price or the value of the redemption of the Class C Shares redeemed. During the year ended January 31, 2020, CDSC fees of $938 were collected for Class C Shares of the Fund.
Trustee Fees and Expenses
Effective January 1, 2020, compensation for their service to the American Beacon Funds Complex, including the Trust (collectively, the “Trusts”), each Trustee is compensated from the Trusts as follows: (1) an annual retainer of $120,000; (2) meeting attendance fee (for attendance in person or via teleconference) of (a) $12,000 for in person attendance, or $5,000 for telephonic attendance, by Board members for each regularly scheduled or special Board meeting, (b) $2,500 for attendance by Committee members at meetings of the Audit Committee and the Investment Committee, (c) $1,500 for attendance by Committee members at meetings of the Nominating and Governance Committee; and (d) $2,500 for attendance by Board members for each special telephonic Board meeting; and (3) reimbursement of reasonable expenses incurred in attending Board meetings, Committee meetings, and relevant educational seminars. The Trustees also may be compensated for attendance at special Board and/or Committee meetings from time to time. For her service as Board Chair, Ms. Cline receives an additional annual retainer of $50,000. Although she attends several committee meetings at each quarterly Board meeting, she receives only a single $2,500 fee each quarter for her attendance at those meetings. The chairpersons of the Audit Committee and the Investment Committee each receive an additional annual retainer of $25,000 and the Chair of the Nominating and Governance Committee receives an additional annual retainer of $15,000.
25
American Beacon Acadian Emerging Markets Managed Volatility FundSM
Notes to Financial Statements
January 31, 2020
3. Security Valuation and Fair Value Measurements
The price of the Fund’s shares is based on its net asset value (“NAV”) per share. The Fund’s NAV is computed by adding total assets, subtracting all the Fund’s liabilities, and dividing the result by the total number of shares outstanding.
The NAV of each class of the Fund’s shares is determined based on a pro rata allocation of the Fund’s investment income, expenses and total capital gains and losses. The Fund’s NAV per share is determined each business day as of the regular close of trading on the New York Stock Exchange (“NYSE” or “Exchange”), which is typically 4:00 p.m. Eastern Time (“ET”). However, if trading on the NYSE closes at a time other than 4:00 p.m. ET, the Fund’s NAV per share typically would still be determined as of the regular close of trading on the NYSE. The Fund does not price its shares on days that the NYSE is closed. Foreign exchanges may permit trading in foreign securities on days when the Fund is not open for business, which may result in the value of the Fund’s portfolio investments being affected at a time when you are unable to buy or sell shares.
Equity securities, including shares ofclosed-end funds and exchange-traded funds (“ETFs”), are valued at the last sale price or official closing price taken from the primary exchange in which each security trades. Investments in other mutual funds are valued at the closing NAV per share on the day of valuation. Debt securities are valued at bid quotes from broker/dealers or evaluated bid prices from pricing services, who may consider a number of inputs and factors, such as prices of comparable securities, yield curves, spreads, credit ratings, coupon rates, maturity, default rates, and underlying collateral. Futures are valued based on their daily settlement prices. Exchange-traded andover-the-counter (“OTC”) options are valued at the last sale price. Options with no last sale for the day are priced at mid quote. Swaps are valued at evaluated mid prices from pricing services.
The valuation of securities traded on foreign markets and certain fixed-income securities will generally be based on prices determined as of the earlier closing time of the markets on which they primarily trade unless a significant event has occurred. When the Fund holds securities or other assets that are denominated in a foreign currency, the Fund will normally use the currency exchange rates as of 4:00 p.m. ET.
Securities may be valued at fair value, as determined in good faith and pursuant to procedures approved by the Board, under certain limited circumstances. For example, fair value pricing will be used when market quotations are not readily available or reliable, as determined by the Manager, such as when (i) trading for a security is restricted or stopped; (ii) a security’s trading market is closed (other than customary closings); or (iii) a security has beende-listed from a national exchange. A security with limited market liquidity may require fair value pricing if the Manager determines that the available price does not reflect the security’s true market value. In addition, if a significant event that the Manager determines to affect the value of one or more securities held by the Fund occurs after the close of a related exchange but before the determination of the Fund’s NAV, fair value pricing may be used on the affected security or securities. Securities of small-capitalization companies are also more likely to require a fair value determination using these procedures because they are more thinly traded and less liquid than the securities of larger-capitalization companies. The Fund may fair value securities as a result of significant events occurring after the close of the foreign markets in which the Fund invests as described below. In addition, the Fund may invest in illiquid securities requiring these procedures.
The Fund may use fair value pricing for securities primarily traded innon-U.S. markets because most foreign markets close well before the Fund’s pricing time of 4:00 p.m. ET. The earlier close of these foreign markets gives rise to the possibility that significant events, including broad market moves, may have occurred in the interim and may materially affect the value of those securities. If the Manager determines that the last quoted prices ofnon-U.S. securities will, in its judgment, materially affect the value of some or all its portfolio securities, the Manager can adjust the previous closing prices to reflect what it believes to be the fair value of the securities as of the close of the Exchange. In deciding whether it is necessary to adjust closing prices to reflect fair value, the Manager reviews a variety of factors, including developments in foreign markets, the performance of U.S. securities markets, and the performance of instruments trading in U.S. markets that represent foreign securities
26
American Beacon Acadian Emerging Markets Managed Volatility FundSM
Notes to Financial Statements
January 31, 2020
and baskets of foreign securities. These securities are fair valued using a pricing service, using methods approved by the Board, that considers the correlation of the trading patterns of the foreign security to intraday trading in the U.S. markets, based on indices of domestic securities and other appropriate indicators such as prices of relevant American Depositary Receipts (“ADRs”) and futures contracts. The Valuation Committee, established by the Board, may also fair value securities in other situations, such as when a particular foreign market is closed but the Fund is open. The Fund uses outside pricing services to provide closing prices and information to evaluate and/or adjust those prices. As a means of evaluating its security valuation process, the Valuation Committee routinely compares closing prices, the next day’s opening prices in the same markets and adjusted prices.
Attempts to determine the fair value of securities introduce an element of subjectivity to the pricing of securities. As a result, the price of a security determined through fair valuation techniques may differ from the price quoted or published by other sources and may not accurately reflect the market value of the security when trading resumes. If a reliable market quotation becomes available for a security formerly valued through fair valuation techniques, the Manager compares the new market quotation to the fair value price to evaluate the effectiveness of the Fund’s fair valuation procedures. If any significant discrepancies are found, the Manager may adjust the Fund’s fair valuation procedures.
Valuation Inputs
Various inputs may be used to determine the fair value of the Fund’s investments. These inputs are summarized in three broad levels for financial statement purposes. The inputs or methodologies used to value securities are not necessarily an indication of the risk associated with investing in those securities.
| Level 1 | - | Quoted prices in active markets for identical securities. | ||
| Level 2 | - | Prices determined using other significant observable inputs. These may include quoted prices for similar securities, interest rates, prepayment speeds, credit risk, and others. | ||
| Level 3 | - | Prices determined using other significant unobservable inputs. Unobservable inputs reflect the Fund’s own assumptions about the factors market participants would use in pricing an investment. | ||
Level 1 and Level 2 trading assets and trading liabilities, at fair value
Common stocks, preferred securities, and financial derivative instruments, such as futures contracts that are traded on a national securities exchange, are stated at the last reported sale or settlement price on the day of valuation. To the extent these securities are actively traded and valuation adjustments are not applied, they are categorized as Level 1 of the fair value hierarchy. Preferred securities and other equities traded on inactive markets or valued by reference to similar instruments are generally categorized as Level 2 of the fair value hierarchy. Valuation adjustments may be applied to certain securities that are solely traded on a foreign exchange to account for the market movement between the close of the foreign market and the close of the Exchange. These securities are valued using pricing service providers that consider the correlation of the trading patterns of the foreign security to the intraday trading in the U.S. markets for investments. Securities using these valuation adjustments are categorized as Level 2 of the fair value hierarchy.
Investments in registeredopen-end investment management companies will be valued based upon the NAVs of such investments and are categorized as Level 1 of the fair value hierarchy.
Level 3 trading assets and trading liabilities, at fair value
The valuation techniques and significant inputs used in determining the fair values of financial instruments classified as Level 3 of the fair value hierarchy are as follows.
Securities and other assets for which market quotes are not readily available are valued at fair value as determined in good faith by the Board or persons acting at their direction and may be categorized as Level 3 of the fair value hierarchy.
27
American Beacon Acadian Emerging Markets Managed Volatility FundSM
Notes to Financial Statements
January 31, 2020
Market quotes are considered not readily available in circumstances where there is an absence of current or reliable market-based data (e.g., trade information or broker quotes), including where events occur after the close of the relevant market, but prior to the Exchange close, that materially affect the values of the Fund’s securities or assets. In addition, market quotes are considered not readily available when, due to extraordinary circumstances, the exchanges or markets on which the securities trade, do not open for trading for the entire day and no other market prices are available. The Board has delegated to the Manager the responsibility for monitoring significant events that may materially affect the fair values of a Fund’s securities or assets and for determining whether the value of the applicable securities or assets should bere-evaluated in light of such significant events.
The Board has adopted methods for valuing securities and other assets in circumstances where market quotes are not readily available, and has delegated the responsibility for applying the valuation methods to the Manager. For instances in which daily market quotes are not readily available, investments may be valued pursuant to guidelines established by the Board. In the event that the security or asset cannot be valued, pursuant to one of the valuation methods established by the Board, the fair value of the security or asset will be determined in good faith by the Valuation Committee, generally based upon recommendations provided by the Manager.
When a Fund uses fair valuation methods applied by the Manager that use significant unobservable inputs to determine its NAV, the securities priced using this methodology are categorized as Level 3 of the fair value hierarchy. These methods may require subjective determinations about the value of a security. While the Trust’s policy is intended to result in a calculation of the Fund’s NAV that fairly reflects security values as of the time of pricing, the Trust cannot guarantee that values determined by the Board or persons acting at their direction would accurately reflect the price that a Fund could obtain for a security if it were to dispose of that security as of the time of pricing (for instance, in a forced or distressed sale). The prices used by a Fund may differ from the value that would be realized if the securities were sold.
4. Securities and Other Investments
American Depositary Receipts, Global Depositary Receipts, andNon-Voting Depositary Receipts
ADRs are depositary receipts for foreign issuers in registered form traded in U.S. securities markets. Global Depositary Receipts (“GDRs”) are in bearer form and traded in both the U.S. and European securities markets.Non-Voting Depositary Receipts (“NVDRs”) represent financial interests in an issuer but the holder is not entitled to any voting rights. Depositary receipts may not be denominated in the same currency as the securities into which they may be converted. Investing in depositary receipts entails substantially the same risks as direct investment in foreign securities. There is generally less publicly available information about foreign companies and there may be less governmental regulation and supervision of foreign stock exchanges, brokers and listed companies. In addition, such companies may use different accounting and financial standards (and certain currencies may become unavailable for transfer from a foreign currency), resulting in the Fund’s possible inability to convert immediately into U.S. currency proceeds realized upon the sale of portfolio securities of the affected foreign companies. In addition, the Fund may invest in unsponsored depositary receipts, the issuers of which are not obligated to disclose material information about the underlying securities to investors in the United States. Ownership of unsponsored depositary receipts may not entitle the Fund to the same benefits and rights as ownership of a sponsored depositary receipt or the underlying security.
Common Stock
Common stock generally takes the form of shares in a corporation which represent an ownership interest. It ranks below preferred stock and debt securities in claims for dividends and for assets of the company in a liquidation or bankruptcy. The value of a company’s common stock may fall as a result of factors directly relating to that company, such as decisions made by its management or decreased demand for the company’s products or services. A stock’s value may also decline because of factors affecting not just the company, but also companies in the same industry or sector. The price of a company’s stock may also be affected by changes in financial markets
28
American Beacon Acadian Emerging Markets Managed Volatility FundSM
Notes to Financial Statements
January 31, 2020
that are relatively unrelated to the company, such as changes in interest rates, currency exchange rates or industry regulation. Companies that elect to pay dividends on their common stock generally only do so after they invest in their own business and make required payments to bondholders and on other debt and preferred stock. Therefore, the value of a company’s common stock will usually be more volatile than its bonds, other debt and preferred stock. Common stock may be exchange-traded or OTC. OTC stock may be less liquid than exchange-traded stock.
Foreign Securities
The Fund may invest in U.S. dollar-denominated andnon-U.S. dollar denominated equity and debt securities of foreign issuers and foreign branches of U.S. banks, including negotiable certificates of deposit (“CDs”), bankers’ acceptances, and commercial paper. Foreign issuers are issuers organized and doing business principally outside the United States and include corporations, banks,non-U.S. governments, and quasi-governmental organizations. While investments in foreign securities may be intended to reduce risk by providing further diversification, such investments involve sovereign and other risks, in addition to the credit and market risks normally associated with domestic securities. These additional risks include the possibility of adverse political and economic developments (including political or social instability, nationalization, expropriation, or confiscatory taxation); the potentially adverse effects of unavailability of public information regarding issuers, different governmental supervision and regulation of financial markets, reduced liquidity of certain financial markets, and the lack of uniform accounting, auditing, and financial reporting standards or the application of standards that are different or less stringent than those applied in the United States; different laws and customs governing securities tracking; and possibly limited access to the courts to enforce the Fund’s rights as an investor.
Illiquid and Restricted Securities
Generally, an illiquid asset is an asset that the Fund reasonably expects cannot be sold or disposed of in current market conditions in seven calendar days or less without the sale or disposition significantly changing the market value of the investment, as determined pursuant to Rule22e-4 under the Investment Company Act or as otherwise permitted or required by SEC rules and interpretations. Historically, illiquid securities have included securities that have not been registered under the Securities Act, securities that are otherwise not readily marketable, and repurchase agreements having a remaining maturity of longer than seven calendar days. Securities that have not been registered under the Securities Act are referred to as private placements or restricted securities and are purchased directly from the issuer or in the secondary market. These securities may be sold only in a privately negotiated transaction or pursuant to an exemption from registration. A large institutional market exists for certain securities that are not registered under the Securities Act, including repurchase agreements, commercial paper, foreign securities, municipal securities and corporate bonds and notes. Institutional investors depend on an efficient institutional market in which the unregistered security can be readily resold or on an issuer’s ability to honor a demand for repayment. However, the fact that there are contractual or legal restrictions on resale of such investments to the general public or to certain institutions may not be indicative of their liquidity.
Limitations on resale may have an adverse effect on the marketability of portfolio securities, and the Fund might be unable to dispose of restricted or other illiquid securities promptly or at reasonable prices and might thereby experience difficulty satisfying redemptions within seven calendar days. In addition, the Fund may get only limited information about an issuer, so it may be less able to predict a loss. The Fund also might have to register such restricted securities in order to dispose of them resulting in additional expense and delay. Adverse market conditions could impede such a public offering of securities. In recognition of the increased size and liquidity of the institutional market for unregistered securities and the importance of institutional investors in the formation of capital, the SEC adopted Rule 144A under the Securities Act. Rule 144A is designed to facilitate efficient trading among institutional investors by permitting the sale of certain unregistered securities to qualified institutional buyers. To the extent privately placed securities held by the Fund qualify under Rule 144A and an institutional market develops for those securities, the Fund likely will be able to dispose of the securities without registering them under the Securities Act. To the extent that institutional buyers become, for a time, uninterested in
29
American Beacon Acadian Emerging Markets Managed Volatility FundSM
Notes to Financial Statements
January 31, 2020
purchasing these securities, investing in Rule 144A securities could increase the level of the Fund’s illiquidity. The Manager or thesub-advisor, as applicable, may determine that certain securities qualified for trading under Rule 144A are liquid. Regulation S under the Securities Act permits the sale abroad of securities that are not registered for sale in the United States and includes a provision for U.S. investors, such as the Fund, to purchase such unregistered securities if certain conditions are met.
Securities sold in private placement offerings made in reliance on the “private placement” exemption from registration afforded by Section 4(a)(2) of the Securities Act and resold to qualified institutional buyers under Rule 144A under the Securities Act (“Section 4(a)(2) securities”) are restricted as to disposition under the federal securities laws, and generally are sold to institutional investors, such as the Fund, that agree they are purchasing the securities for investment and not with an intention to distribute to the public. Any resale by the purchaser must be pursuant to an exempt transaction and may be accomplished in accordance with Rule 144A. Section 4(a)(2) securities normally are resold to other institutional investors through or with the assistance of the issuer or dealers that make a market in the Section 4(a)(2) securities, thus providing liquidity. Restricted securities outstanding during the year ended January 31, 2020 are disclosed in the Notes to the Schedule of Investments.
Regulation S under the Securities Act permits the sale abroad of securities that are not registered for sale in the United States and includes a provision for U.S. investors, such as the Fund, to purchase such unregistered securities if certain conditions are met.
Other Investment Company Securities and Other Exchange-Traded Products
The Fund may invest in shares of other investment companies, includingopen-end funds,closed-end funds, business development companies (“BDCs”), ETFs, unit investment trusts, and other investment companies of the Trust. The Fund may invest in securities of an investment company advised by the Manager or asub-advisor. Investments in the securities of other investment companies may involve duplication of advisory fees and certain other expenses. By investing in another investment company, the Fund becomes a shareholder of that investment company. As a result, the Fund’s shareholders indirectly will bear the Fund’s proportionate share of the fees and expenses paid by shareholders of the other investment company, in addition to the fees and expenses the Fund’s shareholders directly bear in connection with the Fund’s own operations. These other fees and expenses are reflected as Acquired Fund Fees and Expenses and are included in the Fees and Expenses Table for the Fund in its Prospectus, if applicable. Investments in other investment companies may involve the payment of substantial premiums above the value of such issuer’s portfolio securities.
Preferred Stock
A preferred stock blends the characteristics of a bond and common stock. It can offer the higher yield of a bond and has priority over common stock in equity ownership, but does not have the seniority of a bond and its participation in the issuer’s growth may be limited. Preferred stock generally has preference over common stock in the receipt of dividends and in any residual assets after payment to creditors should the issuer be dissolved. Although the dividend is set at a fixed or variable rate, in some circumstances it can be changed or omitted by the issuer.
Real Estate Investment Trusts
The Fund may own shares of real estate investment trusts (“REITs”) which report information on the source of their distributions annually. The Fundre-characterizes distributions received from REIT investments based on information provided by the REITs into the following categories: ordinary income, long-term capital gains, and return of capital. If information is not available on a timely basis from the REITs, there-characterization will be estimated based on available information, which may include the previous year allocation. If new or additional information becomes available from the REITs at a later date, are-characterization will be made the following year.
30
American Beacon Acadian Emerging Markets Managed Volatility FundSM
Notes to Financial Statements
January 31, 2020
5. Financial Derivative Instruments
The Fund may utilize derivative instruments to gain market exposure on cash balances to hedge foreign currency exposure or reduce market exposure in anticipation of liquidity needs. When considering the Fund’s use of derivatives, it is important to note that the Fund does not use derivatives for the purpose of creating financial leverage.
Futures Contracts
Futures contracts are contracts to buy or sell a standard quantity of securities at a specified price on a future date. The Fund may enter into financial futures contracts as a method for keeping assets readily convertible to cash if needed to meet shareholder redemptions or for other needs while maintaining exposure to the stock or bond market, as applicable. The primary risks associated with the use of futures contracts are the possibility of illiquid markets or imperfect correlation between the values of the contracts and the underlying securities or that the counterparty will fail to perform its obligations.
Upon entering into a futures contract, the Fund is required to set aside or deposit with a broker an amount, termed the initial margin, which typically represents a portion of the face value of the futures contract. The Fund usually reflects this amount on the Schedule of Investments as a U.S. Treasury Bill held as collateral for futures contracts or as cash deposited with broker on the Statement of Assets and Liabilities. Payments to and from the broker, known as variation margin, are required to be made on a daily basis as the price of the futures contract fluctuates. Changes in initial settlement values are accounted for as unrealized appreciation (depreciation) until the contracts are terminated, at which time realized gains and losses are recognized. Futures contracts are valued at the most recent settlement price established each day by the exchange on which they are traded.
During the year ended January 31, 2020, the Fund entered into futures contracts primarily for exposing cash to markets.
The Fund’s average futures contracts outstanding fluctuate throughout the operating year as required to meet strategic requirements. The following table illustrates the average quarterly volume of futures contracts. For the purpose of this disclosure, volume is measured by contracts outstanding at each quarter end.
Average Futures Contracts Outstanding | ||
Fund | Year Ended January 31, 2020 | |
Acadian Emerging Markets Managed Volatility | 6 | |
The following is a summary of the fair valuations of the Fund’s derivative instruments categorized by risk exposure(1):
| Fair values of financial instruments on the Statement of Assets and Liabilities as of January 31, 2020: |
| ||||||||||||||||||||||||||||||||||||||||||||||||||||||
| Derivatives not accounted for as hedging instruments | |||||||||||||||||||||||||||||||||||||||||||||||||||||||
Liabilities: | Credit contracts | Foreign exchange contracts | Commodity contracts | Interest rate contracts | Equity contracts | Total | |||||||||||||||||||||||||||||||||||||||||||||||||
| Payable for variation margin from open futures contracts(2) | $ | - | $ | - | $ | - | $ | - | $ | (4,161 | ) | $ | (4,161 | ) | |||||||||||||||||||||||||||||||||||||||||
31
American Beacon Acadian Emerging Markets Managed Volatility FundSM
Notes to Financial Statements
January 31, 2020
| The effect of financial derivative instruments on the Statement of Operations as of January 31, 2020: |
| ||||||||||||||||||||||||||||||||||||||||||||||||||||||
| Derivatives not accounted for as hedging instruments | |||||||||||||||||||||||||||||||||||||||||||||||||||||||
Realized gain (loss) from derivatives | Credit contracts | Foreign exchange contracts | Commodity contracts | Interest rate contracts | Equity contracts | Total | |||||||||||||||||||||||||||||||||||||||||||||||||
| Futures contracts | $ | - | $ | - | $ | - | $ | - | $ | (25,408 | ) | $ | (25,408 | ) | |||||||||||||||||||||||||||||||||||||||||
Net change in unrealized appreciation | Credit contracts | Foreign exchange contracts | Commodity contracts | Interest rate contracts | Equity contracts | Total | |||||||||||||||||||||||||||||||||||||||||||||||||
| Futures contracts | $ | - | $ | - | $ | - | $ | - | $ | (40,840 | ) | $ | (40,840 | ) | |||||||||||||||||||||||||||||||||||||||||
(1)See Note 3 in the Notes to Financial Statements for additional information.
(2)Includes cumulative appreciation (depreciation) of futures contracts as reported in the Fund’s Schedule of Investments footnotes. Only current day’s variation margin is reported within the Statement of Assets and Liabilities.
Offsetting Assets and Liabilities
The Fund is a party to enforceable master netting agreements between brokers and counterparties which provide for the right to offset under certain circumstances. The Fund employs multiple money managers and counterparties and has elected not to offset qualifying financial and derivative instruments on the Statement of Assets and Liabilities, as such all financial and derivative instruments are presented on a gross basis. The impacts of netting arrangements that provide the right to offset are detailed below. The net amount represents the net receivable or payable that would be due from or to the counterparty in the event of default. Exposure from borrowings and other financing agreements such as repurchase agreements can only be netted across transactions governed by the same Master Agreement with the same legal entity. All amounts reported below represent the balance as of the report date, January 31, 2020.
| Offsetting of Financial and Derivative Assets as of January 31, 2020: |
| |||||||||||
| Assets | Liabilities | |||||||||||
| Futures Contracts(1) | $ | - | $ | 4,161 | ||||||||
|
|
|
| |||||||||
| Total derivative assets and liabilities in the Statement of Assets and Liabilities | $ | - | $ | 4,161 | ||||||||
|
|
|
| |||||||||
| Derivatives not subject to a Master Netting Agreement or similar agreement (“MNA”) | $ | - | $ | (4,161 | ) | |||||||
|
|
|
| |||||||||
| Total derivative assets and liabilities subject to an MNA | $ | - | $ | - | ||||||||
|
|
|
| |||||||||
(1) Includes cumulative appreciation or (depreciation) of futures contracts as reported in the Schedule of Investments footnotes. Only current
day’s variation margin is reported within the Statement of Assets and Liabilities.
6. Principal Risks
Investing in the Fund may involve certain risks including, but not limited to, those described below.
China Investment Risk
Investing in securities of Chinese issuers, includingA-Shares, involves certain risks and considerations not typically associated with investing in securities of U.S. issuers, including, among others, more frequent trading suspensions and government interventions (including by nationalization of assets), currency exchange rate fluctuations or blockages, limits on the use of brokers and on foreign ownership, different financial reporting standards, higher dependence on exports and international trade, potential for increased trade tariffs, embargoes and other trade limitations, and custody risks associated with programs used to access Chinese securities. Significant portions of the Chinese securities markets may become rapidly illiquid, as Chinese issuers have the ability to suspend the trading of their equity securities, and have shown a willingness to exercise that option in response to market volatility and other events.
32
American Beacon Acadian Emerging Markets Managed Volatility FundSM
Notes to Financial Statements
January 31, 2020
Counterparty Risk
The Fund is subject to the risk that a party or participant to a transaction, such as a broker or derivative counterparty, will be unwilling or unable to satisfy its obligation to make timely principal, interest or settlement payments or to otherwise honor its obligations to the Fund. As a result the Fund may obtain no recovery of its investment or may only obtain a limited recovery, and any recovery may be delayed. Not all derivative transactions require a counterparty to post collateral, which may expose the Fund to greater losses in the event of a default by a counterparty.
Currency Risk
The Fund may have exposure to foreign currencies by making direct investments innon-U.S. currencies or in securities denominated innon-U.S. currencies, or by purchasing or selling forward currency exchange contracts innon-U.S. currencies. Foreign currencies may decline in value relative to the U.S. dollar, or, in the case of hedging positions, the U.S. dollar may decline in value relative to the currency being hedged, and thereby affect the Fund’s investments in foreign(non-U.S.) currencies or in securities that trade in, and receive revenues in, or in derivatives that provide exposure to, foreign(non-U.S.) currencies. Currency exchange rates may fluctuate significantly over short periods of time for a number of reasons, including changes in interest rates, intervention (or the failure to intervene) by U.S. or foreign governments, central banks or supranational entities such as the International Monetary Fund, or by the imposition of currency controls or other political developments in the United States or abroad. As a result, the Fund’s investments in foreign currency denominated securities may reduce the returns of the Fund. Currency futures, forwards, options or swaps may not always work as intended, and in specific cases, the Fund may be worse off than if it had not used such instrument(s). There may not always be suitable hedging instruments available. Even where suitable hedging instruments are available, the Fund may choose to not hedge its currency risks.
Derivatives Risk
Derivatives may involve significant risk. The use of derivative instruments may expose the Fund to additional risks that it would not be subject to if it invested directly in the securities or other instruments underlying those derivatives, including the high degree of leverage often embedded in such instruments, and potential material and prolonged deviations between the theoretical value and realizable value of a derivative. Some derivatives have the potential for unlimited loss, regardless of the size of the Fund’s initial investment. Derivatives may be illiquid and may be more volatile than other types of investments. The Fund may buy or sell derivatives not traded on an exchange and which may be subject to heightened liquidity and valuation risk. Derivative investments can increase portfolio turnover and transaction costs. Derivatives also are subject to counterparty risk and credit risk. As a result, the Fund may obtain no recovery of its investment or may only obtain a limited recovery, and any recovery may be delayed. Not all derivative transactions require a counterparty to post collateral, which may expose the Fund to greater losses in the event of a default by a counterparty.
Equity Investments Risk
Equity securities are subject to market risk. The Fund’s investments in equity securities may include common stocks, preferred stocks, securities convertible into or exchangeable for common stocks, REITs, depositary receipts, and U.S. dollar-denominated foreign stocks traded on U.S. exchanges. Such investments may expose the Fund to additional risk. The value of a company’s common stock may fall as a result of factors affecting the company, companies in the same industry or sector, or the financial markets overall. Common stock generally is subordinate to preferred stock upon the liquidation or bankruptcy of the issuing company. Preferred stocks and convertible securities are sensitive to movements in interest rates. Preferred stocks may be less liquid than common stocks and, unlike common stocks, participation in the growth of an issuer may be limited. Distributions on preferred stocks generally are payable at the discretion of an issuer and after required payments to bond holders. Convertible securities are subject to the risk that the credit standing of the issuer may have an effect on
33
American Beacon Acadian Emerging Markets Managed Volatility FundSM
Notes to Financial Statements
January 31, 2020
the convertible securities’ investment value. Investments in REITs are subject to the risks associated with investing in the real estate industry such as adverse developments affecting the real estate industry and real property values. Depositary receipts and U.S. dollar-denominated foreign stocks traded on U.S. exchanges are subject to certain of the risks associated with investing directly in foreign securities, including, but not limited to, currency exchange rate fluctuations, political and financial instability in the home country of a particular depositary receipt, less liquidity and more volatility, less government regulation and supervision and delays in transaction settlement.
Foreign Investing and Emerging Markets Risk
Non-U.S. investments carry potential risks not associated with U.S. investments. Such risks include, but are not limited to: (1) currency exchange rate fluctuations, (2) political and financial instability, (3) less liquidity, (4) lack of uniform accounting, auditing and financial reporting standards, (5) increased price volatility, (6) different government regulation and supervision of foreign stock exchanges, brokers and listed companies, and (7) delays in transaction settlement in some foreign markets. To the extent the Fund invests a significant portion of its assets in securities of a single country or region, it is more likely to be affected by events or conditions of that country or region. In addition, the economies and political environments of emerging market countries tend to be more unstable than those of developed countries, resulting in more volatile rates of return than the developed markets and substantially greater risk to investors. There may be very limited oversight of certain foreign banks or securities depositories that hold foreign securities and currency and the laws of certain countries may limit the ability to recover such assets if a foreign bank or depository or their agents goes bankrupt. When investing in emerging markets, the risks of investing in foreign securities are heightened. Emerging markets have unique risks that are greater than, or in addition to, investing in developed markets because emerging markets are generally smaller, less developed, less liquid and more volatile than the securities markets of the U.S. and other developed markets. There are also risks of: greater political uncertainties; an economy’s dependence on revenues from particular commodities or on international aid or development assistance; currency transfer restrictions; a limited number of potential buyers for such securities, resulting in increased volatility and limited liquidity for emerging market securities; trading suspensions; and delays and disruptions in securities settlement procedures. In addition, there may be less information available to make investment decisions and more volatile rates of return.
Futures Contracts Risk
Futures contracts are derivative instruments where one party pays a fixed price for an agreed amount of securities or other underlying assets at an agreed date. The use of such derivative instruments may expose the Fund to additional risks that it would not be subject to if it invested directly in the securities underlying those derivatives. Futures contracts may experience potentially dramatic price changes (losses) and imperfect correlation between the price of the contract and the underlying security or index, which will increase the volatility of the Fund and may involve a small investment of cash (the amount of initial and variation margin) relative to the magnitude of the risk assumed (the potential increase or decrease in the price of the futures contract).
Market Disruption Risk
Geopolitical and other events, including war, terrorism, economic uncertainty, trade disputes, pandemics, public health crises and related geopolitical events have led, and in the future may continue to lead, to instability in world economies and markets generally. This instability has disrupted, and may continue to disrupt, U.S. and world economies and markets and adversely affect the value of your investment. Such market disruptions have caused, and may continue to cause, broad changes in market value, negative public perceptions concerning these developments, and adverse investor sentiment or publicity. Changes in value may be temporary or may last for extended periods. Although multiple asset classes have been and may continue to be affected by a market disruption, the duration and effects may not be the same for all types of assets. Events that have led to market disruptions include the recent pandemic spread of the novel coronavirus known as COVID-19, which has resulted in travel restrictions, closed international borders, quarantines, disruptions to supply chains and lower consumer demand. The duration and full effects of these market disruptions are still uncertain. The effect of recent efforts
34
American Beacon Acadian Emerging Markets Managed Volatility FundSM
Notes to Financial Statements
January 31, 2020
undertaken by the Federal Reserve System to address the economic impact of the COVID-19 pandemic, such as the reduction of the federal funds target rate, and other monetary and fiscal actions that may be taken by the U.S. federal government to stimulate the U.S. economy, are not yet known. In addition, COVID-19 could cause the need for employees and vendors at various businesses, including the Manager, the sub-advisor(s) or other service providers, to work at external locations, and extensive medical absences. Because a large epidemic may create significant market and business uncertainties and disruptions, not all events that could affect the business of the Manager, the sub-advisor(s) or other service providers can be determined and addressed in advance.
Market Risk
Conditions in the U.S. and many foreign economies have resulted, and may continue to result, in certain instruments experiencing unusual liquidity issues, increased price volatility and, in some cases, credit downgrades and increased likelihood of default. These events have reduced the willingness and ability of some lenders to extend credit, and have made it more difficult for some borrowers to obtain financing on attractive terms, if at all. In some cases, traditional market participants have been less willing to make a market in some types of debt instruments, which has affected the liquidity of those instruments. During times of market turmoil, investors tend to look to the safety of securities issued or backed by the U.S. Treasury, causing the prices of these securities to rise and the yields to decline. Reduced liquidity in fixed income and credit markets may negatively affect many issuers worldwide. In addition, global economies and financial markets are becoming increasingly interconnected, which increases the possibilities that conditions in one country or region might adversely impact issuers in a different country or region. A rise in protectionist trade policies, and the possibility of changes to some international trade agreements, could affect the economies of many nations, including the United States, in ways that cannot necessarily be foreseen at the present time.
In response to the financial crisis, the U.S. and other governments and the Federal Reserve and certain foreign central banks have taken steps to support financial markets. In some countries where economic conditions are recovering, they are nevertheless perceived as still fragile. Withdrawal of government support, failure of efforts in response to the crisis, or investor perception that such efforts are not succeeding, could adversely impact the value and liquidity of certain securities. The severity or duration of adverse economic conditions may also be affected by policy changes made by governments or quasi-governmental organizations, including changes in tax laws. The impact of new financial regulation legislation on the markets and the practical implications for market participants may not be fully known for some time. Regulatory changes are causing some financial services companies to exit long-standing lines of business, resulting in dislocations for other market participants. In addition, political and governmental events within the U.S. and abroad, such as the U.S. government’s inability at times to agree on a long-term budget and deficit reduction plan, the threat of a federal government shutdown and threats not to increase the federal government’s debt limit, may affect investor and consumer confidence and may adversely impact financial markets and the broader economy, perhaps suddenly and to a significant degree. The U.S. government has reduced the federal corporate income tax rates, and future legislative, regulatory and policy changes may result in more restrictions on international trade, less stringent prudential regulation of certain players in the financial markets, and significant new investments in infrastructure and national defense. Markets may react strongly to expectations about the changes in these policies, which could increase volatility, especially if the markets’ expectations for changes in government policies are not borne out.
Changes in market conditions will not have the same impact on all types of securities. Interest rates have been unusually low in recent years in the U.S. and abroad. Because there is little precedent for this situation, it is difficult to predict the impact of a significant rate increase on various markets. For example, because investors may buy securities or other investments with borrowed money, a significant increase in interest rates may cause a decline in the markets for those investments. Because of the sharp decline in the worldwide price of oil, there is a concern that oil producing nations may withdraw significant assets now held in U.S. Treasuries, which could force a substantial increase in interest rates. Regulators have expressed concern that rate increases may cause investors to sell fixed income securities faster than the market can absorb them, contributing to price volatility. In addition, there is a risk that the prices of goods and services in the U.S. and many foreign economies may decline over time, known as deflation (the opposite of inflation). Deflation may have an adverse effect on stock prices and
35
American Beacon Acadian Emerging Markets Managed Volatility FundSM
Notes to Financial Statements
January 31, 2020
creditworthiness and may make defaults on debt more likely. If a country’s economy slips into a deflationary pattern, it could last for a prolonged period and may be difficult to reverse.
The precise timing and the resulting impact of the United Kingdom’s departure from the EU, commonly referred to as “Brexit,” are not yet known. The effect on the United Kingdom’s economy will likely depend on the nature of trade relations with the EU and other major economies following its exit, which are matters to be negotiated. The outcomes may cause increased volatility and have a significant adverse impact on world financial markets, other international trade agreements, and the United Kingdom and European economies, as well as the broader global economy for some time, which could significantly adversely affect the value of a Fund’s investments in the United Kingdom and Europe.
Market Timing Risk
Because the Fund invests in foreign securities, it is particularly subject to the risk of market timing activities. Frequent trading by Fund shareholders poses risks to other shareholders in the Fund, including (i) the dilution of the Fund’s NAV, (ii) an increase in the Fund’s expenses, and (iii) interference with the portfolio manager’s ability to execute efficient investment strategies. Because of specific securities in which the Fund may invest, it could be subject to the risk of market timing activities by shareholders. Some examples of these types of securities are high-yield and foreign securities. The limited trading activity of some high-yield securities may result in market prices that do not reflect the true market value of these securities. The Fund generally prices foreign securities using their closing prices from the foreign markets in which they trade, typically prior to the Fund’s calculation of its NAV. These prices may be affected by events that occur after the close of a foreign market but before the Fund price its shares. In such instances, the Fund may fair value high yield and foreign securities. However, some investors may engage in frequent short-term trading in the Fund to take advantage of any price differentials that may be reflected in the NAV of the Fund’s shares. While the Manager monitors trading in the Fund, there is no guarantee that it can detect all market timing activities.
Other Investment Companies Risk
The Fund may invest in shares of other registered investment companies, including money market funds, ETFs and BDCs. To the extent that the Fund invests in shares of other registered investment companies, the Fund will indirectly bear the fees and expenses, including for example, advisory and administrative fees, charged by those investment companies in addition to the Fund direct fees and expenses and will be subject to the risks associated with investments in those companies. For example, the Fund investments in money market funds are subject to interest rate risk, credit risk, and market risk. The Fund must rely on the investment company in which it invests to achieve its investment objective. If the investment company fails to achieve its investment objective, the value of the Fund investment may decline, adversely affecting the Fund performance. ETFs are subject to the following risks that do not apply to conventional funds: (1) the market price of an ETF’s shares may trade at a discount or premium to its NAV; (2) an active trading market for an ETF’s shares may not develop or be maintained; or (3) trading of an ETF’s shares may be halted if the listing exchange’s officials deem such action appropriate, the shares are delisted from the exchange, or the activation of market-wide “circuit breakers” (which are tied to large decreases in stock prices) halts stock trading generally. An ETF that tracks an index may not precisely replicate the returns of its benchmark index. To the extent the Fund invests in other investment companies that invest in equity securities, fixed-income securities and/or foreign securities, or that track an index, the Fund are subject to the risks associated with the underlying investments held by the investment company or the index fluctuations to which the investment company is subject. ETFs have expenses associated with their operation, typically including advisory fees. BDCs generally invest in small developing companies, private companies, and thinly traded securities of public companies, and many debt instruments in which a BDC may invest may not be rated by a credit rating agency and may be below investment grade quality. The Fund investments in BDCs may be subject to certain additional risks, including competition for limited investment opportunities, the liquidity of a BDC’s investments, uncertainty as to the value of a BDC’s investments, risks associated with access to capital and leverage, and reliance on the management of a BDC.
36
American Beacon Acadian Emerging Markets Managed Volatility FundSM
Notes to Financial Statements
January 31, 2020
Securities Lending Risk
A Fund may lend its portfolio securities to brokers, dealers and financial institutions to seek income. There is a risk that a borrower may default on its obligations to return loaned securities; however, a Fund’s securities lending agent indemnifies the Fund against that risk. There is a risk that the assets of a Fund’s securities lending agent may be insufficient to satisfy any contractual indemnification requirements to the Fund. Borrowers of a Fund’s securities typically provide collateral in the form of cash that is reinvested in securities. A Fund will be responsible for the risks associated with the investment of cash collateral, including any collateral invested in an affiliated money market fund. A Fund may lose money on its investment of cash collateral or may fail to earn sufficient income on its investment to meet obligations to the borrower. In addition, delays may occur in the recovery of securities from borrowers, which could interfere with a Fund’s ability to vote proxies or to settle transactions and there is the risk of possible loss of rights in the collateral should the borrower fail financially. In any case in which the loaned securities are not returned to the Fund before anex-dividend date, the payment in lieu of the dividend that the Fund receives from the securities’ borrower would not be treated as a dividend for federal income tax purposes and thus would not qualify for treatment as “qualified dividend income”.
7. Federal Income and Excise Taxes
It is the policy of the Fund to qualify as a regulated investment company (“RIC”), by complying with all applicable provisions of Subchapter M of the Internal Revenue Code, as amended, and to make distributions of taxable income sufficient to relieve it from substantially all federal income and excise taxes. For federal income tax purposes, the Fund is treated as a single entity for the purpose of determining such qualification.
The Fund does not have any unrecorded tax liabilities in the accompanying financial statements. Each of the tax years in the four year period ended January 31, 2020 remain subject to examination by the Internal Revenue Service. If applicable, the Fund recognizes interest accrued related to unrecognized tax benefits in interest expense and penalties in “Other expenses” on the Statement of Operations.
The Fund may be subject to taxes imposed by countries in which it invests. Such taxes are generally based on returns of income earned or gains realized or repatriated. Taxes are accrued and applied to net investment income, net realized capital gains and net unrealized appreciation (depreciation), as applicable, as the income is earned or capital gains are recorded.
Dividends are categorized in accordance with income tax regulations which may treat certain transactions differently than U.S. GAAP. Accordingly, the character of distributions and composition of net assets for tax purposes may differ from those reflected in the accompanying financial statements. The Fund also utilize earnings and profits distributed to shareholders on redemptions of shares as part of the dividends paid deduction.
The tax character of distributions paid were as follows:
| Year Ended January 31, 2020 | Year Ended January 31, 2019 | |||||||||||
Distributions paid from: |
| |||||||||||
Ordinary income* |
| |||||||||||
Institutional Class | $ | 246,581 | $ | 130,377 | ||||||||
Y Class | 411,870 | 723,726 | ||||||||||
Investor Class | 151,767 | 76,685 | ||||||||||
A Class | 24,305 | 10,753 | ||||||||||
C Class | 5,336 | 3,640 | ||||||||||
Long-term capital gains |
| |||||||||||
Institutional Class | 760,706 | 113,458 | ||||||||||
Y Class | 1,270,626 | 629,809 | ||||||||||
Investor Class | 468,204 | 66,733 | ||||||||||
A Class | 74,980 | 9,984 | ||||||||||
C Class | 27,574 | 6,067 | ||||||||||
|
|
|
| |||||||||
Total distributions paid | $ | 3,441,949 | $ | 1,771,232 | ||||||||
|
|
|
| |||||||||
*For tax purposes, short-term gains are considered ordinary income distributions.
37
American Beacon Acadian Emerging Markets Managed Volatility FundSM
Notes to Financial Statements
January 31, 2020
As of January 31, 2020, the components of distributable earnings (deficits) on a tax basis were as follows:
Fund | Tax Cost | Unrealized Appreciation | Unrealized (Depreciation) | Net Unrealized Appreciation (Depreciation) | ||||||||||||||||||||||||
| Acadian Emerging Markets Managed Volatility | $ | 9,900,462 | $ | 1,178,621 | $ | (991,574 | ) | $ | 187,047 | |||||||||||||||||||
Fund | Net Unrealized Appreciation (Depreciation) | Undistributed Ordinary Income | Undistributed Long-Term Capital Gains | Accumulated Capital and Other (Losses) | Other Temporary Differences | Distributable Earnings | ||||||||||||||||||||||||||||||||||||||
| Acadian Emerging Markets Managed Volatility | $ | 187,047 | $ | 178,497 | $ | 690,724 | $ | (37,595 | ) | $ | - | $ | 1,018,673 | |||||||||||||||||||||||||||||||
Financial reporting records are adjusted for permanent book/tax differences to reflect tax character. Financial records are not adjusted for temporary differences. The temporary differences between financial reporting andtax-basis reporting of unrealized appreciation (depreciation) are attributable primarily to the tax deferral of losses from wash sales, the tax deferral of specified late year ordinary losses, the realization for tax purposes of unrealized gains (losses) on investments in passive foreign investment companies and the realization for tax purposes of unrealized gains (losses) on certain derivative instruments.
Due to inherent differences in the recognition of income, expenses, and realized gains (losses) under U.S. GAAP and federal income tax regulations, permanent differences between book and tax reporting have been identified and appropriately reclassified on the Statement of Assets and Liabilities.
The Fund had no permanent differences as of January 31, 2020.
Under the Regulated Investment Company Modernization Act of 2010 (“RIC MOD”), net capital losses recognized by the Fund in taxable years beginning after December 22, 2010 are carried forward indefinitely and retain their character as short-term and/or long-term losses.
As of January 31, 2020, the Fund did not have any capital loss carryforwards.
The Fund is permitted for tax purposes to defer into its next fiscal year qualified late year losses. Qualified late year capital losses are any capital losses incurred after October 31 through the Fund’s fiscal year end, January 31, 2020. Qualified late year ordinary losses are specified losses generally incurred after October 31 and ordinary losses incurred after December 31 through the end of the Fund’s fiscal year, January 31, 2020. For the period ended January 31, 2020, the Fund deferred $37,595 in late year ordinary losses to February 1, 2020.
8. Investment Transactions
The aggregate cost of purchases and proceeds from sales and maturities of investments, other than short-term obligations, for the year ended January 31, 2020 were as follows:
Fund | Purchases (non-U.S. Government Securities) | Sales (non-U.S. Government Securities) | ||||||
Acadian Emerging Markets Managed Volatility | $ | 5,718,271 | $ | 29,903,250 | ||||
38
American Beacon Acadian Emerging Markets Managed Volatility FundSM
Notes to Financial Statements
January 31, 2020
A summary of the Fund’s transactions in the USG Select Fund for the year ended January 31, 2020 were as follows:
Fund | Type of Transaction | January 31, 2019 Shares/Fair Value | Purchases | Sales | January 31, 2020 Shares/Fair Value | Dividend Income | ||||||||||||||||||||||||||||||||||||
| Acadian Emerging Markets Managed Volatility | Direct | $ | 392,084 | $ | 15,565,099 | $ | 15,666,402 | $ | 290,781 | $ | 5,576 | |||||||||||||||||||||||||||||||
| Acadian Emerging Markets Managed Volatility | Securities Lending | - | 815,908 | 815,908 | - | N/A | ||||||||||||||||||||||||||||||||||||
9. Securities Lending
The Fund may lend its securities to qualified financial institutions, such as certain broker-dealers, to earn additional income. The borrowers are required to secure their loans continuously with collateral in an amount at least equal to the fair value of the securities loaned, initially in an amount at least equal to 102% of the fair value of domestic securities loaned and 105% of the fair value of international securities loaned. Collateral is monitored andmarked-to-market daily. Dailymark-to-market amounts are required to be paid to the borrower or received from the borrower by the end of the following business day. This one day settlement formark-to-market amounts may result in the collateral being temporarily less than the value of the securities on loan or temporarily more than the required minimum collateral.
To the extent that a loan is collateralized by cash, such cash collateral shall be invested by the securities lending agent (the “Agent”) in money market mutual funds and other short-term investments, provided the investments meet certain quality and diversification requirements. Securities purchased with cash collateral proceeds are listed in the Fund’s Schedule of Investments and the collateral is shown on the Statement of Assets and Liabilities as a payable.
Securities lending income is generated from the demand premium (if any) paid by the borrower to borrow a specific security and from the return on investment of cash collateral, reduced by negotiated rebate fees paid to the borrower and transaction costs. To the extent that a loan is secured bynon-cash collateral, securities lending income is generated as a demand premium reduced by transaction costs. The Fund, the Agent, and the Manager retained 80%, 10%, and 10%, respectively, of the income generated from securities lending.
While securities are on loan, the Fund continues to receive certain income associated with that security and any gain or loss in the market price that may occur during the term of the loan. In the case of domestic equities, the value of any dividend is received in the form of a substitute payment approximately equal to the dividend. In the case of foreign securities, a negotiated amount is received that is less than the actual dividend, but higher than the dividend amount minus the foreign tax that the Fund would be subject to on the dividend.
Securities lending transactions pose certain risks to the Fund, including that the borrower may not provide additional collateral when required or return the securities when due, that the value of the short-term investments will be less than the amount of cash collateral required to be returned to the borrower, thatnon-cash collateral may be subject to legal constraints in the event of a borrower bankruptcy, and that the cash collateral investments could become illiquid and unable to be used to return collateral to the borrower. The Fund could also experience delays and costs in gaining access to the collateral. The Fund bears the risk of any deficiency in the amount of the cash collateral available for return to the borrower and any action which impairs its ability to liquidatenon-cash collateral to satisfy a borrower default.
Cash collateral is listed on the Fund’s Schedule of Investments and is shown on the Statement of Assets and Liabilities. Income earned on these investments is included in “Income derived from securities lending” on the Statement of Operations.
39
American Beacon Acadian Emerging Markets Managed Volatility FundSM
Notes to Financial Statements
January 31, 2020
Non-cash collateral received by the Fund may not be sold orre-pledged except to satisfy a borrower default. Therefore,non-cash collateral is not included on the Fund’s Schedule of Investments or Statement of Assets and Liabilities.
The Fund did not have any securities on loan or hold any securities lending collateral as of the year ended January 31, 2020.
10. Borrowing Arrangements
Effective November 14, 2019 (the “Effective Date”), the Fund, along with certain other funds managed by the Manager (“Participating Funds”), entered into a committed revolving line of credit (the “Committed Line”) agreement with State Street Bank and Trust Company (the “Bank”) to be used to facilitate portfolio liquidity. The maximum borrowing amount under the Committed Line is $250 million with interest at a rate equal to the higher of(a) one-month London Inter-Bank Offered Rate (“LIBOR”) plus 1.25% per annum or (b) the Federal Funds rate plus 1.25% per annum on amounts borrowed. Each of the Participating Funds paid a closing fee of $100,000 on the Effective Date and a quarterly commitment fee at a rate of 0.25% per annum on the unused portion of the Committed Line amount. The Committed Line expires November 12, 2020, unless extended by the Bank or terminated by the Participating Funds in accordance with the agreement.
On the Effective Date, the Fund, along with certain other Participating Funds managed by the Manager, also entered into an uncommitted discretionary demand revolving line of credit (the “Uncommitted Line”) agreement with the Bank to be used to facilitate portfolio liquidity. The maximum borrowing amount under the Uncommitted Line is $50 million with interest at a rate equal to the higher of(a) one-month LIBOR plus 1.25% per annum or (b) the Federal Funds rate plus 1.25% per annum on each outstanding loan. Each of the Participating Funds paid a closing fee of $35,000 on the Effective Date. The Uncommitted Line expires November 12, 2020 unless extended by the Bank or terminated by the Participating Funds in accordance with the agreement.
The Participating Funds paid administration, legal and arrangement fees, which are recognized as a component of “Other expenses” on the Statement of Operations, along with commitment fees, that have been allocated among the Participating Funds based on average daily net assets.
During the year ended January 31, 2020, the Fund did not utilize this facility.
11. Capital Share Transactions
The tables below summarize the activity in capital shares for each Class of the Fund:
| Institutional Class | ||||||||||||||||||||||||||||
| Year Ended January 31, | ||||||||||||||||||||||||||||
| Year Ended January 31, 2020 | Year Ended January 31, 2019 | |||||||||||||||||||||||||||
Acadian Emerging Markets Managed Volatility Fund | Shares | Amount | Shares | Amount | ||||||||||||||||||||||||
| Shares sold | 148,733 | $ | 1,277,404 | 102,960 | $ | 1,125,554 | ||||||||||||||||||||||
| Reinvestment of dividends | 124,974 | 1,007,287 | 24,555 | 243,835 | ||||||||||||||||||||||||
| Shares redeemed | (328,662 | ) | (3,060,190 | ) | (132,463 | ) | (1,430,096 | ) | ||||||||||||||||||||
| Redemption fees | – | - | – | 2,672 | ||||||||||||||||||||||||
|
|
|
|
|
|
|
| |||||||||||||||||||||
| Net (decrease) in shares outstanding | (54,955 | ) | $ | (775,499 | ) | (4,948 | ) | $ | (58,035 | ) | ||||||||||||||||||
|
|
|
|
|
|
|
| |||||||||||||||||||||
| Y Class | ||||||||||||||||||||||||||||
| Year Ended January 31, 2020 | Year Ended January 31, 2019 | |||||||||||||||||||||||||||
Acadian Emerging Markets Managed Volatility Fund | Shares | Amount | Shares | Amount | ||||||||||||||||||||||||
| Shares sold | 189,456 | $ | 1,970,943 | 740,434 | $ | 7,994,911 | ||||||||||||||||||||||
| Reinvestment of dividends | 161,265 | 1,288,509 | 130,311 | 1,287,472 | ||||||||||||||||||||||||
| Shares redeemed | (2,217,735 | ) | (22,989,129 | ) | (710,915 | ) | (7,703,853 | ) | ||||||||||||||||||||
| Redemption fees | – | - | – | 11,668 | ||||||||||||||||||||||||
|
|
|
|
|
|
|
| |||||||||||||||||||||
| Net increase (decrease) in shares outstanding | (1,867,014 | ) | $ | (19,729,677 | ) | 159,830 | $ | 1,590,198 | ||||||||||||||||||||
|
|
|
|
|
|
|
| |||||||||||||||||||||
40
American Beacon Acadian Emerging Markets Managed Volatility FundSM
Notes to Financial Statements
January 31, 2020
| Investor Class | ||||||||||||||||||||||||||||
| Year Ended January 31, 2020 | Year Ended January 31, 2019 | |||||||||||||||||||||||||||
Acadian Emerging Markets Managed Volatility Fund | Shares | Amount | Shares | Amount | ||||||||||||||||||||||||
| Shares sold | 26,916 | $ | 278,513 | 55,053 | $ | 582,905 | ||||||||||||||||||||||
| Reinvestment of dividends | 78,358 | 615,894 | 14,395 | 141,069 | ||||||||||||||||||||||||
| Shares redeemed | (86,621 | ) | (875,392 | ) | (60,515 | ) | (635,338 | ) | ||||||||||||||||||||
| Redemption fees | – | - | – | 1,281 | ||||||||||||||||||||||||
|
|
|
|
|
|
|
| |||||||||||||||||||||
| Net increase in shares outstanding | 18,653 | $ | 19,015 | 8,933 | $ | 89,917 | ||||||||||||||||||||||
|
|
|
|
|
|
|
| |||||||||||||||||||||
| A Class | ||||||||||||||||||||||||||||
| Year Ended January 31, 2020 | Year Ended January 31, 2019 | |||||||||||||||||||||||||||
Acadian Emerging Markets Managed Volatility Fund | Shares | Amount | Shares | Amount | ||||||||||||||||||||||||
| Shares sold | 98 | $ | 1,032 | 6,847 | $ | 74,480 | ||||||||||||||||||||||
| Reinvestment of dividends | 12,552 | 99,285 | 2,107 | 20,736 | ||||||||||||||||||||||||
| Shares redeemed | (12,826 | ) | (108,820 | ) | (44,210 | ) | (477,632 | ) | ||||||||||||||||||||
| Redemption fees | – | - | – | 302 | ||||||||||||||||||||||||
|
|
|
|
|
|
|
| |||||||||||||||||||||
| Net (decrease) in shares outstanding | (176 | ) | $ | (8,503 | ) | (35,256 | ) | $ | (382,114 | ) | ||||||||||||||||||
|
|
|
|
|
|
|
| |||||||||||||||||||||
| C Class | ||||||||||||||||||||||||||||
| Year Ended January 31, 2020 | Year Ended January 31, 2019 | |||||||||||||||||||||||||||
Acadian Emerging Markets Managed Volatility Fund | Shares | Amount | Shares | Amount | ||||||||||||||||||||||||
| Shares sold | 9,459 | $ | 98,400 | 2,651 | $ | 27,000 | ||||||||||||||||||||||
| Reinvestment of dividends | 4,093 | 32,910 | 994 | 9,707 | ||||||||||||||||||||||||
| Shares redeemed | (19,959 | ) | (199,162 | ) | (26,413 | ) | (273,213 | ) | ||||||||||||||||||||
| Redemption fees | – | - | – | 208 | ||||||||||||||||||||||||
|
|
|
|
|
|
|
| |||||||||||||||||||||
| Net (decrease) in shares outstanding | (6,407 | ) | $ | (67,852 | ) | (22,768 | ) | $ | (236,298 | ) | ||||||||||||||||||
|
|
|
|
|
|
|
| |||||||||||||||||||||
12. Subsequent Events
On March 4, 2020, the Board of the Trust approved a plan to liquidate and terminate the Fund on or about April 30, 2020.
Beginning in January 2020, global financial markets have experienced and may continue to experience significant volatility resulting from the spread of a virus known as COVID-19. The outbreak of COVID-19 has resulted in travel and border restrictions, quarantines, supply chain disruptions, lower consumer demand and general market uncertainty. The effects of COVID-19 have and may continue to adversely affect the global economy, the economies of certain nations and individual issuers, all of which may negatively impact the Funds performance. Management’s evaluation is ongoing and the financial landscape continues to change.
41
American Beacon Acadian Emerging Markets Managed Volatility FundSM
Financial Highlights
(For a share outstanding throughout the period)
| Institutional Class | ||||||||||||||||||||||||||||||||||||
| Year Ended January 31, | ||||||||||||||||||||||||||||||||||||
| 2020 | 2019 | 2018 | 2017 | 2016 | ||||||||||||||||||||||||||||||||
|
|
|
|
|
| |||||||||||||||||||||||||||||||
Net asset value, beginning of period | $ | 10.59 | $ | 11.78 | $ | 9.22 | $ | 8.36 | $ | 10.24 | ||||||||||||||||||||||||||
|
|
|
|
|
|
|
|
|
| |||||||||||||||||||||||||||
Income (loss) from investment operations: | ||||||||||||||||||||||||||||||||||||
Net investment income | 0.34 | A | 0.20 | 0.12 | B | 0.13 | 0.04 | |||||||||||||||||||||||||||||
Net gains (losses) on investments (both realized and unrealized) | (0.26 | ) | (0.84 | ) | 2.65 | 0.90 | (1.84 | ) | ||||||||||||||||||||||||||||
|
|
|
|
|
|
|
|
|
| |||||||||||||||||||||||||||
Total income (loss) from investment operations | 0.08 | (0.64 | ) | 2.77 | 1.03 | (1.80 | ) | |||||||||||||||||||||||||||||
|
|
|
|
|
|
|
|
|
| |||||||||||||||||||||||||||
Less distributions: | ||||||||||||||||||||||||||||||||||||
Dividends from net investment income | (0.70 | ) | (0.18 | ) | (0.21 | ) | (0.17 | ) | (0.08 | ) | ||||||||||||||||||||||||||
Distributions from net realized gains | (2.16 | ) | (0.37 | ) | – | – | – | |||||||||||||||||||||||||||||
Tax return of capitalC | – | – | – | – | (0.00 | )D | ||||||||||||||||||||||||||||||
|
|
|
|
|
|
|
|
|
| |||||||||||||||||||||||||||
Total distributions | (2.86 | ) | (0.55 | ) | (0.21 | ) | (0.17 | ) | (0.08 | ) | ||||||||||||||||||||||||||
|
|
|
|
|
|
|
|
|
| |||||||||||||||||||||||||||
Redemption fees added to beneficial interestsD | 0.00 | 0.00 | 0.00 | 0.00 | 0.00 | |||||||||||||||||||||||||||||||
|
|
|
|
|
|
|
|
|
| |||||||||||||||||||||||||||
Net asset value, end of period | $ | 7.81 | $ | 10.59 | $ | 11.78 | $ | 9.22 | $ | 8.36 | ||||||||||||||||||||||||||
|
|
|
|
|
|
|
|
|
| |||||||||||||||||||||||||||
Total returnE | (0.09 | )% | (5.13 | )% | 30.24 | % | 12.37 | % | (17.58 | )% | ||||||||||||||||||||||||||
|
|
|
|
|
|
|
|
|
| |||||||||||||||||||||||||||
Ratios and supplemental data: |
| |||||||||||||||||||||||||||||||||||
Net assets, end of period | $ | 3,318,116 | $ | 5,080,038 | $ | 5,706,260 | $ | 52,787,468 | $ | 40,335,580 | ||||||||||||||||||||||||||
Ratios to average net assets: | ||||||||||||||||||||||||||||||||||||
Expenses, before reimbursements | 2.28 | % | 1.71 | % | 1.85 | % | 1.47 | % | 1.68 | % | ||||||||||||||||||||||||||
Expenses, net of reimbursements | 1.35 | % | 1.35 | % | 1.35 | % | 1.35 | % | 1.35 | % | ||||||||||||||||||||||||||
Net investment income, before expense reimbursements | 1.75 | % | 1.44 | % | 0.74 | % | 1.18 | % | 1.16 | % | ||||||||||||||||||||||||||
Net investment income, net of reimbursements | 2.68 | % | 1.80 | % | 1.23 | % | 1.31 | % | 1.49 | % | ||||||||||||||||||||||||||
Portfolio turnover rate | 25 | % | 28 | % | 34 | % | 32 | % | 35 | % | ||||||||||||||||||||||||||
| A | Net investment income includes significant dividend payment from NVC International Holdings Ltd. amounting to $0.2633. |
| B | Per share amounts have been calculated using the average shares method. |
| C | Tax return of capital is calculated based on shares outstanding at the time of distribution. |
| D | Amount represents less than $0.01 per share. |
| E | Based on net asset value, which does not reflect the sales charge, redemption fee, or contingent deferred sales charge, if applicable. May include adjustments in accordance with U.S. GAAP and as such, the net asset value for reporting purposes and the returns based upon those net asset values may differ from the net asset value and returns for shareholder transactions. |
See accompanying notes
42
American Beacon Acadian Emerging Markets Managed Volatility FundSM
Financial Highlights
(For a share outstanding throughout the period)
| Y Class | ||||||||||||||||||||||||||||||||||||
| Year Ended January 31, | ||||||||||||||||||||||||||||||||||||
| 2020 | 2019 | 2018 | 2017 | 2016 | ||||||||||||||||||||||||||||||||
|
| |||||||||||||||||||||||||||||||||||
Net asset value, beginning of period | $ | 10.54 | $ | 11.73 | $ | 9.19 | $ | 8.34 | $ | 10.22 | ||||||||||||||||||||||||||
|
|
|
|
|
|
|
|
|
| |||||||||||||||||||||||||||
Income (loss) from investment operations: | ||||||||||||||||||||||||||||||||||||
Net investment income | 0.20 | A | 0.17 | 0.13 | 0.11 | 0.14 | ||||||||||||||||||||||||||||||
Net gains (losses) on investments (both realized and unrealized) | (0.13 | ) | (0.81 | ) | 2.62 | 0.91 | (1.94 | ) | ||||||||||||||||||||||||||||
|
|
|
|
|
|
|
|
|
| |||||||||||||||||||||||||||
Total income (loss) from investment operations | 0.07 | (0.64 | ) | 2.75 | 1.02 | (1.80 | ) | |||||||||||||||||||||||||||||
|
|
|
|
|
|
|
|
|
| |||||||||||||||||||||||||||
Less distributions: | ||||||||||||||||||||||||||||||||||||
Dividends from net investment income | (0.70 | ) | (0.18 | ) | (0.21 | ) | (0.17 | ) | (0.08 | ) | ||||||||||||||||||||||||||
Distributions from net realized gains | (2.16 | ) | (0.37 | ) | – | – | – | |||||||||||||||||||||||||||||
Tax return of capitalB | – | – | – | – | (0.00 | )C | ||||||||||||||||||||||||||||||
|
|
|
|
|
|
|
|
|
| |||||||||||||||||||||||||||
Total distributions | (2.86 | ) | (0.55 | ) | (0.21 | ) | (0.17 | ) | (0.08 | ) | ||||||||||||||||||||||||||
|
|
|
|
|
|
|
|
|
| |||||||||||||||||||||||||||
Redemption fees added to beneficial interestsC | 0.00 | 0.00 | 0.00 | 0.00 | 0.00 | |||||||||||||||||||||||||||||||
|
|
|
|
|
|
|
|
|
| |||||||||||||||||||||||||||
Net asset value, end of period | $ | 7.75 | $ | 10.54 | $ | 11.73 | $ | 9.19 | $ | 8.34 | ||||||||||||||||||||||||||
|
|
|
|
|
|
|
|
|
| |||||||||||||||||||||||||||
Total returnD | (0.16 | )% | (5.15 | )% | 30.12 | % | 12.28 | % | (17.64 | )% | ||||||||||||||||||||||||||
|
|
|
|
|
|
|
|
|
| |||||||||||||||||||||||||||
Ratios and supplemental data: | ||||||||||||||||||||||||||||||||||||
Net assets, end of period | $ | 5,148,222 | $ | 26,674,824 | $ | 27,820,209 | $ | 32,606,568 | $ | 25,098,823 | ||||||||||||||||||||||||||
Ratios to average net assets: | ||||||||||||||||||||||||||||||||||||
Expenses, before reimbursements | 2.34 | % | 1.76 | % | 1.93 | % | 1.55 | % | 1.77 | % | ||||||||||||||||||||||||||
Expenses, net of reimbursements | 1.45 | % | 1.45 | % | 1.45 | % | 1.45 | % | 1.45 | % | ||||||||||||||||||||||||||
Net investment income, before expense reimbursements | 1.55 | % | 1.26 | % | 1.04 | % | 1.15 | % | 1.23 | % | ||||||||||||||||||||||||||
Net investment income, net of reimbursements | 2.44 | % | 1.57 | % | 1.52 | % | 1.25 | % | 1.55 | % | ||||||||||||||||||||||||||
Portfolio turnover rate | 25 | % | 28 | % | 34 | % | 32 | % | 35 | % | ||||||||||||||||||||||||||
| A | Net investment income includes significant dividend payment from NVC International Holdings Ltd. amounting to $0.1136. |
| B | Tax return of capital is calculated based on shares outstanding at the time of distribution. |
| C | Amount represents less than $0.01 per share. |
| D | Based on net asset value, which does not reflect the sales charge, redemption fee, or contingent deferred sales charge, if applicable. May include adjustments in accordance with U.S. GAAP and as such, the net asset value for reporting purposes and the returns based upon those net asset values may differ from the net asset value and returns for shareholder transactions. |
See accompanying notes
43
American Beacon Acadian Emerging Markets Managed Volatility FundSM
Financial Highlights
(For a share outstanding throughout the period)
| Investor Class | ||||||||||||||||||||||||||||||||||||
| Year Ended January 31, | ||||||||||||||||||||||||||||||||||||
| 2020 | 2019 | 2018 | 2017 | 2016 | ||||||||||||||||||||||||||||||||
|
| |||||||||||||||||||||||||||||||||||
Net asset value, beginning of period | $ | 10.44 | $ | 11.66 | $ | 9.16 | $ | 8.32 | $ | 10.19 | ||||||||||||||||||||||||||
|
|
|
|
|
|
|
|
|
| |||||||||||||||||||||||||||
Income (loss) from investment operations: | ||||||||||||||||||||||||||||||||||||
Net investment income | 0.36 | A | 0.15 | 0.11 | 0.11 | 0.16 | ||||||||||||||||||||||||||||||
Net gains (losses) on investments (both realized and unrealized) | (0.32 | ) | (0.82 | ) | 2.60 | 0.87 | (1.98 | ) | ||||||||||||||||||||||||||||
|
|
|
|
|
|
|
|
|
| |||||||||||||||||||||||||||
Total income (loss) from investment operations | 0.04 | (0.67 | ) | 2.71 | 0.98 | (1.82 | ) | |||||||||||||||||||||||||||||
|
|
|
|
|
|
|
|
|
| |||||||||||||||||||||||||||
Less distributions: | ||||||||||||||||||||||||||||||||||||
Dividends from net investment income | (0.70 | ) | (0.18 | ) | (0.21 | ) | (0.14 | ) | (0.05 | ) | ||||||||||||||||||||||||||
Distributions from net realized gains | (2.16 | ) | (0.37 | ) | - | - | - | |||||||||||||||||||||||||||||
Tax return of capitalB | - | - | - | - | (0.00 | )C | ||||||||||||||||||||||||||||||
|
|
|
|
|
|
|
|
|
| |||||||||||||||||||||||||||
Total distributions | (2.86 | ) | (0.55 | ) | (0.21 | ) | (0.14 | ) | (0.05 | ) | ||||||||||||||||||||||||||
|
|
|
|
|
|
|
|
|
| |||||||||||||||||||||||||||
Redemption fees added to beneficial interestsC | 0.00 | 0.00 | 0.00 | 0.00 | 0.00 | |||||||||||||||||||||||||||||||
|
|
|
|
|
|
|
|
|
| |||||||||||||||||||||||||||
Net asset value, end of period | $ | 7.62 | $ | 10.44 | $ | 11.66 | $ | 9.16 | $ | 8.32 | ||||||||||||||||||||||||||
|
|
|
|
|
|
|
|
|
| |||||||||||||||||||||||||||
Total returnD | (0.46 | )% | (5.45 | )% | 29.78 | % | 11.89 | % | (17.86 | )% | ||||||||||||||||||||||||||
|
|
|
|
|
|
|
|
|
| |||||||||||||||||||||||||||
Ratios and supplemental data: |
| |||||||||||||||||||||||||||||||||||
Net assets, end of period | $ | 2,181,698 | $ | 2,793,978 | $ | 3,016,153 | $ | 3,457,789 | $ | 3,933,437 | ||||||||||||||||||||||||||
Ratios to average net assets: | ||||||||||||||||||||||||||||||||||||
Expenses, before reimbursements | 2.59 | % | 2.15 | % | 2.12 | % | 1.77 | % | 1.98 | % | ||||||||||||||||||||||||||
Expenses, net of reimbursements | 1.73 | % | 1.73 | % | 1.73 | % | 1.73 | % | 1.73 | % | ||||||||||||||||||||||||||
Net investment income, before expense reimbursements | 1.29 | % | 0.93 | % | 0.82 | % | 0.94 | % | 1.30 | % | ||||||||||||||||||||||||||
Net investment income, net of reimbursements | 2.15 | % | 1.35 | % | 1.21 | % | 0.98 | % | 1.55 | % | ||||||||||||||||||||||||||
Portfolio turnover rate | 25 | % | 28 | % | 34 | % | 32 | % | 35 | % | ||||||||||||||||||||||||||
| A | Net investment income includes significant dividend payment from NVC International Holdings Ltd. amounting to $0.3046. |
| B | Tax return of capital is calculated based on shares outstanding at the time of distribution. |
| C | Amount represents less than $0.01 per share. |
| D | Based on net asset value, which does not reflect the sales charge, redemption fee, or contingent deferred sales charge, if applicable. May include adjustments in accordance with U.S. GAAP and as such, the net asset value for reporting purposes and the returns based upon those net asset values may differ from the net asset value and returns for shareholder transactions. |
See accompanying notes
44
American Beacon Acadian Emerging Markets Managed Volatility FundSM
Financial Highlights
(For a share outstanding throughout the period)
| A Class | ||||||||||||||||||||||||||||||||||||
| Year Ended January 31, | ||||||||||||||||||||||||||||||||||||
| 2020 | 2019 | 2018 | 2017 | 2016 | ||||||||||||||||||||||||||||||||
|
| |||||||||||||||||||||||||||||||||||
Net asset value, beginning of period | $ | 10.48 | $ | 11.69 | $ | 9.18 | $ | 8.34 | $ | 10.18 | ||||||||||||||||||||||||||
|
|
|
|
|
|
|
|
|
| |||||||||||||||||||||||||||
Income (loss) from investment operations: | ||||||||||||||||||||||||||||||||||||
Net investment income | 0.26 | A | 0.10 | 0.10 | 0.13 | 0.12 | ||||||||||||||||||||||||||||||
Net gains (losses) on investments (both realized and unrealized) | (0.21 | ) | (0.78 | ) | 2.62 | 0.85 | (1.94 | ) | ||||||||||||||||||||||||||||
|
|
|
|
|
|
|
|
|
| |||||||||||||||||||||||||||
Total income (loss) from investment operations | 0.05 | (0.68 | ) | 2.72 | 0.98 | (1.82 | ) | |||||||||||||||||||||||||||||
|
|
|
|
|
|
|
|
|
| |||||||||||||||||||||||||||
Less distributions: | ||||||||||||||||||||||||||||||||||||
Dividends from net investment income | (0.70 | ) | (0.16 | ) | (0.21 | ) | (0.14 | ) | (0.02 | ) | ||||||||||||||||||||||||||
Distributions from net realized gains | (2.16 | ) | (0.37 | ) | – | – | – | |||||||||||||||||||||||||||||
Tax return of capitalB | – | – | – | – | (0.00 | )C | ||||||||||||||||||||||||||||||
|
|
|
|
|
|
|
|
|
| |||||||||||||||||||||||||||
Total distributions | (2.86 | ) | (0.53 | ) | (0.21 | ) | (0.14 | ) | (0.02 | ) | ||||||||||||||||||||||||||
|
|
|
|
|
|
|
|
|
| |||||||||||||||||||||||||||
Redemption fees added to beneficial interestsC | 0.00 | 0.00 | 0.00 | 0.00 | 0.00 | |||||||||||||||||||||||||||||||
|
|
|
|
|
|
|
|
|
| |||||||||||||||||||||||||||
Net asset value, end of period | $ | 7.67 | $ | 10.48 | $ | 11.69 | $ | 9.18 | $ | 8.34 | ||||||||||||||||||||||||||
|
|
|
|
|
|
|
|
|
| |||||||||||||||||||||||||||
Total returnD | (0.36 | )% | (5.52 | )% | 29.83 | % | 11.84 | % | (17.90 | )% | ||||||||||||||||||||||||||
|
|
|
|
|
|
|
|
|
| |||||||||||||||||||||||||||
Ratios and supplemental data: | ||||||||||||||||||||||||||||||||||||
Net assets, end of period | $ | 285,259 | $ | 391,973 | $ | 849,017 | $ | 510,236 | $ | 740,272 | ||||||||||||||||||||||||||
Ratios to average net assets: | ||||||||||||||||||||||||||||||||||||
Expenses, before reimbursements | 2.53 | % | 2.02 | % | 2.24 | % | 1.90 | % | 2.10 | % | ||||||||||||||||||||||||||
Expenses, net of reimbursements | 1.75 | % | 1.75 | % | 1.75 | % | 1.75 | % | 1.75 | % | ||||||||||||||||||||||||||
Net investment income, before expense reimbursements | 1.36 | % | 1.06 | % | 0.61 | % | 0.86 | % | 1.08 | % | ||||||||||||||||||||||||||
Net investment income, net of reimbursements | 2.14 | % | 1.33 | % | 1.10 | % | 1.01 | % | 1.43 | % | ||||||||||||||||||||||||||
Portfolio turnover rate | 25 | % | 28 | % | 34 | % | 32 | % | 35 | % | ||||||||||||||||||||||||||
| A | Net investment income includes significant dividend payment from NVC International Holdings Ltd. amounting to $0.1887. |
| A | Tax return of capital is calculated based on shares outstanding at the time of distribution. |
| B | Amount represents less than $0.01 per share. |
| C | Based on net asset value, which does not reflect the sales charge, redemption fee, or contingent deferred sales charge, if applicable. May include adjustments in accordance with U.S. GAAP and as such, the net asset value for reporting purposes and the returns based upon those net asset values may differ from the net asset value and returns for shareholder transactions. |
See accompanying notes
45
American Beacon Acadian Emerging Markets Managed Volatility FundSM
Financial Highlights
(For a share outstanding throughout the period)
| C Class | ||||||||||||||||||||||||||||||||||||
| Year Ended January 31, | ||||||||||||||||||||||||||||||||||||
| 2020 | 2019 | 2018 | 2017 | 2016 | ||||||||||||||||||||||||||||||||
|
| |||||||||||||||||||||||||||||||||||
Net asset value, beginning of period | $ | 10.40 | $ | 11.55 | $ | 9.08 | $ | 8.23 | $ | 10.10 | ||||||||||||||||||||||||||
|
|
|
|
|
|
|
|
|
| |||||||||||||||||||||||||||
Income (loss) from investment operations: | ||||||||||||||||||||||||||||||||||||
Net investment income | 0.15 | A | 0.02 | 0.06 | 0.02 | 0.10 | ||||||||||||||||||||||||||||||
Net gains (losses) on investments (both realized and unrealized) | (0.19 | ) | (0.76 | ) | 2.54 | 0.89 | (1.97 | ) | ||||||||||||||||||||||||||||
|
|
|
|
|
|
|
|
|
| |||||||||||||||||||||||||||
Total income (loss) from investment operations | (0.04 | ) | (0.74 | ) | 2.60 | 0.91 | (1.87 | ) | ||||||||||||||||||||||||||||
|
|
|
|
|
|
|
|
|
| |||||||||||||||||||||||||||
Less distributions: | ||||||||||||||||||||||||||||||||||||
Dividends from net investment income | (0.42 | ) | (0.04 | ) | (0.13 | ) | (0.06 | ) | (0.00 | )B | ||||||||||||||||||||||||||
Distributions from net realized gains | (2.16 | ) | (0.37 | ) | – | – | – | |||||||||||||||||||||||||||||
Tax return of capitalC | – | – | – | – | (0.00 | )B | ||||||||||||||||||||||||||||||
|
|
|
|
|
|
|
|
|
| |||||||||||||||||||||||||||
Total distributions | (2.58 | ) | (0.41 | ) | (0.13 | ) | (0.06 | ) | (0.00 | )B | ||||||||||||||||||||||||||
|
|
|
|
|
|
|
|
|
| |||||||||||||||||||||||||||
Redemption fees added to beneficial interestsB | 0.00 | 0.00 | 0.00 | 0.00 | 0.00 | |||||||||||||||||||||||||||||||
|
|
|
|
|
|
|
|
|
| |||||||||||||||||||||||||||
Net asset value, end of period | $ | 7.78 | $ | 10.40 | $ | 11.55 | $ | 9.08 | $ | 8.23 | ||||||||||||||||||||||||||
|
|
|
|
|
|
|
|
|
| |||||||||||||||||||||||||||
Total returnD | (1.21 | )% | (6.19 | )% | 28.71 | % | 11.11 | % | (18.50 | )% | ||||||||||||||||||||||||||
|
|
|
|
|
|
|
|
|
| |||||||||||||||||||||||||||
Ratios and supplemental data: | ||||||||||||||||||||||||||||||||||||
Net assets, end of period | $ | 111,931 | $ | 216,223 | $ | 503,049 | $ | 450,626 | $ | 644,705 | ||||||||||||||||||||||||||
Ratios to average net assets: | ||||||||||||||||||||||||||||||||||||
Expenses, before reimbursements | 3.40 | % | 2.77 | % | 3.00 | % | 2.67 | % | 2.87 | % | ||||||||||||||||||||||||||
Expenses, net of reimbursements | 2.50 | % | 2.50 | % | 2.50 | % | 2.50 | % | 2.50 | % | ||||||||||||||||||||||||||
Net investment income (loss), before expense reimbursements | 0.49 | % | 0.54 | % | (0.01 | )% | 0.11 | % | 0.40 | % | ||||||||||||||||||||||||||
Net investment income, net of reimbursements | 1.39 | % | 0.81 | % | 0.49 | % | 0.28 | % | 0.77 | % | ||||||||||||||||||||||||||
Portfolio turnover rate | 25 | % | 28 | % | 34 | % | 32 | % | 35 | % | ||||||||||||||||||||||||||
| A | Net investment income includes significant dividend payment from NVC International Holdings Ltd. amounting to $0.0871. |
| B | Amount represents less than $0.01 per share. |
| C | Tax return of capital is calculated based on shares outstanding at the time of distribution. |
| D | Based on net asset value, which does not reflect the sales charge, redemption fee, or contingent deferred sales charge, if applicable. May include adjustments in accordance with U.S. GAAP and as such, the net asset value for reporting purposes and the returns based upon those net asset values may differ from the net asset value and returns for shareholder transactions. |
See accompanying notes
46
American Beacon Acadian Emerging Markets Managed Volatility FundSM
January 31, 2020 (Unaudited)
Certain tax information regarding the Fund is required to be provided to shareholders based upon the Fund’s income and distributions for the taxable year ended January 31, 2020. The information and distributions reported herein may differ from information and distributions taxable to the shareholders for the calendar year ended December 31, 2019.
The Fund designated the following items with regard to distributions paid during the fiscal year ended January 31, 2020. All designations are based on financial information available as of this annual report and, accordingly, are subject to change. For each item, it is the intention of the Fund to designate the maximum amount permitted under the Internal Revenue Code of 1986, as amended, and the regulations there under.
Corporate Dividends-Received Deduction:
Acadian Emerging Markets Managed Volatility | 0.01 | % |
Qualified Dividend Income:
Acadian Emerging Markets Managed Volatility | 81.87 | % |
Long-Term Capital Gain Distributions:
Acadian Emerging Markets Managed Volatility | $ | 2,602,090 |
Short-Term Capital Gain Distributions:
Acadian Emerging Markets Managed Volatility | $ | 624 |
Shareholders will receive notification in January 2020 of the applicable tax information necessary to prepare their 2019 income tax returns.
47
Trustees and Officers of the American Beacon FundsSM(Unaudited)
The Trustees and officers of the American Beacon Funds (the “Trust”) are listed below, together with their principal occupations during the past five years. The address of each person listed below is 220 Las Colinas Boulevard East, Suite 1200, Irving, Texas 75039. Each Trustee overseesthirty-six funds in the fund complex that includes the Trust, the American Beacon Select Funds, the American Beacon Institutional Funds Trust, the American Beacon Sound Point Enhanced Income Fund, and the American Beacon Apollo Total Return Fund. The Trust’s Statement of Additional Information contains additional information about the Trustees and is available without charge by calling1-800-658-5811.
Name, Age | Position, Term of Office and Length of Time Served with the Trust | Principal Occupation(s) During Past 5 Years and Current Directorships | ||
| NON-INTERESTED TRUSTEES | Term | |||
Lifetime of Trust until removal, resignation or retirement* | ||||
| Gilbert G. Alvarado (50) | Trustee since 2015 | President, SJVIIF, LLC, Impact Investment Fund (2018-Present); Director, Kura MD, Inc. (local telehealth organization) (2015-2017); Senior Vice President & CFO, Sierra Health Foundation (health conversion private foundation) (2006-Present); Senior Vice President & CFO, Sierra Health Foundation: Center for Health Program Management (California public benefit corporation) (2012-Present); Director, Innovative North State (2012-2015); Director, Sacramento Regional Technology Alliance (2011-2016); Director, Valley Healthcare Staffing (2017-2018); Trustee, American Beacon Select Funds (2015-Present); Trustee, American Beacon Institutional Funds Trust (2017-Present); Trustee, American Beacon Sound Point Enhanced Income Fund(2018-Present); Trustee, American Beacon Apollo Total Return Fund (2018-Present). | ||
| Joseph B. Armes (57) | Trustee since 2015 | Director, Switchback Energy Acquisition (2019-Present); Chairman & CEO, CSW Industrials f/k/a Capital Southwest Corporation (investment company) (2015-Present); Chairman of the Board of Capital Southwest Corporation, predecessor to CSW Industrials, Inc. (2014-2017) (investment company); CEO, Capital Southwest Corporation(2013-2015); President & CEO, JBA Investment Partners (family investment vehicle) (2010-Present); Director and Chair of Audit Committee, RSP Permian (oil and gas producer) (2013-2018); Trustee, American Beacon Select Funds(2015-Present); Trustee, American Beacon Institutional Funds Trust (2017-Present); Trustee, American Beacon Sound Point Enhanced Income Fund (2018-Present); Trustee, American Beacon Apollo Total Return Fund (2018-Present). | ||
| Gerard J. Arpey (61) | Trustee since 2012 | Director, The Home Depot, Inc. (2015-Present); Partner, Emerald Creek Group (private equity firm) (2011-Present); Director, S.C. Johnson & Son, Inc. (privately held company) (2008-present); Trustee, American Beacon Select Funds (2012-Present); Trustee, American Beacon Institutional Funds Trust (2017-Present); Trustee, American Beacon Sound Point Enhanced Income Fund (2018-Present); Trustee, American Beacon Apollo Total Return Fund (2018-Present). | ||
| Brenda A. Cline (59) | Trustee since 2004 Chair since 2019 Vice Chair 2018 | Chief Financial Officer, Treasurer and Secretary, Kimbell Art Foundation (1993-Present); Director, Tyler Technologies, Inc. (public sector software solutions company) (2014-Present); Director, Range Resources Corporation (oil and natural gas company) (2015-Present); Trustee, CushingClosed-End andOpen-End Funds (2017-Present); Trustee, American Beacon Select Funds (2004-Present); ; Trustee, American Beacon Institutional Funds Trust (2017-Present); Trustee, American Beacon Sound Point Enhanced Income Fund (2018-Present); Trustee, American Beacon Apollo Total Return Fund (2018-Present). | ||
48
Trustees and Officers of the American Beacon FundsSM(Unaudited)
Name, Age | Position, Term of Office and Length of Time Served with the Trust | Principal Occupation(s) During Past 5 Years and Current Directorships | ||
| NON-INTERESTED TRUSTEES (CONT.) | Term | |||
Lifetime of Trust until removal, resignation or retirement* | ||||
| Eugene J. Duffy (65) | Trustee since 2008 | Managing Director, Global Investment Management Distribution, Mesirow Financial (2016-Present); Managing Director, Institutional Services, Intercontinental Real Estate Corporation (2014-Present); Trustee, American Beacon Select Funds (2008-Present); Trustee, American Beacon Institutional Funds Trust (2017-Present); Trustee, American Beacon Sound Point Enhanced Income Fund (2018-Present); Trustee, American Beacon Apollo Total Return Fund (2018-Present). | ||
| Claudia A. Holz (62) | Trustee since 2018 | Partner, KPMG LLP (1990-2017); Trustee, American Beacon Select Funds (2018-Present); Trustee, American Beacon Institutional Funds Trust (2018-Present); Trustee, American Beacon Sound Point Enhanced Income Fund (2018-Present); Trustee, American Beacon Apollo Total Return Fund (2018-Present). | ||
| Douglas A. Lindgren (58) | Trustee since 2018 | CEO North America, Carne Global Financial Services (2016-2017); Consultant, Carne Financial Services (2017-2019); Managing Director, IPS Investment Management and Global Head, Content Management, UBS Wealth Management (2010-2016); Trustee, American Beacon Select Funds (2018-Present); Trustee, American Beacon Institutional Funds Trust (2018-Present); Trustee, American Beacon Sound Point Enhanced Income Fund (2018-Present); Trustee, American Beacon Apollo Total Return Fund (2018-Present). | ||
| Barbara J. McKenna, CFA (56) | Trustee since 2012 | President/Managing Principal, Longfellow Investment Management Company (2005-Present); Trustee, American Beacon Select Funds(2012-Present); Trustee, American Beacon Institutional Funds Trust (2017-Present); Trustee, American Beacon Sound Point Enhanced Income Fund (2018-Present); Trustee, American Beacon Apollo Total Return Fund (2018-Present. | ||
| R. Gerald Turner (74) | Trustee since 2001 | President, Southern Methodist University (1995-Present); Director, J.C. Penney Company, Inc. (1996-2019); Director, Kronus Worldwide Inc. (chemical manufacturing) (2003-Present); Trustee, American Beacon Select Funds (2001-Present); Trustee, American Beacon Institutional Funds Trust (2017-Present); Trustee, American Beacon Sound Point Enhanced Income Fund (2018-Present); Trustee, American Beacon Apollo Total Return Fund (2018-Present). | ||
49
Trustees and Officers of the American Beacon FundsSM(Unaudited)
Name, Age | Position, Term of Office and Length of Time Served with the Trust | Principal Occupation(s) During Past 5 Years and Current Directorships | ||
| OFFICERS | Term | |||
| One Year | ||||
| Gene L. Needles, Jr. (65) | President since 2009 | President (2009-2018), CEO and Director (2009-Present), and Chairman (2018-Present), American Beacon Advisors, Inc., President (2015-2018), Director and CEO (2015-Present), and Chairman (2018-Present), Resolute Investment Holdings, LLC; President (2015-2018), Director and CEO(2015-Present), and Chairman (2018-Present), Resolute Topco, Inc.; President (2015-2018); Director, and CEO (2015-Present), and Chairman (2018-Present), Resolute Acquisition, Inc.; President (2015-2018), Director and CEO (2015-Present), Chairman (2018-Present), Resolute Investment Managers, Inc.; Director, Chairman, President and CEO, Resolute Investment Distributors (2017-Present); Director, Chairman, President and CEO; Resolute Investment Services, Inc. (2017-Present); President and CEO, Lighthouse Holdings Parent, Inc. (2009-2015); President, CEO and Director, Lighthouse Holdings, Inc. (2009-2015); Manager, President and CEO, American Private Equity Management, LLC (2012-Present); Director, Chairman, President and CEO, Alpha Quant Advisors, LLC (2016-Present); Director, ARK Investment Management LLC (2016-Present); Director, Shapiro Capital Management LLC (2017-Present); Director, Chairman and CEO, Continuous Capital, LLC (2018-Present); Director, Green Harvest Asset Management (2019-Present); Director, National Investment Services of America, LLC (2019-Present); President, American Beacon Cayman Managed Futures Strategy Fund, Ltd. (2014-Present); Director and President, American Beacon Cayman Transformational Innovation Company, LTD., (2017-2018); President, American Beacon Delaware Transformational Innovation Corporation(2017-2018); President American Beacon Cayman TargetRisk Company, Ltd. (2018-Present); Member, Investment Advisory Committee, Employees Retirement System of Texas (2017-Present); Trustee, American Beacon NextShares Trust (2015-Present); President, American Beacon Select Funds (2009-Present); President, American Beacon Institutional Funds Trust(2017-Present); President, American Beacon Sound Point Enhanced Income Fund (2018-Present); President, American Beacon Apollo Total Return Fund (2018-Present); Director, RSW Investments Holdings LLC, (2019-Present); Manager, SSI Investment Management, LLC (2019-Present). | ||
| Rosemary K. Behan (60) | VP, Secretary and Chief Legal Officer since 2006 | Vice President, Secretary and General Counsel, American Beacon Advisors, Inc. (2006-Present); Secretary, Resolute Investment Holdings, LLC (2015-Present); Secretary, Resolute Topco, Inc. (2015-Present); Secretary, Resolute Acquisition, Inc. (2015-Present); Vice President, Secretary and General Counsel, Resolute Investment Managers, Inc. (2015-Present); Secretary, Resolute Investment Distributors, Inc. (2017-Present); Vice President, Secretary and General Counsel, Resolute Investment Services, Inc. (2017-Present); Vice President and Secretary, Lighthouse Holdings Parent, Inc. (2008-2015); Vice President and Secretary, Lighthouse Holdings, Inc. (2008-2015); Secretary, American Private Equity Management, LLC (2008-Present); Secretary and General Counsel, Alpha Quant Advisors, LLC (2016-Present); Vice President and Secretary, Continuous Capital, LLC (2018-Present); Secretary, Green Harvest Asset Management (2019-Present); Secretary, American Beacon Delaware Transformational Innovation Corporation (2017-2018); Secretary, American Beacon Cayman Transformational Innovation Company, Ltd. (2017-2018); Secretary, American Beacon Cayman Managed Futures Strategy Fund, Ltd. (2014-Present); Secretary, American Beacon Cayman TargetRisk Company, Ltd (2018-Present); Chief Legal Officer, Vice President and Secretary, American Beacon Select Funds (2006-Present); Chief Legal Officer, Vice President and Secretary, American Beacon Institutional Funds Trust (2017-Present); Chief Legal Officer, Vice President and Secretary, American Beacon Sound Point Enhanced Income Fund (2018-Present); Chief Legal Officer, Vice President and Secretary American Beacon Apollo Total Return Fund (2018-Present). | ||
50
Trustees and Officers of the American Beacon FundsSM(Unaudited)
Name, Age | Position, Term of Office and Length of Time Served with the Trust | Principal Occupation(s) During Past 5 Years and Current Directorships | ||
| OFFICERS (CONT.) | Term | |||
| One Year | ||||
| Brian E. Brett (59) | VP since 2004 | Senior Vice President, Head of Distribution (2012-Present), Vice President, Director of Sales (2004-2012), American Beacon Advisors, Inc.; Senior Vice President, Resolute Investment Managers, Inc. (2017-Present); Senior Vice President, Resolute Investment Distributors, Inc. (2018-Present), Senior Vice President, Resolute Investment Services, Inc. (2018-Present); Senior Vice President, Lighthouse Holdings Parent, Inc. (2008-2015); Senior Vice President, Lighthouse Holdings, Inc. (2008-2015); Vice President, American Beacon Select Funds (2004-Present); Vice President, American Beacon Institutional Funds Trust (2017-Present); Vice President American Beacon Sound Point Enhanced Income Fund (2018-Present); Vice President American Beacon Apollo Total Return Fund (2018-Present). | ||
| Paul B. Cavazos (50) | VP since 2016 | Chief Investment Officer and Senior Vice President, American Beacon Advisors, Inc. (2016-Present); Chief Investment Officer, DTE Energy (2007-2016); Vice President, American Private Equity Management, L.L.C. (2017-Present); Vice President, American Beacon Select Funds (2016-Present); Vice President, American Beacon Institutional Funds Trust (2017-Present); Vice President American Beacon Sound Point Enhanced Income Fund (2018-Present); Vice President American Beacon Apollo Total Return Fund (2018-Present). | ||
| Erica Duncan (49) | VP Since 2011 | Vice President, American Beacon Advisors, Inc. (2011-Present); Vice President, Resolute Investment Managers (2018-Present); Vice President, Resolute Investment Services, Inc. (2018-Present); Vice President, American Beacon Select Funds (2011-Present); Vice President, American Beacon Institutional Funds Trust (2017-Present); Vice President American Beacon Sound Point Enhanced Income Fund (2018-Present); Vice President American Beacon Apollo Total Return Fund (2018-Present). | ||
| Melinda G. Heika (58) | Principal Accounting Officer since 2017 and Treasurer since 2010 | Treasurer and CFO (2010-Present), American Beacon Advisors, Inc.; Treasurer, Resolute Topco, Inc. (2015-Present); Treasurer, Resolute Investment Holdings, LLC. (2015-Present); Treasurer, Resolute Acquisition, Inc. (2015-Present); Treasurer and CFO, Resolute Investment Managers, Inc. (2017-Present); Treasurer, Resolute Investment Distributors, Inc. (2017-2017); Treasurer and CFO, Resolute Investment Services, Inc. (2015-Present); Treasurer, Lighthouse Holdings Parent Inc., (2010-2015); Treasurer, Lighthouse Holdings, Inc. (2010-2015); Treasurer, American Private Equity Management, LLC (2012-Present); Treasurer and CFO, Alpha Quant Advisors, LLC (2016-Present); Treasurer and CFO, Continuous Capital, LLC(2018-Present); Treasurer, Green Harvest Asset Management (2019-Present); Treasurer, American Beacon Cayman Transformational Innovation, Ltd. (2017-2018); Treasurer, American Beacon Delaware Transformational Innovation Corporation (2017-2018); Director and Treasurer, American Beacon Cayman Managed Futures Strategy Fund, Ltd. (2014-Present); Treasurer, American Beacon Cayman TargetRisk Company, Ltd. (2018-Present); Treasurer, American Beacon Select Funds (2010-Present); Treasurer, American Beacon Institutional Funds Trust (2017-Present); Treasurer, American Beacon Sound Point Enhanced Income Fund (2018-Present); Treasurer, American Beacon Apollo Total Return Fund (2018-Present). | ||
| Terri L. McKinney (56) | VP since 2010 | Vice President (2009-Present), Managing Director (2003-2009), American Beacon Advisors, Inc.; Vice President, Resolute Investment Managers, Inc. (2017-Present); Vice President, Resolute Investment Services, Inc(2018-Present); Vice President, Alpha Quant Advisors, LLC (2016-Present); Vice President, Continuous Capital, LLC (2018-Present); Vice President, American Beacon Select Funds (2010-Present); Vice President, American Beacon Institutional Funds Trust (2017-Present); Vice President, American Beacon Sound Point Enhanced Income Fund (2018-Present); Vice President, American Beacon Apollo Total Return Fund (2018-Present). | ||
51
Trustees and Officers of the American Beacon FundsSM(Unaudited)
Name, Age | Position, Term of Office and Length of Time Served with the Trust | Principal Occupation(s) During Past 5 Years and Current Directorships | ||
| OFFICERS (CONT.) | Term | |||
| One Year | ||||
| Jeffrey K. Ringdahl (44) | VP since 2010 | Director (2015-Present), President (2018-Present), Chief Operating Officer (2010-Present), Senior Vice President (2013-2018), Vice President (2010-2013), American Beacon Advisors, Inc.; Director (2015-Present), President (2018-Present), Senior Vice Present (2015-2018), Resolute Investment Holdings, LLC; Director (2015-Present), President (2018-Present), Senior Vice President (2015-2018), Resolute Topco, Inc.; Director (2015-Present), President (2018-Present), Senior Vice President (2015-2018), Resolute Acquisition, Inc.; Director (2015-Present), President & COO (2018-Present), Senior Vice President (2015-2018), Resolute Investment Managers, Inc.; Director and Executive Vice President (2017-Present), Resolute Investment Distributors, Inc.; Director (2017-Present), President & COO (2018-Present), Executive Vice President (2017-2018), Resolute Investment Services, Inc.; Senior Vice President (2017-Present), Vice President (2012-2017), Manager (2015-Present), American Private Equity Management, LLC; Senior Vice President, Lighthouse Holdings Parent, Inc. (2013-2015); Senior Vice President, Lighthouse Holdings, Inc. (2013-2015); Trustee, American Beacon NextShares Trust (2015-Present); Director, Executive Vice President & COO, Alpha Quant Advisors, LLC (2016-Present); Director, Shapiro Capital Management, LLC (2017-Present); Director, Executive Vice President & COO, Continuous Capital, LLC (2018-Present); Director, RSW Investments Holdings LLC, (2019-Present); Manager, SSI Investment Management, LLC (2019-Present); Director, National Investment Services of America, LLC (2019-Present); Director and Vice President, American Beacon Cayman Transformational Innovation Company, Ltd., (2017-Present); Vice President, American Beacon Delaware Transformational Innovation Corporation (2017-2018); Director and Vice President, American Beacon Cayman Managed Futures Strategy Fund, Ltd. (2014-Present); Vice President, American Beacon Cayman TargetRisk Company, Ltd (2018-Present); Vice President, American Beacon Select Funds (2010-2018); Vice President, American Beacon Institutional Funds Trust (2017-Present); Vice President, American Beacon Sound Point Enhanced Income Fund (2018-Present); Vice President, American Beacon Apollo Total Return Fund (2018-Present). | ||
| Samuel J. Silver (56) | VP Since 2011 | Vice President (2011-Present), Chief Fixed Income Officer (2016-Present), American Beacon Advisors, Inc. (2011-Present); Vice President, American Beacon Select Funds (2011-Present); Vice President, American Beacon Institutional Funds Trust (2017-Present); Vice President, American Beacon Sound Point Enhanced Income Fund (2018-Present); Vice President, American Beacon Apollo Total Return Fund (2018-Present). | ||
| Christina E. Sears (48) | Chief Compliance Officer since 2004 and Asst. Secretary since 1999 | Vice President, American Beacon Advisors, Inc. (2019-Present); Chief Compliance Officer, American Beacon Advisors, Inc. (2004-Present); Vice President, Resolute Investment Managers, Inc. (2017-Present); Vice President, Resolute Investment Distributors (2017-Present); Vice President, Resolute Investment Services, Inc. (2019-Present); Chief Compliance Officer, American Private Equity Management, LLC (2012-Present); Chief Compliance Officer (2016-2019) and Vice President, Alpha Quant Advisors, LLC (2016-Present); Vice President, Continuous Capital, LLC (2018-Present); Chief Compliance Officer (2004-Present) and Assistant Secretary (1999-Present), American Beacon Select Funds; Chief Compliance Officer and Assistant Secretary, American Beacon Institutional Funds Trust (2017-Present); Chief Compliance Officer and Assistant Secretary, American Beacon Sound Point Enhanced Income Fund (2018-Present); Chief Compliance Officer and Assistant Secretary, American Beacon Apollo Total Return Fund (2018-Present). | ||
52
Trustees and Officers of the American Beacon FundsSM(Unaudited)
Name, Age | Position, Term of Office and Length of Time Served with the Trust | Principal Occupation(s) During Past 5 Years and Current Directorships | ||
| OFFICERS (CONT.) | Term | |||
| One Year | ||||
| Sonia L. Bates (63) | Asst. Treasurer since 2011 | Assistant Treasurer, American Beacon Advisors, Inc. (2011-2018); Assistant Treasurer, Lighthouse Holdings Parent Inc. (2011-2015); Assistant Treasurer, Lighthouse Holdings, Inc. (2011-2015); Assistant Treasurer, American Private Equity Management, LLC (2012-Present); Assistant Treasurer, American Beacon Cayman Transformational Innovation Company, Ltd. (2017-Present); Assistant Treasurer, American Beacon Cayman TargetRisk Company, Ltd. (2018-Present); Assistant Treasurer, American Beacon Select Funds (2011-Present); Assistant Treasurer, American Beacon Institutional Funds Trust (2017-Present); Assistant Treasurer, American Beacon Sound Point Enhanced Income Fund (2018-Present); Assistant Treasurer, American Beacon Apollo Total Return Fund (2018-Present). | ||
| Shelley D. Abrahams (45) | Assistant Secretary since 2008 | Assistant Secretary, American Beacon Select Funds (2008-Present); Assistant Secretary, American Beacon Institutional Funds Trust (2017-Present); Assistant Secretary, American Beacon Sound Point Enhanced Income Fund (2018-Present); Assistant Secretary, American Beacon Apollo Total Return Fund (2018-Present); | ||
| Rebecca L. Harris (53) | Assistant Secretary since 2010 | Vice President, American Beacon Advisors, Inc. (2011-Present); Vice President, Resolute Investment Managers, Inc. (2017-Present); Vice President, Resolute Investment Services (2015-Present); Vice President, Alpha Quant Advisors, LLC (2016-Present); Vice President, Continuous Capital, LLC (2018-Present); Assistant Secretary, American Beacon Select Funds (2010-Present); Assistant Secretary, American Beacon Institutional Funds Trust (2017-Present); Assistant Secretary, American Beacon Sound Point Enhanced Income Fund (2018-Present); Assistant Secretary, American Beacon Apollo Total Return Fund (2018-Present). | ||
| Teresa A. Oxford (61) | Assistant Secretary since 2015 | Assistant Secretary, American Beacon Advisors, Inc. (2015-Present); Assistant Secretary, Resolute Investment Distributors (2018-Present); Assistant Secretary, Resolute Investment Services (2018-Present); Assistant Secretary, Alpha Quant Advisors, LLC (2016-Present); Assistant Secretary, American Beacon Select Funds (2015-Present); Assistant Secretary, American Beacon Institutional Funds Trust (2017-Present); Assistant Secretary, American Beacon Sound Point Enhanced Income Fund (2018-Present); Assistant Secretary, American Beacon Apollo Total Return Fund (2018-Present); . | ||
| Peter A. Davidson (47)** | Assistant Secretary Since 2020 | Assistant Secretary, American Beacon Select Funds (2020-Present); Assistant Secretary, American Beacon Institutional Funds Trust (2020-Present); Assistant Secretary, American Beacon Sound Point Enhanced Income Fund (2020-Present); Assistant Secretary, American Beacon Apollo Total Return Fund (2020-Present). | ||
* As of 11/12/2014, the Board adopted a retirement plan that requires Trustees to retire no later than the last day of the calendar year in which they reach the age of 75.
** Mr. Davidson was elected at the March 3, 2020 meeting of the Board.
53
American Beacon FundsSM
January 31, 2020 (Unaudited)
The American Beacon Funds recognize and respect the privacy of our shareholders. We are providing this notice to you so you will understand how shareholder information may be collected and used.
We may collect nonpublic personal information about you from one or more of the following sources:
| • | information we receive from you on applications or other forms; |
| • | information about your transactions with us or our service providers; and |
| • | information we receive from third parties. |
We do not disclose any nonpublic personal information about our customers or former customers to anyone, except as permitted by law.
We restrict access to your nonpublic personal information to those employees or service providers who need to know that information to provide products or services to you. To ensure the confidentiality of your nonpublic personal information, we maintain safeguards that comply with federal standards.
54
This page intentionally left blank.
55
This page intentionally left blank.
56

eDelivery isNOW AVAILABLE - Stop traditional mail delivery and receive your
shareholder reports and summary prospectuson-line. Sign up at
www.americanbeaconfunds.com
If you invest in the Fund through a financial institution, you may be able to receive the Fund’s regulatory mailings, such as the Prospectus, Annual Report and Semi-Annual Report, bye-mail. If you are interested in this option, please go towww.icsdelivery.comand search for your financial institution’s name or contact your financial institution directly.
To obtain more information about the Fund:
 |  | |
| ByE-mail: | On the Internet: | |
| american_beacon.funds@ambeacon.com | Visit our website atwww.americanbeaconfunds.com | |
By Telephone: Call (800)658-5811 |
By Mail: American Beacon Funds P.O. Box 219643 Kansas City, MO 64121-9643 | |
| Availability of Quarterly Portfolio Schedules | Availability of Proxy Voting Policy and Records | |
| In addition to the Schedule of Investments provided in each semi-annual and annual report, the Fund files a complete schedule of its portfolio holdings with the Securities and Exchange Commission (“SEC”) on FormN-PORT as of the end of each fiscal quarters. The Fund’s FormsN-PORT are available on the SEC’s website atwww.sec.gov. TheForms N-PORT may also be reviewed and copied at the SEC’s Public Reference Section, 100 F Street, NE, Washington, D.C. 20549-2736. Information regarding the operation of the SEC’s Public Reference Room may be obtained by calling(800)-SEC-0330. A complete schedule of the Fund’s portfolio holdings is available atwww.americanbeaconfunds.com approximately sixty days after the end of each quarter. | A description of the policies and procedures the Fund uses to determine how to vote proxies relating to portfolio securities is available in the Fund’s Statement of Additional Information, is available free of charge on the Fund’s websitewww.americanbeaconfunds.com and by calling1-800-967-9009 or by accessing the SEC’s website atwww.sec.gov. The Fund’s proxy voting record for the most recent year ended June 30 is filed annually with the SEC on FormN-PX. The Fund’s FormsN-PX are available on the SEC’s website atwww.sec.gov. The Fund’s proxy voting record may also be obtained by calling1-800-967-9009. | |


Fund Service Providers:
CUSTODIAN State Street Bank and Trust Company Boston, Massachusetts | TRANSFER AGENT DST Asset Manager Solutions, Inc. Quincy, Massachusetts | INDEPENDENT REGISTERED PUBLIC ACCOUNTING FIRM PricewaterhouseCoopers LLP Boston, Massachusetts | DISTRIBUTOR Resolute Investment Distributors, Inc. Irving, Texas |
This report is prepared for shareholders of the American Beacon Funds and may be distributed to others only if preceded or accompanied by a current Prospectus or Summary Prospectus.
American Beacon Funds and American Beacon Acadian Emerging Markets Managed Volatility Fund are service marks of American Beacon Advisors, Inc.
AR 01/20

About American Beacon Advisors
Since 1986, American Beacon Advisors, Inc. has offered a variety of products and investment advisory services to numerous institutional and retail clients, including a variety of mutual funds, corporate cash management, and separate account management.
Our clients include defined benefit plans, defined contribution plans, foundations, endowments, corporations, financial planners, and other institutional investors. With American Beacon Advisors, you can put the experience of a multi-billion dollar asset management firm to work for your company.
CONTINUOUS CAPITAL EMERGING MARKETS FUND
Investing inforeign and emerging market securitiesmay involve heightened risk due to currency fluctuations and economic and political risks. The Fund may havehigh portfolio turnover, which could increase the Fund’s transaction costs and possibly have a negative impact on performance. The Fund participates in asecurities lendingprogram. Please see the prospectus for a complete discussion of the Fund’s risks. There can be no assurances that the investment objectives of this Fund will be met.
Any opinions herein, including forecasts, reflect our judgment as of the end of the reporting period and are subject to change. Each advisor’s strategies and each Fund’s portfolio composition will change depending on economic and market conditions. This report is not a complete analysis of market conditions, and, therefore, should not be relied upon as investment advice. Although economic and market information has been compiled from reliable sources, American Beacon Advisors, Inc. makes no representation as to the completeness or accuracy of the statements contained herein.
American Beacon Funds | January 31, 2020 |
Contents
| 1 | ||||
| 2 | ||||
| 5 | ||||
| 7 | ||||
| 8 | ||||
| 14 | ||||
| 17 | ||||
| 35 | ||||
| 38 | ||||
| 39 | ||||
| 45 | ||||
| Back Cover | ||||
 | Dear Shareholders,
During the 12 months of this reporting period, news reports highlighted multiple disruptive headwinds in the global economy; among them the U.S. trade war with China and its toll on the global economy, Brexit, disruptions in the Middle East and protests in Hong Kong. And although the headlines seemed to be just starting during the period addressed in this report, it’s now undeniable that the global spread of the COVID-19 virus is having an overwhelming effect on the world’s markets, the full impact of which is unknown at this time.
As Peter L. Bernstein said in his treatise on risk,Against the Gods: The Remarkable Story of Risk, published by John Wiley & Sons, Inc. in September 1998, “Volatility is a proxy for uncertainty and must be accommodated in measuring investment risk.”
During times of economic uncertainty and market volatility, fear of loss can be a powerful emotion – one that drives many investors to making short-term decisions |
subject to a variety of potential error-leading biases. Unfortunately, some short-term investment decisions may create more volatility rather than mitigate it.
Instead of dwelling on the markets’ short-term reaction to waves of negative global news, we encourage investors to focus on the horizon instead. Long-term investing isn’t about identifying and anticipating the next big market move, it is about identifying the right investment products for riding out those moves. As a long-term investor, you should keep in mind the three Ds:direction,disciplineanddiversification.
| u | Direction: Achieving your long-term financial goals requires an individualized plan of action. You may want your plan to provide some measure of protection against periods of geopolitical turmoil, economic uncertainty, market volatility and job insecurity. Your plan should be reviewed annually and be adjusted in the event your long-range needs change. |
| u | Discipline:Long-term, systematic participation in an investment portfolio requires your resolution to stay the course. Spending time in the market – rather than trying to time the market – may place you in a better position to reach your long-term financial goals. |
| u | Diversification: By investing in different investment styles and asset classes, you may be able to help mitigate financial risks across your investment portfolio. By allocating your investment portfolio according to your risk-tolerance level, you may be better positioned to weather storms and achieve your long-term financial goals. |
Since 1986, American Beacon has endeavored to provide investors with a disciplined approach to realizing long-term financial goals.As a manager of managers, we strive to provide investment products that may enable investors to participate during market upswings while potentially insulating against market downswings.
Many of thesub-advisors to our mutual funds pursue upside capture and/or downside protection using proprietary strategies. The investment teams behind our mutual funds seek to produce consistent, long-term results rather than focus only on short-term movements in the markets. In managing our investment products, we emphasize identifying opportunities that offer the potential for long-term rewards.
Our management approach is more than a concept; it’s the cornerstone of our culture. And we strive to apply it at every turn as we seek to provide a well-diversified line of investment solutions to help our shareholders seek long-term rewards while mitigating volatility and risk.
Thank you for your continued interest in American Beacon. For additional information about our investment products or to access your account information, please visit our website atwww.americanbeaconfunds.com.
Best Regards,

Gene L. Needles, Jr.
President
American Beacon Funds
1
Global Equity and Emerging Markets Overview
January 31, 2020 (Unaudited)
Global equity markets closed with a gain for the12-month period ended January 31, 2020, as evidenced by the MSCI ACWI Index (up 16.0%). In the U.S., the unemployment rate moved slightly up to 3.6%, and gross domestic product growth for 2019 averaged 2.3%. The fiscal year began with global uncertainty stemming from Brexit-related turmoil in the eurozone, as well as the U.S.-China trade war and the effects reverberating from it.
However, as the year went on, markets were emboldened by progress toward a “phase one” trade deal between the U.S. and China, and the uncertainty regarding the eurozone was reduced with a strong electoral win by the Conservative Party and Boris Johnson in the U.K. Investors welcomed the Federal Reserve’s rate cuts and the monetary easing efforts enacted by other central banks. Although these positive trends were well-received, investors maintained a healthy dose of caution given the history of trade rhetoric between U.S. and China, the U.S. entering a presidential election year, and the emergence of a potential pandemic stemming from the newly identifiedCOVID-19 virus.
Emerging Markets delivered positive returns, with the MSCI Emerging Markets Index up 3.8% for the period under review. Following are some country highlights:
| • | Chinese equities rose 5.8% for the period while awaiting the completion of the phase one trade deal with the U.S., which was officially signed in January 2020. Although Beijing’s stimulus measures took root,pro-democracy protests in Hong Kong remained a dark cloud. |
| • | Brazilian equities closed down 0.8%, despite a positive 2020 forecast for economic and domestic demand recovery. |
| • | Mexican equities ticked up 2.8% on the U.S. House of Representatives’ approval of the United States-Mexico-Canada Agreement, a new trade deal seeking to modernize the26-year-old North American Free Trade Agreement, and the resulting diminished threat of new auto tariffs. |
| • | Turkish equities posted a 4.5% loss despite the central bank cutting interest rates in an effort to revive the nation’s economy. |
Ultimately, Emerging Markets lagged developed markets during the period as investors deliberated over the effect of back and forth U.S.-China trade negotiations, which had an outsized impact on performance.
2
American Beacon Continuous Capital Emerging Markets FundSM
Performance Overview
January 31, 2020 (Unaudited)
The Investor Class of the American Beacon Continuous Capital Emerging Markets Fund (the “Fund”) returned 8.04% for the 12 months ended January 31, 2020. The Fund outperformed the MSCI Emerging Markets Index (the “Index”) return of 3.81% for the same period.
Comparison of Changes in Value of a $10,000 Investment for the period 12/17/2018 Through 1/31/2020
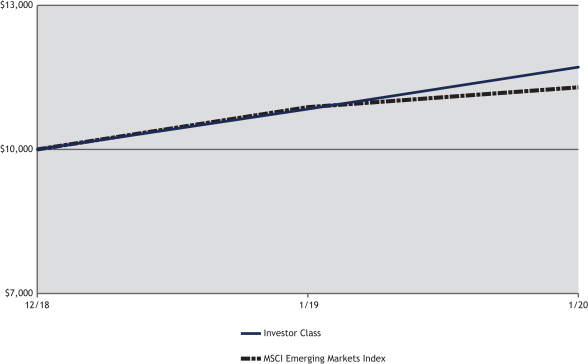
| Total Returns for the Period ended January 31, 2020 |
| |||||||||||||||||||||
Ticker | 1 Year | Since Inception | Value of $10,000 12/17/2018- 1/31/2020 | |||||||||||||||||||
Institutional Class (1,3) . . | CCEIX | 8.40 | % | 15.54 | % | $ | 11,762 | |||||||||||||||
Y Class (1,3) . . . . . . | CCEYX | 8.41 | % | 15.54 | % | $ | 11,762 | |||||||||||||||
Investor Class (1,3) | CCEPX | 8.04 | % | 15.10 | % | $ | 11,712 | |||||||||||||||
MSCI Emerging Markets Index (2) | 3.81 | % | 11.40 | % | $ | 11,293 | ||||||||||||||||
| 1. | Performance shown is historical and is not indicative of future returns. Investment returns and principal value will vary, and shares may be worth more or less at redemption than at original purchase. Performance shown is calculated based on the published end of day net asset values as of the date indicated and current performance may be lower or higher than the performance data quoted. To obtain performance as of the most recent month end, please visitwww.americanbeaconfunds.com or call1-800-967-9009. Fund performance in the table above does not reflect the deduction of taxes a shareholder would pay on distributions or the redemption of shares. Generally accepted accounting principles require adjustments to be made to the net assets of the Fund at period end for financial reporting purposes only, and as such, the total return based on the unadjusted net asset value per share may differ from the total return reported in the financial highlights. A portion of the fees charged to each Class of the Fund has been waived since Fund inception. Performance prior to waiving fees was lower than the actual returns shown since inception. |
| 2. | The MSCI Emerging Markets Index is a market capitalization weighted index composed of companies that are representative of the market structure of developing countries in Latin America, Asia, Eastern Europe, the Middle East and Africa. The MSCI® information contained herein: (1) is provided “as is,” (2) is proprietary to MSCI and/or its content providers, (3) may not be used to create any financial instruments or products or any indexes and (4) may not be copied or distributed without MSCI’s express written consent. MSCI disclaims all warranties with respect to the information. Neither MSCI nor its content providers are responsible for any damages or losses arising from any use of this information. One cannot directly invest in an index. |
| 3. | The Total Annual Fund Operating Expense ratios set forth in the most recent Fund prospectus for the Institutional, Y and Investor Class shares were 2.42%, 2.52% and 2.80%, respectively. The expense ratios above may vary from the expense ratios presented in other sections of this report that are based on expenses incurred during the period covered by this report. |
3
American Beacon Continuous Capital Emerging Markets FundSM
Performance Overview
January 31, 2020 (Unaudited)
For theone-year period ending January 31, 2020, the Fund outperformed the Index primarily through stock selection. Sector allocation was effectively neutral.
Most of the Fund’s outperformance related to security selection was attributed to holdings in the Industrials and Financials sectors. In the Industrials sector, China Lesso Group Holdings Ltd. (up 125.6%) andA-Living Services Co., Ltd. (up 87.2%) added the most to performance. In the Financials sector, Bank Tabungan Pensiunan Nasional Syariah Tbk PT (up 103.1%) and Manappuram Finance Ltd. (up 55.7%) were strong performers. The aforementioned performance was somewhat offset by security selection in the Information Technology sector. Underweight positions relative to the Index in Taiwan Semiconductor Manufacturing Co., Ltd. (up 30.4%) and Samsung Electronics Co., Ltd. (up 12.4%) were the largest detractors from performance.
Looking forward, the Fund’ssub-advisor will continue to focus on its iterative investment process of constructing a portfolio of high-quality companies with consistent value and income characteristics.
| Top Ten Holdings (% Net Assets) |
| |||||||
| Alibaba Group Holding Ltd., Sponsored ADR | 0.8 | |||||||
| Network International Holdings PLC | 0.8 | |||||||
| Taiwan Semiconductor Manufacturing Co., Ltd. | 0.8 | |||||||
| Tencent Holdings Ltd. | 0.8 | |||||||
| Tencent Holdings Ltd., ADR | 0.8 | |||||||
| Vinda International Holdings Ltd. | 0.8 | |||||||
| Gujarat Gas Ltd. | 0.7 | |||||||
| Samsung Electronics Co., Ltd., Common Stock | 0.7 | |||||||
| Samsung Electronics Co., Ltd., Preferred Stock | 0.7 | |||||||
| Taiwan Semiconductor Manufacturing Co., Ltd., Sponsored ADR | 0.7 | |||||||
| Total Fund Holdings | 148 | |||||||
| Sector Allocation (% Equities) |
| |||||||
| Financials | 21.1 | |||||||
| Information Technology | 16.4 | |||||||
| Consumer Discretionary | 13.6 | |||||||
| Industrials | 10.8 | |||||||
| Consumer Staples | 7.6 | |||||||
| Communication Services | 7.2 | |||||||
| Health Care | 6.7 | |||||||
| Energy | 6.2 | |||||||
| Utilities | 5.9 | |||||||
| Real Estate | 3.1 | |||||||
| Materials | 1.4 | |||||||
| Country Allocation (% Equities) |
| |||||||
| China | 28.9 | |||||||
| India | 14.8 | |||||||
| Taiwan | 13.1 | |||||||
| Republic of Korea | 8.8 | |||||||
| Brazil | 5.8 | |||||||
| Thailand | 4.7 | |||||||
| Russia | 4.0 | |||||||
| South Africa | 3.3 | |||||||
| Hong Kong | 2.7 | |||||||
| Philippines | 2.5 | |||||||
| Mexico | 2.3 | |||||||
| Malaysia | 2.2 | |||||||
| Indonesia | 2.1 | |||||||
| Singapore | 2.0 | |||||||
| United Arab Emirates | 1.6 | |||||||
| Saudi Arabia | 0.6 | |||||||
| Turkey | 0.6 | |||||||
4
American Beacon FundsSM
January 31, 2020 (Unaudited)
Fund Expense Example
As a shareholder of a Fund, you incur two types of costs: (1) transaction costs, including sales charges (loads) on purchase payments and redemption fees, if applicable, and (2) ongoing costs, including management fees,sub-transfer agent fees, and other Fund expenses. The Examples are intended to help you understand the ongoing cost (in dollars) of investing in the Fund and to compare these costs with the ongoing costs of investing in other mutual funds. The Examples are based on an investment of $1,000 invested at the beginning of the period in each Class and held for the entire period from August 1, 2019 through January 31, 2020.
Actual Expenses
The “Actual” lines of the tables provide information about actual account values and actual expenses. You may use the information on this page, together with the amount you invested, to estimate the expenses that you paid over the period. Simply divide your account value by $1,000 (for example, an $8,600 account value divided by $1,000 = $8.60), then multiply the result by the “Expenses Paid During Period” to estimate the expenses you paid on your account during this period. Shareholders of the Investor and Institutional Classes that invest in the Fund through an IRA or Roth IRA may be subject to a custodial IRA fee of $15 that is typically deducted each December. If your account was subject to a custodial IRA fee during the period, your costs would have been $15 higher.
Hypothetical Example for Comparison Purposes
The “Hypothetical” lines of the tables provide information about hypothetical account values and hypothetical expenses based on the Fund’s actual expense ratio and an assumed 5% per year rate of return before expenses (not the Fund’s actual return). You may compare the ongoing costs of investing in the Fund with other funds by contrasting this 5% hypothetical example and the 5% hypothetical examples that appear in the shareholder reports of the other funds. The hypothetical account values and expenses may not be used to estimate the actual ending account balance or expenses you paid for the period. Shareholders of the Investor and Institutional Classes that invest in the Funds through an IRA or Roth IRA may be subject to a custodial IRA fee of $15 that is typically deducted each December. If your account was subject to a custodial IRA fee during the period, your costs would have been $15 higher.
You should also be aware that the expenses shown in the table highlight only your ongoing costs and do not reflect any transaction costs charged by the Fund, such as sales charges (loads) or redemption fees, as applicable. Similarly, the expense examples for other funds do not reflect any transaction costs charged by those funds, such as sales charges (loads), redemption fees or exchange fees. Therefore, the “Hypothetical” lines of the tables are useful in comparing ongoing costs only and will not help you determine the relative total costs of owning different funds. If you were subject to any transaction costs during the period, your costs would have been higher.
5
American Beacon Continuous Capital Emerging Markets FundSM
Expense Examples
January 31, 2020 (Unaudited)
| American Beacon Continuous Capital Emerging Markets Fund |
| ||||||||||||||
| Beginning Account Value 8/1/2019 | Ending Account Value 1/31/2020 | Expenses Paid During Period 8/1/2019-1/31/2020* | |||||||||||||
| Institutional Class | |||||||||||||||
| Actual | $1,000.00 | $1,052.00 | $6.00 | ||||||||||||
| Hypothetical** | $1,000.00 | $1,019.36 | $5.90 | ||||||||||||
| Y Class | |||||||||||||||
| Actual | $1,000.00 | $1,052.10 | $6.52 | ||||||||||||
| Hypothetical** | $1,000.00 | $1,018.85 | $6.41 | ||||||||||||
| Investor Class | |||||||||||||||
| Actual | $1,000.00 | $1,050.40 | $7.91 | ||||||||||||
| Hypothetical** | $1,000.00 | $1,017.49 | $7.78 | ||||||||||||
| * | Expenses are equal to the Fund’s annualized expense ratios for thesix-month period of 1.16%, 1.26%, and 1.53% for the Institutional, Y, and Investor Classes, respectively, multiplied by the average account value over the period, multiplied by the number derived by dividing the number of days in the most recent fiscal half-year (184) by days in the year (365) to reflect the half-year period. |
| ** | 5% return before expenses. |
6
American Beacon FundsSM
Report of Independent Registered Public Accounting Firm
To the Board of Trustees of American Beacon Funds and the Shareholders of American Beacon Continuous Capital Emerging Markets Fund
Opinion on the Financial Statements
We have audited the accompanying statement of assets and liabilities, including the schedule of investments, of American Beacon Continuous Capital Emerging Markets Fund (one of the series constituting American Beacon Funds, referred to hereafter as the “Fund”) as of January 31, 2020, the related statement of operations for the year ended January 31, 2020 and the statement of changes in net assets and the financial highlights for the year ended January 31, 2020 and for the period December 17, 2018 (commencement of operations) through January 31, 2019, including the related notes (collectively referred to as the “financial statements”). In our opinion, the financial statements present fairly, in all material respects, the financial position of the Fund as of January 31, 2020, the results of its operations for the year then ended, and the changes in its net assets and the financial highlights for the year ended January 31, 2020 and for the period December 17, 2018 (commencement of operations) through January 31, 2019 in conformity with accounting principles generally accepted in the United States of America.
Basis for Opinion
These financial statements are the responsibility of the Fund’s management. Our responsibility is to express an opinion on the Fund’s financial statements based on our audits. We are a public accounting firm registered with the Public Company Accounting Oversight Board (United States) (PCAOB) and are required to be independent with respect to the Fund in accordance with the U.S. federal securities laws and the applicable rules and regulations of the Securities and Exchange Commission and the PCAOB.
We conducted our audits of these financial statements in accordance with the standards of the PCAOB. Those standards require that we plan and perform the audit to obtain reasonable assurance about whether the financial statements are free of material misstatement, whether due to error or fraud.
Our audits included performing procedures to assess the risks of material misstatement of the financial statements, whether due to error or fraud, and performing procedures that respond to those risks. Such procedures included examining, on a test basis, evidence regarding the amounts and disclosures in the financial statements. Our audits also included evaluating the accounting principles used and significant estimates made by management, as well as evaluating the overall presentation of the financial statements. Our procedures included confirmation of securities owned as of January 31, 2020 by correspondence with the custodian, transfer agent and brokers; when replies were not received from brokers, we performed other auditing procedures. We believe that our audits provide a reasonable basis for our opinion.
PricewaterhouseCoopers LLP
Dallas, TX
March 30, 2020
We have served as the auditor of one or more investment companies in the American Beacon family of funds since 2016.
7
American Beacon Continuous Capital Emerging Markets FundSM
Schedule of Investments
January 31, 2020
| Shares | Fair Value | ||||||||||||||
| Brazil - 5.51% | |||||||||||||||
| Common Stocks - 4.82% | |||||||||||||||
| B3 S.A. - Brasil Bolsa Balcao | 4,406 | $ | 49,589 | ||||||||||||
| Banco do Brasil S.A. | 4,096 | 46,425 | |||||||||||||
| Cia de Locacao das Americas | 7,700 | 42,450 | |||||||||||||
| CPFL Energia S.A. | 5,500 | 49,149 | |||||||||||||
| Lojas Renner S.A. | 3,500 | 46,952 | |||||||||||||
| Neoenergia S.A. | 8,000 | 48,064 | |||||||||||||
| Vivara Participacoes S.A. | 6,800 | 49,969 | |||||||||||||
|
| ||||||||||||||
Total Common Stocks | 332,598 | ||||||||||||||
|
| ||||||||||||||
| Preferred Stocks - 0.69% | |||||||||||||||
| Petroleo Brasileiro S.A.A | 7,100 | 47,166 | |||||||||||||
|
| ||||||||||||||
Total Brazil (Cost $335,734) | 379,764 | ||||||||||||||
|
| ||||||||||||||
| China - 27.19% | |||||||||||||||
| Common Stocks - 27.19% | |||||||||||||||
| A-Living Services Co., Ltd., Class HB C | 11,750 | 38,953 | |||||||||||||
| Alibaba Group Holding Ltd.C D | 2,000 | 50,489 | |||||||||||||
| Alibaba Group Holding Ltd., Sponsored ADRD | 267 | 55,160 | |||||||||||||
| Anhui Gujing Distillery Co., Ltd., Class AC | 2,100 | 41,659 | |||||||||||||
| ANTA Sports Products Ltd.C | 5,228 | 45,162 | |||||||||||||
| Baidu, Inc., Sponsored ADRD | 393 | 48,559 | |||||||||||||
| Bank of China Ltd., Class HC | 89,598 | 34,643 | |||||||||||||
| Bank of Communications Co., Ltd., Class HC | 56,125 | 35,774 | |||||||||||||
| Biem.L.Fdlkk Garment Co., Ltd., Class AC | 11,200 | 40,005 | |||||||||||||
| China Construction Bank Corp., Class HC | 46,814 | 35,512 | |||||||||||||
| China Gas Holdings Ltd.C | 11,400 | 44,825 | |||||||||||||
| China Isotope & Radiation Corp.C | 16,000 | 46,136 | |||||||||||||
| China Lesso Group Holdings Ltd.C | 33,000 | 42,469 | |||||||||||||
| China Medical System Holdings Ltd.C | 31,000 | 41,317 | |||||||||||||
| China Merchants Bank Co., Ltd., Class HC | 9,500 | 45,817 | |||||||||||||
| China Resources Gas Group Ltd.C | 8,300 | 43,662 | |||||||||||||
| CITIC Telecom International Holdings Ltd.C | 111,883 | 38,686 | |||||||||||||
| CNOOC Ltd., Sponsored ADR | 294 | 44,394 | |||||||||||||
| ENN Energy Holdings Ltd.C | 3,894 | 45,325 | |||||||||||||
| Gree Electric Appliances, Inc. of Zhuhai, Class AC | 4,400 | 38,349 | |||||||||||||
| Huami Corp., ADRD | 2,932 | 40,872 | |||||||||||||
| Industrial & Commercial Bank of China Ltd., Class HC | 51,196 | 34,069 | |||||||||||||
| Jiangsu Expressway Co., Ltd., Class HC | 30,754 | 38,056 | |||||||||||||
| Li Ning Co., Ltd.C | 12,500 | 36,639 | |||||||||||||
| Livzon Pharmaceutical Group, Inc., Class HC | 12,700 | 43,531 | |||||||||||||
| Longfor Group Holdings Ltd.B C | 9,424 | 39,714 | |||||||||||||
| Midea Group Co., Ltd., Class AC | 4,600 | 34,856 | |||||||||||||
| NetEase, Inc., ADR | 154 | 49,397 | |||||||||||||
| PICC Property & Casualty Co., Ltd., Class HC | 41,000 | 43,770 | |||||||||||||
| Ping An Insurance Group Co. of China Ltd., Class HC | 3,600 | 40,727 | |||||||||||||
| Prosus N.V.C D | 648 | 46,700 | |||||||||||||
| Shandong Weigao Group Medical Polymer Co., Ltd., Class HC | 36,000 | 42,921 | |||||||||||||
| Shanghai Pharmaceuticals Holding Co., Ltd., Class HC | 24,748 | 46,034 | |||||||||||||
| Shenzhen International Holdings Ltd.C | 18,000 | 35,974 | |||||||||||||
| Shenzhou International Group Holdings Ltd.C | 3,400 | 44,885 | |||||||||||||
| Sinopharm Group Co., Ltd., Class HC | 14,089 | 45,778 | |||||||||||||
| SITC International Holdings Co., Ltd.C | 39,680 | 46,601 | |||||||||||||
| Tencent Holdings Ltd.C | 1,122 | 53,276 | |||||||||||||
| Tencent Holdings Ltd., ADR | 1,105 | 52,941 | |||||||||||||
| Topsports International Holdings Ltd.B C | 34,000 | 41,564 | |||||||||||||
See accompanying notes
8
American Beacon Continuous Capital Emerging Markets FundSM
Schedule of Investments
January 31, 2020
| Shares | Fair Value | ||||||||||||||
| China - 27.19% (continued) | |||||||||||||||
| Common Stocks - 27.19% (continued) | |||||||||||||||
| Wuliangye Yibin Co., Ltd., Class AC | 2,100 | $ | 37,067 | ||||||||||||
| Yealink Network Technology Corp. Ltd., Class AC | 3,700 | 42,847 | |||||||||||||
| YiChang HEC ChangJiang Pharmaceutical Co., Ltd., Class HB C | 7,200 | 41,370 | |||||||||||||
| Yuexiu Transport Infrastructure Ltd.C | 44,000 | 38,377 | |||||||||||||
|
| ||||||||||||||
Total Common Stocks | 1,874,862 | ||||||||||||||
|
| ||||||||||||||
Total China (Cost $1,799,698) | 1,874,862 | ||||||||||||||
|
| ||||||||||||||
| Hong Kong - 2.57% | |||||||||||||||
| Common Stocks - 2.57% | |||||||||||||||
| AIA Group Ltd., Sponsored ADRE | 1,112 | 44,158 | |||||||||||||
| Techtronic Industries Co., Ltd.C | 5,813 | 46,077 | |||||||||||||
| Union Medical Healthcare Ltd.C | 51,000 | 33,578 | |||||||||||||
| Vinda International Holdings Ltd.C | 22,000 | 53,179 | |||||||||||||
|
| ||||||||||||||
Total Common Stocks | 176,992 | ||||||||||||||
|
| ||||||||||||||
Total Hong Kong (Cost $160,040) | 176,992 | ||||||||||||||
|
| ||||||||||||||
| India - 13.90% | |||||||||||||||
| Common Stocks - 13.90% | |||||||||||||||
| Adani Ports & Special Economic Zone Ltd.C | 9,097 | 47,117 | |||||||||||||
| Atul Ltd.C | 700 | 48,193 | |||||||||||||
| Bajaj Finserv Ltd.C | 352 | 46,696 | |||||||||||||
| Granules India Ltd.C | 23,709 | 48,578 | |||||||||||||
| Gujarat Gas Ltd.C | 12,598 | 51,022 | |||||||||||||
| Gujarat State Petronet Ltd.C | 13,521 | 47,953 | |||||||||||||
| HCL Technologies Ltd.C | 5,622 | 46,614 | |||||||||||||
| HDFC Bank Ltd.C | 2,733 | 46,891 | |||||||||||||
| Hexaware Technologies Ltd.C | 9,626 | 49,130 | |||||||||||||
| Infosys Ltd.C | 4,562 | 49,745 | |||||||||||||
| KEI Industries Ltd.C | 5,793 | 45,930 | |||||||||||||
| Larsen & Toubro Ltd.C | 2,150 | 41,283 | |||||||||||||
| Mahanagar Gas Ltd.C | 3,088 | 50,758 | |||||||||||||
| Manappuram Finance Ltd.C | 18,479 | 48,630 | |||||||||||||
| Muthoot Finance Ltd.C | 4,686 | 49,937 | |||||||||||||
| Petronet LNG Ltd.C | 12,413 | 46,345 | |||||||||||||
| Reliance Industries Ltd.C | 2,412 | 47,666 | |||||||||||||
| RITES Ltd.C | 11,240 | 48,989 | |||||||||||||
| Sonata Software Ltd.C | 10,123 | 47,665 | |||||||||||||
| WNS Holdings Ltd., ADRD | 693 | 49,452 | |||||||||||||
|
| ||||||||||||||
Total Common Stocks | 958,594 | ||||||||||||||
|
| ||||||||||||||
Total India (Cost $870,375) | 958,594 | ||||||||||||||
|
| ||||||||||||||
| Indonesia - 1.93% | |||||||||||||||
| Common Stocks - 1.93% | |||||||||||||||
| Bank Tabungan Pensiunan Nasional Syariah Tbk PTC D | 150,200 | 48,272 | |||||||||||||
| Indofood CBP Sukses Makmur Tbk PTC | 55,800 | 46,304 | |||||||||||||
| Mitra Adiperkasa Tbk PTC | 550,600 | 38,520 | |||||||||||||
|
| ||||||||||||||
Total Common Stocks | 133,096 | ||||||||||||||
|
| ||||||||||||||
Total Indonesia (Cost $113,051) | 133,096 | ||||||||||||||
|
| ||||||||||||||
| Malaysia - 2.10% | |||||||||||||||
| Common Stocks - 2.07% | |||||||||||||||
| RHB Bank BhdC | 33,679 | 46,815 | |||||||||||||
| Serba Dinamik Holdings BhdC | 86,065 | 46,677 | |||||||||||||
See accompanying notes
9
American Beacon Continuous Capital Emerging Markets FundSM
Schedule of Investments
January 31, 2020
| Shares | Fair Value | ||||||||||||||
| Malaysia - 2.10% (continued) | |||||||||||||||
| Common Stocks - 2.07% (continued) | |||||||||||||||
| TIME dotCom BhdC | 21,800 | $ | 49,243 | ||||||||||||
|
| ||||||||||||||
Total Common Stocks | 142,735 | ||||||||||||||
|
| ||||||||||||||
| Warrants - 0.03% | |||||||||||||||
| Serba Dinamik Holdings BhdD | 21,504 | 1,758 | |||||||||||||
|
| ||||||||||||||
Total Malaysia (Cost $135,164) | 144,493 | ||||||||||||||
|
| ||||||||||||||
| Mexico - 2.13% | |||||||||||||||
| Common Stocks - 2.13% | |||||||||||||||
| Grupo Aeroportuario del Centro Norte S.A.B. de C.V., ADR | 816 | 49,564 | |||||||||||||
| Grupo Aeroportuario del Pacifico S.A.B. de C.V., Class B | 4,000 | 49,529 | |||||||||||||
| Wal-Mart de Mexico S.A.B. de C.V. | 16,400 | 47,988 | |||||||||||||
|
| ||||||||||||||
Total Common Stocks | 147,081 | ||||||||||||||
|
| ||||||||||||||
Total Mexico (Cost $118,404) | 147,081 | ||||||||||||||
|
| ||||||||||||||
| Philippines - 2.39% | |||||||||||||||
| Common Stocks - 2.39% | |||||||||||||||
| Ayala Land, Inc.C | 45,575 | 37,033 | |||||||||||||
| BDO Unibank, Inc.C | 15,730 | 45,595 | |||||||||||||
| Metropolitan Bank & Trust Co.C | 37,400 | 42,201 | |||||||||||||
| SM Prime Holdings, Inc.C | 52,700 | 40,256 | |||||||||||||
|
| ||||||||||||||
Total Common Stocks | 165,085 | ||||||||||||||
|
| ||||||||||||||
Total Philippines (Cost $177,029) | 165,085 | ||||||||||||||
|
| ||||||||||||||
| Republic of Korea - 8.31% | |||||||||||||||
| Common Stocks - 6.83% | |||||||||||||||
| DIO Corp.C D | 985 | 31,127 | |||||||||||||
| DongKook Pharmaceutical Co., Ltd.C | 645 | 47,414 | |||||||||||||
| Hansol Chemical Co., Ltd.C | 500 | 45,369 | |||||||||||||
| Innocean Worldwide, Inc.C | 688 | 40,419 | |||||||||||||
| JB Financial Group Co., Ltd.C | 7,681 | 32,707 | |||||||||||||
| KT&G Corp.C | 482 | 38,316 | |||||||||||||
| NCSoft Corp.C | 84 | 44,690 | |||||||||||||
| NICE Information Service Co., Ltd.C | 3,354 | 46,980 | |||||||||||||
| Samsung Electronics Co., Ltd.C | 1,091 | 51,058 | |||||||||||||
| Samsung SDS Co., Ltd.C | 289 | 46,642 | |||||||||||||
| Woongjin Coway Co., Ltd.C | 634 | 46,489 | |||||||||||||
|
| ||||||||||||||
Total Common Stocks | 471,211 | ||||||||||||||
|
| ||||||||||||||
| Preferred Stocks - 1.48% | |||||||||||||||
| LG Household & Health Care Ltd.A C | 80 | 50,830 | |||||||||||||
| Samsung Electronics Co., Ltd.A C | 1,305 | 51,479 | |||||||||||||
|
| ||||||||||||||
Total Preferred Stocks | 102,309 | ||||||||||||||
|
| ||||||||||||||
Total Republic of Korea (Cost $545,083) | 573,520 | ||||||||||||||
|
| ||||||||||||||
| Russia - 3.79% | |||||||||||||||
| Common Stocks - 3.79% | |||||||||||||||
| Detsky Mir PJSCB C | 24,670 | 44,350 | |||||||||||||
| Gazprom Neft PJSC, Sponsored ADRC | 1,087 | 37,802 | |||||||||||||
| LUKOIL PJSC, Sponsored ADR | 457 | 46,673 | |||||||||||||
| Rosneft Oil Co. PJSC, GDRC | 6,217 | 46,449 | |||||||||||||
| Sberbank of Russia PJSC, Sponsored ADRC | 2,470 | 39,381 | |||||||||||||
| TCS Group Holding PLC, GDRC | 1,956 | 46,527 | |||||||||||||
|
| ||||||||||||||
Total Common Stocks | 261,182 | ||||||||||||||
|
| ||||||||||||||
Total Russia (Cost $225,155) | 261,182 | ||||||||||||||
|
| ||||||||||||||
See accompanying notes
10
American Beacon Continuous Capital Emerging Markets FundSM
Schedule of Investments
January 31, 2020
| Shares | Fair Value | ||||||||||||||
| Saudi Arabia - 0.58% (Cost $44,900) | |||||||||||||||
| Common Stocks - 0.58% | |||||||||||||||
| Saudi Arabian Oil Co.B D | 4,408 | $ | 40,121 | ||||||||||||
|
| ||||||||||||||
| Singapore - 1.88% | |||||||||||||||
| Common Stocks - 1.88% | |||||||||||||||
| CapitaLand Ltd.C | 14,100 | 37,123 | |||||||||||||
| Keppel DC REITC | 29,414 | 48,670 | |||||||||||||
| NetLink NBN TrustC F | 59,600 | 44,119 | |||||||||||||
|
| ||||||||||||||
Total Common Stocks | 129,912 | ||||||||||||||
|
| ||||||||||||||
Total Singapore (Cost $111,325) | 129,912 | ||||||||||||||
|
| ||||||||||||||
| South Africa - 3.08% | |||||||||||||||
| Common Stocks - 3.08% | |||||||||||||||
| Capitec Bank Holdings Ltd.C | 434 | 38,941 | |||||||||||||
| Clicks Group Ltd.C | 2,740 | 44,649 | |||||||||||||
| FirstRand Ltd.C | 8,954 | 34,311 | |||||||||||||
| Naspers Ltd., Class NC | 297 | 48,753 | |||||||||||||
| Standard Bank Group Ltd., Sponsored ADRE | 4,313 | 45,718 | |||||||||||||
|
| ||||||||||||||
Total Common Stocks | 212,372 | ||||||||||||||
|
| ||||||||||||||
Total South Africa (Cost $222,013) | 212,372 | ||||||||||||||
|
| ||||||||||||||
| Taiwan - 12.33% | |||||||||||||||
| Common Stocks - 12.33% | |||||||||||||||
| Accton Technology Corp.C | 8,000 | 42,640 | |||||||||||||
| Advantech Co., Ltd.C | 4,340 | 41,379 | |||||||||||||
| Chailease Holding Co., Ltd.C | 10,152 | 42,163 | |||||||||||||
| E.Sun Financial Holding Co., Ltd.C | 48,768 | 45,105 | |||||||||||||
| Feng TAY Enterprise Co., Ltd.C | 7,500 | 44,931 | |||||||||||||
| Lotes Co., Ltd.C | 4,391 | 45,267 | |||||||||||||
| Parade Technologies Ltd.C | 2,131 | 44,466 | |||||||||||||
| Poya International Co., Ltd.C | 3,400 | 48,764 | |||||||||||||
| Realtek Semiconductor Corp.C | 4,873 | 39,395 | |||||||||||||
| Simplo Technology Co., Ltd.C | 4,470 | 46,995 | |||||||||||||
| Sinbon Electronics Co., Ltd.C | 9,690 | 41,068 | |||||||||||||
| Taiwan Semiconductor Manufacturing Co., Ltd.C | 4,900 | 52,419 | |||||||||||||
| Taiwan Semiconductor Manufacturing Co., Ltd., Sponsored ADR | 950 | 51,243 | |||||||||||||
| Taiwan Union Technology Corp.C | 11,000 | 45,273 | |||||||||||||
| Topco Scientific Co., Ltd.C | 12,515 | 44,309 | |||||||||||||
| Tripod Technology Corp.C | 11,225 | 40,997 | |||||||||||||
| Uni-President Enterprises Corp.C | 18,910 | 44,942 | |||||||||||||
| Voltronic Power Technology Corp.C | 1,750 | 42,317 | |||||||||||||
| Yuanta Financial Holding Co., Ltd.C | 72,240 | 46,808 | |||||||||||||
|
| ||||||||||||||
Total Common Stocks | 850,481 | ||||||||||||||
|
| ||||||||||||||
Total Taiwan (Cost $708,597) | 850,481 | ||||||||||||||
|
| ||||||||||||||
| Thailand - 4.41% | |||||||||||||||
| Common Stocks - 4.41% | |||||||||||||||
| AEON Thana Sinsap Thailand PCL, NVDRC | 7,059 | 36,761 | |||||||||||||
| Carabao Group PCLC | 15,000 | 42,364 | |||||||||||||
| Carabao Group PCL | 1,900 | 5,410 | |||||||||||||
| Com7 PCL, NVDRC | 50,892 | 43,788 | |||||||||||||
| Plan B Media Pcl, NVDRC | 243,500 | 46,122 | |||||||||||||
| Srisawad Corp. PCL, NVDRC | 20,700 | 49,476 | |||||||||||||
| Thanachart Capital PCL, NVDRC | 24,500 | 40,691 | |||||||||||||
| Tisco Financial Group PCL, NVDRC | 12,116 | 39,740 | |||||||||||||
|
| ||||||||||||||
Total Common Stocks | 304,352 | ||||||||||||||
|
| ||||||||||||||
Total Thailand (Cost $288,999) | 304,352 | ||||||||||||||
|
| ||||||||||||||
See accompanying notes
11
American Beacon Continuous Capital Emerging Markets FundSM
Schedule of Investments
January 31, 2020
| Shares | Fair Value | ||||||||||||||
| Turkey - 0.61% (Cost $35,512) | |||||||||||||||
| Common Stocks - 0.61% | |||||||||||||||
| Ulker Biskuvi Sanayi A/SC D | 10,759 | $ | 41,727 | ||||||||||||
|
| ||||||||||||||
| United Arab Emirates - 1.46% | |||||||||||||||
| Common Stocks - 1.46% | |||||||||||||||
| Emirates NBD Bank PJSCC | 13,021 | 48,725 | |||||||||||||
| Network International Holdings PLCB C D | 6,492 | 52,115 | |||||||||||||
|
| ||||||||||||||
Total Common Stocks | 100,840 | ||||||||||||||
|
| ||||||||||||||
Total United Arab Emirates (Cost $85,850) | 100,840 | ||||||||||||||
|
| ||||||||||||||
| SHORT-TERM INVESTMENTS - 6.81% (Cost $469,454) | |||||||||||||||
| Investment Companies - 6.81% | |||||||||||||||
| American Beacon U.S. Government Money Market Select Fund, Select Class, 1.47%G H | 469,454 | 469,454 | |||||||||||||
|
| ||||||||||||||
| SECURITIES LENDING COLLATERAL - 0.56% (Cost $38,556) | |||||||||||||||
| Investment Companies - 0.56% | |||||||||||||||
| American Beacon U.S. Government Money Market Select Fund, Select Class, 1.47%G H | 38,556 | 38,556 | |||||||||||||
|
| ||||||||||||||
TOTAL INVESTMENTS - 101.54% (Cost $6,484,939) | 7,002,484 | ||||||||||||||
LIABILITIES, NET OF OTHER ASSETS - (1.54%) | (106,143 | ) | |||||||||||||
|
| ||||||||||||||
TOTAL NET ASSETS - 100.00% | $ | 6,896,341 | |||||||||||||
|
| ||||||||||||||
| Percentages are stated as a percent of net assets. |
| ||||||||||||||
A A type of Preferred Stock that has no maturity date.
B Security exempt from registration under the Securities Act of 1933. These securities may be resold to qualified institutional buyers pursuant to Rule 144A. At the period end, the value of these securities amounted to $298,187 or 4.32% of net assets. The Fund has no right to demand registration of these securities.
C Fair valued pursuant to procedures approved by the Board of Trustees. At period end, the value of these securities amounted to $5,391,773 or 78.18% of net assets.
DNon-income producing security.
E All or a portion of this security is on loan, collateralized by either cash and/or U.S.Treasuries, at January 31, 2020 (Note 8).
F Unit - Usually consists of one common stock and/or rights and warrants.
G The Fund is affiliated by having the same investment advisor.
H7-day yield.
ADR - American Depositary Receipt.
GDR – Global Depositary Receipt.
NVDR – Non Voting Depositary Receipt.
PCL - Public Company Limited (Thailand).
PJSC - Private Joint Stock Company.
PLC - Public Limited Company.
REIT - Real Estate Investment Trust.
See accompanying notes
12
American Beacon Continuous Capital Emerging Markets FundSM
Schedule of Investments
January 31, 2020
The Fund’s investments are summarized by level based on the inputs used to determine their values. As of January 31, 2020, the investments were classified as described below:
Continuous Capital Emerging Markets Fund | Level 1 | Level 2 | Level 3 | Total | ||||||||||||||||||||||||
Assets |
| |||||||||||||||||||||||||||
Foreign Common Stocks |
| |||||||||||||||||||||||||||
Brazil | $ | 332,598 | $ | - | $ | - | $ | 332,598 | ||||||||||||||||||||
China | 291,323 | 1,583,539 | - | 1,874,862 | ||||||||||||||||||||||||
Hong Kong | 44,158 | 132,834 | - | 176,992 | ||||||||||||||||||||||||
India | 49,452 | 909,142 | - | 958,594 | ||||||||||||||||||||||||
Indonesia | - | 133,096 | - | 133,096 | ||||||||||||||||||||||||
Malaysia | - | 142,735 | - | 142,735 | ||||||||||||||||||||||||
Mexico | 147,081 | - | - | 147,081 | ||||||||||||||||||||||||
Philippines | - | 165,085 | - | 165,085 | ||||||||||||||||||||||||
Republic of Korea | - | 471,211 | - | 471,211 | ||||||||||||||||||||||||
Russia | 46,673 | 214,509 | - | 261,182 | ||||||||||||||||||||||||
Saudi Arabia | 40,121 | - | - | 40,121 | ||||||||||||||||||||||||
Singapore | - | 129,912 | - | 129,912 | ||||||||||||||||||||||||
South Africa | 45,718 | 166,654 | - | 212,372 | ||||||||||||||||||||||||
Taiwan | 51,243 | 799,238 | - | 850,481 | ||||||||||||||||||||||||
Thailand | 5,410 | 298,942 | - | 304,352 | ||||||||||||||||||||||||
Turkey | - | 41,727 | - | 41,727 | ||||||||||||||||||||||||
United Arab Emirates | - | 100,840 | - | 100,840 | ||||||||||||||||||||||||
Foreign Preferred Stocks |
| |||||||||||||||||||||||||||
Brazil | 47,166 | - | - | 47,166 | ||||||||||||||||||||||||
Republic of Korea | - | 102,309 | - | 102,309 | ||||||||||||||||||||||||
Foreign Warrants |
| |||||||||||||||||||||||||||
Malaysia | 1,758 | - | - | 1,758 | ||||||||||||||||||||||||
Short-Term Investments | 469,454 | - | - | 469,454 | ||||||||||||||||||||||||
Securities Lending Collateral | 38,556 | - | - | 38,556 | ||||||||||||||||||||||||
|
|
|
|
|
|
|
| |||||||||||||||||||||
Total Investments in Securities - Assets | $ | 1,610,711 | $ | 5,391,773 | $ | - | $ | 7,002,484 | ||||||||||||||||||||
|
|
|
|
|
|
|
| |||||||||||||||||||||
U.S. GAAP requires transfers between all levels to/from level 3 be disclosed. During the year ended January 31, 2020, there were no transfers into or out of Level 3.
13
American Beacon Continuous Capital Emerging Markets FundSM
Statement of Assets and Liabilities
January 31, 2020
Assets: |
| |||
Investments in unaffiliated securities, at fair value†§ | $ | 6,494,474 | ||
Investments in affiliated securities, at fair value‡ | 508,010 | |||
Foreign currency, at fair value^ | 147,184 | |||
Cash due from broker | 6,265 | |||
Dividends and interest receivable | 5,817 | |||
Receivable for investments sold | 67,468 | |||
Receivable for fund shares sold | 59,468 | |||
Receivable for tax reclaims | 91 | |||
Prepaid expenses | 27,160 | |||
|
| |||
Total assets | 7,315,937 | |||
|
| |||
Liabilities: |
| |||
Payable for investments purchased | 128,795 | |||
Payable for fund shares redeemed | 16,262 | |||
Payable for expense reimbursement (Note 2) | 137,354 | |||
Management andsub-advisory fees payable (Note 2) | 4,499 | |||
Service fees payable (Note 2) | 64 | |||
Transfer agent fees payable (Note 2) | 458 | |||
Payable upon return of securities loaned (Note 8)§ | 38,556 | |||
Custody and fund accounting fees payable | 31,635 | |||
Professional fees payable | 58,324 | |||
Trustee fees payable (Note 2) | 26 | |||
Payable for prospectus and shareholder reports | 3,243 | |||
Other liabilities | 380 | |||
|
| |||
Total liabilities | 419,596 | |||
|
| |||
Net assets | $ | 6,896,341 | ||
|
| |||
Analysis of net assets: |
| |||
Paid-in-capital | $ | 6,436,689 | ||
Total distributable earnings (deficits)A | 459,652 | |||
|
| |||
Net assets | $ | 6,896,341 | ||
|
| |||
Shares outstanding at no par value (unlimited shares authorized): |
| |||
Institutional Class | 342,527 | |||
|
| |||
Y Class | 241,939 | |||
|
| |||
Investor Class | 17,070 | |||
|
| |||
Net assets: |
| |||
Institutional Class | $ | 3,927,688 | ||
|
| |||
Y Class | $ | 2,773,744 | ||
|
| |||
Investor Class | $ | 194,909 | ||
|
| |||
Net asset value, offering and redemption price per share: |
| |||
Institutional Class | $ | 11.47 | ||
|
| |||
Y Class | $ | 11.46 | ||
|
| |||
Investor Class | $ | 11.42 | ||
|
| |||
† Cost of investments in unaffiliated securities | $ | 5,976,929 | ||
‡ Cost of investments in affiliated securities | $ | 508,010 | ||
§ Fair value of securities on loan | $ | 36,825 | ||
^ Cost of foreign currency | $ | 147,260 | ||
A The Fund’s investments in affiliated securities did not have unrealized appreciation (depreciation) at year end. |
| |||
See accompanying notes
14
American Beacon Continuous Capital Emerging Markets FundSM
Statement of Operations
For the year ended January 31, 2020
Investment income: |
| |||
Dividend income from unaffiliated securities (net of foreign taxes)† | $ | 173,179 | ||
Dividend income from affiliated securities (Note 7) | 4,823 | |||
Income derived from securities lending (Note 8) | 875 | |||
|
| |||
Total investment income | 178,877 | |||
|
| |||
Expenses: |
| |||
Management andsub-advisory fees (Note 2) | 44,485 | |||
Transfer agent fees: | ||||
Institutional Class (Note 2) | 227 | |||
Y Class (Note 2) | 3,211 | |||
Investor Class | 2,864 | |||
Custody and fund accounting fees | 58,512 | |||
Professional fees | 76,527 | |||
Registration fees and expenses | 61,313 | |||
Service fees (Note 2): | ||||
Investor Class | 205 | |||
Prospectus and shareholder report expenses | 15,104 | |||
Trustee fees (Note 2) | 209 | |||
Other expenses | 5,086 | |||
|
| |||
Total expenses | 267,743 | |||
|
| |||
Net fees waived and expenses (reimbursed) (Note 2) | (206,606 | ) | ||
|
| |||
Net expenses | 61,137 | |||
|
| |||
Net investment income | 117,740 | |||
|
| |||
Realized and unrealized gain (loss) from investments: |
| |||
Net realized (loss) from: | ||||
Investments in unaffiliated securitiesA | (57,001 | ) | ||
Foreign currency transactions | (7,860 | ) | ||
Change in net unrealized appreciation (depreciation) of: | ||||
Investments in unaffiliated securitiesB | 295,670 | |||
Foreign currency transactions | (468 | ) | ||
|
| |||
Net gain from investments | 230,341 | |||
|
| |||
Net increase in net assets resulting from operations | $ | 348,081 | ||
|
| |||
† Foreign taxes | $ | 18,135 | ||
A The Fund did not recognize net realized gains (losses) from the sale of investments in affiliated securities. |
| |||
B The Fund’s investments in affiliated securities did not have a change in unrealized appreciation (depreciation) at year end. |
| |||
See accompanying notes
15
American Beacon Continuous Capital Emerging Markets FundSM
Statement of Changes in Net Assets
| Year Ended January 31, 2020 | From December 17, 2018A to January 31, 2019 | |||||||||||
Increase (decrease) in net assets: |
| |||||||||||
Operations: |
| |||||||||||
Net investment income | $ | 117,740 | $ | 3,546 | ||||||||
Net realized gain (loss) from investments in unaffiliated securities and foreign currency transactions | (64,861 | ) | 6,102 | |||||||||
Change in net unrealized appreciation of investments in unaffiliated securities and foreign currency transactions | 295,202 | 234,436 | ||||||||||
|
|
|
| |||||||||
Net increase in net assets resulting from operations | 348,081 | 244,084 | ||||||||||
|
|
|
| |||||||||
Distributions to shareholders: |
| |||||||||||
Total retained earnings: | ||||||||||||
Institutional Class | (76,776 | ) | - | |||||||||
Y Class | (64,411 | ) | - | |||||||||
Investor Class | (3,856 | ) | - | |||||||||
|
|
|
| |||||||||
Net distributions to shareholders | (145,043 | ) | - | |||||||||
|
|
|
| |||||||||
Capital share transactions (Note 10): |
| |||||||||||
Proceeds from sales of shares | 3,523,891 | 208,462 | ||||||||||
Reinvestment of dividends and distributions | 62,374 | - | ||||||||||
Cost of shares redeemed | (145,508 | ) | - | |||||||||
|
|
|
| |||||||||
Net increase in net assets from capital share transactions | 3,440,757 | 208,462 | ||||||||||
|
|
|
| |||||||||
Net increase in net assets | 3,643,795 | 452,546 | ||||||||||
|
|
|
| |||||||||
Net assets: |
| |||||||||||
Beginning of period | 3,252,546 | 2,800,000 | B | |||||||||
|
|
|
| |||||||||
End of period | $ | 6,896,341 | $ | 3,252,546 | ||||||||
|
|
|
| |||||||||
A Commencement of operations. |
| |||||||||||
B Seed capital. |
| |||||||||||
See accompanying notes
16
American Beacon Continuous Capital Emerging Markets FundSM
January 31, 2020
1. Organization and Significant Accounting Policies
American Beacon Funds (the “Trust”) is organized as a Massachusetts business trust. The Fund, a series within the Trust, is registered under the Investment Company Act of 1940, as amended (the “Act”), as a diversified,open-end management investment company. As of January 31, 2020, the Trust consists ofthirty-two active series, one of which is presented in this filing: American Beacon Continuous Capital Emerging Markets Fund (the “Fund”). The remainingthirty-one active series are reported in separate filings.
American Beacon Advisors, Inc. (the “Manager”) is a Delaware corporation and a wholly-owned subsidiary of Resolute Investment Managers, Inc. (“RIM”) organized in 1986 to provide business management, advisory, administrative, and asset management consulting services to the Trust and other investors. The Manager is registered as an investment advisor under the Investment Advisers Act of 1940, as amended (the “Advisers Act”). RIM is, in turn, a wholly-owned subsidiary of Resolute Acquisition, Inc., which is a wholly-owned subsidiary of Resolute Topco, Inc., a wholly-owned subsidiary of Resolute Investment Holdings, LLC (“RIH”). RIH is owned primarily by Kelso Investment Associates VIII, L.P., KEP VI, LLC and Estancia Capital Partners L.P., investment funds affiliated with Kelso & Company, L.P. (“Kelso”) or Estancia Capital Management, LLC (“Estancia”), which are private equity firms.
Recently Adopted Accounting Pronouncements
In March 2017, the Financial Accounting Standards Board (“FASB”) issued Accounting Standards Update (“ASU”)2017-08,Premium Amortization of Purchased Callable Debt Securities. The amendments in the ASU shorten the premium amortization period on a purchased callable debt security from the security’s contractual life to the earliest call date. It is anticipated that this change will enhance disclosures by reducing losses recognized when a security is called on an earlier date. This ASU is effective for fiscal years beginning after December 15, 2018, and has been adopted accordingly with no material impact on the financial statements and other disclosures.
In August 2018, the FASB issued ASU2018-13,Fair Value Measurement (“Topic 820”). The amendments in the ASU impact disclosure requirements for fair value measurement. It is anticipated that this change will enhance the effectiveness of disclosures in the notes to the financial statements. This ASU is effective for fiscal years beginning after December 15, 2019. Early adoption is permitted and can include the entire standard or certain provisions that exclude or amend disclosures. For the year ended January 31, 2020, the Fund has chosen to adopt the standard. The adoption of this ASU guidance did not have a material impact on the financial statements and other disclosures.
Class Disclosure
The Fund has multiple classes of shares designed to meet the needs of different groups of investors. The following table sets forth the differences amongst the classes:
Class | Eligible Investors | Minimum Initial Investments | ||||
| Institutional | Large institutional investors - sold directly or through intermediary channels. | $ | 250,000 | |||
| Y Class | Large institutional retirement plan investors - sold directly or through intermediary channels. | $ | 100,000 | |||
| Investor | All investors using intermediary organizations, such as broker-dealers or retirement plan sponsors. | $ | 2,500 | |||
Each class offered by the Trust has equal rights as to assets and voting privileges. Income andnon-class specific expenses are allocated daily to each class based on the relative net assets. Realized and unrealized capital gains and losses of each class are allocated daily based on the relative net assets of each class of the respective Fund. Class specific expenses, where applicable, currently include service, distribution, transfer agent fees, andsub-transfer agent fees that vary amongst the classes as described more fully in Note 2.
17
American Beacon Continuous Capital Emerging Markets FundSM
Notes to Financial Statements
January 31, 2020
Significant Accounting Policies
The following is a summary of significant accounting policies, consistently followed by the Fund in preparation of the financial statements. The Fund is considered an investment company and accordingly, follows the investment company accounting and reporting guidance of the FASB Accounting Standards Codification Topic 946,Financial Services – Investment Companies,a part of Generally Accepted Accounting Principles (“U.S. GAAP”).
Security Transactions and Investment Income
Security transactions are recorded as of the trade date for financial reporting purposes. Securities purchased or sold on a when-issued or delayed-delivery basis may be settled beyond a standard settlement period for the security after the trade date.
Dividend income, net of foreign taxes, is recorded on theex-dividend date, except certain dividends from foreign securities which are recorded as soon as the information is available to the Fund. Interest income, net of foreign taxes, is earned from settlement date, recorded on the accrual basis, and adjusted, if necessary, for accretion of discounts and amortization of premiums. Realized gains (losses) from securities sold are determined based on specific lot identification.
Distributions to Shareholders
The Fund distributes most or all of its net earnings and realized gains, if any, each taxable year in the form of dividends from net investment income and distributions of realized net capital gains and net gains from foreign currency transactions on an annual basis. The Fund does not have a fixed dividend rate and does not guarantee that it will pay any distributions in any particular period. Dividends to shareholders are determined in accordance with federal income tax regulations, which may differ in amount and character from net investment income and realized gains recognized for purposes of U.S. GAAP. To the extent necessary to fully distribute capital gains, the Fund may designate earnings and profits distributed to shareholders on the redemption of shares.
Currency Translation
All assets and liabilities initially expressed in foreign currency values are converted into U.S. dollar values at the mean of the bid and ask prices of such currencies against U.S. dollars as last quoted by a recognized dealer. Income, expenses, and purchases and sales of investments are translated into U.S. dollars at the rate of the exchange prevailing on the respective dates of such transactions. The effect of changes in foreign currency exchange rates on investments is separately identified from the fluctuations arising from changes in market values of securities held and is reported with all other foreign currency gains and losses on the Fund’s Statement of Operations.
Allocation of Income, Trust Expenses, Gains, and Losses
Investment income, realized and unrealized gains and losses from investments of the Fund is allocated daily to each class of shares based upon the relative proportion of net assets of each class to the total net assets of the Fund. Expenses directly charged or attributable to the Fund will be paid from the assets of the Fund. Generally, expenses of the Trust will be allocated among and charged to the assets of the Fund on a basis that the Trust’s Board of Trustees (the “Board”) deems fair and equitable, which may be based on the relative net assets of the Fund or nature of the services performed and relative applicability to the Fund.
Use of Estimates
The preparation of financial statements in conformity with U.S. GAAP requires management to make estimates and assumptions that affect the amounts reported in the financial statements and accompanying notes. Actual results may differ from those estimated.
18
American Beacon Continuous Capital Emerging Markets FundSM
Notes to Financial Statements
January 31, 2020
Other
Under the Trust’s organizational documents, its officers and trustees are indemnified against certain liabilities arising out of the performance of their duties to the Trust. In the normal course of business, the Trust enters into contracts that provide indemnification to the other party or parties against potential costs or liabilities. The Trust’s maximum exposure under these arrangements is dependent on claims that may be made in the future and, therefore, cannot be estimated. The Trust has had no prior claims or losses pursuant to any such agreement.
2. Transactions with Affiliates
Management and InvestmentSub-Advisory Agreements
The Fund and the Manager are parties to a Management Agreement that obligates the Manager to provide the Fund with investment advisory and administrative services. As compensation for performing the duties under the Management Agreement, the Manager will receive an annualized management fee based on a percentage of the Fund’s average daily net assets that is calculated and accrued daily according to the following schedule:
First $5 billion | 0.35 | % | ||
Next $5 billion | 0.325 | % | ||
Next $10 billion | 0.30 | % | ||
Over $20 billion | 0.275 | % |
The Trust, on behalf of the Fund, and the Manager have entered into an Investment Advisory Agreement with Continuous Capital LLC (the“Sub-Advisor”) pursuant to which the Fund has agreed to pay an annualizedsub-advisory fee that is calculated and accrued daily based on the Fund’s average daily net assets according to the following schedule:
First $500 million | 0.525 | % | ||
Next $500 million | 0.50 | % | ||
Over $1 billion | 0.475 | % |
The Management andSub-Advisory Fees paid by the Fund for the year ended January 31, 2020 were as follows:
| Effective Fee Rate | Amount of Fees Paid | |||||||||||
Management Fees | 0.350 | % | $ | 17,852 | ||||||||
Sub-Advisor Fees | 0.525 | % | 26,633 | |||||||||
|
|
|
| |||||||||
Total | 0.875 | % | $ | 44,485 | ||||||||
|
|
|
| |||||||||
As compensation for services provided by the Manager in connection with securities lending activities conducted by the Fund, the lending Fund pays to the Manager, with respect to cash collateral posted by borrowers, a fee up to 10% of the net monthly interest income (the gross interest income earned by the investment of cash collateral, less the amount paid to borrowers and related expenses) from such activities and, with respect to loan fees paid by borrowers, a fee up to 10% of such loan fees. These fees are included in “Income derived from securities lending” and “Management and investment advisory fees” on the Statement of Operations. During the year ended January 31, 2020, the Manager received securities lending fees of $98 for the securities lending activities of the Fund.
Distribution Plans
The Fund has utilized a “defensive” Distribution Plan (the “Plan”) pursuant to which no separate fees may be charged to the Fund for distribution purposes. However, the Plan authorizes the use of management fees received by the Manager and/or the investment advisors hired by the Manager for distribution purposes. Under this
19
American Beacon Continuous Capital Emerging Markets FundSM
Notes to Financial Statements
January 31, 2020
Plan, the Fund does not intend to compensate the Manager or any other party, either directly or indirectly, for the distribution of Fund shares from these fees.
Service Plans
The Investor Class has adopted a Service Plan (collectively, the “Plans”). The Plans authorize the payment to the Manager an annual fee up to 0.375% of the average daily net assets of the Investor Class. In addition, the Fund may reimburse the Manager for certain non-distribution shareholder services provided by financial intermediaries attributable to Y Class and Institutional Class. The Manager or other approved entities may spend such amounts on any activities or expenses primarily intended to result in or relate to the servicing of Y Class, Institutional Class and Investor Class including, but not limited to, payment of shareholder service fees and transfer agency or sub-transfer agency expenses. The fees will be payable monthly in arrears. The primary expenses expected to be incurred under the Plans are shareholder servicing, record keeping fees and servicing fees paid to financial intermediaries such as plan sponsors and broker-dealers.
Sub-Transfer Agent Fees
The Manager has entered into agreements, which include servicing agreements, with financial intermediaries that provide recordkeeping, processing, shareholder communications and other services to customers of the intermediaries that hold positions in the Institutional and Y Classes of the Fund and has agreed to compensate the intermediaries for providing these services. Intermediaries transact with the Fund primarily through the use of omnibus accounts on behalf of its customers who hold positions in the Fund. Certain services would have been provided by the Fund’s transfer agent and other service providers if the shareholders’ accounts were maintained directly by the Fund’s transfer agent. Accordingly, the Fund, pursuant to Board approval, has agreed to reimburse the Manager for certainnon-distribution shareholder services provided by financial intermediaries for the Institutional and Y Classes. The reimbursement amounts(sub-transfer agent fees) paid to the Manager are subject to a fee limit of up to 0.10% of an intermediary’s average net assets in the Institutional and Y Classes on an annual basis. During the year ended January 31, 2020, thesub-transfer agent fees, as reflected in “Transfer agent fees” on the Statement of Operations, were as follows:
Fund | Sub-Transfer Agent Fees | |||
Continuous Capital Emerging Markets | $ | 1,623 | ||
As of January 31, 2020, the Fund owed the Manager the following reimbursement ofsub-transfer agent fees, as reflected in “Transfer agent fees payable” on the Statement of Assets and Liabilities:
Fund | Reimbursement Sub-Transfer Agent Fees | |||
Continuous Capital Emerging Markets | $ | 187 | ||
Investments in Affiliated Funds
The Fund may invest in the American Beacon U.S. Government Money Market Select Fund (the “USG Select Fund”). Cash collateral received by the Fund in connection with securities lending may also be invested in the USG Select Fund. The Fund and the USG Select Fund have the same investment advisor and therefore, are considered to be affiliated. The Manager serves as investment advisor to the USG Select Fund and receives management fees and administrative fees totaling 0.10% of the average daily net assets of the USG Select Fund. During the year ended January 31, 2020, the Manager earned fees on the Fund’s direct investments and securities lending collateral investments in the USG Select Fund as shown below:
Fund | Direct Investments in USG Select Fund | Securities Lending Collateral Investments in USG Select Fund | Total | |||||||||
Continuous Capital Emerging Markets | $ | 247 | $ | 37 | $ | 284 | ||||||
20
American Beacon Continuous Capital Emerging Markets FundSM
Notes to Financial Statements
January 31, 2020
Interfund Credit Facility
Pursuant to an exemptive order issued by the U.S. Securities and Exchange Commission (“SEC”), the Fund, along with other registered investment companies having management contracts with the Manager, may participate in a credit facility whereby each fund, under certain conditions, is permitted to lend money directly to and borrow directly from other participating funds for temporary purposes. The interfund credit facility is advantageous to the funds because it provides added liquidity and eliminates the need to maintain higher cash balances to meet redemptions. This situation could arise when shareholder redemptions exceed anticipated volumes and certain funds have insufficient cash on hand to satisfy such redemptions or when sales of securities do not settle as expected, resulting in a cash shortfall for a fund. When a fund liquidates portfolio securities to meet redemption requests, they often do not receive payment in settlement for up to two days (or longer for certain foreign transactions). Redemption requests normally are satisfied on the next business day. The credit facility provides a source of immediate, short-term liquidity pending settlement of the sale of portfolio securities. The credit facility is administered by a credit facility team consisting of professionals from the Manager’s asset management, compliance, and accounting areas who report the activities of the credit facility to the Board. During the year ended January 31, 2020, the Fund did not utilize the credit facility.
Expense Reimbursement Plan
The Manager contractually agreed to reduce fees and/or reimburse expenses for the classes of the Fund to the extent that total operating expenses exceed the Fund’s expense cap. During the year ended January 31, 2020, the Manager waived and/or reimbursed expenses as follows:
| Expense Cap | ||||||||||||||||||
Fund | Class | 2/1/2019 - 1/31/2020 | Reimbursed Expenses | (Recouped) Expenses | Expiration of Reimbursed Expenses | |||||||||||||
Continuous Capital Emerging Markets | Institutional | 1.15 | % | $ | 199,142 | $ | (81,769 | ) | 2022-2023 | |||||||||
Continuous Capital Emerging Markets | Y | 1.25 | % | 120,235 | (39,330 | ) | 2022-2023 | |||||||||||
Continuous Capital Emerging Markets | Investor | 1.53 | % | 11,432 | (3,104 | ) | 2022-2023 | |||||||||||
Of these amounts, $137,354 was disclosed as a payable to the Manager on the Statement of Assets and Liabilities at January 31, 2020.
The Fund has adopted an Expense Reimbursement Plan whereby the Manager may seek repayment of such fee or voluntary reductions and expense reimbursements. Under the policy, the Manager can be reimbursed by the Fund for any contractual or voluntary fee reductions or expense reimbursements if reimbursement to the Manager (a) occurs within three years after the date of the Manager’s waiver/reimbursement and (b) does not cause the Fund’s annual operating expenses to exceed the lesser of the contractual percentage limit in effect at the time of the waiver/reimbursement or time of recoupment. The reimbursed expenses listed above will expire in 2022 and 2023. The Fund did not record a liability for potential reimbursement due to the current assessment that a reimbursement is uncertain. The carryover of excess expenses potentially reimbursable to the Manager, but not recorded as a liability are as follows:
Fund | Recouped Expenses | Excess Expense Carryover | Expired Expense Carryover | Expiration of Reimbursed Expenses | ||||||||||||
Continuous Capital Emerging Markets | $ | 91,236 | $ | 43,101 | $ | – | 2021-2022 | |||||||||
Concentration of Ownership
From time to time, the Fund may have a concentration of one or more accounts constituting a significant percentage of shares outstanding. Investment activities by holders of accounts that represent a significant
21
American Beacon Continuous Capital Emerging Markets FundSM
Notes to Financial Statements
January 31, 2020
ownership of more than 5% of the Fund’s outstanding shares could have a material impact on the Fund. As of January 31, 2020, based on management’s evaluation of the shareholder account base, one account in the Fund have been identified as representing an affiliated significant ownership of approximately 43% of the Fund’s outstanding Institutional Class shares.
Trustee Fees and Expenses
Effective January 1, 2020, as compensation for their service to the American Beacon Funds Complex, including the Trust (collectively, the “Trusts”), each Trustee is compensated from the Trusts as follows: (1) an annual retainer of $120,000; (2) meeting attendance fee (for attendance in person or via teleconference) of (a) $12,000 for in person attendance, or $5,000 for telephonic attendance, by Board members for each regularly scheduled or special Board meeting, (b) $2,500 for attendance by Committee members at meetings of the Audit Committee and the Investment Committee, (c) $1,500 for attendance by Committee members at meetings of the Nominating and Governance Committee; and (d) $2,500 for attendance by Board members for each special telephonic Board meeting; and (3) reimbursement of reasonable expenses incurred in attending Board meetings, Committee meetings, and relevant educational seminars. The Trustees also may be compensated for attendance at special Board and/or Committee meetings from time to time. For her service as Board Chair, Ms. Cline receives an additional annual retainer of $50,000. Although she attends several committee meetings at each quarterly Board meeting, she receives only a single $2,500 fee each quarter for her attendance at those meetings. The chairpersons of the Audit Committee and the Investment Committee each receive an additional annual retainer of $25,000 and the Chair of the Nominating and Governance Committee receives an additional annual retainer of $15,000.
3. Security Valuation and Fair Value Measurements
The price of the Fund’s shares is based on its net asset value (“NAV”) per share. The Fund’s NAV is computed by adding total assets, subtracting all the Fund’s liabilities, and dividing the result by the total number of shares outstanding.
The NAV of each class of the Fund’s shares is determined based on a pro rata allocation of the Fund’s investment income, expenses and total capital gains and losses. The Fund’s NAV per share is determined each business day as of the regular close of trading on the New York Stock Exchange (“NYSE” or “Exchange”), which is typically 4:00 p.m. Eastern Time (“ET”). However, if trading on the NYSE closes at a time other than 4:00 p.m. ET, the Fund’s NAV per share typically would still be determined as of the regular close of trading on the NYSE. The Fund does not price its shares on days that the NYSE is closed. Foreign exchanges may permit trading in foreign securities on days when the Fund is not open for business, which may result in the value of the Fund’s portfolio investments being affected at a time when you are unable to buy or sell shares.
Equity securities, including shares ofclosed-end funds and exchange-traded funds (“ETFs”), are valued at the last sale price or official closing price taken from the primary exchange in which each security trades. Investments in other mutual funds are valued at the closing NAV per share on the day of valuation. Debt securities are valued at bid quotes from broker/dealers or evaluated bid prices from pricing services, who may consider a number of inputs and factors, such as prices of comparable securities, yield curves, spreads, credit ratings, coupon rates, maturity, default rates, and underlying collateral. Futures are valued based on their daily settlement prices. Exchange-traded andover-the-counter (“OTC”) options are valued at the last sale price. Options with no last sale for the day are priced at mid quote. Swaps are valued at evaluated mid prices from pricing services.
The valuation of securities traded on foreign markets and certain fixed-income securities will generally be based on prices determined as of the earlier closing time of the markets on which they primarily trade unless a significant event has occurred. When the Fund holds securities or other assets that are denominated in a foreign currency, the Fund will normally use the currency exchange rates as of 4:00 p.m. ET.
22
American Beacon Continuous Capital Emerging Markets FundSM
Notes to Financial Statements
January 31, 2020
Securities may be valued at fair value, as determined in good faith and pursuant to procedures approved by the Board, under certain limited circumstances. For example, fair value pricing will be used when market quotations are not readily available or reliable, as determined by the Manager, such as when (i) trading for a security is restricted or stopped; (ii) a security’s trading market is closed (other than customary closings); or (iii) a security has beende-listed from a national exchange. A security with limited market liquidity may require fair value pricing if the Manager determines that the available price does not reflect the security’s true market value. In addition, if a significant event that the Manager determines to affect the value of one or more securities held by the Fund occurs after the close of a related exchange but before the determination of the Fund’s NAV, fair value pricing may be used on the affected security or securities. Securities of small-capitalization companies are also more likely to require a fair value determination using these procedures because they are more thinly traded and less liquid than the securities of larger-capitalization companies. The Fund may fair value securities as a result of significant events occurring after the close of the foreign markets in which the Fund invests as described below. In addition, the Fund may invest in illiquid securities requiring these procedures.
The Fund may use fair value pricing for securities primarily traded innon-U.S. markets because most foreign markets close well before the Fund’s pricing time of 4:00 p.m. ET. The earlier close of these foreign markets gives rise to the possibility that significant events, including broad market moves, may have occurred in the interim and may materially affect the value of those securities. If the Manager determines that the last quoted prices ofnon-U.S. securities will, in its judgment, materially affect the value of some or all its portfolio securities, the Manager can adjust the previous closing prices to reflect what it believes to be the fair value of the securities as of the close of the Exchange. In deciding whether it is necessary to adjust closing prices to reflect fair value, the Manager reviews a variety of factors, including developments in foreign markets, the performance of U.S. securities markets, and the performance of instruments trading in U.S. markets that represent foreign securities and baskets of foreign securities. These securities are fair valued using a pricing service, using methods approved by the Board, that considers the correlation of the trading patterns of the foreign security to intraday trading in the U.S. markets, based on indices of domestic securities and other appropriate indicators such as prices of relevant American Depositary Receipts (“ADRs”) and futures contracts. The Valuation Committee, established by the Board, may also fair value securities in other situations, such as when a particular foreign market is closed but the Fund is open. The Fund uses outside pricing services to provide closing prices and information to evaluate and/or adjust those prices. As a means of evaluating its security valuation process, the Valuation Committee routinely compares closing prices, the next day’s opening prices in the same markets and adjusted prices.
Attempts to determine the fair value of securities introduce an element of subjectivity to the pricing of securities. As a result, the price of a security determined through fair valuation techniques may differ from the price quoted or published by other sources and may not accurately reflect the market value of the security when trading resumes. If a reliable market quotation becomes available for a security formerly valued through fair valuation techniques, the Manager compares the new market quotation to the fair value price to evaluate the effectiveness of the Fund’s fair valuation procedures. If any significant discrepancies are found, the Manager may adjust the Fund’s fair valuation procedures.
Valuation Inputs
Various inputs may be used to determine the fair value of the Fund’s investments. These inputs are summarized in three broad levels for financial statement purposes. The inputs or methodologies used to value securities are not necessarily an indication of the risk associated with investing in those securities.
| Level 1 | - | Quoted prices in active markets for identical securities. | ||
| Level 2 | - | Prices determined using other significant observable inputs. These may include quoted prices for similar securities, interest rates, prepayment speeds, credit risk, and others. | ||
| Level 3 | - | Prices determined using other significant unobservable inputs. Unobservable inputs reflect the Fund’s own assumptions about the factors market participants would use in pricing an investment. | ||
23
American Beacon Continuous Capital Emerging Markets FundSM
Notes to Financial Statements
January 31, 2020
Level 1 and Level 2 trading assets and trading liabilities, at fair value
Common stocks, ETFs, and financial derivative instruments, such as futures contracts or options that are traded on a national securities exchange, are stated at the last reported sale or settlement price on the day of valuation. To the extent these securities are actively traded and valuation adjustments are not applied, they are categorized as Level 1 of the fair value hierarchy. Preferred securities and other equities traded on inactive markets or valued by reference to similar instruments are generally categorized as Level 2 of the fair value hierarchy.
Investments in registeredopen-end investment management companies will be valued based upon the NAVs of such investments and are categorized as Level 1 of the fair value hierarchy.
4. Securities and Other Investments
American Depositary Receipts, Global Depositary Receipts, andNon-Voting Depositary Receipts
ADRs are depositary receipts for foreign issuers in registered form traded in U.S. securities markets. Global Depositary Receipts (“GDRs”) are in bearer form and traded in both the U.S. and European securities markets.Non-Voting Depositary Receipts (“NVDRs”) represent financial interests in an issuer but the holder is not entitled to any voting rights. Depositary receipts may not be denominated in the same currency as the securities into which they may be converted. Investing in depositary receipts entails substantially the same risks as direct investment in foreign securities. There is generally less publicly available information about foreign companies and there may be less governmental regulation and supervision of foreign stock exchanges, brokers and listed companies. In addition, such companies may use different accounting and financial standards (and certain currencies may become unavailable for transfer from a foreign currency), resulting in the Fund’s possible inability to convert immediately into U.S. currency proceeds realized upon the sale of portfolio securities of the affected foreign companies. In addition, the Fund may invest in unsponsored depositary receipts, the issuers of which are not obligated to disclose material information about the underlying securities to investors in the United States. Ownership of unsponsored depositary receipts may not entitle the Fund to the same benefits and rights as ownership of a sponsored depositary receipt or the underlying security.
Common Stock
Common stock generally takes the form of shares in a corporation which represent an ownership interest. It ranks below preferred stock and debt securities in claims for dividends and for assets of the company in a liquidation or bankruptcy. The value of a company’s common stock may fall as a result of factors directly relating to that company, such as decisions made by its management or decreased demand for the company’s products or services. A stock’s value may also decline because of factors affecting not just the company, but also companies in the same industry or sector. The price of a company’s stock may also be affected by changes in financial markets that are relatively unrelated to the company, such as changes in interest rates, currency exchange rates or industry regulation. Companies that elect to pay dividends on their common stock generally only do so after they invest in their own business and make required payments to bondholders and on other debt and preferred stock. Therefore, the value of a company’s common stock will usually be more volatile than its bonds, other debt and preferred stock. Common stock may be exchange-traded or OTC. OTC stock may be less liquid than exchange-traded stock.
Foreign Securities
The Fund may invest in U.S. dollar-denominated andnon-U.S. dollar denominated equity and debt securities of foreign issuers and foreign branches of U.S. banks, including negotiable certificates of deposit (“CDs”), bankers’ acceptances, and commercial paper. Foreign issuers are issuers organized and doing business principally outside the United States and include corporations, banks,non-U.S. governments, and quasi-governmental organizations. While investments in foreign securities may be intended to reduce risk by providing further diversification, such
24
American Beacon Continuous Capital Emerging Markets FundSM
Notes to Financial Statements
January 31, 2020
investments involve sovereign and other risks, in addition to the credit and market risks normally associated with domestic securities. These additional risks include the possibility of adverse political and economic developments (including political or social instability, nationalization, expropriation, or confiscatory taxation); the potentially adverse effects of unavailability of public information regarding issuers, different governmental supervision and regulation of financial markets, reduced liquidity of certain financial markets, and the lack of uniform accounting, auditing, and financial reporting standards or the application of standards that are different or less stringent than those applied in the United States; different laws and customs governing securities tracking; and possibly limited access to the courts to enforce the Fund’s rights as an investor.
Illiquid and Restricted Securities
Generally, an illiquid asset is an asset that the Fund reasonably expects cannot be sold or disposed of in current market conditions in seven calendar days or less without the sale or disposition significantly changing the market value of the investment, as determined pursuant to Rule22e-4 under the Investment Company Act or as otherwise permitted or required by SEC rules and interpretations. Historically, illiquid securities have included securities that have not been registered under the Securities Act, securities that are otherwise not readily marketable, and repurchase agreements having a remaining maturity of longer than seven calendar days. Securities that have not been registered under the Securities Act are referred to as private placements or restricted securities and are purchased directly from the issuer or in the secondary market. These securities may be sold only in a privately negotiated transaction or pursuant to an exemption from registration. A large institutional market exists for certain securities that are not registered under the Securities Act, including repurchase agreements, commercial paper, foreign securities, municipal securities and corporate bonds and notes. Institutional investors depend on an efficient institutional market in which the unregistered security can be readily resold or on an issuer’s ability to honor a demand for repayment. However, the fact that there are contractual or legal restrictions on resale of such investments to the general public or to certain institutions may not be indicative of their liquidity.
Limitations on resale may have an adverse effect on the marketability of portfolio securities, and the Fund might be unable to dispose of restricted or other illiquid securities promptly or at reasonable prices and might thereby experience difficulty satisfying redemptions within seven calendar days. In addition, the Fund may get only limited information about an issuer, so it may be less able to predict a loss. The Fund also might have to register such restricted securities in order to dispose of them resulting in additional expense and delay. Adverse market conditions could impede such a public offering of securities. In recognition of the increased size and liquidity of the institutional market for unregistered securities and the importance of institutional investors in the formation of capital, the SEC adopted Rule 144A under the Securities Act. Rule 144A is designed to facilitate efficient trading among institutional investors by permitting the sale of certain unregistered securities to qualified institutional buyers. To the extent privately placed securities held by the Fund qualify under Rule 144A and an institutional market develops for those securities, the Fund likely will be able to dispose of the securities without registering them under the Securities Act. To the extent that institutional buyers become, for a time, uninterested in purchasing these securities, investing in Rule 144A securities could increase the level of the Fund’s illiquidity. The Manager or thesub-advisor, as applicable, may determine that certain securities qualified for trading under Rule 144A are liquid. Regulation S under the Securities Act permits the sale abroad of securities that are not registered for sale in the United States and includes a provision for U.S. investors, such as the Fund, to purchase such unregistered securities if certain conditions are met.
Securities sold in private placement offerings made in reliance on the “private placement” exemption from registration afforded by Section 4(a)(2) of the Securities Act and resold to qualified institutional buyers under Rule 144A under the Securities Act (“Section 4(a)(2) securities”) are restricted as to disposition under the federal securities laws, and generally are sold to institutional investors, such as the Fund, that agree they are purchasing the securities for investment and not with an intention to distribute to the public. Any resale by the purchaser must be pursuant to an exempt transaction and may be accomplished in accordance with Rule 144A. Section 4(a)(2) securities normally are resold to other institutional investors through or with the assistance of the issuer or dealers
25
American Beacon Continuous Capital Emerging Markets FundSM
Notes to Financial Statements
January 31, 2020
that make a market in the Section 4(a)(2) securities, thus providing liquidity. Restricted securities outstanding during the year ended January 31, 2020 are disclosed in the Notes to the Schedule of Investments.
Regulation S under the Securities Act permits the sale abroad of securities that are not registered for sale in the United States and includes a provision for U.S. investors, such as the Fund, to purchase such unregistered securities if certain conditions are met.
Other Investment Company Securities and Other Exchange-Traded Products
The Fund at times may invest in shares of other investment companies, including money market funds and ETFs. The Fund may invest in securities of an investment company advised by the Manager or asub-advisor. Investments in the securities of other investment companies may involve duplication of advisory fees and certain other expenses. By investing in another investment company, the Fund becomes a shareholder of that investment company. As a result, the Fund’s shareholders indirectly will bear the Fund’s proportionate share of the fees and expenses paid by shareholders of the other investment company, in addition to the fees and expenses the Fund’s shareholders directly bear in connection with the Fund’s own operations. These other fees and expenses are reflected as Acquired Fund Fees and Expenses and are included in the Fees and Expenses Table for the Fund in its Prospectus, if applicable. Investments in other investment companies may involve the payment of substantial premiums above the value of such issuer’s portfolio securities.
5. Principal Risks
Investing in the Fund may involve certain risks including, but not limited to, those described below.
China Investment Risk
Investing in securities of Chinese issuers, includingA-Shares, involves certain risks and considerations not typically associated with investing in securities of U.S. issuers, including, among others, more frequent trading suspensions and government interventions (including by nationalization of assets), currency exchange rate fluctuations or blockages, limits on the use of brokers and on foreign ownership, different financial reporting standards, higher dependence on exports and international trade, potential for increased trade tariffs, embargoes and other trade limitations, and custody risks associated with programs used to access Chinese securities. Significant portions of the Chinese securities markets may become rapidly illiquid, as Chinese issuers have the ability to suspend the trading of their equity securities, and have shown a willingness to exercise that option in response to market volatility and other events.
Currency Risk
The Fund may have exposure to foreign currencies by making direct investments innon-U.S. currencies or in securities denominated innon-U.S. currencies, or by purchasing or selling forward currency exchange contracts innon-U.S. currencies. Foreign currencies may decline in value relative to the U.S. dollar, or, in the case of hedging positions, the U.S. dollar may decline in value relative to the currency being hedged, and thereby affect the Fund’s investments in foreign(non-U.S.) currencies or in securities that trade in, and receive revenues in, or in derivatives that provide exposure to, foreign(non-U.S.) currencies. Currency exchange rates may fluctuate significantly over short periods of time for a number of reasons, including changes in interest rates, intervention (or the failure to intervene) by U.S. or foreign governments, central banks or supranational entities such as the International Monetary Fund, or by the imposition of currency controls or other political developments in the United States or abroad. As a result, the Fund’s investments in foreign currency denominated securities may reduce the returns of the Fund. Currency futures, forwards, options or swaps may not always work as intended, and in specific cases, the Fund may be worse off than if it had not used such instrument(s). There may not always be suitable hedging instruments available. Even where suitable hedging instruments are available, the Fund may choose to not hedge its currency risks.
26
American Beacon Continuous Capital Emerging Markets FundSM
Notes to Financial Statements
January 31, 2020
Equity Investments Risk
Equity securities are subject to market risk. The Fund’s investments in equity securities may include common stocks, REITs, depositary receipts, and U.S. dollar-denominated foreign stocks traded on U.S. exchanges. Such investments may expose the Fund to additional risk. The value of a company’s common stock may fall as a result of factors affecting the company, companies in the same industry or sector, or the financial markets overall. Common stock generally is subordinate to preferred stock upon the liquidation or bankruptcy of the issuing company. Investments in REITs are subject to the risks associated with investing in the real estate industry such as adverse developments affecting the real estate industry and real property values. Depositary receipts and U.S. dollar-denominated foreign stocks traded on U.S. exchanges are subject to certain of the risks associated with investing directly in foreign securities, including, but not limited to, currency fluctuations and political and financial instability in the home country of a particular depositary receipt or foreign stock.
Foreign Investing and Emerging Markets Risk
Non-U.S. investments carry potential risks not associated with U.S. investments. Such risks include, but are not limited to: (1) currency exchange rate fluctuations, (2) political and financial instability, (3) less liquidity, (4) lack of uniform accounting, auditing and financial reporting standards, (5) increased price volatility, (6) different government regulation and supervision of foreign stock exchanges, brokers and listed companies, and (7) delays in transaction settlement in some foreign markets. To the extent the Fund invests a significant portion of its assets in securities of a single country or region, it is more likely to be affected by events or conditions of that country or region. In addition, the economies and political environments of emerging market countries tend to be more unstable than those of developed countries, resulting in more volatile rates of return than the developed markets and substantially greater risk to investors. There may be very limited oversight of certain foreign banks or securities depositories that hold foreign securities and currency and the laws of certain countries may limit the ability to recover such assets if a foreign bank or depository or their agents goes bankrupt. When investing in emerging markets, the risks of investing in foreign securities are heightened. Emerging markets have unique risks that are greater than, or in addition to, investing in developed markets because emerging markets are generally smaller, less developed, less liquid and more volatile than the securities markets of the U.S. and other developed markets. There are also risks of: greater political uncertainties; an economy’s dependence on revenues from particular commodities or on international aid or development assistance; currency transfer restrictions; a limited number of potential buyers for such securities, resulting in increased volatility and limited liquidity for emerging market securities; trading suspensions; and delays and disruptions in securities settlement procedures. In addition, there may be less information available to make investment decisions and more volatile rates of return.
High Portfolio Turnover Risk
Portfolio turnover is a measure of the Fund’s trading activity over a one-year period. A portfolio turnover rate of 100% would indicate that the Fund sold and replaced the entire value of its securities holdings during the period. High portfolio turnover could increase the Fund’s transaction costs because of increased broker commissions resulting from such transactions. These costs are not reflected in the Fund’s annual operating expenses or in the expense example, but they can have a negative impact on performance. Frequent trading by the Fund could also result in increased realized net capital gains, distributions of which are taxable to the Fund’s shareholders (including net short-term capital gain distributions, which are taxable to them as ordinary income).
Investment Risk
An investment in the Fund is not a deposit with a bank and is not insured or guaranteed by the Federal Deposit Insurance Corporation or any other government agency. When you sell your shares of the Fund, they could be worth less than what you paid for them. Therefore, you may lose money by investing in the Fund.
27
American Beacon Continuous Capital Emerging Markets FundSM
Notes to Financial Statements
January 31, 2020
Market Disruption Risk
Geopolitical and other events, including war, terrorism, economic uncertainty, trade disputes, pandemics, public health crises and related geopolitical events have led, and in the future may continue to lead, to instability in world economies and markets generally. This instability has disrupted, and may continue to disrupt, U.S. and world economies and markets and adversely affect the value of your investment. Such market disruptions have caused, and may continue to cause, broad changes in market value, negative public perceptions concerning these developments, and adverse investor sentiment or publicity. Changes in value may be temporary or may last for extended periods. Although multiple asset classes have been and may continue to be affected by a market disruption, the duration and effects may not be the same for all types of assets. Events that have led to market disruptions include the recent pandemic spread of the novel coronavirus known as COVID-19, which has resulted in travel restrictions, closed international borders, quarantines, disruptions to supply chains and lower consumer demand. The duration and full effects of these market disruptions are still uncertain. The effect of recent efforts undertaken by the Federal Reserve System to address the economic impact of the COVID-19 pandemic, such as the reduction of the federal funds target rate, and other monetary and fiscal actions that may be taken by the U.S. federal government to stimulate the U.S. economy, are not yet known. In addition, COVID-19 could cause the need for employees and vendors at various businesses, including the Manager, the sub-advisor(s) or other service providers, to work at external locations, and extensive medical absences. Because a large epidemic may create significant market and business uncertainties and disruptions, not all events that could affect the business of the Manager, the sub-advisor(s) or other service providers can be determined and addressed in advance.
Market Risk
Conditions in the U.S. and many foreign economies have resulted, and may continue to result, in certain instruments experiencing unusual liquidity issues, increased price volatility and, in some cases, credit downgrades and increased likelihood of default. These events have reduced the willingness and ability of some lenders to extend credit, and have made it more difficult for some borrowers to obtain financing on attractive terms, if at all. In some cases, traditional market participants have been less willing to make a market in some types of debt instruments, which has affected the liquidity of those instruments. During times of market turmoil, investors tend to look to the safety of securities issued or backed by the U.S. Treasury, causing the prices of these securities to rise and the yields to decline. Reduced liquidity in fixed income and credit markets may negatively affect many issuers worldwide. In addition, global economies and financial markets are becoming increasingly interconnected, which increases the possibilities that conditions in one country or region might adversely impact issuers in a different country or region. A rise in protectionist trade policies, and the possibility of changes to some international trade agreements, could affect the economies of many nations, including the United States, in ways that cannot necessarily be foreseen at the present time.
In response to the financial crisis, the U.S. and other governments and the Federal Reserve and certain foreign central banks have taken steps to support financial markets. In some countries where economic conditions are recovering, they are nevertheless perceived as still fragile. Withdrawal of government support, failure of efforts in response to the crisis, or investor perception that such efforts are not succeeding, could adversely impact the value and liquidity of certain securities. The severity or duration of adverse economic conditions may also be affected by policy changes made by governments or quasi-governmental organizations, including changes in tax laws. The impact of new financial regulation legislation on the markets and the practical implications for market participants may not be fully known for some time. Regulatory changes are causing some financial services companies to exit long-standing lines of business, resulting in dislocations for other market participants.
In addition, political and governmental events within the U.S. and abroad, such as the U.S. government’s inability at times to agree on a long-term budget and deficit reduction plan, the threat of a federal government shutdown and threats not to increase the federal government’s debt limit, may affect investor and consumer confidence and may adversely impact financial markets and the broader economy, perhaps suddenly and to a significant degree. The U.S. government has reduced the federal corporate income tax rates, and future legislative, regulatory and policy changes may result in more restrictions on international trade, less stringent
28
American Beacon Continuous Capital Emerging Markets FundSM
Notes to Financial Statements
January 31, 2020
prudential regulation of certain players in the financial markets, and significant new investments in infrastructure and national defense. Markets may react strongly to expectations about the changes in these policies, which could increase volatility, especially if the markets’ expectations for changes in government policies are not borne out.
Changes in market conditions will not have the same impact on all types of securities. Interest rates have been unusually low in recent years in the U.S. and abroad. Because there is little precedent for this situation, it is difficult to predict the impact of a significant rate increase on various markets. For example, because investors may buy securities or other investments with borrowed money, a significant increase in interest rates may cause a decline in the markets for those investments. Because of the sharp decline in the worldwide price of oil, there is a concern that oil producing nations may withdraw significant assets now held in U.S. Treasuries, which could force a substantial increase in interest rates. Regulators have expressed concern that rate increases may cause investors to sell fixed income securities faster than the market can absorb them, contributing to price volatility. In addition, there is a risk that the prices of goods and services in the U.S. and many foreign economies may decline over time, known as deflation (the opposite of inflation). Deflation may have an adverse effect on stock prices and creditworthiness and may make defaults on debt more likely. If a country’s economy slips into a deflationary pattern, it could last for a prolonged period and may be difficult to reverse.
The precise timing and the resulting impact of the United Kingdom’s departure from the EU, commonly referred to as “Brexit,’” are not yet known. The effect on the United Kingdom’s economy will likely depend on the nature of trade relations with the EU and other major economies following its exit, which are matters to be negotiated. The outcomes may cause increased volatility and have a significant adverse impact on world financial markets, other international trade agreements, and the United Kingdom and European economies, as well as the broader global economy for some time, which could significantly adversely affect the value of the Fund’s investments in the United Kingdom and Europe.
Market Timing Risk
Frequent trading by Fund shareholders poses risks to other shareholders in that Fund, including (i) the dilution of the Fund’s NAV, (ii) an increase in the Fund’s expenses, and (iii) interference with the portfolio manager’s ability to execute efficient investment strategies. Because of specific types of securities in which the Fund may invest, it could be subject to the risk of market timing activities by shareholders.
Other Investment Companies Risk
The Fund may invest in shares of other registered investment companies, including money market funds and ETFs. To the extent that the Fund invests in shares of other registered investment companies, the Fund will indirectly bear the fees and expenses, including for example, advisory and administrative fees, charged by those investment companies in addition to the Fund direct fees and expenses and will be subject to the risks associated with investments in those companies. For example, the Fund investments in money market funds are subject to interest rate risk, credit risk, and market risk. The Fund must rely on the investment company in which it invests to achieve its investment objective. If the investment company fails to achieve its investment objective, the value of the Fund investment may decline, adversely affecting the Fund performance. ETFs are subject to the following risks that do not apply to conventional funds: (1) the market price of an ETF’s shares may trade at a discount or premium to its NAV; (2) an active trading market for an ETF’s shares may not develop or be maintained; or (3) trading of an ETF’s shares may be halted if the listing exchange’s officials deem such action appropriate, the shares are delisted from the exchange, or the activation of market-wide “circuit breakers” (which are tied to large decreases in stock prices) halts stock trading generally. An ETF that tracks an index may not precisely replicate the returns of its benchmark index. To the extent the Fund invests in other investment companies that invest in equity securities, fixed-income securities and/or foreign securities, or that track an index, the Fund are subject to the risks associated with the underlying investments held by the investment company or the index fluctuations to which the investment company is subject. ETFs have expenses associated with their operation, typically including advisory fees.
29
American Beacon Continuous Capital Emerging Markets FundSM
Notes to Financial Statements
January 31, 2020
Securities Lending Risk
A Fund may lend its portfolio securities to brokers, dealers and financial institutions to seek income. There is a risk that a borrower may default on its obligations to return loaned securities; however, a Fund’s securities lending agent indemnifies the Fund against that risk. There is a risk that the assets of a Fund’s securities lending agent may be insufficient to satisfy any contractual indemnification requirements to the Fund. Borrowers of a Fund’s securities typically provide collateral in the form of cash that is reinvested in securities. A Fund will be responsible for the risks associated with the investment of cash collateral, including any collateral invested in an affiliated money market fund. A Fund may lose money on its investment of cash collateral or may fail to earn sufficient income on its investment to meet obligations to the borrower. In addition, delays may occur in the recovery of securities from borrowers, which could interfere with a Fund’s ability to vote proxies or to settle transactions and there is the risk of possible loss of rights in the collateral should the borrower fail financially. In any case in which the loaned securities are not returned to the Fund before anex-dividend date, the payment in lieu of the dividend that the Fund receives from the securities’ borrower would not be treated as a dividend for federal income tax purposes and thus would not qualify for treatment as “qualified dividend income”.
Valuation Risk
This is the risk that the Fund has valued a security at a price different from the price at which it can be sold. This risk may be especially pronounced for investments, such as derivatives, which may be illiquid or which may become illiquid and for securities that trade in relatively thin markets and/or markets that experience extreme volatility. If market conditions make it difficult to value certain investments, the Fund may value these investments using more subjective methods, such as fair-value methodologies. Investors who purchase or redeem Fund shares on days when the Fund is holding fair-valued securities may receive fewer or more shares, or lower or higher redemption proceeds, than they would have received if the Fund had not fair-valued the securities or had used a different valuation methodology. The value of foreign securities, certain fixed-income securities and currencies, as applicable, may be materially affected by events after the close of the markets on which they are traded, but before the Fund determines its NAV. A Fund’s ability to value its investments in an accurate and timely manner may be impacted by technological issues and/or errors by third-party service providers, such as pricing services or accounting agents.
Offsetting Assets and Liabilities
The Fund is a party to enforceable master netting agreements between brokers and counterparties which provide for the right to offset under certain circumstances. The Fund employs multiple money managers and counterparties and has elected not to offset qualifying financial and derivative instruments on the Statement of Assets and Liabilities, as such all financial and derivative instruments are presented on a gross basis. The impacts of netting arrangements that provide the right to offset are detailed below. The net amount represents the net receivable or payable that would be due from or to the counterparty in the event of default. Exposure from borrowings and other financing agreements such as repurchase agreements can only be netted across transactions governed by the same Master Agreement with the same legal entity. All amounts reported below represent the balance as of the report date, January 31, 2020.
| Remaining Contractual Maturity of the Agreements As of January 31, 2020 | ||||||||||||||||||||||||||||||||||||
| Overnight and Continuous | <30 days | Between 30 & 90 days | >90 days | Total | ||||||||||||||||||||||||||||||||
Securities Lending Transactions |
| |||||||||||||||||||||||||||||||||||
Common Stocks | $ | 38,556 | $ | - | $ | - | $ | - | $ | 38,556 | ||||||||||||||||||||||||||
|
|
|
|
|
|
|
|
|
| |||||||||||||||||||||||||||
Total Borrowings | $ | 38,556 | $ | - | $ | - | $ | - | $ | 38,556 | ||||||||||||||||||||||||||
|
|
|
|
|
|
|
|
|
| |||||||||||||||||||||||||||
Gross amount of recognized liabilities for securities lending transactions |
| $ | 38,556 | |||||||||||||||||||||||||||||||||
|
| |||||||||||||||||||||||||||||||||||
30
American Beacon Continuous Capital Emerging Markets FundSM
Notes to Financial Statements
January 31, 2020
6. Federal Income and Excise Taxes
It is the policy of the Fund to qualify as a regulated investment company (“RIC”), by complying with all applicable provisions of Subchapter M of the Internal Revenue Code, as amended, and to make distributions of taxable income sufficient to relieve it from substantially all federal income and excise taxes. For federal income tax purposes, the Fund is treated as a single entity for the purpose of determining such qualification.
The Fund does not have any unrecorded tax liabilities in the accompanying financial statements. Each of the tax years in the two year period ended January 31, 2020 remain subject to examination by the Internal Revenue Service. If applicable, the Fund recognizes interest accrued related to unrecognized tax benefits in interest expense and penalties in “Other expenses” on the Statement of Operations.
The Fund may be subject to taxes imposed by countries in which it invests. Such taxes are generally based on returns of income earned or gains realized or repatriated. Taxes are accrued and applied to net investment income, net realized capital gains and net unrealized appreciation (depreciation), as applicable, as the income is earned or capital gains are recorded.
Dividends are categorized in accordance with income tax regulations which may treat certain transactions differently than U.S. GAAP. Accordingly, the character of distributions and composition of net assets for tax purposes may differ from those reflected in the accompanying financial statements. The Fund also utilizes earnings and profits distributed to shareholders on redemptions of shares as part of the dividends paid deduction.
The tax character of distributions paid were as follows:
| Year Ended January 31, 2020 | Year Ended January 31, 2019 | |||||||||||
Distributions paid from: |
| |||||||||||
Ordinary income* |
| |||||||||||
Institutional Class | $ | 76,776 | $ | |||||||||
Y Class | 64,411 | - | ||||||||||
Investor Class | 3,856 | - | ||||||||||
Long-term capital gains |
| |||||||||||
Institutional Class | - | - | ||||||||||
Y Class | - | - | ||||||||||
Investor Class | - | - | ||||||||||
|
|
|
| |||||||||
Total distributions paid | $ | 145,043 | $ | - | ||||||||
|
|
|
| |||||||||
* For tax purposes, short-term gains are considered ordinary income distributions.
As of January 31, 2020, the components of distributable earnings (deficits) on a tax basis were as follows:
Fund | Tax Cost | Unrealized Appreciation | Unrealized (Depreciation) | Net Unrealized Appreciation (Depreciation) | ||||||||||||||||||||||||
| Continuous Capital Emerging Markets | $ | 6,513,406 | $ | 697,704 | $ | (208,860 | ) | $ | 488,844 | |||||||||||||||||||
Fund | Net Unrealized Appreciation (Depreciation) | Undistributed Ordinary Income | Undistributed Long-Term Capital Gains | Accumulated Capital and Other (Losses) | Other Temporary Differences | Distributable Earnings | ||||||||||||||||||||||||||||||||||||||
| Continuous Capital Emerging Markets | $ | 488,844 | $ | 27,389 | $ | - | $ | (69,111 | ) | $ | 12,530 | $ | 459,652 | |||||||||||||||||||||||||||||||
Financial reporting records are adjusted for permanent book/tax differences to reflect tax character. Financial records are not adjusted for temporary differences. The temporary differences between financial reporting andtax-basis reporting of unrealized appreciation (depreciation) are attributable primarily to the tax deferral of losses from wash sales, the realization for tax purposes of unrealized gains (losses) on certain derivative
31
American Beacon Continuous Capital Emerging Markets FundSM
Notes to Financial Statements
January 31, 2020
instruments, unused capital losses, and the realization for tax purposes of unrealized gains (losses) on investments in passive foreign investment companies.
Due to inherent differences in the recognition of income, expenses, and realized gains (losses) under U.S. GAAP and federal income tax regulations, permanent differences between book and tax reporting have been identified and appropriately reclassified on the Statement of Assets and Liabilities.
Accordingly, the following amounts represent current year permanent differences derived from unrealized foreign capital gains tax as of January 31, 2020:
Fund | Paid-In-Capital | Distributable Earnings/(Deficits) | ||||||||||
| Continuous Capital Emerging Markets | $ | (12,530 | ) | $ | 12,530 | |||||||
Under the Regulated Investment Company Modernization Act of 2010 (“RIC MOD”), net capital losses recognized by the Fund in taxable years beginning after December 22, 2010 are carried forward indefinitely and retain their character as short-term and/or long-term losses.
As of January 31, 2020, the Fund had the following post RIC MOD capital loss carryforwards:
Fund | Short-Term Capital Loss Carryforwards | Long-Term Capital Loss Carryforwards | ||||||||||
| Continuous Capital Emerging Markets | $ | 69,111 | $ | - | ||||||||
7. Investment Transactions
The aggregate cost of purchases and proceeds from sales and maturities of investments, other than short-term obligations, for the year ended January 31, 2020 were as follows:
Fund | Purchases (non-U.S. Government Securities) | Sales (non-U.S. Government Securities) | ||||||||||
| Continuous Capital Emerging Markets | $ | 8,913,196 | $ | 5,825,798 | ||||||||
A summary of the Fund’s transactions in the USG Select Fund for the year ended January 31, 2020 were as follows:
Fund | Type of Transaction | January 31, 2019 Shares/Fair Value | Purchases | Sales | January 31, 2020 Shares/Fair Value | Dividend Income | ||||||||||||||||||||||||||||||||||||
| Continuous Capital Emerging Markets | Direct | $ | 118,300 | $ | 6,014,844 | $ | 5,663,690 | $ | 469,454 | $ | 4,823 | |||||||||||||||||||||||||||||||
| Continuous Capital Emerging Markets | Securities Lending | - | 1,439,554 | 1,400,998 | 38,556 | N/A | ||||||||||||||||||||||||||||||||||||
8. Securities Lending
The Fund may lend its securities to qualified financial institutions, such as certain broker-dealers, to earn additional income. The borrowers are required to secure their loans continuously with collateral in an amount at least equal to the fair value of the securities loaned, initially in an amount at least equal to 102% of the fair value of domestic securities loaned and 105% of the fair value of international securities loaned. Collateral is monitored andmarked-to-market daily. Dailymark-to-market amounts are required to be paid to the borrower or received from the borrower by the end of the following business day. This one day settlement formark-to-market amounts may result in the collateral being temporarily less than the value of the securities on loan or temporarily more than the required minimum collateral.
32
American Beacon Continuous Capital Emerging Markets FundSM
Notes to Financial Statements
January 31, 2020
To the extent that a loan is collateralized by cash, such cash collateral shall be invested by the securities lending agent (the “Agent”) in money market mutual funds and other short-term investments, provided the investments meet certain quality and diversification requirements. Securities purchased with cash collateral proceeds are listed in the Fund’s Schedule of Investments and the collateral is shown on the Statement of Assets and Liabilities as a payable.
Securities lending income is generated from the demand premium (if any) paid by the borrower to borrow a specific security and from the return on investment of cash collateral, reduced by negotiated rebate fees paid to the borrower and transaction costs. To the extent that a loan is secured bynon-cash collateral, securities lending income is generated as a demand premium reduced by transaction costs. The Fund, the Agent, and the Manager retained 80%, 10%, and 10%, respectively, of the income generated from securities lending.
While securities are on loan, the Fund continues to receive certain income associated with that security and any gain or loss in the market price that may occur during the term of the loan. In the case of domestic equities, the value of any dividend is received in the form of a substitute payment approximately equal to the dividend. In the case of foreign securities, a negotiated amount is received that is less than the actual dividend, but higher than the dividend amount minus the foreign tax that the Fund would be subject to on the dividend.
Securities lending transactions pose certain risks to the Fund, including that the borrower may not provide additional collateral when required or return the securities when due, that the value of the short-term investments will be less than the amount of cash collateral required to be returned to the borrower, thatnon-cash collateral may be subject to legal constraints in the event of a borrower bankruptcy, and that the cash collateral investments could become illiquid and unable to be used to return collateral to the borrower. The Fund could also experience delays and costs in gaining access to the collateral. The Fund bears the risk of any deficiency in the amount of the cash collateral available for return to the borrower and any action which impairs its ability to liquidatenon-cash collateral to satisfy a borrower default.
As of January 31, 2020, the value of outstanding securities on loan and the value of collateral were as follows:
Fund | Market Value of Securities on Loan | Cash Collateral Received | Non-Cash Collateral Received | Total Collateral Received | ||||||||||||||||||||||||
| Continuous Capital Emerging Markets | $ | 36,825 | $ | 38,556 | $ | 403 | $ | 38,959 | ||||||||||||||||||||
Cash collateral is listed on the Fund’s Schedule of Investments and is shown on the Statement of Assets and Liabilities. Income earned on these investments is included in “Income derived from securities lending” on the Statement of Operations.
Non-cash collateral received by the Fund may not be sold orre-pledged except to satisfy a borrower default. Therefore,non-cash collateral is not included on the Fund’s Schedule of Investments or Statement of Assets and Liabilities.
9. Borrowing Arrangements
Effective November 14, 2019 (the “Effective Date”), the Fund, along with certain other funds managed by the Manager (“Participating Funds”), entered into a committed revolving line of credit (the “Committed Line”) agreement with State Street Bank and Trust Company (the “Bank”) to be used to facilitate portfolio liquidity. The maximum borrowing amount under the Committed Line is $250 million with interest at a rate equal to the higher of(a) one-month London Inter-Bank Offered Rate (“LIBOR”) plus 1.25% per annum or (b) the Federal Funds rate plus 1.25% per annum on amounts borrowed. Each of the Participating Funds paid a closing fee of $100,000 on the Effective Date and a quarterly commitment fee at a rate of 0.25% per annum on the unused portion of the Committed Line amount. The Committed Line expires November 12, 2020, unless extended by the Bank or terminated by the Participating Funds in accordance with the agreement.
33
American Beacon Continuous Capital Emerging Markets FundSM
Notes to Financial Statements
January 31, 2020
On the Effective Date, the Fund, along with certain other Participating Funds managed by the Manager, also entered into an uncommitted discretionary demand revolving line of credit (the “Uncommitted Line”) agreement with the Bank to be used to facilitate portfolio liquidity. The maximum borrowing amount under the Uncommitted Line is $50 million with interest at a rate equal to the higher of(a) one-month LIBOR plus 1.25% per annum or (b) the Federal Funds rate plus 1.25% per annum on each outstanding loan. Each of the Participating Funds paid a closing fee of $35,000 on the Effective Date. The Uncommitted Line expires November 12, 2020 unless extended by the Bank or terminated by the Participating Funds in accordance with the agreement.
The Participating Funds paid administration, legal and arrangement fees, which are recognized as a component of “Other expenses” on the Statement of Operations, along with commitment fees, that have been allocated among the Participating Funds based on average daily net assets.
During the year ended January 31, 2020, the Fund did not utilize this facility.
10. Capital Share Transactions
The tables below summarize the activity in capital shares for each Class of the Fund:
| Institutional Class | ||||||||||||||||||||||||||||
| Year Ended January 31, 2020 | December 17, 2018A to January 31, 2019 | |||||||||||||||||||||||||||
Continuous Capital Emerging Markets Fund | Shares | Amount | Shares | Amount | ||||||||||||||||||||||||
| Shares sold | 85,070 | $ | 1,004,856 | 140 | B | $ | - | B | ||||||||||||||||||||
| Reinvestment of dividends | 1 | 9 | - | - | ||||||||||||||||||||||||
| Shares redeemed | (2,684 | ) | (31,263 | ) | - | - | ||||||||||||||||||||||
|
|
|
|
|
|
|
| |||||||||||||||||||||
| Net increase in shares outstanding | 82,387 | $ | 973,602 | 140 | $ | - | ||||||||||||||||||||||
|
|
|
|
|
|
|
| |||||||||||||||||||||
| Y Class | ||||||||||||||||||||||||||||
| Year Ended January 31, 2020 | December 17, 2018A to January 31, 2019 | |||||||||||||||||||||||||||
Continuous Capital Emerging Markets Fund | Shares | Amount | Shares | Amount | ||||||||||||||||||||||||
| Shares sold | 209,149 | $ | 2,350,101 | 18,956 | B | $ | 199,985 | B | ||||||||||||||||||||
| Reinvestment of dividends | 5,303 | 61,460 | - | - | ||||||||||||||||||||||||
| Shares redeemed | (1,469 | ) | (17,023 | ) | - | - | ||||||||||||||||||||||
|
|
|
|
|
|
|
| |||||||||||||||||||||
| Net increase in shares outstanding | 212,983 | $ | 2,394,538 | 18,956 | $ | 199,985 | ||||||||||||||||||||||
|
|
|
|
|
|
|
| |||||||||||||||||||||
| Investor Class | ||||||||||||||||||||||||||||
| Year Ended January 31, 2020 | December 17, 2018A to January 31, 2019 | |||||||||||||||||||||||||||
Continuous Capital Emerging Markets Fund | Shares | Amount | Shares | Amount | ||||||||||||||||||||||||
| Shares sold | 14,775 | $ | 168,934 | 798 | B | $ | 8,477 | B | ||||||||||||||||||||
| Reinvestment of dividends | 78 | 905 | - | - | ||||||||||||||||||||||||
| Shares redeemed | (8,581 | ) | (97,222 | ) | - | - | ||||||||||||||||||||||
|
|
|
|
|
|
|
| |||||||||||||||||||||
| Net increase in shares outstanding | 6,272 | $ | 72,617 | 798 | $ | 8,477 | ||||||||||||||||||||||
|
|
|
|
|
|
|
| |||||||||||||||||||||
A Commencement of operations.
B Total seed capital was received in the amounts of $2,600,000, $100,000, and $100,000 for the Institutional, Y, and Investor Classes, respectively. As a result, shares were issued in the total amounts of 260,000, 10,000, and 10,000 for Institutional, Y, and Investor Classes, respectively.
11. Subsequent Events
Management has evaluated subsequent events for possible recognition or disclosure in the financial statements through the date the financial statements are issued. Beginning in January 2020, global financial markets have experienced and may continue to experience significant volatility resulting from the spread of a virus known as COVID-19. The outbreak of COVID-19 has resulted in travel and border restrictions, quarantines, supply chain disruptions, lower consumer demand and general market uncertainty. The effects of COVID-19 have and may continue to adversely affect the global economy, the economies of certain nations and individual issuers, all of which may negatively impact the Funds performance. Management’s evaluation is ongoing and the financial landscape continues to change.
34
American Beacon Continuous Capital Emerging Markets FundSM
(For a share outstanding throughout the period)
| Institutional Class | ||||||||||||
| Year Ended January 31, 2020 | December 17, 2018A to January 31, 2019 | |||||||||||
|
| |||||||||||
Net asset value, beginning of period | $ | 10.85 | $ | 10.00 | ||||||||
|
|
|
| |||||||||
Income from investment operations: | ||||||||||||
Net investment income | 0.27 | 0.01 | B | |||||||||
Net gains on investments (both realized and unrealized) | 0.65 | 0.84 | ||||||||||
|
|
|
| |||||||||
Total income from investment operations | 0.92 | 0.85 | ||||||||||
|
|
|
| |||||||||
Less distributions: | ||||||||||||
Dividends from net investment income | (0.27 | ) | - | |||||||||
Distributions from net realized gains | (0.03 | ) | - | |||||||||
|
|
|
| |||||||||
Total distributions | (0.30 | ) | - | |||||||||
|
|
|
| |||||||||
Net asset value, end of period | $ | 11.47 | $ | 10.85 | ||||||||
|
|
|
| |||||||||
Total returnC | 8.40 | % | 8.50 | %D | ||||||||
|
|
|
| |||||||||
Ratios and supplemental data: |
| |||||||||||
Net assets, end of period | $ | 3,927,688 | $ | 2,821,409 | ||||||||
Ratios to average net assets: | ||||||||||||
Expenses, before reimbursements | 5.15 | % | 39.68 | %E | ||||||||
Expenses, net of reimbursements | 1.15 | % | 1.15 | %E | ||||||||
Net investment (loss), before expense reimbursements | (1.61 | )% | (37.54 | )%E | ||||||||
Net investment income, net of reimbursements | 2.39 | % | 0.99 | %E | ||||||||
Portfolio turnover rate | 116 | % | 24 | %F | ||||||||
| A | Commencement of operations. |
| B | Net investment income includes a significant dividend payment from Gazprom Neft PJSC, ADR and iShares Core MSCI Emerging Markets ETF amounting to $0.0057. |
| C | Based on net asset value, which does not reflect the sales charge, redemption fee, or contingent deferred sales charge, if applicable. May include adjustments in accordance with U.S. GAAP and as such, the net asset value for reporting purposes and the returns based upon those net asset values may differ from the net asset value and returns for shareholder transactions. |
| D | Not annualized. |
| E | Annualized. |
| F | Portfolio turnover rate is for the period from December 17, 2018 through January 31, 2019 and is not annualized. |
See accompanying notes
35
American Beacon Continuous Capital Emerging Markets FundSM
Financial Highlights
(For a share outstanding throughout the period)
| Y Class | ||||||||||||
| Year Ended January 31, 2020 | December 17, 2018A to January 31, 2019 | |||||||||||
|
| |||||||||||
Net asset value, beginning of period | $ | 10.85 | $ | 10.00 | ||||||||
|
|
|
| |||||||||
Income from investment operations: | ||||||||||||
Net investment income | 0.20 | 0.01 | B | |||||||||
Net gains on investments (both realized and unrealized) | 0.71 | 0.84 | ||||||||||
|
|
|
| |||||||||
Total income from investment operations | 0.91 | 0.85 | ||||||||||
|
|
|
| |||||||||
Less distributions: | ||||||||||||
Dividends from net investment income | (0.27 | ) | - | |||||||||
Distributions from net realized gains | (0.03 | ) | - | |||||||||
|
|
|
| |||||||||
Total distributions | (0.30 | ) | - | |||||||||
|
|
|
| |||||||||
Net asset value, end of period | $ | 11.46 | $ | 10.85 | ||||||||
|
|
|
| |||||||||
Total returnC | 8.31 | % | 8.50 | %D | ||||||||
|
|
|
| |||||||||
Ratios and supplemental data: |
| |||||||||||
Net assets, end of period | $ | 2,773,744 | $ | 314,086 | ||||||||
Ratios to average net assets: | ||||||||||||
Expenses, before reimbursements | 5.31 | % | 44.25 | %E | ||||||||
Expenses, net of reimbursementsF | 1.26 | % | 1.25 | %E | ||||||||
Net investment (loss), before expense reimbursements | (1.79 | )% | (41.28 | )%E | ||||||||
Net investment income, net of reimbursements | 2.26 | % | 1.72 | %E | ||||||||
Portfolio turnover rate | 116 | % | 24 | %G | ||||||||
| A | Commencement of operations. |
| B | Net investment income includes a significant dividend payment from Gazprom Neft PJSC, ADR and iShares Core MSCI Emerging Markets ETF amounting to $0.0031. |
| C | Based on net asset value, which does not reflect the sales charge, redemption fee, or contingent deferred sales charge, if applicable. May include adjustments in accordance with U.S. GAAP and as such, the net asset value for reporting purposes and the returns based upon those net asset values may differ from the net asset value and returns for shareholder transactions. |
| D | Not annualized. |
| E | Annualized. |
| F | Expense ratios may exceed stated expense caps in Note 2 due to security lending expenses, which are not reimbursable under the agreement with the Manager. |
| G | Portfolio turnover rate is for the period from December 17, 2018 through January 31, 2019 and is not annualized. |
See accompanying notes
36
American Beacon Continuous Capital Emerging Markets FundSM
Financial Highlights
(For a share outstanding throughout the period)
| Investor Class | ||||||||||||
| Year Ended January 31, 2020 | December 17, 2018A to January 31, 2019 | |||||||||||
|
| |||||||||||
Net asset value, beginning of period | $ | 10.84 | $ | 10.00 | ||||||||
|
|
|
| |||||||||
Income from investment operations: | ||||||||||||
Net investment income | 0.21 | 0.01 | B | |||||||||
Net gains on investments (both realized and unrealized) | 0.67 | 0.83 | ||||||||||
|
|
|
| |||||||||
Total income from investment operations | 0.88 | 0.84 | ||||||||||
|
|
|
| |||||||||
Less distributions: | ||||||||||||
Dividends from net investment income | (0.27 | ) | - | |||||||||
Distributions from net realized gains | (0.03 | ) | - | |||||||||
|
|
|
| |||||||||
Total distributions | (0.30 | ) | - | |||||||||
|
|
|
| |||||||||
Net asset value, end of period | $ | 11.42 | $ | 10.84 | ||||||||
|
|
|
| |||||||||
Total returnC | 8.04 | % | 8.40 | %D | ||||||||
|
|
|
| |||||||||
Ratios and supplemental data: |
| |||||||||||
Net assets, end of period | $ | 194,909 | $ | 117,051 | ||||||||
Ratios to average net assets: | ||||||||||||
Expenses, before reimbursements | 7.25 | % | 39.63 | %E | ||||||||
Expenses, net of reimbursements | 1.53 | % | 1.53 | %E | ||||||||
Net investment (loss), before expense reimbursements | (3.99 | )% | (37.17 | )%E | ||||||||
Net investment income, net of reimbursements | 1.73 | % | 0.93 | %E | ||||||||
Portfolio turnover rate | 116 | % | 24 | %F | ||||||||
| A | Commencement of operations. |
| B | Net investment income includes a significant dividend payment from Gazprom Neft PJSC, ADR and iShares Core MSCI Emerging Markets ETF amounting to $0.0010. |
| C | Based on net asset value, which does not reflect the sales charge, redemption fee, or contingent deferred sales charge, if applicable. May include adjustments in accordance with U.S. GAAP and as such, the net asset value for reporting purposes and the returns based upon those net asset values may differ from the net asset value and returns for shareholder transactions. |
| D | Not annualized. |
| E | Annualized. |
| F | Portfolio turnover rate is for the period from December 17, 2018 through January 31, 2019 and is not annualized. |
See accompanying notes
37
American Beacon Continuous Capital Emerging Markets FundSM
January 31, 2020 (Unaudited)
Certain tax information regarding the Fund is required to be provided to shareholders based upon the Fund’s income and distributions for the taxable year ended January 31, 2020. The information and distributions reported herein may differ from information and distributions taxable to the shareholders for the calendar year ended December 31, 2019.
The Fund designated the following items with regard to distributions paid during the fiscal year ended January 31, 2020. All designations are based on financial information available as of this annual report and, accordingly, are subject to change. For each item, it is the intention of the Fund to designate the maximum amount permitted under the Internal Revenue Code of 1986, as amended, and the regulations there under.
Corporate Dividends-Received Deduction:
Continuous Capital Emerging Markets | 0.13 | % |
Qualified Dividend Income:
Continuous Capital Emerging Markets | 74.30 | % |
Long-Term Capital Gain Distributions:
Continuous Capital Emerging Markets | $ | - |
Short-Term Capital Gain Distributions:
Continuous Capital Emerging Markets | $ | 13,092 |
Shareholders will receive notification in January 2020 of the applicable tax information necessary to prepare their 2019 income tax returns.
38
Trustees and Officers of the American Beacon FundsSM(Unaudited)
The Trustees and officers of the American Beacon Funds (the “Trust”) are listed below, together with their principal occupations during the past five years. The address of each person listed below is 220 Las Colinas Boulevard East, Suite 1200, Irving, Texas 75039. Each Trustee overseesthirty-six funds in the fund complex that includes the Trust, the American Beacon Select Funds, the American Beacon Institutional Funds Trust, the American Beacon Sound Point Enhanced Income Fund, and the American Beacon Apollo Total Return Fund.. The Trust’s Statement of Additional Information contains additional information about the Trustees and is available without charge by calling1-800-658-5811.
Name, Age | Position, Term of Office and Length of Time Served with the Trust | Principal Occupation(s) During Past 5 Years and Current Directorships | ||
| NON-INTERESTED TRUSTEES | Term | |||
Lifetime of Trust until removal, resignation or retirement* | ||||
| Gilbert G. Alvarado (50) | Trustee since 2015 | President, SJVIIF, LLC, Impact Investment Fund (2018-Present); Director, Kura MD, Inc. (local telehealth organization) (2015-2017); Senior Vice President & CFO, Sierra Health Foundation (health conversion private foundation) (2006-Present); Senior Vice President & CFO, Sierra Health Foundation: Center for Health Program Management (California public benefit corporation) (2012-Present); Director, Innovative North State (2012-2015); Director, Sacramento Regional Technology Alliance (2011-2016); Director, Valley Healthcare Staffing (2017-2018); Trustee, American Beacon Select Funds (2015-Present); Trustee, American Beacon Institutional Funds Trust (2017-Present); Trustee, American Beacon Sound Point Enhanced Income Fund(2018-Present); Trustee, American Beacon Apollo Total Return Fund (2018-Present). | ||
| Joseph B. Armes (57) | Trustee since 2015 | Director, Switchback Energy Acquisition (2019-Present); Chairman & CEO, CSW Industrials f/k/a Capital Southwest Corporation (investment company) (2015-Present); Chairman of the Board of Capital Southwest Corporation, predecessor to CSW Industrials, Inc. (2014-2017) (investment company); CEO, Capital Southwest Corporation(2013-2015); President & CEO, JBA Investment Partners (family investment vehicle) (2010-Present); Director and Chair of Audit Committee, RSP Permian (oil and gas producer) (2013-2018); Trustee, American Beacon Select Funds(2015-Present); Trustee, American Beacon Institutional Funds Trust (2017-Present); Trustee, American Beacon Sound Point Enhanced Income Fund (2018-Present); Trustee, American Beacon Apollo Total Return Fund (2018-Present). | ||
| Gerard J. Arpey (61) | Trustee since 2012 | Director, The Home Depot, Inc. (2015-Present); Partner, Emerald Creek Group (private equity firm) (2011-Present); Director, S.C. Johnson & Son, Inc. (privately held company) (2008-present); Trustee, American Beacon Select Funds (2012-Present); Trustee, American Beacon Institutional Funds Trust (2017-Present); Trustee, American Beacon Sound Point Enhanced Income Fund (2018-Present); Trustee, American Beacon Apollo Total Return Fund (2018-Present). | ||
| Brenda A. Cline (59) | Trustee since 2004 Chair since 2019 Vice Chair 2018 | Chief Financial Officer, Treasurer and Secretary, Kimbell Art Foundation (1993-Present); Director, Tyler Technologies, Inc. (public sector software solutions company) (2014-Present); Director, Range Resources Corporation (oil and natural gas company) (2015-Present); Trustee, CushingClosed-End andOpen-End Funds (2017-Present); Trustee, American Beacon Select Funds (2004-Present); ; Trustee, American Beacon Institutional Funds Trust (2017-Present); Trustee, American Beacon Sound Point Enhanced Income Fund (2018-Present); Trustee, American Beacon Apollo Total Return Fund (2018-Present). | ||
39
Trustees and Officers of the American Beacon FundsSM(Unaudited)
Name, Age | Position, Term of Office and Length of Time Served with the Trust | Principal Occupation(s) During Past 5 Years and Current Directorships | ||
| NON-INTERESTED TRUSTEES (CONT.) | Term | |||
Lifetime of Trust until removal, resignation or retirement* | ||||
| Eugene J. Duffy (65) | Trustee since 2008 | Managing Director, Global Investment Management Distribution, Mesirow Financial (2016-Present); Managing Director, Institutional Services, Intercontinental Real Estate Corporation (2014-Present); Trustee, American Beacon Select Funds (2008-Present); Trustee, American Beacon Institutional Funds Trust (2017-Present); Trustee, American Beacon Sound Point Enhanced Income Fund (2018-Present); Trustee, American Beacon Apollo Total Return Fund (2018-Present). | ||
| Claudia A. Holz (62) | Trustee since 2018 | Partner, KPMG LLP (1990-2017); Trustee, American Beacon Select Funds (2018-Present); Trustee, American Beacon Institutional Funds Trust (2018-Present); Trustee, American Beacon Sound Point Enhanced Income Fund (2018-Present); Trustee, American Beacon Apollo Total Return Fund (2018-Present). | ||
| Douglas A. Lindgren (58) | Trustee since 2018 | CEO North America, Carne Global Financial Services (2016-2017); Consultant, Carne Financial Services (2017-2019); Managing Director, IPS Investment Management and Global Head, Content Management, UBS Wealth Management (2010-2016); Trustee, American Beacon Select Funds (2018-Present); Trustee, American Beacon Institutional Funds Trust (2018-Present); Trustee, American Beacon Sound Point Enhanced Income Fund (2018-Present); Trustee, American Beacon Apollo Total Return Fund (2018-Present). | ||
| Barbara J. McKenna, CFA (56) | Trustee since 2012 | President/Managing Principal, Longfellow Investment Management Company (2005-Present); Trustee, American Beacon Select Funds(2012-Present); Trustee, American Beacon Institutional Funds Trust (2017-Present); Trustee, American Beacon Sound Point Enhanced Income Fund (2018-Present); Trustee, American Beacon Apollo Total Return Fund (2018-Present. | ||
| R. Gerald Turner (74) | Trustee since 2001 | President, Southern Methodist University (1995-Present); Director, J.C. Penney Company, Inc. (1996-2019); Director, Kronus Worldwide Inc. (chemical manufacturing) (2003-Present); Trustee, American Beacon Select Funds (2001-Present); Trustee, American Beacon Institutional Funds Trust (2017-Present); Trustee, American Beacon Sound Point Enhanced Income Fund (2018-Present); Trustee, American Beacon Apollo Total Return Fund (2018-Present). | ||
40
Trustees and Officers of the American Beacon FundsSM(Unaudited)
Name, Age | Position, Term of Office and Length of Time Served with the Trust | Principal Occupation(s) During Past 5 Years and Current Directorships | ||
| OFFICERS | Term | |||
| One Year | ||||
| Gene L. Needles, Jr. (65) | President since 2009 | President (2009-2018), CEO and Director (2009-Present), and Chairman (2018-Present), American Beacon Advisors, Inc., President (2015-2018), Director and CEO (2015-Present), and Chairman (2018-Present), Resolute Investment Holdings, LLC; President (2015-2018), Director and CEO (2015-Present), and Chairman (2018-Present), Resolute Topco, Inc.; President (2015-2018); Director, and CEO (2015-Present), and Chairman (2018-Present), Resolute Acquisition, Inc.; President (2015-2018), Director and CEO (2015-Present), Chairman (2018-Present), Resolute Investment Managers, Inc.; Director, Chairman, President and CEO, Resolute Investment Distributors (2017-Present); Director, Chairman, President and CEO; Resolute Investment Services, Inc. (2017-Present); President and CEO, Lighthouse Holdings Parent, Inc. (2009-2015); President, CEO and Director, Lighthouse Holdings, Inc. (2009-2015); Manager, President and CEO, American Private Equity Management, LLC (2012-Present); Director, Chairman, President and CEO, Alpha Quant Advisors, LLC (2016-Present); Director, ARK Investment Management LLC (2016-Present); Director, Shapiro Capital Management LLC (2017-Present); Director, Chairman and CEO, Continuous Capital, LLC (2018-Present); Director, Green Harvest Asset Management (2019-Present); Director, National Investment Services of America, LLC (2019-Present); President, American Beacon Cayman Managed Futures Strategy Fund, Ltd. (2014-Present); Director and President, American Beacon Cayman Transformational Innovation Company, LTD., (2017-2018); President, American Beacon Delaware Transformational Innovation Corporation (2017-2018); President American Beacon Cayman TargetRisk Company, Ltd. (2018-Present); Member, Investment Advisory Committee, Employees Retirement System of Texas (2017-Present); Trustee, American Beacon NextShares Trust (2015-Present); President, American Beacon Select Funds (2009-Present); President, American Beacon Institutional Funds Trust (2017-Present); President, American Beacon Sound Point Enhanced Income Fund (2018-Present); President, American Beacon Apollo Total Return Fund (2018-Present); Director, RSW Investments Holdings LLC, (2019-Present); Manager, SSI Investment Management, LLC (2019-Present). | ||
| Rosemary K. Behan (60) | VP, Secretary and Chief Legal Officer since 2006 | Vice President, Secretary and General Counsel, American Beacon Advisors, Inc. (2006-Present); Secretary, Resolute Investment Holdings, LLC (2015-Present); Secretary, Resolute Topco, Inc. (2015-Present); Secretary, Resolute Acquisition, Inc. (2015-Present); Vice President, Secretary and General Counsel, Resolute Investment Managers, Inc. (2015-Present); Secretary, Resolute Investment Distributors, Inc. (2017-Present); Vice President, Secretary and General Counsel, Resolute Investment Services, Inc. (2017-Present); Vice President and Secretary, Lighthouse Holdings Parent, Inc. (2008-2015); Vice President and Secretary, Lighthouse Holdings, Inc. (2008-2015); Secretary, American Private Equity Management, LLC (2008-Present); Secretary and General Counsel, Alpha Quant Advisors, LLC (2016-Present); Vice President and Secretary, Continuous Capital, LLC (2018-Present); Secretary, Green Harvest Asset Management (2019-Present); Secretary, American Beacon Delaware Transformational Innovation Corporation (2017-2018); Secretary, American Beacon Cayman Transformational Innovation Company, Ltd. (2017-2018); Secretary, American Beacon Cayman Managed Futures Strategy Fund, Ltd. (2014-Present); Secretary, American Beacon Cayman TargetRisk Company, Ltd (2018-Present); Chief Legal Officer, Vice President and Secretary, American Beacon Select Funds (2006-Present); Chief Legal Officer, Vice President and Secretary, American Beacon Institutional Funds Trust (2017-Present); Chief Legal Officer, Vice President and Secretary, American Beacon Sound Point Enhanced Income Fund (2018-Present); Chief Legal Officer, Vice President and Secretary American Beacon Apollo Total Return Fund (2018-Present). | ||
41
Trustees and Officers of the American Beacon FundsSM(Unaudited)
Name, Age | Position, Term of Office and Length of Time Served with the Trust | Principal Occupation(s) During Past 5 Years and Current Directorships | ||
| OFFICERS (CONT.) | Term | |||
| One Year | ||||
| Brian E. Brett (59) | VP since 2004 | Senior Vice President, Head of Distribution (2012-Present), Vice President, Director of Sales (2004-2012), American Beacon Advisors, Inc.; Senior Vice President, Resolute Investment Managers, Inc. (2017-Present); Senior Vice President, Resolute Investment Distributors, Inc. (2018-Present), Senior Vice President, Resolute Investment Services, Inc. (2018-Present); Senior Vice President, Lighthouse Holdings Parent, Inc. (2008-2015); Senior Vice President, Lighthouse Holdings, Inc. (2008-2015); Vice President, American Beacon Select Funds (2004-Present); Vice President, American Beacon Institutional Funds Trust (2017-Present); Vice President American Beacon Sound Point Enhanced Income Fund (2018-Present); Vice President American Beacon Apollo Total Return Fund (2018-Present). | ||
| Paul B. Cavazos (50) | VP since 2016 | Chief Investment Officer and Senior Vice President, American Beacon Advisors, Inc. (2016-Present); Chief Investment Officer, DTE Energy (2007-2016); Vice President, American Private Equity Management, L.L.C. (2017-Present); Vice President, American Beacon Select Funds (2016-Present); Vice President, American Beacon Institutional Funds Trust (2017-Present); Vice President American Beacon Sound Point Enhanced Income Fund (2018-Present); Vice President American Beacon Apollo Total Return Fund (2018-Present). | ||
| Erica Duncan (49) | VP Since 2011 | Vice President, American Beacon Advisors, Inc. (2011-Present); Vice President, Resolute Investment Managers (2018-Present); Vice President, Resolute Investment Services, Inc. (2018-Present); Vice President, American Beacon Select Funds (2011-Present); Vice President, American Beacon Institutional Funds Trust (2017-Present); Vice President American Beacon Sound Point Enhanced Income Fund (2018-Present); Vice President American Beacon Apollo Total Return Fund (2018-Present). | ||
| Melinda G. Heika (58) | Principal Accounting Officer since 2017 and Treasurer since 2010 | Treasurer and CFO (2010-Present), American Beacon Advisors, Inc.; Treasurer, Resolute Topco, Inc. (2015-Present); Treasurer, Resolute Investment Holdings, LLC. (2015-Present); Treasurer, Resolute Acquisition, Inc. (2015-Present); Treasurer and CFO, Resolute Investment Managers, Inc. (2017-Present); Treasurer, Resolute Investment Distributors, Inc. (2017-2017); Treasurer and CFO, Resolute Investment Services, Inc. (2015-Present); Treasurer, Lighthouse Holdings Parent Inc., (2010-2015); Treasurer, Lighthouse Holdings, Inc. (2010-2015); Treasurer, American Private Equity Management, LLC (2012-Present); Treasurer and CFO, Alpha Quant Advisors, LLC (2016-Present); Treasurer and CFO, Continuous Capital, LLC (2018-Present); Treasurer, Green Harvest Asset Management (2019-Present); Treasurer, American Beacon Cayman Transformational Innovation, Ltd. (2017-2018); Treasurer, American Beacon Delaware Transformational Innovation Corporation (2017-2018); Director and Treasurer, American Beacon Cayman Managed Futures Strategy Fund, Ltd. (2014-Present); Treasurer, American Beacon Cayman TargetRisk Company, Ltd. (2018-Present); Treasurer, American Beacon Select Funds (2010-Present); Treasurer, American Beacon Institutional Funds Trust (2017-Present); Treasurer, American Beacon Sound Point Enhanced Income Fund (2018-Present); Treasurer, American Beacon Apollo Total Return Fund (2018-Present). | ||
| Terri L. McKinney (56) | VP since 2010 | Vice President (2009-Present), Managing Director (2003-2009), American Beacon Advisors, Inc.; Vice President, Resolute Investment Managers, Inc. (2017-Present); Vice President, Resolute Investment Services, Inc (2018-Present); Vice President, Alpha Quant Advisors, LLC (2016-Present); Vice President, Continuous Capital, LLC (2018-Present); Vice President, American Beacon Select Funds (2010-Present); Vice President, American Beacon Institutional Funds Trust (2017-Present); Vice President, American Beacon Sound Point Enhanced Income Fund (2018-Present); Vice President, American Beacon Apollo Total Return Fund (2018-Present). | ||
42
Trustees and Officers of the American Beacon FundsSM(Unaudited)
Name, Age | Position, Term of Office and Length of Time Served with the Trust | Principal Occupation(s) During Past 5 Years and Current Directorships | ||
| OFFICERS (CONT.) | Term | |||
| One Year | ||||
| Jeffrey K. Ringdahl (44) | VP since 2010 | Director (2015-Present), President (2018-Present), Chief Operating Officer (2010-Present), Senior Vice President (2013-2018), Vice President (2010-2013), American Beacon Advisors, Inc.; Director (2015-Present), President (2018-Present), Senior Vice Present (2015-2018), Resolute Investment Holdings, LLC; Director (2015-Present), President (2018-Present), Senior Vice President (2015-2018), Resolute Topco, Inc.; Director (2015-Present), President (2018-Present), Senior Vice President (2015-2018), Resolute Acquisition, Inc.; Director (2015-Present), President & COO (2018-Present), Senior Vice President (2015-2018), Resolute Investment Managers, Inc.; Director and Executive Vice President (2017-Present), Resolute Investment Distributors, Inc.; Director (2017-Present), President & COO (2018-Present), Executive Vice President (2017-2018), Resolute Investment Services, Inc.; Senior Vice President (2017-Present), Vice President (2012-2017), Manager (2015-Present), American Private Equity Management, LLC; Senior Vice President, Lighthouse Holdings Parent, Inc. (2013-2015); Senior Vice President, Lighthouse Holdings, Inc. (2013-2015); Trustee, American Beacon NextShares Trust (2015-Present); Director, Executive Vice President & COO, Alpha Quant Advisors, LLC (2016-Present); Director, Shapiro Capital Management, LLC (2017-Present); Director, Executive Vice President & COO, Continuous Capital, LLC (2018-Present); Director, RSW Investments Holdings LLC, (2019-Present); Manager, SSI Investment Management, LLC (2019-Present); Director, National Investment Services of America, LLC (2019-Present); Director and Vice President, American Beacon Cayman Transformational Innovation Company, Ltd., (2017-Present); Vice President, American Beacon Delaware Transformational Innovation Corporation (2017-2018); Director and Vice President, American Beacon Cayman Managed Futures Strategy Fund, Ltd. (2014-Present); Vice President, American Beacon Cayman TargetRisk Company, Ltd (2018-Present); Vice President, American Beacon Select Funds (2010-2018); Vice President, American Beacon Institutional Funds Trust (2017-Present); Vice President, American Beacon Sound Point Enhanced Income Fund(2018-Present); Vice President, American Beacon Apollo Total Return Fund(2018-Present). | ||
| Samuel J. Silver (56) | VP Since 2011 | Vice President (2011-Present), Chief Fixed Income Officer (2016-Present), American Beacon Advisors, Inc. (2011-Present); Vice President, American Beacon Select Funds (2011-Present); Vice President, American Beacon Institutional Funds Trust (2017-Present); Vice President, American Beacon Sound Point Enhanced Income Fund (2018-Present); Vice President, American Beacon Apollo Total Return Fund (2018-Present). | ||
| Christina E. Sears (48) | Chief Compliance Officer since 2004 and Asst. Secretary since 1999 | Vice President, American Beacon Advisors, Inc. (2019-Present); Chief Compliance Officer, American Beacon Advisors, Inc. (2004-Present); Vice President, Resolute Investment Managers, Inc. (2017-Present); Vice President, Resolute Investment Distributors (2017-Present); Vice President, Resolute Investment Services, Inc. (2019-Present); Chief Compliance Officer, American Private Equity Management, LLC (2012-Present); Chief Compliance Officer (2016-2019) and Vice President, Alpha Quant Advisors, LLC (2016-Present); Vice President, Continuous Capital, LLC (2018-Present); Chief Compliance Officer (2004-Present) and Assistant Secretary (1999-Present), American Beacon Select Funds; Chief Compliance Officer and Assistant Secretary, American Beacon Institutional Funds Trust (2017-Present); Chief Compliance Officer and Assistant Secretary, American Beacon Sound Point Enhanced Income Fund (2018-Present); Chief Compliance Officer and Assistant Secretary, American Beacon Apollo Total Return Fund (2018-Present). | ||
43
Trustees and Officers of the American Beacon FundsSM(Unaudited)
Name, Age | Position, Term of Office and Length of Time Served with the Trust | Principal Occupation(s) During Past 5 Years and Current Directorships | ||
| OFFICERS (CONT.) | Term | |||
| One Year | ||||
| Sonia L. Bates (63) | Asst. Treasurer since 2011 | Assistant Treasurer, American Beacon Advisors, Inc. (2011-2018); Assistant Treasurer, Lighthouse Holdings Parent Inc. (2011-2015); Assistant Treasurer, Lighthouse Holdings, Inc. (2011-2015); Assistant Treasurer, American Private Equity Management, LLC (2012-Present); Assistant Treasurer, American Beacon Cayman Transformational Innovation Company, Ltd. (2017-Present); Assistant Treasurer, American Beacon Cayman TargetRisk Company, Ltd. (2018-Present); Assistant Treasurer, American Beacon Select Funds (2011-Present); Assistant Treasurer, American Beacon Institutional Funds Trust (2017-Present); Assistant Treasurer, American Beacon Sound Point Enhanced Income Fund (2018-Present); Assistant Treasurer, American Beacon Apollo Total Return Fund (2018-Present). | ||
| Shelley D. Abrahams (45) | Assistant Secretary since 2008 | Assistant Secretary, American Beacon Select Funds (2008-Present); Assistant Secretary, American Beacon Institutional Funds Trust (2017-Present); Assistant Secretary, American Beacon Sound Point Enhanced Income Fund (2018-Present); Assistant Secretary, American Beacon Apollo Total Return Fund (2018-Present); | ||
| Rebecca L. Harris (53) | Assistant Secretary since 2010 | Vice President, American Beacon Advisors, Inc. (2011-Present); Vice President, Resolute Investment Managers, Inc. (2017-Present); Vice President, Resolute Investment Services (2015-Present); Vice President, Alpha Quant Advisors, LLC (2016-Present); Vice President, Continuous Capital, LLC (2018-Present); Assistant Secretary, American Beacon Select Funds (2010-Present); Assistant Secretary, American Beacon Institutional Funds Trust (2017-Present); Assistant Secretary, American Beacon Sound Point Enhanced Income Fund (2018-Present); Assistant Secretary, American Beacon Apollo Total Return Fund (2018-Present). | ||
| Teresa A. Oxford (61) | Assistant Secretary since 2015 | Assistant Secretary, American Beacon Advisors, Inc. (2015-Present); Assistant Secretary, Resolute Investment Distributors (2018-Present); Assistant Secretary, Resolute Investment Services (2018-Present); Assistant Secretary, Alpha Quant Advisors, LLC (2016-Present); Assistant Secretary, American Beacon Select Funds (2015-Present); Assistant Secretary, American Beacon Institutional Funds Trust (2017-Present); Assistant Secretary, American Beacon Sound Point Enhanced Income Fund (2018-Present); Assistant Secretary, American Beacon Apollo Total Return Fund (2018-Present); . | ||
| Peter A. Davidson (47)** | Assistant Secretary Since 2020 | Assistant Secretary, American Beacon Select Funds (2020-Present); Assistant Secretary, American Beacon Institutional Funds Trust (2020-Present); Assistant Secretary, American Beacon Sound Point Enhanced Income Fund (2020-Present); Assistant Secretary, American Beacon Apollo Total Return Fund (2020-Present). | ||
* As of 11/12/2014, the Board adopted a retirement plan that requires Trustees to retire no later than the last day of the calendar year in which they reach the age of 75.
** Mr. Davidson was elected at the March 3, 2020 meeting of the Board.
44
American Beacon FundsSM
January 31, 2020 (Unaudited)
The American Beacon Funds recognize and respect the privacy of our shareholders. We are providing this notice to you so you will understand how shareholder information may be collected and used.
We may collect nonpublic personal information about you from one or more of the following sources:
| • | information we receive from you on applications or other forms; |
| • | information about your transactions with us or our service providers; and |
| • | information we receive from third parties. |
We do not disclose any nonpublic personal information about our customers or former customers to anyone, except as permitted by law.
We restrict access to your nonpublic personal information to those employees or service providers who need to know that information to provide products or services to you. To ensure the confidentiality of your nonpublic personal information, we maintain safeguards that comply with federal standards.
45
This page intentionally left blank.
46
This page intentionally left blank.
47
This page intentionally left blank.
48

eDelivery isNOW AVAILABLE - Stop traditional mail delivery and receive your
shareholder reports and summary prospectuson-line. Sign up at
www.americanbeaconfunds.com
If you invest in the Fund through a financial institution, you may be able to receive the Fund’s regulatory mailings, such as the Prospectus, Annual Report and Semi-Annual Report, bye-mail. If you are interested in this option, please go towww.icsdelivery.comand search for your financial institution’s name or contact your financial institution directly.
To obtain more information about the Fund:
 |  | |
| ByE-mail: | On the Internet: | |
| american_beacon.funds@ambeacon.com | Visit our website atwww.americanbeaconfunds.com | |
By Telephone: Call (800)658-5811 |
By Mail: American Beacon Funds P.O. Box 219643 Kansas City, MO 64121-9643 | |
| Availability of Quarterly Portfolio Schedules | Availability of Proxy Voting Policy and Records | |
| In addition to the Schedule of Investments provided in each semi-annual and annual report, the Fund files a complete schedule of its portfolio holdings with the Securities and Exchange Commission (“SEC”) on FormN-PORT as of the end of each fiscal quarters. The Fund’s FormsN-PORT are available on the SEC’s website atwww.sec.gov. The FormsN-PORT may also be reviewed and copied at the SEC’s Public Reference Section, 100 F Street, NE, Washington, D.C. 20549-2736. Information regarding the operation of the SEC’s Public Reference Room may be obtained by calling(800)-SEC-0330. A complete schedule of the American Beacon Continuous Capital Emerging Markets Fund’s portfolio holdings is also available atwww.americanbeaconfunds.com approximately sixty days after the end of each quarter. | A description of the policies and procedures the Fund uses to determine how to vote proxies relating to portfolio securities is available in the Fund’s Statement of Additional Information, is available free of charge on the Fund’s websitewww.americanbeaconfunds.com and by calling1-800-967-9009 or by accessing the SEC’s website atwww.sec.gov. The Fund’s proxy voting record for the most recent year ended June 30 is filed annually with the SEC on FormN-PX. The Fund’s FormsN-PX are available on the SEC’s website atwww.sec.gov. The Fund’s proxy voting record may also be obtained by calling1-800-967-9009. | |


Fund Service Providers:
CUSTODIAN State Street Bank and Trust Company Boston, Massachusetts | TRANSFER AGENT DST Asset Manager Solutions, Inc. Quincy, Massachusetts | INDEPENDENT REGISTERED PUBLIC ACCOUNTING FIRM PricewaterhouseCoopers LLP Boston, Massachusetts | DISTRIBUTOR Resolute Investment Distributors, Inc. Irving, Texas |
This report is prepared for shareholders of the American Beacon Funds and may be distributed to others only if preceded or accompanied by a current Prospectus or Summary Prospectus.
American Beacon Funds and American Beacon Continuous Capital Emerging Markets Fund are service marks of American Beacon Advisors, Inc.
AR 01/20

About American Beacon Advisors
Since 1986, American Beacon Advisors, Inc. has offered a variety of products and investment advisory services to numerous institutional and retail clients, including a variety of mutual funds, corporate cash management, and separate account management.
Our clients include defined benefit plans, defined contribution plans, foundations, endowments, corporations, financial planners, and other institutional investors. With American Beacon Advisors, you can put the experience of a multi-billion dollar asset management firm to work for your company.
CRESCENT SHORT DURATION HIGH INCOME FUND
The Fund’s investments inhigh-yield securities, includingloans, restricted securitiesandfloating rate securitiesare subject to greater levels of credit, interest rate, market and liquidity risks than investment-grade securities. Investing inforeign securitiesmay involve heightened risk due to currency fluctuations and economic and political risks. Please see the prospectus for a complete discussion of the Fund’s risks. There can be no assurances that the investment objectives of this Fund will be met.
Any opinions herein, including forecasts, reflect our judgment as of the end of the reporting period and are subject to change. Each advisor’s strategies and each Fund’s portfolio composition will change depending on economic and market conditions. This report is not a complete analysis of market conditions, and, therefore, should not be relied upon as investment advice. Although economic and market information has been compiled from reliable sources, American Beacon Advisors, Inc. makes no representation as to the completeness or accuracy of the statements contained herein.
American Beacon Funds | January 31, 2020 |
Contents
| 1 | ||||
| 2 | ||||
| 5 | ||||
| 7 | ||||
| 8 | ||||
| 26 | ||||
| 29 | ||||
| 50 | ||||
| 53 | ||||
| 54 | ||||
| 60 | ||||
| Back Cover | ||||
 | Dear Shareholders,
During the 12 months of this reporting period, news reports highlighted multiple disruptive headwinds in the global economy; among them the U.S. trade war with China and its toll on the global economy, Brexit, disruptions in the Middle East and protests in Hong Kong. And although the headlines seemed to be just starting during the period addressed in this report, it’s now undeniable that the global spread of the COVID-19 virus is having an overwhelming effect on the world’s markets, the full impact of which is unknown at this time.
As Peter L. Bernstein said in his treatise on risk,Against the Gods: The Remarkable Story of Risk, published by John Wiley & Sons, Inc. in September 1998, “Volatility is a proxy for uncertainty and must be accommodated in measuring investment risk.”
During times of economic uncertainty and market volatility, fear of loss can be a powerful emotion – one that drives many investors to making short-term decisions subject to a variety of potential error-leading biases. Unfortunately, some short-term investment decisions may create more volatility rather than mitigate it. |
Instead of dwelling on the markets’ short-term reaction to waves of negative global news, we encourage investors to focus on the horizon instead. Long-term investing isn’t about identifying and anticipating the next big market move, it is about identifying the right investment products for riding out those moves. As a long-term investor, you should keep in mind the three Ds:direction,disciplineanddiversification.
| u | Direction: Achieving your long-term financial goals requires an individualized plan of action. You may want your plan to provide some measure of protection against periods of geopolitical turmoil, economic uncertainty, market volatility and job insecurity. Your plan should be reviewed annually and be adjusted in the event your long-range needs change. |
| u | Discipline:Long-term, systematic participation in an investment portfolio requires your resolution to stay the course. Spending time in the market – rather than trying to time the market – may place you in a better position to reach your long-term financial goals. |
| u | Diversification: By investing in different investment styles and asset classes, you may be able to help mitigate financial risks across your investment portfolio. By allocating your investment portfolio according to your risk-tolerance level, you may be better positioned to weather storms and achieve your long-term financial goals. |
Since 1986, American Beacon has endeavored to provide investors with a disciplined approach to realizing long-term financial goals.As a manager of managers, we strive to provide investment products that may enable investors to participate during market upswings while potentially insulating against market downswings.
Many of thesub-advisors to our mutual funds pursue upside capture and/or downside protection using proprietary strategies. The investment teams behind our mutual funds seek to produce consistent, long-term results rather than focus only on short-term movements in the markets. In managing our investment products, we emphasize identifying opportunities that offer the potential for long-term rewards.
Our management approach is more than a concept; it’s the cornerstone of our culture. And we strive to apply it at every turn as we seek to provide a well-diversified line of investment solutions to help our shareholders seek long-term rewards while mitigating volatility and risk.
Thank you for your continued interest in American Beacon. For additional information about our investment products or to access your account information, please visit our website atwww.americanbeaconfunds.com.
Best Regards,

Gene L. Needles, Jr.
President
American Beacon Funds
1
High Yield Bond Market Overview
January 31, 2020 (Unaudited)
The High Yield and Bank Loan segments of the bond market produced strong results during the12-month period ended January 31, 2020. High-yield bonds (as represented by the ICE BofA U.S. High Yield Index) returned 9.4% and bank loans (as represented by the S&P LSTA Leveraged Loan Total Return Index) returned 6.5%.
The period began on the heels of a steep market selloff in late 2018, sending investors to the sidelines. The Federal Reserve Bank quickly signaled an end to interest rate hikes and eventually cut interest rates in July 2019. The market recovery, beginning in the final days of 2018, continued throughmid-2019 and recouped almost all of the losses.
As markets calmed, U.S. President Donald Trump turned his attention to trade relations with China, among other countries, and put markets on a roller coaster through the fall of 2019. Trade negotiations oscillated between hot and cold, and markets ebbed and flowed in unison. Additionally, chronic uncertainty surrounding Brexit led to volatility as prospects of a disruptive exit concerned global trading partners. With the president’sre-election campaign in sight, the U.S. and China negotiated “phase one” of a larger trade deal in late 2019, giving investors confidence to push U.S. equity markets toall-time highs and bond yields to historic lows.
While the market for risk assets was strong overall, the Bank Loan segment experienced pockets of weakness due to technicalities within collateralized loan obligations. The lowest-rated bank loans underperformed as investors sold and moved into higher-rated issues. The High Yield segment enjoyed spread tightening and declining yields, while floating-rate bank loans were hurt by wider spreads and lower coupons. Thus, the High Yield segment outperformed the Bank Loan segment by more than 3% for the12-month period.
By the end of the period, the Bank Loan segment began to improve and the outlook was generally positive. However, news headlines about China’sCOVID-19 virus epidemic quickly seized investor attention. To help contain its spread, the Chinese New Year holiday was extended, markets were closed and travel within China was severely restricted. International equity markets began to weaken and, just as the period ended on January 31, 2020, the three-month and10-year U.S. Treasury yields inverted amid renewed investor concern.
2
American Beacon Crescent Short Duration High Income FundSM
Performance Overview
January 31, 2020 (Unaudited)
The Investor Class of the American Beacon Crescent Short Duration High Income Fund (the “Fund”) returned 6.64% for theone-year period ended January 31, 2020, underperforming the ICE BofA U.S. High Yield Cash Pay BB-B 1-5 Year Index (the “Index”) return of 7.42%. For additional comparison, the ICE BofA U.S. High Yield Index returned 9.39% and the S&P LSTA Leveraged Loan Total Return Index returned 6.54%.
Comparison of Change in Value of a $10,000 Investment for the period from 10/1/2014 through 1/31/2020
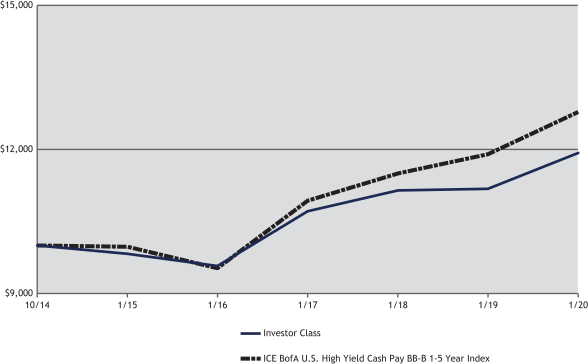
| Total Returns for the Period ended January 31, 2020 |
| |||||||||||||||||||||||||||||||
Ticker | 1 Year | 3 Years | 5 Years | Since Inception | Value of $10,000 10/01/2014- 1/31/2019 | |||||||||||||||||||||||||||
Institutional Class (1,3) | ACHIX | 7.15 | % | 4.03 | % | 4.35 | % | 3.75 | % | $ | 12,167 | |||||||||||||||||||||
Y Class (1,3) | ACHYX | 7.04 | % | 3.93 | % | 4.23 | % | 3.63 | % | $ | 12,094 | |||||||||||||||||||||
Investor Class (1,3) | ACHPX | 6.64 | % | 3.62 | % | 3.95 | % | 3.35 | % | $ | 11,922 | |||||||||||||||||||||
A without Sales Charge (1,3) | ACHAX | 6.71 | % | 3.55 | % | 3.87 | % | 3.28 | % | $ | 11,878 | |||||||||||||||||||||
A with Sales Charge (1,3) | ACHAX | 4.10 | % | 2.67 | % | 3.35 | % | 2.78 | % | $ | 11,577 | |||||||||||||||||||||
C without Sales Charge (1,3) | ACHCX | 5.91 | % | 2.86 | % | 3.15 | % | 2.56 | % | $ | 11,441 | |||||||||||||||||||||
C with Sales Charge (1,3) | ACHCX | 4.91 | % | 2.86 | % | 3.15 | % | 2.56 | % | $ | 11,441 | |||||||||||||||||||||
ICE BofA U.S. High Yield Cash PayBB-B 1-5 Year Index | 7.42 | % | 5.34 | % | 5.08 | % | 4.70 | % | $ | 12,780 | ||||||||||||||||||||||
| 1. | Performance shown is historical and is not indicative of future returns. Investment returns and principal value will vary, and shares may be worth more or less at redemption than at original purchase. Performance shown is calculated based on the published end of day net asset values as of the date indicated and current performance may be lower or higher than the performance data quoted. To obtain performance as of the most recent month end, please visitwww.americanbeaconfunds.com or call1-800-967-9009. Fund performance in the table above does not reflect the deduction of taxes a shareholder would pay on distributions or the redemption of shares. Generally accepted accounting principles require adjustments to be made to the net assets of the Fund at period end for financial reporting purposes only, and as such, the total return based on the unadjusted net asset value per share may differ from the total return reported in the financial highlights. A portion of the fees charged to each Class of the Fund has been waived since Fund inception. Performance prior to waiving fees was lower than the actual returns shown since inception. A Class shares have a maximum sales charge of 2.50%. The maximum contingent deferred sales charge for the C Class is 1.00% for shares redeemed within one year of the date of purchase. |
| 2. | The ICE BofA U.S. High Yield Cash PayBB-B1-5 Year Index is an unmanaged index that generally tracks the performance ofBB-B rated U.S. dollar-denominated corporate bonds publicly issued in the U.S. domestic market with maturities of 1 to 5 years. One cannot directly invest in an index. |
| 3. | The Total Annual Fund Operating Expense ratios set forth in the most recent Fund prospectus for the Institutional, Y, Investor, A and C Class shares were 1.09%, 1.15%, 2.32%, 1.40% and 2.18%, respectively. The expense ratios above may vary from the expense ratios presented in other sections of this report that are based on expenses incurred during the period covered by this report. |
3
American Beacon Crescent Short Duration High Income FundSM
Performance Overview
January 31, 2020 (Unaudited)
Fixed-rate securities outperformed floating rate as the Federal Reserve Bank (the “Fed”) cut interest rates for the first time in over 10 years and bond market yields declined. The Fund benefited from its exposure to fixed-rate high-yield; however, its allocation to floating-rate bank loans lagged given their shorter duration. Note that the Fund’s Index includes only fixed-rate securities. On average, the Fund’s duration was approximately 1.9 years during the period, as compared to 2.1 years for the Index.
The Fund’ssub-advisor actively allocates among traditional fixed-rate high-yield, floating-rate bank loan and private debt sectors of the bond market seeking attractive risk-adjusted returns with lower volatility than the market. This flexibility also allows for opportunity to invest in securities outside of the traditional indexes. On average during the period, the Fund held approximately 70% of assets in traditional high-yield bonds, 18% in floating-rate bank loans and 9% in private debt, with the remainder in cash. Overall, the Fund’s holdings were highly diversified with over 400 positions in total.
Given the Fed’s abrupt change in outlook for interest rates in early 2019, the Fund began to modify its approach toward the credit markets by screening for higher quality securities and by monitoring the relative yield between fixed and floating-rate instruments given the potential for even lower rates going forward.
| Top Ten Holdings (% Net Assets) |
| |||||||
| CCO Holdings LLC / CCO Holdings Capital Corp., 5.375%, Due 5/1/2025 | 1.6 | |||||||
| Navient Corp., 6.125%, Due 3/25/2024 | 1.5 | |||||||
| Tenet Healthcare Corp., 6.250%, Due 2/1/2027 | 1.5 | |||||||
| Dell International LLC / EMC Corp., 7.125%, Due 6/15/2024 | 1.0 | |||||||
| DISH DBS Corp., 5.875%, Due 11/15/2024 | 1.0 | |||||||
| Freeport-McMoRan, Inc., 5.000%, Due 9/1/2027 | 1.0 | |||||||
| Sprint Corp., 7.250%, Due 9/15/2021 | 1.0 | |||||||
| Icahn Enterprises LP / Icahn Enterprises Finance Corp., 6.375%, Due 12/15/2025 | 0.9 | |||||||
| Mauser Packaging Solutions Holding Co., 7.250%, Due 4/15/2025 | 0.9 | |||||||
| Springleaf Finance Corp., 7.125%, Due 3/15/2026 | 0.9 | |||||||
| Total Fund Holdings | 440 | |||||||
| Sector Allocation (% Investments) |
| |||||||
| Communications | 22.3 | |||||||
| Consumer,Non-Cyclical | 17.4 | |||||||
| Consumer, Cyclical | 15.4 | |||||||
| Financial | 15.2 | |||||||
| Industrial | 11.4 | |||||||
| Energy | 9.8 | |||||||
| Technology | 3.8 | |||||||
| Basic Materials | 3.2 | |||||||
| Utilities | 1.3 | |||||||
| Diversified | 0.2 | |||||||
4
American Beacon Crescent Short Duration High Income FundSM
January 31, 2019 (Unaudited)
Fund Expense Example
As a shareholder of a Fund, you incur two types of costs: (1) transaction costs, including sales charges (loads) on purchase payments and redemption fees, if applicable, and (2) ongoing costs, including management fees, distribution(12b-1) fees,sub-transfer agent fees, and other Fund expenses. The Examples are intended to help you understand the ongoing cost (in dollars) of investing in the Fund and to compare these costs with the ongoing costs of investing in other mutual funds. The Examples are based on an investment of $1,000 invested at the beginning of the period in each Class and held for the entire period from August 1, 2019 through January 31, 2020.
Actual Expenses
The “Actual” lines of the tables provide information about actual account values and actual expenses. You may use the information on this page, together with the amount you invested, to estimate the expenses that you paid over the period. Simply divide your account value by $1,000 (for example, an $8,600 account value divided by $1,000 = $8.60), then multiply the result by the “Expenses Paid During Period” to estimate the expenses you paid on your account during this period. Shareholders of the Investor and Institutional Classes that invest in the Fund through an IRA or Roth IRA may be subject to a custodial IRA fee of $15 that is typically deducted each December. If your account was subject to a custodial IRA fee during the period, your costs would have been $15 higher.
Hypothetical Example for Comparison Purposes
The “Hypothetical” lines of the tables provide information about hypothetical account values and hypothetical expenses based on the Fund’s actual expense ratio and an assumed 5% per year rate of return before expenses (not the Fund’s actual return). You may compare the ongoing costs of investing in the Fund with other funds by contrasting this 5% hypothetical example and the 5% hypothetical examples that appear in the shareholder reports of the other funds. The hypothetical account values and expenses may not be used to estimate the actual ending account balance or expenses you paid for the period. Shareholders of the Investor and Institutional Classes that invest in the Funds through an IRA or Roth IRA may be subject to a custodial IRA fee of $15 that is typically deducted each December. If your account was subject to a custodial IRA fee during the period, your costs would have been $15 higher.
You should also be aware that the expenses shown in the table highlight only your ongoing costs and do not reflect any transaction costs charged by the Fund, such as sales charges (loads) or redemption fees, as applicable. Similarly, the expense examples for other funds do not reflect any transaction costs charged by those funds, such as sales charges (loads), redemption fees or exchange fees. Therefore, the “Hypothetical” lines of the tables are useful in comparing ongoing costs only and will not help you determine the relative total costs of owning different funds. If you were subject to any transaction costs during the period, your costs would have been higher.
5
American Beacon Crescent Short Duration High Income FundSM
Expense Examples
January 31, 2020 (Unaudited)
| American Beacon Crescent Short Duration High Income Fund |
| ||||||||||||||
| Beginning Account Value 8/1/2019 | Ending Account Value 1/31/2020 | Expenses Paid During Period 8/1/2019-1/31/2020* | |||||||||||||
| Institutional Class | |||||||||||||||
| Actual | $1,000.00 | $1,028.80 | $4.35 | ||||||||||||
| Hypothetical** | $1,000.00 | $1,020.92 | $4.33 | ||||||||||||
| Y Class | |||||||||||||||
| Actual | $1,000.00 | $1,027.20 | $4.85 | ||||||||||||
| Hypothetical** | $1,000.00 | $1,020.42 | $4.84 | ||||||||||||
| Investor Class | |||||||||||||||
| Actual | $1,000.00 | $1,025.70 | $6.28 | ||||||||||||
| Hypothetical** | $1,000.00 | $1,019.01 | $6.26 | ||||||||||||
| A Class | |||||||||||||||
| Actual | $1,000.00 | $1,025.60 | $6.38 | ||||||||||||
| Hypothetical** | $1,000.00 | $1,018.90 | $6.36 | ||||||||||||
| C Class | |||||||||||||||
| Actual | $1,000.00 | $1,022.70 | $10.20 | ||||||||||||
| Hypothetical** | $1,000.00 | $1,015.12 | $10.16 | ||||||||||||
| * | Expenses are equal to the Fund’s annualized expense ratios for thesix-month period of 0.85%, 0.95%, 1.23%, 1.25%, and 2.00% for the Institutional, Y, Investor, A, and C Classes, respectively, multiplied by the average account value over the period, multiplied by the number derived by dividing the number of days in the most recent fiscal half-year (184) by days in the year (365) to reflect the half-year period. |
| ** | 5% return before expenses. |
6
American Beacon FundsSM
Report of Independent Registered Public Accounting Firm
To the Board of Trustees of American Beacon Funds and the Shareholders of American Beacon Crescent Short Duration High Income Fund
Opinion on the Financial Statements
We have audited the accompanying statement of assets and liabilities, including the schedule of investments, of American Beacon Crescent Short Duration High Income Fund (one of the series constituting American Beacon Funds, referred to hereafter as the “Fund”) as of January 31, 2020, the related statement of operations for the year ended January 31, 2020, the statement of changes in net assets for each of the two years in the period ended January 31, 2020, including the related notes, and the financial highlights for each of the five years in the period ended January 31, 2020 (collectively referred to as the “financial statements”). In our opinion, the financial statements present fairly, in all material respects, the financial position of the Fund as of January 31, 2020, the results of its operations for the year then ended, the changes in its net assets for each of the two years in the period ended January 31, 2020 and the financial highlights for each of the five years in the period ended January 31, 2020 in conformity with accounting principles generally accepted in the United States of America.
The financial statements of the Fund as of and for the year ended January 31, 2016 and the financial highlights for each of the periods ended on or prior to January 31, 2016 (not presented herein, other than the financial highlights) were audited by other auditors whose report dated March 31, 2016 expressed an unqualified opinion on those financial statements and financial highlights.
Basis for Opinion
These financial statements are the responsibility of the Fund’s management. Our responsibility is to express an opinion on the Fund’s financial statements based on our audits. We are a public accounting firm registered with the Public Company Accounting Oversight Board (United States) (PCAOB) and are required to be independent with respect to the Fund in accordance with the U.S. federal securities laws and the applicable rules and regulations of the Securities and Exchange Commission and the PCAOB.
We conducted our audits of these financial statements in accordance with the standards of the PCAOB. Those standards require that we plan and perform the audit to obtain reasonable assurance about whether the financial statements are free of material misstatement, whether due to error or fraud.
Our audits included performing procedures to assess the risks of material misstatement of the financial statements, whether due to error or fraud, and performing procedures that respond to those risks. Such procedures included examining, on a test basis, evidence regarding the amounts and disclosures in the financial statements. Our audits also included evaluating the accounting principles used and significant estimates made by management, as well as evaluating the overall presentation of the financial statements. Our procedures included confirmation of securities owned as of January 31, 2020 by correspondence with the custodian, transfer agent, agent banks and brokers; when replies were not received from brokers, we performed other auditing procedures. We believe that our audits provide a reasonable basis for our opinion.
PricewaterhouseCoopers LLP
Dallas, TX
March 30, 2020
We have served as the auditor of one or more investment companies in the American Beacon family of funds since 2016.
7
American Beacon Crescent Short Duration High Income FundSM
January 31, 2020
| Shares | Fair Value | ||||||||||||||
| COMMON STOCKS - 0.01% (Cost $4,615) | |||||||||||||||
| Energy - 0.01% | |||||||||||||||
| Oil, Gas & Consumable Fuels - 0.01% | |||||||||||||||
| Jones Energy, Inc.A | 355 | $ | 4,615 | ||||||||||||
|
| ||||||||||||||
| WARRANTS - 0.00% (Cost $—) | |||||||||||||||
| Energy - 0.00% | |||||||||||||||
| Jones Energy, Inc., 5/17/2024, Strike Price $31.67A | 1,570 | 212 | |||||||||||||
|
| ||||||||||||||
| Principal Amount | |||||||||||||||
| BANK LOAN OBLIGATIONSB - 25.04% | |||||||||||||||
| Basic Materials - 0.82% | |||||||||||||||
| Chemicals - 0.80% | |||||||||||||||
GrafTech Finance, Inc., 5.145%, Due 2/12/2025, 2018 Term Loan B,(1-mo. LIBOR + 3.500%) | $ | 56,886 | 56,531 | ||||||||||||
H.B. Fuller Co., 3.658%, Due 10/20/2024, 2017 Term Loan B,(1-mo. LIBOR + 2.000%) | 88,826 | 88,856 | |||||||||||||
Ineos US Finance LLC, 3.645%, Due 4/1/2024, 2017 USD Term Loan B,(1-mo. LIBOR + 2.000%) | 62,312 | 62,208 | |||||||||||||
Messer Industries GmbH, 4.445%, Due 3/1/2026, 2018 USD Term Loan,(3-mo. LIBOR + 2.500%) | 99,499 | 99,499 | |||||||||||||
Polar US Borrower LLC, | |||||||||||||||
6.624%, Due 10/15/2025, 2018 1st Lien Term Loan,(3-mo. LIBOR + 4.750%) | 24,201 | 24,049 | |||||||||||||
6.695%, Due 10/15/2025, 2018 1st Lien Term Loan,(3-mo. LIBOR + 4.750%) | 489 | 486 | |||||||||||||
PQ Corp., 4.027%, Due 2/8/2025, 2018 Term Loan B,(3-mo. LIBOR + 2.250%) | 78,207 | 78,221 | |||||||||||||
Solenis Holdings LLC, 5.909%, Due 6/26/2025, 2018 1st Lien Term Loan,(3-mo. LIBOR + 4.000%) | 52,364 | 51,955 | |||||||||||||
Starfruit Finco B.V., 4.699%, Due 10/1/2025, 2018 USD Term Loan B,(1-mo. LIBOR + 3.000%) | 101,769 | 101,642 | |||||||||||||
|
| ||||||||||||||
| 563,447 | |||||||||||||||
|
| ||||||||||||||
| Mining - 0.02% | |||||||||||||||
U.S. Silica Co., 5.688%, Due 5/1/2025, 2018 Term Loan B,(1-mo. LIBOR + 4.000%) | 13,000 | 11,440 | |||||||||||||
|
| ||||||||||||||
Total Basic Materials | 574,887 | ||||||||||||||
|
| ||||||||||||||
| Communications - 3.92% | |||||||||||||||
| Advertising - 0.36% | |||||||||||||||
Red Ventures LLC, 4.161%, Due 11/8/2024, 2018 Term Loan B,(1-mo. LIBOR + 2.500%) | 121,301 | 121,215 | |||||||||||||
Terrier Media Buyer, Inc., 6.148%, Due 12/17/2026, Term Loan B,(3-mo. LIBOR + 4.250%) | 100,000 | 100,725 | |||||||||||||
Vestcom Parent Holdings, Inc., 5.646%, Due 12/19/2023, 2016 1st Lien Term Loan,(1-mo. LIBOR + 4.000%) | 32,417 | 30,796 | |||||||||||||
|
| ||||||||||||||
| 252,736 | |||||||||||||||
|
| ||||||||||||||
| Internet - 1.14% | |||||||||||||||
Buzz Merger Sub Ltd, Due 1/22/2027, Term Loan BC | 100,000 | 100,188 | |||||||||||||
CareerBuilder LLC, 8.395%, Due 7/31/2023, Term Loan,(3-mo. LIBOR + 6.750%) | 137,753 | 136,720 | |||||||||||||
Go Daddy Operating Co. LLC, 3.395%, Due 2/15/2024, 2017 Repriced Term Loan,(1-mo. LIBOR + 1.750%) | 92,684 | 92,800 | |||||||||||||
MH Sub I LLC, 5.395%, Due 9/13/2024, 2017 1st Lien Term Loan,(1-mo. LIBOR + 3.750%) | 130,127 | 129,964 | |||||||||||||
PUG LLC, Due 1/29/2027, USD Term LoanC | 100,000 | 99,500 | |||||||||||||
Rentpath, Inc., 6.660%, Due 12/17/2021, 2017 Term Loan,(3-mo. LIBOR + 4.750%) | 56,382 | 27,158 | |||||||||||||
Titan AcquisitionCo New Zealand Ltd., 6.195%, Due 5/1/2026, Term Loan,(3-mo. LIBOR + 4.250%) | 62,753 | 62,888 | |||||||||||||
Web.com Group, Inc., Due 10/10/2025, 2018 Term Loan BC | 60,000 | 59,903 | |||||||||||||
WeddingWire, Inc., 6.145%, Due 12/19/2025, 1st Lien Term Loan,(1-mo. LIBOR + 4.500%) | 99,000 | 99,000 | |||||||||||||
|
| ||||||||||||||
| 808,121 | |||||||||||||||
|
| ||||||||||||||
| Media - 1.46% | |||||||||||||||
Charter Communications Operating LLC, 3.400%, Due 4/30/2025, 2019 Term Loan B1,(1-mo. LIBOR + 1.750%) | 99,492 | 99,943 | |||||||||||||
CSC Holdings LLC, 4.176%, Due 4/15/2027, 2019 Term Loan B5,(3-mo. LIBOR + 2.500%) | 187,248 | 187,658 | |||||||||||||
Diamond Sports Group LLC, 4.910%, Due 8/24/2026, Term Loan,(1-mo. LIBOR + 3.250%) | 136,658 | 136,444 | |||||||||||||
See accompanying notes
8
American Beacon Crescent Short Duration High Income FundSM
Schedule of Investments
January 31, 2020
| Principal Amount | Fair Value | ||||||||||||||
| BANK LOAN OBLIGATIONS - 25.04% (continued) | |||||||||||||||
| Communications - 3.92% (continued) | |||||||||||||||
| Media - 1.46% (continued) | |||||||||||||||
E.W. Scripps Co., 4.145%, Due 5/1/2026, 2019 Term Loan B2,(1-mo. LIBOR + 2.500%) | $ | 62,843 | $ | 63,141 | |||||||||||
Gray Television, Inc., 4.162%, Due 1/2/2026, 2018 Term Loan C,(1-mo. LIBOR + 2.500%) | 84,964 | 85,283 | |||||||||||||
iHeartCommunications, Inc., Due 5/1/2026, 2020 Term LoanC | 28,000 | 28,021 | |||||||||||||
ION Media Networks, Inc., 4.688%, Due 12/18/2024, 2019 Term Loan B,(1-mo. LIBOR + 3.000%) | 96,496 | 96,576 | |||||||||||||
Mission Broadcasting, Inc., 3.905%, Due 1/17/2024, 2018 Term Loan B3,(1-mo. LIBOR + 2.250%) | 13,618 | 13,629 | |||||||||||||
Nexstar Broadcasting, Inc., 3.900%, Due 1/17/2024, 2018 Term Loan B3,(1-mo. LIBOR + 2.250%) | 66,899 | 66,950 | |||||||||||||
Nielsen Finance LLC, 3.699%, Due 10/4/2023, USD Term Loan B4,(1-mo. LIBOR + 2.000%) | 38,035 | 38,053 | |||||||||||||
Sinclair Television Group, Inc., | |||||||||||||||
3.900%, Due 1/3/2024, Term Loan B2,(1-mo. LIBOR + 2.250%) | 15,959 | 15,975 | |||||||||||||
4.180%, Due 9/30/2026, Term Loan B2B,(3-mo. LIBOR + 2.500%) | 70,823 | 71,044 | |||||||||||||
Univision Communications, Inc., 4.395%, Due 3/15/2024, Term Loan C5,(1-mo. LIBOR + 2.750%) | 48,973 | 48,355 | |||||||||||||
Virgin Media Bristol LLC, 4.176%, Due 1/31/2028, USD Term Loan N,(3-mo. LIBOR + 2.500%) | 81,000 | 80,980 | |||||||||||||
|
| ||||||||||||||
| 1,032,052 | |||||||||||||||
|
| ||||||||||||||
| Telecommunications - 0.96% | |||||||||||||||
Altice France S.A., 5.676%, Due 8/14/2026, 2018 Term Loan B13,(1-mo. LIBOR + 4.000%) | 48,876 | 48,785 | |||||||||||||
Avaya, Inc., 5.926%, Due 12/15/2024, 2018 Term Loan B,(1-mo. LIBOR + 4.250%) | 71,129 | 69,544 | |||||||||||||
CenturyLink, Inc., Due 3/15/2027, 2020 Term Loan BC | 86,495 | 86,361 | |||||||||||||
CommScope, Inc., 4.895%, Due 4/6/2026, 2019 Term Loan B,(1-mo. LIBOR + 3.250%) | 99,750 | 99,583 | |||||||||||||
GTT Communications, Inc., 4.400%, Due 5/31/2025, 2018 USD Term Loan B,(1-mo. LIBOR + 2.750%) | 19,000 | 15,955 | |||||||||||||
Intelsat Jackson Holdings S.A., 5.682%, Due 11/27/2023, 2017 Term Loan B3,(6-mo. LIBOR + 3.750%) | 82,000 | 81,642 | |||||||||||||
Plantronics, Inc., 4.145%, Due 7/2/2025, 2018 Term Loan B,(1-mo. LIBOR + 2.500%) | 75,185 | 72,121 | |||||||||||||
SBA Senior Finance LLC, 3.400%, Due 4/11/2025, 2018 Term Loan B,(1-mo. LIBOR + 1.750%) | 99,235 | 99,298 | |||||||||||||
Sprint Communications, Inc., 4.688%, Due 2/2/2024, 2018 Term Loan B,(1-mo. LIBOR + 3.000%) | 91,080 | 89,771 | |||||||||||||
Syniverse Holdings, Inc., 6.873%, Due 3/9/2023, 2018 1st Lien Term Loan,(6-mo. LIBOR + 5.000%) | 17,000 | 15,512 | |||||||||||||
|
| ||||||||||||||
| 678,572 | |||||||||||||||
|
| ||||||||||||||
Total Communications | 2,771,481 | ||||||||||||||
|
| ||||||||||||||
| Consumer, Cyclical - 4.76% | |||||||||||||||
| Apparel - 0.51% | |||||||||||||||
Next Level Apparel, Inc., 7.589%, Due 7/17/2024, 2018 Term Loan, (1 Week LIBOR + 6.000%) | 186,822 | 184,019 | |||||||||||||
SHO Holding Corp., 6.777%, Due 10/27/2022, Term Loan,(3-mo. LIBOR + 5.000%) | 190,643 | 173,485 | |||||||||||||
|
| ||||||||||||||
| 357,504 | |||||||||||||||
|
| ||||||||||||||
| Auto Parts & Equipment - 0.37% | |||||||||||||||
Panther BF Aggregator LP, 5.160%, Due 4/30/2026, USD Term Loan B,(1-mo. LIBOR + 3.500%) | 99,750 | 100,324 | |||||||||||||
Wheel Pros LLC, 6.395%, Due 4/4/2025, 1st Lien Term Loan,(1-mo. LIBOR + 4.750%) | 165,486 | 163,003 | |||||||||||||
|
| ||||||||||||||
| 263,327 | |||||||||||||||
|
| ||||||||||||||
| Distribution/Wholesale - 0.27% | |||||||||||||||
AMCP Clean Acquisition Co. LLC, | |||||||||||||||
6.195%, Due 6/16/2025, 2018 Term Loan,(3-mo. LIBOR + 4.250%) | 21,673 | 21,253 | |||||||||||||
6.195%, Due 6/16/2025, 2018 Term Loan,(3-mo. LIBOR + 4.250%) | 89,573 | 87,838 | |||||||||||||
Univar, Inc., 3.895%, Due 7/1/2024, 2017 USD Term Loan B,(1-mo. LIBOR + 2.250%) | 80,807 | 80,933 | |||||||||||||
|
| ||||||||||||||
| 190,024 | |||||||||||||||
|
| ||||||||||||||
| Entertainment - 1.39% | |||||||||||||||
Crown Finance US, Inc., 3.895%, Due 2/28/2025, 2018 USD Term Loan,(1-mo. LIBOR + 2.250%) | 99,392 | 98,398 | |||||||||||||
See accompanying notes
9
American Beacon Crescent Short Duration High Income FundSM
Schedule of Investments
January 31, 2020
| Principal Amount | Fair Value | ||||||||||||||
| BANK LOAN OBLIGATIONS - 25.04% (continued) | |||||||||||||||
| Consumer, Cyclical - 4.76% (continued) | |||||||||||||||
| Entertainment - 1.39% (continued) | |||||||||||||||
Motion Finco S.a.r.l., | |||||||||||||||
Due 11/4/2026, Delayed Draw Term Loan B2C | $ | 11,616 | $ | 11,721 | |||||||||||
Due 11/13/2026, USD Term Loan B1C | 88,384 | 89,179 | |||||||||||||
NASCAR Holdings, Inc., 4.408%, Due 10/19/2026, Term Loan B,(1-mo. LIBOR + 2.750%) | 113,234 | 113,942 | |||||||||||||
PCI Gaming Authority, 4.145%, Due 5/29/2026, Term Loan,(1-mo. LIBOR + 2.500%) | 92,923 | 93,306 | |||||||||||||
Playtika Holding Corp., 7.645%, Due 12/10/2024, Term Loan B,(1-mo. LIBOR + 6.000%) | 100,000 | 100,946 | |||||||||||||
Scientific Games International, Inc., 4.395%, Due 8/14/2024, 2018 Term Loan B5,(1-mo. LIBOR + 2.750%) | 65,208 | 64,980 | |||||||||||||
Six Flags Theme Parks, Inc., 3.400%, Due 4/17/2026, 2019 Term Loan B,(1-mo. LIBOR + 1.750%) | 99,500 | 99,583 | |||||||||||||
UFC Holdings LLC, 4.900%, Due 4/29/2026, 2019 Term Loan,(1-mo. LIBOR + 3.250%) | 61,190 | 61,333 | |||||||||||||
World Triathlon Corp., 5.895%, Due 8/15/2026, 2019 Term Loan B,(1-mo. LIBOR + 4.250%) | 249,375 | 249,998 | |||||||||||||
|
| ||||||||||||||
| 983,386 | |||||||||||||||
|
| ||||||||||||||
| Home Furnishings - 0.32% | |||||||||||||||
TGP Holdings LLC, | |||||||||||||||
6.027%, Due 9/25/2024, 2018 1st Lien Term Loan,(3-mo. LIBOR + 4.250%) | 191,275 | 180,755 | |||||||||||||
10.277%, Due 9/25/2025, 2nd Lien Term Loan,(3-mo. LIBOR + 8.500%) | 50,000 | 46,000 | |||||||||||||
|
| ||||||||||||||
| 226,755 | |||||||||||||||
|
| ||||||||||||||
| Leisure Time - 0.42% | |||||||||||||||
Playpower, Inc., 7.461%, Due 5/8/2026, 2019 Term Loan,(3-mo. LIBOR + 5.500%) | 240,625 | 239,422 | |||||||||||||
Varsity Brands, Inc., 5.145%, Due 12/15/2024, 2017 Term Loan B,(1-mo. LIBOR + 3.500%) | 61,128 | 59,905 | |||||||||||||
|
| ||||||||||||||
| 299,327 | |||||||||||||||
|
| ||||||||||||||
| Lodging - 0.31% | |||||||||||||||
Boyd Gaming Corp., 3.835%, Due 9/15/2023, Term Loan B3, (1 Week LIBOR + 2.250%) | 71,923 | 72,080 | |||||||||||||
Caesars Resort Collection LLC, 4.395%, Due 12/23/2024, 2017 1st Lien Term Loan B,(1-mo. LIBOR + 2.750%) | 63,388 | 63,323 | |||||||||||||
Golden Nugget, Inc., | |||||||||||||||
Due 10/4/2023, 2020 Term LoanC | 42,000 | 42,000 | |||||||||||||
4.145%, Due 10/4/2023, 2017 Incremental Term Loan B,(1-mo. LIBOR + 2.500%) | 20,756 | 20,784 | |||||||||||||
4.158%, Due 10/4/2023, 2017 Incremental Term Loan B,(1-mo. LIBOR + 2.500%) | 17,625 | 17,649 | |||||||||||||
|
| ||||||||||||||
| 215,836 | |||||||||||||||
|
| ||||||||||||||
| Retail - 1.17% | |||||||||||||||
Academy Ltd., 5.655%, Due 7/1/2022, 2015 Term Loan B,(1-mo. LIBOR + 4.000%) | 26,450 | 21,141 | |||||||||||||
B.C. Unlimited Liablity Co., 3.395%, Due 11/19/2026, Term Loan B4,(1-mo. LIBOR + 1.750%) | 91,459 | 91,299 | |||||||||||||
Bass Pro Group LLC, 6.645%, Due 9/25/2024, Term Loan B,(1-mo. LIBOR + 5.000%) | 51,767 | 51,530 | |||||||||||||
BJ’s Wholesale Club, Inc., 3.899%, Due 2/3/2024, 2017 1st Lien Term Loan,(1-mo. LIBOR + 2.250%) | 67,763 | 68,009 | |||||||||||||
California Pizza Kitchen, Inc. | |||||||||||||||
7.910%, Due 8/23/2022, 2016 Term Loan,(3-mo. LIBOR + 6.000%) | 241,875 | 206,370 | |||||||||||||
11.910%, Due 8/23/2023, 2016 2nd Lien Term Loan,(3-mo. LIBOR + 10.000%) | 42,000 | 33,810 | |||||||||||||
GYP Holdings Corp., 4.395%, Due 6/1/2025, 2018 Term Loan B,(1-mo. LIBOR + 2.750%) | 46,591 | 46,460 | |||||||||||||
IRB Holding Corp., 4.384%, Due 2/5/2025, 1st Lien Term Loan,(1-mo. LIBOR + 2.750%) | 122,813 | 122,982 | |||||||||||||
Michaels Stores, Inc., | |||||||||||||||
4.150%, Due 1/30/2023, 2018 Term Loan B,(1-mo. LIBOR + 2.500%) | 24,162 | 23,292 | |||||||||||||
4.161%, Due 1/30/2023, 2018 Term Loan B,(1-mo. LIBOR + 2.500%) | 8,745 | 8,430 | |||||||||||||
Petco Animal Supplies, Inc., 5.027%, Due 1/26/2023, 2017 Term Loan B,(3-mo. LIBOR + 3.250%) | 20,945 | 17,669 | |||||||||||||
SRS Distribution, Inc., 4.895%, Due 5/23/2025, 2018 1st Lien Term Loan,(1-mo. LIBOR + 3.250%) | 35,750 | 35,504 | |||||||||||||
Staples, Inc., 6.655%, Due 4/16/2026, 7 Year Term Loan,(1-mo. LIBOR + 5.000%) | 78,255 | 76,768 | |||||||||||||
Whatabrands LLC, Due 8/2/2026, 2020 Term Loan BC | 23,000 | 23,042 | |||||||||||||
|
| ||||||||||||||
| 826,306 | |||||||||||||||
|
| ||||||||||||||
Total Consumer, Cyclical | 3,362,465 | ||||||||||||||
|
| ||||||||||||||
See accompanying notes
10
American Beacon Crescent Short Duration High Income FundSM
Schedule of Investments
January 31, 2020
| Principal Amount | Fair Value | ||||||||||||||
| BANK LOAN OBLIGATIONS - 25.04% (continued) | |||||||||||||||
| Consumer,Non-Cyclical - 4.90% | |||||||||||||||
| Biotechnology - 0.02% | |||||||||||||||
Alphabet Holding Co., Inc., 5.145%, Due 9/26/2024, 2017 1st Lien Term Loan,(1-mo. LIBOR + 3.500%) | $ | 15,000 | $ | 14,282 | |||||||||||
|
| ||||||||||||||
| Commercial Services - 1.94% | |||||||||||||||
Boing US Holdco, Inc., 4.934%, Due 10/3/2024, 2017 1st Lien Term Loan,(1-mo. LIBOR + 3.250%) | 33,956 | 33,334 | |||||||||||||
CRCI Longhorn Holdings, Inc., 5.145%, Due 8/8/2025, 2018 1st Lien Term Loan,(1-mo. LIBOR + 3.500%) | 27,668 | 27,392 | |||||||||||||
Creative Artists Agency LLC, 5.395%, Due 11/27/2026, 2019 Term Loan B,(1-mo. LIBOR + 3.750%) | 100,000 | 100,458 | |||||||||||||
Digital Room Holdings, Inc., 6.645%, Due 5/21/2026, Term Loan,(1-mo. LIBOR + 5.000%) | 74,625 | 70,272 | |||||||||||||
Garda World Security Corp., 6.660%, Due 10/30/2026, 2019 1st Lien Term Loan B,(3-mo. LIBOR + 4.750%) | 70,081 | 70,475 | |||||||||||||
Maverick Purchaser Sub LLC, Due 1/22/2027, Term Loan BC | 100,000 | 100,125 | |||||||||||||
NorthRiver Midstream Finance LP, 5.159%, Due 10/1/2025, 2018 Term Loan B,(3-mo. LIBOR + 3.250%) | 98,750 | 98,133 | |||||||||||||
Parexel International Corp., 4.395%, Due 9/27/2024, Term Loan B,(1-mo. LIBOR + 2.750%) | 67,266 | 66,215 | |||||||||||||
Prime Security Services Borrower LLC, 4.912%, Due 9/23/2026, 2019 Term Loan B1,(1-mo. LIBOR + 3.250%) | 103,800 | 103,800 | |||||||||||||
R.R. Donnelley & Sons Co., 6.645%, Due 1/15/2024, 2018 Term Loan B,(1-mo. LIBOR + 5.000%) | 49,376 | 49,761 | |||||||||||||
Rent-A-Center, Inc., 6.250%, Due 7/31/2026, 2019 Term Loan,(1-mo. LIBOR + 4.500%) | 99,750 | 99,501 | |||||||||||||
Sabert Corp., 6.188%, Due 12/10/2026, Term Loan B,(1-mo. LIBOR + 4.500%) | 100,000 | 100,625 | |||||||||||||
Spin Holdco, Inc., 5.093%, Due 11/14/2022, 2017 Term Loan B,(3-mo. LIBOR + 3.250%) | 33,396 | 33,294 | |||||||||||||
TruGreen Ltd. Partnership, 5.395%, Due 3/19/2026, 2019 Term Loan,(1-mo. LIBOR + 3.750%) | 28,570 | 28,642 | |||||||||||||
United Rentals, Inc., 3.395%, Due 10/31/2025, Term Loan B,(1-mo. LIBOR + 1.750%) | 98,750 | 99,138 | |||||||||||||
Verscend Holding Corp., 6.145%, Due 8/27/2025, 2018 Term Loan B,(1-mo. LIBOR + 4.500%) | 100,526 | 100,877 | |||||||||||||
Wand NewCo 3, Inc., 4.645%, Due 2/5/2026, 2019 1st Lien Term Loan,(1-mo. LIBOR + 3.000%) | 99,500 | 99,728 | |||||||||||||
WEX, Inc., 3.895%, Due 5/15/2026, Term Loan B3,(1-mo. LIBOR + 2.250%) | 90,803 | 91,087 | |||||||||||||
|
| ||||||||||||||
| 1,372,857 | |||||||||||||||
|
| ||||||||||||||
| Food - 0.53% | |||||||||||||||
Dhanani Group, Inc., 5.395%, Due 7/20/2025, 2018 Term Loan B,(1-mo. LIBOR + 3.750%) | 44,743 | 44,109 | |||||||||||||
Edward Don & Co. LLC, 5.895%, Due 7/2/2025, 2018 Term Loan,(1-mo. LIBOR + 4.250%) | 146,892 | 144,689 | |||||||||||||
Froneri International PLC, Due 1/29/2027, 2020 USD Term LoanC | 100,000 | 100,250 | |||||||||||||
United Natural Foods, Inc., 5.895%, Due 10/22/2025, Term Loan B,(1-mo. LIBOR + 4.250%) | 99,000 | 88,481 | |||||||||||||
|
| ||||||||||||||
| 377,529 | |||||||||||||||
|
| ||||||||||||||
| Health Care - Products - 0.57% | |||||||||||||||
Agiliti Health, Inc., 4.688%, Due 1/4/2026, Term Loan,(1-mo. LIBOR + 3.000%) | 39,451 | 39,401 | |||||||||||||
Avalign Technologies, Inc., 6.262%, Due 12/22/2025, 2018 Term Loan B,(2-mo. LIBOR + 4.500%) | 181,396 | 176,861 | |||||||||||||
Avantor, Inc., 3.895%, Due 11/21/2024, 2017 1st Lien Term Loan,(1-mo. LIBOR + 2.250%) | 27,262 | 27,410 | |||||||||||||
Sotera Health Holdings LLC, 6.145%, Due 12/11/2026, 2019 Term Loan,(1-mo. LIBOR + 4.500%) | 102,000 | 102,319 | |||||||||||||
Viant Medical Holdings, Inc., 5.695%, Due 7/2/2025, 2018 1st Lien Term Loan,(3-mo. LIBOR + 3.750%) | 57,333 | 56,229 | |||||||||||||
|
| ||||||||||||||
| 402,220 | |||||||||||||||
|
| ||||||||||||||
| Health Care - Services - 1.45% | |||||||||||||||
ADMI Corp., 4.395%, Due 4/30/2025, 2018 Term Loan B,(1-mo. LIBOR + 2.750%) | 71,438 | 71,348 | |||||||||||||
Air Methods Corp., Due 4/22/2024, 2017 Term Loan BC | 14,000 | 12,005 | |||||||||||||
ATI Holdings Acquisition, Inc., 5.145%, Due 5/10/2023, 2016 Term Loan,(1-mo. LIBOR + 3.500%) | 62,548 | 61,981 | |||||||||||||
Da Vinci Purchaser Corp., 5.872%, Due 1/8/2027, 2019 Term Loan,(3-mo. LIBOR + 4.000%) | 100,000 | 100,563 | |||||||||||||
Envision Healthcare Corp., | |||||||||||||||
5.395%, Due 10/10/2025, 2018 1st Lien Term Loan,(1-mo. LIBOR + 3.750%) | 84,515 | 70,881 | |||||||||||||
4.938%, Due 7/2/2025, 2020 Term Loan,(1-mo. LIBOR + 3.250%) | 99,496 | 99,745 | |||||||||||||
See accompanying notes
11
American Beacon Crescent Short Duration High Income FundSM
Schedule of Investments
January 31, 2020
| Principal Amount | Fair Value | ||||||||||||||
| BANK LOAN OBLIGATIONS - 25.04% (continued) | |||||||||||||||
| Consumer,Non-Cyclical - 4.90% (continued) | |||||||||||||||
| Health Care - Services - 1.45% (continued) | |||||||||||||||
National Mentor Holdings, Inc., | |||||||||||||||
5.650%, Due 3/9/2026, 2019 Term Loan B,(1-mo. LIBOR + 4.000%) | $ | 93,446 | $ | 93,746 | |||||||||||
5.650%, Due 3/9/2026, 2019 Term Loan C,(1-mo. LIBOR + 4.000%) | 5,848 | 5,867 | |||||||||||||
NMSC Holdings, Inc., 6.645%, Due 4/19/2023, 1st Lien Term Loan,(1-mo. LIBOR + 5.000%) | 249,354 | 247,484 | |||||||||||||
RegionalCare Hospital Partners Holdings, Inc., 5.395%, Due 11/17/2025, 2018 Term Loan B,(1-mo. LIBOR + 3.750%) | 88,504 | 88,826 | |||||||||||||
Team Health Holdings, Inc., 4.395%, Due 2/6/2024, 1st Lien Term Loan,(1-mo. LIBOR + 2.750%) | 30,000 | 23,925 | |||||||||||||
Universal Health Services, Inc., 3.395%, Due 10/31/2025, Term Loan B,(1-mo. LIBOR + 1.750%) | 49,376 | 49,705 | |||||||||||||
Upstream Rehabilition, Inc., 6.145%, Due 11/20/2026, 2019 Term Loan,(1-mo. LIBOR + 4.500%) | 100,000 | 100,250 | |||||||||||||
|
| ||||||||||||||
| 1,026,326 | |||||||||||||||
|
| ||||||||||||||
| Leisure Time - 0.02% | |||||||||||||||
ClubCorp Holdings, Inc., 4.695%, Due 9/18/2024, 2017 Term Loan B,(3-mo. LIBOR + 2.750%) | 13,000 | 12,318 | |||||||||||||
|
| ||||||||||||||
| Pharmaceuticals - 0.37% | |||||||||||||||
Amneal Pharmaceuticals LLC, 5.188%, Due 5/4/2025, 2018 Term Loan B,(1-mo. LIBOR + 3.500%) | 66,495 | 60,622 | |||||||||||||
Bausch Health Cos., Inc., 4.670%, Due 6/2/2025, 2018 Term Loan B,(1-mo. LIBOR + 3.000%) | 83,387 | 83,679 | |||||||||||||
Endo Luxembourg Finance Co. S.a r.l., 5.938%, Due 4/29/2024, 2017 Term Loan B,(1-mo. LIBOR + 4.250%) | 72,130 | 69,425 | |||||||||||||
Grifols Worldwide Operations USA, Inc., 3.561%, Due 11/15/2027, USD 2019 Term Loan B, (1 Week LIBOR + 2.000%) | 9,461 | 9,505 | |||||||||||||
Mallinckrodt International Finance S.A., 4.695%, Due 9/24/2024, USD Term Loan B,(3-mo. LIBOR + 2.750%) | 34,381 | 28,717 | |||||||||||||
NVA Holdings, Inc., 7.250%, Due 2/2/2025, Term Loan B4,(3-mo. PRIME + 2.500%) | 6,050 | 6,046 | |||||||||||||
|
| ||||||||||||||
| 257,994 | |||||||||||||||
|
| ||||||||||||||
Total Consumer,Non-Cyclical | 3,463,526 | ||||||||||||||
|
| ||||||||||||||
| Diversified - 0.25% | |||||||||||||||
| Holding Companies - Diversified - 0.25% | |||||||||||||||
Quidditch Acquisition, Inc., 8.645%, Due 3/21/2025, 2018 Term Loan B,(1-mo. LIBOR + 7.000%) | 157,822 | 159,400 | |||||||||||||
Travelport Finance S.a.r.l., Due 5/29/2026, 2019 Term LoanC | 19,000 | 17,081 | |||||||||||||
|
| ||||||||||||||
| 176,481 | |||||||||||||||
|
| ||||||||||||||
Total Diversified | 176,481 | ||||||||||||||
|
| ||||||||||||||
| Energy - 0.39% | |||||||||||||||
| Oil & Gas - 0.00% | |||||||||||||||
Energy & Exploration Partners, Inc., 5.000%, Due 5/13/2022, 2016 2nd Lien PIK, (in-kind rate 5.000%) Term Loan,(12-mo. LIBOR + 5.000%)D | 7,171 | - | |||||||||||||
|
| ||||||||||||||
| - | |||||||||||||||
|
| ||||||||||||||
| Pipelines - 0.39% | |||||||||||||||
BCP Raptor LLC, 5.895%, Due 6/24/2024, Term Loan B,(1-mo. LIBOR + 4.250%) | 13,000 | 11,856 | |||||||||||||
Blackstone CQP Holdco LP, 5.408%, Due 9/30/2024, Term Loan B,(3-mo. LIBOR + 3.500%) | 109,872 | 109,781 | |||||||||||||
Lucid Energy Group Borrower LLC, 4.645%, Due 2/17/2025, 2018 1st Lien Term Loan,(1-mo. LIBOR + 3.000%) | 64,111 | 59,744 | |||||||||||||
Prairie ECI Acquiror LP, 6.695%, Due 3/11/2026, Term Loan B,(3-mo. LIBOR + 4.750%) | 97,744 | 96,603 | |||||||||||||
|
| ||||||||||||||
| 277,984 | |||||||||||||||
|
| ||||||||||||||
Total Energy | 277,984 | ||||||||||||||
|
| ||||||||||||||
See accompanying notes
12
American Beacon Crescent Short Duration High Income FundSM
Schedule of Investments
January 31, 2020
| Principal Amount | Fair Value | ||||||||||||||
| BANK LOAN OBLIGATIONS - 25.04% (continued) | |||||||||||||||
| Financial - 4.36% | |||||||||||||||
| Diversified Financial Services - 1.81% | |||||||||||||||
Avolon TLB Borrower LLC, 3.408%, Due 1/15/2025, Term Loan B3,(1-mo. LIBOR + 1.750%) | $ | 92,340 | $ | 92,661 | |||||||||||
Citadel Securities LP, 5.145%, Due 2/27/2026, Term Loan B,(1-mo. LIBOR + 3.500%) | 99,499 | 99,686 | |||||||||||||
Franklin Square Holdings LP, 3.938%, Due 8/1/2025, 2018 Term Loan B,(1-mo. LIBOR + 2.250%) | 98,750 | 99,059 | |||||||||||||
GGC Aperio Holdings LP, 6.945%, Due 10/25/2024, Term Loan,(3-mo. LIBOR + 5.000%)D | 163,431 | 163,153 | |||||||||||||
Jane Street Group LLC, 4.645%, Due 8/25/2022, 2018 Term Loan B,(1-mo. LIBOR + 3.000%) | 99,496 | 99,435 | |||||||||||||
Jefferies Finance LLC, 4.938%, Due 6/3/2026, 2019 Term Loan,(1-mo. LIBOR + 3.250%) | 99,500 | 99,282 | |||||||||||||
Kestra Advisor Services Holdings, Inc., 6.200%, Due 6/3/2026, 2019 Term Loan,(1-mo. LIBOR + 4.250%) | 149,508 | 148,884 | |||||||||||||
LPL Holdings, Inc., 3.411%, Due 11/12/2026, 2019 Term Loan B1,(1-mo. LIBOR + 1.750%) | 59,234 | 59,345 | |||||||||||||
Nuvei Technologies Corp., 6.645%, Due 9/29/2025, USD Term Loan,(1-mo. LIBOR + 5.000%) | 117,011 | 117,304 | |||||||||||||
StepStone Group LP, 5.762%, Due 3/27/2025, Term Loan B,(2-mo. LIBOR + 4.000%) | 202,511 | 202,511 | |||||||||||||
VFH Parent LLC, 5.263%, Due 3/1/2026, 2019 Term Loan B,(1-mo. LIBOR + 3.500%) | 94,219 | 94,514 | |||||||||||||
|
| ||||||||||||||
| 1,275,834 | |||||||||||||||
|
| ||||||||||||||
| Insurance - 0.54% | |||||||||||||||
Acrisure LLC, 6.195%, Due 11/22/2023, 2017 Term Loan B,(3-mo. LIBOR + 4.250%) | 68,524 | 68,524 | |||||||||||||
AssuredPartners, Inc., 5.145%, Due 10/22/2024, 2017 1st LienAdd-On Term Loan,(1-mo. LIBOR + 3.500%) | 65,864 | 65,814 | |||||||||||||
Asurion LLC, | |||||||||||||||
4.645%, Due 11/3/2023, 2018 Term Loan B6,(1-mo. LIBOR + 3.000%) | 7,937 | 7,943 | |||||||||||||
4.645%, Due 11/3/2024, 2018 Term Loan B7,(1-mo. LIBOR + 3.000%) | 98,769 | 98,810 | |||||||||||||
8.145%, Due 8/4/2025, 2017 2nd Lien Term Loan,(1-mo. LIBOR + 6.500%) | 57,436 | 58,289 | |||||||||||||
Sedgwick Claims Management Services, Inc., 4.895%, Due 12/31/2025, 2018 Term Loan B,(1-mo. LIBOR + 3.250%) | 86,257 | 86,225 | |||||||||||||
|
| ||||||||||||||
| 385,605 | |||||||||||||||
|
| ||||||||||||||
| Investment Companies - 0.44% | |||||||||||||||
EIG Management Co. LLC, 5.395%, Due 2/22/2025, 2018 Term Loan B,(1-mo. LIBOR + 3.750%) | 102,180 | 102,095 | |||||||||||||
NEXUS Buyer LLC, 5.449%, Due 11/9/2026, Term Loan B,(1-mo. LIBOR + 3.750%) | 63,000 | 63,650 | |||||||||||||
Zest Acquisition Corp., 5.180%, Due 3/7/2025, 2018 1st Lien Term Loan,(1-mo. LIBOR + 3.500%) | 149,711 | 143,443 | |||||||||||||
|
| ||||||||||||||
| 309,188 | |||||||||||||||
|
| ||||||||||||||
| Private Equity - 0.12% | |||||||||||||||
Victory Capital Holdings, Inc., 4.155%, Due 7/1/2026, 2020 Term Loan B,(3-mo. LIBOR + 2.500%) | 85,182 | 85,693 | |||||||||||||
|
| ||||||||||||||
| Real Estate - 0.67% | |||||||||||||||
Brookfield Property REIT, Inc., 4.145%, Due 8/27/2025, 1st Lien Term Loan B,(1-mo. LIBOR + 2.500%) | 31,919 | 31,744 | |||||||||||||
Cushman & Wakefield U.S. Borrower LLC, 4.400%, Due 8/21/2025, 2018 Term Loan B,(1-mo. LIBOR + 2.750%) | 129,392 | 129,942 | |||||||||||||
Lightstone Holdco LLC, | |||||||||||||||
5.395%, Due 1/30/2024, 2018 Term Loan B,(1-mo. LIBOR + 3.750%) | 17,039 | 15,953 | |||||||||||||
5.395%, Due 1/30/2024, 2018 Term Loan C,(1-mo. LIBOR + 3.750%) | 961 | 900 | |||||||||||||
Realogy Group LLC, 3.895%, Due 2/8/2025, 2018 Term Loan B,(1-mo. LIBOR + 2.250%) | 99,767 | 98,569 | |||||||||||||
Valet Waste Holdings, Inc., 5.395%, Due 9/28/2025, 2018 1st Lien Term Loan,(1-mo. LIBOR + 3.750%) | 199,847 | 196,350 | |||||||||||||
|
| ||||||||||||||
| 473,458 | |||||||||||||||
|
| ||||||||||||||
| REITS - 0.78% | |||||||||||||||
Apollo Commercial Real Estate Finance, Inc., 4.426%, Due 5/15/2026, Term Loan B,(1-mo. LIBOR + 2.750%) | 99,500 | 99,500 | |||||||||||||
Claros Mortgage Trust, Inc., 4.949%, Due 8/9/2026, Term Loan B,(1-mo. LIBOR + 3.250%) | 99,750 | 99,999 | |||||||||||||
Forest City Enterprises LP, 5.145%, Due 12/8/2025, 2019 Term Loan B,(1-mo. LIBOR + 3.500%) | 99,000 | 99,413 | |||||||||||||
See accompanying notes
13
American Beacon Crescent Short Duration High Income FundSM
Schedule of Investments
January 31, 2020
| Principal Amount | Fair Value | ||||||||||||||
| BANK LOAN OBLIGATIONS - 25.04% (continued) | |||||||||||||||
| Financial - 4.36% (continued) | |||||||||||||||
| REITS - 0.78% (continued) | |||||||||||||||
iStar, Inc., | |||||||||||||||
4.408%, Due 6/28/2023, 2016 Term Loan B,(1-mo. LIBOR + 2.750%) | $ | 22,318 | $ | 22,346 | |||||||||||
4.416%, Due 6/28/2023, 2016 Term Loan B,(1-mo. LIBOR + 2.750%) | 40,411 | 40,461 | |||||||||||||
MGM Growth Properties Operating Partnership LP, 3.581%, Due 3/21/2025, 2016 Term Loan B, (1 Week LIBOR + 2.000%) | 72,160 | 72,251 | |||||||||||||
VICI Properties LLC, 3.409%, Due 12/20/2024, Replacement Term Loan B,(1-mo. LIBOR + 1.750%) | 115,000 | 115,015 | |||||||||||||
|
| ||||||||||||||
| 548,985 | |||||||||||||||
|
| ||||||||||||||
Total Financial | 3,078,763 | ||||||||||||||
|
| ||||||||||||||
| Industrial - 3.13% | |||||||||||||||
| Aerospace/Defense - 0.91% | |||||||||||||||
AI Convoy S.a.r.l., Due 1/29/2027, USD Term Loan BC | 100,000 | 99,500 | |||||||||||||
API Technologies Corp., 5.895%, Due 5/9/2026, 2019 Term Loan B,(1-mo. LIBOR + 4.250%) | 149,250 | 142,534 | |||||||||||||
Forming Machining Industries Holdings LLC, 5.945%, Due 10/9/2025, Term Loan,(3-mo. LIBOR + 4.000%) | 125,750 | 115,061 | |||||||||||||
Nordam Group, Inc., 7.188%, Due 4/9/2026, Term Loan B,(1-mo. LIBOR + 5.500%) | 126,115 | 125,484 | |||||||||||||
TransDigm, Inc., | |||||||||||||||
4.145%, Due 6/9/2023, 2018 Term Loan F,(1-mo. LIBOR + 2.500%) | 133,246 | 133,080 | |||||||||||||
4.145%, Due 5/30/2025, 2018 Term Loan E,(1-mo. LIBOR + 2.500%) | 27,291 | 27,264 | |||||||||||||
|
| ||||||||||||||
| 642,923 | |||||||||||||||
|
| ||||||||||||||
| Building Materials - 0.71% | |||||||||||||||
American Bath Group LLC, 5.895%, Due 9/30/2023, 2018 Term Loan B,(1-mo. LIBOR + 4.250%) | 292,168 | 293,629 | |||||||||||||
MI Windows and Doors LLC, 7.224%, Due 11/6/2026, Term Loan B,(1-mo. LIBOR + 5.500%) | 75,000 | 75,563 | |||||||||||||
NCI Building Systems, Inc., 5.434%, Due 4/12/2025, 2018 Term Loan,(1-mo. LIBOR + 3.750%) | 69,378 | 69,074 | |||||||||||||
Quikrete Holdings, Inc., 4.145%, Due 2/1/2027, 2016 1st Lien Term Loan,(1-mo. LIBOR + 2.500%) | 64,566 | 64,566 | |||||||||||||
|
| ||||||||||||||
| 502,832 | |||||||||||||||
|
| ||||||||||||||
| Electrical Components & Equipment - 0.10% | |||||||||||||||
Coolsys, Inc., | |||||||||||||||
Due 11/20/2026, Delayed Draw Term LoanC E | 10,909 | 10,814 | |||||||||||||
7.645%, Due 11/20/2026, Term Loan,(1-mo. LIBOR + 6.000%) | 64,091 | 63,530 | |||||||||||||
|
| ||||||||||||||
| 74,344 | |||||||||||||||
|
| ||||||||||||||
| Engineering & Construction - 0.24% | |||||||||||||||
DG Investment Intermediate Holdings, Inc., 4.645%, Due 2/3/2025, 2018 1st Lien Term Loan,(1-mo. LIBOR + 3.000%) | 34,505 | 34,246 | |||||||||||||
USIC Holdings, Inc., 4.895%, Due 12/8/2023, 2017 Term Loan B,(1-mo. LIBOR + 3.250%) | 10,536 | 10,493 | |||||||||||||
Wrench Group LLC, | |||||||||||||||
Due 4/30/2026, 2019 Delayed Draw Term LoanC E | 30,850 | 30,850 | |||||||||||||
5.945%, Due 4/30/2026, 2019 Term Loan B,(3-mo. LIBOR + 4.000%) | 92,087 | 92,087 | |||||||||||||
|
| ||||||||||||||
| 167,676 | |||||||||||||||
|
| ||||||||||||||
| Machinery - Construction & Mining - 0.14% | |||||||||||||||
Brookfield WEC Holdings Inc., 4.645%, Due 8/1/2025, 2020 Term Loan,(1-mo. LIBOR + 3.000%) | 95,570 | 95,719 | |||||||||||||
|
| ||||||||||||||
| Machinery - Diversified - 0.06% | |||||||||||||||
Titan Acquisition Ltd., 4.645%, Due 3/28/2025, 2018 Term Loan B,(1-mo. LIBOR + 3.000%) | 42,891 | 41,961 | |||||||||||||
|
| ||||||||||||||
| Metal Fabricate/Hardware - 0.06% | |||||||||||||||
Sabre Industries, Inc., 5.910%, Due 4/15/2026, 2019 Term Loan B,(1-mo. LIBOR + 4.250%) | 42,678 | 42,865 | |||||||||||||
|
| ||||||||||||||
See accompanying notes
14
American Beacon Crescent Short Duration High Income FundSM
Schedule of Investments
January 31, 2020
| Principal Amount | Fair Value | ||||||||||||||
| BANK LOAN OBLIGATIONS - 25.04% (continued) | |||||||||||||||
| Industrial - 3.13% (continued) | |||||||||||||||
| Miscellaneous Manufacturing - 0.02% | |||||||||||||||
LTI Holdings, Inc., 5.145%, Due 9/6/2025, 2018 Add On 1st Lien Term Loan,(1-mo. LIBOR + 3.500%) | $ | 13,000 | $ | 11,920 | |||||||||||
|
| ||||||||||||||
| Packaging & Containers - 0.59% | |||||||||||||||
Berry Global, Inc., 3.781%, Due 7/1/2026, 2019 Term Loan Y,(1-mo. LIBOR + 2.000%) | 129,682 | 130,155 | |||||||||||||
BWAY Holding Co., 5.084%, Due 4/3/2024, 2017 Term Loan B,(3-mo. LIBOR + 3.250%) | 47,775 | 47,377 | |||||||||||||
Flex Acquisition Co., Inc., | |||||||||||||||
4.655%, Due 12/29/2023, 1st Lien Term Loan,(1-mo. LIBOR + 3.000%) | 3,991 | 3,938 | |||||||||||||
4.909%, Due 12/29/2023, 1st Lien Term Loan,(3-mo. LIBOR + 3.000%) | 106,333 | 104,916 | |||||||||||||
Fort Dearborn Co., | |||||||||||||||
5.655%, Due 10/19/2023, 2016 1st Lien Term Loan,(1-mo. LIBOR + 4.000%) | 724 | 709 | |||||||||||||
5.908%, Due 10/19/2023, 2016 1st Lien Term Loan,(3-mo. LIBOR + 4.000%) | 30,196 | 29,573 | |||||||||||||
Reynolds Consumer Products, Inc., Due 1/29/2027, Term LoanC | 100,000 | 100,417 | |||||||||||||
|
| ||||||||||||||
| 417,085 | |||||||||||||||
|
| ||||||||||||||
| Shipbuilding - 0.16% | |||||||||||||||
MHI Holdings LLC, 6.645%, Due 9/21/2026, Term Loan B,(1-mo. LIBOR + 5.000%) | 114,000 | 114,285 | |||||||||||||
|
| ||||||||||||||
| Transportation - 0.14% | |||||||||||||||
Genesee & Wyoming, Inc., 3.906%, Due 12/30/2026, Term Loan,(3-mo. LIBOR + 2.000%) | 100,000 | 100,458 | |||||||||||||
|
| ||||||||||||||
| 100,458 | |||||||||||||||
|
| ||||||||||||||
Total Industrial | 2,212,068 | ||||||||||||||
|
| ||||||||||||||
| Technology - 2.04% | |||||||||||||||
| Computers - 0.39% | |||||||||||||||
Dell International LLC, 3.650%, Due 9/19/2025, 2019 Term Loan B,(1-mo. LIBOR + 2.000%) | 96,117 | 96,451 | |||||||||||||
Flexential Intermediate Corp., 5.445%, Due 8/1/2024, 2017 1st Lien Term Loan,(3-mo. LIBOR + 3.500%) | 14,000 | 11,190 | |||||||||||||
Harland Clarke Holdings Corp., 6.695%, Due 11/3/2023, Term Loan B7,(3-mo. LIBOR + 4.750%) | 16,000 | 12,717 | |||||||||||||
NeuStar, Inc., 5.145%, Due 8/8/2024, 2018 Term Loan B4,(1-mo. LIBOR + 3.500%) | 31,847 | 29,747 | |||||||||||||
Verifone Systems, Inc., 5.899%, Due 8/20/2025, 2018 1st Lien Term Loan,(3-mo. LIBOR + 4.000%) | 63,926 | 63,048 | |||||||||||||
Western Digital Corp., 3.395%, Due 4/29/2023, 2018 Term Loan B4,(1-mo. LIBOR + 1.750%) | 60,999 | 60,974 | |||||||||||||
|
| ||||||||||||||
| 274,127 | |||||||||||||||
|
| ||||||||||||||
| Office/Business Equipment - 0.10% | |||||||||||||||
Pitney Bowes, Inc., Due 1/17/2025, Term Loan BC | 74,000 | 73,537 | |||||||||||||
|
| ||||||||||||||
| Semiconductors - 0.13% | |||||||||||||||
Microchip Technology, Inc., 3.650%, Due 5/29/2025, 2018 Term Loan B,(1-mo. LIBOR + 2.000%) | 91,370 | 91,579 | |||||||||||||
|
| ||||||||||||||
| Software - 1.42% | |||||||||||||||
Castle US Holding Corp., Due 1/27/2027, USD Term Loan BC | 100,000 | 99,125 | |||||||||||||
Compuware Corp., 5.645%, Due 8/22/2025, 2018 Term Loan B,(1-mo. LIBOR + 4.000%) | 69,226 | 69,514 | |||||||||||||
Corel Corp., 6.909%, Due 7/2/2026, 2019 Term Loan,(2-mo. LIBOR + 5.000%) | 125,000 | 123,594 | |||||||||||||
DiscoverOrg LLC, 6.145%, Due 2/2/2026, 2019 1st Lien Term Loan,(1-mo. LIBOR + 4.500%) | 49,749 | 49,791 | |||||||||||||
Dynatrace LLC, 3.895%, Due 8/22/2025, 2018 1st Lien Term Loan,(1-mo. LIBOR + 2.250%) | 48,289 | 48,425 | |||||||||||||
IQVIA, Inc., 3.695%, Due 6/11/2025, 2018 USD Term Loan B3,(3-mo. LIBOR + 1.750%) | 92,530 | 92,906 | |||||||||||||
MA FinanceCo. LLC, 4.145%, Due 6/21/2024, USD Term Loan B3,(1-mo. LIBOR + 2.500%) | 10,464 | 10,388 | |||||||||||||
Omnitracs, Inc., 4.678%, Due 3/21/2025, 2018 Term Loan B,(3-mo. LIBOR + 2.750%) | 61,792 | 61,431 | |||||||||||||
Riverbed Technology, Inc., 4.900%, Due 4/24/2022, 2016 Term Loan,(1-mo. LIBOR + 3.250%) | 17,000 | 14,608 | |||||||||||||
Seattle Spinco, Inc., 4.145%, Due 6/21/2024, USD Term Loan B3,(1-mo. LIBOR + 2.500%) | 70,663 | 70,151 | |||||||||||||
Sophia LP, 5.195%, Due 9/30/2022, 2017 Term Loan B,(3-mo. LIBOR + 3.250%) | 83,408 | 83,542 | |||||||||||||
Sophos Group PLC, Due 1/15/2027, USD Term LoanC | 100,000 | 100,063 | |||||||||||||
See accompanying notes
15
American Beacon Crescent Short Duration High Income FundSM
Schedule of Investments
January 31, 2020
| Principal Amount | Fair Value | ||||||||||||||
| BANK LOAN OBLIGATIONS - 25.04% (continued) | |||||||||||||||
| Technology - 2.04% (continued) | |||||||||||||||
| Software - 1.42% (continued) | |||||||||||||||
SS&C Technologies Holdings Europe S.a.r.l., 3.395%, Due 4/16/2025, 2018 Term Loan B4,(1-mo. LIBOR + 1.750%) | $ | 24,980 | $ | 24,975 | |||||||||||
SS&C Technologies, Inc., | |||||||||||||||
3.395%, Due 4/16/2025, 2018 Term Loan B3,(1-mo. LIBOR + 1.750%) | 35,007 | 35,000 | |||||||||||||
3.395%, Due 4/16/2025, 2018 Term Loan B5,(1-mo. LIBOR + 1.750%) | 19,912 | 19,891 | |||||||||||||
Weld North Education LLC, 6.200%, Due 2/15/2025, Term Loan B,(3-mo. LIBOR + 4.250%) | 98,992 | 99,240 | |||||||||||||
|
| ||||||||||||||
| 1,002,644 | |||||||||||||||
|
| ||||||||||||||
Total Technology | 1,441,887 | ||||||||||||||
|
| ||||||||||||||
| Utilities - 0.47% | |||||||||||||||
| Electric - 0.47% | |||||||||||||||
Calpine Corp., | |||||||||||||||
4.200%, Due 1/15/2024, Term Loan B5,(3-mo. LIBOR + 2.250%) | 99,479 | 99,749 | |||||||||||||
4.200%, Due 4/5/2026, Term Loan B9,(3-mo. LIBOR + 2.250%) | 14,925 | 14,967 | |||||||||||||
Eastern Power LLC, 5.395%, Due 10/2/2025, Term Loan B,(1-mo. LIBOR + 3.750%) | 66,887 | 66,569 | |||||||||||||
Granite Generation LLC, | |||||||||||||||
5.395%, Due 11/9/2026, Term Loan B,(1-mo. LIBOR + 3.750%) | 85,000 | 84,964 | |||||||||||||
5.695%, Due 11/9/2026, Term Loan B,(3-mo. LIBOR + 3.750%) | 15,000 | 14,994 | |||||||||||||
Vistra Operations Co. LLC, | |||||||||||||||
3.395%, Due 12/31/2025, 1st Lien Term Loan B3,(1-mo. LIBOR + 1.750%) | 42,274 | 42,403 | |||||||||||||
3.419%, Due 12/31/2025, 1st Lien Term Loan B3,(1-mo. LIBOR + 1.750%) | 10,084 | 10,115 | |||||||||||||
|
| ||||||||||||||
| 333,761 | |||||||||||||||
|
| ||||||||||||||
Total Utilities | 333,761 | ||||||||||||||
|
| ||||||||||||||
Total Bank Loan Obligations (Cost $17,822,983) | 17,693,303 | ||||||||||||||
|
| ||||||||||||||
| CORPORATE OBLIGATIONS - 62.26% | |||||||||||||||
| Basic Materials - 1.97% | |||||||||||||||
| Chemicals - 0.35% | |||||||||||||||
Chemours Co., 6.625%, Due 5/15/2023 | 250,000 | 246,108 | |||||||||||||
|
| ||||||||||||||
| Forest Products & Paper - 0.30% | |||||||||||||||
Clearwater Paper Corp., 5.375%, Due 2/1/2025F | 200,000 | 208,000 | |||||||||||||
|
| ||||||||||||||
| Mining - 1.32% | |||||||||||||||
Alcoa Nederland Holding B.V., 6.750%, Due 9/30/2024F | 250,000 | 262,525 | |||||||||||||
Freeport-McMoRan, Inc., 5.000%, Due 9/1/2027 | 650,000 | 672,782 | |||||||||||||
|
| ||||||||||||||
| 935,307 | |||||||||||||||
|
| ||||||||||||||
Total Basic Materials | 1,389,415 | ||||||||||||||
|
| ||||||||||||||
| Communications - 14.60% | |||||||||||||||
| Internet - 0.97% | |||||||||||||||
EIG Investors Corp., 10.875%, Due 2/1/2024 | 150,000 | 154,875 | |||||||||||||
Netflix, Inc., 5.750%, Due 3/1/2024 | 250,000 | 276,875 | |||||||||||||
Zayo Group LLC / Zayo Capital, Inc., 6.375%, Due 5/15/2025 | 250,000 | 255,500 | |||||||||||||
|
| ||||||||||||||
| 687,250 | |||||||||||||||
|
| ||||||||||||||
| Media - 8.62% | |||||||||||||||
AMC Networks, Inc., 5.000%, Due 4/1/2024 | 250,000 | 255,000 | |||||||||||||
Block Communications, Inc., 6.875%, Due 2/15/2025F | 300,000 | 310,875 | |||||||||||||
Cablevision Systems Corp., 5.875%, Due 9/15/2022 | 250,000 | 267,500 | |||||||||||||
CCO Holdings LLC / CCO Holdings Capital Corp., 5.375%, Due 5/1/2025F | 1,100,000 | 1,135,750 | |||||||||||||
Clear Channel Worldwide Holdings, Inc., 9.250%, Due 2/15/2024F | 106,000 | 115,408 | |||||||||||||
See accompanying notes
16
American Beacon Crescent Short Duration High Income FundSM
Schedule of Investments
January 31, 2020
| Principal Amount | Fair Value | ||||||||||||||
| CORPORATE OBLIGATIONS - 62.26% (continued) | |||||||||||||||
| Communications - 14.60% (continued) | |||||||||||||||
| Media - 8.62% (continued) | |||||||||||||||
CSC Holdings LLC, | |||||||||||||||
5.500%, Due 5/15/2026F | $ | 500,000 | $ | 523,852 | |||||||||||
5.375%, Due 2/1/2028F | 50,000 | 53,000 | |||||||||||||
Diamond Sports Group LLC / Diamond Sports Finance Co., 6.625%, Due 8/15/2027F | 250,000 | 233,750 | |||||||||||||
DISH DBS Corp., | |||||||||||||||
5.875%, Due 11/15/2024 | 725,000 | 733,649 | |||||||||||||
7.750%, Due 7/1/2026 | 300,000 | 315,000 | |||||||||||||
iHeartCommunications, Inc., 8.375%, Due 5/1/2027 | 100,000 | 108,749 | |||||||||||||
Salem Media Group, Inc., 6.750%, Due 6/1/2024F | 175,000 | 168,875 | |||||||||||||
Sinclair Television Group, Inc., 5.625%, Due 8/1/2024F | 400,000 | 411,500 | |||||||||||||
Sirius XM Radio, Inc., 5.375%, Due 4/15/2025F | 550,000 | 567,242 | |||||||||||||
TEGNA, Inc., 5.500%, Due 9/15/2024F | 300,000 | 309,000 | |||||||||||||
Townsquare Media, Inc., 6.500%, Due 4/1/2023F | 225,000 | 227,813 | |||||||||||||
Univision Communications, Inc., | |||||||||||||||
5.125%, Due 5/15/2023F | 200,000 | 200,000 | |||||||||||||
5.125%, Due 2/15/2025F | 150,000 | 149,625 | |||||||||||||
|
| ||||||||||||||
| 6,086,588 | |||||||||||||||
|
| ||||||||||||||
| Telecommunications - 5.01% | |||||||||||||||
CenturyLink, Inc., | |||||||||||||||
6.750%, Due 12/1/2023, Series W | 250,000 | 277,188 | |||||||||||||
7.500%, Due 4/1/2024, Series Y | 450,000 | 507,748 | |||||||||||||
CommScope Technologies LLC, 5.000%, Due 3/15/2027F | 100,000 | 90,750 | |||||||||||||
CommScope, Inc., 6.000%, Due 3/1/2026F | 225,000 | 235,969 | |||||||||||||
Frontier Communications Corp., 8.500%, Due 4/1/2026F | 50,000 | 51,250 | |||||||||||||
Plantronics, Inc., 5.500%, Due 5/31/2023F | 250,000 | 241,250 | |||||||||||||
Sprint Communications, Inc., 6.000%, Due 11/15/2022 | 575,000 | 593,687 | |||||||||||||
Sprint Corp., | |||||||||||||||
7.250%, Due 9/15/2021 | 700,000 | 734,125 | |||||||||||||
7.875%, Due 9/15/2023 | 250,000 | 265,598 | |||||||||||||
T-Mobile USA, Inc., | |||||||||||||||
6.500%, Due 1/15/2024 | 175,000 | 179,594 | |||||||||||||
6.000%, Due 4/15/2024 | 200,000 | 205,875 | |||||||||||||
5.125%, Due 4/15/2025 | 150,000 | 154,472 | |||||||||||||
|
| ||||||||||||||
| 3,537,506 | |||||||||||||||
|
| ||||||||||||||
Total Communications | 10,311,344 | ||||||||||||||
|
| ||||||||||||||
| Consumer, Cyclical - 9.07% | |||||||||||||||
| Airlines - 0.75% | |||||||||||||||
United Airlines Holdings, Inc., 4.875%, Due 1/15/2025 | 500,000 | 527,500 | |||||||||||||
|
| ||||||||||||||
| Apparel - 0.37% | |||||||||||||||
Hanesbrands, Inc., 4.625%, Due 5/15/2024F | 250,000 | 261,875 | |||||||||||||
|
| ||||||||||||||
| Auto Parts & Equipment - 0.34% | |||||||||||||||
Panther BF Aggregator 2 LP / Panther Finance Co., Inc., | |||||||||||||||
6.250%, Due 5/15/2026F | 50,000 | 53,630 | |||||||||||||
8.500%, Due 5/15/2027F | 175,000 | 188,125 | |||||||||||||
|
| ||||||||||||||
| 241,755 | |||||||||||||||
|
| ||||||||||||||
| Commercial Services - 0.23% | |||||||||||||||
Allied Universal Holdco LLC / Allied Universal Finance Corp., 6.625%, Due 7/15/2026F | 150,000 | 159,469 | |||||||||||||
|
| ||||||||||||||
| Entertainment - 1.82% | |||||||||||||||
AMC Entertainment Holdings, Inc., 5.750%, Due 6/15/2025 | 250,000 | 222,500 | |||||||||||||
Caesars Resort Collection LLC / CRC Finco, Inc., 5.250%, Due 10/15/2025F | 125,000 | 126,863 | |||||||||||||
See accompanying notes
17
American Beacon Crescent Short Duration High Income FundSM
Schedule of Investments
January 31, 2020
| Principal Amount | Fair Value | ||||||||||||||
| CORPORATE OBLIGATIONS - 62.26% (continued) | |||||||||||||||
| Consumer, Cyclical - 9.07% (continued) | |||||||||||||||
| Entertainment - 1.82% (continued) | |||||||||||||||
Churchill Downs, Inc., 5.500%, Due 4/1/2027F | $ | 225,000 | $ | 237,375 | |||||||||||
Cinemark USA, Inc., 4.875%, Due 6/1/2023 | 200,000 | 202,500 | |||||||||||||
Eldorado Resorts, Inc., 6.000%, Due 4/1/2025 | 150,000 | 156,964 | |||||||||||||
International Game Technology PLC, 6.500%, Due 2/15/2025F | 300,000 | 338,250 | |||||||||||||
|
| ||||||||||||||
| 1,284,452 | |||||||||||||||
|
| ||||||||||||||
| Home Builders - 0.53% | |||||||||||||||
Williams Scotsman International, Inc., 7.875%, Due 12/15/2022F | 360,000 | 375,300 | |||||||||||||
|
| ||||||||||||||
| Home Furnishings - 0.58% | |||||||||||||||
Tempur Sealy International, Inc., 5.625%, Due 10/15/2023 | 400,000 | 411,500 | |||||||||||||
|
| ||||||||||||||
| Household Products/Wares - 0.37% | |||||||||||||||
Newell Brands, Inc., 4.200%, Due 4/1/2026 | 250,000 | 261,075 | |||||||||||||
|
| ||||||||||||||
| Lodging - 1.41% | |||||||||||||||
MGM Resorts International, 5.750%, Due 6/15/2025 | 350,000 | 390,187 | |||||||||||||
Wyndham Destinations, Inc., 5.400%, Due 4/1/2024 | 450,000 | 480,375 | |||||||||||||
Wynn Las Vegas LLC / Wynn Las Vegas Capital Corp., 4.250%, Due 5/30/2023F | 125,000 | 128,909 | |||||||||||||
|
| ||||||||||||||
| 999,471 | |||||||||||||||
|
| ||||||||||||||
| Retail - 2.21% | |||||||||||||||
Golden Nugget, Inc., 8.750%, Due 10/1/2025F | 125,000 | 131,346 | |||||||||||||
KGA Escrow LLC, 7.500%, Due 8/15/2023F | 300,000 | 316,500 | |||||||||||||
L Brands, Inc., 5.625%, Due 10/15/2023 | 325,000 | 352,895 | |||||||||||||
PetSmart, Inc., | |||||||||||||||
7.125%, Due 3/15/2023F | 100,000 | 99,625 | |||||||||||||
5.875%, Due 6/1/2025F | 250,000 | 256,525 | |||||||||||||
QVC, Inc., 4.750%, Due 2/15/2027 | 200,000 | 201,846 | |||||||||||||
Staples, Inc., 7.500%, Due 4/15/2026F | 200,000 | 204,880 | |||||||||||||
|
| ||||||||||||||
| 1,563,617 | |||||||||||||||
|
| ||||||||||||||
| Toys/Games/Hobbies - 0.46% | |||||||||||||||
Mattel, Inc., 6.750%, Due 12/31/2025F | 300,000 | 321,750 | |||||||||||||
|
| ||||||||||||||
Total Consumer, Cyclical | 6,407,764 | ||||||||||||||
|
| ||||||||||||||
| Consumer,Non-Cyclical - 11.06% | |||||||||||||||
| Commercial Services - 1.98% | |||||||||||||||
ADT Security Corp., 4.125%, Due 6/15/2023 | 200,000 | 203,250 | |||||||||||||
Cardtronics, Inc. / Cardtronics USA, Inc., 5.500%, Due 5/1/2025F | 300,000 | 310,500 | |||||||||||||
Hertz Corp., 5.500%, Due 10/15/2024F | 325,000 | 329,739 | |||||||||||||
MPH Acquisition Holdings LLC, 7.125%, Due 6/1/2024F | 50,000 | 48,431 | |||||||||||||
Nielsen Finance LLC / Nielsen Finance Co., 5.000%, Due 4/15/2022F | 350,000 | 350,437 | |||||||||||||
Prime Security Services Borrower LLC / Prime Finance, Inc., 5.750%, Due 4/15/2026F | 150,000 | 158,250 | |||||||||||||
|
| ||||||||||||||
| 1,400,607 | |||||||||||||||
|
| ||||||||||||||
| Food - 0.22% | |||||||||||||||
Albertsons Cos. LLC / Safeway, Inc. / New Albertsons LP / Albertson’s LLC, 6.625%, Due 6/15/2024 | 150,000 | 156,000 | |||||||||||||
|
| ||||||||||||||
| Health Care - Products - 0.16% | |||||||||||||||
Avantor, Inc., 9.000%, Due 10/1/2025F | 100,000 | 110,520 | |||||||||||||
|
| ||||||||||||||
| Health Care - Services - 6.18% | |||||||||||||||
Acadia Healthcare Co., Inc., 6.500%, Due 3/1/2024 | 225,000 | 231,680 | |||||||||||||
See accompanying notes
18
American Beacon Crescent Short Duration High Income FundSM
Schedule of Investments
January 31, 2020
| Principal Amount | Fair Value | ||||||||||||||
| CORPORATE OBLIGATIONS - 62.26% (continued) | |||||||||||||||
| Consumer,Non-Cyclical - 11.06% (continued) | |||||||||||||||
| Health Care - Services - 6.18% (continued) | |||||||||||||||
Centene Corp., | |||||||||||||||
4.750%, Due 1/15/2025 | $ | 500,000 | $ | 516,040 | |||||||||||
5.250%, Due 4/1/2025F | 175,000 | 181,344 | |||||||||||||
CHS/Community Health Systems, Inc., | |||||||||||||||
6.250%, Due 3/31/2023 | 350,000 | 357,000 | |||||||||||||
8.625%, Due 1/15/2024F | 250,000 | 265,625 | |||||||||||||
6.625%, Due 2/15/2025F | 275,000 | 277,799 | |||||||||||||
DaVita, Inc., 5.125%, Due 7/15/2024 | 175,000 | 178,938 | |||||||||||||
HCA, Inc., | |||||||||||||||
5.875%, Due 5/1/2023 | 200,000 | 219,860 | |||||||||||||
5.375%, Due 2/1/2025 | 50,000 | 55,880 | |||||||||||||
MEDNAX, Inc., 5.250%, Due 12/1/2023F | 325,000 | 331,500 | |||||||||||||
Polaris Intermediate Corp., 8.500%, Due 12/1/2022, PIK(in-kind rate 8.500%)F | 150,000 | 139,502 | |||||||||||||
RegionalCare Hospital Partners Holdings, Inc., 8.250%, Due 5/1/2023F | 225,000 | 236,317 | |||||||||||||
Tenet Healthcare Corp., | |||||||||||||||
8.125%, Due 4/1/2022 | 100,000 | 109,254 | |||||||||||||
7.000%, Due 8/1/2025 | 200,000 | 207,166 | |||||||||||||
6.250%, Due 2/1/2027F | 1,000,000 | 1,057,600 | |||||||||||||
|
| ||||||||||||||
| 4,365,505 | |||||||||||||||
|
| ||||||||||||||
| Household Products/Wares - 0.04% | |||||||||||||||
Prestige Brands, Inc., 5.125%, Due 1/15/2028F | 25,000 | 26,125 | |||||||||||||
|
| ||||||||||||||
| Pharmaceuticals - 2.48% | |||||||||||||||
Bausch Health Cos., Inc., | |||||||||||||||
7.000%, Due 3/15/2024F | 575,000 | 596,102 | |||||||||||||
6.125%, Due 4/15/2025F | 350,000 | 360,017 | |||||||||||||
Endo Dac / Endo Finance LLC / Endo Finco, Inc., 5.875%, Due 10/15/2024F | 500,000 | 496,250 | |||||||||||||
HLF Financing Sarl LLC / Herbalife International, Inc., 7.250%, Due 8/15/2026F | 250,000 | 260,625 | |||||||||||||
Mallinckrodt International Finance S.A. / Mallinckrodt CB LLC, 5.625%, Due 10/15/2023F | 100,000 | 39,500 | |||||||||||||
|
| ||||||||||||||
| 1,752,494 | |||||||||||||||
|
| ||||||||||||||
Total Consumer,Non-Cyclical | 7,811,251 | ||||||||||||||
|
| ||||||||||||||
| Energy - 8.56% | |||||||||||||||
| Oil & Gas - 4.15% | |||||||||||||||
Antero Resources Corp., 5.125%, Due 12/1/2022 | 225,000 | 194,062 | |||||||||||||
Ascent Resources Utica Holdings LLC / ARU Finance Corp., 10.000%, Due 4/1/2022F | 350,000 | 343,000 | |||||||||||||
Berry Petroleum Co. LLC, 7.000%, Due 2/15/2026F | 125,000 | 115,938 | |||||||||||||
Callon Petroleum Co., 6.375%, Due 7/1/2026 | 125,000 | 118,125 | |||||||||||||
Endeavor Energy Resources LP / EER Finance, Inc., 5.750%, Due 1/30/2028F | 100,000 | 104,000 | |||||||||||||
Hilcorp Energy I LP / Hilcorp Finance Co., 5.000%, Due 12/1/2024F | 200,000 | 182,000 | |||||||||||||
Murphy Oil Corp., 5.750%, Due 8/15/2025 | 250,000 | 257,345 | |||||||||||||
Nabors Industries Ltd., 7.500%, Due 1/15/2028F | 75,000 | 74,250 | |||||||||||||
Oasis Petroleum, Inc., 6.875%, Due 1/15/2023 | 125,000 | 118,242 | |||||||||||||
QEP Resources, Inc., 5.375%, Due 10/1/2022 | 225,000 | 225,562 | |||||||||||||
Range Resources Corp., | |||||||||||||||
5.875%, Due 7/1/2022 | 76,000 | 72,200 | |||||||||||||
5.000%, Due 8/15/2022 | 75,000 | 70,890 | |||||||||||||
SM Energy Co., 5.000%, Due 1/15/2024 | 150,000 | 136,875 | |||||||||||||
Southwestern Energy Co., 6.200%, Due 1/23/2025 | 125,000 | 104,063 | |||||||||||||
Sunoco LP / Sunoco Finance Corp., 4.875%, Due 1/15/2023, Series WI | 250,000 | 256,562 | |||||||||||||
Transocean Pontus Ltd., 6.125%, Due 8/1/2025F | 111,250 | 114,588 | |||||||||||||
Transocean, Inc., 9.000%, Due 7/15/2023F | 150,000 | 161,160 | |||||||||||||
W&T Offshore, Inc., 9.750%, Due 11/1/2023, 2018 Term LoanF | 150,000 | 142,020 | |||||||||||||
Whiting Petroleum Corp., 6.250%, Due 4/1/2023 | 200,000 | 140,000 | |||||||||||||
|
| ||||||||||||||
| 2,930,882 | |||||||||||||||
|
| ||||||||||||||
See accompanying notes
19
American Beacon Crescent Short Duration High Income FundSM
Schedule of Investments
January 31, 2020
| Principal Amount | Fair Value | ||||||||||||||
| CORPORATE OBLIGATIONS - 62.26% (continued) | |||||||||||||||
| Energy - 8.56% (continued) | |||||||||||||||
| Oil & Gas Services - 0.56% | |||||||||||||||
Archrock Partners LP / Archrock Partners Finance Corp., 6.000%, Due 10/1/2022 | $ | 250,000 | $ | 250,313 | |||||||||||
Oceaneering International, Inc., 4.650%, Due 11/15/2024 | 150,000 | 144,750 | |||||||||||||
|
| ||||||||||||||
| 395,063 | |||||||||||||||
|
| ||||||||||||||
| Pipelines - 3.85% | |||||||||||||||
Blue Racer Midstream LLC / Blue Racer Finance Corp., 6.125%, Due 11/15/2022F | 100,000 | 97,710 | |||||||||||||
Buckeye Partners LP, | |||||||||||||||
4.350%, Due 10/15/2024 | 150,000 | 151,347 | |||||||||||||
3.950%, Due 12/1/2026 | 100,000 | 98,629 | |||||||||||||
Cheniere Energy Partners LP, 5.625%, Due 10/1/2026 | 250,000 | 261,875 | |||||||||||||
Crestwood Midstream Partners LP / Crestwood Midstream Finance Corp., 5.625%, Due 5/1/2027F | 200,000 | 201,260 | |||||||||||||
DCP Midstream Operating LP, 5.375%, Due 7/15/2025 | 400,000 | 436,548 | |||||||||||||
Energy Transfer Operating LP, 5.250%, Due 4/15/2029 | 300,000 | 339,804 | |||||||||||||
Genesis Energy LP / Genesis Energy Finance Corp., | |||||||||||||||
5.625%, Due 6/15/2024 | 100,000 | 97,250 | |||||||||||||
6.500%, Due 10/1/2025 | 50,000 | 48,750 | |||||||||||||
Hess Midstream Operations LP, 5.625%, Due 2/15/2026F | 300,000 | 314,011 | |||||||||||||
NGL Energy Partners LP / NGL Energy Finance Corp., | |||||||||||||||
7.500%, Due 11/1/2023 | 100,000 | 99,720 | |||||||||||||
7.500%, Due 4/15/2026F | 150,000 | 145,500 | |||||||||||||
Tallgrass Energy Partners LP / Tallgrass Energy Finance Corp., 5.500%, Due 9/15/2024F | 175,000 | 176,754 | |||||||||||||
Targa Resources Partners LP / Targa Resources Partners Finance Corp., | |||||||||||||||
5.250%, Due 5/1/2023 | 150,000 | 151,313 | |||||||||||||
5.125%, Due 2/1/2025 | 100,000 | 103,000 | |||||||||||||
|
| ||||||||||||||
| 2,723,471 | |||||||||||||||
|
| ||||||||||||||
Total Energy | 6,049,416 | ||||||||||||||
|
| ||||||||||||||
| Financial - 9.03% | |||||||||||||||
| Banks - 0.45% | |||||||||||||||
CIT Group, Inc., 4.750%, Due 2/16/2024 | 300,000 | 319,500 | |||||||||||||
|
| ||||||||||||||
| Diversified Financial Services - 3.82% | |||||||||||||||
Allied Universal Holdco LLC / Allied Universal Finance Corp., 9.750%, Due 7/15/2027F | 125,000 | 133,438 | |||||||||||||
Credit Acceptance Corp., 7.375%, Due 3/15/2023 | 150,000 | 153,000 | |||||||||||||
Nationstar Mortgage Holdings, Inc., 8.125%, Due 7/15/2023F | 250,000 | 264,375 | |||||||||||||
Navient Corp., | |||||||||||||||
6.125%, Due 3/25/2024 | 975,000 | 1,038,687 | |||||||||||||
6.750%, Due 6/15/2026 | 75,000 | 81,375 | |||||||||||||
Oxford Finance LLC / Oxford FinanceCo-Issuer II, Inc., 6.375%, Due 12/15/2022F | 175,000 | 179,812 | |||||||||||||
Springleaf Finance Corp., | |||||||||||||||
5.625%, Due 3/15/2023 | 100,000 | 107,000 | |||||||||||||
6.125%, Due 3/15/2024 | 100,000 | 108,500 | |||||||||||||
7.125%, Due 3/15/2026 | 550,000 | 631,042 | |||||||||||||
|
| ||||||||||||||
| 2,697,229 | |||||||||||||||
|
| ||||||||||||||
| Insurance - 0.85% | |||||||||||||||
Acrisure LLC / Acrisure Finance, Inc., 8.125%, Due 2/15/2024F | 200,000 | 213,750 | |||||||||||||
Genworth Holdings, Inc., 4.900%, Due 8/15/2023 | 225,000 | 227,250 | |||||||||||||
HUB International Ltd., 7.000%, Due 5/1/2026F | 150,000 | 155,625 | |||||||||||||
|
| ||||||||||||||
| 596,625 | |||||||||||||||
|
| ||||||||||||||
| Investment Companies - 0.92% | |||||||||||||||
Icahn Enterprises LP / Icahn Enterprises Finance Corp., 6.375%, Due 12/15/2025 | 625,000 | 652,344 | |||||||||||||
|
| ||||||||||||||
See accompanying notes
20
American Beacon Crescent Short Duration High Income FundSM
Schedule of Investments
January 31, 2020
| Principal Amount | Fair Value | ||||||||||||||
| CORPORATE OBLIGATIONS - 62.26% (continued) | |||||||||||||||
| Financial - 9.03% (continued) | |||||||||||||||
| Real Estate - 0.78% | |||||||||||||||
Kennedy-Wilson, Inc., 5.875%, Due 4/1/2024 | $ | 300,000 | $ | 306,000 | |||||||||||
Newmark Group, Inc., 6.125%, Due 11/15/2023 | 225,000 | 246,757 | |||||||||||||
|
| ||||||||||||||
| 552,757 | |||||||||||||||
|
| ||||||||||||||
| REITS - 2.21% | |||||||||||||||
Iron Mountain US Holdings, Inc., 5.375%, Due 6/1/2026F | 300,000 | 313,875 | |||||||||||||
iStar, Inc., | |||||||||||||||
4.750%, Due 10/1/2024 | 300,000 | 312,000 | |||||||||||||
4.250%, Due 8/1/2025 | 200,000 | 201,000 | |||||||||||||
Ladder Capital Finance Holdings LLLP / Ladder Capital Finance Corp., 5.250%, Due 10/1/2025F | 100,000 | 102,750 | |||||||||||||
MGM Growth Properties Operating Partnership LP / MGP FinanceCo-Issuer, Inc., 5.625%, Due 5/1/2024 | 250,000 | 272,698 | |||||||||||||
Starwood Property Trust, Inc., 5.000%, Due 12/15/2021 | 350,000 | 358,750 | |||||||||||||
|
| ||||||||||||||
| 1,561,073 | |||||||||||||||
|
| ||||||||||||||
Total Financial | 6,379,528 | ||||||||||||||
|
| ||||||||||||||
| Industrial - 5.81% | |||||||||||||||
| Aerospace/Defense - 1.09% | |||||||||||||||
Arconic, Inc., 5.125%, Due 10/1/2024 | 400,000 | 431,908 | |||||||||||||
Signature Aviation US Holdings, Inc., 5.375%, Due 5/1/2026F | 250,000 | 259,700 | |||||||||||||
Spirit AeroSystems, Inc., 4.600%, Due 6/15/2028 | 75,000 | 77,072 | |||||||||||||
|
| ||||||||||||||
| 768,680 | |||||||||||||||
|
| ||||||||||||||
| Building Materials - 0.36% | |||||||||||||||
Standard Industries, Inc., 5.375%, Due 11/15/2024F | 250,000 | 256,875 | |||||||||||||
|
| ||||||||||||||
| Electrical Components & Equipment - 0.45% | |||||||||||||||
Energizer Holdings, Inc., | |||||||||||||||
5.500%, Due 6/15/2025F | 150,000 | 154,875 | |||||||||||||
7.750%, Due 1/15/2027F | 150,000 | 165,382 | |||||||||||||
|
| ||||||||||||||
| 320,257 | |||||||||||||||
|
| ||||||||||||||
| Electronics - 0.26% | |||||||||||||||
Ingram Micro, Inc., 5.450%, Due 12/15/2024 | 175,000 | 186,892 | |||||||||||||
|
| ||||||||||||||
| Engineering & Construction - 0.20% | |||||||||||||||
AECOM, 5.875%, Due 10/15/2024 | 125,000 | 138,563 | |||||||||||||
|
| ||||||||||||||
| Environmental Control - 0.26% | |||||||||||||||
Stericycle, Inc., 5.375%, Due 7/15/2024F | 175,000 | 183,185 | |||||||||||||
|
| ||||||||||||||
| Packaging & Containers - 2.29% | |||||||||||||||
Berry Global, Inc., | |||||||||||||||
5.500%, Due 5/15/2022 | 200,000 | 201,500 | |||||||||||||
5.625%, Due 7/15/2027F | 150,000 | 159,375 | |||||||||||||
Flex Acquisition Co., Inc., 6.875%, Due 1/15/2025F | 250,000 | 250,938 | |||||||||||||
LABL Escrow Issuer LLC, 6.750%, Due 7/15/2026F | 25,000 | 26,851 | |||||||||||||
Mauser Packaging Solutions Holding Co., 7.250%, Due 4/15/2025F | 625,000 | 621,875 | |||||||||||||
Reynolds Group Issuer, Inc. / Reynolds Group Issuer LLC / Reynolds Group Issuer, 5.125%, Due 7/15/2023F | 350,000 | 357,178 | |||||||||||||
|
| ||||||||||||||
| 1,617,717 | |||||||||||||||
|
| ||||||||||||||
| Transportation - 0.23% | |||||||||||||||
XPO Logistics, Inc., 6.750%, Due 8/15/2024F | 150,000 | 161,829 | |||||||||||||
|
| ||||||||||||||
See accompanying notes
21
American Beacon Crescent Short Duration High Income FundSM
Schedule of Investments
January 31, 2020
| Principal Amount | Fair Value | ||||||||||||||
| CORPORATE OBLIGATIONS - 62.26% (continued) | |||||||||||||||
| Industrial - 5.81% (continued) | |||||||||||||||
| Trucking & Leasing - 0.67% | |||||||||||||||
Fortress Transportation & Infrastructure Investors LLC, | |||||||||||||||
6.750%, Due 3/15/2022F | $ | 250,000 | $ | 257,500 | |||||||||||
6.500%, Due 10/1/2025F | 200,000 | 212,334 | |||||||||||||
|
| ||||||||||||||
| 469,834 | |||||||||||||||
|
| ||||||||||||||
Total Industrial | 4,103,832 | ||||||||||||||
|
| ||||||||||||||
| Technology - 1.33% | |||||||||||||||
| Computers - 0.97% | |||||||||||||||
Dell International LLC / EMC Corp., 7.125%, Due 6/15/2024F | 650,000 | 683,312 | |||||||||||||
|
| ||||||||||||||
| Office/Business Equipment - 0.36% | |||||||||||||||
Xerox Corp., 4.125%, Due 3/15/2023 | 250,000 | 258,750 | |||||||||||||
|
| ||||||||||||||
Total Technology | 942,062 | ||||||||||||||
|
| ||||||||||||||
| Utilities - 0.83% | |||||||||||||||
| Electric - 0.68% | |||||||||||||||
AES Corp., | |||||||||||||||
4.500%, Due 3/15/2023 | 200,000 | 203,904 | |||||||||||||
5.500%, Due 4/15/2025 | 150,000 | 154,687 | |||||||||||||
Calpine Corp., 5.125%, Due 3/15/2028F | 125,000 | 124,141 | |||||||||||||
|
| ||||||||||||||
| 482,732 | |||||||||||||||
|
| ||||||||||||||
| Gas - 0.15% | |||||||||||||||
AmeriGas Partners LP / AmeriGas Finance Corp., 5.625%, Due 5/20/2024 | 100,000 | 106,270 | |||||||||||||
|
| ||||||||||||||
Total Utilities | 589,002 | ||||||||||||||
|
| ||||||||||||||
Total Corporate Obligations (Cost $43,237,904) | 43,983,614 | ||||||||||||||
|
| ||||||||||||||
| FOREIGN CORPORATE OBLIGATIONS - 9.91% | |||||||||||||||
| Basic Materials - 0.33% | |||||||||||||||
| Chemicals - 0.11% | |||||||||||||||
NOVA Chemicals Corp., 4.875%, Due 6/1/2024F | 75,000 | 76,125 | |||||||||||||
|
| ||||||||||||||
| Mining - 0.22% | |||||||||||||||
FMG Resources Pty Ltd., 5.125%, Due 5/15/2024F | 150,000 | 158,813 | |||||||||||||
|
| ||||||||||||||
Total Basic Materials | 234,938 | ||||||||||||||
|
| ||||||||||||||
| Communications - 3.15% | |||||||||||||||
| Media - 1.00% | |||||||||||||||
Altice Luxembourg S.A., 10.500%, Due 5/15/2027F | 225,000 | 260,168 | |||||||||||||
VTR Finance B.V., 6.875%, Due 1/15/2024F | 435,000 | 444,787 | |||||||||||||
|
| ||||||||||||||
| 704,955 | |||||||||||||||
|
| ||||||||||||||
| Telecommunications - 2.15% | |||||||||||||||
Altice France S.A., 7.375%, Due 5/1/2026F | 400,000 | 426,032 | |||||||||||||
Connect Finco SARL / Connect US Finco LLC, 6.750%, Due 10/1/2026F | 200,000 | 211,750 | |||||||||||||
Intelsat Jackson Holdings S.A., 9.500%, Due 9/30/2022F | 250,000 | 283,750 | |||||||||||||
Telecom Italia SpA, 5.303%, Due 5/30/2024F | 225,000 | 245,250 | |||||||||||||
Ypso Finance Bis Co., 6.000%, Due 2/15/2028 | 350,000 | 350,000 | |||||||||||||
|
| ||||||||||||||
| 1,516,782 | |||||||||||||||
|
| ||||||||||||||
Total Communications | 2,221,737 | ||||||||||||||
|
| ||||||||||||||
See accompanying notes
22
American Beacon Crescent Short Duration High Income FundSM
Schedule of Investments
January 31, 2020
| Principal Amount | Fair Value | ||||||||||||||
| FOREIGN CORPORATE OBLIGATIONS - 9.91% (continued) | |||||||||||||||
| Consumer, Cyclical - 1.16% | |||||||||||||||
| Auto Manufacturers - 0.58% | |||||||||||||||
Fiat Chrysler Automobiles N.V., 5.250%, Due 4/15/2023 | $ | 200,000 | $ | 214,000 | |||||||||||
Mclaren Finance PLC, 5.750%, Due 8/1/2022F | 200,000 | 192,500 | |||||||||||||
|
| ||||||||||||||
| 406,500 | |||||||||||||||
|
| ||||||||||||||
| Retail - 0.58% | |||||||||||||||
BC ULC / New Red Finance, Inc., 5.000%, Due 10/15/2025F | 400,000 | 412,680 | |||||||||||||
|
| ||||||||||||||
Total Consumer, Cyclical | 819,180 | ||||||||||||||
|
| ||||||||||||||
| Consumer,Non-Cyclical - 0.95% | |||||||||||||||
| Agriculture - 0.07% | |||||||||||||||
Cooke Omega Investments, Inc. / Alpha VesselCo Holdings, Inc., 8.500%, Due 12/15/2022F | 50,000 | 50,875 | |||||||||||||
|
| ||||||||||||||
| Commercial Services - 0.31% | |||||||||||||||
Cimpress PLC, 7.000%, Due 6/15/2026F | 150,000 | 158,521 | |||||||||||||
GWB-CR Security Corp., 9.500%, Due 11/1/2027F | 58,000 | 61,915 | |||||||||||||
|
| ||||||||||||||
| 220,436 | |||||||||||||||
|
| ||||||||||||||
| Food - 0.30% | |||||||||||||||
Clearwater Seafoods, Inc., 6.875%, Due 5/1/2025F | 200,000 | 208,334 | |||||||||||||
|
| ||||||||||||||
| Household Products/Wares - 0.27% | |||||||||||||||
Kronos Acquisition Holdings, Inc., 9.000%, Due 8/15/2023F | 200,000 | 192,076 | |||||||||||||
|
| ||||||||||||||
Total Consumer,Non-Cyclical | 671,721 | ||||||||||||||
|
| ||||||||||||||
| Energy - 0.54% | |||||||||||||||
| Oil & Gas - 0.54% | |||||||||||||||
Aker BP ASA, 4.750%, Due 6/15/2024F | 100,000 | 103,983 | |||||||||||||
MEG Energy Corp., 7.000%, Due 3/31/2024F | 150,000 | 151,125 | |||||||||||||
Seven Generations Energy Ltd., 5.375%, Due 9/30/2025F | 125,000 | 125,312 | |||||||||||||
|
| ||||||||||||||
| 380,420 | |||||||||||||||
|
| ||||||||||||||
Total Energy | 380,420 | ||||||||||||||
|
| ||||||||||||||
| Financial - 1.38% | |||||||||||||||
| Banks - 0.55% | |||||||||||||||
Intesa Sanpaolo SpA, 5.710%, Due 1/15/2026F | 350,000 | 387,890 | |||||||||||||
|
| ||||||||||||||
| Diversified Financial Services - 0.83% | |||||||||||||||
Global Aircraft Leasing Co., Ltd., 6.500%, Due 9/15/2024, PIK(in-kind rate 6.500%)F | 350,000 | 358,067 | |||||||||||||
goeasy Ltd., 5.375%, Due 12/1/2024F | 225,000 | 230,344 | |||||||||||||
|
| ||||||||||||||
| 588,411 | |||||||||||||||
|
| ||||||||||||||
Total Financial | 976,301 | ||||||||||||||
|
| ||||||||||||||
| Industrial - 2.10% | |||||||||||||||
| Aerospace/Defense - 0.93% | |||||||||||||||
Bombardier, Inc., | |||||||||||||||
6.000%, Due 10/15/2022F | 175,000 | 171,500 | |||||||||||||
7.500%, Due 12/1/2024F | 250,000 | 242,812 | |||||||||||||
7.500%, Due 3/15/2025F | 250,000 | 240,313 | |||||||||||||
|
| ||||||||||||||
| 654,625 | |||||||||||||||
|
| ||||||||||||||
See accompanying notes
23
American Beacon Crescent Short Duration High Income FundSM
Schedule of Investments
January 31, 2020
| Principal Amount | Fair Value | ||||||||||||||
| FOREIGN CORPORATE OBLIGATIONS - 9.91% (continued) | |||||||||||||||
| Industrial - 2.10% (continued) | |||||||||||||||
| Packaging & Containers - 1.17% | |||||||||||||||
ARD Finance S.A., 6.500%, Due 6/30/2027, PIK(in-kind rate 6.500%)F | $ | 300,000 | $ | 309,720 | |||||||||||
Ardagh Packaging Finance PLC / Ardagh Holdings USA, Inc., 5.250%, Due 8/15/2027F | 150,000 | 157,313 | |||||||||||||
Cascades Inc/Cascades USA, Inc., 5.125%, Due 1/15/2026F | 275,000 | 283,937 | |||||||||||||
Trivium Packaging Finance B.V., 5.500%, Due 8/15/2026F | 75,000 | 79,031 | |||||||||||||
|
| ||||||||||||||
| 830,001 | |||||||||||||||
|
| ||||||||||||||
Total Industrial | 1,484,626 | ||||||||||||||
|
| ||||||||||||||
| Technology - 0.30% | |||||||||||||||
| Software - 0.30% | |||||||||||||||
Open Text Corp., 5.875%, Due 6/1/2026F | 200,000 | 211,250 | |||||||||||||
|
| ||||||||||||||
Total Foreign Corporate Obligations (Cost $6,861,758) | 7,000,173 | ||||||||||||||
|
| ||||||||||||||
| Shares | |||||||||||||||
| SHORT-TERM INVESTMENTS - 3.65% (Cost $2,580,211) | |||||||||||||||
| Investment Companies - 3.65% | |||||||||||||||
| American Beacon U.S. Government Money Market Select Fund, Select Class, 1.47%G H | 2,580,211 | 2,580,211 | |||||||||||||
|
| ||||||||||||||
TOTAL INVESTMENTS - 100.87% (Cost $70,507,471) | 71,262,128 | ||||||||||||||
LIABILITIES, NET OF OTHER ASSETS - (0.87%) | (615,043 | ) | |||||||||||||
|
| ||||||||||||||
TOTAL NET ASSETS - 100.00% | $ | 70,647,085 | |||||||||||||
|
| ||||||||||||||
| Percentages are stated as a percent of net assets. | |||||||||||||||
ANon-income producing security.
B Bank loan obligations, unless otherwise stated, carry a floating rate of interest. The coupon rate shown on floating or adjustable rate securities represents the rate at period end.
C Coupon rates may not be available for bank loans that are unsettled and/or unfunded as of January 31, 2020.
D Fair valued pursuant to procedures approved by the Board of Trustees. At period end, the value of these securities amounted to $163,153 or 0.23% of net assets. Value was determined using significant unobservable inputs.
E Unfunded Loan Commitment. At period end, the amount of unfunded loan commitments was $41,759 or 0.06% of net assets. Of this amount, $10,909 relate to Coolsys, Inc. and $30,850 relates to Wrench Group LLC.
F Security exempt from registration under the Securities Act of 1933. These securities may be resold to qualified institutional buyers pursuant to Rule 144A. At the period end, the value of these securities amounted to $28,120,378 or 39.80% of net assets. The Fund has no right to demand registration of these securities.
G The Fund is affiliated by having the same investment advisor.
H7-day yield.
LIBOR - London Interbank Offered Rate.
LLC - Limited Liability Company.
LLLP - Limited Liability Limited Partnership.
LP - Limited Partnership.
PIK - Payment in Kind.
PLC - Public Limited Company.
PRIME - A rate, charged by banks, based on the U.S. Federal Funds rate.
REIT - Real Estate Investment Trust.
See accompanying notes
24
American Beacon Crescent Short Duration High Income FundSM
Schedule of Investments
January 31, 2020
The Fund’s investments are summarized by level based on the inputs used to determine their values. As of January 31, 2020, the investments were classified as described below:
Crescent Short Duration High Income Fund | Level 1 | Level 2 | Level 3 | Total | ||||||||||||||||||||||||
Assets | ||||||||||||||||||||||||||||
Common Stocks | $ | 4,615 | $ | - | $ | - | $ | 4,615 | ||||||||||||||||||||
Warrants | 212 | - | - | 212 | ||||||||||||||||||||||||
Bank Loan Obligations(1) | - | 17,530,150 | 163,153 | (2) | 17,693,303 | |||||||||||||||||||||||
Corporate Obligations | - | 43,983,614 | - | 43,983,614 | ||||||||||||||||||||||||
Foreign Corporate Obligations | - | 7,000,173 | - | 7,000,173 | ||||||||||||||||||||||||
Short-Term Investments | 2,580,211 | - | - | 2,580,211 | ||||||||||||||||||||||||
|
|
|
|
|
|
|
| |||||||||||||||||||||
Total Investments in Securities - Assets | $ | 2,585,038 | $ | 68,513,937 | $ | 163,153 | $ | 71,262,128 | ||||||||||||||||||||
|
|
|
|
|
|
|
| |||||||||||||||||||||
| (1) | Unfunded loan commitments represent $41,759 at year end. |
| (2) | Includes investment held in the Fund’s Portfolio with $0 fair value. |
U.S. GAAP requires transfers between all levels to/from level 3 be disclosed. During the year ended January 31, 2020, there were no transfers into or out of Level 3.
The following table is a reconciliation of Level 3 assets within the Fund for which significant unobservable inputs were used to determine fair value. Transfers in or out of Level 3 represent the ending value of any security or instrument where a change in the level has occurred from the beginning to the end of the period:
| Security Type | Balance as of 1/31/2019 | Purchases | Sales | Accrued Discounts (Premiums) | Realized Gain (Loss) | Change in Unrealized Appreciation (Depreciation) | Transfer into Level 3 | Transfer out of Level 3 | Balance as of 1/31/2020 | Unrealized Appreciation (Depreciation) at Period end** | ||||||||||||||||||||||||
| Bank Loan Obligations | $170,888 | $- | $11,569 | $ | 99 | $ | 56 | $ | 3,679 | $ | - | $ | - | $ | 163,153 | (1) | $ | (6,729 | ) | |||||||||||||||
| ** | Change in unrealized appreciation (depreciation) attributable to Level 3 securities held at period end. This balance is included in the change in unrealized appreciation (depreciation) on the Statement of Operations. |
| (1) | Includes investment held in the Fund’s Portfolio with $0 fair value. |
The bank loan obligation was fair valued using a private valuation report from a third party valuation service provider where the market value of the bank loan obligation was $163,153. It has been classified as a Level 3 security due to the use of unobservable inputs that were significant to the valuation.
See accompanying notes
25
American Beacon Crescent Short Duration High Income FundSM
Statement of Assets and Liabilities
January 31, 2020
Assets: |
| |||
Investments in unaffiliated securities, at fair value† | $ | 68,681,917 | ||
Investments in affiliated securities, at fair value‡ | 2,580,211 | |||
Cash | 34,229 | |||
Dividends and interest receivable | 879,405 | |||
Receivable for investments sold | 1,751,703 | |||
Receivable for fund shares sold | 275 | |||
Receivable for expense reimbursement (Note 2) | 52,112 | |||
Prepaid expenses | 33,692 | |||
|
| |||
Total assets | 74,013,544 | |||
|
| |||
Liabilities: |
| |||
Payable for investments purchased | 3,162,645 | |||
Payable for fund shares redeemed | 5,019 | |||
Dividends payable | 896 | |||
Unfunded loan commitments | 41,759 | |||
Management andsub-advisory fees payable (Note 2) | 45,553 | |||
Service fees payable (Note 2) | 1,033 | |||
Transfer agent fees payable (Note 2) | 1,389 | |||
Custody and fund accounting fees payable | 15,288 | |||
Professional fees payable | 86,491 | |||
Trustee fees payable (Note 2) | 331 | |||
Payable for prospectus and shareholder reports | 4,626 | |||
Other liabilities | 1,429 | |||
|
| |||
Total liabilities | 3,366,459 | |||
|
| |||
Net assets | $ | 70,647,085 | ||
|
| |||
Analysis of net assets: |
| |||
Paid-in-capital | $ | 75,026,129 | ||
Total distributable earnings (deficits)A | (4,379,044 | ) | ||
|
| |||
Net assets | $ | 70,647,085 | ||
|
| |||
Shares outstanding at no par value (unlimited shares authorized): |
| |||
Institutional Class | 6,877,790 | |||
|
| |||
Y Class | 406,700 | |||
|
| |||
Investor Class | 65,271 | |||
|
| |||
A Class | 147,739 | |||
|
| |||
C Class | 54,297 | |||
|
| |||
Net assets: |
| |||
Institutional Class | $ | 64,345,935 | ||
|
| |||
Y Class | $ | 3,802,336 | ||
|
| |||
Investor Class | $ | 611,120 | ||
|
| |||
A Class | $ | 1,379,649 | ||
|
| |||
C Class | $ | 508,045 | ||
|
| |||
Net asset value, offering and redemption price per share: |
| |||
Institutional Class | $ | 9.36 | ||
|
| |||
Y Class | $ | 9.35 | ||
|
| |||
Investor Class | $ | 9.36 | ||
|
| |||
A Class | $ | 9.34 | ||
|
| |||
A Class (offering price) | $ | 9.58 | ||
|
| |||
C Class | $ | 9.36 | ||
|
| |||
† Cost of investments in unaffiliated securities | $ | 67,927,260 | ||
‡ Cost of investments in affiliated securities | $ | 2,580,211 | ||
| A The Fund’s investments in affiliated securities did not have unrealized appreciation (depreciation) at year end. |
| |||
See accompanying notes
26
American Beacon Crescent Short Duration High Income FundSM
Statement of Operations
For the year ended January 31, 2020
| Crescent Short Duration High Income Fund | ||||
Investment income: |
| |||
Dividend income from affiliated securities (Note 7) | $ | 74,253 | ||
Interest income | 4,435,000 | |||
|
| |||
Total investment income | 4,509,253 | |||
|
| |||
Expenses: |
| |||
Management andsub-advisory fees (Note 2) | 618,652 | |||
Transfer agent fees: | ||||
Institutional Class (Note 2) | 11,003 | |||
Y Class (Note 2) | 3,691 | |||
Investor Class | 1,430 | |||
A Class | 87 | |||
C Class | 44 | |||
Custody and fund accounting fees | 87,262 | |||
Professional fees | 134,278 | |||
Registration fees and expenses | 61,734 | |||
Service fees (Note 2): | ||||
A Class | 425 | |||
C Class | 303 | |||
Distribution fees (Note 2): | ||||
A Class | 3,365 | |||
C Class | 4,349 | |||
Prospectus and shareholder report expenses | 16,378 | |||
Trustee fees (Note 2) | 5,769 | |||
Other expenses | 15,317 | |||
|
| |||
Total expenses | 964,087 | |||
|
| |||
Net fees waived and expenses (reimbursed) (Note 2)C | (246,526 | ) | ||
|
| |||
Net expenses | 717,561 | |||
|
| |||
Net investment income | 3,791,692 | |||
|
| |||
Realized and unrealized gain (loss) from investments: |
| |||
Net realized gain (loss) from: | ||||
Investments in unaffiliated securitiesA | (741,042 | ) | ||
Change in net unrealized appreciation of: | ||||
Investments in unaffiliated securitiesB | 2,595,365 | |||
|
| |||
Net gain from investments | 1,854,323 | |||
|
| |||
Net increase in net assets resulting from operations | $ | 5,646,015 | ||
|
| |||
A The Fund did not recognize net realized gains (losses) from the sale of investments in affiliated securities. |
| |||
B The Fund’s investments in affiliated securities did not have a change in unrealized appreciation (depreciation) at year end. |
| |||
C The Manager voluntarily reimbursed service fees in the amount of $662. | ||||
See accompanying notes
27
American Beacon Crescent Short Duration High Income FundSM
Statement of Changes in Net Assets
| Year Ended January 31, 2020 | Year Ended January 31, 2019 | |||||||||||
Increase (decrease) in net assets: |
| |||||||||||
Operations: |
| |||||||||||
Net investment income | $ | 3,791,692 | $ | 4,598,725 | ||||||||
Net realized (loss) from investments in unaffiliated securities, and commission recapture | (741,042 | ) | (1,795,322 | ) | ||||||||
Change in net unrealized appreciation (depreciation) of investments in unaffiliated securities | 2,595,365 | (2,269,671 | ) | |||||||||
|
|
|
| |||||||||
Net increase in net assets resulting from operations | 5,646,015 | 533,732 | ||||||||||
|
|
|
| |||||||||
Distributions to shareholders: |
| |||||||||||
Total retained earnings: | ||||||||||||
Institutional Class | (3,635,223 | ) | (4,264,570 | ) | ||||||||
Y Class | (180,199 | ) | (248,726 | ) | ||||||||
Investor Class | (25,037 | ) | (34,886 | ) | ||||||||
A Class | (58,509 | ) | (65,085 | ) | ||||||||
C Class | (15,592 | ) | (21,512 | ) | ||||||||
|
|
|
| |||||||||
Net distributions to shareholders | (3,914,560 | ) | (4,634,779 | ) | ||||||||
|
|
|
| |||||||||
Capital share transactions (Note 9): |
| |||||||||||
Proceeds from sales of shares | 4,786,648 | 16,393,954 | ||||||||||
Reinvestment of dividends and distributions | 3,893,332 | 4,610,610 | ||||||||||
Cost of shares redeemed | (30,332,420 | ) | (14,291,239 | ) | ||||||||
|
|
|
| |||||||||
Net increase (decrease) in net assets from capital share transactions | (21,652,440 | ) | 6,713,325 | |||||||||
|
|
|
| |||||||||
Net increase (decrease) in net assets | (19,920,985 | ) | 2,612,278 | |||||||||
|
|
|
| |||||||||
Net assets: |
| |||||||||||
Beginning of period | 90,568,070 | 87,955,792 | ||||||||||
|
|
|
| |||||||||
End of period | $ | 70,647,085 | $ | 90,568,070 | ||||||||
|
|
|
| |||||||||
See accompanying notes
28
American Beacon Crescent Short Duration High Income FundSM
January 31, 2020
1. Organization and Significant Accounting Policies
American Beacon Funds (the “Trust”) is organized as a Massachusetts business trust. The Fund, a series within the Trust, is registered under the Investment Company Act of 1940, as amended (the “Act”), as a diversified,open-end management investment company. As of January 31, 2020, the Trust consists ofthirty-two active series, one of which is presented in this filing: American Beacon Crescent Short Duration High Income Fund (the “Fund”). The remainingthirty-one active series are reported in separate filings.
American Beacon Advisors, Inc. (the “Manager”) is a Delaware corporation and a wholly-owned subsidiary of Resolute Investment Managers, Inc. (“RIM”) organized in 1986 to provide business management, advisory, administrative, and asset management consulting services to the Trust and other investors. The Manager is registered as an investment advisor under the Investment Advisers Act of 1940, as amended (the “Advisers Act”). RIM is, in turn, a wholly-owned subsidiary of Resolute Acquisition, Inc., which is a wholly-owned subsidiary of Resolute Topco, Inc., a wholly-owned subsidiary of Resolute Investment Holdings, LLC (“RIH”). RIH is owned primarily by Kelso Investment Associates VIII, L.P., KEP VI, LLC and Estancia Capital Partners L.P., investment funds affiliated with Kelso & Company, L.P. (“Kelso”) or Estancia Capital Management, LLC (“Estancia”), which are private equity firms.
Recently Adopted Accounting Pronouncements
In March 2017, the Financial Accounting Standards Board (“FASB”) issued Accounting Standards Update (“ASU”)2017-08,Premium Amortization of Purchased Callable Debt Securities. The amendments in the ASU shorten the premium amortization period on a purchased callable debt security from the security’s contractual life to the earliest call date. It is anticipated that this change will enhance disclosures by reducing losses recognized when a security is called on an earlier date. This ASU is effective for fiscal years beginning after December 15, 2018, and has been adopted accordingly with no material impact on the financial statements and other disclosures.
In August 2018, the FASB issued ASU2018-13,Fair Value Measurement (“Topic 820”). The amendments in the ASU impact disclosure requirements for fair value measurement. It is anticipated that this change will enhance the effectiveness of disclosures in the notes to the financial statements. This ASU is effective for fiscal years beginning after December 15, 2019. Early adoption is permitted and can include the entire standard or certain provisions that exclude or amend disclosures. For the year ended January 31, 2020, the Fund has chosen to adopt the standard. The adoption of this ASU guidance did not have a material impact on the financial statements and other disclosures.
Class Disclosure
The Fund has multiple classes of shares designed to meet the needs of different groups of investors. The following table sets forth the differences amongst the classes:
Class | Eligible Investors | Minimum Initial Investments | ||||
| Institutional | Large institutional investors - sold directly or through intermediary channels. | $ | 250,000 | |||
| Y Class | Large institutional retirement plan investors - sold directly or through intermediary channels. | $ | 100,000 | |||
| Investor | All investors using intermediary organizations, such as broker-dealers or retirement plan sponsors. | $ | 2,500 | |||
| A Class | All investors who invest through intermediary organizations, such as broker-dealers or third party administrator. Retail investors who invest directly through a financial intermediary such as a broker, bank, or registered investment advisor which may include afront-end sales charge and a contingent deferred sales charge (“CDSC”). | $ | 2,500 | |||
| C Class | Retail investors who invest directly through a financial intermediary such as a broker or through employee directed benefit plans with applicable sales charges which may include CDSC. | $ | 1,000 | |||
29
American Beacon Crescent Short Duration High Income FundSM
Notes to Financial Statements
January 31, 2020
Each class offered by the Trust has equal rights as to assets and voting privileges. Income andnon-class specific expenses are allocated daily to each class based on the relative net assets. Realized and unrealized capital gains and losses of each class are allocated daily based on the relative net assets of each class of the Fund. Class specific expenses, where applicable, currently include service, distribution, transfer agent fees, andsub-transfer agent fees that vary amongst the classes as described more fully in Note 2.
Significant Accounting Policies
The following is a summary of significant accounting policies, consistently followed by the Fund in preparation of the financial statements. The Fund is considered an investment company and accordingly, follows the investment company accounting and reporting guidance of the FASB Accounting Standards Codification Topic 946,Financial Services - Investment Companies,a part of Generally Accepted Accounting Principles (“U.S. GAAP”).
Security Transactions and Investment Income
Security transactions are recorded as of the trade date for financial reporting purposes. Securities purchased or sold on a when-issued or delayed-delivery basis may be settled beyond a standard settlement period for the security after the trade date.
Dividend income, net of foreign taxes, is recorded on theex-dividend date, except certain dividends from foreign securities which are recorded as soon as the information is available to the Fund. Interest income, net of foreign taxes, is earned from settlement date, recorded on the accrual basis, and adjusted, if necessary, for accretion of discounts and amortization of premiums. Realized gains (losses) from securities sold are determined based on specific lot identification.
Distributions to Shareholders
The Fund distributes most or all of its net earnings and realized gains, if any, each taxable year in the form of dividends from net investment income on a daily basis and distributions of realized net capital gains and net gains from foreign currency transactions on an annual basis. The Fund does not have a fixed dividend rate and does not guarantee that it will pay any distributions in any particular period. Dividends to shareholders are determined in accordance with federal income tax regulations, which may differ in amount and character from net investment income and realized gains recognized for purposes of U.S. GAAP. To the extent necessary to fully distribute capital gains, the Fund may designate earnings and profits distributed to shareholders on the redemption of shares.
Commission Recapture
The Fund has established brokerage commission recapture arrangements with certain brokers or dealers. If the Fund’s investment advisor chooses to execute a transaction through a participating broker, the broker rebates a portion of the commission back to the Fund. Any collateral benefit received through participation in the commission recapture program is directed exclusively to the Fund. This amount is reported with the net realized gain in the Fund’s Statement of Operations, if applicable.
Allocation of Income, Trust Expenses, Gains, and Losses
Investment income, realized and unrealized gains and losses from investments of the Fund is allocated daily to each class of shares based upon the relative proportion of net assets of each class to the total net assets of the Fund. Expenses directly charged or attributable to the Fund will be paid from the assets of the Fund. Generally, expenses of the Trust will be allocated among and charged to the assets of the Fund on a basis that the Trust’s Board of Trustees (the “Board”) deems fair and equitable, which may be based on the relative net assets of the Fund or nature of the services performed and relative applicability to the Fund.
30
American Beacon Crescent Short Duration High Income FundSM
Notes to Financial Statements
January 31, 2020
Use of Estimates
The preparation of financial statements in conformity with U.S. GAAP requires management to make estimates and assumptions that affect the amounts reported in the financial statements and accompanying notes. Actual results may differ from those estimated.
Other
Under the Trust’s organizational documents, its officers and trustees are indemnified against certain liabilities arising out of the performance of their duties to the Trust. In the normal course of business, the Trust enters into contracts that provide indemnification to the other party or parties against potential costs or liabilities. The Trust’s maximum exposure under these arrangements is dependent on claims that may be made in the future and, therefore, cannot be estimated. The Trust has had no prior claims or losses pursuant to any such agreement.
Concentration of Ownership
From time to time, the Fund may have a concentration of one or more accounts constituting a significant percentage of shares outstanding. Investment activities by holders of accounts that represent a significant ownership of more than 5% of the Fund’s outstanding shares could have a material impact on the Fund. As of January 31, 2020, based on management’s evaluation of the shareholder account base, two accounts have been identified as representing an unaffiliated significant ownership of approximately 55% of the Fund’s outstanding shares.
2. Transactions with Affiliates
Management and InvestmentSub-Advisory Agreements
The Fund and the Manager are parties to a Management Agreement that obligates the Manager to provide the Fund with investment advisory and administrative services. As compensation for performing the duties under the Management Agreement, the Manager will receive an annualized management fee based on a percentage of the Fund’s average daily net assets that is calculated and accrued daily according to the following schedule:
First $5 billion | 0.35 | % | ||
Next $5 billion | 0.325 | % | ||
Next $10 billion | 0.30 | % | ||
Over $20 billion | 0.275 | % |
The Trust, on behalf of the Fund, and the Manager have entered into an Investment Advisory Agreement with Crescent Capital Group LP (the“Sub-Advisor”) pursuant to which the Fund has agreed to pay an annualizedsub-advisory fee that is calculated and accrued daily based on the Fund’s average daily net assets according to the following schedules:
First $250 million | 0.40 | % | ||
Next $750 million | 0.35 | % | ||
Over $1 billion | 0.30 | % |
The Management andSub-Advisory Fees paid by the Fund during the year ended January 31, 2020 were as follows:
| Effective Fee Rate | Amount of Fees Paid | |||||||||||
Management Fees | 0.35 | % | $ | 288,704 | ||||||||
Sub-Advisor Fees | 0.40 | % | 329,948 | |||||||||
|
|
|
| |||||||||
Total | 0.75 | % | $ | 618,652 | ||||||||
|
|
|
| |||||||||
31
American Beacon Crescent Short Duration High Income FundSM
Notes to Financial Statements
January 31, 2020
Distribution Plans
Separate Distribution Plans (the “Distribution Plans”) have been adopted pursuant to Rule 12b-1 under the Act for the A and C Classes of the Funds. Under the Distribution Plans, as compensation for distribution and shareholder servicing assistance, the Funds’ Distributor, Resolute Investment Distributors, Inc. (“RID” or “Distributor”), receives an annual fee of 0.25% of the average daily net assets of the A Class and 1.00% of the average daily net assets of the C Class. The fee will be payable without regard to whether the amount of the fee is more or less than the actual expenses incurred in a particular month by the Distributor for distribution assistance.
For all other share classes, the Funds have utilized a “defensive” distribution plan (the “Plan”) pursuant to which no separate fees may be charged to the Funds for distribution purposes. However, the Plan authorizes the use of management fees received by the Manager and/or the investment advisors hired by the Manager for distribution purposes. Under this Plan, the Funds do not intend to compensate the Manager or any other party, either directly or indirectly, for the distribution of Fund shares from these fees.
Service Plans
The Investor, A and C Classes have each adopted a Service Plan (collectively, the “Plans”). The Plans authorize the payment to the Manager an annual fee up to 0.375% of the average daily net assets of the Investor Class, up to 0.25% of the average daily net assets of the A Class and up to 0.25% of the average daily net assets of the C Class. In addition, the Funds may reimburse the Manager for certain non-distribution shareholder services provided by financial intermediaries attributable to Y Class and Institutional Class. The Manager or other approved entities may spend such amounts on any activities or expenses primarily intended to result in or relate to the servicing of A Class, C Class, Y Class, Institutional Class and Investor Class including, but not limited to, payment of shareholder service fees and transfer agency or sub-transfer agency expenses. The fees will be payable monthly in arrears. The primary expenses expected to be incurred under the Plans are shareholder servicing, record keeping fees and servicing fees paid to financial intermediaries such as plan sponsors and broker-dealers.
Sub-Transfer Agent Fees
The Manager has entered into agreements, which include servicing agreements, with financial intermediaries that provide recordkeeping, processing, shareholder communications and other services to customers of the intermediaries that hold positions in the Institutional and Y Classes of the Fund and has agreed to compensate the intermediaries for providing these services. Intermediaries transact with the Fund primarily through the use of omnibus accounts on behalf of its customers who hold positions in the Fund. Certain services would have been provided by the Fund’s transfer agent and other service providers if the shareholders’ accounts were maintained directly by the Fund’s transfer agent. Accordingly, the Fund, pursuant to Board approval, has agreed to reimburse the Manager for certainnon-distribution shareholder services provided by financial intermediaries for the Institutional and Y Classes. The reimbursement amounts(sub-transfer agent fees) paid to the Manager are subject to a fee limit of up to 0.10% of an intermediary’s average net assets in the Institutional and Y Classes on an annual basis. During the year ended January 31, 2020, thesub-transfer agent fees, as reflected in “Transfer agent fees” on the Statement of Operations, were as follows:
Fund | Sub-Transfer Agent Fees | |||
Crescent Short Duration High Income | $ | 11,666 | ||
As of January 31, 2020, the Fund owed the Manager the following reimbursement ofsub-transfer agent fees, as reflected in “Transfer agent fees payable” on the Statement of Assets and Liabilities:
Fund | Reimbursement Sub-Transfer Agent Fees | |||
Crescent Short Duration High Income | $ | 656 | ||
32
American Beacon Crescent Short Duration High Income FundSM
Notes to Financial Statements
January 31, 2020
Investments in Affiliated Funds
The Fund may invest in the American Beacon U.S. Government Money Market Select Fund (the “USG Select Fund”). The Fund and the USG Select Fund have the same investment advisor and therefore, are considered to be affiliated. The Manager serves as investment advisor to the USG Select Fund and receives management fees and administrative fees totaling 0.10% of the average daily net assets of the USG Select Fund. During the year ended January 31, 2020, the Manager earned fees on the Fund’s direct investments in the USG Select Fund as shown below:
Fund | Direct Investments in USG Select Fund | |||
Crescent Short Duration High Income | $ | 3,564 | ||
Interfund Credit Facility
Pursuant to an exemptive order issued by the U.S. Securities and Exchange Commission (“SEC”), the Fund, along with other registered investment companies having management contracts with the Manager, may participate in a credit facility whereby each fund, under certain conditions, is permitted to lend money directly to and borrow directly from other participating funds for temporary purposes. The interfund credit facility is advantageous to the funds because it provides added liquidity and eliminates the need to maintain higher cash balances to meet redemptions. This situation could arise when shareholder redemptions exceed anticipated volumes and certain funds have insufficient cash on hand to satisfy such redemptions or when sales of securities do not settle as expected, resulting in a cash shortfall for a fund. When a fund liquidates portfolio securities to meet redemption requests, they often do not receive payment in settlement for up to two days (or longer for certain foreign transactions). Redemption requests normally are satisfied on the next business day. The credit facility provides a source of immediate, short-term liquidity pending settlement of the sale of portfolio securities. The credit facility is administered by a credit facility team consisting of professionals from the Manager’s asset management, compliance, and accounting areas who report the activities of the credit facility to the Board. During the year ended January 31, 2020, the Fund did not utilize the credit facility.
Expense Reimbursement Plan
The Manager contractually agreed to reduce fees and/or reimburse expenses for the classes of the Fund to the extent that total operating expenses exceed the Fund’s expense cap. During the year ended January 31, 2020, the Manager waived and/or reimbursed expenses as follows:
| Expense Cap | Reimbursed Expenses | Expiration of Reimbursed Expenses | ||||||||||||||||
Fund | Class | 2/1/2019 - 1/31/2020 | (Recouped) Expenses | |||||||||||||||
Crescent Short Duration High Income | Institutional | 0.85 | % | $ | 231,047 | $ | - | 2022 - 2023 | ||||||||||
Crescent Short Duration High Income | Y | 0.95 | % | 11,115 | - | 2022 - 2023 | ||||||||||||
Crescent Short Duration High Income | Investor | 1.23 | % | 5,309 | (5,032 | ) | 2022 - 2023 | |||||||||||
Crescent Short Duration High Income | A | 1.25 | % | 2,439 | - | 2022 - 2023 | ||||||||||||
Crescent Short Duration High Income | C | 2.00 | % | 986 | - | 2022 - 2023 | ||||||||||||
Of these amounts, $52,112 was disclosed as a receivable from the Manager on the Statement of Assets and Liabilities at January 31, 2020.
The Fund has adopted an Expense Reimbursement Plan whereby the Manager may seek repayment of such fee or voluntary reductions and expense reimbursements. Under the policy, the Manager can be reimbursed by the Fund for any contractual or voluntary fee reductions or expense reimbursements if reimbursement to the Manager (a) occurs within three years after the date of the Manager’s waiver/reimbursement and (b) does not cause the Fund’s annual operating expenses to exceed the lesser of the contractual percentage limit in effect at the time of the waiver/reimbursement or time of recoupment. The reimbursed expenses listed above will expire in 2022 and
33
American Beacon Crescent Short Duration High Income FundSM
Notes to Financial Statements
January 31, 2020
2023. The Fund did not record a liability for potential reimbursements due to the current assessment that reimbursements are uncertain. The carryover of excess expenses potentially reimbursable to the Manager, but not recorded as a liability are as follows:
Fund | Recouped Expenses | Excess Expense Carryover | Expired Expense Carryover | Expiration of Reimbursed Expenses | ||||||||||||
Crescent Short Duration High Income | $ | 3,830 | $ | - | $ | 198,098 | 2019 - 2020 | |||||||||
Crescent Short Duration High Income | 1,498 | 174,203 | - | 2020 - 2021 | ||||||||||||
Crescent Short Duration High Income | - | 208,703 | - | 2021 - 2022 | ||||||||||||
Sales Commissions
The Fund’s Distributor, Resolute Investment Distributors, Inc. (“RID” or “Distributor”), may receive a portion of Class A sales charges from broker dealers which may be used to offset distribution related expenses. During the year ended January 31, 2020 there were fees of $488 collected by RID for Class A Shares.
A CDSC of 0.50% will be deducted with respect to Class A Shares on certain purchases of $1,000,000 or more that are redeemed in whole or part within 18 months of purchase, unless waived as discussed in the Fund’s Prospectus. Any applicable CDSC will be 0.50% of the lesser of the original purchase price or the value of the redemption of the Class A Shares redeemed. During the year ended January 31, 2020, there were no CDSC fees collected for Class A Shares of the Fund.
A CDSC of 1.00% will be deducted with respect to Class C Shares redeemed within 12 months of purchase, unless waived as discussed in the Fund’s Prospectus. Any applicable CDSC will be 1.00% of the lesser of the original purchase price or the value of the redemption of the Class C Shares redeemed. During the year ended January 31, 2020, there were no CDSC fees collected by RID for Class C Shares of the Fund.
Trustee Fees and Expenses
Effective January 1, 2020, as compensation for their service to the American Beacon Funds Complex, including the Trust (collectively, the “Trusts”), each Trustee is compensated from the Trusts as follows: (1) an annual retainer of $120,000; (2) meeting attendance fee (for attendance in person or via teleconference) of (a) $12,000 for in person attendance, or $5,000 for telephonic attendance, by Board members for each regularly scheduled or special Board meeting, (b) $2,500 for attendance by Committee members at meetings of the Audit Committee and the Investment Committee, (c) $1,500 for attendance by Committee members at meetings of the Nominating and Governance Committee; and (d) $2,500 for attendance by Board members for each special telephonic Board meeting; and (3) reimbursement of reasonable expenses incurred in attending Board meetings, Committee meetings, and relevant educational seminars. The Trustees also may be compensated for attendance at special Board and/or Committee meetings from time to time. For her service as Board Chair, Ms. Cline receives an additional annual retainer of $50,000. Although she attends several committee meetings at each quarterly Board meeting, she receives only a single $2,500 fee each quarter for her attendance at those meetings. The chairpersons of the Audit Committee and the Investment Committee each receive an additional annual retainer of $25,000 and the Chair of the Nominating and Governance Committee receives an additional annual retainer of $15,000.
3. Security Valuation and Fair Value Measurements
The price of the Fund’s shares is based on its net asset value (“NAV”) per share. The Fund’s NAV is computed by adding total assets, subtracting all the Fund’s liabilities, and dividing the result by the total number of shares outstanding.
The NAV of each class of the Fund’s shares is determined based on a pro rata allocation of the Fund’s investment income, expenses and total capital gains and losses. The Fund’s NAV per share is determined each
34
American Beacon Crescent Short Duration High Income FundSM
Notes to Financial Statements
January 31, 2020
business day as of the regular close of trading on the New York Stock Exchange (“NYSE” or “Exchange”), which is typically 4:00 p.m. Eastern Time (“ET”). However, if trading on the NYSE closes at a time other than 4:00 p.m. ET, the Fund’s NAV per share typically would still be determined as of the regular close of trading on the NYSE. The Fund does not price its shares on days that the NYSE is closed. Foreign exchanges may permit trading in foreign securities on days when the Fund is not open for business, which may result in the value of the Fund’s portfolio investments being affected at a time when you are unable to buy or sell shares.
Equity securities, including shares ofclosed-end funds and exchange-traded funds (“ETFs”), are valued at the last sale price or official closing price taken from the primary exchange in which each security trades. Investments in other mutual funds are valued at the closing NAV per share on the day of valuation. Debt securities are valued at bid quotes from broker/dealers or evaluated bid prices from pricing services, who may consider a number of inputs and factors, such as prices of comparable securities, yield curves, spreads, credit ratings, coupon rates, maturity, default rates, and underlying collateral. Futures are valued based on their daily settlement prices. Exchange-traded andover-the-counter (“OTC”) options are valued at the last sale price. Options with no last sale for the day are priced at mid quote. Swaps are valued at evaluated mid prices from pricing services.
The valuation of securities traded on foreign markets and certain fixed-income securities will generally be based on prices determined as of the earlier closing time of the markets on which they primarily trade unless a significant event has occurred. When the Fund holds securities or other assets that are denominated in a foreign currency, the Fund will normally use the currency exchange rates as of 4:00 p.m. ET.
Securities may be valued at fair value, as determined in good faith and pursuant to procedures approved by the Board, under certain limited circumstances. For example, fair value pricing will be used when market quotations are not readily available or reliable, as determined by the Manager, such as when (i) trading for a security is restricted or stopped; (ii) a security’s trading market is closed (other than customary closings); or (iii) a security has beende-listed from a national exchange. A security with limited market liquidity may require fair value pricing if the Manager determines that the available price does not reflect the security’s true market value. In addition, if a significant event that the Manager determines to affect the value of one or more securities held by the Fund occurs after the close of a related exchange but before the determination of the Fund’s NAV, fair value pricing may be used on the affected security or securities. Securities of small-capitalization companies are also more likely to require a fair value determination using these procedures because they are more thinly traded and less liquid than the securities of larger-capitalization companies. The Fund may fair value securities as a result of significant events occurring after the close of the foreign markets in which the Fund invests as described below. In addition, the Fund may invest in illiquid securities requiring these procedures.
The Fund may use fair value pricing for securities primarily traded innon-U.S. markets because most foreign markets close well before the Fund’s pricing time of 4:00 p.m. ET. The earlier close of these foreign markets gives rise to the possibility that significant events, including broad market moves, may have occurred in the interim and may materially affect the value of those securities. If the Manager determines that the last quoted prices ofnon-U.S. securities will, in its judgment, materially affect the value of some or all its portfolio securities, the Manager can adjust the previous closing prices to reflect what it believes to be the fair value of the securities as of the close of the Exchange. In deciding whether it is necessary to adjust closing prices to reflect fair value, the Manager reviews a variety of factors, including developments in foreign markets, the performance of U.S. securities markets, and the performance of instruments trading in U.S. markets that represent foreign securities and baskets of foreign securities. These securities are fair valued using a pricing service, using methods approved by the Board, that considers the correlation of the trading patterns of the foreign security to intraday trading in the U.S. markets, based on indices of domestic securities and other appropriate indicators such as prices of relevant American Depositary Receipts (“ADRs”) and futures contracts. The Valuation Committee, established by the Board, may also fair value securities in other situations, such as when a particular foreign market is closed but the Fund is open. The Fund uses outside pricing services to provide closing prices and information to evaluate and/or adjust those prices. As a means of evaluating its security valuation process, the Valuation Committee routinely compares closing prices, the next day’s opening prices in the same markets and adjusted prices.
35
American Beacon Crescent Short Duration High Income FundSM
Notes to Financial Statements
January 31, 2020
Attempts to determine the fair value of securities introduce an element of subjectivity to the pricing of securities. As a result, the price of a security determined through fair valuation techniques may differ from the price quoted or published by other sources and may not accurately reflect the market value of the security when trading resumes. If a reliable market quotation becomes available for a security formerly valued through fair valuation techniques, the Manager compares the new market quotation to the fair value price to evaluate the effectiveness of the Fund’s fair valuation procedures. If any significant discrepancies are found, the Manager may adjust the Fund’s fair valuation procedures.
Valuation Inputs
Various inputs may be used to determine the fair value of the Fund’s investments. These inputs are summarized in three broad levels for financial statement purposes. The inputs or methodologies used to value securities are not necessarily an indication of the risk associated with investing in those securities.
| Level 1 | - | Quoted prices in active markets for identical securities. | ||
| Level 2 | - | Prices determined using other significant observable inputs. These may include quoted prices for similar securities, interest rates, prepayment speeds, credit risk, and others. | ||
| Level 3 | - | Prices determined using other significant unobservable inputs. Unobservable inputs reflect the Fund’s own assumptions about the factors market participants would use in pricing an investment. | ||
Level 1 and Level 2 trading assets and trading liabilities, at fair value
Fixed-income securities including corporate, convertible and municipal bonds and notes, U.S. government agencies, U.S. Treasury obligations, sovereign issues, bank loans, convertible preferred securities, andnon-U.S. bonds are normally valued by pricing service providers that use broker dealer quotations, reported trades or valuation estimates from their internal pricing models. The service providers’ internal models use inputs that are observable such as issuer details, interest rates, yield curves, prepayment speeds, credit risks/spreads, default rates, and quoted prices for similar assets. Securities that use similar valuation techniques and inputs as described above are categorized as Level 2 of the fair value hierarchy. Fixed-income securities purchased on a delayed-delivery basis aremarked-to-market daily until settlement at the forward settlement date and are categorized as Level 2 of the fair value hierarchy.
Common stocks that are traded on a national securities exchange, are stated at the last reported sale or settlement price on the day of valuation. To the extent these securities are actively traded and valuation adjustments are not applied, they are categorized as Level 1 of the fair value hierarchy. Securities using these valuation adjustments are categorized as Level 2 of the fair value hierarchy. Preferred securities and other equities traded on inactive markets or valued by reference to similar instruments are generally categorized as Level 2 of the fair value hierarchy.
Investments in registeredopen-end investment management companies will be valued based upon the NAVs of such investments and are categorized as Level 1 of the fair value hierarchy.
Level 3 trading assets and trading liabilities, at fair value
The valuation techniques and significant inputs used in determining the fair values of financial instruments classified as Level 3 of the fair value hierarchy are as follows.
Securities and other assets for which market quotes are not readily available are valued at fair value as determined in good faith by the Board or persons acting at their direction and may be categorized as Level 3 of the fair value hierarchy.
36
American Beacon Crescent Short Duration High Income FundSM
Notes to Financial Statements
January 31, 2020
Market quotes are considered not readily available in circumstances where there is an absence of current or reliable market-based data (e.g., trade information or broker quotes), including where events occur after the close of the relevant market, but prior to the Exchange close, that materially affect the values of the Fund’s securities or assets. In addition, market quotes are considered not readily available when, due to extraordinary circumstances, the exchanges or markets on which the securities trade, do not open for trading for the entire day and no other market prices are available. The Board has delegated to the Manager the responsibility for monitoring significant events that may materially affect the fair values of a Fund’s securities or assets and for determining whether the value of the applicable securities or assets should bere-evaluated in light of such significant events.
The Board has adopted methods for valuing securities and other assets in circumstances where market quotes are not readily available, and has delegated the responsibility for applying the valuation methods to the Manager. For instances in which daily market quotes are not readily available, investments may be valued pursuant to guidelines established by the Board. In the event that the security or asset cannot be valued, pursuant to one of the valuation methods established by the Board, the fair value of the security or asset will be determined in good faith by the Valuation Committee, generally based upon recommendations provided by the Manager.
When a Fund uses fair valuation methods applied by the Manager that use significant unobservable inputs to determine its NAV, the securities priced using this methodology are categorized as Level 3 of the fair value hierarchy. These methods may require subjective determinations about the value of a security. While the Trust’s policy is intended to result in a calculation of the Fund’s NAV that fairly reflects security values as of the time of pricing, the Trust cannot guarantee that values determined by the Board or persons acting at their direction would accurately reflect the price that a Fund could obtain for a security if it were to dispose of that security as of the time of pricing (for instance, in a forced or distressed sale). The prices used by a Fund may differ from the value that would be realized if the securities were sold.
4. Securities and Other Investments
Bank Loans and Senior Loans
Loans are typically administered by a bank, insurance company, finance company or other financial institution (the “agent”) for a lending syndicate of financial institutions. In a typical loan, the agent administers the terms of the loan agreement and is responsible for the collection of principal and interest and fee payments from the borrower and the apportionment of these payments to all lenders that are parties to the loan agreement. In addition, an institution (which may be the agent) may hold collateral on behalf of the lenders. Typically, under loan agreements, the agent is given broad authority in monitoring the borrower’s performance and is obligated to use the same care it would use in the management of its own property. In asserting rights against a borrower, the Fund normally will be dependent on the willingness of the lead bank to assert these rights, or upon a vote of all the lenders to authorize the action. If an agent becomes insolvent, or has a receiver, conservator, or similar official appointed for it by the appropriate regulatory authority, or becomes a debtor in a bankruptcy proceeding, the agent’s appointment may be terminated and a successor agent would be appointed. If an appropriate regulator or court determines that assets held by the agent for the benefit of purchasers of loans are subject to the claims of the agent’s general or secured creditors, the Fund might incur certain costs and delays in realizing payment on a loan or suffer a loss of principal and/or interest. The Fund may be subject to similar risks when it buys a participation interest or an assignment from an intermediary.
Bank loans are fixed and floating rate loans arranged through private negotiations between a company or anon-U.S. government and one or more financial institutions (lenders). The Fund may invest in senior loans, which are floating rate loans that hold a senior position in the capital structure of U.S. and foreign corporations, partnerships or other business entities. Under normal circumstances, senior loans have priority of claim ahead of other obligations of a borrower in the event of liquidation. Bank loans and senior loans may be collateralized or uncollateralized. They pay interest at rates that float above, or are adjusted periodically based on, a benchmark that reflects current interest rates.
37
American Beacon Crescent Short Duration High Income FundSM
Notes to Financial Statements
January 31, 2020
The Fund may invest in such loans in the form of participations in loans and assignments of all or a portion of loans from third parties. In connection with purchasing participations in such instruments, the Fund generally will have no right to enforce compliance by the borrower with the terms of the loan agreement relating to the loan, nor any rights ofset-off against the borrower, and the Fund may not benefit directly from any collateral supporting the loan in which it has purchased the participation. When the Fund purchases assignments from lenders, the Fund will acquire direct rights against the borrower on the loan. A Fund may acquire bank and senior loan assignments or participations. The purchaser of an assignment typically succeeds to all the rights and obligations of the assigning institution and becomes a lender under the credit agreement with respect to the debt obligation; however, the purchaser’s rights can be more restricted than those of the assigning institution, and, in any event, the Fund may not be able to unilaterally enforce all rights and remedies under the loan and with regard to any associated collateral. A participation typically results in a contractual relationship only with the institution participating out the interest, not with the borrower. In purchasing participations, the Fund generally will have no right to enforce compliance by the borrower with the terms of the loan agreement against the borrower, and the Fund may not directly benefit from the collateral supporting the debt obligation in which it has purchased the participation. As a result, a Fund will be exposed to the credit risk of both the borrower and the institution selling the participation.
The Fund earns a commitment fee, typically set as a percentage of the commitment amount. Such fee income, which is included in “Interest income” on the Statement of Operations, is recognized ratably over the commitment period. Unfunded floating rate loan interests aremarked-to-market daily, and any unrealized appreciation (depreciation) is included on the Statement of Assets and Liabilities and Statement of Operations.
Common Stock
Common stock generally takes the form of shares in a corporation which represent an ownership interest. It ranks below preferred stock and debt securities in claims for dividends and for assets of the company in a liquidation or bankruptcy. The value of a company’s common stock may fall as a result of factors directly relating to that company, such as decisions made by its management or decreased demand for the company’s products or services. A stock’s value may also decline because of factors affecting not just the company, but also companies in the same industry or sector. The price of a company’s stock may also be affected by changes in financial markets that are relatively unrelated to the company, such as changes in interest rates, currency exchange rates or industry regulation. Companies that elect to pay dividends on their common stock generally only do so after they invest in their own business and make required payments to bondholders and on other debt and preferred stock. Therefore, the value of a company’s common stock will usually be more volatile than its bonds, other debt and preferred stock. Common stock may be exchange-traded or OTC. OTC stock may be less liquid than exchange-traded stock.
Corporate Debt and Other Fixed-Income Securities
The Fund may hold debt, including government and corporate debt, and other fixed-income securities. The investment return of corporate debt securities reflects interest earning and changes in the market value of the security. Typically, the values of fixed-income securities change inversely with prevailing interest rates. Therefore, a fundamental risk of fixed-income securities is interest rate risk, which is the risk that their value will generally decline as prevailing interest rates rise, which may cause a Fund’s NAV to likewise decrease, and vice versa. How specific fixed-income securities may react to changes in interest rates will depend on specific characteristics of each security. Fixed-income securities are also subject to credit risk, which is the risk that the credit strength of an issuer of a fixed-income security will weaken and/or that the issuer will be unable to make timely principal and interest payments and that the security may go into default.
Delayed Funding Loans and Revolving Credit Facilities
The Fund may enter into delayed funding loans and revolving credit facilities. Delayed funding loans and revolving credit facilities are borrowing arrangements in which the lender agrees to make loans up to a maximum amount upon demand by the borrower during a specific term. A revolving credit facility differs from a delayed
38
American Beacon Crescent Short Duration High Income FundSM
Notes to Financial Statements
January 31, 2020
funding loan in that as the borrower repays the loan, an amount equal to the repayment may be borrowed again during the term of the revolving credit facility. Delayed funding loans and revolving credit facilities usually provide for floating or variable rates of interest. These commitments may have the effect of requiring a Fund to increase its investment in a company at a time when it might not otherwise decide to do so (including at a time when the company’s financial condition makes it uncertain that such amounts will be repaid). To the extent that a Fund is committed to advance additional funds, it will at all times segregate or “earmark” assets, determined to be liquid in accordance with procedures established by the Board, in an amount sufficient to meet such commitments.
The Fund may invest in delayed funding loans and revolving credit facilities with credit quality comparable to that of issuers of its securities investments. Delayed funding loans and revolving credit facilities may be subject to restrictions on transfer, and only limited opportunities may exist to resell such instruments. As a result, a Fund may be unable to sell such investments at an opportune time or may have to resell them at less than fair market value.
Floating Rate Loan Interest
The Fund may invest in floating rate loan interests. The floating rate loan interests held by the Fund are typically issued to companies (the “borrower”) by banks, other financial institutions, and privately and publicly offered corporations (the “lender”). Floating rate loan interests are generallynon-investment grade, often involve borrowers whose financial condition is troubled or uncertain and companies that are highly leveraged. The Fund may invest in obligations of borrowers who are in bankruptcy proceedings. Floating rate loan interests may include fully funded term loans or revolving lines of credit. Floating rate loan interests are typically senior in the corporate capital structure of the borrower. Floating rate loan interests generally pay interest at rates that are periodically determined by reference to a base lending rate plus a premium. The base lending rates are generally the lending rate offered by one or more European banks, such as the London Interbank Offered Rate (“LIBOR”), the prime rate offered by one or more U.S. banks or the certificate of deposit rate. Floating rate loan interests may involve foreign borrowers, and investments may be denominated in foreign currencies. The Fund considers these investments to be investments in debt securities for purposes of its investment policies.
When the Fund purchases a floating rate loan interest it may receive a facility fee and when it sells a floating rate loan interest, it may pay a facility fee. On an ongoing basis, the Fund may receive a commitment fee based on the undrawn portion of the underlying line of credit amount of a floating rate loan interest. Facility and commitment fees are typically amortized to income over the term of the loan or term of the commitment, respectively. Consent and amendment fees are recorded to income as earned. Prepayment penalty fees, which may be received by the Fund upon the prepayment of a floating rate loan interest by a borrower, are recorded as realized gains. The Fund may invest in multiple series or tranches of a loan. A different series or tranche may have varying terms and carry different associated risks.
Floating rate loan interests are usually freely callable at the borrower’s option. The Fund may invest in such loans in the form of participations in loans (“Participations”) or assignments (“Assignments”) of all or a portion of loans from third parties. Participations typically will result in the Fund having a contractual relationship only with the lender, not with the borrower. The Fund will have the right to receive payments of principal, interest and any fees to which it is entitled only from the lender selling the Participation and only upon receipt by the lender of the payments from the borrower. In connection with purchasing Participations, the Fund generally will have no right to enforce compliance by the borrower with the terms of the loan agreement, nor any rights of offset against the borrower, and the Fund may not benefit directly from any collateral supporting the loan in which it has purchased the Participation. As a result, the Fund will assume the credit risk of both the borrower and the lender that is selling the Participation. The Fund’s investment in Participations involves the risk of insolvency of the financial intermediaries who are parties to the transactions. In the event of the insolvency of the lender selling the Participation, the Fund may be treated as a general creditor of the lender and may not benefit from any offset between the lender and the borrower. Assignments typically result in the Fund having a direct contractual relationship with the borrower, and the Fund may enforce compliance by the borrower with the terms of the loan agreement.
39
American Beacon Crescent Short Duration High Income FundSM
Notes to Financial Statements
January 31, 2020
In connection with floating rate loan interests, the Fund may also enter into unfunded floating rate loan interests (“commitments”). In connection with these commitments, the Fund earns a commitment fee, typically set as a percentage of the commitment amount. Such fee income, which is included in “Interest income” on the Statement of Operations, is recognized ratably over the commitment period. Unfunded floating rate loan interests aremarked-to-market daily, and any unrealized appreciation (depreciation) is included on the Statement of Assets and Liabilities and Statement of Operations.
Foreign Debt Securities
The Fund may invest in foreign fixed and floating rate income securities (including emerging market securities) all or a portion of which may benon-U.S. dollar denominated and which include: (a) debt obligations issued or guaranteed by foreign national, provincial, state, municipal or other governments with taxing authority or by their agencies or instrumentalities, including Brady Bonds; (b) debt obligations of supranational entities; (c) debt obligations of the U.S. Government issued innon-dollar securities; (d) debt obligations and other fixed income securities of foreign corporate issuers (both dollar andnon-dollar denominated); and (e) U.S. corporate issuers (both Eurodollar andnon-dollar denominated). There is no minimum rating criteria for the Fund’s investments in such securities. Investing in the securities of foreign issuers involves special considerations that are not typically associated with investing in the securities of U.S. issuers. In addition, emerging markets are markets that have risks that are different and higher than those in more developed markets.
High-Yield Securities
Non-investment-grade securities are rated below the four highest credit grades by at least one of the public rating agencies (or are unrated if not publicly rated). Participation in high-yielding securities transactions generally involves greater returns in the form of higher average yields. However, participation in such transactions involves greater risks, including sensitivity to economic changes, solvency, and relative liquidity in the secondary trading market. Lower ratings may reflect a greater possibility that the financial condition of the issuer, or adverse changes in general economic conditions, or both, may impair the ability of the issuer to make payments of interest and principal. The prices and yields of lower-rated securities generally fluctuate more than higher-quality securities, and such prices may decline significantly in periods of general economic difficulty or rising interest rates.
Illiquid and Restricted Securities
Generally, an illiquid asset is an asset that the Fund reasonably expects cannot be sold or disposed of in current market conditions in seven calendar days or less without the sale or disposition significantly changing the market value of the investment. Historically, illiquid securities have included securities that have not been registered under the Securities Act, securities that are otherwise not readily marketable, and repurchase agreements having a remaining maturity of longer than seven calendar days. Securities that have not been registered under the Securities Act are referred to as private placements or restricted securities and are purchased directly from the issuer or in the secondary market. These securities may be sold only in a privately negotiated transaction or pursuant to an exemption from registration. A large institutional market exists for certain securities that are not registered under the Securities Act, including repurchase agreements, commercial paper, foreign securities, municipal securities and corporate bonds and notes. Institutional investors depend on an efficient institutional market in which the unregistered security can be readily resold or on an issuer’s ability to honor a demand for repayment. However, the fact that there are contractual or legal restrictions on resale of such investments to the general public or to certain institutions may not be indicative of their liquidity.
Limitations on resale may have an adverse effect on the marketability of portfolio securities, and the Fund might be unable to dispose of restricted or other illiquid securities promptly or at reasonable prices and might thereby experience difficulty satisfying redemptions within seven calendar days. In addition, the Fund may get only limited information about an issuer, so it may be less able to predict a loss. The Fund also might have to register
40
American Beacon Crescent Short Duration High Income FundSM
Notes to Financial Statements
January 31, 2020
such restricted securities in order to dispose of them resulting in additional expense and delay. Adverse market conditions could impede such a public offering of securities. In recognition of the increased size and liquidity of the institutional market for unregistered securities and the importance of institutional investors in the formation of capital, the SEC adopted Rule 144A under the Securities Act. Rule 144A is designed to facilitate efficient trading among institutional investors by permitting the sale of certain unregistered securities to qualified institutional buyers. To the extent privately placed securities held by the Fund qualify under Rule 144A and an institutional market develops for those securities, the Fund likely will be able to dispose of the securities without registering them under the Securities Act. To the extent that institutional buyers become, for a time, uninterested in purchasing these securities, investing in Rule 144A securities could increase the level of the Fund’s illiquidity. The Manager or thesub-advisor, as applicable, may determine that certain securities qualified for trading under Rule 144A are liquid. Regulation S under the Securities Act permits the sale abroad of securities that are not registered for sale in the United States and includes a provision for U.S. investors, such as the Fund, to purchase such unregistered securities if certain conditions are met.
Securities sold in private placement offerings made in reliance on the “private placement” exemption from registration afforded by Section 4(a)(2) of the Securities Act and resold to qualified institutional buyers under Rule 144A under the Securities Act (“Section 4(a)(2) securities”) are restricted as to disposition under the federal securities laws, and generally are sold to institutional investors, such as the Fund, that agree they are purchasing the securities for investment and not with an intention to distribute to the public. Any resale by the purchaser must be pursuant to an exempt transaction and may be accomplished in accordance with Rule 144A. Section 4(a)(2) securities normally are resold to other institutional investors through or with the assistance of the issuer or dealers that make a market in the Section 4(a)(2) securities, thus providing liquidity.
Restricted securities outstanding during the year ended January 31, 2020 are disclosed in the Notes to the Schedule of Investments.
Other Investment Company Securities and Other Exchange-Traded Products
The Fund may invest in shares of other investment companies, includingopen-end funds,closed-end funds, business development companies (“BDCs”), ETFs, unit investment trusts, and other investment companies of the Trust. The Fund may invest in securities of an investment company advised by the Manager or asub-advisor. Investments in the securities of other investment companies may involve duplication of advisory fees and certain other expenses. By investing in another investment company, the Fund becomes a shareholder of that investment company. As a result, the Fund’s shareholders indirectly will bear the Fund’s proportionate share of the fees and expenses paid by shareholders of the other investment company, in addition to the fees and expenses the Fund’s shareholders directly bear in connection with the Fund’s own operations. These other fees and expenses are reflected as Acquired Fund Fees and Expenses and are included in the Fees and Expenses Table for the Fund in its Prospectus, if applicable. Investments in other investment companies may involve the payment of substantial premiums above the value of such issuer’s portfolio securities.
Payment-In-Kind Securities
The Fund may invest inpayment-in-kind securities (“PIKs”). PIKs give the issuer the option at each interest payment date of making interest payments in either cash or additional debt securities. Those additional debt securities usually have the same terms, including maturity dates and interest rates, and associated risks as the original bonds. The daily market quotations of the original bonds may include the accrued interest (referred to as a dirty price) and require apro-rata adjustment from the “Unrealized appreciation (depreciation) of investments” to “Dividend and interest receivable” in the Statement of Assets and Liabilities.
41
American Beacon Crescent Short Duration High Income FundSM
Notes to Financial Statements
January 31, 2020
5. Principal Risks
Investing in the Fund may involve certain risks including, but not limited to, those described below.
Credit Risk
The Fund is subject to the risk that the issuer or guarantor of an obligation, or the counterparty to a transaction, including a derivatives contract or a loan, will fail to make timely payment of interest or principal or otherwise honor its obligations or default completely. The strategies utilized by thesub-advisors require accurate and detailed credit analysis of issuers and there can be no assurance that its analysis will be accurate or complete. The Fund may be subject to substantial losses in the event of credit deterioration or bankruptcy of one or more issuers in its portfolio.
Financial strength and solvency of an issuer are the primary factors influencing credit risk. In addition, inadequacy of collateral or credit enhancement for a debt instrument may affect its credit risk. Credit risk may change over the life of an instrument and debt obligations which are rated by rating agencies may be subject to downgrade. The credit ratings of debt instruments and investments represent the rating agencies’ opinions regarding their credit quality and are not a guarantee of future credit performance of such securities. Rating agencies attempt to evaluate the safety of the timely payment of principal and interest (or dividends) and do not evaluate the risks of fluctuations in market value. The ratings assigned to securities by rating agencies do not purport to fully reflect the true risks of an investment. Further, in recent years many highly-rated structured securities have been subject to substantial losses as the economic assumptions on which their ratings were based proved to be materially inaccurate. A decline in the credit rating of an individual security held by the Fund may have an adverse impact on its price and make it difficult for the Fund to sell it. Ratings represent a rating agency’s opinion regarding the quality of the security and are not a guarantee of quality. Rating agencies might not always change their credit rating on an issuer or security in a timely manner to reflect events that could affect the issuer’s ability to make timely payments on its obligations. Credit risk is typically greater for securities with ratings that are below investment grade (commonly referred to as “junk bonds”). Since the Fund can invest significantly in lower quality debt securities considered speculative in nature, this risk will be substantial. A downgrade or default affecting any of the Fund’s securities could affect the Fund’s performance.
Floating Rate Securities Risk
The coupons on certain fixed income securities in which the Fund may invest are not fixed and may fluctuate based upon changes in market rates. The coupon on a floating rate security is generally based on an interest rate such as a money-market index, London Interbank Offered Rate (“LIBOR”) or a Treasury bill rate. Such securities are subject to interest rate risk and may fluctuate in value in response to interest rate changes if there is a delay between changes in market interest rates and the interest reset date for the obligation, or for other reasons. As short-term interest rates decline, the coupons on floating rate securities typically decrease. Alternatively, during periods of rising interest rates, changes in the coupons of floating rate securities may lag behind changes in market rates or may have limits on the maximum increases in the coupon rates. The value of floating rate securities may decline if their coupons do not rise as much, or as quickly, as interest rates in general. Conversely, floating rate securities will not generally increase in value if interest rates decline. Floating rate obligations are less effective than fixed rate obligations at locking in a particular yield and are subject to credit risk.
High-Yield Securities Risk
Investing in high-yield, below investment-grade securities (commonly referred to as “junk bonds”) generally involves significantly greater risks of loss of your money than an investment in investment grade securities. High-yield debt securities may fluctuate more widely in price and yield and may fall in price when the economy is weak or expected to become weak. High-yield securities are considered to be speculative with respect to an issuer’s
42
American Beacon Crescent Short Duration High Income FundSM
Notes to Financial Statements
January 31, 2020
ability to pay interest and principal and carry a greater risk that the issuers of lower-rated securities will default on the timely payment of principal and interest. Below investment grade securities may experience greater price volatility and less liquidity than investment grade securities.
Illiquid and Restricted Securities Risk
Securities not registered in the U.S. under the Securities Act, including Rule 144A securities, are restricted as to their resale. Such securities may not be listed on an exchange and may have no active trading market. They may be more difficult to purchase or sell at an advantageous time or price because such securities may not be readily marketable in broad public markets. The Fund may not be able to sell a restricted security when thesub-advisor considers it desirable to do so and/or may have to sell the security at a lower price than the Fund believes is its fair market value. In addition, transaction costs may be higher for restricted securities and the Fund may receive only limited information regarding the issuer of a restricted security. The Fund may have to bear the expense of registering restricted securities for resale and the risk of substantial delays in effecting the registration.
Interest Rate Risk
Investments in fixed-income securities or derivatives that are influenced by interest rates are subject to interest rate risk. The value of the Fund’s fixed-income investments typically will fall when interest rates rise. The Fund may be particularly sensitive to changes in interest rates if it invests in debt securities with intermediate and long terms to maturity. Debt securities with longer maturities tend to be more sensitive to changes in interest rates, usually making them more volatile than debt securities with shorter durations. For example, if a bond has a duration of four years, a 1% increase in interest rates could be expected to result in a 4% decrease in the value of the bond. Yields of debt securities will fluctuate over time. Following the financial crisis that started in 2008, the Federal Reserve has attempted to stabilize the economy and support the economic recovery by keeping the federal funds rate (the interest rate at which depository institutions lend reserve balances to each other overnight) at or near zero percent. The Federal Reserve has raised the federal funds rate several times since December 2015 and may continue to increase or decrease rates in the future. Interest rates may rise significantly and/or rapidly, potentially resulting in substantial losses to the Fund. During periods of very low or negative interest rates, the Fund may be unable to maintain positive returns. Certain European countries and Japan have recently experienced negative interest rates on deposits and debt securities have traded at negative yields. Negative interest rates may become more prevalent amongnon-U.S. issuers, and potentially within the United States. Changing interest rates, including rates that fall below zero, may have unpredictable effects on markets, may result in heightened market volatility and may detract from Fund performance to the extent the Fund is exposed to such interest rates.
Liquidity Risk
When there is little or no active trading market for a specific type of security, it can become more difficult to purchase or sell the securities at or near their perceived value. During such periods, certain investments held by the Fund may be difficult to sell or other investments may be difficult to purchase at favorable times or prices. As a result, the Fund may have to lower the price on certain securities that it is trying to sell, sell other securities instead or forgo an investment opportunity, any of which could have a negative effect on Fund management or performance. Additionally, the market for certain investments may become illiquid under adverse market or economic conditions independent of any specific adverse changes in the conditions of a particular issuer.
Loan Interests Risk
Unlike publicly traded common stocks which trade on national exchanges, there is no central place or exchange for loans, including bank loans and senior loans, to trade. Loans trade in anover-the-counter market, and confirmation and settlement, which are effected through standardized procedures and documentation, may take significantly longer than seven days to complete. Extended trade settlement periods may, in unusual market conditions with a high volume of shareholder redemptions, present risk to shareholders regarding a Fund’s ability
43
American Beacon Crescent Short Duration High Income FundSM
Notes to Financial Statements
January 31, 2020
to pay redemption proceeds within the allowable time periods stated in its prospectus. The secondary market for floating rate loans also may be subject to irregular trading activity and wide bid/ask spreads. The lack of an active trading market for certain loans may impair the ability of a Fund to sell its loan interests at a time when it may otherwise be desirable to do so or may require a Fund to sell them at prices that are less than what a Fund regards as their fair market value and may make it difficult to value such loans. Interest in loans made to finance highly leveraged companies or transactions, such as corporate acquisitions, may be especially vulnerable to adverse changes in economic or market conditions. When a Fund’s loan interest is a participation, the Fund is subject to the risk that the party selling the participation interest will not remit a Fund’s pro rata share of loan payments to the Fund, and the Fund may have less control over the exercise of remedies than the party selling the participation interest.
Market Disruption Risk
Geopolitical and other events, including war, terrorism, economic uncertainty, trade disputes, pandemics, public health crises and related geopolitical events have led, and in the future may continue to lead, to instability in world economies and markets generally. This instability has disrupted, and may continue to disrupt, U.S. and world economies and markets and adversely affect the value of your investment. Such market disruptions have caused, and may continue to cause, broad changes in market value, negative public perceptions concerning these developments, and adverse investor sentiment or publicity. Changes in value may be temporary or may last for extended periods. Although multiple asset classes have been and may continue to be affected by a market disruption, the duration and effects may not be the same for all types of assets. Events that have led to market disruptions include the recent pandemic spread of the novel coronavirus known as COVID-19, which has resulted in travel restrictions, closed international borders, quarantines, disruptions to supply chains and lower consumer demand. The duration and full effects of these market disruptions are still uncertain. The effect of recent efforts undertaken by the Federal Reserve System to address the economic impact of the COVID-19 pandemic, such as the reduction of the federal funds target rate, and other monetary and fiscal actions that may be taken by the U.S. federal government to stimulate the U.S. economy, are not yet known. In addition, COVID-19 could cause the need for employees and vendors at various businesses, including the Manager, the sub-advisor(s) or other service providers, to work at external locations, and extensive medical absences. Because a large epidemic may create significant market and business uncertainties and disruptions, not all events that could affect the business of the Manager, the sub-advisor(s) or other service providers can be determined and addressed in advance.
Market Risk
Conditions in the U.S. and many foreign economies have resulted, and may continue to result, in certain instruments experiencing unusual liquidity issues, increased price volatility and, in some cases, credit downgrades and increased likelihood of default. These events have reduced the willingness and ability of some lenders to extend credit, and have made it more difficult for some borrowers to obtain financing on attractive terms, if at all. In some cases, traditional market participants have been less willing to make a market in some types of debt instruments, which has affected the liquidity of those instruments. During times of market turmoil, investors tend to look to the safety of securities issued or backed by the U.S. Treasury, causing the prices of these securities to rise and the yields to decline. Reduced liquidity in fixed income and credit markets may negatively affect many issuers worldwide. In addition, global economies and financial markets are becoming increasingly interconnected, which increases the possibilities that conditions in one country or region might adversely impact issuers in a different country or region. A rise in protectionist trade policies, and the possibility of changes to some international trade agreements, could affect the economies of many nations, including the United States, in ways that cannot necessarily be foreseen at the present time.
In response to the financial crisis, the U.S. and other governments and the Federal Reserve and certain foreign central banks have taken steps to support financial markets. In some countries where economic conditions are recovering, they are nevertheless perceived as still fragile. Withdrawal of government support, failure of efforts in response to the crisis, or investor perception that such efforts are not succeeding, could adversely impact the value and liquidity of certain securities. The severity or duration of adverse economic conditions may also be
44
American Beacon Crescent Short Duration High Income FundSM
Notes to Financial Statements
January 31, 2020
affected by policy changes made by governments or quasi-governmental organizations, including changes in tax laws. The impact of new financial regulation legislation on the markets and the practical implications for market participants may not be fully known for some time. Regulatory changes are causing some financial services companies to exit long-standing lines of business, resulting in dislocations for other market participants. In addition, political and governmental events within the U.S. and abroad, such as the U.S. government’s inability at times to agree on a long-term budget and deficit reduction plan, the threat of a federal government shutdown and threats not to increase the federal government’s debt limit, may affect investor and consumer confidence and may adversely impact financial markets and the broader economy, perhaps suddenly and to a significant degree. The U.S. government has reduced the federal corporate income tax rates, and future legislative, regulatory and policy changes may result in more restrictions on international trade, less stringent prudential regulation of certain players in the financial markets, and significant new investments in infrastructure and national defense. Markets may react strongly to expectations about the changes in these policies, which could increase volatility, especially if the markets’ expectations for changes in government policies are not borne out.
Changes in market conditions will not have the same impact on all types of securities. Interest rates have been unusually low in recent years in the U.S. and abroad. Because there is little precedent for this situation, it is difficult to predict the impact of a significant rate increase on various markets. For example, because investors may buy securities or other investments with borrowed money, a significant increase in interest rates may cause a decline in the markets for those investments. Because of the sharp decline in the worldwide price of oil, there is a concern that oil producing nations may withdraw significant assets now held in U.S. Treasuries, which could force a substantial increase in interest rates. Regulators have expressed concern that rate increases may cause investors to sell fixed income securities faster than the market can absorb them, contributing to price volatility. In addition, there is a risk that the prices of goods and services in the U.S. and many foreign economies may decline over time, known as deflation (the opposite of inflation). Deflation may have an adverse effect on stock prices and creditworthiness and may make defaults on debt more likely. If a country’s economy slips into a deflationary pattern, it could last for a prolonged period and may be difficult to reverse.
The precise timing and the resulting impact of the United Kingdom’s departure from the EU, commonly referred to as “Brexit,” are not yet known. The effect on the United Kingdom’s economy will likely depend on the nature of trade relations with the EU and other major economies following its exit, which are matters to be negotiated. The outcomes may cause increased volatility and have a significant adverse impact on world financial markets, other international trade agreements, and the United Kingdom and European economies, as well as the broader global economy for some time, which could significantly adversely affect the value of a Fund’s investments in the United Kingdom and Europe.
Other Investment Companies Risk
The Fund may invest in shares of other registered investment companies, including money market funds that are advised by the Manager. To the extent that the Fund invests in shares of other registered investment companies, the Fund will indirectly bear the fees and expenses, including for example advisory and administrative fees, charged by those investment companies in addition to the Fund’s direct fees and expenses and will be subject to the risks associated with investments in those companies. For example, the Fund’s investments in money market funds are subject to interest rate risk, credit risk, and market risk. The Fund must rely on the investment company in which it invests to achieve its investment objective. If the investment company fails to achieve its investment objective, the value of the Fund’s investment will decline, adversely affecting the Fund’s performance. To the extent the Fund invests in other investment companies that invest in equity securities, fixed income securities and/or foreign securities, or track an index, the Fund is subject to the risks associated with the underlying investments held by the investment company or the index fluctuations to which the investment company is subject.
Prepayment and Extension Risk
Prepayment risk is the risk that the principal amount of a bond may be repaid prior to the bond’s maturity date. Due to a decline in interest rates or excess cash flow, a debt security may be called or otherwise prepaid
45
American Beacon Crescent Short Duration High Income FundSM
Notes to Financial Statements
January 31, 2020
before maturity. If this occurs, no additional interest will be paid on the investment and the Fund may have to invest at a lower rate, may not benefit from an increase in value that may result from declining interest rates, and may lose any premium it paid to acquire the security. Variable and floating rate securities may be less sensitive to prepayment risk. Extension risk is the risk that a decrease in prepayments may, as a result of higher interest rates or other factors, result in the extension of a security’s effective maturity, heighten interest rate risk and increase the potential for a decline in its price.
Unrated Securities Risk
Because the Fund may purchase securities that are not rated by any rating organization, theSub-Advisor, after assessing their credit quality, may internally assign ratings to certain of those securities in categories of those similar to those of rating organizations. Investing in unrated securities involves the risk that theSub-Advisor may not accurately evaluate the security’s comparative credit rating. Analysis of the creditworthiness of issuers of unrated securities may be more complex than for issuers of higher-quality debt obligations. To the extent that the Fund invests in unrated securities, the Fund’s success in achieving its investment objectives may depend more heavily on theSub-Advisor’s credit analysis than if the Fund invested exclusively in rated securities. Some unrated securities may not have an active trading market or may be difficult to value, which means the Fund might have difficulty selling them promptly at an acceptable price.
6. Federal Income and Excise Taxes
It is the policy of the Fund to qualify as a regulated investment company (“RIC”), by complying with all applicable provisions of Subchapter M of the Internal Revenue Code, as amended, and to make distributions of taxable income sufficient to relieve it from substantially all federal income and excise taxes. For federal income tax purposes, the Fund is treated as a single entity for the purpose of determining such qualification.
The Fund does not have any unrecorded tax liabilities in the accompanying financial statements. Each of the tax years in the four year period ended January 31, 2020 remain subject to examination by the Internal Revenue Service. If applicable, the Fund recognizes interest accrued related to unrecognized tax benefits in interest expense and penalties in “Other expenses” on the Statement of Operations.
The Fund may be subject to taxes imposed by countries in which it invests. Such taxes are generally based on returns of income earned or gains realized or repatriated. Taxes are accrued and applied to net investment income, net realized capital gains and net unrealized appreciation (depreciation), as applicable, as the income is earned or capital gains are recorded.
Dividends are categorized in accordance with income tax regulations which may treat certain transactions differently than U.S. GAAP. Accordingly, the character of distributions and composition of net assets for tax purposes may differ from those reflected in the accompanying financial statements.
The tax character of distributions paid were as follows:
| Year Ended January 31, 2020 | Year Ended January 31, 2019 | |||||||||||
Distributions paid from: |
| |||||||||||
Ordinary income* |
| |||||||||||
Institutional Class | $ | 3,635,223 | $ | 4,264,570 | ||||||||
Y Class | 180,199 | 248,726 | ||||||||||
Investor Class | 25,037 | 34,886 | ||||||||||
A Class | 58,509 | 65,085 | ||||||||||
C Class | 15,592 | 21,512 | ||||||||||
|
|
|
| |||||||||
Total distributions paid | $ | 3,914,560 | $ | 4,634,779 | ||||||||
|
|
|
| |||||||||
*For tax purposes, short-term gains are considered ordinary income distributions.
46
American Beacon Crescent Short Duration High Income FundSM
Notes to Financial Statements
January 31, 2020
As of January 31, 2020, the components of distributable earnings (deficits) on a tax basis were as follows:
Fund | Tax Cost | Unrealized Appreciation | Unrealized (Depreciation) | Net Unrealized Appreciation (Depreciation) | ||||||||||||||||||||||||
| Crescent Short Duration High Income | $ | 70,544,194 | $ | 1,323,079 | $ | (605,145 | ) | $ | 717,934 | |||||||||||||||||||
Fund | Net Unrealized Appreciation (Depreciation) | Undistributed Ordinary Income | Undistributed Long-Term Capital Gains | Accumulated Capital and Other (Losses) | Other Temporary Differences | Distributable Earnings | ||||||||||||||||||||||||||||||||||||||
| Crescent Short Duration High Income | $ | 717,934 | $ | 24,693 | $ | – | $ | (5,120,775 | ) | $ | (896 | ) | $ | (4,379,044 | ) | |||||||||||||||||||||||||||||
Financial reporting records are adjusted for permanent book/tax differences to reflect tax character. Financial records are not adjusted for temporary differences. The temporary differences between financial reporting andtax-basis reporting of unrealized appreciation (depreciation) are attributable primarily to the tax deferral of losses from wash sales, premium amortization accruals, unused capital losses and dividends payable.
Due to inherent differences in the recognition of income, expenses, and realized gains (losses) under U.S. GAAP and federal income tax regulations, permanent differences between book and tax reporting have been identified and appropriately reclassified on the Statement of Assets and Liabilities.
The Fund had no permanent differences as of January 31, 2020.
Under the Regulated Investment Company Modernization Act of 2010 (“RIC MOD”), net capital losses recognized by the Fund in taxable years beginning after December 22, 2010 are carried forward indefinitely and retain their character as short-term and/or long-term losses.
During the year ended January 31, 2020, the Fund had the following post RIC MOD capital loss carryforwards:
Fund | Short-Term Capital Loss Carryforwards | Long-Term Capital Loss Carryforwards | ||||||||||
| Crescent Short Duration High Income | $ | 1,945,383 | $ | 3,175,392 | ||||||||
The ability to utilize capital loss carryforwards in the future may be limited under the Internal Revenue Code and related regulations based on the results of future transactions.
7. Investment Transactions
The aggregate cost of purchases and proceeds from sales and maturities of investments, other than short-term obligations, for the year ended January 31, 2020 were as follows:
Fund | Purchases(non-U.S. Government Securities) | Sales(non-U.S. Government Securities) | ||||||||||
| Crescent Short Duration High Income | $ | 70,519,371 | $ | 83,568,329 | ||||||||
A summary of the Fund’s transactions in the USG Select Fund for the year ended January 31, 2020 were as follows:
Fund | Type of Transaction | January 31, 2019 Shares/Fair Value | Purchases | Sales | January 31, 2020 Shares/Fair Value | Dividend Income | ||||||||||||||||||||||||||||||||||||
| Crescent Short Duration High Income | Direct | $ | 3,744,678 | $ | 54,889,827 | $ | 56,054,294 | $ | 2,580,211 | $ | 74,253 | |||||||||||||||||||||||||||||||
47
American Beacon Crescent Short Duration High Income FundSM
Notes to Financial Statements
January 31, 2020
8. Borrowing Arrangements
Effective November 14, 2019 (the “Effective Date”), the Fund, along with certain other funds managed by the Manager (“Participating Funds”), entered into a committed revolving line of credit (the “Committed Line”) agreement with State Street Bank and Trust Company (the “Bank”) to be used to facilitate portfolio liquidity. The maximum borrowing amount under the Committed Line is $250 million with interest at a rate equal to the higher of(a) one-month London Inter-Bank Offered Rate (“LIBOR”) plus 1.25% per annum or (b) the Federal Funds rate plus 1.25% per annum on amounts borrowed. Each of the Participating Funds paid a closing fee of $100,000 on the Effective Date and a quarterly commitment fee at a rate of 0.25% per annum on the unused portion of the Committed Line amount. The Committed Line expires November 12, 2020, unless extended by the Bank or terminated by the Participating Funds in accordance with the agreement.
On the Effective Date, the Fund, along with certain other Participating Funds managed by the Manager, also entered into an uncommitted discretionary demand revolving line of credit (the “Uncommitted Line”) agreement with the Bank to be used to facilitate portfolio liquidity. The maximum borrowing amount under the Uncommitted Line is $50 million with interest at a rate equal to the higher of(a) one-month LIBOR plus 1.25% per annum or (b) the Federal Funds rate plus 1.25% per annum on each outstanding loan. Each of the Participating Funds paid a closing fee of $35,000 on the Effective Date. The Uncommitted Line expires November 12, 2020 unless extended by the Bank or terminated by the Participating Funds in accordance with the agreement.
The Participating Funds paid administration, legal and arrangement fees, which are recognized as a component of “Other expenses” on the Statement of Operations, along with commitment fees, that have been allocated among the Participating Funds based on average daily net assets. During the year ended January 31, 2020, the Fund did not utilize this facility.
9. Capital Share Transactions
The tables below summarize the activity in capital shares for each Class of the Fund:
| Institutional Class | ||||||||||||||||||||||||||||
| Year Ended January 31, 2020 | Year Ended January 31, 2019 | |||||||||||||||||||||||||||
Crescent Short Duration High Income Fund | Shares | Amount | Shares | Amount | ||||||||||||||||||||||||
| Shares sold | 227,427 | $ | 2,113,900 | 872,633 | $ | 8,204,743 | ||||||||||||||||||||||
| Reinvestment of dividends | 390,561 | 3,628,749 | 458,266 | 4,263,813 | ||||||||||||||||||||||||
| Shares redeemed | (2,833,312 | ) | (26,298,543 | ) | (468,729 | ) | (4,349,929 | ) | ||||||||||||||||||||
|
|
|
|
|
|
|
| |||||||||||||||||||||
| Net increase (decrease) in shares outstanding | (2,215,324 | ) | $ | (20,555,894 | ) | 862,170 | $ | 8,118,627 | ||||||||||||||||||||
|
|
|
|
|
|
|
| |||||||||||||||||||||
| Y Class | ||||||||||||||||||||||||||||
| Year Ended January 31, 2020 | Year Ended January 31, 2019 | |||||||||||||||||||||||||||
Crescent Short Duration High Income Fund | Shares | Amount | Shares | Amount | ||||||||||||||||||||||||
| Shares sold | 153,270 | $ | 1,423,690 | 106,191 | $ | 993,231 | ||||||||||||||||||||||
| Reinvestment of dividends | 18,580 | 172,530 | 25,164 | 234,241 | ||||||||||||||||||||||||
| Shares redeemed | (242,411 | ) | (2,246,371 | ) | (268,217 | ) | (2,513,830 | ) | ||||||||||||||||||||
|
|
|
|
|
|
|
| |||||||||||||||||||||
| Net decrease in shares outstanding | (70,561 | ) | $ | (650,151 | ) | (136,862 | ) | $ | (1,286,358 | ) | ||||||||||||||||||
|
|
|
|
|
|
|
| |||||||||||||||||||||
| Investor Class | ||||||||||||||||||||||||||||
| Year Ended January 31, 2020 | Year Ended January 31, 2019 | |||||||||||||||||||||||||||
Crescent Short Duration High Income Fund | Shares | Amount | Shares | Amount | ||||||||||||||||||||||||
| Shares sold | 83,906 | $ | 777,417 | 49 | $ | 451 | ||||||||||||||||||||||
| Reinvestment of dividends | 2,692 | 25,031 | 3,738 | 34,885 | ||||||||||||||||||||||||
| Shares redeemed | (84,883 | ) | (785,446 | ) | (42,354 | ) | (397,712 | ) | ||||||||||||||||||||
|
|
|
|
|
|
|
| |||||||||||||||||||||
| Net increase (decrease) in shares outstanding | 1,715 | $ | 17,002 | (38,567 | ) | $ | (362,376 | ) | ||||||||||||||||||||
|
|
|
|
|
|
|
| |||||||||||||||||||||
48
American Beacon Crescent Short Duration High Income FundSM
Notes to Financial Statements
January 31, 2020
| A Class | ||||||||||||||||||||||||||||
| Year Ended January 31, 2020 | Year Ended January 31, 2019 | |||||||||||||||||||||||||||
Crescent Short Duration High Income Fund | Shares | Amount | Shares | Amount | ||||||||||||||||||||||||
| Shares sold | 10,651 | $ | 98,737 | 706,492 | $ | 6,385,353 | ||||||||||||||||||||||
| Reinvestment of dividends | 5,636 | 52,273 | 6,212 | 57,728 | ||||||||||||||||||||||||
| Shares redeemed | (55,614 | ) | (511,584 | ) | (697,093 | ) | (6,279,757 | ) | ||||||||||||||||||||
|
|
|
|
|
|
|
| |||||||||||||||||||||
| Net increase (decrease) in shares outstanding | (39,327 | ) | $ | (360,574 | ) | 15,611 | $ | 163,324 | ||||||||||||||||||||
|
|
|
|
|
|
|
| |||||||||||||||||||||
| C Class | ||||||||||||||||||||||||||||
| Year Ended January 31, 2020 | Year Ended January 31, 2019 | |||||||||||||||||||||||||||
Crescent Short Duration High Income Fund | Shares | Amount | Shares | Amount | ||||||||||||||||||||||||
| Shares sold | 40,113 | $ | 372,904 | 89,689 | $ | 810,176 | ||||||||||||||||||||||
| Reinvestment of dividends | 1,587 | 14,749 | 2,148 | 19,943 | ||||||||||||||||||||||||
| Shares redeemed | (53,147 | ) | (490,476 | ) | (82,017 | ) | (750,011 | ) | ||||||||||||||||||||
|
|
|
|
|
|
|
| |||||||||||||||||||||
| Net increase (decrease) in shares outstanding | (11,447 | ) | $ | (102,823 | ) | 9,820 | $ | 80,108 | ||||||||||||||||||||
|
|
|
|
|
|
|
| |||||||||||||||||||||
10. Subsequent Events
On March 4, 2020, the Board of the Trust approved a plan to liquidate and terminate the Fund on or about June 30, 2020.
Beginning in January 2020, global financial markets have experienced and may continue to experience significant volatility resulting from the spread of a virus known as COVID-19. The outbreak of COVID-19 has resulted in travel and border restrictions, quarantines, supply chain disruptions, lower consumer demand and general market uncertainty. The effects of COVID-19 have and may continue to adversely affect the global economy, the economies of certain nations and individual issuers, all of which may negatively impact the Funds performance. Management’s evaluation is ongoing and the financial landscape continues to change.
49
American Beacon Crescent Short Duration High Income FundSM
Financial Highlights
(For a share outstanding throughout the period)
| Institutional Class | ||||||||||||||||||||||||||||||||||||
| Year Ended January 31, | ||||||||||||||||||||||||||||||||||||
| 2020 | 2019 | 2018 | 2017 | 2016 | ||||||||||||||||||||||||||||||||
|
| |||||||||||||||||||||||||||||||||||
Net asset value, beginning of period | $ | 9.16 | $ | 9.59 | $ | 9.64 | $ | 9.01 | $ | 9.68 | ||||||||||||||||||||||||||
|
|
|
|
|
|
|
|
|
| |||||||||||||||||||||||||||
Income (loss) from investment operations: | ||||||||||||||||||||||||||||||||||||
Net investment income | 0.42 | 0.48 | 0.47 | 0.46 | 0.47 | |||||||||||||||||||||||||||||||
Net gains (losses) on investments (both realized and unrealized) | 0.22 | (0.43 | ) | (0.05 | ) | 0.63 | (0.67 | ) | ||||||||||||||||||||||||||||
|
|
|
|
|
|
|
|
|
| |||||||||||||||||||||||||||
Total income (loss) from investment operations | 0.64 | 0.05 | 0.42 | 1.09 | (0.20 | ) | ||||||||||||||||||||||||||||||
|
|
|
|
|
|
|
|
|
| |||||||||||||||||||||||||||
Less distributions: | ||||||||||||||||||||||||||||||||||||
Dividends from net investment income | (0.44 | ) | (0.48 | ) | (0.47 | ) | (0.46 | ) | (0.47 | ) | ||||||||||||||||||||||||||
Distributions from net realized gains | - | - | - | - | - | |||||||||||||||||||||||||||||||
|
|
|
|
|
|
|
|
|
| |||||||||||||||||||||||||||
Total distributions | (0.44 | ) | (0.48 | ) | (0.47 | ) | (0.46 | ) | (0.47 | ) | ||||||||||||||||||||||||||
|
|
|
|
|
|
|
|
|
| |||||||||||||||||||||||||||
Net asset value, end of period | $ | 9.36 | $ | 9.16 | $ | 9.59 | $ | 9.64 | $ | 9.01 | ||||||||||||||||||||||||||
|
|
|
|
|
|
|
|
|
| |||||||||||||||||||||||||||
Total returnA | 7.15 | % | 0.60 | % | 4.45 | % | 12.38 | % | (2.23 | )% | ||||||||||||||||||||||||||
|
|
|
|
|
|
|
|
|
| |||||||||||||||||||||||||||
Ratios and supplemental data: |
| |||||||||||||||||||||||||||||||||||
Net assets, end of period | $ | 64,345,935 | $ | 83,303,910 | $ | 78,914,147 | $ | 51,834,666 | $ | 36,971,459 | ||||||||||||||||||||||||||
Ratios to average net assets: | ||||||||||||||||||||||||||||||||||||
Expenses, before reimbursements | 1.15 | % | 1.08 | % | 1.07 | % | 1.26 | % | 1.27 | % | ||||||||||||||||||||||||||
Expenses, net of reimbursements | 0.85 | % | 0.85 | % | 0.85 | % | 0.85 | % | 0.85 | % | ||||||||||||||||||||||||||
Net investment income, before expense reimbursements | 4.32 | % | 4.92 | % | 4.66 | % | 4.51 | % | 4.41 | % | ||||||||||||||||||||||||||
Net investment income, net of reimbursements | 4.62 | % | 5.15 | % | 4.89 | % | 4.93 | % | 4.83 | % | ||||||||||||||||||||||||||
Portfolio turnover rate | 91 | % | 84 | % | 75 | % | 95 | % | 72 | % | ||||||||||||||||||||||||||
| Y Class | ||||||||||||||||||||||||||||||||||||
| Year Ended January 31, | ||||||||||||||||||||||||||||||||||||
| 2020 | 2019 | 2018 | 2017 | 2016 | ||||||||||||||||||||||||||||||||
|
| |||||||||||||||||||||||||||||||||||
Net asset value, beginning of period | $ | 9.15 | $ | 9.58 | $ | 9.63 | $ | 9.00 | $ | 9.68 | ||||||||||||||||||||||||||
|
|
|
|
|
|
|
|
|
| |||||||||||||||||||||||||||
Income (loss) from investment operations: | ||||||||||||||||||||||||||||||||||||
Net investment income | 0.42 | 0.49 | 0.46 | 0.45 | 0.46 | |||||||||||||||||||||||||||||||
Net gains (losses) on investments (both realized and unrealized) | 0.21 | (0.45 | ) | (0.05 | ) | 0.63 | (0.68 | ) | ||||||||||||||||||||||||||||
|
|
|
|
|
|
|
|
|
| |||||||||||||||||||||||||||
Total income (loss) from investment operations | 0.63 | 0.04 | 0.41 | 1.08 | (0.22 | ) | ||||||||||||||||||||||||||||||
|
|
|
|
|
|
|
|
|
| |||||||||||||||||||||||||||
Less distributions: | ||||||||||||||||||||||||||||||||||||
Dividends from net investment income | (0.43 | ) | (0.47 | ) | (0.46 | ) | (0.45 | ) | (0.46 | ) | ||||||||||||||||||||||||||
Distributions from net realized gains | - | - | - | - | - | |||||||||||||||||||||||||||||||
|
|
|
|
|
|
|
|
|
| |||||||||||||||||||||||||||
Total distributions | (0.43 | ) | (0.47 | ) | (0.46 | ) | (0.45 | ) | (0.46 | ) | ||||||||||||||||||||||||||
|
|
|
|
|
|
|
|
|
| |||||||||||||||||||||||||||
Net asset value, end of period | $ | 9.35 | $ | 9.15 | $ | 9.58 | $ | 9.63 | $ | 9.00 | ||||||||||||||||||||||||||
|
|
|
|
|
|
|
|
|
| |||||||||||||||||||||||||||
Total returnA | 7.04 | % | 0.49 | % | 4.33 | % | 12.27 | % | (2.39 | )% | ||||||||||||||||||||||||||
|
|
|
|
|
|
|
|
|
| |||||||||||||||||||||||||||
Ratios and supplemental data: |
| |||||||||||||||||||||||||||||||||||
Net assets, end of period | $ | 3,802,336 | $ | 4,369,096 | $ | 5,883,759 | $ | 6,277,416 | $ | 8,481,991 | ||||||||||||||||||||||||||
Ratios to average net assets: | ||||||||||||||||||||||||||||||||||||
Expenses, before reimbursements | 1.24 | % | 1.14 | % | 1.14 | % | 1.36 | % | 1.29 | % | ||||||||||||||||||||||||||
Expenses, net of reimbursements | 0.95 | % | 0.95 | % | 0.95 | % | 0.95 | % | 0.95 | % | ||||||||||||||||||||||||||
Net investment income, before expense reimbursements | 4.23 | % | 4.84 | % | 4.59 | % | 4.42 | % | 4.80 | % | ||||||||||||||||||||||||||
Net investment income, net of reimbursements | 4.52 | % | 5.03 | % | 4.78 | % | 4.83 | % | 5.14 | % | ||||||||||||||||||||||||||
Portfolio turnover rate | 91 | % | 84 | % | 75 | % | 95 | % | 72 | % | ||||||||||||||||||||||||||
| A | Based on net asset value, which does not reflect the sales charge, redemption fee, or contingent deferred sales charge, if applicable. May include adjustments in accordance with U.S. GAAP and as such, the net asset value for reporting purposes and the returns based upon those net asset values may differ from the net asset value and returns for shareholder transactions. |
See accompanying notes
50
American Beacon Crescent Short Duration High Income FundSM
Financial Highlights
(For a share outstanding throughout the period)
| Investor Class | ||||||||||||||||||||||||||||||||||||
| Year Ended January 31, | ||||||||||||||||||||||||||||||||||||
| 2020 | 2019 | 2018 | 2017 | 2016 | ||||||||||||||||||||||||||||||||
|
| |||||||||||||||||||||||||||||||||||
Net asset value, beginning of period | $ | 9.17 | $ | 9.59 | $ | 9.64 | $ | 9.01 | $ | 9.69 | ||||||||||||||||||||||||||
|
|
|
|
|
|
|
|
|
| |||||||||||||||||||||||||||
Income (loss) from investment operations: | ||||||||||||||||||||||||||||||||||||
Net investment income | 0.40 | 0.45 | 0.44 | 0.43 | 0.44 | |||||||||||||||||||||||||||||||
Net gains (losses) on investments (both realized and unrealized) | 0.20 | (0.43 | ) | (0.06 | ) | 0.63 | (0.68 | ) | ||||||||||||||||||||||||||||
|
|
|
|
|
|
|
|
|
| |||||||||||||||||||||||||||
Total income (loss) from investment operations | 0.60 | 0.02 | 0.38 | 1.06 | (0.24 | ) | ||||||||||||||||||||||||||||||
|
|
|
|
|
|
|
|
|
| |||||||||||||||||||||||||||
Less distributions: | ||||||||||||||||||||||||||||||||||||
Dividends from net investment income | (0.41 | ) | (0.44 | ) | (0.43 | ) | (0.43 | ) | (0.44 | ) | ||||||||||||||||||||||||||
Distributions from net realized gains | - | - | - | - | - | |||||||||||||||||||||||||||||||
|
|
|
|
|
|
|
|
|
| |||||||||||||||||||||||||||
Total distributions | (0.41 | ) | (0.44 | ) | (0.43 | ) | (0.43 | ) | (0.44 | ) | ||||||||||||||||||||||||||
|
|
|
|
|
|
|
|
|
| |||||||||||||||||||||||||||
Net asset value, end of period | $ | 9.36 | $ | 9.17 | $ | 9.59 | $ | 9.64 | $ | 9.01 | ||||||||||||||||||||||||||
|
|
|
|
|
|
|
|
|
| |||||||||||||||||||||||||||
Total returnA | 6.64 | % | 0.28 | % | 4.04 | % | 11.96 | % | (2.67 | )% | ||||||||||||||||||||||||||
|
|
|
|
|
|
|
|
|
| |||||||||||||||||||||||||||
Ratios and supplemental data: |
| |||||||||||||||||||||||||||||||||||
Net assets, end of period | $ | 611,120 | $ | 582,797 | $ | 979,646 | $ | 2,679,338 | $ | 3,560,159 | ||||||||||||||||||||||||||
Ratios to average net assets: | ||||||||||||||||||||||||||||||||||||
Expenses, before reimbursements | 1.39 | % | 2.31 | % | 1.39 | % | 1.56 | % | 1.46 | % | ||||||||||||||||||||||||||
Expenses, net of reimbursements | 1.23 | % | 1.23 | % | 1.23 | % | 1.23 | % | 1.23 | % | ||||||||||||||||||||||||||
Net investment income, before expense reimbursements | 4.08 | % | 3.66 | % | 4.33 | % | 4.22 | % | 4.44 | % | ||||||||||||||||||||||||||
Net investment income, net of reimbursements | 4.24 | % | 4.74 | % | 4.49 | % | 4.55 | % | 4.68 | % | ||||||||||||||||||||||||||
Portfolio turnover rate | 91 | % | 84 | % | 75 | % | 95 | % | 72 | % | ||||||||||||||||||||||||||
| A Class | ||||||||||||||||||||||||||||||||||||
| Year Ended January 31, | ||||||||||||||||||||||||||||||||||||
| 2020 | 2019 | 2018 | 2017 | 2016 | ||||||||||||||||||||||||||||||||
|
| |||||||||||||||||||||||||||||||||||
Net asset value, beginning of period | $ | 9.14 | $ | 9.58 | $ | 9.63 | $ | 9.00 | $ | 9.68 | ||||||||||||||||||||||||||
|
|
|
|
|
|
|
|
|
| |||||||||||||||||||||||||||
Income (loss) from investment operations: | ||||||||||||||||||||||||||||||||||||
Net investment income | 0.39 | 0.43 | 0.43 | 0.43 | 0.43 | |||||||||||||||||||||||||||||||
Net gains (losses) on investments (both realized and unrealized) | 0.21 | (0.43 | ) | (0.05 | ) | 0.63 | (0.68 | ) | ||||||||||||||||||||||||||||
|
|
|
|
|
|
|
|
|
| |||||||||||||||||||||||||||
Total income (loss) from investment operations | 0.60 | - | 0.38 | 1.06 | (0.25 | ) | ||||||||||||||||||||||||||||||
|
|
|
|
|
|
|
|
|
| |||||||||||||||||||||||||||
Less distributions: | ||||||||||||||||||||||||||||||||||||
Dividends from net investment income | (0.40 | ) | (0.44 | ) | (0.43 | ) | (0.43 | ) | (0.43 | ) | ||||||||||||||||||||||||||
Distributions from net realized gains | - | - | - | - | - | |||||||||||||||||||||||||||||||
|
|
|
|
|
|
|
|
|
| |||||||||||||||||||||||||||
Total distributions | (0.40 | ) | (0.44 | ) | (0.43 | ) | (0.43 | ) | (0.43 | ) | ||||||||||||||||||||||||||
|
|
|
|
|
|
|
|
|
| |||||||||||||||||||||||||||
Net asset value, end of period | $ | 9.34 | $ | 9.14 | $ | 9.58 | $ | 9.63 | $ | 9.00 | ||||||||||||||||||||||||||
|
|
|
|
|
|
|
|
|
| |||||||||||||||||||||||||||
Total returnA | 6.71 | % | 0.02 | % | 4.02 | % | 11.94 | % | (2.71 | )% | ||||||||||||||||||||||||||
|
|
|
|
|
|
|
|
|
| |||||||||||||||||||||||||||
Ratios and supplemental data: | ||||||||||||||||||||||||||||||||||||
Net assets, end of period | $ | 1,379,649 | $ | 1,710,171 | $ | 1,642,414 | $ | 1,183,362 | $ | 1,033,329 | ||||||||||||||||||||||||||
Ratios to average net assets: | ||||||||||||||||||||||||||||||||||||
Expenses, before reimbursements | 1.43 | % | 1.39 | % | 1.46 | % | 1.66 | % | 1.55 | % | ||||||||||||||||||||||||||
Expenses, net of reimbursements | 1.25 | % | 1.25 | % | 1.25 | % | 1.25 | % | 1.25 | % | ||||||||||||||||||||||||||
Net investment income, before expense reimbursements | 4.03 | % | 4.48 | % | 4.26 | % | 4.13 | % | 4.28 | % | ||||||||||||||||||||||||||
Net investment income, net of reimbursements | 4.21 | % | 4.62 | % | 4.47 | % | 4.54 | % | 4.59 | % | ||||||||||||||||||||||||||
Portfolio turnover rate | 91 | % | 84 | % | 75 | % | 95 | % | 72 | % | ||||||||||||||||||||||||||
| A | Based on net asset value, which does not reflect the sales charge, redemption fee, or contingent deferred sales charge, if applicable. May include adjustments in accordance with U.S. GAAP and as such, the net asset value for reporting purposes and the returns based upon those net asset values may differ from the net asset value and returns for shareholder transactions. |
See accompanying notes
51
American Beacon Crescent Short Duration High Income FundSM
Financial Highlights
(For a share outstanding throughout the period)
| C Class | ||||||||||||||||||||||||||||||||||||
| Year Ended January 31, | ||||||||||||||||||||||||||||||||||||
| 2020 | 2019 | 2018 | 2017 | 2016 | ||||||||||||||||||||||||||||||||
|
| |||||||||||||||||||||||||||||||||||
Net asset value, beginning of period | $ | 9.16 | $ | 9.58 | $ | 9.63 | $ | 9.00 | $ | 9.68 | ||||||||||||||||||||||||||
|
|
|
|
|
|
|
|
|
| |||||||||||||||||||||||||||
Income (loss) from investment operations: | ||||||||||||||||||||||||||||||||||||
Net investment income | 0.32 | 0.37 | 0.36 | 0.35 | 0.36 | |||||||||||||||||||||||||||||||
Net gains (losses) on investments (both realized and unrealized) | 0.21 | (0.42 | ) | (0.05 | ) | 0.63 | (0.68 | ) | ||||||||||||||||||||||||||||
|
|
|
|
|
|
|
|
|
| |||||||||||||||||||||||||||
Total income (loss) from investment operations | 0.53 | (0.05 | ) | 0.31 | 0.98 | (0.32 | ) | |||||||||||||||||||||||||||||
|
|
|
|
|
|
|
|
|
| |||||||||||||||||||||||||||
Less distributions: | ||||||||||||||||||||||||||||||||||||
Dividends from net investment income | (0.33 | ) | (0.37 | ) | (0.36 | ) | (0.35 | ) | (0.36 | ) | ||||||||||||||||||||||||||
Distributions from net realized gains | - | - | - | - | - | |||||||||||||||||||||||||||||||
|
|
|
|
|
|
|
|
|
| |||||||||||||||||||||||||||
Total distributions | (0.33 | ) | (0.37 | ) | (0.36 | ) | (0.35 | ) | (0.36 | ) | ||||||||||||||||||||||||||
|
|
|
|
|
|
|
|
|
| |||||||||||||||||||||||||||
Net asset value, end of period | $ | 9.36 | $ | 9.16 | $ | 9.58 | $ | 9.63 | $ | 9.00 | ||||||||||||||||||||||||||
|
|
|
|
|
|
|
|
|
| |||||||||||||||||||||||||||
Total returnA | 5.91 | % | (0.49 | )% | 3.24 | % | 11.10 | % | (3.40 | )% | ||||||||||||||||||||||||||
|
|
|
|
|
|
|
|
|
| |||||||||||||||||||||||||||
Ratios and supplemental data: | ||||||||||||||||||||||||||||||||||||
Net assets, end of period | $ | 508,045 | $ | 602,096 | $ | 535,826 | $ | 427,829 | $ | 456,828 | ||||||||||||||||||||||||||
Ratios to average net assets: | ||||||||||||||||||||||||||||||||||||
Expenses, before reimbursements | 2.23 | % | 2.17 | % | 2.21 | % | 2.41 | % | 2.36 | % | ||||||||||||||||||||||||||
Expenses, net of reimbursements | 2.00 | % | 2.00 | % | 2.00 | % | 2.00 | % | 2.00 | % | ||||||||||||||||||||||||||
Net investment income, before expense reimbursements | 3.22 | % | 3.86 | % | 3.51 | % | 3.37 | % | 3.76 | % | ||||||||||||||||||||||||||
Net investment income, net of reimbursements | 3.45 | % | 4.03 | % | 3.71 | % | 3.78 | % | 4.12 | % | ||||||||||||||||||||||||||
Portfolio turnover rate | 91 | % | 84 | % | 75 | % | 95 | % | 72 | % | ||||||||||||||||||||||||||
| A | Based on net asset value, which does not reflect the sales charge, redemption fee, or contingent deferred sales charge, if applicable. May include adjustments in accordance with U.S. GAAP and as such, the net asset value for reporting purposes and the returns based upon those net asset values may differ from the net asset value and returns for shareholder transactions. |
See accompanying notes
52
American Beacon Crescent Short Duration High Income FundSM
December 31, 2020 (Unaudited)
Certain tax information regarding the Funds is required to be provided to shareholders based upon the Funds’ income and distributions for the taxable year ended January 31, 2020. The information and distributions reported herein may differ from information and distributions taxable to the shareholders for the calendar year ended December 31, 2019.
The Funds designated the following items with regard to distributions paid during the fiscal year ended January 31, 2020. All designations are based on financial information available as of this annual report and, accordingly, are subject to change. For each item, it is the intention of the Funds to designate the maximum amount permitted under the Internal Revenue Code of 1986, as amended, and the regulations there under.
Corporate Dividends-Received Deduction:
Crescent Short Duration High Income | 0.00 | % |
Qualified Dividend Income:
Crescent Short Duration High Income | 0.00 | % |
Long-Term Capital Gain Distributions:
Crescent Short Duration High Income | $ | - |
Short-Term Capital Gain Distributions:
Crescent Short Duration High Income | $ | - |
Shareholders will receive notification in January 2020 of the applicable tax information necessary to prepare their 2019 income tax returns.
53
Trustees and Officers of the American Beacon FundsSM(Unaudited)
The Trustees and officers of the American Beacon Funds (the “Trust”) are listed below, together with their principal occupations during the past five years. The address of each person listed below is 220 Las Colinas Boulevard East, Suite 1200, Irving, Texas 75039. Each Trustee overseesthirty-six funds in the fund complex that includes the Trust, the American Beacon Select Funds, the American Beacon Institutional Funds Trust, the American Beacon Sound Point Enhanced Income Fund, and the American Beacon Apollo Total Return Fund. The Trust’s Statement of Additional Information contains additional information about the Trustees and is available without charge by calling1-800-658-5811.
Name, Age | Position, Term of Office and Length of Time Served with the Trust | Principal Occupation(s) During Past 5 Years and Current Directorships | ||
| NON-INTERESTED TRUSTEES | Term | |||
| Lifetime of Trust until removal, resignation or retirement* | ||||
| Gilbert G. Alvarado (50) | Trustee since 2015 | President, SJVIIF, LLC, Impact Investment Fund (2018-Present); Director, Kura MD, Inc. (local telehealth organization) (2015-2017); Senior Vice President & CFO, Sierra Health Foundation (health conversion private foundation) (2006-Present); Senior Vice President & CFO, Sierra Health Foundation: Center for Health Program Management (California public benefit corporation) (2012-Present); Director, Innovative North State (2012-2015); Director, Sacramento Regional Technology Alliance (2011-2016); Director, Valley Healthcare Staffing (2017–2018); Trustee, American Beacon Select Funds (2015-Present); Trustee, American Beacon Institutional Funds Trust (2017-Present); Trustee, American Beacon Sound Point Enhanced Income Fund (2018–Present); Trustee, American Beacon Apollo Total Return Fund (2018–Present). | ||
| Joseph B. Armes (57) | Trustee since 2015 | Director, Switchback Energy Acquisition (2019-Present); Chairman & CEO, CSW Industrials f/k/a Capital Southwest Corporation (investment company) (2015-Present); Chairman of the Board of Capital Southwest Corporation, predecessor to CSW Industrials, Inc. (2014-2017) (investment company); CEO, Capital Southwest Corporation (2013-2015); President & CEO, JBA Investment Partners (family investment vehicle) (2010-Present); Director and Chair of Audit Committee, RSP Permian (oil and gas producer) (2013-2018); Trustee, American Beacon Select Funds (2015-Present); Trustee, American Beacon Institutional Funds Trust (2017-Present); Trustee, American Beacon Sound Point Enhanced Income Fund (2018–Present); Trustee, American Beacon Apollo Total Return Fund (2018–Present). | ||
| Gerard J. Arpey (61) | Trustee since 2012 | Director, The Home Depot, Inc. (2015-Present); Partner, Emerald Creek Group (private equity firm) (2011-Present); Director, S.C. Johnson & Son, Inc. (privately held company) (2008-present); Trustee, American Beacon Select Funds (2012-Present); Trustee, American Beacon Institutional Funds Trust (2017-Present); Trustee, American Beacon Sound Point Enhanced Income Fund (2018–Present); Trustee, American Beacon Apollo Total Return Fund (2018–Present). | ||
| Brenda A. Cline (59) | Trustee since 2004 Chair since 2019 Vice Chair 2018 | Chief Financial Officer, Treasurer and Secretary, Kimbell Art Foundation (1993-Present); Director, Tyler Technologies, Inc. (public sector software solutions company) (2014-Present); Director, Range Resources Corporation (oil and natural gas company) (2015-Present); Trustee, CushingClosed-End andOpen-End Funds (2017-Present); Trustee, American Beacon Select Funds (2004-Present); ; Trustee, American Beacon Institutional Funds Trust (2017-Present); Trustee, American Beacon Sound Point Enhanced Income Fund (2018–Present); Trustee, American Beacon Apollo Total Return Fund (2018–Present). | ||
54
Trustees and Officers of the American Beacon FundsSM(Unaudited)
Name, Age | Position, Term of Office and Length of Time Served with the Trust | Principal Occupation(s) During Past 5 Years and Current Directorships | ||
| NON-INTERESTED TRUSTEES (CONT.) | Term | |||
| Lifetime of Trust until removal, resignation or retirement* | ||||
| Eugene J. Duffy (65) | Trustee since 2008 | Managing Director, Global Investment Management Distribution, Mesirow Financial (2016-Present); Managing Director, Institutional Services, Intercontinental Real Estate Corporation (2014-Present); Trustee, American Beacon Select Funds (2008-Present); Trustee, American Beacon Institutional Funds Trust (2017-Present); Trustee, American Beacon Sound Point Enhanced Income Fund (2018–Present); Trustee, American Beacon Apollo Total Return Fund (2018–Present). | ||
| Claudia A. Holz (62) | Trustee since 2018 | Partner, KPMG LLP (1990 – 2017); Trustee, American Beacon Select Funds (2018-Present); Trustee, American Beacon Institutional Funds Trust (2018-Present); Trustee, American Beacon Sound Point Enhanced Income Fund (2018–Present); Trustee, American Beacon Apollo Total Return Fund (2018–Present). | ||
| Douglas A. Lindgren (58) | Trustee since 2018 | CEO North America, Carne Global Financial Services (2016-2017); Consultant, Carne Financial Services (2017-2019); Managing Director, IPS Investment Management and Global Head, Content Management, UBS Wealth Management (2010-2016); Trustee, American Beacon Select Funds (2018-Present); Trustee, American Beacon Institutional Funds Trust (2018-Present); Trustee, American Beacon Sound Point Enhanced Income Fund (2018–Present); Trustee, American Beacon Apollo Total Return Fund (2018–Present). | ||
| Barbara J. McKenna, CFA (56) | Trustee since 2012 | President/Managing Principal, Longfellow Investment Management Company (2005-Present); Trustee, American Beacon Select Funds (2012-Present); Trustee, American Beacon Institutional Funds Trust (2017-Present); Trustee, American Beacon Sound Point Enhanced Income Fund (2018–Present); Trustee, American Beacon Apollo Total Return Fund (2018–Present. | ||
| R. Gerald Turner (74) | Trustee since 2001 | President, Southern Methodist University (1995-Present); Director, J.C. Penney Company, Inc. (1996-2019); Director, Kronus Worldwide Inc. (chemical manufacturing) (2003-Present); Trustee, American Beacon Select Funds (2001-Present); Trustee, American Beacon Institutional Funds Trust (2017-Present); Trustee, American Beacon Sound Point Enhanced Income Fund (2018 – Present); Trustee, American Beacon Apollo Total Return Fund (2018–Present). | ||
55
Trustees and Officers of the American Beacon FundsSM(Unaudited)
Name, Age | Position, Term of Office and Length of Time Served with the Trust | Principal Occupation(s) During Past 5 Years and Current Directorships | ||
| OFFICERS | Term | |||
| One Year | ||||
| Gene L. Needles, Jr. (65) | President since 2009 | President (2009-2018), CEO and Director (2009–Present), and Chairman (2018-Present), American Beacon Advisors, Inc., President (2015-2018), Director and CEO (2015–Present), and Chairman (2018-Present), Resolute Investment Holdings, LLC; President (2015-2018), Director and CEO (2015-Present), and Chairman (2018-Present),Resolute Topco, Inc.; President (2015-2018); Director, and CEO (2015-Present), and Chairman (2018-Present), Resolute Acquisition, Inc.; President (2015-2018), Director and CEO (2015-Present), Chairman (2018-Present), Resolute Investment Managers, Inc.; Director, Chairman, President and CEO, Resolute Investment Distributors (2017-Present); Director, Chairman, President and CEO; Resolute Investment Services, Inc. (2017-Present); President and CEO, Lighthouse Holdings Parent, Inc. (2009-2015); President, CEO and Director, Lighthouse Holdings, Inc. (2009-2015); Manager, President and CEO, American Private Equity Management, LLC (2012-Present); Director, Chairman, President and CEO, Alpha Quant Advisors, LLC (2016-Present); Director, ARK Investment Management LLC (2016-Present); Director, Shapiro Capital Management LLC (2017-Present); Director, Chairman and CEO, Continuous Capital, LLC (2018-Present); Director, Green Harvest Asset Management (2019-Present); Director, National Investment Services of America, LLC (2019 – Present); President, American Beacon Cayman Managed Futures Strategy Fund, Ltd. (2014-Present); Director and President, American Beacon Cayman Transformational Innovation Company, LTD., (2017-2018); President, American Beacon Delaware Transformational Innovation Corporation (2017-2018); President American Beacon Cayman TargetRisk Company, Ltd. (2018-Present);Member, Investment Advisory Committee, Employees Retirement System of Texas (2017-Present); Trustee, American Beacon NextShares Trust (2015-Present); President, American Beacon Select Funds (2009-Present); President, American Beacon Institutional Funds Trust (2017-Present); President, American Beacon Sound Point Enhanced Income Fund (2018-Present); President, American Beacon Apollo Total Return Fund (2018-Present); Director, RSW Investments Holdings LLC, (2019-Present); Manager, SSI Investment Management, LLC (2019-Present). | ||
| Rosemary K. Behan (60) | VP, Secretary and Chief Legal Officer since 2006 | Vice President, Secretary and General Counsel, American Beacon Advisors, Inc. (2006-Present); Secretary, Resolute Investment Holdings, LLC (2015-Present); Secretary, Resolute Topco, Inc. (2015-Present); Secretary, Resolute Acquisition, Inc. (2015–Present); Vice President, Secretary and General Counsel, Resolute Investment Managers, Inc. (2015-Present); Secretary, Resolute Investment Distributors, Inc. (2017-Present); Vice President, Secretary and General Counsel, Resolute Investment Services, Inc. (2017-Present); Vice President and Secretary, Lighthouse Holdings Parent, Inc. (2008-2015); Vice President and Secretary, Lighthouse Holdings, Inc. (2008-2015); Secretary, American Private Equity Management, LLC (2008-Present); Secretary and General Counsel, Alpha Quant Advisors, LLC (2016-Present); Vice President and Secretary, Continuous Capital, LLC (2018-Present); Secretary, Green Harvest Asset Management (2019-Present); Secretary, American Beacon Delaware Transformational Innovation Corporation (2017-2018); Secretary, American Beacon Cayman Transformational Innovation Company, Ltd. (2017-2018); Secretary, American Beacon Cayman Managed Futures Strategy Fund, Ltd. (2014-Present); Secretary, American Beacon Cayman TargetRisk Company, Ltd (2018-Present); Chief Legal Officer, Vice President and Secretary, American Beacon Select Funds (2006-Present); Chief Legal Officer, Vice President and Secretary, American Beacon Institutional Funds Trust (2017-Present); Chief Legal Officer, Vice President and Secretary, American Beacon Sound Point Enhanced Income Fund (2018-Present); Chief Legal Officer, Vice President and Secretary American Beacon Apollo Total Return Fund (2018-Present). | ||
56
Trustees and Officers of the American Beacon FundsSM(Unaudited)
Name, Age | Position, Term of Office and Length of Time Served with the Trust | Principal Occupation(s) During Past 5 Years and Current Directorships | ||
| OFFICERS (CONT.) | Term | |||
| One Year | ||||
| Brian E. Brett (59) | VP since 2004 | Senior Vice President, Head of Distribution (2012-Present), Vice President, Director of Sales (2004-2012), American Beacon Advisors, Inc.; Senior Vice President, Resolute Investment Managers, Inc. (2017-Present); Senior Vice President, Resolute Investment Distributors, Inc. (2018-Present), Senior Vice President, Resolute Investment Services, Inc. (2018-Present); Senior Vice President, Lighthouse Holdings Parent, Inc. (2008-2015); Senior Vice President, Lighthouse Holdings, Inc. (2008-2015); Vice President, American Beacon Select Funds (2004-Present); Vice President, American Beacon Institutional Funds Trust (2017-Present); Vice President American Beacon Sound Point Enhanced Income Fund (2018-Present); Vice President American Beacon Apollo Total Return Fund (2018-Present). | ||
| Paul B. Cavazos (50) | VP since 2016 | Chief Investment Officer and Senior Vice President, American Beacon Advisors, Inc. (2016-Present); Chief Investment Officer, DTE Energy (2007-2016); Vice President, American Private Equity Management, L.L.C. (2017–Present); Vice President, American Beacon Select Funds (2016-Present); Vice President, American Beacon Institutional Funds Trust (2017-Present); Vice President American Beacon Sound Point Enhanced Income Fund (2018-Present);Vice President American Beacon Apollo Total Return Fund (2018-Present). | ||
| Erica Duncan (49) | VP Since 2011 | Vice President, American Beacon Advisors, Inc. (2011-Present); Vice President, Resolute Investment Managers (2018-Present); Vice President, Resolute Investment Services, Inc. (2018-Present); Vice President, American Beacon Select Funds (2011-Present); Vice President, American Beacon Institutional Funds Trust (2017-Present); Vice President American Beacon Sound Point Enhanced Income Fund (2018-Present); Vice President American Beacon Apollo Total Return Fund (2018-Present). | ||
| Melinda G. Heika (58) | Principal Accounting Officer since 2017 and Treasurer since 2010 | Treasurer and CFO (2010-Present), American Beacon Advisors, Inc.; Treasurer, Resolute Topco, Inc. (2015-Present); Treasurer, Resolute Investment Holdings, LLC. (2015-Present); Treasurer, Resolute Acquisition, Inc. (2015-Present); Treasurer and CFO, Resolute Investment Managers, Inc. (2017-Present); Treasurer, Resolute Investment Distributors, Inc. (2017-2017); Treasurer and CFO, Resolute Investment Services, Inc. (2015-Present); Treasurer, Lighthouse Holdings Parent Inc., (2010-2015); Treasurer, Lighthouse Holdings, Inc. (2010-2015); Treasurer, American Private Equity Management, LLC (2012-Present); Treasurer and CFO, Alpha Quant Advisors, LLC (2016-Present); Treasurer and CFO, Continuous Capital, LLC (2018-Present); Treasurer, Green Harvest Asset Management (2019-Present); Treasurer, American Beacon Cayman Transformational Innovation, Ltd. (2017-2018); Treasurer, American Beacon Delaware Transformational Innovation Corporation (2017-2018); Director and Treasurer, American Beacon Cayman Managed Futures Strategy Fund, Ltd. (2014-Present); Treasurer, American Beacon Cayman TargetRisk Company, Ltd. (2018-Present); Treasurer, American Beacon Select Funds (2010-Present); Treasurer, American Beacon Institutional Funds Trust (2017-Present); Treasurer, American Beacon Sound Point Enhanced Income Fund (2018-Present); Treasurer, American Beacon Apollo Total Return Fund (2018-Present). | ||
| Terri L. McKinney (56) | VP since 2010 | Vice President (2009-Present), Managing Director (2003-2009), American Beacon Advisors, Inc.; Vice President, Resolute Investment Managers, Inc. (2017-Present); Vice President, Resolute Investment Services, Inc (2018-Present); Vice President, Alpha Quant Advisors, LLC (2016-Present); Vice President, Continuous Capital, LLC (2018-Present); Vice President, American Beacon Select Funds (2010-Present); Vice President, American Beacon Institutional Funds Trust (2017-Present); Vice President, American Beacon Sound Point Enhanced Income Fund (2018-Present); Vice President, American Beacon Apollo Total Return Fund (2018-Present). | ||
57
Trustees and Officers of the American Beacon FundsSM(Unaudited)
Name, Age | Position, Term of Office and Length of Time Served with the Trust | Principal Occupation(s) During Past 5 Years and Current Directorships | ||
| OFFICERS (CONT.) | Term | |||
| One Year | ||||
| Jeffrey K. Ringdahl (44) | VP since 2010 | Director (2015-Present), President (2018-Present), Chief Operating Officer (2010-Present), Senior Vice President (2013-2018), Vice President (2010-2013), American Beacon Advisors, Inc.; Director (2015-Present), President (2018-Present), Senior Vice Present (2015-2018), Resolute Investment Holdings, LLC; Director (2015-Present), President (2018-Present), Senior Vice President (2015-2018), Resolute Topco, Inc.; Director (2015-Present), President (2018-Present), Senior Vice President (2015-2018), Resolute Acquisition, Inc.; Director (2015-Present), President & COO (2018-Present), Senior Vice President (2015-2018), Resolute Investment Managers, Inc.; Director and Executive Vice President (2017-Present), Resolute Investment Distributors, Inc.; Director (2017-Present), President & COO (2018-Present), Executive Vice President (2017-2018), Resolute Investment Services, Inc.; Senior Vice President (2017-Present), Vice President (2012-2017), Manager (2015-Present), American Private Equity Management, LLC; Senior Vice President, Lighthouse Holdings Parent, Inc. (2013-2015); Senior Vice President, Lighthouse Holdings, Inc. (2013-2015); Trustee, American Beacon NextShares Trust (2015-Present); Director, Executive Vice President & COO, Alpha Quant Advisors, LLC (2016-Present); Director, Shapiro Capital Management, LLC (2017-Present); Director, Executive Vice President & COO, Continuous Capital, LLC (2018-Present); Director, RSW Investments Holdings LLC, (2019-Present); Manager, SSI Investment Management, LLC (2019-Present); Director, National Investment Services of America, LLC (2019-Present); Director and Vice President, American Beacon Cayman Transformational Innovation Company, Ltd., (2017-Present); Vice President, American Beacon Delaware Transformational Innovation Corporation (2017-2018); Director and Vice President, American Beacon Cayman Managed Futures Strategy Fund, Ltd. (2014-Present); Vice President, American Beacon Cayman TargetRisk Company, Ltd (2018-Present); Vice President, American Beacon Select Funds (2010-2018); Vice President, American Beacon Institutional Funds Trust (2017-Present); Vice President, American Beacon Sound Point Enhanced Income Fund (2018-Present); Vice President, American Beacon Apollo Total Return Fund (2018-Present). | ||
| Samuel J. Silver (56) | VP Since 2011 | Vice President (2011-Present), Chief Fixed Income Officer (2016-Present), American Beacon Advisors, Inc. (2011-Present); Vice President, American Beacon Select Funds (2011-Present); Vice President, American Beacon Institutional Funds Trust (2017-Present); Vice President, American Beacon Sound Point Enhanced Income Fund (2018-Present); Vice President, American Beacon Apollo Total Return Fund (2018-Present). | ||
| Christina E. Sears (48) | Chief Compliance Officer since 2004 and Asst. Secretary since 1999 | Vice President, American Beacon Advisors, Inc. (2019-Present); Chief Compliance Officer, American Beacon Advisors, Inc. (2004-Present); Vice President, Resolute Investment Managers, Inc. (2017-Present); Vice President, Resolute Investment Distributors (2017-Present); Vice President, Resolute Investment Services, Inc. (2019-Present); Chief Compliance Officer, American Private Equity Management, LLC (2012-Present); Chief Compliance Officer (2016-2019) and Vice President, Alpha Quant Advisors, LLC (2016-Present); Vice President, Continuous Capital, LLC (2018-Present); Chief Compliance Officer (2004-Present) and Assistant Secretary (1999-Present), American Beacon Select Funds; Chief Compliance Officer and Assistant Secretary, American Beacon Institutional Funds Trust (2017-Present); Chief Compliance Officer and Assistant Secretary, American Beacon Sound Point Enhanced Income Fund (2018-Present); Chief Compliance Officer and Assistant Secretary, American Beacon Apollo Total Return Fund (2018-Present). | ||
58
Trustees and Officers of the American Beacon FundsSM(Unaudited)
Name, Age | Position, Term of Office and Length of Time Served with the Trust | Principal Occupation(s) During Past 5 Years and Current Directorships | ||
| OFFICERS (CONT.) | Term | |||
| One Year | ||||
| Sonia L. Bates (63) | Asst. Treasurer since 2011 | Assistant Treasurer, American Beacon Advisors, Inc. (2011-2018); Assistant Treasurer, Lighthouse Holdings Parent Inc. (2011-2015); Assistant Treasurer, Lighthouse Holdings, Inc. (2011-2015); Assistant Treasurer, American Private Equity Management, LLC (2012-Present); Assistant Treasurer, American Beacon Cayman Transformational Innovation Company, Ltd. (2017-Present); Assistant Treasurer, American Beacon Cayman TargetRisk Company, Ltd. (2018-Present); Assistant Treasurer, American Beacon Select Funds (2011-Present); Assistant Treasurer, American Beacon Institutional Funds Trust (2017-Present); Assistant Treasurer, American Beacon Sound Point Enhanced Income Fund (2018-Present); Assistant Treasurer, American Beacon Apollo Total Return Fund (2018-Present). | ||
| Shelley D. Abrahams (45) | Assistant Secretary since 2008 | Assistant Secretary, American Beacon Select Funds (2008-Present); Assistant Secretary, American Beacon Institutional Funds Trust (2017-Present); Assistant Secretary, American Beacon Sound Point Enhanced Income Fund (2018-Present); Assistant Secretary, American Beacon Apollo Total Return Fund (2018-Present); | ||
| Rebecca L. Harris (53) | Assistant Secretary since 2010 | Vice President, American Beacon Advisors, Inc. (2011-Present); Vice President, Resolute Investment Managers, Inc. (2017-Present); Vice President, Resolute Investment Services (2015-Present); Vice President, Alpha Quant Advisors, LLC (2016-Present); Vice President, Continuous Capital, LLC (2018-Present); Assistant Secretary, American Beacon Select Funds (2010-Present); Assistant Secretary, American Beacon Institutional Funds Trust (2017-Present); Assistant Secretary, American Beacon Sound Point Enhanced Income Fund (2018-Present); Assistant Secretary, American Beacon Apollo Total Return Fund (2018-Present). | ||
| Teresa A. Oxford (61) | Assistant Secretary since 2015 | Assistant Secretary, American Beacon Advisors, Inc. (2015-Present); Assistant Secretary, Resolute Investment Distributors (2018-Present); Assistant Secretary, Resolute Investment Services (2018-Present); Assistant Secretary, Alpha Quant Advisors, LLC (2016-Present); Assistant Secretary, American Beacon Select Funds (2015-Present); Assistant Secretary, American Beacon Institutional Funds Trust (2017-Present); Assistant Secretary, American Beacon Sound Point Enhanced Income Fund (2018-Present); Assistant Secretary, American Beacon Apollo Total Return Fund (2018-Present); . | ||
| Peter A. Davidson (47)** | Assistant Secretary Since 2020 | Assistant Secretary, American Beacon Select Funds (2020-Present); Assistant Secretary, American Beacon Institutional Funds Trust (2020-Present); Assistant Secretary, American Beacon Sound Point Enhanced Income Fund (2020-Present); Assistant Secretary, American Beacon Apollo Total Return Fund (2020-Present). | ||
* As of 11/12/2014, the Board adopted a retirement plan that requires Trustees to retire no later than the last day of the calendar year in which they reach the age of 75.
** Mr. Davidson was elected at the March 3, 2020 meeting of the Board.
59
American Beacon FundsSM
January 31, 2020 (Unaudited)
The American Beacon Funds recognize and respect the privacy of our shareholders. We are providing this notice to you so you will understand how shareholder information may be collected and used.
We may collect nonpublic personal information about you from one or more of the following sources:
| • | information we receive from you on applications or other forms; |
| • | information about your transactions with us or our service providers; and |
| • | information we receive from third parties. |
We do not disclose any nonpublic personal information about our customers or former customers to anyone, except as permitted by law.
We restrict access to your nonpublic personal information to those employees or service providers who need to know that information to provide products or services to you. To ensure the confidentiality of your nonpublic personal information, we maintain safeguards that comply with federal standards.
60

Delivery of Documents
eDelivery isNOW AVAILABLE - Stop traditional mail delivery and receive your
shareholder reports and summary prospectuson-line. Sign up at
www.americanbeaconfunds.com
If you invest in the Fund through a financial institution, you may be able to receive the Fund’s regulatory mailings, such as the Prospectus, Annual Report and Semi-Annual Report, bye-mail. If you are interested in this option, please go towww.icsdelivery.com and search for your financial institution’s name or contact your financial institution directly.
To obtain more information about the Fund:
 |  | |
| By E-mail: | On the Internet: | |
| american_beacon.funds@ambeacon.com | Visit our website atwww.americanbeaconfunds.com | |
By Telephone: Call (800) 658-5811 |
By Mail: American Beacon Funds P.O. Box 219643 Kansas City, MO 64121-9643 | |
| Availability of Quarterly Portfolio Schedules | Availability of Proxy Voting Policy and Records | |
| In addition to the Schedule of Investments provided in each semi-annual and annual report, the Fund files a complete schedule of its portfolio holdings with the Securities and Exchange Commission (“SEC”) on Form N-PORT as of the end of each fiscal quarters. The Fund’s Forms N-PORT are available on the SEC’s website atwww.sec.gov. The Forms N-PORT may also be reviewed and copied at the SEC’s Public Reference Section, 100 F Street, NE, Washington, D.C. 20549-2736. Information regarding the operation of the SEC’s Public Reference Room may be obtained by calling (800)-SEC-0330. A complete schedule of the Fund’s portfolio holdings is also available atwww.americanbeaconfunds.com approximately sixty days after the end of each quarter. | A description of the policies and procedures the Fund uses to determine how to vote proxies relating to portfolio securities is available in the Fund’s Statement of Additional Information, is available free of charge on the Fund’s websitewww.americanbeaconfunds.com and by calling 1-800-967-9009 or by accessing the SEC’s website atwww.sec.gov. The Fund’s proxy voting record for the most recent year ended June 30 is filed annually with the SEC on Form N-PX. The Fund’s Forms N-PX are available on the SEC’s website atwww.sec.gov. The Fund’s proxy voting record may also be obtained by calling 1-800-967-9009. | |


Fund Service Providers:
CUSTODIAN State Street Bank and Trust Company Boston, Massachusetts | TRANSFER AGENT DST Asset Manager Solutions, Inc. Quincy, Massachusetts | INDEPENDENT REGISTERED PUBLIC ACCOUNTING FIRM PricewaterhouseCoopers LLP Boston, Massachusetts | DISTRIBUTOR Resolute Investment Distributors, Inc. Irving, Texas |
This report is prepared for shareholders of the American Beacon Funds and may be distributed to others only if preceded or accompanied by a current Prospectus or Summary Prospectus.
American Beacon Funds and American Beacon Crescent Short Duration High Income Fund are service marks of American Beacon Advisors, Inc.
AR 01/20
About American Beacon Advisors
Since 1986, American Beacon Advisors, Inc. has offered a variety of products and investment advisory services to numerous institutional and retail clients, including a variety of mutual funds, corporate cash management, and separate account management.
Our clients include defined benefit plans, defined contribution plans, foundations, endowments, corporations, financial planners, and other institutional investors. With American Beacon Advisors, you can put the experience of a multi-billion dollar asset management firm to work for your company.
FRONTIER MARKETS INCOME FUND
Investing inforeign, emerging and frontier market securitiesmay involve heightened risk due to currency fluctuations and economic and political risks. Investing inderivative instrumentsinvolves liquidity, credit, interest rate and market risks. The use offixed-income securitiesentails interest rate and credit risks. Please see the prospectus for a complete discussion of the Fund’s risks. There can be no assurances that the investment objectives of this Fund will be met.
GLG TOTAL RETURN FUND
Investing inforeign and emerging market securitiesmay involve heightened risk due to currency fluctuations and economic and political risks. Investing inderivative instrumentsinvolves liquidity, credit, interest rate and market risks. The use offixed-income securitiesentails interest rate and credit risks. Because the Fund may invest infewer issuersthan a more diversified portfolio, the fluctuating value of a single holding may have a greater effect on the value of the Fund. Please see the prospectus for a complete discussion of the Fund’s risks. There can be no assurances that the investment objectives of this Fund will be met.
Any opinions herein, including forecasts, reflect our judgment as of the end of the reporting period and are subject to change. Each advisor’s strategies and each Fund’s portfolio composition will change depending on economic and market conditions. This report is not a complete analysis of market conditions, and, therefore, should not be relied upon as investment advice. Although economic and market information has been compiled from reliable sources, American Beacon Advisors, Inc. makes no representation as to the completeness or accuracy of the statements contained herein.
American Beacon Funds | January 31, 2020 |
| 1 | ||||
| 2 | ||||
| 9 | ||||
| 11 | ||||
| 12 | ||||
| 26 | ||||
| 29 | ||||
| 33 | ||||
| 65 | ||||
| 70 | ||||
| 76 | ||||
| 77 | ||||
| 84 | ||||
| Back Cover | ||||
 | Dear Shareholders,
During the 12 months of this reporting period, news reports highlighted multiple disruptive headwinds in the global economy; among them the U.S. trade war with China and its toll on the global economy, Brexit, disruptions in the Middle East and protests in Hong Kong. And although the headlines seemed to be just starting during the period addressed in this report, it’s now undeniable that the global spread of the COVID-19 virus is having an overwhelming effect on the world’s markets, the full impact of which is unknown at this time.
As Peter L. Bernstein said in his treatise on risk,Against the Gods: The Remarkable Story of Risk, published by John Wiley & Sons, Inc. in September 1998, “Volatility is a proxy for uncertainty and must be accommodated in measuring investment risk.”
During times of economic uncertainty and market volatility, fear of loss can be a powerful emotion – one that drives many investors to making short-term decisions subject to a variety of potential error-leading biases. Unfortunately, some short-term investment decisions may create more volatility rather than mitigate it. |
Instead of dwelling on the markets’ short-term reaction to waves of negative global news, we encourage investors to focus on the horizon instead. Long-term investing isn’t about identifying and anticipating the next big market move, it is about identifying the right investment products for riding out those moves. As a long-term investor, you should keep in mind the three Ds:direction,disciplineanddiversification.
| u | Direction: Achieving your long-term financial goals requires an individualized plan of action. You may want your plan to provide some measure of protection against periods of geopolitical turmoil, economic uncertainty, market volatility and job insecurity. Your plan should be reviewed annually and be adjusted in the event your long-range needs change. |
| u | Discipline:Long-term, systematic participation in an investment portfolio requires your resolution to stay the course. Spending time in the market – rather than trying to time the market – may place you in a better position to reach your long-term financial goals. |
| u | Diversification: By investing in different investment styles and asset classes, you may be able to help mitigate financial risks across your investment portfolio. By allocating your investment portfolio according to your risk-tolerance level, you may be better positioned to weather storms and achieve your long-term financial goals. |
Since 1986, American Beacon has endeavored to provide investors with a disciplined approach to realizing long-term financial goals.As a manager of managers, we strive to provide investment products that may enable investors to participate during market upswings while potentially insulating against market downswings.
Many of thesub-advisors to our mutual funds pursue upside capture and/or downside protection using proprietary strategies. The investment teams behind our mutual funds seek to produce consistent, long-term results rather than focus only on short-term movements in the markets. In managing our investment products, we emphasize identifying opportunities that offer the potential for long-term rewards.
Our management approach is more than a concept; it’s the cornerstone of our culture. And we strive to apply it at every turn as we seek to provide a well-diversified line of investment solutions to help our shareholders seek long-term rewards while mitigating volatility and risk.
Thank you for your continued interest in American Beacon. For additional information about our investment products or to access your account information, please visit our website atwww.americanbeaconfunds.com.
Best Regards,

Gene L. Needles, Jr.
President
American Beacon Funds
1
Global Fixed-Income Market Overview
January 31, 2020 (Unaudited)
During the12-month period ended January 31, 2020, hard currency sovereign bonds (as represented by JPMorgan Emerging Market Bond Index-Global Diversified) returned 11.9% and local currency bonds (as represented by JPMorgan Government Bond Index-Emerging Markets Global Diversified) returned 6.2%.
The key driver of strong performance during the period was the decline in yields in developed-market countries, particularly U.S. Treasuries. Lower yields, accompanied by a dovish shift among the primary central banks, reflected lingering concerns for the global economy as trade disputes, Brexit concerns and protests in Hong Kong and other countries weighed on sentiment.
While a defensive economic outlook may lead to caution among investors, the breadth of accommodation among central banks, including a notable expansion in the U.S. money supply, spurred confidence and encouraged investors to search for higher yields in emerging and frontier market countries. However, given the volatility throughout the period, investors preferred hard currency over local currency issues. The dovish tilt by central banks was mirrored by their emerging-market counterparts. Turkey, Egypt, Ukraine, Brazil and Russia cut interest rates reflecting declining inflation rates and stable currencies. In countries such as China, Indonesia and the Philippines, there were sizeable reductions in required reserve ratios.
Interest rates declined globally with little regard for country fundamentals, such as debt balances, fiscal policy, political stability or other comparable metrics. At the extreme, however, were countries such as Argentina, Lebanon, Ecuador, Zambia and Suriname, which were avoided by investors as they dealt with severe internal conflict.
Returns for the period were strong but ended on a weak note in January 2020 as headlines around theCOVID-19 virus outbreak caused investors to reconsider their risk appetite. Lofty valuations in many countries were challenged by the uncertainty, which led to increased volatility as the year began.
2
American Beacon Frontier Markets Income FundSM
Performance Overview
January 31, 2020 (Unaudited)
The Investor Class of the American Beacon Frontier Markets Income Fund (the “Fund”) returned 10.71% for the12-month period ending January 31, 2020. The Fund underperformed the JPMorgan EMBI Global Diversified Index (hard currency) (the “Index”) return of 11.85% for the period. For additional comparison, the JPMorganGBI-EM Global Diversified Index (local currency) returned 6.22%.
Comparison of Change in Value of a $10,000 Investment for the period from 2/25/2014 through 1/31/2020
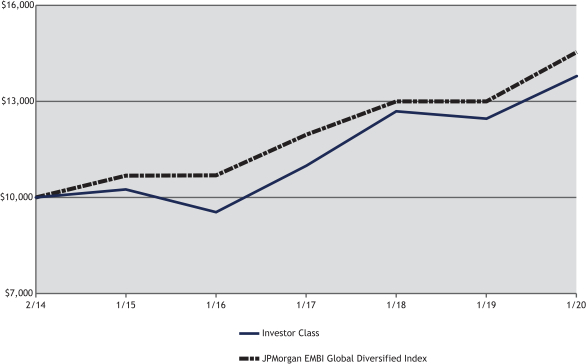
| Total Returns for the Period ended January 31, 2020 |
| |||||||||||||||||||||||||||||||
Ticker | 1 Year | 3 Years | 5 Years | Since Inception | Value of $10,000 02/25/2014- 1/31/2020 | |||||||||||||||||||||||||||
Institutional Class (1,3) | AGEIX | 11.00 | % | 8.19 | % | 6.48 | % | 5.92 | % | $ | 14,066 | |||||||||||||||||||||
Y Class (1,3) | AGEYX | 10.95 | % | 8.12 | % | 6.35 | % | 5.83 | % | $ | 13,996 | |||||||||||||||||||||
Investor Class (1,3) | AGEPX | 10.71 | % | 7.86 | % | 6.11 | % | 5.56 | % | $ | 13,787 | |||||||||||||||||||||
A without Sales Charge (1,3) | AGUAX | 10.77 | % | 7.76 | % | 6.06 | % | 5.51 | % | $ | 13,747 | |||||||||||||||||||||
A with Sales Charge (1,3) | AGUAX | 5.53 | % | 6.02 | % | 5.04 | % | 4.65 | % | $ | 13,092 | |||||||||||||||||||||
C without Sales Charge (1,3) | AGECX | 9.94 | % | 7.03 | % | 5.31 | % | 4.74 | % | $ | 13,160 | |||||||||||||||||||||
C with Sales Charge (1,3) | AGECX | 8.94 | % | 7.03 | % | 5.31 | % | 4.74 | % | $ | 13,160 | |||||||||||||||||||||
JPMorgan EMBI Global Diversified Index (2) | 11.85 | % | 6.71 | % | 6.36 | % | 6.51 | % | $ | 14,535 | ||||||||||||||||||||||
| 1. | Performance shown is historical and is not indicative of future returns. Investment returns and principal value will vary, and shares may be worth more or less at redemption than at original purchase. Performance shown is calculated based on the published end of day net asset values as of date indicated, and current performance may be lower or higher than the performance data quoted. To obtain performance as of the most recent month end, please call1-800-967-9009 or visitwww.americanbeaconfunds.com. Fund performance in the table above does not reflect the deduction of taxes a shareholder would pay on distributions or the redemption of shares. Generally accepted accounting principles require adjustments to be made to the net assets of the Fund at period end for financial reporting purposes only, and as such, the total return based on the unadjusted net asset value per share may differ from the total return reported in the financial highlights. Performance prior to waiving fees was lower than actual returns shown for periods when fee waivers were in place for each Class. A portion of fees charged to the Institutional Class of the Fund was waived from Fund inception through 2015, partially recovered in 2016, waived in 2017 and 2018, and partially recovered in 2019. A portion of fees charged to the Investor Class of the Fund was waived from Fund inception through 2015, partially recovered in 2016, waived in 2017, and partially recovered in 2018. A portion of fees charged to the Y Class of the Fund was waived from Fund inception through 2015, partially recovered in 2016, waived in 2017, and partially recovered in 2019. A portion of fees charged to |
3
American Beacon Frontier Markets Income FundSM
Performance Overview
January 31, 2020 (Unaudited)
| the A Class of the Fund was waived from Fund inception through 2015, partially recovered in 2016, waived in 2017, and partially recovered in 2018 and 2019. A portion of fees charged to the C Class of the Fund was waived from Fund inception through 2017 and was partially recovered in 2018 and 2019. A Class shares have a maximum sales charge of 4.75%. The maximum contingent deferred sales charge for the C Class is 1.00% for shares redeemed within one year of the date of purchase. |
| 2. | The JPMorgan EMBI Global Diversified Index is an emerging market debt benchmark that tracks dollar-denominated bonds issued by frontier and emerging market governments. One cannot directly invest in an index. |
| 3. | The Total Annual Fund Operating Expense ratios set forth in the most recent Fund prospectus for the Institutional, Y, Investor, A and C Class shares were 1.19%, 1.28%, 1.51%, 1.52% and 2.27%, respectively. The expense ratios above may vary from the expense ratios presented in other sections of this report that are based on expenses incurred during the period covered by this report. |
The Fund ended the period with approximately 48% of its investments denominated in local currency bonds, which was the primary source of underperformance relative to the Index. Given the periodic volatility throughout the year, investors preferred the security of hard currency bonds while seeking higher yields available in frontier countries. The Fund actively allocates between hard and local currency as opportunities arise, whereas the Index includes only hard-currency issues. Returns within the frontier market countries were broadly consistent with those of the emerging market countries in the Index.
Markets began on a positive footing until concerns over the economic picture in Argentina and elections in Turkey and South Africa caused uncertainty. However, sentiment was boosted by increasingly supportive central banks, particularly as the U.S. Federal Reserve cut rates three times during the period. Escalating trade tensions between the U.S. and China also shook markets for most of the period. Nevertheless, in December 2019, U.S. and China signed a‘phase-one’ trade deal and announced a partial backtrack on certain tariffs, which fueled hopes of a potential resolution to the18-month trade war. As a result, December was one of the best months of 2019 for emerging market debt. As markets entered 2020, the optimism garnered from the improving global trade environment quickly reversed as the sudden rise of coronavirus in China dominated headlines causing investors to reduce risk exposure.
Within frontier market debt, after struggling during the first half of the period, Mozambique recovered somewhat as it obtained consent from bondholders to restructure its Eurobonds to reduce its debt burden. In Ukraine, President Volodymyr Zelensky’s Servant of the People Party won legislative elections giving him a full mandate to implement his agenda including a potential new International Monetary Fund loan agreement and other reform efforts. Elsewhere, citing weaker global economic activity and a moderation in domestic inflationary pressures, the Central Bank of Egypt continued with its accommodative monetary policy, slashing both the overnight deposit rate and lending rates. The Egyptian government also successfully issued U.S. $2 billion across4-year,12-year and40-year bond tranches – its third issuance in global markets in 2019.
The Fund’ssub-advisors continue to utilize bothtop-down andbottom-up inputs to identify the best relative opportunities across the evolving frontier market spectrum to benefit performance over the long term.
| Top Ten Holdings (% Net Assets) |
| |||||||
| Kenya Infrastructure Bond, 12.500%, Due 1/10/2033, Series 15YR | 1.9 | |||||||
| Zambia Government International Bond, 8.970%, Due 7/30/2027 | 1.5 | |||||||
| Dominican Republic International Bond, 8.900%, Due 2/15/2023 | 1.3 | |||||||
| Angolan Government International Bond, 9.500%, Due 11/12/2025 | 1.2 | |||||||
| Mozambique International Bond, 5.000%, Due 9/15/2031 | 1.2 | |||||||
| Senegal Government International Bond, 4.750%, Due 3/13/2028 | 1.2 | |||||||
| El Salvador Government International Bond, 6.375%, Due 1/18/2027 | 1.0 | |||||||
| Iraq International Bond, 6.752%, Due 3/9/2023 | 1.0 | |||||||
| Ivory Coast Government International Bond, 5.250%, Due 3/22/2030 | 1.0 | |||||||
| Pakistan Treasury Bills, 21.190%, Due 1/14/2021 | 1.0 | |||||||
| Total Fund Holdings | 248 | |||||||
4
American Beacon Frontier Markets Income FundSM
Performance Overview
January 31, 2020 (Unaudited)
| Top Ten Country Weightings (% Investments) |
| |||||||
| Egypt | 7.3 | |||||||
| Nigeria | 6.5 | |||||||
| Ghana | 4.9 | |||||||
| Kenya | 4.8 | |||||||
| Pakistan | 4.5 | |||||||
| Ukraine | 4.5 | |||||||
| Ivory Coast | 4.4 | |||||||
| Dominican Republic | 3.8 | |||||||
| Angola | 3.5 | |||||||
| Costa Rica | 3.5 | |||||||
| Sector Allocation (% Investments) |
| |||||||
| Foreign Sovereign Obligations | 83.2 | |||||||
| Credit-Linked Notes | 9.0 | |||||||
| Financial | 3.3 | |||||||
| Industrial | 1.6 | |||||||
| Energy | 1.0 | |||||||
| Consumer,Non-Cyclical | 0.8 | |||||||
| Basic Materials | 0.6 | |||||||
| Communications | 0.4 | |||||||
| Utilities | 0.1 | |||||||
5
American Beacon Frontier Markets Income FundSM
Performance Overview
January 31, 2020 (Unaudited)
| Country Allocation (% Investments) | ||||
| Egypt | 7.3 | |||
| Nigeria | 6.5 | |||
| Ghana | 4.9 | |||
| Kenya | 4.8 | |||
| Pakistan | 4.5 | |||
| Ukraine | 4.5 | |||
| Ivory Coast | 4.4 | |||
| Dominican Republic | 3.8 | |||
| Angola | 3.5 | |||
| Costa Rica | 3.5 | |||
| Ecuador | 3.4 | |||
| Zambia | 3.3 | |||
| Senegal | 2.9 | |||
| Mozambique | 2.8 | |||
| Belarus | 2.5 | |||
| Supranational | 2.4 | |||
| Uganda | 2.4 | |||
| Argentina | 2.3 | |||
| Iraq | 2.3 | |||
| El Salvador | 2.2 | |||
| Sri Lanka | 2.2 | |||
| Gabon | 1.8 | |||
| Kazakhstan | 1.6 | |||
| Mongolia | 1.4 | |||
| Georgia | 1.2 | |||
| Netherlands | 1.2 | |||
| Armenia | 0.9 | |||
| Cameroon | 0.9 | |||
| Congo | 0.9 | |||
| Rwanda | 0.9 | |||
| Tajikistan | 0.9 | |||
| Tunisia | 0.9 | |||
| Belize | 0.8 | |||
| Benin | 0.8 | |||
| Nicaragua | 0.8 | |||
| Kyrgyzstan | 0.7 | |||
| United Kingdom | 0.7 | |||
| Uruguay | 0.7 | |||
| Ethiopia | 0.6 | |||
| Papua New Guinea | 0.6 | |||
| Azerbaijan | 0.5 | |||
| Bahrain | 0.4 | |||
| Barbados | 0.4 | |||
| Laos | 0.4 | |||
| Montenegro | 0.4 | |||
| Paraguay | 0.4 | |||
| Spain | 0.4 | |||
| South Africa | 0.4 | |||
| Lebanon | 0.3 | |||
| Malawi | 0.3 | |||
| Suriname | 0.3 | |||
| Uzbekistan | 0.3 | |||
| Gambia | 0.2 | |||
| Honduras | 0.2 | |||
| Luxembourg | 0.2 | |||
| Singapore | 0.1 | |||
| United Republic of Tanzania | 0.1 |
6
American Beacon GLG Total Return FundSM
Performance Overview
January 31, 2020 (Unaudited)
The Investor Class of the American Beacon GLG Total Return Fund (the “Fund”) returned-1.10% for the12-month period ended January 31, 2020. The Fund underperformed the ICE BofA 3-Month U.S. Dollar LIBOR Constant Maturity Index (the “Index”) return of 2.54% for the same period. For additional comparison, the JPMorgan EMBI Global Index (hard currency) returned 11.48%, and the JPMorganGBI-EM Global Diversified Index (local currency) returned 11.85%.
Comparison of Change in Value of a $10,000 Investment for the period from 5/20/2016 through 1/31/2020
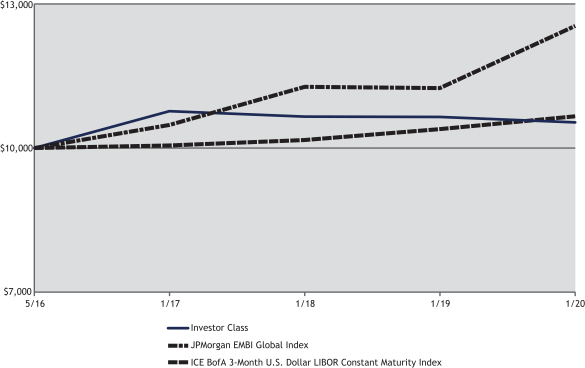
| Total Returns for the Period ended January 31, 2020 |
| ||||||||||||||||||||||||||
Ticker | 1 Year | 3 Year | Since Inception | Value of $10,000 05/20/2016- 1/31/2020 | |||||||||||||||||||||||
Institutional Class (1,3) | GLGIX | (0.79 | )% | (0.32 | )% | 1.82 | % | $ | 10,692 | ||||||||||||||||||
Y Class (1,3) | GLGYX | (0.89 | )% | (0.50 | )% | 1.65 | % | $ | 10,624 | ||||||||||||||||||
Investor Class (1,3) | GLGPX | (1.10 | )% | (0.73 | )% | 1.41 | % | $ | 10,531 | ||||||||||||||||||
A without Sales Charge (1,3) | GLGAX | (1.10 | )% | (0.76 | )% | 1.38 | % | $ | 10,520 | ||||||||||||||||||
A Class with Sales Charge (1,3) | GLGAX | (5.79 | )% | (2.36 | )% | 0.05 | % | $ | 10,019 | ||||||||||||||||||
C without Sales Charge (1,3) | GLGCX | (1.92 | )% | (1.49 | )% | 0.62 | % | $ | 10,233 | ||||||||||||||||||
C Class with Sales Charge (1,3) | GLGCX | (2.92 | )% | (1.49 | )% | 0.62 | % | $ | 10,233 | ||||||||||||||||||
Ultra Class (1,3) | GLGUX | (0.69 | )% | (0.26 | )% | 1.87 | % | $ | 10,710 | ||||||||||||||||||
ICE BofA 3-Month U.S. Dollar LIBOR Constant Maturity Index (2) | 2.54 | % | 1.97 | % | 1.73 | % | $ | 10,656 | |||||||||||||||||||
JPMorgan EMBI Global Index (2) | 11.48 | % | 6.17 | % | 6.30 | % | $ | 12,538 | |||||||||||||||||||
| 1. | Performance shown is historical and is not indicative of future returns. Investment returns and principal value will vary, and shares may be worth more or less at redemption than at original purchase. Performance shown is calculated based on the published end of day net asset values as of the date indicated, and current performance may be lower or higher than the performance data quoted. To obtain performance as of the most recent month end, please visitwww.americanbeaconfunds.comor call1-800-967-9009. Fund performance in the table above does not reflect the deduction of taxes a shareholder would pay on distributions or the redemption of shares. Generally accepted accounting principles require adjustments to be made to the net assets of the Fund at period end for financial reporting purposes only, and as such, the total return based on the unadjusted net asset value per share may differ from the total return reported in the financial highlights. A portion of fees charged to the Institutional, A and C Classes of the Fund was waived from Fund inception through 2017 and partially recovered in 2018 and 2019. Performance prior to waiving fees was lower than actual returns shown through 2017. A portion of fees charged to the Investor and Ultra Classes of the Fund has been waived since Fund inception. Performance prior to waiving fees was lower than actual |
7
American Beacon GLG Total Return FundSM
Performance Overview
January 31, 2020 (Unaudited)
| returns shown since inception. A portion of fees charged to the Y Class of the Fund was waived from Fund inception through 2018 and partially recovered in 2019. Performance prior to waiving fees was lower than actual returns shown through 2018. A Class shares have a maximum sales charge of 4.75%. The maximum contingent deferred sales charge for the C Class is 1.00% for shares redeemed within one year of the date of purchase. |
| 2. | The ICE BofA U.S. Dollar3-Month LIBOR Constant Maturity Index represents the London Interbank Offered Rate (LIBOR) with a constant3-month average maturity. LIBOR is a composite of the rates of interest at which banks borrow from one another in the London market, and it is a widely used benchmark for short-term interest rates. The JPMorgan EMBI Global Index is an emerging market debt benchmark that tracks dollar-denominated bonds issued by emerging market governments. One cannot directly invest in an index. |
| 3. | The Total Annual Fund Operating Expense ratios set forth in the most recent Fund prospectus for the Institutional, Y, Investor, A, C and Ultra Class shares were 1.03%, 1.05%, 1.80%, 1.31%, 2.06% and 1.05%, respectively. The expense ratios above may vary from the expense ratios presented in other sections of this report that are based on expenses incurred during the period covered by this report. |
Emerging market debt rebounded during the period as the Fed and other central banks embraced accommodative monetary policy given global economic and political uncertainties. The support gave investors confidence to return to investments they fled during the volatile fourth quarter of 2018. Strong investor demand and slowing global economies led interest rates to decline in many countries generating attractive returns among the bond indexes. Hard currency bonds outperformed local currency issues for much of the period, reflecting a desire among investors to earn higher yield within the safety of hard currencies. Additionally, accommodation among central banks gave emerging market countries flexibility to lower their own interest rates, which put pressure on currencies.
The Fund, however, maintained its defensive posture toward the credit and currency markets based on deteriorating fundamentals, expensive valuations, crowded investor positioning and other macroeconomic inputs. While the recent central bank action has supported the markets, the Fund’ssub-advisor anticipates that the ultimate removal of excess liquidity will cause investors to pull assets from the risky investments they sought during the era of easy money. The conditions that favored emerging markets debt for so long are expected to gradually change.
During the period, the Fund was short a variety of local currencies including the Brazilian peso, Indonesian rupiah, Colombian peso and South African rand. The Fund was also short credit exposure to countries including Brazil, Colombia, Indonesia, South Africa, Lebanon and Russia, among others, as spreads became too narrow.
The Fund sought to invest selectively in opportunities to generate income while maintaining a highly defensive posture. The Fund’s weighted average duration continued to remain near zero during the period as well.
| Top Ten Holdings (% Net Assets)* |
| |||||||
| U.S. Treasury Bills, 1.560%, Due 6/4/2020 | 47.7 | |||||||
| U.S. Treasury Bills, 1.565%, Due 6/18/2020 | 44.8 | |||||||
| U.S. Treasury Bills, 1.506%, Due 6/11/2020 | 2.3 | |||||||
| U.S. Treasury Bills, 1.545%, Due 7/9/2020 | 0.3 | |||||||
| Total Fund Holdings | 4 | |||||||
| * | The table excludes investments in currencies, money market funds and derivatives. |
| Sector Exposures (% Net Assets)(1) |
| |||
| U.S. Treasury Obligations | 95.1 | |||
| Country Allocation (% Investments)(1) |
| |||
| United States | 100.0 | |||
| 1. | This table does not include derivative instruments. |
8
American Beacon FundsSM
January 31, 2020 (Unaudited)
Fund Expense Example
As a shareholder of a Fund, you incur two types of costs: (1) transaction costs, including sales charges (loads) on purchase payments and redemption fees, if applicable, and (2) ongoing costs, including management fees, distribution(12b-1) fees,sub-transfer agent fees, and other Fund expenses. The Examples are intended to help you understand the ongoing cost (in dollars) of investing in the Fund and to compare these costs with the ongoing costs of investing in other mutual funds. The Examples are based on an investment of $1,000 invested at the beginning of the period in each Class and held for the entire period from August 1, 2019 through January 31, 2020.
Actual Expenses
The “Actual” lines of the tables provide information about actual account values and actual expenses. You may use the information on this page, together with the amount you invested, to estimate the expenses that you paid over the period. Simply divide your account value by $1,000 (for example, an $8,600 account value divided by $1,000 = $8.60), then multiply the result by the “Expenses Paid During Period” to estimate the expenses you paid on your account during this period. Shareholders of the Investor and Institutional Classes that invest in the Fund through an IRA or Roth IRA may be subject to a custodial IRA fee of $15 that is typically deducted each December. If your account was subject to a custodial IRA fee during the period, your costs would have been $15 higher.
Hypothetical Example for Comparison Purposes
The “Hypothetical” lines of the tables provide information about hypothetical account values and hypothetical expenses based on the Fund’s actual expense ratio and an assumed 5% per year rate of return before expenses (not the Fund’s actual return). You may compare the ongoing costs of investing in the Fund with other funds by contrasting this 5% hypothetical example and the 5% hypothetical examples that appear in the shareholder reports of the other funds. The hypothetical account values and expenses may not be used to estimate the actual ending account balance or expenses you paid for the period. Shareholders of the Investor and Institutional Classes that invest in the Funds through an IRA or Roth IRA may be subject to a custodial IRA fee of $15 that is typically deducted each December. If your account was subject to a custodial IRA fee during the period, your costs would have been $15 higher.
You should also be aware that the expenses shown in the table highlight only your ongoing costs and do not reflect any transaction costs charged by the Fund, such as sales charges (loads) or redemption fees, as applicable. Similarly, the expense examples for other funds do not reflect any transaction costs charged by those funds, such as sales charges (loads), redemption fees or exchange fees. Therefore, the “Hypothetical” lines of the tables are useful in comparing ongoing costs only and will not help you determine the relative total costs of owning different funds. If you were subject to any transaction costs during the period, your costs would have been higher.
9
American Beacon FundsSM
Expense Examples
January 31, 2020 (Unaudited)
| American Beacon Frontier Markets Income Fund |
| ||||||||||||||
| Beginning Account Value 8/1/2019 | Ending Account Value 1/31/2020 | Expenses Paid During Period 8/1/2019-1/31/2020* | |||||||||||||
| R5 Class | |||||||||||||||
| Actual | $1,000.00 | $1,040.90 | $5.97 | ||||||||||||
| Hypothetical** | $1,000.00 | $1,019.36 | $5.90 | ||||||||||||
| Y Class | |||||||||||||||
| Actual | $1,000.00 | $1,039.60 | $6.37 | ||||||||||||
| Hypothetical** | $1,000.00 | $1,018.96 | $6.31 | ||||||||||||
| Investor Class | |||||||||||||||
| Actual | $1,000.00 | $1,039.60 | $7.45 | ||||||||||||
| Hypothetical** | $1,000.00 | $1,017.90 | $7.38 | ||||||||||||
| A Class | |||||||||||||||
| Actual | $1,000.00 | $1,038.90 | $8.07 | ||||||||||||
| Hypothetical** | $1,000.00 | $1,017.29 | $7.98 | ||||||||||||
| C Class | |||||||||||||||
| Actual | $1,000.00 | $1,035.80 | $11.49 | ||||||||||||
| Hypothetical** | $1,000.00 | $1,013.91 | $11.37 | ||||||||||||
| * | Expenses are equal to the Fund’s annualized expense ratios for the six-month period of 1.16%, 1.24%, 1.45%, 1.57%, and 2.24% for the Institutional, Y, Investor, A, and C Classes, respectively, multiplied by the average account value over the period, multiplied by the number derived by dividing the number of days in the most recent fiscal half-year (184) by days in the year (365) to reflect the half-year period. |
| ** | 5% return before expenses. |
| American Beacon GLG Total Return Fund | |||||||||||||||
| Beginning Account Value 8/1/2019 | Ending Account Value 1/31/2020 | Expenses Paid During Period 8/1/2019-1/31/2020* | |||||||||||||
| Institutional Class | |||||||||||||||
| Actual | $1,000.00 | $997.00 | $5.69 | ||||||||||||
| Hypothetical** | $1,000.00 | $1,019.51 | $5.75 | ||||||||||||
| Y Class | |||||||||||||||
| Actual | $1,000.00 | $995.00 | $6.94 | ||||||||||||
| Hypothetical** | $1,000.00 | $1,018.25 | $7.02 | ||||||||||||
| Investor Class | |||||||||||||||
| Actual | $1,000.00 | $996.00 | $7.35 | ||||||||||||
| Hypothetical** | $1,000.00 | $1,017.85 | $7.43 | ||||||||||||
| A Class | |||||||||||||||
| Actual | $1,000.00 | $996.00 | $7.45 | ||||||||||||
| Hypothetical** | $1,000.00 | $1,017.75 | $7.53 | ||||||||||||
| C Class | |||||||||||||||
| Actual | $1,000.00 | $991.80 | $11.20 | ||||||||||||
| Hypothetical** | $1,000.00 | $1,013.96 | $11.32 | ||||||||||||
| Ultra Class | |||||||||||||||
| Actual | $1,000.00 | $998.00 | $4.99 | ||||||||||||
| Hypothetical** | $1,000.00 | $1,020.22 | $5.04 | ||||||||||||
| * | Expenses are equal to the Fund’s annualized expense ratios for thesix-month period of 1.13%, 1.38%, 1.46%, 1.48%, 2.23%, and 0.99% for the Institutional, Y, Investor, A, C, and Ultra Classes, respectively, multiplied by the average account value over the period, multiplied by the number derived by dividing the number of days in the most recent fiscal half-year (184) by days in the year (365) to reflect the half-year period. |
| ** | 5% return before expenses. |
10
American Beacon FundsSM
Report of Independent Registered Public Accounting Firm
To the Board of Trustees of American Beacon Funds and the Shareholders of American Beacon Frontier Markets Income Fund and American Beacon GLG Total Return Fund
Opinions on the Financial Statements
We have audited the accompanying statements of assets and liabilities, including the schedules of investments, of American Beacon Frontier Markets Income Fund and American Beacon GLG Total Return Fund (two of the series constituting American Beacon Funds, referred to hereafter as the “Funds”) as of January 31, 2020, the related statements of operations for the year ended January 31, 2020, the statements of changes in net assets for each of the two years in the period ended January 31, 2020, including the related notes, and the financial highlights for each of the periods indicated in the table below (collectively referred to as the “financial statements”). In our opinion, the financial statements present fairly, in all material respects, the financial position of each of the Funds as of January 31, 2020, the results of each of their operations for the year then ended, the changes in each of their net assets for each of the two years in the period ended January 31, 2020 and each of the financial highlights for each of the periods indicated in the table below, in conformity with accounting principles generally accepted in the United States of America.
Fund Name | Financial Highlights | |
| American Beacon Frontier Markets Income Fund | For each of the five years in the period ended January 31, 2020 | |
| American Beacon GLG Total Return Fund | For the years ended January 31, 2020, 2019 and 2018, and the period from May 20, 2016 (commencement of operations) through January 31, 2017 | |
The financial statements of American Beacon Frontier Markets Income Fund as of and for the year ended January 31, 2016 and the financial highlights for each of the periods ended on or prior to January 31, 2016 (not presented herein, other than the financial highlights) were audited by other auditors whose report dated March 31, 2016 expressed an unqualified opinion on those financial statements and financial highlights.
Basis for Opinions
These financial statements are the responsibility of the Funds’ management. Our responsibility is to express an opinion on the Funds’ financial statements based on our audits. We are a public accounting firm registered with the Public Company Accounting Oversight Board (United States) (PCAOB) and are required to be independent with respect to the Funds in accordance with the U.S. federal securities laws and the applicable rules and regulations of the Securities and Exchange Commission and the PCAOB.
We conducted our audits of these financial statements in accordance with the standards of the PCAOB. Those standards require that we plan and perform the audit to obtain reasonable assurance about whether the financial statements are free of material misstatement, whether due to error or fraud.
Our audits included performing procedures to assess the risks of material misstatement of the financial statements, whether due to error or fraud, and performing procedures that respond to those risks. Such procedures included examining, on a test basis, evidence regarding the amounts and disclosures in the financial statements. Our audits also included evaluating the accounting principles used and significant estimates made by management, as well as evaluating the overall presentation of the financial statements. Our procedures included confirmation of securities owned as of January 31, 2020 by correspondence with the custodian, transfer agent and brokers; when replies were not received from brokers, we performed other auditing procedures. We believe that our audits provide a reasonable basis for our opinion.
PricewaterhouseCoopers LLP
Dallas, TX
March 30, 2020
We have served as the auditor of one or more investment companies in the American Beacon family of funds since 2016.
11
American Beacon Frontier Markets Income FundSM
January 31, 2020
| Principal Amount* | Fair Value | ||||||||||||||
| Angola - 3.21% | |||||||||||||||
| Credit-Linked Notes - 0.16% | |||||||||||||||
| Republic of Angola (Issuer Aurora Australis B.V.), 8.143%, Due 12/19/2023,(6-mo. USD LIBOR + 6.250%)A B | $ | 750,000 | $ | 754,575 | |||||||||||
|
| ||||||||||||||
| Foreign Sovereign Obligations - 3.05% | |||||||||||||||
| Angolan Government International Bond, | |||||||||||||||
9.500%, Due 11/12/2025B | 4,950,000 | 5,765,136 | |||||||||||||
8.250%, Due 5/9/2028B | 3,530,000 | 3,801,775 | |||||||||||||
8.000%, Due 11/26/2029, Series 144AC | 3,360,000 | 3,551,587 | |||||||||||||
9.375%, Due 5/8/2048B | 985,000 | 1,066,921 | |||||||||||||
|
| ||||||||||||||
Total Foreign Sovereign Obligations | 14,185,419 | ||||||||||||||
|
| ||||||||||||||
Total Angola (Cost $13,842,854) | 14,939,994 | ||||||||||||||
|
| ||||||||||||||
| Argentina - 2.06% | |||||||||||||||
| Foreign Sovereign Obligations - 2.06% | |||||||||||||||
| Argentina Bonar Bonds, | |||||||||||||||
42.524%, Due 3/1/2020, (BADLARP Index + 3.250%)A | ARS | 4,500,000 | 66,644 | ||||||||||||
38.154%, Due 4/3/2022, (BADLARP Index + 2.000%)A | ARS | 92,100,000 | 969,556 | ||||||||||||
| Argentine Republic Government International Bond, | |||||||||||||||
5.000%, Due 1/15/2027B | EUR | 3,070,000 | 1,421,497 | ||||||||||||
5.875%, Due 1/11/2028 | 7,100,000 | 3,106,250 | |||||||||||||
| Argentinga Treasury Bills, | |||||||||||||||
3.685%, Due 5/28/2020 | ARS | 186,685,000 | 2,604,618 | ||||||||||||
0.459%, Due 10/29/2020 | ARS | 61,897,641 | 664,790 | ||||||||||||
| Provincia de Buenos Aires, | |||||||||||||||
43.104%, Due 5/31/2022, (BADLARP Index + 3.830%)A | ARS35,000,000 | 330,472 | |||||||||||||
39.294%, Due 4/12/2025, (BADLARP Index + 3.750%)A B C | ARS | 51,500,000 | 444,456 | ||||||||||||
|
| ||||||||||||||
Total Foreign Sovereign Obligations | 9,608,283 | ||||||||||||||
|
| ||||||||||||||
Total Argentina (Cost $18,147,689) | 9,608,283 | ||||||||||||||
|
| ||||||||||||||
| Armenia - 0.78% | |||||||||||||||
| Foreign Sovereign Obligations - 0.78% | |||||||||||||||
| Republic of Armenia International Bond, | |||||||||||||||
7.150%, Due 3/26/2025B | 2,540,000 | 3,000,400 | |||||||||||||
3.950%, Due 9/26/2029, Series 144AC | 620,000 | 626,029 | |||||||||||||
|
| ||||||||||||||
Total Foreign Sovereign Obligations | 3,626,429 | ||||||||||||||
|
| ||||||||||||||
Total Armenia (Cost $3,427,487) | 3,626,429 | ||||||||||||||
|
| ||||||||||||||
| Azerbaijan - 0.43% (Cost $2,000,000) | |||||||||||||||
| Credit-Linked Notes - 0.43% | |||||||||||||||
| Republic of Azerbaijan (Issuer Frontera Capital B.V.), 14.000%, Due 3/30/2020, Series BC D | 2,000,000 | 2,004,000 | |||||||||||||
|
| ||||||||||||||
| Bahrain - 0.37% | |||||||||||||||
| Foreign Corporate Obligations - 0.37% | |||||||||||||||
| Oil and Gas Holding Co. BSCC, | |||||||||||||||
7.625%, Due 11/7/2024B | 400,000 | 468,050 | |||||||||||||
7.625%, Due 11/7/2024, Series 144AC | 1,075,000 | 1,257,883 | |||||||||||||
|
| ||||||||||||||
Total Foreign Corporate Obligations | 1,725,933 | ||||||||||||||
|
| ||||||||||||||
Total Bahrain (Cost $1,580,198) | 1,725,933 | ||||||||||||||
|
| ||||||||||||||
| Barbados - 0.38% | |||||||||||||||
| Foreign Corporate Obligations - 0.06% | |||||||||||||||
| Sagicor Finance Ltd., 8.875%, Due 8/11/2022B | 279,000 | 288,765 | |||||||||||||
|
| ||||||||||||||
| Foreign Sovereign Obligations - 0.32% | |||||||||||||||
| Barbados Government International Bond, 6.500%, Due 10/1/2029, Series 144AC | 1,469,100 | 1,478,282 | |||||||||||||
|
| ||||||||||||||
Total Barbados (Cost $1,741,185) | 1,767,047 | ||||||||||||||
|
| ||||||||||||||
See accompanying notes
12
American Beacon Frontier Markets Income FundSM
Schedule of Investments
January 31, 2020
| Principal Amount* | Fair Value | ||||||||||||||
| Belarus - 2.28% | |||||||||||||||
| Foreign Sovereign Obligations - 2.28% | |||||||||||||||
| Development Bank of the Republic of Belarus JSC, | |||||||||||||||
12.000%, Due 5/15/2022B | BYN | 3,100,000 | $ | 1,456,917 | |||||||||||
12.000%, Due 5/15/2022, Series 144AC | BYN | 2,432,000 | 1,142,975 | ||||||||||||
6.750%, Due 5/2/2024B | $ | 1,400,000 | 1,488,452 | ||||||||||||
6.750%, Due 5/2/2024, Series 144AC | 2,030,000 | 2,158,255 | |||||||||||||
| Republic of Belarus International Bond, | |||||||||||||||
6.875%, Due 2/28/2023B | 1,710,000 | 1,842,012 | |||||||||||||
7.625%, Due 6/29/2027B | 997,000 | 1,150,608 | |||||||||||||
6.200%, Due 2/28/2030B | 1,250,000 | 1,361,025 | |||||||||||||
|
| ||||||||||||||
Total Foreign Sovereign Obligations | 10,600,244 | ||||||||||||||
|
| ||||||||||||||
Total Belarus (Cost $10,269,984) | 10,600,244 | ||||||||||||||
|
| ||||||||||||||
| Belize - 0.71% (Cost $3,362,391) | |||||||||||||||
| Foreign Sovereign Obligations - 0.71% | |||||||||||||||
| Belize Government International Bond, 4.938%, Due 2/20/2034B E | 5,288,500 | 3,292,091 | |||||||||||||
|
| ||||||||||||||
| Benin - 0.73% (Cost $3,395,770) | |||||||||||||||
| Foreign Sovereign Obligations - 0.73% | |||||||||||||||
| Benin Government International Bond, 5.750%, Due 3/26/2026B | EUR | 2,988,000 | 3,422,534 | ||||||||||||
|
| ||||||||||||||
| Bosnia & Herzegovina - 0.02% (Cost $122,990) | |||||||||||||||
| Foreign Sovereign Obligations - 0.02% | |||||||||||||||
| Bosnia & Herzegovina Government International Bond, 0.438%, Due 12/20/2021, Series B,(6-mo. EUR LIBOR + 0.813%)A B F | EUR | 187,030 | 94,029 | ||||||||||||
|
| ||||||||||||||
| Cameroon, United Republic Of - 0.78% (Cost $3,409,817) | |||||||||||||||
| Foreign Sovereign Obligations - 0.78% | |||||||||||||||
| Republic of Cameroon International Bond, 9.500%, Due 11/19/2025B | 3,200,000 | 3,642,189 | |||||||||||||
|
| ||||||||||||||
| Congo - 0.77% (Cost $3,592,996) | |||||||||||||||
| Foreign Corporate Obligations - 0.77% | |||||||||||||||
| HTA Group Ltd., 9.125%, Due 3/8/2022B | 3,500,000 | 3,597,545 | |||||||||||||
|
| ||||||||||||||
| Costa Rica - 3.19% | |||||||||||||||
| Foreign Corporate Obligations - 0.36% | |||||||||||||||
| Autopistas del Sol S.A., 7.375%, Due 12/30/2030B | 1,637,152 | 1,692,406 | |||||||||||||
|
| ||||||||||||||
| Foreign Sovereign Obligations - 2.83% | |||||||||||||||
| Costa Rica Government International Bond, | |||||||||||||||
8.050%, Due 9/18/2024B | CRC | 2,250,000,000 | 4,088,120 | ||||||||||||
9.660%, Due 9/30/2026B | CRC | 2,250,000,000 | 4,345,748 | ||||||||||||
9.200%, Due 2/21/2029B | 2,500,000 | 3,000,000 | |||||||||||||
10.580%, Due 9/26/2029B | CRC | 800,000,000 | 1,567,040 | ||||||||||||
10.350%, Due 6/19/2030B | CRC | 81,500,000 | 157,759 | ||||||||||||
|
| ||||||||||||||
Total Foreign Sovereign Obligations | 13,158,667 | ||||||||||||||
|
| ||||||||||||||
Total Costa Rica (Cost $13,221,734) | 14,851,073 | ||||||||||||||
|
| ||||||||||||||
| Dominican Republic - 3.44% | |||||||||||||||
| Foreign Sovereign Obligations - 3.44% | |||||||||||||||
| Dominican Republic Bond, | |||||||||||||||
10.500%, Due 4/7/2023B | DOP | 57,000,000 | 1,096,391 | ||||||||||||
10.750%, Due 8/11/2028B | DOP | 30,000,000 | 581,074 | ||||||||||||
| Dominican Republic International Bond, | |||||||||||||||
8.900%, Due 2/15/2023B | DOP | 315,700,000 | 5,900,136 | ||||||||||||
11.500%, Due 5/10/2024B | DOP | 200,000,000 | 3,991,629 | ||||||||||||
9.750%, Due 6/5/2026B | DOP | 76,450,000 | 1,456,224 | ||||||||||||
9.750%, Due 6/5/2026, Series 144AC | DOP | 157,000,000 | 2,990,546 | ||||||||||||
|
| ||||||||||||||
Total Foreign Sovereign Obligations | 16,016,000 | ||||||||||||||
|
| ||||||||||||||
Total Dominican Republic (Cost $17,385,888) | 16,016,000 | ||||||||||||||
|
| ||||||||||||||
See accompanying notes
13
American Beacon Frontier Markets Income FundSM
Schedule of Investments
January 31, 2020
| Principal Amount* | Fair Value | ||||||||||||||
| Ecuador - 3.08% | |||||||||||||||
| Foreign Sovereign Obligations - 3.08% | |||||||||||||||
| Ecuador Government International Bond, | |||||||||||||||
10.500%, Due 3/24/2020B | $ | 517,000 | $ | 517,000 | |||||||||||
10.750%, Due 3/28/2022B | 770,000 | 762,300 | |||||||||||||
8.750%, Due 6/2/2023B | 1,200,000 | 1,119,000 | |||||||||||||
7.950%, Due 6/20/2024B | 1,000,000 | 880,000 | |||||||||||||
7.875%, Due 3/27/2025, Series 144AC | 1,500,000 | 1,282,500 | |||||||||||||
9.650%, Due 12/13/2026B | 3,170,000 | 2,813,375 | |||||||||||||
9.625%, Due 6/2/2027B | 500,000 | 440,000 | |||||||||||||
8.875%, Due 10/23/2027B | 2,850,000 | 2,411,812 | |||||||||||||
7.875%, Due 1/23/2028B | 2,345,000 | 1,905,336 | |||||||||||||
10.750%, Due 1/31/2029B | 450,000 | 408,375 | |||||||||||||
9.500%, Due 3/27/2030B | 600,000 | 514,500 | |||||||||||||
9.500%, Due 3/27/2030, Series 144AC | 1,500,000 | 1,286,250 | |||||||||||||
|
| ||||||||||||||
Total Foreign Sovereign Obligations | 14,340,448 | ||||||||||||||
|
| ||||||||||||||
Total Ecuador (Cost $15,961,726) | 14,340,448 | ||||||||||||||
|
| ||||||||||||||
| Egypt - 6.59% | |||||||||||||||
| Foreign Sovereign Obligations - 6.59% | |||||||||||||||
| Egypt Government Bond, | |||||||||||||||
16.000%, Due 6/11/2022, Series 3YR | EGP | 30,200,000 | 1,980,546 | ||||||||||||
16.300%, Due 1/1/2023, Series 10YR | EGP | 39,300,000 | 2,633,214 | ||||||||||||
16.300%, Due 4/9/2024, Series 5YR | EGP | 13,990,000 | 952,786 | ||||||||||||
15.900%, Due 9/9/2024, Series 10YR | EGP | 5,280,000 | 357,093 | ||||||||||||
17.180%, Due 5/9/2027, Series 10YR | EGP | 14,500,000 | 1,054,747 | ||||||||||||
15.700%, Due 11/7/2027, Series 10YR | EGP | 10,000,000 | 687,528 | ||||||||||||
13.564%, Due 1/14/2030, Series 10Y | EGP | 40,000,000 | 2,495,699 | ||||||||||||
| Egypt Government International Bond, | |||||||||||||||
6.200%, Due 3/1/2024B | 600,000 | 651,120 | |||||||||||||
6.200%, Due 3/1/2024, Series 144AC | 550,000 | 596,860 | |||||||||||||
7.600%, Due 3/1/2029B | 650,000 | 727,545 | |||||||||||||
7.600%, Due 3/1/2029, Series 144AC | 1,277,000 | 1,429,346 | |||||||||||||
| Egypt Treasury Bills, | |||||||||||||||
15.292%, Due 4/14/2020, Series 364D | EGP | 54,000,000 | 3,326,434 | ||||||||||||
10.429%, Due 4/28/2020, Series 364D | EGP | 44,100,000 | 2,701,838 | ||||||||||||
17.140%, Due 7/7/2020, Series 364D | EGP | 27,950,000 | 1,665,986 | ||||||||||||
14.650%, Due 12/8/2020, Series 364D | EGP | 50,000,000 | 2,814,380 | ||||||||||||
13.684%, Due 1/5/2021, Series 364D | EGP | 72,000,000 | 4,020,275 | ||||||||||||
14.165%, Due 1/19/2021, Series 364D | EGP | 46,200,000 | 2,572,051 | ||||||||||||
|
| ||||||||||||||
Total Foreign Sovereign Obligations | 30,667,448 | ||||||||||||||
|
| ||||||||||||||
Total Egypt (Cost $28,932,308) | 30,667,448 | ||||||||||||||
|
| ||||||||||||||
| El Salvador - 1.97% | |||||||||||||||
| Foreign Corporate Obligations - 0.09% | |||||||||||||||
| AES El Salvador Trust, 6.750%, Due 3/28/2023B | 400,000 | 405,500 | |||||||||||||
|
| ||||||||||||||
| Foreign Sovereign Obligations - 1.88% | |||||||||||||||
| El Salvador Government International Bond, | |||||||||||||||
5.875%, Due 1/30/2025B | 2,100,000 | 2,256,450 | |||||||||||||
6.375%, Due 1/18/2027B | 4,400,000 | 4,818,000 | |||||||||||||
7.625%, Due 2/1/2041B | 1,450,000 | 1,685,625 | |||||||||||||
|
| ||||||||||||||
Total Foreign Sovereign Obligations | 8,760,075 | ||||||||||||||
|
| ||||||||||||||
Total El Salvador (Cost $8,440,440) | 9,165,575 | ||||||||||||||
|
| ||||||||||||||
| Ethiopia - 0.58% (Cost $2,483,316) | |||||||||||||||
| Foreign Sovereign Obligations - 0.58% | |||||||||||||||
| Ethiopia International Bond, 6.625%, Due 12/11/2024B | 2,500,000 | 2,700,500 | |||||||||||||
|
| ||||||||||||||
See accompanying notes
14
American Beacon Frontier Markets Income FundSM
Schedule of Investments
January 31, 2020
| Principal Amount* | Fair Value | ||||||||||||||
| Gabon - 1.63% | |||||||||||||||
| Foreign Sovereign Obligations - 1.63% | |||||||||||||||
| Gabon Government International Bond, | |||||||||||||||
6.375%, Due 12/12/2024B | $ | 4,250,000 | $ | 4,563,233 | |||||||||||
6.950%, Due 6/16/2025B | 900,000 | 971,024 | |||||||||||||
6.625%, Due 2/6/2031C | 2,050,000 | 2,062,724 | |||||||||||||
|
| ||||||||||||||
Total Foreign Sovereign Obligations | 7,596,981 | ||||||||||||||
|
| ||||||||||||||
Total Gabon (Cost $7,060,636) | 7,596,981 | ||||||||||||||
|
| ||||||||||||||
| Gambia - 0.14% (Cost $686,666) | |||||||||||||||
| Credit-Linked Notes - 0.14% | |||||||||||||||
| Republic of Gambia (Issuer Zambezi B.V.), 11.180%, Due 9/11/2020C D | 686,701 | 652,260 | |||||||||||||
|
| ||||||||||||||
| Georgia - 1.10% | |||||||||||||||
| Credit-Linked Notes - 0.44% | |||||||||||||||
| Georgia Government (Issuer Frontera Capital B.V.), 10.000%, Due 8/4/2021B D | 403,930 | 375,170 | |||||||||||||
| Georgia Government (Issuer Zambezi B.V.), 9.500%, Due 8/9/2022C | 2,000,000 | 1,654,131 | |||||||||||||
|
| ||||||||||||||
Total Credit-Linked Notes | 2,029,301 | ||||||||||||||
|
| ||||||||||||||
| Foreign Corporate Obligations - 0.66% | |||||||||||||||
| Bank of Georgia JSC, 11.000%, Due 6/1/2020B | GEL | 8,950,000 | 3,095,902 | ||||||||||||
|
| ||||||||||||||
Total Georgia (Cost $5,658,320) | 5,125,203 | ||||||||||||||
|
| ||||||||||||||
| Ghana - 4.41% | |||||||||||||||
| Credit-Linked Notes - 0.05% | |||||||||||||||
| Ghana Promissory Notes (Issuer Saderea DAC), 12.500%, Due 11/30/2026B | 213,667 | 232,897 | |||||||||||||
|
| ||||||||||||||
| Foreign Sovereign Obligations - 4.36% | |||||||||||||||
| Ghana Government International Bond | |||||||||||||||
10.750%, Due 10/14/2030B | 890,000 | 1,143,276 | |||||||||||||
8.125%, Due 3/26/2032B | 3,900,000 | 3,997,110 | |||||||||||||
8.950%, Due 3/26/2051B | 220,000 | 224,716 | |||||||||||||
| Republic of Ghana Government Bonds, | |||||||||||||||
16.500%, Due 3/22/2021, Series 3Y | GHS | 15,950,000 | 2,869,752 | ||||||||||||
24.750%, Due 7/19/2021, Series 5YR | GHS | 16,180,000 | 3,169,189 | ||||||||||||
18.750%, Due 1/24/2022, Series 5YR | GHS | 2,000,000 | 357,443 | ||||||||||||
19.700%, Due 5/23/2022, Series 3Y | GHS | 1,400,000 | 253,106 | ||||||||||||
18.250%, Due 7/25/2022, Series 5Y | GHS | 11,225,000 | 1,973,435 | ||||||||||||
20.750%, Due 1/16/2023 | GHS | 10,050,000 | 1,853,801 | ||||||||||||
16.500%, Due 2/6/2023, Series 5Y | GHS | 8,200,000 | 1,374,438 | ||||||||||||
21.000%, Due 1/27/2025 | GHS | 1,680,000 | 312,754 | ||||||||||||
19.000%, Due 11/2/2026, Series 10Y | GHS | 15,875,000 | 2,754,304 | ||||||||||||
|
| ||||||||||||||
Total Foreign Sovereign Obligations | 20,283,324 | ||||||||||||||
|
| ||||||||||||||
Total Ghana (Cost $22,920,336) | 20,516,221 | ||||||||||||||
|
| ||||||||||||||
| Honduras - 0.19% (Cost $861,476) | |||||||||||||||
| Foreign Corporate Obligations - 0.19% | |||||||||||||||
| Inversiones Atlantida S.A., 8.250%, Due 7/28/2022B | 840,000 | 871,500 | |||||||||||||
|
| ||||||||||||||
| Iraq - 2.10% | |||||||||||||||
| Foreign Sovereign Obligations - 2.10% | |||||||||||||||
| Iraq International Bond, | |||||||||||||||
6.752%, Due 3/9/2023B | 7,380,000 | 7,445,830 | |||||||||||||
5.800%, Due 1/15/2028B | 2,450,000 | 2,353,445 | |||||||||||||
|
| ||||||||||||||
Total Foreign Sovereign Obligations | 9,799,275 | ||||||||||||||
|
| ||||||||||||||
Total Iraq (Cost $9,438,865) | 9,799,275 | ||||||||||||||
|
| ||||||||||||||
See accompanying notes
15
American Beacon Frontier Markets Income FundSM
Schedule of Investments
January 31, 2020
| Principal Amount* | Fair Value | ||||||||||||||
| Ivory Coast - 3.98% | |||||||||||||||
| Foreign Sovereign Obligations - 3.98% | |||||||||||||||
| Ivory Coast Government International Bond, | |||||||||||||||
5.250%, Due 3/22/2030B | EUR | 4,140,000 | $ | 4,763,645 | |||||||||||
5.875%, Due 10/17/2031, Series 144AC | EUR | 2,250,000 | 2,641,290 | ||||||||||||
5.750%, Due 12/31/2032B E | $ | 7,353,000 | 7,325,794 | ||||||||||||
6.125%, Due 6/15/2033B | 3,700,000 | 3,791,612 | |||||||||||||
|
| ||||||||||||||
Total Foreign Sovereign Obligations | 18,522,341 | ||||||||||||||
|
| ||||||||||||||
Total Ivory Coast (Cost $17,888,242) | 18,522,341 | ||||||||||||||
|
| ||||||||||||||
| Kazakhstan - 1.47% | |||||||||||||||
| Credit-Linked Notes - 0.40% | |||||||||||||||
| National Bank of Kazakhstan (Issuer Citigroup Global Markets Holdings, Inc.), | |||||||||||||||
Due 2/10/2020B G | KZT | 140,000,000 | 368,726 | ||||||||||||
Due 3/17/2020B G | KZT | 565,000,000 | 1,474,665 | ||||||||||||
|
| ||||||||||||||
Total Credit-Linked Notes | 1,843,391 | ||||||||||||||
|
| ||||||||||||||
| Foreign Corporate Obligations - 1.07% | |||||||||||||||
| Development Bank of Kazakhstan JSC, | |||||||||||||||
9.500%, Due 12/14/2020B | KZT | 1,450,000,000 | 3,777,764 | ||||||||||||
8.950%, Due 5/4/2023B | KZT | 486,250,000 | 1,205,223 | ||||||||||||
|
| ||||||||||||||
Total Foreign Corporate Obligations | 4,982,987 | ||||||||||||||
|
| ||||||||||||||
Total Kazakhstan (Cost $6,839,583) | 6,826,378 | ||||||||||||||
|
| ||||||||||||||
| Kenya - 4.36% | |||||||||||||||
| Foreign Sovereign Obligations - 4.36% | |||||||||||||||
| Kenya Government International Bond, 8.250%, Due 2/28/2048B | 3,300,000 | 3,551,757 | |||||||||||||
| Kenya Infrastructure Bond, | |||||||||||||||
12.000%, Due 9/18/2023, Series 12YR | KES | 23,900,000 | 245,686 | ||||||||||||
11.000%, Due 12/2/2024, Series 9YR | KES | 75,000,000 | 769,843 | ||||||||||||
12.500%, Due 5/12/2025, Series 9YR | KES | 36,000,000 | 380,065 | ||||||||||||
11.000%, Due 10/12/2026, Series 12YR | KES | 171,850,000 | 1,753,403 | ||||||||||||
11.000%, Due 3/15/2027, Series 12YR | KES | 187,000,000 | 1,892,424 | ||||||||||||
12.000%, Due 10/6/2031, Series 15YR | KES | 288,000,000 | 2,987,866 | ||||||||||||
12.500%, Due 1/10/2033, Series 15YR | KES | 811,000,000 | 8,708,309 | ||||||||||||
|
| ||||||||||||||
Total Foreign Sovereign Obligations | 20,289,353 | ||||||||||||||
|
| ||||||||||||||
Total Kenya (Cost $19,218,401) | 20,289,353 | ||||||||||||||
|
| ||||||||||||||
| Kyrgyzstan - 0.67% | |||||||||||||||
| Credit-Linked Notes - 0.67% | |||||||||||||||
| Kyrgyz Republic (Issuer Frontera Capital B.V.), 8.000%, Due 5/26/2025 | KGS | 70,000,000 | 888,504 | ||||||||||||
| Kyrgyz Republic (Issuer Zambezi B.V.), 10.000%, Due 4/13/2028C | KGS | 180,000,000 | 2,245,555 | ||||||||||||
|
| ||||||||||||||
Total Credit-Linked Notes | 3,134,059 | ||||||||||||||
|
| ||||||||||||||
Total Kyrgyzstan (Cost $3,274,462) | 3,134,059 | ||||||||||||||
|
| ||||||||||||||
| Laos - 0.33% (Cost $1,542,763) | |||||||||||||||
| Foreign Sovereign Obligations - 0.33% | |||||||||||||||
| Lao People’s Democratic Republic International Bond, 6.875%, Due 6/30/2021, Series 144AC | 1,576,000 | 1,548,420 | |||||||||||||
|
| ||||||||||||||
| Lebanon - 0.26% | |||||||||||||||
| Foreign Sovereign Obligations - 0.26% | |||||||||||||||
| Lebanon Government International Bond, | |||||||||||||||
6.650%, Due 4/22/2024B | 670,000 | 251,250 | |||||||||||||
6.200%, Due 2/26/2025, Series GMTNB | 1,000,000 | 373,250 | |||||||||||||
6.750%, Due 11/29/2027B | 335,000 | 123,280 | |||||||||||||
6.850%, Due 5/25/2029 | 1,000,000 | 360,200 | |||||||||||||
7.250%, Due 3/23/2037B | 335,000 | 121,270 | |||||||||||||
|
| ||||||||||||||
Total Foreign Sovereign Obligations | 1,229,250 | ||||||||||||||
|
| ||||||||||||||
Total Lebanon (Cost $2,676,643) | 1,229,250 | ||||||||||||||
|
| ||||||||||||||
See accompanying notes
16
American Beacon Frontier Markets Income FundSM
Schedule of Investments
January 31, 2020
| Principal Amount* | Fair Value | ||||||||||||||
| Luxembourg - 0.20% (Cost $944,820) | |||||||||||||||
| Foreign Corporate Obligations - 0.20% | |||||||||||||||
| Kernel Holding S.A., 8.750%, Due 1/31/2022B | KGS | 890,000 | $ | 938,870 | |||||||||||
|
| ||||||||||||||
| Malawi - 0.25% (Cost $1,099,203) | |||||||||||||||
| Credit-Linked Notes - 0.25% | |||||||||||||||
| Republic of Malawi (Issuer Zambezi B.V.), 12.000%, Due 10/8/2020C | $ | 1,100,000 | 1,175,957 | ||||||||||||
|
| ||||||||||||||
| Mongolia - 1.26% | |||||||||||||||
| Foreign Sovereign Obligations - 1.26% | |||||||||||||||
| Development Bank of Mongolia LLC, 7.250%, Due 10/23/2023B | 725,000 | 768,500 | |||||||||||||
| Mongolia Government International Bond, 8.750%, Due 3/9/2024B | 4,500,000 | 5,085,000 | |||||||||||||
|
| ||||||||||||||
Total Foreign Sovereign Obligations | 5,853,500 | ||||||||||||||
|
| ||||||||||||||
Total Mongolia (Cost $5,601,587) | 5,853,500 | ||||||||||||||
|
| ||||||||||||||
| Montenegro - 0.37% (Cost $1,672,099) | |||||||||||||||
| Foreign Sovereign Obligations - 0.37% | |||||||||||||||
| Montenegro Government International Bond, 2.550%, Due 10/3/2029, Series 144AC | EUR | 1,550,000 | 1,732,091 | ||||||||||||
|
| ||||||||||||||
| Mozambique - 2.58% | |||||||||||||||
| Credit-Linked Notes - 0.85% | |||||||||||||||
| Mozambique Government Bonds (Issuer ICBC Standard Bank PLC), 27.000%, Due 2/26/2020 | MZN | 180,000,000 | 2,591,057 | ||||||||||||
| Republic of Mozambique (Issuer ICBC Standard Bank PLC), 19.000%, Due 3/28/2021B C D | MZN | 90,500,000 | 1,391,001 | ||||||||||||
|
| ||||||||||||||
Total Credit-Linked Notes | 3,982,058 | ||||||||||||||
|
| ||||||||||||||
| Foreign Sovereign Obligations - 1.73% | |||||||||||||||
| Mozambique International Bond, | |||||||||||||||
5.000%, Due 9/15/2031B | 6,075,000 | 5,802,840 | |||||||||||||
5.000%, Due 9/15/2031, Series 144AC | 2,353,000 | 2,247,586 | |||||||||||||
|
| ||||||||||||||
Total Foreign Sovereign Obligations | 8,050,426 | ||||||||||||||
|
| ||||||||||||||
Total Mozambique (Cost $11,482,388) | 12,032,484 | ||||||||||||||
|
| ||||||||||||||
| Netherlands - 1.12% | |||||||||||||||
| Foreign Sovereign Obligations - 1.12% | |||||||||||||||
| Nederlandse Financierings Maatschappij voor Ontwikkelingslanden N.V., | |||||||||||||||
7.350%, Due 9/11/2020, Series EMTNB | 650,000 | 558,794 | |||||||||||||
8.910%, Due 4/6/2021, Series EMTN, (GGRRC9MX - 0.200%)A | 3,500,000 | 2,880,978 | |||||||||||||
9.280%, Due 1/9/2022, Series EMT3 | 800,000 | 791,412 | |||||||||||||
| Republic of Angola Via Avenir II B.V., 6.388%, Due 12/7/2023 (6-mo. USD LIBOR + 4.500%)A B | 1,000,000 | 975,000 | |||||||||||||
|
| ||||||||||||||
Total Foreign Sovereign Obligations | 5,206,184 | ||||||||||||||
|
| ||||||||||||||
Total Netherlands (Cost $5,912,662) | 5,206,184 | ||||||||||||||
|
| ||||||||||||||
| Nicaragua - 0.77% | |||||||||||||||
| Credit-Linked Notes - 0.77% | |||||||||||||||
| Empresa Administadora de Aeropuertos Internacionales (Issuer Zambezi B.V.), Due 4/8/2024C D | 1,159,400 | 1,113,469 | |||||||||||||
| Republic of Nicaragua (Issuer Zambezi B.V.), 6.750%, Due 8/5/2022C | 2,400,000 | 2,471,575 | |||||||||||||
|
| ||||||||||||||
Total Credit-Linked Notes | 3,585,044 | ||||||||||||||
|
| ||||||||||||||
Total Nicaragua (Cost $3,559,240) | 3,585,044 | ||||||||||||||
|
| ||||||||||||||
| Nigeria - 5.90% | |||||||||||||||
| Credit-Linked Notes - 0.45% | |||||||||||||||
| Republic of Nigeria (Issuer Citigroup Global Markets Holdings, Inc.), | |||||||||||||||
Due 2/11/2020C G | NGN | 184,912,323 | 508,352 | ||||||||||||
Due 7/21/2020G | NGN | 603,079,110 | 1,571,606 | ||||||||||||
|
| ||||||||||||||
Total Credit-Linked Notes | 2,079,958 | ||||||||||||||
|
| ||||||||||||||
See accompanying notes
17
American Beacon Frontier Markets Income FundSM
Schedule of Investments
January 31, 2020
| Principal Amount* | Fair Value | ||||||||||||||
| Nigeria - 5.90% (continued) | |||||||||||||||
| Foreign Corporate Obligations - 0.83% | |||||||||||||||
| Access Bank PLC, 10.500%, Due 10/19/2021B | $ | 390,000 | $ | 431,535 | |||||||||||
| IHS Netherlands Holdco B.V., 8.000%, Due 9/18/2027C | 715,000 | 772,200 | |||||||||||||
| SEPLAT Petroleum Development Co. PLC, 9.250%, Due 4/1/2023B | 1,150,000 | 1,198,829 | |||||||||||||
| United Bank for Africa PLC, 7.750%, Due 6/8/2022B | 1,360,000 | 1,448,150 | |||||||||||||
|
| ||||||||||||||
Total Foreign Corporate Obligations | 3,850,714 | ||||||||||||||
|
| ||||||||||||||
| Foreign Sovereign Obligations - 4.62% | |||||||||||||||
| Nigeria Government Bond, | |||||||||||||||
15.540%, Due 2/13/2020, Series 5YR | NGN | 310,000,000 | 856,828 | ||||||||||||
12.750%, Due 4/27/2023, Series 5YR | NGN | 286,000,000 | 869,881 | ||||||||||||
12.500%, Due 1/22/2026, Series 10YR | NGN | 431,600,000 | 1,327,690 | ||||||||||||
16.288%, Due 3/17/2027, Series 10YR | NGN | 458,560,000 | 1,618,143 | ||||||||||||
| Nigeria OMO Bills, | |||||||||||||||
12.374%, Due 2/6/2020 | NGN | 1,210,000,000 | 3,326,451 | ||||||||||||
12.193%, Due 2/27/2020 | NGN | 636,200,000 | 1,735,996 | ||||||||||||
12.908%, Due 6/18/2020 | NGN | 673,000,000 | 1,768,333 | ||||||||||||
12.212%, Due 8/13/2020 | NGN | 414,000,000 | 1,063,564 | ||||||||||||
13.726%, Due 9/3/2020 | NGN | 238,000,000 | 606,694 | ||||||||||||
12.770%, Due 9/17/2020 | NGN | 233,000,000 | 591,121 | ||||||||||||
26.683%, Due 10/8/2020 | NGN | 540,000,000 | 1,359,240 | ||||||||||||
41.430%, Due 10/27/2020 | NGN | 270,000,000 | 679,620 | ||||||||||||
14.896%, Due 12/1/2020 | NGN | 648,000,000 | 1,597,788 | ||||||||||||
14.680%, Due 12/8/2020 | NGN | 217,000,000 | 533,074 | ||||||||||||
5.432%, Due 12/29/2020 | NGN | 335,270,000 | 817,791 | ||||||||||||
9.416%, Due 12/29/2020 | NGN | 578,200,000 | 1,410,347 | ||||||||||||
14.699%, Due 1/5/2021 | NGN | 277,000,000 | 672,489 | ||||||||||||
14.771%, Due 1/12/2021 | NGN | 277,000,000 | 671,971 | ||||||||||||
|
| ||||||||||||||
Total Foreign Sovereign Obligations | 21,507,021 | ||||||||||||||
|
| ||||||||||||||
Total Nigeria (Cost $26,814,067) | 27,437,693 | ||||||||||||||
|
| ||||||||||||||
| Pakistan - 4.07% | |||||||||||||||
| Credit-Linked Notes - 0.57% | |||||||||||||||
| Republic of Pakistan (Issuer Citigroup Global Markets Holdings, Inc.), Due 7/20/2020C G | PKR | 431,813,403 | 2,636,547 | ||||||||||||
|
| ||||||||||||||
| Foreign Sovereign Obligations - 3.50% | |||||||||||||||
| Pakistan Government International Bond, | |||||||||||||||
8.250%, Due 4/15/2024B | 400,000 | 449,131 | |||||||||||||
6.875%, Due 12/5/2027B | 3,050,000 | 3,219,293 | |||||||||||||
| Pakistan Treasury Bills, | |||||||||||||||
14.055%, Due 7/16/2020 | PKR | 280,000,000 | 1,708,161 | ||||||||||||
14.150%, Due 8/27/2020 | PKR | 450,000,000 | 2,706,025 | ||||||||||||
6.945%, Due 9/10/2020 | PKR | 225,000,000 | 1,346,638 | ||||||||||||
13.110%, Due 12/31/2020F J | PKR | 225,000,000 | 1,299,170 | ||||||||||||
21.190%, Due 1/14/2021 | PKR | 845,000,000 | 4,844,773 | ||||||||||||
13.210%, Due 1/28/2021 | PKR | 125,000,000 | 715,995 | ||||||||||||
|
| ||||||||||||||
Total Foreign Sovereign Obligations | 16,289,186 | ||||||||||||||
|
| ||||||||||||||
Total Pakistan (Cost $18,518,185) | 18,925,733 | ||||||||||||||
|
| ||||||||||||||
| Papua New Guinea - 0.56% (Cost $2,455,027) | |||||||||||||||
| Foreign Sovereign Obligations - 0.56% | |||||||||||||||
| Papua New Guinea Government International Bond, 8.375%, Due 10/4/2028B | 2,401,000 | 2,599,083 | |||||||||||||
|
| ||||||||||||||
| Paraguay - 0.36% (Cost $2,000,407) | |||||||||||||||
| Credit-Linked Notes - 0.36% | |||||||||||||||
| Municipalidad De Asuncion (Issuer Zambezi B.V.), 11.000%, Due 3/23/2027C | 2,000,000 | 1,668,953 | |||||||||||||
|
| ||||||||||||||
| Rwanda - 0.81% (Cost $3,655,915) | |||||||||||||||
| Foreign Sovereign Obligations - 0.81% | |||||||||||||||
| Rwanda International Government Bond, 6.625%, Due 5/2/2023B | 3,500,000 | 3,768,583 | |||||||||||||
|
| ||||||||||||||
See accompanying notes
18
American Beacon Frontier Markets Income FundSM
Schedule of Investments
January 31, 2020
| Principal Amount* | Fair Value | ||||||||||||||
| Senegal - 2.62% | |||||||||||||||
| Foreign Sovereign Obligations - 2.62% | |||||||||||||||
| Senegal Government International Bond, | |||||||||||||||
6.250%, Due 7/30/2024B | $ | 1,700,000 | $ | 1,885,766 | |||||||||||
4.750%, Due 3/13/2028B | EUR | 4,610,000 | 5,444,022 | ||||||||||||
6.250%, Due 5/23/2033B | 1,800,000 | 1,919,466 | |||||||||||||
6.750%, Due 3/13/2048B | 2,860,000 | 2,928,040 | |||||||||||||
|
| ||||||||||||||
Total Foreign Sovereign Obligations | 12,177,294 | ||||||||||||||
|
| ||||||||||||||
Total Senegal (Cost $11,695,371) | 12,177,294 | ||||||||||||||
|
| ||||||||||||||
| Singapore - 0.20% (Cost $908,965) | |||||||||||||||
| Foreign Corporate Obligations - 0.20% | |||||||||||||||
| Puma International Financing S.A.B | 1,000,000 | 938,472 | |||||||||||||
|
| ||||||||||||||
| South Africa - 0.40% | |||||||||||||||
| Foreign Corporate Obligations - 0.40% | |||||||||||||||
| Liquid Telecommunications Financing PLC, | |||||||||||||||
8.500%, Due 7/13/2022B | 1,200,000 | 1,228,200 | |||||||||||||
8.500%, Due 7/13/2022B | 600,000 | 614,100 | |||||||||||||
|
| ||||||||||||||
Total Foreign Corporate Obligations | 1,842,300 | ||||||||||||||
|
| ||||||||||||||
Total South Africa (Cost $1,831,595) | 1,842,300 | ||||||||||||||
|
| ||||||||||||||
| Spain - 0.36% | |||||||||||||||
| Foreign Corporate Obligations - 0.36% | |||||||||||||||
| International Airport Finance S.A., | |||||||||||||||
12.000%, Due 3/15/2033B | 240,000 | 263,400 | |||||||||||||
12.000%, Due 3/15/2033, Series 144AC | 1,274,000 | 1,398,215 | |||||||||||||
|
| ||||||||||||||
Total Foreign Corporate Obligations | 1,661,615 | ||||||||||||||
|
| ||||||||||||||
Total Spain (Cost $1,645,966) | 1,661,615 | ||||||||||||||
|
| ||||||||||||||
| Sri Lanka - 2.03% | |||||||||||||||
| Foreign Sovereign Obligations - 2.03% | |||||||||||||||
| Sri Lanka Government Bonds, | |||||||||||||||
9.250%, Due 5/1/2020 | LKR | 30,000,000 | 165,916 | ||||||||||||
10.750%, Due 3/1/2021, Series A | LKR | 26,000,000 | 146,638 | ||||||||||||
9.000%, Due 5/1/2021, Series A | LKR | 465,000,000 | 2,573,704 | ||||||||||||
11.000%, Due 8/1/2021, Series A | LKR | 470,000,000 | 2,677,554 | ||||||||||||
9.450%, Due 10/15/2021 | LKR | 116,000,000 | 646,652 | ||||||||||||
11.500%, Due 5/15/2023, Series A | LKR | 180,000,000 | 1,053,039 | ||||||||||||
10.200%, Due 7/15/2023, Series A | LKR | 60,000,000 | 335,709 | ||||||||||||
11.000%, Due 8/1/2024, Series A | LKR | 315,000,000 | 1,830,047 | ||||||||||||
|
| ||||||||||||||
Total Foreign Sovereign Obligations | 9,429,259 | ||||||||||||||
|
| ||||||||||||||
Total Sri Lanka (Cost $10,733,963) | 9,429,259 | ||||||||||||||
|
| ||||||||||||||
| Supranational - 2.13% | |||||||||||||||
| Foreign Sovereign Obligations - 2.13% | |||||||||||||||
| European Bank for Reconstruction & Development, | |||||||||||||||
8.000%, Due 2/27/2020B | 1,200,000 | 1,203,456 | |||||||||||||
9.800%, Due 3/19/2020B | 700,000 | 645,141 | |||||||||||||
9.500%, Due 6/21/2021B | 500,000 | 472,690 | |||||||||||||
| International Bank for Reconstruction & Development, | |||||||||||||||
9.500%, Due 10/19/2020 | KZT | 750,000,000 | 1,972,882 | ||||||||||||
9.250%, Due 1/20/2023 | RWF | 2,200,000,000 | 2,317,489 | ||||||||||||
| International Finance Corp., 9.500%, Due 5/31/2020 | UZS | 32,000,000,000 | 3,326,741 | ||||||||||||
|
| ||||||||||||||
Total Foreign Sovereign Obligations | 9,938,399 | ||||||||||||||
|
| ||||||||||||||
Total Supranational (Cost $10,802,291) | 9,938,399 | ||||||||||||||
|
| ||||||||||||||
| Suriname - 0.26% (Cost $1,408,871) | |||||||||||||||
| Foreign Sovereign Obligations - 0.26% | |||||||||||||||
| Suriname Government International Bond, 9.250%, Due 10/26/2026B | 1,400,000 | 1,197,000 | |||||||||||||
|
| ||||||||||||||
See accompanying notes
19
American Beacon Frontier Markets Income FundSM
Schedule of Investments
January 31, 2020
| Principal Amount* | Fair Value | ||||||||||||||
| Tajikistan - 0.82% | |||||||||||||||
| Credit-Linked Notes - 0.22% | |||||||||||||||
| Republic of Tajikistan (Issuer Frontera Capital B.V.), 10.780%, Due 2/15/2023C | UZS | 1,000,000 | $ | 998,772 | |||||||||||
|
| ||||||||||||||
| Foreign Sovereign Obligations - 0.60% | |||||||||||||||
| Republic of Tajikistan International Bond, 7.125%, Due 9/14/2027B | $ | 3,230,000 | 2,818,175 | ||||||||||||
|
| ||||||||||||||
Total Tajikistan (Cost $4,203,912) | 3,816,947 | ||||||||||||||
|
| ||||||||||||||
| Tunisia - 0.78% | |||||||||||||||
| Foreign Sovereign Obligations - 0.78% | |||||||||||||||
| Banque Centrale de Tunisie International Bond, | |||||||||||||||
5.750%, Due 1/30/2025B | 2,000,000 | 1,850,544 | |||||||||||||
6.375%, Due 7/15/2026, Series 144AC | EUR | 1,650,000 | 1,800,982 | ||||||||||||
|
| ||||||||||||||
Total Foreign Sovereign Obligations | 3,651,526 | ||||||||||||||
|
| ||||||||||||||
Total Tunisia (Cost $3,767,591) | 3,651,526 | ||||||||||||||
|
| ||||||||||||||
| Uganda - 2.14% | |||||||||||||||
| Foreign Sovereign Obligations - 2.14% | |||||||||||||||
| Republic of Uganda Government Bonds, | |||||||||||||||
11.000%, Due 1/21/2021, Series 10YR | UGX | 2,800,000,000 | 747,802 | ||||||||||||
18.375%, Due 2/18/2021, Series 5YR | UGX | 1,000,000,000 | 284,140 | ||||||||||||
16.500%, Due 5/13/2021, Series 5YR | UGX | 4,355,000,000 | 1,221,893 | ||||||||||||
16.750%, Due 10/28/2021 | UGX | 6,940,000,000 | 1,972,658 | ||||||||||||
11.000%, Due 6/9/2022, Series 10YR | UGX | 6,100,000,000 | 1,564,124 | ||||||||||||
14.125%, Due 7/7/2022 | UGX | 8,300,000,000 | 2,246,068 | ||||||||||||
19.500%, Due 12/18/2025, Series 10YR | UGX | 4,000,000,000 | 1,250,225 | ||||||||||||
16.000%, Due 5/6/2027 | UGX | 2,500,000,000 | 694,444 | ||||||||||||
|
| ||||||||||||||
Total Foreign Sovereign Obligations | 9,981,354 | ||||||||||||||
|
| ||||||||||||||
Total Uganda (Cost $10,282,187) | 9,981,354 | ||||||||||||||
|
| ||||||||||||||
| Ukraine - 4.06% | |||||||||||||||
| Credit-Linked Notes - 2.28% | |||||||||||||||
| Ukraine Government Bonds (Issuer Citigroup Global Markets Holdings, Inc.), | |||||||||||||||
15.300%, Due 1/25/2021B | UAH | 26,000,000 | 1,097,283 | ||||||||||||
14.160%, Due 10/14/2022B | UAH | 52,000,000 | 2,340,252 | ||||||||||||
14.160%, Due 10/17/2022B | UAH | 45,000,000 | 2,024,504 | ||||||||||||
15.220%, Due 4/26/2023B | UAH | 27,500,000 | 1,299,604 | ||||||||||||
9.300%, Due 8/28/2023B | UAH | 14,500,000 | 591,145 | ||||||||||||
| Ukraine Government Bonds (Issuer ICBC Standard Bank PLC), 14.910%, Due 10/14/2022 | UAH | 74,000,000 | 3,274,102 | ||||||||||||
|
| ||||||||||||||
Total Credit-Linked Notes | 10,626,890 | ||||||||||||||
|
| ||||||||||||||
| Foreign Corporate Obligations - 0.52% | |||||||||||||||
| Metinvest B.V., 8.500%, Due 4/23/2026B | 880,000 | 961,506 | |||||||||||||
| MHP Lux S.A., 6.950%, Due 4/3/2026B | 860,000 | 897,496 | |||||||||||||
| Ukraine Railways Via Rail Capital Markets PLC, 8.250%, Due 7/9/2024B | 500,000 | 548,000 | |||||||||||||
|
| ||||||||||||||
Total Foreign Corporate Obligations | 2,407,002 | ||||||||||||||
|
| ||||||||||||||
| Foreign Sovereign Obligations - 1.26% | |||||||||||||||
| Ukraine Government Bond, 9.790%, Due 5/26/2027 | UAH | 91,100,000 | 3,532,534 | ||||||||||||
| Ukraine Government International Bond, | |||||||||||||||
15.840%, Due 2/26/2025B | UAH | 12,000,000 | 595,460 | ||||||||||||
Due 5/31/2040, Series GDPB DG | 1,750,000 | 1,734,688 | |||||||||||||
|
| ||||||||||||||
Total Foreign Sovereign Obligations | 5,862,682 | ||||||||||||||
|
| ||||||||||||||
Total Ukraine (Cost $16,954,799) | 18,896,574 | ||||||||||||||
|
| ||||||||||||||
| United Kingdom - 0.59% (Cost $2,758,922) | |||||||||||||||
| Foreign Corporate Obligations - 0.59% | |||||||||||||||
| Standard Chartered Bank, Due 2/1/2021C G | PKR | 480,000,000 | 2,756,422 | ||||||||||||
|
| ||||||||||||||
See accompanying notes
20
American Beacon Frontier Markets Income FundSM
Schedule of Investments
January 31, 2020
| Principal Amount* | Fair Value | ||||||||||||||
| United Republic of Tanzania - 0.16% (Cost $764,045) | |||||||||||||||
| Credit-Linked Notes - 0.16% | |||||||||||||||
| United Republic of Tanzania (Issuer Zambezi B.V.), 8.650%, Due 4/23/2021C | TZS | 1,700,000,000 | $ | 740,130 | |||||||||||
|
| ||||||||||||||
| Uruguay - 0.61% | |||||||||||||||
| Foreign Sovereign Obligations - 0.61% | |||||||||||||||
| Uruguay Government International Bond, | |||||||||||||||
9.875%, Due 6/20/2022B | UYU | 48,203,000 | 1,275,225 | ||||||||||||
8.500%, Due 3/15/2028B | UYU | 65,802,000 | 1,547,097 | ||||||||||||
|
| ||||||||||||||
Total Foreign Sovereign Obligations | 2,822,322 | ||||||||||||||
|
| ||||||||||||||
Total Uruguay (Cost $3,996,459) | 2,822,322 | ||||||||||||||
|
| ||||||||||||||
| Uzbekistan - 0.29% | |||||||||||||||
| Foreign Sovereign Obligations - 0.29% | |||||||||||||||
| Republic of Uzbekistan Bond, | |||||||||||||||
4.750%, Due 2/20/2024B | $ | 532,000 | 564,588 | ||||||||||||
5.375%, Due 2/20/2029B | 688,000 | 767,519 | |||||||||||||
|
| ||||||||||||||
Total Foreign Sovereign Obligations | 1,332,107 | ||||||||||||||
|
| ||||||||||||||
Total Uzbekistan (Cost $1,220,000) | 1,332,107 | ||||||||||||||
|
| ||||||||||||||
| Venezuela - 0.02% (Cost $269,875) | |||||||||||||||
| Foreign Corporate Obligations - 0.02% | |||||||||||||||
| Petroleos de Venezuela S.A., 6.000%, Due 5/16/2024B | 1,250,000 | 100,000 | |||||||||||||
|
| ||||||||||||||
| Zambia - 2.99% | |||||||||||||||
| Foreign Corporate Obligations - 0.34% | |||||||||||||||
| First Quantum Minerals Ltd., | |||||||||||||||
7.250%, Due 4/1/2023B | 815,000 | 809,397 | |||||||||||||
6.875%, Due 3/1/2026B | 800,000 | 772,000 | |||||||||||||
|
| ||||||||||||||
Total Foreign Corporate Obligations | 1,581,397 | ||||||||||||||
|
| ||||||||||||||
| Foreign Sovereign Obligations - 2.65% | |||||||||||||||
| Zambia Government Bond, | |||||||||||||||
11.000%, Due 2/16/2020, Series 5YR | ZMW | 500,000 | 33,620 | ||||||||||||
11.000%, Due 5/26/2020, Series 5YR | ZMW | 23,100,000 | 1,482,573 | ||||||||||||
11.000%, Due 8/29/2021, Series 5YR | ZMW | 21,000,000 | 1,086,842 | ||||||||||||
12.000%, Due 5/23/2023, Series 7YR | ZMW | 6,100,000 | 251,282 | ||||||||||||
12.000%, Due 11/21/2023, Series 7YR | ZMW | 14,900,000 | 581,299 | ||||||||||||
12.000%, Due 4/23/2025, Series 7YR | ZMW | 16,500,000 | 540,951 | ||||||||||||
13.000%, Due 8/29/2026, Series 10YR | ZMW | 42,500,000 | 1,342,316 | ||||||||||||
13.000%, Due 12/18/2027, Series 10YR | ZMW | 7,000,000 | 208,521 | ||||||||||||
| Zambia Government International Bond, 8.970%, Due 7/30/2027B | 9,980,000 | 6,822,588 | |||||||||||||
|
| ||||||||||||||
Total Foreign Sovereign Obligations | 12,349,992 | ||||||||||||||
|
| ||||||||||||||
Total Zambia (Cost $20,380,971) | 13,931,389 | ||||||||||||||
|
| ||||||||||||||
| Shares | |||||||||||||||
| SHORT-TERM INVESTMENTS - 6.72% | |||||||||||||||
| Investment Companies - 6.72% | |||||||||||||||
| American Beacon U.S. Government Money Market Select Fund, Select Class, 1.47%H I | 31,297,524 | 31,297,524 | |||||||||||||
|
| ||||||||||||||
Total Short-Term Investments (Cost $31,297,524) | 31,297,524 | ||||||||||||||
|
| ||||||||||||||
TOTAL INVESTMENTS - 97.43% (Cost $468,024,073) | 453,607,412 | ||||||||||||||
OTHER ASSETS, NET OF LIABILITIES - 2.57% | 11,983,472 | ||||||||||||||
|
| ||||||||||||||
TOTAL NET ASSETS - 100.00% | $ | 465,590,884 | |||||||||||||
|
| ||||||||||||||
Percentages are stated as a percent of net assets. *In U.S. Dollars unless otherwise noted. | |||||||||||||||
See accompanying notes
21
American Beacon Frontier Markets Income FundSM
Schedule of Investments
January 31, 2020
A Variable, floating, or adjustable rate securities with an interest rate that changes periodically. Rates are periodically reset with rates that are based on a predetermined benchmark such as a widely followed interest rate such asT-bills, LIBOR or PRIME plus a fixed spread. The interest rate disclosed reflects the rate in effect on January 31, 2020.
B Reg S - Security purchased under the Securities Act of 1933, which exempts from registration securities offered and sold outside of the United States. Such a security cannot be sold in the United States without either an effective registration statement filed pursuant to the Securities Act of 1933, or pursuant to an exemption from registration.
C Security exempt from registration under the Securities Act of 1933. These securities may be resold to qualified institutional buyers pursuant to Rule 144A. At the period end, the value of these securities amounted to $54,893,177 or 11.79% of net assets. The Fund has no right to demand registration of these securities.
D Coupon rate may change based on changes of the underlying collateral or prepayments of principal. The coupon rate shown represents the rate at period end.
E Step Up/Down - A zero coupon bond that converts to a fixed rate or variable interest rate at a designated future date. The rate disclosed represents the coupon rate at January 31, 2020. The maturity date disclosed represents the final maturity date.
F Value was determined using significant unobservable inputs.
G Zero coupon bond.
H The Fund is affiliated by having the same investment advisor.
I7-day yield.
J Fair valued pursuant to procedures approved by the Board of Trustees. At period end, the value of these securities amounted to $1,299,170 or 0.28% of net assets.
BADLARP - Benchmark rate provided by the Banco Central de la Republica Argentina.
GGRRC9MX – Georgia Certificates of Deposits 91 Days Maturity Maximum Rate.
LIBOR - London Interbank Offered Rate.
LLC - Limited Liability Company.
PLC - Public Limited Company.
PRIME - A rate, charged by banks, based on the U.S. Federal Funds rate.
| Forward Foreign Currency Contracts Open on January 31, 2020: |
| |||||||||||||||||||||||||||
| Currency Purchased* | Currency Sold* | Settlement Date | Counterparty | Unrealized Appreciation | Unrealized (Depreciation) | Net Unrealized Appreciation (Depreciation) | ||||||||||||||||||||||
| USD | 16,568,067 | EUR | 16,374,275 | 4/8/2020 | BOA | $ | 193,792 | $ | - | $ | 193,792 | |||||||||||||||||
| KZT | 288,401 | USD | 280,874 | 2/17/2020 | BRC | 7,527 | - | 7,527 | ||||||||||||||||||||
| UAH | 567,070 | USD | 581,124 | 2/18/2020 | BRC | - | (14,054 | ) | (14,054 | ) | ||||||||||||||||||
| KZT | 3,474,027 | USD | 3,325,348 | 2/18/2020 | BRC | �� | 148,679 | - | 148,679 | |||||||||||||||||||
| UAH | 5,925,054 | USD | 5,859,223 | 2/18/2020 | CBK | 65,831 | - | 65,831 | ||||||||||||||||||||
| KZT | 329,250 | USD | 311,526 | 2/7/2020 | ICBC | 17,724 | - | 17,724 | ||||||||||||||||||||
| GEL | 353,565 | USD | 350,000 | 3/23/2020 | ICBC | 3,565 | - | 3,565 | ||||||||||||||||||||
| KZT | 519,468 | USD | 499,999 | 4/13/2020 | ICBC | 19,469 | - | 19,469 | ||||||||||||||||||||
| GEL | 697,308 | USD | 700,000 | 6/16/2020 | ICBC | - | (2,692 | ) | (2,692 | ) | ||||||||||||||||||
| KZT | 2,609,135 | USD | 2,500,000 | 7/30/2020 | ICBC | 109,135 | - | 109,135 | ||||||||||||||||||||
| KZT | 2,052,544 | USD | 2,000,000 | 9/18/2020 | ICBC | 52,544 | - | 52,544 | ||||||||||||||||||||
| USD | 6,701,610 | EUR | 6,675,562 | 3/27/2020 | SSB | 26,048 | - | 26,048 | ||||||||||||||||||||
| EUR | 222,507 | USD | 222,878 | 4/8/2020 | UAG | - | (371 | ) | (371 | ) | ||||||||||||||||||
| EUR | 337,098 | USD | 340,048 | 4/8/2020 | UAG | - | (2,950 | ) | (2,950 | ) | ||||||||||||||||||
|
|
|
|
|
| |||||||||||||||||||||||
| $ | 644,314 | $ | (20,067 | ) | $ | 624,247 | ||||||||||||||||||||||
|
|
|
|
|
| |||||||||||||||||||||||
| * | All values denominated in USD |
| Glossary: | ||
| Counterparty Abbreviations: | ||
| BOA | Merrill Lynch International | |
| BRC | Barclays Bank PLC | |
| CBK | Citibank, N.A. | |
| ICBC | ICBC Standard Bank PLC | |
| SSB | State Street Bank & Trust Co. | |
| UAG | UBS AG | |
See accompanying notes
22
American Beacon Frontier Markets Income FundSM
Schedule of Investments
January 31, 2020
| Currency Abbreviations: | ||
| ARS | Argentine Peso | |
| BYN | Belarusian Ruble | |
| CRC | Costa Rican Colon | |
| DOP | Dominican Peso | |
| EGP | Egyptian Pound | |
| EUR | Euro | |
| GEL | Georgian Lari | |
| GHS | Ghanaian Cedi | |
| KES | Kenyan Shilling | |
| KGS | Kyrgyzstani Som | |
| KZT | Kazakhstani Tenge | |
| LKR | Sri Lankan Rupee | |
| MZN | Mozambique Metical | |
| NGN | Nigerian Naira | |
| PKR | Pakistani Rupee | |
| RWF | Rwandan Franc | |
| TZS | Tanzanian Shilling | |
| UAH | Ukrainian Hryvnia | |
| UGX | Ugandan Shilling | |
| USD | United States Dollar | |
| UYU | Uruguayan Peso | |
| UZS | Uzbekistani Som | |
| ZMW | Zambian Kwacha | |
The Fund’s investments are summarized by level based on the inputs used to determine their values. As of January 31, 2020, the investments were classified as described below:
Frontier Markets Income Fund | Level 1 | Level 2 | Level 3 | Total | ||||||||||||||||||||||||
Assets | ||||||||||||||||||||||||||||
Credit-Linked Notes | ||||||||||||||||||||||||||||
Angola | $ | - | $ | 754,575 | $ | - | $ | 754,575 | ||||||||||||||||||||
Azerbaijan | - | 2,004,000 | - | 2,004,000 | ||||||||||||||||||||||||
Gambia | - | 652,260 | - | 652,260 | ||||||||||||||||||||||||
Georgia | - | 2,029,301 | - | 2,029,301 | ||||||||||||||||||||||||
Ghana | - | 232,897 | - | 232,897 | ||||||||||||||||||||||||
Kazakhstan | - | 1,843,391 | - | 1,843,391 | ||||||||||||||||||||||||
Kyrgyzstan | - | 3,134,059 | - | 3,134,059 | ||||||||||||||||||||||||
Malawi | - | 1,175,957 | - | 1,175,957 | ||||||||||||||||||||||||
Mozambique | - | 3,982,058 | - | 3,982,058 | ||||||||||||||||||||||||
Nicaragua | - | 3,585,044 | - | 3,585,044 | ||||||||||||||||||||||||
Nigeria | - | 2,079,958 | - | 2,079,958 | ||||||||||||||||||||||||
Pakistan | - | 2,636,547 | - | 2,636,547 | ||||||||||||||||||||||||
Paraguay | - | 1,668,953 | - | 1,668,953 | ||||||||||||||||||||||||
Tajikistan | - | 998,772 | - | 998,772 | ||||||||||||||||||||||||
Ukraine | - | 10,626,890 | - | 10,626,890 | ||||||||||||||||||||||||
United Republic of Tanzania | - | 740,130 | - | 740,130 | ||||||||||||||||||||||||
Foreign Sovereign Obligations |
| |||||||||||||||||||||||||||
Angola | - | 14,185,419 | - | 14,185,419 | ||||||||||||||||||||||||
Argentina | - | 9,608,283 | - | 9,608,283 | ||||||||||||||||||||||||
Armenia | - | 3,626,429 | - | 3,626,429 | ||||||||||||||||||||||||
Barbados | - | 1,478,282 | - | 1,478,282 | ||||||||||||||||||||||||
Belarus | - | 10,600,244 | - | 10,600,244 | ||||||||||||||||||||||||
Belize | - | 3,292,091 | - | 3,292,091 | ||||||||||||||||||||||||
Benin | - | 3,422,534 | - | 3,422,534 | ||||||||||||||||||||||||
Bosnia & Herzegovina | - | - | 94,029 | 94,029 | ||||||||||||||||||||||||
Cameroon | - | 3,642,189 | - | 3,642,189 | ||||||||||||||||||||||||
Costa Rica | - | 13,158,667 | - | 13,158,667 | ||||||||||||||||||||||||
Dominican Republic | - | 16,016,000 | - | 16,016,000 | ||||||||||||||||||||||||
Ecuador | - | 14,340,448 | - | 14,340,448 | ||||||||||||||||||||||||
Egypt | - | 30,667,448 | - | 30,667,448 | ||||||||||||||||||||||||
El Salvador | - | 8,760,075 | - | 8,760,075 | ||||||||||||||||||||||||
See accompanying notes
23
American Beacon Frontier Markets Income FundSM
Schedule of Investments
January 31, 2020
Frontier Markets Income Fund | Level 1 | Level 2 | Level 3 | Total | ||||||||||||||||||||||||
Assets (continued) | ||||||||||||||||||||||||||||
Foreign Sovereign Obligations (continued) | ||||||||||||||||||||||||||||
Ethiopia | $ | - | $ | 2,700,500 | $ | - | $ | 2,700,500 | ||||||||||||||||||||
Gabon | - | 7,596,981 | - | 7,596,981 | ||||||||||||||||||||||||
Ghana | - | 20,283,324 | - | 20,283,324 | ||||||||||||||||||||||||
Iraq | - | 9,799,275 | - | 9,799,275 | ||||||||||||||||||||||||
Ivory Coast | - | 18,522,341 | - | 18,522,341 | ||||||||||||||||||||||||
Kenya | - | 20,289,353 | - | 20,289,353 | ||||||||||||||||||||||||
Laos | - | 1,548,420 | - | 1,548,420 | ||||||||||||||||||||||||
Lebanon | - | 1,229,250 | - | 1,229,250 | ||||||||||||||||||||||||
Mongolia | - | 5,853,500 | - | 5,853,500 | ||||||||||||||||||||||||
Montenegro | - | 1,732,091 | - | 1,732,091 | ||||||||||||||||||||||||
Mozambique | - | 8,050,426 | - | 8,050,426 | ||||||||||||||||||||||||
Netherlands | - | 5,206,184 | - | 5,206,184 | ||||||||||||||||||||||||
Nigeria | - | 21,507,021 | - | 21,507,021 | ||||||||||||||||||||||||
Pakistan | - | 14,990,016 | 1,299,170 | 16,289,186 | ||||||||||||||||||||||||
Papua New Guinea | - | 2,599,083 | - | 2,599,083 | ||||||||||||||||||||||||
Rwanda | - | 3,768,583 | - | 3,768,583 | ||||||||||||||||||||||||
Senegal | - | 12,177,294 | - | 12,177,294 | ||||||||||||||||||||||||
Sri Lanka | - | 9,429,259 | - | 9,429,259 | ||||||||||||||||||||||||
Supranational | - | 9,938,399 | - | 9,938,399 | ||||||||||||||||||||||||
Suriname | - | 1,197,000 | - | 1,197,000 | ||||||||||||||||||||||||
Tajikistan | - | 2,818,175 | - | 2,818,175 | ||||||||||||||||||||||||
Tunisia | - | 3,651,526 | - | 3,651,526 | ||||||||||||||||||||||||
Uganda | - | 9,981,354 | - | 9,981,354 | ||||||||||||||||||||||||
Ukraine | - | 5,862,682 | - | 5,862,682 | ||||||||||||||||||||||||
Uruguay | - | 2,822,322 | - | 2,822,322 | ||||||||||||||||||||||||
Uzbekistan | - | 1,332,107 | - | 1,332,107 | ||||||||||||||||||||||||
Zambia | - | 12,349,992 | - | 12,349,992 | ||||||||||||||||||||||||
Foreign Corporate Obligations |
| |||||||||||||||||||||||||||
Bahrain | - | 1,725,933 | - | 1,725,933 | ||||||||||||||||||||||||
Barbados | - | 288,765 | - | 288,765 | ||||||||||||||||||||||||
Congo | - | 3,597,545 | - | 3,597,545 | ||||||||||||||||||||||||
Costa Rica | - | 1,692,406 | - | 1,692,406 | ||||||||||||||||||||||||
El Salvador | - | 405,500 | - | 405,500 | ||||||||||||||||||||||||
Georgia | - | 3,095,902 | - | 3,095,902 | ||||||||||||||||||||||||
Honduras | - | 871,500 | - | 871,500 | ||||||||||||||||||||||||
Kazakhstan | - | 4,982,987 | - | 4,982,987 | ||||||||||||||||||||||||
Luxembourg | - | 938,870 | - | 938,870 | ||||||||||||||||||||||||
Nigeria | - | 3,850,714 | - | 3,850,714 | ||||||||||||||||||||||||
Singapore | - | 938,472 | - | 938,472 | ||||||||||||||||||||||||
South Africa | - | 1,842,300 | - | 1,842,300 | ||||||||||||||||||||||||
Spain | - | 1,661,615 | - | 1,661,615 | ||||||||||||||||||||||||
Ukraine | - | 2,407,002 | - | 2,407,002 | ||||||||||||||||||||||||
United Kingdom | - | 2,756,422 | - | 2,756,422 | ||||||||||||||||||||||||
Venezuela | - | 100,000 | - | 100,000 | ||||||||||||||||||||||||
Zambia | - | 1,581,397 | - | 1,581,397 | ||||||||||||||||||||||||
Short-Term Investments | 31,297,524 | - | - | 31,297,524 | ||||||||||||||||||||||||
|
|
|
|
|
|
|
| |||||||||||||||||||||
Total Investments in Securities - Assets | $ | 31,297,524 | $ | 420,916,689 | $ | 1,393,199 | $ | 453,607,412 | ||||||||||||||||||||
|
|
|
|
|
|
|
| |||||||||||||||||||||
Financial Derivative Instruments - Assets |
| |||||||||||||||||||||||||||
Forward Foreign Currency Contracts | $ | - | $ | 644,314 | $ | - | $ | 644,314 | ||||||||||||||||||||
|
|
|
|
|
|
|
| |||||||||||||||||||||
Total Financial Derivative Instruments - Assets | $ | - | $ | 644,314 | $ | - | $ | 644,314 | ||||||||||||||||||||
|
|
|
|
|
|
|
| |||||||||||||||||||||
Financial Derivative Instruments - Liabilities |
| |||||||||||||||||||||||||||
Forward Foreign Currency Contracts | $ | - | $ | (20,067 | ) | $ | - | $ | (20,067 | ) | ||||||||||||||||||
|
|
|
|
|
|
|
| |||||||||||||||||||||
Total Financial Derivative Instruments - Liabilities | $ | - | $ | (20,067 | ) | $ | - | $ | (20,067 | ) | ||||||||||||||||||
|
|
|
|
|
|
|
| |||||||||||||||||||||
U.S. GAAP requires transfers between all levels to/from level 3 be disclosed. During the year ended January 31, 2020, there were no transfers into or out of Level 3.
See accompanying notes
24
American Beacon Frontier Markets Income FundSM
Schedule of Investments
January 31, 2020
The following table is a reconciliation of Level 3 assets within the Fund for which significant unobservable inputs were used to determine fair value. Transfers in or out of Level 3 represent the ending value of any security or instrument where a change in the level has occurred from the beginning to the end of the period:
| Security Type | Balance as of 1/31/2019 | Purchases | Sales | Accrued Discounts (Premiums) | Realized Gain (Loss) | Change in Unrealized Appreciation (Depreciation) | Transfer into Level 3 | Transfer out of Level 3 | Balance as of 1/31/2020 | Unrealized Appreciation (Depreciation) at Period end** | ||||||||||||||||||||||||
| Foreign Sovereign Obligations | $129,605 | $1,290,135 | $(47,566) | $ | 10,564 | $ | 4,224 | $ | 6,237 | $ | - | $ | - | $ | 1,393,199 | $ | (27,607 | ) | ||||||||||||||||
| ** | Change in unrealized appreciation (depreciation) attributable to Level 3 securities held at period end. This balance is included in the change in unrealized appreciation (depreciation) on the Statements of Operations. |
The foreign sovereign obligations, classified as Level 3 with a collective principal amount valued at $1,393,199, have been deemed as such due to limited market transparency.
See accompanying notes
25
American Beacon GLG Total Return FundSM
Schedule of Investments
January 31, 2020
| Shares | Fair Value | ||||||||||||||
| SHORT-TERM INVESTMENTS - 98.29% | |||||||||||||||
| Investment Companies - 3.21% | |||||||||||||||
| American Beacon U.S. Government Money Market Select Fund, Select Class, 1.47%A B | 612,903 | $ | 612,903 | ||||||||||||
|
| ||||||||||||||
| Par Amount | |||||||||||||||
| U.S. Treasury Obligations - 95.08% | |||||||||||||||
| U.S. Treasury Bills, | |||||||||||||||
1.565%, Due 6/18/2020 | $ | 8,600,000 | 8,551,213 | ||||||||||||
1.560%, Due 6/4/2020 | 9,150,000 | 9,103,017 | |||||||||||||
1.506%, Due 6/11/2020 | 440,000 | 437,623 | |||||||||||||
1.545%, Due 7/9/2020 | 55,000 | 54,640 | |||||||||||||
|
| ||||||||||||||
Total U.S. Treasury Obligations | 18,146,493 | ||||||||||||||
|
| ||||||||||||||
Total Short-Term Investments (Cost $18,756,596) | 18,759,396 | ||||||||||||||
|
| ||||||||||||||
TOTAL INVESTMENTS - 98.29% (Cost $18,756,596) | 18,759,396 | ||||||||||||||
OTHER ASSETS, NET OF LIABILITIES - 1.71% | 326,115 | ||||||||||||||
|
| ||||||||||||||
TOTAL NET ASSETS - 100.00% | $ | 19,085,511 | |||||||||||||
|
| ||||||||||||||
| Percentages are stated as a percent of net assets. | |||||||||||||||
A The Fund is affiliated by having the same investment advisor.
B7-day yield.
| Centrally Cleared Swap Agreements Outstanding on January 31, 2020: |
| |||||||||||||||||||||||||||
| Interest Rate Swaps | ||||||||||||||||||||||||||||
| Pay/Receive Floating Rate | Floating Rate Index | Fixed Rate (%) | Payment Frequency | Expiration Date | Curr | Notional Amount(3) (000s) | Premiums Paid (Received) | Fair Value | Unrealized Appreciation (Depreciation) | |||||||||||||||||||
| Pay | 1-DayBRL-CDI | 9.84 | Maturity | 1/4/2021 | BRL | 41,000 | $ | - | $ | (1,089,679 | ) | $ | (1,089,679 | ) | ||||||||||||||
|
|
|
|
|
| |||||||||||||||||||||||
| $ | - | $ | (1,089,679 | ) | $ | (1,089,679 | ) | |||||||||||||||||||||
|
|
|
|
|
| |||||||||||||||||||||||
| Credit Default Swaps on Corporate and Sovereign Securities - Buy Protection(1) | ||||||||||||||||||||||||||||
| Reference Entity | Fixed Rate (%) | Payment Frequency | Expiration Date | Implied Credit Spread at 1/31/2020(2) (%) | Curr | Notional Amount(3) (000s) | Premiums Paid (Received) | Fair Value(4) | Unrealized Appreciation (Depreciation) | |||||||||||||||||||
| Federation of Malaysia | 1.00 | Quarterly | 12/20/2024 | 0.4162 | USD | 1,300 | $ | (34,935 | ) | $ | (37,350 | ) | $ | (2,415 | ) | |||||||||||||
| Republic of Korea | 1.00 | Quarterly | 12/20/2024 | 0.2739 | USD | 400 | (13,349 | ) | (14,247 | ) | (898 | ) | ||||||||||||||||
| Republic of Brazil | 1.00 | Quarterly | 12/20/2024 | 1.0414 | USD | 2,500 | (2,300 | ) | 2,041 | 4,341 | ||||||||||||||||||
| Republic of Turkey | 1.00 | Quarterly | 12/20/2024 | 2.4069 | USD | 1,700 | 129,955 | 105,935 | (24,020 | ) | ||||||||||||||||||
| Republic of South Africa | 1.00 | Quarterly | 12/20/2024 | 1.8545 | USD | 2,950 | 84,362 | 111,330 | 26,968 | |||||||||||||||||||
| Republic of Colombia | 1.00 | Quarterly | 12/20/2024 | 0.8208 | USD | 2,900 | (42,433 | ) | (27,957 | ) | 14,476 | |||||||||||||||||
| Republic of Indonesia | 1.00 | Quarterly | 12/20/2024 | 0.6701 | USD | 2,000 | (34,728 | ) | (33,214 | ) | 1,514 | |||||||||||||||||
|
|
|
|
|
| |||||||||||||||||||||||
| $ | 86,572 | $ | 106,538 | $ | 19,966 | |||||||||||||||||||||||
|
|
|
|
|
| |||||||||||||||||||||||
(1) If the Fund is a buyer of protection and a credit event occurs, as defined under the terms of that particular swap agreement, the Fund will either (i) receive from the seller of protection an amount equal to the notional amount of the swap and deliver the referenced obligation or underlying securities comprising the referenced index or (ii) receive a net settlement amount in the form of cash or securities equal to the notional amount of the swap less the recovery value of the referenced obligation or underlying securities comprising the referenced index.
(2) Implied credit spreads, represented in absolute terms, utilized in determining the fair value of credit default swaps agreements on corporate issues and sovereign issues of an emerging country as of period end serve as an indicator of the current status of the payment/performance risk and represent the likelihood or risk of default for the credit derivative. The implied credit spread of a particular referenced entity reflects the cost of buying/selling protection and may include upfront payments required to be made to enter into the agreement. Wider credit spreads represent a deterioration of the referenced entity’s credit soundness and a greater likelihood or risk of default or other credit event occurring as defined under the terms of the agreement.
(3) The maximum potential amount the Fund could be required to pay as a seller of credit protection or receive as a buyer of credit protection if a credit event occurs as defined under the terms of that particular swap agreement.
See accompanying notes
26
American Beacon GLG Total Return FundSM
Schedule of Investments
January 31, 2020
(4) The quoted market prices and resulting values for credit default swaps on asset-backed securities and credit indices serve as an indicator of the current status of the payment/performance risk and represent the likelihood of an expected liability (or profit) for the credit derivative should the notional amount of the swap agreement be closed/ sold as of the period end. Increasing fair values, in absolute terms when compared to the notional amount of the swap, represent a deterioration of the referenced entity’s credit soundness and greater likelihood or risk of default or other credit event occurring as defined under the terms of the agreement.
| Forward Foreign Currency Contracts Open on January 31, 2020: |
| |||||||||||||||||||||||||||||
| Currency Purchased* | Currency Sold* | Settlement Date | Counterparty | Unrealized Appreciation | Unrealized (Depreciation) | Net Unrealized Appreciation (Depreciation) | ||||||||||||||||||||||||
| IDR | 104,151 | USD | 100,000 | 2/13/2020 | HUS | $ | 4,151 | $ | - | $ | 4,151 | |||||||||||||||||||
| IDR | 317,013 | USD | 310,000 | 2/13/2020 | HUS | 7,013 | - | 7,013 | ||||||||||||||||||||||
| IDR | 440,877 | USD | 420,000 | 2/13/2020 | HUS | 20,877 | - | 20,877 | ||||||||||||||||||||||
| IDR | 542,599 | USD | 531,923 | 2/13/2020 | HUS | 10,676 | - | 10,676 | ||||||||||||||||||||||
| IDR | 542,599 | USD | 531,656 | 2/13/2020 | HUS | 10,943 | - | 10,943 | ||||||||||||||||||||||
| IDR | 10,601,017 | USD | 10,200,000 | 2/13/2020 | HUS | 401,017 | - | 401,017 | ||||||||||||||||||||||
| USD | 5,963,314 | IDR | 6,274,128 | 2/13/2020 | HUS | - | (310,814 | ) | (310,814 | ) | ||||||||||||||||||||
| USD | 5,964,558 | IDR | 6,274,128 | 2/13/2020 | HUS | - | (309,570 | ) | (309,570 | ) | ||||||||||||||||||||
| COP | 142,435 | USD | 150,000 | 3/24/2020 | HUS | - | (7,565 | ) | (7,565 | ) | ||||||||||||||||||||
| USD | 360,299 | COP | 363,214 | 3/24/2020 | HUS | - | (2,915 | ) | (2,915 | ) | ||||||||||||||||||||
| USD | 360,241 | COP | 363,214 | 3/24/2020 | HUS | - | (2,973 | ) | (2,973 | ) | ||||||||||||||||||||
| ZAR | 171,572 | USD | 180,000 | 3/26/2020 | HUS | - | (8,428 | ) | (8,428 | ) | ||||||||||||||||||||
| USD | 728,606 | ZAR | 721,111 | 3/26/2020 | HUS | 7,495 | - | 7,495 | ||||||||||||||||||||||
| BRL | 313,079 | USD | 330,000 | 4/2/2020 | HUS | - | (16,921 | ) | (16,921 | ) | ||||||||||||||||||||
| USD | 352,975 | BRL | 348,437 | 4/2/2020 | HUS | 4,538 | - | 4,538 | ||||||||||||||||||||||
| USD | 526,784 | IDR | 538,297 | 5/11/2020 | HUS | - | (11,513 | ) | (11,513 | ) | ||||||||||||||||||||
| USD | 526,934 | IDR | 538,297 | 5/11/2020 | HUS | - | (11,363 | ) | (11,363 | ) | ||||||||||||||||||||
|
|
|
|
|
| |||||||||||||||||||||||||
| $ | 466,710 | $ | (682,062 | ) | $ | (215,352 | ) | |||||||||||||||||||||||
|
|
|
|
|
| |||||||||||||||||||||||||
| * | All values denominated in USD |
| Glossary: | ||
| Counterparty Abbreviations: | ||
| HUS | HSBC Bank (USA) | |
| Currency Abbreviations: | ||
| BRL | Brazilian Real | |
| COP | Colombian Peso | |
| IDR | Indonesian Rupiah | |
| USD | United States Dollar | |
| ZAR | South African Rand | |
| Other Abbreviations: | ||
| CDI | Chess Depository Interest | |
See accompanying notes
27
American Beacon GLG Total Return FundSM
Schedule of Investments
January 31, 2020
The Fund’s investments are summarized by level based on the inputs used to determine their values. As of January 31, 2020, the investments were classified as described below:
GLG Total Return Fund | Level 1 | Level 2 | Level 3 | Total | ||||||||||||||||||||||||
Assets |
| |||||||||||||||||||||||||||
Short-Term Investments | $ | 612,903 | $ | 18,146,493 | $ | - | $ | 18,759,396 | ||||||||||||||||||||
|
|
|
|
|
|
|
| |||||||||||||||||||||
Total Investments in Securities - Assets | $ | 612,903 | $ | 18,146,493 | $ | - | $ | 18,759,396 | ||||||||||||||||||||
|
|
|
|
|
|
|
| |||||||||||||||||||||
Financial Derivative Instruments - Assets |
| |||||||||||||||||||||||||||
Swap Contract Agreements | $ | - | $ | 47,299 | $ | - | $ | 47,299 | ||||||||||||||||||||
Forward Foreign Currency Contracts | - | 466,710 | - | 466,710 | ||||||||||||||||||||||||
|
|
|
|
|
|
|
| |||||||||||||||||||||
Total Financial Derivative Instruments - Assets | $ | - | $ | 514,009 | $ | - | $ | 514,009 | ||||||||||||||||||||
|
|
|
|
|
|
|
| |||||||||||||||||||||
Financial Derivative Instruments - Liabilities |
| |||||||||||||||||||||||||||
Swap Contract Agreements | $ | - | $ | (1,117,012 | ) | $ | - | $ | (1,117,012 | ) | ||||||||||||||||||
Forward Foreign Currency Contracts | - | (682,062 | ) | - | (682,062 | ) | ||||||||||||||||||||||
|
|
|
|
|
|
|
| |||||||||||||||||||||
Total Financial Derivative Instruments - Liabilities | $ | - | $ | (1,799,074 | ) | $ | - | $ | (1,799,074 | ) | ||||||||||||||||||
|
|
|
|
|
|
|
| |||||||||||||||||||||
U.S. GAAP requires transfers between all levels to/from level 3 be disclosed. During the year ended January 31, 2020, there were no transfers into or out of Level 3.
See accompanying notes
28
American Beacon FundsSM
Statements of Assets and Liabilities
January 31, 2020
| Frontier Markets Income Fund | GLG Total Return Fund | |||||||||||
Assets: |
| |||||||||||
Investments in unaffiliated securities, at fair value† | $ | 422,309,888 | $ | 18,146,493 | ||||||||
Investments in affiliated securities, at fair value‡ | 31,297,524 | 612,903 | ||||||||||
Foreign currency, at fair value^ | 5,255,229 | 226 | ||||||||||
Cash | 104,714 | 29,955 | ||||||||||
Cash collateral held at custodian for the benefit of the broker | - | 250,000 | ||||||||||
Dividends and interest receivable | 10,158,039 | 955 | ||||||||||
Deposits with broker for swap agreements | - | 1,355,553 | ||||||||||
Receivable for investments sold | 1,850,496 | - | ||||||||||
Receivable for fund shares sold | 1,596,545 | 25,057 | ||||||||||
Receivable for tax reclaims | 11,092 | - | ||||||||||
Receivable for expense reimbursement (Note 2) | 10,173 | 10,138 | ||||||||||
Unrealized appreciation from forward foreign currency contracts | 644,314 | 466,710 | ||||||||||
Receivable for variation margin on open centrally cleared swap agreements (Note 5) | - | 219,222 | ||||||||||
Prepaid expenses | 59,438 | 20,275 | ||||||||||
|
|
|
| |||||||||
Total assets | 473,297,452 | 21,137,487 | ||||||||||
|
|
|
| |||||||||
Liabilities: |
| |||||||||||
Payable for investments purchased | 6,487,641 | - | ||||||||||
Payable for fund shares redeemed | 385,113 | 27,468 | ||||||||||
Cash collateral held at custodian for the benefit of the broker | 190,000 | - | ||||||||||
Management andsub-advisory fees payable (Note 2) | 336,289 | 21,455 | ||||||||||
Service fees payable (Note 2) | 35,291 | 151 | ||||||||||
Transfer agent fees payable (Note 2) | 28,951 | 1,131 | ||||||||||
Custody and fund accounting fees payable | 76,402 | 15,752 | ||||||||||
Professional fees payable | 99,589 | 61,060 | ||||||||||
Trustee fees payable (Note 2) | 1,968 | 494 | ||||||||||
Payable for prospectus and shareholder reports | 5,000 | 28,539 | ||||||||||
Unrealized depreciation from forward foreign currency contracts | 20,067 | 682,062 | ||||||||||
Payable for variation margin from open centrally cleared swap agreements | - | 1,202,447 | ||||||||||
Other liabilities | 40,257 | 11,417 | ||||||||||
|
|
|
| |||||||||
Total liabilities | 7,706,568 | 2,051,976 | ||||||||||
|
|
|
| |||||||||
Net assets | $ | 465,590,884 | $ | 19,085,511 | ||||||||
|
|
|
| |||||||||
Analysis of net assets: |
| |||||||||||
Paid-in-capital | $ | 494,863,007 | $ | 40,717,980 | ||||||||
Total distributable earnings (deficits)A | (29,272,123 | ) | (21,632,469 | ) | ||||||||
|
|
|
| |||||||||
Net assets | $ | 465,590,884 | $ | 19,085,511 | ||||||||
|
|
|
| |||||||||
See accompanying notes
29
American Beacon FundsSM
Statements of Assets and Liabilities
January 31, 2020
| Frontier Markets Income Fund | GLG Total Return Fund | |||||||||||
Shares outstanding at no par value (unlimited shares authorized): |
| |||||||||||
Institutional Class | 8,076,212 | 31,821 | ||||||||||
|
|
|
| |||||||||
Y Class | 34,393,139 | 17,007 | ||||||||||
|
|
|
| |||||||||
Investor Class | 8,331,047 | 13,340 | ||||||||||
|
|
|
| |||||||||
A Class | 484,169 | 10,605 | ||||||||||
|
|
|
| |||||||||
C Class | 1,433,585 | 10,550 | ||||||||||
|
|
|
| |||||||||
Ultra Class | N/A | 1,809,293 | ||||||||||
|
|
|
| |||||||||
Net assets: |
| |||||||||||
Institutional Class | $ | 71,344,608 | $ | 320,815 | ||||||||
|
|
|
| |||||||||
Y Class | $ | 303,866,061 | $ | 170,055 | ||||||||
|
|
|
| |||||||||
Investor Class | $ | 73,505,036 | $ | 132,414 | ||||||||
|
|
|
| |||||||||
A Class | $ | 4,275,426 | $ | 105,189 | ||||||||
|
|
|
| |||||||||
C Class | $ | 12,599,753 | $ | 102,317 | ||||||||
|
|
|
| |||||||||
Ultra Class | N/A | $ | 18,254,721 | |||||||||
|
|
|
| |||||||||
Net asset value, offering and redemption price per share: |
| |||||||||||
Institutional Class | $ | 8.83 | $ | 10.08 | ||||||||
|
|
|
| |||||||||
Y Class | $ | 8.84 | $ | 10.00 | ||||||||
|
|
|
| |||||||||
Investor Class | $ | 8.82 | $ | 9.93 | ||||||||
|
|
|
| |||||||||
A Class | $ | 8.83 | $ | 9.92 | ||||||||
|
|
|
| |||||||||
A Class (offering price) | $ | 9.27 | $ | 10.41 | ||||||||
|
|
|
| |||||||||
C Class | $ | 8.79 | $ | 9.70 | ||||||||
|
|
|
| |||||||||
Ultra Class | N/A | $ | 10.09 | |||||||||
|
|
|
| |||||||||
† Cost of investments in unaffiliated securities | $ | 436,726,549 | $ | 18,143,693 | ||||||||
‡ Cost of investments in affiliated securities | $ | 31,297,524 | $ | 612,903 | ||||||||
^ Cost of foreign currency | $ | 5,266,301 | $ | 240 | ||||||||
A The Fund’s investments in affiliated securities did not have unrealized appreciation (depreciation) at year end. |
| |||||||||||
See accompanying notes
30
American Beacon FundsSM
Statements of Operations
For the year ended January 31, 2020
| Frontier Markets Income Fund | GLG Total Return Fund | |||||||||||
Investment income: |
| |||||||||||
Dividend income from affiliated securities (Note 8) | $ | 653,924 | $ | 146,043 | ||||||||
Interest income (net of foreign taxes)† | 39,023,874 | 5,810,557 | ||||||||||
|
|
|
| |||||||||
Total investment income | 39,677,798 | 5,956,600 | ||||||||||
|
|
|
| |||||||||
Expenses: |
| |||||||||||
Management andsub-advisory fees (Note 2) | 3,275,693 | 2,366,391 | ||||||||||
Transfer agent fees: | ||||||||||||
Institutional Class (Note 2) | 17,081 | 27 | ||||||||||
Y Class (Note 2) | 239,405 | 590 | ||||||||||
Investor Class | 3,563 | 999 | ||||||||||
A Class | 697 | 19 | ||||||||||
C Class | 945 | 19 | ||||||||||
Ultra Class | - | 8,940 | ||||||||||
Custody and fund accounting fees | 527,127 | 102,807 | ||||||||||
Professional fees | 130,162 | 95,594 | ||||||||||
Registration fees and expenses | 102,137 | 89,252 | ||||||||||
Service fees (Note 2): | ||||||||||||
Investor Class | 242,151 | 641 | ||||||||||
A Class | 4,553 | - | ||||||||||
C Class | 9,357 | - | ||||||||||
Distribution fees (Note 2): | ||||||||||||
A Class | 8,595 | 265 | ||||||||||
C Class | 114,521 | 1,034 | ||||||||||
Prospectus and shareholder report expenses | 54,134 | 86,826 | ||||||||||
Trustee fees (Note 2) | 28,862 | 15,346 | ||||||||||
Dividends and interest on securities sold short | - | 91,413 | ||||||||||
Loan fees (Note 9) | 38,292 | - | ||||||||||
Other expenses | 62,790 | 30,989 | ||||||||||
|
|
|
| |||||||||
Total expenses | 4,860,065 | 2,891,152 | ||||||||||
|
|
|
| |||||||||
Net fees waived and expenses (reimbursed) / recouped (Note 2) | 84,395 | (427,316 | ) | |||||||||
|
|
|
| |||||||||
Net expenses | 4,944,460 | 2,463,836 | ||||||||||
|
|
|
| |||||||||
Net investment income | 34,733,338 | 3,492,764 | ||||||||||
|
|
|
| |||||||||
Realized and unrealized gain (loss) from investments: |
| |||||||||||
Net realized gain (loss) from: | ||||||||||||
Investments in unaffiliated securitiesA | (1,931,795 | ) | (142,481 | ) | ||||||||
Foreign currency transactions | (718,182 | ) | 715,383 | |||||||||
Forward foreign currency contracts | 1,135,645 | 191,764 | ||||||||||
Swap agreements | - | (21,016,917 | ) | |||||||||
Change in net unrealized appreciation (depreciation) of: | ||||||||||||
Investments in unaffiliated securitiesB | 5,786,636 | (41,084 | ) | |||||||||
Foreign currency transactions | 22 | (23 | ) | |||||||||
Forward foreign currency contracts | 991,121 | 1,804,289 | ||||||||||
Swap agreements | - | 12,821,425 | ||||||||||
|
|
|
| |||||||||
Net gain (loss) from investments | 5,263,447 | (5,667,644 | ) | |||||||||
|
|
|
| |||||||||
Net increase (decrease) in net assets resulting from operations | $ | 39,996,785 | $ | (2,174,880 | ) | |||||||
|
|
|
| |||||||||
† Foreign taxes | $ | 665,757 | $ | - | ||||||||
A The Fund did not recognize net realized gains (losses) from the sale of investments in affiliated securities. |
| |||||||||||
B The Fund’s investments in affiliated securities did not have a change in unrealized appreciation (depreciation) at year end. |
| |||||||||||
See accompanying notes
31
American Beacon FundsSM
Statements of Changes in Net Assets
| Frontier Markets Income Fund | GLG Total Return Fund | |||||||||||||||||||||||||||
| Year Ended January 31, 2020 | Year Ended January 31, 2019 | Year Ended January 31, 2020 | Year Ended January 31, 2019 | |||||||||||||||||||||||||
Increase (decrease) in net assets: | ||||||||||||||||||||||||||||
Operations: | ||||||||||||||||||||||||||||
Net investment income | $ | 34,733,338 | $ | 22,618,702 | $ | 3,492,764 | $ | 6,936,612 | ||||||||||||||||||||
Net realized (loss) from investments in unaffiliated securities, foreign currency transactions, forward foreign currency contracts, and swap agreements | (1,514,332 | ) | (3,471,194 | ) | (20,252,251 | ) | (1,319,440 | ) | ||||||||||||||||||||
Change in net unrealized appreciation (depreciation) of investments in unaffiliated securities, foreign currency transactions, forward foreign currency contracts, and swap agreements | 6,777,779 | (23,891,914 | ) | 14,584,607 | 2,075,945 | |||||||||||||||||||||||
|
|
|
|
|
|
|
| |||||||||||||||||||||
Net increase (decrease) in net assets resulting from operations | 39,996,785 | (4,744,406 | ) | (2,174,880 | ) | 7,693,117 | ||||||||||||||||||||||
|
|
|
|
|
|
|
| |||||||||||||||||||||
Distributions to shareholders: | ||||||||||||||||||||||||||||
Total retained earnings: | ||||||||||||||||||||||||||||
Institutional Class | (5,751,687 | ) | (6,063,094 | ) | - | (51,527 | ) | |||||||||||||||||||||
Y Class | (19,454,443 | ) | (11,141,405 | ) | - | (21,812 | ) | |||||||||||||||||||||
Investor Class | (5,098,405 | ) | (3,746,033 | ) | - | (5,902 | ) | |||||||||||||||||||||
A Class | (266,177 | ) | (291,836 | ) | - | (3,999 | ) | |||||||||||||||||||||
C Class | (847,405 | ) | (743,483 | ) | - | (3,911 | ) | |||||||||||||||||||||
Ultra Class | - | - | - | (18,802,091 | ) | |||||||||||||||||||||||
Return of capital: | ||||||||||||||||||||||||||||
Institutional Class | (185,581 | ) | - | - | - | |||||||||||||||||||||||
Y Class | (790,312 | ) | - | - | - | |||||||||||||||||||||||
Investor Class | (191,437 | ) | - | - | - | |||||||||||||||||||||||
A Class | (11,126 | ) | - | - | - | |||||||||||||||||||||||
C Class | (32,942 | ) | - | - | - | |||||||||||||||||||||||
Ultra Class | - | - | - | - | ||||||||||||||||||||||||
|
|
|
|
|
|
|
| |||||||||||||||||||||
Net distributions to shareholders | (32,629,515 | ) | (21,985,851 | ) | - | (18,889,242 | ) | |||||||||||||||||||||
|
|
|
|
|
|
|
| |||||||||||||||||||||
Capital share transactions (Note 10): | ||||||||||||||||||||||||||||
Proceeds from sales of shares | 274,530,398 | 175,310,369 | 53,050,602 | 179,029,117 | ||||||||||||||||||||||||
Reinvestment of dividends and distributions | 29,820,229 | 18,991,501 | - | 18,844,081 | ||||||||||||||||||||||||
Cost of shares redeemed | (122,382,975 | ) | (91,797,512 | ) | (501,244,952 | ) | (462,806,614 | ) | ||||||||||||||||||||
Redemption fees | 44,873 | 88,999 | - | - | ||||||||||||||||||||||||
|
|
|
|
|
|
|
| |||||||||||||||||||||
Net increase (decrease) in net assets from capital share transactions | 182,012,525 | 102,593,357 | (448,194,350 | ) | (264,933,416 | ) | ||||||||||||||||||||||
|
|
|
|
|
|
|
| |||||||||||||||||||||
Net increase (decrease) in net assets | 189,379,795 | 75,863,100 | (450,369,230 | ) | (276,129,541 | ) | ||||||||||||||||||||||
|
|
|
|
|
|
|
| |||||||||||||||||||||
Net assets: | ||||||||||||||||||||||||||||
Beginning of period | 276,211,089 | 200,347,989 | 469,454,741 | 745,584,282 | ||||||||||||||||||||||||
|
|
|
|
|
|
|
| |||||||||||||||||||||
End of period | $ | 465,590,884 | $ | 276,211,089 | $ | 19,085,511 | $ | 469,454,741 | ||||||||||||||||||||
|
|
|
|
|
|
|
| |||||||||||||||||||||
See accompanying notes
32
American Beacon FundsSM
January 31, 2020
1. Organization and Significant Accounting Policies
American Beacon Funds (the “Trust”) is organized as a Massachusetts business trust. The Funds, each a series within the Trust, are registered under the Investment Company Act of 1940, as amended (the “Act”), asopen-end management investment companies. As of January 31, 2020, the Trust consists ofthirty-two active series, two of which are presented in this filing: American Beacon Frontier Markets Income Fund and American Beacon GLG Total Return Fund (collectively, the “Funds” and each individually a “Fund”). The remaining thirty active series are reported in separate filings. The American Beacon Frontier Markets Income Fund is registered as a diversified fund and American Beacon GLG Total Return Fund is registered asnon-diversified.
American Beacon Advisors, Inc. (the “Manager”) is a Delaware corporation and a wholly-owned subsidiary of Resolute Investment Managers, Inc. (“RIM”) organized in 1986 to provide business management, advisory, administrative, and asset management consulting services to the Trust and other investors. The Manager is registered as an investment advisor under the Investment Advisers Act of 1940, as amended (the “Advisers Act”). RIM is, in turn, a wholly-owned subsidiary of Resolute Acquisition, Inc., which is a wholly-owned subsidiary of Resolute Topco, Inc., a wholly-owned subsidiary of Resolute Investment Holdings, LLC (“RIH”). RIH is owned primarily by Kelso Investment Associates VIII, L.P., KEP VI, LLC and Estancia Capital Partners L.P., investment funds affiliated with Kelso & Company, L.P. (“Kelso”) or Estancia Capital Management, LLC (“Estancia”), which are private equity firms.
Recently Adopted Accounting Pronouncements
In March 2017, the Financial Accounting Standards Board (“FASB”) issued Accounting Standards Update (“ASU”)2017-08,Premium Amortization of Purchased Callable Debt Securities. The amendments in the ASU shorten the premium amortization period on a purchased callable debt security from the security’s contractual life to the earliest call date. It is anticipated that this change will enhance disclosures by reducing losses recognized when a security is called on an earlier date. This ASU is effective for fiscal years beginning after December 15, 2018, and has been adopted accordingly with no material impact on the financial statements and other disclosures.
In August 2018, the FASB issued ASU2018-13,Fair Value Measurement (“Topic 820”). The amendments in the ASU impact disclosure requirements for fair value measurement. It is anticipated that this change will enhance the effectiveness of disclosures in the notes to the financial statements. This ASU is effective for fiscal years beginning after December 15, 2019. Early adoption is permitted and can include the entire standard or certain provisions that exclude or amend disclosures. For the year ended January 31, 2020, the Funds have chosen to adopt the standard. The adoption of this ASU guidance did not have a material impact on the financial statements and other disclosures.
33
American Beacon FundsSM
Notes to Financial Statements
January 31, 2020
Class Disclosure
Each Fund has multiple classes of shares designed to meet the needs of different groups of investors; however, not all of the Funds offer all classes. The following table sets forth the differences amongst the classes:
Class | Eligible Investors | Minimum Initial Investments | ||||
| Institutional | Large institutional investors - sold directly or through intermediary channels. | $ | 250,000 | |||
| Y Class | Large institutional retirement plan investors - sold directly orthrough intermediary channels. | $ | 100,000 | |||
| Investor | All investors using intermediary organizations such as broker-dealers or retirement plan sponsors. | $ | 2,500 | |||
| A Class | All investors who invest through intermediary organizations, such as broker-dealers or third party administrator. Retail investors who invest directly through a financial intermediary such as a broker, bank, or registered investment advisor which may include afront-end sales charge and a contingent deferred sales charge (“CDSC”). | $ | 2,500 | |||
| C Class | Retail investors who invest directly through a financial intermediary such as a broker or through employee directed benefit plans with applicable sales charges which may include CDSC. | $ | 1,000 | |||
| Ultra | Large institutional investors - sold directly or through intermediary channels. The Manager may allow a reasonable period of time after opening an account for the Ultra Class for the investor to meet the initial investment requirement. In addition, for investors such as trust companies and financial advisors who make investments for a group of clients, the minimum initial investment can be met through aggregated purchase orders for more than one client. | $ | 500,000,000 | |||
Each class offered by the Trust has equal rights as to assets and voting privileges. Income andnon-class specific expenses are allocated daily to each class based on the relative net assets. Realized and unrealized capital gains and losses of each class are allocated daily based on the relative net assets of each class of the respective Fund. Class specific expenses, where applicable, currently include service, distribution, transfer agent fees, andsub-transfer agent fees that vary amongst the classes as described more fully in Note 2.
Significant Accounting Policies
The following is a summary of significant accounting policies, consistently followed by the Funds in preparation of the financial statements. The Funds are considered investment companies and accordingly, follow the investment company accounting and reporting guidance of the FASB Accounting Standards Codification Topic 946,Financial Services – Investment Companies,a part of Generally Accepted Accounting Principles (“U.S. GAAP”).
Security Transactions and Investment Income
Security transactions are recorded as of the trade date for financial reporting purposes. Securities purchased or sold on a when-issued or delayed-delivery basis may be settled beyond a standard settlement period for the security after the trade date.
Dividend income, net of foreign taxes, is recorded on theex-dividend date, except certain dividends from foreign securities which are recorded as soon as the information is available to the Funds. Interest income, net of foreign taxes, is earned from settlement date, recorded on the accrual basis, and adjusted, if necessary, for accretion of discounts and amortization of premiums. Realized gains (losses) from securities sold are determined based on specific lot identification.
34
American Beacon FundsSM
Notes to Financial Statements
January 31, 2020
Currency Translation
All assets and liabilities initially expressed in foreign currency values are converted into U.S. dollar values at the mean of the bid and ask prices of such currencies against U.S. dollars as last quoted by a recognized dealer. Income, expenses, and purchases and sales of investments are translated into U.S. dollars at the rate of the exchange prevailing on the respective dates of such transactions. The effect of changes in foreign currency exchange rates on investments is separately identified from the fluctuations arising from changes in market values of securities held and is reported with all other foreign currency gains and losses on the Funds’ Statements of Operations.
Distributions to Shareholders
The Funds distribute most or all of the net earnings and realized gains, if any, each taxable year in the form of dividends from net investment income and distributions of realized net capital gains and net gains from foreign currency transactions on an annual basis. The Funds do not have a fixed dividend rate and do not guarantee that it will pay any distributions in any particular period. Dividends to shareholders are determined in accordance with federal income tax regulations, which may differ in amount and character from net investment income and realized gains recognized for purposes of U.S. GAAP. To the extent necessary to fully distribute capital gains, the Funds may designate earnings and profits distributed to shareholders on the redemption of shares.
Allocation of Income, Trust Expenses, Gains, and Losses
Investment income, realized and unrealized gains and losses from investments of the Funds are allocated daily to each class of shares based upon the relative proportion of net assets of each class to the total net assets of the Funds. Expenses directly charged or attributable to the Fund will be paid from the assets of the Fund. Generally, expenses of the Trust will be allocated among and charged to the assets of the Funds on a basis that the Trust’s Board of Trustees (the “Board”) deems fair and equitable, which may be based on the relative net assets of the Funds or nature of the services performed and relative applicability to the Funds.
Use of Estimates
The preparation of financial statements in conformity with U.S. GAAP requires management to make estimates and assumptions that affect the amounts reported in the financial statements and accompanying notes. Actual results may differ from those estimated.
Redemption Fees
All Classes of the Frontier Markets Income Fund impose a 2% redemption fee on shares held for less than 90 days. The fee is deducted from the redemption proceeds and is intended to offset the trading costs, market impact, and other costs associated with short-term trading activity in the Fund. The“first-in,first-out” method is used to determine the holding period. The fee is allocated to all classes of this Fundpro-rata based on the net assets.
Other
Under the Trust’s organizational documents, its officers and trustees are indemnified against certain liabilities arising out of the performance of their duties to the Trust. In the normal course of business, the Trust enters into contracts that provide indemnification to the other party or parties against potential costs or liabilities. The Trust’s maximum exposure under these arrangements is dependent on claims that may be made in the future and, therefore, cannot be estimated. The Trust has had no prior claims or losses pursuant to any such agreement.
35
American Beacon FundsSM
Notes to Financial Statements
January 31, 2020
2. Transactions with Affiliates
Management and InvestmentSub-Advisory Agreements
The Funds and the Manager are parties to a Management Agreement that obligates the Manager to provide the Funds with investment advisory and administrative services. As compensation for performing the duties under the Management Agreement, the Manager will receive an annualized management fee based on a percentage of the Funds’ average daily net assets that is calculated and accrued daily according to the following schedule:
First $5 billion | 0.35 | % | ||
Next $5 billion | 0.325 | % | ||
Next $10 billion | 0.30 | % | ||
Over $20 billion | 0.275 | % |
The Trust, on behalf of the Funds, and the Manager have entered into an Investment Advisory Agreements with Aberdeen Asset Managers Limited and Global Evolution USA, LLC for the Frontier Markets Income Fund and GLG LLC for the GLG Total Return Fund (the“Sub-Advisors”) pursuant to which each Fund has agreed to pay an annualizedsub-advisory fee that is calculated and accrued daily based on the applicable Fund’s average daily net assets according to the following schedules:
Aberdeen Asset Managers Limited
All Assets | 0.50 | % |
Global Evolution USA, LLC
All Assets | 0.50 | % |
GLG LLC
First $500 million | 0.60 | % | ||
Next $500 million | 0.55 | % | ||
Over $1 billion | 0.50 | % |
The Management andSub-Advisory Fees paid by the Funds for the year ended January 31, 2020 were as follows:
Frontier Markets Income Fund
| Effective Fee Rate | Amount of Fees Paid | |||||||||||
Management Fees | 0.35 | % | $ | 1,357,050 | ||||||||
Sub-Advisor Fees | 0.50 | % | 1,918,643 | |||||||||
|
|
|
| |||||||||
Total | 0.85 | % | $ | 3,275,693 | ||||||||
|
|
|
| |||||||||
GLG Total Return Fund
| Effective Fee Rate | Amount of Fees Paid | |||||||||||
Management Fees | 0.35 | % | $ | 871,828 | ||||||||
Sub-Advisor Fees | 0.60 | % | 1,494,563 | |||||||||
|
|
|
| |||||||||
Total | 0.95 | % | $ | 2,366,391 | ||||||||
|
|
|
| |||||||||
36
American Beacon FundsSM
Notes to Financial Statements
January 31, 2020
Distribution Plans
Separate Distribution Plans (the “Distribution Plans”) have been adopted pursuant to Rule 12b-1 under the Act for the A and C Classes of the Funds. Under the Distribution Plans, as compensation for distribution and shareholder servicing assistance, the Funds’ Distributor, Resolute Investment Distributors, Inc. (“RID” or “Distributor”), receives an annual fee of 0.25% of the average daily net assets of the A Class and 1.00% of the average daily net assets of the C Class. The fee will be payable without regard to whether the amount of the fee is more or less than the actual expenses incurred in a particular month by the Distributor for distribution assistance.
For all other share classes, the Funds have utilized a “defensive” distribution plan (the “Plan”) pursuant to which no separate fees may be charged to the Funds for distribution purposes. However, the Plan authorizes the use of management fees received by the Manager and/or the investment advisors hired by the Manager for distribution purposes. Under this Plan, the Funds do not intend to compensate the Manager or any other party, either directly or indirectly, for the distribution of Fund shares from these fees.
Service Plans
The Investor, A and C Classes have each adopted a Service Plan (collectively, the “Plans”). The Plans authorize the payment to the Manager an annual fee up to 0.375% of the average daily net assets of the Investor Class, up to 0.25% of the average daily net assets of the A Class and up to 0.25% of the average daily net assets of the C Class. In addition, the Funds may reimburse the Manager for certain non-distribution shareholder services provided by financial intermediaries attributable to Y Class and Institutional Class. The Manager or other approved entities may spend such amounts on any activities or expenses primarily intended to result in or relate to the servicing of A Class, C Class, Y Class, Institutional Class and Investor Class including, but not limited to, payment of shareholder service fees and transfer agency or sub-transfer agency expenses. The fees will be payable monthly in arrears. The primary expenses expected to be incurred under the Plans are shareholder servicing, record keeping fees and servicing fees paid to financial intermediaries such as plan sponsors and broker-dealers.
Sub-Transfer Agent Fees
The Manager has entered into agreements, which include servicing agreements, with financial intermediaries that provide recordkeeping, processing, shareholder communications and other services to customers of the intermediaries that hold positions in the Institutional and Y Classes of the Funds and has agreed to compensate the intermediaries for providing these services. Intermediaries transact with the Funds primarily through the use of omnibus accounts on behalf of their customers who hold positions in the Funds. Certain services would have been provided by the Funds’ transfer agent and other service providers if the shareholders’ accounts were maintained directly by the Funds’ transfer agent. Accordingly, the Funds, pursuant to Board approval, have agreed to reimburse the Manager for certainnon-distribution shareholder services provided by financial intermediaries for the Institutional and Y Classes. The reimbursement amounts(sub-transfer agent fees) paid to the Manager are subject to a fee limit of up to 0.10% of an intermediary’s average net assets in the Institutional and Y Classes on an annual basis. During the year ended January 31, 2020, thesub-transfer agent fees, as reflected in “Transfer agent fees” on the Statements of Operations, were as follows:
Fund | Sub-Transfer Agent Fees | |||
Frontier Markets Income | $ | 239,005 | ||
GLG Total Return | 559 | |||
As of January 31, 2020, the Funds owed the Manager the following reimbursement ofsub-transfer agent fees, as reflected in “Transfer agent fees payable” on the Statements of Assets and Liabilities:
Fund | Reimbursement Sub-Transfer Agent Fees | |||
Frontier Markets Income | $ | 24,631 | ||
GLG Total Return | 14 | |||
37
American Beacon FundsSM
Notes to Financial Statements
January 31, 2020
Investments in Affiliated Funds
The Funds may invest in the American Beacon U.S. Government Money Market Select Fund (the “USG Select Fund”). The Funds and the USG Select Fund have the same investment advisor and therefore, are considered to be affiliated. The Manager serves as investment advisor to the USG Select Fund and receives management fees and administrative fees totaling 0.10% of the average daily net assets of the USG Select Fund. During the year ended January 31, 2020, the Manager earned fees on the Funds’ direct investments in the USG Select Fund as shown below:
Fund | Direct Investments in USG Select Fund | |||
Frontier Markets Income | $ | 31,598 | ||
GLG Total Return | 6,461 | |||
Interfund Credit Facility
Pursuant to an exemptive order issued by the U.S. Securities and Exchange Commission (“SEC”), the Funds, along with other registered investment companies having management contracts with the Manager, may participate in a credit facility whereby each fund, under certain conditions, is permitted to lend money directly to and borrow directly from other participating funds for temporary purposes. The interfund credit facility is advantageous to the funds because it provides added liquidity and eliminates the need to maintain higher cash balances to meet redemptions. This situation could arise when shareholder redemptions exceed anticipated volumes and certain funds have insufficient cash on hand to satisfy such redemptions or when sales of securities do not settle as expected, resulting in a cash shortfall for a fund. When a fund liquidates portfolio securities to meet redemption requests, they often do not receive payment in settlement for up to two days (or longer for certain foreign transactions). Redemption requests normally are satisfied on the next business day. The credit facility provides a source of immediate, short-term liquidity pending settlement of the sale of portfolio securities. The credit facility is administered by a credit facility team consisting of professionals from the Manager’s asset management, compliance, and accounting areas who report the activities of the credit facility to the Board. During the year ended January 31, 2020, the Frontier Markets Income Fund borrowed $18,195,346 for 1 day at an average interest rate of 2.45% with interest charges of $1,221. These amounts are recorded as “Other expenses” in the Statements of Operations. During the year ended January 31, 2020, the GLG Total Return Fund did not utilize the credit facility.
Expense Reimbursement Plan
The Manager contractually agreed to reduce fees and/or reimburse expenses for the classes of the Funds to the extent that total operating expenses exceed the Funds’ expense cap. During the year ended January 31, 2020, the Manager waived and/or reimbursed expenses as follows:
| Expense Cap | ||||||||||||||||||||||
Fund | Class | 2/1/2019 - 5/31/2019 | 6/1/2019 - 1/31/2020 | Reimbursed Expenses | (Recouped) Expenses | Expiration of Reimbursed Expenses | ||||||||||||||||
Frontier Markets Income | Institutional | 1.15 | % | 1.15 | % | $ | 12,591 | $ | (46,005 | ) | 2022-2023 | |||||||||||
Frontier Markets Income | Y | 1.25 | % | 1.25 | % | 27,040 | (94,769 | ) | 2022-2023 | |||||||||||||
Frontier Markets Income | Investor* | - | - | 15,101 | - | 2022-2023 | ||||||||||||||||
Frontier Markets Income | A* | - | - | 2,745 | - | 2022-2023 | ||||||||||||||||
Frontier Markets Income | C* | - | - | - | (1,098 | ) | 2022-2023 | |||||||||||||||
GLG Total Return | Y* | 1.15 | % | - | 14 | - | 2022-2023 | |||||||||||||||
GLG Total Return | Investor | 1.43 | % | 1.43 | % | 1,168 | (39 | ) | 2022-2023 | |||||||||||||
GLG Total Return | A* | - | - | - | (122 | ) | 2022-2023 | |||||||||||||||
GLG Total Return | C* | - | - | - | (119 | ) | 2022-2023 | |||||||||||||||
GLG Total Return | Ultra | 0.95 | % | 0.95 | % | 426,414 | - | 2022-2023 | ||||||||||||||
| * | Prior cap in place until fully recouped. |
38
American Beacon FundsSM
Notes to Financial Statements
January 31, 2020
Of these amounts, $10,173 and $10,138 was disclosed as a receivable from the Manager on the Statements of Assets and Liabilities at January 31, 2020 for the Frontier Markets Income Fund and GLG Total Return Fund, respectively.
The Funds have adopted an Expense Reimbursement Plan whereby the Manager may seek repayment of such fee or voluntary reductions and expense reimbursements. Under the policy, the Manager can be reimbursed by the Funds for any contractual or voluntary fee reductions or expense reimbursements if reimbursement to the Manager (a) occurs within three years after the date of the Manager’s waiver/reimbursement and (b) does not cause the Funds’ annual operating expenses to exceed the lesser of the contractual percentage limit in effect at the time of the waiver/reimbursement or time of recoupment. The reimbursed expenses listed above will expire in 2022 and 2023. The carryover of excess expenses potentially reimbursable to the Manager, but not recorded as a liability are as follows:
Fund | Recouped Expenses | Excess Expense Carryover | Expired Expense Carryover | Expiration of Reimbursed Expenses | ||||||||||||
Frontier Markets Income | $ | 69,711 | $ | - | $ | - | 2019-2020 | |||||||||
Frontier Markets Income | 22,877 | 355 | - | 2020-2021 | ||||||||||||
Frontier Markets Income | 87,429 | 7,314 | - | 2021-2022 | ||||||||||||
GLG Total Return | 102,541 | - | 255,971 | 2019-2020 | ||||||||||||
GLG Total Return | - | 675,074 | - | 2020-2021 | ||||||||||||
GLG Total Return | - | 624,775 | - | 2021-2022 | ||||||||||||
Sales Commissions
The Funds’ Distributor may receive a portion of Class A sales charges from broker dealers which may be used to offset distribution related expenses. During the period ended January 31, 2020, RID collected $4,036 from the sale of Class A Shares of the Frontier Markets Income Fund. RID did not collect any Class A sales charges for GLG Total Return Fund during the year ended January 31, 2020.
A CDSC of 0.50% will be deducted with respect to Class A Shares on certain purchases of $1,000,000 or more that are redeemed in whole or part within 18 months of purchase, unless waived as discussed in the Funds’ Prospectus. Any applicable CDSC will be 0.50% of the lesser of the original purchase price or the value of the redemption of the Class A Shares redeemed. During the year ended January 31, 2020, there were no CDSC fees collected for Class A Shares of the Funds.
A CDSC of 1.00% will be deducted with respect to Class C Shares redeemed within 12 months of purchase, unless waived as discussed in the Funds’ Prospectus. Any applicable CDSC will be 1.00% of the lesser of the original purchase price or the value of the redemption of the Class C Shares redeemed. During the year ended January 31, 2020, CDSC fees of $2,339 were collected for Class C Shares of the Frontier Markets Income Fund. RID did not collect any CDSC fees for Class C Shares for GLG Total Return Fund during the period ended January 31, 2020.
Trustee Fees and Expenses
Effective January 1, 2020, as compensation for their service to the American Beacon Funds Complex, including the Trust (collectively, the “Trusts”), each Trustee is compensated from the Trusts as follows: (1) an annual retainer of $120,000; (2) meeting attendance fee (for attendance in person or via teleconference) of (a) $12,000 for in person attendance, or $5,000 for telephonic attendance, by Board members for each regularly scheduled or special Board meeting, (b) $2,500 for attendance by Committee members at meetings of the Audit Committee and the Investment Committee, (c) $1,500 for attendance by Committee members at meetings of the Nominating and Governance Committee; and (d) $2,500 for attendance by Board members for each special telephonic Board meeting; and (3) reimbursement of reasonable expenses incurred in attending Board meetings, Committee meetings, and relevant educational seminars. The Trustees also may be compensated for attendance at special Board and/or Committee meetings from time to time. For her service as Board Chair, Ms. Cline receives an
39
American Beacon FundsSM
Notes to Financial Statements
January 31, 2020
additional annual retainer of $50,000. Although she attends several committee meetings at each quarterly Board meeting, she receives only a single $2,500 fee each quarter for her attendance at those meetings. The chairpersons of the Audit Committee and the Investment Committee each receive an additional annual retainer of $25,000 and the Chair of the Nominating and Governance Committee receives an additional annual retainer of $15,000.
3. Security Valuation and Fair Value Measurements
The price of the Fund’s shares is based on its net asset value (“NAV”) per share. The Fund’s NAV is computed by adding total assets, subtracting all the Fund’s liabilities, and dividing the result by the total number of shares outstanding.
The NAV of each class of the Fund’s shares is determined based on a pro rata allocation of the Fund’s investment income, expenses and total capital gains and losses. The Fund’s NAV per share is determined each business day as of the regular close of trading on the New York Stock Exchange (“NYSE” or “Exchange”), which is typically 4:00 p.m. Eastern Time (“ET”). However, if trading on the NYSE closes at a time other than 4:00 p.m. ET, the Fund’s NAV per share typically would still be determined as of the regular close of trading on the NYSE. The Fund does not price its shares on days that the NYSE is closed. Foreign exchanges may permit trading in foreign securities on days when the Fund is not open for business, which may result in the value of the Fund’s portfolio investments being affected at a time when you are unable to buy or sell shares.
Equity securities, including shares ofclosed-end funds and exchange-traded funds (“ETFs”), are valued at the last sale price or official closing price taken from the primary exchange in which each security trades. Investments in other mutual funds are valued at the closing NAV per share on the day of valuation. Debt securities are valued at bid quotes from broker/dealers or evaluated bid prices from pricing services, who may consider a number of inputs and factors, such as prices of comparable securities, yield curves, spreads, credit ratings, coupon rates, maturity, default rates, and underlying collateral. Futures are valued based on their daily settlement prices. Exchange-traded andover-the-counter (“OTC”) options are valued at the last sale price. Options with no last sale for the day are priced at mid quote. Swaps are valued at evaluated mid prices from pricing services.
The valuation of securities traded on foreign markets and certain fixed-income securities will generally be based on prices determined as of the earlier closing time of the markets on which they primarily trade unless a significant event has occurred. When the Fund holds securities or other assets that are denominated in a foreign currency, the Fund will normally use the currency exchange rates as of 4:00 p.m. ET.
Securities may be valued at fair value, as determined in good faith and pursuant to procedures approved by the Board, under certain limited circumstances. For example, fair value pricing will be used when market quotations are not readily available or reliable, as determined by the Manager, such as when (i) trading for a security is restricted or stopped; (ii) a security’s trading market is closed (other than customary closings); or (iii) a security has beende-listed from a national exchange. A security with limited market liquidity may require fair value pricing if the Manager determines that the available price does not reflect the security’s true market value. In addition, if a significant event that the Manager determines to affect the value of one or more securities held by the Fund occurs after the close of a related exchange but before the determination of the Fund’s NAV, fair value pricing may be used on the affected security or securities. Securities of small-capitalization companies are also more likely to require a fair value determination using these procedures because they are more thinly traded and less liquid than the securities of larger-capitalization companies. The Fund may fair value securities as a result of significant events occurring after the close of the foreign markets in which the Fund invests as described below. In addition, the Fund may invest in illiquid securities requiring these procedures.
The Fund may use fair value pricing for securities primarily traded innon-U.S. markets because most foreign markets close well before the Fund’s pricing time of 4:00 p.m. ET. The earlier close of these foreign markets gives rise to the possibility that significant events, including broad market moves, may have occurred in the interim and may materially affect the value of those securities. If the Manager determines that the last quoted prices of
40
American Beacon FundsSM
Notes to Financial Statements
January 31, 2020
non-U.S. securities will, in its judgment, materially affect the value of some or all its portfolio securities, the Manager can adjust the previous closing prices to reflect what it believes to be the fair value of the securities as of the close of the Exchange. In deciding whether it is necessary to adjust closing prices to reflect fair value, the Manager reviews a variety of factors, including developments in foreign markets, the performance of U.S. securities markets, and the performance of instruments trading in U.S. markets that represent foreign securities and baskets of foreign securities. These securities are fair valued using a pricing service, using methods approved by the Board, that considers the correlation of the trading patterns of the foreign security to intraday trading in the U.S. markets, based on indices of domestic securities and other appropriate indicators such as prices of relevant American Depositary Receipts (“ADRs”) and futures contracts. The Valuation Committee, established by the Board, may also fair value securities in other situations, such as when a particular foreign market is closed but the Fund is open. The Fund uses outside pricing services to provide closing prices and information to evaluate and/or adjust those prices. As a means of evaluating its security valuation process, the Valuation Committee routinely compares closing prices, the next day’s opening prices in the same markets and adjusted prices.
Attempts to determine the fair value of securities introduce an element of subjectivity to the pricing of securities. As a result, the price of a security determined through fair valuation techniques may differ from the price quoted or published by other sources and may not accurately reflect the market value of the security when trading resumes. If a reliable market quotation becomes available for a security formerly valued through fair valuation techniques, the Manager compares the new market quotation to the fair value price to evaluate the effectiveness of the Fund’s fair valuation procedures. If any significant discrepancies are found, the Manager may adjust the Fund’s fair valuation procedures.
Valuation Inputs
Various inputs may be used to determine the fair value of the Funds’ investments. These inputs are summarized in three broad levels for financial statement purposes. The inputs or methodologies used to value securities are not necessarily an indication of the risk associated with investing in those securities.
| Level 1 | - | Quoted prices in active markets for identical securities. | ||
| Level 2 | - | Prices determined using other significant observable inputs. These may include quoted prices for similar securities, interest rates, prepayment speeds, credit risk, and others. | ||
| Level 3 | - | Prices determined using other significant unobservable inputs. Unobservable inputs reflect the Fund’s own assumptions about the factors market participants would use in pricing an investment. | ||
Level 1 and Level 2 trading assets and trading liabilities, at fair value
Fixed-income securities including corporate, convertible and municipal bonds and notes, U.S. government agencies, U.S. Treasury obligations, sovereign issues, bank loans, convertible preferred securities, andnon-U.S. bonds are normally valued by pricing service providers that use broker dealer quotations, reported trades or valuation estimates from their internal pricing models. The service providers’ internal models use inputs that are observable such as issuer details, interest rates, yield curves, prepayment speeds, credit risks/spreads, default rates, and quoted prices for similar assets. Securities that use similar valuation techniques and inputs as described above are categorized as Level 2 of the fair value hierarchy. Fixed-income securities purchased on a delayed-delivery basis aremarked-to-market daily until settlement at the forward settlement date and are categorized as Level 2 of the fair value hierarchy.
Common stocks, ETFs and financial derivative instruments, such as futures contracts or options that are traded on a national securities exchange, are stated at the last reported sale or settlement price on the day of valuation. To the extent these securities are actively traded and valuation adjustments are not applied, they are categorized as Level 1 of the fair value hierarchy. Preferred securities and other equities traded on inactive markets or valued by reference to similar instruments are generally categorized as Level 2 of the fair value hierarchy.
41
American Beacon FundsSM
Notes to Financial Statements
January 31, 2020
Investments in registeredopen-end investment management companies will be valued based upon the NAVs of such investments and are categorized as Level 1 of the fair value hierarchy.
OTC financial derivative instruments, such as foreign currency contracts and structured notes, derive their value from underlying asset prices, indices, reference rates, and other inputs or a combination of these factors. These contracts are normally valued on the basis of broker dealer quotations or pricing service providers. Depending on the product and the terms of the transaction, the fair value of the financial derivative contracts can be estimated by a pricing service provider using a series of techniques, including simulation pricing models. The pricing models use inputs that are observed from actively quoted markets such as issuer details, indices, spreads, interest rates, curves, dividends, and exchange rates. Financial derivatives that use similar valuation techniques and inputs as described above are categorized as Level 2 of the fair value hierarchy.
Level 3 trading assets and trading liabilities, at fair value
The valuation techniques and significant inputs used in determining the fair values of financial instruments classified as Level 3 of the fair value hierarchy are as follows.
Securities and other assets for which market quotes are not readily available are valued at fair value as determined in good faith by the Board or persons acting at their direction and may be categorized as Level 3 of the fair value hierarchy.
Market quotes are considered not readily available in circumstances where there is an absence of current or reliable market-based data (e.g., trade information or broker quotes), including where events occur after the close of the relevant market, but prior to the Exchange close, that materially affect the values of the Fund’s securities or assets. In addition, market quotes are considered not readily available when, due to extraordinary circumstances, the exchanges or markets on which the securities trade, do not open for trading for the entire day and no other market prices are available. The Board has delegated to the Manager the responsibility for monitoring significant events that may materially affect the fair values of a Fund’s securities or assets and for determining whether the value of the applicable securities or assets should bere-evaluated in light of such significant events.
The Board has adopted methods for valuing securities and other assets in circumstances where market quotes are not readily available, and has delegated the responsibility for applying the valuation methods to the Manager. For instances in which daily market quotes are not readily available, investments may be valued pursuant to guidelines established by the Board. In the event that the security or asset cannot be valued, pursuant to one of the valuation methods established by the Board, the fair value of the security or asset will be determined in good faith by the Valuation Committee, generally based upon recommendations provided by the Manager.
When a Fund uses fair valuation methods applied by the Manager that use significant unobservable inputs to determine its NAV, the securities priced using this methodology are categorized as Level 3 of the fair value hierarchy. These methods may require subjective determinations about the value of a security. While the Trust’s policy is intended to result in a calculation of the Fund’s NAV that fairly reflects security values as of the time of pricing, the Trust cannot guarantee that values determined by the Board or persons acting at their direction would accurately reflect the price that a Fund could obtain for a security if it were to dispose of that security as of the time of pricing (for instance, in a forced or distressed sale). The prices used by a Fund may differ from the value that would be realized if the securities were sold.
4. Securities and Other Investments
Credit-Linked Notes
The Frontier Markets Income Fund may invest in credit-linked notes (“CLNs”). CLNs are derivative debt obligations that are issued by limited purpose entities, such as Special Purpose Vehicles (“SPVs”), or by financial
42
American Beacon FundsSM
Notes to Financial Statements
January 31, 2020
firms, such as banks, securities firms or their affiliates. They are structured so that their performance is linked to that of an underlying bond or other debt obligation (a “reference asset”), normally by means of an embedded or underlying credit default swap. The reference assets for the CLNs in which the Fund may invest will be limited to sovereign or quasi-sovereign debt instruments or other investments in which the Fund’s investment policies permit it to invest directly. The Fund may invest in CLNs when the Fund’sSub-Advisor believes that doing so is more efficient than investing in the reference assets directly or when such direct investment by the Fund is not feasible due to legal or other restrictions.
The issuer or one of the affiliates of the issuer of the CLNs in which the Fund will invest, normally will purchase the reference asset underlying the CLN directly, but in some cases it may gain exposure to the reference asset through a credit default swap or other derivative. Under the terms of a CLN, the Fund will receive a fixed or variable rate of interest on the outstanding principal amount of the CLN, which in turn will be subject to reduction (potentially down to zero) if a “credit event” occurs with respect to the underlying reference asset or its issuer. Such credit events will include payment defaults on the reference asset, and normally will also include events that do not involve an actual default, such as actual or potential insolvencies, repudiations of indebtedness, moratoria on payments, reference asset restructurings, limits on the convertibility or repatriation of currencies, and the imposition of ownership restrictions. If a credit event occurs, payments on the CLN would terminate, and the Fund normally would receive delivery of the underlying reference asset (or, in some cases, a comparable “deliverable” asset) in lieu of the repayment of principal. In some cases, however, including but not limited to instances where there has been a market disruption or in which it is or has become illegal, impossible or impracticable for the Fund to purchase, hold or receive the reference assets, the Fund may receive a cash settlement based on the value of the reference asset or a comparable instrument, less fees charged and certain expenses incurred by the CLN issuer.
CLNs are debt obligations of the CLN issuers, and the Fund would have no ownership or other property interest in the reference assets (other than following a credit event that results in the reference assets being delivered to the Fund) or any direct recourse to the issuers of those reference assets. Thus, the Fund will be exposed to the credit risk of the issuers of the reference assets that underlie its CLNs, as well as to the credit risk of the issuers of the CLNs themselves. CLNs will also be subject to currency risk, liquidity risk, valuation risks, and the other risks of a credit default swap. Various determinations that may need to be made with respect to the CLNs, including the occurrence of a credit event, the selection of deliverable assets (where applicable) and the valuation of the reference asset for purposes of determining any cash settlement amount, normally will be made by the issuer or sponsor of the CLN. The interests of such issuer or sponsor may not be aligned with those of the Fund or other investors in the CLN. Accordingly, CLNs may also be subject to potential conflicts of interest. There may be no established trading market for the Fund’s CLNs, in which event they may constitute illiquid investments.
Fixed-Income Investments
The Funds may hold debt, including government and corporate debt, and other fixed-income securities. Typically, the values of fixed-income securities change inversely with prevailing interest rates. Therefore, a fundamental risk of fixed-income securities is interest rate risk, which is the risk that their value will generally decline as prevailing interest rates rise, which may cause the Funds’ NAV to likewise decrease, and vice versa. How specific fixed-income securities may react to changes in interest rates will depend on the specific characteristics of each security. For example, while securities with longer maturities tend to produce higher yields, they also tend to be more sensitive to changes in prevailing interest rates and are, therefore, more volatile than shorter-term securities and are subject to greater market fluctuations as a result of changes in interest rates. Fixed-income securities are also subject to credit risk, which is the risk that the credit strength of an issuer of a fixed-income security will weaken and/or that the issuer will be unable to make timely principal and interest payments and that the security may go into default. In addition, there is prepayment risk, which is the risk that during periods of falling interest rates, certain fixed-income securities with higher interest rates, such as mortgage-backed securities (“MBS”) and asset-backed securities (“ABS”), may be prepaid by their issuers thereby reducing the amount of interest payments. This may result in a Fund having to reinvest its proceeds in lower yielding securities. Securities underlying MBS and ABS, which may include subprime mortgages, also may be subject to a higher degree of credit risk, valuation risk, and liquidity risk.
43
American Beacon FundsSM
Notes to Financial Statements
January 31, 2020
Foreign Debt Securities
The Funds may invest in foreign fixed and floating rate income securities (including emerging market securities) all or a portion of which may benon-U.S. dollar denominated and which include: (a) debt obligations issued or guaranteed by foreign national, provincial, state, municipal or other governments with taxing authority or by their agencies or instrumentalities, including Brady Bonds; (b) debt obligations of supranational entities; (c) debt obligations of the U.S. Government issued innon-dollar securities; (d) debt obligations and other fixed income securities of foreign corporate issuers (both dollar andnon-dollar denominated); and (e) U.S. corporate issuers (both Eurodollar andnon-dollar denominated). There is no minimum rating criteria for the Funds’ investments in such securities. Investing in the securities of foreign issuers involves special considerations that are not typically associated with investing in the securities of U.S. issuers. In addition, emerging markets are markets that have risks that are different and higher than those in more developed markets.
Foreign Securities
The Funds may invest in U.S. dollar-denominated andnon-U.S. dollar denominated equity and debt securities of foreign issuers and foreign branches of U.S. banks, including negotiable certificates of deposit (“CDs”), bankers’ acceptances, and commercial paper. Foreign issuers are issuers organized and doing business principally outside the United States and include corporations, banks,non-U.S. governments, and quasi-governmental organizations. While investments in foreign securities may be intended to reduce risk by providing further diversification, such investments involve sovereign and other risks, in addition to the credit and market risks normally associated with domestic securities. These additional risks include the possibility of adverse political and economic developments (including political or social instability, nationalization, expropriation, or confiscatory taxation); the potentially adverse effects of unavailability of public information regarding issuers, different governmental supervision and regulation of financial markets, reduced liquidity of certain financial markets, and the lack of uniform accounting, auditing, and financial reporting standards or the application of standards that are different or less stringent than those applied in the United States; different laws and customs governing securities tracking; and possibly limited access to the courts to enforce the Funds’ rights as an investor.
Frontier and Emerging Market Investments
The Funds may invest in the securities and derivatives with exposure to various countries with emerging capital markets. Investments in the securities and derivatives with exposure to countries with emerging capital markets involve significantly higher risks not involved in investments in securities in more developed capital markets, such as (i) low ornon-existent trading volume, resulting in a lack of liquidity and increased volatility in prices for such securities, as compared to securities from more developed capital markets, (ii) uncertain national policies and social, political and economic instability, increasing the potential for expropriation of assets, confiscatory taxation, high rates of inflation or unfavorable diplomatic developments, (iii) possible fluctuations in exchange rates, differing legal systems and the existence or possible imposition of exchange controls, custodial restrictions or othernon-U.S. or U.S. governmental laws or restrictions applicable to such investments, (iv) national policies that may limit the Fund’s investment opportunities such as restrictions on investment in issuers or industries deemed sensitive to national interests, (v) the lack or relatively early development of legal structures governing private and foreign investments and private property, and (vi) less diverse or immature economic structures. In addition to withholding taxes on investment income, some countries with emerging capital markets may impose differential capital gain taxes on foreign investors.
Illiquid and Restricted Securities
Generally, an illiquid asset is an asset that the Funds reasonably expect cannot be sold or disposed of in current market conditions in seven calendar days or less without the sale or disposition significantly changing the market value of the investment. Historically, illiquid securities have included securities that have not been registered under the Securities Act, securities that are otherwise not readily marketable, and repurchase agreements having a remaining maturity of longer than seven calendar days. Securities that have not been
44
American Beacon FundsSM
Notes to Financial Statements
January 31, 2020
registered under the Securities Act are referred to as private placements or restricted securities and are purchased directly from the issuer or in the secondary market. These securities may be sold only in a privately negotiated transaction or pursuant to an exemption from registration. A large institutional market exists for certain securities that are not registered under the Securities Act, including repurchase agreements, commercial paper, foreign securities, municipal securities and corporate bonds and notes. Institutional investors depend on an efficient institutional market in which the unregistered security can be readily resold or on an issuer’s ability to honor a demand for repayment. However, the fact that there are contractual or legal restrictions on resale of such investments to the general public or to certain institutions may not be indicative of their liquidity.
Limitations on resale may have an adverse effect on the marketability of portfolio securities, and the Fund might be unable to dispose of restricted or other illiquid securities promptly or at reasonable prices and might thereby experience difficulty satisfying redemptions within seven calendar days. In addition, the Fund may get only limited information about an issuer, so it may be less able to predict a loss. The Fund also might have to register such restricted securities in order to dispose of them resulting in additional expense and delay. Adverse market conditions could impede such a public offering of securities. In recognition of the increased size and liquidity of the institutional market for unregistered securities and the importance of institutional investors in the formation of capital, the SEC adopted Rule 144A under the Securities Act. Rule 144A is designed to facilitate efficient trading among institutional investors by permitting the sale of certain unregistered securities to qualified institutional buyers. To the extent privately placed securities held by the Fund qualify under Rule 144A and an institutional market develops for those securities, the Fund likely will be able to dispose of the securities without registering them under the Securities Act. To the extent that institutional buyers become, for a time, uninterested in purchasing these securities, investing in Rule 144A securities could increase the level of the Fund’s illiquidity. The Manager or thesub-advisor, as applicable, may determine that certain securities qualified for trading under Rule 144A are liquid. Regulation S under the Securities Act permits the sale abroad of securities that are not registered for sale in the United States and includes a provision for U.S. investors, such as the Fund, to purchase such unregistered securities if certain conditions are met.
Securities sold in private placement offerings made in reliance on the “private placement” exemption from registration afforded by Section 4(a)(2) of the Securities Act and resold to qualified institutional buyers under Rule 144A under the Securities Act (“Section 4(a)(2) securities”) are restricted as to disposition under the federal securities laws, and generally are sold to institutional investors, such as the Fund, that agree they are purchasing the securities for investment and not with an intention to distribute to the public. Any resale by the purchaser must be pursuant to an exempt transaction and may be accomplished in accordance with Rule 144A. Section 4(a)(2) securities normally are resold to other institutional investors through or with the assistance of the issuer or dealers that make a market in the Section 4(a)(2) securities, thus providing liquidity.
Regulation S under the Securities Act permits the sale abroad of securities that are not registered for sale in the United States and includes a provision for U.S. investors, such as the Funds, to purchase such unregistered securities if certain conditions are met.
Inflation-Indexed Linked Securities
The Funds may invest in inflation-indexed bonds. Inflation-indexed bonds are fixed-income securities whose principal value is periodically adjusted based on the rate of inflation. The interest rate on these bonds is generally fixed at issuance at a rate lower than typical bonds. Over the life of an inflation-indexed bond, however, interest will be paid based on principal value, which is adjusted for inflation. Any increase or decrease in the principal amount of an inflation-indexed bond will be included as interest income on the Statements of Operations, even though investors do not receive their principal until maturity.
Other Investment Company Securities and Other Exchange-Traded Products
The Funds may invest in shares of other investment companies, includingopen-end funds,closed-end funds, business development companies (“BDCs”), ETFs, unit investment trusts, and other investment companies of the
45
American Beacon FundsSM
Notes to Financial Statements
January 31, 2020
Trust. The Funds may invest in securities of an investment company advised by the Manager or asub-advisor. Investments in the securities of other investment companies may involve duplication of advisory fees and certain other expenses. By investing in another investment company, the Funds become a shareholder of that investment company. As a result, the Funds’ shareholders indirectly will bear the Funds’ proportionate share of the fees and expenses paid by shareholders of the other investment company, in addition to the fees and expenses the Funds’ shareholders directly bear in connection with the Funds’ own operations. These other fees and expenses are reflected as Acquired Fund Fees and Expenses and are included in the Fees and Expenses Table for the Funds in their Prospectus, if applicable. Investments in other investment companies may involve the payment of substantial premiums above the value of such issuer’s portfolio securities.
The Funds can invest free cash balances in registeredopen-end investment companies regulated as money market funds under the Investment Company Act, to provide liquidity or for defensive purposes. The Funds could invest in money market funds rather than purchasing individual short-term investments. If the Funds invests in money market funds, shareholders will bear their proportionate share of the expenses, including for example, advisory and administrative fees, of the money market funds in which the Funds invest, including advisory fees charged by the Manager to any applicable money market funds advised by the Manager.
Sovereign and Quasi-Sovereign Government and Supranational Debt
The Funds can invest in debt securities issued or guaranteed by foreign governments and their political subdivisions or agencies which involve special risks. Sovereign debt differs from debt obligations issued by private entities in that, generally, remedies for defaults must be pursued in the courts of the defaulting party. Sovereign debt securities may include: debt securities issued or guaranteed by governments, governmental agencies or instrumentalities and political subdivisions located in emerging market countries; debt securities issued by government owned, controlled or sponsored entities located in emerging market countries; interests in entities organized and operated for the purpose of restructuring the investment characteristics of instruments issued by government owned, controlled or sponsored entities located in emerging market countries; interests in entities organized and operated for the purpose of restructuring the investment characteristics of instruments issued by any of the above issuers; participations in loans between emerging market governments and financial institutions; and Brady Bonds, which are debt securities issued under the framework of the Brady Plan as a means for debtor nations to restructure their outstanding external indebtedness.
Supranational entities may also issue debt securities. Supranational organizations are entities designated or supported by a government or governmental group to promote economic development. Included among these organizations are the Asian Development Bank, the European Investment Bank, the Inter-American Development Bank, the International Monetary Fund, the United Nations, the World Bank and the European Bank for Reconstruction and Development. Supranational organizations have no taxing authority and are dependent on their members for payments of interest and principal to the extent their assets are insufficient. Further, the lending activities of such entities are limited to a percentage of their total capital, reserves and net income.
Variable or Floating Rate Obligations
The coupon on certain fixed-income securities in which the Fund may invest is not fixed and may fluctuate based upon changes in market rates. The coupon on a floating rate security is generally based on an interest rate such as a money market index, London Inter-Bank Offered Rate (“LIBOR”) or a Treasury bill rate. A variable rate obligation has an interest rate which is adjusted at predesignated periods in response to changes in the market rate of interest on which the interest rate is based. Variable and floating rate obligations are less effective than fixed rate obligations at locking in a particular yield. Nevertheless, such obligations may fluctuate in value in response to interest rate changes if there is a delay between changes in market interest rates and the interest reset date for the obligation, or for other reasons.
46
American Beacon FundsSM
Notes to Financial Statements
January 31, 2020
As short-term interest rates decline, the coupons on floating rate securities typically decrease. Alternatively, during periods of increasing interest rates, changes in the coupons of floating rate securities may lag behind changes in market rates or may have limits on the maximum increases in the coupon rates. The value of floating rate securities may decline if their coupons do not rise as much, or as quickly, as interest rates in general. Floating rate securities will not generally increase in value if interest rates decline.
5. Financial Derivative Instruments
The Funds may utilize derivative instruments to enhance return, hedge risk, gain efficient exposure to an asset class or to manage liquidity. When considering the Funds’ use of derivatives, it is important to note that the Funds do not use derivatives for the purpose of creating financial leverage.
Forward Foreign Currency Contracts
The Funds may enter into forward foreign currency contracts to hedge the exchange rate risk on investment transactions or to hedge the value of the Funds’ securities denominated in foreign currencies. Forward foreign currency contracts are valued at the forward exchange rate prevailing on the day of valuation. The Funds may also use currency contracts to increase exposure to a foreign currency or to shift exposure to foreign currency fluctuations from one country to another. The Funds bear the market risk that arises from changes in foreign exchange rates, and accordingly, the unrealized gain (loss) on these contracts is reflected in the accompanying financial statements. The Funds also bear the credit risk if the counterparty fails to perform under the contract.
During the year ended January 31, 2020, the Funds entered into forward foreign currency contracts primarily for return enhancement and hedging foreign currency fluctuations.
The Funds’ forward foreign currency contract notional dollar values outstanding fluctuate throughout the operating year as required to meet strategic requirements. The following table illustrates the average quarterly volume of forward foreign currency contracts. For the purpose of this disclosure, volume is measured by the amounts bought and sold in USD at each quarter end.
Average Forward Foreign Currency Notional Amounts Outstanding | ||||||||||||
Fund | Purchased Contracts | Sold Contracts | ||||||||||
Frontier Markets Income | $ | 14,462,143 | $ | 18,446,456 | ||||||||
GLG Total Return | 70,743,086 | 89,793,304 | ||||||||||
Swap Agreements
The Funds may invest in swap agreements. Swap agreements are negotiated between the Fund and a counterparty to exchange or swap investment cash flows, assets, foreign currencies, or market-linked returns at specified, future intervals. Swap agreements are either privately negotiated in the OTC market (“OTC Swaps”) or cleared in a central clearing house (“Centrally Cleared Swaps”). The Fund may enter into credit default, cross-currency, interest rate and other forms of swap agreements to manage its exposure to credit, currency, interest rate, and inflation risk. In connection with these agreements, securities or cash may be identified as collateral in accordance with the terms of the respective swap agreements to provide assets of value and recourse in the event of default or bankruptcy/insolvency.
Swaps are marked to market daily based upon values from third party vendors or quotations from market makers to the extent available and the change in value, if any, is recorded as an unrealized gain or loss on the Statement of Assets and Liabilities. Daily fluctuations in the value of centrally cleared swaps are recorded in variation margin on the Statement of Assets and Liabilities and recorded as unrealized gain or loss. In the event that market quotes are not readily available and the swap cannot be valued pursuant to one of the valuation methods, the value of the swap will be determined in good faith by the Valuation Committee pursuant to procedures approved by the Board.
47
American Beacon FundsSM
Notes to Financial Statements
January 31, 2020
OTC payments received or made at the beginning of the measurement period are reflected as such on the Statement of Assets and Liabilities and represent payments made or received upon entering into the swap agreement to compensate for differences between the stated terms of the swap agreement and prevailing market conditions (credit spreads, currency exchange rates, interest rates, and other relevant factors). Centrally cleared swaps provide the same rights to the protection buyer and seller except the payments between parties, including upfront premiums, are settled through a central clearing agent through variation margin payments. Upfront and periodic payments for OTC and centrally cleared swaps are recorded as realized gains or losses on the Statement of Operations upon termination or maturity of the swap. A liquidation payment received or made at the termination of the swap is recorded as realized gain or loss on the Statement of Operations. Net periodic payments received or paid by the Fund are included as part of realized gains or losses on the Statement of Operations.
Entering into these agreements involves, to varying degrees, elements of credit, market and documentation risk in excess of the amounts recognized on the Statement of Assets and Liabilities. Such risks involve the possibility that there will be no liquid market for these agreements, that the counterparty to the agreements may default on its obligation to perform or disagree as to the meaning of contractual terms in the agreements and that there may be unfavorable changes in interest rates.
The Fund’s maximum risk of loss from counterparty credit risk is the discounted net value of the cash flows to be received from the counterparty over the contract’s remaining life, to the extent that amount is positive. The risk is mitigated by having a master netting arrangement between the Fund and the counterparty and by the posting of collateral to the Fund to cover the Fund’s exposure to the counterparty.
Credit Default Swap Agreements
Credit default swap agreements involve one party making a stream of payments (referred to as the buyer of protection) to another party (the seller of protection) in exchange for the right to receive a specified return in the event of a default or other credit event for the referenced entity, obligation or index. As a seller of protection on credit default swap agreements, the Fund will generally receive from the buyer of protection a fixed rate of periodic premiums throughout the term of the swap provided that there is no credit event. As the seller, the Fund would effectively add leverage to its portfolio because, in addition to its total net assets, the Fund would be subject to investment exposure up to the notional amount of the swap.
If the Fund is a seller of protection and a credit event occurs, as defined under the terms of that particular swap agreement, the Fund will either (i) pay to the buyer of protection an amount equal to the notional amount of the swap and take delivery of the referenced obligation, other deliverable obligations or underlying securities comprising the referenced index or (ii) pay a net settlement amount in the form of cash or securities equal to the notional amount of the swap less the recovery value of the referenced obligation or underlying securities comprising the referenced index. If the Fund is a buyer of protection and a credit event occurs, as defined under the terms of that particular swap agreement, the Fund will either (i) receive from the seller of protection an amount equal to the notional amount of the swap and deliver the referenced obligation, other deliverable obligations or underlying securities comprising the referenced index or (ii) receive a net settlement amount in the form of cash or securities equal to the notional amount of the swap less the recovery value of the referenced obligation or underlying securities comprising the referenced index. Recovery values are estimated by market makers considering either industry standard recovery rates or entity specific factors and considerations until a credit event occurs. If a credit event has occurred, the recovery value is determined by a facilitated auction whereby a minimum number of allowable broker bids, together with a specified valuation method, are used to calculate the settlement value.
Credit default swap agreements on corporate issues, sovereign issues of an emerging country or U.S. municipal issues involve one party making a stream of payments to another party in exchange for the right to receive a specified return in the event of a default or other credit event. If a credit event occurs and cash settlement is not elected, a variety of other deliverable obligations may be delivered in lieu of the specific referenced obligation. The ability to deliver other obligations may result in acheapest-to-deliver option (the buyer
48
American Beacon FundsSM
Notes to Financial Statements
January 31, 2020
of protection’s right to choose the deliverable obligation with the lowest value following a credit event). The Fund may use credit default swaps on corporate issues, sovereign issues of an emerging country or U.S. municipal issues to provide a measure of protection against defaults of the issuers (i.e., to reduce risk where the Fund owns or has exposure to the referenced obligation) or to take an active long or short position with respect to the likelihood of a particular issuer’s default.
Credit default swap agreements on asset-backed securities involve one party making a stream of payments to another party in exchange for the right to receive a specified return in the event of a default or other credit event. Unlike credit default swaps on corporate issues, sovereign issues of an emerging country or U.S. municipal issues, deliverable obligations in most instances would be limited to the specific referenced obligation as performance for asset-backed securities can vary across deals. Prepayments, principal paydowns, and other writedown or loss events on the underlying mortgage loans will reduce the outstanding principal balance of the referenced obligation. These reductions may be temporary or permanent as defined under the terms of the swap agreement and the notional amount for the swap agreement will be adjusted by corresponding amounts. The Fund may use credit default swaps on asset-backed securities to provide a measure of protection against defaults of the referenced obligation that the Fund owns or to take an active long or short position with respect to the likelihood of a particular referenced obligation’s default that the Fund does not own.
Credit default swap agreements on credit indices involve one party making a stream of payments to another party in exchange for the right to receive a specified return in the event of a write-down, principal shortfall, interest shortfall or default of all or part of the referenced entities comprising the credit index. A credit index is a basket of credit instruments or exposures designed to be representative of some part of the credit market as a whole. These indices are made up of reference credits that are judged by a poll of dealers to be the most liquid entities in the credit default swap market based on the sector of the index. Components of the indices may include, but are not limited to, investment grade securities, high yield securities, asset-backed securities, emerging markets, and/or various credit ratings within each sector. Credit indices are traded using credit default swaps with standardized terms including a fixed spread and standard maturity dates. An index credit default swap references all the names in the index, and if there is a default, the credit event is settled based on that name’s weight in the index. The composition of the indices changes periodically, usually every six months, and for most indices, each name has an equal weight in the index. The Fund may use credit default swaps on credit indices to hedge a portfolio of credit default swaps or bonds, which is less expensive than it would be to buy many credit default swaps to achieve a similar effect. Credit default swaps on indices are benchmarks for protecting investors owning bonds against default, and traders use them to speculate on changes in credit quality.
Implied credit spreads, represented in absolute terms, utilized in determining the market value of credit default swap agreements on corporate issues, sovereign issues of an emerging country or U.S. municipal issues as of period end are disclosed in the Notes to the Schedule of Investments and serve as an indicator of the current status of the payment/performance risk and represent a market participant view of the likelihood or risk of default for the underlying referenced security to credit derivative. The implied credit spread of a particular referenced entity reflects the cost of buying/selling protection and may include upfront payments required to be made to enter into the agreement. For credit default swap agreements on asset-backed securities and credit indices, the quoted market prices and resulting values serve as the indicator of the current status of the payment/performance risk. Wider credit spreads represent a deterioration of the referenced entity’s credit soundness and a greater likelihood or risk of default or other credit event occurring as defined under the terms of the agreement.
The maximum potential amount of future payments (undiscounted) that the Fund as a seller of protection could be required to make under a credit default swap agreement would be an amount equal to the notional amount of the agreement. Notional amounts of each individual credit default swap agreement outstanding as of January 31, 2020, for which the Fund is the seller of protection is disclosed in the Notes to the Schedule of Investments. These potential amounts would be partially offset by any recovery values of the respective referenced obligations, upfront payments received upon entering into the agreement, or net amounts received from the settlement of buy protection credit default swap agreements entered into by the Fund for the same referenced entity or entities.
49
American Beacon FundsSM
Notes to Financial Statements
January 31, 2020
During the year ended January 31, 2020, the GLG Total Return Fund entered into credit default swaps primarily for return enhancement, hedging, and exposing cash to markets.
The Fund’s credit default swap contract notional amounts outstanding fluctuate throughout the operating year as required to meet the strategic requirements. The following table illustrates the average quarterly volume of credit default swap contracts. For the purpose of this disclosure, the volume is measure by the notional amounts outstanding at each quarter end.
Average Credit Default Swap Notional Amounts Outstanding | ||||
Fund | Year Ended January 31, 2020 | |||
GLG Total Return | 202,776,520 | |||
Interest Rate Swap Agreements
The GLG Total Return Fund is subject to interest rate risk exposure in the normal course of pursuing its investment objectives. Because the Fund holds fixed rate bonds, the value of these bonds may decrease if interest rates rise. To help hedge against this risk and to maintain its ability to generate income at prevailing market rates, the Fund may enter into interest rate swap agreements. Interest rate swap agreements involve the exchange by the Fund with another party of their respective commitments to pay or receive interest with respect to the notional amount of principal.
During the year ended January 31, 2020, the GLG Total Return Fund entered into interest rate swaps primarily for return enhancement, hedging and exposing cash to markets.
The Fund’s interest rate swap contract notional amounts outstanding fluctuate throughout the operating year as required to meet the strategic requirements. The following table illustrates the average quarterly volume of interest rate swap contracts. For the purpose of this disclosure, the volume is measured by the notional amounts outstanding at each quarter end.
Average Interest Rate Swaps Notional Amounts Outstanding | ||||
Fund | Year Ended January 31, 2020 | |||
GLG Total Return | 376,725,000 | |||
The following is a summary of the fair valuations of the Funds’ derivative instruments categorized by risk exposure(1):
Frontier Markets Income Fund
| Fair values of financial instruments on the Statements of Assets and Liabilities as of January 31, 2020: |
| ||||||||||||||||||||||||||||||||||||||||||||||||||||||
| Derivatives not accounted for as hedging instruments | |||||||||||||||||||||||||||||||||||||||||||||||||||||||
Assets: | Credit contracts | Foreign exchange contracts | Commodity contracts | Interest rate contracts | Equity contracts | Total | |||||||||||||||||||||||||||||||||||||||||||||||||
| Unrealized appreciation of forward foreign currency contracts | $ | - | $ | 644,314 | $ | - | $ | - | $ | - | $ | 644,314 | |||||||||||||||||||||||||||||||||||||||||||
Liabilities: | Credit contracts | Foreign exchange contracts | Commodity contracts | Interest rate contracts | Equity contracts | Total | |||||||||||||||||||||||||||||||||||||||||||||||||
| Unrealized depreciation of forward foreign currency contracts | $ | - | $ | (20,067 | ) | $ | - | $ | - | $ | - | $ | (20,067 | ) | |||||||||||||||||||||||||||||||||||||||||
50
American Beacon FundsSM
Notes to Financial Statements
January 31, 2020
| The effect of financial derivative instruments on the Statements of Operations as of January 31, 2020: |
| ||||||||||||||||||||||||||||||||||||||||||||||||||||||
| Derivatives not accounted for as hedging instruments | |||||||||||||||||||||||||||||||||||||||||||||||||||||||
Realized gain (loss) from derivatives | Credit contracts | Foreign exchange contracts | Commodity contracts | Interest rate contracts | Equity contracts | Total | |||||||||||||||||||||||||||||||||||||||||||||||||
| Forward foreign currency contracts | $ | - | $ | 1,135,645 | $ | - | $ | - | $ | - | $ | 1,135,645 | |||||||||||||||||||||||||||||||||||||||||||
Net change in unrealized appreciation | Credit contracts | Foreign exchange contracts | Commodity contracts | Interest rate contracts | Equity contracts | Total | |||||||||||||||||||||||||||||||||||||||||||||||||
| Forward foreign currency contracts | $ | - | $ | 991,121 | $ | - | $ | - | $ | - | $ | 991,121 | |||||||||||||||||||||||||||||||||||||||||||
GLG Total Return Fund
| Fair values of financial instruments on the Statements of Assets and Liabilities as of January 31, 2020: |
| ||||||||||||||||||||||||||||||||||||||||||||||||||||||
| Derivatives not accounted for as hedging instruments | |||||||||||||||||||||||||||||||||||||||||||||||||||||||
Assets: | Credit contracts | Foreign exchange contracts | Commodity contracts | Interest rate contracts | Equity contracts | Total | |||||||||||||||||||||||||||||||||||||||||||||||||
| Unrealized appreciation of forward foreign currency contracts | $ | - | $ | 466,710 | $ | - | $ | - | $ | - | $ | 466,710 | |||||||||||||||||||||||||||||||||||||||||||
| Unrealized appreciation from swap agreements | 47,299 | - | - | - | - | 47,299 | |||||||||||||||||||||||||||||||||||||||||||||||||
Liabilities: | Credit contracts | Foreign exchange contracts | Commodity contracts | Interest rate contracts | Equity contracts | Total | |||||||||||||||||||||||||||||||||||||||||||||||||
| Unrealized depreciation of forward foreign currency contracts | $ | - | $ | (682,062 | ) | $ | - | $ | - | $ | - | $ | (682,062 | ) | |||||||||||||||||||||||||||||||||||||||||
| Unrealized depreciation from swap agreements | (27,333 | ) | - | - | (1,089,679 | ) | - | (1,117,012 | ) | ||||||||||||||||||||||||||||||||||||||||||||||
| The effect of financial derivative instruments on the Statements of Operations as of January 31, 2020: |
| ||||||||||||||||||||||||||||||||||||||||||||||||||||||
| Derivatives not accounted for as hedging instruments | |||||||||||||||||||||||||||||||||||||||||||||||||||||||
Realized gain (loss) from derivatives | Credit contracts | Foreign exchange contracts | Commodity contracts | Interest rate contracts | Equity contracts | Total | |||||||||||||||||||||||||||||||||||||||||||||||||
| Forward foreign currency contracts | $ | - | $ | 191,764 | $ | - | $ | - | $ | - | $ | 191,764 | |||||||||||||||||||||||||||||||||||||||||||
| Swap agreements | (6,075,503 | ) | - | - | (14,941,414 | ) | - | (21,016,917 | ) | ||||||||||||||||||||||||||||||||||||||||||||||
Net change in unrealized appreciation | Credit contracts | Foreign exchange contracts | Commodity contracts | Interest rate contracts | Equity contracts | Total | |||||||||||||||||||||||||||||||||||||||||||||||||
| Forward foreign currency contracts | $ | - | $ | 1,804,289 | $ | - | $ | - | $ | - | $ | 1,804,289 | |||||||||||||||||||||||||||||||||||||||||||
| Swap agreements | 553,672 | - | - | 12,267,753 | - | 12,821,425 | |||||||||||||||||||||||||||||||||||||||||||||||||
(1) See Note 3 in the Notes to Financial Statements for additional information.
Master Agreements
International Swaps and Derivatives Association, Inc. Master Agreements (“ISDA Master Agreements”) with counterparties govern transactions in OTC derivative and foreign exchange contracts entered into by the Fund and those counterparties. The ISDA Master Agreements contain provisions for general obligations, representations, agreements, collateral and events of default or termination. Events of termination include conditions that may entitle counterparties to elect to terminate early and cause settlement of all outstanding transactions under the applicable ISDA Master Agreement. Any election to terminate early could be material to the financial statements. Since different types of forward and OTC financial derivative transactions have different mechanics and are sometimes traded out of different legal entities of a particular counterparty organization, each type of transaction may be covered by a different Master Agreement, resulting in the need for multiple agreements with a single
51
American Beacon FundsSM
Notes to Financial Statements
January 31, 2020
counterparty. As the ISDA Master Agreements are specific to unique operations of different asset types, they allow a Fund to net its total exposure to a counterparty in the event of a default with respect to all the transactions governed under a single agreement with a counterparty.
Master Securities Forward Transaction Agreements (“Master Forward Agreements”) govern the considerations and factors surrounding the settlement of certain forward settling transactions, such as delayed delivery or sale-buyback financing transactions by and between a Fund and select counterparties. The Master Forward Agreements maintain provisions for, among other things, initiation and confirmation, payment and transfer, events of default, termination, and maintenance of collateral.
Offsetting Assets and Liabilities
The Funds are parties to enforceable master netting agreements between brokers and counterparties which provide for the right to offset under certain circumstances. The Funds employ multiple money managers and counterparties and have elected not to offset qualifying financial and derivative instruments on the Statements of Assets and Liabilities, as such all financial and derivative instruments are presented on a gross basis. The impacts of netting arrangements that provide the right to offset are detailed below. The net amount represents the net receivable or payable that would be due from or to the counterparty in the event of default. Exposure from borrowings and other financing agreements such as repurchase agreements can only be netted across transactions governed by the same Master Agreement with the same legal entity. All amounts reported below represent the balance as of the report date, January 31, 2020.
Frontier Markets Income Fund
| Offsetting of Financial and Derivative Assets as of January 31, 2020: |
| |||||||||||
| Assets | Liabilities | |||||||||||
| Forward Foreign Currency Contracts | $ | 644,314 | $ | 20,067 | ||||||||
|
|
|
| |||||||||
| Total derivative assets and liabilities in the Statement of Assets and Liabilities | $ | 644,314 | $ | 20,067 | ||||||||
|
|
|
| |||||||||
| Total derivative assets and liabilities subject to an MNA | $ | 644,314 | $ | 20,067 | ||||||||
|
|
|
| |||||||||
| Financial Assets, Derivatives, and Collateral Received/(Pledged) by Counterparty as of January 31, 2020: |
| |||||||||||||||||||||||||||||||||||
| Gross Amounts Not Offset in the Statement of Assets and Liabilities | ||||||||||||||||||||||||||||||||||||
Counterparty | Gross Amounts of Assets Presented in the Statement of Assets and Liabilities | Derivatives Available for Offset | Non-Cash Collateral Received(2) | Cash Collateral Received(2) | Net Amount | |||||||||||||||||||||||||||||||
| Barclays Bank PLC | $ | 156,206 | $ | (14,054 | ) | $ | - | $ | (110,000 | ) | $ | 32,152 | ||||||||||||||||||||||||
| Citibank, N.A. | 65,831 | - | - | (65,831 | ) | - | ||||||||||||||||||||||||||||||
| ICBC Standard Bank PLC | 202,437 | (2,692 | ) | - | - | 199,745 | ||||||||||||||||||||||||||||||
| Merrill Lynch International | 193,792 | - | - | - | 193,792 | |||||||||||||||||||||||||||||||
| State Street Bank & Trust Co. | 26,048 | - | - | - | 26,048 | |||||||||||||||||||||||||||||||
|
|
|
|
|
|
|
|
|
| |||||||||||||||||||||||||||
| Total | $ | 644,314 | $ | (16,746 | ) | $ | - | $ | (175,831 | ) | $ | 45,737 | ||||||||||||||||||||||||
|
|
|
|
|
|
|
|
|
| |||||||||||||||||||||||||||
| Gross Amounts Not Offset in the Statement of Assets and Liabilities | ||||||||||||||||||||||||||||||||||||
Counterparty | Gross Amounts of Liabilities Presented in the Statement of Assets and Liabilities | Derivatives Available for Offset | Non-Cash Collateral Pledged(2) | Cash Collateral Pledged(2) | Net Amount | |||||||||||||||||||||||||||||||
| Barclays Bank PLC | $ | 14,054 | $ | (14,054 | ) | $ | - | $ | - | $ | - | |||||||||||||||||||||||||
| ICBC Standard Bank PLC | 2,692 | (2,692 | ) | - | - | - | ||||||||||||||||||||||||||||||
| UBS AG | 3,321 | - | - | - | 3,321 | |||||||||||||||||||||||||||||||
|
|
|
|
|
|
|
|
|
| |||||||||||||||||||||||||||
| Total | $ | 20,067 | $ | (16,746 | ) | $ | - | $ | - | $ | 3,321 | |||||||||||||||||||||||||
|
|
|
|
|
|
|
|
|
| |||||||||||||||||||||||||||
52
American Beacon FundsSM
Notes to Financial Statements
January 31, 2020
GLG Total Return Fund
| Offsetting of Financial and Derivative Assets as of January 31, 2020: |
| |||||||||||
| Assets | Liabilities | |||||||||||
| Swap Agreement - Centrally Cleared(1) | $ | 47,299 | $ | 1,117,012 | ||||||||
| Forward Foreign Currency Contracts | 466,710 | 682,062 | ||||||||||
|
|
|
| |||||||||
| Total derivative assets and liabilities in the Statement of Assets and Liabilities | $ | 514,009 | $ | 1,799,074 | ||||||||
|
|
|
| |||||||||
| Derivatives not subject to a Master Netting Agreement or similar agreement (“MNA”) | $ | (47,299 | ) | $ | (1,117,012 | ) | ||||||
|
|
|
| |||||||||
| Total derivative assets and liabilities subject to an MNA | $ | 466,710 | $ | 682,062 | ||||||||
|
|
|
| |||||||||
| Financial Assets, Derivatives, and Collateral Received/(Pledged) by Counterparty as of January 31, 2020: |
| |||||||||||||||||||||||||||||||||||
| Gross Amounts Not Offset in the Statement of Assets and Liabilities | ||||||||||||||||||||||||||||||||||||
Counterparty | Gross Amounts of Assets Presented in the Statement of Assets and Liabilities | Derivatives Available for Offset | Non-Cash Collateral Received(2) | Cash Collateral Received(2) | Net Amount | |||||||||||||||||||||||||||||||
| HSBC Bank (USA) | $ | 466,710 | $ | (466,710 | ) | $ | - | $ | - | $ | - | |||||||||||||||||||||||||
| Gross Amounts Not Offset in the Statement of Assets and Liabilities | ||||||||||||||||||||||||||||||||||||
Counterparty | Gross Amounts of Liabilities Presented in the Statement of Assets and Liabilities | Derivatives Available for Offset | Non-Cash Collateral Pledged(2) | Cash Collateral Pledged(2) | Net Amount | |||||||||||||||||||||||||||||||
| HSBC Bank (USA) | $ | 682,062 | $ | (466,710 | ) | $ | - | $ | (215,352 | ) | $ | - | ||||||||||||||||||||||||
(1) The securities presented here within are not subject to master netting agreements. As such, this is disclosed for informational purposes only.
(2) The actual collateral received/pledged may be more than the amount reported due to overcollateralization.
6. Principal Risks
Investing in the Funds may involve certain risks including, but not limited to, those described below.
Counterparty Risk
The Funds are subject to the risk that a party or participant to a transaction, such as a broker or derivative counterparty, will be unwilling or unable to satisfy its obligation to make timely principal, interest or settlement payments or to otherwise honor its obligations to the Funds. As a result the Fund may obtain no recovery of its investment or may only obtain a limited recovery, and any recovery may be delayed. Not all derivative transactions require a counterparty to post collateral, which may expose the Fund to greater losses in the event of a default by a counterparty.
Credit Risk
The Funds are subject to the risk that the issuer or guarantor of a debt security, or the counterparty to a derivatives contract or a loan will fail to make timely payment of interest or principal or otherwise honor its obligations or default completely. A decline in the credit rating of an individual security held by the Funds may have an adverse impact on its price and make it difficult for the Funds to sell it. Ratings represent a rating agency’s opinion regarding the quality of the security and are not a guarantee of quality. Rating agencies might not always change their credit rating on an issuer or security in a timely manner to reflect events that could affect the issuer’s ability to make timely payments on its obligations. Credit risk is typically greater for securities with ratings that are below investment grade. Since the Funds can invest significantly in high-yield investments considered speculative in nature, this risk may be substantial.
53
American Beacon FundsSM
Notes to Financial Statements
January 31, 2020
Currency Risk
The Funds may have exposure to foreign currencies by making direct investments innon-U.S. currencies or in securities denominated innon-U.S. currencies, or by purchasing or selling forward currency exchange contracts innon-U.S. currencies. Foreign currencies may decline in value relative to the U.S. dollar, or, in the case of hedging positions, the U.S. dollar may decline in value relative to the currency being hedged, and thereby affect a Fund’s investments in foreign(non-U.S.) currencies or in securities that trade in, and receive revenues in, or in derivatives that provide exposure to, foreign(non-U.S.) currencies. Currency exchange rates may fluctuate significantly over short periods of time for a number of reasons, including changes in interest rates, intervention (or the failure to intervene) by U.S. or foreign governments, central banks or supranational entities such as the International Monetary Fund, or by the imposition of currency controls or other political developments in the United States or abroad. As a result, the Funds’ investments in foreign currency denominated securities may reduce the returns of the Funds. Currency futures, forwards, options or swaps may not always work as intended, and in specific cases, the Funds may be worse off than if it had not used such instrument(s). There may not always be suitable hedging instruments available. Even where suitable hedging instruments are available, the Funds may choose to not hedge its currency risks.
Custody Risk
The Funds may invest in markets that are less developed than those in the U.S., which may expose the Funds to risks in the process of clearing and settling trades and the holding of securities by foreign banks, agents and depositories. Investments in frontier and emerging markets may be subject to greater custody risks than investments in more developed markets.
Derivatives Risk
Derivatives may involve significant risk. The use of derivative instruments may expose the Funds to additional risks that they would not be subject to if they invested directly in the securities or other instruments underlying those derivatives, including the high degree of leverage often embedded in such instruments, and potential material and prolonged deviations between the theoretical value and realizable value of a derivative. Some derivatives have the potential for unlimited loss, regardless of the size of the Funds’ initial investment. Derivatives may be illiquid and may be more volatile than other types of investments. The Funds may buy or sell derivatives not traded on an exchange and which may be subject to heightened liquidity and valuation risk. Derivative investments can increase portfolio turnover and transaction costs. Derivatives also are subject to counterparty risk and credit risk. As a result, the Funds may obtain no recovery of their investment or may only obtain a limited recovery, and any recovery may be delayed. Not all derivative transactions require a counterparty to post collateral, which may expose the Funds to greater losses in the event of a default by a counterparty.
Foreign Investing and Emerging Markets Risk
Non-U.S. investments carry potential risks not associated with U.S. investments. Such risks include, but are not limited to: (1) currency exchange rate fluctuations, (2) political and financial instability, (3) less liquidity, (4) lack of uniform accounting, auditing and financial reporting standards, (5) increased price volatility, (6) less government regulation and supervision of foreign stock exchanges, brokers and listed companies, and (7) delays in transaction settlement in some foreign markets. To the extent the Funds invests a significant portion of its assets in securities of a single country or region, it is more likely to be affected by events or conditions of that country or region. In addition, the economies and political environments of emerging market countries tend to be more unstable than those of developed countries, resulting in more volatile rates of return than the developed markets and substantially greater risk to investors. There may be very limited oversight of certain foreign banks or securities depositories that hold foreign securities and currency and the laws of certain countries may limit the ability to recover such assets if a foreign bank or depository or their agents goes bankrupt. When investing in emerging markets, the risks of investing in foreign securities are heightened. Emerging markets have unique risks that are greater than, or in addition to, investing in developed markets because emerging markets are generally
54
American Beacon FundsSM
Notes to Financial Statements
January 31, 2020
smaller, less developed, less liquid and more volatile than the securities markets of the U.S. and other developed markets. There are also risks of: greater political uncertainties; an economy’s dependence on revenues from particular commodities or on international aid or development assistance; currency transfer restrictions; a limited number of potential buyers for such securities, resulting in increased volatility and limited liquidity for emerging market securities; trading suspensions; and delays and disruptions in securities settlement procedures. In addition, there may be less information available to make investment decisions and more volatile rates of return.
Forward Foreign Currency Contracts Risk
Forward foreign currency contracts, includingnon-deliverable forwards, are derivative instruments pursuant to a contract with a counterparty to pay a fixed price for an agreed amount of securities or other underlying assets at an agreed date or to buy or sell a specific currency at a future date at a price set at the time of the contract. The use of forward foreign currency contracts may expose the Funds to additional risks that it would not be subject to if it invested directly in the securities or currencies underlying the forward foreign currency contract.
Frontier Markets Risk
Frontier market countries generally have smaller economies and less developed capital markets or legal, regulatory and political systems than traditional emerging market countries. As a result, the risks of investing in emerging market countries are magnified in frontier market countries. The magnification of risks are the result of (1) the potential for extreme price volatility and illiquidity in frontier markets; (2) government ownership or control of parts of the private sector or other protectionist measures; (3) large currency fluctuations; (4) fewer companies and investment opportunities; or (5) inadequate investor protections and regulatory enforcement. In certain frontier and emerging markets, fraud and corruption may be more prevalent than in developed market countries. Investments that the Fund holds may be exposed to these risks, which could have a negative impact on their value. Additional risks of frontier market securities may include: greater political instability (including the risk of war or natural disaster); increased risk of nationalization, expropriation, or other confiscation of assets of issuers to which the Fund is exposed; increased risk of embargoes or economic sanctions on a country, sector or issuer; greater risk of default (by both government and private issuers); more substantial governmental involvement in the economy; less governmental supervision and regulation; differences in, or lack of, auditing and financial reporting standards, which may result in unavailability of material information about issuers; less developed legal systems; inability to purchase and sell investments or otherwise settle security or derivative transactions (i.e., a market freeze); unavailability of currency hedging techniques; slower clearance and settlement; difficulties in obtaining and/or enforcing legal judgments; and significantly smaller market capitalizations of issuers.
Illiquid and Restricted Securities Risk
Securities not registered in the U.S. under the Securities Act, including Rule 144A securities, are restricted as to their resale. Such securities may not be listed on an exchange and may have no active trading market. They may be more difficult to purchase or sell at an advantageous time or price because such securities may not be readily marketable in broad public markets. The Funds may not be able to sell a restricted security when thesub-advisor considers it desirable to do so and/or may have to sell the security at a lower price than the Funds believe is its fair market value. In addition, transaction costs may be higher for restricted securities and the Funds may receive only limited information regarding the issuer of a restricted security. The Funds may have to bear the expense of registering restricted securities for resale and the risk of substantial delays in effecting the registration.
Interest Rate Risk
Investments in investment-grade andnon-investment grade fixed-income securities are subject to interest rate risk. The value of the Funds’ fixed-income investments typically will fall when interest rates rise. The Funds may be particularly sensitive to changes in interest rates if it invests in debt securities with intermediate and long
55
American Beacon FundsSM
Notes to Financial Statements
January 31, 2020
terms to maturity. Debt securities with longer durations tend to be more sensitive to changes in interest rates, usually making them more volatile than debt securities with shorter durations. For example, if a bond has a duration of seven years, a 1% increase in interest rates could be expected to result in a 7% decrease in the value of the bond. Yields of debt securities will fluctuate over time. Following the financial crisis that started in 2008, the Federal Reserve attempted to stabilize the economy and support the economic recovery by keeping the federal funds rate (the interest rate at which depository institutions lend reserve balances to each other overnight) at or near zero percent. The Federal Reserve has raised the federal funds rate several times since December 2015 and may increase or decrease rates in the future. Interest rates may rise significantly and/or rapidly, potentially resulting in substantial losses to the Funds. During periods of very low or negative interest rates, the Funds may be unable to maintain positive returns. Certain European countries and Japan have recently experienced negative interest rates on deposits and debt securities have traded at negative yields. Negative interest rates may become more prevalent amongnon-U.S. issuers, and potentially within the United States. Changing interest rates, including rates that fall below zero, may have unpredictable effects on markets, may result in heightened market volatility and may detract from Funds’ performance to the extent the Funds are exposed to such interest rates.
Leverage Risk
The Funds’ use of futures, forward foreign currency contracts, swaps, other derivative instruments and selling securities short will have the economic effect of financial leverage. Financial leverage magnifies the exposure to the swings in prices of an asset or class of assets underlying a derivative instrument and results in increased volatility, which means that the Funds will have the potential for greater losses than if the Funds do not use the derivative instruments that have a leveraging effect. Leverage may result in losses that exceed the amount originally invested and may accelerate the rate of losses. Leverage tends to magnify, sometimes significantly, the effect of an increase or decrease in the Funds’ exposure to an asset or class of assets and may cause the Funds’ NAV to be volatile.
LIBOR Risk
The Fund’s investments, payment obligations and financing terms may be based on floating rates, such as LIBOR, Euro Interbank Offered Rate and other similar types of reference rates (each, a “Reference Rate”). On July 27, 2017, the Chief Executive of the UK Financial Conduct Authority (“FCA”), which regulates LIBOR, announced that the FCA will no longer persuade nor require banks to submit rates for the calculation of LIBOR and certain other Reference Rates after 2021. Such announcement indicates that the continuation of LIBOR and other Reference Rates on the current basis cannot and will not be guaranteed after 2021. This announcement and any additional regulatory or market changes may have an adverse impact on the Fund or its investments, including increased volatility or illiquidity in markets for instruments that rely on LIBOR.
Liquidity Risk
When there is little or no active trading market for a specific type of security, it can become more difficult to purchase or sell the securities at or near their perceived value. During such periods, certain investments held by the Funds may be difficult to sell or other investments may be difficult to purchase at favorable times or prices. As a result, the Fund may have to lower the price on certain securities that it is trying to sell, sell other securities instead or forgo an investment opportunity, any of which could have a negative effect on Fund management or performance. Additionally, the market for certain investments may become illiquid under adverse market or economic conditions independent of any specific adverse changes in the conditions of a particular issuer.
Market Disruption Risk
Geopolitical and other events, including war, terrorism, economic uncertainty, trade disputes, pandemics, public health crises and related geopolitical events have led, and in the future may continue to lead, to instability in world economies and markets generally. This instability has disrupted, and may continue to disrupt, U.S. and
56
American Beacon FundsSM
Notes to Financial Statements
January 31, 2020
world economies and markets and adversely affect the value of your investment. Such market disruptions have caused, and may continue to cause, broad changes in market value, negative public perceptions concerning these developments, and adverse investor sentiment or publicity. Changes in value may be temporary or may last for extended periods. Although multiple asset classes have been and may continue to be affected by a market disruption, the duration and effects may not be the same for all types of assets. Events that have led to market disruptions include the recent pandemic spread of the novel coronavirus known as COVID-19, which has resulted in travel restrictions, closed international borders, quarantines, disruptions to supply chains and lower consumer demand. The duration and full effects of these market disruptions are still uncertain. The effect of recent efforts undertaken by the Federal Reserve System to address the economic impact of the COVID-19 pandemic, such as the reduction of the federal funds target rate, and other monetary and fiscal actions that may be taken by the U.S. federal government to stimulate the U.S. economy, are not yet known. In addition, COVID-19 could cause the need for employees and vendors at various businesses, including the Manager, the sub-advisor(s) or other service providers, to work at external locations, and extensive medical absences. Because a large epidemic may create significant market and business uncertainties and disruptions, not all events that could affect the business of the Manager, the sub-advisor(s) or other service providers can be determined and addressed in advance.
Market Risk
In recent periods, fixed-income instruments have experienced unusual liquidity issues, increased price volatility and, in some cases, credit downgrades and increased likelihood of default. These events have reduced the willingness and ability of some lenders to extend credit, and have made it more difficult for some borrowers to obtain financing on attractive terms, if at all. In addition, global economies and financial markets are becoming increasingly interconnected, which increases the possibilities that conditions in one country or region might adversely impact issuers in a different country or region. A rise in protectionist trade policies, risks associated with the United Kingdom’s vote to leave the European Union, the risk of a ªtrade warº between the United States and China, and the possibility of changes to some international trade agreements, could affect the economies of many nations, including the United States, in ways that cannot necessarily be foreseen at the present time. The severity or duration of adverse economic conditions may also be affected by policy changes made by governments or quasi-governmental organizations.
In addition, political and governmental events within the U.S. and abroad may affect investor and consumer confidence and may adversely impact financial markets and the broader economy, perhaps suddenly and to a significant degree. High public debt in the U.S. and other countries creates ongoing systemic and market risks and policymaking uncertainty. Because the impact on the markets has been widespread, it may be difficult to identify both risks and opportunities using past models of the interplay of market forces, or to predict the duration of these market conditions. Interest rates have been unusually low in recent years in the U.S. and abroad. Because there is little precedent for this situation, it is difficult to predict the impact on various markets of a significant rate increase, whether brought about by U.S. policy makers or by dislocations in world markets. In addition, there is a risk that the prices of goods and services in the U.S. and many foreign economies may decline over time, known as deflation (the opposite of inflation). Deflation may have an adverse effect on stock prices and creditworthiness and may make defaults on debt more likely.
Market Timing Risk
Because the Funds invest in foreign securities, it is particularly subject to the risk of market timing activities. Frequent trading by Fund shareholders poses risks to other shareholders in the Funds, including (i) the dilution of the Funds’ NAV, (ii) an increase in the Funds’ expenses, and (iii) interference with the portfolio manager’s ability to execute efficient investment strategies. Because of specific securities in which the Funds may invest, it could be subject to the risk of market timing activities by shareholders. Some examples of these types of securities are high-yield and foreign securities. The limited trading activity of some high-yield securities may result in market prices that do not reflect the true market value of these securities. The Funds generally prices foreign securities using their closing prices from the foreign markets in which they trade, typically prior to the Funds’
57
American Beacon FundsSM
Notes to Financial Statements
January 31, 2020
calculation of its NAV. These prices may be affected by events that occur after the close of a foreign market but before the Funds price its shares. In such instances, the Funds may fair value high yield and foreign securities. However, some investors may engage in frequent short-term trading in the Funds to take advantage of any price differentials that may be reflected in the NAV of the Funds’ shares. While the Manager monitors trading in the Funds, there is no guarantee that it can detect all market timing activities.
Non-Diversification Risk
The GLG Total Return Fund isnon-diversified, which means it may focus its investments in the securities of a comparatively small number of issuers. Investments in securities of a limited number of issuers exposes the Funds to greater market risk and potential losses than if assets were diversified among the securities of a greater number of issuers.
Other Investment Companies Risk
The Funds may invest in shares of other registered investment companies, including exchange-traded funds (“ETFs”) and money market funds. To the extent that the Funds invest in shares of other registered investment companies, the Funds will indirectly bear the fees and expenses, including for example, advisory and administrative fees, charged by those investment companies in addition to the Fund’s direct fees and expenses and will be subject to the risks associated with investments in those companies. For example, the Fund’s investments in money market funds are subject to interest rate risk, credit risk, and market risk. The Funds must rely on the investment company in which it invests to achieve its investment objective. If the investment company fails to achieve its investment objective, the value of the Fund’s investment may decline, adversely affecting the Fund’s performance. ETFs are subject to the following risks that do not apply to conventional funds: (1) the market price of an ETF’s shares may trade at a discount or premium to its NAV; (2) an active trading market for an ETF’s shares may not develop or be maintained; or (3) trading of an ETF’s shares may be halted if the listing exchange’s officials deem such action appropriate, the shares are delisted from the exchange, or the activation of market-wide “circuit breakers” (which are tied to large decreases in stock prices) halts stock trading generally. An ETF that tracks an index may not precisely replicate the returns of its benchmark index. To the extent the Funds invest in other investment companies that invest in equity securities, fixed-income securities and/or foreign securities, or that track an index, the Funds are subject to the risks associated with the underlying investments held by the investment company or the index fluctuations to which the investment company is subject. ETFs have expenses associated with their operation, typically including advisory fees. For example, ETF shares may trade at a premium or discount to their net asset value. An ETF that tracks an index may not precisely replicate the returns of its benchmark index.
Redemption Risk
The Funds may experience periods of heavy redemptions that could cause the Funds to sell assets at inopportune times or at a loss or depressed value. Redemption risk is greater to the extent that one or more investors or intermediaries control a large percentage of investments in the Funds, have short investment horizons, or have unpredictable cash flow needs. A general rise in interest rates has the potential to cause investors to move out of fixed-income securities on a large scale, which may increase redemptions from mutual funds that hold large amounts of fixed-income securities. This, coupled with a reduction in the ability or willingness of dealers and other institutional investors to buy or hold fixed-income securities, may result in decreased liquidity and increased volatility in the fixed-income markets, and heightened redemption risk. Heavy redemptions, whether by a few large investors or many smaller investors, could hurt the Funds’ performance. This risk is heightened if the Fund invests in emerging market securities, which are generally less liquid than the securities of U.S. and other developed markets. The sale of assets to meet redemption requests may create net capital gains or losses, which could cause the Funds to have to distribute substantial capital gains.
58
American Beacon FundsSM
Notes to Financial Statements
January 31, 2020
Sovereign and Quasi Sovereign Debt Risk
An investment in sovereign and quasi-sovereign debt obligations involves special risks not present in corporate debt obligations. Sovereign and quasi-sovereign debt securities are issued or guaranteed by a sovereign government or entity affiliated with or backed by a sovereign government. The issuer of the sovereign or quasisovereign debt that controls the repayment of the debt may be unable or unwilling to repay principal or interest when due, and the Fund may have limited recourse in the event of a default. In addition, these investments are subject to risk of payment delays or defaults due to (1) country cash flow problems, (2) insufficient foreign currency reserves, (3) political considerations, (4) large debt positions relative to the country’s economy, (5) policies toward foreign lenders or investors, (6) the failure to implement economic reforms required by the International Monetary Fund or other multilateral agencies, or (7) an inability or unwillingness to repay debts. It may be particularly difficult to enforce the rights of debt holders in frontier and emerging markets. A governmental entity that defaults on an obligation may request additional time in which to pay or receive further loans or may seek to restructure its obligations to reduce interest rates or outstanding principal. There is no legal process for collecting sovereign and quasi-sovereign debt that a government does not pay nor are there bankruptcy proceedings through which all or part of the sovereign debt that a governmental entity has not repaid may be collected. Sovereign and quasi-sovereign debt risk is increased for emerging and frontier markets issuers, which are among the largest debtors to commercial banks and foreign governments. At times, certain emerging market countries have declared moratoria on the payment of principal and interest on external debt. Certain emerging market countries have experienced difficulty in servicing their sovereign debt on a timely basis, which has led to defaults and the restructuring of certain indebtedness.
Swap Agreement Risk
The GLG Total Return Fund may invest in swap agreements. Swaps can involve greater risks than a direct investment in an underlying asset, because swaps typically include a certain amount of embedded leverage and as such are subject to leveraging risk. If swaps are used as a hedging strategy, a Fund is subject to the risk that the hedging strategy may not eliminate the risk that is intended to offset, due to, among other reasons, the occurrence of unexpected price movements or thenon-occurrence of expected price movements. Swaps also may be difficult to value. Interest rate swaps, total return swaps, currency swaps, credit default swaps and commodities swaps are subject to counterparty risk, credit risk and liquidity risk. In addition, interest rate swaps are subject to interest rate risk, total return swaps are subject to market risk, and interest rate risk if the underlying securities are bonds or other debt obligations, currency swaps are subject to currency risk, and commodities swaps are subject to commodities risk.
Variable and Floating Rate Securities Risk
The coupons on certain fixed income securities in which a Fund may invest are not fixed and may fluctuate based upon changes in market rates. The coupon on a floating rate security is generally based on an interest rate such as a money-market index, LIBOR or a Treasury bill rate. Such securities are subject to interest rate risk and may fluctuate in value in response to interest rate changes if there is a delay between changes in market interest rates and the interest reset date for the obligation, or for other reasons. As short-term interest rates decline, the coupons on variable and floating rate securities typically decrease. Alternatively, during periods of rising interest rates, changes in the coupons of variable and floating rate securities may lag behind changes in market rates or may have limits on the maximum increases in the coupon rates. The value of variable and floating rate securities may decline if their coupons do not rise as much, or as quickly, as interest rates in general. Conversely, variable and floating rate securities will not generally increase in value if interest rates decline. Variable and floating rate securities are less effective at locking in a particular yield and are subject to credit risk.
59
American Beacon FundsSM
Notes to Financial Statements
January 31, 2020
7. Federal Income and Excise Taxes
It is the policy of each Fund to qualify as a regulated investment company (“RIC”), by complying with all applicable provisions of Subchapter M of the Internal Revenue Code, as amended, and to make distributions of taxable income sufficient to relieve it from substantially all federal income and excise taxes. For federal income tax purposes, each Fund is treated as a single entity for the purpose of determining such qualification.
The Funds do not have any unrecorded tax liabilities in the accompanying financial statements. Each of the tax years in the four year period ended January 31, 2020 remain subject to examination by the Internal Revenue Service. If applicable, the Funds recognize interest accrued related to unrecognized tax benefits in interest expense and penalties in “Other expenses” on the Statements of Operations.
The Funds may be subject to taxes imposed by countries in which it invests. Such taxes are generally based on returns of income earned or gains realized or repatriated. Taxes are accrued and applied to net investment income, net realized capital gains and net unrealized appreciation (depreciation), as applicable, as the income is earned or capital gains are recorded.
Dividends are categorized in accordance with income tax regulations which may treat certain transactions differently than U.S. GAAP. Accordingly, the character of distributions and composition of net assets for tax purposes may differ from those reflected in the accompanying financial statements. The Funds also utilize earnings and profits distributed to shareholders on redemptions of shares as part of the dividends paid deduction.
The tax character of distributions paid were as follows:
| Frontier Markets Income Fund | GLG Total Return Fund | |||||||||||||||||||||||||||
| Year Ended January 31, 2020 | Year Ended January 31, 2019 | Year Ended January 31, 2020 | Year Ended January 31, 2019 | |||||||||||||||||||||||||
Distributions paid from: |
| |||||||||||||||||||||||||||
Ordinary income* |
| |||||||||||||||||||||||||||
Institutional Class | $ | 5,751,687 | $ | 6,063,094 | $ | $ | 51,365 | |||||||||||||||||||||
Y Class | 19,454,443 | 11,141,405 | - | 21,744 | ||||||||||||||||||||||||
Investor Class | 5,098,405 | 3,746,033 | - | 5,883 | ||||||||||||||||||||||||
A Class | 266,177 | 291,836 | - | 3,987 | ||||||||||||||||||||||||
C Class | 847,405 | 743,483 | - | 3,899 | ||||||||||||||||||||||||
Ultra Class | - | - | - | 18,743,203 | ||||||||||||||||||||||||
Long-term capital gains |
| |||||||||||||||||||||||||||
Institutional Class | - | - | - | 162 | ||||||||||||||||||||||||
Y Class | - | - | - | 68 | ||||||||||||||||||||||||
Investor Class | - | - | - | 19 | ||||||||||||||||||||||||
A Class | - | - | - | 12 | ||||||||||||||||||||||||
C Class | - | - | - | 12 | ||||||||||||||||||||||||
Ultra Class | - | - | - | 58,888 | ||||||||||||||||||||||||
Return of capital | ||||||||||||||||||||||||||||
Institutional Class | 185,581 | - | - | - | ||||||||||||||||||||||||
Y Class | 790,312 | - | - | - | ||||||||||||||||||||||||
Investor Class | 191,437 | - | - | - | ||||||||||||||||||||||||
A Class | 11,126 | - | - | - | ||||||||||||||||||||||||
C Class | 32,942 | - | - | - | ||||||||||||||||||||||||
Ultra Class | - | - | - | - | ||||||||||||||||||||||||
|
|
|
|
|
|
|
| |||||||||||||||||||||
Total distributions paid | $ | 32,629,515 | $ | 21,985,851 | $ | - | $ | 18,889,242 | ||||||||||||||||||||
|
|
|
|
|
|
|
| |||||||||||||||||||||
* For tax purposes, short-term gains are considered ordinary income distributions.
60
American Beacon FundsSM
Notes to Financial Statements
January 31, 2020
As of January 31, 2020, the components of distributable earnings (deficits) on a tax basis were as follows:
Fund | Tax Cost | Unrealized Appreciation | Unrealized (Depreciation) | Net Unrealized Appreciation (Depreciation) | ||||||||||||||||||||||||
| Frontier Markets Income | $ | 468,677,234 | $ | 17,000,303 | $ | (31,685,400 | ) | $ | (14,685,097 | ) | ||||||||||||||||||
| GLG Total Return | 18,793,449 | 2,303,690 | (3,579,169 | ) | (1,275,479 | ) | ||||||||||||||||||||||
Fund | Net Unrealized Appreciation (Depreciation) | Undistributed Ordinary Income | Undistributed Long-Term Capital Gains | Accumulated Capital and Other (Losses) | Other Temporary Differences | Distributable Earnings | ||||||||||||||||||||||||||||||||||||||
| Frontier Markets Income | $ | (14,685,097 | ) | $ | - | $ | - | $ | (14,587,025 | ) | $ | (1 | ) | $ | (29,272,123 | ) | ||||||||||||||||||||||||||||
| GLG Total Return | (1,275,479 | ) | - | - | (20,356,406 | ) | (584 | ) | (21,632,469 | ) | ||||||||||||||||||||||||||||||||||
Financial reporting records are adjusted for permanent book/tax differences to reflect tax character. Financial records are not adjusted for temporary differences. The temporary differences between financial reporting andtax-basis reporting of unrealized appreciation (depreciation) are attributable primarily to the tax deferral of losses from wash sales, unused capital losses, premium amortization accruals, the tax deferral of losses from straddles, and the realization for tax purposes of unrealized gains (losses) on certain derivative instruments.
Due to inherent differences in the recognition of income, expenses, and realized gains (losses) under U.S. GAAP and federal income tax regulations, permanent differences between book and tax reporting have been identified and appropriately reclassified on the Statements of Assets and Liabilities.
Accordingly, the following amounts represent current year permanent differences derived from net operating losses as of January 31, 2020:
Fund | Paid-In-Capital | Distributable Earnings/(Deficits) | ||||||||||||||
| Frontier Markets Income | $ | - | $ | - | ||||||||||||
| GLG Total Return | (8,593,898 | ) | 8,593,898 | |||||||||||||
Under the Regulated Investment Company Modernization Act of 2010 (“RIC MOD”), net capital losses recognized by the Funds in taxable years beginning after December 22, 2010 are carried forward indefinitely and retain their character as short-term and/or long-term losses.
During the year ended January 31, 2020, the Funds had the following post RIC MOD capital loss carryforwards:
Fund | Short-Term Capital Loss Carryforwards | Long-Term Capital Loss Carryforwards | ||||||||||
| Frontier Markets Income | $ | 3,079,874 | $ | 11,507,151 | ||||||||
| GLG Total Return | 20,005,212 | - | ||||||||||
The Fund is permitted for tax purposes to defer into its next fiscal year qualified late year losses. Qualified late year capital losses are any capital losses incurred after October 31 through the Fund’s fiscal year end, January 31, 2020. Qualified late year ordinary losses are specified losses generally incurred after October 31 and ordinary losses incurred after December 31 through the end of the Fund’s fiscal year, January 31, 2020. For the period ended January 31, 2020, GLG Total Return Fund $351,194 in late year ordinary losses to February 1, 2020.
61
American Beacon FundsSM
Notes to Financial Statements
January 31, 2020
8. Investment Transactions
The aggregate cost of purchases and proceeds from sales and maturities of investments, other than short-term obligations, for the year ended January 31, 2020 were as follows:
Fund | Purchases (non-U.S. Government Securities) | Sales (non-U.S. Government Securities) | ||||||||||
| Frontier Markets Income | $ | 261,529,974 | $ | 125,963,172 | ||||||||
| GLG Total Return | 4,256,970 | 55,665,191 | ||||||||||
A summary of the Funds’ transactions in the USG Select Fund for the year ended January 31, 2020 were as follows:
Fund | Type of Transaction | January 31, 2019 Shares/Fair Value | Purchases | Sales | January 31, 2020 Shares/Fair Value | Dividend Income | ||||||||||||||||||||||||||||||||||||||
| Frontier Markets Income | Direct | $ | 21,053,587 | $ | 356,260,063 | $ | 346,016,126 | $ | 31,297,524 | $ | 653,924 | |||||||||||||||||||||||||||||||||
| GLG Total Return | Direct | 4,402,966 | 278,357,136 | 282,147,199 | 612,903 | 146,043 | ||||||||||||||||||||||||||||||||||||||
9. Borrowing Arrangements
Effective November 14, 2019 (the “Effective Date”), the Funds, along with certain other funds managed by the Manager (“Participating Funds”), entered into a committed revolving line of credit (the “Committed Line”) agreement with State Street Bank and Trust Company (the “Bank”) to be used to facilitate portfolio liquidity. The maximum borrowing amount under the Committed Line is $250 million with interest at a rate equal to the higher of(a) one-month London Inter-Bank Offered Rate (“LIBOR”) plus 1.25% per annum or (b) the Federal Funds rate plus 1.25% per annum on amounts borrowed. Each of the Participating Funds paid a closing fee of $100,000 on the Effective Date and a quarterly commitment fee at a rate of 0.25% per annum on the unused portion of the Committed Line amount. The Committed Line expires November 12, 2020, unless extended by the Bank or terminated by the Participating Funds in accordance with the agreement.
On the Effective Date, the Funds, along with certain other Participating Funds managed by the Manager, also entered into an uncommitted discretionary demand revolving line of credit (the “Uncommitted Line”) agreement with the Bank to be used to facilitate portfolio liquidity. The maximum borrowing amount under the Uncommitted Line is $50 million with interest at a rate equal to the higher of(a) one-month LIBOR plus 1.25% per annum or (b) the Federal Funds rate plus 1.25% per annum on each outstanding loan. Each of the Participating Funds paid a closing fee of $35,000 on the Effective Date. The Uncommitted Line expires November 12, 2020 unless extended by the Bank or terminated by the Participating Funds in accordance with the agreement.
The Participating Funds paid administration, legal and arrangement fees, which are recognized as a component of “Other expenses” on the Statements of Operations, along with commitment fees, that have been allocated among the Participating Funds based on average daily net assets.
During the year ended January 31, 2020, the Frontier Markets Income Fund borrowed $16,000,000 from the Committed Line for 57 day with interest charges of $38,292 in order to facilitate portfolio liquidity. The amount is recorded as “Loan fees” in the Statements of Operations. At January 31, 2020, neither Fund had an outstanding balance with either facility.
62
American Beacon FundsSM
Notes to Financial Statements
January 31, 2020
10. Capital Share Transactions
The tables below summarize the activity in capital shares for each Class of the Funds:
| Institutional Class | ||||||||||||||||||||||||||||
| Year Ended January 31, 2020 | Year Ended January 31, 2019 | |||||||||||||||||||||||||||
Frontier Markets Income Fund | Shares | Amount | Shares | Amount | ||||||||||||||||||||||||
| Shares sold | 3,338,617 | $ | 29,122,162 | 3,070,392 | $ | 28,213,463 | ||||||||||||||||||||||
| Reinvestment of dividends | 399,825 | 3,453,629 | 355,822 | 3,176,717 | ||||||||||||||||||||||||
| Shares redeemed | (2,868,171 | ) | (24,787,306 | ) | (3,251,151 | ) | (28,839,715 | ) | ||||||||||||||||||||
| Redemption fees | - | 8,602 | - | 29,120 | ||||||||||||||||||||||||
|
|
|
|
|
|
|
| |||||||||||||||||||||
| Net increase in shares outstanding | 870,271 | $ | 7,797,087 | 175,063 | $ | 2,579,585 | ||||||||||||||||||||||
|
|
|
|
|
|
|
| |||||||||||||||||||||
| Y Class | ||||||||||||||||||||||||||||
| Year Ended January 31, 2020 | Year Ended January 31, 2019 | |||||||||||||||||||||||||||
Frontier Markets Income Fund | Shares | Amount | Shares | Amount | ||||||||||||||||||||||||
| Shares sold | 23,563,975 | $ | 204,831,707 | 12,531,283 | $ | 114,296,669 | ||||||||||||||||||||||
| Reinvestment of dividends | 2,321,564 | 20,058,116 | 1,247,796 | 11,082,499 | ||||||||||||||||||||||||
| Shares redeemed | (8,975,647 | ) | (77,509,708 | ) | (4,502,098 | ) | (39,757,884 | ) | ||||||||||||||||||||
| Redemption fees | - | 26,883 | - | 48,302 | ||||||||||||||||||||||||
|
|
|
|
|
|
|
| |||||||||||||||||||||
| Net increase in shares outstanding | 16,909,892 | $ | 147,406,998 | 9,276,981 | $ | 85,669,586 | ||||||||||||||||||||||
|
|
|
|
|
|
|
| |||||||||||||||||||||
| Investor Class | ||||||||||||||||||||||||||||
| Year Ended January 31, 2020 | Year Ended January 31, 2019 | |||||||||||||||||||||||||||
Frontier Markets Income Fund | Shares | Amount | Shares | Amount | ||||||||||||||||||||||||
| Shares sold | 4,047,163 | $ | 35,054,234 | 2,973,069 | $ | 26,636,928 | ||||||||||||||||||||||
| Reinvestment of dividends | 606,567 | 5,233,427 | 418,581 | 3,726,381 | ||||||||||||||||||||||||
| Shares redeemed | (1,915,567 | ) | (16,587,248 | ) | (2,122,257 | ) | (18,832,117 | ) | ||||||||||||||||||||
| Redemption fees | - | 7,572 | - | 7,815 | ||||||||||||||||||||||||
|
|
|
|
|
|
|
| |||||||||||||||||||||
| Net increase in shares outstanding | 2,738,163 | $ | 23,707,985 | 1,269,393 | $ | 11,539,007 | ||||||||||||||||||||||
|
|
|
|
|
|
|
| |||||||||||||||||||||
| A Class | ||||||||||||||||||||||||||||
| Year Ended January 31, 2020 | Year Ended January 31, 2019 | |||||||||||||||||||||||||||
Frontier Markets Income Fund | Shares | Amount | Shares | Amount | ||||||||||||||||||||||||
| Shares sold | 216,868 | $ | 1,888,083 | 206,492 | $ | 1,906,208 | ||||||||||||||||||||||
| Reinvestment of dividends | 28,278 | 244,111 | 29,710 | 266,124 | ||||||||||||||||||||||||
| Shares redeemed | (130,733 | ) | (1,137,187 | ) | (253,821 | ) | (2,289,629 | ) | ||||||||||||||||||||
| Redemption fees | - | 423 | - | 1,491 | ||||||||||||||||||||||||
|
|
|
|
|
|
|
| |||||||||||||||||||||
| Net increase (decrease) in shares outstanding | 114,413 | $ | 995,430 | (17,619 | ) | $ | (115,806 | ) | ||||||||||||||||||||
|
|
|
|
|
|
|
| |||||||||||||||||||||
| C Class | ||||||||||||||||||||||||||||
| Year Ended January 31, 2020 | Year Ended January 31, 2019 | |||||||||||||||||||||||||||
Frontier Markets Income Fund | Shares | Amount | Shares | Amount | ||||||||||||||||||||||||
| Shares sold | 420,289 | $ | 3,634,212 | 463,799 | $ | 4,257,101 | ||||||||||||||||||||||
| Reinvestment of dividends | 96,607 | 830,946 | 83,406 | 739,780 | ||||||||||||||||||||||||
| Shares redeemed | (273,906 | ) | (2,361,526 | ) | (233,451 | ) | (2,078,167 | ) | ||||||||||||||||||||
| Redemption fees | - | 1,393 | - | 2,271 | ||||||||||||||||||||||||
|
|
|
|
|
|
|
| |||||||||||||||||||||
| Net increase in shares outstanding | 242,990 | $ | 2,105,025 | 313,754 | $ | 2,920,985 | ||||||||||||||||||||||
|
|
|
|
|
|
|
| |||||||||||||||||||||
| Institutional Class | ||||||||||||||||||||||||||||
| Year Ended January 31, 2020 | Year Ended January 31, 2019 | |||||||||||||||||||||||||||
GLG Total Return Fund | Shares | Amount | Shares | Amount | ||||||||||||||||||||||||
| Shares sold | - | $ | - | 100,000 | $ | 1,090,000 | ||||||||||||||||||||||
| Reinvestment of dividends | - | - | 1,175 | 12,087 | ||||||||||||||||||||||||
| Shares redeemed | - | - | (100,000 | ) | (1,029,000 | ) | ||||||||||||||||||||||
|
|
|
|
|
|
|
| |||||||||||||||||||||
| Net increase in shares outstanding | - | $ | - | 1,175 | $ | 73,087 | ||||||||||||||||||||||
|
|
|
|
|
|
|
| |||||||||||||||||||||
63
American Beacon FundsSM
Notes to Financial Statements
January 31, 2020
| Y Class | ||||||||||||||||||||||||||||
| Year Ended January 31, 2020 | Year Ended January 31, 2019 | |||||||||||||||||||||||||||
GLG Total Return Fund | Shares | Amount | Shares | Amount | ||||||||||||||||||||||||
| Shares sold | 2,764 | $ | 27,850 | 24,399 | $ | 255,017 | ||||||||||||||||||||||
| Reinvestment of dividends | - | - | 2,128 | 21,812 | ||||||||||||||||||||||||
| Shares redeemed | (53,446 | ) | (534,513 | ) | (58,066 | ) | (610,285 | ) | ||||||||||||||||||||
|
|
|
|
|
|
|
| |||||||||||||||||||||
| Net decrease in shares outstanding | (50,682 | ) | $ | (506,663 | ) | (31,539 | ) | $ | (333,456 | ) | ||||||||||||||||||
|
|
|
|
|
|
|
| |||||||||||||||||||||
| Investor Class | ||||||||||||||||||||||||||||
| Year Ended January 31, 2020 | Year Ended January 31, 2019 | |||||||||||||||||||||||||||
GLG Total Return Fund | Shares | Amount | Shares | Amount | ||||||||||||||||||||||||
| Shares sold | 99 | $ | 1,000 | 858 | $ | 9,000 | ||||||||||||||||||||||
| Reinvestment of dividends | - | - | 579 | 5,902 | ||||||||||||||||||||||||
| Shares redeemed | (590 | ) | (5,811 | ) | (2,078 | ) | (21,008 | ) | ||||||||||||||||||||
|
|
|
|
|
|
|
| |||||||||||||||||||||
| Net decrease in shares outstanding | (491 | ) | $ | (4,811 | ) | (641 | ) | $ | (6,106 | ) | ||||||||||||||||||
|
|
|
|
|
|
|
| |||||||||||||||||||||
| A Class | ||||||||||||||||||||||||||||
| Year Ended January 31, 2020 | Year Ended January 31, 2019 | |||||||||||||||||||||||||||
GLG Total Return Fund | Shares | Amount | Shares | Amount | ||||||||||||||||||||||||
| Reinvestment of dividends | - | $ | - | 393 | $ | 3,999 | ||||||||||||||||||||||
|
|
|
|
|
|
|
| |||||||||||||||||||||
| Net increase in shares outstanding | - | $ | - | 393 | $ | 3,999 | ||||||||||||||||||||||
|
|
|
|
|
|
|
| |||||||||||||||||||||
| C Class | ||||||||||||||||||||||||||||
| Year Ended January 31, 2020 | Year Ended January 31, 2019 | |||||||||||||||||||||||||||
GLG Total Return Fund | Shares | Amount | Shares | Amount | ||||||||||||||||||||||||
| Reinvestment of dividends | - | $ | - | 390 | $ | 3,911 | ||||||||||||||||||||||
|
|
|
|
|
|
|
| |||||||||||||||||||||
| Net increase in shares outstanding | - | $ | - | 390 | $ | 3,911 | ||||||||||||||||||||||
|
|
|
|
|
|
|
| |||||||||||||||||||||
| Ultra Class | ||||||||||||||||||||||||||||
| Year Ended January 31, 2020 | Year Ended January 31, 2019 | |||||||||||||||||||||||||||
GLG Total Return Fund | Shares | Amount | Shares | Amount | ||||||||||||||||||||||||
| Shares sold | 5,219,045 | $ | 53,021,752 | 16,668,784 | $ | 177,675,100 | ||||||||||||||||||||||
| Reinvestment of dividends | - | - | 1,824,890 | 18,796,370 | ||||||||||||||||||||||||
| Shares redeemed | (49,503,239 | ) | (500,704,628 | ) | (43,275,069 | ) | (461,146,321 | ) | ||||||||||||||||||||
|
|
|
|
|
|
|
| |||||||||||||||||||||
| Net decrease in shares outstanding | (44,284,194 | ) | $ | (447,682,876 | ) | (24,781,395 | ) | $ | (264,674,851 | ) | ||||||||||||||||||
|
|
|
|
|
|
|
| |||||||||||||||||||||
11. Subsequent Events
On March 4, 2020, the Board of the Trust approved a plan to liquidate and terminate the American Beacon GLG Total Return Fund, on or about June 30, 2020.
Beginning in January 2020, global financial markets have experienced and may continue to experience significant volatility resulting from the spread of a virus known as COVID-19. The outbreak of COVID-19 has resulted in travel and border restrictions, quarantines, supply chain disruptions, lower consumer demand and general market uncertainty. The effects of COVID-19 have and may continue to adversely affect the global economy, the economies of certain nations and individual issuers, all of which may negatively impact the Funds performance. Management’s evaluation is ongoing and the financial landscape continues to change.
64
American Beacon Frontier Markets Income FundSM
(For a share outstanding throughout the period)
| Institutional Class | ||||||||||||||||||||||||||||||||||||
| Year Ended January 31, | ||||||||||||||||||||||||||||||||||||
| 2020 | 2019A | 2018 | 2017 | 2016 | ||||||||||||||||||||||||||||||||
|
| |||||||||||||||||||||||||||||||||||
Net asset value, beginning of period | $ | 8.68 | $ | 9.62 | $ | 8.96 | $ | 8.35 | $ | 9.68 | ||||||||||||||||||||||||||
|
|
|
|
|
|
|
|
|
| |||||||||||||||||||||||||||
Income (loss) from investment operations: | ||||||||||||||||||||||||||||||||||||
Net investment income | 0.76 | 0.80 | 0.77 | 0.88 | 0.67 | |||||||||||||||||||||||||||||||
Net gains (losses) on investments (both realized and unrealized) | 0.15 | (0.96 | ) | 0.61 | 0.44 | (1.30 | ) | |||||||||||||||||||||||||||||
|
|
|
|
|
|
|
|
|
| |||||||||||||||||||||||||||
Total income (loss) from investment operations | 0.91 | (0.16 | ) | 1.38 | 1.32 | (0.63 | ) | |||||||||||||||||||||||||||||
|
|
|
|
|
|
|
|
|
| |||||||||||||||||||||||||||
Less distributions: | ||||||||||||||||||||||||||||||||||||
Dividends from net investment income | (0.74 | ) | (0.78 | ) | (0.72 | ) | (0.08 | ) | (0.50 | ) | ||||||||||||||||||||||||||
Distributions from net realized gains | - | - | - | - | - | |||||||||||||||||||||||||||||||
Tax return of capital | (0.02 | )B | - | - | (0.63 | )B | (0.20 | )B | ||||||||||||||||||||||||||||
|
|
|
|
|
|
|
|
|
| |||||||||||||||||||||||||||
Total distributions | (0.76 | ) | (0.78 | ) | (0.72 | ) | (0.71 | ) | (0.70 | ) | ||||||||||||||||||||||||||
|
|
|
|
|
|
|
|
|
| |||||||||||||||||||||||||||
Redemption fees added to beneficial interestsC | - | - | - | - | - | |||||||||||||||||||||||||||||||
|
|
|
|
|
|
|
|
|
| |||||||||||||||||||||||||||
Net asset value, end of period | $ | 8.83 | $ | 8.68 | $ | 9.62 | $ | 8.96 | $ | 8.35 | ||||||||||||||||||||||||||
|
|
|
|
|
|
|
|
|
| |||||||||||||||||||||||||||
Total returnD | 11.00 | % | (1.58 | )% | 15.92 | % | 16.20 | % | (6.98 | )% | ||||||||||||||||||||||||||
|
|
|
|
|
|
|
|
|
| |||||||||||||||||||||||||||
Ratios and supplemental data: | ||||||||||||||||||||||||||||||||||||
Net assets, end of period | $ | 71,344,608 | $ | 62,523,243 | $ | 67,653,731 | $ | 13,047,515 | $ | 10,531,288 | ||||||||||||||||||||||||||
Ratios to average net assets: | ||||||||||||||||||||||||||||||||||||
Expenses, before reimbursements or recoupments | 1.11 | % | 1.20 | % | 1.17 | % | 1.40 | % | 1.14 | % | ||||||||||||||||||||||||||
Expenses, net of reimbursements or recoupments | 1.16 | %F | 1.17 | %F | 1.15 | % | 1.27 | %E | 1.15 | % | ||||||||||||||||||||||||||
Net investment income, before expense reimbursements or recoupments | 8.92 | % | 8.87 | % | 9.04 | % | 9.98 | % | 7.14 | % | ||||||||||||||||||||||||||
Net investment income, net of reimbursements or recoupments | 8.87 | % | 8.90 | % | 9.06 | % | 10.11 | % | 7.13 | % | ||||||||||||||||||||||||||
Portfolio turnover rate | 39 | % | 21 | % | 22 | % | 69 | % | 68 | % | ||||||||||||||||||||||||||
| A | On October 1, 2018, Aberdeen Asset Managers Limited began managing a portion of the assets of the American Beacon Frontier Markets Income Fund. |
| B | Tax return of capital is calculated based on shares outstanding at the time of distribution. |
| C | Amount represents less than $0.01 per share. |
| D | Based on net asset value, which does not reflect the sales charge, redemption fee, or contingent deferred sales charge, if applicable. May include adjustments in accordance with U.S. GAAP and as such, the net asset value for reporting purposes and the returns based upon those net asset values may differ from the net asset value and returns for shareholder transactions. |
| E | Voluntary expense cap. See Note 2 of the Notes to the Financial Statements. |
| F | Includesnon-operating expenses consisting of loan interest expenses. The expenses, net of reimbursements or recoupments ratio excludingnon-operating expenses is 1.15% for the year ended 2020 and 2019, respectively. |
See accompanying notes
65
American Beacon Frontier Markets Income FundSM
Financial Highlights
(For a share outstanding throughout the period)
| Y Class | ||||||||||||||||||||||||||||||||||||
| Year Ended January 31, | ||||||||||||||||||||||||||||||||||||
| 2020 | 2019A | 2018 | 2017 | 2016 | ||||||||||||||||||||||||||||||||
|
| |||||||||||||||||||||||||||||||||||
Net asset value, beginning of period | $ | 8.68 | $ | 9.63 | $ | 8.97 | $ | 8.34 | $ | 9.69 | ||||||||||||||||||||||||||
|
|
|
|
|
|
|
|
|
| |||||||||||||||||||||||||||
Income (loss) from investment operations: | ||||||||||||||||||||||||||||||||||||
Net investment income | 0.77 | 0.74 | 0.79 | 0.90 | 0.61 | |||||||||||||||||||||||||||||||
Net gains (losses) on investments (both realized and unrealized) | 0.14 | (0.92 | ) | 0.58 | 0.44 | (1.28 | ) | |||||||||||||||||||||||||||||
|
|
|
|
|
|
|
|
|
| |||||||||||||||||||||||||||
Total income (loss) from investment operations | 0.91 | (0.18 | ) | 1.37 | 1.34 | (0.67 | ) | |||||||||||||||||||||||||||||
|
|
|
|
|
|
|
|
|
| |||||||||||||||||||||||||||
Less distributions: | ||||||||||||||||||||||||||||||||||||
Dividends from net investment income | (0.73 | ) | (0.77 | ) | (0.71 | ) | (0.08 | ) | (0.50 | ) | ||||||||||||||||||||||||||
Distributions from net realized gains | - | - | - | - | - | |||||||||||||||||||||||||||||||
Tax return of capital | (0.02 | )B | - | - | (0.63 | )B | (0.18 | )B | ||||||||||||||||||||||||||||
|
|
|
|
|
|
|
|
|
| |||||||||||||||||||||||||||
Total distributions | (0.75 | ) | (0.77 | ) | (0.71 | ) | (0.71 | ) | (0.68 | ) | ||||||||||||||||||||||||||
|
|
|
|
|
|
|
|
|
| |||||||||||||||||||||||||||
Redemption fees added to beneficial interestsC | - | - | - | - | - | |||||||||||||||||||||||||||||||
|
|
|
|
|
|
|
|
|
| |||||||||||||||||||||||||||
Net asset value, end of period | $ | 8.84 | $ | 8.68 | $ | 9.63 | $ | 8.97 | $ | 8.34 | ||||||||||||||||||||||||||
|
|
|
|
|
|
|
|
|
| |||||||||||||||||||||||||||
Total returnD | 11.08 | % | (1.76 | )% | 15.83 | % | 16.37 | % | (7.40 | )% | ||||||||||||||||||||||||||
|
|
|
|
|
|
|
|
|
| |||||||||||||||||||||||||||
Ratios and supplemental data: | ||||||||||||||||||||||||||||||||||||
Net assets, end of period | $ | 303,866,061 | $ | 151,728,470 | $ | 79,007,953 | $ | 23,715,300 | $ | 29,434,613 | ||||||||||||||||||||||||||
Ratios to average net assets: | ||||||||||||||||||||||||||||||||||||
Expenses, before reimbursements or recoupments | 1.19 | % | 1.29 | % | 1.25 | % | 1.48 | % | 1.18 | % | ||||||||||||||||||||||||||
Expenses, net of reimbursements or recoupments | 1.22 | %F | 1.27 | %F | 1.25 | % | 1.37 | %E | 1.25 | % | ||||||||||||||||||||||||||
Net investment income, before expense reimbursements or recoupments | 9.11 | % | 8.79 | % | 8.94 | % | 10.49 | % | 7.35 | % | ||||||||||||||||||||||||||
Net investment income, net of reimbursements or recoupments | 9.08 | % | 8.80 | % | 8.94 | % | 10.61 | % | 7.28 | % | ||||||||||||||||||||||||||
Portfolio turnover rate | 39 | % | 21 | % | 22 | % | 69 | % | 68 | % | ||||||||||||||||||||||||||
| A | On October 1, 2018, Aberdeen Asset Managers Limited began managing a portion of the assets of the American Beacon Frontier Markets Income Fund. |
| B | Tax return of capital is calculated based on shares outstanding at the time of distribution. |
| C | Amount represents less than $0.01 per share. |
| D | Based on net asset value, which does not reflect the sales charge, redemption fee, or contingent deferred sales charge, if applicable. May include adjustments in accordance with U.S. GAAP and as such, the net asset value for reporting purposes and the returns based upon those net asset values may differ from the net asset value and returns for shareholder transactions. |
| E | Voluntary expense cap. See Note 2 of the Notes to the Financial Statements. |
| F | Includesnon-operating expenses consisting of loan interest expenses. The expenses, net of reimbursements or recoupments ratio excludingnon-operating expenses is 1.21 and 1.25% for the year ended 2020 and 2019, respectively. |
See accompanying notes
66
American Beacon Frontier Markets Income FundSM
Financial Highlights
(For a share outstanding throughout the period)
| Investor Class | ||||||||||||||||||||||||||||||||||||
| Year Ended January 31, | ||||||||||||||||||||||||||||||||||||
| 2020 | 2019A | 2018 | 2017 | 2016 | ||||||||||||||||||||||||||||||||
|
| |||||||||||||||||||||||||||||||||||
Net asset value, beginning of period | $ | 8.67 | $ | 9.61 | $ | 8.95 | $ | 8.35 | $ | 9.68 | ||||||||||||||||||||||||||
|
|
|
|
|
|
|
|
|
| |||||||||||||||||||||||||||
Income (loss) from investment operations: | ||||||||||||||||||||||||||||||||||||
Net investment income | 0.73 | 0.74 | 0.78 | 0.85 | 0.63 | |||||||||||||||||||||||||||||||
Net gains (losses) on investments (both realized and unrealized) | 0.15 | (0.93 | ) | 0.57 | 0.43 | (1.30 | ) | |||||||||||||||||||||||||||||
|
|
|
|
|
|
|
|
|
| |||||||||||||||||||||||||||
Total income (loss) from investment operations | 0.88 | (0.19 | ) | 1.35 | 1.28 | (0.67 | ) | |||||||||||||||||||||||||||||
|
|
|
|
|
|
|
|
|
| |||||||||||||||||||||||||||
Less distributions: | ||||||||||||||||||||||||||||||||||||
Dividends from net investment income | (0.71 | ) | (0.75 | ) | (0.69 | ) | (0.07 | ) | (0.47 | ) | ||||||||||||||||||||||||||
Distributions from net realized gains | - | - | - | - | - | |||||||||||||||||||||||||||||||
Tax return of capital | (0.02 | )B | - | - | (0.61 | )B | (0.19 | )B | ||||||||||||||||||||||||||||
|
|
|
|
|
|
|
|
|
| |||||||||||||||||||||||||||
Total distributions | (0.73 | ) | (0.75 | ) | (0.69 | ) | (0.68 | ) | (0.66 | ) | ||||||||||||||||||||||||||
|
|
|
|
|
|
|
|
|
| |||||||||||||||||||||||||||
Redemption fees added to beneficial interestsC | - | - | - | - | - | |||||||||||||||||||||||||||||||
|
|
|
|
|
|
|
|
|
| |||||||||||||||||||||||||||
Net asset value, end of period | $ | 8.82 | $ | 8.67 | $ | 9.61 | $ | 8.95 | $ | 8.35 | ||||||||||||||||||||||||||
|
|
|
|
|
|
|
|
|
| |||||||||||||||||||||||||||
Total returnD | 10.71 | % | (1.94 | )% | 15.59 | % | 15.69 | % | (7.33 | )% | ||||||||||||||||||||||||||
|
|
|
|
|
|
|
|
|
| |||||||||||||||||||||||||||
Ratios and supplemental data: | ||||||||||||||||||||||||||||||||||||
Net assets, end of period | $ | 73,505,036 | $ | 48,475,727 | $ | 41,560,845 | $ | 20,120,332 | $ | 15,934,048 | ||||||||||||||||||||||||||
Ratios to average net assets: | ||||||||||||||||||||||||||||||||||||
Expenses, before reimbursements or recoupments | 1.47 | % | 1.52 | % | 1.41 | % | 1.72 | % | 1.44 | % | ||||||||||||||||||||||||||
Expenses, net of reimbursements or recoupments | 1.45 | %F | 1.52 | %F | 1.51 | % | 1.63 | %E | 1.53 | % | ||||||||||||||||||||||||||
Net investment income, before expense reimbursements or recoupments | 8.77 | % | 8.57 | % | 8.73 | % | 9.62 | % | 6.84 | % | ||||||||||||||||||||||||||
Net investment income, net of reimbursements or recoupments | 8.79 | % | 8.57 | % | 8.64 | % | 9.71 | % | 6.76 | % | ||||||||||||||||||||||||||
Portfolio turnover rate | 39 | % | 21 | % | 22 | % | 69 | % | 68 | % | ||||||||||||||||||||||||||
| A | On October 1, 2018, Aberdeen Asset Managers Limited began managing a portion of the assets of the American Beacon Frontier Markets Income Fund. |
| B | Tax return of capital is calculated based on shares outstanding at the time of distribution. |
| C | Amount represents less than $0.01 per share. |
| D | Based on net asset value, which does not reflect the sales charge, redemption fee, or contingent deferred sales charge, if applicable. May include adjustments in accordance with U.S. GAAP and as such, the net asset value for reporting purposes and the returns based upon those net asset values may differ from the net asset value and returns for shareholder transactions. |
| E | Voluntary expense cap. See Note 2 of the Notes to the Financial Statements. |
| F | Includesnon-operating expenses consisting of loan interest expenses. The expenses, net of reimbursements or recoupments ratio excludingnon-operating expenses is 1.44% and 1.50% for the year ended 2020 and 2019, respectively. |
See accompanying notes
67
American Beacon Frontier Markets Income FundSM
Financial Highlights
(For a share outstanding throughout the period)
| A Class | ||||||||||||||||||||||||||||||||||||
| Year Ended January 31, | ||||||||||||||||||||||||||||||||||||
| 2020 | 2019A | 2018 | 2017 | 2016 | ||||||||||||||||||||||||||||||||
|
| |||||||||||||||||||||||||||||||||||
Net asset value, beginning of period | $ | 8.65 | $ | 9.62 | $ | 8.96 | $ | 8.35 | $ | 9.68 | ||||||||||||||||||||||||||
|
|
|
|
|
|
|
|
|
| |||||||||||||||||||||||||||
Income (loss) from investment operations: | ||||||||||||||||||||||||||||||||||||
Net investment income | 0.72 | 0.75 | 0.81 | 0.90 | 0.62 | |||||||||||||||||||||||||||||||
Net gains (losses) on investments (both realized and unrealized) | 0.18 | (0.98 | ) | 0.53 | 0.39 | (1.29 | ) | |||||||||||||||||||||||||||||
|
|
|
|
|
|
|
|
|
| |||||||||||||||||||||||||||
Total income (loss) from investment operations | 0.90 | (0.23 | ) | 1.34 | 1.29 | (0.67 | ) | |||||||||||||||||||||||||||||
|
|
|
|
|
|
|
|
|
| |||||||||||||||||||||||||||
Less distributions: | ||||||||||||||||||||||||||||||||||||
Dividends from net investment income | (0.70 | ) | (0.74 | ) | (0.68 | ) | (0.07 | ) | (0.47 | ) | ||||||||||||||||||||||||||
Distributions from net realized gains | - | - | - | - | - | |||||||||||||||||||||||||||||||
Tax return of capital | (0.02 | )B | - | - | (0.61 | )B | (0.19 | )B | ||||||||||||||||||||||||||||
|
|
|
|
|
|
|
|
|
| |||||||||||||||||||||||||||
Total distributions | (0.72 | ) | (0.74 | ) | (0.68 | ) | (0.68 | ) | (0.66 | ) | ||||||||||||||||||||||||||
|
|
|
|
|
|
|
|
|
| |||||||||||||||||||||||||||
Redemption fees added to beneficial interestsC | - | - | - | - | - | |||||||||||||||||||||||||||||||
|
|
|
|
|
|
|
|
|
| |||||||||||||||||||||||||||
Net asset value, end of period | $ | 8.83 | $ | 8.65 | $ | 9.62 | $ | 8.96 | $ | 8.35 | ||||||||||||||||||||||||||
|
|
|
|
|
|
|
|
|
| |||||||||||||||||||||||||||
Total returnD | 10.89 | % | (2.31 | )% | 15.51 | % | 15.77 | % | (7.36 | )% | ||||||||||||||||||||||||||
|
|
|
|
|
|
|
|
|
| |||||||||||||||||||||||||||
Ratios and supplemental data: | ||||||||||||||||||||||||||||||||||||
Net assets, end of period | $ | 4,275,426 | $ | 3,200,206 | $ | 3,726,687 | $ | 4,648,954 | $ | 7,513,980 | ||||||||||||||||||||||||||
Ratios to average net assets: | ||||||||||||||||||||||||||||||||||||
Expenses, before reimbursements or recoupments | 1.49 | % | 1.53 | % | 1.48 | % | 1.78 | % | 1.52 | % | ||||||||||||||||||||||||||
Expenses, net of reimbursements or recoupments | 1.41 | %F | 1.71 | %F | 1.55 | % | 1.67 | %E | 1.55 | % | ||||||||||||||||||||||||||
Net investment income, before expense reimbursements or recoupments | 8.53 | % | 8.49 | % | 8.65 | % | 9.85 | % | 6.89 | % | ||||||||||||||||||||||||||
Net investment income, net of reimbursements or recoupments | 8.61 | % | 8.30 | % | 8.58 | % | 9.96 | % | 6.86 | % | ||||||||||||||||||||||||||
Portfolio turnover rate | 39 | % | 21 | % | 22 | % | 69 | % | 68 | % | ||||||||||||||||||||||||||
| A | On October 1, 2018, Aberdeen Asset Managers Limited began managing a portion of the assets of the American Beacon Frontier Markets Income Fund. |
| B | Tax return of capital is calculated based on shares outstanding at the time of distribution. |
| C | Amount represents less than $0.01 per share. |
| D | Based on net asset value, which does not reflect the sales charge, redemption fee, or contingent deferred sales charge, if applicable. May include adjustments in accordance with U.S. GAAP and as such, the net asset value for reporting purposes and the returns based upon those net asset values may differ from the net asset value and returns for shareholder transactions. |
| E | Voluntary expense cap. See Note 2 of the Notes to the Financial Statements. |
| F | Includesnon-operating expenses consisting of loan interest expenses. The expenses, net of reimbursements or recoupments ratio excludingnon-operating expenses is 1.40% and 1.69% for the year ended 2020 and 2019, respectively. |
See accompanying notes
68
American Beacon Frontier Markets Income FundSM
Financial Highlights
(For a share outstanding throughout the period)
| C Class | ||||||||||||||||||||||||||||||||||||
| Year Ended January 31, | ||||||||||||||||||||||||||||||||||||
| 2020 | 2019A | 2018 | 2017 | 2016 | ||||||||||||||||||||||||||||||||
|
| |||||||||||||||||||||||||||||||||||
Net asset value, beginning of period | $ | 8.64 | $ | 9.58 | $ | 8.93 | $ | 8.34 | $ | 9.67 | ||||||||||||||||||||||||||
|
|
|
|
|
|
|
|
|
| |||||||||||||||||||||||||||
Income (loss) from investment operations: | ||||||||||||||||||||||||||||||||||||
Net investment income | 0.68 | 0.68 | 0.65 | 0.83 | 0.56 | |||||||||||||||||||||||||||||||
Net gains (losses) on investments (both realized and unrealized) | 0.14 | (0.95 | ) | 0.62 | 0.39 | (1.30 | ) | |||||||||||||||||||||||||||||
|
|
|
|
|
|
|
|
|
| |||||||||||||||||||||||||||
Total income (loss) from investment operations | 0.82 | (0.27 | ) | 1.27 | 1.22 | (0.74 | ) | |||||||||||||||||||||||||||||
|
|
|
|
|
|
|
|
|
| |||||||||||||||||||||||||||
Less distributions: | ||||||||||||||||||||||||||||||||||||
Dividends from net investment income | (0.65 | ) | (0.67 | ) | (0.62 | ) | (0.07 | ) | (0.42 | ) | ||||||||||||||||||||||||||
Distributions from net realized gains | - | - | - | - | - | |||||||||||||||||||||||||||||||
Tax return of capital | (0.02 | )B | - | - | (0.56 | )B | (0.17 | )B | ||||||||||||||||||||||||||||
|
|
|
|
|
|
|
|
|
| |||||||||||||||||||||||||||
Total distributions | (0.67 | ) | (0.67 | ) | (0.62 | ) | (0.63 | ) | (0.59 | ) | ||||||||||||||||||||||||||
|
|
|
|
|
|
|
|
|
| |||||||||||||||||||||||||||
Redemption fees added to beneficial interestsC | - | - | - | - | - | |||||||||||||||||||||||||||||||
|
|
|
|
|
|
|
|
|
| |||||||||||||||||||||||||||
Net asset value, end of period | $ | 8.79 | $ | 8.64 | $ | 9.58 | $ | 8.93 | $ | 8.34 | ||||||||||||||||||||||||||
|
|
|
|
|
|
|
|
|
| |||||||||||||||||||||||||||
Total returnD | 9.94 | % | (2.74 | )% | 14.66 | % | 14.90 | % | (8.06 | )% | ||||||||||||||||||||||||||
|
|
|
|
|
|
|
|
|
| |||||||||||||||||||||||||||
Ratios and supplemental data: | ||||||||||||||||||||||||||||||||||||
Net assets, end of period | $ | 12,599,753 | $ | 10,283,443 | $ | 8,398,773 | $ | 1,724,982 | $ | 2,049,234 | ||||||||||||||||||||||||||
Ratios to average net assets: | ||||||||||||||||||||||||||||||||||||
Expenses, before reimbursements or recoupments | 2.18 | % | 2.28 | % | 2.29 | % | 2.55 | % | 2.31 | % | ||||||||||||||||||||||||||
Expenses, net of reimbursements or recoupments | 2.19 | %E | 2.33 | %E | 2.30 | % | 2.30 | % | 2.30 | % | ||||||||||||||||||||||||||
Net investment income, before expense reimbursements or recoupments | 7.96 | % | 7.79 | % | 7.81 | % | 8.90 | % | 5.89 | % | ||||||||||||||||||||||||||
Net investment income, net of reimbursements or recoupments | 7.95 | % | 7.75 | % | 7.81 | % | 9.14 | % | 5.90 | % | ||||||||||||||||||||||||||
Portfolio turnover rate | 39 | % | 21 | % | 22 | % | 69 | % | 68 | % | ||||||||||||||||||||||||||
| A | On October 1, 2018, Aberdeen Asset Managers Limited began managing a portion of the assets of the American Beacon Frontier Markets Income Fund. |
| B | Tax return of capital is calculated based on shares outstanding at the time of distribution. |
| C | Amount represents less than $0.01 per share. |
| D | Based on net asset value, which does not reflect the sales charge, redemption fee, or contingent deferred sales charge, if applicable. May include adjustments in accordance with U.S. GAAP and as such, the net asset value for reporting purposes and the returns based upon those net asset values may differ from the net asset value and returns for shareholder transactions. |
| E | Includesnon-operating expenses consisting of loan interest expenses. The expenses, net of reimbursements or recoupments ratio excludingnon-operating expenses is 2.17% and 2.30% for the year 2020 and 2019, respectively. |
See accompanying notes
69
American Beacon GLG Total Return FundSM
Financial Highlights
(For a share outstanding throughout the period)
| Institutional Class | ||||||||||||||||||||||||||||
| Year Ended January 31, | May 20, 2016A to January 31, | |||||||||||||||||||||||||||
| 2020 | 2019 | 2018 | 2017 | |||||||||||||||||||||||||
|
| |||||||||||||||||||||||||||
Net asset value, beginning of period | $ | 10.16 | $ | 10.50 | $ | 10.69 | $ | 10.00 | ||||||||||||||||||||
|
|
|
|
|
|
|
| |||||||||||||||||||||
Income (loss) from investment operations: | ||||||||||||||||||||||||||||
Net investment income | 0.11 | 0.11 | B | 0.06 | B | 0.07 | ||||||||||||||||||||||
Net gains (losses) on investments (both realized and unrealized) | (0.19 | ) | (0.06 | ) | (0.12 | ) | 0.73 | |||||||||||||||||||||
|
|
|
|
|
|
|
| |||||||||||||||||||||
Total income (loss) from investment operations | (0.08 | ) | 0.05 | (0.06 | ) | 0.80 | ||||||||||||||||||||||
|
|
|
|
|
|
|
| |||||||||||||||||||||
Less distributions: | ||||||||||||||||||||||||||||
Dividends from net investment income | - | (0.15 | ) | (0.11 | ) | (0.10 | ) | |||||||||||||||||||||
Distributions from net realized gains | - | (0.24 | ) | (0.02 | ) | (0.01 | ) | |||||||||||||||||||||
Tax return of capital | - | - | (0.00 | )CD | - | |||||||||||||||||||||||
|
|
|
|
|
|
|
| |||||||||||||||||||||
Total distributions | - | (0.39 | ) | (0.13 | ) | (0.11 | ) | |||||||||||||||||||||
|
|
|
|
|
|
|
| |||||||||||||||||||||
Net asset value, end of period | $ | 10.08 | $ | 10.16 | $ | 10.50 | $ | 10.69 | ||||||||||||||||||||
|
|
|
|
|
|
|
| |||||||||||||||||||||
Total returnE | (0.79 | )% | 0.47 | % | (0.64 | )% | 7.95 | %F | ||||||||||||||||||||
|
|
|
|
|
|
|
| |||||||||||||||||||||
Ratios and supplemental data: | ||||||||||||||||||||||||||||
Net assets, end of period | $ | 320,815 | $ | 323,306 | $ | 321,683 | $ | 7,560,278 | ||||||||||||||||||||
Ratios to average net assets: | ||||||||||||||||||||||||||||
Expenses, before reimbursements or recoupments | 1.11 | % | 1.03 | % | 1.03 | % | 2.09 | %G | ||||||||||||||||||||
Expenses, net of reimbursements or recoupments | 1.11 | % | 1.06 | % | 1.05 | % | 1.05 | %G | ||||||||||||||||||||
Net investment income, before expense reimbursements or recoupments | 1.04 | % | 1.06 | % | 0.49 | % | 0.01 | %G | ||||||||||||||||||||
Net investment income, net of reimbursements or recoupments | 1.04 | % | 1.04 | % | 0.46 | % | 1.05 | %G | ||||||||||||||||||||
Portfolio turnover rate | 19 | % | 326 | % | 248 | % | 311 | %H | ||||||||||||||||||||
| A | Commencement of operations. |
| B | Per share amounts have been calculated using the average shares method. |
| C | Tax return of capital is calculated based on outstanding shares at the time of distribution. |
| D | Amount represents less than $0.01 per share. |
| E | Based on net asset value, which does not reflect the sales charge, redemption fee, or contingent deferred sales charge, if applicable. May include adjustments in accordance with U.S. GAAP and as such, the net asset value for reporting purposes and the returns based upon those net asset values may differ from the net asset value and returns for shareholder transactions. |
| F | Not annualized. |
| G | Annualized. |
| H | Portfolio turnover rate is for the period from May 20, 2016 through January 31, 2017 and is not annualized. |
See accompanying notes
70
American Beacon GLG Total Return FundSM
Financial Highlights
(For a share outstanding throughout the period)
| Y Class | ||||||||||||||||||||||||||||
| Year Ended January 31, | May 20, 2016A to January 31, | |||||||||||||||||||||||||||
| 2020 | 2019 | 2018 | 2017 | |||||||||||||||||||||||||
|
| |||||||||||||||||||||||||||
Net asset value, beginning of period | $ | 10.10 | $ | 10.47 | $ | 10.68 | $ | 10.00 | ||||||||||||||||||||
|
|
|
|
|
|
|
| |||||||||||||||||||||
Income (loss) from investment operations: | ||||||||||||||||||||||||||||
Net investment income | 0.11 | G | 0.08 | 0.09 | 0.07 | |||||||||||||||||||||||
Net gains (losses) on investments (both realized and unrealized) | (0.21 | ) | (0.06 | ) | (0.17 | ) | 0.72 | |||||||||||||||||||||
|
|
|
|
|
|
|
| |||||||||||||||||||||
Total income (loss) from investment operations | (0.10 | ) | 0.02 | (0.08 | ) | 0.79 | ||||||||||||||||||||||
|
|
|
|
|
|
|
| |||||||||||||||||||||
Less distributions: | ||||||||||||||||||||||||||||
Dividends from net investment income | - | (0.15 | ) | (0.10 | ) | (0.10 | ) | |||||||||||||||||||||
Distributions from net realized gains | - | (0.24 | ) | (0.02 | ) | (0.01 | ) | |||||||||||||||||||||
Tax return of capital | - | - | (0.01 | )B | - | |||||||||||||||||||||||
|
|
|
|
|
|
|
| |||||||||||||||||||||
Total distributions | - | (0.39 | ) | (0.13 | ) | (0.11 | ) | |||||||||||||||||||||
|
|
|
|
|
|
|
| |||||||||||||||||||||
Redemption fees added to beneficial interests | - | - | - | - | ||||||||||||||||||||||||
|
|
|
|
|
|
|
| |||||||||||||||||||||
Net asset value, end of period | $ | 10.00 | $ | 10.10 | $ | 10.47 | $ | 10.68 | ||||||||||||||||||||
|
|
|
|
|
|
|
| |||||||||||||||||||||
Total returnC | (0.99 | )% | 0.17 | % | (0.78 | )% | 7.85 | %D | ||||||||||||||||||||
|
|
|
|
|
|
|
| |||||||||||||||||||||
Ratios and supplemental data: | ||||||||||||||||||||||||||||
Net assets, end of period | $ | 170,055 | $ | 683,994 | $ | 1,038,736 | $ | 107,884 | ||||||||||||||||||||
Ratios to average net assets: | ||||||||||||||||||||||||||||
Expenses, before reimbursements or recoupments | 1.26 | % | 1.05 | % | 1.18 | % | 5.31 | %E | ||||||||||||||||||||
Expenses, net of reimbursements or recoupments | 1.26 | % | 1.15 | % | 1.15 | % | 1.15 | %E | ||||||||||||||||||||
Net investment income (loss), before expense reimbursements or recoupments | 1.05 | % | 0.88 | % | 0.18 | % | (3.21 | )%E | ||||||||||||||||||||
Net investment income, net of reimbursements or recoupments | 1.05 | % | 0.78 | % | 0.21 | % | 0.95 | %E | ||||||||||||||||||||
Portfolio turnover rate | 19 | % | 326 | % | 248 | % | 311 | %F | ||||||||||||||||||||
| A | Commencement of operations. |
| B | Tax return of capital is calculated based on shares outstanding at the time of distribution. |
| C | Based on net asset value, which does not reflect the sales charge, redemption fee, or contingent deferred sales charge, if applicable. May include adjustments in accordance with U.S. GAAP and as such, the net asset value for reporting purposes and the returns based upon those net asset values may differ from the net asset value and returns for shareholder transactions. |
| D | Not annualized. |
| E | Annualized. |
| F | Portfolio turnover rate is for the period from May 20, 2016 through January 31, 2016 and is not annualized. |
| G | Per share amounts have been calculated using the average shares method. |
See accompanying notes
71
American Beacon GLG Total Return FundSM
Financial Highlights
(For a share outstanding throughout the period)
| Investor Class | ||||||||||||||||||||||||||||
| Year Ended January 31, | May 20, 2016A to January 31, | |||||||||||||||||||||||||||
| 2020 | 2019 | 2018 | 2017 | |||||||||||||||||||||||||
|
| |||||||||||||||||||||||||||
Net asset value, beginning of period | $ | 10.04 | $ | 10.43 | $ | 10.66 | $ | 10.00 | ||||||||||||||||||||
|
|
|
|
|
|
|
| |||||||||||||||||||||
Income (loss) from investment operations: | ||||||||||||||||||||||||||||
Net investment income | 0.06 | 0.05 | 0.02 | 0.05 | ||||||||||||||||||||||||
Net gains (losses) on investments (both realized and unrealized) | (0.17 | ) | (0.05 | ) | (0.13 | ) | 0.72 | |||||||||||||||||||||
|
|
|
|
|
|
|
| |||||||||||||||||||||
Total income (loss) from investment operations | (0.11 | ) | - | (0.11 | ) | 0.77 | ||||||||||||||||||||||
|
|
|
|
|
|
|
| |||||||||||||||||||||
Less distributions: | ||||||||||||||||||||||||||||
Dividends from net investment income | - | (0.15 | ) | (0.09 | ) | (0.10 | ) | |||||||||||||||||||||
Distributions from net realized gains | - | (0.24 | ) | (0.02 | ) | (0.01 | ) | |||||||||||||||||||||
Tax return of capital | - | - | (0.01 | )B | - | |||||||||||||||||||||||
|
|
|
|
|
|
|
| |||||||||||||||||||||
Total distributions | - | (0.39 | ) | (0.12 | ) | (0.11 | ) | |||||||||||||||||||||
|
|
|
|
|
|
|
| |||||||||||||||||||||
Net asset value, end of period | $ | 9.93 | $ | 10.04 | $ | 10.43 | $ | 10.66 | ||||||||||||||||||||
|
|
|
|
|
|
|
| |||||||||||||||||||||
Total returnC | (1.10 | )% | (0.04 | )% | (1.05 | )% | 7.65 | %D | ||||||||||||||||||||
|
|
|
|
|
|
|
| |||||||||||||||||||||
Ratios and supplemental data: | ||||||||||||||||||||||||||||
Net assets, end of period | $ | 132,414 | $ | 138,852 | $ | 150,889 | $ | 128,790 | ||||||||||||||||||||
Ratios to average net assets: | ||||||||||||||||||||||||||||
Expenses, before reimbursements or recoupments | 2.29 | % | 1.80 | % | 2.09 | % | 5.14 | %E | ||||||||||||||||||||
Expenses, net of reimbursements or recoupments | 1.46 | %F | 1.43 | % | 1.43 | % | 1.43 | %E | ||||||||||||||||||||
Net investment income (loss), before expense reimbursements or recoupments | (0.13 | )% | 0.21 | % | (0.62 | )% | (3.04 | )%E | ||||||||||||||||||||
Net investment income, net of reimbursements or recoupments | 0.70 | % | 0.57 | % | 0.03 | % | 0.67 | %E | ||||||||||||||||||||
Portfolio turnover rate | 19 | % | 326 | % | 248 | % | 311 | %G | ||||||||||||||||||||
| A | Commencement of operations. |
| B | Tax return of capital is calculated based on shares outstanding at the time of distribution. |
| C | Based on net asset value, which does not reflect the sales charge, redemption fee, or contingent deferred sales charge, if applicable. May include adjustments in accordance with U.S. GAAP and as such, the net asset value for reporting purposes and the returns based upon those net asset values may differ from the net asset value and returns for shareholder transactions. |
| D | Not annualized. |
| E | Annualized. |
| F | Includesnon-operating expenses consisting of prime broker fees and dividends from securities sold short. The Expenses, net of reimbursements, excludingnon-operating expenses is 1.43% for the year ended January 31, 2020. |
| G | Portfolio turnover rate is for the period from May 20, 2016 through January 31, 2017 and is not annualized. |
See accompanying notes
72
American Beacon GLG Total Return FundSM
Financial Highlights
(For a share outstanding throughout the period)
| A Class | ||||||||||||||||||||||||||||
| Year Ended January 31, | May 20, 2016A to January 31, | |||||||||||||||||||||||||||
| 2020 | 2019 | 2018 | 2017 | |||||||||||||||||||||||||
|
| |||||||||||||||||||||||||||
Net asset value, beginning of period | $ | 10.03 | $ | 10.42 | $ | 10.66 | $ | 10.00 | ||||||||||||||||||||
|
|
|
|
|
|
|
| |||||||||||||||||||||
Income (loss) from investment operations: | ||||||||||||||||||||||||||||
Net investment income | 0.07 | 0.07 | 0.00 | B | 0.05 | |||||||||||||||||||||||
Net gains (losses) on investments (both realized and unrealized) | (0.18 | ) | (0.07 | ) | (0.12 | ) | 0.72 | |||||||||||||||||||||
|
|
|
|
|
|
|
| |||||||||||||||||||||
Total income (loss) from investment operations | (0.11 | ) | - | (0.12 | ) | 0.77 | ||||||||||||||||||||||
|
|
|
|
|
|
|
| |||||||||||||||||||||
Less distributions: | ||||||||||||||||||||||||||||
Dividends from net investment income | - | (0.15 | ) | (0.10 | ) | (0.10 | ) | |||||||||||||||||||||
Distributions from net realized gains | - | (0.24 | ) | (0.02 | ) | (0.01 | ) | |||||||||||||||||||||
Tax return of capital | - | - | (0.00 | )BC | - | |||||||||||||||||||||||
|
|
|
|
|
|
|
| |||||||||||||||||||||
Total distributions | - | (0.39 | ) | (0.12 | ) | (0.11 | ) | |||||||||||||||||||||
|
|
|
|
|
|
|
| |||||||||||||||||||||
Net asset value, end of period | $ | 9.92 | $ | 10.03 | $ | 10.42 | $ | 10.66 | ||||||||||||||||||||
|
|
|
|
|
|
|
| |||||||||||||||||||||
Total returnD | (1.10 | )% | (0.04 | )% | (1.15 | )% | 7.65 | %E | ||||||||||||||||||||
|
|
|
|
|
|
|
| |||||||||||||||||||||
Ratios and supplemental data: | ||||||||||||||||||||||||||||
Net assets, end of period | $ | 105,189 | $ | 106,404 | $ | 106,439 | $ | 107,660 | ||||||||||||||||||||
Ratios to average net assets: | ||||||||||||||||||||||||||||
Expenses, before reimbursements or recoupments | 1.37 | % | 1.31 | % | 1.42 | % | 5.62 | %F | ||||||||||||||||||||
Expenses, net of reimbursements or recoupments | 1.48 | % | 1.46 | % | 1.45 | % | 1.45 | %F | ||||||||||||||||||||
Net investment income (loss), before expense reimbursements or recoupments | 0.78 | % | 0.69 | % | 0.05 | % | (3.51 | )%F | ||||||||||||||||||||
Net investment income, net of reimbursements or recoupments | 0.67 | % | 0.55 | % | 0.02 | % | 0.65 | %F | ||||||||||||||||||||
Portfolio turnover rate | 19 | % | 326 | % | 248 | % | 311 | %G | ||||||||||||||||||||
| A | Commencement of operations. |
| B | Amount represents less than $0.01 per share. |
| C | Tax return of capital is calculated based on shares outstanding at the time of distribution. |
| D | Based on net asset value, which does not reflect the sales charge, redemption fee, or contingent deferred sales charge, if applicable. May include adjustments in accordance with U.S. GAAP and as such, the net asset value for reporting purposes and the returns based upon those net asset values may differ from the net asset value and returns for shareholder transactions. |
| E | Not annualized. |
| F | Annualized. |
| G | Portfolio turnover rate is for the period from May 20, 2016 through January 31, 2017 and is not annualized. |
See accompanying notes
73
American Beacon GLG Total Return FundSM
Financial Highlights
(For a share outstanding throughout the period)
| C Class | ||||||||||||||||||||||||||||
| Year Ended January 31, | May 20, 2016A to January 31, | |||||||||||||||||||||||||||
| 2020 | 2019 | 2018 | 2017 | |||||||||||||||||||||||||
|
| |||||||||||||||||||||||||||
Net asset value, beginning of period | $ | 9.88 | $ | 10.34 | $ | 10.61 | $ | 10.00 | ||||||||||||||||||||
|
|
|
|
|
|
|
| |||||||||||||||||||||
Income (loss) from investment operations: | ||||||||||||||||||||||||||||
Net investment income (loss) | (0.01 | ) | (0.01 | ) | (0.08 | ) | (0.01 | ) | ||||||||||||||||||||
Net gains (losses) on investments (both realized and unrealized) | (0.17 | ) | (0.07 | ) | (0.12 | ) | 0.73 | |||||||||||||||||||||
|
|
|
|
|
|
|
| |||||||||||||||||||||
Total income (loss) from investment operations | (0.18 | ) | (0.08 | ) | (0.20 | ) | 0.72 | |||||||||||||||||||||
|
|
|
|
|
|
|
| |||||||||||||||||||||
Less distributions: | ||||||||||||||||||||||||||||
Dividends from net investment income | - | (0.14 | ) | (0.04 | ) | (0.10 | ) | |||||||||||||||||||||
Distributions from net realized gains | - | (0.24 | ) | (0.02 | ) | (0.01 | ) | |||||||||||||||||||||
Tax return of capital | - | - | (0.01 | )B | - | |||||||||||||||||||||||
|
|
|
|
|
|
|
| |||||||||||||||||||||
Total distributions | - | (0.38 | ) | (0.07 | ) | (0.11 | ) | |||||||||||||||||||||
|
|
|
|
|
|
|
| |||||||||||||||||||||
Net asset value, end of period | $ | 9.70 | $ | 9.88 | $ | 10.34 | $ | 10.61 | ||||||||||||||||||||
|
|
|
|
|
|
|
| |||||||||||||||||||||
Total returnC | (1.82 | )% | (0.79 | )% | (1.95 | )% | 7.15 | %D | ||||||||||||||||||||
|
|
|
|
|
|
|
| |||||||||||||||||||||
Ratios and supplemental data: | ||||||||||||||||||||||||||||
Net assets, end of period | $ | 102,317 | $ | 104,277 | $ | 105,096 | $ | 107,101 | ||||||||||||||||||||
Ratios to average net assets: | ||||||||||||||||||||||||||||
Expenses, before reimbursements or recoupments | 2.12 | % | 2.06 | % | 2.17 | % | 6.37 | %E | ||||||||||||||||||||
Expenses, net of reimbursements or recoupments | 2.23 | % | 2.21 | % | 2.20 | % | 2.20 | %E | ||||||||||||||||||||
Net investment income (loss), before expense reimbursements or recoupments | 0.03 | % | (0.06 | )% | (0.70 | )% | (4.27 | )%E | ||||||||||||||||||||
Net investment income (loss), net of reimbursements or recoupments | (0.08 | )% | (0.20 | )% | (0.73 | )% | (0.10 | )%E | ||||||||||||||||||||
Portfolio turnover rate | 19 | % | 326 | % | 248 | % | 311 | %F | ||||||||||||||||||||
| A | Commencement of operations. |
| B | Tax return of capital is calculated based on outstanding shares at the time of distribution. |
| C | Based on net asset value, which does not reflect the sales charge, redemption fee, or contingent deferred sales charge, if applicable. May include adjustments in accordance with U.S. GAAP and as such, the net asset value for reporting purposes and the returns based upon those net asset values may differ from the net asset value and returns for shareholder transactions. |
| D | Not annualized. |
| E | Annualized. |
| F | Portfolio turnover rate is for the period from May 20, 2016 through January 31, 2017 and is not annualized. |
See accompanying notes
74
American Beacon GLG Total Return FundSM
Financial Highlights
(For a share outstanding throughout the period)
| Ultra | ||||||||||||||||||||||||||||
| Year Ended January 31, | May 20, 2016A to January 31, | |||||||||||||||||||||||||||
| 2020 | 2019 | 2018 | 2017 | |||||||||||||||||||||||||
|
| |||||||||||||||||||||||||||
Net asset value, beginning of period | $ | 10.16 | $ | 10.50 | $ | 10.69 | $ | 10.00 | ||||||||||||||||||||
|
|
|
|
|
|
|
| |||||||||||||||||||||
Income from investment operations: | ||||||||||||||||||||||||||||
Net investment income | 0.58 | 0.13 | 0.11 | 0.07 | ||||||||||||||||||||||||
Net gains (losses) on investments (both realized and unrealized) | (0.65 | ) | (0.08 | ) | (0.17 | ) | 0.73 | |||||||||||||||||||||
|
|
|
|
|
|
|
| |||||||||||||||||||||
Total income (loss) from investment operations | (0.07 | ) | 0.05 | (0.06 | ) | 0.80 | ||||||||||||||||||||||
|
|
|
|
|
|
|
| |||||||||||||||||||||
Less distributions: | ||||||||||||||||||||||||||||
Dividends from net investment income | - | (0.15 | ) | (0.10 | ) | (0.10 | ) | |||||||||||||||||||||
Distributions from net realized gains | - | (0.24 | ) | (0.02 | ) | (0.01 | ) | |||||||||||||||||||||
Tax return of capital | - | - | (0.01 | )B | - | |||||||||||||||||||||||
|
|
|
|
|
|
|
| |||||||||||||||||||||
Total distributions | - | (0.39 | ) | (0.13 | ) | (0.11 | ) | |||||||||||||||||||||
|
|
|
|
|
|
|
| |||||||||||||||||||||
Net asset value, end of period | $ | 10.09 | $ | 10.16 | $ | 10.50 | $ | 10.69 | ||||||||||||||||||||
|
|
|
|
|
|
|
| |||||||||||||||||||||
Total returnC | (0.69 | )% | 0.47 | % | (0.57 | )% | 7.95 | %D | ||||||||||||||||||||
|
|
|
|
|
| �� |
|
| ||||||||||||||||||||
Ratios and supplemental data: | ||||||||||||||||||||||||||||
Net assets, end of period | $ | 18,254,721 | $ | 468,097,908 | $ | 743,861,439 | $ | 67,330,248 | ||||||||||||||||||||
Ratios to average net assets: | ||||||||||||||||||||||||||||
Expenses, before reimbursements or recoupments | 1.16 | % | 1.05 | % | 1.07 | % | 2.09 | %E | ||||||||||||||||||||
Expenses, net of reimbursements or recoupments | 0.99 | %F | 0.95 | % | 0.95 | % | 0.95 | %E | ||||||||||||||||||||
Net investment income, before expense reimbursements or recoupments | 1.23 | % | 0.92 | % | 0.34 | % | 0.76 | %E | ||||||||||||||||||||
Net investment income, net of reimbursements or recoupments | 1.40 | % | 1.02 | % | 0.46 | % | 1.91 | %E | ||||||||||||||||||||
Portfolio turnover rate | 19 | % | 326 | % | 248 | % | 311 | %G | ||||||||||||||||||||
| A | Commencement of operations. |
| B | Tax return of capital is calculated based on outstanding shares at the time of distribution. |
| C | Based on net asset value, which does not reflect the sales charge, redemption fee, or contingent deferred sales charge, if applicable. May include adjustments in accordance with U.S. GAAP and as such, the net asset value for reporting purposes and the returns based upon those net asset values may differ from the net asset value and returns for shareholder transactions. |
| D | Not annualized. |
| E | Annualized. |
| F | Includesnon-operating expenses consisting of prime broker fees and dividends from securities sold short. The Expenses, net of reimbursements, excludingnon-operating expenses is 0.95% for the year ended January 31, 2020. |
| G | Portfolio turnover rate is for the period from May 20, 2016 through January 31, 2017 and is not annualized. |
See accompanying notes
75
American Beacon FundsSM
December 31, 2020 (Unaudited)
Certain tax information regarding the Funds is required to be provided to shareholders based upon the Funds’ income and distributions for the taxable year ended January 31, 2020. The information and distributions reported herein may differ from information and distributions taxable to the shareholders for the calendar year ended December 31, 2019.
The Funds designated the following items with regard to distributions paid during the fiscal year ended January 31, 2020. All designations are based on financial information available as of this annual report and, accordingly, are subject to change. For each item, it is the intention of the Funds to designate the maximum amount permitted under the Internal Revenue Code of 1986, as amended, and the regulations there under.
Corporate Dividends-Received Deduction:
Frontier Markets Income | 0 | % | ||
GLG Total Return | 0 | % |
Qualified Dividend Income:
Frontier Markets Income | 0 | % | ||
GLG Total Return | 0 | % |
Long-Term Capital Gain Distributions:
Frontier Markets Income | $ | - | ||
GLG Total Return | - |
Short-Term Capital Gain Distributions:
Frontier Markets Income | $ | - | ||
GLG Total Return | - |
Shareholders will receive notification in January 2020 of the applicable tax information necessary to prepare their 2019 income tax returns.
76
Trustees and Officers of the American Beacon FundsSM(Unaudited)
The Trustees and officers of the American Beacon Funds (the “Trust”) are listed below, together with their principal occupations during the past five years. The address of each person listed below is 220 Las Colinas Boulevard East, Suite 1200, Irving, Texas 75039. Each Trustee overseesthirty-six funds in the fund complex that includes the Trust, the American Beacon Select Funds, the American Beacon Institutional Funds Trust, the American Beacon Sound Point Enhanced Income Fund, and the American Beacon Apollo Total Return Fund.. The Trust’s Statement of Additional Information contains additional information about the Trustees and is available without charge by calling1-800-658-5811.
Name, Age | Position, Term of Office and Length of Time Served with the Trust | Principal Occupation(s) During Past 5 Years and Current Directorships | ||
| NON-INTERESTED TRUSTEES | Term | |||
| Lifetime of Trust until removal, resignation or retirement* | ||||
| Gilbert G. Alvarado (50) | Trustee since 2015 | President, SJVIIF, LLC, Impact Investment Fund (2018-Present); Director, Kura MD, Inc. (local telehealth organization) (2015-2017); Senior Vice President & CFO, Sierra Health Foundation (health conversion private foundation) (2006-Present); Senior Vice President & CFO, Sierra Health Foundation: Center for Health Program Management (California public benefit corporation) (2012-Present); Director, Innovative North State (2012-2015); Director, Sacramento Regional Technology Alliance (2011-2016); Director, Valley Healthcare Staffing (2017-2018); Trustee, American Beacon Select Funds (2015-Present); Trustee, American Beacon Institutional Funds Trust (2017-Present); Trustee, American Beacon Sound Point Enhanced Income Fund (2018-Present); Trustee, American Beacon Apollo Total Return Fund (2018-Present). | ||
| Joseph B. Armes (57) | Trustee since 2015 | Director, Switchback Energy Acquisition (2019-Present); Chairman & CEO, CSW Industrials f/k/a Capital Southwest Corporation (investment company) (2015-Present); Chairman of the Board of Capital Southwest Corporation, predecessor to CSW Industrials, Inc. (2014-2017) (investment company); CEO, Capital Southwest Corporation (2013-2015); President & CEO, JBA Investment Partners (family investment vehicle) (2010-Present); Director and Chair of Audit Committee, RSP Permian (oil and gas producer) (2013-2018); Trustee, American Beacon Select Funds (2015-Present); Trustee, American Beacon Institutional Funds Trust (2017-Present); Trustee, American Beacon Sound Point Enhanced Income Fund (2018-Present); Trustee, American Beacon Apollo Total Return Fund (2018-Present). | ||
| Gerard J. Arpey (61) | Trustee since 2012 | Director, The Home Depot, Inc. (2015-Present); Partner, Emerald Creek Group (private equity firm) (2011-Present); Director, S.C. Johnson & Son, Inc. (privately held company) (2008-present); Trustee, American Beacon Select Funds (2012-Present); Trustee, American Beacon Institutional Funds Trust (2017-Present); Trustee, American Beacon Sound Point Enhanced Income Fund (2018-Present); Trustee, American Beacon Apollo Total Return Fund (2018-Present). | ||
| Brenda A. Cline (59) | Trustee since 2004 Chair since 2019 Vice Chair 2018 | Chief Financial Officer, Treasurer and Secretary, Kimbell Art Foundation (1993-Present); Director, Tyler Technologies, Inc. (public sector software solutions company) (2014-Present); Director, Range Resources Corporation (oil and natural gas company) (2015-Present); Trustee, CushingClosed-End andOpen-End Funds (2017-Present); Trustee, American Beacon Select Funds (2004-Present); ; Trustee, American Beacon Institutional Funds Trust (2017-Present); Trustee, American Beacon Sound Point Enhanced Income Fund (2018-Present); Trustee, American Beacon Apollo Total Return Fund (2018-Present). | ||
77
Trustees and Officers of the American Beacon FundsSM(Unaudited)
Name, Age | Position, Term of Office and Length of Time Served with the Trust | Principal Occupation(s) During Past 5 Years and Current Directorships | ||
| NON-INTERESTED TRUSTEES (CONT.) | Term | |||
| Lifetime of Trust until removal, resignation or retirement* | ||||
| Eugene J. Duffy (65) | Trustee since 2008 | Managing Director, Global Investment Management Distribution, Mesirow Financial (2016-Present); Managing Director, Institutional Services, Intercontinental Real Estate Corporation (2014-Present); Trustee, American Beacon Select Funds (2008-Present); Trustee, American Beacon Institutional Funds Trust (2017-Present); Trustee, American Beacon Sound Point Enhanced Income Fund (2018-Present); Trustee, American Beacon Apollo Total Return Fund (2018-Present). | ||
| Claudia A. Holz (62) | Trustee since 2018 | Partner, KPMG LLP (1990-2017); Trustee, American Beacon Select Funds (2018-Present); Trustee, American Beacon Institutional Funds Trust (2018-Present); Trustee, American Beacon Sound Point Enhanced Income Fund (2018-Present); Trustee, American Beacon Apollo Total Return Fund (2018-Present). | ||
| Douglas A. Lindgren (58) | Trustee since 2018 | CEO North America, Carne Global Financial Services (2016-2017); Consultant, Carne Financial Services (2017-2019); Managing Director, IPS Investment Management and Global Head, Content Management, UBS Wealth Management (2010-2016); Trustee, American Beacon Select Funds (2018-Present); Trustee, American Beacon Institutional Funds Trust (2018-Present); Trustee, American Beacon Sound Point Enhanced Income Fund (2018-Present); Trustee, American Beacon Apollo Total Return Fund (2018-Present). | ||
| Barbara J. McKenna, CFA (56) | Trustee since 2012 | President/Managing Principal, Longfellow Investment Management Company (2005-Present); Trustee, American Beacon Select Funds (2012-Present); Trustee, American Beacon Institutional Funds Trust (2017-Present); Trustee, American Beacon Sound Point Enhanced Income Fund (2018-Present); Trustee, American Beacon Apollo Total Return Fund (2018-Present. | ||
| R. Gerald Turner (74) | Trustee since 2001 | President, Southern Methodist University (1995-Present); Director, J.C. Penney Company, Inc. (1996-2019); Director, Kronus Worldwide Inc. (chemical manufacturing) (2003-Present); Trustee, American Beacon Select Funds (2001-Present); Trustee, American Beacon Institutional Funds Trust (2017-Present); Trustee, American Beacon Sound Point Enhanced Income Fund (2018-Present); Trustee, American Beacon Apollo Total Return Fund (2018-Present). | ||
78
Trustees and Officers of the American Beacon FundsSM(Unaudited)
Name, Age | Position, Term of Office and Length of Time Served with the Trust | Principal Occupation(s) During Past 5 Years and Current Directorships | ||
| OFFICERS | Term | |||
| One Year | ||||
| Gene L. Needles, Jr. (65) | President since 2009 | President (2009-2018), CEO and Director (2009-Present), and Chairman (2018-Present), American Beacon Advisors, Inc., President (2015-2018), Director and CEO (2015-Present), and Chairman (2018-Present), Resolute Investment Holdings, LLC; President (2015-2018), Director and CEO (2015-Present), and Chairman (2018-Present), Resolute Topco, Inc.; President (2015-2018); Director, and CEO (2015-Present), and Chairman (2018-Present), Resolute Acquisition, Inc.; President (2015-2018), Director and CEO (2015-Present), Chairman (2018-Present), Resolute Investment Managers, Inc.; Director, Chairman, President and CEO, Resolute Investment Distributors (2017-Present); Director, Chairman, President and CEO; Resolute Investment Services, Inc. (2017-Present); President and CEO, Lighthouse Holdings Parent, Inc. (2009-2015); President, CEO and Director, Lighthouse Holdings, Inc. (2009-2015); Manager, President and CEO, American Private Equity Management, LLC (2012-Present); Director, Chairman, President and CEO, Alpha Quant Advisors, LLC (2016-Present); Director, ARK Investment Management LLC (2016-Present); Director, Shapiro Capital Management LLC (2017-Present); Director, Chairman and CEO, Continuous Capital, LLC (2018-Present); Director, Green Harvest Asset Management (2019-Present); Director, National Investment Services of America, LLC (2019-Present); President, American Beacon Cayman Managed Futures Strategy Fund, Ltd. (2014-Present); Director and President, American Beacon Cayman Transformational Innovation Company, LTD., (2017-2018); President, American Beacon Delaware Transformational Innovation Corporation (2017-2018); President American Beacon Cayman TargetRisk Company, Ltd. (2018-Present); Member, Investment Advisory Committee, Employees Retirement System of Texas (2017-Present); Trustee, American Beacon NextShares Trust (2015-Present); President, American Beacon Select Funds (2009-Present); President, American Beacon Institutional Funds Trust (2017-Present); President, American Beacon Sound Point Enhanced Income Fund (2018-Present); President, American Beacon Apollo Total Return Fund (2018-Present); Director, RSW Investments Holdings LLC, (2019-Present); Manager, SSI Investment Management, LLC (2019-Present). | ||
79
Trustees and Officers of the American Beacon FundsSM(Unaudited)
Name, Age | Position, Term of Office and Length of Time Served with the Trust | Principal Occupation(s) During Past 5 Years and Current Directorships | ||
| OFFICERS (CONT.) | Term | |||
| One Year | ||||
| Rosemary K. Behan (60) | VP, Secretary and Chief Legal Officer since 2006 | Vice President, Secretary and General Counsel, American Beacon Advisors, Inc. (2006-Present); Secretary, Resolute Investment Holdings, LLC(2015-Present); Secretary, Resolute Topco, Inc. (2015-Present); Secretary, Resolute Acquisition, Inc. (2015-Present); Vice President, Secretary and General Counsel, Resolute Investment Managers, Inc. (2015-Present); Secretary, Resolute Investment Distributors, Inc. (2017-Present); Vice President, Secretary and General Counsel, Resolute Investment Services, Inc. (2017-Present); Vice President and Secretary, Lighthouse Holdings Parent, Inc. (2008-2015); Vice President and Secretary, Lighthouse Holdings, Inc. (2008-2015); Secretary, American Private Equity Management, LLC (2008-Present); Secretary and General Counsel, Alpha Quant Advisors, LLC (2016-Present); Vice President and Secretary, Continuous Capital, LLC (2018-Present); Secretary, Green Harvest Asset Management (2019-Present); Secretary, American Beacon Delaware Transformational Innovation Corporation (2017-2018); Secretary, American Beacon Cayman Transformational Innovation Company, Ltd. (2017-2018); Secretary, American Beacon Cayman Managed Futures Strategy Fund, Ltd. (2014-Present); Secretary, American Beacon Cayman TargetRisk Company, Ltd (2018-Present); Chief Legal Officer, Vice President and Secretary, American Beacon Select Funds (2006-Present); Chief Legal Officer, Vice President and Secretary, American Beacon Institutional Funds Trust (2017-Present); Chief Legal Officer, Vice President and Secretary, American Beacon Sound Point Enhanced Income Fund (2018-Present); Chief Legal Officer, Vice President and Secretary American Beacon Apollo Total Return Fund (2018-Present). | ||
| Brian E. Brett (59) | VP since 2004 | Senior Vice President, Head of Distribution (2012-Present), Vice President, Director of Sales (2004-2012), American Beacon Advisors, Inc.; Senior Vice President, Resolute Investment Managers, Inc. (2017-Present); Senior Vice President, Resolute Investment Distributors, Inc. (2018-Present), Senior Vice President, Resolute Investment Services, Inc. (2018-Present); Senior Vice President, Lighthouse Holdings Parent, Inc. (2008-2015); Senior Vice President, Lighthouse Holdings, Inc. (2008-2015); Vice President, American Beacon Select Funds (2004-Present); Vice President, American Beacon Institutional Funds Trust (2017-Present); Vice President American Beacon Sound Point Enhanced Income Fund (2018-Present); Vice President American Beacon Apollo Total Return Fund (2018-Present). | ||
| Paul B. Cavazos (50) | VP since 2016 | Chief Investment Officer and Senior Vice President, American Beacon Advisors, Inc. (2016-Present); Chief Investment Officer, DTE Energy (2007-2016); Vice President, American Private Equity Management, L.L.C. (2017-Present); Vice President, American Beacon Select Funds (2016-Present); Vice President, American Beacon Institutional Funds Trust (2017-Present); Vice President American Beacon Sound Point Enhanced Income Fund (2018-Present);Vice President American Beacon Apollo Total Return Fund (2018-Present). | ||
| Erica Duncan (49) | VP Since 2011 | Vice President, American Beacon Advisors, Inc. (2011-Present); Vice President, Resolute Investment Managers (2018-Present); Vice President, Resolute Investment Services, Inc. (2018-Present); Vice President, American Beacon Select Funds (2011-Present); Vice President, American Beacon Institutional Funds Trust (2017-Present); Vice President American Beacon Sound Point Enhanced Income Fund (2018-Present); Vice President American Beacon Apollo Total Return Fund (2018-Present). | ||
80
Trustees and Officers of the American Beacon FundsSM(Unaudited)
Name, Age | Position, Term of Office and Length of Time Served with the Trust | Principal Occupation(s) During Past 5 Years and Current Directorships | ||
| OFFICERS (CONT.) | Term | |||
| One Year | ||||
| Melinda G. Heika (58) | Principal Accounting Officer since 2017 and Treasurer since 2010 | Treasurer and CFO (2010-Present), American Beacon Advisors, Inc.; Treasurer, Resolute Topco, Inc. (2015-Present); Treasurer, Resolute Investment Holdings, LLC. (2015-Present); Treasurer, Resolute Acquisition, Inc. (2015-Present); Treasurer and CFO, Resolute Investment Managers, Inc. (2017-Present); Treasurer, Resolute Investment Distributors, Inc. (2017-2017); Treasurer and CFO, Resolute Investment Services, Inc. (2015-Present); Treasurer, Lighthouse Holdings Parent Inc., (2010-2015); Treasurer, Lighthouse Holdings, Inc. (2010-2015); Treasurer, American Private Equity Management, LLC (2012-Present); Treasurer and CFO, Alpha Quant Advisors, LLC (2016-Present); Treasurer and CFO, Continuous Capital, LLC (2018-Present); Treasurer, Green Harvest Asset Management (2019-Present); Treasurer, American Beacon Cayman Transformational Innovation, Ltd. (2017-2018); Treasurer, American Beacon Delaware Transformational Innovation Corporation (2017-2018); Director and Treasurer, American Beacon Cayman Managed Futures Strategy Fund, Ltd. (2014-Present); Treasurer, American Beacon Cayman TargetRisk Company, Ltd. (2018-Present); Treasurer, American Beacon Select Funds (2010-Present); Treasurer, American Beacon Institutional Funds Trust (2017-Present); Treasurer, American Beacon Sound Point Enhanced Income Fund (2018-Present); Treasurer, American Beacon Apollo Total Return Fund (2018-Present). | ||
| Terri L. McKinney (56) | VP since 2010 | Vice President (2009-Present), Managing Director (2003-2009), American Beacon Advisors, Inc.; Vice President, Resolute Investment Managers, Inc. (2017-Present); Vice President, Resolute Investment Services, Inc (2018-Present); Vice President, Alpha Quant Advisors, LLC (2016-Present); Vice President, Continuous Capital, LLC (2018-Present); Vice President, American Beacon Select Funds (2010-Present); Vice President, American Beacon Institutional Funds Trust (2017-Present); Vice President, American Beacon Sound Point Enhanced Income Fund (2018-Present); Vice President, American Beacon Apollo Total Return Fund (2018-Present). | ||
81
Trustees and Officers of the American Beacon FundsSM(Unaudited)
Name, Age | Position, Term of Office and Length of Time Served with the Trust | Principal Occupation(s) During Past 5 Years and Current Directorships | ||
| OFFICERS (CONT.) | Term | |||
| One Year | ||||
| Jeffrey K. Ringdahl (44) | VP since 2010 | Director (2015-Present), President (2018-Present), Chief Operating Officer (2010-Present), Senior Vice President (2013-2018), Vice President (2010-2013), American Beacon Advisors, Inc.; Director (2015-Present), President (2018-Present), Senior Vice Present (2015-2018), Resolute Investment Holdings, LLC; Director (2015-Present), President (2018-Present), Senior Vice President (2015-2018), Resolute Topco, Inc.; Director (2015-Present), President (2018-Present), Senior Vice President (2015-2018), Resolute Acquisition, Inc.; Director (2015-Present), President & COO (2018-Present), Senior Vice President (2015-2018), Resolute Investment Managers, Inc.; Director and Executive Vice President (2017-Present), Resolute Investment Distributors, Inc.; Director (2017-Present), President & COO (2018-Present), Executive Vice President (2017-2018), Resolute Investment Services, Inc.; Senior Vice President (2017-Present), Vice President (2012-2017), Manager (2015-Present), American Private Equity Management, LLC; Senior Vice President, Lighthouse Holdings Parent, Inc. (2013-2015); Senior Vice President, Lighthouse Holdings, Inc. (2013-2015); Trustee, American Beacon NextShares Trust (2015-Present); Director, Executive Vice President & COO, Alpha Quant Advisors, LLC (2016-Present); Director, Shapiro Capital Management, LLC (2017-Present); Director, Executive Vice President & COO, Continuous Capital, LLC (2018-Present); Director, RSW Investments Holdings LLC, (2019-Present); Manager, SSI Investment Management, LLC (2019-Present); Director, National Investment Services of America, LLC (2019-Present); Director and Vice President, American Beacon Cayman Transformational Innovation Company, Ltd., (2017-Present); Vice President, American Beacon Delaware Transformational Innovation Corporation (2017-2018); Director and Vice President, American Beacon Cayman Managed Futures Strategy Fund, Ltd. (2014-Present); Vice President, American Beacon Cayman TargetRisk Company, Ltd (2018-Present); Vice President, American Beacon Select Funds (2010-2018); Vice President, American Beacon Institutional Funds Trust (2017-Present); Vice President, American Beacon Sound Point Enhanced Income Fund (2018-Present); Vice President, American Beacon Apollo Total Return Fund (2018-Present). | ||
| Samuel J. Silver (56) | VP Since 2011 | Vice President (2011-Present), Chief Fixed Income Officer (2016-Present), American Beacon Advisors, Inc. (2011-Present); Vice President, American Beacon Select Funds (2011-Present); Vice President, American Beacon Institutional Funds Trust (2017-Present); Vice President, American Beacon Sound Point Enhanced Income Fund (2018-Present); Vice President, American Beacon Apollo Total Return Fund (2018-Present). | ||
| Christina E. Sears (48) | Chief Compliance Officer since 2004 and Asst. Secretary since 1999 | Vice President, American Beacon Advisors, Inc. (2019-Present); Chief Compliance Officer, American Beacon Advisors, Inc. (2004-Present); Vice President, Resolute Investment Managers, Inc. (2017-Present); Vice President, Resolute Investment Distributors (2017-Present); Vice President, Resolute Investment Services, Inc. (2019-Present); Chief Compliance Officer, American Private Equity Management, LLC (2012-Present); Chief Compliance Officer (2016-2019) and Vice President, Alpha Quant Advisors, LLC (2016-Present); Vice President, Continuous Capital, LLC (2018-Present); Chief Compliance Officer (2004-Present) and Assistant Secretary (1999-Present), American Beacon Select Funds; Chief Compliance Officer and Assistant Secretary, American Beacon Institutional Funds Trust (2017-Present); Chief Compliance Officer and Assistant Secretary, American Beacon Sound Point Enhanced Income Fund (2018-Present); Chief Compliance Officer and Assistant Secretary, American Beacon Apollo Total Return Fund (2018-Present). | ||
82
Trustees and Officers of the American Beacon FundsSM(Unaudited)
Name, Age | Position, Term of Office and Length of Time Served with the Trust | Principal Occupation(s) During Past 5 Years and Current Directorships | ||
| OFFICERS (CONT.) | Term | |||
| One Year | ||||
| Sonia L. Bates (63) | Asst. Treasurer since 2011 | Assistant Treasurer, American Beacon Advisors, Inc. (2011-2018); Assistant Treasurer, Lighthouse Holdings Parent Inc. (2011-2015); Assistant Treasurer, Lighthouse Holdings, Inc. (2011-2015); Assistant Treasurer, American Private Equity Management, LLC (2012-Present); Assistant Treasurer, American Beacon Cayman Transformational Innovation Company, Ltd. (2017-Present); Assistant Treasurer, American Beacon Cayman TargetRisk Company, Ltd. (2018-Present); Assistant Treasurer, American Beacon Select Funds (2011-Present); Assistant Treasurer, American Beacon Institutional Funds Trust (2017-Present); Assistant Treasurer, American Beacon Sound Point Enhanced Income Fund (2018-Present); Assistant Treasurer, American Beacon Apollo Total Return Fund (2018-Present). | ||
| Shelley D. Abrahams (45) | Assistant Secretary since 2008 | Assistant Secretary, American Beacon Select Funds (2008-Present); Assistant Secretary, American Beacon Institutional Funds Trust (2017-Present); Assistant Secretary, American Beacon Sound Point Enhanced Income Fund (2018-Present); Assistant Secretary, American Beacon Apollo Total Return Fund (2018-Present); | ||
| Rebecca L. Harris (53) | Assistant Secretary since 2010 | Vice President, American Beacon Advisors, Inc. (2011-Present); Vice President, Resolute Investment Managers, Inc. (2017-Present); Vice President, Resolute Investment Services (2015-Present); Vice President, Alpha Quant Advisors, LLC (2016-Present); Vice President, Continuous Capital, LLC (2018-Present); Assistant Secretary, American Beacon Select Funds (2010-Present); Assistant Secretary, American Beacon Institutional Funds Trust (2017-Present); Assistant Secretary, American Beacon Sound Point Enhanced Income Fund (2018-Present); Assistant Secretary, American Beacon Apollo Total Return Fund (2018-Present). | ||
| Teresa A. Oxford (61) | Assistant Secretary since 2015 | Assistant Secretary, American Beacon Advisors, Inc. (2015-Present); Assistant Secretary, Resolute Investment Distributors (2018-Present); Assistant Secretary, Resolute Investment Services (2018-Present); Assistant Secretary, Alpha Quant Advisors, LLC (2016-Present); Assistant Secretary, American Beacon Select Funds (2015-Present); Assistant Secretary, American Beacon Institutional Funds Trust (2017-Present); Assistant Secretary, American Beacon Sound Point Enhanced Income Fund (2018-Present); Assistant Secretary, American Beacon Apollo Total Return Fund (2018-Present); . | ||
| Peter A. Davidson (47)** | Assistant Secretary Since 2020 | Assistant Secretary, American Beacon Select Funds (2020-Present); Assistant Secretary, American Beacon Institutional Funds Trust (2020-Present); Assistant Secretary, American Beacon Sound Point Enhanced Income Fund (2020-Present); Assistant Secretary, American Beacon Apollo Total Return Fund (2020-Present). | ||
* As of 11/12/2014, the Board adopted a retirement plan that requires Trustees to retire no later than the last day of the calendar year in which they reach the age of 75.
** Mr. Davidson was elected at the March 3, 2020 meeting of the Board.
83
American Beacon FundsSM
January 31, 2020 (Unaudited)
The American Beacon Funds recognize and respect the privacy of our shareholders. We are providing this notice to you so you will understand how shareholder information may be collected and used.
We may collect nonpublic personal information about you from one or more of the following sources:
| • | information we receive from you on applications or other forms; |
| • | information about your transactions with us or our service providers; and |
| • | information we receive from third parties. |
We do not disclose any nonpublic personal information about our customers or former customers to anyone, except as permitted by law.
We restrict access to your nonpublic personal information to those employees or service providers who need to know that information to provide products or services to you. To ensure the confidentiality of your nonpublic personal information, we maintain safeguards that comply with federal standards.
84

Delivery of Documents
eDelivery isNOW AVAILABLE - Stop traditional mail delivery and receive your shareholder reports and summary prospectuson-line. Sign up at
www.americanbeaconfunds.com
If you invest in the Fund through a financial institution, you may be able to receive the Fund’s regulatory mailings, such as the Prospectus, Annual Report and Semi-Annual Report, bye-mail. If you are interested in this option, please go to www.icsdelivery.com and search for your financial institution’s name or contact your financial institution directly.
To obtain more information about the Fund:
 |  | |
| ByE-mail: | On the Internet: | |
| american_beacon.funds@ambeacon.com | Visit our website atwww.americanbeaconfunds.com | |
By Telephone: Call (800)658-5811 |
By Mail: American Beacon Funds P.O. Box 219643 Kansas City, MO 64121-9643 | |
| Availability of Quarterly Portfolio Schedules | Availability of Proxy Voting Policy and Records | |
| In addition to the Schedule of Investments provided in each semi-annual and annual report, the Fund files a complete schedule of its portfolio holdings with the Securities and Exchange Commission (“SEC”) on Form N-PORT as of the end of each fiscal quarters. The Fund’s Forms N-PORT are available on the SEC’s website atwww.sec.gov. The FormsN-PORT may also be reviewed and copied at the SEC’s Public Reference Section, 100 F Street, NE, Washington, D.C.20549-2736. Information regarding the operation of the SEC’s Public Reference Room may be obtained by calling(800)-SEC-0330. A complete schedule of each Fund’s portfolio holdings is also available atwww.americanbeaconfunds.com approximately twenty days after the end of each month. | A description of the policies and procedures the Fund uses to determine how to vote proxies relating to portfolio securities is available in the Fund’s Statement of Additional Information, is available free of charge on the Fund’s websitewww.americanbeaconfunds.com and by calling1-800-967-9009 or by accessing the SEC’s website atwww.sec.gov. The Fund’s proxy voting record for the most recent year ended June 30 is filed annually with the SEC on FormN-PX. The Fund’s FormsN-PX are available on the SEC’s website atwww.sec.gov. The Fund’s proxy voting record may also be obtained by calling1-800-967-9009. | |


Fund Service Providers:
CUSTODIAN State Street Bank and Trust Company Boston, Massachusetts | TRANSFER AGENT DST Asset Manager Solutions, Inc. Kansas City, Missouri | INDEPENDENT REGISTERED PUBLIC ACCOUNTING FIRM PricewaterhouseCoopers LLP Boston, Massachusetts | DISTRIBUTOR Resolute Investment Distributors, Inc. Irving, Texas |
This report is prepared for shareholders of the American Beacon Funds and may be distributed to others only if preceded or accompanied by a current Prospectus or Summary Prospectus.
American Beacon Funds, American Beacon Frontier Markets Income Fund and American Beacon GLG Total Return Fund are service marks of American Beacon Advisors, Inc.
AR 1/20
| ITEM 2. | CODE OF ETHICS. |
The Trust adopted a code of ethics that applies to its principal executive and financial officers (the “Code”). The Trust amended its code August 19, 2019 to disclose the addition of the American Beacon Sound Point Enhanced Income Fund, American Beacon Apollo Total Return Fund and American Beacon Sound Point Alternative Lending Fund and to disclose a change to limit the value of gifts received by the principal officer or financial officer to $100. The Trust did not grant any waivers to the provisions of the Code during the period covered by the shareholder reports presented in Item 1. The Code is filed herewith as Exhibit 99.CODE ETH.
| ITEM 3. | AUDIT COMMITTEE FINANCIAL EXPERT. |
The Trust’s Board of Trustees has determined that Gilbert G. Alvarado and Claudia Holz, members of the Trust’s Audit and Compliance Committee, are “audit committee financial experts” as defined in FormN-CSR. Mr. Gilbert Alvarado and Ms. Claudia Holz are “independent” as defined in FormN-CSR.
| ITEM 4. | PRINCIPAL ACCOUNTANT FEES AND SERVICES. |
(a)
Audit Fees | Fiscal Year Ended | |||
$288,530 | 1/31/2019 | |||
$280,711 | 1/31/2020 | |||
(b)
Audit-Related Fees | Fiscal Year Ended | |||
$0 | 1/31/2019 | |||
$0 | 1/31/2020 | |||
(c)
Tax Fees | Fiscal Year Ended | |||
$71,090 | 1/31/2019 | |||
$84,526 | 1/31/2020 | |||
(d)
All Other Fees | Fiscal Year Ended | |||
$0 | 1/31/2019 | |||
$0 | 1/31/2020 | |||
(e)(1) Pursuant to its charter, the Trust’s Audit and Compliance Committee shall have the following duties and powers pertaining topre-approval of audit andnon-audit services provided by the Trust’s principal accountant:
• to approve, prior to appointment, the engagement of auditors to annually audit and provide their opinion on the Trusts’ financial statements, and, in connection therewith, reviewing and evaluating matters potentially affecting the independence and capabilities of the auditors;
• to approve, prior to appointment, the engagement of the auditors to providenon-audit services to the Trusts, an investment adviser to any series of the Trusts or any entity controlling, controlled by, or under common control with an investment adviser (“adviser affiliate”) that provides ongoing services to the Trusts, if the engagement relates directly to the operations and financial reporting of the Trusts;
• to consider whether thenon-audit services provided by a Trust’s auditor to an investment adviser or any adviser affiliate that provides ongoing services to a series of the Trusts, which services were notpre-approved by the Committee, are compatible with maintaining the auditor’s independence;
• to review the arrangements for and scope of the annual audit and any special audits; and
• to review and approving the fees proposed to be charged to the Trusts by the auditors for each audit andnon-audit service.
The Audit and Compliance Committee may delegate any portion of its authority, including the authority to grantpre-approvals of audit and permittednon-audit services, to a subcommittee of one or more members. Any decisions of the subcommittee to grantpre-approvals shall be presented to the full audit committee at its next regularly scheduled meeting.
(e)(2) None of the fees disclosed in paragraphs (b) through (d) above were approved by the audit committee pursuant to paragraph (c)(7)(i)(C) of Rule2-01 of RegulationS-X.
(f) Not applicable.
(g) AggregateNon-Audit Fees for Services Rendered to the:
Registrant | Adviser | Adviser’s Affiliates Providing Ongoing Services to Registrant | Fiscal Year Ended | |||||||
| $71,090 | $ | 0 | N/A | 1/31/2019 | ||||||
| $84,526 | $ | 0 | N/A | 1/31/2020 | ||||||
(h) Not applicable.
| ITEM 5. | AUDIT COMMITTEE OF LISTED REGISTRANTS. |
Not applicable.
| ITEM 6. | SCHEDULE OF INVESTMENTS. |
The schedules of investments for each series of the Trust are included in the shareholder reports presented in Item 1.
| ITEM 7. | DISCLOSURE OF PROXY VOTING POLICIES AND PROCEDURES FORCLOSED-END MANAGEMENT INVESTMENT COMPANIES. |
Not applicable.
| ITEM 8. | PORTFOLIO MANAGERS OFCLOSED-END MANAGEMENT INVESTMENT COMPANIES. |
Not applicable.
| ITEM 9. | PURCHASES OF EQUITY SECURITIES BYCLOSED-END MANAGEMENT INVESTMENT COMPANY AND AFFILIATED PURCHASERS. |
Not applicable.
| ITEM 10. | SUBMISSION OF MATTERS TO A VOTE OF SECURITY HOLDERS. |
The Trust has made no material changes to the procedures by which shareholders may recommend nominees to the Trust’s Board of Trustees since the Trust last disclosed such procedures in Schedule 14A.
| ITEM 11. | CONTROLS AND PROCEDURES. |
(a) Based upon an evaluation within 90 days of the filing date of this report, the principal executive and financial officers concluded that the disclosure controls and procedures of the Trust are effective.
(b) There were no changes in the Trust’s internal control over financial reporting during the second fiscal quarter of the period covered by this report that has materially affected, or is reasonably likely to materially affect, the Trust’s internal control over financial reporting.
| ITEM 12. | EXHIBITS. |
(a)(1) Filed herewith asEX-99.CODE ETH.
(a)(3) Not applicable.
SIGNATURES
Pursuant to the requirements of the Securities Exchange Act of 1934 and the Investment Company Act of 1940, the registrant has duly caused this report to be signed on its behalf by the undersigned, thereunto duly authorized.
(Registrant): American Beacon Funds
By /s/ Gene L. Needles, Jr. |
| Gene L. Needles, Jr. |
| President |
| American Beacon Funds |
Date: April 7, 2020
Pursuant to the requirements of the Securities Exchange Act of 1934 and the Investment Company Act of 1940, this report has been signed below by the following persons on behalf of the registrant and in the capacities and on the dates indicated.
By /s/ Gene L. Needles, Jr. |
| Gene L. Needles, Jr. |
| President |
| American Beacon Funds |
Date: April 7, 2020
By /s/ Melinda G. Heika |
| Melinda G. Heika |
| Treasurer |
| American Beacon Funds |
Date: April 7, 2020