UNITED STATES SECURITIES AND EXCHANGE COMMISSION
Washington, D.C. 20549
FORM N-CSR
CERTIFIED SHAREHOLDER REPORT OF REGISTERED MANAGEMENT
INVESTMENT COMPANIES
| Investment Company Act file number: | 811-04997 | |
| Exact name of registrant as specified in charter: | Delaware Group®Equity Funds V | |
| Address of principal executive offices: | 2005 Market Street | |
| Philadelphia, PA 19103 | ||
| Name and address of agent for service: | David F. Connor, Esq. | |
| 2005 Market Street | ||
| Philadelphia, PA 19103 | ||
| Registrant’s telephone number, including area code: | (800) 523-1918 | |
| Date of fiscal year end: | November 30 | |
| Date of reporting period: | November 30, 2018 |
Item 1. Reports to Stockholders
Table of Contents
Multi-asset mutual fund
Delaware Wealth Builder Fund
November 30, 2018
Carefully consider the Fund’s investment objectives, risk factors, charges, and expenses before investing. This and other information can be found in the Fund’s prospectus and its summary prospectus, which may be obtained by visiting delawarefunds.com/literature or calling 800523-1918. Investors should read the prospectus and the summary prospectus carefully before investing.
You can obtain shareholder reports and prospectuses online instead of in the mail. Visit delawarefunds.com/edelivery.
Visit delawarefunds.com/edelivery.
Table of Contents
Experience Delaware Funds®by Macquarie
Macquarie Investment Management (MIM) is a global asset manager with offices throughout the United States, Europe, Asia, and Australia. We are active managers who prioritize autonomy and accountability at the investment team level in pursuit of opportunities that matter for our clients. Delaware Funds is one of the longest-standing mutual fund families, with more than 75 years in existence.
If you are interested in learning more about creating an investment plan, contact your financial advisor.
You can learn more about Delaware Funds or obtain a prospectus for Delaware Wealth Builder Fund at delawarefunds.com/literature.
Manage your account online
| ● | Check your account balance and transactions |
| ● | View statements and tax forms |
| ● | Make purchases and redemptions |
Visit delawarefunds.com/account-access.
Macquarie Asset Management (MAM) offers a diverse range of products including securities investment management, infrastructure and real asset management, and fund and equity-based structured products. MIM is the marketing name for certain companies comprising the asset management division of Macquarie Group. This includes the following registered investment advisers: Macquarie Investment Management Business Trust (MIMBT), Macquarie Funds Management Hong Kong Limited, Macquarie Investment Management Austria Kapitalanlage AG, Macquarie Investment Management Global Limited, Macquarie Investment Management Europe Limited, and Macquarie Capital Investment Management LLC.
The Fund is distributed byDelaware Distributors, L.P. (DDLP), an affiliate of MIMBT and Macquarie Group Limited.
Other than Macquarie Bank Limited (MBL), none of the entities noted are authorized deposit-taking institutions for the purposes of the Banking Act 1959 (Commonwealth of Australia). The obligations of these entities do not represent deposits or other liabilities of MBL. MBL does not guarantee or otherwise provide assurance in respect of the obligations of these entities, unless noted otherwise. The Fund is governed by US laws and regulations.
| ||||
| 1 | ||||
| 5 | ||||
| 9 | ||||
Security type / sector allocation and top 10 equity holdings | 11 | |||
| 14 | ||||
| 38 | ||||
| 40 | ||||
| 42 | ||||
| 44 | ||||
| 52 | ||||
| 76 | ||||
| 77 | ||||
| 82 | ||||
| 92 | ||||
Unless otherwise noted, views expressed herein are current as of Nov. 30, 2018, and subject to change for events occurring after such date.
The Fund is not FDIC insured and is not guaranteed. It is possible to lose the principal amount invested.
Advisory services provided by Delaware Management Company, a series of MIMBT, a US registered investment advisor.
All third-party marks cited are the property of their respective owners.
© 2019 Macquarie Management Holdings, Inc.
Table of Contents
| Portfolio management review | ||
| Delaware Wealth Builder Fund | December 11, 2018 |
Performance preview (for the year ended November 30, 2018) | ||||||||
Delaware Wealth Builder Fund (Institutional Class shares) | 1-year return | -0.37 | % | |||||
Delaware Wealth Builder Fund (Class A shares)* | 1-year return | -0.63 | % | |||||
60% S&P 500® Index / 40% Bloomberg Barclays US Aggregate Index (primary benchmark) | 1-year return | +3.32 | % | |||||
S&P 500 Index (secondary benchmark) | 1-year return | +6.27 | % |
Past performance does not guarantee future results.
For complete, annualized performance for Delaware Wealth Builder Fund, please see the table on page 5.
Institutional Class shares are not subject to a sales charge and are offered for sale exclusively to certain eligible investors. In addition, Institutional Class shares pay no distribution and service fee.
The performance of Class A shares excludes the applicable sales charge. Both Institutional Class shares and Class A shares reflect the reinvestment of all distributions.
Please see page 7 for a description of the index. Index performance returns do not reflect any management fees, transaction costs, or expenses. Indices are unmanaged and one cannot invest directly in an index.
*Total return for the report period presented in the table differs from the return in “Financial highlights.” The total return presented in the above table is calculated based on the net asset value (NAV) at which shareholder transactions were processed. The total returns presented in “Financial highlights” is calculated in the same manner, but also take into account certain adjustments that are necessary under US generally accepted accounting principles (US GAAP) required in the annual report.
A strong US economy
Throughout the Fund’s fiscal year ended Nov. 30, 2018, the US economy continued along its expansionary path. US gross domestic product (GDP) – a measure of national economic output – grew in all four quarters of the Fund’s fiscal year. The expansion was especially rapid in the second quarter (+4.2%) and third quarter (+3.5%) of 2018, which represented the country’s fastest half year of GDP growth since 2014. Meanwhile, the US unemployment rate continued to drop, reaching 3.7% in October, a nearly50-year low. (Sources: US Bureau of Economic Analysis and US Bureau of Labor Statistics.) To combat potential inflation that can accelerate during periods of economic growth, the US Federal Reserve raised the federal funds rate by a quarter percentage point on four occasions during the fiscal year, ending in a target range of 2.00% to 2.25%, up from a range of 1.00% to 1.25% a year earlier. Outside the United States, the economic picture was more mixed, with momentum slowing in many countries and regions. Higher interest rates and a |
|
● Market volatility was elevated throughout the fiscal year.
● International equities trailed US stocks, reflecting a weaker economic backdrop.
● Investors favored growth-oriented stocks during most of the fiscal year. |
| 1 |
Table of Contents
| Portfolio management review | ||
| Delaware Wealth Builder Fund |
stronger US dollar proved to be headwinds for China and other emerging markets. Europe, meanwhile, struggled amid political challenges and a lack of economic catalysts.
Rising market volatility
Global equity markets began the fiscal year on a strong upswing before turning volatile and suddenly selling off in February 2018. The volatility remained elevated throughout much of the remainder of the reporting period, reflecting rising concern about US inflation, the imposition of US tariffs, and growing fears of a trade war with China, among other challenges, and the performance of US andnon-US equity markets ultimately diverged widely.
For the12-month period, USlarge-cap value stocks, as measured by the Russell 1000® Value Index, gained 3.0%, with a significant late-period market correction wiping out many earlier gains. International developed market stocks, as measured by the MSCI EAFE (Europe, Australasia, Far East) Index (net), declined 7.9% for the same period, reflecting the weakernon-US economic backdrop.
Of all the asset classes reflected in the Fund, only convertible securities and real estate investment trusts (REITs) outpaced USlarge-cap value equities. Convertibles, as measured by the ICE BofAML US Convertible Index, gained 4.9%, while the US REIT market, as measured by the FTSE NAREIT Equity REITs Index, advanced 3.7%.
Meanwhile, high yield corporate bonds, as measured by the Bloomberg Barclays US Corporate High-Yield Index, gained 0.4%. Credit spreads widened over the period as investors demanded more income to own riskier debt. Investment grade bonds, with their lower yields, were hurt by rising rates and declined 1.3%, as measured by the Bloomberg Barclays US Aggregate Index.
Within the Fund
For its fiscal year ended Nov. 30, 2018, Delaware Wealth Builder Fund underperformed its primary benchmark, a blend of 60% S&P 500 Index and 40% Bloomberg Barclays US Aggregate Index. The Fund also underperformed its secondary benchmark, the S&P 500 Index. The Fund’s Institutional Class shares declined 0.37%. The Fund’s Class A shares fell 0.63% at net asset value and fell 6.33% at maximum offer price. These figures reflect all distributions reinvested. For the same period, the blend of 60% S&P 500 Index and 40% Bloomberg Barclays US Aggregate Index rose 3.32% and the S&P 500 Index advanced 6.27%. Complete annualized performance for Delaware Wealth Builder Fund is shown in the table on page 5.
The Fund’s natural focus on yield-oriented investments was a headwind to performance. For most of the fiscal year, investors tended to favor growth-oriented stocks, which are not well represented in the Fund’s portfolio. The Fund’s exposure to international equities, which significantly lagged US equities during the period, presented another meaningful performance challenge. That said, our decision in the first half of the fiscal year to significantly scale back this exposure limited the negative impact.
On the positive side, the Fund’s exposure tolarge-cap value equities and convertible securities proved beneficial as both categories outperformed the blended benchmark.
Individual contributors and detractors
Many of the Fund’s biggest individual detractors for the fiscal year werenon-US stocks, including Japanese imaging companyCanon Inc.and tobacco manufacturerBritish American Tobacco PLC.Canon issued weaker-than-expected earnings guidance while shares of British American Tobacco fell on concern about new potential US cigarette regulations and increased
| 2 |
Table of Contents
competition in the market for next-generation tobacco products.
Othernon-US holdings to weigh on results includedPlaytech Plc, a UK developer of online gaming software; French automotive supplierValeo S.A., and financial services companiesStandard Chartered PLC(United Kingdom) andING Groep NV(Netherlands).
Meanwhile, in the Fund’s REIT subportfolio, positions inBrookdale Senior Living Inc., an owner and operator of senior housing facilities, andAssura PLC, aUK-based REIT that owns healthcare properties, significantly hampered performance.
In contrast, severalUS-based holdings in the Fund’slarge-cap value subportfolio added to performance, includingMerck & Co. Inc.andPfizer Inc., pharmaceutical manufacturers that reported favorable financial results;Verizon Communications Inc., a telecommunication services provider that issued better-than-expected earnings; and garbage and recycling companyWaste Management Inc., which benefited from growth in the firm’s core waste collection business as well as US tax policy changes.
Also, among the Fund’s real estate investments, the Fund benefited from its exposure totriple-net REITsSTORE Capital Corp.andNational Retail Properties Inc., both of which profited from a favorable cost of capital. Manufactured home community ownerSun Communities Inc.and Canadian residential property ownerKillam Apartment Real Estate Investment Trustalso added value.
Sticking to our strategy
Throughout the Fund’s fiscal year, we pursued the same management approach we apply in all market conditions: We continued to look across multiple asset classes for securities with competitive yield and the potential for dividend growth. In addition, we maintained our emphasis
on managing downside risk in the portfolio and seeking to limit potential capital losses.
Our main portfolio shift during the past 12 months was to reduce exposure to international equities. Coming into the fiscal year, we viewed this asset class favorably. However, as data mounted suggesting slowing global economic growth, and as rising interest rates lifted the value of the dollar, we began to see a more challenging backdrop fornon-US equities. This situation led us to significantly reduce exposure to international equities, from about 16% of the Fund at the start of the fiscal year to just 3% at fiscal year end.
We distributed the proceeds of this reduction across several asset classes. Exposure tolarge-cap value equities, for example, rose from roughly 35% of the portfolio a year ago to 38% at fiscal year end. Meanwhile, the Fund’s exposure to REITs increased from 9% to 11% of the portfolio, while the Fund’s convertibles allocation inched higher to 13%, from 12% a year earlier.
The Fund’s municipal bond allocation drifted incrementally higher, reaching 5% of the portfolio at fiscal year end, while exposure to investment grade bonds decreased modestly, finishing the period at 4%. Of final note, the Fund’s high yield bond allocation remained steady at 10%, while a small allocation tonon-US debt was essentially unchanged at 2%.
We employed derivative securities in the Fund during the fiscal year. These included foreign currency exchange contracts to facilitate the purchase and sale of securities in the Fund, futures contracts to hedge currency risks, options contracts to receive premiums for writing options, and credit default swap contracts to hedge against credit events. The Fund owned futures on the S&P 500 Index, which we used tactically in an attempt to increase the defensive characteristics of the portfolio in a highly valued market. None of these positions had a material effect on the Fund’s performance during the fiscal year.
| 3 |
Table of Contents
| Portfolio management review | ||
| Delaware Wealth Builder Fund |
A modestly defensive stance
At the end of the fiscal year, the Fund’s exposure to equities was several percentage points below what we consider a neutral level of 60%. This relative underweight reflects what we see as the potential for diminished global economic growth, coupled with our view that stock valuations are relatively expensive. Another factor behind our somewhat defensive stance is
an increasingly volatile US political backdrop, which has added a new layer of uncertainty to the investment process.
We will continue to monitor economic and market conditions as we focus on providing a desirable total return to investors, with close attention to managing downside risk while seeking potential upside via income-generating securities across multiple asset classes and regions.
| 4 |
Table of Contents
| Performance summary | ||
| Delaware Wealth Builder Fund | November 30, 2018 |
The performance quoted represents past performance and does not guarantee future results. Investment return and principal value of an investment will fluctuate so that shares, when redeemed, may be worth more or less than their original cost. Current performance may be lower or higher than the performance quoted. Performance data current to the most recent month end may be obtained by calling 800523-1918 or visiting delawarefunds.com/performance.
| Fund and benchmark performance1,2 | Average annual total returns through November 30, 2018 | |||||||
| 1 year | 5 years | 10 years | Lifetime | |||||
Class A (Est. Dec. 2, 1996) | ||||||||
Excluding sales charge | -0.63%* | +4.53% | +10.79% | +7.45% | ||||
Including sales charge | -6.33% | +3.31% | +10.14% | +7.16% | ||||
Class C (Est. Oct. 1, 2003) | ||||||||
Excluding sales charge | -1.34% | +3.75% | +9.97% | +5.43% | ||||
Including sales charge | -2.31% | +3.75% | +9.97% | +5.43% | ||||
Class R (Est. Oct. 1, 2003) | ||||||||
Excluding sales charge | -0.78% | +4.28% | +10.53% | +5.94% | ||||
Including sales charge | -0.78% | +4.28% | +10.53% | +5.94% | ||||
Institutional Class (Est. Dec. 2, 1996) | ||||||||
Excluding sales charge | -0.37% | +4.79% | +11.08% | +7.64% | ||||
Including sales charge | -0.37% | +4.79% | +11.08% | +7.64% | ||||
60% S&P 500 Index / 40% Bloomberg | ||||||||
Barclays US Aggregate Index | +3.32% | +7.54% | +10.18% | +7.17%** | ||||
S&P 500 Index | +6.27% | +11.12% | +14.32% | +8.20%** | ||||
* Total returns for the report period presented in the table differ from the returns in “Financial highlights.” The total returns presented in the above table are calculated based on the net asset value (NAV) at which shareholder transactions were processed. The total returns presented in “Financial highlights” are calculated in the same manner, but also take into account certain adjustments that are necessary under US generally accepted accounting principles (US GAAP) required in the annual report.
** The benchmark lifetime return is for Institutional Class share comparison only and is calculated using the last business day in the month of the Fund’s Institutional Class inception date.
1 Returns reflect the reinvestment of all distributions and are presented both with and without the applicable sales charges described below. Returns do not reflect the deduction of taxes the shareholder would pay on Fund distributions or redemptions of Fund shares.
Expense limitations were in effect for certain classes during some or all of the periods shown in the “Fund and benchmark performance” table. Expenses for each class are listed on the “Fund expense ratios” table on page 6. Performance
would have been lower had expense limitations not been in effect.
Institutional Class shares are not subject to a sales charge and are offered for sale exclusively to certain eligible investors. In addition, Institutional Class shares pay no distribution and service fee.
Class A shares are sold with a maximumfront-end sales charge of 5.75%, and have an annual distribution and service fee of 0.25% of average daily net assets. Performance for Class A shares,
| 5 |
Table of Contents
| Performance summary | ||
| Delaware Wealth Builder Fund |
excluding sales charges, assumes that nofront-end sales charge applied.
Class C shares are sold with a contingent deferred sales charge of 1.00% if redeemed during the first 12 months. They are also subject to an annual distribution and service fee of 1.00% of average daily net assets. Performance for Class C shares, excluding sales charges, assumes either that contingent deferred sales charges did not apply or that the investment was not redeemed.
Class R shares are available only for certain retirement plan products. They are sold without a sales charge and have an annual distribution and service fee of 0.50% of average daily net assets.
Investment in the Fund does not in any way provide an indication of future performance or a guarantee of positive returns.
The Fund may invest up to 45% of its net assets in high yield, higher-risk corporate bonds.
Fixed income securities and bond funds can lose value, and investors can lose principal, as interest rates rise. They also may be affected by economic conditions that hinder an issuer’s ability to make interest and principal payments on its debt.
The Fund may also be subject to prepayment risk, the risk that the principal of a bond that is held by a portfolio will be prepaid prior to maturity, at the time when interest rates are lower than what the bond was paying. A portfolio may then have to reinvest that money at a lower interest rate.
High yielding,non-investment-grade bonds (junk bonds) involve higher risk than investment grade bonds.
International investments entail risks not ordinarily associated with US investments including fluctuation in currency values, differences in accounting principles, or economic or political instability in other nations.
Investing in emerging markets can be riskier than investing in established foreign markets due to increased volatility and lower trading volume.
2 The Fund’s expense ratios, as described in the most recent prospectus, are disclosed in the following “Fund expense ratios” table. Please see the “Financial highlights” section in this report for the most recent expense ratios.
| Fund expense ratios | Class A | Class C | Class R | Institutional Class | ||||
Total annual operating expenses | 1.09% | 1.84% | 1.34% | 0.84% | ||||
(without fee waivers) | ||||||||
Net expenses | 1.09% | 1.84% | 1.34% | 0.84% | ||||
(including fee waivers, if any) | ||||||||
Type of waiver | n/a | n/a | n/a | n/a |
| 6 |
Table of Contents
Performance of a $10,000 investment1
Average annual total returns from Nov. 30, 2008 through Nov. 30, 2018
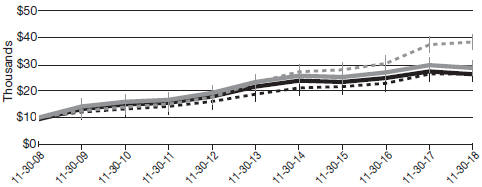
| For the period beginning Nov. 30, 2008 through Nov. 30, 2018 | Starting value | Ending value | ||||||||
| S&P 500 Index | $10,000 | $38,109 | |||||||
| Delaware Wealth Builder Fund — Institutional Class shares | $10,000 | $28,589 | |||||||
| 60% S&P 500 Index / 40% Bloomberg Barclays US Aggregate Index | $10,000 | $26,370 | |||||||
| Delaware Wealth Builder Fund — Class A shares | $9,425 | $26,267 | |||||||


1 The “Performance of a $10,000 investment” graph assumes $10,000 invested in Institutional Class and Class A shares of the Fund on Nov. 30, 2008, and includes the effect of a 5.75%front-end sales charge (for Class A shares) and the reinvestment of all distributions. The graph does not reflect the deduction of taxes the shareholders would pay on Fund distributions or redemptions of Fund shares. Expense limitations were in effect for some or all of the periods shown. Performance would have been lower had expense limitations not been in effect. Expenses are listed in the “Fund expense ratios” table on page 6. Please note additional details on pages 5 through 8.
The graph also assumes $10,000 invested in 60% S&P 500 Index / 40% Bloomberg Barclays US Aggregate Index (the Fund’s primary benchmark) and the S&P 500 Index (the Fund’s secondary benchmark) as of Nov. 30, 2008. The S&P 500 Index measures the performance
of 500 mostlylarge-cap stocks weighted by market value, and is often used to represent performance of the US stock market. The Bloomberg Barclays US Aggregate Index is a broad composite that tracks the investment grade domestic bond market.
The Russell 1000 Value Index, mentioned on page 2, measures the performance of the large-cap value segment of the US equity universe. It includes those Russell 1000 companies with lowerprice-to-book ratios and lower forecasted growth values.
The MSCI EAFE (Europe, Australasia, Far East) Index, mentioned on page 2, is a free float-adjusted market capitalization weighted index designed to measure equity market performance of developed markets, excluding the United States and Canada. Index “net” return approximates the minimum possible dividend reinvestment, after
| 7 |
Table of Contents
| Performance summary | ||
| Delaware Wealth Builder Fund |
deduction of withholding tax at the highest possible rate.
The ICE BofAML US Convertible Index (formerly known as the BofA Merrill Lynch All US Convertibles Index), mentioned on page 2, tracks the performance of publicly issued US dollar-denominated convertible securities of US companies. Qualifying securities must have at least $50 million face amount outstanding and at least one month remaining to the final conversion date.
The FTSE NAREIT Equity REITs Index, mentioned on page 2, measures the performance of all publicly traded equity real estate investment trusts (REITs) traded on US exchanges, excluding timber and infrastructure REITs.
The Bloomberg Barclays US Corporate High-Yield Index, mentioned on page 2, is composed of US
dollar-denominated,non-investment-grade corporate bonds for which the middle rating among Moody’s Investors Service, Inc., Fitch, Inc., and Standard & Poor’s is Ba1/BB+/BB+ or below.
Frank Russell Company (“Russell”) is the source and owner of the trademarks, service marks, and copyrights related to the Russell Indexes. Russell® is a trademark of the Frank Russell Company.
Index performance returns do not reflect any management fees, transaction costs, or expenses. Indices are unmanaged and one cannot invest directly in an index. Past performance is not a guarantee of future results.
Performance of other Fund classes will vary due to different charges and expenses.
| Nasdaq symbols | CUSIPs | |||||
Class A | DDIAX | 24610B107 | ||||
Class C | DDICX | 24610B305 | ||||
Class R | DDDRX | 24610B842 | ||||
Institutional Class
| DDIIX
| 24610B404
|
| 8 |
Table of Contents
| Disclosure of Fund expenses | ||
| For thesix-month period from June 1, 2018 to November 30, 2018 (Unaudited) |
As a shareholder of the Fund, you incur two types of costs: (1) transaction costs, including sales charges (loads) on purchase payments, reinvested dividends, or other distributions; redemption fees; and exchange fees; and (2) ongoing costs, including management fees; distribution and/or service(12b-1) fees; and other Fund expenses. This example is intended to help you understand your ongoing costs (in dollars) of investing in the Fund and to compare these costs with the ongoing costs of investing in other mutual funds.
The example is based on an investment of $1,000 invested at the beginning of the period and held for the entiresix-month period from June 1, 2018 to Nov. 30, 2018.
Actual expenses
The first section of the table shown, “Actual Fund return,” provides information about actual account values and actual expenses. You may use the information in this section of the table, together with the amount you invested, to estimate the expenses that you paid over the period. Simply divide your account value by $1,000 (for example, an $8,600 account value divided by $1,000 = 8.6), then multiply the result by the number in the first section under the heading entitled “Expenses Paid During Period” to estimate the expenses you paid on your account during this period.
Hypothetical example for comparison purposes
The second section of the table shown, “Hypothetical 5% return,” provides information about hypothetical account values and hypothetical expenses based on the Fund’s actual expense ratio and an assumed rate of return of 5% per year before expenses, which is not the Fund’s actual return. The hypothetical account values and expenses may not be used to estimate the actual ending account balance or expenses you paid for the period. You may use this information to compare the ongoing costs of investing in the Fund and other funds. To do so, compare this 5% hypothetical example with the 5% hypothetical examples that appear in the shareholder reports of the other funds.
Please note that the expenses shown in the table are meant to highlight your ongoing costs only and do not reflect any transactional costs, such as sales charges (loads), redemption fees, or exchange fees. Therefore, the second section of the table is useful in comparing ongoing costs only, and will not help you determine the relative total costs of owning different funds. In addition, if these transactional costs were included, your costs would have been higher. The Fund’s expenses shown in the table reflect fee waivers in effect. The Fund’s expenses shown in the table assume reinvestment of all dividends and distributions.
| 9 |
Table of Contents
| Disclosure of Fund expenses | ||
| For thesix-month period from June 1, 2018 to November 30, 2018 (Unaudited) |
Delaware Wealth Builder Fund
Expense analysis of an investment of $1,000
Beginning
Account Value
6/1/18 | Ending
Account Value
11/30/18 | Annualized
Expense Ratio | Expenses
Paid During Period
6/1/18 to 11/30/18* | |||||||||||
Actual Fund return† | ||||||||||||||
Class A | $1,000.00 | $1,008.20 | 1.07% | $5.39 | ||||||||||
Class C | 1,000.00 | 1,004.90 | 1.82% | 9.15 | ||||||||||
Class R | 1,000.00 | 1,007.50 | 1.32% | 6.64 | ||||||||||
Institutional Class | 1,000.00 | 1,009.40 | 0.82% | 4.13 | ||||||||||
Hypothetical 5% return(5% return before expenses) |
| |||||||||||||
Class A | $1,000.00 | $1,019.70 | 1.07% | $5.42 | ||||||||||
Class C | 1,000.00 | 1,015.94 | 1.82% | 9.20 | ||||||||||
Class R | 1,000.00 | 1,018.45 | 1.32% | 6.68 | ||||||||||
Institutional Class | 1,000.00 | 1,020.96 | 0.82% | 4.15 | ||||||||||
*“Expenses Paid During Period” are equal to the Fund’s annualized expense ratio, multiplied by the average account value over the period, multiplied by 183/365 (to reflect theone-half year period).
†Because actual returns reflect only the most recentsix-month period, the returns shown may differ significantly from fiscal year returns.
In addition to the Fund’s expenses reflected above, the Fund also indirectly bears its portion of the fees and expenses of the investment companies in which it invests (Underlying Funds), including exchange-traded funds. The table above does not reflect the expenses of the Underlying Funds.
| 10 |
Table of Contents
| Security type / sector allocation and top 10 equity holdings | ||
| Delaware Wealth Builder Fund | As of November 30, 2018 (Unaudited) | |
Sector designations may be different than the sector designations presented in other Fund materials. The sector designations may represent the investment manager’s internal sector classifications.
| Security type / sector | Percentage of net assets | ||||
Common Stock | 57.46% | ||||
Communication Services | 3.12% | ||||
Consumer Discretionary | 3.63% | ||||
Consumer Staples | 4.01% | ||||
Diversified REITs | 1.12% | ||||
Energy | 5.54% | ||||
Financials | 7.50% | ||||
Healthcare | 12.80% | ||||
Healthcare REITs | 1.29% | ||||
Hotel REITs | 0.28% | ||||
Industrial REITs | 0.18% | ||||
Industrials | 4.07% | ||||
Information Technology | 4.56% | ||||
Mall REITs | 0.51% | ||||
Manufactured Housing REITs | 0.27% | ||||
Materials | 1.33% | ||||
Multifamily REITs | 2.92% | ||||
Office REITs | 0.38% | ||||
Real Estate Operating/Development | 0.42% | ||||
Self-Storage REITs | 0.04% | ||||
Shopping Center REITs | 0.22% | ||||
Single Tenant REITs | 0.58% | ||||
Specialty REITs | 1.33% | ||||
Utilities | 1.36% | ||||
Closed-End Funds | 0.53% | ||||
Convertible Preferred Stock | 2.26% | ||||
Exchange-Traded Funds | 1.62% | ||||
Limited Partnerships | 1.62% | ||||
Master Limited Partnership | 0.40% | ||||
Convertible Bonds | 11.05% | ||||
Brokerage | 0.33% | ||||
Capital Goods | 1.43% | ||||
Communications | 1.07% | ||||
Consumer Cyclical | 0.65% | ||||
ConsumerNon-Cyclical | 2.06% | ||||
Energy | 1.09% | ||||
Financials | 0.74% | ||||
Real Estate Investment Trusts | 1.28% | ||||
| 11 |
Table of Contents
| Security type / sector allocation and top 10 equity holdings | ||
| Delaware Wealth Builder Fund |
| Security type / sector | Percentage of net assets | ||||
Technology | 1.82% | ||||
Utilities | 0.58% | ||||
Corporate Bonds | 13.51% | ||||
Banking | 1.60% | ||||
Basic Industry | 1.68% | ||||
Capital Goods | 0.67% | ||||
Consumer Cyclical | 0.75% | ||||
ConsumerNon-Cyclical | 1.06% | ||||
Energy | 2.43% | ||||
Financials | 0.41% | ||||
Healthcare | 0.74% | ||||
Insurance | 0.23% | ||||
Media | 0.86% | ||||
Real Estate Investment Trusts | 0.56% | ||||
Services | 0.50% | ||||
Technology & Electronics | 0.63% | ||||
Telecommunications | 0.63% | ||||
Transportation | 0.15% | ||||
Utilities | 0.61% | ||||
LeveragedNon-Recourse Security | 0.00% | ||||
Municipal Bonds | 5.13% | ||||
Non-Agency Commercial Mortgage-Backed Security | 0.08% | ||||
Regional Bond | 0.07% | ||||
Loan Agreement | 0.00% | ||||
Sovereign Bonds | 0.71% | ||||
US Treasury Obligations | 0.39% | ||||
Preferred Stock | 0.67% | ||||
Warrant | 0.00% | ||||
Short-Term Investments | 4.35% | ||||
Total Value of Securities | 99.85% | ||||
Receivables and Other Assets Net of Liabilities | 0.15% | ||||
Total Net Assets | 100.00% | ||||
| 12 |
Table of Contents
Holdings are for informational purposes only and are subject to change at any time. They are not a recommendation to buy, sell, or hold any security.
| Top 10 equity holdings | Percentage of net assets | ||||
Brookdale Senior Living | 3.32% | ||||
Pfizer | 1.56% | ||||
Merck & Co. | 1.52% | ||||
AT&T | 1.45% | ||||
Verizon Communications | 1.43% | ||||
BB&T | 1.40% | ||||
Occidental Petroleum | 1.31% | ||||
Waste Management | 1.25% | ||||
Cisco Systems | 1.23% | ||||
Intel
|
| 1.23%
|
| ||
| 13 |
Table of Contents
| Schedule of investments | ||
| Delaware Wealth Builder Fund | November 30, 2018 |
| Number of shares | Value (US $) | |||||||
Common Stock – 57.46% | ||||||||
Communication Services – 3.12% | ||||||||
AT&T | 277,605 | $ | 8,672,380 | |||||
Century Communications =† | 1,625,000 | 0 | ||||||
Mobile TeleSystems PJSC ADR | 18,907 | 140,101 | ||||||
Nippon Telegraph & Telephone | 17,686 | 729,566 | ||||||
Tele2 Class B | 45,575 | 570,808 | ||||||
Verizon Communications | 142,300 | 8,580,690 | ||||||
|
| |||||||
| 18,693,545 | ||||||||
|
| |||||||
Consumer Discretionary – 3.63% | ||||||||
Aramark | 1,045 | 39,773 | ||||||
Bayerische Motoren Werke | 7,606 | 624,554 | ||||||
BorgWarner | 905 | 35,820 | ||||||
Casey’s General Stores | 255 | 33,015 | ||||||
Cie Generale des Etablissements Michelin | 4,600 | 482,039 | ||||||
Cinemark Holdings | 570 | 21,871 | ||||||
Comcast Class A | 1,505 | 58,710 | ||||||
DR Horton | 46,400 | 1,727,008 | ||||||
Ford Motor | 606,810 | 5,710,082 | ||||||
Garrett Motion † | 25 | 287 | ||||||
Home Depot | 455 | 82,046 | ||||||
Kering | 1,437 | 625,501 | ||||||
Lowe’s | 2,200 | 207,614 | ||||||
Marriott International Class A | 8,500 | 977,755 | ||||||
NIKE Class B | 825 | 61,974 | ||||||
Nitori Holdings | 1,028 | 137,849 | ||||||
Publicis Groupe | 4,154 | 246,742 | ||||||
Puma | 34 | 17,052 | ||||||
Starbucks | 925 | 61,716 | ||||||
Target | 66,600 | 4,725,936 | ||||||
Techtronic Industries | 117,000 | 634,519 | ||||||
Toyota Motor | 12,886 | 778,977 | ||||||
Tractor Supply | 370 | 35,198 | ||||||
Valeo | 8,627 | 246,192 | ||||||
Walt Disney | 750 | 86,617 | ||||||
Whirlpool | 25,400 | 3,203,702 | ||||||
Yue Yuen Industrial Holdings | 288,500 | 840,710 | ||||||
|
| |||||||
| 21,703,259 | ||||||||
|
| |||||||
Consumer Staples – 4.01% | ||||||||
Archer-Daniels-Midland | 73,600 | 3,387,072 | ||||||
British American Tobacco ADR | 101,984 | 3,556,182 | ||||||
Carlsberg Class B | 4,560 | 505,681 | ||||||
Coca-Cola Amatil | 15,690 | 99,098 | ||||||
Conagra Brands | 312 | 10,081 | ||||||
| 14 |
Table of Contents
| Number of shares | Value (US $) | |||||||
Common Stock(continued) | ||||||||
Consumer Staples(continued) | ||||||||
General Mills | 475 | $ | 20,097 | |||||
Imperial Brands | 28,760 | 886,502 | ||||||
Japan Tobacco | 6,200 | 154,195 | ||||||
Kimberly-Clark | 29,100 | 3,357,267 | ||||||
Kraft Heinz | 62,700 | 3,205,224 | ||||||
Matsumotokiyoshi Holdings | 12,100 | 450,913 | ||||||
Mondelez International Class A | 83,900 | 3,773,822 | ||||||
PepsiCo | 355 | 43,289 | ||||||
Procter & Gamble | 48,000 | 4,536,480 | ||||||
|
| |||||||
| 23,985,903 | ||||||||
|
| |||||||
Diversified REITs – 1.12% | ||||||||
American Tower | 6,895 | 1,134,159 | ||||||
Colony Capital | 217,400 | 1,339,184 | ||||||
Cousins Properties | 4,025 | 34,011 | ||||||
EPR Properties | 925 | 65,518 | ||||||
Equinix | 2,200 | 847,616 | ||||||
Lexington Realty Trust | 3,175 | 27,877 | ||||||
PS Business Parks | 650 | 91,663 | ||||||
Spirit MTA REIT | 442 | 4,301 | ||||||
Tritax EuroBox 144A #† | 1,696,417 | 2,093,360 | ||||||
Vornado Realty Trust | 14,525 | 1,045,219 | ||||||
|
| |||||||
| 6,682,908 | ||||||||
|
| |||||||
Energy – 5.54% | ||||||||
Chevron | 41,035 | 4,880,703 | ||||||
ConocoPhillips | 3,700 | 244,866 | ||||||
EOG Resources | 595 | 61,469 | ||||||
Halliburton | 5,635 | 177,108 | ||||||
Marathon Oil | 12,632 | 210,828 | ||||||
Occidental Petroleum | 111,375 | 7,826,321 | ||||||
Pioneer Natural Resources | 295 | 43,586 | ||||||
Royal Dutch Shell ADR Class B | 107,900 | 6,693,037 | ||||||
Suncor Energy | 16,600 | 535,238 | ||||||
Targa Resources | 26,000 | 1,160,380 | ||||||
TOTAL | 13,164 | 732,178 | ||||||
TOTAL ADR | 116,600 | 6,484,126 | ||||||
Williams | 162,500 | 4,114,500 | ||||||
|
| |||||||
| 33,164,340 | ||||||||
|
| |||||||
Financials – 7.50% | ||||||||
Aflac | 1,740 | 79,588 | ||||||
Allstate | 1,800 | 160,542 | ||||||
American International Group | 142,900 | 6,180,425 | ||||||
| 15 |
Table of Contents
| Schedule of investments | ||
| Delaware Wealth Builder Fund |
| Number of shares | Value (US $) | |||||||
Common Stock(continued) | ||||||||
Financials(continued) | ||||||||
Arthur J Gallagher & Co. | 45,100 | $ | 3,475,857 | |||||
AXA | 33,579 | 817,723 | ||||||
Banco Espirito Santo =† | 105,000 | 0 | ||||||
Banco Santander | 80,442 | 382,134 | ||||||
Bank of America | 63,600 | 1,806,240 | ||||||
Bank of New York Mellon | 100,300 | 5,146,393 | ||||||
Bank Rakyat Indonesia Persero | 2,555,190 | 648,456 | ||||||
BB&T | 163,500 | 8,354,850 | ||||||
BlackRock | 135 | 57,781 | ||||||
Capital One Financial | 540 | 48,427 | ||||||
Comerica | 585 | 46,320 | ||||||
East West Bancorp | 600 | 32,214 | ||||||
ING Groep | 52,560 | 636,592 | ||||||
Intercontinental Exchange | 2,417 | 197,517 | ||||||
Invesco | 1,605 | 32,662 | ||||||
JPMorgan Chase & Co. | 54,980 | 6,113,226 | ||||||
KeyCorp | 2,975 | 54,561 | ||||||
Marsh & McLennan | 2,200 | 195,140 | ||||||
MGIC Investment † | 5,885 | 68,913 | ||||||
Mitsubishi UFJ Financial Group | 142,514 | 779,752 | ||||||
Nordea Bank | 101,946 | 905,401 | ||||||
Prudential Financial | 380 | 35,629 | ||||||
Raymond James Financial | 480 | 38,270 | ||||||
Reinsurance Group of America | 170 | 25,395 | ||||||
Standard Chartered | 63,133 | 492,498 | ||||||
State Street | 465 | 33,954 | ||||||
Travelers | 265 | 34,548 | ||||||
UniCredit | 29,049 | 374,954 | ||||||
United Overseas Bank | 18,900 | 347,031 | ||||||
US Bancorp | 865 | 47,108 | ||||||
Wells Fargo & Co. | 132,900 | 7,213,812 | ||||||
|
| |||||||
| 44,863,913 | ||||||||
|
| |||||||
Healthcare – 12.80% | ||||||||
Abbott Laboratories | 4,430 | 328,041 | ||||||
AbbVie | 66,620 | 6,280,267 | ||||||
Amgen | 18,700 | 3,894,275 | ||||||
AstraZeneca ADR | 168,800 | 6,721,616 | ||||||
Brookdale Senior Living † | 2,320,604 | 19,841,164 | ||||||
Cardinal Health | 99,000 | 5,428,170 | ||||||
Cigna | 285 | 63,663 | ||||||
CVS Health | 87,500 | 7,017,500 | ||||||
Eli Lilly & Co. | 480 | 56,947 | ||||||
| 16 |
Table of Contents
| Number of shares | Value (US $) | |||||||
Common Stock(continued) | ||||||||
Healthcare(continued) | ||||||||
Johnson & Johnson | 38,685 | $ | 5,682,827 | |||||
Koninklijke Philips | 19,163 | 726,659 | ||||||
Merck & Co. | 114,285 | 9,067,372 | ||||||
Novartis | 11,569 | 1,056,266 | ||||||
Pfizer | 202,576 | 9,365,088 | ||||||
Quest Diagnostics | 1,900 | 168,283 | ||||||
Sanofi | 6,585 | 596,998 | ||||||
Shire | 4,172 | 243,653 | ||||||
Thermo Fisher Scientific | 270 | 67,379 | ||||||
West Pharmaceutical Services | 255 | 27,938 | ||||||
|
| |||||||
| 76,634,106 | ||||||||
|
| |||||||
Healthcare REITs – 1.29% | ||||||||
Assura | 3,477,787 | 2,366,458 | ||||||
HCP | 40,100 | 1,173,326 | ||||||
Healthcare Realty Trust | 1,225 | 37,975 | ||||||
Healthcare Trust of America Class A | 2,137 | 60,092 | ||||||
LTC Properties | 1,350 | 62,694 | ||||||
Sabra Health Care REIT | 91,125 | 1,757,801 | ||||||
Ventas | 800 | 50,792 | ||||||
Welltower | 30,600 | 2,213,298 | ||||||
|
| |||||||
| 7,722,436 | ||||||||
|
| |||||||
Hotel REITs – 0.28% | ||||||||
Host Hotels & Resorts | 5,260 | 99,940 | ||||||
LaSalle Hotel Properties | 2,745 | 88,005 | ||||||
MGM Growth Properties Class A | 47,800 | 1,361,822 | ||||||
Pebblebrook Hotel Trust | 2,345 | 81,887 | ||||||
RLJ Lodging Trust | 1,675 | 34,069 | ||||||
|
| |||||||
| 1,665,723 | ||||||||
|
| |||||||
Industrial REITs – 0.18% | ||||||||
EastGroup Properties | 360 | 36,007 | ||||||
First Industrial Realty Trust | 4,250 | 136,255 | ||||||
Liberty Property Trust | 16,200 | 733,698 | ||||||
Prologis | 2,976 | 200,404 | ||||||
|
| |||||||
| 1,106,364 | ||||||||
|
| |||||||
Industrials – 4.07% | ||||||||
Copa Holdings Class A | 1,203 | 102,291 | ||||||
Deutsche Post | 25,795 | 824,485 | ||||||
East Japan Railway | 5,049 | 459,334 | ||||||
Eaton | 445 | 34,238 | ||||||
Honeywell International | 16,555 | 2,429,446 | ||||||
Ingersoll-Rand | 255 | 26,398 | ||||||
ITOCHU | 63,862 | 1,136,727 | ||||||
| 17 |
Table of Contents
| Schedule of investments | ||
| Delaware Wealth Builder Fund |
| Number of shares | Value (US $) | |||||||
Common Stock(continued) | ||||||||
Industrials(continued) | ||||||||
Leonardo | 23,385 | $ | 231,277 | |||||
Lockheed Martin | 14,820 | 4,452,373 | ||||||
Meggitt | 90,725 | 601,476 | ||||||
MINEBEA MITSUMI | 51,700 | 843,861 | ||||||
Nielsen Holdings | 2,185 | 59,366 | ||||||
Northrop Grumman | 600 | 155,928 | ||||||
Oshkosh | 335 | 23,896 | ||||||
Parker-Hannifin | 350 | 60,214 | ||||||
Raytheon | 1,000 | 175,340 | ||||||
Resideo Technologies † | 42 | 866 | ||||||
Rexel | 11,543 | 138,657 | ||||||
Rockwell Automation | 85 | 14,819 | ||||||
Southwest Airlines | 405 | 22,117 | ||||||
Teleperformance | 3,693 | 612,174 | ||||||
Union Pacific | 580 | 89,192 | ||||||
United Technologies | 28,166 | 3,431,708 | ||||||
Vinci | 10,321 | 900,609 | ||||||
Waste Management | 79,900 | 7,490,625 | ||||||
Westrock | 748 | 35,238 | ||||||
|
| |||||||
| 24,352,655 | ||||||||
|
| |||||||
Information Technology – 4.56% | ||||||||
Accenture Class A | 350 | 57,582 | ||||||
Analog Devices | 300 | 27,576 | ||||||
Apple | 950 | 169,651 | ||||||
Broadcom | 265 | 62,914 | ||||||
Canon ADR | 114,600 | 3,242,034 | ||||||
Cisco Systems | 153,815 | 7,363,124 | ||||||
Hitachi | 6,700 | 195,114 | ||||||
Intel | 148,805 | 7,337,575 | ||||||
International Business Machines | 33,400 | 4,150,618 | ||||||
Microsoft | 20,810 | 2,307,621 | ||||||
Oracle | 3,900 | 190,164 | ||||||
Playtech | 98,346 | 556,910 | ||||||
Sabre | 44,758 | 1,144,462 | ||||||
Samsung Electronics | 12,418 | 465,317 | ||||||
SS&C Technologies Holdings | 725 | 34,909 | ||||||
|
| |||||||
| 27,305,571 | ||||||||
|
| |||||||
Mall REITs – 0.51% | ||||||||
Macerich | 750 | 37,717 | ||||||
Simon Property Group | 15,888 | 2,950,243 | ||||||
Tanger Factory Outlet Centers | 1,500 | 35,475 | ||||||
| 18 |
Table of Contents
| Number of shares | Value (US $) | |||||||
Common Stock(continued) | ||||||||
Mall REITs(continued) | ||||||||
Taubman Centers | 725 | $ | 38,381 | |||||
|
| |||||||
| 3,061,816 | ||||||||
|
| |||||||
Manufactured Housing REITs – 0.27% | ||||||||
Equity LifeStyle Properties | 1,125 | 111,971 | ||||||
Sun Communities | 14,600 | 1,519,860 | ||||||
|
| |||||||
| 1,631,831 | ||||||||
|
| |||||||
Materials – 1.33% | ||||||||
Alamos Gold Class A | 7,180 | 23,075 | ||||||
DowDuPont | 121,461 | 7,026,519 | ||||||
Eastman Chemical | 625 | 49,263 | ||||||
Rio Tinto | 17,853 | 815,920 | ||||||
Yamana Gold | 9,748 | 20,323 | ||||||
|
| |||||||
| 7,935,100 | ||||||||
|
| |||||||
Multifamily REITs – 2.92% | ||||||||
Apartment Investment & Management Class A | 27,800 | 1,309,102 | ||||||
AvalonBay Communities | 350 | 66,699 | ||||||
Bluerock Residential Growth REIT | 71,300 | 648,830 | ||||||
Camden Property Trust | 27,600 | 2,626,416 | ||||||
Equity Residential | 101,510 | 7,232,587 | ||||||
Essex Property Trust | 225 | 59,065 | ||||||
Killam Apartment Real Estate Investment Trust | 161,400 | 2,000,721 | ||||||
Mid-America Apartment Communities | 698 | 72,285 | ||||||
NexPoint Residential Trust | 51,800 | 1,890,182 | ||||||
UDR | 37,075 | 1,580,137 | ||||||
|
| |||||||
| 17,486,024 | ||||||||
|
| |||||||
Office REITs – 0.38% | ||||||||
Boston Properties | 575 | 75,440 | ||||||
Brandywine Realty Trust | 3,300 | 47,091 | ||||||
Columbia Property Trust | 88,400 | 1,897,948 | ||||||
Douglas Emmett | 1,750 | 64,610 | ||||||
Empire State Realty Trust Class A | 725 | 11,738 | ||||||
Highwoods Properties | 1,325 | 57,465 | ||||||
JBG SMITH Properties | 300 | 12,021 | ||||||
Kilroy Realty | 825 | 57,824 | ||||||
SL Green Realty | 500 | 48,210 | ||||||
|
| |||||||
| 2,272,347 | ||||||||
|
| |||||||
Real Estate Operating/Development – 0.42% | ||||||||
Etalon Group GDR 144A # | 6,500 | 12,870 | ||||||
Grainger | 781,805 | 2,529,415 | ||||||
|
| |||||||
| 2,542,285 | ||||||||
|
| |||||||
Self-Storage REITs – 0.04% | ||||||||
Extra Space Storage | 1,000 | 95,980 | ||||||
| 19 |
Table of Contents
| Schedule of investments | ||
| Delaware Wealth Builder Fund |
| Number of shares | Value (US $) | |||||||
Common Stock(continued) | ||||||||
Self-Storage REITs(continued) | ||||||||
Life Storage | 300 | $ | 29,292 | |||||
Public Storage | 450 | 95,967 | ||||||
|
| |||||||
| 221,239 | ||||||||
|
| |||||||
Shopping Center REITs – 0.22% | ||||||||
Brixmor Property Group | 1,505 | 24,833 | ||||||
Federal Realty Investment Trust | 475 | 62,743 | ||||||
Kimco Realty | 2,250 | 36,787 | ||||||
Kite Realty Group Trust | 2,400 | 39,624 | ||||||
Regency Centers | 1,907 | 121,400 | ||||||
Retail Properties of America Class A | 70,700 | 890,113 | ||||||
Retail Value † | 143 | 4,146 | ||||||
RPT Realty | 6,310 | 90,170 | ||||||
SITE Centers | 1,437 | 17,876 | ||||||
Urban Edge Properties | 325 | 6,481 | ||||||
|
| |||||||
| 1,294,173 | ||||||||
|
| |||||||
Single Tenant REITs – 0.58% | ||||||||
National Retail Properties | 21,900 | 1,096,314 | ||||||
Spirit Realty Capital | 171,825 | 1,274,941 | ||||||
STORE Capital | 37,200 | 1,114,512 | ||||||
|
| |||||||
| 3,485,767 | ||||||||
|
| |||||||
Specialty REITs – 1.33% | ||||||||
Cushman & Wakefield † | 232,290 | 4,325,240 | ||||||
GEO Group | 48,300 | 1,122,492 | ||||||
Invitation Homes | 85,700 | 1,839,122 | ||||||
Safety Income & Growth | 33,400 | 659,316 | ||||||
|
| |||||||
| 7,946,170 | ||||||||
|
| |||||||
Utilities – 1.36% | ||||||||
Edison International | 52,300 | 2,893,236 | ||||||
National Grid | 46,498 | 496,366 | ||||||
National Grid ADR | 88,908 | 4,752,133 | ||||||
|
| |||||||
| 8,141,735 | ||||||||
|
| |||||||
Total Common Stock(cost $334,688,199) | 343,899,210 | |||||||
|
| |||||||
Closed-End Funds – 0.53% | ||||||||
Aberdeen Total Dynamic Dividend Fund | 108,235 | 877,786 | ||||||
Western Asset Emerging Markets Debt Fund | 185,780 | 2,283,236 | ||||||
|
| |||||||
TotalClosed-End Funds (cost $3,481,881) | 3,161,022 | |||||||
|
| |||||||
| 20 |
Table of Contents
| Number of shares | Value (US $) | |||||||
Convertible Preferred Stock – 2.26% | ||||||||
A Schulman 6.00% exercise price $52.33y | 2,140 | $ | 2,209,550 | |||||
AMG Capital Trust II 5.15% exercise price $198.02, | 43,948 | 2,318,520 | ||||||
Bank of America 7.25% exercise price $50.00y | 1,873 | 2,397,440 | ||||||
El Paso Energy Capital Trust I 4.75% exercise price | 49,900 | 2,207,077 | ||||||
QTS Realty Trust 6.50% exercise price $47.03y | 13,504 | 1,370,521 | ||||||
SITE Centers 6.50% exercise price $25.00y | 22,900 | 526,700 | ||||||
Wells Fargo & Co. 7.50% exercise price $156.71y | 1,989 | 2,513,599 | ||||||
|
| |||||||
Total Convertible Preferred Stock(cost $13,218,129) | 13,543,407 | |||||||
|
| |||||||
Exchange-Traded Funds – 1.62% | ||||||||
iShares MSCI Emerging Markets ETF | 42,000 | 1,725,360 | ||||||
ProShares Short High Yield | 50,400 | 1,164,744 | ||||||
SPDR Gold Shares † | 32,100 | 3,708,834 | ||||||
VanEck Vectors High-Yield Municipal Index ETF | 51,000 | 3,103,350 | ||||||
|
| |||||||
Total Exchange-Traded Funds(cost $10,075,512) | 9,702,288 | |||||||
|
| |||||||
Limited Partnerships – 1.62% | ||||||||
Brookfield Property Partners | 864 | 15,258 | ||||||
Merion Champion’s Walk =p† | 2,724,434 | 2,588,212 | ||||||
Merion Countryside 144A #=p† | 2,342,813 | 3,450,026 | ||||||
Merion The Ledges =p† | 3,822,000 | 3,630,900 | ||||||
|
| |||||||
Total Limited Partnerships(cost $8,195,001) | 9,684,396 | |||||||
|
| |||||||
Master Limited Partnership – 0.40% | ||||||||
Blackstone Group | 70,700 | 2,384,711 | ||||||
|
| |||||||
Total Master Limited Partnership(cost $2,396,818) | 2,384,711 | |||||||
|
| |||||||
| Principal amount° | ||||||||
Convertible Bonds – 11.05% | ||||||||
Brokerage – 0.33% | ||||||||
GAIN Capital Holdings | 1,764,000 | 1,984,500 | ||||||
|
| |||||||
| 1,984,500 | ||||||||
|
| |||||||
Capital Goods – 1.43% | ||||||||
Aerojet Rocketdyne Holdings | 1,222,000 | 1,796,340 | ||||||
Cemex | 2,140,000 | 2,105,090 | ||||||
3.72% exercise price $11.01, maturity date 3/15/20 | 805,000 | 787,845 | ||||||
| 21 |
Table of Contents
| Schedule of investments | ||
| Delaware Wealth Builder Fund |
| Principal amount° | Value (US $) | |||||||
Convertible Bonds(continued) | ||||||||
Capital Goods(continued) | ||||||||
Chart Industries | 1,391,000 | $ | 1,705,952 | |||||
Tesla Energy Operations | 2,270,000 | 2,134,974 | ||||||
|
| |||||||
| 8,530,201 | ||||||||
|
| |||||||
Communications – 1.07% | ||||||||
DISH Network | 2,480,000 | 2,070,671 | ||||||
3.375% exercise price $65.18, maturity date 8/15/26 | 1,225,000 | 1,078,490 | ||||||
GCI Liberty | 1,533,000 | 1,623,021 | ||||||
Liberty Media | 3,088,000 | 1,607,579 | ||||||
|
| |||||||
| 6,379,761 | ||||||||
|
| |||||||
Consumer Cyclical – 0.65% | ||||||||
Booking Holdings | 700,000 | 1,018,400 | ||||||
Huron Consulting Group | 1,969,000 | 1,957,186 | ||||||
Meritor | 1,053,000 | 945,393 | ||||||
|
| |||||||
| 3,920,979 | ||||||||
|
| |||||||
ConsumerNon-Cyclical – 2.06% | ||||||||
BioMarin Pharmaceutical | 945,000 | 1,136,235 | ||||||
Insulet | 721,000 | 788,236 | ||||||
Medicines | 2,488,000 | 2,054,685 | ||||||
Pacira Pharmaceuticals | 985,000 | 1,032,309 | ||||||
Paratek Pharmaceuticals | 1,874,000 | 1,612,794 | ||||||
Retrophin | 350,000 | 323,358 | ||||||
Spectrum Pharmaceuticals | 425,000 | 584,117 | ||||||
| 22 |
Table of Contents
| Principal amount° | Value (US $) | |||||||
Convertible Bonds(continued) | ||||||||
ConsumerNon-Cyclical(continued) | ||||||||
Team | 1,504,000 | $ | 1,603,460 | |||||
Vector Group | 2,566,000 | 2,627,017 | ||||||
2.50% exercise price $13.81, maturity date 1/15/19 • | 550,000 | 566,875 | ||||||
|
| |||||||
| 12,329,086 | ||||||||
|
| |||||||
Energy – 1.09% | ||||||||
Cheniere Energy | 2,892,000 | 2,173,283 | ||||||
Helix Energy Solutions Group | 69,000 | 77,440 | ||||||
4.25% exercise price $13.89, maturity date 5/1/22 | 2,574,000 | 2,619,302 | ||||||
PDC Energy | 1,803,000 | 1,666,491 | ||||||
|
| |||||||
| 6,536,516 | ||||||||
|
| |||||||
Financials – 0.74% | ||||||||
Ares Capital | 2,220,000 | 2,234,450 | ||||||
New Mountain Finance | 2,166,000 | 2,175,836 | ||||||
|
| |||||||
| 4,410,286 | ||||||||
|
| |||||||
Real Estate Investment Trusts – 1.28% | ||||||||
Blackstone Mortgage Trust | 468,000 | 470,023 | ||||||
4.75% exercise price $36.23, maturity date 3/15/23 | 1,599,000 | 1,606,774 | ||||||
5.25% exercise price $27.36, maturity date 12/1/18 | 1,693,000 | 2,177,621 | ||||||
Spirit Realty Capital | 2,499,000 | 2,475,532 | ||||||
VEREIT | 924,000 | 918,812 | ||||||
|
| |||||||
| 7,648,762 | ||||||||
|
| |||||||
Technology – 1.82% | ||||||||
Boingo Wireless | 1,170,000 | 1,065,063 | ||||||
CSG Systems International | 1,652,000 | 1,691,777 | ||||||
Knowles | 1,515,000 | 1,654,107 | ||||||
PROS Holdings | 1,515,000 | 1,425,160 | ||||||
| 23 |
Table of Contents
| Schedule of investments | ||
| Delaware Wealth Builder Fund |
| Principal amount° | Value (US $) | |||||||
Convertible Bonds(continued) | ||||||||
Technology(continued) | ||||||||
Synaptics | 1,812,000 | $ | 1,602,685 | |||||
Verint Systems | 2,231,000 | 2,217,308 | ||||||
Vishay Intertechnology | 1,330,000 | 1,251,902 | ||||||
|
| |||||||
| 10,908,002 | ||||||||
|
| |||||||
Utilities – 0.58% | ||||||||
Cree | 1,984,000 | 1,953,875 | ||||||
NRG Energy | 1,419,000 | 1,524,215 | ||||||
|
| |||||||
| 3,478,090 | ||||||||
|
| |||||||
Total Convertible Bonds(cost $65,471,159) | 66,126,183 | |||||||
|
| |||||||
Corporate Bonds – 13.51% | ||||||||
Banking – 1.60% | ||||||||
Ally Financial 5.75% 11/20/25 | 448,000 | 459,200 | ||||||
Bank of America 4.183% 11/25/27 | 680,000 | 651,422 | ||||||
Bank of New York Mellon 2.661% 5/16/23 µ | 680,000 | 656,469 | ||||||
Credit Suisse Group 144A 6.25% #µy | 360,000 | 343,047 | ||||||
Fifth Third Bancorp 2.60% 6/15/22 | 600,000 | 579,251 | ||||||
Goldman Sachs Group 6.00% 6/15/20 | 600,000 | 620,996 | ||||||
JPMorgan Chase & Co. 6.75% µy | 700,000 | 741,300 | ||||||
Lloyds Banking Group 7.50% µy | 450,000 | 427,401 | ||||||
Morgan Stanley 5.00% 11/24/25 | 600,000 | 609,224 | ||||||
PNC Financial Services Group 5.00% µy | 700,000 | 666,750 | ||||||
Popular 6.125% 9/14/23 | 455,000 | 455,569 | ||||||
Royal Bank of Scotland Group | 600,000 | 568,873 | ||||||
8.625% µy | 520,000 | 536,900 | ||||||
State Street 2.653% 5/15/23 µ | 600,000 | 578,437 | ||||||
SunTrust Bank 2.45% 8/1/22 | 600,000 | 576,032 | ||||||
UBS Group Funding Switzerland 6.875% µy | 520,000 | 505,034 | ||||||
Wells Fargo & Co. 3.757% (LIBOR03M + 1.23%) | 600,000 | 601,595 | ||||||
|
| |||||||
| 9,577,500 | ||||||||
|
| |||||||
| 24 |
Table of Contents
| Principal amount° | Value (US $) | |||||||
Corporate Bonds(continued) | ||||||||
Basic Industry – 1.68% | ||||||||
BHP Billiton Finance USA 144A 6.25% 10/19/75 #µ | 700,000 | $ | 721,910 | |||||
BMC East 144A 5.50% 10/1/24 # | 318,000 | 299,317 | ||||||
Boise Cascade 144A 5.625% 9/1/24 # | 515,000 | 496,975 | ||||||
Braskem Netherlands Finance 144A 4.50% 1/10/28 # | 750,000 | 692,813 | ||||||
Builders FirstSource 144A 5.625% 9/1/24 # | 140,000 | 129,150 | ||||||
Chemours 5.375% 5/15/27 | 379,000 | 343,943 | ||||||
CSN Resources 144A 7.625% 2/13/23 # | 500,000 | 460,005 | ||||||
FMG Resources August 2006 144A 5.125% 5/15/24 # | 246,000 | 230,010 | ||||||
Freeport-McMoRan | ||||||||
4.55% 11/14/24 | 200,000 | 186,500 | ||||||
6.875% 2/15/23 | 614,000 | 641,630 | ||||||
Hudbay Minerals | ||||||||
144A 7.25% 1/15/23 # | 55,000 | 55,344 | ||||||
144A 7.625% 1/15/25 # | 470,000 | 468,825 | ||||||
Joseph T Ryerson & Son 144A 11.00% 5/15/22 # | 198,000 | 211,365 | ||||||
Koppers 144A 6.00% 2/15/25 # | 434,000 | 390,600 | ||||||
NOVA Chemicals 144A 5.25% 6/1/27 # | 370,000 | 340,400 | ||||||
Novelis 144A 6.25% 8/15/24 # | 467,000 | 463,497 | ||||||
Olin | ||||||||
5.00% 2/1/30 | 135,000 | 120,656 | ||||||
5.125% 9/15/27 | 437,000 | 412,550 | ||||||
SASOL Financing USA | ||||||||
5.875% 3/27/24 | 225,000 | 225,068 | ||||||
6.50% 9/27/28 | 275,000 | 274,040 | ||||||
Standard Industries | ||||||||
144A 4.75% 1/15/28 # | 445,000 | 391,044 | ||||||
144A 5.00% 2/15/27 # | 160,000 | 144,400 | ||||||
Steel Dynamics 5.00% 12/15/26 | 330,000 | 318,037 | ||||||
Suzano Austria 144A 6.00% 1/15/29 # | 1,000,000 | 1,012,500 | ||||||
Tronox Finance 144A 5.75% 10/1/25 # | 305,000 | 260,013 | ||||||
US Concrete 6.375% 6/1/24 | 10,000 | 9,525 | ||||||
Zekelman Industries 144A 9.875% 6/15/23 # | 715,000 | 763,263 | ||||||
|
| |||||||
| 10,063,380 | ||||||||
|
| |||||||
Capital Goods – 0.67% | ||||||||
Ardagh Packaging Finance 144A 6.00% 2/15/25 # | 275,000 | 256,781 | ||||||
Bombardier 144A 6.00% 10/15/22 # | 375,000 | 357,225 | ||||||
BWAY Holding | ||||||||
144A 5.50% 4/15/24 # | 551,000 | 529,649 | ||||||
144A 7.25% 4/15/25 # | 295,000 | 268,819 | ||||||
Crown Americas 144A 4.75% 2/1/26 # | 463,000 | 447,397 | ||||||
John Deere Capital 2.15% 9/8/22 | 600,000 | 573,046 | ||||||
L3 Technologies 3.85% 6/15/23 | 660,000 | 655,156 | ||||||
| 25 |
Table of Contents
| Schedule of investments | ||
| Delaware Wealth Builder Fund |
| Principal amount° | Value (US $) | |||||||
Corporate Bonds(continued) | ||||||||
Capital Goods(continued) | ||||||||
Siemens Financieringsmaatschappij 144A 3.125% 3/16/24 # | 630,000 | $ | 611,420 | |||||
TransDigm 6.375% 6/15/26 | 332,000 | 324,908 | ||||||
|
| |||||||
| 4,024,401 | ||||||||
|
| |||||||
Consumer Cyclical – 0.75% | ||||||||
AMC Entertainment Holdings 6.125% 5/15/27 | 539,000 | 479,710 | ||||||
Atento Luxco 1 144A 6.125% 8/10/22 # | 5,000 | 4,825 | ||||||
Boyd Gaming 6.375% 4/1/26 | 542,000 | 540,645 | ||||||
Ford Motor Credit 3.096% 5/4/23 | 480,000 | 433,721 | ||||||
Hilton Worldwide Finance 4.875% 4/1/27 | 545,000 | 521,837 | ||||||
KFC Holding/Pizza Hut Holdings/Taco Bell of America 144A 5.25% 6/1/26 # | 470,000 | 462,066 | ||||||
Lennar 4.75% 5/30/25 | 460,000 | 438,150 | ||||||
MGM Resorts International | ||||||||
4.625% 9/1/26 | 10,000 | 9,137 | ||||||
5.75% 6/15/25 | 285,000 | 281,794 | ||||||
Penn National Gaming 144A 5.625% 1/15/27 # | 337,000 | 310,883 | ||||||
Penske Automotive Group 5.50% 5/15/26 | 244,000 | 226,615 | ||||||
PulteGroup 5.00% 1/15/27 | 15,000 | 13,987 | ||||||
Scientific Games International 10.00% 12/1/22 | 722,000 | 752,143 | ||||||
|
| |||||||
| 4,475,513 | ||||||||
|
| |||||||
ConsumerNon-Cyclical – 1.06% | ||||||||
Abbott Laboratories 3.40% 11/30/23 | 462,000 | 455,048 | ||||||
Becton Dickinson 3.363% 6/6/24 | 680,000 | 649,663 | ||||||
Cott Holdings 144A 5.50% 4/1/25 # | 272,000 | 263,160 | ||||||
CVS Health 4.10% 3/25/25 | 680,000 | 670,681 | ||||||
JBS Investments 144A 7.25% 4/3/24 # | 650,000 | 654,777 | ||||||
JBS USA | ||||||||
144A 5.75% 6/15/25 # | 548,000 | 532,245 | ||||||
144A 6.75% 2/15/28 # | 350,000 | 340,813 | ||||||
Live Nation Entertainment 144A 4.875% 11/1/24 # | 15,000 | 14,550 | ||||||
Pernod Ricard 144A 4.45% 1/15/22 # | 500,000 | 507,387 | ||||||
Post Holdings | ||||||||
144A 5.00% 8/15/26 # | 311,000 | 286,897 | ||||||
144A 5.625% 1/15/28 # | 160,000 | 149,200 | ||||||
144A 5.75% 3/1/27 # | 5,000 | 4,713 | ||||||
Shire Acquisitions Investments Ireland 2.875% 9/23/23 | 600,000 | 562,280 | ||||||
Thermo Fisher Scientific 3.00% 4/15/23 | 600,000 | 577,599 | ||||||
United Rentals North America 5.50% 5/15/27 | 713,000 | 674,676 | ||||||
|
| |||||||
| 6,343,689 | ||||||||
|
| |||||||
| 26 |
Table of Contents
| Principal amount° | Value (US $) | |||||||
Corporate Bonds(continued) | ||||||||
Energy – 2.43% | ||||||||
Alta Mesa Holdings 7.875% 12/15/24 | 603,000 | $ | 435,667 | |||||
AmeriGas Partners 5.875% 8/20/26 | 469,000 | 439,687 | ||||||
Antero Resources 5.625% 6/1/23 | 331,000 | 329,345 | ||||||
Banco do Brasil 144A 4.875% 4/19/23 # | 500,000 | 495,000 | ||||||
Cheniere Corpus Christi Holdings | ||||||||
5.125% 6/30/27 | 23,000 | 22,339 | ||||||
7.00% 6/30/24 | 235,000 | 253,800 | ||||||
Cheniere Energy Partners 5.25% 10/1/25 | 305,000 | 298,137 | ||||||
Chesapeake Energy | ||||||||
7.00% 10/1/24 | 205,000 | 191,675 | ||||||
8.00% 1/15/25 | 175,000 | 169,094 | ||||||
Crestwood Midstream Partners 5.75% 4/1/25 | 484,000 | 467,060 | ||||||
Energy Transfer Partners 5.875% 3/1/22 | 600,000 | 626,364 | ||||||
Genesis Energy 6.75% 8/1/22 | 662,000 | 660,345 | ||||||
Gulfport Energy | ||||||||
6.00% 10/15/24 | 15,000 | 13,800 | ||||||
6.625% 5/1/23 | 600,000 | 586,500 | ||||||
Hilcorp Energy I 144A 5.00% 12/1/24 # | 240,000 | 219,000 | ||||||
Israel Electric 144A 4.25% 8/14/28 # | 500,000 | 469,380 | ||||||
Laredo Petroleum 6.25% 3/15/23 | 594,000 | 556,875 | ||||||
MPLX 4.875% 12/1/24 | 600,000 | 607,680 | ||||||
Murphy Oil 6.875% 8/15/24 | 695,000 | 709,828 | ||||||
Murphy Oil USA 5.625% 5/1/27 | 479,000 | 467,923 | ||||||
Newfield Exploration 5.375% 1/1/26 | 423,000 | 422,471 | ||||||
NuStar Logistics 5.625% 4/28/27 | 493,000 | 467,734 | ||||||
ONEOK 7.50% 9/1/23 | 545,000 | 615,548 | ||||||
Petrobras Global Finance 7.25% 3/17/44 | 400,000 | 387,650 | ||||||
Petroleos Mexicanos 6.75% 9/21/47 | 810,000 | 672,300 | ||||||
QEP Resources | ||||||||
5.25% 5/1/23 | 275,000 | 263,313 | ||||||
5.625% 3/1/26 | 465,000 | 426,637 | ||||||
Sabine Pass Liquefaction 5.75% 5/15/24 | 600,000 | 632,672 | ||||||
Southwestern Energy 6.20% 1/23/25 | 577,000 | 554,641 | ||||||
Syngenta Finance 144A 5.182% 4/24/28 # | 500,000 | 459,749 | ||||||
Targa Resources Partners | ||||||||
5.125% 2/1/25 | 10,000 | 9,700 | ||||||
5.375% 2/1/27 | 452,000 | 436,180 | ||||||
Tecpetrol 144A 4.875% 12/12/22 # | 500,000 | 462,500 | ||||||
Transocean 144A 9.00% 7/15/23 # | 498,000 | 510,761 | ||||||
Transocean Proteus 144A 6.25% 12/1/24 # | 215,900 | 212,661 | ||||||
|
| |||||||
| 14,554,016 | ||||||||
|
| |||||||
| 27 |
Table of Contents
| Schedule of investments | ||
| Delaware Wealth Builder Fund |
| Principal amount° | Value (US $) | |||||||
Corporate Bonds(continued) | ||||||||
Financials – 0.41% | ||||||||
AerCap Global Aviation Trust 144A 6.50% 6/15/45 #µ | 240,000 | $ | 230,400 | |||||
Air Lease 3.625% 4/1/27 | 600,000 | 537,464 | ||||||
E*TRADE Financial 5.875% µy | 530,000 | 510,125 | ||||||
International Lease Finance 8.625% 1/15/22 | 600,000 | 672,472 | ||||||
Jefferies Group 5.125% 1/20/23 | 500,000 | 513,490 | ||||||
|
| |||||||
| 2,463,951 | ||||||||
|
| |||||||
Healthcare – 0.74% | ||||||||
DaVita 5.00% 5/1/25 | 334,000 | 315,213 | ||||||
Encompass Health | ||||||||
5.75% 11/1/24 | 410,000 | 412,050 | ||||||
5.75% 9/15/25 | 244,000 | 243,085 | ||||||
HCA | ||||||||
5.375% 2/1/25 | 569,000 | 573,979 | ||||||
5.875% 2/15/26 | 309,000 | 319,043 | ||||||
7.58% 9/15/25 | 219,000 | 237,615 | ||||||
Hill-Rom Holdings | ||||||||
144A 5.00% 2/15/25 # | 242,000 | 237,160 | ||||||
144A 5.75% 9/1/23 # | 272,000 | 277,440 | ||||||
Hologic 144A 4.625% 2/1/28 # | 300,000 | 282,186 | ||||||
MPH Acquisition Holdings 144A 7.125% 6/1/24 # | 403,000 | 402,496 | ||||||
Service Corp. International 4.625% 12/15/27 | 280,000 | 261,800 | ||||||
Tenet Healthcare | ||||||||
5.125% 5/1/25 | 345,000 | 327,966 | ||||||
8.125% 4/1/22 | 241,000 | 250,640 | ||||||
Universal Health Services 144A 5.00% 6/1/26 # | 5,000 | 4,956 | ||||||
WellCare Health Plans 144A 5.375% 8/15/26 # | 310,000 | 308,506 | ||||||
|
| |||||||
| 4,454,135 | ||||||||
|
| |||||||
Insurance – 0.23% | ||||||||
HUB International 144A 7.00% 5/1/26 # | 85,000 | 81,175 | ||||||
Nuveen Finance 144A 4.125% 11/1/24 # | 600,000 | 603,861 | ||||||
USIS Merger Sub 144A 6.875% 5/1/25 # | 698,000 | 664,845 | ||||||
XLIT 4.894% (LIBOR03M + 2.458%)y• | 10,000 | 9,438 | ||||||
|
| |||||||
| 1,359,319 | ||||||||
|
| |||||||
Media – 0.86% | ||||||||
Altice France 144A 7.375% 5/1/26 # | 565,000 | 544,519 | ||||||
AMC Networks 4.75% 8/1/25 | 215,000 | 200,496 | ||||||
CCO Holdings | ||||||||
144A 5.50% 5/1/26 # | 41,000 | 40,026 | ||||||
144A 5.75% 2/15/26 # | 218,000 | 218,547 | ||||||
144A 5.875% 5/1/27 # | 744,000 | 733,770 | ||||||
| 28 |
Table of Contents
| Principal amount° | Value (US $) | |||||||
Corporate Bonds(continued) | ||||||||
Media(continued) | ||||||||
CSC Holdings | ||||||||
5.25% 6/1/24 | 5,000 | $ | 4,763 | |||||
6.75% 11/15/21 | 370,000 | 388,500 | ||||||
144A 7.75% 7/15/25 # | 465,000 | 488,241 | ||||||
Gray Television 144A 5.875% 7/15/26 # | 473,000 | 461,175 | ||||||
Lamar Media 5.75% 2/1/26 | 453,000 | 462,626 | ||||||
Nexstar Broadcasting 144A 5.625% 8/1/24 # | 15,000 | 14,513 | ||||||
Radiate Holdco 144A 6.625% 2/15/25 # | 10,000 | 9,025 | ||||||
Sinclair Television Group 144A 5.125% 2/15/27 # | 362,000 | 323,990 | ||||||
Sirius XM Radio | ||||||||
144A 5.00% 8/1/27 # | 540,000 | 510,300 | ||||||
144A 5.375% 4/15/25 # | 286,000 | 282,425 | ||||||
144A 5.375% 7/15/26 # | 20,000 | 19,525 | ||||||
Tribune Media 5.875% 7/15/22 | 433,000 | 440,578 | ||||||
|
| |||||||
| 5,143,019 | ||||||||
|
| |||||||
Real Estate Investment Trusts – 0.56% | ||||||||
American Tower 4.00% 6/1/25 | 600,000 | 582,395 | ||||||
Crown Castle International 5.25% 1/15/23 | 680,000 | 704,588 | ||||||
CyrusOne 5.375% 3/15/27 | 378,000 | 371,385 | ||||||
ESH Hospitality 144A 5.25% 5/1/25 # | 494,000 | 473,623 | ||||||
GEO Group 6.00% 4/15/26 | 336,000 | 299,460 | ||||||
Iron Mountain US Holdings 144A 5.375% 6/1/26 # | 586,000 | 544,247 | ||||||
MGM Growth Properties Operating Partnership 4.50% 9/1/26 | 15,000 | 13,904 | ||||||
SBA Communications 4.875% 9/1/24 | 390,000 | 380,737 | ||||||
|
| |||||||
| 3,370,339 | ||||||||
|
| |||||||
Services – 0.50% | ||||||||
Advanced Disposal Services 144A 5.625% 11/15/24 # | 544,000 | 537,200 | ||||||
Aramark Services 144A 5.00% 2/1/28 # | 120,000 | 114,300 | ||||||
Ashtead Capital 144A 5.25% 8/1/26 # | 690,000 | 679,650 | ||||||
Avis Budget Car Rental 144A 6.375% 4/1/24 # | 249,000 | 244,219 | ||||||
Covanta Holding 5.875% 7/1/25 | 548,000 | 517,860 | ||||||
KAR Auction Services 144A 5.125% 6/1/25 # | 200,000 | 188,000 | ||||||
Prime Security Services Borrower 144A 9.25% 5/15/23 # | 636,000 | 675,750 | ||||||
United Rentals North America 5.875% 9/15/26 | 5,000 | 4,875 | ||||||
|
| |||||||
| 2,961,854 | ||||||||
|
| |||||||
Technology & Electronics – 0.63% | ||||||||
Apple 2.10% 9/12/22 | 600,000 | 572,803 | ||||||
Baidu 4.375% 3/29/28 | 500,000 | 485,654 | ||||||
CDK Global | ||||||||
5.00% 10/15/24 | 161,000 | 160,195 | ||||||
5.875% 6/15/26 | 570,000 | 567,863 | ||||||
| 29 |
Table of Contents
| Schedule of investments | ||
| Delaware Wealth Builder Fund |
| Principal amount° | Value (US $) | |||||||
Corporate Bonds(continued) | ||||||||
Technology & Electronics(continued) | ||||||||
CDW Finance 5.00% 9/1/25 | 156,000 | $ | 152,685 | |||||
CommScope Technologies 144A 5.00% 3/15/27 # | 561,000 | 463,526 | ||||||
First Data | ||||||||
144A 5.75% 1/15/24 # | 605,000 | 609,537 | ||||||
144A 7.00% 12/1/23 # | 17,000 | 17,595 | ||||||
Infor US 6.50% 5/15/22 | 447,000 | 446,441 | ||||||
Sensata Technologies UK Financing 144A 6.25% 2/15/26 # | 285,000 | 291,239 | ||||||
|
| |||||||
| 3,767,538 | ||||||||
|
| |||||||
Telecommunications – 0.63% | ||||||||
C&W Senior Financing 144A 7.50% 10/15/26 # | 250,000 | 242,345 | ||||||
Digicel Group 144A 7.125% 4/1/22 # | 850,000 | 485,571 | ||||||
Level 3 Financing 5.375% 5/1/25 | 519,000 | 506,674 | ||||||
Myriad International Holdings 144A 4.85% 7/6/27 # | 635,000 | 602,301 | ||||||
Sprint | ||||||||
7.125% 6/15/24 | 682,000 | 693,935 | ||||||
7.875% 9/15/23 | 22,000 | 23,155 | ||||||
Telecom Italia 144A 5.303% 5/30/24 # | 200,000 | 188,500 | ||||||
T-Mobile USA 6.50% 1/15/26 | 370,000 | 384,800 | ||||||
Zayo Group | ||||||||
144A 5.75% 1/15/27 # | 15,000 | 14,363 | ||||||
6.375% 5/15/25 | 627,000 | 617,595 | ||||||
|
| |||||||
| 3,759,239 | ||||||||
|
| |||||||
Transportation – 0.15% | ||||||||
DAE Funding 144A 5.75% 11/15/23 # | 554,000 | 545,690 | ||||||
XPO Logistics 144A 6.125% 9/1/23 # | 368,000 | 371,680 | ||||||
|
| |||||||
| 917,370 | ||||||||
|
| |||||||
Utilities – 0.61% | ||||||||
AES | ||||||||
5.50% 4/15/25 | 5,000 | 5,063 | ||||||
6.00% 5/15/26 | 103,000 | 106,605 | ||||||
Calpine | ||||||||
144A 5.25% 6/1/26 # | 443,000 | 413,651 | ||||||
5.75% 1/15/25 | 230,000 | 212,175 | ||||||
DTE Energy 2.85% 10/1/26 | 525,000 | 476,439 | ||||||
Emera 6.75% 6/15/76 µ | 500,000 | 512,750 | ||||||
Enel 144A 8.75% 9/24/73 #µ | 200,000 | 210,500 | ||||||
Enel Finance International 144A 3.625% 5/25/27 # | 480,000 | 414,328 | ||||||
| 30 |
Table of Contents
| Principal amount° | Value (US $) | |||||||
Corporate Bonds(continued) | ||||||||
Utilities(continued) | ||||||||
Exelon 3.497% 6/1/22 | 600,000 | $ | 582,407 | |||||
National Rural Utilities Cooperative Finance 5.25% 4/20/46 µ | 700,000 | 703,946 | ||||||
|
| |||||||
| 3,637,864 | ||||||||
|
| |||||||
Total Corporate Bonds(cost $85,304,346) | 80,873,127 | |||||||
|
| |||||||
| ||||||||
LeveragedNon-Recourse Security – 0.00% | ||||||||
JPMorgan Fixed Income Pass Through Trust Auction 144A 0.00% 1/15/87 #◆= | 1,300,000 | 0 | ||||||
|
| |||||||
Total LeveragedNon-Recourse Security(cost $1,105,000) | 0 | |||||||
|
| |||||||
| ||||||||
Municipal Bonds – 5.13% | ||||||||
Allentown, Pennsylvania Neighborhood Improvement Zone Development Authority Revenue | ||||||||
(City Center Project) 144A 5.00% 5/1/42 # | 500,000 | 519,805 | ||||||
Arizona Industrial Development Authority | ||||||||
(American Charter Schools Foundation Project) 144A 6.00% 7/1/47 # | 1,000,000 | 1,024,840 | ||||||
Buckeye, Ohio Tobacco Settlement Financing Authority | ||||||||
(Asset-Backed Senior Turbo) | ||||||||
SeriesA-2 5.875% 6/1/47 | 1,250,000 | 1,186,075 | ||||||
SeriesA-2 6.00% 6/1/42 | 1,000,000 | 962,400 | ||||||
SeriesA-2 6.50% 6/1/47 | 750,000 | 743,460 | ||||||
California Municipal Finance Authority | ||||||||
(Senior Lien LINXS APM Project) Series A 5.00% 12/31/47 (AMT) | 300,000 | 321,120 | ||||||
California State | ||||||||
(Various Purposes) 5.00% 11/1/43 | 1,000,000 | 1,093,750 | ||||||
California Statewide Communities Development Authority | ||||||||
(California Baptist University) Series A 6.375% 11/1/43 | 1,000,000 | 1,126,670 | ||||||
Capital Trust Agency | ||||||||
(University Bridge, LLC Student Housing Project) Series | ||||||||
A 144A 5.25% 12/1/58 # | 1,000,000 | 980,330 | ||||||
City of Apple Valley, Minnesota | ||||||||
(Minnesota Senior Living Project) Series 2016 D 7.25% 1/1/52 | 1,000,000 | 975,460 | ||||||
City of Chicago, Illinois | ||||||||
(General Obligation Bonds Project) Series 2005D 5.50% 1/1/40 | 1,000,000 | 1,046,110 | ||||||
Colorado Health Facilities Authority Revenue | ||||||||
(Catholic Health Initiatives) Series A 5.25% 1/1/45 | 1,250,000 | 1,323,463 | ||||||
| 31 |
Table of Contents
| Schedule of investments | ||
| Delaware Wealth Builder Fund |
| Principal amount° | Value (US $) | |||||||
Municipal Bonds(continued) | ||||||||
Conley Road Transportation Development District, Missouri | ||||||||
5.375% 5/1/47 | 500,000 | $ | 500,915 | |||||
Cuyahoga County, Ohio | ||||||||
(Metrohealth System) | ||||||||
5.00% 2/15/57 | 1,000,000 | 1,009,190 | ||||||
Series 2017 5.50% 2/15/57 | 1,000,000 | 1,057,900 | ||||||
Dallas/Fort Worth International Airport, Texas | ||||||||
Series H 5.00% 11/1/42 (AMT) | 1,000,000 | 1,044,360 | ||||||
Dominion Water & Sanitation District, Colorado | 1,000,000 | 1,051,850 | ||||||
Golden State Tobacco Securitization Settlement Revenue | ||||||||
SeriesA-1 5.25% 6/1/47 | 500,000 | 497,380 | ||||||
Illinois State | ||||||||
Series A 5.00% 12/1/34 | 400,000 | 412,564 | ||||||
Series A 5.00% 4/1/38 | 100,000 | 102,057 | ||||||
Lower Alabama Gas District, Alabama | ||||||||
Series 2016 A 5.00% 9/1/46 | 1,000,000 | 1,144,660 | ||||||
M-S-R Energy Authority, California | ||||||||
Series 2009 C 6.50% 11/1/39 | 1,000,000 | 1,371,620 | ||||||
New Jersey Economic Development Authority | ||||||||
(School Facilities Construction Bonds) 5.00% 6/15/40 | 250,000 | 258,597 | ||||||
New Jersey Transportation Trust Fund Authority | ||||||||
(Transportation Program Bonds) Series AA 5.00%6/15/44 | 1,000,000 | 1,036,380 | ||||||
New York City Industrial Development Agency | ||||||||
(Brooklyn Navy Yard Cogeneration Partners, LP Project) 5.75% 10/1/36 (AMT) | 750,000 | 757,073 | ||||||
New York Liberty Development Revenue | ||||||||
(Goldman Sachs Headquarters) 5.25% 10/1/35 | 1,000,000 | 1,205,410 | ||||||
(World Trade Center Project)Class 1-3 144A 5.00% 11/15/44 # | 1,000,000 | 1,022,150 | ||||||
New York State Thruway Authority | ||||||||
Series J 5.00% 1/1/41 | 1,000,000 | 1,080,760 | ||||||
New York Transportation Development | ||||||||
(Delta Air Lines, Inc. LaGuardia Airport Terminals C&D | ||||||||
Redevelopment Project) Series 2018 5.00% 1/1/34 (AMT) | 500,000 | 546,080 | ||||||
Palm Beach County, Florida Health Facilities Authority | ||||||||
(Sinai Residences Boca Raton Project) | ||||||||
Series A 7.25% 6/1/34 | 65,000 | 72,771 | ||||||
Series A 7.50% 6/1/49 | 325,000 | 365,908 | ||||||
Public Authority for Colorado Energy Natural Gas Revenue | ||||||||
Series 2008 6.50% 11/15/38 | 1,000,000 | 1,346,550 | ||||||
| 32 |
Table of Contents
| Principal amount° | Value (US $) | |||||||
Municipal Bonds(continued) | ||||||||
Public Finance Authority, Wisconsin | ||||||||
(Marys Woods at Marylhurst Project) Series 2017 A 144A 5.25% 5/15/47 # | 1,000,000 | $ | 1,028,820 | |||||
Salt Verde, Arizona Financial Senior Gas Revenue | 1,000,000 | 1,139,410 | ||||||
Tobacco Settlement Financing | ||||||||
Series 2018 B 5.00% 6/1/46 | 500,000 | 501,385 | ||||||
Utility Debt Securitization Authority, New York | ||||||||
(Restructuring) Series TE 5.00% 12/15/41 | 750,000 | 819,547 | ||||||
|
| |||||||
Total Municipal Bonds(cost $30,232,101) | 30,676,820 | |||||||
|
| |||||||
| ||||||||
Non-Agency Commercial Mortgage-Backed Security – 0.08% | ||||||||
JPMBB Commercial Mortgage Securities Trust | ||||||||
Series2015-C33 A4 3.77% 12/15/48 | 500,000 | 499,542 | ||||||
|
| |||||||
TotalNon-Agency Commercial Mortgage-Backed Security(cost $528,066) | 499,542 | |||||||
|
| |||||||
| ||||||||
Regional Bond – 0.07%D | ||||||||
Argentina – 0.07% | ||||||||
Provincia de Cordoba 144A 7.125% 8/1/27 # | 500,000 | 387,750 | ||||||
|
| |||||||
Total Regional Bond(cost $492,500) | 387,750 | |||||||
|
| |||||||
| ||||||||
Loan Agreement – 0.00% | ||||||||
Republic of Angola 0.087% (LIBOR06M + 6.25%) 12/16/23 =• | 21,313 | 20,183 | ||||||
|
| |||||||
Total Loan Agreement(cost $21,313) | 20,183 | |||||||
|
| |||||||
| ||||||||
Sovereign Bonds – 0.71%D | ||||||||
Argentina – 0.12% | ||||||||
Argentine Republic Government International Bond 6.875% 1/11/48 | 1,000,000 | 725,000 | ||||||
|
| |||||||
| 725,000 | ||||||||
|
| |||||||
Indonesia – 0.59% | ||||||||
Indonesia Government International Bonds | ||||||||
144A 5.125% 1/15/45 # | 1,500,000 | 1,421,101 | ||||||
144A 6.75% 1/15/44 # | 1,800,000 | 2,083,322 | ||||||
|
| |||||||
| 3,504,423 | ||||||||
|
| |||||||
Total Sovereign Bonds(cost $4,649,850) | 4,229,423 | |||||||
|
| |||||||
| 33 |
Table of Contents
| Schedule of investments | ||
| Delaware Wealth Builder Fund |
| Principal amount° | Value (US $) | |||||||
US Treasury Obligations – 0.39% | ||||||||
US Treasury Notes | ||||||||
2.00% 10/31/22 | 340,000 | $ | 329,461 | |||||
2.875% 8/15/28 | 2,045,000 | 2,021,954 | ||||||
|
| |||||||
Total US Treasury Obligations(cost $2,327,083) | 2,351,415 | |||||||
|
| |||||||
| Number of shares | ||||||||
Preferred Stock – 0.67% | ||||||||
Bank of America 6.50% µy | 440,000 | 460,350 | ||||||
Federal Home Loan Mortgage 6.02%y | 40,000 | 191,000 | ||||||
GMAC Capital Trust I 8.401%(LIBOR03M + 5.785%) 2/15/40 • | 5,000 | 127,500 | ||||||
LaSalle Hotel Properties 6.375%y | 46,295 | 1,071,729 | ||||||
Taubman Centers 6.50%y | 68,477 | 1,670,839 | ||||||
Washington Prime Group 6.875%y | 28,700 | 515,452 | ||||||
|
| |||||||
Total Preferred Stock(cost $5,183,424) | 4,036,870 | |||||||
|
| |||||||
| ||||||||
Warrant – 0.00% | ||||||||
Wheeler Real Estate Investment Trust strike price $44.00, expiration date 4/29/19 † | 43,188 | 432 | ||||||
|
| |||||||
Total Warrant(cost $358) | 432 | |||||||
|
| |||||||
| Principal amount° | ||||||||
Short-Term Investments – 4.35% | ||||||||
Discount Note – 1.44%≠ | ||||||||
Federal Home Loan Bank 1.333% 12/3/18 | 8,617,628 | 8,617,628 | ||||||
|
| |||||||
| 8,617,628 | ||||||||
|
| |||||||
Repurchase Agreements – 2.91% | ||||||||
Bank of America Merrill Lynch | ||||||||
2.20%, dated 11/30/18, to be repurchased on 12/3/18, repurchase price $2,102,246 (collateralized by US government obligations 1.50%–1.75% 12/31/20–2/28/23; market value $2,143,899) | 2,101,860 | 2,101,860 | ||||||
Bank of Montreal | ||||||||
2.15%, dated 11/30/18, to be repurchased on 12/3/18, repurchase price $5,781,152 (collateralized by US government obligations 0.00%–3.75% 12/6/18–11/15/47; market value $5,895,719) | 5,780,117 | 5,780,117 | ||||||
| 34 |
Table of Contents
| Principal amount° | Value (US $) | |||||||
Short-Term Investments(continued) | ||||||||
Repurchase Agreements(continued) | ||||||||
BNP Paribas | ||||||||
2.25%, dated 11/30/18, to be repurchased on 12/3/18, repurchase price $9,506,627 (collateralized by US government obligations 0.00%–2.875% 3/31/20–8/15/46; market value $9,694,943) | 9,504,845 | $ | 9,504,845 | |||||
|
| |||||||
| 17,386,822 | ||||||||
|
| |||||||
Total Short-Term Investments(cost $26,003,493) | 26,004,450 | |||||||
|
| |||||||
Total Value of Securities – 99.85% | $ | 597,581,229 | ||||||
|
| |||||||
| # | Security exempt from registration under Rule 144A of the Securities Act of 1933, as amended. At Nov. 30, 2018, the aggregate value of Rule 144A securities was $57,322,664, which represents 9.58% of the Fund’s net assets. See Note 11 in “Notes to financial statements.” |
| ◆ | Pass Through Agreement. Security represents the contractual right to receive a proportionate amount of underlying payments due to the counterparty pursuant to various agreements related to the rescheduling of obligations and the exchange of certain notes. |
| = | The value of this security was determined using significant unobservable inputs and is reported as a Level 3 security in the disclosure table located in Note 3 in “Notes to financial statements.” |
| ≠ | The rate shown is the effective yield at the time of purchase. |
| ° | Principal amount shown is stated in USD unless noted that the security is denominated in another currency. |
| D | Securities have been classified by country of origin. |
| µ | Fixed to variable rate investment. The rate shown reflects the fixed rate in effect at Nov. 30, 2018. Rate will reset at a future date. |
| p | Restricted security. These investments are in securities not registered under the Securities Act of 1933, as amended, and have certain restrictions on resale which may limit their liquidity. At Nov. 30, 2018, the aggregate value of restricted securities was $9,669,139, which represented 1.62% of the Fund’s net assets. See table on next page for additional details on restricted securities. |
| y | No contractual maturity date. |
| † | Non-income producing security. |
| • | Variable rate investment. Rates reset periodically. Rate shown reflects the rate in effect at Nov. 30, 2018. For securities based on a published reference rate and spread, the reference rate and spread are indicated in their description above. The reference rate descriptions (i.e. LIBOR03M, LIBOR06M, etc.) used in this report are identical for different securities, but the underlying reference rates may differ due to the timing of the reset period. Certain variable rate securities are not based on a published reference rate and spread but are determined by the issuer or agent and are based on current market conditions, or for mortgage-backed securities, are impacted by the individual |
| 35 |
Table of Contents
| Schedule of investments | ||
| Delaware Wealth Builder Fund |
mortgages which are paying off over time. These securities do not indicate a reference rate and spread in their description above.
Restricted Securities
Investments | Date of Acquisition | Cost | Value | |||||||||
Merion Champion’s Walk | 8/4/17 | $ | 2,384,862 | $ | 2,401,352 | |||||||
Merion Champion’s Walk | 2/13/18 | 61,859 | 62,287 | |||||||||
Merion Champion’s Walk | 7/11/18 | 64,630 | 62,287 | |||||||||
Merion Champion’s Walk | 10/22/18 | 65,565 | 62,287 | |||||||||
Merion Countryside | 5/11/16 | 1,547,718 | 3,063,623 | |||||||||
Merion Countryside | 4/7/17 | 142,013 | 248,402 | |||||||||
Merion Countryside | 5/3/18 | 88,296 | 138,001 | |||||||||
Merion The Ledges | 9/26/18 | 3,822,000 | 3,630,900 | |||||||||
|
|
|
| |||||||||
Total | $ | 8,176,943 | $ | 9,669,139 | ||||||||
|
|
|
| |||||||||
The following foreign currency exchange contracts, futures contracts, and swap contracts were outstanding at Nov. 30, 2018:1
Foreign Currency Exchange Contracts
Counterparty | Contracts to Receive (Deliver) | In Exchange For | Settlement Date | Unrealized Depreciation | ||||||||
BNYM | JPY (2,990,899) | USD 26,327 | 12/3/18 | $ | (24 | ) | ||||||
| Futures Contracts | ||||||||||||||||||||||
Contracts to Buy (Sell) | Notional Amount | Notional Cost (Proceeds) | Expiration Date | Value/ Unrealized Appreciation | Variation Margin Due from (Due to Brokers) | |||||||||||||||||
(50) | E-mini S&P 500 Index | $ | (6,895,750 | ) | $ | (6,929,234 | ) | 12/24/18 | $ | 33,484 | $ | (35,250 | ) | |||||||||
| Swap Contracts | ||||||||||||||||||||||||
| CDS Contracts2 | ||||||||||||||||||||||||
| Variation | ||||||||||||||||||||||||
| Upfront | Margin | |||||||||||||||||||||||
| Reference Obligation/ | Annual | Payments | Due from | |||||||||||||||||||||
| Termination Date/ | Notional | Protection | Paid | Unrealized | (Due to) | |||||||||||||||||||
Payment Frequency | Amount3 | Payments | Value | (Received) | Appreciation4 | Brokers | ||||||||||||||||||
Centrally Cleared/ Protection Purchased: | ||||||||||||||||||||||||
CDX.NA.HY.315 | 8,500,000 | 5.00 | % | $ | (376,678 | ) | $ | (440,587 | ) | $ | 63,909 | $ | 17,757 | |||||||||||
| 36 |
Table of Contents
The use of foreign currency exchange contracts, futures contracts, and swap contracts involve elements of market risk and risks in excess of the amounts disclosed in these financial statements. The foreign currency exchange contract and notional amounts presented above represent the Fund’s total exposure in such contracts, whereas only the net unrealized appreciation (depreciation) is reflected in the Fund’s net assets.
1See Note 9 in “Notes to financial statements.”
2A CDS contract is a risk-transfer instrument through which one party (purchaser of protection) transfers to another party (seller of protection) the financial risk of a credit event (as defined in the CDS agreement), as it relates to a particular reference security or basket of securities (such as an index). Periodic payments (receipts) on such contracts are accrued daily and recorded as unrealized losses (gains) on swap contracts. Upon payment (receipt), such amounts are recorded as realized losses (gains) on swap contracts. Upfront payments made or received in connection with CDS contracts are amortized over the expected life of the CDS contracts as unrealized losses (gains) on swap contracts. The change in value of CDS contracts is recorded daily as unrealized appreciation or depreciation. A realized gain or loss is recorded upon a credit event (as defined in the CDS agreement) or the maturity or termination of the CDS agreement.
3Notional amount shown is stated in USD unless noted that the swap is denominated in another currency.
4Unrealized appreciation (depreciation) does not include periodic interest payments on swap contracts accrued daily in the amount of $(26,131).
5Markit’s CDX.NA.HY Index is composed of one hundred (100) of the most liquid North American entities with high yield credit ratings that trade in the CDS market.
Summary of abbreviations:
ADR – American Depositary Receipt
AMT – Subject to Alternative Minimum Tax
BNYM – The Bank of New York Mellon
CDS – Credit Default Swap
CDX.NA.HY – Credit Default Swap Index North America High Yield
ETF – Exchange-Traded Fund
GDR – Global Depository Receipt
ICE – Intercontinental Exchange
JPY – Japanese Yen
LIBOR – London Interbank Offered Rate
LIBOR03M – ICE LIBOR USD 3 Month
LIBOR06M – ICE LIBOR USD 6 Month
MSCI – Morgan Stanley Capital International
REIT – Real Estate Investment Trust
SPDR – S&P Depositary Receipts
S&P – Standard & Poor’s
USD – US Dollar
See accompanying notes, which are an integral part of the financial statements.
| 37 |
Table of Contents
| Statement of assets and liabilities | ||
| Delaware Wealth Builder Fund | November 30, 2018 |
Assets: | ||||
Investments, at value1 | $ | 597,581,229 | ||
Cash | 89,674 | |||
Cash collateral due from broker | 1,075,383 | |||
Foreign currencies, at value2 | 156,588 | |||
Dividends and interest receivable | 3,490,686 | |||
Receivable for securities sold | 1,503,084 | |||
Foreign tax reclaims receivable | 469,432 | |||
Receivable for fund shares sold | 73,482 | |||
Variation margin due from broker on centrally cleared credit default swap contracts | 17,757 | |||
Other assets3 | 270,461 | |||
|
| |||
Total assets | 604,727,776 | |||
|
| |||
Liabilities: | ||||
Payable for securities purchased | 3,222,641 | |||
Payable for fund shares redeemed | 864,802 | |||
Upfront payments received on centrally cleared credit default swap contracts | 440,587 | |||
Contingent liabilities3 | 901,538 | |||
Investment management fees payable to affiliates | 315,950 | |||
Distribution fees payable to affiliates | 170,779 | |||
Dividend disbursing and transfer agent fees and expenses payable | 104,849 | |||
Other accrued expenses | 97,846 | |||
Swap payments payable | 85,000 | |||
Variation margin due to broker on futures contracts | 35,250 | |||
Dividend disbursing and transfer agent fees and expenses payable to affiliates | 4,913 | |||
Trustees’ fees and expenses payable | 4,780 | |||
Accounting and administration expenses payable to affiliates | 2,201 | |||
Legal fees payable to affiliates | 978 | |||
Reports and statements to shareholders expenses payable to affiliates | 515 | |||
Unrealized depreciation on foreign currency exchange contracts | 24 | |||
|
| |||
Total liabilities | 6,252,653 | |||
|
| |||
Total Net Assets | $ | 598,475,123 | ||
|
|
| 38 |
Table of Contents
Net Assets Consist of: | ||||
Paid-in capital | $ | 565,479,834 | ||
Total distributable earnings (loss) | 32,995,289 | |||
|
| |||
Total Net Assets | $ | 598,475,123 | ||
|
| |||
Net Asset Value | ||||
Class A: | ||||
Net assets | $ | 273,383,565 | ||
Shares of beneficial interest outstanding, unlimited authorization, no par | 19,316,004 | |||
Net asset value per share | $ | 14.15 | ||
Sales charge | 5.75 | % | ||
Offering price per share, equal to net asset value per share / (1 – sales charge) | $ | 15.01 | ||
Class C: | ||||
Net assets | $ | 137,402,641 | ||
Shares of beneficial interest outstanding, unlimited authorization, no par | 9,690,502 | |||
Net asset value per share | $ | 14.18 | ||
Class R: | ||||
Net assets | $ | 1,968,529 | ||
Shares of beneficial interest outstanding, unlimited authorization, no par | 139,062 | |||
Net asset value per share | $ | 14.16 | ||
Institutional Class: | ||||
Net assets | $ | 185,720,388 | ||
Shares of beneficial interest outstanding, unlimited authorization, no par | 13,123,869 | |||
Net asset value per share | $ | 14.15 | ||
| ||||
1Investments, at cost | $ | 593,374,233 | ||
3Foreign currencies, at cost | 155,274 | |||
3See Note 14 in “Notes to financial statements.” | ||||
See accompanying notes, which are an integral part of the financial statements.
| 39 |
Table of Contents
| Statement of operations | ||
| Delaware Wealth Builder Fund | Year ended November 30, 2018 |
Investment Income: | ||||
Dividends | $ | 13,757,400 | ||
Interest | 10,148,107 | |||
Foreign tax withheld | (472,049 | ) | ||
|
| |||
| 23,433,458 | ||||
|
| |||
Expenses: | ||||
Management fees | 4,265,545 | |||
Distribution expenses – Class A | 706,443 | |||
Distribution expenses – Class C | 1,881,590 | |||
Distribution expenses – Class R | 14,900 | |||
Dividend disbursing and transfer agent fees and expenses | 702,342 | |||
Accounting and administration expenses | 152,155 | |||
Legal fees | 120,270 | |||
Reports and statements to shareholders expenses | 103,200 | |||
Audit and tax fees | 64,879 | |||
Custodian fees | 62,955 | |||
Registration fees | 62,416 | |||
Trustees’ fees and expenses | 31,932 | |||
Other | 69,543 | |||
|
| |||
Expenses before interest expense | 8,238,170 | |||
Interest expense | 1,218 | |||
Less expenses paid indirectly | (8,997 | ) | ||
|
| |||
Total operating expenses | 8,230,391 | |||
|
| |||
Net Investment Income | 15,203,067 | |||
|
|
| 40 |
Table of Contents
Net Realized and Unrealized Gain (Loss): | ||||
Net realized gain (loss) on: | ||||
Investments | $ | 33,920,796 | ||
Foreign currencies | (20,352 | ) | ||
Foreign currency exchange contracts | (20,964 | ) | ||
Futures contracts | (1,055,995 | ) | ||
Options written | 355 | |||
Swap contracts | (612,405 | ) | ||
|
| |||
Net realized gain | 32,211,435 | |||
|
| |||
Net change in unrealized appreciation (depreciation) of: | ||||
Investments | (53,260,146 | ) | ||
Foreign currencies | (19,603 | ) | ||
Foreign currency exchange contracts | (24 | ) | ||
Futures contracts | 973,345 | |||
Swap contracts | 312,252 | |||
|
| |||
Net change in unrealized appreciation (depreciation) | (51,994,176 | ) | ||
|
| |||
Net Realized and Unrealized Loss | (19,782,741 | ) | ||
|
| |||
Net Decrease in Net Assets Resulting from Operations | $ | (4,579,674 | ) | |
|
| |||
See accompanying notes, which are an integral part of the financial statements.
| 41 |
Table of Contents
| Statements of changes in net assets | ||
| Delaware Wealth Builder Fund |
| Year ended | ||||||||
| 11/30/18 | 11/30/17 | |||||||
Increase (Decrease) in Net Assets from Operations: | ||||||||
Net investment income | $ | 15,203,067 | $ | 16,487,907 | ||||
Net realized gain | 32,211,435 | 26,446,430 | ||||||
Net change in unrealized appreciation (depreciation) | (51,994,176 | ) | 23,132,642 | |||||
|
|
|
| |||||
Net increase (decrease) in net assets resulting from operations | (4,579,674 | ) | 66,066,979 | |||||
|
|
|
| |||||
Dividends and Distributions to Shareholders from: | ||||||||
Distributable earnings*: | ||||||||
Class A | (7,546,199 | ) | (6,460,107 | ) | ||||
Class C | (3,570,496 | ) | (4,557,137 | ) | ||||
Class R | (67,220 | ) | (61,239 | ) | ||||
Institutional Class | (5,777,766 | ) | (5,303,643 | ) | ||||
|
|
|
| |||||
| (16,961,681 | ) | (16,382,126 | ) | |||||
|
|
|
| |||||
Capital Share Transactions: | ||||||||
Proceeds from shares sold: | ||||||||
Class A | 58,772,382 | 50,478,605 | ||||||
Class C | 6,019,571 | 17,815,034 | ||||||
Class R | 744,682 | 722,521 | ||||||
Institutional Class | 49,348,771 | 96,767,403 | ||||||
Net assets from merger**: | ||||||||
Class A | 34,209,151 | — | ||||||
Class C | 10,597,997 | — | ||||||
Class R | 1,907,750 | — | ||||||
Institutional Class | 4,798,603 | — | ||||||
| 42 |
Table of Contents
| Year ended | ||||||||
| 11/30/18 | 11/30/17 | |||||||
Capital Share Transactions (continued): | ||||||||
Net asset value of shares issued upon reinvestment of dividends and distributions: | ||||||||
Class A | $ | 7,101,684 | $ | 6,003,456 | ||||
Class C | 3,383,522 | 4,192,231 | ||||||
Class R | 72,796 | 60,760 | ||||||
Institutional Class | 5,187,021 | 4,701,398 | ||||||
|
|
|
| |||||
| 182,143,930 | 180,741,408 | |||||||
|
|
|
| |||||
Cost of shares redeemed: | ||||||||
Class A | (73,756,847 | ) | (89,148,963 | ) | ||||
Class C | (102,200,279 | ) | (97,966,095 | ) | ||||
Class R | (2,999,542 | ) | (1,866,979 | ) | ||||
Institutional Class | (68,536,803 | ) | (62,703,837 | ) | ||||
|
|
|
| |||||
| (247,493,471 | ) | (251,685,874 | ) | |||||
|
|
|
| |||||
Decrease in net assets derived from capital share transactions | (65,349,541 | ) | (70,944,466 | ) | ||||
|
|
|
| |||||
Net Decrease in Net Assets | (86,890,896 | ) | (21,259,613 | ) | ||||
Net Assets: | ||||||||
Beginning of year | 685,366,019 | 706,625,632 | ||||||
|
|
|
| |||||
End of year1 | $ | 598,475,123 | $ | 685,366,019 | ||||
|
|
|
| |||||
| 1 | Net Assets – End of year includes undistributed net investment income of $125,078 in 2017. The Securities and Exchange Commission eliminated the requirement to disclose undistributed (distributions in excess of) net investment income in 2018. |
| * | For the year ended Nov. 30, 2018, the Fund has adopted amendments to RegulationS-X (see Note 15 in “Notes to financial statements”). For the year ended Nov. 30, 2017 the dividends and distributions to shareholders were as follows: |
| Class A | Class C | Class R | Institutional Class | |||||||||||||
Dividends from net investment income | $ | (6,460,107 | ) | $ | (4,557,137 | ) | $ | (61,239 | ) | $ | (5,303,643 | ) | ||||
**See Note 7 in “Notes to financial statements.”
See accompanying notes, which are an integral part of the financial statements.
| 43 |
Table of Contents
Delaware Wealth Builder Fund Class A
Selected data for each share of the Fund outstanding throughout each period were as follows:
|
Net asset value, beginning of period |
|
Income (loss) from investment operations: |
Net investment income1 |
Net realized and unrealized gain (loss) |
Total from investment operations |
|
Less dividends and distributions from: |
Net investment income |
Net realized gain |
Total dividends and distributions |
|
Net asset value, end of period |
|
Total return2 |
|
Ratios and supplemental data: |
Net assets, end of period (000 omitted) |
Ratio of expenses to average net assets3,4 |
Ratio of net investment income to average net assets5 |
Portfolio turnover |
|
|
| 1 | The average shares outstanding method has been applied for per share information. |
| 2 | Total investment return is based on the change in net asset value of a share during the period and assumes reinvestment of dividends and distributions at net asset value and does not reflect the impact of a sales charge. |
| 3 | Expense ratios do not include expenses of the Underlying Funds in which the Fund invests. |
| 4 | The ratios of expenses to average net assets excluding interest expense and dividend expense for the years ended Nov. 30, 2018, 2017, and 2016 were 1.09%, 1.09%, and 1.12%, respectively. |
| 5 | The ratios of net investment income to average net assets excluding interest expense and dividend expense for the years ended Nov. 30, 2018, 2017, and 2016 were 2.40%, 2.51%, and 2.05%, respectively. |
See accompanying notes, which are an integral part of the financial statements.
| 44 |
Table of Contents
| Year ended | ||||||||||||||||||||||||||||
|
| |||||||||||||||||||||||||||
| 11/30/18 | 11/30/17 | 11/30/16 | 11/30/15 | 11/30/14 | ||||||||||||||||||||||||
| ||||||||||||||||||||||||||||
| $ | 14.62 | $ | 13.64 | $ | 13.16 | $ | 13.73 | $ | 12.81 | |||||||||||||||||||
| ||||||||||||||||||||||||||||
| ||||||||||||||||||||||||||||
| 0.35 | 0.36 | 0.27 | 0.32 | 0.31 | ||||||||||||||||||||||||
| (0.43 | ) | 0.98 | 0.52 | (0.58 | ) | 0.92 | ||||||||||||||||||||||
|
|
|
|
|
|
|
|
|
| |||||||||||||||||||
| (0.08 | ) | 1.34 | 0.79 | (0.26 | ) | 1.23 | ||||||||||||||||||||||
|
|
|
|
|
|
|
|
|
| |||||||||||||||||||
| ||||||||||||||||||||||||||||
| ||||||||||||||||||||||||||||
| (0.34 | ) | (0.36 | ) | (0.31 | ) | (0.31 | ) | (0.31 | ) | |||||||||||||||||||
| (0.05 | ) | — | — | — | — | |||||||||||||||||||||||
|
|
|
|
|
|
|
|
|
| |||||||||||||||||||
| (0.39 | ) | (0.36 | ) | (0.31 | ) | (0.31 | ) | (0.31 | ) | |||||||||||||||||||
|
|
|
|
|
|
|
|
|
| |||||||||||||||||||
| ||||||||||||||||||||||||||||
| $ | 14.15 | $ | 14.62 | $ | 13.64 | $ | 13.16 | $ | 13.73 | |||||||||||||||||||
|
|
|
|
|
|
|
|
|
| |||||||||||||||||||
| ||||||||||||||||||||||||||||
| (0.56% | ) | 9.90% | 6.11% | (1.91% | ) | 9.74% | ||||||||||||||||||||||
| ||||||||||||||||||||||||||||
| $ | 273,384 | $ | 256,157 | $ | 270,324 | $ | 291,876 | $ | 315,098 | |||||||||||||||||||
| 1.09% | 1.09% | 1.13% | 1.10% | 1.10% | ||||||||||||||||||||||||
| 2.41% | 2.51% | 2.04% | 2.38% | 2.35% | ||||||||||||||||||||||||
| 57% | 81% | 102% | 67% | 56% | ||||||||||||||||||||||||
| ||||||||||||||||||||||||||||
| ||||||||||||||||||||||||||||
| 45 |
Table of Contents
Financial highlights
Delaware Wealth Builder Fund Class C
Selected data for each share of the Fund outstanding throughout each period were as follows:
|
Net asset value, beginning of period |
|
Income (loss) from investment operations: |
Net investment income1 |
Net realized and unrealized gain (loss) |
Total from investment operations |
|
Less dividends and distributions from: |
Net investment income |
Net realized gain |
Total dividends and distributions |
|
Net asset value, end of period |
|
Total return2 |
|
Ratios and supplemental data: |
Net assets, end of period (000 omitted) |
Ratio of expenses to average net assets3,4 |
Ratio of net investment income to average net assets5 |
Portfolio turnover |
|
|
| 1 | The average shares outstanding method has been applied for per share information. |
| 2 | Total investment return is based on the change in net asset value of a share during the period and assumes reinvestment of dividends and distributions at net asset value and does not reflect the impact of a sales charge. |
| 3 | Expense ratios do not include expenses of the Underlying Funds in which the Fund invests. |
| 4 | The ratios of expenses to average net assets excluding interest expense and dividend expense for the years ended Nov. 30, 2018, 2017, and 2016 were 1.84%, 1.84%, and 1.87%, respectively. |
| 5 | The ratios of net investment income to average net assets excluding interest expense and dividend expense for the years ended Nov. 30, 2018, 2017, and 2016 were 1.65%, 1.76%, and 1.30%, respectively. |
See accompanying notes, which are an integral part of the financial statements.
| 46 |
Table of Contents
| Year ended | ||||||||||||||||||||||||||||
|
| |||||||||||||||||||||||||||
| 11/30/18 | 11/30/17 | 11/30/16 | 11/30/15 | 11/30/14 | ||||||||||||||||||||||||
| ||||||||||||||||||||||||||||
| $ | 14.65 | $ | 13.66 | $ | 13.18 | $ | 13.75 | $ | 12.83 | |||||||||||||||||||
| ||||||||||||||||||||||||||||
| ||||||||||||||||||||||||||||
| 0.24 | 0.25 | 0.17 | 0.22 | 0.21 | ||||||||||||||||||||||||
| (0.43 | ) | 0.99 | 0.52 | (0.58 | ) | 0.92 | ||||||||||||||||||||||
|
|
|
|
|
|
|
|
|
| |||||||||||||||||||
| (0.19 | ) | 1.24 | 0.69 | (0.36 | ) | 1.13 | ||||||||||||||||||||||
|
|
|
|
|
|
|
|
|
| |||||||||||||||||||
| ||||||||||||||||||||||||||||
| ||||||||||||||||||||||||||||
| (0.23 | ) | (0.25 | ) | (0.21 | ) | (0.21 | ) | (0.21 | ) | |||||||||||||||||||
| (0.05 | ) | — | — | — | — | |||||||||||||||||||||||
|
|
|
|
|
|
|
|
|
| |||||||||||||||||||
| (0.28 | ) | (0.25 | ) | (0.21 | ) | (0.21 | ) | (0.21 | ) | |||||||||||||||||||
|
|
|
|
|
|
|
|
|
| |||||||||||||||||||
| ||||||||||||||||||||||||||||
| $ | 14.18 | $ | 14.65 | $ | 13.66 | $ | 13.18 | $ | 13.75 | |||||||||||||||||||
|
|
|
|
|
|
|
|
|
| |||||||||||||||||||
| ||||||||||||||||||||||||||||
| (1.34% | ) | 9.13% | 5.30% | (2.63% | ) | 8.90% | ||||||||||||||||||||||
�� | ||||||||||||||||||||||||||||
| $ | 137,403 | $ | 225,604 | $ | 283,243 | $ | 298,833 | $ | 308,975 | |||||||||||||||||||
| 1.84% | 1.84% | 1.88% | 1.85% | 1.85% | ||||||||||||||||||||||||
| 1.66% | 1.76% | 1.29% | 1.63% | 1.60% | ||||||||||||||||||||||||
| 57% | 81% | 102% | 67% | 56% | ||||||||||||||||||||||||
| ||||||||||||||||||||||||||||
| ||||||||||||||||||||||||||||
| 47 |
Table of Contents
Financial highlights
Delaware Wealth Builder Fund Class R
Selected data for each share of the Fund outstanding throughout each period were as follows:
|
Net asset value, beginning of period |
|
Income (loss) from investment operations: |
Net investment income1 |
Net realized and unrealized gain (loss) |
Total from investment operations |
|
Less dividends and distributions from: |
Net investment income |
Net realized gain |
Total dividends and distributions |
|
Net asset value, end of period |
|
Total return2 |
|
Ratios and supplemental data: |
Net assets, end of period (000 omitted) |
Ratio of expenses to average net assets3,4 |
Ratio of net investment income to average net assets5 |
Portfolio turnover |
|
|
| 1 | The average shares outstanding method has been applied for per share information. |
| 2 | Total investment return is based on the change in a net asset value of a share during the period and assumes reinvestment of dividends and distributions at net asset value. |
| 3 | Expense ratios do not include expenses of the Underlying Funds in which the Fund invests. |
| 4 | The ratios of expenses to average net assets excluding interest expense and dividend expense for the years ended Nov. 30, 2018, 2017, and 2016 were 1.34%, 1.34%, and 1.37%, respectively. |
| 5 | The ratios of net investment income to average net assets excluding interest expense and dividend expense for the years ended Nov. 30, 2018, 2017, and 2016 were 2.15%, 2.26%, and 1.80%, respectively. |
See accompanying notes, which are an integral part of the financial statements.
| 48 |
Table of Contents
| Year ended | ||||||||||||||||||||||||||||
|
| |||||||||||||||||||||||||||
| 11/30/18 | 11/30/17 | 11/30/16 | 11/30/15 | 11/30/14 | ||||||||||||||||||||||||
| ||||||||||||||||||||||||||||
| $ | 14.62 | $ | 13.63 | $ | 13.16 | $ | 13.73 | $ | 12.81 | |||||||||||||||||||
| ||||||||||||||||||||||||||||
| ||||||||||||||||||||||||||||
| 0.31 | 0.32 | 0.24 | 0.29 | 0.28 | ||||||||||||||||||||||||
| (0.42 | ) | 0.99 | 0.51 | (0.58 | ) | 0.92 | ||||||||||||||||||||||
|
|
|
|
|
|
|
|
|
| |||||||||||||||||||
| (0.11 | ) | 1.31 | 0.75 | (0.29 | ) | 1.20 | ||||||||||||||||||||||
|
|
|
|
|
|
|
|
|
| |||||||||||||||||||
| ||||||||||||||||||||||||||||
| ||||||||||||||||||||||||||||
| (0.30 | ) | (0.32 | ) | (0.28 | ) | (0.28 | ) | (0.28 | ) | |||||||||||||||||||
| (0.05 | ) | — | — | — | — | |||||||||||||||||||||||
|
|
|
|
|
|
|
|
|
| |||||||||||||||||||
| (0.35 | ) | (0.32 | ) | (0.28 | ) | (0.28 | ) | (0.28 | ) | |||||||||||||||||||
|
|
|
|
|
|
|
|
|
| |||||||||||||||||||
| ||||||||||||||||||||||||||||
| $ | 14.16 | $ | 14.62 | $ | 13.63 | $ | 13.16 | $ | 13.73 | |||||||||||||||||||
|
|
|
|
|
|
|
|
|
| |||||||||||||||||||
| ||||||||||||||||||||||||||||
| (0.78% | ) | 9.70% | 5.76% | (2.15% | ) | 9.46% | ||||||||||||||||||||||
| ||||||||||||||||||||||||||||
| $ | 1,968 | $ | 2,320 | $ | 3,229 | $ | 3,682 | $ | 3,983 | |||||||||||||||||||
| 1.34% | 1.34% | 1.38% | 1.35% | 1.35% | ||||||||||||||||||||||||
| 2.16% | 2.26% | 1.79% | 2.13% | 2.10% | ||||||||||||||||||||||||
| 57% | 81% | 102% | 67% | 56% | ||||||||||||||||||||||||
| ||||||||||||||||||||||||||||
| ||||||||||||||||||||||||||||
| 49 |
Table of Contents
Financial highlights
Delaware Wealth Builder Fund Institutional Class
Selected data for each share of the Fund outstanding throughout each period were as follows:
|
Net asset value, beginning of period |
|
Income (loss) from investment operations: |
Net investment income1 |
Net realized and unrealized gain (loss) |
Total from investment operations |
|
Less dividends and distributions from: |
Net investment income |
Net realized gain |
Total dividends and distributions |
|
Net asset value, end of period |
|
Total return2 |
|
Ratios and supplemental data: |
Net assets, end of period (000 omitted) |
Ratio of expenses to average net assets3,4 |
Ratio of net investment income to average net assets3,5 |
Portfolio turnover |
|
|
| 1 | The average shares outstanding method has been applied for per share information. |
| 2 | Total investment return is based on the change in net asset value of a share during the period and assumes reinvestment of dividends and distributions at net asset value. |
| 3 | Expense ratios do not include expenses of the Underlying Funds in which the Fund invests. |
| 4 | The ratios of expenses to average net assets excluding interest expense and dividend expense for the years ended Nov. 30, 2018, 2017, and 2016 were 0.84%, 0.84%, and 0.87%, respectively. |
| 5 | The ratios of net investment income to average net assets excluding interest expense and dividend expense for the years ended Nov. 30, 2018, 2017, and 2016 were 2.65%, 2.76%, and 2.30%, respectively. |
See accompanying notes, which are an integral part of the financial statements.
| 50 |
Table of Contents
| Year ended | ||||||||||||||||||||||||||||
|
| |||||||||||||||||||||||||||
| 11/30/18 | 11/30/17 | 11/30/16 | 11/30/15 | 11/30/14 | ||||||||||||||||||||||||
| ||||||||||||||||||||||||||||
| $ | 14.63 | $ | 13.64 | $ | 13.16 | $ | 13.73 | $ | 12.81 | |||||||||||||||||||
| ||||||||||||||||||||||||||||
| ||||||||||||||||||||||||||||
| 0.38 | 0.39 | 0.30 | 0.36 | 0.35 | ||||||||||||||||||||||||
| (0.43 | ) | 0.99 | 0.52 | (0.58 | ) | 0.92 | ||||||||||||||||||||||
|
|
|
|
|
|
|
|
|
| |||||||||||||||||||
| (0.05 | ) | 1.38 | 0.82 | (0.22 | ) | 1.27 | ||||||||||||||||||||||
|
|
|
|
|
|
|
|
|
| |||||||||||||||||||
| ||||||||||||||||||||||||||||
| ||||||||||||||||||||||||||||
| (0.38 | ) | (0.39 | ) | (0.34 | ) | (0.35 | ) | (0.35 | ) | |||||||||||||||||||
| (0.05 | ) | — | — | — | — | |||||||||||||||||||||||
|
|
|
|
|
|
|
|
|
| |||||||||||||||||||
| (0.43 | ) | (0.39 | ) | (0.34 | ) | (0.35 | ) | (0.35 | ) | |||||||||||||||||||
|
|
|
|
|
|
|
|
|
| |||||||||||||||||||
| ||||||||||||||||||||||||||||
| $ | 14.15 | $ | 14.63 | $ | 13.64 | $ | 13.16 | $ | 13.73 | |||||||||||||||||||
|
|
|
|
|
|
|
|
|
| |||||||||||||||||||
| ||||||||||||||||||||||||||||
| (0.37% | ) | 10.24% | 6.37% | (1.66% | ) | 10.01% | ||||||||||||||||||||||
| ||||||||||||||||||||||||||||
| $ | 185,720 | $ | 201,285 | $ | 149,830 | $ | 147,133 | $ | 149,914 | |||||||||||||||||||
| 0.84% | 0.84% | 0.88% | 0.85% | 0.85% | ||||||||||||||||||||||||
| 2.66% | 2.76% | 2.29% | 2.63% | 2.60% | ||||||||||||||||||||||||
| 57% | 81% | 102% | 67% | 56% | ||||||||||||||||||||||||
| ||||||||||||||||||||||||||||
| ||||||||||||||||||||||||||||
| 51 |
Table of Contents
| Notes to financial statements | ||
| Delaware Wealth Builder Fund | November 30, 2018 |
Delaware Group® Equity Funds V (Trust) is organized as a Delaware statutory trust and offers three series: Delaware Wealth Builder Fund, Delaware Small Cap Core Fund, and Delaware Small Cap Value Fund. These financial statements and the related notes pertain to Delaware Wealth Builder Fund (Fund). The Trust is anopen-end investment company. The Fund is considered diversified under the Investment Company Act of 1940, as amended (1940 Act), and offers Class A, Class C, Class R, and Institutional Class shares. Class A shares are sold with a maximumfront-end sales charge of 5.75%. Class A share purchases of $1,000,000 or more will incur a contingent deferred sales charge (CDSC) instead of afront-end sales charge of 1.00%, if redeemed during the first year, and 0.50% during the second year, provided that Delaware Distributors, L.P. (DDLP) paid a financial advisor a commission on the purchase of those shares. Class C shares are sold with a CDSC of 1.00%, which will be incurred if redeemed during the first 12 months. Class R and Institutional Class shares are not subject to a sales charge and are offered for sale exclusively to certain eligible investors.
The investment objective of the Fund is to seek to provide high current income and an investment that has the potential for capital appreciation.
1. Significant Accounting Policies
The Fund is an investment company and follows accounting and reporting guidance under Financial Accounting Standards Board (FASB) Accounting Standards Codification (ASC) Topic 946, Financial Services - Investment Companies. The following accounting policies are in accordance with US generally accepted accounting principles (US GAAP) and are consistently followed by the Fund.
Security Valuation– Equity securities and exchange-traded funds (ETFs), except those traded on the Nasdaq Stock Market LLC (Nasdaq), are valued at the last quoted sales price as of the time of the regular close of the New York Stock Exchange on the valuation date. Equity securities and ETFs traded on the Nasdaq are valued in accordance with the Nasdaq Official Closing Price, which may not be the last sales price. If, on a particular day, an equity security or ETF does not trade, the mean between the bid and ask prices will be used, which approximates fair value. Equity securities listed on a foreign exchange are normally valued at the last quoted sales price on the valuation date. Investments in repurchase agreements are generally valued at par, which approximates fair value, each business day. Other debt securities and credit default swap contracts are valued based upon valuations provided by an independent pricing service or broker/counterparty and reviewed by management. To the extent current market prices are not available, the pricing service may take into account developments related to the specific security, as well as transactions in comparable securities. US government and agency securities are valued at the mean between the bid and ask prices, which approximates fair value. Valuations for fixed income securities utilize matrix systems, which reflect such factors as security prices, yields, maturities, and ratings, and are supplemented by dealer and exchange quotations. For asset-backed securities, collateralized mortgage obligations, commercial mortgage securities and US government agency mortgage securities, pricing vendors utilize matrix pricing which considers prepayment speed; attributes of the collateral; yield or price of bonds of comparable quality, coupon, maturity, and type as well as broker/dealer-supplied prices. Swap prices are derived using daily swap curves and models that incorporate a number of market data factors, such as discounted cash flows, trades, and values of the underlying reference instruments. Foreign currency exchange contracts are valued at the mean between the bid and ask prices, which approximates fair value. Interpolated values are derived when the
| 52 |
Table of Contents
settlement date of the contract is an interim date for which quotations are not available. Futures contracts are valued at the daily quoted settlement prices. Generally, other securities and assets for which market quotations are not readily available are valued at fair value as determined in good faith under the direction of the Trust’s Board of Trustees (Board). In determining whether market quotations are readily available or fair valuation will be used, various factors will be taken into consideration, such as market closures or suspension of trading in a security. The Fund may use fair value pricing more frequently for securities traded primarily innon-US markets because, among other things, most foreign markets close well before the Fund values its securities, generally as of 4:00pm Eastern time. The earlier close of these foreign markets gives rise to the possibility that significant events, including broad market moves, government actions or pronouncements, aftermarket trading, or news events may have occurred in the interim. Whenever such a significant event occurs, the Fund may value foreign securities using fair value prices based on third-party vendor modeling tools (international fair value pricing). Restricted securities are valued at fair value using methods approved by the Board.
Federal and Foreign Income Taxes– No provision for federal income taxes has been made as the Fund intends to continue to qualify for federal income tax purposes as a regulated investment company under Subchapter M of the Internal Revenue Code of 1986, as amended, and make the requisite distributions to shareholders. The Fund evaluates tax positions taken or expected to be taken in the course of preparing the Fund’s tax returns to determine whether the tax positions are“more-likely-than-not” of being sustained by the applicable tax authority. Tax positions not deemed to meet the“more-likely-than-not” threshold are recorded as a tax benefit or expense in the current year. Management has analyzed the Fund’s tax positions taken or expected to be taken on the Fund’s federal income tax returns through the year ended Nov. 30, 2018 and for all open tax years (years ended Nov. 30, 2015–Nov. 30, 2017), and has concluded that no provision for federal income tax is required in the Fund’s financial statements. In regard to foreign taxes only, the Fund has open tax years in certain foreign countries in which it invests that may date back to the inception of the Fund. If applicable, the Fund recognizes interest accrued on unrecognized tax benefits in interest expense and penalties in other expenses on the “Statement of operations.” During the year ended Nov. 30, 2018, the Fund did not incur any interest or tax penalties.
Class Accounting– Investment income, common expenses, and realized and unrealized gain (loss) on investments are allocated to the various classes of the Fund on the basis of daily net assets of each class. Distribution expenses relating to a specific class are charged directly to that class.
Underlying Funds– The Fund may invest in other investment companies (Underlying Funds) to the extent permitted by the 1940 Act. The Underlying Funds in which the Fund invests include ETFs. The Fund will indirectly bear the investment management fees and other expenses of the Underlying Funds.
Repurchase Agreements– The Fund may purchase certain US government securities subject to the counterparty’s agreement to repurchase them at an agreed upon date and price. The counterparty will be required on a daily basis to maintain the value of the collateral subject to the agreement at not less than the repurchase price (including accrued interest). The agreements are conditioned upon the collateral being deposited under the Federal Reserve book-entry system with the Fund’s custodian or a third-partysub-custodian. In the event of default or bankruptcy by the other party to the agreement,
| 53 |
Table of Contents
| Notes to financial statements | ||
| Delaware Wealth Builder Fund |
1. Significant Accounting Policies (continued)
retention of the collateral may be subject to legal proceedings. All open repurchase agreements as of the date of this report were entered into on Nov. 30, 2018, and matured on the next business day.
Short Sales– The Fund may make short sales in an attempt to protect against declines in an individual security or the overall market, to manage duration or for such other purposes consistent with the Fund’s investment objectives and strategies. Typically, short sales are transactions in which the Fund sells a security it does not own and, at the time a short sale is effected, the Fund incurs an obligation to replace the security borrowed at whatever its price may be at the time the Fund purchases it for delivery to the lender. The price at such time may be more or less than the price at which the security was sold by the Fund. When a short sale transaction is closed out by delivery of the security, any gain or loss on the transaction generally is taxable as short-term capital gain or loss. Until the security is replaced, the Fund is required to pay the lender amounts equal to any dividends or interest that accrue during the period of the loan. To borrow the security, the Fund also may be required to pay a premium, which would increase the cost of the security sold. The proceeds of the short sale, and potentially additional margin, will be retained by the broker from whom the security is borrowed, to the extent necessary to meet margin requirements, until the short position is closed out.
Foreign Currency Transactions– Transactions denominated in foreign currencies are recorded at the prevailing exchange rates on the valuation date in accordance with the Fund’s prospectus. The value of all assets and liabilities denominated in foreign currencies is translated daily into US dollars at the exchange rate of such currencies against the US dollar. Transaction gains or losses resulting from changes in exchange rates during the reporting period or upon settlement of the foreign currency transaction are reported in operations for the current period. The Fund generally bifurcates that portion of realized gains and losses on investments in debt securities which is due to changes in foreign exchange rates from that which is due to changes in market prices of debt securities. That portion of gains (losses), which is due to changes in foreign exchange rates, is included on the “Statement of operations” under “Net realized gain (loss) on foreign currencies.” For foreign equity securities, these changes are included on the “Statement of operations” under “Net realized and unrealized gain (loss) on investments.” The Fund reports certain foreign currency related transactions as components of realized gains (losses) for financial reporting purposes, whereas such components are treated as ordinary income (loss) for federal income tax purposes.
Use of Estimates– The preparation of financial statements in conformity with US GAAP requires management to make estimates and assumptions that affect the fair value of investments, the reported amounts of assets and liabilities and disclosure of contingent assets and liabilities at the date of the financial statements, and the reported amounts of revenues and expenses during the reporting period. Actual results could differ from those estimates and the differences could be material.
Other– Expenses directly attributable to the Fund are charged directly to the Fund. Other expenses common to various funds within the Delaware Funds® by Macquarie (Delaware Funds) are generally allocated among such funds on the basis of average net assets. Management fees and certain other expenses are paid monthly. Security transactions are recorded on the date the securities are purchased or sold (trade date) for financial reporting purposes. Costs used in calculating realized gains and losses on the sale of investment securities are those of the specific securities sold. Dividend income is recorded
| 54 |
Table of Contents
on theex-dividend date and interest income is recorded on the accrual basis. Discounts and premiums on debt securities are accreted or amortized to interest income, respectively, over the lives of the respective securities using the effective interest method. Realized gain (loss) on paydowns of asset- and mortgage-backed securities are classified as interest income. Distributions received from investments in real estate investment trusts (REITs) are recorded as dividend income on theex-dividend date, subject to reclassification upon notice of the character of such distributions by the issuer. Distributions received from investments in master limited partnerships are recorded as return of capital on investments. Foreign dividends are also recorded on theex-dividend date or as soon after theex-dividend date that the Fund is aware of such dividends, net of all tax withholdings, a portion of which may be reclaimable. Withholding taxes and reclaims on foreign dividends have been recorded in accordance with the Fund’s understanding of the applicable country’s tax rules and rates. The Fund declares and pays dividends from net investment income monthly and distributions from net realized gain on investments, if any, annually. The Fund may distribute more frequently, if necessary for tax purposes. Dividends and distributions, if any, are recorded on theex-dividend date.
Subject to seeking best execution, the Fund may direct certain security trades to brokers who have agreed to rebate a portion of the related brokerage commission to the Fund in cash. In general, best execution refers to many factors, including the price paid or received for a security, the commission charged, the promptness and reliability of execution, the confidentiality and placement accorded the order, and other factors affecting the overall benefit obtained by the Fund on the transaction. There were no commission rebates for the year ended Nov. 30, 2018.
The Fund receives earnings credits from its custodian when positive cash balances are maintained, which may be used to offset custody fees. The expense paid under this arrangement is included on the “Statement of operations” under “Custodian fees” with the corresponding expense offset included under “Less expenses paid indirectly.” For the year ended Nov. 30, 2018, the Fund earned $8,107 under this arrangement.
The Fund receives earnings credits from its transfer agent when positive cash balances are maintained, which may be used to offset transfer agent fees. If the amount earned is greater than $1, the expense paid under this arrangement is included on the “Statement of operations” under “Dividend disbursing and transfer agent fees and expenses” with the corresponding expense offset included under “Less expenses paid indirectly.” For the year ended Nov. 30, 2018, the Fund earned $890 under this arrangement.
2. Investment Management, Administration Agreements, and Other Transactions with Affiliates
In accordance with the terms of its investment management agreement, the Fund pays Delaware Management Company (DMC), a series of Macquarie Investment Management Business Trust and the investment manager, an annual fee which is calculated daily and paid monthly at the rate of 0.65% on the first $500 million of average daily net assets of the Fund, 0.60% on the next $500 million, 0.55% on the next $1.5 billion, and 0.50% on average daily net assets in excess of $2.5 billion.
Delaware Investments Fund Services Company (DIFSC), an affiliate of DMC, provides fund accounting and financial administration oversight services to the Fund. For these services, DIFSC’s fees were calculated daily and paid monthly based on the aggregate daily net assets of all funds within the
| 55 |
Table of Contents
| Notes to financial statements | ||
| Delaware Wealth Builder Fund |
2. Investment Management, Administration Agreements, and Other Transactions with Affiliates (continued)
Delaware Funds at the following annual rate: 0.00475% of the first $35 billion; 0.0040% of the next $10 billion; and 0.0025% of aggregate average daily net assets in excess of $45 billion (Total Fee). Each Fund in the Delaware Funds pays a minimum of $4,000, which, in aggregate, is subtracted from the Total Fee. Each Fund then pays its portion of the remainder of the Total Fee on a relative net asset value (NAV) basis. This amount is included on the “Statement of operations” under “Accounting and administration expenses.” For the year ended Nov. 30, 2018, the Fund was charged $29,244 for these services.
DIFSC is also the transfer agent and dividend disbursing agent of the Fund. For these services, DIFSC’s fees were calculated daily and paid monthly based on the aggregate daily net assets of the retail funds within the Delaware Funds from Dec. 1, 2017 through June 30, 2018 at the following annual rate: 0.025% of the first $20 billion; 0.020% of the next $5 billion; 0.015% of the next $5 billion; and 0.013% of average daily net assets in excess of $30 billion. Effective July 1, 2018, the Fund as well as the other Delaware Funds entered into an amendment to the DIFSC agreement. Under the amendment to the DIFSC agreement, DIFSC’s fees are calculated daily and paid monthly based on the aggregate daily net assets of the retail funds within the Delaware Funds at the following annual rate: 0.014% of the first $20 billion; 0.011% of the next $5 billion; 0.007% of the next $5 billion; 0.005% of the next $20 billion; and 0.0025% of average daily net assets in excess of $50 billion. The fees payable to DIFSC under the transfer agent agreement described above are allocated among all retail funds in the Delaware Funds on a relative NAV basis. This amount is included on the “Statement of operations” under “Dividend disbursing and transfer agent fees and expenses.” For the year ended Nov. 30, 2018, the Fund was charged $104,724 for these services. Pursuant to asub-transfer agency agreement between DIFSC and BNY Mellon Investment Servicing (US) Inc. (BNYMIS), BNYMIS provides certainsub-transfer agency services to the Fund.Sub-transfer agency fees are paid by the Fund and are also included on the “Statement of operations” under “Dividend disbursing and transfer agent fees and expenses.”
Pursuant to a distribution agreement and distribution plan, the Fund pays DDLP, the distributor and an affiliate of DMC, an annual distribution and service(12b-1) fee of 0.25% of the average daily net assets of the Class A shares, 1.00% of the average daily net assets of the Class C shares, and 0.50% of the average daily net assets of Class R shares. The fees are calculated daily and paid monthly. Institutional Class shares pay no12b-1 fees.
As provided in the investment management agreement, the Fund bears a portion of the cost of certain resources shared with DMC, including the cost of internal personnel of DMC and/or its affiliates that provide legal, tax, and regulatory reporting services to the Fund. For the year ended Nov. 30, 2018, the Fund was charged $26,320 for internal legal, tax, and regulatory reporting services provided by DMC and/or its affiliates’ employees. This amount is included on the “Statement of operations” under “Legal fees.”
For the year ended Nov. 30, 2018, DDLP earned $29,149 for commissions on sales of the Fund’s Class A shares. For the year ended Nov. 30, 2018, DDLP received gross CDSC commissions of $1,234 and $8,619 on redemptions of the Fund’s Class A and Class C shares, respectively, and these commissions were entirely used to offset upfront commissions previously paid by DDLP to broker/dealers on sales of those shares.
| 56 |
Table of Contents
Trustees’ fees include expenses accrued by the Fund for each Trustee’s retainer and meeting fees. Certain officers of DMC, DIFSC, and DDLP are officers and/or Trustees of the Trust. These officers and Trustees are paid no compensation by the Fund.
In addition to the management fees and other expenses of the Fund, the Fund indirectly bears the investment management fees and other expenses of the Underlying Funds. The amount of these fees and expenses incurred indirectly by the Fund will vary based upon the expense and fee levels of the Underlying Funds and the amount of shares that are owned of the Underlying Funds at different times.
Cross trades for the year ended Nov. 30, 2018 were executed by the Fund pursuant to procedures adopted by the Board designed to ensure compliance with Rule17a-7 under the 1940 Act. Cross trading is the buying or selling of portfolio securities between funds of investment companies, or between a fund of an investment company and another entity, that are or could be considered affiliates by virtue of having a common investment advisor (or affiliated investment advisors), common directors/trustees and/or common officers. At its regularly scheduled meetings, the Board reviews such transactions for compliance with the procedures adopted by the Board. Pursuant to these procedures, for the year ended Nov. 30, 2018, the Fund engaged in Rule17a-7 securities purchases of $1,049,919, and Rule17a-7 securities sales of $6,552,498, which resulted in net realized losses of ($23,209).
3. Investments
For the year ended Nov. 30, 2018, the Fund made purchases and sales of investment securities other than US government securities and short-term investments as follows:
Purchases other than US government securities | $ | 356,901,038 | ||
Purchases of US government securities | 5,960,616 | |||
Sales other than US government securities | 463,471,391 | |||
Sales of US government securities | 19,918,306 |
The tax cost of investments includes adjustments to net unrealized appreciation (depreciation) which may not necessarily be final tax cost basis adjustments, but approximate the tax basis unrealized gains and losses that may be realized and distributed to shareholders. At Nov. 30, 2018, the cost and unrealized appreciation (depreciation) of investments and derivatives for federal income tax purposes for the Fund were as follows:
Cost of investments and derivatives | $ | 598,878,568 | ||
|
| |||
Aggregate unrealized appreciation of investments and derivatives | $ | 40,697,737 | ||
Aggregate unrealized depreciation of investments and derivatives | (41,897,707 | ) | ||
|
| |||
Net unrealized depreciation of investments and derivatives | $ | (1,199,970 | ) | |
|
|
US GAAP defines fair value as the price that the Fund would receive to sell an asset or pay to transfer a liability in an orderly transaction between market participants at the measurement date under current market conditions. A three-level hierarchy for fair value measurements has been established based upon the transparency of inputs to the valuation of an asset or liability. Inputs may be observable or unobservable and refer broadly to the assumptions that market participants would use in pricing the asset or liability. Observable inputs reflect the assumptions market participants would use in pricing the asset or liability based on market data obtained from sources independent of the reporting entity. Unobservable inputs reflect the reporting entity’s own assumptions about the assumptions that market
| 57 |
Table of Contents
| Notes to financial statements | ||
| Delaware Wealth Builder Fund |
3. Investments (continued)
participants would use in pricing the asset or liability based on the best information available under the circumstances. The Fund’s investment in its entirety is assigned a level based upon the observability of the inputs which are significant to the overall valuation. The three-level hierarchy of inputs is summarized below.
| Level 1 – | Inputs are quoted prices in active markets for identical investments. (Examples: equity securities,open-end investment companies, futures contracts, exchange-traded options contracts) | |
| Level 2 – | Other observable inputs, including, but not limited to: quoted prices for similar assets or liabilities in markets that are active, quoted prices for identical or similar assets or liabilities in markets that are not active, inputs other than quoted prices that are observable for the assets or liabilities (such as interest rates, yield curves, volatilities, prepayment speeds, loss severities, credit risks, and default rates) or other market-corroborated inputs. (Examples: debt securities, government securities, swap contracts, foreign currency exchange contracts, foreign securities utilizing international fair value pricing, broker-quoted securities, fair valued securities) | |
| Level 3 – | Significant unobservable inputs, including the Fund’s own assumptions used to determine the fair value of investments. (Examples: broker-quoted securities, fair valued securities) | |
Level 3 investments are valued using significant unobservable inputs. The Fund may also use an income-based valuation approach in which the anticipated future cash flows of the investment are discounted to calculate fair value. Discounts may also be applied due to the nature or duration of any restrictions on the disposition of the investments. Valuations may also be based upon current market prices of securities that are comparable in coupon, rating, maturity, and industry. The derived value of a Level 3 investment may not represent the value which is received upon disposition and this could impact the results of operations.
| 58 |
Table of Contents
The following table summarizes the valuation of the Fund’s investments by fair value hierarchy levels as of Nov. 30, 2018:
Level 1 | Level 2 | Level 3 | Total | |||||||||||||
Securities | ||||||||||||||||
Assets: | ||||||||||||||||
Common Stock | ||||||||||||||||
Communication Services | $ | 17,393,171 | $ | 1,300,374 | $ | — | $ | 18,693,545 | ||||||||
Consumer Discretionary | 17,086,176 | 4,617,083 | — | 21,703,259 | ||||||||||||
Consumer Staples | 21,889,514 | 2,096,389 | — | 23,985,903 | ||||||||||||
Diversified REITs | 6,682,908 | — | — | 6,682,908 | ||||||||||||
Energy | 32,432,162 | 732,178 | — | 33,164,340 | ||||||||||||
Financials | 39,479,372 | 5,384,541 | — | 44,863,913 | ||||||||||||
Healthcare | 74,010,530 | 2,623,576 | — | 76,634,106 | ||||||||||||
Healthcare REITs | 7,722,436 | — | — | 7,722,436 | ||||||||||||
Hotel REITs | 1,665,723 | — | — | 1,665,723 | ||||||||||||
Industrial REITs | 1,106,364 | — | — | 1,106,364 | ||||||||||||
Industrials | 18,604,055 | 5,748,600 | — | 24,352,655 | ||||||||||||
Information Technology | 26,645,140 | 660,431 | — | 27,305,571 | ||||||||||||
Mall REITs | 3,061,816 | — | — | 3,061,816 | ||||||||||||
Manufactured Housing REITs | 1,631,831 | — | — | 1,631,831 | ||||||||||||
Materials | 7,119,180 | 815,920 | — | 7,935,100 | ||||||||||||
Multifamily REITs | 17,486,024 | — | — | 17,486,024 | ||||||||||||
Office REITs | 2,272,347 | — | — | 2,272,347 | ||||||||||||
Real Estate Operating/Development | — | 2,542,285 | — | 2,542,285 | ||||||||||||
Self-Storage REITs | 221,239 | — | — | 221,239 | ||||||||||||
Shopping Center REITs | 1,294,173 | — | — | 1,294,173 | ||||||||||||
Single Tenant REITs | 3,485,767 | — | — | 3,485,767 | ||||||||||||
Specialty REITs | 7,946,170 | — | — | 7,946,170 | ||||||||||||
Utilities | 7,645,369 | 496,366 | — | 8,141,735 | ||||||||||||
Exchange-Traded Funds | 9,702,288 | — | — | 9,702,288 | ||||||||||||
Limited Partnerships1 | 15,258 | — | 9,669,138 | 9,684,396 | ||||||||||||
Master Limited Partnerships | 2,384,711 | — | — | 2,384,711 | ||||||||||||
Convertible Preferred Stock1 | 6,808,260 | 6,735,147 | — | 13,543,407 | ||||||||||||
Corporate Debt | — | 146,999,310 | — | 146,999,310 | ||||||||||||
LeveragedNon-Recourse Security | — | — | — | — | ||||||||||||
Municipal Bonds | — | 30,676,820 | — | 30,676,820 | ||||||||||||
Non-Agency Commercial Mortgage-Backed Security | — | 499,542 | — | 499,542 | ||||||||||||
Loan Agreements | — | — | 20,183 | 20,183 | ||||||||||||
Foreign Debt | — | 4,617,173 | — | 4,617,173 | ||||||||||||
US Treasury Obligations | — | 2,351,415 | — | 2,351,415 | ||||||||||||
| 59 |
Table of Contents
| Notes to financial statements | ||
| Delaware Wealth Builder Fund |
3. Investments (continued)
Level 1 | Level 2 | Level 3 | Total | |||||||||||||
Preferred Stock1 | $ | 3,385,520 | $ | 651,350 | $ | — | $ | 4,036,870 | ||||||||
Warrant | 432 | — | — | 432 | ||||||||||||
Closed End Fund | 3,161,022 | — | — | 3,161,022 | ||||||||||||
Short-Term Investments | — | 26,004,450 | — | 26,004,450 | ||||||||||||
|
|
|
|
|
|
|
| |||||||||
Total Value of Securities | $ | 342,338,958 | $ | 245,552,950 | $ | 9,689,321 | $ | 597,581,229 | ||||||||
|
|
|
|
|
|
|
| |||||||||
Derivatives2 | ||||||||||||||||
Assets: | ||||||||||||||||
Futures Contracts | $ | 33,484 | $ | — | $ | — | $ | 33,484 | ||||||||
Swap Contract | — | 63,909 | — | 63,909 | ||||||||||||
Liabilities: | ||||||||||||||||
Foreign Currency Exchange Contracts | $ | — | $ | (24 | ) | $ | — | $ | (24 | ) | ||||||
1Security type is valued across multiple levels. Level 1 investments represent exchange-traded investments, Level 2 investments represent investments with observable inputs or matrix-priced investments, and Level 3 investments represent investments without observable inputs. The amounts attributed to Level 1 investments, Level 2 investments, and Level 3 investments represent the following percentages of the total value of these security types:
Level 1 | Level 2 | Level 3 | Total | |||||||||||||
Limited Partnerships | 0.16 | % | — | 99.84 | % | 100.00 | % | |||||||||
Convertible Preferred Stock | 50.27 | % | 49.73 | % | — | 100.00 | % | |||||||||
Preferred Stock | 83.86 | % | 16.14 | % | — | 100.00 | % | |||||||||
2Foreign currency exchange contracts, futures contracts, and swap contracts are valued at the unrealized appreciation (depreciation) on the instrument at the year end.
The security that has been valued at zero on the “Schedule of investments” is considered to be a Level 3 investment in this table.
During the year ended Nov. 30, 2018, there were no transfers between Level 1 investments, Level 2 investments, or Level 3 investments that had a significant impact to the Fund. This does not include transfers between Level 1 investments and Level 2 investments due to the Fund utilizing international fair value pricing during the year. In accordance with the fair valuation procedures described in Note 1, international fair value pricing of securities in the Fund occurs when market volatility exceeds an established rolling threshold. If the threshold is exceeded on a given date, then prices of international securities (those that traded on exchanges that close at a different time than the time that the Fund’s NAV is determined) are established using a separate pricing feed from a third-party vendor designed to establish a price for each such security as of the time that the Fund’s NAV is determined. Further, international fair value pricing uses other observable market-based inputs in place of the closing exchange price due to the events occurring after the close of the exchange or market on which the investment is principally traded, causing a change in classification between levels. The Fund’s policy is to recognize transfers between levels based on fair value at the beginning of the reporting period.
| 60 |
Table of Contents
A reconciliation of Level 3 investments is presented when the Fund has a significant amount of Level 3 investments at the beginning, interim, or end of the period in relation to the Fund’s net assets.
| Limited Partnerships | Loan Agreements | Total | |||||||||||||
Beginning balance Nov. 30, 2017 | $ | 5,078,221 | $ | — | $ | 5,078,221 | |||||||||
Purchases | 4,112,419 | 23,250 | 4,135,669 | ||||||||||||
Sales | — | (1,937 | ) | ||||||||||||
Return of capital on investments | (394,888 | ) | — | (394,888 | ) | ||||||||||
Net change in unrealized appreciation (depreciation) | 873,386 | (1,130 | ) | 872,256 | |||||||||||
|
|
|
|
|
| ||||||||||
Ending balance Nov. 30, 2018 | $ | 9,669,138 | $ | 20,183 | $ | 9,689,321 | |||||||||
|
|
|
|
|
| ||||||||||
Net change in unrealized appreciation from investments still held at the end of the year | $ | 873,386 | $ | (1,130 | ) | $ | 872,256 | ||||||||
|
|
|
|
|
| ||||||||||
When market quotations are not readily available for one or more portfolio securities, the Fund’s NAV shall be calculated by using the “fair value” of the securities as determined by the Pricing Committee. Such “fair value” is the amount that the Fund might reasonably expect to receive for the security (or asset) upon its current sale. Each such determination should be based on a consideration of all relevant factors, which are likely to vary from one pricing context to another. Examples of such factors may include, but are not limited to: (i) the type of security, (ii) the size of the holding, (iii) the initial cost of the security, (iv) the existence of any contractual restrictions of the security’s disposition, (v) the price and extent of public trading in similar securities of the issuer or of comparable companies, (vi) quotations or evaluated prices from broker/dealers and/or pricing services, (vii) information obtained from the issuer, analysts, and/or appropriate stock exchange (for exchange-traded securities), (viii) an analysis of the company’s financial statements, and (ix) an evaluation of the forces that influence the issuer and the market(s) in which the security is purchased and sold.
The Pricing Committee, or its delegate, employs various methods for calibrating these valuation approaches, including due diligence of the Fund’s pricing vendors and periodic back-testing of the prices that are fair valued under these procedures and reviews of any market related activity. The pricing of all securities fair valued by the Pricing Committee is subsequently reported to and approved by the Board on a quarterly basis.
| 61 |
Table of Contents
| Notes to financial statements | ||
| Delaware Wealth Builder Fund |
3. Investments(continued)
Quantitative information about Level 3 fair value measurements for the Fund are as follows:
Assets | Value | Valuation Techniques | Unobservable Inputs | ||||||
| Limited Partnership | $3,450,026 | Market cap rate method | Trailing 12 months NOI, adjusted for assets and liabilities; liquidity discount | ||||||
| Limited Partnership | 6,219,112 | Acquisition price | Acquisition price adjusted for liquidity discount | ||||||
| Bank Loan | 20,183 | Valued by 3rd party | Unadjusted price provided by 3rd party | ||||||
|
| ||||||||
Total | $9,689,321 | ||||||||
|
| ||||||||
A significant change to the inputs may result in a significant change to the valuation.
4. Dividend and Distribution Information
Income and long-term capital gain distributions are determined in accordance with federal income tax regulations, which may differ from US GAAP. Additionally, distributions from net gains on foreign currency transactions and net short-term gains on sales of investment securities are treated as ordinary income for federal income tax purposes. The tax character of dividends and distributions paid during the years ended Nov. 30, 2018 and 2017 were as follows:
| Year ended | ||||||||
| 11/30/18 | 11/30/17 | |||||||
Ordinary income | $ | 14,654,949 | $ | 16,382,126 | ||||
Long-term capital gain | 2,306,732 | — | ||||||
|
|
|
| |||||
Total | $ | 16,961,681 | $ | 16,382,126 | ||||
|
|
|
| |||||
5. Components of Net Assets on a Tax Basis
As of Nov. 30, 2018, the components of net assets on a tax basis were as follows
Shares of beneficial interest | $ | 565,479,834 | ||
Undistributed ordinary income | 2,121,202 | |||
Undistributed long-term capital gains | 32,705,133 | |||
Other temporary differences | (631,076 | ) | ||
Net unrealized depreciation of investments, foreign currencies, and derivatives | (1,199,970 | ) | ||
|
| |||
Net assets | $ | 598,475,123 | ||
|
|
The differences between book basis and tax basis components of net assets are primarily attributable to tax deferral of losses on wash sales and straddles,mark-to-market on forward currency contracts,mark-to-market of passive foreign investment companies, tax treatment of contingent payment on debt instruments, partnership income, trust preferred securities, market discount and premium on debt instruments,mark-to-market on futures and CDS contracts, deemed dividend income, and troubled debt.
| 62 |
Table of Contents
For financial reporting purposes, capital accounts are adjusted to reflect the tax character of permanent book/tax differences. Reclassifications are primarily due to partnership expenses and ROCSOP adjustment from Delaware Foundation® Growth Allocation Fund. Results of operations and net assets were not affected by these reclassifications. For the year ended Nov. 30, 2018, the Fund recorded the following reclassifications:
Distributable earnings | $ | (776,940 | ) | |
Paid-in capital | 776,940 |
6. Capital Shares
Transactions in capital shares were as follows:
| Year ended | ||||||||
| 11/30/18 | 11/30/17 | |||||||
Shares sold: | ||||||||
Class A | 4,082,871 | 3,558,392 | ||||||
Class C | 414,960 | 1,260,578 | ||||||
Class R | 51,084 | 49,560 | ||||||
Institutional Class | 3,412,530 | 6,849,903 | ||||||
Shares from merger: | ||||||||
Class A | 2,344,699 | — | ||||||
Class C | 725,393 | — | ||||||
Class R | 130,757 | — | ||||||
Institutional Class | 328,897 | — | ||||||
Shares issued upon reinvestment of dividends and distributions: | ||||||||
Class A | 494,157 | 423,219 | ||||||
Class C | 234,968 | 295,329 | ||||||
Class R | 5,054 | 4,288 | ||||||
Institutional Class | 360,758 | 331,025 | ||||||
|
|
|
| |||||
| 12,586,128 | 12,772,294 | |||||||
|
|
|
| |||||
Shares redeemed: | ||||||||
Class A | (5,120,956 | ) | (6,290,900 | ) | ||||
Class C | (7,087,765 | ) | (6,895,030 | ) | ||||
Class R | (206,501 | ) | (132,046 | ) | ||||
Institutional Class | (4,741,179 | ) | (4,406,185 | ) | ||||
|
|
|
| |||||
| (17,156,401 | ) | (17,724,161 | ) | |||||
|
|
|
| |||||
Net decrease | (4,570,273 | ) | (4,951,867 | ) | ||||
|
|
|
| |||||
| 63 |
Table of Contents
| Notes to financial statements | ||
| Delaware Wealth Builder Fund |
6. Capital Shares(continued)
Certain shareholders may exchange shares of one class for shares of another class in the same Fund. These exchange transactions are included as subscriptions and redemptions in the tables on the previous page and on the “Statements of changes in net assets.” For the years ended Nov. 30, 2018 and 2017, the Fund had the following exchange transactions:
Exchange Redemptions | Exchange Subscriptions | |||||||||||||||||||||
Year ended | Class A | Class C | Class A | Institutional | Value | |||||||||||||||||
| 11/30/18 | 27,361 | 374,773 | 298,584 | 106,942 | $ | 5,847,175 | ||||||||||||||||
| 11/30/17 | 1,609,809 | 119,691 | 10,386 | 1,718,180 | 24,317,380 | |||||||||||||||||
7. Fund Merger
As of the close of business on Dec. 15, 2017, the Fund acquired all of the assets and liabilities of Delaware Foundation® Growth Allocation Fund (“Acquired Fund”), anopen-end investment company, in exchange for the shares of Delaware Wealth Builder Fund (“Acquiring Fund”) pursuant to a Plan and Agreement of Reorganization (“Reorganization”). For financial reporting purposes, assets received and shares issued by the Acquiring Fund were recorded at fair value. The shareholders of the Acquired Fund received shares of the respective class of the Acquiring Fund equal to the aggregate net asset value of their shares in the Acquired Fund by a taxable exchange prior to the Reorganization, as shown in the following table:
Acquired Fund Shares Outstanding | Shares Converted to | Acquired Fund Net Assets | Conversion Ratio | |||||||||||||
Class A | 3,642,448 | 2,344,699 | $ | 34,209,151 | 0.644 | |||||||||||
Class C | 1,167,237 | 725,393 | 10,597,997 | 0.621 | ||||||||||||
Class R | 205,030 | 130,757 | 1,907,750 | 0.638 | ||||||||||||
Institutional Class | 507,236 | 328,897 | 4,798,603 | 0.648 | ||||||||||||
The net assets of the Acquiring Fund before the acquisition were $687,884,216. The net assets of the Acquiring Fund immediately following the acquisition were $739,397,717.
| 64 |
Table of Contents
If the acquisition had been completed on Dec. 1, 2017, the beginning of the Acquiring Fund’s reporting period, the Acquiring Fund’s pro forma results of operations for the year ended Nov 30, 2018, would have been as follows (unaudited):
Net investment income | $ | 15,806,818 | (a) | |
Net realized gain | 36,664,200 | (b) | ||
Net change in unrealized appreciation (depreciation) | (50,776,959 | )(c) | ||
|
| |||
Net increase in net assets resulting from operations | $ | 1,694,059 | ||
|
|
(a)$15,203,067, as reported in the Statement of operations, plus $603,751 net investment income from Delaware Foundation® Growth Allocation Fundpre-merger.
(b)$32,211,435, as reported in the Statement of operations, plus $4,452,765 net realized gain from Delaware Foundation Growth Allocation Fundpre-merger.
(c)$(51,994,176), as reported in the Statement of operations, plus $1,217,217 net change in unrealized appreciation (depreciation) from Delaware Foundation Growth Allocation Fundpre-merger.
Because the combined investment portfolios have been managed as a single integrated portfolio since the acquisition was completed, it is not practical to separate the amounts of revenue and earnings of the Acquired Fund that have been included in the Fund’s Statement of operations since Dec. 18, 2017.
8. Line of Credit
The Fund, along with certain other funds in the Delaware Funds (Participants), was a participant in a $155,000,000 revolving line of credit intended to be used for temporary or emergency purposes as an additional source of liquidity to fund redemptions of investor shares. Under the agreement, the Participants were charged an annual commitment fee of 0.15%, which was allocated across the Participants based on a weighted average of the respective net assets of each Participant. The revolving line of credit available was reduced from $155,000,000 to 130,000,000 on Sept. 6, 2018. The Participants were permitted to borrow up to a maximum ofone-third of their net assets under the agreement. Each Participant was individually, and not jointly, liable for its particular advances, if any, under the line of credit. The line of credit available under the agreement expired on Nov. 5, 2018.
On Nov. 5, 2018, the Fund, along with the other Participants, entered into an amendment to the agreement for a $190,000,000 revolving line of credit. The revolving line of credit available was increased from $190,000,000 to $220,000,000 on Nov. 29, 2018. The revolving line of credit is to be used as described above and operates in substantially the same manner as the original agreement. The line of credit available under the agreement expires on Nov. 4, 2019.
The Fund had no amounts outstanding as of Nov. 30, 2018, or at any time during the year then ended.
9. Derivatives
US GAAP requires disclosures that enable investors to understand: (1) how and why an entity uses derivatives; (2) how they are accounted for; and (3) how they affect an entity’s results of operations and financial position.
| 65 |
Table of Contents
| Notes to financial statements | ||
| Delaware Wealth Builder Fund |
9. Derivatives (continued)
Foreign Currency Exchange Contracts– The Fund may enter into foreign currency exchange contracts and foreign cross currency exchange contracts as a way of managing foreign exchange rate risk. The Fund may enter into these contracts to fix the US dollar value of a security that it has agreed to buy or sell for the period between the date the trade was entered into and the date the security is delivered and paid for. The Fund may also use these contracts to hedge the US dollar value of securities it already owns that are denominated in foreign currencies. In addition, the Fund may enter into these contracts to facilitate or expedite the settlement of portfolio transactions. The change in value is recorded as an unrealized gain or loss. When the contract is closed, a realized gain or loss is recorded equal to the difference between the value of the contract at the time it was opened and the value at the time it was closed.
The use of foreign currency exchange contracts and foreign cross currency exchange contracts does not eliminate fluctuations in the underlying prices of the securities, but does establish a rate of exchange that can be achieved in the future. Although foreign currency exchange contracts and foreign cross currency exchange contracts limit the risk of loss due to an unfavorable change in the value of the hedged currency, they also limit any potential gain that might result should the value of the currency change favorably. In addition, the Fund could be exposed to risks if the counterparties to the contracts are unable to meet the terms of their contracts. The Fund’s maximum risk of loss from counterparty credit risk is the value of its currency exchanged with the counterparty. The risk is generally mitigated by having a netting arrangement between the Fund and the counterparty and by the posting of collateral by the counterparty to the Fund to cover the Fund’s exposure to the counterparty.
During the year ended Nov. 30, 2018, the Fund entered into foreign currency exchange contracts to fix the US dollar value of a security between trade date and settlement date.
Futures Contracts– A futures contract is an agreement in which the writer (or seller) of the contract agrees to deliver to the buyer an amount of cash or securities equal to a specific dollar amount times the difference between the value of a specific security or index at the close of the last trading day of the contract and the price at which the agreement is made. The Fund may use futures contracts in the normal course of pursuing its investment objective. The Fund may invest in futures contracts to hedge its existing portfolio securities against fluctuations in value caused by changes in interest rates or market conditions. Upon entering into a futures contract, the Fund deposits cash or pledges US government securities to a broker, equal to the minimum “initial margin” requirements of the exchange on which the contract is traded. Subsequent payments are received from the broker or paid to the broker each day, based on the daily fluctuation in the market value of the contract. These receipts or payments are known as “variation margin” and are recorded daily by the Fund as unrealized gains or losses until the contracts are closed. When the contracts are closed, the Fund records a realized gain or loss equal to the difference between the value of the contract at the time it was opened and the value at the time it was closed. Risks of entering into futures contracts include potential imperfect correlation between the futures contracts and the underlying securities and the possibility of an illiquid secondary market for these instruments. When investing in futures, there is reduced counterparty credit risk to the Fund because futures are exchange-traded and the exchange’s clearinghouse, as counterparty to all exchange-traded futures, guarantees against default. At Nov. 30, 2018, the Fund posted $312,000 in
| 66 |
Table of Contents
cash as margin for open futures contracts, which is included in “Cash collateral due from broker” on the “Statement of assets and liabilities.”
During the year ended Nov. 30, 2018, the Fund used futures contracts to hedge currency risks associated with the Fund’s investments.
Options Contracts– The Fund may enter into options contracts in the normal course of pursuing its investment objective. The Fund may buy or write options contracts for any number of reasons, including without limitation: to manage the Fund’s exposure to changes in securities prices caused by interest rates or market conditions and foreign currencies; as an efficient means of adjusting the Fund’s overall exposure to certain markets; to protect the value of portfolio securities; and as a cash management tool. The Fund may buy or write call or put options on securities, futures, swaps, swaptions, financial indices, and foreign currencies. When the Fund buys an option, a premium is paid and an asset is recorded and adjusted on a daily basis to reflect the current market value of the option purchased. When the Fund writes an option, a premium is received and a liability is recorded and adjusted on a daily basis to reflect the current market value of the option written. Premiums received from writing options that expire unexercised are treated by the Fund on the expiration date as realized gains. The difference between the premium received and the amount paid on effecting a closing purchase transaction, including brokerage commissions, is treated as realized gain or loss. If a call option is exercised, the premium is added to the proceeds from the sale of the underlying security in determining whether the Fund has a realized gain or loss. If a put option is exercised, the premium reduces the cost basis of the securities purchased by the Fund. The Fund, as writer of an option, bears the market risk of an unfavorable change in the price of the security underlying the written option. When writing options, the Fund is subject to minimal counterparty risk because the counterparty is only obligated to pay premiums and does not bear the market risk of an unfavorable market change. There were no open written option contracts at Nov. 30, 2018.
During the year ended Nov. 30, 2018, the Fund used options contracts to receive premiums for writing options.
Swap Contracts– The Fund may enter into CDS contracts in the normal course of pursuing its investment objective. The Fund may enter into CDS contracts in order to hedge against a credit event, to enhance total return or to gain exposure to certain securities or markets. The Fund will not be permitted to enter into any swap transactions unless, at the time of entering into such transactions, the unsecured long-term debt of the actual counterparty, combined with any credit enhancements, is rated at leastBBB- by Standard & Poor’s Financial Services LLC (S&P) or Baa3 by Moody’s Investors Service, Inc. (Moody’s) or is determined to be of equivalent credit quality by DMC.
Credit Default Swaps. A CDS contract is a risk-transfer instrument through which one party (purchaser of protection) transfers to another party (seller of protection) the financial risk of a credit event (as defined in the CDS agreement), as it relates to a particular reference security or basket of securities (such as an index). In exchange for the protection offered by the seller of protection, the purchaser of protection agrees to pay the seller of protection a periodic amount at a stated rate that is applied to the notional amount of the CDS contract. In addition, an upfront payment may be made or received by the Fund in connection with an unwinding or assignment of a CDS contract. Upon the occurrence of a credit event, the seller of protection would pay the par (or other agreed-upon) value of the reference security (or
| 67 |
Table of Contents
| Notes to financial statements | ||
| Delaware Wealth Builder Fund |
9. Derivatives (continued)
basket of securities) to the counterparty. Credit events generally include, among others, bankruptcy, failure to pay, and obligation default.
During the year ended Nov. 30, 2018, the Fund entered into CDS contracts as a purchaser of protection. Periodic payments (receipts) on such contracts are accrued daily and recorded as unrealized losses (gains) on swap contracts. Upon payment (receipt), such amounts are recorded as realized losses (gains) on swap contracts. Upfront payments made or received in connection with CDS contracts are amortized over the expected life of the CDS contracts as unrealized losses (gains) on swap contracts. The change in value of CDS contracts is recorded daily as unrealized appreciation or depreciation. A realized gain or loss is recorded upon a credit event (as defined in the CDS agreement) or the maturity or termination of the agreement. Initial margin and variation margin are posted to central counterparties for central cleared CDS basket trades, as determined by the applicable central counterparty. During the year ended Nov. 30, 2018, the Fund did not enter into any CDS contracts as a seller of protection.
CDS contracts may involve greater risks than if the Fund had invested in the reference obligation directly. CDS contracts are subject to general market risk, liquidity risk, counterparty risk, and credit risk. The Fund’s maximum risk of loss from counterparty credit risk, either as the seller of protection or the buyer of protection, is the fair value of the contract. This risk is mitigated by (1) for bilateral swap contracts, having a netting arrangement between the Fund and the counterparty and by the posting of collateral by the counterparty to the Fund to cover the Fund’s exposure to the counterparty, and (2) for cleared swaps, trading these instruments through a central counterparty.
During the year ended Nov. 30, 2018, the Fund used CDS contracts to hedge against credit events.
Swaps Generally. The value of open swaps may differ from that which would be realized in the event the Fund terminated its position in the contract on a given day. Risks of entering into these contracts include the potential inability of the counterparty to meet the terms of the contracts. This type of risk is generally limited to the amount of favorable movement in the value of the underlying security, instrument, or basket of instruments, if any, at the day of default. Risks also arise from potential losses from adverse market movements and such losses could exceed the unrealized amounts shown on the “Schedule of investments.”
At Nov. 30, 2018, the Fund posted $763,383 in cash collateral for open centrally cleared CDS contracts, which is included in “Cash collateral due from broker” on the “Statement of assets and liabilities.”
Fair values of derivative instruments as of Nov. 30, 2018 were as follows:
| Asset Derivatives Fair Value | ||||||||||||
| Equity | Credit | |||||||||||
Statements of Assets and Liabilities Location | Contracts | Contracts | Total | |||||||||
Variation margin due from broker on centrally cleared credit default swap contracts | $ | — | $ | 63,909 | $ | 63,909 | ||||||
Variation margin due from broker on futures contracts* | 33,484 | 33,484 | ||||||||||
|
|
|
|
|
| |||||||
Total | $ | 33,484 | $ | 63,909 | $ | 97,393 | ||||||
|
|
|
|
|
| |||||||
| 68 |
Table of Contents
| Liability Derivatives | ||
| Fair Value | ||
| Currency | ||
Statements of Assets and Liabilities Location | Contracts | |
Unrealized depreciation on foreign currency exchange contracts | $24 |
*Includes cumulative appreciation/depreciation of futures contracts from the date the contracts were opened through Nov. 30, 2018. Only current day variation margin is reported on the “Statement of assets and liabilities.”
The effect of derivative instruments on the “Statement of operations” for the year ended Nov. 30, 2018 was as follows:
| Net Realized Gain (Loss) on: | |||||||||||||||||||||||||
Foreign | Futures | Options | Swap | Total | |||||||||||||||||||||
Currency contracts | $ | (20,964 | ) | $ | — | $ | — | $ | — | $ | (20,964) | ||||||||||||||
Interest rate contracts | — | 71,550 | — | — | 71,550 | ||||||||||||||||||||
Equity contracts | — | (1,127,545 | ) | 355 | — | (1,127,190 | ) | ||||||||||||||||||
Credit contracts | — | — | — | (612,405 | ) | (612,405 | ) | ||||||||||||||||||
|
|
|
|
|
|
|
|
|
| ||||||||||||||||
Total | $ | (20,964 | ) | $ | (1,055,995 | ) | $ | 355 | $ | (612,405 | ) | $ | (1,689,009 | ) | |||||||||||
|
|
|
|
|
|
|
|
|
| ||||||||||||||||
Net Change in Unrealized Appreciation (Depreciation) of: | ||||||||||||||||||||
| Foreign | ||||||||||||||||||||
| Currency | ||||||||||||||||||||
| Exchange | Futures | Swap | ||||||||||||||||||
| Contracts | Contracts | Contracts | Total | |||||||||||||||||
Currency contracts | $ | (24 | ) | $ | — | $ | — | $ | (24 | ) | ||||||||||
Equity contracts | — | 973,345 | — | 973,345 | ||||||||||||||||
Credit contracts | — | — | 312,252 | 312,252 | ||||||||||||||||
|
|
|
|
|
|
|
| |||||||||||||
Total | $ | (24 | ) | $ | 973,345 | $ | 312,252 | $ | 1,285,573 | |||||||||||
|
|
|
|
|
|
|
| |||||||||||||
Derivatives Generally. The table below summarizes the average balance of derivative holdings by the Fund during the year ended Nov. 30, 2018.
| Long Derivatives Volume | Short Derivatives Volume | |||||||
Foreign currency exchange contracts (average cost) | $ | 177,537 | $ | 563,631 | ||||
Futures contracts (average notional value) | 83,745 | 17,605,695 | ||||||
Options contracts (average notional value) | — | 14 | ||||||
CDS contracts (average notional value)* | 10,802,044 | — | ||||||
*Long represents buying protection and short represents selling protection.
| 69 |
Table of Contents
| Notes to financial statements | ||
| Delaware Wealth Builder Fund |
10. Offsetting
The Fund entered into an International Swaps and Derivatives Association, Inc. Master Agreement (ISDA Master Agreement) or a similar agreement with certain of its derivative contract counterparties in order to better define its contractual rights and to secure rights that will help the Fund mitigate its counterparty risk. An ISDA Master Agreement is a bilateral agreement between the Fund and a counterparty that governs certainover-the-counter (OTC) derivatives and foreign exchange contracts and typically contains, among other things, collateral posting items and netting provisions in the event of a default and/or termination event. Under an ISDA Master Agreement, the Fund may, under certain circumstances, offset with the counterparty certain derivative financial instruments’ payables and/or receivables with collateral held and/or posted and create one single net payment. The provisions of the ISDA Master Agreement typically permit a single net payment in the event of default(close-out), including the bankruptcy or insolvency of the counterparty. However, bankruptcy or insolvency laws of a particular jurisdiction may impose restrictions on or prohibitions against the right of offset in bankruptcy, insolvency, or other events.
For financial reporting purposes, the Fund does not offset derivative assets and derivative liabilities that are subject to netting arrangements on the “Statement of assets and liabilities.”
At Nov. 30, 2018, the Fund had the following assets and liabilities subject to offsetting provisions:
Offsetting of Financial Assets and Liabilities and Derivative Assets and Liabilities
| Gross Value of | Gross Value of | |||||
Counterparty | Derivative Asset | Derivative Liability | Net Position | |||
The Bank of New York Mellon | — | $(24) | $(24) |
Counterparty | Net Position | Fair Value of Non-Cash Collateral Received | Cash Collateral | Fair Value of | Cash | Net Exposure(b) | ||||||
The Bank of New York Mellon | $(24) | $— | $— | $— | $— | $(24) |
Master Repurchase Agreements
Repurchase agreements are entered into by the Fund under Master Repurchase Agreements (each, an “MRA”). The MRA permits the Fund, under certain circumstances including an event of default (such as bankruptcy or insolvency), to offset payables and/or receivables with collateral held by and/or posted to the counterparty. As a result, one single net payment is created. Bankruptcy or insolvency laws of a particular jurisdiction may impose restrictions on or prohibitions against such a right of offset in the event of the MRA counterparty’s bankruptcy or insolvency. Based on the terms of the MRA, the Fund receives securities as collateral with a market value in excess of the repurchase price at maturity. Upon a bankruptcy or insolvency of the MRA counterparty, the Fund would recognize a liability with respect to such excess collateral. The liability reflects the Fund’s obligation under bankruptcy law to return the
| 70 |
Table of Contents
excess to the counterparty. As of Nov. 30, 2018, the following table is a summary of the Fund’s repurchase agreements by counterparty which are subject to offset under an MRA:
Counterparty | Repurchase | Fair Value of | Cash Collateral | Net Collateral | Net Exposure(b) | ||||||||||||||||||||
Bank of America Merrill Lynch | $ | 2,101,860 | $ | (2,101,860 | ) | $ | — | $ | (2,101,860 | ) | $ | — | |||||||||||||
Bank of Montreal | 5,780,117 | (5,780,117 | ) | — | (5,780,117 | ) | — | ||||||||||||||||||
BNP Paribas | 9,504,845 | (9,504,845 | ) | — | (9,504,845 | ) | — | ||||||||||||||||||
|
|
|
|
|
|
|
|
|
| ||||||||||||||||
Total | $ | 17,386,822 | $ | (17,386,822 | ) | $ | — | $ | (17,386,822 | ) | $ | — | |||||||||||||
|
|
|
|
|
|
|
|
|
| ||||||||||||||||
(a)The value of the related collateral received exceeded the value of the repurchase agreements as of Nov. 30, 2018.
(b)Net exposure represents the receivable (payable) that would be due from (to) the counterparty in the event of default.
11. Securities Lending
The Fund, along with other funds in the Delaware Funds, may lend its securities pursuant to a security lending agreement (Lending Agreement) with The Bank of New York Mellon (BNY Mellon). At the time a security is loaned, the borrower must post collateral equal to the required percentage of the market value of the loaned security, including any accrued interest. The required percentage is: (1) 102% with respect to US securities and foreign securities that are denominated and payable in US dollars; and (2) 105% with respect to foreign securities. With respect to each loan, if on any business day the aggregate market value of securities collateral plus cash collateral held is less than the aggregate market value of the securities which are the subject of such loan, the borrower will be notified to provide additional collateral by the end of the following business day which, together with the collateral already held, will be not less than the applicable initial collateral requirements for such security loan. If the aggregate market value of securities collateral and cash collateral held with respect to a security loan exceeds the applicable initial collateral requirement, upon request of the borrower, BNY Mellon must return enough collateral to the borrower by the end of the following business day to reduce the value of the remaining collateral to the applicable initial collateral requirement for such security loan. As a result of the foregoing, the value of the collateral held with respect to a loaned security on any particular day may be more or less than the value of the security on loan. The collateral percentage with respect to the market value of the loaned security is determined by the security lending agent.
Cash collateral received by each fund of the Trust is generally invested in a series of individual separate accounts, each corresponding to a fund. The investment guidelines permit each separate account to hold certain securities that would be considered eligible securities for a money market fund. Cash collateral received is generally invested in government securities; certain obligations issued by government sponsored enterprises; repurchase agreements collateralized by US Treasury securities; obligations issued by the central government of any Organization for Economic Cooperation and Development (OECD) country or its agencies, instrumentalities, or establishments; obligations of supranational organizations; commercial paper, notes, bonds, and other debt obligations; certificates of deposit, time deposits, and other bank obligations; and asset-backed securities. A fund can also accept US government securities and letters of credit(non-cash collateral) in connection with securities loans.
| 71 |
Table of Contents
| Notes to financial statements | ||
| Delaware Wealth Builder Fund |
11. Securities Lending (continued)
In the event of default or bankruptcy by the lending agent, realization and/or retention of the collateral may be subject to legal proceedings. In the event the borrower fails to return loaned securities and the collateral received is insufficient to cover the value of the loaned securities and provided such collateral shortfall is not the result of investment losses, the lending agent has agreed to pay the amount of the shortfall to the Fund or, at the discretion of the lending agent, replace the loaned securities. The Fund continues to record dividends or interest, as applicable, on the securities loaned and is subject to changes in value of the securities loaned that may occur during the term of the loan. The Fund has the right under the Lending Agreement to recover the securities from the borrower on demand. With respect to security loans collateralized bynon-cash collateral, the Fund receives loan premiums paid by the borrower. With respect to security loans collateralized by cash collateral, the earnings from the collateral investments are shared among the Fund, the security lending agent, and the borrower. The Fund records security lending income net of allocations to the security lending agent and the borrower.
The Fund may incur investment losses as a result of investing securities lending collateral. This could occur if an investment in the collateral investment account defaulted or became impaired. Under those circumstances, the value of a Fund’s cash collateral account may be less than the amount the Fund would be required to return to the borrowers of the securities and the Fund would be required to make up for this shortfall.
During the year ended Nov. 30, 2018, the Fund had no securities out on loan.
12. Credit and Market Risk
When interest rates rise, fixed income securities (i.e., debt obligations) generally will decline in value. These declines in value are greater for fixed income securities with longer maturities or durations.
Some countries in which the Fund may invest require governmental approval for the repatriation of investment income, capital, or the proceeds of sales of securities by foreign investors. In addition, if there is deterioration in a country’s balance of payments or for other reasons, a country may impose temporary restrictions on foreign capital remittances abroad.
The securities exchanges of certain foreign markets are substantially smaller, less liquid, and more volatile than the major securities markets in the United States. Consequently, acquisition and disposition of securities by the Fund may be inhibited. In addition, a significant portion of the aggregate market value of equity securities listed on the major securities exchanges in emerging markets is held by a smaller number of investors. This may limit the number of shares available for acquisition or disposition by the Fund.
The Fund invests a portion of its assets in high yield fixed income securities, which are securities rated lower thanBBB- by S&P and Baa3 by Moody’s, or similarly rated by another nationally recognized statistical rating organization. Investments in these higher yielding securities are generally accompanied by a greater degree of credit risk than higher rated securities. Additionally, lower rated securities may be more susceptible to adverse economic and competitive industry conditions than investment grade securities.
| 72 |
Table of Contents
The Fund invests in fixed income securities whose value is derived from an underlying pool of mortgages or consumer loans. The value of these securities is sensitive to changes in economic conditions, including delinquencies and/or defaults, and may be adversely affected by shifts in the market’s perception of the issuers and changes in interest rates. Investors receive principal and interest payments as the underlying mortgages and consumer loans are paid back. Some of these securities are collateralized mortgage obligations (CMOs). CMOs are debt securities issued by US government agencies or by financial institutions and other mortgage lenders, which are collateralized by a pool of mortgages held under an indenture. Prepayment of mortgages may shorten the stated maturity of the obligations and can result in a loss of premium, if any has been paid. Certain of these securities may be stripped (securities which provide only the principal or interest feature of the underlying security). The yield to maturity on an interest-only CMO is extremely sensitive not only to changes in prevailing interest rates, but also to the rate of principal payments (including prepayments) on the related underlying mortgage assets. A rapid rate of principal payments may have a material adverse effect on the Fund’s yield to maturity. If the underlying mortgage assets experience greater than anticipated prepayments of principal, the Fund may fail to fully recoup its initial investment in these securities even if the securities are rated in the highest rating categories.
The Fund invests in REITs and is subject to the risks associated with that industry. If the Fund holds real estate directly as a result of defaults or receives rental income directly from real estate holdings, its tax status as a regulated investment company may be jeopardized. There were no direct real estate holdings during the year ended Nov. 30, 2018. The Fund’s REIT holdings are also affected by interest rate changes, particularly if the REITs it holds use floating rate debt to finance their ongoing operations. The Fund also invests in real estate acquired as a result of ownership of securities or other instruments, including issuers that invest, deal, or otherwise engage in transactions in real estate or interests therein. These instruments may include interests in private equity limited partnerships or limited liability companies that hold real estate investments (Real Estate Limited Partnerships). The Fund will limit its investments in Real Estate Limited Partnerships to 5% of its total assets at the time of purchase.
The Fund invests in certain obligations that may have liquidity protection designed to ensure that the receipt of payments due on the underlying security is timely. Such protection may be provided through guarantees, insurance policies, or letters of credit obtained by the issuer or sponsor through third parties, through various means of structuring the transaction, or through a combination of such approaches. The Fund will not pay any additional fees for such credit support, although the existence of credit support may increase the price of a security.
The Fund invests in bank loans and other securities that may subject it to direct indebtedness risk, the risk that the Fund will not receive payment of principal, interest, and other amounts due in connection with these investments and will depend primarily on the financial condition of the borrower. Loans that are fully secured offer the Fund more protection than unsecured loans in the event of nonpayment of scheduled interest or principal, although there is no assurance that the liquidation of collateral from a secured loan would satisfy the corporate borrower’s obligation, or that the collateral can be liquidated. Some loans or claims may be in default at the time of purchase. Certain of the loans and the other direct indebtedness acquired by the Fund may involve revolving credit facilities or other standby financing commitments that obligate the Fund to pay additional cash on a certain date or on demand. These commitments may require the Fund to increase its investment in a company at a time when the Fund
| 73 |
Table of Contents
| Notes to financial statements | ||
| Delaware Wealth Builder Fund |
12. Credit and Market Risk (continued)
might not otherwise decide to do so (including at a time when the company’s financial condition makes it unlikely that such amounts will be repaid). To the extent that the Fund is committed to advance additional funds, it will at all times hold and maintain cash or other high grade debt obligations in an amount sufficient to meet such commitments. When a loan agreement is purchased the Fund may pay an assignment fee. On an ongoing basis, the Fund may receive a commitment fee based on the undrawn portion of the underlying line of credit portion of a loan agreement. Prepayment penalty fees are received upon the prepayment of a loan agreement by a borrower. Prepayment penalty, facility, commitment, consent and amendment fees are recorded to income as earned or paid.
As the Fund may be required to rely upon another lending institution to collect and pass on to the Fund amounts payable with respect to the loan and to enforce the Fund’s rights under the loan and other direct indebtedness, an insolvency, bankruptcy, or reorganization of the lending institution may delay or prevent the Fund from receiving such amounts. The highly leveraged nature of many loans may make them especially vulnerable to adverse changes in economic or market conditions. Investments in such loans and other direct indebtedness may involve additional risk to the Fund.
The Fund may invest up to 15% of its net assets in illiquid securities, which may include securities with contractual restrictions on resale, securities exempt from registration under Rule 144A promulgated under the Securities Act of 1933, as amended, and other securities which may not be readily marketable. The relative illiquidity of these securities may impair the Fund from disposing of them in a timely manner and at a fair price when it is necessary or desirable to do so. While maintaining oversight, the Board has delegated to DMC theday-to-day functions of determining whether individual securities are liquid for purposes of the Fund’s limitation on investments in illiquid securities. Securities eligible for resale pursuant to Rule 144A, which are determined to be liquid, are not subject to the Fund’s 15% limit on investments in illiquid securities. Rule 144A and restricted securities held by the Fund have been identified on the “Schedule of investments.” Restricted securities are valued pursuant to the security valuation procedures described in Note 1.
13. Contractual Obligations
The Fund enters into contracts in the normal course of business that contain a variety of indemnifications. The Fund’s maximum exposure under these arrangements is unknown. However, the Fund has not had prior claims or losses pursuant to these contracts. Management has reviewed the Fund’s existing contracts and expects the risk of loss to be remote.
14. General Motors Term Loan Litigation
The Fund received notice of a litigation proceeding related to a General Motors Corporation (G.M.) term loan participation previously held by the Fund in 2009. Management believes the matter subject to the litigation notice may lead to a recovery from the Fund of certain amounts received by the Fund because a US Court of Appeals has ruled that the Fund and similarly situated investors were unsecured creditors rather than secured lenders of G.M. as a result of an erroneous Uniform Commercial Code filing made by a third party. The Fund received the full principal on the loans in 2009 after the G.M. bankruptcy. However, based on the court ruling the estate is seeking to recover such amounts arguing that, as unsecured creditors, the Fund (and other similarly situated lenders) should not have received payment in
| 74 |
Table of Contents
full. Based on currently available information related to the litigation and the Fund’s potential exposure, the Fund recorded a contingent liability of $901,538 and an asset of $270,461 based on the expected recoveries to unsecured creditors as of Nov. 30, 2018 that resulted in a net decrease in the Fund’s NAV to reflect this potential recovery.
15. Recent Accounting Pronouncements
In March 2017, the FASB issued an Accounting Standards Update (ASU), ASU2017-08, Receivables — Nonrefundable Fees and Other Costs (Subtopic310-20), Premium Amortization on Purchased Callable Debt Securities which amends the amortization period for certain callable debt securities purchased at a premium, shortening such period to the earliest call date. The ASU2017-08 does not require any accounting change for debt securities held at a discount; the discount continues to be amortized to maturity. The ASU2017-08 is effective for fiscal years, and interim periods within those fiscal years, beginning after Dec. 15, 2018. At this time, management is evaluating the implications of these changes on the financial statements.
In August 2018, the FASB issued an ASU2018-13, which changes certain fair value measurement disclosure requirements. The ASU2018-13, in addition to other modifications and additions, removes the requirement to disclose the amount and reasons for transfers between Level 1 and Level 2 of the fair value hierarchy, the policy for the timing of transfers between levels and the valuation process for Level 3 fair value measurements. The ASU2018-13 is effective for fiscal years, and interim periods within those fiscal years, beginning after Dec. 15, 2019. At this time, management is evaluating the implications of these changes on the financial statements.
In August 2018, the Securities and Exchange Commission (SEC) adopted amendments to RegulationS-X to update and simplify the disclosure requirements for registered investment companies by eliminating requirements that are redundant or duplicative of US GAAP requirements or other SEC disclosure requirements. The new amendments require the presentation of the total, rather than the components, of distributable earnings on the “Statement of assets and liabilities” and the total, rather than the components, of dividends from net investment income and distributions from net realized gains on the “Statements of changes in net assets.” The amendments also removed the requirement for the parenthetical disclosure of undistributed net investment income on the “Statements of changes in net assets” and certain tax adjustments that were reflected in the “Notes to financial statements.” All of these have been reflected in the Fund’s financial statements.
16. Subsequent Events
Management has determined that no material events or transactions occurred subsequent to Nov. 30, 2018, that would require recognition or disclosure in the Fund’s financial statements.
| 75 |
Table of Contents
registered public accounting firm
To the Board of Trustees of Delaware Group® Equity Funds V and Shareholders of Delaware Wealth Builder Fund
Opinion on the Financial Statements
We have audited the accompanying statement of assets and liabilities, including the schedule of investments, of Delaware Wealth Builder Fund (one of the funds constituting Delaware Group® Equity Funds V, referred to hereafter as the “Fund”) as of November 30, 2018, the related statement of operations for the year ended November 30, 2018, the statements of changes in net assets for each of the two years in the period ended November 30, 2018, including the related notes, and the financial highlights for each of the five years in the period ended November 30, 2018 (collectively referred to as the “financial statements”). In our opinion, the financial statements present fairly, in all material respects, the financial position of the Fund as of November 30, 2018, the results of its operations for the year then ended, the changes in its net assets for each of the two years in the period ended November 30, 2018 and the financial highlights for each of the five years in the period ended November 30, 2018 in conformity with accounting principles generally accepted in the United States of America.
Basis for Opinion
These financial statements are the responsibility of the Fund’s management. Our responsibility is to express an opinion on the Fund’s financial statements based on our audits. We are a public accounting firm registered with the Public Company Accounting Oversight Board (United States) (PCAOB) and are required to be independent with respect to the Fund in accordance with the U.S. federal securities laws and the applicable rules and regulations of the Securities and Exchange Commission and the PCAOB.
We conducted our audits of these financial statements in accordance with the standards of the PCAOB. Those standards require that we plan and perform the audit to obtain reasonable assurance about whether the financial statements are free of material misstatement, whether due to error or fraud.
Our audits included performing procedures to assess the risks of material misstatement of the financial statements, whether due to error or fraud, and performing procedures that respond to those risks. Such procedures included examining, on a test basis, evidence regarding the amounts and disclosures in the financial statements. Our audits also included evaluating the accounting principles used and significant estimates made by management, as well as evaluating the overall presentation of the financial statements. Our procedures included confirmation of securities owned as of November 30, 2018 by correspondence with the custodian and brokers; when replies were not received from brokers, we performed other auditing procedures. We believe that our audits provide a reasonable basis for our opinion.
/s/PricewaterhouseCoopers LLP
Philadelphia, Pennsylvania
January 22, 2019
We have served as the auditor of one or more investment companies in Delaware Funds® by Macquarie since 2010.
| 76 |
Table of Contents
Other Fund information (Unaudited)
Delaware Wealth Builder Fund
Tax Information
The information set forth below is for the Fund’s fiscal year as required by federal income tax laws. Shareholders, however, must report distributions on a calendar year basis for income tax purposes, which may include distributions for portions of two fiscal years of the Fund. Accordingly, the information needed by shareholders for income tax purposes will be sent to them in January of each year. Please consult your tax advisor for proper treatment of this information.
All disclosures are based on financial information available as of the date of this annual report and, accordingly are subject to change. For any and all items requiring reporting, it is the intention of the Fund to report the maximum amount permitted under the Internal Revenue Code and the regulations thereunder.
For the fiscal year ended Nov. 30, 2018, the Fund reports distributions paid during the year as follows:
(A) Long-Term Capital Gain Distributions (Tax Basis) | 13.60 | % | ||
(B) Ordinary Income Distribution (Tax Basis)1 | 86.40 | % | ||
Total Distributions (Tax Basis) | 100.00 | % | ||
(C) Qualified Dividends2 | 52.72 | % |
(A) and (B) are based on a percentage of the Fund’s total distributions.
(C) is based on the Fund’s ordinary income distributions.
| 1 | For the fiscal year ended Nov. 30, 2018, certain dividends paid by the Fund may be subject to a maximum tax rate of 20%. The percentage of dividends paid by the Fund from ordinary income reported as qualified dividend income is 78.00%. Complete information will be computed and reported in conjunction with your 2018 Form1099-DIV, as applicable. |
| 2 | Qualified dividends represent dividends which qualify for the corporate dividends received deduction. |
For the fiscal year ended Nov. 30, 2018, certain interest income paid by the Fund has been determined to be Qualified Interest Income and Short Term Capital Gains, which may be subject to relief from US withholding for foreign shareholders, as provided by the American Jobs Creation Act of 2004; the Tax Relief, Unemployment Insurance Reauthorization, and Job Creations Act of 2010; and as extended by the American Taxpayer Relief Act of 2012. For the fiscal year ended Nov. 30, 2018, the Fund has reported maximum distributions of Qualified Interest Income and Short Term Capital Gains of $6,819,950 and $1,393,649, respectively.
Board consideration of advisory agreement for Delaware Wealth Builder Fund at a meeting held August15-16, 2018
At a meeting held on Aug.15-16, 2018 (the “Annual Meeting”), the Board of Trustees (the “Board”), including a majority of disinterested or independent Trustees, approved the renewal of the Investment Advisory Agreement for Delaware Wealth Builder Fund (the “Fund”). In making its decision, the Board considered information furnished at regular quarterly Board meetings, including reports detailing Fund performance, investment strategies, and expenses, as well as information prepared specifically in connection with the renewal of the investment advisory contract. Information furnished specifically in connection with the renewal of the Investment Management Agreement with Delaware Management Company (“DMC”), a series of Macquarie Investment Management Business Trust (“MIMBT”), included
| 77 |
Table of Contents
Other Fund information (Unaudited)
Delaware Wealth Builder Fund
Board consideration of advisory agreement for Delaware Wealth Builder Fund at a meeting held August15-16, 2018 (continued)
materials provided by DMC and its affiliates (collectively, “Macquarie Investment Management”) concerning, among other things, the nature, extent, and quality of services provided to the Fund; the costs of such services to the Fund; economies of scale; and the investment manager’s financial condition and profitability. In addition, in connection with the Annual Meeting, materials were provided to the Trustees in May 2018, including reports provided by Broadridge Financial Solutions (“Broadridge”). The Broadridge reports compared the Fund’s investment performance and expenses with those of other comparable mutual funds. The Independent Trustees reviewed and discussed the Broadridge reports with independent legal counsel to the Independent Trustees. In addition to the information noted above, the Board also requested and received information regarding DMC’s policy with respect to advisory fee levels and its breakpoint philosophy; the structure of portfolio manager compensation; comparative client fee information; and any constraints or limitations on the availability of securities for certain investment styles, which had in the past year inhibited, or which were likely in the future to inhibit, the investment manager’s ability to invest fully in accordance with Fund policies.
In considering information relating to the approval of the Fund’s advisory agreement, the Independent Trustees received assistance and advice from and met separately with independent legal counsel to the Independent Trustees and also received assistance and advice from an experienced and knowledgeable independent fund consultant, JDL Consultants, LLC (“JDL”). Although the Board gave attention to all information furnished, the following discussion identifies, under separate headings, the primary factors taken into account by the Board during its contract renewal considerations.
Nature, extent, and quality of services. The Board considered the services provided by DMC to the Fund and its shareholders. In reviewing the nature, extent, and quality of services, the Board considered reports furnished to it throughout the year, which covered matters such as the relative performance of the Fund; compliance of portfolio managers with the investment policies, strategies, and restrictions for the Fund; compliance by DMC and Delaware Distributors, L.P. (together, “Management”) personnel with the Code of Ethics adopted throughout the Delaware Funds® by Macquarie (“Delaware Funds”); and adherence to fair value pricing procedures as established by the Board. The Board was pleased with the current staffing of DMC and the emphasis placed on research in the investment process. The Board recognized DMC’s receipt of certain favorable industry distinctions during the past several years. The Board gave favorable consideration to DMC’s efforts to control expenses while maintaining service levels committed to Fund matters. The Board also noted the benefits provided to Fund shareholders (a) through each shareholder’s ability to: (i) exchange an investment in one Delaware Fund for the same class of shares in another Delaware Fund without a sales charge, or (ii) reinvest Fund dividends into additional shares of the Fund or into additional shares of other Delaware Funds, and (b) the privilege to combine holdings in other Delaware Funds to obtain a reduced sales charge. The Board was satisfied with the nature, extent, and quality of the overall services provided by DMC.
Investment performance.The Board placed significant emphasis on the investment performance of the Fund in view of the importance of investment performance to shareholders. Although the Board considered performance reports and discussions with portfolio managers at Investment Committee meetings throughout the year, the Board gave particular weight to the Broadridge reports furnished for the Annual Meeting. The Broadridge reports prepared for the Fund showed the investment performance
| 78 |
Table of Contents
of its Class A shares in comparison to a group of similar funds as selected by Broadridge (the “Performance Universe”). A fund with the best performance ranked first, and a fund with the poorest performance ranked last. The highest/best performing 25% of funds in the Performance Universe make up the first quartile; the next 25%, the second quartile; the next 25%, the third quartile; and the poorest/ worst performing 25% of funds in the Performance Universe make up the fourth quartile. Comparative annualized performance for the Fund was shown for the past1-,3-,5-, and10-year periods, to the extent applicable, ended Jan. 31, 2018. The Board’s objective is that the Fund’s performance for the1-,3-, and5-year periods be at or above the median of its Performance Universe.
The Performance Universe for the Fund consisted of the Fund and all retail and institutional flexible portfolio funds as selected by Broadridge. The Broadridge report comparison showed that the Fund’s total return for the1-year period was in the third quartile of its Performance Universe. The report further showed that the Fund’s total return for the3- and5-year periods was in the second quartile of its Performance Universe and the Fund’s total return for the10-year period was in the first quartile of its Performance Universe. The Board was satisfied with the Fund’s intermediate- and long-term performance.
Comparative expenses.The Board considered expense data for the Delaware Funds. Management provided the Board with information on pricing levels and fee structures for the Fund as of its most recently completed fiscal year. The Board also focused on the comparative analysis of effective management fees and total expense ratios of the Fund versus effective management fees and total expense ratios of a group of similar funds as selected by Broadridge (the “Expense Group”). In reviewing comparative costs, the Fund’s contractual management fee and the actual management fee incurred by the Fund were compared with the contractual management fees (assuming all funds in the Expense Group were similar in size to the Fund) and actual management fees (as reported by each fund) within the Expense Group, taking into account any applicable breakpoints and fee waivers. The Fund’s total expenses were also compared with those of its Expense Group. The Broadridge total expenses, for comparative consistency, were shown by Broadridge for Class A shares and comparative total expenses including12b-1 andnon-12b-1 service fees. The Board’s objective is for the Fund’s total expense ratio to be competitive with those of the peer funds within its Expense Group.
The expense comparisons for the Fund showed that its actual management fee and total expenses were in the quartile with the second lowest expenses of its Expense Group. The Board was satisfied with the management fee and total expenses of the Fund in comparison to those of its Expense Group as shown in the Broadridge report.
Management profitability.The Board considered the level of profits realized by DMC in connection with the operation of the Fund. In this respect, the Board reviewed the Investment Management Profitability Analysis that addressed the overall profitability of DMC’s business in providing management and other services to each of the individual funds and the Delaware Funds as a whole. Specific attention was given to the methodology used by DMC in allocating costs for the purpose of determining profitability. Management stated that the level of profits of DMC, to a certain extent, reflects recent operational cost savings and efficiencies initiated by DMC. The Board considered DMC’s efforts to improve services provided to Fund shareholders and to meet additional regulatory and compliance requirements resulting from recent industry-wide Securities and Exchange Commission initiatives. The Board also considered
| 79 |
Table of Contents
| Other Fund information (Unaudited) | ||
| Delaware Wealth Builder Fund |
Board consideration of advisory agreement for Delaware Wealth Builder Fund at a meeting held August15-16, 2018 (continued)
the extent to which DMC might derive ancillary benefits from fund operations, including the potential for procuring additional business as a result of the prestige and visibility associated with its role as service provider to the Delaware Funds and the benefits from allocation of fund brokerage to improve trading efficiencies. As part of its work, the Board also reviewed a report prepared by JDL regarding MIMBT profitability as compared to certain peer fund complexes and the Independent Trustees met with JDL personnel to discuss DMC’s profitability in such context. The Board found that the management fees were reasonable in light of the services rendered and the level of profitability of DMC.
Economies of scale.The Trustees considered whether economies of scale are realized by DMC as the Fund’s assets increase and the extent to which any economies of scale are reflected in the level of management fees charged. The Trustees reviewed the Fund’s advisory fee pricing and structure, approved by the Board and shareholders, which includes breakpoints, and which applies to most funds in the Delaware Funds complex. Breakpoints in the advisory fee occur when the advisory fee rate is reduced on assets in excess of specified levels. Breakpoints result in a lower advisory fee than would otherwise be the case in the absence of breakpoints, when the asset levels specified in the breakpoints are exceeded. The Board noted that, as of March 31, 2018, the Fund’s assets exceeded the first breakpoint level. The Board believed that, given the extent to which economies of scale might be realized by DMC and its affiliates, the schedule of fees under the Investment Management Agreement provides a sharing of benefits with the Fund and its shareholders.
| 80 |
Table of Contents
This page intentionally left blank.
Table of Contents
| Board of trustees / directors and officers addendum | ||
| Delaware Funds®by Macquarie | ||
A mutual fund is governed by a Board of Trustees/Directors (“Trustees”), which has oversight responsibility for the management of a fund’s business affairs. Trustees establish procedures and oversee and review the performance of the investment manager, the distributor, and others who perform services for the fund. The independent fund trustees, in particular, are advocates
Name, Address, and Birth Date | Position(s) Held with Fund(s) | Length of Time Served | ||
Interested Trustee
| ||||
Shawn K. Lytle1,2 | President, | Trustee since | ||
2005 Market Street | Chief Executive Officer, | September 2015 | ||
Philadelphia, PA 19103 | and Trustee | |||
February 1970 | President and | |||
| Chief Executive Officer | ||||
| since August 2015 | ||||
Independent Trustees
| ||||
Thomas L. Bennett | Chair and Trustee | Trustee since | ||
2005 Market Street | March 2005 | |||
Philadelphia, PA 19103 | ||||
October 1947 | Chair since | |||
March 2015
| ||||
Jerome D. Abernathy | Trustee | Since January 2019 | ||
2005 Market Street | ||||
Philadelphia, PA 19103 | ||||
July 1959 | ||||
| Ann D. Borowiec | Trustee | Since March 2015 | ||
| 2005 Market Street | ||||
| Philadelphia, PA 19103 | ||||
| November 1958 | ||||
| 1 | Shawn K. Lytle is considered to be an “Interested Trustee” because he is an executive officer of the Fund’s(s’) investment advisor. |
| 2 | Shawn K. Lytle, David F. Connor, Daniel V. Geatens, and Richard Salus serve in similar capacities for the six portfolios of the Optimum Fund Trust, which have the same investment advisor, principal underwriter, and transfer agent as the registrant. Mr. Geatens also serves as the Chief Financial Officer and Treasurer for Macquarie Global Infrastructure Total Return Fund Inc., which has an affiliated investment manager. |
| 82 |
Table of Contents
for shareholder interests. Each trustee has served in that capacity since he or she was elected to or appointed to the Board of Trustees, and will continue to serve until his or her retirement or the election of a new trustee in his or her place. The following is a list of the Trustees and Officers with certain background and related information.
Principal Occupation(s) During the Past Five Years | Number of Portfolios in Fund Complex Overseen by Trustee or Officer | Other Directorships Held by Trustee or Officer | ||
| ||||
| President — Macquarie | 59 | Trustee — UBS | ||
| Investment Management3 | Relationship Funds, | |||
| (June 2015–Present) | SMA Relationship | |||
Trust, and UBS Funds | ||||
| Regional Head of | (May 2010–April 2015) | |||
| Americas —UBS Global | ||||
| Asset Management | ||||
(April 2010–May 2015)
| ||||
| ||||
| Private Investor | 59 | None | ||
| (March 2004–Present) | ||||
| Managing Member, | 59 | None | ||
| Stonebrook Capital | ||||
| Management, LLC (financial | ||||
| technology: macro factors | ||||
| and databases) | ||||
| (January 1993–Present) | ||||
| Chief Executive Officer, | 59 | Director — | ||
| Private Wealth Management | Banco Santander International | |||
| (2011–2013) and | (October 2016–Present) | |||
| Market Manager, | ||||
| New Jersey Private | Director — | |||
| Bank (2005–2011) — | Santander Bank, N.A. | |||
| J.P. Morgan Chase & Co. | (December 2016–Present) | |||
| 3 | Macquarie Investment Management is the marketing name for Macquarie Management Holdings, Inc. and its subsidiaries, including the Fund’s(s’) investment advisor, principal underwriter, and its transfer agent. |
| 83 |
Table of Contents
| Board of trustees / directors and officers addendum | ||
| Delaware Funds®by Macquarie |
Name, Address, and Birth Date | Position(s) Held with Fund(s) | Length of Time Served | ||
Independent Trustees (continued)
| ||||
Joseph W. Chow | Trustee | Since January 2013 | ||
2005 Market Street | ||||
Philadelphia, PA 19103 | ||||
January 1953 | ||||
John A. Fry | Trustee | Since January 2001 | ||
2005 Market Street | ||||
Philadelphia, PA 19103 | ||||
May 1960 | ||||
Lucinda S. Landreth | Trustee | Since March 2005 | ||
2005 Market Street | ||||
Philadelphia, PA 19103 | ||||
June 1947 | ||||
| 84 |
Table of Contents
Principal Occupation(s) During the Past Five Years | Number of Portfolios in Fund Complex Overseen by Trustee or Officer | Other Directorships Held by Trustee or Officer | ||
| ||||
Private Investor | 59 | Director and Audit Committee | ||
(April 2011–Present) | Member — Hercules | |||
| Technology Growth | ||||
| Capital, Inc. | ||||
| (July 2004–July 2014) | ||||
President — | 59 | Director; Compensation | ||
Drexel University | Committee and | |||
(August 2010–Present) | Governance Committee | |||
| Member — Community | ||||
President — | Health Systems | |||
Franklin & Marshall College | ||||
(July 2002–July 2010) | Director — Drexel | |||
| Morgan & Co. | ||||
| Director; Audit Committee | ||||
| Member — vTv | ||||
| Therapeutics LLC | ||||
| Director; Audit Committee | ||||
| Member — FS Credit Real | ||||
| Estate Income Trust, Inc. | ||||
Private Investor | 59 | None | ||
(2004–Present) | ||||
| 85 |
Table of Contents
| Board of trustees / directors and officers addendum | ||
| Delaware Funds®by Macquarie |
Name, Address, and Birth Date | Position(s) Held with Fund(s) | Length of Time Served | ||
Independent Trustees (continued)
| ||||
| Frances A. Sevilla-Sacasa | Trustee | Since September 2011 | ||
2005 Market Street | ||||
Philadelphia, PA 19103 | ||||
January 1956 | ||||
Thomas K. Whitford | Trustee | Since January 2013 | ||
| 2005 Market Street | ||||
| Philadelphia, PA 19103 | ||||
| March 1956 | ||||
| 86 |
Table of Contents
Principal Occupation(s) During the Past Five Years | Number of Portfolios in Fund Complex Overseen by Trustee or Officer | Other Directorships Held by Trustee or Officer | ||
| ||||
| Private Investor | 59 | Trust Manager and | ||
(January 2017–Present) | Audit Committee | |||
| Chair — Camden | ||||
Chief Executive Officer — | Property Trust | |||
Banco Itaú | (August 2011–Present) | |||
International | ||||
| (April 2012–December 2016) | Director — | |||
| Carrizo Oil & Gas, Inc. | ||||
Executive Advisor to Dean | (March 2018–Present) | |||
(August 2011–March 2012) | ||||
and Interim Dean | ||||
(January 2011–July 2011) — | ||||
| University of Miami School of | ||||
| Business Administration | ||||
| President — U.S. Trust, | ||||
| Bank of America Private | ||||
| Wealth Management | ||||
| (Private Banking) | ||||
| (July 2007–December 2008) | ||||
| Vice Chairman | 59 | Director — HSBC North | ||
| (2010–April 2013) — | America Holdings Inc. | |||
| PNC Financial | (December 2013–Present) | |||
| Services Group | ||||
| Director — HSBC USA Inc. | ||||
| (July 2014–Present) | ||||
| ||||
| Director — | ||||
| HSBC Bank USA, | ||||
| National Association | ||||
| (July 2014–March 2017) | ||||
| ||||
| Director — HSBC | ||||
| Finance Corporation | ||||
| (December 2013–April 2018) |
| 87 |
Table of Contents
| Board of trustees / directors and officers addendum | ||
| Delaware Funds®by Macquarie | ||
Name, Address, and Birth Date | Position(s) Held with Fund(s) | Length of Time Served | ||
Independent Trustees (continued)
| ||||
| Christianna Wood | Trustee | Since January 2019 | ||
| 2005 Market Street | ||||
| Philadelphia, PA 19103 | ||||
| August 1959 | ||||
| Janet L. Yeomans | Trustee | Since April 1999 | ||
| 2005 Market Street | ||||
| Philadelphia, PA 19103 | ||||
| July 1948 | ||||
| 88 |
Table of Contents
Principal Occupation(s) During the Past Five Years | Number of Portfolios in Fund Complex Overseen by Trustee or Officer | Other Directorships Held by Trustee or Officer | ||
| ||||
| Chief Executive Officer | 59 | Director of H&R Block | ||
| and President — | Corporation | |||
| Gore Creek | (July 2008–Present); | |||
| Capital, Ltd. | Director of Grange | |||
| (August 2009–Present) | Insurance (2013-Present); | |||
| Trustee of Merger Fund | ||||
| (August 2009-Present), | ||||
| WCM Alternatives: | ||||
| Event-Driven Fund | ||||
| (March 2017-Present), | ||||
| and WCM Alternatives: | ||||
| Credit Event Fund | ||||
(December 2017-Present)
| ||||
| Vice President and Treasurer | 59 | Director (2009–2017); | ||
| (January 2006–July 2012), | Personnel and Compensation | |||
| Vice President — | Committee Chair; Member of | |||
| Mergers & Acquisitions | Nominating, Investments, and | |||
| (January 2003–January 2006), | Audit Committees for various | |||
| and Vice President | periods throughout | |||
| and Treasurer | directorship — | |||
| (July 1995–January 2003) — | Okabena Company | |||
| 3M Company | ||||
| 89 |
Table of Contents
| Board of trustees / directors and officers addendum | ||
| Delaware Funds®by Macquarie |
Name, Address, and Birth Date | Position(s) Held with Fund(s) | Length of Time Served | ||
Officers | ||||
| David F. Connor | Senior Vice President, | Senior Vice President since | ||
| 2005 Market Street | General Counsel, | May 2013; General | ||
| Philadelphia, PA 19103 | and Secretary | Counsel since May 2015; | ||
| December 1963 | Secretary since | |||
October 2005
| ||||
| Daniel V. Geatens | Vice President | Vice President and | ||
| 2005 Market Street | and Treasurer | Treasurer since October 2007 | ||
| Philadelphia, PA 19103 | ||||
| October 1972 | ||||
| Richard Salus | Senior Vice President | Senior Vice President and | ||
| 2005 Market Street | and Chief Financial Officer | Chief Financial Officer | ||
| Philadelphia, PA 19103 | since November 2006 | |||
| October 1963 | ||||
The Statement of Additional Information for the Fund(s) includes additional information about the Trustees and Officers and is available, without charge, upon request by calling 800523-1918. |
| 90 |
Table of Contents
Principal Occupation(s) During the Past Five Years | Number of Portfolios in Fund Complex Overseen by Trustee or Officer | Other Directorships Held by Trustee or Officer | ||
| ||||
| David F. Connor has served | 59 | None2 | ||
| in various capacities at | ||||
| different times at | ||||
| Macquarie Investment | ||||
| Management. | ||||
| Daniel V. Geatens has served | 59 | None2 | ||
| in various capacities at | ||||
| different times at | ||||
| Macquarie Investment | ||||
| Management. | ||||
| Richard Salus has served | 59 | None2 | ||
| in various executive capacities | ||||
| at different times at | ||||
| Macquarie Investment | ||||
| Management. | ||||
| 91 |
Table of Contents
| Board of trustees | ||||||
| Shawn K. Lytle | Ann D. Borowiec | Lucinda S. Landreth | Thomas K. Whitford | |||
| President and | Former Chief Executive | Former Chief Investment | Former Vice Chairman | |||
| Chief Executive Officer | Officer | Officer | PNC Financial Services Group | |||
| Delaware Funds® | Private Wealth Management | Assurant, Inc. | Pittsburgh, PA | |||
by Macquarie Philadelphia, PA
Thomas L. Bennett Chairman of the Board Delaware Funds by Macquarie Private Investor Rosemont, PA | J.P. Morgan Chase & Co. New York, NY
Joseph W. Chow Former Executive Vice President State Street Corporation Boston, MA | New York, NY
Frances A. Sevilla-Sacasa Former Chief Executive Officer Banco Itaú International Miami, FL |
Christianna Wood Chief Executive Officer and President Gore Creek Capital, Ltd. Golden, CO
Janet L. Yeomans Former Vice President and | |||
Jerome D. Abernathy Managing Member Stonebrook Capital Management, LLC New York, NY | John A. Fry President Drexel University Philadelphia, PA | Treasurer 3M Company St. Paul, MN | ||||
| Affiliated officers | ||||||
| David F. Connor | Daniel V. Geatens | Richard Salus | ||||
| Senior Vice President, | Vice President and | Senior Vice President and | ||||
| General Counsel, | Treasurer | Chief Financial Officer | ||||
| and Secretary | Delaware Funds | Delaware Funds | ||||
| Delaware Funds | by Macquarie | by Macquarie | ||||
| by Macquarie | Philadelphia, PA | Philadelphia, PA | ||||
| Philadelphia, PA | ||||||
This annual report is for the information of Delaware Wealth Builder Fund shareholders, but it may be used with prospective investors when preceded or accompanied by the Delaware Fund fact sheet for the most recently completed calendar quarter. These documents are available at delawarefunds.com/literature.
The Fund files its complete schedule of portfolio holdings with the Securities and Exchange Commission (SEC) for the first and third quarters of each fiscal year on FormN-Q. The Fund’s FormsN-Q, as well as a description of the policies and procedures that the Fund uses to determine how to vote proxies (if any) relating to portfolio securities are available without charge (i) upon request, by calling 800523-1918; and (ii) on the SEC’s website at sec.gov. In addition, a description of the policies and procedures that the Fund uses to determine how to vote proxies (if any) relating to portfolio securities and the Schedule of Investments included in the Fund’s most recent FormN-Q are available without charge on the Fund’s website at delawarefunds.com/literature. The Fund’s FormsN-Q may be reviewed and copied at the SEC’s Public Reference Room in Washington, D.C.; information on the operation of the Public Reference Room may be obtained by calling 800SEC-0330.
Information (if any) regarding how the Fund voted proxies relating to portfolio securities during the most recently disclosed12-month period ended June 30 is available without charge (i) through the Fund’s website at delawarefunds.com/proxy; and (ii) on the SEC’s website at sec.gov.
92
Table of Contents
US equity mutual fund
Delaware Small Cap Core Fund
November 30, 2018
Carefully consider the Fund’s investment objectives, risk factors, charges, and expenses before investing. This and other information can be found in the Fund’s prospectus and its summary prospectus, which may be obtained by visiting delawarefunds.com/literature or calling 800523-1918. Investors should read the prospectus and the summary prospectus carefully before investing.
You can obtain shareholder reports and prospectuses online instead of in the mail. Visit delawarefunds.com/edelivery.
Table of Contents
Experience Delaware Funds®by Macquarie
Macquarie Investment Management (MIM) is a global asset manager with offices throughout the United States, Europe, Asia, and Australia. We are active managers who prioritize autonomy and accountability at the investment team level in pursuit of opportunities that matter for our clients. Delaware Funds is one of the longest-standing mutual fund families, with more than 75 years in existence.
If you are interested in learning more about creating an investment plan, contact your financial advisor.
You can learn more about Delaware Funds or obtain a prospectus for Delaware Small Cap Core Fund at delawarefunds.com/literature.
Manage your account online
| · | Check your account balance and transactions |
| · | View statements and tax forms |
| · | Make purchases and redemptions |
Visit delawarefunds.com/account-access.
Macquarie Asset Management (MAM) offers a diverse range of products including securities investment management, infrastructure and real asset management, and fund and equity-based structured products. MIM is the marketing name for certain companies comprising the asset management division of Macquarie Group. This includes the following registered investment advisers: Macquarie Investment Management Business Trust (MIMBT), Macquarie Funds Management Hong Kong Limited, Macquarie Investment Management Austria Kapitalanlage AG, Macquarie Investment Management Global Limited, Macquarie Investment Management Europe Limited, and Macquarie Capital Investment Management LLC.
The Fund is distributed byDelaware Distributors, L.P. (DDLP), an affiliate of MIMBT and Macquarie Group Limited.
Other than Macquarie Bank Limited (MBL), none of the entities noted are authorized deposit-taking institutions for the purposes of the Banking Act 1959 (Commonwealth of Australia). The obligations of these entities do not represent deposits or other liabilities of MBL. MBL does not guarantee or otherwise provide assurance in respect of the obligations of these entities, unless noted otherwise. The Fund is governed by US laws and regulations.
| 1 | ||||
| 4 | ||||
| 8 | ||||
Security type / sector allocation and top 10 equity holdings | 10 | |||
| 11 | ||||
| 16 | ||||
| 18 | ||||
| 20 | ||||
| 22 | ||||
| 32 | ||||
| 43 | ||||
| 44 | ||||
| 48 | ||||
| 58 | ||||
Unless otherwise noted, views expressed herein are current as of Nov. 30, 2018, and subject to change for events occurring after such date.
The Fund is not FDIC insured and is not guaranteed. It is possible to lose the principal amount invested.
Advisory services provided by Delaware Management Company, a series of MIMBT, a US registered investment advisor.
All third-party marks cited are the property of their respective owners.
© 2019 Macquarie Management Holdings, Inc.
Table of Contents
| Portfolio management review | ||
| Delaware Small Cap Core Fund | December 11, 2018 |
| Performance preview (for the year ended November 30, 2018) | ||||||
Delaware Small Cap Core Fund (Institutional Class shares) | 1-year return | +0.69% | ||||
Delaware Small Cap Core Fund (Class A shares) | 1-year return | +0.44% | ||||
Russell 2000® Index (benchmark) | 1-year return | +0.57% | ||||
Past performance does not guarantee future results.
For complete, annualized performance for Delaware Small Cap Core Fund, please see the table on page 4. Institutional Class shares are not subject to a sales charge and are offered for sale exclusively to certain eligible investors. In addition, Institutional Class shares pay no distribution and service fee.
The performance of Class A shares excludes the applicable sales charge. Both Institutional Class shares and Class A shares reflect the reinvestment of all distributions.
Please see page 6 for a description of the index. Index performance returns do not reflect any management fees, transaction costs, or expenses. Indices are unmanaged and one cannot invest directly in an index.
Small-cap stocks experienced periods of volatility during the Fund’s fiscal year ended Nov. 30, 2018. The Fund’s benchmark, the Russell 2000 Index, reached a new all-time high in August 2018 and then began a decline in September, finishing the fiscal year with a total return of 0.57%. Growth stocks led the small-cap market during the fiscal year as the Russell 2000® Growth Index appreciated 2.81% and the Russell 2000® Value Index fell 1.83%. Larger-cap companies outperformed during the fiscal year, with the Russell 1000® Index gaining 5.92% and the smallest segment of the US equity market, tracked by the Russell Microcap® Index, declining 1.64%.
The benchmark ended the fiscal year trading at a forward price-to-earnings (P/E) ratio of 15.4x after starting the fiscal year at 19.3x. The valuation compression was a result of earnings-per-share (EPS) growth. On a relative basis, the Russell 2000 Index trades at a 4% discount to the Russell 1000 Index, which is significantly lower than the long-term average of a 4% small-cap premium. During the fiscal year, the companies in the Russell 2000 Index with higher P/E ratios outperformed companies with lower P/E ratios; additionally, high-beta (more volatile) stocks outperformed low-beta stocks. Within the benchmark, the more growth-oriented consumer discretionary, technology, and healthcare sectors were the strongest performing. Companies in the credit cyclicals, energy, and basic materials
We continue to maintain our strategy of investing in companies that, in our view, have strong balance sheets and cash flow, sustainable competitive advantages, and high-quality management teams with the ability to deliver value to shareholders.
|
1
Table of Contents
Portfolio management review
Delaware Small Cap Core Fund
sectors of the benchmark were the weakest performing during the fiscal year, with all three declining by more than 10%.
On the economic front, the third-quarter gross domestic product (GDP) growth rate was a strong 3.4%. This put full-year 2018 GDP growth on pace to achieve close to 3%. Historically, the optimal GDP growth rate forsmall-cap equity performance has been between 2% and 4%. The unemployment rate reached its lowest level since 1969, at 3.7%, in November 2018.
With respect to the survey data that we carefully monitor, the Conference Board Consumer Confidence Index® (1985=100, SA) continued to measure above 100, with a November survey of 136.4. This index has remained above 135 for three consecutive months, a level we haven’t seen since October 2000. The National Federation of Independent Business (NFIB) Small Business Optimism Index ended a historictwo-year, month-over-month positive trend, with a still strong November reading of 104.8, down from 107.4 in October. Economic activity in the manufacturing sector continued to expand. The Purchasing Managers’ Index was strong, with a reading of 59.3 for November. Overall, these readings indicate a relatively healthy economy, albeit one that we continue to carefully monitor.
Within the Fund
For the fiscal year ended Nov. 30, 2018, Delaware Small Cap Core Fund outperformed its benchmark, the Russell 2000 Index. The Fund’s Institutional Class shares gained 0.69%. The Fund’s Class A shares gained 0.44% at net asset value (NAV) and declined 5.34% at maximum offer price. These figures reflect reinvestment of all distributions. During the same period, the Fund’s benchmark rose 0.57%. For complete, annualized performance of Delaware Small Cap Core Fund, please see the table on page 4.
During the fiscal year, stock selection was the largest contributor to the Fund’s relative
outperformance. Stock selection in the consumer discretionary, communications services, technology, and healthcare sectors provided the largest performance benefit to the Fund. Risk factors generally contributed to performance, with the Fund’s underweight to residual volatility providing the most notable contribution. Stock selection in the finance and consumer services sectors detracted from the Fund’s performance during the fiscal year.
In the technology sector, stock selection contributed to the Fund’s performance, led by businesses in the software, semiconductors, and Internet industries. Shares of online and mobile restaurantpick-up and delivery companyGrubHub Inc.outperformed during the fiscal year. The company’s outperformance resulted from consistently beating earnings expectations and a number of key business developments. GrubHub announced a transformative partnership with Yum! Brands in February 2018, which boosted the stock’s price. This partnership will leverage Yum! Brands’ Pizza Hut delivery infrastructure, the largest in the nation, to deliver food from GrubHub clients as well as Yum! Brands’ other restaurants: Taco Bell and KFC. Additionally, GrubHub benefited from acquiring restaurant software company, LevelUp. We have been gradually exiting the Fund’s position in GrubHub as the company graduated from the Russell 2000 Index during the 2018 Russell US Index Reconstitution.
Stock selection in the consumer discretionary sector boosted returns for the Fund, led by recreational powerboat manufacturer and distributorMalibu Boats Inc. Malibu Boats reported multiple quarters of strong earnings and revenue growth during the fiscal year. After successfully acquiring and integrating luxury powerboat company Cobalt Boats in 2017, Malibu Boats signed a definitive agreement to acquire Pursuit Boats from privately held S2 Yachts in August 2018. Pursuit Boats is a leader in the saltwater outboard fishing-boat market, a new
2
Table of Contents
market for Malibu Boats to operate in. We maintained the Fund’s position in Malibu Boats as the business continues to elevate its positioning in the market, innovate, and grow earnings to support its valuation.
At the sector level, stock selection in healthcare contributed, while within each industry of the sector, performance results were slightly mixed. The Fund’s holdings in the life sciences and diagnostics industry contributed, led by shares ofRepligen Corp.Repligen focuses on the design and manufacturing of products used in the production of biologic drugs. Repligen’s earnings and revenues were strong during the fiscal year, which helped propel the stock’s price. The company reported order momentum across its product suite, driving organic growth and helping to expand margins. Stock selection in the biotechnology industry detracted from performance.Clovis Oncology Inc.is a commercial stage biotechnology company focused on developing therapies for cancer. Part of our original investment thesis on Clovis Oncology was that it was expanding sales of Rubraca®, its ovarian cancer treatment. During the fiscal year, sales of Rubraca missed expectations, however, as the company faced increased competition. This resulted in reduced sales estimates for Rubraca, changing Clovis Oncology’s financial picture. We exited the Fund’s position prior to the end of the fiscal year.
ABM Industries Inc., a leading provider of facility services, detracted from performance during the fiscal year. In October 2015, ABM Industries outlined a new strategic operating plan that should result in improved financial performance by 2020. In order to meet the goals of the plan, management has focused on organic revenue growth and operating margin improvements. During the Fund’s fiscal year, ABM Industries worked towards its long-term goals; however, unexpected labor cost pressure weighed on
earnings. We maintained the Fund’s position in ABM Industries as its revenues have achieved record levels and the company appears on track to reach its long-term objectives.
Tenneco Inc.designs, manufactures, and distributes emissions-reduction and suspension technologies for vehicles. Shares of Tenneco fell in April 2018 after it announced plans to acquire Federal-Mogul from Icahn Enterprises in an equity- and debt-financed deal that would eventually allow for the separation of the company into two independent, publicly traded companies through atax-freespin-off to shareholders. Tenneco plans to complete thespin-off in 2019 by establishing one company to focus on aftermarket and ride performance and a second one to focus on powertrain technology. While the acquisition is expected to be accretive in Tenneco’s 2019 fiscal year and was approved by its shareholders, the stock has underperformed as investors had anticipated Tenneco would complete a deal that would have boosted its profile in the battery electric vehicle powertrain market. As of the end of the fiscal year, we continued to hold shares of Tenneco as its revenues and profits have remained strong and the company has announced additional merger-related cost savings.
With respect to sector positioning, the Fund ended the fiscal period with its largest relative overweight positions in finance, basic materials, and capital goods. The largest sector underweights were in credit cyclicals, media, and consumer discretionary. On balance, we believe the macroeconomic environment favors active managers that can apply thorough company-level analysis when making investment decisions. We continue to maintain our strategy of investing in companies that, in our view, have strong balance sheets and cash flow, sustainable competitive advantages, and high-quality management teams with the ability to deliver value to shareholders.
3
Table of Contents
| Performance summary | ||
| Delaware Small Cap Core Fund | November 30, 2018 |
The performance quoted represents past performance and does not guarantee future results. Investment return and principal value of an investment will fluctuate so that shares, when redeemed, may be worth more or less than their original cost. Current performance may be lower or higher than the performance quoted. Performance data current to the most recent month end may be obtained by calling 800523-1918 or visiting delawarefunds.com/performance.
| Fund and benchmark performance1,2 | Average annual total returns through November 30, 2018
| |||||||||||||||
| 1 year | 5 years | 10 years | Lifetime | |||||||||||||
Class A (Est. Dec. 29, 1998) | ||||||||||||||||
Excluding sales charge | +0.44% | +8.33% | +15.43% | +10.54% | ||||||||||||
Including sales charge | -5.34% | +7.06% | +14.75% | +10.21% | ||||||||||||
Class C (Est. Aug. 1, 2005) | ||||||||||||||||
Excluding sales charge | -0.31% | +7.53% | +14.58% | +7.17% | ||||||||||||
Including sales charge | -1.22% | +7.53% | +14.58% | +7.17% | ||||||||||||
Class R (Est. Aug. 1, 2005) | ||||||||||||||||
Excluding sales charge | +0.19% | +8.07% | +15.16% | +7.71% | ||||||||||||
Including sales charge | +0.19% | +8.07% | +15.16% | +7.71% | ||||||||||||
Institutional Class (Est. Dec. 29, 1998) | ||||||||||||||||
Excluding sales charge | +0.69% | +8.60% | +15.73% | +10.72% | ||||||||||||
Including sales charge | +0.69% | +8.60% | +15.73% | +10.72% | ||||||||||||
Class R6 (Est. May 2, 2016) | ||||||||||||||||
Excluding sales charge | +0.86% | n/a | n/a | +14.16% | ||||||||||||
Including sales charge | +0.86% | n/a | n/a | +14.16% | ||||||||||||
Russell 2000 Index | +0.57% | +7.50% | +14.04% | +8.12%* | ||||||||||||
*The benchmark lifetime return is for Institutional Class share comparison only and is calculated using the last business day in the month of the Fund’s Institutional Class inception date.
1 Returns reflect the reinvestment of all distributions and are presented both with and without the applicable sales charges described below. Returns do not reflect the deduction of taxes the shareholder would pay on Fund distributions or redemptions of Fund shares.
Expense limitations were in effect for certain classes during some or all of the periods shown in the “Fund and benchmark performance” table. Expenses for each class are listed on the “Fund expense ratios” table on page 5. Performance would have been lower had expense limitations not been in effect.
Institutional Class shares are not subject to a sales charge and are offered for sale exclusively to certain eligible investors. In addition, Institutional Class shares pay no distribution and service fee.
Class A shares are sold with a maximumfront-end sales charge of 5.75%, and have an annual distribution and service fee of 0.25% of average daily net assets. Performance for Class A shares, excluding sales charges, assumes that nofront-end sales charge applied.
Class C shares are sold with a contingent deferred sales charge of 1.00% if redeemed during the first 12 months. They are also subject to an annual distribution and service fee of 1.00% of average
4
Table of Contents
daily net assets. Performance for Class C shares, excluding sales charges, assumes either that contingent deferred sales charges did not apply or that the investment was not redeemed.
Class R shares are available only for certain retirement plan products. They are sold without a sales charge and have an annual distribution and service fee of 0.50% of average daily net assets.
Class R6 shares are available only to certain investors. In addition, Class R6 shares do not pay any service fees,sub-accounting fees, and/orsub-transfer agency fees to any brokers, dealers, or other financial intermediaries. Class R6 shares pay no distribution and service fee.
Narrowly focused investments may exhibit higher volatility than investments in multiple industry sectors.
Investments in small and/ormedium-sized companies typically exhibit greater risk and higher volatility than larger, more established companies.
REIT investments are subject to many of the risks associated with direct real estate ownership, including changes in economic conditions, credit risk, and interest rate fluctuations.
International investments entail risks not ordinarily associated with US investments including fluctuation in currency values, differences in accounting principles, or economic or political instability in other nations. Investing in emerging markets can be riskier than investing in established foreign markets due to increased volatility and lower trading volume.
2The Fund’s expense ratios, as described in the most recent prospectus, are disclosed in the following “Fund expense ratios” table. Please see the “Financial highlights” section in this report for the most recent expense ratios.
| Fund expense ratios | Class A | Class C | Class R | Institutional Class | Class R6 | |||||||||||||||
| Total annual operating expenses (without fee waivers) | 1.18% | 1.93% | 1.43% | 0.93% | 0.79% | |||||||||||||||
| Net expenses (including fee waivers, if any) | 1.18% | 1.93% | 1.43% | 0.93% | 0.79% | |||||||||||||||
Type of waiver | n/a | n/a | n/a | n/a | n/a | |||||||||||||||
5
Table of Contents
Performance summary
Delaware Small Cap Core Fund
Performance of a $10,000 investment1
Average annual total returns from Nov. 30, 2008 through Nov. 30, 2018
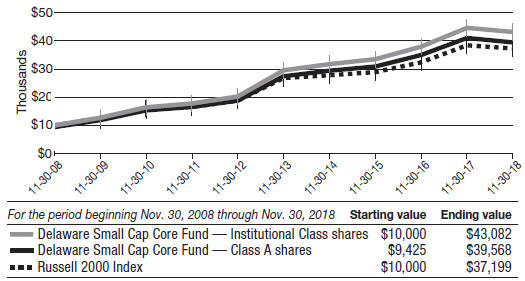
1 The “Performance of a $10,000 investment” graph assumes $10,000 invested in Institutional Class and Class A shares of the Fund on Nov. 30, 2008, and includes the effect of a 5.75%front-end sales charge (for Class A shares) and the reinvestment of all distributions. The graph does not reflect the deduction of taxes the shareholders would pay on Fund distributions or redemptions of Fund shares. Expense limitations were in effect for some or all of the periods shown. Performance would have been lower had expense limitations not been in effect. Expenses are listed in the “Fund expense ratios” table on page 5. Please note additional details on pages 4 through 7.
The graph also assumes $10,000 invested in the Russell 2000 Index as of Nov. 30, 2008. The Russell 2000 Index measures the performance of thesmall-cap segment of the US equity universe.
The Russell 2000 Growth Index, mentioned on page 1, measures the performance of thesmall-cap growth segment of the US equity universe. It includes those Russell 2000
companies with higherprice-to-book ratios and higher forecasted growth values.
The Russell 2000 Value Index, mentioned on page 1, measures the performance of thesmall-cap value segment of the US equity universe. It includes those Russell 2000 companies with lowerprice-to-book ratios and lower forecasted growth values.
The Russell 1000 Index, mentioned on page 1, measures the performance of thelarge-cap segment of the US equity universe.
The Russell Microcap Index, mentioned on page 1, measures almost 1,550small-cap andmicro-cap stocks, including the smallest 1,000 companies in the Russell 2000 Index, plus 1,000 smallerUS-based listed stocks.
The Conference Board Consumer Confidence Index, mentioned on page 2, is a barometer of the health of the US economy from the perspective of the consumer. The index is based on consumers’ perceptions of current business and employment conditions, as well as their expectations for six
6
Table of Contents
months hence regarding business conditions, employment, and income. The resulting relative value is then used as an “index value” and compared against each respective monthly value for 1985. In that year, the result of the index was arbitrarily set at 100, representing it as index benchmark.
The NFIB Small Business Optimism Index, mentioned on page 2, is a survey asking small business owners a battery of questions related to their expectations for the future and their plans to hire, build inventory, borrow, and expand.
The Purchasing Managers’ Index, mentioned on page 2, is an indicator of the economic health of the manufacturing sector. A PMI reading above
50% indicates that the manufacturing economy is generally expanding; below 50% indicates that it is generally declining.
Frank Russell Company (“Russell”) is the source and owner of the trademarks, service marks, and copyrights related to the Russell Indexes. Russell® is a trademark of the Frank Russell Company. Index performance returns do not reflect any management fees, transaction costs, or expenses. Indices are unmanaged and one cannot invest directly in an index. Past performance is not a guarantee of future results.
Performance of other Fund classes will vary due to different charges and expenses.
Nasdaq symbols |
CUSIPs | |||||
| Class A | DCCAX | 24610B883 | ||||
| Class C | DCCCX | 24610B867 | ||||
| Class R | DCCRX | 24610B834 | ||||
| Institutional Class | DCCIX | 24610B859 | ||||
Class R6
| DCZRX
| 24610B826
|
7
Table of Contents
For thesix-month period from June 1, 2018 to November 30, 2018 (Unaudited)
As a shareholder of the Fund, you incur two types of costs: (1) transaction costs, including sales charges (loads) on purchase payments, reinvested dividends, or other distributions; redemption fees; and exchange fees; and (2) ongoing costs, including management fees; distribution and service(12b-1) fees; and other Fund expenses. This example is intended to help you understand your ongoing costs (in dollars) of investing in the Fund and to compare these costs with the ongoing costs of investing in other mutual funds.
The example is based on an investment of $1,000 invested at the beginning of the period and held for the entiresix-month period from June 1, 2018 to Nov. 30, 2018.
Actual expenses
The first section of the table shown, “Actual Fund return,” provides information about actual account values and actual expenses. You may use the information in this section of the table, together with the amount you invested, to estimate the expenses that you paid over the period. Simply divide your account value by $1,000 (for example, an $8,600 account value divided by $1,000 = 8.6), then multiply the result by the number in the first section under the heading entitled “Expenses Paid During Period” to estimate the expenses you paid on your account during this period.
Hypothetical example for comparison purposes
The second section of the table shown, “Hypothetical 5% return,” provides information about hypothetical account values and hypothetical expenses based on the Fund’s actual expense ratio and an assumed rate of return of 5% per year before expenses, which is not the Fund’s actual return. The hypothetical account values and expenses may not be used to estimate the actual ending account balance or expenses you paid for the period. You may use this information to compare the ongoing costs of investing in the Fund and other funds. To do so, compare this 5% hypothetical example with the 5% hypothetical examples that appear in the shareholder reports of the other funds.
Please note that the expenses shown in the table are meant to highlight your ongoing costs only and do not reflect any transactional costs, such as sales charges (loads), redemption fees, or exchange fees. Therefore, the second section of the table is useful in comparing ongoing costs only, and will not help you determine the relative total costs of owning different funds. In addition, if these transactional costs were included, your costs would have been higher. The Fund’s expenses shown in the table assume reinvestment of all dividends and distributions.
8
Table of Contents
Delaware Small Cap Core Fund
Expense analysis of an investment of $1,000
| Beginning | Ending | Expenses | ||||||||||||||
Account Value | Account Value | Annualized | Paid During Period | |||||||||||||
6/1/18 | 11/30/18 | Expense Ratio | 6/1/18 to 11/30/18* | |||||||||||||
Actual Fund return† | ||||||||||||||||
Class A | $1,000.00 | $949.20 | 1.11% | $5.42 | ||||||||||||
Class C | 1,000.00 | 946.00 | 1.86% | 9.07 | ||||||||||||
Class R | 1,000.00 | 947.90 | 1.36% | 6.64 | ||||||||||||
Institutional Class | 1,000.00 | 950.40 | 0.86% | 4.20 | ||||||||||||
Class R6 | 1,000.00 | 951.20 | 0.73% | 3.57 | ||||||||||||
Hypothetical 5% return(5% return before expenses) |
| |||||||||||||||
Class A | $1,000.00 | $1,019.50 | 1.11% | $5.62 | ||||||||||||
Class C | 1,000.00 | 1,015.74 | 1.86% | 9.40 | ||||||||||||
Class R | 1,000.00 | 1,018.25 | 1.36% | 6.88 | ||||||||||||
Institutional Class | 1,000.00 | 1,020.76 | 0.86% | 4.36 | ||||||||||||
Class R6 | 1,000.00 | 1,021.41 | 0.73% | 3.70 | ||||||||||||
| * | “Expenses Paid During Period” are equal to the Fund’s annualized expense ratio, multiplied by the average account value over the period, multiplied by 183/365 (to reflect theone-half year period). |
| † | Because actual returns reflect only the most recentsix-month period, the returns shown may differ significantly from fiscal year returns. |
9
Table of Contents
Security type / sector allocation and
top 10 equity holdings
Delaware Small Cap Core Fund | As of November 30, 2018 (Unaudited) |
Sector designations may be different than the sector designations presented in other Fund materials. The sector designations may represent the investment manager’s internal sector classifications.
Security type / sector
| Percentage of net assets
| |
Common Stock | 98.90% | |
Basic Materials | 7.47% | |
Business Services | 4.87% | |
Capital Goods | 10.29% | |
Communications Services | 1.78% | |
Consumer Discretionary | 3.83% | |
Consumer Services | 2.85% | |
Consumer Staples | 1.88% | |
Credit Cyclicals | 0.75% | |
Energy | 2.68% | |
Financials | 19.61% | |
Healthcare | 15.19% | |
Media | 0.33% | |
Real Estate Investment Trusts | 7.85% | |
Technology | 14.18% | |
Transportation | 0.93% | |
Utilities
| 4.41%
| |
Short-Term Investments | 1.01% | |
Total Value of Securities | 99.91% | |
Receivables and Other Assets Net of Liabilities | 0.09% | |
Total Net Assets | 100.00% |
Holdings are for informational purposes only and are subject to change at any time. They are not a recommendation to buy, sell, or hold any security.
Top 10 equity holdings
| Percentage of net assets
| |
NorthWestern | 1.66% | |
Spire | 1.48% | |
South Jersey Industries | 1.27% | |
Essent Group | 1.20% | |
Merit Medical Systems | 1.18% | |
Repligen | 1.18% | |
MGIC Investment | 1.17% | |
RPT Realty | 1.17% | |
Applied Industrial Technologies | 1.16% | |
Steven Madden | 1.16% |
10
Table of Contents
| Schedule of investments | ||
Delaware Small Cap Core Fund | November 30, 2018 | |
| Number of shares | Value (US $) | |||||||
Common Stock – 98.90% | ||||||||
Basic Materials – 7.47% | ||||||||
Balchem | 230,000 | $ | 19,941,000 | |||||
Boise Cascade | 1,210,165 | 32,166,186 | ||||||
Coeur Mining † | 3,466,900 | 13,694,255 | ||||||
Continental Building Products † | 1,596,299 | 45,622,225 | ||||||
Kaiser Aluminum | 423,800 | 41,417,974 | ||||||
Minerals Technologies | 717,300 | 40,369,644 | ||||||
Neenah | 640,863 | 44,142,643 | ||||||
Quaker Chemical | 220,000 | 45,372,800 | ||||||
Worthington Industries | 1,020,500 | 42,269,110 | ||||||
|
| |||||||
| 324,995,837 | ||||||||
|
| |||||||
Business Services – 4.87% | ||||||||
ABM Industries | 1,536,279 | 48,669,319 | ||||||
ASGN † | 395,000 | 27,353,750 | ||||||
BrightView Holdings † | 507,400 | 6,393,240 | ||||||
Casella Waste Systems Class A † | 1,187,558 | 38,773,769 | ||||||
Kforce | 382,370 | 12,117,305 | ||||||
Navigant Consulting | 1,328,800 | 34,043,856 | ||||||
US Ecology | 394,427 | 27,479,729 | ||||||
WageWorks † | 514,451 | 17,146,652 | ||||||
|
| |||||||
| 211,977,620 | ||||||||
|
| |||||||
Capital Goods – 10.29% | ||||||||
Applied Industrial Technologies | 776,440 | 50,647,181 | ||||||
Barnes Group | 814,932 | 48,936,667 | ||||||
Belden | 610,248 | 34,039,634 | ||||||
Columbus McKinnon | 1,093,182 | �� | 38,042,734 | |||||
ESCO Technologies | 452,910 | 31,830,515 | ||||||
Federal Signal | 1,620,100 | 38,007,546 | ||||||
Granite Construction | 798,241 | 40,414,942 | ||||||
Kadant | 474,260 | 43,195,601 | ||||||
MasTec † | 537,100 | 24,217,839 | ||||||
MYR Group † | 998,853 | 31,264,099 | ||||||
Tetra Tech | 746,100 | 45,482,256 | ||||||
Woodward | 258,700 | 21,648,016 | ||||||
|
| |||||||
| 447,727,030 | ||||||||
|
| |||||||
Communications Services – 1.78% | ||||||||
ATN International | 425,644 | 35,992,457 | ||||||
InterXion Holding † | 666,091 | 41,477,487 | ||||||
|
| |||||||
| 77,469,944 | ||||||||
|
| |||||||
Consumer Discretionary – 3.83% | ||||||||
American Eagle Outfitters | 1,829,000 | 38,280,970 | ||||||
Five Below † | 359,400 | 37,661,526 | ||||||
Malibu Boats Class A † | 824,768 | 39,935,267 | ||||||
11
Table of Contents
Schedule of investments
Delaware Small Cap Core Fund
| Number of shares | Value (US $) | |||||||
Common Stock(continued) | ||||||||
Consumer Discretionary (continued) | ||||||||
Steven Madden | 1,567,501 | $ | 50,520,557 | |||||
|
| |||||||
| 166,398,320 | ||||||||
|
| |||||||
Consumer Services – 2.85% | ||||||||
Cheesecake Factory | 883,600 | 41,697,084 | ||||||
Chuy’s Holdings † | 688,100 | 14,725,340 | ||||||
Hawaiian Holdings | 520,582 | 20,896,162 | ||||||
Jack in the Box | 526,041 | 46,654,576 | ||||||
|
| |||||||
| 123,973,162 | ||||||||
|
| |||||||
Consumer Staples – 1.88% | ||||||||
J&J Snack Foods | 251,414 | 39,439,314 | ||||||
Prestige Consumer Healthcare † | 1,095,300 | 42,519,546 | ||||||
|
| |||||||
| 81,958,860 | ||||||||
|
| |||||||
Credit Cyclicals – 0.75% | ||||||||
Tenneco Class A | 971,300 | 32,781,375 | ||||||
|
| |||||||
| 32,781,375 | ||||||||
|
| |||||||
Energy – 2.68% | ||||||||
Carrizo Oil & Gas † | 2,305,500 | 39,447,105 | ||||||
Keane Group † | 2,398,300 | 26,669,096 | ||||||
KLX Energy Services Holdings † | 311,520 | 6,289,589 | ||||||
Patterson-UTI Energy | 521,200 | 7,234,256 | ||||||
Pioneer Energy Services † | 4,956,300 | 12,539,439 | ||||||
SRC Energy † | 286,000 | 1,650,220 | ||||||
Superior Energy Services † | 1,912,687 | 10,424,144 | ||||||
US Silica Holdings | 864,500 | 12,267,255 | ||||||
|
| |||||||
| 116,521,104 | ||||||||
|
| |||||||
Financials – 19.61% | ||||||||
American Equity Investment Life Holding | 1,076,094 | 36,727,088 | ||||||
Bryn Mawr Bank | 360,859 | 14,188,976 | ||||||
CenterState Bank | 1,518,600 | 37,980,186 | ||||||
City Holding | 416,535 | 31,960,731 | ||||||
Essent Group † | 1,355,600 | 52,271,936 | ||||||
Evercore Class A | 245,925 | 20,303,568 | ||||||
FCB Financial Holdings Class A † | 686,800 | 27,224,752 | ||||||
First Bancorp | 770,155 | 30,821,603 | ||||||
First Financial Bancorp | 1,513,673 | 42,261,750 | ||||||
First Interstate BancSystem Class A | 981,830 | 42,640,877 | ||||||
Great Western Bancorp | 1,243,632 | 46,412,346 | ||||||
Hamilton Lane Class A | 394,300 | 14,912,426 | ||||||
Hope Bancorp | 2,023,758 | 30,761,122 | ||||||
Independent Bank | 451,500 | 36,287,055 | ||||||
Independent Bank Group | 673,400 | 38,531,948 | ||||||
12
Table of Contents
| Number of shares | Value (US $) | |||||||
Common Stock(continued) | ||||||||
Financials (continued) | ||||||||
MGIC Investment † | 4,355,960 | $ | 51,008,292 | |||||
Old National Bancorp | 2,206,800 | 41,333,364 | ||||||
Primerica | 327,200 | 38,897,536 | ||||||
Selective Insurance Group | 695,900 | 46,186,883 | ||||||
Sterling Bancorp | 1,428,100 | 27,562,330 | ||||||
Stifel Financial | 840,200 | 40,556,454 | ||||||
Umpqua Holdings | 1,174,200 | 22,591,608 | ||||||
Valley National Bancorp | 3,410,300 | 36,899,446 | ||||||
WSFS Financial | 1,059,261 | 44,563,110 | ||||||
|
| |||||||
| 852,885,387 | ||||||||
|
| |||||||
Healthcare – 15.19% | ||||||||
Adamas Pharmaceuticals † | 2,037,900 | 20,868,096 | ||||||
Catalent † | 519,000 | 20,578,350 | ||||||
CONMED | 599,040 | 40,710,758 | ||||||
CryoLife † | 1,221,193 | 37,026,572 | ||||||
Encompass Health | 112,300 | 8,446,083 | ||||||
Exact Sciences † | 145,000 | 11,307,100 | ||||||
Ligand Pharmaceuticals Class B † | 255,200 | 40,262,904 | ||||||
Medicines † | 1,274,300 | 28,200,259 | ||||||
Merit Medical Systems † | 814,587 | 51,359,710 | ||||||
Natera † | 1,521,670 | 26,355,324 | ||||||
NuVasive † | 625,400 | 39,831,726 | ||||||
Puma Biotechnology † | 577,800 | 13,428,072 | ||||||
Quidel † | 706,400 | 42,963,248 | ||||||
Repligen † | 791,700 | 51,199,239 | ||||||
Retrophin † | 1,720,900 | 42,230,886 | ||||||
Spark Therapeutics † | 401,300 | 16,906,769 | ||||||
Spectrum Pharmaceuticals † | 1,283,600 | 18,560,856 | ||||||
Supernus Pharmaceuticals † | 455,900 | 21,618,778 | ||||||
Tabula Rasa HealthCare † | 199,500 | 15,058,260 | ||||||
Ultragenyx Pharmaceutical † | 372,900 | 20,013,543 | ||||||
Vanda Pharmaceuticals † | 1,853,460 | 46,410,638 | ||||||
Wright Medical Group † | 1,697,900 | 47,473,284 | ||||||
|
| |||||||
| 660,810,455 | ||||||||
|
| |||||||
Media – 0.33% | ||||||||
Nexstar Media Group Class A | 173,500 | 14,338,040 | ||||||
|
| |||||||
| 14,338,040 | ||||||||
|
| |||||||
Real Estate Investment Trusts – 7.85% | ||||||||
Armada Hoffler Properties | 1,283,300 | 19,518,993 | ||||||
Cousins Properties | 2,545,400 | 21,508,630 | ||||||
EastGroup Properties | 492,000 | 49,209,840 | ||||||
13
Table of Contents
Schedule of investments
Delaware Small Cap Core Fund
| Number of shares | Value (US $) | |||||||
Common Stock(continued) | ||||||||
Real Estate Investment Trusts (continued) | ||||||||
First Industrial Realty Trust | 1,564,600 | $ | 50,161,076 | |||||
Kite Realty Group Trust | 2,764,800 | 45,646,848 | ||||||
Mack-Cali Realty | 2,142,600 | 46,408,716 | ||||||
Pebblebrook Hotel Trust | 1,078,000 | 37,643,760 | ||||||
Physicians Realty Trust | 1,147,200 | 20,431,632 | ||||||
RPT Realty | 3,547,900 | 50,699,491 | ||||||
|
| |||||||
| 341,228,986 | ||||||||
|
| |||||||
Technology – 14.18% | ||||||||
Anixter International † | 491,750 | 31,452,330 | ||||||
Apptio Class A † | 587,715 | 22,427,204 | ||||||
Arlo Technologies † | 762,000 | 9,166,860 | ||||||
Blackbaud | 203,300 | 14,891,725 | ||||||
Brooks Automation | 1,236,600 | 37,543,176 | ||||||
ExlService Holdings † | 805,190 | 46,668,812 | ||||||
GrubHub † | 85,500 | 6,693,795 | ||||||
II-VI † | 1,069,700 | 40,028,174 | ||||||
j2 Global | 647,100 | 47,762,451 | ||||||
KeyW Holding † | 684,900 | 6,691,473 | ||||||
LendingTree † | 81,300 | 21,165,642 | ||||||
MACOM Technology Solutions Holdings † | 311,004 | 5,526,541 | ||||||
MaxLinear Class A † | 2,272,300 | 46,354,920 | ||||||
NETGEAR † | 569,110 | 31,528,694 | ||||||
Paycom Software † | 77,500 | 10,289,675 | ||||||
Plantronics | 544,020 | 24,899,795 | ||||||
Proofpoint † | 112,300 | 10,894,223 | ||||||
Q2 Holdings † | 870,000 | 47,232,300 | ||||||
Semtech † | 872,100 | 46,517,814 | ||||||
Silicon Laboratories † | 341,600 | 30,187,192 | ||||||
SYNNEX | 69,227 | 5,589,388 | ||||||
WNS Holdings ADR † | 1,005,241 | 49,095,970 | ||||||
Yelp † | 711,800 | 23,966,306 | ||||||
|
| |||||||
| 616,574,460 | ||||||||
|
| |||||||
Transportation – 0.93% | ||||||||
Hub Group Class A † | 370,900 | 16,482,796 | ||||||
Knight-Swift Transportation Holdings | 687,064 | 23,813,638 | ||||||
|
| |||||||
| 40,296,434 | ||||||||
|
| |||||||
Utilities – 4.41% | ||||||||
NorthWestern | 1,130,600 | 72,313,176 | ||||||
14
Table of Contents
| Number of shares | Value (US $) | |||||||
Common Stock(continued) | ||||||||
Utilities (continued) | ||||||||
South Jersey Industries | 1,771,100 | $ | 55,258,320 | |||||
Spire | 816,000 | 64,390,560 | ||||||
|
| |||||||
| 191,962,056 | ||||||||
|
| |||||||
Total Common Stock(cost $4,302,765,197) | 4,301,899,070 | |||||||
|
| |||||||
| Principal amount° | ||||||||
Short-Term Investments – 1.01% | ||||||||
Discount Note – 0.33%≠ | ||||||||
Federal Home Loan Bank 1.333% 12/3/18 | 14,614,806 | 14,614,806 | ||||||
|
| |||||||
| 14,614,806 | ||||||||
|
| |||||||
Repurchase Agreements – 0.68% | ||||||||
Bank of America Merrill Lynch | ||||||||
2.20%, dated 11/30/18, to be repurchased on 12/3/18, repurchase price $3,565,240 (collateralized by US government obligations 1.50%–1.75% 12/31/20–2/28/23; market value $3,635,881) | 3,564,587 | 3,564,587 | ||||||
Bank of Montreal | ||||||||
2.15%, dated 11/30/18, to be repurchased on 12/3/18, repurchase price $9,804,370 (collateralized by US government obligations 0.00%–3.75% 12/6/18–11/15/47; market value $9,998,666) | 9,802,614 | 9,802,614 | ||||||
BNP Paribas | ||||||||
2.25%, dated 11/30/18, to be repurchased on 12/3/18, repurchase price $16,122,476 (collateralized by US government obligations 0.00%–2.875% 3/31/20–8/15/46; market value $16,441,845) | 16,119,453 | 16,119,453 | ||||||
|
| |||||||
| 29,486,654 | ||||||||
|
| |||||||
Total Short-Term Investments(cost $44,099,836) | 44,101,460 | |||||||
|
| |||||||
Total Value of Securities – 99.91% | $ | 4,346,000,530 | ||||||
|
| |||||||
| ≠ | The rate shown is the effective yield at the time of purchase. |
| ° | Principal amount shown is stated in USD unless noted that the security is denominated in another currency. |
| † | Non-income producing security. |
Summary of Abbreviations:
ADR – American Depositary Receipt
USD – US Dollar
See accompanying notes, which are an integral part of the financial statements.
15
Table of Contents
| Statement of assets and liabilities | ||
| Delaware Small Cap Core Fund | November 30, 2018 |
Assets: | ||||
Investments, at value1 | $ | 4,346,000,530 | ||
Cash | 158,780 | |||
Receivable for securities sold | 8,858,657 | |||
Receivable for fund shares sold | 7,872,626 | |||
Dividends and interest receivable | 2,820,417 | |||
|
| |||
Total assets | 4,365,711,010 | |||
|
| |||
Liabilities: | ||||
Payable for fund shares redeemed | 12,087,912 | |||
Investment management fees payable to affiliates | 2,310,960 | |||
Dividend disbursing and transfer agent fees and expenses payable tonon-affiliates | 782,131 | |||
Other accrued expenses | 384,134 | |||
Distribution fees payable to affiliates | 210,585 | |||
Dividend disbursing and transfer agent fees and expenses payable to affiliates | 35,702 | |||
Trustees’ fees and expenses payable to affiliates | 33,336 | |||
Accounting and administration expenses payable to affiliates | 13,937 | |||
Legal fees payable to affiliates | 6,810 | |||
Reports and statements to shareholders expenses payable to affiliates | 3,748 | |||
|
| |||
Total liabilities | 15,869,255 | |||
|
| |||
Total Net Assets | $ | 4,349,841,755 | ||
|
| |||
Net Assets Consist of: | ||||
Paid-in capital | $ | 4,003,590,063 | ||
Total distributable earnings (loss) | 346,251,692 | |||
|
| |||
Total Net Assets | $ | 4,349,841,755 | ||
|
| |||
16
Table of Contents
Net Asset Value | ||||
Class A: | ||||
Net assets | $ | 288,720,649 | ||
Shares of beneficial interest outstanding, unlimited authorization, no par | 12,074,586 | |||
Net asset value per share | $ | 23.91 | ||
Sales charge | 5.75 | % | ||
Offering price per share, equal to net asset value per share / (1 – sales charge) | $ | 25.37 | ||
Class C: | ||||
Net assets | $ | 168,400,330 | ||
Shares of beneficial interest outstanding, unlimited authorization, no par | 7,876,803 | |||
Net asset value per share | $ | 21.38 | ||
Class R: | ||||
Net assets | $ | 28,137,466 | ||
Shares of beneficial interest outstanding, unlimited authorization, no par | 1,216,879 | |||
Net asset value per share | $ | 23.12 | ||
Institutional Class: | ||||
Net assets | $ | 3,451,251,329 | ||
Shares of beneficial interest outstanding, unlimited authorization, no par | 140,848,183 | |||
Net asset value per share | $ | 24.50 | ||
Class R6: | ||||
Net assets | $ | 413,331,981 | ||
Shares of beneficial interest outstanding, unlimited authorization, no par | 16,845,087 | |||
Net asset value per share | $ | 24.54 | ||
| ||||
1Investments, at cost | $ | 4,346,865,033 | ||
See accompanying notes, which are an integral part of the financial statements.
17
Table of Contents
| Statement of operations | ||
| Delaware Small Cap Core Fund | Year ended November 30, 2018 |
Investment Income: | ||||
Dividends | $ | 45,513,058 | ||
Interest | 1,510,179 | |||
|
| |||
| 47,023,237 | ||||
|
| |||
Expenses: | ||||
Management fees | 23,605,292 | |||
Dividend disbursing and transfer agent fees and expenses | 5,158,775 | |||
Distribution expenses — Class A | 794,267 | |||
Distribution expenses — Class C | 1,673,554 | |||
Distribution expenses — Class R | 160,653 | |||
Accounting and administration expenses | 671,854 | |||
Registration fees | 472,089 | |||
Reports and statements to shareholders expenses | 409,838 | |||
Legal fees | 180,904 | |||
Trustees’ fees and expenses | 171,837 | |||
Custodian fees | 108,057 | |||
Audit and tax fees | 35,284 | |||
Other | 78,253 | |||
|
| |||
| 33,520,657 | ||||
Less expenses paid indirectly | (14,089 | ) | ||
|
| |||
Total operating expenses | 33,506,568 | |||
|
| |||
Net Investment Income | 13,516,669 | |||
|
| |||
Net Realized and Unrealized Gain (Loss): | ||||
Net realized gain on investments | 343,964,368 | |||
Net change in unrealized appreciation (depreciation) of investments | (438,421,978 | ) | ||
|
| |||
Net Realized and Unrealized Loss | (94,457,610 | ) | ||
|
| |||
Net Decrease in Net Assets Resulting from Operations | $ | (80,940,941 | ) | |
|
|
See accompanying notes, which are an integral part of the financial statements.
18
Table of Contents
This page intentionally left blank.
Table of Contents
Statements of changes in net assets
Delaware Small Cap Core Fund
| Year ended | ||||||||
| 11/30/18 | 11/30/17 | |||||||
Increase (Decrease) in Net Assets from Operations: | ||||||||
Net investment income | $ | 13,516,669 | $ | 620,251 | ||||
Net realized gain | 343,964,368 | 207,474,687 | ||||||
Net change in unrealized appreciation (depreciation) | (438,421,978 | ) | 170,832,691 | |||||
|
|
|
| |||||
Net increase (decrease) in net assets resulting from operations | (80,940,941 | ) | 378,927,629 | |||||
|
|
|
| |||||
Dividends and Distributions to Shareholders from: | ||||||||
Distributable earnings*: | ||||||||
Class A | (24,118,583 | ) | (3,903,942 | ) | ||||
Class C | (12,756,944 | ) | (1,510,740 | ) | ||||
Class R | (2,553,434 | ) | (346,986 | ) | ||||
Institutional Class | (170,782,143 | ) | (14,384,000 | ) | ||||
Class R6 | (3,959,994 | ) | (19,058 | ) | ||||
|
|
|
| |||||
| (214,171,098 | ) | (20,164,726 | ) | |||||
|
|
|
| |||||
Capital Share Transactions: | ||||||||
Proceeds from shares sold: | ||||||||
Class A | 122,183,732 | 161,876,763 | ||||||
Class C | 55,673,270 | 44,410,670 | ||||||
Class R | 9,215,190 | 6,940,237 | ||||||
Institutional Class | 2,097,348,975 | 1,456,982,329 | ||||||
Class R6 | 501,388,246 | 52,674,963 | ||||||
Net asset value of shares issued upon reinvestment of dividends and distributions: | ||||||||
Class A | 23,939,317 | 3,749,448 | ||||||
Class C | 12,623,788 | 1,476,159 | ||||||
Class R | 2,553,432 | 346,986 | ||||||
Institutional Class | 138,241,898 | 11,069,889 | ||||||
Class R6 | 3,959,994 | 19,058 | ||||||
|
|
|
| |||||
| 2,967,127,842 | 1,739,546,502 | |||||||
|
|
|
| |||||
20
Table of Contents
| Year ended | ||||||||
| 11/30/18 | 11/30/17 | |||||||
Capital Share Transactions (continued): | ||||||||
Cost of shares redeemed: | ||||||||
Class A | $ | (161,013,497 | ) | $ | (246,287,634 | ) | ||
Class C | (40,269,838 | ) | (37,650,829 | ) | ||||
Class R | (14,304,721 | ) | (10,179,818 | ) | ||||
Institutional Class | (819,289,460 | ) | (745,224,675 | ) | ||||
Class R6 | (125,112,319 | ) | (8,942,832 | ) | ||||
|
|
|
| |||||
| (1,159,989,835 | ) | (1,048,285,788 | ) | |||||
|
|
|
| |||||
Increase in net assets derived from capital share transactions | 1,807,138,007 | 691,260,714 | ||||||
|
|
|
| |||||
Net Increase in Net Assets | 1,512,025,968 | 1,050,023,617 | ||||||
Net Assets: | ||||||||
Beginning of year | 2,837,815,787 | 1,787,792,170 | ||||||
|
|
|
| |||||
End of year1 | $ | 4,349,841,755 | $ | 2,837,815,787 | ||||
|
|
|
| |||||
| 1 | Net Assets – There were no undistributed net investment income for the year ended 11/30/17. The Securities and Exchange Commission eliminated the requirement to disclose undistributed (distributions in excess of) net investment income in 2018. |
| * | For the year ended Nov. 30, 2018, the Fund has adopted amendments to RegulationS-X (see Note 12 in “Notes to financial statements”). For the year ended Nov. 30, 2017, the dividends and distributions to shareholders were as follows: |
| Institutional | ||||||||||||||||||||
| Class A | Class C | Class R | Class | Class R6 | ||||||||||||||||
Dividends from net investment income | $ | — | $ | — | $ | — | $ | (849,453 | ) | $ | (2,555 | ) | ||||||||
Distributions from net realized gains | (3,903,942 | ) | (1,510,740 | ) | (346,986 | ) | (13,534,547 | ) | (16,503 | ) | ||||||||||
See accompanying notes, which are an integral part of the financial statements.
21
Table of Contents
Delaware Small Cap Core Fund Class A
Selected data for each share of the Fund outstanding throughout each period were as follows:
Net asset value, beginning of period |
Income (loss) from investment operations: |
Net investment income (loss)1 |
Net realized and unrealized gain |
Total from investment operations |
Less dividends and distributions from: |
Net realized gain |
Total dividends and distributions |
Net asset value, end of period |
Total return2 |
Ratios and supplemental data: |
Net assets, end of period (000 omitted) |
Ratio of expenses to average net assets |
Ratio of net investment income (loss) to average net assets |
Portfolio turnover
|
| 1 | The average shares outstanding method has been applied for per share information. |
| 2 | Total investment return is based on the change in net asset value of a share during the period and assumes reinvestment of dividends and distributions at net asset value and does not reflect the impact of a sales charge. |
See accompanying notes, which are an integral part of the financial statements.
22
Table of Contents
| Year ended | ||||||||||||||||||||
|
| |||||||||||||||||||
| 11/30/18 | 11/30/17 | 11/30/16 | 11/30/15 | 11/30/14 | ||||||||||||||||
| ||||||||||||||||||||
| $ | 25.74 | $ | 22.23 | $ | 20.32 | $ | 20.43 | $ | 19.54 | |||||||||||
| 0.05 | (0.03 | ) | (0.02 | ) | (0.04 | ) | (0.06 | ) | ||||||||||||
| 0.04 | 3.78 | 2.52 | 1.01 | 1.45 | ||||||||||||||||
|
|
|
|
|
|
|
|
|
| |||||||||||
| 0.09 | 3.75 | 2.50 | 0.97 | 1.39 | ||||||||||||||||
|
|
|
|
|
|
|
|
|
| |||||||||||
| (1.92 | ) | (0.24 | ) | (0.59 | ) | (1.08 | ) | (0.50 | ) | |||||||||||
|
|
|
|
|
|
|
|
|
| |||||||||||
| (1.92 | ) | (0.24 | ) | (0.59 | ) | (1.08 | ) | (0.50 | ) | |||||||||||
|
|
|
|
|
|
|
|
|
| |||||||||||
| $ | 23.91 | $ | 25.74 | $ | 22.23 | $ | 20.32 | $ | 20.43 | |||||||||||
|
|
|
|
|
|
|
|
|
| |||||||||||
| 0.44% | 17.02% | 12.86% | 4.86% | 7.28% | ||||||||||||||||
| $288,721 | $ | 324,710 | $ | 358,054 | $ | 266,427 | $ | 136,070 | ||||||||||||
| 1.12% | 1.18% | 1.24% | 1.28% | 1.32% | ||||||||||||||||
| 0.19% | (0.12% | ) | (0.09% | ) | (0.22% | ) | (0.30% | ) | ||||||||||||
| 38% | 54% | 43% | 38% | 30% | ||||||||||||||||
| ||||||||||||||||||||
23
Table of Contents
Financial highlights
Delaware Small Cap Core Fund Class C
Selected data for each share of the Fund outstanding throughout each period were as follows:
Net asset value, beginning of period |
Income (loss) from investment operations: |
Net investment loss1 |
Net realized and unrealized gain |
Total from investment operations |
Less dividends and distributions from: |
Net realized gain |
Total dividends and distributions |
Net asset value, end of period |
Total return2 |
Ratios and supplemental data: |
Net assets, end of period (000 omitted) |
Ratio of expenses to average net assets |
Ratio of net investment loss to average net assets |
Portfolio turnover
|
| 1 | The average shares outstanding method has been applied for per share information. |
| 2 | Total investment return is based on the change in net asset value of a share during the period and assumes reinvestment of dividends and distributions at net asset value and does not reflect the impact of a sales charge. |
See accompanying notes, which are an integral part of the financial statements.
24
Table of Contents
| Year ended | ||||||||||||||||||||
|
| |||||||||||||||||||
| 11/30/18 | 11/30/17 | 11/30/16 | 11/30/15 | 11/30/14 | ||||||||||||||||
| ||||||||||||||||||||
| $ | 23.38 | $ | 20.36 | $ | 18.80 | $ | 19.11 | $ | 18.45 | |||||||||||
| (0.13 | ) | (0.19 | ) | (0.15 | ) | (0.18 | ) | (0.19 | ) | |||||||||||
| 0.05 | 3.45 | 2.30 | 0.95 | 1.35 | ||||||||||||||||
|
|
|
|
|
|
|
|
|
| |||||||||||
| (0.08 | ) | 3.26 | 2.15 | 0.77 | 1.16 | |||||||||||||||
|
|
|
|
|
|
|
|
|
| |||||||||||
| (1.92 | ) | (0.24 | ) | (0.59 | ) | (1.08 | ) | (0.50 | ) | |||||||||||
|
|
|
|
|
|
|
|
|
| |||||||||||
| (1.92 | ) | (0.24 | ) | (0.59 | ) | (1.08 | ) | (0.50 | ) | |||||||||||
|
|
|
|
|
|
|
|
|
| |||||||||||
| $ | 21.38 | $ | 23.38 | $ | 20.36 | $ | 18.80 | $ | 19.11 | |||||||||||
|
|
|
|
|
|
|
|
|
| |||||||||||
| (0.31% | ) | 16.17% | 12.01% | 4.11% | 6.44% | |||||||||||||||
| $ | 168,400 | $ | 154,837 | $ | 126,787 | $ | 99,019 | $ | 51,923 | |||||||||||
| 1.87% | 1.93% | 1.99% | 2.03% | 2.07% | ||||||||||||||||
| (0.56% | ) | (0.87% | ) | (0.84% | ) | (0.97% | ) | (1.05% | ) | |||||||||||
| 38% | 54% | 43% | 38% | 30% | ||||||||||||||||
| ||||||||||||||||||||
25
Table of Contents
Financial highlights
Delaware Small Cap Core Fund Class R
Selected data for each share of the Fund outstanding throughout each period were as follows:
Net asset value, beginning of period |
Income (loss) from investment operations: |
Net investment loss1 |
Net realized and unrealized gain |
Total from investment operations |
Less dividends and distributions from: |
Net realized gain |
Total dividends and distributions |
Net asset value, end of period |
Total return2 |
Ratios and supplemental data: |
Net assets, end of period (000 omitted) |
Ratio of expenses to average net assets |
Ratio of net investment loss to average net assets |
Portfolio turnover
|
| 1 | The average shares outstanding method has been applied for per share information. |
| 2 | Total investment return is based on the change in net asset value of a share during the period and assumes reinvestment of dividends and distributions at net asset value. |
See accompanying notes, which are an integral part of the financial statements.
26
Table of Contents
| Year ended | ||||||||||||||||||||
|
| |||||||||||||||||||
| 11/30/18 | 11/30/17 | 11/30/16 | 11/30/15 | 11/30/14 | ||||||||||||||||
| ||||||||||||||||||||
| $ | 25.01 | $ | 21.66 | $ | 19.86 | $ | 20.04 | $ | 19.22 | |||||||||||
| (0.02 | ) | (0.08 | ) | (0.06 | ) | (0.09 | ) | (0.11 | ) | |||||||||||
| 0.05 | 3.67 | 2.45 | 0.99 | 1.43 | ||||||||||||||||
|
|
|
|
|
|
|
|
|
| |||||||||||
| 0.03 | 3.59 | 2.39 | 0.90 | 1.32 | ||||||||||||||||
|
|
|
|
|
|
|
|
|
| |||||||||||
| (1.92 | ) | (0.24 | ) | (0.59 | ) | (1.08 | ) | (0.50 | ) | |||||||||||
|
|
|
|
|
|
|
|
|
| |||||||||||
| (1.92 | ) | (0.24 | ) | (0.59 | ) | (1.08 | ) | (0.50 | ) | |||||||||||
|
|
|
|
|
|
|
|
|
| |||||||||||
| $ | 23.12 | $ | 25.01 | $ | 21.66 | $ | 19.86 | $ | 20.04 | |||||||||||
|
|
|
|
|
|
|
|
|
| |||||||||||
| 0.19% | 16.73% | 12.60% | 4.60% | 7.03% | ||||||||||||||||
| $ | 28,138 | $ | 33,112 | $ | 31,416 | $ | 28,178 | $ | 15,833 | |||||||||||
| 1.37% | 1.43% | 1.49% | 1.53% | 1.57% | ||||||||||||||||
| (0.06% | ) | (0.37% | ) | (0.34% | ) | (0.47% | ) | (0.55% | ) | |||||||||||
| 38% | 54% | 43% | 38% | 30% | ||||||||||||||||
| ||||||||||||||||||||
27
Table of Contents
Financial highlights
Delaware Small Cap Core Fund Institutional Class
Selected data for each share of the Fund outstanding throughout each period were as follows:
Net asset value, beginning of period |
Income (loss) from investment operations: |
Net investment income (loss)1 |
Net realized and unrealized gain |
Total from investment operations |
Less dividends and distributions from: |
Net investment income |
Net realized gain |
Total dividends and distributions |
Net asset value, end of period |
Total return2 |
Ratios and supplemental data: |
Net assets, end of period (000 omitted) |
Ratio of expenses to average net assets |
Ratio of net investment income (loss) to average net assets |
Portfolio turnover
|
| 1 | The average shares outstanding method has been applied for per share information. |
| 2 | Total investment return is based on the change in net asset value of a share during the period and assumes reinvestment of dividends and distributions at net asset value. |
See accompanying notes, which are an integral part of the financial statements.
28
Table of Contents
| Year ended | ||||||||||||||||||||
|
| |||||||||||||||||||
| 11/30/18 | 11/30/17 | 11/30/16 | 11/30/15 | 11/30/14 | ||||||||||||||||
| ||||||||||||||||||||
| $ | 26.29 | $ | 22.66 | $ | 20.65 | $ | 20.69 | $ | 19.74 | |||||||||||
| 0.11 | 0.03 | 0.03 | 0.01 | (0.01 | ) | |||||||||||||||
| 0.05 | 3.86 | 2.57 | 1.03 | 1.46 | ||||||||||||||||
|
|
|
|
|
|
|
|
|
| |||||||||||
| 0.16 | 3.89 | 2.60 | 1.04 | 1.45 | ||||||||||||||||
|
|
|
|
|
|
|
|
|
| |||||||||||
| (0.03 | ) | (0.02 | ) | — | — | — | ||||||||||||||
| (1.92 | ) | (0.24 | ) | (0.59 | ) | (1.08 | ) | (0.50 | ) | |||||||||||
|
|
|
|
|
|
|
|
|
| |||||||||||
| (1.95 | ) | (0.26 | ) | (0.59 | ) | (1.08 | ) | (0.50 | ) | |||||||||||
|
|
|
|
|
|
|
|
|
| |||||||||||
| $ | 24.50 | $ | 26.29 | $ | 22.66 | $ | 20.65 | $ | 20.69 | |||||||||||
|
|
|
|
|
|
|
|
|
| |||||||||||
| 0.69% | 17.31% | 13.15% | 5.15% | 7.51% | ||||||||||||||||
| $ | 3,451,251 | $ | 2,275,563 | $ | 1,271,533 | $ | 620,220 | $ | 224,771 | |||||||||||
| 0.87% | 0.93% | 0.99% | 1.03% | 1.07% | ||||||||||||||||
| 0.44% | 0.13% | 0.16% | 0.03% | (0.05% | ) | |||||||||||||||
| 38% | 54% | 43% | 38% | 30% | ||||||||||||||||
| ||||||||||||||||||||
29
Table of Contents
Financial highlights
Delaware Small Cap Core Fund Class R6
Selected data for each share of the Fund outstanding throughout each period were as follows:
Net asset value, beginning of period |
Income from investment operations: |
Net investment income2 |
Net realized and unrealized gain |
Total from investment operations |
Less dividends and distributions from: |
Net investment income |
Net realized gain |
Total dividends and distributions |
Net asset value, end of period |
Total return3 |
Ratios and supplemental data: |
Net assets, end of period (000 omitted) |
Ratio of expenses to average net assets |
Ratio of net investment income to average net assets |
Portfolio turnover
|
| 1 | Date of commencement of operations; ratios have been annualized and total return has not been annualized. |
| 2 | The average shares outstanding method has been applied for per share information. |
| 3 | Total investment return is based on the change in a net asset value of a share during the period and assumes reinvestment of dividends and distributions at net asset value. |
| 4 | Portfolio turnover is representative of the Fund for the entire year ended Nov. 30, 2016. |
See accompanying notes, which are an integral part of the financial statements.
30
Table of Contents
| 5/2/161 | ||||||||||||
| Year ended | to | |||||||||||
|
| |||||||||||
| 11/30/18 | 11/30/17 | 11/30/16 | ||||||||||
| ||||||||||||
| $ | 26.32 | $ | 22.68 | $ | 19.09 | |||||||
| 0.15 | 0.06 | 0.03 | ||||||||||
| 0.05 | 3.86 | 3.56 | ||||||||||
|
|
|
|
|
| |||||||
| 0.20 | 3.92 | 3.59 | ||||||||||
|
|
|
|
|
| |||||||
| (0.06 | ) | (0.04 | ) | — | ||||||||
| (1.92 | ) | (0.24 | ) | — | ||||||||
|
|
|
|
|
| |||||||
| (1.98 | ) | (0.28 | ) | — | ||||||||
|
|
|
|
|
| |||||||
| $ | 24.54 | $ | 26.32 | $ | 22.68 | |||||||
|
|
|
|
|
| |||||||
| 0.86% | 17.45% | 18.81% | ||||||||||
| $ | 413,332 | $ | 49,594 | $ | 2 | |||||||
| 0.74% | 0.79% | 0.82% | ||||||||||
| 0.57% | 0.27% | 0.29% | ||||||||||
| 38% | 54% | 43% | 4 | |||||||||
| ||||||||||||
31
Table of Contents
| ||
| Delaware Small Cap Core Fund | November 30, 2018 |
Delaware Group® Equity Funds V (Trust) is organized as a Delaware statutory trust and offers three series: Delaware Wealth Builder Fund, Delaware Small Cap Core Fund, and Delaware Small Cap Value Fund. These financial statements and the related notes pertain to Delaware Small Cap Core Fund (Fund). The Trust is anopen-end investment company. The Fund is considered diversified under the Investment Company Act of 1940, as amended (1940 Act), and offers Class A, Class C, Class R, Institutional Class, and Class R6 shares. Class A shares are sold with a maximumfront-end sales charge of 5.75%. Class A share purchases of $1,000,000 or more will incur a contingent deferred sales charge (CDSC) instead of afront-end sales charge of 1.00%, if redeemed during the first year, and 0.50% during the second year, provided that Delaware Distributors, L.P. (DDLP) paid a financial advisor a commission on the purchase of those shares. Class C shares are sold with a CDSC of 1.00%, which will be incurred if redeemed during the first 12 months. Class R, Institutional Class, and Class R6 shares are not subject to a sales charge and are offered for sale exclusively to certain eligible investors. In addition, Class R6 shares do not pay any service fees,sub-accounting fees, and/orsub-transfer agency fees to any brokers, dealers, or other financial intermediaries.
The investment objective of the Fund is to seek long-term capital appreciation.
1. Significant Accounting Policies
The Fund is an investment company and follows accounting and reporting guidance under Financial Accounting Standards Board (FASB) Accounting Standards Codification Topic 946, Financial Services –Investment Companies. The following accounting policies are in accordance with US generally accepted accounting principles (US GAAP) and are consistently followed by the Fund.
Security Valuation– Equity securities, except those traded on the Nasdaq Stock Market LLC (Nasdaq), are valued at the last quoted sales price as of the time of the regular close of the New York Stock Exchange on the valuation date. Equity securities traded on the Nasdaq are valued in accordance with the Nasdaq Official Closing Price, which may not be the last sales price. If, on a particular day, an equity security does not trade, the mean between the bid and ask prices will be used, which approximates fair value. US government and agency securities are valued at the mean between the bid and ask prices, which approximates fair value. Investments in repurchase agreements are generally valued at par, which approximates fair value, each business day. Generally, other securities and assets for which market quotations are not readily available are valued at fair value as determined in good faith under the direction of the Trust’s Board of Trustees (Board). In determining whether market quotations are readily available or fair valuation will be used, various factors will be taken into consideration, such as market closures or suspension of trading in a security. Restricted securities are valued at fair value using methods approved by the Board.
Federal Income Taxes– No provision for federal income taxes has been made as the Fund intends to continue to qualify for federal income tax purposes as a regulated investment company under Subchapter M of the Internal Revenue Code of 1986, as amended, and make the requisite distributions to shareholders. The Fund evaluates tax positions taken or expected to be taken in the course of preparing the Fund’s tax returns to determine whether the tax positions are“more-likely-than-not” of being sustained by the applicable tax authority. Tax positions not deemed to meet the“more-likely-than-not” threshold are recorded as a tax benefit or expense in the current year. Management has analyzed the Fund’s tax positions taken or expected to be taken on the Fund’s federal income tax returns through
32
Table of Contents
the year ended Nov. 30, 2018 and for all open tax years (years ended Nov. 30, 2015–Nov. 30, 2017), and has concluded that no provision for federal income tax is required in the Fund’s financial statements. If applicable, the Fund recognizes interest accrued on unrecognized tax benefits in interest expense and penalties in other expenses on the “Statement of operations.” During the year ended Nov. 30, 2018, the Fund did not incur any interest or tax penalties.
Class Accounting– Investment income, common expenses, and realized and unrealized gain (loss) on investments are allocated to the various classes of the Fund on the basis of daily net assets of each class. Distribution expenses relating to a specific class are charged directly to that class. Class R6 shares are not allocated any expenses related to service fees,sub-accounting fees, and/orsub-transfer agency fees paid to brokers, dealers, or financial intermediaries.
Repurchase Agreements– The Fund may purchase certain US government securities subject to the counterparty’s agreement to repurchase them at an agreed upon date and price. The counterparty will be required on a daily basis to maintain the value of the collateral subject to the agreement at not less than the repurchase price (including accrued interest). The agreements are conditioned upon the collateral being deposited under the Federal Reserve book-entry system with the Fund’s custodian or a third-partysub-custodian. In the event of default or bankruptcy by the other party to the agreement, retention of the collateral may be subject to legal proceedings. All open repurchase agreements as of the date of this report were entered into on Nov. 30, 2018, and matured on the next business day.
Use of Estimates– The preparation of financial statements in conformity with US GAAP requires management to make estimates and assumptions that affect the fair value of investments, the reported amounts of assets and liabilities and disclosure of contingent assets and liabilities at the date of the financial statements, and the reported amounts of revenues and expenses during the reporting period. Actual results could differ from those estimates and the differences could be material.
Other– Expenses directly attributable to the Fund are charged directly to the Fund. Other expenses common to various funds within the Delaware Funds® by Macquarie (Delaware Funds) are generally allocated among such funds on the basis of average net assets. Management fees and certain other expenses are paid monthly. Security transactions are recorded on the date the securities are purchased or sold (trade date) for financial reporting purposes. Costs used in calculating realized gains and losses on the sale of investment securities are those of the specific securities sold. Dividend income is recorded on theex-dividend date and interest income is recorded on the accrual basis. Discounts and premiums on debt securities are accreted or amortized to interest income, respectively, over the lives of the respective securities using the effective interest method. Distributions received from investments in real estate investment trusts (REITs) are recorded as dividend income on theex-dividend date, subject to reclassification upon notice of the character of such distributions by the issuer. The Fund declares and pays dividends from net investment income and distributions from net realized gain on investments, if any, annually. The Fund may distribute more frequently, if necessary for tax purposes. Dividends and distributions, if any, are recorded on theex-dividend date.
Subject to seeking best execution, the Fund may direct certain security trades to brokers who have agreed to rebate a portion of the related brokerage commission to the Fund in cash. Such commission rebates are included on the “Statement of operations” under “Net realized gain on investments.” In general, best execution refers to many factors, including the price paid or received for a security, the
33
Table of Contents
Notes to financial statements
Delaware Small Cap Core Fund
1. Significant Accounting Policies (continued)
commission charged, the promptness and reliability of execution, the confidentiality and placement accorded the order, and other factors affecting the overall benefit obtained by the Fund on the transaction. There were no commission rebates for the year ended Nov. 30, 2018.
The Fund receives earnings credits from its custodian when positive cash balances are maintained, which may be used to offset custody fees. The expense paid under this arrangement is included on the “Statement of operations” under “Custodian fees” with the corresponding expense offset included under “Less expenses paid indirectly.” For the year ended Nov. 30, 2018, the Fund earned $10,350 under this arrangement.
The Fund receives earnings credits from its transfer agent when positive cash balances are maintained, which may be used to offset transfer agent fees. If the amount earned is greater than $1, the expense paid under this arrangement is included on the “Statement of operations” under “Dividend disbursing and transfer agent fees and expenses” with the corresponding expense offset included under “Less expenses paid indirectly.” For the year ended Nov. 30, 2018, the Fund earned $3,739 under this arrangement.
2. Investment Management, Administration Agreements, and Other Transactions with Affiliates
In accordance with the terms of its investment management agreement, the Fund pays Delaware Management Company (DMC), a series of Macquarie Investment Management Business Trust and the investment manager, an annual fee which is calculated daily and paid monthly at the rate of 0.75% on the first $500 million of average daily net assets of the Fund, 0.70% on the next $500 million, 0.65% on the next $1.5 billion, and 0.60% on average daily net assets in excess of $2.5 billion.
Delaware Investments Fund Services Company (DIFSC), an affiliate of DMC, provides fund accounting and financial administration oversight services to the Fund. For these services, DIFSC’s fees are calculated daily and paid monthly based on the aggregate daily net assets of all funds within the Delaware Funds at the following annual rate: 0.00475% of the first $35 billion; 0.0040% of the next $10 billion; and 0.0025% of aggregate average daily net assets in excess of $45 billion (Total Fee). Each fund in the Delaware Funds pays a minimum of $4,000, which, in aggregate, is subtracted from the Total Fee. Each fund then pays its portion of the remainder of the Total Fee on a relative net asset value (NAV) basis. For the year ended Nov. 30, 2018, the Fund was charged $139,761 for these services. This amount is included on the “Statement of operations” under “Accounting and administration expenses.”
DIFSC is also the transfer agent and dividend disbursing agent of the Fund. For these services, DIFSC’s fees are calculated daily and paid monthly based on the aggregate daily net assets of the retail funds within the Delaware Funds from Dec. 1, 2017 through June 30, 2018 at the following annual rate: 0.025% of the first $20 billion; 0.020% of the next $5 billion; 0.015% of the next $5 billion; and 0.013% of average daily net assets in excess of $30 billion. Effective July 1, 2018, the Fund as well as the other Delaware Funds entered into an amendment to the DIFSC agreement. Under the amendment to the DIFSC agreement, DIFSC’s fees are calculated daily and paid monthly based on the aggregate daily net assets of the retail funds within the Delaware Funds at the following annual rate: 0.014% of the first $20 billion; 0.011% of the next $5 billion; 0.007% of the next $5 billion; 0.005% of the next $20 billion; and 0.0025% of average daily net assets in excess of $50 billion. The fees payable to DIFSC
34
Table of Contents
under the transfer agent agreement described above are allocated among all retail funds in the Delaware Funds on a relative NAV basis. This amount is included on the “Statement of operations” under “Dividend disbursing and transfer agent fees and expenses.” For the year ended Nov. 30, 2018, the Fund was charged $529,865 for these services. Pursuant to asub-transfer agency agreement between DIFSC and BNY Mellon Investment Servicing (US) Inc. (BNYMIS), BNYMIS provides certainsub-transfer agency services to the Fund.Sub-transfer agency fees are paid by the Fund and are also included on the “Statement of operations” under “Dividend disbursing and transfer agent fees and expenses.”
Pursuant to a distribution agreement and distribution plan, the Fund pays DDLP, the distributor and an affiliate of DMC, an annual distribution and service(12b-1) fee of 0.25% of the average daily net assets of the Class A shares, 1.00% of the average daily net assets of the Class C shares, and 0.50% of the average daily net assets of the Class R shares. These fees are calculated daily and paid monthly. Institutional Class shares and Class R6 shares pay no12b-1 fees.
As provided in the investment management agreement, the Fund bears a portion of the cost of certain resources shared with DMC, including the cost of internal personnel of DMC and/or its affiliates that provide legal, tax, and regulatory reporting services to the Fund. For the year ended Nov. 30, 2018, the Fund was charged $104,588 for internal legal, tax, and regulatory reporting services provided by DMC and/or its affiliates’ employees. This amount is included on the “Statement of operations” under “Legal fees.”
For the year ended Nov. 30, 2018, DDLP earned $113,124 for commissions on sales of the Fund’s Class A shares. For the year ended Nov. 30, 2018, DDLP received gross CDSC commissions of $63 and $16,606, on redemptions of the Fund’s Class A and Class C shares, respectively, and these commissions were entirely used to offset upfront commissions previously paid by DDLP to broker/dealers on sales of those shares.
Trustees’ fees include expenses accrued by the Fund for each Trustee’s retainer and meeting fees. Certain officers of DMC, DIFSC, and DDLP are officers and/or Trustees of the Trust. These officers and Trustees are paid no compensation by the Fund.
Cross trades for the year ended Nov. 30, 2018 were executed by the Fund pursuant to procedures adopted by the Board designed to ensure compliance with Rule17a-7 under the 1940 Act. Cross trading is the buying or selling of portfolio securities between funds of investment companies, or between a fund of an investment company and another entity, that are or could be considered affiliates by virtue of having a common investment advisor (or affiliated investment advisors), common directors/trustees and/or common officers. At its regularly scheduled meetings, the Board reviews such transactions for compliance with the procedures adopted by the Board. Pursuant to these procedures, for the year ended Nov. 30, 2018, the Fund engaged in Rule17a-7 securities purchases of $5,675,759. The Fund did not engage in Rule17a-7 securities sales for the year ended Nov. 30, 2018.
35
Table of Contents
Notes to financial statements
Delaware Small Cap Core Fund
3. Investments
For the year ended Nov. 30, 2018, the Fund made purchases and sales of investment securities other than short-term investments as follows:
Purchases | $ | 2,971,302,644 | ||
Sales | 1,341,916,723 |
The tax cost of investments includes adjustments to net unrealized appreciation (depreciation) which may not necessarily be final tax cost basis adjustments, but approximate the tax basis unrealized gains and losses that may be realized and distributed to shareholders. At Nov. 30, 2018, the cost and unrealized appreciation (depreciation) of investments for federal income tax purposes for the Fund were as follows:
Cost of investments | $ | 4,356,262,764 | ||
|
| |||
Aggregate unrealized appreciation of investments | $ | 318,788,882 | ||
Aggregate unrealized depreciation of investments | (329,051,116 | ) | ||
|
| |||
Net unrealized depreciation of investments | $ | (10,262,234 | ) | |
|
|
US GAAP defines fair value as the price that the Fund would receive to sell an asset or pay to transfer a liability in an orderly transaction between market participants at the measurement date under current market conditions. A three-level hierarchy for fair value measurements has been established based upon the transparency of inputs to the valuation of an asset or liability. Inputs may be observable or unobservable and refer broadly to the assumptions that market participants would use in pricing the asset or liability. Observable inputs reflect the assumptions market participants would use in pricing the asset or liability based on market data obtained from sources independent of the reporting entity. Unobservable inputs reflect the reporting entity’s own assumptions about the assumptions that market participants would use in pricing the asset or liability based on the best information available under the circumstances. The Fund’s investment in its entirety is assigned a level based upon the observability of the inputs which are significant to the overall valuation. The three-level hierarchy of inputs is summarized below.
| Level 1 – | Inputs are quoted prices in active markets for identical investments. (Examples: equity securities,open-end investment companies, futures contracts, exchange-traded options contracts) | |
| Level 2 – | Other observable inputs, including, but not limited to: quoted prices for similar assets or liabilities in markets that are active, quoted prices for identical or similar assets or liabilities in markets that are not active, inputs other than quoted prices that are observable for the assets or liabilities (such as interest rates, yield curves, volatilities, prepayment speeds, loss severities, credit risks, and default rates) or other market-corroborated inputs. (Examples: debt securities, government securities, swap contracts, foreign currency exchange contracts, foreign securities utilizing international fair value pricing, broker-quoted securities, fair valued securities) | |
| Level 3 – | Significant unobservable inputs, including the Fund’s own assumptions used to determine the fair value of investments. (Examples: broker-quoted securities, fair valued securities) | |
36
Table of Contents
Level 3 investments are valued using significant unobservable inputs. The Fund may also use an income-based valuation approach in which the anticipated future cash flows of the investment are discounted to calculate fair value. Discounts may also be applied due to the nature or duration of any restrictions on the disposition of the investments. Valuations may also be based upon current market prices of securities that are comparable in coupon, rating, maturity, and industry. The derived value of a Level 3 investment may not represent the value which is received upon disposition and this could impact the results of operations.
The following table summarizes the valuation of the Fund’s investments by fair value hierarchy levels as of Nov. 30, 2018:
Level 1 | Level 2 | Total | ||||||||||
Securities | ||||||||||||
Assets: | ||||||||||||
Common Stock | $ | 4,301,899,070 | $ | — | $ | 4,301,899,070 | ||||||
Short-Term Investments | — | 44,101,460 | 44,101,460 | |||||||||
|
|
|
|
|
| |||||||
Total Value of Securities | $ | 4,301,899,070 | $ | 44,101,460 | $ | 4,346,000,530 | ||||||
|
|
|
|
|
| |||||||
During the year ended Nov. 30, 2018, there were no transfers between Level 1 investments, Level 2 investments, or Level 3 investments that had a significant impact to the Fund. The Fund’s policy is to recognize transfers between levels based on fair value at the beginning of the reporting period.
A reconciliation of Level 3 investments is presented when the Fund has a significant amount of Level 3 investments at the beginning, interim, or end of the period in relation to net assets. During the year ended Nov. 30, 2018, there were no Level 3 investments.
4. Dividend and Distribution Information
Income and long-term capital gain distributions are determined in accordance with federal income tax regulations, which may differ from US GAAP. Additionally, distributions from net short-term gains on sales of investment securities are treated as ordinary income for federal income tax purposes. The tax character of dividends and distributions paid during the years ended Nov. 30, 2018 and 2017 was as follows:
| Year ended | ||||||||
| 11/30/18 | 11/30/17 | |||||||
Ordinary Income | $ | 28,212,954 | $ | 852,008 | ||||
Long-term capital gain | 185,958,144 | 19,312,718 | ||||||
|
|
|
| |||||
Total | $ | 214,171,098 | $ | 20,164,726 | ||||
|
|
|
| |||||
37
Table of Contents
Notes to financial statements
Delaware Small Cap Core Fund
5. Components of Net Assets on a Tax Basis
As of Nov. 30, 2018, the components of net assets on a tax basis were as follows:
Shares of beneficial interest | $4,003,590,063 | |||
Undistributed ordinary income | 13,545,868 | |||
Undistributed long-term capital gains | 342,968,058 | |||
Net unrealized depreciation of investments | (10,262,234 | ) | ||
Net assets | $4,349,841,755 |
The differences between book basis and tax basis components of net assets are primarily attributable to tax deferral of losses on wash sales.
6. Capital Shares
Transactions in capital shares were as follows:
| Year ended | ||||||||
| 11/30/18 | 11/30/17 | |||||||
Shares sold: | ||||||||
Class A | 4,906,025 | 6,976,702 | ||||||
Class C | 2,466,280 | 2,100,726 | ||||||
Class R | 380,376 | 306,291 | ||||||
Institutional Class | 81,160,139 | 61,332,627 | ||||||
Class R6 | 19,845,721 | 2,255,245 | ||||||
Shares issued upon reinvestment of dividends and distributions: | ||||||||
Class A | 1,011,807 | 167,249 | ||||||
Class C | 592,386 | 71,973 | ||||||
Class R | 111,309 | 15,887 | ||||||
Institutional Class | 5,714,837 | 484,462 | ||||||
Class R6 | 163,636 | 834 | ||||||
|
|
|
| |||||
| 116,352,516 | 73,711,996 | |||||||
|
|
|
| |||||
Shares redeemed: | ||||||||
Class A | (6,460,395 | ) | (10,631,863 | ) | ||||
Class C | (1,805,769 | ) | (1,774,799 | ) | ||||
Class R | (598,874 | ) | (448,362 | ) | ||||
Institutional Class | (32,589,388 | ) | (31,365,381 | ) | ||||
Class R6 | (5,048,255 | ) | (372,199 | ) | ||||
|
|
|
| |||||
| (46,502,681 | ) | (44,592,604 | ) | |||||
|
|
|
| |||||
Net increase | 69,849,835 | 29,119,392 | ||||||
|
|
|
| |||||
38
Table of Contents
Certain shareholders may exchange shares of one class for shares of another class in the same Fund. These exchange transactions are included as subscriptions and redemptions in the table on the previous page and on the “Statements of changes in net assets.” For the years ended Nov. 30, 2018 and 2017, the Fund had the following exchange transactions:
Exchange Redemptions | Exchange Subscriptions | |||||||||||||||||||||||||||
| Institutional | Institutional | |||||||||||||||||||||||||||
| Class A | Class C | Class | Class A | Class | Class R6 | |||||||||||||||||||||||
| Year ended | Shares | Shares | Shares | Shares | Shares | Shares | Value | |||||||||||||||||||||
11/30/18 | 18,792 | 14,031 | 153,738 | 10,080 | 20,821 | 153,562 | $ | 4,907,742 | ||||||||||||||||||||
11/30/17 | 4,562,936 | 182,362 | 189,608 | 98 | 4,638,858 | 189,373 | 113,439,504 | |||||||||||||||||||||
7. Line of Credit
The Fund, along with certain other funds in the Delaware Funds (Participants), was a participant in a $155,000,000 revolving line of credit intended to be used for temporary or emergency purposes as an additional source of liquidity to fund redemptions of investor shares. The revolving line of credit available was reduced from $155,000,000 to 130,000,0000 on Sept. 6, 2018. Under the agreement, the Participants were charged an annual commitment fee of 0.15%, which was allocated across the Participants based on a weighted average of the respective net assets of each Participant. The Participants were permitted to borrow up to a maximum ofone-third of their net assets under the agreement. Each Participant was individually, and not jointly, liable for its particular advances, if any, under the line of credit. The line of credit available under the agreement expired on Nov. 5, 2018.
On Nov. 5, 2018, the Fund, along with the other Participants, entered into an amendment to the agreement for a $190,000,000 revolving line of credit. The revolving line of credit available was increased from $190,000,000 to $220,000,000 on Nov. 29, 2018. The revolving line of credit is to be used as described above and operates in substantially the same manner as the original agreement. The line of credit available under the agreement expires on Nov. 4, 2019.
The Fund had no amounts outstanding as of Nov. 30, 2018, or at any time during the year then ended.
8.Offsetting
Master Repurchase Agreements
Repurchase agreements are entered into by the Fund under Master Repurchase Agreements (each, an MRA). The MRA permits the Fund, under certain circumstances including an event of default (such as bankruptcy or insolvency), to offset payables and/or receivables with collateral held by and/or posted to the counterparty. As a result, one single net payment is created. Bankruptcy or insolvency laws of a particular jurisdiction may impose restrictions on or prohibitions against such a right of offset in the event of the MRA counterparty’s bankruptcy or insolvency. Based on the terms of the MRA, the Fund receives securities as collateral with a market value in excess of the repurchase price at maturity. Upon a bankruptcy or insolvency of the MRA counterparty, the Fund would recognize a liability with respect to such excess collateral. The liability reflects the Fund’s obligation under bankruptcy law to return the excess to the counterparty. As of Nov. 30, 2018, the following table is a summary of the Fund’s
39
Table of Contents
Notes to financial statements
Delaware Small Cap Core Fund
8. Offsetting (continued)
repurchase agreements by counterparty which are subject to offset under an MRA:
| Counterparty | Repurchase Agreements | Fair Value of Non-Cash Collateral Received(a) | Cash Collateral Received | Net Collateral Received | Net Exposure(b) | ||||||||||||||||||||
Bank of America | |||||||||||||||||||||||||
Merrill Lynch | $ | 3,564,587 | $ | (3,564,587 | ) | $ | — | $ | (3,564,587 | ) | $ | — | |||||||||||||
Bank of Montreal | 9,802,614 | (9,802,614 | ) | — | (9,802,614 | ) | — | ||||||||||||||||||
BNP Paribas | 16,119,453 | (16,119,453 | ) | — | (16,119,453 | ) | — | ||||||||||||||||||
|
|
|
|
|
|
|
|
|
| ||||||||||||||||
Total | $ | 29,486,654 | $ | (29,486,654 | ) | $ | — | $ | (29,486,654 | ) | $ | — | |||||||||||||
|
|
|
|
|
|
|
|
|
| ||||||||||||||||
(a)The value of the related collateral received exceeded the value of the repurchase agreements as of Nov. 30, 2018.
(b)Net exposure represents the net receivable (payable) that would be due from (to) the counterparty in the event of default.
9. Securities Lending
The Fund, along with other funds in the Delaware Funds, may lend its securities pursuant to a security lending agreement (Lending Agreement) with The Bank of New York Mellon (BNY Mellon). At the time a security is loaned, the borrower must post collateral equal to the required percentage of the market value of the loaned security, including any accrued interest. The required percentage is: (1) 102% with respect to US securities and foreign securities that are denominated and payable in US dollars; and (2) 105% with respect to foreign securities. With respect to each loan, if on any business day the aggregate market value of securities collateral plus cash collateral held is less than the aggregate market value of the securities which are the subject of such loan, the borrower will be notified to provide additional collateral by the end of the following business day which, together with the collateral already held, will be not less than the applicable initial collateral requirements for such security loan. If the aggregate market value of securities collateral and cash collateral held with respect to a security loan exceeds the applicable initial collateral requirement, upon the request of the borrower, BNY Mellon must return enough collateral to the borrower by the end of the following business day to reduce the value of the remaining collateral to the applicable initial collateral requirement for such security loan. As a result of the foregoing, the value of the collateral held with respect to a loaned security on any particular day may be more or less than the value of the security on loan. The collateral percentage with respect to the market value of the loaned security is determined by the security lending agent.
Cash collateral received by each fund of the Trust is generally invested in a series of individual separate accounts, each corresponding to a fund. The investment guidelines permit each separate account to hold certain securities that would be considered eligible securities for a money market fund. Cash collateral received is generally invested in government securities; certain obligations issued by government sponsored enterprises; repurchase agreements collateralized by US Treasury securities; obligations issued by the central government of any Organization for Economic Cooperation and Development (OECD) country or its agencies, instrumentalities or establishments; obligations of supranational organizations; commercial paper, notes, bonds and other debt obligations; certificates of deposit, time deposits, and other bank obligations; and asset-backed securities. The Fund can also accept US government securities and letters of credit(non-cash collateral) in connection with securities loans.
40
Table of Contents
In the event of default or bankruptcy by the lending agent, realization and/or retention of the collateral may be subject to legal proceedings. In the event the borrower fails to return loaned securities and the collateral received is insufficient to cover the value of the loaned securities and provided such collateral shortfall is not the result of investment losses, the lending agent has agreed to pay the amount of the shortfall to the Fund or, at the discretion of the lending agent, replace the loaned securities. The Fund continues to record dividends or interest, as applicable, on the securities loaned and is subject to changes in value of the securities loaned that may occur during the term of the loan. The Fund has the right under the Lending Agreement to recover the securities from the borrower on demand. With respect to security loans collateralized bynon-cash collateral, the Fund receives loan premiums paid by the borrower. With respect to security loans collateralized by cash collateral, the earnings from the collateral investments are shared among the Fund, the security lending agent, and the borrower. The Fund records security lending income net of allocations to the security lending agent and the borrower.
The Fund may incur investment losses as a result of investing securities lending collateral. This could occur if an investment in the collateral investment account defaulted or became impaired. Under those circumstances, the value of the Fund’s cash collateral account may be less than the amount the Fund would be required to return to the borrowers of the securities and the Fund would be required to make up for this shortfall.
During the year ended Nov. 30, 2018, the Fund had no securities out on loan.
10. Credit and Market Risk
The Fund invests a significant portion of its assets in small companies and may be subject to certain risks associated with ownership of securities of such companies. Investments in small sized companies may be more volatile than investments in larger companies for a number of reasons, which include limited financial resources or a dependence on narrow product lines.
The Fund invests in REITs and is subject to the risks associated with that industry. If the Fund holds real estate directly as a result of defaults or receives rental income directly from real estate holdings, its tax status as a regulated investment company may be jeopardized. There were no direct real estate holdings during the year ended Nov. 30, 2018. The Fund’s REIT holdings are also affected by interest rate changes, particularly if the REITs it holds use floating rate debt to finance their ongoing operations.
The Fund may invest up to 15% of its net assets in illiquid securities, which may include securities with contractual restrictions on resale, securities exempt from registration under Rule 144A promulgated under the Securities Act of 1933, as amended, and other securities which may not be readily marketable. The relative illiquidity of these securities may impair the Fund from disposing of them in a timely manner and at a fair price when it is necessary or desirable to do so. While maintaining oversight, the Board has delegated to DMC theday-to-day functions of determining whether individual securities are liquid for purposes of the Fund’s limitation on investments in illiquid securities. Securities eligible for resale pursuant to Rule 144A, which are determined to be liquid, are not subject to the Fund’s 15% limit on investments in illiquid securities. As of Nov. 30, 2018, there were no Rule 144A securities held by the Fund. Restricted securities are valued pursuant to the security valuation procedures described in Note 1.
41
Table of Contents
Notes to financial statements
Delaware Small Cap Core Fund
11. Contractual Obligations
The Fund enters into contracts in the normal course of business that contain a variety of indemnifications. The Fund’s maximum exposure under these arrangements is unknown. However, the Fund has not had prior claims or losses pursuant to these contracts. Management has reviewed the Fund’s existing contracts and expects the risk of loss to be remote.
12. Recent Accounting Pronouncements
In August 2018, the FASB issued an Accounting Standards Update, ASU2018-13, which changes certain fair value measurement disclosure requirements. The ASU2018-13, in addition to other modifications and additions, removes the requirement to disclose the amount and reasons for transfers between Level 1 and Level 2 of the fair value hierarchy, the policy for the timing of transfers between levels and the valuation process for Level 3 fair value measurements. The ASU2018-13 is effective for fiscal years, and interim periods within those fiscal years, beginning after Dec. 15, 2019. At this time, management is evaluating the implications of these changes on the financial statements.
In August 2018, the Securities and Exchange Commission (SEC) adopted amendments to RegulationS-X to update and simplify the disclosure requirements for registered investment companies by eliminating requirements that are redundant or duplicative of US GAAP requirements or other SEC disclosure requirements. The new amendments require the presentation of the total, rather than the components, of distributable earnings on the “Statement of assets and liabilities” and the total, rather than the components, of dividends from net investment income and distributions from net realized gains on the “Statements of changes in net assets.” The amendments also removed the requirement for the parenthetical disclosure of undistributed net investment income on the “Statements of changes in net assets” and certain tax adjustments that were reflected in the “Notes to financial statements.” All of these have been reflected in the Fund’s financial statements.
13. Subsequent Events
Management has determined that no material events or transactions occurred subsequent to Nov. 30, 2018, that would require recognition or disclosure in the Fund’s financial statements.
42
Table of Contents
registered public accounting firm
To the Board of Trustees of Delaware Group® Equity Funds V
and Shareholders of Delaware Small Cap Core Fund
Opinion on the Financial Statements
We have audited the accompanying statement of assets and liabilities, including the schedule of investments, of Delaware Small Cap Core Fund (one of the funds constituting Delaware Group® Equity Funds V, referred to hereafter as the “Fund”) as of November 30, 2018, the related statement of operations for the year ended November 30, 2018, the statements of changes in net assets for each of the two years in the period ended November 30, 2018, including the related notes, and the financial highlights for each of the periods indicated therein (collectively referred to as the “financial statements”). In our opinion, the financial statements present fairly, in all material respects, the financial position of the Fund as of November 30, 2018, the results of its operations for the year then ended, the changes in its net assets for each of the two years in the period ended November 30, 2018 and the financial highlights for each of the periods indicated therein in conformity with accounting principles generally accepted in the United States of America.
Basis for Opinion
These financial statements are the responsibility of the Fund’s management. Our responsibility is to express an opinion on the Fund’s financial statements based on our audits. We are a public accounting firm registered with the Public Company Accounting Oversight Board (United States) (PCAOB) and are required to be independent with respect to the Fund in accordance with the U.S. federal securities laws and the applicable rules and regulations of the Securities and Exchange Commission and the PCAOB.
We conducted our audits of these financial statements in accordance with the standards of the PCAOB. Those standards require that we plan and perform the audit to obtain reasonable assurance about whether the financial statements are free of material misstatement, whether due to error or fraud.
Our audits included performing procedures to assess the risks of material misstatement of the financial statements, whether due to error or fraud, and performing procedures that respond to those risks. Such procedures included examining, on a test basis, evidence regarding the amounts and disclosures in the financial statements. Our audits also included evaluating the accounting principles used and significant estimates made by management, as well as evaluating the overall presentation of the financial statements. Our procedures included confirmation of securities owned as of November 30, 2018 by correspondence with the custodian and brokers. We believe that our audits provide a reasonable basis for our opinion.
/s/PricewaterhouseCoopers LLP
Philadelphia, Pennsylvania
January 22, 2019
We have served as the auditor of one or more investment companies in Delaware Funds® by Macquarie since 2010.
43
Table of Contents
Other Fund information (Unaudited)
Delaware Small Cap Core Fund
Tax Information
The information set forth below is for the Fund’s fiscal year as required by federal income tax laws. Shareholders, however, must report distributions on a calendar year basis for income tax purposes, which may include distributions for portions of two fiscal years of the Fund. Accordingly, the information needed by shareholders for income tax purposes will be sent to them in January of each year. Please consult your tax advisor for proper treatment of this information.
All disclosures are based on financial information available as of the date of this annual report and, accordingly are subject to change. For any and all items requiring reporting, it is the intention of the Fund to report the maximum amount permitted under the Internal Revenue Code and the regulations thereunder.
For the fiscal year ended Nov. 30, 2018, the Fund reports distributions paid during the year as follows:
(A) Long-Term Capital Gain Distributions (Tax Basis) | 86.83 | % | ||
(B) Ordinary Income Distributions (Tax Basis)1 | 13.17 | % | ||
Total Distributions (Tax Basis) | 100.00 | % | ||
(C) Qualified Dividends2 | 70.20 | % |
(A) and (B) are based on a percentage of the Fund’s total distributions.
(C) is based on a percentage of the Fund’s ordinary income distributions.
| 1 | For the fiscal year ended Nov. 30, 2018, certain dividends paid by the Fund may be subject to a maximum tax rate of 20%. The percentage of dividends paid by the Fund from ordinary income reported as qualified dividend income is 69.93%. Complete information will be compiled and reported in conjunction with your 2018 Form1099-DIV. |
| 2 | Qualified dividends represent dividends which qualify for the corporate dividends received deduction. |
For the fiscal year ended Nov. 30, 2018, certain interest income paid by the Fund, determined to be Qualified Short-Term Capital Gains may be subject to relief from US withholding for foreign shareholders, as provided by the American Jobs Creation Act of 2004; the Tax Relief Unemployment Insurance Reauthorization, and Job Creations Act of 2010; and as extended by the American Taxpayer Relief Act of 2012. For the fiscal year ended Nov. 30, 2018, the Fund has reported maximum distributions of Qualified Short-Term Capital Gains of $2,436,384.
Board consideration of advisory agreement for Delaware Small Cap Core Fund at a meeting held August15-16, 2018
At a meeting held on Aug.15-16, 2018 (the “Annual Meeting”), the Board of Trustees (the “Board”), including a majority of disinterested or independent Trustees, approved the renewal of the Investment Advisory Agreement for Delaware Small Cap Core Fund (the “Fund”). In making its decision, the Board considered information furnished at regular quarterly Board meetings, including reports detailing Fund performance, investment strategies, and expenses, as well as information prepared specifically in connection with the renewal of the investment advisory contract. Information furnished specifically in connection with the renewal of the Investment Management Agreement with Delaware Management Company (“DMC”), a series of Macquarie Investment Management Business Trust (“MIMBT”), included materials provided by DMC and its affiliates (collectively, “Macquarie Investment Management”) concerning, among other things, the nature, extent, and quality of services provided to the Fund; the costs of such services to the Fund; economies of scale; and the investment manager’s financial
44
Table of Contents
condition and profitability. In addition, in connection with the Annual Meeting, materials were provided to the Trustees in May 2018, including reports provided by Broadridge Financial Solutions (“Broadridge”). The Broadridge reports compared the Fund’s investment performance and expenses with those of other comparable mutual funds. The Independent Trustees reviewed and discussed the Broadridge reports with independent legal counsel to the Independent Trustees. In addition to the information noted above, the Board also requested and received information regarding DMC’s policy with respect to advisory fee levels and its breakpoint philosophy; the structure of portfolio manager compensation; comparative client fee information; and any constraints or limitations on the availability of securities for certain investment styles, which had in the past year inhibited, or which were likely in the future to inhibit, the investment manager’s ability to invest fully in accordance with Fund policies.
In considering information relating to the approval of the Fund’s advisory agreement, the Independent Trustees received assistance and advice from and met separately with independent legal counsel to the Independent Trustees and also received assistance and advice from an experienced and knowledgeable independent fund consultant, JDL Consultants, LLC (“JDL”). Although the Board gave attention to all information furnished, the following discussion identifies, under separate headings, the primary factors taken into account by the Board during its contract renewal considerations.
Nature, extent, and quality of services.The Board considered the services provided by DMC to the Fund and its shareholders. In reviewing the nature, extent, and quality of services, the Board considered reports furnished to it throughout the year, which covered matters such as the relative performance of the Fund; compliance of portfolio managers with the investment policies, strategies, and restrictions for the Fund; compliance by DMC and Delaware Distributors, L.P. (together, “Management”) personnel with the Code of Ethics adopted throughout the Delaware Funds® by Macquarie (“Delaware Funds”); and adherence to fair value pricing procedures as established by the Board. The Board was pleased with the current staffing of DMC and the emphasis placed on research in the investment process. The Board recognized DMC’s receipt of certain favorable industry distinctions during the past several years. The Board gave favorable consideration to DMC’s efforts to control expenses while maintaining service levels committed to Fund matters. The Board also noted the benefits provided to Fund shareholders (a) through each shareholder’s ability to: (i) exchange an investment in one Delaware Fund for the same class of shares in another Delaware Fund without a sales charge, or (ii) reinvest Fund dividends into additional shares of the Fund or into additional shares of other Delaware Funds, and (b) the privilege to combine holdings in other Delaware Funds to obtain a reduced sales charge. The Board was satisfied with the nature, extent, and quality of the overall services provided by DMC.
Investment performance.The Board placed significant emphasis on the investment performance of the Fund in view of the importance of investment performance to shareholders. Although the Board considered performance reports and discussions with portfolio managers at Investment Committee meetings throughout the year, the Board gave particular weight to the Broadridge reports furnished for the Annual Meeting. The Broadridge reports prepared for the Fund showed the investment performance of its Class A shares in comparison to a group of similar funds as selected by Broadridge (the “Performance Universe”). A fund with the best performance ranked first, and a fund with the poorest performance ranked last. The highest/best performing 25% of funds in the Performance Universe make up the first quartile; the next 25%, the second quartile; the next 25%, the third quartile; and the poorest/worst performing 25% of funds in the Performance Universe make up the fourth quartile.
45
Table of Contents
Other Fund information (Unaudited)
Delaware Small Cap Core Fund
Board consideration of advisory agreement for Delaware Small Cap Core Fund at a meeting held August15-16, 2018 (continued)
Comparative annualized performance for the Fund was shown for the past1-,3-,5-, and10-year periods, to the extent applicable, ended Jan. 31, 2018. The Board’s objective is that the Fund’s performance for the1-,3-, and5-year periods be at or above the median of its Performance Universe.
The Performance Universe for the Fund consisted of the Fund and all retail and institutionalsmall-cap core funds as selected by Broadridge. The Broadridge report comparison showed that the Fund’s total return for the1- and3-year periods was in the second quartile of its Performance Universe. The report further showed that the Fund’s total return for the5- and10-year periods was in the first quartile of its Performance Universe. The Board was satisfied with performance.
Comparative expenses.The Board considered expense data for the Delaware Funds. Management provided the Board with information on pricing levels and fee structures for the Fund as of its most recently completed fiscal year. The Board also focused on the comparative analysis of effective management fees and total expense ratios of the Fund versus effective management fees and total expense ratios of a group of similar funds as selected by Broadridge (the “Expense Group”). In reviewing comparative costs, the Fund’s contractual management fee and the actual management fee incurred by the Fund were compared with the contractual management fees (assuming all funds in the Expense Group were similar in size to the Fund) and actual management fees (as reported by each fund) within the Expense Group, taking into account any applicable breakpoints and fee waivers. The Fund’s total expenses were also compared with those of its Expense Group. The Broadridge total expenses, for comparative consistency, were shown by Broadridge for Class A shares and comparative total expenses including12b-1 andnon-12b-1 service fees. The Board’s objective is for the Fund’s total expense ratio to be competitive with those of the peer funds within its Expense Group.
The expense comparisons for the Fund showed that its actual management fee was in the quartile with the lowest expenses of its Expense Group and its total expenses were in the quartile the second lowest expenses of its Expense Group. The Board was satisfied with the management fee and total expenses of the Fund in comparison to those of its Expense Group as shown in the Broadridge report.
Management profitability.The Board considered the level of profits realized by DMC in connection with the operation of the Fund. In this respect, the Board reviewed the Investment Management Profitability Analysis that addressed the overall profitability of DMC’s business in providing management and other services to each of the individual funds and the Delaware Funds as a whole. Specific attention was given to the methodology used by DMC in allocating costs for the purpose of determining profitability. Management stated that the level of profits of DMC, to a certain extent, reflects recent operational cost savings and efficiencies initiated by DMC. The Board considered DMC’s efforts to improve services provided to Fund shareholders and to meet additional regulatory and compliance requirements resulting from recent industry-wide Securities and Exchange Commission initiatives. The Board also considered the extent to which DMC might derive ancillary benefits from fund operations, including the potential for procuring additional business as a result of the prestige and visibility associated with its role as service provider to the Delaware Funds and the benefits from allocation of fund brokerage to improve trading efficiencies. As part of its work, the Board also reviewed a report prepared by JDL regarding MIMBT profitability as compared to certain peer fund complexes and the Independent Trustees met with JDL
46
Table of Contents
personnel to discuss DMC’s profitability in such context. The Board found that the management fees were reasonable in light of the services rendered and the level of profitability of DMC.
Economies of scale.The Trustees considered whether economies of scale are realized by DMC as the Fund’s assets increase and the extent to which any economies of scale are reflected in the level of management fees charged. The Trustees reviewed the Fund’s advisory fee pricing and structure, approved by the Board and shareholders, which includes breakpoints, and which applies to most funds in the Delaware Funds complex. Breakpoints in the advisory fee occur when the advisory fee rate is reduced on assets in excess of specified levels. Breakpoints result in a lower advisory fee than would otherwise be the case in the absence of breakpoints, when the asset levels specified in the breakpoints are exceeded. The Board also noted that, as of March 31, 2018, the Fund’s assets exceeded the final breakpoint level. The Board believed that, given the extent to which economies of scale might be realized by DMC and its affiliates, the schedule of fees under the Investment Management Agreement provides a sharing of benefits with the Fund and its shareholders.
47
Table of Contents
Board of trustees / directors and officers addendum
Delaware Funds®by Macquarie
A mutual fund is governed by a Board of Trustees/Directors (“Trustees”), which has oversight responsibility for the management of a fund’s business affairs. Trustees establish procedures and oversee and review the performance of the investment manager, the distributor, and others who perform services for the fund. The independent fund trustees, in particular, are advocates
| Name, Address, | Position(s) | Length of | ||
| and Birth Date | Held with Fund(s) | Time Served | ||
Interested Trustee
| ||||
Shawn K. Lytle1,2 | President, | Trustee since | ||
2005 Market Street | Chief Executive Officer, | September 2015 | ||
Philadelphia, PA 19103 | and Trustee | |||
February 1970 | President and | |||
| Chief Executive Officer | ||||
since August 2015
| ||||
Independent Trustees
| ||||
| Thomas L. Bennett | Chair and Trustee | Trustee since | ||
| 2005 Market Street | March 2005 | |||
| Philadelphia, PA 19103 | ||||
| October 1947 | Chair since | |||
March 2015
| ||||
| Jerome D. Abernathy | Trustee | Since January 2019 | ||
| 2005 Market Street | ||||
| Philadelphia, PA 19103 | ||||
| July 1959 | ||||
| Ann D. Borowiec | Trustee | Since March 2015 | ||
| 2005 Market Street | ||||
| Philadelphia, PA 19103 | ||||
| November 1958 | ||||
| 1 | Shawn K. Lytle is considered to be an “Interested Trustee ”because he is an executive officer of the Fund’s(s’) investment advisor. |
| 2 | Shawn K. Lytle, David F. Connor, Daniel V. Geatens, and Richard Salus serve in similar capacities for the six portfolios of the Optimum Fund Trust, which have the same investment advisor, principal underwriter, and transfer agent as the registrant. Mr. Geatens also serves as the Chief Financial Officer and Treasurer for Macquarie Global Infrastructure Total Return Fund Inc., which has an affiliated investment manager. |
48
Table of Contents
for shareholder interests. Each trustee has served in that capacity since he or she was elected to or appointed to the Board of Trustees, and will continue to serve until his or her retirement or the election of a new trustee in his or her place. The following is a list of the Trustees and Officers with certain background and related information.
| Number of Portfolios in | ||||
| Principal Occupation(s) | Fund Complex Overseen | Other Directorships | ||
| During the Past Five Years | by Trustee or Officer | Held by Trustee or Officer | ||
| President — Macquarie | 59 | Trustee — UBS | ||
| Investment Management3 | Relationship Funds, | |||
| (June 2015–Present) | SMA Relationship | |||
| Trust, and UBS Funds | ||||
| Regional Head of | (May 2010–April 2015) | |||
| Americas — UBS Global | ||||
| Asset Management | ||||
| (April 2010–May 2015) | ||||
| Private Investor | 59 | None | ||
| (March 2004–Present) | ||||
| Managing Member, | 59 | None | ||
| Stonebrook Capital | ||||
| Management, LLC (financial | ||||
| technology: macro factors | ||||
| and databases) | ||||
| (January 1993–Present) | ||||
| Chief Executive Officer, | 59 | Director — | ||
| Private Wealth Management | Banco Santander International | |||
| (2011–2013) and | (October 2016–Present) | |||
| Market Manager, | ||||
| New Jersey Private | Director — | |||
| Bank (2005–2011) — | Santander Bank, N.A. | |||
| J.P. Morgan Chase & Co. | (December 2016–Present) | |||
| 3 | Macquarie Investment Management is the marketing name for Macquarie Management Holdings, Inc. and its subsidiaries, including the Fund’s(s’) investment advisor, principal underwriter, and its transfer agent. |
49
Table of Contents
Board of trustees / directors and officers addendum
Delaware Funds®by Macquarie
| Name, Address, | Position(s) | Length of | ||
| and Birth Date | Held with Fund(s) | Time Served | ||
Independent Trustees (continued)
| ||||
| Joseph W. Chow | Trustee | Since January 2013 | ||
| 2005 Market Street | ||||
| Philadelphia, PA 19103 | ||||
| January 1953 | ||||
| John A. Fry | Trustee | Since January 2001 | ||
| 2005 Market Street | ||||
| Philadelphia, PA 19103 | ||||
| May 1960 | ||||
| Lucinda S. Landreth | Trustee | Since March 2005 | ||
| 2005 Market Street | ||||
| Philadelphia, PA 19103 | ||||
| June 1947 | ||||
50
Table of Contents
| Number of Portfolios in | ||||
| Principal Occupation(s) | Fund Complex Overseen | Other Directorships | ||
| During the Past Five Years | by Trustee or Officer | Held by Trustee or Officer | ||
| �� | ||||
Private Investor | 59 | Director and Audit Committee | ||
(April 2011–Present) | Member — Hercules | |||
| Technology Growth | ||||
| Capital, Inc. | ||||
| (July 2004–July 2014) | ||||
President — | 59 | Director; Compensation | ||
Drexel University | Committee and | |||
(August 2010–Present) | Governance Committee | |||
| Member — Community | ||||
President — | Health Systems | |||
Franklin & Marshall College | ||||
| (July 2002–July 2010) | Director — Drexel | |||
| Morgan & Co. | ||||
| Director; Audit Committee | ||||
| Member — vTv | ||||
| Therapeutics LLC | ||||
| Director; Audit Committee | ||||
| Member — FS Credit Real | ||||
| Estate Income Trust, Inc. | ||||
Private Investor | 59 | None | ||
(2004–Present) | ||||
51
Table of Contents
Board of trustees / directors and officers addendum
Delaware Funds®by Macquarie
| Name, Address, | Position(s) | Length of | ||
| and Birth Date | Held with Fund(s) | Time Served | ||
Independent Trustees (continued)
| ||||
| Frances A. Sevilla-Sacasa | Trustee | Since September 2011 | ||
| 2005 Market Street | ||||
| Philadelphia, PA 19103 | ||||
| January 1956 | ||||
| Thomas K. Whitford | Trustee | Since January 2013 | ||
| 2005 Market Street | ||||
| Philadelphia, PA 19103 | ||||
| March 1956 | ||||
52
Table of Contents
| Number of Portfolios in | ||||
| Principal Occupation(s) | Fund Complex Overseen | Other Directorships | ||
| During the Past Five Years | by Trustee or Officer | Held by Trustee or Officer | ||
Private Investor | 59 | Trust Manager and | ||
(January 2017–Present) | Audit Committee | |||
| Chair — Camden | ||||
| Chief Executive Officer — | Property Trust | |||
| Banco Itaú | (August 2011–Present) | |||
| International | ||||
(April 2012–December 2016)
Executive Advisor to Dean (August 2011–March 2012) | Director — Carrizo Oil & Gas, Inc. (March 2018–Present) | |||
| and Interim Dean | ||||
| (January 2011–July 2011) — | ||||
| University of Miami School of | ||||
| Business Administration | ||||
| President — U.S. Trust, | ||||
| Bank of America Private | ||||
| Wealth Management | ||||
| (Private Banking) | ||||
(July 2007–December 2008) | ||||
Vice Chairman | 59 | Director — HSBC North | ||
(2010–April 2013) — | America Holdings Inc. | |||
PNC Financial Services Group | (December 2013–Present)
Director — HSBC USA Inc. | |||
| (July 2014–Present) | ||||
| Director — | ||||
| HSBC Bank USA, | ||||
| National Association | ||||
| (July 2014–March 2017) | ||||
| Director — HSBC | ||||
| Finance Corporation | ||||
| (December 2013–April 2018) | ||||
53
Table of Contents
Board of trustees / directors and officers addendum
Delaware Funds®by Macquarie
| Name, Address, | Position(s) | Length of | ||
| and Birth Date | Held with Fund(s) | Time Served | ||
Independent Trustees (continued)
| ||||
| Christianna Wood | Trustee | Since January 2019 | ||
| 2005 Market Street | ||||
| Philadelphia, PA 19103 | ||||
| August 1959 | ||||
| Janet L. Yeomans | Trustee | Since April 1999 | ||
| 2005 Market Street | ||||
| Philadelphia, PA 19103 | ||||
| July 1948 | ||||
54
Table of Contents
| Number of Portfolios in | ||||
| Principal Occupation(s) | Fund Complex Overseen | Other Directorships | ||
| During the Past Five Years | by Trustee or Officer | Held by Trustee or Officer | ||
| Chief Executive Officer | 59 | Director of H&R Block | ||
| and President — | Corporation | |||
| Gore Creek | (July 2008–Present); | |||
| Capital, Ltd. | Director of Grange | |||
| (August 2009–Present) | Insurance (2013-Present); | |||
| Trustee of Merger Fund | ||||
| (August 2009-Present), | ||||
| WCM Alternatives: | ||||
| Event-Driven Fund | ||||
| (March 2017-Present), | ||||
| and WCM Alternatives: | ||||
| Credit Event Fund | ||||
| (December 2017-Present) | ||||
| Vice President and Treasurer | 59 | Director (2009–2017); | ||
| (January 2006–July 2012), | Personnel and Compensation | |||
| Vice President — | Committee Chair; Member of | |||
| Mergers & Acquisitions | Nominating, Investments, and | |||
| (January 2003–January 2006), | Audit Committees for various | |||
| and Vice President | periods throughout | |||
| and Treasurer | directorship — | |||
| (July 1995–January 2003) — | Okabena Company | |||
3M Company
| ||||
55
Table of Contents
Board of trustees / directors and officers addendum
Delaware Funds®by Macquarie
| Name, Address, | Position(s) | Length of | ||
| and Birth Date | Held with Fund(s) | Time Served | ||
Officers
| ||||
| David F. Connor | Senior Vice President, | Senior Vice President since | ||
| 2005 Market Street | General Counsel, | May 2013; General | ||
| Philadelphia, PA 19103 | and Secretary | Counsel since May 2015; | ||
| December 1963 | Secretary since | |||
October 2005
| ||||
| Daniel V. Geatens | Vice President | Vice President and | ||
| 2005 Market Street | and Treasurer | Treasurer since October 2007 | ||
| Philadelphia, PA 19103 | ||||
| October 1972 | ||||
| Richard Salus | Senior Vice President | Senior Vice President and | ||
| 2005 Market Street | and Chief Financial Officer | Chief Financial Officer | ||
| Philadelphia, PA 19103 | since November 2006 | |||
| October 1963 | ||||
The Statement of Additional Information for the Fund(s) includes additional information about the Trustees and Officers and is available, without charge, upon request by calling 800523-1918.
56
Table of Contents
| Number of Portfolios in | ||||
| Principal Occupation(s) | Fund Complex Overseen | Other Directorships | ||
| During the Past Five Years | by Trustee or Officer | Held by Trustee or Officer | ||
| David F. Connor has served | 59 | None2 | ||
| in various capacities at | ||||
| different times at | ||||
| Macquarie Investment | ||||
Management.
| ||||
| Daniel V. Geatens has served | 59 | None2 | ||
| in various capacities at | ||||
| different times at | ||||
| Macquarie Investment | ||||
Management.
| ||||
| Richard Salus has served | 59 | None2 | ||
| in various executive capacities | ||||
| at different times at | ||||
| Macquarie Investment | ||||
| Management. | ||||
57
Table of Contents
Board of trustees | ||||||
| Shawn K. Lytle | Ann D. Borowiec | Lucinda S. Landreth | Thomas K. Whitford | |||
President and Chief Executive Officer Delaware Funds® by Macquarie Philadelphia, PA
Thomas L. Bennett Chairman of the Board Delaware Funds by Macquarie Private Investor Rosemont, PA
Jerome D. Abernathy Managing Member Stonebrook Capital Management, LLC New York, NY | Former Chief Executive Officer Private Wealth Management J.P. Morgan Chase & Co. New York, NY
Joseph W. Chow Former Executive Vice President State Street Corporation Boston, MA
John A. Fry President Drexel University Philadelphia, PA | Former Chief Investment Officer Assurant, Inc. New York, NY
Frances A. Sevilla-Sacasa Former Chief Executive Officer Banco Itaú International Miami, FL | Former Vice Chairman PNC Financial Services Group Pittsburgh, PA
Christianna Wood Chief Executive Officer and President Gore Creek Capital, Ltd. Golden, CO
Janet L. Yeomans Former Vice President and Treasurer 3M Company St. Paul, MN | |||
Affiliated officers | ||||||
| David F. Connor | Daniel V. Geatens | Richard Salus | ||||
| Senior Vice President, | Vice President and | Senior Vice President and | ||||
| General Counsel, | Treasurer | Chief Financial Officer | ||||
| and Secretary | Delaware Funds | Delaware Funds | ||||
| Delaware Funds | by Macquarie | by Macquarie | ||||
| by Macquarie | Philadelphia, PA | Philadelphia, PA | ||||
| Philadelphia, PA | ||||||
This annual report is for the information of Delaware Small Cap Core Fund shareholders, but it may be used with prospective investors when preceded or accompanied by the Delaware Fund fact sheet for the most recently completed calendar quarter. These documents are available at delawarefunds.com/literature.
The Fund files its complete schedule of portfolio holdings with the Securities and Exchange Commission (SEC) for the first and third quarters of each fiscal year on FormN-Q. The Fund’s FormsN-Q, as well as a description of the policies and procedures that the Fund uses to determine how to vote proxies (if any) relating to portfolio securities are available without charge (i) upon request, by calling 800523-1918; and (ii) on the SEC’s website at sec.gov. In addition, a description of the policies and procedures that the Fund uses to determine how to vote proxies (if any) relating to portfolio securities and the Schedule of Investments included in the Fund’s most recent FormN-Q are available without charge on the Fund’s website at delawarefunds.com/literature. The Fund’s FormsN-Q may be reviewed and copied at the SEC’s Public Reference Room in Washington, D.C.; information on the operation of the Public Reference Room may be obtained by calling 800SEC-0330.
Information (if any) regarding how the Fund voted proxies relating to portfolio securities during the most recently disclosed12-month period ended June 30 is available without charge (i) through the Fund’s website at delawarefunds.com/proxy; and (ii) on the SEC’s website at sec.gov.
58
Table of Contents
|
Annual report
|


US equity mutual fund
Delaware Small Cap Value Fund
November 30, 2018
Carefully consider the Fund’s investment objectives, risk factors, charges, and expenses before investing. This and other information can be found in the Fund’s prospectus and its summary prospectus, which may be obtained by visiting delawarefunds.com/literature or calling 800523-1918. Investors should read the prospectus and the summary prospectus carefully before investing.
You can obtain shareholder reports and prospectuses online instead of in the mail.
Visit delawarefunds.com/edelivery.
Table of Contents
Experience Delaware Funds®by Macquarie
Macquarie Investment Management (MIM) is a global asset manager with offices throughout the United States, Europe, Asia, and Australia. We are active managers who prioritize autonomy and accountability at the investment team level in pursuit of opportunities that matter for our clients. Delaware Funds is one of the longest-standing mutual fund families, with more than 75 years in existence.
If you are interested in learning more about creating an investment plan, contact your financial advisor.
You can learn more about Delaware Funds or obtain a prospectus for Delaware Small Cap Value Fund at delawarefunds.com/literature.
Manage your account online
| ● | Check your account balance and transactions |
| ● | View statements and tax forms |
| ● | Make purchases and redemptions |
Visit delawarefunds.com/account-access.
Macquarie Asset Management (MAM) offers a diverse range of products including securities investment management, infrastructure and real asset management, and fund and equity-based structured products. MIM is the marketing name for certain companies comprising the asset management division of Macquarie Group. This includes the following registered investment advisers: Macquarie Investment Management Business Trust (MIMBT), Macquarie Funds Management Hong Kong Limited, Macquarie Investment Management Austria Kapitalanlage AG, Macquarie Investment Management Global Limited, Macquarie Investment Management Europe Limited, and Macquarie Capital Investment Management LLC.
The Fund is distributed byDelaware Distributors, L.P. (DDLP), an affiliate of MIMBT and Macquarie Group Limited.
Other than Macquarie Bank Limited (MBL), none of the entities noted are authorized deposit-taking institutions for the purposes of the Banking Act 1959 (Commonwealth of Australia). The obligations of these entities do not represent deposits or other liabilities of MBL. MBL does not guarantee or otherwise provide assurance in respect of the obligations of these entities, unless noted otherwise. The Fund is governed by US laws and regulations.
| 1 | ||||
| 4 | ||||
| 8 | ||||
Security type / sector allocation and top 10 equity holdings | 10 | |||
| 12 | ||||
| 18 | ||||
| 20 | ||||
| 22 | ||||
| 24 | ||||
| 34 | ||||
| 45 | ||||
| 46 | ||||
| 50 | ||||
| 60 |
Unless otherwise noted, views expressed herein are current as of Nov. 30, 2018, and subject to change for events occurring after such date.
The Fund is not FDIC insured and is not guaranteed. It is possible to lose the principal amount invested.
Advisory services provided by Delaware Management Company, a series of MIMBT, a US registered investment advisor.
All third-party marks cited are the property of their respective owners.
© 2019 Macquarie Management Holdings, Inc.
Table of Contents
| Portfolio management review | ||
| Delaware Small Cap Value Fund | December 11, 2018 |
Performance preview (for the year ended November 30, 2018) | ||||||||
Delaware Small Cap Value Fund (Institutional Class shares) | 1-year return | -6.46 | % | |||||
Delaware Small Cap Value Fund (Class A shares) | 1-year return | -6.70 | % | |||||
Russell 2000®Value Index (benchmark) | 1-year return | -1.83 | % |
Past performance does not guarantee future results.
For complete, annualized performance for Delaware Small Cap Value Fund, please see the table on page 4.
Institutional Class shares are not subject to a sales charge and are offered for sale exclusively to certain eligible investors. In addition, Institutional Class shares pay no distribution and service fee.
The performance of Class A shares excludes the applicable sales charge. Both Institutional Class shares and Class A shares reflect the reinvestment of all distributions.
Please see page 6 for a description of the index. Index performance returns do not reflect any management fees, transaction costs, or expenses. Indices are unmanaged and one cannot invest directly in an index.
Small-cap value stocks repeatedly traced anup-and-down pattern during the Fund’s fiscal year ended Nov. 30, 2018, when they finished at their lowest point of the period (source: FTSE Russell). While the economic and fiscal backdrop remained strongly supportive, investors grew concerned that rising interest rates, uncertainty over trade policy, and the looming end of easy earnings comparisons would warrant a more cautious approach. The consumer cyclical, energy, and basic industry sectors each declined more than 10% during the fiscal year. Companies in the consumer services sector outperformed on the heels of the highest consumer confidence readings in 18 years, and utilities stocks gained from a late-period flight to safety (source: Bloomberg).
Though value stocks were among the major beneficiaries of thetax-reform legislation, the group nonetheless underperformed its growth counterpart over the fiscal period, a probable reflection, in our view, of continued investor preference for faster-growing companies, even those with little or no earnings. The prior outperformance of growth stocks was likely a logical reaction to the long stretch of slow economic growth in the aftermath of the global financial crisis. However, 2018 could be the first year in more than a decade during which the US economy has the potential to grow by at
The following
factors affected
small-cap value
stocks during the
Fund’s fiscal year:
| ● | strong year-over-year earnings growth |
| ● | falling unemployment and soaring consumer confidence |
| ● | tightening US monetary policy |
| ● | trade tensions between the US and China. |
| 1 |
Table of Contents
| Portfolio management review | ||
| Delaware Small Cap Value Fund |
least 3%, suggesting that value stocks — with their more-compelling valuations — could soon begin to attract increased interest from investors seeking to dampen their portfolios’ volatility in a less-certain economic and geopolitical environment.
Within the Fund
For the fiscal year ended Nov. 30, 2018, Delaware Small Cap Value Fund underperformed its benchmark, the Russell 2000 Value Index. The Fund’s Institutional Class shares declined 6.46%. The Fund’s Class A shares fell 6.70% at net asset value (NAV) and fell 12.07% at maximum offer price. These figures reflect reinvestment of all distributions. During the same period, the Fund’s benchmark declined 1.83%. For complete, annualized performance of Delaware Small Cap Value Fund, please see the table on page 4.
Sector allocation had a modestly negative effect, as stock selection was the main detractor from the Fund’s relative performance during the fiscal year. Stock selection in the technology and basic industry sectors was the largest relative detractor, followed by stock selection in the real estate investment trust (REIT), capital spending, and business services sectors. Stock selection in four sectors contributed during the fiscal year: financial services, consumer services, healthcare, and energy.
Stock selection in the technology sector hurt the Fund’s relative performance. Semiconductor and integrated circuits manufacturerTower Semiconductor Ltd.underperformed during the fiscal year. The company’s earnings during the period were lower than expected as management worked to reduce the company’s lower-margin business in favor of increasing its higher-margin business lines. As the stock’s price declined during the fiscal year, we increased the Fund’s position in Tower Semiconductor as we believe in management’s ability to execute on its planned
shift in business mix, which should benefit the company’s financials.
Shares ofCommScope Holding Co. Inc.experienced two sharp declines during the fiscal year. In May, CommScope sold off after the company cut its full-year profitability expectations, the result of unanticipated price pressure from several major North American telecommunications operators. In November, on the same day that CommScope reported its fiscal third-quarter 2018 earnings, the company announced an accretive acquisition of ARRIS International plc. Investors viewed the purchase negatively, which weighed on the stock’s price. We trimmed the Fund’s position in CommScope while we continue to evaluate the company’s financials prior to the closing of the ARRIS acquisition.
Olin Corp.is a commodity chemical company that primarily produces chlorine, caustic soda, epoxy, and derivative chlorine products. Shares of Olin detracted during the Fund’s fiscal year, the result of rising input costs across its businesses and a temporary demand imbalance in the chlor-alkali market that resulted in a modest reversal of caustic soda pricing gains that had been realized over the previous 18 months. The decline in Olin’s share price during the Fund’s fiscal year coincided with the company’s reporting its highest adjusted EBITDA (earnings before interest, taxes, depreciation, and amortization) since the acquisition of the DowDuPont Chlorine Products businesses. We maintained the Fund’s position in Olin as the company trades at an attractive valuation, in our view, and is returning cash to shareholders through debt pay down, dividends, and opportunistic stock repurchases.
The Fund benefited from a surge in merger and acquisition activity, which reached a total of nine companies during the fiscal year.Validus Holdings Ltd., a Bermuda-based reinsurer and provider of specialty insurance products, was the first takeout of the year. The Fund’s position in Validus contributed as American International
| 2 |
Table of Contents
Group Inc. (AIG) acquired the company in a cash deal worth $5.56 billion that closed in July 2018. We exited the Fund’s position in Validus shortly after the deal was announced.
Stock selection in the consumer services sector contributed to the Fund’s performance and was led bydrive-in restaurant operatorSonic Corp.In September, Sonic announced plans to be acquired at a premium, in cash, by privately owned Inspire Brands Inc. We reduced the Fund’s position in Sonic but continued to hold a small position in the company as we received cash for the Fund’s shares when the deal closed on Dec. 7, 2018.
In the healthcare sector, shares of healthcare product company,STERIS PLC,outperformed. Early in the fiscal year, shares of STERIS were trading at a relative discount to its peers in the healthcare equipment and supplies industry. While the industry performed well during the fiscal year, STERIS experienced strong fundamental trends, prompting an increase to earnings guidance with resulting outperformance. During the fiscal year, we trimmed the Fund’s position in STERIS as the stock’s valuation gap narrowed relative to its peers.
At fiscal year end, we have positioned the Fund to benefit from less vigorous but still solid economic growth. For example, we remained underweight the defensive sectors, including REITs and utilities. The Fund ended the fiscal year overweight relative to some of the more cyclical sectors, as we
believe valuations and free-cash-flow generation are more attractive in these sectors. We also believe these sectors are well positioned to continue to benefit from the reduced US corporate tax rate. The largest overweight sector positions in the Fund were in capital spending, financial services, and basic industry.
Earnings growth for 2019 is likely to come in well below the 2018 levels, which were enhanced by corporate tax reform and fiscal stimulus. Regarding fears of tighter monetary policy, however, we think it is important to keep in mind that benchmark interest rates — while rising and likely to continue doing so — are still at historically low levels.
Despite a nearly decade-long bull market, we are finding no shortage of companies that trade at what we view as attractive valuations, generate strong free-cash flow, and implement shareholder-friendly policies through share buybacks, dividend increases, and debt reduction. In fact, in recent months there have been record levels of dividend increases and share buybacks as companies remain cautious about expanding capital budgets this late in an economic expansion (source: Bloomberg). We believe that such caution plays well into our value-oriented, shareholder-friendly investment process, one that has worked well over time. As always, we appreciate your confidence and look forward to serving your investment needs in the new year.
| 3 |
Table of Contents
| Performance summary | ||
| Delaware Small Cap Value Fund | November 30, 2018 |
The performance quoted represents past performance and does not guarantee future results. Investment return and principal value of an investment will fluctuate so that shares, when redeemed, may be worth more or less than their original cost. Current performance may be lower or higher than the performance quoted. Performance data current to the most recent month end may be obtained by calling 800523-1918 or visiting delawarefunds.com/performance.
| Fund and benchmark performance1,2 | Average annual total returns through November 30, 2018 | |||||||
| 1 year | 5 years | 10 years | Lifetime | |||||
Class A (Est. June 24, 1987) | ||||||||
Excluding sales charge | -6.70% | +6.74% | +13.72% | +11.00% | ||||
Including sales charge | -12.07% | +5.49% | +13.04% | +10.79% | ||||
Class C (Est. Nov. 29, 1995) | ||||||||
Excluding sales charge | -7.41% | +5.94% | +12.86% | +9.10% | ||||
Including sales charge | -8.32% | +5.94% | +12.86% | +9.10% | ||||
Class R (Est. June 2, 2003) | ||||||||
Excluding sales charge | -6.92% | +6.48% | +13.43% | +9.41% | ||||
Including sales charge | -6.92% | +6.48% | +13.43% | +9.41% | ||||
Institutional Class (Est. Nov. 9, 1992) | ||||||||
Excluding sales charge | -6.46% | +7.02% | +14.00% | +10.49% | ||||
Including sales charge | -6.46% | +7.02% | +14.00% | +10.49% | ||||
Class R6 (Est. May 2, 2016) | ||||||||
Excluding sales charge | -6.29% | n/a | n/a | +10.78% | ||||
Including sales charge | -6.29% | n/a | n/a | +10.78% | ||||
Russell 2000 Value Index | -1.83% | +6.71% | +12.50% | +10.44%* | ||||
*The benchmark lifetime return is for Institutional Class share comparison only and is calculated using the last business day in the month of the Fund’s Institutional Class inception date.
1 Returns reflect the reinvestment of all distributions and are presented both with and without the applicable sales charges described below. Returns do not reflect the deduction of taxes the shareholder would pay on Fund distributions or redemptions of Fund shares.
Expense limitations were in effect for certain classes during some or all of the periods shown in the “Fund and benchmark performance” table. Expenses for each class are listed on the “Fund expense ratios” table on page 5. Performance would have been lower had expense limitations not been in effect.
Institutional Class shares are not subject to a sales charge and are offered for sale exclusively to certain eligible investors. In addition, Institutional Class shares pay no distribution and service fee.
Class A shares are sold with a maximumfront-end sales charge of 5.75%, and have an annual distribution and service fee of 0.25% of average daily net assets. Performance for Class A shares, excluding sales charges, assumes that nofront-end sales charge applied.
Class C shares are sold with a contingent deferred sales charge of 1.00% if redeemed during the first 12 months. They are also subject to an annual distribution and service fee of 1.00% of average
| 4 |
Table of Contents
daily net assets. Performance for Class C shares, excluding sales charges, assumes either that contingent deferred sales charges did not apply or that the investment was not redeemed.
Class R shares are available only for certain retirement plan products. They are sold without a sales charge and have an annual distribution and service fee of 0.50% of average daily net assets.
Class R6 shares are available only to certain investors. In addition, Class R6 shares do not pay any service fees,sub-accounting fees, and/orsub-transfer agency fees to any brokers, dealers, or other financial intermediaries. Class R6 shares pay no distribution and service fee.
Investments in small and/ormedium-sized companies typically exhibit greater risk and higher volatility than larger, more established companies.
Narrowly focused investments may exhibit higher volatility than investments in multiple industry sectors.
REIT investments are subject to many of the risks associated with direct real estate ownership, including changes in economic conditions, credit risk, and interest rate fluctuations.
2 The Fund’s expense ratios, as described in the most recent prospectus, are disclosed in the following “Fund expense ratios” table. Please see the “Financial highlights” section in this report for the most recent expense ratios.
| Fund expense ratios | Class A | Class C | Class R | Institutional Class | Class R6 | |||||
Total annual operating expenses | 1.18% | 1.93% | 1.43% | 0.93% | 0.75% | |||||
(without fee waivers) | ||||||||||
Net expenses | 1.18% | 1.93% | 1.43% | 0.93% | 0.75% | |||||
(including fee waivers, if any) | ||||||||||
Type of waiver | n/a | n/a | n/a | n/a | n/a |
| 5 |
Table of Contents
| Performance summary | ||
| Delaware Small Cap Value Fund |
Performance of a $10,000 investment1
Average annual total returns from Nov. 30, 2008 through Nov. 30, 2018
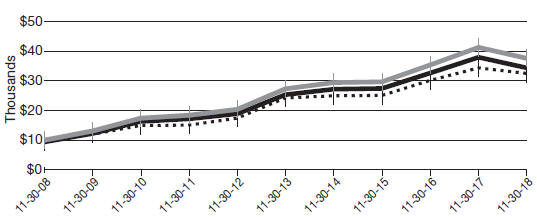
| For the period beginning Nov. 30, 2008, through Nov. 30, 2018 | Starting value | Ending value | ||||||||
| Delaware Small Cap Value Fund — Institutional Class shares | $10,000 | $37,068 | |||||||
| Delaware Small Cap Value Fund — Class A shares | $9,425 | $34,074 | |||||||
| Russell 2000 Value Index | $10,000 | $32,468 | |||||||


1 The “Performance of a $10,000 investment” graph assumes $10,000 invested in Institutional Class and Class A shares of the Fund on Nov. 30, 2008, and includes the effect of a 5.75%front-end sales charge (for Class A shares) and the reinvestment of all distributions. The graph does not reflect the deduction of taxes the shareholders would pay on Fund distributions or redemptions of Fund shares. Expense limitations were in effect for some or all of the periods shown. Performance would have been lower had expense limitations not been in effect. Expenses are listed in the “Fund expense ratios” table on page 5. Please note additional details on pages 4 through 7.
The graph also assumes $10,000 invested in the Russell 2000 Value Index as of Nov. 30, 2008. The Russell 2000 Value Index measures the performance of the small-cap value segment of the US equity universe. It includes those Russell 2000 companies with lower price-to-book ratios and lower forecasted growth values.
Frank Russell Company (“Russell”) is the source and owner of the trademarks, service marks, and copyrights related to the Russell Indexes. Russell® is a trademark of the Frank Russell Company.
Index performance returns do not reflect any management fees, transaction costs, or expenses. Indices are unmanaged and one cannot invest directly in an index. Past performance is not a guarantee of future results.
Performance of other Fund classes will vary due to different charges and expenses.
| 6 |
Table of Contents
Nasdaq symbols | CUSIPs | |||||
Class A | DEVLX | 246097109 | ||||
Class C | DEVCX | 246097406 | ||||
Class R | DVLRX | 246097505 | ||||
Institutional Class | DEVIX | 246097208 | ||||
Class R6
| DVZRX | 24610B818 |
| 7 |
Table of Contents
| Disclosure of Fund expenses | ||
| For thesix-month period from June 1, 2018 to November 30, 2018 (Unaudited) |
As a shareholder of the Fund, you incur two types of costs: (1) transaction costs, including sales charges (loads) on purchase payments, reinvested dividends, or other distributions; redemption fees; and exchange fees; and (2) ongoing costs, including management fees; distribution and service(12b-1) fees; and other Fund expenses. This example is intended to help you understand your ongoing costs (in dollars) of investing in the Fund and to compare these costs with the ongoing costs of investing in other mutual funds.
The example is based on an investment of $1,000 invested at the beginning of the period and held for the entiresix-month period from June 1, 2018 to Nov. 30, 2018.
Actual expenses
The first section of the table shown, “Actual Fund return,” provides information about actual account values and actual expenses. You may use the information in this section of the table, together with the amount you invested, to estimate the expenses that you paid over the period. Simply divide your account value by $1,000 (for example, an $8,600 account value divided by $1,000 = 8.6), then multiply the result by the number in the first section under the heading entitled “Expenses Paid During Period” to estimate the expenses you paid on your account during this period.
Hypothetical example for comparison purposes
The second section of the table shown, “Hypothetical 5% return,” provides information about hypothetical account values and hypothetical expenses based on the Fund’s actual expense ratio and an assumed rate of return of 5% per year before expenses, which is not the Fund’s actual return. The hypothetical account values and expenses may not be used to estimate the actual ending account balance or expenses you paid for the period. You may use this information to compare the ongoing costs of investing in the Fund and other funds. To do so, compare this 5% hypothetical example with the 5% hypothetical examples that appear in the shareholder reports of the other funds.
Please note that the expenses shown in the table are meant to highlight your ongoing costs only and do not reflect any transactional costs, such as sales charges (loads), redemption fees, or exchange fees. Therefore, the second section of the table is useful in comparing ongoing costs only, and will not help you determine the relative total costs of owning different funds. In addition, if these transactional costs were included, your costs would have been higher. The Fund’s expenses shown in the table assume reinvestment of all dividends and distributions.
| 8 |
Table of Contents
Delaware Small Cap Value Fund
Expense analysis of an investment of $1,000
Beginning Account Value 6/1/18 | Ending Account Value 11/30/18 | Annualized Expense Ratio | Expenses Paid During Period 6/1/18 to 11/30/18* | |||||||||||||||||
Actual Fund return† | ||||||||||||||||||||
Class A | $1,000.00 | $920.20 | 1.14% | $5.49 | ||||||||||||||||
Class C | 1,000.00 | 916.70 | 1.89% | 9.08 | ||||||||||||||||
Class R | 1,000.00 | 919.10 | 1.39% | 6.69 | ||||||||||||||||
Institutional Class | 1,000.00 | 921.40 | 0.89% | 4.29 | ||||||||||||||||
Class R6 | 1,000.00 | 922.10 | 0.71% | 3.42 | ||||||||||||||||
Hypothetical 5% return(5% return before expenses) |
| |||||||||||||||||||
Class A | $1,000.00 | $1,019.35 | 1.14% | $5.77 | ||||||||||||||||
Class C | 1,000.00 | 1,015.59 | 1.89% | 9.55 | ||||||||||||||||
Class R | 1,000.00 | 1,018.10 | 1.39% | 7.03 | ||||||||||||||||
Institutional Class | 1,000.00 | 1,020.61 | 0.89% | 4.51 | ||||||||||||||||
Class R6 | 1,000.00 | 1,021.51 | 0.71% | 3.60 | ||||||||||||||||
*“Expenses Paid During Period” are equal to the Fund’s annualized expense ratio, multiplied by the average account value over the period, multiplied by 183/365 (to reflect theone-half year period).
†Because actual returns reflect only the most recentsix-month period, the returns shown may differ significantly from fiscal year returns.
In addition to the Fund’s expenses reflected above, the Fund also indirectly bears its portion of the fees and expenses of the investment companies in which it invests (Underlying Funds), including business development corporations and exchange-traded funds. The table above does not reflect the expenses of the Underlying Fund.
| 9 |
Table of Contents
Security type / sector allocation and top 10 equity holdings | ||
| Delaware Small Cap Value Fund | As of November 30, 2018 (Unaudited) |
Sector designations may be different than the sector designations presented in other Fund materials. The sector designations may represent the investment manager’s internal sector classifications.
| Security type / sector | Percentage of net assets | ||||
Common Stock² | 99.09% | ||||
Basic Industry | 7.06% | ||||
Business Services | 0.97% | ||||
Capital Spending | 8.41% | ||||
Consumer Cyclical | 3.70% | ||||
Consumer Services | 10.06% | ||||
Consumer Staples | 2.22% | ||||
Energy | 7.10% | ||||
Financial Services | 30.46% | ||||
Healthcare | 3.75% | ||||
Real Estate Investment Trusts | 8.16% | ||||
Technology | 12.26% | ||||
Transportation | 1.95% | ||||
Utilities | 2.99% | ||||
Short-Term Investments | 0.94% | ||||
Total Value of Securities | 100.03% | ||||
Liabilities Net of Receivables and Other Assets | (0.03% | ) | |||
Total Net Assets | 100.00% | ||||
| ² | Narrow industries are utilized for compliance purposes for diversification whereas broad sectors are used for financial reporting. |
To monitor compliance with the Fund’s concentration guidelines as described in the Fund’s prospectus and statement of additional information, the Financial Services sector (as disclosed herein for financial reporting purposes) is subdivided into a variety of “industries” (in accordance with the requirements of the Investment Company Act of 1940). The Financial Services sector consisted of banks, diversified financial services, insurance, and investment companies. As of Nov. 30, 2018, such amounts, as a percentage of total net assets were 22.68%, 1.97%, 5.18%, and 0.63%, respectively. The percentage in any such single industry will comply with the Fund’s concentration policy even if the percentage in the Financial Services sector for financial reporting purposes may exceed 25%.
| 10 |
Table of Contents
Holdings are for informational purposes only and are subject to change at any time. They are not a recommendation to buy, sell, or hold any security.
| Top 10 equity holdings | Percentage of net assets | |
East West Bancorp | 2.70% | |
ITT | 2.28% | |
MasTec | 2.27% | |
Selective Insurance Group | 2.22% | |
Webster Financial | 2.10% | |
Berry Global Group | 1.96% | |
Synopsys | 1.92% | |
Hancock Whitney | 1.73% | |
Hanover Insurance Group | 1.50% | |
American Equity Investment Life Holding
| 1.46%
|
| 11 |
Table of Contents
| Schedule of investments | ||
| Delaware Small Cap Value Fund | November 30, 2018 |
| Number of shares | Value (US $) | |||||||
Common Stock – 99.09%² | ||||||||
Basic Industry – 7.06% | ||||||||
Berry Global Group † | 1,559,110 | $ | 78,454,415 | |||||
HB Fuller | 1,134,900 | 54,747,576 | ||||||
Louisiana-Pacific | 1,018,600 | 23,285,196 | ||||||
Minerals Technologies | 242,412 | 13,642,947 | ||||||
Olin | 2,703,500 | 58,206,355 | ||||||
Trinseo | 1,066,400 | 53,885,192 | ||||||
|
| |||||||
| 282,221,681 | ||||||||
|
| |||||||
Business Services – 0.97% | ||||||||
Deluxe | 406,000 | 20,442,100 | ||||||
WESCO International † | 340,200 | 18,170,082 | ||||||
|
| |||||||
| 38,612,182 | ||||||||
|
| |||||||
Capital Spending – 8.41% | ||||||||
Altra Industrial Motion | 811,143 | 25,591,562 | ||||||
Atkore International Group † | 1,277,400 | 26,084,508 | ||||||
EnPro Industries | 402,300 | 28,313,874 | ||||||
H&E Equipment Services | 992,800 | 21,990,520 | ||||||
ITT | 1,640,600 | 90,971,270 | ||||||
MasTec † | 2,015,559 | 90,881,555 | ||||||
Primoris Services | 1,270,600 | 30,684,990 | ||||||
Rexnord† | 756,300 | 21,410,853 | ||||||
|
| |||||||
| 335,929,132 | ||||||||
|
| |||||||
Consumer Cyclical – 3.70% | ||||||||
Barnes Group | 682,700 | 40,996,135 | ||||||
Knoll | 1,292,969 | 25,044,810 | ||||||
Meritage Homes † | 1,260,100 | 48,198,825 | ||||||
Standard Motor Products | 283,940 | 14,955,120 | ||||||
Tenneco Class A | 553,700 | 18,687,375 | ||||||
|
| |||||||
| 147,882,265 | ||||||||
|
| |||||||
Consumer Services – 10.06% | ||||||||
Asbury Automotive Group † | 284,700 | 19,678,464 | ||||||
Cable One | 45,200 | 40,647,908 | ||||||
Caleres | 936,100 | 28,298,303 | ||||||
Cheesecake Factory | 594,100 | 28,035,579 | ||||||
Choice Hotels International | 600,800 | 46,784,296 | ||||||
Cinemark Holdings | 982,431 | 37,695,877 | ||||||
Cracker Barrel Old Country Store | 100,200 | 18,117,162 | ||||||
International Speedway Class A | 725,500 | 30,717,670 | ||||||
Meredith | 443,118 | 25,372,937 | ||||||
Sonic | 394,400 | 17,136,680 | ||||||
Steven Madden | 865,725 | 27,902,317 | ||||||
Texas Roadhouse | 332,600 | 21,961,578 | ||||||
UniFirst | 200,000 | 30,882,000 | ||||||
| 12 |
Table of Contents
| Number of shares | Value (US $) | |||||||
Common Stock²(continued) | ||||||||
Consumer Services(continued) | ||||||||
Wolverine World Wide | 832,500 | $ | 28,804,500 | |||||
|
| |||||||
| 402,035,271 | ||||||||
|
| |||||||
Consumer Staples – 2.22% | ||||||||
Core-Mark Holding | 680,400 | 17,880,912 | ||||||
J&J Snack Foods | 226,500 | 35,531,055 | ||||||
Scotts Miracle-Gro Class A | 331,900 | 25,217,762 | ||||||
Spectrum Brands Holdings | 203,600 | 10,053,768 | ||||||
|
| |||||||
| 88,683,497 | ||||||||
|
| |||||||
Energy – 7.10% | ||||||||
Delek US Holdings | 969,300 | 38,568,447 | ||||||
Dril-Quip † | 463,100 | 18,181,306 | ||||||
Helix Energy Solutions Group † | 2,957,500 | 24,251,500 | ||||||
KLX Energy Services Holdings † | 190,360 | 3,843,368 | ||||||
Oasis Petroleum † | 3,232,400 | 23,079,336 | ||||||
Patterson-UTI Energy | 2,800,300 | 38,868,164 | ||||||
Rowan Class A † | 2,291,400 | 31,758,804 | ||||||
SM Energy | 2,020,900 | 41,226,360 | ||||||
Southwest Gas Holdings | 631,000 | 49,703,870 | ||||||
Whiting Petroleum † | 474,975 | 14,377,493 | ||||||
|
| |||||||
| 283,858,648 | ||||||||
|
| |||||||
Financial Services – 30.46% | ||||||||
American Equity Investment Life Holding | 1,709,600 | 58,348,648 | ||||||
Bank of Hawaii | 288,300 | 22,991,925 | ||||||
Bank of NT Butterfield & Son | 502,000 | 19,919,360 | ||||||
Boston Private Financial Holdings | 2,003,400 | 25,423,146 | ||||||
Community Bank System | 714,600 | 46,920,636 | ||||||
East West Bancorp | 2,007,223 | 107,767,803 | ||||||
First Financial Bancorp | 1,834,700 | 51,224,824 | ||||||
First Hawaiian | 1,502,400 | 39,092,448 | ||||||
First Interstate BancSystem Class A | 980,700 | 42,591,801 | ||||||
First Midwest Bancorp | 1,827,100 | 43,101,289 | ||||||
FNB | 3,895,700 | 47,761,282 | ||||||
Great Western Bancorp | 1,478,450 | 55,175,754 | ||||||
Hancock Whitney | 1,714,700 | 68,965,234 | ||||||
Hanover Insurance Group | 523,500 | 60,050,685 | ||||||
Legg Mason | 839,500 | 24,320,315 | ||||||
Main Street Capital (BDC) | 656,100 | 25,095,825 | ||||||
NBT Bancorp | 988,300 | 38,514,051 | ||||||
Prosperity Bancshares | 674,000 | 46,768,860 | ||||||
S&T Bancorp | 726,756 | 30,719,976 | ||||||
Selective Insurance Group | 1,336,400 | 88,696,868 | ||||||
Stifel Financial | 1,131,500 | 54,617,505 | ||||||
| 13 |
Table of Contents
| Schedule of investments | ||
| Delaware Small Cap Value Fund |
| Number of shares | Value (US $) | |||||||
Common Stock²(continued) | ||||||||
Financial Services(continued) | ||||||||
Umpqua Holdings | 2,612,000 | $ | 50,254,880 | |||||
Valley National Bancorp | 4,015,500 | 43,447,710 | ||||||
Webster Financial | 1,398,100 | 84,123,677 | ||||||
WesBanco | 955,700 | 41,553,836 | ||||||
|
| |||||||
| 1,217,448,338 | ||||||||
|
| |||||||
Healthcare – 3.75% | ||||||||
Avanos Medical † | 602,600 | 28,750,046 | ||||||
Catalent † | 808,700 | 32,064,955 | ||||||
Service Corp. International | 778,300 | 35,957,460 | ||||||
STERIS | 447,080 | 53,238,286 | ||||||
|
| |||||||
| 150,010,747 | ||||||||
|
| |||||||
Real Estate Investment Trusts – 8.16% | ||||||||
Brandywine Realty Trust | 2,972,837 | 42,422,384 | ||||||
Healthcare Realty Trust | 1,178,300 | 36,527,300 | ||||||
Highwoods Properties | 956,100 | 41,466,057 | ||||||
Lexington Realty Trust | 3,514,600 | 30,858,188 | ||||||
Life Storage | 370,500 | 36,175,620 | ||||||
Outfront Media | 2,390,800 | 49,680,824 | ||||||
RPT Realty | 1,972,689 | 28,189,726 | ||||||
Summit Hotel Properties | 2,291,000 | 25,544,650 | ||||||
Washington Real Estate Investment Trust | 1,308,900 | 35,287,944 | ||||||
|
| |||||||
| 326,152,693 | ||||||||
|
| |||||||
Technology – 12.26% | ||||||||
Cirrus Logic † | 510,400 | 19,109,376 | ||||||
Coherent † | 137,200 | 18,955,552 | ||||||
CommScope Holding † | 1,266,448 | 22,922,709 | ||||||
Flex † | 1,724,000 | 15,085,000 | ||||||
MaxLinear Class A † | 1,029,200 | 20,995,680 | ||||||
NCR † | 1,103,559 | 30,579,620 | ||||||
NetScout Systems † | 859,906 | 23,028,283 | ||||||
ON Semiconductor † | 2,159,300 | 41,415,374 | ||||||
PTC † | 91,400 | 7,905,186 | ||||||
Synopsys † | 834,500 | 76,723,930 | ||||||
Tech Data † | 588,219 | 52,910,299 | ||||||
Teradyne | 1,332,600 | 47,560,494 | ||||||
Tower Semiconductor † | 1,532,600 | 24,153,776 | ||||||
TTM Technologies † | 1,776,502 | 21,122,609 | ||||||
Viavi Solutions † | 1,897,200 | 19,237,608 | ||||||
Vishay Intertechnology | 2,322,900 | 48,432,465 | ||||||
|
| |||||||
| 490,137,961 | ||||||||
|
| |||||||
| 14 |
Table of Contents
| Number of shares | Value (US $) | |||||||
Common Stock²(continued) | ||||||||
Transportation – 1.95% | ||||||||
Kirby† | 256,000 | $ | 19,543,040 | |||||
Saia† | 330,650 | 19,941,501 | ||||||
Werner Enterprises | 1,140,100 | 38,603,786 | ||||||
|
| |||||||
| 78,088,327 | ||||||||
|
| |||||||
Utilities – 2.99% | ||||||||
ALLETE | 436,200 | 35,497,956 | ||||||
Black Hills | 717,300 | 47,492,433 | ||||||
El Paso Electric | 662,800 | 36,685,980 | ||||||
|
| |||||||
| 119,676,369 | ||||||||
|
| |||||||
Total Common Stock(cost $3,087,409,449) | 3,960,737,111 | |||||||
|
| |||||||
| Principal amount° | ||||||||
Short-Term Investments – 0.94% | ||||||||
Discount Note – 0.31%≠ | ||||||||
Federal Home Loan Bank 1.333% 12/3/18 | 12,400,662 | 12,400,662 | ||||||
|
| |||||||
| 12,400,662 | ||||||||
|
| |||||||
Repurchase Agreements – 0.63% | ||||||||
Bank of America Merrill Lynch | 3,024,552 | 3,024,552 | ||||||
Bank of Montreal | 8,317,517 | 8,317,517 | ||||||
BNP Paribas | 13,677,356 | 13,677,356 | ||||||
|
| |||||||
| 25,019,425 | ||||||||
|
| |||||||
Total Short-Term Investments(cost $37,418,709) | 37,420,087 | |||||||
|
| |||||||
Total Value of Securities – 100.03% | $ | 3,998,157,198 | ||||||
|
| |||||||
| ² | Narrow industries are utilized for compliance purposes for diversification whereas broad sectors are used for financial reporting. |
| ≠ | The rate shown is the effective yield at the time of purchase. |
| ° | Principal amount shown is stated in USD unless noted that the security is denominated in another currency. |
| 15 |
Table of Contents
| Schedule of investments | ||
| Delaware Small Cap Value Fund |
| † | Non-income producing security. |
Summary of abbreviations:
BDC – Business Development Corporation
USD – US Dollar
See accompanying notes, which are an integral part of the financial statements.
| 16 |
Table of Contents
This page intentionally left blank.
Table of Contents
| Statement of assets and liabilities | ||
| Delaware Small Cap Value Fund | November 30, 2018 |
Assets: | ||||
Investments, at value1 | $ | 3,998,157,198 | ||
Cash | 734,467 | |||
Dividends and interest receivable | 6,334,012 | |||
Receivable for fund shares sold | 4,563,085 | |||
|
| |||
Total assets | 4,009,788,762 | |||
|
| |||
Liabilities: | ||||
Payable for fund shares redeemed | 8,169,970 | |||
Payable for securities purchased | 578,785 | |||
Investment management fees payable to affiliates | 2,123,126 | |||
Dividend disbursing and transfer agent fees and expenses payable tonon-affiliates | 1,414,972 | |||
Other accrued expenses | 286,632 | |||
Distribution fees payable to affiliates | 238,163 | |||
Dividend disbursing and transfer agent fees and expenses payable to affiliates | 32,578 | |||
Trustees’ fees and expenses payable to affiliates | 31,186 | |||
Accounting and administration expenses payable to affiliates | 12,746 | |||
Legal fees payable to affiliates | 6,368 | |||
Reports and statements to shareholders expenses payable to affiliates | 3,443 | |||
|
| |||
Total liabilities | 12,897,969 | |||
|
| |||
Total Net Assets | $ | 3,996,890,793 | ||
|
| |||
Net Assets Consist of: | ||||
Paid-in capital | $ | 2,871,032,076 | ||
Total distributable earnings (loss) | 1,125,858,717 | |||
|
| |||
Total Net Assets | $ | 3,996,890,793 | ||
|
| |||
| 18 |
Table of Contents
Net Asset Value | ||||
Class A: | ||||
Net assets | $ | 733,863,546 | ||
Shares of beneficial interest outstanding, unlimited authorization, no par | 11,872,698 | |||
Net asset value per share | $ | 61.81 | ||
Sales charge | 5.75 | % | ||
Offering price per share, equal to net asset value per share / (1 – sales charge) | $ | 65.58 | ||
Class C: | ||||
Net assets | $ | 74,828,207 | ||
Shares of beneficial interest outstanding, unlimited authorization, no par | 1,468,278 | |||
Net asset value per share | $ | 50.96 | ||
Class R: | ||||
Net assets | $ | 62,791,202 | ||
Shares of beneficial interest outstanding, unlimited authorization, no par | 1,048,939 | |||
Net asset value per share | $ | 59.86 | ||
Institutional Class: | ||||
Net assets | $ | 2,731,344,034 | ||
Shares of beneficial interest outstanding, unlimited authorization, no par | 41,835,527 | |||
Net asset value per share | $ | 65.29 | ||
Class R6: | ||||
Net assets | $ | 394,063,804 | ||
Shares of beneficial interest outstanding, unlimited authorization, no par | 6,024,702 | |||
Net asset value per share | $ | 65.41 | ||
| ||||
1Investments, at cost | $ | 3,124,828,158 | ||
See accompanying notes, which are an integral part of the financial statements.
| 19 |
Table of Contents
| Statement of operations | ||
| Delaware Small Cap Value Fund | Year ended November 30, 2018 |
Investment Income: | ||||
Dividends | $ | 75,061,756 | ||
Interest | 1,264,120 | |||
|
| |||
| 76,325,876 | ||||
|
| |||
Expenses: | ||||
Management fees | 28,742,392 | |||
Dividend disbursing and transfer agent fees and expenses | 8,670,696 | |||
Distribution expenses – Class A | 2,071,475 | |||
Distribution expenses – Class C | 943,499 | |||
Distribution expenses – Class R | 375,910 | |||
Accounting and administration expenses | 822,748 | |||
Reports and statements to shareholders expenses | 493,805 | |||
Legal fees | 223,532 | |||
Trustees’ fees and expenses | 210,841 | |||
Registration fees | 150,568 | |||
Custodian fees | 124,785 | |||
Audit and tax fees | 35,341 | |||
Other | 108,432 | |||
|
| |||
| 42,974,024 | ||||
Less expenses paid indirectly | (6,128 | ) | ||
|
| |||
Total operating expenses | 42,967,896 | |||
|
| |||
Net Investment Income | 33,357,980 | |||
|
| |||
Net Realized and Unrealized Gain (Loss): | ||||
Net realized gain on investments | 244,545,395 | |||
Net change in unrealized appreciation (depreciation) of investments | (552,002,875 | ) | ||
|
| |||
Net Realized and Unrealized Loss | (307,457,480 | ) | ||
|
| |||
Net Decrease in Net Assets Resulting from Operations | $ | (274,099,500 | ) | |
|
| |||
See accompanying notes, which are an integral part of the financial statements.
| 20 |
Table of Contents
This page intentionally left blank.
Table of Contents
| Statements of changes in net assets | ||
| Delaware Small Cap Value Fund |
| Year ended | ||||||||
| 11/30/18 | 11/30/17 | |||||||
Increase (Decrease) in Net Assets from Operations: | ||||||||
Net investment income | $ | 33,357,980 | $ | 27,375,580 | ||||
Net realized gain | 244,545,395 | 108,206,465 | ||||||
Net change in unrealized appreciation (depreciation) | (552,002,875 | ) | 470,343,133 | |||||
|
|
|
| |||||
Net increase (decrease) in net assets resulting from operations | (274,099,500 | ) | 605,925,178 | |||||
|
|
|
| |||||
Dividends and Distributions to Shareholders from: | ||||||||
Distributable earnings*: | ||||||||
Class A | (11,503,582 | ) | (4,638,922 | ) | ||||
Class C | (1,165,335 | ) | (42,490 | ) | ||||
Class R | (951,441 | ) | (281,262 | ) | ||||
Institutional Class | (47,820,037 | ) | (15,499,648 | ) | ||||
Class R6 | (3,498,224 | ) | (351,782 | ) | ||||
|
|
|
| |||||
| (64,938,619 | ) | (20,814,104 | ) | |||||
|
|
|
| |||||
Capital Share Transactions: | ||||||||
Proceeds from shares sold: | ||||||||
Class A | 164,517,883 | 440,751,690 | ||||||
Class C | 14,056,663 | 21,696,263 | ||||||
Class R | 16,145,594 | 26,217,173 | ||||||
Institutional Class | 735,000,602 | 1,490,574,808 | ||||||
Class R6 | 285,889,067 | 213,808,719 | ||||||
Net asset value of shares issued upon reinvestment of dividends and distributions: | ||||||||
Class A | 11,370,015 | 4,549,812 | ||||||
Class C | 1,146,823 | 40,532 | ||||||
Class R | 951,281 | 281,226 | ||||||
Institutional Class | 47,031,805 | 15,214,524 | ||||||
Class R6 | 3,491,535 | 351,782 | ||||||
|
|
|
| |||||
| 1,279,601,268 | 2,213,486,529 | |||||||
|
|
|
| |||||
| 22 |
Table of Contents
| Year ended | ||||||||
| 11/30/18 | 11/30/17 | |||||||
Capital Share Transactions (continued): | ||||||||
Cost of shares redeemed: | ||||||||
Class A | $ | (257,975,480 | ) | $ | (556,756,789 | ) | ||
Class C | (39,418,359 | ) | (37,832,082 | ) | ||||
Class R | (32,694,944 | ) | (37,845,894 | ) | ||||
Institutional Class | (1,092,309,296 | ) | (817,565,441 | ) | ||||
Class R6 | (71,544,371 | ) | (29,505,064 | ) | ||||
|
|
|
| |||||
| (1,493,942,450 | ) | (1,479,505,270 | ) | |||||
|
|
|
| |||||
Increase (Decrease) in net assets derived from capital share transactions | (214,341,182 | ) | 733,981,259 | |||||
|
|
|
| |||||
Net Increase (Decrease) in Net Assets | (553,379,301 | ) | 1,319,092,333 | |||||
Net Assets: | ||||||||
Beginning of year | 4,550,270,094 | 3,231,177,761 | ||||||
|
|
|
| |||||
End of year1 | $ | 3,996,890,793 | $ | 4,550,270,094 | ||||
|
|
|
| |||||
| 1 | Net Assets – End of year includes undistributed net investment income of $20,864,407 in 2017. The Securities and Exchange Commission eliminated the requirement to disclose undistributed (distributions in excess of) net investment income in 2018. |
| * | For the year ended Nov. 30, 2018, the Fund has adopted amendments to RegulationS-X (see Note 12 in “Notes to financial statements”). For the year ended Nov. 30, 2017, the dividends and distributions to shareholders were as follows: |
| Institutional | ||||||||||||||||||||
| Class A | Class C | Class R | Class | Class R6 | ||||||||||||||||
Dividends from net investment income | $ | (4,638,922 | ) | $ | (42,490 | ) | $ | (281,262 | ) | $ | (15,499,648 | ) | $ | (351,782 | ) | |||||
See accompanying notes, which are an integral part of the financial statements.
| 23 |
Table of Contents
Delaware Small Cap Value Fund Class A
Selected data for each share of the Fund outstanding throughout each period were as follows:
|
Net asset value, beginning of period |
Income (loss) from investment operations: |
Net investment income1 |
Net realized and unrealized gain (loss) |
Total from investment operations |
Less dividends and distributions from: |
Net investment income |
Net realized gain |
Total dividends and distributions |
Net asset value, end of period |
Total return2 |
Ratios and supplemental data: |
Net assets, end of period (000 omitted) |
Ratio of expenses to average net assets3 |
Ratio of net investment income to average net assets |
Portfolio turnover |
|
|
| 1 | The average shares outstanding method has been applied for per share information. |
| 2 | Total investment return is based on the change in net asset value of a share during the period and assumes reinvestment of dividends and distributions at net asset value and does not reflect the impact of a sales charge. |
| 3 | Expense ratios do not include expenses of the Underlying Fund in which the Fund invests. |
See accompanying notes, which are an integral part of the financial statements.
24
Table of Contents
| Year ended | ||||||||||||||||||||||||||||
|
| |||||||||||||||||||||||||||
| 11/30/18 | 11/30/17 | 11/30/16 | 11/30/15 | 11/30/14 | ||||||||||||||||||||||||
| ||||||||||||||||||||||||||||
| $ | 67.13 | $ | 58.16 | $ | 52.55 | $ | 54.87 | $ | 52.37 | |||||||||||||||||||
| 0.37 | 0.34 | 0.28 | 0.32 | 0.15 | ||||||||||||||||||||||||
| (4.81 | ) | 8.94 | 8.55 | 0.16 | 3.51 | |||||||||||||||||||||||
|
|
|
|
|
|
|
|
|
| |||||||||||||||||||
| (4.44 | ) | 9.28 | 8.83 | 0.48 | 3.66 | |||||||||||||||||||||||
|
|
|
|
|
|
|
|
|
| |||||||||||||||||||
| (0.27 | ) | (0.31 | ) | (0.32 | ) | (0.18 | ) | (0.06 | ) | |||||||||||||||||||
| (0.61 | ) | — | (2.90 | ) | (2.62 | ) | (1.10 | ) | ||||||||||||||||||||
|
|
|
|
|
|
|
|
|
| |||||||||||||||||||
| (0.88 | ) | (0.31 | ) | (3.22 | ) | (2.80 | ) | (1.16 | ) | |||||||||||||||||||
|
|
|
|
|
|
|
|
|
| |||||||||||||||||||
| $ | 61.81 | $ | 67.13 | $ | 58.16 | $ | 52.55 | $ | 54.87 | |||||||||||||||||||
|
|
|
|
|
|
|
|
|
| |||||||||||||||||||
| (6.70% | ) | 16.01% | 18.47% | 0.90% | 7.12% | |||||||||||||||||||||||
| $ | 733,864 | $ | 881,709 | $ | 870,158 | $ | 794,664 | $ | 775,076 | |||||||||||||||||||
| 1.15% | 1.18% | 1.24% | 1.22% | 1.22% | ||||||||||||||||||||||||
| 0.56% | 0.55% | 0.57% | 0.62% | 0.27% | ||||||||||||||||||||||||
| 18% | 15% | 19% | 20% | 17% | ||||||||||||||||||||||||
| ||||||||||||||||||||||||||||
| 25 |
Table of Contents
Financial highlights
Delaware Small Cap Value Fund Class C
Selected data for each share of the Fund outstanding throughout each period were as follows:
|
Net asset value, beginning of period |
Income (loss) from investment operations: |
Net investment loss1 |
Net realized and unrealized gain (loss) |
Total from investment operations |
Less dividends and distributions from: |
Net investment income |
Net realized gain |
Total dividends and distributions |
Net asset value, end of period |
Total return2 |
Ratios and supplemental data: |
Net assets, end of period (000 omitted) |
Ratio of expenses to average net assets3 |
Ratio of net investment loss to average net assets |
Portfolio turnover |
|
|
| 1 | The average shares outstanding method has been applied for per share information. |
| 2 | Total investment return is based on the change in net asset value of a share during the period and assumes reinvestment of dividends and distributions at net asset value and does not reflect the impact of a sales charge. |
| 3 | Expense ratios do not include expenses of the Underlying Fund in which the Fund invests. |
See accompanying notes, which are an integral part of the financial statements.
| 26 |
Table of Contents
| Year ended | ||||||||||||||||||||||||||||
|
| |||||||||||||||||||||||||||
| 11/30/18 | 11/30/17 | 11/30/16 | 11/30/15 | 11/30/14 | ||||||||||||||||||||||||
| ||||||||||||||||||||||||||||
| $ | 55.65 | $ | 48.34 | $ | 44.24 | $ | 46.79 | $ | 45.11 | |||||||||||||||||||
| (0.10 | ) | (0.10 | ) | (0.07 | ) | (0.06 | ) | (0.22 | ) | |||||||||||||||||||
| (3.98 | ) | 7.43 | 7.09 | 0.13 | 3.00 | |||||||||||||||||||||||
|
|
|
|
|
|
|
|
|
| |||||||||||||||||||
| (4.08 | ) | 7.33 | 7.02 | 0.07 | 2.78 | |||||||||||||||||||||||
|
|
|
|
|
|
|
|
|
| |||||||||||||||||||
| — | (0.02 | ) | (0.02 | ) | — | — | ||||||||||||||||||||||
| (0.61 | ) | — | (2.90 | ) | (2.62 | ) | (1.10 | ) | ||||||||||||||||||||
|
|
|
|
|
|
|
|
|
| |||||||||||||||||||
| (0.61 | ) | (0.02 | ) | (2.92 | ) | (2.62 | ) | (1.10 | ) | |||||||||||||||||||
|
|
|
|
|
|
|
| �� |
| |||||||||||||||||||
| $ | 50.96 | $ | 55.65 | $ | 48.34 | $ | 44.24 | $ | 46.79 | |||||||||||||||||||
|
|
|
|
|
|
|
|
|
| |||||||||||||||||||
| (7.41% | ) | 15.17% | 17.58% | 0.14% | 6.30% | |||||||||||||||||||||||
| $ | 74,828 | $ | 105,757 | $ | 107,104 | $ | 108,890 | $ | 109,368 | |||||||||||||||||||
| 1.90% | 1.93% | 1.99% | 1.97% | 1.97% | ||||||||||||||||||||||||
| (0.19% | ) | (0.20% | ) | (0.18% | ) | (0.13% | ) | (0.48% | ) | |||||||||||||||||||
| 18% | 15% | 19% | 20% | 17% | ||||||||||||||||||||||||
| ||||||||||||||||||||||||||||
| 27 |
Table of Contents
Financial highlights
Delaware Small Cap Value Fund Class R
Selected data for each share of the Fund outstanding throughout each period were as follows:
|
Net asset value, beginning of period |
Income (loss) from investment operations: |
Net investment income1 |
Net realized and unrealized gain (loss) |
Total from investment operations |
Less dividends and distributions from: |
Net investment income |
Net realized gain |
Total dividends and distributions |
Net asset value, end of period |
Total return2 |
Ratios and supplemental data: |
Net assets, end of period (000 omitted) |
Ratio of expenses to average net assets3 |
Ratio of net investment income to average net assets |
Portfolio turnover |
|
|
| 1 | The average shares outstanding method has been applied for per share information. |
| 2 | Total investment return is based on the change in net asset value of a share during the period and assumes reinvestment of dividends and distributions at net asset value. |
| 3 | Expense ratios do not include expenses of the Underlying Fund in which the Fund invests. |
See accompanying notes, which are an integral part of the financial statements.
| 28 |
Table of Contents
| Year ended | ||||||||||||||||||||||||||||
|
| |||||||||||||||||||||||||||
| 11/30/18 | 11/30/17 | 11/30/16 | 11/30/15 | 11/30/14 | ||||||||||||||||||||||||
| ||||||||||||||||||||||||||||
| $ | 65.05 | $ | 56.40 | $ | 51.05 | $ | 53.39 | $ | 51.06 | |||||||||||||||||||
| 0.20 | 0.18 | 0.15 | 0.19 | 0.01 | ||||||||||||||||||||||||
| (4.66 | ) | 8.66 | 8.30 | 0.14 | 3.42 | |||||||||||||||||||||||
|
|
|
|
|
|
|
|
|
| |||||||||||||||||||
| (4.46 | ) | 8.84 | 8.45 | 0.33 | 3.43 | |||||||||||||||||||||||
|
|
|
|
|
|
|
|
|
| |||||||||||||||||||
| (0.12 | ) | (0.19 | ) | (0.20 | ) | (0.05 | ) | — | ||||||||||||||||||||
| (0.61 | ) | — | (2.90 | ) | (2.62 | ) | (1.10 | ) | ||||||||||||||||||||
|
|
|
|
|
|
|
|
|
| |||||||||||||||||||
| (0.73 | ) | (0.19 | ) | (3.10 | ) | (2.67 | ) | (1.10 | ) | |||||||||||||||||||
|
|
|
|
|
|
|
|
|
| |||||||||||||||||||
| $ | 59.86 | $ | 65.05 | $ | 56.40 | $ | 51.05 | $ | 53.39 | |||||||||||||||||||
|
|
|
|
|
|
|
|
|
| |||||||||||||||||||
| (6.92% | ) | 15.71% | 18.19% | 0.63% | 6.85% | |||||||||||||||||||||||
| $ | 62,791 | $ | 84,131 | $ | 83,557 | $ | 81,187 | $ | 82,577 | |||||||||||||||||||
| 1.40% | 1.43% | 1.49% | 1.47% | 1.47% | ||||||||||||||||||||||||
| 0.31% | 0.30% | 0.32% | 0.37% | 0.02% | ||||||||||||||||||||||||
| 18% | 15% | 19% | 20% | 17% | ||||||||||||||||||||||||
| ||||||||||||||||||||||||||||
| 29 |
Table of Contents
Financial highlights
Delaware Small Cap Value Fund Institutional Class
Selected data for each share of the Fund outstanding throughout each period were as follows:
|
Net asset value, beginning of period |
Income (loss) from investment operations: |
Net investment income1 |
Net realized and unrealized gain (loss) |
Total from investment operations |
Less dividends and distributions from: |
Net investment income |
Net realized gain |
Total dividends and distributions |
Net asset value, end of period |
Total return2 |
Ratios and supplemental data: |
Net assets, end of period (000 omitted) |
Ratio of expenses to average net assets3 |
Ratio of net investment income to average net assets |
Portfolio turnover |
|
|
| 1 | The average shares outstanding method has been applied for per share information. |
| 2 | Total investment return is based on the change in net asset value of a share during the period and assumes reinvestment of dividends and distributions at net asset value. |
| 3 | Expense ratios do not include expenses of the Underlying Fund in which the Fund invests. |
See accompanying notes, which are an integral part of the financial statements.
| 30 |
Table of Contents
| Year ended | ||||||||||||||||||||||||||||
|
| |||||||||||||||||||||||||||
| 11/30/18 | 11/30/17 | 11/30/16 | 11/30/15 | 11/30/14 | ||||||||||||||||||||||||
| ||||||||||||||||||||||||||||
| $ | 70.83 | $ | 61.32 | $ | 55.23 | $ | 57.52 | $ | 54.83 | |||||||||||||||||||
| 0.57 | 0.52 | 0.42 | 0.48 | 0.29 | ||||||||||||||||||||||||
| (5.08 | ) | 9.42 | 9.02 | 0.16 | 3.67 | |||||||||||||||||||||||
|
|
|
|
|
|
|
|
|
| |||||||||||||||||||
| (4.51 | ) | 9.94 | 9.44 | 0.64 | 3.96 | |||||||||||||||||||||||
|
|
|
|
|
|
|
|
|
| |||||||||||||||||||
| (0.42 | ) | (0.43 | ) | (0.45 | ) | (0.31 | ) | (0.17 | ) | |||||||||||||||||||
| (0.61 | ) | — | (2.90 | ) | (2.62 | ) | (1.10 | ) | ||||||||||||||||||||
|
|
|
|
|
|
|
|
|
| |||||||||||||||||||
| (1.03 | ) | (0.43 | ) | (3.35 | ) | (2.93 | ) | (1.27 | ) | |||||||||||||||||||
|
|
|
|
|
|
|
|
|
| |||||||||||||||||||
| $ | 65.29 | $ | 70.83 | $ | 61.32 | $ | 55.23 | $ | 57.52 | |||||||||||||||||||
|
|
|
|
|
|
|
|
|
| |||||||||||||||||||
| (6.46% | ) | 16.30% | 18.77% | 1.15% | 7.38% | |||||||||||||||||||||||
| $ | 2,731,344 | $ | 3,270,954 | $ | 2,166,172 | $ | 1,969,355 | $ | 1,768,420 | |||||||||||||||||||
| 0.90% | 0.93% | 0.99% | 0.97% | 0.97% | ||||||||||||||||||||||||
| 0.81% | 0.80% | 0.82% | 0.87% | 0.52% | ||||||||||||||||||||||||
| 18% | 15% | 19% | 20% | 17% | ||||||||||||||||||||||||
| ||||||||||||||||||||||||||||
| 31 |
Table of Contents
Financial highlights
Delaware Small Cap Value Fund Class R6
Selected data for each share of the Fund outstanding throughout each period were as follows:
|
Net asset value, beginning of period |
Income (loss) from investment operations: |
Net investment income2 |
Net realized and unrealized gain (loss) |
Total from investment operations |
Less dividends and distributions from: |
Net investment income |
Net realized gain |
Total dividends and distributions |
Net asset value, end of period |
Total return3 |
Ratios and supplemental data: |
Net assets, end of period (000 omitted) |
Ratio of expenses to average net assets4 |
Ratio of net investment income to average net assets |
Portfolio turnover |
|
|
| 1 | Date of commencement of operations; ratios have been annualized and total return has not been annualized. |
| 2 | The average shares outstanding method has been applied for per share information. |
| 3 | Total investment return is based on the change in net asset value of a share during the period and assumes reinvestment of dividends and distributions at net asset value. |
| 4 | Expense ratios do not include expenses of the Underlying Fund in which the Fund invests. |
| 5 | Portfolio turnover is representative of the Fund for the entire year ended Nov. 30, 2016. |
See accompanying notes, which are an integral part of the financial statements.
| 32 |
Table of Contents
| 5/2/161 | ||||||||||||||||
| Year ended | to | |||||||||||||||
| 11/30/18 | 11/30/17 | 11/30/16 | ||||||||||||||
| ||||||||||||||||
| $ | 70.95 | $ | 61.38 | $ | 51.46 | |||||||||||
| 0.69 | 0.65 | 0.32 | ||||||||||||||
| (5.08 | ) | 9.43 | 9.60 | |||||||||||||
|
|
|
|
|
| |||||||||||
| (4.39 | ) | 10.08 | 9.92 | |||||||||||||
|
|
|
|
|
| |||||||||||
| (0.54 | ) | (0.51 | ) | — | ||||||||||||
| (0.61 | ) | — | — | |||||||||||||
|
|
|
|
|
| |||||||||||
| (1.15 | ) | (0.51 | ) | — | ||||||||||||
|
|
|
|
|
| |||||||||||
| $ | 65.41 | $ | 70.95 | $ | 61.38 | |||||||||||
|
|
|
|
|
| |||||||||||
| (6.29% | ) | 16.52% | 19.28% | |||||||||||||
| $ | 394,064 | $ | 207,719 | $ | 4,187 | |||||||||||
| 0.72% | 0.75% | 0.77% | ||||||||||||||
| 0.99% | 0.98% | 0.96% | ||||||||||||||
| 18% | 15% | 19% | 5 | |||||||||||||
| ||||||||||||||||
| 33 |
Table of Contents
| Notes to financial statements | ||
| Delaware Small Cap Value Fund | November 30, 2018 |
Delaware Group® Equity Funds V (Trust) is organized as a Delaware statutory trust and offers three series: Delaware Wealth Builder Fund, Delaware Small Cap Core Fund, and Delaware Small Cap Value Fund. These financial statements and the related notes pertain to Delaware Small Cap Value Fund (Fund). The Trust is anopen-end investment company. The Fund is considered diversified under the Investment Company Act of 1940, as amended (1940 Act), and offers Class A, Class C, Class R, Institutional Class, and Class R6 shares. Class A shares are sold with a maximumfront-end sales charge of 5.75%. Class A share purchases of $1,000,000 or more will incur a contingent deferred sales charge (CDSC) instead of afront-end sales charge of 1.00%, if redeemed during the first year, and 0.50% during the second year, provided that Delaware Distributors, L.P. (DDLP) paid a financial advisor a commission on the purchase of those shares. Class C shares are sold with a CDSC of 1.00%, which will be incurred if redeemed during the first 12 months. Class R, Institutional Class, and Class R6 shares are not subject to a sales charge and are offered for sale exclusively to certain eligible investors. In addition, Class R6 shares do not pay any service fees,sub-accounting fees, and/orsub-transfer agency fees to any brokers, dealers, or other financial intermediaries.
The investment objective of the Fund is to seek capital appreciation.
1. Significant Accounting Policies
The Fund is an investment company and follows accounting and reporting guidance under Financial Accounting Standards Board (FASB) Accounting Standards Codification Topic 946, Financial Services -Investment Companies. The following accounting policies are in accordance with US generally accepted accounting principles (US GAAP) and are consistently followed by the Fund.
Security Valuation– Equity securities and exchange-traded funds (ETFs), except those traded on the Nasdaq Stock Market LLC (Nasdaq), are valued at the last quoted sales price as of the time of the regular close of the New York Stock Exchange on the valuation date. Equity securities and ETFs traded on the Nasdaq are valued in accordance with the Nasdaq Official Closing Price, which may not be the last sales price. If, on a particular day, an equity security or ETF does not trade, the mean between the bid and ask prices will be used, which approximates fair value. US government and agency securities are valued at the mean between the bid and ask prices, which approximates fair value. Investments in repurchase agreements are generally valued at par, which approximates fair value, each business day. Generally, other securities and assets for which market quotations are not readily available are valued at fair value as determined in good faith under the direction of the Trust’s Board of Trustees (Board). In determining whether market quotations are readily available or fair valuation will be used, various factors will be taken into consideration, such as market closures or suspension of trading in a security. Restricted securities are valued at fair value using methods approved by the Board.
Federal and Foreign Income Taxes– No provision for federal income taxes has been made as the Fund intends to continue to qualify for federal income tax purposes as a regulated investment company under Subchapter M of the Internal Revenue Code of 1986, as amended, and make the requisite distributions to shareholders. The Fund evaluates tax positions taken or expected to be taken in the course of preparing the Fund’s tax returns to determine whether the tax positions are“more-likely-than-not” of being sustained by the applicable tax authority. Tax positions not deemed to meet the“more-likely-than-not” threshold are recorded as a tax benefit or expense in the current year. Management has analyzed the Fund’s tax positions taken or expected to be taken on the
| 34 |
Table of Contents
Fund’s federal income tax returns through the year ended Nov. 30, 2018 and for all open tax years (years ended Nov. 30, 2015–Nov. 30, 2017), and has concluded that no provision for federal income tax is required in the Fund’s financial statements. If applicable, the Fund recognizes interest accrued on unrecognized tax benefits in interest expense and penalties in other expenses on the “Statement of operations.” During the year ended Nov. 30, 2018, the Fund did not incur any interest or tax penalties. In regard to foreign taxes only, the Fund has open tax years in certain foreign countries in which it invests that may date back to the inception of the Fund.
Class Accounting– Investment income, common expenses, and realized and unrealized gain (loss) on investments are allocated to the various classes of the Fund on the basis of daily net assets of each class. Distribution expenses relating to a specific class are charged directly to that class. Class R6 shares are not allocated any expenses related to service fees,sub-accounting fees, and/orsub-transfer agency fees paid to brokers, dealers, or financial intermediaries.
Underlying Funds– The Fund may invest in other investment companies (Underlying Funds) to the extent permitted by the 1940 Act. The Underlying Funds in which the Fund invests include business development corporations (BDC) and ETFs. The Fund will indirectly bear the investment management fees and other expenses of the Underlying Funds.
Repurchase Agreements– The Fund may purchase certain US government securities subject to the counterparty’s agreement to repurchase them at an agreed upon date and price. The counterparty will be required on a daily basis to maintain the value of the collateral subject to the agreement at not less than the repurchase price (including accrued interest). The agreements are conditioned upon the collateral being deposited under the Federal Reserve book-entry system with the Fund’s custodian or a third-partysub-custodian. In the event of default or bankruptcy by the other party to the agreement, retention of the collateral may be subject to legal proceedings. All open repurchase agreements as of the date of this report were entered into on Nov. 30, 2018, and matured on the next business day.
Use of Estimates– The preparation of financial statements in conformity with US GAAP requires management to make estimates and assumptions that affect the fair value of investments, the reported amounts of assets and liabilities and disclosure of contingent assets and liabilities at the date of the financial statements, and the reported amounts of revenues and expenses during the reporting period. Actual results could differ from those estimates and the differences could be material.
Other– Expenses directly attributable to the Fund are charged directly to the Fund. Other expenses common to various funds within the Delaware Funds® by Macquarie (Delaware Funds) are generally allocated among such funds on the basis of average net assets. Management fees and certain other expenses are paid monthly. Security transactions are recorded on the date the securities are purchased or sold (trade date) for financial reporting purposes. Costs used in calculating realized gains and losses on the sale of investment securities are those of the specific securities sold. Dividend income is recorded on theex-dividend date and interest income is recorded on the accrual basis. Discounts and premiums on debt securities are accreted or amortized to interest income, respectively, over the lives of the respective securities using the effective interest method. Distributions received from investments in real estate investment trusts (REITs) are recorded as dividend income on theex-dividend date, subject to reclassification upon notice of the character of such distributions by the issuer. The Fund declares and pays dividends from net investment income and distributions from net realized gain on investments, if
| 35 |
Table of Contents
| Notes to financial statements | ||
| Delaware Small Cap Value Fund |
1. Significant Accounting Policies (continued)
any, annually. The Fund may distribute more frequently, if necessary for tax purposes. Dividends and distributions, if any, are recorded on theex-dividend date.
Subject to seeking best execution, the Fund may direct certain security trades to brokers who have agreed to rebate a portion of the related brokerage commission to the Fund in cash. In general, best execution refers to many factors, including the price paid or received for a security, the commission charged, the promptness and reliability of execution, the confidentiality and placement accorded the order, and other factors affecting the overall benefit obtained by the Fund on the transaction. There were no commission rebates for the year ended Nov. 30, 2018.
The Fund receives earnings credits from its custodian when positive cash balances are maintained, which may be used to offset custody fees. The expense paid under this arrangement is included on the “Statement of operations” under “Custodian fees” with the corresponding expense offset included under “Less expenses paid indirectly.” For the year ended Nov. 30, 2018, the Fund earned $4,099 under this arrangement.
The Fund receives earnings credits from its transfer agent when positive cash balances are maintained, which may be used to offset transfer agent fees. If the amount earned is greater than $1, the expense paid under this arrangement is included on the “Statement of operations” under “Dividend disbursing and transfer agent fees and expenses” with the corresponding expense offset included under “Less expenses paid indirectly.” For the year ended Nov. 30, 2018, the Fund earned $2,029 under this arrangement.
2. Investment Management, Administration Agreements, and Other Transactions with Affiliates
In accordance with the terms of its investment management agreement, the Fund pays Delaware Management Company (DMC), a series of Macquarie Investment Management Business Trust and the investment manager, an annual fee which is calculated daily and paid monthly at the rate of 0.75% on the first $500 million of average daily net assets of the Fund, 0.70% on the next $500 million, 0.65% on the next $1.5 billion, and 0.60% on average daily net assets in excess of $2.5 billion.
Delaware Investments Fund Services Company (DIFSC), an affiliate of DMC, provides fund accounting and financial administration oversight services to the Fund. For these services, DIFSC’s fees were calculated daily and paid monthly based on the aggregate daily net assets of all funds within the Delaware Funds at the following annual rate: 0.00475% of the first $35 billion; 0.0040% of the next $10 billion; and 0.0025% of aggregate average daily net assets in excess of $45 billion (Total Fee). Each fund in the Delaware Funds pays a minimum of $4,000, which, in aggregate, is subtracted from the Total Fee. Each fund then pays its portion of the remainder of the Total Fee on a relative net asset value (NAV) basis. This amount is included on the “Statement of operations” under “Accounting and administration expenses.” For the year ended Nov. 30, 2018, the Fund was charged $172,081 for these services.
DIFSC is also the transfer agent and dividend disbursing agent of the Fund. For these services, DIFSC’s fees were calculated daily and paid monthly based on the aggregate daily net assets of the retail funds within the Delaware Funds from Dec. 1, 2017 through June 30, 2018 at the following annual rate: 0.025% of the first $20 billion; 0.020% of the next $5 billion; 0.015% of the next $5 billion; and 0.013%
| 36 |
Table of Contents
of average daily net assets in excess of $30 billion. Effective July 1, 2018, the Fund as well as the other Delaware Funds entered into an amendment to the DIFSC agreement. Under the amendment to the DIFSC agreement, DIFSC’s fees are calculated daily and paid monthly based on the aggregate daily net assets of the retail funds within the Delaware Funds at the following annual rate: 0.014% of the first $20 billion; 0.011% of the next $5 billion; 0.007% of the next $5 billion; 0.005% of the next $20 billion; and 0.0025% of average daily net assets in excess of $50 billion. The fees payable to DIFSC under the transfer agent agreement described above are allocated among all retail funds in the Delaware Funds on a relative NAV basis. This amount is included on the “Statement of operations” under “Dividend disbursing and transfer agent fees and expenses.” For the year ended Nov. 30, 2018, the Fund was charged $689,687 for these services. Pursuant to asub-transfer agency agreement between DIFSC and BNY Mellon Investment Servicing (US) Inc. (BNYMIS), BNYMIS provides certainsub-transfer agency services to the Fund.Sub-transfer agency fees are paid by the Fund and are also included on the “Statement of operations” under “Dividend disbursing and transfer agent fees and expenses.”
Pursuant to a distribution agreement and distribution plan, the Fund pays DDLP, the distributor and an affiliate of DMC, an annual distribution and service(12b-1) fee of 0.25% of the average daily net assets of the Class A shares, 1.00% of the average daily net assets of the Class C shares, and 0.50% of the average daily net assets of the Class R shares. The fees are calculated daily and paid monthly. Institutional Class and Class R6 shares pay no12b-1 fees.
As provided in the investment management agreement, the Fund bears a portion of the cost of certain resources shared with DMC, including the cost of internal personnel of DMC and/or its affiliates that provide legal, tax, and regulatory reporting services to the Fund. For the year ended Nov. 30, 2018, the Fund was charged $125,196 for internal legal, tax, and regulatory reporting services provided by DMC and/or its affiliates’ employees. This amount is included on the “Statement of operations” under “Legal fees.”
For the year ended Nov. 30, 2018, DDLP earned $51,325 for commissions on sales of the Fund’s Class A shares. For the year ended Nov. 30, 2018, DDLP received gross CDSC commissions of $29 and $6,289 on redemption of the Fund’s Class A and Class C shares, respectively, and these commissions were entirely used to offset upfront commissions previously paid by DDLP to broker/dealers on sales of those shares.
Trustees’ fees include expenses accrued by the Fund for each Trustee’s retainer and meeting fees. Certain officers of DMC, DIFSC, and DDLP are officers and/or Trustees of the Trust. These officers and Trustees are paid no compensation by the Fund.
In addition to the management fees and other expenses of the Fund, the Fund indirectly bears the investment management fees and other expenses of the Underlying Fund. The amount of these fees and expenses incurred indirectly by the Fund will vary based upon the expense and fee levels of the Underlying Fund and the amount of shares that are owned of the Underlying Fund at different times.
Cross trades for the year ended Nov. 30, 2018 were executed by the Fund pursuant to procedures adopted by the Board designed to ensure compliance with Rule17a-7 under the 1940 Act. Cross trading is the buying or selling of portfolio securities between funds of investment companies, or between a fund of an investment company and another entity, that are or could be considered affiliates by virtue of
| 37 |
Table of Contents
| Notes to financial statements | ||
| Delaware Small Cap Value Fund |
2. Investment Management, Administration Agreements, and Other Transactions with Affiliates (continued)
having a common investment advisor (or affiliated investment advisors), common directors/trustees and/or common officers. At its regularly scheduled meetings, the Board reviews such transactions for compliance with the procedures adopted by the Board. Pursuant to these procedures, for the year ended Nov. 30, 2018, the Fund engaged in Rule17a-7 securities sales of $5,675,759, which resulted in net realized gains of $246,104. The Fund did not engage in Rule17a-7 securities purchases for the year ended Nov. 30, 2018.
3. Investments
For the year ended Nov. 30, 2018, the Fund made purchases and sales of investment securities other than short-term investments as follows:
Purchases | $ | 770,960,476 | ||
Sales | 964,430,752 |
The tax cost of investments includes adjustments to net unrealized appreciation (depreciation) which may not necessarily be final tax cost basis adjustments, but approximate the tax basis unrealized gains and losses that may be realized and distributed to shareholders. At Nov. 30, 2018, the cost and unrealized appreciation (depreciation) of investments for federal income tax purposes for the Fund were as follows:
Cost of investments | $ | 3,146,643,762 | ||
|
| |||
Aggregate unrealized appreciation of investments | $ | 1,013,385,799 | ||
Aggregate unrealized depreciation of investments | (161,872,363 | ) | ||
|
| |||
Net unrealized appreciation of investments | $ | 851,513,436 | ||
|
|
US GAAP defines fair value as the price that the Fund would receive to sell an asset or pay to transfer a liability in an orderly transaction between market participants at the measurement date under current market conditions. A three-level hierarchy for fair value measurements has been established based upon the transparency of inputs to the valuation of an asset or liability. Inputs may be observable or unobservable and refer broadly to the assumptions that market participants would use in pricing the asset or liability. Observable inputs reflect the assumptions market participants would use in pricing the asset or liability based on market data obtained from sources independent of the reporting entity. Unobservable inputs reflect the reporting entity’s own assumptions about the assumptions that market participants would use in pricing the asset or liability based on the best information available under the circumstances. The Fund’s investment in its entirety is assigned a level based upon the observability of the inputs which are significant to the overall valuation. The three-level hierarchy of inputs is summarized below and on the next page.
| Level 1 – | Inputs are quoted prices in active markets for identical investments. (Examples: equity securities,open-end investment companies, futures contracts, exchange-traded options contracts) | |
| Level 2 – | Other observable inputs, including, but not limited to: quoted prices for similar assets or liabilities in markets that are active, quoted prices for identical or similar assets or liabilities in | |
| 38 |
Table of Contents
| markets that are not active, inputs other than quoted prices that are observable for the assets or liabilities (such as interest rates, yield curves, volatilities, prepayment speeds, loss severities, credit risks, and default rates) or other market-corroborated inputs. (Examples: debt securities, government securities, swap contracts, foreign currency exchange contracts, foreign securities utilizing international fair value pricing, broker-quoted securities, fair valued securities) | ||
| Level 3 – | Significant unobservable inputs, including the Fund’s own assumptions used to determine the fair value of investments. (Examples: broker-quoted securities, fair valued securities) | |
Level 3 investments are valued using significant unobservable inputs. The Fund may also use an income-based valuation approach in which the anticipated future cash flows of the investment are discounted to calculate fair value. Discounts may also be applied due to the nature or duration of any restrictions on the disposition of the investments. Valuations may also be based upon current market prices of securities that are comparable in coupon, rating, maturity, and industry. The derived value of a Level 3 investment may not represent the value which is received upon disposition and this could impact the results of operations.
The following table summarizes the valuation of the Fund’s investments by fair value hierarchy levels as of Nov. 30, 2018:
Level 1 | Level 2 | Total | ||||||||||
Securities | ||||||||||||
Assets: | ||||||||||||
Common Stock | $ | 3,960,737,111 | $ | — | $ | 3,960,737,111 | ||||||
Short-Term Investments | — | 37,420,087 | 37,420,087 | |||||||||
|
|
|
|
|
| |||||||
Total Value of Securities | $ | 3,960,737,111 | $ | 37,420,087 | $ | 3,998,157,198 | ||||||
|
|
|
|
|
| |||||||
During the year ended Nov. 30, 2018, there were no transfers between Level 1 investments, Level 2 investments, or Level 3 investments that had a significant impact to the Fund. The Fund’s policy is to recognize transfers between levels based on fair value at the beginning of the reporting period.
A reconciliation of Level 3 investments is presented when the Fund has a significant amount of Level 3 investments at the beginning, interim, or end of the period in relation to net assets. During the year ended Nov. 30, 2018, there were no Level 3 investments.
4. Dividend and Distribution Information
Income and long-term capital gain distributions are determined in accordance with federal income tax regulations, which may differ from US GAAP. Additionally, distributions from net short-term gains on sales of investment securities are treated as ordinary income for federal income tax purposes. The tax character of dividends and distributions paid during the years ended Nov. 30, 2018 and 2017 was as follows:
| Year ended | ||||||||
| 11/30/18 | 11/30/17 | |||||||
Ordinary income | $ | 24,728,138 | $ | 20,814,104 | ||||
Long-term capital gain | 40,210,481 | — | ||||||
|
|
|
| |||||
Total | $ | 64,938,619 | $ | 20,814,104 | ||||
|
|
|
| |||||
| 39 |
Table of Contents
| Notes to financial statements | ||
| Delaware Small Cap Value Fund |
5. Components of Net Assets on a Tax Basis
As of Nov. 30, 2018, the components of net assets on a tax basis were as follows:
Shares of beneficial interest | $ | 2,871,032,076 | ||
Undistributed ordinary income | 59,830,733 | |||
Undistributed long-term capital gains | 214,514,548 | |||
Net unrealized appreciation of investments | 851,513,436 | |||
|
| |||
Net assets | $ | 3,996,890,793 | ||
|
|
The differences between book basis and tax basis components of net assets are primarily attributable to tax deferral of losses on wash sales.
6. Capital Shares
Transactions in capital shares were as follows:
| Year ended | ||||||||
| 11/30/18 | 11/30/17 | |||||||
Shares sold: | ||||||||
Class A | 2,478,313 | 7,239,929 | ||||||
Class C | 256,541 | 426,747 | ||||||
Class R | 251,704 | 440,813 | ||||||
Institutional Class | 10,515,739 | 23,247,010 | ||||||
Class R6 | 4,075,356 | 3,307,662 | ||||||
Shares issued upon reinvestment of dividends and distributions: | ||||||||
Class A | 171,779 | 75,579 | ||||||
Class C | 20,871 | 807 | ||||||
Class R | 14,806 | 4,810 | ||||||
Institutional Class | 674,291 | 240,092 | ||||||
Class R6 | 50,051 | 5,551 | ||||||
|
|
|
| |||||
| 18,509,451 | 34,989,000 | |||||||
|
|
|
| |||||
Shares redeemed: | ||||||||
Class A | (3,912,064 | ) | (9,142,742 | ) | ||||
Class C | (709,620 | ) | (742,508 | ) | ||||
Class R | (510,815 | ) | (633,928 | ) | ||||
Institutional Class | (15,532,652 | ) | (12,635,791 | ) | ||||
Class R6 | (1,028,271 | ) | (453,861 | ) | ||||
|
|
|
| |||||
| (21,693,422 | ) | (23,608,830 | ) | |||||
|
|
|
| |||||
Net increase (decrease) | (3,183,971 | ) | 11,380,170 | |||||
|
|
|
| |||||
| 40 |
Table of Contents
Certain shareholders may exchange shares of one class for shares of another class in the same Fund. These exchange transactions are included as subscriptions and redemptions in the table above and on the “Statements of changes in net assets.” For the years ended Nov. 30, 2018 and 2017, the Fund had the following exchange transactions:
Exchange Redemptions | Exchange Subscriptions | |||||||||||||||||||||||||||||||
| Institutional | Institutional | |||||||||||||||||||||||||||||||
| Class A | Class C | Class | Class R6 | Class A | Class | Class R6 | ||||||||||||||||||||||||||
| Year ended | Shares | Shares | Shares | Shares | Shares | Shares | Shares | Value | ||||||||||||||||||||||||
11/30/18 | 41,984 | 70,004 | 574,181 | 6,184 | 52,297 | 51,349 | 573,522 | $ | 48,981,556 | |||||||||||||||||||||||
11/30/17 | 3,650,914 | 10,474 | 19,860 | — | 671 | 3,470,119 | 19,831 | 221,673,975 | ||||||||||||||||||||||||
7. Line of Credit
The Fund, along with certain other funds in the Delaware Funds (Participants), was a participant in a $155,000,000 revolving line of credit intended to be used for temporary or emergency purposes as an additional source of liquidity to fund redemptions of investor shares. The revolving line of credit available was reduced from $155,000,000 to $130,000,0000 on Sept. 6, 2018. Under the agreement, the Participants were charged an annual commitment fee of 0.15%, which was allocated across the Participants based on a weighted average of the respective net assets of each Participant. The Participants were permitted to borrow up to a maximum ofone-third of their net assets under the agreement. Each Participant was individually, and not jointly, liable for its particular advances, if any, under the line of credit. The line of credit available under the agreement expired on Nov. 5, 2018.
On Nov. 5, 2018, the Fund, along with the other Participants, entered into an amendment to the agreement for a $190,000,000 revolving line of credit. The revolving line of credit available was increased from $190,000,000 to $220,000,000 on Nov. 29, 2018. The revolving line of credit is to be used as described above and operates in substantially the same manner as the original agreement. The line of credit available under the agreement expires on Nov. 4, 2019.
The Fund had no amounts outstanding as of Nov. 30, 2018, or at any time during the year then ended.
8. Offsetting
Master Repurchase Agreements
Repurchase agreements are entered into by the Fund under Master Repurchase Agreements (each, an MRA). The MRA permits the Fund, under certain circumstances including an event of default (such as bankruptcy or insolvency), to offset payables and/or receivables with collateral held by and/or posted to the counterparty. As a result, one single net payment is created. Bankruptcy or insolvency laws of a particular jurisdiction may impose restrictions on or prohibitions against such a right of offset in the event of the MRA counterparty’s bankruptcy or insolvency. Based on the terms of the MRA, the Fund receives securities as collateral with a market value in excess of the repurchase price at maturity. Upon a bankruptcy or insolvency of the MRA counterparty, the Fund would recognize a liability with respect to such excess collateral. The liability reflects the Fund’s obligation under bankruptcy law to return the
| 41 |
Table of Contents
| Notes to financial statements | ||
| Delaware Small Cap Value Fund |
8. Offsetting (continued)
excess to the counterparty. As of Nov. 30, 2018, the following table is a summary of the Fund’s repurchase agreements by counterparty which are subject to offset under an MRA:
| Fair Value of | ||||||||||
| Repurchase | Non-cash | Cash Collateral | Net Collateral | |||||||
Counterparty | Agreements | Collateral Received(a) | Received | Received | Net Exposure(b) | |||||
Bank of America | $ 3,024,552 | $ (3,024,552) | $— | $ (3,024,552) | $— | |||||
Bank of Montreal | 8,317,517 | (8,317,517) | — | (8,317,517) | — | |||||
BNP Paribas | 13,677,356 | (13,677,356) | — | (13,677,356) | — | |||||
Total | $25,019,425 | $(25,019,425) | $— | $(25,019,425) | $— |
(a)The value of the related collateral received exceeded the value of the repurchase agreements as of Nov. 30, 2018.
(b)Net exposure represents the net receivable (payable) that would be due from (to) the counterparty in the event of default.
9. Securities Lending
The Fund, along with other funds in the Delaware Funds, may lend its securities pursuant to a security lending agreement (Lending Agreement) with The Bank of New York Mellon (BNY Mellon). At the time a security is loaned, the borrower must post collateral equal to the required percentage of the market value of the loaned security, including any accrued interest. The required percentage is: (1) 102% with respect to US securities and foreign securities that are denominated and payable in US dollars; and (2) 105% with respect to foreign securities. With respect to each loan, if on any business day the aggregate market value of securities collateral plus cash collateral held is less than the aggregate market value of the securities which are the subject of such loan, the borrower will be notified to provide additional collateral by the end of the following business day which, together with the collateral already held, will be not less than the applicable initial collateral requirements for such security loan. If the aggregate market value of securities collateral and cash collateral held with respect to a security loan exceeds the applicable initial collateral requirement, upon request of the borrower, BNY Mellon must return enough collateral to the borrower by the end of the following business day to reduce the value of the remaining collateral to the applicable initial collateral requirement for such security loan. As a result of the foregoing, the value of the collateral held with respect to a loaned security on any particular day may be more or less than the value of the security on loan. The collateral percentage with respect to the market value of the loaned security is determined by the security lending agent.
Cash collateral received by each fund of the Trust is generally invested in a series of individual separate accounts, each corresponding to a fund. The investment guidelines permit each separate account to hold certain securities that would be considered eligible securities for a money market fund. Cash collateral received is generally invested in government securities; certain obligations issued by government sponsored enterprises; repurchase agreements collateralized by US Treasury securities; obligations issued by the central government of any Organization for Economic Cooperation and Development (OECD) country or its agencies, instrumentalities or establishments; obligations of supranational organizations, commercial paper, notes, bonds and other debt obligations; certificates of
| 42 |
Table of Contents
deposit, time deposits, and other bank obligations; and asset-backed securities. A fund can also accept US government securities and letters of credit(non-cash collateral) in connection with securities loans.
In the event of default or bankruptcy by the lending agent, realization and/or retention of the collateral may be subject to legal proceedings. In the event the borrower fails to return loaned securities and the collateral received is insufficient to cover the value of the loaned securities and provided such collateral shortfall is not the result of investment losses, the lending agent has agreed to pay the amount of the shortfall to the Fund or, at the discretion of the lending agent, replace the loaned securities. The Fund continues to record dividends or interest, as applicable, on the securities loaned and is subject to changes in value of the securities loaned that may occur during the term of the loan. The Fund has the right under the Lending Agreement to recover the securities from the borrower on demand. With respect to security loans collateralized bynon-cash collateral, the Fund receives loan premiums paid by the borrower. With respect to security loans collateralized by cash collateral, the earnings from the collateral investments are shared among the Fund, the security lending agent, and the borrower. The Fund records security lending income net of allocations to the security lending agent, and the borrower.
The Fund may incur investment losses as a result of investing securities lending collateral. This could occur if an investment in the collateral investment account defaulted or became impaired. Under those circumstances, the value of the Fund’s cash collateral account may be less than the amount the Fund would be required to return to the borrowers of the securities and the Fund would be required to make up for this shortfall.
During the year ended Nov. 30, 2018, the Fund had no securities out on loan.
10. Credit and Market Risk
The Fund invests in growth stocks (such as those in the financial services sector), which reflect projections of future earnings and revenue. These prices may rise or fall dramatically depending on whether those projections are met. These companies’ stock prices may be more volatile, particularly over the short term.
The Fund invests a significant portion of its assets in small companies and may be subject to certain risks associated with ownership of securities of such companies. Investments in small sized companies may be more volatile than investments in larger companies for a number of reasons, which include limited financial resources or a dependence on narrow product lines.
The Fund invests in REITs and is subject to the risks associated with that industry. If the Fund holds real estate directly as a result of defaults or receives rental income directly from real estate holdings, its tax status as a regulated investment company may be jeopardized. There were no direct real estate holdings during the year ended Nov. 30, 2018. The Fund’s REIT holdings are also affected by interest rate changes, particularly if the REITs it holds use floating rate debt to finance their ongoing operations.
The Fund may invest up to 15% of its net assets in illiquid securities, which may include securities with contractual restrictions on resale, securities exempt from registration under Rule 144A promulgated under the Securities Act of 1933, as amended, and other securities which may not be readily marketable. The relative illiquidity of these securities may impair the Fund from disposing of them in a timely manner and at a fair price when it is necessary or desirable to do so. While maintaining oversight, the Board has
| 43 |
Table of Contents
| Notes to financial statements | ||
| Delaware Small Cap Value Fund |
10. Credit and Market Risk (continued)
delegated to DMC, theday-to-day functions of determining whether individual securities are liquid for purposes of the Fund’s limitation on investments in illiquid securities. Securities eligible for resale pursuant to Rule 144A, which are determined to be liquid, are not subject to the Fund’s 15% limit on investments in illiquid securities. As of Nov. 30, 2018, there were no Rule 144A securities held by the Fund. Restricted securities are valued pursuant to the security valuation procedures described in Note 1.
11. Contractual Obligations
The Fund enters into contracts in the normal course of business that contain a variety of indemnifications. The Fund’s maximum exposure under these arrangements is unknown. However, the Fund has not had prior claims or losses pursuant to these contracts. Management has reviewed the Fund’s existing contracts and expects the risk of loss to be remote.
12. Recent Accounting Pronouncements
In August 2018, the FASB issued an Accounting Standards Update, ASU2018-13, which changes certain fair value measurement disclosure requirements. ASU2018-13, in addition to other modifications and additions, removes the requirement to disclose the amount and reasons for transfers between Level 1 and Level 2 of the fair value hierarchy, the policy for the timing of transfers between levels and the valuation process for Level 3 fair value measurements. ASU2018-13 is effective for fiscal years, and interim periods within those fiscal years, beginning after Dec. 15, 2019. At this time, management is evaluating the implications of these changes on the financial statements.
In August 2018, the Securities and Exchange Commission (SEC) adopted amendments to RegulationS-X to update and simplify the disclosure requirements for registered investment companies by eliminating requirements that are redundant or duplicative of US GAAP requirements or other SEC disclosure requirements. The new amendments require the presentation of the total, rather than the components, of distributable earnings on the “Statement of assets and liabilities” and the total, rather than the components, of dividends from net investment income and distributions from net realized gains on the “Statements of changes in net assets.” The amendments also removed the requirement for the parenthetical disclosure of undistributed net investment income on the “Statements of changes in net assets” and certain tax adjustments that were reflected in the “Notes to financial statements.” All of these have been reflected in the Fund’s financial statements.
13. Subsequent Events
Management has determined that no material events or transactions occurred subsequent to Nov. 30, 2018, that would require recognition or disclosure in the Fund’s financial statements.
| 44 |
Table of Contents
registered public accounting firm
To the Board of Trustees of Delaware Group® Equity Funds V
and the Shareholders of Delaware Small Cap Value Fund
Opinion on the Financial Statements
We have audited the accompanying statement of assets and liabilities, including the schedule of investments, of Delaware Small Cap Value Fund (one of the funds constituting Delaware Group® Equity Funds V, referred to hereafter as the “Fund”) as of November 30, 2018, the related statement of operations for the year ended November 30, 2018, the statements of changes in net assets for each of the two years in the period ended November 30, 2018, including the related notes, and the financial highlights for each of the periods indicated therein (collectively referred to as the “financial statements”). In our opinion, the financial statements present fairly, in all material respects, the financial position of the Fund as of November 30, 2018, the results of its operations for the year then ended, the changes in its net assets for each of the two years in the period ended November 30, 2018 and the financial highlights for each of the periods indicated therein in conformity with accounting principles generally accepted in the United States of America.
Basis for Opinion
These financial statements are the responsibility of the Fund’s management. Our responsibility is to express an opinion on the Fund’s financial statements based on our audits. We are a public accounting firm registered with the Public Company Accounting Oversight Board (United States) (PCAOB) and are required to be independent with respect to the Fund in accordance with the U.S. federal securities laws and the applicable rules and regulations of the Securities and Exchange Commission and the PCAOB.
We conducted our audits of these financial statements in accordance with the standards of the PCAOB. Those standards require that we plan and perform the audit to obtain reasonable assurance about whether the financial statements are free of material misstatement, whether due to error or fraud.
Our audits included performing procedures to assess the risks of material misstatement of the financial statements, whether due to error or fraud, and performing procedures that respond to those risks. Such procedures included examining, on a test basis, evidence regarding the amounts and disclosures in the financial statements. Our audits also included evaluating the accounting principles used and significant estimates made by management, as well as evaluating the overall presentation of the financial statements. Our procedures included confirmation of securities owned as of November 30, 2018 by correspondence with the custodian and brokers; when replies were not received from brokers, we performed other auditing procedures. We believe that our audits provide a reasonable basis for our opinion.
/s/ PricewaterhouseCoopers LLP
Philadelphia, Pennsylvania
January 22, 2019
We have served as the auditor of one or more investment companies in Delaware Funds® by Macquarie since 2010.
45
Table of Contents
| Other Fund information (Unaudited) | ||
| Delaware Small Cap Value Fund |
Tax Information
The information set forth below is for the Fund’s fiscal year as required by federal income tax laws. Shareholders, however, must report distributions on a calendar year basis for income tax purposes, which may include distributions for portions of two fiscal years of the Fund. Accordingly, the information needed by shareholders for income tax purposes will be sent to them in January of each year. Please consult your tax advisor for proper treatment of this information.
All disclosures are based on financial information available as of the date of this annual report and, accordingly are subject to change. For any and all items requiring reporting, it is the intention of the Fund to report the maximum amount permitted under the Internal Revenue Code and the regulations thereunder.
For the fiscal year ended Nov. 30, 2018, the Fund reports distributions paid during the year as follows:
(A) Long-Term Capital Gain Distributions (Tax Basis) | 61.92 | % | ||
(B) Ordinary Income Distributions (Tax Basis)1 | 38.08 | % | ||
Total Distributions (Tax Basis) | 100.00 | % | ||
(C) Qualified Dividends2 | 97.02 | % |
(A) and (B) are based on a percentage of the Fund’s total distributions.
(C) is based on a percentage of the Fund’s ordinary income distributions.
| 1 | For the fiscal year ended Nov. 30, 2018, certain dividends paid by the Fund may be subject to a maximum tax rate of 20%. The percentage of dividends paid by the Fund from ordinary income reported as qualified dividend income is 97.70%. Complete information will be compiled and reported in conjunction with your 2018 Form1099-DIV. |
| 2 | Qualified dividends represent dividends which qualify for the corporate dividends received deduction. |
For the fiscal year ended Nov. 30, 2018, certain interest income paid by the Fund, has been determined to be Qualified Short-Term Capital Gains, and may be subject to relief from US withholding for foreign shareholders, as provided by the American Jobs Creation Act of 2004, the Tax Relief Unemployment Insurance Reauthorization and Job Creations Act of 2010, and as extended by the American Taxpayer Relief Act of 2012. For the fiscal year ended Nov. 30, 2018, the Fund has reported maximum distributions of Qualified Short-Term Capital Gains of $30,336,484.
Board consideration of advisory agreement for Delaware Small Cap Value Fund at a meeting held August15-16, 2018
At a meeting held on Aug.15-16, 2018 (the “Annual Meeting”), the Board of Trustees (the “Board”), including a majority of disinterested or independent Trustees, approved the renewal of the Investment Advisory Agreement for Delaware Small Cap Value Fund (the “Fund”). In making its decision, the Board considered information furnished at regular quarterly Board meetings, including reports detailing Fund performance, investment strategies, and expenses, as well as information prepared specifically in connection with the renewal of the investment advisory contract. Information furnished specifically in connection with the renewal of the Investment Management Agreement with Delaware Management Company (“DMC”), a series of Macquarie Investment Management Business Trust (“MIMBT”), included materials provided by DMC and its affiliates (collectively, “Macquarie Investment Management”) concerning, among other things, the nature, extent, and quality of services provided to the Fund; the costs of such services to the Fund; economies of scale; and the investment manager’s financial
| 46 |
Table of Contents
condition and profitability. In addition, in connection with the Annual Meeting, materials were provided to the Trustees in May 2018, including reports provided by Broadridge Financial Solutions (“Broadridge”). The Broadridge reports compared the Fund’s investment performance and expenses with those of other comparable mutual funds. The Independent Trustees reviewed and discussed the Broadridge reports with independent legal counsel to the Independent Trustees. In addition to the information noted above, the Board also requested and received information regarding DMC’s policy with respect to advisory fee levels and its breakpoint philosophy; the structure of portfolio manager compensation; comparative client fee information; and any constraints or limitations on the availability of securities for certain investment styles, which had in the past year inhibited, or which were likely in the future to inhibit, the investment manager’s ability to invest fully in accordance with Fund policies.
In considering information relating to the approval of the Fund’s advisory agreement, the Independent Trustees received assistance and advice from and met separately with independent legal counsel to the Independent Trustees and also received assistance and advice from an experienced and knowledgeable independent fund consultant, JDL Consultants, LLC (“JDL”). Although the Board gave attention to all information furnished, the following discussion identifies, under separate headings, the primary factors taken into account by the Board during its contract renewal considerations.
Nature, extent, and quality of services.The Board considered the services provided by DMC to the Fund and its shareholders. In reviewing the nature, extent, and quality of services, the Board considered reports furnished to it throughout the year, which covered matters such as the relative performance of the Fund; compliance of portfolio managers with the investment policies, strategies, and restrictions for the Fund; compliance by DMC and Delaware Distributors, L.P. (together, “Management”) personnel with the Code of Ethics adopted throughout the Delaware Funds® by Macquarie (“Delaware Funds”); and adherence to fair value pricing procedures as established by the Board. The Board was pleased with the current staffing of DMC and the emphasis placed on research in the investment process. The Board recognized DMC’s receipt of certain favorable industry distinctions during the past several years. The Board gave favorable consideration to DMC’s efforts to control expenses while maintaining service levels committed to Fund matters. The Board also noted the benefits provided to Fund shareholders (a) through each shareholder’s ability to: (i) exchange an investment in one Delaware Fund for the same class of shares in another Delaware Fund without a sales charge, or (ii) reinvest Fund dividends into additional shares of the Fund or into additional shares of other Delaware Funds, and (b) the privilege to combine holdings in other Delaware Funds to obtain a reduced sales charge. The Board was satisfied with the nature, extent, and quality of the overall services provided by DMC.
Investment performance.The Board placed significant emphasis on the investment performance of the Fund in view of the importance of investment performance to shareholders. Although the Board considered performance reports and discussions with portfolio managers at Investment Committee meetings throughout the year, the Board gave particular weight to the Broadridge reports furnished for the Annual Meeting. The Broadridge reports prepared for the Fund showed the investment performance of its Class A shares in comparison to a group of similar funds as selected by Broadridge (the “Performance Universe”). A fund with the best performance ranked first, and a fund with the poorest performance ranked last. The highest/best performing 25% of funds in the Performance Universe make up the first quartile; the next 25%, the second quartile; the next 25%, the third quartile; and the poorest/ worst performing 25% of funds in the Performance Universe make up the fourth quartile. Comparative
| 47 |
Table of Contents
| Other Fund information (Unaudited) | ||
| Delaware Small Cap Value Fund |
Board consideration of advisory agreement for Delaware Small Cap Value Fund at a meeting held August15-16, 2018 (continued)
annualized performance for the Fund was shown for the past1-,3-,5-, and10-year periods, to the extent applicable, ended Jan. 31, 2018. The Board’s objective is that the Fund’s performance for the1-,3-, and5-year periods be at or above the median of its Performance Universe.
Broadridge currently classifies the Fund as asmall-cap core fund. However, Management believes that, because the Fund utilizes a value investment philosophy and process, it would be more appropriate to include the Fund in thesmall-cap value funds category. Accordingly, the Broadridge report prepared for the Fund compares the Fund’s performance to two separate Performance Universes – one consisting of the Fund and all retail and institutionalsmall-cap core funds and the other consisting of the Fund and all retail and institutionalsmall-cap value funds. When compared to othersmall-cap core funds, the Broadridge report comparison showed that the Fund’s total return for the1-year period was in the third quartile of the Performance Universe. The report further showed that the Fund’s total return for the3-and10-year periods was in the first quartile and the Fund’s total return for the5-year period was in the second quartile of the Performance Universe. When compared to othersmall-cap value funds, the Broadridge report comparison showed that the Fund’s total return for the1-,3-,5-, and10-year periods was in the first quartile of the Performance Universe. The Board was satisfied with performance.
Comparative expenses.The Board considered expense data for the Delaware Funds. Management provided the Board with information on pricing levels and fee structures for the Fund as of its most recently completed fiscal year. The Board also focused on the comparative analysis of effective management fees and total expense ratios of the Fund versus effective management fees and total expense ratios of a group of similar funds as selected by Broadridge (the “Expense Group”). In reviewing comparative costs, the Fund’s contractual management fee and the actual management fee incurred by the Fund were compared with the contractual management fees (assuming all funds in the Expense Group were similar in size to the Fund) and actual management fees (as reported by each fund) within the Expense Group, taking into account any applicable breakpoints and fee waivers. The Fund’s total expenses were also compared with those of its Expense Group. The Broadridge total expenses, for comparative consistency, were shown by Broadridge for Class A shares and comparative total expenses including12b-1 andnon-12b-1 service fees. The Board’s objective is for the Fund’s total expense ratio to be competitive with those of the peer funds within its Expense Group.
Broadridge currently classifies the Fund as asmall-cap core fund. However, Management believes that, because the Fund utilizes a value investment philosophy and process, it would be more appropriate to include the Fund in thesmall-cap value funds category. Accordingly, the Broadridge report prepared for the Fund compares the Fund’s expenses to two separate Expense Groups – one consisting of the Fund and all retail and institutionalsmall-cap core funds and the other consisting of the Fund and all retail and institutionalsmall-cap value funds. When compared to othersmall-cap core funds, the expense comparisons for the Fund showed that its actual management fee and total expenses were in the quartile with the lowest expenses of its Expense Group. When compared to othersmall-cap value funds, the expense comparisons for the Fund showed that its actual management fee and total expenses were in the quartile with the second lowest expenses of its Expense Group. The Board was satisfied with the management fee and total expenses of the Fund in comparison to those of its Expense Group as shown in the Broadridge report.
| 48 |
Table of Contents
Management profitability.The Board considered the level of profits realized by DMC in connection with the operation of the Fund. In this respect, the Board reviewed the Investment Management Profitability Analysis that addressed the overall profitability of DMC’s business in providing management and other services to each of the individual funds and the Delaware Funds as a whole. Specific attention was given to the methodology used by DMC in allocating costs for the purpose of determining profitability. Management stated that the level of profits of DMC, to a certain extent, reflects recent operational cost savings and efficiencies initiated by DMC. The Board considered DMC’s efforts to improve services provided to Fund shareholders and to meet additional regulatory and compliance requirements resulting from recent industry-wide Securities and Exchange Commission initiatives. The Board also considered the extent to which DMC might derive ancillary benefits from fund operations, including the potential for procuring additional business as a result of the prestige and visibility associated with its role as service provider to the Delaware Funds and the benefits from allocation of fund brokerage to improve trading efficiencies. As part of its work, the Board also reviewed a report prepared by JDL regarding MIMBT profitability as compared to certain peer fund complexes and the Independent Trustees met with JDL personnel to discuss DMC’s profitability in such context. The Board found that the management fees were reasonable in light of the services rendered and the level of profitability of DMC.
Economies of scale.Trustees considered whether economies of scale are realized by DMC as the Fund’s assets increase and the extent to which any economies of scale are reflected in the level of management fees charged. The Trustees reviewed the Fund’s advisory fee pricing and structure, approved by the Board and shareholders, which includes breakpoints, and which applies to most funds in the Delaware Funds complex. Breakpoints in the advisory fee occur when the advisory fee rate is reduced on assets in excess of specified levels. Breakpoints result in a lower advisory fee than would otherwise be the case in the absence of breakpoints, when the asset levels specified in the breakpoints are exceeded. The Board noted that, as of March 31, 2018, the Fund’s assets exceeded the final breakpoint level. The Board believed that, given the extent to which economies of scale might be realized by DMC and its affiliates, the schedule of fees under the Investment Management Agreement provides a sharing of benefits with the Fund and its shareholders.
| 49 |
Table of Contents
| Board of trustees / directors and officers addendum | ||
| Delaware Funds®by Macquarie |
A mutual fund is governed by a Board of Trustees/Directors (“Trustees”), which has oversight responsibility for the management of a fund’s business affairs. Trustees establish procedures and oversee and review the performance of the investment manager, the distributor, and others who perform services for the fund. The independent fund trustees, in particular, are advocates
Name, Address, and Birth Date | Position(s) Held with Fund(s) | Length of Time Served | ||
Interested Trustee
| ||||
Shawn K. Lytle1,2 | President, | Trustee since | ||
2005 Market Street | Chief Executive Officer, | September 2015 | ||
Philadelphia, PA 19103 | and Trustee | |||
February 1970 | President and | |||
| Chief Executive Officer | ||||
| since August 2015 | ||||
Independent Trustees
| ||||
Thomas L. Bennett | Chair and Trustee | Trustee since | ||
2005 Market Street | March 2005 | |||
Philadelphia, PA 19103 | ||||
October 1947 | Chair since | |||
| March 2015 | ||||
Jerome D. Abernathy | Trustee | Since January 2019 | ||
2005 Market Street | ||||
Philadelphia, PA 19103 | ||||
July 1959 | ||||
Ann D. Borowiec | Trustee | Since March 2015 | ||
2005 Market Street | ||||
Philadelphia, PA 19103 | ||||
November 1958 | ||||
| 1 | Shawn K. Lytle is considered to be an “Interested Trustee” because he is an executive officer of the Fund’s(s’) investment advisor. |
| 2 | Shawn K. Lytle, David F. Connor, Daniel V. Geatens, and Richard Salus serve in similar capacities for the six portfolios of the Optimum Fund Trust, which have the same investment advisor, principal underwriter, and transfer agent as the registrant. Mr. Geatens also serves as the Chief Financial Officer and Treasurer for Macquarie Global Infrastructure Total Return Fund Inc., which has an affiliated investment manager. |
| 50 |
Table of Contents
for shareholder interests. Each trustee has served in that capacity since he or she was elected to or appointed to the Board of Trustees, and will continue to serve until his or her retirement or the election of a new trustee in his or her place. The following is a list of the Trustees and Officers with certain background and related information.
Principal Occupation(s) During the Past Five Years | Number of Portfolios in Fund Complex Overseen by Trustee or Officer | Other Directorships Held by Trustee or Officer | ||
| ||||
| President — Macquarie | 59 | Trustee — UBS | ||
Investment Management3 | Relationship Funds, | |||
(June 2015–Present) | SMA Relationship | |||
| Trust, and UBS Funds | ||||
Regional Head of | (May 2010–April 2015) | |||
Americas — UBS Global | ||||
Asset Management | ||||
(April 2010–May 2015) | ||||
| ||||
Private Investor | 59 | None | ||
(March 2004–Present) | ||||
Managing Member, | 59 | None | ||
Stonebrook Capital | ||||
Management, LLC (financial | ||||
technology: macro factors | ||||
and databases) | ||||
(January 1993–Present) | ||||
Chief Executive Officer, | 59 | Director — | ||
Private Wealth Management | Banco Santander International | |||
(2011–2013) and | (October 2016-Present) | |||
Market Manager, | ||||
New Jersey Private | Director — | |||
Bank (2005–2011) — | Santander Bank, N.A. | |||
J.P. Morgan Chase & Co. | (December 2016–Present) |
| 3 | Macquarie Investment Management is the marketing name for Macquarie Management Holdings, Inc. and its subsidiaries, including the Fund’s(s’) investment advisor, principal underwriter, and its transfer agent. |
| 51 |
Table of Contents
| Board of trustees / directors and officers addendum | ||
| Delaware Funds®by Macquarie |
Name, Address, and Birth Date | Position(s) Held with Fund(s) | Length of Time Served | ||
Independent Trustees (continued)
| ||||
| Joseph W. Chow | Trustee | Since January 2013 | ||
2005 Market Street | ||||
Philadelphia, PA 19103 | ||||
January 1953 | ||||
| John A. Fry | Trustee | Since January 2001 | ||
2005 Market Street | ||||
Philadelphia, PA 19103 | ||||
May 1960 | ||||
| Lucinda S. Landreth | Trustee | Since March 2005 | ||
| 2005 Market Street | ||||
| Philadelphia, PA 19103 | ||||
June 1947
| ||||
| 52 |
Table of Contents
Principal Occupation(s) During the Past Five Years | Number of Portfolios in Fund Complex Overseen by Trustee or Officer | Other Directorships Held by Trustee or Officer | ||
| ||||
Private Investor | 59 | Director and Audit Committee | ||
(April 2011–Present) | Member — Hercules | |||
| Technology Growth | ||||
| Capital, Inc. | ||||
(July 2004–July 2014)
| ||||
President — | 59 | Director; Compensation | ||
Drexel University | Committee and | |||
(August 2010–Present) | Governance Committee | |||
| Member — Community | ||||
President — | Health Systems | |||
Franklin & Marshall College | ||||
(July 2002–July 2010) | Director — Drexel | |||
| Morgan & Co. | ||||
| Director; Audit Committee | ||||
| Member — vTv | ||||
| Therapeutics LLC | ||||
| Director; Audit Committee | ||||
| Member — FS Credit Real | ||||
Estate Income Trust, Inc.
| ||||
Private Investor | 59 | None | ||
(2004–Present) | ||||
| ||||
| 53 |
Table of Contents
| Board of trustees / directors and officers addendum | ||
| Delaware Funds®by Macquarie |
Name, Address, and Birth Date | Position(s) Held with Fund(s) | Length of Time Served | ||
Independent Trustees (continued)
| ||||
| Frances A. Sevilla-Sacasa | Trustee | Since September 2011 | ||
2005 Market Street | ||||
Philadelphia, PA 19103 | ||||
January 1956 | ||||
Thomas K. Whitford | Trustee | Since January 2013 | ||
2005 Market Street | ||||
Philadelphia, PA 19103 | ||||
March 1956 | ||||
| 54 |
Table of Contents
Principal Occupation(s) During the Past Five Years | Number of Portfolios in Fund Complex Overseen by Trustee or Officer | Other Directorships Held by Trustee or Officer | ||
| ||||
| Private Investor | 59 | Trust Manager and | ||
(January 2017–Present) | Audit Committee | |||
| Chair — Camden | ||||
Chief Executive Officer — | Property Trust | |||
Banco Itaú | (August 2011–Present) | |||
International | ||||
(April 2012–December 2016) | Director — | |||
| Carrizo Oil & Gas, Inc. | ||||
Executive Advisor to Dean | (March 2018-Present) | |||
(August 2011–March 2012) | ||||
and Interim Dean | ||||
(January 2011–July 2011) — | ||||
University of Miami School of | ||||
Business Administration | ||||
President — U.S. Trust, | ||||
Bank of America Private | ||||
Wealth Management | ||||
(Private Banking) | ||||
(July 2007–December 2008) | ||||
| Vice Chairman | 59 | Director — HSBC North | ||
| (2010-April 2013) — | America Holdings Inc. | |||
| PNC Financial | (December 2013–Present) | |||
| Services Group | ||||
| Director — HSBC USA Inc. | ||||
| (July 2014–Present) | ||||
| Director — | ||||
| HSBC Bank USA, | ||||
| National Association | ||||
| (July 2014–March 2017) | ||||
| Director — HSBC | ||||
| Finance Corporation | ||||
(December 2013–April 2018)
| ||||
| 55 |
Table of Contents
| Board of trustees / directors and officers addendum | ||
| Delaware Funds®by Macquarie |
Name, Address, and Birth Date | Position(s) Held with Fund(s) | Length of Time Served | ||
Independent Trustees (continued)
| ||||
| Christianna Wood | Trustee | Since January 2019 | ||
2005 Market Street | ||||
Philadelphia, PA 19103 | ||||
August 1959 | ||||
Janet L. Yeomans | Trustee | Since April 1999 | ||
2005 Market Street | ||||
Philadelphia, PA 19103 | ||||
July 1948 | ||||
| 56 |
Table of Contents
Principal Occupation(s) During the Past Five Years | Number of Portfolios in Fund Complex Overseen by Trustee or Officer | Other Directorships Held by Trustee or Officer | ||
| ||||
| Chief Executive Officer | 59 | Director of H&R Block | ||
and President — | Corporation | |||
Gore Creek | (July 2008–Present); | |||
Capital, Ltd. | Director of Grange | |||
(August 2009–Present) | Insurance (2013–Present); | |||
| Trustee of Merger Fund | ||||
| (August 2009-Present), | ||||
| WCM Alternatives: | ||||
| Event-Driven Fund | ||||
| (March 2017-Present), | ||||
| and WCM Alternatives: | ||||
| Credit Event Fund | ||||
| (December 2017-Present) | ||||
Vice President and Treasurer | 59 | Director (2009–2017); | ||
(January 2006–July 2012), | Personnel and Compensation | |||
Vice President — | Committee Chair; Member of | |||
Mergers & Acquisitions | Nominating, Investments, and | |||
(January 2003–January 2006), | Audit Committees for various | |||
and Vice President | periods throughout | |||
and Treasurer | directorship — | |||
(July 1995–January 2003) — | Okabena Company | |||
3M Company | ||||
| 57 |
Table of Contents
| Board of trustees / directors and officers addendum | ||
| Delaware Funds®by Macquarie |
Name, Address, and Birth Date | Position(s) Held with Fund(s) | Length of Time Served | ||
Officers
| ||||
| David F. Connor | Senior Vice President, | Senior Vice President since | ||
2005 Market Street | General Counsel, | May 2013; General | ||
| Philadelphia, PA 19103 | and Secretary | Counsel since May 2015; | ||
December 1963 | Secretary since | |||
October 2005
| ||||
Daniel V. Geatens | Vice President | Vice President and | ||
2005 Market Street | and Treasurer | Treasurer since October 2007 | ||
Philadelphia, PA 19103 | ||||
October 1972 | ||||
Richard Salus | Senior Vice President | Senior Vice President and | ||
2005 Market Street | and Chief Financial Officer | Chief Financial Officer | ||
Philadelphia, PA 19103 | since November 2006 | |||
October 1963 | ||||
The Statement of Additional Information for the Fund(s) includes additional information about the Trustees and Officers and is available, without charge, upon request by calling 800523-1918.
| 58 |
Table of Contents
Principal Occupation(s) During the Past Five Years | Number of Portfolios in Fund Complex Overseen by Trustee or Officer | Other Directorships Held by Trustee or Officer | ||
| ||||
| David F. Connor has served | 59 | None2 | ||
in various capacities at | ||||
different times at | ||||
| Macquarie Investment | ||||
| Management. | ||||
Daniel V. Geatens has served | 59 | None2 | ||
in various capacities at | ||||
different times at | ||||
Macquarie Investment | ||||
Management. | ||||
Richard Salus has served | 59 | None2 | ||
in various executive capacities | ||||
at different times at | ||||
Macquarie Investment | ||||
Management. |
| 59 |
Table of Contents
| Board of trustees | ||||||
| Shawn K. Lytle | Ann D. Borowiec | Lucinda S. Landreth | Thomas K. Whitford | |||
President and Chief Executive Officer Delaware Funds® by Macquarie Philadelphia, PA
Thomas L. Bennett Chairman of the Board Delaware Funds by Macquarie Private Investor Rosemont, PA
Jerome D. Abernathy Managing Member Stonebrook Capital Management, LLC New York, NY | Former Chief Executive Officer Private Wealth Management J.P. Morgan Chase & Co. New York, NY
Joseph W. Chow Former Executive Vice President State Street Corporation Boston, MA
John A. Fry President Drexel University Philadelphia, PA | Former Chief Investment Officer Assurant, Inc. New York, NY Frances A. Sevilla-Sacasa Former Chief Executive Officer Banco Itaú International Miami, FL | Former Vice Chairman PNC Financial Services Group Pittsburgh, PA
Christianna Wood Chief Executive Officer and President Gore Creek Capital, Ltd. Golden, CO
Janet L. Yeomans Former Vice President and Treasurer 3M Company St. Paul, MN | |||
| Affiliated officers | ||||||
| David F. Connor | Daniel V. Geatens | Richard Salus | ||||
| Senior Vice President, | Vice President and | Senior Vice President and | ||||
| General Counsel, | Treasurer | Chief Financial Officer | ||||
| and Secretary | Delaware Funds | Delaware Funds | ||||
| Delaware Funds | by Macquarie | by Macquarie | ||||
| by Macquarie | Philadelphia, PA | Philadelphia, PA | ||||
| Philadelphia, PA | ||||||
This annual report is for the information of Delaware Small Cap Value Fund shareholders, but it may be used with prospective investors when preceded or accompanied by the Delaware Fund fact sheet for the most recently completed calendar quarter. These documents are available at delawarefunds.com/literature.
The Fund files its complete schedule of portfolio holdings with the Securities and Exchange Commission (SEC) for the first and third quarters of each fiscal year on FormN-Q. The Fund’s FormsN-Q, as well as a description of the policies and procedures that the Fund uses to determine how to vote proxies (if any) relating to portfolio securities are available without charge (i) upon request, by calling 800523-1918; and (ii) on the SEC’s website at sec.gov. In addition, a description of the policies and procedures that the Fund uses to determine how to vote proxies (if any) relating to portfolio securities and the Schedule of Investments included in the Fund’s most recent FormN-Q are available without charge on the Fund’s website at delawarefunds.com/literature. The Fund’s FormsN-Q may be reviewed and copied at the SEC’s Public Reference Room in Washington, D.C.; information on the operation of the Public Reference Room may be obtained by calling 800SEC-0330.
Information (if any) regarding how the Fund voted proxies relating to portfolio securities during the most recently disclosed12-month period ended June 30 is available without charge (i) through the Fund’s website at delawarefunds.com/proxy; and (ii) on the SEC’s website at sec.gov.
60
Item 2. Code of Ethics
The registrant has adopted a code of ethics that applies to the registrant’s principal executive officer, principal financial officer, principal accounting officer or controller, or persons performing similar functions, regardless of whether these individuals are employed by the registrant or a third party. A copy of the registrant’s Code of Business Ethics has been posted on the Delaware Funds®by Macquarie Internet Web site at www.delawarefunds.com. Any amendments to the Code of Business Ethics, and information on any waiver from its provisions granted by the registrant, will also be posted on this Web site within five business days of such amendment or waiver and will remain on the Web site for at least 12 months.
Item 3. Audit Committee Financial Expert
The registrant’s Board of Trustees has determined that certain members of the registrant’s Audit Committee are audit committee financial experts, as defined below. For purposes of this item, an “audit committee financial expert” is a person who has the following attributes:
a. An understanding of generally accepted accounting principles and financial statements;
b. The ability to assess the general application of such principles in connection with the accounting for estimates, accruals, and reserves;
c. Experience preparing, auditing, analyzing, or evaluating financial statements that present a breadth and level of complexity of accounting issues that are generally comparable to the breadth and complexity of issues that can reasonably be expected to be raised by the registrant’s financial statements, or experience actively supervising one or more persons engaged in such activities;
d. An understanding of internal controls and procedures for financial reporting; and
e. An understanding of audit committee functions.
An “audit committee financial expert” shall have acquired such attributes through:
a. Education and experience as a principal financial officer, principal accounting officer, controller, public accountant, or auditor or experience in one or more positions that involve the performance of similar functions;
b. Experience actively supervising a principal financial officer, principal accounting officer, controller, public accountant, auditor, or person performing similar functions;
c. Experience overseeing or assessing the performance of companies or public accountants with respect to the preparation, auditing, or evaluation of financial statements; or
d. Other relevant experience.
The registrant’s Board of Trustees has also determined that each member of the registrant’s Audit Committee is independent. In order to be “independent” for purposes of this item, the Audit Committee member may not: (i) other than in his or her capacity as a member of the Board of Trustees or any committee thereof, accept directly or indirectly any consulting, advisory or other compensatory fee from the issuer; or (ii) be an “interested person” of the registrant as defined in Section 2(a)(19) of the Investment Company Act of 1940.
The names of the audit committee financial experts on the registrant’s Audit Committee are set forth below:
John A. Fry
Lucinda S. Landreth
Thomas K. Whitford
Christianna Wood
Janet L. Yeomans
Item 4. Principal Accountant Fees and Services
(a)Audit fees.
The aggregate fees billed for services provided to the registrant by its independent auditors for the audit of the registrant’s annual financial statements and for services normally provided by the independent auditors in connection with statutory and regulatory filings or engagements were $101,900 for the fiscal year ended November 30, 2018.
The aggregate fees billed for services provided to the registrant by its independent auditors for the audit of the registrant’s annual financial statements and for services normally provided by the independent auditors in connection with statutory and regulatory filings or engagements were $99,060 for the fiscal year ended November 30, 2017.
(b)Audit-related fees.
The aggregate fees billed by the registrant’s independent auditors for services relating to the performance of the audit of the registrant’s financial statements and not reported under paragraph (a) of this Item were $0 for the fiscal year ended November 30, 2018.
The aggregate fees billed by the registrant’s independent auditors for services relating to the performance of the audit of the financial statements of the registrant’s investment adviser and other service providers under common control with the adviser and that relate directly to the operations or financial reporting of the registrant were $640,000 for the registrant’s fiscal year ended November 30, 2018. The percentage of these fees relating to services approved by the registrant’s Audit Committee pursuant to thedeminimis exception from the pre-approval requirement in Rule 2-01(c)(7)(i)(C) of Regulation S-X was 0%. These audit-related services were as follows: year-end audit procedures; group reporting and subsidiary statutory audits.
The aggregate fees billed by the registrant’s independent auditors for services relating to the performance of the audit of the registrant’s financial statements and not reported under paragraph (a) of this Item were $0 for the fiscal year ended November 30, 2017.
The aggregate fees billed by the registrant’s independent auditors for services relating to the performance of the audit of the financial statements of the registrant’s investment adviser and other service providers under common control with the adviser and that relate directly to the operations or financial reporting of the registrant were $640,000 for the registrant’s fiscal year ended November 30, 2017. The percentage of these fees relating to services approved by the registrant’s Audit Committee pursuant to thedeminimis exception from the pre-approval requirement in Rule 2-01(c)(7)(i)(C) of Regulation S-X was 0%. These audit-related services were as follows: year-end audit procedures; group reporting and subsidiary statutory audits.
(c)Tax fees.
The aggregate fees billed by the registrant’s independent auditors for tax-related services provided to the registrant were $15,972 for the fiscal year ended November 30, 2018. The percentage of these fees relating to services approved by the registrant’s Audit Committee pursuant to thedeminimis exception from the pre-approval requirement in Rule 2-01(c)(7)(i)(C) of Regulation S-X was 0%. These tax-related services were as follows: review of income tax returns and review of annual excise distribution calculations.
The aggregate fees billed by the registrant’s independent auditors for tax-related services provided to the registrant’s investment adviser and other service providers under common control with the adviser and that relate directly to the operations or financial reporting of the registrant were $0 for the registrant’s fiscal year ended November 30, 2018. The percentage of these fees relating to services approved by the registrant’s Audit Committee pursuant to the de minimis exception from the pre-approval requirement in Rule 2-01(c)(7)(i)(C) of Regulation S-X was 0%.
The aggregate fees billed by the registrant’s independent auditors for tax-related services provided to the registrant were $15,957 for the fiscal year ended November 30, 2017. The percentage of these fees relating to services approved by the registrant’s Audit Committee pursuant to thedeminimis exception from the pre-approval requirement in Rule 2-01(c)(7)(i)(C) of Regulation S-X was 0%. These tax-related services were as follows: review of income tax returns and review of annual excise distribution calculations.
The aggregate fees billed by the registrant’s independent auditors for tax-related services provided to the registrant’s investment adviser and other service providers under common control with the adviser and that relate directly to the operations or financial reporting of the registrant were $0 for the registrant’s fiscal year ended November 30, 2017. The percentage of these fees relating to services approved by the registrant’s Audit Committee pursuant to the de minimis exception from the pre-approval requirement in Rule 2-01(c)(7)(i)(C) of Regulation S-X was 0%.
(d)All other fees.
The aggregate fees billed for all services provided by the independent auditors to the registrant other than those set forth in paragraphs (a), (b) and (c) of this Item were $0 for the fiscal year ended November 30, 2018.
The aggregate fees billed for all services other than those set forth in paragraphs (b) and (c) of this Item provided by the registrant’s independent auditors to the registrant’s adviser and other service providers under common control with the adviser and that relate directly to the operations or financial reporting of the registrant were $0 for the registrant’s fiscal year ended November 30, 2018. The percentage of these fees relating to services approved by the registrant’s Audit Committee pursuant to thedeminimis exception from the pre-approval requirement in Rule 2-01(c)(7)(i)(C) of Regulation S-X was 0%.
The aggregate fees billed for all services provided by the independent auditors to the registrant other than those set forth in paragraphs (a), (b) and (c) of this Item were $0 for the fiscal year ended November 30, 2017.
The aggregate fees billed for all services other than those set forth in paragraphs (b) and (c) of this Item provided by the registrant’s independent auditors to the registrant’s adviser and other service providers under common control with the adviser and that relate directly to the operations or financial reporting of the registrant were $0 for the registrant’s fiscal year ended November 30, 2017. The percentage of these fees relating to services approved by the registrant’s Audit Committee pursuant to thedeminimis exception from the pre-approval requirement in Rule 2-01(c)(7)(i)(C) of Regulation S-X was 0%.
(e) The registrant’s Audit Committee has established pre-approval policies and procedures as permitted by Rule 2-01(c)(7)(i)(B) of Regulation S-X (the “Pre-Approval Policy”) with respect to services provided by the registrant’s independent auditors. Pursuant to the Pre-Approval Policy, the Audit Committee has pre-approved the services set forth in the table below with respect to the registrant up to the specified fee limits. Certain fee limits are based on aggregate fees to the registrant and other registrants within the Delaware Funds®by Macquarie.
| Service | Range of Fees |
| Audit Services | |
| Statutory audits or financial audits for new Funds | up to $40,000 per Fund |
| Services associated with SEC registration statements (e.g., Form N-1A, Form N-14, etc.), periodic reports and other documents filed with the SEC or other documents issued in connection with securities offerings (e.g., comfort letters for closed-end Fund offerings, consents), and assistance in responding to SEC comment letters | up to $10,000 per Fund |
| Consultations by Fund management as to the accounting or disclosure treatment of transactions or events and/or the actual or potential impact of final or proposed rules, standards or interpretations by the SEC, FASB, or other regulatory or standard-setting bodies (Note: Under SEC rules, some consultations may be considered “audit-related services” rather than “audit services”) | up to $25,000 in the aggregate |
| Audit-Related Services | |
| Consultations by Fund management as to the accounting or disclosure treatment of transactions or events and/or the actual or potential impact of final or proposed rules, standards or interpretations by the SEC, FASB, or other regulatory or standard-setting bodies (Note: Under SEC rules, some consultations may be considered “audit services” rather than “audit-related services”) | up to $25,000 in the aggregate |
| Tax Services | |
| U.S. federal, state and local and international tax planning and advice (e.g., consulting on statutory, regulatory or administrative developments, evaluation of Funds’ tax compliance function, etc.) | up to $25,000 in the aggregate |
| U.S. federal, state and local tax compliance (e.g., excise distribution reviews, etc.) | up to $5,000 per Fund |
| Review of federal, state, local and international income, franchise and other tax returns | up to $5,000 per Fund |
Under the Pre-Approval Policy, the Audit Committee has also pre-approved the services set forth in the table below with respect to the registrant’s investment adviser and other entities controlling, controlled by or under common control with the investment adviser that provide ongoing services to the registrant (the “Control Affiliates”) up to the specified fee limit. This fee limit is based on aggregate fees to the investment adviser and its Control Affiliates.
| Service | Range of Fees |
| Non-Audit Services | |
| Services associated with periodic reports and other documents filed with the SEC and assistance in responding to SEC comment letters | up to $10,000 in the aggregate |
The Pre-Approval Policy requires the registrant’s independent auditors to report to the Audit Committee at each of its regular meetings regarding all services initiated since the last such report was rendered, including those services authorized by the Pre-Approval Policy.
(f) Not applicable.
(g) The aggregate non-audit fees billed by the registrant’s independent auditors for services rendered to the registrant and to its investment adviser and other service providers under common control with the adviser were $11,748,000 and $11,180,000 for the registrant’s fiscal years ended November 30, 2018 and November 30, 2017, respectively.
(h) In connection with its selection of the independent auditors, the registrant’s Audit Committee has considered the independent auditors’ provision of non-audit services to the registrant’s investment adviser and other service providers under common control with the adviser that were not required to be pre-approved pursuant to Rule 2-01(c)(7)(ii) of Regulation S-X. The Audit Committee has determined that the independent auditors’ provision of these services is compatible with maintaining the auditors’ independence.
Item 5. Audit Committee of Listed Registrants
Not applicable.
Item 6. Investments
(a) Included as part of report to shareholders filed under Item 1 of this Form N-CSR.
(b) Divestment of securities in accordance with Section 13(c) of the Investment Company Act of 1940.
Not applicable.
Item 7. Disclosure of Proxy Voting Policies and Procedures for Closed-End Management Investment Companies
Not applicable.
Item 8. Portfolio Managers of Closed-End Management Investment Companies
Not applicable.
Item 9. Purchases of Equity Securities by Closed-End Management Investment Company and Affiliated Purchasers
Not applicable.
Item 10. Submission of Matters to a Vote of Security Holders
Not applicable.
Item 11. Controls and Procedures
The registrant’s principal executive officer and principal financial officer have evaluated the registrant’s disclosure controls and procedures within 90 days of the filing of this report and have concluded that they are effective in providing reasonable assurance that the information required to be disclosed by the registrant in its reports or statements filed under the Securities Exchange Act of 1934 is recorded, processed, summarized and reported within the time periods specified in the rules and forms of the Securities and Exchange Commission.
There were no significant changes in the registrant’s internal control over financial reporting that occurred during the second fiscal quarter of the period covered by the report to stockholders included herein (i.e., the registrant’s fourth fiscal quarter) that have materially affected, or are reasonably likely to materially affect, the registrant’s internal control over financial reporting.
Item 12. Disclosure of Securities Lending Activities for Closed-End Management Investment Companies
Not applicable.
Item 13. Exhibits
(a) (1) Code of Ethics
Not applicable.
(2) Certifications of Principal Executive Officer and Principal Financial Officer pursuant to Rule 30a-2 under the Investment Company Act of 1940 are attached hereto as Exhibit 99.CERT.
(3) Written solicitations to purchase securities pursuant to Rule 23c-1 under the Securities Exchange Act of 1934.
Not applicable.
(b) Certifications pursuant to Section 906 of the Sarbanes-Oxley Act of 2002 are furnished herewith as Exhibit 99.906CERT.
SIGNATURES
Pursuant to the requirements of the Securities Exchange Act of 1934 and the Investment Company Act of 1940, the registrant has duly caused this report to be signed on its behalf, by the undersigned, thereunto duly authorized.
DELAWARE GROUP®EQUITY FUNDS V
| SHAWN K. LYTLE | |
| By: | Shawn K. Lytle |
| Title: | President and Chief Executive Officer |
| Date: | February 4, 2019 |
Pursuant to the requirements of the Securities Exchange Act of 1934 and the Investment Company Act of 1940, this report has been signed below by the following persons on behalf of the registrant and in the capacities and on the dates indicated.
| SHAWN K. LYTLE | |
| By: | Shawn K. Lytle |
| Title: | President and Chief Executive Officer |
| Date: | February 4, 2019 |
| RICHARD SALUS | |
| By: | Richard Salus |
| Title: | Chief Financial Officer |
| Date: | February 4, 2019 |