CLEARWATER INVESTMENT TRUST
Schedule of Investments - Clearwater Core Equity Fund
September 30, 2020 (unaudited)
| Shares | Security | Cost | Fair value (a) | Percent of net assets | ||||
| Common Stocks: | ||||||||
| Communication Services: | ||||||||
| 27,592 | ACTIVISION BLIZZARD, INC. | $1,363,990 | 2,233,572 | |||||
| 5,002 | ALPHABET, INC., CLASS A(b) | 2,292,897 | 7,330,931 | |||||
| 4,079 | ALPHABET, INC., CLASS C(b) | 1,734,443 | 5,994,498 | |||||
| 2,000 | ALTICE U.S.A., INC., CLASS A(b) | 43,775 | 52,000 | |||||
| 147,503 | AT&T, INC. | 3,933,657 | 4,205,310 | |||||
| 300 | CABLE ONE, INC. | 113,966 | 565,629 | |||||
| 123,585 | CENTURYLINK, INC. | 1,241,084 | 1,246,973 | |||||
| 590 | CHARTER COMMUNICATIONS, INC., CLASS A(b) | 292,304 | 368,361 | |||||
| 49,281 | CINEMARK HOLDINGS, INC. | 463,207 | 492,810 | |||||
| 57,795 | COMCAST CORP., CLASS A | 632,884 | 2,673,597 | |||||
| 88,129 | DISCOVERY, INC., CLASS A(b) | 2,142,227 | 1,918,568 | |||||
| 385 | DISH NETWORK CORP., CLASS A(b) | 4,926 | 11,177 | |||||
| 29,670 | ELECTRONIC ARTS, INC.(b) | 2,694,992 | 3,869,265 | |||||
| 31,337 | FACEBOOK, INC., CLASS A(b) | 1,845,029 | 8,207,160 | |||||
| 1,360 | GCI LIBERTY, INC., CLASS A(b) | 51,149 | 111,466 | |||||
| 300 | IAC/INTERACTIVECORP(b) | 11,572 | 35,934 | |||||
| 2,115 | INTERPUBLIC GROUP OF (THE) COS., INC. | 31,161 | 35,257 | |||||
| 5,832 | LIBERTY GLOBAL PLC, CLASS A(b)(c) | 42,377 | 122,530 | |||||
| 7,374 | LIBERTY GLOBAL PLC, CLASS C(b)(c) | 51,974 | 151,425 | |||||
| 1,800 | LIBERTY MEDIA CORP.-LIBERTY FORMULA ONE, CLASS C(b) | 45,464 | 65,286 | |||||
| 4,046 | MATCH GROUP, INC.(b) | 234,961 | 447,690 | |||||
| 4,262 | NETFLIX, INC.(b) | 1,436,618 | 2,131,128 | |||||
| 2,375 | NEWS CORP., CLASS A | 7,170 | 33,297 | |||||
| 700 | NEXSTAR MEDIA GROUP, INC., CLASS A | 44,492 | 62,951 | |||||
| 5,434 | OMNICOM GROUP, INC. | 271,408 | 268,983 | |||||
| 600 | ROKU, INC.(b) | 80,378 | 113,280 | |||||
| 1,200 | SPOTIFY TECHNOLOGY S.A.(b)(c) | 149,087 | 291,084 | |||||
| 1,544 | TEGNA, INC. | 7,743 | 18,142 | |||||
| 27,736 | T-MOBILE U.S., INC.(b) | 1,959,092 | 3,171,889 | |||||
| 3,305 | TRIPADVISOR, INC. | 56,130 | 64,745 | |||||
| 9,852 | TWITTER, INC.(b) | 231,498 | 438,414 | |||||
| 67,275 | VERIZON COMMUNICATIONS, INC. | 2,992,840 | 4,002,190 | |||||
| 1 | VIACOMCBS, INC., CLASS B | 48 | 28 | |||||
| 27,007 | WALT DISNEY (THE) CO. | 679,844 | 3,351,029 | |||||
| 27,184,387 | 54,086,599 | 9.98% | ||||||
| Consumer Discretionary: | ||||||||
| 1,500 | ADVANCE AUTO PARTS, INC. | 53,557 | 230,250 | |||||
| 5,534 | AMAZON.COM, INC.(b) | 5,899,211 | 17,425,072 | |||||
| 2,400 | ARAMARK | 47,393 | 63,480 | |||||
| 1,100 | AUTOLIV, INC.(c) | 13,982 | 80,168 | |||||
| 13,174 | AUTONATION, INC.(b) | 340,741 | 697,300 | |||||
| 800 | AUTOZONE, INC.(b) | 571,776 | 942,112 | |||||
| 57,075 | BEST BUY CO., INC. | 3,242,872 | 6,351,877 | |||||
| 1,400 | BIG LOTS, INC. | 15,477 | 62,440 | |||||
| 1,461 | BOOKING HOLDINGS, INC.(b) | 2,144,770 | 2,499,303 | |||||
| 7,742 | BORGWARNER, INC. | 164,658 | 299,925 | |||||
| 831 | BURLINGTON STORES, INC.(b) | 85,265 | 171,261 | |||||
| 3,068 | CARMAX, INC.(b) | 33,093 | 281,980 | |||||
| 57,484 | CARNIVAL CORP. | 601,788 | 872,607 | |||||
| 1,199 | CARTER'S, INC. | 97,866 | 103,809 | |||||
| 1,000 | CARVANA CO.(b) | 127,620 | 223,060 | |||||
| 5,227 | D.R. HORTON, INC. | 58,864 | 395,318 | |||||
| 2,326 | DARDEN RESTAURANTS, INC. | 108,803 | 234,321 | |||||
| 1,500 | DICK'S SPORTING GOODS, INC. | 24,803 | 86,820 | |||||
| 3,389 | DOLLAR GENERAL CORP. | 248,398 | 710,402 | |||||
| 5,224 | DOLLAR TREE, INC.(b) | 52,773 | 477,160 | |||||
| 1,100 | DOMINO'S PIZZA, INC. | 154,333 | 467,808 | |||||
| 67,839 | EBAY, INC. | 2,318,161 | 3,534,412 | |||||
| 1,200 | ETSY, INC.(b) | 49,559 | 145,956 | |||||
| 822 | EXPEDIA GROUP, INC. | 13,985 | 75,369 | |||||
| 1,391 | FLOOR & DECOR HOLDINGS, INC., CLASS A(b) | 42,485 | 104,047 | |||||
| 19,572 | FOOT LOCKER, INC. | 464,589 | 646,463 | |||||
| 22,163 | FORD MOTOR CO. | 72,511 | 147,606 | |||||
| 1,300 | FRONTDOOR, INC.(b) | 30,171 | 50,583 | |||||
| 18,248 | GAP (THE), INC. | 140,118 | 310,763 | |||||
| 1 | (Continued) |
CLEARWATER INVESTMENT TRUST
Schedule of Investments - Clearwater Core Equity Fund
September 30, 2020 (unaudited)
| Shares | Security | Cost | Fair value (a) | Percent of net assets | ||||
| Consumer Discretionary (Cont'd): | ||||||||
| 5,273 | GARMIN LTD.(c) | $188,068 | 500,197 | |||||
| 14,081 | GENERAL MOTORS CO. | 351,158 | 416,657 | |||||
| 15,000 | GENTEX CORP. | 106,860 | 386,250 | |||||
| 3,450 | GENUINE PARTS CO. | 102,424 | 328,337 | |||||
| 15,152 | HANESBRANDS, INC. | 128,268 | 238,644 | |||||
| 400 | HASBRO, INC. | 10,206 | 33,088 | |||||
| 1,600 | HILTON WORLDWIDE HOLDINGS, INC. | 115,613 | 136,512 | |||||
| 15,500 | HOME DEPOT (THE), INC. | 2,435,136 | 4,304,505 | |||||
| 30,418 | INTERNATIONAL GAME TECHNOLOGY PLC | 167,706 | 338,552 | |||||
| 6,950 | KOHL'S CORP. | 55,508 | 128,784 | |||||
| 971 | KONTOOR BRANDS, INC. | 5,113 | 23,498 | |||||
| 3,290 | L BRANDS, INC. | 38,158 | 104,655 | |||||
| 2,338 | LAS VEGAS SANDS CORP. | 14,654 | 109,091 | |||||
| 29,465 | LENNAR CORP., CLASS A | 1,344,687 | 2,406,701 | |||||
| 58 | LENNAR CORP., CLASS B | 652 | 3,808 | |||||
| 15,160 | LKQ CORP.(b) | 410,648 | 420,387 | |||||
| 924 | LOWE'S COS., INC. | 153,051 | 153,255 | |||||
| 4,767 | LULULEMON ATHLETICA, INC.(b)(c) | 606,562 | 1,570,107 | |||||
| 3,038 | MARRIOTT INTERNATIONAL, INC., CLASS A | 63,603 | 281,258 | |||||
| 294 | MARRIOTT VACATIONS WORLDWIDE CORP. | 4,103 | 26,698 | |||||
| 10,620 | MCDONALD'S CORP. | 433,348 | 2,330,984 | |||||
| 6,600 | MGM RESORTS INTERNATIONAL | 54,921 | 143,550 | |||||
| 600 | MOHAWK INDUSTRIES, INC.(b) | 26,796 | 58,554 | |||||
| 600 | MURPHY U.S.A., INC.(b) | 4,392 | 76,962 | |||||
| 4,915 | NEWELL BRANDS, INC. | 52,223 | 84,341 | |||||
| 10,000 | NIKE, INC., CLASS B | 221,030 | 1,255,400 | |||||
| 4,300 | NORDSTROM, INC. | 45,233 | 51,256 | |||||
| 103 | NVR, INC.(b) | 133,164 | 420,561 | |||||
| 900 | O'REILLY AUTOMOTIVE, INC.(b) | 27,059 | 414,972 | |||||
| 4,707 | PENSKE AUTOMOTIVE GROUP, INC. | 191,281 | 224,336 | |||||
| 900 | PLANET FITNESS, INC., CLASS A(b) | 45,306 | 55,458 | |||||
| 1,225 | POOL CORP. | 308,981 | 409,811 | |||||
| 26,129 | PULTEGROUP, INC. | 480,957 | 1,209,511 | |||||
| 2,342 | PVH CORP. | 101,514 | 139,677 | |||||
| 20,045 | QURATE RETAIL, INC., CLASS A | 55,417 | 143,923 | |||||
| 1,500 | RALPH LAUREN CORP. | 31,320 | 101,955 | |||||
| 4,543 | ROSS STORES, INC. | 175,795 | 423,953 | |||||
| 9,411 | ROYAL CARIBBEAN CRUISES LTD. | 228,563 | 609,174 | |||||
| 3,200 | SIX FLAGS ENTERTAINMENT CORP. | 48,149 | 64,960 | |||||
| 30,689 | STARBUCKS CORP. | 714,369 | 2,636,799 | |||||
| 4,800 | TAPESTRY, INC. | 14,970 | 75,024 | |||||
| 22,005 | TARGET CORP. | 2,265,472 | 3,464,027 | |||||
| 8,870 | TESLA, INC.(b) | 1,225,120 | 3,805,319 | |||||
| 2,576 | THOR INDUSTRIES, INC. | 90,958 | 245,390 | |||||
| 1,400 | TIFFANY & CO. | 35,210 | 162,190 | |||||
| 20,188 | TJX (THE) COS., INC. | 86,033 | 1,123,462 | |||||
| 1,466 | TOPBUILD CORP.(b) | 11,809 | 250,232 | |||||
| 553 | ULTA BEAUTY, INC.(b) | 73,007 | 123,861 | |||||
| 1,100 | VEONEER, INC.(b)(c) | 5,428 | 16,170 | |||||
| 6,800 | VF CORP. | 81,950 | 477,700 | |||||
| 407 | WAYFAIR, INC., CLASS A(b) | 88,670 | 118,441 | |||||
| 3,000 | WENDY'S (THE) CO. | 43,280 | 66,885 | |||||
| 7,417 | WHIRLPOOL CORP. | 755,937 | 1,363,912 | |||||
| 2,773 | WILLIAMS-SONOMA, INC. | 149,190 | 250,790 | |||||
| 23,166 | WYNDHAM DESTINATIONS, INC. | 477,832 | 712,586 | |||||
| 1,400 | WYNDHAM HOTELS & RESORTS, INC. | 46,408 | 70,700 | |||||
| 1,600 | WYNN RESORTS LTD. | 32,322 | 114,896 | |||||
| 900 | YUM CHINA HOLDINGS, INC.(c) | 40,023 | 47,655 | |||||
| 32,425,237 | 72,948,033 | 13.46% | ||||||
| Consumer Staples: | ||||||||
| 51,876 | ALTRIA GROUP, INC. | 2,129,220 | 2,004,489 | |||||
| 10,300 | ARCHER-DANIELS-MIDLAND CO. | 188,618 | 478,847 | |||||
| 700 | BEYOND MEAT, INC.(b) | 51,107 | 116,242 | |||||
| 500 | BOSTON BEER (THE) CO., INC., CLASS A(b) | 267,930 | 441,680 | |||||
| 7,290 | BROWN-FORMAN CORP., CLASS B | 57,343 | 549,083 | |||||
| 2,704 | CAMPBELL SOUP CO. | 131,380 | 130,792 | |||||
| 14,871 | CHURCH & DWIGHT CO., INC. | 691,573 | 1,393,561 | |||||
| 2 | (Continued) |
CLEARWATER INVESTMENT TRUST
Schedule of Investments - Clearwater Core Equity Fund
September 30, 2020 (unaudited)
| Shares | Security | Cost | Fair value (a) | Percent of net assets | ||||
| Consumer Staples (Cont'd): | ||||||||
| 4,072 | CLOROX (THE) CO. | $633,919 | 855,812 | |||||
| 56,139 | COCA-COLA (THE) CO. | 844,179 | 2,771,582 | |||||
| 1,280 | COLGATE-PALMOLIVE CO. | 36,019 | 98,752 | |||||
| 1,900 | CONAGRA BRANDS, INC. | 26,152 | 67,849 | |||||
| 1,600 | CONSTELLATION BRANDS, INC., CLASS A | 202,589 | 303,216 | |||||
| 4,049 | COSTCO WHOLESALE CORP. | 173,164 | 1,437,395 | |||||
| 1,646 | ESTEE LAUDER (THE) COS., INC., CLASS A | 288,146 | 359,240 | |||||
| 3,709 | FLOWERS FOODS, INC. | 79,756 | 90,240 | |||||
| 22,764 | GENERAL MILLS, INC. | 832,581 | 1,404,084 | |||||
| 5,300 | HERBALIFE NUTRITION LTD.(b) | 36,401 | 247,245 | |||||
| 11,038 | HERSHEY (THE) CO. | 1,444,006 | 1,582,187 | |||||
| 6,000 | HORMEL FOODS CORP. | 102,466 | 293,340 | |||||
| 7,814 | INGREDION, INC. | 510,701 | 591,364 | |||||
| 8,927 | J M SMUCKER (THE) CO. | 903,851 | 1,031,247 | |||||
| 1,643 | KEURIG DR. PEPPER, INC. | - | 45,347 | |||||
| 5,938 | KIMBERLY-CLARK CORP. | 663,076 | 876,805 | |||||
| 3,714 | KRAFT HEINZ (THE) CO. | 26,692 | 111,234 | |||||
| 102,010 | KROGER (THE) CO. | 2,460,878 | 3,459,159 | |||||
| 633 | LAMB WESTON HOLDINGS, INC. | 7,452 | 41,949 | |||||
| 700 | MCCORMICK & CO., INC. (NON VOTING) | 21,613 | 135,870 | |||||
| 1,300 | MOLSON COORS BEVERAGE CO., CLASS B | 37,841 | 43,628 | |||||
| 6,969 | MONDELEZ INTERNATIONAL, INC., CLASS A | 94,887 | 400,369 | |||||
| 5,164 | MONSTER BEVERAGE CORP.(b) | 225,908 | 414,153 | |||||
| 232 | NU SKIN ENTERPRISES, INC., CLASS A | 8,194 | 11,621 | |||||
| 24,270 | PEPSICO, INC. | 1,881,046 | 3,363,822 | |||||
| 11,902 | PHILIP MORRIS INTERNATIONAL, INC. | 711,597 | 892,531 | |||||
| 700 | POST HOLDINGS, INC.(b) | 43,421 | 60,200 | |||||
| 34,396 | PROCTER & GAMBLE (THE) CO. | 1,138,085 | 4,780,700 | |||||
| 19,604 | SPROUTS FARMERS MARKET, INC.(b) | 483,508 | 410,312 | |||||
| 12,432 | SYSCO CORP. | 389,192 | 773,519 | |||||
| 9,301 | TYSON FOODS, INC., CLASS A | 229,865 | 553,223 | |||||
| 2,700 | US FOODS HOLDING CORP.(b) | 45,757 | 59,994 | |||||
| 29,675 | WALGREENS BOOTS ALLIANCE, INC. | 977,767 | 1,065,926 | |||||
| 19,018 | WALMART, INC. | 1,729,702 | 2,660,808 | |||||
| 20,807,582 | 36,409,417 | 6.72% | ||||||
| Energy: | ||||||||
| 485 | ANTERO MIDSTREAM CORP. | 1,094 | 2,604 | |||||
| 7,500 | APACHE CORP. | 44,218 | 71,025 | |||||
| 6,600 | BAKER HUGHES CO. | 77,964 | 87,714 | |||||
| 2,200 | CHENIERE ENERGY, INC.(b) | 73,298 | 101,794 | |||||
| 28,175 | CHEVRON CORP. | 1,278,870 | 2,028,600 | |||||
| 2,700 | CIMAREX ENERGY CO. | 45,271 | 65,691 | |||||
| 1,700 | CONCHO RESOURCES, INC. | 49,631 | 75,004 | |||||
| 41,073 | CONOCOPHILLIPS | 1,118,102 | 1,348,837 | |||||
| 2,000 | CONTINENTAL RESOURCES, INC. | 20,765 | 24,560 | |||||
| 9,794 | ENBRIDGE, INC.(c) | 137,797 | 285,985 | |||||
| 12,548 | EOG RESOURCES, INC. | 570,060 | 450,975 | |||||
| 16,551 | EXXON MOBIL CORP. | 628,157 | 568,196 | |||||
| 3,100 | HELMERICH & PAYNE, INC. | 39,003 | 45,415 | |||||
| 2,600 | HESS CORP. | 90,342 | 106,418 | |||||
| 18,112 | KINDER MORGAN, INC. | 209,947 | 223,321 | |||||
| 7,200 | NOBLE ENERGY, INC. | 44,105 | 61,560 | |||||
| 5,994 | OCCIDENTAL PETROLEUM CORP. | 53,941 | 60,000 | |||||
| 3,900 | ONEOK, INC. | 59,690 | 101,322 | |||||
| 6,900 | PBF ENERGY, INC., CLASS A | 45,786 | 39,261 | |||||
| 1,000 | PHILLIPS 66 | 50,510 | 51,840 | |||||
| 1,500 | PIONEER NATURAL RESOURCES CO. | 108,477 | 128,985 | |||||
| 9,633 | SCHLUMBERGER N.V. | 108,848 | 149,890 | |||||
| 18,535 | VALERO ENERGY CORP. | 764,933 | 802,936 | |||||
| 11,500 | WILLIAMS (THE) COS., INC. | 154,047 | 225,975 | |||||
| 5,774,856 | 7,107,908 | 1.31% | ||||||
| Financials: | ||||||||
| 500 | ALLEGHANY CORP. | 140,685 | 260,225 | |||||
| 26,264 | ALLSTATE (THE) CORP. | 1,916,211 | 2,472,493 | |||||
| 3,633 | AMERICAN EXPRESS CO. | 111,938 | 364,208 | |||||
| 2,208 | AMERICAN FINANCIAL GROUP, INC. | 135,743 | 147,892 | |||||
| 5,500 | AMERICAN INTERNATIONAL GROUP, INC. | 129,086 | 151,415 | |||||
| 3 | (Continued) |
CLEARWATER INVESTMENT TRUST
Schedule of Investments - Clearwater Core Equity Fund
September 30, 2020 (unaudited)
| Shares | Security | Cost | Fair value (a) | Percent of net assets | ||||
| Financials (Cont'd): | ||||||||
| 3,642 | AMERICAN NATIONAL GROUP, INC. | $245,405 | 245,944 | |||||
| 13,465 | AMERIPRISE FINANCIAL, INC. | 1,169,211 | 2,075,091 | |||||
| 13,600 | ANNALY CAPITAL MANAGEMENT, INC. | 80,993 | 96,832 | |||||
| 1,848 | AON PLC, CLASS A | 223,031 | 381,242 | |||||
| 15,811 | ARCH CAPITAL GROUP LTD.(b)(c) | 307,170 | 462,472 | |||||
| 2,300 | ARTHUR J. GALLAGHER & CO. | 80,002 | 242,834 | |||||
| 4,900 | ASSURANT, INC. | 218,575 | 594,419 | |||||
| 1,000 | AXIS CAPITAL HOLDINGS LTD.(c) | 28,371 | 44,040 | |||||
| 118,115 | BANK OF AMERICA CORP. | 1,191,619 | 2,845,390 | |||||
| 10,000 | BANK OF NEW YORK MELLON (THE) CORP. | 206,454 | 343,400 | |||||
| 22,651 | BERKSHIRE HATHAWAY, INC., CLASS B(b) | 2,584,621 | 4,823,304 | |||||
| 3,658 | BRIGHTHOUSE FINANCIAL, INC.(b) | 92,969 | 98,437 | |||||
| 620 | CANNAE HOLDINGS, INC.(b) | 2,893 | 23,101 | |||||
| 9,258 | CAPITAL ONE FINANCIAL CORP. | 345,636 | 665,280 | |||||
| 17,900 | CHARLES SCHWAB (THE) CORP. | 156,088 | 648,517 | |||||
| 2,385 | CHUBB LTD.(c) | 126,355 | 276,946 | |||||
| 72,636 | CITIGROUP, INC. | 3,581,374 | 3,131,338 | |||||
| 7,030 | CITIZENS FINANCIAL GROUP, INC. | 131,016 | 177,718 | |||||
| 1,965 | CME GROUP, INC. | 203,851 | 328,764 | |||||
| 500 | CREDIT ACCEPTANCE CORP.(b) | 86,421 | 169,320 | |||||
| 8,202 | DISCOVER FINANCIAL SERVICES | 125,376 | 473,912 | |||||
| 3,601 | E*TRADE FINANCIAL CORP. | 49,884 | 180,230 | |||||
| 469 | FAIRFAX FINANCIAL HOLDINGS LTD.(c) | 86,576 | 137,548 | |||||
| 1,863 | FIDELITY NATIONAL FINANCIAL, INC. | 15,560 | 58,331 | |||||
| 10,565 | FIFTH THIRD BANCORP | 109,297 | 225,246 | |||||
| 400 | FIRST CITIZENS BANCSHARES, INC., CLASS A | 57,523 | 127,512 | |||||
| 30,500 | FIRST HORIZON NATIONAL CORP. | 193,065 | 287,615 | |||||
| 5,327 | FNB CORP. | 36,403 | 36,117 | |||||
| 15,329 | GOLDMAN SACHS GROUP (THE), INC. | 1,896,007 | 3,080,669 | |||||
| 3,000 | HANOVER INSURANCE GROUP (THE), INC. | 215,948 | 279,540 | |||||
| 19,283 | HARTFORD FINANCIAL SERVICES GROUP (THE), INC. | 719,250 | 710,771 | |||||
| 35,000 | HUNTINGTON BANCSHARES, INC. | 169,770 | 320,950 | |||||
| 505 | INTERCONTINENTAL EXCHANGE, INC. | 12,819 | 50,525 | |||||
| 15,903 | JANUS HENDERSON GROUP PLC(c) | 222,792 | 345,413 | |||||
| 47,492 | JPMORGAN CHASE & CO. | 1,723,282 | 4,572,055 | |||||
| 5,904 | KEYCORP | 30,107 | 70,435 | |||||
| 200 | MARKEL CORP.(b) | 67,789 | 194,740 | |||||
| 200 | MARKETAXESS HOLDINGS, INC. | 100,378 | 96,318 | |||||
| 5,684 | MARSH & MCLENNAN COS., INC. | 240,120 | 651,955 | |||||
| 1,300 | MERCURY GENERAL CORP. | 38,019 | 53,781 | |||||
| 5,091 | METLIFE, INC. | 162,948 | 189,232 | |||||
| 800 | MOODY'S CORP. | 28,632 | 231,880 | |||||
| 75,102 | MORGAN STANLEY | 2,245,740 | 3,631,182 | |||||
| 931 | MSCI, INC. | 257,575 | 332,162 | |||||
| 5,900 | NASDAQ, INC. | 240,309 | 723,989 | |||||
| 17,289 | OLD REPUBLIC INTERNATIONAL CORP. | 256,475 | 254,840 | |||||
| 2,326 | ONEMAIN HOLDINGS, INC. | 40,168 | 72,687 | |||||
| 2,485 | PACWEST BANCORP | 28,898 | 42,444 | |||||
| 7,214 | PNC FINANCIAL SERVICES GROUP (THE), INC. | 276,365 | 792,891 | |||||
| 16,472 | POPULAR, INC. | 556,536 | 597,439 | |||||
| 1,800 | PRINCIPAL FINANCIAL GROUP, INC. | 37,586 | 72,486 | |||||
| 15,939 | PROGRESSIVE (THE) CORP. | 1,042,320 | 1,508,945 | |||||
| 5,900 | PRUDENTIAL FINANCIAL, INC. | 182,565 | 374,768 | |||||
| 16,006 | RAYMOND JAMES FINANCIAL, INC. | 1,016,976 | 1,164,597 | |||||
| 12,839 | REGIONS FINANCIAL CORP. | 73,436 | 148,034 | |||||
| 800 | RENAISSANCERE HOLDINGS LTD.(c) | 81,779 | 135,792 | |||||
| 3,151 | ROYAL BANK OF CANADA(c) | 75,539 | 221,011 | |||||
| 7,500 | SEI INVESTMENTS CO. | 108,537 | 380,400 | |||||
| 18,352 | SLM CORP. | 93,485 | 148,468 | |||||
| 24,290 | STATE STREET CORP. | 1,295,516 | 1,441,126 | |||||
| 48,997 | SYNCHRONY FINANCIAL | 1,089,720 | 1,282,251 | |||||
| 3,657 | SYNOVUS FINANCIAL CORP. | 49,372 | 77,419 | |||||
| 3,549 | T. ROWE PRICE GROUP, INC. | 106,978 | 455,053 | |||||
| 2,946 | TCF FINANCIAL CORP. | 51,834 | 68,819 | |||||
| 1,300 | TD AMERITRADE HOLDING CORP. | 45,798 | 50,895 | |||||
| 15,374 | TRAVELERS (THE) COS., INC. | 1,378,221 | 1,663,313 | |||||
| 12,994 | TRUIST FINANCIAL CORP. | 242,181 | 494,422 | |||||
| 4 | (Continued) |
CLEARWATER INVESTMENT TRUST
Schedule of Investments - Clearwater Core Equity Fund
September 30, 2020 (unaudited)
| Shares | Security | Cost | Fair value (a) | Percent of net assets | ||||
| Financials (Cont'd): | ||||||||
| 16,200 | TWO HARBORS INVESTMENT CORP. | $75,902 | 82,458 | |||||
| 17,585 | US BANCORP | 318,503 | 630,422 | |||||
| 7,855 | W R BERKLEY CORP. | 230,563 | 480,333 | |||||
| 1,800 | WASHINGTON FEDERAL, INC. | 23,535 | 37,548 | |||||
| 47,427 | WELLS FARGO & CO. | 593,148 | 1,115,009 | |||||
| 2,568 | WESTERN ALLIANCE BANCORP | 59,789 | 81,200 | |||||
| 2,600 | ZIONS BANCORP N.A. | 49,361 | 75,972 | |||||
| 32,021,973 | 52,083,772 | 9.61% | ||||||
| Health Care: | ||||||||
| 12,487 | ABBOTT LABORATORIES | 246,035 | 1,358,960 | |||||
| 22,394 | ABBVIE, INC. | 940,731 | 1,961,491 | |||||
| 300 | ABIOMED, INC.(b) | 44,070 | 83,118 | |||||
| 500 | ACCELERON PHARMA, INC.(b) | 48,935 | 56,265 | |||||
| 1,800 | ADAPTIVE BIOTECHNOLOGIES CORP.(b) | 45,536 | 87,534 | |||||
| 1,457 | AGILENT TECHNOLOGIES, INC. | 63,335 | 147,070 | |||||
| 1,200 | AGIOS PHARMACEUTICALS, INC.(b) | 44,843 | 42,000 | |||||
| 5,390 | ALEXION PHARMACEUTICALS, INC.(b) | 376,663 | 616,778 | |||||
| 2,191 | ALIGN TECHNOLOGY, INC.(b) | 327,961 | 717,246 | |||||
| 1,200 | ALNYLAM PHARMACEUTICALS, INC.(b) | 181,534 | 174,720 | |||||
| 20,217 | AMERISOURCEBERGEN CORP. | 1,223,078 | 1,959,432 | |||||
| 15,271 | AMGEN, INC. | 2,749,906 | 3,881,277 | |||||
| 5,455 | ANTHEM, INC. | 483,009 | 1,465,158 | |||||
| 193 | AVANOS MEDICAL, INC.(b) | 3,014 | 6,411 | |||||
| 3,700 | AVANTOR, INC.(b) | 41,168 | 83,213 | |||||
| 9,039 | BAXTER INTERNATIONAL, INC. | 441,749 | 726,916 | |||||
| 2,865 | BECTON DICKINSON AND CO. | 250,650 | 666,628 | |||||
| 13,038 | BIOGEN, INC.(b) | 3,603,415 | 3,698,620 | |||||
| 2,814 | BIO-RAD LABORATORIES, INC., CLASS A(b) | 1,417,545 | 1,450,504 | |||||
| 32,800 | BOSTON SCIENTIFIC CORP.(b) | 182,160 | 1,253,288 | |||||
| 47,070 | BRISTOL-MYERS SQUIBB CO. | 2,055,080 | 2,837,850 | |||||
| 2,145 | BRUKER CORP. | 43,219 | 85,264 | |||||
| 18,197 | CARDINAL HEALTH, INC. | 835,060 | 854,349 | |||||
| 1,500 | CATALENT, INC.(b) | 72,508 | 128,490 | |||||
| 3,672 | CENTENE CORP.(b) | 139,553 | 214,188 | |||||
| 4,446 | CERNER CORP. | 101,620 | 321,401 | |||||
| 241 | CHARLES RIVER LABORATORIES INTERNATIONAL, INC.(b) | 31,337 | 54,574 | |||||
| 3,042 | CIGNA CORP. | 173,127 | 515,345 | |||||
| 200 | COOPER (THE) COS., INC. | 50,902 | 67,424 | |||||
| 17,037 | CVS HEALTH CORP. | 769,515 | 994,961 | |||||
| 9,229 | DANAHER CORP. | 272,153 | 1,987,281 | |||||
| 18,392 | DAVITA, INC.(b) | 1,365,141 | 1,575,275 | |||||
| 5,332 | DENTSPLY SIRONA, INC. | 141,306 | 233,168 | |||||
| 1,500 | DEXCOM, INC.(b) | 87,311 | 618,345 | |||||
| 11,778 | EDWARDS LIFESCIENCES CORP.(b) | 161,745 | 940,120 | |||||
| 3,800 | ELANCO ANIMAL HEALTH, INC.(b) | 74,580 | 106,134 | |||||
| 23,244 | ELI LILLY AND CO. | 2,171,317 | 3,440,577 | |||||
| 35,059 | EXELIXIS, INC.(b) | 612,930 | 857,193 | |||||
| 18,177 | GILEAD SCIENCES, INC. | 209,925 | 1,148,605 | |||||
| 8,969 | HCA HEALTHCARE, INC. | 1,189,581 | 1,118,255 | |||||
| 3,800 | HENRY SCHEIN, INC.(b) | 67,547 | 223,364 | |||||
| 9,930 | HOLOGIC, INC.(b) | 329,319 | 660,047 | |||||
| 6,925 | HORIZON THERAPEUTICS PLC(b) | 168,428 | 537,934 | |||||
| 2,378 | HUMANA, INC. | 820,169 | 984,230 | |||||
| 3,655 | IDEXX LABORATORIES, INC.(b) | 629,727 | 1,436,817 | |||||
| 2,300 | ILLUMINA, INC.(b) | 98,233 | 710,884 | |||||
| 1,900 | INCYTE CORP.(b) | 120,835 | 170,506 | |||||
| 1,462 | INTUITIVE SURGICAL, INC.(b) | 560,949 | 1,037,348 | |||||
| 2,000 | IOVANCE BIOTHERAPEUTICS, INC.(b) | 54,955 | 65,840 | |||||
| 5,634 | IQVIA HOLDINGS, INC.(b) | 560,732 | 888,087 | |||||
| 24,723 | JOHNSON & JOHNSON | 1,598,544 | 3,680,760 | |||||
| 842 | LABORATORY CORP. OF AMERICA HOLDINGS(b) | 53,269 | 158,523 | |||||
| 500 | MASIMO CORP.(b) | 110,177 | 118,030 | |||||
| 6,227 | MCKESSON CORP. | 278,873 | 927,387 | |||||
| 12,348 | MEDTRONIC PLC(c) | 1,077,575 | 1,283,204 | |||||
| 43,396 | MERCK & CO., INC. | 1,384,084 | 3,599,698 | |||||
| 1,317 | METTLER-TOLEDO INTERNATIONAL, INC.(b) | 123,051 | 1,271,893 | |||||
| 2,392 | MOLINA HEALTHCARE, INC.(b) | 385,437 | 437,832 | |||||
| 5 | (Continued) |
CLEARWATER INVESTMENT TRUST
Schedule of Investments - Clearwater Core Equity Fund
September 30, 2020 (unaudited)
| Shares | Security | Cost | Fair value (a) | Percent of net assets | ||||
| Health Care (Cont'd): | ||||||||
| 3,217 | MYLAN N.V.(b) | $50,337 | 47,708 | |||||
| 800 | NEUROCRINE BIOSCIENCES, INC.(b) | 72,192 | 76,928 | |||||
| 300 | PENUMBRA, INC.(b) | 36,663 | 58,314 | |||||
| 1,200 | PERRIGO CO. PLC(c) | 53,711 | 55,092 | |||||
| 103,063 | PFIZER, INC. | 2,621,305 | 3,782,412 | |||||
| 2,600 | PPD, INC.(b) | 45,518 | 96,174 | |||||
| 2,000 | QIAGEN N.V.(b)(c) | 83,380 | 104,520 | |||||
| 992 | REGENERON PHARMACEUTICALS, INC.(b) | 572,258 | 555,302 | |||||
| 400 | REPLIGEN CORP.(b) | 46,604 | 59,016 | |||||
| 8,022 | RESMED, INC. | 644,542 | 1,375,211 | |||||
| 700 | SAREPTA THERAPEUTICS, INC.(b) | 66,178 | 98,301 | |||||
| 2,100 | SEATTLE GENETICS, INC.(b) | 357,076 | 410,949 | |||||
| 900 | TELADOC HEALTH, INC.(b) | 179,423 | 197,316 | |||||
| 1,800 | TELEFLEX, INC. | 195,858 | 612,756 | |||||
| 3,026 | THERMO FISHER SCIENTIFIC, INC. | 769,422 | 1,336,040 | |||||
| 830 | UNITED THERAPEUTICS CORP.(b) | 72,357 | 83,830 | |||||
| 15,291 | UNITEDHEALTH GROUP, INC. | 2,299,636 | 4,767,275 | |||||
| 2,036 | UNIVERSAL HEALTH SERVICES, INC., CLASS B | 38,822 | 217,893 | |||||
| 1,880 | VAREX IMAGING CORP.(b) | 19,829 | 23,914 | |||||
| 5,199 | VARIAN MEDICAL SYSTEMS, INC.(b) | 193,000 | 894,228 | |||||
| 1,800 | VEEVA SYSTEMS, INC., CLASS A(b) | 318,742 | 506,142 | |||||
| 4,100 | VERTEX PHARMACEUTICALS, INC.(b) | 824,040 | 1,115,692 | |||||
| 8,978 | WATERS CORP.(b) | 1,428,708 | 1,756,815 | |||||
| 300 | WEST PHARMACEUTICAL SERVICES, INC. | 68,922 | 82,470 | |||||
| 4,304 | ZIMMER BIOMET HOLDINGS, INC. | 233,961 | 585,947 | |||||
| 1,047 | ZOETIS, INC. | 108,002 | 173,142 | |||||
| 43,095,637 | 75,801,199 | 13.99% | ||||||
| Industrials: | ||||||||
| 6,987 | 3M CO. | 417,187 | 1,119,178 | |||||
| 923 | ACCO BRANDS CORP. | 3,137 | 5,353 | |||||
| 1,508 | ACUITY BRANDS, INC. | 138,403 | 154,344 | |||||
| 11,607 | ADT, INC. | 45,143 | 94,829 | |||||
| 2,812 | AGCO CORP. | 136,874 | 208,847 | |||||
| 8,255 | AIR LEASE CORP. | 223,546 | 242,862 | |||||
| 1,533 | ALLEGION PLC(c) | 40,913 | 151,629 | |||||
| 5,175 | AMETEK, INC. | 73,220 | 514,395 | |||||
| 3,387 | BOEING (THE) CO. | 231,093 | 559,736 | |||||
| 1,200 | BWX TECHNOLOGIES, INC. | 54,215 | 67,572 | |||||
| 2,996 | CARLISLE COS., INC. | 114,358 | 366,621 | |||||
| 10,640 | CARRIER GLOBAL CORP. | 57,007 | 324,946 | |||||
| 10,504 | CATERPILLAR, INC. | 272,491 | 1,566,672 | |||||
| 3,200 | CINTAS CORP. | 258,101 | 1,065,056 | |||||
| 2,000 | COPART, INC.(b) | 143,195 | 210,320 | |||||
| 6,700 | CORELOGIC, INC. | 76,313 | 453,389 | |||||
| 3,948 | CRANE CO. | 66,572 | 197,913 | |||||
| 7,324 | CSX CORP. | 382,113 | 568,855 | |||||
| 15,626 | CUMMINS, INC. | 2,500,639 | 3,299,586 | |||||
| 7,300 | DEERE & CO. | 199,160 | 1,617,899 | |||||
| 10,100 | DELTA AIR LINES, INC. | 100,965 | 308,858 | |||||
| 1,525 | DOVER CORP. | 32,899 | 165,218 | |||||
| 19,882 | EATON CORP. PLC | 752,240 | 2,028,560 | |||||
| 2,980 | EXPEDITORS INTERNATIONAL OF WASHINGTON, INC. | 166,704 | 269,750 | |||||
| 1,953 | FEDEX CORP. | 39,089 | 491,219 | |||||
| 3,325 | FORTIVE CORP. | 43,068 | 253,398 | |||||
| 36,852 | FORTUNE BRANDS HOME & SECURITY, INC. | 1,732,360 | 3,188,435 | |||||
| 1,400 | GATX CORP. | 24,276 | 89,250 | |||||
| 2,128 | GENERAL DYNAMICS CORP. | 296,250 | 294,579 | |||||
| 50,000 | GENERAL ELECTRIC CO. | 348,445 | 311,500 | |||||
| 875 | HEICO CORP. | 61,334 | 91,578 | |||||
| 2,156 | HEICO CORP., CLASS A | 109,365 | 191,151 | |||||
| 360 | HERC HOLDINGS, INC.(b) | 5,808 | 14,260 | |||||
| 9,188 | HONEYWELL INTERNATIONAL, INC. | 265,803 | 1,512,437 | |||||
| 25,039 | HOWMET AEROSPACE, INC. | 299,194 | 418,652 | |||||
| 1,200 | HUBBELL, INC. | 43,310 | 164,208 | |||||
| 510 | HUNTINGTON INGALLS INDUSTRIES, INC. | 13,001 | 71,783 | |||||
| 1,500 | IAA, INC.(b) | 45,882 | 78,105 | |||||
| 2,271 | IDEX CORP. | 140,770 | 414,253 | |||||
| 6 | (Continued) |
CLEARWATER INVESTMENT TRUST
Schedule of Investments - Clearwater Core Equity Fund
September 30, 2020 (unaudited)
| Shares | Security | Cost | Fair value (a) | Percent of net assets | ||||
| Industrials (Cont'd): | ||||||||
| 6,025 | IHS MARKIT LTD.(c) | $423,559 | 473,023 | |||||
| 4,824 | ILLINOIS TOOL WORKS, INC. | 155,812 | 932,045 | |||||
| 2,382 | INGERSOLL RAND, INC.(b) | 18,866 | 84,799 | |||||
| 1,468 | JACOBS ENGINEERING GROUP, INC. | 29,713 | 136,186 | |||||
| 2,100 | JB HUNT TRANSPORT SERVICES, INC. | 40,530 | 265,398 | |||||
| 37,751 | JOHNSON CONTROLS INTERNATIONAL PLC | 982,980 | 1,542,128 | |||||
| 4,274 | L3HARRIS TECHNOLOGIES, INC. | 274,846 | 725,896 | |||||
| 600 | LENNOX INTERNATIONAL, INC. | 17,874 | 163,566 | |||||
| 1,400 | LINCOLN ELECTRIC HOLDINGS, INC. | 28,970 | 128,856 | |||||
| 3,232 | LOCKHEED MARTIN CORP. | 941,979 | 1,238,761 | |||||
| 1,800 | LYFT, INC., CLASS A(b) | 50,324 | 49,590 | |||||
| 1,200 | MANITOWOC (THE) CO., INC.(b) | 10,053 | 10,092 | |||||
| 2,475 | MANPOWERGROUP, INC. | 81,957 | 181,492 | |||||
| 15,263 | MASCO CORP. | 139,724 | 841,449 | |||||
| 577 | NORDSON CORP. | 57,299 | 110,680 | |||||
| 760 | NORFOLK SOUTHERN CORP. | 14,546 | 162,632 | |||||
| 4,673 | NORTHROP GRUMMAN CORP. | 480,108 | 1,474,285 | |||||
| 2,519 | NVENT ELECTRIC PLC(c) | 24,113 | 44,561 | |||||
| 7,066 | OLD DOMINION FREIGHT LINE, INC. | 1,046,366 | 1,278,381 | |||||
| 12,377 | OSHKOSH CORP. | 642,397 | 909,709 | |||||
| 5,320 | OTIS WORLDWIDE CORP. | 90,693 | 332,074 | |||||
| 1,100 | OWENS CORNING | 22,578 | 75,691 | |||||
| 1,067 | PACCAR, INC. | 47,468 | 90,994 | |||||
| 4,628 | PARKER-HANNIFIN CORP. | 350,966 | 936,430 | |||||
| 2,519 | PENTAIR PLC(c) | 49,295 | 115,295 | |||||
| 4,100 | QUANTA SERVICES, INC. | 52,131 | 216,726 | |||||
| 13,341 | RAYTHEON TECHNOLOGIES CORP. | 243,956 | 767,641 | |||||
| 12,257 | REPUBLIC SERVICES, INC. | 732,074 | 1,144,191 | |||||
| 6,280 | ROLLINS, INC. | 221,629 | 340,313 | |||||
| 700 | ROPER TECHNOLOGIES, INC. | 94,317 | 276,577 | |||||
| 700 | SNAP-ON, INC. | 17,991 | 102,991 | |||||
| 26,799 | SOUTHWEST AIRLINES CO. | 909,504 | 1,004,962 | |||||
| 1,500 | SPIRIT AEROSYSTEMS HOLDINGS, INC., CLASS A | 25,470 | 28,365 | |||||
| 2,557 | STANLEY BLACK & DECKER, INC. | 72,048 | 414,745 | |||||
| 600 | STERICYCLE, INC.(b) | 18,858 | 37,836 | |||||
| 5,162 | TIMKEN (THE) CO. | 171,352 | 279,884 | |||||
| 1,596 | TORO (THE) CO. | 76,510 | 133,984 | |||||
| 10,505 | TRANE TECHNOLOGIES PLC(c) | 490,333 | 1,273,731 | |||||
| 200 | TRANSDIGM GROUP, INC. | 60,439 | 95,024 | |||||
| 11,000 | UBER TECHNOLOGIES, INC.(b) | 307,924 | 401,280 | |||||
| 5,202 | UNION PACIFIC CORP. | 230,095 | 1,024,118 | |||||
| 1,928 | UNITED AIRLINES HOLDINGS, INC.(b) | 38,137 | 66,998 | |||||
| 4,957 | UNITED PARCEL SERVICE, INC., CLASS B | 392,428 | 825,985 | |||||
| 12,194 | UNITED RENTALS, INC.(b) | 1,319,924 | 2,127,853 | |||||
| 794 | VERISK ANALYTICS, INC. | 137,235 | 147,136 | |||||
| 180 | VERITIV CORP.(b) | 1,653 | 2,279 | |||||
| 700 | W.W. GRAINGER, INC. | 30,601 | 249,739 | |||||
| 975 | WASTE CONNECTIONS, INC. | 42,575 | 101,205 | |||||
| 17,554 | WASTE MANAGEMENT, INC. | 879,219 | 1,986,586 | |||||
| 1,200 | WESTINGHOUSE AIR BRAKE TECHNOLOGIES CORP. | 21,945 | 74,256 | |||||
| 1,600 | XYLEM, INC. | 30,618 | 134,592 | |||||
| 22,596,425 | 48,710,206 | 8.99% | ||||||
| Information Technology: | ||||||||
| 2,200 | 2U, INC.(b) | 40,782 | 74,492 | |||||
| 4,949 | ACCENTURE PLC, CLASS A(c) | 304,426 | 1,118,425 | |||||
| 9,323 | ADOBE, INC.(b) | 2,002,597 | 4,572,279 | |||||
| 12,800 | ADVANCED MICRO DEVICES, INC.(b) | 228,636 | 1,049,472 | |||||
| 12,626 | AKAMAI TECHNOLOGIES, INC.(b) | 715,662 | 1,395,678 | |||||
| 5,916 | ALLIANCE DATA SYSTEMS CORP. | 254,871 | 248,354 | |||||
| 1,236 | ALTERYX, INC., CLASS A(b) | 140,231 | 140,348 | |||||
| 4,065 | AMDOCS LTD. | 200,086 | 233,372 | |||||
| 4,400 | ANALOG DEVICES, INC. | 82,698 | 513,656 | |||||
| 1,400 | ANAPLAN, INC.(b) | 47,612 | 87,612 | |||||
| 1,200 | ANSYS, INC.(b) | 30,630 | 392,676 | |||||
| 275,563 | APPLE, INC. | 6,182,823 | 31,912,951 | |||||
| 7,400 | APPLIED MATERIALS, INC. | 134,145 | 439,930 | |||||
| 6,842 | ARROW ELECTRONICS, INC.(b) | 397,790 | 538,192 | |||||
| 7 | (Continued) |
CLEARWATER INVESTMENT TRUST
Schedule of Investments - Clearwater Core Equity Fund
September 30, 2020 (unaudited)
| Shares | Security | Cost | Fair value (a) | Percent of net assets | ||||
| Information Technology (Cont'd): | ||||||||
| 1,800 | ATLASSIAN CORP. PLC, CLASS A(b)(c) | $206,509 | 327,222 | |||||
| 4,347 | AUTODESK, INC.(b) | 578,347 | 1,004,200 | |||||
| 6,766 | AUTOMATIC DATA PROCESSING, INC. | 361,211 | 943,789 | |||||
| 7,371 | BLACK KNIGHT, INC.(b) | 272,636 | 641,646 | |||||
| 9,493 | BOOZ ALLEN HAMILTON HOLDING CORP. | 296,190 | 787,729 | |||||
| 2,791 | BROADCOM, INC. | 153,147 | 1,016,817 | |||||
| 3,413 | BROADRIDGE FINANCIAL SOLUTIONS, INC. | 106,898 | 450,516 | |||||
| 165 | CACI INTERNATIONAL, INC., CLASS A(b) | 28,971 | 35,171 | |||||
| 11,400 | CADENCE DESIGN SYSTEMS, INC.(b) | 154,632 | 1,215,582 | |||||
| 1,522 | CDK GLOBAL, INC. | 19,712 | 66,344 | |||||
| 7,000 | CDW CORP. | 292,424 | 836,710 | |||||
| 9,515 | CERENCE, INC.(b) | 225,769 | 464,998 | |||||
| 75,070 | CISCO SYSTEMS, INC. | 1,586,892 | 2,957,007 | |||||
| 18,376 | CITRIX SYSTEMS, INC. | 2,131,097 | 2,530,559 | |||||
| 2,200 | CLOUDFLARE, INC., CLASS A(b) | 78,522 | 90,332 | |||||
| 1,000 | COGNEX CORP. | 44,753 | 65,100 | |||||
| 2,700 | COGNIZANT TECHNOLOGY SOLUTIONS CORP., CLASS A | 25,751 | 187,434 | |||||
| 15,600 | CORNING, INC. | 85,176 | 505,596 | |||||
| 900 | COUPA SOFTWARE, INC.(b) | 111,897 | 246,816 | |||||
| 1,000 | CROWDSTRIKE HOLDINGS, INC., CLASS A(b) | 98,800 | 137,320 | |||||
| 2,100 | DATADOG, INC., CLASS A(b) | 179,184 | 214,536 | |||||
| 10,926 | DELL TECHNOLOGIES, INC., CLASS C(b) | 625,523 | 739,581 | |||||
| 3,700 | DOCUSIGN, INC.(b) | 464,753 | 796,388 | |||||
| 2,000 | DOLBY LABORATORIES, INC., CLASS A | 43,420 | 132,560 | |||||
| 2,300 | DROPBOX, INC., CLASS A(b) | 42,360 | 44,298 | |||||
| 4,992 | DXC TECHNOLOGY CO. | 158,627 | 89,107 | |||||
| 1,640 | ECHOSTAR CORP., CLASS A(b) | 21,050 | 40,820 | |||||
| 954 | EPAM SYSTEMS, INC.(b) | 163,143 | 308,409 | |||||
| 300 | EURONET WORLDWIDE, INC.(b) | 25,458 | 27,330 | |||||
| 300 | EVERBRIDGE, INC.(b) | 42,279 | 37,719 | |||||
| 1,300 | F5 NETWORKS, INC.(b) | 30,063 | 159,601 | |||||
| 300 | FAIR ISAAC CORP.(b) | 80,682 | 127,614 | |||||
| 12,959 | FIDELITY NATIONAL INFORMATION SERVICES, INC. | 538,426 | 1,907,694 | |||||
| 3,900 | FIREEYE, INC.(b) | 44,602 | 48,146 | |||||
| 9,784 | FISERV, INC.(b) | 172,685 | 1,008,241 | |||||
| 600 | FIVE9, INC.(b) | 64,638 | 77,808 | |||||
| 200 | FLEETCOR TECHNOLOGIES, INC.(b) | 33,618 | 47,620 | |||||
| 5,523 | FORTINET, INC.(b) | 393,491 | 650,665 | |||||
| 3,708 | GLOBAL PAYMENTS, INC. | 264,415 | 658,467 | |||||
| 800 | GODADDY, INC., CLASS A(b) | 39,006 | 60,776 | |||||
| 18,800 | HEWLETT PACKARD ENTERPRISE CO. | 102,062 | 176,156 | |||||
| 11,910 | HP, INC. | 179,763 | 226,171 | |||||
| 400 | HUBSPOT, INC.(b) | 54,548 | 116,892 | |||||
| 1,200 | INPHI CORP.(b) | 136,907 | 134,700 | |||||
| 47,401 | INTEL CORP. | 1,194,476 | 2,454,424 | |||||
| 8,323 | INTERNATIONAL BUSINESS MACHINES CORP. | 812,001 | 1,012,659 | |||||
| 3,500 | INTUIT, INC. | 75,843 | 1,141,735 | |||||
| 13,175 | JABIL, INC. | 259,881 | 451,376 | |||||
| 2,356 | JACK HENRY & ASSOCIATES, INC. | 428,498 | 383,062 | |||||
| 991 | KEYSIGHT TECHNOLOGIES, INC.(b) | 89,833 | 97,891 | |||||
| 7,012 | LAM RESEARCH CORP. | 401,371 | 2,326,231 | |||||
| 18,124 | LEIDOS HOLDINGS, INC. | 1,474,427 | 1,615,755 | |||||
| 3,770 | MARVELL TECHNOLOGY GROUP LTD. | 20,234 | 149,669 | |||||
| 8,874 | MASTERCARD, INC., CLASS A | 1,993,235 | 3,000,921 | |||||
| 1,900 | MEDALLIA, INC.(b) | 44,418 | 52,098 | |||||
| 4,200 | MICROCHIP TECHNOLOGY, INC. | 38,962 | 431,592 | |||||
| 36,285 | MICRON TECHNOLOGY, INC.(b) | 707,380 | 1,703,944 | |||||
| 111,661 | MICROSOFT CORP. | 4,788,071 | 23,485,658 | |||||
| 500 | MKS INSTRUMENTS, INC. | 32,310 | 54,615 | |||||
| 900 | MONGODB, INC.(b) | 115,074 | 208,359 | |||||
| 6,993 | NETAPP, INC. | 301,461 | 306,573 | |||||
| 900 | NEW RELIC, INC.(b) | 42,264 | 50,724 | |||||
| 36,573 | NORTONLIFELOCK, INC. | 432,755 | 762,181 | |||||
| 9,984 | NVIDIA CORP. | 1,873,485 | 5,403,540 | |||||
| 3,900 | NXP SEMICONDUCTORS N.V.(c) | 334,137 | 486,759 | |||||
| 3,297 | OKTA, INC.(b) | 513,168 | 705,063 | |||||
| 67,769 | ORACLE CORP. | 3,615,684 | 4,045,809 | |||||
| 8 | (Continued) |
CLEARWATER INVESTMENT TRUST
Schedule of Investments - Clearwater Core Equity Fund
September 30, 2020 (unaudited)
| Shares | Security | Cost | Fair value (a) | Percent of net assets | ||||
| Information Technology (Cont'd): | ||||||||
| 2,800 | PALO ALTO NETWORKS, INC.(b) | $116,508 | 685,300 | |||||
| 466 | PAYCHEX, INC. | 27,642 | 37,173 | |||||
| 1,553 | PAYCOM SOFTWARE, INC.(b) | 217,948 | 483,449 | |||||
| 9,661 | PAYPAL HOLDINGS, INC.(b) | 957,404 | 1,903,507 | |||||
| 907 | PERSPECTA, INC. | 8,504 | 17,641 | |||||
| 3,800 | PLURALSIGHT, INC., CLASS A(b) | 42,888 | 65,094 | |||||
| 600 | PROOFPOINT, INC.(b) | 56,232 | 63,330 | |||||
| 2,400 | PTC, INC.(b) | 82,674 | 198,528 | |||||
| 2,403 | QORVO, INC.(b) | 185,625 | 310,011 | |||||
| 30,433 | QUALCOMM, INC. | 2,788,687 | 3,581,355 | |||||
| 1,500 | RINGCENTRAL, INC., CLASS A(b) | 152,618 | 411,915 | |||||
| 8,372 | SALESFORCE.COM, INC.(b) | 147,727 | 2,104,051 | |||||
| 76,375 | SEAGATE TECHNOLOGY PLC | 3,154,086 | 3,762,996 | |||||
| 2,100 | SERVICENOW, INC.(b) | 273,110 | 1,018,500 | |||||
| 6,675 | SKYWORKS SOLUTIONS, INC. | 640,777 | 971,212 | |||||
| 900 | SMARTSHEET, INC., CLASS A(b) | 39,015 | 44,478 | |||||
| 1,400 | SPLUNK, INC.(b) | 162,032 | 263,382 | |||||
| 3,000 | SQUARE, INC., CLASS A(b) | 111,050 | 487,650 | |||||
| 1,938 | SS&C TECHNOLOGIES HOLDINGS, INC. | 86,602 | 117,288 | |||||
| 6,955 | SYNNEX CORP. | 493,509 | 974,117 | |||||
| 4,400 | SYNOPSYS, INC.(b) | 172,415 | 941,512 | |||||
| 4,600 | TERADYNE, INC. | 82,730 | 365,516 | |||||
| 27,940 | TEXAS INSTRUMENTS, INC. | 943,662 | 3,989,553 | |||||
| 7,049 | TRIMBLE, INC.(b) | 94,849 | 343,286 | |||||
| 1,000 | TWILIO, INC., CLASS A(b) | 215,260 | 247,090 | |||||
| 2,100 | UBIQUITI, INC. | 357,603 | 349,986 | |||||
| 200 | VERISIGN, INC.(b) | 23,200 | 40,970 | |||||
| 13,443 | VISA, INC., CLASS A | 762,987 | 2,688,197 | |||||
| 7,800 | VISHAY INTERTECHNOLOGY, INC. | 48,931 | 121,446 | |||||
| 3,772 | VMWARE, INC., CLASS A(b) | 190,784 | 541,923 | |||||
| 5,845 | WESTERN DIGITAL CORP. | 90,457 | 213,635 | |||||
| 174,923 | WESTERN UNION (THE) CO. | 3,459,515 | 3,748,600 | |||||
| 1,000 | WORKDAY, INC., CLASS A(b) | 137,260 | 215,130 | |||||
| 24,464 | XEROX HOLDINGS CORP. | 374,155 | 459,189 | |||||
| 6,750 | XILINX, INC. | 47,180 | 703,620 | |||||
| 2,685 | ZEBRA TECHNOLOGIES CORP., CLASS A(b) | 397,763 | 677,855 | |||||
| 1,300 | ZENDESK, INC.(b) | 79,216 | 133,796 | |||||
| 2,300 | ZOOM VIDEO COMMUNICATIONS, INC., CLASS A(b) | 581,479 | 1,081,253 | |||||
| 700 | ZSCALER, INC.(b) | 41,398 | 98,483 | |||||
| 58,957,476 | 149,852,279 | 27.65% | ||||||
| Materials: | ||||||||
| 1,075 | AIR PRODUCTS AND CHEMICALS, INC. | 43,205 | 320,199 | |||||
| 1,300 | ALBEMARLE CORP. | 29,152 | 116,064 | |||||
| 13,770 | AMCOR PLC(c) | 60,200 | 152,159 | |||||
| 700 | ASHLAND GLOBAL HOLDINGS, INC. | 12,006 | 49,644 | |||||
| 3,165 | AVERY DENNISON CORP. | 207,899 | 404,614 | |||||
| 2,804 | CABOT CORP. | 78,012 | 101,028 | |||||
| 16,337 | CELANESE CORP. | 1,176,262 | 1,755,411 | |||||
| 4,500 | CHEMOURS (THE) CO. | 49,032 | 94,095 | |||||
| 7,262 | CORTEVA, INC. | 88,857 | 209,218 | |||||
| 1,800 | CROWN HOLDINGS, INC.(b) | 57,831 | 138,348 | |||||
| 7,262 | DOW, INC. | 147,036 | 341,677 | |||||
| 10,454 | DUPONT DE NEMOURS, INC. | 408,910 | 579,988 | |||||
| 7,748 | EASTMAN CHEMICAL CO. | 296,568 | 605,274 | |||||
| 3,191 | ECOLAB, INC. | 114,294 | 637,689 | |||||
| 15,800 | FREEPORT-MCMORAN, INC. | 103,648 | 247,112 | |||||
| 15,846 | HUNTSMAN CORP. | 249,978 | 351,940 | |||||
| 238 | INTERNATIONAL FLAVORS & FRAGRANCES, INC. | 5,120 | 29,143 | |||||
| 38,587 | INTERNATIONAL PAPER CO. | 1,300,493 | 1,564,317 | |||||
| 4,679 | LINDE PLC(c) | 777,043 | 1,114,210 | |||||
| 9,574 | LYONDELLBASELL INDUSTRIES N.V., CLASS A | 429,495 | 674,871 | |||||
| 700 | MARTIN MARIETTA MATERIALS, INC. | 27,965 | 164,752 | |||||
| 25,934 | NEWMONT CORP. | 1,006,086 | 1,645,512 | |||||
| 5,844 | NUCOR CORP. | 99,313 | 262,162 | |||||
| 8,317 | PACKAGING CORP. OF AMERICA | 742,458 | 906,969 | |||||
| 5,172 | PPG INDUSTRIES, INC. | 123,888 | 631,398 | |||||
| 6,625 | RELIANCE STEEL & ALUMINUM CO. | 325,929 | 676,015 | |||||
| 9 | (Continued) |
CLEARWATER INVESTMENT TRUST
Schedule of Investments - Clearwater Core Equity Fund
September 30, 2020 (unaudited)
| Shares | Security | Cost | Fair value (a) | Percent of net assets | ||||
| Materials (Cont'd): | ||||||||
| 600 | ROYAL GOLD, INC. | $22,314 | 72,102 | |||||
| 2,400 | RPM INTERNATIONAL, INC. | 24,657 | 198,816 | |||||
| 500 | SCOTTS MIRACLE-GRO (THE) CO. | 37,765 | 76,455 | |||||
| 1,400 | SEALED AIR CORP. | 24,528 | 54,334 | |||||
| 3,600 | SONOCO PRODUCTS CO. | 74,519 | 183,852 | |||||
| 3,234 | SOUTHERN COPPER CORP.(c) | 38,445 | 146,403 | |||||
| 11,903 | STEEL DYNAMICS, INC. | 182,235 | 340,783 | |||||
| 4,392 | VALVOLINE, INC. | 24,184 | 83,624 | |||||
| 2,100 | VULCAN MATERIALS CO. | 63,441 | 284,634 | |||||
| 2,242 | WESTROCK CO. | 24,357 | 77,887 | |||||
| 8,477,125 | 15,292,699 | 2.82% | ||||||
| Real Estate: | ||||||||
| 2,100 | ALEXANDRIA REAL ESTATE EQUITIES, INC. | 106,066 | 336,000 | |||||
| 3,148 | AMERICAN TOWER CORP. | 239,658 | 760,966 | |||||
| 3,729 | APARTMENT INVESTMENT AND MANAGEMENT CO., CLASS A | 47,243 | 125,742 | |||||
| 21,906 | APPLE HOSPITALITY REIT, INC. | 171,757 | 210,517 | |||||
| 734 | AVALONBAY COMMUNITIES, INC. | 31,138 | 109,616 | |||||
| 14,826 | BOSTON PROPERTIES, INC. | 1,272,891 | 1,190,528 | |||||
| 46,503 | BRIXMOR PROPERTY GROUP, INC. | 409,622 | 543,620 | |||||
| 2,153 | CAMDEN PROPERTY TRUST | 123,556 | 191,574 | |||||
| 24,200 | COLONY CAPITAL, INC. | 47,800 | 66,066 | |||||
| 500 | CORESITE REALTY CORP. | 43,021 | 59,440 | |||||
| 4,700 | CROWN CASTLE INTERNATIONAL CORP. | 190,955 | 782,550 | |||||
| 2,027 | CUBESMART | 53,159 | 65,492 | |||||
| 900 | CYRUSONE, INC. | 45,900 | 63,027 | |||||
| 2,500 | DIGITAL REALTY TRUST, INC. | 269,780 | 366,900 | |||||
| 5,200 | DOUGLAS EMMETT, INC. | 44,883 | 130,520 | |||||
| 1,700 | DUKE REALTY CORP. | 28,435 | 62,730 | |||||
| 315 | EPR PROPERTIES | 6,875 | 8,662 | |||||
| 2,140 | EQUINIX, INC. | 817,154 | 1,626,678 | |||||
| 1,600 | EQUITY LIFESTYLE PROPERTIES, INC. | 26,751 | 98,080 | |||||
| 5,416 | EQUITY RESIDENTIAL | 174,162 | 278,003 | |||||
| 1,625 | ESSEX PROPERTY TRUST, INC. | 275,634 | 326,284 | |||||
| 900 | FEDERAL REALTY INVESTMENT TRUST | 48,326 | 66,096 | |||||
| 1,046 | FOUR CORNERS PROPERTY TRUST, INC. | 8,684 | 26,767 | |||||
| 2,049 | GAMING AND LEISURE PROPERTIES, INC. | 55,768 | 75,680 | |||||
| 7,000 | HEALTHPEAK PROPERTIES, INC. | 72,217 | 190,050 | |||||
| 2,015 | HIGHWOODS PROPERTIES, INC. | 68,519 | 67,644 | |||||
| 70,821 | HOST HOTELS & RESORTS, INC. | 798,690 | 764,159 | |||||
| 678 | HOWARD HUGHES (THE) CORP.(b) | 20,502 | 39,053 | |||||
| 700 | JBG SMITH PROPERTIES | 17,888 | 18,718 | |||||
| 700 | JONES LANG LASALLE, INC. | 39,951 | 66,962 | |||||
| 4,001 | KIMCO REALTY CORP. | 33,139 | 45,051 | |||||
| 4,678 | LAMAR ADVERTISING CO., CLASS A | 77,075 | 309,543 | |||||
| 6,311 | MID-AMERICA APARTMENT COMMUNITIES, INC. | 643,774 | 731,760 | |||||
| 15,318 | OUTFRONT MEDIA, INC. | 184,437 | 222,877 | |||||
| 10,911 | PROLOGIS, INC. | 282,240 | 1,097,865 | |||||
| 1,014 | PUBLIC STORAGE | 62,914 | 225,838 | |||||
| 6,972 | RAYONIER, INC. | 74,591 | 184,340 | |||||
| 2,600 | REALTY INCOME CORP. | 49,031 | 157,950 | |||||
| 3,900 | REGENCY CENTERS CORP. | 85,344 | 148,278 | |||||
| 4,528 | SBA COMMUNICATIONS CORP. | 826,171 | 1,442,077 | |||||
| 1,594 | SIMON PROPERTY GROUP, INC. | 75,050 | 103,100 | |||||
| 1,100 | SUN COMMUNITIES, INC. | 83,011 | 154,671 | |||||
| 2,100 | TAUBMAN CENTERS, INC. | 53,754 | 69,909 | |||||
| 4,100 | UDR, INC. | 63,318 | 133,701 | |||||
| 10,100 | VEREIT, INC. | 51,263 | 65,650 | |||||
| 4,300 | VICI PROPERTIES, INC. | 66,376 | 100,491 | |||||
| 21,709 | VORNADO REALTY TRUST | 843,765 | 731,810 | |||||
| 21,812 | WEINGARTEN REALTY INVESTORS | 307,488 | 369,932 | |||||
| 4,916 | WEYERHAEUSER CO. | 64,713 | 140,204 | |||||
| 9,484,439 | 15,153,171 | 2.79% | ||||||
| Utilities: | ||||||||
| 3,000 | AES (THE) CORP. | 32,870 | 54,330 | |||||
| 2,000 | ALLIANT ENERGY CORP. | 24,835 | 103,300 | |||||
| 1,600 | AMEREN CORP. | 40,872 | 126,528 | |||||
| 10 | (Continued) |
CLEARWATER INVESTMENT TRUST
Schedule of Investments - Clearwater Core Equity Fund
September 30, 2020 (unaudited)
| Shares | Security | Cost | Fair value (a) | Percent of net assets | ||||
| Utilities (Cont'd): | ||||||||
| 3,406 | AMERICAN ELECTRIC POWER CO., INC. | $147,690 | 278,372 | |||||
| 13,200 | AVANGRID, INC. | 502,113 | 666,072 | |||||
| 5,800 | CENTERPOINT ENERGY, INC. | 66,308 | 112,230 | |||||
| 13,300 | CMS ENERGY CORP. | 259,708 | 816,753 | |||||
| 4,875 | CONSOLIDATED EDISON, INC. | 311,551 | 379,275 | |||||
| 12,073 | DOMINION ENERGY, INC. | 450,978 | 952,922 | |||||
| 2,300 | DTE ENERGY CO. | 84,036 | 264,592 | |||||
| 12,117 | DUKE ENERGY CORP. | 582,142 | 1,073,081 | |||||
| 4,425 | EDISON INTERNATIONAL | 136,263 | 224,967 | |||||
| 4,321 | ENTERGY CORP. | 369,658 | 425,748 | |||||
| 1,735 | ESSENTIAL UTILITIES, INC. | 22,973 | 69,834 | |||||
| 2,974 | EVERGY, INC. | 67,407 | 151,139 | |||||
| 4,961 | EVERSOURCE ENERGY | 125,492 | 414,492 | |||||
| 5,500 | FIRSTENERGY CORP. | 176,693 | 157,905 | |||||
| 900 | NATIONAL FUEL GAS CO. | 20,790 | 36,531 | |||||
| 4,400 | NEXTERA ENERGY, INC. | 204,691 | 1,221,264 | |||||
| 6,900 | NISOURCE, INC. | 43,973 | 151,800 | |||||
| 17,950 | NRG ENERGY, INC. | 528,378 | 551,783 | |||||
| 4,800 | OGE ENERGY CORP. | 43,344 | 143,952 | |||||
| 5,000 | PG&E CORP.(b) | 46,280 | 46,950 | |||||
| 2,400 | PINNACLE WEST CAPITAL CORP. | 71,637 | 178,920 | |||||
| 700 | PPL CORP. | 10,384 | 19,047 | |||||
| 14,873 | PUBLIC SERVICE ENTERPRISE GROUP, INC. | 687,970 | 816,676 | |||||
| 3,200 | SEMPRA ENERGY | 174,758 | 378,752 | |||||
| 8,600 | SOUTHERN (THE) CO. | 176,010 | 466,292 | |||||
| 4,650 | UGI CORP. | 51,203 | 153,357 | |||||
| 1,600 | WEC ENERGY GROUP, INC. | 91,440 | 155,040 | |||||
| 968 | XCEL ENERGY, INC. | 36,241 | 66,802 | |||||
| 5,588,688 | 10,658,706 | 1.97% | ||||||
| Sub-total Common Stocks: | 266,413,825 | 538,103,989 | 99.29% | |||||
| Preferred Stocks: | ||||||||
| Consumer Discretionary: | ||||||||
| 356 | QURATE RETAIL, INC.(b) | 14,261 | 35,002 | |||||
| 14,261 | 35,002 | 0.01% | ||||||
| Sub-total Preferred Stocks: | 14,261 | 35,002 | 0.01% | |||||
| Short-Term Investments: | ||||||||
| 3,639,552 | NORTHERN INSTITUTIONAL FUNDS - U.S. GOVERNMENT SELECT PORTFOLIO, 0.03%(d) | 3,639,552 | 3,639,552 | |||||
| Sub-total Short-Term Investments: | 3,639,552 | 3,639,552 | 0.67% | |||||
| Grand total | $270,067,638 | 541,778,543 | 99.97% | |||||
| Notes to Schedule of Investments: | |
| (a) | Investments in U.S. and foreign equity securities are valued at the last sales price or the regular trading session closing price on the principal exchange or market where the securities are traded. Foreign security values are stated in U.S. dollars. |
| (b) | Non-income producing assets. |
| (c) | Foreign security values are stated in U.S. dollars. As of September 30, 2020, the value of foreign stocks or depositary receipts of companies based outside of the United States represented 2.13% of net assets. |
| (d) | The short-term investment is a money market portfolio of the investment company, Northern Institutional Funds. At December 31, 2019, the value of the Clearwater Core Equity Fund's investment in the U.S. Government Select Portfolio of the Northern Institutional Funds was $2,916,876 with net purchases of $722,676 during the nine months ended September 30, 2020. |
| 11 | (Continued) |
CLEARWATER INVESTMENT TRUST
Schedule of Investments - Clearwater Core Equity Fund
September 30, 2020 (unaudited)
Fair value is an estimate of the price the Clearwater Core Equity Fund would receive upon selling a security in a timely transaction to an independent buyer in the principal or most advantageous market for the security. This guidance establishes a three-tier hierarchy to maximize the use of observable market data and minimize the use of unobservable inputs and to establish classification of fair value measurements for disclosure purposes. Various inputs are used in determining the value of the Clearwater Core Equity Fund's investments, as described below. These inputs are summarized in the three broad levels listed below.
| • | Level 1 – Unadjusted quoted market prices in active markets for identical securities on the measurement date. |
| • | Level 2 – Other significant observable inputs including quoted prices for similar investments, interest rates, prepayment speeds, credit risk, etc. or quoted prices for identical or similar assets in markets that are not active. Inputs that are derived principally from or corroborated by observable market data are also considered Level 2 measurements. An adjustment to any observable input that is significant to the fair value may render the measurement a Level 3 measurement. |
| • | Level 3 – Valuations based on unobservable inputs, which may include the Adviser’s own assumptions in determining the fair value of an investment. |
Investments in U.S. and foreign equity securities are valued at the last sales price or the regular trading session closing price on the principal exchange or market in which such securities are traded, with foreign security values stated in U.S. dollars. Equity securities which have not traded on the date of valuation or securities for which sales prices are not generally reported are valued at the mean between the last bid and asked prices. Security transactions are accounted for as of trade date. Wherever possible, the Clearwater Core Equity Fund uses independent pricing services approved by the Board of Trustees of Clearwater Investment Trust to value its investments. When prices are not readily available (including those for which trading has been suspended), are determined not to reflect fair value, or when the Adviser becomes aware that a significant event impacting the value of a security or group of securities has occurred after the closing of the exchange on which the security or securities principally trade, but before the calculation of the daily net asset value, the Clearwater Core Equity Fund may value these securities at fair value as determined in good faith using procedures established by the Board of Trustees.
The inputs or methodology used for valuing securities are not necessarily an indication of the risk associated with investing in those securities and other financial instruments, if any. The following is a summary of the inputs used in valuing the Clearwater Core Equity Fund’s investments and other financial instruments, if any, which are carried at fair value, as of September 30, 2020.
| Level 1 | Level 2 | Level 3 | Total | ||||
| Common Stocks | $538,103,989 | $— | $— | $538,103,989 | |||
| Preferred Stocks | 35,002 | — | — | 35,002 | |||
| Short-Term Investments | 3,639,552 | — | — | 3,639,552 | |||
| Total | $541,778,543 | $— | $— | $541,778,543 |
For the Clearwater Core Equity Fund, the investment value is comprised of equity securities and short-term investments. See the Clearwater Core Equity Fund’s Schedule of Investments for industry classification. Investments in equity and short-term securities generally are valued at the last sales price or the regular trading session closing price on the principal exchange or market where they are traded.
| 12 | (Continued) |
CLEARWATER INVESTMENT TRUST
Schedule of Investments - Clearwater Core Equity Fund
September 30, 2020 (unaudited)
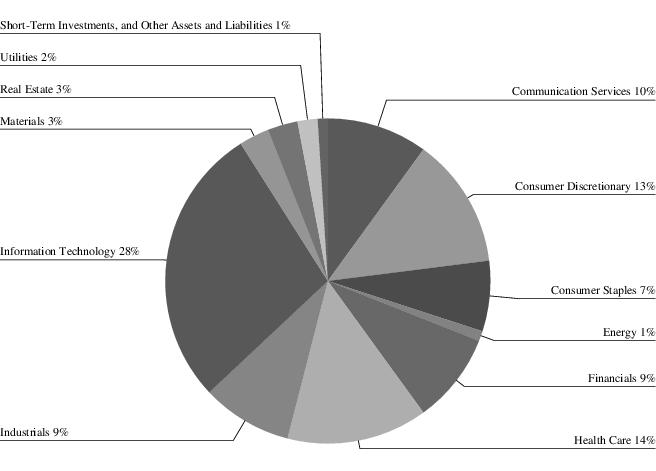
Clearwater Core Equity Fund Portfolio Diversification
(as a percentage of net assets)
| 13 | (Continued) |
CLEARWATER INVESTMENT TRUST
Schedule of Investments - Clearwater Small Companies Fund
September 30, 2020 (unaudited)
| Shares | Security | Cost | Fair value (a) | Percent of net assets | ||||
| Common Stocks: | ||||||||
| Communication Services: | ||||||||
| 232,117 | ALASKA COMMUNICATIONS SYSTEMS GROUP, INC. | $466,648 | 464,234 | |||||
| 2,932 | CINCINNATI BELL, INC.(b) | 43,797 | 43,980 | |||||
| 2,166 | COGENT COMMUNICATIONS HOLDINGS, INC. | 147,768 | 130,068 | |||||
| 3,900 | CONSOLIDATED COMMUNICATIONS HOLDINGS, INC.(b) | 25,218 | 22,191 | |||||
| 48,713 | EW SCRIPPS (THE) CO., CLASS A | 643,750 | 557,277 | |||||
| 12,551 | GANNETT CO., INC. | 23,297 | 16,316 | |||||
| 46,922 | GCI LIBERTY, INC., CLASS A(b) | 3,862,526 | 3,845,727 | |||||
| 9,690 | GLU MOBILE, INC.(b) | 71,372 | 74,371 | |||||
| 20,836 | HEMISPHERE MEDIA GROUP, INC.(b) | 174,112 | 181,065 | |||||
| 5,367 | IRIDIUM COMMUNICATIONS, INC.(b) | 143,076 | 137,288 | |||||
| 1,545 | MARCUS (THE) CORP. | 21,359 | 11,943 | |||||
| 2,151 | MEREDITH CORP. | 30,667 | 28,221 | |||||
| 86,597 | NEW YORK TIMES (THE) CO., CLASS A | 3,674,716 | 3,705,486 | |||||
| 266 | QUINSTREET, INC.(b) | 3,557 | 4,213 | |||||
| 39,699 | SAGA COMMUNICATIONS, INC., CLASS A | 1,173,176 | 789,216 | |||||
| 2,082 | SCHOLASTIC CORP. | 44,820 | 43,701 | |||||
| 2,170 | SHENANDOAH TELECOMMUNICATIONS CO. | 107,251 | 96,424 | |||||
| 10,561 | SPOK HOLDINGS, INC. | 98,882 | 100,435 | |||||
| 406 | TECHTARGET, INC.(b) | 15,077 | 17,848 | |||||
| 12,314 | VONAGE HOLDINGS CORP.(b) | 133,673 | 125,972 | |||||
| 10,904,742 | 10,395,976 | 3.00% | ||||||
| Consumer Discretionary: | ||||||||
| 2,673 | ABERCROMBIE & FITCH CO., CLASS A | 27,872 | 37,235 | |||||
| 6,038 | AMERICAN AXLE & MANUFACTURING HOLDINGS, INC.(b) | 43,448 | 34,839 | |||||
| 189,700 | AMERICAN EAGLE OUTFITTERS, INC. | 3,387,557 | 2,809,457 | |||||
| 909 | AMERICAN PUBLIC EDUCATION, INC.(b) | 26,610 | 25,625 | |||||
| 1,902 | AMERICA'S CAR-MART, INC.(b) | 119,276 | 161,442 | |||||
| 1,030 | ASBURY AUTOMOTIVE GROUP, INC.(b) | 88,312 | 100,373 | |||||
| 5,930 | BED BATH & BEYOND, INC. | 60,818 | 88,831 | |||||
| 2,008 | BIG LOTS, INC. | 82,362 | 89,557 | |||||
| 518 | BJ'S RESTAURANTS, INC. | 12,128 | 15,250 | |||||
| 3,673 | BLOOMIN' BRANDS, INC. | 38,034 | 56,087 | |||||
| 133,302 | BLUEGREEN VACATIONS CORP.(c) | 1,148,955 | 653,180 | |||||
| 56,421 | BLUEGREEN VACATIONS HOLDING CORP.(b) | 1,354,365 | 755,477 | |||||
| 8,351 | BOOT BARN HOLDINGS, INC.(b) | 175,092 | 234,997 | |||||
| 376 | BRINKER INTERNATIONAL, INC. | 14,943 | 16,063 | |||||
| 1,060 | BUCKLE (THE), INC. | 17,193 | 21,613 | |||||
| 2,030 | CALERES, INC. | 21,289 | 19,407 | |||||
| 13,046 | CALLAWAY GOLF CO. | 212,055 | 249,700 | |||||
| 7,975 | CAPRI HOLDINGS LTD.(b)(d) | 123,897 | 143,550 | |||||
| 63,936 | CARRIAGE SERVICES, INC. | 1,180,115 | 1,426,412 | |||||
| 2,074 | CATO (THE) CORP., CLASS A | 16,670 | 16,219 | |||||
| 460 | CAVCO INDUSTRIES, INC.(b) | 85,256 | 82,943 | |||||
| 1,644 | CENTURY COMMUNITIES, INC.(b) | 50,732 | 69,591 | |||||
| 2,233 | CHEESECAKE FACTORY (THE), INC. | 47,155 | 61,943 | |||||
| 759 | CHILDREN'S PLACE (THE), INC. | 21,260 | 21,518 | |||||
| 137,020 | CLARUS CORP. | 656,770 | 1,934,722 | |||||
| 3,663 | COOPER TIRE & RUBBER CO. | 101,122 | 116,117 | |||||
| 1,390 | COOPER-STANDARD HOLDINGS, INC.(b) | 16,303 | 18,362 | |||||
| 9,541 | CORE-MARK HOLDING CO., INC. | 232,132 | 276,021 | |||||
| 3,256 | CROCS, INC.(b) | 110,131 | 139,129 | |||||
| 159,068 | DANA, INC. | 1,694,073 | 1,959,718 | |||||
| 2,806 | DAVE & BUSTER'S ENTERTAINMENT, INC. | 35,959 | 42,539 | |||||
| 663 | DINE BRANDS GLOBAL, INC. | 28,696 | 36,193 | |||||
| 1,651 | DORMAN PRODUCTS, INC.(b) | 108,287 | 149,217 | |||||
| 30,578 | DUNKIN' BRANDS GROUP, INC. | 2,357,734 | 2,504,644 | |||||
| 1,141 | EL POLLO LOCO HOLDINGS, INC.(b) | 17,103 | 18,484 | |||||
| 1,508 | ETHAN ALLEN INTERIORS, INC. | 17,324 | 20,418 | |||||
| 71,600 | EXTENDED STAY AMERICA, INC. | 1,089,639 | 855,620 | |||||
| 105,291 | FARFETCH LTD., CLASS A(b)(d) | 2,562,025 | 2,649,122 | |||||
| 36,001 | FIESTA RESTAURANT GROUP, INC.(b) | 375,056 | 337,329 | |||||
| 12,096 | FIVE BELOW, INC.(b) | 1,552,000 | 1,536,192 | |||||
| 3,843 | FOSSIL GROUP, INC.(b) | 15,973 | 22,059 | |||||
| 306,645 | FULL HOUSE RESORTS, INC.(b) | 702,274 | 594,891 | |||||
| 3,969 | GAMESTOP CORP., CLASS A(b)(c) | 16,258 | 40,484 | |||||
| 2,667 | GENTHERM, INC.(b) | 101,951 | 109,080 | |||||
| 14 | (Continued) |
CLEARWATER INVESTMENT TRUST
Schedule of Investments - Clearwater Small Companies Fund
September 30, 2020 (unaudited)
| Shares | Security | Cost | Fair value (a) | Percent of net assets | ||||
| Consumer Discretionary (Cont'd): | ||||||||
| 2,387 | G-III APPAREL GROUP LTD.(b) | $34,366 | 31,294 | |||||
| 140,300 | GILDAN ACTIVEWEAR, INC.(d) | 3,431,431 | 2,759,701 | |||||
| 913 | GROUP 1 AUTOMOTIVE, INC. | 59,610 | 80,700 | |||||
| 1,751 | GUESS?, INC. | 16,316 | 20,347 | |||||
| 60,400 | HANESBRANDS, INC. | 828,344 | 951,300 | |||||
| 1,118 | HAVERTY FURNITURE COS., INC. | 17,384 | 23,411 | |||||
| 13,600 | HELEN OF TROY LTD.(b) | 1,396,045 | 2,631,872 | |||||
| 58,638 | HOOKER FURNITURE CORP. | 1,347,057 | 1,514,620 | |||||
| 657 | INSTALLED BUILDING PRODUCTS, INC.(b) | 53,344 | 66,850 | |||||
| 1,288 | IROBOT CORP.(b) | 107,547 | 97,759 | |||||
| 2,499 | KONTOOR BRANDS, INC. | 42,251 | 60,476 | |||||
| 2,457 | LA-Z-BOY, INC. | 67,314 | 77,715 | |||||
| 1,374 | LCI INDUSTRIES | 152,143 | 146,042 | |||||
| 1,164 | LGI HOMES, INC.(b) | 113,699 | 135,222 | |||||
| 187,783 | LIFETIME BRANDS, INC. | 1,743,539 | 1,774,549 | |||||
| 432 | LITHIA MOTORS, INC., CLASS A | 69,202 | 98,470 | |||||
| 1,246 | LUMBER LIQUIDATORS HOLDINGS, INC.(b) | 17,493 | 27,474 | |||||
| 1,629 | M/I HOMES, INC.(b) | 53,545 | 75,015 | |||||
| 16,345 | MACY'S, INC.(c) | 107,310 | 93,166 | |||||
| 24,730 | MALIBU BOATS, INC., CLASS A(b) | 608,583 | 1,225,619 | |||||
| 889 | MARINEMAX, INC.(b) | 20,195 | 22,821 | |||||
| 1,895 | MDC HOLDINGS, INC. | 69,256 | 89,254 | |||||
| 1,931 | MERITAGE HOMES CORP.(b) | 148,992 | 213,163 | |||||
| 3,541 | MICHAELS (THE) COS., INC.(b) | 26,020 | 34,188 | |||||
| 79,706 | MOTORCAR PARTS OF AMERICA, INC.(b) | 1,466,568 | 1,240,225 | |||||
| 1,832 | MOVADO GROUP, INC. | 19,444 | 18,210 | |||||
| 14,588 | ODP (THE) CORP. | 276,863 | 283,737 | |||||
| 646 | OXFORD INDUSTRIES, INC. | 27,145 | 26,073 | |||||
| 43,234 | PAPA JOHN'S INTERNATIONAL, INC. | 3,747,599 | 3,557,294 | |||||
| 770 | PETMED EXPRESS, INC. | 22,469 | 24,347 | |||||
| 92,948 | POTBELLY CORP.(b) | 282,462 | 352,273 | |||||
| 17,047 | PVH CORP. | 828,451 | 1,016,683 | |||||
| 1,350 | RED ROBIN GOURMET BURGERS, INC.(b) | 19,978 | 17,766 | |||||
| 2,585 | RENT-A-CENTER, INC. | 68,779 | 77,266 | |||||
| 2,351 | RUTH'S HOSPITALITY GROUP, INC. | 20,747 | 26,002 | |||||
| 13,457 | SELECT INTERIOR CONCEPTS, INC., CLASS A(b) | 78,816 | 92,853 | |||||
| 1,875 | SHAKE SHACK, INC., CLASS A(b) | 93,633 | 120,900 | |||||
| 1,028 | SHUTTERSTOCK, INC. | 38,313 | 53,497 | |||||
| 2,795 | SIGNET JEWELERS LTD. | 28,612 | 52,266 | |||||
| 892 | SONIC AUTOMOTIVE, INC., CLASS A | 30,582 | 35,823 | |||||
| 829 | STAMPS.COM, INC.(b) | 163,911 | 199,748 | |||||
| 1,726 | STANDARD MOTOR PRODUCTS, INC. | 69,295 | 77,066 | |||||
| 3,094 | STEVEN MADDEN LTD. | 70,023 | 60,333 | |||||
| 124,558 | STITCH FIX, INC., CLASS A(b)(c) | 3,890,669 | 3,379,259 | |||||
| 72,100 | STONERIDGE, INC.(b) | 1,508,914 | 1,324,477 | |||||
| 2,437 | TUPPERWARE BRANDS CORP.(b) | 64,378 | 49,130 | |||||
| 37,148 | UNIFI, INC.(b) | 605,573 | 476,980 | |||||
| 3,955 | UNIVERSAL ELECTRONICS, INC.(b) | 146,082 | 149,262 | |||||
| 3,098 | VISTA OUTDOOR, INC.(b) | 47,234 | 62,518 | |||||
| 54,007 | WINNEBAGO INDUSTRIES, INC. | 1,576,833 | 2,790,542 | |||||
| 3,529 | WOLVERINE WORLD WIDE, INC. | 77,930 | 91,189 | |||||
| 44,968 | WYNDHAM HOTELS & RESORTS, INC. | 2,191,001 | 2,270,884 | |||||
| 3,271 | YETI HOLDINGS, INC.(b) | 142,676 | 148,242 | |||||
| 48,282,170 | 50,877,523 | 14.69% | ||||||
| Consumer Staples: | ||||||||
| 3,518 | B&G FOODS, INC.(c) | 91,617 | 97,695 | |||||
| 1,361 | CALAVO GROWERS, INC. | 84,804 | 90,193 | |||||
| 527 | CENTRAL GARDEN & PET CO.(b) | 22,709 | 21,043 | |||||
| 2,151 | CENTRAL GARDEN & PET CO., CLASS A(b) | 73,350 | 77,737 | |||||
| 261 | COCA-COLA CONSOLIDATED, INC. | 60,974 | 62,817 | |||||
| 1,500 | FRESH DEL MONTE PRODUCE, INC. | 35,547 | 34,380 | |||||
| 117,046 | GROCERY OUTLET HOLDING CORP.(b) | 4,534,205 | 4,602,249 | |||||
| 572 | J & J SNACK FOODS CORP. | 77,729 | 74,583 | |||||
| 11,604 | JOHN B. SANFILIPPO & SON, INC. | 930,340 | 874,709 | |||||
| 52,876 | LANDEC CORP.(b) | 503,926 | 513,955 | |||||
| 646 | MEDIFAST, INC. | 108,263 | 106,235 | |||||
| 853 | MGP INGREDIENTS, INC. | 31,102 | 33,898 | |||||
| 15 | (Continued) |
CLEARWATER INVESTMENT TRUST
Schedule of Investments - Clearwater Small Companies Fund
September 30, 2020 (unaudited)
| Shares | Security | Cost | Fair value (a) | Percent of net assets | ||||
| Consumer Staples (Cont'd): | ||||||||
| 490 | NATIONAL BEVERAGE CORP.(b) | $33,897 | 33,325 | |||||
| 89,591 | NATURE'S SUNSHINE PRODUCTS, INC.(b) | 832,409 | 1,036,568 | |||||
| 7,900 | PERFORMANCE FOOD GROUP CO.(b) | 256,026 | 273,498 | |||||
| 18,127 | SENECA FOODS CORP., CLASS A(b) | 613,180 | 647,678 | |||||
| 16,915 | SPECTRUM BRANDS HOLDINGS, INC. | 880,456 | 966,861 | |||||
| 433,799 | SUNOPTA, INC.(b)(d) | 1,201,815 | 3,218,789 | |||||
| 31,694 | UNIVERSAL CORP. | 1,591,629 | 1,327,345 | |||||
| 651 | USANA HEALTH SCIENCES, INC.(b) | 52,920 | 47,946 | |||||
| 7,458 | VECTOR GROUP LTD. | 72,236 | 72,268 | |||||
| 749 | WD-40 CO. | 153,736 | 141,793 | |||||
| 12,242,870 | 14,355,565 | 4.15% | ||||||
| Energy: | ||||||||
| 1,330 | BONANZA CREEK ENERGY, INC.(b) | 20,228 | 25,004 | |||||
| 1,386 | BRISTOW GROUP, INC.(b) | 33,470 | 29,453 | |||||
| 3,615 | CALLON PETROLEUM CO.(b) | 20,376 | 17,424 | |||||
| 22,533 | DMC GLOBAL, INC. | 637,373 | 742,237 | |||||
| 2,317 | DORIAN LPG LTD.(b) | 17,440 | 18,559 | |||||
| 2,055 | DRIL-QUIP, INC.(b) | 60,496 | 50,882 | |||||
| 1,659 | GREEN PLAINS, INC.(b) | 17,283 | 25,681 | |||||
| 7,608 | HELIX ENERGY SOLUTIONS GROUP, INC.(b) | 26,138 | 18,335 | |||||
| 6,710 | HELMERICH & PAYNE, INC. | 104,513 | 98,302 | |||||
| 1,257 | LAREDO PETROLEUM, INC.(b) | 15,435 | 12,319 | |||||
| 5,849 | MATADOR RESOURCES CO.(b) | 43,375 | 48,313 | |||||
| 127,550 | MURPHY OIL CORP. | 1,647,231 | 1,137,746 | |||||
| 87,165 | NATIONAL OILWELL VARCO, INC. | 935,289 | 789,715 | |||||
| 11,679 | NEWPARK RESOURCES, INC.(b) | 18,049 | 12,263 | |||||
| 639,502 | NEXTIER OILFIELD SOLUTIONS, INC.(b) | 2,437,785 | 1,183,079 | |||||
| 9,957 | PATTERSON-UTI ENERGY, INC. | 33,361 | 28,377 | |||||
| 6,664 | PBF ENERGY, INC., CLASS A | 46,153 | 37,918 | |||||
| 5,102 | PDC ENERGY, INC.(b) | 67,785 | 63,239 | |||||
| 1,773 | PENN VIRGINIA CORP.(b) | 16,077 | 17,464 | |||||
| 3,584 | PROPETRO HOLDING CORP.(b) | 18,182 | 14,551 | |||||
| 11,333 | RANGE RESOURCES CORP. | 75,993 | 75,025 | |||||
| 258 | REX AMERICAN RESOURCES CORP.(b) | 16,958 | 16,927 | |||||
| 8,731 | RPC, INC.(b) | 26,853 | 23,050 | |||||
| 1,075 | SEACOR HOLDINGS, INC.(b) | 28,849 | 31,261 | |||||
| 14,605 | SM ENERGY CO. | 27,828 | 23,222 | |||||
| 17,124 | SOUTHWESTERN ENERGY CO.(b) | 48,036 | 40,241 | |||||
| 3,300 | TALOS ENERGY, INC.(b) | 18,568 | 21,285 | |||||
| 94,016 | TECHNIPFMC PLC(d) | 703,376 | 593,241 | |||||
| 5,083 | US SILICA HOLDINGS, INC. | 18,278 | 15,249 | |||||
| 7,180,778 | 5,210,362 | 1.50% | ||||||
| Financials: | ||||||||
| 10,485 | 1ST CONSTITUTION BANCORP | 178,934 | 124,772 | |||||
| 1,030 | ALLEGIANCE BANCSHARES, INC. | 25,237 | 24,071 | |||||
| 7,330 | ALTABANCORP | 148,107 | 147,480 | |||||
| 48,921 | AMBAC FINANCIAL GROUP, INC.(b) | 807,516 | 624,721 | |||||
| 65,817 | AMERICAN EQUITY INVESTMENT LIFE HOLDING CO. | 1,571,540 | 1,447,316 | |||||
| 1,083 | AMERISAFE, INC. | 64,571 | 62,121 | |||||
| 8,567 | APOLLO COMMERCIAL REAL ESTATE FINANCE, INC. | 77,749 | 77,189 | |||||
| 34,288 | ARGO GROUP INTERNATIONAL HOLDINGS LTD.(d) | 1,415,051 | 1,180,536 | |||||
| 3,448 | ARMOUR RESIDENTIAL REIT, INC. | 31,261 | 32,791 | |||||
| 149,268 | ASSOCIATED BANC-CORP | 2,978,723 | 1,883,762 | |||||
| 54,522 | AXIS CAPITAL HOLDINGS LTD.(d) | 2,718,034 | 2,401,149 | |||||
| 2,771 | AXOS FINANCIAL, INC.(b) | 55,910 | 64,592 | |||||
| 2,140 | BANC OF CALIFORNIA, INC. | 21,614 | 21,657 | |||||
| 844 | BANCFIRST CORP. | 38,007 | 34,469 | |||||
| 40,949 | BANCORP (THE), INC.(b) | 369,780 | 353,799 | |||||
| 6,905 | BANK OF MARIN BANCORP | 216,556 | 199,969 | |||||
| 4,296 | BANKUNITED, INC. | 99,866 | 94,125 | |||||
| 16,369 | BANKWELL FINANCIAL GROUP, INC. | 414,111 | 231,621 | |||||
| 1,876 | BANNER CORP. | 65,693 | 60,520 | |||||
| 33,930 | BARINGS BDC, INC. | 276,379 | 271,440 | |||||
| 10,793 | BERKSHIRE HILLS BANCORP, INC. | 110,226 | 109,117 | |||||
| 12,141 | BLACKROCK TCP CAPITAL CORP. | 164,841 | 119,103 | |||||
| 8,948 | BOSTON PRIVATE FINANCIAL HOLDINGS, INC. | 54,539 | 49,393 | |||||
| 15,272 | BRIDGE BANCORP, INC. | 401,537 | 266,191 | |||||
| 16 | (Continued) |
CLEARWATER INVESTMENT TRUST
Schedule of Investments - Clearwater Small Companies Fund
September 30, 2020 (unaudited)
| Shares | Security | Cost | Fair value (a) | Percent of net assets | ||||
| Financials (Cont'd): | ||||||||
| 3,329 | BRIGHTSPHERE INVESTMENT GROUP, INC. | $42,433 | 42,944 | |||||
| 4,213 | BROOKLINE BANCORP, INC. | 39,081 | 36,421 | |||||
| 6,376 | CADENCE BANCORP | 52,965 | 54,770 | |||||
| 5,516 | CAPSTEAD MORTGAGE CORP. | 31,048 | 31,000 | |||||
| 54,777 | CARLYLE GROUP (THE), INC. | 1,337,161 | 1,351,349 | |||||
| 878 | CITY HOLDING CO. | 54,286 | 50,582 | |||||
| 148,600 | CNO FINANCIAL GROUP, INC. | 2,487,716 | 2,383,544 | |||||
| 3,820 | COLUMBIA BANKING SYSTEM, INC. | 101,216 | 91,107 | |||||
| 20,831 | COMMERCE BANCSHARES, INC. | 991,681 | 1,172,577 | |||||
| 2,756 | COMMUNITY BANK SYSTEM, INC. | 152,076 | 150,092 | |||||
| 12,153 | COMMUNITY BANKERS TRUST CORP. | 108,443 | 61,737 | |||||
| 59,839 | COWEN, INC., CLASS A | 970,620 | 973,581 | |||||
| 93,756 | CRAWFORD & CO., CLASS A | 729,470 | 613,164 | |||||
| 36,361 | CRAWFORD & CO., CLASS B | 257,247 | 234,165 | |||||
| 1,545 | CUSTOMERS BANCORP, INC.(b) | 16,791 | 17,304 | |||||
| 6,872 | CVB FINANCIAL CORP. | 121,949 | 114,281 | |||||
| 2,298 | DIME COMMUNITY BANCSHARES, INC. | 31,131 | 25,990 | |||||
| 101,211 | DONEGAL GROUP, INC., CLASS A | 1,520,565 | 1,424,039 | |||||
| 1,921 | DONNELLEY FINANCIAL SOLUTIONS, INC.(b) | 16,285 | 25,665 | |||||
| 22,396 | EAGLE BANCORP MONTANA, INC. | 395,572 | 394,618 | |||||
| 1,718 | EAGLE BANCORP, INC. | 51,468 | 46,025 | |||||
| 1,254 | EHEALTH, INC.(b) | 94,814 | 99,066 | |||||
| 33,111 | EMPIRE BANCORP, INC.(b) | 447,702 | 347,997 | |||||
| 2,593 | EMPLOYERS HOLDINGS, INC. | 75,526 | 78,438 | |||||
| 1,484 | ENCORE CAPITAL GROUP, INC.(b) | 48,257 | 57,268 | |||||
| 1,604 | ENOVA INTERNATIONAL, INC.(b) | 22,712 | 26,290 | |||||
| 61,000 | ESSENT GROUP LTD. | 1,858,300 | 2,257,610 | |||||
| 920 | FB FINANCIAL CORP. | 26,566 | 23,110 | |||||
| 13,979 | FIDUS INVESTMENT CORP. | 179,332 | 137,693 | |||||
| 6,244 | FIRST BANCORP | 128,773 | 130,687 | |||||
| 12,245 | FIRST BANCORP (NEW YORK EXCHANGE) | 64,921 | 63,919 | |||||
| 2,241 | FIRST COMMONWEALTH FINANCIAL CORP. | 16,878 | 17,345 | |||||
| 6,947 | FIRST FINANCIAL BANCORP | 89,400 | 83,399 | |||||
| 17,108 | FIRST MID BANCSHARES, INC. | 520,349 | 426,845 | |||||
| 118,082 | FIRST MIDWEST BANCORP, INC. | 2,170,618 | 1,272,924 | |||||
| 12,623 | FIRST NORTHWEST BANCORP | 185,304 | 124,968 | |||||
| 24,525 | FIRST WESTERN FINANCIAL, INC.(b) | 313,837 | 317,599 | |||||
| 36,100 | FIRSTCASH, INC. | 2,488,500 | 2,065,281 | |||||
| 1,899 | FLAGSTAR BANCORP, INC. | 55,987 | 56,267 | |||||
| 36,721 | FLUSHING FINANCIAL CORP. | 555,117 | 386,305 | |||||
| 61,800 | GLACIER BANCORP, INC. | 2,494,408 | 1,980,690 | |||||
| 2,943 | GRANITE POINT MORTGAGE TRUST, INC. | 19,414 | 20,866 | |||||
| 6,235 | GREAT SOUTHERN BANCORP, INC. | 235,315 | 225,832 | |||||
| 3,625 | GREAT WESTERN BANCORP, INC. | 47,061 | 45,131 | |||||
| 2,602 | GREEN DOT CORP., CLASS A(b) | 131,289 | 131,687 | |||||
| 2,221 | HANMI FINANCIAL CORP. | 20,334 | 18,234 | |||||
| 48,927 | HARBORONE BANCORP, INC. | 475,499 | 394,841 | |||||
| 375 | HCI GROUP, INC. | 16,590 | 18,484 | |||||
| 3,000 | HERITAGE FINANCIAL CORP. | 57,598 | 55,170 | |||||
| 3,479 | HOMESTREET, INC. | 83,790 | 89,619 | |||||
| 176,592 | HOPE BANCORP, INC. | 2,460,627 | 1,339,450 | |||||
| 1,373 | HORACE MANN EDUCATORS CORP. | 48,818 | 45,858 | |||||
| 52,658 | HORIZON BANCORP, INC. | 577,868 | 531,319 | |||||
| 1,759 | INDEPENDENT BANK CORP. | 109,723 | 92,136 | |||||
| 1,953 | INDEPENDENT BANK GROUP, INC. | 74,619 | 86,284 | |||||
| 11,469 | INVESCO MORTGAGE CAPITAL, INC. | 35,464 | 31,081 | |||||
| 101,546 | INVESTCORP CREDIT MANAGEMENT BDC, INC. | 698,187 | 368,612 | |||||
| 1,630 | JAMES RIVER GROUP HOLDINGS LTD.(d) | 72,890 | 72,584 | |||||
| 846 | KINSALE CAPITAL GROUP, INC. | 141,502 | 160,892 | |||||
| 1,669 | KKR REAL ESTATE FINANCE TRUST, INC. | 26,512 | 27,589 | |||||
| 93,598 | LAKELAND BANCORP, INC. | 1,332,365 | 931,300 | |||||
| 19,485 | LCNB CORP. | 333,352 | 265,970 | |||||
| 7,117 | LENDINGTREE, INC.(b) | 1,762,524 | 2,184,136 | |||||
| 50,834 | MACKINAC FINANCIAL CORP. | 749,363 | 490,548 | |||||
| 13,606 | MAINSTREET BANCSHARES, INC.(b) | 246,658 | 166,537 | |||||
| 1,169 | META FINANCIAL GROUP, INC. | 20,305 | 22,468 | |||||
| 3,129 | MR COOPER GROUP, INC.(b) | 67,200 | 69,839 | |||||
| 17 | (Continued) |
CLEARWATER INVESTMENT TRUST
Schedule of Investments - Clearwater Small Companies Fund
September 30, 2020 (unaudited)
| Shares | Security | Cost | Fair value (a) | Percent of net assets | ||||
| Financials (Cont'd): | ||||||||
| 75,391 | MVC CAPITAL, INC. | $628,341 | 588,804 | |||||
| 660 | NATIONAL BANK HOLDINGS CORP., CLASS A | 16,757 | 17,325 | |||||
| 5,689 | NATIONAL WESTERN LIFE GROUP, INC., CLASS A | 1,646,680 | 1,039,779 | |||||
| 2,590 | NBT BANCORP, INC. | 73,547 | 69,464 | |||||
| 13,071 | NEW YORK MORTGAGE TRUST, INC. | 31,179 | 33,331 | |||||
| 4,524 | NMI HOLDINGS, INC., CLASS A(b) | 65,445 | 80,527 | |||||
| 5,240 | NORTHFIELD BANCORP, INC. | 52,376 | 47,789 | |||||
| 7,463 | NORTHWEST BANCSHARES, INC. | 71,467 | 68,660 | |||||
| 339,539 | OAKTREE SPECIALTY LENDING CORP. | 1,478,120 | 1,643,369 | |||||
| 166,963 | OAKTREE STRATEGIC INCOME CORP. | 1,382,352 | 1,086,929 | |||||
| 2,740 | OFG BANCORP | 34,981 | 34,140 | |||||
| 8,796 | OLD NATIONAL BANCORP | 112,946 | 110,478 | |||||
| 4,463 | PACIFIC PREMIER BANCORP, INC. | 90,386 | 89,885 | |||||
| 856 | PALOMAR HOLDINGS, INC.(b) | 75,661 | 89,229 | |||||
| 839 | PARK NATIONAL CORP. | 75,067 | 68,764 | |||||
| 5,566 | PENNS WOODS BANCORP, INC. | 155,350 | 110,485 | |||||
| 5,068 | PENNYMAC MORTGAGE INVESTMENT TRUST | 87,803 | 81,443 | |||||
| 22,306 | PEOPLES BANCORP OF NORTH CAROLINA, INC. | 453,269 | 344,182 | |||||
| 41,848 | PIONEER BANCORP, INC.(b) | 536,014 | 371,610 | |||||
| 494 | PIPER SANDLER COS. | 33,799 | 36,062 | |||||
| 2,431 | PRA GROUP, INC.(b) | 89,381 | 97,118 | |||||
| 3,353 | PROASSURANCE CORP. | 45,882 | 52,441 | |||||
| 3,992 | PROVIDENT FINANCIAL SERVICES, INC. | 53,301 | 48,702 | |||||
| 2,849 | READY CAPITAL CORP. | 25,829 | 31,909 | |||||
| 9,485 | RED RIVER BANCSHARES, INC. | 378,357 | 407,855 | |||||
| 6,963 | REDWOOD TRUST, INC. | 47,768 | 52,362 | |||||
| 848 | SAFETY INSURANCE GROUP, INC. | 62,948 | 58,588 | |||||
| 2,815 | SEACOAST BANKING CORP. OF FLORIDA(b) | 52,406 | 50,754 | |||||
| 20,000 | SELECTIVE INSURANCE GROUP, INC. | 1,150,261 | 1,029,800 | |||||
| 1,524 | SERVISFIRST BANCSHARES, INC. | 51,290 | 51,862 | |||||
| 16,458 | SHORE BANCSHARES, INC. | 242,246 | 180,709 | |||||
| 6,591 | SIMMONS FIRST NATIONAL CORP., CLASS A | 105,067 | 104,500 | |||||
| 48,455 | SOUTHERN NATIONAL BANCORP OF VIRGINIA, INC. | 757,960 | 420,589 | |||||
| 779 | SOUTHSIDE BANCSHARES, INC. | 20,080 | 19,031 | |||||
| 2,216 | STEWART INFORMATION SERVICES CORP. | 69,731 | 96,906 | |||||
| 804 | STONEX GROUP, INC.(b) | 45,619 | 41,133 | |||||
| 22,763 | SUMMIT STATE BANK | 288,477 | 253,807 | |||||
| 146,953 | TCF FINANCIAL CORP. | 4,464,047 | 3,432,822 | |||||
| 8,300 | THIRD POINT REINSURANCE LTD.(b)(d) | 60,222 | 57,685 | |||||
| 653 | TOMPKINS FINANCIAL CORP. | 39,591 | 37,097 | |||||
| 869 | TRIUMPH BANCORP, INC.(b) | 20,206 | 27,061 | |||||
| 1,476 | TRUPANION, INC.(b) | 105,797 | 116,456 | |||||
| 5,783 | TRUSTCO BANK CORP. NY | 33,499 | 30,187 | |||||
| 284,839 | UMPQUA HOLDINGS CORP. | 4,046,718 | 3,024,990 | |||||
| 16,486 | UNITED BANCORP, INC. | 204,353 | 207,064 | |||||
| 5,970 | UNITED BANCSHARES, INC. | 129,860 | 122,684 | |||||
| 4,681 | UNITED COMMUNITY BANKS, INC. | 83,634 | 79,249 | |||||
| 3,338 | UNITED INSURANCE HOLDINGS CORP. | 24,784 | 20,228 | |||||
| 49,941 | UNITED SECURITY BANCSHARES | 457,442 | 305,140 | |||||
| 41,721 | UNITY BANCORP, INC. | 687,940 | 483,129 | |||||
| 3,053 | UNIVERSAL INSURANCE HOLDINGS, INC. | 52,532 | 42,254 | |||||
| 84,836 | UNIVEST FINANCIAL CORP. | 1,831,888 | 1,219,093 | |||||
| 2,866 | VERITEX HOLDINGS, INC. | 48,563 | 48,808 | |||||
| 388 | VIRTUS INVESTMENT PARTNERS, INC. | 49,590 | 53,796 | |||||
| 3,729 | WADDELL & REED FINANCIAL, INC., CLASS A | 58,547 | 55,376 | |||||
| 4,318 | WALKER & DUNLOP, INC. | 182,461 | 228,854 | |||||
| 74,223 | WEBSTER FINANCIAL CORP. | 2,862,929 | 1,960,229 | |||||
| 38,961 | WEST BANCORP, INC. | 739,763 | 617,142 | |||||
| 1,439 | WESTAMERICA BANCORP | 80,208 | 78,210 | |||||
| 1,465 | WHITEHORSE FINANCE, INC. | 14,413 | 14,342 | |||||
| 48,963 | WSFS FINANCIAL CORP. | 1,774,070 | 1,320,532 | |||||
| 72,138,354 | 59,609,776 | 17.22% | ||||||
| Health Care: | ||||||||
| 9,747 | ABIOMED, INC.(b) | 2,611,055 | 2,700,504 | |||||
| 3,404 | ADDUS HOMECARE CORP.(b) | 241,780 | 321,712 | |||||
| 8,678 | ALLSCRIPTS HEALTHCARE SOLUTIONS, INC.(b) | 57,150 | 70,639 | |||||
| 2,116 | AMAG PHARMACEUTICALS, INC.(b) | 16,711 | 19,890 | |||||
| 18 | (Continued) |
CLEARWATER INVESTMENT TRUST
Schedule of Investments - Clearwater Small Companies Fund
September 30, 2020 (unaudited)
| Shares | Security | Cost | Fair value (a) | Percent of net assets | ||||
| Health Care (Cont'd): | ||||||||
| 2,454 | AMN HEALTHCARE SERVICES, INC.(b) | $131,517 | 143,461 | |||||
| 4,267 | ANGIODYNAMICS, INC.(b) | 39,027 | 51,460 | |||||
| 667 | ANI PHARMACEUTICALS, INC.(b) | 20,634 | 18,816 | |||||
| 758 | ANIKA THERAPEUTICS, INC.(b) | 27,364 | 26,826 | |||||
| 6,335 | BIOSPECIFICS TECHNOLOGIES CORP.(b) | 373,145 | 334,678 | |||||
| 16,050 | BIO-TECHNE CORP. | 3,901,125 | 3,976,066 | |||||
| 15,770 | BIOTELEMETRY, INC.(b) | 619,748 | 718,797 | |||||
| 2,254 | CARDIOVASCULAR SYSTEMS, INC.(b) | 72,322 | 88,695 | |||||
| 3,255 | COHERUS BIOSCIENCES, INC.(b) | 58,253 | 59,697 | |||||
| 6,953 | COMMUNITY HEALTH SYSTEMS, INC.(b) | 24,308 | 29,342 | |||||
| 760 | COMPUTER PROGRAMS AND SYSTEMS, INC. | 17,092 | 20,984 | |||||
| 1,523 | CONMED CORP. | 107,872 | 119,814 | |||||
| 5,151 | CORCEPT THERAPEUTICS, INC.(b) | 91,306 | 89,653 | |||||
| 236 | CORVEL CORP.(b) | 17,275 | 20,161 | |||||
| 4,687 | COVETRUS, INC.(b) | 88,788 | 114,363 | |||||
| 46,889 | CRYOLIFE, INC.(b) | 881,880 | 866,040 | |||||
| 26,778 | CUTERA, INC.(b) | 340,624 | 507,979 | |||||
| 2,976 | CYTOKINETICS, INC.(b) | 69,123 | 64,430 | |||||
| 1,647 | EMERGENT BIOSOLUTIONS, INC.(b) | 106,034 | 170,185 | |||||
| 16,143 | ENDO INTERNATIONAL PLC(b)(d) | 49,160 | 53,272 | |||||
| 2,178 | ENSIGN GROUP (THE), INC. | 116,465 | 124,277 | |||||
| 2,497 | GLAUKOS CORP.(b) | 97,525 | 123,651 | |||||
| 1,056 | HANGER, INC.(b) | 16,338 | 16,706 | |||||
| 127,535 | HARVARD BIOSCIENCE, INC.(b) | 243,257 | 383,880 | |||||
| 53,814 | HEALTHEQUITY, INC.(b) | 2,561,235 | 2,764,425 | |||||
| 19,101 | HEALTHSTREAM, INC.(b) | 428,499 | 383,357 | |||||
| 341 | HESKA CORP.(b) | 31,451 | 33,687 | |||||
| 21,500 | HILL-ROM HOLDINGS, INC. | 1,810,413 | 1,795,465 | |||||
| 25,571 | IMMUNOGEN, INC.(b) | 118,305 | 92,056 | |||||
| 40,095 | INFUSYSTEM HOLDINGS, INC.(b) | 233,835 | 514,018 | |||||
| 1,693 | INTEGER HOLDINGS CORP.(b) | 111,654 | 99,904 | |||||
| 44,890 | INTEGRA LIFESCIENCES HOLDINGS CORP.(b) | 2,560,910 | 2,119,706 | |||||
| 2,704 | INVACARE CORP. | 19,534 | 20,334 | |||||
| 33,266 | KADMON HOLDINGS, INC.(b) | 153,421 | 130,403 | |||||
| 3,112 | LANNETT CO., INC.(b) | 17,883 | 19,014 | |||||
| 4,918 | LANTHEUS HOLDINGS, INC.(b) | 67,442 | 62,311 | |||||
| 753 | LEMAITRE VASCULAR, INC. | 22,531 | 24,495 | |||||
| 2,431 | MAGELLAN HEALTH, INC.(b) | 139,451 | 184,221 | |||||
| 1,009 | MEDPACE HOLDINGS, INC.(b) | 98,861 | 112,756 | |||||
| 68,097 | MERIDIAN BIOSCIENCE, INC.(b) | 852,268 | 1,156,287 | |||||
| 2,957 | MERIT MEDICAL SYSTEMS, INC.(b) | 128,856 | 128,630 | |||||
| 215 | MESA LABORATORIES, INC. | 46,939 | 54,773 | |||||
| 5,859 | MOMENTA PHARMACEUTICALS, INC.(b) | 197,834 | 307,480 | |||||
| 3,980 | MYRIAD GENETICS, INC.(b) | 46,034 | 51,899 | |||||
| 73,953 | NANOVIBRONIX, INC.(b) | 177,431 | 51,789 | |||||
| 2,825 | NEOGEN CORP.(b) | 219,013 | 221,056 | |||||
| 5,523 | NEOGENOMICS, INC.(b) | 195,554 | 203,743 | |||||
| 16,245 | NEVRO CORP.(b) | 2,336,378 | 2,262,929 | |||||
| 52,321 | NEXTGEN HEALTHCARE, INC.(b) | 480,728 | 666,570 | |||||
| 2,337 | OMNICELL, INC.(b) | 165,274 | 174,480 | |||||
| 179,492 | ORASURE TECHNOLOGIES, INC.(b) | 2,082,200 | 2,184,418 | |||||
| 1,025 | ORTHOFIX MEDICAL, INC.(b) | 31,385 | 31,919 | |||||
| 3,458 | OWENS & MINOR, INC. | 31,330 | 86,830 | |||||
| 2,249 | PACIRA BIOSCIENCES, INC.(b) | 121,845 | 135,210 | |||||
| 770 | PENNANT GROUP (THE), INC.(b) | 17,397 | 29,691 | |||||
| 1,394 | PHIBRO ANIMAL HEALTH CORP., CLASS A | 25,794 | 24,256 | |||||
| 2,326 | PROVIDENCE SERVICE (THE) CORP.(b) | 151,639 | 216,109 | |||||
| 20,977 | PSYCHEMEDICS CORP. | 241,473 | 92,509 | |||||
| 4,478 | R1 RCM, INC.(b) | 76,243 | 76,798 | |||||
| 1,533 | RADNET, INC.(b) | 22,949 | 23,532 | |||||
| 1,139 | REGENXBIO, INC.(b) | 33,235 | 31,345 | |||||
| 5,020 | SELECT MEDICAL HOLDINGS CORP.(b) | 77,782 | 104,516 | |||||
| 511 | SIMULATIONS PLUS, INC. | 31,714 | 38,509 | |||||
| 5,364 | SPECTRUM PHARMACEUTICALS, INC.(b) | 22,212 | 21,885 | |||||
| 2,956 | SUPERNUS PHARMACEUTICALS, INC.(b) | 68,281 | 61,603 | |||||
| 7,605 | SURMODICS, INC.(b) | 300,430 | 295,911 | |||||
| 33,400 | SYNEOS HEALTH, INC.(b) | 1,431,924 | 1,775,544 | |||||
| 19 | (Continued) |
CLEARWATER INVESTMENT TRUST
Schedule of Investments - Clearwater Small Companies Fund
September 30, 2020 (unaudited)
| Shares | Security | Cost | Fair value (a) | Percent of net assets | ||||
| Health Care (Cont'd): | ||||||||
| 1,233 | TABULA RASA HEALTHCARE, INC.(b) | $49,319 | 50,269 | |||||
| 1,368 | TACTILE SYSTEMS TECHNOLOGY, INC.(b) | 45,580 | 50,055 | |||||
| 1,818 | TIVITY HEALTH, INC.(b) | 20,831 | 25,488 | |||||
| 93,545 | TRIPLE-S MANAGEMENT CORP., CLASS B(b) | 2,136,298 | 1,671,649 | |||||
| 475 | US PHYSICAL THERAPY, INC. | 37,734 | 41,268 | |||||
| 136,924 | VAREX IMAGING CORP.(b) | 3,514,931 | 1,741,673 | |||||
| 2,612 | XENCOR, INC.(b) | 90,485 | 101,319 | |||||
| 1,200 | ZYNEX, INC.(b) | 19,187 | 20,940 | |||||
| 34,340,810 | 33,805,012 | 9.76% | ||||||
| Industrials: | ||||||||
| 2,233 | AAON, INC. | 123,232 | 134,538 | |||||
| 8,781 | AAR CORP. | 168,267 | 165,083 | |||||
| 3,557 | ABM INDUSTRIES, INC. | 120,321 | 130,400 | |||||
| 13,900 | ACUITY BRANDS, INC. | 1,580,104 | 1,422,665 | |||||
| 1,617 | AEGION CORP.(b) | 24,543 | 22,848 | |||||
| 3,956 | AEROJET ROCKETDYNE HOLDINGS, INC.(b) | 147,108 | 157,805 | |||||
| 845 | AEROVIRONMENT, INC.(b) | 54,807 | 50,708 | |||||
| 53,320 | AIR LEASE CORP. | 1,690,020 | 1,568,674 | |||||
| 26,909 | AIR TRANSPORT SERVICES GROUP, INC.(b) | 540,349 | 674,340 | |||||
| 555 | ALAMO GROUP, INC. | 55,130 | 59,957 | |||||
| 3,456 | ALBANY INTERNATIONAL CORP., CLASS A | 152,852 | 171,107 | |||||
| 748 | ALLEGIANT TRAVEL CO. | 80,014 | 89,610 | |||||
| 27,191 | AMERICAN WOODMARK CORP.(b) | 2,142,060 | 2,135,581 | |||||
| 2,066 | APPLIED INDUSTRIAL TECHNOLOGIES, INC. | 125,566 | 113,837 | |||||
| 1,349 | ARCBEST CORP. | 37,892 | 41,900 | |||||
| 2,574 | ARCOSA, INC. | 102,643 | 113,488 | |||||
| 1,206 | ASTEC INDUSTRIES, INC. | 53,461 | 65,426 | |||||
| 33,614 | ASTRONICS CORP.(b) | 395,237 | 259,500 | |||||
| 1,395 | ATLAS AIR WORLDWIDE HOLDINGS, INC.(b) | 64,070 | 84,956 | |||||
| 43,729 | AVIS BUDGET GROUP, INC.(b) | 1,345,149 | 1,150,947 | |||||
| 10,519 | AZZ, INC. | 326,008 | 358,908 | |||||
| 2,068 | BARNES GROUP, INC. | 77,523 | 73,910 | |||||
| 5,084 | BG STAFFING, INC. | 47,995 | 43,061 | |||||
| 2,667 | BRADY CORP., CLASS A | 120,572 | 106,733 | |||||
| 33,900 | BWX TECHNOLOGIES, INC. | 1,827,527 | 1,908,909 | |||||
| 20,013 | CECO ENVIRONMENTAL CORP.(b) | 146,158 | 145,895 | |||||
| 946 | CHART INDUSTRIES, INC.(b) | 66,636 | 66,475 | |||||
| 30,711 | CIRCOR INTERNATIONAL, INC.(b) | 1,067,680 | 839,946 | |||||
| 66,100 | COLFAX CORP.(b) | 1,486,207 | 2,072,896 | |||||
| 7,511 | COLUMBUS MCKINNON CORP. | 202,004 | 248,614 | |||||
| 1,430 | COMFORT SYSTEMS U.S.A, INC. | 72,885 | 73,659 | |||||
| 106,530 | COVANTA HOLDING CORP. | 844,904 | 825,607 | |||||
| 1,435 | CUBIC CORP. | 63,497 | 83,474 | |||||
| 15,900 | DONALDSON CO., INC. | 712,473 | 738,078 | |||||
| 891 | DXP ENTERPRISES, INC.(b) | 16,466 | 14,372 | |||||
| 1,253 | ENCORE WIRE CORP. | 58,883 | 58,164 | |||||
| 143,874 | ENERPAC TOOL GROUP CORP. | 3,182,327 | 2,706,270 | |||||
| 1,711 | ENPRO INDUSTRIES, INC. | 79,951 | 96,518 | |||||
| 1,434 | ESCO TECHNOLOGIES, INC. | 116,528 | 115,523 | |||||
| 2,751 | EXPONENT, INC. | 219,273 | 198,155 | |||||
| 3,216 | FEDERAL SIGNAL CORP. | 92,803 | 94,068 | |||||
| 533 | FORRESTER RESEARCH, INC.(b) | 16,896 | 17,477 | |||||
| 1,921 | FORWARD AIR CORP. | 94,009 | 110,227 | |||||
| 1,145 | FOUNDATION BUILDING MATERIALS, INC.(b) | 16,762 | 17,999 | |||||
| 2,045 | FRANKLIN ELECTRIC CO., INC. | 101,427 | 120,307 | |||||
| 69,600 | GATES INDUSTRIAL CORP. PLC(b) | 957,226 | 773,952 | |||||
| 1,805 | GIBRALTAR INDUSTRIES, INC.(b) | 84,384 | 117,578 | |||||
| 2,411 | GMS, INC.(b) | 55,860 | 58,105 | |||||
| 19,000 | GORMAN-RUPP (THE) CO. | 560,570 | 559,740 | |||||
| 38,431 | GRACO, INC. | 2,311,195 | 2,357,742 | |||||
| 51,910 | GRAHAM CORP. | 751,430 | 662,891 | |||||
| 2,495 | GRANITE CONSTRUCTION, INC. | 44,279 | 43,937 | |||||
| 1,905 | GREENBRIER (THE) COS., INC. | 41,695 | 56,007 | |||||
| 1,955 | GRIFFON CORP. | 38,098 | 38,201 | |||||
| 8,449 | H&E EQUIPMENT SERVICES, INC. | 118,140 | 166,107 | |||||
| 4,075 | HAWAIIAN HOLDINGS, INC. | 55,364 | 52,527 | |||||
| 2,476 | HEARTLAND EXPRESS, INC. | 52,013 | 46,054 | |||||
| 20 | (Continued) |
CLEARWATER INVESTMENT TRUST
Schedule of Investments - Clearwater Small Companies Fund
September 30, 2020 (unaudited)
| Shares | Security | Cost | Fair value (a) | Percent of net assets | ||||
| Industrials (Cont'd): | ||||||||
| 1,393 | HEIDRICK & STRUGGLES INTERNATIONAL, INC. | $29,329 | 27,372 | |||||
| 5,034 | HERC HOLDINGS, INC.(b) | 106,246 | 199,397 | |||||
| 19,600 | HEXCEL CORP. | 1,157,602 | 657,580 | |||||
| 1,860 | HUB GROUP, INC., CLASS A(b) | 92,802 | 93,363 | |||||
| 5,117 | HURON CONSULTING GROUP, INC.(b) | 221,421 | 201,252 | |||||
| 42,000 | IAA, INC.(b) | 1,773,888 | 2,186,940 | |||||
| 977 | INSTEEL INDUSTRIES, INC. | 18,377 | 18,270 | |||||
| 92,137 | JELD-WEN HOLDING, INC.(b) | 1,532,807 | 2,082,296 | |||||
| 1,691 | JOHN BEAN TECHNOLOGIES CORP. | 137,914 | 155,386 | |||||
| 7,600 | KADANT, INC. | 672,505 | 833,112 | |||||
| 1,476 | KAMAN CORP. | 58,477 | 57,520 | |||||
| 2,938 | KORN FERRY | 81,138 | 85,202 | |||||
| 579 | LINDSAY CORP. | 54,200 | 55,978 | |||||
| 236,216 | LSI INDUSTRIES, INC. | 1,227,838 | 1,594,458 | |||||
| 1,251 | LYDALL, INC.(b) | 16,937 | 20,692 | |||||
| 80,141 | LYFT, INC., CLASS A(b) | 2,262,132 | 2,207,885 | |||||
| 3,118 | MARTEN TRANSPORT LTD. | 55,287 | 50,886 | |||||
| 2,297 | MATSON, INC. | 65,780 | 92,087 | |||||
| 2,075 | MATTHEWS INTERNATIONAL CORP., CLASS A | 39,214 | 46,397 | |||||
| 4,042 | MERITOR, INC.(b) | 76,835 | 84,639 | |||||
| 21,220 | MOOG, INC., CLASS A | 1,078,937 | 1,348,107 | |||||
| 3,030 | MUELLER INDUSTRIES, INC. | 78,800 | 81,992 | |||||
| 643 | MYR GROUP, INC.(b) | 19,666 | 23,907 | |||||
| 351 | NATIONAL PRESTO INDUSTRIES, INC. | 30,447 | 28,733 | |||||
| 16,110 | NOW, INC.(b) | 151,231 | 73,139 | |||||
| 15,500 | NV5 GLOBAL, INC.(b) | 708,179 | 817,935 | |||||
| 1,539 | PARK AEROSPACE CORP. | 16,372 | 16,806 | |||||
| 1,179 | PATRICK INDUSTRIES, INC. | 65,976 | 67,816 | |||||
| 140,735 | PGT INNOVATIONS, INC.(b) | 1,954,781 | 2,465,677 | |||||
| 51,713 | PIONEER POWER SOLUTIONS, INC.(b)(c) | 261,487 | 79,638 | |||||
| 6,784 | PITNEY BOWES, INC. | 16,863 | 36,023 | |||||
| 615 | POWELL INDUSTRIES, INC. | 16,562 | 14,840 | |||||
| 1,421 | PROTO LABS, INC.(b) | 159,264 | 184,019 | |||||
| 2,019 | QUANEX BUILDING PRODUCTS CORP. | 26,383 | 37,230 | |||||
| 7,797 | RAVEN INDUSTRIES, INC. | 179,356 | 167,791 | |||||
| 6,575 | RESIDEO TECHNOLOGIES, INC.(b) | 74,730 | 72,325 | |||||
| 1,915 | RESOURCES CONNECTION, INC. | 22,152 | 22,118 | |||||
| 173,867 | REV GROUP, INC. | 1,963,728 | 1,371,811 | |||||
| 30,500 | RUSH ENTERPRISES, INC., CLASS A | 1,261,715 | 1,541,470 | |||||
| 51,572 | RYDER SYSTEM, INC. | 2,751,305 | 2,178,401 | |||||
| 1,392 | SAIA, INC.(b) | 165,159 | 175,587 | |||||
| 37,693 | SCORPIO BULKERS, INC. | 616,435 | 533,733 | |||||
| 59,070 | SHYFT GROUP (THE), INC. | 938,019 | 1,115,242 | |||||
| 2,112 | SIMPSON MANUFACTURING CO., INC. | 169,145 | 205,202 | |||||
| 2,055 | SKYWEST, INC. | 69,400 | 61,362 | |||||
| 2,379 | SPX CORP.(b) | 95,034 | 110,338 | |||||
| 9,280 | SPX FLOW, INC.(b) | 279,576 | 397,370 | |||||
| 727 | STANDEX INTERNATIONAL CORP. | 39,599 | 43,038 | |||||
| 200,346 | STEELCASE, INC., CLASS A | 2,631,299 | 2,025,498 | |||||
| 2,924 | TEAM, INC.(b) | 18,119 | 16,082 | |||||
| 1,039 | TENNANT CO. | 66,258 | 62,714 | |||||
| 99,529 | TEREX CORP. | 3,330,859 | 1,926,881 | |||||
| 35,693 | TITAN MACHINERY, INC.(b) | 478,828 | 472,218 | |||||
| 55,279 | TRIMAS CORP.(b) | 1,411,070 | 1,260,361 | |||||
| 2,722 | TRIUMPH GROUP, INC. | 20,706 | 17,720 | |||||
| 41,225 | TRUEBLUE, INC.(b) | 667,771 | 638,575 | |||||
| 3,336 | UFP INDUSTRIES, INC. | 159,029 | 188,517 | |||||
| 835 | UNIFIRST CORP. | 142,857 | 158,124 | |||||
| 1,523 | US ECOLOGY, INC. | 50,465 | 49,756 | |||||
| 19,306 | US XPRESS ENTERPRISES, INC., CLASS A(b) | 170,604 | 159,468 | |||||
| 7,362 | VECTRUS, INC.(b) | 306,495 | 279,756 | |||||
| 1,394 | VIAD CORP. | 25,927 | 29,037 | |||||
| 988 | VICOR CORP.(b) | 72,341 | 76,797 | |||||
| 4,675 | WABASH NATIONAL CORP. | 47,573 | 55,913 | |||||
| 1,484 | WATTS WATER TECHNOLOGIES, INC., CLASS A | 117,203 | 148,623 | |||||
| 19,600 | WOODWARD, INC. | 1,578,797 | 1,571,136 | |||||
| 59,317,704 | 57,840,994 | 16.70% | ||||||
| 21 | (Continued) |
CLEARWATER INVESTMENT TRUST
Schedule of Investments - Clearwater Small Companies Fund
September 30, 2020 (unaudited)
| Shares | Security | Cost | Fair value (a) | Percent of net assets | ||||
| Information Technology: | ||||||||
| 10,802 | 3D SYSTEMS CORP.(b) | $56,985 | 53,038 | |||||
| 6,589 | 8X8, INC.(b) | 104,347 | 102,459 | |||||
| 49,075 | A10 NETWORKS, INC.(b) | 431,917 | 312,608 | |||||
| 3,058 | ADTRAN, INC. | 32,282 | 31,360 | |||||
| 2,042 | ADVANCED ENERGY INDUSTRIES, INC.(b) | 137,503 | 128,523 | |||||
| 679 | AGILYSYS, INC.(b) | 14,129 | 16,405 | |||||
| 2,350 | ALARM.COM HOLDINGS, INC.(b) | 135,048 | 129,838 | |||||
| 43,755 | ANAPLAN, INC.(b) | 2,616,601 | 2,738,188 | |||||
| 1,775 | APPLIED OPTOELECTRONICS, INC.(b) | 18,492 | 19,969 | |||||
| 4,207 | ARLO TECHNOLOGIES, INC.(b) | 25,512 | 22,129 | |||||
| 6,367 | ASTRONOVA, INC. | 46,340 | 51,063 | |||||
| 38,252 | ASURE SOFTWARE, INC.(b)(c) | 281,452 | 288,803 | |||||
| 62,947 | AVIAT NETWORKS, INC.(b) | 1,127,974 | 1,382,316 | |||||
| 72,710 | AVNET, INC. | 2,478,163 | 1,878,826 | |||||
| 37,818 | AXT, INC.(b) | 145,896 | 231,446 | |||||
| 1,458 | BADGER METER, INC. | 92,421 | 95,309 | |||||
| 49,943 | BELDEN, INC. | 1,865,929 | 1,554,226 | |||||
| 18,993 | BENCHMARK ELECTRONICS, INC. | 380,013 | 382,709 | |||||
| 27,559 | BILL.COM HOLDINGS, INC.(b) | 2,504,972 | 2,764,443 | |||||
| 3,938 | BROOKS AUTOMATION, INC. | 172,076 | 182,172 | |||||
| 3,453 | CALAMP CORP.(b) | 29,407 | 24,827 | |||||
| 1,426 | CARDTRONICS PLC, CLASS A(b)(d) | 29,131 | 28,235 | |||||
| 326,251 | CELESTICA, INC.(b)(d) | 2,592,668 | 2,251,132 | |||||
| 1,321 | CEVA, INC.(b) | 48,656 | 52,008 | |||||
| 70,330 | COHU, INC. | 1,054,552 | 1,208,269 | |||||
| 13,989 | COMMUNICATIONS SYSTEMS, INC. | 70,270 | 53,578 | |||||
| 1,959 | COMTECH TELECOMMUNICATIONS CORP. | 29,694 | 27,426 | |||||
| 1,766 | CSG SYSTEMS INTERNATIONAL, INC. | 70,000 | 72,318 | |||||
| 2,782 | CTS CORP. | 58,247 | 61,287 | |||||
| 8,231 | DAKTRONICS, INC. | 33,875 | 32,595 | |||||
| 4,290 | DIEBOLD NIXDORF, INC.(b) | 27,669 | 32,776 | |||||
| 1,395 | DIGI INTERNATIONAL, INC.(b) | 20,491 | 21,804 | |||||
| 2,401 | DIODES, INC.(b) | 118,436 | 135,536 | |||||
| 103,490 | DSP GROUP, INC.(b) | 1,349,005 | 1,363,998 | |||||
| 2,099 | EBIX, INC. | 43,890 | 43,239 | |||||
| 34,726 | ELASTIC N.V.(b) | 3,742,477 | 3,746,588 | |||||
| 720 | EPLUS, INC.(b) | 48,694 | 52,704 | |||||
| 3,272 | EVERTEC, INC. | 93,000 | 113,571 | |||||
| 1,883 | EXLSERVICE HOLDINGS, INC.(b) | 116,337 | 124,222 | |||||
| 8,040 | EXTREME NETWORKS, INC.(b) | 32,929 | 32,321 | |||||
| 1,961 | FABRINET(b)(d) | 125,617 | 123,602 | |||||
| 10,063 | FARO TECHNOLOGIES, INC.(b) | 484,205 | 613,642 | |||||
| 5,507 | FORMFACTOR, INC.(b) | 131,485 | 137,290 | |||||
| 142,799 | FRANKLIN WIRELESS CORP.(b) | 414,920 | 2,283,356 | |||||
| 112,503 | FREQUENCY ELECTRONICS, INC.(b) | 1,027,519 | 1,137,405 | |||||
| 28,981 | GUIDEWIRE SOFTWARE, INC.(b) | 3,069,061 | 3,021,849 | |||||
| 74,677 | HARMONIC, INC.(b) | 464,826 | 416,698 | |||||
| 89,237 | IDENTIV, INC.(b) | 440,116 | 558,624 | |||||
| 49,009 | IMMERSION CORP.(b) | 350,207 | 345,513 | |||||
| 90,701 | INFINERA CORP.(b) | 560,695 | 558,718 | |||||
| 6,819 | INSIGHT ENTERPRISES, INC.(b) | 303,929 | 385,819 | |||||
| 5,139 | KNOWLES CORP.(b) | 77,505 | 76,571 | |||||
| 4,811 | KULICKE & SOFFA INDUSTRIES, INC.(d) | 103,904 | 107,766 | |||||
| 96,687 | LIMELIGHT NETWORKS, INC.(b) | 541,843 | 556,917 | |||||
| 2,917 | LIVEPERSON, INC.(b) | 126,326 | 151,655 | |||||
| 91,131 | LIVERAMP HOLDINGS, INC.(b) | 4,748,962 | 4,717,852 | |||||
| 31,085 | LOGITECH INTERNATIONAL S.A. (REGISTERED)(d) | 2,283,627 | 2,403,181 | |||||
| 1,485 | MANTECH INTERNATIONAL CORP., CLASS A | 100,992 | 102,287 | |||||
| 2,686 | MAXLINEAR, INC.(b) | 67,981 | 62,423 | |||||
| 1,980 | METHODE ELECTRONICS, INC. | 56,960 | 56,430 | |||||
| 494 | MICROSTRATEGY, INC., CLASS A(b) | 64,798 | 74,377 | |||||
| 9,300 | MKS INSTRUMENTS, INC. | 888,060 | 1,015,839 | |||||
| 1,418 | MTS SYSTEMS CORP. | 25,738 | 27,098 | |||||
| 2,361 | NETGEAR, INC.(b) | 56,550 | 72,766 | |||||
| 3,730 | NIC, INC. | 83,295 | 73,481 | |||||
| 41,800 | ONTO INNOVATION, INC.(b) | 1,275,289 | 1,244,804 | |||||
| 9,495 | OSI SYSTEMS, INC.(b) | 665,585 | 736,907 | |||||
| 22 | (Continued) |
CLEARWATER INVESTMENT TRUST
Schedule of Investments - Clearwater Small Companies Fund
September 30, 2020 (unaudited)
| Shares | Security | Cost | Fair value (a) | Percent of net assets | ||||
| Information Technology (Cont'd): | ||||||||
| 1,686 | PDF SOLUTIONS, INC.(b) | $32,813 | 31,545 | |||||
| 2,494 | PERFICIENT, INC.(b) | 80,051 | 106,594 | |||||
| 23,412 | PFSWEB, INC.(b) | 60,691 | 156,626 | |||||
| 50,123 | PHOTRONICS, INC.(b) | 542,830 | 499,225 | |||||
| 42,456 | PLANTRONICS, INC. | 423,206 | 502,679 | |||||
| 12,623 | PLEXUS CORP.(b) | 694,593 | 891,562 | |||||
| 2,642 | POWER INTEGRATIONS, INC. | 158,518 | 146,367 | |||||
| 2,889 | PROGRESS SOFTWARE CORP. | 106,362 | 105,969 | |||||
| 7,080 | RAMBUS, INC.(b) | 102,818 | 96,925 | |||||
| 65,441 | SAILPOINT TECHNOLOGIES HOLDINGS, INC.(b) | 2,483,777 | 2,589,500 | |||||
| 3,642 | SANMINA CORP.(b) | 87,795 | 98,516 | |||||
| 65,846 | SCANSOURCE, INC.(b) | 2,514,326 | 1,305,726 | |||||
| 18,549 | SEQUANS COMMUNICATIONS S.A. (ADR)(b)(d)(e) | 121,383 | 110,738 | |||||
| 335,031 | SERVICESOURCE INTERNATIONAL, INC.(b) | 326,940 | 492,496 | |||||
| 1,164 | SMART GLOBAL HOLDINGS, INC.(b) | 30,795 | 31,824 | |||||
| 1,915 | SPS COMMERCE, INC.(b) | 143,863 | 149,121 | |||||
| 139,100 | STEEL CONNECT, INC.(b) | 122,588 | 75,448 | |||||
| 35,245 | SUPER MICRO COMPUTER, INC.(b) | 708,392 | 930,468 | |||||
| 943 | SYKES ENTERPRISES, INC.(b) | 30,827 | 32,260 | |||||
| 1,006 | TTEC HOLDINGS, INC. | 46,035 | 54,877 | |||||
| 6,274 | TTM TECHNOLOGIES, INC.(b) | 72,311 | 71,586 | |||||
| 177,973 | UNISYS CORP.(b) | 1,895,132 | 1,898,972 | |||||
| 29,786 | VARONIS SYSTEMS, INC.(b) | 3,407,368 | 3,437,900 | |||||
| 11,125 | VIAVI SOLUTIONS, INC.(b) | 134,347 | 130,496 | |||||
| 1,269 | VIRTUSA CORP.(b) | 63,905 | 62,384 | |||||
| 13,951 | WIX.COM LTD.(b)(d) | 3,611,105 | 3,555,412 | |||||
| 164,862 | XPERI HOLDING CORP. | 2,321,180 | 1,894,264 | |||||
| 19,750 | ZIX CORP.(b) | 114,356 | 115,340 | |||||
| 61,255,782 | 62,481,954 | 18.05% | ||||||
| Materials: | ||||||||
| 1,495 | ADVANSIX, INC.(b) | 17,055 | 19,256 | |||||
| 8,034 | ALLEGHENY TECHNOLOGIES, INC.(b) | 73,155 | 70,056 | |||||
| 2,099 | AMERICAN VANGUARD CORP. | 31,339 | 27,581 | |||||
| 5,643 | ARCONIC CORP.(b) | 83,038 | 107,499 | |||||
| 46,800 | AXALTA COATING SYSTEMS LTD.(b) | 715,685 | 1,037,556 | |||||
| 1,760 | BALCHEM CORP. | 164,751 | 171,829 | |||||
| 2,186 | BOISE CASCADE CO. | 82,334 | 87,265 | |||||
| 3,097 | CENTURY ALUMINUM CO.(b) | 23,195 | 22,051 | |||||
| 22,471 | CLEVELAND-CLIFFS, INC. | 121,818 | 144,264 | |||||
| 4,390 | FERRO CORP.(b) | 49,722 | 54,436 | |||||
| 1,481 | FUTUREFUEL CORP. | 17,133 | 16,839 | |||||
| 2,880 | GCP APPLIED TECHNOLOGIES, INC.(b) | 53,386 | 60,336 | |||||
| 35,668 | GOLD RESOURCE CORP. | 163,722 | 121,628 | |||||
| 35,603 | H.B. FULLER CO. | 1,866,777 | 1,629,905 | |||||
| 583 | HAWKINS, INC. | 25,673 | 26,876 | |||||
| 1,120 | KOPPERS HOLDINGS, INC.(b) | 19,868 | 23,419 | |||||
| 1,882 | KRATON CORP.(b) | 32,648 | 33,537 | |||||
| 8,541 | LIVENT CORP.(b) | 53,380 | 76,613 | |||||
| 4,001 | MERCER INTERNATIONAL, INC.(d) | 30,072 | 26,406 | |||||
| 1,910 | MYERS INDUSTRIES, INC. | 27,366 | 25,269 | |||||
| 96,286 | OLIN CORP. | 1,617,324 | 1,192,021 | |||||
| 2,253 | OLYMPIC STEEL, INC. | 24,280 | 25,594 | |||||
| 77,141 | ORION ENGINEERED CARBONS S.A.(d) | 629,041 | 965,034 | |||||
| 3,227 | P H GLATFELTER CO. | 48,898 | 44,436 | |||||
| 693 | QUAKER CHEMICAL CORP. | 128,226 | 124,539 | |||||
| 4,529 | RAYONIER ADVANCED MATERIALS, INC.(b) | 18,914 | 14,493 | |||||
| 16,000 | RELIANCE STEEL & ALUMINUM CO. | 1,215,752 | 1,632,640 | |||||
| 73,659 | SCHWEITZER-MAUDUIT INTERNATIONAL, INC. | 2,787,521 | 2,238,497 | |||||
| 1,154 | STEPAN CO. | 110,502 | 125,786 | |||||
| 8,610 | SUNCOKE ENERGY, INC. | 25,724 | 29,446 | |||||
| 13,321 | SYNALLOY CORP.(b) | 100,307 | 73,532 | |||||
| 7,386 | TIMKENSTEEL CORP.(b) | 26,484 | 26,220 | |||||
| 37,576 | TREDEGAR CORP. | 618,805 | 558,755 | |||||
| 2,198 | TRINSEO S.A. | 48,917 | 56,357 | |||||
| 846 | US CONCRETE, INC.(b) | 19,856 | 24,568 | |||||
| 2,998 | WARRIOR MET COAL, INC. | 45,871 | 51,206 | |||||
| 11,118,539 | 10,965,745 | 3.17% | ||||||
| 23 | (Continued) |
CLEARWATER INVESTMENT TRUST
Schedule of Investments - Clearwater Small Companies Fund
September 30, 2020 (unaudited)
| Shares | Security | Cost | Fair value (a) | Percent of net assets | ||||
| Real Estate: | ||||||||
| 5,816 | ACADIA REALTY TRUST | $74,006 | 61,068 | |||||
| 2,732 | AGREE REALTY CORP. | 176,943 | 173,865 | |||||
| 4,425 | ALEXANDER & BALDWIN, INC. | 53,431 | 49,604 | |||||
| 41,973 | ALPINE INCOME PROPERTY TRUST, INC. | 687,425 | 652,680 | |||||
| 2,963 | AMERICAN ASSETS TRUST, INC. | 78,306 | 71,379 | |||||
| 3,015 | ARMADA HOFFLER PROPERTIES, INC. | 28,994 | 27,919 | |||||
| 66,538 | BLUEROCK RESIDENTIAL GROWTH REIT, INC. | 509,916 | 504,358 | |||||
| 9,103 | BRANDYWINE REALTY TRUST | 93,265 | 94,125 | |||||
| 4,784 | CARETRUST REIT, INC. | 82,906 | 85,131 | |||||
| 3,809 | CHATHAM LODGING TRUST | 23,679 | 29,025 | |||||
| 6,170 | CORECIVIC, INC. | 56,491 | 49,360 | |||||
| 157,860 | DIAMONDROCK HOSPITALITY CO. | 1,158,653 | 800,350 | |||||
| 4,010 | EASTERLY GOVERNMENT PROPERTIES, INC. | 90,651 | 89,864 | |||||
| 89,613 | EQUITY COMMONWEALTH | 2,660,421 | 2,386,394 | |||||
| 4,724 | ESSENTIAL PROPERTIES REALTY TRUST, INC. | 76,046 | 86,544 | |||||
| 3,754 | FOUR CORNERS PROPERTY TRUST, INC. | 87,192 | 96,065 | |||||
| 1,834 | GETTY REALTY CORP. | 53,879 | 47,702 | |||||
| 47,489 | GLOBAL MEDICAL REIT, INC. | 467,151 | 641,102 | |||||
| 4,776 | GLOBAL NET LEASE, INC. | 79,740 | 75,938 | |||||
| 125,062 | INDEPENDENCE REALTY TRUST, INC. | 1,191,381 | 1,449,469 | |||||
| 3,481 | INDUSTRIAL LOGISTICS PROPERTIES TRUST | 71,070 | 76,129 | |||||
| 1,157 | INNOVATIVE INDUSTRIAL PROPERTIES, INC. | 114,184 | 143,595 | |||||
| 649 | INVESTORS REAL ESTATE TRUST | 45,943 | 42,295 | |||||
| 52,066 | ISTAR, INC. | 512,365 | 614,899 | |||||
| 39,176 | KITE REALTY GROUP TRUST | 438,398 | 453,658 | |||||
| 14,749 | LEXINGTON REALTY TRUST | 155,533 | 154,127 | |||||
| 2,093 | LTC PROPERTIES, INC. | 78,294 | 72,962 | |||||
| 6,389 | MACK-CALI REALTY CORP. | 89,738 | 80,629 | |||||
| 891 | MARCUS & MILLICHAP, INC.(b) | 25,083 | 24,520 | |||||
| 3,311 | NATIONAL STORAGE AFFILIATES TRUST | 94,650 | 108,303 | |||||
| 30,061 | NEXPOINT RESIDENTIAL TRUST, INC. | 849,583 | 1,333,205 | |||||
| 3,086 | OFFICE PROPERTIES INCOME TRUST | 75,403 | 63,942 | |||||
| 37,225 | PLYMOUTH INDUSTRIAL REIT, INC. | 477,073 | 459,357 | |||||
| 40,604 | POSTAL REALTY TRUST, INC., CLASS A | 531,221 | 614,745 | |||||
| 28,862 | RAFAEL HOLDINGS, INC., CLASS B(b) | 475,457 | 447,361 | |||||
| 968 | RE/MAX HOLDINGS, INC., CLASS A | 30,056 | 31,683 | |||||
| 75,443 | REALOGY HOLDINGS CORP.(b) | 1,873,483 | 712,182 | |||||
| 49,127 | REDFIN CORP.(b) | 2,303,826 | 2,452,911 | |||||
| 4,165 | RETAIL OPPORTUNITY INVESTMENTS CORP. | 45,228 | 43,379 | |||||
| 12,377 | RETAIL PROPERTIES OF AMERICA, INC., CLASS A | 84,751 | 71,910 | |||||
| 5,327 | RPT REALTY | 34,214 | 28,979 | |||||
| 633 | SAFEHOLD, INC. | 35,172 | 39,309 | |||||
| 7,941 | SITE CENTERS CORP. | 59,761 | 57,175 | |||||
| 1,667 | ST. JOE (THE) CO.(b) | 31,303 | 34,390 | |||||
| 61,501 | STRATUS PROPERTIES, INC.(b) | 1,642,631 | 1,325,962 | |||||
| 7,832 | SUMMIT HOTEL PROPERTIES, INC. | 45,245 | 40,570 | |||||
| 7,677 | TANGER FACTORY OUTLET CENTERS, INC.(c) | 48,408 | 46,292 | |||||
| 35,052 | UMH PROPERTIES, INC. | 408,688 | 474,604 | |||||
| 10,364 | UNITI GROUP, INC. | 96,701 | 109,185 | |||||
| 761 | UNIVERSAL HEALTH REALTY INCOME TRUST | 51,886 | 43,369 | |||||
| 15,144 | URBAN EDGE PROPERTIES | 148,337 | 147,200 | |||||
| 3,979 | URSTADT BIDDLE PROPERTIES, INC., CLASS A | 37,666 | 36,607 | |||||
| 4,639 | WASHINGTON REAL ESTATE INVESTMENT TRUST | 100,168 | 93,383 | |||||
| 4,519 | WHITESTONE REIT | 29,383 | 27,114 | |||||
| 7,444 | XENIA HOTELS & RESORTS, INC. | 66,151 | 65,358 | |||||
| 18,937,529 | 18,043,231 | 5.21% | ||||||
| Utilities: | ||||||||
| 1,970 | AMERICAN STATES WATER CO. | 152,237 | 147,651 | |||||
| 3,838 | AVISTA CORP. | 136,945 | 130,953 | |||||
| 2,673 | CALIFORNIA WATER SERVICE GROUP | 127,827 | 116,142 | |||||
| 1,938 | NORTHWEST NATURAL HOLDING CO. | 100,985 | 87,966 | |||||
| 163,622 | PURE CYCLE CORP.(b) | 1,173,813 | 1,474,234 | |||||
| 2,710 | UNITIL CORP. | 109,845 | 104,714 | |||||
| 1,801,652 | 2,061,660 | 0.60% | ||||||
| Sub-total Common Stocks: | 337,520,930 | 325,647,798 | 94.05% | |||||
| Convertible Bonds: | ||||||||
| 24 | (Continued) |
CLEARWATER INVESTMENT TRUST
Schedule of Investments - Clearwater Small Companies Fund
September 30, 2020 (unaudited)
| Shares | Security | Cost | Fair value (a) | Percent of net assets | ||||
| Health Care: | ||||||||
| 578,000 | INVACARE CORP., 4.50%, 6/1/22 | $523,341 | 521,052 | |||||
| 523,341 | 521,052 | 0.15% | ||||||
| Sub-total Convertible Bonds: | 523,341 | 521,052 | 0.15% | |||||
| Convertible Preferred Stocks: | ||||||||
| Real Estate: | ||||||||
| 11,529 | WHEELER REAL ESTATE INVESTMENT TRUST, INC.(b) | 105,675 | 110,909 | |||||
| 17,641 | WHEELER REAL ESTATE INVESTMENT TRUST, INC. (Step to 10.75% on 9/21/2023), 8.75%(b)(f) | 220,408 | 269,025 | |||||
| 326,083 | 379,934 | 0.11% | ||||||
| Sub-total Convertible Preferred Stocks: | 326,083 | 379,934 | 0.11% | |||||
| Investment Companies: | ||||||||
| Financials: | ||||||||
| 30,190 | ISHARES RUSSELL 2000 VALUE ETF | 2,938,946 | 2,998,773 | |||||
| 2,938,946 | 2,998,773 | 0.87% | ||||||
| Sub-total Investment Companies: | 2,938,946 | 2,998,773 | 0.87% | |||||
| Master Limited Partnerships: | ||||||||
| Industrials: | ||||||||
| 59,840 | STEEL PARTNERS HOLDINGS L.P.(b) | 674,076 | 369,446 | |||||
| 674,076 | 369,446 | 0.11% | ||||||
| Sub-total Master Limited Partnerships: | 674,076 | 369,446 | 0.11% | |||||
| Preferred Stocks: | ||||||||
| Industrials: | ||||||||
| 150,152 | STEEL PARTNERS HOLDINGS L.P. | 2,399,287 | 2,858,894 | |||||
| 2,399,287 | 2,858,894 | 0.82% | ||||||
| Sub-total Preferred Stocks: | 2,399,287 | 2,858,894 | 0.82% | |||||
| Rights: | ||||||||
| Communication Services: | ||||||||
| 55,700 | MEDIA GENERAL, INC. (CONTINGENT VALUE RIGHTS)(b)(g) | - | - | |||||
| - | - | 0.00% | ||||||
| Sub-total Rights: | - | - | 0.00% | |||||
| Warrants: | ||||||||
| Health Care: | ||||||||
| 19,977 | NANOVIBRONIX, INC.(b)(g) | 200 | - | |||||
| 200 | - | 0.00% | ||||||
| Sub-total Warrants: | 200 | - | 0.00% | |||||
| Short-Term Investments: | ||||||||
| 3,649,759 | FIDELITY INVESTMENTS MONEY MARKET GOVERNMENT PORTFOLIO(h) | 3,649,759 | 3,649,759 | |||||
| 14,049,355 | NORTHERN INSTITUTIONAL FUNDS - U.S. GOVERNMENT SELECT PORTFOLIO, 0.03%(i) | 14,049,355 | 14,049,355 | |||||
| Sub-total Short-Term Investments: | 17,699,114 | 17,699,114 | 5.11% | |||||
| Grand total | $362,081,977 | 350,475,011 | 101.22% | |||||
| Notes to Schedule of Investments: | |
| (a) | Investments in U.S. and foreign equity securities are valued at the last sales price or the regular trading session closing price on the principal exchange or market where the securities are traded. Foreign security values are stated in U.S. dollars. |
| (b) | Non-income producing assets. |
| (c) | Security is either wholly or partially on loan. |
| (d) | Foreign security values are stated in U.S. dollars. As of September 30, 2020, the value of foreign stocks or depositary receipts of companies based outside of the United States represented 6.56% of net assets. |
| (e) | Securities are American Depositary Receipts of companies based outside of the United States representing 0.03% of net assets as of Septmember 30, 2020. |
| (f) | For step bonds, the coupon rate disclosed is the current rate in effect. |
| (g) | Security has been deemed worthless and is a Level 3 investment. |
| (h) | Investment relates to cash collateral received from portfolio securities loaned. |
| 25 | (Continued) |
CLEARWATER INVESTMENT TRUST
Schedule of Investments - Clearwater Small Companies Fund
September 30, 2020 (unaudited)
| (i) | The short-term investment is a money market portfolio of the investment company, Northern Institutional Funds. At December 31, 2019, the value of the Clearwater Small Companies Fund's investment in the U.S. Government Select Portfolio of the Northern Institutional Funds was $9,691,925 with net purchases of $4,357,430 during the nine months ended September 30, 2020. |
| 26 | (Continued) |
CLEARWATER INVESTMENT TRUST
Schedule of Investments - Clearwater Small Companies Fund
September 30, 2020 (unaudited)
Fair value is an estimate of the price the Clearwater Small Companies Fund would receive upon selling a security in a timely transaction to an independent buyer in the principal or most advantageous market for the security. This guidance establishes a three-tier hierarchy to maximize the use of observable market data and minimize the use of unobservable inputs and to establish classification of fair value measurements for disclosure purposes. Various inputs are used in determining the value of the Clearwater Small Companies Fund's investments, as described below. These inputs are summarized in the three broad levels listed below.
| • | Level 1 – Unadjusted quoted market prices in active markets for identical securities on the measurement date. |
| • | Level 2 – Other significant observable inputs including quoted prices for similar investments, interest rates, prepayment speeds, credit risk, etc. or quoted prices for identical or similar assets in markets that are not active. Inputs that are derived principally from or corroborated by observable market data are also considered Level 2 measurements. An adjustment to any observable input that is significant to the fair value may render the measurement a Level 3 measurement. |
| • | Level 3 – Valuations based on unobservable inputs, which may include the Adviser’s own assumptions in determining the fair value of an investment. |
Investments in U.S. and foreign equity securities are valued at the last sales price or the regular trading session closing price on the principal exchange or market in which such securities are traded, with foreign security values stated in U.S. dollars. Equity securities which have not traded on the date of valuation or securities for which sales prices are not generally reported are valued at the mean between the last bid and asked prices. Security transactions are accounted for as of trade date. Wherever possible, the Clearwater Small Companies Fund uses independent pricing services approved by the Board of Trustees of Clearwater Investment Trust to value its investments. When prices are not readily available (including those for which trading has been suspended), are determined not to reflect fair value, or when the Adviser becomes aware that a significant event impacting the value of a security or group of securities has occurred after the closing of the exchange on which the security or securities principally trade, but before the calculation of the daily net asset value, the Clearwater Small Companies Fund may value these securities at fair value as determined in good faith using procedures established by the Board of Trustees.
The inputs or methodology used for valuing securities are not necessarily an indication of the risk associated with investing in those securities and other financial instruments, if any. The following is a summary of the inputs used in valuing the Clearwater Small Companies Fund’s investments and other financial instruments, if any, which are carried at fair value, as of September 30, 2020.
| Level 1 | Level 2 | Level 3 | Total | ||||
| Common Stocks | $325,299,801 | $347,997 | $— | $325,647,798 | |||
| Convertible Bonds | — | 521,052 | — | 521,052 | |||
| Convertible Preferred Stocks | 379,934 | — | — | 379,934 | |||
| Investment Companies | 2,998,773 | — | — | 2,998,773 | |||
| Master Limited Partnerships | 369,446 | — | — | 369,446 | |||
| Preferred Stocks | 2,858,894 | — | — | 2,858,894 | |||
| Rights | — | — | —* | —* | |||
| Warrants | — | — | —* | —* | |||
| Short-Term Investments | 17,699,114 | — | — | 17,699,114 | |||
| Total | $349,605,962 | $869,049 | $—* | $350,475,011 |
* Security has been deemed worthless and is a Level 3 investment.
For the Clearwater Small Companies Fund, the investment value is comprised of equity securities, convertible bonds, investment companies, master limited partnerships, rights, warrants and short-term investments. See the Clearwater Small Companies Fund’s Schedule of Investments for industry classification. Investments in equity and short-term securities are valued at the last sales price or the regular trading session closing price on the principal exchange or market where the securities are traded.
There were no significant Level 3 valuations at September 30, 2020.
| 27 | (Continued) |
CLEARWATER INVESTMENT TRUST
Schedule of Investments - Clearwater Small Companies Fund
September 30, 2020 (unaudited)
Clearwater Small Companies Fund Portfolio Diversification
(as a percentage of net assets)
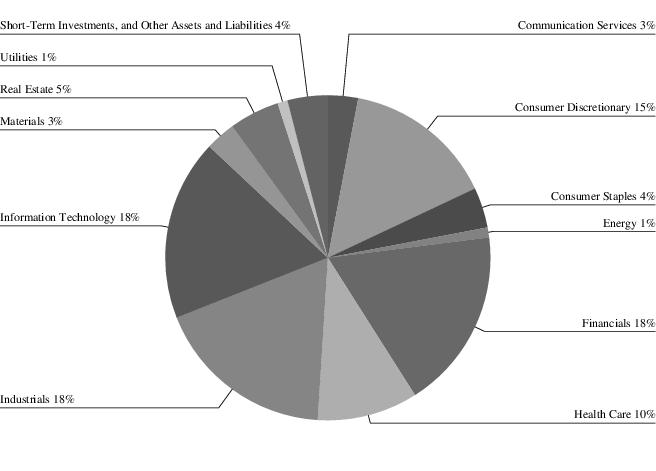
| 28 | (Continued) |
CLEARWATER INVESTMENT TRUST
Schedule of Investments - Clearwater Tax-Exempt Bond Fund
September 30, 2020 (unaudited)
| Par/Shares | Security | Maturity date | Coupon rate | Cost | Fair value (a) | Percent of net assets | ||||||
| Closed-End Funds: | ||||||||||||
| 171,824 | BLACKROCK LONG-TERM MUNICIPAL ADVANTAGE TRUST | $1,701,436 | 2,027,523 | |||||||||
| 54,180 | BLACKROCK MUNICIPAL INCOME QUALITY TRUST | 739,165 | 771,523 | |||||||||
| 17,900 | BLACKROCK MUNIENHANCED FUND INC | 188,128 | 202,270 | |||||||||
| 58,171 | BLACKROCK MUNIHOLDINGS FUND II INC | 822,153 | 853,369 | |||||||||
| 91,327 | BLACKROCK MUNIHOLDINGS INVESTMENT QUALITY FUND | 1,010,095 | 1,224,695 | |||||||||
| 46,838 | BLACKROCK MUNIHOLDINGS NEW JERSEY QUALITY FUND INC | 651,076 | 636,528 | |||||||||
| 83,977 | BLACKROCK MUNIHOLDINGS QUALITY FUND II INC | 1,060,121 | 1,069,867 | |||||||||
| 74,300 | BLACKROCK MUNIHOLDINGS QUALITY FUND INC | 956,132 | 956,984 | |||||||||
| 55,111 | BLACKROCK MUNIYIELD INVESTMENT QUALITY FUND | 701,111 | 755,021 | |||||||||
| 157,958 | BLACKROCK MUNIYIELD MICHIGAN QUALITY FUND INC | 2,064,776 | 2,214,571 | |||||||||
| 51,700 | BLACKROCK MUNIYIELD PENNSYLVANIA QUALITY FUND | 729,423 | 719,147 | |||||||||
| 102,096 | BLACKROCK MUNIYIELD QUALITY FUND II INC | 1,309,732 | 1,335,416 | |||||||||
| 118,472 | BLACKROCK MUNIYIELD QUALITY FUND III INC | 1,572,465 | 1,592,264 | |||||||||
| 42,549 | BNY MELLON STRATEGIC MUNICIPAL BOND FUND INC | 298,824 | 310,182 | |||||||||
| 177,634 | DWS MUNICIPAL INCOME TRUST | 2,001,406 | 1,968,185 | |||||||||
| 4,215 | EATON VANCE MUNICIPAL BOND FUND | 56,127 | 55,511 | |||||||||
| 178,050 | INVESCO ADVANTAGE MUNICIPAL INCOME TRUST II | 1,981,830 | 1,924,721 | |||||||||
| 149,405 | INVESCO MUNICIPAL OPPORTUNITY TRUST | 1,832,549 | 1,825,729 | |||||||||
| 101,614 | INVESCO MUNICIPAL TRUST | 1,263,444 | 1,220,384 | |||||||||
| 144,886 | INVESCO QUALITY MUNICIPAL INCOME TRUST | 1,749,794 | 1,790,791 | |||||||||
| 65,173 | INVESCO TRUST FOR INVESTMENT GRADE MUNICIPALS | 835,890 | 809,449 | |||||||||
| 21,234 | INVESCO VALUE MUNICIPAL INCOME TRUST | 270,107 | 312,352 | |||||||||
| 83,434 | NUVEEN AMT-FREE MUNICIPAL CREDIT INCOME FUND | 1,220,326 | 1,306,576 | |||||||||
| 300,875 | NUVEEN AMT-FREE QUALITY MUNICIPAL INCOME FUND | 4,065,667 | 4,314,547 | |||||||||
| 15,963 | NUVEEN MICHIGAN QUALITY MUNICIPAL INCOME FUND | 214,604 | 226,355 | |||||||||
| 52,779 | NUVEEN PENNSYLVANIA QUALITY MUNICIPAL INCOME FUND | 723,142 | 709,350 | |||||||||
| 234,784 | NUVEEN QUALITY MUNICIPAL INCOME FUND | 3,323,368 | 3,409,064 | |||||||||
| 28,000 | PUTNAM MUNICIPAL OPPORTUNITIES TRUST | 371,050 | 363,160 | |||||||||
| Sub-total Closed-End Funds: | 33,713,941 | 34,905,534 | 5.81% | |||||||||
| Municipal Bonds: | ||||||||||||
| Alabama | ||||||||||||
| 500,000 | MOBILE CNTY AL LTD OBLG(b) | 11/1/2045 | 4.00 | 500,000 | 499,975 | |||||||
| 1,000,000 | PELL CITY AL SPL CARE FACS FING AUTH REVENUE | 12/1/2031 | 5.00 | 1,013,218 | 1,040,530 | |||||||
| 1,513,218 | 1,540,505 | 0.26% | ||||||||||
| Alaska | ||||||||||||
| 970,000 | ALASKA ST HSG FIN CORP MTGE REVENUE | 12/1/2040 | 3.75 | 1,037,916 | 1,049,550 | |||||||
| 350,000 | ALASKA ST INDL DEV & EXPORT AUTH CMNTY PROVIDER REVENUE(c) | 12/1/2010 | 5.40 | 350,000 | 17,500 | |||||||
| 1,387,916 | 1,067,050 | 0.18% | ||||||||||
| Arizona | ||||||||||||
| 1,250,000 | ARIZONA ST INDL DEV AUTH ECON DEV REVENUE(b) | 7/1/2030 | 6.75 | 1,237,602 | 1,253,187 | |||||||
| 1,250,000 | ARIZONA ST INDL DEV AUTH ECON DEV REVENUE(b) | 7/1/2050 | 7.75 | 1,237,512 | 1,258,250 | |||||||
| 500,000 | ARIZONA ST INDL DEV AUTH EDU REVENUE(b) | 7/15/2038 | 5.75 | 519,896 | 554,015 | |||||||
| 1,000,000 | ARIZONA ST INDL DEV AUTH MF HSG REVENUE | 1/1/2038 | 5.38 | 1,000,000 | 945,630 | |||||||
| 700,000 | GLENDALE AZ INDL DEV AUTH | 11/15/2036 | 5.00 | 722,565 | 735,882 | |||||||
| 550,000 | GLENDALE AZ INDL DEV AUTH | 11/15/2046 | 5.25 | 557,146 | 528,814 | |||||||
| 800,000 | MARICOPA CNTY AZ INDL DEV AUTH EDU REVENUE | 7/1/2035 | 5.00 | 837,821 | 833,568 | |||||||
| 870,000 | MARICOPA CNTY AZ INDL DEV AUTH EDU REVENUE(b) | 7/1/2052 | 6.00 | 916,676 | 981,169 | |||||||
| 750,000 | MARICOPA CNTY AZ INDL DEV AUTH SENIOR LIVING FACS REVENUE(b) | 1/1/2036 | 5.75 | 742,442 | 756,968 | |||||||
| 500,000 | NAVAJO NATION AZ(b) | 12/1/2030 | 5.50 | 521,178 | 552,810 | |||||||
| 1,000,000 | PEORIA AZ INDL DEV AUTH | 11/15/2029 | 5.25 | 1,000,000 | 960,030 | |||||||
| 1,000,000 | PHOENIX AZ INDL DEV AUTH EDU REVENUE(b) | 7/1/2036 | 5.13 | 986,647 | 1,049,340 | |||||||
| 1,000,000 | PHOENIX AZ INDL DEV AUTH EDU REVENUE(b) | 9/1/2045 | 5.00 | 1,045,307 | 1,044,480 | |||||||
| 2,500,000 | PHOENIX AZ INDL DEV AUTH LEASE REVENUE | 6/1/2034 | 5.25 | 2,509,864 | 2,613,075 | |||||||
| 800,000 | PIMA CNTY AZ INDL DEV AUTH EDU REVENUE(b) | 12/1/2026 | 5.25 | 800,000 | 823,520 | |||||||
| 29 | (Continued) |
CLEARWATER INVESTMENT TRUST
Schedule of Investments - Clearwater Tax-Exempt Bond Fund
September 30, 2020 (unaudited)
| Par/Shares | Security | Maturity date | Coupon rate | Cost | Fair value (a) | Percent of net assets | ||||||
| Arizona (Cont'd): | ||||||||||||
| 10,000 | PIMA CNTY AZ INDL DEV AUTH EDU REVENUE | 7/1/2031 | 6.75 | $7,987 | 10,050 | |||||||
| 1,370,000 | PIMA CNTY AZ INDL DEV AUTH EDU REVENUE(b) | 6/15/2035 | 5.38 | 1,446,908 | 1,454,762 | |||||||
| 750,000 | PIMA CNTY AZ INDL DEV AUTH EDU REVENUE(b) | 6/15/2037 | 4.75 | 737,256 | 756,788 | |||||||
| 815,000 | QUECHAN INDIAN TRIBE AZ FORT YUMA INDIAN RESERVATION | 5/1/2025 | 9.75 | 815,000 | 859,352 | |||||||
| 500,000 | TEMPE AZ INDL DEV AUTH REVENUE(b) | 10/1/2024 | 4.70 | 499,076 | 501,240 | |||||||
| 500,000 | TEMPE AZ INDL DEV AUTH REVENUE(b) | 10/1/2037 | 6.00 | 502,507 | 519,945 | |||||||
| 18,643,390 | 18,992,875 | 3.16% | ||||||||||
| Arkansas | ||||||||||||
| 525,000 | SHERIDAN AR SCH DIST #37 | 2/1/2047 | 4.00 | 529,683 | 537,043 | |||||||
| 1,000,000 | SPRINGDALE AR SALES & USE REVENUE | 4/1/2041 | 3.60 | 973,053 | 1,030,320 | |||||||
| 1,502,736 | 1,567,363 | 0.26% | ||||||||||
| California | ||||||||||||
| 2,350,000 | ACALANES CA UNION HIGH SCH DIST (Step to 6.55% on 8/1/2024)(d) | 8/1/2039 | 0.00 | 1,837,796 | 2,666,921 | |||||||
| 1,000,000 | ALVORD CA UNIF SCH DIST | 8/1/2036 | 5.25 | 1,010,448 | 1,142,470 | |||||||
| 1,000,000 | ALVORD CA UNIF SCH DIST (Step to 7.35% on 8/1/2026)(d) | 8/1/2046 | 0.00 | 659,406 | 1,285,070 | |||||||
| 500,000 | CALIFORNIA ST HLTH FACS FING AUTH REVENUE | 8/15/2033 | 5.50 | 501,131 | 519,180 | |||||||
| 1,500,000 | CALIFORNIA ST SCH FACS FING AUTH REVENUE | 8/1/2029 | 6.00 | 1,490,815 | 1,940,685 | |||||||
| 750,000 | CALIFORNIA ST STWD CMNTYS DEV AUTH REVENUE | 10/1/2042 | 6.00 | 772,704 | 784,245 | |||||||
| 1,000,000 | CARLSBAD CA UNIF SCH DIST (Step to 6.13% on 8/1/2021)(d) | 8/1/2031 | 0.00 | 948,817 | 1,364,060 | |||||||
| 1,500,000 | CLOVIS CA UNIF SCH DIST(e) | 8/1/2030 | 0.00 | 829,132 | 975,870 | |||||||
| 1,000,000 | COLTON CA JT UNIF SCH DIST (Step to 5.80% on 8/1/2021)(d) | 8/1/2035 | 0.00 | 953,137 | 1,199,840 | |||||||
| 1,105,000 | CORONA-NORCO CA UNIF SCH DIST | 8/1/2039 | 6.80 | 1,103,764 | 1,560,105 | |||||||
| 750,000 | EL PASO DE ROBLES CA REDEV AGY TAX ALLOCATION REVENUE | 7/1/2033 | 6.38 | 743,834 | 753,353 | |||||||
| 1,000,000 | ENCINITAS CA UNION SCH DIST (Step to 6.75% on 8/1/2022)(d) | 8/1/2035 | 0.00 | 885,300 | 1,401,920 | |||||||
| 1,155,000 | ENTERPRISE CA ELEM SCH DIST (Step to 6.20% on 8/1/2021)(d) | 8/1/2035 | 0.00 | 1,097,691 | 1,605,843 | |||||||
| 600,000 | ESCONDIDO CA SPL TAX | 9/1/2036 | 5.00 | 629,799 | 708,432 | |||||||
| 1,500,000 | HARTNELL CA CMNTY CLG DIST (Step to 7.00% on 8/1/2022)(d) | 8/1/2034 | 0.00 | 1,322,339 | 1,844,505 | |||||||
| 3,500,000 | HEALDSBURG CA UNIF SCH DIST (Step to 4.60% on 8/1/2022)(d) | 8/1/2037 | 0.00 | 3,216,838 | 3,737,335 | |||||||
| 1,000,000 | HELENDALE CA SCH DIST | 8/1/2034 | 6.25 | 998,767 | 1,412,410 | |||||||
| 1,000,000 | IMPERIAL CA CMNTY CLG DIST | 8/1/2040 | 6.75 | 1,006,768 | 1,301,260 | |||||||
| 750,000 | MARTINEZ CA UNIF SCH DIST | 8/1/2035 | 6.13 | 747,448 | 918,517 | |||||||
| 2,000,000 | OAK PARK CA UNIF SCH DIST (Step to 7.10% on 8/1/2021)(d) | 8/1/2038 | 0.00 | 1,887,808 | 2,873,420 | |||||||
| 2,625,000 | PITTSBURG CALIF UNI SCH DIST FING AUTH REVENUE(e) | 9/1/2031 | 0.00 | 1,302,313 | 1,277,220 | |||||||
| 1,000,000 | REDONDO BEACH CA UNIF SCH DIST | 8/1/2034 | 6.38 | 997,197 | 1,305,130 | |||||||
| 750,000 | REEF-SUNSET CA UNIF SCH DIST (Step to 4.85% on 8/1/2021)(d) | 8/1/2038 | 0.00 | 720,461 | 835,222 | |||||||
| 1,000,000 | RIVERSIDE CA CMNTY PPTYS DEV INC LEASE REVENUE | 10/15/2038 | 6.00 | 1,009,914 | 1,175,470 | |||||||
| 1,500,000 | S TAHOE CA JT PWRS FING AUTH LEASE REVENUE | 10/1/2030 | 5.00 | 1,574,130 | 1,726,275 | |||||||
| 350,000 | SACRAMENTO CNTY CA WTR FING AUTH REVENUE (Floating, ICE LIBOR USD 3M + 0.57%)(f) | 6/1/2039 | 0.74 | 350,000 | 284,921 | |||||||
| 500,000 | SAN DIEGO CA HSG AUTH MF HSG REVENUE | 5/1/2029 | 5.00 | 500,000 | 510,585 | |||||||
| 1,500,000 | SAN GABRIEL CA UNIF SCH DIST | 8/1/2039 | 5.35 | 1,495,827 | 1,617,495 | |||||||
| 1,000,000 | SAN JOSE CA FING AUTH LEASE REVENUE | 6/1/2039 | 5.00 | 1,021,999 | 1,090,490 | |||||||
| 500,000 | SANTA MONICA CA REDEV AGY | 7/1/2036 | 5.88 | 502,048 | 517,170 | |||||||
| 2,250,000 | SULPHUR SPRINGS CA UNION SCH DIST COPS | 12/1/2037 | 6.50 | 2,248,295 | 2,802,884 | |||||||
| 30 | (Continued) |
CLEARWATER INVESTMENT TRUST
Schedule of Investments - Clearwater Tax-Exempt Bond Fund
September 30, 2020 (unaudited)
| Par/Shares | Security | Maturity date | Coupon rate | Cost | Fair value (a) | Percent of net assets | ||||||
| California (Cont'd): | ||||||||||||
| 1,500,000 | SUTTER BUTTE CA FLOOD AGY ASSMNT REVENUE | 10/1/2038 | 4.00 | $1,484,741 | 1,598,445 | |||||||
| 1,000,000 | TRACY CA JT UNIF SCH DIST (Step to 7.30% on 8/1/2027)(d) | 8/1/2041 | 0.00 | 706,806 | 1,078,590 | |||||||
| 1,250,000 | TUSTIN CA UNIF SCH DIST | 8/1/2028 | 6.00 | 1,244,526 | 1,310,125 | |||||||
| 37,801,999 | 47,125,463 | 7.84% | ||||||||||
| Colorado | ||||||||||||
| 500,000 | 9TH AVENUE MET DIST #2 CO | 12/1/2048 | 5.00 | 500,000 | 517,980 | |||||||
| 1,000,000 | AEROTROPOLIS REGL TRANPRTN AUTH CO SPL REVENUE | 12/1/2051 | 5.00 | 1,014,515 | 1,019,580 | |||||||
| 750,000 | BROADWAY STATION MET DIST #2 CO | 12/1/2048 | 5.13 | 750,000 | 777,862 | |||||||
| 1,000,000 | BROADWAY STATION MET DIST #3 CO | 12/1/2049 | 5.00 | 1,023,039 | 1,033,410 | |||||||
| 650,000 | BUFFALO HIGHLANDS MET DIST | 12/1/2038 | 5.25 | 651,662 | 669,370 | |||||||
| 500,000 | COLORADO SCIENCE AND TECH PARK MET DIST #1 | 12/1/2033 | 5.00 | 505,917 | 518,685 | |||||||
| 1,000,000 | COLORADO ST EDUCTNL & CULTURAL FACS AUTH REVENUE | 7/1/2034 | 5.60 | 995,199 | 1,003,690 | |||||||
| 1,000,000 | COLORADO ST EDUCTNL & CULTURAL FACS AUTH REVENUE(b) | 9/1/2046 | 5.00 | 1,002,658 | 1,001,110 | |||||||
| 1,250,000 | COLORADO ST HLTH FACS AUTH HOSP REVENUE | 12/1/2048 | 5.00 | 1,307,305 | 1,424,950 | |||||||
| 1,000,000 | COLORADO ST HLTH FACS AUTH REVENUE | 8/1/2033 | 7.63 | 989,862 | 1,057,530 | |||||||
| 650,000 | COPPER RIDGE MET DIST CO TAX INCR & SALES TAX SUPPORTED REVENUE | 12/1/2043 | 5.00 | 668,660 | 606,873 | |||||||
| 500,000 | COPPERLEAF CO MET DIST #2 | 12/1/2030 | 5.25 | 500,000 | 515,840 | |||||||
| 500,000 | COPPERLEAF CO MET DIST #2 | 12/1/2045 | 5.75 | 500,000 | 514,640 | |||||||
| 750,000 | COPPERLEAF CO MET DIST #4 | 12/1/2049 | 5.00 | 780,554 | 759,435 | |||||||
| 1,000,000 | CREEKWALK MARKETPLACE BUSINESS IMPT DIST CO(b) | 12/1/2039 | 5.50 | 1,000,000 | 1,023,250 | |||||||
| 750,000 | CRYSTAL CO CROSSING MET DIST | 12/1/2040 | 5.25 | 750,000 | 774,112 | |||||||
| 1,000,000 | DENVER CO URBAN RENEWAL AUTH TAX INCR REVENUE(b) | 12/1/2039 | 5.25 | 985,680 | 1,029,070 | |||||||
| 1,000,000 | DIATC MET DIST CO(b) | 12/1/2049 | 5.00 | 1,060,293 | 1,022,830 | |||||||
| 1,000,000 | DOUGLAS CNTY CO MF REVENUE | 10/1/2029 | 4.50 | 1,000,000 | 1,028,040 | |||||||
| 1,000,000 | GREEN VALLEY RANCH EAST MET DIST #6 CO | 12/1/2050 | 5.88 | 1,000,000 | 1,035,400 | |||||||
| 500,000 | HASKINS STATION CO MET DIST | 12/1/2039 | 5.00 | 516,457 | 511,615 | |||||||
| 500,000 | HUNTERS OVERLOOK METRO DIST #5 CO | 12/1/2049 | 5.00 | 526,655 | 515,595 | |||||||
| 710,000 | IRON MOUNTAIN MET DIST #2 CO | 12/1/2049 | 5.00 | 723,800 | 720,629 | |||||||
| 500,000 | JOHNSTOWN VL MET DIST #2 CO | 12/1/2050 | 5.00 | 504,045 | 503,715 | |||||||
| 1,000,000 | LAMBERTSON FARMS CO MET DIST #1 REVENUE | 12/15/2025 | 5.00 | 991,140 | 898,590 | |||||||
| 500,000 | LAMBERTSON FARMS CO MET DIST #1 REVENUE | 12/15/2035 | 5.50 | 500,000 | 410,925 | |||||||
| 750,000 | LEYDEN ROCK MET DIST #10 | 12/1/2045 | 5.00 | 766,125 | 770,392 | |||||||
| 1,000,000 | LITTLETON VLG MET DIST #2 COLO SPL REVENUE | 12/1/2045 | 5.38 | 996,546 | 1,020,320 | |||||||
| 750,000 | MIRABELLE MET DIST #2 CO | 12/1/2049 | 5.00 | 792,045 | 757,838 | |||||||
| 583,045 | MOUNT CARBON CO MET DIST REVENUE (Step to 0.00% on 6/1/2033)(d) | 6/1/2043 | 7.00 | 583,045 | 583,045 | |||||||
| 200,000 | MOUNT CARBON CO MET DIST REVENUE(c) | 6/1/2043 | 8.00 | - | 44,000 | |||||||
| 1,000,000 | PAINTED PRAIRIE PUB IMPT AUTH CO | 12/1/2039 | 5.00 | 1,032,572 | 1,054,690 | |||||||
| 500,000 | PALISADE CO MET DIST #2 LIMITED TAX | 12/1/2046 | 5.00 | 510,701 | 507,850 | |||||||
| 1,000,000 | PROMENADE CASTLE ROCK CO MET DIST #1 | 12/1/2025 | 5.13 | 1,000,000 | 1,033,050 | |||||||
| 500,000 | ST VRAIN LAKES MET DIST #2 | 12/1/2037 | 5.00 | 500,000 | 512,790 | |||||||
| 1,000,000 | STC MET DIST #2 CO | 12/1/2049 | 5.00 | 1,054,600 | 1,014,320 | |||||||
| 500,000 | TALLMAN GULCH MET DIST CO | 12/1/2047 | 5.25 | 500,000 | 511,525 | |||||||
| 1,000,000 | THOMPSON CROSSING MET DIST #4 CO | 12/1/2049 | 5.00 | 1,051,905 | 1,021,640 | |||||||
| 700,000 | VAUXMONT MET DIST CO | 12/15/2050 | 3.25 | 700,000 | 745,920 | |||||||
| 500,000 | VELOCITY MET DIST #3 CO | 12/1/2039 | 5.38 | 500,000 | 521,405 | |||||||
| 1,000,000 | WINDSHIRE PARK CO MET DIST #2 | 12/1/2047 | 6.50 | 1,077,760 | 1,080,210 | |||||||
| 31,812,740 | 32,073,721 | 5.34% | ||||||||||
| 31 | (Continued) |
CLEARWATER INVESTMENT TRUST
Schedule of Investments - Clearwater Tax-Exempt Bond Fund
September 30, 2020 (unaudited)
| Par/Shares | Security | Maturity date | Coupon rate | Cost | Fair value (a) | Percent of net assets | ||||||
| Connecticut | ||||||||||||
| 500,000 | CONNECTICUT ST HLTH & EDUCTNL FACS AUTH REVENUE(b) | 1/1/2027 | 3.25 | $500,000 | 503,110 | |||||||
| 500,000 | CONNECTICUT ST HLTH & EDUCTNL FACS AUTH REVENUE(b) | 1/1/2055 | 5.00 | 513,903 | 525,970 | |||||||
| 1,000,000 | CONNECTICUT ST HSG FIN AUTH HSG MTGE FIN PROGRAM | 11/15/2035 | 3.88 | 1,000,000 | 1,102,340 | |||||||
| 515,000 | CONNECTICUT ST HSG FIN AUTH HSG MTGE FIN PROGRAM | 5/15/2038 | 3.95 | 515,000 | 540,318 | |||||||
| 2,000,000 | CONNECTICUT ST HSG FIN AUTH HSG MTGE FIN PROGRAM | 5/15/2045 | 3.85 | 2,055,816 | 2,071,020 | |||||||
| 5,000,000 | CONNECTICUT ST HSG FIN AUTH HSG MTGE FIN PROGRAM | 11/15/2047 | 3.65 | 5,000,000 | 5,062,550 | |||||||
| 580,434 | MASHANTUCKET WSTRN PEQUOT TRIBE CT | 7/1/2031 | 6.05 | 593,828 | 37,728 | |||||||
| 10,178,547 | 9,843,036 | 1.64% | ||||||||||
| District of Columbia | ||||||||||||
| 500,000 | DIST OF COLUMBIA HSG FIN AGY MF HSG REVENUE | 7/1/2033 | 5.45 | 500,000 | 513,145 | |||||||
| 1,000,000 | DIST OF COLUMBIA HSG FIN AGY MF HSG REVENUE | 6/1/2040 | 4.90 | 1,000,000 | 1,039,310 | |||||||
| 1,000,000 | DIST OF COLUMBIA HSG FIN AGY MF HSG REVENUE | 6/1/2041 | 5.00 | 1,000,000 | 1,038,750 | |||||||
| 665,000 | DIST OF COLUMBIA REVENUE | 7/1/2027 | 4.13 | 617,543 | 649,452 | |||||||
| 1,250,000 | DIST OF COLUMBIA REVENUE | 7/1/2042 | 5.00 | 1,095,056 | 1,168,175 | |||||||
| 1,000,000 | DISTRICT OF COLUMBIA HSG FIN AGY | 9/1/2043 | 4.05 | 1,000,000 | 1,103,260 | |||||||
| 5,212,599 | 5,512,092 | 0.92% | ||||||||||
| Florida | ||||||||||||
| 1,000,000 | ALACHUA CNTY FL HLTH FACS AUTH CCRC | 10/1/2032 | 8.00 | 1,062,225 | 1,103,710 | |||||||
| 500,000 | ALTA LAKES CMNTY DEV DIST FL SPL ASSMNT | 5/1/2039 | 4.40 | 497,467 | 524,615 | |||||||
| 395,000 | ASTURIA FL CMNTY DEV DIST SPL ASSMNT | 5/1/2034 | 5.75 | 395,000 | 417,728 | |||||||
| 1,175,000 | BAY CNTY FL EDUCTNL FACS REVENUE | 9/1/2030 | 5.25 | 1,094,712 | 1,178,149 | |||||||
| 1,000,000 | BELLALAGO FL EDUCTNL FACS BENEFIT DIST CAPITAL IMPT REVENUE | 5/1/2030 | 4.38 | 988,031 | 1,117,520 | |||||||
| 500,000 | BLACKBURN CREEK CMNTY DEV DISTFL CAP IMPT REVENUE | 5/1/2035 | 6.25 | 500,000 | 555,950 | |||||||
| 185,000 | BLACKBURN CREEK CMNTY DEV DISTFL CAP IMPT REVENUE | 5/1/2045 | 6.25 | 185,000 | 204,029 | |||||||
| 1,370,000 | CAPITAL TRUST AGY FL CHRT SCH REVENUE | 2/1/2035 | 5.38 | 1,370,000 | 1,416,607 | |||||||
| 750,000 | CAPITAL TRUST AGY FL REVENUE | 4/1/2035 | 7.00 | 750,000 | 516,300 | |||||||
| 1,750,000 | CAPITAL TRUST AGY FL REVENUE(b)(c)(g) | 12/1/2035 | 6.75 | 1,745,953 | 962,500 | |||||||
| 750,000 | CAPITAL TRUST AGY FL REVENUE(b)(c)(g) | 7/1/2037 | 6.75 | 750,000 | 450,000 | |||||||
| 750,000 | CAPITAL TRUST AGY FL SENIOR LIVING REVENUE(b) | 8/1/2027 | 5.00 | 750,000 | 672,210 | |||||||
| 750,000 | CAPITAL TRUST AGY FL SENIOR LIVING REVENUE(b) | 8/1/2032 | 5.38 | 750,000 | 635,243 | |||||||
| 500,000 | CAPITAL TRUST AGY FL STUDENT HSG REVENUE(b) | 12/1/2043 | 5.25 | 514,000 | 499,375 | |||||||
| 710,000 | CELEBRATION POINTE CMNTY DEV DIST #1 FL SPL ASSMNT REVENUE(b) | 5/1/2032 | 5.00 | 713,937 | 759,750 | |||||||
| 750,000 | COLLIER CNTY FL INDL DEV AUTH | 10/1/2039 | 6.25 | 737,712 | 765,450 | |||||||
| 1,750,000 | COLLIER CNTY FLA INDL DEV AUTH CONTINUING CARE CMNTY REV(b)(c)(g) | 5/15/2044 | 8.13 | 1,913,765 | 1,354,062 | |||||||
| 750,000 | COLLIER CNTY FLA INDL DEV AUTH CONTINUING CARE CMNTY REVENUE(b)(c)(g) | 5/15/2026 | 7.25 | 750,000 | 580,313 | |||||||
| 1,000,000 | DAVIE FL EDUCTNL FACS REVENUE | 4/1/2042 | 6.00 | 1,010,109 | 1,142,510 | |||||||
| 500,000 | DOWDEN WEST CMNTY DEV DIST FL SPL ASSMNT REVENUE(b) | 5/1/2039 | 5.40 | 500,000 | 555,450 | |||||||
| 980,000 | ESCAMBIA CNTY FL HSG FIN AUTH SF MTGE REVENUE | 10/1/2049 | 3.75 | 980,000 | 1,055,068 | |||||||
| 715,000 | FISHHAWK CCD IV FL SPL ASSMNT REVENUE | 5/1/2033 | 7.00 | 715,000 | 792,256 | |||||||
| 32 | (Continued) |
CLEARWATER INVESTMENT TRUST
Schedule of Investments - Clearwater Tax-Exempt Bond Fund
September 30, 2020 (unaudited)
| Par/Shares | Security | Maturity date | Coupon rate | Cost | Fair value (a) | Percent of net assets | ||||||
| Florida (Cont'd): | ||||||||||||
| 1,000,000 | FLORIDA ST DEPT OF EDU CMNTY CLG CAPITAL IMPT REVENUE | 7/1/2030 | 4.38 | $1,007,531 | 1,013,410 | |||||||
| 1,000,000 | FLORIDA ST DEV FIN CORP EDUCTNL FACS REVENUE(b) | 6/15/2035 | 6.00 | 1,000,775 | 1,118,050 | |||||||
| 920,000 | FLORIDA ST DEV FIN CORP EDUCTNL FACS REVENUE(b) | 6/1/2040 | 5.00 | 949,320 | 951,979 | |||||||
| 765,000 | FLORIDA ST HSG FIN CORP REVENUE | 7/1/2035 | 3.75 | 765,000 | 817,211 | |||||||
| 485,000 | FLORIDA ST HSG FIN CORP REVENUE | 7/1/2039 | 4.20 | 485,000 | 500,821 | |||||||
| 1,955,000 | FLORIDA ST HSG FIN CORP REVENUE | 1/1/2045 | 4.20 | 1,955,000 | 2,180,666 | |||||||
| 1,000,000 | FLORIDA ST HSG FIN CORP REVENUE | 7/1/2049 | 3.30 | 1,000,000 | 1,059,330 | |||||||
| 1,000,000 | FRERC CDD FL | 11/1/2040 | 5.38 | 1,000,000 | 1,018,290 | |||||||
| 650,000 | HARBOR BAY FL CDD CAPITAL IMPT REVENUE | 5/1/2048 | 4.10 | 645,715 | 678,087 | |||||||
| 800,000 | HERITAGE HARBOUR FL N CDD SPL ASSMNT | 5/1/2034 | 5.00 | 800,000 | 902,392 | |||||||
| 710,000 | LAKE CNTY FLA RETMNT FAC REVENUE | 8/15/2050 | 5.75 | 724,385 | 724,392 | |||||||
| 240,000 | LAKEWOOD RANCH FL STEWARDSHIP DIST SPL ASSMNT REVENUE | 5/1/2025 | 4.25 | 239,699 | 248,561 | |||||||
| 1,500,000 | LAKEWOOD RANCH FL STEWARDSHIP DIST SPL ASSMNT REVENUE | 5/1/2030 | 7.40 | 1,489,825 | 1,562,355 | |||||||
| 700,000 | LAKEWOOD RANCH FL STEWARDSHIP DIST SPL ASSMNT REVENUE | 5/1/2033 | 6.70 | 700,000 | 748,713 | |||||||
| 1,000,000 | LAKEWOOD RANCH FL STEWARDSHIP DIST SPL ASSMNT REVENUE | 5/1/2034 | 5.35 | 1,000,000 | 1,112,690 | |||||||
| 1,300,000 | LAKEWOOD RANCH FL STEWARDSHIP DIST SPL ASSMNT REVENUE | 5/1/2036 | 5.00 | 1,300,000 | 1,398,215 | |||||||
| 750,000 | LAKEWOOD RANCH FL STEWARDSHIP DIST SPL ASSMNT REVENUE(b) | 5/1/2037 | 5.00 | 744,975 | 804,202 | |||||||
| 750,000 | LAKEWOOD RANCH FL STEWARDSHIP DIST SPL ASSMNT REVENUE | 5/1/2037 | 5.25 | 745,838 | 819,615 | |||||||
| 700,000 | LAKEWOOD RANCH FL STEWARDSHIP DIST SPL ASSMNT REVENUE | 5/1/2038 | 5.00 | 700,000 | 745,794 | |||||||
| 1,000,000 | LAKEWOOD RANCH FL STEWARDSHIP DIST SPL ASSMNT REVENUE | 5/1/2039 | 5.30 | 1,000,000 | 1,092,080 | |||||||
| 580,000 | LAKEWOOD RANCH FL STEWARDSHIP DIST SPL ASSMNT REVENUE(b) | 5/1/2040 | 3.63 | 575,558 | 578,776 | |||||||
| 630,000 | LAKEWOOD RANCH FL STEWARDSHIP DIST SPL ASSMNT REVENUE | 5/1/2049 | 4.00 | 626,749 | 638,215 | |||||||
| 490,000 | LAKEWOOD RANCH FL STEWARDSHIP DIST SPL ASSMNT REVENUE | 5/1/2049 | 4.50 | 483,004 | 514,525 | |||||||
| 940,000 | LAKEWOOD RANCH FL STEWARDSHIP DIST SPL ASSMNT REVENUE | 5/1/2050 | 4.00 | 925,520 | 952,690 | |||||||
| 465,000 | LEXINGTON OAKS FL CDD SPL ASSMNT REVENUE | 5/1/2033 | 5.65 | 465,000 | 476,616 | |||||||
| 315,000 | LONG LAKE RANCH CMNTY DEV DIST FLA CAP IMPT REVENUE | 5/1/2024 | 5.63 | 315,000 | 325,902 | |||||||
| 500,000 | LT RANCH CDD FL CAPITAL IMPT REVENUE | 5/1/2040 | 4.00 | 505,945 | 512,810 | |||||||
| 250,000 | MAGNOLIA CREEK FL CDD CAPITAL IMPT REVENUE(c) | 5/1/2014 | 5.60 | 250,000 | 45,000 | |||||||
| 735,000 | MARSHALL CREEK FL CDD SPL ASSMNT | 5/1/2032 | 5.00 | 745,491 | 768,369 | |||||||
| 500,000 | MIAMI BEACH FL HLTH FACS AUTH | 11/15/2044 | 5.00 | 526,980 | 544,570 | |||||||
| 135,000 | MIAMI-DADE CNTY FL HLTH FACS AUTH HOSP REVENUE | 8/1/2030 | 6.00 | 131,055 | 135,513 | |||||||
| 300,000 | N SPRINGS FL IMPT DIST | 5/1/2027 | 6.00 | 300,000 | 325,623 | |||||||
| 115,000 | NEW RIVER FL CDD CAPITAL IMPT REVENUE(c) | 5/1/2013 | 5.00 | 114,821 | 1 | |||||||
| 500,000 | NORTH SPRINGS FL IMPT DIST | 5/1/2044 | 6.50 | 500,000 | 542,250 | |||||||
| 1,400,000 | NTHRN PALM BEACH CNTY FL IMPT DIST | 8/1/2029 | 5.00 | 1,405,426 | 1,514,408 | |||||||
| 500,000 | NTHRN PALM BEACH CNTY FL IMPT DIST | 8/1/2037 | 5.00 | 508,661 | 554,980 | |||||||
| 1,000,000 | ORANGE CNTY FL HLTH FACS AUTH REVENUE | 8/1/2034 | 5.00 | 1,029,108 | 1,099,580 | |||||||
| 750,000 | ORANGE CNTY FL HLTH FACS AUTH REVENUE | 8/1/2035 | 5.00 | 773,330 | 841,327 | |||||||
| 1,000,000 | ORANGE CNTY FL HLTH FACS AUTH REVENUE | 8/1/2047 | 5.00 | 1,059,445 | 1,090,040 | |||||||
| 440,000 | ORANGE CNTY FL HSG FIN AUTH | 9/1/2035 | 3.80 | 440,000 | 469,282 | |||||||
| 33 | (Continued) |
CLEARWATER INVESTMENT TRUST
Schedule of Investments - Clearwater Tax-Exempt Bond Fund
September 30, 2020 (unaudited)
| Par/Shares | Security | Maturity date | Coupon rate | Cost | Fair value (a) | Percent of net assets | ||||||
| Florida (Cont'd): | ||||||||||||
| 500,000 | PALM BEACH CNTY FL HLTH FACS AUTH REVENUE | 6/1/2034 | 7.25 | $500,000 | 547,350 | |||||||
| 1,200,000 | PALM BEACH CNTY FL HLTH FACS AUTH REVENUE | 5/15/2036 | 5.00 | 1,288,599 | 1,283,472 | |||||||
| 1,000,000 | PALM BEACH CNTY FL HLTH FACS AUTH REVENUE | 6/1/2049 | 7.50 | 1,038,964 | 1,094,410 | |||||||
| 1,935,000 | PALM BEACH CNTY FL HLTH FACS AUTH REVENUE | 5/15/2053 | 4.00 | 1,785,026 | 1,863,211 | |||||||
| 500,000 | PALM BEACH CNTY FL HLTH FACS AUTH REVENUE | 6/1/2055 | 5.00 | 512,806 | 516,350 | |||||||
| 500,000 | PARKER ROAD FL CDD CAPITAL IMPT REVENUE | 5/1/2050 | 4.10 | 498,273 | 504,320 | |||||||
| 500,000 | PINELLAS CNTY FL INDL DEV AUTH INDL DEV REVENUE | 7/1/2039 | 5.00 | 551,135 | 560,470 | |||||||
| 715,000 | POINCIANA FL W CDD SPL ASSMNT | 5/1/2030 | 5.38 | 708,354 | 766,223 | |||||||
| 1,900,000 | SAINT JOHNS CNTY FL INDL DEV AUTH REVENUE | 8/1/2055 | 4.00 | 2,018,059 | 2,027,547 | |||||||
| 495,000 | SEVEN OAKS FL CMNTY DEV DIST SPL ASSMNT REVENUE | 5/1/2033 | 5.50 | 486,184 | 508,830 | |||||||
| 165,000 | SILVERLEAF FL CDD CAPITAL IMPT REVENUE | 5/1/2044 | 6.75 | 162,115 | 181,061 | |||||||
| 142,538 | STERLING HILL FL CDD CAPITAL IMPT REVENUE(c) | 11/1/2010 | 5.50 | 142,538 | 89,799 | |||||||
| 1,100,000 | TALLAHASSEE FL HLTH FACS REVENUE | 12/1/2040 | 5.00 | 1,140,229 | 1,219,801 | |||||||
| 500,000 | TOLOMATO FL CDD | 5/1/2037 | 4.25 | 500,000 | 538,800 | |||||||
| 50,000 | TOLOMATO FL CDD (Step to 6.61% on 5/1/2022)(d) | 5/1/2040 | 0.00 | 49,865 | 39,161 | |||||||
| 185,000 | TOLOMATO FL CDD (Step to 6.61% on 11/1/2021)(d) | 5/1/2040 | 0.00 | 173,457 | 167,297 | |||||||
| 115,000 | TOLOMATO FL CDD (Step to 6.61% on 11/1/2024)(d) | 5/1/2040 | 0.00 | 86,500 | 80,260 | |||||||
| 1,490,000 | TOLOMATO FL CDD | 5/1/2040 | 3.75 | 1,433,826 | 1,669,634 | |||||||
| 125,000 | TOLOMATO FL CDD(c) | 5/1/2040 | 6.61 | - | 1 | |||||||
| 700,000 | TROUT CREEK CDD FL CAPITAL IMPT REVENUE | 5/1/2038 | 5.38 | 700,000 | 768,019 | |||||||
| 500,000 | TSR CDD FL SPL ASSMNT REVENUE | 11/1/2035 | 5.38 | 498,716 | 553,235 | |||||||
| 1,500,000 | UNIVERSITY PARK RECREATION DIST FL ON-AD VALOREM ASSMNT | 5/1/2050 | 3.50 | 1,500,000 | 1,652,220 | |||||||
| 1,150,000 | VLG FL CDD #7 SPL ASSMNT REVENUE | 5/1/2036 | 4.00 | 1,143,400 | 1,232,386 | |||||||
| 4,000 | WATERS EDGE FL CDD CAPITAL IMPT REVENUE | 5/1/2039 | 5.35 | 4,000 | 4,002 | |||||||
| 85,000 | WATERS EDGE FL CDD CAPITAL IMPT REVENUE | 5/1/2039 | 6.60 | 84,383 | 85,829 | |||||||
| 735,000 | WIREGRASS FL CDD CAPITAL IMPT REVENUE | 5/1/2035 | 5.38 | 731,269 | 786,773 | |||||||
| 750,000 | WYNNFIELD LAKES FL CDD | 5/1/2036 | 4.50 | 745,447 | 799,433 | |||||||
| 350,934 | ZEPHYR RIDGE FL CDD CAPITAL IMPT REVENUE(c) | 5/1/2013 | 5.25 | 351,276 | 154,411 | |||||||
| 67,441,488 | 68,380,430 | 11.38% | ||||||||||
| Georgia | ||||||||||||
| 500,000 | ATHENS-CLARKE CNTY GA UNIF GOVT DEV AUTH REVENUE | 6/15/2039 | 5.00 | 508,079 | 551,940 | |||||||
| 500,000 | ATLANTA GA ARPT REVENUE | 1/1/2030 | 6.00 | 500,673 | 506,885 | |||||||
| 1,350,000 | COBB CNTY GA DEV AUTH(b) | 12/1/2039 | 5.00 | 1,417,528 | 1,338,403 | |||||||
| 845,000 | FULTON CNTY GA DEV AUTH | 11/1/2028 | 5.25 | 745,853 | 845,549 | |||||||
| 3,500,000 | GEORGIA ST HSG & FIN AUTH REVENUE | 12/1/2037 | 3.80 | 3,500,000 | 3,614,800 | |||||||
| 2,000,000 | GEORGIA ST HSG & FIN AUTH REVENUE | 12/1/2037 | 4.00 | 2,000,000 | 2,040,220 | |||||||
| 925,000 | GEORGIA ST HSG & FIN AUTH REVENUE | 12/1/2038 | 3.85 | 925,000 | 1,011,303 | |||||||
| 370,000 | GEORGIA ST HSG & FIN AUTH REVENUE | 12/1/2039 | 4.00 | 370,000 | 394,154 | |||||||
| 2,500,000 | GEORGIA ST HSG & FIN AUTH REVENUE | 12/1/2040 | 3.80 | 2,500,000 | 2,658,050 | |||||||
| 1,000,000 | GEORGIA ST HSG & FIN AUTH REVENUE | 12/1/2041 | 3.85 | 1,002,230 | 1,030,260 | |||||||
| 1,950,000 | GEORGIA ST HSG & FIN AUTH REVENUE | 12/1/2043 | 3.90 | 1,940,230 | 2,006,433 | |||||||
| 34 | (Continued) |
CLEARWATER INVESTMENT TRUST
Schedule of Investments - Clearwater Tax-Exempt Bond Fund
September 30, 2020 (unaudited)
| Par/Shares | Security | Maturity date | Coupon rate | Cost | Fair value (a) | Percent of net assets | ||||||
| Georgia (Cont'd): | ||||||||||||
| 1,100,000 | GEORGIA ST HSG & FIN AUTH REVENUE | 12/1/2048 | 4.00 | $1,100,000 | 1,181,004 | |||||||
| 1,500,000 | GEORGIA ST HSG & FIN AUTH REVENUE | 12/1/2048 | 4.20 | 1,506,170 | 1,658,865 | |||||||
| 1,750,000 | GEORGIA ST HSG & FIN AUTH REVENUE | 12/1/2049 | 3.25 | 1,750,000 | 1,856,802 | |||||||
| 19,765,763 | 20,694,668 | 3.44% | ||||||||||
| Idaho | ||||||||||||
| 655,000 | IDAHO ST HLTH FACS AUTH REVENUE | 10/1/2024 | 7.00 | 655,000 | 524,013 | |||||||
| 750,000 | IDAHO ST HLTH FACS AUTH REVENUE | 10/1/2029 | 7.38 | 743,858 | 599,993 | |||||||
| 1,000,000 | IDAHO ST HLTH FACS AUTH REVENUE | 10/1/2044 | 8.00 | 1,037,797 | 799,980 | |||||||
| 2,436,655 | 1,923,986 | 0.32% | ||||||||||
| Illinois | ||||||||||||
| 1,195,000 | BELLWOOD IL | 12/1/2027 | 5.88 | 1,188,450 | 1,325,231 | |||||||
| 1,495,000 | BOLINGBROOK IL SPL SVC AREA SPL TAX | 3/1/2030 | 4.00 | 1,541,919 | 1,733,692 | |||||||
| 1,250,000 | BURBANK IL EDUCTNL FACS REVENUE(b) | 9/1/2035 | 6.00 | 1,259,777 | 1,333,487 | |||||||
| 1,000,000 | BUREAU CNTY TWP IL HIGH SCH DIST #502 | 10/1/2043 | 6.63 | 1,027,874 | 1,197,960 | |||||||
| 1,000,000 | CHICAGO HEIGHTS IL | 12/1/2029 | 4.50 | 1,044,441 | 1,112,810 | |||||||
| 1,000,000 | CHICAGO IL MIDWAY ARPT REVENUE | 1/1/2035 | 5.25 | 1,000,826 | 1,082,370 | |||||||
| 1,000,000 | CHICAGO IL PARK DIST | 1/1/2028 | 5.00 | 1,068,518 | 1,096,620 | |||||||
| 750,000 | CHICAGO IL PARK DIST | 1/1/2042 | 4.00 | 771,622 | 811,515 | |||||||
| 637,000 | CORTLAND IL SPL TAX REVENUE(c) | 3/1/2017 | 5.50 | 633,881 | 95,550 | |||||||
| 500,000 | DECATUR IL | 3/1/2034 | 5.00 | 507,827 | 568,030 | |||||||
| 1,500,000 | ILLINOIS ST | 2/1/2030 | 4.00 | 1,494,159 | 1,613,310 | |||||||
| 500,000 | ILLINOIS ST | 7/1/2033 | 5.50 | 498,790 | 520,460 | |||||||
| 1,000,000 | ILLINOIS ST EDUCTNL FACS AUTH | 11/1/2036 | 4.50 | 1,000,000 | 1,108,710 | |||||||
| 675,000 | ILLINOIS ST FIN AUTH EDUCTNL FAC REVENUE | 2/1/2034 | 6.00 | 679,013 | 714,501 | |||||||
| 600,000 | ILLINOIS ST FIN AUTH REVENUE | 5/15/2027 | 6.13 | 600,000 | 601,512 | |||||||
| 500,000 | ILLINOIS ST FIN AUTH REVENUE | 5/15/2036 | 5.00 | 501,195 | 530,085 | |||||||
| 750,000 | ILLINOIS ST FIN AUTH REVENUE | 12/1/2037 | 5.00 | 764,321 | 808,665 | |||||||
| 500,000 | ILLINOIS ST FIN AUTH REVENUE | 5/1/2038 | 5.25 | 508,464 | 510,630 | |||||||
| 1,450,000 | ILLINOIS ST FIN AUTH REVENUE | 5/15/2038 | 5.13 | 1,410,763 | 1,320,414 | |||||||
| 1,000,000 | ILLINOIS ST FIN AUTH REVENUE | 5/15/2045 | 5.00 | 1,050,341 | 1,043,040 | |||||||
| 1,000,000 | ILLINOIS ST HSG DEV AUTH MF REVENUE | 7/1/2044 | 3.15 | 1,000,000 | 1,050,690 | |||||||
| 975,000 | ILLINOIS ST HSG DEV AUTH REVENUE | 4/1/2041 | 3.88 | 975,000 | 1,059,464 | |||||||
| 1,000,000 | ILLINOIS ST SALES TAX REVENUE | 6/15/2033 | 5.00 | 1,065,717 | 1,139,200 | |||||||
| 1,500,000 | ILLINOIS ST SPORTS FACS AUTH | 6/15/2031 | 5.25 | 1,558,171 | 1,670,400 | |||||||
| 500,000 | LAKE CNTY IL SCH DIST #33 | 12/1/2040 | 5.00 | 516,045 | 553,540 | |||||||
| 1,000,000 | MACON & MOULTRIE CNTYS IL CMNTY SCH DIST #3 MOUNT ZION | 12/1/2041 | 5.50 | 1,013,286 | 1,100,120 | |||||||
| 1,000,000 | MACON CNTY IL SCH DIST #61 | 1/1/2037 | 5.25 | 1,001,152 | 1,012,600 | |||||||
| 1,080,000 | MACOUPIN SANGAMON & MONTGOMERY CNTYS IL CMNTY SCH DIST #34 | 12/1/2037 | 4.25 | 1,100,149 | 1,157,987 | |||||||
| 1,000,000 | MALTA IL TAX INCR REVENUE(c) | 12/30/2025 | 5.75 | 1,000,000 | 320,000 | |||||||
| 500,000 | MET PIER & EXPOSITION AUTH IL REVENUE | 6/15/2057 | 5.00 | 517,723 | 543,075 | |||||||
| 500,000 | RICHTON PARK IL PUBLIC LIBRARY DIST | 12/15/2032 | 4.50 | 521,326 | 527,825 | |||||||
| 750,000 | ROCKFORD IL | 12/15/2030 | 4.00 | 750,943 | 751,425 | |||||||
| 375,000 | S WSTRN IL DEV AUTH(c) | 10/1/2022 | 7.00 | 375,000 | 217,500 | |||||||
| 620,000 | UPPER IL RIVER VLY DEV AUTH(b) | 12/1/2022 | 4.00 | 617,451 | 623,850 | |||||||
| 750,000 | UPPER IL RIVER VLY DEV AUTH(b) | 12/1/2037 | 5.25 | 766,742 | 773,415 | |||||||
| 465,000 | UPPER IL RIVER VLY DEV AUTH(b) | 1/1/2045 | 5.00 | 494,710 | 473,956 | |||||||
| 685,000 | WESTMONT IL PARK DIST(e) | 12/1/2031 | 0.00 | 356,310 | 409,623 | |||||||
| 685,000 | WESTMONT IL PARK DIST(e) | 12/1/2033 | 0.00 | 310,927 | 358,426 | |||||||
| 32,492,833 | 32,871,688 | 5.47% | ||||||||||
| Indiana | ||||||||||||
| 233,864 | CARMEL IN REVENUE(c) | 11/15/2022 | 6.00 | 237,266 | 2,339 | |||||||
| 331,723 | CARMEL IN REVENUE(c) | 11/15/2027 | 7.00 | 324,812 | 3,317 | |||||||
| 500,000 | DAVIESS CNTY IN HOSP ASSN LEASE RENTAL REVENUE | 1/15/2029 | 5.25 | 493,376 | 505,550 | |||||||
| 1,000,000 | EAST CHICAGO IN SAN DIST REVENUE | 7/15/2035 | 4.00 | 993,270 | 1,076,340 | |||||||
| 3,000,000 | INDIANA ST FIN AUTH REVENUE | 9/15/2030 | 6.50 | 3,010,951 | 3,176,820 | |||||||
| 35 | (Continued) |
CLEARWATER INVESTMENT TRUST
Schedule of Investments - Clearwater Tax-Exempt Bond Fund
September 30, 2020 (unaudited)
| Par/Shares | Security | Maturity date | Coupon rate | Cost | Fair value (a) | Percent of net assets | ||||||
| Indiana (Cont'd): | ||||||||||||
| 500,000 | INDIANA ST FIN AUTH REVENUE | 11/15/2031 | 5.50 | $494,658 | 513,140 | |||||||
| 1,000,000 | INDIANA ST FIN AUTH REVENUE | 11/15/2033 | 6.50 | 989,079 | 1,066,230 | |||||||
| 1,000,000 | INDIANA ST FIN AUTH REVENUE | 3/1/2041 | 5.00 | 1,013,636 | 1,067,590 | |||||||
| 500,000 | INDIANA ST FIN AUTH REVENUE | 11/15/2041 | 5.88 | 519,815 | 536,620 | |||||||
| 1,000,000 | INDIANA ST FIN AUTH REVENUE | 11/15/2041 | 6.00 | 988,109 | 1,078,750 | |||||||
| 1,000,000 | INDIANA ST FIN AUTH REVENUE | 11/15/2046 | 5.25 | 1,027,864 | 1,071,700 | |||||||
| 1,500,000 | INDIANA ST HSG & CMNTY DEV AUTH MF HSG REVENUE | 1/1/2036 | 5.75 | 1,500,000 | 1,524,660 | |||||||
| 600,000 | MERRILLVILLE IN ECON DEV REVENUE | 4/1/2036 | 5.75 | 600,000 | 613,302 | |||||||
| 615,000 | MUNSTER IN ECON DEV TAX INCR REVENUE | 7/15/2026 | 4.75 | 613,447 | 671,795 | |||||||
| 1,000,000 | SCHERERVILLE IN ECON DEV REVENUE | 1/15/2030 | 6.00 | 1,006,323 | 1,115,890 | |||||||
| 13,812,606 | 14,024,043 | 2.33% | ||||||||||
| Iowa | ||||||||||||
| 1,500,000 | IOWA ST FIN AUTH REVENUE | 5/15/2036 | 5.00 | 1,610,749 | 1,604,340 | |||||||
| 1,610,749 | 1,604,340 | 0.27% | ||||||||||
| Kansas | ||||||||||||
| 1,000,000 | FRANKLIN CNTY KS UNIF SCH DIST #290 | 9/1/2039 | 4.75 | 1,030,443 | 1,209,830 | |||||||
| 700,000 | WICHITA KS HLTH CARE FACS REVENUE | 12/1/2036 | 5.25 | 710,663 | 696,927 | |||||||
| 935,000 | WYANDOTTE CNTY KS KANSAS CITY UNIF GOVT SPL OBLG REVENUE | 9/1/2032 | 5.75 | 929,402 | 847,110 | |||||||
| 2,670,508 | 2,753,867 | 0.46% | ||||||||||
| Kentucky | ||||||||||||
| 720,000 | KENTUCKY ST HSG CORP HSG REVENUE | 7/1/2028 | 3.75 | 712,829 | 758,419 | |||||||
| 712,829 | 758,419 | 0.13% | ||||||||||
| Louisiana | ||||||||||||
| 1,000,000 | LOUISIANA ST ENERGY & PWR AUTH PWR PROJ REVENUE | 6/1/2038 | 5.25 | 1,007,387 | 1,107,000 | |||||||
| 650,000 | LOUISIANA ST LOCAL GOVT ENVRNMNTL FACS & CMNTY DEV AUTH | 11/15/2025 | 5.25 | 681,901 | 669,682 | |||||||
| 1,000,000 | LOUISIANA ST LOCAL GOVT ENVRNMNTL FACS & CMNTY DEV AUTH | 11/15/2030 | 6.00 | 1,010,905 | 1,051,980 | |||||||
| 700,000 | LOUISIANA ST LOCAL GOVT ENVRNMNTL FACS & CMNTY DEV AUTH REVE(b) | 11/1/2037 | 5.65 | 700,000 | 776,503 | |||||||
| 1,000,000 | LOUISIANA ST LOCAL GOVT ENVRNMNTL FACS & CMNTY DEV AUTH REVE(b) | 7/1/2039 | 5.00 | 1,062,545 | 985,570 | |||||||
| 600,000 | LOUISIANA ST LOCAL GOVT ENVRNMNTL FACS & CMNTY DEV AUTH REVENUE(b) | 11/1/2039 | 5.50 | 600,000 | 644,010 | |||||||
| 1,000,000 | LOUISIANA ST LOCAL GOVT ENVRNMNTL FACS & CMNTY DEV AUTH REVENUE(b) | 11/1/2044 | 4.00 | 1,000,000 | 999,970 | |||||||
| 750,000 | LOUISIANA ST LOCAL GOVT ENVRNMNTL FACS & CMNTY DEV AUTH REVENUE(b) | 11/1/2044 | 4.40 | 750,000 | 770,520 | |||||||
| 500,000 | LOUISIANA ST PUBLIC FACS AUTH HOSP REVENUE | 7/1/2035 | 5.00 | 526,274 | 568,906 | |||||||
| 750,000 | LOUISIANA ST PUBLIC FACS AUTH REVENUE | 5/1/2031 | 6.50 | 747,679 | 776,272 | |||||||
| 385,000 | LOUISIANA ST PUBLIC FACS AUTH REVENUE (Floating, ICE LIBOR USD 3M + 0.70%)(f) | 2/15/2036 | 0.89 | 385,000 | 376,557 | |||||||
| 750,000 | SAINT TAMMANY LA PUBLIC TRUST FING AUTH | 11/15/2037 | 5.25 | 756,880 | 771,750 | |||||||
| 9,228,571 | 9,498,720 | 1.58% | ||||||||||
| Maine | ||||||||||||
| 1,000,000 | MAINE ST HSG AUTH MTGE PURCHASE | 11/15/2035 | 4.00 | 1,000,000 | 1,073,170 | |||||||
| 1,000,000 | MAINE ST HSG AUTH MTGE PURCHASE | 11/15/2036 | 3.90 | 1,000,000 | 1,087,130 | |||||||
| 1,500,000 | MAINE ST HSG AUTH MTGE PURCHASE | 11/15/2040 | 3.85 | 1,500,000 | 1,589,940 | |||||||
| 500,000 | MAINE ST HSG AUTH MTGE PURCHASE | 11/15/2042 | 4.05 | 500,000 | 540,430 | |||||||
| 115,000 | MAINE ST HSG AUTH MTGE REVENUE | 11/15/2037 | 4.50 | 115,000 | 120,139 | |||||||
| 4,115,000 | 4,410,809 | 0.73% | ||||||||||
| 36 | (Continued) |
CLEARWATER INVESTMENT TRUST
Schedule of Investments - Clearwater Tax-Exempt Bond Fund
September 30, 2020 (unaudited)
| Par/Shares | Security | Maturity date | Coupon rate | Cost | Fair value (a) | Percent of net assets | ||||||
| Maryland | ||||||||||||
| 500,000 | MARYLAND ST CMNTY DEV ADMIN DEPT HSG & CMNTY DEV | 7/1/2031 | 4.50 | $500,000 | 512,465 | |||||||
| 1,250,000 | MARYLAND ST HLTH & HGR EDUCTNL FACS AUTH REVENUE | 7/1/2048 | 4.00 | 1,222,081 | 1,384,475 | |||||||
| 500,000 | MONTGOMERY CNTY MD HSG OPPORTUNITIES COMMISSION MF REVENUE | 7/1/2037 | 5.13 | 500,000 | 504,240 | |||||||
| 890,000 | MONTGOMERY CNTY MD HSG OPPORTUNITIES COMMISSION SF MTGE REVENUE | 7/1/2038 | 4.00 | 890,000 | 908,014 | |||||||
| 3,112,081 | 3,309,194 | 0.55% | ||||||||||
| Massachusetts | ||||||||||||
| 700,000 | MASSACHUSETTS ST DEV FIN AGY REVENUE(b) | 10/1/2047 | 5.00 | 743,066 | 747,481 | |||||||
| 1,500,000 | MASSACHUSETTS ST DEV FIN AGY REVENUE | 6/1/2049 | 4.00 | 1,516,430 | 1,609,830 | |||||||
| 250,000 | MASSACHUSETTS ST EDUCTNL FING AUTH | 1/1/2028 | 5.25 | 250,000 | 252,413 | |||||||
| 1,500,000 | MASSACHUSETTS ST EDUCTNL FING AUTH | 7/1/2034 | 3.63 | 1,515,792 | 1,544,445 | |||||||
| 700,000 | MASSACHUSETTS ST HSG FIN AGY | 12/1/2033 | 5.00 | 700,000 | 754,411 | |||||||
| 700,000 | MASSACHUSETTS ST HSG FIN AGY | 12/1/2038 | 5.15 | 700,000 | 751,618 | |||||||
| 1,000,000 | MASSACHUSETTS ST HSG FIN AGY | 12/1/2043 | 5.00 | 1,000,000 | 1,064,910 | |||||||
| 2,735,000 | MASSACHUSETTS ST HSG FIN AGY HSG REVENUE | 12/1/2043 | 4.00 | 2,735,000 | 2,812,291 | |||||||
| 1,875,000 | MASSACHUSETTS ST HSG FIN AGY HSG REVENUE | 6/1/2046 | 4.20 | 1,875,000 | 2,033,400 | |||||||
| 500,000 | ROWLEY MA | 5/1/2027 | 4.00 | 500,000 | 501,365 | |||||||
| 11,535,288 | 12,072,164 | 2.01% | ||||||||||
| Michigan | ||||||||||||
| 275,000 | CHANDLER PARK ACADEMY MI PUBLIC SCH ACADEMY REVENUE | 11/1/2022 | 5.00 | 256,956 | 275,591 | |||||||
| 500,000 | KALAMAZOO MI ECON DEV CORP | 5/15/2043 | 5.00 | 531,775 | 531,770 | |||||||
| 750,000 | MICHIGAN ST FIN AUTH REVENUE | 11/15/2035 | 5.25 | 746,091 | 784,148 | |||||||
| 500,000 | MICHIGAN ST FIN AUTH REVENUE | 11/15/2042 | 5.00 | 519,885 | 530,020 | |||||||
| 1,850,000 | MICHIGAN ST HSG DEV AUTH | 10/1/2035 | 4.10 | 1,850,000 | 1,996,501 | |||||||
| 860,000 | MICHIGAN ST HSG DEV AUTH | 12/1/2036 | 3.70 | 860,000 | 925,128 | |||||||
| 600,000 | MICHIGAN ST HSG DEV AUTH | 10/1/2042 | 3.75 | 600,000 | 643,770 | |||||||
| 1,650,000 | MICHIGAN ST HSG DEV AUTH | 10/1/2043 | 4.00 | 1,650,000 | 1,820,181 | |||||||
| 1,000,000 | MICHIGAN ST HSG DEV AUTH | 10/1/2054 | 3.50 | 1,000,000 | 1,065,330 | |||||||
| 635,000 | MICHIGAN ST HSG DEV AUTH SF MTGE REVENUE | 12/1/2038 | 4.13 | 635,000 | 668,369 | |||||||
| 1,000,000 | MICHIGAN ST HSG DEV AUTH SF MTGE REVENUE | 6/1/2049 | 4.00 | 1,003,241 | 1,076,340 | |||||||
| 1,000,000 | MICHIGAN ST HSG DEV AUTH SF MTGE REVENUE | 6/1/2050 | 3.15 | 1,000,000 | 1,036,720 | |||||||
| 460,000 | MICHIGAN ST PUBLIC EDUCTNL FACS AUTH | 11/1/2028 | 6.35 | 460,000 | 461,044 | |||||||
| 280,000 | OAKLAND CNTY MI ECON DEV CORP LTD OBLG REVENUE | 12/1/2020 | 6.50 | 279,958 | 280,078 | |||||||
| 750,000 | TAYLOR MI BROWNFIELD REDEV AUTH | 5/1/2032 | 5.00 | 772,277 | 858,945 | |||||||
| 410,000 | UNIVERSAL ACADEMY MI PUBLIC SCH ACADEMY REVENUE | 12/1/2023 | 6.50 | 407,114 | 427,614 | |||||||
| 12,572,297 | 13,381,549 | 2.23% | ||||||||||
| Minnesota | ||||||||||||
| 1,000,000 | APPLE VLY MN SENIOR LIVING REVENUE | 1/1/2047 | 5.00 | 978,528 | 638,100 | |||||||
| 1,000,000 | APPLE VY MN SENIOR HSG REVENUE | 9/1/2058 | 5.00 | 980,000 | 1,023,550 | |||||||
| 2,500,000 | MINNESOTA ST OFFICE OF HGR EDU REVENUE | 11/1/2038 | 2.65 | 2,366,416 | 2,469,275 | |||||||
| 4,324,944 | 4,130,925 | 0.69% | ||||||||||
| Mississippi | ||||||||||||
| 1,000,000 | MISSISSIPPI ST DEV BANK SPL OBLG(b) | 11/1/2039 | 4.55 | 1,000,000 | 1,036,930 | |||||||
| 1,000,000 | 1,036,930 | 0.17% | ||||||||||
| Missouri | ||||||||||||
| 380,000 | KANSAS CITY MO INDL DEV AUTH | 9/1/2023 | 5.45 | 380,000 | 380,072 | |||||||
| 37 | (Continued) |
CLEARWATER INVESTMENT TRUST
Schedule of Investments - Clearwater Tax-Exempt Bond Fund
September 30, 2020 (unaudited)
| Par/Shares | Security | Maturity date | Coupon rate | Cost | Fair value (a) | Percent of net assets | ||||||
| Missouri (Cont'd): | ||||||||||||
| 1,300,000 | KANSAS CITY MO INDL DEV AUTH SENIOR LIVING FACS REVENUE(b)(c)(g) | 11/15/2036 | 5.75 | $1,300,000 | 455,650 | |||||||
| 1,000,000 | KIRKWOOD MO INDL DEV AUTH RETMNT CMNTY REVENUE | 5/15/2037 | 5.25 | 1,016,716 | 1,067,820 | |||||||
| 1,000,000 | MISSOURI ST HLTH & EDUCTNL FACS AUTH | 2/1/2042 | 5.00 | 908,413 | 1,102,180 | |||||||
| 2,000,000 | MISSOURI ST HLTH & EDUCTNL FACS AUTH | 2/1/2048 | 4.00 | 2,077,521 | 2,045,480 | |||||||
| 885,000 | MISSOURI ST HSG DEV COMMISSION SF MTGE REVENUE | 11/1/2048 | 3.80 | 885,000 | 955,075 | |||||||
| 485,000 | MISSOURI ST HSG DEV COMMISSION SF MTGE REVENUE | 11/1/2049 | 3.35 | 485,000 | 509,890 | |||||||
| 750,000 | SAINT LOUIS CNTY MO INDL DEV AUTH SENIOR LIVING FACS | 9/1/2042 | 5.00 | 756,127 | 763,800 | |||||||
| 7,808,777 | 7,279,967 | 1.21% | ||||||||||
| Montana | ||||||||||||
| 885,000 | MONTANA ST BRD OF HSG | 12/1/2038 | 3.75 | 885,000 | 918,780 | |||||||
| 560,000 | MONTANA ST BRD OF HSG | 12/1/2038 | 5.20 | 560,000 | 602,017 | |||||||
| 995,000 | MONTANA ST BRD OF HSG | 6/1/2045 | 4.00 | 995,000 | 1,097,624 | |||||||
| 895,000 | MONTANA ST BRD OF HSG SF MTGE | 12/1/2037 | 3.95 | 895,000 | 982,764 | |||||||
| 800,000 | MONTANA ST BRD OF HSG SF MTGE | 12/1/2038 | 4.00 | 801,677 | 860,536 | |||||||
| 4,136,677 | 4,461,721 | 0.74% | ||||||||||
| Nebraska | ||||||||||||
| 160,000 | MEAD NE TAX INCR REVENUE(c) | 7/1/2012 | 5.13 | 160,000 | 6,640 | |||||||
| 765,000 | NEBRASKA ST INVESTMENT FIN AUTH SF HSG REVENUE | 9/1/2042 | 3.05 | 765,000 | 800,756 | |||||||
| 925,000 | 807,396 | 0.14% | ||||||||||
| Nevada | ||||||||||||
| 865,000 | NEVADA ST HSG DIV SF MTGE REVENUE | 10/1/2039 | 3.85 | 865,000 | 907,117 | |||||||
| 1,000,000 | NEVADA ST HSG DIV SF MTGE REVENUE | 10/1/2049 | 3.35 | 1,000,000 | 1,054,620 | |||||||
| 515,000 | NORTH LAS VEGAS NV LOCAL IMPT(b) | 12/1/2027 | 4.00 | 504,933 | 536,733 | |||||||
| 515,000 | NORTH LAS VEGAS NV LOCAL IMPT(b) | 12/1/2037 | 5.00 | 515,918 | 551,215 | |||||||
| 2,885,851 | 3,049,685 | 0.51% | ||||||||||
| New Hampshire | ||||||||||||
| 1,000,000 | NEW HAMPSHIRE ST HSG FIN AUTH MF REVENUE | 7/1/2031 | 5.20 | 1,000,000 | 1,024,280 | |||||||
| 1,500,000 | NEW HAMPSHIRE ST HSG FIN AUTH MF REVENUE | 7/1/2052 | 4.00 | 1,500,000 | 1,623,225 | |||||||
| 145,000 | NEW HAMPSHIRE ST HSG FIN AUTH SF REVENUE | 7/1/2034 | 5.38 | 145,000 | 145,525 | |||||||
| 2,645,000 | 2,793,030 | 0.47% | ||||||||||
| New Jersey | ||||||||||||
| 750,000 | NEW JERSEY ST ECON DEV AUTH | 6/15/2037 | 5.00 | 776,492 | 852,608 | |||||||
| 500,000 | NEW JERSEY ST ECON DEV AUTH | 6/15/2042 | 5.00 | 533,603 | 555,400 | |||||||
| 750,000 | NEW JERSEY ST ECON DEV AUTH REVENUE | 7/15/2047 | 5.00 | 792,790 | 822,435 | |||||||
| 2,500,000 | NEW JERSEY ST HGR EDU ASSISTANCE AUTH STUDENT LOAN REVENUE | 12/1/2039 | 3.50 | 2,493,059 | 2,513,525 | |||||||
| 1,000,000 | NEW JERSEY ST HGR EDU ASSISTANCE AUTH STUDENT LOAN REVENUE | 12/1/2050 | 4.25 | 988,253 | 1,008,760 | |||||||
| 1,000,000 | NEW JERSEY ST HSG & MTGE FIN AGY MF CONDUIT REVENUE | 1/1/2030 | 3.60 | 1,000,000 | 1,049,530 | |||||||
| 480,000 | NEW JERSEY ST HSG & MTGE FIN AGY REVENUE | 10/1/2030 | 4.50 | 480,000 | 500,011 | |||||||
| 3,270,000 | NEW JERSEY ST HSG & MTGE FIN AGY REVENUE | 10/1/2035 | 3.75 | 3,270,000 | 3,647,031 | |||||||
| 955,000 | NEW JERSEY ST HSG & MTGE FIN AGY REVENUE | 4/1/2049 | 4.00 | 957,448 | 1,020,112 | |||||||
| 500,000 | NEW JERSEY ST TRANSPRTN TRUST FUND AUTH | 12/15/2039 | 4.00 | 527,180 | 525,140 | |||||||
| 500,000 | NEW JERSEY ST TRANSPRTN TRUST FUND AUTH | 6/15/2041 | 5.25 | 506,848 | 548,235 | |||||||
| 700,000 | TOBACCO SETTLEMENT FING CORP NJ | 6/1/2046 | 5.00 | 704,392 | 791,098 | |||||||
| 13,030,065 | 13,833,885 | 2.30% | ||||||||||
| 38 | (Continued) |
CLEARWATER INVESTMENT TRUST
Schedule of Investments - Clearwater Tax-Exempt Bond Fund
September 30, 2020 (unaudited)
| Par/Shares | Security | Maturity date | Coupon rate | Cost | Fair value (a) | Percent of net assets | ||||||
| New Mexico | ||||||||||||
| 575,000 | NEW MEXICO ST MTGE FIN AUTH | 9/1/2042 | 3.90 | $575,000 | 586,649 | |||||||
| 820,000 | NEW MEXICO ST MTGE FIN AUTH | 9/1/2042 | 4.13 | 820,000 | 839,163 | |||||||
| 1,530,000 | NEW MEXICO ST MTGE FIN AUTH | 7/1/2043 | 3.85 | 1,530,000 | 1,662,008 | |||||||
| 795,000 | NEW MEXICO ST MTGE FIN AUTH | 9/1/2046 | 3.80 | 795,000 | 834,774 | |||||||
| 715,000 | NEW MEXICO ST MTGE FIN AUTH | 7/1/2048 | 3.90 | 715,000 | 771,485 | |||||||
| 995,000 | NEW MEXICO ST MTGE FIN AUTH | 7/1/2048 | 4.00 | 996,824 | 1,082,003 | |||||||
| 990,000 | NEW MEXICO ST MTGE FIN AUTH | 7/1/2049 | 3.35 | 990,000 | 1,045,975 | |||||||
| 955,000 | NEW MEXICO ST MTGE FIN AUTH | 7/1/2049 | 4.00 | 955,000 | 1,040,253 | |||||||
| 550,000 | NEW MEXICO ST MTGE FIN AUTH | 7/1/2050 | 3.00 | 551,296 | 572,462 | |||||||
| 7,928,120 | 8,434,772 | 1.40% | ||||||||||
| New York | ||||||||||||
| 1,000,000 | BUFFALO & ERIE CNTY NY INDL LAND DEV CORP REVENUE | 11/1/2040 | 4.00 | 1,042,152 | 1,039,020 | |||||||
| 750,000 | HEMPSTEAD TOWN NY LOCAL DEV CORP REVENUE | 9/1/2038 | 5.00 | 752,603 | 802,155 | |||||||
| 750,000 | MONROE CNTY NY INDL DEV CORP REVENUE | 1/1/2030 | 4.00 | 670,769 | 751,012 | |||||||
| 1,250,000 | MONROE CNTY NY INDL DEV CORP REVENUE | 1/1/2050 | 5.00 | 1,335,634 | 1,283,912 | |||||||
| 1,000,000 | NEW YORK CITY NY HSG DEV CORP MF HSG REVENUE | 11/1/2037 | 3.80 | 1,000,000 | 1,022,610 | |||||||
| 1,000,000 | NEW YORK CITY NY HSG DEV CORP MF HSG REVENUE | 11/1/2039 | 4.30 | 1,000,000 | 1,050,670 | |||||||
| 600,000 | NEW YORK CITY NY HSG DEV CORP MF HSG REVENUE | 11/1/2042 | 3.85 | 601,416 | 643,668 | |||||||
| 3,000,000 | NEW YORK CITY NY HSG DEV CORP MF HSG REVENUE | 5/1/2045 | 3.90 | 2,838,750 | 3,121,050 | |||||||
| 1,000,000 | NEW YORK CITY NY HSG DEV CORP MF HSG REVENUE | 11/1/2047 | 3.65 | 1,000,000 | 1,043,860 | |||||||
| 1,000,000 | NEW YORK CITY NY HSG DEV CORP MF HSG REVENUE | 11/1/2049 | 3.95 | 1,000,000 | 1,074,650 | |||||||
| 1,000,000 | NEW YORK CITY NY HSG DEV CORP MF HSG REVENUE | 11/1/2055 | 3.00 | 1,000,000 | 1,020,410 | |||||||
| 2,000,000 | NEW YORK CITY NY MUNI WTR FIN AUTH WTR & SWR SYS REVENUE | 6/15/2038 | 5.00 | 2,078,309 | 2,233,900 | |||||||
| 1,000,000 | NEW YORK ST HSG FIN AGY | 11/1/2041 | 4.10 | 1,000,000 | 1,085,430 | |||||||
| 1,000,000 | NEW YORK ST HSG FIN AGY | 11/1/2042 | 4.00 | 1,000,000 | 1,078,350 | |||||||
| 1,000,000 | NEW YORK ST HSG FIN AGY | 11/1/2048 | 3.95 | 1,000,000 | 1,075,540 | |||||||
| 1,500,000 | NEW YORK ST HSG FIN AGY REVENUE | 11/1/2034 | 3.65 | 1,500,000 | 1,591,845 | |||||||
| 500,000 | NEW YORK ST HSG FIN AGY REVENUE | 11/1/2045 | 5.10 | 500,000 | 530,710 | |||||||
| 4,000,000 | NEW YORK ST HSG FIN AGY REVENUE | 5/1/2048 | 4.10 | 4,000,000 | 4,087,080 | |||||||
| 930,000 | NEW YORK ST MTGE AGY HOMEOWNER MTGE REVENUE | 10/1/2036 | 3.90 | 930,000 | 1,007,404 | |||||||
| 435,000 | NEW YORK ST MTGE AGY HOMEOWNER MTGE REVENUE | 10/1/2042 | 3.75 | 435,000 | 444,005 | |||||||
| 1,000,000 | NEW YORK ST MTGE AGY HOMEOWNER MTGE REVENUE | 10/1/2043 | 4.20 | 1,000,000 | 1,106,450 | |||||||
| 1,490,000 | NEW YORK ST MTGE AGY HOMEOWNER MTGE REVENUE | 10/1/2048 | 3.80 | 1,490,000 | 1,594,628 | |||||||
| 2,000,000 | NEW YORK ST MTGE AGY HOMEOWNER MTGE REVENUE | 10/1/2049 | 2.95 | 2,000,000 | 2,095,180 | |||||||
| 1,500,000 | NEW YORK ST MTGE AGY HOMEOWNER MTGE REVENUE | 4/1/2050 | 2.55 | 1,500,000 | 1,519,950 | |||||||
| 1,250,000 | NEW YORK ST TRANSPRTN DEV CORP SPL FAC REVENUE | 10/1/2030 | 4.00 | 1,244,868 | 1,276,900 | |||||||
| 550,000 | WESTCHESTER CNTY NY LOCAL DEV CORP REVENUE | 1/1/2034 | 5.00 | 560,881 | 567,650 | |||||||
| 32,480,382 | 34,148,039 | 5.68% | ||||||||||
| North Carolina | ||||||||||||
| 1,750,000 | MECKLENBURG CNTY NC MF HSG REVENUE | 1/1/2036 | 5.38 | 1,750,000 | 1,768,147 | |||||||
| 500,000 | NORTH CAROLINA ST EDU ASSISTANCE AUTH | 6/1/2039 | 3.13 | 494,745 | 488,980 | |||||||
| 975,000 | NORTH CAROLINA ST HSG FIN AGY HOME OWNERSHIP REVENUE | 1/1/2041 | 3.95 | 985,760 | 1,064,291 | |||||||
| 940,000 | NORTH CAROLINA ST HSG FIN AGY HOME OWNERSHIP REVENUE | 1/1/2048 | 4.00 | 940,000 | 1,023,416 | |||||||
| 1,000,000 | NORTH CAROLINA ST MED CARE COMMISSION HLTH CARE FACS REVENUE | 11/1/2037 | 5.00 | 1,084,396 | 1,129,360 | |||||||
| 39 | (Continued) |
CLEARWATER INVESTMENT TRUST
Schedule of Investments - Clearwater Tax-Exempt Bond Fund
September 30, 2020 (unaudited)
| Par/Shares | Security | Maturity date | Coupon rate | Cost | Fair value (a) | Percent of net assets | ||||||
| North Carolina (Cont'd): | ||||||||||||
| 600,000 | NORTH CAROLINA ST MED CARE COMMISSION RETMNT FACS REVENUE | 10/1/2038 | 5.00 | $596,447 | 643,692 | |||||||
| 5,851,348 | 6,117,886 | 1.02% | ||||||||||
| North Dakota | ||||||||||||
| 1,110,000 | NORTH DAKOTA ST HSG FIN AGY | 1/1/2044 | 3.05 | 1,110,000 | 1,160,416 | |||||||
| 1,110,000 | 1,160,416 | 0.19% | ||||||||||
| Ohio | ||||||||||||
| 750,000 | BUTLER CNTY OH PORT AUTH PUBLIC INFRASTRUCTURE REVENUE | 12/1/2041 | 5.00 | 753,708 | 753,443 | |||||||
| 1,500,000 | COLUMBUS-FRANKLIN CNTY OH FIN AUTH DEV REVENUE | 5/15/2049 | 4.00 | 1,595,571 | 1,639,215 | |||||||
| 500,000 | COVENTRY OH LOCAL SCH DIST | 11/1/2037 | 5.25 | 501,301 | 525,555 | |||||||
| 1,000,000 | DAYTON-MONTGOMERY CNTY OH PORT AUTH PROJ REVENUE | 1/15/2040 | 7.00 | 1,000,000 | 846,050 | |||||||
| 2,000,000 | FRANKLIN CNTY OH HLTH CARE FACS REVENUE | 7/1/2045 | 4.00 | 2,043,700 | 2,042,060 | |||||||
| 750,000 | LAKE CNTY OH PORT & ECON DEV AUTH LEASE REVENUE(b)(g) | 12/1/2037 | 6.50 | 750,000 | 264,045 | |||||||
| 500,000 | LUCAS CNTY OH HLTH CARE FACS REVENUE | 8/15/2030 | 5.50 | 494,350 | 512,675 | |||||||
| 1,500,000 | LUCAS MET HSG AUTH OH COPS | 11/1/2036 | 5.00 | 1,547,456 | 1,672,620 | |||||||
| 2,000,000 | OHIO ST HGR EDUCTNL FAC COMMISSION | 11/1/2049 | 4.00 | 2,039,703 | 1,844,620 | |||||||
| 790,000 | OHIO ST HSG FIN AGY RSDL MTGE REVENUE | 9/1/2039 | 3.35 | 712,512 | 837,376 | |||||||
| 1,260,000 | OHIO ST HSG FIN AGY RSDL MTGE REVENUE | 9/1/2048 | 4.00 | 1,260,000 | 1,360,447 | |||||||
| 1,365,000 | OHIO ST HSG FIN AGY RSDL MTGE REVENUE | 3/1/2049 | 4.00 | 1,365,000 | 1,467,634 | |||||||
| 955,000 | OHIO ST HSG FIN AGY RSDL MTGE REVENUE | 9/1/2049 | 3.35 | 955,000 | 1,012,405 | |||||||
| 1,000,000 | REVERE OH LOCAL SCH DIST | 12/1/2043 | 4.00 | 1,041,017 | 1,044,520 | |||||||
| 16,059,318 | 15,822,665 | 2.63% | ||||||||||
| Oklahoma | ||||||||||||
| 970,000 | FORT SILL APACHE TRIBE OK ECON DEV AUTH GAMING ENTERPRISE REVENUE(b) | 8/25/2026 | 8.50 | 970,000 | 1,040,015 | |||||||
| 2,000,000 | OKLAHOMA ST DEV FIN AUTH | 8/1/2049 | 5.00 | 2,219,734 | 2,194,900 | |||||||
| 3,189,734 | 3,234,915 | 0.54% | ||||||||||
| Oregon | ||||||||||||
| 1,000,000 | CLACKAMAS CNTY OR HOSP FAC AUTH REVENUE | 11/15/2047 | 5.00 | 970,850 | 1,047,490 | |||||||
| 500,000 | CLACKAMAS CNTY OR HOSP FAC AUTH REVENUE | 11/15/2055 | 5.38 | 502,169 | 531,380 | |||||||
| 1,000,000 | MEDFORD OR HOSP FACS AUTH REVENUE | 10/1/2042 | 5.00 | 1,018,090 | 1,052,660 | |||||||
| 500,000 | MULTNOMAH CNTY OR HOSP FACS AUTH REVENUE | 12/1/2029 | 5.00 | 510,273 | 520,885 | |||||||
| 2,000,000 | OREGON ST | 12/1/2039 | 3.90 | 2,000,000 | 2,105,200 | |||||||
| 460,000 | OREGON ST HSG & CMNTY SVCS DEPT MTGE REVENUE | 7/1/2035 | 3.75 | 460,000 | 507,095 | |||||||
| 745,000 | OREGON ST HSG & CMNTY SVCS DEPT MTGE REVENUE | 7/1/2038 | 4.00 | 745,000 | 779,434 | |||||||
| 1,245,000 | OREGON ST HSG & CMNTY SVCS DEPT MTGE REVENUE | 7/1/2048 | 3.75 | 1,245,000 | 1,329,647 | |||||||
| 2,000,000 | POLK CNTY OR HOSP FAC AUTH REVENUE | 7/1/2024 | 4.00 | 2,000,000 | 2,004,700 | |||||||
| 1,500,000 | POLK CNTY OR HOSP FAC AUTH REVENUE | 7/1/2035 | 5.13 | 1,526,287 | 1,529,925 | |||||||
| 1,000,000 | POLK CNTY OR HOSP FAC AUTH REVENUE | 7/1/2055 | 5.13 | 964,640 | 1,005,300 | |||||||
| 11,942,309 | 12,413,716 | 2.07% | ||||||||||
| Pennsylvania | ||||||||||||
| 480,000 | ALLEGHENY CNTY PA INDL DEV AUTH CHRT SCH REVENUE | 8/15/2026 | 5.90 | 480,000 | 481,464 | |||||||
| 380,000 | BUTLER CNTY PA GEN AUTH REVENUE (Floating, ICE LIBOR USD 3M + 0.70%)(f) | 10/1/2034 | 0.85 | 380,000 | 363,329 | |||||||
| 40 | (Continued) |
CLEARWATER INVESTMENT TRUST
Schedule of Investments - Clearwater Tax-Exempt Bond Fund
September 30, 2020 (unaudited)
| Par/Shares | Security | Maturity date | Coupon rate | Cost | Fair value (a) | Percent of net assets | ||||||
| Pennsylvania (Cont'd): | ||||||||||||
| 1,000,000 | CENTRL BRADFORD PROGRESS AUTH PA | 12/1/2031 | 5.50 | $1,005,586 | 1,060,250 | |||||||
| 650,000 | CMWLTH FING AUTH PA TOBACCO MASTER SETTLEMENT PAYMENT REVENUE | 6/1/2039 | 4.00 | 647,017 | 737,477 | |||||||
| 600,000 | DAUPHIN CNTY PA GEN AUTH UNIV REVENUE(b) | 10/15/2022 | 4.00 | 599,379 | 593,184 | |||||||
| 500,000 | MONTGOMERY CNTY PA INDL DEV AUTH | 11/15/2033 | 5.00 | 522,759 | 581,290 | |||||||
| 1,250,000 | MONTGOMERY CNTY PA INDL DEV AUTH | 11/15/2036 | 5.00 | 1,263,118 | 1,439,287 | |||||||
| 1,700,000 | PENNSYLVANIA HGR EDU ASSISTANCE AGY LOAN REVENUE | 6/1/2047 | 3.00 | 1,700,000 | 1,538,993 | |||||||
| 1,000,000 | PENNSYLVANIA ST ECON DEV FING AUTH UPMC REVENUE | 4/15/2045 | 4.00 | 1,038,764 | 1,123,070 | |||||||
| 500,000 | PENNSYLVANIA ST HGR EDUCTNL FACS AUTH REVENUE (Floating, ICE LIBOR USD 3M + 0.65%)(f) | 7/1/2039 | 0.80 | 500,000 | 453,940 | |||||||
| 1,000,000 | PENNSYLVANIA ST HSG FIN AGY SF MTGE REVENUE | 10/1/2038 | 3.95 | 1,000,000 | 1,000,000 | |||||||
| 440,000 | PENNSYLVANIA ST HSG FIN AGY SF MTGE REVENUE | 10/1/2038 | 4.00 | 440,000 | 440,000 | |||||||
| 1,835,000 | PENNSYLVANIA ST HSG FIN AGY SF MTGE REVENUE | 10/1/2042 | 3.65 | 1,835,000 | 1,927,264 | |||||||
| 535,000 | PENNSYLVANIA ST HSG FIN AGY SF MTGE REVENUE | 10/1/2042 | 3.70 | 535,000 | 540,045 | |||||||
| 495,000 | PENNSYLVANIA ST HSG FIN AGY SF MTGE REVENUE | 10/1/2047 | 4.00 | 495,000 | 529,383 | |||||||
| 1,000,000 | PENNSYLVANIA ST HSG FIN AGY SF MTGE REVENUE | 10/1/2049 | 3.40 | 1,000,000 | 1,050,080 | |||||||
| 1,500,000 | PENNSYLVANIA ST TURNPIKE COMMISSION TURNPIKE REVENUE (Step to 4.60% on 12/1/2021)(d) | 12/1/2037 | 0.00 | 1,418,959 | 1,661,340 | |||||||
| 200,000 | PHILADELPHIA PA AUTH FOR INDL DEV REVENUES | 6/15/2023 | 6.13 | 200,000 | 211,480 | |||||||
| 750,000 | PHILADELPHIA PA AUTH FOR INDL DEV REVENUES | 8/1/2036 | 5.63 | 740,292 | 820,935 | |||||||
| 750,000 | PHILADELPHIA PA AUTH FOR INDL DEV REVENUES | 6/15/2049 | 5.00 | 778,189 | 773,190 | |||||||
| 16,579,063 | 17,326,001 | 2.88% | ||||||||||
| Puerto Rico | ||||||||||||
| 1,500,000 | PUERTO RICO CMWLTH | 7/1/2035 | 5.00 | 1,500,000 | 1,563,840 | |||||||
| 1,500,000 | 1,563,840 | 0.26% | ||||||||||
| Rhode Island | ||||||||||||
| 665,000 | RHODE ISLAND ST HSG & MTGE FIN CORP | 10/1/2028 | 4.00 | 662,728 | 673,326 | |||||||
| 750,000 | RHODE ISLAND ST HSG & MTGE FIN CORP | 10/1/2037 | 3.90 | 750,000 | 776,415 | |||||||
| 1,250,000 | RHODE ISLAND ST STUDENT LOAN AUTH STUDENT LOAN REVENUE | 12/1/2037 | 3.63 | 1,238,158 | 1,256,037 | |||||||
| 2,650,886 | 2,705,778 | 0.45% | ||||||||||
| South Carolina | ||||||||||||
| 650,000 | BERKELEY CNTY SC ASSMNT REVENUE | 11/1/2040 | 4.25 | 647,372 | 655,688 | |||||||
| 145,000 | SOUTH CAROLINA ST EDU ASSISTANCE AUTH | 10/1/2029 | 5.10 | 143,964 | 145,087 | |||||||
| 1,250,000 | SOUTH CAROLINA ST HSG FIN & DEV AUTH MTGE REVENUE | 7/1/2045 | 3.05 | 1,250,000 | 1,307,312 | |||||||
| 665,000 | SOUTH CAROLINA ST JOBS-ECON DEV AUTH ECON DEV REVENUE | 4/1/2054 | 4.00 | 688,535 | 662,566 | |||||||
| 1,250,000 | SOUTH CAROLINA ST JOBS-ECON DEV AUTH HOSP FACS REVENUE | 12/1/2044 | 4.00 | 1,298,757 | 1,421,625 | |||||||
| 1,000,000 | SOUTH CAROLINA ST PUBLIC SVC AUTH REVENUE | 12/1/2038 | 5.00 | 1,032,047 | 1,115,590 | |||||||
| 1,400,000 | SOUTH CAROLINA ST PUBLIC SVC AUTH REVENUE | 12/1/2043 | 5.75 | 1,434,466 | 1,642,508 | |||||||
| 6,495,141 | 6,950,376 | 1.16% | ||||||||||
| 41 | (Continued) |
CLEARWATER INVESTMENT TRUST
Schedule of Investments - Clearwater Tax-Exempt Bond Fund
September 30, 2020 (unaudited)
| Par/Shares | Security | Maturity date | Coupon rate | Cost | Fair value (a) | Percent of net assets | ||||||
| South Dakota | ||||||||||||
| 500,000 | SOUTH DAKOTA ST HLTH & EDUCTNL FACS AUTH | 9/1/2032 | 5.00 | $499,500 | 501,090 | |||||||
| 499,500 | 501,090 | 0.08% | ||||||||||
| Tennessee | ||||||||||||
| 1,000,000 | FRANKLIN TN HLTH & EDUCTNL FACS BRD REVENUE(b)(c)(g) | 6/1/2027 | 6.50 | 1,000,000 | 650,000 | |||||||
| 600,000 | NASHVILLE MET DEV & HSG AGY TN TAX INCR REVENUE(b) | 6/1/2036 | 5.13 | 600,000 | 629,658 | |||||||
| 1,350,000 | SHELBY CNTY TN HLTH EDUCTNL & HSG FACS BRD RETMNT FACS REVENUE | 10/1/2039 | 5.50 | 1,342,029 | 1,314,333 | |||||||
| 150,000 | SHELBY CNTY TN HLTH EDUCTNL & HSG FACS BRD REVENUE(c) | 1/1/2019 | 5.35 | 134,966 | 375 | |||||||
| 625,000 | SHELBY CNTY TN HLTH EDUCTNL & HSG FACS BRD REVENUE(c) | 1/1/2029 | 5.55 | 556,862 | 1,563 | |||||||
| 130,000 | SHELBY CNTY TN HLTH EDUCTNL & HSG FACS BRD REVENUE(c) | 1/1/2029 | 6.00 | - | 1 | |||||||
| 670,000 | TENNESSEE HSG DEV AGY RSDL FING PROGRAM REVENUE | 1/1/2031 | 3.60 | 673,735 | 697,805 | |||||||
| 980,000 | TENNESSEE HSG DEV AGY RSDL FING PROGRAM REVENUE | 7/1/2042 | 3.85 | 980,000 | 1,066,328 | |||||||
| 915,000 | TENNESSEE HSG DEV AGY RSDL FING PROGRAM REVENUE | 7/1/2042 | 3.90 | 915,000 | 998,439 | |||||||
| 2,000,000 | TENNESSEE HSG DEV AGY RSDL FING PROGRAM REVENUE | 7/1/2044 | 4.00 | 2,013,172 | 2,203,140 | |||||||
| 985,000 | TENNESSEE HSG DEV AGY RSDL FING PROGRAM REVENUE | 1/1/2049 | 3.95 | 985,000 | 1,047,114 | |||||||
| 1,965,000 | TENNESSEE HSG DEV AGY RSDL FING PROGRAM REVENUE | 1/1/2049 | 4.05 | 1,965,000 | 2,100,644 | |||||||
| 485,000 | TENNESSEE ST HSG DEV AGY | 1/1/2035 | 3.85 | 485,000 | 521,404 | |||||||
| 11,650,764 | 11,230,804 | 1.87% | ||||||||||
| Texas | ||||||||||||
| 500,000 | ARLINGTON TX HGR EDU FIN CORP EDU REVENUE | 6/15/2036 | 5.00 | 502,141 | 503,850 | |||||||
| 650,000 | ARLINGTON TX SPL TAX REVENUE | 2/15/2041 | 5.00 | 689,165 | 738,114 | |||||||
| 815,000 | BEXAR CNTY TX HSG FIN CORP(h) | 2/1/2035 | 3.75 | 815,000 | 848,961 | |||||||
| 2,000,000 | BEXAR CNTY TX REVENUE | 8/15/2039 | 5.00 | 2,038,250 | 2,128,540 | |||||||
| 675,000 | BRAZORIA CNTY TX MUNI UTILITYDIST #28 | 9/1/2032 | 4.00 | 691,715 | 687,434 | |||||||
| 1,000,000 | BRAZOS TX HGR EDU AUTH STUDENT LOAN PROGRAM REVENUE | 4/1/2040 | 3.00 | 1,004,098 | 930,720 | |||||||
| 625,000 | CLIFTON TX HGR EDU FIN CORP EDU REVENUE | 12/1/2035 | 5.00 | 648,057 | 679,938 | |||||||
| 1,000,000 | DALLAS-FORT WORTH TX INTERNATIONAL ARPT REVENUE | 11/1/2037 | 5.25 | 1,004,511 | 1,113,710 | |||||||
| 1,350,000 | DANBURY TX HGR EDU AUTH INC EDU REVENUE | 8/15/2049 | 5.13 | 1,401,062 | 1,397,817 | |||||||
| 1,500,000 | EL PASO CNTY TX HOSP DIST | 8/15/2043 | 5.00 | 1,581,963 | 1,540,320 | |||||||
| 1,000,000 | EL PASO TX DOWNTOWN DEV CORP SPL REVENUE | 8/15/2038 | 7.25 | 1,033,848 | 1,182,040 | |||||||
| 1,000,000 | FORT BEND CNTY TX MUNI UTILITY DIST #23 | 9/1/2033 | 4.00 | 1,024,577 | 1,017,300 | |||||||
| 610,000 | FORT BEND CNTY TX MUNI UTILITY DIST #50 | 9/1/2029 | 4.00 | 624,992 | 621,901 | |||||||
| 800,000 | GILMER TX ECON DEV CORP SALES TAX REVENUE | 7/15/2030 | 5.00 | 823,619 | 826,072 | |||||||
| 1,500,000 | GRAND PARKWAY TRANSPRTN CORP TX SYS TOLL REVENUE (Step to 5.50% on 10/1/2023)(d) | 10/1/2035 | 0.00 | 1,273,412 | 1,730,460 | |||||||
| 560,000 | HARRIS CNTY TX MUNI UTILITY DIST #400 | 9/1/2033 | 4.00 | 573,768 | 569,688 | |||||||
| 1,000,000 | HIDALGO CNTY TX REGL MOBILITY AUTH VEHICLE REGISTRATION FEE | 12/1/2038 | 5.25 | 1,013,360 | 1,155,750 | |||||||
| 1,500,000 | HOUSTON TX HGR EDU FIN CORP | 9/1/2038 | 5.50 | 1,513,518 | 1,649,655 | |||||||
| 750,000 | LEWISVILLE TX COMB CONTRACT REVENUE | 9/1/2024 | 3.00 | 745,881 | 780,690 | |||||||
| 1,000,000 | MEADOWHILL TX REGL MUNI UTILITY DIST | 10/1/2034 | 4.00 | 1,051,150 | 1,049,640 | |||||||
| 273,000 | N CENTRL TEXAS ST HLTH FAC DEV CORP | 2/15/2025 | 5.38 | 273,000 | 221,570 | |||||||
| 42 | (Continued) |
CLEARWATER INVESTMENT TRUST
Schedule of Investments - Clearwater Tax-Exempt Bond Fund
September 30, 2020 (unaudited)
| Par/Shares | Security | Maturity date | Coupon rate | Cost | Fair value (a) | Percent of net assets | ||||||
| Texas (Cont'd): | ||||||||||||
| 1,000,000 | N TX TOLLWAY AUTH REVENUE | 1/1/2042 | 6.20 | $998,894 | 1,198,000 | |||||||
| 1,000,000 | NEW HOPE CULTURAL ED FACS FIN CORP TX RETIREMENT FAC REVENUE | 10/1/2034 | 5.00 | 1,005,871 | 1,023,820 | |||||||
| 750,000 | NEW HOPE CULTURAL ED FACS FIN CORP TX RETIREMENT FAC REVENUE | 1/1/2035 | 5.50 | 759,033 | 780,705 | |||||||
| 500,000 | NEW HOPE CULTURAL ED FACS FIN CORP TX RETIREMENT FAC REVENUE | 10/1/2049 | 5.25 | 507,487 | 505,530 | |||||||
| 1,100,000 | NEW HOPE CULTURAL ED FACS FIN CORP TX RETIREMENT FAC REVENUE | 1/1/2055 | 5.00 | 1,146,992 | 1,100,649 | |||||||
| 750,000 | NEW HOPE CULTURAL EDU FACS FIN CORP TX EDU REVENUE(b) | 8/15/2036 | 5.00 | 751,699 | 756,052 | |||||||
| 1,000,000 | NEW HOPE CULTURAL EDU FACS FIN CORP TX EDU REVENUE | 8/15/2036 | 5.50 | 1,001,410 | 1,016,590 | |||||||
| 670,000 | NEW HOPE CULTURAL EDU FACS FIN CORP TX EDU REVENUE(b) | 8/15/2049 | 5.00 | 693,810 | 688,887 | |||||||
| 645,000 | NEW HOPE CULTURAL EDU FACS FIN CORP TX SENIOR LIVING REVENUE | 7/1/2025 | 4.00 | 631,337 | 598,889 | |||||||
| 1,100,000 | NEW HOPE CULTURAL EDU FACS FIN CORP TX STUDENT HSG REVENUE | 4/1/2046 | 5.00 | 1,127,617 | 1,183,039 | |||||||
| 750,000 | RED RIVER TX HLTH FACS DEV CORP RETIREMENT FAC REVENUE | 11/15/2034 | 7.50 | 746,689 | 779,107 | |||||||
| 1,000,000 | SUGAR LAND TX DEV CORP SALES TAX REVENUE | 2/15/2033 | 5.00 | 1,037,308 | 1,106,090 | |||||||
| 1,000,000 | TARRANT CNTY TX CULTURAL EDU FACS FIN CORP HOSP REVENUE | 11/15/2038 | 5.00 | 1,033,460 | 1,086,910 | |||||||
| 1,000,000 | TARRANT CNTY TX CULTURAL EDU FACS FIN CORP RETMNT FAC REVENUE(c) | 11/15/2022 | 5.50 | 1,000,000 | 650,000 | |||||||
| 610,000 | TARRANT CNTY TX CULTURAL EDU FACS FIN CORP RETMNT FAC REVENUE | 11/15/2024 | 5.63 | 610,000 | 610,567 | |||||||
| 970,000 | TEXAS ST AFFORDABLE HSG CORP SF MTGE REVENUE | 3/1/2050 | 4.00 | 992,254 | 1,068,630 | |||||||
| 2,000,000 | TEXAS ST DEPT OF HSG & CMNTY AFFAIRS | 9/1/2044 | 3.63 | 2,043,534 | 2,169,240 | |||||||
| 1,000,000 | TEXAS ST DEPT OF HSG & CMNTY AFFAIRS | 9/1/2048 | 4.25 | 1,016,778 | 1,102,670 | |||||||
| 37,431,260 | 38,799,545 | 6.46% | ||||||||||
| Utah | ||||||||||||
| 1,000,000 | UTAH ST CHRT SCH FIN AUTH CHRT SCH REVENUE | 10/15/2033 | 6.50 | 1,000,000 | 1,003,090 | |||||||
| 1,000,000 | UTAH ST CHRT SCH FIN AUTH CHRT SCH REVENUE(b) | 4/15/2045 | 6.00 | 1,000,000 | 1,004,500 | |||||||
| 75,000 | UTAH ST HSG CORP SF MTGE REVENUE | 1/1/2033 | 5.75 | 75,000 | 75,853 | |||||||
| 1,500,000 | WEST VLY CITY UT MUNI BLDG AUTH LEASE REVENUE | 2/1/2039 | 5.00 | 1,626,730 | 1,787,265 | |||||||
| 3,701,730 | 3,870,708 | 0.64% | ||||||||||
| Vermont | ||||||||||||
| 680,000 | VERMONT ST HSG FIN AGY | 5/1/2032 | 4.88 | 677,554 | 731,184 | |||||||
| 1,000,000 | VERMONT ST STUDENT ASSISTANCE CORP EDU LOAN REVENUE | 6/15/2036 | 3.38 | 990,957 | 985,840 | |||||||
| 1,668,511 | 1,717,024 | 0.29% | ||||||||||
| Virginia | ||||||||||||
| 500,000 | FAIRFAX CNTY VA REDEV & HSG AUTH MF REVENUE | 8/1/2039 | 5.60 | 500,000 | 501,425 | |||||||
| 462,000 | MARQUIS VA CMNTY DEV AUTH REVENUE(e) | 9/1/2041 | 0.00 | 159,101 | 21,700 | |||||||
| 349,000 | MARQUIS VA CMNTY DEV AUTH REVENUE | 9/1/2041 | 5.63 | 373,769 | 173,868 | |||||||
| 1,000,000 | VIRGINIA ST HSG DEV AUTH | 7/1/2033 | 4.13 | 1,000,000 | 1,051,740 | |||||||
| 1,000,000 | VIRGINIA ST HSG DEV AUTH | 9/1/2050 | 2.50 | 1,000,000 | 989,710 | |||||||
| 2,005,000 | VIRGINIA ST HSG DEV AUTH CMWLTH MTGE | 1/1/2038 | 3.88 | 1,995,250 | 2,076,599 | |||||||
| 5,028,120 | 4,815,042 | 0.80% | ||||||||||
| Washington | ||||||||||||
| 700,000 | KALISPEL TRIBE OF INDIANS PRIORITY DIST WA REVENUE(b) | 1/1/2038 | 5.25 | 686,735 | 781,571 | |||||||
| 445,000 | KING CNTY WA HSG AUTH | 5/1/2028 | 5.20 | 445,000 | 451,559 | |||||||
| 43 | (Continued) |
CLEARWATER INVESTMENT TRUST
Schedule of Investments - Clearwater Tax-Exempt Bond Fund
September 30, 2020 (unaudited)
| Par/Shares | Security | Maturity date | Coupon rate | Cost | Fair value (a) | Percent of net assets | ||||||
| Washington (Cont'd): | ||||||||||||
| 1,500,000 | KING CNTY WA HSG AUTH | 11/1/2039 | 3.00 | $1,467,899 | 1,577,175 | |||||||
| 1,000,000 | KING CNTY WA HSG AUTH | 8/1/2040 | 3.00 | 1,040,677 | 1,057,120 | |||||||
| 1,000,000 | PIKE PLACE MARKET WA PRESERVATION & DEV AUTH SPL OBLG | 12/1/2040 | 5.00 | 1,044,357 | 1,085,520 | |||||||
| 770,000 | SEATTLE WA HSG AUTH POOLED HSG REVENUE | 9/15/2033 | 5.75 | 776,223 | 894,756 | |||||||
| 500,000 | SNOHOMISH CNTY WA HSG AUTH | 4/1/2044 | 4.00 | 507,928 | 549,940 | |||||||
| 1,000,000 | VANCOUVER WA HSG AUTH | 8/1/2034 | 3.75 | 984,071 | 1,096,520 | |||||||
| 1,500,000 | VANCOUVER WA HSG AUTH | 6/1/2038 | 3.00 | 1,495,899 | 1,549,785 | |||||||
| 1,500,000 | VANCOUVER WA HSG AUTH | 12/1/2051 | 3.30 | 1,500,000 | 1,577,340 | |||||||
| 530,000 | WASHINGTON ST HSG FIN COMMISSION(b) | 7/1/2025 | 6.00 | 532,148 | 572,766 | |||||||
| 1,000,000 | WASHINGTON ST HSG FIN COMMISSION(b) | 1/1/2031 | 5.00 | 1,001,292 | 1,071,070 | |||||||
| 750,000 | WASHINGTON ST HSG FIN COMMISSION(b) | 7/1/2031 | 5.00 | 788,527 | 794,145 | |||||||
| 675,000 | WASHINGTON ST HSG FIN COMMISSION(b) | 1/1/2035 | 5.75 | 675,000 | 701,156 | |||||||
| 600,000 | WASHINGTON ST HSG FIN COMMISSION(b) | 7/1/2036 | 5.00 | 628,015 | 615,006 | |||||||
| 500,000 | WASHINGTON ST HSG FIN COMMISSION(b) | 1/1/2038 | 5.00 | 537,254 | 540,965 | |||||||
| 1,000,000 | WASHINGTON ST HSG FIN COMMISSION(b) | 1/1/2044 | 5.00 | 1,083,389 | 1,052,710 | |||||||
| 1,000,000 | WASHINGTON ST HSG FIN COMMISSION(b) | 7/1/2048 | 5.00 | 1,090,669 | 1,001,200 | |||||||
| 16,285,083 | 16,970,304 | 2.82% | ||||||||||
| West Virginia | ||||||||||||
| 1,500,000 | WEST VIRGINIA ST HSG DEV FUND | 11/1/2032 | 3.75 | 1,500,000 | 1,616,490 | |||||||
| 1,500,000 | 1,616,490 | 0.27% | ||||||||||
| Wisconsin | ||||||||||||
| 1,500,000 | PUBLIC FIN AUTH WI CCRC REVENUE(b) | 6/1/2046 | 8.25 | 1,533,619 | 1,572,285 | |||||||
| 16,520 | PUBLIC FIN AUTH WI CONFERENCE CENTER & HOTEL REVENUE(b)(e) | 1/1/2046 | 0.00 | 1,193 | 410 | |||||||
| 18,299 | PUBLIC FIN AUTH WI CONFERENCE CENTER & HOTEL REVENUE(b)(e) | 1/1/2047 | 0.00 | 1,282 | 436 | |||||||
| 17,930 | PUBLIC FIN AUTH WI CONFERENCE CENTER & HOTEL REVENUE(b)(e) | 1/1/2048 | 0.00 | 1,227 | 419 | |||||||
| 17,786 | PUBLIC FIN AUTH WI CONFERENCE CENTER & HOTEL REVENUE(b)(e) | 1/1/2049 | 0.00 | 1,188 | 406 | |||||||
| 17,496 | PUBLIC FIN AUTH WI CONFERENCE CENTER & HOTEL REVENUE(b)(e) | 1/1/2050 | 0.00 | 1,141 | 384 | |||||||
| 18,980 | PUBLIC FIN AUTH WI CONFERENCE CENTER & HOTEL REVENUE(b)(e) | 1/1/2051 | 0.00 | 1,211 | 407 | |||||||
| 446,246 | PUBLIC FIN AUTH WI CONFERENCE CENTER & HOTEL REVENUE(b)(f)(i) | 7/1/2051 | 3.75 | 443,916 | 281,947 | |||||||
| 19,357 | PUBLIC FIN AUTH WI CONFERENCE CENTER & HOTEL REVENUE(b)(e) | 1/1/2052 | 0.00 | 1,206 | 399 | |||||||
| 19,095 | PUBLIC FIN AUTH WI CONFERENCE CENTER & HOTEL REVENUE(b)(e) | 1/1/2053 | 0.00 | 1,163 | 385 | |||||||
| 18,909 | PUBLIC FIN AUTH WI CONFERENCE CENTER & HOTEL REVENUE(b)(e) | 1/1/2054 | 0.00 | 1,127 | 370 | |||||||
| 18,634 | PUBLIC FIN AUTH WI CONFERENCE CENTER & HOTEL REVENUE(b)(e) | 1/1/2055 | 0.00 | 1,088 | 356 | |||||||
| 18,360 | PUBLIC FIN AUTH WI CONFERENCE CENTER & HOTEL REVENUE(b)(e) | 1/1/2056 | 0.00 | 1,050 | 344 | |||||||
| 100,837 | PUBLIC FIN AUTH WI CONFERENCE CENTER & HOTEL REVENUE(b)(c)(g) | 7/1/2056 | 5.50 | 100,665 | 72,885 | |||||||
| 18,454 | PUBLIC FIN AUTH WI CONFERENCE CENTER & HOTEL REVENUE(b)(e) | 1/1/2057 | 0.00 | 1,820 | 335 | |||||||
| 18,165 | PUBLIC FIN AUTH WI CONFERENCE CENTER & HOTEL REVENUE(b)(e) | 1/1/2058 | 0.00 | 993 | 321 | |||||||
| 17,992 | PUBLIC FIN AUTH WI CONFERENCE CENTER & HOTEL REVENUE(b)(e) | 1/1/2059 | 0.00 | 965 | 312 | |||||||
| 17,834 | PUBLIC FIN AUTH WI CONFERENCE CENTER & HOTEL REVENUE(b)(e) | 1/1/2060 | 0.00 | 939 | 299 | |||||||
| 17,573 | PUBLIC FIN AUTH WI CONFERENCE CENTER & HOTEL REVENUE(b)(e) | 1/1/2061 | 0.00 | 910 | 285 | |||||||
| 44 | (Continued) |
CLEARWATER INVESTMENT TRUST
Schedule of Investments - Clearwater Tax-Exempt Bond Fund
September 30, 2020 (unaudited)
| Par/Shares | Security | Maturity date | Coupon rate | Cost | Fair value (a) | Percent of net assets | ||||||
| Wisconsin (Cont'd): | ||||||||||||
| 17,400 | PUBLIC FIN AUTH WI CONFERENCE CENTER & HOTEL REVENUE(b)(e) | 1/1/2062 | 0.00 | $884 | 274 | |||||||
| 17,125 | PUBLIC FIN AUTH WI CONFERENCE CENTER & HOTEL REVENUE(b)(e) | 1/1/2063 | 0.00 | 856 | 263 | |||||||
| 16,967 | PUBLIC FIN AUTH WI CONFERENCE CENTER & HOTEL REVENUE(b)(e) | 1/1/2064 | 0.00 | 835 | 256 | |||||||
| 16,823 | PUBLIC FIN AUTH WI CONFERENCE CENTER & HOTEL REVENUE(b)(e) | 1/1/2065 | 0.00 | 815 | 244 | |||||||
| 16,731 | PUBLIC FIN AUTH WI CONFERENCE CENTER & HOTEL REVENUE(b)(e) | 1/1/2066 | 0.00 | 796 | 231 | |||||||
| 215,987 | PUBLIC FIN AUTH WI CONFERENCE CENTER & HOTEL REVENUE(b)(e) | 1/1/2067 | 0.00 | 9,646 | 2,756 | |||||||
| 520,000 | PUBLIC FIN AUTH WI EDU REVENUE(b) | 6/15/2049 | 5.00 | 526,406 | 530,031 | |||||||
| 445,000 | PUBLIC FIN AUTH WI REVENUE | 4/1/2025 | 5.00 | 446,773 | 467,406 | |||||||
| 1,250,000 | PUBLIC FIN AUTH WI REVENUE(b) | 11/1/2028 | 6.25 | 1,250,000 | 1,340,787 | |||||||
| 600,000 | PUBLIC FIN AUTH WI REVENUE | 4/1/2032 | 5.50 | 600,000 | 618,066 | |||||||
| 1,000,000 | PUBLIC FIN AUTH WI REVENUE(b) | 1/1/2033 | 6.13 | 989,314 | 863,570 | |||||||
| 341,000 | PUBLIC FIN AUTH WI REVENUE(e) | 10/1/2042 | 0.00 | 374,765 | 51,300 | |||||||
| 515,000 | PUBLIC FIN AUTH WI REVENUE | 10/1/2042 | 7.00 | 525,300 | 493,972 | |||||||
| 13,694 | PUBLIC FIN AUTH WI REVENUE(b)(c)(g) | 12/1/2048 | 5.50 | 13,694 | 6,847 | |||||||
| 1,195,000 | PUBLIC FIN AUTH WI SENIOR LIVING REVENUE(b) | 11/15/2024 | 5.00 | 1,193,282 | 1,251,595 | |||||||
| 500,000 | WISCONSIN ST HLTH & EDUCTNL FACS AUTH REVENUE | 8/1/2032 | 5.00 | 539,892 | 489,915 | |||||||
| 1,300,000 | WISCONSIN ST HLTH & EDUCTNL FACS AUTH REVENUE | 8/15/2032 | 5.00 | 1,373,282 | 1,479,855 | |||||||
| 700,000 | WISCONSIN ST HLTH & EDUCTNL FACS AUTH REVENUE | 6/1/2037 | 5.00 | 731,385 | 739,151 | |||||||
| 500,000 | WISCONSIN ST HLTH & EDUCTNL FACS AUTH REVENUE | 9/15/2040 | 5.00 | 511,840 | 514,345 | |||||||
| 2,000,000 | WISCONSIN ST HLTH & EDUCTNL FACS AUTH REVENUE | 8/15/2043 | 5.00 | 2,045,593 | 2,125,992 | |||||||
| 1,400,000 | WISCONSIN ST HLTH & EDUCTNL FACS AUTH REVENUE | 9/15/2045 | 5.00 | 1,431,193 | 1,434,678 | |||||||
| 650,000 | WISCONSIN ST HLTH & EDUCTNL FACS AUTH REVENUE | 11/1/2046 | 5.00 | 673,222 | 661,063 | |||||||
| 2,000,000 | WISCONSIN ST HLTH & EDUCTNL FACS AUTH REVENUE | 10/1/2048 | 5.13 | 1,963,525 | 2,008,300 | |||||||
| 500,000 | WISCONSIN ST HSG & ECON DEV AUTH | 11/1/2035 | 3.88 | 500,000 | 537,825 | |||||||
| 1,000,000 | WISCONSIN ST HSG & ECON DEV AUTH | 11/1/2040 | 4.00 | 1,000,000 | 1,073,220 | |||||||
| 1,000,000 | WISCONSIN ST HSG & ECON DEV AUTH | 11/1/2042 | 3.90 | 1,003,662 | 1,085,130 | |||||||
| 1,500,000 | WISCONSIN ST HSG & ECON DEV AUTH | 5/1/2055 | 4.15 | 1,500,000 | 1,621,530 | |||||||
| 21,303,663 | 21,331,587 | 3.55% | ||||||||||
| Wyoming | ||||||||||||
| 335,000 | WYOMING ST CMNTY DEV AUTH HSG REVENUE | 12/1/2038 | 3.90 | 335,000 | 358,474 | |||||||
| 1,645,000 | WYOMING ST CMNTY DEV AUTH HSG REVENUE | 12/1/2038 | 4.05 | 1,645,000 | 1,700,798 | |||||||
| 1,980,000 | 2,059,272 | 0.34% | ||||||||||
| Sub-total Municipal Bonds: | 533,151,059 | 553,589,791 | 92.13% | |||||||||
| Short-Term Investments: | ||||||||||||
| 10,586,275 | NORTHERN INSTITUTIONAL FUNDS - U.S. GOVERNMENT SELECT PORTFOLIO, 0.03%(j) | 10,586,275 | 10,586,275 | |||||||||
| Sub-total Short-Term Investments: | 10,586,275 | 10,586,275 | 1.76% | |||||||||
| Grand total | $577,451,275 | 599,081,600 | 99.70% | |||||||||
| Notes to Schedule of Investments: | |
| (a) | Investments in U.S. and foreign securities generally are valued at the last sales price or the regular trading session closing price on the principal exchange or market in which such securities are traded. Foreign security values are stated in U.S. dollars. Debt securities are valued at the market price supplied by an independent pricing vendor provided such prices are believed to reflect the fair value of such securities. |
| (b) | Securities exempt from registration under Rule 144A of the Securities Act of 1933. These securities may be resold in transactions exempt from registration, normally to qualified institutional buyers. The value of these securities is determined by valuations supplied by a pricing service or brokers, or, if not available, in accordance with procedures established by the Board of Trustees. |
| (c) | Non-income producing assets. For long-term debt securities, item identified is in default as to payment of interest and/or principal. |
| (d) | For step bonds, the coupon rate disclosed is the current rate in effect. |
| 45 | (Continued) |
CLEARWATER INVESTMENT TRUST
Schedule of Investments - Clearwater Tax-Exempt Bond Fund
September 30, 2020 (unaudited)
| (e) | Zero coupon bond. |
| (f) | Variable rate security. Rate as of September 30, 2020 is disclosed. |
| (g) | Restricted security that has been deemed illiquid. At September 30, 2020, the value of these restricted illiquid securities amounted to $4,796,302 or 0.80% of net assets. Additional information on these restricted illiquid securities is as follows: |
| SECURITY | AQUISITION DATE | ACQUISITION COST |
| CAPITAL TRUST AGY FL REVENUE, 6.75%, 12/1/35 | 12/2/15-1/21/16 | $1,748,875 |
| CAPITAL TRUST AGY FL REVENUE, 6.75%, 7/1/37 | 6/28/17 | 750,000 |
| COLLIER CNTY FLA INDL DEV AUTH CONTINUING CARE CMNTY REV, 8.13%, 5/15/44 | 6/27/17-4/12/18 | 1,961,290 |
| COLLIER CNTY FLA INDL DEV AUTH CONTINUING CARE CMNTY REVENUE, 7.25%, 5/15/26 | 12/16/13 | 750,000 |
| FRANKLIN TN HLTH & EDUCTNL FACS BRD REVENUE, 6.50%, 6/1/27 | 5/24/17 | 1,000,000 |
| KANSAS CITY MO INDL DEV AUTH SENIOR LIVING FACS REVENUE, 5.75%, 11/15/36 | 12/18/15 | 1,300,000 |
| LAKE CNTY OH PORT & ECON DEV AUTH LEASE REVENUE, 6.50%, 12/1/37 | 10/27/17 | 750,000 |
| PUBLIC FIN AUTH WI CONFERENCE CENTER & HOTEL REVENUE, 5.50%, 7/1/56 | 3/26/18-8/26/20 | 100,665 |
| PUBLIC FIN AUTH WI REVENUE, 5.50%, 12/1/48 | 3/26/19 | 13,694 |
| (h) | Security has converted to a fixed rate as of February 1, 2015, and will be going forward. |
| (i) | These securities are remarketed by an agent, and the rate at which these securities are set are determined by general market conditions and supply and demand. |
| (j) | The short-term investment is a money market portfolio of the investment company, Northern Institutional Funds. At December 31, 2019, the value of the Clearwater Tax-Exempt Bond Fund's investment in the U.S. Government Select Portfolio of the Northern Institutional Funds was $22,581,520 with net sales of $11,995,245 for the nine months ended September 30, 2020. |
Diversification of investments representing geographic diversification, as a percentage of total investments at fair value, is as follows:
| Geographical Diversification | Percent | |
| Florida | 11.41% | |
| Illinois | 9.53 | |
| California | 7.87 | |
| New York | 6.83 | |
| Texas | 6.48 | |
| Colorado | 5.35 | |
| Georgia | 3.94 | |
| Wisconsin | 3.56 | |
| Arizona | 3.17 | |
| New Jersey | 2.90 | |
| Other | 38.96 | |
| 100.00% | ||
Fair value is an estimate of the price the Clearwater Tax-Exempt Bond Fund would receive upon selling a security in a timely transaction to an independent buyer in the principal or most advantageous market for the security. This guidance establishes a three-tier hierarchy to maximize the use of observable market data and minimize the use of unobservable inputs and to establish classification of fair value measurements for disclosure purposes. Various inputs are used in determining the value of the Clearwater Tax-Exempt Bond Fund's investments and other financial instruments, as described below. These inputs are summarized in the three broad levels listed below.
| 46 | (Continued) |
CLEARWATER INVESTMENT TRUST
Schedule of Investments - Clearwater Tax-Exempt Bond Fund
September 30, 2020 (unaudited)
| • | Level 1 – Unadjusted quoted market prices in active markets for identical securities on the measurement date. |
| • | Level 2 – Other significant observable inputs including quoted prices for similar investments, interest rates, prepayment speeds, credit risk, etc. or quoted prices for identical or similar assets in markets that are not active. Inputs that are derived principally from or corroborated by observable market data are also considered Level 2 measurements. An adjustment to any observable input that is significant to the fair value may render the measurement a Level 3 measurement. |
| • | Level 3 – Valuations based on unobservable inputs, which may include the Adviser’s own assumptions in determining the fair value of an investment. |
Debt securities are valued at the market price supplied by an independent pricing vendor provided such prices are believed to reflect the fair value of such securities. Investments in closed-end funds are valued at the last sales price or the regular trading session closing price on the principal exchange or market in which the funds are traded. Equity securities which have not traded on the date of valuation or securities for which sales prices are not generally reported are valued at the mean between the last bid and asked prices. Security transactions are accounted for as of trade date. Wherever possible, the Clearwater Tax-Exempt Bond Fund uses independent pricing services approved by the Board of Trustees of Clearwater Investment Trust to value its investments. When prices are not readily available (including those for which trading has been suspended), are determined not to reflect fair value, or when the Adviser becomes aware that a significant event impacting the value of a security or group of securities has occurred after the closing of the exchange on which the security or securities principally trade, but before the calculation of the daily net asset value, the Clearwater Tax-Exempt Bond Fund may value these securities at fair value as determined in good faith using procedures established by the Board of Trustees.
| 47 | (Continued) |
CLEARWATER INVESTMENT TRUST
Schedule of Investments - Clearwater Tax-Exempt Bond Fund
September 30, 2020 (unaudited)
The inputs or methodology used for valuing securities are not necessarily an indication of the risk associated with investing in those securities and other financial instruments, if any. The following is a summary of the inputs used in valuing the Clearwater Tax-Exempt Bond Fund’s investments and other financial instruments, if any, which are carried at fair value, as of September 30, 2020.
| Level 1 | Level 2 | Level 3 | Total | ||||
| Closed-End Funds | $34,905,534 | $— | $— | $34,905,534 | |||
| Municipal Bonds | |||||||
| Alabama | — | 1,540,505 | — | 1,540,505 | |||
| Alaska | — | 1,067,050 | — | 1,067,050 | |||
| Arizona | — | 18,992,875 | — | 18,992,875 | |||
| Arkansas | — | 1,567,363 | — | 1,567,363 | |||
| California | — | 47,125,463 | — | 47,125,463 | |||
| Colorado | — | 32,073,721 | — | 32,073,721 | |||
| Connecticut | — | 9,843,036 | — | 9,843,036 | |||
| District of Columbia | — | 5,512,092 | — | 5,512,092 | |||
| Florida | — | 68,380,430 | — | 68,380,430 | |||
| Georgia | — | 20,694,668 | — | 20,694,668 | |||
| Idaho | — | 1,923,986 | — | 1,923,986 | |||
| Illinois | — | 32,871,688 | — | 32,871,688 | |||
| Indiana | — | 14,024,043 | — | 14,024,043 | |||
| Iowa | — | 1,604,340 | — | 1,604,340 | |||
| Kansas | — | 2,753,867 | — | 2,753,867 | |||
| Kentucky | — | 758,419 | — | 758,419 | |||
| Louisiana | — | 9,498,720 | — | 9,498,720 | |||
| Maine | — | 4,410,809 | — | 4,410,809 | |||
| Maryland | — | 3,309,194 | — | 3,309,194 | |||
| Massachusetts | — | 12,072,164 | — | 12,072,164 | |||
| Michigan | — | 13,381,549 | — | 13,381,549 | |||
| Minnesota | — | 4,130,925 | — | 4,130,925 | |||
| Mississippi | — | 1,036,930 | — | 1,036,930 | |||
| Missouri | — | 7,279,967 | — | 7,279,967 | |||
| Montana | — | 4,461,721 | — | 4,461,721 | |||
| Nebraska | — | 807,396 | — | 807,396 | |||
| Nevada | — | 3,049,685 | — | 3,049,685 | |||
| New Hampshire | — | 2,793,030 | — | 2,793,030 | |||
| New Jersey | — | 13,833,885 | — | 13,833,885 | |||
| New Mexico | — | 8,434,772 | — | 8,434,772 | |||
| New York | — | 34,148,039 | — | 34,148,039 | |||
| North Carolina | — | 6,117,886 | — | 6,117,886 | |||
| North Dakota | — | 1,160,416 | — | 1,160,416 | |||
| Ohio | — | 15,822,665 | — | 15,822,665 | |||
| Oklahoma | — | 3,234,915 | — | 3,234,915 | |||
| Oregon | — | 12,413,716 | — | 12,413,716 | |||
| Pennsylvania | — | 17,326,001 | — | 17,326,001 | |||
| Puerto Rico | — | 1,563,840 | — | 1,563,840 | |||
| Rhode Island | — | 2,705,778 | — | 2,705,778 | |||
| South Carolina | — | 6,950,376 | — | 6,950,376 | |||
| South Dakota | — | 501,090 | — | 501,090 | |||
| Tennessee | — | 11,230,804 | — | 11,230,804 | |||
| Texas | — | 38,799,545 | — | 38,799,545 | |||
| Utah | — | 3,870,708 | — | 3,870,708 | |||
| Vermont | — | 1,717,024 | — | 1,717,024 | |||
| Virginia | — | 4,815,042 | — | 4,815,042 | |||
| Washington | — | 16,970,304 | — | 16,970,304 | |||
| West Virginia | — | 1,616,490 | — | 1,616,490 | |||
| Wisconsin | — | 21,331,587 | — | 21,331,587 | |||
| Wyoming | — | 2,059,272 | — | 2,059,272 | |||
| Short-Term Investments | 10,586,275 | — | — | 10,586,275 | |||
| Total | $45,491,809 | $553,589,791 | $— | $599,081,600 |
| 48 | (Continued) |
CLEARWATER INVESTMENT TRUST
Schedule of Investments - Clearwater Tax-Exempt Bond Fund
September 30, 2020 (unaudited)
For the Clearwater Tax-Exempt Bond Fund, the investment value is comprised of closed-end funds, municipal bonds, and short-term investments. Investments in closed-end funds and short-term securities generally are valued at the last sales price or the regular trading session closing price on the principal exchange or market where they are traded. Investments in municipal bonds generally are based on valuations using adjusted evaluated prices provided by the primary pricing provider. The Board of Trustees has delegated to the Valuation Committee the responsibility to determine in good faith the fair value of securities for which no price quotation is available from an approved pricing service or broker-dealer at the time the Clearwater Tax-Exempt Bond Fund’s net asset value is calculated, including securities for which the prices do not represent fair value or for which a significant event occurs that materially affects the value of the security after the close of the market on which the security principally trades and before the time the Clearwater Tax-Exempt Bond Fund’s net asset value is calculated.
| 49 | (Continued) |
CLEARWATER INVESTMENT TRUST
Schedule of Investments - Clearwater Tax-Exempt Bond Fund
September 30, 2020 (unaudited)
Clearwater Tax-Exempt Bond Fund Portfolio Diversification
(as a percentage of net assets)
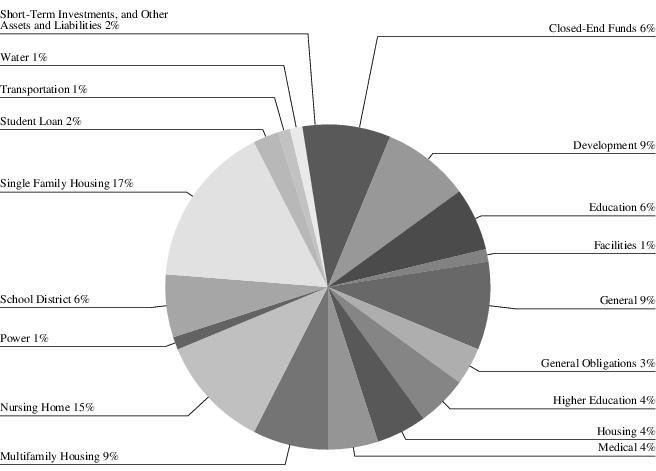
| 50 | (Continued) |
CLEARWATER INVESTMENT TRUST
Schedule of Investments - Clearwater International Fund
September 30, 2020 (unaudited)
| Shares | Security | Cost | Fair value (a) | Percent of net assets | ||||
| Common Stocks: | ||||||||
| Argentina: | ||||||||
| 8,595 | GLOBANT S.A.(b) | $837,731 | 1,540,396 | |||||
| 7,047 | MERCADOLIBRE, INC.(b) | 4,513,655 | 7,628,236 | |||||
| 5,351,386 | 9,168,632 | 1.26% | ||||||
| Australia: | ||||||||
| 275,180 | ADAIRS LTD. | 331,893 | 640,567 | |||||
| 102,780 | ALLIANCE AVIATION SERVICES LTD.(b) | 167,434 | 258,393 | |||||
| 89,441 | APA GROUP | 554,557 | 661,762 | |||||
| 55,160 | APPEN LTD. | 794,280 | 1,346,445 | |||||
| 5,412 | ARISTOCRAT LEISURE LTD. | 111,219 | 116,174 | |||||
| 2,792 | ASX LTD. | 61,614 | 162,021 | |||||
| 19,807 | AUSTRALIA & NEW ZEALAND BANKING GROUP LTD. | 188,757 | 244,296 | |||||
| 195,700 | AVENTUS GROUP | 351,688 | 330,801 | |||||
| 250,708 | BEACH ENERGY LTD. | 466,720 | 237,032 | |||||
| 179,910 | BGP HOLDINGS PLC(b)(c) | - | - | |||||
| 10,935 | BHP GROUP LTD. | 182,389 | 278,826 | |||||
| 37,600 | BLUESCOPE STEEL LTD. | 301,071 | 342,024 | |||||
| 17,400 | BRAMBLES LTD. | 64,294 | 130,734 | |||||
| 49,542 | CEDAR WOODS PROPERTIES LTD. | 234,956 | 204,036 | |||||
| 971 | COCHLEAR LTD. | 35,893 | 137,705 | |||||
| 19,339 | COLES GROUP LTD. | 154,507 | 235,476 | |||||
| 11,157 | COMMONWEALTH BANK OF AUSTRALIA | 235,177 | 508,320 | |||||
| 43,827 | CSL LTD. | 3,060,527 | 9,009,243 | |||||
| 14,184 | DEXUS | 62,970 | 90,316 | |||||
| 97,180 | FORTESCUE METALS GROUP LTD. | 212,026 | 1,134,564 | |||||
| 22,072 | GOODMAN GROUP | 76,819 | 283,615 | |||||
| 35,107 | GPT GROUP (THE) | 96,585 | 98,067 | |||||
| 191,776 | HT&E LTD. | 241,003 | 197,798 | |||||
| 46,448 | INSURANCE AUSTRALIA GROUP LTD. | 119,637 | 145,716 | |||||
| 10,015 | LENDLEASE CORP. LTD. | 61,130 | 79,121 | |||||
| 7,819 | MACQUARIE GROUP LTD. | 175,414 | 669,635 | |||||
| 25,670 | MINERAL RESOURCES LTD. | 246,214 | 457,999 | |||||
| 573,700 | MOUNT GIBSON IRON LTD. | 260,031 | 297,912 | |||||
| 278,133 | NANOSONICS LTD.(b) | 1,198,411 | 1,131,529 | |||||
| 44,772 | NATIONAL AUSTRALIA BANK LTD. | 551,214 | 569,206 | |||||
| 319,500 | NEW HOPE CORP. LTD. | 444,174 | 294,062 | |||||
| 7,157 | NEWCREST MINING LTD. | 59,115 | 160,143 | |||||
| 12,984 | ORIGIN ENERGY LTD. | 42,778 | 39,989 | |||||
| 256,036 | QANTAS AIRWAYS LTD.(b) | 746,678 | 742,712 | |||||
| 2,805 | RAMSAY HEALTH CARE LTD. | 60,296 | 132,760 | |||||
| 169,500 | REGIS RESOURCES LTD. | 501,445 | 608,236 | |||||
| 321,800 | RURAL FUNDS GROUP | 463,060 | 532,430 | |||||
| 173,937 | SANTOS LTD. | 509,938 | 607,962 | |||||
| 186,510 | SCENTRE GROUP | 296,462 | 293,893 | |||||
| 22,739 | SEEK LTD. | 233,310 | 346,746 | |||||
| 102,600 | SMARTGROUP CORP. LTD. | 452,529 | 420,347 | |||||
| 39,820 | SONIC HEALTHCARE LTD. | 470,951 | 945,759 | |||||
| 57,859 | SOUTH32 LTD. | 37,234 | 84,541 | |||||
| 33,184 | STOCKLAND | 95,300 | 89,843 | |||||
| 75,800 | SUPER RETAIL GROUP LTD. | 517,213 | 571,149 | |||||
| 11,916 | SYDNEY AIRPORT | 40,965 | 50,014 | |||||
| 30,856 | TABCORP HOLDINGS LTD. | 79,836 | 73,816 | |||||
| 13,099 | TRANSURBAN GROUP | 36,728 | 132,382 | |||||
| 12,261 | TREASURY WINE ESTATES LTD. | 49,081 | 78,511 | |||||
| 1,320 | WESFARMERS LTD. | 31,901 | 41,997 | |||||
| 38,203 | WESTPAC BANKING CORP. | 452,674 | 460,791 | |||||
| 282,633 | ZIP CO. LTD.(b)(d) | 695,124 | 1,249,029 | |||||
| 16,915,222 | 27,956,445 | 3.85% | ||||||
| Austria: | ||||||||
| 15,700 | BAWAG GROUP A.G.(b)(e) | 600,064 | 566,950 | |||||
| 1,821 | ERSTE GROUP BANK A.G.(b) | 28,050 | 38,164 | |||||
| 93 | IMMOFINANZ A.G.(b) | - | 1,473 | |||||
| 32,264 | RAIFFEISEN BANK INTERNATIONAL A.G.(b) | 563,262 | 494,411 | |||||
| 313 | STRABAG S.E. (BEARER) | 5,505 | 9,633 | |||||
| 57,900 | TELEKOM AUSTRIA A.G. | 422,512 | 409,346 | |||||
| 631 | UBM DEVELOPMENT A.G. | 28,973 | 22,934 | |||||
| 51 | (Continued) |
CLEARWATER INVESTMENT TRUST
Schedule of Investments - Clearwater International Fund
September 30, 2020 (unaudited)
| Shares | Security | Cost | Fair value (a) | Percent of net assets | ||||
| Austria (Cont'd): | ||||||||
| 21,794 | VIENNA INSURANCE GROUP A.G. WIENER VERSICHERUNG GRUPPE | $595,919 | 484,984 | |||||
| 23,500 | WIENERBERGER A.G.(b) | 561,499 | 621,035 | |||||
| 2,805,784 | 2,648,930 | 0.36% | ||||||
| Belgium: | ||||||||
| 7,478 | AGEAS S.A./N.V. | 117,910 | 305,638 | |||||
| 10,113 | ANHEUSER-BUSCH INBEV S.A./N.V. | 285,546 | 548,089 | |||||
| 19,000 | BPOST S.A. | 195,697 | 167,408 | |||||
| 42,740 | GROUPE BRUXELLES LAMBERT S.A. | 3,730,124 | 3,857,508 | |||||
| 4,347 | KBC GROUP N.V. | 101,356 | 218,085 | |||||
| 21,394 | ONTEX GROUP N.V.(b) | 501,601 | 279,680 | |||||
| 9,969 | TELENET GROUP HOLDING N.V. | 411,318 | 387,345 | |||||
| 1,080 | UCB S.A. | 30,239 | 122,826 | |||||
| 1,502 | UMICORE S.A. | 44,422 | 62,604 | |||||
| 66,839 | UNIFIEDPOST GROUP S.A.(b) | 1,565,637 | 1,723,255 | |||||
| 6,983,850 | 7,672,438 | 1.06% | ||||||
| Brazil: | ||||||||
| 129,000 | CAMIL ALIMENTOS S.A.(b) | 274,164 | 286,212 | |||||
| 753,716 | EMPREENDIMENTOS PAGUE MENOS S/A(b) | 1,241,269 | 1,234,742 | |||||
| 199,800 | GRUPO SBF S.A.(b) | 1,122,975 | 903,314 | |||||
| 116,800 | IOCHPE-MAXION S.A. | 415,995 | 284,934 | |||||
| 3,054,403 | 2,709,202 | 0.37% | ||||||
| Canada: | ||||||||
| 2,027 | AGNICO EAGLE MINES LTD. | 57,973 | 161,499 | |||||
| 12,428 | ALIMENTATION COUCHE-TARD, INC., CLASS B | 223,779 | 432,794 | |||||
| 78,700 | B2GOLD CORP. | 426,606 | 512,432 | |||||
| 785 | BANK OF MONTREAL | 34,168 | 45,890 | |||||
| 2,936 | BANK OF NOVA SCOTIA (THE) | 67,574 | 121,978 | |||||
| 40,918 | BARRICK GOLD CORP. | 384,639 | 1,149,287 | |||||
| 27,148 | BROOKFIELD ASSET MANAGEMENT, INC., CLASS A | 174,133 | 898,307 | |||||
| 11,000 | BRP, INC. (SUB VOTING) | 430,510 | 581,165 | |||||
| 82,874 | CAE, INC. | 1,731,159 | 1,212,411 | |||||
| 14,528 | CANADIAN IMPERIAL BANK OF COMMERCE | 674,491 | 1,085,931 | |||||
| 15,994 | CANADIAN NATIONAL RAILWAY CO. | 292,557 | 1,703,360 | |||||
| 3,606 | CANADIAN PACIFIC RAILWAY LTD. | 112,878 | 1,096,925 | |||||
| 22,029 | CANADIAN PACIFIC RAILWAY LTD. (NEW YORK EXCHANGE) | 2,964,365 | 6,706,288 | |||||
| 5,809 | CANADIAN TIRE CORP. LTD., CLASS A | 625,049 | 585,110 | |||||
| 10,300 | CARGOJET, INC. | 764,310 | 1,475,208 | |||||
| 35,300 | CASCADES, INC. | 347,472 | 446,436 | |||||
| 45,100 | CENTERRA GOLD, INC. | 366,388 | 524,651 | |||||
| 6,978 | CGI, INC.(b) | 55,128 | 473,637 | |||||
| 52,600 | COMINAR REAL ESTATE INVESTMENT TRUST | 432,533 | 289,951 | |||||
| 167 | CONSTELLATION SOFTWARE, INC. | 49,226 | 185,572 | |||||
| 98,400 | CORUS ENTERTAINMENT, INC., CLASS B | 312,084 | 213,568 | |||||
| 29,100 | DESCARTES SYSTEMS GROUP (THE), INC.(b) | 1,133,860 | 1,657,643 | |||||
| 6,582 | DOLLARAMA, INC. | 86,132 | 252,296 | |||||
| 25,600 | DOREL INDUSTRIES, INC., CLASS B(b) | 175,448 | 228,209 | |||||
| 110,655 | ECN CAPITAL CORP. | 366,000 | 420,498 | |||||
| 4,440 | ENBRIDGE, INC. | 133,440 | 129,711 | |||||
| 72,100 | ENERPLUS CORP. | 414,689 | 132,120 | |||||
| 28,366 | EQUINOX GOLD CORP.(b) | 177,520 | 331,262 | |||||
| 211 | FAIRFAX FINANCIAL HOLDINGS LTD. | 52,589 | 62,133 | |||||
| 15,430 | FIRSTSERVICE CORP. | 1,564,619 | 2,036,243 | |||||
| 1,025 | FORTIS, INC. | 32,011 | 41,907 | |||||
| 2,389 | FRANCO-NEVADA CORP. | 109,265 | 333,837 | |||||
| 6,104 | GILDAN ACTIVEWEAR, INC. | 33,435 | 120,288 | |||||
| 208,410 | HUSKY ENERGY, INC. | 454,613 | 482,072 | |||||
| 19,500 | IA FINANCIAL CORP., INC. | 882,358 | 678,777 | |||||
| 129,646 | IMPERIAL OIL LTD. | 3,634,710 | 1,551,994 | |||||
| 415 | INTACT FINANCIAL CORP. | 33,776 | 44,437 | |||||
| 1,100 | INTERNATIONAL PETROLEUM CORP.(b) | 2,833 | 2,024 | |||||
| 11,661 | KINAXIS, INC.(b) | 734,073 | 1,716,550 | |||||
| 35,289 | KINROSS GOLD CORP.(b) | 70,483 | 311,401 | |||||
| 2,064 | LOBLAW COS. LTD. | 70,779 | 108,087 | |||||
| 16,429 | LULULEMON ATHLETICA, INC.(b) | 3,030,250 | 5,411,220 | |||||
| 52 | (Continued) |
CLEARWATER INVESTMENT TRUST
Schedule of Investments - Clearwater International Fund
September 30, 2020 (unaudited)
| Shares | Security | Cost | Fair value (a) | Percent of net assets | ||||
| Canada (Cont'd): | ||||||||
| 9,753 | MAGNA INTERNATIONAL, INC. | $71,192 | 446,285 | |||||
| 3,590 | MANULIFE FINANCIAL CORP. | 39,610 | 49,932 | |||||
| 3,000 | METRO, INC. | 54,328 | 143,945 | |||||
| 19,328 | NATIONAL BANK OF CANADA | 618,005 | 960,049 | |||||
| 18,700 | NFI GROUP, INC. | 423,076 | 232,565 | |||||
| 6,762 | NUTRIEN LTD. | 114,296 | 265,138 | |||||
| 6,564 | OPEN TEXT CORP. | 72,477 | 277,438 | |||||
| 1,612 | PARKLAND CORP. | 43,114 | 42,626 | |||||
| 4,522 | PEMBINA PIPELINE CORP. | 33,296 | 95,972 | |||||
| 49,000 | PIZZA PIZZA ROYALTY CORP. | 343,236 | 307,273 | |||||
| 27,894 | RIOCAN REAL ESTATE INVESTMENT TRUST | 313,497 | 294,536 | |||||
| 2,701 | RITCHIE BROS. AUCTIONEERS, INC. | 50,064 | 160,188 | |||||
| 9,320 | ROGERS COMMUNICATIONS, INC., CLASS B | 220,803 | 369,706 | |||||
| 27,055 | ROYAL BANK OF CANADA | 908,895 | 1,899,570 | |||||
| 13,700 | SEVEN GENERATIONS ENERGY LTD., CLASS A(b) | 93,128 | 36,937 | |||||
| 1,375 | SHOPIFY, INC., CLASS A(b) | 371,506 | 1,406,123 | |||||
| 5,229 | SHOPIFY, INC., CLASS A (NEW YORK EXCHANGE)(b) | 998,685 | 5,349,110 | |||||
| 12,101 | SUN LIFE FINANCIAL, INC. | 245,097 | 493,110 | |||||
| 99,863 | SUNCOR ENERGY, INC. | 2,451,017 | 1,219,460 | |||||
| 3,667 | TC ENERGY CORP. | 103,969 | 153,945 | |||||
| 31,989 | TECK RESOURCES LTD., CLASS B | 174,290 | 445,403 | |||||
| 9,096 | TELUS CORP. | 59,716 | 160,054 | |||||
| 10,700 | TFI INTERNATIONAL, INC. | 328,109 | 447,430 | |||||
| 8,040 | THOMSON REUTERS CORP. | 206,603 | 641,606 | |||||
| 30,009 | TORONTO-DOMINION BANK (THE) | 557,653 | 1,389,399 | |||||
| 104 | TRISURA GROUP LTD.(b) | 490 | 6,619 | |||||
| 16,800 | WAJAX CORP. | 206,860 | 150,141 | |||||
| 26,600 | WESTSHORE TERMINALS INVESTMENT CORP. | 397,133 | 303,846 | |||||
| 6,930 | WHEATON PRECIOUS METALS CORP. | 114,647 | 340,007 | |||||
| 25,967 | YAMANA GOLD, INC. | 47,753 | 147,625 | |||||
| 33,382,450 | 54,191,147 | 7.46% | ||||||
| Chile: | ||||||||
| 1,115,900 | AGUAS ANDINAS S.A., CLASS A | 339,399 | 312,710 | |||||
| 5,893,187 | ENEL CHILE S.A. | 532,931 | 413,615 | |||||
| 872,330 | 726,325 | 0.10% | ||||||
| China: | ||||||||
| 290,000 | AGILE GROUP HOLDINGS LTD. | 352,847 | 378,681 | |||||
| 53,000 | AIRTAC INTERNATIONAL GROUP | 728,716 | 1,191,320 | |||||
| 9,171 | ALIBABA GROUP HOLDING LTD. ADR(b)(f) | 1,794,965 | 2,696,091 | |||||
| 291,500 | ASIA CEMENT CHINA HOLDINGS CORP. | 362,392 | 256,142 | |||||
| 29,612 | BAIDU, INC. ADR(b)(f) | 3,578,387 | 3,748,583 | |||||
| 656,000 | CHINA BLUECHEMICAL LTD., CLASS H | 177,444 | 94,802 | |||||
| 408,000 | CHINA MEDICAL SYSTEM HOLDINGS LTD. | 472,941 | 449,060 | |||||
| 1,191,000 | CHINA SUNTIEN GREEN ENERGY CORP. LTD., CLASS H(b) | 329,834 | 307,353 | |||||
| 21,000 | SILERGY CORP. | 674,111 | 1,236,275 | |||||
| 95,155 | TENCENT HOLDINGS LTD. | 1,490,900 | 6,280,190 | |||||
| 108,689 | TRIP.COM GROUP LTD. ADR(b)(f) | 3,085,007 | 3,384,575 | |||||
| 412,000 | ZHEJIANG EXPRESSWAY CO. LTD., CLASS H | 352,186 | 297,170 | |||||
| 13,399,730 | 20,320,242 | 2.80% | ||||||
| Czech Republic: | ||||||||
| 88,400 | MONETA MONEY BANK A.S.(e) | 268,732 | 203,769 | |||||
| 701 | PHILIP MORRIS CR A.S. | 402,293 | 416,115 | |||||
| 671,025 | 619,884 | 0.09% | ||||||
| Denmark: | ||||||||
| 5,605 | ALK-ABELLO A/S(b) | 1,511,731 | 1,851,886 | |||||
| 44 | AP MOLLER - MAERSK A/S, CLASS A | 35,561 | 64,685 | |||||
| 65 | AP MOLLER - MAERSK A/S, CLASS B | 52,319 | 103,183 | |||||
| 1,537 | CARLSBERG A.S., CLASS B | 70,497 | 207,196 | |||||
| 1,178 | CHR HANSEN HOLDING A/S | 71,480 | 130,936 | |||||
| 1,500 | COLOPLAST A/S, CLASS B | 27,666 | 237,051 | |||||
| 22,200 | D/S NORDEN A/S | 318,702 | 360,799 | |||||
| 6,700 | DANSKE BANK A/S(b) | 54,825 | 90,847 | |||||
| 4,348 | DEMANT A/S(b) | 81,241 | 136,605 | |||||
| 69,611 | DSV PANALPINA A/S | 6,522,012 | 11,373,630 | |||||
| 804 | GENMAB A/S(b) | 100,710 | 291,217 | |||||
| 6,944 | ISS A/S(b) | 96,080 | 91,750 | |||||
| 53 | (Continued) |
CLEARWATER INVESTMENT TRUST
Schedule of Investments - Clearwater International Fund
September 30, 2020 (unaudited)
| Shares | Security | Cost | Fair value (a) | Percent of net assets | ||||
| Denmark (Cont'd): | ||||||||
| 21,394 | NOVO NORDISK A/S, CLASS B | $252,539 | 1,480,252 | |||||
| 2,460 | NOVOZYMES A/S, CLASS B | 38,505 | 154,924 | |||||
| 864 | ORSTED A/S(e) | 68,168 | 119,111 | |||||
| 9,400 | PANDORA A/S | 311,027 | 677,551 | |||||
| 26,987 | ROYAL UNIBREW A/S | 1,783,176 | 2,786,292 | |||||
| 6,035 | SIMCORP A/S | 555,031 | 794,066 | |||||
| 2,699 | SOLAR A/S, CLASS B | 116,641 | 127,726 | |||||
| 3,250 | TOPDANMARK A/S | 33,362 | 157,129 | |||||
| 3,362 | VESTAS WIND SYSTEMS A/S | 160,514 | 545,341 | |||||
| 12,261,787 | 21,782,177 | 3.00% | ||||||
| Egypt: | ||||||||
| 323,300 | EASTERN CO. S.A.E. | 244,707 | 247,115 | |||||
| 244,707 | 247,115 | 0.03% | ||||||
| Finland: | ||||||||
| 2,770 | ELISA OYJ | 86,574 | 163,294 | |||||
| 5,584 | KESKO OYJ, CLASS B | 30,705 | 144,033 | |||||
| 5,273 | KONE OYJ, CLASS B | 105,699 | 464,046 | |||||
| 21,225 | NESTE OYJ | 67,704 | 1,119,090 | |||||
| 3,741 | NOKIAN RENKAAT OYJ | 60,808 | 105,925 | |||||
| 1,960 | ORION OYJ, CLASS B | 49,561 | 88,864 | |||||
| 36,100 | SANOMA OYJ | 389,480 | 462,194 | |||||
| 18,590 | STORA ENSO OYJ (REGISTERED) | 105,291 | 291,519 | |||||
| 11,934 | UPM-KYMMENE OYJ | 99,929 | 363,652 | |||||
| 1,849 | VALMET OYJ | 14,443 | 45,807 | |||||
| 1,010,194 | 3,248,424 | 0.45% | ||||||
| France: | ||||||||
| 2,327 | AEROPORTS DE PARIS | 211,828 | 232,860 | |||||
| 22,200 | AIR FRANCE-KLM(b)(d) | 263,182 | 77,096 | |||||
| 259 | AIR LIQUIDE S.A. | 42,023 | 41,147 | |||||
| 11,027 | AIRBUS S.E.(b) | 366,293 | 802,479 | |||||
| 4,707 | ARKEMA S.A. | 419,345 | 500,107 | |||||
| 27,762 | AXA S.A. | 358,341 | 513,502 | |||||
| 3,062 | CAPGEMINI S.E. | 111,713 | 394,007 | |||||
| 19,252 | CIE DE SAINT-GOBAIN(b) | 430,348 | 812,818 | |||||
| 5,399 | CIE DES ALPES | 143,643 | 106,978 | |||||
| 3,383 | CIE GENERALE DES ETABLISSEMENTS MICHELIN S.C.A. | 179,029 | 363,798 | |||||
| 12,397 | CIE PLASTIC OMNIUM S.A. | 365,091 | 327,907 | |||||
| 37,390 | COFACE S.A.(b) | 449,179 | 261,712 | |||||
| 7,706 | COVIVIO | 482,654 | 542,997 | |||||
| 29,989 | CREDIT AGRICOLE S.A.(b) | 267,369 | 262,720 | |||||
| 23,811 | DANONE S.A. | 1,370,006 | 1,541,588 | |||||
| 1,736 | EDENRED | 25,484 | 78,158 | |||||
| 417 | EIFFAGE S.A.(b) | 34,325 | 34,136 | |||||
| 4,785 | ENGIE S.A.(b) | 49,329 | 64,068 | |||||
| 15,893 | ESSILORLUXOTTICA S.A.(b) | 1,815,130 | 2,171,763 | |||||
| 8,050 | ESSILORLUXOTTICA S.A. (EURONEXT PARIS EXCHANGE)(b) | 948,207 | 1,096,250 | |||||
| 2,901 | EURAZEO S.E.(b) | 76,265 | 157,139 | |||||
| 564 | GECINA S.A. | 51,331 | 74,524 | |||||
| 9,197 | GETLINK S.E.(b) | 70,409 | 125,083 | |||||
| 3,791 | ILIAD S.A. | 536,903 | 698,049 | |||||
| 3,399 | INFOTEL S.A. | 145,404 | 147,052 | |||||
| 6,762 | IPSEN S.A. | 538,954 | 709,962 | |||||
| 9,500 | KAUFMAN & BROAD S.A. | 362,957 | 377,588 | |||||
| 1,026 | KERING S.A. | 174,510 | 682,785 | |||||
| 4,545 | KLEPIERRE S.A. | 71,744 | 63,865 | |||||
| 4,848 | LEGRAND S.A. | 109,851 | 387,538 | |||||
| 6,266 | L'OREAL S.A. | 661,338 | 2,039,408 | |||||
| 16,073 | LVMH MOET HENNESSY LOUIS VUITTON S.E. | 2,533,629 | 7,526,609 | |||||
| 14,296 | MERSEN S.A.(b) | 465,081 | 439,985 | |||||
| 8,798 | NEXITY S.A. | 431,993 | 267,989 | |||||
| 22,589 | PERNOD RICARD S.A. | 3,500,417 | 3,605,861 | |||||
| 12,760 | PEUGEOT S.A.(b) | 76,914 | 231,887 | |||||
| 23,074 | RENAULT S.A.(b) | 423,958 | 600,444 | |||||
| 2,684 | SAFRAN S.A.(b) | 123,278 | 265,721 | |||||
| 18,127 | SANOFI | 1,018,143 | 1,813,519 | |||||
| 54 | (Continued) |
CLEARWATER INVESTMENT TRUST
Schedule of Investments - Clearwater International Fund
September 30, 2020 (unaudited)
| Shares | Security | Cost | Fair value (a) | Percent of net assets | ||||
| France (Cont'd): | ||||||||
| 278 | SCHNEIDER ELECTRIC S.E. | $8,838 | 34,811 | |||||
| 7,138 | SCHNEIDER ELECTRIC S.E. (EURONEXT PARIS EXCHANGE) | 267,356 | 887,527 | |||||
| 1,821 | SCOR S.E.(b) | 36,624 | 50,515 | |||||
| 13,970 | SOCIETE GENERALE S.A.(b) | 192,352 | 185,379 | |||||
| 3,699 | SOCIETE POUR L'INFORMATIQUE INDUSTRIELLE | 108,264 | 85,870 | |||||
| 7,150 | SODEXO S.A.(b) | 647,363 | 511,532 | |||||
| 24,489 | SODEXO S.A. (EURONEXT PARIS EXCHANGE) | 2,158,127 | 1,752,014 | |||||
| 9,980 | SOITEC(b) | 824,319 | 1,440,399 | |||||
| 51,800 | TELEVISION FRANCAISE 1(b) | 458,222 | 317,937 | |||||
| 1,413 | THALES S.A. | 81,763 | 106,292 | |||||
| 20,803 | TOTAL S.E. | 742,470 | 712,202 | |||||
| 3,269 | VALEO S.A. | 58,895 | 100,609 | |||||
| 13,514 | VEOLIA ENVIRONNEMENT S.A. | 143,775 | 291,856 | |||||
| 10,500 | VICAT S.A. | 406,419 | 351,471 | |||||
| 8,179 | VINCI S.A. | 345,228 | 685,839 | |||||
| 95,834 | VIVENDI S.A. | 2,001,171 | 2,674,182 | |||||
| 6,004 | WENDEL S.E. | 462,932 | 545,201 | |||||
| 28,649,716 | 41,174,735 | 5.67% | ||||||
| Georgia: | ||||||||
| 21,875 | BANK OF GEORGIA GROUP PLC(b) | 355,261 | 252,062 | |||||
| 355,261 | 252,062 | 0.04% | ||||||
| Germany: | ||||||||
| 3,994 | ADIDAS A.G.(b) | 192,837 | 1,292,912 | |||||
| 9,283 | ALLIANZ S.E. (REGISTERED) | 904,298 | 1,780,816 | |||||
| 166,833 | ARCH CAPITAL GROUP LTD.(b) | 3,025,026 | 4,879,865 | |||||
| 38,556 | AROUNDTOWN S.A.(b) | 192,935 | 193,929 | |||||
| 6,098 | AURUBIS A.G. | 286,000 | 415,678 | |||||
| 13,539 | BASF S.E. | 453,717 | 825,120 | |||||
| 9,925 | BAYER A.G. (REGISTERED) | 473,075 | 620,345 | |||||
| 8,787 | BAYERISCHE MOTOREN WERKE A.G. | 501,991 | 638,641 | |||||
| 2,206 | BEIERSDORF A.G. | 146,950 | 250,883 | |||||
| 1,188 | BRENNTAG A.G. | 43,546 | 75,633 | |||||
| 1,042 | CONTINENTAL A.G. | 57,443 | 112,982 | |||||
| 1,858 | DELIVERY HERO S.E.(b)(e) | 87,405 | 213,746 | |||||
| 4,594 | DEUTSCHE BOERSE A.G. | 283,235 | 806,858 | |||||
| 15,996 | DEUTSCHE EUROSHOP A.G.(b) | 435,440 | 198,798 | |||||
| 37,890 | DEUTSCHE PFANDBRIEFBANK A.G.(b)(e) | 469,871 | 251,218 | |||||
| 18,572 | DEUTSCHE POST A.G. (REGISTERED) | 230,768 | 847,038 | |||||
| 33,147 | DEUTSCHE TELEKOM A.G. (REGISTERED) | 373,793 | 555,355 | |||||
| 9,111 | DEUTSCHE WOHNEN S.E. | 295,363 | 456,023 | |||||
| 82,454 | E.ON S.E. | 724,674 | 911,435 | |||||
| 35,540 | ECKERT & ZIEGLER STRAHLEN- UND MEDIZINTECHNIK A.G. | 1,304,333 | 1,818,430 | |||||
| 40,921 | EVOTEC S.E.(b)(d) | 933,333 | 1,082,860 | |||||
| 23,600 | FREENET A.G. | 557,311 | 477,858 | |||||
| 56,759 | FRESENIUS MEDICAL CARE A.G. & CO. KGAA | 4,335,734 | 4,792,722 | |||||
| 5,544 | FRESENIUS S.E. & CO. KGAA | 99,810 | 252,397 | |||||
| 17,795 | HAMBURGER HAFEN UND LOGISTIK A.G. | 443,620 | 312,122 | |||||
| 2,246 | HANNOVER RUECK S.E. | 94,321 | 348,125 | |||||
| 3,671 | HEIDELBERGCEMENT A.G. | 131,196 | 225,189 | |||||
| 23,695 | HELLA GMBH & CO. KGAA(b) | 1,045,191 | 1,195,147 | |||||
| 2,730 | HOCHTIEF A.G. | 118,140 | 212,692 | |||||
| 3,375 | HYPOPORT S.E.(b) | 1,234,587 | 2,113,048 | |||||
| 22,002 | INFINEON TECHNOLOGIES A.G. | 133,608 | 622,077 | |||||
| 6,898 | JOST WERKE A.G.(b)(e) | 220,852 | 278,212 | |||||
| 2,159 | MERCK KGAA | 96,589 | 315,276 | |||||
| 3,139 | MUENCHENER RUECKVERSICHERUNGS-GESELLSCHAFT A.G. IN MUENCHEN (REGISTERED) | 392,853 | 797,158 | |||||
| 19,095 | PROSIEBENSAT.1 MEDIA S.E.(b) | 286,490 | 250,857 | |||||
| 7,700 | PUBLITY A.G.(b)(d) | 286,657 | 323,649 | |||||
| 3,999 | RHEINMETALL A.G. | 520,402 | 359,899 | |||||
| 4,035 | RWE A.G. | 88,431 | 151,292 | |||||
| 17,103 | SAP S.E. | 683,559 | 2,662,158 | |||||
| 13,327 | SIEMENS A.G. (REGISTERED) | 815,103 | 1,685,651 | |||||
| 6,663 | SIEMENS ENERGY A.G.(b) | 171,156 | 179,690 | |||||
| 3,600 | SILTRONIC A.G. | 264,192 | 323,399 | |||||
| 55 | (Continued) |
CLEARWATER INVESTMENT TRUST
Schedule of Investments - Clearwater International Fund
September 30, 2020 (unaudited)
| Shares | Security | Cost | Fair value (a) | Percent of net assets | ||||
| Germany (Cont'd): | ||||||||
| 188,717 | TELEFONICA DEUTSCHLAND HOLDING A.G. | $459,389 | 484,341 | |||||
| 141,527 | TUI A.G. - CDI(d) | 548,893 | 534,892 | |||||
| 4,171 | UNIPER S.E. | 46,925 | 134,776 | |||||
| 404 | VOLKSWAGEN A.G. | 40,235 | 70,672 | |||||
| 7,564 | VONOVIA S.E. | 341,426 | 519,512 | |||||
| 1,141 | ZALANDO S.E.(b)(e) | 44,879 | 106,887 | |||||
| 24,917,582 | 37,958,263 | 5.22% | ||||||
| Greece: | ||||||||
| 6,746 | HELLENIC TELECOMMUNICATIONS ORGANIZATION S.A. | 54,075 | 97,364 | |||||
| 54,075 | 97,364 | 0.01% | ||||||
| Hong Kong: | ||||||||
| 813,200 | AIA GROUP LTD. | 5,326,832 | 7,964,062 | |||||
| 46,000 | BOC HONG KONG HOLDINGS LTD. | 63,016 | 121,083 | |||||
| 1,462,000 | CITIC TELECOM INTERNATIONAL HOLDINGS LTD. | 547,331 | 465,951 | |||||
| 52,544 | CK ASSET HOLDINGS LTD. | 147,485 | 255,939 | |||||
| 24,544 | CK HUTCHISON HOLDINGS LTD. | 120,441 | 147,580 | |||||
| 35,500 | CLP HOLDINGS LTD. | 245,345 | 329,804 | |||||
| 722,000 | FIRST PACIFIC CO. LTD. | 288,855 | 195,637 | |||||
| 18,000 | GALAXY ENTERTAINMENT GROUP LTD. | 39,054 | 120,657 | |||||
| 2,228,000 | GEMDALE PROPERTIES & INVESTMENT CORP. LTD. | 413,300 | 376,601 | |||||
| 15,300 | HANG SENG BANK LTD. | 175,457 | 225,254 | |||||
| 27,331 | HENDERSON LAND DEVELOPMENT CO. LTD. | 52,934 | 100,683 | |||||
| 11,800 | HONG KONG EXCHANGES & CLEARING LTD. | 203,281 | 550,866 | |||||
| 40,500 | LINK REIT | 84,196 | 329,224 | |||||
| 3,006 | MELCO RESORTS & ENTERTAINMENT LTD. (ADR)(f) | 56,366 | 50,050 | |||||
| 30,500 | MTR CORP. LTD. | 88,703 | 150,531 | |||||
| 20,520 | PACIFIC CENTURY PREMIUM DEVELOPMENTS LTD.(b) | 4,660 | 5,375 | |||||
| 190,000 | PCCW LTD. | 77,805 | 113,264 | |||||
| 392,000 | PERFECT SHAPE MEDICAL LTD. | 140,251 | 113,806 | |||||
| 185,000 | SHENZHEN INTERNATIONAL HOLDINGS LTD. | 343,057 | 293,134 | |||||
| 289,000 | SITC INTERNATIONAL HOLDINGS CO. LTD. | 303,932 | 399,004 | |||||
| 8,000 | SUN HUNG KAI PROPERTIES LTD. | 65,036 | 101,986 | |||||
| 47,000 | SWIRE PACIFIC LTD., CLASS A | 244,518 | 225,599 | |||||
| 7,000 | TECHTRONIC INDUSTRIES CO. LTD. | 44,938 | 91,767 | |||||
| 600,000 | UNITED LABORATORIES INTERNATIONAL HOLDINGS (THE) LTD. | 352,686 | 617,802 | |||||
| 469,800 | VALUETRONICS HOLDINGS LTD. | 216,550 | 194,452 | |||||
| 83,500 | WH GROUP LTD.(e) | 45,547 | 67,662 | |||||
| 21,000 | WHARF HOLDINGS (THE) LTD. | 43,463 | 41,783 | |||||
| 18,000 | WHARF REAL ESTATE INVESTMENT CO. LTD. | 88,257 | 73,161 | |||||
| 418,000 | XINYI GLASS HOLDINGS LTD. | 481,711 | 840,309 | |||||
| 358,000 | YUEXIU TRANSPORT INFRASTRUCTURE LTD. | 311,883 | 207,870 | |||||
| 10,616,890 | 14,770,896 | 2.03% | ||||||
| India: | ||||||||
| 523,748 | BHARTI INFRATEL LTD. | 2,187,419 | 1,244,416 | |||||
| 81,725 | CREDITACCESS GRAMEEN LTD.(b) | 952,330 | 822,844 | |||||
| 687,800 | FIRSTSOURCE SOLUTIONS LTD. | 375,974 | 678,198 | |||||
| 386,194 | HCL TECHNOLOGIES LTD. | 2,483,490 | 4,248,239 | |||||
| 73,854 | HDFC BANK LTD. ADR(b)(f) | 2,388,893 | 3,689,746 | |||||
| 114,700 | HINDUSTAN PETROLEUM CORP. LTD. | 431,628 | 280,842 | |||||
| 578,685 | INDIAN ENERGY EXCHANGE LTD.(e) | 1,424,815 | 1,630,248 | |||||
| 40,400 | JUBILANT LIFE SCIENCES LTD. | 314,717 | 400,249 | |||||
| 42,000 | MPHASIS LTD. | 670,244 | 787,543 | |||||
| 322,000 | NMDC LTD. | 521,633 | 358,966 | |||||
| 1,107,100 | SJVN LTD. | 377,345 | 329,369 | |||||
| 254,392 | SYNGENE INTERNATIONAL LTD.(b)(e) | 1,124,396 | 1,906,561 | |||||
| 24,958 | WNS HOLDINGS LTD. ADR(b)(f) | 1,477,591 | 1,596,313 | |||||
| 14,730,475 | 17,973,534 | 2.47% | ||||||
| Indonesia: | ||||||||
| 4,097,000 | ADARO ENERGY TBK PT | 470,816 | 312,506 | |||||
| 5,314,800 | BANK BTPN SYARIAH TBK PT | 1,314,458 | 1,171,542 | |||||
| 2,022,800 | MATAHARI DEPARTMENT STORE TBK PT(b) | 317,587 | 133,222 | |||||
| 2,102,861 | 1,617,270 | 0.22% | ||||||
| Ireland: | ||||||||
| 27,587 | ACCENTURE PLC, CLASS A | 3,381,563 | 6,234,386 | |||||
| 1,530 | AERCAP HOLDINGS N.V.(b) | 38,135 | 38,541 | |||||
| 56 | (Continued) |
CLEARWATER INVESTMENT TRUST
Schedule of Investments - Clearwater International Fund
September 30, 2020 (unaudited)
| Shares | Security | Cost | Fair value (a) | Percent of net assets | ||||
| Ireland (Cont'd): | ||||||||
| 92,606 | CRH PLC | $2,703,923 | 3,351,738 | |||||
| 65,382 | DALATA HOTEL GROUP PLC(b) | 368,686 | 189,726 | |||||
| 167,302 | EXPERIAN PLC | 3,058,939 | 6,303,642 | |||||
| 904 | FLUTTER ENTERTAINMENT PLC | 76,633 | 143,828 | |||||
| 13,695 | ICON PLC(b) | 955,941 | 2,616,977 | |||||
| 11,485 | JAMES HARDIE INDUSTRIES PLC - CDI | 103,360 | 272,614 | |||||
| 3,255 | KERRY GROUP PLC, CLASS A | 214,084 | 417,888 | |||||
| 48,411 | KEYWORDS STUDIOS PLC | 819,001 | 1,359,285 | |||||
| 17,539 | RYANAIR HOLDINGS PLC(b) | 235,787 | 236,070 | |||||
| 1,812 | SMURFIT KAPPA GROUP PLC | 50,442 | 71,213 | |||||
| 12,006,494 | 21,235,908 | 2.92% | ||||||
| Isle of Man: | ||||||||
| 8,963 | GVC HOLDINGS PLC(b) | 96,395 | 112,647 | |||||
| 96,395 | 112,647 | 0.02% | ||||||
| Israel: | ||||||||
| 74,833 | BANK HAPOALIM B.M. | 372,182 | 399,756 | |||||
| 1,532 | CHECK POINT SOFTWARE TECHNOLOGIES LTD.(b) | 119,497 | 184,361 | |||||
| 29,044 | MIZRAHI TEFAHOT BANK LTD. | 475,042 | 514,970 | |||||
| 3,072 | NICE LTD.(b) | 169,095 | 693,995 | |||||
| 1,135,816 | 1,793,082 | 0.25% | ||||||
| Italy: | ||||||||
| 285,200 | A2A S.P.A. | 555,841 | 414,635 | |||||
| 52,711 | AMPLIFON S.P.A.(b) | 1,265,536 | 1,888,021 | |||||
| 18,874 | ASSICURAZIONI GENERALI S.P.A. | 228,503 | 266,099 | |||||
| 34,463 | ATLANTIA S.P.A.(b) | 455,057 | 542,655 | |||||
| 17,500 | AVIO S.P.A.(b) | 264,310 | 275,350 | |||||
| 25,272 | BANCA MEDIOLANUM S.P.A. | 87,322 | 182,225 | |||||
| 11,397 | EL.EN. S.P.A.(b) | 291,927 | 289,964 | |||||
| 84,847 | ENEL S.P.A. | 298,823 | 737,934 | |||||
| 4,500 | ENI S.P.A. | 39,200 | 35,286 | |||||
| 18,516 | FERRARI N.V. | 2,409,274 | 3,400,728 | |||||
| 1,022 | FERRARI N.V. (NEW YORK EXCHANGE) | 7,571 | 188,140 | |||||
| 44,854 | INTERPUMP GROUP S.P.A. | 794,570 | 1,668,125 | |||||
| 26,311 | INTESA SANPAOLO S.P.A.(b) | 41,384 | 49,450 | |||||
| 173,553 | IREN S.P.A. | 474,559 | 446,440 | |||||
| 28,600 | LA DORIA S.P.A. | 361,264 | 374,889 | |||||
| 12,059 | LEONARDO S.P.A. | 61,595 | 70,693 | |||||
| 70,149 | SNAM S.P.A. | 252,658 | 360,979 | |||||
| 49,687 | SOCIETA CATTOLICA DI ASSICURAZIONI S.C.(b) | 431,868 | 265,063 | |||||
| 178,235 | TENARIS S.A. | 1,693,601 | 890,428 | |||||
| 24,707 | TENARIS S.A. ADR(f) | 546,314 | 243,364 | |||||
| 39,609 | TERNA RETE ELETTRICA NAZIONALE S.P.A. | 160,166 | 277,430 | |||||
| 29,771 | UNICREDIT S.P.A.(b) | 261,654 | 245,906 | |||||
| 71,681 | UNIPOL GRUPPO S.P.A.(b) | 376,844 | 313,478 | |||||
| 95,230 | UNIPOLSAI ASSICURAZIONI S.P.A. | 153,826 | 248,538 | |||||
| 11,513,667 | 13,675,820 | 1.88% | ||||||
| Japan: | ||||||||
| 1,500 | ABC-MART, INC. | 56,540 | 77,798 | |||||
| 30,600 | ADEKA CORP. | 390,224 | 438,407 | |||||
| 4,700 | AEON CO. LTD. | 52,433 | 125,939 | |||||
| 600 | AEON REIT INVESTMENT CORP. | 728,822 | 688,949 | |||||
| 2,300 | AISIN SEIKI CO. LTD. | 37,584 | 73,057 | |||||
| 15,000 | AJINOMOTO CO., INC. | 116,767 | 307,069 | |||||
| 2,500 | ALFRESA HOLDINGS CORP. | 24,420 | 54,473 | |||||
| 15,600 | ARCS CO. LTD. | 325,913 | 398,487 | |||||
| 11,900 | AS ONE CORP. | 1,284,683 | 1,702,660 | |||||
| 5,500 | ASAHI GROUP HOLDINGS LTD. | 83,346 | 190,660 | |||||
| 32,500 | ASAHI KASEI CORP. | 157,083 | 281,873 | |||||
| 22,100 | ASAHI YUKIZAI CORP. | 276,792 | 284,147 | |||||
| 9,300 | ASANUMA CORP. | 324,412 | 361,983 | |||||
| 37,000 | ASTELLAS PHARMA, INC. | 236,149 | 549,746 | |||||
| 1,500 | BANDAI NAMCO HOLDINGS, INC. | 14,652 | 109,359 | |||||
| 16,500 | BAYCURRENT CONSULTING, INC. | 1,502,068 | 2,284,170 | |||||
| 13,800 | BRIDGESTONE CORP. | 205,726 | 434,026 | |||||
| 32,100 | BROTHER INDUSTRIES LTD. | 541,898 | 507,074 | |||||
| 48,400 | BUNKA SHUTTER CO. LTD. | 363,296 | 382,280 | |||||
| 57 | (Continued) |
CLEARWATER INVESTMENT TRUST
Schedule of Investments - Clearwater International Fund
September 30, 2020 (unaudited)
| Shares | Security | Cost | Fair value (a) | Percent of net assets | ||||
| Japan (Cont'd): | ||||||||
| 2,700 | CENTRAL JAPAN RAILWAY CO. | $229,516 | 386,318 | |||||
| 13,500 | CHUGAI PHARMACEUTICAL CO. LTD. | 82,278 | 603,541 | |||||
| 21,900 | CMIC HOLDINGS CO. LTD. | 316,498 | 280,330 | |||||
| 28,400 | CREDIT SAISON CO. LTD. | 361,395 | 299,443 | |||||
| 29,100 | DAIICHI SANKYO CO. LTD. | 150,922 | 890,949 | |||||
| 4,600 | DAIKIN INDUSTRIES LTD. | 136,302 | 841,796 | |||||
| 19,000 | DAITRON CO. LTD. | 328,045 | 275,276 | |||||
| 10,000 | DAIWA HOUSE INDUSTRY CO. LTD. | 103,706 | 255,772 | |||||
| 17,500 | DAIWA SECURITIES GROUP, INC. | 60,410 | 73,126 | |||||
| 5,600 | DAIWABO HOLDINGS CO. LTD. | 223,879 | 359,475 | |||||
| 8,200 | DENSO CORP. | 185,234 | 357,421 | |||||
| 3,300 | DENTSU GROUP, INC. | 56,753 | 96,843 | |||||
| 3,600 | EAST JAPAN RAILWAY CO. | 188,040 | 221,192 | |||||
| 19,700 | EBARA CORP. | 478,039 | 531,049 | |||||
| 17,800 | ECO'S CO. LTD. | 285,796 | 382,110 | |||||
| 57,500 | EGUARANTEE, INC. | 1,459,265 | 1,305,765 | |||||
| 3,400 | EISAI CO. LTD. | 112,861 | 308,971 | |||||
| 4,600 | ELECTRIC POWER DEVELOPMENT CO. LTD. | 72,574 | 70,789 | |||||
| 28,300 | ELEMATEC CORP. | 262,160 | 265,920 | |||||
| 185,600 | ENEOS HOLDINGS, INC. | 691,234 | 659,935 | |||||
| 20,400 | EXEDY CORP. | 319,517 | 264,224 | |||||
| 2,600 | FANUC CORP. | 182,941 | 496,013 | |||||
| 1,300 | FAST RETAILING CO. LTD. | 188,734 | 811,814 | |||||
| 50,120 | FEED ONE CO. LTD. | 432,664 | 441,963 | |||||
| 54,400 | FERROTEC HOLDINGS CORP.(d) | 435,460 | 463,714 | |||||
| 34,200 | FJ NEXT CO. LTD. | 337,056 | 290,229 | |||||
| 25,000 | FREEE K.K.(b) | 480,166 | 1,884,511 | |||||
| 31,700 | FUJI CORP. | 564,353 | 624,291 | |||||
| 4,700 | FUJI ELECTRIC CO. LTD. | 61,631 | 147,509 | |||||
| 10,400 | FUJIBO HOLDINGS, INC. | 287,084 | 360,916 | |||||
| 8,700 | FUJIFILM HOLDINGS CORP. | 163,215 | 427,720 | |||||
| 2,300 | FUJITSU LTD. | 106,202 | 312,729 | |||||
| 41,400 | FUKUOKA FINANCIAL GROUP, INC. | 523,630 | 692,453 | |||||
| 35,800 | FURUNO ELECTRIC CO. LTD. | 322,070 | 338,431 | |||||
| 400 | GMO PAYMENT GATEWAY, INC. | 36,072 | 42,630 | |||||
| 119,800 | HACHIJUNI BANK (THE) LTD. | 476,117 | 469,136 | |||||
| 3,000 | HAMAMATSU PHOTONICS K.K. | 52,686 | 150,476 | |||||
| 2,200 | HANKYU HANSHIN HOLDINGS, INC. | 51,221 | 70,507 | |||||
| 55,300 | HASEKO CORP. | 721,604 | 723,596 | |||||
| 29,100 | HENNGE K.K.(b)(d) | 744,932 | 1,862,466 | |||||
| 341 | HIROSE ELECTRIC CO. LTD. | 29,327 | 43,747 | |||||
| 19,000 | HITACHI LTD. | 295,895 | 638,288 | |||||
| 7,000 | HITACHI METALS LTD. | 55,542 | 107,192 | |||||
| 5,300 | HOYA CORP. | 112,594 | 596,008 | |||||
| 5,700 | HULIC CO. LTD. | 48,487 | 53,182 | |||||
| 26,100 | INNOTECH CORP. | 231,054 | 260,344 | |||||
| 7,600 | INPEX CORP. | 42,824 | 40,607 | |||||
| 13,800 | INTAGE HOLDINGS, INC. | 121,039 | 130,064 | |||||
| 1,300 | INVINCIBLE INVESTMENT CORP. | 761,926 | 384,583 | |||||
| 18,400 | ITOCHU CORP. | 196,261 | 468,440 | |||||
| 63,100 | IWAKI & CO. LTD. | 295,237 | 303,340 | |||||
| 21,900 | JACCS CO. LTD. | 467,646 | 353,008 | |||||
| 30,400 | JAPAN AVIATION ELECTRONICS INDUSTRY LTD. | 458,316 | 415,653 | |||||
| 49,300 | JAPAN ELEVATOR SERVICE HOLDINGS CO. LTD. | 1,122,150 | 1,708,543 | |||||
| 7,000 | JAPAN EXCHANGE GROUP, INC. | 56,090 | 195,003 | |||||
| 105,400 | JAPAN MATERIAL CO. LTD. | 1,339,600 | 1,466,096 | |||||
| 4,500 | KAJIMA CORP. | 25,084 | 53,847 | |||||
| 57,300 | KANDENKO CO. LTD. | 547,713 | 467,245 | |||||
| 12,300 | KANEKA CORP. | 387,968 | 343,465 | |||||
| 2,000 | KANSAI PAINT CO. LTD. | 10,449 | 49,457 | |||||
| 10,000 | KAO CORP. | 208,279 | 747,831 | |||||
| 29,762 | KDDI CORP. | 238,488 | 749,518 | |||||
| 1,200 | KEIO CORP. | 36,571 | 73,958 | |||||
| 2,400 | KEISEI ELECTRIC RAILWAY CO. LTD. | 22,185 | 67,564 | |||||
| 15,424 | KEYENCE CORP. | 1,762,769 | 7,163,206 | |||||
| 6,000 | KIKKOMAN CORP. | 52,867 | 331,105 | |||||
| 1,200 | KINTETSU GROUP HOLDINGS CO. LTD. | 35,697 | 51,031 | |||||
| 58 | (Continued) |
CLEARWATER INVESTMENT TRUST
Schedule of Investments - Clearwater International Fund
September 30, 2020 (unaudited)
| Shares | Security | Cost | Fair value (a) | Percent of net assets | ||||
| Japan (Cont'd): | ||||||||
| 9,900 | KIRIN HOLDINGS CO. LTD. | $101,976 | 185,252 | |||||
| 10,000 | KIRINDO HOLDINGS CO. LTD. | 194,672 | 331,864 | |||||
| 67,600 | KITZ CORP. | 466,295 | 383,301 | |||||
| 34,900 | KOBE BUSSAN CO. LTD. | 1,392,771 | 1,912,691 | |||||
| 2,300 | KONAMI HOLDINGS CORP. | 50,313 | 99,009 | |||||
| 21,800 | KUBOTA CORP. | 139,630 | 388,086 | |||||
| 6,900 | KUREHA CORP. | 316,117 | 297,682 | |||||
| 4,000 | KYOCERA CORP. | 133,049 | 227,450 | |||||
| 49,000 | KYOSAN ELECTRIC MANUFACTURING CO. LTD. | 177,172 | 224,406 | |||||
| 5,000 | KYOWA KIRIN CO. LTD. | 54,616 | 141,564 | |||||
| 38,000 | LASERTEC CORP. | 1,395,058 | 3,102,261 | |||||
| 13,100 | LINTEC CORP. | 259,789 | 303,574 | |||||
| 5,100 | M3, INC. | 59,204 | 314,322 | |||||
| 1,900 | MAKITA CORP. | 46,157 | 90,438 | |||||
| 7,100 | MARUI GROUP CO. LTD. | 41,710 | 135,382 | |||||
| 14,600 | MATSUMOTOKIYOSHI HOLDINGS CO. LTD. | 542,531 | 531,589 | |||||
| 16,000 | MAZDA MOTOR CORP. | 87,861 | 92,694 | |||||
| 19,300 | MEDIA DO CO. LTD. | 1,096,323 | 1,392,623 | |||||
| 2,400 | MEIJI HOLDINGS CO. LTD. | 38,749 | 182,961 | |||||
| 12,800 | MELCO HOLDINGS, INC. | 351,215 | 289,825 | |||||
| 6,200 | MERCARI, INC.(b) | 176,315 | 285,118 | |||||
| 8,700 | MINEBEA MITSUMI, INC. | 84,406 | 164,159 | |||||
| 597 | MIRAI CORP. | 328,940 | 225,294 | |||||
| 24,900 | MITSUBISHI CHEMICAL HOLDINGS CORP. | 102,543 | 143,004 | |||||
| 17,500 | MITSUBISHI CORP. | 230,376 | 416,904 | |||||
| 40,000 | MITSUBISHI ELECTRIC CORP. | 322,860 | 539,136 | |||||
| 15,000 | MITSUBISHI ESTATE CO. LTD. | 173,227 | 225,715 | |||||
| 9,200 | MITSUBISHI GAS CHEMICAL CO., INC. | 84,078 | 169,755 | |||||
| 26,600 | MITSUBISHI UFJ LEASE & FINANCE CO. LTD. | 82,462 | 122,325 | |||||
| 20,800 | MITSUBOSHI BELTING LTD. | 335,754 | 336,658 | |||||
| 14,000 | MITSUI & CO. LTD. | 128,045 | 239,340 | |||||
| 7,400 | MITSUI CHEMICALS, INC. | 87,469 | 177,940 | |||||
| 3,800 | MONOTARO CO. LTD. | 113,793 | 188,081 | |||||
| 6,080 | MS&AD INSURANCE GROUP HOLDINGS, INC. | 125,874 | 162,802 | |||||
| 37,400 | MUGEN ESTATE CO. LTD. | 216,786 | 171,281 | |||||
| 11,000 | MURATA MANUFACTURING CO. LTD. | 171,994 | 706,424 | |||||
| 20,200 | NANTO BANK (THE) LTD. | 470,557 | 372,531 | |||||
| 3,800 | NGK SPARK PLUG CO. LTD. | 38,830 | 65,937 | |||||
| 2,900 | NH FOODS LTD. | 69,814 | 128,962 | |||||
| 16,700 | NICHIAS CORP. | 297,341 | 393,016 | |||||
| 7,800 | NIDEC CORP. | 129,234 | 725,160 | |||||
| 27,200 | NIHON M&A CENTER, INC. | 752,189 | 1,542,275 | |||||
| 2,600 | NINTENDO CO. LTD. | 285,625 | 1,470,782 | |||||
| 22 | NIPPON BUILDING FUND, INC. | 90,970 | 124,326 | |||||
| 1,700 | NIPPON EXPRESS CO. LTD. | 60,747 | 98,971 | |||||
| 26 | NIPPON PROLOGIS REIT, INC. | 54,492 | 87,640 | |||||
| 30,400 | NIPPON TELEGRAPH & TELEPHONE CORP. | 342,697 | 619,732 | |||||
| 3,100 | NIPPON YUSEN K.K. | 39,009 | 53,408 | |||||
| 60,900 | NISHI-NIPPON FINANCIAL HOLDINGS, INC. | 426,037 | 422,688 | |||||
| 5,300 | NISSAN CHEMICAL CORP. | 61,593 | 281,420 | |||||
| 3,670 | NISSHIN SEIFUN GROUP, INC. | 31,991 | 58,009 | |||||
| 1,200 | NISSIN FOODS HOLDINGS CO. LTD. | 43,959 | 112,644 | |||||
| 2,800 | NITORI HOLDINGS CO. LTD. | 102,246 | 580,098 | |||||
| 3,200 | NITTO DENKO CORP. | 77,639 | 207,538 | |||||
| 3,500 | NITTO FUJI FLOUR MILLING CO. LTD. | 211,323 | 215,380 | |||||
| 144,800 | NOMURA HOLDINGS, INC. | 534,256 | 657,102 | |||||
| 32,900 | NOMURA REAL ESTATE HOLDINGS, INC. | 674,503 | 622,032 | |||||
| 10,301 | NOMURA RESEARCH INSTITUTE LTD. | 53,983 | 302,296 | |||||
| 8,300 | NTT DATA CORP. | 48,334 | 105,614 | |||||
| 23,700 | NTT DOCOMO, INC. | 361,213 | 873,034 | |||||
| 13,300 | OBAYASHI CORP. | 58,485 | 120,433 | |||||
| 35,800 | OKI ELECTRIC INDUSTRY CO. LTD. | 358,218 | 383,578 | |||||
| 33,200 | OLYMPUS CORP. | 211,415 | 686,886 | |||||
| 1,100 | OMRON CORP. | 31,828 | 85,317 | |||||
| 5,000 | ONO PHARMACEUTICAL CO. LTD. | 43,040 | 156,640 | |||||
| 4,800 | ORIENTAL LAND CO. LTD. | 113,097 | 670,858 | |||||
| 5,500 | OTSUKA HOLDINGS CO. LTD. | 158,190 | 231,963 | |||||
| 59 | (Continued) |
CLEARWATER INVESTMENT TRUST
Schedule of Investments - Clearwater International Fund
September 30, 2020 (unaudited)
| Shares | Security | Cost | Fair value (a) | Percent of net assets | ||||
| Japan (Cont'd): | ||||||||
| 21,600 | PANASONIC CORP. | $133,086 | 182,033 | |||||
| 4,100 | PERSOL HOLDINGS CO. LTD. | 37,131 | 66,205 | |||||
| 92,400 | RAKUS CO. LTD. | 669,461 | 1,650,610 | |||||
| 8,400 | RAKUTEN, INC. | 40,327 | 90,161 | |||||
| 2,400 | RECRUIT HOLDINGS CO. LTD. | 31,274 | 94,667 | |||||
| 184,100 | RESONA HOLDINGS, INC. | 558,258 | 624,228 | |||||
| 1,200 | RINNAI CORP. | 52,047 | 116,626 | |||||
| 16,700 | RION CO. LTD. | 361,264 | 380,506 | |||||
| 1,200 | ROHM CO. LTD. | 45,377 | 92,163 | |||||
| 34,600 | SANKI ENGINEERING CO. LTD. | 423,298 | 377,938 | |||||
| 13,000 | SANTEN PHARMACEUTICAL CO. LTD. | 85,886 | 264,894 | |||||
| 13,620 | SBI HOLDINGS, INC. | 110,355 | 350,363 | |||||
| 3,400 | SECOM CO. LTD. | 133,812 | 309,680 | |||||
| 7,100 | SEGA SAMMY HOLDINGS, INC. | 66,480 | 86,036 | |||||
| 49,400 | SEIKITOKYU KOGYO CO. LTD. | 333,527 | 374,721 | |||||
| 12,800 | SEKISUI CHEMICAL CO. LTD. | 65,116 | 203,533 | |||||
| 6,600 | SEKISUI HOUSE LTD. | 53,502 | 116,242 | |||||
| 57,500 | SEVEN & I HOLDINGS CO. LTD. | 1,880,751 | 1,771,915 | |||||
| 4,000 | SHIMADZU CORP. | 25,419 | 120,988 | |||||
| 1,500 | SHIMANO, INC. | 58,204 | 294,695 | |||||
| 9,200 | SHIN-ETSU CHEMICAL CO. LTD. | 461,684 | 1,193,780 | |||||
| 36,500 | SHINOKEN GROUP CO. LTD. | 314,113 | 339,165 | |||||
| 11,600 | SHINSEI BANK LTD. | 149,876 | 142,326 | |||||
| 4,000 | SHIONOGI & CO. LTD. | 67,679 | 213,493 | |||||
| 5,800 | SHISEIDO CO. LTD. | 87,058 | 331,892 | |||||
| 28,700 | SHOWA CORP.(b) | 405,945 | 623,718 | |||||
| 20,200 | SK-ELECTRONICS CO. LTD.(d) | 355,639 | 206,855 | |||||
| 1,100 | SMC CORP. | 183,450 | 609,738 | |||||
| 37,200 | SOFTBANK GROUP CORP. | 425,837 | 2,281,769 | |||||
| 5,700 | SOMPO HOLDINGS, INC. | 114,918 | 196,134 | |||||
| 23,400 | SONY CORP. | 534,651 | 1,782,096 | |||||
| 3,300 | STANLEY ELECTRIC CO. LTD. | 41,403 | 94,339 | |||||
| 5,700 | SUBARU CORP. | 26,572 | 109,822 | |||||
| 7,800 | SUMITOMO CORP. | 67,035 | 93,076 | |||||
| 5,600 | SUMITOMO ELECTRIC INDUSTRIES LTD. | 44,717 | 62,603 | |||||
| 17,100 | SUMITOMO HEAVY INDUSTRIES LTD. | 494,606 | 395,944 | |||||
| 5,800 | SUZUKI MOTOR CORP. | 104,611 | 246,541 | |||||
| 2,600 | SYSMEX CORP. | 51,707 | 247,267 | |||||
| 13,700 | T RAD CO. LTD. | 264,171 | 170,560 | |||||
| 72,200 | T&D HOLDINGS, INC. | 714,836 | 706,494 | |||||
| 2,200 | TAISEI CORP. | 19,821 | 74,053 | |||||
| 109,800 | TAKARA LEBEN CO. LTD. | 430,207 | 323,783 | |||||
| 74,100 | TATSUTA ELECTRIC WIRE AND CABLE CO. LTD. | 327,189 | 429,993 | |||||
| 1,200 | TDK CORP. | 61,120 | 129,825 | |||||
| 11,600 | TERUMO CORP. | 117,165 | 459,754 | |||||
| 2,000 | THK CO. LTD. | 29,290 | 49,855 | |||||
| 1,500 | TOHO CO. LTD. | 25,533 | 61,656 | |||||
| 3,600 | TOHO GAS CO. LTD. | 88,559 | 178,182 | |||||
| 4,100 | TOHOKU ELECTRIC POWER CO., INC. | 31,947 | 41,052 | |||||
| 14,400 | TOKIO MARINE HOLDINGS, INC. | 359,676 | 628,076 | |||||
| 167,600 | TOKYO ELECTRIC POWER CO. HOLDINGS, INC.(b) | 496,936 | 459,265 | |||||
| 3,300 | TOKYO ELECTRON LTD. | 135,391 | 855,156 | |||||
| 6,000 | TOKYO GAS CO. LTD. | 103,615 | 136,880 | |||||
| 11,200 | TOKYO SEIMITSU CO. LTD. | 346,916 | 353,634 | |||||
| 51,200 | TOKYO STEEL MANUFACTURING CO. LTD. | 317,332 | 347,110 | |||||
| 12,500 | TOKYU CORP. | 103,448 | 161,547 | |||||
| 20,000 | TOKYU FUDOSAN HOLDINGS CORP. | 69,576 | 85,526 | |||||
| 3,000 | TOTO LTD. | 30,029 | 137,249 | |||||
| 75,200 | TOYO CONSTRUCTION CO. LTD. | 312,593 | 292,343 | |||||
| 3,000 | TOYO SUISAN KAISHA LTD. | 74,690 | 158,157 | |||||
| 4,000 | TOYOTA INDUSTRIES CORP. | 101,266 | 251,837 | |||||
| 46,662 | TOYOTA MOTOR CORP. | 1,594,403 | 3,066,998 | |||||
| 1,700 | TOYOTA TSUSHO CORP. | 14,142 | 47,422 | |||||
| 900 | TREND MICRO, INC. | 26,540 | 54,701 | |||||
| 19,200 | UBE INDUSTRIES LTD. | 387,205 | 322,412 | |||||
| 7,700 | UNICHARM CORP. | 67,055 | 344,023 | |||||
| 5,500 | USS CO. LTD. | 64,763 | 97,990 | |||||
| 60 | (Continued) |
CLEARWATER INVESTMENT TRUST
Schedule of Investments - Clearwater International Fund
September 30, 2020 (unaudited)
| Shares | Security | Cost | Fair value (a) | Percent of net assets | ||||
| Japan (Cont'd): | ||||||||
| 7,200 | V TECHNOLOGY CO. LTD.(d) | $262,608 | 301,408 | |||||
| 3,000 | WELCIA HOLDINGS CO. LTD. | 54,205 | 131,560 | |||||
| 4,100 | WEST JAPAN RAILWAY CO. | 134,756 | 201,803 | |||||
| 1,300 | YAKULT HONSHA CO. LTD. | 22,252 | 72,109 | |||||
| 16,300 | YAMADA HOLDINGS CO. LTD. | 56,674 | 80,986 | |||||
| 46,400 | YAMAGUCHI FINANCIAL GROUP, INC. | 326,523 | 300,490 | |||||
| 4,600 | YAMAHA MOTOR CO. LTD. | 46,377 | 66,384 | |||||
| 4,000 | YAMAZAKI BAKING CO. LTD. | 44,679 | 69,748 | |||||
| 5,000 | YASKAWA ELECTRIC CORP. | 48,019 | 194,140 | |||||
| 3,100 | YOKOGAWA ELECTRIC CORP. | 39,797 | 48,940 | |||||
| 10,100 | YUASA TRADING CO. LTD. | 293,394 | 313,156 | |||||
| 25,500 | Z HOLDINGS CORP. | 64,236 | 169,009 | |||||
| 61,105,123 | 102,327,039 | 14.08% | ||||||
| Jersey: | ||||||||
| 217,400 | XLMEDIA PLC | 170,743 | 62,416 | |||||
| 170,743 | 62,416 | 0.01% | ||||||
| Macau: | ||||||||
| 18,400 | SANDS CHINA LTD. | 30,745 | 70,869 | |||||
| 30,745 | 70,869 | 0.01% | ||||||
| Malaysia: | ||||||||
| 274,300 | RHB BANK BHD. | 377,864 | 301,661 | |||||
| 377,864 | 301,661 | 0.04% | ||||||
| Mexico: | ||||||||
| 201,200 | BANCO DEL BAJIO S.A.(b)(e) | 360,811 | 150,685 | |||||
| 76,900 | QUALITAS CONTROLADORA S.A.B. DE C.V. | 281,555 | 290,016 | |||||
| 322,800 | REGIONAL S.A.B. DE C.V.(b) | 1,237,503 | 766,288 | |||||
| 1,879,869 | 1,206,989 | 0.17% | ||||||
| Netherlands: | ||||||||
| 14,796 | ABN AMRO BANK N.V. - C.V.A.(b)(e) | 146,576 | 124,070 | |||||
| 1,950 | ADYEN N.V.(b)(e) | 3,470,797 | 3,595,172 | |||||
| 266,723 | AEGON N.V. | 664,548 | 694,237 | |||||
| 2,925 | AKZO NOBEL N.V. | 135,104 | 296,370 | |||||
| 9,048 | ALTICE EUROPE N.V.(b) | 43,578 | 43,409 | |||||
| 7,173 | ASML HOLDING N.V. | 106,863 | 2,646,622 | |||||
| 14,388 | ASML HOLDING N.V. (REGISTERED) | 2,834,935 | 5,313,057 | |||||
| 14,000 | ASR NEDERLAND N.V. | 434,452 | 471,090 | |||||
| 3,610 | EXOR N.V. | 90,616 | 196,729 | |||||
| 51,500 | FORFARMERS N.V. | 322,452 | 315,190 | |||||
| 980 | HEINEKEN HOLDING N.V. | 24,979 | 76,351 | |||||
| 3,662 | HEINEKEN N.V. | 128,663 | 325,792 | |||||
| 13,823 | IMCD N.V. | 1,051,880 | 1,646,609 | |||||
| 582,369 | ING GROEP N.V.(b) | 5,696,148 | 4,135,711 | |||||
| 19,595 | INTERTRUST N.V.(e) | 321,331 | 334,044 | |||||
| 17,656 | KONINKLIJKE AHOLD DELHAIZE N.V. | 203,381 | 522,695 | |||||
| 3,368 | KONINKLIJKE DSM N.V. | 132,647 | 555,203 | |||||
| 54,610 | KONINKLIJKE KPN N.V. | 115,548 | 128,503 | |||||
| 20,502 | KONINKLIJKE PHILIPS N.V.(b) | 343,630 | 966,310 | |||||
| 17,389 | NXP SEMICONDUCTORS N.V.(d) | 1,465,608 | 2,170,321 | |||||
| 8,117 | QIAGEN N.V.(b) | 119,394 | 421,593 | |||||
| 3,238 | RANDSTAD N.V.(b) | 99,928 | 169,053 | |||||
| 97,281 | ROYAL DUTCH SHELL PLC, CLASS A | 1,347,119 | 1,209,950 | |||||
| 93,363 | ROYAL DUTCH SHELL PLC, CLASS B | 1,453,670 | 1,132,668 | |||||
| 23,800 | SIGNIFY N.V.(b)(e) | 640,632 | 881,218 | |||||
| 6,193 | WOLTERS KLUWER N.V. | 101,075 | 528,890 | |||||
| 21,495,554 | 28,900,857 | 3.98% | ||||||
| New Zealand: | ||||||||
| 15,712 | AUCKLAND INTERNATIONAL AIRPORT LTD. | 47,473 | 75,722 | |||||
| 31,147 | HALLENSTEIN GLASSON HOLDINGS LTD. | 115,879 | 112,093 | |||||
| 163,352 | 187,815 | 0.03% | ||||||
| Norway: | ||||||||
| 2,949 | AKER BP ASA | 36,352 | 46,128 | |||||
| 25,540 | BAKKAFROST P/F(b) | 1,776,703 | 1,646,991 | |||||
| 9,200 | DNB ASA(b) | 37,422 | 127,533 | |||||
| 155,600 | KITRON ASA(b) | 178,558 | 304,944 | |||||
| 23,955 | NORSK HYDRO ASA(b) | 48,328 | 66,106 | |||||
| 61 | (Continued) |
CLEARWATER INVESTMENT TRUST
Schedule of Investments - Clearwater International Fund
September 30, 2020 (unaudited)
| Shares | Security | Cost | Fair value (a) | Percent of net assets | ||||
| Norway (Cont'd): | ||||||||
| 10,286 | ORKLA ASA | $69,398 | 104,079 | |||||
| 228,209 | PEXIP HOLDING ASA(b) | 1,881,258 | 2,039,262 | |||||
| 57,040 | STOREBRAND ASA(b) | 364,067 | 299,280 | |||||
| 2,793 | YARA INTERNATIONAL ASA | 67,399 | 107,648 | |||||
| 4,459,485 | 4,741,971 | 0.65% | ||||||
| Philippines: | ||||||||
| 9,000 | GLOBE TELECOM, INC. | 319,161 | 386,139 | |||||
| 319,161 | 386,139 | 0.05% | ||||||
| Poland: | ||||||||
| 37,500 | CYFROWY POLSAT S.A.(b) | 259,610 | 262,133 | |||||
| 259,610 | 262,133 | 0.04% | ||||||
| Portugal: | ||||||||
| 85,477 | ALTRI SGPS S.A. | 583,770 | 375,415 | |||||
| 20,567 | EDP - ENERGIAS DE PORTUGAL S.A. | 48,529 | 101,157 | |||||
| 9,417 | JERONIMO MARTINS SGPS S.A. | 105,676 | 151,317 | |||||
| 123,300 | NAVIGATOR (THE) CO. S.A.(b) | 307,999 | 307,052 | |||||
| 1,045,974 | 934,941 | 0.13% | ||||||
| Russia: | ||||||||
| 56,840 | HEADHUNTER GROUP PLC ADR(f) | 1,196,958 | 1,391,443 | |||||
| 126,800 | HIGHLAND GOLD MINING LTD. | 364,876 | 489,868 | |||||
| 257,400 | RUSHYDRO PJSC ADR(b)(d)(f) | 218,665 | 235,778 | |||||
| 1,780,499 | 2,117,089 | 0.29% | ||||||
| Singapore: | ||||||||
| 302,700 | AEM HOLDINGS LTD. | 265,969 | 853,738 | |||||
| 529,900 | ASCOTT RESIDENCE TRUST | 504,028 | 345,490 | |||||
| 19,500 | CAPITALAND LTD. | 25,645 | 38,713 | |||||
| 33,500 | CAPITALAND MALL TRUST | 31,763 | 47,365 | |||||
| 7,200 | CITY DEVELOPMENTS LTD. | 27,082 | 40,139 | |||||
| 28,200 | DBS GROUP HOLDINGS LTD. | 158,529 | 411,312 | |||||
| 503,500 | FRENCKEN GROUP LTD. | 337,379 | 363,318 | |||||
| 3,000 | JARDINE CYCLE & CARRIAGE LTD. | 41,532 | 39,537 | |||||
| 21,000 | KEPPEL CORP. LTD. | 53,869 | 68,459 | |||||
| 7,840 | KEPPEL REIT | 3,183 | 6,145 | |||||
| 6,000 | OVERSEA-CHINESE BANKING CORP. LTD. | 32,488 | 37,010 | |||||
| 13,000 | SINGAPORE EXCHANGE LTD. | 40,226 | 87,140 | |||||
| 4,600 | UNITED OVERSEAS BANK LTD. | 26,071 | 64,128 | |||||
| 15,000 | UOL GROUP LTD. | 49,917 | 73,074 | |||||
| 48,200 | VENTURE CORP. LTD. | 558,851 | 679,366 | |||||
| 43,600 | WILMAR INTERNATIONAL LTD. | 88,595 | 140,537 | |||||
| 2,245,127 | 3,295,471 | 0.45% | ||||||
| South Africa: | ||||||||
| 92,000 | ADCOCK INGRAM HOLDINGS LTD. | 249,383 | 213,001 | |||||
| 33,591 | AFRICAN RAINBOW MINERALS LTD. | 339,096 | 388,051 | |||||
| 42,500 | BARLOWORLD LTD. | 289,872 | 155,943 | |||||
| 79,610 | INVESTEC PLC | 490,976 | 146,691 | |||||
| 117,469 | METAIR INVESTMENTS LTD.(b) | 184,301 | 125,534 | |||||
| 68,600 | OCEANA GROUP LTD. | 268,470 | 253,922 | |||||
| 83,378 | TELKOM S.A. SOC LTD. | 425,342 | 130,568 | |||||
| 2,247,440 | 1,413,710 | 0.19% | ||||||
| South Korea: | ||||||||
| 4,300 | DAELIM INDUSTRIAL CO. LTD. | 351,532 | 284,583 | |||||
| 15,700 | DAESANG CORP. | 366,086 | 349,038 | |||||
| 21,500 | DAEWON PHARMACEUTICAL CO. LTD. | 277,342 | 373,194 | |||||
| 20,489 | DB HITEK CO. LTD. | 270,468 | 656,979 | |||||
| 15,169 | DOUZONE BIZON CO. LTD. | 825,545 | 1,355,417 | |||||
| 9,900 | GS HOLDINGS CORP. | 371,567 | 262,420 | |||||
| 3,500 | HYUNDAI GLOVIS CO. LTD. | 391,747 | 430,953 | |||||
| 46,124 | HYUNDAI GREENFOOD CO. LTD. | 465,431 | 292,638 | |||||
| 23,300 | JW LIFE SCIENCE CORP. | 391,190 | 378,538 | |||||
| 18,600 | KC TECH CO. LTD. | 295,116 | 362,617 | |||||
| 18,400 | KT CORP. | 365,565 | 361,077 | |||||
| 30,770 | LG UPLUS CORP. | 348,896 | 302,569 | |||||
| 10,183 | LOTTE FINE CHEMICAL CO. LTD. | 404,389 | 432,310 | |||||
| 4,775 | MAEIL DAIRIES CO. LTD. | 380,764 | 276,007 | |||||
| 21,625 | NAVER CORP. | 2,693,468 | 5,482,525 | |||||
| 62 | (Continued) |
CLEARWATER INVESTMENT TRUST
Schedule of Investments - Clearwater International Fund
September 30, 2020 (unaudited)
| Shares | Security | Cost | Fair value (a) | Percent of net assets | ||||
| South Korea (Cont'd): | ||||||||
| 12,900 | SAMJIN PHARMACEUTICAL CO. LTD. | $284,383 | 318,226 | |||||
| 140,511 | SAMSUNG ELECTRONICS CO. LTD. | 4,227,389 | 6,992,510 | |||||
| 14,251 | SAMSUNG SECURITIES CO. LTD. | 434,059 | 372,878 | |||||
| 28,400 | UNITEST, INC. | 315,214 | 615,596 | |||||
| 10,200 | VIEWORKS CO. LTD. | 234,573 | 262,522 | |||||
| 13,694,724 | 20,162,597 | 2.77% | ||||||
| Spain: | ||||||||
| 1,260 | ACCIONA S.A. | 78,312 | 137,092 | |||||
| 2,420 | ACS ACTIVIDADES DE CONSTRUCCION Y SERVICIOS S.A. | 53,419 | 54,945 | |||||
| 583 | AENA S.M.E. S.A.(b)(e) | 50,200 | 81,546 | |||||
| 48,246 | AMADEUS IT GROUP S.A. | 3,571,077 | 2,691,977 | |||||
| 256,570 | BANCO BILBAO VIZCAYA ARGENTARIA S.A. | 764,978 | 713,535 | |||||
| 284,591 | BANCO DE SABADELL S.A. | 262,572 | 99,166 | |||||
| 369,329 | BANCO SANTANDER S.A. | 691,255 | 692,659 | |||||
| 883,391 | BANKIA S.A. | 2,445,988 | 1,285,861 | |||||
| 23,111 | CAIXABANK S.A. | 39,733 | 49,126 | |||||
| 24,100 | CIA DE DISTRIBUCION INTEGRAL LOGISTA HOLDINGS S.A. | 458,757 | 412,538 | |||||
| 2,531 | ENAGAS S.A. | 38,143 | 58,444 | |||||
| 61,100 | FAES FARMA S.A. | 274,848 | 246,430 | |||||
| 5,329 | FERROVIAL S.A. | 88,868 | 129,646 | |||||
| 15,282 | GRIFOLS S.A. | 273,864 | 440,589 | |||||
| 62,004 | IBERDROLA S.A. | 341,951 | 764,041 | |||||
| 2,120 | INDUSTRIA DE DISENO TEXTIL S.A. | 14,078 | 59,157 | |||||
| 87,000 | MEDIASET ESPANA COMUNICACION S.A.(b) | 475,447 | 323,350 | |||||
| 13,196 | MIQUEL Y COSTAS & MIQUEL S.A. | 241,236 | 190,920 | |||||
| 16,093 | NATURGY ENERGY GROUP S.A. | 256,441 | 323,024 | |||||
| 128,100 | PROSEGUR CIA DE SEGURIDAD S.A. | 305,625 | 306,389 | |||||
| 33,279 | RED ELECTRICA CORP. S.A. | 472,607 | 624,873 | |||||
| 20,840 | REPSOL S.A. | 149,937 | 139,811 | |||||
| 2,773 | SIEMENS GAMESA RENEWABLE ENERGY S.A. | 40,458 | 75,070 | |||||
| 11,389,794 | 9,900,189 | 1.36% | ||||||
| Sweden: | ||||||||
| 22,200 | ASSA ABLOY AB, CLASS B | 89,466 | 520,801 | |||||
| 100,888 | ATLAS COPCO AB, CLASS A | 2,771,136 | 4,830,449 | |||||
| 3,980 | ATLAS COPCO AB, CLASS B | 22,691 | 166,740 | |||||
| 95,794 | AVANZA BANK HOLDING AB | 813,077 | 1,880,401 | |||||
| 41,106 | BEIJER REF AB | 950,509 | 1,359,513 | |||||
| 73,099 | BIOTAGE AB(b) | 803,942 | 1,447,149 | |||||
| 32,900 | BOLIDEN AB | 800,179 | 979,743 | |||||
| 7,501 | ELECTROLUX AB, CLASS B | 79,015 | 175,384 | |||||
| 7,501 | ELECTROLUX PROFESSIONAL AB, CLASS B(b) | 16,773 | 30,152 | |||||
| 10,554 | EPIROC AB, CLASS A | 27,811 | 153,375 | |||||
| 4,533 | EPIROC AB, CLASS B | 12,252 | 63,117 | |||||
| 8,600 | ESSITY AB, CLASS B(b) | 62,137 | 290,769 | |||||
| 3,651 | HEXAGON AB, CLASS B(b) | 56,077 | 276,316 | |||||
| 80,300 | HUMANA AB(b) | 413,356 | 517,350 | |||||
| 38,321 | HUSQVARNA AB, CLASS B | 174,072 | 422,411 | |||||
| 8,270 | INDUSTRIVARDEN AB, CLASS C(b) | 85,948 | 220,605 | |||||
| 33,009 | INDUTRADE AB(b) | 997,352 | 1,772,107 | |||||
| 11,210 | INVESTOR AB, CLASS B | 160,645 | 734,745 | |||||
| 56,909 | INWIDO AB(b) | 320,042 | 580,156 | |||||
| 74,302 | KAMBI GROUP PLC(b) | 1,764,951 | 2,430,868 | |||||
| 55,400 | KINDRED GROUP PLC | 287,801 | 402,950 | |||||
| 3,000 | KINNEVIK AB, CLASS A | 51,225 | 122,149 | |||||
| 7,801 | KNOW IT AB(b) | 144,666 | 198,164 | |||||
| 29,428 | LUNDIN ENERGY AB | 485,724 | 586,533 | |||||
| 44,500 | MEKONOMEN AB(b) | 323,086 | 463,342 | |||||
| 77,913 | NOBIA AB(b) | 452,973 | 522,851 | |||||
| 46,408 | NOBINA AB(b)(e) | 300,038 | 305,730 | |||||
| 77,000 | RESURS HOLDING AB(e) | 449,843 | 399,279 | |||||
| 14,651 | SANDVIK AB(b) | 121,756 | 287,757 | |||||
| 29,115 | SECTRA AB, CLASS B(b) | 1,225,853 | 1,931,063 | |||||
| 14,236 | SECURITAS AB, CLASS B(b) | 116,133 | 218,169 | |||||
| 63,171 | SKANDINAVISKA ENSKILDA BANKEN AB, CLASS A(b) | 322,937 | 561,749 | |||||
| 2,634 | SKANSKA AB, CLASS B(b) | 22,223 | 55,822 | |||||
| 8,600 | SVENSKA CELLULOSA AB S.C.A., CLASS B(b) | 15,915 | 118,161 | |||||
| 11,864 | SVENSKA HANDELSBANKEN AB, CLASS A(b) | 54,195 | 99,778 | |||||
| 63 | (Continued) |
CLEARWATER INVESTMENT TRUST
Schedule of Investments - Clearwater International Fund
September 30, 2020 (unaudited)
| Shares | Security | Cost | Fair value (a) | Percent of net assets | ||||
| Sweden (Cont'd): | ||||||||
| 40,373 | SWEDBANK AB, CLASS A(b) | $450,231 | 634,456 | |||||
| 59,340 | TELEFONAKTIEBOLAGET LM ERICSSON, CLASS B | 307,816 | 651,187 | |||||
| 35,506 | TETHYS OIL AB | 259,465 | 170,872 | |||||
| 29,300 | TRELLEBORG AB, CLASS B(b) | 420,080 | 521,003 | |||||
| 67,845 | VITEC SOFTWARE GROUP AB, CLASS B | 1,167,900 | 2,246,134 | |||||
| 26,685 | VOLVO AB, CLASS B(b) | 185,306 | 515,623 | |||||
| 17,586,597 | 29,864,923 | 4.11% | ||||||
| Switzerland: | ||||||||
| 300,667 | ABB LTD. (REGISTERED) | 5,669,890 | 7,655,004 | |||||
| 2,686 | ADECCO GROUP A.G. (REGISTERED) | 82,183 | 141,962 | |||||
| 81,091 | ALCON, INC.(b) | 4,415,996 | 4,604,592 | |||||
| 484 | BALOISE HOLDING A.G. (REGISTERED) | 26,452 | 71,204 | |||||
| 1,098 | BUCHER INDUSTRIES A.G. (REGISTERED) | 236,188 | 418,910 | |||||
| 34 | CHOCOLADEFABRIKEN LINDT & SPRUENGLI A.G. (PARTICIPATION CERTIFICATE) | 48,855 | 287,009 | |||||
| 3 | CHOCOLADEFABRIKEN LINDT & SPRUENGLI A.G. (REGISTERED) | 75,352 | 267,087 | |||||
| 63,396 | CIE FINANCIERE RICHEMONT S.A., CLASS A (REGISTERED) | 4,352,467 | 4,246,820 | |||||
| 4,900 | DKSH HOLDING A.G. | 291,993 | 341,811 | |||||
| 5,142 | DUFRY A.G. (REGISTERED)(b) | 334,095 | 159,109 | |||||
| 990 | GEBERIT A.G. (REGISTERED) | 85,632 | 586,659 | |||||
| 140 | GIVAUDAN S.A. (REGISTERED) | 76,496 | 603,442 | |||||
| 6,000 | HELVETIA HOLDING A.G. (REGISTERED) | 567,039 | 510,070 | |||||
| 1,807 | IDORSIA LTD.(b) | 18,603 | 48,537 | |||||
| 18,059 | JULIUS BAER GROUP LTD. | 558,057 | 769,966 | |||||
| 68,901 | LAFARGEHOLCIM LTD. (REGISTERED)(b) | 3,468,216 | 3,141,147 | |||||
| 3,700 | LANDIS+GYR GROUP A.G.(b) | 249,447 | 202,665 | |||||
| 9,077 | LONZA GROUP A.G. (REGISTERED) | 4,860,021 | 5,603,585 | |||||
| 96,394 | NESTLE S.A. (REGISTERED) | 4,403,234 | 11,443,157 | |||||
| 73,899 | NOVARTIS A.G. (REGISTERED) | 4,117,483 | 6,411,453 | |||||
| 11,952 | ROCHE HOLDING A.G. | 1,552,784 | 4,089,542 | |||||
| 1,381 | SCHINDLER HOLDING A.G. (PARTICIPATION CERTIFICATE) | 108,493 | 377,093 | |||||
| 589 | SCHINDLER HOLDING A.G. (REGISTERED) | 68,597 | 160,256 | |||||
| 120 | SGS S.A. (REGISTERED) | 129,434 | 321,676 | |||||
| 24,066 | SIKA A.G. (REGISTERED) | 2,986,554 | 5,912,964 | |||||
| 1,308 | SONOVA HOLDING A.G. (REGISTERED)(b) | 84,414 | 331,740 | |||||
| 32,211 | STMICROELECTRONICS N.V. | 517,002 | 991,730 | |||||
| 635 | SULZER A.G. (REGISTERED) | 30,609 | 51,052 | |||||
| 743 | SWISS LIFE HOLDING A.G. (REGISTERED) | 101,194 | 281,131 | |||||
| 194 | SWISSCOM A.G. (REGISTERED) | 49,414 | 102,913 | |||||
| 3,809 | TECAN GROUP A.G. (REGISTERED) | 742,603 | 1,898,193 | |||||
| 433,977 | UBS GROUP A.G. (REGISTERED) | 6,181,859 | 4,853,117 | |||||
| 7,700 | VALIANT HOLDING A.G. (REGISTERED) | 734,240 | 648,738 | |||||
| 7,331 | VAT GROUP A.G.(e) | 989,996 | 1,401,649 | |||||
| 5,000 | VETROPACK HOLDING A.G. (REGISTERED)(b) | 256,087 | 307,258 | |||||
| 6,700 | VONTOBEL HOLDING A.G. (REGISTERED) | 477,708 | 440,459 | |||||
| 32,506 | WIZZ AIR HOLDINGS PLC(b)(e) | 1,249,494 | 1,306,140 | |||||
| 7,800 | ZEHNDER GROUP A.G. (REGISTERED) | 303,280 | 377,699 | |||||
| 13,115 | ZUR ROSE GROUP A.G.(b) | 3,157,381 | 3,132,620 | |||||
| 4,209 | ZURICH INSURANCE GROUP A.G. | 808,513 | 1,465,530 | |||||
| 54,467,355 | 75,965,689 | 10.45% | ||||||
| Taiwan: | ||||||||
| 305,000 | ASIA CEMENT CORP. | 434,632 | 437,038 | |||||
| 50,000 | BIOTEQUE CORP. | 216,137 | 237,380 | |||||
| 125,000 | CHC HEALTHCARE GROUP | 178,135 | 164,655 | |||||
| 146,000 | CHIPBOND TECHNOLOGY CORP. | 286,157 | 319,605 | |||||
| 419,000 | CHIPMOS TECHNOLOGIES, INC. | 449,603 | 413,039 | |||||
| 179,000 | ESON PRECISION IND CO. LTD. | 236,267 | 207,356 | |||||
| 38,000 | GLOBALWAFERS CO. LTD. | 372,583 | 503,833 | |||||
| 145,000 | JARLLYTEC CO. LTD. | 327,630 | 333,938 | |||||
| 241,000 | MIRLE AUTOMATION CORP. | 311,936 | 342,003 | |||||
| 90,000 | RADIANT OPTO-ELECTRONICS CORP. | 361,908 | 343,381 | |||||
| 62,000 | SCI PHARMTECH, INC. | 252,185 | 257,959 | |||||
| 1,260,000 | SINOPAC FINANCIAL HOLDINGS CO. LTD. | 492,562 | 472,032 | |||||
| 225,000 | TAIWAN HON CHUAN ENTERPRISE CO. LTD. | 422,583 | 426,507 | |||||
| 64 | (Continued) |
CLEARWATER INVESTMENT TRUST
Schedule of Investments - Clearwater International Fund
September 30, 2020 (unaudited)
| Shares | Security | Cost | Fair value (a) | Percent of net assets | ||||
| Taiwan (Cont'd): | ||||||||
| 93,337 | TAIWAN SEMICONDUCTOR MANUFACTURING CO. LTD. ADR(f) | $1,926,910 | 7,566,831 | |||||
| 82,000 | TOPCO SCIENTIFIC CO. LTD. | 252,353 | 322,768 | |||||
| 151,000 | UNIVERSAL VISION BIOTECHNOLOGY CO. LTD. | 1,302,178 | 1,371,210 | |||||
| 644,000 | WISTRON CORP. | 522,109 | 662,634 | |||||
| 90,000 | ZHEN DING TECHNOLOGY HOLDING LTD. | 335,681 | 391,548 | |||||
| 8,681,549 | 14,773,717 | 2.03% | ||||||
| Thailand: | ||||||||
| 432,100 | PRUKSA HOLDING PCL (REGISTERED) | 233,658 | 147,272 | |||||
| 301,200 | THAI VEGETABLE OIL PCL (REGISTERED) | 265,122 | 311,299 | |||||
| 498,780 | 458,571 | 0.06% | ||||||
| Turkey: | ||||||||
| 53,800 | COCA-COLA ICECEK A.S. | 315,265 | 312,096 | |||||
| 186,400 | TURKCELL ILETISIM HIZMETLERI A.S. | 453,929 | 366,875 | |||||
| 769,194 | 678,971 | 0.09% | ||||||
| United Arab Emirates: | ||||||||
| 250,852 | NETWORK INTERNATIONAL HOLDINGS PLC(b)(e) | 1,721,418 | 884,313 | |||||
| 1,721,418 | 884,313 | 0.12% | ||||||
| United Kingdom: | ||||||||
| 26,524 | 3I GROUP PLC | 99,606 | 341,089 | |||||
| 163,000 | 888 HOLDINGS PLC | 318,087 | 530,024 | |||||
| 3,206 | ADMIRAL GROUP PLC | 44,520 | 108,013 | |||||
| 38,656 | AGGREKO PLC | 408,897 | 184,455 | |||||
| 52,849 | ANGLO AMERICAN PLC | 411,011 | 1,279,178 | |||||
| 26,375 | ASTRAZENECA PLC | 983,695 | 2,878,169 | |||||
| 14,995 | AUTO TRADER GROUP PLC(e) | 74,948 | 108,934 | |||||
| 55,018 | AVIVA PLC | 187,586 | 202,826 | |||||
| 28,050 | AVON RUBBER PLC | 1,220,291 | 1,538,259 | |||||
| 73,500 | BABCOCK INTERNATIONAL GROUP PLC | 428,761 | 237,481 | |||||
| 19,513 | BAE SYSTEMS PLC | 93,862 | 121,361 | |||||
| 113,471 | BAKKAVOR GROUP PLC(b)(e) | 166,389 | 98,685 | |||||
| 9,400 | BELLWAY PLC | 411,711 | 285,160 | |||||
| 2,391 | BERKELEY GROUP HOLDINGS PLC | 71,739 | 130,443 | |||||
| 27,424 | BRITISH AMERICAN TOBACCO PLC | 764,176 | 982,862 | |||||
| 93,984 | BRITISH LAND (THE) CO. PLC | 402,942 | 409,173 | |||||
| 5,069 | BUNZL PLC | 39,524 | 163,977 | |||||
| 8,193 | BURBERRY GROUP PLC | 40,501 | 164,286 | |||||
| 135,923 | CNH INDUSTRIAL N.V.(b) | 1,161,363 | 1,059,445 | |||||
| 436,072 | COMPASS GROUP PLC | 5,577,256 | 6,577,794 | |||||
| 2,457 | CRODA INTERNATIONAL PLC | 92,898 | 198,149 | |||||
| 41,565 | DIAGEO PLC | 506,960 | 1,421,285 | |||||
| 177,500 | DIRECT LINE INSURANCE GROUP PLC | 614,920 | 617,026 | |||||
| 108,100 | DRAX GROUP PLC | 316,682 | 371,314 | |||||
| 40,654 | EASYJET PLC | 523,562 | 263,129 | |||||
| 4,107 | FERGUSON PLC | 80,053 | 413,994 | |||||
| 49,106 | FEVERTREE DRINKS PLC | 1,228,171 | 1,467,509 | |||||
| 17,467 | FIAT CHRYSLER AUTOMOBILES N.V.(b) | 108,686 | 214,376 | |||||
| 10,222 | FIAT CHRYSLER AUTOMOBILES N.V. (NEW YORK EXCHANGE)(b) | 17,872 | 124,913 | |||||
| 41,295 | GAN LTD.(b)(d) | 1,078,857 | 697,885 | |||||
| 52,259 | GLAXOSMITHKLINE PLC | 768,484 | 979,118 | |||||
| 15,524 | HSBC HOLDINGS PLC | 71,243 | 60,395 | |||||
| 23,951 | IMI PLC | 280,889 | 324,504 | |||||
| 2,417 | IMPERIAL BRANDS PLC | 41,769 | 42,649 | |||||
| 21,041 | INFORMA PLC(b) | 99,674 | 102,221 | |||||
| 272,520 | INTEGRAFIN HOLDINGS PLC | 1,780,953 | 1,786,363 | |||||
| 2,594 | INTERCONTINENTAL HOTELS GROUP PLC(b) | 150,347 | 137,033 | |||||
| 32,745 | INTERNATIONAL CONSOLIDATED AIRLINES GROUP S.A. | 60,221 | 39,736 | |||||
| 423,658 | J SAINSBURY PLC | 1,107,817 | 1,043,861 | |||||
| 7,050 | JD SPORTS FASHION PLC | 68,564 | 73,631 | |||||
| 43,200 | JET2 PLC | 431,313 | 374,315 | |||||
| 2,128 | JOHNSON MATTHEY PLC | 33,879 | 64,720 | |||||
| 325,255 | KINGFISHER PLC | 867,860 | 1,245,229 | |||||
| 58,758 | LAND SECURITIES GROUP PLC | 385,246 | 396,151 | |||||
| 4,941,624 | LLOYDS BANKING GROUP PLC(b) | 3,643,536 | 1,680,507 | |||||
| 6,030 | LONDON STOCK EXCHANGE GROUP PLC | 69,795 | 690,625 | |||||
| 65 | (Continued) |
CLEARWATER INVESTMENT TRUST
Schedule of Investments - Clearwater International Fund
September 30, 2020 (unaudited)
| Shares | Security | Cost | Fair value (a) | Percent of net assets | ||||
| United Kingdom (Cont'd): | ||||||||
| 191,900 | MAN GROUP PLC | $264,558 | 284,761 | |||||
| 300,659 | MARSTON'S PLC | 477,602 | 170,700 | |||||
| 7,217 | MEGGITT PLC(b) | 16,687 | 23,980 | |||||
| 68,053 | MELROSE INDUSTRIES PLC(b) | 95,941 | 101,423 | |||||
| 61,400 | MICRO FOCUS INTERNATIONAL PLC(b) | 366,236 | 194,979 | |||||
| 145,235 | MORGAN ADVANCED MATERIALS PLC | 467,561 | 446,021 | |||||
| 22,756 | NATIONAL GRID PLC | 142,793 | 261,274 | |||||
| 825,557 | NATWEST GROUP PLC(b) | 1,889,929 | 1,129,706 | |||||
| 6,959 | NEXT PLC | 416,496 | 534,283 | |||||
| 39,805 | NINETY ONE PLC(b) | 72,784 | 104,779 | |||||
| 103,083 | ONESAVINGS BANK PLC(b) | 483,067 | 371,107 | |||||
| 12,212 | RECKITT BENCKISER GROUP PLC | 510,135 | 1,191,286 | |||||
| 109,800 | REDDE NORTHGATE PLC | 378,816 | 262,109 | |||||
| 57,235 | REDROW PLC(b) | 447,916 | 298,219 | |||||
| 47,054 | RELX PLC | 574,910 | 1,049,856 | |||||
| 166,623 | RELX PLC (LONDON EXCHANGE) | 1,889,353 | 3,710,934 | |||||
| 23,058 | RENTOKIL INITIAL PLC(b) | 117,249 | 159,356 | |||||
| 18,171 | RIO TINTO LTD. | 570,958 | 1,227,573 | |||||
| 34,005 | RIO TINTO PLC | 893,598 | 2,042,757 | |||||
| 27,049 | ROLLS-ROYCE HOLDINGS PLC(b) | 56,016 | 45,373 | |||||
| 77,712 | ROYAL MAIL PLC | 220,280 | 239,659 | |||||
| 20,657 | SAGE GROUP (THE) PLC | 74,323 | 192,128 | |||||
| 16,135 | SEGRO PLC | 67,053 | 194,124 | |||||
| 114,270 | SENIOR PLC | 287,158 | 65,614 | |||||
| 13,084 | SEVERN TRENT PLC | 276,407 | 411,775 | |||||
| 247,066 | SMITH & NEPHEW PLC | 5,310,992 | 4,834,627 | |||||
| 3,071 | SMITHS GROUP PLC | 37,103 | 54,487 | |||||
| 110,490 | SOFTCAT PLC | 1,415,845 | 1,720,829 | |||||
| 9,489 | SPECTRIS PLC | 300,454 | 298,389 | |||||
| 414,000 | SPEEDY HIRE PLC | 294,411 | 276,718 | |||||
| 82,413 | STHREE PLC | 315,585 | 255,220 | |||||
| 101,900 | STOCK SPIRITS GROUP PLC | 321,342 | 283,354 | |||||
| 77,600 | TATE & LYLE PLC | 713,986 | 666,072 | |||||
| 184,280 | TEAM17 GROUP PLC(b) | 1,542,672 | 1,652,611 | |||||
| 830,179 | TESCO PLC | 2,082,066 | 2,276,346 | |||||
| 148,000 | TP ICAP PLC | 641,118 | 435,798 | |||||
| 204,625 | TRAINLINE PLC(b)(e) | 738,616 | 958,457 | |||||
| 126,800 | TYMAN PLC(b) | 343,290 | 364,046 | |||||
| 10,104 | UNILEVER N.V. | 262,590 | 610,091 | |||||
| 24,244 | UNILEVER PLC | 545,189 | 1,494,088 | |||||
| 8,137 | UNITED UTILITIES GROUP PLC | 56,989 | 89,855 | |||||
| 2,809 | WHITBREAD PLC | 69,922 | 77,023 | |||||
| 8,755 | WILLIS TOWERS WATSON PLC | 1,302,810 | 1,828,219 | |||||
| 324,500 | WM MORRISON SUPERMARKETS PLC | 792,191 | 712,450 | |||||
| 64,102 | WPP PLC | 434,931 | 502,901 | |||||
| 55,917,044 | 66,337,609 | 9.13% | ||||||
| United States: | ||||||||
| 15,760 | AON PLC, CLASS A | 3,118,210 | 3,251,288 | |||||
| 248,400 | DIVERSIFIED GAS & OIL PLC | 347,000 | 336,549 | |||||
| 14,692 | ELASTIC N.V.(b) | 1,273,434 | 1,585,120 | |||||
| 3,424 | FIDELITY NATIONAL INFORMATION SERVICES, INC. | 289,873 | 504,047 | |||||
| 4,177 | METTLER-TOLEDO INTERNATIONAL, INC.(b) | 2,465,181 | 4,033,938 | |||||
| 3,157 | NEWMONT CORP. | 101,845 | 201,386 | |||||
| 31,395 | RESMED, INC. | 3,425,925 | 5,382,045 | |||||
| 163,184 | SCHLUMBERGER N.V. | 2,705,472 | 2,539,143 | |||||
| 23,139 | STERIS PLC | 3,706,900 | 4,076,860 | |||||
| 17,433,840 | 21,910,376 | 3.02% | ||||||
| Sub-total Common Stocks: | 482,872,941 | 689,098,597 | 94.82% | |||||
| Preferred Stocks: | ||||||||
| Brazil: | ||||||||
| 107,213 | AZUL S.A. ADR(b)(d)(f) | 1,743,177 | 1,410,923 | |||||
| 263,400 | CIA DE SANEAMENTO DO PARANA(b) | 350,151 | 238,734 | |||||
| 259,574 | TELEFONICA BRASIL S.A. ADR, 3.35%(f)(g) | 3,256,219 | 1,990,932 | |||||
| 5,349,547 | 3,640,589 | 0.50% | ||||||
| Germany: | ||||||||
| 1,739 | BAYERISCHE MOTOREN WERKE A.G., 5.31%(g) | 59,403 | 95,216 | |||||
| 66 | (Continued) |
CLEARWATER INVESTMENT TRUST
Schedule of Investments - Clearwater International Fund
September 30, 2020 (unaudited)
| Shares | Security | Cost | Fair value (a) | Percent of net assets | ||||
| Germany (Cont'd): | ||||||||
| 3,800 | DRAEGERWERK A.G. & CO. KGAA, 0.26%(g) | $311,648 | 329,693 | |||||
| 10,197 | JUNGHEINRICH A.G., 1.51.%(g) | 253,285 | 351,969 | |||||
| 693 | PORSCHE AUTOMOBIL HOLDING S.E., 4.38%(g) | 39,866 | 41,357 | |||||
| 312 | SARTORIUS A.G., 0.10%(g) | 56,342 | 128,178 | |||||
| 2,800 | STO S.E. & CO. KGAA, 0.28%(g) | 304,841 | 372,276 | |||||
| 1,025,385 | 1,318,689 | 0.18% | ||||||
| South Korea: | ||||||||
| 48,493 | SAMSUNG ELECTRONICS CO. LTD., 2.81%(g) | 1,439,460 | 2,093,969 | |||||
| 1,439,460 | 2,093,969 | 0.29% | ||||||
| Sub-total Preferred Stocks: | 7,814,392 | 7,053,247 | 0.97% | |||||
| Warrants: | ||||||||
| Ireland: | ||||||||
| 307,400 | ANHUI SUNHERE PHARMACEUTICAL EXCIPIENTS CO. LTD.(b) | 1,206,914 | 1,132,901 | |||||
| 160,284 | RYANAIR HOLDINGS PLC(b) | 1,649,516 | 2,143,558 | |||||
| 171,217 | SINOSEAL HOLDING CO. LTD.(b) | 1,146,359 | 1,203,190 | |||||
| 4,002,789 | 4,479,649 | 0.62% | ||||||
| Sub-total Warrants: | 4,002,789 | 4,479,649 | 0.62% | |||||
| Short-Term Investments: | ||||||||
| 9,305,842 | FIDELITY INVESTMENTS MONEY MARKET GOVERNMENT PORTFOLIO(h) | 9,305,842 | 9,305,842 | |||||
| 24,400,478 | NORTHERN INSTITUTIONAL FUNDS - U.S. GOVERNMENT SELECT PORTFOLIO, 0.03%(i) | 24,400,478 | 24,400,478 | |||||
| Sub-total Short-Term Investments: | 33,706,320 | 33,706,320 | 4.64% | |||||
| Grand total | $528,396,442 | 734,337,813 | 101.05% | |||||
| Notes to Schedule of Investments: | |
| (a) | Investments in U.S. and foreign equity securities are valued at the last sales price or the regular trading session closing price on the principal exchange or market where the securities are traded. Foreign security values are stated in U.S. dollars. |
| (b) | Non-income producing assets. |
| (c) | Security has been deemed worthless and is a Level 3 investment. |
| (d) | Security is either wholly or partially on loan. |
| (e) | Securities exempt from registration under Rule 144A of the Securities Act of 1933. These securities may be resold in transactions exempt from registration, normally to qualified institutional buyers. The value of these securities is determined by valuations supplied by a pricing service or brokers, or, if not available, in accordance with procedures established by the Board of Trustees. |
| (f) | Securities are American Depositary Receipts of companies based outside of the United States representing 3.85% of net assets as of September 30, 2020. |
| (g) | Current yield is disclosed. Dividends are calculated based on a percentage of the issuer’s net income. |
| (h) | Investment relates to cash collateral received from portfolio securities loaned. |
| (i) | The short-term investment is a money market portfolio of the investment company, Northern Institutional Funds. At December 31, 2019, the value of the Clearwater International Fund's investment in the U.S. Government Select Portfolio of the Northern Institutional Funds was $32,652,940 with net sales of $8,252,462 during the nine months ended September 30, 2020. |
| 67 | (Continued) |
CLEARWATER INVESTMENT TRUST
Schedule of Investments - Clearwater International Fund
September 30, 2020 (unaudited)
At September 30, 2020, the industry sectors for the Clearwater International Fund were:
| Industry Sector | Percent of Long-Term Investments | |
| Communication Services | 5.56% | |
| Consumer Discretionary | 12.29 | |
| Consumer Staples | 8.24 | |
| Energy | 2.29 | |
| Financials | 14.19 | |
| Health Care | 14.25 | |
| Industrials | 16.61 | |
| Information Technology | 16.98 | |
| Materials | 6.02 | |
| Real Estate | 2.07 | |
| Utilities | 1.50 | |
| 100.00% |
At September 30, 2020, the Clearwater International Fund’s investments were denominated in the following currencies:
| Concentration by Currency | Percent of Long-Term Investments | |
| Euro | 20.02% | |
| United States Dollar | 14.95 | |
| Japanese Yen | 14.60 | |
| Swiss Franc | 10.51 | |
| British Pound | 10.51 | |
| Canadian Dollar | 5.27 | |
| Other currencies | 24.14 | |
| 100.00% |
At September 30, 2020, the Clearwater International Fund had outstanding forward foreign currency exchange contracts as follows:
| Counterparty | Contract Settlement Date | Contract Amount | Unrealized Appreciation (Depreciation) | |||||
| Deliver | Receive | |||||||
| Northern Trust | 10/22/2020 | USD | 1,899,788 | CNH | 13,323,055 | $60,945 | ||
| Northern Trust | 10/22/2020 | USD | 559,548 | JPY | 60,021,786 | 9,710 | ||
| $70,655 | ||||||||
| Northern Trust | 10/22/2020 | JPY | 186,886,118 | USD | 1,745,302 | $(27,160) | ||
| Northern Trust | 10/22/2020 | CNH | 50,797,319 | USD | 7,121,117 | (354,644) | ||
| $(381,804) | ||||||||
| $(311,149) | ||||||||
| 68 | (Continued) |
CLEARWATER INVESTMENT TRUST
Schedule of Investments - Clearwater International Fund
September 30, 2020 (unaudited)
Fair value is an estimate of the price the Clearwater International Fund would receive upon selling a security in a timely transaction to an independent buyer in the principal or most advantageous market for the security. This guidance establishes a three-tier hierarchy to maximize the use of observable market data and minimize the use of unobservable inputs and to establish classification of fair value measurements for disclosure purposes. Various inputs are used in determining the value of the Clearwater International Fund's investments and other financial instruments, as described below. These inputs are summarized in the three broad levels listed below.
| • | Level 1 – Unadjusted quoted market prices in active markets for identical securities on the measurement date. |
| • | Level 2 – Other significant observable inputs including quoted prices for similar investments, interest rates, prepayment speeds, credit risk, etc. or quoted prices for identical or similar assets in markets that are not active. Inputs that are derived principally from or corroborated by observable market data are also considered Level 2 measurements. An adjustment to any observable input that is significant to the fair value may render the measurement a Level 3 measurement. |
| • | Level 3 – Valuations based on unobservable inputs, which may include the Adviser’s own assumptions in determining the fair value of an investment. |
Investments in U.S. and foreign equity securities are valued at the last sales price or the regular trading session closing price on the principal exchange or market in which such securities are traded, with foreign security values stated in U.S. dollars. Equity securities which have not traded on the date of valuation or securities for which sales prices are not generally reported are valued at the mean between the last bid and asked prices. Security transactions are accounted for as of trade date. Wherever possible, the Clearwater International Fund uses independent pricing services approved by the Board of Trustees of Clearwater Investment Trust to value its investments. When prices are not readily available (including those for which trading has been suspended), are determined not to reflect fair value, or when the Adviser becomes aware that a significant event impacting the value of a security or group of securities has occurred after the closing of the exchange on which the security or securities principally trade, but before the calculation of the daily net asset value, the Clearwater International Fund may value these securities at fair value as determined in good faith using procedures established by the Board of Trustees.
The inputs or methodology used for valuing securities are not necessarily an indication of the risk associated with investing in those securities and other financial instruments, if any. The following is a summary of the inputs used in valuing the Clearwater International Fund’s investments and other financial instruments, if any, which are carried at fair value, as of September 30, 2020.
| Level 1 | Level 2 | Level 3 | Total | ||||
| Common Stocks | |||||||
| France | $40,663,203 | $— | $511,532 | $41,174,735 | |||
| Thailand | — | 458,571 | — | 458,571 | |||
| All other countries | 647,465,291 | — | —* | 647,465,291 | |||
| Preferred Stocks | 7,053,247 | — | — | 7,053,247 | |||
| Warrants | 4,479,649 | — | — | 4,479,649 | |||
| Short-Term Investments | 33,706,320 | — | — | 33,706,320 | |||
| Total | $733,367,710 | $458,571 | $511,532 | $734,337,813 |
* Security has been deemed worthless and is a Level 3 investment.
For the Clearwater International Fund, the investment value is comprised of equity securities, warrants and short-term investments. See the Clearwater International Fund’s Schedule of Investments for additional information on industry sector and currency concentration information. Investments in equity securities and short-term securities generally are valued at the last sales price or the regular trading session closing price on the principal exchange or market where the securities are traded.
| Other Financial Instruments | Level 1 | Level 2 | Level 3 | Total | |||
| Assets | |||||||
| Forward foreign currency exchange contracts | $— | $70,655 | $— | $70,655 | |||
| Liabilities | |||||||
| Forward foreign currency exchange contracts | — | (381,804) | — | (381,804) | |||
| Net Other Financial Instruments | $— | $(311,149) | $— | $(311,149) |
The forward foreign currency exchange contracts outstanding at September 30, 2020 are considered Level 2 investments due to the contracts being marked-to-market daily at the applicable exchange rates that have been adjusted from the initial quoted rate. Forward foreign currency exchange contracts are shown on a gross basis in the above table.
| 69 | (Continued) |
CLEARWATER INVESTMENT TRUST
Schedule of Investments - Clearwater International Fund
September 30, 2020 (unaudited)
Clearwater International Fund Portfolio Diversification
(as a percentage of net assets)
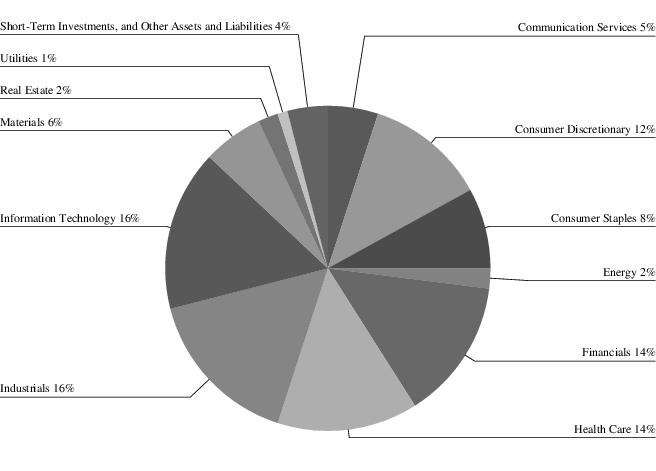
| 70 | (Continued) |