Exhibit 99.1
|
Santander Holdings USA, Inc.
Fixed Income Investor Update
Data as of March 31, 2015
June 4, 2015
|
Disclaimer
2
Santander Holdings USA, Inc. (“SHUSA”) cautions that this presentation may contain forward-looking statements within the meaning of the U.S. Private Securities Litigation Reform Act of 1995. These forward-looking statements are found in various places throughout this presentation and include, without limitation, statements concerning our future business development and economic performance. While these forward-looking statements represent our judgment and future expectations concerning the development of our business, a number of risks, uncertainties, and other important factors could cause actual developments and results to differ materially from our expectations. These factors include, but are not limited to: (1) increased regulation and regulatory developments; (2) domestic and international market, macro-economic, governmental, regulatory conditions and trends; (3) movements in local and international securities markets, currency exchange rates, and interest rates; (4) competitive pressures; (5) technological developments; and (6) changes in the financial position or creditworthiness of our customers, obligors, and counterparties. The risk factors and other key factors that we have indicated in our past and future filings and reports, including our Annual Report on Form 10-K and those of Santander Bank, N.A. (“Santander Bank” or “SBNA”) or Santander Consumer USA Inc. (“SCUSA”) for the year ended December 31, 2014 and other filings and reports with the Securities and Exchange Commission (the “SEC”), could adversely affect our business and financial performance. Other factors could cause actual results to differ materially from those in the forward-looking statements.
The information contained in this presentation is not complete. It is subject to, and must be read in conjunction with, all other publicly available information, including reports filed with or furnished to the SEC, press releases, and other relevant information. Because this information is intended only to assist investors, it does not constitute investment advice or an offer to invest, and in making this presentation available, SHUSA gives no advice and makes no recommendation to buy, sell, or otherwise deal in shares or other securities of Banco Santander, S.A. (“Santander”), SHUSA, Santander Bank, or SCUSA in any other securities or investments.
This presentation is subject to correction, completion, and amendment without notice. It is not our intention to state, indicate, or imply in any manner that current or past results are indicative of future results or expectations. As with all investments, there are associated risks, and you could lose money investing. Prior to making any investment, a prospective investor should consult with its own investment, accounting, legal, and tax advisers to evaluate independently the risks, consequences, and suitability of that investment. The information in this presentation is not intended to constitute “research” as that term is defined by applicable regulations.
No offering of securities shall be made in the United States except pursuant to registration under the U.S. Securities Act of 1933, as amended, or an exemption therefrom.
In this presentation, we may sometimes refer to certain non-GAAP figures or financial ratios to help illustrate certain concepts. These ratios, each of which is defined in this document, if utilized, may include Pre-Tax Pre-Provision Income, the Tangible Common Equity to Tangible Assets Ratio, and the Texas Ratio. This information supplements our results as reported in accordance with GAAP and should not be viewed in isolation from, or as a substitute for, our GAAP results, among others. We believe that this additional information and the reconciliations we provide may be useful to investors, analysts, regulators and others as they evaluate the impact of these items on our results for the periods presented due to the extent to which the items are indicative of our ongoing operations. Where applicable, we provide GAAP reconciliations for such additional information.
This presentation is provided for information purposes only.
|
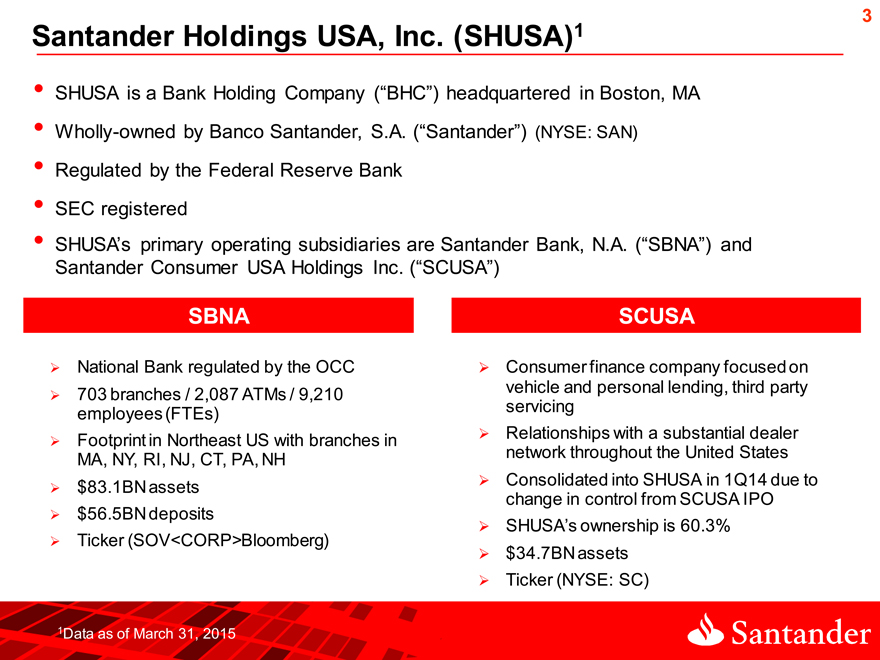
Santander Holdings USA, Inc. (SHUSA)1
3
SHUSA is a Bank Holding Company (“BHC”) headquartered in Boston, MA
Wholly-owned by Banco Santander, S.A. (“Santander”) (NYSE: SAN)
Regulated by the Federal Reserve Bank
SEC registered
SHUSA’s primary operating subsidiaries are Santander Bank, N.A. (“SBNA”) and Santander Consumer USA Holdings Inc. (“SCUSA”)
SBNA
National Bank regulated by the OCC
703 branches / 2,087 ATMs / 9,210 employees (FTEs)
Footprint in Northeast US with branches in MA, NY, RI, NJ, CT, PA, NH
$83.1BN assets
$56.5BN deposits
Ticker (SOV<CORP>Bloomberg)
SCUSA
Consumer finance company focused on vehicle and personal lending, third party servicing
Relationships with a substantial dealer network throughout the United States
Consolidated into SHUSA in 1Q14 due to change in control from SCUSA IPO
SHUSA’s ownership is 60.3%
$34.7BN assets
Ticker (NYSE: SC)
Data as of March 31, 2015
|
4
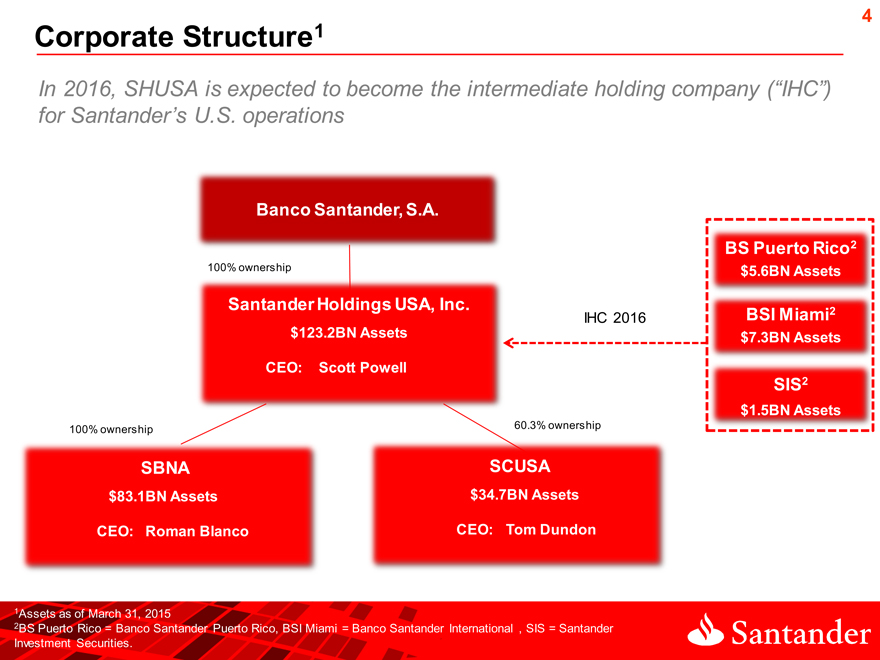
Corporate Structure 1
In 2016, SHUSA is expected to become the intermediate holding company (“IHC”)
for Santander’s U.S. operations
Banco Santander, S.A.
BS Puerto Rico2
100% ownership $ 5.6BN Assets
Santander Holdings USA, Inc. IHC 2016 BSI Miami2
$123.2BN Assets $ 7.3BN Assets
CEO: Scott Powell
SIS2
$ 1.5BN Assets
100% ownership 60.3% ownership
SBNA SCUSA
$83.1BN Assets $ 34.7BN Assets
CEO: Roman Blanco CEO: Tom Dundon
1Assets as of March 31, 2015
2BS Puerto Rico = Banco Santander Puerto Rico, BSI Miami = Banco Santander International , SIS = Santander
Investment Securities.
|
Q1 2015 Highlights1
5
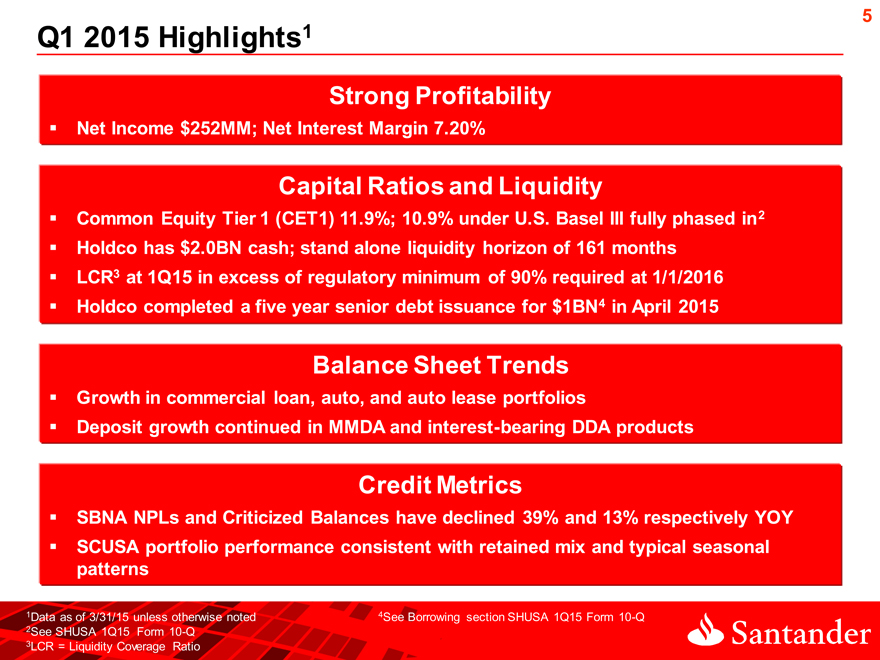
Strong Profitability
Net Income $252MM; Net Interest Margin 7.20%
Capital Ratios and Liquidity
Common Equity Tier 1 (CET1) 11.9%; 10.9% under U.S. Basel III fully phased in 2
Holdco has $2.0BN cash; stand alone liquidity horizon of 161 months
LCR3 at 1Q15 in excess of regulatory minimum of 90% required at 1/1/2016
Holdco completed a five year senior debt issuance for $1BN4 in April 2015
Balance Sheet Trends
Growth in commercial loan, auto, and auto lease portfolios
Deposit growth continued in MMDA and interest -bearing DDA products
Credit Metrics
SBNA NPLs and Criticized Balances have declined 39% and 13% respectively YOY
SCUSA portfolio performance consistent with retained mix and typical seasonal patterns
1Data as of 3/31/15 unless otherwise noted 4See Borrowing section SHUSA 1Q15 Form 10-Q
2See SHUSA 1Q15 Form 10-Q
3LCR = Liquidity Coverage Ratio
[Graphic Appears Here]
|
6
Quarterly Profitability
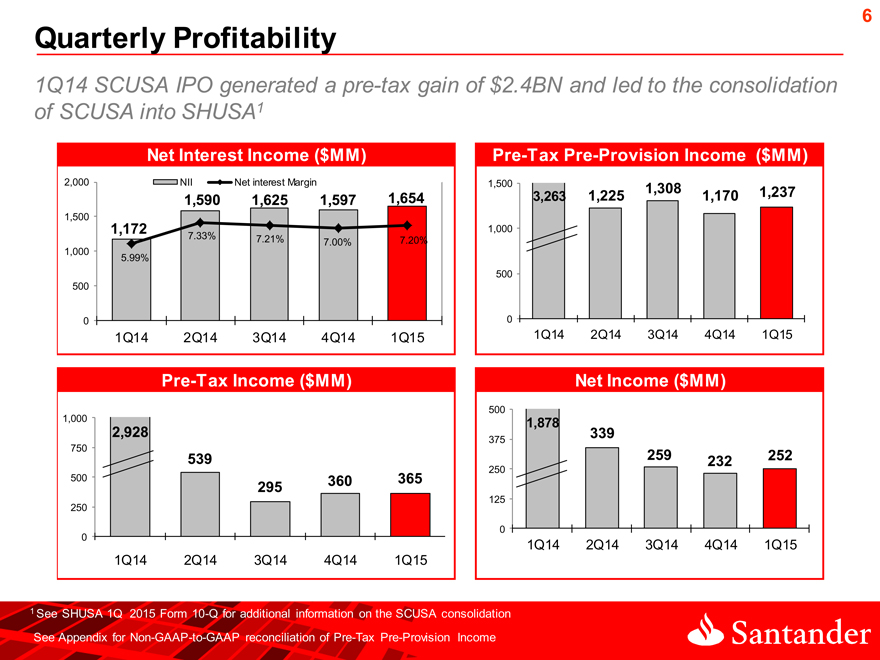
1Q14 SCUSA IPO generated a pre-tax gain of $2.4BN and led to the consolidation
of SCUSA into SHUSA1
2
Net Interest Income ($MM) Pre-Tax Pre-Provision Income ($MM)
2,000 NII 1,590 Net 1,625 interest Margin 1,597 1,654 1,500 3,263 1,225 1,308 1,170 1,237
1,500
1,172 1,000
7.33% 7.21% 7.20%
7.00%
1,000 5.99%
500
500
0 0
1Q14 2Q14 3Q14 4Q14 1Q15 1Q14 2Q14 3Q14 4Q14 1Q15
Pre-Tax Income ($MM) Net Income ($MM)
500
1,000 1,878
2,928 339
375
750
539 259 232 252
250
500 295 360 365
125
250
0
0 1Q14 2Q14 3Q14 4Q14 1Q15
1Q14 2Q14 3Q14 4Q14 1Q15
1 See SHUSA 1Q 2015 Form 10-Q for additional information on the SCUSA consolidation
See Appendix for Non-GAAP-to-GAAP reconciliation of Pre-Tax Pre-Provision Income
|
Balance Sheet
7
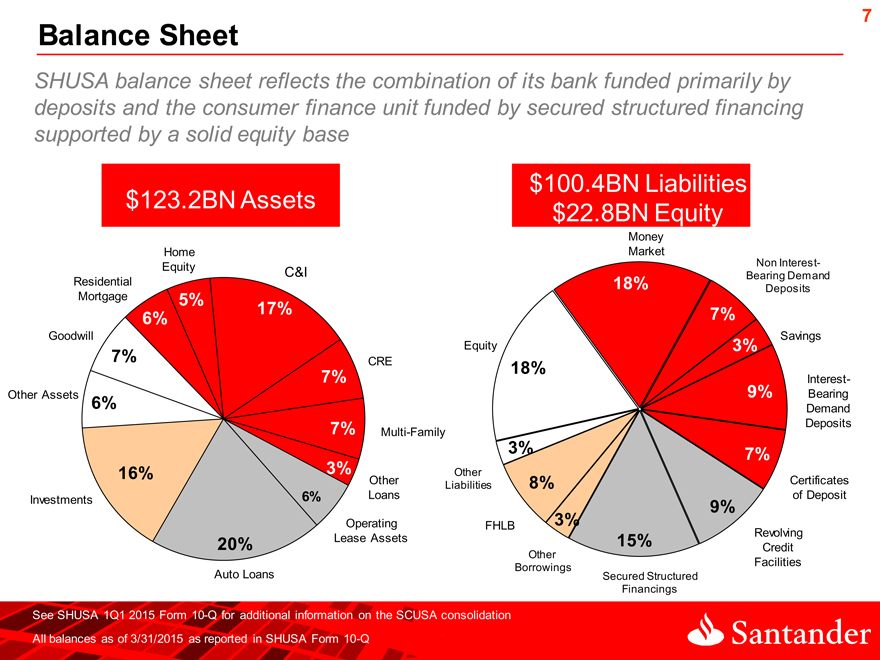
SHUSA balance sheet reflects the combination of its bank funded primarily by deposits and the consumer finance unit funded by secured structured financing supported by a solid equity base 2
$100.4BN Liabilities
$123.2BN Assets $22.8BN Equity
Money
Home Market
Non Interest-
Equity C&I Bearing Demand
Residential 18% Deposits
Mortgage 5% 17%
6% 7%
Goodwill Savings
Equity 3%
7% CRE 18%
7% Interest-
Other Assets 9% Bearing
6% Demand
7% Multi-Family Deposits
3% 7%
16% 3% Other
Other Liabilities 8% Certificates
Investments 6% Loans of Deposit
9%
Operating FHLB 3% Revolving
20% Lease Assets 15% Credit
Other
Borrowings Facilities
Auto Loans Secured Structured
Financings
See SHUSA 1Q1 2015 Form 10-Q for additional information on the SCUSA consolidation
All balances as of 3/31/2015 as reported in SHUSA Form 10-Q
|
8
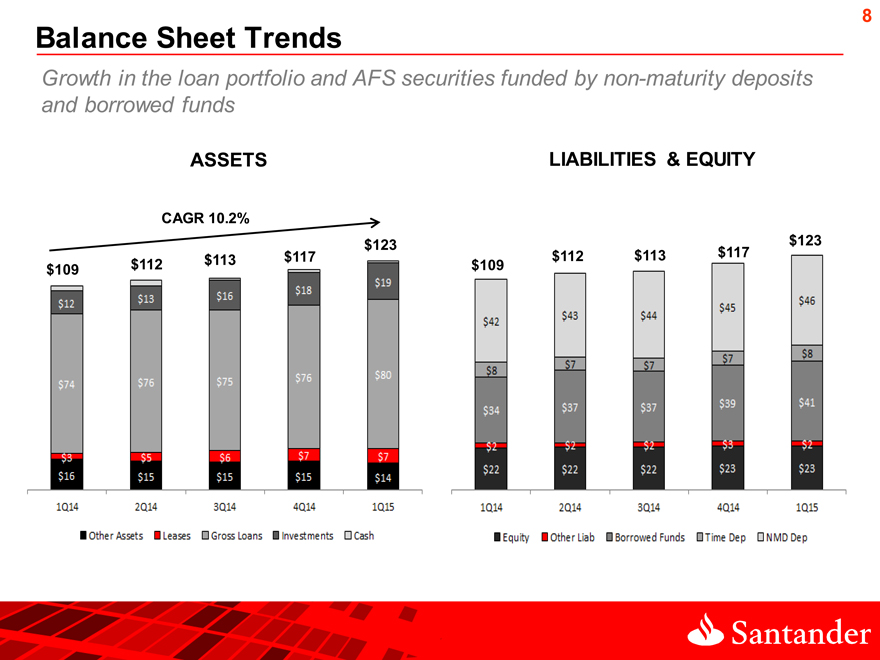
Balance Sheet Trends
Growth in the loan portfolio and AFS securities funded by non-maturity deposits and borrowed funds
2
ASSETS LIABILITIES & EQUITY
CAGR 10.2%
$123 $123
$109 $112 $113 $117 $109 $112 $113 $117
|
9
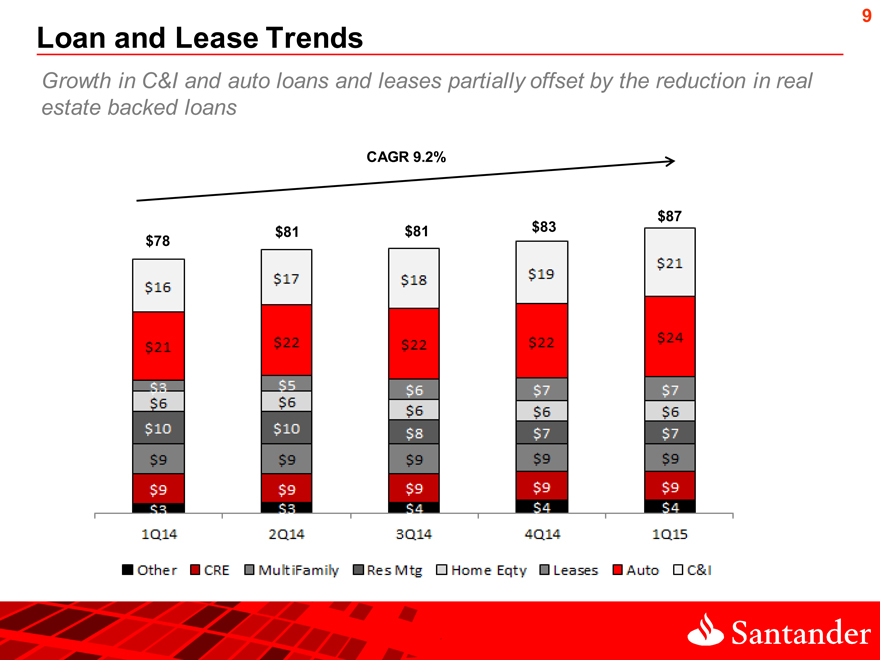
Loan and Lease Trends
Growth in C&I and auto loans and leases partially offset by the reduction in real
estate backed loans
2
CAGR 9.2%
$87
$78 $81 $81 $83
|
10
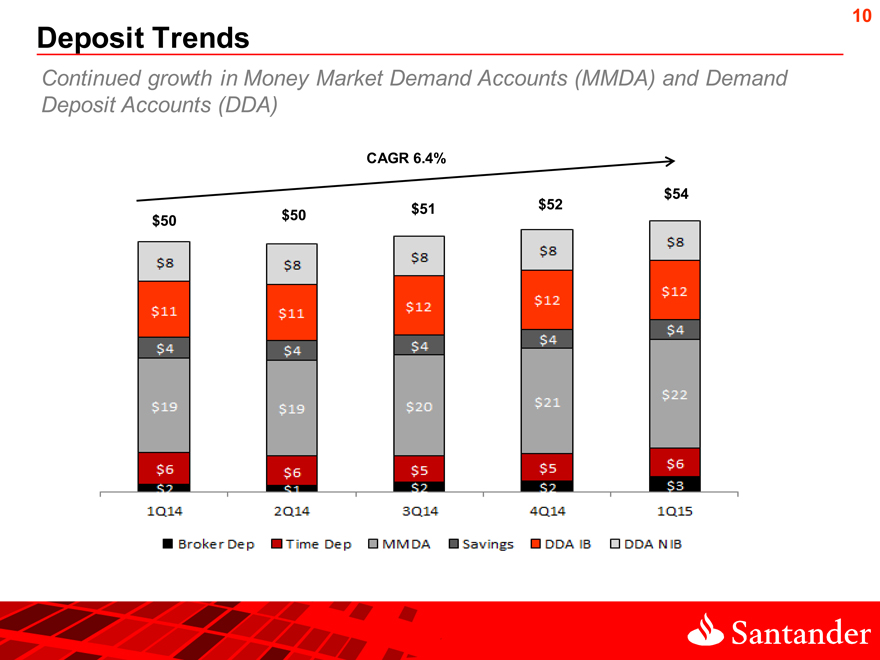
Deposit Trends
Continued growth in Money Market Demand Accounts(MMDA) and Demand
Deposit Accounts(DDA)
2
CAGR 6.4%
$54
$51 $52
$50 $50
|
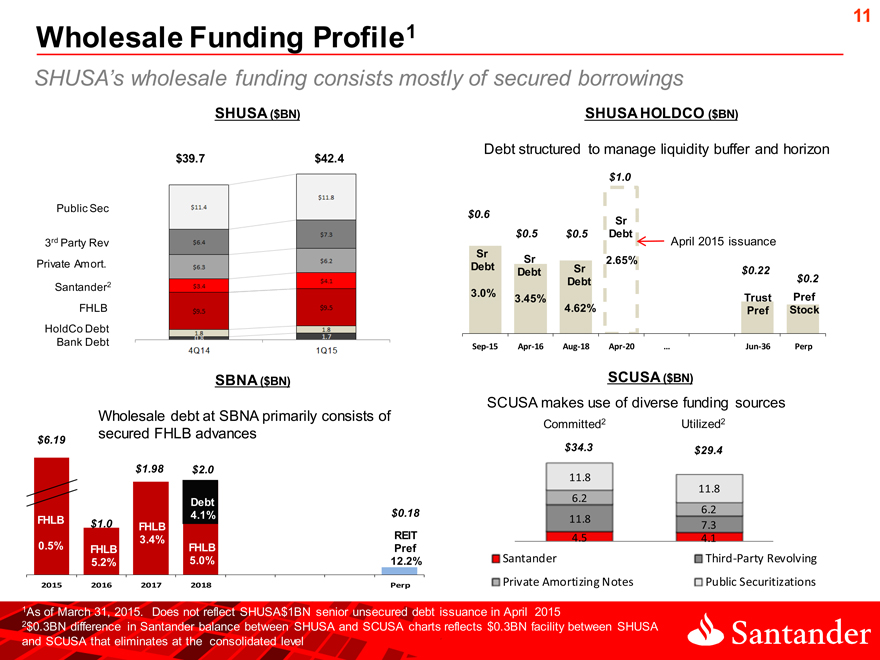
Wholesale Funding Profile1
11
SHUSA’s wholesale funding consists mostly of secured borrowings
SHUSA ($BN)
$39.7 $42.4
Public Sec
3rd Party Rev
Private Amort.
Santander2
FHLB
HoldCo Debt
Bank Debt
Sr SBNA ($BN)
Debt
Sr Sr
Wholesale debt at SBNA primarily Debt consists of
secured3.0% FHLB advances Debt
$6.19
625% 3.45%
$1.98 $2.0
Debt
4.1% $0.18
FHLB $1.0 FHLB
3.4% REIT
0.5% FHLB FHLB Pref
5.2% 5.0% 12.2%
2015 2016 2017 2018 Perp
SHUSA HOLDCO ($BN)
2
Debt structured to manage liquidity buffer and horizon
$1.0
$0.6 Sr
$0.5 $0.5 Debt
April 2015 issuance
Sr Sr 2.65%
Debt Debt Sr $0.22
Debt $0.2
3.0% 3.45% Trust Pref
4.62% Pref Stock
Sep-15 Apr-16 Aug-18 Apr-20 … Jun-36 Perp
SCUSA ($BN)
SCUSA makes use of diverse funding sources
Committed2 Utilized2
$34.3 $29.4
11.8
11.8
6.2
6.2
11.8 7.3
4.5 4.1
$150
Santander Third-Party Revolving
Private Amortizing Notes Public Securitizations
1As of March 31, 2015. Does not reflect SHUSA$1BN senior unsecured debt issuance in April 2015
2$0.3BN difference in Santander balance between SHUSA and SCUSA charts reflects $0.3BN facility between SHUSA and SCUSA that eliminates at the consolidated level
[Graphic Appears Here]
|
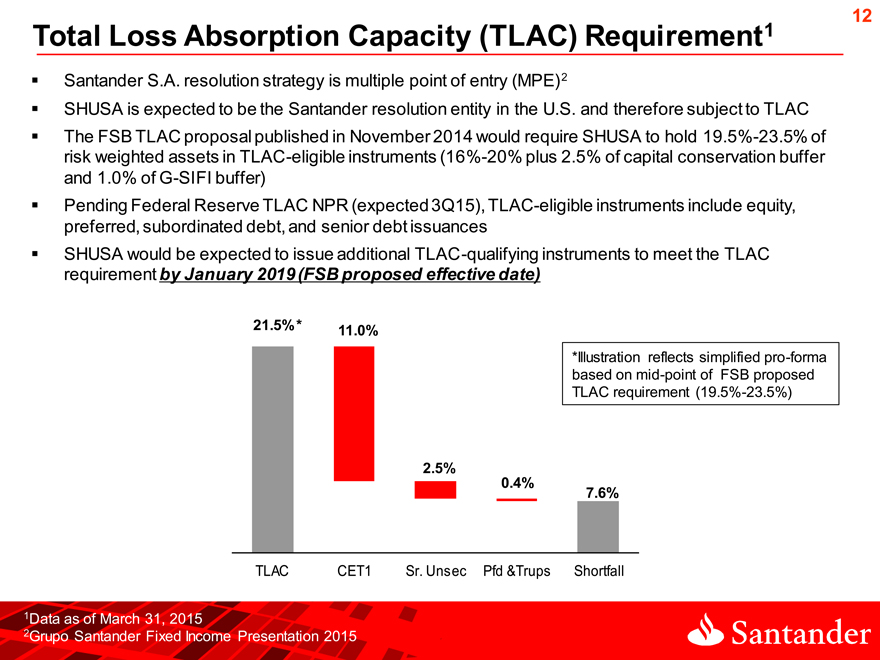
Total Loss Absorption Capacity (TLAC) Requirement1
12
Santander S.A. resolution strategy is multiple point of entry (MPE)2
SHUSA is expected to be the Santander resolution entity in the U.S. and therefore subject to TLAC
The FSB TLAC proposal published in November 2014 would require SHUSA to hold 19.5%-23.5% of risk weighted assets in TLAC-eligible instruments (16%-20% plus 2.5% of capital conservation buffer and 1.0% of G-SIFI buffer)
Pending Federal Reserve TLAC NPR (expected 3Q15), TLAC-eligible instruments include equity, preferred, subordinated debt, and senior debt issuances
SHUSA would be expected to issue additional TLAC -qualifying instruments to meet the TLAC requirement by January 2019 (FSB proposed effective date)
21.5%*
11.0%
*Illustration reflects simplified pro-forma
based on mid-point of FSB proposed
TLAC requirement (19.5%-23.5%)
2.5%
0.4%
7.6%
TLAC CET1 Sr. Unsec Pfd &Trups Shortfall
1Data as of March 31, 2015
2Grupo Santander Fixed Income Presentation 2015
|
13
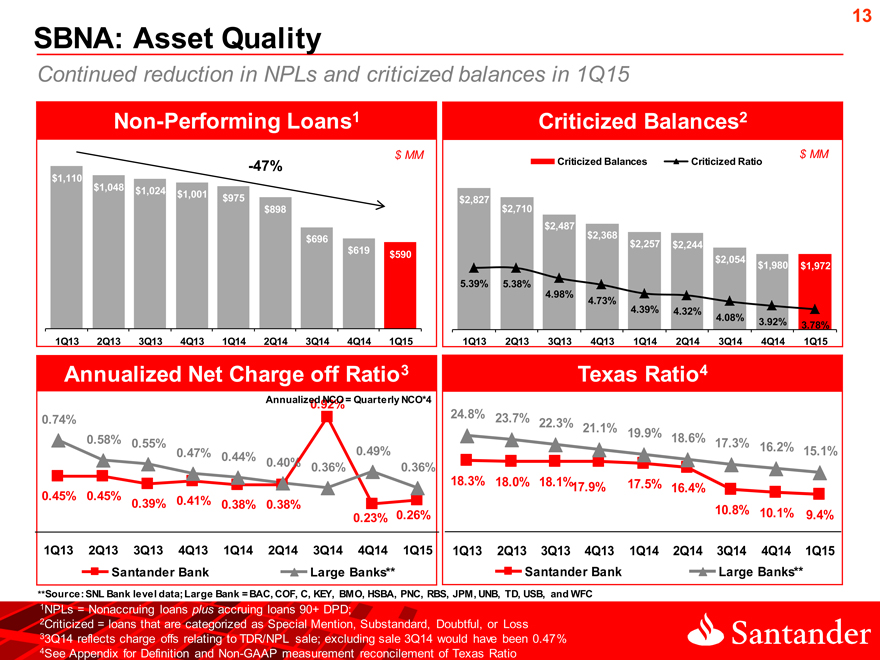
SBNA: Asset Quality
Continued reduction in NPLs and criticized balances in 1Q15
Non-Performing Loans1
$ MM
-47%
$1,110
$1,048
$1,024 $1,001 $975
$898
$696
$619 $590
1Q13 2Q13 3Q13 4Q13 1Q14 2Q14 3Q14 4Q14 1Q15
Criticized Balances2
$ MM
Criticized Balances Criticized Ratio
$2,827
$2,710
$2,487
$2,368
$2,257 $2,244
$2,054 $1,980 $ 1,972
5.39% 5.38%
4.98% 4.73%
4.39% 4.32%
4.08% 3.92% 3.78%
1Q13 2Q13 3Q13 4Q13 1Q14 2Q14 3Q14 4Q14 1Q15
Annualized Net Charge off Ratio 3
Annualized 0.92% NCO = Quarterly NCO*4
0.74%
0.58% 0.55%
0.47% 0.44% 0.49%
0.40% 0.36% 0.36%
0.45% 0.45% 0.41%
0.39% 0.38% 0.38%
0.23% 0.26%
1Q13 2Q13 3Q13 4Q13 1Q14 2Q14 3Q14 4Q14 1Q15
Santander Bank Large Banks**
Texas Ratio4
24.8% 23.7%
22.3% 21.1%
19.9% 18.6%
17.3% 16.2% 15.1%
18.3% 18.0% 18.1%17.9% 17.5% 16.4%
10.8% 10.1% 9.4%
1Q13 2Q13 3Q13 4Q13 1Q14 2Q14 3Q14 4Q14 1Q15
Santander Bank Large Banks**
**Source: SNL Bank level data; Large Bank = BAC, COF, C, KEY, BMO, HSBA, PNC, RBS, JPM, UNB, TD, USB, and WFC
1NPLs = Nonaccruing loans plus accruing loans 90+ DPD;
2Criticized = loans that are categorized as Special Mention, Substandard, Doubtful, or Loss 33Q14 reflects charge offs relating to TDR/NPL sale; excluding sale 3Q14 would have been 0.47% 4See Appendix for Definition and Non-GAAP measurement reconcilement of Texas Ratio
[Graphic Appears Here]
|
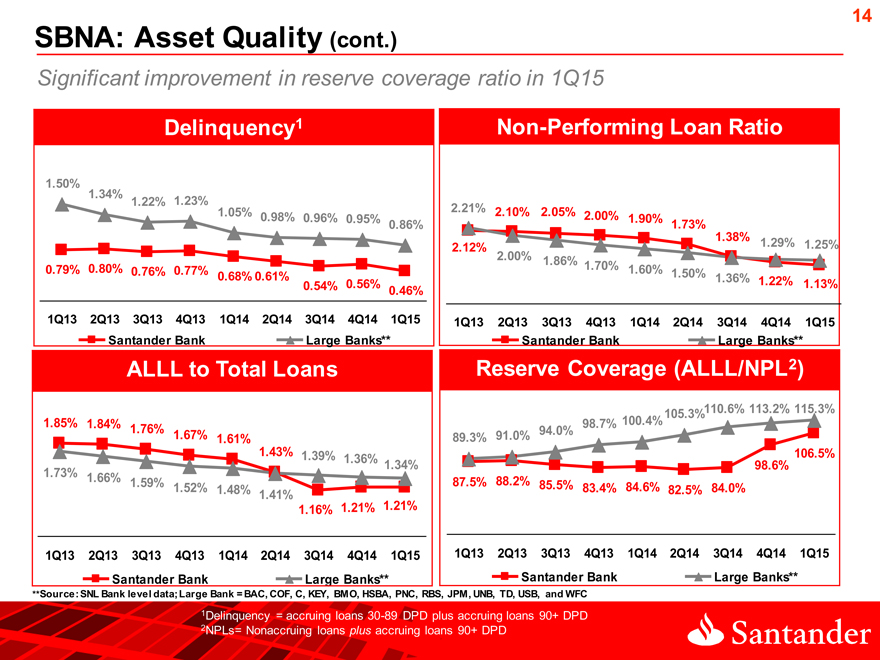
SBNA: Asset Quality (cont.)
Significant improvement in reserve coverage ratio in 1Q15
14
Delinquency1
1.50% 1.34%
1.22% 1.23%
1.05% 0.98% 0.96% 0.95%
0.86%
0.79% 0.80% 0.76% 0.77% 0.68% 0.61%
0.54% 0.56% 0.46%
1Q13 2Q13 3Q13 4Q13 1Q14 2Q14 3Q14 4Q14 1Q15
Santander Bank Large Banks**
Non-Performing Loan Ratio
2.21% 2.10% 2.05% 2.00% 1.90%
1.73%
2.12% 1.38% 1.29% 1.25%
2.00% 1.86%
1.70% 1.60%
1.50% 1.36% 1.22% 1.13%
1Q13 2Q13 3Q13 4Q13 1Q14 2Q14 3Q14 4Q14 1Q15
Santander Bank Large Banks**
ALLL to Total Loans
1.85% 1.84% 1.76%
1.67% 1.61%
1.43% 1.39% 1.36%
1.34%
1.73% 1.66%
1.59% 1.52% 1.48% 1.41%
1.16% 1.21% 1.21%
1Q13 2Q13 3Q13 4Q13 1Q14 2Q14 3Q14 4Q14 1Q15
Santander Bank Large Banks**
Reserve Coverage(ALLL/NPL 2)
105.3% 110.6% 113.2% 115.3%
98.7% 100.4%
89.3% 91.0% 94.0%
106.5%
98.6%
87.5% 88.2% 85.5% 83.4% 84.6% 82.5% 84.0%
1Q13 2Q13 3Q13 4Q13 1Q14 2Q14 3Q14 4Q14 1Q15
Santander Bank Large Banks**
**Source: SNL Bank level data; Large Bank = BAC, COF, C, KEY, BMO, HSBA, PNC, RBS, JPM, UNB, TD, USB, and WFC
1Delinquency = accruing loans 30-89 DPD plus accruing loans 90+ DPD
2NPLs= Nonaccruing loans plus accruing loans 90+ DPD
|
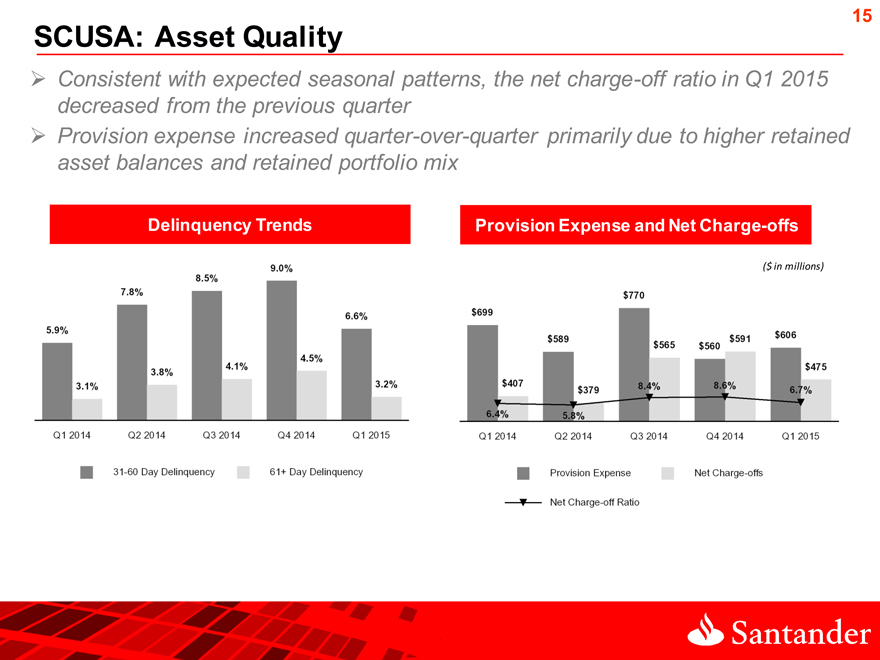
SCUSA: Asset Quality
15
Consistent with expected seasonal patterns, the net charge-off ratio in Q1 2015 decreased from the previous quarter
Provision expense increased quarter-over-quarter primarily due to higher retained asset balances and retained portfolio mix
Delinquency Trends Provision Expense and Net Charge-offs
|
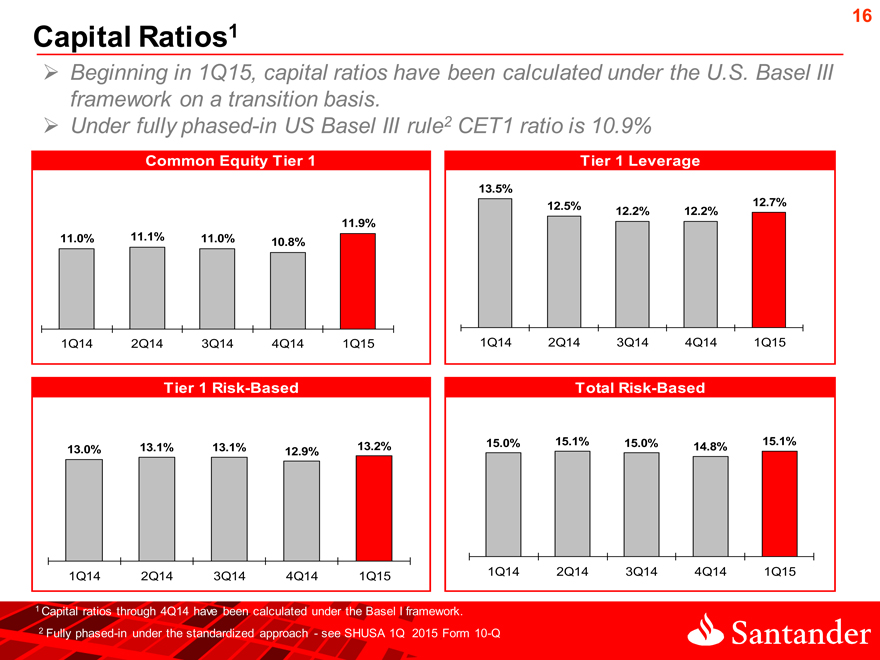
Capital Ratios1
16
Beginning in 1Q15, capital ratios have been calculated under the U.S. Basel III framework on a transition basis.
Under fully phased-in US Basel III rule2 CET1 ratio is 10.9%
Common Equity Tier 1 Tier 1 Leverage
13.5%
12.5% 12.7%
12.2% 12.2%
11.9%
11.0% 11.1% 11.0%
10.8%
1Q14 2Q14 3Q14 4Q14 1Q15 1Q14 2Q14 3Q14 4Q14 1Q15
Tier 1 Risk-Based Total Risk-Based
15.0% 15.1% 15.0% 15.1%
13.0% 13.1% 13.1% 13.2% 14.8%
12.9%
1Q14
2Q14
3Q14
4Q14
1Q15
1Q14
1 Capital ratios through 4Q14 have been calculated under the Basel I framework.
2 Fully phased-in under the standardized approach—see SHUSA 1Q 2015 Form 10-Q
2Q14 3Q14 4Q14 1Q15
|
17
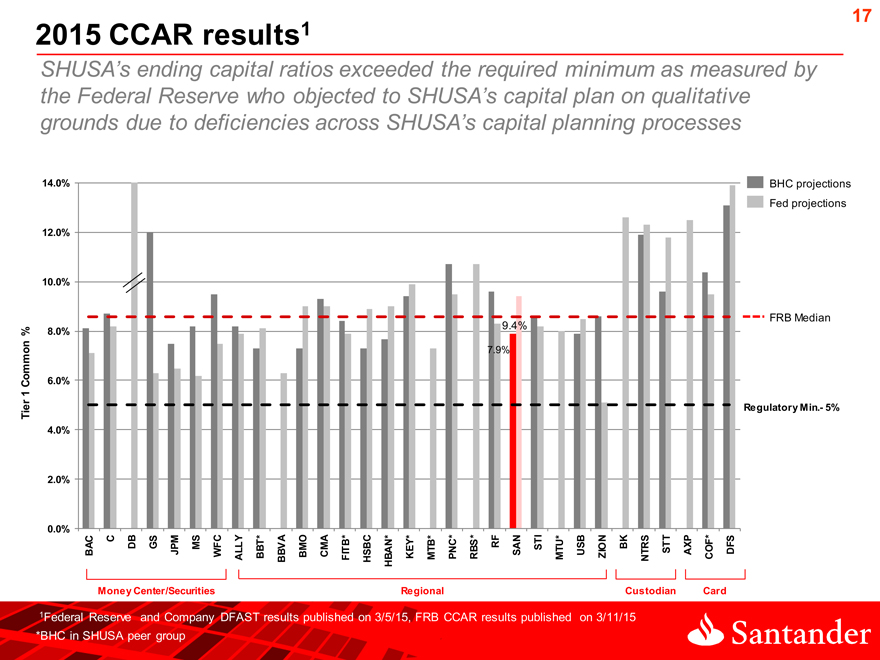
2015 CCAR results1
SHUSA’s ending capital ratios exceeded the required minimum as measured by the Federal Reserve who objected to SHUSA’s capital plan on qualitative grounds due to deficiencies across SHUSA’s capital planning processes
14.0% BHC projections
Fed projections
12.0%
10.0%
FRB Median
% 8.0% 9.4%
7.9%
Common 6.0%
1
Tier Regulatory Min.- 5%
4.0%
2.0%
0.0%
BAC C DB GS JPM MS WFC ALLY BBT* BBVA BMO CMA FITB* HSBC HBAN* KEY* MTB* PNC* RBS* RF SAN STI MTU* USB ZION BK NTRS STT AXP COF* DFS
Money Center/Securities Regional Custodian Card
1Federal Reserve and Company DFAST results published on 3/5/15, FRB CCAR results published on 3/11/15
*BHC in SHUSA peer group
|
Rating Agencies
18
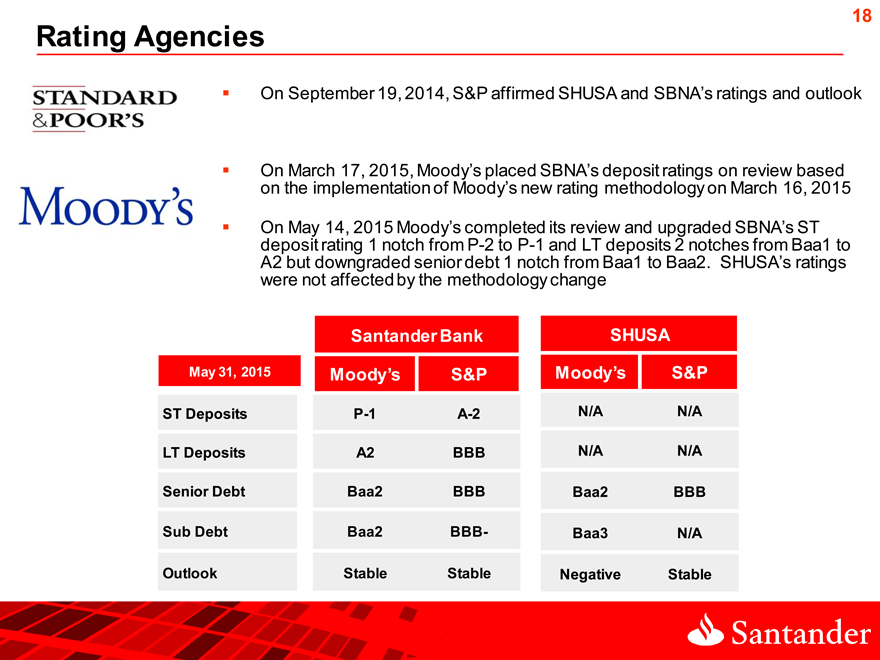
On September 19, 2014, S&P affirmed SHUSA and SBNA’s ratings and outlook
On March 17, 2015, Moody’s placed SBNA’s deposit ratings on review based on the implementation of Moody’s new rating methodology on March 16, 2015
On May 14, 2015 Moody’s completed its review and upgraded SBNA’s ST deposit rating 1 notch from P-2 to P-1 and LT deposits 2 notches from Baa1 to
A2 but downgraded senior debt 1 notch from Baa1 to Baa2. SHUSA’s ratings were not affected by the methodology change
Santander Bank SHUSA
May 31, 2015 Moody’s S&P Moody’s S&P
ST Deposits P-1 A-2 N/A N/A
LT Deposits A2 BBB N/A N/A
Senior Debt Baa2 BBB Baa2 BBB
Sub Debt Baa2 BBB- Baa3 N/A
Outlook Stable Stable Negative Stable
[Graphic Appears Here]
|

Appendix
|
Quarterly Trended Statement of Operations
20
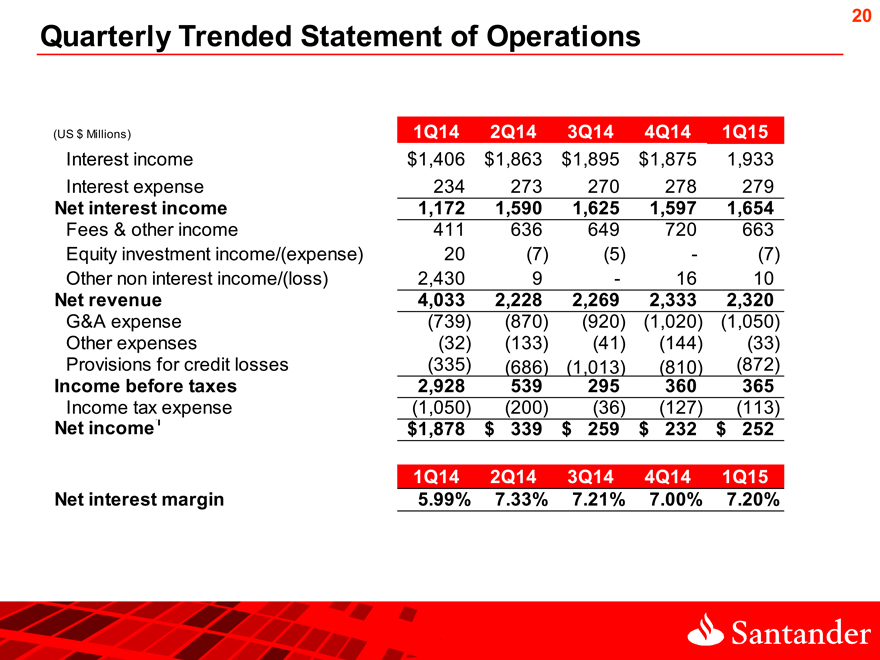
(US $ Millions) 1Q14 2Q14 3Q14 4Q14 1Q15
Interest income $1,406 $ 1,863 $1,895 $1,875 1,933
Interest expense 234 273 270 278 279
Net interest income 1,172 1,590 1,625 1,597 1,654
Fees & other income 411 636 649 720 663
Equity investment income/(expense) 20(7)(5) -(7)
Other non interest income/(loss) 2,430 9—16 10
Net revenue 4,033 2,228 2,269 2,333 2,320
G&A expense(739)(870)(920)(1,020)(1,050)
Other expenses(32)(133)(41)(144)(33)
Provisions for credit losses(335)(686)(1,013)(810)(872)
Income before taxes 2,928 539 295 360 365
Income tax expense(1,050)(200)(36)(127)(113)
Net income1 $1,878 $ 339 $ 259 $ 232 $ 252
1Q14 2Q14 3Q14 4Q14 1Q15
Net interest margin 5.99% 7.33% 7.21% 7.00% 7.20%
[Graphic Appears Here]
|
21
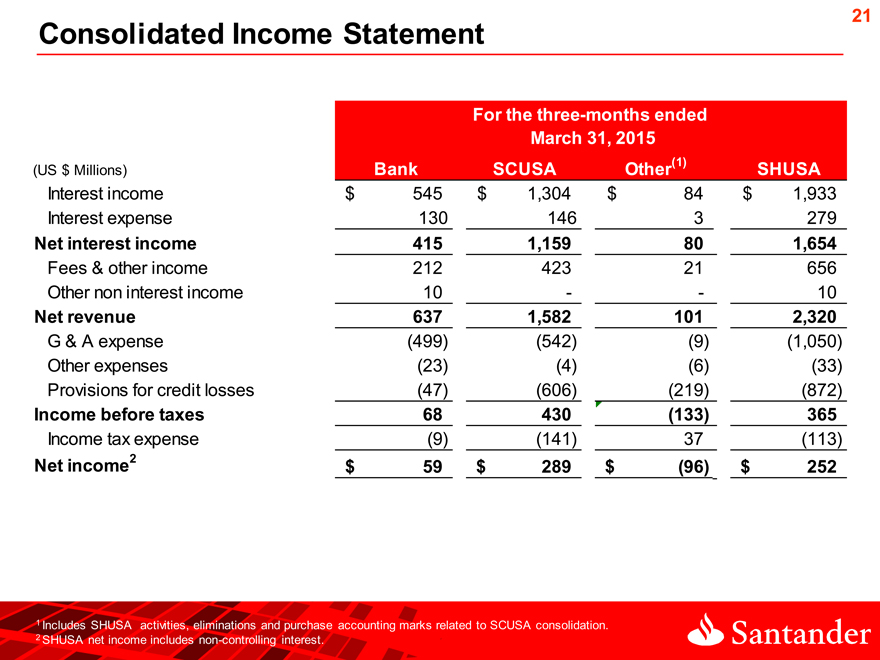
Consolidated Income Statement
For the three-months ended
March 31, 2015
(US $ Millions) Bank SCUSA Other(1) SHUSA
Interest income $ 545 $ 1,304 $ 84 $ 1,933
Interest expense 130 146 3 279
Net interest income 415 1,159 80 1,654
Fees & other income 212 423 21 656
Other non interest income 10 — 10
Net revenue 637 1,582 101 2,320
G & A expense(499)(542)(9)(1,050)
Other expenses(23)(4)(6)(33)
Provisions for credit losses(47)(606)(219)(872)
Income before taxes 68 430(133) 365
Income tax expense(9)(141) 37(113)
Net income2 $ 59 $ 289 $(96) $ 252
1 Includes SHUSA activities, eliminations and purchase accounting marks related to SCUSA consolidation.
2 SHUSA net income includes non-controlling interest.
[Graphic Appears Here]
|
22
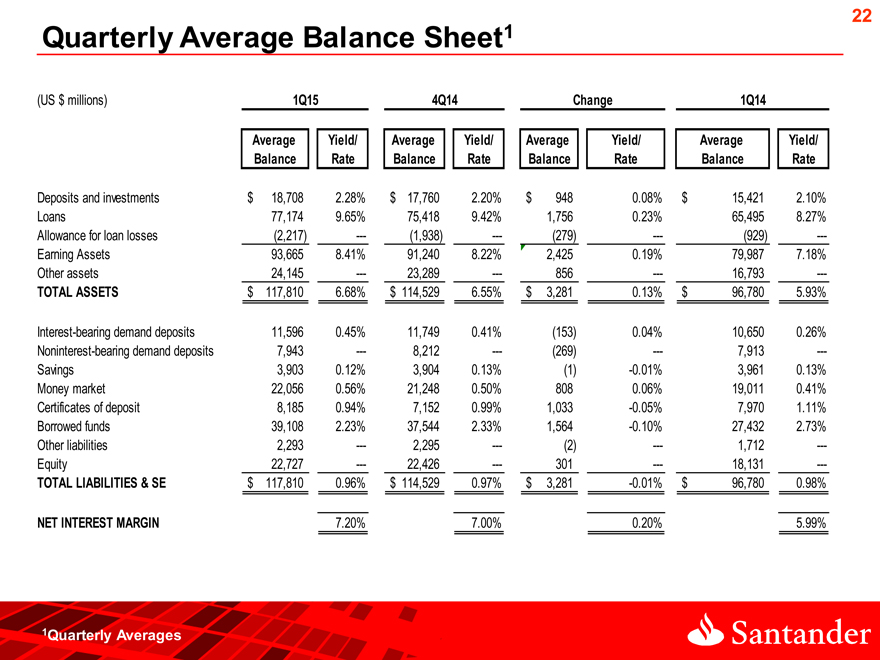
Quarterly Average Balance Sheet1
(US $ millions) 1Q15 4Q14 Change 1Q14
Average Yield/ Average Yield/ Average Yield/ Average Yield/
Balance Rate Balance Rate Balance Rate Balance Rate
Deposits and investments $ 18,708 2.28% $ 17,760 2.20% $ 948 0.08% $ 15,421 2.10%
Loans 77,174 9.65% 75,418 9.42% 1,756 0.23% 65,495 8.27%
Allowance for loan losses(2,217) —-(1,938) —-(279) —-(929) —-
Earning Assets 93,665 8.41% 91,240 8.22% 2,425 0.19% 79,987 7.18%
Other assets 24,145 —- 23,289 —- 856 —- 16,793 —-
TOTAL ASSETS $ 117,810 6.68% $ 114,529 6.55% $ 3,281 0.13% $ 96,780 5.93%
Interest-bearing demand deposits 11,596 0.45% 11,749 0.41%(153) 0.04% 10,650 0.26%
Noninterest-bearing demand deposits 7,943 —- 8,212 —-(269) —- 7,913 —-
Savings 3,903 0.12% 3,904 0.13%(1) -0.01% 3,961 0.13%
Money market 22,056 0.56% 21,248 0.50% 808 0.06% 19,011 0.41%
Certificates of deposit 8,185 0.94% 7,152 0.99% 1,033 -0.05% 7,970 1.11%
Borrowed funds 39,108 2.23% 37,544 2.33% 1,564 -0.10% 27,432 2.73%
Other liabilities 2,293 —- 2,295 —-(2) —- 1,712 —-
Equity 22,727 —- 22,426 —- 301 —- 18,131 —-
TOTAL LIABILITIES & SE $ 117,810 0.96% $ 114,529 0.97% $ 3,281 -0.01% $ 96,780 0.98%
NET INTEREST MARGIN 7.20% 7.00% 0.20% 5.99%
1Quarterly Averages
|
23
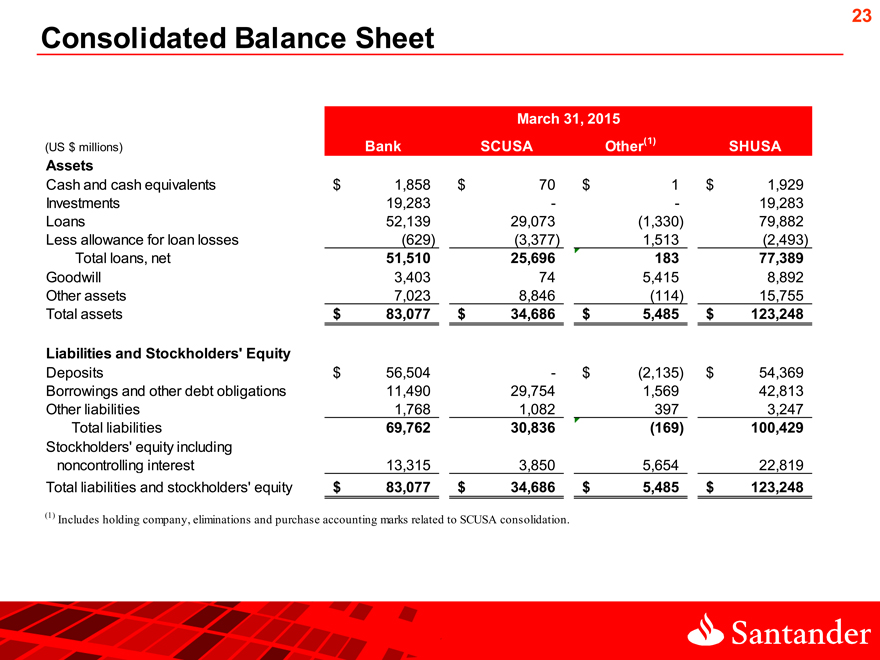
Consolidated Balance Sheet
March 31, 2015
(US $ millions) Bank SCUSA Other(1) SHUSA
Assets
Cash and cash equivalents $ 1,858 $ 70 $ 1 $ 1,929
Investments 19,283 — 19,283
Loans 52,139 29,073(1,330) 79,882
Less allowance for loan losses(629)(3,377) 1,513(2,493)
Total loans, net 51,510 25,696 183 77,389
Goodwill 3,403 74 5,415 8,892
Other assets 7,023 8,846(114) 15,755
Total assets $ 83,077 $ 34,686 $ 5,485 $ 123,248
Liabilities and Stockholders’ Equity
Deposits $ 56,504—$(2,135) $ 54,369
Borrowings and other debt obligations 11,490 29,754 1,569 42,813
Other liabilities 1,768 1,082 397 3,247
Total liabilities 69,762 30,836(169) 100,429
Stockholders’ equity including
noncontrolling interest 13,315 3,850 5,654 22,819
Total liabilities and stockholders’ equity $ 83,077 $ 34,686 $ 5,485 $ 123,248
(1) Includes holding company, eliminations and purchase accounting marks related to SCUSA consolidation.
[Graphic Appears Here]
|
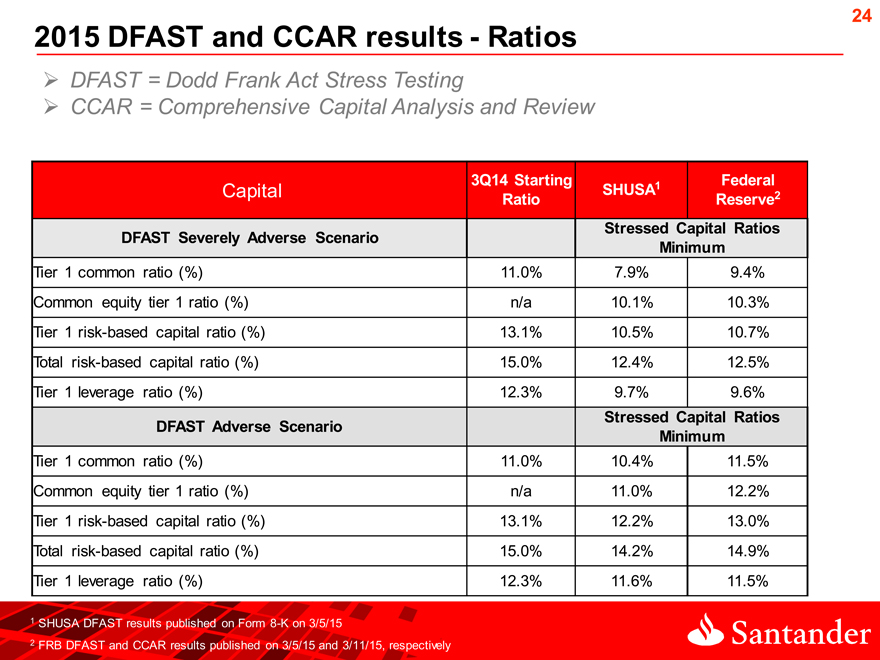
2015 DFAST and CCAR results—Ratios
24
DFAST = Dodd Frank Act Stress Testing
CCAR = Comprehensive Capital Analysis and Review
3Q14 Starting Federal
Capital Ratio SHUSA1 Reserve2
DFAST Severely Adverse Scenario Stressed Capital Ratios
Minimum
Tier 1 common ratio (%) 11.0% 7.9% 9.4%
Common equity tier 1 ratio (%) n/a 10.1% 10.3%
Tier 1 risk-based capital ratio (%) 13.1% 10.5% 10.7%
Total risk-based capital ratio (%) 15.0% 12.4% 12.5%
Tier 1 leverage ratio (%) 12.3% 9.7% 9.6%
DFAST Adverse Scenario Stressed Capital Ratios
Minimum
Tier 1 common ratio (%) 11.0% 10.4% 11.5%
Common equity tier 1 ratio (%) n/a 11.0% 12.2%
Tier 1 risk-based capital ratio (%) 13.1% 12.2% 13.0%
Total risk-based capital ratio (%) 15.0% 14.2% 14.9%
Tier 1 leverage ratio (%) 12.3% 11.6% 11.5%
1 SHUSA DFAST results published on Form 8-K on 3/5/15
2 FRB DFAST and CCAR results published on 3/5/15 and 3/11/15, respectively
[Graphic Appears Here]
|
25
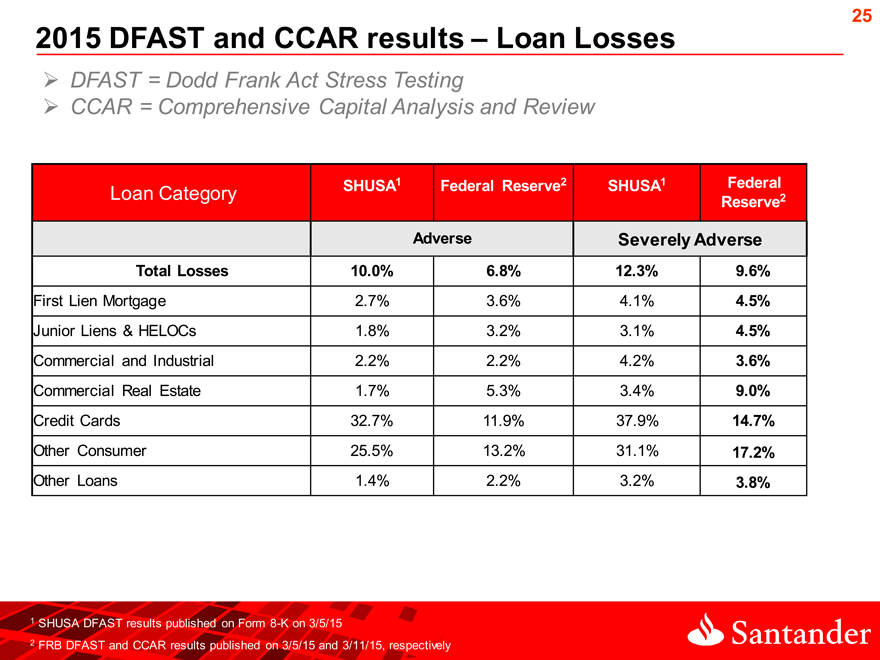
2015 DFAST and CCAR results – Loan Losses
DFAST = Dodd Frank Act Stress Testing
CCAR = Comprehensive Capital Analysis and Review
SHUSA1 Federal Reserve2 SHUSA1 Federal
Loan Category Reserve2
Adverse Severely Adverse
Total Losses 10.0% 6.8% 12.3% 9.6%
First Lien Mortgage 2.7% 3.6% 4.1% 4.5%
Junior Liens & HELOCs 1.8% 3.2% 3.1% 4.5%
Commercial and Industrial 2.2% 2.2% 4.2% 3.6%
Commercial Real Estate 1.7% 5.3% 3.4% 9.0%
Credit Cards 32.7% 11.9% 37.9% 14.7%
Other Consumer 25.5% 13.2% 31.1% 17.2%
Other Loans 1.4% 2.2% 3.2% 3.8%
1 SHUSA DFAST results published on Form 8-K on 3/5/15
2 FRB DFAST and CCAR results published on 3/5/15 and 3/11/15, respectively
[Graphic Appears Here]
|
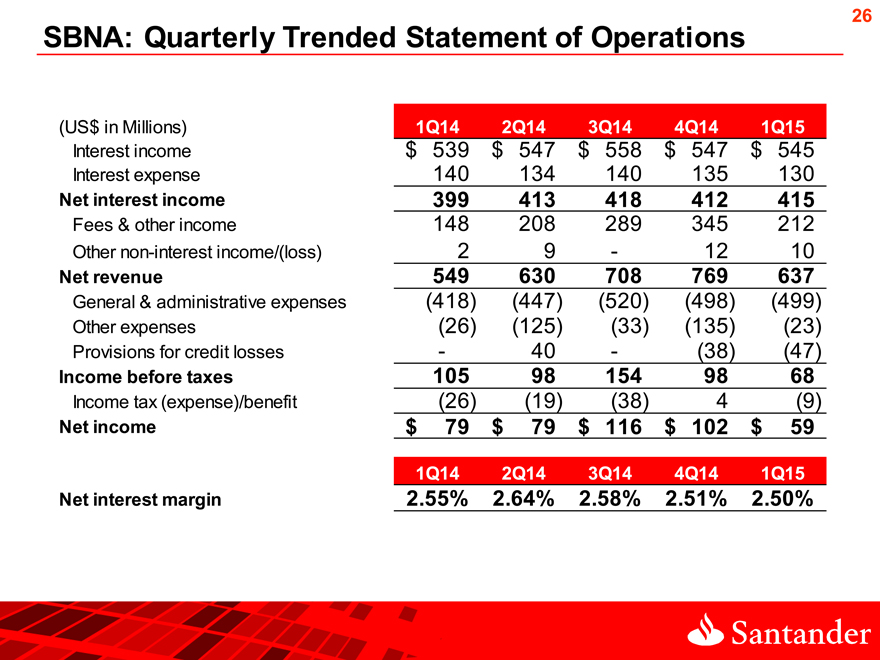
SBNA: Quarterly Trended Statement of Operations
26
(US$ in Millions) 1Q14 2Q14 3Q14 4Q14 1Q15
Interest income $ 539 $ 547 $ 558 $ 547 $ 545
Interest expense 140 134 140 135 130
Net interest income 399 413 418 412 415
Fees & other income 148 208 289 345 212
Other non-interest income/(loss) 2 9—12 10
Net revenue 549 630 708 769 637
General & administrative expenses(418)(447)(520)(498)(499)
Other expenses(26)(125)(33)(135)(23)
Provisions for credit losses—40 -(38)(47)
Income before taxes 105 98 154 98 68
Income tax (expense)/benefit(26)(19)(38) 4(9)
Net income $ 79 $ 79 $ 116 $ 102 $ 59
1Q14 2Q14 3Q14 4Q14 1Q15
Net interest margin 2.55% 2.64% 2.58% 2.51% 2.50%
[Graphic Appears Here]
|
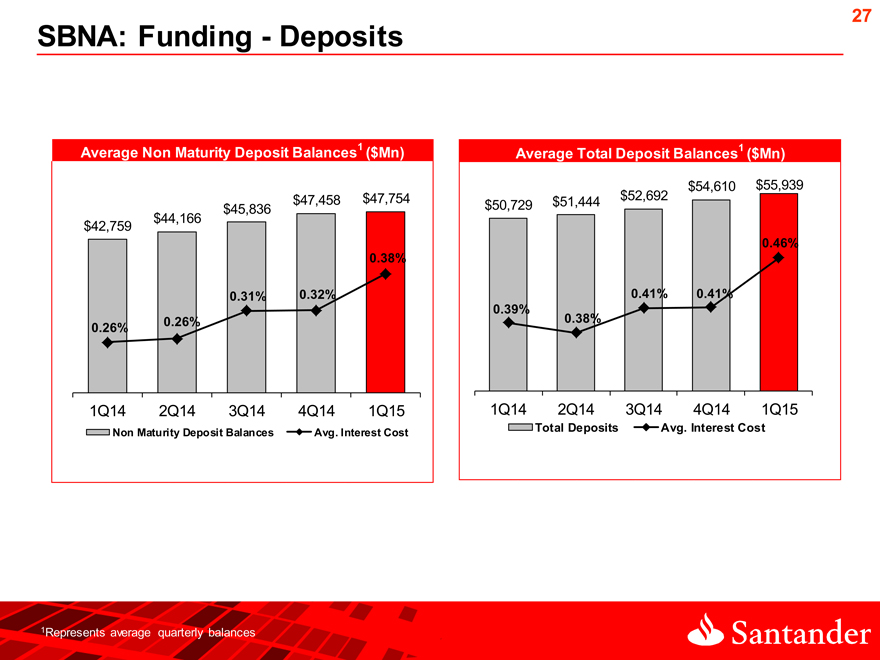
SBNA: Funding—Deposits
27
Average Non Maturity Deposit Balances1 ($Mn) Average Total Deposit Balances1 ($Mn)
$54,610 $55,939
$45,836 $47,458 $47,754 $50,729 $51,444 $52,692
$42,759 $44,166
0.46%
0.38%
0.31% 0.32% 0.41% 0.41%
0.39%
0.26% 0.26% 0.38%
1Q14 2Q14 3Q14 4Q14 1Q15 1Q14 2Q14 3Q14 4Q14 1Q15
Non Maturity Deposit Balances Avg. Interest Cost Total Deposits Avg. Interest Cost
1Represents average quarterly balances
|
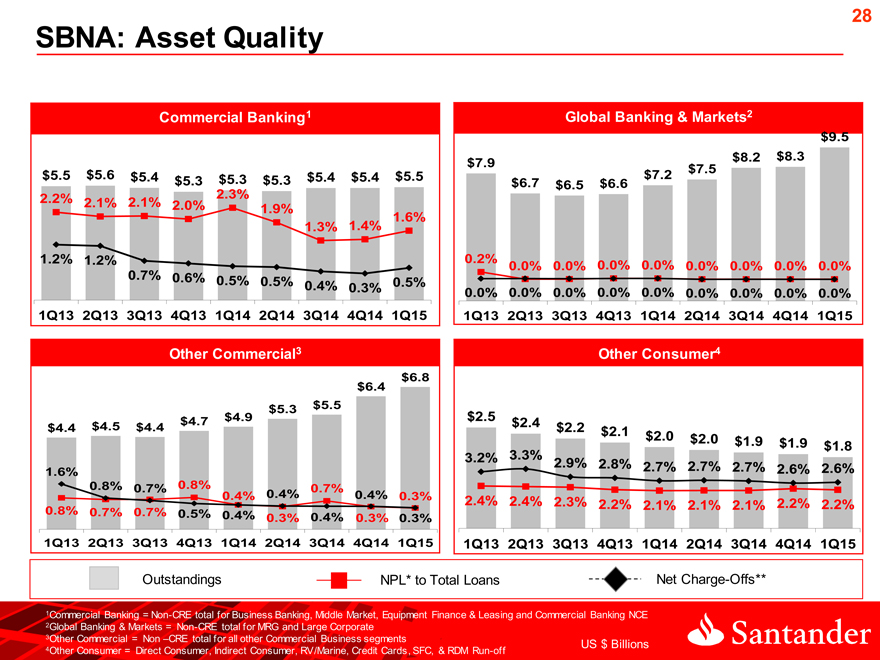
28
SBNA: Asset Quality
Commercial Banking1 Global Banking & Markets2
$9.5
$7.9 $8.2 $8.3
$7.5
$5.5 $5.6 $5.4 $5.3 $5.3 $5.3 $5.4 $5.4 $5.5 $6.7 $6.5 $6.6 $7.2
2.3%
2.2% 2.1% 2.1% 2.0% 1.9%
1.3% 1.4% 1.6%
1.2% 1.2% 0.2% 0.0% 0.0% 0.0% 0.0% 0.0% 0.0% 0.0% 0.0%
0.7% 0.6% 0.5% 0.5% 0.4% 0.3% 0.5%
0.0% 0.0% 0.0% 0.0% 0.0% 0.0% 0.0% 0.0% 0.0%
1Q13 2Q13 3Q13 4Q13 1Q14 2Q14 3Q14 4Q14 1Q15 1Q13 2Q13 3Q13 4Q13 1Q14 2Q14 3Q14 4Q14 1Q15
Other Commercial3 Other Consumer4
$6.8
$6.4
$5.3 $5.5
$4.7 $4.9 $2.5 $2.4
$4.4 $4.5 $4.4 $2.2 $2.1 $2.0 $2.0 $1.9 $1.9 $1.8
3.2% 3.3% 2.9% 2.8% 2.7% 2.7% 2.7%
1.6% 2.6% 2.6%
0.8% 0.7% 0.8% 0.7%
0.4% 0.4% 0.4% 0.3% 2.4% 2.4% 2.3% 2.2% 2.1% 2.1% 2.1% 2.2% 2.2%
0.8% 0.7% 0.7% 0.5% 0.4% 0.3% 0.4% 0.3% 0.3%
1Q13 2Q13 3Q13 4Q13 1Q14 2Q14 3Q14 4Q14 1Q15 1Q13 2Q13 3Q13 4Q13 1Q14 2Q14 3Q14 4Q14 1Q15
Outstandings NPL* to Total Loans Net Charge-Offs**
1Commercial Banking = Non-CRE total for Business Banking, Middle Market, Equipment Finance & Leasing and Commercial Banking NCE
2Global Banking & Markets = Non-CRE total for MRG and Large Corporate
3Other Commercial = Non –CRE total for all other Commercial Business segments US $ Billions
4Other Consumer = Direct Consumer, Indirect Consumer, RV/Marine, Credit Cards, SFC, & RDM Run-off
[Graphic Appears Here]
|
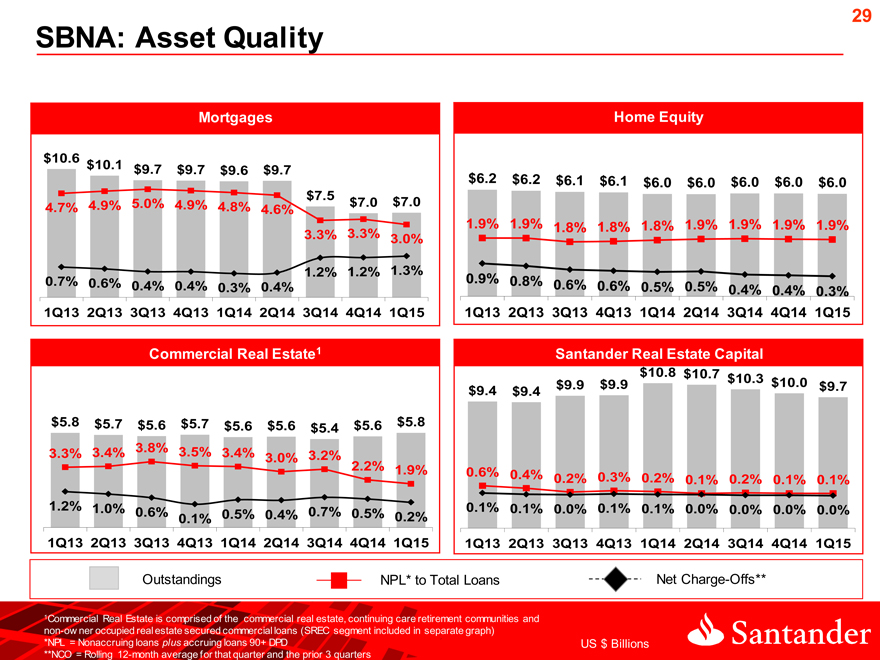
SBNA: Asset Quality
29
Mortgages
$10.6
$10.1 $9.7 $9.7 $9.6 $9.7
$7.5
4.7% 4.9% 5.0% 4.9% 4.8% 4.6% $7.0 $7.0
3.3% 3.3% 3.0%
1.2% 1.2% 1.3%
0.7% 0.6% 0.4% 0.4% 0.3% 0.4%
1Q13 2Q13 3Q13 4Q13 1Q14 2Q14 3Q14 4Q14 1Q15
Commercial Real Estate1
$5.8 $5.7 $5.6 $5.7 $5.6 $5.6 $5.6 $5.8
$5.4
3.3% 3.4% 3.8% 3.5% 3.4%
3.0% 3.2%
2.2% 1.9%
1.2% 1.0%
0.6% 0.5% 0.4% 0.7% 0.5% 0.2%
0.1%
1Q13 2Q13 3Q13 4Q13 1Q14 2Q14 3Q14 4Q14 1Q15
Home Equity
$6.2 $6.2 $6.1 $6.1 $6.0 $6.0 $6.0 $6.0 $6.0
1.9% 1.9% 1.8% 1.8% 1.8% 1.9% 1.9% 1.9% 1.9%
0.9% 0.8% 0.6% 0.6% 0.5% 0.5% 0.4% 0.4% 0.3%
1Q13 2Q13 3Q13 4Q13 1Q14 2Q14 3Q14 4Q14 1Q15
Santander Real Estate Capital
$10.8 $10.7 $10.3
$9.4 $9.4 $9.9 $9.9 $10.0 $9.7
0.6% 0.4% 0.2% 0.3% 0.2% 0.1% 0.2% 0.1% 0.1%
0.1% 0.1% 0.0% 0.1% 0.1% 0.0% 0.0% 0.0% 0.0%
1Q13 2Q13 3Q13 4Q13 1Q14 2Q14 3Q14 4Q14 1Q15
Outstandings NPL* to Total Loans Net Charge-Offs**
1Commercial Real Estate is comprised of the commercial real estate, continuing care retirement communities and
non-ow ner occupied real estate secured commercial loans (SREC segment included in separate graph)
*NPL = Nonaccruing loans plus accruing loans 90+ DPD US $ Billions
**NCO = Rolling 12-month average for that quarter and the prior 3 quarters
|
30
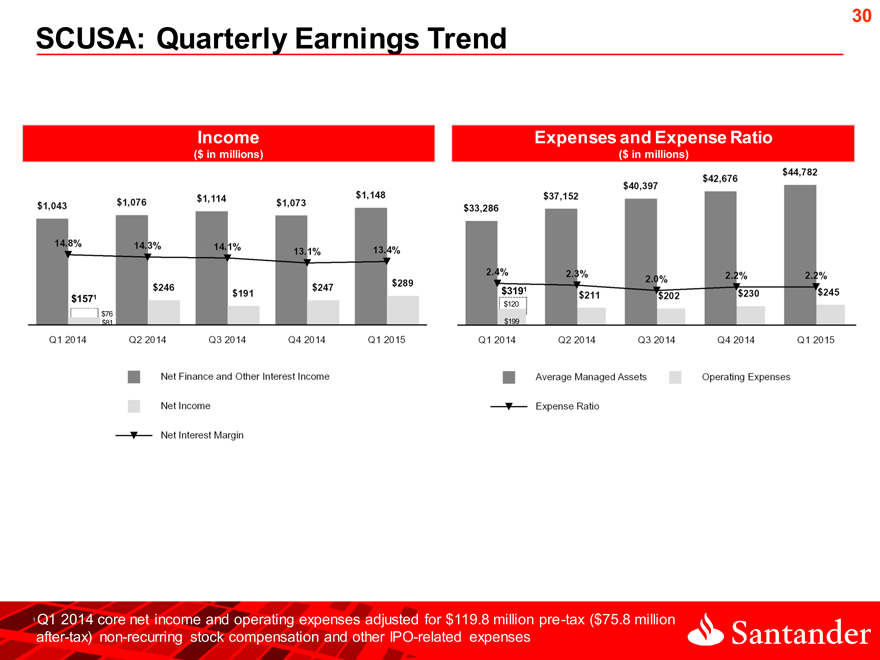
SCUSA: Quarterly Earnings Trend
Income
$3191
$ 1571 $120
$ 76
$81 $199
1 Q1 2014 core net income and operating expenses adjusted for $119.8 million pre-tax ($75.8 million after-tax) non-recurring stock compensation and other IPO-related expenses
[Graphic Appears Here]
|
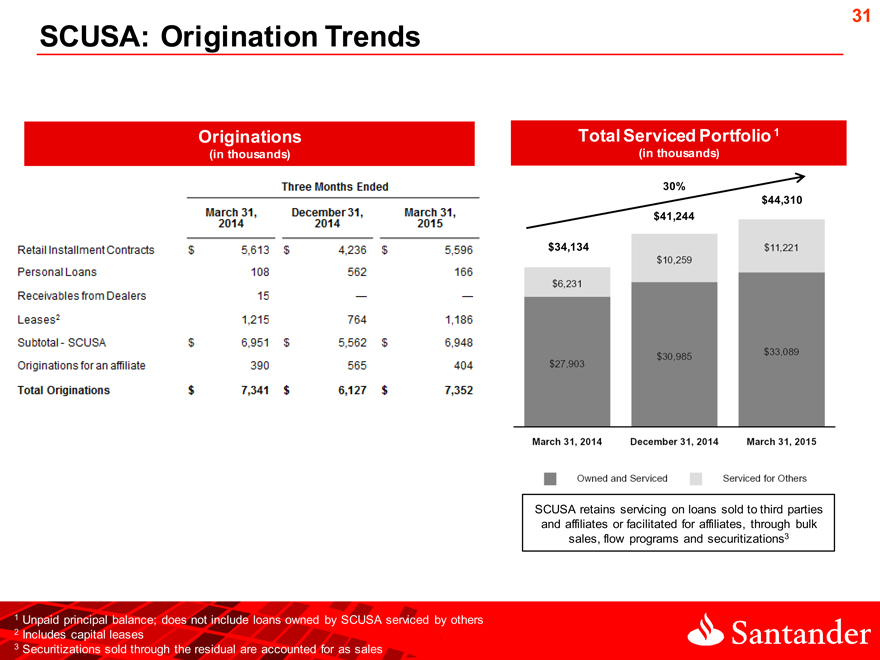
SCUSA: Origination Trends
31
Originations Total Serviced Portfolio 1
(in thousands)(in thousands)
30%
$44,310
$41,244
$34,134
SCUSA retains servicing on loans sold to third parties
and affiliates or facilitated for affiliates, through bulk
sales, flow programs and securitizations3
1 Unpaid principal balance; does not include loans owned by SCUSA serviced by others
2 Includes capital leases
3 Securitizations sold through the residual are accounted for as sales
|
32
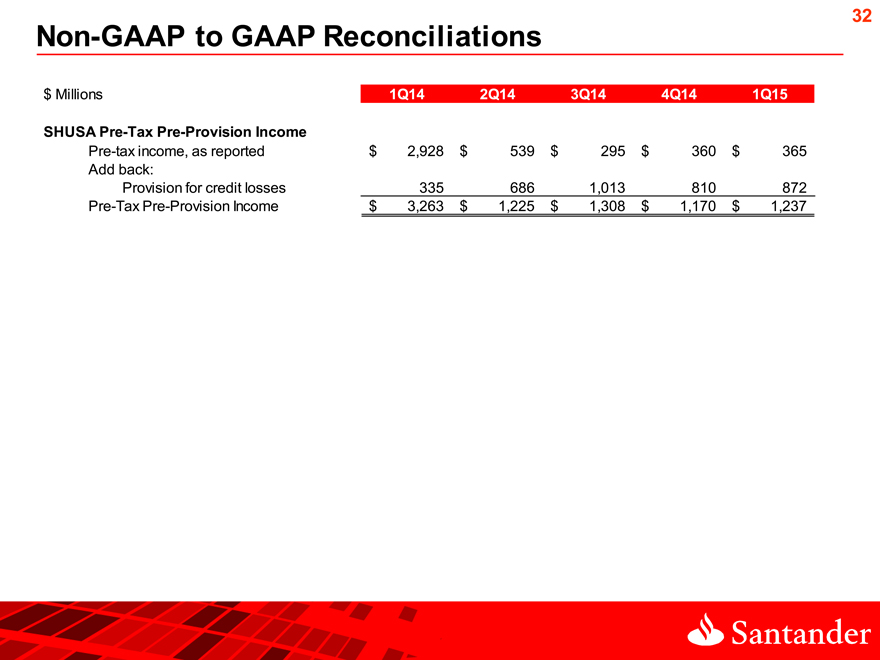
Non-GAAP to GAAP Reconciliations
$ Millions 1Q14 2Q14 3Q14 4Q14 1Q15
SHUSA Pre-Tax Pre-Provision Income
Pre-tax income, as reported $ 2,928 $ 539 $ 295 $ 360 $ 365 Add back: Provision for credit losses 335 686 1,013 810 872 Pre-Tax Pre-Provision Income $ 3,263 $ 1,225 $ 1,308 $ 1,170 $ 1,237
[Graphic Appears Here]
|
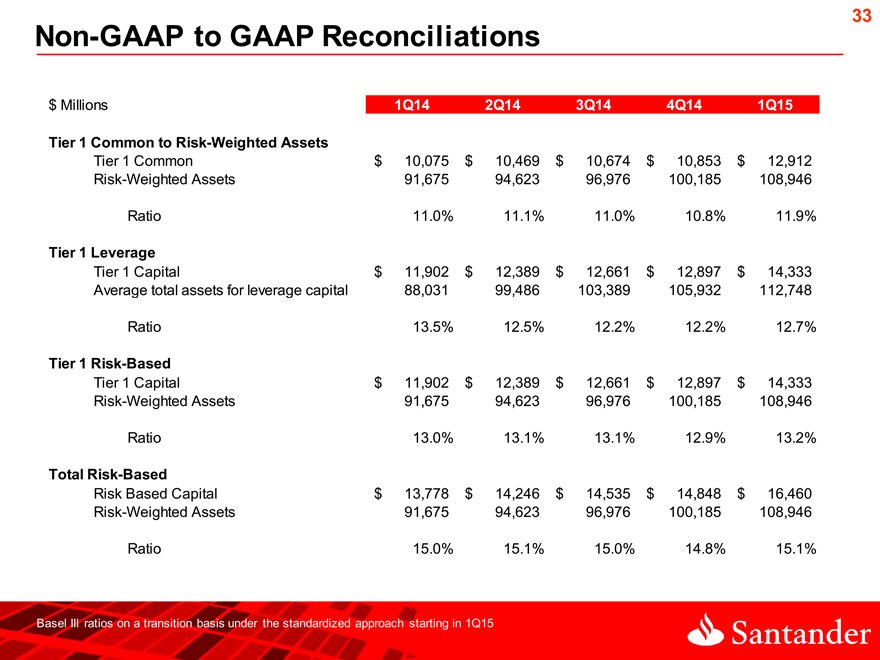
Non-GAAP to GAAP Reconciliations
33
$ Millions 1Q14 2Q14 3Q14 4Q14 1Q15
Tier 1 Common to Risk-Weighted Assets
Tier 1 Common $ 10,075 $ 10,469 $ 10,674 $ 10,853 $ 12,912
Risk-Weighted Assets 91,675 94,623 96,976 100,185 108,946
Ratio 11.0% 11.1% 11.0% 10.8% 11.9%
Tier 1 Leverage
Tier 1 Capital $ 11,902 $ 12,389 $ 12,661 $ 12,897 $ 14,333
Average total assets for leverage capital 88,031 99,486 103,389 105,932 112,748
Ratio 13.5% 12.5% 12.2% 12.2% 12.7%
Tier 1 Risk-Based
Tier 1 Capital $ 11,902 $ 12,389 $ 12,661 $ 12,897 $ 14,333
Risk-Weighted Assets 91,675 94,623 96,976 100,185 108,946
Ratio 13.0% 13.1% 13.1% 12.9% 13.2%
Total Risk-Based
Risk Based Capital $ 13,778 $ 14,246 $ 14,535 $ 14,848 $ 16,460
Risk-Weighted Assets 91,675 94,623 96,976 100,185 108,946
Ratio 15.0% 15.1% 15.0% 14.8% 15.1%
[Graphic Appears Here]
|
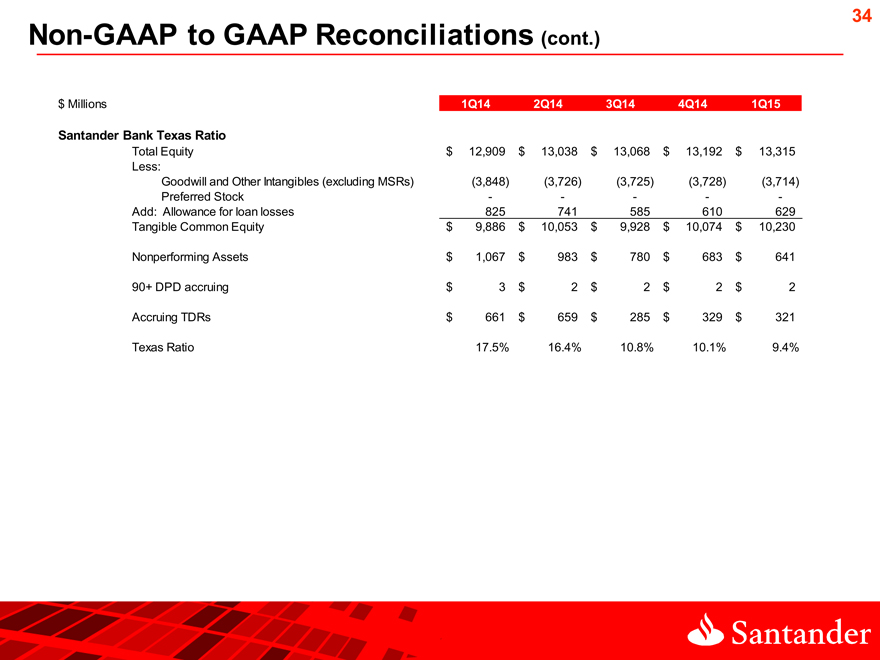
Non-GAAP to GAAP Reconciliations (cont.)
34
$ Millions 1Q14 2Q14 3Q14 4Q14 1Q15
Santander Bank Texas Ratio
Total Equity $ 12,909 $ 13,038 $ 13,068 $ 13,192 $ 13,315
Less:
Goodwill and Other Intangibles (excluding MSRs)(3,848)(3,726)(3,725)(3,728)(3,714)
Preferred Stock — — -
Add: Allowance for loan losses 825 741 585 610 629
Tangible Common Equity $ 9,886 $ 10,053 $ 9,928 $ 10,074 $ 10,230
Nonperforming Assets $ 1,067 $ 983 $ 780 $ 683 $ 641
90+ DPD accruing $ 3 $ 2 $ 2 $ 2 $ 2
Accruing TDRs $ 661 $ 659 $ 285 $ 329 $ 321
Texas Ratio 17.5% 16.4% 10.8% 10.1% 9.4%
[Graphic Appears Here]
|