UNITED STATES
SECURITIES AND EXCHANGE COMMISSION
WASHINGTON, D.C. 20549
FORM N-CSR
CERTIFIED SHAREHOLDER REPORT OF REGISTERED
MANAGEMENT INVESTMENT COMPANIES
Investment Company Act file number: 811-05088
THE ALLIANCEBERNSTEIN PORTFOLIOS
(Exact name of registrant as specified in charter)
1345 Avenue of the Americas, New York, New York 10105
(Address of principal executive offices) (Zip code)
Joseph J. Mantineo
AllianceBernstein L.P.
1345 Avenue of the Americas
New York, New York 10105
(Name and address of agent for service)
Registrant’s telephone number, including area code: (800) 221-5672
Date of fiscal year end: August 31, 2014
Date of reporting period: February 28, 2014
ITEM 1. REPORTS TO STOCKHOLDERS.
SEMI-ANNUAL REPORT
AllianceBernstein
Tax-Managed Wealth Strategies
Wealth Appreciation Strategy
Balanced Wealth Strategy
Conservative Wealth Strategy
February 28, 2014
Semi-Annual Report

Investment Products Offered
| • | Are Not FDIC Insured |
| • | May Lose Value |
| • | Are Not Bank Guaranteed |
Investors should consider the investment objectives, risks, charges and expenses of the
Fund carefully before investing. For copies of our prospectus or summary prospectus, which
contain this and other information, visit us online at www.alliancebernstein.com or contact your
AllianceBernstein Investments representative. Please read the prospectus and/or summary
prospectus carefully before investing.
This shareholder report must be preceded or accompanied by the Fund’s prospectus for individuals
who are not current shareholders of the Fund.
You may obtain a description of the Fund’s proxy voting policies and procedures, and information
regarding how the Fund voted proxies relating to portfolio securities during the most recent 12-month
period ended June 30, without charge. Simply visit AllianceBernstein’s website at
www.alliancebernstein.com, or go to the Securities and Exchange Commission’s (the “Commission”)
website at www.sec.gov, or call AllianceBernstein at (800) 227-4618.
The Fund files its complete schedule of portfolio holdings with the Commission for the first and third
quarters of each fiscal year on Form N-Q. The Fund’s Forms N-Q are available on the Commission’s
website at www.sec.gov. The Fund’s Forms N-Q may also be reviewed and copied at the
Commission’s Public Reference Room in Washington, DC; information on the operation of the Public
Reference Room may be obtained by calling (800) SEC-0330. AllianceBernstein publishes full portfolio
holdings for the Fund monthly at www.alliancebernstein.com.
AllianceBernstein Investments, Inc. (ABI) is the distributor of the AllianceBernstein family of
mutual funds. ABI is a member of FINRA and is an affiliate of AllianceBernstein L.P., the manager of
the funds.
AllianceBernstein® and the AB Logo are registered trademarks and service marks used by permission
of the owner, AllianceBernstein L.P.
April 10, 2014
Semi-Annual Report
This report provides management’s discussion of fund performance for the portfolios of AllianceBernstein Tax-Managed Wealth Strategies (the “Strategies” and individually a “Strategy”) for the semi-annual reporting period ended February 28, 2014.
Currencies can have a dramatic impact on equity returns, significantly adding to returns in some years and greatly diminishing them in others. Currency and equity positions are evaluated separately. AllianceBernstein L.P. (the “Adviser”) may seek to hedge the currency exposure resulting from securities positions when it finds the currency exposure unattractive. To hedge all or a portion of its currency risk, the Strategies may, from time to time, invest in currency-related derivatives, including forward currency exchange contracts, futures, options on futures, swaps and options. The Adviser may also seek investment opportunities by taking long or short positions in currencies through the use of currency-related derivatives. The Strategies may enter into other derivatives transactions, such as options, futures contracts, forwards, and swaps.
AllianceBernstein Tax-Managed Wealth Appreciation Strategy Investment Objective and Policies
AllianceBernstein Tax-Managed Wealth Appreciation Strategy’s investment objective is long-term growth of capital. The Strategy invests in a portfolio of equity securities that is designed for investors who seek tax-efficient equity returns but also want broad diversification of the related risks across styles, capitalization ranges and geographic regions. In managing the Strategy, the
Adviser efficiently diversifies between growth and value equity investment styles, and between U.S. and non-U.S. markets. Normally, the Strategy targets an equal weighting of growth and value style stocks (50% each), with approximately 60% of each equity style invested in U.S. companies and the remaining 40% in non-U.S. companies. The Adviser will allow the relative weightings of the Strategy’s growth and value components, and U.S. and non-U.S. companies to change in response to market conditions, but ordinarily only by ±5% of the portfolio. Beyond those ranges, the Adviser will rebalance the portfolio toward the targeted blends. However, under extraordinary circumstances, such as when the Adviser believes that market conditions favoring one investment style are compelling, the range may expand to ±10% of the portfolio.
The Strategy invests approximately 20% of its assets in the Volatility Management Portfolio (the “Portfolio”), which is managed by the Adviser. The Portfolio is designed to reduce the overall effect of equity market volatility on the Strategy’s portfolio and the effects of adverse market conditions on its performance. The Portfolio will normally be considered to be part of the Strategy’s equity asset allocation. Under normal market conditions, the Portfolio will invest predominantly in equity securities. If the Adviser determines that the equity markets pose disproportionate risks, the Adviser will reduce the Portfolio’s equity investments and invest in fixed-income securities or other non-equity asset classes to reduce the risks of the Strategy’s investments in equity securities.
| ALLIANCEBERNSTEIN TAX-MANAGED WEALTH STRATEGIES • | 1 |
The Strategy also may enter into forward commitments, make short sales of securities or maintain a short position, invest in rights or warrants, and may invest in the securities of companies in emerging markets.
AllianceBernstein Tax-Managed Balanced Wealth Strategy Investment Objective and Policies
AllianceBernstein Tax-Managed Balanced Wealth Strategy’s investment objective is to achieve the highest total return consistent with the Adviser’s determination of reasonable risk. The Strategy invests in a portfolio of equity and debt securities that is designed for investors who seek a moderate tilt toward tax-efficient equity returns but also want the risk diversification offered by tax-exempt debt securities and the broad diversification of their equity risk across styles, capitalization ranges and geographic regions. In managing the Strategy, the Adviser efficiently diversifies between the debt and equity components to produce the desired risk/return profile of the Strategy. The Strategy targets a weighting of 50% equities and 50% tax-exempt debt securities with a goal of providing moderate upside potential without excessive volatility.
Within the Strategy’s equity component, the targeted blend is an equal weighting of growth and value style stocks (50% each), with approximately 60% of each equity style invested in U.S. companies and the remaining 40% in non-U.S. companies. The Adviser will allow the relative weightings of the Strategy’s debt and equity components, the equity component’s growth and value and U.S. and non-
U.S. companies’ weightings to change in response to market conditions, but ordinarily only by ±5% of the portfolio. However, under extraordinary circumstances, such as when market conditions favoring one investment style are compelling, the range may expand to ±10% of the portfolio.
The Strategy invests approximately 15% of its assets in the Volatility Management Portfolio (the “Portfolio”), which is managed by the Adviser. The Portfolio is designed to reduce the overall effect of equity market volatility on the Strategy’s portfolio and the effects of adverse market conditions on its performance. The Portfolio will normally be considered to be part of the Strategy’s equity asset allocation. Under normal market conditions, the Portfolio will invest predominantly in equity securities. If the Adviser determines that the equity markets pose disproportionate risks, the Adviser will reduce the Portfolio’s equity investments and invest in fixed-income securities or other non-equity asset classes to reduce the risks of the Strategy’s investments in equity securities.
All fixed-income securities held by the Strategy will be of investment grade at the time of purchase. In the event that the rating of any security held by the Strategy falls below investment grade, the Strategy will not be obligated to dispose of such security and may continue to hold the obligation if, in the opinion of the Adviser, such investment is appropriate under the circumstances.
With the goal of protecting against inflation risk, the Strategy may (i) allocate approximately 10% of the
| 2 | • ALLIANCEBERNSTEIN TAX-MANAGED WEALTH STRATEGIES |
Strategy’s portfolio from traditional municipal bonds to inflation-protected securities, including inflation-protected municipal securities, (ii) enter into inflation (“CPI”) swap agreements or other types of swap agreements that the Adviser believes offer protection against inflation risk, with a combined notional amount of approximately 10% of the Strategy’s assets, or (iii) use a combination of the foregoing so that approximately 10% of the Strategy’s assets are “inflation-protected”.
The Strategy also may enter into forward commitments, make short sales of securities or maintain a short position, invest in rights and warrants, and invest up to 10% of its total assets in the securities of companies in emerging markets.
AllianceBernstein Tax-Managed Conservative Wealth Strategy Investment Objective and Policies
AllianceBernstein Tax-Managed Conservative Wealth Strategy’s investment objective is to achieve a high total return without, in the opinion of the Adviser, undue risk to principal. The Strategy invests in a portfolio of equity and debt securities that is designed for investors who seek some opportunity for tax-efficient equity returns if the related risks are broadly diversified and overall portfolio volatility reflects a preponderance of debt securities. The Strategy targets a weighting of 30% equity securities and 70% tax-exempt debt securities with a goal of providing reduced volatility and modest upside potential. In managing the Strategy, the Adviser efficiently diversifies between the debt and equity components to produce the desired risk/return profile of the Strategy. Within the equity component, the
Strategy’s targeted blend is an equal weighting of growth and value style stocks (50% each), with approximately 60% of each equity style invested in U.S. companies and the remaining 40% in non-U.S. companies. The Adviser will allow the relative weightings of the Strategy’s debt and equity components, the equity component’s growth and value weightings and U.S. and non-U.S. companies to change in response to market conditions, but ordinarily only by ±5% of the portfolio. However, under extraordinary circumstances, such as when market conditions favoring one investment style are compelling, the range may expand to ±10% of the portfolio.
The Strategy invests approximately 10% of its assets in the Volatility Management Portfolio (the “Portfolio”), which is managed by the Adviser. The Portfolio is designed to reduce the overall effect of equity market volatility on the Strategy’s portfolio and the effects of adverse market conditions on its performance. The Portfolio will normally be considered to be part of the Strategy’s equity asset allocation. Under normal market conditions, the Portfolio will invest predominantly in equity securities. If the Adviser determines that the equity markets pose disproportionate risks, the Adviser will reduce the Portfolio’s equity investments and invest in fixed-income securities or other non-equity asset classes to reduce the risks of the Strategy’s investments in equity securities.
All fixed-income securities held by the Strategy will be of investment grade at the time of purchase. In the event that the rating of any security held by the Strategy falls below investment grade,
| ALLIANCEBERNSTEIN TAX-MANAGED WEALTH STRATEGIES • | 3 |
the Strategy will not be obligated to dispose of such security and may continue to hold the obligation if, in the opinion of the Adviser, such investment is appropriate under the circumstances.
With the goal of protecting against inflation risk, the Strategy may (i) allocate approximately 10% of the Strategy’s portfolio from traditional municipal bonds to inflation-protected securities, including inflation-protected municipal securities, (ii) enter into inflation (“CPI”) swap agreements or other types of swap agreements that the Adviser believes offer protection against inflation risk, with a combined notional amount of approximately 10% of the Strategy’s assets, or (iii) use a combination of the foregoing so that approximately 10% of the Strategy’s assets are inflation-protected.
The Strategy also may enter into forward commitments, make short sales of securities or maintain a short position, invest in rights or warrants, and invest up to 10% of its total assets in the securities of companies in emerging markets.
Investment Results
The tables on pages 10-12 show performance for each Strategy compared to its respective benchmarks for the six- and 12-month periods ended February 28, 2014. Each Strategy’s blended benchmark is as follows: AllianceBernstein Tax-Managed Wealth Appreciation Strategy, 60% Standard & Poor’s (“S&P”) 500 Index/40% Morgan Stanley Capital International All Country World Index (“MSCI ACWI”) ex-U.S.; AllianceBernstein Tax-Managed Balanced Wealth Strategy, 50% Barclays 5-Year General Obligation (“GO”) Municipal Bond Index/50% S&P 500
Index and AllianceBernstein Tax-Managed Conservative Wealth Strategy, 70% Barclays 5-Year GO Municipal Bond Index/30% S&P 500 Index.
For the six-month period ended February 28, 2014, all share classes of the Tax-Managed Wealth Appreciation Strategy underperformed the primary benchmark, the S&P 500 Index, while all share classes of the Tax-Managed Balanced Wealth and Tax-Managed Conservative Wealth Strategies outperformed the primary benchmark, the Barclays 5-Year GO Municipal Index. All share classes of the Tax-Managed Wealth Appreciation Strategy outperformed the blended benchmark, while all share classes of the Tax-Managed Balanced Wealth and the Tax-Managed Conservative Wealth Strategies underperformed the blended benchmark. At the component level, U.S. Value, U.S. Growth, Non-U.S. Value and Volatility Management outperformed in all of the Strategies. Non-U.S. Growth underperformed its style benchmark. Intermediate-Term Municipal Bonds and Inflation-Protected Bonds underperformed in the Tax-Managed Balanced Wealth Strategy and the Tax-Managed Conservative Wealth Strategy. Short-Term Municipal Bonds outperformed in the Tax-Managed Conservative Wealth Strategy.
For the 12-month period ended February 28, 2014, all share classes of the Tax-Managed Wealth Appreciation Strategy underperformed the primary benchmark, while all share classes of the Tax-Managed Balanced Wealth and Tax-Managed Conservative Wealth Strategies outperformed the primary benchmark. All share classes of the Tax-Managed Wealth Appreciation Strategy outperformed the blended benchmark, while
| 4 | • ALLIANCEBERNSTEIN TAX-MANAGED WEALTH STRATEGIES |
all share classes of the Tax-Managed Balanced Wealth and the Tax-Managed Conservative Wealth Strategies underperformed their blended benchmark. At the component level, all equity sleeves—U.S. Value, U.S. Growth, Non-U.S. Value—beat their style benchmarks except for Non-U.S. Growth. Volatility Management also outperformed its benchmark in all three Strategies. Inflation-Protected Bonds fell in absolute terms and underperformed in Tax-Managed Balanced Wealth and Tax-Managed Conservative Wealth Strategies. Intermediate-Term Municipal Bonds underperformed in Tax-Managed Balanced Wealth and Tax-Managed Conservative Wealth. Short-Term Municipal Bonds outperformed in Tax-Managed Conservative Wealth Strategies.
The Tax-Managed Wealth Appreciation Strategy utilized derivatives including futures for hedging purposes, which had no material impact on performance for both periods; forwards for hedging and investment purposes, which had no material impact on performance for the six-month period and added to performance for the 12-month period; and purchased and written options for hedging purposes, which had no material impact on performance for the 12-month period. The Tax-Managed Balanced Wealth Strategy utilized futures for hedging purposes, which had no material impact on performance for both periods; forwards for hedging and investment purposes, which had no material impact on performance for both periods; and purchased options for hedging purposes, which had no material impact on performance for the 12-month period, and were not used during the six-month period. The Tax-Managed Conservative Wealth Strategy utilized inflation swaps for hedging
purposes, which detracted from performance for the 12-month period, futures for hedging purposes which had no material impact on performance for the 12-month period, and forwards for hedging and investment purposes, which had no material impact on performance for both periods.
Market Review and Investment Strategy
The global equity markets responded positively to economic improvement in key developed countries and the accommodative monetary policies of major central banks during the six-month period ended February 28, 2014. In the U.S., solid data on employment, consumer spending and housing pointed to continued economic recovery. Despite wide differences between individual countries, the euro area showed signs of modest economic growth reflected by stronger manufacturing activity and an increase in consumer confidence. In Japan, both employment growth and core inflation have turned positive suggesting that the aggressive government efforts to reverse a decade of deflation and stimulate growth are delivering results.
By contrast, emerging-market equities continued to underperform developed- market equities as sluggish exports and weak domestic demand have hampered economic growth in several bellwether countries such as China and Brazil. Investors were also concerned about the impact on growth for those emerging market countries that have relied on abundant global liquidity and low interest rates to finance government spending as the U.S. Federal Reserve (the “Fed”) began to rein in its bond purchase program.
| ALLIANCEBERNSTEIN TAX-MANAGED WEALTH STRATEGIES • | 5 |
The direction of the Fed’s policy also played a significant role in market activity in the six-month period. Fixed income markets underperformed in the beginning of the period, as interest rates rose in response to signals by the Fed that it would consider reducing its bond-buying program, which then came to pass in December. At the end of the period, however, capital markets rebounded with almost all major fixed-income sectors outperforming (with the notable exception of local-currency emerging market debt), as Fed Chair Janet Yellen reaffirmed that tapering should continue unabated. Investors were encouraged to hear that the program is expected to be reduced in measured steps and that monetary stance should remain accommodative for the foreseeable future.
The components are well positioned to invest opportunistically across a wide range of asset classes and market circumstances. In equities, the Growth Team has focused its holdings on companies that are market leaders with attractive earnings growth prospects and high returns on invested capital, while the Value Team is focused on companies with robust cash-flow generation and strong balance sheets, whose stocks are trading at deep valuation discounts. Meanwhile, the Fixed-Income Team continues to emphasize credit sectors with positive fundamentals over U.S. Treasuries.
The municipal components may purchase municipal securities that are insured under policies issued by certain insurance companies. Historically, insured municipal securities typically received a higher credit rating, which meant that the issuer of the securities paid a lower interest rate. As a result of declines in the credit quality and associated downgrades of most fund
insurers, insurance has less value than it did in the past. The market now values insured municipal securities primarily based on the credit quality of the issuer of the security with little value given to the insurance feature. In purchasing such insured securities, the Adviser evaluates the risk and return of municipal securities through its own research. If an insurance company’s rating is downgraded or the company becomes insolvent, the prices of municipal securities insured by the insurance company may decline. As of February 28, 2014, the Strategies’ percentages of total investments in insured bonds and in insured bonds that have been prerefunded (a type of bond issued to fund another callable bond, where the issuer actually decides to exercise its right to buy its bonds back before the scheduled maturity date) are as follows:
| Portfolio | Insured Bonds* | Prerefunded/ ETM Insured Bonds*^ | ||||||
Tax- Managed Conservative Strategy | 12.78 | % | 0.00 | % | ||||
Tax-Managed Balanced Wealth Strategy | 13.65 | % | 2.09 | % | ||||
| * | Breakdowns expressed as a percentage of investments in municipal bonds. |
| ^ | Escrowed to maturity. |
The Municipal Bond Investment Team believes that downgrades in insurance company ratings or insurance company insolvencies present limited risk to the Strategies. The municipal components generally invest in investment-grade, as the underlying credit quality of the insured municipal securities reduces the risk of a significant reduction in the value of the insured municipal security.
| 6 | • ALLIANCEBERNSTEIN TAX-MANAGED WEALTH STRATEGIES |
DISCLOSURES AND RISKS
Benchmark Disclosure
The unmanaged S&P 500® Index, the unmanaged MSCI ACWI ex-U.S., and the unmanaged Barclays 5-Year GO Municipal Bond Index do not reflect fees and expenses associated with the active management of a mutual fund portfolio. The S&P 500 Index includes 500 U.S. stocks and is a common representation of the performance of the overall U.S. stock market. The Barclays 5-Year GO Municipal Bond Index represents the performance of long-term, investment-grade tax-exempt bonds with maturities ranging from four to six years. The MSCI ACWI ex-U.S. (free float-adjusted, market capitalization weighted) represents the equity market performance of developed and emerging markets, excluding the United States. MSCI makes no express or implied warranties or representations, and shall have no liability whatsoever with respect to any MSCI data contained herein. The MSCI data may not be further redistributed or used as a basis for other indices, any securities or financial products. This report is not approved, reviewed or produced by MSCI. An investor cannot invest directly in an index, and its results are not indicative of the performance for any specific investment, including the Strategies.
A Word About Risk
The Strategies may employ strategies that take into account the tax impact of buy and sell decisions on the Strategies’ shareholders. While the Strategies seek to maximize after-tax returns, there can be no assurance that the strategies will be effective, and the use of these strategies may affect the gross returns of the Strategies. The Strategies may not be suitable for tax-advantaged accounts, such as qualified retirement plans. The Strategies allocate their investments among multiple asset classes which will include U.S. and foreign securities. AllianceBernstein Tax-Managed Balanced Wealth Strategy and AllianceBernstein Tax-Managed Conservative Wealth Strategy will include both equity and fixed-income securities.
Market Risk: The value of the Strategies’ assets will fluctuate as the stock or bond market fluctuates. The value of its investments may decline, sometimes rapidly and unpredictably, simply because of economic changes or other events that affect large portions of the market. It includes the risk that a particular style of investing, such as growth or value, may be underperforming the stock market generally.
Foreign (Non-U.S.) Risk: The Strategies’ investments in securities of non-U.S. issuers may involve more risk than those of U.S. issuers. These securities may fluctuate more widely in price and may be less liquid due to adverse market, economic, political, regulatory or other factors. These risks may be heightened if the Strategy invests in securities of emerging market countries.
Currency Risk: Fluctuations in currency exchange rates may negatively affect the value of the Strategies’ investments or reduce their returns.
Capitalization Risk: Investments in small- and mid-capitalization companies may be more volatile than investments in large-cap companies. Investments in small-cap companies may have additional risks because these companies have limited product lines, markets, or financial resources.
Allocation Risk: The allocation of investments among different investment styles, such as equity or debt, growth or value, or U.S. or non-U.S. securities, may have a more significant effect on the Strategies’ net asset value (“NAV”) when one of these investments is performing more poorly than another.
(Disclosures, Risks and Note about Historical Performance continued on next page)
| ALLIANCEBERNSTEIN TAX-MANAGED WEALTH STRATEGIES • | 7 |
Disclosures and Risks
DISCLOSURES AND RISKS
(continued from previous page)
Interest Rate Risk: (Tax-Managed Balanced Wealth and Tax-Managed Conservative Wealth Strategies) Changes in interest rates will affect the value of the Strategies’ investments in fixed-income securities. When interest rates rise, the value of investments in fixed-income securities tend to fall and this decrease in value may not be offset by higher income from new investments. Interest rate risk is generally greater for fixed-income securities with longer maturities or durations. Investments in fixed-income securities with lower credit ratings (“junk bonds”) tend to have a higher probability that an issuer will default or fail to meet its payment obligations.
Credit Risk: (Tax-Managed Balanced Wealth and Tax-Managed Conservative Wealth Strategies) An issuer or guarantor of a fixed-income security, or the counterparty to a derivatives or other contract, may be unable or unwilling to make timely payments of interest or principal, or to otherwise honor its obligations. The issuer or guarantor may default, causing a loss of the full principal amount of a security. The degree of risk for a particular security may be reflected in its credit rating. There is the possibility that the credit rating of a fixed-income security may be downgraded after purchase, which may adversely affect the value of the security.
Below Investment Grade Securities Risk: (Tax-Managed Balanced Wealth) Investments in fixed-income securities with lower ratings (commonly known as “junk bonds”) tend to have a higher probability that an issuer will default or fail to meet its payment obligations. Their securities may be subject to greater price volatility due to such factors as specific corporate developments, interest rate sensitivity, negative perceptions of the junk bond market generally and less secondary market liquidity.
Municipal Market Risk: (Tax-Managed Balanced Wealth and Tax-Managed Conservative Wealth Strategies) This is the risk that special factors may adversely affect the value of municipal securities and have a significant effect on the yield or value of the Strategies’ investments in municipal securities. These factors include economic conditions, political or legislative changes, uncertainties related to the tax status of municipal securities, or the rights of investors in these securities. Recent adverse economic conditions have not affected the Strategies’ investments or performance. To the extent that the Strategies invest more of their assets in a particular state’s municipal securities, the Strategies may be vulnerable to events adversely affecting that state, including economic, political and regulatory occurrences, court decisions, terrorism and catastrophic natural disasters, such as hurricanes or earthquakes. The Strategies’ investments in certain municipal securities with principal and interest payments that are made from the revenues of a specific project or facility, and not general tax revenues, may have increased risks. Factors affecting the project or facility, such as local business or economic conditions, could have a significant effect on the project’s ability to make payments of principal and interest on these securities.
Derivatives Risk: (Tax-Managed Balanced Wealth and Tax-Managed Conservative Wealth Strategies) Investments in derivatives may be illiquid, difficult to price, and leveraged so that small changes may produce disproportionate losses for the Strategies and may be subject to counterparty risk to a greater degree than more traditional investments.
These risks are fully discussed in the Strategies’ prospectus.
An Important Note About Historical Performance
The investment return and principal value of an investment in the Strategies will fluctuate as the prices of the individual securities in which it invests fluctuate, so that your shares, when redeemed, may be worth more or less than their original cost. Performance shown on the following pages represents past performance and does not guarantee future results. Current performance may
(Disclosures, Risks and Note about Historical Performance continued on next page)
| 8 | • ALLIANCEBERNSTEIN TAX-MANAGED WEALTH STRATEGIES |
Disclosures and Risks
DISCLOSURES AND RISKS
(continued from previous page)
be lower or higher than the performance information shown. You may obtain performance information current to the most recent month-end by visiting www.alliancebernstein.com.
All fees and expenses related to the operation of the Strategies have been deducted. NAV returns do not reflect sales charges; if sales charges were reflected, the Strategies’ quoted performance would be lower. SEC returns reflect the applicable sales charges for each share class: a 4.25% maximum front-end sales charge for Class A shares; the applicable contingent deferred sales charge for Class B shares (4% year 1, 3% year 2, 2% year 3, 1% year 4); a 1% 1-year contingent deferred sales charge for Class C shares. Returns for the different share classes will vary due to different expenses associated with each class. Performance assumes reinvestment of distributions and does not account for taxes.
| ALLIANCEBERNSTEIN TAX-MANAGED WEALTH STRATEGIES • | 9 |
Disclosures and Risks
TAX-MANAGED WEALTH APPRECIATION STRATEGY
HISTORICAL PERFORMANCE
| THE STRATEGY VS. ITS BENCHMARKS PERIODS ENDED FEBRUARY 28, 2014 (unaudited) | NAV Returns | |||||||||
| 6 Months | 12 Months | |||||||||
| AllianceBernstein Tax-Managed Wealth Appreciation Strategy | ||||||||||
Class A | 14.66% | 21.96% | ||||||||
| ||||||||||
Class B* | 14.25% | 21.10% | ||||||||
| ||||||||||
Class C | 14.35% | 21.11% | ||||||||
| ||||||||||
Advisor Class† | 14.94% | 22.42% | ||||||||
| ||||||||||
| Primary Benchmark: S&P 500 Index | 15.07% | 25.37% | ||||||||
| ||||||||||
| Secondary Benchmark: MSCI ACWI ex-U.S. | 12.32% | 12.25% | ||||||||
| ||||||||||
Blended Benchmark: 60% S&P 500 Index | 14.00% | 20.06% | ||||||||
| ||||||||||
* Effective January 31, 2009, Class B shares are no longer available for purchase to new investors. See Note A for additional information.
† Please note that this share class is for investors purchasing shares through accounts established under certain fee-based programs sponsored and maintained by certain broker-dealers and financial intermediaries, institutional pension plans and/or investment advisory clients of, and certain other persons associated with, the Adviser and its affiliates or the Strategies.
Please keep in mind that high, double-digit returns are highly unusual and cannot be sustained. Investors should also be aware that these returns were primarily achieved during favorable market conditions. | ||||||||||
See Disclosures, Risks and Note about Historical Performance on pages 7-9.
(Historical Performance continued on next page)
| 10 | • ALLIANCEBERNSTEIN TAX-MANAGED WEALTH STRATEGIES |
Historical Performance
TAX-MANAGED BALANCED WEALTH STRATEGY
HISTORICAL PERFORMANCE
(continued from previous page)
THE STRATEGY VS. ITS BENCHMARKS | NAV Returns | |||||||||
| 6 Months | 12 Months | |||||||||
| AllianceBernstein Tax-Managed Balanced Wealth Strategy | ||||||||||
Class A | 8.08% | 8.94% | ||||||||
| ||||||||||
Class B* | 7.75% | 8.25% | ||||||||
| ||||||||||
Class C | 7.78% | 8.21% | ||||||||
| ||||||||||
Advisor Class† | 8.33% | 9.33% | ||||||||
| ||||||||||
Primary Benchmark: Barclays 5-Year GO Municipal Bond Index | 3.70% | 1.73% | ||||||||
| ||||||||||
| Secondary Benchmark: S&P 500 Index | 15.07% | 25.37% | ||||||||
| ||||||||||
Blended Benchmark: 50% Barclays 5-Year GO Municipal Bond Index/50% S&P 500 Index | 9.33% | 13.10% | ||||||||
| ||||||||||
* Effective January 31, 2009, Class B shares are no longer available for purchase to new investors. See Note A for additional information.
† Please note that this share class is for investors purchasing shares through accounts established under certain fee-based programs sponsored and maintained by certain broker-dealers and financial intermediaries, institutional pension plans and/or investment advisory clients of, and certain other persons associated with, the Adviser and its affiliates or the Strategies. | ||||||||||
See Disclosures, Risks and Note about Historical Performance on pages 7-9.
(Historical Performance continued on next page)
| ALLIANCEBERNSTEIN TAX-MANAGED WEALTH STRATEGIES • | 11 |
Historical Performance
TAX-MANAGED CONSERVATIVE WEALTH STRATEGY
HISTORICAL PERFORMANCE
(continued from previous page)
| THE STRATEGY VS. ITS BENCHMARKS PERIODS ENDED FEBRUARY 28, 2014 (unaudited) | NAV Returns | |||||||||
| 6 Months | 12 Months | |||||||||
| AllianceBernstein Tax-Managed Conservative Wealth Strategy | ||||||||||
Class A | 5.35% | 5.32% | ||||||||
| ||||||||||
Class B* | 5.08% | 4.55% | ||||||||
| ||||||||||
Class C | 5.08% | 4.56% | ||||||||
| ||||||||||
Advisor Class† | 5.51% | 5.57% | ||||||||
| ||||||||||
Primary Benchmark: Barclays 5-Year GO | 3.70% | 1.73% | ||||||||
| ||||||||||
| Secondary Benchmark: S&P 500 Index | 15.07% | 25.37% | ||||||||
| ||||||||||
Blended Benchmark: 70% Barclays 5-Year GO Municipal Bond Index/30% S&P 500 Index | 7.07% | 8.45% | ||||||||
| ||||||||||
* Effective January 31, 2009, Class B shares are no longer available for purchase to new investors. See Note A for additional information.
| ||||||||||
† Please note that this share class is for investors purchasing shares through accounts established under certain fee-based programs sponsored and maintained by certain broker-dealers and financial intermediaries, institutional pension plans and/or investment advisory clients of, and certain other persons associated with, the Adviser and its affiliates or the Strategies. | ||||||||||
See Disclosures, Risks and Note about Historical Performance on pages 7-9.
(Historical Performance continued on next page)
| 12 | • ALLIANCEBERNSTEIN TAX-MANAGED WEALTH STRATEGIES |
Historical Performance
TAX-MANAGED WEALTH APPRECIATION STRATEGY
HISTORICAL PERFORMANCE
(continued from previous page)
| AVERAGE ANNUAL RETURNS AS OF FEBRUARY 28, 2014 (unaudited) | ||||||||
| NAV Returns | SEC Returns (reflects applicable sales charges) | |||||||
| Class A Shares | ||||||||
1 Year | 21.96 | % | 16.76 | % | ||||
5 Years | 18.16 | % | 17.14 | % | ||||
10 Years | 4.82 | % | 4.36 | % | ||||
| Class B Shares | ||||||||
1 Year | 21.10 | % | 17.10 | % | ||||
5 Years | 17.28 | % | 17.28 | % | ||||
10 Years(a) | 4.21 | % | 4.21 | % | ||||
| Class C Shares | ||||||||
1 Year | 21.11 | % | 20.11 | % | ||||
5 Years | 17.34 | % | 17.34 | % | ||||
10 Years | 4.09 | % | 4.09 | % | ||||
| Advisor Class Shares† | ||||||||
1 Year | 22.42 | % | 22.42 | % | ||||
5 Years | 18.53 | % | 18.53 | % | ||||
10 Years | 5.13 | % | 5.13 | % | ||||
The Strategy’s current prospectus fee table shows the Strategy’s total annual operating expense ratios as 1.07%, 1.80%, 1.78% and 0.77% for Class A, Class B, Class C and Advisor Class shares, respectively. The Financial Highlights section of this report sets forth expense ratio data for the current reporting period; the expense ratios shown above may differ from the expense ratios in the Financial Highlights section since they are based on different time periods.
| (a) | Assumes conversion of Class B shares into Class A shares after eight years. |
| † | This share class is offered at NAV to eligible investors and its SEC returns are the same as the NAV returns. Please note that this share class is for investors purchasing shares through accounts established under certain fee-based programs sponsored and maintained by certain broker-dealers and financial intermediaries, institutional pension plans and/or investment advisory clients of, and certain other persons associated with, the Adviser and its affiliates or the Strategies. |
See Disclosures, Risks and Note about Historical Performance on pages 7-9.
(Historical Performance continued on next page)
| ALLIANCEBERNSTEIN TAX-MANAGED WEALTH STRATEGIES • | 13 |
Historical Performance
TAX-MANAGED WEALTH APPRECIATION STRATEGY
HISTORICAL PERFORMANCE
(continued from previous page)
SEC AVERAGE ANNUAL RETURNS AS OF THE MOST RECENT CALENDAR QUARTER-END MARCH 31, 2014 (unaudited) | ||||
SEC Returns (reflects applicable | ||||
| Class A Shares | ||||
1 Year | 14.23 | % | ||
5 Years | 15.27 | % | ||
10 Years | 4.44 | % | ||
| Class B Shares | ||||
1 Year | 14.49 | % | ||
5 Years | 15.42 | % | ||
10 Years(a) | 4.28 | % | ||
| Class C Shares | ||||
1 Year | 17.51 | % | ||
5 Years | 15.47 | % | ||
10 Years | 4.15 | % | ||
| Advisor Class Shares† | ||||
1 Year | 19.64 | % | ||
5 Years | 16.62 | % | ||
10 Years | 5.20 | % | ||
| (a) | Assumes conversion of Class B shares into Class A shares after eight years. |
| † | Please note that this share class is for investors purchasing shares through accounts established under certain fee-based programs sponsored and maintained by certain broker-dealers and financial intermediaries, institutional pension plans and/or investment advisory clients of, and certain other persons associated with, the Adviser and its affiliates or the Strategies. |
See Disclosures, Risks and Note about Historical Performance on pages 7-9.
(Historical Performance continued on next page)
| 14 | • ALLIANCEBERNSTEIN TAX-MANAGED WEALTH STRATEGIES |
Historical Performance
TAX-MANAGED WEALTH APPRECIATION STRATEGY
HISTORICAL PERFORMANCE
(continued from previous page)
RETURNS AFTER TAXES ON DISTRIBUTIONS AS OF THE MOST RECENT CALENDAR QUARTER-END MARCH 31, 2014 (unaudited) | ||||
Returns (reflects applicable | ||||
| Class A Shares | ||||
1 Year | 13.44 | % | ||
5 Years | 14.97 | % | ||
10 Years | 4.20 | % | ||
| Class B Shares | ||||
1 Year | 14.01 | % | ||
5 Years | 15.28 | % | ||
Since 10 Years(a) | 4.11 | % | ||
| Class C Shares | ||||
1 Year | 16.98 | % | ||
5 Years | 15.31 | % | ||
10 Years | 4.02 | % | ||
| Advisor Class Shares† | ||||
1 Year | 18.71 | % | ||
5 Years | 16.25 | % | ||
10 Years | 4.91 | % | ||
RETURNS AFTER TAXES ON DISTRIBUTIONS AND SALE OF FUND SHARES AS OF THE MOST RECENT CALENDAR QUARTER-END MARCH 31, 2014 (unaudited) | ||||
| Class A Shares | ||||
1 Year | 8.27 | % | ||
5 Years | 12.31 | % | ||
10 Years | 3.56 | % | ||
| Class B Shares | ||||
1 Year | 8.33 | % | ||
5 Years | 12.44 | % | ||
10 Years(a) | 3.41 | % | ||
| Class C Shares | ||||
1 Year | 10.06 | % | ||
5 Years | 12.47 | % | ||
10 Years | 3.32 | % | ||
| Advisor Class Shares† | ||||
1 Year | 11.37 | % | ||
5 Years | 13.45 | % | ||
10 Years | 4.19 | % | ||
| (a) | Assumes conversion of Class B shares into Class A shares after eight years. |
| † | Please note that this share class is for investors purchasing shares through accounts established under certain fee-based programs sponsored and maintained by certain broker-dealers and financial intermediaries, institutional pension plans and/or investment advisory clients of, and certain other persons associated with, the Adviser and its affiliates or the Strategies. |
See Disclosures, Risks and Note about Historical Performance on pages 7-9.
(Historical Performance continued on next page)
| ALLIANCEBERNSTEIN TAX-MANAGED WEALTH STRATEGIES • | 15 |
Historical Performance
TAX-MANAGED BALANCED WEALTH STRATEGY
HISTORICAL PERFORMANCE
(continued from previous page)
| AVERAGE ANNUAL RETURNS AS OF FEBRUARY 28, 2014 (unaudited) | ||||||||
| NAV Returns | SEC Returns (reflects applicable | |||||||
| Class A Shares | ||||||||
1 Year | 8.94 | % | 4.31 | % | ||||
5 Years | 10.22 | % | 9.27 | % | ||||
10 Years | 4.15 | % | 3.70 | % | ||||
| Class B Shares | ||||||||
1 Year | 8.25 | % | 4.25 | % | ||||
5 Years | 9.46 | % | 9.46 | % | ||||
10 Years(a) | 3.55 | % | 3.55 | % | ||||
| Class C Shares | ||||||||
1 Year | 8.21 | % | 7.21 | % | ||||
5 Years | 9.46 | % | 9.46 | % | ||||
10 Years | 3.42 | % | 3.42 | % | ||||
| Advisor Class Shares† | ||||||||
1 Year | 9.33 | % | 9.33 | % | ||||
5 Years | 10.56 | % | 10.56 | % | ||||
10 Years | 4.46 | % | 4.46 | % | ||||
The Strategy’s current prospectus fee table shows the Strategy’s total annual operating expense ratios as 1.24%, 1.96%, 1.95% and 0.94% for Class A, Class B, Class C and Advisor Class shares, respectively. The Financial Highlights section of this report sets forth expense ratio data for the current reporting period; the expense ratios shown above may differ from the expense ratios in the Financial Highlights section since they are based on different time periods.
| (a) | Assumes conversion of Class B shares into Class A shares after eight years. |
| † | This share class is offered at NAV to eligible investors and its SEC returns are the same as the NAV returns. Please note that this share class is for investors purchasing shares through accounts established under certain fee-based programs sponsored and maintained by certain broker-dealers and financial intermediaries, institutional pension plans and/or investment advisory clients of, and certain other persons associated with, the Adviser and its affiliates or the Strategies. |
See Disclosures, Risks and Note about Historical Performance on pages 7-9.
(Historical Performance continued on next page)
| 16 | • ALLIANCEBERNSTEIN TAX-MANAGED WEALTH STRATEGIES |
Historical Performance
TAX-MANAGED BALANCED WEALTH STRATEGY
HISTORICAL PERFORMANCE
(continued from previous page)
SEC AVERAGE ANNUAL RETURNS AS OF THE MOST RECENT CALENDAR QUARTER-END MARCH 31, 2014 (unaudited) | ||||
SEC Returns (reflects applicable | ||||
| Class A Shares | ||||
1 Year | 3.33% | |||
5 Years | 8.44% | |||
10 Years | 3.76% | |||
| Class B Shares | ||||
1 Year | 3.10% | |||
5 Years | 8.58% | |||
10 Years(a) | 3.63% | |||
| Class C Shares | ||||
1 Year | 6.07% | |||
5 Years | 8.61% | |||
10 Years | 3.48% | |||
| Advisor Class Shares† | ||||
1 Year | 8.20% | |||
5 Years | 9.71% | |||
10 Years | 4.53% | |||
| (a) | Assumes conversion of Class B shares into Class A shares after eight years. |
| † | Please note that this share class is for investors purchasing shares through accounts established under certain fee-based programs sponsored and maintained by certain broker-dealers and financial intermediaries, institutional pension plans and/or investment advisory clients of, and certain other persons associated with, the Adviser and its affiliates or the Strategies. |
See Disclosures, Risks and Note about Historical Performance on pages 7-9.
(Historical Performance continued on next page)
| ALLIANCEBERNSTEIN TAX-MANAGED WEALTH STRATEGIES • | 17 |
Historical Performance
TAX-MANAGED BALANCED WEALTH STRATEGY
HISTORICAL PERFORMANCE
(continued from previous page)
RETURNS AFTER TAXES ON DISTRIBUTIONS AS OF THE MOST RECENT CALENDAR QUARTER-END MARCH 31, 2014 (unaudited) | ||||
| Returns (reflects applicable sales charges) | ||||
| Class A Shares | ||||
1 Year | 2.62% | |||
5 Years | 8.20% | |||
10 Years | 3.60% | |||
| Class B Shares | ||||
1 Year | 2.54% | |||
5 Years | 8.42% | |||
10 Years(a) | 3.50% | |||
| Class C Shares | ||||
1 Year | 5.50% | |||
5 Years | 8.44% | |||
10 Years | 3.38% | |||
| Advisor Class Shares† | ||||
1 Year | 7.40% | |||
5 Years | 9.44% | |||
10 Years | 4.34% | |||
RETURNS AFTER TAXES ON DISTRIBUTIONS AND SALE OF FUND SHARES AS OF THE MOST RECENT CALENDAR QUARTER-END MARCH 31, 2014 (unaudited) | ||||
| Class A Shares | ||||
1 Year | 2.16% | |||
5 Years | 6.85% | |||
10 Years | 3.18% | |||
| Class B Shares | ||||
1 Year | 1.86% | |||
5 Years | 6.87% | |||
10 Years(a) | 2.99% | |||
| Class C Shares | ||||
1 Year | 3.55% | |||
5 Years | 6.89% | |||
10 Years | 2.86% | |||
| Advisor Class Shares† | ||||
1 Year | 5.00% | |||
5 Years | 7.93% | |||
10 Years | 3.84% | |||
| (a) | Assumes conversion of Class B shares into Class A shares after eight years. |
| † | Please note that this share class is for investors purchasing shares through accounts established under certain fee-based programs sponsored and maintained by certain broker-dealers and financial intermediaries, institutional pension plans and/or investment advisory clients of, and certain other persons associated with, the Adviser and its affiliates or the Strategies. |
See Disclosures, Risks and Note about Historical Performance on pages 7-9.
(Historical Performance continued on next page)
| 18 | • ALLIANCEBERNSTEIN TAX-MANAGED WEALTH STRATEGIES |
Historical Performance
TAX-MANAGED CONSERVATIVE WEALTH STRATEGY
HISTORICAL PERFORMANCE
(continued from previous page)
| AVERAGE ANNUAL RETURNS AS OF FEBRUARY 28, 2014 (unaudited) | ||||||||
| NAV Returns | SEC Returns (reflects applicable | |||||||
| Class A Shares | ||||||||
1 Year | 5.32 | % | 0.85 | % | ||||
5 Years | 6.85 | % | 5.93 | % | ||||
10 Years | 3.17 | % | 2.72 | % | ||||
| Class B Shares | ||||||||
1 Year | 4.55 | % | 0.55 | % | ||||
5 Years | 6.12 | % | 6.12 | % | ||||
10 Years(a) | 2.58 | % | 2.58 | % | ||||
| Class C Shares | ||||||||
1 Year | 4.56 | % | 3.56 | % | ||||
5 Years | 6.12 | % | 6.12 | % | ||||
10 Years | 2.44 | % | 2.44 | % | ||||
| Advisor Class Shares† | ||||||||
1 Year | 5.57 | % | 5.57 | % | ||||
5 Years | 7.17 | % | 7.17 | % | ||||
10 Years | 3.47 | % | 3.47 | % | ||||
The Strategy’s current prospectus fee table shows the Strategy’s total annual operating expense ratios 1.56%, 2.26%, 2.26%, and 1.26% for Class A, Class B and Class C and Advisor Class shares, respectively, gross of any fee waivers or expense reimbursements. Contractual fee waivers and/or expense reimbursements limit the Strategies’ annual operating expense ratios to 1.20%, 1.90%, 1.90% and 0.90% for Class A, Class B, Class C and Advisor Class, respectively. These waivers/reimbursements may not be terminated before December 31, 2014 and may be extended by the Adviser for additional one-year terms. Absent reimbursements or waivers, performance would have been lower. The Financial Highlights section of this report sets forth expense ratio data for the current reporting period; the expense ratios shown above may differ from the expense ratios in the Financial Highlights section since they are based on different time periods.
| (a) | Assumes conversion of Class B shares into Class A shares after eight years. |
| † | This share class is offered at NAV to eligible investors and its SEC returns are the same as the NAV returns. Please note that this share class is for investors purchasing shares through accounts established under certain fee-based programs sponsored and maintained by certain broker-dealers and financial intermediaries, institutional pension plans and/or investment advisory clients of, and certain other persons associated with, the Adviser and its affiliates or the Strategies. |
See Disclosures, Risks and Note about Historical Performance on pages 7-9.
(Historical Performance continued on next page)
| ALLIANCEBERNSTEIN TAX-MANAGED WEALTH STRATEGIES • | 19 |
Historical Performance
TAX-MANAGED CONSERVATIVE WEALTH STRATEGY
HISTORICAL PERFORMANCE
(continued from previous page)
SEC AVERAGE ANNUAL RETURNS AS OF THE MOST RECENT CALENDAR QUARTER-END MARCH 31, 2014 (unaudited) | ||||
SEC Returns (reflects applicable | ||||
| Class A Shares | ||||
1 Year | 0.00 | % | ||
5 Years | 5.35 | % | ||
10 Years | 2.74 | % | ||
| Class B Shares | ||||
1 Year | -0.33 | % | ||
5 Years | 5.51 | % | ||
10 Years(a) | 2.60 | % | ||
| Class C Shares | ||||
1 Year | 2.62 | % | ||
5 Years | 5.51 | % | ||
10 Years | 2.45 | % | ||
| Advisor Class Shares† | ||||
1 Year | 4.71 | % | ||
5 Years | 6.56 | % | ||
10 Years | 3.48 | % | ||
| (a) | Assumes conversion of Class B shares into Class A shares after eight years. |
| † | Please note that this share class is for investors purchasing shares through accounts established under certain fee-based programs sponsored and maintained by certain broker-dealers and financial intermediaries, institutional pension plans and/or investment advisory clients of, and certain other persons associated with, the Adviser and its affiliates or the Strategies. |
See Disclosures, Risks and Note about Historical Performance on pages 7-9.
(Historical Performance continued on next page)
| 20 | • ALLIANCEBERNSTEIN TAX-MANAGED WEALTH STRATEGIES |
Historical Performance
TAX-MANAGED CONSERVATIVE WEALTH STRATEGY
HISTORICAL PERFORMANCE
(continued from previous page)
RETURNS AFTER TAXES ON DISTRIBUTIONS AS OF THE MOST RECENT CALENDAR QUARTER-END MARCH 31, 2014 (unaudited) | ||||
| Returns (reflects applicable sales charges) | ||||
| Class A Shares | ||||
1 Year | -1.13 | % | ||
5 Years | 5.05 | % | ||
10 Years | 2.49 | % | ||
| Class B Shares | ||||
1 Year | -1.28 | % | ||
5 Years | 5.29 | % | ||
10 Years(a) | 2.38 | % | ||
| Class C Shares | ||||
1 Year | 1.66 | % | ||
5 Years | 5.28 | % | ||
10 Years | 2.25 | % | ||
| Advisor Class Shares† | ||||
1 Year | 3.46 | % | ||
5 Years | 6.24 | % | ||
10 Years | 3.21 | % | ||
RETURNS AFTER TAXES ON DISTRIBUTIONS AND SALE OF FUND SHARES AS OF THE MOST RECENT CALENDAR QUARTER-END MARCH 31, 2014 | ||||
| Class A Shares | ||||
1 Year | 0.62 | % | ||
5 Years | 4.35 | % | ||
10 Years | 2.41 | % | ||
| Class B Shares | ||||
1 Year | 0.30 | % | ||
5 Years | 4.37 | % | ||
10 Years(a) | 2.20 | % | ||
| Class C Shares | ||||
1 Year | 1.98 | % | ||
5 Years | 4.37 | % | ||
10 Years | 2.07 | % | ||
| Advisor Class Shares† | ||||
1 Year | 3.37 | % | ||
5 Years | 5.36 | % | ||
10 Years | 3.05 | % | ||
| (a) | Assumes conversion of Class B shares into Class A shares after eight years. |
| † | Please note that this share class is for investors purchasing shares through accounts established under certain fee-based programs sponsored and maintained by certain broker-dealers and financial intermediaries, institutional pension plans and/or investment advisory clients of, and certain other persons associated with, the Adviser and its affiliates or the Strategies. |
See Disclosures, Risks and Note about Historical Performance on pages 7-9.
| ALLIANCEBERNSTEIN TAX-MANAGED WEALTH STRATEGIES • | 21 |
Historical Performance
EXPENSE EXAMPLE
(unaudited)
As a shareholder of the Strategy, you incur two types of costs: (1) transaction costs, including sales charges (loads) on purchase payments, contingent deferred sales charges on redemptions and (2) ongoing costs, including management fees; distribution (12b-1) fees; and other Strategy expenses. This example is intended to help you understand your ongoing costs (in dollars) of investing in the Strategy and to compare these costs with the ongoing costs of investing in other mutual funds.
The Example is based on an investment of $1,000 invested at the beginning of the period and held for the entire period as indicated below.
Actual Expenses
The table below provides information about actual account values and actual expenses. You may use the information, together with the amount you invested, to estimate the expenses that you paid over the period. Simply divide your account value by $1,000 (for example, an $8,600 account value divided by $1,000 = 8.6), then multiply the result by the number under the heading entitled “Expenses Paid During Period” to estimate the expenses you paid on your account during this period.
Hypothetical Example for Comparison Purposes
The table below also provides information about hypothetical account values and hypothetical expenses based on the Strategy’s actual expense ratio and an assumed annual rate of return of 5% before expenses, which is not the Strategy’s actual return. The hypothetical account values and expenses may not be used to estimate the actual ending account balance or expenses you paid for the period. You may use this information to compare the ongoing costs of investing in the Strategy and other funds by comparing this 5% hypothetical example with the 5% hypothetical examples that appear in the shareholder reports of other funds.
Please note that the expenses shown in the table are meant to highlight your ongoing costs only and do not reflect any transactional costs, such as sales charges (loads), or contingent deferred sales charges on redemptions. Therefore, the hypothetical example is useful in comparing ongoing costs only, and will not help you determine the relative total costs of owning different funds. In addition, if these transactional costs were included, your costs would have been higher.
Tax-Managed Wealth Appreciation Strategy
| Beginning Account Value September 1, 2013 | Ending Account Value February 28, 2014 | Expenses Paid During Period* | Annualized Expense Ratio* | |||||||||||||
| Class A | ||||||||||||||||
Actual | $ | 1,000 | $ | 1,146.60 | $ | 5.59 | 1.05 | % | ||||||||
Hypothetical** | $ | 1,000 | $ | 1,019.59 | $ | 5.26 | 1.05 | % | ||||||||
| Class B | ||||||||||||||||
Actual | $ | 1,000 | $ | 1,142.50 | $ | 9.40 | 1.77 | % | ||||||||
Hypothetical** | $ | 1,000 | $ | 1,016.02 | $ | 8.85 | 1.77 | % | ||||||||
| Class C | ||||||||||||||||
Actual | $ | 1,000 | $ | 1,143.50 | $ | 9.35 | 1.76 | % | ||||||||
Hypothetical** | $ | 1,000 | $ | 1,016.07 | $ | 8.80 | 1.76 | % | ||||||||
| Advisor Class | ||||||||||||||||
Actual | $ | 1,000 | $ | 1,149.40 | $ | 4.00 | 0.75 | % | ||||||||
Hypothetical** | $ | 1,000 | $ | 1,021.08 | $ | 3.76 | 0.75 | % | ||||||||
| 22 | • ALLIANCEBERNSTEIN TAX-MANAGED WEALTH STRATEGIES |
Expense Example
EXPENSE EXAMPLE
(unaudited)
(continued from previous page)
Tax-Managed Balanced Wealth Strategy
| Beginning Account Value September 1, 2013 | Ending Account Value February 28, 2014 | Expenses Paid During Period* | Annualized Expense Ratio* | |||||||||||||
| Class A | ||||||||||||||||
Actual | $ | 1,000 | $ | 1,080.80 | $ | 6.29 | 1.22 | % | ||||||||
Hypothetical** | $ | 1,000 | $ | 1,018.74 | $ | 6.11 | 1.22 | % | ||||||||
| Class B | ||||||||||||||||
Actual | $ | 1,000 | $ | 1,077.50 | $ | 9.94 | 1.93 | % | ||||||||
Hypothetical** | $ | 1,000 | $ | 1,015.22 | $ | 9.64 | 1.93 | % | ||||||||
| Class C | ||||||||||||||||
Actual | $ | 1,000 | $ | 1,077.80 | $ | 9.94 | 1.93 | % | ||||||||
Hypothetical** | $ | 1,000 | $ | 1,015.22 | $ | 9.64 | 1.93 | % | ||||||||
| Advisor Class | ||||||||||||||||
Actual | $ | 1,000 | $ | 1,083.30 | $ | 4.75 | 0.92 | % | ||||||||
Hypothetical** | $ | 1,000 | $ | 1,020.23 | $ | 4.61 | 0.92 | % | ||||||||
Tax-Managed Conservative Wealth Strategy
| Beginning Account Value September 1, 2013 | Ending Account Value February 28, 2014 | Expenses Paid During Period* | Annualized Expense Ratio* | |||||||||||||
| Class A | ||||||||||||||||
Actual | $ | 1,000 | $ | 1,053.50 | $ | 6.11 | 1.20 | % | ||||||||
Hypothetical** | $ | 1,000 | $ | 1,018.84 | $ | 6.01 | 1.20 | % | ||||||||
| Class B | ||||||||||||||||
Actual | $ | 1,000 | $ | 1,050.80 | $ | 9.66 | 1.90 | % | ||||||||
Hypothetical** | $ | 1,000 | $ | 1,015.37 | $ | 9.49 | 1.90 | % | ||||||||
| Class C | ||||||||||||||||
Actual | $ | 1,000 | $ | 1,050.80 | $ | 9.66 | 1.90 | % | ||||||||
Hypothetical** | $ | 1,000 | $ | 1,015.37 | $ | 9.49 | 1.90 | % | ||||||||
| Advisor Class | ||||||||||||||||
Actual | $ | 1,000 | $ | 1,055.10 | $ | 4.59 | 0.90 | % | ||||||||
Hypothetical** | $ | 1,000 | $ | 1,020.33 | $ | 4.51 | 0.90 | % | ||||||||
| * | Expenses are equal to the classes’ annualized expense ratios multiplied by the average account value over the period, multiplied by 181/365 (to reflect the one-half year period). |
| ** | Assumes 5% annual return before expenses. |
| ALLIANCEBERNSTEIN TAX-MANAGED WEALTH STRATEGIES • | 23 |
Expense Example
TAX-MANAGED WEALTH APPRECIATION STRATEGY
PORTFOLIO SUMMARY
February 28, 2014 (unaudited)
PORTFOLIO STATISTICS
Net Assets ($mil): $712.8
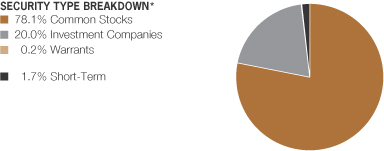
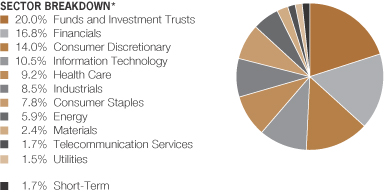
| * | All data are as of February 28, 2014. The Strategy’s security type and sector breakdowns are expressed as a percentage of total investments and may vary over time. The Strategy also enters into derivative transactions, which may be used for hedging or investment purposes (see “Portfolio of Investments” section of the report for additional details). |
Please note: The sector classifications presented herein are based on the Global Industry Classification Standard (GICS) which was developed by Morgan Stanley Capital International and Standard & Poor’s. The components are divided into sector, industry group, and industry sub-indices as classified by the GICS for each of the market capitalization indices in the broad market. These sector classifications are broadly defined. The “Portfolio of Investments” section of the report reflects more specific industry information and is consistent with the investment restrictions discussed in the Strategy’s prospectus.
| 24 | • ALLIANCEBERNSTEIN TAX-MANAGED WEALTH STRATEGIES |
Portfolio Summary
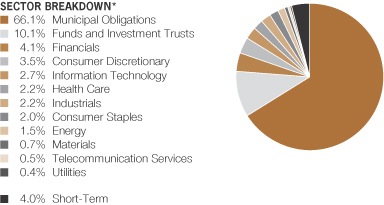
TAX-MANAGED BALANCED WEALTH STRATEGY
PORTFOLIO SUMMARY
February 28, 2014 (unaudited)
PORTFOLIO STATISTICS
Net Assets ($mil): $165.6
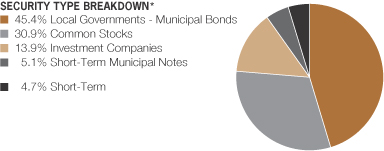
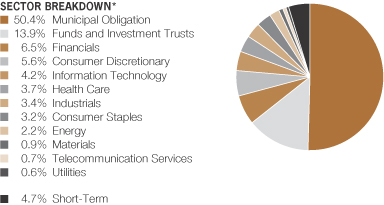
| * | All data are as of February 28, 2014. The Strategy’s security type and sector breakdowns are expressed as a percentage of total investments and may vary over time. The Strategy also enters into derivative transactions, which may be used for hedging or investment purposes (see “Portfolio of Investments” section of the report for additional details). |
Please note: The sector classifications presented herein are based on the Global Industry Classification Standard (GICS) which was developed by Morgan Stanley Capital International and Standard & Poor’s. The components are divided into sector, industry group, and industry sub-indices as classified by the GICS for each of the market capitalization indices in the broad market. These sector classifications are broadly defined. The “Portfolio of Investments” section of the report reflects more specific industry information and is consistent with the investment restrictions discussed in the Strategy’s prospectus.
| ALLIANCEBERNSTEIN TAX-MANAGED WEALTH STRATEGIES • | 25 |
Portfolio Summary
TAX-MANAGED BALANCED WEALTH STRATEGY
PORTFOLIO SUMMARY
February 28, 2014 (unaudited)
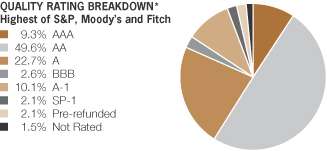
| * | All data are as of February 28, 2014. The Strategy’s quality rating distribution is expressed as a percentage of the Strategy’s total investments in municipal securities and may vary over time. The quality ratings are determined by using the Standard & Poor’s Ratings Services (“S&P”), Moody’s Investors Services, Inc.(“Moody’s”) and Fitch Ratings, Ltd.(“Fitch”). These ratings are a measure of the quality and safety of a bond or portfolio, based on the issuer’s financial condition. AAA is the highest (best) and D is the lowest (worst). If applicable, the pre-refunded category includes bonds which are secured by US Government Securities and therefore are deemed high-quality investment grade by the Adviser. If applicable, Not Applicable (N/A) includes non credit worthy investments; such as, equities, currency contracts, futures and options. If applicable, the Not Rated category includes bonds that are not rated by a Nationally Recognized Statistical Rating Organization. |
| 26 | • ALLIANCEBERNSTEIN TAX-MANAGED WEALTH STRATEGIES |
Portfolio Summary
TAX-MANAGED CONSERVATIVE WEALTH STRATEGY
PORTFOLIO SUMMARY
February 28, 2014 (unaudited)
PORTFOLIO STATISTICS
Net Assets ($mil): $62.8

| * | All data are as of February 28, 2014. The Strategy’s security type and sector breakdowns are expressed as a percentage of total investments and may vary over time. The Strategy also enters into derivative transactions, which may be used for hedging or investment purposes (see “Portfolio of Investments” section of the report for additional details). |
Please note: The sector classifications presented herein are based on the Global Industry Classification Standard (GICS) which was developed by Morgan Stanley Capital International and Standard & Poor’s. The components are divided into sector, industry group, and industry sub-indices as classified by the GICS for each of the market capitalization indices in the broad market. These sector classifications are broadly defined. The “Portfolio of Investments” section of the report reflects more specific industry information and is consistent with the investment restrictions discussed in the Strategy’s prospectus.
| ALLIANCEBERNSTEIN TAX-MANAGED WEALTH STRATEGIES • | 27 |
Portfolio Summary
TAX-MANAGED CONSERVATIVE WEALTH STRATEGY
PORTFOLIO SUMMARY
February 28, 2014 (unaudited)
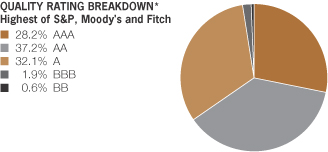
| * | All data are as of February 28, 2014. The Strategy’s quality rating distribution is expressed as a percentage of the Strategy’s total investments in municipal securities and may vary over time. The quality ratings are determined by using the Standard & Poor’s Ratings Services (“S&P”), Moody’s Investors Services, Inc.(“Moody’s”) and Fitch Ratings, Ltd.(“Fitch”). These ratings are a measure of the quality and safety of a bond or portfolio, based on the issuer’s financial condition. AAA is the highest (best) and D is the lowest (worst). If applicable, the pre-refunded category includes bonds which are secured by US Government Securities and therefore are deemed high-quality investment grade by the Adviser. If applicable, Not Applicable (N/A) includes non credit worthy investments; such as, equities, currency contracts, futures and options. If applicable, the Not Rated category includes bonds that are not rated by a Nationally Recognized Statistical Rating Organization. |
| 28 | • ALLIANCEBERNSTEIN TAX-MANAGED WEALTH STRATEGIES |
Portfolio Summary
TAX-MANAGED WEALTH APPRECIATION
PORTFOLIO OF INVESTMENTS
February 28, 2014 (unaudited)
| Company | Shares | U.S. $ Value | ||||||
| ||||||||
COMMON STOCKS – 78.0% | ||||||||
Financials – 16.7% | ||||||||
Capital Markets – 2.2% | ||||||||
Affiliated Managers Group, Inc.(a) | 9,457 | $ | 1,778,389 | |||||
BlackRock, Inc. – Class A | 4,840 | 1,475,426 | ||||||
Daiwa Securities Group, Inc. | 108,000 | 977,365 | ||||||
Deutsche Bank AG (REG) | 28,263 | 1,366,924 | ||||||
E*Trade Financial Corp.(a) | 31,300 | 703,311 | ||||||
Goldman Sachs Group, Inc. (The) | 5,200 | 865,540 | ||||||
Macquarie Group Ltd. | 27,737 | 1,398,765 | ||||||
Morgan Stanley | 65,300 | 2,011,240 | ||||||
State Street Corp. | 28,300 | 1,858,461 | ||||||
UBS AG (REG)(a) | 162,219 | 3,470,344 | ||||||
|
| |||||||
| 15,905,765 | ||||||||
|
| |||||||
Commercial Banks – 3.4% | ||||||||
Banco do Brasil SA | 42,200 | 373,221 | ||||||
Bank Hapoalim BM | 115,180 | 629,519 | ||||||
Bank of Montreal | 8,720 | 574,403 | ||||||
Bank of Nova Scotia | 11,300 | 646,181 | ||||||
Barclays PLC | 189,800 | 799,545 | ||||||
China Construction Bank Corp. – Class H | 1,210,000 | 835,232 | ||||||
CIT Group, Inc. | 37,800 | 1,840,104 | ||||||
Fifth Third Bancorp | 16,200 | 351,459 | ||||||
Grupo Financiero Banorte SAB de CV – | 70,780 | 458,229 | ||||||
HDFC Bank Ltd. | 78,100 | 844,093 | ||||||
HSBC Holdings PLC | 114,734 | 1,210,904 | ||||||
Industrial & Commercial Bank of China Ltd. – Class H | 1,196,000 | 720,550 | ||||||
KBC Groep NV | 13,970 | 883,490 | ||||||
Lloyds Banking Group PLC(a) | 1,104,740 | 1,525,648 | ||||||
Mitsubishi UFJ Financial Group, Inc. | 185,100 | 1,072,590 | ||||||
National Australia Bank Ltd. | 25,870 | 804,529 | ||||||
National Bank of Canada | 10,020 | 402,139 | ||||||
PNC Financial Services Group, Inc. (The) | 4,400 | 359,832 | ||||||
Sberbank of Russia (Sponsored ADR) | 116,297 | 1,182,740 | ||||||
Societe Generale SA | 26,359 | 1,749,084 | ||||||
State Bank of India | 13,020 | 322,724 | ||||||
Sumitomo Mitsui Financial Group, Inc. | 18,000 | 808,165 | ||||||
Toronto-Dominion Bank (The) | 22,550 | 1,021,501 | ||||||
UniCredit SpA | 214,510 | 1,702,313 | ||||||
Wells Fargo & Co. | 61,700 | 2,864,114 | ||||||
|
| |||||||
| 23,982,309 | ||||||||
|
| |||||||
Consumer Finance – 1.0% | ||||||||
Capital One Financial Corp. | 45,700 | 3,355,751 | ||||||
Discover Financial Services | 35,100 | 2,014,038 | ||||||
Muthoot Finance Ltd. | 258,375 | 689,172 | ||||||
Shriram Transport Finance Co., Ltd. | 109,258 | 1,039,646 | ||||||
|
| |||||||
| 7,098,607 | ||||||||
|
| |||||||
| ALLIANCEBERNSTEIN TAX-MANAGED WEALTH STRATEGIES • | 29 |
Tax-Managed Wealth Appreciation—Portfolio of Investments
| Company | Shares | U.S. $ Value | ||||||
| ||||||||
Diversified Financial Services – 3.3% | ||||||||
Bank of America Corp. | 284,000 | $ | 4,694,520 | |||||
Berkshire Hathaway, Inc. – Class B(a) | 10,700 | 1,238,846 | ||||||
Citigroup, Inc. | 73,300 | 3,564,579 | ||||||
IG Group Holdings PLC | 79,188 | 839,030 | ||||||
ING Groep NV(a) | 56,283 | 817,345 | ||||||
ING US, Inc. | 38,200 | 1,370,234 | ||||||
IntercontinentalExchange Group, Inc. | 26,162 | 5,463,672 | ||||||
JPMorgan Chase & Co. | 66,700 | 3,789,894 | ||||||
McGraw Hill Financial, Inc. | 2,700 | 215,082 | ||||||
ORIX Corp. | 120,300 | 1,784,120 | ||||||
|
| |||||||
| 23,777,322 | ||||||||
|
| |||||||
Insurance – 5.0% | ||||||||
Admiral Group PLC | 142,363 | 3,417,805 | ||||||
AIA Group Ltd. | 670,400 | 3,284,652 | ||||||
Allstate Corp. (The) | 24,200 | 1,313,092 | ||||||
American Financial Group, Inc./OH | 23,500 | 1,343,260 | ||||||
American International Group, Inc. | 60,600 | 3,016,062 | ||||||
AON PLC | 22,800 | 1,951,680 | ||||||
Assurant, Inc. | 20,200 | 1,325,726 | ||||||
Aviva PLC | 83,010 | 659,974 | ||||||
BB Seguridade Participacoes SA | 153,400 | 1,524,350 | ||||||
Chubb Corp. (The) | 17,800 | 1,557,144 | ||||||
Everest Re Group Ltd. | 7,400 | 1,104,376 | ||||||
Genworth Financial, Inc. – Class A(a) | 105,000 | 1,631,700 | ||||||
Lancashire Holdings Ltd. | 160,136 | 1,966,924 | ||||||
Lincoln National Corp. | 56,300 | 2,822,319 | ||||||
Muenchener Rueckversicherungs AG | 6,570 | 1,436,473 | ||||||
PartnerRe Ltd. | 18,300 | 1,809,504 | ||||||
Prudential PLC | 148,830 | 3,369,919 | ||||||
Reinsurance Group of America, Inc. – Class A | 12,300 | 946,977 | ||||||
Travelers Cos., Inc. (The) | 8,900 | 746,176 | ||||||
Unum Group | 4,900 | 170,422 | ||||||
XL Group PLC | 10,100 | 307,040 | ||||||
|
| |||||||
| 35,705,575 | ||||||||
|
| |||||||
Real Estate Investment Trusts | ||||||||
GLP J-Reit | 615 | 649,233 | ||||||
Stockland | 389 | 1,343 | ||||||
|
| |||||||
| 650,576 | ||||||||
|
| |||||||
Real Estate Management & | ||||||||
Aeon Mall Co., Ltd. | 23,500 | 652,528 | ||||||
China Overseas Land & Investment Ltd. | 128,000 | 344,971 | ||||||
Country Garden Holdings Co., Ltd. | 1,725,000 | 892,927 | ||||||
Daito Trust Construction Co., Ltd. | 20,800 | 1,938,556 | ||||||
Global Logistic Properties Ltd. | 1,187,000 | 2,654,362 | ||||||
| 30 | • ALLIANCEBERNSTEIN TAX-MANAGED WEALTH STRATEGIES |
Tax-Managed Wealth Appreciation—Portfolio of Investments
| Company | Shares | U.S. $ Value | ||||||
| ||||||||
Hang Lung Properties Ltd. | 580,000 | $ | 1,617,765 | |||||
Lend Lease Group | 78,790 | 795,975 | ||||||
Mitsubishi Estate Co., Ltd. | 34,000 | 806,413 | ||||||
|
| |||||||
| 9,703,497 | ||||||||
|
| |||||||
Thrifts & Mortgage Finance – 0.3% | ||||||||
Housing Development Finance Corp. | 165,040 | 2,177,712 | ||||||
|
| |||||||
| 119,001,363 | ||||||||
|
| |||||||
Consumer Discretionary – 14.0% | ||||||||
Auto Components – 1.2% | ||||||||
Cie Generale des Etablissements Michelin – Class B | 12,158 | 1,477,931 | ||||||
GKN PLC | 141,930 | 962,557 | ||||||
Lear Corp. | 7,400 | 600,880 | ||||||
Magna International, Inc. (New York) – Class A | 11,800 | 1,051,616 | ||||||
Magna International, Inc. (Toronto) – Class A | 5,660 | 503,844 | ||||||
TRW Automotive Holdings Corp.(a) | 19,600 | 1,613,472 | ||||||
Valeo SA | 17,050 | 2,384,999 | ||||||
|
| |||||||
| 8,595,299 | ||||||||
|
| |||||||
Automobiles – 1.9% | ||||||||
Ford Motor Co. | 111,300 | 1,712,907 | ||||||
Honda Motor Co., Ltd. | 28,800 | 1,036,600 | ||||||
Hyundai Motor Co. | 2,630 | 604,246 | ||||||
Hyundai Motor Co. (Preference Shares) | 11,940 | 1,544,455 | ||||||
Mazda Motor Corp.(a) | 86,000 | 415,381 | ||||||
Nissan Motor Co., Ltd. | 183,200 | 1,635,176 | ||||||
Tata Motors Ltd. | 123,960 | 839,564 | ||||||
Toyota Motor Corp. | 70,800 | 4,074,758 | ||||||
Volkswagen AG (Preference Shares) | 5,170 | 1,343,895 | ||||||
|
| |||||||
| 13,206,982 | ||||||||
|
| |||||||
Distributors – 0.3% | ||||||||
LKQ Corp.(a) | 69,270 | 1,931,940 | ||||||
|
| |||||||
Diversified Consumer Services – 0.6% | ||||||||
Anhanguera Educacional Participacoes SA | 89,900 | 503,417 | ||||||
Estacio Participacoes SA | 219,200 | 2,066,028 | ||||||
Kroton Educacional SA | 98,100 | 1,828,327 | ||||||
|
| |||||||
| 4,397,772 | ||||||||
|
| |||||||
Hotels, Restaurants & Leisure – 1.3% | ||||||||
Ajisen China Holdings Ltd. | 628,000 | 691,965 | ||||||
Melco Crown Entertainment Ltd. (ADR)(a) | 27,300 | 1,171,716 | ||||||
Merlin Entertainments PLC(a)(b) | 105,897 | 643,708 | ||||||
Sodexo | 24,150 | 2,572,375 | ||||||
Starbucks Corp. | 50,620 | 3,591,995 | ||||||
William Hill PLC | 105,121 | 698,832 | ||||||
|
| |||||||
| 9,370,591 | ||||||||
|
| |||||||
| ALLIANCEBERNSTEIN TAX-MANAGED WEALTH STRATEGIES • | 31 |
Tax-Managed Wealth Appreciation—Portfolio of Investments
| Company | Shares | U.S. $ Value | ||||||
| ||||||||
Household Durables – 0.2% | ||||||||
PulteGroup, Inc. | 78,300 | $ | 1,643,517 | |||||
|
| |||||||
Internet & Catalog Retail – 1.0% | ||||||||
Amazon.com, Inc.(a) | 7,140 | 2,585,394 | ||||||
priceline.com, Inc.(a) | 3,470 | 4,680,475 | ||||||
|
| |||||||
| 7,265,869 | ||||||||
|
| |||||||
Leisure Equipment & Products – 0.3% | ||||||||
Polaris Industries, Inc. | 15,400 | 2,064,062 | ||||||
|
| |||||||
Media – 2.6% | ||||||||
Comcast Corp. – Class A | 89,070 | 4,604,028 | ||||||
Gannett Co., Inc. | 64,100 | 1,906,975 | ||||||
Liberty Global PLC – Class A(a) | 8,107 | 701,661 | ||||||
Liberty Global PLC – Series C(a) | 23,603 | 1,998,230 | ||||||
Liberty Media Corp. – Class A(a) | 19,710 | 2,703,424 | ||||||
Regal Entertainment Group – Class A | 22,000 | 404,800 | ||||||
Twenty-First Century Fox, Inc. – Class A | 47,100 | 1,579,734 | ||||||
Viacom, Inc. – Class B | 14,500 | 1,272,085 | ||||||
Walt Disney Co. (The) | 39,613 | 3,201,126 | ||||||
|
| |||||||
| 18,372,063 | ||||||||
|
| |||||||
Multiline Retail – 0.3% | ||||||||
Macy’s, Inc. | 32,000 | 1,851,520 | ||||||
Myer Holdings Ltd. | 127,310 | 298,716 | ||||||
|
| |||||||
| 2,150,236 | ||||||||
|
| |||||||
Specialty Retail – 2.7% | ||||||||
Belle International Holdings Ltd. | 956,000 | 1,178,956 | ||||||
GameStop Corp. – Class A | 50,000 | 1,865,500 | ||||||
Gap, Inc. (The) | 20,000 | 875,000 | ||||||
Home Depot, Inc. (The) | 46,900 | 3,847,207 | ||||||
Kingfisher PLC | 91,070 | 600,276 | ||||||
L’Occitane International SA | 147,500 | 324,823 | ||||||
Lowe’s Cos., Inc. | 4,100 | 205,123 | ||||||
Mr. Price Group Ltd. | 34,000 | 471,274 | ||||||
O’Reilly Automotive, Inc.(a) | 9,980 | 1,505,483 | ||||||
Office Depot, Inc.(a) | 252,800 | 1,246,304 | ||||||
Shimamura Co., Ltd. | 6,400 | 579,711 | ||||||
Sports Direct International PLC(a) | 146,388 | 1,974,929 | ||||||
Staples, Inc. | 12,300 | 167,157 | ||||||
TJX Cos., Inc. (The) | 46,100 | 2,833,306 | ||||||
Yamada Denki Co., Ltd. | 358,800 | 1,191,427 | ||||||
Zhongsheng Group Holdings Ltd. | 142,000 | 205,602 | ||||||
|
| |||||||
| 19,072,078 | ||||||||
|
| |||||||
Textiles, Apparel & Luxury Goods – 1.6% | ||||||||
Cie Financiere Richemont SA | 28,570 | 2,838,294 | ||||||
Hugo Boss AG | 8,184 | 1,088,713 | ||||||
Li & Fung Ltd. | 1,726,000 | 2,259,367 | ||||||
LVMH Moet Hennessy Louis Vuitton SA | 1,140 | 210,799 | ||||||
| 32 | • ALLIANCEBERNSTEIN TAX-MANAGED WEALTH STRATEGIES |
Tax-Managed Wealth Appreciation—Portfolio of Investments
| Company | Shares | U.S. $ Value | ||||||
| ||||||||
Michael Kors Holdings Ltd.(a) | 13,360 | $ | 1,309,681 | |||||
NIKE, Inc. – Class B | 25,599 | 2,004,402 | ||||||
Prada SpA | 33,300 | 250,536 | ||||||
Samsonite International SA | 192,300 | 528,019 | ||||||
VF Corp. | 16,510 | 967,321 | ||||||
|
| |||||||
| 11,457,132 | ||||||||
|
| |||||||
| 99,527,541 | ||||||||
|
| |||||||
Information Technology – 10.5% | ||||||||
Communications Equipment – 1.0% | ||||||||
Cisco Systems, Inc. | 66,800 | 1,456,240 | ||||||
F5 Networks, Inc.(a) | 24,320 | 2,732,109 | ||||||
Harris Corp. | 22,300 | 1,646,186 | ||||||
QUALCOMM, Inc. | 13,015 | 979,899 | ||||||
|
| |||||||
| 6,814,434 | ||||||||
|
| |||||||
Computers & Peripherals – 1.8% | ||||||||
Apple, Inc. | 13,050 | 6,867,432 | ||||||
Casetek Holdings Ltd. | 103,000 | 596,321 | ||||||
Catcher Technology Co., Ltd. | 175,000 | 1,275,230 | ||||||
Hewlett-Packard Co. | 127,600 | 3,812,688 | ||||||
Inventec Corp. | 450,000 | 476,465 | ||||||
|
| |||||||
| 13,028,136 | ||||||||
|
| |||||||
Electronic Equipment, Instruments & | ||||||||
Amphenol Corp. – Class A | 29,808 | 2,623,700 | ||||||
Arrow Electronics, Inc.(a) | 18,300 | 1,036,329 | ||||||
LG Display Co., Ltd.(a) | 49,410 | 1,127,290 | ||||||
|
| |||||||
| 4,787,319 | ||||||||
|
| |||||||
Internet Software & Services – 1.8% | ||||||||
Baidu, Inc. (Sponsored ADR)(a) | 3,128 | 534,669 | ||||||
Facebook, Inc. – Class A(a) | 30,690 | 2,101,038 | ||||||
Google, Inc. – Class A(a) | 7,525 | 9,147,766 | ||||||
Telecity Group PLC | 125,408 | 1,384,433 | ||||||
|
| |||||||
| 13,167,906 | ||||||||
|
| |||||||
IT Services – 2.3% | ||||||||
Booz Allen Hamilton Holding Corp. | 21,800 | 458,454 | ||||||
Cognizant Technology Solutions Corp. – Class A(a) | 53,950 | 5,614,037 | ||||||
Fujitsu Ltd.(a) | 132,000 | 825,373 | ||||||
HCL Technologies Ltd. | 15,400 | 392,195 | ||||||
Tata Consultancy Services Ltd. | 15,660 | 574,556 | ||||||
Visa, Inc. – Class A | 29,230 | 6,604,226 | ||||||
Xerox Corp. | 180,400 | 1,982,596 | ||||||
|
| |||||||
| 16,451,437 | ||||||||
|
| |||||||
Semiconductors & Semiconductor | ||||||||
Applied Materials, Inc. | 80,500 | 1,526,280 | ||||||
Lam Research Corp.(a) | 13,600 | 703,528 | ||||||
| ALLIANCEBERNSTEIN TAX-MANAGED WEALTH STRATEGIES • | 33 |
Tax-Managed Wealth Appreciation—Portfolio of Investments
| Company | Shares | U.S. $ Value | ||||||
| ||||||||
Linear Technology Corp. | 57,750 | $ | 2,705,010 | |||||
Micron Technology, Inc.(a) | 43,000 | 1,040,170 | ||||||
NVIDIA Corp. | 10,700 | 196,666 | ||||||
Samsung Electronics Co., Ltd. | 1,320 | 1,672,179 | ||||||
Samsung Electronics Co., Ltd. (Preference Shares) | 2,148 | 2,140,783 | ||||||
SK Hynix, Inc.(a) | 33,300 | 1,210,769 | ||||||
Sumco Corp. | 69,800 | 537,475 | ||||||
Taiwan Semiconductor Manufacturing Co., Ltd. | 315,000 | 1,136,301 | ||||||
Tokyo Electron Ltd. | 10,000 | 573,119 | ||||||
|
| |||||||
| 13,442,280 | ||||||||
|
| |||||||
Software – 1.0% | ||||||||
ANSYS, Inc.(a) | 33,232 | 2,775,536 | ||||||
CA, Inc. | 8,500 | 284,750 | ||||||
Dassault Systemes | 1,880 | 216,109 | ||||||
Electronic Arts, Inc.(a) | 69,900 | 1,998,441 | ||||||
Informatica Corp.(a) | 28,030 | 1,164,927 | ||||||
Red Hat, Inc.(a) | 11,110 | 655,379 | ||||||
|
| |||||||
| 7,095,142 | ||||||||
|
| |||||||
| 74,786,654 | ||||||||
|
| |||||||
Health Care – 9.2% | ||||||||
Biotechnology – 2.1% | ||||||||
Actelion Ltd. (REG)(a) | 10,324 | 1,093,921 | ||||||
Biogen Idec, Inc.(a) | 14,512 | 4,943,948 | ||||||
Celgene Corp.(a) | 6,960 | 1,118,820 | ||||||
Gilead Sciences, Inc.(a) | 40,360 | 3,341,405 | ||||||
Quintiles Transnational Holdings, Inc.(a) | 56,887 | 3,080,431 | ||||||
Theravance, Inc.(a) | 11,200 | 414,400 | ||||||
Vertex Pharmaceuticals, Inc.(a) | 9,100 | 735,826 | ||||||
|
| |||||||
| 14,728,751 | ||||||||
|
| |||||||
Health Care Equipment & | ||||||||
Intuitive Surgical, Inc.(a) | 2,600 | 1,156,558 | ||||||
Medtronic, Inc. | 48,300 | 2,862,258 | ||||||
|
| |||||||
| 4,018,816 | ||||||||
|
| |||||||
Health Care Providers & Services – 1.1% | ||||||||
Aetna, Inc. | 26,300 | 1,912,273 | ||||||
Health Net, Inc./CA(a) | 23,700 | 806,985 | ||||||
McKesson Corp. | 10,080 | 1,784,664 | ||||||
UnitedHealth Group, Inc. | 36,389 | 2,811,778 | ||||||
WellPoint, Inc. | 9,100 | 824,369 | ||||||
|
| |||||||
| 8,140,069 | ||||||||
|
| |||||||
Life Sciences Tools & Services – 0.6% | ||||||||
Eurofins Scientific SE | 5,389 | 1,572,685 | ||||||
Illumina, Inc.(a) | 8,230 | 1,411,363 | ||||||
Mettler-Toledo International, Inc.(a) | 5,697 | 1,400,095 | ||||||
|
| |||||||
| 4,384,143 | ||||||||
|
| |||||||
| 34 | • ALLIANCEBERNSTEIN TAX-MANAGED WEALTH STRATEGIES |
Tax-Managed Wealth Appreciation—Portfolio of Investments
| Company | Shares | U.S. $ Value | ||||||
| ||||||||
Pharmaceuticals – 4.8% | ||||||||
Allergan, Inc./United States | 46,133 | $ | 5,858,891 | |||||
Astellas Pharma, Inc. | 14,700 | 955,511 | ||||||
Daiichi Sankyo Co., Ltd. | 41,800 | 722,398 | ||||||
GlaxoSmithKline PLC | 99,460 | 2,785,838 | ||||||
GlaxoSmithKline PLC (Sponsored ADR) | 31,200 | 1,745,328 | ||||||
Johnson & Johnson | 48,800 | 4,495,456 | ||||||
Lupin Ltd. | 1,441 | 23,205 | ||||||
Merck & Co., Inc. | 56,900 | 3,242,731 | ||||||
Novartis AG | 22,390 | 1,863,522 | ||||||
Pfizer, Inc. | 205,000 | 6,582,550 | ||||||
Richter Gedeon Nyrt | 30,590 | 543,537 | ||||||
Roche Holding AG | 7,790 | 2,398,541 | ||||||
Roche Holding AG (Sponsored ADR) | 48,000 | 1,842,240 | ||||||
Sun Pharmaceutical Industries Ltd. | 88,440 | 923,039 | ||||||
|
| |||||||
| 33,982,787 | ||||||||
|
| |||||||
| 65,254,566 | ||||||||
|
| |||||||
Industrials – 8.4% | ||||||||
Aerospace & Defense – 1.6% | ||||||||
Airbus Group NV | 32,650 | 2,399,033 | ||||||
Boeing Co. (The) | 32,466 | 4,185,517 | ||||||
MTU Aero Engines AG | 5,950 | 499,801 | ||||||
Northrop Grumman Corp. | 5,900 | 714,077 | ||||||
Precision Castparts Corp. | 7,550 | 1,946,994 | ||||||
Safran SA | 11,080 | 778,855 | ||||||
Thales SA | 6,680 | 443,536 | ||||||
Zodiac Aerospace | 12,400 | 436,855 | ||||||
|
| |||||||
| 11,404,668 | ||||||||
|
| |||||||
Air Freight & Logistics – 0.1% | ||||||||
Expeditors International of Washington, Inc. | 15,280 | 603,713 | ||||||
|
| |||||||
Airlines – 0.7% | ||||||||
Copa Holdings SA – Class A | 19,840 | 2,687,526 | ||||||
Delta Air Lines, Inc. | 24,500 | 813,645 | ||||||
Japan Airlines Co., Ltd. | 6,400 | 318,682 | ||||||
Qantas Airways Ltd.(a) | 541,916 | 566,385 | ||||||
Turk Hava Yollari | 176,299 | 523,090 | ||||||
|
| |||||||
| 4,909,328 | ||||||||
|
| |||||||
Building Products – 0.1% | ||||||||
Asahi Glass Co., Ltd. | 66,000 | 363,431 | ||||||
|
| |||||||
Commercial Services & Supplies – 0.5% | ||||||||
Babcock International Group PLC | 80,430 | 1,980,118 | ||||||
Edenred | 43,111 | 1,383,097 | ||||||
|
| |||||||
| 3,363,215 | ||||||||
|
| |||||||
Electrical Equipment – 0.5% | ||||||||
AMETEK, Inc. | 46,256 | 2,462,669 | ||||||
Sumitomo Electric Industries Ltd. | 74,000 | 1,135,897 | ||||||
|
| |||||||
| 3,598,566 | ||||||||
|
| |||||||
| ALLIANCEBERNSTEIN TAX-MANAGED WEALTH STRATEGIES • | 35 |
Tax-Managed Wealth Appreciation—Portfolio of Investments
| Company | Shares | U.S. $ Value | ||||||
| ||||||||
Industrial Conglomerates – 1.7% | ||||||||
Alliance Global Group, Inc. | 493,300 | $ | 332,815 | |||||
Bidvest Group Ltd. | 26,920 | 632,477 | ||||||
Danaher Corp. | 58,918 | 4,506,638 | ||||||
General Electric Co. | 191,500 | 4,877,505 | ||||||
Hutchison Whampoa Ltd. | 62,000 | 837,510 | ||||||
Siemens AG | 3,350 | 446,647 | ||||||
Toshiba Corp. | 192,000 | 833,318 | ||||||
|
| |||||||
| 12,466,910 | ||||||||
|
| |||||||
Machinery – 0.8% | ||||||||
Illinois Tool Works, Inc. | 26,200 | 2,161,500 | ||||||
Komatsu Ltd. | 58,700 | 1,241,193 | ||||||
Parker Hannifin Corp. | 19,960 | 2,406,178 | ||||||
|
| |||||||
| 5,808,871 | ||||||||
|
| |||||||
Marine – 0.3% | ||||||||
AP Moeller – Maersk A/S – Class B | 104 | 1,270,141 | ||||||
Nippon Yusen KK | 223,000 | 714,351 | ||||||
|
| |||||||
| 1,984,492 | ||||||||
|
| |||||||
Professional Services – 1.7% | ||||||||
Bureau Veritas SA | 100,959 | 2,778,750 | ||||||
Capita PLC | 135,659 | 2,589,124 | ||||||
Intertek Group PLC | 90,712 | 4,461,926 | ||||||
SGS SA | 603 | 1,492,138 | ||||||
Verisk Analytics, Inc. – Class A(a) | 17,736 | 1,130,049 | ||||||
|
| |||||||
| 12,451,987 | ||||||||
|
| |||||||
Road & Rail – 0.3% | ||||||||
Canadian National Railway Co. | 8,300 | 468,932 | ||||||
Central Japan Railway Co. | 8,400 | 980,381 | ||||||
Globaltrans Investment PLC | 63,281 | 822,020 | ||||||
|
| |||||||
| 2,271,333 | ||||||||
|
| |||||||
Trading Companies & | ||||||||
Mitsubishi Corp. | 37,500 | 719,753 | ||||||
|
| |||||||
Transportation Infrastructure – 0.0% | ||||||||
Sydney Airport | 26,465 | 96,053 | ||||||
|
| |||||||
| 60,042,320 | ||||||||
|
| |||||||
Consumer Staples – 7.8% | ||||||||
Beverages – 1.0% | ||||||||
Anheuser-Busch InBev NV | 8,140 | 851,396 | ||||||
Asahi Group Holdings Ltd. | 14,600 | 410,501 | ||||||
Carlsberg A/S – Class B | 7,180 | 756,430 | ||||||
Diageo PLC | 77,790 | 2,442,763 | ||||||
Monster Beverage Corp.(a) | 27,547 | 2,038,478 | ||||||
SABMiller PLC (London) | 16,550 | 810,479 | ||||||
|
| |||||||
| 7,310,047 | ||||||||
|
| |||||||
| 36 | • ALLIANCEBERNSTEIN TAX-MANAGED WEALTH STRATEGIES |
Tax-Managed Wealth Appreciation—Portfolio of Investments
| Company | Shares | U.S. $ Value | ||||||
| ||||||||
Food & Staples Retailing – 2.6% | ||||||||
Costco Wholesale Corp. | 24,790 | $ | 2,895,472 | |||||
CVS Caremark Corp. | 83,090 | 6,077,203 | ||||||
Jeronimo Martins SGPS SA | 69,202 | 1,173,279 | ||||||
Koninklijke Ahold NV | 89,570 | 1,669,649 | ||||||
Kroger Co. (The) | 66,700 | 2,797,398 | ||||||
Lenta Ltd. (GDR)(a)(b) | 98,502 | 985,020 | ||||||
Magnit OJSC (Sponsored GDR)(b) | 1,844 | 103,264 | ||||||
Olam International Ltd. | 1,840,105 | 2,579,867 | ||||||
Tsuruha Holdings, Inc. | 2,500 | 232,965 | ||||||
|
| |||||||
| 18,514,117 | ||||||||
|
| |||||||
Food Products – 1.2% | ||||||||
Ajinomoto Co., Inc. | 38,000 | 589,945 | ||||||
Danone | 5,060 | 356,810 | ||||||
Green Mountain Coffee Roasters, Inc. | 16,540 | 1,815,761 | ||||||
Hershey Co. (The) | 27,210 | 2,879,362 | ||||||
Mead Johnson Nutrition Co. – Class A | 32,780 | 2,673,209 | ||||||
Unilever PLC | 6,990 | 285,891 | ||||||
|
| |||||||
| 8,600,978 | ||||||||
|
| |||||||
Household Products – 0.8% | ||||||||
Henkel AG & Co. KGaA | 28,490 | 2,877,852 | ||||||
LG Household & Health Care Ltd. | 2,180 | 934,556 | ||||||
Procter & Gamble Co. (The) | 20,300 | 1,596,798 | ||||||
|
| |||||||
| 5,409,206 | ||||||||
|
| |||||||
Personal Products – 0.2% | ||||||||
Estee Lauder Cos., Inc. (The) – Class A | 22,050 | 1,517,922 | ||||||
|
| |||||||
Tobacco – 2.0% | ||||||||
British American Tobacco PLC | 110,686 | 6,033,649 | ||||||
Imperial Tobacco Group PLC | 31,201 | 1,272,677 | ||||||
Japan Tobacco, Inc. | 146,000 | 4,650,060 | ||||||
Philip Morris International, Inc. | 29,377 | 2,376,893 | ||||||
|
| |||||||
| 14,333,279 | ||||||||
|
| |||||||
| 55,685,549 | ||||||||
|
| |||||||
Energy – 5.8% | ||||||||
Energy Equipment & Services – 1.6% | ||||||||
Aker Solutions ASA | 50,590 | 848,759 | ||||||
Halliburton Co. | 34,200 | 1,949,400 | ||||||
Helmerich & Payne, Inc. | 15,100 | 1,491,125 | ||||||
Nabors Industries Ltd. | 21,200 | 488,024 | ||||||
Oceaneering International, Inc. | 17,252 | 1,234,898 | ||||||
Saipem SpA | 35,530 | 834,704 | ||||||
Schlumberger Ltd. | 44,612 | 4,148,916 | ||||||
Seadrill Ltd. | 17,100 | 629,986 | ||||||
|
| |||||||
| 11,625,812 | ||||||||
|
| |||||||
Oil, Gas & Consumable Fuels – 4.2% | ||||||||
BG Group PLC | 60,490 | 1,100,539 | ||||||
Canadian Natural Resources Ltd. | 15,700 | 574,518 | ||||||
| ALLIANCEBERNSTEIN TAX-MANAGED WEALTH STRATEGIES • | 37 |
Tax-Managed Wealth Appreciation—Portfolio of Investments
| Company | Shares | U.S. $ Value | ||||||
| ||||||||
Chesapeake Energy Corp. | 10,700 | $ | 277,237 | |||||
Chevron Corp. | 32,600 | 3,759,758 | ||||||
China Petroleum & Chemical Corp. – | 884,400 | 782,877 | ||||||
ENI SpA | 48,670 | 1,168,401 | ||||||
Exxon Mobil Corp. | 55,100 | 5,304,477 | ||||||
Gazprom OAO (Sponsored ADR) | 64,890 | 493,813 | ||||||
Hess Corp. | 38,400 | 3,073,152 | ||||||
JX Holdings, Inc. | 150,900 | 783,699 | ||||||
LUKOIL OAO (London) (Sponsored ADR) | 9,630 | 523,872 | ||||||
Marathon Petroleum Corp. | 30,700 | 2,578,800 | ||||||
NovaTek OAO (Sponsored GDR)(b) | 4,000 | 506,400 | ||||||
Occidental Petroleum Corp. | 32,400 | 3,127,248 | ||||||
Petroleo Brasileiro SA (Sponsored ADR) | 27,990 | 326,363 | ||||||
Phillips 66 | 11,300 | 845,918 | ||||||
Royal Dutch Shell PLC (Euronext Amsterdam) – Class A | 37,390 | 1,364,489 | ||||||
Suncor Energy, Inc. (Toronto) | 16,880 | 556,874 | ||||||
Valero Energy Corp. | 59,400 | 2,850,012 | ||||||
|
| |||||||
| 29,998,447 | ||||||||
|
| |||||||
| 41,624,259 | ||||||||
|
| |||||||
Materials – 2.4% | ||||||||
Chemicals – 1.6% | ||||||||
Arkema SA | 11,070 | 1,200,793 | ||||||
BASF SE | 3,780 | 434,488 | ||||||
Denki Kagaku Kogyo KK | 139,000 | 537,517 | ||||||
Essentra PLC | 168,913 | 2,514,863 | ||||||
Huntsman Corp. | 65,100 | 1,585,836 | ||||||
Koninklijke DSM NV | 12,437 | 793,571 | ||||||
LyondellBasell Industries NV – Class A | 20,400 | 1,796,832 | ||||||
Monsanto Co. | 17,554 | 1,931,291 | ||||||
Nippon Shokubai Co., Ltd. | 53,000 | 645,367 | ||||||
|
| |||||||
| 11,440,558 | ||||||||
|
| |||||||
Construction Materials – 0.0% | ||||||||
Grasim Industries Ltd. (GDR)(b) | 5,324 | 218,081 | ||||||
|
| |||||||
Metals & Mining – 0.6% | ||||||||
Barrick Gold Corp. | 31,040 | 632,405 | ||||||
BHP Billiton PLC | 35,490 | 1,143,730 | ||||||
Dowa Holdings Co., Ltd. | 37,000 | 307,881 | ||||||
MMC Norilsk Nickel OJSC (ADR) | 67,260 | 1,142,075 | ||||||
Rio Tinto PLC | 14,950 | 857,243 | ||||||
|
| |||||||
| 4,083,334 | ||||||||
|
| |||||||
Paper & Forest Products – 0.2% | ||||||||
Duratex SA | 54,500 | 253,015 | ||||||
Mondi PLC | 48,084 | 881,729 | ||||||
|
| |||||||
| 1,134,744 | ||||||||
|
| |||||||
| 16,876,717 | ||||||||
|
| |||||||
| 38 | • ALLIANCEBERNSTEIN TAX-MANAGED WEALTH STRATEGIES |
Tax-Managed Wealth Appreciation—Portfolio of Investments
| Company | Shares | U.S. $ Value | ||||||
| ||||||||
Telecommunication Services – 1.7% | ||||||||
Diversified Telecommunication | ||||||||
AT&T, Inc. | 75,800 | $ | 2,420,294 | |||||
Bezeq The Israeli Telecommunication Corp., Ltd. | 225,053 | 366,618 | ||||||
Hellenic Telecommunications Organization SA(a) | 34,060 | 595,901 | ||||||
Nippon Telegraph & Telephone Corp. | 12,600 | 709,368 | ||||||
Verizon Communications, Inc.(London) | 16,966 | 802,437 | ||||||
Verizon Communications, Inc. | 13,808 | 656,963 | ||||||
Vivendi SA | 70,728 | 2,016,854 | ||||||
Ziggo NV | 9,270 | 422,677 | ||||||
|
| |||||||
| 7,991,112 | ||||||||
|
| |||||||
Wireless Telecommunication | ||||||||
China Mobile Ltd. | 84,500 | 801,519 | ||||||
Rogers Communications, Inc. – Class B | 7,040 | 272,114 | ||||||
Turkcell Iletisim Hizmetleri AS(a) | 132,910 | 690,360 | ||||||
Vodafone Group PLC | 351,867 | 1,466,218 | ||||||
Vodafone Group PLC (Sponsored ADR) | 28,636 | 1,190,414 | ||||||
|
| |||||||
| 4,420,625 | ||||||||
|
| |||||||
| 12,411,737 | ||||||||
|
| |||||||
Utilities – 1.5% | ||||||||
Electric Utilities – 0.6% | ||||||||
Edison International | 42,600 | 2,230,962 | ||||||
EDP – Energias de Portugal SA | 210,920 | 912,800 | ||||||
Electricite de France | 13,230 | 524,908 | ||||||
Enel SpA | 173,750 | 890,386 | ||||||
|
| |||||||
| 4,559,056 | ||||||||
|
| |||||||
Gas Utilities – 0.3% | ||||||||
Atmos Energy Corp. | 26,400 | 1,217,040 | ||||||
UGI Corp. | 21,400 | 956,366 | ||||||
|
| |||||||
| 2,173,406 | ||||||||
|
| |||||||
Independent Power Producers & Energy | ||||||||
APR Energy PLC | 125,142 | 1,812,665 | ||||||
|
| |||||||
Multi-Utilities – 0.3% | ||||||||
CenterPoint Energy, Inc. | 42,800 | 1,012,220 | ||||||
DTE Energy Co. | 3,500 | 251,160 | ||||||
National Grid PLC | 62,270 | 871,359 | ||||||
|
| |||||||
| 2,134,739 | ||||||||
|
| |||||||
| 10,679,866 | ||||||||
|
| |||||||
Total Common Stocks | 555,890,572 | |||||||
|
| |||||||
| ALLIANCEBERNSTEIN TAX-MANAGED WEALTH STRATEGIES • | 39 |
Tax-Managed Wealth Appreciation—Portfolio of Investments
| Company | Shares | U.S. $ Value | ||||||
| ||||||||
INVESTMENT COMPANIES – 20.0% | ||||||||
Funds and Investment Trusts – 20.0% | ||||||||
AllianceBernstein Pooling Portfolio – Volatility Management Portfolio* | 12,150,298 | $ | 142,523,000 | |||||
|
| |||||||
WARRANTS – 0.1% | ||||||||
Financials – 0.1% | ||||||||
Real Estate Management & | ||||||||
Emaar Properties PJSC, Merrill Lynch Intl & Co., expiring 10/01/15(a) | 309,920 | 767,881 | ||||||
|
| |||||||
Industrials – 0.0% | ||||||||
Industrial Conglomerates – 0.0% | ||||||||
John Keells Holdings PLC, Deutsche Bank AG London, expiring 7/05/19(a) | 144,570 | 247,771 | ||||||
|
| |||||||
Consumer Staples – 0.0% | ||||||||
Food & Staples Retailing – 0.0% | ||||||||
Olam International Ltd., expiring 1/29/18(a) | 274,367 | 76,823 | ||||||
|
| |||||||
Total Warrants | 1,092,475 | |||||||
|
| |||||||
SHORT-TERM INVESTMENTS – 1.7% | ||||||||
Investment Companies – 1.7% | ||||||||
AllianceBernstein Fixed-Income Shares, Inc.–Government STIF Portfolio, 0.08%(c) | 11,983,373 | 11,983,373 | ||||||
|
| |||||||
Total Investments – 99.8% | 711,489,420 | |||||||
Other assets less liabilities – 0.2% | 1,271,549 | |||||||
|
| |||||||
Net Assets – 100.0% | $ | 712,760,969 | ||||||
|
| |||||||
FUTURES (see Note D)
| Type | Number of Contracts | Expiration Month | Original Value | Value at February 28, 2014 | Unrealized Appreciation/ (Depreciation) | |||||||||||||||
Purchased Contracts | ||||||||||||||||||||
Euro STOXX 50 Futures | 21 | March 2014 | $ | 878,276 | $ | 910,170 | $ | 31,894 | ||||||||||||
FORWARD CURRENCY EXCHANGE CONTRACTS (see Note D)
| Counterparty | Contracts to | In Exchange For (000) | Settlement Date | Unrealized Appreciation/ (Depreciation) | ||||||||||||||||||||
BNP Paribas SA | CAD | 958 | USD | 864 | 5/15/14 | $ | 819 | |||||||||||||||||
BNP Paribas SA | CHF | 3,215 | USD | 3,576 | 5/15/14 | (81,278 | ) | |||||||||||||||||
| 40 | • ALLIANCEBERNSTEIN TAX-MANAGED WEALTH STRATEGIES |
Tax-Managed Wealth Appreciation—Portfolio of Investments
| Counterparty | Contracts to | In Exchange For (000) | Settlement Date | Unrealized Appreciation/ (Depreciation) | ||||||||||||||||||||
BNP Paribas SA | HKD | 52,574 | USD | 6,776 | 5/15/14 | $ | 821 | |||||||||||||||||
BNP Paribas SA | USD | 1,336 | AUD | 1,499 | 5/15/14 | (4,816 | ) | |||||||||||||||||
BNP Paribas SA | USD | 7,190 | CAD | 7,968 | 5/15/14 | (6,810 | ) | |||||||||||||||||
BNP Paribas SA | USD | 2,977 | CHF | 2,676 | 5/15/14 | 67,652 | ||||||||||||||||||
BNP Paribas SA | USD | 6,940 | GBP | 4,165 | 5/15/14 | 31,144 | ||||||||||||||||||
BNP Paribas SA | USD | 3,674 | NZD | 4,492 | 5/15/14 | 71,119 | ||||||||||||||||||
Credit Suisse International | USD | 681 | CHF | 606 | 5/15/14 | 8,044 | ||||||||||||||||||
Goldman Sachs Bank USA | EUR | 3,674 | USD | 5,037 | 5/15/14 | (34,429 | ) | |||||||||||||||||
HSBC Bank USA | GBP | 2,923 | USD | 4,772 | 5/15/14 | (120,542 | ) | |||||||||||||||||
Morgan Stanley & Co., Inc. | JPY | 862,866 | USD | 8,472 | 5/15/14 | (10,216 | ) | |||||||||||||||||
Morgan Stanley & Co., Inc. | NZD | 3,983 | USD | 3,315 | 5/15/14 | (6,452 | ) | |||||||||||||||||
Morgan Stanley & Co., Inc. | SEK | 6,512 | USD | 996 | 5/15/14 | (18,751 | ) | |||||||||||||||||
Morgan Stanley & Co., Inc. | USD | 1,381 | NOK | 8,391 | 5/15/14 | 12,959 | ||||||||||||||||||
Royal Bank of Scotland PLC | GBP | 7,602 | USD | 12,399 | 5/15/14 | (324,524 | ) | |||||||||||||||||
Standard Chartered Bank | RUB | 28,662 | USD | 797 | 5/15/14 | 9,677 | ||||||||||||||||||
Standard Chartered Bank | USD | 1,805 | SGD | 2,288 | 5/15/14 | 418 | ||||||||||||||||||
State Street Bank & Trust Co. | CHF | 366 | USD | 409 | 5/15/14 | (7,244 | ) | |||||||||||||||||
State Street Bank & Trust Co. | EUR | 372 | USD | 509 | 5/15/14 | (4,701 | ) | |||||||||||||||||
State Street Bank & Trust Co. | GBP | 175 | USD | 288 | 5/15/14 | (4,707 | ) | |||||||||||||||||
State Street Bank & Trust Co. | USD | 750 | CAD | 830 | 5/15/14 | (2,067 | ) | |||||||||||||||||
State Street Bank & Trust Co. | USD | 2,060 | EUR | 1,515 | 5/15/14 | 31,073 | ||||||||||||||||||
State Street Bank & Trust Co. | USD | 2,338 | NOK | 14,530 | 5/15/14 | 76,327 | ||||||||||||||||||
State Street Bank & Trust Co. | USD | 283 | NZD | 342 | 5/15/14 | 2,484 | ||||||||||||||||||
State Street Bank & Trust Co. | USD | 7,966 | SEK | 51,735 | 5/15/14 | 93,008 | ||||||||||||||||||
UBS AG | USD | 1,287 | AUD | 1,473 | 5/15/14 | 20,615 | ||||||||||||||||||
|
| |||||||||||||||||||||||
| $ | (200,377 | ) | ||||||||||||||||||||||
|
| |||||||||||||||||||||||
| * | To obtain a copy of the fund’s financial statements, please go to the Securities and Exchange Commission’s website at www.sec.gov, or call AllianceBernstein at (800) 227-4618. |
| (a) | Non-income producing security. |
| (b) | Security is exempt from registration under Rule 144A of the Securities Act of 1933. These securities are considered liquid and may be resold in transactions exempt from registration, normally to qualified institutional buyers. At February 28, 2014, the aggregate market value of these securities amounted to $3,278,493 or 0.5% of net assets. |
| (c) | Investment in affiliated money market mutual fund. The rate shown represents the 7-day yield as of period end. |
Currency Abbreviations:
| AUD | – Australian Dollar |
| CAD | – Canadian Dollar |
| CHF | – Swiss Franc |
| EUR | – Euro |
| GBP | – Great British Pound |
| ALLIANCEBERNSTEIN TAX-MANAGED WEALTH STRATEGIES • | 41 |
Tax-Managed Wealth Appreciation—Portfolio of Investments
| HKD | – Hong Kong Dollar |
JPY – Japanese Yen
| NOK | – Norwegian Krone |
| NZD | – New Zealand Dollar |
| RUB | – Russian Ruble |
| SEK | – Swedish Krona |
| SGD | – Singapore Dollar |
| USD | – United States Dollar |
| Glossary: |
| ADR | – American Depositary Receipt |
| GDR | – Global Depositary Receipt |
| OJSC | – Open Joint Stock Company |
| PJSC | – Public Joint Stock Company |
| REG | – Registered Shares |
See notes to financial statements.
| 42 | • ALLIANCEBERNSTEIN TAX-MANAGED WEALTH STRATEGIES |
Tax-Managed Wealth Appreciation—Portfolio of Investments
TAX-MANAGED BALANCED WEALTH
PORTFOLIO OF INVESTMENTS
February 28, 2014 (unaudited)
| Principal Amount (000) | U.S. $ Value | |||||||
| ||||||||
MUNICIPAL OBLIGATIONS – 52.2% | ||||||||
Long-Term Municipal Bonds – 46.9% | ||||||||
Alabama – 4.2% | ||||||||
Alabama Pub Sch & Clg Auth | $ | 2,040 | $ | 2,381,292 | ||||
Birmingham AL Wtrwks Brd | 3,980 | 4,493,818 | ||||||
|
| |||||||
| 6,875,110 | ||||||||
|
| |||||||
Arizona – 1.6% | ||||||||
Arizona Trnsp Brd Hwy | 2,100 | 2,417,373 | ||||||
Pima Cnty AZ IDA | 240 | 246,305 | ||||||
Pima Cnty AZ IDA | 15 | 15,001 | ||||||
|
| |||||||
| 2,678,679 | ||||||||
|
| |||||||
California – 4.9% | ||||||||
California Dept Wtr Res Pwr | 1,905 | 2,296,859 | ||||||
California Econ Recovery | 2,450 | 2,921,601 | ||||||
California GO | 2,225 | 2,428,476 | ||||||
Los Angeles CA Dept Arpts | 365 | 416,826 | ||||||
|
| |||||||
| 8,063,762 | ||||||||
|
| |||||||
Colorado – 1.0% | ||||||||
Denver Co. City & Cnty Arpt | 1,220 | 1,310,634 | ||||||
PV Wtr & San Met Dist CO | 710 | 297,831 | ||||||
Todd Creek Farms Met Dist #1 CO | 260 | 130,000 | ||||||
|
| |||||||
| 1,738,465 | ||||||||
|
| |||||||
| ALLIANCEBERNSTEIN TAX-MANAGED WEALTH STRATEGIES • | 43 |
Tax-Managed Balanced Wealth—Portfolio of Investments
| Principal Amount (000) | U.S. $ Value | |||||||
| ||||||||
Connecticut – 1.6% | ||||||||
Connecticut Spl Tax Obl | $ | 2,390 | $ | 2,732,105 | ||||
|
| |||||||
District of Columbia – 0.9% | ||||||||
District of Columbia GO | 1,200 | 1,410,588 | ||||||
|
| |||||||
Florida – 5.0% | ||||||||
Citizens Ppty Ins Corp. FL | 4,000 | 4,306,410 | ||||||
Heritage Plantation CDD FL | 105 | 31,500 | ||||||
Miami Dade Cnty FL Spl Tax | 560 | 620,855 | ||||||
Midtown Miami CDD FL | 220 | 220,156 | ||||||
Overoaks CDD FL | 25 | – 0 | – | |||||
Series 2010A-1 | 15 | 15,231 | ||||||
Series 2010A-2 | 35 | 35,072 | ||||||
Series 2010B | 60 | 60,074 | ||||||
Parkway Center CDD FL | 95 | 92,689 | ||||||
Sarasota Cnty FL Sch Brd COP | 1,165 | 1,318,290 | ||||||
Tampa Bay Reg Wtr Supply Auth FL | 1,380 | 1,598,067 | ||||||
Villages of Westport CDD FL | 80 | 28,000 | ||||||
|
| |||||||
| 8,326,344 | ||||||||
|
| |||||||
Hawaii – 1.9% | ||||||||
Hawaii GO | 2,950 | 3,169,382 | ||||||
|
| |||||||
| 44 | • ALLIANCEBERNSTEIN TAX-MANAGED WEALTH STRATEGIES |
Tax-Managed Balanced Wealth—Portfolio of Investments
| Principal Amount (000) | U.S. $ Value | |||||||
| ||||||||
Illinois – 1.3% | ||||||||
Chicago IL Wtr | $ | 950 | $ | 1,008,168 | ||||
Illinois GO | 785 | 823,858 | ||||||
Illinois Toll Hwy Auth | 305 | 359,772 | ||||||
|
| |||||||
| 2,191,798 | ||||||||
|
| |||||||
Indiana – 1.3% | ||||||||
Indiana Bond Bank Gas | ||||||||
Series 2007A | 1,945 | 2,227,745 | ||||||
|
| |||||||
Massachusetts – 1.1% | ||||||||
Massachusetts Sch Bldg Auth | ||||||||
AGM Series 2005A | 1,690 | 1,806,441 | ||||||
|
| |||||||
Michigan – 0.7% | ||||||||
Michigan Finance Auth | ||||||||
Series 2012A | 955 | 1,142,094 | ||||||
|
| |||||||
Minnesota – 0.3% | ||||||||
Minneapolis MN | ||||||||
Series 2013D | 460 | 500,402 | ||||||
|
| |||||||
Nevada – 1.4% | ||||||||
Clark Cnty NV Arpt | ||||||||
2.50%, 7/01/15 | 2,275 | 2,331,215 | ||||||
|
| |||||||
New Jersey – 2.1% | ||||||||
New Jersey EDA | 1,195 | 1,306,135 | ||||||
New Jersey Trnsp Trust Fd Auth | ||||||||
Series 2013A | 1,840 | 2,157,505 | ||||||
|
| |||||||
| 3,463,640 | ||||||||
|
| |||||||
New York – 4.9% | ||||||||
Metropolitan Trnsp Auth NY | ||||||||
Series 2012C | 460 | 531,452 | ||||||
New York NY GO | ||||||||
Series 2012G | 870 | 952,885 | ||||||
New York NY Trnsl Fin Auth | ||||||||
| ALLIANCEBERNSTEIN TAX-MANAGED WEALTH STRATEGIES • | 45 |
Tax-Managed Balanced Wealth—Portfolio of Investments
| Principal Amount (000) | U.S. $ Value | |||||||
| ||||||||
Series 2012B | $ | 2,875 | $ | 3,252,051 | ||||
New York St Dormitory Auth | ||||||||
Series 2013A | 205 | 233,113 | ||||||
New York St Thruway Auth | ||||||||
Series 2013A | 425 | 497,603 | ||||||
Triborough Brdg & Tunl Auth NY | ||||||||
Series 2012B | 1,000 | 1,145,430 | ||||||
Series 2013B 5.00%, 11/15/20 | 1,215 | 1,451,524 | ||||||
|
| |||||||
| 8,064,058 | ||||||||
|
| |||||||
North Carolina – 0.9% | ||||||||
North Carolina Eastern Mun Pwr Agy | ||||||||
Series 2008A | 785 | 814,940 | ||||||
Series 2012B | 150 | 172,975 | ||||||
North Carolina Ltd. Oblig | ||||||||
Series 2013A | 385 | 422,973 | ||||||
|
| |||||||
| 1,410,888 | ||||||||
|
| |||||||
Ohio – 0.0% | ||||||||
Columbiana Cnty Port Auth OH (Liberty Waste Trnsp LLC) | ||||||||
Series 2004A | 32 | 12,800 | ||||||
|
| |||||||
Pennsylvania – 0.1% | ||||||||
Allegheny Cnty PA Redev Auth | 50 | 50,136 | ||||||
Philadelphia PA IDA | ||||||||
Series 2005A | 110 | 101,685 | ||||||
|
| |||||||
| 151,821 | ||||||||
|
| |||||||
Puerto Rico – 1.4% | ||||||||
Puerto Rico Elec Pwr Auth | ||||||||
Series 2010ZZ | 1,125 | 940,601 | ||||||
Puerto Rico Sales Tax Fin Corp. | ||||||||
Series 2009A | 1,610 | 1,416,848 | ||||||
|
| |||||||
| 2,357,449 | ||||||||
|
| |||||||
| 46 | • ALLIANCEBERNSTEIN TAX-MANAGED WEALTH STRATEGIES |
Tax-Managed Balanced Wealth—Portfolio of Investments
| Principal Amount (000) | U.S. $ Value | |||||||
| ||||||||
Texas – 7.1% | ||||||||
Grand Parkway Trnsp Corp. TX | ||||||||
Series 2014A | $ | 1,710 | $ | 1,822,877 | ||||
Houston TX Arpt Sys | ||||||||
Series 2009A | 2,815 | 3,164,689 | ||||||
Houston TX GO | ||||||||
NPFGC Series 2007A | 3,300 | 3,452,360 | ||||||
Texas A & M Univ | ||||||||
Series 2009D | 2,765 | 3,248,046 | ||||||
|
| |||||||
| 11,687,972 | ||||||||
|
| |||||||
Virginia – 0.9% | ||||||||
Virginia Trnsp Brd | ||||||||
(Virginia Fed Hwy Grant) | 1,370 | 1,494,519 | ||||||
|
| |||||||
Washington – 2.3% | ||||||||
Chelan Cnty WA PUD #1 | ||||||||
Series 2011B | 1,815 | 2,082,930 | ||||||
King Cnty WA GO | ||||||||
5.00%, 6/01/15 | 380 | 402,656 | ||||||
Washington Fed Hwy Grant | ||||||||
5.00%, 9/01/22 | 535 | 625,137 | ||||||
Series 2012F | 700 | 777,819 | ||||||
|
| |||||||
| 3,888,542 | ||||||||
|
| |||||||
Total Long-Term Municipal Bonds | 77,725,819 | |||||||
|
| |||||||
Short-Term Municipal Notes – 5.3% | ||||||||
Connecticut – 4.3% | ||||||||
Connecticut Hlth & Ed Fac Auth | 7,000 | 7,000,000 | ||||||
|
| |||||||
Mississippi – 1.0% | ||||||||
Mississippi Business Fin Corp. | 1,700 | 1,700,000 | ||||||
|
| |||||||
Total Short-Term Municipal Notes | 8,700,000 | |||||||
|
| |||||||
Total Municipal Obligations | 86,425,819 | |||||||
|
| |||||||
| ALLIANCEBERNSTEIN TAX-MANAGED WEALTH STRATEGIES • | 47 |
Tax-Managed Balanced Wealth—Portfolio of Investments
Shares | U.S. $ Value | |||||||
| ||||||||
COMMON STOCKS – 32.0% | ||||||||
Financials – 6.7% | ||||||||
Capital Markets – 0.8% | ||||||||
Affiliated Managers Group, Inc.(e) | 934 | $ | 175,639 | |||||
Bank of New York Mellon Corp. (The) | 2,100 | 67,200 | ||||||
BlackRock, Inc.—Class A | 480 | 146,323 | ||||||
Daiwa Securities Group, Inc. | 10,000 | 90,497 | ||||||
Deutsche Bank AG (REG) | 2,721 | 131,600 | ||||||
E*Trade Financial Corp.(e) | 2,500 | 56,175 | ||||||
Goldman Sachs Group, Inc. (The) | 900 | 149,805 | ||||||
Macquarie Group Ltd. | 2,595 | 130,865 | ||||||
State Street Corp. | 850 | 55,819 | ||||||
UBS AG (REG)(e) | 15,193 | 325,023 | ||||||
|
| |||||||
| 1,328,946 | ||||||||
|
| |||||||
Commercial Banks – 1.4% | ||||||||
Banco do Brasil SA | 4,400 | 38,914 | ||||||
Bank Hapoalim BM | 11,420 | 62,416 | ||||||
Bank of Montreal | 860 | 56,650 | ||||||
Bank of Nova Scotia | 1,090 | 62,331 | ||||||
Barclays PLC | 17,287 | 72,823 | ||||||
China Construction Bank Corp.—Class H | 126,000 | 86,975 | ||||||
CIT Group, Inc. | 3,900 | 189,852 | ||||||
Comerica, Inc. | 850 | 40,953 | ||||||
Fifth Third Bancorp | 2,100 | 45,559 | ||||||
Grupo Financiero Banorte SAB | 6,450 | 41,757 | ||||||
HDFC Bank Ltd. | 7,240 | 78,249 | ||||||
HSBC Holdings PLC | 10,810 | 114,089 | ||||||
Industrial & Commercial Bank of China Ltd.—Class H | 119,000 | 71,693 | ||||||
KBC Groep NV | 1,210 | 76,523 | ||||||
Lloyds Banking Group PLC(e) | 98,660 | 136,250 | ||||||
Mitsubishi UFJ Financial Group, Inc. | 18,500 | 107,201 | ||||||
National Australia Bank Ltd. | 2,560 | 79,613 | ||||||
Sberbank of Russia (Sponsored ADR) | 10,984 | 111,707 | ||||||
Societe Generale SA | 2,305 | 152,951 | ||||||
State Bank of India | 1,280 | 31,727 | ||||||
Sumitomo Mitsui Financial Group, Inc. | 1,900 | 85,306 | ||||||
SunTrust Banks, Inc. | 1,000 | 37,680 | ||||||
Toronto-Dominion Bank (The) | 2,230 | 101,018 | ||||||
UniCredit SpA | 18,820 | 149,352 | ||||||
Wells Fargo & Co. | 5,800 | 269,236 | ||||||
|
| |||||||
| 2,300,825 | ||||||||
|
| |||||||
Consumer Finance – 0.4% | ||||||||
Capital One Financial Corp. | 4,400 | 323,092 | ||||||
Discover Financial Services | 3,000 | 172,140 | ||||||
Muthoot Finance Ltd. | 21,070 | 56,201 | ||||||
| 48 | • ALLIANCEBERNSTEIN TAX-MANAGED WEALTH STRATEGIES |
Tax-Managed Balanced Wealth—Portfolio of Investments
Shares | U.S. $ Value | |||||||
| ||||||||
Shriram Transport Finance Co., Ltd. | 10,270 | $ | 97,724 | |||||
|
| |||||||
| 649,157 | ||||||||
|
| |||||||
Diversified Financial Services – 1.4% | ||||||||
Bank of America Corp. | 28,800 | 476,064 | ||||||
Berkshire Hathaway, Inc.—Class B(e) | 1,050 | 121,569 | ||||||
Citigroup, Inc. | 6,900 | 335,547 | ||||||
IG Group Holdings PLC | 7,413 | 78,544 | ||||||
ING Groep NV(e) | 5,554 | 80,655 | ||||||
ING US, Inc. | 3,800 | 136,306 | ||||||
IntercontinentalExchange Group, Inc. | 2,590 | 540,896 | ||||||
JPMorgan Chase & Co. | 7,000 | 397,740 | ||||||
McGraw Hill Financial, Inc. | 275 | 21,906 | ||||||
ORIX Corp. | 11,200 | 166,103 | ||||||
|
| |||||||
| 2,355,330 | ||||||||
|
| |||||||
Insurance – 2.0% | ||||||||
Admiral Group PLC | 14,370 | 344,990 | ||||||
AIA Group Ltd. | 64,600 | 316,511 | ||||||
American Financial Group, Inc./OH | 2,400 | 137,184 | ||||||
American International Group, Inc. | 5,900 | 293,643 | ||||||
AON PLC | 2,000 | 171,200 | ||||||
Assurant, Inc. | 2,200 | 144,386 | ||||||
Aviva PLC | 7,370 | 58,596 | ||||||
BB Seguridade Participacoes SA | 14,400 | 143,094 | ||||||
Chubb Corp. (The) | 1,800 | 157,464 | ||||||
Genworth Financial, Inc. – Class A(e) | 10,600 | 164,724 | ||||||
Lancashire Holdings Ltd. | 15,141 | 185,974 | ||||||
Lincoln National Corp. | 5,300 | 265,689 | ||||||
Muenchener Rueckversicherungs AG | 610 | 133,371 | ||||||
PartnerRe Ltd. | 1,700 | 168,096 | ||||||
Prudential PLC | 14,890 | 337,150 | ||||||
Reinsurance Group of America, Inc. – Class A | 1,225 | 94,313 | ||||||
Travelers Cos., Inc. (The) | 1,100 | 92,224 | ||||||
Unum Group | 550 | 19,129 | ||||||
XL Group PLC | 3,100 | 94,240 | ||||||
|
| |||||||
| 3,321,978 | ||||||||
|
| |||||||
Real Estate Investment Trusts | ||||||||
GLP J-Reit | 65 | 68,618 | ||||||
|
| |||||||
Real Estate Management & | ||||||||
Aeon Mall Co., Ltd. | 2,100 | 58,311 | ||||||
China Overseas Land & Investment Ltd. | 12,000 | 32,341 | ||||||
Country Garden Holdings Co., Ltd. | 192,000 | 99,387 | ||||||
Daito Trust Construction Co., Ltd. | 1,900 | 177,080 | ||||||
Global Logistic Properties Ltd. | 111,000 | 248,217 | ||||||
| ALLIANCEBERNSTEIN TAX-MANAGED WEALTH STRATEGIES • | 49 |
Tax-Managed Balanced Wealth—Portfolio of Investments
Shares | U.S. $ Value | |||||||
| ||||||||
Hang Lung Properties Ltd. | 54,000 | $ | 150,619 | |||||
Lend Lease Group | 7,220 | 72,940 | ||||||
Mitsubishi Estate Co., Ltd. | 3,000 | 71,154 | ||||||
|
| |||||||
| 910,049 | ||||||||
|
| |||||||
Thrifts & Mortgage Finance – 0.1% | ||||||||
Housing Development Finance Corp. | 16,570 | 218,642 | ||||||
|
| |||||||
| 11,153,545 | ||||||||
|
| |||||||
Consumer Discretionary – 5.8% | ||||||||
Auto Components – 0.4% | ||||||||
Cie Generale des Etablissements | 1,108 | 134,689 | ||||||
GKN PLC | 12,830 | 87,012 | ||||||
Lear Corp. | 850 | 69,020 | ||||||
Magna International, Inc. (Toronto) – Class A | 490 | 43,619 | ||||||
TRW Automotive Holdings Corp.(e) | 1,600 | 131,712 | ||||||
Valeo SA | 1,390 | 194,437 | ||||||
|
| |||||||
| 660,489 | ||||||||
|
| |||||||
Automobiles – 0.8% | ||||||||
Ford Motor Co. | 11,600 | 178,524 | ||||||
Honda Motor Co., Ltd. | 2,800 | 100,780 | ||||||
Hyundai Motor Co. | 260 | 59,735 | ||||||
Hyundai Motor Co. (Preference Shares) | 1,200 | 155,221 | ||||||
Mazda Motor Corp.(e) | 8,000 | 38,640 | ||||||
Nissan Motor Co., Ltd. | 23,500 | 209,753 | ||||||
Tata Motors Ltd. | 11,690 | 79,175 | ||||||
Toyota Motor Corp. | 6,700 | 385,606 | ||||||
Volkswagen AG (Preference Shares) | 470 | 122,172 | ||||||
|
| |||||||
| 1,329,606 | ||||||||
|
| |||||||
Distributors – 0.1% | ||||||||
LKQ Corp.(e) | 7,098 | 197,963 | ||||||
|
| |||||||
Diversified Consumer Services – 0.3% | ||||||||
Anhanguera Educacional Participacoes SA | 7,600 | 42,558 | ||||||
Estacio Participacoes SA | 20,000 | 188,506 | ||||||
Kroton Educacional SA | 9,300 | 173,328 | ||||||
|
| |||||||
| 404,392 | ||||||||
|
| |||||||
Hotels, Restaurants & Leisure – 0.6% | ||||||||
Ajisen China Holdings Ltd. | 60,000 | 66,111 | ||||||
Melco Crown Entertainment Ltd. (ADR)(e) | 2,800 | 120,176 | ||||||
Merlin Entertainments PLC(e)(f) | 9,606 | 58,391 | ||||||
Sodexo | 2,280 | 242,858 | ||||||
Starbucks Corp. | 5,060 | 359,058 | ||||||
William Hill PLC | 10,346 | 68,779 | ||||||
|
| |||||||
| 915,373 | ||||||||
|
| |||||||
Household Durables – 0.1% | ||||||||
PulteGroup, Inc. | 5,800 | 121,742 | ||||||
|
| |||||||
| 50 | • ALLIANCEBERNSTEIN TAX-MANAGED WEALTH STRATEGIES |
Tax-Managed Balanced Wealth—Portfolio of Investments
Shares | U.S. $ Value | |||||||
| ||||||||
Internet & Catalog Retail – 0.4% | ||||||||
Amazon.com, Inc.(e) | 685 | $ | 248,039 | |||||
priceline.com, Inc.(e) | 342 | 461,303 | ||||||
|
| |||||||
| 709,342 | ||||||||
|
| |||||||
Leisure Equipment & Products – 0.1% | ||||||||
Polaris Industries, Inc. | 1,540 | 206,406 | ||||||
|
| |||||||
Media – 1.2% | ||||||||
Comcast Corp. – Class A | 8,980 | 464,176 | ||||||
Gannett Co., Inc. | 6,400 | 190,400 | ||||||
Liberty Global PLC – Class A(e) | 826 | 71,490 | ||||||
Liberty Global PLC – Series C(e) | 2,146 | 181,681 | ||||||
Liberty Media Corp. – Class A(e) | 1,970 | 270,205 | ||||||
Regal Entertainment Group – Class A | 2,300 | 42,320 | ||||||
Thomson Reuters Corp. | 700 | 24,038 | ||||||
Time Warner, Inc. | 1,800 | 120,834 | ||||||
Twenty-First Century Fox, Inc.– Class A | 4,800 | 160,992 | ||||||
Viacom, Inc. – Class B | 1,500 | 131,595 | ||||||
Walt Disney Co. (The) | 3,807 | 307,644 | ||||||
|
| |||||||
| 1,965,375 | ||||||||
|
| |||||||
Multiline Retail – 0.1% | ||||||||
Macy’s, Inc. | 2,400 | 138,864 | ||||||
Myer Holdings Ltd. | 17,290 | 40,569 | ||||||
|
| |||||||
| 179,433 | ||||||||
|
| |||||||
Specialty Retail – 1.1% | ||||||||
Belle International Holdings Ltd. | 88,000 | 108,523 | ||||||
GameStop Corp. – Class A | 5,000 | 186,550 | ||||||
Gap, Inc. (The) | 2,000 | 87,500 | ||||||
Home Depot, Inc. (The) | 4,690 | 384,720 | ||||||
Kingfisher PLC | 9,070 | 59,784 | ||||||
L’Occitane International SA | 14,500 | 31,932 | ||||||
Lowe’s Cos., Inc. | 1,500 | 75,045 | ||||||
Mr. Price Group Ltd. | 2,760 | 38,256 | ||||||
O’Reilly Automotive, Inc.(e) | 1,000 | 150,850 | ||||||
Office Depot, Inc.(e) | 25,200 | 124,236 | ||||||
Shimamura Co., Ltd. | 600 | 54,348 | ||||||
Sports Direct International PLC(e) | 13,782 | 185,934 | ||||||
Staples, Inc. | 1,300 | 17,667 | ||||||
TJX Cos., Inc. (The) | 3,800 | 233,548 | ||||||
Yamada Denki Co., Ltd. | 32,700 | 108,583 | ||||||
Zhongsheng Group Holdings Ltd. | 13,500 | 19,547 | ||||||
|
| |||||||
| 1,867,023 | ||||||||
|
| |||||||
Textiles, Apparel & Luxury Goods – 0.6% | ||||||||
Cie Financiere Richemont SA | 2,680 | 266,246 | ||||||
Hugo Boss AG | 740 | 98,442 | ||||||
Li & Fung Ltd. | 160,000 | 209,443 | ||||||
| ALLIANCEBERNSTEIN TAX-MANAGED WEALTH STRATEGIES • | 51 |
Tax-Managed Balanced Wealth—Portfolio of Investments
Shares | U.S. $ Value | |||||||
| ||||||||
LVMH Moet Hennessy Louis Vuitton SA | 100 | $ | 18,491 | |||||
Michael Kors Holdings Ltd.(e) | 1,270 | 124,498 | ||||||
NIKE, Inc. – Class B | 2,436 | 190,739 | ||||||
Prada SpA | 2,600 | 19,561 | ||||||
Samsonite International SA | 16,600 | 45,580 | ||||||
VF Corp. | 1,570 | 91,986 | ||||||
|
| |||||||
| 1,064,986 | ||||||||
|
| |||||||
| 9,622,130 | ||||||||
|
| |||||||
Information Technology – 4.4% | ||||||||
Communications Equipment – 0.4% | ||||||||
Cisco Systems, Inc. | 4,900 | 106,820 | ||||||
F5 Networks, Inc.(e) | 2,430 | 272,986 | ||||||
Harris Corp. | 2,300 | 169,786 | ||||||
QUALCOMM, Inc. | 1,285 | 96,748 | ||||||
|
| |||||||
| 646,340 | ||||||||
|
| |||||||
Computers & Peripherals – 0.8% | ||||||||
Apple, Inc. | 1,513 | 796,201 | ||||||
Casetek Holdings Ltd. | 10,000 | 57,895 | ||||||
Catcher Technology Co., Ltd. | 17,000 | 123,880 | ||||||
Hewlett-Packard Co. | 11,500 | 343,620 | ||||||
Inventec Corp. | 44,000 | 46,588 | ||||||
|
| |||||||
| 1,368,184 | ||||||||
|
| |||||||
Electronic Equipment, Instruments & Components – 0.3% | ||||||||
Amphenol Corp. – Class A | 2,920 | 257,018 | ||||||
Arrow Electronics, Inc.(e) | 1,600 | 90,608 | ||||||
LG Display Co., Ltd.(e) | 4,430 | 101,071 | ||||||
|
| |||||||
| 448,697 | ||||||||
|
| |||||||
Internet Software & Services – 0.8% | ||||||||
Baidu, Inc. (Sponsored ADR)(e) | 296 | 50,595 | ||||||
Facebook, Inc. – Class A(e) | 3,110 | 212,911 | ||||||
Google, Inc. – Class A(e) | 742 | 902,012 | ||||||
Telecity Group PLC | 11,738 | 129,581 | ||||||
|
| |||||||
| 1,295,099 | ||||||||
|
| |||||||
IT Services – 1.0% | ||||||||
Booz Allen Hamilton Holding Corp. | 2,200 | 46,266 | ||||||
Cognizant Technology Solutions Corp. – | 5,451 | 567,231 | ||||||
Fujitsu Ltd.(e) | 12,000 | 75,034 | ||||||
HCL Technologies Ltd. | 1,550 | 39,474 | ||||||
Tata Consultancy Services Ltd. | 1,550 | 56,868 | ||||||
Visa, Inc. – Class A | 2,775 | 626,984 | ||||||
Xerox Corp. | 17,800 | 195,622 | ||||||
|
| |||||||
| 1,607,479 | ||||||||
|
| |||||||
| 52 | • ALLIANCEBERNSTEIN TAX-MANAGED WEALTH STRATEGIES |
Tax-Managed Balanced Wealth—Portfolio of Investments
Shares | U.S. $ Value | |||||||
| ||||||||
Semiconductors & Semiconductor Equipment – 0.7% | ||||||||
Applied Materials, Inc. | 7,500 | $ | 142,200 | |||||
Lam Research Corp.(e) | 1,100 | 56,903 | ||||||
Linear Technology Corp. | 5,490 | 257,152 | ||||||
Micron Technology, Inc.(e) | 4,400 | 106,436 | ||||||
Samsung Electronics Co., Ltd. | 120 | 152,016 | ||||||
Samsung Electronics Co., Ltd. (Preference Shares) | 200 | 199,328 | ||||||
SK Hynix, Inc.(e) | 2,960 | 107,624 | ||||||
Sumco Corp. | 6,900 | 53,131 | ||||||
Taiwan Semiconductor Manufacturing Co., Ltd. | 30,000 | 108,219 | ||||||
Tokyo Electron Ltd. | 1,100 | 63,043 | ||||||
|
| |||||||
| 1,246,052 | ||||||||
|
| |||||||
Software – 0.4% | ||||||||
ANSYS, Inc.(e) | 3,326 | 277,787 | ||||||
Dassault Systemes | 175 | 20,116 | ||||||
Electronic Arts, Inc.(e) | 5,900 | 168,681 | ||||||
Informatica Corp.(e) | 2,660 | 110,550 | ||||||
Red Hat, Inc.(e) | 1,120 | 66,069 | ||||||
|
| |||||||
| 643,203 | ||||||||
|
| |||||||
| 7,255,054 | ||||||||
|
| |||||||
Health Care – 3.8% | ||||||||
Biotechnology – 0.9% | ||||||||
Actelion Ltd. (REG)(e) | 950 | 100,661 | ||||||
Biogen Idec, Inc.(e) | 1,450 | 493,986 | ||||||
Celgene Corp.(e) | 700 | 112,525 | ||||||
Gilead Sciences, Inc.(e) | 4,220 | 349,374 | ||||||
Quintiles Transnational Holdings, Inc.(e) | 5,636 | 305,189 | ||||||
Theravance, Inc.(e) | 1,100 | 40,700 | ||||||
Vertex Pharmaceuticals, Inc.(e) | 945 | 76,413 | ||||||
|
| |||||||
| 1,478,848 | ||||||||
|
| |||||||
Health Care Equipment & Supplies – 0.2% | ||||||||
Intuitive Surgical, Inc.(e) | 259 | 115,211 | ||||||
Medtronic, Inc. | 4,600 | 272,596 | ||||||
|
| |||||||
| 387,807 | ||||||||
|
| |||||||
Health Care Providers & Services – 0.5% | ||||||||
Aetna, Inc. | 2,200 | 159,962 | ||||||
Health Net, Inc./CA(e) | 2,700 | 91,935 | ||||||
McKesson Corp. | 1,060 | 187,673 | ||||||
UnitedHealth Group, Inc. | 3,687 | 284,894 | ||||||
WellPoint, Inc. | 1,500 | 135,885 | ||||||
|
| |||||||
| 860,349 | ||||||||
|
| |||||||
| ALLIANCEBERNSTEIN TAX-MANAGED WEALTH STRATEGIES • | 53 |
Tax-Managed Balanced Wealth—Portfolio of Investments
| Company | Shares | U.S. $ Value | ||||||
| ||||||||
Life Sciences Tools & Services – 0.3% | ||||||||
Eurofins Scientific SE | 506 | $ | 147,667 | |||||
Illumina, Inc.(e) | 830 | 142,337 | ||||||
Mettler-Toledo International, Inc.(e) | 525 | 129,024 | ||||||
|
| |||||||
| 419,028 | ||||||||
|
| |||||||
Pharmaceuticals – 1.9% | ||||||||
Allergan, Inc./United States | 4,594 | 583,438 | ||||||
Astellas Pharma, Inc. | 1,300 | 84,501 | ||||||
Daiichi Sankyo Co., Ltd. | 4,100 | 70,857 | ||||||
GlaxoSmithKline PLC | 9,370 | 262,450 | ||||||
GlaxoSmithKline PLC (Sponsored ADR) | 3,100 | 173,414 | ||||||
Johnson & Johnson | 3,900 | 359,268 | ||||||
Merck & Co., Inc. | 5,400 | 307,746 | ||||||
Novartis AG | 2,060 | 171,454 | ||||||
Pfizer, Inc. | 19,300 | 619,723 | ||||||
Richter Gedeon Nyrt | 3,020 | 53,661 | ||||||
Roche Holding AG | 740 | 227,846 | ||||||
Roche Holding AG (Sponsored ADR) | 3,600 | 138,168 | ||||||
Sun Pharmaceutical Industries Ltd. | 8,720 | 91,010 | ||||||
|
| |||||||
| 3,143,536 | ||||||||
|
| |||||||
| 6,289,568 | ||||||||
|
| |||||||
Industrials – 3.5% | ||||||||
Aerospace & Defense – 0.7% | ||||||||
Airbus Group NV | 3,170 | 232,923 | ||||||
Boeing Co. (The) | 3,220 | 415,123 | ||||||
MTU Aero Engines AG | 570 | 47,880 | ||||||
Northrop Grumman Corp. | 700 | 84,721 | ||||||
Precision Castparts Corp. | 767 | 197,794 | ||||||
Safran SA | 1,090 | 76,620 | ||||||
Thales SA | 630 | 41,831 | ||||||
Zodiac Aerospace | 575 | 20,257 | ||||||
|
| |||||||
| 1,117,149 | ||||||||
|
| |||||||
Air Freight & Logistics – 0.1% | ||||||||
Expeditors International of Washington, Inc. | 1,530 | 60,450 | ||||||
|
| |||||||
Airlines – 0.3% | ||||||||
Copa Holdings SA – Class A | 2,010 | 272,275 | ||||||
Delta Air Lines, Inc. | 2,500 | 83,025 | ||||||
Japan Airlines Co., Ltd. | 700 | 34,856 | ||||||
Qantas Airways Ltd.(e) | 52,410 | 54,776 | ||||||
Turk Hava Yollari | 20,250 | 60,083 | ||||||
|
| |||||||
| 505,015 | ||||||||
|
| |||||||
Building Products – 0.0% | ||||||||
Asahi Glass Co., Ltd. | 6,000 | 33,039 | ||||||
|
| |||||||
| 54 | • ALLIANCEBERNSTEIN TAX-MANAGED WEALTH STRATEGIES |
Tax-Managed Balanced Wealth—Portfolio of Investments
| Company | Shares | U.S. $ Value | ||||||
| ||||||||
Commercial Services & Supplies – 0.2% | ||||||||
Babcock International Group PLC | 7,360 | $ | 181,197 | |||||
Edenred | 4,038 | 129,548 | ||||||
|
| |||||||
| 310,745 | ||||||||
|
| |||||||
Electrical Equipment – 0.2% | ||||||||
AMETEK, Inc. | 4,586 | 244,158 | ||||||
Sumitomo Electric Industries Ltd. | 7,200 | 110,520 | ||||||
|
| |||||||
| 354,678 | ||||||||
|
| |||||||
Industrial Conglomerates – 0.7% | ||||||||
Alliance Global Group, Inc. | 49,500 | 33,396 | ||||||
Bidvest Group Ltd. | 2,680 | 62,966 | ||||||
Danaher Corp. | 5,876 | 449,455 | ||||||
General Electric Co. | 18,400 | 468,648 | ||||||
Hutchison Whampoa Ltd. | 6,000 | 81,050 | ||||||
Toshiba Corp. | 19,000 | 82,464 | ||||||
|
| |||||||
| 1,177,979 | ||||||||
|
| |||||||
Machinery – 0.3% | ||||||||
Illinois Tool Works, Inc. | 2,400 | 198,000 | ||||||
Komatsu Ltd. | 5,400 | 114,181 | ||||||
Parker Hannifin Corp. | 1,585 | 191,072 | ||||||
|
| |||||||
| 503,253 | ||||||||
|
| |||||||
Marine – 0.1% | ||||||||
AP Moeller – Maersk A/S – Class B | 10 | 122,129 | ||||||
Nippon Yusen KK | 25,000 | 80,084 | ||||||
|
| |||||||
| 202,213 | ||||||||
|
| |||||||
Professional Services – 0.7% | ||||||||
Bureau Veritas SA | 9,402 | 258,777 | ||||||
Capita PLC | 13,368 | 255,135 | ||||||
Intertek Group PLC | 8,546 | 420,359 | ||||||
SGS SA | 56 | 138,573 | ||||||
Verisk Analytics, Inc. – Class A(e) | 1,800 | 114,687 | ||||||
|
| |||||||
| 1,187,531 | ||||||||
|
| |||||||
Road & Rail – 0.1% | ||||||||
Canadian National Railway Co. | 740 | 41,808 | ||||||
Central Japan Railway Co. | 800 | 93,370 | ||||||
Globaltrans Investment PLC (Sponsored GDR)(f) | 5,980 | 77,680 | ||||||
|
| |||||||
| 212,858 | ||||||||
|
| |||||||
Trading Companies & Distributors – 0.1% | ||||||||
Mitsubishi Corp. | 4,000 | 76,774 | ||||||
|
| |||||||
| 5,741,684 | ||||||||
|
| |||||||
| ALLIANCEBERNSTEIN TAX-MANAGED WEALTH STRATEGIES • | 55 |
Tax-Managed Balanced Wealth—Portfolio of Investments
| Company | Shares | U.S. $ Value | ||||||
| ||||||||
Consumer Staples – 3.3% | ||||||||
Beverages – 0.4% | ||||||||
Anheuser-Busch InBev NV | 760 | $ | 79,491 | |||||
Asahi Group Holdings Ltd. | 1,300 | 36,552 | ||||||
Carlsberg A/S – Class B | 710 | 74,800 | ||||||
Diageo PLC | 7,150 | 224,524 | ||||||
Monster Beverage Corp.(e) | 2,788 | 206,312 | ||||||
SABMiller PLC (London) | 1,490 | 72,968 | ||||||
|
| |||||||
| 694,647 | ||||||||
|
| |||||||
Food & Staples Retailing – 1.1% | ||||||||
Costco Wholesale Corp. | 2,500 | 292,000 | ||||||
CVS Caremark Corp. | 8,380 | 612,913 | ||||||
Jeronimo Martins SGPS SA | 6,324 | 107,220 | ||||||
Koninklijke Ahold NV | 8,190 | 152,667 | ||||||
Kroger Co. (The) | 6,300 | 264,222 | ||||||
Lenta Ltd. (GDR)(e)(f) | 9,291 | 92,910 | ||||||
Olam International Ltd. | 172,136 | 241,339 | ||||||
Tsuruha Holdings, Inc. | 300 | 27,956 | ||||||
|
| |||||||
| 1,791,227 | ||||||||
|
| |||||||
Food Products – 0.5% | ||||||||
Ajinomoto Co., Inc. | 4,000 | 62,100 | ||||||
Danone | 520 | 36,668 | ||||||
Green Mountain Coffee Roasters, Inc. | 1,680 | 184,430 | ||||||
Hershey Co. (The) | 2,820 | 298,412 | ||||||
Mead Johnson Nutrition Co. – Class A | 3,250 | 265,038 | ||||||
Unilever PLC | 746 | 30,512 | ||||||
|
| |||||||
| 877,160 | ||||||||
|
| |||||||
Household Products – 0.3% | ||||||||
Henkel AG & Co. KGaA | 2,670 | 269,704 | ||||||
LG Household & Health Care Ltd. | 230 | 98,600 | ||||||
Procter & Gamble Co. (The) | 1,700 | 133,722 | ||||||
|
| |||||||
| 502,026 | ||||||||
|
| |||||||
Personal Products – 0.1% | ||||||||
Estee Lauder Cos., Inc. (The) – Class A | 2,230 | 153,513 | ||||||
|
| |||||||
Tobacco – 0.9% | ||||||||
British American Tobacco PLC | 10,715 | 584,089 | ||||||
Imperial Tobacco Group PLC | 2,840 | 115,843 | ||||||
Japan Tobacco, Inc. | 13,800 | 439,526 | ||||||
Philip Morris International, Inc. | 2,979 | 241,031 | ||||||
|
| |||||||
| 1,380,489 | ||||||||
|
| |||||||
| 5,399,062 | ||||||||
|
| |||||||
Energy – 2.2% | ||||||||
Energy Equipment & Services – 0.6% | ||||||||
Aker Solutions ASA | 4,530 | 76,001 | ||||||
Halliburton Co. | 2,900 | 165,300 | ||||||
| 56 | • ALLIANCEBERNSTEIN TAX-MANAGED WEALTH STRATEGIES |
Tax-Managed Balanced Wealth—Portfolio of Investments
| Company | Shares | U.S. $ Value | ||||||
| ||||||||
Nabors Industries Ltd. | 5,300 | $ | 122,006 | |||||
Oceaneering International, Inc. | 1,729 | 123,762 | ||||||
Saipem SpA | 3,340 | 78,466 | ||||||
Schlumberger Ltd. | 4,457 | 414,501 | ||||||
Seadrill Ltd. | 1,710 | 62,999 | ||||||
|
| |||||||
| 1,043,035 | ||||||||
|
| |||||||
Oil, Gas & Consumable Fuels – 1.6% | ||||||||
BG Group PLC | 5,653 | 102,849 | ||||||
Canadian Natural Resources Ltd. | 1,410 | 51,597 | ||||||
Chesapeake Energy Corp. | 1,100 | 28,501 | ||||||
Chevron Corp. | 2,200 | 253,726 | ||||||
China Petroleum & Chemical | 81,000 | 71,702 | ||||||
ENI SpA | 4,710 | 113,071 | ||||||
Exxon Mobil Corp. | 5,300 | 510,231 | ||||||
Gazprom OAO (Sponsored ADR) | 6,570 | 49,998 | ||||||
Hess Corp. | 3,500 | 280,105 | ||||||
JX Holdings, Inc. | 14,500 | 75,306 | ||||||
LUKOIL OAO (London) (Sponsored ADR) | 950 | 51,680 | ||||||
Marathon Petroleum Corp. | 2,000 | 168,000 | ||||||
NovaTek OAO (Sponsored GDR)(f) | 380 | 48,108 | ||||||
Occidental Petroleum Corp. | 3,100 | 299,212 | ||||||
Petroleo Brasileiro SA (Sponsored ADR) | 2,670 | 31,132 | ||||||
Phillips 66 | 1,200 | 89,832 | ||||||
Royal Dutch Shell PLC (Euronext Amsterdam) – Class A | 3,458 | 126,194 | ||||||
Suncor Energy, Inc. (Toronto) | 1,780 | 58,722 | ||||||
Valero Energy Corp. | 5,700 | 273,486 | ||||||
|
| |||||||
| 2,683,452 | ||||||||
|
| |||||||
| 3,726,487 | ||||||||
|
| |||||||
Materials – 1.0% | ||||||||
Chemicals – 0.6% | ||||||||
Arkema SA | 1,010 | 109,557 | ||||||
BASF SE | 340 | 39,081 | ||||||
Denki Kagaku Kogyo KK | 14,000 | 54,138 | ||||||
Essentra PLC | 15,911 | 236,891 | ||||||
Huntsman Corp. | 3,400 | 82,824 | ||||||
Koninklijke DSM NV | 1,140 | 72,740 | ||||||
LyondellBasell Industries NV – Class A | 1,900 | 167,352 | ||||||
Monsanto Co. | 1,774 | 195,176 | ||||||
Nippon Shokubai Co., Ltd. | 5,000 | 60,884 | ||||||
|
| |||||||
| 1,018,643 | ||||||||
|
| |||||||
Construction Materials – 0.0% | ||||||||
Grasim Industries Ltd. (GDR)(f) | 371 | 15,197 | ||||||
|
| |||||||
Containers & Packaging – 0.1% | ||||||||
Rock-Tenn Co. – Class A | 800 | 89,296 | ||||||
|
| |||||||
| ALLIANCEBERNSTEIN TAX-MANAGED WEALTH STRATEGIES • | 57 |
Tax-Managed Balanced Wealth—Portfolio of Investments
| Company | Shares | U.S. $ Value | ||||||
| ||||||||
Metals & Mining – 0.2% | ||||||||
Barrick Gold Corp. | 2,540 | $ | 51,750 | |||||
BHP Billiton PLC | 3,360 | 108,282 | ||||||
Dowa Holdings Co., Ltd. | 4,000 | 33,284 | ||||||
MMC Norilsk Nickel OJSC (ADR) | 6,320 | 107,314 | ||||||
Rio Tinto PLC | 1,250 | 71,676 | ||||||
|
| |||||||
| 372,306 | ||||||||
|
| |||||||
Paper & Forest Products – 0.1% | ||||||||
Mondi PLC | 4,290 | 78,667 | ||||||
|
| |||||||
| 1,574,109 | ||||||||
|
| |||||||
Telecommunication Services – 0.7% | ||||||||
Diversified Telecommunication | ||||||||
AT&T, Inc. | 7,200 | 229,896 | ||||||
Bezeq The Israeli Telecommunication Corp., Ltd. | 24,118 | 39,289 | ||||||
Hellenic Telecommunications Organization SA(e) | 3,340 | 58,436 | ||||||
Nippon Telegraph & Telephone Corp. | 1,900 | 106,968 | ||||||
Verizon Communications, Inc.(London) | 1,713 | 81,000 | ||||||
Verizon Communications, Inc. | 579 | 27,525 | ||||||
Vivendi SA | 6,575 | 187,490 | ||||||
Ziggo NV | 910 | 41,493 | ||||||
|
| |||||||
| 772,097 | ||||||||
|
| |||||||
Wireless Telecommunication | ||||||||
China Mobile Ltd. | 7,500 | 71,141 | ||||||
Rogers Communications, Inc. – Class B | 820 | 31,695 | ||||||
Turkcell Iletisim Hizmetleri AS(e) | 12,070 | 62,694 | ||||||
Vodafone Group PLC | 35,518 | 148,004 | ||||||
Vodafone Group PLC (Sponsored ADR) | 2,455 | 102,035 | ||||||
|
| |||||||
| 415,569 | ||||||||
|
| |||||||
| 1,187,666 | ||||||||
|
| |||||||
Utilities – 0.6% | ||||||||
Electric Utilities – 0.3% | ||||||||
American Electric Power Co., Inc. | 700 | 35,140 | ||||||
Edison International | 3,800 | 199,006 | ||||||
EDP - Energias de Portugal SA | 18,230 | 78,894 | ||||||
Electricite de France | 1,090 | 43,246 | ||||||
Enel SpA | 14,510 | 74,357 | ||||||
|
| |||||||
| 430,643 | ||||||||
|
| |||||||
Gas Utilities – 0.1% | ||||||||
Atmos Energy Corp. | 2,650 | 122,165 | ||||||
UGI Corp. | 2,100 | 93,849 | ||||||
|
| |||||||
| 216,014 | ||||||||
|
| |||||||
| 58 | • ALLIANCEBERNSTEIN TAX-MANAGED WEALTH STRATEGIES |
Tax-Managed Balanced Wealth—Portfolio of Investments
| Company | Shares | U.S. $ Value | ||||||
| ||||||||
Independent Power Producers & Energy Traders – 0.1% | ||||||||
APR Energy PLC | 11,925 | $ | 172,732 | |||||
|
| |||||||
Multi-Utilities – 0.1% | ||||||||
CenterPoint Energy, Inc. | 4,200 | 99,330 | ||||||
DTE Energy Co. | 425 | 30,498 | ||||||
National Grid PLC | 5,400 | 75,564 | ||||||
|
| |||||||
| 205,392 | ||||||||
|
| |||||||
| 1,024,781 | ||||||||
|
| |||||||
Total Common Stocks | 52,974,086 | |||||||
|
| |||||||
INVESTMENT COMPANIES – 14.3% | ||||||||
Funds and Investment Trusts – 14.3% | ||||||||
AllianceBernstein Pooling Portfolio Volatility Management Portfolio* | 2,025,613 | 23,760,436 | ||||||
|
| |||||||
WARRANTS – 0.1% | ||||||||
Financials – 0.1% | ||||||||
Real Estate Management & | ||||||||
Emaar Properties PJSC, Merrill Lynch Intl & Co., expiring 10/01/15(e) | 32,390 | 80,252 | ||||||
|
| |||||||
Industrials – 0.0% | ||||||||
Industrial Conglomerates – 0.0% | ||||||||
John Keells Holdings PLC, Deutsche Bank AG London, expiring 7/05/19(e) | 13,879 | 23,786 | ||||||
|
| |||||||
Consumer Staples – 0.0% | ||||||||
Food & Staples Retailing – 0.0% | ||||||||
Olam International Ltd., , expiring 1/29/18(e) | 31,299 | 8,764 | ||||||
|
| |||||||
Total Warrants | 112,802 | |||||||
|
| |||||||
SHORT-TERM INVESTMENTS – 4.8% | ||||||||
Investment Companies – 4.8% | ||||||||
AllianceBernstein Fixed-Income Shares, Inc. – Government STIF Portfolio, 0.08%(g) | 8,034,055 | 8,034,055 | ||||||
|
| |||||||
Total Investments – 103.4% | 171,307,198 | |||||||
Other assets less liabilities – (3.4)% | (5,687,928 | ) | ||||||
|
| |||||||
Net Assets – 100.0% | $ | 165,619,270 | ||||||
|
| |||||||
| ALLIANCEBERNSTEIN TAX-MANAGED WEALTH STRATEGIES • | 59 |
Tax-Managed Balanced Wealth—Portfolio of Investments
FUTURES (see Note D)
| Type | Number of Contracts | Expiration Month | Original Value | Value at February 28, 2014 | Unrealized Appreciation/ (Depreciation) | |||||||||||||||
Purchased Contracts | ||||||||||||||||||||
Euro STOXX 50 Futures | 2 | March 2014 | $ | 85,444 | $ | 86,683 | $ | 1,239 | ||||||||||||
FORWARD CURRENCY EXCHANGE CONTRACTS (see Note D)
| Counterparty | Contracts to Deliver (000) | In Exchange For (000) | Settlement Date | Unrealized Appreciation/ (Depreciation) | ||||||||||||||||||||
BNP Paribas SA | CHF | 321 | USD | 357 | 5/15/14 | $ | (8,115 | ) | ||||||||||||||||
BNP Paribas SA | HKD | 3,487 | USD | 449 | 5/15/14 | 54 | ||||||||||||||||||
BNP Paribas SA | USD | 765 | CAD | 848 | 5/15/14 | (725 | ) | |||||||||||||||||
BNP Paribas SA | USD | 485 | GBP | 291 | 5/15/14 | 2,176 | ||||||||||||||||||
BNP Paribas SA | USD | 371 | NZD | 453 | 5/15/14 | 7,172 | ||||||||||||||||||
HSBC Bank USA | GBP | 291 | USD | 475 | 5/15/14 | (12,001 | ) | |||||||||||||||||
Morgan Stanley & Co., Inc. | JPY | 82,846 | USD | 813 | 5/15/14 | (981 | ) | |||||||||||||||||
Royal Bank of Scotland PLC | GBP | 773 | USD | 1,261 | 5/15/14 | (32,999 | ) | |||||||||||||||||
Standard Chartered Bank | RUB | 2,974 | USD | 83 | 5/15/14 | 1,004 | ||||||||||||||||||
State Street Bank & Trust Co. | CAD | 113 | USD | 102 | 5/15/14 | 25 | ||||||||||||||||||
State Street Bank & Trust Co. | CHF | 52 | USD | 58 | 5/15/14 | (1,036 | ) | |||||||||||||||||
State Street Bank & Trust Co. | EUR | 232 | USD | 318 | 5/15/14 | (2,310 | ) | |||||||||||||||||
State Street Bank & Trust Co. | HKD | 207 | USD | 27 | 5/15/14 | (2 | ) | |||||||||||||||||
State Street Bank & Trust Co. | HKD | 1,806 | USD | 233 | 5/15/14 | 35 | ||||||||||||||||||
State Street Bank & Trust Co. | JPY | 17,055 | USD | 167 | 5/15/14 | (362 | ) | |||||||||||||||||
State Street Bank & Trust Co. | NZD | 378 | USD | 315 | 5/15/14 | (549 | ) | |||||||||||||||||
State Street Bank & Trust Co. | SEK | 816 | USD | 125 | 5/15/14 | (2,117 | ) | |||||||||||||||||
State Street Bank & Trust Co. | USD | 114 | AUD | 128 | 5/15/14 | (445 | ) | |||||||||||||||||
State Street Bank & Trust Co. | USD | 136 | AUD | 156 | 5/15/14 | 2,107 | ||||||||||||||||||
State Street Bank & Trust Co. | USD | 414 | CHF | 371 | 5/15/14 | 8,002 | ||||||||||||||||||
State Street Bank & Trust Co. | USD | 135 | EUR | 99 | 5/15/14 | 2,030 | ||||||||||||||||||
State Street Bank & Trust Co. | USD | 224 | GBP | 135 | 5/15/14 | 1,461 | ||||||||||||||||||
State Street Bank & Trust Co. | USD | 366 | NOK | 2,261 | 5/15/14 | 10,023 | ||||||||||||||||||
State Street Bank & Trust Co. | USD | 786 | SEK | 5,104 | 5/15/14 | 9,420 | ||||||||||||||||||
State Street Bank & Trust Co. | USD | 194 | SGD | 246 | 5/15/14 | 76 | ||||||||||||||||||
|
| |||||||||||||||||||||||
| $ | (18,057 | ) | ||||||||||||||||||||||
|
| |||||||||||||||||||||||
INFLATION (CPI) SWAPS (see Note D)
| Rate Type | ||||||||||||||||||||
Swap Counterparty | Notional Amount (000) | Termination Date | Payments by the | Payments received by the Fund | Unrealized Appreciation/ (Depreciation) | |||||||||||||||
Barclays Bank PLC | $ | 2,000 | 1/31/19 | 2.385 | % | CPI | # | $ | (59,701 | ) | ||||||||||
Barclays Bank PLC | 1,800 | 1/31/27 | 2.628 | % | CPI | # | (41,519 | ) | ||||||||||||
Citibank, NA | 450 | 8/26/20 | 2.298 | % | CPI | # | (2,489 | ) | ||||||||||||
Citibank, NA | 300 | 5/24/23 | 2.533 | % | CPI | # | (5,461 | ) | ||||||||||||
Goldman Sachs International | 1,400 | 1/31/22 | 2.515 | % | CPI | # | (43,610 | ) | ||||||||||||
Goldman Sachs International | 6,000 | 1/31/15 | 1.990 | % | CPI | # | (68,029 | ) | ||||||||||||
JPMorgan Chase Bank, NA | 900 | 3/4/24 | 2.493 | % | CPI | # | 0 | |||||||||||||
Morgan Stanley Capital Services LLC | 250 | 4/16/23 | 2.690 | % | CPI | # | (8,653 | ) | ||||||||||||
|
| |||||||||||||||||||
| $ | (229,462 | ) | ||||||||||||||||||
|
| |||||||||||||||||||
| 60 | • ALLIANCEBERNSTEIN TAX-MANAGED WEALTH STRATEGIES |
Tax-Managed Balanced Wealth—Portfolio of Investments
| * | To obtain a copy of the fund’s financial statements, please go to the Securities and Exchange Commission’s website at www.sec.gov, or call AllianceBernstein at (800) 227-4618. |
| # | Variable interest rate based on the rate of inflation as determined by the Consumer Price Index (CPI). |
| (a) | Security is in default and is non-income producing. |
| (b) | Illiquid security. |
| (c) | Fair valued by the Adviser. |
| (d) | Variable Rate Demand Notes are instruments whose interest rates change on a specific date (such as coupon date or interest payment date) or whose interest rates vary with changes in a designated base rate (such as the prime interest rate). This instrument is payable on demand and is secured by letters of credit or other credit support agreements from major banks. |
| (e) | Non-income producing security. |
| (f) | Security is exempt from registration under Rule 144A of the Securities Act of 1933. These securities are considered liquid and may be resold in transactions exempt from registration, normally to qualified institutional buyers. At February 28, 2014, the aggregate market value of these securities amounted to $292,286 or 0.2% of net assets. |
| (g) | Investment in affiliated money market mutual fund. The rate shown represents the 7-day yield as of period end. |
As of February 28, 2014, the Strategy held 50.5% of its total investments in municipal bonds. Of the total investments in municipal bonds, 13.7% is insured (15.3% of this amount represents the Strategy’s holding in pre-refunded or escrowed to maturity bonds).
Currency Abbreviations:
| AUD | – Australian Dollar |
| CAD | – Canadian Dollar |
| CHF | – Swiss Franc |
| EUR | – Euro |
| GBP | – Great British Pound |
| HKD | – Hong Kong Dollar |
| JPY | – Japanese Yen |
| NOK | – Norwegian Krone |
| NZD | – New Zealand Dollar |
| RUB | – Russian Ruble |
| SEK | – Swedish Krona |
| SGD | – Singapore Dollar |
| USD | – United States Dollar |
Glossary:
| ADR | – American Depositary Receipt |
| AGM | – Assured Guaranty Municipal |
| AMBAC | – Ambac Assurance Corporation |
| CDD | – Community Development District |
| COP | – Certificate of Participation |
| EDA | – Economic Development Agency |
| ETM | – Escrowed to Maturity |
| GDR | – Global Depositary Receipt |
| GO | – General Obligation |
| IDA | – Industrial Development Authority/Agency |
| NPFGC | – National Public Finance Guarantee Corporation |
| NPFGC-RE | – National Public Finance Guarantee Corporation Reinsuring Financial Guaranty Insurance Company |
| OJSC | – Open Joint Stock Company |
| PJSC | – Public Joint Stock Company |
| PUD | – Public Utility District |
| REG | – Registered Shares |
| SD | – School District |
See notes to financial statements.
| ALLIANCEBERNSTEIN TAX-MANAGED WEALTH STRATEGIES • | 61 |
Tax-Managed Balanced Wealth—Portfolio of Investments
TAX-MANAGED CONSERVATIVE WEALTH
PORTFOLIO OF INVESTMENTS
February 28, 2014 (unaudited)
Principal (000) | U.S. $ Value | |||||||
| ||||||||
MUNICIPAL OBLIGATIONS – 65.7% | ||||||||
Long-Term Municipal Bonds – 65.7% | ||||||||
Alabama – 1.0% | ||||||||
Alabama Pub Sch & Clg Auth | $ | 575 | $ | 622,673 | ||||
|
| |||||||
Alaska – 1.3% | ||||||||
Anchorage AK GO | 775 | 827,072 | ||||||
|
| |||||||
Arizona – 1.2% | ||||||||
Arizona Trnsp Brd Hwy | 675 | 781,866 | ||||||
|
| |||||||
California – 0.5% | ||||||||
California GO | 270 | 323,239 | ||||||
|
| |||||||
Colorado – 4.3% | ||||||||
Denver CO City & Cnty Arpt | 500 | 586,165 | ||||||
Series 2011B | 500 | 513,035 | ||||||
Denver CO City & Cnty Wtr Commr | 800 | 867,808 | ||||||
Denver CO Urban Renewal Auth (Stapleton) | 415 | 463,798 | ||||||
Mun Subdist No CO Wtr Conserv Dist | 230 | 237,500 | ||||||
|
| |||||||
| 2,668,306 | ||||||||
|
| |||||||
District of Columbia – 0.5% | ||||||||
Metro Washington Arpt Auth VA | 275 | 304,419 | ||||||
|
| |||||||
Florida – 8.0% | ||||||||
Broward Cnty FL Arpt Sys | 205 | 230,994 | ||||||
Citizens Ppty Ins Corp. FL | 110 | 125,949 | ||||||
| 62 | • ALLIANCEBERNSTEIN TAX-MANAGED WEALTH STRATEGIES |
Tax-Managed Conservative Wealth—Portfolio of Investments
Principal (000) | U.S. $ Value | |||||||
| ||||||||
Florida Brd of Ed Lottery | $ | 490 | $ | 494,498 | ||||
Florida Dept Envrn Protn FL Forever | ||||||||
Series 2008B | 910 | 1,021,878 | ||||||
Florida GO | 550 | 632,621 | ||||||
Florida Hurricane Catastr Fd Fin Corp. | 365 | 403,230 | ||||||
Jacksonville FL Spl Rev Appropriation | 1,140 | 1,357,900 | ||||||
Miami Beach FL Hlth Fac Auth | 200 | 206,428 | ||||||
Miami-Dade Cnty FL Aviation | 375 | 395,831 | ||||||
Orlando & Orange Cnty Expwy Auth FL | 155 | 182,165 | ||||||
|
| |||||||
| 5,051,494 | ||||||||
|
| |||||||
Georgia – 3.0% | ||||||||
Fulton Cnty GA Dev Auth | 305 | 330,727 | ||||||
Georgia GO | 265 | 293,800 | ||||||
Georgia Mun Elec Auth | 190 | 214,514 | ||||||
Series 2012B | 555 | 638,944 | ||||||
Main Street Nat Gas, Inc. | 385 | 418,529 | ||||||
|
| |||||||
| 1,896,514 | ||||||||
|
| |||||||
Illinois – 3.9% | ||||||||
Chicago IL Wtr | 620 | 672,985 | ||||||
| ALLIANCEBERNSTEIN TAX-MANAGED WEALTH STRATEGIES • | 63 |
Tax-Managed Conservative Wealth—Portfolio of Investments
Principal (000) | U.S. $ Value | |||||||
| ||||||||
Illinois Finance Auth | $ | 685 | $ | 749,962 | ||||
Series 2012B | 255 | 270,104 | ||||||
Illinois GO | 175 | 186,296 | ||||||
AMBAC Series 2004B | 600 | 600,000 | ||||||
|
| |||||||
| 2,479,347 | ||||||||
|
| |||||||
Indiana – 0.9% | ||||||||
Indiana Bond Bank Gas | 150 | 172,230 | ||||||
Indiana Finance Auth | 275 | 309,067 | ||||||
Jasper Cnty IN PCR | 75 | 81,988 | ||||||
|
| |||||||
| 563,285 | ||||||||
|
| |||||||
Louisiana – 0.8% | ||||||||
New Orleans LA GO | 450 | 481,585 | ||||||
|
| |||||||
Massachusetts – 1.4% | ||||||||
Massachusetts GO | 300 | 313,452 | ||||||
Massachusetts Hlth & Ed Facs Auth | 540 | 592,202 | ||||||
|
| |||||||
| 905,654 | ||||||||
|
| |||||||
Michigan – 3.8% | ||||||||
Detroit MI City SD GO | 145 | 145,513 | ||||||
Detroit MI Swr Disp | 410 | 318,787 | ||||||
| 64 | • ALLIANCEBERNSTEIN TAX-MANAGED WEALTH STRATEGIES |
Tax-Managed Conservative Wealth—Portfolio of Investments
Principal (000) | U.S. $ Value | |||||||
| ||||||||
Michigan Fin Auth | $ | 915 | $ | 1,083,360 | ||||
Series 2012A | 845 | 858,309 | ||||||
|
| |||||||
| 2,405,969 | ||||||||
|
| |||||||
Missouri – 2.1% | ||||||||
Springfield MO Pub Util | 850 | 878,237 | ||||||
St. Louis MO Arpt | 375 | 416,846 | ||||||
|
| |||||||
| 1,295,083 | ||||||||
|
| |||||||
Nevada – 2.6% | ||||||||
Clark Cnty NV Arpt | 190 | 194,695 | ||||||
Nevada GO | 260 | 275,434 | ||||||
Nevada Hwy Motor Veh Fuel Tax | 325 | 363,597 | ||||||
Nevada Unemployment | 685 | 769,344 | ||||||
|
| |||||||
| 1,603,070 | ||||||||
|
| |||||||
New Jersey – 1.0% | ||||||||
New Jersey EDA | 330 | 361,060 | ||||||
New Jersey EDA | 250 | 281,815 | ||||||
|
| |||||||
| 642,875 | ||||||||
|
| |||||||
New Mexico – 0.4% | ||||||||
New Mexico Severance Tax | 250 | 276,922 | ||||||
|
| |||||||
New York – 9.4% | ||||||||
Metropolitan Trnsp Auth NY | 625 | 665,156 | ||||||
Series 2012F | 475 | 536,125 | ||||||
| ALLIANCEBERNSTEIN TAX-MANAGED WEALTH STRATEGIES • | 65 |
Tax-Managed Conservative Wealth—Portfolio of Investments
Principal (000) | U.S. $ Value | |||||||
| ||||||||
New York NY GO | $ | 160 | $ | 184,866 | ||||
New York NY Trnsl Fin Auth | 780 | 841,713 | ||||||
New York St Dormitory Auth | 150 | 166,042 | ||||||
New York St Dormitory Auth | 1,000 | 1,160,030 | ||||||
New York St Dormitory Auth | 385 | 436,498 | ||||||
Series 2013A | 355 | 423,401 | ||||||
New York St Thruway Auth | 270 | 314,391 | ||||||
New York St Thruway Auth | 280 | 306,737 | ||||||
New York St Thruway Auth | 165 | 193,187 | ||||||
New York St UDC | 480 | 525,370 | ||||||
Port Authority of NY & NJ | 120 | 132,964 | ||||||
|
| |||||||
| 5,886,480 | ||||||||
|
| |||||||
North Carolina – 0.4% | ||||||||
North Carolina GO | 240 | 264,382 | ||||||
|
| |||||||
| 66 | • ALLIANCEBERNSTEIN TAX-MANAGED WEALTH STRATEGIES |
Tax-Managed Conservative Wealth—Portfolio of Investments
Principal (000) | U.S. $ Value | |||||||
| ||||||||
Ohio – 2.6% | ||||||||
Cleveland OH Arpt Sys | $ | 490 | $ | 527,799 | ||||
Cuyahoga Cnty OH Econ Dev | 285 | 320,149 | ||||||
Ohio GO | 680 | 756,717 | ||||||
|
| |||||||
| 1,604,665 | ||||||||
|
| |||||||
Pennsylvania – 3.0% | ||||||||
Pennsylvania IDA | 655 | 695,322 | ||||||
Philadelphia PA Parking Auth | 800 | 881,215 | ||||||
Pittsburgh PA GO | 285 | 291,296 | ||||||
|
| |||||||
| 1,867,833 | ||||||||
|
| |||||||
Puerto Rico – 1.1% | ||||||||
Puerto Rico Elec Pwr Auth | 300 | 225,558 | ||||||
Puerto Rico GO | 120 | 102,689 | ||||||
Puerto Rico Hwy & Trnsp Auth | 280 | 147,977 | ||||||
Puerto Rico Sales Tax Fin Corp. | ||||||||
5.50%, 8/01/23 | 225 | 198,007 | ||||||
|
| |||||||
| 674,231 | ||||||||
|
| |||||||
Rhode Island – 1.1% | ||||||||
Rhode Island Higher Ed Svgs Tr | 600 | 692,070 | ||||||
|
| |||||||
| ALLIANCEBERNSTEIN TAX-MANAGED WEALTH STRATEGIES • | 67 |
Tax-Managed Conservative Wealth—Portfolio of Investments
Principal (000) | U.S. $ Value | |||||||
| ||||||||
Texas – 8.8% | ||||||||
Dallas Fort Worth TX Intl Arpt | $ | 1,010 | $ | 1,087,457 | ||||
Denton TX ISD GO | 180 | 183,938 | ||||||
Houston TX ISD GO | 450 | 451,823 | ||||||
SA Energy Acq Pub Fac Corp. Gas | 460 | 524,322 | ||||||
San Antonio TX Elec & Gas | 635 | 652,348 | ||||||
San Antonio TX Util Drainage Sys | 135 | 155,277 | ||||||
San Antonio TX Wtr | 1,220 | 1,356,652 | ||||||
Spring TX ISD GO | 600 | 690,306 | ||||||
Tarrant TX Regional WTR Dist | 385 | 403,445 | ||||||
|
| |||||||
| 5,505,568 | ||||||||
|
| |||||||
Virginia – 0.5% | ||||||||
Virginia Trnsp Brd | 310 | 338,176 | ||||||
|
| |||||||
Washington – 2.1% | ||||||||
Energy Northwest WA | 620 | 741,464 | ||||||
King Cnty WA GO | 550 | 582,791 | ||||||
|
| |||||||
| 1,324,255 | ||||||||
|
| |||||||
Total Municipal Obligations | 41,287,033 | |||||||
|
| |||||||
| 68 | • ALLIANCEBERNSTEIN TAX-MANAGED WEALTH STRATEGIES |
Tax-Managed Conservative Wealth—Portfolio of Investments
| Company | Shares | U.S. $ Value | ||||||
| ||||||||
COMMON STOCKS – 19.8% | ||||||||
Financials – 4.1% | ||||||||
Capital Markets – 0.5% | ||||||||
Affiliated Managers Group, Inc.(c) | 217 | $ | 40,807 | |||||
Bank of New York Mellon Corp. (The) | 450 | 14,400 | ||||||
BlackRock, Inc. – Class A | 108 | 32,923 | ||||||
Daiwa Securities Group, Inc. | 2,000 | 18,099 | ||||||
Deutsche Bank AG (REG) | 631 | 30,518 | ||||||
E*Trade Financial Corp.(c) | 850 | 19,100 | ||||||
Macquarie Group Ltd. | 622 | 31,367 | ||||||
Morgan Stanley | 1,100 | 33,880 | ||||||
State Street Corp. | 450 | 29,551 | ||||||
UBS AG (REG)(c) | 3,648 | 78,042 | ||||||
|
| |||||||
| 328,687 | ||||||||
|
| |||||||
Commercial Banks – 0.8% | ||||||||
Banco do Brasil SA | 1,000 | 8,844 | ||||||
Bank Hapoalim BM | 2,580 | 14,101 | ||||||
Bank of Montreal | 190 | 12,516 | ||||||
Bank of Nova Scotia | 260 | 14,868 | ||||||
Barclays PLC | 3,670 | 15,460 | ||||||
China Construction Bank Corp. – Class H | 26,000 | 17,947 | ||||||
CIT Group, Inc. | 875 | 42,595 | ||||||
Comerica, Inc. | 175 | 8,432 | ||||||
Fifth Third Bancorp | 350 | 7,593 | ||||||
Grupo Financiero Banorte SAB de CV – Class O | 1,580 | 10,229 | ||||||
HDFC Bank Ltd. | 1,670 | 18,049 | ||||||
HSBC Holdings PLC | 2,560 | 27,018 | ||||||
Industrial & Commercial Bank of China Ltd. – | 27,000 | 16,267 | ||||||
KBC Groep NV | 310 | 19,605 | ||||||
Lloyds Banking Group PLC(c) | 22,820 | 31,514 | ||||||
Mitsubishi UFJ Financial Group, Inc. | 4,300 | 24,917 | ||||||
National Australia Bank Ltd. | 580 | 18,037 | ||||||
Regions Financial Corp. | 900 | 9,576 | ||||||
Sberbank of Russia (Sponsored ADR) | 2,642 | 26,869 | ||||||
Societe Generale SA | 569 | 37,757 | ||||||
State Bank of India | 310 | 7,684 | ||||||
Sumitomo Mitsui Financial Group, Inc. | 400 | 17,959 | ||||||
Toronto-Dominion Bank (The) | 500 | 22,650 | ||||||
UniCredit SpA | 4,300 | 34,124 | ||||||
Wells Fargo & Co. | 1,400 | 64,988 | ||||||
|
| |||||||
| 529,599 | ||||||||
|
| |||||||
Consumer Finance – 0.3% | ||||||||
Capital One Financial Corp. | 1,000 | 73,430 | ||||||
Discover Financial Services | 775 | 44,469 | ||||||
| ALLIANCEBERNSTEIN TAX-MANAGED WEALTH STRATEGIES • | 69 |
Tax-Managed Conservative Wealth—Portfolio of Investments
| Company | Shares | U.S. $ Value | ||||||
| ||||||||
Muthoot Finance Ltd. | 5,150 | $ | 13,737 | |||||
Shriram Transport Finance Co., Ltd. | 2,340 | 22,266 | ||||||
|
| |||||||
| 153,902 | ||||||||
|
| |||||||
Diversified Financial Services – 0.8% | ||||||||
Bank of America Corp. | 6,300 | 104,139 | ||||||
Berkshire Hathaway, Inc. – Class B(c) | 260 | 30,103 | ||||||
Citigroup, Inc. | 1,625 | 79,024 | ||||||
IG Group Holdings PLC | 1,773 | 18,786 | ||||||
ING Groep NV(c) | 1,240 | 18,007 | ||||||
ING US, Inc. | 850 | 30,489 | ||||||
IntercontinentalExchange Group, Inc. | 576 | 120,292 | ||||||
JPMorgan Chase & Co. | 1,200 | 68,184 | ||||||
McGraw Hill Financial, Inc. | 50 | 3,983 | ||||||
ORIX Corp. | 2,400 | 35,593 | ||||||
|
| |||||||
| 508,600 | ||||||||
|
| |||||||
Insurance – 1.3% | ||||||||
Admiral Group PLC | 3,112 | 74,712 | ||||||
AIA Group Ltd. | 15,400 | 75,453 | ||||||
American Financial Group, Inc./OH | 600 | 34,296 | ||||||
American International Group, Inc. | 1,400 | 69,678 | ||||||
AON PLC | 500 | 42,800 | ||||||
Assurant, Inc. | 450 | 29,534 | ||||||
Aviva PLC | 1,610 | 12,800 | ||||||
BB Seguridade Participacoes SA | 3,400 | 33,786 | ||||||
Chubb Corp. (The) | 400 | 34,992 | ||||||
Everest Re Group Ltd. | 250 | 37,310 | ||||||
Genworth Financial, Inc. – Class A(c) | 2,500 | 38,850 | ||||||
Lancashire Holdings Ltd. | 3,555 | 43,665 | ||||||
Lincoln National Corp. | 1,300 | 65,169 | ||||||
Muenchener Rueckversicherungs AG | 145 | 31,703 | ||||||
PartnerRe Ltd. | 400 | 39,552 | ||||||
Prudential PLC | 3,360 | 76,080 | ||||||
Reinsurance Group of America, Inc. – Class A | 275 | 21,172 | ||||||
Travelers Cos., Inc. (The) | 275 | 23,056 | ||||||
Unum Group | 125 | 4,348 | ||||||
|
| |||||||
| 788,956 | ||||||||
|
| |||||||
Real Estate Investment Trusts (REITs) – 0.0% | ||||||||
GLP J-Reit | 13 | 13,724 | ||||||
|
| |||||||
Real Estate Management & | ||||||||
Aeon Mall Co., Ltd. | 500 | 13,883 | ||||||
China Overseas Land & Investment Ltd. | 2,000 | 5,390 | ||||||
Country Garden Holdings Co., Ltd. | 45,000 | 23,294 | ||||||
Daito Trust Construction Co., Ltd. | 500 | 46,600 | ||||||
| 70 | • ALLIANCEBERNSTEIN TAX-MANAGED WEALTH STRATEGIES |
Tax-Managed Conservative Wealth—Portfolio of Investments
| Company | Shares | U.S. $ Value | ||||||
| ||||||||
Global Logistic Properties Ltd. | 26,000 | $ | 58,141 | |||||
Hang Lung Properties Ltd. | 13,000 | 36,260 | ||||||
Lend Lease Group | 1,850 | 18,690 | ||||||
Mitsubishi Estate Co., Ltd. | 600 | 14,231 | ||||||
|
| |||||||
| 216,489 | ||||||||
|
| |||||||
Thrifts & Mortgage Finance – 0.1% | ||||||||
Housing Development Finance Corp. | 2,830 | 37,342 | ||||||
|
| |||||||
| 2,577,299 | ||||||||
|
| |||||||
Consumer Discretionary – 3.5% | ||||||||
Auto Components – 0.3% | ||||||||
Cie Generale des Etablissements Michelin – | 262 | 31,849 | ||||||
GKN PLC | 2,640 | 17,904 | ||||||
Lear Corp. | 425 | 34,510 | ||||||
Magna International, Inc. (Toronto) – Class A | 130 | 11,573 | ||||||
TRW Automotive Holdings Corp.(c) | 425 | 34,986 | ||||||
Valeo SA | 340 | 47,560 | ||||||
|
| |||||||
| 178,382 | ||||||||
|
| |||||||
Automobiles – 0.5% | ||||||||
Ford Motor Co. | 2,700 | 41,553 | ||||||
Honda Motor Co., Ltd. | 700 | 25,195 | ||||||
Hyundai Motor Co. | 60 | 13,785 | ||||||
Hyundai Motor Co. (Preference Shares) | 270 | 34,925 | ||||||
Mazda Motor Corp.(c) | 2,000 | 9,660 | ||||||
Nissan Motor Co., Ltd. | 5,500 | 49,091 | ||||||
Tata Motors Ltd. | 3,040 | 20,589 | ||||||
Toyota Motor Corp. | 1,600 | 92,085 | ||||||
Volkswagen AG (Preference Shares) | 108 | 28,074 | ||||||
|
| |||||||
| 314,957 | ||||||||
|
| |||||||
Distributors – 0.1% | ||||||||
LKQ Corp.(c) | 1,613 | 44,987 | ||||||
|
| |||||||
Diversified Consumer Services – 0.1% | ||||||||
Anhanguera Educacional Participacoes SA | 1,800 | 10,080 | ||||||
Estacio Participacoes SA | 4,800 | 45,241 | ||||||
Kroton Educacional SA | 2,200 | 41,002 | ||||||
|
| |||||||
| 96,323 | ||||||||
|
| |||||||
Hotels, Restaurants & Leisure – 0.3% | ||||||||
Ajisen China Holdings Ltd. | 14,000 | 15,426 | ||||||
Melco Crown Entertainment Ltd. (ADR)(c) | 580 | 24,893 | ||||||
Merlin Entertainments PLC(c)(d) | 2,248 | 13,665 | ||||||
Sodexo | 536 | 57,093 | ||||||
Starbucks Corp. | 1,122 | 79,617 | ||||||
William Hill PLC | 1,854 | 12,325 | ||||||
|
| |||||||
| 203,019 | ||||||||
|
| |||||||
| ALLIANCEBERNSTEIN TAX-MANAGED WEALTH STRATEGIES • | 71 |
Tax-Managed Conservative Wealth—Portfolio of Investments
| Company | Shares | U.S. $ Value | ||||||
| ||||||||
Household Durables – 0.0% | ||||||||
PulteGroup, Inc. | 1,350 | $ | 28,337 | |||||
|
| |||||||
Internet & Catalog Retail – 0.2% | ||||||||
Amazon.com, Inc.(c) | 155 | 56,125 | ||||||
priceline.com, Inc.(c) | 76 | 102,512 | ||||||
|
| |||||||
| 158,637 | ||||||||
|
| |||||||
Leisure Equipment & Products – 0.1% | ||||||||
Polaris Industries, Inc. | 340 | 45,570 | ||||||
|
| |||||||
Media – 0.7% | ||||||||
Comcast Corp. – Class A | 1,989 | 102,811 | ||||||
Gannett Co., Inc. | 1,500 | 44,625 | ||||||
Liberty Global PLC – Class A(c) | 193 | 16,704 | ||||||
Liberty Global PLC – Series C(c) | 524 | 44,362 | ||||||
Liberty Media Corp. �� Class A(c) | 434 | 59,527 | ||||||
Regal Entertainment Group – Class A | 550 | 10,120 | ||||||
Twenty-First Century Fox, Inc. – Class A | 1,075 | 36,056 | ||||||
Viacom, Inc. – Class B | 375 | 32,899 | ||||||
Walt Disney Co. (The) | 913 | 73,780 | ||||||
|
| |||||||
| 420,884 | ||||||||
|
| |||||||
Multiline Retail – 0.1% | ||||||||
Macy’s, Inc. | 700 | 40,502 | ||||||
Myer Holdings Ltd. | 4,060 | 9,526 | ||||||
|
| |||||||
| 50,028 | ||||||||
|
| |||||||
Specialty Retail – 0.7% | ||||||||
Belle International Holdings Ltd. | 21,000 | 25,898 | ||||||
GameStop Corp. – Class A | 1,100 | 41,041 | ||||||
Gap, Inc. (The) | 450 | 19,687 | ||||||
Home Depot, Inc. (The) | 1,044 | 85,639 | ||||||
Kingfisher PLC | 2,140 | 14,106 | ||||||
L’Occitane International SA | 3,250 | 7,157 | ||||||
Lowe’s Cos., Inc. | 200 | 10,006 | ||||||
Mr. Price Group Ltd. | 720 | 9,980 | ||||||
O’Reilly Automotive, Inc.(c) | 222 | 33,489 | ||||||
Office Depot, Inc.(c) | 5,900 | 29,087 | ||||||
Shimamura Co., Ltd. | 100 | 9,058 | ||||||
Sports Direct International PLC(c) | 3,279 | 44,237 | ||||||
Staples, Inc. | 300 | 4,077 | ||||||
TJX Cos., Inc. (The) | 975 | 59,923 | ||||||
Yamada Denki Co., Ltd. | 7,200 | 23,908 | ||||||
Zhongsheng Group Holdings Ltd. | 3,500 | 5,068 | ||||||
|
| |||||||
| 422,361 | ||||||||
|
| |||||||
| 72 | • ALLIANCEBERNSTEIN TAX-MANAGED WEALTH STRATEGIES |
Tax-Managed Conservative Wealth—Portfolio of Investments
| Company | Shares | U.S. $ Value | ||||||
| ||||||||
Textiles, Apparel & Luxury Goods – 0.4% | ||||||||
Cie Financiere Richemont SA | 641 | $ | 63,681 | |||||
Hugo Boss AG | 144 | 19,156 | ||||||
Li & Fung Ltd. | 38,000 | 49,743 | ||||||
LVMH Moet Hennessy Louis Vuitton SA | 25 | 4,623 | ||||||
Michael Kors Holdings Ltd.(c) | 296 | 29,017 | ||||||
NIKE, Inc. – Class B | 568 | 44,474 | ||||||
Prada SpA | 700 | 5,267 | ||||||
Samsonite International SA | 4,200 | 11,532 | ||||||
VF Corp. | 365 | 21,385 | ||||||
|
| |||||||
| 248,878 | ||||||||
|
| |||||||
| 2,212,363 | ||||||||
|
| |||||||
Information Technology – 2.7% | ||||||||
Communications Equipment – 0.2% | ||||||||
Cisco Systems, Inc. | 1,600 | 34,880 | ||||||
F5 Networks, Inc.(c) | 542 | 60,888 | ||||||
Harris Corp. | 550 | 40,601 | ||||||
QUALCOMM, Inc. | 282 | 21,232 | ||||||
|
| |||||||
| 157,601 | ||||||||
|
| |||||||
Computers & Peripherals – 0.5% | ||||||||
Apple, Inc. | 315 | 165,766 | ||||||
Casetek Holdings Ltd. | 2,000 | 11,579 | ||||||
Catcher Technology Co., Ltd. | 4,000 | 29,148 | ||||||
Hewlett-Packard Co. | 2,700 | 80,676 | ||||||
Inventec Corp. | 12,000 | 12,706 | ||||||
|
| |||||||
| 299,875 | ||||||||
|
| |||||||
Electronic Equipment, Instruments & | ||||||||
Amphenol Corp. – Class A | 662 | 58,269 | ||||||
Arrow Electronics, Inc.(c) | 475 | 26,900 | ||||||
LG Display Co., Ltd.(c) | 1,080 | 24,640 | ||||||
|
| |||||||
| 109,809 | ||||||||
|
| |||||||
Internet Software & Services – 0.5% | ||||||||
Baidu, Inc. (Sponsored ADR)(c) | 70 | 11,965 | ||||||
Facebook, Inc. – Class A(c) | 691 | 47,306 | ||||||
Google, Inc. – Class A(c) | 167 | 203,013 | ||||||
Telecity Group PLC | 2,730 | 30,138 | ||||||
|
| |||||||
| 292,422 | ||||||||
|
| |||||||
IT Services – 0.6% | ||||||||
Booz Allen Hamilton Holding Corp. | 475 | 9,989 | ||||||
Cognizant Technology Solutions Corp. – | 1,205 | 125,392 | ||||||
Fujitsu Ltd.(c) | 3,000 | 18,759 | ||||||
HCL Technologies Ltd. | 300 | 7,640 | ||||||
| ALLIANCEBERNSTEIN TAX-MANAGED WEALTH STRATEGIES • | 73 |
Tax-Managed Conservative Wealth—Portfolio of Investments
| Company | Shares | U.S. $ Value | ||||||
| ||||||||
Tata Consultancy Services Ltd. | 350 | $ | 12,841 | |||||
Visa, Inc. – Class A | 649 | 146,635 | ||||||
Western Union Co. (The) – Class W | 475 | 7,947 | ||||||
Xerox Corp. | 4,000 | 43,960 | ||||||
|
| |||||||
| 373,163 | ||||||||
|
| |||||||
Semiconductors & Semiconductor | ||||||||
Applied Materials, Inc. | 1,800 | 34,128 | ||||||
Lam Research Corp.(c) | 375 | 19,399 | ||||||
Linear Technology Corp. | 1,282 | 60,049 | ||||||
Micron Technology, Inc.(c) | 1,000 | 24,190 | ||||||
Samsung Electronics Co., Ltd. | 30 | 38,004 | ||||||
Samsung Electronics Co., Ltd. (Preference Shares) | 44 | 43,852 | ||||||
SK Hynix, Inc.(c) | 720 | 26,179 | ||||||
Sumco Corp. | 1,700 | 13,090 | ||||||
Taiwan Semiconductor Manufacturing Co., Ltd. | 7,000 | 25,251 | ||||||
Tokyo Electron Ltd. | 300 | 17,194 | ||||||
|
| |||||||
| 301,336 | ||||||||
|
| |||||||
Software – 0.2% | ||||||||
ANSYS, Inc.(c) | 737 | 61,554 | ||||||
CA, Inc. | 275 | 9,212 | ||||||
Dassault Systemes | 42 | 4,828 | ||||||
Electronic Arts, Inc.(c) | 1,425 | 40,741 | ||||||
Informatica Corp.(c) | 622 | 25,850 | ||||||
Red Hat, Inc.(c) | 248 | 14,630 | ||||||
|
| |||||||
| 156,815 | ||||||||
|
| |||||||
| 1,691,021 | ||||||||
|
| |||||||
Health Care – 2.2% | ||||||||
Biotechnology – 0.5% | ||||||||
Actelion Ltd. (REG)(c) | 230 | 24,371 | ||||||
Biogen Idec, Inc.(c) | 323 | 110,040 | ||||||
Celgene Corp.(c) | 155 | 24,916 | ||||||
Gilead Sciences, Inc.(c) | 1,022 | 84,611 | ||||||
Quintiles Transnational Holdings, Inc.(c) | 1,252 | 67,796 | ||||||
Theravance, Inc.(c) | 250 | 9,250 | ||||||
Vertex Pharmaceuticals, Inc.(c) | 225 | 18,193 | ||||||
|
| |||||||
| 339,177 | ||||||||
|
| |||||||
Health Care Equipment & Supplies – 0.1% | ||||||||
Intuitive Surgical, Inc.(c) | 58 | 25,800 | ||||||
Medtronic, Inc. | 1,100 | 65,186 | ||||||
|
| |||||||
| 90,986 | ||||||||
|
| |||||||
Health Care Providers & Services – 0.3% | ||||||||
Aetna, Inc. | 500 | 36,355 | ||||||
Health Net, Inc./CA(c) | 710 | 24,175 | ||||||
| 74 | • ALLIANCEBERNSTEIN TAX-MANAGED WEALTH STRATEGIES |
Tax-Managed Conservative Wealth—Portfolio of Investments
| Company | Shares | U.S. $ Value | ||||||
| ||||||||
McKesson Corp. | 242 | $ | 42,846 | |||||
UnitedHealth Group, Inc. | 821 | 63,439 | ||||||
WellPoint, Inc. | 125 | 11,324 | ||||||
|
| |||||||
| 178,139 | ||||||||
|
| |||||||
Life Sciences Tools & Services – 0.2% | ||||||||
Eurofins Scientific SE | 119 | 34,728 | ||||||
Illumina, Inc.(c) | 185 | 31,726 | ||||||
Mettler-Toledo International, Inc.(c) | 135 | 33,177 | ||||||
|
| |||||||
| 99,631 | ||||||||
|
| |||||||
Pharmaceuticals – 1.1% | ||||||||
Allergan, Inc./United States | 1,012 | 128,524 | ||||||
Astellas Pharma, Inc. | 300 | 19,500 | ||||||
Daiichi Sankyo Co., Ltd. | 1,000 | 17,282 | ||||||
GlaxoSmithKline PLC | 2,280 | 63,862 | ||||||
GlaxoSmithKline PLC (Sponsored ADR) | 750 | 41,955 | ||||||
Johnson & Johnson | 850 | 78,302 | ||||||
Lupin Ltd. | 460 | 7,408 | ||||||
Merck & Co., Inc. | 650 | 37,044 | ||||||
Novartis AG | 510 | 42,447 | ||||||
Pfizer, Inc. | 4,650 | 149,311 | ||||||
Richter Gedeon Nyrt | 680 | 12,083 | ||||||
Roche Holding AG | 170 | 52,343 | ||||||
Roche Holding AG (Sponsored ADR) | 700 | 26,866 | ||||||
Sun Pharmaceutical Industries Ltd. | 1,950 | 20,352 | ||||||
|
| |||||||
| 697,279 | ||||||||
|
| |||||||
| 1,405,212 | ||||||||
|
| |||||||
Industrials – 2.2% | ||||||||
Aerospace & Defense – 0.4% | ||||||||
Airbus Group NV | 720 | 52,904 | ||||||
Boeing Co. (The) | 714 | 92,049 | ||||||
MTU Aero Engines AG | 140 | 11,760 | ||||||
Northrop Grumman Corp. | 175 | 21,180 | ||||||
Precision Castparts Corp. | 169 | 43,582 | ||||||
Safran SA | 270 | 18,979 | ||||||
Thales SA | 160 | 10,624 | ||||||
Zodiac Aerospace | 385 | 13,563 | ||||||
|
| |||||||
| 264,641 | ||||||||
|
| |||||||
Air Freight & Logistics – 0.0% | ||||||||
Expeditors International of Washington, Inc. | 340 | 13,433 | ||||||
|
| |||||||
Airlines – 0.2% | ||||||||
Copa Holdings SA—Class A | 459 | 62,176 | ||||||
Delta Air Lines, Inc. | 575 | 19,096 | ||||||
Japan Airlines Co., Ltd. | 200 | 9,959 | ||||||
| ALLIANCEBERNSTEIN TAX-MANAGED WEALTH STRATEGIES • | 75 |
Tax-Managed Conservative Wealth—Portfolio of Investments
| Company | Shares | U.S. $ Value | ||||||
| ||||||||
Qantas Airways Ltd.(c) | 13,010 | $ | 13,597 | |||||
Turk Hava Yollari | 4,435 | 13,159 | ||||||
|
| |||||||
| 117,987 | ||||||||
|
| |||||||
Building Products – 0.0% | ||||||||
Asahi Glass Co., Ltd. | 2,000 | 11,013 | ||||||
|
| |||||||
Commercial Services & Supplies – 0.1% | ||||||||
Babcock International Group PLC | 1,740 | 42,837 | ||||||
Edenred | 960 | 30,799 | ||||||
|
| |||||||
| 73,636 | ||||||||
|
| |||||||
Electrical Equipment – 0.2% | ||||||||
AMETEK, Inc. | 1,081 | 57,552 | ||||||
Sumitomo Electric Industries Ltd. | 1,600 | 24,560 | ||||||
|
| |||||||
| 82,112 | ||||||||
|
| |||||||
Industrial Conglomerates – 0.4% | ||||||||
Alliance Global Group, Inc. | 9,300 | 6,274 | ||||||
Bidvest Group Ltd. | 590 | 13,862 | ||||||
Danaher Corp. | 1,294 | 98,978 | ||||||
General Electric Co. | 3,700 | 94,239 | ||||||
Hutchison Whampoa Ltd. | 2,000 | 27,017 | ||||||
Siemens AG | 70 | 9,333 | ||||||
Toshiba Corp. | 4,000 | 17,361 | ||||||
|
| |||||||
| 267,064 | ||||||||
|
| |||||||
Machinery – 0.2% | ||||||||
Illinois Tool Works, Inc. | 600 | 49,500 | ||||||
Komatsu Ltd. | 1,300 | 27,488 | ||||||
Parker Hannifin Corp. | 325 | 39,179 | ||||||
|
| |||||||
| 116,167 | ||||||||
|
| |||||||
Marine – 0.1% | ||||||||
AP Moeller—Maersk A/S—Class B | 2 | 24,426 | ||||||
Nippon Yusen KK | 6,000 | 19,220 | ||||||
|
| |||||||
| 43,646 | ||||||||
|
| |||||||
Professional Services – 0.5% | ||||||||
Bureau Veritas SA | 2,225 | 61,240 | ||||||
Capita PLC | 3,043 | 58,077 | ||||||
Intertek Group PLC | 2,020 | 99,360 | ||||||
SGS SA | 14 | 34,643 | ||||||
Verisk Analytics, Inc.—Class A(c) | 527 | 33,578 | ||||||
|
| |||||||
| 286,898 | ||||||||
|
| |||||||
Road & Rail – 0.1% | ||||||||
Canadian National Railway Co. | 180 | 10,170 | ||||||
Central Japan Railway Co. | 200 | 23,342 | ||||||
Globaltrans Investment PLC (Sponsored GDR)(d) | 1,440 | 18,706 | ||||||
|
| |||||||
| 52,218 | ||||||||
|
| |||||||
| 76 | • ALLIANCEBERNSTEIN TAX-MANAGED WEALTH STRATEGIES |
Tax-Managed Conservative Wealth—Portfolio of Investments
| Company | Shares | U.S. $ Value | ||||||
| ||||||||
Trading Companies & Distributors – 0.0% | ||||||||
Mitsubishi Corp. | 900 | $ | 17,274 | |||||
|
| |||||||
Transportation Infrastructure – 0.0% | ||||||||
Sydney Airport | 660 | 2,395 | ||||||
|
| |||||||
| 1,348,484 | ||||||||
|
| |||||||
Consumer Staples – 2.0% | ||||||||
Beverages – 0.2% | ||||||||
Anheuser-Busch InBev NV | 180 | 18,827 | ||||||
Asahi Group Holdings Ltd. | 300 | 8,435 | ||||||
Carlsberg A/S—Class B | 160 | 16,856 | ||||||
Diageo PLC | 1,700 | 53,383 | ||||||
Monster Beverage Corp.(c) | 623 | 46,102 | ||||||
SABMiller PLC (London) | 365 | 17,875 | ||||||
|
| |||||||
| 161,478 | ||||||||
|
| |||||||
Food & Staples Retailing – 0.7% | ||||||||
Costco Wholesale Corp. | 553 | 64,590 | ||||||
CVS Caremark Corp. | 1,871 | 136,845 | ||||||
Jeronimo Martins SGPS SA | 1,499 | 25,415 | ||||||
Koninklijke Ahold NV | 1,990 | 37,095 | ||||||
Kroger Co. (The) | 1,400 | 58,716 | ||||||
Lenta Ltd. (GDR)(c)(d) | 2,203 | 22,030 | ||||||
Magnit OJSC (Sponsored GDR)(d) | 20 | 1,120 | ||||||
Olam International Ltd. | 46,636 | 65,385 | ||||||
Tsuruha Holdings, Inc. | 100 | 9,318 | ||||||
|
| |||||||
| 420,514 | ||||||||
|
| |||||||
Food Products – 0.3% | ||||||||
Ajinomoto Co., Inc. | 1,000 | 15,525 | ||||||
Danone | 130 | 9,167 | ||||||
Green Mountain Coffee Roasters, Inc. | 372 | 40,838 | ||||||
Hershey Co. (The) | 663 | 70,159 | ||||||
Mead Johnson Nutrition Co.—Class A | 722 | 58,879 | ||||||
Unilever PLC | 320 | 13,088 | ||||||
|
| |||||||
| 207,656 | ||||||||
|
| |||||||
Household Products – 0.2% | ||||||||
Henkel AG & Co. KGaA | 630 | 63,638 | ||||||
LG Household & Health Care Ltd. | 50 | 21,435 | ||||||
Procter & Gamble Co. (The) | 425 | 33,430 | ||||||
|
| |||||||
| 118,503 | ||||||||
|
| |||||||
Personal Products – 0.1% | ||||||||
Estee Lauder Cos., Inc. (The)—Class A | 497 | 34,214 | ||||||
|
| |||||||
Tobacco – 0.5% | ||||||||
British American Tobacco PLC | 2,500 | 136,279 | ||||||
Imperial Tobacco Group PLC | 694 | 28,308 | ||||||
| ALLIANCEBERNSTEIN TAX-MANAGED WEALTH STRATEGIES • | 77 |
Tax-Managed Conservative Wealth—Portfolio of Investments
| Company | Shares | U.S. $ Value | ||||||
| ||||||||
Japan Tobacco, Inc. | 3,300 | $ | 105,104 | |||||
Philip Morris International, Inc. | 717 | 58,012 | ||||||
|
| |||||||
| 327,703 | ||||||||
|
| |||||||
| 1,270,068 | ||||||||
|
| |||||||
Energy – 1.5% | ||||||||
Energy Equipment & Services – 0.4% | ||||||||
Aker Solutions ASA | 1,040 | 17,448 | ||||||
Halliburton Co. | 850 | 48,450 | ||||||
Nabors Industries Ltd. | 300 | 6,906 | ||||||
Oceaneering International, Inc. | 384 | 27,487 | ||||||
Saipem SpA | 850 | 19,969 | ||||||
Schlumberger Ltd. | 992 | 92,256 | ||||||
Seadrill Ltd. | 400 | 14,737 | ||||||
|
| |||||||
| 227,253 | ||||||||
|
| |||||||
Oil, Gas & Consumable Fuels – 1.1% | ||||||||
BG Group PLC | 1,350 | 24,562 | ||||||
Canadian Natural Resources Ltd. | 360 | 13,174 | ||||||
Chesapeake Energy Corp. | 250 | 6,478 | ||||||
Chevron Corp. | 780 | 89,957 | ||||||
China Petroleum & Chemical Corp.—Class H | 20,200 | 17,881 | ||||||
ENI SpA | 1,110 | 26,647 | ||||||
Exxon Mobil Corp. | 1,250 | 120,337 | ||||||
Gazprom OAO (Sponsored ADR) | 1,450 | 11,034 | ||||||
Hess Corp. | 850 | 68,025 | ||||||
JX Holdings, Inc. | 3,600 | 18,697 | ||||||
LUKOIL OAO (London) (Sponsored ADR) | 210 | 11,424 | ||||||
Marathon Petroleum Corp. | 800 | 67,200 | ||||||
NovaTek OAO (Sponsored GDR)(d) | 96 | 12,154 | ||||||
Occidental Petroleum Corp. | 750 | 72,390 | ||||||
Petroleo Brasileiro SA (Sponsored ADR) | 645 | 7,521 | ||||||
Phillips 66 | 300 | 22,458 | ||||||
Royal Dutch Shell PLC (Euronext Amsterdam)—Class A | 830 | 30,290 | ||||||
Suncor Energy, Inc. (Toronto) | 400 | 13,196 | ||||||
Valero Energy Corp. | 1,325 | 63,573 | ||||||
|
| |||||||
| 696,998 | ||||||||
|
| |||||||
| 924,251 | ||||||||
|
| |||||||
Materials – 0.7% | ||||||||
Chemicals – 0.4% | ||||||||
Arkema SA | 240 | 26,033 | ||||||
BASF SE | 90 | 10,345 | ||||||
Denki Kagaku Kogyo KK | 3,000 | 11,601 | ||||||
Essentra PLC | 3,760 | 55,981 | ||||||
Huntsman Corp. | 1,725 | 42,021 | ||||||
| 78 | • ALLIANCEBERNSTEIN TAX-MANAGED WEALTH STRATEGIES |
Tax-Managed Conservative Wealth—Portfolio of Investments
| Company | Shares | U.S. $ Value | ||||||
| ||||||||
Koninklijke DSM NV | 293 | $ | 18,696 | |||||
LyondellBasell Industries NV—Class A | 450 | 39,636 | ||||||
Monsanto Co. | 409 | 44,998 | ||||||
Nippon Shokubai Co., Ltd. | 1,000 | 12,177 | ||||||
|
| |||||||
| 261,488 | ||||||||
|
| |||||||
Construction Materials – 0.0% | ||||||||
Grasim Industries Ltd. (GDR)(d) | 127 | 5,202 | ||||||
|
| |||||||
Containers & Packaging – 0.1% | ||||||||
Rock-Tenn Co.—Class A | 375 | 41,858 | ||||||
|
| |||||||
Metals & Mining – 0.2% | ||||||||
Barrick Gold Corp. | 690 | 14,058 | ||||||
BHP Billiton PLC | 795 | 25,620 | ||||||
Dowa Holdings Co., Ltd. | 1,000 | 8,321 | ||||||
MMC Norilsk Nickel OJSC (ADR) | 1,530 | 25,980 | ||||||
Rio Tinto PLC | 320 | 18,349 | ||||||
|
| |||||||
| 92,328 | ||||||||
|
| |||||||
Paper & Forest Products – 0.0% | ||||||||
Mondi PLC | 1,122 | 20,574 | ||||||
|
| |||||||
| 421,450 | ||||||||
|
| |||||||
Telecommunication Services – 0.5% | ||||||||
Diversified Telecommunication | ||||||||
AT&T, Inc. | 1,900 | 60,667 | ||||||
Bezeq The Israeli Telecommunication Corp., Ltd. | 5,702 | 9,289 | ||||||
Hellenic Telecommunications Organization SA(c) | 760 | 13,297 | ||||||
Nippon Telegraph & Telephone Corp. | 600 | 33,779 | ||||||
Verizon Communications, Inc. | 368 | 17,519 | ||||||
Verizon Communications, Inc.(London) | 396 | 18,724 | ||||||
Vivendi SA | 1,586 | 45,226 | ||||||
Ziggo NV | 210 | 9,575 | ||||||
|
| |||||||
| 208,076 | ||||||||
|
| |||||||
Wireless Telecommunication Services – 0.2% | ||||||||
China Mobile Ltd. | 2,000 | 18,971 | ||||||
Rogers Communications, Inc. – Class B | 210 | 8,117 | ||||||
Turkcell Iletisim Hizmetleri AS(c) | 2,640 | 13,713 | ||||||
Vodafone Group PLC | 8,211 | 34,214 | ||||||
Vodafone Group PLC (Sponsored ADR) | 764 | 31,744 | ||||||
|
| |||||||
| 106,759 | ||||||||
|
| |||||||
| 314,835 | ||||||||
|
| |||||||
Utilities – 0.4% | ||||||||
Electric Utilities – 0.1% | ||||||||
Edison International | 950 | 49,751 | ||||||
EDP – Energias de Portugal SA | 4,540 | 19,648 | ||||||
| ALLIANCEBERNSTEIN TAX-MANAGED WEALTH STRATEGIES • | 79 |
Tax-Managed Conservative Wealth—Portfolio of Investments
| Company | Shares | U.S. $ Value | ||||||
| ||||||||
Electricite de France | 290 | $ | 11,506 | |||||
Enel SpA | 3,950 | 20,242 | ||||||
|
| |||||||
| 101,147 | ||||||||
|
| |||||||
Gas Utilities – 0.1% | ||||||||
Atmos Energy Corp. | 425 | 19,592 | ||||||
UGI Corp. | 475 | 21,228 | ||||||
|
| |||||||
| 40,820 | ||||||||
|
| |||||||
Independent Power Producers & Energy | ||||||||
APR Energy PLC | 2,787 | 40,370 | ||||||
|
| |||||||
Multi-Utilities – 0.1% | ||||||||
CenterPoint Energy, Inc. | 950 | 22,468 | ||||||
DTE Energy Co. | 100 | 7,176 | ||||||
National Grid PLC | 1,370 | 19,171 | ||||||
|
| |||||||
| 48,815 | ||||||||
|
| |||||||
| 231,152 | ||||||||
|
| |||||||
Total Common Stocks | 12,396,135 | |||||||
|
| |||||||
INVESTMENT COMPANIES – 10.0% | ||||||||
Funds and Investment Trusts – 10.0% | ||||||||
AllianceBernstein Pooling Portfolio Volatility Management Portfolio* | 536,553 | $ | 6,293,763 | |||||
|
| |||||||
WARRANTS – 0.0% | ||||||||
Financials – 0.0% | ||||||||
Thrifts & Mortgage Finance – 0.0% | ||||||||
Housing Development Finance Corp., Merrill Lynch International, expiring 8/19/15(c) | 1,010 | 13,376 | ||||||
|
| |||||||
Industrials – 0.0% | ||||||||
Industrial Conglomerates – 0.0% | ||||||||
John Keells Holdings PLC, Deutsche Bank AG London, expiring 7/05/19(c) | 2,440 | 4,182 | ||||||
|
| |||||||
Consumer Staples – 0.0% | ||||||||
Food & Staples Retailing – 0.0% | ||||||||
Olam International Ltd., expiring 1/29/18(c) | 7,924 | 2,219 | ||||||
|
| |||||||
Total Warrants | 19,777 | |||||||
|
| |||||||
| 80 | • ALLIANCEBERNSTEIN TAX-MANAGED WEALTH STRATEGIES |
Tax-Managed Conservative Wealth—Portfolio of Investments
| Company | Shares | U.S. $ Value | ||||||
| ||||||||
SHORT-TERM INVESTMENTS – 4.0% | ||||||||
Investment Companies – 4.0% | ||||||||
AllianceBernstein Fixed-Income Shares, Inc. – Government STIF Portfolio, 0.08%(e) | 2,481,354 | $ | 2,481,354 | |||||
|
| |||||||
Total Investments – 99.5% | 62,478,062 | |||||||
Other assets less liabilities – 0.5% | 328,321 | |||||||
|
| |||||||
Net Assets – 100.0% | $ | 62,806,383 | ||||||
|
| |||||||
FORWARD CURRENCY EXCHANGE CONTRACTS (see Note D)
| Counterparty | Contracts to (000) | In Exchange (000) | Settlement Date | Unrealized Appreciation/ (Depreciation) | ||||||||||||
Barclays Bank PLC Wholesale | JPY | 1,008 | USD | 10 | 5/15/14 | $ | (38 | ) | ||||||||
Standard Chartered Bank | RUB | 655 | USD | 18 | 5/15/14 | 221 | ||||||||||
State Street Bank & Trust Co. | CAD | 28 | USD | 25 | 5/15/14 | 6 | ||||||||||
State Street Bank & Trust Co. | CHF | 89 | USD | 99 | 5/15/14 | (2,192 | ) | |||||||||
State Street Bank & Trust Co. | EUR | 74 | USD | 101 | 5/15/14 | (769 | ) | |||||||||
State Street Bank & Trust Co. | GBP | 250 | USD | 408 | 5/15/14 | (10,451 | ) | |||||||||
State Street Bank & Trust Co. | HKD | 1,267 | USD | 163 | 5/15/14 | 25 | ||||||||||
State Street Bank & Trust Co. | JPY | 22,625 | USD | 222 | 5/15/14 | (239 | ) | |||||||||
State Street Bank & Trust Co. | NZD | 77 | USD | 64 | 5/15/14 | (112 | ) | |||||||||
State Street Bank & Trust Co. | SEK | 173 | USD | 27 | 5/15/14 | (449 | ) | |||||||||
State Street Bank & Trust Co. | USD | 24 | AUD | 28 | 5/15/14 | 378 | ||||||||||
State Street Bank & Trust Co. | USD | 29 | AUD | 32 | 5/15/14 | (111 | ) | |||||||||
State Street Bank & Trust Co. | USD | 178 | CAD | 197 | 5/15/14 | (79 | ) | |||||||||
State Street Bank & Trust Co. | USD | 87 | CHF | 78 | 5/15/14 | 1,741 | ||||||||||
State Street Bank & Trust Co. | USD | 46 | EUR | 34 | 5/15/14 | 697 | ||||||||||
State Street Bank & Trust Co. | USD | 173 | GBP | 104 | 5/15/14 | 816 | ||||||||||
State Street Bank & Trust Co. | USD | 19 | JPY | 1,972 | 5/15/14 | 157 | ||||||||||
State Street Bank & Trust Co. | USD | 88 | NOK | 544 | 5/15/14 | 1,966 | ||||||||||
State Street Bank & Trust Co. | USD | 85 | NZD | 104 | 5/15/14 | 1,326 | ||||||||||
State Street Bank & Trust Co. | USD | 185 | SEK | 1,205 | 5/15/14 | 2,234 | ||||||||||
State Street Bank & Trust Co. | USD | 39 | SGD | 50 | 5/15/14 | 15 | ||||||||||
|
| |||||||||||||||
| $ | (4,858 | ) | ||||||||||||||
|
| |||||||||||||||
| ALLIANCEBERNSTEIN TAX-MANAGED WEALTH STRATEGIES • | 81 |
Tax-Managed Conservative Wealth—Portfolio of Investments
INFLATION (CPI) SWAPS (see Note D)
| Rate Type | ||||||||||||||||
| Swap Counterparty | Notional Amount (000) | Termination Date | Payments made by the Fund | Payments received by the Fund | Unrealized Appreciation/ (Depreciation) | |||||||||||
Barclays Bank PLC | $ | 3,000 | 8/11/15 | 2.030% | CPI# | $ | (150,120 | ) | ||||||||
Barclays Bank PLC | 500 | 7/19/17 | 2.038% | CPI# | 226 | |||||||||||
Barclays Bank PLC | 300 | 10/05/22 | 2.765% | CPI# | (13,519 | ) | ||||||||||
Citibank, NA | 250 | 8/26/20 | 2.298% | CPI# | (1,383 | ) | ||||||||||
JPMorgan Chase Bank, NA | 200 | 3/04/24 | 2.493% | CPI# | 0 | |||||||||||
Morgan Stanley Capital Services LLC | 1,500 | 10/31/18 | 1.960% | CPI# | (45,106 | ) | ||||||||||
Morgan Stanley Capital Services LLC | 150 | 4/16/23 | 2.690% | CPI# | (5,191 | ) | ||||||||||
|
| |||||||||||||||
| $ | (215,093 | ) | ||||||||||||||
|
| |||||||||||||||
| * | To obtain a copy of the fund’s financial statements, please go to the Securities and Exchange Commission’s website at www.sec.gov, or call AllianceBernstein at (800) 227-4618. |
| # | Variable interest rate based on the rate of inflation as determined by the Consumer Price Index (CPI). |
| (a) | Variable rate coupon, rate shown as of February 28, 2014. |
| (b) | Floating Rate Security. Stated interest rate was in effect at February 28, 2014. |
| (c) | Non-income producing security. |
| (d) | Security is exempt from registration under Rule 144A of the Securities Act of 1933. These securities are considered liquid and may be resold in transactions exempt from registration, normally to qualified institutional buyers. At February 28, 2014, the aggregate market value of these securities amounted to $72,877 or 0.1% of net assets. |
| (e) | Investment in affiliated money market mutual fund. The rate shown represents the 7-day yield as of period end. |
As of February 28, 2014, the Strategy held 66.1% of its total investments in municipal bonds. Of the total investments in municipal bonds, 12.8% is insured (0.0% of this amount represents the Strategy’s holding in pre-refunded or escrowed to maturity bonds).
Currency Abbreviations:
| AUD | – Australian Dollar |
| CAD | – Canadian Dollar |
| CHF | – Swiss Franc |
| EUR | – Euro |
| GBP | – Great British Pound |
| HKD | – Hong Kong Dollar |
| JPY | – Japanese Yen |
| NOK | – Norwegian Krone |
| NZD | – New Zealand Dollar |
| RUB | – Russian Ruble |
| SEK | – Swedish Krona |
| SGD | – Singapore Dollar |
| USD | – United States Dollar |
| 82 | • ALLIANCEBERNSTEIN TAX-MANAGED WEALTH STRATEGIES |
Tax-Managed Conservative Wealth—Portfolio of Investments
| Glossary: |
| ADR | – American Depositary Receipt |
| AGC | – Assured Guaranty Corporation |
| AGM | – Assured Guaranty Municipal |
| AMBAC | – Ambac Assurance Corporation |
| DOT | – Department of Transportation |
| EDA | – Economic Development Agency |
| FGIC | – Financial Guaranty Insurance Company |
| GDR | – Global Depositary Receipt |
| GO | – General Obligation |
| IDA | – Industrial Development Authority/Agency |
| ISD | – Independent School District |
| NPFGC | – National Public Finance Guarantee Corporation |
| NPFGC-RE | – National Public Finance Guarantee Corporation Reinsuring Financial Guaranty Insurance Company |
| OJSC | – Open Joint Stock Company |
| PCR | – Pollution Control Revenue Bond |
| REG | – Registered Shares |
| SD | – School District |
| SRF | – State Revolving Fund |
| UDC | – Urban Development Corporation |
See notes to financial statements.
| ALLIANCEBERNSTEIN TAX-MANAGED WEALTH STRATEGIES • | 83 |
Tax-Managed Conservative Wealth—Portfolio of Investments
STATEMENT OF ASSETS & LIABILITIES
February 28, 2014 (unaudited)
| Tax-Managed Wealth Appreciation Strategy | Tax-Managed Balanced Wealth Strategy | Tax-Managed Conservative Wealth Strategy | ||||||||||
| Assets | ||||||||||||
Investments in securities, at value | ||||||||||||
Unaffiliated issuers (cost $430,303,847, $125,009,953 and $49,690,485, respectively) | $ | 556,983,047 | $ | 139,512,707 | $ | 53,702,945 | ||||||
Affiliated issuers (cost $139,144,708, $29,392,185 and $8,088,467, respectively) | 154,506,373 | 31,794,491 | 8,775,117 | |||||||||
Cash(a) | 886,502 | 7,671 | 20,679 | |||||||||
Foreign currencies, at value (cost $1,273,456, $75,401 and $23,314, respectively) | 1,276,976 | 75,499 | 23,295 | |||||||||
Receivable for investment securities sold and foreign currency transactions | 4,286,421 | 1,427,422 | 214,945 | |||||||||
Dividends and interest receivable | 1,529,244 | 1,097,773 | 504,959 | |||||||||
Receivable for shares of beneficial interest sold | 739,165 | 88,799 | 101,887 | |||||||||
Unrealized appreciation of forward currency exchange contracts | 426,160 | 43,585 | 9,582 | |||||||||
Receivable for variation margin on futures | 216 | 8 | – 0 | – | ||||||||
Unrealized appreciation on inflation swaps | – 0 | – | – 0 | – | 226 | |||||||
|
|
|
|
|
| |||||||
Total assets | 720,634,104 | 174,047,955 | 63,353,635 | |||||||||
|
|
|
|
|
| |||||||
| Liabilities | ||||||||||||
Due to custodian | – 0 | – | 7,451,442 | – 0 | – | |||||||
Payable for investment securities purchased and foreign currency transactions | 5,759,095 | 329,103 | 81,188 | |||||||||
Payable for shares of beneficial interest redeemed | 947,637 | 85,800 | 88,533 | |||||||||
Unrealized depreciation of forward currency exchange contracts | 626,537 | 61,642 | 14,440 | |||||||||
Advisory fee payable | 348,179 | 69,281 | 7,060 | |||||||||
Audit fee payable | 36,704 | 42,564 | 40,899 | |||||||||
Distribution fee payable | 23,187 | 50,145 | 22,121 | |||||||||
Transfer Agent fee payable | 12,750 | 15,595 | 8,049 | |||||||||
Unrealized depreciation on inflation swaps | – 0 | – | 229,462 | 215,319 | ||||||||
Accrued expenses | 119,046 | 93,651 | 69,643 | |||||||||
|
|
|
|
|
| |||||||
Total liabilities | 7,873,135 | 8,428,685 | 547,252 | |||||||||
|
|
|
|
|
| |||||||
Net Assets | $ | 712,760,969 | $ | 165,619,270 | $ | 62,806,383 | ||||||
|
|
|
|
|
| |||||||
See notes to financial statements.
| 84 | • ALLIANCEBERNSTEIN TAX-MANAGED WEALTH STRATEGIES |
Statement of Assets & Liabilities
| Tax-Managed Wealth Appreciation Strategy | Tax-Managed Balanced Wealth Strategy | Tax-Managed Conservative Wealth Strategy | ||||||||||
| Composition of Net Assets | ||||||||||||
Shares of beneficial interest, at par | $ | 457 | $ | 120 | $ | 53 | ||||||
Additional paid-in capital | 613,932,275 | 146,226,804 | 56,735,757 | |||||||||
Undistributed net investment income | 1,181,963 | 1,907,677 | 537,507 | |||||||||
Accumulated net realized gain (loss) on investment and foreign currency transactions | (44,247,600 | ) | 824,114 | 1,053,505 | ||||||||
Net unrealized appreciation on investments and foreign currency denominated assets and liabilities | 141,893,874 | 16,660,555 | 4,479,561 | |||||||||
|
|
|
|
|
| |||||||
Net Assets | $ | 712,760,969 | $ | 165,619,270 | $ | 62,806,383 | ||||||
|
|
|
|
|
| |||||||
| (a) | Amounts of $80,550, $7,671 and $0, respectively, have been segregated to collateralize margin requirements for the open futures outstanding at February 28, 2014. |
Net Asset Value Per Share—unlimited shares authorized, $.00001 par value
| Tax-Managed Wealth Appreciation Strategy | Net Assets | Shares Outstanding | Net Asset Value | |||||||||
| ||||||||||||
| Class A | $ | 37,137,377 | 2,386,241 | $ | 15.56 | * | ||||||
| ||||||||||||
| Class B | $ | 2,439,279 | 158,772 | $ | 15.36 | |||||||
| ||||||||||||
| Class C | $ | 17,227,018 | 1,121,614 | $ | 15.36 | |||||||
| ||||||||||||
| Advisor Class | $ | 655,957,295 | 42,026,566 | $ | 15.61 | |||||||
| ||||||||||||
| Tax-Managed Balanced Wealth Strategy | ||||||||||||
| ||||||||||||
| Class A | $ | 94,256,267 | 6,818,154 | $ | 13.82 | * | ||||||
| ||||||||||||
| Class B | $ | 5,997,469 | 432,508 | $ | 13.87 | |||||||
| ||||||||||||
| Class C | $ | 31,611,472 | 2,276,096 | $ | 13.89 | |||||||
| ||||||||||||
| Advisor Class | $ | 33,754,062 | 2,438,589 | $ | 13.84 | |||||||
| ||||||||||||
| Tax-Managed Conservative Wealth Strategy | ||||||||||||
| ||||||||||||
| Class A | $ | 39,389,853 | 3,358,013 | $ | 11.73 | * | ||||||
| ||||||||||||
| Class B | $ | 1,998,289 | 165,607 | $ | 12.07 | |||||||
| ||||||||||||
| Class C | $ | 15,227,064 | 1,261,729 | $ | 12.07 | |||||||
| ||||||||||||
| Advisor Class | $ | 6,191,177 | 526,385 | $ | 11.76 | |||||||
| ||||||||||||
| * | The maximum offering price per share for Class A shares of Tax-Managed Wealth Appreciation Strategy, Tax-Managed Balanced Wealth Strategy and Tax-Managed Conservative Wealth Strategy was $16.25, $14.43 and $12.25, respectively, which reflects a sales charge of 4.25%. |
See notes to financial statements.
| ALLIANCEBERNSTEIN TAX-MANAGED WEALTH STRATEGIES • | 85 |
Statement of Assets & Liabilities
STATEMENT OF OPERATIONS
Six Months Ended February 28, 2014 (unaudited)
| Tax-Managed Wealth Appreciation Strategy | Tax-Managed Balanced Wealth Strategy | Tax-Managed Conservative Wealth Strategy | ||||||||||
| Investment Income | ||||||||||||
Dividends | ||||||||||||
Affiliated issuers | $ | 9,136,739 | $ | 1,637,141 | $ | 425,339 | ||||||
Unaffiliated issuers (net of foreign taxes withheld of $130,184, $13,345 and $3,799, respectively) | 6,112,440 | 603,189 | 146,283 | |||||||||
Interest | 2,810 | 1,274,785 | 492,354 | |||||||||
|
|
|
|
|
| |||||||
Total income | 15,251,989 | 3,515,115 | 1,063,976 | |||||||||
|
|
|
|
|
| |||||||
| Expenses | ||||||||||||
Advisory fee (see Note B) | 2,235,291 | 447,258 | 175,748 | |||||||||
Distribution fee – Class A | 53,700 | 140,337 | 60,359 | |||||||||
Distribution fee – Class B | 12,936 | 32,963 | 11,662 | |||||||||
Distribution fee – Class C | 84,567 | 156,860 | 77,116 | |||||||||
Transfer agency – Class A | 4,468 | 43,167 | 21,545 | |||||||||
Transfer agency – Class B | 545 | 3,446 | 1,394 | |||||||||
Transfer agency – Class C | 2,372 | 14,957 | 8,567 | |||||||||
Transfer agency – Advisor Class | 78,922 | 14,387 | 3,174 | |||||||||
Custodian | 119,559 | 86,861 | 75,901 | |||||||||
Registration fees | 30,452 | 24,660 | 23,620 | |||||||||
Trustees’ fees | 30,215 | 30,215 | 30,227 | |||||||||
Audit | 28,469 | 32,067 | 31,137 | |||||||||
Legal | 19,460 | 19,467 | 19,466 | |||||||||
Printing | 16,284 | 20,577 | 9,789 | |||||||||
Miscellaneous | 23,160 | 14,452 | 12,181 | |||||||||
|
|
|
|
|
| |||||||
Total expenses | 2,740,400 | 1,081,674 | 561,886 | |||||||||
Less: expenses waived and reimbursed by the Adviser | – 0 | – | – 0 | – | (125,161 | ) | ||||||
|
|
|
|
|
| |||||||
Net expenses | 2,740,400 | 1,081,674 | 436,725 | |||||||||
|
|
|
|
|
| |||||||
Net investment income | 12,511,589 | 2,433,441 | 627,251 | |||||||||
|
|
|
|
|
| |||||||
| Realized and Unrealized Gain (Loss) on Investment and Foreign Currency Transactions | ||||||||||||
Net realized gain (loss) on: | ||||||||||||
Investment transactions | 40,672,508 | 5,294,532 | 1,473,394 | |||||||||
Futures | 80,507 | 6,421 | – 0 | – | ||||||||
Foreign currency transactions | (162,970 | ) | (17,615 | ) | (2,624 | ) | ||||||
Net change in unrealized appreciation/depreciation of: | ||||||||||||
Investments | 40,273,163 | 4,787,778 | 1,247,540 | |||||||||
Futures | 24,947 | 705 | – 0 | – | ||||||||
Swaps | – 0 | – | (8,222 | ) | (13,065 | ) | ||||||
Foreign currency denominated assets and liabilities | (160,094 | ) | (16,289 | ) | (4,068 | ) | ||||||
|
|
|
|
|
| |||||||
Net gain on investment and foreign currency transactions | 80,728,061 | 10,047,310 | 2,701,177 | |||||||||
|
|
|
|
|
| |||||||
Net Increase in Net Assets from Operations | $ | 93,239,650 | $ | 12,480,751 | $ | 3,328,428 | ||||||
|
|
|
|
|
| |||||||
See notes to financial statements.
| 86 | • ALLIANCEBERNSTEIN TAX-MANAGED WEALTH STRATEGIES |
Statement of Operations
STATEMENT OF CHANGES IN NET ASSETS
| Tax-Managed Wealth Appreciation Strategy | ||||||||
| Six Months Ended February 28, 2014 (unaudited) | Year Ended August 31, 2013 | |||||||
| Increase in Net Assets from Operations | ||||||||
Net investment income | $ | 12,511,589 | $ | 6,620,921 | ||||
Net realized gain on investment and foreign currency transactions | 40,590,045 | 34,910,419 | ||||||
Net change in unrealized appreciation/depreciation of investments and foreign currency denominated assets and liabilities | 40,138,016 | 62,430,620 | ||||||
|
|
|
| |||||
Net increase in net assets from operations | 93,239,650 | 103,961,960 | ||||||
| Dividends to Shareholders from | ||||||||
Net investment income | ||||||||
Class A | (746,693 | ) | (194,803 | ) | ||||
Class B | (29,793 | ) | – 0 | – | ||||
Class C | (227,250 | ) | – 0 | – | ||||
Advisor Class | (14,774,092 | ) | (5,011,098 | ) | ||||
| Transactions in Shares of Beneficial Interest | ||||||||
Net decrease | (2,016,854 | ) | (70,389,043 | ) | ||||
|
|
|
| |||||
Total increase | 75,444,968 | 28,367,016 | ||||||
| Net Assets | ||||||||
Beginning of period | 637,316,001 | 608,948,985 | ||||||
|
|
|
| |||||
End of period (including undistributed net investment income of $1,181,963 and $4,448,202, respectively) | $ | 712,760,969 | $ | 637,316,001 | ||||
|
|
|
| |||||
See notes to financial statements.
| ALLIANCEBERNSTEIN TAX-MANAGED WEALTH STRATEGIES • | 87 |
Statement of Changes in Net Assets
| Tax-Managed Balanced Wealth Strategy | ||||||||
| Six Months Ended February 28, 2014 (unaudited) | Year Ended August 31, 2013 | |||||||
| Increase in Net Assets from Operations | ||||||||
Net investment income | $ | 2,433,441 | $ | 1,913,567 | ||||
Net realized gain on investment and foreign currency transactions | 5,283,338 | 5,822,442 | ||||||
Net change in unrealized appreciation/depreciation of investments and foreign currency denominated assets and liabilities | 4,763,972 | 1,742,299 | ||||||
|
|
|
| |||||
Net increase in net assets from operations | 12,480,751 | 9,478,308 | ||||||
| Dividends to Shareholders from | ||||||||
Net investment income | ||||||||
Class A | (598,880 | ) | (1,145,905 | ) | ||||
Class B | (14,390 | ) | (39,632 | ) | ||||
Class C | (78,828 | ) | (155,989 | ) | ||||
Advisor Class | (242,544 | ) | (375,343 | ) | ||||
| Transactions in Shares of Beneficial Interest | ||||||||
Net decrease | (669,226 | ) | (20,710,334 | ) | ||||
|
|
|
| |||||
Total increase (decrease) | 10,876,883 | (12,948,895 | ) | |||||
| Net Assets | ||||||||
Beginning of period | 154,742,387 | 167,691,282 | ||||||
|
|
|
| |||||
End of period (including undistributed net investment income of $1,907,677 and $408,878, respectively) | $ | 165,619,270 | $ | 154,742,387 | ||||
|
|
|
| |||||
See notes to financial statements.
| 88 | • ALLIANCEBERNSTEIN TAX-MANAGED WEALTH STRATEGIES |
Statement of Changes in Net Assets
| Tax-Managed Conservative Wealth Strategy | ||||||||
| Six Months Ended February 28, 2014 (unaudited) | Year Ended August 31, 2013 | |||||||
| Increase in Net Assets from Operations | ||||||||
Net investment income | $ | 627,251 | $ | 463,108 | ||||
Net realized gain on investment and foreign currency transactions | 1,470,770 | 1,674,425 | ||||||
Net change in unrealized appreciation/depreciation of investments and foreign currency denominated assets and liabilities | 1,230,407 | 93,796 | ||||||
|
|
|
| |||||
Net increase in net assets from operations | 3,328,428 | 2,231,329 | ||||||
| Dividends and Distributions to Shareholders from | ||||||||
Net investment income | ||||||||
Class A | (154,471 | ) | (334,933 | ) | ||||
Class B | – 0 | – | (5,316 | ) | ||||
Class C | (251 | ) | (30,903 | ) | ||||
Advisor Class | (32,713 | ) | (53,123 | ) | ||||
Net realized gain on investment transactions | ||||||||
Class A | (1,018,098 | ) | – 0 | – | ||||
Class B | (56,565 | ) | – 0 | – | ||||
Class C | (378,381 | ) | – 0 | – | ||||
Advisor Class | (157,319 | ) | – 0 | – | ||||
| Transactions in Shares of Beneficial Interest | ||||||||
Net decrease | (3,463,910 | ) | (10,258,520 | ) | ||||
|
|
|
| |||||
Total decrease | (1,933,280 | ) | (8,451,466 | ) | ||||
| Net Assets | ||||||||
Beginning of period | 64,739,663 | 73,191,129 | ||||||
|
|
|
| |||||
End of period (including undistributed net investment income of $537,507 and $97,691, respectively) | $ | 62,806,383 | $ | 64,739,663 | ||||
|
|
|
| |||||
See notes to financial statements.
| ALLIANCEBERNSTEIN TAX-MANAGED WEALTH STRATEGIES • | 89 |
Statement of Changes in Net Assets
NOTES TO FINANCIAL STATEMENTS
February 28, 2014 (unaudited)
NOTE A
Significant Accounting Policies
The AllianceBernstein Portfolios (the “Trust”) was organized as a Massachusetts Business Trust on March 26, 1987 and is registered under the Investment Company Act of 1940 as a diversified, open end management investment company. The Trust operates as a series company currently comprised of seven series: the AllianceBernstein Growth Fund, the Wealth Appreciation Strategy, the Balanced Wealth Strategy, the Conservative Wealth Strategy, the Tax-Managed Wealth Appreciation Strategy, the Tax-Managed Balanced Wealth Strategy and the Tax-Managed Conservative Wealth Strategy. Each series is considered to be a separate entity for financial reporting and tax purposes. This report relates only to the Tax-Managed Wealth Appreciation Strategy, the Tax-Managed Balanced Wealth Strategy and the Tax-Managed Conservative Wealth Strategy (the “Strategies”). The Strategies offer Class A, Class B, Class C and Advisor Class shares. Class A shares are sold with a front-end sales charge of up to 4.25% for purchases not exceeding $1,000,000. With respect to purchases of $1,000,000 or more, Class A shares redeemed within one year of purchase may be subject to a contingent deferred sales charge of 1%. Class B shares are currently sold with a contingent deferred sales charge which declines from 4% to zero depending on the period of time the shares are held. Effective January 31, 2009, sales of Class B shares of the Strategies to new investors were suspended. Class B shares will only be issued (i) upon the exchange of Class B shares from another AllianceBernstein Mutual Fund, (ii) for purposes of dividend reinvestment, (iii) through the Strategies’ Automatic Investment Program (the “Program”) for accounts that established the Program prior to January 31, 2009, and (iv) for purchases of additional shares by Class B shareholders as of January 31, 2009. The ability to establish a new Program for accounts containing Class B shares was suspended as of January 31, 2009. Class B shares will automatically convert to Class A shares eight years after the end of the calendar month of purchase. Class C shares are subject to a contingent deferred sales charge of 1% on redemptions made within the first year after purchase. Advisor Class shares are sold without any initial or contingent deferred sales charge and are not subject to ongoing distribution expenses. All four classes of shares have identical voting, dividend, liquidation and other rights, except that the classes bear different distribution and transfer agency expenses. Each class has exclusive voting rights with respect to its distribution plan. The financial statements have been prepared in conformity with U.S. generally accepted accounting principles (“U.S. GAAP”) which require management to make certain estimates and assumptions that affect the reported amounts of assets and liabilities in the financial statements and amounts of income and expenses during the reporting period. Actual results could differ from those estimates. The following is a summary of significant accounting policies followed by the Strategies.
1. Security Valuation
Portfolio securities are valued at their current market value determined on the basis of market quotations or, if market quotations are not readily available or are deemed unreliable, at “fair value” as determined in accordance with procedures established by and under the general supervision of the Trust’s Board of Trustees (the “Board”).
| 90 | • ALLIANCEBERNSTEIN TAX-MANAGED WEALTH STRATEGIES |
Notes to Financial Statements
In general, the market values of securities which are readily available and deemed reliable are determined as follows: securities listed on a national securities exchange (other than securities listed on the NASDAQ Stock Market, Inc. (“NASDAQ”)) or on a foreign securities exchange are valued at the last sale price at the close of the exchange or foreign securities exchange. If there has been no sale on such day, the securities are valued at the last traded price from the previous day. Securities listed on more than one exchange are valued by reference to the principal exchange on which the securities are traded; securities listed only on NASDAQ are valued in accordance with the NASDAQ Official Closing Price; listed or over the counter (“OTC”) market put or call options are valued at the mid level between the current bid and ask prices. If either a current bid or current ask price is unavailable, AllianceBernstein L.P. (the “Adviser”) will have discretion to determine the best valuation (e.g. last trade price in the case of listed options); open futures are valued using the closing settlement price or, in the absence of such a price, the most recent quoted bid price. If there are no quotations available for the day of valuation, the last available closing settlement price is used; U.S. government securities and other debt instruments having 60 days or less remaining until maturity are valued at amortized cost if their original maturity was 60 days or less. If the orginal term to maturity exceeded 60 days, the securities are valued by a pricing service, if a market price is available. If a market price is not available, the securities are valued by using amortized cost as of the 61st day prior to maturity. Fixed-income securities, including mortgage-backed and asset-backed securities, may be valued on the basis of prices provided by a pricing service or at a price obtained from one or more of the major broker-dealers. In cases where broker-dealer quotes are obtained, the Adviser may establish procedures whereby changes in market yields or spreads are used to adjust, on a daily basis, a recently obtained quoted price on a security. Swaps and other derivatives are valued daily, primarily using independent pricing services, independent pricing models using market inputs, as well as third party broker-dealers or counterparties. Investment companies are valued at their net asset value each day.
Securities for which market quotations are not readily available (including restricted securities) or are deemed unreliable are valued at fair value. Factors considered in making this determination may include, but are not limited to, information obtained by contacting the issuer, analysts, analysis of the issuer’s financial statements or other available documents. In addition, the Strategies may use fair value pricing for securities primarily traded in non-U.S. markets because most foreign markets close well before the Strategies value their securities at 4:00 p.m., Eastern Time. The earlier close of these foreign markets gives rise to the possibility that significant events, including broad market moves, may have occurred in the interim and may materially affect the value of those securities.
2. Fair Value Measurements
In accordance with U.S. GAAP regarding fair value measurements, fair value is defined as the price that the Strategies would receive to sell an asset or pay to transfer a liability in an orderly transaction between market participants at the measurement date. U.S. GAAP establishes a framework for measuring fair value,
| ALLIANCEBERNSTEIN TAX-MANAGED WEALTH STRATEGIES • | 91 |
Notes to Financial Statements
and a three-level hierarchy for fair value measurements based upon the transparency of inputs to the valuation of an asset or liability (including those valued based on their market value as described in Note A.1 above). Inputs may be observable or unobservable and refer broadly to the assumptions that market participants would use in pricing the asset or liability. Observable inputs reflect the assumptions market participants would use in pricing the asset or liability based on market data obtained from sources independent of the Strategies. Unobservable inputs reflect the Strategies’ own assumptions about the assumptions that market participants would use in pricing the asset or liability based on the best information available in the circumstances. Each investment is assigned a level based upon the observability of the inputs which are significant to the overall valuation. The three-tier hierarchy of inputs is summarized below.
| • | Level 1—quoted prices in active markets for identical investments |
| • | Level 2—other significant observable inputs (including quoted prices for similar investments, interest rates, prepayment speeds, credit risk, etc.) |
| • | Level 3—significant unobservable inputs (including the Strategies’ own assumptions in determining the fair value of investments) |
The fair value of debt instruments, such as bonds, and over-the-counter derivatives is generally based on market price quotations, recently executed market transactions (where observable) or industry recognized modeling techniques and are generally classified as Level 2. Pricing vendor inputs to Level 2 valuations may include quoted prices for similar investments in active markets, interest rate curves, coupon rates, currency rates, yield curves, option adjusted spreads, default rates, credit spreads and other unique security features in order to estimate the relevant cash flows which are then discounted to calculate fair values. If these inputs are unobservable and significant to the fair value, these investments will be classified as Level 3. In addition, non-agency rated investments are classified as Level 3.
Where readily available market prices or relevant bid prices are not available for certain equity investments, such investments may be valued based on similar publicly traded investments, movements in relevant indices since last available prices or based upon underlying company fundamentals and comparable company data (such as multiples to earnings or other multiples to equity). Where an investment is valued using an observable input, such as another publicly traded security, the investment will be classified as Level 2. If management determines that an adjustment is appropriate based on restrictions on resale, illiquidity or uncertainty, and such adjustment is a significant component of the valuation, the investment will be classified as Level 3. An investment will also be classified as Level 3 where management uses company fundamentals and other significant inputs to determine the valuation.
Options and warrants are valued using market-based inputs to models, broker or dealer quotations, or alternative pricing sources with reasonable levels of price transparency, where such inputs and models are available. Alternatively the values may be obtained through unobservable management determined inputs
| 92 | • ALLIANCEBERNSTEIN TAX-MANAGED WEALTH STRATEGIES |
Notes to Financial Statements
and/or management’s proprietary models. Where models are used, the selection of a particular model to value an option or a warrant depends upon the contractual terms of, and specific risks inherent in, the option or warrant as well as the availability of pricing information in the market. Valuation models require a variety of inputs, including contractual terms, market prices, measures of volatility and correlations of such inputs. Exchange traded options will be classified as Level 2. For options or warrants that do not trade on exchange but trade in liquid markets, inputs can generally be verified and model selection does not involve significant management judgment. Options and warrants are classified within Level 2 on the fair value hierarchy when all of the significant inputs can be corroborated to market evidence. Otherwise such instruments are classified as Level 3.
Other fixed income investments, including non-U.S. government and corporate debt, are generally valued using quoted market prices, if available, which are typically impacted by current interest rates, maturity dates and any perceived credit risk of the issuer. Additionally, in the absence of quoted market prices, these inputs are used by pricing vendors to derive a valuation based upon industry or proprietary models which incorporate issuer specific data with relevant yield/spread comparisons with more widely quoted bonds with similar key characteristics. Those investments for which there are observable inputs are classified as Level 2. Where the inputs are not observable, the investments are classified as Level 3.
The following tables summarize the valuation of the Strategies’ investments by the above fair value hierarchy levels as of February 28, 2014:
| Tax-Managed Wealth Appreciation Strategy | ||||||||||||||||
| Investments in Securities: | Level 1 | Level 2 | Level 3 | Total | ||||||||||||
Assets: | ||||||||||||||||
Common Stocks: | ||||||||||||||||
Financials | $ | 67,636,437 | $ | 51,364,926 | $ | – 0 | – | $ | 119,001,363 | |||||||
Consumer Discretionary | 65,243,365 | 34,284,176 | – 0 | – | 99,527,541 | |||||||||||
Information Technology | 60,864,165 | 13,922,489 | – 0 | – | 74,786,654 | |||||||||||
Health Care | 52,372,369 | 12,882,197 | – 0 | – | 65,254,566 | |||||||||||
Industrials | 29,786,963 | 30,255,357 | – 0 | – | 60,042,320 | |||||||||||
Consumer Staples | 27,756,780 | 27,928,769 | – 0 | – | 55,685,549 | |||||||||||
Energy | 33,604,405 | 8,019,854 | – 0 | – | 41,624,259 | |||||||||||
Materials | 7,088,439 | 9,788,278 | – 0 | – | 16,876,717 | |||||||||||
Telecommunication Services | 4,539,785 | 7,871,952 | – 0 | – | 12,411,737 | |||||||||||
Utilities | 7,480,413 | 3,199,453 | – 0 | – | 10,679,866 | |||||||||||
Investment Companies | 142,523,000 | – 0 | – | – 0 | – | 142,523,000 | ||||||||||
Warrants | 76,823 | 1,015,652 | – 0 | – | 1,092,475 | |||||||||||
Short-Term Investments | 11,983,373 | – 0 | – | – 0 | – | 11,983,373 | ||||||||||
|
|
|
|
|
|
|
| |||||||||
Total Investments in Securities | 510,956,317 | 200,533,103 | – 0 | – | 711,489,420 | |||||||||||
| ALLIANCEBERNSTEIN TAX-MANAGED WEALTH STRATEGIES • | 93 |
Notes to Financial Statements
| Investments in Securities: | Level 1 | Level 2 | Level 3 | Total | ||||||||||||
Other Financial Instruments*: | ||||||||||||||||
Assets: | ||||||||||||||||
Futures | $ | – 0 | – | $ | 31,894 | $ | – 0 | – | $ | 31,894 | # | |||||
Forward Currency Exchange Contracts | – 0 | – | 426,160 | – 0 | – | 426,160 | ||||||||||
Liabilities: | ||||||||||||||||
Forward Currency Exchange Contracts | – 0 | – | (626,537 | ) | – 0 | – | (626,537 | ) | ||||||||
|
|
|
|
|
|
|
| |||||||||
Total+ | $ | 510,956,317 | $ | 200,364,620 | $ | – 0 | – | $ | 711,320,937 | |||||||
|
|
|
|
|
|
|
| |||||||||
| Tax-Managed Balanced Wealth Strategy | ||||||||||||||||
| Investments in Securities: | Level 1 | Level 2 | Level 3 | Total | ||||||||||||
Assets: | ||||||||||||||||
Municipal Obligations | $ | – 0 | – | $ | 85,104,340 | $ | 1,321,479 | ^ | $ | 86,425,819 | ||||||
Common Stocks: | ||||||||||||||||
Financials | 6,264,324 | 4,889,222 | – 0 | – | 11,153,546 | |||||||||||
Consumer Discretionary | 6,371,923 | 3,250,207 | – 0 | – | 9,622,130 | |||||||||||
Information Technology | 5,941,302 | 1,313,752 | – 0 | – | 7,255,054 | |||||||||||
Health Care | 5,079,461 | 1,210,107 | – 0 | – | 6,289,568 | |||||||||||
Industrials | 2,898,896 | 2,842,788 | – 0 | – | 5,741,684 | |||||||||||
Consumer Staples | 2,744,503 | 2,654,558 | – 0 | – | 5,399,061 | |||||||||||
Energy | 2,971,791 | 754,696 | – 0 | – | 3,726,487 | |||||||||||
Materials | 693,712 | 880,397 | – 0 | – | 1,574,109 | |||||||||||
Telecommunication Services | 391,151 | 796,515 | – 0 | – | 1,187,666 | |||||||||||
Utilities | 752,720 | 272,061 | – 0 | – | 1,024,781 | |||||||||||
Investment Companies | 23,760,436 | – 0 | – | – 0 | – | 23,760,436 | ||||||||||
Warrants | 8,764 | 104,038 | – 0 | – | 112,802 | |||||||||||
Short-Term Investments | 8,034,055 | – 0 | – | – 0 | – | 8,034,055 | ||||||||||
|
|
|
|
|
|
|
| |||||||||
Total Investments in Securities | 65,913,038 | 104,072,681 | 1,321,479 | 171,307,198 | ||||||||||||
Other Financial Instruments*: | ||||||||||||||||
Assets: | ||||||||||||||||
Futures | – 0 | – | 1,239 | – 0 | – | 1,239 | # | |||||||||
Forward Currency Exchange Contracts | – 0 | – | 43,585 | – 0 | – | 43,585 | ||||||||||
Liabilities: | ||||||||||||||||
Forward Currency Exchange Contracts | – 0 | – | (61,642 | ) | – 0 | – | (61,642 | ) | ||||||||
Inflation (CPI) Swaps | – 0 | – | (229,462 | ) | – 0 | – | (229,462 | ) | ||||||||
|
|
|
|
|
|
|
| |||||||||
Total+ | $ | 65,913,038 | $ | 103,826,401 | $ | 1,321,479 | $ | 171,060,918 | ||||||||
|
|
|
|
|
|
|
| |||||||||
| 94 | • ALLIANCEBERNSTEIN TAX-MANAGED WEALTH STRATEGIES |
Notes to Financial Statements
| Tax-Managed Conservative Wealth Strategy | ||||||||||||||||
| Investments in Securities: | Level 1 | Level 2 | Level 3 | Total | ||||||||||||
Assets: | ||||||||||||||||
Municipal Obligations | $ | – 0 | – | $ | 41,287,033 | $ | – 0 | – | $ | 41,287,033 | ||||||
Common Stocks: | ||||||||||||||||
Financials | 1,463,298 | 1,114,001 | – 0 | – | 2,577,299 | |||||||||||
Consumer Discretionary | 1,453,862 | 758,501 | – 0 | – | 2,212,363 | |||||||||||
Information Technology | 1,380,000 | 311,021 | – 0 | – | 1,691,021 | |||||||||||
Health Care | 1,110,836 | 294,376 | – 0 | – | 1,405,212 | |||||||||||
Industrials | 653,418 | 695,066 | – 0 | – | 1,348,484 | |||||||||||
Consumer Staples | 624,935 | 645,133 | – 0 | – | 1,270,068 | |||||||||||
Energy | 741,866 | 182,385 | – 0 | – | 924,251 | |||||||||||
Materials | 208,551 | 212,899 | – 0 | – | 421,450 | |||||||||||
Telecommunication Services | 118,047 | 196,788 | – 0 | – | 314,835 | |||||||||||
Utilities | 160,585 | 70,567 | – 0 | – | 231,152 | |||||||||||
Investment Companies | 6,293,763 | – 0 | – | – 0 | – | 6,293,763 | ||||||||||
Warrants | 2,219 | 17,558 | – 0 | – | 19,777 | |||||||||||
Short-Term Investments | 2,481,354 | – 0 | – | – 0 | – | 2,481,354 | ||||||||||
|
|
|
|
|
|
|
| |||||||||
Total Investments in Securities | 16,692,734 | 45,785,328 | – 0 | – | 62,478,062 | |||||||||||
Other Financial Instruments*: | ||||||||||||||||
Assets: | ||||||||||||||||
Forward Currency Exchange Contracts | – 0 | – | 9,582 | – 0 | – | 9,582 | ||||||||||
Inflation (CPI) Swaps | – 0 | – | 226 | – 0 | – | 226 | ||||||||||
Liabilities: | ||||||||||||||||
Forward Currency Exchange Contracts | – 0 | – | (14,440 | ) | – 0 | – | (14,440 | ) | ||||||||
Inflation (CPI) Swaps | – 0 | – | (215,319 | ) | – 0 | – | (215,319 | ) | ||||||||
|
|
|
|
|
|
|
| |||||||||
Total+ | $ | 16,692,734 | $ | 45,565,377 | $ | – 0 | – | $ | 62,258,111 | |||||||
|
|
|
|
|
|
|
| |||||||||
| * | Other financial instruments are derivative instruments, such as futures, forwards and swaps, which are valued at the unrealized appreciation/depreciation on the instrument. |
| # | Only variation margin receivable/payable at period end is reported within the statement of assets and liabilities. This amount reflects cumulative appreciation/(depreciation) of futures contracts as reported in the portfolio of investments. |
| ^ | The Strategy held a security with zero market value at period end. |
| + | There were de minimis transfers under 1% of net assets between Level 1 and Level 2 during the reporting period. |
The Strategies recognize all transfers between levels of the fair value hierarchy assuming the financial instruments were transferred at the beginning of the reporting period.
| ALLIANCEBERNSTEIN TAX-MANAGED WEALTH STRATEGIES • | 95 |
Notes to Financial Statements
The following is a reconciliation of investments in which significant unobservable inputs (Level 3) were used in determining fair value.
Tax-Managed Wealth | Warrants | Corporates - Non- Investment Grades | Rights^^ | |||||||||
Balance as of 8/31/13 | $ | 233,437 | $ | 192,821 | $ | – 0 | – | |||||
Accrued discounts/(premiums) | – 0 | – | 320 | – 0 | – | |||||||
Realized gain (loss) | – 0 | – | (1,225 | ) | – 0 | – | ||||||
Change in unrealized appreciation/depreciation | – 0 | – | 2,626 | – 0 | – | |||||||
Purchases | – 0 | – | – 0 | – | ||||||||
Sales | – 0 | – | – 0 | – | – 0 | – | ||||||
Transfers in to Level 3 | – 0 | – | (194,542 | ) | – 0 | – | ||||||
Transfers out of Level 3 | (233,437 | ) | – 0 | – | – 0 | – | ||||||
|
|
|
|
|
| |||||||
Balance as of 2/28/14 | $ | – 0 | – | $ | – 0 | – | $ | – 0 | – | |||
|
|
|
|
|
| |||||||
Net change in unrealized appreciation/depreciationfrom Investments held as of 2/28/14* | $ | – 0 | – | $ | – 0 | – | $ | – 0 | – | |||
|
|
|
|
|
| |||||||
| Total | ||||||||||||
Balance as of 8/31/13 | $ | 426,258 | ||||||||||
Accrued discounts/(premiums) | 320 | |||||||||||
Realized gain (loss) | (1,225 | ) | ||||||||||
Change in unrealized appreciation/depreciation | 2,626 | |||||||||||
Purchases | – 0 | – | ||||||||||
Sales | – 0 | – | ||||||||||
Transfers in to Level 3 | (194,542 | ) | ||||||||||
Transfers out of Level 3 | (233,437 | ) | ||||||||||
|
| |||||||||||
Balance as of 2/28/14 | $ | – 0 | –+ | |||||||||
|
| |||||||||||
Net change in unrealized appreciation/depreciation from Investments held as of 2/28/14* | $ | – 0 | – | |||||||||
|
| |||||||||||
Tax-Managed Balanced | Municipal Obligations^ | Warrants | Corporates - Non- Investment Grades | |||||||||
Balance as of 8/31/13 | $ | 1,574,155 | $ | 22,411 | $ | 20,116 | ||||||
Accrued discounts/(premiums) | 1,645 | – 0 | – | 33 | ||||||||
Realized gain (loss) | (126,118 | ) | – 0 | – | (128 | ) | ||||||
Change in unrealized appreciation/depreciation | 127,245 | – 0 | – | 274 | ||||||||
Purchases | – 0 | – | – 0 | – | – 0 | – | ||||||
Sales | – 0 | – | – 0 | – | – 0 | – | ||||||
Transfers in to Level 3 | (255,448 | ) | – 0 | – | (20,295 | ) | ||||||
Transfers out of Level 3 | – 0 | – | (22,411 | ) | – 0 | – | ||||||
|
|
|
|
|
| |||||||
Balance as of 2/28/14 | $ | 1,321,479 | $ | – 0 | – | $ | – 0 | – | ||||
|
|
|
|
|
| |||||||
Net change in unrealized appreciation/depreciation from Investments held as of 2/28/14* | $ | 105,245 | $ | – 0 | – | $ | – 0 | – | ||||
|
|
|
|
|
| |||||||
| 96 | • ALLIANCEBERNSTEIN TAX-MANAGED WEALTH STRATEGIES |
Notes to Financial Statements
| Rights^^ | Total | |||||||||||
Balance as of 8/31/13 | $ | – 0 | – | $ | 1,616,682 | |||||||
Accrued discounts/(premiums) | – 0 | – | 1,678 | |||||||||
Realized gain (loss) | – 0 | – | (126,246 | ) | ||||||||
Change in unrealized appreciation/depreciation | – 0 | – | 127,519 | |||||||||
Purchases | – 0 | – | – 0 | – | ||||||||
Sales | – 0 | – | – 0 | – | ||||||||
Transfers in to Level 3 | – 0 | – | (275,743 | ) | ||||||||
Transfers out of Level 3 | – 0 | – | (22,411 | ) | ||||||||
|
|
|
| |||||||||
Balance as of 2/28/14 | $ | – 0 | – | $ | 1,321,479 | + | ||||||
|
|
|
| |||||||||
Net change in unrealized appreciation/depreciation from Investments held as of 2/28/14* | $ | – 0 | – | $ | 105,245 | |||||||
|
|
|
| |||||||||
Tax-Managed Conservative | Warrants | Corporates - Non- Investment Grades | Rights^^ | |||||||||
Balance as of 8/31/13 | $ | 21,611 | $ | 3,507 | $ | – 0 | – | |||||
Accrued discounts/(premiums) | – 0 | – | 6 | – 0 | – | |||||||
Realized gain (loss) | – 0 | – | (23 | ) | – 0 | – | ||||||
Change in unrealized appreciation/depreciation | – 0 | – | 48 | – 0 | – | |||||||
Purchases | – 0 | – | – 0 | – | – 0 | – | ||||||
Sales | – 0 | – | (3,538 | ) | – 0 | – | ||||||
Transfers in to Level 3 | – 0 | – | – 0 | – | – 0 | – | ||||||
Transfers out of Level 3 | (21,611 | ) | – 0 | – | – 0 | – | ||||||
|
|
|
|
|
| |||||||
Balance as of 2/28/14 | $ | – 0 | – | $ | – 0 | – | $ | – 0 | – | |||
|
|
|
|
|
| |||||||
Net change in unrealized appreciation/depreciation from Investments held as of 2/28/14* | $ | – 0 | – | $ | – 0 | – | $ | – 0 | – | |||
|
|
|
|
|
| |||||||
| Total | ||||||||||||
Balance as of 8/31/13 | $ | 25,118 | ||||||||||
Accrued discounts/(premiums) | 6 | |||||||||||
Realized gain (loss) | (23 | ) | ||||||||||
Change in unrealized appreciation/depreciation | 48 | |||||||||||
Purchases | – 0 | – | ||||||||||
Sales | (3,538 | ) | ||||||||||
Transfers in to Level 3 | – 0 | – | ||||||||||
Transfers out of Level 3 | (21,611 | ) | ||||||||||
|
| |||||||||||
Balance as of 2/28/14 | $ | – 0 | –+ | |||||||||
|
| |||||||||||
Net change in unrealized appreciation/depreciation from Investments held as of 2/28/14* | $ | – 0 | – | |||||||||
|
| |||||||||||
| ^^ | The security which had zero market value at year end is no longer held by the Strategy. |
| ^ | The Strategy held a security with zero market value at period end. |
| * | The unrealized appreciation/depreciation is included in net change in unrealized appreciation/depreciation of investments in the accompanying statement of operations. |
| + | There were de minimis transfers under 1% of net assets during the reporting period. |
| ALLIANCEBERNSTEIN TAX-MANAGED WEALTH STRATEGIES • | 97 |
Notes to Financial Statements
The Adviser has established a Valuation Committee (the “Committee”) which is responsible for overseeing the pricing and valuation of all securities held in the Strategies. The Committee operates under pricing and valuation policies and procedures established by the Adviser and approved by the Board, including pricing policies which set forth the mechanisms and processes to be employed on a daily basis to implement these policies and procedures. In particular, the pricing policies describe how to determine market quotations for securities and other instruments. The Committee’s responsibilities include: 1) fair value and liquidity determinations (and oversight of any third parties to whom any responsibility for fair value and liquidity determinations is delegated), and 2) regular monitoring of the Adviser’s pricing and valuation policies and procedures and modification or enhancement of these policies and procedures (or recommendation of the modification of these policies and procedures) as the Committee believes appropriate.
The Committee is also responsible for monitoring the implementation of the pricing policies by the Adviser’s Pricing Group (the “Pricing Group”) and a third party which performs certain pricing functions in accordance with the pricing policies. The Pricing Group is responsible for the oversight of the third party on a day-to-day basis. The Committee and the Pricing Group perform a series of activities to provide reasonable assurance of the accuracy of prices including: 1) periodic vendor due diligence meetings, review of methodologies, new developments and processes at vendors, 2) daily comparison of security valuation versus prior day for all securities that exceeded established thresholds, and 3) daily review of unpriced, stale, and variance reports with exceptions reviewed by senior management and the Committee.
In addition, several processes outside of the pricing process are used to monitor valuation issues including: 1) performance and performance attribution reports are monitored for anomalous impacts based upon benchmark performance, and 2) portfolio managers review all portfolios for performance and analytics (which are generated using the Adviser’s prices).
3. Currency Translation
Assets and liabilities denominated in foreign currencies and commitments under forward currency exchange contracts are translated into U.S. dollars at the mean of the quoted bid and ask prices of such currencies against the U.S. dollar. Purchases and sales of portfolio securities are translated into U.S. dollars at the rates of exchange prevailing when such securities were acquired or sold. Income and expenses are translated into U.S. dollars at rates of exchange prevailing when accrued.
Net realized gain or loss on foreign currency transactions represents foreign exchange gains and losses from sales and maturities of foreign fixed income investments, foreign currency exchange contracts, holding of foreign currencies, currency gains or losses realized between the trade and settlement dates on foreign investment transactions, and the difference between the amounts of dividends, interest
| 98 | • ALLIANCEBERNSTEIN TAX-MANAGED WEALTH STRATEGIES |
Notes to Financial Statements
and foreign withholding taxes recorded on the Strategies’ books and the U.S. dollar equivalent amounts actually received or paid. Net unrealized currency gains and losses from valuing foreign currency denominated assets and liabilities at period end exchange rates are reflected as a component of net unrealized appreciation or depreciation of foreign currency denominated assets and liabilities.
4. Taxes
It is each Strategy’s policy to meet the requirements of the Internal Revenue Code applicable to regulated investment companies and to distribute all of its investment company taxable income and net realized gains, if any, to shareholders. Therefore, no provisions for federal income or excise taxes are required. The Strategies may be subject to taxes imposed by countries in which they invest. Such taxes are generally based on income and/or capital gains earned or repatriated. Taxes are accrued and applied to net investment income, net realized gains and net unrealized appreciation/depreciation as such income and/or gains are earned.
In accordance with U.S. GAAP requirements regarding accounting for uncertainties in income taxes, management has analyzed the Strategies’ tax positions taken or expected to be taken on federal and state income tax returns for all open tax years (the current and the prior three tax years) and has concluded that no provision for income tax is required in the Strategies’ financial statements.
5. Investment Income and Investment Transactions
Dividend income is recorded on the ex-dividend date or as soon as the Strategies are informed of the dividend. Interest income is accrued daily. Investment transactions are accounted for on the date the securities are purchased or sold. Investment gains or losses are determined on the identified cost basis. The Strategies amortize premiums and accrete discounts as adjustments to interest income.
6. Class Allocations
All income earned and expenses incurred by the Strategies are borne on a pro-rata basis by each outstanding class of shares, based on the proportionate interest in the Strategy represented by the net assets of such class, except for class specific expenses which are allocated to the respective class. Expenses of the Trust are charged proportionately to each Strategy or based on other appropriate methods. Realized and unrealized gains and losses are allocated among the various share classes based on respective net assets.
7. Dividends and Distributions
Dividends and distributions to shareholders, if any, are recorded on the ex-dividend date. Income dividends and capital gains distributions are determined in accordance with federal tax regulations and may differ from those determined in accordance with U.S. GAAP. To the extent these differences are permanent, such amounts are reclassified within the capital accounts based on their federal tax basis treatment; temporary differences do not require such reclassification.
| ALLIANCEBERNSTEIN TAX-MANAGED WEALTH STRATEGIES • | 99 |
Notes to Financial Statements
NOTE B
Advisory Fee and Other Transactions with Affiliates
Under the terms of the investment advisory agreement, the Strategies pay the Adviser at the annual rates as follows:
| Average Daily Net Assets | ||||||||||||
| Tax-Managed Strategy | First $2.5 Billion | Next $2.5 Billion | In Excess of $5 Billion | |||||||||
Wealth Appreciation | .65 | % | .55 | % | .50 | % | ||||||
Balanced Wealth | .55 | % | .45 | % | .40 | % | ||||||
Conservative Wealth | .55 | % | .45 | % | .40 | % | ||||||
Such fees are accrued daily and paid monthly.
The Adviser has agreed to waive its fees and bear certain expenses to the extent necessary to limit total operating expenses on an annual basis as follows:
| Tax-Managed Strategy | Class A | Class B | Class C | Advisor Class | ||||||||||||
Conservative Wealth | 1.20 | % | 1.90 | % | 1.90 | % | .90 | % | ||||||||
For the six months ended February 28, 2014, such waiver/reimbursement amounted to $125,161 for the Tax-Managed Conservative Wealth Strategy.
The Strategies compensate AllianceBernstein Investor Services, Inc. (“ABIS”), a wholly-owned subsidiary of the Adviser, under a Transfer Agency Agreement for providing personnel and facilities to perform transfer agency services for the Strategies. ABIS may make payments to intermediaries that provide omnibus account services, sub-accounting services and/or networking services. Such compensation retained by ABIS amounted to $55,182, $37,603 and $14,278 for the Tax-Managed Wealth Appreciation Strategy, Tax-Managed Balanced Wealth Strategy and Tax-Managed Conservative Wealth Strategy, respectively, for the six months ended February 28, 2014.
The Strategies may invest in the AllianceBernstein Fixed-Income Shares, Inc.—Government STIF Portfolio (“Government STIF Portfolio”), an open-end management investment company managed by the Adviser. The Government STIF Portfolio is offered as a cash management option to mutual funds and other institutional accounts of the Adviser, and is not available for direct purchase by members of the public. The Government STIF Portfolio pays no investment management fees but does bear its own expenses. A summary of the Strategies’ transactions in shares of the Government STIF Portfolio for the six months ended February 28, 2014 is as follows:
| Tax-Managed Strategy | Market August 31, (000) | Purchases at Cost (000) | Sales Proceeds (000) | Market February 28, (000) | Dividend Income (000) | |||||||||||||||
Wealth Appreciation | $ | 7,244 | $ | 65,262 | $ | 60,523 | $ | 11,983 | $ | 6 | ||||||||||
Balanced Wealth | 1,732 | 33,706 | 27,404 | 8,034 | 2 | |||||||||||||||
Conservative Wealth | 1,377 | 9,934 | 8,830 | 2,481 | 1 | |||||||||||||||
| 100 | • ALLIANCEBERNSTEIN TAX-MANAGED WEALTH STRATEGIES |
Notes to Financial Statements
The Strategies may invest in the AllianceBernstein Pooling Portfolios—Volatility Management Portfolio (“Volatility Management Portfolio”), an open-end management investment company managed by the Adviser. A summary of the Strategies’ transactions in shares of the Volatility Management Portfolio for the six months ended February 28, 2014 is as follows:
| Tax-Managed Strategy | Market August 31, (000) | Purchases at Cost (000) | Sales Proceeds (000) | Realized Gain (000)* | Change in (Depreciation) (000) | Market February 28, (000) | Dividend Income (000) | |||||||||||||||||||||
Wealth Appreciation | $ | 127,468 | $ | 17,960 | $ | 7,417 | $ | 595 | $ | 3,917 | $ | 142,523 | $ | 9,131 | ||||||||||||||
Balanced Wealth | 21,982 | 5,590 | 4,626 | 227 | 587 | 23,760 | 1,635 | |||||||||||||||||||||
Conservative Wealth | 6,371 | 1,394 | 1,718 | 103 | 144 | 6,294 | 424 | |||||||||||||||||||||
| * | During the six months ended February 28, 2014, the Strategies had realized gain distributions from the Volatility Management Portfolio in the amounts of $4,057,425, $726,513 and $188,649 for the Tax-Managed Wealth Appreciation Strategy, Tax-Managed Balanced Wealth Strategy and Tax-Managed Conservative Wealth Strategy, respectively. |
AllianceBernstein Investments, Inc. (the “Distributor”), a wholly-owned subsidiary of the Adviser, serves as the distributor of the Strategies’ shares. The Distributor has advised the Strategies that it has retained front-end sales charges from the sale of Class A shares and received contingent deferred sales charges imposed upon redemptions by shareholders of Class A, Class B and Class C shares for each Strategy for the six months ended February 28, 2014 as follows:
| Front-End Sales Charges | Contingent Deferred Sales Charges | |||||||||||||||
| Tax-Managed Strategy | Class A | Class A | Class B | Class C | ||||||||||||
Wealth Appreciation | $ | 1,458 | $ | – 0 | – | $ | 1 | $ | 117 | |||||||
Balanced Wealth | 2,144 | 24 | 434 | 280 | ||||||||||||
Conservative Wealth | 418 | 14 | 259 | 264 | ||||||||||||
Brokerage commissions paid on investment transactions for the six months ended February 28, 2014 amounted to $218,894, $24,878 and $5,318 for the Tax-Managed Wealth Appreciation Strategy, Tax-Managed Balanced Wealth Strategy and Tax-Managed Conservative Wealth Strategy, respectively, of which $191 and $0; $27 and $0; and $6 and $0 were paid, respectively, to Sanford C. Bernstein & Co. LLC and Sanford C. Bernstein Limited, affiliates of the Adviser.
NOTE C
Distribution Plans
The Strategies have adopted a Plan for each class of shares of the Strategies pursuant to Rule 12b-1 under the Investment Company Act of 1940 (each a “Plan” and collectively the “Plans”). Under the Plans, the Strategies pay distribution
| ALLIANCEBERNSTEIN TAX-MANAGED WEALTH STRATEGIES • | 101 |
Notes to Financial Statements
and servicing fees to the Distributor at an annual rate of up to .50% of the Strategies’ average daily net assets attributable to Class A shares and 1% of the Strategies’ average daily net assets attributable to both Class B and Class C shares. There are no distribution and servicing fees on the Advisor Class shares. The fees are accrued daily and paid monthly. Payments under the Class A plan are currently limited to ..30% of the Strategies’ average daily net assets attributable to Class A shares. The Plans provide that the Distributor will use such payments in their entirety for distribution assistance and promotional activities. The Strategies are not obligated under the Plans to pay any distribution services fee in excess of the amounts set forth above. The purpose of the payments to the Distributor under the Plans is to compensate the Distributor for its distribution services with respect to the sale of the Strategies’ shares. Since the Distributor’s compensation is not directly tied to its expenses, the amount of compensation received by it under the Plan during any year may be more or less than its actual expenses. For this reason, the Plans are characterized by the staff of the Securities Exchange Commission as being a “compensation” plan.
In the event that a Plan is terminated or not continued, no distribution services fees (other than current amounts accrued but not yet paid) would be owed by the Strategies to the Distributor with respect to the relevant class. The Plans also provide that the Adviser may use its own resources to finance the distribution of the Strategies’ shares.
NOTE D
Investment Transactions
Purchases and sales of investment securities (excluding short-term investments) for the six months ended February 28, 2014, were as follows:
| Tax-Managed Strategy | Purchases | Sales | ||||||
Wealth Appreciation | $ | 167,246,387 | $ | 171,646,886 | ||||
Balanced Wealth | 49,473,681 | 51,868,736 | ||||||
Conservative Wealth | 8,294,874 | 13,536,169 | ||||||
There were no investment transactions in U.S. government securities during the six months ended February 28, 2014.
The cost of investments for federal income tax purposes was substantially the same as the cost for financial reporting purposes. Accordingly, gross unrealized appreciation and unrealized depreciation (excluding futures, foreign currency and swap transactions) are as follows:
| Gross Unrealized | Net Unrealized Appreciation | |||||||||||
Tax-Managed Strategy | Appreciation | (Depreciation) | ||||||||||
Wealth Appreciation | $ | 151,238,550 | $ | (9,197,685 | ) | $ | 142,040,865 | |||||
Balanced Wealth | 18,876,501 | (1,971,441 | ) | 16,905,060 | ||||||||
Conservative Wealth | 5,273,868 | (574,758 | ) | 4,699,110 | ||||||||
| 102 | • ALLIANCEBERNSTEIN TAX-MANAGED WEALTH STRATEGIES |
Notes to Financial Statements
1. Derivative Financial Instruments
The Strategies may use derivatives in an effort to earn income and enhance returns, to replace more traditional direct investments, to obtain exposure to otherwise inaccessible markets (collectively, “investment purposes”), or to hedge or adjust the risk profile of its portfolio.
The principal types of derivatives utilized by the Strategies, as well as the methods in which they may be used are:
| • | Futures |
The Strategies may buy or sell futures for investment purposes or for the purpose of hedging their portfolios against adverse effects of potential movements in the market. The Strategy bears the market risk that arises from changes in the value of these instruments and the imperfect correlation between movements in the price of the futures and movements in the price of the assets, reference rates or indices which they are designed to track. Among other things, the Strategies may purchase or sell futures for foreign currencies or options thereon for non-hedging purposes as a means of making direct investment in foreign currencies, as described below under “Currency Transactions”.
At the time the Strategy enters into futures, the Strategy deposits and maintains as collateral an initial margin with the broker, as required by the exchange on which the transaction is effected. Pursuant to the contract, the Strategy agrees to receive from or pay to the broker an amount of cash equal to the daily fluctuation in the value of the contract. Such receipts or payments are known as variation margin and are recorded by the Strategy as unrealized gains or losses. Risks may arise from the potential inability of a counterparty to meet the terms of the contract. The credit/counterparty risk for exchange-traded futures is generally less than privately negotiated futures, since the clearinghouse, which is the issuer or counterparty to each exchange-traded future, has robust risk mitigation standards, including the requirement to provide initial and variation margin. When the contract is closed, the Strategy records a realized gain or loss equal to the difference between the value of the contract at the time it was opened and the time it was closed.
Use of long futures subjects the Strategy to risk of loss in excess of the amounts shown on the statement of assets and liabilities, up to the notional value of the futures. Use of short futures subjects the Strategy to unlimited risk of loss. Under some circumstances, futures exchanges may establish daily limits on the amount that the price of futures can vary from the previous day’s settlement price, which could effectively prevent liquidation of unfavorable positions.
During the six months ended February 28, 2014, Tax-Managed Wealth Appreciation Strategy and Tax-Managed Balanced Wealth Strategy held futures for hedging purposes.
| ALLIANCEBERNSTEIN TAX-MANAGED WEALTH STRATEGIES • | 103 |
Notes to Financial Statements
| • | Forward Currency Exchange Contracts |
The Strategies may enter into forward currency exchange contracts in order to hedge their exposure to changes in foreign currency exchange rates on their foreign portfolio holdings, to hedge certain firm purchase and sale commitments denominated in foreign currencies and for non-hedging purposes as a means of making direct investments in foreign currencies, as described below under “Currency Transactions”.
A forward currency exchange contract is a commitment to purchase or sell a foreign currency at a future date at a negotiated forward rate. The gain or loss arising from the difference between the original contract and the closing of such contract would be included in net realized gain or loss on foreign currency transactions. Fluctuations in the value of open forward currency exchange contracts are recorded for financial reporting purposes as unrealized appreciation and/or depreciation by the Strategy. Risks may arise from the potential inability of a counterparty to meet the terms of a contract and from unanticipated movements in the value of a foreign currency relative to the U.S. dollar.
During the six months ended February 28, 2014, the Strategies held forward currency exchange contracts for hedging and non-hedging purposes.
| • | Swaps |
The Strategies may enter into swaps to hedge their exposure to interest rates, credit risk, or currencies. The Strategies may also enter into swaps for non-hedging purposes as a means of gaining market exposures, including by making direct investments in foreign currencies, as described below under “Currency Transactions”. A swap is an agreement that obligates two parties to exchange a series of cash flows at specified intervals based upon or calculated by reference to changes in specified prices or rates for a specified amount of an underlying asset. The payment flows are usually netted against each other, with the difference being paid by one party to the other. In addition, collateral may be pledged or received by the Strategy in accordance with the terms of the respective swaps to provide value and recourse to the Strategy or its counterparties in the event of default, bankruptcy or insolvency by one of the parties to the swap.
Risks may arise as a result of the failure of the counterparty to the swap to comply with the terms of the swap. The loss incurred by the failure of a counterparty is generally limited to the net interim payment to be received by the Strategy, and/or the termination value at the end of the contract. Therefore, the Strategy considers the creditworthiness of each counterparty to a swap in evaluating potential counterparty risk. This risk is mitigated by having a netting arrangement between the Strategy and the counterparty and by the posting of collateral by the counterparty to the Strategy to cover the Strategies’ exposure to the counterparty. Additionally, risks may
| 104 | • ALLIANCEBERNSTEIN TAX-MANAGED WEALTH STRATEGIES |
Notes to Financial Statements
arise from unanticipated movements in interest rates or in the value of the underlying securities. The Strategy accrues for the interim payments on swaps on a daily basis, with the net amount recorded within unrealized appreciation/depreciation of swaps on the statement of assets and liabilities, where applicable. Once the interim payments are settled in cash, the net amount is recorded as realized gain/(loss) on swaps on the statement of operations, in addition to any realized gain/(loss) recorded upon the termination of swaps. Upfront premiums paid or received are recognized as cost or proceeds on the statement of assets and liabilities and are amortized on a straight line basis over the life of the contract. Amortized upfront premiums are included in net realized gain/(loss) from swaps on the statement of operations. Fluctuations in the value of swaps are recorded as a component of net change in unrealized appreciation/depreciation of swaps on the statement of operations.
Inflation (CPI) Swaps:
Inflation swaps are contracts in which one party agrees to pay the cumulative percentage increase in a price index (the Consumer Price Index with respect to CPI swaps) over the term of the swap (with some lag on the inflation index), and the other pays a compounded fixed rate. Inflation swaps may be used to protect the net asset value, or NAV, of a Strategy against an unexpected change in the rate of inflation measured by an inflation index since the value of these agreements is expected to increase if unexpected inflation increases.
During the six months ended February 28, 2014, Tax-Managed Balanced Wealth Strategy and Tax-Managed Conservative Wealth Strategy held inflation (CPI) swaps for hedging purposes.
The Strategies typically enter into International Swaps and Derivatives Association, Inc. Master Agreements (“ISDA Master Agreement”) or similar master agreements (collectively, “Master Agreements”) with its OTC derivative contract counterparties in order to, among other things, reduce its credit risk to counterparties. ISDA Master Agreements include provisions for general obligations, representations, collateral and events of default or termination. Under an ISDA Master Agreement, the Strategies typically may offset with the counterparty certain derivative financial instrument’s payables and/or receivables with collateral held and/or posted and create one single net payment (close-out netting) in the event of default or termination.
Various Master Agreements govern the terms of certain transactions with counterparties, including transactions such as exchange-traded derivative transactions, repurchase and reverse repurchase agreements. These Master Agreements typically attempt to reduce the counterparty risk associated with such transactions by specifying credit protection mechanisms and providing standardization that improves legal certainty. Cross-termination provisions under Master Agreements typically provide that a default in connection with one transaction between the
| ALLIANCEBERNSTEIN TAX-MANAGED WEALTH STRATEGIES • | 105 |
Notes to Financial Statements
Strategy and a counterparty gives the non-defaulting party the right to terminate any other transactions in place with the defaulting party to create one single net payment due to/due from the defaulting party. In the event of a default by a Master Agreements counterparty, the return of collateral with market value in excess of the Strategies’ net liability, held by the defaulting party, may be delayed or denied.
The Strategies’ Master Agreements may contain provisions for early termination of OTC derivative transactions in the event the net assets of the Strategy decline below specific levels (“net asset contingent features”). If these levels are triggered, the Strategies’ counterparty has the right to terminate such transaction and require the Strategy to pay or receive a settlement amount in connection with the terminated transaction. As of February 28, 2014, the Strategies had OTC derivatives with contingent features in net liability positions in the amount of $501,955, $275,443 and $220,172 for the Tax-Managed Wealth Appreciation Strategy, Tax-Managed Balanced Wealth Strategy and Tax-Managed Conservative Wealth Strategy, respectively. If a trigger event had occurred at February 28, 2014, for those derivatives in a net liability position, $501,955, $275,443 and $220,172 would be required to be posted by the Tax-Managed Wealth Appreciation Strategy, Tax-Managed Balanced Wealth Strategy and Tax-Managed Conservative Wealth Strategy, respectively.
At February 28, 2014, the Strategies had entered into the following derivatives:
Tax-Managed Wealth Appreciation Strategy
| Asset Derivatives | Liability Derivatives | |||||||||||
| Derivative Type | Statement of Assets and Liabilities Location | Fair Value | Statement of Assets and Liabilities Location | Fair Value | ||||||||
Equity contracts | Receivable/ Payable for variation margin on futures | $ | 31,894 | * | ||||||||
Foreign exchange contracts | Unrealized |
| 426,160 |
| Unrealized | $ | 626,537 |
| ||||
|
|
|
| |||||||||
Total | $ | 458,054 | $ | 626,537 | ||||||||
|
|
|
| |||||||||
| * | Only variation margin receivable/payable at period end is reported within the statement of assets and liabilities. This amount reflects cumulative appreciation/(depreciation) of exchange-traded derivatives as reported in the portfolio of investments. |
| 106 | • ALLIANCEBERNSTEIN TAX-MANAGED WEALTH STRATEGIES |
Notes to Financial Statements
The effect of derivative instruments on the statement of operations for the six months ended February 28, 2014:
Derivative Type | Location of Gain or (Loss) on Derivatives | Realized Gain or (Loss) on Derivatives | Change in Unrealized Appreciation or (Depreciation) | |||||||
Equity contracts | Net realized gain (loss) on futures; Net change in unrealized appreciation/depreciation of futures | $ | 80,507 | $ | 24,947 | |||||
Foreign exchange contracts | Net realized gain (loss) on foreign currency transactions; Net change in unrealized appreciation/depreciation of foreign currency denominated assets and liabilities | (159,758 | ) | (180,163 | ) | |||||
|
|
|
| |||||||
Total | $ | (79,251 | ) | $ | (155,216 | ) | ||||
|
|
|
| |||||||
Tax-Managed Balanced Wealth Strategy
| Asset Derivatives | Liability Derivatives | |||||||||||
| Derivative Type | Statement of Assets and Liabilities Location | Fair Value | Statement of Assets and Liabilities Location | Fair Value | ||||||||
Equity contracts | Receivable/ Payable for variation margin on futures | $ | 1,239 | * | ||||||||
Foreign exchange contracts | Unrealized |
| 43,585 |
| Unrealized | $ | 61,642 |
| ||||
Interest rate contracts | Unrealized depreciation on inflation swaps | 229,462 | ||||||||||
|
|
|
| |||||||||
Total | $ | 44,824 | $ | 291,104 | ||||||||
|
|
|
| |||||||||
| * | Only variation margin receivable/payable at period end is reported within the statement of assets and liabilities. This amount reflects cumulative appreciation/(depreciation) of exchange-traded derivatives as reported in the portfolio of investments. |
| ALLIANCEBERNSTEIN TAX-MANAGED WEALTH STRATEGIES • | 107 |
Notes to Financial Statements
The effect of derivative instruments on the statement of operations for the six months ended February 28, 2014:
Derivative Type | Location of Gain or (Loss) on | Realized Gain or (Loss) on Derivatives | Change in Unrealized Appreciation or (Depreciation) | |||||||
Equity contracts | Net realized gain (loss) on futures; Net change in unrealized appreciation/depreciation of futures | $ | 6,421 | $ | 705 | |||||
Foreign exchange contracts | Net realized gain (loss) on foreign currency transactions; Net change in unrealized appreciation/depreciation of foreign currency denominated assets and liabilities | (19,659 | ) | (16,555 | ) | |||||
Interest rate contracts | Net realized gain (loss) on swaps; Net change in unrealized appreciation/depreciation of swaps | – 0 | – | (8,222 | ) | |||||
|
|
|
| |||||||
Total | $ | (13,238 | ) | $ | (24,072 | ) | ||||
|
|
|
| |||||||
Tax-Managed Conservative Wealth Strategy
| Asset Derivatives | Liability Derivatives | |||||||||||
| Derivative Type | Statement of Assets and Liabilities Location | Fair Value | Statement of Assets and Liabilities Location | Fair Value | ||||||||
Foreign exchange contracts | Unrealized appreciation of forward currency exchange contracts | $ | 9,582 | Unrealized depreciation of forward currency exchange contracts | $ | 14,440 | ||||||
Interest rate contracts | Unrealized appreciation on inflation swaps | 226 | Unrealized depreciation on inflation swaps | 215,319 | ||||||||
|
|
|
| |||||||||
Total | $ | 9,808 | $ | 229,759 | ||||||||
|
|
|
| |||||||||
| 108 | • ALLIANCEBERNSTEIN TAX-MANAGED WEALTH STRATEGIES |
Notes to Financial Statements
The effect of derivative instruments on the statement of operations for the six months ended February 28, 2014:
Derivative Type | Location of Gain or (Loss) on Derivatives | Realized Gain or (Loss) on Derivatives | Change in Unrealized Appreciation or (Depreciation) | |||||||
Foreign exchange contracts | Net realized gain (loss) on foreign currency transactions; Net change in unrealized appreciation/depreciation of foreign currency denominated assets and liabilities | $ | (7,700 | ) | $ | (4,048 | ) | |||
Interest rate contracts | Net realized gain (loss) on swaps; Net change in unrealized appreciation/depreciation of swaps | – 0 | – | (13,065 | ) | |||||
|
|
|
| |||||||
Total | $ | (7,700 | ) | $ | (17,113 | ) | ||||
|
|
|
| |||||||
The following tables represent the volume of the Strategies’ derivative transactions during the six months ended February 28, 2014:
Tax-Managed Wealth Appreciation Strategy | ||||
Futures: | ||||
Average original value of buy contracts | $ | 789,477 | ||
Forward Currency Exchange Contracts: | ||||
Average principal amount of buy contracts | $ | 50,786,733 | ||
Average principal amount of sale contracts | $ | 58,178,658 | ||
Tax-Managed Balanced Wealth Strategy | ||||
Futures: | ||||
Average original value of buy contracts | $ | 63,924 | ||
Forward Currency Exchange Contracts: | ||||
Average principal amount of buy contracts | $ | 5,259,186 | ||
Average principal amount of sale contracts | $ | 6,018,189 | ||
Inflation Swaps: | ||||
Average notional amount | $ | 12,328,571 | ||
Tax-Managed Conservative Wealth Strategy | ||||
Forward Currency Exchange Contracts: | ||||
Average principal amount of buy contracts | $ | 1,236,642 | ||
Average principal amount of sale contracts | $ | 1,438,934 | ||
Inflation Swaps: | ||||
Average notional amount | $ | 5,728,571 |
For financial reporting purposes, the Strategies do not offset derivative assets and derivative liabilities that are subject to netting arrangements in the statement of assets and liabilities.
| ALLIANCEBERNSTEIN TAX-MANAGED WEALTH STRATEGIES • | 109 |
Notes to Financial Statements
All derivatives held during the reporting period were subject to netting arrangements. The following tables present the Strategies’ derivative assets and liabilities by counterparty net of amounts available for offset under Master Agreements (“MA”) and net of the related collateral received/ pledged by the Strategies as of February 28, 2014:
Tax-Managed Wealth Appreciation Strategy
| Counterparty | Derivative Assets Subject to MA | Derivative for Offset | Collateral Received | Net Amount of Derivatives Assets | ||||||||||||
BNP Paribas SA | $ | 171,555 | $ | (92,904 | ) | $ | – 0 | – | $ | 78,651 | ||||||
Credit Suisse International | 8,044 | – 0 | – | – 0 | – | 8,044 | ||||||||||
Exchange-Traded Goldman Sachs Co.* | 216 | – 0 | – | – 0 | – | 216 | ||||||||||
Morgan Stanley & Co., Inc. | 12,959 | (12,959 | ) | – 0 | – | – 0 | – | |||||||||
Standard Chartered Bank | 10,095 | – 0 | – | – 0 | – | 10,095 | ||||||||||
State Street Bank & Trust Co. | 202,892 | (18,719 | ) | – 0 | – | 184,173 | ||||||||||
UBS AG | 20,615 | – 0 | – | – 0 | – | 20,615 | ||||||||||
|
|
|
|
|
|
|
| |||||||||
Total | $ | 426,376 | $ | (124,582 | ) | $ | – 0 | – | $ | 301,794 | ||||||
|
|
|
|
|
|
|
| |||||||||
| Counterparty | Derivative Liabilities Subject to MA | Derivative Available for Offset | Collateral Pledged | Net Amount of Derivatives Liabilities | ||||||||||||
BNP Paribas SA | $ | 92,904 | $ | (92,904 | ) | $ | – 0 | – | $ | – 0 | – | |||||
Goldman Sachs Bank USA | 34,429 | – 0 | – | – 0 | – | 34,429 | ||||||||||
HSBC Bank USA | 120,542 | – 0 | – | – 0 | – | 120,542 | ||||||||||
Morgan Stanley & Co., Inc. | 35,419 | (12,959 | ) | – 0 | – | 22,460 | ||||||||||
Royal Bank of Scotland PLC | 324,524 | – 0 | – | – 0 | – | 324,524 | ||||||||||
State Street Bank & Trust Co. | 18,719 | (18,719 | ) | – 0 | – | – 0 | – | |||||||||
|
|
|
|
|
|
|
| |||||||||
Total | $ | 626,537 | $ | (124,582 | ) | $ | – 0 | – | $ | 501,955 | ||||||
|
|
|
|
|
|
|
| |||||||||
| * | Cash has been posted for initial margin requirements for open futures outstanding at February 28, 2014. |
| 110 | • ALLIANCEBERNSTEIN TAX-MANAGED WEALTH STRATEGIES |
Notes to Financial Statements
Tax-Managed Balanced Wealth Strategy
| Counterparty | Derivative Assets Subject to MA | Derivative Available for Offset | Collateral Received | Net Amount of Derivatives Assets | ||||||||||||
BNP Paribas SA | $ | 9,402 | $ | (8,840 | ) | $ | – 0 | – | $ | 562 | ||||||
Exchange-Traded Goldman Sachs Co.* | 8 | – 0 | – | – 0 | – | 8 | ||||||||||
Standard Chartered Bank | 1,004 | – 0 | – | – 0 | – | 1,004 | ||||||||||
State Street Bank & Trust Co. | 33,179 | (6,821 | ) | – 0 | – | 26,358 | ||||||||||
|
|
|
|
|
|
|
| |||||||||
Total | $ | 43,593 | $ | (15,661 | ) | $ | – 0 | – | $ | 27,932 | ||||||
|
|
|
|
|
|
|
| |||||||||
| Counterparty | Derivative Liabilities Subject to MA | Derivative Available for Offset | Collateral Pledged | Net Amount of Derivatives Liabilities | ||||||||||||
Barclays Bank PLC | $ | 101,220 | $ | – 0 | – | $ | – 0 | – | $ | 101,220 | ||||||
BNP Paribas SA | 8,840 | (8,840 | ) | – 0 | – | – 0 | – | |||||||||
Citibank, NA | 7,950 | – 0 | – | – 0 | – | 7,950 | ||||||||||
Goldman Sachs International | 111,639 | – 0 | – | – 0 | – | 111,639 | ||||||||||
HSBC Bank USA | 12,001 | – 0 | – | – 0 | – | 12,001 | ||||||||||
Morgan Stanley & Co., Inc. | 981 | – 0 | – | – 0 | – | 981 | ||||||||||
Morgan Stanley Capital Services LLC | 8,653 | – 0 | – | – 0 | – | 8,653 | ||||||||||
Royal Bank of Scotland PLC | 32,999 | – 0 | – | – 0 | – | 32,999 | ||||||||||
State Street Bank & Trust Co. | 6,821 | (6,821 | ) | – 0 | – | – 0 | – | |||||||||
|
|
|
|
|
|
|
| |||||||||
Total | $ | 291,104 | $ | (15,661 | ) | $ | – 0 | – | $ | 275,443 | ||||||
|
|
|
|
|
|
|
| |||||||||
| * | Cash has been posted for initial margin requirements for open futures outstanding at February 28, 2014. |
Tax-Managed Conservative Wealth Strategy
| Counterparty | Derivative Assets Subject to MA | Derivative Available for Offset | Collateral Received | Net Amount of Derivatives Assets | ||||||||||||
Barclays Bank PLC | $ | 226 | $ | (226 | ) | $ | – 0 | – | $ | – 0 | – | |||||
Standard Chartered Bank | 221 | – 0 | – | – 0 | – | 221 | ||||||||||
State Street Bank & Trust Co. | 9,361 | (9,361 | ) | – 0 | – | – 0 | – | |||||||||
|
|
|
|
|
|
|
| |||||||||
Total | $ | 9,808 | $ | (9,587 | ) | $ | – 0 | – | $ | 221 | ||||||
|
|
|
|
|
|
|
| |||||||||
| ALLIANCEBERNSTEIN TAX-MANAGED WEALTH STRATEGIES • | 111 |
Notes to Financial Statements
| Counterparty | Derivative Liabilities Subject to MA | Derivative Available for Offset | Collateral Pledged | Net Amount of Derivatives Liabilities | ||||||||||||
Barclays Bank PLC | $ | 163,639 | $ | (226 | ) | $ | – 0 | – | $ | 163,413 | ||||||
Barclays Bank PLC Wholesale | 38 | – 0 | – | – 0 | – | 38 | ||||||||||
Citibank, NA | 1,383 | – 0 | – | – 0 | – | 1,383 | ||||||||||
Morgan Stanley Capital Services LLC | 50,297 | – 0 | – | – 0 | – | 50,297 | ||||||||||
State Street Bank & Trust Co. | 14,402 | (9,361 | ) | – 0 | – | 5,041 | ||||||||||
|
|
|
|
|
|
|
| |||||||||
Total | $ | 229,759 | $ | (9,587 | ) | $ | – 0 | – | $ | 220,172 | ||||||
|
|
|
|
|
|
|
| |||||||||
2. Currency Transactions
The Strategies may invest in non-U.S. dollar securities on a currency hedged or unhedged basis. The Strategies may seek investment opportunities by taking long or short positions in currencies through the use of currency-related derivatives, including forward currency exchange contracts, futures and options on futures, swaps, and other options. The Strategies may enter into transactions for investment opportunities when it anticipates that a foreign currency will appreciate or depreciate in value but securities denominated in that currency are not held by the Strategies and do not present attractive investment opportunities. Such transactions may also be used when the Adviser believes that it may be more efficient than a direct investment in a foreign currency-denominated security. The Strategies may also conduct currency exchange contracts on a spot basis (i.e., for cash at the spot rate prevailing in the currency exchange market for buying or selling currencies).
NOTE E
Shares of Beneficial Interest
Transactions in shares of beneficial interest for each class were as follows:
| Tax-Managed Wealth Appreciation Strategy | ||||||||||||||||||||
| Shares | Amount | |||||||||||||||||||
| Six Months Ended February 28, 2014 (unaudited) | Year Ended August 31, 2013 | Six Months Ended February 28, 2014 (unaudited) | Year Ended August 31, 2013 | |||||||||||||||||
|
|
|
|
|
|
|
|
| ||||||||||||
| Class A | ||||||||||||||||||||
Shares sold | 94,486 | 137,172 | $ | 1,419,555 | $ | 1,801,198 | ||||||||||||||
| ||||||||||||||||||||
Shares issued in reinvestment of dividends | 45,276 | 14,317 | 670,981 | 175,963 | ||||||||||||||||
| ||||||||||||||||||||
Shares converted from Class B | 35,176 | 76,051 | 521,657 | 969,490 | ||||||||||||||||
| ||||||||||||||||||||
Shares redeemed | (140,552 | ) | (740,597 | ) | (2,109,759 | ) | (9,606,310 | ) | ||||||||||||
| ||||||||||||||||||||
Net increase (decrease) | 34,386 | (513,057 | ) | $ | 502,434 | $ | (6,659,659 | ) | ||||||||||||
| ||||||||||||||||||||
| 112 | • ALLIANCEBERNSTEIN TAX-MANAGED WEALTH STRATEGIES |
Notes to Financial Statements
| Tax-Managed Wealth Appreciation Strategy | ||||||||||||||||||||
| Shares | Amount | |||||||||||||||||||
| Six Months Ended February 28, 2014 (unaudited) | Year Ended August 31, 2013 | Six Months Ended February 28, 2014 (unaudited) | Year Ended August 31, 2013 | |||||||||||||||||
|
|
|
|
|
|
|
|
| ||||||||||||
| Class B | ||||||||||||||||||||
Shares sold | 2,621 | 6,117 | $ | 38,218 | $ | 80,019 | ||||||||||||||
| ||||||||||||||||||||
Shares issued in reinvestment of dividends | 1,904 | – 0 | – | 27,895 | – 0 | – | ||||||||||||||
| ||||||||||||||||||||
Shares converted to Class A | (35,804 | ) | (77,267 | ) | (521,657 | ) | (969,490 | ) | ||||||||||||
| ||||||||||||||||||||
Shares redeemed | (9,039 | ) | (76,572 | ) | (134,141 | ) | (962,482 | ) | ||||||||||||
| ||||||||||||||||||||
Net decrease | (40,318 | ) | (147,722 | ) | $ | (589,685 | ) | $ | (1,851,953 | ) | ||||||||||
| ||||||||||||||||||||
| Class C | ||||||||||||||||||||
Shares sold | 37,079 | 46,505 | $ | 548,461 | $ | 618,741 | ||||||||||||||
| ||||||||||||||||||||
Shares issued in reinvestment of dividends | 11,838 | – 0 | – | 173,309 | – 0 | – | ||||||||||||||
| ||||||||||||||||||||
Shares redeemed | (145,010 | ) | (400,297 | ) | (2,119,514 | ) | (5,095,211 | ) | ||||||||||||
| ||||||||||||||||||||
Net decrease | (96,093 | ) | (353,792 | ) | $ | (1,397,744 | ) | $ | (4,476,470 | ) | ||||||||||
| ||||||||||||||||||||
| Advisor Class | ||||||||||||||||||||
Shares sold | 3,829,228 | 11,063,176 | $ | 57,940,876 | $ | 144,189,574 | ||||||||||||||
| ||||||||||||||||||||
Shares issued in reinvestment of dividends | 843,970 | 352,742 | 12,532,959 | 4,345,774 | ||||||||||||||||
| ||||||||||||||||||||
Shares redeemed | (4,721,003 | ) | (15,760,286 | ) | (71,005,694 | ) | (205,936,309 | ) | ||||||||||||
| ||||||||||||||||||||
Net decrease | (47,805 | ) | (4,344,368 | ) | $ | (531,859 | ) | $ | (57,400,961 | ) | ||||||||||
| ||||||||||||||||||||
| Tax-Managed Balanced Wealth Strategy | ||||||||||||||||||||
| Shares | Amount | |||||||||||||||||||
| Six Months Ended February 28, 2014 (unaudited) | Year Ended 2013 | Six Months Ended February 28, 2014 (unaudited) | Year Ended 2013 | |||||||||||||||||
|
| |||||||||||||||||||
| Class A | ||||||||||||||||||||
Shares sold | 351,596 | 399,501 | $ | 4,737,093 | $ | 5,168,158 | ||||||||||||||
| ||||||||||||||||||||
Shares issued in reinvestment of dividends | 40,233 | 81,311 | 534,977 | 1,030,948 | ||||||||||||||||
| ||||||||||||||||||||
Shares converted from Class B | 77,897 | 237,704 | 1,042,866 | 3,032,445 | ||||||||||||||||
| ||||||||||||||||||||
Shares redeemed | (604,737 | ) | (1,737,125 | ) | (8,144,140 | ) | (22,153,871 | ) | ||||||||||||
| ||||||||||||||||||||
Net decrease | (135,011 | ) | (1,018,609 | ) | $ | (1,829,204 | ) | $ | (12,922,320 | ) | ||||||||||
| ||||||||||||||||||||
| ALLIANCEBERNSTEIN TAX-MANAGED WEALTH STRATEGIES • | 113 |
Notes to Financial Statements
| Tax-Managed Balanced Wealth Strategy | ||||||||||||||||||||
| Shares | Amount | |||||||||||||||||||
| Six Months Ended February 28, 2014 (unaudited) | Year Ended 2013 | Six Months Ended February 28, 2014 (unaudited) | Year Ended 2013 | |||||||||||||||||
|
| |||||||||||||||||||
| Class B | ||||||||||||||||||||
Shares sold | 5,376 | 12,496 | $ | 72,344 | $ | 159,206 | ||||||||||||||
| ||||||||||||||||||||
Shares issued in reinvestment of dividends | 1,000 | 2,960 | 13,404 | 37,457 | ||||||||||||||||
| ||||||||||||||||||||
Shares converted to Class A | (77,646 | ) | (237,146 | ) | (1,042,866 | ) | (3,032,445 | ) | ||||||||||||
| ||||||||||||||||||||
Shares redeemed | (44,187 | ) | (156,407 | ) | (595,742 | ) | (1,996,816 | ) | ||||||||||||
| ||||||||||||||||||||
Net decrease | (115,457 | ) | (378,097 | ) | $ | (1,552,860 | ) | $ | (4,832,598 | ) | ||||||||||
| ||||||||||||||||||||
| Class C | ||||||||||||||||||||
Shares sold | 64,915 | 136,556 | $ | 881,606 | $ | 1,752,884 | ||||||||||||||
| ||||||||||||||||||||
Shares issued in reinvestment of dividends | 5,092 | 10,728 | 68,268 | 136,303 | ||||||||||||||||
| ||||||||||||||||||||
Shares redeemed | (149,579 | ) | (681,657 | ) | (2,022,188 | ) | (8,687,394 | ) | ||||||||||||
| ||||||||||||||||||||
Net decrease | (79,572 | ) | (534,373 | ) | $ | (1,072,314 | ) | $ | (6,798,207 | ) | ||||||||||
| ||||||||||||||||||||
| Advisor Class | ||||||||||||||||||||
Shares sold | 445,910 | 853,637 | $ | 6,018,263 | $ | 10,924,268 | ||||||||||||||
| ||||||||||||||||||||
Shares issued in reinvestment of dividends | 13,518 | 21,204 | 179,881 | 269,509 | ||||||||||||||||
| ||||||||||||||||||||
Shares redeemed | (177,944 | ) | (574,659 | ) | (2,412,992 | ) | (7,350,986 | ) | ||||||||||||
| ||||||||||||||||||||
Net increase | 281,484 | 300,182 | $ | 3,785,152 | $ | 3,842,791 | ||||||||||||||
| ||||||||||||||||||||
| Tax-Managed Conservative Wealth Strategy | ||||||||||||||||||||
| Shares | Amount | |||||||||||||||||||
| Six Months Ended February 28, 2014 (unaudited) | Year Ended 2013 | Six Months Ended February 28, 2014 (unaudited) | Year Ended 2013 | |||||||||||||||||
|
|
|
|
|
|
|
|
| ||||||||||||
| Class A | ||||||||||||||||||||
Shares sold | 117,413 | 405,466 | $ | 1,372,019 | $ | 4,643,955 | ||||||||||||||
| ||||||||||||||||||||
Shares issued in reinvestment of dividends and distributions | 96,460 | 25,486 | 1,107,951 | 289,777 | ||||||||||||||||
| ||||||||||||||||||||
Shares converted from Class B | 38,177 | 110,183 | 443,604 | 1,255,957 | ||||||||||||||||
| ||||||||||||||||||||
Shares redeemed | (459,311 | ) | (1,017,763 | ) | (5,371,521 | ) | (11,653,164 | ) | ||||||||||||
| ||||||||||||||||||||
Net decrease | (207,261 | ) | (476,628 | ) | $ | (2,447,947 | ) | $ | (5,463,475 | ) | ||||||||||
| ||||||||||||||||||||
| 114 | • ALLIANCEBERNSTEIN TAX-MANAGED WEALTH STRATEGIES |
Notes to Financial Statements
| Tax-Managed Conservative Wealth Strategy | ||||||||||||||||||||
| Shares | Amount | |||||||||||||||||||
| Six Months Ended February 28, 2014 (unaudited) | Year Ended 2013 | Six Months Ended February 28, 2014 (unaudited) | Year Ended 2013 | |||||||||||||||||
|
| |||||||||||||||||||
| Class B | ||||||||||||||||||||
Shares sold | 3,146 | 6,621 | $ | 37,353 | $ | 78,242 | ||||||||||||||
| ||||||||||||||||||||
Shares issued in reinvestment of dividends and distributions | 4,687 | 414 | 55,395 | 4,830 | ||||||||||||||||
| ||||||||||||||||||||
Shares converted to Class A | (37,116 | ) | (107,077 | ) | (443,604 | ) | (1,255,957 | ) | ||||||||||||
| ||||||||||||||||||||
Shares redeemed | (28,230 | ) | (73,416 | ) | (340,831 | ) | (867,038 | ) | ||||||||||||
| ||||||||||||||||||||
Net decrease | (57,513 | ) | (173,458 | ) | $ | (691,687 | ) | $ | (2,039,923 | ) | ||||||||||
| ||||||||||||||||||||
| Class C | ||||||||||||||||||||
Shares sold | 42,432 | 93,441 | $ | 507,259 | $ | 1,103,077 | ||||||||||||||
| ||||||||||||||||||||
Shares issued in reinvestment of dividends and distributions | 30,490 | 2,198 | 360,706 | 25,651 | ||||||||||||||||
| ||||||||||||||||||||
Shares redeemed | (126,388 | ) | (387,621 | ) | (1,521,648 | ) | (4,577,112 | ) | ||||||||||||
| ||||||||||||||||||||
Net decrease | (53,466 | ) | (291,982 | ) | $ | (653,683 | ) | $ | (3,448,384 | ) | ||||||||||
| ||||||||||||||||||||
| Advisor Class | ||||||||||||||||||||
Shares sold | 113,169 | 151,780 | $ | 1,324,605 | $ | 1,746,921 | ||||||||||||||
| ||||||||||||||||||||
Shares issued in reinvestment of dividends and distributions | 16,155 | 4,114 | 185,909 | 46,927 | ||||||||||||||||
| ||||||||||||||||||||
Shares redeemed | (101,662 | ) | (95,081 | ) | (1,181,107 | ) | (1,100,586 | ) | ||||||||||||
| ||||||||||||||||||||
Net increase | 27,662 | 60,813 | $ | 329,407 | $ | 693,262 | ||||||||||||||
| ||||||||||||||||||||
NOTE F
Risks Involved in Investing in the Strategies
Interest Rate Risk and Credit Risk—Interest rate risk is the risk that changes in interest rates will affect the value of the Strategies’ investments in fixed-income debt securities such as bonds or notes. Increases in interest rates may cause the value of the Strategies’ investments to decline. Credit risk is the risk that the issuer or guarantor of a debt security, or the counterparty to a derivative contract, will be unable or unwilling to make timely principal and/or interest payments, or to otherwise honor its obligations. The degree of risk for a particular security may be reflected in its credit risk rating. Credit risk is greater for medium quality and lower-rated securities. Lower-rated debt securities and similar unrated securities (commonly known as “junk bonds”) have speculative elements or are predominantly speculative risks.
| ALLIANCEBERNSTEIN TAX-MANAGED WEALTH STRATEGIES • | 115 |
Notes to Financial Statements
Foreign Securities Risk—Investing in securities of foreign companies or foreign governments involves special risks which include changes in foreign currency exchange rates and the possibility of future political and economic developments which could adversely affect the value of such securities. Moreover, securities of many foreign companies or foreign governments and their markets may be less liquid and their prices more volatile than those of comparable U.S. companies or of the U.S. government.
Currency Risk—This is the risk that changes in foreign currency exchange rates may negatively affect the value of the Strategies’ investments or reduce the returns of the Strategies. For example, the value of the Strategies’ investments in foreign currency-denominated securities or currencies may decrease if the U.S. dollar is strong (i.e., gaining value relative to other currencies) and other currencies are weak (i.e., losing value relative to the U.S. dollar). Currency markets are generally not as regulated as securities markets. Independent of the Strategies’ investments denominated in foreign currencies, the Strategies’ positions in various foreign currencies may cause the Strategies to experience investment losses due to the changes in exchange rates and interest rates.
Derivatives Risk—The Strategies may enter into derivative transactions such as forwards, options, futures and swaps. Derivatives may be illiquid, difficult to price, and leveraged so that small changes may produce disproportionate losses for the Strategies, and subject to counterparty risk to a greater degree than more traditional investments. Derivatives may result in significant losses, including losses that are far greater than the value of the derivatives reflected in the statement of assets and liabilities.
Indemnification Risk—In the ordinary course of business, the Strategies enter into contracts that contain a variety of indemnifications. The Strategies’ maximum exposure under these arrangements is unknown. However, the Strategies have not had prior claims or losses pursuant to these indemnification provisions and expect the risk of loss thereunder to be remote. Therefore, the Strategies have not accrued any liability in connection with these indemnification provisions.
NOTE G
Joint Credit Facility
A number of open-end mutual funds managed by the Adviser, including the Strategies, participate in a $140 million revolving credit facility (the “Facility”) intended to provide short-term financing, if necessary, subject to certain restrictions in connection with abnormal redemption activity. Commitment fees related to the Facility are paid by the participating funds and are included in miscellaneous expenses in the statement of operations. The Strategies did not utilize the Facility during the six months ended February 28, 2014.
| 116 | • ALLIANCEBERNSTEIN TAX-MANAGED WEALTH STRATEGIES |
Notes to Financial Statements
NOTE H
Distributions to Shareholders
The tax character of distributions to be paid for the year ending August 30, 2014 will be determined at the end of the current fiscal year. The tax character of distributions paid during the fiscal years ended August 31, 2013 and August 31, 2012 were as follows:
| Tax-Managed Wealth Appreciation Strategy | 2013 | 2012 | ||||||
Distributions paid from: | ||||||||
Ordinary income | $ | 5,205,901 | $ | 9,038,732 | ||||
|
|
|
| |||||
Total taxable distributions | 5,205,901 | 9,038,732 | ||||||
|
|
|
| |||||
Total distributions paid | $ | 5,205,901 | $ | 9,038,732 | ||||
|
|
|
| |||||
| Tax-Managed Balanced Wealth Strategy | 2013 | 2012 | ||||||
Distributions paid from: | ||||||||
Ordinary income | $ | 529,744 | $ | 1,225,550 | ||||
|
|
|
| |||||
Total taxable distributions | 529,744 | 1,225,550 | ||||||
Tax exempt distributions | 1,187,125 | 1,730,112 | ||||||
|
|
|
| |||||
Total distributions paid | $ | 1,716,869 | $ | 2,955,662 | ||||
|
|
|
| |||||
| Tax-Managed Conservative Wealth Strategy | 2013 | 2012 | ||||||
Distributions paid from: | ||||||||
Ordinary income | $ | 171,724 | $ | 447,554 | ||||
|
|
|
| |||||
Total taxable distributions | 171,724 | 447,554 | ||||||
Tax exempt distributions | 252,551 | 506,208 | ||||||
|
|
|
| |||||
Total distributions paid | $ | 424,275 | $ | 953,762 | ||||
|
|
|
| |||||
As of August 31, 2013, the components of accumulated earnings/(deficit) on a tax basis were as follows:
| Tax-Managed Strategy | Undistributed Ordinary Income(a) | Undistributed Capital Gains | Accumulated Capital and Other Gains (Losses)(b) | Unrealized Appreciation/ (Depreciation)(c) | Total Accumulated Earnings/ (Deficit) | |||||||||||||||
Wealth Appreciation | $ | 4,952,123 | $ | – 0 – | $ | (80,830,416 | ) | $ | 97,309,927 | $ | 21,431,634 | |||||||||
Balanced Wealth | 456,181 | – 0 – | (3,878,127 | ) | 11,268,183 | 7,846,237 | ||||||||||||||
Conservative Wealth | 106,932 | 1,296,732 | – 0 – | 3,136,272 | 4,539,936 | |||||||||||||||
| (a) | All amounts reflect taxable income: no amounts include tax exempt income. |
| (b) | During the fiscal year ended August 31, 2013 all three Strategies utilized capital loss carryforwards to offset current year net realized gains, and two of the Strategies also had net capital loss carryforwards at August 31, 2013. Tax-Managed Wealth Appreciation Strategy utilized $27,348,683 of capital loss carryforwards during the fiscal year, and had a net capital loss carryforward of $80,330,884 at fiscal year end. Tax-Managed Balanced Wealth Strategy utilized $5,482,311 of capital loss carryforwards during the fiscal year, and had a net capital loss carryforward of $3,878,127 at fiscal year end. Tax-Managed Conservative Wealth Strategy utilized $208,753 of capital loss carryforwards during the fiscal year, and had no capital loss carryforward at fiscal year end. Net capital losses incurred after October 31 and within the taxable year are deemed to arise on the first business day of the Strategy’s next taxable year. Tax-Managed Wealth Appreciation Strategy elected to defer $499,532 of post-October short-term capital losses that are deemed to arise on September 1, 2013. |
| ALLIANCEBERNSTEIN TAX-MANAGED WEALTH STRATEGIES • | 117 |
Notes to Financial Statements
| (c) | The differences between book-basis and tax-basis unrealized appreciation/(depreciation) are attributable primarily to the tax deferral of losses on wash sales, the tax treatment of passive foreign investment companies (PFICs), return of capital distributions received from underlying securities, and the realization for tax purposes of gains/losses on certain derivative instruments. |
For tax purposes, net capital losses may be carried over to offset future capital gains, if any. Under the Regulated Investment Company Modernization Act of 2010, funds are permitted to carry forward capital losses incurred in taxable years beginning after December 22, 2010 for an indefinite period. These post-enactment capital losses must be utilized prior to the pre-enactment capital losses, which are subject to expiration. Post-enactment capital loss carryforwards will retain their character as either short-term or long-term capital losses rather than being considered short-term as under previous regulation.
As of August 31, 2013, two of the Strategies had net capital loss carryforwards which will expire as follows:
| Tax-Managed Strategy | SHORT-TERM AMOUNT | LONG-TERM AMOUNT | EXPIRATION | |||||||||
Wealth Appreciation | $ | 80,330,884 | n/a | 2018 | ||||||||
Balanced Wealth | 3,878,127 | n/a | 2018 | |||||||||
NOTE I
Subsequent Events
Management has evaluated subsequent events for possible recognition or disclosure in the financial statements through the date the financial statements are issued. Management has determined that there are no material events that would require disclosure in the Strategies’ financial statements through this date.
| 118 | • ALLIANCEBERNSTEIN TAX-MANAGED WEALTH STRATEGIES |
Notes to Financial Statements
FINANCIAL HIGHLIGHTS
Selected Data For A Share Of Beneficial Interest Outstanding Throughout Each Period
| Tax-Managed Wealth Appreciation Strategy | ||||||||||||||||||||||||
| Class A | ||||||||||||||||||||||||
Six Months Ended February 28, 2014 (unaudited) | Year Ended August 31, | |||||||||||||||||||||||
| 2013 | 2012 | 2011 | 2010 | 2009 | ||||||||||||||||||||
|
| |||||||||||||||||||||||
Net asset value, beginning of period | $ 13.86 | $ 11.85 | $ 11.36 | $ 10.18 | $ 10.35 | $ 12.98 | ||||||||||||||||||
|
| |||||||||||||||||||||||
Income From Investment Operations | ||||||||||||||||||||||||
Net investment income(a) | .26 | .10 | .11 | .10 | .09 | .14 | ||||||||||||||||||
Net realized and unrealized gain (loss) on investment and foreign currency transactions | 1.76 | 1.98 | .53 | 1.20 | (.12 | ) | (2.65 | ) | ||||||||||||||||
Contributions from Adviser | – 0 | – | – 0 | – | – 0 | – | – 0 | – | – 0 | – | .00 | (b) | ||||||||||||
|
| |||||||||||||||||||||||
Net increase (decrease) in net asset value from operations | 2.02 | 2.08 | .64 | 1.30 | (.03 | ) | (2.51 | ) | ||||||||||||||||
|
| |||||||||||||||||||||||
Less: Dividends | ||||||||||||||||||||||||
Dividends from net investment income | (.32 | ) | (.07 | ) | (.15 | ) | (.12 | ) | (.14 | ) | (.12 | ) | ||||||||||||
|
| |||||||||||||||||||||||
Net asset value, end of period | $ 15.56 | $ 13.86 | $ 11.85 | $ 11.36 | $ 10.18 | $ 10.35 | ||||||||||||||||||
|
| |||||||||||||||||||||||
Total Return | ||||||||||||||||||||||||
Total investment return based on net asset value(c) | 14.66 | % | 17.65 | %* | 5.76 | %* | 12.74 | %* | (.37 | ) %* | (19.21 | ) % | ||||||||||||
Ratios/Supplemental Data | ||||||||||||||||||||||||
Net assets, end of period | $37,138 | $32,587 | $33,959 | $39,441 | $51,952 | $72,253 | ||||||||||||||||||
Ratio to average net | ||||||||||||||||||||||||
Expenses | 1.05 | %^ | 1.07 | % | 1.08 | % | 1.05 | %+ | 1.05 | %+ | 1.11 | % | ||||||||||||
Net investment income | 3.41 | %^ | .80 | % | .93 | % | .82 | %+ | .83 | %+ | 1.58 | % | ||||||||||||
Portfolio turnover rate | 25 | % | 46 | % | 93 | % | 73 | % | 82 | % | 111 | % | ||||||||||||
See footnote summary on page 131.
| ALLIANCEBERNSTEIN TAX-MANAGED WEALTH STRATEGIES • | 119 |
Financial Highlights
Selected Data For A Share Of Beneficial Interest Outstanding Throughout Each Period
| Tax-Managed Wealth Appreciation Strategy | ||||||||||||||||||||||||
| Class B | ||||||||||||||||||||||||
Six Months (unaudited) | Year Ended August 31, | |||||||||||||||||||||||
| 2013 | 2012 | 2011 | 2010 | 2009 | ||||||||||||||||||||
|
| |||||||||||||||||||||||
Net asset value, beginning of period | $ 13.61 | $ 11.66 | $ 11.14 | $ 9.99 | $ 10.16 | $ 12.70 | ||||||||||||||||||
|
| |||||||||||||||||||||||
Income From Investment Operations | ||||||||||||||||||||||||
Net investment income(a) | .18 | .01 | .02 | .01 | .01 | .07 | ||||||||||||||||||
Net realized and unrealized gain (loss) on investment and foreign currency transactions | 1.75 | 1.94 | .54 | 1.17 | (.11 | ) | (2.59 | ) | ||||||||||||||||
Contributions from Adviser | – 0 | – | – 0 | – | – 0 | – | – 0 | – | – 0 | – | .00 | (b) | ||||||||||||
|
| |||||||||||||||||||||||
Net increase (decrease) in net asset value from operations | 1.93 | 1.95 | .56 | 1.18 | (.10 | ) | (2.52 | ) | ||||||||||||||||
|
| |||||||||||||||||||||||
Less: Dividends | ||||||||||||||||||||||||
Dividends from net investment income | (.18 | ) | – 0 | – | (.04 | ) | (.03 | ) | (.07 | ) | (.02 | ) | ||||||||||||
|
| |||||||||||||||||||||||
Net asset value, end of period | $ 15.36 | $ 13.61 | $ 11.66 | $ 11.14 | $ 9.99 | $ 10.16 | ||||||||||||||||||
|
| |||||||||||||||||||||||
Total Return | ||||||||||||||||||||||||
Total investment return based on net asset value(c) | 14.25 | % | 16.72 | %* | 5.08 | %* | 11.83 | %* | (1.06 | )%* | (19.85 | )% | ||||||||||||
Ratios/Supplemental Data | ||||||||||||||||||||||||
Net assets, end of period | $2,439 | $2,709 | $4,043 | $7,297 | $9,283 | $12,827 | ||||||||||||||||||
Ratio to average net | ||||||||||||||||||||||||
Expenses | 1.77 | %^ | 1.80 | % | 1.82 | % | 1.81 | %+ | 1.81 | %+ | 1.86 | % | ||||||||||||
Net investment income | 2.50 | %^ | .08 | % | .19 | % | .07 | %+ | .06 | %+ | .81 | % | ||||||||||||
Portfolio turnover rate | 25 | % | 46 | % | 93 | % | 73 | % | 82 | % | 111 | % | ||||||||||||
See footnote summary on page 131.
| 120 | • ALLIANCEBERNSTEIN TAX-MANAGED WEALTH STRATEGIES |
Financial Highlights
Selected Data For A Share Of Beneficial Interest Outstanding Throughout Each Period
| Tax-Managed Wealth Appreciation Strategy | ||||||||||||||||||||||||
| Class C | ||||||||||||||||||||||||
Six Months (unaudited) | Year Ended August 31, | |||||||||||||||||||||||
| 2013 | 2012 | 2011 | 2010 | 2009 | ||||||||||||||||||||
|
|
|
|
|
|
|
|
|
|
|
| |||||||||||||
Net asset value, beginning of period | $13.62 | $11.67 | $11.16 | $10.00 | $10.17 | $12.71 | ||||||||||||||||||
|
|
|
|
|
|
|
|
|
|
|
| |||||||||||||
Income From Investment Operations | ||||||||||||||||||||||||
Net investment income(a) | .19 | .01 | .03 | .01 | .01 | .08 | ||||||||||||||||||
Net realized and unrealized gain (loss) on investment and foreign currency transactions | 1.75 | 1.94 | .53 | 1.18 | (.11 | ) | (2.60 | ) | ||||||||||||||||
Contributions from Adviser | – 0 | – | – 0 | – | – 0 | – | – 0 | – | – 0 | – | .00 | (b) | ||||||||||||
|
|
|
|
|
|
|
|
|
|
|
| |||||||||||||
Net increase (decrease) in net asset value from operations | 1.94 | 1.95 | .56 | 1.19 | (.10 | ) | (2.52 | ) | ||||||||||||||||
|
|
|
|
|
|
|
|
|
|
|
| |||||||||||||
Less: Dividends | ||||||||||||||||||||||||
Dividends from net investment income | (.20 | ) | – 0 | – | (.05 | ) | (.03 | ) | (.07 | ) | (.02 | ) | ||||||||||||
|
|
|
|
|
|
|
|
|
|
|
| |||||||||||||
Net asset value, end of period | $ 15.36 | $ 13.62 | $ 11.67 | $ 11.16 | $ 10.00 | $ 10.17 | ||||||||||||||||||
|
| |||||||||||||||||||||||
Total Return | �� | |||||||||||||||||||||||
Total investment return based on net asset value(c) | 14.35 | % | 16.71 | %* | 5.09 | %* | 11.92 | %* | (1.06 | )%* | (19.84 | )% | ||||||||||||
Ratios/Supplemental Data | ||||||||||||||||||||||||
Net assets, end of period | $17,227 | $16,589 | $18,337 | $22,611 | $27,754 | $34,643 | ||||||||||||||||||
Ratio to average net | ||||||||||||||||||||||||
Expenses | 1.76 | %^ | 1.78 | % | 1.79 | % | 1.78 | %+ | 1.78 | %+ | 1.83 | % | ||||||||||||
Net investment income | 2.64 | %^ | .10 | % | .22 | % | .10 | %+ | .09 | %+ | .84 | % | ||||||||||||
Portfolio turnover rate | 25 | % | 46 | % | 93 | % | 73 | % | 82 | % | 111 | % | ||||||||||||
See footnote summary on page 131.
| ALLIANCEBERNSTEIN TAX-MANAGED WEALTH STRATEGIES • | 121 |
Financial Highlights
Selected Data For A Share Of Beneficial Interest Outstanding Throughout Each Period
| Tax-Managed Wealth Appreciation Strategy | ||||||||||||||||||||||||
| Advisor Class | ||||||||||||||||||||||||
Six Months (unaudited) | Year Ended August 31, | |||||||||||||||||||||||
| 2013 | 2012 | 2011 | 2010 | 2009 | ||||||||||||||||||||
|
|
|
|
|
|
|
|
|
|
|
| |||||||||||||
Net asset value, beginning of period | $ 13.91 | $ 11.90 | $ 11.42 | $ 10.23 | $ 10.40 | $ 13.07 | ||||||||||||||||||
|
|
|
|
|
|
|
|
|
|
|
| |||||||||||||
Income From Investment Operations | ||||||||||||||||||||||||
Net investment income(a) | .28 | .14 | .14 | .14 | .12 | .17 | ||||||||||||||||||
Net realized and unrealized gain (loss) on investment and foreign currency transactions | 1.78 | 1.98 | .53 | 1.21 | (.12 | ) | (2.68 | ) | ||||||||||||||||
Contributions from Adviser | – 0 | – | – 0 | – | – 0 | – | – 0 | – | – 0 | – | .00 | (b) | ||||||||||||
|
|
|
|
|
|
|
|
|
|
|
| |||||||||||||
Net increase (decrease) in net asset value from operations | 2.06 | 2.12 | .67 | 1.35 | – 0 | – | (2.51 | ) | ||||||||||||||||
|
|
|
|
|
|
|
|
|
|
|
| |||||||||||||
Less: Dividends | ||||||||||||||||||||||||
Dividends from net investment income | (.36 | ) | (.11 | ) | (.19 | ) | (.16 | ) | (.17 | ) | (.16 | ) | ||||||||||||
|
|
|
|
|
|
|
|
|
|
|
| |||||||||||||
Net asset value, end of period | $ 15.61 | $ 13.91 | $ 11.90 | $ 11.42 | $ 10.23 | $ 10.40 | ||||||||||||||||||
|
| |||||||||||||||||||||||
Total Return | ||||||||||||||||||||||||
Total investment return based on net asset value(c) | 14.94 | % | 17.95 | %* | 6.04 | %* | 13.13 | %* | (.11 | )%* | (19.00 | )% | ||||||||||||
Ratios/Supplemental Data | ||||||||||||||||||||||||
Net assets, end of period | $655,957 | $585,431 | $552,610 | $511,697 | $448,476 | $409,753 | ||||||||||||||||||
Ratio to average net | ||||||||||||||||||||||||
Expenses | .75 | %^ | .77 | % | .78 | % | .77 | %+ | .78 | %+ | .82 | % | ||||||||||||
Net investment income | 3.68 | %^ | 1.09 | % | 1.23 | % | 1.13 | %+ | 1.12 | %+ | 1.83 | % | ||||||||||||
Portfolio turnover rate | 25 | % | 46 | % | 93 | % | 73 | % | 82 | % | 111 | % | ||||||||||||
See footnote summary on page 131.
| 122 | • ALLIANCEBERNSTEIN TAX-MANAGED WEALTH STRATEGIES |
Financial Highlights
Selected Data For A Share Of Beneficial Interest Outstanding Throughout Each Period
| Tax-Managed Balanced Wealth Strategy | ||||||||||||||||||||||||
| Class A | ||||||||||||||||||||||||
Six Months (unaudited) | Year Ended August 31, | |||||||||||||||||||||||
| 2013 | 2012 | 2011 | 2010 | 2009 | ||||||||||||||||||||
|
| |||||||||||||||||||||||
Net asset value, beginning of period | $ 12.87 | $ 12.28 | $ 11.88 | $ 11.29 | $ 11.07 | $ 11.94 | ||||||||||||||||||
|
| |||||||||||||||||||||||
Income From Investment Operations | ||||||||||||||||||||||||
Net investment income(a) | .21 | .17 | .18 | .21 | .20 | .23 | ||||||||||||||||||
Net realized and unrealized gain (loss) on investment and foreign currency transactions | .83 | .57 | .44 | .63 | .22 | (.87 | ) | |||||||||||||||||
Contributions from Adviser | – 0 | – | – 0 | – | – 0 | – | – 0 | – | – 0 | – | .00 | (b) | ||||||||||||
|
| |||||||||||||||||||||||
Net increase (decrease) in net asset value from operations | 1.04 | .74 | .62 | .84 | .42 | (.64 | ) | |||||||||||||||||
|
| |||||||||||||||||||||||
Less: Dividends | ||||||||||||||||||||||||
Dividends from net investment income | (.09 | ) | (.15 | ) | (.22 | ) | (.25 | ) | (.20 | ) | (.23 | ) | ||||||||||||
|
| |||||||||||||||||||||||
Net asset value, end of period | $ 13.82 | $ 12.87 | $ 12.28 | $ 11.88 | $ 11.29 | $ 11.07 | ||||||||||||||||||
|
| |||||||||||||||||||||||
Total Return | ||||||||||||||||||||||||
Total investment return based on net asset value(c) | 8.08 | % | 6.08 | %* | 5.26 | %* | 7.39 | %* | 3.76 | %* | (5.14 | ) % | ||||||||||||
Ratios/Supplemental | ||||||||||||||||||||||||
Net assets, end of period | $94,256 | $89,453 | $97,866 | $115,446 | $140,601 | $174,795 | ||||||||||||||||||
Ratio to average net | ||||||||||||||||||||||||
Expenses | 1.22 | %^ | 1.24 | % | 1.19 | % | 1.17 | %+ | 1.11 | %+ | 1.10 | % | ||||||||||||
Net investment income | 3.10 | %^ | 1.32 | % | 1.53 | % | 1.71 | %+ | 1.72 | %+ | 2.21 | % | ||||||||||||
Portfolio turnover rate | 32 | % | 32 | % | 55 | % | 41 | % | 44 | % | 54 | % | ||||||||||||
| See | footnote summary on page 131. |
| ALLIANCEBERNSTEIN TAX-MANAGED WEALTH STRATEGIES • | 123 |
Financial Highlights
Selected Data For A Share Of Beneficial Interest Outstanding Throughout Each Period
| Tax-Managed Balanced Wealth Strategy | ||||||||||||||||||||||||
| Class B | ||||||||||||||||||||||||
Six Months (unaudited) | Year Ended August 31, | |||||||||||||||||||||||
| 2013 | 2012 | 2011 | 2010 | 2009 | ||||||||||||||||||||
|
| |||||||||||||||||||||||
Net asset value, beginning of period | $ 12.90 | $ 12.29 | $ 11.88 | $ 11.30 | $ 11.08 | $ 11.94 | ||||||||||||||||||
|
| |||||||||||||||||||||||
Income From Investment Operations | ||||||||||||||||||||||||
Net investment income(a) | .16 | .08 | .10 | .12 | .12 | .15 | ||||||||||||||||||
Net realized and unrealized gain (loss) on investment and foreign currency transactions | .84 | .58 | .43 | .62 | .22 | (.85 | ) | |||||||||||||||||
Contributions from Adviser | – 0 | – | – 0 | – | – 0 | – | – 0 | – | – 0 | – | .00 | (b) | ||||||||||||
|
| |||||||||||||||||||||||
Net increase (decrease) in net asset value from operations | 1.00 | .66 | .53 | .74 | .34 | (.70 | ) | |||||||||||||||||
|
| |||||||||||||||||||||||
Less: Dividends | ||||||||||||||||||||||||
Dividends from net investment income | (.03 | ) | (.05 | ) | (.12 | ) | (.16 | ) | (.12 | ) | (.16 | ) | ||||||||||||
|
| |||||||||||||||||||||||
Net asset value, end of period | $ 13.87 | $ 12.90 | $ 12.29 | $ 11.88 | $ 11.30 | $ 11.08 | ||||||||||||||||||
|
| |||||||||||||||||||||||
Total Return | ||||||||||||||||||||||||
Total investment return based on net asset value(c) | 7.75 | % | 5.39 | %* | 4.49 | %* | 6.54 | %* | 3.02 | %* | (5.78 | ) % | ||||||||||||
Ratios/Supplemental Data | ||||||||||||||||||||||||
Net assets, end of period | $5,997 | $7,066 | $11,386 | $19,606 | $24,819 | $31,658 | ||||||||||||||||||
Ratio to average net | ||||||||||||||||||||||||
Expenses | 1.93 | %^ | 1.96 | % | 1.91 | % | 1.89 | %+ | 1.83 | %+ | 1.83 | % | ||||||||||||
Net investment income | 2.33 | %^ | .62 | % | .82 | % | .98 | %+ | 1.00 | %+ | 1.48 | % | ||||||||||||
Portfolio turnover rate | 32 | % | 32 | % | 55 | % | 41 | % | 44 | % | 54 | % | ||||||||||||
| See | footnote summary on page 131. |
| 124 | • ALLIANCEBERNSTEIN TAX-MANAGED WEALTH STRATEGIES |
Financial Highlights
Selected Data For A Share Of Beneficial Interest Outstanding Throughout Each Period
| Tax-Managed Balanced Wealth Strategy | ||||||||||||||||||||||||
| Class C | ||||||||||||||||||||||||
Six Months (unaudited) | Year Ended August 31, | |||||||||||||||||||||||
| 2013 | 2012 | 2011 | 2010 | 2009 | ||||||||||||||||||||
|
| |||||||||||||||||||||||
Net asset value, beginning of period | $ 12.92 | $ 12.32 | $ 11.92 | $ 11.33 | $ 11.11 | $ 11.97 | ||||||||||||||||||
|
| |||||||||||||||||||||||
Income From Investment Operations | ||||||||||||||||||||||||
Net investment income(a) | .16 | .08 | .10 | .12 | .12 | .15 | ||||||||||||||||||
Net realized and unrealized gain (loss) on investment and foreign currency transactions | .84 | .58 | .43 | .63 | .22 | (.85 | ) | |||||||||||||||||
Contributions from Adviser | – | 0 – | – 0 | – | – 0 | – | – 0 | – | – 0 | – | .00 | (b) | ||||||||||||
|
| |||||||||||||||||||||||
Net increase (decrease) in net asset value from operations | 1.00 | .66 | .53 | .75 | .34 | (.70 | ) | |||||||||||||||||
|
| |||||||||||||||||||||||
Less: Dividends | ||||||||||||||||||||||||
Dividends from net investment income | (.03 | ) | (.06 | ) | (.13 | ) | (.16 | ) | (.12 | ) | (.16 | ) | ||||||||||||
|
| |||||||||||||||||||||||
Net asset value, end of period | $ 13.89 | $ 12.92 | $ 12.32 | $ 11.92 | $ 11.33 | $ 11.11 | ||||||||||||||||||
|
| |||||||||||||||||||||||
Total Return | ||||||||||||||||||||||||
Total investment return based on net asset value(c) | 7.78 | % | 5.36 | %* | 4.48 | %* | 6.62 | %* | 3.01 | %* | (5.76 | ) % | ||||||||||||
Ratios/Supplemental Data | ||||||||||||||||||||||||
Net assets, end of period | $31,612 | $30,434 | $35,615 | $43,257 | $51,940 | $61,986 | ||||||||||||||||||
Ratio to average net | ||||||||||||||||||||||||
Expenses | 1.93 | %^ | 1.95 | % | 1.90 | % | 1.87 | %+ | 1.82 | %+ | 1.81 | % | ||||||||||||
Net investment income | 2.39 | %^ | .62 | % | .83 | % | 1.00 | %+ | 1.02 | %+ | 1.50 | % | ||||||||||||
Portfolio turnover rate | 32 | % | 32 | % | 55 | % | 41 | % | 44 | % | 54 | % | ||||||||||||
| See | footnote summary on page 131. |
| ALLIANCEBERNSTEIN TAX-MANAGED WEALTH STRATEGIES • | 125 |
Financial Highlights
Selected Data For A Share Of Beneficial Interest Outstanding Throughout Each Period
| Tax-Managed Balanced Wealth Strategy | ||||||||||||||||||||||||
| Advisor Class | ||||||||||||||||||||||||
Six Months (unaudited) | Year Ended August 31, | |||||||||||||||||||||||
| 2013 | 2012 | 2011 | 2010 | 2009 | ||||||||||||||||||||
|
|
|
|
|
|
|
|
|
|
|
| |||||||||||||
Net asset value, beginning of period | $ 12.88 | $ 12.29 | $ 11.89 | $ 11.31 | $ 11.08 | $ 11.95 | ||||||||||||||||||
|
| |||||||||||||||||||||||
Income From Investment Operations | ||||||||||||||||||||||||
Net investment income(a) | .23 | .21 | .22 | .25 | .23 | .26 | ||||||||||||||||||
Net realized and unrealized gain (loss) on investment and foreign currency transactions | .84 | .57 | .44 | .61 | .23 | (.86 | ) | |||||||||||||||||
Contributions from Adviser | – 0 | – | – 0 | – | – 0 | – | – 0 | – | – 0 | – | .00 | (b) | ||||||||||||
|
| |||||||||||||||||||||||
Net increase (decrease) in net asset value from operations | 1.07 | .78 | .66 | .86 | .46 | (.60 | ) | |||||||||||||||||
|
| |||||||||||||||||||||||
Less: Dividends | ||||||||||||||||||||||||
Dividends from net investment income | (.11 | ) | (.19 | ) | (.26 | ) | (.28 | ) | (.23 | ) | (.27 | ) | ||||||||||||
|
| |||||||||||||||||||||||
Net asset value, end of period | $ 13.84 | $ 12.88 | $ 12.29 | $ 11.89 | $ 11.31 | $ 11.08 | ||||||||||||||||||
|
| |||||||||||||||||||||||
Total Return | ||||||||||||||||||||||||
Total investment return based on net asset value(c) | 8.33 | % | 6.37 | %* | 5.58 | %* | 7.59 | %* | 4.16 | %* | (4.85 | )% | ||||||||||||
Ratios/Supplemental Data | ||||||||||||||||||||||||
Net assets, end of period (000’s omitted) | $33,754 | $27,789 | $22,824 | $17,257 | $12,919 | $8,687 | ||||||||||||||||||
Ratio to average net | ||||||||||||||||||||||||
Expenses | .92 | %^ | .94 | % | .90 | % | .87 | %+ | .82 | %+ | .80 | % | ||||||||||||
Net investment income | 3.41 | %^ | 1.60 | % | 1.83 | % | 2.02 | %+ | 2.06 | %+ | 2.50 | % | ||||||||||||
Portfolio turnover rate | 32 | % | 32 | % | 55 | % | 41 | % | 44 | % | 54 | % | ||||||||||||
| See | footnote summary on page 131. |
| 126 | • ALLIANCEBERNSTEIN TAX-MANAGED WEALTH STRATEGIES |
Financial Highlights
Selected Data For A Share Of Beneficial Interest Outstanding Throughout Each Period
| Tax-Managed Conservative Wealth Strategy | ||||||||||||||||||||||||
| Class A | ||||||||||||||||||||||||
Six Months (unaudited) | Year Ended August 31, | |||||||||||||||||||||||
| 2013 | 2012 | 2011 | 2010 | 2009 | ||||||||||||||||||||
|
|
|
|
|
|
|
|
|
|
|
| |||||||||||||
Net asset value, beginning of period | $ 11.47 | $ 11.19 | $ 10.94 | $ 10.59 | $ 10.44 | $ 11.01 | ||||||||||||||||||
|
| |||||||||||||||||||||||
Income From Investment Operations | ||||||||||||||||||||||||
Net investment income(a)(d) | .12 | .10 | .13 | .16 | .18 | .22 | ||||||||||||||||||
Net realized and unrealized gain (loss) on investment and foreign currency transactions | .49 | .27 | .27 | .39 | .14 | (.52 | ) | |||||||||||||||||
Contributions from Adviser | – 0 | – | – 0 | – | – 0 | – | – 0 | – | – 0 | – | .00 | (b) | ||||||||||||
|
| |||||||||||||||||||||||
Net increase (decrease) in net asset value from operations | .61 | .37 | .40 | .55 | .32 | (.30 | ) | |||||||||||||||||
|
| |||||||||||||||||||||||
Less: Dividends and Distributions | ||||||||||||||||||||||||
Dividends from net investment income | (.05 | ) | (.09 | ) | (.15 | ) | (.20 | ) | (.17 | ) | (.23 | ) | ||||||||||||
Distributions from net realized gain on investment transactions | (.30 | ) | – 0 | – | – 0 | – | – 0 | – | – 0 | – | (.04 | ) | ||||||||||||
|
| |||||||||||||||||||||||
Total dividends and distributions | (.35 | ) | (.09 | ) | (.15 | ) | (.20 | ) | (.17 | ) | (.27 | ) | ||||||||||||
|
| |||||||||||||||||||||||
Net asset value, end of period | $ 11.73 | $ 11.47 | $ 11.19 | $ 10.94 | $ 10.59 | $ 10.44 | ||||||||||||||||||
|
| |||||||||||||||||||||||
Total Return | ||||||||||||||||||||||||
Total investment return based on net asset value(c) | 5.35 | % | 3.30 | %* | 3.72 | %* | 5.19 | % | 3.07 | % | (2.57 | )% | ||||||||||||
Ratios/Supplemental Data | ||||||||||||||||||||||||
Net assets, end of period (000’s omitted) | $39,390 | $40,879 | $45,221 | $54,035 | $65,732 | $73,643 | ||||||||||||||||||
Ratio to average net | ||||||||||||||||||||||||
Expenses, net of waivers/reimbursements | 1.20 | %^ | 1.20 | % | 1.20 | % | 1.20 | %+ | 1.20 | %+ | 1.20 | % | ||||||||||||
Expenses, before waivers/reimbursements | 1.59 | %^ | 1.56 | % | 1.47 | % | 1.35 | %+ | 1.27 | %+ | 1.25 | % | ||||||||||||
Net investment income(d) | 2.13 | %^ | .85 | % | 1.18 | % | 1.49 | %+ | 1.63 | %+ | 2.23 | % | ||||||||||||
Portfolio turnover rate | 13 | % | 29 | % | 51 | % | 37 | % | 41 | % | 48 | % | ||||||||||||
See footnote summary on page 131.
| ALLIANCEBERNSTEIN TAX-MANAGED WEALTH STRATEGIES • | 127 |
Financial Highlights
Selected Data For A Share Of Beneficial Interest Outstanding Throughout Each Period
| Tax-Managed Conservative Wealth Strategy | ||||||||||||||||||||||||
| Class B | ||||||||||||||||||||||||
Six Months 2014 (unaudited) | Year Ended August 31, | |||||||||||||||||||||||
| 2013 | 2012 | 2011 | 2010 | 2009 | ||||||||||||||||||||
|
| |||||||||||||||||||||||
Net asset value, beginning of period | $ 11.78 | $ 11.50 | $ 11.23 | $ 10.86 | $ 10.70 | $ 11.27 | ||||||||||||||||||
|
| |||||||||||||||||||||||
Income From Investment Operations | ||||||||||||||||||||||||
Net investment income(a)(d) | .08 | .02 | .06 | .09 | .10 | .16 | ||||||||||||||||||
Net realized and unrealized gain (loss) on investment and foreign currency transactions | .51 | .28 | .27 | .40 | .15 | (.54 | ) | |||||||||||||||||
Contributions from Adviser | – 0 | – | – 0 | – | – 0 | – | – 0 | – | – 0 | – | .00 | (b) | ||||||||||||
|
| |||||||||||||||||||||||
Net increase (decrease) in net asset value from operations | .59 | .30 | .33 | .49 | .25 | (.38 | ) | |||||||||||||||||
|
| |||||||||||||||||||||||
Less: Dividends and Distributions | ||||||||||||||||||||||||
Dividends from net investment income | – 0 | – | (.02 | ) | (.06 | ) | (.12 | ) | (.09 | ) | (.15 | ) | ||||||||||||
Distributions from net realized gain on investment transactions | (.30 | ) | – 0 | – | – 0 | – | – 0 | – | – 0 | – | (.04 | ) | ||||||||||||
|
| |||||||||||||||||||||||
Total dividends and distributions | (.30 | ) | (.02 | ) | (.06 | ) | (.12 | ) | (.09 | ) | (.19 | ) | ||||||||||||
|
| |||||||||||||||||||||||
Net asset value, end of period | $ 12.07 | $ 11.78 | $ 11.50 | $ 11.23 | $ 10.86 | $ 10.70 | ||||||||||||||||||
|
| |||||||||||||||||||||||
Total Return | ||||||||||||||||||||||||
Total investment return based on net asset value(c) | 5.08 | % | 2.57 | %* | 2.93 | %* | 4.46 | % | 2.35 | % | (3.25 | )% | ||||||||||||
Ratios/Supplemental Data | ||||||||||||||||||||||||
Net assets, end of period | $1,998 | $2,629 | $4,562 | $7,758 | $11,813 | $16,376 | ||||||||||||||||||
Ratio to average net | ||||||||||||||||||||||||
Expenses, net of waivers/reimbursements | 1.90 | %^ | 1.90 | % | 1.90 | % | 1.90 | %+ | 1.90 | %+ | 1.90 | % | ||||||||||||
Expenses, before waivers/reimbursements | 2.30 | %^ | 2.26 | % | 2.20 | % | 2.07 | %+ | 1.99 | %+ | 1.98 | % | ||||||||||||
Net investment income(d) | 1.38 | %^ | .16 | % | .50 | % | .78 | %+ | .92 | %+ | 1.54 | % | ||||||||||||
Portfolio turnover rate | 13 | % | 29 | % | 51 | % | 37 | % | 41 | % | 48 | % | ||||||||||||
| See | footnote summary on page 131. |
| 128 | • ALLIANCEBERNSTEIN TAX-MANAGED WEALTH STRATEGIES |
Financial Highlights
Selected Data For A Share Of Beneficial Interest Outstanding Throughout Each Period
| Tax-Managed Conservative Wealth Strategy | ||||||||||||||||||||||||
| Class C | ||||||||||||||||||||||||
Six Months (unaudited) | Year Ended August 31, | |||||||||||||||||||||||
| 2013 | 2012 | 2011 | 2010 | 2009 | ||||||||||||||||||||
|
| |||||||||||||||||||||||
Net asset value, beginning of period | $11.78 | $11.51 | $11.24 | $10.88 | $10.71 | $11.28 | ||||||||||||||||||
|
|
|
|
|
|
|
|
|
|
|
| |||||||||||||
Income From Investment Operations | ||||||||||||||||||||||||
Net investment income(a)(d) | .09 | .02 | .05 | .09 | .10 | .16 | ||||||||||||||||||
Net realized and unrealized gain (loss) on investment and foreign currency transactions | .50 | .27 | .29 | .39 | .16 | (.54 | ) | |||||||||||||||||
Contributions from Adviser | – 0 | – | – 0 | – | – 0 | – | – 0 | – | – 0 | – | .00 | (b) | ||||||||||||
|
|
|
|
|
|
|
|
|
|
|
| |||||||||||||
Net increase (decrease) in net asset value from operations | .59 | .29 | .34 | .48 | .26 | (.38 | ) | |||||||||||||||||
|
|
|
|
|
|
|
|
|
|
|
| |||||||||||||
Less: Dividends and Distributions | ||||||||||||||||||||||||
Dividends from net investment income | – 0 | – | (.02 | ) | (.07 | ) | (.12 | ) | (.09 | ) | (.15 | ) | ||||||||||||
Distributions from net realized gain on investment transactions | (.30 | ) | – 0 | – | – 0 | – | – 0 | – | – 0 | – | (.04 | ) | ||||||||||||
|
|
|
|
|
|
|
|
|
|
|
| |||||||||||||
Total dividends and distributions | (.30 | ) | (.02 | ) | (.07 | ) | (.12 | ) | (.09 | ) | (.19 | ) | ||||||||||||
|
|
|
|
|
|
|
|
|
|
|
| |||||||||||||
Net asset value, end of period | $ 12.07 | $ 11.78 | $ 11.51 | $ 11.24 | $ 10.88 | $ 10.71 | ||||||||||||||||||
|
| |||||||||||||||||||||||
Total Return | ||||||||||||||||||||||||
Total investment return based on net asset value(c) | 5.08 | % | 2.53 | %* | 3.02 | %* | 4.37 | % | 2.44 | % | (3.25 | ) % | ||||||||||||
Ratios/Supplemental Data | ||||||||||||||||||||||||
Net assets, end of period (000’s omitted) | $15,227 | $15,498 | $18,499 | $22,580 | $27,088 | $30,079 | ||||||||||||||||||
Ratio to average net | ||||||||||||||||||||||||
Expenses, net of waivers/reimbursements | 1.90 | %^ | 1.90 | % | 1.90 | % | 1.90 | %+ | 1.90 | %+ | 1.90 | % | ||||||||||||
Expenses, before waivers/reimbursements | 2.29 | %^ | 2.26 | % | 2.17 | % | 2.05 | %+ | 1.97 | %+ | 1.96 | % | ||||||||||||
Net investment income(d) | 1.42 | %^ | .16 | % | .48 | % | .79 | %+ | .93 | %+ | 1.53 | % | ||||||||||||
Portfolio turnover rate | 13 | % | 29 | % | 51 | % | 37 | % | 41 | % | 48 | % | ||||||||||||
See footnote summary on page 131.
| ALLIANCEBERNSTEIN TAX-MANAGED WEALTH STRATEGIES • | 129 |
Financial Highlights
Selected Data For A Share Of Beneficial Interest Outstanding Throughout Each Period
| Tax-Managed Conservative Wealth Strategy | ||||||||||||||||||||||||
| Advisor Class | ||||||||||||||||||||||||
Six Months Ended February 28, 2014 (unaudited) | Year Ended August 31, | |||||||||||||||||||||||
| 2013 | 2012 | 2011 | 2010 | 2009 | ||||||||||||||||||||
|
| |||||||||||||||||||||||
Net asset value, beginning of period | $ 11.50 | $ 11.21 | $ 10.96 | $ 10.61 | $ 10.46 | $ 11.03 | ||||||||||||||||||
|
| |||||||||||||||||||||||
Income From Investment Operations | ||||||||||||||||||||||||
Net investment income(a)(d) | .15 | .13 | .16 | .20 | .21 | .25 | ||||||||||||||||||
Net realized and unrealized gain (loss) on investment and foreign currency transactions | .48 | .27 | .28 | .38 | .14 | (.52 | ) | |||||||||||||||||
Contributions from Adviser | – 0 | – | – 0 | – | – 0 | – | – 0 | – | – 0 | – | .00 | (b) | ||||||||||||
|
| |||||||||||||||||||||||
Net increase (decrease) in net asset value from operations | .63 | .40 | .44 | .58 | .35 | (.27 | ) | |||||||||||||||||
|
| |||||||||||||||||||||||
Less: Dividends and Distributions | ||||||||||||||||||||||||
Dividends from net investment income | (.07 | ) | (.11 | ) | (.19 | ) | (.23 | ) | (.20 | ) | (.26 | ) | ||||||||||||
Distributions from net realized gain on investment transactions | (.30 | ) | – 0 | – | – 0 | – | – 0 | – | – 0 | – | (.04 | ) | ||||||||||||
|
| |||||||||||||||||||||||
Total dividends and distributions | (.37 | ) | (.11 | ) | (.19 | ) | (.23 | ) | (.20 | ) | (.30 | ) | ||||||||||||
|
| |||||||||||||||||||||||
Net asset value, end of period | $ 11.76 | $ 11.50 | $ 11.21 | $ 10.96 | $ 10.61 | $ 10.46 | ||||||||||||||||||
|
| |||||||||||||||||||||||
Total Return | ||||||||||||||||||||||||
Total investment return based on net asset value(c) | 5.51 | % | 3.62 | %* | 4.04 | %* | 5.51 | % | 3.37 | % | (2.27 | )% | ||||||||||||
Ratios/Supplemental Data | ||||||||||||||||||||||||
Net assets, end of period (000’s omitted) | $6,191 | $5,734 | $4,909 | $4,913 | $4,859 | $5,423 | ||||||||||||||||||
Ratio to average net | ||||||||||||||||||||||||
Expenses, net of waivers/ | .90 | %^ | .90 | % | .90 | % | .90 | %+ | .90 | %+ | .90 | % | ||||||||||||
Expenses, before waivers/ | 1.29 | %^ | 1.26 | % | 1.17 | % | 1.05 | %+ | .97 | %+ | .95 | % | ||||||||||||
Net investment income(d) | 2.50 | %^ | 1.15 | % | 1.47 | % | 1.79 | %+ | 1.93 | %+ | 2.54 | % | ||||||||||||
Portfolio turnover rate | 13 | % | 29 | % | 51 | % | 37 | % | 41 | % | 48 | % | ||||||||||||
See footnote summary on page 131.
| 130 | • ALLIANCEBERNSTEIN TAX-MANAGED WEALTH STRATEGIES |
Financial Highlights
| (a) | Based on average shares outstanding. |
| (b) | Amount is less than $.005. |
| (c) | Total investment return is calculated assuming an initial investment made at the net asset value at the beginning of the period, reinvestment of all dividends and distributions at net asset value during the period, and redemption on the last day of the period. Initial sales charges or contingent deferred sales charges are not reflected in the calculation of total investment return. Total return does not reflect the deduction of taxes that a shareholder would pay on strategy distributions or the redemption of strategy shares. Total investment return calculated for a period of less than one year is not annualized. |
| (d) | Net of fees and expenses waived/reimbursed by the Adviser. |
| * | Includes the impact of proceeds received and credited to the Strategy resulting from class action settlements, which enhanced the performance for the Tax-Managed Wealth Appreciation Strategy for years ended August 31, 2013, August 31, 2012, August 31, 2011 and August 31, 2010 by 0.01%, 0.01%, 0.01% and 0.01%, respectively, Tax-Managed Balanced Wealth Strategy for the years ended August 31, 2013, August 31, 2012, August 31, 2011 and August 31, 2010 by 0.01%, 0.02%, 0.01% and 0.04%, respectively, and Tax-Managed Conservative Wealth Strategy for the years ended August 31, 2013 and August 31, 2012 by 0.01% and 0.01%, respectively. |
| ^ | Annualized. |
| + | The ratio includes expenses attributable to costs of proxy solicitation. |
See notes to financial statements.
| ALLIANCEBERNSTEIN TAX-MANAGED WEALTH STRATEGIES • | 131 |
Financial Highlights
TRUSTEES
Marshall C. Turner, Jr.(1), Chairman John H. Dobkin(1) Michael J. Downey(1) William H. Foulk, Jr.(1) D. James Guzy(1) | Nancy P. Jacklin(1) Robert M. Keith, President and Garry L. Moody(1) Earl D. Weiner(1) |
OFFICERS
Philip L. Kirstein, Senior Vice President and Independent Compliance Officer Daniel J. Loewy(2), Vice President Christopher H. Nikolich(2), Vice President Patrick J. Rudden(2) , Vice President | Vadim Zlotnikov(2), Vice President Emilie D. Wrapp, Clerk Joseph J. Mantineo, Treasurer and Chief Financial Officer Phyllis J. Clarke, Controller and Chief Accounting Officer Vincent S. Noto, Chief Compliance Officer |
Custodian and Accounting Agent State Street Bank and Trust Company One Lincoln Street Boston, MA 02111
Principal Underwriter AllianceBernstein Investments, Inc. 1345 Avenue of the Americas New York, NY 10105
Legal Counsel Seward & Kissel LLP One Battery Park Plaza New York, NY 10004 | Transfer Agent AllianceBernstein Investor Services, Inc. P.O. Box 786003 San Antonio, TX 78278-6003 Toll-Free (800) 221-5672
Independent Registered Public Accounting Firm Ernst & Young LLP 5 Times Square New York, NY 10036 |
| (1) | Member of the Audit Committee, the Governance and Nominating Committee and the Independent Directors Committee. Mr. Foulk and Ms. Jacklin are members of the Fair Value Pricing Committee. |
| (2) | The day-to-day management of, and investment decisions for, each Strategy’s portfolio are made by the Adviser’s Multi-Asset Solutions Team. Messrs. Loewy, Nikolich, Rudden and Zlotnikov are the members of the Adviser’s Multi-Asset Solutions Team primarily responsible for the day-to-day management of each Strategy’s portfolio. |
| 132 | • ALLIANCEBERNSTEIN TAX-MANAGED WEALTH STRATEGIES |
Trustees
THE FOLLOWING IS NOT PART OF THE SHAREHOLDER REPORT OR THE FINANCIAL STATEMENTS
SUMMARY OF SENIOR OFFICER’S EVALUATION OF INVESTMENT ADVISORY AGREEMENT1
The following is a summary of the evaluation of the Investment Advisory Agreement between AllianceBernstein L.P. (the “Adviser”) and The AllianceBernstein Portfolios (the “Trust”) in respect of AllianceBernstein Tax-Managed Balanced Wealth Strategy, AllianceBernstein Tax-Managed Wealth Appreciation Strategy and AllianceBernstein Tax-Managed Conservative Wealth Strategy (each a “Strategy” and collectively the “Strategies”),2 prepared by Philip L. Kirstein, the Senior Officer of the Trust for the Trustees of the Trust, as required by the August 2004 agreement between the Adviser and the New York State Attorney General (the “NYAG”). The purpose of the summary is to provide shareholders with a synopsis of the independent evaluation of the reasonableness of the advisory fees proposed to be paid by the Strategies which was provided to the Trustees in connection with their review of the proposed approval of the continuance of the Investment Advisory Agreement.
The investment objective of the Strategies is to achieve the highest total return consistent with the Adviser’s determination of reasonable risk. The Strategies seek to maximize after-tax returns by pursuing a number of strategies that take into account the tax impact of buy and sell investment decisions on shareholders as well as investing their debt portion in tax-exempt securities. The Adviser utilizes separate portfolio accounts (or “portfolio sleeves”) to manage the equity and fixed income (tax-exempt) securities of Tax-Managed Balanced Wealth Strategy, Tax-Managed Wealth Appreciation Strategy and Tax-Managed Conservative Wealth Strategy3. Each portfolio sleeve is managed according to the investment style/asset class of the portfolio securities held within the sleeve.
The Senior Officer’s evaluation considered the following factors:
| 1. | Advisory fees charged to institutional and other clients of the Adviser for like services; |
| 2. | Advisory fees charged by other mutual fund companies for like services; |
| 3. | Costs to the Adviser and its affiliates of supplying services pursuant to the advisory agreement, excluding any intra-corporate profit; |
| 1 | It should be noted that the information in the fee evaluation was completed on July 25, 2013 and discussed with the Board of Trustees on August 6-8, 2013. |
| 2 | Future references to the Strategies do not include “AllianceBernstein.” References in the fee summary pertaining to performance and expense ratios refer to Class A shares of the Strategies. |
| 3 | To cite an example, Tax-Managed Balanced Wealth Strategy is managed using separate sleeves for Intermediate Municipal, U.S. Growth, U.S. Value, Non-U.S. Growth and Non-U.S. Value, Volatility Management and Blend Currency. |
| ALLIANCEBERNSTEIN TAX-MANAGED WEALTH STRATEGIES • | 133 |
| 4. | Profit margins of the Adviser and its affiliates from supplying such services; |
| 5. | Possible economies of scale as the Strategies grow larger; and |
| 6. | Nature and quality of the Adviser’s services including the performance of the Strategies. |
These factors, with the exception of the first factor, are generally referred to as the “Gartenberg factors,” which were articulated by the United States Court of Appeals for the Second Circuit in 1982. Gartenberg v. Merrill Lynch Asset Management, Inc., 694 F. 2d 923 (2d Cir. 1982). On March 30, 2010, the Supreme Court held the Gartenberg decision was correct in its basic formulation of what §36(b) requires: to face liability under §36(b), “an investment adviser must charge a fee that is so disproportionately large that it bears no reasonable relationship to the services rendered and could not have been the product of arm’s length bargaining.” Jones v. Harris Associates L.P., 130 S. Ct. 1418 (2010). In Jones, the Court stated the Gartenberg approach fully incorporates the correct understanding of fiduciary duty within the context of section 36(b) and noted with approval that “Gartenberg insists that all relevant circumstances be taken into account” and “uses the range of fees that might result from arm’s length bargaining as the benchmark for reviewing challenged fees.”4
ADVISORY FEES, NET ASSETS, & EXPENSE RATIOS
The Adviser proposed that each Strategy pay the advisory fee set forth in the table below for receiving the services to be provided pursuant to the Investment Advisory Agreement. The fee schedule below, implemented in January 2004 in consideration of the Adviser’s settlement with the NYAG in December 2003, is based on a master schedule that contemplates eight categories of funds with almost all funds in each category having the same advisory fee schedule.5
| Category | Advisory Fees Based on a percentage of | Net Assets 6/30/13 ($MIL) | Strategy | |||||
| Balanced | 0.55% on 1st $2.5 billion 0.45% on next $2.5 billion 0.40% on the balance | $ | 154.9 | Tax-Managed Balanced Wealth Strategy | ||||
| Blend | 0.65% on 1st $2.5 billion 0.55% on next $2.5 billion 0.50% on the balance | $ | 627.3 | Tax-Managed Wealth Appreciation Strategy | ||||
| Balanced | 0.55% on 1st $2.5 billion 0.45% on next $2.5 billion 0.40% on the balance | $ | 65.6 | Tax-Managed Conservative Wealth Strategy | ||||
With respect to Tax-Managed Wealth Appreciation Strategy, the Strategy’s Investment Advisory Agreement provides for the Adviser to be reimbursed for
| 4 | Jones v. Harris at 1427. |
| 5 | Most of the AllianceBernstein Mutual Funds, which the Adviser manages, were affected by the Adviser’s settlement with the NYAG. |
| 134 | • ALLIANCEBERNSTEIN TAX-MANAGED WEALTH STRATEGIES |
certain clerical, legal, accounting, administrative and other services provided to the Strategy. To date, the Trustees have not authorized reimbursement payments under these provisions.
With respect to Tax-Managed Conservative Wealth Strategy, the Adviser has agreed to reimburse the Strategy for that portion of the Strategy’s total operating expenses to the degree necessary to limit the Strategy’s expense ratios to the amounts set forth below for the Strategy’s fiscal year. The terms of the expense limitation undertaking permit modification or termination by the Adviser upon at least 60 days’ notice prior to the Strategy’s prospectus update. Set forth below are Tax-Managed Conservative Wealth Strategy’s expense caps and gross expense ratios for the most recent semi-annual period:6
| Fund | Expense Cap Pursuant to Expense Limitation Undertaking | Gross Expense | Fiscal Year End | |||||||||||
| Tax-Managed | Class A | 1.20 | % | 1.50 | % | August 31 | ||||||||
| Conservative Wealth | Class B | 1.90 | % | 2.21 | % | |||||||||
| Strategy | Class C | 1.90 | % | 2.20 | % | |||||||||
| Advisor | 0.90 | % | 1.20 | % | ||||||||||
Set forth below are Tax-Managed Balanced Wealth and Tax-Managed Wealth Appreciation Strategy’s total expense ratios for the most recent semi-annual period:6
| Strategy | Total Expense (2/28/13)7 | Fiscal Year End | ||||||||
| Tax-Managed Balanced Wealth Strategy | Class A Class B Class C Advisor |
| 1.23 1.95 1.94 0.93 | % % % % | August 31 | |||||
| Tax-Managed Wealth Appreciation Strategy | Class A Class B Class C Advisor |
| 1.07 1.80 1.77 0.77 | % % % % | August 31 | |||||
| I. | ADVISORY FEES CHARGED TO INSTITUTIONAL AND OTHER CLIENTS |
The advisory fees charged to investment companies which the Adviser manages and sponsors are normally higher than those charged to similar sized institutional accounts, including pension plans and sub-advised investment companies. The fee differential reflects, among other things, different services provided to such clients, and different liabilities assumed. Services provided by the Adviser to the Strategies that are not provided to non-investment company clients and sub-advised investment companies include providing office space and personnel to
| 6 | Semi-annual total expense ratios are unaudited. |
| 7 | Annualized |
| ALLIANCEBERNSTEIN TAX-MANAGED WEALTH STRATEGIES • | 135 |
serve as Fund Officers, who among other responsibilities make the certifications required under the Sarbanes–Oxley Act of 2002, and coordinating with and monitoring the Strategies’ third party service providers such as Fund counsel, auditors, custodians, transfer agents and pricing services. The accounting, administrative, legal and compliance requirements for the Strategies are more costly than those for institutional assets due to the greater complexities and time required for investment companies. Also, retail mutual funds managed by the Adviser are widely held. Servicing the Strategies’ investors is more time consuming and labor intensive compared to institutional clients since the Adviser needs to communicate with a more extensive network of financial intermediaries and shareholders. The Adviser also believes that it incurs substantial entrepreneurial risk when offering a new mutual fund since establishing a new mutual fund requires a large upfront investment and it may take a long time for the fund to achieve profitability since the fund must be priced to scale from inception in order to be competitive and assets are acquired one account at a time. In addition, managing the cash flow of an investment company may be more difficult than managing that of a stable pool of assets, such as an institutional account with little cash movement in either direction, particularly, if a fund is in net redemption and the Adviser is frequently forced to sell securities to raise cash for redemptions. However, managing a fund with positive cash flow may be easier at times than managing a stable pool of assets. Finally, in recent years, investment advisers have been sued by institutional clients and have suffered reputational damage both by the attendant publicity and outcomes other than complete victories. Accordingly, the legal and reputational risks associated with institutional accounts are greater than previously thought, although still not equal to those related to the mutual fund industry.
Notwithstanding the Adviser’s view that managing an investment company is not comparable to managing other institutional accounts because the services provided are different, the Supreme Court has indicated consideration should be given to the advisory fees charged to institutional accounts with a similar investment style as the Strategies.8 However, the Adviser represented that there are no categories in the Form ADV for institutional products that have a substantially similar investment style as any of the Strategies.
The Adviser represented that it does not sub-advise any registered investment companies with a substantially similar investment style as any of the Strategies.
| 8 | The Supreme Court stated that “courts may give such comparisons the weight that they merit in light of the similarities and differences between the services that the clients in question require, but the courts must be wary of inapt comparisons.” Among the significant differences the Supreme Court noted that may exist between services provided to mutual funds and institutional accounts are “higher marketing costs.” Jones v. Harris at 1428. |
| 136 | • ALLIANCEBERNSTEIN TAX-MANAGED WEALTH STRATEGIES |
| II. | MANAGEMENT FEES CHARGED BY OTHER MUTUAL FUND COMPANIES FOR LIKE SERVICES. |
Lipper, Inc. (“Lipper”), an analytical service that is not affiliated with the Adviser, compared the fees charged to the Strategies with fees charged to other investment companies for similar services offered by other investment advisers.9 Lipper’s analysis included the comparison of each Strategy’s contractual management fee, estimated at the approximate current asset level of the Strategy, to the median of the Strategy’s Lipper Expense Group (“EG”)10 and the Strategy’s contractual management fee ranking.11
Lipper describes an EG as a representative sample of comparable funds. Lipper’s standard methodology for screening funds to be included in an EG entails the consideration of several fund criteria, including fund type, investment classification/objective, load type and similar 12b-1/non-12b-1 service fees, asset (size) comparability, expense components and attributes. An EG will typically consist of seven to twenty funds.
The original EG for Tax-Managed Wealth Appreciation Strategy had an insufficient number of peers. Consequently, Lipper expanded the Strategy’s EG to include peers that have a similar but not the same Lipper investment classification/objective.
| Strategy | Contractual Management Fee (%) | Lipper EG Median (%) | Lipper EG Rank | |||||||
| Tax-Managed Balanced Wealth Strategy | 0.550 | 0.700 | 2/14 | |||||||
| Tax-Managed Wealth Appreciation Strategy12 | 0.650 | 0.863 | 3/14 | |||||||
| Tax-Managed Conservative Wealth Strategy | 0.550 | 0.570 | 4/11 | |||||||
| 9 | The Supreme Court cautioned against accepting mutual fund fee comparisons without careful scrutiny since “these comparisons are problematic because these fees, like those challenged, may not be the product of the negotiations conducted at arm’s-length.” Jones v. Harris at 1429. |
| 10 | Lipper does not consider average account size when constructing EGs. Funds with relatively small average account sizes tend to have higher transfer agent expense ratio than comparable sized funds that have relatively large average account sizes. There are limitations to Lipper expense category data because different funds categorize expenses differently. |
| 11 | The contractual management fee is calculated by Lipper using each Strategy’s contractual management fee rate at a hypothetical asset level. The hypothetical asset level is based on the combined net assets of all classes of each Strategy, rounded up to the next $25 million. Lipper’s total expense ratio information is based on the most recent annual report except as otherwise noted. A ranking of “1” would mean that the Strategy had the lowest effective fee rate in the Lipper peer group. |
| 12 | The Strategy’s EG includes the Strategy, four other Global Multi-Cap Core funds (“GMLC”) and nine Global Multi-Cap Growth funds (“GMLG”). |
| ALLIANCEBERNSTEIN TAX-MANAGED WEALTH STRATEGIES • | 137 |
However, because Lipper had expanded the EG of Tax-Managed Wealth Appreciation Strategy, under Lipper’s standard guidelines, the Lipper Expense Universe (��EU”) was also expanded to include the universe of those peers that had a similar but not the same Lipper investment classification/objective.13 A “normal” EU will include funds that have the same investment classification/objective as the subject Strategy.
Set forth below is a comparison of the Strategies’ total expense ratios and the medians of the Strategies’ EGs and EUs. The Strategies’ total expense ratio rankings are also shown.
| Strategy | Total Expense | Lipper EG | Lipper EG Rank | Lipper EU Median (%) | Lipper EU Rank | |||||||||||
| Tax-Managed Balanced Wealth Strategy | 1.194 | 1.161 | 9/14 | 1.160 | 22/35 | |||||||||||
| Tax-Managed Wealth Appreciation Strategy15 | 1.079 | 1.380 | 2/14 | 1.498 | 2/36 | |||||||||||
| Tax-Managed Conservative Wealth Strategy | 1.199 | 1.122 | 8/11 | 1.074 | 22/26 | |||||||||||
Based on this analysis, Tax-Managed Balanced Wealth and Tax-Managed Conservative Wealth have a more favorable ranking on a contractual management fee basis than on a total expense ratio basis; Tax-Managed Wealth Appreciation has a more favorable ranking on a total expense ratio basis than a contractual management fee basis.
| III. | COSTS TO THE ADVISER AND ITS AFFILIATES OF SUPPLYING SERVICES PURSUANT TO THE MANAGEMENT FEE ARRANGEMENT, EXCLUDING ANY INTRA-CORPORATE PROFIT. |
The Adviser utilizes two profitability reporting systems, which operate independently but are aligned with each other, to estimate the Adviser’s profitability in connection with investment advisory services provided to the Strategies. The Senior Officer has retained a consultant to provide independent advice regarding the alignment of the two profitability systems as well as the methodologies and allocations utilized by both profitability systems. See Section IV for additional discussion.
| 13 | Except for asset (size) comparability, Lipper uses the same criteria for selecting an EG peer when selecting an EU peer. Unlike the EG, the EU allows for the same adviser to be repre-sented by more than just one fund. |
| 14 | Most recently completed fiscal year Class A share total expense ratio. |
| 15 | The Strategy’s EU includes the Strategy, the EG, and all other retail front-end GMLC and GMLG, excluding outliers. |
| 138 | • ALLIANCEBERNSTEIN TAX-MANAGED WEALTH STRATEGIES |
| IV. | PROFIT MARGINS OF THE ADVISER AND ITS AFFILIATES FOR SUPPLYING SUCH SERVICES. |
The Strategies’ profitability information, prepared by the Adviser for the Board of Trustees, was reviewed by the Senior Officer and the consultant. Except for Tax-Managed Balanced Wealth Strategy, the Adviser’s profitability from providing investment advisory services to the Strategies decreased during calendar year 2012, relative to 2011.
In addition to the Adviser’s direct profits from managing the Strategies, certain of the Adviser’s affiliates have business relationships with the Strategies and may earn a profit from providing other services to the Strategies. The courts have referred to this type of business opportunity as “fall-out benefits” to the Adviser and indicated that such benefits should be factored into the evaluation of the total relationship between the Strategies and the Adviser. Neither case law nor common business practice precludes the Adviser’s affiliates from earning a reasonable profit on this type of relationship provided the affiliates’ charges and services are competitive and the relationship otherwise complies with the 40 Act restrictions. These affiliates provide transfer agent, distribution and brokerage related services to the Strategies and receive transfer agent fees, Rule 12b-1 payments, front-end sales loads, contingent deferred sales charges (“CDSC”) and brokerage commissions. In addition, the Adviser benefits from soft dollar arrangements which offset expenses the Adviser would otherwise incur.
AllianceBernstein Investments, Inc. (“ABI”), an affiliate of the Adviser, is the Trust’s principal underwriter. ABI and the Adviser have disclosed in the Strategies’ prospectus that they may make revenue sharing payments from their own resources, in addition to resources derived from sales loads and Rule 12b-1 fees, to firms that sell shares of the Trust. In 2012, ABI paid approximately 0.05% of the average monthly assets of the AllianceBernstein Mutual Funds or approximately $19 million for distribution services and educational support (revenue sharing payments).
ABI retained the following front-end load sales charges from sales of the Strategies’ Class A shares during the Strategies’ most recently completed fiscal year:
| Strategy | Amount Received | |||
| Tax-Managed Balanced Wealth Strategy | $ | 4,020 | ||
| Tax-Managed Wealth Appreciation Strategy | $ | 1,612 | ||
| Tax-Managed Conservative Wealth Strategy | $ | 2,758 | ||
| ALLIANCEBERNSTEIN TAX-MANAGED WEALTH STRATEGIES • | 139 |
ABI received the amounts set forth below in Rule 12b-1 fees and CDSC for the Strategies during the Strategies’ most recently completed fiscal year:
| Strategy | 12b-1 Fees Received | CDSC Received | ||||||
| Tax-Managed Balanced Wealth Strategy | $ | 861,135 | $ | 7,964 | ||||
| Tax-Managed Wealth Appreciation Strategy | $ | 370,997 | $ | 2,877 | ||||
| Tax-Managed Conservative Wealth Strategy | $ | 415,895 | $ | 2,693 | ||||
Fees and reimbursements for out of pocket expenses charged by AllianceBernstein Investor Services, Inc. (“ABIS”), the affiliated transfer agent for the Strategies, are based on the level of the network account and the class of shares held by the account. ABIS also receives a fee per shareholder sub-account for each account maintained by an intermediary on an omnibus basis. ABIS received the following net fees from the Strategies in the most recently completed fiscal year:
| Strategy | ABIS Fee | |||
| Tax-Managed Balanced Wealth Strategy | $ | 93,856 | ||
| Tax-Managed Wealth Appreciation Strategy | $ | 124,739 | ||
| Tax-Managed Conservative Wealth Strategy | $ | 37,147 | ||
The Tax-Managed Wealth Strategies effected brokerage transactions through the Adviser’s affiliate, Sanford C. Bernstein & Co., LLC (“SCB & Co.”) and its U.K. affiliate, Sanford C. Bernstein Limited (“SCB Ltd.”), collectively “SCB,” and paid commissions for such transactions during the Strategies’ most recently completed fiscal year. The Adviser represented that SCB’s profitability from business conducted with the Strategies is comparable to the profitability of SCB’s dealings with other similar third party clients. In the ordinary course of business, SCB receives and pays liquidity rebates from electronic communications networks (“ECNs”) derived from trading for its clients, including the Strategies. These credits and charges are not being passed onto any SCB client. The Adviser also receives certain soft dollar benefits from brokers that execute agency trades for the Strategies and other clients. These soft dollar benefits reduce the Adviser’s cost of doing business and increase its profitability.
| V. | POSSIBLE ECONOMIES OF SCALE |
The Adviser has indicated that economies of scale are being shared with shareholders through pricing to scale, breakpoints, fee reductions/waivers and enhancement to services.
In May 2012, an independent consultant, retained by the Senior Officer, provided the Board of Trustees information on the Adviser’s firm-wide average costs from 2005 through 2011 and the potential economies of scale. The independent consultant noted that from 2005 through 2007 the Adviser experienced
| 140 | • ALLIANCEBERNSTEIN TAX-MANAGED WEALTH STRATEGIES |
significant growth in assets under management (“AUM”). During this period, operating expenses increased, in part to keep up with growth, and in part reflecting market returns. However, from 2008 through the first quarter of 2009, AUM rapidly and significantly decreased due to declines in market value and client withdrawals. When AUM rapidly decreased, some operating expenses categories, including base compensation and office space, adjusted more slowly during this period, resulting in an increase in average costs. Since 2009, AUM has experienced less significant changes. The independent consultant noted that changes in operating expenses reflect changes in business composition and business practices in response to changes in financial markets. Finally, the independent consultant concluded that the increase in average cost and the decline in net operating margin across the Adviser since late 2008 are inconsistent with the view that there are currently reductions in average costs due to economies of scale that can be shared with the AllianceBernstein Mutual Funds managed by the Adviser through lower fees.
Previously, in February 2008, the independent consultant provided the Board of Trustees an update of the Deli16 study on advisory fees and various fund characteristics.17 The independent consultant first reiterated the results of his previous two dimensional comparison analysis (fund size and family size) with the Board of Trustees.18 The independent consultant then discussed the results of the regression model that was utilized to study the effects of various factors on advisory fees. The regression model output indicated that the bulk of the variation in fees predicted were explained by various factors, but substantially by fund AUM, family AUM, index fund indicator and investment style. The independent consultant also compared the advisory fees of the AllianceBernstein Mutual Funds to similar funds managed by 19 other large asset managers, regardless of the fund size and each Adviser’s proportion of mutual fund assets to non-mutual fund assets.
| VI. | NATURE AND QUALITY OF THE ADVISER’S SERVICES, INCLUDING THE PERFORMANCE OF THE FUND |
With assets under management of approximately $435 billion as of June 30, 2013, the Adviser has the investment experience to manage and provide non-investment services (described in Section I) to the Strategies.
| 16 | The Deli study, originally published in 2002 based on 1997 data and updated for the February 2008 Presentation, may be of diminished value due to the age of the data used in the presentation and the changes experienced in the industry over the last four years. |
| 17 | As mentioned previously, the Supreme Court cautioned against accepting mutual fund fee comparisons without careful scrutiny since the fees may not be the product of negotiations conducted at arm’s length. See Jones V. Harris at 1429. |
| 18 | The two dimensional analysis showed patterns of lower advisory fees for funds with larger asset sizes and funds from larger family sizes compared to funds with smaller asset sizes and funds from smaller family sizes, which according to the independent consultant is indicative of a sharing of economies of scale and scope. However, in less liquid and active markets, such is not the case, as the empirical analysis showed potential for diseconomies of scale in those markets. The empirical analysis also showed diminishing economies of scale and scope as funds surpassed a certain high level of assets. |
| ALLIANCEBERNSTEIN TAX-MANAGED WEALTH STRATEGIES • | 141 |
The information prepared by Lipper shows the 1, 3, 5 and 10 year performance returns and rankings19 of the Strategies relative to their Lipper Performance Groups (“PGs”) and Lipper Performance Universes (“PUs”)20 for the periods ended May 31, 2013.21
| Strategy | Portfolio Return (%) | PG Median (%) | PU Median (%) | PG Rank | PU Rank | |||||||||||||||||
| Tax-Managed Balanced Wealth Strategy22 | ||||||||||||||||||||||
1 year | 11.26 | 15.54 | 15.85 | 14/14 | 85/94 | |||||||||||||||||
3 year | 6.69 | 10.21 | 10.05 | 11/11 | 79/80 | |||||||||||||||||
5 year | 2.49 | 4.58 | 4.57 | 11/11 | 65/74 | |||||||||||||||||
10 year | 4.59 | 6.30 | 6.37 | 7/7 | 45/47 | |||||||||||||||||
| Tax-Managed Wealth Appreciation Strategy22 | ||||||||||||||||||||||
1 year | 24.69 | 29.31 | 25.33 | 5/5 | 12/22 | |||||||||||||||||
3 year | 10.42 | 10.86 | 10.85 | 4/5 | 13/18 | |||||||||||||||||
5 year | -0.39 | 0.63 | 1.50 | 4/5 | 14/16 | |||||||||||||||||
| Tax-Managed Conservative Wealth Strategy22 | ||||||||||||||||||||||
1 year | 7.01 | 10.86 | 10.65 | 11/11 | 62/74 | |||||||||||||||||
3 year | 4.50 | 8.79 | 7.96 | 10/10 | 64/67 | |||||||||||||||||
5 year | 2.12 | 4.98 | 4.88 | 9/10 | 58/61 | |||||||||||||||||
10 year | 3.17 | 6.15 | 5.63 | 7/7 | 25/25 | |||||||||||||||||
| 19 | The performance returns and rankings of the Strategies are for the Strategies’ Class A shares. The performance returns of the Strategies were provided by Lipper. |
| 20 | A Strategy’s PG/PU may not necessarily be identical to its respective EG/EU. Strategies with negative management fees are excluded from EGs/EUs but not necessarily from PGs/PUs. In addition, PGs/PUs only include funds of the same Lipper investment classification/objective as the Strategies, in contrast to certain of the Strategies’ EGs/EUs, which may include strategies of similar but not the same investment classification/objective. |
| 21 | Note that the current Lipper investment classification/objective dictates the PG and PU throughout the life of each Strategy even if a Strategy had a different investment classification/objective at a different point in time. |
| 22 | Lipper does not have a separate classification for tax-managed funds. Accordingly, unlike the Strategy, many of the Strategy’s Lipper peers are not tax-managed. |
| 142 | • ALLIANCEBERNSTEIN TAX-MANAGED WEALTH STRATEGIES |
Set forth below are the 1, 3, 5, 10 year and since inception performance returns of the Strategies (in bold)23 versus their benchmarks for the periods ending May 31, 2013.24
Periods Ending May 31, 2013 | ||||||||||||||||||||
| 1 Year (%) | 3 Year (%) | 5 Year (%) | 10 Year (%) | Since Inception (%) | ||||||||||||||||
| Tax-Managed Balanced Wealth Strategy | 11.26 | 6.69 | 2.49 | 4.59 | 5.95 | |||||||||||||||
| 50% S&P 500 / 50% Barclays Capital 5 Yr. GO Municipal Bond Index | 13.78 | 10.34 | 5.56 | 6.04 | 7.28 | |||||||||||||||
| Barclays Capital 5Yr GO Municipal Bond Index | 1.51 | 3.59 | 4.74 | 3.93 | 5.08 | |||||||||||||||
| S&P 500 Index | 27.28 | 16.87 | 5.43 | 7.58 | 8.88 | |||||||||||||||
| Inception Date: May 4, 1992 | ||||||||||||||||||||
| Tax-Managed Wealth Appreciation Strategy | 24.69 | 10.42 | -0.39 | N/A | 4.52 | |||||||||||||||
| 60% S&P 500 Index / 40% MSCI ACWI Ex USA Net Index | 26.77 | 13.82 | 2.68 | N/A | 7.95 | |||||||||||||||
| S&P 500 Index | 27.28 | 16.87 | 5.43 | N/A | 7.42 | |||||||||||||||
| MSCI ACWI Ex USA Net Index | 25.79 | 9.13 | -1.62 | N/A | 8.58 | |||||||||||||||
| Inception Date: September 2, 2003 | ||||||||||||||||||||
| Tax-Managed Conservative Wealth Strategy | 7.01 | 4.50 | 2.12 | 3.17 | 4.96 | |||||||||||||||
| 70% Barclays Capital 5 Year GO Muni / 30% S&P 500 Index | 8.73 | 7.66 | 5.35 | 5.26 | 6.47 | |||||||||||||||
| Barclays Capital 5 Year GO Muni Bond Index | 1.51 | 3.59 | 4.74 | 3.93 | 5.08 | |||||||||||||||
| S&P 500 Index | 27.28 | 16.87 | 5.43 | 7.58 | 8.82 | |||||||||||||||
| Inception Date: May 4, 1992 | ||||||||||||||||||||
CONCLUSION:
Based on the factors discussed above the Senior Officer’s conclusion is that the proposed advisory fee for each Strategy is reasonable and within the range of what would have been negotiated at arm’s-length in light of all the surrounding circumstances. This conclusion in respect of each Strategy is based on an evaluation of all of these factors and no single factor was dispositive.
Dated: September 15, 2013
| 23 | The performance returns shown in the table are for the Class A shares of the Strategies. |
| 24 | The Adviser provided Strategy and benchmark performance return information. |
| ALLIANCEBERNSTEIN TAX-MANAGED WEALTH STRATEGIES • | 143 |
THIS PAGE IS NOT PART OF THE SHAREHOLDER REPORT OR THE FINANCIAL STATEMENTS
ALLIANCEBERNSTEIN FAMILY OF FUNDS
US Equity
US Core
Core Opportunities Fund
Growth & Income Fund
Select US Equity Portfolio
US Growth
Concentrated Growth Fund
Discovery Growth Fund
Growth Fund
Large Cap Growth Fund
Small Cap Growth Portfolio
US Value
Discovery Value Fund
Equity Income Fund
Value Fund
International/Global Equity
International/Global Core
Global Equity & Covered Call Strategy Fund
Global Thematic Growth Fund
International Portfolio
Tax-Managed International Portfolio
International/Global Growth
International Discovery Equity Portfolio
International Growth Fund
International/Global Value
Global Value Fund
International Value Fund
Fixed Income
Municipal
High Income Municipal Portfolio
Intermediate California Portfolio
Intermediate Diversified Portfolio
Intermediate New York Portfolio
Municipal Bond Inflation Strategy
Tax-Aware Fixed Income Portfolio
National Portfolio
Arizona Portfolio
California Portfolio
Massachusetts Portfolio
Michigan Portfolio
Minnesota Portfolio
New Jersey Portfolio
New York Portfolio
Ohio Portfolio
Pennsylvania Portfolio
Virginia Portfolio
Fixed Income (continued)
Taxable
Bond Inflation Strategy
Global Bond Fund
High Income Fund
Intermediate Bond Portfolio
Limited Duration High Income Portfolio
Short Duration Portfolio
Alternatives
Dynamic All Market Fund
Global Real Estate Investment Fund
Global Risk Allocation Fund
Market Neutral Strategy-Global
Market Neutral Strategy-U.S.
Real Asset Strategy
Select US Long/Short Portfolio
Unconstrained Bond Fund
Asset Allocation/Multi-Asset
Multi-Asset
Emerging Markets Multi-Asset Portfolio
Retirement Strategies
2000 Retirement Strategy
2005 Retirement Strategy
2010 Retirement Strategy
2015 Retirement Strategy
2020 Retirement Strategy
2025 Retirement Strategy
2030 Retirement Strategy
2035 Retirement Strategy
2040 Retirement Strategy
2045 Retirement Strategy
2050 Retirement Strategy
2055 Retirement Strategy
Wealth Strategies
Balanced Wealth Strategy
Conservative Wealth Strategy
Wealth Appreciation Strategy
Tax-Managed Balanced Wealth Strategy
Tax-Managed Conservative Wealth Strategy
Tax-Managed Wealth Appreciation Strategy
Closed-End Funds
Alliance California Municipal Income Fund
Alliance New York Municipal Income Fund
AllianceBernstein Global High Income Fund
AllianceBernstein Income Fund
AllianceBernstein National Municipal Income Fund
We also offer Exchange Reserves, which serves as the money market fund exchange vehicle for the AllianceBernstein mutual funds. An investment in Exchange Reserves is not a deposit in a bank and is not insured or guaranteed by the Federal Deposit Insurance Corporation or any other government agency. Although the Fund seeks to preserve the value of your investment at $1.00 per share, it is possible to lose money by investing in the Fund.
Investors should consider the investment objectives, risks, charges and expenses of the Fund carefully before investing. For copies of our prospectus or summary prospectus, which contain this and other information, visit us online at www.alliancebernstein.com or contact your AllianceBernstein investments representative. Please read the prospectus and/or summary prospectus carefully before investing.
| 144 | • ALLIANCEBERNSTEIN TAX-MANAGED WEALTH STRATEGIES |
AllianceBernstein Family of Funds
ALLIANCEBERNSTEIN TAX-MANAGED WEALTH STRATEGIES
1345 Avenue of the Americas
New York, NY 10105
800.221.5672
| TMW-0152-0214 |  | |
SEMI-ANNUAL REPORT
AllianceBernstein Wealth Strategies
Wealth Appreciation Strategy
Balanced Wealth Strategy
Conservative Wealth Strategy
February 28, 2014
Semi-Annual Report

Investment Products Offered
•Are Not FDIC Insured •May Lose Value •Are Not Bank Guaranteed |
Investors should consider the investment objectives, risks, charges and expenses of the Fund carefully before investing. For copies of our prospectus or summary prospectus, which contain this and other information, visit us online at www.alliancebernstein.com or contact your AllianceBernstein Investments representative. Please read the prospectus and/or summary prospectus carefully before investing.
This shareholder report must be preceded or accompanied by the Fund’s prospectus for individuals who are not current shareholders of the Fund.
You may obtain a description of the Fund’s proxy voting policies and procedures, and information regarding how the Fund voted proxies relating to portfolio securities during the most recent 12-month period ended June 30, without charge. Simply visit AllianceBernstein’s website at www.alliancebernstein.com, or go to the Securities and Exchange Commission’s (the “Commission”) website at www.sec.gov, or call AllianceBernstein at (800) 227-4618.
The Fund files its complete schedule of portfolio holdings with the Commission for the first and third quarters of each fiscal year on Form N-Q. The Fund’s Forms N-Q are available on the Commission’s website at www.sec.gov. The Fund’s Forms N-Q may also be reviewed and copied at the Commission’s Public Reference Room in Washington, DC; information on the operation of the Public Reference Room may be obtained by calling (800) SEC-0330. AllianceBernstein publishes full portfolio holdings for the Fund monthly at www.alliancebernstein.com.
AllianceBernstein Investments, Inc. (ABI) is the distributor of the AllianceBernstein family of mutual funds. ABI is a member of FINRA and is an affiliate of AllianceBernstein L.P., the manager of the funds.
AllianceBernstein® and the AB Logo are registered trademarks and service marks used by permission of the owner, AllianceBernstein L.P.
April 10, 2014
Semi-Annual Report
This report provides management’s discussion of fund performance for the portfolios of AllianceBernstein Wealth Strategies (the “Strategies”, and individually a “Strategy”) for the semi-annual reporting period ended February 28, 2014.
The Strategies invest in a combination of Portfolios (the “Underlying Portfolios”) of the AllianceBernstein Pooling Portfolios (the “Trust”) representing a variety of asset classes and investment styles.
Currencies can have a dramatic impact on equity returns, significantly adding to returns in some years and greatly diminishing them in others. Currency and equity positions are evaluated separately. AllianceBernstein L.P. (the “Adviser”) may seek to hedge the currency exposure resulting from securities positions when it finds the currency exposure unattractive. To hedge all or a portion of their currency risk, the Underlying Portfolios may, from time to time, invest in currency-related derivatives, including forward currency exchange contracts, futures, options on futures, swaps and options. The Adviser may also seek investment opportunities by taking long or short positions in currencies through the use of currency-related derivatives. The Underlying Portfolios may enter into other derivatives transactions, such as options, futures contracts, forwards, and swaps.
AllianceBernstein Wealth Appreciation Strategy
Investment Objective and Policies
AllianceBernstein Wealth Appreciation Strategy’s investment objective is long-
term growth of capital. The Strategy seeks to achieve its objective by investing in a combination of Underlying Portfolios representing a variety of asset classes and investment styles that are also managed by the Adviser. By allocating its assets among the Underlying Portfolios, the Strategy creates a portfolio that is designed as a solution for investors who seek equity returns without regard to taxes but also want broad diversification of the related risks across styles, capitalization ranges and geographic regions. The Strategy invests approximately 92% of its assets in Underlying Portfolios that focus on growth and value investment styles and in U.S. and non-U.S. markets. Through these investments, the Adviser efficiently diversifies the Strategy between growth and value equity investment styles, and between U.S. and non-U.S. markets. Normally, the Strategy’s targeted blend for its equity investments is an equal weighting of growth and value style Underlying Portfolios (50% each). The Strategy invests approximately 8% of its assets in the Multi-Asset Real Return Underlying Portfolio.
The Adviser will allow the relative weightings of the Strategy’s investments in growth and value and U.S. and non-U.S. Underlying Portfolios to vary in response to market conditions, but ordinarily only by ±5% of the Strategy’s net assets. Beyond those ranges, the Adviser will generally rebalance the portfolio toward the targeted blend. However, under extraordinary circumstances, such as when market conditions favoring one investment component are compelling, the range may expand to ±10% of
| ALLIANCEBERNSTEIN WEALTH STRATEGIES • | 1 |
the Strategy’s net assets. The Strategy’s targeted percentages may change from time to time without notice to shareholders based on the Adviser’s assessment of market conditions.
In addition to blending growth and value styles, the Strategy blends each style component across Underlying Portfolios that invest in U.S. and non-U.S. companies and various capitalization ranges. Within each of the growth and value components, the Strategy’s targeted blend is approximately 60% in Underlying Portfolios that invest in U.S. companies and the remaining 40% in Underlying Portfolios that invest in non-U.S. companies. The Strategy invests approximately 20% of its assets in the Volatility Management Underlying Portfolio, which is designed to reduce the overall effect of equity market volatility on the Strategy’s portfolio and the effects of adverse market conditions on its performance. The Volatility Management Underlying Portfolio will normally be considered to be part of the Strategy’s equity asset allocation. Under normal market conditions, this Underlying Portfolio will invest predominantly in equity securities. If the Adviser determines that the equity markets pose disproportionate risks, the Adviser will reduce the Portfolio’s equity investments and invest in fixed-income securities or other non-equity asset classes to reduce the risks of the Strategy’s investments in equity securities.
AllianceBernstein Balanced
Wealth Strategy Investment Objective and Policies
AllianceBernstein Balanced Wealth Strategy’s investment objective is to
achieve the highest total return consistent with the Adviser’s determination of reasonable risk. The Strategy seeks to achieve its objective by investing in a combination of Underlying Portfolios representing a variety of asset classes and investment styles that are also managed by the Adviser. By allocating its assets among the Underlying Portfolios, the Strategy creates a portfolio that is designed as a solution for investors who seek a moderate tilt toward equity returns without regard to taxes but also want the risk diversification offered by debt securities and the broad diversification of their equity risk across styles, capitalization ranges and geographic regions. Through investments in the Underlying Portfolios, the Adviser efficiently diversifies between the debt and equity components to produce the desired risk/return profile of the Strategy. The Strategy targets a weighting of 65% of Underlying Portfolios that invest primarily in equity securities and 35% of Underlying Portfolios that invest primarily in debt securities with a goal of providing moderate upside potential without excessive volatility. An investment in the Multi-Asset Real Return Underlying Portfolio is treated as 100% equity for the purpose of these allocations.
The Adviser will allow the relative weightings of the Strategy’s investments in equity and debt, growth and value, and in U.S. and non-U.S. company Underlying Portfolios to vary in response to market conditions, but ordinarily, only by ±5% of the Strategy’s net assets. Beyond those ranges, the Adviser will rebalance the Strategy toward the targeted blend. However, under extraordinary circumstances,
| 2 | • ALLIANCEBERNSTEIN WEALTH STRATEGIES |
such as when market conditions favoring one investment style are compelling, the range may expand to ±10% of the Strategy’s net assets. The Strategy’s targeted percentages may change from time to time without notice to shareholders based on the Adviser’s assessment of market conditions.
Within the Strategy’s equity component, the targeted blend is an equal weighting of Underlying Portfolios that invest primarily in growth and value-style stocks (50% each), with approximately 60% of each equity style invested in Underlying Portfolios that invest in U.S. companies and the remaining 40% in Underlying Portfolios that invest in non-U.S. companies. The Strategy invests approximately 20% of its assets in the Volatility Management Underlying Portfolio, which is designed to reduce the overall effect of equity market volatility on the Strategy’s portfolio and the effects of adverse market conditions on its performance. The Volatility Management Portfolio will normally be considered to be part of the Strategy’s equity asset allocation. Under normal market conditions, this Underlying Portfolio will invest predominantly in equity securities. If the Adviser determines that the equity markets pose disproportionate risks, the Adviser will reduce the Portfolio’s equity investments and invest in fixed-income securities or other non-equity asset classes to reduce the risks of the Strategy’s investments in equity securities.
The Underlying Portfolios’ fixed-income securities will primarily be investment-grade debt securities, but
are expected to include lower-rated securities (“junk bonds”) and preferred stock. The Strategy will not invest more than 25% of its total assets in Underlying Portfolios investing in securities rated, at the time of purchase, below investment-grade.
AllianceBernstein Conservative Wealth Strategy Investment Objective and Policies
AllianceBernstein Conservative Wealth Strategy’s investment objective is to achieve a high total return without, in the opinion of the Adviser, undue risk to principal. The Strategy seeks to achieve its objective by investing in a combination of portfolios of the Underlying Portfolios representing a variety of asset classes and investment styles that are also managed by the Adviser. By allocating its assets among the Underlying Portfolios, the Strategy creates a portfolio that is designed as a solution for investors who seek some opportunities for equity returns without regard to taxes if the related risks are broadly diversified and overall portfolio volatility reflects a preponderance of debt securities. Through investments in the Underlying Portfolios, the Adviser efficiently diversifies between debt and equity components to produce the desired risk/return profile of the Strategy. The Strategy targets a weighting of 35% in Underlying Portfolios that invest primarily in equity securities and 65% in Underlying Portfolios that invest in debt securities with a goal of providing reduced volatility and modest upside potential. An investment in the Multi-Asset Real Return Underlying Portfolio is treated as 100% equity for the purpose of these allocations.
| ALLIANCEBERNSTEIN WEALTH STRATEGIES • | 3 |
The Adviser will allow the relative weightings of the Strategy’s investments in equity and debt, growth and value, and in U.S. and non-U.S. company Underlying Portfolios to vary in response to market conditions, but ordinarily only by ±5% of the Strategy’s net assets. Beyond those ranges, the Adviser will rebalance the Strategy toward the targeted blends. However, under extraordinary circumstances, such as when market conditions favoring one investment style are compelling, the range may expand to ±10% of the Strategy’s net assets. The Strategy’s targeted percentages may change from time to time without notice to shareholders based on the Adviser’s assessment of market conditions.
All fixed-income securities of the Short Duration Bond Underlying Portfolio and Global Core Bond Underlying Portfolios in which the Strategy invests will be of investment-grade at the time of purchase. In the event that the rating of any security held by these Underlying Portfolios falls below investment-grade, the Strategy will not be obligated to dispose of its investment in such Underlying Portfolio and may continue to hold such investment if, in the opinion of the Adviser, such investment is appropriate under the circumstances.
Investment Results
The tables on pages 10-12 show performance for each Strategy compared to its respective benchmarks for the six- and 12-month periods ended February 28, 2014. Each Strategy’s blended benchmark is as follows: AllianceBernstein Wealth Appreciation Strategy, 60% Standard & Poor’s
(“S&P”) 500 Index/40% Morgan Stanley Capital International All Country World Index (“MSCI ACWI”) ex-U.S.; AllianceBernstein Balanced Wealth Strategy, 65% S&P 500 Index/35% Barclays U.S. Aggregate Bond Index; and AllianceBernstein Conservative Wealth Strategy, 65% Barclays U.S. Aggregate Bond Index/35% S&P 500 Index. Performance for each of the Underlying Portfolios compared to its benchmark may be found on page 13. Additional performance for the Underlying Portfolios may be found on pages 20-23.
For the six-month period ended February 28, 2014, all share classes of the Wealth Appreciation and the Balanced Wealth Strategies underperformed the primary benchmark, the S&P 500 Index. All share classes of the Conservative Wealth Strategy outperformed the primary benchmark, the Barclays U.S. Aggregate Bond Index. Versus the blended benchmark, Class A, I and Advisor Class shares of the Wealth Appreciation Strategy outperformed, the rest of the share classes underperformed; all share classes of Balanced Wealth and Conservative Wealth Strategies underperformed the blended benchmark. The equity and Volatility Management Underlying Portfolios contributed most to overall portfolio returns and outperformed each of their respective benchmarks, with the exception of the U.S. Small-Mid Cap Value, International Growth and Multi-Asset Real Return Underlying Portfolios. The fixed income Underlying Portfolios outperformed their respective benchmarks for the six-month period.
| 4 | • ALLIANCEBERNSTEIN WEALTH STRATEGIES |
For the 12-month period ended February 28, 2014, all share classes of the Wealth Appreciation Strategy underperformed the primary benchmark; Class A, I and Advisor Class shares outperformed the blended benchmark, all other share classes underperformed. All share classes of the Balanced Wealth Strategy underperformed the primary benchmark and the blended benchmark. All share classes of the Conservative Wealth Strategy outperformed the primary benchmark, and underperformed the blended benchmark. The International Growth and Multi-Asset Real Return Underlying Portfolios underperformed their respective benchmarks, while all other equity Underlying Portfolios outperformed their benchmarks. The fixed-income Underlying Portfolios had mixed performance. Bond Inflation Protection posted negative absolute returns, although it outperformed its benchmark. Global Bond Underlying Portfolio underperformed its benchmark; High-Yield and Short Duration Bond Underlying Portfolios outperformed their benchmarks.
The U.S. Value, U.S. Large Cap Growth, Small-Mid Cap Value and Small-Mid Cap Growth Underlying Portfolios did not use derivatives during the six- and 12-month periods. The International Value Underlying Portfolio utilized currency forwards for hedging and investment purposes, and futures for investment purposes, which added to returns during both periods. The International Growth Underlying Portfolio utilized currency forwards for hedging and investment purposes,
which detracted from returns during both periods. For both periods, the Short Duration Bond Underlying Portfolio utilized Treasury futures in order to manage duration and yield curve positioning. Overall yield curve positioning detracted for both periods. Currency forwards were utilized during both periods to hedge out non-dollar currency exposure; cross-currency swaps were also utilized for hedging purposes during both periods, which had an immaterial impact on performance. During both periods, the Global Core Bond Underlying Portfolio utilized Treasury futures in order to manage duration and yield curve positioning. Overall yield curve positioning detracted for both periods. Currency forwards were also utilized during both periods to hedge out non-dollar currency exposure. The Bond Inflation Protection Underlying Portfolio utilized currency forwards for both establishing currency positions and for hedging purposes; overall currency positioning was positive for the six- and 12-month periods. Interest rate swaps were utilized during both periods to manage duration and yield curve positioning. Yield curve positioning did not have a meaningful impact for the six-month period; as interest rates rose early in the 12-month period, the Bond Inflation Protection Underlying Portfolio’s longer-duration positioning and overweight to the intermediate part of the curve detracted. Credit default swaps were utilized for investment purposes, and inflation swaps for hedging purposes, which had an immaterial impact during both periods. Leverage was used through
| ALLIANCEBERNSTEIN WEALTH STRATEGIES • | 5 |
reverse repurchase agreements. During both periods, the High-Yield Underlying Portfolio utilized futures and interest rate swaps to manage the overall interest rate risk. Currency forwards, purchased and written swaptions and credit default swaps were used for hedging and investment purposes, which contributed to returns for both periods; purchased options for hedging and investment purposes, and dividend swaps for investment purposes, detracted for both periods. Written options were used for hedging and investment purposes, which detracted for the six-month period and contributed for the 12-month period. Total return swaps were utilized for investment purposes, which added for the six-month period and had an immaterial impact for the 12-month period. Leverage was utilized through reverse repurchase agreements. The Multi-Asset Real Return Underlying Portfolio utilized interest rate swaps for investment purposes, which detracted from performance for the six-month period and had an immaterial impact for the 12-month period; inflation swaps for hedging purposes, which detracted from performance during both periods; total return swaps for investment purposes, which added to returns for the six-month period and detracted for the 12-month period; currencies for hedging and investment purposes, which detracted for the six-month period and added for the 12-month period; futures for hedging and investment purposes, which added for both periods; and purchased and written options for hedging purposes, which added in the six-month period
and detracted for the 12-month period. The Volatility Management Underlying Portfolio utilized purchased options for hedging and investment purposes during the 12-month period, which detracted from performance; written options for hedging and investment purposes during the 12-month period, which added to performance; and currency forwards, futures, and total return swaps for hedging and investment purposes, which added to performance during both periods.
Market Review and Investment Strategy
The global equity markets responded positively to economic improvement in key developed countries and the accommodative monetary policies of major central banks during the six-month period ended February 28, 2014. In the US, solid data on employment, consumer spending and housing pointed to continued economic recovery. Despite wide differences between individual countries, the euro area showed signs of modest economic growth reflected by stronger manufacturing activity and an increase in consumer confidence. In Japan, both employment growth and core inflation have turned positive suggesting that the aggressive government efforts to reverse a decade of deflation and stimulate growth are delivering results.
By contrast, emerging-market equities continued to underperform developed-market equities as sluggish exports and weak domestic demand have hampered economic growth in several bellwether
| 6 | • ALLIANCEBERNSTEIN WEALTH STRATEGIES |
countries such as China and Brazil. Investors were also concerned about the impact on growth for those emerging market countries that have relied on abundant global liquidity and low interest rates to finance government spending as the U.S. Federal Reserve (the “Fed”) began to rein in its bond purchase program.
The direction of the Fed’s policy also played a significant role in market activity in the six-month period. Fixed income markets underperformed in the beginning of the period, as interest rates rose in response to signals by the Fed that it would consider reducing its bond-buying program, which then came to pass in December. At the end of the period, however, capital markets rebounded with almost all major fixed-income sectors outperforming (with the notable exception of local-currency emerging market debt), as Fed Chair Janet Yellen reaffirmed that
tapering should continue unabated. Investors were encouraged to hear that the program is expected to be reduced in measured steps and that monetary stance should remain accommodative for the foreseeable future.
The Underlying Portfolios are well positioned to invest opportunistically across a wide range of asset classes and market circumstances. In equities, the Growth Team has focused its holdings on companies that are market leaders with attractive earnings growth prospects and high returns on invested capital, while the Value Team is focused on companies with robust cash-flow generation and strong balance sheets, whose stocks are trading at deep valuation discounts. Meanwhile, the Fixed-Income Team continues to emphasize credit sectors with positive fundamentals over U.S. Treasuries.
| ALLIANCEBERNSTEIN WEALTH STRATEGIES • | 7 |
DISCLOSURES AND RISKS
Benchmark Disclosure
The unmanaged S&P 500® Index, the MSCI ACWI ex-U.S. and the Barclays U.S. Aggregate Bond Index do not reflect fees and expenses associated with the active management of a mutual fund portfolio. The Barclays U.S. Aggregate Bond Index represents the performance of securities within the U.S. investment-grade fixed-rate bond market, with index components for government and corporate securities, mortgage pass-through securities, asset-backed securities, and commercial mortgage-backed securities. The S&P 500 Index includes 500 U.S. stocks and is a common representation of the performance of the overall U.S. stock market. MSCI makes no express or implied warranties or representations, and shall have no liability whatsoever with respect to any MSCI data contained herein. The MSCI data may not be further redistributed or used as a basis for other indices, any securities or financial products. This report is not approved, reviewed or produced by MSCI. The MSCI ACWI ex-U.S. (free float-adjusted, market capitalization weighted) represents the equity market performance of developed and emerging markets, excluding the United States. An investor cannot invest directly in an index, and its results are not indicative of the performance for any specific investment, including the Strategies.
A Word About Risk
The Strategies allocate their investments among multiple asset classes which will include U.S. and foreign securities. AllianceBernstein Balanced Wealth Strategy and AllianceBernstein Conservative Wealth Strategy will include both equity and fixed-income securities. Price fluctuation in the Underlying Portfolio securities may be caused by changes in the general level of interest rates or changes in bond credit quality ratings.
Market Risk: The value of the Strategies’ assets will fluctuate as the stock or bond market fluctuates. The value of its investments may decline, sometimes rapidly and unpredictably, simply because of economic changes or other events that affect large portions of the market. It includes the risk that a particular style of investing, such as growth or value, may be underperforming the stock market generally.
Interest Rate Risk: (Balanced Wealth and Conservative Wealth Strategies) Changes in interest rates will affect the value of the Strategies’ investments in Underlying Portfolios that invest in fixed-income securities. When interest rates rise, the value of investments in fixed-income securities tend to fall and this decrease in value may not be offset by higher income from new investments. Interest rate risk is generally greater for fixed-income securities with longer maturities or durations. Investments in fixed-income securities with lower credit ratings (“junk bonds”) tend to have a higher probability that an issuer will default or fail to meet its payment obligations.
Credit Risk: (Balanced Wealth and Conservative Wealth Strategies) The issuer or guarantor of a fixed-income security, or the counterparty to a derivatives or other contract, may be unable or unwilling to make timely payments of interest or principal, or to otherwise honor its obligations. The issuer or guarantor may default causing a loss of the full principal amount of a security. The degree of risk for a particular security may be reflected in its credit rating. There is the possibility that the credit rating of a fixed-income security may be downgraded after purchase, which may adversely affect the value of the security. Investments in fixed-income securities with lower ratings tend to have a higher probability that an issuer will default or fail to meet its payment obligations.
Foreign (Non-U.S.) Risk: The Strategies’ investments in Underlying Portfolios that invest in securities of non-U.S. issuers may involve more risk than those of U.S. issuers. These securities may fluctuate more widely in price and may be less liquid due to adverse market, economic, political, regulatory or other factors.
(Disclosures, Risks and Note about Historical Performance continued on next page)
| 8 | • ALLIANCEBERNSTEIN WEALTH STRATEGIES |
Disclosures and Risks
DISCLOSURES AND RISKS
(continued from previous page)
Currency Risk: Fluctuations in currency exchange rates may negatively affect the value of the Strategy’s investments or reduce its returns.
Capitalization Risk: Investments in small- and mid-capitalization companies by Underlying Portfolios may be more volatile than investments in large-cap companies. Investments in small-cap companies may have additional risks because these companies have limited product lines, markets, or financial resources.
Allocation Risk: The allocation of investments among the Underlying Portfolios’ different investment styles, such as growth or value, or U.S. or non-U.S. securities, may have a more significant effect on the Strategies’ net asset value (“NAV”) when one of these investments is performing more poorly than another.
Derivatives Risk: Derivatives may be illiquid, difficult to price, and leveraged so that small changes may produce disproportionate losses for the Strategies, and may be subject to counterparty risk to a greater degree than more traditional investments.
These risks are fully discussed in the Strategies’ prospectus.
An Important Note About Historical Performance
The investment return and principal value of an investment in the Strategies will fluctuate as the prices of the individual securities in which it invests fluctuate, so that your shares, when redeemed, may be worth more or less than their original cost. Performance shown on the following pages represents past performance and does not guarantee future results. Current performance may be lower or higher than the performance information shown. You may obtain performance information current to the most recent month-end by visiting www.alliancebernstein.com.
All fees and expenses related to the operation of the Strategies have been deducted. NAV returns do not reflect sales charges; if sales charges were reflected, the Strategies’ quoted performance would be lower. SEC returns reflect the applicable sales charges for each share class: a 4.25% maximum front-end sales charge for Class A shares; the applicable contingent deferred sales charge for Class B shares (4% year 1, 3% year 2, 2% year 3, 1% year 4); a 1% 1-year contingent deferred sales charge for Class C shares. Returns for the different share classes will vary due to different expenses associated with each class. Performance assumes reinvestment of distributions and does not account for taxes.
| ALLIANCEBERNSTEIN WEALTH STRATEGIES • | 9 |
Disclosures and Risks
WEALTH APPRECIATION STRATEGY
HISTORICAL PERFORMANCE
| THE STRATEGY VS. ITS BENCHMARKS PERIODS ENDED FEBRUARY 28, 2014 (unaudited) | NAV Returns | |||||||||
| 6 Months | 12 Months | |||||||||
| AllianceBernstein Wealth Appreciation Strategy | ||||||||||
Class A | 14.03% | 20.14% | ||||||||
| ||||||||||
Class B* | 13.61% | 19.21% | ||||||||
| ||||||||||
Class C | 13.63% | 19.22% | ||||||||
| ||||||||||
Advisor Class** | 14.18% | 20.49% | ||||||||
| ||||||||||
Class R** | 13.85% | 19.65% | ||||||||
| ||||||||||
Class K** | 13.99% | 20.04% | ||||||||
| ||||||||||
Class I** | 14.25% | 20.48% | ||||||||
| ||||||||||
| Primary Benchmark: S&P 500 Index | 15.07% | 25.37% | ||||||||
| ||||||||||
| Secondary Benchmark: MSCI ACWI ex-U.S. | 12.32% | 12.25% | ||||||||
| ||||||||||
Blended Benchmark: 60% S&P 500 Index/ | 14.00% | 20.06% | ||||||||
| ||||||||||
* Effective January 31, 2009, Class B shares are no longer available for purchase to new investors. Please see Note A for additional information.
** Please note that these share classes are for investors purchasing shares through accounts established under certain fee-based programs sponsored and maintained by certain broker-dealers and financial intermediaries, institutional pension plans and/or investment advisory clients of, and certain other persons associated with, the Adviser and its affiliates or the Strategies.
Please keep in mind that high, double-digit returns are highly unusual and cannot be sustained. Investors should also be aware that these returns were primarily achieved during favorable market conditions. | ||||||||||
See Disclosures, Risks and Note about Historical Performance on pages 8-9.
(Historical Performance continued on next page)
| 10 | • ALLIANCEBERNSTEIN WEALTH STRATEGIES |
Historical Performance
BALANCED WEALTH STRATEGY
HISTORICAL PERFORMANCE
(continued from previous page)
| THE STRATEGY VS. ITS BENCHMARKS PERIODS ENDED FEBRUARY 28, 2014 (unaudited) | NAV Returns | |||||||||
| 6 Months | 12 Months | |||||||||
| AllianceBernstein Balanced Wealth Strategy | ||||||||||
Class A | 10.23% | 12.76% | ||||||||
| ||||||||||
Class B* | 9.88% | 12.03% | ||||||||
| ||||||||||
Class C | 9.88% | 12.03% | ||||||||
| ||||||||||
Advisor Class** | 10.46% | 13.16% | ||||||||
| ||||||||||
Class R** | 10.07% | 12.41% | ||||||||
| ||||||||||
Class K** | 10.26% | 12.78% | ||||||||
| ||||||||||
Class I** | 10.41% | 13.11% | ||||||||
| ||||||||||
| Primary Benchmark: S&P 500 Index | 15.07% | 25.37% | ||||||||
| ||||||||||
Secondary Benchmark: Barclays U.S. Aggregate Bond Index | 2.84% | 0.15% | ||||||||
| ||||||||||
Blended Benchmark: 65% S&P 500 Index/ | 10.73% | 16.08% | ||||||||
| ||||||||||
* Effective January 31, 2009, Class B shares are no longer available for purchase to new investors. Please see Note A for additional information.
** Please note that these share classes are for investors purchasing shares through accounts established under certain fee-based programs sponsored and maintained by certain broker-dealers and financial intermediaries, institutional pension plans and/or investment advisory clients of, and certain other persons associated with, the Adviser and its affiliates or the Strategies. | ||||||||||
See Disclosures, Risks and Note about Historical Performance on pages 8-9.
(Historical Performance continued on next page)
| ALLIANCEBERNSTEIN WEALTH STRATEGIES • | 11 |
Historical Performance
CONSERVATIVE WEALTH STRATEGY
HISTORICAL PERFORMANCE
(continued from previous page)
THE STRATEGY VS. ITS BENCHMARKS PERIODS ENDED FEBRUARY 28, 2014 (unaudited) | NAV Returns | |||||||||
| 6 Months | 12 Months | |||||||||
| AllianceBernstein Conservative Wealth Strategy | ||||||||||
Class A | 5.85% | 6.09% | ||||||||
| ||||||||||
Class B* | 5.46% | 5.32% | ||||||||
| ||||||||||
Class C | 5.47% | 5.34% | ||||||||
| ||||||||||
Advisor Class** | 6.03% | 6.44% | ||||||||
| ||||||||||
Class R** | 5.73% | 5.68% | ||||||||
| ||||||||||
Class K** | 5.87% | 6.10% | ||||||||
| ||||||||||
Class I** | 6.05% | 6.45% | ||||||||
| ||||||||||
Primary Benchmark: Barclays | 2.84% | 0.15% | ||||||||
| ||||||||||
| Secondary Benchmark: S&P 500 Index | 15.07% | 25.37% | ||||||||
| ||||||||||
Blended Benchmark: 65% Barclays | 7.06% | 8.52% | ||||||||
| ||||||||||
* Effective January 31, 2009, Class B shares are no longer available for purchase to new investors. Please see Note A for additional information.
** Please note that these share classes are for investors purchasing shares through accounts established under certain fee-based programs sponsored and maintained by certain broker-dealers and financial intermediaries, institutional pension plans and/or investment advisory clients of, and certain other persons associated with, the Adviser and its affiliates or the Strategies. | ||||||||||
See Disclosures, Risks and Note about Historical Performance on pages 8-9.
(Historical Performance continued on next page)
| 12 | • ALLIANCEBERNSTEIN WEALTH STRATEGIES |
Historical Performance
THE UNDERLYING PORTFOLIOS
HISTORICAL PERFORMANCE
(continued from previous page)
EACH UNDERLYING PORTFOLIO* VS. ITS BENCHMARKS PERIODS ENDED FEBRUARY 28, 2014 (unaudited) | Returns | |||||||||
| 6 Months | 12 Months | |||||||||
AllianceBernstein U.S. Value Portfolio | 13.97% | 28.12% | ||||||||
| ||||||||||
| Russell 1000 Value Index | 13.46% | 23.44% | ||||||||
| ||||||||||
AllianceBernstein U.S. Large Cap Growth Portfolio | 21.04% | 33.24% | ||||||||
| ||||||||||
| Russell 1000 Growth Index | 17.84% | 29.14% | ||||||||
| ||||||||||
AllianceBernstein International Value Portfolio | 15.30% | 18.80% | ||||||||
| ||||||||||
| MSCI ACWI ex-U.S. | 12.32% | 12.25% | ||||||||
| ||||||||||
AllianceBernstein International Growth Portfolio | 9.88% | 10.55% | ||||||||
| ||||||||||
| MSCI ACWI ex-U.S. | 12.32% | 12.25% | ||||||||
| ||||||||||
AllianceBernstein Short Duration Bond Portfolio | 0.93% | 0.74% | ||||||||
| ||||||||||
| BofA ML 1-3 Year Treasury Index | 0.53% | 0.51% | ||||||||
| ||||||||||
AllianceBernstein Global Core Bond Portfolio | 3.30% | 0.90% | ||||||||
| ||||||||||
| Barclays Global Aggregate Bond Index (U.S. dollar hedged) | 2.98% | 1.74% | ||||||||
| ||||||||||
AllianceBernstein Bond Inflation Protection Portfolio | 2.64% | -3.44% | ||||||||
| ||||||||||
| Barclays 1-10 Year TIPS Index | 1.65% | -3.94% | ||||||||
| ||||||||||
AllianceBernstein High-Yield Portfolio | 8.42% | 10.30% | ||||||||
| ||||||||||
| Barclays U.S. High Yield 2% Issuer Cap Index | 7.46% | 8.36% | ||||||||
| ||||||||||
AllianceBernstein Small-Mid Cap Value Portfolio | 16.62% | 28.66% | ||||||||
| ||||||||||
| Russell 2500 Value Index | 16.79% | 25.52% | ||||||||
| ||||||||||
AllianceBernstein Small-Mid Cap Growth Portfolio | 20.94% | 37.66% | ||||||||
| ||||||||||
| Russell 2500 Growth Index | 19.17% | 35.03% | ||||||||
| ||||||||||
AllianceBernstein Multi-Asset Real Return Portfolio | 6.49% | 1.68% | ||||||||
| ||||||||||
| MSCI AC World Commodity Producers Index | 7.38% | 2.92% | ||||||||
| ||||||||||
AllianceBernstein Volatility Management Portfolio | 13.92% | 18.82% | ||||||||
| ||||||||||
| MSCI ACWI | 13.57% | 18.16% | ||||||||
| ||||||||||
* Please note, shares of the Underlying Portfolios are offered exclusively to mutual funds advised by, and certain institutional clients of, AllianceBernstein that seek a blend of asset classes for investment, like the Strategies. These share classes are not currently offered for direct investment from the general public. The Underlying Portfolios do not contain sales charges or management fees.
Please keep in mind that high, double-digit returns are highly unusual and cannot be sustained. Investors should also be aware that these returns were primarily achieved during favorable market conditions. | ||||||||||
See Disclosures, Risks and Note about Historical Performance on pages 8-9.
(Historical Performance continued on next page)
| ALLIANCEBERNSTEIN WEALTH STRATEGIES • | 13 |
Historical Performance
WEALTH APPRECIATION STRATEGY
HISTORICAL PERFORMANCE
(continued from previous page)
| AVERAGE ANNUAL RETURNS AS OF FEBRUARY 28, 2014 (unaudited) | ||||||||
| NAV Returns | SEC Returns (reflects applicable sales charges) | |||||||
| Class A Shares | ||||||||
1 Year | 20.14 | % | 15.06 | % | ||||
5 Years | 18.91 | % | 17.88 | % | ||||
10 Years | 5.29 | % | 4.84 | % | ||||
| Class B Shares | ||||||||
1 Year | 19.21 | % | 15.21 | % | ||||
5 Years | 18.04 | % | 18.04 | % | ||||
10 Years | 4.68 | % | 4.68 | % | ||||
| Class C Shares | ||||||||
1 Year | 19.22 | % | 18.22 | % | ||||
5 Years | 18.08 | % | 18.08 | % | ||||
10 Years | 4.54 | % | 4.54 | % | ||||
| Advisor Class Shares† | ||||||||
1 Year | 20.49 | % | 20.49 | % | ||||
5 Years | 19.28 | % | 19.28 | % | ||||
10 Years | 5.60 | % | 5.60 | % | ||||
| Class R Shares† | ||||||||
1 Year | 19.65 | % | 19.65 | % | ||||
5 Years | 18.52 | % | 18.52 | % | ||||
10 Years | 4.94 | % | 4.94 | % | ||||
| Class K Shares† | ||||||||
1 Year | 20.04 | % | 20.04 | % | ||||
5 Years | 18.87 | % | 18.87 | % | ||||
Since Inception* | 4.72 | % | 4.72 | % | ||||
| Class I Shares† | ||||||||
1 Year | 20.48 | % | 20.48 | % | ||||
5 Years | 19.28 | % | 19.28 | % | ||||
Since Inception* | 5.06 | % | 5.06 | % | ||||
The Strategy’s current prospectus fee table shows the Strategy’s total annual operating expense ratios as 1.11%, 1.83%, 1.82%, 0.81%, 1.45%, 1.15% and 0.83% for Class A, Class B, Class C, Advisor Class, Class R, Class K and Class I shares, respectively. The expenses shown include the total operating expenses of the Strategy and the indirect expenses of the Strategy’s Underlying Portfolios, as based upon the allocation of the Strategy’s assets among the Underlying Portfolios. The Financial Highlights section of this report sets forth expense ratio data for the current reporting period; the expense ratios shown above may differ from the expense ratios in the Financial Highlights section since they are based on different time periods.
| * | Inception date: 3/1/05 for Class K and Class I shares. |
| † | These share classes are offered at NAV to eligible investors and their SEC returns are the same as the NAV returns. Please note that these share classes are for investors purchasing shares through accounts established under certain fee-based programs sponsored and maintained by certain broker-dealers and financial intermediaries, institutional pension plans and/or investment advisory clients of, and certain other persons associated with, the Adviser and its affiliates or the Strategies. The inception date for Class K and I is listed above. |
See Disclosures, Risks and Note about Historical Performance on pages 8-9.
(Historical Performance continued on next page)
| 14 | • ALLIANCEBERNSTEIN WEALTH STRATEGIES |
Historical Performance
WEALTH APPRECIATION STRATEGY
HISTORICAL PERFORMANCE
(continued from previous page)
SEC AVERAGE ANNUAL RETURNS AS OF THE MOST RECENT CALENDAR QUARTER-END MARCH 31, 2014 (unaudited) | ||||
SEC Returns (reflects applicable sales charges) | ||||
| Class A Shares | ||||
1 Year | 12.43 | % | ||
5 Years | 15.93 | % | ||
10 Years | 4.83 | % | ||
| Class B Shares | ||||
1 Year | 12.70 | % | ||
5 Years | 16.08 | % | ||
10 Years | 4.68 | % | ||
| Class C Shares | ||||
1 Year | 15.72 | % | ||
5 Years | 16.11 | % | ||
10 Years | 4.54 | % | ||
| Advisor Class Shares† | ||||
1 Year | 17.87 | % | ||
5 Years | 17.27 | % | ||
10 Years | 5.60 | % | ||
| Class R Shares† | ||||
1 Year | 17.04 | % | ||
5 Years | 16.52 | % | ||
10 Years | 4.93 | % | ||
| Class K Shares† | ||||
1 Year | 17.42 | % | ||
5 Years | 16.88 | % | ||
Since Inception* | 4.68 | % | ||
| Class I Shares† | ||||
1 Year | 17.78 | % | ||
5 Years | 17.25 | % | ||
Since Inception* | 5.01 | % | ||
| * | Inception date: 3/1/05 for Class K and Class I shares. |
| † | Please note that these share classes are for investors purchasing shares through accounts established under certain fee-based programs sponsored and maintained by certain broker-dealers and financial intermediaries, institutional pension plans and/or investment advisory clients of, and certain other persons associated with, the Adviser and its affiliates or the Strategies. The inception date for Class K and I is listed above. |
See Disclosures, Risks and Note about Historical Performance on pages 8-9.
(Historical Performance continued on next page)
| ALLIANCEBERNSTEIN WEALTH STRATEGIES • | 15 |
Historical Performance
BALANCED WEALTH STRATEGY
HISTORICAL PERFORMANCE
(continued from previous page)
| AVERAGE ANNUAL RETURNS AS FEBRUARY 28, 2014 (unaudited) | ||||||||
| NAV Returns | SEC Returns (reflects applicable sales charges) | |||||||
| Class A Shares | ||||||||
1 Year | 12.76 | % | 7.95 | % | ||||
5 Years | 15.78 | % | 14.79 | % | ||||
10 Years | 5.58 | % | 5.12 | % | ||||
| Class B Shares | ||||||||
1 Year | 12.03 | % | 8.03 | % | ||||
5 Years | 14.95 | % | 14.95 | % | ||||
10 Years | 4.97 | % | 4.97 | % | ||||
| Class C Shares | ||||||||
1 Year | 12.03 | % | 11.03 | % | ||||
5 Years | 14.96 | % | 14.96 | % | ||||
10 Years | 4.84 | % | 4.84 | % | ||||
| Advisor Class Shares† | ||||||||
1 Year | 13.16 | % | 13.16 | % | ||||
5 Years | 16.13 | % | 16.13 | % | ||||
10 Years | 5.90 | % | 5.90 | % | ||||
| Class R Shares† | ||||||||
1 Year | 12.41 | % | 12.41 | % | ||||
5 Years | 15.36 | % | 15.36 | % | ||||
10 Years | 5.22 | % | 5.22 | % | ||||
| Class K Shares† | ||||||||
1 Year | 12.78 | % | 12.78 | % | ||||
5 Years | 15.71 | % | 15.71 | % | ||||
Since Inception* | 5.25 | % | 5.25 | % | ||||
| Class I Shares† | ||||||||
1 Year | 13.11 | % | 13.11 | % | ||||
5 Years | 16.13 | % | 16.13 | % | ||||
Since Inception* | 5.60 | % | 5.60 | % | ||||
The Strategy’s current prospectus fee table shows the Strategy’s total annual operating expense ratios as 1.03%, 1.74%, 1.73%, 0.73%, 1.39%, 1.08% and 0.75% for Class A, Class B, Class C, Advisor Class, Class R, Class K and Class I shares, respectively. The expenses shown include the total operating expenses of the Strategy and the indirect expenses of the Strategy’s Underlying Portfolios, as based upon the allocation of the Strategy’s assets among the Underlying Portfolios. The Financial Highlights section of this report sets forth expense ratio data for the current reporting period; the expense ratios shown above may differ from the expense ratios in the Financial Highlights section since they are based on different time periods.
| * | Inception date: 3/1/05 for Class K and Class I shares. |
| † | These share classes are offered at NAV to eligible investors and their SEC returns are the same as the NAV returns. Please note that these share classes are for investors purchasing shares through accounts established under certain fee-based programs sponsored and maintained by certain broker-dealers and financial intermediaries, institutional pension plans and/or investment advisory clients of, and certain other persons associated with, the Adviser and its affiliates or the Strategies. The inception date for Class K and I is listed above. |
See Disclosures, Risks and Note about Historical Performance on pages 8-9.
(Historical Performance continued on next page)
| 16 | • ALLIANCEBERNSTEIN WEALTH STRATEGIES |
Historical Performance
BALANCED WEALTH STRATEGY
HISTORICAL PERFORMANCE
(continued from previous page)
SEC AVERAGE ANNUAL RETURNS AS OF THE MOST RECENT CALENDAR QUARTER-END MARCH 31, 2014 (unaudited) | ||||
SEC Returns (reflects applicable sales charges) | ||||
| Class A Shares | ||||
1 Year | 6.31 | % | ||
5 Years | 13.36 | % | ||
10 Years | 5.06 | % | ||
| Class B Shares | ||||
1 Year | 6.23 | % | ||
5 Years | 13.51 | % | ||
10 Years | 4.92 | % | ||
| Class C Shares | ||||
1 Year | 9.22 | % | ||
5 Years | 13.55 | % | ||
10 Years | 4.78 | % | ||
| Advisor Class Shares† | ||||
1 Year | 11.42 | % | ||
5 Years | 14.68 | % | ||
10 Years | 5.84 | % | ||
| Class R Shares† | ||||
1 Year | 10.59 | % | ||
5 Years | 13.92 | % | ||
10 Years | 5.15 | % | ||
| Class K Shares† | ||||
1 Year | 10.96 | % | ||
5 Years | 14.29 | % | ||
Since Inception* | 5.20 | % | ||
| Class I Shares† | ||||
1 Year | 11.37 | % | ||
5 Years | 14.67 | % | ||
Since Inception* | 5.55 | % | ||
| * | Inception date: 3/1/05 for Class K and Class I shares. |
| † | Please note that these share classes are for investors purchasing shares through accounts established under certain fee-based programs sponsored and maintained by certain broker-dealers and financial intermediaries, institutional pension plans and/or investment advisory clients of, and certain other persons associated with, the Adviser and its affiliates or the Strategies. The inception date for Class K and I is listed above. |
See Disclosures, Risks and Note about Historical Performance on pages 8-9.
(Historical Performance continued on next page)
| ALLIANCEBERNSTEIN WEALTH STRATEGIES • | 17 |
Historical Performance
CONSERVATIVE WEALTH STRATEGY
HISTORICAL PERFORMANCE
(continued from previous page)
| AVERAGE ANNUAL RETURNS AS OF FEBRUARY 28, 2014 (unaudited) | ||||||||
| NAV Returns | SEC Returns (reflects applicable sales charges) | |||||||
| Class A Shares | ||||||||
1 Year | 6.09 | % | 1.58 | % | ||||
5 Years | 9.89 | % | 8.93 | % | ||||
10 Years | 4.29 | % | 3.84 | % | ||||
| Class B Shares | ||||||||
1 Year | 5.32 | % | 1.32 | % | ||||
5 Years | 9.11 | % | 9.11 | % | ||||
10 Years | 3.68 | % | 3.68 | % | ||||
| Class C Shares | ||||||||
1 Year | 5.34 | % | 4.34 | % | ||||
5 Years | 9.12 | % | 9.12 | % | ||||
10 Years | 3.55 | % | 3.55 | % | ||||
| Advisor Class Shares† | ||||||||
1 Year | 6.44 | % | 6.44 | % | ||||
5 Years | 10.23 | % | 10.23 | % | ||||
10 Years | 4.60 | % | 4.60 | % | ||||
| Class R Shares† | ||||||||
1 Year | 5.68 | % | 5.68 | % | ||||
5 Years | 9.51 | % | 9.51 | % | ||||
10 Years | 3.94 | % | 3.94 | % | ||||
| Class K Shares† | ||||||||
1 Year | 6.10 | % | 6.10 | % | ||||
5 Years | 9.85 | % | 9.85 | % | ||||
Since Inception* | 4.13 | % | 4.13 | % | ||||
| Class I Shares† | ||||||||
1 Year | 6.45 | % | 6.45 | % | ||||
5 Years | 10.22 | % | 10.22 | % | ||||
Since Inception* | 4.45 | % | 4.45 | % | ||||
The Strategy’s current prospectus fee table shows the Strategy’s total annual operating expense ratios as 1.06%, 1.77%, 1.76%, 0.76%, 1.42%, 1.1% and 0.78% for Class A, Class B, Class C, Advisor Class, Class R, Class K and Class I shares, respectively. The expenses shown include the total operating expenses of the Strategy and the indirect expenses of the Strategy’s Underlying Portfolios, as based upon the allocation of the Strategy’s assets among the Underlying Portfolios. The Financial Highlights section of this report sets forth expense ratio data for the current reporting period; the expense ratios shown above may differ from the expense ratios in the Financial Highlights section since they are based on different time periods.
| * | Inception date: 3/1/05 for Class K and Class I shares. |
| † | These share classes are offered at NAV to eligible investors and their SEC returns are the same as the NAV returns. Please note that these share classes are for investors purchasing shares through accounts established under certain fee-based programs sponsored and maintained by certain broker-dealers and financial intermediaries, institutional pension plans and/or investment advisory clients of, and certain other persons associated with, the Adviser and its affiliates or the Strategies. The inception date for Class K and I is listed above. |
See Disclosures, Risks and Note about Historical Performance on pages 8-9.
(Historical Performance continued on next page)
| 18 | • ALLIANCEBERNSTEIN WEALTH STRATEGIES |
Historical Performance
CONSERVATIVE WEALTH STRATEGY
HISTORICAL PERFORMANCE
(continued from previous page)
SEC AVERAGE ANNUAL RETURNS AS OF THE MOST RECENT CALENDAR QUARTER-END MARCH 31, 2014(unaudited) | ||||
SEC Returns (reflects applicable sales charges) | ||||
| Class A Shares | ||||
1 Year | 0.57 | % | ||
5 Years | 8.07 | % | ||
10 Years | 3.73 | % | ||
| Class B Shares | ||||
1 Year | 0.37 | % | ||
5 Years | 8.25 | % | ||
10 Years | 3.59 | % | ||
| Class C Shares | ||||
1 Year | 3.38 | % | ||
5 Years | 8.26 | % | ||
10 Years | 3.46 | % | ||
| Advisor Class Shares† | ||||
1 Year | 5.46 | % | ||
5 Years | 9.36 | % | ||
10 Years | 4.50 | % | ||
| Class R Shares† | ||||
1 Year | 4.70 | % | ||
5 Years | 8.62 | % | ||
10 Years | 3.84 | % | ||
| Class K Shares† | ||||
1 Year | 5.06 | % | ||
5 Years | 8.96 | % | ||
Since Inception* | 4.08 | % | ||
| Class I Shares† | ||||
1 Year | 5.48 | % | ||
5 Years | 9.35 | % | ||
Since Inception* | 4.41 | % | ||
| * | Inception date: 3/1/05 for Class K and Class I shares. |
| † | Please note that these share classes are for investors purchasing shares through accounts established under certain fee-based programs sponsored and maintained by certain broker-dealers and financial intermediaries, institutional pension plans and/or investment advisory clients of, and certain other persons associated with, the Adviser and its affiliates or the Strategies. The inception date for Class K and I is listed above. |
See Disclosures, Risks and Note about Historical Performance on pages 8-9.
(Historical Performance continued on next page)
| ALLIANCEBERNSTEIN WEALTH STRATEGIES • | 19 |
Historical Performance
THE UNDERLYING PORTFOLIOS
HISTORICAL PERFORMANCE
(continued from previous page)
AVERAGE ANNUAL RETURNS FOR THE UNDERLYING PORTFOLIOS AS OF FEBRUARY 28, 2014 (unaudited) | ||||
| NAV/SEC Returns† | ||||
| AllianceBernstein U.S. Value Portfolio | ||||
1 Year | 28.12 | % | ||
5 Year | 22.76 | % | ||
Since Inception* | 5.71 | % | ||
| AllianceBernstein U.S. Large Cap Growth Portfolio | ||||
1 Year | 33.24 | % | ||
5 Year | 22.20 | % | ||
Since Inception* | 8.13 | % | ||
| AllianceBernstein International Value Portfolio | ||||
1 Year | 18.80 | % | ||
5 Year | 15.65 | % | ||
Since Inception* | 3.89 | % | ||
| AllianceBernstein International Growth Portfolio | ||||
1 Year | 10.55 | % | ||
5 Year | 11.14 | % | ||
Since Inception* | 2.30 | % | ||
| Alliance Bernstein Short Duration Bond Portfolio | ||||
1 Year | 0.74 | % | ||
5 Year | 3.20 | % | ||
Since Inception* | 2.53 | % | ||
| AllianceBernstein Global Core Bond Portfolio | ||||
1 Year | 0.90 | % | ||
5 Year | 8.13 | % | ||
Since Inception* | 5.58 | % | ||
| AllianceBernstein Bond Inflation Protection Portfolio | ||||
1 Year | -3.44 | % | ||
5 Year | 6.24 | % | ||
Since Inception* | 4.91 | % | ||
| AllianceBernstein High-Yield Portfolio | ||||
1 Year | 10.30 | % | ||
5 Year | 20.77 | % | ||
Since Inception* | 9.56 | % | ||
| AllianceBernstein Small-Mid Cap Value Portfolio | ||||
1 Year | 28.66 | % | ||
5 Years | 29.27 | % | ||
Since Inception* | 10.31 | % | ||
See Disclosures, Risks and Note about Historical Performance on pages 8-9.
(Historical Performance continued on next page)
| 20 | • ALLIANCEBERNSTEIN WEALTH STRATEGIES |
Historical Performance
THE UNDERLYING PORTFOLIOS
HISTORICAL PERFORMANCE
(continued from previous page)
AVERAGE ANNUAL RETURNS FOR THE UNDERLYING PORTFOLIOS AS OF FEBRUARY 28, 2014 (unaudited) | ||||
| NAV/SEC Returns† | ||||
| AllianceBernstein Small-Mid Cap Growth Portfolio | ||||
1 Year | 37.66 | % | ||
5 Year | 33.29 | % | ||
Since Inception* | 14.58 | % | ||
| AllianceBernstein Multi-Asset Real Return Portfolio | ||||
1 Year | 1.68 | % | ||
5 Year | 18.26 | % | ||
Since Inception* | 4.26 | % | ||
| AllianceBernstein Volatility Management Portfolio | ||||
1 Year | 18.82 | % | ||
Since Inception** | 9.50 | % | ||
| † | Please note, shares of the Underlying Portfolios are offered exclusively to mutual funds advised by, and certain institutional clients of, AllianceBernstein that seek a blend of asset classes for investment, like the Strategies. These share classes are not currently offered for direct investment from the general public. The Underlying Portfolios do not contain sales charges or management fees. These Portfolios are offered at NAV and their SEC returns are the same as their NAV returns. The Underlying Portfolios can be purchased at the relevant NAV without a sales charge or other fee. However, there are sales charges in connection to purchases of other AllianceBernstein share classes invested in these Underlying Portfolios. |
| * | Inception date: 5/20/05. |
| ** | Inception date: 4/16/10. |
See Disclosures, Risks and Note about Historical Performance on pages 8-9.
(Historical Performance continued on next page)
| ALLIANCEBERNSTEIN WEALTH STRATEGIES • | 21 |
Historical Performance
THE UNDERLYING PORTFOLIOS
HISTORICAL PERFORMANCE
(continued from previous page)
SEC AVERAGE ANNUAL RETURNS FOR THE UNDERLYING PORTFOLIOS AS OF THE MOST RECENT CALENDAR QUARTER-END MARCH 31, 2014 (unaudited) | ||||
| NAV/SEC Returns† | ||||
| AllianceBernstein U.S. Value Portfolio | ||||
1 Year | 25.27 | % | ||
5 Year | 20.95 | % | ||
Since Inception* | 5.93 | % | ||
| AllianceBernstein U.S. Large Cap Growth Portfolio | ||||
1 Year | 26.13 | % | ||
5 Year | 19.61 | % | ||
Since Inception* | 7.72 | % | ||
| AllianceBernstein International Value Portfolio | ||||
1 Year | 17.58 | % | ||
5 Year | 13.54 | % | ||
Since Inception* | 3.78 | % | ||
| AllianceBernstein International Growth Portfolio | ||||
1 Year | 11.31 | % | ||
5 Year | 10.35 | % | ||
Since Inception* | 2.48 | % | ||
| Alliance Bernstein Short Duration Bond Portfolio | ||||
1 Year | 0.72 | % | ||
5 Year | 3.10 | % | ||
Since Inception* | 2.51 | % | ||
| AllianceBernstein Global Core Bond Portfolio | ||||
1 Year | 0.42 | % | ||
5 Year | 7.69 | % | ||
Since Inception* | 5.53 | % | ||
| AllianceBernstein Bond Inflation Protection Portfolio | ||||
1 Year | -4.28 | % | ||
5 Year | 5.16 | % | ||
Since Inception* | 4.81 | % | ||
| AllianceBernstein High-Yield Portfolio | ||||
1 Year | 9.49 | % | ||
5 Year | 20.15 | % | ||
Since Inception* | 9.52 | % | ||
| AllianceBernstein Small-Mid Cap Value Portfolio | ||||
1 Year | 24.97 | % | ||
5 Years | 27.00 | % | ||
Since Inception* | 10.42 | % | ||
See Disclosures, Risks and Note about Historical Performance on pages 8-9.
(Historical Performance continued on next page)
| 22 | • ALLIANCEBERNSTEIN WEALTH STRATEGIES |
Historical Performance
THE UNDERLYING PORTFOLIOS
HISTORICAL PERFORMANCE
(continued from previous page)
SEC AVERAGE ANNUAL RETURNS FOR THE UNDERLYING PORTFOLIOS AS OF THE MOST RECENT CALENDAR QUARTER-END MARCH 31, 2014 (unaudited) | ||||
| NAV/SEC Returns† | ||||
| AllianceBernstein Small-Mid Cap Growth Portfolio | ||||
1 Year | 26.96 | % | ||
5 Year | 29.22 | % | ||
Since Inception* | 13.80 | % | ||
| AllianceBernstein Multi-Asset Real Return Portfolio | ||||
1 Year | 1.69 | % | ||
5 Year | 16.48 | % | ||
Since Inception* | 4.29 | % | ||
| AllianceBernstein Volatility Management Portfolio | ||||
1 Year | 16.97 | % | ||
Since Inception** | 9.43 | % | ||
| † | Please note, shares of the Underlying Portfolios are offered exclusively to mutual funds advised by, and certain institutional clients of, AllianceBernstein that seek a blend of asset classes for investment, like the Strategies. These share classes are not currently offered for direct investment from the general public. The Underlying Portfolios do not contain sales charges or management fees. These Portfolios are offered at NAV and their SEC returns are the same as their NAV returns. The Underlying Portfolios can be purchased at the relevant NAV without a sales charge or other fee. However, there are sales charges in connection to purchases of other AllianceBernstein share classes invested in these Underlying Portfolios. |
| * | Inception date: 5/20/05. |
| ** | Inception date: 4/16/10. |
See Disclosures, Risks and Note about Historical Performance on pages 8-9.
| ALLIANCEBERNSTEIN WEALTH STRATEGIES • | 23 |
Historical Performance
EXPENSE EXAMPLE
(unaudited)
As a shareholder of the Strategy, you incur two types of costs: (1) transaction costs, including sales charges (loads) on purchase payments, contingent deferred sales charges on redemptions and (2) ongoing costs, including management fees; distribution (12b-1) fees; and other Strategy expenses. This example is intended to help you understand your ongoing costs (in dollars) of investing in the Strategy and to compare these costs with the ongoing costs of investing in other mutual funds.
The Example is based on an investment of $1,000 invested at the beginning of the period and held for the entire period as indicated below.
Actual Expenses
The first line of the table below provides information about actual account values and actual expenses. You may use the information in this line, together with the amount you invested, to estimate the expenses that you paid over the period. Simply divide your account value by $1,000 (for example, an $8,600 account value divided by $1,000 = 8.6), then multiply the result by the number in the first line under the heading entitled “Expenses Paid During Period” to estimate the expenses you paid on your account during this period. Each Strategy will indirectly bear its pro rata share of the expenses incurred by the Underlying Portfolios in which the Strategies invest. These expenses are not included in the table below.
Hypothetical Example for Comparison Purposes
The second line of the table below provides information about hypothetical account values and hypothetical expenses based on the Strategy’s actual expense ratio and an assumed annual rate of return of 5% before expenses, which is not the Strategy’s actual return. The hypothetical account values and expenses may not be used to estimate the actual ending account balance or expenses you paid for the period. You may use this information to compare the ongoing costs of investing in the Strategy and other funds by comparing this 5% hypothetical example with the 5% hypothetical examples that appear in the shareholder reports of other funds. Each Strategy will indirectly bear its pro rata share of the expenses incurred by the Underlying Portfolios in which the Strategies invest. These expenses are not included in the table below.
Please note that the expenses shown in the table are meant to highlight your ongoing costs only and do not reflect any transactional costs, such as sales charges (loads), or contingent deferred sales charges on redemptions. Therefore, the second line of the table is useful in comparing ongoing costs only, and will not help you determine the relative total costs of owning different funds. In addition, if these transactional costs were included, your costs would have been higher.
Wealth Appreciation Strategy
| Beginning Account Value September 1, 2013 | Ending Account Value February 28, 2014 | Expenses Paid During Period* | Annualized Expense Ratio* | |||||||||||||
| Class A | ||||||||||||||||
Actual | $ | 1,000 | $ | 1,140.30 | $ | 5.68 | 1.07 | % | ||||||||
Hypothetical** | $ | 1,000 | $ | 1,019.49 | $ | 5.36 | 1.07 | % | ||||||||
| Class B | ||||||||||||||||
Actual | $ | 1,000 | $ | 1,136.10 | $ | 9.43 | 1.78 | % | ||||||||
Hypothetical** | $ | 1,000 | $ | 1,015.97 | $ | 8.90 | 1.78 | % | ||||||||
| Class C | ||||||||||||||||
Actual | $ | 1,000 | $ | 1,136.30 | $ | 9.43 | 1.78 | % | ||||||||
Hypothetical** | $ | 1,000 | $ | 1,015.97 | $ | 8.90 | 1.78 | % | ||||||||
| 24 | • ALLIANCEBERNSTEIN WEALTH STRATEGIES |
Expense Example
EXPENSE EXAMPLE
(unaudited)
(continued from previous page)
| Beginning Account Value September 1, 2013 | Ending Account Value February 28, 2014 | Expenses Paid During Period* | Annualized Expense Ratio* | |||||||||||||
| Advisor Class | ||||||||||||||||
Actual | $ | 1,000 | $ | 1,141.80 | $ | 4.09 | 0.77 | % | ||||||||
Hypothetical** | $ | 1,000 | $ | 1,020.98 | $ | 3.86 | 0.77 | % | ||||||||
| Class R | ||||||||||||||||
Actual | $ | 1,000 | $ | 1,138.50 | $ | 7.64 | 1.44 | % | ||||||||
Hypothetical** | $ | 1,000 | $ | 1,017.65 | $ | 7.20 | 1.44 | % | ||||||||
| Class K | ||||||||||||||||
Actual | $ | 1,000 | $ | 1,139.90 | $ | 6.00 | 1.13 | % | ||||||||
Hypothetical** | $ | 1,000 | $ | 1,019.19 | $ | 5.66 | 1.13 | % | ||||||||
| Class I | ||||||||||||||||
Actual | $ | 1,000 | $ | 1,142.50 | $ | 4.25 | 0.80 | % | ||||||||
Hypothetical** | $ | 1,000 | $ | 1,020.83 | $ | 4.01 | 0.80 | % | ||||||||
Balanced Wealth Strategy
| Beginning Account Value September 1, 2013 | Ending Account Value February 28, 2014 | Expenses Paid During Period* | Annualized Expense Ratio* | |||||||||||||
| Class A | ||||||||||||||||
Actual | $ | 1,000 | $ | 1,102.30 | $ | 5.32 | 1.02 | % | ||||||||
Hypothetical** | $ | 1,000 | $ | 1,019.74 | $ | 5.11 | 1.02 | % | ||||||||
| Class B | ||||||||||||||||
Actual | $ | 1,000 | $ | 1,098.80 | $ | 8.95 | 1.72 | % | ||||||||
Hypothetical** | $ | 1,000 | $ | 1,016.27 | $ | 8.60 | 1.72 | % | ||||||||
| Class C | ||||||||||||||||
Actual | $ | 1,000 | $ | 1,098.80 | $ | 8.95 | 1.72 | % | ||||||||
Hypothetical** | $ | 1,000 | $ | 1,016.27 | $ | 8.60 | 1.72 | % | ||||||||
| Advisor Class | ||||||||||||||||
Actual | $ | 1,000 | $ | 1,104.60 | $ | 3.76 | 0.72 | % | ||||||||
Hypothetical** | $ | 1,000 | $ | 1,021.22 | $ | 3.61 | 0.72 | % | ||||||||
| Class R | ||||||||||||||||
Actual | $ | 1,000 | $ | 1,100.70 | $ | 7.03 | 1.35 | % | ||||||||
Hypothetical** | $ | 1,000 | $ | 1,018.10 | $ | 6.76 | 1.35 | % | ||||||||
| Class K | ||||||||||||||||
Actual | $ | 1,000 | $ | 1,102.60 | $ | 5.42 | 1.04 | % | ||||||||
Hypothetical** | $ | 1,000 | $ | 1,019.64 | $ | 5.21 | 1.04 | % | ||||||||
| Class I | ||||||||||||||||
Actual | $ | 1,000 | $ | 1,104.10 | $ | 3.70 | 0.71 | % | ||||||||
Hypothetical** | $ | 1,000 | $ | 1,021.27 | $ | 3.56 | 0.71 | % | ||||||||
| ALLIANCEBERNSTEIN WEALTH STRATEGIES • | 25 |
Expense Example
EXPENSE EXAMPLE
(unaudited)
(continued from previous page)
Conservative Wealth Strategy
| Beginning Account Value September 1, 2013 | Ending Account Value February 28, 2014 | Expenses Paid During Period* | Annualized Expense Ratio* | |||||||||||||
| Class A | ||||||||||||||||
Actual | $ | 1,000 | $ | 1,058.50 | $ | 5.46 | 1.07 | % | ||||||||
Hypothetical** | $ | 1,000 | $ | 1,019.49 | $ | 5.36 | 1.07 | % | ||||||||
| Class B | ||||||||||||||||
Actual | $ | 1,000 | $ | 1,054.60 | $ | 9.07 | 1.78 | % | ||||||||
Hypothetical** | $ | 1,000 | $ | 1,015.97 | $ | 8.90 | 1.78 | % | ||||||||
| Class C | ||||||||||||||||
Actual | $ | 1,000 | $ | 1,054.70 | $ | 9.07 | 1.78 | % | ||||||||
Hypothetical** | $ | 1,000 | $ | 1,015.97 | $ | 8.90 | 1.78 | % | ||||||||
| Advisor Class | ||||||||||||||||
Actual | $ | 1,000 | $ | 1,060.30 | $ | 3.98 | 0.78 | % | ||||||||
Hypothetical** | $ | 1,000 | $ | 1,020.93 | $ | 3.91 | 0.78 | % | ||||||||
| Class R | ||||||||||||||||
Actual | $ | 1,000 | $ | 1,057.30 | $ | 7.14 | 1.40 | % | ||||||||
Hypothetical** | $ | 1,000 | $ | 1,017.85 | $ | 7.00 | 1.40 | % | ||||||||
| Class K | ||||||||||||||||
Actual | $ | 1,000 | $ | 1,058.70 | $ | 5.51 | 1.08 | % | ||||||||
Hypothetical** | $ | 1,000 | $ | 1,019.44 | $ | 5.41 | 1.08 | % | ||||||||
| Class I | ||||||||||||||||
Actual | $ | 1,000 | $ | 1,060.50 | $ | 3.88 | 0.76 | % | ||||||||
Hypothetical** | $ | 1,000 | $ | 1,021.03 | $ | 3.81 | 0.76 | % | ||||||||
| * | Expenses are equal to the classes’ annualized expense ratios multiplied by the average account value over the period, multiplied by 181/365 (to reflect the one-half year period). |
| ** | Assumes 5% annual return before expenses. |
| 26 | • ALLIANCEBERNSTEIN WEALTH STRATEGIES |
Expense Example
WEALTH APPRECIATION STRATEGY
PORTFOLIO SUMMARY
February 28, 2014 (unaudited)
PORTFOLIO STATISTICS
Net Assets ($mil): $1,533.6
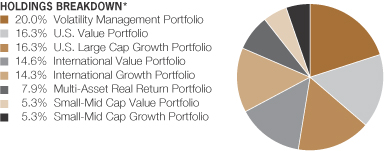
| * | All data are as of February 28, 2014. The Strategy’s holdings breakdown is expressed as a percentage of total investments and may vary over time. |
The Strategy invests in the Underlying Portfolios. For more details regarding the Strategy’s holdings, including specific breakdowns within the Underlying Portfolios, please refer to pages 77-278. Performance for each of the Underlying Portfolios compared to its benchmark may be found on page 13. Additional performance for the Underlying Portfolios may be found on pages 20-23.
| ALLIANCEBERNSTEIN WEALTH STRATEGIES • | 27 |
Portfolio Summary
BALANCED WEALTH STRATEGY
PORTFOLIO SUMMARY
February 28, 2014 (unaudited)
PORTFOLIO STATISTICS
Net Assets ($mil): $1,346.5
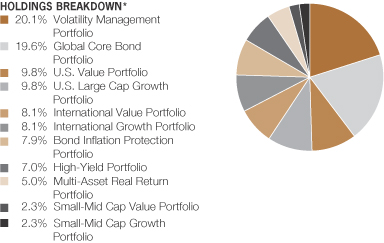
| * | All data are as of February 28, 2014. The Strategy’s holdings breakdown is expressed as a percentage of total investments and may vary over time. |
The Strategy invests in the Underlying Portfolios. For more details regarding the Strategy’s holdings, including specific breakdowns within the Underlying Portfolios, please refer to pages 77-278. Performance for each of the Underlying Portfolios compared to its benchmark may be found on page 13. Additional performance for the Underlying Portfolios may be found on pages 20-23.
| 28 | • ALLIANCEBERNSTEIN WEALTH STRATEGIES |
Portfolio Summary
CONSERVATIVE WEALTH STRATEGY
PORTFOLIO SUMMARY
February 28, 2014 (unaudited)
PORTFOLIO STATISTICS
Net Assets ($mil): $392.0
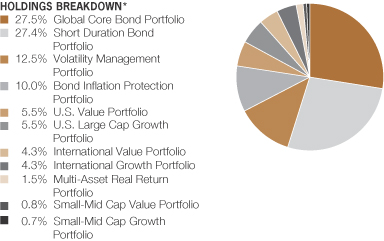
| * | All data are as of February 28, 2014. The Strategy’s holdings breakdown is expressed as a percentage of total investments and may vary over time. |
The Strategy invests in the Underlying Portfolios. For more details regarding the Strategy’s holdings, including specific breakdowns within the Underlying Portfolios, please refer to pages 77-278. Performance for each of the Underlying Portfolios compared to its benchmark may be found on page 13. Additional performance for the Underlying Portfolios may be found on pages 20-23.
| ALLIANCEBERNSTEIN WEALTH STRATEGIES • | 29 |
Portfolio Summary
WEALTH APPRECIATION STRATEGY
PORTFOLIO OF INVESTMENTS
February 28, 2014 (unaudited)
| Company | Shares | U.S. $ Value | ||||||
| ||||||||
INVESTMENT COMPANIES – 100.1% | ||||||||
The AllianceBernstein Pooling | ||||||||
International Growth Portfolio | 24,616,950 | $ | 219,829,365 | |||||
International Value Portfolio | 27,565,014 | 223,827,911 | ||||||
Multi-Asset Real Return Portfolio | 14,166,986 | 120,986,064 | ||||||
Small-Mid Cap Growth Portfolio | 6,217,808 | 80,831,503 | ||||||
Small-Mid Cap Value Portfolio | 6,110,622 | 81,637,905 | ||||||
U.S. Large Cap Growth Portfolio | 15,830,117 | 249,799,251 | ||||||
U.S. Value Portfolio | 20,253,274 | 249,925,394 | ||||||
Volatility Management Portfolio | 26,241,161 | 307,808,820 | ||||||
|
| |||||||
Total Investments – 100.1% | 1,534,646,213 | |||||||
Other assets less liabilities – (0.1)% | (1,087,115 | ) | ||||||
|
| |||||||
Net Assets – 100.0% | $ | 1,533,559,098 | ||||||
|
| |||||||
See notes to financial statements.
| 30 | • ALLIANCEBERNSTEIN WEALTH STRATEGIES |
Wealth Appreciation Strategy—Portfolio of Investments
BALANCED WEALTH STRATEGY
PORTFOLIO OF INVESTMENTS
February 28, 2014 (unaudited)
| Company | Shares | U.S. $ Value | ||||||
| ||||||||
INVESTMENT COMPANIES – 100.2% | ||||||||
The AllianceBernstein Pooling | ||||||||
International Growth Portfolio | 12,191,936 | $ | 108,873,992 | |||||
International Value Portfolio | 13,430,767 | 109,057,824 | ||||||
Multi-Asset Real Return Portfolio | 7,957,457 | 67,956,679 | ||||||
Small-Mid Cap Growth Portfolio | 2,369,052 | 30,797,675 | ||||||
Small-Mid Cap Value Portfolio | 2,328,211 | 31,104,896 | ||||||
U.S. Large Cap Growth Portfolio | 8,366,651 | 132,025,749 | ||||||
U.S. Value Portfolio | 10,735,794 | 132,479,703 | ||||||
Volatility Management Portfolio | 23,069,624 | 270,606,694 | ||||||
|
| |||||||
| 882,903,212 | ||||||||
|
| |||||||
The AllianceBernstein Pooling | ||||||||
Bond Inflation Protection Portfolio | 10,693,394 | 106,506,209 | ||||||
Global Core Bond Portfolio | 25,710,583 | 264,819,006 | ||||||
High-Yield Portfolio | 8,730,717 | 94,640,970 | ||||||
|
| |||||||
| 465,966,185 | ||||||||
|
| |||||||
Total Investments – 100.2% | 1,348,869,397 | |||||||
Other assets less liabilities – (0.2)% | (2,340,155 | ) | ||||||
|
| |||||||
Net Assets – 100.0% | $ | 1,346,529,242 | ||||||
|
| |||||||
See notes to financial statements.
| ALLIANCEBERNSTEIN WEALTH STRATEGIES • | 31 |
Balanced Wealth Strategy—Portfolio of Investments
CONSERVATIVE WEALTH STRATEGY
PORTFOLIO OF INVESTMENTS
February 28, 2014 (unaudited)
| Company | Shares | U.S. $ Value | ||||||
| ||||||||
INVESTMENT COMPANIES – 100.2% | ||||||||
The AllianceBernstein Pooling | ||||||||
Bond Inflation Protection Portfolio | 3,941,996 | $ | 39,262,275 | |||||
Global Core Bond Portfolio | 10,475,827 | 107,901,017 | ||||||
Short Duration Bond Portfolio | 11,373,737 | 107,481,818 | ||||||
|
| |||||||
| 254,645,110 | ||||||||
|
| |||||||
The AllianceBernstein Pooling | ||||||||
International Growth Portfolio | 1,877,183 | 16,763,240 | ||||||
International Value Portfolio | 2,068,075 | 16,792,768 | ||||||
Multi-Asset Real Return Portfolio | 691,560 | 5,905,920 | ||||||
Small-Mid Cap Growth Portfolio | 228,694 | 2,973,018 | ||||||
Small-Mid Cap Value Portfolio | 224,623 | 3,000,969 | ||||||
U.S. Large Cap Growth Portfolio | 1,370,069 | 21,619,697 | ||||||
U.S. Value Portfolio | 1,758,960 | 21,705,568 | ||||||
Volatility Management Portfolio | 4,194,313 | 49,199,291 | ||||||
|
| |||||||
| 137,960,471 | ||||||||
|
| |||||||
Total Investments – 100.2% | 392,605,581 | |||||||
Other assets less liabilities – (0.2)% | (613,678 | ) | ||||||
|
| |||||||
Net Assets – 100.0% | $ | 391,991,903 | ||||||
|
| |||||||
See notes to financial statements.
| 32 | • ALLIANCEBERNSTEIN WEALTH STRATEGIES |
Conservative Wealth Strategy—Portfolio of Investments
STATEMENT OF ASSETS & LIABILITIES
February 28, 2014 (unaudited)
| Wealth Appreciation Strategy | ||||
| Assets | ||||
Investments in affiliated Underlying Portfolios, at value | $ | 1,534,646,213 | ||
Receivable for investments sold | 1,800,277 | |||
Receivable for shares of beneficial interest sold | 1,448,687 | |||
|
| |||
Total assets | 1,537,895,177 | |||
|
| |||
| Liabilities | ||||
Payable for shares of beneficial interest redeemed | 2,969,863 | |||
Advisory fee payable | 749,146 | |||
Distribution fee payable | 257,395 | |||
Transfer Agent fee payable | 167,391 | |||
Accrued expenses | 192,284 | |||
|
| |||
Total liabilities | 4,336,079 | |||
|
| |||
Net Assets | $ | 1,533,559,098 | ||
|
| |||
| Composition of Net Assets | ||||
Shares of beneficial interest, at par | $ | 1,028 | ||
Additional paid-in capital | 1,530,780,859 | |||
Undistributed net investment income | 19,109,621 | |||
Accumulated net realized loss on investment transactions | (256,520,579 | ) | ||
Net unrealized appreciation on investments | 240,188,169 | |||
|
| |||
| $ | 1,533,559,098 | |||
|
| |||
Net Asset Value Per Share—unlimited shares authorized, $.00001 par value
| Class | Net Assets | Shares Outstanding | Net Asset Value | |||||||||
| ||||||||||||
| A | $ | 412,285,023 | 27,576,684 | $ | 14.95 | * | ||||||
| ||||||||||||
| B | $ | 73,045,336 | 4,905,020 | $ | 14.89 | |||||||
| ||||||||||||
| C | $ | 136,924,547 | 9,207,397 | $ | 14.87 | |||||||
| ||||||||||||
| Advisor | $ | 883,025,998 | 59,173,866 | $ | 14.92 | |||||||
| ||||||||||||
| R | $ | 5,739,274 | 386,322 | $ | 14.86 | |||||||
| ||||||||||||
| K | $ | 18,248,731 | 1,227,740 | $ | 14.86 | |||||||
| ||||||||||||
| I | $ | 4,290,189 | 288,006 | $ | 14.90 | |||||||
| ||||||||||||
| * | The maximum offering price per share for Class A shares was $15.61 which reflects a sales charge of 4.25%. |
See notes to financial statements.
| ALLIANCEBERNSTEIN WEALTH STRATEGIES • | 33 |
Statement of Assets & Liabilities
| Balanced Wealth Strategy | ||||
| Assets | ||||
Investments in affiliated Underlying Portfolios, at value | $ | 1,348,869,397 | ||
Receivable for investments sold | 1,497,594 | |||
Receivable for shares of beneficial interest sold | 623,785 | |||
|
| |||
Total assets | 1,350,990,776 | |||
|
| |||
| Liabilities | ||||
Payable for shares of beneficial interest redeemed | 2,893,059 | |||
Advisory fee payable | 561,220 | |||
Distribution fee payable | 503,922 | |||
Transfer Agent fee payable | 209,993 | |||
Accrued expenses | 293,340 | |||
|
| |||
Total liabilities | 4,461,534 | |||
|
| |||
Net Assets | $ | 1,346,529,242 | ||
|
| |||
| Composition of Net Assets | ||||
Shares of beneficial interest, at par | $ | 988 | ||
Additional paid-in capital | 1,421,081,948 | |||
Distributions in excess of net investment income | (2,625,731 | ) | ||
Accumulated net realized loss on investment transactions | (256,205,094 | ) | ||
Net unrealized appreciation on investments | 184,277,131 | |||
|
| |||
| $ | 1,346,529,242 | |||
|
| |||
Net Asset Value Per Share—unlimited shares authorized, $.00001 par value
| Class | Net Assets | Shares Outstanding | Net Asset Value | |||||||||
| ||||||||||||
| A | $ | 765,977,473 | 56,101,057 | $ | 13.65 | * | ||||||
| ||||||||||||
| B | $ | 149,967,379 | 11,083,383 | $ | 13.53 | |||||||
| ||||||||||||
| C | $ | 271,853,452 | 20,062,390 | $ | 13.55 | |||||||
| ||||||||||||
| Advisor | $ | 105,246,213 | 7,672,253 | $ | 13.72 | |||||||
| ||||||||||||
| R | $ | 13,125,819 | 965,773 | $ | 13.59 | |||||||
| ||||||||||||
| K | $ | 26,901,301 | 1,975,588 | $ | 13.62 | |||||||
| ||||||||||||
| I | $ | 13,457,605 | 983,781 | $ | 13.68 | |||||||
| ||||||||||||
| * | The maximum offering price per share for Class A shares was $14.26 which reflects a sales charge of 4.25%. |
See notes to financial statements.
| 34 | • ALLIANCEBERNSTEIN WEALTH STRATEGIES |
Statement of Assets & Liabilities
| Conservative Wealth Strategy | ||||
| Assets | ||||
Investments in affiliated Underlying Portfolios, at value | $ | 392,605,581 | ||
Receivable for investments sold | 191,510 | |||
Receivable for shares of beneficial interest sold | 81,559 | |||
|
| |||
Total assets | 392,878,650 | |||
|
| |||
| Liabilities | ||||
Payable for shares of beneficial interest redeemed | 347,005 | |||
Distribution fee payable | 164,826 | |||
Advisory fee payable | 164,528 | |||
Transfer Agent fee payable | 67,486 | |||
Accrued expenses | 142,902 | |||
|
| |||
Total liabilities | 886,747 | |||
|
| |||
Net Assets | $ | 391,991,903 | ||
|
| |||
| Composition of Net Assets | ||||
Shares of beneficial interest, at par | $ | 326 | ||
Additional paid-in capital | 396,051,669 | |||
Distributions in excess of net investment income | (719,889 | ) | ||
Accumulated net realized loss on investment transactions | (44,100,673 | ) | ||
Net unrealized appreciation on investments | 40,760,470 | |||
|
| |||
| $ | 391,991,903 | |||
|
| |||
Net Asset Value Per Share—unlimited shares authorized, $.00001 par value
| Class | Net Assets | Shares Outstanding | Net Asset Value | |||||||||
| ||||||||||||
| A | $ | 213,536,679 | 17,710,521 | $ | 12.06 | * | ||||||
| ||||||||||||
| B | $ | 45,321,209 | 3,792,757 | $ | 11.95 | |||||||
| ||||||||||||
| C | $ | 100,348,705 | 8,398,947 | $ | 11.95 | |||||||
| ||||||||||||
| Advisor | $ | 14,801,397 | 1,223,642 | $ | 12.10 | |||||||
| ||||||||||||
| R | $ | 7,188,936 | 595,737 | $ | 12.07 | |||||||
| ||||||||||||
| K | $ | 10,042,780 | 834,320 | $ | 12.04 | |||||||
| ||||||||||||
| I | $ | 752,197 | 62,293 | $ | 12.08 | |||||||
| ||||||||||||
| * | The maximum offering price per share for Class A shares was $12.60 which reflects a sales charge of 4.25%. |
See notes to financial statements.
| ALLIANCEBERNSTEIN WEALTH STRATEGIES • | 35 |
Statement of Assets & Liabilities
STATEMENT OF OPERATIONS
Six Months Ended February 28, 2014 (unaudited)
| Wealth Appreciation Strategy | Balanced Wealth Strategy | Conservative Wealth Strategy | ||||||||||
| Investment Income | ||||||||||||
Income distributions from affiliated Underlying Portfolios | $ | 48,844,714 | $ | 42,931,448 | $ | 8,853,028 | ||||||
|
|
|
|
|
| |||||||
| Expenses | ||||||||||||
Advisory fee (see Note B) | 4,892,448 | 3,720,172 | 1,102,911 | |||||||||
Distribution fee – Class A | 608,741 | 1,141,967 | 326,464 | |||||||||
Distribution fee – Class B | 385,792 | 800,946 | 245,544 | |||||||||
Distribution fee – Class C | 681,693 | 1,360,255 | 515,507 | |||||||||
Distribution fee – Class R | 14,661 | 41,655 | 18,415 | |||||||||
Distribution fee – Class K | 22,648 | 33,222 | 11,929 | |||||||||
Transfer agency – Class A | 181,102 | 494,505 | 146,343 | |||||||||
Transfer agency – Class B | 38,663 | 107,923 | 33,946 | |||||||||
Transfer agency – Class C | 64,456 | 181,462 | 70,618 | |||||||||
Transfer agency – Advisor Class | 383,066 | 66,885 | 9,185 | |||||||||
Transfer agency – Class R | 7,623 | 21,661 | 9,576 | |||||||||
Transfer agency – Class K | 18,118 | 26,578 | 9,301 | |||||||||
Transfer agency – Class I | 2,521 | 7,959 | 504 | |||||||||
Printing | 94,653 | 108,254 | 31,939 | |||||||||
Registration fees | 47,754 | 46,958 | 41,635 | |||||||||
Custodian | 31,916 | 32,024 | 32,024 | |||||||||
Trustees’ fees | 30,209 | 30,209 | 30,209 | |||||||||
Legal | 19,486 | 19,488 | 19,488 | |||||||||
Audit | 14,373 | 14,373 | 14,373 | |||||||||
Miscellaneous | 17,377 | 18,962 | 7,813 | |||||||||
|
|
|
|
|
| |||||||
Total expenses | 7,557,300 | 8,275,458 | 2,677,724 | |||||||||
|
|
|
|
|
| |||||||
Net investment income | 41,287,414 | 34,655,990 | 6,175,304 | |||||||||
|
|
|
|
|
| |||||||
| Realized and Unrealized Gain on Investment Transactions | ||||||||||||
Net realized gain on sale of affiliated Underlying Portfolio shares | 8,500,160 | 13,223,170 | 4,096,699 | |||||||||
Net realized gain distributions from affiliated Underlying Portfolios | 52,966,919 | 31,640,916 | 5,502,723 | |||||||||
Net change in unrealized appreciation/depreciation of investments in affiliated Underlying Portfolios | 92,636,477 | 50,317,923 | 6,606,667 | |||||||||
|
|
|
|
|
| |||||||
Net gain on investment transactions | 154,103,556 | 95,182,009 | 16,206,089 | |||||||||
|
|
|
|
|
| |||||||
Net Increase in Net Assets from Operations | $ | 195,390,970 | $ | 129,837,999 | $ | 22,381,393 | ||||||
|
|
|
|
|
| |||||||
See notes to financial statements.
| 36 | • ALLIANCEBERNSTEIN WEALTH STRATEGIES |
Statement of Operations
STATEMENT OF CHANGES IN NET ASSETS
| Wealth Appreciation Strategy | ||||||||
| Six Months Ended February 28, 2014 (unaudited) | Year Ended August 31, 2013 | |||||||
| Increase (Decrease) in Net Assets from Operations | ||||||||
Net investment income | $ | 41,287,414 | $ | 7,492,034 | ||||
Net realized gain (loss) on sale of affiliated Underlying Portfolio shares | 8,500,160 | (32,948,276 | ) | |||||
Net realized gain distributions from affiliated Underlying Portfolios | 52,966,919 | 23,848,628 | ||||||
Net change in unrealized appreciation/depreciation of investments in affiliated Underlying Portfolios | 92,636,477 | 215,852,862 | ||||||
|
|
|
| |||||
Net increase in net assets from operations | 195,390,970 | 214,245,248 | ||||||
| Dividends to Shareholders from | ||||||||
Net investment income | ||||||||
Class A | (7,497,358 | ) | (3,318,812 | ) | ||||
Class B | (534,151 | ) | – 0 | – | ||||
Class C | (1,256,342 | ) | (56,564 | ) | ||||
Advisor Class | (19,219,440 | ) | (9,207,335 | ) | ||||
Class R | (74,719 | ) | – 0 | – | ||||
Class K | (328,012 | ) | (139,066 | ) | ||||
Class I | (95,327 | ) | (41,603 | ) | ||||
| Transactions in Shares of Beneficial Interest | ||||||||
Net decrease | (49,338,566 | ) | (227,386,081 | ) | ||||
|
|
|
| |||||
Total increase (decrease) | 117,047,055 | (25,904,213 | ) | |||||
| Net Assets | ||||||||
Beginning of period | 1,416,512,043 | 1,442,416,256 | ||||||
|
|
|
| |||||
End of period (including undistributed net investment income of $19,109,621 and $6,827,556, respectively) | $ | 1,533,559,098 | $ | 1,416,512,043 | ||||
|
|
|
| |||||
See notes to financial statements.
| ALLIANCEBERNSTEIN WEALTH STRATEGIES • | 37 |
Statement of Changes in Net Assets
| Balanced Wealth Strategy | ||||||||
| Six Months Ended February 28, 2014 (unaudited) | Year Ended August 31, 2013 | |||||||
| Increase (Decrease) in Net Assets from Operations | ||||||||
Net investment income | $ | 34,655,990 | $ | 23,342,080 | ||||
Net realized gain (loss) on sale of affiliated Underlying Portfolio shares | 13,223,170 | (1,623,623 | ) | |||||
Net realized gain distributions from affiliated Underlying Portfolios | 31,640,916 | 18,043,420 | ||||||
Net change in unrealized appreciation/depreciation of investments in affiliated Underlying Portfolios | 50,317,923 | 87,426,068 | ||||||
|
|
|
| |||||
Net increase in net assets from operations | 129,837,999 | 127,187,945 | ||||||
| Dividends and Distributions to Shareholders from | ||||||||
Net investment income | ||||||||
Class A | (21,149,159 | ) | (13,838,754 | ) | ||||
Class B | (4,050,692 | ) | (2,980,171 | ) | ||||
Class C | (6,990,883 | ) | (4,065,644 | ) | ||||
Advisor Class | (2,953,558 | ) | (1,944,900 | ) | ||||
Class R | (468,665 | ) | (310,464 | ) | ||||
Class K | (759,565 | ) | (464,673 | ) | ||||
Class I | (385,330 | ) | (261,343 | ) | ||||
Return of capital | ||||||||
Class A | – 0 | – | (174,104 | ) | ||||
Class B | – 0 | – | (37,493 | ) | ||||
Class C | – 0 | – | (51,149 | ) | ||||
Advisor Class | – 0 | – | (24,469 | ) | ||||
Class R | – 0 | – | (3,906 | ) | ||||
Class K | – 0 | – | (5,846 | ) | ||||
Class I | – 0 | – | (3,288 | ) | ||||
| Transactions in Shares of Beneficial Interest | ||||||||
Net decrease | (59,580,500 | ) | (274,442,254 | ) | ||||
|
|
|
| |||||
Total increase (decrease) | 33,499,647 | (171,420,513 | ) | |||||
| Net Assets | ||||||||
Beginning of period | 1,313,029,595 | 1,484,450,108 | ||||||
|
|
|
| |||||
End of period (including distributions in excess of net investment income of ($2,625,731) and ($523,869), respectively) | $ | 1,346,529,242 | $ | 1,313,029,595 | ||||
|
|
|
| |||||
See notes to financial statements.
| 38 | • ALLIANCEBERNSTEIN WEALTH STRATEGIES |
Statement of Changes in Net Assets
| Conservative Wealth Strategy | ||||||||
| Six Months Ended February 28, 2014 (unaudited) | Year Ended August 31, 2013 | |||||||
| Increase in Net Assets from Operations | ||||||||
Net investment income | $ | 6,175,304 | $ | 6,378,204 | ||||
Net realized gain on sale of affiliated Underlying Portfolio shares | 4,096,699 | 3,942,204 | ||||||
Net realized gain distributions from affiliated Underlying Portfolios | 5,502,723 | 4,458,852 | ||||||
Net change in unrealized appreciation/depreciation of investments in affiliated Underlying Portfolios | 6,606,667 | 2,210,273 | ||||||
|
|
|
| |||||
Net increase in net assets from operations | 22,381,393 | 16,989,533 | ||||||
| Dividends to Shareholders from | ||||||||
Net investment income | ||||||||
Class A | (3,656,675 | ) | (4,035,785 | ) | ||||
Class B | (705,952 | ) | (843,787 | ) | ||||
Class C | (1,501,887 | ) | (1,479,459 | ) | ||||
Advisor Class | (237,787 | ) | (215,031 | ) | ||||
Class R | (117,027 | ) | (105,205 | ) | ||||
Class K | (169,316 | ) | (151,778 | ) | ||||
Class I | (16,581 | ) | (19,722 | ) | ||||
| Transactions in Shares of Beneficial Interest | ||||||||
Net decrease | (29,213,168 | ) | (93,450,528 | ) | ||||
|
|
|
| |||||
Total decrease | (13,237,000 | ) | (83,311,762 | ) | ||||
| Net Assets | ||||||||
Beginning of period | 405,228,903 | 488,540,665 | ||||||
|
|
|
| |||||
End of period (including distributions in excess of net investment income of ($719,889) and ($489,968), respectively) | $ | 391,991,903 | $ | 405,228,903 | ||||
|
|
|
| |||||
See notes to financial statements.
| ALLIANCEBERNSTEIN WEALTH STRATEGIES • | 39 |
Statement of Changes in Net Assets
NOTES TO FINANCIAL STATEMENTS
February 28, 2014 (unaudited)
NOTE A
Significant Accounting Policies
The AllianceBernstein Portfolios (the “Trust”) was organized as a Massachusetts Business Trust on March 26, 1987 and is registered under the Investment Company Act of 1940 as a diversified, open end management investment company. The Trust operates as a series company currently comprised of seven series: the AllianceBernstein Growth Fund, the Wealth Appreciation Strategy, the Balanced Wealth Strategy, the Conservative Wealth Strategy, the Tax-Managed Wealth Appreciation Strategy, the Tax-Managed Balanced Wealth Strategy and the Tax-Managed Conservative Wealth Strategy. Each series is considered to be a separate entity for financial reporting and tax purposes. This report relates only to the Wealth Appreciation Strategy, the Balanced Wealth Strategy and the Conservative Wealth Strategy (the “Strategies”). The Strategies offer Class A, Class B, Class C, Advisor Class, Class R, Class K and Class I shares. Class A shares are sold with a front-end sales charge of up to 4.25% for purchases not exceeding $1,000,000. With respect to purchases of $1,000,000 or more, Class A shares redeemed within one year of purchase may be subject to a contingent deferred sales charge of 1%. Class B shares are currently sold with a contingent deferred sales charge which declines from 4% to zero depending on the period of time the shares are held. Effective January 31, 2009, sales of Class B shares of the Strategies to new investors were suspended. Class B shares will only be issued (i) upon the exchange of Class B shares from another AllianceBernstein Mutual Fund, (ii) for purposes of dividend reinvestment, (iii) through the Strategies’ Automatic Investment Program (the “Program”) for accounts that established the Program prior to January 31, 2009, and (iv) for purchases of additional shares by Class B shareholders as of January 31, 2009. The ability to establish a new Program for accounts containing Class B shares was suspended as of January 31, 2009. Class B shares will automatically convert to Class A shares eight years after the end of the calendar month of purchase. Class C shares are subject to a contingent deferred sales charge of 1% on redemptions made within the first year after purchase. Class R and Class K shares are sold without an initial or contingent deferred sales charge. Advisor Class and Class I shares are sold without an initial or contingent deferred sales charge and are not subject to ongoing distribution expenses. All seven classes of shares have identical voting, dividend, liquidation and other rights, except that the classes bear different distribution and transfer agency expenses. Each class has exclusive voting rights with respect to its distribution plan. The Strategies invest primarily in a combination of portfolios of The AllianceBernstein Pooling Portfolios (the “Underlying Portfolios”) representing a variety of asset classes and investment styles that are managed by AllianceBernstein L.P. (the “Adviser”). The financial statements have been prepared in conformity with U.S. generally accepted accounting principles (“U.S. GAAP”) which require management to make certain estimates and assumptions that affect the reported amounts of assets and liabilities in the financial statements and amounts of income and expenses during the reporting period. Actual results could differ from those estimates. The following is a summary of significant accounting policies followed by the Strategies.
| 40 | • ALLIANCEBERNSTEIN WEALTH STRATEGIES |
Notes to Financial Statements
1. Security Valuation
Net asset value per share is calculated as of the close of business of the New York Stock Exchange, normally 4:00 p.m., Eastern Time. Investments in the Underlying Portfolios are valued at their net asset value each business day.
2. Fair Value Measurements
In accordance with U.S. GAAP regarding fair value measurements, fair value is defined as the price that the Strategies would receive to sell an asset or pay to transfer a liability in an orderly transaction between market participants at the measurement date. U.S. GAAP establishes a framework for measuring fair value, and a three-level hierarchy for fair value measurements based upon the transparency of inputs to the valuation of an asset or liability. Inputs may be observable or unobservable and refer broadly to the assumptions that market participants would use in pricing the asset or liability. Observable inputs reflect the assumptions market participants would use in pricing the asset or liability based on market data obtained from sources independent of the Strategies. Unobservable inputs reflect the Strategies’ own assumptions about the assumptions that market participants would use in pricing the asset or liability based on the best information available in the circumstances. Each investment is assigned a level based upon the observability of the inputs which are significant to the overall valuation. The three-tier hierarchy of inputs is summarized below.
| • | Level 1—quoted prices in active markets for identical investments |
| • | Level 2—other significant observable inputs (including quoted prices for similar investments, interest rates, prepayment speeds, credit risk, etc.) |
| • | Level 3—significant unobservable inputs (including the Strategies’ own assumptions in determining the fair value of investments) |
The following table summarizes the valuation of the Strategies’ investments by the above fair value hierarchy levels as of February 28, 2014:
| Investments in Underlying Securities* | Level 1 | Level 2 | Level 3 | Total | ||||||||||||
Wealth Appreciation Strategy | ||||||||||||||||
Investment Companies | $ | 1,534,646,213 | $ | – 0 | – | $ | – 0 | – | $ | 1,534,646,213 | ||||||
|
|
|
|
|
|
|
| |||||||||
Balanced Wealth Strategy | ||||||||||||||||
Investment Companies | 1,348,869,397 | – 0 | – | – 0 | – | 1,348,869,397 | ||||||||||
|
|
|
|
|
|
|
| |||||||||
Conservative Wealth Strategy | ||||||||||||||||
Investment Companies | 392,605,581 | – 0 | – | – 0 | – | 392,605,581 | ||||||||||
|
|
|
|
|
|
|
| |||||||||
| * | There were no transfers between Level 1 and Level 2 during the reporting period. |
The Adviser has established a Valuation Committee (the “Committee”) which is responsible for overseeing the pricing and valuation of all securities held in the Strategies. The Committee operates under pricing and valuation policies and
| ALLIANCEBERNSTEIN WEALTH STRATEGIES • | 41 |
Notes to Financial Statements
procedures established by the Adviser and approved by the Board, including pricing policies which set forth the mechanisms and processes to be employed on a daily basis to implement these policies and procedures. In particular, the pricing policies describe how to determine market quotations for securities and other instruments. The Committee’s responsibilities include: 1) fair value and liquidity determinations (and oversight of any third parties to whom any responsibility for fair value and liquidity determinations is delegated), and 2) regular monitoring of the Adviser’s pricing and valuation policies and procedures and modification or enhancement of these policies and procedures (or recommendation of the modification of these policies and procedures) as the Committee believes appropriate.
The Committee is also responsible for monitoring the implementation of the pricing policies by the Adviser’s Pricing Group (the “Pricing Group”) and a third party which performs certain pricing functions in accordance with the pricing policies. The Pricing Group is responsible for the oversight of the third party on a day-to-day basis. The Committee and the Pricing Group perform a series of activities to provide reasonable assurance of the accuracy of prices including: 1) periodic vendor due diligence meetings, review of methodologies, new developments and processes at vendors, 2) daily comparison of security valuation versus prior day for all securities that exceeded established thresholds, and 3) daily review of unpriced, stale, and variance reports with exceptions reviewed by senior management and the Committee.
In addition, several processes outside of the pricing process are used to monitor valuation issues including: 1) performance and performance attribution reports are monitored for anomalous impacts based upon benchmark performance, and 2) portfolio managers review all portfolios for performance and analytics (which are generated using the Adviser’s prices).
3. Taxes
It is each Strategy’s policy to meet the requirements of the Internal Revenue Code applicable to regulated investment companies and to distribute all of its investment company taxable income and net realized gains, if any, to shareholders. Therefore, no provisions for federal income or excise taxes are required. Taxes are accrued and applied to net investment income, net realized gains and net unrealized appreciation/depreciation as such income and/or gains are earned.
In accordance with U.S. GAAP requirements regarding accounting for uncertainties in income taxes, management has analyzed the Strategies’ tax positions taken or expected to be taken on federal and state income tax returns for all open tax years (the current and the prior three tax years) and has concluded that no provision for income tax is required in the Strategies’ financial statements.
| 42 | • ALLIANCEBERNSTEIN WEALTH STRATEGIES |
Notes to Financial Statements
4. Investment Income and Investment Transactions
Income and capital gain distributions from the Underlying Portfolios, if any, are recorded on the ex-dividend date. Transactions in shares of the Underlying Portfolios are accounted for on the trade date. Investment gains and losses are determined on the identified cost basis.
5. Class Allocations
All income earned and expenses incurred by the Strategies are borne on a pro-rata basis by each settled class of shares, based on the proportionate interest in each Strategy represented by the net assets of such class, except for class specific expenses which are allocated to the respective class. Expenses included in the accompanying statements of operations do not include any expenses of the Underlying Portfolios. Expenses of the Trust are charged proportionately to each Strategy or based on other appropriate methods. Realized and unrealized gains and losses are allocated among the various share classes based on respective net assets.
6. Dividends and Distributions
Dividends and distributions to shareholders, if any, are recorded on the ex-dividend date. Income dividends and capital gains distributions are determined in accordance with federal tax regulations and may differ from those determined in accordance with U.S. GAAP. To the extent these differences are permanent, such amounts are reclassified within the capital accounts based on their federal tax basis treatment; temporary differences do not require such reclassification.
NOTE B
Advisory Fee and Other Transactions with Affiliates
Under the terms of the investment advisory agreement, the Strategies pay the Adviser at the annual rates as follows:
| Average Daily Net Assets | ||||||||||||
| Strategy | First $2.5 Billion | Next $2.5 Billion | In Excess of $5 Billion | |||||||||
Wealth Appreciation | .65 | % | .55 | % | .50 | % | ||||||
Balanced Wealth | .55 | % | .45 | % | .40 | % | ||||||
Conservative Wealth | .55 | % | .45 | % | .40 | % | ||||||
Such fees are accrued daily and paid monthly.
The Strategies compensate AllianceBernstein Investor Services, Inc. (“ABIS”), a wholly-owned subsidiary of the Adviser, under a Transfer Agency Agreement for providing personnel and facilities to perform transfer agency services for the Strategies. ABIS may make payments to intermediaries that provide omnibus account services, sub-accounting services and/or networking services. Such compensation retained by ABIS amounted to $254,185, $257,123 and $76,299 for the Wealth Appreciation Strategy, Balanced Wealth Strategy and Conservative Wealth Strategy, respectively, for the six months ended February 28, 2014.
| ALLIANCEBERNSTEIN WEALTH STRATEGIES • | 43 |
Notes to Financial Statements
AllianceBernstein Investments, Inc. (the “Distributor”), a wholly-owned subsidiary of the Adviser, serves as the distributor of the Strategies’ shares. The Distributor has advised the Strategies that it has retained front-end sales charges from the sale of Class A shares and received contingent deferred sales charges imposed upon redemptions by shareholders of Class A, Class B and Class C shares for each Strategy for the six months ended February 28, 2014 as follows:
| Front-End Sales Charges | Contingent Deferred Sales Charges | |||||||||||||||
| Strategy | Class A | Class A | Class B | Class C | ||||||||||||
Wealth Appreciation | $ | 10,810 | $ | 4,204 | $ | 5,687 | $ | 2,547 | ||||||||
Balanced Wealth | 22,215 | 7,111 | 10,982 | 4,829 | ||||||||||||
Conservative Wealth | 5,352 | 1,400 | 2,978 | 1,325 | ||||||||||||
NOTE C
Distribution Plans
The Strategies have adopted a Plan for each class of shares of the Strategies pursuant to Rule 12b-1 under the Investment Company Act of 1940 (each a “Plan” and collectively the “Plans”). Under the Plans, the Strategies pay distribution and servicing fees to the Distributor at an annual rate of up to .50% of each Strategy’s average daily net assets attributable to Class A shares, 1% of the Strategies’ average daily net assets attributable to both Class B and Class C shares, .50% of the Strategies’ average daily net assets attributable to Class R shares and .25% of the Strategies’ average daily net assets attributable to Class K shares. There are no distribution and servicing fees on the Advisor Class and Class I shares. The fees are accrued daily and paid monthly. The Trustees currently limit payments under the Class A plan to .30% of each Strategy’s average daily net assets attributable to Class A shares. The Plans provide that the Distributor will use such payments in their entirety for distribution assistance and promotional activities. The Strategies are not obligated under the Plans to pay any distribution services fee in excess of the amounts set forth above. The purpose of the payments to the Distributor under the Plans is to compensate the Distributor for its distribution services with respect to the sale of each Strategies’ shares. Since the Distributor’s compensation is not directly tied to its expenses, the amount of compensation received by it under the Plan during any year may be more or less than its actual expenses. For this reason, the Plans are characterized by the staff of the Securities and Exchange Commission as being of the “compensation” variety.
In the event that a Plan is terminated or not continued, no distribution services fees (other than current amounts accrued but not yet paid) would be owed by the Strategies to the Distributor with respect to the relevant class. The Plans also provide that the Adviser may use its own resources to finance the distribution of each Strategies’ shares.
| 44 | • ALLIANCEBERNSTEIN WEALTH STRATEGIES |
Notes to Financial Statements
NOTE D
Investment Transactions
Purchases and sales of investments in the Underlying Portfolios for the six months ended February 28, 2014 were as follows:
| Strategy | Purchases | Sales | ||||||
Wealth Appreciation | $ | 105,151,416 | $ | 88,947,579 | ||||
Balanced Wealth | 78,260,908 | 108,076,372 | ||||||
Conservative Wealth | 16,181,437 | 40,359,396 | ||||||
The cost of investments for federal income tax purposes was substantially the same as the cost for financial reporting purposes. Accordingly, gross unrealized appreciation and unrealized depreciation are as follows:
| Gross Unrealized | Net Unrealized Appreciation | |||||||||||
Strategy | Appreciation | (Depreciation) | ||||||||||
Wealth Appreciation | $ | 251,267,764 | $ | (11,079,595 | ) | $ | 240,188,169 | |||||
Balanced Wealth | 193,203,855 | (8,926,724 | ) | 184,277,131 | ||||||||
Conservative Wealth | 42,114,414 | (1,353,944 | ) | 40,760,470 | ||||||||
1. Currency Transactions
A Strategy may invest in non-U.S. dollar securities on a currency hedged or unhedged basis through its investments in an Underlying Portfolio. A Strategy or an Underlying Portfolio may seek investment opportunities by taking long or short positions in currencies through the use of currency-related derivatives, including forward currency exchange contracts, futures and options on futures, swaps, and other options. A Strategy or an Underlying Portfolio may enter into transactions for investment opportunities when it anticipates that a foreign currency will appreciate or depreciate in value but securities denominated in that currency are not held by the Strategy or the Underlying Portfolio and do not present attractive investment opportunities. Such transactions may also be used when the Adviser believes that it may be more efficient than a direct investment in a foreign currency-denominated security. A Strategy or an Underlying Portfolio may also conduct currency exchange contracts on a spot basis (i.e., for cash at the spot rate prevailing in the currency exchange market for buying or selling currencies).
| ALLIANCEBERNSTEIN WEALTH STRATEGIES • | 45 |
Notes to Financial Statements
NOTE E
Shares of Beneficial Interest
Transactions in shares of beneficial interest for each class were as follows:
| Wealth Appreciation Strategy | ||||||||||||||||||||
| Shares | Amount | |||||||||||||||||||
| Six Months Ended February 28, 2014 (unaudited) | Year Ended August 31, 2013 | Six Months Ended (unaudited) | Year Ended August 31, 2013 | |||||||||||||||||
|
| |||||||||||||||||||
| Class A | ||||||||||||||||||||
Shares sold | 711,746 | 1,770,240 | $ | 10,255,547 | $ | 22,526,194 | ||||||||||||||
| ||||||||||||||||||||
Shares issued in reinvestment of dividends | 503,044 | 264,657 | 7,148,256 | 3,170,594 | ||||||||||||||||
| ||||||||||||||||||||
Shares converted from Class B | 654,084 | 1,365,949 | 9,315,908 | 17,321,112 | ||||||||||||||||
| ||||||||||||||||||||
Shares redeemed | (2,895,545 | ) | (9,752,759 | ) | (41,773,817 | ) | (123,192,289 | ) | ||||||||||||
| ||||||||||||||||||||
Net decrease | (1,026,671 | ) | (6,351,913 | ) | $ | (15,054,106 | ) | $ | (80,174,389 | ) | ||||||||||
| ||||||||||||||||||||
| Class B | ||||||||||||||||||||
Shares sold | 43,593 | 122,953 | $ | 621,808 | $ | 1,548,366 | ||||||||||||||
| ||||||||||||||||||||
Shares issued in reinvestment of dividends | 35,711 | – 0 | – | 506,385 | – 0 | – | ||||||||||||||
| ||||||||||||||||||||
Shares converted to Class A | (660,090 | ) | (1,379,983 | ) | (9,315,908 | ) | (17,321,112 | ) | ||||||||||||
| ||||||||||||||||||||
Shares redeemed | (407,426 | ) | (1,493,125 | ) | (5,826,553 | ) | (18,606,603 | ) | ||||||||||||
| ||||||||||||||||||||
Net decrease | (988,212 | ) | (2,750,155 | ) | $ | (14,014,268 | ) | $ | (34,379,349 | ) | ||||||||||
| ||||||||||||||||||||
| Class C | ||||||||||||||||||||
Shares sold | 240,043 | 439,981 | $ | 3,455,414 | $ | 5,539,965 | ||||||||||||||
| ||||||||||||||||||||
Shares issued in reinvestment of dividends | 81,012 | 4,345 | 1,147,125 | 51,702 | ||||||||||||||||
| ||||||||||||||||||||
Shares redeemed | (939,539 | ) | (2,913,839 | ) | (13,479,556 | ) | (36,250,274 | ) | ||||||||||||
| ||||||||||||||||||||
Net decrease | (618,484 | ) | (2,469,513 | ) | $ | (8,877,017 | ) | $ | (30,658,607 | ) | ||||||||||
| ||||||||||||||||||||
| Advisor Class | ||||||||||||||||||||
Shares sold | 4,032,109 | 10,813,378 | $ | 58,198,767 | $ | 137,085,604 | ||||||||||||||
| ||||||||||||||||||||
Shares issued in reinvestment of dividends | 1,290,979 | 731,703 | 18,306,078 | 8,751,172 | ||||||||||||||||
| ||||||||||||||||||||
Shares redeemed | (6,024,336 | ) | (17,544,625 | ) | (86,928,859 | ) | (221,659,729 | ) | ||||||||||||
| ||||||||||||||||||||
Net decrease | (701,248 | ) | (5,999,544 | ) | $ | (10,424,014 | ) | $ | (75,822,953 | ) | ||||||||||
| ||||||||||||||||||||
| Class R | ||||||||||||||||||||
Shares sold | 31,337 | 102,846 | $ | 448,624 | $ | 1,284,219 | ||||||||||||||
| ||||||||||||||||||||
Shares issued in reinvestment of dividends | 5,288 | – 0 | – | 74,718 | – 0 | – | ||||||||||||||
| ||||||||||||||||||||
Shares redeemed | (100,562 | ) | (355,289 | ) | (1,423,131 | ) | (4,387,596 | ) | ||||||||||||
| ||||||||||||||||||||
Net decrease | (63,937 | ) | (252,443 | ) | $ | (899,789 | ) | $ | (3,103,377 | ) | ||||||||||
| ||||||||||||||||||||
| 46 | • ALLIANCEBERNSTEIN WEALTH STRATEGIES |
Notes to Financial Statements
| Wealth Appreciation Strategy | ||||||||||||||||||||
| Shares | Amount | |||||||||||||||||||
| Six Months Ended February 28, 2014 (unaudited) | Year Ended August 31, 2013 | Six Months Ended (unaudited) | Year Ended August 31, 2013 | |||||||||||||||||
|
| |||||||||||||||||||
| Class K | ||||||||||||||||||||
Shares sold | 182,475 | 183,959 | $ | 2,607,435 | $ | 2,328,849 | ||||||||||||||
| ||||||||||||||||||||
Shares issued in reinvestment of dividends | 23,213 | 11,677 | 328,011 | 139,066 | ||||||||||||||||
| ||||||||||||||||||||
Shares redeemed | (206,506 | ) | (403,515 | ) | (2,959,040 | ) | (5,108,800 | ) | ||||||||||||
| ||||||||||||||||||||
Net decrease | (818 | ) | (207,879 | ) | $ | (23,594 | ) | $ | (2,640,885 | ) | ||||||||||
| ||||||||||||||||||||
| Class I | ||||||||||||||||||||
Shares sold | 9,097 | 24,138 | $ | 131,761 | $ | 306,980 | ||||||||||||||
| ||||||||||||||||||||
Shares issued in reinvestment of dividends | 6,737 | 3,484 | 95,327 | 41,603 | ||||||||||||||||
| ||||||||||||||||||||
Shares redeemed | (19,024 | ) | (75,278 | ) | (272,866 | ) | (955,104 | ) | ||||||||||||
| ||||||||||||||||||||
Net decrease | (3,190 | ) | (47,656 | ) | $ | (45,778 | ) | $ | (606,521 | ) | ||||||||||
| ||||||||||||||||||||
| Balanced Wealth Strategy | ||||||||||||||||||||
| Shares | Amount | |||||||||||||||||||
Six Months Ended February 28, 2014 (unaudited) | Year Ended August 31, 2013 | Six Months Ended February 28, 2014 (unaudited) | Year Ended August 31, 2013 | |||||||||||||||||
|
| |||||||||||||||||||
| Class A | ||||||||||||||||||||
Shares sold | 1,941,159 | 3,741,429 | $ | 25,926,548 | $ | 46,806,212 | ||||||||||||||
| ||||||||||||||||||||
Shares issued in reinvestment of dividends and distributions | 1,502,522 | 1,068,061 | 19,710,872 | 13,155,083 | ||||||||||||||||
| ||||||||||||||||||||
Shares converted from Class B | 1,507,252 | 3,170,746 | 19,946,008 | 39,722,421 | ||||||||||||||||
| ||||||||||||||||||||
Shares redeemed | (6,332,830 | ) | (17,201,776 | ) | (84,716,766 | ) | (213,996,980 | ) | ||||||||||||
| ||||||||||||||||||||
Net decrease | (1,381,897 | ) | (9,221,540 | ) | $ | (19,133,338 | ) | $ | (114,313,264 | ) | ||||||||||
| ||||||||||||||||||||
| Class B | ||||||||||||||||||||
Shares sold | 73,569 | 160,715 | $ | 974,474 | $ | 1,999,408 | ||||||||||||||
| ||||||||||||||||||||
Shares issued in reinvestment of dividends and distributions | 296,302 | 234,093 | 3,857,417 | 2,866,346 | ||||||||||||||||
| ||||||||||||||||||||
Shares converted to Class A | (1,520,055 | ) | (3,188,509 | ) | (19,946,008 | ) | (39,722,421 | ) | ||||||||||||
| ||||||||||||||||||||
Shares redeemed | (971,269 | ) | (3,517,500 | ) | (12,879,940 | ) | (43,509,632 | ) | ||||||||||||
| ||||||||||||||||||||
Net decrease | (2,121,453 | ) | (6,311,201 | ) | $ | (27,994,057 | ) | $ | (78,366,299 | ) | ||||||||||
| ||||||||||||||||||||
| ALLIANCEBERNSTEIN WEALTH STRATEGIES • | 47 |
Notes to Financial Statements
| Balanced Wealth Strategy | ||||||||||||||||||||
| Shares | Amount | |||||||||||||||||||
Six Months Ended February 28, 2014 (unaudited) | Year Ended August 31, 2013 | Six Months Ended February 28, 2014 (unaudited) | Year Ended August 31, 2013 | |||||||||||||||||
|
| |||||||||||||||||||
| Class C | ||||||||||||||||||||
Shares sold | 705,347 | 953,180 | $ | 9,352,922 | $ | 11,900,107 | ||||||||||||||
| ||||||||||||||||||||
Shares issued in reinvestment of dividends and distributions | 479,909 | 301,511 | 6,257,354 | 3,700,327 | ||||||||||||||||
| ||||||||||||||||||||
Shares redeemed | (1,876,433 | ) | (5,587,139 | ) | (24,920,513 | ) | (69,258,564 | ) | ||||||||||||
| ||||||||||||||||||||
Net decrease | (691,177 | ) | (4,332,448 | ) | $ | (9,310,237 | ) | $ | (53,658,130 | ) | ||||||||||
| ||||||||||||||||||||
| Advisor Class | ||||||||||||||||||||
Shares sold | 899,323 | 1,626,380 | $ | 12,079,221 | $ | 20,380,214 | ||||||||||||||
| ||||||||||||||||||||
Shares issued in reinvestment of dividends and distributions | 158,121 | 112,008 | 2,082,303 | 1,383,157 | ||||||||||||||||
| ||||||||||||||||||||
Shares redeemed | (888,495 | ) | (2,963,730 | ) | (11,924,505 | ) | (37,057,739 | ) | ||||||||||||
| ||||||||||||||||||||
Net increase (decrease) | 168,949 | (1,225,342 | ) | $ | 2,237,019 | $ | (15,294,368 | ) | ||||||||||||
| ||||||||||||||||||||
| Class R | ||||||||||||||||||||
Shares sold | 85,903 | 218,321 | $ | 1,139,819 | $ | 2,722,397 | ||||||||||||||
| ||||||||||||||||||||
Shares issued in reinvestment of dividends and distributions | 35,888 | 25,592 | 468,665 | 314,042 | ||||||||||||||||
| ||||||||||||||||||||
Shares redeemed | (520,721 | ) | (572,306 | ) | (6,870,747 | ) | (7,109,098 | ) | ||||||||||||
| ||||||||||||||||||||
Net decrease | (398,930 | ) | (328,393 | ) | $ | (5,262,263 | ) | $ | (4,072,659 | ) | ||||||||||
| ||||||||||||||||||||
| Class K | ||||||||||||||||||||
Shares sold | 267,077 | 181,078 | $ | 3,573,780 | $ | 2,269,970 | ||||||||||||||
| ||||||||||||||||||||
Shares issued in reinvestment of dividends and distributions | 58,074 | 38,291 | 759,563 | 470,518 | ||||||||||||||||
| ||||||||||||||||||||
Shares redeemed | (323,237 | ) | (827,972 | ) | (4,337,592 | ) | (10,207,617 | ) | ||||||||||||
| ||||||||||||||||||||
Net increase (decrease) | 1,914 | (608,603 | ) | $ | (4,249 | ) | $ | (7,467,129 | ) | |||||||||||
| ||||||||||||||||||||
| Class I | ||||||||||||||||||||
Shares sold | 29,646 | 81,402 | $ | 398,536 | $ | 1,010,219 | ||||||||||||||
| ||||||||||||||||||||
Shares issued in reinvestment of dividends and distributions | 29,257 | 21,412 | 384,114 | 263,874 | ||||||||||||||||
| ||||||||||||||||||||
Shares redeemed | (67,016 | ) | (201,489 | ) | (896,025 | ) | (2,544,498 | ) | ||||||||||||
| ||||||||||||||||||||
Net decrease | (8,113 | ) | (98,675 | ) | $ | (113,375 | ) | $ | (1,270,405 | ) | ||||||||||
| ||||||||||||||||||||
| 48 | • ALLIANCEBERNSTEIN WEALTH STRATEGIES |
Notes to Financial Statements
| Conservative Wealth Strategy | ||||||||||||||||||||
| Shares | Amount | |||||||||||||||||||
| Six Months Ended February 28, 2014 (unaudited) | Year Ended 2013 | Six Months Ended February 28, 2014 (unaudited) | Year Ended 2013 | |||||||||||||||||
|
| |||||||||||||||||||
| Class A | ||||||||||||||||||||
Shares sold | 639,216 | 2,037,172 | $ | 7,611,004 | $ | 23,645,471 | ||||||||||||||
| ||||||||||||||||||||
Shares issued in reinvestment of dividends | 283,469 | 320,173 | 3,335,702 | 3,713,788 | ||||||||||||||||
| ||||||||||||||||||||
Shares converted from Class B | 435,358 | 1,036,152 | 5,149,045 | 12,052,474 | ||||||||||||||||
| ||||||||||||||||||||
Shares redeemed | (2,606,557 | ) | (6,988,949 | ) | (31,006,337 | ) | (81,150,186 | ) | ||||||||||||
| ||||||||||||||||||||
Net decrease | (1,248,514 | ) | (3,595,452 | ) | $ | (14,910,586 | ) | $ | (41,738,453 | ) | ||||||||||
| ||||||||||||||||||||
| Class B | ||||||||||||||||||||
Shares sold | 29,796 | 72,315 | $ | 353,455 | $ | 828,765 | ||||||||||||||
| ||||||||||||||||||||
Shares issued in reinvestment of dividends | 56,725 | 68,290 | 662,401 | 789,548 | ||||||||||||||||
| ||||||||||||||||||||
Shares converted to Class A | (439,029 | ) | (1,042,141 | ) | (5,149,045 | ) | (12,052,474 | ) | ||||||||||||
| ||||||||||||||||||||
Shares redeemed | (410,501 | ) | (1,296,198 | ) | (4,854,077 | ) | (14,931,215 | ) | ||||||||||||
| ||||||||||||||||||||
Net decrease | (763,009 | ) | (2,197,734 | ) | $ | (8,987,266 | ) | $ | (25,365,376 | ) | ||||||||||
| ||||||||||||||||||||
| Class C | ||||||||||||||||||||
Shares sold | 224,091 | 562,338 | $ | 2,645,076 | $ | 6,489,095 | ||||||||||||||
| ||||||||||||||||||||
Shares issued in reinvestment of dividends | 113,467 | 112,412 | 1,325,010 | 1,299,872 | ||||||||||||||||
| ||||||||||||||||||||
Shares redeemed | (1,058,077 | ) | (2,616,738 | ) | (12,488,643 | ) | (30,106,672 | ) | ||||||||||||
| ||||||||||||||||||||
Net decrease | (720,519 | ) | (1,941,988 | ) | $ | (8,518,557 | ) | $ | (22,317,705 | ) | ||||||||||
| ||||||||||||||||||||
| Advisor Class | ||||||||||||||||||||
Shares sold | 401,495 | 413,762 | $ | 4,779,417 | $ | 4,807,869 | ||||||||||||||
| ||||||||||||||||||||
Shares issued in reinvestment of dividends | 16,152 | 14,541 | 190,556 | 168,874 | ||||||||||||||||
| ||||||||||||||||||||
Shares redeemed | (201,248 | ) | (610,319 | ) | (2,404,578 | ) | (7,098,408 | ) | ||||||||||||
| ||||||||||||||||||||
Net increase (decrease) | 216,399 | (182,016 | ) | $ | 2,565,395 | $ | (2,121,665 | ) | ||||||||||||
| ||||||||||||||||||||
| Class R | ||||||||||||||||||||
Shares sold | 40,746 | 148,974 | $ | 486,235 | $ | 1,731,018 | ||||||||||||||
| ||||||||||||||||||||
Shares issued in reinvestment of dividends | 9,936 | 9,035 | 117,027 | 105,205 | ||||||||||||||||
| ||||||||||||||||||||
Shares redeemed | (82,441 | ) | (239,101 | ) | (984,918 | ) | (2,759,677 | ) | ||||||||||||
| ||||||||||||||||||||
Net decrease | (31,759 | ) | (81,092 | ) | $ | (381,656 | ) | $ | (923,454 | ) | ||||||||||
| ||||||||||||||||||||
| ALLIANCEBERNSTEIN WEALTH STRATEGIES • | 49 |
Notes to Financial Statements
| Conservative Wealth Strategy | ||||||||||||||||||||
| Shares | Amount | |||||||||||||||||||
| Six Months Ended February 28, 2014 (unaudited) | Year Ended 2013 | Six Months Ended February 28, 2014 (unaudited) | Year Ended 2013 | |||||||||||||||||
|
| |||||||||||||||||||
| Class K | ||||||||||||||||||||
Shares sold | 146,904 | 140,301 | $ | 1,757,370 | $ | 1,620,858 | ||||||||||||||
| ||||||||||||||||||||
Shares issued in reinvestment of dividends | 14,413 | 13,094 | 169,315 | 151,777 | ||||||||||||||||
| ||||||||||||||||||||
Shares redeemed | (63,410 | ) | (215,169 | ) | (751,991 | ) | (2,487,114 | ) | ||||||||||||
| ||||||||||||||||||||
Net increase (decrease) | 97,907 | (61,774 | ) | $ | 1,174,694 | $ | (714,479 | ) | ||||||||||||
| ||||||||||||||||||||
| Class I | ||||||||||||||||||||
Shares sold | 5,435 | 14,274 | $ | 64,722 | $ | 164,702 | ||||||||||||||
| ||||||||||||||||||||
Shares issued in reinvestment of dividends | 1,407 | 1,701 | 16,581 | 19,722 | ||||||||||||||||
| ||||||||||||||||||||
Shares redeemed | (19,944 | ) | (39,255 | ) | (236,495 | ) | (453,820 | ) | ||||||||||||
| ||||||||||||||||||||
Net decrease | (13,102 | ) | (23,280 | ) | $ | (155,192 | ) | $ | (269,396 | ) | ||||||||||
| ||||||||||||||||||||
NOTE F
Risks Involved in Investing in the Strategies
Interest Rate Risk and Credit Risk—Interest rate risk is the risk that changes in interest rates will affect the value of an Underlying Portfolio’s investments in fixed-income debt securities such as bonds or notes. Increases in interest rates may cause the value of the Underlying Portfolio’s investments to decline. Credit risk is the risk that the issuer or guarantor of a debt security, or the counterparty to a derivative contract, will be unable or unwilling to make timely principal and/or interest payments, or to otherwise honor its obligations. The degree of risk for a particular security may be reflected in its credit risk rating. Credit risk is greater for medium quality and lower-rated securities. Lower-rated debt securities and similar unrated securities (commonly known as “junk bonds”) have speculative elements or are predominantly speculative risks.
Foreign Securities Risk—An Underlying Portfolio’s investments in securities of foreign companies or foreign governments involves special risks which include changes in foreign currency exchange rates and the possibility of future political and economic developments which could adversely affect the value of such securities. Moreover, securities of many foreign companies or foreign governments and their markets may be less liquid and their prices more volatile than those of comparable U.S. companies or of the U.S. government.
Currency Risk—This is the risk that changes in foreign currency exchange rates may negatively affect the value of an Underlying Portfolio’s investments or reduce the returns of the Underlying Portfolio. For example, the value of the Underlying Portfolio’s investments in foreign currency-denominated securities or currencies may decrease if the U.S. dollar is strong (i.e., gaining value relative
| 50 | • ALLIANCEBERNSTEIN WEALTH STRATEGIES |
Notes to Financial Statements
to other currencies) and other currencies are weak (i.e., losing value relative to the U.S. dollar). Currency markets are generally not as regulated as securities markets. Independent of the Underlying Portfolio’s investments denominated in foreign currencies, the Underlying Portfolio’s positions in various foreign currencies may cause the Underlying Portfolio to experience investment losses due to the changes in exchange rates and interest rates.
Derivatives Risk—The Strategies may enter into derivative transactions such as forwards, options, futures and swaps. Derivatives may be illiquid, difficult to price, and leveraged so that small changes may produce disproportionate losses for the Strategies, and subject to counterparty risk to a greater degree than more traditional investments.
Indemnification Risk—In the ordinary course of business, the Strategies enter into contracts that contain a variety of indemnifications. The Strategies’ maximum exposure under these arrangements is unknown. However, the Strategies have not had prior claims or losses pursuant to these indemnification provisions and expect the risk of loss thereunder to be remote. Therefore, the Strategies have not accrued any liability in connection with these indemnification provisions.
NOTE G
Joint Credit Facility
A number of open-end mutual funds managed by the Adviser, including the Strategies, participate in a $140 million revolving credit facility (the “Facility”) intended to provide short-term financing, if necessary, subject to certain restrictions in connection with abnormal redemption activity. Commitment fees related to the Facility are paid by the participating funds and are included in miscellaneous expenses in the statement of operations. The Strategies did not utilize the Facility during the six months ended February 28, 2014.
NOTE H
Distributions to Shareholders
The tax character of distributions to be paid for the year ending August 31, 2014 will be determined at the end of the current fiscal year. The tax character of distributions paid during the fiscal years ended August 31, 2013 and August 31, 2012 were as follows:
| Wealth Appreciation Strategy | 2013 | 2012 | ||||||
Distributions paid from: | ||||||||
Ordinary income | $ | 12,763,380 | $ | 24,366,584 | ||||
|
|
|
| |||||
Total taxable distributions | 12,763,380 | 24,366,584 | ||||||
|
|
|
| |||||
Total distributions paid | $ | 12,763,380 | $ | 24,366,584 | ||||
|
|
|
| |||||
| ALLIANCEBERNSTEIN WEALTH STRATEGIES • | 51 |
Notes to Financial Statements
| Balanced Wealth Strategy | 2013 | 2012 | ||||||
Distributions paid from: | ||||||||
Ordinary income | $ | 23,865,949 | $ | 32,232,219 | ||||
|
|
|
| |||||
Total taxable distributions | 23,865,949 | 32,232,219 | ||||||
Tax return of capital | 300,255 | 2,550,653 | ||||||
|
|
|
| |||||
Total distributions paid | $ | 24,166,204 | $ | 34,782,872 | ||||
|
|
|
| |||||
| Conservative Wealth Strategy | 2013 | 2012 | ||||||
Distributions paid from: | ||||||||
Ordinary income | $ | 6,850,767 | $ | 10,621,296 | ||||
|
|
|
| |||||
Total taxable distributions | 6,850,767 | 10,621,296 | ||||||
|
|
|
| |||||
Total distributions paid | $ | 6,850,767 | $ | 10,621,296 | ||||
|
|
|
| |||||
As of August 31, 2013, the components of accumulated earnings/(deficit) on a tax basis were as follows:
| Strategy | Undistributed Ordinary Income | Accumulated Capital and Other Losses(a) | Unrealized Appreciation/ (Depreciation)(b) | Total Accumulated Earnings/ (Deficit) | ||||||||||||
Wealth Appreciation | $ | 6,827,556 | $ | (210,612,713 | ) | $ | 40,176,748 | $ | (163,608,409 | ) | ||||||
Balanced Wealth | – 0 | – | (252,034,425 | ) | 84,400,589 | (167,633,836 | ) | |||||||||
Conservative Wealth | – 0 | – | (44,358,377 | ) | 24,322,117 | (20,036,260 | ) | |||||||||
| (a) | During the fiscal year ended August 31, 2013 all three Strategies utilized capital loss carryforwards to offset current year net realized gains. Wealth Appreciation Strategy utilized $85,216 of capital loss carryforwards during the fiscal year, and had a net capital loss carryforward of $210,612,713 at fiscal year end. Balanced Wealth Strategy utilized $18,478,377 of capital loss carryforwards during the fiscal year, and had a net capital loss carryforward of $251,510,556 at fiscal year end. Conservative Wealth Strategy utilized $7,404,718 of capital loss carryforwards during the fiscal year, and had a net capital loss carryforward of $43,868,409 at fiscal year end. Net ordinary losses incurred after December 31 and within the taxable year are deemed to arise on the first business day of the Strategy’s next taxable year. Balanced Wealth Strategy and Conservative Wealth Strategy elected to defer $523,869 and $489,968, respectively, of qualified late-year ordinary losses that are deemed to arise on September 1, 2013. |
| (b) | The difference between book-basis and tax-basis unrealized appreciation/(depreciation) is attributable primarily to the tax deferral of losses on wash sales. |
For tax purposes, net capital losses may be carried over to offset future capital gains, if any. Under the Regulated Investment Company Modernization Act of 2010, funds are permitted to carry forward capital losses incurred in taxable years beginning after December 22, 2010 for an indefinite period. These post-enactment capital losses must be utilized prior to the pre-enactment capital losses, which are subject to expiration. Post-enactment capital loss carryforwards will retain their character as either short-term or long-term capital losses rather than being considered short-term as under previous regulation.
| 52 | • ALLIANCEBERNSTEIN WEALTH STRATEGIES |
Notes to Financial Statements
As of August 31, 2013, the Strategies had net capital loss carryforwards which will expire as follows:
| Strategy | SHORT-TERM AMOUNT | LONG-TERM AMOUNT | EXPIRATION | |||||
Wealth Appreciation | $ | 21,540,462 | NA | 2017 | ||||
Wealth Appreciation | 91,501,019 | NA | 2018 | |||||
Wealth Appreciation | 47,886,250 | NA | 2019 | |||||
Wealth Appreciation | 313,560 | 49,371,422 | No expiration | |||||
Balanced Wealth | 10,504,401 | NA | 2017 | |||||
Balanced Wealth | 140,364,791 | NA | 2018 | |||||
Balanced Wealth | 80,057,439 | NA | 2019 | |||||
Balanced Wealth | – 0 | – | 20,583,925 | No expiration | ||||
Conservative Wealth | 37,441,345 | NA | 2018 | |||||
Conservative Wealth | 6,427,064 | NA | 2019 | |||||
NOTE I
Subsequent Events
Management has evaluated subsequent events for possible recognition or disclosure in the financial statements through the date the financial statements are issued. Management has determined that there are no material events that would require disclosure in the Strategies’ financial statements through this date.
| ALLIANCEBERNSTEIN WEALTH STRATEGIES • | 53 |
Notes to Financial Statements
FINANCIAL HIGHLIGHTS
Selected Data For A Share Of Beneficial Interest Outstanding Throughout Each Period
| Wealth Appreciation Strategy | ||||||||||||||||||||||||
| Class A | ||||||||||||||||||||||||
Six Months 2014 (unaudited) | Year Ended August 31, | |||||||||||||||||||||||
| 2013 | 2012 | 2011 | 2010 | 2009 | ||||||||||||||||||||
|
| |||||||||||||||||||||||
Net asset value, beginning of period | $ 13.36 | $ 11.63 | $ 11.26 | $ 10.00 | $ 9.89 | $ 13.38 | ||||||||||||||||||
|
| |||||||||||||||||||||||
Income From Investment Operations | ||||||||||||||||||||||||
Net investment income(a) | .39 | .06 | .10 | .19 | .09 | .12 | ||||||||||||||||||
Net realized and unrealized gain (loss) on | 1.47 | 1.77 | .46 | 1.17 | .14 | (2.91 | ) | |||||||||||||||||
|
| |||||||||||||||||||||||
Net increase (decrease) in net asset value from operations | 1.86 | 1.83 | .56 | 1.36 | .23 | (2.79 | ) | |||||||||||||||||
|
| |||||||||||||||||||||||
Less: Dividends and Distributions | ||||||||||||||||||||||||
Dividends from net investment income | (.27 | ) | (.10 | ) | (.19 | ) | (.10 | ) | (.12 | ) | (.07 | ) | ||||||||||||
Distributions from net realized gain on investment transactions | – 0 | – | – 0 | – | – 0 | – | – 0 | – | – 0 | – | (.63 | ) | ||||||||||||
|
| |||||||||||||||||||||||
Total dividends and distributions | (.27 | ) | (.10 | ) | (.19 | ) | (.10 | ) | (.12 | ) | (.70 | ) | ||||||||||||
|
| |||||||||||||||||||||||
Net asset value, end of period | $ 14.95 | $ 13.36 | $ 11.63 | $ 11.26 | $ 10.00 | $ 9.89 | ||||||||||||||||||
|
| |||||||||||||||||||||||
Total Return | ||||||||||||||||||||||||
Total investment return based on net asset value(b) | 14.03 | % | 15.86 | % | 5.11 | % | 13.58 | % | 2.27 | % | (19.63 | )% | ||||||||||||
Ratios/Supplemental Data | ||||||||||||||||||||||||
Net assets, end of period (000’s omitted) | $412,285 | $382,178 | $406,461 | $471,196 | $518,314 | $569,413 | ||||||||||||||||||
Ratio to average net assets of: | ||||||||||||||||||||||||
Expenses(c) | 1.07 | %^ | 1.07 | % | 1.09 | % | 1.09 | %+ | 1.10 | %+ | 1.14 | % | ||||||||||||
Net investment income | 5.43 | %^ | .48 | % | .88 | % | 1.60 | %+ | .86 | %+ | 1.33 | % | ||||||||||||
Portfolio turnover rate | 6 | % | 4 | % | 29 | % | 4 | % | 4 | % | 9 | % | ||||||||||||
See footnote summary on page 75.
| 54 | • ALLIANCEBERNSTEIN WEALTH STRATEGIES |
Financial Highlights
Selected Data For A Share Of Beneficial Interest Outstanding Throughout Each Period
| Wealth Appreciation Strategy | ||||||||||||||||||||||||
| Class B | ||||||||||||||||||||||||
Six Months 2014 (unaudited) | Year Ended August 31, | |||||||||||||||||||||||
| 2013 | 2012 | 2011 | 2010 | 2009 | ||||||||||||||||||||
|
| |||||||||||||||||||||||
Net asset value, beginning of period | $ 13.20 | $ 11.47 | $ 11.08 | $ 9.84 | $ 9.73 | $ 13.17 | ||||||||||||||||||
|
| |||||||||||||||||||||||
Income From Investment Operations | ||||||||||||||||||||||||
Net investment income (loss)(a) | .33 | (.02 | ) | .02 | .10 | .01 | .05 | |||||||||||||||||
Net realized and unrealized gain (loss) on investment transactions | 1.46 | 1.75 | .45 | 1.16 | .15 | (2.86 | ) | |||||||||||||||||
|
| |||||||||||||||||||||||
Net increase (decrease) in net asset value from operations | 1.79 | 1.73 | .47 | 1.26 | .16 | (2.81 | ) | |||||||||||||||||
|
| |||||||||||||||||||||||
Less: Dividends and Distributions | ||||||||||||||||||||||||
Dividends from net investment income | (.10 | ) | – 0 | – | (.08 | ) | (.02 | ) | (.05 | ) | – 0 | – | ||||||||||||
Distributions from net realized gain on investment transactions | – 0 | – | – 0 | – | – 0 | – | – 0 | – | – 0 | – | (.63 | ) | ||||||||||||
|
| |||||||||||||||||||||||
Total dividends and distributions | (.10 | ) | – 0 | – | (.08 | ) | (.02 | ) | (.05 | ) | (.63 | ) | ||||||||||||
|
| |||||||||||||||||||||||
Net asset value, end of period | $ 14.89 | $ 13.20 | $ 11.47 | $ 11.08 | $ 9.84 | $ 9.73 | ||||||||||||||||||
|
| |||||||||||||||||||||||
Total Return | ||||||||||||||||||||||||
Total investment return based on net asset value(b) | 13.61 | % | 15.08 | % | 4.29 | % | 12.76 | % | 1.57 | % | (20.24 | )% | ||||||||||||
Ratios/Supplemental Data | ||||||||||||||||||||||||
Net assets, end of period (000’s omitted) | $73,045 | $77,795 | $99,167 | $135,139 | $151,107 | $184,655 | ||||||||||||||||||
Ratio to average net assets of: | ||||||||||||||||||||||||
Expenses(c) | 1.78 | %^ | 1.79 | % | 1.82 | % | 1.83 | %+ | 1.84 | %+ | 1.89 | % | ||||||||||||
Net investment income (loss) | 4.65 | %^ | (.17 | )% | .21 | % | .85 | %+ | .13 | %+ | .60 | % | ||||||||||||
Portfolio turnover rate | 6 | % | 4 | % | 29 | % | 4 | % | 4 | % | 9 | % | ||||||||||||
See footnote summary on page 75.
| ALLIANCEBERNSTEIN WEALTH STRATEGIES • | 55 |
Financial Highlights
Selected Data For A Share Of Beneficial Interest Outstanding Throughout Each Period
| Wealth Appreciation Strategy | ||||||||||||||||||||||||
| Class C | ||||||||||||||||||||||||
Six Months (unaudited) | Year Ended August 31, | |||||||||||||||||||||||
| 2013 | 2012 | 2011 | 2010 | 2009 | ||||||||||||||||||||
|
| |||||||||||||||||||||||
Net asset value, beginning of period | $ 13.21 | $ 11.49 | $ 11.09 | $ 9.85 | $ 9.74 | $ 13.18 | ||||||||||||||||||
|
| |||||||||||||||||||||||
Income From Investment Operations | ||||||||||||||||||||||||
Net investment income (loss)(a) | .34 | (.03 | ) | .02 | .10 | .02 | .05 | |||||||||||||||||
Net realized and unrealized gain (loss) on investment transactions | 1.45 | 1.76 | .46 | 1.16 | .14 | (2.86 | ) | |||||||||||||||||
|
| |||||||||||||||||||||||
Net increase (decrease) in net asset value from operations | 1.79 | 1.73 | .48 | 1.26 | .16 | (2.81 | ) | |||||||||||||||||
|
| |||||||||||||||||||||||
Less: Dividends and Distributions | ||||||||||||||||||||||||
Dividends from net investment income | (.13 | ) | (.01 | ) | (.08 | ) | (.02 | ) | (.05 | ) | – 0 | – | ||||||||||||
Distributions from net realized gain on investment transactions | – 0 | – | – 0 | – | – 0 | – | – 0 | – | – 0 | – | (.63 | ) | ||||||||||||
|
| |||||||||||||||||||||||
Total dividends and distributions | (.13 | ) | (.01 | ) | (.08 | ) | (.02 | ) | (.05 | ) | (.63 | ) | ||||||||||||
|
| |||||||||||||||||||||||
Net asset value, end of period | $ 14.87 | $ 13.21 | $ 11.49 | $ 11.09 | $ 9.85 | $ 9.74 | ||||||||||||||||||
|
| |||||||||||||||||||||||
Total Return | ||||||||||||||||||||||||
Total investment return based on net asset value(b) | 13.63 | % | 15.02 | % | 4.39 | % | 12.74 | % | 1.57 | % | (20.23 | )% | ||||||||||||
Ratios/Supplemental Data | ||||||||||||||||||||||||
Net assets, end of period (000’s omitted) | $136,925 | $129,818 | $141,224 | $173,437 | $198,641 | $236,908 | ||||||||||||||||||
Ratio to average net assets of: | ||||||||||||||||||||||||
Expenses(c) | 1.78 | %^ | 1.78 | % | 1.80 | % | 1.80 | %+ | 1.82 | %+ | 1.86 | % | ||||||||||||
Net investment | 4.70 | %^ | (.22 | )% | .19 | % | .88 | %+ | .15 | %+ | .63 | % | ||||||||||||
Portfolio turnover rate | 6 | % | 4 | % | 29 | % | 4 | % | 4 | % | 9 | % | ||||||||||||
See footnote summary on page 75.
| 56 | • ALLIANCEBERNSTEIN WEALTH STRATEGIES |
Financial Highlights
Selected Data For A Share Of Beneficial Interest Outstanding Throughout Each Period
| Wealth Appreciation Strategy | ||||||||||||||||||||||||
| Advisor Class | ||||||||||||||||||||||||
Six Months (unaudited) | Year Ended August 31, | |||||||||||||||||||||||
| 2013 | 2012 | 2011 | 2010 | 2009 | ||||||||||||||||||||
|
| |||||||||||||||||||||||
Net asset value, beginning of period | $ 13.37 | $ 11.64 | $ 11.29 | $ 10.02 | $ 9.91 | $ 13.44 | ||||||||||||||||||
|
| |||||||||||||||||||||||
Income From Investment Operations | ||||||||||||||||||||||||
Net investment income(a) | .41 | .09 | .12 | .22 | .12 | .13 | ||||||||||||||||||
Net realized and unrealized gain (loss) on investment transactions | 1.47 | 1.79 | .46 | 1.19 | .14 | (2.91 | ) | |||||||||||||||||
|
| |||||||||||||||||||||||
Net increase (decrease) in net asset value from operations | 1.88 | 1.88 | .58 | 1.41 | .26 | (2.78 | ) | |||||||||||||||||
|
| |||||||||||||||||||||||
Less: Dividends and Distributions | ||||||||||||||||||||||||
Dividends from net investment income | (.33 | ) | (.15 | ) | (.23 | ) | (.14 | ) | (.15 | ) | (.12 | ) | ||||||||||||
Distributions from net realized gain on investment transactions | – 0 | – | – 0 | – | – 0 | – | – 0 | – | – 0 | – | (.63 | ) | ||||||||||||
|
| |||||||||||||||||||||||
Total dividends and distributions | (.33 | ) | (.15 | ) | (.23 | ) | (.14 | ) | (.15 | ) | (.75 | ) | ||||||||||||
|
| |||||||||||||||||||||||
Net asset value, end of period | $ 14.92 | $ 13.37 | $ 11.64 | $ 11.29 | $ 10.02 | $ 9.91 | ||||||||||||||||||
|
| |||||||||||||||||||||||
Total Return | ||||||||||||||||||||||||
Total investment return based on net asset value(b) | 14.18 | % | 16.27 | % | 5.36 | % | 13.99 | % | 2.54 | % | (19.39 | )% | ||||||||||||
Ratios/Supplemental Data | ||||||||||||||||||||||||
Net assets, end of period | $883,026 | $800,563 | $766,969 | $716,998 | $595,665 | $529,636 | ||||||||||||||||||
Ratio to average net assets of: | ||||||||||||||||||||||||
Expenses(c) | .77 | %^ | .77 | % | .79 | % | .79 | %+ | .80 | %+ | .84 | % | ||||||||||||
Net investment income | 5.72 | %^ | .74 | % | 1.07 | % | 1.79 | %+ | 1.13 | %+ | 1.54 | % | ||||||||||||
Portfolio turnover rate | 6 | % | 4 | % | 29 | % | 4 | % | 4 | % | 9 | % | ||||||||||||
See footnote summary on page 75.
| ALLIANCEBERNSTEIN WEALTH STRATEGIES • | 57 |
Financial Highlights
Selected Data For A Share Of Beneficial Interest Outstanding Throughout Each Period
| Wealth Appreciation Strategy | ||||||||||||||||||||||||
| Class R | ||||||||||||||||||||||||
| Six Months Ended February 28, 2014 (unaudited) | Year Ended August 31, | |||||||||||||||||||||||
| 2013 | 2012 | 2011 | 2010 | 2009 | ||||||||||||||||||||
|
| |||||||||||||||||||||||
Net asset value, beginning of period | $ 13.22 | $ 11.45 | $ 11.07 | $ 9.83 | $ 9.75 | $ 13.20 | ||||||||||||||||||
|
| |||||||||||||||||||||||
Income From Investment Operations | ||||||||||||||||||||||||
Net investment income(a) | .36 | .03 | .08 | .14 | .05 | .08 | ||||||||||||||||||
Net realized and unrealized gain (loss) on | 1.46 | 1.74 | .44 | 1.16 | .14 | (2.85 | ) | |||||||||||||||||
|
| |||||||||||||||||||||||
Net increase (decrease) in net asset value from operations | 1.82 | 1.77 | .52 | 1.30 | .19 | (2.77 | ) | |||||||||||||||||
|
| |||||||||||||||||||||||
Less: Dividends and Distributions | ||||||||||||||||||||||||
Dividends from net investment income | (.18 | ) | – 0 | – | (.14 | ) | (.06 | ) | (.11 | ) | (.05 | ) | ||||||||||||
Distributions from net realized gain on investment transactions | – 0 | – | – 0 | – | – 0 | – | – 0 | – | – 0 | – | (.63 | ) | ||||||||||||
|
| |||||||||||||||||||||||
Total dividends and distributions | (.18 | ) | – 0 | – | (.14 | ) | (.06 | ) | (.11 | ) | (.68 | ) | ||||||||||||
|
| |||||||||||||||||||||||
Net asset value, end of period | $ 14.86 | $ 13.22 | $ 11.45 | $ 11.07 | $ 9.83 | $ 9.75 | ||||||||||||||||||
|
| |||||||||||||||||||||||
Total Return | ||||||||||||||||||||||||
Total investment return based on net asset value(b) | 13.85 | % | 15.46 | % | 4.78 | % | 13.21 | % | 1.85 | % | (19.86 | )% | ||||||||||||
Ratios/Supplemental Data | ||||||||||||||||||||||||
Net assets, end of period | $5,739 | $5,953 | $8,045 | $17,480 | $17,617 | $16,317 | ||||||||||||||||||
Ratio to average net assets of: | ||||||||||||||||||||||||
Expenses(c) | 1.44 | %^ | 1.41 | % | 1.45 | % | 1.46 | %+ | 1.45 | %+ | 1.45 | % | ||||||||||||
Net investment income | 5.10 | %^ | .21 | % | .69 | % | 1.17 | %+ | .50 | %+ | .94 | % | ||||||||||||
Portfolio turnover rate | 6 | % | 4 | % | 29 | % | 4 | % | 4 | % | 9 | % | ||||||||||||
See footnote summary on page 75.
| 58 | • ALLIANCEBERNSTEIN WEALTH STRATEGIES |
Financial Highlights
Selected Data For A Share Of Beneficial Interest Outstanding Throughout Each Period
| Wealth Appreciation Strategy | ||||||||||||||||||||||||
| Class K | ||||||||||||||||||||||||
| Six Months Ended February 28, 2014 (unaudited) | Year Ended August 31, | |||||||||||||||||||||||
| 2013 | 2012 | 2011 | 2010 | 2009 | ||||||||||||||||||||
|
| |||||||||||||||||||||||
Net asset value, beginning of period | $ 13.28 | $ 11.57 | $ 11.18 | $ 9.93 | $ 9.83 | $ 13.32 | ||||||||||||||||||
|
| |||||||||||||||||||||||
Income From Investment Operations | ||||||||||||||||||||||||
Net investment income(a) | .38 | .05 | .09 | .17 | .08 | .11 | ||||||||||||||||||
Net realized and unrealized gain (loss) on | 1.46 | 1.76 | .46 | 1.18 | .15 | (2.89 | ) | |||||||||||||||||
|
| |||||||||||||||||||||||
Net increase (decrease) in net asset value from operations | 1.84 | 1.81 | .55 | 1.35 | .23 | (2.78 | ) | |||||||||||||||||
|
| |||||||||||||||||||||||
Less: Dividends and Distributions | ||||||||||||||||||||||||
Dividends from net investment income | (.26 | ) | (.10 | ) | (.16 | ) | (.10 | ) | (.13 | ) | (.08 | ) | ||||||||||||
Distributions from net realized gain on investment transactions | – 0 | – | – 0 | – | – 0 | – | – 0 | – | – 0 | – | (.63 | ) | ||||||||||||
|
| |||||||||||||||||||||||
Total dividends and distributions | (.26 | ) | (.10 | ) | (.16 | ) | (.10 | ) | (.13 | ) | (.71 | ) | ||||||||||||
|
| |||||||||||||||||||||||
Net asset value, end of period | $ 14.86 | $ 13.28 | $ 11.57 | $ 11.18 | $ 9.93 | $ 9.83 | ||||||||||||||||||
|
| |||||||||||||||||||||||
Total Return | ||||||||||||||||||||||||
Total investment return based on net asset value(b) | 13.99 | % | 15.78 | % | 5.07 | % | 13.53 | % | 2.28 | % | (19.66 | )% | ||||||||||||
Ratios/Supplemental Data | ||||||||||||||||||||||||
Net assets, end of period | $18,249 | $16,319 | $16,616 | $21,677 | $20,044 | $16,494 | ||||||||||||||||||
Ratio to average net assets of: | ||||||||||||||||||||||||
Expenses(c) | 1.13 | %^ | 1.11 | % | 1.13 | % | 1.15 | %+ | 1.13 | %+ | 1.14 | % | ||||||||||||
Net investment income | 5.32 | %^ | .42 | % | .83 | % | 1.45 | %+ | .78 | %+ | 1.23 | % | ||||||||||||
Portfolio turnover rate | 6 | % | 4 | % | 29 | % | 4 | % | 4 | % | 9 | % | ||||||||||||
See footnote summary on page 75.
| ALLIANCEBERNSTEIN WEALTH STRATEGIES • | 59 |
Financial Highlights
Selected Data For A Share Of Beneficial Interest Outstanding Throughout Each Period
| Wealth Appreciation Strategy | ||||||||||||||||||||||||
| Class I | ||||||||||||||||||||||||
Six Months 2014 (unaudited) | Year Ended August 31, | |||||||||||||||||||||||
| 2013 | 2012 | 2011 | 2010 | 2009 | ||||||||||||||||||||
|
| |||||||||||||||||||||||
Net asset value, beginning of period | $ 13.34 | $ 11.61 | $ 11.25 | $ 9.99 | $ 9.88 | $ 13.41 | ||||||||||||||||||
|
| |||||||||||||||||||||||
Income From Investment Operations | ||||||||||||||||||||||||
Net investment income(a) | .42 | .09 | .18 | .22 | .13 | .14 | ||||||||||||||||||
Net realized and unrealized gain (loss) on investment transactions | 1.46 | 1.77 | .41 | 1.18 | .13 | (2.91 | ) | |||||||||||||||||
|
| |||||||||||||||||||||||
Net increase (decrease) in net asset value from operations | 1.88 | 1.86 | .59 | 1.40 | .26 | (2.77 | ) | |||||||||||||||||
|
| |||||||||||||||||||||||
Less: Dividends and Distributions | ||||||||||||||||||||||||
Dividends from net investment income | (.32 | ) | (.13 | ) | (.23 | ) | (.14 | ) | (.15 | ) | (.13 | ) | ||||||||||||
Distributions from net realized gain on investment transactions | – 0 | – | – 0 | – | – 0 | – | – 0 | – | – 0 | – | (.63 | ) | ||||||||||||
|
| |||||||||||||||||||||||
Total dividends and distributions | (.32 | ) | (.13 | ) | (.23 | ) | (.14 | ) | (.15 | ) | (.76 | ) | ||||||||||||
|
| |||||||||||||||||||||||
Net asset value, end of period | $ 14.90 | $ 13.34 | $ 11.61 | $ 11.25 | $ 9.99 | $ 9.88 | ||||||||||||||||||
|
| |||||||||||||||||||||||
Total Return | ||||||||||||||||||||||||
Total investment return based on net asset value(b) | 14.25 | % | 16.16 | % | 5.43 | % | 13.90 | % | 2.58 | % | (19.38 | )% | ||||||||||||
Ratios/Supplemental | ||||||||||||||||||||||||
Net assets, end of period | $4,290 | $3,886 | $3,934 | $10,552 | $11,094 | $12,584 | ||||||||||||||||||
Ratio to average net | ||||||||||||||||||||||||
Expenses(c) | .80 | %^ | .79 | % | .80 | % | .82 | %+ | .80 | %+ | .81 | % | ||||||||||||
Net investment income | 5.82 | %^ | .72 | % | 1.53 | % | 1.82 | %+ | 1.18 | %+ | 1.61 | % | ||||||||||||
Portfolio turnover rate | 6 | % | 4 | % | 29 | % | 4 | % | 4 | % | 9 | % | ||||||||||||
See footnote summary on page 75.
| 60 | • ALLIANCEBERNSTEIN WEALTH STRATEGIES |
Financial Highlights
Selected Data For A Share Of Beneficial Interest Outstanding Throughout Each Period
| Balanced Wealth Strategy | ||||||||||||||||||||||||
| Class A | ||||||||||||||||||||||||
Six Months (unaudited) | Year Ended August 31, | |||||||||||||||||||||||
| 2013 | 2012 | 2011 | 2010 | 2009 | ||||||||||||||||||||
|
| |||||||||||||||||||||||
Net asset value, beginning of period | $ 12.74 | $ 11.85 | $ 11.47 | $ 10.61 | $ 10.14 | $ 12.04 | ||||||||||||||||||
|
| |||||||||||||||||||||||
Income From | ||||||||||||||||||||||||
Net investment income(a) | .36 | .23 | .22 | .33 | .24 | .27 | ||||||||||||||||||
Net realized and unrealized gain (loss) on | .93 | .89 | .44 | .83 | .47 | (1.50 | ) | |||||||||||||||||
|
| |||||||||||||||||||||||
Net increase (decrease) in net asset value from operations | 1.29 | 1.12 | .66 | 1.16 | .71 | (1.23 | ) | |||||||||||||||||
|
| |||||||||||||||||||||||
Less: Dividends and Distributions | ||||||||||||||||||||||||
Dividends from net investment income | (.38 | ) | (.23 | ) | (.26 | ) | (.30 | ) | (.24 | ) | (.28 | ) | ||||||||||||
Distributions from net realized gain on investment transactions | – 0 | – | – 0 | – | – 0 | – | – 0 | – | – 0 | – | (.39 | ) | ||||||||||||
Tax return of capital | – 0 | – | (.00 | )(d) | (.02 | ) | – 0 | – | (.00 | )(d) | – 0 | – | ||||||||||||
|
| |||||||||||||||||||||||
Total dividends and distributions | (.38 | ) | (.23 | ) | (.28 | ) | (.30 | ) | (.24 | ) | (.67 | ) | ||||||||||||
|
| |||||||||||||||||||||||
Net asset value, end of period | $ 13.65 | $ 12.74 | $ 11.85 | $ 11.47 | $ 10.61 | $ 10.14 | ||||||||||||||||||
|
| |||||||||||||||||||||||
Total Return | ||||||||||||||||||||||||
Total investment return based on net asset value(b) | 10.23 | % | 9.49 | % | 5.81 | % | 10.86 | % | 6.98 | % | (9.09 | )% | ||||||||||||
Ratios/Supplemental Data | ||||||||||||||||||||||||
Net assets, end of period (000,000’s omitted) | $766 | $732 | $791 | $927 | $1,022 | $1,069 | ||||||||||||||||||
Ratio to average net assets of: | ||||||||||||||||||||||||
Expenses(c) | 1.02 | %^ | .99 | % | 1.00 | % | .99 | %+ | .99 | %+ | 1.01 | % | ||||||||||||
Net investment | 5.34 | %^ | 1.87 | % | 1.93 | % | 2.77 | %+ | 2.19 | %+ | 3.05 | % | ||||||||||||
Portfolio turnover rate | 6 | % | 4 | % | 34 | % | 4 | % | 5 | % | 9 | % | ||||||||||||
See footnote summary on page 75.
| ALLIANCEBERNSTEIN WEALTH STRATEGIES • | 61 |
Financial Highlights
Selected Data For A Share Of Beneficial Interest Outstanding Throughout Each Period
| Balanced Wealth Strategy | ||||||||||||||||||||||||
| Class B | ||||||||||||||||||||||||
Six Months 2014 (unaudited) | Year Ended August 31, | |||||||||||||||||||||||
| 2013 | 2012 | 2011 | 2010 | 2009 | ||||||||||||||||||||
|
|
|
|
|
|
|
|
|
|
|
| |||||||||||||
Net asset value, beginning of period | $ 12.64 | $ 11.80 | $ 11.40 | $ 10.55 | $ 10.09 | $ 11.97 | ||||||||||||||||||
|
| |||||||||||||||||||||||
Income From Investment Operations | ||||||||||||||||||||||||
Net investment income(a) | .30 | .16 | .14 | .24 | .16 | .21 | ||||||||||||||||||
Net realized and unrealized gain (loss) on | .93 | .86 | .43 | .82 | .46 | (1.49 | ) | |||||||||||||||||
|
| |||||||||||||||||||||||
Net increase (decrease) in net asset value from operations | 1.23 | 1.02 | .57 | 1.06 | .62 | (1.28 | ) | |||||||||||||||||
|
| |||||||||||||||||||||||
Less: Dividends and Distributions | ||||||||||||||||||||||||
Dividends from net investment income | (.34 | ) | (.18 | ) | (.16 | ) | (.21 | ) | (.16 | ) | (.21 | ) | ||||||||||||
Distributions from net realized gain on investment transactions | – 0 | – | – 0 | – | – 0 | – | – 0 | – | – 0 | – | (.39 | ) | ||||||||||||
Tax return of capital | – 0 | – | (.00 | )(d) | (.01 | ) | – 0 | – | (.00 | )(d) | – 0 | – | ||||||||||||
|
| |||||||||||||||||||||||
Total dividends and distributions | (.34 | ) | (.18 | ) | (.17 | ) | (.21 | ) | (.16 | ) | (.60 | ) | ||||||||||||
|
| |||||||||||||||||||||||
Net asset value, end of period | $ 13.53 | $ 12.64 | $ 11.80 | $ 11.40 | $ 10.55 | $ 10.09 | ||||||||||||||||||
|
| |||||||||||||||||||||||
Total Return | ||||||||||||||||||||||||
Total investment return based on net asset value(b) | 9.88 | % | 8.66 | % | 5.06 | % | 10.04 | % | 6.16 | % | (9.69 | )% | ||||||||||||
Ratios/Supplemental Data | ||||||||||||||||||||||||
Net assets, end of period (000’s omitted) | $149,967 | $166,923 | $230,241 | $309,895 | $354,756 | $405,281 | ||||||||||||||||||
Ratio to average net assets of: | ||||||||||||||||||||||||
Expenses(c) | 1.72 | %^ | 1.70 | % | 1.72 | % | 1.72 | %+ | 1.72 | %+ | 1.74 | % | ||||||||||||
Net investment income | 4.57 | %^ | 1.26 | % | 1.25 | % | 2.06 | %+ | 1.47 | %+ | 2.33 | % | ||||||||||||
Portfolio turnover rate | 6 | % | 4 | % | 34 | % | 4 | % | 5 | % | 9 | % | ||||||||||||
See footnote summary on page 75.
| 62 | • ALLIANCEBERNSTEIN WEALTH STRATEGIES |
Financial Highlights
Selected Data For A Share Of Beneficial Interest Outstanding Throughout Each Period
| Balanced Wealth Strategy | ||||||||||||||||||||||||
| Class C | ||||||||||||||||||||||||
Six Months Ended 2014 (unaudited) | Year Ended August 31, | |||||||||||||||||||||||
| 2013 | 2012 | 2011 | 2010 | 2009 | ||||||||||||||||||||
|
| |||||||||||||||||||||||
Net asset value, beginning of period | $ 12.66 | $ 11.82 | $ 11.42 | $ 10.56 | $ 10.10 | $ 11.98 | ||||||||||||||||||
|
| |||||||||||||||||||||||
Income From Investment Operations | ||||||||||||||||||||||||
Net investment income(a) | .31 | .15 | .14 | .24 | .16 | .21 | ||||||||||||||||||
Net realized and unrealized gain (loss) on investment transactions | .93 | .87 | .43 | .83 | .46 | (1.49 | ) | |||||||||||||||||
|
| |||||||||||||||||||||||
Net increase (decrease) in net asset value from operations | 1.24 | 1.02 | .57 | 1.07 | .62 | (1.28 | ) | |||||||||||||||||
|
| |||||||||||||||||||||||
Less: Dividends and Distributions | ||||||||||||||||||||||||
Dividends from net investment income | (.35 | ) | (.18 | ) | (.16 | ) | (.21 | ) | (.16 | ) | (.21 | ) | ||||||||||||
Distributions from net realized gain on investment transactions | – 0 | – | – 0 | – | – 0 | – | – 0 | – | – 0 | – | (.39 | ) | ||||||||||||
Tax return of capital | – 0 | – | (.00 | )(d) | (.01 | ) | – 0 | – | (.00 | )(d) | – 0 | – | ||||||||||||
|
| |||||||||||||||||||||||
Total dividends and distributions | (.35 | ) | (.18 | ) | (.17 | ) | (.21 | ) | (.16 | ) | (.60 | ) | ||||||||||||
|
| |||||||||||||||||||||||
Net asset value, end of period | $ 13.55 | $ 12.66 | $ 11.82 | $ 11.42 | $ 10.56 | $ 10.10 | ||||||||||||||||||
|
| |||||||||||||||||||||||
Total Return | ||||||||||||||||||||||||
Total investment return based on net asset value(b) | 9.88 | % | 8.67 | % | 5.08 | % | 10.12 | % | 6.15 | % | (9.69 | )% | ||||||||||||
Ratios/Supplemental Data | ||||||||||||||||||||||||
Net assets, end of period (000’s omitted) | $271,853 | $262,751 | $296,426 | $375,644 | $430,059 | $472,336 | ||||||||||||||||||
Ratio to average net assets of: | ||||||||||||||||||||||||
Expenses(c) | 1.72 | %^ | 1.69 | % | 1.70 | % | 1.70 | %+ | 1.70 | %+ | 1.72 | % | ||||||||||||
Net investment income | 4.62 | %^ | 1.17 | % | 1.24 | % | 2.07 | %+ | 1.49 | %+ | 2.37 | % | ||||||||||||
Portfolio turnover rate | 6 | % | 4 | % | 34 | % | 4 | % | 5 | % | 9 | % | ||||||||||||
See footnote summary on page 75.
| ALLIANCEBERNSTEIN WEALTH STRATEGIES • | 63 |
Financial Highlights
Selected Data For A Share Of Beneficial Interest Outstanding Throughout Each Period
| Balanced Wealth Strategy | ||||||||||||||||||||||||
| Advisor Class | ||||||||||||||||||||||||
Six Months Ended February 28, (unaudited) | Year Ended August 31, | |||||||||||||||||||||||
| 2013 | 2012 | 2011 | 2010 | 2009 | ||||||||||||||||||||
|
| |||||||||||||||||||||||
Net asset value, beginning of period | $ 12.79 | $ 11.88 | $ 11.51 | $ 10.64 | $ 10.17 | $ 12.07 | ||||||||||||||||||
|
| |||||||||||||||||||||||
Income From | ||||||||||||||||||||||||
Net investment income(a) | .38 | .27 | .24 | .35 | .26 | .30 | ||||||||||||||||||
Net realized and unrealized gain (loss) on | .94 | .89 | .45 | .85 | .48 | (1.50 | ) | |||||||||||||||||
|
| |||||||||||||||||||||||
Net increase (decrease) in net asset value from operations | 1.32 | 1.16 | .69 | 1.20 | .74 | (1.20 | ) | |||||||||||||||||
|
| |||||||||||||||||||||||
Less: Dividends and Distributions | ||||||||||||||||||||||||
Dividends from net investment income | (.39 | ) | (.25 | ) | (.30 | ) | (.33 | ) | (.27 | ) | (.31 | ) | ||||||||||||
Distributions from net realized gain on investment | – 0 | – | – 0 | – | – 0 | – | – 0 | – | – 0 | – | (.39 | ) | ||||||||||||
Tax return of capital | – 0 | – | (.00 | )(d) | (.02 | ) | – 0 | – | (.00 | )(d) | – 0 | – | ||||||||||||
|
| |||||||||||||||||||||||
Total dividends and distributions | (.39 | ) | (.25 | ) | (.32 | ) | (.33 | ) | (.27 | ) | (.70 | ) | ||||||||||||
|
| |||||||||||||||||||||||
Net asset value, end of period | $ 13.72 | $ 12.79 | $ 11.88 | $ 11.51 | $ 10.64 | $ 10.17 | ||||||||||||||||||
|
| |||||||||||||||||||||||
Total Return | ||||||||||||||||||||||||
Total investment return based on net asset value(b) | 10.46 | % | 9.81 | % | 6.09 | % | 11.24 | % | 7.27 | % | (8.79 | )% | ||||||||||||
Ratios/Supplemental Data | ||||||||||||||||||||||||
Net assets, end of period | $105,246 | $95,982 | $103,716 | $103,772 | $84,269 | $85,434 | ||||||||||||||||||
Ratio to average net | ||||||||||||||||||||||||
Expenses(c) | .72 | %^ | .69 | % | .70 | % | .69 | %+ | .69 | %+ | .71 | % | ||||||||||||
Net investment | 5.68 | %^ | 2.14 | % | 2.12 | % | 2.93 | %+ | 2.45 | %+ | 3.35 | % | ||||||||||||
Portfolio turnover rate | 6 | % | 4 | % | 34 | % | 4 | % | 5 | % | 9 | % | ||||||||||||
See footnote summary on page 75.
| 64 | • ALLIANCEBERNSTEIN WEALTH STRATEGIES |
Financial Highlights
Selected Data For A Share Of Beneficial Interest Outstanding Throughout Each Period
| Balanced Wealth Strategy | ||||||||||||||||||||||||
| Class R | ||||||||||||||||||||||||
Six Months Ended | Year Ended August 31, | |||||||||||||||||||||||
| 2013 | 2012 | 2011 | 2010 | 2009 | ||||||||||||||||||||
|
| |||||||||||||||||||||||
Net asset value, beginning of period | $ 12.69 | $ 11.82 | $ 11.44 | $ 10.58 | $ 10.12 | $ 12.02 | ||||||||||||||||||
|
| |||||||||||||||||||||||
Income From Investment Operations | ||||||||||||||||||||||||
Net investment income(a) | .36 | .20 | .18 | .25 | .19 | .23 | ||||||||||||||||||
Net realized and unrealized gain (loss) on investment transactions | .90 | .87 | .42 | .87 | .47 | (1.49 | ) | |||||||||||||||||
|
| |||||||||||||||||||||||
Net increase (decrease) in net asset value from operations | 1.26 | 1.07 | .60 | 1.12 | .66 | (1.26 | ) | |||||||||||||||||
|
| |||||||||||||||||||||||
Less: Dividends and Distributions | ||||||||||||||||||||||||
Dividends from net investment income | (.36 | ) | (.20 | ) | (.20 | ) | (.26 | ) | (.20 | ) | (.25 | ) | ||||||||||||
Distributions from net realized gain on investment transactions | – 0 | – | – 0 | – | – 0 | – | – 0 | – | – 0 | – | (.39 | ) | ||||||||||||
Tax return of capital | – 0 | – | (.00 | )(d) | (.02 | ) | – 0 | – | (.00 | )(d) | – 0 | – | ||||||||||||
|
| |||||||||||||||||||||||
Total dividends and distributions | (.36 | ) | (.20 | ) | (.22 | ) | (.26 | ) | (.20 | ) | (.64 | ) | ||||||||||||
|
| |||||||||||||||||||||||
Net asset value, end of period | $ 13.59 | $ 12.69 | $ 11.82 | $ 11.44 | $ 10.58 | $ 10.12 | ||||||||||||||||||
|
| |||||||||||||||||||||||
Total Return | ||||||||||||||||||||||||
Total investment return based on net asset value(b) | 10.07 | % | 9.13 | % | 5.35 | % | 10.55 | % | 6.52 | % | (9.37 | )% | ||||||||||||
Ratios/Supplemental Data | ||||||||||||||||||||||||
Net assets, end of period | $13,126 | $17,316 | $20,020 | $34,602 | $24,966 | $22,659 | ||||||||||||||||||
Ratio to average net assets of: | ||||||||||||||||||||||||
Expenses(c) | 1.35 | %^ | 1.35 | % | 1.35 | % | 1.35 | %+ | 1.35 | %+ | 1.33 | % | ||||||||||||
Net investment income | 5.28 | %^ | 1.62 | % | 1.56 | % | 2.08 | %+ | 1.80 | %+ | 2.59 | % | ||||||||||||
Portfolio turnover rate | 6 | % | 4 | % | 34 | % | 4 | % | 5 | % | 9 | % | ||||||||||||
See footnote summary on page 75.
| ALLIANCEBERNSTEIN WEALTH STRATEGIES • | 65 |
Financial Highlights
Selected Data For A Share Of Beneficial Interest Outstanding Throughout Each Period
| Balanced Wealth Strategy | ||||||||||||||||||||||||
| Class K | ||||||||||||||||||||||||
Six Months Ended February 28, (unaudited) | Year Ended August 31, | |||||||||||||||||||||||
| 2013 | 2012 | 2011 | 2010 | 2009 | ||||||||||||||||||||
|
| |||||||||||||||||||||||
Net asset value, beginning of period | $ 12.71 | $ 11.83 | $ 11.45 | $ 10.60 | $ 10.13 | $ 12.03 | ||||||||||||||||||
|
| |||||||||||||||||||||||
Income From Investment Operations | ||||||||||||||||||||||||
Net investment income(a) | .33 | .22 | .23 | .32 | .22 | .26 | ||||||||||||||||||
Net realized and unrealized gain (loss) on | .96 | .88 | .43 | .82 | .49 | (1.49 | ) | |||||||||||||||||
|
| |||||||||||||||||||||||
Net increase (decrease) in net asset value from operations | 1.29 | 1.10 | .66 | 1.14 | .71 | (1.23 | ) | |||||||||||||||||
|
| |||||||||||||||||||||||
Less: Dividends and Distributions | ||||||||||||||||||||||||
Dividends from net investment income | (.38 | ) | (.22 | ) | (.26 | ) | (.29 | ) | (.24 | ) | (.28 | ) | ||||||||||||
Distributions from net realized gain on investment transactions | – 0 | – | – 0 | – | – 0 | – | – 0 | – | – 0 | – | (.39 | ) | ||||||||||||
Tax return of capital | – 0 | – | (.00 | )(d) | (.02 | ) | – 0 | – | (.00 | )(d) | – 0 | – | ||||||||||||
|
| |||||||||||||||||||||||
Total dividends and distributions | (.38 | ) | (.22 | ) | (.28 | ) | (.29 | ) | (.24 | ) | (.67 | ) | ||||||||||||
|
| |||||||||||||||||||||||
Net asset value, end of period | $ 13.62 | $ 12.71 | $ 11.83 | $ 11.45 | $ 10.60 | $ 10.13 | ||||||||||||||||||
|
| |||||||||||||||||||||||
Total Return | ||||||||||||||||||||||||
Total investment return based on net asset value(b) | 10.26 | % | 9.40 | % | 5.85 | % | 10.74 | % | 6.95 | % | (9.12 | )% | ||||||||||||
Ratios/Supplemental Data | ||||||||||||||||||||||||
Net assets, end of period (000’s omitted) | $26,901 | $25,081 | $30,538 | $26,355 | $24,859 | $16,961 | ||||||||||||||||||
Ratio to average net assets of: | ||||||||||||||||||||||||
Expenses(c) | 1.04 | %^ | 1.04 | % | 1.02 | % | 1.04 | %+ | 1.03 | %+ | 1.03 | % | ||||||||||||
Net investment income | 4.98 | %^ | 1.76 | % | 1.95 | % | 2.72 | %+ | 2.06 | %+ | 2.83 | % | ||||||||||||
Portfolio turnover rate | 6 | % | 4 | % | 34 | % | 4 | % | 5 | % | 9 | % | ||||||||||||
See footnote summary on page 75.
| 66 | • ALLIANCEBERNSTEIN WEALTH STRATEGIES |
Financial Highlights
Selected Data For A Share Of Beneficial Interest Outstanding Throughout Each Period
| Balanced Wealth Strategy | ||||||||||||||||||||||||
| Class I | ||||||||||||||||||||||||
Six Months 2014 (unaudited) | Year Ended August 31, | |||||||||||||||||||||||
| 2013 | 2012 | 2011 | 2010 | 2009 | ||||||||||||||||||||
|
| |||||||||||||||||||||||
Net asset value, beginning of period | $ 12.76 | $ 11.85 | $ 11.48 | $ 10.62 | $ 10.15 | $ 12.04 | ||||||||||||||||||
|
| |||||||||||||||||||||||
Income From Investment Operations | ||||||||||||||||||||||||
Net investment income(a) | .38 | .26 | .27 | .36 | .26 | .28 | ||||||||||||||||||
Net realized and unrealized gain (loss) on | .93 | .89 | .42 | .83 | .48 | (1.47 | ) | |||||||||||||||||
|
| |||||||||||||||||||||||
Net increase (decrease) in net asset value from operations | 1.31 | 1.15 | .69 | 1.19 | .74 | (1.19 | ) | |||||||||||||||||
|
| |||||||||||||||||||||||
Less: Dividends and Distributions | ||||||||||||||||||||||||
Dividends from net investment income | (.39 | ) | (.24 | ) | (.30 | ) | (.33 | ) | (.27 | ) | (.31 | ) | ||||||||||||
Distributions from net realized gain on investment transactions | – 0 | – | – 0 | – | – 0 | – | – 0 | – | – 0 | – | (.39 | ) | ||||||||||||
Tax return of capital | – 0 | – | (.00 | )(d) | (.02 | ) | – 0 | – | (.00 | )(d) | – 0 | – | ||||||||||||
|
| |||||||||||||||||||||||
Total dividends and distributions | (.39 | ) | (.24 | ) | (.32 | ) | (.33 | ) | (.27 | ) | (.70 | ) | ||||||||||||
|
| |||||||||||||||||||||||
Net asset value, end of period | $ 13.68 | $ 12.76 | $ 11.85 | $ 11.48 | $ 10.62 | $ 10.15 | ||||||||||||||||||
|
| |||||||||||||||||||||||
Total Return | ||||||||||||||||||||||||
Total investment return based on net asset value(b) | 10.41 | % | 9.82 | % | 6.10 | % | 11.14 | % | 7.27 | % | (8.73 | )% | ||||||||||||
Ratios/Supplemental Data | ||||||||||||||||||||||||
Net assets, end of period (000’s omitted) | $13,458 | $12,653 | $12,925 | $21,796 | $21,211 | $31,728 | ||||||||||||||||||
Ratio to average net assets of: | ||||||||||||||||||||||||
Expenses(c) | .71 | %^ | .71 | % | .70 | % | .71 | %+ | .69 | %+ | .71 | % | ||||||||||||
Net investment income | 5.69 | %^ | 2.12 | % | 2.34 | % | 3.00 | %+ | 2.49 | %+ | 3.18 | % | ||||||||||||
Portfolio turnover rate | 6 | % | 4 | % | 34 | % | 4 | % | 5 | % | 9 | % | ||||||||||||
See footnote summary on page 75.
| ALLIANCEBERNSTEIN WEALTH STRATEGIES • | 67 |
Financial Highlights
Selected Data For A Share Of Beneficial Interest Outstanding Throughout Each Period
| Conservative Wealth Strategy | ||||||||||||||||||||||||
| Class A | ||||||||||||||||||||||||
Six Months Ended February 28, 2014 (unaudited) | Year Ended August 31, | |||||||||||||||||||||||
| 2013 | 2012 | 2011 | 2010 | 2009 | ||||||||||||||||||||
|
| |||||||||||||||||||||||
Net asset value, beginning of period | $ 11.59 | $ 11.34 | $ 11.17 | $ 10.66 | $ 10.14 | $ 11.09 | ||||||||||||||||||
|
| |||||||||||||||||||||||
Income From Investment Operations | ||||||||||||||||||||||||
Net investment income(a) | .20 | .20 | .23 | .26 | .20 | .31 | ||||||||||||||||||
Net realized and unrealized gain (loss) on | .47 | .25 | .20 | .51 | .53 | (.71 | ) | |||||||||||||||||
|
| |||||||||||||||||||||||
Net increase (decrease) in net asset value from operations | .67 | .45 | .43 | .77 | .73 | (.40 | ) | |||||||||||||||||
|
| |||||||||||||||||||||||
Less: Dividends and Distributions | ||||||||||||||||||||||||
Dividends from net investment income | (.20 | ) | (.20 | ) | (.26 | ) | (.26 | ) | (.21 | ) | (.33 | ) | ||||||||||||
Distributions from net realized gain on investment transactions | – 0 | – | – 0 | – | – 0 | – | – 0 | – | – 0 | – | (.22 | ) | ||||||||||||
Tax return of capital | – 0 | – | – 0 | – | – 0 | – | – 0 | – | (.00 | )(d) | – 0 | – | ||||||||||||
|
| |||||||||||||||||||||||
Total dividends and distributions | (.20 | ) | (.20 | ) | (.26 | ) | (.26 | ) | (.21 | ) | (.55 | ) | ||||||||||||
|
| |||||||||||||||||||||||
Net asset value, end of period | $ 12.06 | $ 11.59 | $ 11.34 | $ 11.17 | $ 10.66 | $ 10.14 | ||||||||||||||||||
|
| |||||||||||||||||||||||
Total Return | ||||||||||||||||||||||||
Total investment return based on net asset value(b) | 5.85 | % | 3.93 | % | 3.93 | % | 7.23 | % | 7.21 | % | (3.01 | )% | ||||||||||||
Ratios/Supplemental Data | ||||||||||||||||||||||||
Net assets, end of period (000’s omitted) | $213,537 | $219,653 | $255,748 | $292,825 | $346,347 | $354,786 | ||||||||||||||||||
Ratio to average net assets of: | ||||||||||||||||||||||||
Expenses(c) | 1.07 | %^ | 1.03 | % | 1.02 | % | 1.01 | %+ | 1.00 | %+ | 1.00 | % | ||||||||||||
Net investment income | 3.34 | %^ | 1.70 | % | 2.08 | % | 2.34 | %+ | 1.87 | %+ | 3.35 | % | ||||||||||||
Portfolio turnover rate | 4 | % | 4 | % | 21 | % | 4 | % | 5 | % | 13 | % | ||||||||||||
See footnote summary on page 75.
| 68 | • ALLIANCEBERNSTEIN WEALTH STRATEGIES |
Financial Highlights
Selected Data For A Share Of Beneficial Interest Outstanding Throughout Each Period
| Conservative Wealth Strategy | ||||||||||||||||||||||||
| Class B | ||||||||||||||||||||||||
Six Months (unaudited) | Year Ended August 31, | |||||||||||||||||||||||
| 2013 | 2012 | 2011 | 2010 | 2009 | ||||||||||||||||||||
|
| |||||||||||||||||||||||
Net asset value, beginning of period | $ 11.50 | $ 11.29 | $ 11.10 | $ 10.60 | $ 10.08 | $ 11.03 | ||||||||||||||||||
|
| |||||||||||||||||||||||
Income From Investment Operations | ||||||||||||||||||||||||
Net investment income(a) | .15 | .12 | .16 | .18 | .12 | .25 | ||||||||||||||||||
Net realized and unrealized gain (loss) on investment transactions | .47 | .24 | .19 | .50 | .53 | (.72 | ) | |||||||||||||||||
|
| |||||||||||||||||||||||
Net increase (decrease) in net asset value from operations | .62 | .36 | .35 | .68 | .65 | (.47 | ) | |||||||||||||||||
|
| |||||||||||||||||||||||
Less: Dividends and Distributions | ||||||||||||||||||||||||
Dividends from net investment income | (.17 | ) | (.15 | ) | (.16 | ) | (.18 | ) | (.13 | ) | (.26 | ) | ||||||||||||
Distributions from net realized gain on investment transactions | – 0 | – | – 0 | – | – 0 | – | – 0 | – | – 0 | – | (.22 | ) | ||||||||||||
Tax return of capital | – 0 | – | – 0 | – | – 0 | – | – 0 | – | (.00 | )(d) | – 0 | – | ||||||||||||
|
| |||||||||||||||||||||||
Total dividends and distributions | (.17 | ) | (.15 | ) | (.16 | ) | (.18 | ) | (.13 | ) | (.48 | ) | ||||||||||||
|
| |||||||||||||||||||||||
Net asset value, end of period | $ 11.95 | $ 11.50 | $ 11.29 | $ 11.10 | $ 10.60 | $ 10.08 | ||||||||||||||||||
|
| |||||||||||||||||||||||
Total Return | ||||||||||||||||||||||||
Total investment return based on net asset value(b) | 5.46 | % | 3.17 | % | 3.21 | % | 6.43 | % | 6.48 | % | (3.75 | )% | ||||||||||||
Ratios/Supplemental Data | ||||||||||||||||||||||||
Net assets, end of period | $45,321 | $52,372 | $76,229 | $101,883 | $119,926 | $138,128 | ||||||||||||||||||
Ratio to average net assets of: | ||||||||||||||||||||||||
Expenses(c) | 1.78 | %^ | 1.74 | % | 1.75 | % | 1.74 | %+ | 1.72 | %+ | 1.73 | % | ||||||||||||
Net investment income | 2.61 | %^ | 1.06 | % | 1.42 | % | 1.61 | %+ | 1.17 | %+ | 2.64 | % | ||||||||||||
Portfolio turnover rate | 4 | % | 4 | % | 21 | % | 4 | % | 5 | % | 13 | % | ||||||||||||
See footnote summary on page 75.
| ALLIANCEBERNSTEIN WEALTH STRATEGIES • | 69 |
Financial Highlights
Selected Data For A Share Of Beneficial Interest Outstanding Throughout Each Period
| Conservative Wealth Strategy | ||||||||||||||||||||||||
| Class C | ||||||||||||||||||||||||
Six Months (unaudited) | Year Ended August 31, | |||||||||||||||||||||||
| 2013 | 2012 | 2011 | 2010 | 2009 | ||||||||||||||||||||
|
| |||||||||||||||||||||||
Net asset value, beginning of period | $ 11.50 | $ 11.29 | $ 11.10 | $ 10.60 | $ 10.08 | $ 11.02 | ||||||||||||||||||
|
| |||||||||||||||||||||||
Income From Investment Operations | ||||||||||||||||||||||||
Net investment income(a) | .16 | .11 | .15 | .18 | .12 | .25 | ||||||||||||||||||
Net realized and unrealized gain (loss) on investment transactions | .46 | .25 | .21 | .50 | .53 | (.71 | ) | |||||||||||||||||
|
| |||||||||||||||||||||||
Net increase (decrease) in net asset value from operations | .62 | .36 | .36 | .68 | .65 | (.46 | ) | |||||||||||||||||
|
| |||||||||||||||||||||||
Less: Dividends and Distributions | ||||||||||||||||||||||||
Dividends from net investment income | (.17 | ) | (.15 | ) | (.17 | ) | (.18 | ) | (.13 | ) | (.26 | ) | ||||||||||||
Distributions from net realized gain on investment transactions | – 0 | – | – 0 | – | – 0 | – | – 0 | – | – 0 | – | (.22 | ) | ||||||||||||
Tax return of capital | – 0 | – | – 0 | – | – 0 | – | – 0 | – | (.00 | )(d) | – 0 | – | ||||||||||||
|
| |||||||||||||||||||||||
Total dividends and distributions | (.17 | ) | (.15 | ) | (.17 | ) | (.18 | ) | (.13 | ) | (.48 | ) | ||||||||||||
|
| |||||||||||||||||||||||
Net asset value, end of period | $ 11.95 | $ 11.50 | $ 11.29 | $ 11.10 | $ 10.60 | $ 10.08 | ||||||||||||||||||
|
| |||||||||||||||||||||||
Total Return | ||||||||||||||||||||||||
Total investment return based on net asset value(b) | 5.47 | % | 3.18 | % | 3.24 | % | 6.43 | % | 6.48 | % | (3.66 | )% | ||||||||||||
Ratios/Supplemental Data | ||||||||||||||||||||||||
Net assets, end of period | $100,349 | $104,830 | $124,847 | $148,245 | $171,195 | $183,559 | ||||||||||||||||||
Ratio to average net assets of: | ||||||||||||||||||||||||
Expenses(c) | 1.78 | %^ | 1.73 | % | 1.73 | % | 1.72 | %+ | 1.71 | %+ | 1.71 | % | ||||||||||||
Net investment income | 2.64 | %^ | .98 | % | 1.39 | % | 1.63 | %+ | 1.17 | %+ | 2.65 | % | ||||||||||||
Portfolio turnover rate | 4 | % | 4 | % | 21 | % | 4 | % | 5 | % | 13 | % | ||||||||||||
See footnote summary on page 75.
| 70 | • ALLIANCEBERNSTEIN WEALTH STRATEGIES |
Financial Highlights
Selected Data For A Share Of Beneficial Interest Outstanding Throughout Each Period
| Conservative Wealth Strategy | ||||||||||||||||||||||||
| Advisor Class | ||||||||||||||||||||||||
Six Months 2014 (unaudited) | Year Ended August 31, | |||||||||||||||||||||||
| 2013 | 2012 | 2011 | 2010 | 2009 | ||||||||||||||||||||
|
| |||||||||||||||||||||||
Net asset value, beginning of period | $ 11.62 | $ 11.35 | $ 11.19 | $ 10.68 | $ 10.15 | $ 11.11 | ||||||||||||||||||
|
| |||||||||||||||||||||||
Income From Investment Operations | ||||||||||||||||||||||||
Net investment income(a) | .22 | .24 | .27 | .29 | .23 | .32 | ||||||||||||||||||
Net realized and unrealized gain (loss) on investment transactions | .48 | .24 | .19 | .51 | .54 | (.70 | ) | |||||||||||||||||
|
| |||||||||||||||||||||||
Net increase (decrease) in net asset value from operations | .70 | .48 | .46 | .80 | .77 | (.38 | ) | |||||||||||||||||
|
| |||||||||||||||||||||||
Less: Dividends and Distributions | ||||||||||||||||||||||||
Dividends from net | (.22 | ) | (.21 | ) | (.30 | ) | (.29 | ) | (.23 | ) | (.36 | ) | ||||||||||||
Distributions from net realized gain on investment transactions | – 0 | – | – 0 | – | – 0 | – | – 0 | – | – 0 | – | (.22 | ) | ||||||||||||
Tax return of capital | – 0 | – | – 0 | – | – 0 | – | – 0 | – | (.01 | ) | – 0 | – | ||||||||||||
|
| |||||||||||||||||||||||
Total dividends and distributions | (.22 | ) | (.21 | ) | (.30 | ) | (.29 | ) | (.24 | ) | (.58 | ) | ||||||||||||
|
| |||||||||||||||||||||||
Net asset value, end of period | $ 12.10 | $ 11.62 | $ 11.35 | $ 11.19 | $ 10.68 | $ 10.15 | ||||||||||||||||||
|
| |||||||||||||||||||||||
Total Return | ||||||||||||||||||||||||
Total investment return based on net asset value(b) | 6.03 | % | 4.27 | % | 4.22 | % | 7.52 | % | 7.62 | % | (2.79 | )% | ||||||||||||
Ratios/Supplemental | ||||||||||||||||||||||||
Net assets, end of period | $14,801 | $11,701 | $13,501 | $17,706 | $23,631 | $29,458 | ||||||||||||||||||
Ratio to average net | ||||||||||||||||||||||||
Expenses(c) | .78 | %^ | .73 | % | .72 | % | .71 | %+ | .70 | %+ | .70 | % | ||||||||||||
Net investment income | 3.61 | %^ | 2.03 | % | 2.40 | % | 2.63 | %+ | 2.15 | %+ | 3.43 | % | ||||||||||||
Portfolio turnover rate | 4 | % | 4 | % | 21 | % | 4 | % | 5 | % | 13 | % | ||||||||||||
See footnote summary on page 75.
| ALLIANCEBERNSTEIN WEALTH STRATEGIES • | 71 |
Financial Highlights
Selected Data For A Share Of Beneficial Interest Outstanding Throughout Each Period
| Conservative Wealth Strategy | ||||||||||||||||||||||||
| Class R | ||||||||||||||||||||||||
Six Months 2014 (unaudited) | Year Ended August 31, | |||||||||||||||||||||||
| 2013 | 2012 | 2011 | 2010 | 2009 | ||||||||||||||||||||
|
| |||||||||||||||||||||||
Net asset value, beginning of period | $ 11.60 | $ 11.37 | $ 11.19 | $ 10.67 | $ 10.15 | $ 11.11 | ||||||||||||||||||
|
| |||||||||||||||||||||||
Income From Investment Operations | ||||||||||||||||||||||||
Net investment income(a) | .18 | .15 | .22 | .21 | .16 | .26 | (e) | |||||||||||||||||
Net realized and unrealized gain (loss) on investment transactions | .48 | .25 | .16 | .53 | .53 | (.70 | ) | |||||||||||||||||
|
| |||||||||||||||||||||||
Net increase (decrease) in net asset value from operations | .66 | .40 | .38 | .74 | .69 | (.44 | ) | |||||||||||||||||
|
| |||||||||||||||||||||||
Less: Dividends and Distributions | ||||||||||||||||||||||||
Dividends from net investment income | (.19 | ) | (.17 | ) | (.20 | ) | (.22 | ) | (.17 | ) | (.30 | ) | ||||||||||||
Distributions from net realized gain on investment transactions | – 0 | – | – 0 | – | – 0 | – | – 0 | – | – 0 | – | (.22 | ) | ||||||||||||
Tax return of capital | – 0 | – | – 0 | – | – 0 | – | – 0 | – | (.00 | )(d) | – 0 | – | ||||||||||||
|
| |||||||||||||||||||||||
Total dividends and distributions | (.19 | ) | (.17 | ) | (.20 | ) | (.22 | ) | (.17 | ) | (.52 | ) | ||||||||||||
|
| |||||||||||||||||||||||
Net asset value, end of period | $ 12.07 | $ 11.60 | $ 11.37 | $ 11.19 | $ 10.67 | $ 10.15 | ||||||||||||||||||
|
| |||||||||||||||||||||||
Total Return | ||||||||||||||||||||||||
Total investment return based on net asset value(b) | 5.73 | % | 3.53 | % | 3.46 | % | 6.93 | % | 6.83 | % | (3.40 | )% | ||||||||||||
Ratios/Supplemental Data | ||||||||||||||||||||||||
Net assets, end of period (000’s omitted) | $7,189 | $7,280 | $8,059 | $15,068 | $14,726 | $12,756 | ||||||||||||||||||
Ratio to average net assets of: | ||||||||||||||||||||||||
Expenses(c) | 1.40 | %^ | 1.39 | % | 1.39 | % | 1.39 | %+ | 1.37 | %+ | 1.35 | % | ||||||||||||
Net investment income | 3.06 | %^ | 1.27 | % | 1.94 | % | 1.86 | %+ | 1.49 | %+ | 2.77 | %(e) | ||||||||||||
Portfolio turnover rate | 434 | % | 4 | % | 21 | % | 4 | % | 5 | % | 13 | % | ||||||||||||
See footnote summary on page 75.
| 72 | • ALLIANCEBERNSTEIN WEALTH STRATEGIES |
Financial Highlights
Selected Data For A Share Of Beneficial Interest Outstanding Throughout Each Period
| Conservative Wealth Strategy | ||||||||||||||||||||||||
| Class K | ||||||||||||||||||||||||
Six Months 2014 (unaudited) | Year Ended August 31, | |||||||||||||||||||||||
| 2013 | 2012 | 2011 | 2010 | 2009 | ||||||||||||||||||||
|
| |||||||||||||||||||||||
Net asset value, beginning of period | $ 11.57 | $ 11.32 | $ 11.16 | $ 10.65 | $ 10.13 | $ 11.09 | ||||||||||||||||||
|
| |||||||||||||||||||||||
Income From Investment Operations | ||||||||||||||||||||||||
Net investment income(a) | .21 | .18 | .20 | .23 | .19 | .27 | ||||||||||||||||||
Net realized and unrealized gain (loss) on investment transactions | .46 | .26 | .22 | .53 | .53 | (.68 | ) | |||||||||||||||||
|
| |||||||||||||||||||||||
Net increase (decrease) in net asset value from operations | .67 | .44 | .42 | .76 | .72 | (.41 | ) | |||||||||||||||||
|
| |||||||||||||||||||||||
Less: Dividends and Distributions | ||||||||||||||||||||||||
Dividends from net investment income | (.20 | ) | (.19 | ) | (.26 | ) | (.25 | ) | (.20 | ) | (.33 | ) | ||||||||||||
Distributions from net realized gain on investment transactions | – 0 | – | – 0 | – | – 0 | – | – 0 | – | – 0 | – | (.22 | ) | ||||||||||||
Tax return of capital | – 0 | – | – 0 | – | – 0 | – | – 0 | – | (.00 | )(d) | – 0 | – | ||||||||||||
|
| |||||||||||||||||||||||
Total dividends and distributions | (.20 | ) | (.19 | ) | (.26 | ) | (.25 | ) | (.20 | ) | (.55 | ) | ||||||||||||
|
| |||||||||||||||||||||||
Net asset value, end of period | $ 12.04 | $ 11.57 | $ 11.32 | $ 11.16 | $ 10.65 | $ 10.13 | ||||||||||||||||||
|
| |||||||||||||||||||||||
Total Return | ||||||||||||||||||||||||
Total investment return based on net asset value(b) | 5.87 | % | 3.91 | % | 3.82 | % | 7.18 | % | 7.16 | % | (3.05 | )% | ||||||||||||
Ratios/Supplemental Data | ||||||||||||||||||||||||
Net assets, end of period (000’s omitted) | $10,043 | $8,519 | $9,039 | $7,684 | $5,447 | $4,730 | ||||||||||||||||||
Ratio to average net assets of: | ||||||||||||||||||||||||
Expenses(c) | 1.08 | %^ | 1.07 | % | 1.05 | % | 1.08 | %+ | 1.05 | %+ | 1.05 | % | ||||||||||||
Net investment income | 3.49 | %^ | 1.58 | % | 1.82 | % | 2.05 | %+ | 1.80 | %+ | 2.74 | % | ||||||||||||
Portfolio turnover rate | 4 | % | 4 | % | 21 | % | 4 | % | 5 | % | 13 | % | ||||||||||||
See footnote summary on page 75.
| ALLIANCEBERNSTEIN WEALTH STRATEGIES • | 73 |
Financial Highlights
Selected Data For A Share Of Beneficial Interest Outstanding Throughout Each Period
| Conservative Wealth Strategy | ||||||||||||||||||||||||
| Class I | ||||||||||||||||||||||||
Six Months (unaudited) | Year Ended August 31, | |||||||||||||||||||||||
| 2013 | 2012 | 2011 | 2010 | 2009 | ||||||||||||||||||||
|
| |||||||||||||||||||||||
Net asset value, beginning of period | $ 11.60 | $ 11.33 | $ 11.17 | $ 10.66 | $ 10.14 | $ 11.09 | ||||||||||||||||||
|
| |||||||||||||||||||||||
Income From Investment Operations | ||||||||||||||||||||||||
Net investment income(a) | .24 | .23 | .35 | .28 | .22 | .34 | ||||||||||||||||||
Net realized and unrealized gain (loss) on investment transactions | .46 | .25 | .11 | .52 | .54 | (.71 | ) | |||||||||||||||||
|
| |||||||||||||||||||||||
Net increase (decrease) in net asset value from operations | .70 | .48 | .46 | .80 | .76 | (.37 | ) | |||||||||||||||||
|
| |||||||||||||||||||||||
Less: Dividends and Distributions | ||||||||||||||||||||||||
Dividends from net investment income | (.22 | ) | (.21 | ) | (.30 | ) | (.29 | ) | (.23 | ) | (.36 | ) | ||||||||||||
Distributions from net realized gain on investment transactions | – 0 | – | – 0 | – | – 0 | – | – 0 | – | – 0 | – | (.22 | ) | ||||||||||||
Tax return of capital | – 0 | – | – 0 | – | – 0 | – | – 0 | – | (.01 | ) | – 0 | – | ||||||||||||
|
| |||||||||||||||||||||||
Total dividends and distributions | (.22 | ) | (.21 | ) | (.30 | ) | (.29 | ) | (.24 | ) | (.58 | ) | ||||||||||||
|
| |||||||||||||||||||||||
Net asset value, end of period | $ 12.08 | $ 11.60 | $ 11.33 | $ 11.17 | $ 10.66 | $ 10.14 | ||||||||||||||||||
|
| |||||||||||||||||||||||
Total Return | ||||||||||||||||||||||||
Total investment return based on net asset value(b) | 6.05 | % | 4.26 | % | 4.19 | % | 7.49 | % | 7.50 | % | (2.72 | )% | ||||||||||||
Ratios/Supplemental Data | ||||||||||||||||||||||||
Net assets, end of period (000’s omitted) | $752 | $874 | $1,118 | $2,868 | $3,038 | $2,728 | ||||||||||||||||||
Ratio to average net assets of: | ||||||||||||||||||||||||
Expenses(c) | .76 | %^ | .75 | % | .73 | % | .74 | %+ | .73 | %+ | .72 | % | ||||||||||||
Net investment income | 4.06 | %^ | 1.98 | % | 3.04 | % | 2.45 | %+ | 2.12 | %+ | 3.64 | % | ||||||||||||
Portfolio turnover rate | 4 | % | 4 | % | 21 | % | 4 | % | 5 | % | 13 | % | ||||||||||||
See footnote summary on page 75.
| 74 | • ALLIANCEBERNSTEIN WEALTH STRATEGIES |
Financial Highlights
| (a) | Based on average shares outstanding. |
| (b) | Total investment return is calculated assuming an initial investment made at the net asset value at the beginning of the period, reinvestment of all dividends and distributions at net asset value during the period, and redemption on the last day of the period. Initial sales charges or contingent deferred sales charges are not reflected in the calculation of total investment return. Total return does not reflect the deduction of taxes that a shareholder would pay on strategy distributions or the redemption of strategy shares. Total investment return calculated for a period of less than one year is not annualized. |
| (c) | Expense ratios do not include expenses of the Underlying Portfolios in which the Strategy invests. For the periods shown below, the estimated annualized blended expense ratios of the Underlying Portfolios were as follows: |
| Six Months Ended February 28, 2014 (unaudited) | Year Ended August 31, | |||||||||||||||||||||||
| 2013 | 2012 | 2011 | 2010 | 2009 | ||||||||||||||||||||
Wealth Appreciation Strategy | .04 | % | .04 | % | .03 | % | .03 | % | .02 | % | .04 | % | ||||||||||||
Balanced Wealth Strategy | .04 | % | .04 | % | .03 | % | .03 | % | .03 | % | .04 | % | ||||||||||||
Conservative Wealth Strategy | .03 | % | .03 | % | .03 | % | .03 | % | .03 | % | .04 | % | ||||||||||||
| (d) | Amount is less than $.005. |
| (e) | Net of fees and expenses waived/reimbursed by the Adviser. |
| ^ | Annualized. |
| + | The ratio includes expenses attributable to costs of proxy solicitation. |
See notes to financial statements.
| ALLIANCEBERNSTEIN WEALTH STRATEGIES • | 75 |
Financial Highlights
TRUSTEES
Marshall C. Turner, Jr.(1), Chairman John H. Dobkin(1) Michael J. Downey(1) William H. Foulk, Jr.(1) D. James Guzy(1) | Nancy P. Jacklin(1) Robert M. Keith, President and Chief Executive Officer Garry L. Moody(1) Earl D. Weiner(1) | |
| OFFICERS | ||
Philip L. Kirstein, Senior Vice President and Independent Compliance Officer Daniel J. Loewy(2), Vice President Christopher H. Nikolich(2), Vice President Patrick J. Rudden(2), Vice President | Vadim Zlotnikov(2), Vice President Emilie D. Wrapp, Clerk Joseph J. Mantineo, Treasurer and Chief Financial Officer Phyllis J. Clarke, Controller and Chief Accounting Officer Vincent S. Noto, Chief Compliance Officer | |
Custodian and Accounting Agent State Street Bank and Trust Company
Principal Underwriter AllianceBernstein Investments, Inc.
Legal Counsel Seward & Kissel LLP | Transfer Agent AllianceBernstein Investor
Independent Registered Public Accounting Firm Ernst & Young LLP |
| (1) | Member of the Audit Committee, the Governance and Nominating Committee and the Independent Directors Committee. Mr. Foulk and Ms. Jacklin are members of the Fair Value Pricing Committee. |
| (2) | The day-to-day management of, and investment decisions for, each Strategy’s portfolio are made by the Adviser’s Multi-Asset Solutions Team. Messrs. Loewy, Nikolich, Rudden and Zlotnikov are the members of the Adviser’s Multi-Asset Solutions Team primarily responsible for the day-to-day management of each Strategy’s portfolio. |
| 76 | • ALLIANCEBERNSTEIN WEALTH STRATEGIES |
Trustees
The information on pages 77-278 represent the holdings of the Underlying Portfolios in which the Strategies may invest, including specific breakdowns within Underlying Portfolios. The Portfolio of Investments information has been derived from each fund’s February 28, 2014 unaudited financial statements which is available upon request.
U.S. VALUE PORTFOLIO
PORTFOLIO SUMMARY
February 28, 2014 (unaudited)
PORTFOLIO STATISTICS
Net Assets ($mil): $1,186.1
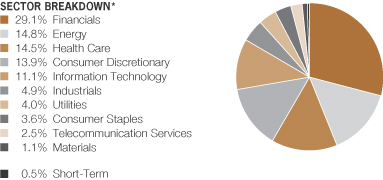
| * | All data are as of February 28, 2014. The Portfolio’s sector breakdown is expressed as a percentage of total investments and may vary over time. |
Please note: The sector classifications presented herein are based on the Global Industry Classification Standard (“GICS”) which was developed by Morgan Stanley Capital International and Standard & Poor’s. The components are divided into sector, industry group, and industry sub-indices as classified by the GICS for each of the market capitalization indices in the broad market. These sector classifications are broadly defined. The “Portfolio of Investments” section of the report reflects more specific industry information and is consistent with the investment restrictions discussed in the Portfolio’s prospectus.
| ALLIANCEBERNSTEIN WEALTH STRATEGIES • | 77 |
Portfolio Summary
U.S. LARGE CAP GROWTH PORTFOLIO
PORTFOLIO SUMMARY
February 28, 2014 (unaudited)
PORTFOLIO STATISTICS
Net Assets ($mil): $1,187.4
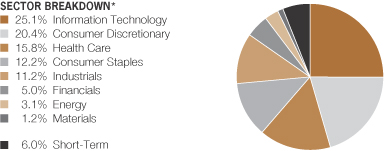
| * | All data are as of February 28, 2014. The Portfolio’s sector breakdown is expressed as a percentage of total investments and may vary over time. |
Please note: The sector classifications presented herein are based on the Global Industry Classification Standard (“GICS”) which was developed by Morgan Stanley Capital International and Standard & Poor’s. The components are divided into sector, industry group, and industry sub-indices as classified by the GICS for each of the market capitalization indices in the broad market. These sector classifications are broadly defined. The “Portfolio of Investments” section of the report reflects more specific industry information and is consistent with the investment restrictions discussed in the Portfolio’s prospectus.
| 78 | • ALLIANCEBERNSTEIN WEALTH STRATEGIES |
Portfolio Summary
INTERNATIONAL VALUE PORTFOLIO
PORTFOLIO SUMMARY
February 28, 2014 (unaudited)
PORTFOLIO STATISTICS
Net Assets ($mil): $1,017.5

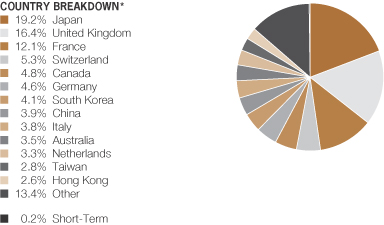
| * | All data are as of February 28, 2014. The Portfolio’s sector and country breakdowns are expressed as a percentage of total investments (excluding security lending collateral) and may vary over time. The Portfolio also enters into derivative transactions, which may be used for hedging or investment purposes (see “Portfolio of Investments” section of the report for additional details). “Other” country weightings represent 1.9% or less in the following countries: Belgium, Brazil, Denmark, Greece, Hungary, India, Israel, Norway, Portugal, Russia, South Africa, Turkey, United Arab Emirates and United States. |
Please note: The sector classifications presented herein are based on the Global Industry Classification Standard (“GICS”) which was developed by Morgan Stanley Capital International and Standard & Poor’s. The components are divided into sector, industry group, and industry sub-indices as classified by the GICS for each of the market capitalization indices in the broad market. These sector classifications are broadly defined. The “Portfolio of Investments” section of the report reflects more specific industry information and is consistent with the investment restrictions discussed in the Portfolio’s prospectus.
| ALLIANCEBERNSTEIN WEALTH STRATEGIES • | 79 |
Portfolio Summary
INTERNATIONAL GROWTH PORTFOLIO
PORTFOLIO SUMMARY
February 28, 2014 (unaudited)
PORTFOLIO STATISTICS
Net Assets ($mil): $1,000.9
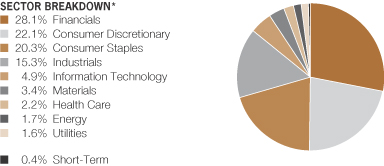
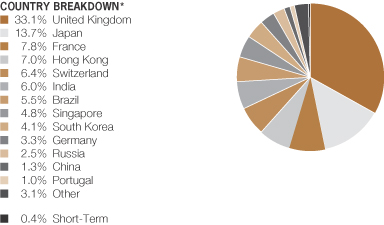
| * | All data are as of February 28, 2014. The Portfolio’s sector and country breakdowns are expressed as a percentage of total investments (excluding security lending collateral) and may vary over time. The Portfolio also enters into derivative transactions, which may be used for hedging or investment purposes (see “Portfolio of Investments” section of the report for additional details). “Other” country weightings represent 0.8% or less in the following countries: Belgium, Cyprus, Italy, Luxembourg, Mexico, Philippines, Sri Lanka and Taiwan. |
Please note: The sector classifications presented herein are based on the Global Industry Classification Standard (“GICS”) which was developed by Morgan Stanley Capital International and Standard & Poor’s. The components are divided into sector, industry group, and industry sub-indices as classified by the GICS for each of the market capitalization indices in the broad market. These sector classifications are broadly defined. The “Portfolio of Investments” section of the report reflects more specific industry information and is consistent with the investment restrictions discussed in the Portfolio’s prospectus.
| 80 | • ALLIANCEBERNSTEIN WEALTH STRATEGIES |
Portfolio Summary
SHORT DURATION BOND PORTFOLIO
PORTFOLIO SUMMARY
February 28, 2014 (unaudited)
PORTFOLIO STATISTICS
Net Assets ($mil): $962.1
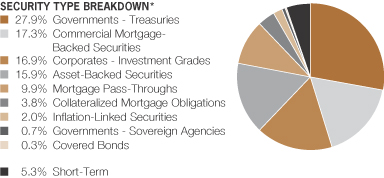
| * | All data are as of February 28, 2014. The Portfolio’s security type breakdown is expressed as a percentage of total investments and may vary over time. The Portfolio also enters into derivative transactions, which may be used for hedging or investment purposes (see “Portfolio of Investments” section of the report for additional details). |
| ALLIANCEBERNSTEIN WEALTH STRATEGIES • | 81 |
Portfolio Summary
GLOBAL CORE BOND PORTFOLIO
PORTFOLIO SUMMARY
February 28, 2014 (unaudited)
PORTFOLIO STATISTICS
Net Assets ($mil): $1,066.0
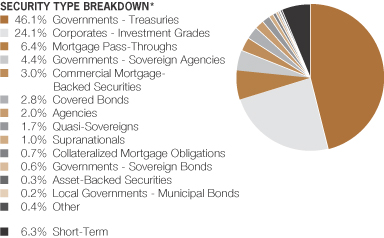
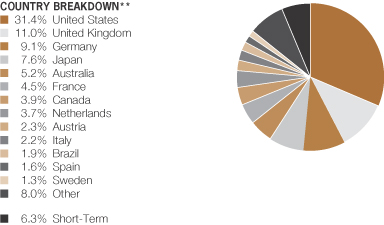
| * | All data are as of February 28, 2014. The Portfolio’s security type breakdown is expressed as a percentage of total investments and may vary over time. The Portfolio also enters into derivative transactions, which may be used for hedging or investment purposes (see “Portfolio of Investments” section of the report for additional details). “Other” security type weightings represent 0.2% or less in the following types: Corporates – Non-Investment Grades and Emerging Markets – Corporate Bonds. |
| ** | All data are as of February 28, 2014. The Portfolio’s country breakdown is expressed as a percentage of total investments and may vary over time. The Fund also enters into derivative transactions, which may be used for hedging or investment purposes (see “Portfolio of Investments” section of the report for additional details). “Other” country weightings represent 1.0% or less in the following countries: Belgium, Chile, China, Colombia, Denmark, India, Indonesia, Ireland, Israel, Kazakhstan, Malaysia, Mexico, New Zealand, Norway, Peru, Poland, Qatar, South Africa, South Korea, Supranational, Switzerland, Turkey and United Arab Emirates. |
| 82 | • ALLIANCEBERNSTEIN WEALTH STRATEGIES |
Portfolio Summary
BOND INFLATION PROTECTION PORTFOLIO
PORTFOLIO SUMMARY
February 28, 2014 (unaudited)
PORTFOLIO STATISTICS
Net Assets ($mil): $782.8
Total Investments ($mil): $1,046.9
| INFLATION PROTECTION BREAKDOWN* | ||||
U.S. Inflation-Protected Exposure | 100.4 | % | ||
Non-U.S. | — | |||
Non-Inflation Exposure | (0.4 | )% | ||
|
| |||
| 100.0 | % | |||
| SECTOR BREAKDOWN OF NET PORTFOLIO ASSETS, EXCLUDING TREASURY SECURITIES, TIPS, INTEREST RATE DERIVATIVES AND NET CASH EQUIVALENTS* | ||||
Corporates – Investment Grades | 12.3 | % | ||
Asset-Backed Securities | 11.7 | % | ||
Commercial Mortgage-Backed Securities | 8.6 | % | ||
Quasi-Sovereigns | 1.5 | % | ||
Mortgage Pass-Throughs | 1.3 | % | ||
Collateralized Mortgage Obligations | 0.7 | % | ||
Emerging Markets – Corporate Bonds | 0.4 | % | ||
Preferred Stocks | 0.3 | % | ||
Governments – Sovereign Bonds | 0.3 | % | ||
Governments – Sovereign Agencies | 0.1 | % | ||
Corporates – Non-Investment Grades | (0.8 | )% | ||
| SECTOR BREAKDOWN OF TOTAL PORTFOLIO INVESTMENTS, EXCLUDING DERIVATIVES** | ||||
Inflation-Linked Securities | 67.7 | % | ||
Corporates – Investment Grades | 11.1 | % | ||
Asset-Backed Securities | 8.8 | % | ||
Commercial Mortgage-Backed Securities | 6.5 | % | ||
Corporates – Non-Investment Grades | 1.6 | % | ||
Quasi-Sovereigns | 1.1 | % | ||
Mortgage Pass-Through | 1.0 | % | ||
Governments – Treasuries | 0.9 | % | ||
Collateralized Mortgage Obligations | 0.5 | % | ||
Emerging Markets – Corporate Bonds | 0.3 | % | ||
Preferred Stocks | 0.2 | % | ||
Governments – Sovereign Bonds | 0.2 | % | ||
Governments – Sovereign Agencies | 0.1 | % | ||
| * | All data are as of February 28, 2014. The Portfolio’s sector and inflation protection exposure breakdowns are expressed as an approximate percentage of the Portfolio’s total net assets (and may vary over time) inclusive of derivative exposure except as noted, based on the Adviser’s internal classification. |
| ** | The Portfolio’s sector breakdown is expressed, based on the Adviser’s internal classification, as a percentage of total investments and may vary over time. The Portfolio also enters into derivative transactions (not reflected in the table), which may be used for hedging or investment purposes or to adjust the risk profile or exposures of the Portfolio (see “Portfolio of Investments” section of the report for additional details). Derivative transactions may result in a form of leverage for the Portfolio. The Portfolio uses leverage for investment purposes by entering into reverse repurchase agreements. As a result, the Portfolio’s total investments will generally exceed its net assets. |
| ALLIANCEBERNSTEIN WEALTH STRATEGIES • | 83 |
Portfolio Summary
HIGH-YIELD PORTFOLIO
PORTFOLIO SUMMARY
February 28, 2014 (unaudited)
PORTFOLIO STATISTICS
Net Assets ($mil): $379.0
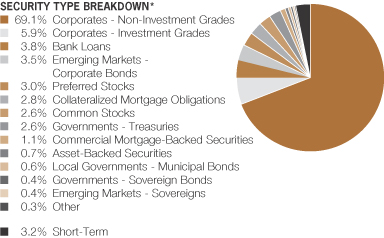
| * | All data are as of February 28, 2014. The Portfolio’s security type breakdown is expressed as a percentage of total investments and may vary over time. The Portfolio also enters into derivative transactions, which may be used for hedging or investment purposes (see “Portfolio of Investments” section of the report for additional details). “Other” securities type weightings represent 0.2% or less in the following security types: Governments – Sovereign Agencies, Options Purchased – Calls, Options Purchased – Puts and Warrants. |
| 84 | • ALLIANCEBERNSTEIN WEALTH STRATEGIES |
Portfolio Summary
SMALL-MID CAP VALUE PORTFOLIO
PORTFOLIO SUMMARY
February 28, 2014 (unaudited)
PORTFOLIO STATISTICS
Net Assets ($mil): $337.6

| * | All data are as of February 28, 2014. The Portfolio’s sector breakdown is expressed as a percentage of total investments and may vary over time. |
Please note: The sector classifications presented herein are based on the Global Industry Classification Standard (“GICS”) which was developed by Morgan Stanley Capital International and Standard & Poor’s. The components are divided into sector, industry group, and industry sub-indices as classified by the GICS for each of the market capitalization indices in the broad market. These sector classifications are broadly defined. The “Portfolio of Investments” section of the report reflects more specific industry information and is consistent with the investment restrictions discussed in the Portfolio’s prospectus.
| ALLIANCEBERNSTEIN WEALTH STRATEGIES • | 85 |
Portfolio Summary
SMALL-MID CAP GROWTH PORTFOLIO
PORTFOLIO SUMMARY
February 28, 2014 (unaudited)
PORTFOLIO STATISTICS
Net Assets ($mil): $336.6
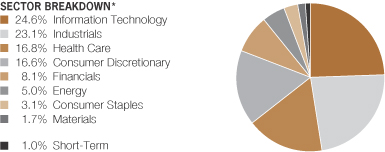
| * | All data are as of February 28, 2014. The Portfolio’s sector breakdown is expressed as a percentage of total investments (excluding security lending collateral) and may vary over time. |
Please note: The sector classifications presented herein are based on the Global Industry Classification Standard (“GICS”) which was developed by Morgan Stanley Capital International and Standard & Poor’s. The components are divided into sector, industry group, and industry sub-indices as classified by the GICS for each of the market capitalization indices in the broad market. These sector classifications are broadly defined. The “Portfolio of Investments” section of the report reflects more specific industry information and is consistent with the investment restrictions discussed in the Portfolio’s prospectus.
| 86 | • ALLIANCEBERNSTEIN WEALTH STRATEGIES |
Portfolio Summary
MULTI-ASSET REAL RETURN PORTFOLIO
PORTFOLIO SUMMARY
February 28, 2014 (unaudited)
PORTFOLIO STATISTICS
Net Assets ($mil): $779.2
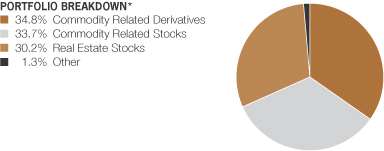
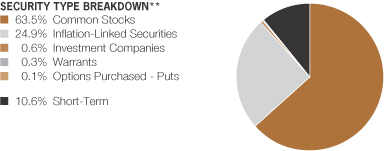
| * | All data are as of February 28, 2014. The Portfolio’s portfolio type breakdown is expressed as an approximate percentage of the Portfolio’s net assets inclusive of derivative exposure, based on the Adviser’s internal classification guidelines. |
| ** | The Portfolio’s security type and country breakdowns are expressed as a percentage of total investments (excluding security lending collateral) and may vary over time. The Portfolio also enters into derivative transactions, which may be used for hedging or investment purposes (see “Portfolio of Investments” section of the report for additional details). “Other” country weightings represent 0.6% or less in the following countries: Argentina, Austria, Belgium, Finland, Germany, India, Indonesia, Israel, Jersey (Channel Islands), Malaysia, Mexico, Netherlands, New Zealand, Peru, Philippines, Poland, Portugal, South Africa, South Korea, Spain, Sweden, Switzerland, Thailand, Turkey and United Arab Emirates. |
| ALLIANCEBERNSTEIN WEALTH STRATEGIES • | 87 |
Portfolio Summary
MULTI-ASSET REAL RETURN PORTFOLIO
PORTFOLIO SUMMARY
February 28, 2014 (unaudited)
PORTFOLIO STATISTICS
Net Assets ($mil): $779.2
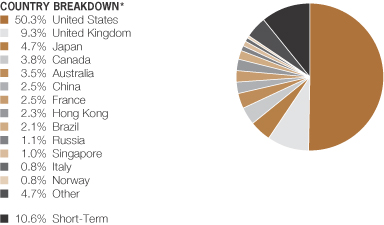
| * | All data are as of February 28, 2014. The Portfolio’s portfolio type breakdown is expressed as an approximate percentage of the Portfolio’s net assets inclusive of derivative exposure, based on the Adviser’s internal classification guidelines. |
| 88 | • ALLIANCEBERNSTEIN WEALTH STRATEGIES |
Portfolio Summary
VOLATILITY MANAGEMENT PORTFOLIO
PORTFOLIO SUMMARY
February 28, 2014 (unaudited)
PORTFOLIO STATISTICS
Net Assets ($mil): $1,694.7
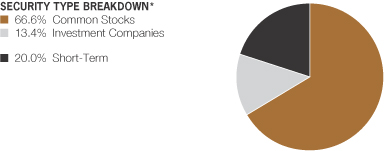
TEN LARGEST HOLDINGS**
February 28, 2014 (unaudited)
| Company | U.S. $ Value | Percent of Net Assets | ||||||
iShares Core MSCI Emerging Markets ETF | $ | 126,685,592 | 7.5 | % | ||||
Vanguard REIT ETF | 97,498,452 | 5.7 | ||||||
Apple, Inc. | 17,988,462 | 1.1 | ||||||
Exxon Mobil Corp. | 15,976,295 | 0.9 | ||||||
Google, Inc. — Class A | 12,969,770 | 0.8 | ||||||
Microsoft Corp. | 11,055,117 | 0.6 | ||||||
Johnson & Johnson | 9,875,264 | 0.6 | ||||||
General Electric Co. | 9,786,847 | 0.6 | ||||||
Wells Fargo & Co. | 8,450,761 | 0.5 | ||||||
Chevron Corp. | 8,424,856 | 0.5 | ||||||
| $ | 318,711,416 | 18.8 | % | |||||
| * | All data are as of February 28, 2014. The Portfolio’s security type breakdown is expressed as a percentage of total investments (excluding security lending collateral) and may vary over time. The Portfolio also enters into derivative transactions, which may be used for hedging or investment purposes (see “Portfolio of Investments” section of the report for additional details). |
| ** | Long-term investments. |
| ALLIANCEBERNSTEIN WEALTH STRATEGIES • | 89 |
Portfolio Summary and Ten Largest Holdings
U.S. VALUE PORTFOLIO
PORTFOLIO OF INVESTMENTS
February 28, 2014 (unaudited)
| Company |
Shares | U.S. $ Value | ||||||
| ||||||||
COMMON STOCKS – 98.7% | ||||||||
Financials – 28.9% | ||||||||
Capital Markets – 1.5% | ||||||||
Bank of New York Mellon Corp. (The) | 147,300 | $ | 4,713,600 | |||||
Goldman Sachs Group, Inc. (The) | 58,500 | 9,737,325 | ||||||
State Street Corp. | 55,800 | 3,664,386 | ||||||
|
| |||||||
| 18,115,311 | ||||||||
|
| |||||||
Commercial Banks – 4.5% | ||||||||
CIT Group, Inc. | 270,900 | 13,187,412 | ||||||
Comerica, Inc. | 148,200 | 7,140,276 | ||||||
Fifth Third Bancorp | 116,500 | 2,527,468 | ||||||
PNC Financial Services Group, Inc. (The) | 28,600 | 2,338,908 | ||||||
Regions Financial Corp. | 151,100 | 1,607,704 | ||||||
SunTrust Banks, Inc. | 164,400 | 6,194,592 | ||||||
Wells Fargo & Co. | 424,000 | 19,682,080 | ||||||
|
| |||||||
| 52,678,440 | ||||||||
|
| |||||||
Consumer Finance – 2.6% | ||||||||
Capital One Financial Corp. | 243,900 | 17,909,577 | ||||||
Discover Financial Services | 229,800 | 13,185,924 | ||||||
|
| |||||||
| 31,095,501 | ||||||||
|
| |||||||
Diversified Financial Services – 8.6% | ||||||||
Bank of America Corp. | 2,104,100 | 34,780,773 | ||||||
Berkshire Hathaway, Inc. – Class B(a) | 81,600 | 9,447,648 | ||||||
Citigroup, Inc. | 503,800 | 24,499,794 | ||||||
ING US, Inc. | 262,300 | 9,408,701 | ||||||
JPMorgan Chase & Co. | 384,300 | 21,835,926 | ||||||
McGraw Hill Financial, Inc. | 19,100 | 1,521,506 | ||||||
|
| |||||||
| 101,494,348 | ||||||||
|
| |||||||
Insurance – 11.7% | ||||||||
Allstate Corp. (The) | 147,565 | 8,006,877 | ||||||
American Financial Group, Inc./OH | 175,700 | 10,043,012 | ||||||
American International Group, Inc. | 428,900 | 21,346,353 | ||||||
AON PLC | 167,300 | 14,320,880 | ||||||
Assurant, Inc. | 138,600 | 9,096,318 | ||||||
Chubb Corp. (The) | 124,900 | 10,926,252 | ||||||
Genworth Financial, Inc. – Class A(a) | 720,500 | 11,196,570 | ||||||
Lincoln National Corp. | 395,500 | 19,826,415 | ||||||
PartnerRe Ltd. | 135,600 | 13,408,128 | ||||||
Reinsurance Group of America, Inc. – Class A | 85,900 | 6,613,441 | ||||||
Travelers Cos., Inc. (The) | 74,500 | 6,246,080 | ||||||
Unum Group | 34,800 | 1,210,344 | ||||||
XL Group PLC | 227,600 | 6,919,040 | ||||||
|
| |||||||
| 139,159,710 | ||||||||
|
| |||||||
| 342,543,310 | ||||||||
|
| |||||||
| 90 | • ALLIANCEBERNSTEIN WEALTH STRATEGIES |
U.S. Value Portfolio—Portfolio of Investments
| Company | Shares | U.S. $ Value | ||||||
| ||||||||
Energy – 14.7% | ||||||||
Energy Equipment & Services – 1.9% | ||||||||
Halliburton Co. | 232,900 | $ | 13,275,300 | |||||
Nabors Industries Ltd. | 388,800 | 8,950,176 | ||||||
|
| |||||||
| 22,225,476 | ||||||||
|
| |||||||
Oil, Gas & Consumable Fuels – 12.8% | ||||||||
Chesapeake Energy Corp. | 77,700 | 2,013,207 | ||||||
Chevron Corp. | 254,000 | 29,293,820 | ||||||
Exxon Mobil Corp. | 398,100 | 38,325,087 | ||||||
Hess Corp. | 258,500 | 20,687,755 | ||||||
Marathon Petroleum Corp. | 139,600 | 11,726,400 | ||||||
Occidental Petroleum Corp. | 233,900 | 22,576,028 | ||||||
Phillips 66 | 86,400 | 6,467,904 | ||||||
Valero Energy Corp. | 429,600 | 20,612,208 | ||||||
|
| |||||||
| 151,702,409 | ||||||||
|
| |||||||
| 173,927,885 | ||||||||
|
| |||||||
Health Care – 14.4% | ||||||||
Biotechnology – 0.7% | ||||||||
Theravance, Inc.(a) | 75,900 | 2,808,300 | ||||||
Vertex Pharmaceuticals, Inc.(a) | 67,900 | 5,490,394 | ||||||
|
| |||||||
| 8,298,694 | ||||||||
|
| |||||||
Health Care Equipment & | ||||||||
Covidien PLC | 62,200 | 4,475,290 | ||||||
Medtronic, Inc. | 345,600 | 20,480,256 | ||||||
|
| |||||||
| 24,955,546 | ||||||||
|
| |||||||
Health Care Providers & | ||||||||
Aetna, Inc. | 158,800 | 11,546,348 | ||||||
Health Net, Inc./CA(a) | 194,000 | 6,605,700 | ||||||
WellPoint, Inc. | 39,400 | 3,569,246 | ||||||
|
| |||||||
| 21,721,294 | ||||||||
|
| |||||||
Pharmaceuticals – 9.8% | ||||||||
GlaxoSmithKline PLC (Sponsored ADR) | 225,900 | 12,636,846 | ||||||
Johnson & Johnson | 390,000 | 35,926,800 | ||||||
Merck & Co., Inc. | 163,700 | 9,329,263 | ||||||
Pfizer, Inc. | 1,461,000 | 46,912,710 | ||||||
Roche Holding AG (Sponsored ADR) | 290,000 | 11,130,200 | ||||||
|
| |||||||
| 115,935,819 | ||||||||
|
| |||||||
| 170,911,353 | ||||||||
|
| |||||||
Consumer Discretionary – 13.8% | ||||||||
Auto Components – 1.7% | ||||||||
Lear Corp. | 54,300 | 4,409,160 | ||||||
| ALLIANCEBERNSTEIN WEALTH STRATEGIES • | 91 |
U.S. Value Portfolio—Portfolio of Investments
| Company | Shares | U.S. $ Value | ||||||
| ||||||||
Magna International, Inc. – Class A | 58,100 | $ | 5,177,872 | |||||
TRW Automotive Holdings Corp.(a) | 125,600 | 10,339,392 | ||||||
|
| |||||||
| 19,926,424 | ||||||||
|
| |||||||
Automobiles – 1.1% | ||||||||
Ford Motor Co. | 847,100 | 13,036,869 | ||||||
|
| |||||||
Household Durables – 0.9% | ||||||||
PulteGroup, Inc. | 511,000 | 10,725,890 | ||||||
|
| |||||||
Media – 5.0% | ||||||||
Gannett Co., Inc. | 427,300 | 12,712,175 | ||||||
Liberty Global PLC – Class A(a) | 58,895 | 5,097,362 | ||||||
Liberty Global PLC – Series C(a) | 106,200 | 8,990,892 | ||||||
Regal Entertainment Group – Class A | 169,200 | 3,113,280 | ||||||
Time Warner, Inc. | 134,000 | 8,995,420 | ||||||
Twenty-First Century Fox, Inc. – Class A | 335,100 | 11,239,254 | ||||||
Viacom, Inc. – Class B | 104,600 | 9,176,558 | ||||||
|
| |||||||
| 59,324,941 | ||||||||
|
| |||||||
Multiline Retail – 1.1% | ||||||||
Dillard’s, Inc. – Class A | 27,000 | 2,499,660 | ||||||
Macy’s, Inc. | 182,900 | 10,582,594 | ||||||
|
| |||||||
| 13,082,254 | ||||||||
|
| |||||||
Specialty Retail – 4.0% | ||||||||
GameStop Corp. – Class A | 343,800 | 12,827,178 | ||||||
Gap, Inc. (The) | 154,700 | 6,768,125 | ||||||
Office Depot, Inc.(a) | 1,692,900 | 8,345,997 | ||||||
Staples, Inc. | 96,200 | 1,307,358 | ||||||
TJX Cos., Inc. (The) | 299,400 | 18,401,124 | ||||||
|
| |||||||
| 47,649,782 | ||||||||
|
| |||||||
| 163,746,160 | ||||||||
|
| |||||||
Information Technology – 11.0% | ||||||||
Communications Equipment – 2.0% | ||||||||
Cisco Systems, Inc. | 559,700 | 12,201,460 | ||||||
Harris Corp. | 160,100 | 11,818,582 | ||||||
|
| |||||||
| 24,020,042 | ||||||||
|
| |||||||
Computers & Peripherals – 3.5% | ||||||||
Apple, Inc. | 28,700 | 15,103,088 | ||||||
Hewlett-Packard Co. | 886,300 | 26,482,644 | ||||||
|
| |||||||
| 41,585,732 | ||||||||
|
| |||||||
Electronic Equipment, Instruments & Components – 0.7% | ||||||||
Arrow Electronics, Inc.(a) | 132,700 | 7,514,801 | ||||||
|
| |||||||
IT Services – 1.8% | ||||||||
Booz Allen Hamilton Holding Corp. | 104,700 | 2,201,841 | ||||||
| 92 | • ALLIANCEBERNSTEIN WEALTH STRATEGIES |
U.S. Value Portfolio—Portfolio of Investments
| Company | Shares | U.S. $ Value | ||||||
| ||||||||
Western Union Co. (The) – Class W | 351,597 | $ | 5,882,218 | |||||
Xerox Corp. | 1,223,600 | 13,447,364 | ||||||
|
| |||||||
| 21,531,423 | ||||||||
|
| |||||||
Semiconductors & Semiconductor | ||||||||
Applied Materials, Inc. | 510,800 | 9,684,768 | ||||||
Lam Research Corp.(a) | 94,000 | 4,862,620 | ||||||
Micron Technology, Inc.(a) | 303,200 | 7,334,408 | ||||||
NVIDIA Corp. | 77,500 | 1,424,450 | ||||||
|
| |||||||
| 23,306,246 | ||||||||
|
| |||||||
Software – 1.0% | ||||||||
Electronic Arts, Inc.(a) | 425,600 | 12,167,904 | ||||||
|
| |||||||
| 130,126,148 | ||||||||
|
| |||||||
Industrials – 4.8% | ||||||||
Aerospace & Defense – 0.5% | ||||||||
Northrop Grumman Corp. | 47,900 | 5,797,337 | ||||||
|
| |||||||
Airlines – 0.5% | ||||||||
Delta Air Lines, Inc. | 177,000 | 5,878,170 | ||||||
|
| |||||||
Industrial Conglomerates – 2.7% | ||||||||
General Electric Co. | 1,274,600 | 32,464,062 | ||||||
|
| |||||||
Machinery – 1.1% | ||||||||
Illinois Tool Works, Inc. | 139,300 | 11,492,250 | ||||||
Parker Hannifin Corp. | 14,000 | 1,687,700 | ||||||
|
| |||||||
| 13,179,950 | ||||||||
|
| |||||||
| 57,319,519 | ||||||||
|
| |||||||
Utilities – 4.0% | ||||||||
Electric Utilities – 1.3% | ||||||||
Edison International | 306,500 | 16,051,405 | ||||||
|
| |||||||
Gas Utilities – 1.6% | ||||||||
Atmos Energy Corp. | 223,400 | 10,298,740 | ||||||
UGI Corp. | 192,390 | 8,597,909 | ||||||
|
| |||||||
| 18,896,649 | ||||||||
|
| |||||||
Multi-Utilities – 1.1% | ||||||||
CenterPoint Energy, Inc. | 295,400 | 6,986,210 | ||||||
DTE Energy Co. | 28,400 | 2,037,984 | ||||||
Sempra Energy | 36,800 | 3,476,496 | ||||||
|
| |||||||
| 12,500,690 | ||||||||
|
| |||||||
| 47,448,744 | ||||||||
|
| |||||||
Consumer Staples – 3.6% | ||||||||
Food & Staples Retailing – 2.5% | ||||||||
CVS Caremark Corp. | 137,300 | 10,042,122 | ||||||
Kroger Co. (The) | 464,600 | 19,485,324 | ||||||
|
| |||||||
| 29,527,446 | ||||||||
|
| |||||||
| ALLIANCEBERNSTEIN WEALTH STRATEGIES • | 93 |
U.S. Value Portfolio—Portfolio of Investments
| Company | Shares | U.S. $ Value | ||||||
| ||||||||
Food Products – 0.2% | ||||||||
Mondelez International, Inc. – Class A | 86,000 | $ | 2,926,580 | |||||
|
| |||||||
Household Products – 0.9% | ||||||||
Procter & Gamble Co. (The) | 127,900 | 10,060,614 | ||||||
|
| |||||||
| 42,514,640 | ||||||||
|
| |||||||
Telecommunication Services – 2.5% | ||||||||
Diversified Telecommunication | ||||||||
AT&T, Inc. | 712,000 | 22,734,160 | ||||||
Verizon Communications, Inc. | 1 | 34 | ||||||
|
| |||||||
| 22,734,194 | ||||||||
|
| |||||||
Wireless Telecommunication | ||||||||
Vodafone Group PLC (Sponsored ADR) | 175,527 | 7,296,669 | ||||||
|
| |||||||
| 30,030,863 | ||||||||
|
| |||||||
Materials – 1.0% | ||||||||
Chemicals – 1.0% | ||||||||
LyondellBasell Industries NV – Class A | 141,000 | 12,419,280 | ||||||
|
| |||||||
Total Common Stocks | 1,170,987,902 | |||||||
|
| |||||||
SHORT-TERM INVESTMENTS – 0.5% | ||||||||
Investment Companies – 0.5% | ||||||||
AllianceBernstein Fixed-Income Shares, Inc. – Government STIF Portfolio, 0.08%(b) | 5,575,559 | 5,575,559 | ||||||
|
| |||||||
Total Investments – 99.2% | 1,176,563,461 | |||||||
Other assets less liabilities – 0.8% | 9,581,895 | |||||||
|
| |||||||
Net Assets – 100.0% | $ | 1,186,145,356 | ||||||
|
| |||||||
| (a) | Non-income producing security. |
| (b) | Investment in affiliated money market mutual fund. The rate shown represents the 7-day yield as of period end. |
Glossary:
| ADR | – American Depositary Receipt |
See notes to financial statements.
| 94 | • ALLIANCEBERNSTEIN WEALTH STRATEGIES |
U.S. Value Portfolio—Portfolio of Investments
U.S. LARGE CAP GROWTH PORTFOLIO
PORTFOLIO OF INVESTMENTS
February 28, 2014 (unaudited)
| Company | Shares | U.S. $ Value | ||||||
| ||||||||
COMMON STOCKS – 94.8% | ||||||||
Information Technology – 25.3% | ||||||||
Communications Equipment – 2.2% | ||||||||
F5 Networks, Inc.(a) | 167,990 | $ | 18,871,997 | |||||
QUALCOMM, Inc. | 90,060 | 6,780,617 | ||||||
|
| |||||||
| 25,652,614 | ||||||||
|
| |||||||
Computers & Peripherals – 3.5% | ||||||||
Apple, Inc. | 79,890 | �� | 42,041,314 | |||||
|
| |||||||
Electronic Equipment, Instruments & Components – 1.5% | ||||||||
Amphenol Corp. – Class A | 210,367 | 18,516,503 | ||||||
|
| |||||||
Internet Software & Services – 6.6% | ||||||||
Facebook, Inc. – Class A(a) | 214,200 | 14,664,132 | ||||||
Google, Inc. – Class A(a) | 52,345 | 63,633,199 | ||||||
|
| |||||||
| 78,297,331 | ||||||||
|
| |||||||
IT Services – 7.2% | ||||||||
Cognizant Technology Solutions Corp. – | 376,360 | 39,164,022 | ||||||
Visa, Inc. – Class A | 203,390 | 45,953,936 | ||||||
|
| |||||||
| 85,117,958 | ||||||||
|
| |||||||
Semiconductors & Semiconductor | ||||||||
Linear Technology Corp. | 401,920 | 18,825,933 | ||||||
|
| |||||||
Software – 2.7% | ||||||||
ANSYS, Inc.(a) | 229,940 | 19,204,589 | ||||||
Informatica Corp.(a) | 195,070 | 8,107,109 | ||||||
Red Hat, Inc.(a) | 77,490 | 4,571,135 | ||||||
|
| |||||||
| 31,882,833 | ||||||||
|
| |||||||
| 300,334,486 | ||||||||
|
| |||||||
Consumer Discretionary – 20.6% | ||||||||
Distributors – 1.2% | ||||||||
LKQ Corp.(a) | 484,054 | 13,500,266 | ||||||
|
| |||||||
Hotels, Restaurants & Leisure – 2.1% | ||||||||
Starbucks Corp. | 350,310 | 24,857,998 | ||||||
|
| |||||||
Internet & Catalog Retail – 4.3% | ||||||||
Amazon.com, Inc.(a) | 51,130 | 18,514,173 | ||||||
priceline.com, Inc.(a) | 24,180 | 32,614,951 | ||||||
|
| |||||||
| 51,129,124 | ||||||||
|
| |||||||
Leisure Equipment & Products – 1.2% | ||||||||
Polaris Industries, Inc. | 106,300 | 14,247,389 | ||||||
|
| |||||||
| ALLIANCEBERNSTEIN WEALTH STRATEGIES • | 95 |
U.S. Large Cap Growth Portfolio—Portfolio of Investments
| Company | Shares | U.S. $ Value | ||||||
| ||||||||
Media – 6.2% | ||||||||
Comcast Corp. – Class A | 619,940 | $ | 32,044,699 | |||||
Liberty Media Corp. – Class A(a) | 136,850 | 18,770,346 | ||||||
Walt Disney Co. (The) | 283,626 | 22,919,817 | ||||||
|
| |||||||
| 73,734,862 | ||||||||
|
| |||||||
Specialty Retail – 3.1% | ||||||||
Home Depot, Inc. (The) | 323,900 | 26,569,517 | ||||||
O’Reilly Automotive, Inc.(a) | 70,150 | 10,582,127 | ||||||
|
| |||||||
| 37,151,644 | ||||||||
|
| |||||||
Textiles, Apparel & Luxury Goods – 2.5% | ||||||||
Michael Kors Holdings Ltd.(a) | 93,020 | 9,118,750 | ||||||
NIKE, Inc. – Class B | 178,226 | 13,955,096 | ||||||
VF Corp. | 114,820 | 6,727,304 | ||||||
|
| |||||||
| 29,801,150 | ||||||||
|
| |||||||
| 244,422,433 | ||||||||
|
| |||||||
Health Care – 15.9% | ||||||||
Biotechnology – 7.4% | ||||||||
Biogen Idec, Inc.(a) | 100,387 | 34,199,843 | ||||||
Celgene Corp.(a) | 48,560 | 7,806,020 | ||||||
Gilead Sciences, Inc.(a) | 296,020 | 24,507,496 | ||||||
Quintiles Transnational Holdings, Inc.(a) | 393,519 | 21,309,054 | ||||||
|
| |||||||
| 87,822,413 | ||||||||
|
| |||||||
Health Care Equipment & Supplies – 0.7% | ||||||||
Intuitive Surgical, Inc.(a) | 18,150 | 8,073,664 | ||||||
|
| |||||||
Health Care Providers & Services – 2.8% | ||||||||
McKesson Corp. | 74,470 | 13,184,913 | ||||||
UnitedHealth Group, Inc. | 254,625 | 19,674,874 | ||||||
|
| |||||||
| 32,859,787 | ||||||||
|
| |||||||
Life Sciences Tools & Services – 1.6% | ||||||||
Illumina, Inc.(a) | 57,410 | 9,845,241 | ||||||
Mettler-Toledo International, Inc.(a) | 39,747 | 9,768,223 | ||||||
|
| |||||||
| 19,613,464 | ||||||||
|
| |||||||
Pharmaceuticals – 3.4% | ||||||||
Allergan, Inc./United States | 317,790 | 40,359,330 | ||||||
|
| |||||||
| 188,728,658 | ||||||||
|
| |||||||
Consumer Staples – 12.3% | ||||||||
Beverages – 1.2% | ||||||||
Monster Beverage Corp.(a) | 192,268 | 14,227,832 | ||||||
|
| |||||||
Food & Staples Retailing – 4.4% | ||||||||
Costco Wholesale Corp. | 172,530 | 20,151,504 | ||||||
CVS Caremark Corp. | 440,380 | 32,209,393 | ||||||
|
| |||||||
| 52,360,897 | ||||||||
|
| |||||||
| 96 | • ALLIANCEBERNSTEIN WEALTH STRATEGIES |
U.S. Large Cap Growth Portfolio—Portfolio of Investments
| Company | Shares | U.S. $ Value | ||||||
| ||||||||
Food Products – 4.4% | ||||||||
Green Mountain Coffee Roasters, Inc. | 115,780 | $ | 12,710,328 | |||||
Hershey Co. (The) | 199,480 | 21,108,974 | ||||||
Mead Johnson Nutrition Co. – Class A | 227,420 | 18,546,101 | ||||||
|
| |||||||
| 52,365,403 | ||||||||
|
| |||||||
Personal Products – 0.9% | ||||||||
Estee Lauder Cos., Inc. (The) – Class A | 153,940 | 10,597,230 | ||||||
|
| |||||||
Tobacco – 1.4% | ||||||||
Philip Morris International, Inc. | 212,365 | 17,182,452 | ||||||
|
| |||||||
| 146,733,814 | ||||||||
|
| |||||||
Industrials – 11.3% | ||||||||
Aerospace & Defense – 3.6% | ||||||||
Boeing Co. (The) | 224,570 | 28,951,565 | ||||||
Precision Castparts Corp. | 52,798 | 13,615,548 | ||||||
|
| |||||||
| 42,567,113 | ||||||||
|
| |||||||
Air Freight & Logistics – 0.4% | ||||||||
Expeditors International of Washington, Inc. | 105,680 | 4,175,417 | ||||||
|
| |||||||
Airlines – 1.6% | ||||||||
Copa Holdings SA – Class A | 142,190 | 19,261,057 | ||||||
|
| |||||||
Electrical Equipment – 1.4% | ||||||||
AMETEK, Inc. | 320,021 | 17,037,918 | ||||||
|
| |||||||
Industrial Conglomerates – 2.6% | ||||||||
Danaher Corp. | 408,539 | 31,249,148 | ||||||
|
| |||||||
Machinery – 1.0% | ||||||||
Parker Hannifin Corp. | 96,650 | 11,651,157 | ||||||
|
| |||||||
Professional Services – 0.7% | ||||||||
Verisk Analytics, Inc. – Class A(a) | 126,693 | 8,072,245 | ||||||
|
| |||||||
| 134,014,055 | ||||||||
|
| |||||||
Financials – 5.1% | ||||||||
Capital Markets – 1.9% | ||||||||
Affiliated Managers Group, Inc.(a) | 65,843 | 12,381,776 | ||||||
BlackRock, Inc. – Class A | 33,470 | 10,202,995 | ||||||
|
| |||||||
| 22,584,771 | ||||||||
|
| |||||||
Diversified Financial Services – 3.2% | ||||||||
IntercontinentalExchange Group, Inc. | 181,081 | 37,816,956 | ||||||
|
| |||||||
| 60,401,727 | ||||||||
|
| |||||||
Energy – 3.1% | ||||||||
Energy Equipment & Services – 3.1% | ||||||||
Oceaneering International, Inc. | 121,268 | 8,680,364 | ||||||
Schlumberger Ltd. | 308,113 | 28,654,509 | ||||||
|
| |||||||
| 37,334,873 | ||||||||
|
| |||||||
| ALLIANCEBERNSTEIN WEALTH STRATEGIES • | 97 |
U.S. Large Cap Growth Portfolio—Portfolio of Investments
| Company | Shares | U.S. $ Value | ||||||
| ||||||||
Materials – 1.2% | ||||||||
Chemicals – 1.2% | ||||||||
Monsanto Co. | 126,495 | $ | 13,916,980 | |||||
|
| |||||||
Total Common Stocks | 1,125,887,026 | |||||||
|
| |||||||
SHORT-TERM INVESTMENTS – 6.0% | ||||||||
Investment Companies – 6.0% | ||||||||
AllianceBernstein Fixed-Income Shares, Inc. – Government STIF Portfolio, 0.08%(b) | 71,583,041 | 71,583,041 | ||||||
|
| |||||||
Total Investments – 100.8% | 1,197,470,067 | |||||||
Other assets less liabilities – (0.8)% | (10,047,752 | ) | ||||||
|
| |||||||
Net Assets – 100.0% | $ | 1,187,422,315 | ||||||
|
| |||||||
| (a) | Non-income producing security. |
| (b) | Investment in affiliated money market mutual fund. The rate shown represents the 7-day yield as of period end. |
See notes to financial statements.
| 98 | • ALLIANCEBERNSTEIN WEALTH STRATEGIES |
U.S. Large Cap Growth Portfolio—Portfolio of Investments
INTERNATIONAL VALUE PORTFOLIO
PORTFOLIO OF INVESTMENTS
February 28, 2014 (unaudited)
| Company | Shares | U.S. $ Value | ||||||
| ||||||||
COMMON STOCKS – 97.9% | ||||||||
Financials – 23.4% | ||||||||
Capital Markets – 2.4% | ||||||||
Deutsche Bank AG (REG) | 248,527 | $ | 12,019,866 | |||||
Macquarie Group Ltd. | 248,292 | 12,521,262 | ||||||
|
| |||||||
| 24,541,128 | ||||||||
|
| |||||||
Commercial Banks – 13.7% | ||||||||
Banco do Brasil SA | 376,000 | 3,325,377 | ||||||
Bank Hapoalim BM | 1,024,520 | 5,599,537 | ||||||
Bank of Montreal | 77,270 | 5,089,925 | ||||||
Bank of Nova Scotia | 104,910 | 5,999,188 | ||||||
Barclays PLC | 1,551,112 | 6,534,164 | ||||||
China Construction Bank Corp. – Class H | 9,612,000 | 6,634,914 | ||||||
HSBC Holdings PLC | 1,027,670 | 10,846,040 | ||||||
Industrial & Commercial Bank of China Ltd. – Class H | 11,092,000 | 6,682,558 | ||||||
KBC Groep NV | 125,740 | 7,952,039 | ||||||
Lloyds Banking Group PLC(a) | 9,632,170 | 13,302,048 | ||||||
Mitsubishi UFJ Financial Group, Inc. | 1,669,300 | 9,673,016 | ||||||
National Australia Bank Ltd. | 229,610 | 7,140,625 | ||||||
Societe Generale SA | 246,410 | 16,350,841 | ||||||
State Bank of India | 133,320 | 3,304,574 | ||||||
Sumitomo Mitsui Financial Group, Inc. | 165,900 | 7,448,586 | ||||||
Toronto-Dominion Bank (The) | 200,350 | 9,075,730 | ||||||
UniCredit SpA | 1,748,270 | 13,873,954 | ||||||
|
| |||||||
| 138,833,116 | ||||||||
|
| |||||||
Diversified Financial Services – 2.2% | ||||||||
ING Groep NV(a) | 499,650 | 7,255,948 | ||||||
ORIX Corp. | 1,036,000 | 15,364,490 | ||||||
|
| |||||||
| 22,620,438 | ||||||||
|
| |||||||
Insurance – 2.6% | ||||||||
AIA Group Ltd. | 1,597,400 | 7,826,526 | ||||||
Aviva PLC | 742,490 | 5,903,195 | ||||||
Muenchener Rueckversicherungs AG | 57,960 | 12,672,449 | ||||||
|
| |||||||
| 26,402,170 | ||||||||
|
| |||||||
Real Estate Investment Trusts | ||||||||
Stockland | 3,536 | 12,212 | ||||||
|
| |||||||
Real Estate Management & | ||||||||
Aeon Mall Co., Ltd. | 217,900 | 6,050,463 | ||||||
China Overseas Land & Investment Ltd. | 1,228,000 | 3,309,571 | ||||||
Country Garden Holdings Co., Ltd. | 17,135,000 | 8,869,739 | ||||||
Lend Lease Group | 713,269 | 7,205,788 | ||||||
|
| |||||||
| 25,435,561 | ||||||||
|
| |||||||
| 237,844,625 | ||||||||
|
| |||||||
| ALLIANCEBERNSTEIN WEALTH STRATEGIES • | 99 |
International Value Portfolio—Portfolio of Investments
| Company | Shares | U.S. $ Value | ||||||
| ||||||||
Consumer Discretionary – 15.7% | ||||||||
Auto Components – 4.8% | ||||||||
Cie Generale des Etablissements Michelin – | 115,815 | $ | 14,078,517 | |||||
GKN PLC | 1,246,480 | 8,453,519 | ||||||
Magna International, Inc. (Toronto) – Class A | 52,230 | 4,649,428 | ||||||
Valeo SA | 156,440 | 21,883,236 | ||||||
|
| |||||||
| 49,064,700 | ||||||||
|
| |||||||
Automobiles – 4.7% | ||||||||
Honda Motor Co., Ltd. | 260,300 | 9,368,994 | ||||||
Hyundai Motor Co. | 23,360 | 5,366,989 | ||||||
Mazda Motor Corp.(a) | 759,000 | 3,665,978 | ||||||
Nissan Motor Co., Ltd. | 1,105,400 | 9,866,396 | ||||||
Tata Motors Ltd. | 1,093,850 | 7,408,499 | ||||||
Volkswagen AG (Preference Shares) | 48,070 | 12,495,364 | ||||||
|
| |||||||
| 48,172,220 | ||||||||
|
| |||||||
Hotels, Restaurants & Leisure – 1.7% | ||||||||
Melco Crown Entertainment Ltd. (ADR)(a) | 248,830 | 10,679,783 | ||||||
William Hill PLC | 906,536 | 6,026,543 | ||||||
|
| |||||||
| 16,706,326 | ||||||||
|
| |||||||
Media – 1.3% | ||||||||
Liberty Global PLC – Series C(a) | 157,160 | 13,305,166 | ||||||
|
| |||||||
Multiline Retail – 0.3% | ||||||||
Myer Holdings Ltd.(b) | 1,185,070 | 2,780,607 | ||||||
|
| |||||||
Specialty Retail – 2.4% | ||||||||
Kingfisher PLC | 822,690 | 5,422,654 | ||||||
Mr. Price Group Ltd. | 260,460 | 3,610,232 | ||||||
Shimamura Co., Ltd. | 56,600 | 5,126,821 | ||||||
Yamada Denki Co., Ltd.(b) | 3,116,100 | 10,347,283 | ||||||
|
| |||||||
| 24,506,990 | ||||||||
|
| |||||||
Textiles, Apparel & Luxury Goods – 0.5% | ||||||||
Cie Financiere Richemont SA | 51,760 | 5,142,111 | ||||||
|
| |||||||
| 159,678,120 | ||||||||
|
| |||||||
Industrials – 12.1% | ||||||||
Aerospace & Defense – 3.7% | ||||||||
Airbus Group NV | 284,988 | 20,940,143 | ||||||
MTU Aero Engines AG | 55,370 | 4,651,090 | ||||||
Safran SA | 116,349 | 8,178,612 | ||||||
Thales SA | 60,520 | 4,018,380 | ||||||
|
| |||||||
| 37,788,225 | ||||||||
|
| |||||||
Airlines – 1.3% | ||||||||
Japan Airlines Co., Ltd. | 58,800 | 2,927,895 | ||||||
Qantas Airways Ltd.(a) | 4,995,008 | 5,220,543 | ||||||
Turk Hava Yollari | 1,634,693 | 4,850,236 | ||||||
|
| |||||||
| 12,998,674 | ||||||||
|
| |||||||
| 100 | • ALLIANCEBERNSTEIN WEALTH STRATEGIES |
International Value Portfolio—Portfolio of Investments
| Company | Shares | U.S. $ Value | ||||||
| ||||||||
Building Products – 0.3% | ||||||||
Asahi Glass Co., Ltd. | 581,000 | $ | 3,199,292 | |||||
|
| |||||||
Electrical Equipment – 1.1% | ||||||||
Sumitomo Electric Industries Ltd. | 698,700 | 10,725,013 | ||||||
|
| |||||||
Industrial Conglomerates – 2.1% | ||||||||
Bidvest Group Ltd. | 241,650 | 5,677,496 | ||||||
Hutchison Whampoa Ltd. | 552,000 | 7,456,541 | ||||||
Toshiba Corp. | 1,792,000 | 7,777,634 | ||||||
|
| |||||||
| 20,911,671 | ||||||||
|
| |||||||
Marine – 1.7% | ||||||||
AP Moeller - Maersk A/S – Class B | 914 | 11,162,585 | ||||||
Nippon Yusen KK | 2,068,000 | 6,624,567 | ||||||
|
| |||||||
| 17,787,152 | ||||||||
|
| |||||||
Road & Rail – 1.3% | ||||||||
Canadian National Railway Co. | 78,900 | 4,457,675 | ||||||
Central Japan Railway Co. | 76,500 | 8,928,471 | ||||||
|
| |||||||
| 13,386,146 | ||||||||
|
| |||||||
Trading Companies & | ||||||||
Mitsubishi Corp. | 326,500 | 6,266,651 | ||||||
|
| |||||||
| 123,062,824 | ||||||||
|
| |||||||
Health Care – 9.1% | ||||||||
Biotechnology – 1.0% | ||||||||
Actelion Ltd. (REG)(a) | 91,630 | 9,709,027 | ||||||
|
| |||||||
Pharmaceuticals – 8.1% | ||||||||
Astellas Pharma, Inc. | 120,300 | 7,819,591 | ||||||
Daiichi Sankyo Co., Ltd. | 381,300 | 6,589,725 | ||||||
GlaxoSmithKline PLC | 885,710 | 24,808,408 | ||||||
Novartis AG | 208,380 | 17,343,484 | ||||||
Richter Gedeon Nyrt | 275,090 | 4,887,927 | ||||||
Roche Holding AG | 69,350 | 21,352,864 | ||||||
|
| |||||||
| 82,801,999 | ||||||||
|
| |||||||
| 92,511,026 | ||||||||
|
| |||||||
Information Technology – 8.1% | ||||||||
Computers & Peripherals – 2.1% | ||||||||
Casetek Holdings Ltd. | 920,000 | 5,326,364 | ||||||
Catcher Technology Co., Ltd. | 1,584,000 | 11,542,650 | ||||||
Inventec Corp. | 4,166,000 | 4,411,009 | ||||||
|
| |||||||
| 21,280,023 | ||||||||
|
| |||||||
Electronic Equipment, Instruments & Components – 0.9% | ||||||||
LG Display Co., Ltd.(a) | 424,960 | 9,695,474 | ||||||
|
| |||||||
IT Services – 0.7% | ||||||||
Fujitsu Ltd.(a) | 1,185,000 | 7,409,600 | ||||||
|
| |||||||
| ALLIANCEBERNSTEIN WEALTH STRATEGIES • | 101 |
International Value Portfolio—Portfolio of Investments
| Company | Shares | U.S. $ Value | ||||||
| ||||||||
Semiconductors & Semiconductor | ||||||||
Samsung Electronics Co., Ltd. | 11,650 | $ | 14,758,251 | |||||
SK Hynix, Inc.(a) | 301,340 | 10,956,554 | ||||||
Sumco Corp. | 617,900 | 4,757,960 | ||||||
Taiwan Semiconductor Manufacturing Co., Ltd. | 2,048,000 | 7,387,756 | ||||||
Tokyo Electron Ltd. | 114,100 | 6,539,291 | ||||||
|
| |||||||
| 44,399,812 | ||||||||
|
| |||||||
| 82,784,909 | ||||||||
|
| |||||||
Telecommunication Services – 7.3% | ||||||||
Diversified Telecommunication | ||||||||
Bezeq The Israeli Telecommunication Corp., Ltd. | 2,090,038 | 3,404,731 | ||||||
Hellenic Telecommunications Organization SA(a) | 298,980 | 5,230,844 | ||||||
Nippon Telegraph & Telephone Corp. | 141,000 | 7,938,169 | ||||||
Verizon Communications, Inc. | 154,070 | 7,287,033 | ||||||
Vivendi SA | 636,827 | 18,159,526 | ||||||
Ziggo NV | 82,400 | 3,757,132 | ||||||
|
| |||||||
| 45,777,435 | ||||||||
|
| |||||||
Wireless Telecommunication | ||||||||
China Mobile Ltd. | 784,500 | 7,441,320 | ||||||
Rogers Communications, Inc. – Class B(b) | 80,320 | 3,104,575 | ||||||
Turkcell Iletisim Hizmetleri AS(a) | 973,890 | 5,058,572 | ||||||
Vodafone Group PLC | 3,195,353 | 13,314,917 | ||||||
|
| |||||||
| 28,919,384 | ||||||||
|
| |||||||
| 74,696,819 | ||||||||
|
| |||||||
Energy – 7.3% | ||||||||
Energy Equipment & Services – 1.8% | ||||||||
Aker Solutions ASA | 447,617 | 7,509,762 | ||||||
Saipem SpA | 248,630 | 5,841,044 | ||||||
Seadrill Ltd.(b) | 133,730 | 4,926,787 | ||||||
|
| |||||||
| 18,277,593 | ||||||||
|
| |||||||
Oil, Gas & Consumable Fuels – 5.5% | ||||||||
Canadian Natural Resources Ltd. | 148,280 | 5,426,086 | ||||||
China Petroleum & Chemical Corp. – Class H | 6,752,200 | 5,977,090 | ||||||
ENI SpA | 443,700 | 10,651,729 | ||||||
Gazprom OAO (Sponsored ADR) | 582,510 | 4,432,901 | ||||||
JX Holdings, Inc. | 1,377,000 | 7,151,450 | ||||||
LUKOIL OAO (London) (Sponsored ADR) | 85,470 | 4,649,568 | ||||||
Royal Dutch Shell PLC (Euronext Amsterdam) – Class A | 354,552 | 12,938,817 | ||||||
Suncor Energy, Inc. (Toronto) | 156,630 | 5,167,248 | ||||||
|
| |||||||
| 56,394,889 | ||||||||
|
| |||||||
| 74,672,482 | ||||||||
|
| |||||||
| 102 | • ALLIANCEBERNSTEIN WEALTH STRATEGIES |
International Value Portfolio—Portfolio of Investments
| Company | Shares | U.S. $ Value | ||||||
| ||||||||
Materials – 6.7% | ||||||||
Chemicals – 3.1% | ||||||||
Arkema SA | 92,400 | $ | 10,022,876 | |||||
BASF SE | 36,710 | 4,219,593 | ||||||
Denki Kagaku Kogyo KK | 1,268,000 | 4,903,389 | ||||||
Koninklijke DSM NV | 116,109 | 7,408,597 | ||||||
Nippon Shokubai Co., Ltd. | 430,000 | 5,236,000 | ||||||
|
| |||||||
| 31,790,455 | ||||||||
|
| |||||||
Metals & Mining – 2.6% | ||||||||
Barrick Gold Corp.(b) | 279,820 | 5,701,020 | ||||||
Dowa Holdings Co., Ltd. | 346,000 | 2,879,100 | ||||||
MMC Norilsk Nickel OJSC (ADR) | 603,800 | 10,252,524 | ||||||
Rio Tinto PLC | 135,400 | 7,763,926 | ||||||
|
| |||||||
| 26,596,570 | ||||||||
|
| |||||||
Paper & Forest Products – 1.0% | ||||||||
Duratex SA | 375,600 | 1,743,714 | ||||||
Mondi PLC | 435,724 | 7,989,992 | ||||||
|
| |||||||
| 9,733,706 | ||||||||
|
| |||||||
| 68,120,731 | ||||||||
|
| |||||||
Consumer Staples – 5.3% | ||||||||
Beverages – 1.0% | ||||||||
Asahi Group Holdings Ltd. | 136,200 | 3,829,472 | ||||||
Carlsberg A/S – Class B | 63,160 | 6,654,058 | ||||||
|
| |||||||
| 10,483,530 | ||||||||
|
| |||||||
Food & Staples Retailing – 1.4% | ||||||||
Koninklijke Ahold NV | 771,330 | 14,378,140 | ||||||
|
| |||||||
Food Products – 0.9% | ||||||||
Ajinomoto Co., Inc. | 332,000 | 5,154,258 | ||||||
Danone | 48,930 | 3,450,333 | ||||||
|
| |||||||
| 8,604,591 | ||||||||
|
| |||||||
Tobacco – 2.0% | ||||||||
British American Tobacco PLC | 155,490 | 8,475,978 | ||||||
Imperial Tobacco Group PLC | 289,150 | 11,794,321 | ||||||
|
| |||||||
| 20,270,299 | ||||||||
|
| |||||||
| 53,736,560 | ||||||||
|
| |||||||
Utilities – 2.9% | ||||||||
Electric Utilities – 2.1% | ||||||||
EDP - Energias de Portugal SA | 2,033,080 | 8,798,574 | ||||||
Electricite de France | 117,400 | 4,657,914 | ||||||
Enel SpA | 1,538,458 | 7,883,858 | ||||||
|
| |||||||
| 21,340,346 | ||||||||
|
| |||||||
Multi-Utilities – 0.8% | ||||||||
National Grid PLC | 599,710 | 8,391,888 | ||||||
|
| |||||||
| 29,732,234 | ||||||||
|
| |||||||
Total Common Stocks | 996,840,330 | |||||||
|
| |||||||
| ALLIANCEBERNSTEIN WEALTH STRATEGIES • | 103 |
International Value Portfolio—Portfolio of Investments
| Company | Shares | U.S. $ Value | ||||||
| ||||||||
WARRANTS – 0.7% | ||||||||
Financials – 0.7% | ||||||||
Real Estate Management & | ||||||||
Emaar Properties PJSC, Merrill Lynch Intl & Co., expiring 10/01/15(a) | 2,795,490 | $ | 6,926,313 | |||||
|
| |||||||
SHORT-TERM INVESTMENTS – 0.2% | ||||||||
Investment Companies – 0.2% | ||||||||
AllianceBernstein Fixed-Income Shares, Inc. – Government STIF Portfolio, 0.08%(c) | 1,812,988 | 1,812,988 | ||||||
|
| |||||||
Total Investments Before Security Lending Collateral for Securities Loaned – 98.8% | 1,005,579,631 | |||||||
|
| |||||||
INVESTMENTS OF CASH COLLATERAL FOR SECURITIES LOANED – 1.7% | ||||||||
Investment Companies – 1.7% | ||||||||
AllianceBernstein Exchange Reserves – | 16,917,441 | 16,917,441 | ||||||
|
| |||||||
Total Investments – 100.5% | 1,022,497,072 | |||||||
Other assets less liabilities – (0.5)% | (4,970,455 | ) | ||||||
|
| |||||||
Net Assets – 100.0% | $ | 1,017,526,617 | ||||||
|
| |||||||
FUTURES (see Note C)
| Type | Number of Contracts | Expiration Month | Original Value | Value at February 28, 2014 | Unrealized Appreciation/ (Depreciation) | |||||||||||||||
Purchased Contracts |
| |||||||||||||||||||
Euro STOXX 50 Futures | 102 | March 2014 | $ | 4,176,007 | $ | 4,420,826 | $ | 244,819 | ||||||||||||
FORWARD CURRENCY EXCHANGE CONTRACTS (see Note C)
| Counterparty | Contracts to Deliver (000) | In Exchange For (000) | Settlement Date | Unrealized Appreciation/ (Depreciation) | ||||||||||||||||||||
BNP Paribas SA | CAD | 11,234 | USD | 10,137 | 5/15/14 | $ | 9,601 | |||||||||||||||||
BNP Paribas SA | CHF | 29,967 | USD | 33,335 | 5/15/14 | (757,591 | ) | |||||||||||||||||
BNP Paribas SA | USD | 5,433 | AUD | 6,096 | 5/15/14 | (19,583 | ) | |||||||||||||||||
BNP Paribas SA | USD | 62,107 | GBP | 37,275 | 5/15/14 | 278,726 | ||||||||||||||||||
BNP Paribas SA | USD | 33,199 | NZD | 40,586 | 5/15/14 | 642,570 | ||||||||||||||||||
Credit Suisse International | CHF | 2,577 | USD | 2,847 | 5/15/14 | (84,806 | ) | |||||||||||||||||
Credit Suisse International | USD | 8,991 | CHF | 7,996 | 5/15/14 | 106,144 | ||||||||||||||||||
HSBC Bank USA | GBP | 27,203 | USD | 44,407 | 5/15/14 | (1,121,832 | ) | |||||||||||||||||
HSBC Bank USA | HKD | 172,309 | USD | 22,209 | 5/15/14 | 2,404 | ||||||||||||||||||
| 104 | • ALLIANCEBERNSTEIN WEALTH STRATEGIES |
International Value Portfolio—Portfolio of Investments
| Counterparty | Contracts to Deliver (000) | In Exchange For (000) | Settlement Date | Unrealized Appreciation/ (Depreciation) | ||||||||||||||||||||
Morgan Stanley & Co., Inc. | JPY | 1,185,707 | USD | 11,641 | 5/15/14 | $ | (14,038 | ) | ||||||||||||||||
Morgan Stanley & Co., Inc. | NZD | 30,534 | USD | 25,410 | 5/15/14 | (49,459 | ) | |||||||||||||||||
Morgan Stanley & Co., Inc. | SEK | 67,114 | USD | 10,262 | 5/15/14 | (193,251 | ) | |||||||||||||||||
Morgan Stanley & Co., Inc. | USD | 12,886 | NOK | 78,281 | 5/15/14 | 120,901 | ||||||||||||||||||
Standard Chartered Bank | RUB | 263,755 | USD | 7,332 | 5/15/14 | 89,052 | ||||||||||||||||||
State Street Bank & Trust Co. | EUR | 27,878 | USD | 38,221 | 5/15/14 | (258,625 | ) | |||||||||||||||||
State Street Bank & Trust Co. | USD | 7,204 | EUR | 5,298 | 5/15/14 | 108,662 | ||||||||||||||||||
State Street Bank & Trust Co. | USD | 15,828 | NOK | 98,365 | 5/15/14 | 516,720 | ||||||||||||||||||
State Street Bank & Trust Co. | USD | 49,356 | SEK | 320,638 | 5/15/14 | 594,374 | ||||||||||||||||||
UBS AG | USD | 11,596 | AUD | 13,267 | 5/15/14 | 185,678 | ||||||||||||||||||
|
| |||||||||||||||||||||||
| $ | 155,647 | |||||||||||||||||||||||
|
| |||||||||||||||||||||||
| (a) | Non-income producing security. |
| (b) | Represents entire or partial securities out on loan. See Note D for securities lending information. |
| (c) | Investment in affiliated money market mutual fund. The rate shown represents the 7-day yield as of period end. |
Currency Abbreviations:
| AUD | – Australian Dollar |
| CAD | – Canadian Dollar |
| CHF | – Swiss Franc |
| EUR | – Euro |
| GBP | – Great British Pound |
| HKD | – Hong Kong Dollar |
| JPY | – Japanese Yen |
| NOK | – Norwegian Krone |
| NZD | – New Zealand Dollar |
| RUB | – Russian Ruble |
| SEK | – Swedish Krona |
| USD | – United States Dollar |
Glossary:
| ADR | – American Depositary Receipt |
| OJSC | – Open Joint Stock Company |
| PJSC | – Public Joint Stock Company |
| REG | – Registered Shares |
See notes to financial statements.
| ALLIANCEBERNSTEIN WEALTH STRATEGIES • | 105 |
International Value Portfolio—Portfolio of Investments
INTERNATIONAL GROWTH PORTFOLIO
PORTFOLIO OF INVESTMENTS
February 28, 2014 (unaudited)
| Company | Shares | U.S. $ Value | ||||||
| ||||||||
COMMON STOCKS – 99.6% | ||||||||
Financials – 28.2% | ||||||||
Capital Markets – 3.9% | ||||||||
Daiwa Securities Group, Inc. | 945,000 | $ | 8,551,946 | |||||
UBS AG (REG)(a) | 1,422,273 | 30,426,628 | ||||||
|
| |||||||
| 38,978,574 | ||||||||
|
| |||||||
Commercial Banks – 2.2% | ||||||||
Grupo Financiero Banorte SAB de CV – Class O | 619,550 | 4,010,962 | ||||||
HDFC Bank Ltd. | 691,340 | 7,471,897 | ||||||
Sberbank of Russia (Sponsored ADR) | 1,053,844 | 10,717,594 | ||||||
|
| |||||||
| 22,200,453 | ||||||||
|
| |||||||
Consumer Finance – 1.4% | ||||||||
Muthoot Finance Ltd. | 2,051,429 | 5,471,843 | ||||||
Shriram Transport Finance Co., Ltd. | 924,410 | 8,796,233 | ||||||
|
| |||||||
| 14,268,076 | ||||||||
|
| |||||||
Diversified Financial Services – 0.7% | ||||||||
IG Group Holdings PLC | 697,400 | 7,389,241 | ||||||
|
| |||||||
Insurance – 11.2% | ||||||||
Admiral Group PLC | 1,236,914 | 29,695,429 | ||||||
AIA Group Ltd. | 4,365,200 | 21,387,474 | ||||||
BB Seguridade Participacoes SA | 1,389,300 | 13,805,604 | ||||||
Lancashire Holdings Ltd. | 1,428,462 | 17,545,558 | ||||||
Prudential PLC | 1,309,090 | 29,641,388 | ||||||
|
| |||||||
| 112,075,453 | ||||||||
|
| |||||||
Real Estate Investment Trusts | ||||||||
GLP J-Reit(b) | 5,349 | 5,646,739 | ||||||
|
| |||||||
Real Estate Management & | ||||||||
Daito Trust Construction Co., Ltd. | 177,600 | 16,552,283 | ||||||
Global Logistic Properties Ltd. | 10,595,000 | 23,692,473 | ||||||
Hang Lung Properties Ltd. | 5,184,000 | 14,459,473 | ||||||
Mitsubishi Estate Co., Ltd. | 304,000 | 7,210,283 | ||||||
|
| |||||||
| 61,914,512 | ||||||||
|
| |||||||
Thrifts & Mortgage Finance – 2.0% | ||||||||
Housing Development Finance Corp. | 1,480,030 | 19,529,081 | ||||||
|
| |||||||
| 282,002,129 | ||||||||
|
| |||||||
Consumer Discretionary – 22.2% | ||||||||
Automobiles – 5.8% | ||||||||
Hyundai Motor Co. (Preference Shares) | 106,960 | 13,835,416 | ||||||
Nissan Motor Co., Ltd. | 931,600 | 8,315,120 | ||||||
Toyota Motor Corp. | 626,900 | 36,080,025 | ||||||
|
| |||||||
| 58,230,561 | ||||||||
|
| |||||||
| 106 | • ALLIANCEBERNSTEIN WEALTH STRATEGIES |
International Growth Portfolio—Portfolio of Investments
| Company | Shares | U.S. $ Value | ||||||
| ||||||||
Diversified Consumer Services – 3.9% | ||||||||
Anhanguera Educacional Participacoes SA | 802,400 | $ | 4,493,235 | |||||
Estacio Participacoes SA | 1,914,400 | 18,043,817 | ||||||
Kroton Educacional SA | 864,100 | 16,104,561 | ||||||
|
| |||||||
| 38,641,613 | ||||||||
|
| |||||||
Hotels, Restaurants & Leisure – 3.4% | ||||||||
Ajisen China Holdings Ltd.(b) | 5,579,800 | 6,148,129 | ||||||
Merlin Entertainments PLC(a)(c) | 902,055 | 5,483,250 | ||||||
Sodexo | 212,796 | 22,666,302 | ||||||
|
| |||||||
| 34,297,681 | ||||||||
|
| |||||||
Specialty Retail – 3.2% | ||||||||
Belle International Holdings Ltd. | 8,288,000 | 10,220,902 | ||||||
L’Occitane International SA(b) | 1,285,750 | 2,831,467 | ||||||
Sports Direct International PLC(a) | 1,286,991 | 17,362,871 | ||||||
Zhongsheng Group Holdings Ltd.(b) | 1,343,000 | 1,944,536 | ||||||
|
| |||||||
| 32,359,776 | ||||||||
|
| |||||||
Textiles, Apparel & Luxury Goods – 5.9% | ||||||||
Cie Financiere Richemont SA | 203,640 | 20,230,671 | ||||||
Hugo Boss AG | 71,575 | 9,521,586 | ||||||
Li & Fung Ltd. | 15,294,000 | 20,020,138 | ||||||
LVMH Moet Hennessy Louis Vuitton SA | 9,720 | 1,797,337 | ||||||
Prada SpA | 295,300 | 2,221,724 | ||||||
Samsonite International SA | 1,687,700 | 4,634,097 | ||||||
|
| |||||||
| 58,425,553 | ||||||||
|
| |||||||
| 221,955,184 | ||||||||
|
| |||||||
Consumer Staples – 20.3% | ||||||||
Beverages – 3.6% | ||||||||
Anheuser-Busch InBev NV | 72,270 | 7,559,012 | ||||||
Diageo PLC | 680,230 | 21,360,596 | ||||||
SABMiller PLC (London) | 143,660 | 7,035,248 | ||||||
|
| |||||||
| 35,954,856 | ||||||||
|
| |||||||
Food & Staples Retailing – 4.6% | ||||||||
Jeronimo Martins SGPS SA(b) | 609,598 | 10,335,372 | ||||||
Lenta Ltd. (GDR)(a)(c) | 867,581 | 8,675,810 | ||||||
Magnit OJSC (Sponsored GDR)(c) | 16,130 | 903,280 | ||||||
Olam International Ltd. | 16,840,370 | 23,610,567 | ||||||
Tsuruha Holdings, Inc. | 25,700 | 2,394,882 | ||||||
|
| |||||||
| 45,919,911 | ||||||||
|
| |||||||
Food Products – 0.2% | ||||||||
Unilever PLC | 61,916 | 2,532,366 | ||||||
|
| |||||||
Household Products – 3.2% | ||||||||
Henkel AG & Co. KGaA | 231,983 | 23,433,228 | ||||||
LG Household & Health Care Ltd. | 20,120 | 8,625,354 | ||||||
|
| |||||||
| 32,058,582 | ||||||||
|
| |||||||
| ALLIANCEBERNSTEIN WEALTH STRATEGIES • | 107 |
International Growth Portfolio—Portfolio of Investments
| Company | Shares | U.S. $ Value | ||||||
| ||||||||
Tobacco – 8.7% | ||||||||
British American Tobacco PLC | 831,159 | $ | 45,307,640 | |||||
Japan Tobacco, Inc. | 1,296,700 | 41,299,544 | ||||||
|
| |||||||
| 86,607,184 | ||||||||
|
| |||||||
| 203,072,899 | ||||||||
|
| |||||||
Industrials – 15.1% | ||||||||
Aerospace & Defense – 0.2% | ||||||||
Zodiac Aerospace | 51,550 | 1,816,118 | ||||||
|
| |||||||
Commercial Services & Supplies – 2.9% | ||||||||
Babcock International Group PLC | 682,920 | 16,812,907 | ||||||
Edenred | 379,374 | 12,171,166 | ||||||
|
| |||||||
| 28,984,073 | ||||||||
|
| |||||||
Industrial Conglomerates – 0.3% | ||||||||
Alliance Global Group, Inc. | 4,424,500 | 2,985,076 | ||||||
|
| |||||||
Machinery – 1.1% | ||||||||
Komatsu Ltd. | 518,200 | 10,957,175 | ||||||
|
| |||||||
Professional Services – 10.0% | ||||||||
Bureau Veritas SA | 891,168 | 24,528,110 | ||||||
Capita PLC | 1,183,230 | 22,582,569 | ||||||
Intertek Group PLC | 798,259 | 39,264,621 | ||||||
SGS SA | 5,479 | 13,557,916 | ||||||
|
| |||||||
| 99,933,216 | ||||||||
|
| |||||||
Road & Rail – 0.6% | ||||||||
Globaltrans Investment PLC | 504,251 | 6,550,221 | ||||||
|
| |||||||
| 151,225,879 | ||||||||
|
| |||||||
Information Technology – 4.9% | ||||||||
Internet Software & Services – 1.7% | ||||||||
Baidu, Inc. (Sponsored ADR)(a) | 27,633 | 4,723,309 | ||||||
Telecity Group PLC | 1,104,907 | 12,197,548 | ||||||
|
| |||||||
| 16,920,857 | ||||||||
|
| |||||||
IT Services – 0.8% | ||||||||
HCL Technologies Ltd. | 140,730 | 3,584,002 | ||||||
Tata Consultancy Services Ltd. | 137,050 | 5,028,276 | ||||||
|
| |||||||
| 8,612,278 | ||||||||
|
| |||||||
Semiconductors & Semiconductor | ||||||||
Samsung Electronics Co., Ltd. | 18,933 | 18,869,384 | ||||||
Taiwan Semiconductor Manufacturing Co., Ltd. | 844,000 | 3,044,563 | ||||||
|
| |||||||
| 21,913,947 | ||||||||
|
| |||||||
| 108 | • ALLIANCEBERNSTEIN WEALTH STRATEGIES |
International Growth Portfolio—Portfolio of Investments
| Company | Shares | U.S. $ Value | ||||||
| ||||||||
Software – 0.2% | ||||||||
Dassault Systemes | 16,580 | $ | 1,905,894 | |||||
|
| |||||||
| 49,352,976 | ||||||||
|
| |||||||
Materials – 3.4% | ||||||||
Chemicals – 2.2% | ||||||||
Essentra PLC | 1,487,640 | 22,148,743 | ||||||
|
| |||||||
Construction Materials – 0.2% | ||||||||
Grasim Industries Ltd. (GDR)(c) | 47,846 | 1,959,863 | ||||||
|
| |||||||
Metals & Mining – 1.0% | ||||||||
BHP Billiton PLC | 313,320 | 10,097,312 | ||||||
|
| |||||||
| 34,205,918 | ||||||||
|
| |||||||
Health Care – 2.2% | ||||||||
Life Sciences Tools & Services – 1.4% | ||||||||
Eurofins Scientific SE | 47,273 | 13,795,798 | ||||||
|
| |||||||
Pharmaceuticals – 0.8% | ||||||||
Lupin Ltd. | 13,268 | 213,661 | ||||||
Sun Pharmaceutical Industries Ltd. | 772,007 | 8,057,357 | ||||||
|
| |||||||
| 8,271,018 | ||||||||
|
| |||||||
| 22,066,816 | ||||||||
|
| |||||||
Energy – 1.7% | ||||||||
Oil, Gas & Consumable Fuels – 1.7% | ||||||||
BG Group PLC | 528,451 | 9,614,494 | ||||||
NovaTek OAO (Sponsored GDR)(c) | 35,200 | 4,456,320 | ||||||
Petroleo Brasileiro SA (Sponsored ADR) | 250,980 | 2,926,427 | ||||||
|
| |||||||
| 16,997,241 | ||||||||
|
| |||||||
Utilities – 1.6% | ||||||||
Independent Power Producers & Energy Traders – 1.6% | ||||||||
APR Energy PLC | 1,114,141 | 16,138,183 | ||||||
|
| |||||||
Total Common Stocks | 997,017,225 | |||||||
|
| |||||||
WARRANTS – 0.3% | ||||||||
Industrials – 0.2% | ||||||||
Industrial Conglomerates – 0.2% | ||||||||
John Keells Holdings PLC, Deutsche Bank AG London, expiring 7/05/19(a) | 1,241,384 | 2,127,545 | ||||||
|
| |||||||
Consumer Staples – 0.1% | ||||||||
Food & Staples Retailing – 0.1% | ||||||||
Olam International Ltd., expiring 1/29/18(a) | 2,775,012 | 777,003 | ||||||
|
| |||||||
Total Warrants | 2,904,548 | |||||||
|
| |||||||
| ALLIANCEBERNSTEIN WEALTH STRATEGIES • | 109 |
International Growth Portfolio—Portfolio of Investments
| Company | Shares | U.S. $ Value | ||||||
| ||||||||
SHORT-TERM INVESTMENTS – 0.4% | ||||||||
Investment Companies – 0.4% | ||||||||
AllianceBernstein Fixed-Income Shares, Inc. – Government STIF Portfolio, 0.08%(d) | 3,461,155 | $ | 3,461,155 | |||||
|
| |||||||
Total Investments Before Security Lending Collateral for Securities Loaned – 100.3% | 1,003,382,928 | |||||||
|
| |||||||
INVESTMENTS OF CASH COLLATERAL FOR SECURITIES LOANED – 1.1% | ||||||||
Investment Companies – 1.1% | ||||||||
AllianceBernstein Exchange Reserves – Class I, 0.07%(d) | 11,139,093 | 11,139,093 | ||||||
|
| |||||||
Total Investments – 101.4% | 1,014,522,021 | |||||||
Other assets less liabilities – (1.4)% | (13,642,382 | ) | ||||||
|
| |||||||
Net Assets – 100.0% | $ | 1,000,879,639 | ||||||
|
| |||||||
FORWARD CURRENCY EXCHANGE CONTRACTS (see Note C)
| Counterparty | Contracts to Deliver (000) | In Exchange For (000) | Settlement Date | Unrealized Appreciation/ (Depreciation) | ||||||||||||||||||||
Barclays Bank PLC | JPY | 7,386,284 | USD | 71,585 | 3/18/14 | $ | (998,354 | ) | ||||||||||||||||
Barclays Bank PLC | USD | 26,435 | CHF | 23,645 | 3/18/14 | 452,310 | ||||||||||||||||||
Barclays Bank PLC | USD | 5,981 | NOK | 36,863 | 3/18/14 | 157,623 | ||||||||||||||||||
Barclays Bank PLC | USD | 21,380 | SEK | 139,715 | 3/18/14 | 405,886 | ||||||||||||||||||
BNP Paribas SA | USD | 5,611 | AUD | 6,213 | 3/18/14 | (72,110 | ) | |||||||||||||||||
Goldman Sachs Bank USA | GBP | 6,903 | USD | 11,288 | 3/18/14 | (269,734 | ) | |||||||||||||||||
Goldman Sachs Bank USA | HKD | 403,995 | USD | 52,116 | 3/18/14 | 56,453 | ||||||||||||||||||
Goldman Sachs Bank USA | USD | 13,369 | EUR | 9,774 | 3/18/14 | 121,675 | ||||||||||||||||||
Royal Bank of Scotland PLC | GBP | 57,075 | USD | 93,587 | 3/18/14 | (1,977,641 | ) | |||||||||||||||||
Royal Bank of Scotland PLC | USD | 67,945 | CAD | 72,447 | 3/18/14 | (2,541,084 | ) | |||||||||||||||||
Standard Chartered Bank | USD | 12,769 | HKD | 99,001 | 3/18/14 | (11,775 | ) | |||||||||||||||||
Standard Chartered Bank | USD | 18,512 | SGD | 23,127 | 3/18/14 | (268,277 | ) | |||||||||||||||||
State Street Bank & Trust Co. | CHF | 4,721 | USD | 5,274 | 3/18/14 | (94,072 | ) | |||||||||||||||||
State Street Bank & Trust Co. | EUR | 4,561 | USD | 6,235 | 3/18/14 | (60,328 | ) | |||||||||||||||||
State Street Bank & Trust Co. | SGD | 4,868 | USD | 3,841 | 3/18/14 | 410 | ||||||||||||||||||
State Street Bank & Trust Co. | USD | 5,196 | GBP | 3,154 | 3/18/14 | 85,047 | ||||||||||||||||||
State Street Bank & Trust Co. | USD | 3,249 | CAD | 3,597 | 6/18/14 | (8,999 | ) | |||||||||||||||||
UBS AG | GBP | 6,554 | USD | 10,422 | 3/18/14 | (552,272 | ) | |||||||||||||||||
|
| |||||||||||||||||||||||
| $ | (5,575,242 | ) | ||||||||||||||||||||||
|
| |||||||||||||||||||||||
| 110 | • ALLIANCEBERNSTEIN WEALTH STRATEGIES |
International Growth Portfolio—Portfolio of Investments
| (a) | Non-income producing security. |
| (b) | Represents entire or partial securities out on loan. See Note D for securities lending information. |
| (c) | Security is exempt from registration under Rule 144A of the Securities Act of 1933. These securities are considered liquid and may be resold in transactions exempt from registration, normally to qualified institutional buyers. At February 28, 2014, the aggregate market value of these securities amounted to $28,028,744 or 2.8% of net assets. |
| (d) | Investment in affiliated money market mutual fund. The rate shown represents the 7-day yield as of period end. |
Currency Abbreviations:
AUD – Australian Dollar
CAD – Canadian Dollar
CHF – Swiss Franc
EUR – Euro
GBP – Great British Pound
HKD – Hong Kong Dollar
JPY – Japanese Yen
NOK – Norwegian Krone
SEK – Swedish Krona
SGD – Singapore Dollar
USD – United States Dollar
Glossary:
ADR – American Depositary Receipt
GDR – Global Depositary Receipt
OJSC – Open Joint Stock Company
REG – Registered Shares
See notes to financial statements.
| ALLIANCEBERNSTEIN WEALTH STRATEGIES • | 111 |
International Growth Portfolio—Portfolio of Investments
SHORT DURATION BOND PORTFOLIO
PORTFOLIO OF INVESTMENTS
February 28, 2014 (unaudited)
| Principal Amount (000) | U.S. $ Value | |||||||||
| ||||||||||
GOVERNMENTS - TREASURIES – 27.8% | ||||||||||
Australia – 2.0% | ||||||||||
Australia Government Bond | AUD | 20,395 | $ | 19,035,554 | ||||||
|
| |||||||||
United States – 25.8% | ||||||||||
U.S. Treasury Notes | U.S.$ | 115,406 | 115,378,995 | |||||||
0.25%, 9/30/14-5/31/15 | 113,369 | 113,479,511 | ||||||||
0.75%, 10/31/17 | 2,070 | 2,050,594 | ||||||||
1.375%, 6/30/18 | 17,685 | 17,752,698 | ||||||||
|
| |||||||||
| 248,661,798 | ||||||||||
|
| |||||||||
Total Governments – Treasuries | 267,697,352 | |||||||||
|
| |||||||||
COMMERCIAL MORTGAGE-BACKED SECURITIES – 17.2% | ||||||||||
Non-Agency Fixed Rate CMBS – 16.2% | ||||||||||
Banc of America Commercial Mortgage Trust | 3,094 | 3,373,103 | ||||||||
Citigroup Commercial Mortgage Trust | 716 | 777,357 | ||||||||
Commercial Mortgage Pass Through Certificates | 6,161 | 6,337,397 | ||||||||
Series 2012-CR3, Class A1 | 2,839 | 2,825,901 | ||||||||
Series 2012-CR4, Class A1 | 3,002 | 2,989,244 | ||||||||
Series 2012-CR5, Class A1 | 2,273 | 2,261,873 | ||||||||
Series 2013-CR12, Class A2 | 5,000 | 5,200,241 | ||||||||
Series 2013-CR6, Class A1 | 3,902 | 3,881,684 | ||||||||
Series 2013-CR9, Class A2 | 3,046 | 3,190,302 | ||||||||
Series 2013-LC6, Class A1 | 1,853 | 1,840,817 | ||||||||
DBUBS Mortgage Trust | 5,305 | 5,565,857 | ||||||||
| 112 | • ALLIANCEBERNSTEIN WEALTH STRATEGIES |
Short Duration Bond Portfolio—Portfolio of Investments
| Principal Amount (000) | U.S. $ Value | |||||||||
| ||||||||||
GS Mortgage Securities Corp. II | U.S.$ | 3,366 | $ | 3,348,731 | ||||||
Series 2013-GC10, Class A1 | 2,213 | 2,203,569 | ||||||||
GS Mortgage Securities Trust | 2,187 | 2,126,223 | ||||||||
Series 2013-GC14, Class A1 | 2,256 | 2,264,377 | ||||||||
JP Morgan Chase Commercial Mortgage Securities Corp. | 1,072 | 1,066,054 | ||||||||
JP Morgan Chase Commercial Mortgage Securities Trust | 3,099 | 3,130,485 | ||||||||
Series 2007-CB18, Class A1A | 4,685 | 5,159,479 | ||||||||
Series 2007-CB20, Class A1A | 4,186 | 4,709,926 | ||||||||
Series 2007-LDPX, Class A1A | 4,803 | 5,315,342 | ||||||||
Series 2010-C1, Class A1 | 3,946 | 4,070,265 | ||||||||
Series 2010-C2, Class A1 | 1,539 | 1,578,496 | ||||||||
Series 2011-C3, Class A1 | 1,326 | 1,330,666 | ||||||||
Series 2011-C4, Class A1 | 316 | 316,158 | ||||||||
Series 2012-CBX, Class A1 | 2,845 | 2,847,005 | ||||||||
Series 2013-C10, Class A1 | 2,087 | 2,072,972 | ||||||||
Series 2013-C16, Class A2 | 4,682 | 4,889,898 | ||||||||
Series 2013-LC11, Class A2 | 4,895 | 4,898,324 | ||||||||
JPMBB Commercial Mortgage Securities Trust | 3,998 | 3,994,622 | ||||||||
Series 2013-C15, Class A2 | 4,720 | 4,915,040 | ||||||||
| ALLIANCEBERNSTEIN WEALTH STRATEGIES • | 113 |
Short Duration Bond Portfolio—Portfolio of Investments
| Principal Amount (000) | U.S. $ Value | |||||||||
| ||||||||||
Merrill Lynch Mortgage Trust | U.S.$ | 1,029 | $ | 1,029,115 | ||||||
Series 2006-C2, Class A1A | 1,590 | 1,741,734 | ||||||||
ML-CFC Commercial Mortgage Trust | 5,951 | 6,503,532 | ||||||||
Morgan Stanley Bank of America Merrill Lynch Trust | 3,701 | 3,684,385 | ||||||||
Series 2013-C8, Class A1 | 3,740 | 3,720,468 | ||||||||
Morgan Stanley Capital I Trust | 3,613 | 4,072,392 | ||||||||
Series 2011-C1, Class A1 | 3,018 | 3,066,791 | ||||||||
UBS-Barclays Commercial Mortgage Trust | 2,568 | 2,554,399 | ||||||||
Series 2013-C5, Class A1 | 3,899 | 3,880,187 | ||||||||
Wachovia Bank Commercial Mortgage Trust | 3,976 | 4,344,398 | ||||||||
Wells Fargo Commercial Mortgage Trust | 3,649 | 3,640,186 | ||||||||
WF-RBS Commercial Mortgage Trust | 1,225 | 1,240,670 | ||||||||
Series 2012-C10, Class A1 | 4,371 | 4,362,975 | ||||||||
Series 2012-C9, Class A1 | 3,633 | 3,622,038 | ||||||||
Series 2013-C11, Class A1 | 1,947 | 1,939,080 | ||||||||
Series 2013-C12, Class A1 | 2,700 | 2,677,317 | ||||||||
Series 2013-C17, Class A2 | 4,790 | 4,959,250 | ||||||||
|
| |||||||||
| 155,520,325 | ||||||||||
|
| |||||||||
| 114 | • ALLIANCEBERNSTEIN WEALTH STRATEGIES |
Short Duration Bond Portfolio—Portfolio of Investments
| Principal Amount (000) | U.S. $ Value | |||||||||
| ||||||||||
Non-Agency Floating Rate CMBS – 0.7% | ||||||||||
Commercial Mortgage Trust | U.S.$ | 2,298 | $ | 2,232,464 | ||||||
Credit Suisse Mortgage Capital Certificates | 4,900 | 4,874,192 | ||||||||
|
| |||||||||
| 7,106,656 | ||||||||||
|
| |||||||||
Agency CMBS – 0.3% | ||||||||||
NCUA Guaranteed Notes Trust | 3,195 | 3,219,780 | ||||||||
|
| |||||||||
Total Commercial Mortgage-Backed Securities | 165,846,761 | |||||||||
|
| |||||||||
CORPORATES - INVESTMENT | ||||||||||
Financial Institutions – 9.3% | ||||||||||
Banking – 7.0% | ||||||||||
Abbey National Treasury Services PLC/London | 3,145 | 3,346,356 | ||||||||
American Express Credit Corp. | 3,340 | 3,374,399 | ||||||||
Australia & New Zealand Banking Group Ltd./New York NY | 3,300 | 3,315,504 | ||||||||
Bank of America Corp. | 3,220 | 3,241,487 | ||||||||
Bank of New York Mellon Corp. (The) | 3,330 | 3,338,501 | ||||||||
BB&T Corp. | 3,350 | 3,383,453 | ||||||||
Capital One Bank USA NA | 3,355 | 3,360,237 | ||||||||
Citigroup, Inc. | 3,335 | 3,355,537 | ||||||||
Fifth Third Bancorp | 3,175 | 3,342,465 | ||||||||
Goldman Sachs Group, Inc. (The) | 3,080 | 3,233,809 | ||||||||
Huntington National Bank (The) | 3,355 | 3,366,465 | ||||||||
ING Bank NV | 3,310 | 3,324,895 | ||||||||
| ALLIANCEBERNSTEIN WEALTH STRATEGIES • | 115 |
Short Duration Bond Portfolio—Portfolio of Investments
| Principal Amount (000) | U.S. $ Value | |||||||||
| ||||||||||
JPMorgan Chase & Co. | U.S.$ | 3,290 | $ | 3,309,174 | ||||||
KeyBank NA/Cleveland OH | 1,847 | 1,845,486 | ||||||||
Manufacturers & Traders Trust Co. | 3,315 | 3,273,736 | ||||||||
Morgan Stanley | 1,988 | 2,021,923 | ||||||||
PNC Funding Corp. | 3,130 | 3,263,779 | ||||||||
Royal Bank of Canada | 3,335 | 3,345,932 | ||||||||
Royal Bank of Scotland Group PLC | 3,280 | 3,356,017 | ||||||||
SunTrust Bank/Atlanta GA | 3,330 | 3,325,078 | ||||||||
US Bancorp/MN | 3,355 | 3,353,477 | ||||||||
|
| |||||||||
| 67,077,710 | ||||||||||
|
| |||||||||
Finance – 0.5% | ||||||||||
General Electric Capital Corp. | 4,740 | 4,785,812 | ||||||||
|
| |||||||||
Insurance – 1.8% | ||||||||||
American International Group, Inc. | 3,225 | 3,308,086 | ||||||||
Berkshire Hathaway, Inc. | 3,315 | 3,321,080 | ||||||||
MetLife Institutional Funding II | 4,500 | 4,512,343 | ||||||||
New York Life Global Funding | 3,315 | 3,330,216 | ||||||||
Prudential Financial, Inc. | 3,075 | 3,263,851 | ||||||||
|
| |||||||||
| 17,735,576 | ||||||||||
|
| |||||||||
| 89,599,098 | ||||||||||
|
| |||||||||
Industrial – 7.3% | ||||||||||
Basic – 0.4% | ||||||||||
Monsanto Co. | 3,355 | 3,361,264 | ||||||||
|
| |||||||||
Capital Goods – 0.6% | ||||||||||
Caterpillar Financial Services Corp. | 3,360 | 3,359,425 | ||||||||
Eaton Corp. | 2,469 | 2,470,946 | ||||||||
|
| |||||||||
| 5,830,371 | ||||||||||
|
| |||||||||
| 116 | • ALLIANCEBERNSTEIN WEALTH STRATEGIES |
Short Duration Bond Portfolio—Portfolio of Investments
| Principal Amount (000) | U.S. $ Value | |||||||||
| ||||||||||
Communications - Media – 0.4% | ||||||||||
NBCUniversal Enterprise, Inc. | U.S.$ | 3,795 | $ | 3,805,201 | ||||||
|
| |||||||||
Communications - Telecommunications – 1.4% | ||||||||||
AT&T, Inc. | 2,365 | 2,372,925 | ||||||||
1.40%, 12/01/17 | 3,320 | 3,296,475 | ||||||||
Verizon Communications, Inc. | 1,685 | 1,693,629 | ||||||||
1.95%, 3/28/14 | 3,130 | 3,133,308 | ||||||||
Vodafone Group PLC | 3,310 | 3,289,875 | ||||||||
|
| |||||||||
| 13,786,212 | ||||||||||
|
| |||||||||
Consumer Cyclical - Automotive – 0.8% | ||||||||||
Daimler Finance North America LLC | 4,430 | 4,462,007 | ||||||||
Volkswagen International Finance NV | 3,350 | 3,356,187 | ||||||||
|
| |||||||||
| 7,818,194 | ||||||||||
|
| |||||||||
Consumer Cyclical - Retailers – 0.2% | ||||||||||
Wal-Mart Stores, Inc. | 2,375 | 2,379,192 | ||||||||
|
| |||||||||
Consumer Non-Cyclical – 2.4% | ||||||||||
AbbVie, Inc. | 3,280 | 3,303,780 | ||||||||
Allergan, Inc./United States | 1,540 | 1,519,595 | ||||||||
Eli Lilly & Co. | 2,845 | 2,845,304 | ||||||||
Gilead Sciences, Inc. | 3,085 | 3,259,253 | ||||||||
McKesson Corp. | 1,298 | 1,302,600 | ||||||||
Merck & Co., Inc. | 4,805 | 4,746,288 | ||||||||
PepsiCo, Inc. | 3,315 | 3,314,652 | ||||||||
Sanofi | 2,445 | 2,447,218 | ||||||||
|
| |||||||||
| 22,738,690 | ||||||||||
|
| |||||||||
Energy – 0.7% | ||||||||||
BP Capital Markets PLC | 3,290 | 3,301,725 | ||||||||
Chevron Corp. | 3,305 | 3,296,308 | ||||||||
|
| |||||||||
| 6,598,033 | ||||||||||
|
| |||||||||
| ALLIANCEBERNSTEIN WEALTH STRATEGIES • | 117 |
Short Duration Bond Portfolio—Portfolio of Investments
| Principal Amount (000) | U.S. $ Value | |||||||||
| ||||||||||
Technology – 0.4% | ||||||||||
Cisco Systems, Inc. | U.S.$ | 3,360 | $ | 3,367,994 | ||||||
|
| |||||||||
| 69,685,151 | ||||||||||
|
| |||||||||
Utility – 0.3% | ||||||||||
Natural Gas – 0.3% | ||||||||||
TransCanada PipeLines Ltd. | 3,290 | 3,292,708 | ||||||||
|
| |||||||||
Total Corporates – Investment Grades | 162,576,957 | |||||||||
|
| |||||||||
ASSET-BACKED SECURITIES – 15.9% | ||||||||||
Autos - Fixed Rate – 8.3% | ||||||||||
Ally Auto Receivables Trust | 2,415 | 2,482,795 | ||||||||
Series 2013-SN1, Class A3 | 3,744 | 3,752,747 | ||||||||
Ally Master Owner Trust | 945 | 948,590 | ||||||||
Series 2014-1, Class A2 | 3,293 | 3,292,251 | ||||||||
AmeriCredit Automobile Receivables Trust | 3,615 | 3,753,223 | ||||||||
Series 2012-2, Class A3 | 3,560 | 3,568,946 | ||||||||
Series 2013-1, Class A2 | 1,061 | 1,061,360 | ||||||||
Series 2013-3, Class A3 | 3,455 | 3,458,884 | ||||||||
Series 2013-4, Class A3 | 1,340 | 1,343,595 | ||||||||
ARI Fleet Lease Trust | 2,164 | 2,163,401 | ||||||||
Avis Budget Rental Car Funding AESOP LLC | 1,730 | 1,747,451 | ||||||||
Series 2013-2A, Class A | 4,101 | 4,233,676 | ||||||||
Bank of America Auto Trust | 1,650 | 1,663,083 | ||||||||
Series 2012-1, Class C | 2,960 | 3,029,900 | ||||||||
| 118 | • ALLIANCEBERNSTEIN WEALTH STRATEGIES |
Short Duration Bond Portfolio—Portfolio of Investments
| Principal Amount (000) | U.S. $ Value | |||||||||
| ||||||||||
Capital Auto Receivables Asset Trust/Ally | U.S.$ | 1,785 | $ | 1,785,220 | ||||||
CarMax Auto Owner Trust | 2,674 | 2,681,345 | ||||||||
Series 2012-3, Class A2 | 356 | 356,036 | ||||||||
Enterprise Fleet Financing LLC | 841 | 840,993 | ||||||||
Fifth Third Auto Trust | 1,868 | 1,870,556 | ||||||||
Ford Auto Securitization Trust | CAD | 75 | 67,807 | |||||||
Series 2013-R4A, Class A1 | 1,804 | 1,630,067 | ||||||||
Ford Credit Auto Lease Trust | U.S.$ | 427 | 426,593 | |||||||
Ford Credit Floorplan Master Owner Trust | 2,742 | 2,746,369 | ||||||||
Series 2013-1, Class A1 | 1,457 | 1,460,506 | ||||||||
Ford Credit Floorplan Master Owner | 2,300 | 2,299,879 | ||||||||
Hertz Vehicle Financing LLC | 4,270 | 4,228,999 | ||||||||
Hyundai Auto Lease Securitization Trust | 2,509 | 2,513,566 | ||||||||
M&T Bank Auto Receivables Trust | 3,924 | 3,937,893 | ||||||||
Mercedes-Benz Auto Lease Trust | 1,594 | 1,595,722 | ||||||||
Mercedes-Benz Master Owner Trust | 3,854 | 3,865,265 | ||||||||
Navistar Financial Corp. Owner Trust | 204 | 204,173 | ||||||||
| ALLIANCEBERNSTEIN WEALTH STRATEGIES • | 119 |
Short Duration Bond Portfolio—Portfolio of Investments
| Principal Amount (000) | U.S. $ Value | |||||||||||
| ||||||||||||
Santander Drive Auto Receivables Trust | U.S.$ | 229 | $ | 229,297 | ||||||||
Series 2013-4, Class A3 | 2,655 | 2,670,767 | ||||||||||
Series 2013-5, Class A2A | 2,002 | 2,003,092 | ||||||||||
SMART Trust/Australia | 601 | 601,288 | ||||||||||
World Omni Auto Receivables Trust | 2,854 | 2,863,318 | ||||||||||
World Omni Automobile Lease Securitization Trust | 2,843 | 2,849,430 | ||||||||||
|
| |||||||||||
| 80,228,083 | ||||||||||||
|
| |||||||||||
Credit Cards - Fixed Rate – 2.4% | ||||||||||||
American Express Credit Account Master Trust | 4,975 | 4,989,981 | ||||||||||
Chase Issuance Trust | 3,310 | 3,282,740 | ||||||||||
Citibank Credit Card Issuance Trust | 4,015 | 4,324,677 | ||||||||||
Discover Card Execution Note Trust | 1,322 | 1,327,370 | ||||||||||
Discover Card Master Trust | 1,621 | 1,628,982 | ||||||||||
GE Capital Credit Card Master Note Trust | 5,170 | 5,185,872 | ||||||||||
World Financial Network Credit Card Master Trust | 1,540 | 1,545,602 | ||||||||||
Series 2013-A, Class A | 950 | 945,162 | ||||||||||
|
| |||||||||||
| 23,230,386 | ||||||||||||
|
| |||||||||||
| 120 | • ALLIANCEBERNSTEIN WEALTH STRATEGIES |
Short Duration Bond Portfolio—Portfolio of Investments
| Principal Amount (000) | U.S. $ Value | |||||||||||
| ||||||||||||
Credit Cards - Floating Rate – 2.3% | ||||||||||||
Barclays Dryrock Issuance Trust | U.S.$ | 2,074 | $ | 2,074,025 | ||||||||
Cabela’s Master Credit Card Trust | 3,365 | 3,382,183 | ||||||||||
Chase Issuance Trust | 4,632 | 4,646,194 | ||||||||||
Discover Card Execution Note Trust | 1,905 | 1,905,088 | ||||||||||
First National Master Note Trust | 2,006 | 2,006,024 | ||||||||||
Gracechurch Card Funding PLC | EUR | 2,140 | 2,967,717 | |||||||||
Penarth Master Issuer PLC | U.S.$ | 2,796 | 2,796,271 | |||||||||
World Financial Network Credit Card Master Trust | 2,110 | 2,110,074 | ||||||||||
|
| |||||||||||
| 21,887,576 | ||||||||||||
|
| |||||||||||
Other ABS - Fixed Rate – 1.5% | ||||||||||||
CIT Equipment Collateral | 2,328 | 2,329,022 | ||||||||||
CNH Capital Canada Receivables Trust | CAD | 2,663 | 2,405,347 | |||||||||
CNH Equipment Trust | U.S.$ | 1,860 | 1,862,284 | |||||||||
Series 2013-D, Class A4 | 4,975 | 4,984,517 | ||||||||||
GE Equipment Transportation LLC | 2,607 | 2,612,414 | ||||||||||
|
| |||||||||||
| 14,193,584 | ||||||||||||
|
| |||||||||||
Autos - Floating Rate – 1.3% | ||||||||||||
Ally Master Owner Trust | 1,715 | 1,718,807 | ||||||||||
| ALLIANCEBERNSTEIN WEALTH STRATEGIES • | 121 |
Short Duration Bond Portfolio—Portfolio of Investments
| Principal Amount (000) | U.S. $ Value | |||||||||
| ||||||||||
BMW Floorplan Master Owner Trust | U.S.$ | 1,413 | $ | 1,416,533 | ||||||
Ford Credit Floorplan Master Owner Trust | 3,025 | 3,069,534 | ||||||||
GE Dealer Floorplan Master Note Trust | 3,880 | 3,891,427 | ||||||||
Hertz Fleet Lease Funding LP | 2,252 | 2,251,999 | ||||||||
|
| |||||||||
| 12,348,300 | ||||||||||
|
| |||||||||
Home Equity Loans - Fixed Rate – 0.1% | ||||||||||
Credit-Based Asset Servicing and Securitization LLC | 672 | 665,859 | ||||||||
Nationstar NIM Ltd. | 35 | – 0 | – | |||||||
|
| |||||||||
| 665,859 | ||||||||||
|
| |||||||||
Total Asset-Backed Securities | 152,553,788 | |||||||||
|
| |||||||||
MORTGAGE PASS-THROUGHS – 9.9% | ||||||||||
Agency ARMs – 9.5% | ||||||||||
Federal Home Loan Mortgage Corp. 2.045%, 8/01/42(e) | 5,560 | 5,720,745 | ||||||||
2.43%, 7/01/42(e) | 8,862 | 9,047,883 | ||||||||
2.721%, 6/01/37(e) | 7,381 | 7,928,776 | ||||||||
Series 2005 | 2,359 | 2,522,919 | ||||||||
Federal National Mortgage Association 2.131%, 8/01/42(e) | 5,978 | 6,169,643 | ||||||||
2.234%, 8/01/42(e) | 5,443 | 5,629,758 | ||||||||
2.378%, 6/01/42(e) | 4,054 | 4,218,667 | ||||||||
2.397%, 1/01/36(e) | 1,442 | 1,532,329 | ||||||||
2.442%, 5/01/42(e) | 7,213 | 7,516,388 | ||||||||
2.523%, 6/01/42(b) | 4,655 | 4,858,066 | ||||||||
2.643%, 8/01/42(e) | 8,201 | 8,438,436 | ||||||||
2.662%, 8/01/42(e) | 7,739 | 7,966,122 | ||||||||
2.72%, 6/01/42(e) | 9,844 | 10,145,533 | ||||||||
Series 2003 | 584 | 628,520 | ||||||||
| 122 | • ALLIANCEBERNSTEIN WEALTH STRATEGIES |
Short Duration Bond Portfolio—Portfolio of Investments
| Principal Amount (000) | U.S. $ Value | |||||||||
| ||||||||||
Series 2005 | U.S.$ | 3,068 | $ | 3,314,146 | ||||||
2.71%, 10/01/35(e) | 1,904 | 2,038,493 | ||||||||
Series 2006 | 1,473 | 1,584,441 | ||||||||
Series 2007 | 964 | 1,010,217 | ||||||||
Series 2009 | 1,267 | 1,359,513 | ||||||||
|
| |||||||||
| 91,630,595 | ||||||||||
|
| |||||||||
Agency Fixed Rate 15-Year – 0.4% | ||||||||||
Federal Home Loan Mortgage Corp. Gold | 1,863 | 2,031,588 | ||||||||
Federal National Mortgage Association | 25 | 26,139 | ||||||||
Series 2002 | 31 | 32,719 | ||||||||
Series 2005 | 44 | 46,084 | ||||||||
Series 2006 | 1,148 | 1,238,682 | ||||||||
Series 2007 | 304 | 331,361 | ||||||||
|
| |||||||||
| 3,706,573 | ||||||||||
|
| |||||||||
Total Mortgage Pass-Throughs | 95,337,168 | |||||||||
|
| |||||||||
| COLLATERALIZED MORTGAGE OBLIGATIONS – 3.8% | ||||||||||
Agency Floating Rate – 1.4% | ||||||||||
Fannie Mae Whole Loan | 89 | 84,812 | ||||||||
Federal Home Loan Mortgage Corp. | 3,728 | 3,734,836 | ||||||||
Series 4286, Class VF | 4,650 | 4,629,822 | ||||||||
Federal National Mortgage Association | 4,702 | 4,671,095 | ||||||||
|
| |||||||||
| 13,120,565 | ||||||||||
|
| |||||||||
Agency Fixed Rate – 1.1% | ||||||||||
Federal Home Loan Mortgage Corp. | 5,533 | 5,819,874 | ||||||||
| ALLIANCEBERNSTEIN WEALTH STRATEGIES • | 123 |
Short Duration Bond Portfolio—Portfolio of Investments
| Principal Amount (000) | U.S. $ Value | |||||||||
| ||||||||||
Federal National Mortgage Association | U.S.$ | 2,387 | $ | 2,500,932 | ||||||
Series 2011-39, Class DA | 2,004 | 2,076,551 | ||||||||
|
| |||||||||
| 10,397,357 | ||||||||||
|
| |||||||||
Non-Agency Floating Rate – 1.0% | ||||||||||
Connecticut Avenue Securities | 2,640 | 2,671,503 | ||||||||
Federal National Mortgage Association | 1,653 | 1,660,272 | ||||||||
Mortgage Equity Conversion Asset Trust | 2,576 | 2,061,108 | ||||||||
Structured Agency Credit Risk Debt Notes | 3,301 | 3,303,665 | ||||||||
|
| |||||||||
| 9,696,548 | ||||||||||
|
| |||||||||
Non-Agency Fixed Rate – 0.3% | ||||||||||
JP Morgan Mortgage Trust | 3,650 | 3,433,665 | ||||||||
Merrill Lynch Mortgage Investors Trust | 40 | 39,662 | ||||||||
|
| |||||||||
| 3,473,327 | ||||||||||
|
| |||||||||
Total Collateralized Mortgage Obligations | 36,687,797 | |||||||||
|
| |||||||||
INFLATION-LINKED | ||||||||||
United States – 2.0% | ||||||||||
U.S. Treasury Inflation Index | 18,289 | 18,910,410 | ||||||||
|
| |||||||||
GOVERNMENTS - SOVEREIGN AGENCIES – 0.7% | ||||||||||
Netherlands – 0.7% | ||||||||||
Achmea Hypotheekbank NV | 6,456 | 6,467,537 | ||||||||
|
| |||||||||
COVERED BONDS – 0.4% | ||||||||||
DNB Boligkreditt AS | 3,335 | 3,298,649 | ||||||||
|
| |||||||||
| 124 | • ALLIANCEBERNSTEIN WEALTH STRATEGIES |
Short Duration Bond Portfolio—Portfolio of Investments
| Company | Shares | U.S. $ Value | ||||||||
| ||||||||||
SHORT-TERM INVESTMENTS – 5.3% | ||||||||||
Investment Companies – 5.3% | ||||||||||
AllianceBernstein Fixed-Income Shares, Inc. – Government STIF Portfolio, | 51,324,621 | $ | 51,324,621 | |||||||
|
| |||||||||
Total Investments – 99.9% | 960,701,040 | |||||||||
Other assets less liabilities – 0.1% | 1,372,647 | |||||||||
|
| |||||||||
Net Assets – 100.0% | $ | 962,073,687 | ||||||||
|
| |||||||||
FUTURES (see Note C)
| Type | Number of Contracts | Expiration Month | Original Value | Value at February 28, | Unrealized Appreciation/ (Depreciation) | |||||||||||||||
Purchased Contracts |
| |||||||||||||||||||
U.S. T-Note 2Yr (CBT) Futures | 1,094 | June 2014 | $ | 240,493,584 | $ | 240,543,250 | $ | 49,666 | ||||||||||||
Sold Contracts |
| |||||||||||||||||||
U.S. T-Note 5 Yr (CBT) Futures | 412 | June 2014 | �� | 49,245,137 | 49,382,062 | (136,925 | ) | |||||||||||||
U.S. T-Note 10 Yr (CBT) Futures | 81 | June 2014 | 10,048,298 | 10,087,031 | (38,733 | ) | ||||||||||||||
|
| |||||||||||||||||||
| $ | (125,992 | ) | ||||||||||||||||||
|
| |||||||||||||||||||
FORWARD CURRENCY EXCHANGE CONTRACTS (see Note C)
| Counterparty | Contracts to Deliver (000) | In Exchange For (000) | Settlement Date | Unrealized Appreciation/ (Depreciation) | ||||||||||||||||||||
BNP Paribas SA | AUD | 203 | USD | 181 | 3/07/14 | $ | (154 | ) | ||||||||||||||||
BNP Paribas SA | CAD | 4,521 | USD | 4,076 | 4/10/14 | (2,928 | ) | |||||||||||||||||
Citibank, NA | AUD | 10,578 | USD | 9,403 | 3/07/14 | (34,489 | ) | |||||||||||||||||
State Street Bank & Trust Co. | AUD | 10,758 | USD | 9,650 | 3/07/14 | 51,647 | ||||||||||||||||||
|
| |||||||||||||||||||||||
| $ | 14,076 | |||||||||||||||||||||||
|
| |||||||||||||||||||||||
CROSS CURRENCY SWAPS (see Note C)
| Counter party | Expiration Date | Pay Currency | Pay Rate | Receive Currency | Receive Rate | Market Value | Upfront Premiums Paid (Received) | Unrealized Appreciation/ (Depreciation) | ||||||||||||||||||||||||
Barclays Bank PLC | 2/15/15 | EUR | | 1 Month EURIBOR Plus a Specified Spread | | USD | | 1 Month LIBOR Plus a Specified Spread | | $ | (125,941 | ) | $ | (1,712 | ) | $ | (124,229 | ) | ||||||||||||||
| ALLIANCEBERNSTEIN WEALTH STRATEGIES • | 125 |
Short Duration Bond Portfolio—Portfolio of Investments
| (a) | Security is exempt from registration under Rule 144A of the Securities Act of 1933. These securities are considered liquid and may be resold in transactions exempt from registration, normally to qualified institutional buyers. At February 28, 2014, the aggregate market value of these securities amounted to $116,890,307 or 12.1% of net assets. |
| (b) | Floating Rate Security. Stated interest rate was in effect at February 28, 2014. |
| (c) | Security is exempt from registration under Rule 144A of the Securities Act of 1933. This security, which represents 0.00% of net assets as of February 28, 2014, is considered illiquid and restricted. |
| Restricted Securities | Acquisition Date | Cost | Market Value | Percentage of Net Assets | ||||||||||||
Nationstar NIM Ltd. Series 2007-A, Class A | 4/04/07 | $ | 35,213 | $ | – 0 | – | 0.00 | % | ||||||||
| (d) | Fair valued by the Adviser. |
| (e) | Variable rate coupon, rate shown as of February 28, 2014. |
| (f) | Investment in affiliated money market mutual fund. The rate shown represents the 7-day yield as of period end. |
Currency Abbreviations:
AUD – Australian Dollar
CAD – Canadian Dollar
EUR – Euro
USD – United States Dollar
Glossary:
| ABS | – Asset-Backed Securities |
| ARMs | – Adjustable Rate Mortgages |
| CBT | – Chicago Board of Trade |
| CMBS | – Commercial Mortgage-Backed Securities |
| EURIBOR | – Euro Interbank Offered Rate |
| LIBOR | – London Interbank Offered Rates |
| NCUA | – National Credit Union Administration |
| TBA | – To Be Announced |
| TIPS | – Treasury Inflation Protected Security |
See notes to financial statements.
| 126 | • ALLIANCEBERNSTEIN WEALTH STRATEGIES |
Short Duration Bond Portfolio—Portfolio of Investments
GLOBAL CORE BOND PORTFOLIO
PORTFOLIO OF INVESTMENTS
February 28, 2014 (unaudited)
| Principal Amount (000) | U.S. $ Value | |||||||||
| ||||||||||
GOVERNMENTS - TREASURIES – 48.5% | ||||||||||
Australia – 4.7% | ||||||||||
Australia Government Bond | AUD | 24,240 | $ | 23,567,138 | ||||||
Series 128 | 13,959 | 14,125,827 | ||||||||
Series 132 | 12,775 | 12,407,734 | ||||||||
|
| |||||||||
| 50,100,699 | ||||||||||
|
| |||||||||
Austria – 2.4% | ||||||||||
Austria Government Bond | EUR | 2,920 | 4,596,759 | |||||||
3.90%, 7/15/20(a) | 13,130 | 21,037,577 | ||||||||
|
| |||||||||
| 25,634,336 | ||||||||||
|
| |||||||||
Belgium – 0.9% | ||||||||||
Belgium Government Bond | 4,875 | 7,939,909 | ||||||||
Series 71 | 750 | 1,131,056 | ||||||||
|
| |||||||||
| 9,070,965 | ||||||||||
|
| |||||||||
Brazil – 1.3% | ||||||||||
Brazil Notas do Tesouro Nacional | BRL | 34,480 | 13,961,551 | |||||||
|
| |||||||||
Canada – 1.4% | ||||||||||
Canadian Government Bond | CAD | 15,395 | 14,517,014 | |||||||
|
| |||||||||
Denmark – 0.4% | ||||||||||
Denmark Government Bond | DKK | 21,530 | 4,484,405 | |||||||
|
| |||||||||
France – 2.2% | ||||||||||
France Government Bond OAT | EUR | 6,495 | 9,819,707 | |||||||
3.25%, 5/25/45(a) | 2,770 | 3,871,007 | ||||||||
3.50%, 4/25/20 | 6,000 | 9,380,855 | ||||||||
|
| |||||||||
| 23,071,569 | ||||||||||
|
| |||||||||
Germany – 7.2% | ||||||||||
Bundesobligation | 34,670 | 49,099,722 | ||||||||
| ALLIANCEBERNSTEIN WEALTH STRATEGIES • | 127 |
Global Core Bond Portfolio—Portfolio of Investments
| Principal Amount (000) | U.S. $ Value | |||||||||
| ||||||||||
Bundesrepublik Deutschland | EUR | 11,380 | $ | 15,717,871 | ||||||
2.25%, 9/04/21 | 2,104 | 3,132,859 | ||||||||
3.25%, 7/04/42 | 1,735 | 2,774,925 | ||||||||
Series 2007 | 3,143 | 5,807,444 | ||||||||
|
| |||||||||
| 76,532,821 | ||||||||||
|
| |||||||||
Italy – 2.0% | ||||||||||
Italy Buoni Poliennali Del Tesoro | 3,455 | 5,067,874 | ||||||||
3.75%, 3/01/21 | 1,515 | 2,219,343 | ||||||||
4.25%, 9/01/19 | 2,245 | 3,411,447 | ||||||||
4.50%, 2/01/20(a) | 1,665 | 2,555,070 | ||||||||
4.75%, 5/01/17-9/01/21 | 4,230 | 6,476,705 | ||||||||
5.00%, 9/01/40(a) | 1,210 | 1,837,363 | ||||||||
|
| |||||||||
| 21,567,802 | ||||||||||
|
| |||||||||
Japan – 6.8% | ||||||||||
Japan Government Ten Year Bond | JPY | 1,447,750 | 15,198,060 | |||||||
Series 332 | 1,040,050 | 10,231,028 | ||||||||
Japan Government Thirty Year Bond | 250,050 | 2,655,992 | ||||||||
Japan Government Twenty Year Bond | 2,053,350 | 23,211,168 | ||||||||
Series 143 | 1,648,700 | 16,744,276 | ||||||||
Series 144 | 460,050 | 4,596,952 | ||||||||
|
| |||||||||
| 72,637,476 | ||||||||||
|
| |||||||||
Mexico – 0.7% | ||||||||||
Mexican Bonos | MXN | 90,175 | 7,088,979 | |||||||
|
| |||||||||
Netherlands – 2.7% | ||||||||||
Netherlands Government Bond | EUR | 1,735 | 2,373,004 | |||||||
4.00%, 7/15/19(a) | 1,340 | 2,140,375 | ||||||||
4.50%, 7/15/17(a) | 15,612 | 24,447,235 | ||||||||
|
| |||||||||
| 28,960,614 | ||||||||||
|
| |||||||||
| 128 | • ALLIANCEBERNSTEIN WEALTH STRATEGIES |
Global Core Bond Portfolio—Portfolio of Investments
| Principal Amount (000) | U.S. $ Value | |||||||||
| ||||||||||
New Zealand – 0.4% | ||||||||||
New Zealand Government Bond | NZD | 4,727 | $ | 4,235,423 | ||||||
|
| |||||||||
Poland – 0.3% | ||||||||||
Poland Government Bond | PLN | 8,150 | 2,969,806 | |||||||
|
| |||||||||
Spain – 1.3% | ||||||||||
Spain Government Bond | EUR | 1,295 | 1,935,893 | |||||||
4.80%, 1/31/24 | 3,425 | 5,251,315 | ||||||||
4.85%, 10/31/20 | 2,520 | 3,919,587 | ||||||||
5.85%, 1/31/22 | 2,000 | 3,286,992 | ||||||||
|
| |||||||||
| 14,393,787 | ||||||||||
|
| |||||||||
Sweden – 0.4% | ||||||||||
Sweden Government Bond | SEK | 24,950 | 4,317,084 | |||||||
|
| |||||||||
United Kingdom – 8.5% | ||||||||||
United Kingdom Gilt | GBP | 6,835 | 11,330,185 | |||||||
1.75%, 1/22/17-9/07/22(a) | 24,250 | 40,015,264 | ||||||||
2.25%, 9/07/23(a) | 2,305 | 3,708,110 | ||||||||
3.75%, 9/07/19(a) | 6,245 | 11,451,250 | ||||||||
4.50%, 12/07/42(a) | 6,993 | 13,923,468 | ||||||||
4.75%, 12/07/30(a) | 5,269 | 10,538,176 | ||||||||
|
| |||||||||
| 90,966,453 | ||||||||||
|
| |||||||||
United States – 4.9% | ||||||||||
U.S. Treasury Bonds | U.S.$ | 1,690 | 1,701,090 | |||||||
4.50%, 2/15/36 | 5,630 | 6,595,894 | ||||||||
4.625%, 2/15/40 | 21,888 | 26,162,511 | ||||||||
5.375%, 2/15/31 | 2,225 | 2,849,391 | ||||||||
U.S. Treasury Notes | 15,430 | 15,444,473 | ||||||||
|
| |||||||||
| 52,753,359 | ||||||||||
|
| |||||||||
Total Governments - Treasuries | 517,264,143 | |||||||||
|
| |||||||||
| ALLIANCEBERNSTEIN WEALTH STRATEGIES • | 129 |
Global Core Bond Portfolio—Portfolio of Investments
| Principal Amount (000) | U.S. $ Value | |||||||||
| ||||||||||
CORPORATES - INVESTMENT | ||||||||||
Industrial – 11.9% | ||||||||||
Basic – 1.4% | ||||||||||
Air Products & Chemicals, Inc. | U.S.$ | 2,067 | $ | 1,947,633 | ||||||
Barrick North America Finance LLC | 1,304 | 1,320,048 | ||||||||
Dow Chemical Co. (The) | 1,640 | 2,121,196 | ||||||||
Freeport-McMoRan Copper & Gold, Inc. | 1,077 | 1,085,400 | ||||||||
Gerdau Trade, Inc. | 2,415 | 2,289,698 | ||||||||
5.75%, 1/30/21(a) | 122 | 126,575 | ||||||||
Glencore Funding LLC | 1,455 | 1,397,018 | ||||||||
Minsur SA | 714 | 735,931 | ||||||||
Rio Tinto Finance USA PLC | 2,220 | 2,115,973 | ||||||||
3.50%, 3/22/22 | 760 | 762,636 | ||||||||
Samarco Mineracao SA | 475 | 435,813 | ||||||||
5.75%, 10/24/23(a) | 960 | 964,800 | ||||||||
|
| |||||||||
| 15,302,721 | ||||||||||
|
| |||||||||
Capital Goods – 0.2% | ||||||||||
Republic Services, Inc. | 85 | 91,048 | ||||||||
5.25%, 11/15/21 | 1,213 | 1,362,866 | ||||||||
|
| |||||||||
| 1,453,914 | ||||||||||
|
| |||||||||
Communications - Media – 2.1% | ||||||||||
21st Century Fox America, Inc. | 890 | 970,196 | ||||||||
6.55%, 3/15/33 | 1,383 | 1,642,943 | ||||||||
CBS Corp. | 1,410 | 1,609,492 | ||||||||
Comcast Cable Communications Holdings, Inc. | 1,906 | 2,713,214 | ||||||||
Comcast Corp. | 965 | 951,830 | ||||||||
DirecTV Holdings LLC/DirecTV Financing Co., Inc. | 1,870 | 1,971,021 | ||||||||
4.75%, 10/01/14 | 1,200 | 1,229,063 | ||||||||
| 130 | • ALLIANCEBERNSTEIN WEALTH STRATEGIES |
Global Core Bond Portfolio—Portfolio of Investments
| Principal Amount (000) | U.S. $ Value | |||||||||
| ||||||||||
Globo Comunicacao e Participacoes SA | U.S.$ | 681 | $ | 709,942 | ||||||
Myriad International Holdings BV | 1,582 | 1,705,237 | ||||||||
Omnicom Group, Inc. | 1,008 | 1,005,490 | ||||||||
Reed Elsevier Capital, Inc. | 2,894 | 3,678,925 | ||||||||
Time Warner Cable, Inc. | 1,837 | 1,919,882 | ||||||||
Time Warner Entertainment Co. LP | 1,305 | 1,715,443 | ||||||||
WPP Finance 2010 | 417 | 445,252 | ||||||||
|
| |||||||||
| 22,267,930 | ||||||||||
|
| |||||||||
Communications - | ||||||||||
American Tower Corp. | 2,750 | 2,991,906 | ||||||||
AT&T, Inc. | 463 | 411,443 | ||||||||
4.45%, 5/15/21 | 1,694 | 1,824,523 | ||||||||
British Telecommunications PLC | 1,215 | 1,235,747 | ||||||||
Deutsche Telekom International Finance BV | 2,586 | 2,577,570 | ||||||||
United States Cellular Corp. | 1,391 | 1,363,008 | ||||||||
Verizon Communications, Inc. | 2,254 | 2,468,869 | ||||||||
6.55%, 9/15/43 | 2,358 | 2,886,621 | ||||||||
|
| |||||||||
| 15,759,687 | ||||||||||
|
| |||||||||
Consumer Cyclical - Automotive – 0.8% | ||||||||||
Harley-Davidson Funding Corp. | 2,465 | 2,561,253 | ||||||||
Nissan Motor Acceptance Corp. | 2,650 | 2,644,625 | ||||||||
Toyota Motor Credit Corp. | 3,270 | 3,335,780 | ||||||||
|
| |||||||||
| 8,541,658 | ||||||||||
|
| |||||||||
Consumer Cyclical - Entertainment – 0.5% | ||||||||||
Time Warner, Inc. | 1,460 | 1,592,010 | ||||||||
7.625%, 4/15/31 | 2,810 | 3,702,982 | ||||||||
|
| |||||||||
| 5,294,992 | ||||||||||
|
| |||||||||
| ALLIANCEBERNSTEIN WEALTH STRATEGIES • | 131 |
Global Core Bond Portfolio—Portfolio of Investments
| Principal Amount (000) | U.S. $ Value | |||||||||
| ||||||||||
Consumer Cyclical - Other – 0.2% | ||||||||||
Wyndham Worldwide Corp. | U.S.$ | 1,620 | $ | 1,639,220 | ||||||
|
| |||||||||
Consumer Cyclical - Retailers – 0.1% | ||||||||||
Macy’s Retail Holdings, Inc. | 1,133 | 1,165,749 | ||||||||
|
| |||||||||
Consumer Non-Cyclical – 1.3% | ||||||||||
Actavis, Inc. | 999 | 959,097 | ||||||||
Ahold Finance USA LLC | 3,105 | 3,823,298 | ||||||||
Alicorp SAA | 1,060 | 983,804 | ||||||||
Bunge Ltd. Finance Corp. | 481 | 507,755 | ||||||||
Kroger Co. (The) | 242 | 242,163 | ||||||||
McKesson Corp. | 1,201 | 1,126,277 | ||||||||
Reynolds American, Inc. | 1,269 | 1,206,153 | ||||||||
Tesco PLC | GBP | 1,300 | 2,474,279 | |||||||
Teva Pharmaceutical Finance Co. BV | U.S.$ | 1,852 | 1,853,150 | |||||||
Thermo Fisher Scientific, Inc. | 955 | 981,464 | ||||||||
|
| |||||||||
| 14,157,440 | ||||||||||
|
| |||||||||
Energy – 1.9% | ||||||||||
Anadarko Petroleum Corp. | 735 | 820,976 | ||||||||
6.45%, 9/15/36 | 877 | 1,040,202 | ||||||||
Nabors Industries, Inc. | 2,590 | 2,638,879 | ||||||||
Noble Energy, Inc. | 2,858 | 3,599,545 | ||||||||
Noble Holding International Ltd. | 251 | 272,927 | ||||||||
Occidental Petroleum Corp. | 2,558 | 2,544,207 | ||||||||
Phillips 66 | 3,940 | 4,157,039 | ||||||||
Reliance Holdings USA, Inc. | 2,345 | 2,442,913 | ||||||||
| 132 | • ALLIANCEBERNSTEIN WEALTH STRATEGIES |
Global Core Bond Portfolio—Portfolio of Investments
| Principal Amount (000) | U.S. $ Value | |||||||||
| ||||||||||
Southwestern Energy Co. | U.S.$ | 823 | $ | 845,096 | ||||||
Weatherford International Ltd./Bermuda | 1,540 | 2,010,162 | ||||||||
|
| |||||||||
| 20,371,946 | ||||||||||
|
| |||||||||
Technology – 1.1% | ||||||||||
Agilent Technologies, Inc. | 505 | 555,653 | ||||||||
Baidu, Inc. | 788 | 785,877 | ||||||||
EMC Corp./MA | 2,675 | 2,646,600 | ||||||||
Hewlett-Packard Co. | 1,503 | 1,524,777 | ||||||||
Motorola Solutions, Inc. | 1,650 | 1,577,372 | ||||||||
7.50%, 5/15/25 | 290 | 352,941 | ||||||||
Telefonaktiebolaget LM Ericsson | 2,995 | 3,079,848 | ||||||||
Total System Services, Inc. | 791 | 787,296 | ||||||||
3.75%, 6/01/23 | 751 | 712,034 | ||||||||
|
| |||||||||
| 12,022,398 | ||||||||||
|
| |||||||||
Transportation - Airlines – 0.3% | ||||||||||
Southwest Airlines Co. | 1,695 | 1,738,407 | ||||||||
5.75%, 12/15/16 | 1,115 | 1,244,871 | ||||||||
|
| |||||||||
| 2,983,278 | ||||||||||
|
| |||||||||
Transportation - Services – 0.5% | ||||||||||
Asciano Finance Ltd. | 2,199 | 2,260,191 | ||||||||
5.00%, 4/07/18(a) | 1,163 | 1,259,227 | ||||||||
Ryder System, Inc. | 930 | 1,039,943 | ||||||||
7.20%, 9/01/15 | 908 | 992,478 | ||||||||
|
| |||||||||
| 5,551,839 | ||||||||||
|
| |||||||||
| 126,512,772 | ||||||||||
|
| |||||||||
Financial Institutions – 10.7% | ||||||||||
Banking – 7.4% | ||||||||||
ABN AMRO Bank NV | 2,655 | 2,667,362 | ||||||||
Bank of America Corp. | ||||||||||
5.875%, 2/07/42 | 2,896 | 3,383,623 | ||||||||
7.625%, 6/01/19 | 1,700 | 2,117,501 | ||||||||
Series L | ||||||||||
5.65%, 5/01/18 | 1,130 | 1,291,627 | ||||||||
| ALLIANCEBERNSTEIN WEALTH STRATEGIES • | 133 |
Global Core Bond Portfolio—Portfolio of Investments
| Principal Amount (000) | U.S. $ Value | |||||||||
| ||||||||||
Barclays Bank PLC | EUR | 1,800 | $ | 3,031,015 | ||||||
BNP Paribas SA | ||||||||||
5.00%, 1/15/21 | U.S.$ | 2,966 | 3,302,074 | |||||||
5.186%, 6/29/15(a) | 846 | 869,265 | ||||||||
BPCE SA | 1,947 | 2,051,164 | ||||||||
Branch Banking & Trust Co. | 2,660 | 2,657,766 | ||||||||
Citigroup, Inc. | ||||||||||
4.50%, 1/14/22 | 3,160 | 3,366,380 | ||||||||
8.50%, 5/22/19 | 790 | 1,017,556 | ||||||||
Compass Bank | 4,989 | 5,280,757 | ||||||||
Cooperatieve Centrale Raiffeisen-Boerenleenbank BA/Netherlands | 1,486 | 1,472,996 | ||||||||
DNB Bank ASA | EUR | 1,675 | 2,667,113 | |||||||
Fifth Third Bancorp | U.S.$ | 1,132 | 1,133,487 | |||||||
Goldman Sachs Group, Inc. (The) | ||||||||||
Series D | ||||||||||
6.00%, 6/15/20 | 920 | 1,068,719 | ||||||||
Series G | ||||||||||
7.50%, 2/15/19 | 2,855 | 3,496,881 | ||||||||
ING Bank NV | 3,020 | 3,225,789 | ||||||||
JPMorgan Chase & Co. | ||||||||||
4.40%, 7/22/20 | 1,335 | 1,453,959 | ||||||||
4.625%, 5/10/21 | 857 | 940,517 | ||||||||
Lloyds Bank PLC | 2,702 | 3,109,691 | ||||||||
Macquarie Bank Ltd. | 651 | 708,939 | ||||||||
Macquarie Group Ltd. | 647 | 699,795 | ||||||||
Morgan Stanley | ||||||||||
Series G | ||||||||||
5.45%, 1/09/17 | 1,615 | 1,796,460 | ||||||||
5.50%, 7/24/20 | 2,455 | 2,795,180 | ||||||||
Murray Street Investment Trust I | 272 | 294,799 | ||||||||
Nationwide Building Society | 3,415 | 3,988,037 | ||||||||
Nordea Bank AB | 2,990 | 3,143,545 | ||||||||
| 134 | • ALLIANCEBERNSTEIN WEALTH STRATEGIES |
Global Core Bond Portfolio—Portfolio of Investments
| Principal Amount (000) | U.S. $ Value | |||||||||
| ||||||||||
Rabobank Capital Funding Trust III | U.S.$ | 605 | $ | 636,763 | ||||||
Skandinaviska Enskilda Banken AB | 430 | 438,600 | ||||||||
Standard Chartered Bank Hong Kong Ltd. | 724 | 801,720 | ||||||||
Standard Chartered PLC | 2,214 | 2,260,051 | ||||||||
State Street Corp. | 1,060 | 1,085,177 | ||||||||
Sumitomo Mitsui Banking Corp. | 1,377 | 1,330,981 | ||||||||
Svenska Handelsbanken AB | 3,000 | 3,137,400 | ||||||||
Turkiye Halk Bankasi AS | 1,624 | 1,457,540 | ||||||||
UBS AG/Stamford CT | 2,889 | 3,626,579 | ||||||||
Unicredit Luxembourg Finance SA | 1,386 | 1,488,255 | ||||||||
|
| |||||||||
| 79,295,063 | ||||||||||
|
| |||||||||
Brokerage – 0.3% | ||||||||||
Nomura Holdings, Inc. | 2,586 | 2,620,751 | ||||||||
|
| |||||||||
Finance – 0.2% | ||||||||||
General Electric Capital Corp. | 1,635 | 1,694,653 | ||||||||
|
| |||||||||
Insurance – 2.4% | ||||||||||
Allied World Assurance Co. Holdings Ltd. | 1,820 | 2,079,099 | ||||||||
American International Group, Inc. | 1,050 | 1,079,010 | ||||||||
Coventry Health Care, Inc. | 665 | 751,727 | ||||||||
6.125%, 1/15/15 | 260 | 272,421 | ||||||||
6.30%, 8/15/14 | 2,060 | 2,111,978 | ||||||||
Five Corners Funding Trust | 1,060 | 1,081,666 | ||||||||
Hartford Financial Services Group, Inc. | 685 | 709,149 | ||||||||
5.50%, 3/30/20 | 922 | 1,054,974 | ||||||||
Hartford Financial Services Group, Inc. (The) | 600 | 670,102 | ||||||||
| ALLIANCEBERNSTEIN WEALTH STRATEGIES • | 135 |
Global Core Bond Portfolio—Portfolio of Investments
| Principal Amount (000) | U.S. $ Value | |||||||||
| ||||||||||
Humana, Inc. | U.S.$ | 369 | $ | 431,817 | ||||||
6.45%, 6/01/16 | 285 | 317,442 | ||||||||
7.20%, 6/15/18 | 610 | 732,139 | ||||||||
Lincoln National Corp. | 791 | 1,028,923 | ||||||||
Markel Corp. | 1,105 | 1,325,135 | ||||||||
Massachusetts Mutual Life Insurance Co. | 815 | 1,227,554 | ||||||||
MetLife, Inc. | 1,085 | 1,206,726 | ||||||||
7.717%, 2/15/19 | 1,159 | 1,455,039 | ||||||||
Muenchener Rueckversicherungs AG | EUR | 1,400 | 2,340,838 | |||||||
Nationwide Mutual Insurance Co. | U.S.$ | 1,080 | 1,602,495 | |||||||
Prudential Financial, Inc. | 2,045 | 2,111,462 | ||||||||
Swiss Re Solutions Holding Corp. | 1,295 | 1,603,794 | ||||||||
|
| |||||||||
| 25,193,490 | ||||||||||
|
| |||||||||
Other Finance – 0.2% | ||||||||||
ORIX Corp. | 2,467 | 2,570,994 | ||||||||
|
| |||||||||
REITS – 0.2% | ||||||||||
HCP, Inc. | 2,195 | 2,479,472 | ||||||||
|
| |||||||||
| 113,854,423 | ||||||||||
|
| |||||||||
Utility – 2.4% | ||||||||||
Electric – 0.5% | ||||||||||
Constellation Energy Group, Inc. | 504 | 551,559 | ||||||||
Enel Finance International NV | EUR | 1,125 | 1,792,605 | |||||||
Monongahela Power Co. | U.S.$ | 1,059 | 1,095,345 | |||||||
TECO Finance, Inc. | 745 | 790,134 | ||||||||
5.15%, 3/15/20 | 915 | 1,022,111 | ||||||||
Union Electric Co. | 315 | 381,355 | ||||||||
|
| |||||||||
| 5,633,109 | ||||||||||
|
| |||||||||
| 136 | • ALLIANCEBERNSTEIN WEALTH STRATEGIES |
Global Core Bond Portfolio—Portfolio of Investments
| Principal Amount (000) | U.S. $ Value | |||||||||
| ||||||||||
Natural Gas – 1.8% | ||||||||||
Empresa de Energia de Bogota SA ESP | U.S.$ | 1,515 | $ | 1,618,067 | ||||||
Energy Transfer Partners LP | 972 | 1,136,414 | ||||||||
7.50%, 7/01/38 | 2,264 | 2,766,726 | ||||||||
GDF Suez | 975 | 979,436 | ||||||||
Kinder Morgan Energy Partners LP | 413 | 415,426 | ||||||||
3.50%, 9/01/23 | 698 | 659,554 | ||||||||
3.95%, 9/01/22 | 495 | 494,995 | ||||||||
4.15%, 3/01/22 | 863 | 871,769 | ||||||||
6.85%, 2/15/20 | 517 | 615,577 | ||||||||
NiSource Finance Corp. | 3,445 | 4,122,166 | ||||||||
Talent Yield Investments Ltd. | 2,400 | 2,369,304 | ||||||||
Williams Partners LP | 425 | 435,042 | ||||||||
5.25%, 3/15/20 | 2,198 | 2,448,106 | ||||||||
|
| |||||||||
| 18,932,582 | ||||||||||
|
| |||||||||
Other Utility – 0.1% | ||||||||||
Veolia Environnement SA | EUR | 640 | 1,129,638 | |||||||
|
| |||||||||
| 25,695,329 | ||||||||||
|
| |||||||||
Non Corporate Sectors – 0.4% | ||||||||||
Agencies - Not Government | ||||||||||
Abu Dhabi National Energy Co. | U.S.$ | 819 | 801,228 | |||||||
4.125%, 3/13/17(a) | 757 | 813,677 | ||||||||
Electricite de France | 2,143 | 2,137,642 | ||||||||
Petrobras Global Finance BV | EUR | 775 | 1,054,222 | |||||||
|
| |||||||||
| 4,806,769 | ||||||||||
|
| |||||||||
Total Corporates - Investment Grades | 270,869,293 | |||||||||
|
| |||||||||
MORTGAGE PASS-THROUGHS – 6.7% | ||||||||||
Agency Fixed Rate 30-Year – 4.8% | ||||||||||
Federal Home Loan Mortgage Corp. Gold | U.S.$ | 43 | 46,461 | |||||||
| ALLIANCEBERNSTEIN WEALTH STRATEGIES • | 137 |
Global Core Bond Portfolio—Portfolio of Investments
| Principal Amount (000) | U.S. $ Value | |||||||||
| ||||||||||
Series 2007 | U.S.$ | 1,173 | $ | 1,304,736 | ||||||
Federal National Mortgage Association | 8,535 | 8,302,522 | ||||||||
3.50%, 3/01/44, TBA | 12,635 | 12,808,731 | ||||||||
4.00%, 3/01/44, TBA | 22,760 | 23,855,325 | ||||||||
Series 2003 | 906 | 1,005,028 | ||||||||
Series 2004 | 2,857 | 3,169,002 | ||||||||
Series 2005 | 717 | 795,648 | ||||||||
Series 2006 | 2 | 2,318 | ||||||||
Series 2007 | 225 | 241,252 | ||||||||
|
| |||||||||
| 51,531,023 | ||||||||||
|
| |||||||||
Agency Fixed Rate 15-Year – 1.5% | ||||||||||
Federal National Mortgage Association | 15,225 | 16,095,680 | ||||||||
|
| |||||||||
Agency ARMs – 0.4% | ||||||||||
Federal Home Loan Mortgage Corp. | 1,583 | 1,688,638 | ||||||||
Federal National Mortgage Association | 811 | 872,163 | ||||||||
Series 2007 | 1,586 | 1,681,867 | ||||||||
|
| |||||||||
| 4,242,668 | ||||||||||
|
| |||||||||
Total Mortgage Pass-Throughs | 71,869,371 | |||||||||
|
| |||||||||
GOVERNMENTS - SOVEREIGN | ||||||||||
Canada – 2.2% | ||||||||||
Canada Housing Trust No. 1 | CAD | 24,915 | 24,025,548 | |||||||
|
| |||||||||
France – 0.4% | ||||||||||
Dexia Credit Local SA/New York, NY | U.S.$ | 4,014 | 4,034,546 | |||||||
|
| |||||||||
Germany – 1.9% | ||||||||||
FMS Wertmanagement AoeR | EUR | 3,900 | 5,448,415 | |||||||
3.00%, 8/03/18(a) | 1,400 | 2,115,825 | ||||||||
KFW | 4,460 | 6,242,572 | ||||||||
3.875%, 1/21/19 | 4,410 | 6,960,079 | ||||||||
|
| |||||||||
| 20,766,891 | ||||||||||
|
| |||||||||
| 138 | • ALLIANCEBERNSTEIN WEALTH STRATEGIES |
Global Core Bond Portfolio—Portfolio of Investments
| Principal Amount (000) | U.S. $ Value | |||||||||
| ||||||||||
Qatar – 0.1% | ||||||||||
Qtel International Finance Ltd. | U.S.$ | 647 | $ | 592,011 | ||||||
|
| |||||||||
Total Governments - Sovereign Agencies | 49,418,996 | |||||||||
|
| |||||||||
COMMERCIAL MORTGAGE-BACKED SECURITIES – 3.2% | ||||||||||
Non-Agency Fixed Rate CMBS – 2.7% | ||||||||||
Citigroup Commercial Mortgage Trust | 2,406 | 2,614,160 | ||||||||
Commercial Mortgage Loan Trust | 3,725 | 4,216,510 | ||||||||
Commercial Mortgage Pass Through Certificates | 5,420 | 5,481,278 | ||||||||
GS Mortgage Securities Trust | 1,615 | 1,548,346 | ||||||||
LB-UBS Commercial Mortgage Trust | 1,017 | 1,020,376 | ||||||||
ML-CFC Commercial Mortgage Trust | 3,041 | 3,323,031 | ||||||||
ML-CFC Commercial Mortgage Trust | 6,663 | 7,257,943 | ||||||||
Wachovia Bank Commercial Mortgage Trust | 2,930 | 3,201,179 | ||||||||
|
| |||||||||
| 28,662,823 | ||||||||||
|
| |||||||||
Agency CMBS – 0.5% | ||||||||||
FHLMC Multifamily Structured Pass Through Certificates | 4,653 | 4,931,591 | ||||||||
|
| |||||||||
Total Commercial Mortgage-Backed Securities | 33,594,414 | |||||||||
|
| |||||||||
| ALLIANCEBERNSTEIN WEALTH STRATEGIES • | 139 |
Global Core Bond Portfolio—Portfolio of Investments
| Principal Amount (000) | U.S. $ Value | |||||||||||
| ||||||||||||
COVERED BONDS – 3.0% | ||||||||||||
Aib Mortgage Bank | EUR | 665 | $ | 1,014,725 | ||||||||
Bank of Ireland Mortgage Bank | 580 | 827,036 | ||||||||||
Bank of Nova Scotia | U.S.$ | 2,900 | 2,964,989 | |||||||||
Bank of Scotland PLC | EUR | 3,180 | 5,380,981 | |||||||||
BPCE SFH SA | 400 | 589,509 | ||||||||||
Series E | 1,800 | 2,635,067 | ||||||||||
Caisse Francaise de Financement Local | 883 | 1,308,028 | ||||||||||
CaixaBank SA | 1,250 | 1,872,650 | ||||||||||
Cie de Financement Foncier SA | 3,457 | 5,029,256 | ||||||||||
National Australia Bank Ltd. | U.S.$ | 3,190 | 3,182,531 | |||||||||
Nationwide Building Society | EUR | 2,610 | 3,843,157 | |||||||||
Santander Consumer Finance SA | 1,300 | 1,893,710 | ||||||||||
Societe Generale SFH | EUR | 900 | 1,319,713 | |||||||||
|
| |||||||||||
Total Covered Bonds | 31,861,352 | |||||||||||
|
| |||||||||||
AGENCIES – 2.2% | ||||||||||||
Agency Debentures – 2.2% | ||||||||||||
Federal Home Loan Mortgage Corp. | ||||||||||||
1.75%, 5/30/19 | U.S.$ | 1,985 | 1,978,130 | |||||||||
6.75%, 3/15/31 | 1,345 | 1,850,748 | ||||||||||
Residual Funding Corp. Principal Strip | 22,014 | 19,085,324 | ||||||||||
|
| |||||||||||
Total Agencies | 22,914,202 | |||||||||||
|
| |||||||||||
| 140 | • ALLIANCEBERNSTEIN WEALTH STRATEGIES |
Global Core Bond Portfolio—Portfolio of Investments
| Principal Amount (000) | U.S. $ Value | |||||||||||
| ||||||||||||
QUASI-SOVEREIGNS – 1.8% | ||||||||||||
Quasi-Sovereign Bonds – 1.8% | ||||||||||||
Chile – 0.2% | ||||||||||||
Empresa de Transporte de Pasajeros | U.S.$ | 2,595 | $ | 2,671,720 | ||||||||
|
| |||||||||||
China – 0.1% | ||||||||||||
CNOOC Curtis Funding No. 1 Pty Ltd. | 687 | 693,265 | ||||||||||
|
| |||||||||||
Kazakhstan – 0.2% | ||||||||||||
KazMunayGas National Co. JSC | 1,990 | 2,236,163 | ||||||||||
|
| |||||||||||
Malaysia – 0.4% | ||||||||||||
Petronas Capital Ltd. | 3,390 | 3,836,802 | ||||||||||
|
| |||||||||||
Mexico – 0.2% | ||||||||||||
Petroleos Mexicanos | 2,645 | 2,718,943 | ||||||||||
|
| |||||||||||
Peru – 0.1% | ||||||||||||
El Fondo Mivivienda SA | 613 | 551,700 | ||||||||||
|
| |||||||||||
South Korea – 0.3% | ||||||||||||
Korea National Oil Corp. | 2,995 | 3,119,185 | ||||||||||
|
| |||||||||||
United Arab Emirates – 0.3% | ||||||||||||
IPIC GMTN Ltd. | 3,300 | 3,514,533 | ||||||||||
|
| |||||||||||
Total Quasi-Sovereigns | 19,342,311 | |||||||||||
|
| |||||||||||
SUPRANATIONALS – 1.0% | ||||||||||||
European Investment Bank | EUR | 5,095 | 8,165,235 | |||||||||
International Bank for Reconstruction & Development | U.S.$ | 2,340 | 2,974,770 | |||||||||
|
| |||||||||||
Total Supranationals | 11,140,005 | |||||||||||
|
| |||||||||||
| ALLIANCEBERNSTEIN WEALTH STRATEGIES • | 141 |
Global Core Bond Portfolio—Portfolio of Investments
| Principal Amount (000) | U.S. $ Value | |||||||||||
| ||||||||||||
COLLATERALIZED MORTGAGE OBLIGATIONS – 0.7% | ||||||||||||
Non-Agency Floating Rate – 0.6% | ||||||||||||
Connecticut Avenue Securities | U.S.$ | 1,003 | $ | 1,014,672 | ||||||||
Federal National Mortgage Association | 2,569 | 2,579,053 | ||||||||||
Structured Agency Credit Risk Debt Notes Series 2014-DN1, Class M2 | 2,665 | 2,700,680 | ||||||||||
|
| |||||||||||
| 6,294,405 | ||||||||||||
|
| |||||||||||
Non-Agency Fixed Rate – 0.1% | ||||||||||||
Citigroup Mortgage Loan Trust, Inc. | 1,086 | 1,045,279 | ||||||||||
|
| |||||||||||
Agency Fixed Rate – 0.0% | ||||||||||||
Fannie Mae Grantor Trust | 392 | 350,603 | ||||||||||
|
| |||||||||||
Total Collateralized Mortgage Obligations | 7,690,287 | |||||||||||
|
| |||||||||||
GOVERNMENTS - SOVEREIGN BONDS – 0.6% | ||||||||||||
Indonesia – 0.3% | ||||||||||||
Indonesia Government International Bond | 3,326 | 2,985,085 | ||||||||||
|
| |||||||||||
Qatar – 0.3% | ||||||||||||
Qatar Government International Bond | 2,944 | 3,223,680 | ||||||||||
|
| |||||||||||
Total Governments - Sovereign Bonds | 6,208,765 | |||||||||||
|
| |||||||||||
ASSET-BACKED SECURITIES – 0.3% | ||||||||||||
Autos - Fixed Rate – 0.1% | ||||||||||||
Ford Auto Securitization Trust | CAD | 710 | 641,658 | |||||||||
Huntington Auto Trust | U.S.$ | 764 | 765,733 | |||||||||
|
| |||||||||||
| 1,407,391 | ||||||||||||
|
| |||||||||||
Home Equity Loans - Floating Rate – 0.1% |
| |||||||||||
Asset Backed Funding Certificates | 356 | 341,629 | ||||||||||
| 142 | • ALLIANCEBERNSTEIN WEALTH STRATEGIES |
Global Core Bond Portfolio—Portfolio of Investments
| Principal Amount (000) | U.S. $ Value | |||||||||
| ||||||||||
HSBC Home Equity Loan Trust | U.S.$ | 421 | $ | 418,371 | ||||||
|
| |||||||||
| 760,000 | ||||||||||
|
| |||||||||
Other ABS - Fixed Rate – 0.1% | ||||||||||
GE Equipment Midticket LLC | 478 | 478,947 | ||||||||
|
| |||||||||
Home Equity Loans - Fixed Rate – 0.0% | ||||||||||
CitiFinancial Mortgage Securities, Inc. | 338 | 345,405 | ||||||||
|
| |||||||||
Total Asset-Backed Securities | 2,991,743 | |||||||||
|
| |||||||||
LOCAL GOVERNMENTS - MUNICIPAL BONDS – 0.3% | ||||||||||
United States – 0.3% | ||||||||||
California GO | 1,985 | 2,768,559 | ||||||||
|
| |||||||||
CORPORATES - NON-INVESTMENT GRADES – 0.2% | ||||||||||
Financial Institutions – 0.2% | ||||||||||
Banking – 0.1% | ||||||||||
Societe Generale SA | 1,515 | 1,620,750 | ||||||||
|
| |||||||||
Insurance – 0.1% | ||||||||||
ING Groep NV | 719 | 744,165 | ||||||||
|
| |||||||||
Total Corporates - Non-Investment Grades | 2,364,915 | |||||||||
|
| |||||||||
EMERGING MARKETS - CORPORATE BONDS – 0.2% | ||||||||||
Industrial – 0.2% | ||||||||||
Consumer Non-Cyclical – 0.2% | ||||||||||
Raizen Energy Finance Ltd. | 1,885 | 2,069,730 | ||||||||
|
| |||||||||
SHORT-TERM INVESTMENTS – 6.6% | ||||||||||
U.S. Treasury Bills – 4.9% | ||||||||||
U.S. Treasury Bill | 52,690 | 52,688,582 | ||||||||
|
| |||||||||
| ALLIANCEBERNSTEIN WEALTH STRATEGIES • | 143 |
Global Core Bond Portfolio—Portfolio of Investments
| Company | Shares | U.S. $ Value | ||||||||
| ||||||||||
Investment Companies – 1.7% | ||||||||||
AllianceBerstein Fixed-Income Shares Inc. – | 17,542,612 | $ | 17,542,612 | |||||||
|
| |||||||||
Total Short-Term Investments | 70,231,194 | |||||||||
|
| |||||||||
Total Investments – 105.3% | 1,122,599,280 | |||||||||
Other assets less liabilities – (5.3)% | (56,621,593 | ) | ||||||||
|
| |||||||||
Net Assets – 100.0% | $ | 1,065,977,687 | ||||||||
|
| |||||||||
FUTURES (see Note C)
| Type | Number of Contracts | Expiration Month | Original Value | Value at February 28, 2014 | Unrealized Appreciation/ (Depreciation) | |||||||||||||||
Sold Contracts |
| |||||||||||||||||||
U.S. T-Note 5 Yr (CBT) Futures | 283 | June 2014 | $ | 33,826,151 | $ | 33,920,203 | $ | (94,052 | ) | |||||||||||
U.S. T-Note 10 Yr (CBT) Futures | 170 | June 2014 | 21,089,022 | 21,170,313 | (81,291 | ) | ||||||||||||||
U.S. Long Bond (CBT) Futures | 198 | June 2014 | 26,053,695 | 26,346,375 | (292,680 | ) | ||||||||||||||
|
| |||||||||||||||||||
| $ | (468,023 | ) | ||||||||||||||||||
|
| |||||||||||||||||||
FORWARD CURRENCY EXCHANGE CONTRACTS (see Note C)
| Counterparty | Contracts to (000) | In Exchange For (000) | Settlement Date | Unrealized Appreciation/ (Depreciation) | ||||||||||||||||||||
Barclays Bank PLC | EUR | 1,287 | USD | 1,770 | 3/12/14 | $ | (5,796 | ) | ||||||||||||||||
Barclays Bank PLC | JPY | 7,310,314 | USD | 71,361 | 4/11/14 | (484,748 | ) | |||||||||||||||||
Barclays Bank PLC | PLN | 9,259 | USD | 3,062 | 4/03/14 | (3,890 | ) | |||||||||||||||||
Barclays Bank PLC | USD | 270 | MXN | 3,533 | 3/14/14 | (3,324 | ) | |||||||||||||||||
BNP Paribas SA | CAD | 42,537 | USD | 38,353 | 4/10/14 | (27,554 | ) | |||||||||||||||||
BNP Paribas SA | GBP | 55,483 | USD | 91,961 | 3/13/14 | (942,033 | ) | |||||||||||||||||
BNP Paribas SA | NZD | 5,267 | USD | 4,370 | 3/14/14 | (42,665 | ) | |||||||||||||||||
Royal Bank of Canada | MXN | 96,263 | USD | 7,378 | 3/14/14 | 124,657 | ||||||||||||||||||
Royal Bank of Scotland PLC | AUD | 56,045 | USD | 49,858 | 3/07/14 | (143,658 | ) | |||||||||||||||||
Royal Bank of Scotland PLC | SEK | 26,823 | USD | 4,137 | 3/06/14 | (46,604 | ) | |||||||||||||||||
State Street Bank & Trust Co. | BRL | 32,958 | USD | 13,329 | 5/05/14 | (511,290 | ) | |||||||||||||||||
State Street Bank & Trust Co. | EUR | 2,521 | USD | 3,412 | 3/12/14 | (67,449 | ) | |||||||||||||||||
| 144 | • ALLIANCEBERNSTEIN WEALTH STRATEGIES |
Global Core Bond Portfolio—Portfolio of Investments
| Counterparty | Contracts to (000) | In Exchange For (000) | Settlement Date | Unrealized Appreciation/ (Depreciation) | ||||||||||||||||||||
State Street Bank & Trust Co. | USD | 133 | GBP | 80 | 3/13/14 | $ | 788 | |||||||||||||||||
UBS AG | EUR | 189,067 | USD | 258,438 | 3/12/14 | (2,529,960 | ) | |||||||||||||||||
|
| |||||||||||||||||||||||
| $ | (4,683,526 | ) | ||||||||||||||||||||||
|
| |||||||||||||||||||||||
| (a) | Security is exempt from registration under Rule 144A of the Securities Act of 1933. These securities are considered liquid and may be resold in transactions exempt from registration, normally to qualified institutional buyers. At February 28, 2014, the aggregate market value of these securities amounted to $317,328,379 or 29.8% of net assets. |
| (b) | Coupon rate adjusts periodically based upon a predetermined schedule. Stated interest rate in effect at February 28, 2014. |
| (c) | Variable rate coupon, rate shown as of February 28, 2014. |
| (d) | Floating Rate Security. Stated interest rate was in effect at February 28, 2014. |
| (e) | Investment in affiliated money market mutual fund. The rate shown represents the 7-day yield as of period end. |
Currency Abbreviations:
AUD – Australian Dollar
BRL – Brazilian Real
CAD – Canadian Dollar
DKK – Danish Krone
EUR – Euro
GBP – Great British Pound
JPY – Japanese Yen
MXN – Mexican Peso
NZD – New Zealand Dollar
PLN – Polish Zloty
SEK – Swedish Krona
USD – United States Dollar
Glossary:
ABS – Asset-Backed Securities
ARMs – Adjustable Rate Mortgages
CBT – Chicago Board of Trade
CMBS – Commercial Mortgage-Backed Securities
FHLMC – Federal Home Loan Mortgage Corporation
JSC – Joint Stock Company
OAT – Obligations Assimilables du Trésor
REIT – Real Estate Investment Trust
TBA – To Be Announced
See notes to financial statements.
| ALLIANCEBERNSTEIN WEALTH STRATEGIES • | 145 |
Global Core Bond Portfolio—Portfolio of Investments
BOND INFLATION PROTECTION PORTFOLIO
PORTFOLIO OF INVESTMENTS
February 28, 2014 (unaudited)
| Principal Amount (000) | U.S. $ Value | |||||||||
| ||||||||||
INFLATION-LINKED | ||||||||||
United States – 90.5% | ||||||||||
U.S. Treasury Inflation Index | U.S.$ | 337,697 | $ | 343,939,098 | ||||||
0.125%, 1/15/23 (TIPS) | 45,924 | 44,883,878 | ||||||||
0.375%, 7/15/23 (TIPS) | 34,403 | 34,394,849 | ||||||||
0.625%, 7/15/21 (TIPS)(a) | 36,794 | 38,398,358 | ||||||||
0.625%, 1/15/24 (TIPS) | 19,414 | 19,679,242 | ||||||||
1.125%, 1/15/21 (TIPS) | 14,022 | 15,096,355 | ||||||||
1.25%, 7/15/20 (TIPS)(a)(b) | 60,694 | 66,369,581 | ||||||||
1.375%, 7/15/18 (TIPS) | 621 | 683,304 | ||||||||
1.375%, 1/15/20 (TIPS)(a) | 42,607 | 46,690,848 | ||||||||
1.625%, 1/15/18 (TIPS) | 22,540 | 24,769,853 | ||||||||
1.875%, 7/15/19 (TIPS) | 24,398 | 27,547,252 | ||||||||
2.00%, 7/15/14-1/15/16 (TIPS) | 15,987 | 16,814,960 | ||||||||
2.125%, 1/15/19 (TIPS) | 22,602 | 25,607,583 | ||||||||
2.50%, 7/15/16 (TIPS)(a) | 3,514 | 3,870,666 | ||||||||
|
| |||||||||
Total Inflation-Linked Securities | 708,745,827 | |||||||||
|
| |||||||||
CORPORATES - INVESTMENT | ||||||||||
Industrial – 7.6% | ||||||||||
Basic – 1.4% | ||||||||||
Barrick North America Finance LLC | 596 | 603,335 | ||||||||
Basell Finance Co. BV | 590 | 760,902 | ||||||||
Cia Minera Milpo SAA | 893 | 831,026 | ||||||||
Dow Chemical Co. (The) | 637 | 823,903 | ||||||||
Gerdau Trade, Inc. | 1,400 | 1,327,361 | ||||||||
5.75%, 1/30/21(c) | 113 | 117,238 | ||||||||
International Paper Co. | 1,710 | 1,854,319 | ||||||||
LyondellBasell Industries NV | 1,087 | 1,252,664 | ||||||||
Minsur SA | 1,402 | 1,445,063 | ||||||||
Rio Tinto Finance USA PLC | 1,008 | 960,766 | ||||||||
3.50%, 3/22/22 | 370 | 371,284 | ||||||||
Sociedad Quimica y Minera de Chile SA | 832 | 749,055 | ||||||||
|
| |||||||||
| 11,096,916 | ||||||||||
|
| |||||||||
| 146 | • ALLIANCEBERNSTEIN WEALTH STRATEGIES |
Bond Inflation Protection Portfolio—Portfolio of Investments
| Principal Amount (000) | U.S. $ Value | |||||||||
| ||||||||||
Capital Goods – 0.4% | ||||||||||
CRH Finance Ltd. | EUR | 1,100 | $ | 1,541,530 | ||||||
Embraer SA | U.S.$ | 550 | 568,563 | |||||||
Odebrecht Finance Ltd. | 730 | 728,175 | ||||||||
|
| |||||||||
| 2,838,268 | ||||||||||
|
| |||||||||
Communications - Media – 1.1% | ||||||||||
21st Century Fox America, Inc. | 1,584 | 1,833,077 | ||||||||
CBS Corp. | 1,625 | 1,854,910 | ||||||||
DirecTV Holdings LLC/DirecTV Financing | 1,330 | 1,314,567 | ||||||||
Globo Comunicacao e Participacoes SA | 606 | 631,755 | ||||||||
NBCUniversal Enterprise, Inc. | 906 | 910,530 | ||||||||
Omnicom Group, Inc. | 703 | 701,250 | ||||||||
Time Warner Cable, Inc. | 1,435 | 1,442,402 | ||||||||
|
| |||||||||
| 8,688,491 | ||||||||||
|
| |||||||||
Communications - | ||||||||||
American Tower Corp. | 1,355 | 1,474,194 | ||||||||
AT&T, Inc. | 1,397 | 1,433,759 | ||||||||
Rogers Communications, Inc. | CAD | 150 | 137,728 | |||||||
Telefonica Emisiones SAU | U.S.$ | 835 | 916,344 | |||||||
Verizon Communications, Inc. | 1,957 | 2,143,557 | ||||||||
5.50%, 2/15/18 | 885 | 1,004,012 | ||||||||
7.35%, 4/01/39 | 780 | 1,011,252 | ||||||||
|
| |||||||||
| 8,120,846 | ||||||||||
|
| |||||||||
Consumer Cyclical - Automotive – 0.4% | ||||||||||
Ford Motor Credit Co. LLC | 337 | 374,576 | ||||||||
5.875%, 8/02/21 | 1,166 | 1,346,115 | ||||||||
Harley-Davidson Funding Corp. | 1,640 | 1,704,039 | ||||||||
|
| |||||||||
| 3,424,730 | ||||||||||
|
| |||||||||
| ALLIANCEBERNSTEIN WEALTH STRATEGIES • | 147 |
Bond Inflation Protection Portfolio—Portfolio of Investments
| Principal Amount (000) | U.S. $ Value | |||||||||
| ||||||||||
Consumer Non-Cyclical – 0.6% | ||||||||||
Bunge Ltd. Finance Corp. | U.S.$ | 1,610 | $ | 1,699,553 | ||||||
Kroger Co. (The) | 1,324 | 1,324,892 | ||||||||
Reynolds American, Inc. | 899 | 854,477 | ||||||||
Thermo Fisher Scientific, Inc. | 696 | 715,287 | ||||||||
|
| |||||||||
| 4,594,209 | ||||||||||
|
| |||||||||
Energy – 1.3% | ||||||||||
Marathon Petroleum Corp. | 590 | 659,835 | ||||||||
Nabors Industries, Inc. | 715 | 728,494 | ||||||||
Noble Energy, Inc. | 1,370 | 1,725,464 | ||||||||
Reliance Holdings USA, Inc. | 2,065 | 2,151,222 | ||||||||
Transocean, Inc. | 1,555 | 1,474,736 | ||||||||
6.375%, 12/15/21 | 5 | 5,609 | ||||||||
Valero Energy Corp. | 998 | 1,171,998 | ||||||||
Weatherford International Ltd./Bermuda | 1,860 | 2,051,933 | ||||||||
|
| |||||||||
| 9,969,291 | ||||||||||
|
| |||||||||
Technology – 0.8% | ||||||||||
Baidu, Inc. | 280 | 279,246 | ||||||||
3.25%, 8/06/18 | 977 | 998,344 | ||||||||
Motorola Solutions, Inc. | 1,540 | 1,874,238 | ||||||||
Telefonaktiebolaget LM Ericsson | 2,095 | 2,154,351 | ||||||||
Total System Services, Inc. | 530 | 527,518 | ||||||||
3.75%, 6/01/23 | 542 | 513,878 | ||||||||
|
| |||||||||
| 6,347,575 | ||||||||||
|
| |||||||||
Transportation - Airlines – 0.2% | ||||||||||
Southwest Airlines Co. | 1,615 | 1,803,109 | ||||||||
|
| |||||||||
Transportation - Services – 0.4% | ||||||||||
Asciano Finance Ltd. | 950 | 1,028,603 | ||||||||
| 148 | • ALLIANCEBERNSTEIN WEALTH STRATEGIES |
Bond Inflation Protection Portfolio—Portfolio of Investments
| Principal Amount (000) | U.S. $ Value | |||||||||
| ||||||||||
Ryder System, Inc. | U.S.$ | 1,105 | $ | 1,132,203 | ||||||
5.85%, 11/01/16 | 630 | 704,477 | ||||||||
|
| |||||||||
| 2,865,283 | ||||||||||
|
| |||||||||
| 59,748,718 | ||||||||||
|
| |||||||||
Financial Institutions – 5.0% | ||||||||||
Banking – 2.9% | ||||||||||
Bank of America Corp. | 705 | 811,626 | ||||||||
Barclays Bank PLC | EUR | 830 | 1,397,635 | |||||||
BNP Paribas SA | U.S.$ | 502 | 515,805 | |||||||
BPCE SA | 1,390 | 1,464,365 | ||||||||
Cooperatieve Centrale Raiffeisen- | 361 | 357,841 | ||||||||
Credit Suisse AG | 1,392 | 1,513,511 | ||||||||
Danske Bank A/S | GBP | 772 | 1,328,304 | |||||||
Goldman Sachs Group, Inc. (The) | U.S.$ | 1,550 | 1,582,875 | |||||||
ING Bank NV | 1,995 | 2,024,122 | ||||||||
Macquarie Group Ltd. | 720 | 871,186 | ||||||||
Morgan Stanley | 1,718 | 1,956,571 | ||||||||
Murray Street Investment Trust I | 184 | 199,423 | ||||||||
National Capital Trust II Delaware | 1,090 | 1,117,250 | ||||||||
PNC Bank NA | 1,930 | 1,948,073 | ||||||||
Rabobank Capital Funding Trust III | 735 | 773,587 | ||||||||
Royal Bank of Scotland PLC (The) | 285 | 335,473 | ||||||||
Skandinaviska Enskilda Banken AB | 340 | 346,800 | ||||||||
Standard Chartered PLC | 1,900 | 1,939,520 | ||||||||
| ALLIANCEBERNSTEIN WEALTH STRATEGIES • | 149 |
Bond Inflation Protection Portfolio—Portfolio of Investments
| Principal Amount (000) | U.S. $ Value | |||||||||
| ||||||||||
UBS AG/Stamford CT | U.S.$ | 655 | $ | 727,601 | ||||||
7.625%, 8/17/22 | 929 | 1,102,404 | ||||||||
|
| |||||||||
| 22,313,972 | ||||||||||
|
| |||||||||
Insurance – 1.4% | ||||||||||
American International Group, Inc. | 1,660 | 1,990,035 | ||||||||
Hartford Financial Services Group, Inc. (The) | 1,330 | 1,485,393 | ||||||||
6.10%, 10/01/41 | 760 | 913,246 | ||||||||
Lincoln National Corp. | 550 | 715,433 | ||||||||
Nationwide Mutual Insurance Co. | 805 | 1,194,453 | ||||||||
Prudential Financial, Inc. | 940 | 970,550 | ||||||||
Swiss Re Capital I LP | 1,815 | 1,944,772 | ||||||||
XLIT Ltd. | 1,590 | 1,628,647 | ||||||||
|
| |||||||||
| 10,842,529 | ||||||||||
|
| |||||||||
REITS – 0.7% | ||||||||||
HCP, Inc. | 1,877 | 2,103,276 | ||||||||
Health Care REIT, Inc. | 1,945 | 2,140,554 | ||||||||
Trust F/1401 | 1,555 | 1,547,225 | ||||||||
|
| |||||||||
| 5,791,055 | ||||||||||
|
| |||||||||
| 38,947,556 | ||||||||||
|
| |||||||||
Utility – 1.8% | ||||||||||
Electric – 0.1% | ||||||||||
CMS Energy Corp. | 669 | 746,469 | ||||||||
Constellation Energy Group, Inc. | 263 | 287,817 | ||||||||
|
| |||||||||
| 1,034,286 | ||||||||||
|
| |||||||||
Natural Gas – 1.7% | ||||||||||
DCP Midstream LLC | 1,290 | 1,659,305 | ||||||||
Energy Transfer Partners LP | 1,645 | 1,841,791 | ||||||||
Enterprise Products Operating LLC | 720 | 810,884 | ||||||||
| 150 | • ALLIANCEBERNSTEIN WEALTH STRATEGIES |
Bond Inflation Protection Portfolio—Portfolio of Investments
| Principal Amount (000) | U.S. $ Value | |||||||||
| ||||||||||
Kinder Morgan Energy Partners LP | U.S.$ | 1,439 | $ | 1,438,986 | ||||||
4.15%, 3/01/22 | 625 | 631,351 | ||||||||
Spectra Energy Capital LLC | 1,395 | 1,695,932 | ||||||||
Talent Yield Investments Ltd. | 2,090 | 2,063,269 | ||||||||
Williams Cos., Inc. (The) | 1,758 | 1,591,210 | ||||||||
Williams Partners LP | 1,660 | 1,708,143 | ||||||||
|
| |||||||||
| 13,440,871 | ||||||||||
|
| |||||||||
| 14,475,157 | ||||||||||
|
| |||||||||
Non Corporate Sectors – 0.4% | ||||||||||
Agencies - Not Government Guaranteed – 0.4% | ||||||||||
CNOOC Finance 2013 Ltd. | 1,478 | 1,338,741 | ||||||||
Gazprom OAO Via Gaz Capital SA | 1,292 | 1,430,503 | ||||||||
|
| |||||||||
| 2,769,244 | ||||||||||
|
| |||||||||
Total Corporates - Investment Grades | 115,940,675 | |||||||||
|
| |||||||||
ASSET-BACKED SECURITIES – 11.7% | ||||||||||
Autos - Fixed Rate – 7.5% | ||||||||||
Ally Auto Receivables Trust | 3,017 | 3,024,049 | ||||||||
Ally Master Owner Trust | 3,150 | 3,158,562 | ||||||||
Series 2013-1, Class A2 | 1,555 | 1,560,907 | ||||||||
Series 2014-1, Class A2 | 2,665 | 2,664,394 | ||||||||
AmeriCredit Automobile Receivables Trust | 2,415 | 2,421,156 | ||||||||
Series 2013-1, Class A2 | 873 | 873,129 | ||||||||
Series 2013-3, Class A3 | 2,725 | 2,728,063 | ||||||||
Series 2013-4, Class A3 | 1,085 | 1,087,911 | ||||||||
| ALLIANCEBERNSTEIN WEALTH STRATEGIES • | 151 |
Bond Inflation Protection Portfolio—Portfolio of Investments
| Principal Amount (000) | U.S. $ Value | |||||||||
| ||||||||||
ARI Fleet Lease Trust | U.S.$ | 1,766 | $ | 1,765,511 | ||||||
Avis Budget Rental Car Funding AESOP LLC | 3,140 | 3,241,586 | ||||||||
Series 2014-1A, Class A | 1,591 | 1,590,350 | ||||||||
Bank of America Auto Trust | 1,335 | 1,345,585 | ||||||||
Capital Auto Receivables Asset Trust | 2,250 | 2,260,345 | ||||||||
Series 2014-1, Class B | 400 | 402,337 | ||||||||
Capital Auto Receivables Asset Trust/Ally | 1,469 | 1,469,181 | ||||||||
Enterprise Fleet Financing LLC | 706 | 705,994 | ||||||||
Exeter Automobile Receivables Trust | 722 | 723,861 | ||||||||
Series 2013-1A, Class A | 665 | 666,110 | ||||||||
Series 2014-1A, Class A | 1,045 | 1,044,956 | ||||||||
Fifth Third Auto Trust | 1,537 | 1,539,103 | ||||||||
Flagship Credit Auto Trust | 583 | 582,841 | ||||||||
Ford Auto Securitization Trust | CAD | 1,271 | 1,148,870 | |||||||
Series 2013-R4A, Class A1 | 726 | 655,990 | ||||||||
Ford Credit Auto Owner Trust | U.S.$ | 645 | 640,038 | |||||||
Ford Credit Floorplan Master Owner Trust | 1,234 | 1,235,966 | ||||||||
| 152 | • ALLIANCEBERNSTEIN WEALTH STRATEGIES |
Bond Inflation Protection Portfolio—Portfolio of Investments
| Principal Amount (000) | U.S. $ Value | |||||||||
| ||||||||||
Ford Credit Floorplan Master Owner Trust | U.S.$ | 1,873 | $ | 1,872,902 | ||||||
Hertz Vehicle Financing LLC | 4,705 | 4,701,956 | ||||||||
Huntington Auto Trust | 409 | 410,155 | ||||||||
Hyundai Auto Lease Securitization Trust | 2,063 | 2,066,754 | ||||||||
Hyundai Auto Receivables Trust | 585 | 598,012 | ||||||||
Mercedes-Benz Auto Lease Trust | 1,315 | 1,316,420 | ||||||||
Mercedes-Benz Master Owner Trust | 3,196 | 3,205,342 | ||||||||
Navistar Financial Corp. Owner Trust | 174 | 173,969 | ||||||||
Santander Drive Auto Receivables Trust | 244 | 244,011 | ||||||||
Series 2013-3, Class C | 1,919 | 1,924,695 | ||||||||
Series 2013-4, Class A3 | 2,105 | 2,117,501 | ||||||||
Series 2013-5, Class A2A | 1,151 | 1,151,628 | ||||||||
SMART Trust/Australia | 512 | 512,065 | ||||||||
|
| |||||||||
| 58,832,205 | ||||||||||
|
| |||||||||
Credit Cards - Fixed Rate – 1.3% | ||||||||||
American Express Credit Account Master Trust | 2,310 | 2,312,995 | ||||||||
Cabela’s Master Credit Card Trust | 1,905 | 1,812,506 | ||||||||
Chase Issuance Trust | 2,720 | 2,697,599 | ||||||||
| ALLIANCEBERNSTEIN WEALTH STRATEGIES • | 153 |
Bond Inflation Protection Portfolio—Portfolio of Investments
| Principal Amount (000) | U.S. $ Value | |||||||||
| ||||||||||
Citibank Credit Card Issuance Trust | U.S.$ | 1,300 | $ | 1,400,269 | ||||||
World Financial Network Credit Card Master Trust | 1,310 | 1,314,766 | ||||||||
Series 2013-A, Class A | 809 | 804,881 | ||||||||
|
| |||||||||
| 10,343,016 | ||||||||||
|
| |||||||||
Autos - Floating Rate – 1.3% | ||||||||||
BMW Floorplan Master Owner Trust | 3,034 | 3,041,585 | ||||||||
Ford Credit Floorplan Master Owner Trust | 2,082 | 2,084,823 | ||||||||
GE Dealer Floorplan Master Note Trust | 3,340 | 3,349,836 | ||||||||
Hertz Fleet Lease Funding LP | 1,815 | 1,814,999 | ||||||||
|
| |||||||||
| 10,291,243 | ||||||||||
|
| |||||||||
Credit Cards - Floating Rate – 1.0% | ||||||||||
Barclays Dryrock Issuance Trust | 1,685 | 1,685,020 | ||||||||
First National Master Note Trust | 1,619 | 1,619,019 | ||||||||
Penarth Master Issuer PLC | 2,401 | 2,401,233 | ||||||||
World Financial Network Credit Card Master Trust | 1,715 | 1,715,060 | ||||||||
|
| |||||||||
| 7,420,332 | ||||||||||
|
| |||||||||
Other ABS - Fixed Rate – 0.6% | ||||||||||
CIT Equipment Collateral | 603 | 603,124 | ||||||||
CNH Equipment Trust | 679 | 681,484 | ||||||||
| 154 | • ALLIANCEBERNSTEIN WEALTH STRATEGIES |
Bond Inflation Protection Portfolio—Portfolio of Investments
| Principal Amount (000) | U.S. $ Value | |||||||||
| ||||||||||
Series 2013-C, Class A2 | U.S.$ | 1,480 | $ | 1,481,337 | ||||||
Series 2013-D, Class A2 | 1,868 | 1,868,650 | ||||||||
GE Equipment Midticket LLC | 240 | 240,572 | ||||||||
|
| |||||||||
| 4,875,167 | ||||||||||
|
| |||||||||
Total Asset-Backed Securities | 91,761,963 | |||||||||
|
| |||||||||
COMMERCIAL MORTGAGE-BACKED SECURITIES – 8.6% | ||||||||||
Non-Agency Fixed Rate CMBS – 7.8% | ||||||||||
Banc of America Commercial Mortgage Trust | 2,466 | 2,687,790 | ||||||||
Series 2007-5, Class AM | 618 | 660,035 | ||||||||
CGRBS Commercial Mortgage Trust | 1,970 | 1,917,823 | ||||||||
Citigroup Commercial Mortgage Trust | 576 | 625,905 | ||||||||
COBALT CMBS Commercial Mortgage Trust | 2,263 | 2,517,150 | ||||||||
Commercial Mortgage Pass-Through Certificates | 943 | 921,201 | ||||||||
Credit Suisse Commercial Mortgage Trust | 770 | 768,837 | ||||||||
Extended Stay America Trust | 1,320 | 1,307,557 | ||||||||
Greenwich Capital Commercial Funding Corp. | 3,382 | 3,727,788 | ||||||||
Series 2007-GG9, Class AM | 1,282 | 1,387,257 | ||||||||
| ALLIANCEBERNSTEIN WEALTH STRATEGIES • | 155 |
Bond Inflation Protection Portfolio—Portfolio of Investments
| Principal Amount (000) | U.S. $ Value | |||||||||
| ||||||||||
GS Mortgage Securities Corp. II | U.S.$ | 2,029 | $ | 2,034,302 | ||||||
GS Mortgage Securities Trust | 1,791 | 1,741,265 | ||||||||
JP Morgan Chase Commercial Mortgage Securities Trust | 2,226 | 2,248,732 | ||||||||
Series 2006-CB15, Class A4 | 1,968 | 2,136,015 | ||||||||
Series 2007-CB18, Class A1A | 3,797 | 4,181,791 | ||||||||
Series 2007-CB19, Class AM | 700 | 762,270 | ||||||||
Series 2007-CB20, Class A1A | 3,374 | 3,796,512 | ||||||||
Series 2007-LD12, Class AM | 598 | 669,242 | ||||||||
Series 2007-LDPX, Class A1A | 3,889 | 4,304,198 | ||||||||
Series 2010-C2, Class A1 | 1,325 | 1,358,640 | ||||||||
Merrill Lynch Mortgage Trust | 717 | 716,930 | ||||||||
Series 2006-C2, Class A1A | 1,280 | 1,402,314 | ||||||||
ML-CFC Commercial Mortgage Trust | 3,160 | 3,441,857 | ||||||||
Series 2006-4, Class A1A | 4,792 | 5,237,710 | ||||||||
Morgan Stanley Capital I Trust | 3,005 | 3,386,646 | ||||||||
Motel 6 Trust | 1,518 | 1,507,339 | ||||||||
UBS-Barclays Commercial Mortgage Trust | �� | 317 | 310,304 | |||||||
Series 2012-C4, Class A5 | 637 | 609,727 | ||||||||
Wachovia Bank Commercial Mortgage Trust | 3,203 | 3,499,267 | ||||||||
| 156 | • ALLIANCEBERNSTEIN WEALTH STRATEGIES |
Bond Inflation Protection Portfolio—Portfolio of Investments
| Principal Amount (000) | U.S. $ Value | |||||||||
| ||||||||||
WF-RBS Commercial Mortgage Trust | U.S.$ | 1,776 | $ | 1,753,871 | ||||||
|
| |||||||||
| 61,620,275 | ||||||||||
|
| |||||||||
Non-Agency Floating Rate CMBS – 0.4% | ||||||||||
Extended Stay America Trust | 1,010 | 1,005,575 | ||||||||
GS Mortgage Securities Corp. II | 2,035 | 2,029,938 | ||||||||
|
| |||||||||
| 3,035,513 | ||||||||||
|
| |||||||||
Agency CMBS – 0.4% | ||||||||||
FHLMC Multifamily Structured Pass | 2,812 | 2,934,010 | ||||||||
|
| |||||||||
Total Commercial Mortgage-Backed Securities | 67,589,798 | |||||||||
|
| |||||||||
CORPORATES - NON-INVESTMENT GRADES – 2.2% | ||||||||||
Financial Institutions – 1.2% | ||||||||||
Banking – 1.2% | ||||||||||
Bank of America Corp. | 857 | 805,580 | ||||||||
Barclays Bank PLC | 1,213 | 1,340,365 | ||||||||
Citigroup, Inc. | 1,164 | 1,149,450 | ||||||||
Credit Agricole SA | 368 | 395,600 | ||||||||
Credit Suisse Group AG | 305 | 335,881 | ||||||||
HBOS Capital Funding LP | EUR | 2,440 | 3,165,857 | |||||||
6.071%, 6/30/14(c) | U.S.$ | 769 | 770,923 | |||||||
Societe Generale SA | EUR | 396 | 551,136 | |||||||
5.922%, 4/05/17(c) | U.S.$ | 230 | 246,054 | |||||||
7.875%, 12/18/23(c) | 723 | 766,380 | ||||||||
|
| |||||||||
| 9,527,226 | ||||||||||
|
| |||||||||
| ALLIANCEBERNSTEIN WEALTH STRATEGIES • | 157 |
Bond Inflation Protection Portfolio—Portfolio of Investments
| Principal Amount (000) | U.S. $ Value | |||||||||
| ||||||||||
Finance – 0.0% | ||||||||||
SLM Corp. | U.S.$ | 132 | $ | 145,200 | ||||||
|
| |||||||||
| 9,672,426 | ||||||||||
|
| |||||||||
Industrial – 0.8% | ||||||||||
Capital Goods – 0.1% | ||||||||||
Sealed Air Corp. | 672 | 682,080 | ||||||||
|
| |||||||||
Communications - Media – 0.2% | ||||||||||
DISH DBS Corp. | 835 | 828,737 | ||||||||
Sirius XM Holdings, Inc. | 844 | 793,360 | ||||||||
|
| |||||||||
| 1,622,097 | ||||||||||
|
| |||||||||
Communications - Telecommunications – 0.2% | ||||||||||
Sprint Corp. | 810 | 897,075 | ||||||||
T-Mobile USA, Inc. | 765 | 822,375 | ||||||||
|
| |||||||||
| 1,719,450 | ||||||||||
|
| |||||||||
Consumer Cyclical - Automotive – 0.0% | ||||||||||
Dana Holding Corp. | 295 | 305,325 | ||||||||
|
| |||||||||
Consumer Cyclical - Other – 0.1% | ||||||||||
MCE Finance Ltd. | 385 | 384,038 | ||||||||
|
| |||||||||
Energy – 0.2% | ||||||||||
Cimarex Energy Co. | 596 | 643,680 | ||||||||
Denbury Resources, Inc. | 836 | 787,930 | ||||||||
|
| |||||||||
| 1,431,610 | ||||||||||
|
| |||||||||
| 6,144,600 | ||||||||||
|
| |||||||||
Utility – 0.2% | ||||||||||
Natural Gas – 0.2% | ||||||||||
ONEOK, Inc. | 1,321 | 1,279,523 | ||||||||
Regency Energy Partners LP/Regency Energy Finance Corp. | 229 | 214,115 | ||||||||
|
| |||||||||
| 1,493,638 | ||||||||||
|
| |||||||||
Total Corporates – Non-Investment Grades | 17,310,664 | |||||||||
|
| |||||||||
| 158 | • ALLIANCEBERNSTEIN WEALTH STRATEGIES |
Bond Inflation Protection Portfolio—Portfolio of Investments
| Principal Amount (000) | U.S. $ Value | |||||||||
| ||||||||||
QUASI-SOVEREIGNS – 1.5% | ||||||||||
Quasi-Sovereign Bonds – 1.5% | ||||||||||
Chile – 0.1% | ||||||||||
Empresa de Transporte de Pasajeros Metro SA | U.S.$ | 586 | $ | 603,325 | ||||||
|
| |||||||||
China – 0.3% | ||||||||||
Sinopec Group Overseas Development 2013 Ltd. | 1,910 | 1,909,082 | ||||||||
|
| |||||||||
Indonesia – 0.1% | ||||||||||
Perusahaan Listrik Negara PT | 1,083 | 1,099,245 | ||||||||
|
| |||||||||
Kazakhstan – 0.2% | ||||||||||
KazMunayGas National Co. JSC | 1,328 | 1,492,274 | ||||||||
|
| |||||||||
Malaysia – 0.2% | ||||||||||
Petronas Capital Ltd. | 1,500 | 1,697,700 | ||||||||
|
| |||||||||
Mexico – 0.1% | ||||||||||
Petroleos Mexicanos | 1,025 | 1,063,438 | ||||||||
|
| |||||||||
South Korea – 0.3% | ||||||||||
Korea National Oil Corp. | 2,070 | 2,155,830 | ||||||||
|
| |||||||||
United Arab Emirates – 0.2% | ||||||||||
IPIC GMTN Ltd. | 1,695 | 1,805,192 | ||||||||
|
| |||||||||
Total Quasi-Sovereigns | 11,826,086 | |||||||||
|
| |||||||||
MORTGAGE PASS-THROUGHS – 1.3% | ||||||||||
Agency Fixed Rate 30-Year – 1.0% | ||||||||||
Federal National Mortgage Association | 7,300 | 7,423,482 | ||||||||
|
| |||||||||
Agency ARMs – 0.3% | ||||||||||
Federal Home Loan Mortgage Corp. | 1,715 | 1,831,711 | ||||||||
2.496%, 5/01/38(f) | 817 | 871,555 | ||||||||
|
| |||||||||
| 2,703,266 | ||||||||||
|
| |||||||||
Total Mortgage Pass-Throughs | 10,126,748 | |||||||||
|
| |||||||||
| ALLIANCEBERNSTEIN WEALTH STRATEGIES • | 159 |
Bond Inflation Protection Portfolio—Portfolio of Investments
| Principal Amount (000) | U.S. $ Value | |||||||||
| ||||||||||
GOVERNMENTS - TREASURIES – 1.3% | ||||||||||
Brazil – 1.3% | ||||||||||
Brazil Notas do Tesouro Nacional | BRL | 24,460 | $ | 9,904,279 | ||||||
|
| |||||||||
COLLATERALIZED MORTGAGE | ||||||||||
Non-Agency Floating Rate – 0.7% | ||||||||||
Fannie Mae Connecticut Avenue Securities | U.S.$ | 544 | 554,489 | |||||||
Structured Agency Credit Risk Debt Notes | 1,940 | 1,949,789 | ||||||||
Series 2014-DN1, Class M2 | 1,170 | 1,185,664 | ||||||||
Series 2014-DN1, Class M3 | 1,375 | 1,407,236 | ||||||||
|
| |||||||||
Total Collateralized Mortgage Obligations | 5,097,178 | |||||||||
|
| |||||||||
EMERGING MARKETS - | ||||||||||
Industrial – 0.4% | ||||||||||
Communications - | ||||||||||
Comcel Trust (Cayman Islands) | 387 | 400,061 | ||||||||
Mobile Telesystems OJSC via MTS International Funding Ltd. | 322 | 298,096 | ||||||||
VimpelCom Holdings BV | 497 | 495,922 | ||||||||
|
| |||||||||
| 1,194,079 | ||||||||||
|
| |||||||||
Consumer Non - Cyclical – 0.2% | ||||||||||
Marfrig Overseas Ltd. | 760 | 746,700 | ||||||||
Virgolino de Oliveira Finance Ltd. | 761 | 452,795 | ||||||||
11.75%, 2/09/22(c) | 560 | 329,000 | ||||||||
|
| |||||||||
| 1,528,495 | ||||||||||
|
| |||||||||
Total Emerging Markets – Corporate Bonds | 2,722,574 | |||||||||
|
| |||||||||
| 160 | • ALLIANCEBERNSTEIN WEALTH STRATEGIES |
Bond Inflation Protection Portfolio—Portfolio of Investments
| Company | Shares | U.S. $ Value | ||||||||||
| ||||||||||||
PREFERRED STOCKS – 0.3% | ||||||||||||
Financial Institutions – 0.3% | ||||||||||||
Banking – 0.2% | ||||||||||||
Morgan Stanley 7.125% | 30,000 | $ | 802,200 | |||||||||
State Street Corp. 5.90% | 27,400 | 695,960 | ||||||||||
|
| |||||||||||
| 1,498,160 | ||||||||||||
|
| |||||||||||
Insurance – 0.1% | ||||||||||||
Allstate Corp. (The) 5.10% | 41,400 | 1,034,172 | ||||||||||
|
| |||||||||||
Total Preferred Stocks | 2,532,332 | |||||||||||
|
| |||||||||||
| Principal Amount (000) | ||||||||||||
GOVERNMENTS - | ||||||||||||
Indonesia – 0.1% | ||||||||||||
Indonesia Government International Bond | U.S.$ | 971 | 871,473 | |||||||||
|
| |||||||||||
Qatar – 0.2% | ||||||||||||
Qatar Government International Bond | 1,445 | 1,582,275 | ||||||||||
|
| |||||||||||
Total Governments – Sovereign Bonds | 2,453,748 | |||||||||||
|
| |||||||||||
GOVERNMENTS - SOVEREIGN AGENCIES – 0.1% |
| |||||||||||
Ireland – 0.1% | ||||||||||||
Bank of Ireland | CAD | 1,060 | 909,419 | |||||||||
|
| |||||||||||
Total Investments – 133.7% | 1,046,921,291 | |||||||||||
Other assets less liabilities – (33.7)% | (264,135,332 | ) | ||||||||||
|
| |||||||||||
Net Assets – 100.0% | $ | 782,785,959 | ||||||||||
|
| |||||||||||
FUTURES (see Note C)
| Type | Number of Contracts | Expiration Month | Original Value | Value at February 28, 2014 | Unrealized Appreciation/ (Depreciation) | |||||||||||||||
Purchased Contracts |
| |||||||||||||||||||
U.S. T-Note 2Yr (CBT) Futures | 195 | June 2014 | $ | 42,866,769 | $ | 42,875,625 | $ | 8,856 | ||||||||||||
| ALLIANCEBERNSTEIN WEALTH STRATEGIES • | 161 |
Bond Inflation Protection Portfolio—Portfolio of Investments
| Type | Number of Contracts | Expiration Month | Original Value | Value at February 28, 2014 | Unrealized Appreciation/ (Depreciation) | |||||||||||||||
Sold Contracts | ||||||||||||||||||||
U.S. Long Bond (CBT) Futures | 36 | June 2014 | $ | 4,737,035 | $ | 4,790,250 | $ | (53,215 | ) | |||||||||||
U.S. T-Note 5 Yr (CBT) Futures | 674 | June 2014 | 80,561,221 | 80,785,219 | (223,998 | ) | ||||||||||||||
U.S. T-Note 10 Yr (CBT) Futures | 446 | June 2014 | 55,327,668 | 55,540,937 | (213,269 | ) | ||||||||||||||
|
| |||||||||||||||||||
| $ | (481,626 | ) | ||||||||||||||||||
|
| |||||||||||||||||||
FORWARD CURRENCY EXCHANGE CONTRACTS (see Note C)
| Counterparty | Contracts to Deliver (000) | In Exchange For (000) | Settlement Date | Unrealized Appreciation/ (Depreciation) | ||||||||||||||||
Barclays Bank PLC | IDR | 46,807,796 | USD | 4,025 | 4/11/14 | $ | 708 | |||||||||||||
Barclays Bank PLC | USD | 1,960 | IDR | 23,553,274 | 4/11/14 | 65,176 | ||||||||||||||
BNP Paribas SA | BRL | 4,652 | USD | 1,994 | 3/06/14 | 9,651 | ||||||||||||||
BNP Paribas SA | USD | 1,915 | BRL | 4,652 | 3/06/14 | 68,660 | ||||||||||||||
BNP Paribas SA | USD | 3,899 | GBP | 2,339 | 3/13/14 | 17,553 | ||||||||||||||
BNP Paribas SA | CAD | 3,397 | USD | 3,063 | 4/10/14 | (2,201 | ) | |||||||||||||
Credit Suisse International | SEK | 25,373 | USD | 3,885 | 3/06/14 | (72,595 | ) | |||||||||||||
Goldman Sachs Bank USA | BRL | 9,901 | USD | 4,159 | 5/05/14 | 1,349 | ||||||||||||||
Goldman Sachs Bank USA | BRL | 5,488 | USD | 2,201 | 5/05/14 | (103,277 | ) | |||||||||||||
JPMorgan Chase Bank, NA | GBP | 3,079 | USD | 5,099 | 3/13/14 | (55,345 | ) | |||||||||||||
Royal Bank of Scotland PLC | BRL | 4,652 | USD | 1,986 | 3/06/14 | 2,330 | ||||||||||||||
Royal Bank of Scotland PLC | USD | 1,994 | BRL | 4,652 | 3/06/14 | (9,651 | ) | |||||||||||||
Royal Bank of Scotland PLC | USD | 1,957 | BRL | 4,652 | 5/05/14 | (3,635 | ) | |||||||||||||
Standard Chartered Bank | USD | 3,917 | SEK | 25,378 | 3/06/14 | 40,671 | ||||||||||||||
State Street Bank & Trust Co. | EUR | 115 | USD | 159 | 3/12/14 | 57 | ||||||||||||||
State Street Bank & Trust Co. | EUR | 5,062 | USD | 6,916 | 3/12/14 | (71,542 | ) | |||||||||||||
State Street Bank & Trust Co. | USD | 73 | GBP | 44 | 3/13/14 | 144 | ||||||||||||||
State Street Bank & Trust Co. | BRL | 13,129 | USD | 5,409 | 4/02/14 | (150,047 | ) | |||||||||||||
State Street Bank & Trust Co. | USD | 206 | CAD | 229 | 4/10/14 | 227 | ||||||||||||||
|
| |||||||||||||||||||
| $ | (261,767 | ) | ||||||||||||||||||
|
| |||||||||||||||||||
CENTRALLY CLEARED CREDIT DEFAULT SWAPS(see Note C)
| Clearing Broker/ (Exchange) & Referenced Obligation | Fixed Rate (Pay) Receive | Implied Credit Spread at February 28, 2014 | Notional Amount (000) | Market Value | Unrealized Appreciation/ (Depreciation) | |||||||||||||||
Buy Contracts | ||||||||||||||||||||
Morgan Stanley & Co., LLC/(INTRCONX): | ||||||||||||||||||||
CDX-NAHY | (5.00 | )% | 3.09 | % | $ | 6,245 | $ | (567,085 | ) | $ | (325,554 | ) | ||||||||
CDX-NAHY | (5.00 | ) | 3.09 | 15,580 | (1,414,761 | ) | (352,702 | ) | ||||||||||||
CDX-NAIG | (1.00 | ) | 0.64 | 23,410 | (443,094 | ) | (51,083 | ) | ||||||||||||
|
|
|
| |||||||||||||||||
| $ | (2,424,940 | ) | $ | (729,339 | ) | |||||||||||||||
|
|
|
| |||||||||||||||||
| * | Termination date |
| 162 | • ALLIANCEBERNSTEIN WEALTH STRATEGIES |
Bond Inflation Protection Portfolio—Portfolio of Investments
CENTRALLY CLEARED INTEREST RATE SWAPS(see Note C)
| Rate Type | ||||||||||||||||||||
| Broker /(Exchange) | Notional Amount (000) | Termination Date | Payments made by the Fund | Payments received by the Fund | Unrealized Appreciation/ (Depreciation) | |||||||||||||||
Morgan Stanley & Co., LLC/(CME Group) | AUD | 17,400 | 1/13/17 | 3 Month BBR | 3.170% | $ | 71,438 | |||||||||||||
Morgan Stanley & Co., LLC/(CME Group) | 15,420 | 2/13/17 | 3 Month BBR | 3.245% | 98,226 | |||||||||||||||
Morgan Stanley & Co., LLC/(CME Group) | 4,910 | 1/14/24 | 2.980% | 3 Month LIBOR | (121,501 | ) | ||||||||||||||
Morgan Stanley & Co., LLC/(CME Group) | 4,330 | 2/14/24 | 2.889% | 3 Month LIBOR | (57,223 | ) | ||||||||||||||
|
| |||||||||||||||||||
| $ | (9,060 | ) | ||||||||||||||||||
|
| |||||||||||||||||||
CREDIT DEFAULT SWAPS (see Note C)
| Swap Counterparty & Referenced Obligation | Fixed Rate (Pay) Receive | Implied Credit Spread at February 28, 2014 | Notional (000) | Market Value | Upfront Premiums Paid (Received) | Unrealized Appreciation/ (Depreciation) | ||||||||||||||||||||||
Sale Contracts | ||||||||||||||||||||||||||||
Bank of America, NA: |
| |||||||||||||||||||||||||||
Societe Generale, 5.25% 3/28/13, 12/20/17* | 3.00 | % | 0.69 | % | EUR | 1,400 | $ | 178,715 | $ | 64,266 | $ | 114,449 | ||||||||||||||||
Credit Suisse International: |
| |||||||||||||||||||||||||||
Anadarko Petroleum Corp., 5.95%, 9/15/16, 9/20/17* | 1.00 | 0.45 | 2,140 | 44,672 | (53,494 | ) | 98,166 | |||||||||||||||||||||
|
|
|
|
|
| |||||||||||||||||||||||
| $ | 223,387 | $ | 10,772 | $ | 212,615 | |||||||||||||||||||||||
|
|
|
|
|
| |||||||||||||||||||||||
| * | Termination date |
| ALLIANCEBERNSTEIN WEALTH STRATEGIES • | 163 |
Bond Inflation Protection Portfolio—Portfolio of Investments
INTEREST RATE SWAPS (see Note C)
| Rate Type | ||||||||||||||||||||
| Swap Counterparty | Notional Amount (000) | Termination Date | Payments by the | Payments received by the Fund | Unrealized Appreciation/ (Depreciation) | |||||||||||||||
Barclays Bank PLC | $ | 7,590 | 1/17/22 | 2.050 | % | 3 MonthLIBOR | $ | 179,799 | ||||||||||||
JPMorgan Chase Bank, NA | 8,040 | 5/17/21 | 3.268 | % | 3 MonthLIBOR | (636,237 | ) | |||||||||||||
Morgan Stanley Capital Services LLC | 46,600 | 3/12/14 | 0.563 | % | 3 MonthLIBOR | (105,586 | ) | |||||||||||||
Morgan Stanley Capital Services LLC | 5,480 | 2/21/42 | 2.813 | % | 3 MonthLIBOR | 764,204 | ||||||||||||||
Morgan Stanley Capital Services LLC | 3,990 | 3/06/42 | 2.804 | % | 3 MonthLIBOR | 514,078 | ||||||||||||||
|
| |||||||||||||||||||
| $ | 716,258 | |||||||||||||||||||
|
| |||||||||||||||||||
INFLATION (CPI) SWAPS (see Note C)
| Rate Type | ||||||||||||||||||||
Swap Counterparty | Notional Amount (000) | Termination Date | Payments made by the Fund | Payments received by the Fund | Unrealized Appreciation/ (Depreciation) | |||||||||||||||
Barclays Bank PLC | $ | 29,200 | 4/15/15 | 1.209 | % | CPI | # | $ | (12,816 | ) | ||||||||||
Morgan Stanley Capital Services LLC | 36,700 | 7/15/15 | 1.675 | % | CPI# | 12,420 | ||||||||||||||
Morgan Stanley Capital Services LLC | 10,900 | 7/15/17 | 1.955% | CPI | # | (4,932 | ) | |||||||||||||
|
| |||||||||||||||||||
| $ | (5,328 | ) | ||||||||||||||||||
|
| |||||||||||||||||||
| # | Variable interest rate based on the rate of inflation as determined by the Consumer Price Index (CPI). |
REVERSE REPURCHASE AGREEMENTS (see Note C)
| Broker | Interest Rate | Maturity | U.S. $ Value at February 28, 2014 | |||||||||
Bank of America+ | 0.08 | % | — | $ | 7,194,048 | |||||||
Barclays Capital | 0.13 | % | 3/07/14 | 17,595,342 | ||||||||
Barclays Capital+ | 0.06 | % | — | 14,007,050 | ||||||||
JPMorgan Chase | 0.10 | % | 3/13/14 | 49,883,184 | ||||||||
JPMorgan Chase | 0.12 | % | 4/07/14 | 81,208,808 | ||||||||
JPMorgan Chase | 0.12 | % | 4/15/14 | 24,195,459 | ||||||||
|
| |||||||||||
| $ | 194,083,891 | |||||||||||
|
| |||||||||||
| 164 | • ALLIANCEBERNSTEIN WEALTH STRATEGIES |
Bond Inflation Protection Portfolio—Portfolio of Investments
| + | The reverse repurchase agreement matures on demand. Interest rate resets daily and the rate shown is the rate in effect on February 28, 2014 |
| (a) | Position, or a portion thereof, has been segregated to collateralize reverse repurchase agreements. The market value of the collateral amounted to $280,326,024. |
| (b) | Position, or a portion thereof, has been segregated to collateralize OTC derivatives outstanding. The aggregate market value of these securities amounted to $583,108. |
| (c) | Security is exempt from registration under Rule 144A of the Securities Act of 1933. These securities are considered liquid and may be resold in transactions exempt from registration, normally to qualified institutional buyers. At February 28, 2014, the aggregate market value of these securities amounted to $106,434,199 or 13.6% of net assets. |
| (d) | Coupon rate adjusts periodically based upon a predetermined schedule. Stated interest rate in effect at February 28, 2014. |
| (e) | Floating Rate Security. Stated interest rate was in effect at February 28, 2014. |
| (f) | Variable rate coupon, rate shown as of February 28, 2014. |
Currency Abbreviations:
| AUD | – Australian Dollar |
| BRL | – Brazilian Real |
| CAD | – Canadian Dollar |
| EUR | – Euro |
| GBP | – Great British Pound |
| IDR | – Indonesian Rupiah |
| SEK | – Swedish Krona |
| USD | – United States Dollar |
Glossary:
| ABS | – Asset-Backed Securities |
| ARMs | – Adjustable Rate Mortgages |
| CBT | – Chicago Board of Trade |
| CDX-NAHY | – North American High Yield Credit Default Swap Index |
| CDX-NAIG | – North American Investment Grade Credit Default Swap Index |
| CMBS | – Commercial Mortgage-Backed Securities |
| FHLMC | – Federal Home Loan Mortgage Corporation |
| JSC | – Joint Stock Company |
| LIBOR | – London Interbank Offered Rates |
| OJSC | – Open Joint Stock Company |
| REIT | – Real Estate Investment Trust |
| TIPS | – Treasury Inflation Protected Security |
See notes to financial statements.
| ALLIANCEBERNSTEIN WEALTH STRATEGIES • | 165 |
Bond Inflation Protection Portfolio—Portfolio of Investments
HIGH-YIELD PORTFOLIO
PORTFOLIO OF INVESTMENTS
February 28, 2014 (unaudited)
| Principal Amount (000) | U.S. $ Value | |||||||||
| ||||||||||
CORPORATES - NON-INVESTMENT | ||||||||||
Industrial – 58.9% | ||||||||||
Basic – 5.8% | ||||||||||
AK Steel Corp. | U.S.$ | 355 | $ | 399,819 | ||||||
Aleris International, Inc. | 519 | 548,842 | ||||||||
7.875%, 11/01/20 | 230 | 244,375 | ||||||||
ArcelorMittal | 600 | 648,000 | ||||||||
6.125%, 6/01/18 | 1,330 | 1,463,000 | ||||||||
7.25%, 3/01/41 | 61 | 62,068 | ||||||||
7.50%, 10/15/39 | 837 | 872,572 | ||||||||
Arch Coal, Inc. | 594 | 478,170 | ||||||||
Ashland, Inc. | 65 | 67,275 | ||||||||
Axalta Coating Systems US Holdings, Inc./Axalta Coating Systems Dutch | EUR | 280 | 408,707 | |||||||
7.375%, 5/01/21(b) | U.S.$ | 535 | 577,800 | |||||||
Axiall Corp. | 242 | 238,975 | ||||||||
Commercial Metals Co. | 1,016 | 1,137,920 | ||||||||
FMG Resources August 206 Pty Ltd. | 485 | 526,225 | ||||||||
8.25%, 11/01/19(b) | 500 | 551,250 | ||||||||
GrafTech International Ltd. | 365 | 375,038 | ||||||||
Hexion US Finance Corp. | 901 | 931,409 | ||||||||
Huntsman International LLC | 831 | 939,030 | ||||||||
INEOS Finance PLC | 376 | 413,600 | ||||||||
8.375%, 2/15/19(b) | 425 | 470,688 | ||||||||
INEOS Group Holdings SA | EUR | 275 | 391,919 | |||||||
5.875%, 2/15/19(b) | U.S.$ | 375 | 386,250 | |||||||
6.125%, 8/15/18(b) | 345 | 357,075 | ||||||||
JMC Steel Group, Inc. | 696 | 723,840 | ||||||||
Kerling PLC | EUR | 255 | 375,735 | |||||||
| 166 | • ALLIANCEBERNSTEIN WEALTH STRATEGIES |
High-Yield Portfolio—Portfolio of Investments
| Principal Amount (000) | U.S. $ Value | |||||||||
| ||||||||||
Magnetation LLC/Mag Finance Corp. | U.S.$ | 897 | $ | 1,006,882 | ||||||
Molycorp, Inc. | 667 | 530,265 | ||||||||
10.00%, 6/01/20 | 869 | 869,000 | ||||||||
Momentive Performance Materials, Inc. | 461 | 493,270 | ||||||||
Novelis, Inc./GA | 509 | 572,625 | ||||||||
Peabody Energy Corp. | 682 | 738,265 | ||||||||
6.25%, 11/15/21(a) | 659 | 680,417 | ||||||||
PetroLogistics LP/ | 288 | 292,320 | ||||||||
Rain CII Carbon LLC/CII Carbon Corp. | 501 | 522,167 | ||||||||
Ryerson, Inc./ | 400 | 436,000 | ||||||||
11.25%, 10/15/18 | 170 | 190,825 | ||||||||
Steel Dynamics, Inc. | 307 | 315,443 | ||||||||
6.125%, 8/15/19 | 515 | 562,637 | ||||||||
Thompson Creek Metals Co., Inc. | 500 | 558,750 | ||||||||
TPC Group, Inc. | 422 | 455,760 | ||||||||
|
| |||||||||
| 21,814,208 | ||||||||||
|
| |||||||||
Capital Goods – 4.6% | ||||||||||
Accudyne Industries Borrower/ | 328 | 350,960 | ||||||||
Ardagh Packaging Finance PLC/ | EUR | 650 | 954,535 | |||||||
BC Mountain LLC/ | U.S.$ | 403 | 400,985 | |||||||
Befesa Zinc SAU Via Zinc Capital SA | EUR | 100 | 148,065 | |||||||
Beverage Packaging Holdings | U.S.$ | 575 | 592,969 | |||||||
6.00%, 6/15/17(b) | 171 | 177,840 | ||||||||
Bombardier, Inc. | 967 | 979,087 | ||||||||
| ALLIANCEBERNSTEIN WEALTH STRATEGIES • | 167 |
High-Yield Portfolio—Portfolio of Investments
| Principal Amount (000) | U.S. $ Value | |||||||||
| ||||||||||
CNH Capital LLC | U.S.$ | 770 | $ | 781,550 | ||||||
Graphic Packaging International, Inc. | 500 | 535,625 | ||||||||
HD Supply, Inc. | 1,060 | 1,160,700 | ||||||||
8.125%, 4/15/19 | 300 | 337,500 | ||||||||
Manitowoc Co., Inc. (The) | 572 | 648,505 | ||||||||
Masco Corp. | 650 | 752,375 | ||||||||
Milacron LLC/Mcron Finance Corp. | 308 | 329,560 | ||||||||
Nuverra Environmental Solutions, Inc. | 190 | 190,238 | ||||||||
Rexel SA | 502 | 510,785 | ||||||||
6.125%, 12/15/19(b) | 645 | 680,475 | ||||||||
Reynolds Group Issuer, Inc./Reynolds Group Issuer LLC/Reynolds Group Issuer Lu | 1,999 | 2,183,907 | ||||||||
9.00%, 4/15/19 | 1,005 | 1,080,375 | ||||||||
9.875%, 8/15/19 | 400 | 451,000 | ||||||||
RSI Home Products, Inc. | 1,012 | 1,070,190 | ||||||||
Sealed Air Corp. | 681 | 687,810 | ||||||||
8.125%, 9/15/19(b) | 310 | 347,588 | ||||||||
Summit Materials LLC/Summit Materials Finance Corp. | 188 | 210,090 | ||||||||
10.50%, 1/31/20 | 330 | 368,775 | ||||||||
TransDigm, Inc. | 370 | 374,625 | ||||||||
7.75%, 12/15/18 | 1,200 | 1,285,500 | ||||||||
|
| |||||||||
| 17,591,614 | ||||||||||
|
| |||||||||
Communications - Media – 7.8% | ||||||||||
Arqiva Broadcast Finance PLC | GBP | 555 | 1,038,577 | |||||||
CBS Outdoor Americas Capital LLC/CBS Outdoor Americas Capital Corp. | U.S.$ | 186 | 190,650 | |||||||
CCO Holdings LLC/ | 785 | 765,375 | ||||||||
5.75%, 1/15/24 | 623 | 626,115 | ||||||||
| 168 | • ALLIANCEBERNSTEIN WEALTH STRATEGIES |
High-Yield Portfolio—Portfolio of Investments
| Principal Amount (000) | U.S. $ Value | |||||||||
| ||||||||||
Cequel Communications Holdings I LLC/Cequel Capital Corp. | U.S.$ | 644 | $ | 642,390 | ||||||
6.375%, 9/15/20(b) | 490 | 518,175 | ||||||||
Clear Channel Communications, Inc. | 855 | 801,562 | ||||||||
9.00%, 12/15/19(a) | 910 | 955,500 | ||||||||
Clear Channel Worldwide Holdings, Inc. | 525 | 555,188 | ||||||||
Series A | 100 | 107,500 | ||||||||
Series B | 1,475 | 1,570,875 | ||||||||
Columbus International, Inc. | 698 | 738,135 | ||||||||
Crown Media Holdings, Inc. | 470 | 533,450 | ||||||||
CSC Holdings LLC | 1,140 | 1,325,250 | ||||||||
DigitalGlobe, Inc. | 159 | 157,410 | ||||||||
DISH DBS Corp. | 2,900 | 2,878,250 | ||||||||
6.75%, 6/01/21 | 350 | 392,000 | ||||||||
Gannett Co., Inc. | 710 | 749,050 | ||||||||
Hughes Satellite Systems Corp. | 965 | 1,090,450 | ||||||||
Intelsat Jackson Holdings SA | 2,734 | 2,703,242 | ||||||||
7.25%, 10/15/20 | 1,900 | 2,066,250 | ||||||||
Mediacom Broadband LLC/Mediacom Broadband Corp. | 530 | 559,150 | ||||||||
Radio One, Inc. | 308 | 323,400 | ||||||||
RR Donnelley & Sons Co. | 824 | 955,840 | ||||||||
Sinclair Television Group, Inc. | 576 | 596,160 | ||||||||
Sirius XM Holdings, Inc. | 263 | 247,220 | ||||||||
5.25%, 8/15/22(b) | 165 | 170,775 | ||||||||
5.875%, 10/01/20(b) | 381 | 400,526 | ||||||||
Starz LLC/Starz Finance Corp. | 745 | 773,869 | ||||||||
Telenet Finance III Luxembourg SCA | EUR | 420 | 630,452 | |||||||
| ALLIANCEBERNSTEIN WEALTH STRATEGIES • | 169 |
High-Yield Portfolio—Portfolio of Investments
| Principal Amount (000) | U.S. $ Value | |||||||||
| ||||||||||
Townsquare Radio LLC/ | U.S.$ | 332 | $ | 367,690 | ||||||
Unitymedia Hessen GmbH & Co. | 580 | 600,300 | ||||||||
6.25%, 1/15/29(b) | EUR | 126 | 185,223 | |||||||
7.50%, 3/15/19(b) | U.S.$ | 402 | 437,013 | |||||||
Univision Communications, Inc. | 514 | 526,850 | ||||||||
6.75%, 9/15/22(b) | 335 | 371,850 | ||||||||
8.50%, 5/15/21(b) | 650 | 722,312 | ||||||||
UPCB Finance III Ltd. | 550 | 587,813 | ||||||||
Virgin Media Finance PLC | 545 | 576,338 | ||||||||
|
| |||||||||
| 29,438,175 | ||||||||||
|
| |||||||||
Communications - | ||||||||||
CenturyLink, Inc. | 265 | 271,625 | ||||||||
Series U | 680 | 639,200 | ||||||||
Series W | 335 | 355,100 | ||||||||
Frontier Communications Corp. | 258 | 273,480 | ||||||||
7.875%, 1/15/27 | 127 | 127,318 | ||||||||
9.00%, 8/15/31 | 545 | 569,525 | ||||||||
InterXion Holding NV | EUR | 213 | 314,593 | |||||||
Level 3 Communications, Inc. | U.S.$ | 169 | 186,323 | |||||||
Level 3 Financing, Inc. | 642 | 678,915 | ||||||||
7.00%, 6/01/20 | 800 | 872,000 | ||||||||
Sprint Capital Corp. | 3,030 | 3,007,275 | ||||||||
8.75%, 3/15/32 | 300 | 336,750 | ||||||||
Sprint Communications, Inc. | 785 | 804,625 | ||||||||
9.00%, 11/15/18(b) | 945 | 1,157,625 | ||||||||
Sprint Corp. | 520 | 569,400 | ||||||||
7.875%, 9/15/23(b) | 938 | 1,038,835 | ||||||||
Sunrise Communications Holdings SA | EUR | 350 | 522,720 | |||||||
| 170 | • ALLIANCEBERNSTEIN WEALTH STRATEGIES |
High-Yield Portfolio—Portfolio of Investments
| Principal Amount (000) | U.S. $ Value | |||||||||
| ||||||||||
T-Mobile USA, Inc. | U.S.$ | 377 | $ | 398,206 | ||||||
6.25%, 4/01/21 | 900 | 959,625 | ||||||||
6.50%, 1/15/24 | 715 | 757,900 | ||||||||
6.542%, 4/28/20 | 600 | 649,500 | ||||||||
6.625%, 4/01/23 | 239 | 256,925 | ||||||||
6.731%, 4/28/22 | 420 | 453,600 | ||||||||
6.836%, 4/28/23 | 241 | 260,882 | ||||||||
Telecom Italia Capital SA | 1,050 | 1,023,750 | ||||||||
tw telecom holdings, Inc. | 729 | 780,030 | ||||||||
Wind Acquisition Finance SA | 1,430 | 1,576,575 | ||||||||
Windstream Corp. | 715 | 750,750 | ||||||||
7.875%, 11/01/17 | 675 | 772,875 | ||||||||
8.125%, 9/01/18 | 900 | 960,750 | ||||||||
|
| |||||||||
| 21,326,677 | ||||||||||
|
| |||||||||
Consumer Cyclical - Automotive – 2.2% | ||||||||||
Affinia Group, Inc. | 718 | 775,440 | ||||||||
Allison Transmission, Inc. | 298 | 321,840 | ||||||||
Banque PSA Finance SA | 546 | 568,719 | ||||||||
Commercial Vehicle Group, Inc. | 427 | 438,209 | ||||||||
Dana Holding Corp. | 755 | 777,650 | ||||||||
Exide Technologies | 586 | 476,125 | ||||||||
General Motors Financial Co., Inc. | 369 | 377,764 | ||||||||
6.75%, 6/01/18 | 760 | 885,400 | ||||||||
LKQ Corp. | 720 | 685,800 | ||||||||
Meritor, Inc. | 185 | 201,650 | ||||||||
Rhino Bondco S.P.A | EUR | 200 | 276,639 | |||||||
7.25%, 11/15/20(b) | 275 | 401,029 | ||||||||
Schaeffler Finance BV | 217 | 311,881 | ||||||||
Schaeffler Holding Finance BV | 544 | 801,568 | ||||||||
| ALLIANCEBERNSTEIN WEALTH STRATEGIES • | 171 |
High-Yield Portfolio—Portfolio of Investments
| Principal Amount (000) | U.S. $ Value | |||||||||
| ||||||||||
Servus Luxembourg Holding SCA | EUR | 384 | $ | 570,943 | ||||||
UCI International, Inc. | U.S.$ | 402 | 386,925 | |||||||
|
| |||||||||
| 8,257,582 | ||||||||||
|
| |||||||||
Consumer Cyclical - Entertainment – 0.5% | ||||||||||
Activision Blizzard, Inc. | 636 | 683,700 | ||||||||
6.125%, 9/15/23(b) | 382 | 414,470 | ||||||||
ClubCorp Club Operations, Inc. | 250 | 276,563 | ||||||||
Greektown Holdings LLC | 525 | – 0 | – | |||||||
Live Nation Entertainment, Inc. | 284 | 311,690 | ||||||||
Regal Entertainment Group | 385 | 393,662 | ||||||||
|
| |||||||||
| 2,080,085 | ||||||||||
|
| |||||||||
Consumer Cyclical - Other – 2.2% | ||||||||||
Boyd Gaming Corp. | 870 | 946,125 | ||||||||
Caesars Entertainment Operating Co., Inc. | 825 | 396,000 | ||||||||
DR Horton, Inc. | 1,180 | 1,292,100 | ||||||||
Isle of Capri Casinos, Inc. | 545 | 592,006 | ||||||||
Lennar Corp. | 1,260 | 1,370,250 | ||||||||
M/I Homes, Inc. | 790 | 854,187 | ||||||||
Marina District Finance Co., Inc. | 370 | 398,213 | ||||||||
PVH Corp. | 765 | 851,062 | ||||||||
Ryland Group, Inc. (The) | 335 | 361,800 | ||||||||
Shea Homes LP/Shea Homes Funding Corp. 8.625%, 5/15/19(a) | 503 | 554,558 | ||||||||
Standard Pacific Corp. | 500 | 595,000 | ||||||||
Wolverine World Wide, Inc. | 251 | 271,080 | ||||||||
|
| |||||||||
| 8,482,381 | ||||||||||
|
| |||||||||
| 172 | • ALLIANCEBERNSTEIN WEALTH STRATEGIES |
High-Yield Portfolio—Portfolio of Investments
| Principal Amount (000) | U.S. $ Value | |||||||||
| ||||||||||
Consumer Cyclical - Retailers – 2.4% | ||||||||||
Asbury Automotive Group, Inc. | U.S.$ | 357 | $ | 402,518 | ||||||
Brighthouse Group PLC | GBP | 669 | 1,178,193 | |||||||
Burlington Coat Factory Warehouse Corp. | U.S.$ | 960 | 1,068,000 | |||||||
Burlington Holdings LLC/Burlington Holding Finance, Inc. | 93 | 95,325 | ||||||||
Chinos Intermediate Holdings A, Inc. | 566 | 591,470 | ||||||||
CST Brands, Inc. | 1,572 | 1,528,770 | ||||||||
L Brands, Inc. | 400 | 448,500 | ||||||||
8.50%, 6/15/19 | 820 | 994,250 | ||||||||
Michaels Stores, Inc. | 500 | 536,250 | ||||||||
Murphy Oil USA, Inc. | 204 | 207,570 | ||||||||
Neiman Marcus Group Ltd. LLC | 139 | 149,425 | ||||||||
New Look Bondco I PLC | 370 | 394,975 | ||||||||
Phones4u Finance PLC | GBP | 470 | 826,501 | |||||||
Toys R US – Delaware, Inc. | U.S.$ | 731 | 670,692 | |||||||
|
| |||||||||
| 9,092,439 | ||||||||||
|
| |||||||||
Consumer Non-Cyclical – 10.2% | ||||||||||
Air Medical Group Holdings, Inc. | 750 | 813,750 | ||||||||
Alere, Inc. | 62 | 65,100 | ||||||||
8.625%, 10/01/18 | 739 | 794,425 | ||||||||
ARAMARK Corp. | 244 | 257,420 | ||||||||
Big Heart Pet Brands | 350 | 364,437 | ||||||||
Biomet, Inc. | 465 | 495,806 | ||||||||
Capsugel Finance Co. SCA | EUR | 740 | 1,123,667 | |||||||
Capsugel SA | U.S.$ | 93 | 96,488 | |||||||
Care UK Health & Social Care PLC | GBP | 510 | 911,667 | |||||||
| ALLIANCEBERNSTEIN WEALTH STRATEGIES • | 173 |
High-Yield Portfolio—Portfolio of Investments
| Principal Amount (000) | U.S. $ Value | |||||||||
| ||||||||||
Cerba European Lab SAS | EUR | 850 | $ | 1,256,850 | ||||||
CHS/Community Health Systems, Inc. | U.S.$ | 2,726 | 2,899,782 | |||||||
7.125%, 7/15/20 | 685 | 748,362 | ||||||||
Constellation Brands, Inc. | 790 | 914,425 | ||||||||
Elli Finance UK PLC | GBP | 503 | 937,058 | |||||||
Endo Finance Co. | U.S.$ | 225 | 232,313 | |||||||
Endo Health Solutions, Inc. | 670 | 725,275 | ||||||||
7.25%, 1/15/22 | 255 | 278,906 | ||||||||
Envision Healthcare Corp. | 730 | 783,837 | ||||||||
First Quality Finance Co., Inc. | 1,535 | 1,504,300 | ||||||||
Forest Laboratories, Inc. | 230 | 246,100 | ||||||||
Fresenius Medical Care US Finance, Inc. | 385 | 433,125 | ||||||||
HCA, Inc. | 1,545 | 1,743,919 | ||||||||
Healthcare Technology Intermediate, Inc. | 1,098 | 1,136,430 | ||||||||
Holding Medi-Partenaires SAS | EUR | 735 | 1,053,336 | |||||||
Hologic, Inc. | U.S.$ | 291 | 309,187 | |||||||
IASIS Healthcare LLC/IASIS Capital Corp. | 1,010 | 1,080,700 | ||||||||
Jaguar Holding Co. II/ | 995 | 1,114,400 | ||||||||
Kinetic Concepts, Inc./KCI USA, Inc. | 1,015 | 1,173,594 | ||||||||
Labco SA | EUR | 400 | 588,698 | |||||||
New Albertsons, Inc. | U.S.$ | 680 | 574,600 | |||||||
Par Pharmaceutical Cos., Inc. | 360 | 389,700 | ||||||||
Pinnacle Merger Sub, Inc. | 670 | 723,600 | ||||||||
Post Holdings, Inc. | 76 | 81,415 | ||||||||
7.375%, 2/15/22 | 222 | 241,703 | ||||||||
7.375%, 2/15/22(b) | 185 | 201,419 | ||||||||
| 174 | • ALLIANCEBERNSTEIN WEALTH STRATEGIES |
High-Yield Portfolio—Portfolio of Investments
| Principal Amount (000) | U.S. $ Value | |||||||||
| ||||||||||
Priory Group No. 3 PLC | GBP | 665 | $ | 1,174,823 | ||||||
R&R Ice Cream PLC | EUR | 600 | 882,012 | |||||||
Salix Pharmaceuticals Ltd. | U.S.$ | 176 | 188,320 | |||||||
Smithfield Foods, Inc. | 660 | 692,175 | ||||||||
5.875%, 8/01/21(b) | 220 | 226,600 | ||||||||
6.625%, 8/15/22 | 410 | 442,800 | ||||||||
Spectrum Brands, Inc. | 48 | 52,320 | ||||||||
6.625%, 11/15/22 | 464 | 505,760 | ||||||||
6.75%, 3/15/20 | 900 | 976,500 | ||||||||
Tenet Healthcare Corp. | 70 | 63,350 | ||||||||
8.00%, 8/01/20 | 1,040 | 1,141,400 | ||||||||
8.125%, 4/01/22 | 1,780 | 1,993,600 | ||||||||
United Surgical Partners International, Inc. | 382 | 430,629 | ||||||||
Valeant Pharmaceuticals International | 800 | 874,000 | ||||||||
6.875%, 12/01/18(b) | 825 | 877,594 | ||||||||
7.00%, 10/01/20(b) | 1,215 | 1,325,869 | ||||||||
Voyage Care Bondco PLC | GBP | 100 | 174,572 | |||||||
WellCare Health Plans, Inc. | U.S.$ | 356 | 371,130 | |||||||
|
| |||||||||
| 38,689,248 | ||||||||||
|
| |||||||||
Energy – 7.7% | ||||||||||
Antero Resources Finance Corp. | 250 | 268,750 | ||||||||
Athlon Holdings LP/Athlon Finance Corp. | 1,337 | 1,417,220 | ||||||||
ATP Oil & Gas Corp./United States | 410 | 3,075 | ||||||||
Atwood Oceanics, Inc. | 700 | 754,250 | ||||||||
Basic Energy Services, Inc. | 500 | 533,750 | ||||||||
Bill Barrett Corp. | 400 | 431,000 | ||||||||
Bonanza Creek Energy, Inc. | 123 | 132,225 | ||||||||
Bristow Group, Inc. | 222 | 235,875 | ||||||||
Chaparral Energy, Inc. | 835 | 905,975 | ||||||||
| ALLIANCEBERNSTEIN WEALTH STRATEGIES • | 175 |
High-Yield Portfolio—Portfolio of Investments
| Principal Amount (000) | U.S. $ Value | |||||||||
| ||||||||||
CHC Helicopter SA | U.S.$ | 548 | $ | 597,593 | ||||||
Chesapeake Energy Corp. | 1,225 | 1,251,031 | ||||||||
6.875%, 11/15/20 | 1,200 | 1,380,000 | ||||||||
CITGO Petroleum Corp. | 891 | 962,280 | ||||||||
Denbury Resources, Inc. | 315 | 296,888 | ||||||||
Diamondback Energy, Inc. | 343 | 363,580 | ||||||||
Energy XXI Gulf Coast, Inc. | 489 | 525,675 | ||||||||
9.25%, 12/15/17 | 800 | 874,000 | ||||||||
EP Energy LLC/Everest Acquisition Finance, Inc. | 823 | 887,811 | ||||||||
Golden Close Maritime Corp., Ltd. | 342 | 358,840 | ||||||||
Hornbeck Offshore Services, Inc. | 543 | 566,077 | ||||||||
Key Energy Services, Inc. | 901 | 943,797 | ||||||||
Linn Energy LLC/Linn Energy Finance Corp. | 2,224 | 2,318,520 | ||||||||
Northern Blizzard Resources, Inc. | 570 | 581,400 | ||||||||
Oasis Petroleum, Inc. | 1,152 | 1,249,920 | ||||||||
Offshore Group Investment Ltd. | 483 | 520,433 | ||||||||
Oil States International, Inc. | 722 | 763,515 | ||||||||
Pacific Drilling SA | 936 | 947,700 | ||||||||
Petroleum Geo-Services ASA | 348 | 374,970 | ||||||||
PHI, Inc. | 400 | 430,000 | ||||||||
Pioneer Energy Services Corp. | 716 | 754,485 | ||||||||
Precision Drilling Corp. | 299 | 320,678 | ||||||||
QEP Resources, Inc. | 2,200 | 2,211,000 | ||||||||
Quicksilver Resources, Inc. | 593 | 569,280 | ||||||||
| 176 | • ALLIANCEBERNSTEIN WEALTH STRATEGIES |
High-Yield Portfolio—Portfolio of Investments
| Principal Amount (000) | U.S. $ Value | |||||||||
| ||||||||||
Range Resources Corp. | U.S.$ | 526 | $ | 565,450 | ||||||
Sanchez Energy Corp. | 430 | 449,350 | ||||||||
Seven Generations Energy Ltd. | 1,034 | 1,129,645 | ||||||||
Tervita Corp. | 811 | 855,605 | ||||||||
10.875%, 2/15/18(b) | 375 | 403,125 | ||||||||
W&T Offshore, Inc. | 550 | 595,375 | ||||||||
Whiting Petroleum Corp. | 299 | 316,193 | ||||||||
|
| |||||||||
| 29,046,336 | ||||||||||
|
| |||||||||
Other Industrial – 2.7% | ||||||||||
Algeco Scotsman Global Finance PLC | 1,010 | 1,100,900 | ||||||||
B456 Systems, Inc. | 270 | 44,550 | ||||||||
Belden, Inc. | EUR | 425 | 593,667 | |||||||
General Cable Corp. | U.S.$ | 387 | 390,870 | |||||||
Interline Brands, Inc. | 590 | 646,787 | ||||||||
Interline Brands, Inc./NJ | 704 | 746,592 | ||||||||
Laureate Education, Inc. | 889 | 951,230 | ||||||||
Modular Space Corp. | 487 | 508,915 | ||||||||
NANA Development Corp. | 1,156 | 1,196,460 | ||||||||
New Enterprise Stone & Lime Co., Inc. | 924 | 850,080 | ||||||||
13.00%, 3/15/18(e) | 350 | 406,000 | ||||||||
Safway Group Holding LLC/Safway Finance Corp. | 452 | 480,250 | ||||||||
Trionista Holdco GmbH | EUR | 413 | 593,682 | |||||||
Trionista TopCo GmbH | 253 | 378,899 | ||||||||
Xella Holdco Finance SA | 820 | 1,211,076 | ||||||||
|
| |||||||||
| 10,099,958 | ||||||||||
|
| |||||||||
| ALLIANCEBERNSTEIN WEALTH STRATEGIES • | 177 |
High-Yield Portfolio—Portfolio of Investments
| Principal Amount (000) | U.S. $ Value | |||||||||
| ||||||||||
Services – 1.8% | ||||||||||
ADT Corp. (The) | U.S.$ | 1,300 | $ | 1,186,250 | ||||||
6.25%, 10/15/21(b) | 270 | 284,175 | ||||||||
Cerved Group SpA | EUR | 241 | 355,938 | |||||||
8.00%, 1/15/21(b) | 270 | 402,764 | ||||||||
Gtech SpA | 730 | 1,098,607 | ||||||||
Mobile Mini, Inc. | U.S.$ | 309 | 345,308 | |||||||
Sabre GLBL, Inc. | 847 | 943,346 | ||||||||
ServiceMaster Co./TN | 29 | 30,160 | ||||||||
8.00%, 2/15/20 | 342 | 365,085 | ||||||||
Travelport LLC | EUR | 300 | 417,196 | |||||||
Travelport LLC/Travelport Holdings, Inc. | U.S.$ | 386 | 410,607 | |||||||
West Corp. | 880 | 946,000 | ||||||||
|
| |||||||||
| 6,785,436 | ||||||||||
|
| |||||||||
Technology – 4.8% | ||||||||||
Alcatel-Lucent USA, Inc. | 228 | 242,820 | ||||||||
8.875%, 1/01/20(b) | 651 | 738,885 | ||||||||
Audatex North America, Inc. | 193 | 206,028 | ||||||||
6.125%, 11/01/23(b) | 154 | 164,780 | ||||||||
Avaya, Inc. | 102 | 101,235 | ||||||||
10.50%, 3/01/21(b) | 1,055 | 999,612 | ||||||||
Blackboard, Inc. | 334 | 345,690 | ||||||||
BMC Software Finance, Inc. | 459 | 482,524 | ||||||||
Brightstar Corp. | 883 | 966,885 | ||||||||
CDW LLC/CDW Finance Corp. | 436 | 471,970 | ||||||||
8.50%, 4/01/19 | 1,049 | 1,153,900 | ||||||||
Ceridian Corp. | 456 | 520,980 | ||||||||
Ceridian HCM Holding, Inc. | 840 | 960,750 | ||||||||
CommScope, Inc. | 557 | 607,130 | ||||||||
| 178 | • ALLIANCEBERNSTEIN WEALTH STRATEGIES |
High-Yield Portfolio—Portfolio of Investments
| Principal Amount (000) | U.S. $ Value | |||||||||
| ||||||||||
First Data Corp. | U.S.$ | 652 | $ | 702,530 | ||||||
7.375%, 6/15/19(b) | 1,825 | 1,975,562 | ||||||||
8.25%, 1/15/21(b) | 355 | 385,175 | ||||||||
11.75%, 8/15/21(b) | 450 | 481,500 | ||||||||
12.625%, 1/15/21 | 492 | 587,940 | ||||||||
First Data Holdings, Inc. | 148 | 147,003 | ||||||||
Freescale Semiconductor, Inc. | 212 | 216,505 | ||||||||
Goodman Networks, Inc. | 775 | 823,438 | ||||||||
Infor US, Inc. | 318 | 359,340 | ||||||||
10.00%, 4/01/19 | EUR | 251 | 391,495 | |||||||
Iron Mountain, Inc. | U.S.$ | 533 | 519,675 | |||||||
Micron Technology, Inc. | 188 | 196,460 | ||||||||
MMI International Ltd. | 475 | 475,000 | ||||||||
Sanmina Corp. | 603 | 639,180 | ||||||||
Sensata Technologies BV | 800 | 858,000 | ||||||||
Serena Software, Inc. | 702 | 666,900 | ||||||||
SunGard Data Systems, Inc. | 800 | 882,000 | ||||||||
|
| |||||||||
| 18,270,892 | ||||||||||
|
| |||||||||
Transportation - Airlines – 0.1% | ||||||||||
Air Canada | 292 | 315,360 | ||||||||
|
| |||||||||
Transportation - Services – 0.5% | ||||||||||
Europcar Groupe SA | EUR | 225 | 358,861 | |||||||
Hertz Corp. (The) | U.S.$ | 360 | 381,600 | |||||||
6.75%, 4/15/19 | 811 | 868,784 | ||||||||
LBC Tank Terminals Holding Netherlands BV | 400 | 423,000 | ||||||||
|
| |||||||||
| 2,032,245 | ||||||||||
|
| |||||||||
| 223,322,636 | ||||||||||
|
| |||||||||
Financial Institutions – 7.9% | ||||||||||
Banking – 2.7% | ||||||||||
ABN AMRO Bank NV | EUR | 980 | 1,362,839 | |||||||
| ALLIANCEBERNSTEIN WEALTH STRATEGIES • | 179 |
High-Yield Portfolio—Portfolio of Investments
| Principal Amount (000) | U.S. $ Value | |||||||||
| ||||||||||
Ally Financial, Inc. | U.S.$ | 501 | $ | 623,745 | ||||||
Baggot Securities Ltd. | EUR | 169 | 251,641 | |||||||
Bank of America Corp. | U.S.$ | 625 | 587,500 | |||||||
Barclays Bank PLC | 200 | 221,000 | ||||||||
7.75%, 4/10/23 | 719 | 801,685 | ||||||||
BBVA International Preferred SAU | EUR | 100 | 132,509 | |||||||
Commerzbank AG | U.S.$ | 342 | 386,460 | |||||||
Countrywide Capital III | 600 | 723,100 | ||||||||
Credit Agricole SA | 237 | 254,775 | ||||||||
Credit Suisse Group AG | 407 | 448,209 | ||||||||
HBOS Capital Funding LP | EUR | 217 | 281,554 | |||||||
6.071%, 6/30/14(b) | U.S.$ | 665 | 666,662 | |||||||
HT1 Funding GmbH | EUR | 825 | 1,159,815 | |||||||
LBG Capital No.1 PLC | U.S.$ | 370 | 393,125 | |||||||
RBS Capital Trust C | EUR | 700 | 927,562 | |||||||
Societe Generale SA | U.S.$ | 432 | 462,154 | |||||||
7.875%, 12/18/23(b) | 321 | 340,260 | ||||||||
Zions Bancorporation | 350 | 320,250 | ||||||||
|
| |||||||||
| 10,344,845 | ||||||||||
|
| |||||||||
Brokerage – 0.6% | ||||||||||
E*Trade Financial Corp. | 496 | 538,160 | ||||||||
6.75%, 6/01/16 | 329 | 356,143 | ||||||||
Lehman Brothers Holdings, Inc. | 5,500 | 1,320,000 | ||||||||
|
| |||||||||
| 2,214,303 | ||||||||||
|
| |||||||||
Finance – 2.9% | ||||||||||
AerCap Aviation Solutions BV | 300 | 327,000 | ||||||||
Aviation Capital Group Corp. | 133 | 138,575 | ||||||||
| 180 | • ALLIANCEBERNSTEIN WEALTH STRATEGIES |
High-Yield Portfolio—Portfolio of Investments
| Principal Amount (000) | U.S. $ Value | |||||||||
| ||||||||||
CIT Group, Inc. | U.S.$ | 1,400 | $ | 1,519,000 | ||||||
Creditcorp | 925 | 938,875 | ||||||||
International Lease Finance Corp. | 1,200 | 1,326,000 | ||||||||
8.25%, 12/15/20 | 635 | 777,081 | ||||||||
8.75%, 3/15/17 | 433 | 511,481 | ||||||||
8.875%, 9/01/17 | 687 | 824,400 | ||||||||
Milestone Aviation Group Ltd. (The) | 720 | 770,400 | ||||||||
SLM Corp. | 470 | 492,325 | ||||||||
4.875%, 6/17/19 | 965 | 996,363 | ||||||||
5.625%, 8/01/33 | 234 | 202,410 | ||||||||
7.25%, 1/25/22 | 37 | 40,700 | ||||||||
8.00%, 3/25/20 | 1,255 | 1,449,525 | ||||||||
TMX Finance LLC/TitleMax Finance Corp. | 555 | 606,338 | ||||||||
|
| |||||||||
| 10,920,473 | ||||||||||
|
| |||||||||
Insurance – 0.6% | ||||||||||
American Equity Investment Life Holding | 564 | 595,020 | ||||||||
Hartford Financial Services Group, Inc. | 820 | 957,350 | ||||||||
Hockey Merger Sub 2, Inc. | 365 | 384,162 | ||||||||
Liberty Mutual Group, Inc. | 410 | 444,850 | ||||||||
|
| |||||||||
| 2,381,382 | ||||||||||
|
| |||||||||
Other Finance – 1.1% | ||||||||||
ACE Cash Express, Inc. | 122 | 107,512 | ||||||||
CNG Holdings, Inc./OH | 585 | 555,750 | ||||||||
FTI Consulting, Inc. | 500 | 543,750 | ||||||||
Gardner Denver, Inc. | 539 | 551,127 | ||||||||
Harbinger Group, Inc. | 180 | 181,800 | ||||||||
7.875%, 7/15/19 | 431 | 467,635 | ||||||||
iPayment Holdings, Inc. | 3 | 1,594 | ||||||||
| ALLIANCEBERNSTEIN WEALTH STRATEGIES • | 181 |
High-Yield Portfolio—Portfolio of Investments
| Principal Amount (000) | U.S. $ Value | |||||||||||
| ||||||||||||
iPayment, Inc. | U.S.$ | 938 | $ | 731,640 | ||||||||
National Money Mart Co. | 535 | 532,994 | ||||||||||
Speedy Group Holdings Corp. | 519 | 537,165 | ||||||||||
|
| |||||||||||
| 4,210,967 | ||||||||||||
|
| |||||||||||
| 30,071,970 | ||||||||||||
|
| |||||||||||
Utility – 4.6% | ||||||||||||
Electric – 2.8% | ||||||||||||
AES Corp./VA | ||||||||||||
4.875%, 5/15/23 | 382 | 370,540 | ||||||||||
7.375%, 7/01/21 | 489 | 556,238 | ||||||||||
8.00%, 10/15/17 | 612 | 725,220 | ||||||||||
Calpine Corp. | ||||||||||||
5.875%, 1/15/24(b) | 400 | 410,000 | ||||||||||
6.00%, 1/15/22(b) | 491 | 520,460 | ||||||||||
Enel SpA | 386 | 430,188 | ||||||||||
Energy Future Intermediate Holding Co. LLC/EFIH Finance, Inc. | 994 | 1,020,092 | ||||||||||
10.00%, 12/01/20 | 792 | 823,680 | ||||||||||
10.25%, 12/01/20(b) | 694 | 721,760 | ||||||||||
FirstEnergy Corp. | 355 | 357,813 | ||||||||||
Series C | 322 | 370,728 | ||||||||||
GenOn Energy, Inc. | 840 | 846,300 | ||||||||||
9.50%, 10/15/18(a) | 721 | 742,630 | ||||||||||
NRG Energy, Inc. | 901 | 1,000,110 | ||||||||||
PPL Capital Funding, Inc. | 375 | 375,938 | ||||||||||
Techem Energy Metering Service | EUR | 300 | 467,880 | |||||||||
Techem GmbH | 300 | 450,406 | ||||||||||
Texas Competitive Electric Holdings Co. LLC/TCEH Finance, Inc. | U.S.$ | 761 | 560,286 | |||||||||
|
| |||||||||||
| 10,750,269 | ||||||||||||
|
| |||||||||||
| 182 | • ALLIANCEBERNSTEIN WEALTH STRATEGIES |
High-Yield Portfolio—Portfolio of Investments
| Principal Amount (000) | U.S. $ Value | |||||||||
| ||||||||||
Natural Gas – 1.8% | ||||||||||
Access Midstream Partners LP/ACMP Finance Corp. | U.S.$ | 199 | $ | 215,915 | ||||||
El Paso LLC | 362 | 383,822 | ||||||||
Hiland Partners LP/Hiland Partners Finance Corp. | 917 | 990,360 | ||||||||
Kinder Morgan Finance Co. LLC | 1,765 | 1,884,138 | ||||||||
Kinder Morgan, Inc./DE | 168 | 168,876 | ||||||||
MarkWest Energy Partners LP/MarkWest Energy Finance Corp. | 381 | 413,385 | ||||||||
Regency Energy Partners LP/Regency Energy Finance Corp. | 571 | 533,885 | ||||||||
5.50%, 4/15/23 | 387 | 390,870 | ||||||||
Sabine Pass Liquefaction LLC | 1,000 | 1,025,000 | ||||||||
6.25%, 3/15/22(b) | 565 | 584,775 | ||||||||
|
| |||||||||
| 6,591,026 | ||||||||||
|
| |||||||||
| 17,341,295 | ||||||||||
|
| |||||||||
Total Corporates – Non-Investment Grades | 270,735,901 | |||||||||
|
| |||||||||
CORPORATES - INVESTMENT GRADES – 6.1% | ||||||||||
Financial Institutions – 4.1% | ||||||||||
Banking – 2.7% | ||||||||||
Barclays Bank PLC | 162 | 171,923 | ||||||||
7.434%, 12/15/17(b) | 540 | 599,400 | ||||||||
BNP Paribas SA | 957 | 983,317 | ||||||||
BPCE SA | 202 | 212,807 | ||||||||
Cooperatieve Centrale Raiffeisen-Boerenleenbank BA/Netherlands | 410 | 451,000 | ||||||||
8.40%, 6/29/17(b) | 330 | 369,600 | ||||||||
Credit Agricole SA | GBP | 450 | 811,496 | |||||||
| ALLIANCEBERNSTEIN WEALTH STRATEGIES • | 183 |
High-Yield Portfolio—Portfolio of Investments
| Principal Amount (000) | U.S. $ Value | |||||||||
| ||||||||||
Credit Suisse AG | U.S.$ | 475 | $ | 516,464 | ||||||
Danske Bank A/S | GBP | 330 | 567,798 | |||||||
HSBC Capital Funding LP/Jersey | U.S.$ | 674 | 973,852 | |||||||
JPMorgan Chase & Co. | 379 | 395,107 | ||||||||
Series Q | 673 | 635,985 | ||||||||
Series R | 336 | 334,320 | ||||||||
Nationwide Building Society | GBP | 234 | 405,560 | |||||||
Santander Bank NA | U.S.$ | 360 | 433,800 | |||||||
Standard Chartered PLC | 549 | 563,735 | ||||||||
UBS AG/Jersey | 657 | 726,806 | ||||||||
UBS AG/Stamford CT | 650 | 771,327 | ||||||||
Zions Bancorporation | 145 | 152,735 | ||||||||
|
| |||||||||
| 10,077,032 | ||||||||||
|
| |||||||||
Finance – 0.3% | ||||||||||
General Electric Capital Corp. | 800 | 908,000 | ||||||||
HSBC Finance Capital Trust IX | 200 | 206,250 | ||||||||
|
| |||||||||
| 1,114,250 | ||||||||||
|
| |||||||||
Insurance – 0.7% | ||||||||||
MetLife Capital Trust IV | 750 | 875,625 | ||||||||
Mitsui Sumitomo Insurance Co., Ltd. | 489 | 563,126 | ||||||||
Nationwide Mutual Insurance Co. | 325 | 482,232 | ||||||||
Prudential Financial, Inc. | 756 | 780,570 | ||||||||
|
| |||||||||
| 2,701,553 | ||||||||||
|
| |||||||||
REITS – 0.4% | ||||||||||
EPR Properties | 842 | 997,390 | ||||||||
| 184 | • ALLIANCEBERNSTEIN WEALTH STRATEGIES |
High-Yield Portfolio—Portfolio of Investments
| Principal Amount (000) | U.S. $ Value | |||||||||
| ||||||||||
Senior Housing Properties Trust | U.S.$ | 600 | $ | 680,550 | ||||||
|
| |||||||||
| 1,677,940 | ||||||||||
|
| |||||||||
| 15,570,775 | ||||||||||
|
| |||||||||
Industrial – 1.8% | ||||||||||
Basic – 0.8% | ||||||||||
Basell Finance Co. BV | 419 | 540,369 | ||||||||
Braskem Finance Ltd. | 247 | 250,705 | ||||||||
Minsur SA | 185 | 190,683 | ||||||||
Plains Exploration & Production Co. | 344 | 380,120 | ||||||||
6.75%, 2/01/22 | 1,485 | 1,640,925 | ||||||||
|
| |||||||||
| 3,002,802 | ||||||||||
|
| |||||||||
Communications – Media – 0.3% | ||||||||||
Kabel Deutschland Holding AG | EUR | 640 | 940,813 | |||||||
|
| |||||||||
Communications - Telecommunications – 0.3% | ||||||||||
Oi SA | U.S.$ | 210 | 199,392 | |||||||
Qwest Corp. | 720 | 715,280 | ||||||||
Telemar Norte Leste SA | 210 | 205,275 | ||||||||
|
| |||||||||
| 1,119,947 | ||||||||||
|
| |||||||||
Consumer Cyclical – Automotive – 0.1% | ||||||||||
Delphi Corp. | 480 | 511,800 | ||||||||
|
| |||||||||
Consumer Cyclical – Other – 0.0% | ||||||||||
Seminole Tribe of Florida, Inc. | 94 | 103,400 | ||||||||
|
| |||||||||
Consumer Cyclical – Retailers – 0.2% | ||||||||||
Cash America International, Inc. | 600 | 579,750 | ||||||||
|
| |||||||||
Energy – 0.1% | ||||||||||
National Oilwell Varco, Inc. | 506 | 506,632 | ||||||||
|
| |||||||||
| 6,765,144 | ||||||||||
|
| |||||||||
| ALLIANCEBERNSTEIN WEALTH STRATEGIES • | 185 |
High-Yield Portfolio—Portfolio of Investments
| Principal Amount (000) | U.S. $ Value | |||||||||
| ||||||||||
Utility – 0.2% | ||||||||||
Natural Gas – 0.2% | ||||||||||
Empresa de Energia de Bogota SA ESP | U.S.$ | 350 | $ | 373,811 | ||||||
Enterprise Products Operating LLC | 420 | 469,350 | ||||||||
|
| |||||||||
| 843,161 | ||||||||||
|
| |||||||||
Total Corporates – Investment Grades | 23,179,080 | |||||||||
|
| |||||||||
BANK LOANS – 3.9% | ||||||||||
Industrial – 3.7% | ||||||||||
Basic – 0.2% | ||||||||||
FMG Resources (August 2006) Pty Ltd. | 597 | 602,806 | ||||||||
Unifrax Holding Co. | EUR | 246 | 338,635 | |||||||
|
| |||||||||
| 941,441 | ||||||||||
|
| |||||||||
Capital Goods – 0.2% | ||||||||||
ClubCorp Club Operations, Inc. | U.S.$ | 516 | 518,415 | |||||||
NewPage Corporation | 380 | 382,216 | ||||||||
|
| |||||||||
| 900,631 | ||||||||||
|
| |||||||||
Communications - Media – 0.3% | ||||||||||
TWCC Holding Corp. | 1,050 | 1,015,875 | ||||||||
|
| |||||||||
Consumer Cyclical - Automotive – 0.7% | ||||||||||
Exide Technologies | 1,492 | 1,514,439 | ||||||||
Navistar, Inc. | 420 | 425,426 | ||||||||
TI Group Automotive Systems, LLC | 772 | 776,769 | ||||||||
|
| |||||||||
| 2,716,634 | ||||||||||
|
| |||||||||
Consumer Cyclical - Entertainment – 0.4% | ||||||||||
Alpha Topco Limited | 993 | 1,001,869 | ||||||||
Station Casinos LLC | 372 | 372,303 | ||||||||
|
| |||||||||
| 1,374,172 | ||||||||||
|
| |||||||||
| 186 | • ALLIANCEBERNSTEIN WEALTH STRATEGIES |
High-Yield Portfolio—Portfolio of Investments
| Principal Amount (000) | U.S. $ Value | |||||||||
| ||||||||||
Consumer Cyclical - Other – 0.5% | ||||||||||
CityCenter Holdings, LLC | U.S.$ | 1,000 | $ | 1,009,220 | ||||||
La Quinta Intermediate Holdings LLC | 220 | 220,440 | ||||||||
New HB Acquisition, LLC | 560 | 581,700 | ||||||||
|
| |||||||||
| 1,811,360 | ||||||||||
|
| |||||||||
Consumer Cyclical - Retailers – 0.1% | ||||||||||
Harbor Freight Tools USA, Inc. | 494 | 500,059 | ||||||||
|
| |||||||||
Consumer Non-Cyclical – 0.4% | ||||||||||
Catalent Pharma Solutions, Inc. | 800 | 810,000 | ||||||||
Pharmedium Healthcare Corporation | 780 | 789,750 | ||||||||
|
| |||||||||
| 1,599,750 | ||||||||||
|
| |||||||||
Other Industrial – 0.3% | ||||||||||
Accudyne Industries Borrower S.C.A./Accudyne Industries, LLC (fka Silver II US Holdings, LLC) | 268 | 268,478 | ||||||||
Gardner Denver, Inc. | 299 | 297,867 | ||||||||
Veyance Technologies, Inc. | 645 | 649,693 | ||||||||
|
| |||||||||
| 1,216,038 | ||||||||||
|
| |||||||||
Services – 0.2% | ||||||||||
Travelport LLC (fka Travelport, Inc.) | 736 | 762,384 | ||||||||
|
| |||||||||
Technology – 0.4% | ||||||||||
MMI International Ltd. (MMI International | 760 | 755,964 | ||||||||
Smart Modular Technologies (Global), Inc. | 660 | 587,178 | ||||||||
|
| |||||||||
| 1,343,142 | ||||||||||
|
| |||||||||
| 14,181,486 | ||||||||||
|
| |||||||||
Financial Institutions – 0.2% | ||||||||||
Finance – 0.2% | ||||||||||
International Lease Finance Corp. | 570 | 571,710 | ||||||||
|
| |||||||||
Total Bank Loans | 14,753,196 | |||||||||
|
| |||||||||
| ALLIANCEBERNSTEIN WEALTH STRATEGIES • | 187 |
High-Yield Portfolio—Portfolio of Investments
| Principal Amount (000) | U.S. $ Value | |||||||||
| ||||||||||
EMERGING MARKETS - CORPORATE BONDS – 3.6% | ||||||||||
Industrial – 3.2% | ||||||||||
Basic – 0.5% | ||||||||||
Gold Fields Orogen Holding BVI Ltd. | U.S.$ | 700 | $ | 609,350 | ||||||
Sappi Papier Holding GmbH | 370 | 377,400 | ||||||||
8.375%, 6/15/19(b) | 350 | 388,500 | ||||||||
Severstal OAO Via Steel Capital SA | 293 | 284,754 | ||||||||
9.25%, 4/19/14(b) | 8 | 8,074 | ||||||||
Vedanta Resources PLC | 400 | 397,127 | ||||||||
|
| |||||||||
| 2,065,205 | ||||||||||
|
| |||||||||
Capital Goods – 0.2% | ||||||||||
Cemex Espana Luxembourg | 335 | 383,575 | ||||||||
Cemex SAB de CV | 370 | 395,815 | ||||||||
|
| |||||||||
| 779,390 | ||||||||||
|
| |||||||||
Communications - | ||||||||||
Comcel Trust (Cayman Islands) | 380 | 392,825 | ||||||||
Vimpel Communications Via VIP Finance Ireland Ltd. OJSC | 158 | 182,490 | ||||||||
|
| |||||||||
| 575,315 | ||||||||||
|
| |||||||||
Consumer Cyclical - Other – 0.3% | ||||||||||
Studio City Finance Ltd. | 1,025 | 1,148,000 | ||||||||
|
| |||||||||
Consumer Cyclical - Retailers – 0.2% | ||||||||||
Office Depot de Mexico SA de CV | 730 | 764,675 | ||||||||
|
| |||||||||
Consumer Non-Cyclical – 1.6% | ||||||||||
Arcelik AS | 498 | 432,286 | ||||||||
Cosan Luxembourg SA | 570 | 515,552 | ||||||||
Foodcorp Pty Ltd. | EUR | 578 | 872,307 | |||||||
Marfrig Holding Europe BV | U.S.$ | 997 | 957,120 | |||||||
Marfrig Overseas Ltd. | 240 | 235,800 | ||||||||
| 188 | • ALLIANCEBERNSTEIN WEALTH STRATEGIES |
High-Yield Portfolio—Portfolio of Investments
| Principal Amount (000) | U.S. $ Value | |||||||||
| ||||||||||
Minerva Luxembourg SA | U.S.$ | 925 | $ | 916,906 | ||||||
Tonon Bioenergia SA | 775 | 667,430 | ||||||||
USJ Acucar e Alcool SA | 850 | 777,750 | ||||||||
Virgolino de Oliveira Finance Ltd. | 930 | 553,350 | ||||||||
|
| |||||||||
| 5,928,501 | ||||||||||
|
| |||||||||
Transportation - Airlines – 0.2% | ||||||||||
Guanay Finance Ltd. 6.00%, 12/15/20(b) | 283 | 291,844 | ||||||||
TAM Capital 3, Inc. | 465 | 488,831 | ||||||||
|
| |||||||||
| 780,675 | ||||||||||
|
| |||||||||
| 12,041,761 | ||||||||||
|
| |||||||||
Financial Institutions – 0.4% | ||||||||||
Banking – 0.2% | ||||||||||
Banco de Reservas de la Republica Dominicana | 875 | 814,625 | ||||||||
|
| |||||||||
Finance – 0.2% | ||||||||||
Sistema JSFC via Sistema International Funding SA 6.95%, 5/17/19(b) | 850 | 897,079 | ||||||||
|
| |||||||||
| 1,711,704 | ||||||||||
|
| |||||||||
Total Emerging Markets - Corporate Bonds | 13,753,465 | |||||||||
|
| |||||||||
| Shares | ||||||||||
PREFERRED STOCKS – 3.1% | ||||||||||
Financial Institutions – 2.8% | ||||||||||
Banking – 2.1% | ||||||||||
Citigroup, Inc. | 38,100 | 987,552 | ||||||||
GMAC Capital Trust I | 37,000 | 1,004,550 | ||||||||
Goldman Sachs Group, Inc. (The) | 56,800 | 1,345,592 | ||||||||
Morgan Stanley | 59,700 | 1,545,036 | ||||||||
Royal Bank of Scotland Group PLC | 45,000 | 1,026,900 | ||||||||
State Street Corp. | 15,875 | 403,225 | ||||||||
| ALLIANCEBERNSTEIN WEALTH STRATEGIES • | 189 |
High-Yield Portfolio—Portfolio of Investments
| Company | Shares | U.S. $ Value | ||||||||
| ||||||||||
US Bancorp/MN | 35,000 | $ | 967,050 | |||||||
Wells Fargo & Co. | 2,300 | 57,017 | ||||||||
Wells Fargo & Co. | 28,225 | 755,301 | ||||||||
|
| |||||||||
| 8,092,223 | ||||||||||
|
| |||||||||
REITS – 0.7% | ||||||||||
DDR Corp. | 1,000 | 22,170 | ||||||||
Health Care REIT, Inc. | 16,775 | 405,452 | ||||||||
Kilroy Realty Corp. | 7,525 | 181,353 | ||||||||
Kilroy Realty Corp. | 1,000 | 23,090 | ||||||||
Kimco Realty Corp. | 9,925 | 226,389 | ||||||||
Kimco Realty Corp. | 5,125 | 109,419 | ||||||||
National Retail Properties, Inc. | 7,000 | 166,810 | ||||||||
National Retail Properties, Inc. | 16,350 | 336,973 | ||||||||
Public Storage | 5,400 | 111,942 | ||||||||
Public Storage | 1,000 | 20,730 | ||||||||
Sovereign Real Estate Investment Trust | 624 | 825,423 | ||||||||
Vornado Realty Trust | 3,875 | 84,940 | ||||||||
|
| |||||||||
| 2,514,691 | ||||||||||
|
| |||||||||
| 10,606,914 | ||||||||||
|
| |||||||||
Industrial – 0.2% | ||||||||||
Basic – 0.1% | ||||||||||
ArcelorMittal | 24,350 | 574,173 | ||||||||
|
| |||||||||
| 190 | • ALLIANCEBERNSTEIN WEALTH STRATEGIES |
High-Yield Portfolio—Portfolio of Investments
| Company | Shares | U.S. $ Value | ||||||||
| ||||||||||
Consumer Cyclical - Other – 0.1% | ||||||||||
Hovnanian Enterprises, Inc. | 20,250 | $ | 316,913 | |||||||
|
| |||||||||
| 891,086 | ||||||||||
|
| |||||||||
Utility – 0.1% | ||||||||||
Electric – 0.1% | ||||||||||
SCE Trust III | 5,525 | 139,672 | ||||||||
|
| |||||||||
Total Preferred Stocks | 11,637,672 | |||||||||
|
| |||||||||
| Principal Amount (000) | ||||||||||
COLLATERALIZED MORTGAGE | ||||||||||
Non-Agency Floating Rate – 2.0% | ||||||||||
Deutsche Alt-A Securities Mortgage Loan Trust | U.S.$ | 1,560 | 1,295,951 | |||||||
Fannie Mae Connecticut Avenue Securities | 333 | 338,890 | ||||||||
GreenPoint Mortgage Funding Trust | 554 | 464,164 | ||||||||
HarborView Mortgage Loan Trust | 806 | 693,694 | ||||||||
Lehman XS Trust | 270 | 234,936 | ||||||||
Residential Accredit Loans, Inc. | 2,677 | 1,223,146 | ||||||||
Series 2007-QH6, Class A1 | 1,523 | 1,255,318 | ||||||||
Series 2007-QO1, Class A1 | 1,206 | 932,390 | ||||||||
Structured Agency Credit Risk Debt Notes | 380 | 381,917 | ||||||||
Series 2014-DN1, Class M3 | 400 | 409,378 | ||||||||
| ALLIANCEBERNSTEIN WEALTH STRATEGIES • | 191 |
High-Yield Portfolio—Portfolio of Investments
| Principal Amount (000) | U.S. $ Value | |||||||||
| ||||||||||
Structured Asset Mortgage Investments II Trust | U.S.$ | 576 | $ | 507,073 | ||||||
|
| |||||||||
| 7,736,857 | ||||||||||
|
| |||||||||
Non-Agency Fixed Rate – 0.9% | ||||||||||
Credit Suisse Mortgage-Backed Trust | 351 | 308,681 | ||||||||
Residential Accredit Loans, Inc. | 1,496 | 1,247,967 | ||||||||
Series 2006-QS2, Class 1A8 | 986 | 828,677 | ||||||||
Series 2006-QS2, Class 1A9 | 997 | 815,391 | ||||||||
|
| |||||||||
| 3,200,716 | ||||||||||
|
| |||||||||
Total Collateralized Mortgage Obligations | 10,937,573 | |||||||||
|
| |||||||||
| Shares | ||||||||||
COMMON STOCKS – 2.7% | ||||||||||
Air Canada – Class A(h) | 45,051 | 242,078 | ||||||||
Amkor Technology, Inc.(h) | 46,559 | 275,629 | ||||||||
Beazer Homes USA, Inc.(h) | 25,754 | 597,235 | ||||||||
Crown Castle International Corp.(h) | 9,194 | 697,825 | ||||||||
DFC Global Corp.(h) | 18,969 | 156,115 | ||||||||
Goodyear Tire & Rubber Co. (The) | 7,448 | 200,128 | ||||||||
Isle of Capri Casinos, Inc.(h) | 29,767 | 267,903 | ||||||||
Keystone Automotive Operations, Inc. | 61,065 | 737,052 | ||||||||
Las Vegas Sands Corp. | 8,388 | 715,077 | ||||||||
LifePoint Hospitals, Inc.(h) | 13,469 | 730,693 | ||||||||
LyondellBasell Industries NV – Class A | 6,076 | 535,174 | ||||||||
Mt. Logan Re (Preference Shares)(h)(k)^ | 1,900 | 2,050,460 | ||||||||
Neenah Enterprises, Inc.(f)(g)(h) | 58,199 | 453,952 | ||||||||
Nortek, Inc.(h) | 8,380 | 606,628 | ||||||||
Orbitz Worldwide, Inc.(h) | 4,800 | 46,368 | ||||||||
Salix Pharmaceuticals Ltd.(h) | 3,856 | 416,140 | ||||||||
SBA Communications Corp. – Class A(h) | 9,819 | 934,474 | ||||||||
Travelport LLC(h) | 255,000 | 437,835 | ||||||||
|
| |||||||||
Total Common Stocks | 10,100,766 | |||||||||
|
| |||||||||
| 192 | • ALLIANCEBERNSTEIN WEALTH STRATEGIES |
High-Yield Portfolio—Portfolio of Investments
| Principal Amount (000) | U.S. $ Value | |||||||||
| ||||||||||
GOVERNMENTS - | ||||||||||
Brazil – 0.2% | ||||||||||
Brazil Notas do Tesouro Nacional | BRL | 2,360 | $ | 955,605 | ||||||
|
| |||||||||
Canada – 0.3% | ||||||||||
Canadian Government Bond | CAD | 550 | 507,497 | |||||||
2.75%, 6/01/22 | 855 | 806,239 | ||||||||
|
| |||||||||
| 1,313,736 | ||||||||||
|
| |||||||||
United Kingdom – 0.8% | ||||||||||
United Kingdom Gilt | GBP | 1,725 | 2,962,173 | |||||||
|
| |||||||||
United States – 1.3% | ||||||||||
U.S. Treasury Bonds | U.S.$ | 1,755 | 1,617,067 | |||||||
U.S. Treasury Notes | 1,000 | 1,012,266 | ||||||||
2.625%, 11/15/20(l) | 2,125 | 2,202,363 | ||||||||
|
| |||||||||
| 4,831,696 | ||||||||||
|
| |||||||||
Total Governments - Treasuries | 10,063,210 | |||||||||
|
| |||||||||
COMMERCIAL MORTGAGE-BACKED SECURITIES – 1.2% | ||||||||||
Non-Agency Fixed Rate CMBS – 1.2% | ||||||||||
Bear Stearns Commercial Mortgage Securities Trust | 167 | 172,276 | ||||||||
GS Mortgage Securities Trust | 1,000 | 1,020,930 | ||||||||
LB-UBS Commercial Mortgage Trust | 1,565 | 1,584,736 | ||||||||
Series 2007-C1, Class AJ | 1,380 | 1,418,577 | ||||||||
Merrill Lynch/Countrywide Commercial Mortgage Trust | 315 | 311,400 | ||||||||
|
| |||||||||
Total Commercial Mortgage-Backed Securities | 4,507,919 | |||||||||
|
| |||||||||
| ALLIANCEBERNSTEIN WEALTH STRATEGIES • | 193 |
High-Yield Portfolio—Portfolio of Investments
| Principal Amount (000) | U.S. $ Value | |||||||||
| ||||||||||
ASSET-BACKED SECURITIES – 0.7% | ||||||||||
Home Equity Loans - Fixed Rate – 0.5% | ||||||||||
Countrywide Asset-Backed Certificates | U.S.$ | 737 | $ | 702,044 | ||||||
Lehman XS Trust | 1,159 | 1,191,717 | ||||||||
|
| |||||||||
| 1,893,761 | ||||||||||
|
| |||||||||
Home Equity Loans - Floating Rate – 0.2% | ||||||||||
GSAA Home Equity Trust | 1,307 | 792,235 | ||||||||
|
| |||||||||
Total Asset-Backed Securities | 2,685,996 | |||||||||
|
| |||||||||
LOCAL GOVERNMENTS - MUNICIPAL BONDS – 0.6% | ||||||||||
United States – 0.6% | ||||||||||
Buckeye OH Tobacco Settlement Fin Auth | 165 | 135,566 | ||||||||
California GO | 325 | 458,175 | ||||||||
7.95%, 3/01/36 | 700 | 825,048 | ||||||||
Golden St Tobacco Securitization CA | 310 | 231,285 | ||||||||
Tobacco Settlement Fin Corp. NJ | 565 | 430,513 | ||||||||
Tobacco Settlement Fin Corp. VA | 220 | 154,189 | ||||||||
|
| |||||||||
Total Local Governments – Municipal Bonds | 2,234,776 | |||||||||
|
| |||||||||
GOVERNMENTS - SOVEREIGN | ||||||||||
Bahrain – 0.2% | ||||||||||
Bahrain Government International Bond | 460 | 507,150 | ||||||||
|
| |||||||||
| 194 | • ALLIANCEBERNSTEIN WEALTH STRATEGIES |
High-Yield Portfolio—Portfolio of Investments
| Principal Amount (000) | U.S. $ Value | |||||||||
| ||||||||||
Hungary – 0.3% | ||||||||||
Hungary Government International Bond | U.S.$ | 1,130 | $ | 1,237,350 | ||||||
|
| |||||||||
Total Governments—Sovereign Bonds | 1,744,500 | |||||||||
|
| |||||||||
EMERGING MARKETS - SOVEREIGNS – 0.4% | ||||||||||
Argentina – 0.2% | ||||||||||
Argentina Boden Bonds | 1,000 | 938,445 | ||||||||
|
| |||||||||
Serbia – 0.2% | ||||||||||
Republic of Serbia | 578 | 572,439 | ||||||||
|
| |||||||||
Total Emerging Markets—Sovereigns | 1,510,884 | |||||||||
|
| |||||||||
GOVERNMENTS - SOVEREIGN AGENCIES – 0.2% | ||||||||||
Ireland – 0.2% | ||||||||||
Bank of Ireland | EUR | 304 | 454,754 | |||||||
Series MPLE | CAD | 370 | 317,439 | |||||||
|
| |||||||||
Total Governments – Sovereign Agencies | 772,193 | |||||||||
|
| |||||||||
| Contracts | ||||||||||
OPTIONS PURCHASED - CALLS – 0.1% | ||||||||||
Options on Equities – 0.1% | ||||||||||
Salix Pharmaceuticals Ltd. Expiration: Jul 2014, Exercise Price: $ 115.00(h)(m) | 63 | 63,630 | ||||||||
Goodyear Tire & Rubber Co. (The) Expiration: Jan 2015, Exercise Price: $ 20.00(h)(m) | 320 | 244,800 | ||||||||
|
| |||||||||
Total Options Purchased – Calls | 308,430 | |||||||||
|
| |||||||||
| Notional Amount (000) | ||||||||||
OPTIONS PURCHASED - PUTS – 0.0% | ||||||||||
Swaptions – 0.0% | ||||||||||
CDX-NAHY Series 21, RTP BNP Paribas | 9,500 | 4,340 | ||||||||
| ALLIANCEBERNSTEIN WEALTH STRATEGIES • | 195 |
High-Yield Portfolio—Portfolio of Investments
Notional Amount | U.S. $ Value | |||||||
| ||||||||
CDX-NAHY Series 21, RTP Deutsche Bank AG | 18,715 | $ | 34,532 | |||||
CDX-NAHY Series 21, RTP Deutsche Bank AG | 7,450 | 20,769 | ||||||
|
| |||||||
| 59,641 | ||||||||
|
| |||||||
| Contracts | ||||||||
Options on Funds and Investment |
| |||||||
iShares U.S. Home Construction | 1,084 | 10,840 | ||||||
SPDR S&P 500 ETF Trust | 310 | 2,945 | ||||||
SPDR S&P 500 ETF Trust | 310 | 7,595 | ||||||
SPDR S&P 500 ETF Trust | 814 | 34,595 | ||||||
|
| |||||||
| 55,975 | ||||||||
|
| |||||||
Total Options Purchased – Puts | 115,616 | |||||||
|
| |||||||
| Shares | ||||||||
WARRANTS – 0.0% | ||||||||
Fairpoint Communications, Inc., | 12,643 | 379 | ||||||
iPayment Holdings, Inc., | 272 | – 0 | – | |||||
Talon Equity Co. NV, | 671 | – 0 | – | |||||
|
| |||||||
Total Warrants | 379 | |||||||
|
| |||||||
| 196 | • ALLIANCEBERNSTEIN WEALTH STRATEGIES |
High-Yield Portfolio—Portfolio of Investments
| Company | Shares | U.S. $ Value | ||||||
| ||||||||
SHORT-TERM INVESTMENTS – 3.3% | ||||||||
Investment Companies – 3.3% | ||||||||
AllianceBerstein Fixed-Income Shares Inc.—Government STIF Portfolio, 0.08%(n) | 12,374,119 | $ | 12,374,119 | |||||
|
| |||||||
Total Short-Term Investments | 12,374,119 | |||||||
|
| |||||||
Total Investments – 103.3% | $ | 391,415,675 | ||||||
Other assets less liabilities – (3.3)% | (12,458,245 | ) | ||||||
|
| |||||||
Net Assets – 100.0% | $ | 378,957,430 | ||||||
|
| |||||||
FUTURES (see Note C)
| Type | Number of Contracts | Expiration Month | Original Value | Value at 2014 | Unrealized Appreciation/ (Depreciation) | |||||||||||||||
Purchased Contracts |
| |||||||||||||||||||
Euro STOXX 50 Futures | 51 | March 2014 | $ | 2,135,831 | $ | 2,210,413 | $ | 74,582 | ||||||||||||
Russell 2000 Mini Futures | 4 | March 2014 | 450,568 | 472,760 | 22,192 | |||||||||||||||
S&P 500 E Mini Futures | 21 | March 2014 | 1,845,263 | 1,950,480 | 105,217 | |||||||||||||||
U.S. T-Note 5 Yr (CBT) Futures | 318 | June 2014 | 38,010,403 | 38,115,281 | 104,878 | |||||||||||||||
Sold Contracts |
| |||||||||||||||||||
U.S. T-Note 10 Yr (CBT) Futures | 77 | June 2014 | 9,552,100 | 9,588,906 | (36,806 | ) | ||||||||||||||
|
| |||||||||||||||||||
| $ | 270,063 | |||||||||||||||||||
|
| |||||||||||||||||||
FORWARD CURRENCY EXCHANGE CONTRACTS (see Note C)
| Counterparty | Contracts to Deliver (000) | In Exchange For (000) | Settlement Date | Unrealized Appreciation/ (Depreciation) | ||||||||||||||||||||
Barclays Bank PLC | GBP | 162 | USD | 264 | 3/13/14 | $ | (7,161 | ) | ||||||||||||||||
Barclays Bank PLC | USD | 952 | ZAR | 10,417 | 3/28/14 | 11,474 | ||||||||||||||||||
BNP Paribas SA | USD | 1,906 | NZD | 2,297 | 3/14/14 | 18,609 | ||||||||||||||||||
BNP Paribas SA | CAD | 4,132 | USD | 3,725 | 4/10/14 | (2,677 | ) | |||||||||||||||||
BNP Paribas SA | IDR | 11,747,987 | USD | 1,002 | 4/11/14 | (8,434 | ) | |||||||||||||||||
BNP Paribas SA | BRL | 2,311 | USD | 968 | 5/05/14 | (2,207 | ) | |||||||||||||||||
| ALLIANCEBERNSTEIN WEALTH STRATEGIES • | 197 |
High-Yield Portfolio—Portfolio of Investments
| Counterparty | Contracts to Deliver (000) | In Exchange For (000) | Settlement Date | Unrealized Appreciation/ (Depreciation) | ||||||||||||||||||||
Citibank, NA | GBP | 7,504 | USD | 12,429 | 3/13/14 | $ | (136,599 | ) | ||||||||||||||||
Credit Suisse International | EUR | 287 | USD | 394 | 3/12/14 | (1,543 | ) | |||||||||||||||||
Deutsche Bank AG London | GBP | 456 | USD | 744 | 3/13/14 | (18,966 | ) | |||||||||||||||||
Goldman Sachs Bank USA | EUR | 18,412 | USD | 25,149 | 3/12/14 | (264,295 | ) | |||||||||||||||||
Goldman Sachs Bank USA | USD | 937 | GBP | 569 | 3/13/14 | 15,357 | ||||||||||||||||||
Goldman Sachs Bank USA | USD | 1,858 | IDR | 22,784,176 | 4/11/14 | 101,084 | ||||||||||||||||||
Royal Bank of Scotland PLC | BRL | 2,236 | USD | 955 | 3/06/14 | 1,120 | ||||||||||||||||||
Royal Bank of Scotland PLC | USD | 958 | BRL | 2,236 | 3/06/14 | (4,638 | ) | |||||||||||||||||
Royal Bank of Scotland PLC | GBP | 94 | USD | 157 | 3/13/14 | (521 | ) | |||||||||||||||||
Royal Bank of Scotland PLC | JPY | 189,917 | USD | 1,854 | 4/11/14 | (12,711 | ) | |||||||||||||||||
Royal Bank of Scotland PLC | USD | 941 | BRL | 2,236 | 5/05/14 | (1,747 | ) | |||||||||||||||||
State Street Bank & Trust Co. | USD | 956 | SEK | 6,198 | 3/06/14 | 10,630 | ||||||||||||||||||
State Street Bank & Trust Co. | EUR | 1,568 | USD | 2,136 | 3/12/14 | (27,725 | ) | |||||||||||||||||
State Street Bank & Trust | GBP | 85 | USD | 143 | 3/13/14 | (535 | ) | |||||||||||||||||
State Street Bank & Trust | USD | 1,868 | MXN | 24,768 | 3/14/14 | (1,628 | ) | |||||||||||||||||
State Street Bank & Trust | USD | 1,000 | TRY | 2,206 | 3/28/14 | (9,397 | ) | |||||||||||||||||
UBS AG | BRL | 2,236 | USD | 958 | 3/06/14 | 4,638 | ||||||||||||||||||
UBS AG | USD | 915 | BRL | 2,236 | 3/06/14 | 38,384 | ||||||||||||||||||
|
| |||||||||||||||||||||||
| $ | (299,488 | ) | ||||||||||||||||||||||
|
| |||||||||||||||||||||||
CALL OPTIONS WRITTEN (see Note C)
| Description | Contracts | Exercise Price | Expiration Date | Premiums Received | U.S. $ Value | |||||||||||||||
Goodyear Tire & | 107 | $ | 17.00 | January 2015 | $ | 43,865 | $ | (109,140 | ) | |||||||||||
CREDIT DEFAULT SWAPTIONS WRITTEN
| Description | Counter- party | Buy/Sell Protection | Strike Rate | Expiration Date | Notional Amount (000) | Premiums Received | Market Value | |||||||||||||||||||||
CDX-NAHY | | BNP Paribas SA | | Sell | 102.00 | % | 3/19/14 | $ | 18,900 | $ | 33,075 | $ | (5,134 | ) | ||||||||||||||
CDX-NAHY | | Deutsche Bank AG London | | Sell | 101.00 | 4/16/14 | 37,430 | 44,916 | (27,914 | ) | ||||||||||||||||||
CDX-NAHY | | Deutsche Bank AG London | | Sell | 100.00 | 6/18/14 | 33,920 | 23,744 | (22,405 | ) | ||||||||||||||||||
|
|
|
| |||||||||||||||||||||||||
| $ | 101,735 | $ | (55,453 | ) | ||||||||||||||||||||||||
|
|
|
| |||||||||||||||||||||||||
| 198 | • ALLIANCEBERNSTEIN WEALTH STRATEGIES |
High-Yield Portfolio—Portfolio of Investments
CENTRALLY CLEARED CREDIT DEFAULT SWAPS(see Note C)
| Broker/(Exchange) & Referenced Obligation | Fixed Rate (Pay) Receive | Implied Credit Spread at February 28, 2014 | Notional Amount (000) | Market Value | Unrealized Appreciation/ (Depreciation) | |||||||||||||||
Buy Contracts | ||||||||||||||||||||
Morgan Stanley & Co. LLC/(INTRCONX): |
| |||||||||||||||||||
CDX-NAHY Series | (5.00 | )% | 2.69 | % | $ | 3,760 | $ | (376,547 | ) | $ | (168,399 | ) | ||||||||
CDX-NAHY Series | (5.00 | ) | 2.69 | 3,800 | (380,552 | ) | (248,635 | ) | ||||||||||||
CDX-NAHY Series | (5.00 | ) | 2.69 | 7,320 | (733,064 | ) | (346,424 | ) | ||||||||||||
CDX-NAHY Series 21, 5 Year Index, 12/20/18* | (5.00 | ) | 3.09 | 1,900 | (172,532 | ) | (63,816 | ) | ||||||||||||
CDX-NAHY Series 21, 5 Year Index, 12/20/18* | (5.00 | ) | 3.09 | 3,800 | (345,064 | ) | (67,599 | ) | ||||||||||||
CDX-NAHY Series 21, 5 Year Index, 12/20/18* | (5.00 | ) | 3.09 | 2,000 | (181,612 | ) | (92,467 | ) | ||||||||||||
Sale Contracts | ||||||||||||||||||||
Morgan Stanley & Co. LLC/(INTRCONX): |
| |||||||||||||||||||
CDX-NAHY Series 20, 5 Year Index, 6/20/18* | 5.00 | 2.69 | 4,224 | 423,014 | 275,811 | |||||||||||||||
CDX-NAIG Series 20, 5 Year Index, 6/20/18* | 1.00 | 0.55 | 5,980 | 124,425 | 73,849 | |||||||||||||||
|
|
|
| |||||||||||||||||
| $ | (1,641,932 | ) | $ | (637,680 | ) | |||||||||||||||
|
|
|
| |||||||||||||||||
| * | Termination date |
CENTRALLY CLEARED INTEREST RATE SWAPS(see Note C)
| Rate Type | ||||||||||||||||||
| Broker/ (Exchange) | Notional Amount (000) | Termination Date | Payments made by the Fund | Payments received by the Fund | Unrealized Appreciation/ (Depreciation) | |||||||||||||
Morgan Stanley & | $ | 38,800 | 11/07/18 | 1.530 | %3MonthLIBOR | $ | (241,572 | ) | ||||||||||
| ALLIANCEBERNSTEIN WEALTH STRATEGIES • | 199 |
High-Yield Portfolio—Portfolio of Investments
CREDIT DEFAULT SWAPS (see Note C)
| Swap Counterparty & Referenced Obligation | Fixed Rate (Pay) Receive | Implied Credit Spread at February 28, 2014 | Notional Amount (000) | Market Value | Upfront Premiums Paid (Received) | Unrealized Appreciation/ (Depreciation) | ||||||||||||||||||
Buy Contracts | ||||||||||||||||||||||||
Bank of America, NA: |
| |||||||||||||||||||||||
CDX-EM Series 20, 5 Year Index, 12/20/18* | (5.00 | )% | 2.98 | % | $ | 10,640 | $ | (1,016,773 | ) | $ | (1,063,343 | ) | $ | 46,570 | ||||||||||
CDX-NAHY Series 20, 5 Year Index, 6/20/18* | (5.00 | ) | 2.69 | 1,610 | (161,234 | ) | (41,093 | ) | (120,141 | ) | ||||||||||||||
Citibank, NA: | (5.00 | ) | 2.13 | 3,960 | $ | (395,696 | ) | (18,843 | ) | (376,853 | ) | |||||||||||||
Credit Suisse International: | (5.00 | ) | 2.94 | 57 | (5,633 | ) | (3,638 | ) | (1,995 | ) | ||||||||||||||
Alcatel-Lucent USA, Inc., 6.50%, | (5.00 | ) | 2.94 | 113 | (11,167 | ) | (6,966 | ) | (4,201 | ) | ||||||||||||||
Alcatel-Lucent USA, Inc., 6.50%, | (5.00 | ) | 2.94 | 160 | (15,812 | ) | (7,955 | ) | (7,857 | ) | ||||||||||||||
Goldman Sachs Bank USA: | ||||||||||||||||||||||||
CDX-NAIG | (1.00 | ) | 0.39 | 16,500 | (364,102 | ) | 65,148 | (429,250 | ) | |||||||||||||||
JPMorgan Chase Bank, NA: | ||||||||||||||||||||||||
CDX-NAIG | (1.00 | ) | 0.32 | 8,300 | (175,482 | ) | 87,578 | (263,060 | ) | |||||||||||||||
Morgan Stanley Capital Services LLC: | ||||||||||||||||||||||||
AK Steel Corp., 7.625%, | (5.00 | ) | 2.04 | 203 | (9,609 | ) | 10,142 | (19,751 | ) | |||||||||||||||
AK Steel Corp., 7.625%, | (5.00 | ) | 2.04 | 1,161 | (54,801 | ) | 76,509 | (131,310 | ) | |||||||||||||||
| 200 | • ALLIANCEBERNSTEIN WEALTH STRATEGIES |
High-Yield Portfolio—Portfolio of Investments
| Swap Counterparty & Referenced Obligation | Fixed Rate (Pay) Receive | Implied Credit Spread at February 28, 2014 | Notional Amount (000) | Market Value | Upfront Premiums Paid (Received) | Unrealized Appreciation/ (Depreciation) | ||||||||||||||||||
CDX-NAIG | (1.000 | )% | 0.55 | % | $ | 6,840 | $ | (142,320 | ) | $ | (82,017 | ) | $ | (60,303 | ) | |||||||||
Cooper Tire & Rubber Co., 7.625%, | (5.00 | ) | 2.53 | 108 | (12,246 | ) | (3,750 | ) | (8,496 | ) | ||||||||||||||
Fiat Finance North America, Inc., 5.625%, | (5.00 | ) | 2.79 | EUR 403 | (62,774 | ) | (42,152 | ) | (20,622 | ) | ||||||||||||||
Fiat Finance North America, Inc., 5.625%, | (5.00 | ) | 2.79 | 427 | (66,477 | ) | (39,723 | ) | (26,754 | ) | ||||||||||||||
UBS AG: | ||||||||||||||||||||||||
Alcatel-Lucent USA, | (5.00 | ) | 2.76 | $ | 140 | (14,309 | ) | 4,343 | (18,652 | ) | ||||||||||||||
Alcatel-Lucent USA, | (5.00 | ) | 2.76 | 224 | (22,894 | ) | 6,946 | (29,840 | ) | |||||||||||||||
Sale Contracts | ||||||||||||||||||||||||
Bank of America, NA: | ||||||||||||||||||||||||
Sanmina-SCI | 5.00 | 1.25 | 640 | 83,027 | (24,011 | ) | 107,038 | |||||||||||||||||
Barclays Bank PLC: | ||||||||||||||||||||||||
Amkor Technology, | 5.00 | 2.40 | 132 | 15,042 | 1,872 | 13,170 | ||||||||||||||||||
Amkor Technology, | 5.00 | 2.40 | 118 | 13,446 | 1,673 | 11,773 | ||||||||||||||||||
Freescale Semiconductor, | 5.00 | 0.78 | 1,850 | 195,763 | (23,316 | ) | 219,079 | |||||||||||||||||
MGM Resorts International, 7.625%, | 5.00 | 1.26 | 470 | 61,018 | (17,313 | ) | 78,331 | |||||||||||||||||
MGM Resorts International, 7.625%, | 5.00 | 1.84 | 689 | 95,677 | 38,268 | 57,409 | ||||||||||||||||||
NXP BV, 0.00%, | 5.00 | 0.72 | 550 | 54,243 | 13,281 | 40,962 | ||||||||||||||||||
Owens-Illinois, Inc., 7.80%, | 5.00 | 0.75 | 430 | 63,712 | 20,151 | 43,561 | ||||||||||||||||||
Virgin Media Finance PLC, 9.50%, | 5.00 | 1.84 | 650 | 71,496 | 12,436 | 59,060 | ||||||||||||||||||
Citibank, NA: | 5.00 | 1.84 | 909 | 126,227 | 51,923 | 74,304 | ||||||||||||||||||
| ALLIANCEBERNSTEIN WEALTH STRATEGIES • | 201 |
High-Yield Portfolio—Portfolio of Investments
| Swap Counterparty & Referenced Obligation | Fixed Rate (Pay) Receive | Implied Credit Spread at February 28, 2014 | Notional Amount (000) | Market Value | Upfront Premiums Paid (Received) | Unrealized Appreciation/ (Depreciation) | ||||||||||||||||||
Credit Suisse International: | 5.00 | % | 2.13 | % | $ | 580 | $ | 72,941 | $ | 9,878 | $ | 63,063 | ||||||||||||
Avis Budget Car Rental LLC, | 5.00 | 1.89 | 540 | 81,210 | 66,135 | 15,075 | ||||||||||||||||||
Avis Budget Car Rental LLC, | 5.00 | 1.74 | 101 | 15,147 | 8,207 | 6,940 | ||||||||||||||||||
Avis Budget Car Rental LLC, | 5.00 | 1.74 | 89 | 13,347 | 7,625 | 5,722 | ||||||||||||||||||
Dell, Inc., | 1.00 | 3.11 | 380 | (35,582 | ) | (48,490 | ) | 12,908 | ||||||||||||||||
MGM Resorts International, | 5.00 | 1.84 | 332 | 46,103 | 19,747 | 26,356 | ||||||||||||||||||
Telecom Italia SPA, | 1.00 | 2.12 | EUR 1,000 | (70,311 | ) | (76,169 | ) | 5,858 | ||||||||||||||||
The Goodyear Tire & Rubber Co., | 5.00 | 1.87 | $ | 1,020 | 153,707 | 105,465 | 48,242 | |||||||||||||||||
Wind Acquisition Finance S.A., | 5.00 | 1.22 | 520 | 49,628 | 10,812 | 38,816 | ||||||||||||||||||
Deutsche Bank AG London: | 5.00 | 1.77 | 209 | 34,211 | 30,858 | 3,353 | ||||||||||||||||||
| 202 | • ALLIANCEBERNSTEIN WEALTH STRATEGIES |
High-Yield Portfolio—Portfolio of Investments
| Swap Counterparty & Referenced Obligation | Fixed Rate (Pay) Receive | Implied Credit Spread at February 28, 2014 | Notional Amount (000) | Market Value | Upfront Premiums Paid (Received) | Unrealized Appreciation/ (Depreciation) | ||||||||||||||||||
Goldman Sachs Bank USA: | 5.00 | % | 2.13 | % | $ | 421 | $ | 52,945 | $ | 5,198 | $ | 47,747 | ||||||||||||
Chesapeake Energy Corp., | 5.00 | 1.22 | 1,250 | 164,706 | (58,304 | ) | 223,010 | |||||||||||||||||
ConvaTec Healthcare E SA, | 5.00 | 1.86 | EUR 590 | 89,029 | (78,589 | ) | 167,618 | |||||||||||||||||
HCA Inc., | 5.00 | 1.77 | $ | 1,760 | 288,090 | 241,687 | 46,403 | |||||||||||||||||
HCA Inc., | 5.00 | 1.77 | 1,731 | 283,344 | 248,706 | 34,638 | ||||||||||||||||||
JPMorgan Chase Bank, NA: | 5.00 | 2.90 | 1,080 | 116,193 | 99,132 | 17,061 | ||||||||||||||||||
Morgan Stanley Capital Services LLC: | 5.00 | 7.78 | 550 | (24,432 | ) | 3,624 | (28,056 | ) | ||||||||||||||||
AK Steel Corp., | 5.00 | 6.03 | 908 | (28,491 | ) | (199,840 | ) | 171,349 | ||||||||||||||||
AK Steel Corp., | 5.00 | 6.03 | 142 | (4,456 | ) | (28,111 | ) | 23,655 | ||||||||||||||||
NXP BV, 0.00%, | 5.00 | 1.21 | EUR 230 | 41,856 | (9,759 | ) | 51,615 | |||||||||||||||||
NXP BV, | 5.00 | 1.32 | 330 | 62,039 | (15,471 | ) | 77,510 | |||||||||||||||||
| ALLIANCEBERNSTEIN WEALTH STRATEGIES • | 203 |
High-Yield Portfolio—Portfolio of Investments
| Swap Counterparty & Referenced Obligation | Fixed Rate (Pay) Receive | Implied Credit Spread at February 28, 2014 | Notional Amount (000) | Market Value | Upfront Premiums Paid (Received) | Unrealized Appreciation/ (Depreciation) | ||||||||||||||||||
UBS AG: | ||||||||||||||||||||||||
Levi Strauss & Co., | 5.00 | % | 1.04 | % | $ | 850 | $ | 117,121 | $ | (33,799 | ) | $ | 150,920 | |||||||||||
|
|
|
|
|
| |||||||||||||||||||
| $ | (233,333 | ) | $ | (675,308 | ) | $ | 441,975 | |||||||||||||||||
|
|
|
|
|
| |||||||||||||||||||
| * | Termination date |
TOTAL RETURN SWAPS (see Note C)
| Receive/ Pay Total Return on Reference Index | Index | # of Shares or Units | Rate Paid/ Received by the Fund | Notional Amount (000) | Maturity Date | Counterparty | Unrealized Appreciation/ (Depreciation) | |||||||||||||||||
Pay Total Return on Reference Index |
| |||||||||||||||||||||||
Pay | iBoxx $ Liquid High Yield Index | 3,690,000 | 0.25 | % | $ | 3,690 | 3/20/14 | JPMorgan Chase Bank, NA | $ | (176,733 | ) | |||||||||||||
REVERSE REPURCHASE AGREEMENTS (see Note C)
| Broker | Interest Rate | Maturity | U.S. $ Value at February 28, 2014 | |||||||||
Barclays Capital+ | (4.00 | )%* | – 0 – | $ | 965,162 | |||||||
Barclays Capital+ | (2.25 | )%* | – 0 – | 632,685 | ||||||||
Barclays Capital+ | (1.25 | )%* | – 0 – | 534,267 | ||||||||
Barclays Capital+ | (0.25 | )%* | – 0 – | 1,581,835 | ||||||||
Barclays Capital+ | 0.00 | % | – 0 – | 314,625 | ||||||||
Credit Suisse Securities (USA) LLC+ | (2.75 | )%* | – 0 – | 230,372 | ||||||||
Credit Suisse Securities (USA) LLC+ | (1.00 | )%* | – 0 – | 806,120 | ||||||||
Credit Suisse Securities (USA) LLC+ | (0.25 | )%* | – 0 – | 3,116,250 | ||||||||
Credit Suisse Securities (USA) LLC+ | (0.15 | )%* | – 0 – | 1,581,515 | ||||||||
Credit Suisse Securities (USA) LLC+ | (0.05 | )%* | – 0 – | 647,404 | ||||||||
Credit Suisse Securities (USA) LLC+ | 0.00 | % | – 0 – | 7,982,816 | ||||||||
|
| |||||||||||
| $ | 18,393,051 | |||||||||||
|
| |||||||||||
| + | The reverse repurchase agreement matures on demand. Interest rate resets daily and the rate shown is the rate in effect on February 28, 2014. |
| * | Interest payment due from counterparty. |
| (a) | Position, or a portion thereof, has been segregated to collateralize reverse repurchase agreements. The market value of the collateral amounted to $18,361,869. |
| (b) | Security is exempt from registration under Rule 144A of the Securities Act of 1933. These securities are considered liquid and may be resold in transactions exempt from registration, normally to qualified institutional buyers. At February 28, 2014, the aggregate market value of these securities amounted to $145,622,670 or 38.4% of net assets. |
| (c) | Security is in default and is non-income producing. |
| (d) | Floating Rate Security. Stated interest rate was in effect at February 28, 2014. |
| (e) | Pay-In-Kind Payments (PIK). |
| (f) | Fair valued by the Adviser. |
| (g) | Illiquid security. |
| 204 | • ALLIANCEBERNSTEIN WEALTH STRATEGIES |
High-Yield Portfolio—Portfolio of Investments
| (h) | Non-income producing security. |
| (i) | Variable rate coupon, rate shown as of February 28, 2014. |
| (j) | This position or a portion of this position represents an unsettled loan purchase. At February 28, 2014, the market value and unrealized gain of these unsettled loan purchases amounted to $1,174,366 and $4,515, respectively. The coupon rate will be determined at the time of settlement and will be based upon the London-Interbank Offered Rate (“LIBOR”) plus a premium which was determined at the time of purchase. |
| (k) | Restricted and illiquid security. |
| Restricted Securities | Acquisition Date | Cost | Market Value | Percentage of Net Assets | ||||||||||||
Mt. Logan Re (Preference Shares) | 7/01/13 | $ | 1,900,000 | $ | 2,050,460 | 0.54 | % | |||||||||
| (l) | Position, or a portion thereof, has been segregated to collateralize OTC derivatives outstanding. The aggregate market value of these securities amounted to $1,575,837. |
| (m) | One contract relates to 100 shares. |
| (n) | Investment in affiliated money market mutual fund. The rate shown represents the 7-day yield as of period end. |
| ^ | The security is subject to a 12 month lock-up period, after which semi-annual redemptions are permitted. |
Currency Abbreviations:
BRL – Brazilian Real
CAD – Canadian Dollar
EUR – Euro
GBP – Great British Pound
IDR – Indonesian Rupiah
JPY – Japanese Yen
MXN – Mexican Peso
NZD – New Zealand Dollar
SEK – Swedish Krona
TRY – Turkish Lira
USD – United States Dollar
ZAR – South African Rand
Glossary:
CBT – Chicago Board of Trade
CDX-EM – Emerging Market Credit Default Swap Index
CDX-NAHY – North American High Yield Credit Default Swap Index
CDX-NAIG – North American Investment Grade Credit Default Swap Index
CMBS – Commercial Mortgage-Backed
ETF – Exchange Traded Fund
GO – General Obligation
INTRCONX – Inter-Continental Exchange
JSFC – Joint Stock Financial Corporation
LCH – London Clearing House
LIBOR – London Interbank Offered Rates
OJSC – Open Joint Stock Company
REIT – Real Estate Investment Trust
RTP – Real Time Pricing
SPDR – Standard & Poor’s Depository Receipt
See notes to financial statements.
| ALLIANCEBERNSTEIN WEALTH STRATEGIES • | 205 |
High-Yield Portfolio—Portfolio of Investments
SMALL-MID CAP VALUE PORTFOLIO
PORTFOLIO OF INVESTMENTS
February 28, 2014 (unaudited)
| Company | Shares | U.S. $ Value | ||||||
| ||||||||
COMMON STOCKS – 98.3% | ||||||||
Financials – 28.6% | ||||||||
Capital Markets – 1.1% | ||||||||
E*Trade Financial Corp.(a) | 161,220 | $ | 3,622,613 | |||||
|
| |||||||
Commercial Banks – 9.8% | ||||||||
Associated Banc-Corp | 177,410 | 2,960,973 | ||||||
CapitalSource, Inc. | 231,950 | 3,409,665 | ||||||
Comerica, Inc. | 95,790 | 4,615,162 | ||||||
First Niagara Financial Group, Inc. | 418,278 | 3,793,782 | ||||||
Huntington Bancshares, Inc./OH | 474,320 | 4,520,270 | ||||||
Popular, Inc.(a) | 129,037 | 3,689,168 | ||||||
Susquehanna Bancshares, Inc. | 227,213 | 2,485,710 | ||||||
Webster Financial Corp. | 89,890 | 2,783,893 | ||||||
Zions Bancorporation | 151,310 | 4,720,872 | ||||||
|
| |||||||
| 32,979,495 | ||||||||
|
| |||||||
Insurance – 8.5% | ||||||||
American Financial Group, Inc./OH | 86,850 | 4,964,346 | ||||||
Aspen Insurance Holdings Ltd. | 117,870 | 4,427,197 | ||||||
Genworth Financial, Inc. – Class A(a) | 314,310 | 4,884,377 | ||||||
PartnerRe Ltd. | 30,400 | 3,005,952 | ||||||
Reinsurance Group of America, Inc. – Class A | 41,050 | 3,160,439 | ||||||
Unum Group | 113,320 | 3,941,270 | ||||||
Validus Holdings Ltd. | 119,080 | 4,383,335 | ||||||
|
| |||||||
| 28,766,916 | ||||||||
|
| |||||||
Real Estate Investment Trusts (REITs) – 9.1% | ||||||||
BioMed Realty Trust, Inc. | 132,630 | 2,742,788 | ||||||
Camden Property Trust | 40,460 | 2,698,682 | ||||||
DDR Corp. | 192,810 | 3,204,502 | ||||||
DiamondRock Hospitality Co. | 322,520 | 4,070,203 | ||||||
LTC Properties, Inc. | 104,660 | 3,943,589 | ||||||
Medical Properties Trust, Inc. | 310,150 | 4,090,879 | ||||||
Mid-America Apartment Communities, Inc. | 58,510 | 3,957,616 | ||||||
Parkway Properties, Inc./MD | 203,060 | 3,742,396 | ||||||
STAG Industrial, Inc. | 100,730 | 2,348,016 | ||||||
|
| |||||||
| 30,798,671 | ||||||||
|
| |||||||
Thrifts & Mortgage Finance – 0.1% | ||||||||
Essent Group Ltd.(a) | 23,090 | 535,688 | ||||||
|
| |||||||
| 96,703,383 | ||||||||
|
| |||||||
Information Technology – 19.0% | ||||||||
Communications Equipment – 1.2% | ||||||||
Harris Corp. | 56,440 | 4,166,401 | ||||||
|
| |||||||
Electronic Equipment, Instruments & | ||||||||
Anixter International, Inc. | 32,450 | 3,470,527 | ||||||
Arrow Electronics, Inc.(a) | 87,370 | 4,947,763 | ||||||
| 206 | • ALLIANCEBERNSTEIN WEALTH STRATEGIES |
Small-Mid Cap Value Portfolio—Portfolio of Investments
| Company | Shares | U.S. $ Value | ||||||
| ||||||||
Avnet, Inc. | 112,500 | $ | 4,897,125 | |||||
CDW Corp./DE | 139,960 | 3,662,753 | ||||||
Insight Enterprises, Inc.(a) | 98,593 | 2,265,667 | ||||||
Jabil Circuit, Inc. | 221,570 | 4,101,261 | ||||||
TTM Technologies, Inc.(a) | 286,628 | 2,407,675 | ||||||
Vishay Intertechnology, Inc. | 350,690 | 4,958,757 | ||||||
|
| |||||||
| 30,711,528 | ||||||||
|
| |||||||
IT Services – 3.6% | ||||||||
Amdocs Ltd. | 90,540 | 4,027,219 | ||||||
Booz Allen Hamilton Holding Corp. | 52,900 | 1,112,487 | ||||||
Convergys Corp. | 182,301 | 3,731,702 | ||||||
Genpact Ltd.(a) | 193,980 | 3,235,586 | ||||||
|
| |||||||
| 12,106,994 | ||||||||
|
| |||||||
Semiconductors & Semiconductor | ||||||||
Entegris, Inc.(a) | 248,970 | 3,000,089 | ||||||
Lam Research Corp.(a) | 75,800 | 3,921,134 | ||||||
MKS Instruments, Inc. | 77,304 | 2,323,758 | ||||||
Teradyne, Inc.(a) | 168,650 | 3,420,222 | ||||||
|
| |||||||
| 12,665,203 | ||||||||
|
| |||||||
Software – 1.3% | ||||||||
Electronic Arts, Inc.(a) | 150,970 | 4,316,232 | ||||||
|
| |||||||
| 63,966,358 | ||||||||
|
| |||||||
Consumer Discretionary – 18.2% | ||||||||
Auto Components – 5.7% | ||||||||
Dana Holding Corp. | 229,690 | 4,979,679 | ||||||
Lear Corp. | 60,230 | 4,890,676 | ||||||
Tenneco, Inc.(a) | 79,070 | 4,763,177 | ||||||
TRW Automotive Holdings Corp.(a) | 55,460 | 4,565,467 | ||||||
|
| |||||||
| 19,198,999 | ||||||||
|
| |||||||
Automobiles – 1.3% | ||||||||
Thor Industries, Inc. | 75,840 | 4,247,799 | ||||||
|
| |||||||
Hotels, Restaurants & Leisure – 0.9% | ||||||||
DineEquity, Inc. | 37,580 | 3,147,325 | ||||||
|
| |||||||
Household Durables – 3.8% | ||||||||
Helen of Troy Ltd.(a) | 31,370 | 2,048,775 | ||||||
Meritage Homes Corp.(a) | 82,970 | 3,999,984 | ||||||
NVR, Inc.(a) | 1,866 | 2,224,272 | ||||||
PulteGroup, Inc. | 210,530 | 4,419,024 | ||||||
|
| |||||||
| 12,692,055 | ||||||||
|
| |||||||
Media – 2.8% | ||||||||
Gannett Co., Inc. | 179,320 | 5,334,770 | ||||||
Regal Entertainment Group – Class A | 229,210 | 4,217,464 | ||||||
|
| |||||||
| 9,552,234 | ||||||||
|
| |||||||
| ALLIANCEBERNSTEIN WEALTH STRATEGIES • | 207 |
Small-Mid Cap Value Portfolio—Portfolio of Investments
| Company | Shares | U.S. $ Value | ||||||
| ||||||||
Specialty Retail – 3.7% | ||||||||
Children’s Place Retail Stores, Inc. (The)(a) | 80,000 | $ | 4,333,600 | |||||
GameStop Corp. – Class A | 92,200 | 3,439,982 | ||||||
Office Depot, Inc.(a) | 952,370 | 4,695,184 | ||||||
|
| |||||||
| 12,468,766 | ||||||||
|
| |||||||
| 61,307,178 | ||||||||
|
| |||||||
Industrials – 9.5% | ||||||||
Commercial Services & Supplies – 1.0% | ||||||||
Steelcase, Inc.– Class A | 226,120 | 3,362,404 | ||||||
|
| |||||||
Construction & Engineering – 2.1% | ||||||||
Aecom Technology Corp.(a) | 43,210 | 1,380,128 | ||||||
Granite Construction, Inc. | 67,250 | 2,472,110 | ||||||
Tutor Perini Corp.(a) | 138,600 | 3,416,490 | ||||||
|
| |||||||
| 7,268,728 | ||||||||
|
| |||||||
Electrical Equipment – 0.9% | ||||||||
General Cable Corp. | 101,240 | 3,116,167 | ||||||
|
| |||||||
Machinery – 2.4% | ||||||||
Kennametal, Inc. | 74,270 | 3,248,570 | ||||||
Terex Corp. | 107,610 | 4,791,873 | ||||||
|
| |||||||
| 8,040,443 | ||||||||
|
| |||||||
Road & Rail – 2.4% | ||||||||
Con-way, Inc. | 94,600 | 3,608,044 | ||||||
Ryder System, Inc. | 59,030 | 4,446,140 | ||||||
|
| |||||||
| 8,054,184 | ||||||||
|
| |||||||
Trading Companies & Distributors – 0.7% | ||||||||
Aircastle Ltd. | 118,770 | 2,339,769 | ||||||
|
| |||||||
| 32,181,695 | ||||||||
|
| |||||||
Materials – 6.9% | ||||||||
Chemicals – 1.4% | ||||||||
Huntsman Corp. | 192,310 | 4,684,672 | ||||||
|
| |||||||
Containers & Packaging – 2.4% | ||||||||
Avery Dennison Corp. | 74,330 | 3,703,121 | �� | |||||
Graphic Packaging Holding Co.(a) | 411,010 | 4,208,742 | ||||||
|
| |||||||
| 7,911,863 | ||||||||
|
| |||||||
Metals & Mining – 3.1% | ||||||||
Commercial Metals Co. | 183,640 | 3,553,434 | ||||||
Reliance Steel & Aluminum Co. | 46,700 | 3,235,376 | ||||||
Steel Dynamics, Inc. | 216,480 | 3,775,411 | ||||||
|
| |||||||
| 10,564,221 | ||||||||
|
| |||||||
| 23,160,756 | ||||||||
|
| |||||||
| 208 | • ALLIANCEBERNSTEIN WEALTH STRATEGIES |
Small-Mid Cap Value Portfolio—Portfolio of Investments
| Company | Shares | U.S. $ Value | ||||||
| ||||||||
Utilities – 6.3% | ||||||||
Electric Utilities – 2.6% | ||||||||
PNM Resources, Inc. | 167,090 | $ | 4,369,404 | |||||
Westar Energy, Inc. | 125,361 | 4,289,853 | ||||||
|
| |||||||
| 8,659,257 | ||||||||
|
| |||||||
Gas Utilities – 3.7% | ||||||||
Atmos Energy Corp. | 93,170 | 4,295,137 | ||||||
Southwest Gas Corp. | 73,460 | 3,968,309 | ||||||
UGI Corp. | 97,410 | 4,353,253 | ||||||
|
| |||||||
| 12,616,699 | ||||||||
|
| |||||||
| 21,275,956 | ||||||||
|
| |||||||
Energy – 4.6% | ||||||||
Energy Equipment & Services – 0.7% | ||||||||
Helix Energy Solutions Group, Inc.(a) | 97,120 | 2,295,917 | ||||||
|
| |||||||
Oil, Gas & Consumable Fuels – 3.9% | ||||||||
Bill Barrett Corp.(a) | 172,100 | 4,361,014 | ||||||
Cimarex Energy Co. | 20,780 | 2,404,454 | ||||||
Rosetta Resources, Inc.(a) | 66,850 | 2,966,134 | ||||||
Stone Energy Corp.(a) | 97,180 | 3,492,649 | ||||||
|
| |||||||
| 13,224,251 | ||||||||
|
| |||||||
| 15,520,168 | ||||||||
|
| |||||||
Health Care – 4.3% | ||||||||
Biotechnology – 0.6% | ||||||||
Theravance, Inc.(a) | 54,250 | 2,007,250 | ||||||
|
| |||||||
Health Care Providers & Services – 3.7% |
| |||||||
Health Net, Inc./CA(a) | 141,960 | 4,833,738 | ||||||
LifePoint Hospitals, Inc.(a) | 67,998 | 3,688,891 | ||||||
Molina Healthcare, Inc.(a) | 109,450 | 4,124,076 | ||||||
|
| |||||||
| 12,646,705 | ||||||||
|
| |||||||
| 14,653,955 | ||||||||
|
| |||||||
Consumer Staples – 0.9% | ||||||||
Food Products – 0.9% | ||||||||
Dean Foods Co.(a) | 211,445 | 3,127,272 | ||||||
|
| |||||||
Total Common Stocks | 331,896,721 | |||||||
|
| |||||||
SHORT-TERM INVESTMENTS – 1.6% | ||||||||
Investment Companies – 1.6% | ||||||||
AllianceBernstein Fixed-Income Shares, Inc.– Government STIF Portfolio, 0.08%(b) | 5,455,662 | 5,455,662 | ||||||
|
| |||||||
Total Investments – 99.9% | 337,352,383 | |||||||
Other assets less liabilities – 0.1% | 233,126 | |||||||
|
| |||||||
Net Assets – 100.0% | $ | 337,585,509 | ||||||
|
| |||||||
| ALLIANCEBERNSTEIN WEALTH STRATEGIES • | 209 |
Small-Mid Cap Value Portfolio—Portfolio of Investments
| (a) | Non-income producing security. |
| (b) | Investment in affiliated money market mutual fund. The rate shown represents the 7-day yield as of period end. |
See notes to financial statements.
| 210 | • ALLIANCEBERNSTEIN WEALTH STRATEGIES |
Small-Mid Cap Value Portfolio—Portfolio of Investments
SMALL-MID CAP GROWTH PORTFOLIO
PORTFOLIO OF INVESTMENTS
February 28, 2014 (unaudited)
| Company | Shares | U.S. $ Value | ||||||
| ||||||||
COMMON STOCKS – 98.8% | ||||||||
Information Technology – 24.5% | ||||||||
Communications Equipment – 2.2% | ||||||||
Ciena Corp.(a) | 102,059 | $ | 2,507,589 | |||||
F5 Networks, Inc.(a) | 44,720 | 5,023,845 | ||||||
|
| |||||||
| 7,531,434 | ||||||||
|
| |||||||
Internet Software & Services – 6.8% | ||||||||
CoStar Group, Inc.(a) | 31,244 | 6,281,294 | ||||||
Criteo SA (Sponsored ADR)(a) | 14,659 | 783,817 | ||||||
Cvent, Inc.(a) | 79,623 | 3,127,591 | ||||||
Pandora Media, Inc.(a) | 131,350 | 4,915,117 | ||||||
Yelp, Inc.(a) | 47,179 | 4,454,641 | ||||||
Zillow, Inc.(a)(b) | 40,250 | 3,364,900 | ||||||
|
| |||||||
| 22,927,360 | ||||||||
|
| |||||||
IT Services – 1.1% | ||||||||
MAXIMUS, Inc. | 74,050 | 3,538,850 | ||||||
|
| |||||||
Semiconductors & Semiconductor | ||||||||
Cavium, Inc.(a) | 69,930 | 2,946,151 | ||||||
Intersil Corp. – Class A | 255,048 | 3,244,210 | ||||||
Teradyne, Inc.(a) | 194,210 | 3,938,579 | ||||||
|
| |||||||
| 10,128,940 | ||||||||
|
| |||||||
Software – 11.4% | ||||||||
ANSYS, Inc.(a) | 37,070 | 3,096,086 | ||||||
Aspen Technology, Inc.(a) | 69,486 | 3,262,368 | ||||||
Concur Technologies, Inc.(a) | 39,240 | 4,844,178 | ||||||
FireEye, Inc.(a) | 21,105 | 1,807,432 | ||||||
Guidewire Software, Inc.(a) | 83,936 | 4,499,809 | ||||||
Informatica Corp.(a) | 97,880 | 4,067,893 | ||||||
NetSuite, Inc.(a) | 24,200 | 2,785,178 | ||||||
ServiceNow, Inc.(a) | 74,643 | 5,080,203 | ||||||
Tableau Software, Inc. – Class A(a) | 49,153 | 4,637,094 | ||||||
Ultimate Software Group, Inc. (The)(a) | 26,199 | 4,349,034 | ||||||
|
| |||||||
| 38,429,275 | ||||||||
|
| |||||||
| 82,555,859 | ||||||||
|
| |||||||
Industrials – 23.0% | ||||||||
Aerospace & Defense – 3.0% | ||||||||
Hexcel Corp.(a) | 132,186 | 5,948,370 | ||||||
TransDigm Group, Inc. | 23,551 | 4,195,375 | ||||||
|
| |||||||
| 10,143,745 | ||||||||
|
| |||||||
Air Freight & Logistics – 1.0% | ||||||||
Expeditors International of Washington, Inc. | 82,600 | 3,263,526 | ||||||
|
| |||||||
| ALLIANCEBERNSTEIN WEALTH STRATEGIES • | 211 |
Small-Mid Cap Growth Portfolio—Portfolio of Investments
| Company | Shares | U.S. $ Value | ||||||
| ||||||||
Electrical Equipment – 1.3% | ||||||||
AMETEK, Inc. | 80,756 | $ | 4,299,449 | |||||
|
| |||||||
Industrial Conglomerates – 1.4% | ||||||||
Carlisle Cos., Inc. | 61,040 | 4,841,693 | ||||||
|
| |||||||
Machinery – 8.4% | ||||||||
Actuant Corp. – Class A | 105,493 | 3,698,585 | ||||||
Chart Industries, Inc.(a) | 40,572 | 3,390,196 | ||||||
IDEX Corp. | 77,695 | 5,832,564 | ||||||
Joy Global, Inc. | 8,810 | 484,550 | ||||||
Lincoln Electric Holdings, Inc. | 72,460 | 5,432,326 | ||||||
Middleby Corp. (The)(a) | 17,780 | 5,272,837 | ||||||
Valmont Industries, Inc. | 29,732 | 4,329,871 | ||||||
|
| |||||||
| 28,440,929 | ||||||||
|
| |||||||
Marine – 1.8% | ||||||||
Kirby Corp.(a) | 59,378 | 6,211,533 | ||||||
|
| |||||||
Professional Services – 2.5% | ||||||||
Robert Half International, Inc. | 97,350 | 3,985,509 | ||||||
WageWorks, Inc.(a) | 77,267 | 4,570,343 | ||||||
|
| |||||||
| 8,555,852 | ||||||||
|
| |||||||
Road & Rail – 1.5% | ||||||||
Genesee & Wyoming, Inc. – Class A(a) | 49,482 | 4,894,759 | ||||||
|
| |||||||
Trading Companies & Distributors – 2.1% | ||||||||
United Rentals, Inc.(a) | 78,352 | 6,921,616 | ||||||
|
| |||||||
| 77,573,102 | ||||||||
|
| |||||||
Health Care – 16.8% | ||||||||
Biotechnology – 6.2% | ||||||||
Aegerion Pharmaceuticals, Inc.(a) | 12,890 | 705,856 | ||||||
Arrowhead Research Corp.(a) | 34,240 | 665,626 | ||||||
BioMarin Pharmaceutical, Inc.(a) | 33,356 | 2,701,836 | ||||||
Cubist Pharmaceuticals, Inc.(a) | 48,236 | 3,835,727 | ||||||
Intercept Pharmaceuticals, Inc.(a) | 2,930 | 1,202,765 | ||||||
Isis Pharmaceuticals, Inc.(a) | 18,132 | 924,732 | ||||||
NPS Pharmaceuticals, Inc.(a) | 72,730 | 2,544,095 | ||||||
Pharmacyclics, Inc.(a) | 14,090 | 1,953,719 | ||||||
Puma Biotechnology, Inc.(a) | 13,796 | 1,603,923 | ||||||
Quintiles Transnational Holdings, Inc.(a) | 61,405 | 3,325,081 | ||||||
TESARO, Inc.(a) | 40,386 | 1,333,142 | ||||||
|
| |||||||
| 20,796,502 | ||||||||
|
| |||||||
Health Care Equipment & Supplies – 2.8% | ||||||||
Align Technology, Inc.(a) | 57,180 | 2,992,229 | ||||||
HeartWare International, Inc.(a) | 33,868 | 3,252,344 | ||||||
Sirona Dental Systems, Inc.(a) | 43,636 | 3,074,593 | ||||||
|
| |||||||
| 9,319,166 | ||||||||
|
| |||||||
| 212 | • ALLIANCEBERNSTEIN WEALTH STRATEGIES |
Small-Mid Cap Growth Portfolio—Portfolio of Investments
| Company | Shares | U.S. $ Value | ||||||
| ||||||||
Health Care Providers & Services – 4.6% | ||||||||
Acadia Healthcare Co., Inc.(a) | 94,749 | $ | 4,684,390 | |||||
Envision Healthcare Holdings, Inc.(a) | 98,326 | 3,309,653 | ||||||
Mednax, Inc.(a) | 64,584 | 3,927,999 | ||||||
Premier, Inc. – Class A(a) | 75,828 | 2,536,447 | ||||||
WellCare Health Plans, Inc.(a) | 20,050 | 1,239,491 | ||||||
|
| |||||||
| 15,697,980 | ||||||||
|
| |||||||
Life Sciences Tools & Services – 1.1% | ||||||||
ICON PLC(a) | 79,488 | 3,723,218 | ||||||
|
| |||||||
Pharmaceuticals – 2.1% | ||||||||
Akorn, Inc.(a) | 123,007 | 3,176,041 | ||||||
Jazz Pharmaceuticals PLC(a) | 25,040 | 3,804,703 | ||||||
|
| |||||||
| 6,980,744 | ||||||||
|
| |||||||
| 56,517,610 | ||||||||
|
| |||||||
Consumer Discretionary – 16.6% | ||||||||
Distributors – 1.6% | ||||||||
LKQ Corp.(a) | 198,538 | 5,537,225 | ||||||
|
| |||||||
Diversified Consumer Services – 1.4% | ||||||||
Grand Canyon Education, Inc.(a) | 99,680 | 4,724,832 | ||||||
|
| |||||||
Hotels, Restaurants & Leisure – 1.1% | ||||||||
Norwegian Cruise Line Holdings Ltd.(a) | 105,897 | 3,629,090 | ||||||
|
| |||||||
Internet & Catalog Retail – 2.4% | ||||||||
HomeAway, Inc.(a) | 118,499 | 5,435,549 | ||||||
Shutterfly, Inc.(a) | 49,972 | 2,726,473 | ||||||
|
| |||||||
| 8,162,022 | ||||||||
|
| |||||||
Leisure Equipment & Products – 1.4% | ||||||||
Polaris Industries, Inc. | 34,650 | 4,644,140 | ||||||
|
| |||||||
Media – 0.7% | ||||||||
National CineMedia, Inc. | 158,479 | 2,434,237 | ||||||
|
| |||||||
Specialty Retail – 6.5% | ||||||||
Cabela’s, Inc.(a) | 65,850 | 4,367,172 | ||||||
CarMax, Inc.(a) | 16,307 | 789,748 | ||||||
Dick’s Sporting Goods, Inc. | 100,160 | 5,375,587 | ||||||
Five Below, Inc.(a) | 81,724 | 3,149,643 | ||||||
Lumber Liquidators Holdings, Inc.(a) | 37,050 | 3,974,724 | ||||||
Tractor Supply Co. | 61,070 | 4,309,099 | ||||||
|
| |||||||
| 21,965,973 | ||||||||
|
| |||||||
Textiles, Apparel & Luxury Goods – 1.5% | ||||||||
Under Armour, Inc. – Class A(a) | 43,180 | 4,885,817 | ||||||
|
| |||||||
| 55,983,336 | ||||||||
|
| |||||||
| ALLIANCEBERNSTEIN WEALTH STRATEGIES • | 213 |
Small-Mid Cap Growth Portfolio—Portfolio of Investments
| Company | Shares | U.S. $ Value | ||||||
| ||||||||
Financials – 8.1% | ||||||||
Capital Markets – 3.5% | ||||||||
Affiliated Managers Group, Inc.(a) | 20,877 | $ | 3,925,920 | |||||
Lazard Ltd. – Class A | 96,313 | 4,333,122 | ||||||
Stifel Financial Corp.(a) | 69,541 | 3,344,226 | ||||||
|
| |||||||
| 11,603,268 | ||||||||
|
| |||||||
Commercial Banks – 4.6% | ||||||||
First Republic Bank/CA | 71,736 | 3,728,120 | ||||||
Iberiabank Corp. | 48,642 | 3,186,051 | ||||||
Signature Bank/New York NY(a) | 32,090 | 4,201,544 | ||||||
SVB Financial Group(a) | 35,920 | 4,522,687 | ||||||
|
| |||||||
| 15,638,402 | ||||||||
|
| |||||||
| 27,241,670 | ||||||||
|
| |||||||
Energy – 5.0% | ||||||||
Energy Equipment & Services – 2.8% | ||||||||
FMC Technologies, Inc.(a) | 41,390 | 2,079,434 | ||||||
Oceaneering International, Inc. | 56,636 | 4,054,005 | ||||||
Oil States International, Inc.(a) | 13,951 | 1,324,229 | ||||||
Superior Energy Services, Inc. | 60,960 | 1,803,806 | ||||||
|
| |||||||
| 9,261,474 | ||||||||
|
| |||||||
Oil, Gas & Consumable Fuels – 2.2% | ||||||||
Concho Resources, Inc.(a) | 18,703 | 2,265,494 | ||||||
Oasis Petroleum, Inc.(a) | 64,896 | 2,827,519 | ||||||
SM Energy Co. | 32,363 | 2,386,771 | ||||||
|
| |||||||
| 7,479,784 | ||||||||
|
| |||||||
| 16,741,258 | ||||||||
|
| |||||||
Consumer Staples – 3.1% | ||||||||
Food & Staples Retailing – 1.3% | ||||||||
Sprouts Farmers Market, Inc.(a) | 110,235 | 4,301,370 | ||||||
|
| |||||||
Food Products – 1.8% | ||||||||
Green Mountain Coffee Roasters, Inc. | 54,716 | 6,006,722 | ||||||
|
| |||||||
| 10,308,092 | ||||||||
|
| |||||||
Materials – 1.7% | ||||||||
Chemicals – 1.7% | ||||||||
PolyOne Corp. | 151,530 | 5,682,375 | ||||||
|
| |||||||
Total Common Stocks | 332,603,302 | |||||||
|
| |||||||
SHORT-TERM INVESTMENTS – 1.0% | ||||||||
Investment Companies – 1.0% | ||||||||
AllianceBernstein Fixed-Income Shares, Inc. –Government STIF Portfolio, 0.08%(c) | 3,270,843 | 3,270,843 | ||||||
|
| |||||||
| 214 | • ALLIANCEBERNSTEIN WEALTH STRATEGIES |
Small-Mid Cap Growth Portfolio—Portfolio of Investments
| Company |
Shares | U.S. $ Value | ||||||
| ||||||||
Total Investments Before Security Lending Collateral for Securities Loaned – 99.8% | $ | 335,874,145 | ||||||
|
| |||||||
INVESTMENTS OF CASH COLLATERAL FOR SECURITIES LOANED – 1.1% | ||||||||
Investment Companies – 1.1% | ||||||||
AllianceBernstein Exchange Reserves – Class I, 0.07%(c) (cost $3,607,746) | 3,607,746 | 3,607,746 | ||||||
|
| |||||||
Total Investments – 100.9% | 339,481,891 | |||||||
Other assets less liabilities – (0.9)% | (2,880,913 | ) | ||||||
|
| |||||||
Net Assets – 100.0% | $ | 336,600,978 | ||||||
|
| |||||||
| (a) | Non-income producing security. |
| (b) | Represents entire or partial securities out on loan. See Note D for securities lending information. |
| (c) | Investment in affiliated money market mutual fund. The rate shown represents the 7-day yield as of period end. |
Glossary:
| ADR | – American Depositary Receipt |
See notes to financial statements.
| ALLIANCEBERNSTEIN WEALTH STRATEGIES • | 215 |
Small-Mid Cap Growth Portfolio—Portfolio of Investments
MULTI-ASSET REAL RETURN PORTFOLIO
CONSOLIDATED PORTFOLIO OF INVESTMENTS
February 28, 2014 (unaudited)
| Company | Shares | U.S. $ Value | ||||||
| ||||||||
COMMON STOCKS – 62.8% | ||||||||
Energy – 22.7% | ||||||||
Coal & Consumable Fuels – 0.2% | ||||||||
Adaro Energy Tbk PT | 1,436,800 | $ | 123,603 | |||||
Cameco Corp. | 12,700 | 307,493 | ||||||
China Coal Energy Co., Ltd. – Class H(a) | 206,700 | 106,064 | ||||||
China Shenhua Energy Co., Ltd. – Class H | 109,570 | 298,964 | ||||||
Coal India Ltd. | 31,010 | 122,121 | ||||||
Consol Energy, Inc. | 9,980 | 400,198 | ||||||
|
| |||||||
| 1,358,443 | ||||||||
|
| |||||||
Integrated Oil & Gas – 15.8% | ||||||||
BG Group PLC | 407,540 | 7,414,672 | ||||||
BP PLC | 1,185,690 | 10,020,332 | ||||||
Cenovus Energy, Inc. | 33,900 | 897,326 | ||||||
Chevron Corp. | 142,810 | 16,470,277 | ||||||
China Petroleum & Chemical Corp. – Class H | 4,676,130 | 4,139,340 | ||||||
ENI SpA | 225,480 | 5,413,008 | ||||||
Exxon Mobil Corp. | 277,650 | 26,729,365 | ||||||
Gazprom OAO (Sponsored ADR) | 604,120 | 4,597,354 | ||||||
Hess Corp. | 29,040 | 2,324,072 | ||||||
LUKOIL OAO (Sponsored ADR) | 14,260 | 775,744 | ||||||
PetroChina Co., Ltd. – Class H | 947,800 | 998,555 | ||||||
Petroleo Brasileiro SA | 133,700 | 742,728 | ||||||
Petroleo Brasileiro SA (ADR) | 259,430 | 2,905,616 | ||||||
Petroleo Brasileiro SA (Preference Shares) | 131,300 | 762,804 | ||||||
Petroleo Brasileiro SA (Sponsored ADR) | 133,188 | 1,552,972 | ||||||
Repsol SA | 24,300 | 608,614 | ||||||
Rosneft OAO (GDR)(b) | 27,913 | 188,413 | ||||||
Royal Dutch Shell PLC (Euronext Amsterdam) – Class A | 250,033 | 9,124,560 | ||||||
Royal Dutch Shell PLC – Class A | 101,915 | 3,710,224 | ||||||
Royal Dutch Shell PLC – Class B | 140,210 | 5,454,520 | ||||||
Sasol Ltd. | 24,600 | 1,249,012 | ||||||
Statoil ASA | 104,180 | 2,747,855 | ||||||
Suncor Energy, Inc. | 41,180 | 1,358,535 | ||||||
Suncor Energy, Inc. (Toronto) | 119,220 | 3,933,086 | ||||||
Total SA | 134,230 | 8,708,723 | ||||||
|
| |||||||
| 122,827,707 | ||||||||
|
| |||||||
Oil & Gas Drilling – 0.2% | ||||||||
Nabors Industries Ltd. | 45,470 | 1,046,719 | ||||||
Odfjell Drilling Ltd.(c) | 111,890 | 644,288 | ||||||
|
| |||||||
| 1,691,007 | ||||||||
|
| |||||||
Oil & Gas Equipment & Services – 0.7% | ||||||||
Aker Solutions ASA | 101,550 | 1,703,725 | ||||||
Halliburton Co. | 22,730 | 1,295,610 | ||||||
Helix Energy Solutions Group, Inc.(c) | 34,790 | 822,436 | ||||||
Schlumberger Ltd. | 21,690 | 2,017,170 | ||||||
|
| |||||||
| 5,838,941 | ||||||||
|
| |||||||
| 216 | • ALLIANCEBERNSTEIN WEALTH STRATEGIES |
Multi-Asset Real Return Portfolio—Consolidated Portfolio of Investments
| Company | Shares | U.S. $ Value | ||||||
| ||||||||
Oil & Gas Exploration & Production – 5.6% | ||||||||
Anadarko Petroleum Corp. | 42,230 | $ | 3,554,077 | |||||
Apache Corp. | 12,600 | 999,054 | ||||||
Cabot Oil & Gas Corp. | 11,340 | 396,900 | ||||||
Canadian Natural Resources Ltd. | 35,300 | 1,291,751 | ||||||
Canadian Oil Sands Ltd. | 21,800 | 415,604 | ||||||
Chesapeake Energy Corp. | 17,200 | 445,652 | ||||||
Cimarex Energy Co. | 13,820 | 1,599,112 | ||||||
CNOOC Ltd. | 575,800 | 942,650 | ||||||
Concho Resources Inc.(c) | 3,400 | 411,842 | ||||||
ConocoPhillips | 55,070 | 3,662,155 | ||||||
Continental Resources, Inc./OK(a)(c) | 1,900 | 227,088 | ||||||
Crescent Point Energy Corp.(a) | 15,600 | 547,472 | ||||||
Denbury Resources, Inc. | 12,000 | 196,320 | ||||||
Det Norske Oljeselskap ASA(a)(c) | 89,350 | 968,499 | ||||||
Devon Energy Corp. | 12,400 | 798,808 | ||||||
Encana Corp. | 19,900 | 377,404 | ||||||
EOG Resources, Inc. | 20,320 | 3,849,014 | ||||||
EQT Corp. | 4,100 | 419,389 | ||||||
Inpex Corp. | 170,200 | 2,162,678 | ||||||
Kunlun Energy Co., Ltd. | 173,700 | 310,074 | ||||||
Lundin Petroleum AB(c) | 48,970 | 980,433 | ||||||
Marathon Oil Corp. | 22,790 | 763,465 | ||||||
Murphy Oil Corp. | 21,230 | 1,260,425 | ||||||
Noble Energy, Inc. | 35,810 | 2,462,296 | ||||||
NovaTek OAO (Sponsored GDR)(b) | 4,100 | 519,060 | ||||||
Occidental Petroleum Corp. | 71,940 | 6,943,649 | ||||||
Oil & Natural Gas Corp. Ltd. | 308,220 | 1,442,711 | ||||||
Pacific Rubiales Energy Corp. | 9,900 | 136,345 | ||||||
Pioneer Natural Resources Co. | 3,600 | 724,248 | ||||||
Range Resources Corp. | 4,400 | 378,620 | ||||||
Rosetta Resources, Inc.(c) | 13,830 | 613,637 | ||||||
Santos Ltd.(a) | 26,000 | 317,004 | ||||||
Southwestern Energy Co.(c) | 9,500 | 392,730 | ||||||
Talisman Energy, Inc. | 46,400 | 477,702 | ||||||
Tourmaline Oil Corp.(c) | 5,000 | 228,980 | ||||||
Tullow Oil PLC | 24,500 | 327,799 | ||||||
Vermilion Energy, Inc.(a) | 3,200 | 180,620 | ||||||
Whiting Petroleum Corp.(c) | 15,600 | 1,071,876 | ||||||
Woodside Petroleum Ltd. | 21,300 | 722,483 | ||||||
|
| |||||||
| 43,519,626 | ||||||||
|
| |||||||
Oil & Gas Refining & Marketing – 0.2% | ||||||||
Valero Energy Corp. | 31,320 | 1,502,734 | ||||||
|
| |||||||
| 176,738,458 | ||||||||
|
| |||||||
| ALLIANCEBERNSTEIN WEALTH STRATEGIES • | 217 |
Multi-Asset Real Return Portfolio—Consolidated Portfolio of Investments
| Company | Shares | U.S. $ Value | ||||||
| ||||||||
Equity: Other – 11.1% | ||||||||
Diversified/Specialty – 9.4% | ||||||||
Activia Properties, Inc. | 146 | $ | 1,244,010 | |||||
Agung Podomoro Land Tbk PT | 31,150 | 625 | ||||||
Alam Sutera Realty Tbk PT | 1,076,450 | 53,631 | ||||||
Alexander’s, Inc. | 650 | 243,562 | ||||||
Alexandria Real Estate Equities, Inc. | 2,750 | 199,238 | ||||||
American Assets Trust, Inc. | 7,650 | 252,986 | ||||||
American Homes 4 Rent – Class A | 6,850 | 112,203 | ||||||
Armada Hoffler Properties, Inc. | 65,944 | 645,592 | ||||||
Artis Real Estate Investment Trust | 8,700 | 123,118 | ||||||
Australand Property Group | 271,340 | 948,833 | ||||||
Ayala Land, Inc. | 1,151,282 | 789,905 | ||||||
Azrieli Group | 1,700 | 55,959 | ||||||
Bakrieland Development Tbk PT(c) | 3,227,600 | 13,901 | ||||||
Beni Stabili SpA(a) | 23,100 | 20,401 | ||||||
BioMed Realty Trust, Inc. | 7,600 | 157,168 | ||||||
British Land Co. PLC | 266,899 | 3,115,244 | ||||||
Buzzi Unicem SpA | 42,840 | 891,448 | ||||||
CA Immobilien Anlagen AG(c) | 5,778 | 108,068 | ||||||
Canadian Real Estate Investment Trust | 2,600 | 102,422 | ||||||
Capital Property Fund | 538,050 | 494,167 | ||||||
CapitaLand Ltd. | 201,000 | 452,542 | ||||||
Central Pattana PCL | 130,100 | 164,494 | ||||||
Chambers Street Properties | 11,750 | 92,943 | ||||||
Cheung Kong Holdings Ltd. | 100,000 | 1,570,241 | ||||||
Ciputra Development Tbk PT | 1,287,400 | 108,549 | ||||||
Ciputra Surya Tbk PT | 57,300 | 9,965 | ||||||
City Developments Ltd. | 47,000 | 348,405 | ||||||
Cofinimmo | 1,250 | 149,886 | ||||||
Conwert Immobilien Invest SE(c) | 12,600 | 172,005 | ||||||
Country Garden Holdings Co., Ltd. | 3,664,300 | 1,896,784 | ||||||
CTT-Correios de Portugal SA(c) | 75,326 | 758,999 | ||||||
Dexus Property Group | 729,160 | 697,536 | ||||||
Digital Realty Trust, Inc.(a) | 20,410 | 1,105,406 | ||||||
DLF Ltd. | 36,400 | 83,476 | ||||||
Duke Realty Corp. | 12,750 | 214,200 | ||||||
Dundee Real Estate Investment Trust – Class A | 37,736 | 1,006,362 | ||||||
DuPont Fabros Technology, Inc. | 8,700 | 231,072 | ||||||
Eastern & Oriental Bhd | 77,350 | 47,521 | ||||||
Even Construtora e Incorporadora SA | 202,700 | 617,242 | ||||||
Evergrande Real Estate Group Ltd.(a) | 393,750 | 166,802 | ||||||
F&C Commercial Property Trust Ltd. | 207,200 | 417,748 | ||||||
Fastighets AB Balder – Class B(c) | 10,000 | 128,610 | ||||||
Fibra Uno Administracion SA de CV | 258,050 | 813,415 | ||||||
Fonciere Des Regions | 2,600 | 243,678 | ||||||
Forest City Enterprises, Inc. – Class A(c) | 9,800 | 190,904 | ||||||
| 218 | • ALLIANCEBERNSTEIN WEALTH STRATEGIES |
Multi-Asset Real Return Portfolio—Consolidated Portfolio of Investments
| Company | Shares | U.S. $ Value | ||||||
| ||||||||
Franshion Properties China Ltd. | 333,200 | $ | 104,508 | |||||
Gecina SA | 1,350 | 185,007 | ||||||
Globe Trade Centre SA(c) | 21,200 | 51,743 | ||||||
GPT Group | 120,170 | 399,636 | ||||||
Gramercy Property Trust, Inc.(c) | 180,560 | 1,047,248 | ||||||
Granite Real Estate Investment Trust | 6,050 | 209,261 | ||||||
Greentown China Holdings Ltd. | 105,500 | 137,883 | ||||||
Growthpoint Properties Ltd. | 389,050 | 846,713 | ||||||
Guangzhou R&F Properties Co., Ltd. – Class H | 74,600 | 100,662 | ||||||
Hang Lung Properties Ltd. | 177,000 | 493,697 | ||||||
Helbor Empreendimentos SA | 12,680 | 37,239 | ||||||
Helical Bar PLC | 350 | 2,186 | ||||||
Henderson Land Development Co., Ltd. | 158,500 | 891,929 | ||||||
Hopson Development Holdings Ltd.(c) | 256,400 | 239,661 | ||||||
Hui Xian Real Estate Investment Trust | 243,100 | 150,803 | ||||||
Hulic Co., Ltd. | 23,350 | 270,096 | ||||||
Hysan Development Co., Ltd. | 63,000 | 262,640 | ||||||
ICADE | 9,610 | 946,454 | ||||||
IJM Land Bhd | 34,500 | 27,822 | ||||||
IMMOFINANZ AG(c) | 76,550 | 387,365 | ||||||
Is Gayrimenkul Yatirim Ortakligi AS | 31,897 | 18,269 | ||||||
Japan Hotel REIT Investment Corp.(a) | 1,995 | 979,426 | ||||||
Kawasan Industri Jababeka Tbk PT | 1,492,117 | 28,503 | ||||||
Kennedy-Wilson Holdings, Inc. | 63,080 | 1,595,924 | ||||||
Keppel Land Ltd.(a) | 126,000 | 319,659 | ||||||
Kerry Properties Ltd. | 67,500 | 223,291 | ||||||
Kiwi Income Property Trust | 54,950 | 51,829 | ||||||
KLCC Property Holdings Bhd | 45,900 | 86,094 | ||||||
Klovern AB | 79,192 | 442,080 | ||||||
Kungsleden AB | 12,614 | 108,750 | ||||||
Land Securities Group PLC | 201,722 | 3,668,994 | ||||||
Lend Lease Group | 195,490 | 1,974,935 | ||||||
Lexington Realty Trust | 14,650 | 167,157 | ||||||
Lippo Karawaci Tbk PT | 1,950,600 | 158,345 | ||||||
Londonmetric Property PLC | 18,050 | 43,676 | ||||||
Longfor Properties Co., Ltd. | 85,950 | 118,719 | ||||||
LPN Development PCL | 652,900 | 302,185 | ||||||
Mah Sing Group Bhd | 105,400 | 66,656 | ||||||
Mapletree Commercial Trust | 113,200 | 108,132 | ||||||
Mapletree Greater China Commercial Trust(b) | 138,500 | 91,837 | ||||||
Megaworld Corp. | 3,302,650 | 311,806 | ||||||
Mexico Real Estate Management SA de CV(c) | 61,150 | 106,061 | ||||||
Mingfa Group International Co., Ltd.(a)(c) | 910,500 | 234,952 | ||||||
Mitchells & Butlers PLC(c) | 92,460 | 749,888 | ||||||
Mitsubishi Estate Co., Ltd. | 169,000 | 4,008,348 | ||||||
Mitsui Fudosan Co., Ltd. | 151,000 | 4,513,812 | ||||||
Morguard Real Estate Investment Trust | 9,400 | 141,429 | ||||||
| ALLIANCEBERNSTEIN WEALTH STRATEGIES • | 219 |
Multi-Asset Real Return Portfolio—Consolidated Portfolio of Investments
| Company | Shares | U.S. $ Value | ||||||
| ||||||||
New World China Land Ltd. | 573,900 | $ | 340,726 | |||||
New World Development Co., Ltd.(a) | 773,000 | 1,001,488 | ||||||
Nomura Real Estate Holdings, Inc. | 7,300 | 150,098 | ||||||
Nomura Real Estate Master Fund, Inc. | 50 | 52,132 | ||||||
Pakuwon Jati Tbk PT | 2,207,000 | 62,981 | ||||||
Poly Property Group Co., Ltd.(a) | 254,600 | 117,122 | ||||||
Pruksa Real Estate PCL | 144,400 | 86,751 | ||||||
Quintain Estates & Development PLC(c) | 150 | 261 | ||||||
Redefine Properties Ltd. | 271,950 | 238,405 | ||||||
Regal Entertainment Group – Class A | 75,940 | 1,397,296 | ||||||
Resilient Property Income Fund Ltd. | 48,462 | 243,024 | ||||||
Robinsons Land Corp. | 155,600 | 72,864 | ||||||
SA Corporate Real Estate Fund Nominees Pty Ltd. | 170,400 | 60,806 | ||||||
Select Income REIT | 5,650 | 164,698 | ||||||
Shui On Land Ltd. | 846,050 | 232,628 | ||||||
Sino Land Co., Ltd. | 124,000 | 176,805 | ||||||
Sinpas Gayrimenkul Yatirim Ortakligi AS | 19,800 | 6,077 | ||||||
Soho China Ltd. | 171,050 | 129,275 | ||||||
SP Setia Bhd | 76,250 | 67,710 | ||||||
Spirit Realty Capital, Inc. | 14,112 | 154,103 | ||||||
Sponda Oyj | 39,700 | 215,695 | ||||||
ST Modwen Properties PLC | 4,350 | 28,737 | ||||||
Sumitomo Realty & Development Co., Ltd. | 69,000 | 2,787,914 | ||||||
Summarecon Agung Tbk PT | 1,101,900 | 95,723 | ||||||
Sun Hung Kai Properties Ltd. | 317,305 | 4,067,385 | ||||||
Suntec Real Estate Investment Trust | 150,000 | 197,120 | ||||||
Supalai PCL | 1,091,600 | 592,224 | ||||||
Swire Properties Ltd. | 655,350 | 1,747,057 | ||||||
TAG Immobilien AG | 3,250 | 41,023 | ||||||
Taiheiyo Cement Corp. | 106,000 | 374,355 | ||||||
Unite Group PLC | 5,150 | 38,673 | ||||||
Unitech Ltd.(c) | 97,650 | 18,129 | ||||||
United Urban Investment Corp. | 300 | 459,568 | ||||||
UOL Group Ltd. | 268,602 | 1,297,586 | ||||||
Vornado Realty Trust | 13,680 | 1,317,247 | ||||||
Wallenstam AB – Class B | 5,300 | 87,581 | ||||||
Washington Real Estate Investment Trust | 8,100 | 203,715 | ||||||
Wereldhave NV | 2,050 | 175,855 | ||||||
WHA Corp. PCL | 91,350 | 86,800 | ||||||
Wharf Holdings Ltd. | 435,000 | 3,049,731 | ||||||
Wheelock & Co., Ltd. | 160,000 | 656,191 | ||||||
Wihlborgs Fastigheter AB | 4,400 | 87,713 | ||||||
W.P. Carey, Inc. | 36,720 | 2,332,454 | ||||||
Yuexiu Property Co., Ltd. | 504,455 | 104,244 | ||||||
|
| |||||||
| 73,492,546 | ||||||||
|
| |||||||
| 220 | • ALLIANCEBERNSTEIN WEALTH STRATEGIES |
Multi-Asset Real Return Portfolio—Consolidated Portfolio of Investments
| Company | Shares | U.S. $ Value | ||||||
| ||||||||
Health Care – 1.5% | ||||||||
Chartwell Retirement Residences | 99,610 | $ | 929,262 | |||||
HCP, Inc. | 42,270 | 1,638,808 | ||||||
Health Care REIT, Inc. | 25,780 | 1,514,317 | ||||||
Healthcare Realty Trust, Inc. | 7,450 | 178,576 | ||||||
LTC Properties, Inc. | 47,000 | 1,770,960 | ||||||
Medical Properties Trust, Inc. | 143,035 | 1,886,632 | ||||||
National Health Investors, Inc. | 3,450 | 212,865 | ||||||
Omega Healthcare Investors, Inc. | 64,690 | 2,067,492 | ||||||
Senior Housing Properties Trust | 7,400 | 165,020 | ||||||
Ventas, Inc. | 26,920 | 1,680,616 | ||||||
|
| |||||||
| 12,044,548 | ||||||||
|
| |||||||
Triple Net – 0.2% | ||||||||
EPR Properties | 3,450 | 183,747 | ||||||
National Retail Properties, Inc.(a) | 19,550 | 701,649 | ||||||
Realty Income Corp.(a) | 9,950 | 441,979 | ||||||
|
| |||||||
| 1,327,375 | ||||||||
|
| |||||||
| 86,864,469 | ||||||||
|
| |||||||
Materials – 10.4% | ||||||||
Aluminum – 0.1% | ||||||||
Alcoa, Inc. | 29,700 | 348,678 | ||||||
Hindalco Industries Ltd. | 77,300 | 132,454 | ||||||
Norsk Hydro ASA | 35,000 | 172,807 | ||||||
|
| |||||||
| 653,939 | ||||||||
|
| |||||||
Commodity Chemicals – 0.3% | ||||||||
Denki Kagaku Kogyo KK | 197,000 | 761,804 | ||||||
LyondellBasell Industries NV – Class A | 18,180 | 1,601,294 | ||||||
|
| |||||||
| 2,363,098 | ||||||||
|
| |||||||
Construction Materials – 0.1% | ||||||||
Anhui Conch Cement Co., Ltd. – Class H(a) | �� | 234,000 | 856,850 | |||||
|
| |||||||
Diversified Chemicals – 0.4% | ||||||||
Arkema SA | 10,750 | 1,166,082 | ||||||
Huntsman Corp. | 69,520 | 1,693,507 | ||||||
|
| |||||||
| 2,859,589 | ||||||||
|
| |||||||
Diversified Metals & Mining – 4.4% | ||||||||
Anglo American PLC | 38,720 | 988,896 | ||||||
Aurubis AG(a) | 12,770 | 709,458 | ||||||
BHP Billiton Ltd. | 213,880 | 7,335,782 | ||||||
BHP Billiton PLC | 58,700 | 1,891,715 | ||||||
First Quantum Minerals Ltd. | 29,900 | 580,016 | ||||||
Freeport-McMoRan Copper & Gold, Inc. | 98,770 | 3,221,878 | ||||||
Glencore Xstrata PLC | 974,630 | 5,367,044 | ||||||
Grupo Mexico SAB de CV Series B | 182,300 | 558,142 | ||||||
Iluka Resources Ltd. | 6,414 | 53,867 | ||||||
MMC Norilsk Nickel OJSC (ADR) | 133,530 | 2,267,339 | ||||||
| ALLIANCEBERNSTEIN WEALTH STRATEGIES • | 221 |
Multi-Asset Real Return Portfolio—Consolidated Portfolio of Investments
| Company | Shares | U.S. $ Value | ||||||
| ||||||||
Rio Tinto Ltd. | 12,120 | $ | 724,082 | |||||
Rio Tinto PLC | 160,190 | 9,185,402 | ||||||
Sesa Sterlite Ltd. | 76,920 | 219,512 | ||||||
Southern Copper Corp. | 11,190 | 341,407 | ||||||
Sumitomo Metal Mining Co., Ltd. | 52,960 | 693,267 | ||||||
Turquoise Hill Resources Ltd.(c) | 28,400 | 108,491 | ||||||
|
| |||||||
| 34,246,298 | ||||||||
|
| |||||||
Fertilizers & Agricultural Chemicals – 1.2% | ||||||||
Agrium, Inc. | 4,910 | 452,245 | ||||||
CF Industries Holdings, Inc. | 2,100 | 526,890 | ||||||
Israel Corp. Ltd. (The)(c) | 209 | 111,633 | ||||||
K&S AG | 6,700 | 226,196 | ||||||
Monsanto Co. | 44,940 | 4,944,299 | ||||||
Mosaic Co. (The) | 10,200 | 498,372 | ||||||
Potash Corp. of Saskatchewan, Inc. | 47,180 | 1,559,458 | ||||||
Syngenta AG | 3,000 | 1,092,122 | ||||||
|
| |||||||
| 9,411,215 | ||||||||
|
| |||||||
Forest Products – 0.1% | ||||||||
Duratex SA | 130,960 | 607,979 | ||||||
|
| |||||||
Gold – 1.0% | ||||||||
Barrick Gold Corp.(a) | 75,300 | 1,534,153 | ||||||
Cia de Minas Buenaventura SAA (ADR) – Class B | 9,598 | 120,935 | ||||||
Eldorado Gold Corp. | 19,420 | 128,905 | ||||||
Franco-Nevada Corp. | 4,400 | 224,868 | ||||||
Goldcorp, Inc. | 130,280 | 3,502,606 | ||||||
Kinross Gold Corp. | 35,160 | 183,532 | ||||||
Koza Altin Isletmeleri AS | 37,990 | 325,158 | ||||||
New Gold, Inc.(c) | 86,870 | 531,121 | ||||||
Newcrest Mining Ltd. | 20,700 | 208,607 | ||||||
Newmont Mining Corp. | 13,400 | 311,684 | ||||||
Randgold Resources Ltd. | 2,400 | 190,082 | ||||||
Real Gold Mining Ltd.(a)(c)(d)(e) | 686,500 | 9 | ||||||
Yamana Gold, Inc. | 20,290 | 203,028 | ||||||
|
| |||||||
| 7,464,688 | ||||||||
|
| |||||||
Paper Products – 0.5% | ||||||||
Fibria Celulose SA(c) | 19,600 | 207,785 | ||||||
International Paper Co. | 11,600 | 567,124 | ||||||
Mondi PLC | 66,000 | 1,210,260 | ||||||
Oji Holdings Corp. | 67,000 | 321,808 | ||||||
Sappi Ltd.(c) | 265,750 | 851,219 | ||||||
Stora Enso Oyj – Class R | 10,604 | 120,592 | ||||||
UPM-Kymmene Oyj | 14,800 | 268,411 | ||||||
|
| |||||||
| 3,547,199 | ||||||||
|
| |||||||
| 222 | • ALLIANCEBERNSTEIN WEALTH STRATEGIES |
Multi-Asset Real Return Portfolio—Consolidated Portfolio of Investments
| Company | Shares | U.S. $ Value | ||||||
| ||||||||
Precious Metals & Minerals – 0.2% | ||||||||
Dominion Diamond Corp.(c) | 51,620 | $ | 735,069 | |||||
Fresnillo PLC | 7,400 | 118,257 | ||||||
Impala Platinum Holdings Ltd. | 14,500 | 152,889 | ||||||
Industrias Penoles SAB de CV | 4,300 | 103,869 | ||||||
North American Palladium Ltd.(a)(c) | 881,200 | 341,024 | ||||||
Northam Platinum Ltd.(c) | 27,900 | 109,572 | ||||||
Silver Wheaton Corp. | 9,600 | 244,920 | ||||||
|
| |||||||
| 1,805,600 | ||||||||
|
| |||||||
Specialty Chemicals – 0.3% | ||||||||
Johnson Matthey PLC | 16,440 | 897,678 | ||||||
Koninklijke DSM NV | 25,936 | 1,654,905 | ||||||
|
| |||||||
| 2,552,583 | ||||||||
|
| |||||||
Steel – 1.8% | ||||||||
ArcelorMittal | 27,800 | 436,563 | ||||||
BlueScope Steel Ltd.(c) | 170,240 | 937,887 | ||||||
Bradespar SA (Preference Shares) | 11,000 | 100,170 | ||||||
Cia Siderurgica Nacional SA | 12,300 | 53,789 | ||||||
Daido Steel Co., Ltd. | 15,700 | 72,376 | ||||||
Eregli Demir ve Celik Fabrikalari TAS | 49,627 | 54,217 | ||||||
Fortescue Metals Group Ltd. | 43,070 | 209,651 | ||||||
Fosun International Ltd. | 92,700 | 115,950 | ||||||
Gerdau SA (Preference Shares) | 25,200 | 155,484 | ||||||
Hitachi Metals Ltd. | 5,000 | 74,745 | ||||||
Hyundai Steel Co. | 1,900 | 121,241 | ||||||
JFE Holdings, Inc. | 80,000 | 1,632,853 | ||||||
Jindal Steel & Power Ltd. | 15,200 | 58,644 | ||||||
Kobe Steel Ltd.(c) | 69,170 | 94,757 | ||||||
Kumba Iron Ore Ltd.(a) | 2,100 | 86,696 | ||||||
Maruichi Steel Tube Ltd. | 4,100 | 114,811 | ||||||
Metalurgica Gerdau SA (Preference Shares) | 13,300 | 101,709 | ||||||
Nippon Steel & Sumitomo Metal Corp. | 211,920 | 620,910 | ||||||
Nucor Corp. | 8,800 | 442,112 | ||||||
POSCO | 1,770 | 470,790 | ||||||
Ternium SA (Sponsored ADR) | 32,850 | 973,017 | ||||||
ThyssenKrupp AG(c) | 10,700 | 291,029 | ||||||
Vale SA | 36,270 | 512,167 | ||||||
Vale SA (Preference Shares) | 52,790 | 656,623 | ||||||
Vale SA (Sponsored ADR) (Local Preference Shares) | 394,410 | 4,926,181 | ||||||
Voestalpine AG | 20,270 | 911,600 | ||||||
Yamato Kogyo Co., Ltd. | 3,000 | 90,713 | ||||||
|
| |||||||
| 14,316,685 | ||||||||
|
| |||||||
| 80,685,723 | ||||||||
|
| |||||||
| ALLIANCEBERNSTEIN WEALTH STRATEGIES • | 223 |
Multi-Asset Real Return Portfolio—Consolidated Portfolio of Investments
| Company | Shares | U.S. $ Value | ||||||
| ||||||||
Retail – 5.9% | ||||||||
Regional Mall – 2.0% | ||||||||
BR Malls Participacoes SA | 84,810 | $ | 649,958 | |||||
CapitaMall Trust | 205,000 | 307,615 | ||||||
CBL & Associates Properties, Inc. | 6,500 | 115,635 | ||||||
CFS Retail Property Trust Group | 630,050 | 1,109,313 | ||||||
General Growth Properties, Inc. | 96,350 | 2,121,627 | ||||||
Glimcher Realty Trust | 20,700 | 201,411 | ||||||
Macerich Co. (The) | 7,200 | 432,936 | ||||||
Multiplan Empreendimentos Imobiliarios SA | 33,450 | 657,836 | ||||||
Pennsylvania Real Estate Investment Trust | 12,350 | 231,686 | ||||||
Rouse Properties, Inc.(a) | 11,750 | 219,960 | ||||||
Simon Property Group, Inc. | 38,621 | 6,229,181 | ||||||
Taubman Centers, Inc. | 2,450 | 172,603 | ||||||
Westfield Group | 291,857 | 2,680,743 | ||||||
|
| |||||||
| 15,130,504 | ||||||||
|
| |||||||
Shopping Center/Other Retail – 3.9% | ||||||||
Acadia Realty Trust | 8,100 | 214,245 | ||||||
Aeon Mall Co., Ltd. | 48,100 | 1,335,600 | ||||||
American Realty Capital Properties, Inc. | 8,200 | 120,458 | ||||||
Atrium European Real Estate Ltd.(c) | 15,100 | 91,916 | ||||||
Calloway Real Estate Investment Trust | 4,000 | 93,380 | ||||||
Capital & Counties Properties PLC | 47,650 | 300,421 | ||||||
CapitaMalls Asia Ltd. | 176,050 | 248,866 | ||||||
CapitaMalls Malaysia Trust | 126,400 | 56,709 | ||||||
Citycon Oyj | 21,850 | 85,930 | ||||||
Corio NV | 4,750 | 222,488 | ||||||
Crombie Real Estate Investment Trust | 16,300 | 200,051 | ||||||
DDR Corp. | 97,730 | 1,624,273 | ||||||
Deutsche Euroshop AG | 3,550 | 159,454 | ||||||
Development Securities PLC | 7,650 | 32,794 | ||||||
Equity One, Inc. | 7,900 | 183,280 | ||||||
Eurocommercial Properties NV | 7,600 | 342,415 | ||||||
Federal Realty Investment Trust | 11,620 | 1,293,422 | ||||||
Federation Centres Ltd. | 205,050 | 438,103 | ||||||
First Capital Realty, Inc.(a) | 12,300 | 197,280 | ||||||
Fountainhead Property Trust | 130,800 | 90,008 | ||||||
Frontier Real Estate Investment Corp. | 35 | 190,155 | ||||||
Fukuoka REIT Co.(a) | 230 | 387,901 | ||||||
Hammerson PLC | 56,100 | 539,620 | ||||||
Hyprop Investments Ltd. | 70,750 | 507,620 | ||||||
Iguatemi Empresa de Shopping Centers SA | 15,350 | 139,965 | ||||||
Inland Real Estate Corp. | 21,700 | 232,407 | ||||||
Intu Properties PLC | 58,500 | 318,094 | ||||||
Japan Retail Fund Investment Corp.(a) | 431 | 851,704 | ||||||
Kimco Realty Corp. | 36,390 | 810,041 | ||||||
Kite Realty Group Trust | 137,402 | 849,144 | ||||||
| 224 | • ALLIANCEBERNSTEIN WEALTH STRATEGIES |
Multi-Asset Real Return Portfolio—Consolidated Portfolio of Investments
| Company | Shares | U.S. $ Value | ||||||
| ||||||||
Klepierre | 45,062 | $ | 2,052,290 | |||||
Link REIT (The) | 229,878 | 1,069,286 | ||||||
Mercialys SA | 4,000 | 91,045 | ||||||
Pavilion Real Estate Investment Trust | 126,700 | 52,228 | ||||||
Ramco-Gershenson Properties Trust | 116,474 | 1,945,116 | ||||||
Regency Centers Corp. | 15,140 | 768,658 | ||||||
Retail Opportunity Investments Corp. | 11,100 | 164,613 | ||||||
RioCan Real Estate Investment Trust | 28,171 | 668,085 | ||||||
Saul Centers, Inc. | 3,350 | 155,675 | ||||||
Shaftesbury PLC | 20,945 | 232,551 | ||||||
SM Prime Holdings, Inc. | 536,350 | 176,038 | ||||||
Tanger Factory Outlet Centers, Inc. | 5,450 | 186,990 | ||||||
Unibail-Rodamco SE | 21,287 | 5,603,401 | ||||||
Vastned Retail NV | 31,966 | 1,611,573 | ||||||
Weingarten Realty Investors | 43,470 | 1,325,835 | ||||||
Westfield Retail Trust | 828,350 | 2,302,295 | ||||||
|
| |||||||
| 30,563,423 | ||||||||
|
| |||||||
| 45,693,927 | ||||||||
|
| |||||||
Residential – 5.2% | ||||||||
Multi-Family – 4.3% | ||||||||
Advance Residence Investment Corp. | 150 | 321,768 | ||||||
Agile Property Holdings Ltd. | 102,850 | 87,781 | ||||||
Apartment Investment & Management Co. – Class A | 5,750 | 171,868 | ||||||
Associated Estates Realty Corp. | 95,090 | 1,626,039 | ||||||
AvalonBay Communities, Inc. | 6,550 | 844,753 | ||||||
Boardwalk Real Estate Investment Trust | 1,500 | 80,656 | ||||||
BRE Properties, Inc. | 3,000 | 185,310 | ||||||
Brookfield Residential Properties, Inc.(c) | 32,867 | 731,291 | ||||||
Camden Property Trust | 3,350 | 223,445 | ||||||
Canadian Apartment Properties REIT | 5,850 | 115,542 | ||||||
China Overseas Land & Investment Ltd. | 1,258,650 | 3,392,176 | ||||||
China Resources Land Ltd. | 147,700 | 334,645 | ||||||
China Vanke Co., Ltd. – Class B | 1,083,475 | 1,608,143 | ||||||
CIFI Holdings Group Co., Ltd.(a) | 3,410,000 | 686,885 | ||||||
Comforia Residential REIT, Inc.(a) | 67 | 470,804 | ||||||
Consorcio ARA SAB de CV(c) | 92,160 | 34,749 | ||||||
Corp. GEO SAB de CV(c)(d)(e) | 108,590 | 2,224 | ||||||
Cyrela Brazil Realty SA Empreendimentos e Participacoes | 27,720 | 154,593 | ||||||
Desarrolladora Homex SAB de CV(a)(c) | 1,300 | 316 | ||||||
Deutsche Annington Immobilien SE(c) | 35,492 | 963,625 | ||||||
Deutsche Wohnen AG | 13,400 | 283,834 | ||||||
Deutsche Wohnen AG – New(c) | 15,198 | 312,674 | ||||||
Emlak Konut Gayrimenkul Yatirim Ortakligi AS | 173,100 | 176,447 | ||||||
Equity Lifestyle Properties, Inc. | 4,700 | 189,175 | ||||||
Equity Residential | 36,710 | 2,146,433 | ||||||
| ALLIANCEBERNSTEIN WEALTH STRATEGIES • | 225 |
Multi-Asset Real Return Portfolio—Consolidated Portfolio of Investments
| Company | Shares | U.S. $ Value | ||||||
| ||||||||
Essex Property Trust, Inc. | 15,130 | $ | 2,530,492 | |||||
Ez Tec Empreendimentos e Participacoes SA | 7,100 | 78,527 | ||||||
GAGFAH SA(c) | 8,250 | 125,347 | ||||||
Grainger PLC | 101,000 | 415,325 | ||||||
Home Properties, Inc. | 2,050 | 120,827 | ||||||
Japan Rental Housing Investments, Inc. | 514 | 328,852 | ||||||
Kaisa Group Holdings Ltd.(a)(c) | 532,300 | 178,705 | ||||||
Killam Properties, Inc. | 5,650 | 52,862 | ||||||
KWG Property Holding Ltd. | 1,981,050 | 1,005,786 | ||||||
Land and Houses PCL | 321,400 | 91,786 | ||||||
LEG Immobilien AG(c) | 24,601 | 1,599,364 | ||||||
Mid-America Apartment Communities, Inc. | 30,450 | 2,059,638 | ||||||
Mirvac Group | 249,030 | 393,167 | ||||||
MRV Engenharia e Participacoes SA | 31,100 | 107,835 | ||||||
Nippon Accommodations Fund, Inc.(a) | 100 | 345,598 | ||||||
Northern Property Real Estate Investment Trust | 1,500 | 39,772 | ||||||
PDG Realty SA Empreendimentos e Participacoes(c) | 142,930 | 92,212 | ||||||
Post Properties, Inc. | 3,650 | 177,135 | ||||||
Rossi Residencial SA(c) | 792,521 | 579,437 | ||||||
Sekisui Chemical Co., Ltd. | 35,000 | 399,955 | ||||||
Shenzhen Investment Ltd. | 285,250 | 95,690 | ||||||
Shimao Property Holdings Ltd. | 304,500 | 612,690 | ||||||
Sino-Ocean Land Holdings Ltd. | 337,350 | 179,362 | ||||||
Stockland | 950,690 | 3,283,208 | ||||||
Sun Communities, Inc. | 6,995 | 322,190 | ||||||
Sunac China Holdings Ltd.(a) | 147,400 | 78,255 | ||||||
Taylor Wimpey PLC | 372,180 | 778,267 | ||||||
UDR, Inc. | 44,740 | 1,154,739 | ||||||
UEM Sunrise Bhd | 119,900 | 80,662 | ||||||
Urbi Desarrollos Urbanos SAB de CV(a)(c)(d)(e) | 52,560 | 1,545 | ||||||
Wing Tai Holdings Ltd. | 518,400 | 757,340 | ||||||
Yanlord Land Group Ltd. | 151,950 | 134,428 | ||||||
|
| |||||||
| 33,346,174 | ||||||||
|
| |||||||
Self Storage – 0.8% | ||||||||
Big Yellow Group PLC | 3,250 | 31,103 | ||||||
CubeSmart | 10,200 | 178,602 | ||||||
Extra Space Storage, Inc. | 50,940 | 2,501,154 | ||||||
Public Storage | 15,870 | 2,682,030 | ||||||
Safestore Holdings PLC | 202,600 | 806,600 | ||||||
Sovran Self Storage, Inc. | 2,900 | 214,571 | ||||||
|
| |||||||
| 6,414,060 | ||||||||
|
| |||||||
Student Housing – 0.1% | ||||||||
American Campus Communities, Inc. | 17,220 | 636,107 | ||||||
Education Realty Trust, Inc. | 27,300 | 257,439 | ||||||
|
| |||||||
| 893,546 | ||||||||
|
| |||||||
| 40,653,780 | ||||||||
|
| |||||||
| 226 | • ALLIANCEBERNSTEIN WEALTH STRATEGIES |
Multi-Asset Real Return Portfolio—Consolidated Portfolio of Investments
| Company | Shares | U.S. $ Value | ||||||
| ||||||||
Office – 4.2% | ||||||||
Office – 4.2% | ||||||||
Allied Properties Real Estate Investment Trust | 37,824 | $ | 1,144,319 | |||||
Allreal Holding AG(c) | 1,850 | 258,635 | ||||||
Alstria Office REIT-AG(c) | 300 | 4,168 | ||||||
Befimmo SA | 3,224 | 231,405 | ||||||
Boston Properties, Inc. | 12,913 | 1,451,809 | ||||||
Brandywine Realty Trust | 13,300 | 194,845 | ||||||
Brookfield Office Properties, Inc.(a) | 9,900 | 189,006 | ||||||
CapitaCommercial Trust | 1,296,000 | 1,499,356 | ||||||
Castellum AB | 12,970 | 226,936 | ||||||
Columbia Property Trust, Inc. | 62,340 | 1,654,504 | ||||||
Cominar Real Estate Investment Trust | 70,183 | 1,148,483 | ||||||
CommonWealth REIT | 7,200 | 195,480 | ||||||
Corporate Office Properties Trust | 7,300 | 194,691 | ||||||
Cousins Properties, Inc. | 180,565 | 2,085,525 | ||||||
Derwent London PLC | 6,550 | 303,929 | ||||||
Douglas Emmett, Inc. | 21,770 | 586,266 | ||||||
Dundee International Real Estate Investment Trust | 4,050 | 33,796 | ||||||
Empire State Realty Trust, Inc. – Class A | 9,500 | 145,540 | ||||||
Fabege AB | 29,590 | 410,996 | ||||||
Franklin Street Properties Corp. | 16,800 | 210,336 | ||||||
Government Properties Income Trust | 8,600 | 214,226 | ||||||
Great Portland Estates PLC | 28,400 | 306,641 | ||||||
Highwoods Properties, Inc. | 5,050 | 190,436 | ||||||
Hongkong Land Holdings Ltd. | 140,000 | 879,172 | ||||||
Hudson Pacific Properties, Inc. | 11,050 | 252,050 | ||||||
Hufvudstaden AB – Class A | 14,700 | 220,571 | ||||||
Investa Office Fund | 327,240 | 936,583 | ||||||
Japan Excellent, Inc. | 230 | 292,105 | ||||||
Japan Prime Realty Investment Corp. | 80 | 277,661 | ||||||
Japan Real Estate Investment Corp. | 302 | 1,639,952 | ||||||
Kenedix Office Investment Corp. – Class A | 203 | 1,009,958 | ||||||
Keppel REIT(a) | 101,400 | 94,115 | ||||||
Kilroy Realty Corp. | 13,390 | 770,193 | ||||||
Liberty Property Trust | 22,830 | 873,476 | ||||||
Mack-Cali Realty Corp. | 24,140 | 537,115 | ||||||
Mori Hills REIT Investment Corp. | 250 | 339,640 | ||||||
Mori Trust Sogo Reit, Inc.(a) | 22 | 181,922 | ||||||
Nippon Building Fund, Inc. | 106 | 607,918 | ||||||
Nomura Real Estate Office Fund, Inc.(a) | 35 | 148,201 | ||||||
Norwegian Property ASA | 34,650 | 42,143 | ||||||
NTT Urban Development Corp. | 106,816 | 924,451 | ||||||
Orix JREIT, Inc.(a) | 1,470 | 1,863,124 | ||||||
Parkway Properties, Inc./MD | 103,358 | 1,904,888 | ||||||
Piedmont Office Realty Trust, Inc. – Class A(a) | 9,900 | 171,072 | ||||||
| ALLIANCEBERNSTEIN WEALTH STRATEGIES • | 227 |
Multi-Asset Real Return Portfolio—Consolidated Portfolio of Investments
| Company | Shares | U.S. $ Value | ||||||
| ||||||||
PS Business Parks, Inc. | 2,450 | $ | 205,849 | |||||
PSP Swiss Property AG(c) | 3,300 | 305,686 | ||||||
SL Green Realty Corp. | 31,312 | 3,110,221 | ||||||
Swiss Prime Site AG(c) | 4,300 | 360,959 | ||||||
Tokyo Tatemono Co., Ltd.(a) | 120,000 | 980,134 | ||||||
Workspace Group PLC | 89,760 | 891,324 | ||||||
|
| |||||||
| 32,701,811 | ||||||||
|
| |||||||
Industrials – 1.5% | ||||||||
Industrial Warehouse Distribution – 1.4% | ||||||||
Ascendas Real Estate Investment Trust | 163,000 | 277,973 | ||||||
Daiwa House REIT Investment Corp. | 81 | 332,125 | ||||||
DCT Industrial Trust, Inc. | 25,150 | 199,188 | ||||||
EastGroup Properties, Inc. | 3,100 | 192,324 | ||||||
First Industrial Realty Trust, Inc. | 11,300 | 217,412 | ||||||
Global Logistic Properties Ltd. | 237,800 | 531,767 | ||||||
GLP J-Reit | 100 | 105,566 | ||||||
Granite Real Estate Investment Trust | 41,570 | 1,434,997 | ||||||
Hansteen Holdings PLC | 265,600 | 499,021 | ||||||
Hopewell Holdings Ltd.(a) | 187,500 | 635,016 | ||||||
Japan Logistics Fund, Inc. | 301 | 674,664 | ||||||
Mapletree Industrial Trust | 4,040 | 4,306 | ||||||
Mapletree Logistics Trust | 1,202,200 | 982,838 | ||||||
Nippon Prologis REIT, Inc. | 171 | 367,056 | ||||||
ProLogis, Inc. | 51,466 | 2,119,885 | ||||||
Segro PLC | 78,370 | 468,348 | ||||||
STAG Industrial, Inc. | 72,680 | 1,694,171 | ||||||
Warehouses De Pauw SCA | 1,200 | 90,948 | ||||||
|
| |||||||
| 10,827,605 | ||||||||
|
| |||||||
Mixed Office Industrial – 0.1% | ||||||||
BR Properties SA | 21,120 | 153,138 | ||||||
Goodman Group | 253,150 | 1,087,625 | ||||||
|
| |||||||
| 1,240,763 | ||||||||
|
| |||||||
| 12,068,368 | ||||||||
|
| |||||||
Lodging – 1.3% | ||||||||
Lodging – 1.3% | ||||||||
Ashford Hospitality Prime, Inc. | 91,712 | 1,536,176 | ||||||
Ashford Hospitality Trust, Inc. | 149,398 | 1,670,270 | ||||||
Chesapeake Lodging Trust | 31,640 | 824,222 | ||||||
DiamondRock Hospitality Co. | 166,860 | 2,105,773 | ||||||
Hersha Hospitality Trust | 207,070 | 1,163,733 | ||||||
Hospitality Properties Trust | 5,500 | 145,750 | ||||||
Host Hotels & Resorts, Inc. | 70,200 | 1,380,833 | ||||||
LaSalle Hotel Properties | 6,550 | 205,277 | ||||||
Pebblebrook Hotel Trust | 25,172 | 836,717 | ||||||
RLJ Lodging Trust | 7,550 | 196,225 | ||||||
Strategic Hotels & Resorts, Inc.(c) | 20,750 | 207,293 | ||||||
Sunstone Hotel Investors, Inc. | 14,300 | 193,336 | ||||||
|
| |||||||
| 10,465,605 | ||||||||
|
| |||||||
| 228 | • ALLIANCEBERNSTEIN WEALTH STRATEGIES |
Multi-Asset Real Return Portfolio—Consolidated Portfolio of Investments
| Company | Shares | U.S. $ Value | ||||||
| ||||||||
Mortgage – 0.3% | ||||||||
Mortgage – 0.3% | ||||||||
Altisource Residential Corp. | 21,695 | $ | 620,043 | |||||
NorthStar Realty Finance Corp. | 88,200 | 1,367,982 | ||||||
|
| |||||||
| 1,988,025 | ||||||||
|
| |||||||
Food Beverage & Tobacco – 0.2% | ||||||||
Agricultural Products – 0.2% | ||||||||
Archer-Daniels-Midland Co. | 18,200 | 738,920 | ||||||
Bunge Ltd. | 4,870 | 387,701 | ||||||
Charoen Pokphand Indonesia Tbk PT | 204,200 | 74,770 | ||||||
Golden Agri-Resources Ltd.(a) | 262,000 | 114,851 | ||||||
IOI Corp. Bhd | 89,600 | 126,103 | ||||||
Kuala Lumpur Kepong Bhd | 19,800 | 145,005 | ||||||
Wilmar International Ltd. | 59,000 | 160,794 | ||||||
|
| |||||||
| 1,748,144 | ||||||||
|
| |||||||
Total Common Stocks | 489,608,310 | |||||||
|
| |||||||
| Principal Amount (000) | ||||||||
INFLATION-LINKED SECURITIES – 24.6% | ||||||||
United States – 24.6% | ||||||||
U.S. Treasury Inflation Index | $ | 112,428 | 116,248,689 | |||||
0.625%, 7/15/21 (TIPS) | 5,727 | 5,976,676 | ||||||
1.875%, 7/15/15 (TIPS) | 65,697 | 69,274,419 | ||||||
|
| |||||||
Total Inflation-Linked Securities | 191,499,784 | |||||||
|
| |||||||
| Shares | ||||||||
INVESTMENT COMPANIES – 0.6% | ||||||||
Funds and Investment Trusts – 0.6% | ||||||||
CPN Retail Growth Leasehold Property Fund | 131,150 | 62,385 | ||||||
iShares US Real Estate ETF(a) | 38,220 | 2,612,337 | ||||||
Kennedy Wilson Europe Real Estate PLC(c) | 85,850 | 1,525,296 | ||||||
UK Commercial Property Trust Ltd./Fund | 302,950 | 401,278 | ||||||
|
| |||||||
Total Investment Companies | 4,601,296 | |||||||
|
| |||||||
WARRANTS – 0.3% | ||||||||
Equity: Other – 0.3% | ||||||||
Diversified/Specialty – 0.3% | ||||||||
Aldar Properties PJSC, Deutsche Bank AG London, expiring 5/15/17(c) | 818,820 | 740,166 | ||||||
Emaar Properties PJSC, Merrill Lynch Intl & Co., expiring 10/01/15(c) | 764,631 | 1,894,506 | ||||||
|
| |||||||
| ALLIANCEBERNSTEIN WEALTH STRATEGIES • | 229 |
Multi-Asset Real Return Portfolio—Consolidated Portfolio of Investments
| Company | Contracts | U.S. $ Value | ||||||||
| ||||||||||
Total Warrants | $ | 2,634,672 | ||||||||
|
| |||||||||
OPTIONS PURCHASED - PUTS – 0.1% | ||||||||||
Options on Funds and Investment | ||||||||||
iShares US Real Estate ETF | 1,988 | 262,416 | ||||||||
Expiration: Jan 2015, | 1,028 | 173,218 | ||||||||
|
| |||||||||
Total Options Purchased – Puts | 435,634 | |||||||||
|
| |||||||||
| Principal Amount (000) | ||||||||||
SHORT-TERM INVESTMENTS – 10.5% | ||||||||||
U.S. Treasury Bills – 7.7% | ||||||||||
U.S. Treasury Bill | U.S.$ | 59,905 | 59,890,290 | |||||||
|
| |||||||||
Time Deposit – 2.3% | ||||||||||
State Street Time Deposit | 18,022 | 18,022,161 | ||||||||
|
| |||||||||
| Shares | ||||||||||
Investment Companies – 0.5% | ||||||||||
AllianceBernstein Fixed-Income Shares, Inc. – Government STIF Portfolio, 0.08%(h) | 3,791,793 | 3,791,793 | ||||||||
|
| |||||||||
Total Short-Term Investments | 81,704,244 | |||||||||
|
| |||||||||
Total Investments Before Security Lending Collateral for Securities Loaned – 98.9% | 770,483,940 | |||||||||
|
| |||||||||
INVESTMENTS OF CASH COLLATERAL FOR SECURITIES LOANED – 1.8% | ||||||||||
Investment Companies – 1.8% | ||||||||||
AllianceBernstein Exchange Reserves – | 14,234,175 | 14,234,175 | ||||||||
|
| |||||||||
| 230 | • ALLIANCEBERNSTEIN WEALTH STRATEGIES |
Multi-Asset Real Return Portfolio—Consolidated Portfolio of Investments
| U.S. $ Value | ||||||
| ||||||
Total Investments – 100.7% | $ | 784,718,115 | ||||
Other assets less liabilities – (0.7)% | (5,488,252 | ) | ||||
|
| |||||
Net Assets – 100.0% | $ | 779,229,863 | ||||
|
| |||||
FUTURES (see Note C)
| Type | Number of Contracts | Expiration Month | Original Value | Value at February 28, 2014 | Unrealized Appreciation/ (Depreciation) | |||||||||||||||
Purchased Contracts |
| |||||||||||||||||||
Cocoa Futures | 48 | May 2014 | $ | 1,402,712 | $ | 1,419,360 | $ | 16,648 | ||||||||||||
Cocoa Futures | 65 | September 2014 | 1,895,568 | 1,930,500 | 34,932 | |||||||||||||||
Coffee C Futures | 29 | May 2014 | 1,815,276 | 1,960,762 | 145,486 | |||||||||||||||
Copper London Metal Exchange Futures | 33 | March 2014 | 5,987,221 | 5,823,675 | (163,546 | ) | ||||||||||||||
Live Cattle Futures | 130 | June 2014 | 6,756,935 | 6,978,400 | 221,465 | |||||||||||||||
Nickel London Metal Exchange Futures | 55 | March 2014 | 4,738,882 | 4,850,670 | 111,788 | |||||||||||||||
NY Harbor USLD Futures | 30 | March 2014 | 3,865,263 | 3,800,538 | (64,725 | ) | ||||||||||||||
Platinum Futures | 68 | April 2014 | 4,662,938 | 4,919,120 | 256,182 | |||||||||||||||
Platinum Futures | 40 | July 2014 | 2,902,124 | 2,896,400 | (5,724 | ) | ||||||||||||||
PRI Alum London Metal Exchange Futures | 102 | March 2014 | 4,223,019 | 4,383,833 | 160,814 | |||||||||||||||
Soybean Futures | 44 | November 2014 | 2,551,841 | 2,572,350 | 20,509 | |||||||||||||||
Soybean Meal Futures | 89 | May 2014 | 3,904,849 | 4,073,530 | 168,681 | |||||||||||||||
WTI Crude Futures | 27 | December 2014 | 2,468,167 | 2,569,590 | 101,423 | |||||||||||||||
WTI Crude Futures | 27 | June 2015 | 2,301,982 | 2,437,020 | 135,038 | |||||||||||||||
Zinc London Metal Exchange Futures | 86 | March 2014 | 4,416,735 | 4,482,750 | 66,015 | |||||||||||||||
Sold Contracts | ||||||||||||||||||||
Brent Crude Oil Futures | 27 | December 2014 | 2,813,075 | 2,846,880 | (33,805 | ) | ||||||||||||||
Brent Crude Oil Futures | 27 | June 2015 | 2,711,684 | 2,779,110 | (67,426 | ) | ||||||||||||||
Cattle Feeder Futures | 50 | May 2014 | 4,341,756 | 4,342,500 | (744 | ) | ||||||||||||||
Coffee Robusta Futures | 71 | May 2014 | 1,360,294 | 1,450,530 | (90,236 | ) | ||||||||||||||
Corn Futures | 74 | May 2014 | 1,686,055 | 1,714,950 | (28,895 | ) | ||||||||||||||
Cotton No.2 Futures | 29 | May 2014 | 1,281,517 | 1,263,530 | 17,987 | |||||||||||||||
Gasoline Rbob Futures | 7 | March 2014 | 884,041 | 875,356 | 8,685 | |||||||||||||||
Gold 100 OZ Futures | 39 | April 2014 | 4,823,814 | 5,154,240 | (330,426 | ) | ||||||||||||||
Lead London Metal Exchange Futures | 27 | April 2014 | 1,476,692 | 1,437,244 | 39,448 | |||||||||||||||
PRI Aluminum London Metal Exchange Futures | 306 | March 2014 | 13,541,717 | 13,151,498 | 390,219 | |||||||||||||||
Soybean Oil Futures | 163 | May 2014 | 3,973,130 | 4,087,062 | (113,932 | ) | ||||||||||||||
Sugar 11 Futures (World) | 140 | May 2014 | 2,632,407 | 2,769,088 | (136,681 | ) | ||||||||||||||
Wheat Futures (CBT) | 43 | May 2014 | 1,302,772 | 1,294,838 | 7,934 | |||||||||||||||
|
| |||||||||||||||||||
| $ | 867,114 | |||||||||||||||||||
|
| |||||||||||||||||||
| ALLIANCEBERNSTEIN WEALTH STRATEGIES • | 231 |
Multi-Asset Real Return Portfolio—Consolidated Portfolio of Investments
FORWARD CURRENCY EXCHANGE CONTRACTS (see Note C)
| Counterparty | Contracts to (000) | In Exchange For (000) | Settlement Date | Unrealized Appreciation/ (Depreciation) | ||||||||||||||||||||
Barclays Bank PLC | JPY | 434,206 | USD | 4,348 | 3/18/14 | $ | 81,395 | |||||||||||||||||
Barclays Bank PLC | JPY | 4,079,267 | USD | 39,488 | 3/18/14 | (598,155 | ) | |||||||||||||||||
Barclays Bank PLC | NOK | 11,550 | USD | 1,874 | 3/18/14 | (49,387 | ) | |||||||||||||||||
Barclays Bank PLC | USD | 3,383 | CHF | 3,013 | 3/18/14 | 43,390 | ||||||||||||||||||
Barclays Bank PLC | USD | 588 | MYR | 1,893 | 3/18/14 | (10,800 | ) | |||||||||||||||||
BNP Paribas SA | BRL | 11,863 | USD | 5,084 | 3/06/14 | 24,610 | ||||||||||||||||||
BNP Paribas SA | USD | 5,046 | BRL | 11,863 | 3/06/14 | 13,665 | ||||||||||||||||||
BNP Paribas SA | USD | 2,557 | AUD | 2,831 | 3/18/14 | (32,858 | ) | |||||||||||||||||
BNP Paribas SA | USD | 2,136 | EUR | 1,582 | 3/18/14 | 47,935 | ||||||||||||||||||
BNP Paribas SA | USD | 3,319 | JPY | 336,786 | 3/18/14 | (9,366 | ) | |||||||||||||||||
BNP Paribas SA | BRL | 5,134 | USD | 2,079 | 5/05/14 | (77,195 | ) | |||||||||||||||||
BNP Paribas SA | BRL | 11,863 | USD | 4,932 | 6/03/14 | (9,720 | ) | |||||||||||||||||
Deutsche Bank AG London | USD | 2,201 | GBP | 1,351 | 6/18/14 | 59,675 | ||||||||||||||||||
Goldman Sachs Bank USA | BRL | 11,863 | USD | 4,901 | 3/06/14 | (158,334 | ) | |||||||||||||||||
Goldman Sachs Bank USA | USD | 5,084 | BRL | 11,863 | 3/06/14 | (24,610 | ) | |||||||||||||||||
Goldman Sachs Bank USA | USD | 5,621 | CAD | 5,909 | 3/18/14 | (286,679 | ) | |||||||||||||||||
Goldman Sachs Bank USA | USD | 902 | HKD | 6,991 | 3/18/14 | (977 | ) | |||||||||||||||||
HSBC Bank USA | EUR | 5,443 | USD | 7,469 | 3/18/14 | (44,071 | ) | |||||||||||||||||
HSBC Bank USA | USD | 1,819 | MXN | 24,293 | 3/18/14 | 10,785 | ||||||||||||||||||
JPMorgan Chase Bank, NA | EUR | 3,318 | USD | 4,470 | 3/18/14 | (109,755 | ) | |||||||||||||||||
Royal Bank of Scotland PLC | MXN | 24,293 | USD | 1,878 | 3/18/14 | 48,098 | ||||||||||||||||||
Royal Bank of Scotland PLC | USD | 3,157 | CAD | 3,366 | 3/18/14 | (118,063 | ) | |||||||||||||||||
Royal Bank of Scotland PLC | USD | 387 | ZAR | 4,054 | 3/18/14 | (11,490 | ) | |||||||||||||||||
Standard Chartered Bank | CNY | 14,380 | USD | 2,356 | 3/18/14 | 14,469 | ||||||||||||||||||
Standard Chartered Bank | USD | 22,007 | CNY | 134,390 | 3/18/14 | (122,244 | ) | |||||||||||||||||
Standard Chartered Bank | USD | 1,674 | IDR | 20,453,303 | 3/18/14 | 87,681 | ||||||||||||||||||
Standard Chartered Bank | USD | 2,265 | SGD | 2,830 | 3/18/14 | (32,828 | ) | |||||||||||||||||
State Street Bank & Trust Co. | GBP | 7 | USD | 11 | 3/18/14 | (249 | ) | |||||||||||||||||
State Street Bank & Trust Co. | USD | 11 | GBP | 7 | 3/18/14 | 312 | ||||||||||||||||||
State Street Bank & Trust Co. | USD | 84 | SEK | 551 | 3/18/14 | 1,760 | ||||||||||||||||||
State Street Bank & Trust Co. | USD | 1,963 | ZAR | 20,538 | 3/18/14 | (59,670 | ) | |||||||||||||||||
UBS AG | USD | 2,399 | JPY | 246,401 | 3/18/14 | 22,751 | ||||||||||||||||||
|
| |||||||||||||||||||||||
| $ | (1,299,925 | ) | ||||||||||||||||||||||
|
| |||||||||||||||||||||||
INTEREST RATE SWAPS (see Note C)
| Rate Type | ||||||||||||||
| Swap Counterparty | Notional Amount (000) | Termination Date | Payments made | Payments received by the Fund | Unrealized Appreciation/ (Depreciation) | |||||||||
Bank of America, NA | $ 6,040 | 3/30/22 | 2.263% | 3 Month LIBOR | $ | 24,380 | ||||||||
| 232 | • ALLIANCEBERNSTEIN WEALTH STRATEGIES |
Multi-Asset Real Return Portfolio—Consolidated Portfolio of Investments
INFLATION (CPI) SWAPS (see Note C)
| Rate Type | ||||||||||||||||||||
| Swap Counterparty | Notional Amount (000) | Termination Date | Payments by the | Payments received by the Fund | Unrealized Appreciation/ (Depreciation) | |||||||||||||||
Barclays Bank PLC | $ | 10,000 | 10/31/16 | 1.930 | % | CPI | # | $ | (31,234 | ) | ||||||||||
Citibank, NA | 1,500 | 3/27/18 | 2.450 | % | CPI | # | (53,848 | ) | ||||||||||||
JPMorgan Chase Bank, NA | 112,219 | 10/01/16 | 1.918 | % | CPI | # | (385,568 | ) | ||||||||||||
|
| |||||||||||||||||||
| $ | (470,650 | ) | ||||||||||||||||||
|
| |||||||||||||||||||
| # | Variable interest rate based on the rate of inflation as determined by the Consumer Price Index (CPI). |
TOTAL RETURN SWAPS (see Note C)
| Receive/ Pay Total Return on Reference Index | Index | # of Shares or Units | Rate Paid by the Fund | Notional Amount (000) | Maturity Date | Counterparty | Unrealized Appreciation/ (Depreciation) | |||||||||||||||||
Receive Total Return on Reference Index |
| |||||||||||||||||||||||
Receive | Dow Jones-UBS Commodity Index 2 Month Forward | 300,000 | 0.13% | $ | 84,324 | 3/17/14 | | Credit Suisse International | | $ | 550,331 | |||||||||||||
Receive | Dow Jones-UBS Commodity Index 2 Month Forward | 315,925 | 0.12% | 88,801 | 3/17/14 | | Goldman Sachs International | | 579,836 | |||||||||||||||
Receive | Dow Jones-UBS Commodity Index 2 Month Forward | 300,000 | 0.13% | 84,324 | 3/17/14 | | JPMorgan Chase Bank, NA | | 550,331 | |||||||||||||||
|
| |||||||||||||||||||||||
| $ | 1,680,498 | |||||||||||||||||||||||
|
| |||||||||||||||||||||||
| (a) | Represents entire or partial securities out on loan. See Note D for securities lending information. |
| (b) | Security is exempt from registration under Rule 144A of the Securities Act of 1933. These securities are considered liquid and may be resold in transactions exempt from registration, normally to qualified institutional buyers. At February 28, 2014, the aggregate market value of these securities amounted to $799,310 or 0.1% of net assets. |
| (c) | Non-income producing security. |
| (d) | Fair valued by the Adviser. |
| (e) | Illiquid security. |
| (f) | Position, or a portion thereof, has been segregated to collateralize OTC derivatives outstanding. The aggregate market value of these securities amounted to $18,697,386. |
| (g) | One contract relates to 100 shares. |
| ALLIANCEBERNSTEIN WEALTH STRATEGIES • | 233 |
Multi-Asset Real Return Portfolio—Consolidated Portfolio of Investments
| (h) | Investment in affiliated money market mutual fund. The rate shown represents the 7-day yield as of period end. |
Currency Abbreviations:
| AUD | – Australian Dollar |
| BRL | – Brazilian Real |
| CAD | – Canadian Dollar |
| CHF | – Swiss Franc |
| CNY | – Chinese Yuan Renminbi |
| EUR | – Euro |
| GBP | – Great British Pound |
| HKD | – Hong Kong Dollar |
| IDR | – Indonesian Rupiah |
| JPY | – Japanese Yen |
| MXN | – Mexican Peso |
| MYR | – Malaysian Ringgit |
| NOK | – Norwegian Krone |
| SEK | – Swedish Krona |
| SGD | – Singapore Dollar |
| USD | – United States Dollar |
| ZAR | – South African Rand |
Glossary:
| ADR | – American Depositary Receipt |
| CBT | – Chicago Board of Trade |
| ETF | – Exchange Traded Fund |
| GDR | – Global Depositary Receipt |
| LIBOR | – London Interbank Offered Rates |
| OJSC | – Open Joint Stock Company |
| PJSC | – Public Joint Stock Company |
| REIT | – Real Estate Investment Trust |
| TIPS | – Treasury Inflation Protected Security |
| WTI | – West Texas Intermediate |
See notes to financial statements.
| 234 | • ALLIANCEBERNSTEIN WEALTH STRATEGIES |
Multi-Asset Real Return Portfolio—Consolidated Portfolio of Investments
VOLATILITY MANAGEMENT PORTFOLIO
PORTFOLIO OF INVESTMENTS
February 28, 2014 (unaudited)
| Company | Shares | U.S. $ Value | ||||||
| ||||||||
COMMON STOCKS – 66.0% | ||||||||
Financials – 10.6% | ||||||||
Capital Markets – 1.3% | ||||||||
3i Group PLC | 28,436 | $ | 200,313 | |||||
Aberdeen Asset Management PLC | 28,935 | 188,783 | ||||||
Ameriprise Financial, Inc. | 7,400 | 806,526 | ||||||
Bank of New York Mellon Corp. (The) | 43,550 | 1,393,600 | ||||||
BlackRock, Inc. – Class A | 4,840 | 1,475,426 | ||||||
Charles Schwab Corp. (The) | 44,000 | 1,166,440 | ||||||
Credit Suisse Group AG(a) | 45,635 | 1,432,867 | ||||||
Daiwa Securities Group, Inc. | 50,000 | 452,484 | ||||||
Deutsche Bank AG (REG) | 30,760 | 1,487,690 | ||||||
E*Trade Financial Corp.(a) | 10,850 | 243,799 | ||||||
Franklin Resources, Inc. | 15,300 | 814,725 | ||||||
Goldman Sachs Group, Inc. (The) | 16,000 | 2,663,200 | ||||||
Hargreaves Lansdown PLC | 6,440 | 150,547 | ||||||
ICAP PLC | 16,576 | 121,617 | ||||||
Invesco Ltd. | 16,800 | 576,240 | ||||||
Investec PLC | 17,346 | 129,012 | ||||||
Julius Baer Group Ltd.(a) | 6,753 | 316,021 | ||||||
Legg Mason, Inc. | 4,000 | 183,840 | ||||||
Macquarie Group Ltd. | 8,707 | 439,090 | ||||||
Mediobanca SpA(a) | 15,567 | 154,855 | ||||||
Morgan Stanley | 52,600 | 1,620,080 | ||||||
Nomura Holdings, Inc. | 109,400 | 742,113 | ||||||
Northern Trust Corp. | 8,500 | 525,725 | ||||||
Partners Group Holding AG | 524 | 136,428 | ||||||
SBI Holdings, Inc./Japan | 6,090 | 72,876 | ||||||
Schroders PLC | 3,069 | 139,249 | ||||||
State Street Corp. | 16,650 | 1,093,405 | ||||||
T. Rowe Price Group, Inc. | 9,900 | 803,583 | ||||||
UBS AG (REG)(a) | 109,978 | 2,352,755 | ||||||
|
| |||||||
| 21,883,289 | ||||||||
|
| |||||||
Commercial Banks – 4.2% | ||||||||
Aozora Bank Ltd. | 32,000 | 93,247 | ||||||
Australia & New Zealand Banking Group Ltd. | 82,789 | 2,380,218 | ||||||
Banca Monte dei Paschi di Siena SpA(a)(b) | 176,636 | 44,716 | ||||||
Banco Bilbao Vizcaya Argentaria SA | 174,580 | 2,156,849 | ||||||
Banco de Sabadell SA | 102,401 | 337,243 | ||||||
Banco Espirito Santo SA(a)(b) | 50,818 | 98,687 | ||||||
Banco Popular Espanol SA | 37,874 | 271,599 | ||||||
Banco Santander SA | 342,363 | 3,090,386 | ||||||
Bank Hapoalim BM | 30,897 | 168,868 | ||||||
Bank Leumi Le-Israel BM(a) | 36,522 | 140,522 | ||||||
Bank of East Asia Ltd. | 37,400 | 154,838 | ||||||
Bank of Ireland(a) | 622,276 | 330,903 | ||||||
| ALLIANCEBERNSTEIN WEALTH STRATEGIES • | 235 |
Volatility Management Portfolio—Portfolio of Investments
| Company | Shares | U.S. $ Value | ||||||
| ||||||||
Bank of Kyoto Ltd. (The) | 9,000 | $ | 69,697 | |||||
Bank of Queensland Ltd. | 9,636 | 103,370 | ||||||
Bank of Yokohama Ltd. (The) | 35,000 | 177,023 | ||||||
Bankia SA(a) | 117,495 | 245,217 | ||||||
Barclays PLC | 459,720 | 1,936,602 | ||||||
BB&T Corp. | 26,700 | 1,009,260 | ||||||
Bendigo and Adelaide Bank Ltd. | 12,285 | 122,264 | ||||||
BNP Paribas SA | 29,997 | 2,450,225 | ||||||
BOC Hong Kong Holdings Ltd. | 111,000 | 338,077 | ||||||
CaixaBank SA | 51,570 | 324,731 | ||||||
Chiba Bank Ltd. (The) | 22,000 | 133,584 | ||||||
Chugoku Bank Ltd. (The) | 5,000 | 62,098 | ||||||
Comerica, Inc. | 6,900 | 332,442 | ||||||
Commerzbank AG(a) | 29,198 | 527,549 | ||||||
Commonwealth Bank of Australia | 48,565 | 3,243,684 | ||||||
Credit Agricole SA(a) | 31,301 | 495,569 | ||||||
Danske Bank A/S(a) | 19,781 | 523,109 | ||||||
DBS Group Holdings Ltd. | 52,000 | 678,347 | ||||||
DnB ASA | 29,486 | 533,732 | ||||||
Erste Group Bank AG | 7,778 | 275,331 | ||||||
Fifth Third Bancorp | 33,450 | 725,698 | ||||||
Fukuoka Financial Group, Inc. | 23,000 | 92,976 | ||||||
Gunma Bank Ltd. (The) | 11,000 | 58,006 | ||||||
Hachijuni Bank Ltd. (The) | 12,000 | 64,606 | ||||||
Hang Seng Bank Ltd. | 23,100 | 375,027 | ||||||
Hiroshima Bank Ltd. (The) | 15,000 | 57,234 | ||||||
Hokuhoku Financial Group, Inc. | 34,000 | 64,007 | ||||||
HSBC Holdings PLC | 561,979 | 5,931,132 | ||||||
Huntington Bancshares, Inc./OH | 31,450 | 299,718 | ||||||
Intesa Sanpaolo SpA | 348,588 | 1,078,161 | ||||||
Iyo Bank Ltd. (The) | 8,000 | 72,595 | ||||||
Joyo Bank Ltd. (The) | 20,000 | 95,618 | ||||||
KBC Groep NV | 7,538 | 476,718 | ||||||
KeyCorp | 34,000 | 447,780 | ||||||
Lloyds Banking Group PLC(a) | 1,505,233 | 2,078,730 | ||||||
M&T Bank Corp. | 4,950 | 577,120 | ||||||
Mitsubishi UFJ Financial Group, Inc. | 384,000 | 2,225,147 | ||||||
Mizrahi Tefahot Bank Ltd. | 3,782 | 46,911 | ||||||
Mizuho Financial Group, Inc. | 692,500 | 1,424,333 | ||||||
National Australia Bank Ltd. | 70,851 | 2,203,390 | ||||||
Natixis | 27,930 | 200,585 | ||||||
Nishi-Nippon City Bank Ltd. (The) | 20,000 | 47,548 | ||||||
Nordea Bank AB | 91,520 | 1,308,955 | ||||||
Oversea-Chinese Banking Corp., Ltd. | 77,000 | 581,073 | ||||||
PNC Financial Services Group, Inc. (The) | 20,200 | 1,651,956 | ||||||
Raiffeisen Bank International AG | 1,475 | 51,186 | ||||||
Regions Financial Corp. | 52,300 | 556,472 | ||||||
| 236 | • ALLIANCEBERNSTEIN WEALTH STRATEGIES |
Volatility Management Portfolio—Portfolio of Investments
| Company | Shares | U.S. $ Value | ||||||
| ||||||||
Resona Holdings, Inc. | 56,000 | $ | 292,581 | |||||
Royal Bank of Scotland Group PLC(a) | 64,627 | 353,896 | ||||||
Seven Bank Ltd. | 17,941 | 65,808 | ||||||
Shinsei Bank Ltd. | 49,000 | 102,158 | ||||||
Shizuoka Bank Ltd. (The) | 17,000 | 164,545 | ||||||
Skandinaviska Enskilda Banken AB – Class A | 45,831 | 643,178 | ||||||
Societe Generale SA | 21,658 | 1,437,143 | ||||||
Standard Chartered PLC | 73,037 | 1,546,074 | ||||||
Sumitomo Mitsui Financial Group, Inc. | 38,400 | 1,724,085 | ||||||
Sumitomo Mitsui Trust Holdings, Inc. | 99,000 | 464,426 | ||||||
SunTrust Banks, Inc. | 20,350 | 766,788 | ||||||
Suruga Bank Ltd. | 5,152 | 90,995 | ||||||
Svenska Handelsbanken AB – Class A | 15,051 | 785,414 | ||||||
Swedbank AB – Class A | 27,324 | 770,094 | ||||||
UniCredit SpA | 130,279 | 1,033,871 | ||||||
Unione di Banche Italiane SCPA | 25,096 | 217,415 | ||||||
United Overseas Bank Ltd. | 38,000 | 618,923 | ||||||
US Bancorp | 69,350 | 2,853,059 | ||||||
Wells Fargo & Co. | 182,050 | 8,450,761 | ||||||
Westpac Banking Corp. | 93,644 | 2,810,441 | ||||||
Yamaguchi Financial Group, Inc. | 6,000 | 52,456 | ||||||
Zions Bancorporation | 7,000 | 218,400 | ||||||
|
| |||||||
| 71,105,180 | ||||||||
|
| |||||||
Consumer Finance – 0.4% | ||||||||
Acom Co., Ltd.(a)(b) | 12,020 | 34,681 | ||||||
AEON Financial Service Co., Ltd. | 2,000 | 49,146 | ||||||
American Express Co. | 35,050 | 3,199,364 | ||||||
Capital One Financial Corp. | 21,885 | 1,607,015 | ||||||
Credit Saison Co., Ltd. | 4,800 | 105,678 | ||||||
Discover Financial Services | 18,150 | 1,041,447 | ||||||
SLM Corp. | 16,500 | 395,010 | ||||||
|
| |||||||
| 6,432,341 | ||||||||
|
| |||||||
Diversified Financial Services – 2.2% | ||||||||
ASX Ltd. | 5,841 | 196,148 | ||||||
Bank of America Corp. | 405,152 | 6,697,163 | ||||||
Berkshire Hathaway, Inc. – Class B(a) | 68,350 | 7,913,563 | ||||||
Citigroup, Inc. | 115,199 | 5,602,127 | ||||||
CME Group, Inc./IL – Class A | 11,950 | 882,149 | ||||||
Deutsche Boerse AG | 5,823 | 477,022 | ||||||
Eurazeo SA | 978 | 76,545 | ||||||
Exor SpA | 2,972 | 120,702 | ||||||
First Pacific Co., Ltd./Hong Kong(b) | 71,400 | 70,829 | ||||||
Groupe Bruxelles Lambert SA | 2,435 | 239,024 | ||||||
Hong Kong Exchanges and Clearing Ltd. | 33,000 | 513,420 | ||||||
Industrivarden AB – Class C | 3,718 | 71,813 | ||||||
ING Groep NV(a) | 115,586 | 1,678,547 | ||||||
| ALLIANCEBERNSTEIN WEALTH STRATEGIES • | 237 |
Volatility Management Portfolio—Portfolio of Investments
| Company | Shares | U.S. $ Value | ||||||
| ||||||||
IntercontinentalExchange Group, Inc. | 4,395 | $ | 917,852 | |||||
Investment AB Kinnevik – Class B | 6,747 | 261,664 | ||||||
Investor AB – Class B | 13,743 | 489,001 | ||||||
Japan Exchange Group, Inc. | 7,400 | 176,559 | ||||||
JPMorgan Chase & Co. | 142,750 | 8,111,055 | ||||||
Leucadia National Corp. | 11,850 | 331,089 | ||||||
London Stock Exchange Group PLC | 5,317 | 180,335 | ||||||
McGraw Hill Financial, Inc. | 10,250 | 816,515 | ||||||
Mitsubishi UFJ Lease & Finance Co., Ltd. | 17,540 | 89,864 | ||||||
Moody’s Corp. | 7,250 | 572,750 | ||||||
NASDAQ OMX Group, Inc. (The) | 4,350 | 166,997 | ||||||
ORIX Corp. | 38,170 | 566,084 | ||||||
Pargesa Holding SA | 816 | 70,098 | ||||||
Pohjola Bank PLC – Class A | 4,181 | 96,853 | ||||||
Resolution Ltd. | 41,892 | 264,714 | ||||||
Singapore Exchange Ltd. | 25,000 | 135,808 | ||||||
Wendel SA | 972 | 145,865 | ||||||
|
| |||||||
| 37,932,155 | ||||||||
|
| |||||||
Insurance – 2.3% | ||||||||
ACE Ltd. | 12,900 | 1,262,523 | ||||||
Admiral Group PLC | 5,785 | 138,884 | ||||||
Aegon NV | 53,669 | 483,803 | ||||||
Aflac, Inc. | 17,750 | 1,137,420 | ||||||
Ageas | 6,684 | 305,761 | ||||||
AIA Group Ltd. | 362,300 | 1,775,104 | ||||||
Allianz SE | 13,757 | 2,453,362 | ||||||
Allstate Corp. (The) | 17,250 | 935,985 | ||||||
American International Group, Inc. | 55,940 | 2,784,134 | ||||||
AMP Ltd. | 87,681 | 378,626 | ||||||
Aon PLC | 11,500 | 984,400 | ||||||
Assicurazioni Generali SpA | 35,230 | 791,029 | ||||||
Assurant, Inc. | 2,750 | 180,483 | ||||||
Aviva PLC | 88,192 | 701,174 | ||||||
AXA SA | 54,061 | 1,408,144 | ||||||
Baloise Holding AG | 1,434 | 184,662 | ||||||
Chubb Corp. (The) | 9,550 | 835,434 | ||||||
Cincinnati Financial Corp. | 5,550 | 260,184 | ||||||
CNP Assurances | 5,109 | 110,024 | ||||||
Dai-ichi Life Insurance Co., Ltd. (The) | 25,700 | 376,453 | ||||||
Delta Lloyd NV | 5,709 | 162,627 | ||||||
Direct Line Insurance Group PLC | 33,896 | 150,152 | ||||||
Genworth Financial, Inc. – Class A(a) | 18,700 | 290,598 | ||||||
Gjensidige Forsikring ASA | 6,034 | 126,325 | ||||||
Hannover Rueck SE | 1,820 | 154,791 | ||||||
Hartford Financial Services Group, Inc. (The) | 16,950 | 596,470 | ||||||
Insurance Australia Group Ltd. | 61,844 | 300,292 | ||||||
Legal & General Group PLC | 176,979 | 711,719 | ||||||
| 238 | • ALLIANCEBERNSTEIN WEALTH STRATEGIES |
Volatility Management Portfolio—Portfolio of Investments
| Company | Shares | U.S. $ Value | ||||||
| ||||||||
Lincoln National Corp. | 9,950 | $ | 498,793 | |||||
Loews Corp. | 11,600 | 504,368 | ||||||
Mapfre SA | 32,476 | 134,128 | ||||||
Marsh & McLennan Cos., Inc. | 20,800 | 1,001,728 | ||||||
MetLife, Inc. | 42,600 | 2,158,542 | ||||||
MS&AD Insurance Group Holdings | 15,300 | 363,547 | ||||||
Muenchener Rueckversicherungs AG | 5,411 | 1,183,068 | ||||||
NKSJ Holdings, Inc. | 10,000 | 253,364 | ||||||
Old Mutual PLC | 146,138 | 481,680 | ||||||
Principal Financial Group, Inc. | 10,350 | 469,372 | ||||||
Progressive Corp. (The) | 20,900 | 511,841 | ||||||
Prudential Financial, Inc. | 17,650 | 1,492,837 | ||||||
Prudential PLC | 77,216 | 1,748,382 | ||||||
QBE Insurance Group Ltd. | 36,785 | 422,870 | ||||||
RSA Insurance Group PLC | 107,257 | 174,668 | ||||||
Sampo – Class A | 12,645 | 639,848 | ||||||
SCOR SE | 4,628 | 161,814 | ||||||
Sony Financial Holdings, Inc. | 5,243 | 84,825 | ||||||
Standard Life PLC | 71,148 | 464,257 | ||||||
Suncorp Group Ltd. | 38,818 | 422,084 | ||||||
Swiss Life Holding AG(a) | 968 | 240,774 | ||||||
Swiss Re AG(a) | 10,626 | 991,816 | ||||||
T&D Holdings, Inc. | 17,450 | 214,579 | ||||||
Tokio Marine Holdings, Inc. | 20,900 | 620,908 | ||||||
Torchmark Corp. | 3,450 | 267,410 | ||||||
Travelers Cos., Inc. (The) | 13,800 | 1,156,992 | ||||||
Tryg A/S | 740 | 71,423 | ||||||
UnipolSai SpA(a) | 27,286 | 93,148 | ||||||
Unum Group | 9,900 | 344,322 | ||||||
Vienna Insurance Group AG Wiener Versicherung Gruppe | 1,159 | 59,326 | ||||||
XL Group PLC | 10,700 | 325,280 | ||||||
Zurich Insurance Group AG(a) | 4,494 | 1,375,216 | ||||||
|
| |||||||
| 38,913,773 | ||||||||
|
| |||||||
Real Estate Investment Trusts | ||||||||
American Tower Corp. | 15,020 | 1,223,679 | ||||||
Plum Creek Timber Co., Inc. | 6,700 | 290,043 | ||||||
Weyerhaeuser Co. | 22,100 | 652,171 | ||||||
|
| |||||||
| 2,165,893 | ||||||||
|
| |||||||
Real Estate Management & | ||||||||
CBRE Group, Inc. – Class A(a) | 10,540 | 294,593 | ||||||
Daito Trust Construction Co., Ltd. | 2,200 | 205,039 | ||||||
Daiwa House Industry Co., Ltd. | 18,000 | 327,614 | ||||||
IMMOFINANZ AG(a) | 27,863 | 140,995 | ||||||
Tokyu Fudosan Holdings Corp.(a) | 15,832 | 125,062 | ||||||
|
| |||||||
| 1,093,303 | ||||||||
|
| |||||||
| ALLIANCEBERNSTEIN WEALTH STRATEGIES • | 239 |
Volatility Management Portfolio—Portfolio of Investments
| Company | Shares | U.S. $ Value | ||||||
| ||||||||
Thrifts & Mortgage Finance – 0.0% | ||||||||
Hudson City Bancorp, Inc. | 18,000 | $ | 171,000 | |||||
People’s United Financial, Inc. | 12,050 | 170,749 | ||||||
|
| |||||||
| 341,749 | ||||||||
|
| |||||||
| 179,867,683 | ||||||||
|
| |||||||
Information Technology – 8.1% | ||||||||
Communications Equipment – 0.8% | ||||||||
Alcatel-Lucent(a) | 83,882 | 362,980 | ||||||
Cisco Systems, Inc. | 203,090 | 4,427,362 | ||||||
F5 Networks, Inc.(a) | 2,940 | 330,280 | ||||||
Harris Corp. | 4,040 | 298,233 | ||||||
Juniper Networks, Inc.(a) | 19,180 | 512,873 | ||||||
Motorola Solutions, Inc. | 8,740 | 578,588 | ||||||
Nokia Oyj(a) | 112,363 | 855,272 | ||||||
QUALCOMM, Inc. | 64,160 | 4,830,606 | ||||||
Telefonaktiebolaget LM Ericsson – Class B | 91,820 | 1,186,941 | ||||||
|
| |||||||
| 13,383,135 | ||||||||
|
| |||||||
Computers & Peripherals – 1.5% | ||||||||
Apple, Inc. | 34,183 | 17,988,462 | ||||||
EMC Corp./MA | 78,140 | 2,060,552 | ||||||
Hewlett-Packard Co. | 72,980 | 2,180,642 | ||||||
NEC Corp. | 74,000 | 250,221 | ||||||
NetApp, Inc. | 12,950 | 523,310 | ||||||
SanDisk Corp. | 8,570 | 636,751 | ||||||
Seagate Technology PLC | 12,400 | 647,156 | ||||||
Western Digital Corp. | 7,980 | 694,180 | ||||||
|
| |||||||
| 24,981,274 | ||||||||
|
| |||||||
Electronic Equipment, Instruments & Components – 0.5% | ||||||||
Amphenol Corp. – Class A | 6,010 | 529,000 | ||||||
Citizen Holdings Co., Ltd. | 7,900 | 64,979 | ||||||
Corning, Inc. | 54,930 | 1,058,501 | ||||||
FLIR Systems, Inc. | 5,360 | 182,990 | ||||||
Fujifilm Holdings Corp. | 14,000 | 403,753 | ||||||
Hamamatsu Photonics KK | 2,200 | 89,465 | ||||||
Hexagon AB – Class B | 7,137 | 252,783 | ||||||
Hirose Electric Co., Ltd. | 900 | 128,591 | ||||||
Hitachi High-Technologies Corp. | 1,900 | 46,011 | ||||||
Hitachi Ltd. | 145,000 | 1,148,255 | ||||||
Hoya Corp. | 13,100 | 389,368 | ||||||
Ibiden Co., Ltd. | 3,400 | 66,689 | ||||||
Jabil Circuit, Inc. | 6,990 | 129,385 | ||||||
Keyence Corp. | 1,400 | 602,876 | ||||||
Kyocera Corp. | 9,800 | 443,929 | ||||||
Murata Manufacturing Co., Ltd. | 6,200 | 591,915 | ||||||
Nippon Electric Glass Co., Ltd.(b) | 11,000 | 49,937 | ||||||
| 240 | • ALLIANCEBERNSTEIN WEALTH STRATEGIES |
Volatility Management Portfolio—Portfolio of Investments
| Company | Shares | U.S. $ Value | ||||||
| ||||||||
Omron Corp. | 6,200 | $ | 261,497 | |||||
Shimadzu Corp. | 7,000 | 58,129 | ||||||
TDK Corp. | 3,700 | 160,293 | ||||||
TE Connectivity Ltd. | 15,600 | 913,848 | ||||||
Yaskawa Electric Corp. | 6,000 | 89,602 | ||||||
Yokogawa Electric Corp. | 6,500 | 101,684 | ||||||
|
| |||||||
| 7,763,480 | ||||||||
|
| |||||||
Internet Software & Services – 1.3% | ||||||||
Akamai Technologies, Inc.(a) | 6,810 | 416,295 | ||||||
Dena Co., Ltd.(b) | 3,181 | 68,963 | ||||||
eBay, Inc.(a) | 44,280 | 2,602,336 | ||||||
Facebook, Inc. – Class A(a) | 62,475 | 4,277,039 | ||||||
Google, Inc. – Class A(a) | 10,669 | 12,969,770 | ||||||
Kakaku.com, Inc. | 4,441 | 74,162 | ||||||
United Internet AG | 3,220 | 149,530 | ||||||
VeriSign, Inc.(a) | 4,890 | 269,488 | ||||||
Yahoo Japan Corp. | 43,325 | 274,699 | ||||||
Yahoo!, Inc.(a) | 35,800 | 1,384,386 | ||||||
|
| |||||||
| 22,486,668 | ||||||||
|
| |||||||
IT Services – 1.5% | ||||||||
Accenture PLC – Class A | 24,170 | 2,014,569 | ||||||
Alliance Data Systems Corp.(a) | 1,860 | 530,305 | ||||||
Amadeus IT Holding SA – Class A | 11,479 | 504,100 | ||||||
AtoS | 1,746 | 169,301 | ||||||
Automatic Data Processing, Inc. | 18,300 | 1,423,374 | ||||||
Cap Gemini SA | 4,316 | 337,230 | ||||||
Cognizant Technology Solutions Corp. – Class A(a) | 11,510 | 1,197,731 | ||||||
Computer Sciences Corp. | 5,580 | 352,656 | ||||||
Computershare Ltd. | 14,264 | 151,540 | ||||||
Fidelity National Information Services, Inc. | 11,040 | 613,934 | ||||||
Fiserv, Inc.(a) | 9,800 | 568,890 | ||||||
Fujitsu Ltd.(a) | 56,000 | 350,158 | ||||||
International Business Machines Corp. | 38,770 | 7,179,041 | ||||||
Itochu Techno-Solutions Corp. | 800 | 37,133 | ||||||
MasterCard, Inc. – Class A | 39,350 | 3,058,282 | ||||||
Nomura Research Institute Ltd. | 3,100 | 101,416 | ||||||
NTT Data Corp. | 3,804 | 157,934 | ||||||
Otsuka Corp.(b) | 500 | 64,280 | ||||||
Paychex, Inc. | 12,320 | 514,483 | ||||||
Teradata Corp.(a) | 6,220 | 285,622 | ||||||
Total System Services, Inc. | 6,330 | 192,812 | ||||||
Visa, Inc. – Class A | 19,370 | 4,376,458 | ||||||
Western Union Co. (The) – Class W | 20,970 | 350,828 | ||||||
Xerox Corp. | 43,910 | 482,571 | ||||||
|
| |||||||
| 25,014,648 | ||||||||
|
| |||||||
| ALLIANCEBERNSTEIN WEALTH STRATEGIES • | 241 |
Volatility Management Portfolio—Portfolio of Investments
| Company | Shares | U.S. $ Value | ||||||
| ||||||||
Office Electronics – 0.1% | ||||||||
Brother Industries Ltd. | 7,100 | $ | 101,881 | |||||
Canon, Inc. | 34,200 | 1,067,066 | ||||||
Konica Minolta, Inc. | 14,500 | 147,935 | ||||||
Ricoh Co., Ltd. | 20,000 | 251,928 | ||||||
|
| |||||||
| 1,568,810 | ||||||||
|
| |||||||
Semiconductors & Semiconductor | ||||||||
Advantest Corp. | 4,500 | 49,028 | ||||||
Altera Corp. | 12,150 | 441,166 | ||||||
Analog Devices, Inc. | 11,800 | 599,676 | ||||||
Applied Materials, Inc. | 45,650 | 865,524 | ||||||
ARM Holdings PLC | 42,167 | 706,845 | ||||||
ASM Pacific Technology Ltd. | 7,200 | 65,325 | ||||||
ASML Holding NV | 10,783 | 930,631 | ||||||
Broadcom Corp. – Class A | 20,450 | 607,774 | ||||||
Infineon Technologies AG | 32,611 | 369,163 | ||||||
Intel Corp. | 188,800 | 4,674,688 | ||||||
KLA-Tencor Corp. | 6,300 | 410,445 | ||||||
Lam Research Corp.(a) | 6,138 | 317,519 | ||||||
Linear Technology Corp. | 8,850 | 414,534 | ||||||
LSI Corp. | 20,650 | 229,008 | ||||||
Microchip Technology, Inc. | 7,500 | 341,625 | ||||||
Micron Technology, Inc.(a) | 39,950 | 966,390 | ||||||
NVIDIA Corp. | 21,900 | 402,522 | ||||||
Rohm Co., Ltd. | 2,900 | 150,743 | ||||||
STMicroelectronics NV | 19,205 | 174,189 | ||||||
Sumco Corp. | 3,500 | 26,951 | ||||||
Texas Instruments, Inc. | 41,600 | 1,870,336 | ||||||
Tokyo Electron Ltd. | 5,200 | 298,022 | ||||||
Xilinx, Inc. | 10,150 | 529,830 | ||||||
|
| |||||||
| 15,441,934 | ||||||||
|
| |||||||
Software – 1.5% | ||||||||
Adobe Systems, Inc.(a) | 17,670 | 1,212,339 | ||||||
Autodesk, Inc.(a) | 8,580 | 450,107 | ||||||
CA, Inc. | 12,320 | 412,720 | ||||||
Citrix Systems, Inc.(a) | 7,070 | 424,553 | ||||||
Dassault Systemes | 1,901 | 218,523 | ||||||
Electronic Arts, Inc.(a) | 11,700 | 334,503 | ||||||
Gemalto NV(b) | 2,390 | 267,830 | ||||||
GungHo Online Entertainment, Inc.(b) | 10,500 | 64,997 | ||||||
Intuit, Inc. | 10,810 | 844,801 | ||||||
Konami Corp. | 3,100 | 78,072 | ||||||
Microsoft Corp. | 288,570 | 11,055,117 | ||||||
Nexon Co., Ltd. | 3,295 | 28,037 | ||||||
NICE Systems Ltd. | 1,741 | 71,801 | ||||||
Nintendo Co., Ltd. | 3,200 | 395,517 | ||||||
| 242 | • ALLIANCEBERNSTEIN WEALTH STRATEGIES |
Volatility Management Portfolio—Portfolio of Investments
| Company | Shares | U.S. $ Value | ||||||
| ||||||||
Oracle Corp. | 133,280 | $ | 5,212,581 | |||||
Oracle Corp. Japan | 1,200 | 50,072 | ||||||
Red Hat, Inc.(a) | 7,220 | 425,908 | ||||||
Sage Group PLC (The) | 32,587 | 235,318 | ||||||
Salesforce.com, Inc.(a) | 21,090 | 1,315,383 | ||||||
SAP AG | 27,800 | 2,236,013 | ||||||
Symantec Corp. | 26,420 | 567,502 | ||||||
Trend Micro, Inc./Japan | 3,200 | 107,659 | ||||||
|
| |||||||
| 26,009,353 | ||||||||
|
| |||||||
| 136,649,302 | ||||||||
|
| |||||||
Health Care – 7.6% | ||||||||
Biotechnology – 1.1% | ||||||||
Actelion Ltd. (REG)(a) | 3,081 | 326,460 | ||||||
Alexion Pharmaceuticals, Inc.(a) | 7,440 | 1,315,392 | ||||||
Amgen, Inc. | 28,700 | 3,559,374 | ||||||
Biogen Idec, Inc.(a) | 9,000 | 3,066,120 | ||||||
Celgene Corp.(a) | 15,650 | 2,515,738 | ||||||
CSL Ltd. | 14,677 | 947,826 | ||||||
Gilead Sciences, Inc.(a) | 58,250 | 4,822,517 | ||||||
Grifols SA | 4,500 | 256,427 | ||||||
Novozymes A/S – Class B(b) | 6,821 | 317,023 | ||||||
Regeneron Pharmaceuticals, Inc.(a) | 3,000 | 997,500 | ||||||
Vertex Pharmaceuticals, Inc.(a) | 8,855 | 716,015 | ||||||
|
| |||||||
| 18,840,392 | ||||||||
|
| |||||||
Health Care Equipment & Supplies – 0.9% | ||||||||
Abbott Laboratories | 58,700 | 2,335,086 | ||||||
Baxter International, Inc. | 20,650 | 1,435,175 | ||||||
Becton Dickinson and Co. | 7,350 | 846,867 | ||||||
Boston Scientific Corp.(a) | 50,700 | 664,170 | ||||||
CareFusion Corp.(a) | 8,000 | 324,240 | ||||||
Cochlear Ltd. | 1,721 | 88,157 | ||||||
Coloplast A/S – Class B | 3,352 | 282,200 | ||||||
Covidien PLC | 17,450 | 1,255,528 | ||||||
CR Bard, Inc. | 2,950 | 425,272 | ||||||
DENTSPLY International, Inc. | 5,400 | 245,052 | ||||||
Edwards Lifesciences Corp.(a) | 4,150 | 289,504 | ||||||
Elekta AB – Class B | 11,120 | 147,853 | ||||||
Essilor International SA | 6,168 | 642,491 | ||||||
Getinge AB – Class B | 6,039 | 217,353 | ||||||
Intuitive Surgical, Inc.(a) | 1,480 | 658,349 | ||||||
Medtronic, Inc. | 37,950 | 2,248,917 | ||||||
Olympus Corp.(a) | 7,300 | 253,637 | ||||||
Smith & Nephew PLC | 26,916 | 428,403 | ||||||
Sonova Holding AG(a) | 1,544 | 217,972 | ||||||
St. Jude Medical, Inc. | 11,050 | 743,886 | ||||||
| ALLIANCEBERNSTEIN WEALTH STRATEGIES • | 243 |
Volatility Management Portfolio—Portfolio of Investments
| Company | Shares | U.S. $ Value | ||||||
| ||||||||
Stryker Corp. | 11,200 | $ | 898,688 | |||||
Sysmex Corp. | 2,200 | 131,808 | ||||||
Terumo Corp. | 4,600 | 196,929 | ||||||
Varian Medical Systems, Inc.(a) | 4,000 | 335,320 | ||||||
William Demant Holding A/S(a)(b) | 770 | 69,293 | ||||||
Zimmer Holdings, Inc. | 6,500 | 609,960 | ||||||
|
| |||||||
| 15,992,110 | ||||||||
|
| |||||||
Health Care Providers & Services – 0.9% | ||||||||
Aetna, Inc. | 14,009 | 1,018,594 | ||||||
Alfresa Holdings Corp. | 1,300 | 76,218 | ||||||
AmerisourceBergen Corp. – Class A | 8,700 | 590,295 | ||||||
Cardinal Health, Inc. | 12,950 | 926,314 | ||||||
Celesio AG | 2,530 | 89,109 | ||||||
CIGNA Corp. | 10,500 | 835,695 | ||||||
DaVita HealthCare Partners, Inc.(a) | 6,700 | 460,491 | ||||||
Express Scripts Holding Co.(a) | 30,633 | 2,306,971 | ||||||
Fresenius Medical Care AG & Co. KGaA | 6,496 | 445,686 | ||||||
Fresenius SE & Co. KGaA | 3,806 | 590,623 | ||||||
Humana, Inc. | 5,900 | 663,514 | ||||||
Laboratory Corp. of America Holdings(a) | 3,300 | 308,682 | ||||||
McKesson Corp. | 8,800 | 1,558,040 | ||||||
Medipal Holdings Corp. | 4,100 | 63,380 | ||||||
Miraca Holdings, Inc. | 1,700 | 77,560 | ||||||
Patterson Cos., Inc. | 3,150 | 129,654 | ||||||
Quest Diagnostics, Inc. | 5,500 | 291,500 | ||||||
Ramsay Health Care Ltd. | 3,963 | 171,286 | ||||||
Ryman Healthcare Ltd. | 11,244 | 74,448 | ||||||
Sonic Healthcare Ltd. | 11,373 | 177,053 | ||||||
Suzuken Co., Ltd./Aichi Japan | 2,200 | 83,607 | ||||||
Tenet Healthcare Corp.(a) | 3,750 | 165,450 | ||||||
UnitedHealth Group, Inc. | 38,250 | 2,955,577 | ||||||
WellPoint, Inc. | 11,200 | 1,014,608 | ||||||
|
| |||||||
| 15,074,355 | ||||||||
|
| |||||||
Health Care Technology – 0.1% | ||||||||
Cerner Corp.(a) | 11,200 | 687,344 | ||||||
M3, Inc. | 22 | 73,315 | ||||||
|
| |||||||
| 760,659 | ||||||||
|
| |||||||
Life Sciences Tools & Services – 0.2% | ||||||||
Agilent Technologies, Inc. | 12,550 | 714,472 | ||||||
Lonza Group AG(a) | 1,597 | 168,535 | ||||||
PerkinElmer, Inc. | 4,250 | 192,610 | ||||||
QIAGEN NV(a) | 7,138 | 160,545 | ||||||
Thermo Fisher Scientific, Inc. | 15,100 | 1,880,554 | ||||||
Waters Corp.(a) | 3,250 | 362,050 | ||||||
|
| |||||||
| 3,478,766 | ||||||||
|
| |||||||
| 244 | • ALLIANCEBERNSTEIN WEALTH STRATEGIES |
Volatility Management Portfolio—Portfolio of Investments
| Company | Shares | U.S. $ Value | ||||||
| ||||||||
Pharmaceuticals – 4.4% | ||||||||
AbbVie, Inc. | 60,400 | $ | 3,074,964 | |||||
Actavis PLC(a) | 6,692 | 1,477,728 | ||||||
Allergan, Inc./United States | 11,350 | 1,441,450 | ||||||
Astellas Pharma, Inc. | 13,100 | 851,510 | ||||||
AstraZeneca PLC | 37,778 | 2,568,044 | ||||||
Bayer AG | 24,951 | 3,538,062 | ||||||
Bristol-Myers Squibb Co. | 62,550 | 3,363,314 | ||||||
Chugai Pharmaceutical Co., Ltd. | 6,800 | 174,264 | ||||||
Daiichi Sankyo Co., Ltd. | 20,300 | 350,830 | ||||||
Dainippon Sumitomo Pharma Co., Ltd. | 4,800 | 89,107 | ||||||
Eisai Co., Ltd. | 7,600 | 297,379 | ||||||
Eli Lilly & Co. | 37,700 | 2,247,297 | ||||||
Forest Laboratories, Inc.(a) | 9,000 | 878,130 | ||||||
GlaxoSmithKline PLC | 147,603 | 4,134,305 | ||||||
Hisamitsu Pharmaceutical Co., Inc. | 1,900 | 89,047 | ||||||
Hospira, Inc.(a) | 6,250 | 270,500 | ||||||
Johnson & Johnson | 107,200 | 9,875,264 | ||||||
Kyowa Hakko Kirin Co., Ltd. | 7,000 | 75,258 | ||||||
Merck & Co., Inc. | 111,000 | 6,325,890 | ||||||
Merck KGaA | 1,950 | 342,235 | ||||||
Mitsubishi Tanabe Pharma Corp. | 7,000 | 103,205 | ||||||
Mylan, Inc./PA(a) | 14,500 | 805,765 | ||||||
Novartis AG | 69,309 | 5,768,594 | ||||||
Novo Nordisk A/S – Class B | 60,085 | 2,859,386 | ||||||
Ono Pharmaceutical Co., Ltd. | 2,500 | 247,854 | ||||||
Orion Oyj – Class B | 2,986 | 98,202 | ||||||
Otsuka Holdings Co., Ltd. | 10,940 | 336,613 | ||||||
Perrigo Co. PLC | 5,039 | 828,613 | ||||||
Pfizer, Inc. | 246,157 | 7,904,101 | ||||||
Roche Holding AG | 21,169 | 6,517,935 | ||||||
Sanofi | 35,979 | 3,742,170 | ||||||
Santen Pharmaceutical Co., Ltd. | 2,300 | 107,831 | ||||||
Shionogi & Co., Ltd. | 9,000 | 195,546 | ||||||
Shire PLC | 16,716 | 924,648 | ||||||
Taisho Pharmaceutical Holdings Co., Ltd. | 952 | 72,451 | ||||||
Takeda Pharmaceutical Co., Ltd. | 23,800 | 1,143,754 | ||||||
Teva Pharmaceutical Industries Ltd. | 25,634 | 1,280,330 | ||||||
Tsumura & Co. | 1,800 | 48,010 | ||||||
UCB SA | 3,321 | 265,649 | ||||||
Zoetis, Inc. | 18,914 | 586,712 | ||||||
|
| |||||||
| 75,301,947 | ||||||||
|
| |||||||
| 129,448,229 | ||||||||
|
| |||||||
Consumer Discretionary – 7.4% | ||||||||
Auto Components – 0.5% | ||||||||
Aisin Seiki Co., Ltd. | 5,800 | 201,970 | ||||||
BorgWarner, Inc. | 8,600 | 528,470 | ||||||
| ALLIANCEBERNSTEIN WEALTH STRATEGIES • | 245 |
Volatility Management Portfolio—Portfolio of Investments
| Company | Shares | U.S. $ Value | ||||||
| ||||||||
Bridgestone Corp. | 19,600 | $ | 708,872 | |||||
Cie Generale des Etablissements Michelin—Class B | 5,640 | 685,601 | ||||||
Continental AG | 3,315 | 805,726 | ||||||
Delphi Automotive PLC | 10,621 | 707,040 | ||||||
Denso Corp. | 14,700 | 788,674 | ||||||
GKN PLC | 49,375 | 334,857 | ||||||
Goodyear Tire & Rubber Co. (The) | 9,350 | 251,234 | ||||||
Johnson Controls, Inc. | 26,050 | 1,286,870 | ||||||
Koito Manufacturing Co., Ltd. | 3,000 | 56,844 | ||||||
NGK Spark Plug Co., Ltd. | 6,000 | 135,491 | ||||||
NHK Spring Co., Ltd. | 5,000 | 52,172 | ||||||
NOK Corp. | 2,900 | 47,631 | ||||||
Nokian Renkaat Oyj | 3,401 | 152,421 | ||||||
Pirelli & C. SpA | 7,177 | 124,799 | ||||||
Stanley Electric Co., Ltd. | 4,300 | 98,931 | ||||||
Sumitomo Rubber Industries Ltd.(b) | 5,200 | 70,232 | ||||||
Toyoda Gosei Co., Ltd. | 2,000 | 42,353 | ||||||
Toyota Boshoku Corp. | 2,000 | 21,301 | ||||||
Toyota Industries Corp. | 4,900 | 227,062 | ||||||
Valeo SA | 2,275 | 318,233 | ||||||
Yokohama Rubber Co., Ltd. (The) | 6,000 | 58,640 | ||||||
|
| |||||||
| 7,705,424 | ||||||||
|
| |||||||
Automobiles – 1.2% | ||||||||
Bayerische Motoren Werke AG | 9,990 | 1,159,114 | ||||||
Bayerische Motoren Werke AG (Preference Shares) | 1,629 | 142,818 | ||||||
Daihatsu Motor Co., Ltd. | 6,000 | 96,659 | ||||||
Daimler AG | 29,025 | 2,700,107 | ||||||
Fiat SpA(a) | 26,408 | 275,730 | ||||||
Ford Motor Co. | 149,750 | 2,304,653 | ||||||
Fuji Heavy Industries Ltd. | 18,000 | 488,602 | ||||||
General Motors Co.(a) | 49,465 | 1,790,633 | ||||||
Harley-Davidson, Inc. | 8,400 | 554,904 | ||||||
Honda Motor Co., Ltd. | 49,200 | 1,770,859 | ||||||
Isuzu Motors Ltd. | 35,000 | 213,998 | ||||||
Mazda Motor Corp.(a) | 81,000 | 391,231 | ||||||
Mitsubishi Motors Corp.(a) | 13,300 | 147,620 | ||||||
Nissan Motor Co., Ltd. | 74,900 | 668,530 | ||||||
Porsche Automobil Holding SE (Preference Shares) | 4,620 | 485,256 | ||||||
Renault SA | 5,792 | 573,262 | ||||||
Suzuki Motor Corp. | 11,000 | 295,953 | ||||||
Toyota Motor Corp. | 83,200 | 4,788,416 | ||||||
Volkswagen AG | 891 | 227,043 | ||||||
Volkswagen AG (Preference Shares) | 4,364 | 1,134,383 | ||||||
Yamaha Motor Co., Ltd. | 8,400 | 122,002 | ||||||
|
| |||||||
| 20,331,773 | ||||||||
|
| |||||||
| 246 | • ALLIANCEBERNSTEIN WEALTH STRATEGIES |
Volatility Management Portfolio—Portfolio of Investments
| Company | Shares | U.S. $ Value | ||||||
| ||||||||
Distributors – 0.0% | ||||||||
Genuine Parts Co. | 5,890 | $ | 518,850 | |||||
Jardine Cycle & Carriage Ltd. | 3,000 | 92,976 | ||||||
|
| |||||||
| 611,826 | ||||||||
|
| |||||||
Diversified Consumer Services – 0.0% | ||||||||
Benesse Holdings, Inc. | 2,200 | 82,862 | ||||||
Graham Holdings Co. – Class B | 200 | 143,740 | ||||||
Gree, Inc.(b) | 3,190 | 35,401 | ||||||
H&R Block, Inc. | 10,350 | 327,474 | ||||||
|
| |||||||
| 589,477 | ||||||||
|
| |||||||
Hotels, Restaurants & Leisure – 0.9% | ||||||||
Accor SA | 4,798 | 244,622 | ||||||
Carnival Corp. | 16,600 | 658,356 | ||||||
Carnival PLC | 5,538 | 227,743 | ||||||
Chipotle Mexican Grill, Inc. – Class A(a) | 1,200 | 678,252 | ||||||
Compass Group PLC | 54,484 | 861,182 | ||||||
Crown Resorts Ltd. | 12,087 | 186,943 | ||||||
Darden Restaurants, Inc. | 4,950 | 252,747 | ||||||
Echo Entertainment Group Ltd. | 21,554 | 51,421 | ||||||
Flight Centre Travel Group Ltd. | 1,667 | 77,481 | ||||||
Galaxy Entertainment Group Ltd.(a) | 63,400 | 638,155 | ||||||
Genting Singapore PLC(b) | 184,000 | 195,306 | ||||||
International Game Technology | 9,400 | 141,846 | ||||||
Marriott International, Inc./DE – Class A | 8,500 | 460,955 | ||||||
McDonald’s Corp. | 37,850 | 3,601,427 | ||||||
McDonald’s Holdings Co. Japan Ltd.(b) | 2,000 | 53,454 | ||||||
MGM China Holdings Ltd. | 28,600 | 122,439 | ||||||
Oriental Land Co., Ltd./Japan | 1,600 | 240,373 | ||||||
Sands China Ltd. | 72,200 | 606,745 | ||||||
Shangri-La Asia Ltd. | 46,000 | 76,871 | ||||||
SJM Holdings Ltd. | 58,500 | 188,966 | ||||||
Sodexo | 2,841 | 302,614 | ||||||
Starbucks Corp. | 28,600 | 2,029,456 | ||||||
Starwood Hotels & Resorts Worldwide, Inc. | 7,250 | 597,835 | ||||||
TABCORP Holdings Ltd. | 20,931 | 66,378 | ||||||
Tatts Group Ltd.(b) | 40,615 | 106,083 | ||||||
TUI Travel PLC | 12,695 | 94,996 | ||||||
Whitbread PLC | 5,502 | 412,924 | ||||||
William Hill PLC | 25,262 | 167,939 | ||||||
Wyndham Worldwide Corp. | 4,950 | 360,756 | ||||||
Wynn Macau Ltd. | 45,500 | 219,048 | ||||||
Wynn Resorts Ltd. | 3,100 | 751,719 | ||||||
Yum! Brands, Inc. | 16,900 | 1,251,952 | ||||||
|
| |||||||
| 15,926,984 | ||||||||
|
| |||||||
Household Durables – 0.3% | ||||||||
Casio Computer Co., Ltd. | 6,700 | 75,940 | ||||||
DR Horton, Inc. | 10,750 | 264,020 | ||||||
| ALLIANCEBERNSTEIN WEALTH STRATEGIES • | 247 |
Volatility Management Portfolio—Portfolio of Investments
| Company | Shares | U.S. $ Value | ||||||
| ||||||||
Electrolux AB – Class B | 7,258 | $ | 171,866 | |||||
Garmin Ltd.(b) | 4,630 | 248,446 | ||||||
Harman International Industries, Inc. | 2,550 | 267,061 | ||||||
Husqvarna AB – Class B | 11,342 | 76,597 | ||||||
Iida Group Holdings Co., Ltd.(a) | 3,989 | 60,675 | ||||||
Leggett & Platt, Inc. | 5,350 | 171,468 | ||||||
Lennar Corp. – Class A | 6,700 | 293,996 | ||||||
Mohawk Industries, Inc.(a) | 2,300 | 325,519 | ||||||
Newell Rubbermaid, Inc. | 10,850 | 348,393 | ||||||
Panasonic Corp. | 66,500 | 832,937 | ||||||
PulteGroup, Inc. | 13,050 | 273,919 | ||||||
Rinnai Corp. | 1,100 | 92,589 | ||||||
Sekisui House Ltd. | 16,000 | 201,051 | ||||||
Sharp Corp./Japan(a) | 43,000 | 139,751 | ||||||
Sony Corp. | 30,500 | 533,359 | ||||||
Whirlpool Corp. | 3,000 | 433,890 | ||||||
|
| |||||||
| 4,811,477 | ||||||||
|
| |||||||
Internet & Catalog Retail – 0.6% | ||||||||
Amazon.com, Inc.(a) | 14,120 | 5,112,852 | ||||||
ASOS PLC(a) | 1,650 | 192,306 | ||||||
Expedia, Inc. | 3,940 | 309,408 | ||||||
NetFlix, Inc.(a) | 2,260 | 1,007,124 | ||||||
priceline.com, Inc.(a) | 1,960 | 2,643,726 | ||||||
Rakuten, Inc. | 21,913 | 315,015 | ||||||
TripAdvisor, Inc.(a) | 4,200 | 421,008 | ||||||
|
| |||||||
| 10,001,439 | ||||||||
|
| |||||||
Leisure Equipment & Products – 0.1% | ||||||||
Hasbro, Inc. | 4,350 | 239,946 | ||||||
Mattel, Inc. | 12,800 | 477,568 | ||||||
Namco Bandai Holdings, Inc. | 5,400 | 121,109 | ||||||
Nikon Corp. | 10,300 | 189,082 | ||||||
Sankyo Co., Ltd. | 1,700 | 70,691 | ||||||
Sega Sammy Holdings, Inc. | 5,600 | 131,305 | ||||||
Shimano, Inc. | 2,400 | 217,534 | ||||||
Yamaha Corp. | 4,800 | 65,906 | ||||||
|
| |||||||
| 1,513,141 | ||||||||
|
| |||||||
Media – 1.7% | ||||||||
Axel Springer SE | 1,194 | 84,244 | ||||||
British Sky Broadcasting Group PLC | 31,275 | 492,293 | ||||||
Cablevision Systems Corp. – Class A | 8,100 | 142,560 | ||||||
CBS Corp. – Class B | 21,250 | 1,425,450 | ||||||
Comcast Corp. – Class A | 99,000 | 5,117,310 | ||||||
Dentsu, Inc. | 6,600 | 248,898 | ||||||
DIRECTV(a) | 18,600 | 1,443,360 | ||||||
Discovery Communications, Inc. – Class A(a) | 8,550 | 712,386 | ||||||
Eutelsat Communications SA | 4,311 | 140,479 | ||||||
| 248 | • ALLIANCEBERNSTEIN WEALTH STRATEGIES |
Volatility Management Portfolio—Portfolio of Investments
| Company | Shares | U.S. $ Value | ||||||
| ||||||||
Gannett Co., Inc. | 8,600 | $ | 255,850 | |||||
Hakuhodo DY Holdings, Inc. | 7,020 | 52,557 | ||||||
Interpublic Group of Cos., Inc. (The) | 15,750 | 279,090 | ||||||
ITV PLC | 111,000 | 375,141 | ||||||
JCDecaux SA | 2,088 | 92,087 | ||||||
Kabel Deutschland Holding AG | 667 | 94,782 | ||||||
Lagardere SCA | 3,344 | 134,113 | ||||||
News Corp. – Class A(a) | 18,875 | 345,979 | ||||||
Omnicom Group, Inc. | 9,750 | 737,880 | ||||||
Pearson PLC | 24,665 | 417,699 | ||||||
ProSiebenSat.1 Media AG | 5,604 | 266,758 | ||||||
Publicis Groupe SA | 5,454 | 517,613 | ||||||
REA Group Ltd.(b) | 1,588 | 70,302 | ||||||
Reed Elsevier NV | 20,893 | 457,240 | ||||||
Reed Elsevier PLC | 35,474 | 543,862 | ||||||
RTL Group SA | 1,166 | 150,562 | ||||||
Scripps Networks Interactive, Inc. – Class A | 4,150 | 337,146 | ||||||
SES SA | 9,155 | 318,843 | ||||||
Singapore Press Holdings Ltd.(b) | 48,000 | 157,295 | ||||||
Sky Deutschland AG(a) | 13,215 | 138,144 | ||||||
Telenet Group Holding NV | 1,546 | 98,674 | ||||||
Time Warner Cable, Inc. – Class A | 10,700 | 1,501,745 | ||||||
Time Warner, Inc. | 34,400 | 2,309,272 | ||||||
Toho Co., Ltd./Tokyo | 3,400 | 65,953 | ||||||
Twenty-First Century Fox, Inc. – Class A | 74,500 | 2,498,730 | ||||||
Viacom, Inc. – Class B | 15,400 | 1,351,042 | ||||||
Walt Disney Co. (The) | 62,088 | 5,017,331 | ||||||
Wolters Kluwer NV | 9,109 | 262,432 | ||||||
WPP PLC | 40,227 | 881,064 | ||||||
|
| |||||||
| 29,536,166 | ||||||||
|
| |||||||
Multiline Retail – 0.4% | ||||||||
Dollar General Corp.(a) | 11,180 | 669,682 | ||||||
Dollar Tree, Inc.(a) | 7,920 | 433,778 | ||||||
Don Quijote Holdings Co., Ltd. | 1,700 | 92,598 | ||||||
Family Dollar Stores, Inc. | 3,660 | 239,730 | ||||||
Harvey Norman Holdings Ltd.(b) | 14,346 | 41,218 | ||||||
Isetan Mitsukoshi Holdings Ltd. | 10,700 | 121,188 | ||||||
J Front Retailing Co., Ltd.(b) | 14,000 | 88,982 | ||||||
Kohl’s Corp. | 7,660 | 430,415 | ||||||
Macy’s, Inc. | 14,010 | 810,619 | ||||||
Marks & Spencer Group PLC | 48,738 | 410,273 | ||||||
Marui Group Co., Ltd. | 6,700 | 55,343 | ||||||
Next PLC | 4,741 | 534,452 | ||||||
Nordstrom, Inc. | 5,420 | 333,222 | ||||||
Takashimaya Co., Ltd. | 7,392 | 64,371 | ||||||
Target Corp. | 24,020 | 1,502,211 | ||||||
|
| |||||||
| 5,828,082 | ||||||||
|
| |||||||
| ALLIANCEBERNSTEIN WEALTH STRATEGIES • | 249 |
Volatility Management Portfolio—Portfolio of Investments
| Company | Shares | U.S. $ Value | ||||||
| ||||||||
Specialty Retail – 1.0% | ||||||||
ABC-Mart, Inc. | 800 | $ | 31,759 | |||||
AutoNation, Inc.(a) | 2,430 | 127,915 | ||||||
AutoZone, Inc.(a) | 1,310 | 705,356 | ||||||
Bed Bath & Beyond, Inc.(a) | 8,150 | 552,733 | ||||||
Best Buy Co., Inc. | 10,340 | 275,354 | ||||||
CarMax, Inc.(a) | 8,470 | 410,202 | ||||||
Fast Retailing Co., Ltd. | 1,600 | 553,905 | ||||||
GameStop Corp. – Class A | 4,410 | 164,537 | ||||||
Gap, Inc. (The) | 10,040 | 439,250 | ||||||
Hennes & Mauritz AB – Class B | 28,646 | 1,289,944 | ||||||
Home Depot, Inc. (The) | 53,490 | 4,387,785 | ||||||
Inditex SA | 6,583 | 945,282 | ||||||
Kingfisher PLC | 70,786 | 466,577 | ||||||
L Brands, Inc. | 9,250 | 521,053 | ||||||
Lowe’s Cos., Inc. | 39,740 | 1,988,192 | ||||||
Nitori Holdings Co., Ltd. | 2,100 | 95,126 | ||||||
O’Reilly Automotive, Inc.(a) | 4,080 | 615,468 | ||||||
PetSmart, Inc. | 3,920 | 262,875 | ||||||
Ross Stores, Inc. | 8,210 | 597,688 | ||||||
Sanrio Co., Ltd.(b) | 1,400 | 53,586 | ||||||
Shimamura Co., Ltd. | 700 | 63,406 | ||||||
Staples, Inc. | 25,040 | 340,294 | ||||||
Tiffany & Co. | 4,170 | 388,853 | ||||||
TJX Cos., Inc. (The) | 27,020 | 1,660,649 | ||||||
Tractor Supply Co. | 5,323 | 375,591 | ||||||
Urban Outfitters, Inc.(a) | 4,130 | 154,627 | ||||||
USS Co., Ltd. | 6,610 | 89,327 | ||||||
Yamada Denki Co., Ltd. | 27,660 | 91,847 | ||||||
|
| |||||||
| 17,649,181 | ||||||||
|
| |||||||
Textiles, Apparel & Luxury Goods – 0.7% | ||||||||
Adidas AG | 6,313 | 734,017 | ||||||
Asics Corp. | 5,000 | 97,928 | ||||||
Burberry Group PLC | 13,344 | 343,811 | ||||||
Christian Dior SA | 1,643 | 323,540 | ||||||
Cie Financiere Richemont SA | 15,750 | 1,564,688 | ||||||
Coach, Inc. | 10,600 | 517,386 | ||||||
Fossil Group, Inc.(a) | 1,879 | 215,916 | ||||||
Hugo Boss AG | 956 | 127,176 | ||||||
Kering | 2,280 | 465,905 | ||||||
Li & Fung Ltd. | 176,000 | 230,387 | ||||||
Luxottica Group SpA | 5,027 | 279,107 | ||||||
LVMH Moet Hennessy Louis Vuitton SA | 7,651 | 1,414,755 | ||||||
Michael Kors Holdings Ltd.(a) | 6,810 | 667,584 | ||||||
NIKE, Inc. – Class B | 28,350 | 2,219,805 | ||||||
PVH Corp. | 3,111 | 393,324 | ||||||
Ralph Lauren Corp. | 2,250 | 362,430 | ||||||
| 250 | • ALLIANCEBERNSTEIN WEALTH STRATEGIES |
Volatility Management Portfolio—Portfolio of Investments
| Company | Shares | U.S. $ Value | ||||||
| ||||||||
Swatch Group AG (The) | 931 | $ | 620,009 | |||||
Swatch Group AG (The) (REG) | 1,310 | 153,739 | ||||||
VF Corp. | 13,400 | 785,106 | ||||||
Yue Yuen Industrial Holdings Ltd. | 22,000 | 67,141 | ||||||
|
| |||||||
| 11,583,754 | ||||||||
|
| |||||||
| 126,088,724 | ||||||||
|
| |||||||
Industrials – 7.4% | ||||||||
Aerospace & Defense – 1.3% | ||||||||
Airbus Group NV | 17,792 | 1,307,308 | ||||||
BAE Systems PLC | 96,992 | 665,774 | ||||||
Boeing Co. (The) | 26,250 | 3,384,150 | ||||||
Cobham PLC | 31,371 | 156,610 | ||||||
Finmeccanica SpA(a) | 12,210 | 119,823 | ||||||
General Dynamics Corp. | 12,700 | 1,391,158 | ||||||
Honeywell International, Inc. | 29,850 | 2,819,034 | ||||||
L-3 Communications Holdings, Inc. | 3,350 | 386,590 | ||||||
Lockheed Martin Corp. | 10,300 | 1,671,690 | ||||||
Meggitt PLC | 23,803 | 200,516 | ||||||
Northrop Grumman Corp. | 8,500 | 1,028,755 | ||||||
Precision Castparts Corp. | 5,550 | 1,431,234 | ||||||
Raytheon Co. | 12,200 | 1,194,502 | ||||||
Rockwell Collins, Inc. | 5,100 | 420,954 | ||||||
Rolls-Royce Holdings PLC(a) | 56,729 | 948,037 | ||||||
Safran SA | 8,168 | 574,160 | ||||||
Singapore Technologies Engineering Ltd.(b) | 46,000 | 137,993 | ||||||
Textron, Inc. | 10,650 | 422,805 | ||||||
Thales SA | 2,744 | 182,195 | ||||||
United Technologies Corp. | 32,100 | 3,756,342 | ||||||
Zodiac Aerospace | 5,145 | 181,260 | ||||||
|
| |||||||
| 22,380,890 | ||||||||
|
| |||||||
Air Freight & Logistics – 0.4% | ||||||||
CH Robinson Worldwide, Inc. | 5,750 | 298,195 | ||||||
Deutsche Post AG | 27,359 | 1,025,779 | ||||||
Expeditors International of Washington, Inc. | 7,750 | 306,203 | ||||||
FedEx Corp. | 11,300 | 1,506,629 | ||||||
Kuehne & Nagel International AG | 1,630 | 232,669 | ||||||
TNT Express NV | 10,713 | 104,066 | ||||||
Toll Holdings Ltd. | 19,628 | 93,385 | ||||||
United Parcel Service, Inc. – Class B | 27,200 | 2,604,944 | ||||||
Yamato Holdings Co., Ltd. | 11,100 | 230,447 | ||||||
|
| |||||||
| 6,402,317 | ||||||||
|
| |||||||
Airlines – 0.2% | ||||||||
ANA Holdings, Inc.(b) | 34,000 | 75,930 | ||||||
Cathay Pacific Airways Ltd. | 35,000 | 71,154 | ||||||
Delta Air Lines, Inc. | 32,433 | 1,077,100 | ||||||
Deutsche Lufthansa AG (REG)(a) | 6,939 | 179,460 | ||||||
| ALLIANCEBERNSTEIN WEALTH STRATEGIES • | 251 |
Volatility Management Portfolio—Portfolio of Investments
| Company | Shares | U.S. $ Value | ||||||
| ||||||||
easyJet PLC | 4,785 | $ | 137,615 | |||||
International Consolidated Airlines Group SA(a) | 27,989 | 204,114 | ||||||
Japan Airlines Co., Ltd. | 1,806 | 89,928 | ||||||
Qantas Airways Ltd.(a) | 28,514 | 29,801 | ||||||
Ryanair Holdings PLC (Sponsored ADR)(a) | 820 | 46,543 | ||||||
Singapore Airlines Ltd. | 16,000 | 128,562 | ||||||
Southwest Airlines Co. | 26,400 | 592,416 | ||||||
|
| |||||||
| 2,632,623 | ||||||||
|
| |||||||
Building Products – 0.2% | ||||||||
Allegion PLC(a) | 3,350 | 182,072 | ||||||
Asahi Glass Co., Ltd. | 30,000 | 165,196 | ||||||
Assa Abloy AB – Class B | 10,081 | 512,577 | ||||||
Cie de St-Gobain | 12,577 | 754,203 | ||||||
Daikin Industries Ltd. | 7,100 | 409,080 | ||||||
Geberit AG | 1,139 | 357,948 | ||||||
LIXIL Group Corp. | 8,000 | 234,537 | ||||||
Masco Corp. | 13,500 | 315,225 | ||||||
TOTO Ltd. | 9,000 | 127,715 | ||||||
|
| |||||||
| 3,058,553 | ||||||||
|
| |||||||
Commercial Services & Supplies – 0.3% | ||||||||
ADT Corp. (The) | 6,950 | 213,434 | ||||||
Aggreko PLC | 8,116 | 211,855 | ||||||
Babcock International Group PLC | 10,924 | 268,940 | ||||||
Brambles Ltd. | 46,985 | 394,107 | ||||||
Cintas Corp. | 3,800 | 230,508 | ||||||
Dai Nippon Printing Co., Ltd. | 17,000 | 171,266 | ||||||
Edenred | 6,126 | 196,536 | ||||||
G4S PLC | 45,624 | 181,426 | ||||||
Iron Mountain, Inc. | 6,414 | 174,461 | ||||||
Park24 Co., Ltd. | 3,000 | 60,653 | ||||||
Pitney Bowes, Inc. | 7,650 | 194,692 | ||||||
Republic Services, Inc. – Class A | 10,200 | 347,922 | ||||||
Secom Co., Ltd. | 6,400 | 362,325 | ||||||
Securitas AB – Class B | 9,447 | 103,975 | ||||||
Serco Group PLC | 14,544 | 112,153 | ||||||
Societe BIC SA | 909 | 116,443 | ||||||
Stericycle, Inc.(a) | 3,250 | 370,500 | ||||||
Toppan Printing Co., Ltd. | 17,000 | 126,622 | ||||||
Tyco International Ltd. | 17,700 | 746,586 | ||||||
Waste Management, Inc. | 16,600 | 688,900 | ||||||
|
| |||||||
| 5,273,304 | ||||||||
|
| |||||||
Construction & Engineering – 0.2% | ||||||||
ACS Actividades de Construccion y Servicios SA | 4,348 | 155,967 | ||||||
Bouygues SA(b) | 5,770 | 232,240 | ||||||
| 252 | • ALLIANCEBERNSTEIN WEALTH STRATEGIES |
Volatility Management Portfolio—Portfolio of Investments
| Company | Shares | U.S. $ Value | ||||||
| ||||||||
Chiyoda Corp. | 5,000 | $ | 76,106 | |||||
Ferrovial SA | 12,172 | 256,490 | ||||||
Fluor Corp. | 6,200 | 481,678 | ||||||
Hochtief AG | 930 | 86,396 | ||||||
Jacobs Engineering Group, Inc.(a) | 5,000 | 303,250 | ||||||
JGC Corp. | 7,000 | 259,631 | ||||||
Kajima Corp. | 25,000 | 88,311 | ||||||
Kinden Corp. | 4,000 | 41,627 | ||||||
Koninklijke Boskalis Westminster NV | 2,396 | 119,739 | ||||||
Leighton Holdings Ltd.(b) | 5,087 | 82,350 | ||||||
Obayashi Corp. | 19,000 | 116,733 | ||||||
OCI(a) | 2,738 | 133,937 | ||||||
Quanta Services, Inc.(a) | 8,150 | 286,962 | ||||||
Shimizu Corp. | 17,000 | 92,038 | ||||||
Skanska AB – Class B | 11,464 | 248,548 | ||||||
Taisei Corp. | 29,000 | 129,560 | ||||||
Vinci SA | 14,438 | 1,076,722 | ||||||
|
| |||||||
| 4,268,285 | ||||||||
|
| |||||||
Electrical Equipment – 0.6% | ||||||||
ABB Ltd. (REG)(a) | 66,347 | 1,693,316 | ||||||
Alstom SA | 6,507 | 175,091 | ||||||
AMETEK, Inc. | 9,339 | 497,208 | ||||||
Eaton Corp. PLC | 18,009 | 1,345,452 | ||||||
Emerson Electric Co. | 26,700 | 1,742,442 | ||||||
First Solar, Inc.(a) | 2,650 | 151,236 | ||||||
Fuji Electric Co., Ltd. | 16,000 | 73,553 | ||||||
Legrand SA | 7,981 | 493,456 | ||||||
Mabuchi Motor Co., Ltd. | 800 | 53,614 | ||||||
Mitsubishi Electric Corp. | 58,000 | 690,272 | ||||||
Nidec Corp. | 3,100 | 381,201 | ||||||
Osram Licht AG(a) | 2,527 | 171,533 | ||||||
Prysmian SpA | 6,151 | 158,892 | ||||||
Rockwell Automation, Inc. | 5,250 | 644,910 | ||||||
Roper Industries, Inc. | 3,750 | 508,575 | ||||||
Schneider Electric SA (Paris) | 16,040 | 1,427,356 | ||||||
Schneider Electric SA (London) | 510 | 45,337 | ||||||
Sumitomo Electric Industries Ltd. | 22,700 | 348,444 | ||||||
|
| |||||||
| 10,601,888 | ||||||||
|
| |||||||
Industrial Conglomerates – 1.3% | ||||||||
3M Co. | 24,350 | 3,280,675 | ||||||
Danaher Corp. | 22,750 | 1,740,148 | ||||||
General Electric Co. | 384,250 | 9,786,847 | ||||||
Hopewell Holdings Ltd. | 17,000 | 57,575 | ||||||
Hutchison Whampoa Ltd. | 64,000 | 864,527 | ||||||
Keppel Corp., Ltd. | 43,000 | 355,563 | ||||||
Koninklijke Philips NV | 29,396 | 1,026,628 | ||||||
NWS Holdings Ltd. | 44,000 | 69,028 | ||||||
| ALLIANCEBERNSTEIN WEALTH STRATEGIES • | 253 |
Volatility Management Portfolio—Portfolio of Investments
| Company | Shares | U.S. $ Value | ||||||
| ||||||||
SembCorp Industries Ltd. | 29,000 | $ | 123,900 | |||||
Siemens AG | 23,923 | 3,189,593 | ||||||
Smiths Group PLC | 11,879 | 272,006 | ||||||
Toshiba Corp. | 121,000 | 525,164 | ||||||
|
| |||||||
| 21,291,654 | ||||||||
|
| |||||||
Industrial Warehouse Distribution – 0.3% | ||||||||
Ascendas Real Estate Investment Trust | 212,150 | 361,792 | ||||||
DCT Industrial Trust, Inc. | 24,260 | 192,139 | ||||||
EastGroup Properties, Inc. | 2,330 | 144,553 | ||||||
First Industrial Realty Trust, Inc. | 8,400 | 161,616 | ||||||
Global Logistic Properties Ltd. | 323,115 | 722,547 | ||||||
GLP J-Reit | 125 | 131,958 | ||||||
Hansteen Holdings PLC | 48,963 | 91,994 | ||||||
Industrial & Infrastructure Fund Investment Corp.(b) | 11 | 94,316 | ||||||
Japan Logistics Fund, Inc. | 60 | 134,485 | ||||||
Mapletree Industrial Trust | 88,762 | 94,613 | ||||||
Mapletree Logistics Trust | 109,755 | 89,728 | ||||||
Nippon Prologis REIT, Inc. | 145 | 311,247 | ||||||
ProLogis, Inc. | 57,175 | 2,355,039 | ||||||
Pure Industrial Real Estate Trust | 11,550 | 49,755 | ||||||
Segro PLC | 78,301 | 467,935 | ||||||
STAG Industrial, Inc. | 3,350 | 78,088 | ||||||
Warehouses De Pauw SCA | 840 | 63,664 | ||||||
|
| |||||||
| 5,545,469 | ||||||||
|
| |||||||
Machinery – 1.3% | ||||||||
Alfa Laval AB | 9,492 | 257,207 | ||||||
Amada Co., Ltd. | 10,000 | 83,596 | ||||||
Andritz AG | 2,197 | 137,793 | ||||||
Atlas Copco AB – Class A | 20,261 | 568,035 | ||||||
Atlas Copco AB – Class B | 11,774 | 312,115 | ||||||
Caterpillar, Inc. | 24,150 | 2,341,826 | ||||||
CNH Industrial NV(a) | 28,447 | 312,598 | ||||||
Cummins, Inc. | 6,600 | 963,072 | ||||||
Deere & Co. | 14,600 | 1,254,578 | ||||||
Dover Corp. | 6,450 | 608,235 | ||||||
FANUC Corp. | 5,800 | 1,009,686 | ||||||
Flowserve Corp. | 5,300 | 430,413 | ||||||
GEA Group AG | 5,518 | 267,035 | ||||||
Hino Motors Ltd. | 8,000 | 118,723 | ||||||
Hitachi Construction Machinery Co., Ltd. | 3,300 | 64,314 | ||||||
IHI Corp. | 39,000 | 179,071 | ||||||
Illinois Tool Works, Inc. | 15,500 | 1,278,750 | ||||||
IMI PLC | 8,394 | 214,155 | ||||||
Ingersoll-Rand PLC | 10,150 | 620,571 | ||||||
Japan Steel Works Ltd. (The) | 9,000 | 44,165 | ||||||
Joy Global, Inc. | 4,000 | 220,000 | ||||||
| 254 | • ALLIANCEBERNSTEIN WEALTH STRATEGIES |
Volatility Management Portfolio—Portfolio of Investments
| Company | Shares | U.S. $ Value | ||||||
| ||||||||
JTEKT Corp. | 6,200 | $ | 103,773 | |||||
Kawasaki Heavy Industries Ltd. | 42,000 | 172,381 | ||||||
Komatsu Ltd. | 28,200 | 596,280 | ||||||
Kone Oyj – Class B | 9,402 | 382,372 | ||||||
Kubota Corp. | 32,000 | 449,691 | ||||||
Kurita Water Industries Ltd. | 3,200 | 67,661 | ||||||
Makita Corp. | 3,400 | 189,860 | ||||||
MAN SE | 1,064 | 137,284 | ||||||
Melrose Industries PLC | 31,455 | 172,740 | ||||||
Metso Oyj(b) | 3,856 | 124,661 | ||||||
Mitsubishi Heavy Industries Ltd. | 91,000 | 560,618 | ||||||
Nabtesco Corp. | 4,000 | 100,458 | ||||||
NGK Insulators Ltd. | 8,000 | 173,677 | ||||||
NSK Ltd. | 14,000 | 153,994 | ||||||
PACCAR, Inc. | 13,500 | 888,840 | ||||||
Pall Corp. | 4,200 | 361,200 | ||||||
Parker Hannifin Corp. | 5,650 | 681,108 | ||||||
Pentair Ltd. | 7,534 | 608,823 | ||||||
Sandvik AB | 32,170 | 448,056 | ||||||
Scania AB – Class B | 9,655 | 296,141 | ||||||
Schindler Holding AG | 1,392 | 208,557 | ||||||
Schindler Holding AG (REG) | 650 | 98,595 | ||||||
SembCorp Marine Ltd.(b) | 25,000 | 81,147 | ||||||
SKF AB – Class B | 12,024 | 321,555 | ||||||
SMC Corp./Japan | 1,600 | 407,611 | ||||||
Snap-On, Inc. | 2,200 | 246,774 | ||||||
Stanley Black & Decker, Inc. | 5,900 | 489,936 | ||||||
Sulzer AG | 724 | 102,360 | ||||||
Sumitomo Heavy Industries Ltd. | 16,000 | 74,003 | ||||||
THK Co., Ltd. | 3,400 | 78,210 | ||||||
Vallourec SA | 3,235 | 173,187 | ||||||
Volvo AB – Class B | 45,668 | 686,231 | ||||||
Wartsila Oyj Abp | 5,356 | 316,143 | ||||||
Weir Group PLC (The) | 6,430 | 276,007 | ||||||
Xylem, Inc./NY | 6,950 | 273,483 | ||||||
Yangzijiang Shipbuilding Holdings Ltd. | 52,500 | 47,068 | ||||||
Zardoya Otis SA(b) | 5,150 | 89,062 | ||||||
|
| |||||||
| 21,925,485 | ||||||||
|
| |||||||
Marine – 0.1% | ||||||||
AP Moeller - Maersk A/S – Class A | 17 | 198,952 | ||||||
AP Moeller - Maersk A/S – Class B | 40 | 488,516 | ||||||
Mitsui OSK Lines Ltd. | 32,000 | 133,225 | ||||||
Nippon Yusen KK | 48,000 | 153,762 | ||||||
|
| |||||||
| 974,455 | ||||||||
|
| |||||||
Mixed Office Industrial – 0.0% | ||||||||
Goodman Group | 183,148 | 786,870 | ||||||
|
| |||||||
| ALLIANCEBERNSTEIN WEALTH STRATEGIES • | 255 |
Volatility Management Portfolio—Portfolio of Investments
| Company | Shares | U.S. $ Value | ||||||
| ||||||||
Professional Services – 0.2% | ||||||||
Adecco SA(a) | 3,998 | $ | 344,504 | |||||
ALS Ltd./Queensland(b) | 11,308 | 76,740 | ||||||
Bureau Veritas SA | 6,657 | 183,224 | ||||||
Capita PLC | 19,845 | 378,752 | ||||||
Dun & Bradstreet Corp. (The) | 1,450 | 143,855 | ||||||
Equifax, Inc. | 4,600 | 322,276 | ||||||
Experian PLC | 30,199 | 546,229 | ||||||
Intertek Group PLC | 4,868 | 239,446 | ||||||
Nielsen Holdings NV | 9,588 | 453,896 | ||||||
Randstad Holding NV | 3,742 | 235,060 | ||||||
Robert Half International, Inc. | 5,250 | 214,935 | ||||||
Seek Ltd. | 9,683 | 148,377 | ||||||
SGS SA | 166 | 410,771 | ||||||
|
| |||||||
| 3,698,065 | ||||||||
|
| |||||||
Road & Rail – 0.6% | ||||||||
Asciano Ltd. | 28,502 | 137,448 | ||||||
Aurizon Holdings Ltd. | 60,118 | 273,851 | ||||||
Central Japan Railway Co. | 4,345 | 507,114 | ||||||
ComfortDelGro Corp., Ltd. | 60,000 | 91,398 | ||||||
CSX Corp. | 38,500 | 1,066,835 | ||||||
DSV A/S | 5,431 | 173,878 | ||||||
East Japan Railway Co. | 10,200 | 797,659 | ||||||
Hankyu Hanshin Holdings, Inc. | 34,000 | 186,831 | ||||||
Kansas City Southern | 4,200 | 394,464 | ||||||
Keikyu Corp. | 14,000 | 117,643 | ||||||
Keio Corp. | 17,000 | 120,494 | ||||||
Keisei Electric Railway Co., Ltd. | 8,000 | 70,354 | ||||||
Kintetsu Corp. | 53,000 | 192,504 | ||||||
MTR Corp., Ltd. | 43,500 | 158,531 | ||||||
Nippon Express Co., Ltd. | 24,000 | 112,116 | ||||||
Norfolk Southern Corp. | 11,800 | 1,084,538 | ||||||
Odakyu Electric Railway Co., Ltd. | 19,000 | 170,282 | ||||||
Ryder System, Inc. | 2,000 | 150,640 | ||||||
Tobu Railway Co., Ltd. | 30,000 | 146,028 | ||||||
Tokyu Corp. | 34,000 | 207,772 | ||||||
Union Pacific Corp. | 17,500 | 3,156,650 | ||||||
West Japan Railway Co. | 5,078 | 208,745 | ||||||
|
| |||||||
| 9,525,775 | ||||||||
|
| |||||||
Trading Companies & Distributors – 0.3% | ||||||||
Brenntag AG | 1,554 | 288,730 | ||||||
Bunzl PLC | 10,036 | 264,161 | ||||||
Fastenal Co. | 10,350 | 488,416 | ||||||
ITOCHU Corp. | 45,000 | 560,786 | ||||||
Marubeni Corp. | 49,000 | 344,480 | ||||||
Mitsubishi Corp. | 42,400 | 813,801 | ||||||
| 256 | • ALLIANCEBERNSTEIN WEALTH STRATEGIES |
Volatility Management Portfolio—Portfolio of Investments
| Company | Shares | U.S. $ Value | ||||||
| ||||||||
Mitsui & Co., Ltd. | 52,400 | $ | 807,787 | |||||
Noble Group Ltd. | 129,000 | 104,960 | ||||||
Rexel SA | 6,397 | 161,541 | ||||||
Sojitz Corp. | 37,700 | 66,931 | ||||||
Sumitomo Corp. | 33,900 | 448,455 | ||||||
Toyota Tsusho Corp. | 6,400 | 158,204 | ||||||
Travis Perkins PLC | 7,395 | 241,750 | ||||||
Wolseley PLC | 8,007 | 465,504 | ||||||
WW Grainger, Inc. | 2,350 | 599,297 | ||||||
|
| |||||||
| 5,814,803 | ||||||||
|
| |||||||
Transportation Infrastructure – 0.1% | ||||||||
Abertis Infraestructuras SA(b) | 11,600 | 271,889 | ||||||
Aeroports de Paris | 930 | 112,679 | ||||||
Atlantia SpA | 9,984 | 252,702 | ||||||
Auckland International Airport Ltd. | 30,155 | 94,604 | ||||||
Fraport AG Frankfurt Airport Services Worldwide | 1,113 | 88,569 | ||||||
Groupe Eurotunnel SA | 16,572 | 198,969 | ||||||
Hutchison Port Holdings Trust – Class U | 150,500 | 94,123 | ||||||
Kamigumi Co., Ltd. | 7,000 | 65,037 | ||||||
Mitsubishi Logistics Corp. | 4,000 | 55,693 | ||||||
Sydney Airport | 15,643 | 56,776 | ||||||
Transurban Group | 42,466 | 268,377 | ||||||
|
| |||||||
| 1,559,418 | ||||||||
|
| |||||||
| 125,739,854 | ||||||||
|
| |||||||
Consumer Staples – 6.1% | ||||||||
Beverages – 1.3% | ||||||||
Anheuser-Busch InBev NV | 24,244 | 2,535,778 | ||||||
Asahi Group Holdings Ltd. | 11,700 | 328,963 | ||||||
Beam, Inc. | 6,200 | 514,352 | ||||||
Brown-Forman Corp. – Class B | 6,150 | 515,370 | ||||||
Carlsberg A/S – Class B | 3,228 | 340,078 | ||||||
Coca-Cola Amatil Ltd. | 17,279 | 174,437 | ||||||
Coca-Cola Co. (The) | 144,200 | 5,508,440 | ||||||
Coca-Cola Enterprises, Inc. | 9,150 | 430,782 | ||||||
Coca-Cola HBC AG(a) | 6,028 | 149,628 | ||||||
Coca-Cola West Co., Ltd. | 1,900 | 35,270 | ||||||
Constellation Brands, Inc. – Class A(a) | 6,300 | 510,489 | ||||||
Diageo PLC | 75,738 | 2,378,326 | ||||||
Dr Pepper Snapple Group, Inc. | 7,600 | 396,036 | ||||||
Heineken Holding NV | 3,042 | 196,565 | ||||||
Heineken NV | 6,952 | 469,426 | ||||||
Kirin Holdings Co., Ltd. | 26,000 | 354,904 | ||||||
Molson Coors Brewing Co. – Class B | 6,000 | 340,980 | ||||||
Monster Beverage Corp.(a) | 5,160 | 381,840 | ||||||
PepsiCo, Inc. | 58,250 | 4,664,077 | ||||||
Pernod Ricard SA | 6,396 | 750,490 | ||||||
| ALLIANCEBERNSTEIN WEALTH STRATEGIES • | 257 |
Volatility Management Portfolio—Portfolio of Investments
| Company | Shares | U.S. $ Value | ||||||
| ||||||||
Remy Cointreau SA(b) | 798 | $ | 67,601 | |||||
SABMiller PLC (London) | 29,010 | 1,420,664 | ||||||
Suntory Beverage & Food Ltd. | 3,729 | 131,584 | ||||||
Treasury Wine Estates Ltd. | 18,445 | 64,025 | ||||||
|
| |||||||
| 22,660,105 | ||||||||
|
| |||||||
Food & Staples Retailing – 1.3% | ||||||||
Aeon Co., Ltd.(b) | 18,300 | 224,249 | ||||||
Carrefour SA | 18,542 | 682,156 | ||||||
Casino Guichard Perrachon SA | 1,701 | 192,686 | ||||||
Colruyt SA | 2,288 | 126,741 | ||||||
Costco Wholesale Corp. | 16,600 | 1,938,880 | ||||||
CVS Caremark Corp. | 45,250 | 3,309,585 | ||||||
Delhaize Group SA | 3,075 | 220,800 | ||||||
Distribuidora Internacional de Alimentacion SA | 18,446 | 157,994 | ||||||
FamilyMart Co., Ltd.(b) | 1,800 | 80,334 | ||||||
J Sainsbury PLC | 36,482 | 209,138 | ||||||
Jeronimo Martins SGPS SA | 7,595 | 128,769 | ||||||
Koninklijke Ahold NV | 30,411 | 566,883 | ||||||
Kroger Co. (The) | 19,700 | 826,218 | ||||||
Lawson, Inc.(b) | 2,000 | 139,063 | ||||||
Metcash Ltd.(b) | 24,909 | 68,929 | ||||||
Metro AG | 3,912 | 161,807 | ||||||
Olam International Ltd. | 44,000 | 61,689 | ||||||
Safeway, Inc. | 9,350 | 350,157 | ||||||
Seven & I Holdings Co., Ltd.(b) | 22,700 | 853,545 | ||||||
Sysco Corp. | 22,050 | 794,241 | ||||||
Tesco PLC | 242,892 | 1,337,516 | ||||||
Wal-Mart Stores, Inc. | 61,450 | 4,590,315 | ||||||
Walgreen Co. | 33,100 | 2,249,145 | ||||||
Wesfarmers Ltd. | 34,789 | 1,335,871 | ||||||
Whole Foods Market, Inc. | 14,100 | 762,105 | ||||||
WM Morrison Supermarkets PLC | 66,599 | 262,069 | ||||||
Woolworths Ltd. | 37,741 | 1,216,487 | ||||||
|
| |||||||
| 22,847,372 | ||||||||
|
| |||||||
Food Products – 1.5% | ||||||||
Ajinomoto Co., Inc. | 18,000 | 279,448 | ||||||
Archer-Daniels-Midland Co. | 24,950 | 1,012,970 | ||||||
Aryzta AG(a) | 2,632 | 219,487 | ||||||
Associated British Foods PLC | 10,749 | 539,209 | ||||||
Barry Callebaut AG(a) | 67 | 83,522 | ||||||
Calbee, Inc. | 2,292 | 55,754 | ||||||
Campbell Soup Co. | 6,800 | 294,508 | ||||||
ConAgra Foods, Inc. | 15,950 | 452,980 | ||||||
Danone(b) | 17,112 | 1,206,665 | ||||||
General Mills, Inc. | 24,050 | 1,203,221 | ||||||
Golden Agri-Resources Ltd. | 212,000 | 92,933 | ||||||
Hershey Co. (The) | 5,700 | 603,174 | ||||||
| 258 | • ALLIANCEBERNSTEIN WEALTH STRATEGIES |
Volatility Management Portfolio—Portfolio of Investments
| Company | Shares | U.S. $ Value | ||||||
| ||||||||
Hormel Foods Corp. | 5,100 | $ | 241,995 | |||||
JM Smucker Co. (The) | 4,000 | 400,040 | ||||||
Kellogg Co. | 9,750 | 591,728 | ||||||
Kerry Group PLC – Class A | 4,506 | 340,401 | ||||||
Kikkoman Corp. | 5,000 | 97,484 | ||||||
Kraft Foods Group, Inc. | 22,600 | 1,249,102 | ||||||
Lindt & Spruengli AG | 26 | 128,123 | ||||||
Lindt & Spruengli AG (REG) | 4 | 232,246 | ||||||
McCormick & Co., Inc./MD | 5,000 | 332,000 | ||||||
Mead Johnson Nutrition Co. – Class A | 7,650 | 623,858 | ||||||
MEIJI Holdings Co., Ltd. | 1,900 | 125,408 | ||||||
Mondelez International, Inc. – Class A | 66,600 | 2,266,398 | ||||||
Nestle SA | 97,165 | 7,340,344 | ||||||
Nippon Meat Packers, Inc. | 5,000 | 80,425 | ||||||
Nisshin Seifun Group, Inc. | 6,000 | 64,776 | ||||||
Nissin Foods Holdings Co., Ltd. | 1,800 | 80,601 | ||||||
Orkla ASA | 23,056 | 181,891 | ||||||
Suedzucker AG | 2,464 | 68,464 | ||||||
Tate & Lyle PLC | 14,070 | 151,261 | ||||||
Toyo Suisan Kaisha Ltd. | 3,000 | 101,011 | ||||||
Tyson Foods, Inc. – Class A | 10,300 | 406,335 | ||||||
Unilever NV | 49,149 | 1,943,587 | ||||||
Unilever PLC | 38,724 | 1,583,813 | ||||||
Wilmar International Ltd. | 57,000 | 155,343 | ||||||
Yakult Honsha Co., Ltd. | 2,700 | 129,889 | ||||||
Yamazaki Baking Co., Ltd. | 3,000 | 34,825 | ||||||
|
| |||||||
| 24,995,219 | ||||||||
|
| |||||||
Household Products – 0.9% | ||||||||
Clorox Co. (The) | 4,900 | 427,672 | ||||||
Colgate-Palmolive Co. | 33,400 | 2,098,522 | ||||||
Henkel AG & Co. KGaA | 3,920 | 395,970 | ||||||
Henkel AG & Co. KGaA (Preference Shares) | 5,376 | 599,047 | ||||||
Kimberly-Clark Corp. | 14,500 | 1,600,075 | ||||||
Procter & Gamble Co. (The) | 103,300 | 8,125,578 | ||||||
Reckitt Benckiser Group PLC | 19,517 | 1,605,548 | ||||||
Svenska Cellulosa AB SCA – Class B | 17,783 | 539,358 | ||||||
Unicharm Corp. | 3,500 | 198,965 | ||||||
|
| |||||||
| 15,590,735 | ||||||||
|
| |||||||
Personal Products – 0.2% | ||||||||
Avon Products, Inc. | 16,450 | 254,481 | ||||||
Beiersdorf AG | 3,042 | 310,342 | ||||||
Estee Lauder Cos., Inc. (The) – Class A | 9,700 | 667,748 | ||||||
Kao Corp. | 15,600 | 537,173 | ||||||
L’Oreal SA | 7,576 | 1,283,494 | ||||||
Shiseido Co., Ltd. | 10,900 | 193,438 | ||||||
|
| |||||||
| 3,246,676 | ||||||||
|
| |||||||
| ALLIANCEBERNSTEIN WEALTH STRATEGIES • | 259 |
Volatility Management Portfolio—Portfolio of Investments
| Company | Shares | U.S. $ Value | ||||||
| ||||||||
Tobacco – 0.9% | ||||||||
Altria Group, Inc. | 75,900 | $ | 2,752,134 | |||||
British American Tobacco PLC | 57,335 | 3,125,411 | ||||||
Imperial Tobacco Group PLC | 29,208 | 1,191,383 | ||||||
Japan Tobacco, Inc. | 33,144 | 1,055,627 | ||||||
Lorillard, Inc. | 13,950 | 684,387 | ||||||
Philip Morris International, Inc. | 60,850 | 4,923,374 | ||||||
Reynolds American, Inc. | 11,850 | 602,336 | ||||||
Swedish Match AB | 6,095 | 192,827 | ||||||
|
| |||||||
| 14,527,479 | ||||||||
|
| |||||||
| 103,867,586 | ||||||||
|
| |||||||
Energy – 5.4% | ||||||||
Energy Equipment & Services – 0.9% | ||||||||
Aker Solutions ASA | 4,960 | 83,215 | ||||||
AMEC PLC | 8,970 | 168,460 | ||||||
Baker Hughes, Inc. | 16,800 | 1,063,104 | ||||||
Cameron International Corp.(a) | 9,000 | 576,540 | ||||||
CGG SA(a) | 4,749 | 72,516 | ||||||
Diamond Offshore Drilling, Inc.(b) | 2,600 | 122,980 | ||||||
Ensco PLC – Class A | 8,850 | 466,041 | ||||||
FMC Technologies, Inc.(a) | 8,950 | 449,648 | ||||||
Fugro NV | 2,125 | 123,224 | ||||||
Halliburton Co. | 32,250 | 1,838,250 | ||||||
Helmerich & Payne, Inc. | 4,050 | 399,938 | ||||||
Nabors Industries Ltd. | 9,850 | 226,747 | ||||||
National Oilwell Varco, Inc. | 16,250 | 1,251,900 | ||||||
Noble Corp. PLC | 9,600 | 298,080 | ||||||
Petrofac Ltd. | 7,827 | 179,300 | ||||||
Rowan Cos., PLC – Class A(a) | 4,700 | 156,792 | ||||||
Saipem SpA | 7,989 | 187,685 | ||||||
Schlumberger Ltd. | 50,050 | 4,654,650 | ||||||
Seadrill Ltd. | 11,327 | 417,301 | ||||||
Subsea 7 SA | 7,961 | 151,872 | ||||||
Technip SA | 3,066 | 300,159 | ||||||
Tenaris SA | 14,248 | 297,534 | ||||||
Transocean Ltd. | 12,815 | 543,356 | ||||||
Transocean Ltd. (Zurich) | �� | 10,872 | 458,330 | |||||
WorleyParsons Ltd. | 6,235 | 93,888 | ||||||
|
| |||||||
| 14,581,510 | ||||||||
|
| |||||||
Oil, Gas & Consumable Fuels – 4.5% | ||||||||
Anadarko Petroleum Corp. | 19,100 | 1,607,456 | ||||||
Apache Corp. | 15,150 | 1,201,243 | ||||||
BG Group PLC | 102,695 | 1,868,405 | ||||||
BP PLC | 567,946 | 4,799,743 | ||||||
Cabot Oil & Gas Corp. | 15,950 | 558,250 | ||||||
Caltex Australia Ltd. | 4,073 | 76,335 | ||||||
Chesapeake Energy Corp. | 19,150 | 496,176 | ||||||
| 260 | • ALLIANCEBERNSTEIN WEALTH STRATEGIES |
Volatility Management Portfolio—Portfolio of Investments
| Company | Shares | U.S. $ Value | ||||||
| ||||||||
Chevron Corp. | 73,050 | $ | 8,424,856 | |||||
ConocoPhillips | 46,550 | 3,095,575 | ||||||
CONSOL Energy, Inc. | 8,650 | 346,865 | ||||||
Delek Group Ltd. | 130 | 48,860 | ||||||
Denbury Resources, Inc. | 13,900 | 227,404 | ||||||
Devon Energy Corp. | 14,450 | 930,869 | ||||||
ENI SpA | 76,754 | 1,842,603 | ||||||
EOG Resources, Inc. | 10,450 | 1,979,439 | ||||||
EQT Corp. | 5,700 | 583,053 | ||||||
Exxon Mobil Corp. | 165,953 | 15,976,295 | ||||||
Galp Energia SGPS SA | 10,470 | 175,575 | ||||||
Hess Corp. | 10,800 | 864,324 | ||||||
Idemitsu Kosan Co., Ltd. | 2,800 | 57,306 | ||||||
Inpex Corp. | 26,436 | 335,914 | ||||||
Japan Petroleum Exploration Co. | 900 | 33,001 | ||||||
JX Holdings, Inc. | 67,000 | 347,965 | ||||||
Kinder Morgan, Inc./DE | 25,485 | 811,697 | ||||||
Koninklijke Vopak NV | 2,122 | 124,084 | ||||||
Lundin Petroleum AB(a) | 6,714 | 134,422 | ||||||
Marathon Oil Corp. | 26,400 | 884,400 | ||||||
Marathon Petroleum Corp. | 11,400 | 957,600 | ||||||
Murphy Oil Corp. | 6,650 | 394,810 | ||||||
Neste Oil Oyj(b) | 3,868 | 82,808 | ||||||
Newfield Exploration Co.(a) | 5,150 | 145,179 | ||||||
Noble Energy, Inc. | 13,700 | 942,012 | ||||||
Occidental Petroleum Corp. | 30,650 | 2,958,338 | ||||||
OMV AG | 4,444 | 202,240 | ||||||
ONEOK, Inc. | 7,800 | 461,292 | ||||||
Origin Energy Ltd. | 33,127 | 428,097 | ||||||
Peabody Energy Corp. | 10,200 | 179,112 | ||||||
Phillips 66 | 22,750 | 1,703,065 | ||||||
Pioneer Natural Resources Co. | 5,500 | 1,106,490 | ||||||
QEP Resources, Inc. | 6,750 | 195,278 | ||||||
Range Resources Corp. | 6,200 | 533,510 | ||||||
Repsol SA | 25,509 | 638,894 | ||||||
Royal Dutch Shell PLC – Class A | 115,148 | 4,191,973 | ||||||
Royal Dutch Shell PLC –Class B | 75,700 | 2,944,920 | ||||||
Santos Ltd.(b) | 29,168 | 355,630 | ||||||
Showa Shell Sekiyu KK | 5,700 | 56,126 | ||||||
Southwestern Energy Co.(a) | 13,350 | 551,889 | ||||||
Spectra Energy Corp. | 25,400 | 946,912 | ||||||
Statoil ASA | 33,672 | 888,134 | ||||||
Tesoro Corp. | 5,000 | 255,050 | ||||||
TonenGeneral Sekiyu KK | 8,000 | 70,716 | ||||||
Total SA | 64,452 | 4,181,588 | ||||||
Tullow Oil PLC | 27,400 | 366,600 | ||||||
Valero Energy Corp. | 20,450 | 981,191 | ||||||
| ALLIANCEBERNSTEIN WEALTH STRATEGIES • | 261 |
Volatility Management Portfolio—Portfolio of Investments
| Company | Shares | U.S. $ Value | ||||||
| ||||||||
Williams Cos., Inc. (The) | 25,900 | $ | 1,069,670 | |||||
Woodside Petroleum Ltd. | 19,887 | 674,555 | ||||||
WPX Energy, Inc.(a) | 7,600 | 133,912 | ||||||
|
| |||||||
| 76,429,706 | ||||||||
|
| |||||||
| 91,011,216 | ||||||||
|
| |||||||
Materials – 3.2% | ||||||||
Chemicals – 1.8% | ||||||||
Air Liquide SA | 9,765 | 1,340,397 | ||||||
Air Products & Chemicals, Inc. | 8,000 | 970,560 | ||||||
Air Water, Inc. | 5,000 | 74,289 | ||||||
Airgas, Inc. | 2,500 | 269,500 | ||||||
Akzo Nobel NV | 7,236 | 598,182 | ||||||
Arkema SA | 1,892 | 205,230 | ||||||
Asahi Kasei Corp. | 38,000 | 270,812 | ||||||
BASF SE | 27,712 | 3,185,327 | ||||||
CF Industries Holdings, Inc. | 2,200 | 551,980 | ||||||
Croda International PLC | 4,097 | 174,225 | ||||||
Daicel Corp. | 8,000 | 69,256 | ||||||
Dow Chemical Co. (The) | 46,050 | 2,243,095 | ||||||
Eastman Chemical Co. | 5,850 | 511,465 | ||||||
Ecolab, Inc. | 10,300 | 1,109,825 | ||||||
EI du Pont de Nemours & Co. | 35,200 | 2,345,024 | ||||||
EMS-Chemie Holding AG (REG) | 247 | 95,048 | ||||||
FMC Corp. | 5,050 | 389,759 | ||||||
Fuchs Petrolub SE (Preference Shares) | 1,071 | 106,719 | ||||||
Givaudan SA(a) | 251 | 393,241 | ||||||
Hitachi Chemical Co., Ltd. | 3,100 | 43,371 | ||||||
Incitec Pivot Ltd. | 47,170 | 132,542 | ||||||
International Flavors & Fragrances, Inc. | 3,100 | 290,749 | ||||||
Israel Chemicals Ltd. | 13,439 | 114,084 | ||||||
Israel Corp., Ltd. (The)(a) | 82 | 43,798 | ||||||
Johnson Matthey PLC | 6,183 | 337,612 | ||||||
JSR Corp. | 5,400 | 92,832 | ||||||
K&S AG | 5,198 | 175,488 | ||||||
Kaneka Corp. | 8,000 | 52,363 | ||||||
Kansai Paint Co., Ltd. | 7,000 | 91,039 | ||||||
Koninklijke DSM NV | 4,653 | 296,895 | ||||||
Kuraray Co., Ltd. | 10,500 | 117,881 | ||||||
Lanxess AG | 2,511 | 186,190 | ||||||
Linde AG | 5,615 | 1,162,186 | ||||||
LyondellBasell Industries NV – Class A | 16,640 | 1,465,651 | ||||||
Mitsubishi Chemical Holdings Corp. | 40,500 | 183,271 | ||||||
Mitsubishi Gas Chemical Co., Inc. | 11,000 | 70,431 | ||||||
Mitsui Chemicals, Inc. | 24,000 | 62,223 | ||||||
Monsanto Co. | 19,950 | 2,194,899 | ||||||
Mosaic Co. (The) | 12,900 | 630,294 | ||||||
Nippon Paint Co., Ltd. | 5,000 | 76,875 | ||||||
| 262 | • ALLIANCEBERNSTEIN WEALTH STRATEGIES |
Volatility Management Portfolio—Portfolio of Investments
| Company | Shares | U.S. $ Value | ||||||
| ||||||||
Nitto Denko Corp. | 5,000 | $ | 234,637 | |||||
Orica Ltd. | 11,069 | 239,356 | ||||||
PPG Industries, Inc. | 5,400 | 1,068,228 | ||||||
Praxair, Inc. | 11,250 | 1,466,662 | ||||||
Sherwin-Williams Co. (The) | 3,300 | 661,584 | ||||||
Shin-Etsu Chemical Co., Ltd. | 12,400 | 704,281 | ||||||
Showa Denko KK | 45,000 | 65,204 | ||||||
Sigma-Aldrich Corp. | 4,550 | 429,565 | ||||||
Sika AG | 65 | 239,482 | ||||||
Solvay SA | 1,789 | 276,838 | ||||||
Sumitomo Chemical Co., Ltd. | 44,000 | 180,687 | ||||||
Syngenta AG | 2,810 | 1,022,954 | ||||||
Taiyo Nippon Sanso Corp. | 7,000 | 52,628 | ||||||
Teijin Ltd. | 28,000 | 67,352 | ||||||
Toray Industries, Inc. | 44,000 | 304,005 | ||||||
Ube Industries Ltd./Japan | 31,000 | 59,309 | ||||||
Umicore SA | 3,440 | 168,963 | ||||||
Yara International ASA | 5,455 | 221,171 | ||||||
|
| |||||||
| 30,187,514 | ||||||||
|
| |||||||
Construction Materials – 0.1% | ||||||||
Boral Ltd. | 22,259 | 110,935 | ||||||
CRH PLC | 22,007 | 649,045 | ||||||
Fletcher Building Ltd. | 20,700 | 163,684 | ||||||
HeidelbergCement AG | 4,243 | 349,085 | ||||||
Holcim Ltd.(a) | 6,908 | 560,506 | ||||||
Imerys SA | 1,063 | 99,008 | ||||||
James Hardie Industries PLC | 13,325 | 173,285 | ||||||
Lafarge SA | 4,591 | 344,216 | ||||||
Taiheiyo Cement Corp. | 35,000 | 123,608 | ||||||
Vulcan Materials Co. | 4,900 | 332,857 | ||||||
|
| |||||||
| 2,906,229 | ||||||||
|
| |||||||
Containers & Packaging – 0.1% | ||||||||
Amcor Ltd./Australia | 36,407 | 329,108 | ||||||
Avery Dennison Corp. | 3,650 | 181,843 | ||||||
Ball Corp. | 5,450 | 302,802 | ||||||
Bemis Co., Inc. | 3,900 | 153,192 | ||||||
MeadWestvaco Corp. | 6,700 | 250,781 | ||||||
Owens-Illinois, Inc.(a) | 6,250 | 212,000 | ||||||
Rexam PLC | 23,881 | 197,342 | ||||||
Sealed Air Corp. | 7,400 | 251,896 | ||||||
Toyo Seikan Group Holdings Ltd. | 4,900 | 86,022 | ||||||
|
| |||||||
| 1,964,986 | ||||||||
|
| |||||||
Metals & Mining – 1.1% | ||||||||
Alcoa, Inc. | 40,550 | 476,057 | ||||||
Allegheny Technologies, Inc. | 4,050 | 128,709 | ||||||
Alumina Ltd.(a) | 70,569 | 81,002 | ||||||
| ALLIANCEBERNSTEIN WEALTH STRATEGIES • | 263 |
Volatility Management Portfolio—Portfolio of Investments
| Company | Shares | U.S. $ Value | ||||||
| ||||||||
Anglo American PLC | 42,050 | $ | 1,073,943 | |||||
Antofagasta PLC | 11,898 | 179,354 | ||||||
ArcelorMittal (Euronext Amsterdam) | 30,148 | 473,436 | ||||||
BHP Billiton Ltd. | 96,759 | 3,318,697 | ||||||
BHP Billiton PLC | 63,724 | 2,053,623 | ||||||
Boliden AB | 8,252 | 130,738 | ||||||
Cliffs Natural Resources, Inc.(b) | 5,800 | 116,174 | ||||||
Daido Steel Co., Ltd. | 8,000 | 36,879 | ||||||
Fortescue Metals Group Ltd. | 46,054 | 224,176 | ||||||
Freeport-McMoRan Copper & Gold, Inc. | 39,350 | 1,283,597 | ||||||
Fresnillo PLC | 5,558 | 88,821 | ||||||
Glencore Xstrata PLC | 319,170 | 1,757,590 | ||||||
Hitachi Metals Ltd. | 6,000 | 89,694 | ||||||
Iluka Resources Ltd. | 12,633 | 106,096 | ||||||
JFE Holdings, Inc. | 14,800 | 302,078 | ||||||
Kobe Steel Ltd.(a) | 75,000 | 102,744 | ||||||
Maruichi Steel Tube Ltd. | 1,400 | 39,204 | ||||||
Mitsubishi Materials Corp. | 33,000 | 103,784 | ||||||
Newcrest Mining Ltd. | 23,127 | 233,065 | ||||||
Newmont Mining Corp. | 18,850 | 438,451 | ||||||
Nippon Steel & Sumitomo Metal Corp. | 229,000 | 670,953 | ||||||
Norsk Hydro ASA | 40,521 | 200,066 | ||||||
Nucor Corp. | 12,050 | 605,392 | ||||||
Randgold Resources Ltd. | 2,643 | 209,328 | ||||||
Rio Tinto Ltd. | 13,148 | 785,498 | ||||||
Rio Tinto PLC | 38,353 | 2,199,187 | ||||||
Sumitomo Metal Mining Co., Ltd. | 16,000 | 209,446 | ||||||
ThyssenKrupp AG(a) | 11,642 | 316,651 | ||||||
United States Steel Corp.(b) | 5,450 | 131,999 | ||||||
Voestalpine AG | 3,382 | 152,098 | ||||||
Yamato Kogyo Co., Ltd. | 1,300 | 39,309 | ||||||
|
| |||||||
| 18,357,839 | ||||||||
|
| |||||||
Paper & Forest Products – 0.1% | ||||||||
International Paper Co. | 16,800 | 821,352 | ||||||
OJI Holdings Corp. | 24,000 | 115,274 | ||||||
Stora Enso OYJ – Class R | 16,604 | 188,826 | ||||||
UPM-Kymmene OYJ | 15,934 | 288,977 | ||||||
|
| |||||||
| 1,414,429 | ||||||||
|
| |||||||
| 54,830,997 | ||||||||
|
| |||||||
Equity: Other – 2.5% | ||||||||
Diversified/Specialty – 2.0% | ||||||||
Activia Properties, Inc.(b) | 15 | 127,809 | ||||||
Aedifica SA | 650 | 47,417 | ||||||
Affine SA | 400 | 8,254 | ||||||
Alexander’s, Inc. | 190 | 71,195 | ||||||
Alexandria Real Estate Equities, Inc. | 5,510 | 399,200 | ||||||
| 264 | • ALLIANCEBERNSTEIN WEALTH STRATEGIES |
Volatility Management Portfolio—Portfolio of Investments
| Company | Shares | U.S. $ Value | ||||||
| ||||||||
American Assets Trust, Inc. | 2,650 | $ | 87,636 | |||||
American Homes 4 Rent – Class A | 3,500 | 57,330 | ||||||
ANF Immobilier | 550 | 18,220 | ||||||
Artis Real Estate Investment Trust | 9,650 | 136,562 | ||||||
Australand Property Group | 27,000 | 94,415 | ||||||
Azrieli Group | 2,800 | 92,168 | ||||||
Beni Stabili SpA | 63,200 | 55,815 | ||||||
BioMed Realty Trust, Inc. | 14,700 | 303,996 | ||||||
British Land Co. PLC | 104,990 | 1,225,443 | ||||||
CA Immobilien Anlagen AG(a) | 5,619 | 105,094 | ||||||
Campus Crest Communities, Inc. | 4,950 | 40,986 | ||||||
Canadian Real Estate Investment Trust | 5,200 | 204,844 | ||||||
CapitaLand Ltd. | 271,950 | 612,283 | ||||||
Chambers Street Properties | 18,100 | 143,171 | ||||||
Cheung Kong Holdings Ltd. | 42,000 | 659,501 | ||||||
City Developments Ltd. | 57,450 | 425,869 | ||||||
Cofinimmo | 1,320 | 158,279 | ||||||
Conwert Immobilien Invest SE(a) | 4,694 | 64,079 | ||||||
Country Garden Holdings Co., Ltd. | 335,599 | 173,719 | ||||||
Daejan Holdings PLC | 405 | 33,977 | ||||||
Dexus Property Group | 582,519 | 557,255 | ||||||
DIC Asset AG | 2,600 | 24,540 | ||||||
Digital Realty Trust, Inc.(b) | 9,860 | 534,018 | ||||||
Duke Realty Corp. | 24,910 | 418,488 | ||||||
Dundee Real Estate Investment Trust – Class A | 8,000 | 213,348 | ||||||
DuPont Fabros Technology, Inc. | 4,940 | 131,206 | ||||||
Eurobank Properties Real Estate Investment Co.(a) | 1,850 | 20,428 | ||||||
F&C Commercial Property Trust Ltd. | 37,983 | 76,580 | ||||||
Fastighets AB Balder – Class B(a) | 7,050 | 90,670 | ||||||
Fonciere Des Regions | 3,477 | 325,873 | ||||||
Forest City Enterprises, Inc. – Class A(a) | 11,410 | 222,267 | ||||||
Gecina SA | 2,099 | 287,651 | ||||||
GPT Group | 172,500 | 573,664 | ||||||
Granite Real Estate Investment Trust | 3,600 | 124,519 | ||||||
H&R Real Estate Investment Trust | 20,556 | 412,865 | ||||||
Hamborner REIT AG | 3,500 | 37,016 | ||||||
Hang Lung Properties Ltd. | 237,500 | 662,447 | ||||||
Helical Bar PLC | 7,600 | 47,470 | ||||||
Henderson Land Development Co., Ltd. | 111,440 | 627,107 | ||||||
Hulic Co., Ltd. | 30,736 | 355,533 | ||||||
Hysan Development Co., Ltd. | 67,150 | 279,941 | ||||||
ICADE | 3,567 | 351,301 | ||||||
Investors Real Estate Trust | 7,910 | 69,450 | ||||||
Keppel Land Ltd. | 74,350 | 188,624 | ||||||
Kerry Properties Ltd. | 68,900 | 227,922 | ||||||
| ALLIANCEBERNSTEIN WEALTH STRATEGIES • | 265 |
Volatility Management Portfolio—Portfolio of Investments
| Company | Shares | U.S. $ Value | ||||||
| ||||||||
Kiwi Income Property Trust | 75,850 | $ | 71,542 | |||||
Klovern AB | 5,740 | 32,043 | ||||||
Kungsleden AB | 10,450 | 90,094 | ||||||
Land Securities Group PLC | 84,001 | 1,527,842 | ||||||
Lend Lease Group | 16,495 | 166,640 | ||||||
Lexington Realty Trust | 17,480 | 199,447 | ||||||
Londonmetric Property PLC | 44,777 | 108,348 | ||||||
Mapletree Commercial Trust | 98,100 | 93,708 | ||||||
Mitsubishi Estate Co., Ltd. | 134,190 | 3,182,723 | ||||||
Mitsui Fudosan Co., Ltd. | 89,990 | 2,690,053 | ||||||
Mobimo Holding AG(a) | 500 | 111,401 | ||||||
Morguard Real Estate Investment Trust | 2,650 | 39,871 | ||||||
Mucklow A & J Group PLC | 3,500 | 29,891 | ||||||
New World China Land Ltd. | 198,850 | 118,058 | ||||||
New World Development Co., Ltd. | 379,550 | 491,740 | ||||||
Nieuwe Steen Investments NV | 9,974 | 61,315 | ||||||
Nomura Real Estate Holdings, Inc. | 12,980 | 266,886 | ||||||
Nomura Real Estate Master Fund, Inc. | 161 | 167,865 | ||||||
Premier Investment Corp. | 15 | 58,241 | ||||||
Quintain Estates & Development PLC(a) | 34,912 | 60,800 | ||||||
Redefine International PLC | 54,900 | 46,886 | ||||||
Royal Mail PLC(a) | 19,779 | 198,726 | ||||||
Schroder Real Estate Investment Trust Ltd. | 27,263 | 24,310 | ||||||
Select Income REIT | 2,100 | 61,215 | ||||||
Shui On Land Ltd. | 262,450 | 72,163 | ||||||
Silver Bay Realty Trust Corp.(b) | 2,800 | 43,876 | ||||||
Sino Land Co., Ltd. | 314,660 | 448,658 | ||||||
SOHO China Ltd. | 118,050 | 89,219 | ||||||
Spirit Realty Capital, Inc. | 27,226 | 297,308 | ||||||
Sponda Oyj | 18,460 | 100,296 | ||||||
ST Modwen Properties PLC | 12,673 | 83,719 | ||||||
Sumitomo Realty & Development Co., Ltd. | 46,540 | 1,880,428 | ||||||
Sun Hung Kai Properties Ltd. | 166,450 | 2,133,645 | ||||||
Suntec Real Estate Investment Trust | 156,750 | 205,991 | ||||||
Swire Pacific Ltd. – Class A | 20,500 | 230,686 | ||||||
Swire Properties Ltd. | 123,150 | 328,298 | ||||||
TAG Immobilien AG | 9,520 | 120,167 | ||||||
Tokyu REIT, Inc. | 70 | 85,772 | ||||||
Top REIT, Inc. | 12 | 55,275 | ||||||
Unite Group PLC | 13,523 | 101,549 | ||||||
United Urban Investment Corp. | 284 | 435,057 | ||||||
UOL Group Ltd. | 48,400 | 233,815 | ||||||
Vornado Realty Trust | 19,510 | 1,878,618 | ||||||
Wallenstam AB – Class B | 7,700 | 127,241 | ||||||
Washington Real Estate Investment Trust | 5,040 | 126,756 | ||||||
Wereldhave Belgium NV | 150 | 18,427 | ||||||
Wereldhave NV | 1,670 | 143,257 | ||||||
Wharf Holdings Ltd. | 161,300 | 1,130,854 | ||||||
Wheelock & Co., Ltd. | 27,000 | 110,732 | ||||||
Wihlborgs Fastigheter AB | 5,070 | 101,069 | ||||||
Winthrop Realty Trust | 2,450 | 28,518 | ||||||
| 266 | • ALLIANCEBERNSTEIN WEALTH STRATEGIES |
Volatility Management Portfolio—Portfolio of Investments
| Company | Shares | U.S. $ Value | ||||||
| ||||||||
W.P. Carey, Inc. | 6,459 | $ | 410,276 | |||||
|
| |||||||
| 33,128,760 | ||||||||
|
| |||||||
Health Care – 0.4% | ||||||||
Chartwell Retirement Residences | 13,250 | 123,609 | ||||||
Extendicare, Inc./US(b) | 6,600 | 42,677 | ||||||
HCP, Inc. | 52,100 | 2,019,917 | ||||||
Health Care REIT, Inc. | 32,770 | 1,924,910 | ||||||
Healthcare Realty Trust, Inc. | 7,350 | 176,179 | ||||||
LTC Properties, Inc. | 2,650 | 99,852 | ||||||
Medical Properties Trust, Inc. | 12,380 | 163,292 | ||||||
National Health Investors, Inc. | 2,250 | 138,825 | ||||||
Omega Healthcare Investors, Inc. | 9,390 | 300,104 | ||||||
Primary Health Properties PLC | 8,095 | 48,529 | ||||||
Sabra Health Care REIT, Inc. | 2,900 | 82,563 | ||||||
Senior Housing Properties Trust | 14,380 | 320,674 | ||||||
Universal Health Realty Income Trust | 960 | 40,877 | ||||||
Ventas, Inc. | 33,770 | 2,108,261 | ||||||
|
| |||||||
| 7,590,269 | ||||||||
|
| |||||||
Triple Net – 0.1% | ||||||||
Agree Realty Corp. | 1,100 | 33,814 | ||||||
EPR Properties | 3,910 | 208,247 | ||||||
Getty Realty Corp. | 1,900 | 36,556 | ||||||
National Retail Properties, Inc.(b) | 9,300 | 333,777 | ||||||
Realty Income Corp.(b) | 15,717 | 698,149 | ||||||
|
| |||||||
| 1,310,543 | ||||||||
|
| |||||||
| 42,029,572 | ||||||||
|
| |||||||
Telecommunication Services – 2.1% | ||||||||
Diversified Telecommunication Services – 1.6% | ||||||||
AT&T, Inc. | 200,104 | 6,389,321 | ||||||
Belgacom SA | 4,590 | 138,080 | ||||||
Bezeq The Israeli Telecommunication Corp., Ltd. | 54,723 | 89,145 | ||||||
BT Group PLC | 237,768 | 1,635,328 | ||||||
CenturyLink, Inc. | 22,450 | 701,787 | ||||||
Deutsche Telekom AG | 87,176 | 1,474,781 | ||||||
Elisa Oyj | 4,287 | 120,004 | ||||||
Frontier Communications Corp.(b) | 37,940 | 185,147 | ||||||
HKT Trust and HKT Ltd. | 61,700 | 66,087 | ||||||
Iliad SA | 785 | 191,461 | ||||||
Inmarsat PLC | 13,526 | 157,279 | ||||||
Koninklijke KPN NV(a) | 95,096 | 338,926 | ||||||
Nippon Telegraph & Telephone Corp. | 11,300 | 636,179 | ||||||
Orange SA | 55,869 | 696,800 | ||||||
PCCW Ltd. | 120,000 | 56,903 | ||||||
Portugal Telecom SGPS SA(b) | 17,736 | 79,415 | ||||||
Singapore Telecommunications Ltd. | 240,000 | 680,105 | ||||||
| ALLIANCEBERNSTEIN WEALTH STRATEGIES • | 267 |
Volatility Management Portfolio—Portfolio of Investments
| Company | Shares | U.S. $ Value | ||||||
| ||||||||
Swisscom AG | 704 | $ | 416,671 | |||||
TDC A/S | 24,466 | 243,008 | ||||||
Telecom Corp. of New Zealand Ltd. | 52,201 | 109,529 | ||||||
Telecom Italia SpA (ordinary shares) | 298,142 | 338,650 | ||||||
Telecom Italia SpA (savings shares) | 174,906 | 153,135 | ||||||
Telefonica Deutschland Holding AG | 8,424 | 67,393 | ||||||
Telefonica SA | 123,580 | 1,889,577 | ||||||
Telekom Austria AG | 6,682 | 64,964 | ||||||
Telenor ASA | 20,564 | 453,073 | ||||||
TeliaSonera AB | 71,854 | 553,098 | ||||||
Telstra Corp., Ltd. | 130,348 | 588,031 | ||||||
Verizon Communications, Inc. (London) | 1 | 41 | ||||||
Verizon Communications, Inc. | 157,120 | 7,475,770 | ||||||
Vivendi SA | 36,311 | 1,035,431 | ||||||
Windstream Holdings, Inc.(b) | 22,630 | 181,493 | ||||||
Ziggo NV | 4,526 | 206,369 | ||||||
|
| |||||||
| 27,412,981 | ||||||||
|
| |||||||
Wireless Telecommunication Services – 0.5% | ||||||||
Crown Castle International Corp.(a) | 12,680 | 962,412 | ||||||
KDDI Corp. | 16,216 | 991,700 | ||||||
Millicom International Cellular SA | 1,995 | 207,729 | ||||||
NTT DoCoMo, Inc. | 46,032 | 767,240 | ||||||
Softbank Corp. | 29,000 | 2,197,716 | ||||||
StarHub Ltd. | 18,000 | 59,393 | ||||||
Tele2 AB – Class B | 9,609 | 119,090 | ||||||
Vodafone Group PLC | 796,275 | 3,318,047 | ||||||
|
| |||||||
| 8,623,327 | ||||||||
|
| |||||||
| 36,036,308 | ||||||||
|
| |||||||
Utilities – 2.0% | ||||||||
Electric Utilities – 1.0% | ||||||||
American Electric Power Co., Inc. | 18,450 | 926,190 | ||||||
Cheung Kong Infrastructure Holdings Ltd. | 18,000 | 117,914 | ||||||
Chubu Electric Power Co., Inc. | 19,400 | 240,005 | ||||||
Chugoku Electric Power Co., Inc. (The) | 8,900 | 126,580 | ||||||
CLP Holdings Ltd. | 53,000 | 412,740 | ||||||
Contact Energy Ltd. | 9,841 | 44,161 | ||||||
Duke Energy Corp. | 26,858 | 1,903,695 | ||||||
Edison International | 12,350 | 646,769 | ||||||
EDP – Energias de Portugal SA | 59,203 | 256,213 | ||||||
Electricite de France | 5,910 | 234,483 | ||||||
Enel SpA | 197,464 | 1,011,908 | ||||||
Entergy Corp. | 6,750 | 430,785 | ||||||
Exelon Corp. | 32,482 | 987,778 | ||||||
FirstEnergy Corp. | 15,850 | 487,863 | ||||||
Fortum Oyj | 13,402 | 317,439 | ||||||
Hokkaido Electric Power Co., Inc.(a) | 5,500 | 56,198 | ||||||
Hokuriku Electric Power Co. | 5,100 | 65,672 | ||||||
| 268 | • ALLIANCEBERNSTEIN WEALTH STRATEGIES |
Volatility Management Portfolio—Portfolio of Investments
| Company | Shares | U.S. $ Value | ||||||
| ||||||||
Iberdrola SA | 141,010 | $ | 933,971 | |||||
Kansai Electric Power Co., Inc. (The)(a) | 21,200 | 236,984 | ||||||
Kyushu Electric Power Co., Inc.(a) | 12,900 | 166,097 | ||||||
NextEra Energy, Inc. | 16,350 | 1,494,226 | ||||||
Northeast Utilities | 12,000 | 533,400 | ||||||
Pepco Holdings, Inc. | 9,450 | 192,686 | ||||||
Pinnacle West Capital Corp. | 4,150 | 230,948 | ||||||
Power Assets Holdings Ltd. | 41,500 | 347,140 | ||||||
PPL Corp. | 23,900 | 771,731 | ||||||
Red Electrica Corp. SA | 3,265 | 253,864 | ||||||
Shikoku Electric Power Co., Inc.(a) | 5,400 | 83,940 | ||||||
Southern Co. (The) | 33,500 | 1,418,725 | ||||||
SP AusNet | 50,801 | 60,154 | ||||||
SSE PLC | 29,096 | 683,109 | ||||||
Terna Rete Elettrica Nazionale SpA | 44,418 | 226,582 | ||||||
Tohoku Electric Power Co., Inc.(a) | 13,600 | 160,156 | ||||||
Tokyo Electric Power Co., Inc.(a) | 43,500 | 203,452 | ||||||
Xcel Energy, Inc. | 18,850 | 570,967 | ||||||
|
| |||||||
| 16,834,525 | ||||||||
|
| |||||||
Gas Utilities – 0.1% | ||||||||
AGL Resources, Inc. | 4,500 | 211,680 | ||||||
APA Group(b) | 24,339 | 145,234 | ||||||
Enagas SA | 5,763 | 167,441 | ||||||
Gas Natural SDG SA | 10,567 | 270,625 | ||||||
Hong Kong & China Gas Co., Ltd. | 172,800 | 372,592 | ||||||
Osaka Gas Co., Ltd. | 56,000 | 233,276 | ||||||
Snam SpA | 60,245 | 342,749 | ||||||
Toho Gas Co., Ltd. | 12,000 | 60,969 | ||||||
Tokyo Gas Co., Ltd. | 72,000 | 361,694 | ||||||
|
| |||||||
| 2,166,260 | ||||||||
|
| |||||||
Independent Power Producers & Energy | ||||||||
AES Corp./VA | 24,900 | 339,885 | ||||||
Electric Power Development Co., Ltd. | 3,500 | 108,946 | ||||||
Enel Green Power SpA | 50,724 | 142,250 | ||||||
NRG Energy, Inc. | 12,250 | 356,108 | ||||||
|
| |||||||
| 947,189 | ||||||||
|
| |||||||
Multi-Utilities – 0.8% | ||||||||
AGL Energy Ltd. | 16,721 | 234,009 | ||||||
Ameren Corp. | 9,200 | 371,772 | ||||||
CenterPoint Energy, Inc. | 16,250 | 384,312 | ||||||
Centrica PLC | 155,058 | 828,084 | ||||||
CMS Energy Corp. | 10,050 | 285,721 | ||||||
Consolidated Edison, Inc. | 11,100 | 622,155 | ||||||
Dominion Resources, Inc./VA | 22,100 | 1,533,740 | ||||||
DTE Energy Co. | 6,700 | 480,792 | ||||||
E.ON SE | 54,336 | 1,034,595 | ||||||
| ALLIANCEBERNSTEIN WEALTH STRATEGIES • | 269 |
Volatility Management Portfolio—Portfolio of Investments
| Company | Shares | U.S. $ Value | ||||||
| ||||||||
GDF Suez | 39,985 | $ | 1,023,972 | |||||
Integrys Energy Group, Inc. | 3,000 | 171,810 | ||||||
National Grid PLC | 112,385 | 1,572,631 | ||||||
NiSource, Inc. | 11,850 | 412,617 | ||||||
PG&E Corp. | 17,000 | 749,020 | ||||||
Public Service Enterprise Group, Inc. | 19,150 | 702,039 | ||||||
RWE AG | 14,766 | 590,448 | ||||||
SCANA Corp. | 5,300 | 262,350 | ||||||
Sempra Energy | 8,700 | 821,889 | ||||||
Suez Environnement Co. | 8,456 | 169,008 | ||||||
TECO Energy, Inc. | 7,700 | 129,206 | ||||||
United Utilities Group PLC | 20,573 | 268,505 | ||||||
Veolia Environnement SA | 10,631 | 200,843 | ||||||
Wisconsin Energy Corp. | 8,550 | 375,858 | ||||||
|
| |||||||
| 13,225,376 | ||||||||
|
| |||||||
Water Utilities – 0.0% | ||||||||
Severn Trent PLC | 7,207 | 223,267 | ||||||
|
| |||||||
| 33,396,617 | ||||||||
|
| |||||||
Retail – 1.6% | ||||||||
Regional Mall – 0.7% | ||||||||
CapitaMall Trust | 270,200 | 405,451 | ||||||
CBL & Associates Properties, Inc. | 12,990 | 231,092 | ||||||
CFS Retail Property Trust Group | 212,800 | 374,672 | ||||||
General Growth Properties, Inc. | 60,220 | 1,326,044 | ||||||
Glimcher Realty Trust | 11,080 | 107,808 | ||||||
Macerich Co. (The) | 16,090 | 967,492 | ||||||
Pennsylvania Real Estate Investment Trust | 5,010 | 93,988 | ||||||
Rouse Properties, Inc.(b) | 2,750 | 51,480 | ||||||
Simon Property Group, Inc. | 35,390 | 5,708,053 | ||||||
Taubman Centers, Inc. | 4,900 | 345,205 | ||||||
Westfield Group | 221,045 | 2,030,326 | ||||||
|
| |||||||
| 11,641,611 | ||||||||
|
| |||||||
Shopping Center/Other Retail – 0.9% | ||||||||
Acadia Realty Trust | 4,210 | 111,354 | ||||||
Aeon Mall Co., Ltd. | 11,920 | 330,985 | ||||||
American Realty Capital Properties, Inc. | 57,650 | 846,878 | ||||||
Brixmor Property Group, Inc. | 3,150 | 69,552 | ||||||
BWP Trust | 36,410 | 77,421 | ||||||
Calloway Real Estate Investment Trust | 7,800 | 182,092 | ||||||
Capital & Counties Properties PLC | 50,215 | 316,592 | ||||||
CapitaMalls Asia Ltd. | 142,246 | 201,080 | ||||||
Cedar Realty Trust, Inc. | 5,500 | 33,825 | ||||||
Charter Hall Retail REIT | 23,676 | 76,240 | ||||||
Citycon OYJ | 17,630 | 69,334 | ||||||
Corio NV | 7,289 | 341,414 | ||||||
Crombie Real Estate Investment Trust | 5,550 | 68,116 | ||||||
DDR Corp. | 23,420 | 389,240 | ||||||
| 270 | • ALLIANCEBERNSTEIN WEALTH STRATEGIES |
Volatility Management Portfolio—Portfolio of Investments
| Company | Shares | U.S. $ Value | ||||||
| ||||||||
Deutsche Euroshop AG | 3,515 | $ | 157,882 | |||||
Development Securities PLC | 9,363 | 40,138 | ||||||
Equity One, Inc. | 4,530 | 105,096 | ||||||
Eurocommercial Properties NV | 3,190 | 143,724 | ||||||
Excel Trust, Inc. | 3,450 | 43,229 | ||||||
Federal Realty Investment Trust | 5,030 | 559,889 | ||||||
Federation Centres Ltd. | 150,308 | 321,143 | ||||||
First Capital Realty, Inc.(b) | 6,330 | 101,527 | ||||||
Fortune Real Estate Investment Trust(b) | 99,200 | 76,951 | ||||||
Frontier Real Estate Investment Corp.(b) | 37 | 201,021 | ||||||
Hammerson PLC | 75,786 | 728,977 | ||||||
Immobiliare Grande Distribuzione | 10,374 | 16,324 | ||||||
Inland Real Estate Corp. | 6,550 | 70,150 | ||||||
Intu Properties PLC | 72,119 | 392,148 | ||||||
Japan Retail Fund Investment Corp.(b) | 247 | 488,100 | ||||||
Kimco Realty Corp. | 46,650 | 1,038,429 | ||||||
Kite Realty Group Trust | 9,900 | 61,182 | ||||||
Klepierre | 10,505 | 478,437 | ||||||
Link REIT (The) | 244,550 | 1,137,534 | ||||||
Mercialys SA | 3,140 | 71,470 | ||||||
Ramco-Gershenson Properties Trust | 5,030 | 84,001 | ||||||
Regency Centers Corp. | 7,020 | 356,405 | ||||||
Retail Opportunity Investments Corp. | 5,500 | 81,565 | ||||||
RioCan Real Estate Investment Trust (Toronto) | 23,050 | 546,639 | ||||||
Saul Centers, Inc. | 990 | 46,005 | ||||||
Shaftesbury PLC | 19,183 | 212,987 | ||||||
Tanger Factory Outlet Centers | 7,190 | 246,689 | ||||||
Unibail-Rodamco SE | 10,396 | 2,736,550 | ||||||
Urstadt Biddle Properties, Inc. – Class A | 1,750 | 34,318 | ||||||
Vastned Retail NV | 1,460 | 73,606 | ||||||
Weingarten Realty Investors | 8,320 | 253,760 | ||||||
Westfield Retail Trust | 324,549 | 902,043 | ||||||
|
| |||||||
| 14,922,042 | ||||||||
|
| |||||||
| 26,563,653 | ||||||||
|
| |||||||
Residential – 1.0% | ||||||||
Multi-Family – 0.7% | ||||||||
Advance Residence Investment Corp. | 93 | 199,496 | ||||||
Agile Property Holdings Ltd. | 95,900 | 81,849 | ||||||
Apartment Investment & Management Co. – Class A | 16,670 | 498,267 | ||||||
Associated Estates Realty Corp. | 4,400 | 75,240 | ||||||
AvalonBay Communities, Inc. | 14,580 | 1,880,382 | ||||||
Boardwalk Real Estate Investment Trust | 3,050 | 164,000 | ||||||
BRE Properties, Inc. | 5,870 | 362,590 | ||||||
Camden Property Trust | 6,500 | 433,550 | ||||||
Canadian Apartment Properties REIT | 8,350 | 164,919 | ||||||
Daiwahouse Residential Investment Corp. | 25 | 102,895 | ||||||
| ALLIANCEBERNSTEIN WEALTH STRATEGIES • | 271 |
Volatility Management Portfolio—Portfolio of Investments
| Company | Shares | U.S. $ Value | ||||||
| ||||||||
Deutsche Annington Immobilien SE(a) | 2,750 | $ | 74,664 | |||||
Deutsche Wohnen AG | 21,972 | 465,403 | ||||||
Deutsche Wohnen AG(a) | 9,872 | 203,100 | ||||||
Equity Lifestyle Properties, Inc. | 5,780 | 232,645 | ||||||
Equity Residential | 40,100 | 2,344,646 | ||||||
Essex Property Trust, Inc. | 2,930 | 490,043 | ||||||
GAGFAH SA(a) | 9,750 | 148,137 | ||||||
Grainger PLC | 31,465 | 129,388 | ||||||
Home Properties, Inc. | 4,350 | 256,389 | ||||||
Killam Properties, Inc.(b) | 3,900 | 36,489 | ||||||
LEG Immobilien AG(a) | 3,750 | 243,796 | ||||||
Mid-America Apartment Communities, Inc. | 5,712 | 386,360 | ||||||
Mirvac Group | 388,291 | 613,031 | ||||||
Nippon Accommodations Fund, Inc.(b) | 36 | 124,415 | ||||||
Northern Property Real Estate Investment Trust | 2,450 | 64,962 | ||||||
Persimmon PLC(a) | 9,168 | 221,803 | ||||||
Post Properties, Inc. | 4,150 | 201,400 | ||||||
Sekisui Chemical Co., Ltd. | 13,000 | 148,555 | ||||||
Shimao Property Holdings Ltd. | 95,750 | 192,660 | ||||||
Stockland | 245,106 | 846,473 | ||||||
Sun Communities, Inc. | 2,640 | 121,598 | ||||||
UDR, Inc. | 19,180 | 495,036 | ||||||
Wing Tai Holdings Ltd. | 29,325 | 42,841 | ||||||
Yanlord Land Group Ltd. | 50,788 | 44,932 | ||||||
|
| |||||||
| 12,091,954 | ||||||||
|
| |||||||
Self Storage – 0.2% | ||||||||
Big Yellow Group PLC | 9,854 | 94,304 | ||||||
CubeSmart | 10,630 | 186,131 | ||||||
Extra Space Storage, Inc. | 8,800 | 432,080 | ||||||
Public Storage | 16,470 | 2,783,430 | ||||||
Safestore Holdings PLC | 14,350 | 57,131 | ||||||
Sovran Self Storage, Inc. | 2,480 | 183,495 | ||||||
|
| |||||||
| 3,736,571 | ||||||||
|
| |||||||
Student Housing – 0.1% | ||||||||
American Campus Communities, Inc. | 8,020 | 296,259 | ||||||
Education Realty Trust, Inc. | 8,780 | 82,795 | ||||||
|
| |||||||
| 379,054 | ||||||||
|
| |||||||
| 16,207,579 | ||||||||
|
| |||||||
Office – 0.8% | ||||||||
Office – 0.8% | ||||||||
Allied Properties Real Estate Investment Trust | 5,200 | 157,320 | ||||||
Allreal Holding AG(a) | 730 | 102,056 | ||||||
Alstria Office REIT-AG(a) | 5,220 | 72,520 | ||||||
Befimmo SA | 1,270 | 91,155 | ||||||
Boston Properties, Inc. | 17,450 | 1,961,903 | ||||||
| 272 | • ALLIANCEBERNSTEIN WEALTH STRATEGIES |
Volatility Management Portfolio—Portfolio of Investments
| Company | Shares | U.S. $ Value | ||||||
| ||||||||
Brandywine Realty Trust | 12,000 | $ | 175,800 | |||||
Brookfield Office Properties, Inc.(b) | 19,200 | 366,556 | ||||||
CapitaCommercial Trust | 209,300 | 242,142 | ||||||
Castellum AB | 13,210 | 231,136 | ||||||
Champion REIT | 178,350 | 80,094 | ||||||
Cominar Real Estate Investment Trust | 9,555 | 156,359 | ||||||
CommonWealth REIT | 9,080 | 246,522 | ||||||
Corporate Office Properties Trust | 6,300 | 168,021 | ||||||
Cousins Properties, Inc. | 13,514 | 156,087 | ||||||
Derwent London PLC | 7,020 | 325,737 | ||||||
Douglas Emmett, Inc. | 10,140 | 273,070 | ||||||
Dundee International Real Estate Investment Trust | 7,250 | 60,499 | ||||||
Empire State Realty Trust, Inc. – Class A | 5,750 | 88,090 | ||||||
Fabege AB | 10,140 | 140,841 | ||||||
First Potomac Realty Trust | 4,500 | 57,060 | ||||||
Franklin Street Properties Corp. | 6,720 | 84,134 | ||||||
Government Properties Income Trust | 4,170 | 103,875 | ||||||
Great Portland Estates PLC | 26,381 | 284,842 | ||||||
Highwoods Properties, Inc. | 6,880 | 259,445 | ||||||
Hongkong Land Holdings Ltd. | 90,200 | 566,438 | ||||||
Hudson Pacific Properties, Inc. | 3,750 | 85,538 | ||||||
Hufvudstaden AB – Class A | 8,730 | 130,992 | ||||||
Intervest Offices & Warehouses | 500 | 15,128 | ||||||
Investa Office Fund | 46,183 | 132,179 | ||||||
Japan Excellent, Inc. | 80 | 101,602 | ||||||
Japan Prime Realty Investment Corp. | 85 | 295,014 | ||||||
Japan Real Estate Investment Corp. | 127 | 689,649 | ||||||
Kenedix Office Investment Corp. – Class A | 22 | 109,454 | ||||||
Keppel REIT(b) | 113,100 | 104,975 | ||||||
Kilroy Realty Corp. | 6,320 | 363,526 | ||||||
Liberty Property Trust | 11,180 | 427,747 | ||||||
Mack-Cali Realty Corp. | 6,720 | 149,520 | ||||||
Mori Hills REIT Investment Corp.(b) | 90 | 122,270 | ||||||
Mori Trust Sogo Reit, Inc.(b) | 16 | 132,307 | ||||||
Nippon Building Fund, Inc. | 144 | 825,851 | ||||||
Nomura Real Estate Office Fund, Inc.(b) | 39 | 165,138 | ||||||
NorthWest Healthcare Properties Real Estate Investment Trust | 2,300 | 21,311 | ||||||
Norwegian Property ASA | 40,000 | 48,650 | ||||||
NTT Urban Development Corp. | 11,799 | 102,116 | ||||||
Orix JREIT, Inc.(b) | 121 | 153,359 | ||||||
Parkway Properties, Inc./MD | 5,350 | 98,601 | ||||||
Piedmont Office Realty Trust, Inc. – Class A(b) | 12,350 | 213,408 | ||||||
Prime Office AG(a) | 3,650 | 15,014 | ||||||
PS Business Parks, Inc. | 1,540 | 129,391 | ||||||
PSP Swiss Property AG(a) | 3,030 | 280,675 | ||||||
| ALLIANCEBERNSTEIN WEALTH STRATEGIES • | 273 |
Volatility Management Portfolio—Portfolio of Investments
| Company | Shares | U.S. $ Value | ||||||
| ||||||||
SL Green Realty Corp. | 7,280 | $ | 723,122 | |||||
Societe de la Tour Eiffel | 450 | 31,678 | ||||||
Swiss Prime Site AG(a) | 5,877 | 493,339 | ||||||
Technopolis Oyj | 7,300 | 46,752 | ||||||
Tokyo Tatemono Co., Ltd. | 42,910 | 350,479 | ||||||
Workspace Group PLC | 7,997 | 79,411 | ||||||
|
| |||||||
| 13,089,898 | ||||||||
|
| |||||||
Lodging – 0.2% | ||||||||
Lodging – 0.2% | ||||||||
Ashford Hospitality Trust, Inc. | 4,860 | 54,335 | ||||||
CDL Hospitality Trusts | 48,238 | 62,143 | ||||||
Chesapeake Lodging Trust | 3,800 | 98,990 | ||||||
DiamondRock Hospitality Co. | 14,920 | 188,290 | ||||||
FelCor Lodging Trust, Inc. | 9,540 | 83,093 | ||||||
Hersha Hospitality Trust | 13,190 | 74,128 | ||||||
Hospitality Properties Trust | 11,460 | 303,690 | ||||||
Host Hotels & Resorts, Inc. | 85,790 | 1,687,490 | ||||||
InnVest Real Estate Investment Trust | 6,500 | 31,053 | ||||||
InterContinental Hotels Group PLC | 8,042 | 261,557 | ||||||
LaSalle Hotel Properties | 7,950 | 249,153 | ||||||
Pebblebrook Hotel Trust | 4,900 | 162,876 | ||||||
RLJ Lodging Trust | 9,400 | 244,306 | ||||||
Strategic Hotels & Resorts, Inc.(a) | 12,800 | 127,872 | ||||||
Sunstone Hotel Investors, Inc. | 13,980 | 189,010 | ||||||
|
| |||||||
| 3,817,986 | ||||||||
|
| |||||||
Total Common Stocks | 1,118,645,204 | |||||||
|
| |||||||
INVESTMENT COMPANIES – 13.2% | ||||||||
Funds and Investment | ||||||||
F&C UK Real Estate Investment Ltd. | 16,310 | 23,079 | ||||||
iShares Core MSCI Emerging Markets ETF(b) | 2,673,820 | 126,685,592 | ||||||
Medicx Fund Ltd. | 26,075 | 36,366 | ||||||
Picton Property Income Ltd. | 27,434 | 26,415 | ||||||
Standard Life Investment Property Income Trust PLC | 11,850 | 14,396 | ||||||
UK Commercial Property Trust Ltd./fund | 31,199 | 41,325 | ||||||
Vanguard REIT ETF | 1,378,070 | 97,498,452 | ||||||
|
| |||||||
Total Investment Companies | 224,325,625 | |||||||
|
| |||||||
| 274 | • ALLIANCEBERNSTEIN WEALTH STRATEGIES |
Volatility Management Portfolio—Portfolio of Investments
| Company | Shares | U.S. $ Value | ||||||
| ||||||||
SHORT-TERM INVESTMENTS – 19.8% | ||||||||
Investment Companies – 19.6% | ||||||||
AllianceBernstein Fixed-Income Shares, Inc.– Government STIF Portfolio, 0.08%+ (c) | 331,343,169 | $ | 331,343,169 | |||||
|
| |||||||
| Principal Amount (000) | ||||||||
U.S. Treasury Bills – 0.2% | ||||||||
U.S. Treasury Bill | U.S.$ | 4,000 | 3,999,908 | |||||
|
| |||||||
| Shares | ||||||||
Total Investments Before Security Lending Collateral for Securities Loaned – 99.0% | 1,678,313,906 | |||||||
|
| |||||||
INVESTMENTS OF CASH COLLATERAL FOR SECURITIES LOANED – 0.7% | ||||||||
Investment Companies – 0.7% | ||||||||
AllianceBernstein Exchange Reserves – | 11,219,012 | 11,219,012 | ||||||
|
| |||||||
Total Investments – 99.7% | 1,689,532,918 | |||||||
Other assets less liabilities – 0.3% | 5,195,944 | |||||||
|
| |||||||
Net Assets – 100.0% | $ | 1,694,728,862 | ||||||
|
| |||||||
FUTURES (see Note C)
| Type | Number of Contracts | Expiration Month | Original Value | Value at 2014 | Unrealized Appreciation/ (Depreciation) | |||||||||||||||
Purchased Contracts |
| |||||||||||||||||||
Euro STOXX 50 Index Futures | 244 | March 2014 | $ | 9,965,244 | $ | 10,575,309 | $ | 610,065 | ||||||||||||
FTSE 100 Index Futures | 38 | March 2014 | 4,100,371 | 4,311,450 | 211,079 | |||||||||||||||
Hang Seng Index Futures | 11 | March 2014 | 1,592,329 | 1,616,361 | 24,032 | |||||||||||||||
Mini MSCI EAFE Futures | 40 | March 2014 | 3,789,849 | 3,858,600 | 68,751 | |||||||||||||||
S&P 500 E Mini Futures | 1,086 | March 2014 | 97,821,159 | 100,867,680 | 3,046,521 | |||||||||||||||
| ALLIANCEBERNSTEIN WEALTH STRATEGIES • | 275 |
Volatility Management Portfolio—Portfolio of Investments
| Type | Number of Contracts | Expiration Month | Original Value | Value at 2014 | Unrealized Appreciation/ (Depreciation) | |||||||||||||||
S&P Mid 400 E Mini Futures | 727 | March 2014 | $ | 95,088,455 | $ | 99,904,340 | $ | 4,815,885 | ||||||||||||
S&P TSX 60 Index Futures | 294 | March 2014 | 40,379,186 | 43,140,179 | 2,760,993 | |||||||||||||||
SPI 200 Futures | 20 | March 2014 | 2,262,153 | 2,407,559 | 145,406 | |||||||||||||||
TOPIX Index Futures | 107 | March 2014 | 12,814,383 | 12,732,338 | (82,045 | ) | ||||||||||||||
|
| |||||||||||||||||||
| $ | 11,600,687 | |||||||||||||||||||
|
| |||||||||||||||||||
FORWARD CURRENCY EXCHANGE CONTRACTS (see Note C)
| Counterparty | Contracts to Deliver (000) | In Exchange For (000) | Settlement Date | Unrealized Appreciation/ (Depreciation) | ||||||||||||||||||||
Bank of America, NA | USD | 42,043 | EUR | 30,737 | 3/18/14 | $ | 382,885 | |||||||||||||||||
Barclays Bank PLC | CAD | 2,052 | USD | 1,838 | 6/18/14 | (10,443 | ) | |||||||||||||||||
BNP Paribas SA | USD | 3,506 | JPY | 356,065 | 3/18/14 | (7,378 | ) | |||||||||||||||||
BNP Paribas SA | AUD | 1,919 | USD | 1,707 | 6/18/14 | 6,868 | ||||||||||||||||||
Citibank, NA | USD | 2,237 | CAD | 2,485 | 3/18/14 | 6,700 | ||||||||||||||||||
Citibank, NA | GBP | 1,339 | USD | 2,227 | 6/18/14 | (13,346 | ) | |||||||||||||||||
Credit Suisse International | AUD | 17,432 | USD | 15,715 | 3/18/14 | 173,820 | ||||||||||||||||||
Credit Suisse International | CHF | 12,744 | USD | 14,051 | 3/18/14 | (440,758 | ) | |||||||||||||||||
Credit Suisse International | GBP | 20,359 | USD | 33,255 | 3/18/14 | (834,024 | ) | |||||||||||||||||
Credit Suisse International | USD | 18,605 | CHF | 16,650 | 3/18/14 | 327,822 | ||||||||||||||||||
Goldman Sachs Bank USA | CHF | 1,588 | USD | 1,756 | 3/18/14 | (49,576 | ) | |||||||||||||||||
Royal Bank of Canada | CAD | 15,232 | USD | 14,253 | 3/18/14 | 501,715 | ||||||||||||||||||
Royal Bank of Scotland PLC | USD | 11,955 | CAD | 12,747 | 3/18/14 | (447,102 | ) | |||||||||||||||||
Royal Bank of Scotland PLC | USD | 11,783 | GBP | 7,186 | 3/18/14 | 248,994 | ||||||||||||||||||
Royal Bank of Scotland PLC | USD | 1,834 | JPY | 187,909 | 3/18/14 | 12,370 | ||||||||||||||||||
Standard Chartered Bank | EUR | 1,349 | USD | 1,834 | 3/18/14 | (28,210 | ) | |||||||||||||||||
Standard Chartered Bank | EUR | 1,728 | USD | 2,387 | 3/18/14 | 2,045 | ||||||||||||||||||
Standard Chartered Bank | GBP | 1,443 | USD | 2,383 | 3/18/14 | (33,153 | ) | |||||||||||||||||
State Street Bank & | EUR | 18,155 | USD | 24,652 | 3/18/14 | (407,431 | ) | |||||||||||||||||
State Street Bank & | USD | 1,757 | AUD | 1,884 | 3/18/14 | (77,718 | ) | |||||||||||||||||
State Street Bank & | USD | 1,802 | GBP | 1,119 | 3/18/14 | 71,856 | ||||||||||||||||||
UBS AG | JPY | 3,713,028 | USD | 36,373 | 3/18/14 | (113,922 | ) | |||||||||||||||||
Westpac Banking Corp. | AUD | 13,045 | USD | 11,572 | 3/18/14 | (58,033 | ) | |||||||||||||||||
|
| |||||||||||||||||||||||
| $ | (786,019 | ) | ||||||||||||||||||||||
|
| |||||||||||||||||||||||
| 276 | • ALLIANCEBERNSTEIN WEALTH STRATEGIES |
Volatility Management Portfolio—Portfolio of Investments
TOTAL RETURN SWAPS (see Note C)
Receive/ Pay Total Return on Reference Index | Index | # of Shares or Units | Rate Paid the Fund | Notional Amount | Maturity Date | Counterparty | Unrealized Appreciation/ (Depreciation) | |||||||||||||||||
Receive Total Return on Reference Index | ||||||||||||||||||||||||
Receive | Russell 2000 Total Return Index | 6,161 | 0.29 | % | $ | 33,348 | 1/15/15 | Bank of America, NA | $ | 618,495 | ||||||||||||||
Receive | Russell 2000 Total Return Index | 1,731 | 1.00 | % | 9,370 | 3/17/14 | JPMorgan Chase Bank, NA | 172,828 | ||||||||||||||||
Receive | Russell 2000 Total Return Index | 245 | 1.00 | % | 1,326 | 4/15/14 | JPMorgan Chase Bank, NA | 24,462 | ||||||||||||||||
Receive | FTSE EPRA/ NAREIT Developed Real Estate Index | 279 | 0.71 | % | 1,060 | 8/15/14 | UBS AG | 4,204 | ||||||||||||||||
Receive | Russell 2000 Total Return Index | 2,505 | 1.00 | % | 13,559 | 10/15/14 | UBS AG | 252,644 | ||||||||||||||||
Receive | Russell 2000 Total Return Index | 3,757 | 1.00 | % | 20,336 | 3/16/15 | UBS AG | 379,336 | ||||||||||||||||
|
| |||||||||||||||||||||||
| $ | 1,451,969 | |||||||||||||||||||||||
|
| |||||||||||||||||||||||
| + | To obtain a copy of the fund’s financial statements, please go to the Securities and Exchange Commission’s website at www.sec.gov, or call AllianceBernstein at (800) 227-4618. |
| (a) | Non-income producing security. |
| (b) | Represents entire or partial securities out on loan. See Note D for securities lending information. |
| (c) | Investment in affiliated money market mutual fund. The rate shown represents the 7-day yield as of period end. |
| (d) | Position, or a portion thereof, has been segregated to collateralize OTC derivatives outstanding. The aggregate market value of these securities amounted to $251,994. |
Currency Abbreviations:
| AUD | – Australian Dollar |
| CAD | – Canadian Dollar |
| CHF | – Swiss Franc |
| EUR | – Euro |
| GBP | – Great British Pound |
| JPY | – Japanese Yen |
| USD | – United States Dollar |
| ALLIANCEBERNSTEIN WEALTH STRATEGIES • | 277 |
Volatility Management Portfolio—Portfolio of Investments
Glossary:
| ADR | – American Depositary Receipt |
| EAFE | – Europe, Australia, and Far East |
| EPRA | – European Public Real Estate Association |
| ETF | – Exchange Traded Fund |
| FTSE | – Financial Times Stock Exchange |
| MSCI | – Morgan Stanley Capital International |
| NAREIT | – National Association of Real Estate Investment Trusts |
| REG | – Registered Shares |
| REIT | – Real Estate Investment Trust |
| SPI | – Share Price Index |
| TOPIX | – Tokyo Price Index |
| TSX | – Toronto Stock Exchange |
See notes to financial statements.
| 278 | • ALLIANCEBERNSTEIN WEALTH STRATEGIES |
Volatility Management Portfolio—Portfolio of Investments
THE FOLLOWING IS NOT PART OF THE SHAREHOLDER REPORT OR THE FINANCIAL STATEMENTS
SUMMARY OF SENIOR OFFICER’S EVALUATION OF INVESTMENT ADVISORY AGREEMENT1
The following is a summary of the evaluation of the Investment Advisory Agreement between AllianceBernstein L.P. (the “Adviser”) and The AllianceBernstein Portfolios (the “Trust”) in respect of AllianceBernstein Balanced Wealth Strategy, AllianceBernstein Wealth Appreciation Strategy and AllianceBernstein Conservative Wealth Strategy (each a “Strategy” and collectively the “Strategies”),2 prepared by Philip L. Kirstein, the Senior Officer of the Trust for the Trustees of the Trust, as required by the August 2004 agreement between the Adviser and the New York State Attorney General (the “NYAG”). The purpose of the summary is to provide shareholders with a synopsis of the independent evaluation of the reasonableness of the advisory fees proposed to be paid by the Strategies which was provided to the Trustees in connection with their review of the proposed approval of the continuance of the Investment Advisory Agreement.
The Strategies seek to achieve their investment objectives by investing in a combination of the AllianceBernstein Pooling Portfolios (the “Pooling Portfolios”),3 which represent a variety of asset classes and investment styles. As a result, certain expenses will be minimal, such as custodian charges, or non-existent, such as brokerage commissions, except as incurred indirectly through the Pooling Portfolios.
The Senior Officer’s evaluation considered the following factors:
| 1. | Advisory fees charged to institutional and other clients of the Adviser for like services; |
| 2. | Advisory fees charged by other mutual fund companies for like services; |
| 3. | Costs to the Adviser and its affiliates of supplying services pursuant to the advisory agreement, excluding any intra-corporate profit; |
| 1 | The information in the fee evaluation was completed on July 25, 2013 and discussed with the Board of Trustees on August 6-8, 2013. |
| 2 | Future references to the Strategies do not include “AllianceBernstein.” References in the fee summary pertaining to performance and expense ratios refer to Class A shares of the Strategies. |
| 3 | The AllianceBernstein Pooling Portfolios include U.S. Value Portfolio, U.S. Large Cap Growth Portfolio, Multi-Asset Real Return Portfolio, International Value Portfolio, International Growth Portfolio, Small-Mid Cap Value Portfolio, Small-Mid Cap Growth Portfolio, Short Duration Bond Portfolio, Global Core Bond Portfolio, Bond Inflation Protection Portfolio, High Yield Portfolio and Volatility Management Portfolio. |
| ALLIANCEBERNSTEIN WEALTH STRATEGIES • | 279 |
| 4. | Profit margins of the Adviser and its affiliates from supplying such services; |
| 5. | Possible economies of scale as the Strategies grows larger; and |
| 6. | Nature and quality of the Adviser’s services including the performance of the Strategies. |
These factors, with the exception of the first factor, are generally referred to as the “Gartenberg factors,” which were articulated by the United States Court of Appeals for the Second Circuit in 1982. Gartenberg v. Merrill Lynch Asset Management, Inc., 694 F. 2d 923 (2d Cir. 1982). On March 30, 2010, the Supreme Court held the Gartenberg decision was correct in its basic formulation of what §36(b) requires: to face liability under §36(b), “an investment adviser must charge a fee that is so disproportionately large that it bears no reasonable relationship to the services rendered and could not have been the product of arm’s length bargaining.” Jones v. Harris Associates L.P., 130 S. Ct. 1418 (2010). In Jones, the Court stated the Gartenberg approach fully incorporates the correct understanding of fiduciary duty within the context of section 36(b) and noted with approval that “Gartenberg insists that all relevant circumstances be taken into account” and “uses the range of fees that might result from arm’s length bargaining as the benchmark for reviewing challenged fees.”4
ADVISORY FEES, NET ASSETS, & EXPENSE RATIOS
The Adviser proposed that each Strategy pay the advisory fee set forth in the table below for receiving the services to be provided pursuant to the Investment Advisory Agreement. The fee schedule below, implemented in January 2004 in consideration of the Adviser’s settlement with the NYAG in December 2003, is based on a master schedule that contemplates eight categories of funds with almost all funds in each category having the same advisory fee schedule.5
| Category | Advisory Fees Based on a percentage of | Net 6/30/13 ($MIL) | Strategy | |||
| Balanced | 0.55% on 1st $2.5 billion 0.45% on next $2.5 billion 0.40% on the balance | $1,326.2 | Balanced Wealth Strategy | |||
| Blend | 0.65% on 1st $2.5 billion 0.55% on next $2.5 billion 0.50% on the balance | $1,406.0 | Wealth Appreciation Strategy | |||
| Balanced | 0.55% on 1st $2.5 billion 0.45% on next $2.5 billion 0.40% on the balance | $412.2 | Conservative Wealth Strategy |
| 4 | Jones v. Harris at 1427. |
| 5 | Most of the AllianceBernstein Mutual Funds, which the Adviser manages, were affected by the Adviser’s settlement with the NYAG. |
| 280 | • ALLIANCEBERNSTEIN WEALTH STRATEGIES |
With respect to Wealth Appreciation Strategy, the Strategy’s Investment Advisory Agreement provides for the Adviser to be reimbursed for certain clerical, legal, accounting, administrative and other services provided to the Strategy. To date, the Trustees have not authorized reimbursement payments under the provisions. The Investment Advisory Agreements for Balanced Wealth Strategy and Conservative Wealth Strategy do not provide for reimbursement to the Adviser for the above described expenses.
Set forth below are the total expense ratios6 of the Strategies for the most recent semi-annual period:7
Strategy | Total Expense Ratio (2/28/13) | Fiscal Year End | ||||||
| Balanced Wealth Strategy | Class A Class B Class C Class R Class K Class I Advisor |
| 1.00 1.72 1.71 1.35 1.04 0.71 0.70 | % % % % % % % | August 31 | |||
| Wealth Appreciation Strategy | Class A Class B Class C Class R Class K Class I Advisor |
| 1.08 1.82 1.79 1.38 1.09 0.78 0.78 | % % % % % % % | August 31 | |||
| Conservative Wealth Strategy | Class A Class B Class C Class R Class K Class I Advisor |
| 1.03 1.75 1.74 1.39 1.08 0.75 0.73 | % % % % % % % | August 31 | |||
| I. | ADVISORY FEES CHARGED TO INSTITUTIONAL AND OTHER CLIENTS |
The advisory fees charged to investment companies which the Adviser manages and sponsors are normally higher than those charged to similar sized institutional accounts, including pension plans and sub-advised investment companies. The fee differential reflects, among other things, different services provided to
| 6 | The expense ratios include expenses of the underlying Pooling Portfolios in which the Strategies invest. With respect to Balanced Wealth Strategy, Wealth Appreciation Strategy and Conservative Wealth Strategy, for the six-month period ended February 28, 2013, the estimated annualized blended expense ratios related to the Pooling Portfolios were 0.03%, 0.03% and 0.03%, respectively. |
| 7 | Semi-annual total expense ratios are unaudited. |
| ALLIANCEBERNSTEIN WEALTH STRATEGIES • | 281 |
such clients, and different liabilities assumed. Services provided by the Adviser to the Strategies that are not provided to non-investment company clients and sub-advised investment companies include providing office space and personnel to serve as Fund Officers, who among other responsibilities make the certifications required under the Sarbanes–Oxley Act of 2002, and coordinating with and monitoring the Strategies’ third party service providers such as Fund counsel, auditors, custodians, transfer agents and pricing services. The accounting, administrative, legal and compliance requirements for the Strategies are more costly than those for institutional assets due to the greater complexities and time required for investment companies. Also, retail mutual funds managed by the Adviser are widely held. Servicing the Strategies’ investors is more time consuming and labor intensive compared to institutional clients since the Adviser needs to communicate with a more extensive network of financial intermediaries and shareholders. The Adviser also believes that it incurs substantial entrepreneurial risk when offering a new mutual fund since establishing a new mutual fund requires a large upfront investment and it may take a long time for the fund to achieve profitability since the fund must be priced to scale from inception in order to be competitive and assets are acquired one account at a time. In addition, managing the cash flow of an investment company may be more difficult than managing that of a stable pool of assets, such as an institutional account with little cash movement in either direction, particularly, if a fund is in net redemption and the Adviser is frequently forced to sell securities to raise cash for redemptions. However, managing a fund with positive cash flow may be easier at times than managing a stable pool of assets. Finally, in recent years, investment advisers have been sued by institutional clients and have suffered reputational damage both by the attendant publicity and outcomes other than complete victories. Accordingly, the legal and reputational risks associated with institutional accounts are greater than previously thought, although still not equal to those related to the mutual fund industry.
Notwithstanding the Adviser’s view that managing an investment company is not comparable to managing other institutional accounts because the services provided are different, the Supreme Court has indicated consideration should be given to the advisory fees charged to institutional accounts with a similar investment style as the Strategies.8 However, the Adviser represented that there are no categories in the Form ADV for institutional products that have a substantially similar investment style as any of the Strategies.
The AllianceBernstein Variable Products Series Fund, Inc. (“AVPS”), which is managed by the Adviser and is available through variable annuity and variable
| 8 | The Supreme Court stated that “courts may give such comparisons the weight that they merit in light of the similarities and differences between the services that the clients in question require, but the courts must be wary of inapt comparisons.” Among the significant differences the Supreme Court noted that may exist between services provided to mutual funds and institutional accounts are “higher marketing costs.” Jones v. Harris at 1428. |
| 282 | • ALLIANCEBERNSTEIN WEALTH STRATEGIES |
life contracts offered by other financial institutions, offers policyholders the option to utilize certain AVPS portfolios as the investment option underlying their insurance contracts. Set forth below is the fee schedule of AVPS – Balanced Wealth Strategy Portfolio, which has a similar investment style as Balanced Wealth Strategy.9
| Fund | AVPS Portfolio | Fee Schedule | ||
| Balanced Wealth Strategy | Balanced Wealth Strategy Portfolio | 0.55% on first $2.5 billion 0.45% on next $2.5 billion 0.40% Excess of $5 billion |
The Adviser also manages and sponsors retail mutual funds, which are organized in jurisdictions outside the United States, generally Luxembourg and Japan, and sold to non-United States resident investors. The Adviser charges the fees set forth below for the Luxembourg fund that has a somewhat similar investment style as the Conservative Wealth Strategy:
| Fund | Luxembourg Fund | Fee10 | ||
| Conservative Wealth Strategy | Global Conservative Portfolio Class A Class I (Institutional) |
0.60% |
The AllianceBernstein Investment Trust Management mutual funds (“ITM”), which are offered to investors in Japan, have an “all-in” fee to compensate the Adviser for investment advisory as well as fund accounting and administrative services, but not for distribution-related services. The fee schedules of the ITM mutual funds that have a somewhat similar investment style as the Strategies are as follows:
| Strategy | ITM Mutual Fund | Fee | ||
| Balanced Wealth Strategy | Alliance Global Balanced—Neutral11 | 0.70% | ||
| Wealth Appreciation Strategy | Alliance Global Balanced—Aggressive11 | 0.75% | ||
| Conservative Wealth Strategy | Alliance Global Balanced—Conservative11 | 0.65% |
The Adviser represented that it does not provide any sub-advisory investment services to other investment companies that have a substantially similar investment style as the Strategies.
| 9 | The AVPS portfolio was also affected by the settlement between the Adviser and the NYAG. As a result, Balanced Wealth Strategy has the same breakpoints in its advisory fee schedule as the AVPS portfolio. |
| 10 | Class A shares of the Luxembourg funds are charged an “all-in” fee, which includes investment advisory and distribution-related services, unlike Class I shares, whose fee is only for investment advisory services. |
| 11 | This ITM fund is privately placed or institutional. |
| ALLIANCEBERNSTEIN WEALTH STRATEGIES • | 283 |
| II. | MANAGEMENT FEES CHARGED BY OTHER MUTUAL FUND COMPANIES FOR LIKE SERVICES. |
Lipper, Inc. (“Lipper”), an analytical service that is not affiliated with the Adviser, compared the fees charged to the Strategies with fees charged to other investment companies for similar services offered by other investment advisers.12 Lipper’s analysis included the comparison of each Strategy’s contractual management fee, estimated at the approximate current asset level of the Strategy, to the median of the Strategy’s Lipper Expense Group (“EG”)13 and the Strategy’s contractual management fee ranking.14
Lipper describes an EG as a representative sample of comparable funds. Lipper’s standard methodology for screening funds to be included in an EG entails the consideration of several fund criteria, including fund type, investment classification/objective, load type and similar 12b-1/non-12b-1 service fees, asset (size) comparability, expense components and attributes. An EG will typically consist of seven to twenty funds.
The original EGs for Balanced Wealth Strategy and Wealth Appreciation Strategy had an insufficient number of peers. Consequently, Lipper expanded the Strategies’ EGs to include peers that have a similar but not the same Lipper investment classification/objective.
| Strategy | Contractual Management Fee (%) | Lipper EG Median (%) | Lipper EG Rank | |||||||||
| Balanced Wealth Strategy15 | 0.550 | 0.617 | 4/14 | |||||||||
| Wealth Appreciation Strategy16 | 0.650 | 0.891 | 2/10 | |||||||||
| Conservative Wealth Strategy | 0.550 | 0.570 | 5/11 | |||||||||
| 12 | The Supreme Court cautioned against accepting mutual fund fee comparisons without careful scrutiny since “these comparisons are problematic because these fees, like those challenged, may not be the product of the negotiations conducted at arm’s-length.” Jones v. Harris at 1429. |
| 13 | Lipper does not consider average account size when constructing EGs. Funds with relatively small average account sizes tend to have higher transfer agent expense ratio than comparable sized funds that have relatively large average account sizes. There are limitations to Lipper expense category data because different funds categorize expenses differently. |
| 14 | The contractual management fee is calculated by Lipper using each Strategy’s contractual management fee rate at a hypothetical asset level. The hypothetical asset level is based on the combined net assets of all classes of each Strategy, rounded up to the next $25 million. Lipper’s total expense ratio information is based on the most recent annual report except as otherwise noted. A ranking of “1” would mean that the Strategy had the lowest effective fee rate in the Lipper peer group. |
| 15 | The Strategy’s EG includes the Strategy, six other Mixed-Asset Target Allocation Moderate funds (“MTAM”) and seven Mixed-Asset Target Allocation Growth funds (“MTAG”). |
| 16 | The Strategy’s EG includes the Strategy, three other Global Multi-Cap Core funds (“GMLC”) and six Global Multi-Cap Growth funds (“GMLG”). |
| 284 | • ALLIANCEBERNSTEIN WEALTH STRATEGIES |
However, because Lipper had expanded the EGs of Balanced Wealth Strategy and Wealth Appreciation Strategy, under Lipper’s standard guidelines, the Lipper Expense Universes (“EUs”) for these Strategies were also expanded to include the universe of those peers that had a similar but not the same Lipper investment
classification/objective.17 A “normal” EU will include funds that have the same investment classification/objective as the subject Strategy.
Set forth below is a comparison of the Strategies’ total expense ratios (inclusive of their underlying expenses) and the medians of the Strategies’ EGs and EUs. The Strategies’ total expense ratio rankings are also shown.
| Strategy | Expense Ratio (%)18 | Lipper EG Median (%) | Lipper EG Rank | Lipper EU Median (%) | Lipper EU Rank | |||||||||||
| Balanced Wealth Strategy19 | 1.027 | 1.081 | 4/14 | 1.179 | 17/81 | |||||||||||
| Wealth Appreciation Strategy20 | 1.117 | 1.380 | 1/10 | 1.510 | 3/37 | |||||||||||
| Conservative Wealth Strategy | 1.050 | 1.066 | 5/11 | 1.066 | 13/27 | |||||||||||
Based on this analysis, Balanced Wealth Strategy and Conservative Wealth Strategy have equally favorable rankings on a contractual management fee basis and an expense ratio basis; Wealth Appreciation Strategy has a more favorable ranking on a total expense ratio basis than on a contractual management fee basis.
| III. | COSTS TO THE ADVISER AND ITS AFFILIATES OF SUPPLYING SERVICES PURSUANT TO THE MANAGEMENT FEE ARRANGEMENT, EXCLUDING ANY INTRA-CORPORATE PROFIT. |
The Adviser utilizes two profitability reporting systems, which operate independently but are aligned with each other, to estimate the Adviser’s profitability in connection with investment advisory services provided to the Strategies. The Senior Officer has retained a consultant to provide independent advice regarding the alignment of the two profitability systems as well as the methodologies and allocations utilized by both profitability systems. See Section IV for additional discussion.
| 17 | Except for asset (size) comparability, Lipper uses the same criteria for selecting an EG peer when selecting an EU peer. Unlike the EG, the EU allows for the same adviser to be represented by more than just one fund. |
| 18 | Most recently completed fiscal year end Class A total expense ratio. |
| 19 | The Strategy’s EU includes the Strategy, the EG, and all other retail front-end MTAM and MTAG, excluding outliers. |
| 20 | The Strategy’s EU includes the Strategy, the EG, and all other retail front-end GMLC and GMLG, excluding outliers. |
| ALLIANCEBERNSTEIN WEALTH STRATEGIES • | 285 |
| IV. | PROFIT MARGINS OF THE ADVISER AND ITS AFFILIATES FOR SUPPLYING SUCH SERVICES. |
The Strategies’ profitability information, prepared by the Adviser for the Board of Trustees, was reviewed by the Senior Officer and the consultant. The Adviser’s profitability from providing investment advisory services to the Strategies increased during calendar year 2012, relative to 2011.
In addition to the Adviser’s direct profits from managing the Strategies, certain of the Adviser’s affiliates have business relationships with the Strategies and may earn a profit from providing other services to the Strategies. The courts have referred to this type of business opportunity as “fall-out benefits” to the Adviser and indicated that such benefits should be factored into the evaluation of the total relationship between the Strategies and the Adviser. Neither case law nor common business practice precludes the Adviser’s affiliates from earning a reasonable profit on this type of relationship provided the affiliates’ charges and services are competitive and the relationship otherwise complies with the 40 Act restrictions. These affiliates provide transfer agent, distribution and brokerage related services to the Strategies and/or the Pooling Portfolios and receive transfer agent fees, Rule 12b-1 payments, front-end sales loads, contingent deferred sales charges (“CDSC”) and brokerage commissions. In addition, the Adviser benefits from soft dollar arrangements which offset expenses the Adviser would otherwise incur.
AllianceBernstein Investments, Inc. (“ABI”), an affiliate of the Adviser, is the Trust’s principal underwriter. ABI and the Adviser have disclosed in the Strategies’ prospectus that they may make revenue sharing payments from their own resources, in addition to resources derived from sales loads and Rule 12b-1 fees, to firms that sell shares of the Strategies. In 2012, ABI paid approximately 0.05% of the average monthly assets of the AllianceBernstein Mutual Funds or approximately $19 million for distribution services and educational support (revenue sharing payments).
ABI retained the following front-end load sales charges from sales of the Strategies’ Class A shares during the Strategies’ most recently completed fiscal year:
| Strategy | Amount Received | |||
| Balanced Wealth Strategy | $ | 68,951 | ||
| Wealth Appreciation Strategy | $ | 26,509 | ||
| Conservative Wealth Strategy | $ | 26,702 | ||
ABI received the amounts set forth below in Rule 12b-1 fees and CDSC fees from the Strategies during the Strategies’ most recently completed fiscal year:
| Strategy | 12b-1 Fees Received | CDSC Received | ||||||
| Balanced Wealth Strategy | $ | 8,746,067 | $ | 151,116 | ||||
| Wealth Appreciation Strategy | $ | 4,138,447 | $ | 63,584 | ||||
| Conservative Wealth Strategy | $ | 3,138,535 | $ | 53,868 | ||||
| 286 | • ALLIANCEBERNSTEIN WEALTH STRATEGIES |
Fees and reimbursements for out of pocket expenses charged by AllianceBernstein Investor Services, Inc. (“ABIS”), the affiliated transfer agent for the Strategies are based on the level of the network account and the class of shares held by the account. ABIS also receives a fee per shareholder sub-account for each account maintained by an intermediary on an omnibus basis. ABIS received the following net fees from the Strategies during the most recently completed fiscal year:
| Strategy | ABIS Fee | |||
| Balanced Wealth Strategy | $ | 690,916 | ||
| Wealth Appreciation Strategy | $ | 689,386 | ||
| Conservative Wealth Strategy | $ | 184,192 | ||
There are no portfolio transactions for the Strategies since the Strategies pursue their investment objectives through investing in combinations of the Pooling Portfolios. However, the Pooling Portfolios do engage in portfolio transactions. Multi-Asset Real Return Portfolio, International Value Portfolio and International Growth Portfolio effected brokerage transactions through the Adviser’s affiliate, Sanford C. Bernstein & Co., LLC (“SCB & Co.”) and its U.K. affiliate, Sanford C. Bernstein Limited (“SCB Ltd.”), collectively “SCB,” and paid commissions for such transactions during the Pooling Portfolios’ most recently completed fiscal year. The Adviser represented that SCB’s profitability from business conducted with the Pooling Portfolios is comparable to the profitability of SCB’s dealings with other similar third party clients. In the ordinary course of business, SCB receives and pays liquidity rebates from electronic communications networks (“ECNs”) derived from trading for its clients. These credits and charges are not being passed onto any SCB client. The Adviser also receives certain soft dollar benefits from brokers that execute agency trades for its clients. These soft dollar benefits reduce the Adviser’s cost of doing business and increase its profitability.
| V. | POSSIBLE ECONOMIES OF SCALE |
The Adviser has indicated that economies of scale are being shared with shareholders through pricing to scale, breakpoints, fee reductions/waivers and enhancement to services.
In May 2012, an independent consultant, retained by the Senior Officer, provided the Board of Trustees information on the Adviser’s firm-wide average costs from 2005 through 2011 and the potential economies of scale. The independent consultant noted that from 2005 through 2007 the Adviser experienced significant growth in assets under management (“AUM”). During this period, operating expenses increased, in part to keep up with growth, and in part reflecting market returns. However, from 2008 through the first quarter of 2009, AUM rapidly and significantly decreased due to declines in market value and client withdrawals. When AUM rapidly decreased, some operating expenses
| ALLIANCEBERNSTEIN WEALTH STRATEGIES • | 287 |
categories, including base compensation and office space, adjusted more slowly during this period, resulting in an increase in average costs. Since 2009, AUM has experienced less significant changes. The independent consultant noted that changes in operating expenses reflect changes in business composition and business practices in response to changes in financial markets. Finally, the independent consultant concluded that the increase in average cost and the decline in net operating margin across the Adviser since late 2008 are inconsistent with the view that there are currently reductions in average costs due to economies of scale that can be shared with the AllianceBernstein Mutual Funds managed by the Adviser through lower fees.
Previously, in February 2008, the independent consultant provided the Board of Trustees an update of the Deli21 study on advisory fees and various fund characteristics.22 The independent consultant first reiterated the results of his previous two dimensional comparison analysis (fund size and family size) with the Board of Trustees.23 The independent consultant then discussed the results of the regression model that was utilized to study the effects of various factors on advisory fees. The regression model output indicated that the bulk of the variation in fees predicted were explained by various factors, but substantially by fund AUM, family AUM, index fund indicator and investment style. The independent consultant also compared the advisory fees of the AllianceBernstein Mutual Funds to similar funds managed by 19 other large asset managers, regardless of the fund size and each Adviser’s proportion of mutual fund assets to non-mutual fund assets.
| VI. | NATURE AND QUALITY OF THE ADVISER’S SERVICES, INCLUDING THE PERFORMANCE OF THE FUND |
With assets under management of approximately $435 billion as of June 30, 2013, the Adviser has the investment experience to manage and provide non-investment services (described in Section I) to the Strategies.
| 21 | The Deli study, originally published in 2002 based on 1997 data and updated for the February 2008 Presentation, may be of diminished value due to the age of the data used in the presentation and the changes experienced in the industry over the last four years. |
| 22 | The Supreme Court cautioned against accepting mutual fund fee comparisons without careful scrutiny since the fees may not be the product of negotiations conducted at arm’s length. See Jones V. Harris at 1429. |
| 23 | The two dimensional analysis showed patterns of lower advisory fees for funds with larger asset sizes and funds from larger family sizes compared to funds with smaller asset sizes and funds from smaller family sizes, which according to the independent consultant is indicative of a sharing of economies of scale and scope. However, in less liquid and active markets, such is not the case, as the empirical analysis showed potential for diseconomies of scale in those markets. The empirical analysis also showed diminishing economies of scale and scope as funds surpassed a certain high level of assets. |
| 288 | • ALLIANCEBERNSTEIN WEALTH STRATEGIES |
The information prepared by Lipper shows the 1, 3 and 5 year performance rankings24 of the Strategies relative to their Lipper Performance Group (“PG”) and Lipper Performance Universe (“PU”)25 for the periods ended May 31, 2013.26
| Strategy | Fund Return | PG Median (%) | PU Median (%) | PG Rank | PU Rank | |||||||||||
| Balanced Wealth Strategy | ||||||||||||||||
1 year | 16.02 | 16.78 | 15.85 | 7/8 | 45/94 | |||||||||||
3 year | 9.06 | 11.36 | 10.05 | 7/7 | 63/80 | |||||||||||
5 year | 2.88 | 4.13 | 4.57 | 6/7 | 63/74 | |||||||||||
| Wealth Appreciation Strategy | ||||||||||||||||
1 year | 23.29 | 29.55 | 24.85 | 4/4 | 13/22 | |||||||||||
3 year | 10.30 | 10.58 | 10.85 | 3/4 | 13/18 | |||||||||||
5 year | -0.06 | 0.29 | 1.50 | 3/4 | 14/16 | |||||||||||
| Conservative Wealth Strategy | ||||||||||||||||
1 year | 8.12 | 11.46 | 10.65 | 9/11 | 55/74 | |||||||||||
3 year | 5.98 | 9.48 | 7.96 | 10/10 | 59/67 | |||||||||||
5 year | 3.03 | 5.34 | 4.88 | 9/10 | 55/61 | |||||||||||
| 24 | The performance returns and rankings of the Strategies are for the Strategies’ Class A shares. The performance returns of the Strategies were provided by Lipper. |
| 25 | A Strategy’s PG/PU may not necessarily be identical to its respective EG/EU. Strategies with negative management fees are excluded from EGs/EUs but not necessarily from PGs/PUs. In addition, PGs/PUs only include strategies of the same Lipper investment classification/objective as the Strategies, in contrast to certain of the Strategies’ EGs/EUs, which may include strategies of similar but not the same investment classification/objective. |
| 26 | Lipper investment classification/objective dictates the PG and PU throughout the life of each Strategy even if a Strategy had a different investment classification/objective at a different point in time. |
| ALLIANCEBERNSTEIN WEALTH STRATEGIES • | 289 |
Set forth below are the 1, 3, 5 year and since inception performance returns of the Strategies (in bold)27 versus their benchmarks for the periods ending May 31, 2013.28
| Periods Ending May 31, 2013 Annualized Net Performance (%) | ||||||||||||||||
1 Year (%) | 3 Year (%) | 5 Year (%) | Since (%) | |||||||||||||
| Balanced Wealth Strategy | 16.02 | 9.06 | 2.88 | 5.74 | ||||||||||||
| 65% S&P 500 / 35% Barclays Capital U.S. Aggregate Index | 17.47 | 12.72 | 5.88 | 6.80 | ||||||||||||
| S&P 500 Index | 27.28 | 16.87 | 5.43 | 7.06 | ||||||||||||
| Barclays Capital U.S. Aggregate Index | 0.91 | 4.59 | 5.50 | 5.15 | ||||||||||||
| Inception Date: September 2, 2003 | ||||||||||||||||
| Wealth Appreciation Strategy | 23.29 | 10.30 | -0.06 | 5.16 | ||||||||||||
| 60% S&P 500 / 40% MSCI AC World Ex US Index | 26.77 | 13.82 | 2.68 | 7.95 | ||||||||||||
| S&P 500 Index | 27.28 | 16.87 | 5.43 | 7.06 | ||||||||||||
| MSCI AC World Ex US Index | 25.79 | 9.13 | -1.62 | 8.58 | ||||||||||||
| Inception Date: September 2, 2003 | ||||||||||||||||
| Conservative Wealth Strategy | 8.12 | 5.99 | 3.03 | 4.61 | ||||||||||||
| 65% Barclays Capital U.S. Aggregate / 35% S&P 500 Index | 9.57 | 9.03 | 5.90 | 6.03 | ||||||||||||
| Barclays Capital U.S. Aggregate Index | 0.91 | 4.59 | 5.50 | 5.15 | ||||||||||||
| S&P 500 Index | 27.28 | 16.87 | 5.43 | 7.06 | ||||||||||||
| Inception Date: September 2, 2003 | ||||||||||||||||
CONCLUSION:
Based on the factors discussed above the Senior Officer’s conclusion is that the proposed advisory fee for each Strategy is reasonable and within the range of what would have been negotiated at arm’s-length in light of all the surrounding circumstances. This conclusion in respect of the Strategy is based on an evaluation of all of these factors and no single factor was dispositive.
Dated: September 5, 2013
| 27 | The performance returns shown in the table are for the Class A shares of the Strategies. |
| 28 | The Adviser provided Strategy and benchmark performance return information. |
| 290 | • ALLIANCEBERNSTEIN WEALTH STRATEGIES |
THIS PAGE IS NOT PART OF THE SHAREHOLDER REPORT OR THE FINANCIAL STATEMENTS
ALLIANCEBERNSTEIN FAMILY OF FUNDS
US Equity
US Core
Core Opportunities Fund
Growth & Income Fund
Select US Equity Portfolio
US Growth
Concentrated Growth Fund
Discovery Growth Fund
Growth Fund
Large Cap Growth Fund
Small Cap Growth Portfolio
US Value
Discovery Value Fund
Equity Income Fund
Value Fund
International/Global Equity
International/Global Core
Global Equity & Covered Call Strategy Fund
Global Thematic Growth Fund
International Portfolio
Tax-Managed International Portfolio
International/Global Growth
International Discovery Equity Portfolio
International Growth Fund
International/Global Value
Global Value Fund
International Value Fund
Fixed Income
Municipal
High Income Municipal Portfolio
Intermediate California Portfolio
Intermediate Diversified Portfolio
Intermediate New York Portfolio
Municipal Bond Inflation Strategy
Tax-Aware Fixed Income Portfolio
National Portfolio
Arizona Portfolio
California Portfolio
Massachusetts Portfolio
Michigan Portfolio
Minnesota Portfolio
New Jersey Portfolio
New York Portfolio
Ohio Portfolio
Pennsylvania Portfolio
Virginia Portfolio
Fixed Income (continued)
Taxable
Bond Inflation Strategy
Global Bond Fund
High Income Fund
Intermediate Bond Portfolio
Limited Duration High Income Portfolio
Short Duration Portfolio
Alternatives
Dynamic All Market Fund
Global Real Estate Investment Fund
Global Risk Allocation Fund
Market Neutral Strategy-Global
Market Neutral Strategy-U.S.
Real Asset Strategy
Select US Long/Short Portfolio
Unconstrained Bond Fund
Asset Allocation/Multi-Asset
Multi-Asset
Emerging Markets Multi-Asset Portfolio
Retirement Strategies
2000 Retirement Strategy
2005 Retirement Strategy
2010 Retirement Strategy
2015 Retirement Strategy
2020 Retirement Strategy
2025 Retirement Strategy
2030 Retirement Strategy
2035 Retirement Strategy
2040 Retirement Strategy
2045 Retirement Strategy
2050 Retirement Strategy
2055 Retirement Strategy
Wealth Strategies
Balanced Wealth Strategy
Conservative Wealth Strategy
Wealth Appreciation Strategy
Tax-Managed Balanced Wealth Strategy
Tax-Managed Conservative Wealth Strategy
Tax-Managed Wealth Appreciation Strategy
Closed-End Funds
Alliance California Municipal Income Fund
Alliance New York Municipal Income Fund
AllianceBernstein Global High Income Fund
AllianceBernstein Income Fund
AllianceBernstein National Municipal Income Fund
We also offer Exchange Reserves, which serves as the money market fund exchange vehicle for the AllianceBernstein mutual funds. An investment in Exchange Reserves is not a deposit in a bank and is not insured or guaranteed by the Federal Deposit Insurance Corporation or any other government agency. Although the Fund seeks to preserve the value of your investment at $1.00 per share, it is possible to lose money by investing in the Fund.
Investors should consider the investment objectives, risks, charges and expenses of the Fund carefully before investing. For copies of our prospectus or summary prospectus, which contain this and other information, visit us online at www.alliancebernstein.com or contact your AllianceBernstein investments representative. Please read the prospectus and/or summary prospectus carefully before investing.
| ALLIANCEBERNSTEIN WEALTH STRATEGIES • | 291 |
AllianceBernstein Family of Funds
NOTES
| 292 | • ALLIANCEBERNSTEIN WEALTH STRATEGIES |
NOTES
| ALLIANCEBERNSTEIN WEALTH STRATEGIES • | 293 |
NOTES
| 294 | • ALLIANCEBERNSTEIN WEALTH STRATEGIES |
NOTES
| ALLIANCEBERNSTEIN WEALTH STRATEGIES • | 295 |
NOTES
| 296 | • ALLIANCEBERNSTEIN WEALTH STRATEGIES |
ALLIANCEBERNSTEIN WEALTH STRATEGIES
1345 Avenue of the Americas
New York, NY 10105
800.221.5672
| WS-0152-0214 |  | |
ITEM 2. CODE OF ETHICS.
Not applicable when filing a semi-annual report to shareholders.
ITEM 3. AUDIT COMMITTEE FINANCIAL EXPERT.
Not applicable when filing a semi-annual report to shareholders.
ITEM 4. PRINCIPAL ACCOUNTANT FEES AND SERVICES.
Not applicable when filing a semi-annual report to shareholders.
ITEM 5. AUDIT COMMITTEE OF LISTED REGISTRANTS.
Not applicable to the registrant.
ITEM 6. SCHEDULE OF INVESTMENTS.
Please see Schedule of Investments contained in the Report to Shareholders included under Item 1 of this Form N-CSR.
ITEM 7. DISCLOSURE OF PROXY VOTING POLICIES AND PROCEDURES FOR CLOSED-END MANAGEMENT INVESTMENT COMPANIES.
Not applicable to the registrant.
ITEM 8. PORTFOLIO MANAGERS OF CLOSED-END MANAGEMENT INVESTMENT COMPANIES.
Not applicable to the registrant.
ITEM 9. PURCHASES OF EQUITY SECURITIES BY CLOSED-END MANAGEMENT INVESTMENT COMPANY AND AFFILIATED PURCHASERS.
Not applicable to the registrant.
ITEM 10. SUBMISSION OF MATTERS TO A VOTE OF SECURITY HOLDERS.
There have been no material changes to the procedures by which shareholders may recommend nominees to the Fund’s Board of Directors since the Fund last provided disclosure in response to this item.
ITEM 11. CONTROLS AND PROCEDURES.
(a) The registrant’s principal executive officer and principal financial officer have concluded that the registrant’s disclosure controls and procedures (as defined in Rule 30a-2(c) under the Investment Company Act of 1940, as amended) are effective at the reasonable assurance level based on their evaluation of these controls and procedures as of a date within 90 days of the filing date of this document.
(b) There were no changes in the registrant’s internal controls over financial reporting that occurred during the second fiscal quarter of the period that has materially affected, or is reasonably likely to materially affect, the registrant’s internal control over financial reporting.
ITEM 12. EXHIBITS.
The following exhibits are attached to this Form N-CSR:
EXHIBIT NO. | DESCRIPTION OF EXHIBIT | |
| 12 (b)(1) | Certification of Principal Executive Officer Pursuant to Section 302 of the Sarbanes-Oxley Act of 2002 | |
| 12 (b)(2) | Certification of Principal Financial Officer Pursuant to Section 302 of the Sarbanes-Oxley Act of 2002 | |
| 12 (c) | Certification of Principal Executive Officer and Principal Financial Officer Pursuant to Section 906 of the Sarbanes-Oxley Act of 2002 | |
SIGNATURES
Pursuant to the requirements of the Securities Exchange Act of 1934 and the Investment Company Act of 1940, the registrant has duly caused this report to be signed on its behalf by the undersigned, thereunto duly authorized.
(Registrant): The AllianceBernstein Portfolios
| By: | /s/ Robert M. Keith | |
| Robert M. Keith | ||
| President | ||
| Date: | April 21, 2014 | |
Pursuant to the requirements of the Securities Exchange Act of 1934 and the Investment Company Act of 1940, this report has been signed below by the following persons on behalf of the registrant and in the capacities and on the dates indicated.
| By: | /s/ Robert M. Keith | |
| Robert M. Keith | ||
| President | ||
| Date: | April 21, 2014 | |
| By: | /s/ Joseph J. Mantineo | |
| Joseph J. Mantineo | ||
| Treasurer and Chief Financial Officer | ||
| Date: | April 21, 2014 | |