UNITED STATES
SECURITIES AND EXCHANGE COMMISSION
Washington, D.C. 20549
FORM N-CSR
CERTIFIED SHAREHOLDER REPORT OF REGISTERED
MANAGEMENT INVESTMENT COMPANIES
Investment Company Act file number 811-00649
Fidelity Puritan Trust
(Exact name of registrant as specified in charter)
245 Summer St., Boston, Massachusetts 02210
(Address of principal executive offices) (Zip code)
Margaret Carey, Secretary
245 Summer St.
Boston, Massachusetts 02210
(Name and address of agent for service)
Registrant's telephone number, including area code:
617-563-7000
Date of fiscal year end: | August 31 |
Date of reporting period: | August 31, 2023 |
Item 1.
Reports to Stockholders


Contents
| Average Annual Total Returns | |||
Periods ended August 31, 2023 | Past 1 year | Past 5 years | Past 10 years |
| Fidelity® Puritan® Fund | 12.00% | 7.82% | 9.34% |
| Class K | 12.10% | 7.90% | 9.43% |
| $10,000 Over 10 Years |
Let's say hypothetically that $10,000 was invested in Fidelity® Puritan® Fund, a class of the fund, on August 31, 2013. The chart shows how the value of your investment would have changed, and also shows how the S&P 500® Index performed over the same period. |
 |
Top Holdings (% of Fund's net assets) | ||
| Microsoft Corp. | 5.8 | |
| NVIDIA Corp. | 3.7 | |
| Alphabet, Inc. Class C | 3.4 | |
| Amazon.com, Inc. | 2.2 | |
| Meta Platforms, Inc. Class A | 2.2 | |
| Eaton Corp. PLC | 1.9 | |
| Apple, Inc. | 1.8 | |
| MasterCard, Inc. Class A | 1.7 | |
| Eli Lilly & Co. | 1.4 | |
| The Boeing Co. | 1.4 | |
| 25.5 | ||
| Top Bond Issuers (% of Fund's net assets) | ||
(with maturities greater than one year) | ||
| U.S. Treasury Obligations | 11.5 | |
| Fannie Mae | 2.2 | |
| Freddie Mac | 1.9 | |
| Ginnie Mae | 1.2 | |
| Uniform Mortgage Backed Securities | 1.0 | |
| JPMorgan Chase & Co. | 0.7 | |
| Morgan Stanley | 0.4 | |
| Bank of America Corp. | 0.4 | |
| Citigroup, Inc. | 0.3 | |
| Ally Financial, Inc. | 0.2 | |
| 19.8 | ||
| Market Sectors (% of Fund's net assets) | ||
| Information Technology | 20.5 | |
| Financials | 11.3 | |
| Industrials | 10.0 | |
| Health Care | 8.5 | |
| Communication Services | 8.4 | |
| Consumer Discretionary | 7.6 | |
| Energy | 4.6 | |
| Materials | 2.5 | |
| Consumer Staples | 2.2 | |
| Real Estate | 0.9 | |
| Utilities | 0.6 | |
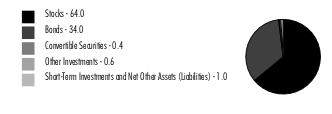
Asset Allocation (% of Fund's net assets) |
 |
Futures and Swaps - 0.7% |
| Common Stocks - 63.8% | |||
| Shares | Value ($) (000s) | ||
| COMMUNICATION SERVICES - 6.9% | |||
| Entertainment - 0.8% | |||
| Electronic Arts, Inc. | 77,767 | 9,330 | |
| LiveOne, Inc. (a)(b)(c) | 6,716,730 | 14,374 | |
| Netflix, Inc. (a) | 408,485 | 177,152 | |
| Spotify Technology SA (a) | 54,582 | 8,404 | |
| Universal Music Group NV | 704,536 | 17,468 | |
| 226,728 | |||
| Interactive Media & Services - 5.6% | |||
| Alphabet, Inc. Class C (a) | 6,896,198 | 947,193 | |
| Meta Platforms, Inc. Class A (a) | 2,006,396 | 593,673 | |
| 1,540,866 | |||
| Media - 0.5% | |||
| Comcast Corp. Class A | 2,989,582 | 139,793 | |
| Vice Holding, Inc. (a)(d) | 1,498,461 | 0 | |
| 139,793 | |||
TOTAL COMMUNICATION SERVICES | 1,907,387 | ||
| CONSUMER DISCRETIONARY - 6.7% | |||
| Automobile Components - 0.1% | |||
| Aptiv PLC (a) | 168,566 | 17,101 | |
| Automobiles - 0.0% | |||
| Li Auto, Inc. ADR (a) | 89,482 | 3,727 | |
| Neutron Holdings, Inc. (a)(d)(e) | 4,168,198 | 120 | |
| 3,847 | |||
| Broadline Retail - 2.3% | |||
| Amazon.com, Inc. (a) | 4,383,213 | 604,927 | |
| Global-e Online Ltd. (a)(b) | 741,350 | 29,380 | |
| 634,307 | |||
| Hotels, Restaurants & Leisure - 1.7% | |||
| Airbnb, Inc. Class A (a) | 650,425 | 85,563 | |
| Caesars Entertainment, Inc. (a) | 656,130 | 36,258 | |
| Compass Group PLC | 1,097,683 | 27,680 | |
| Domino's Pizza, Inc. | 139,122 | 53,896 | |
| Flutter Entertainment PLC (a) | 207,435 | 37,866 | |
| Hilton Worldwide Holdings, Inc. | 743,661 | 110,545 | |
| Marriott International, Inc. Class A | 294,472 | 59,928 | |
| McDonald's Corp. | 201,848 | 56,750 | |
| 468,486 | |||
| Household Durables - 0.1% | |||
| Blu Investments LLC (a)(d)(e) | 14,988,638 | 5 | |
| Chervon Holdings Ltd. | 1,418,113 | 4,683 | |
| D.R. Horton, Inc. | 245,619 | 29,234 | |
| 33,922 | |||
| Specialty Retail - 1.7% | |||
| Lowe's Companies, Inc. | 747,175 | 172,209 | |
| Revolve Group, Inc. (a) | 216,646 | 3,174 | |
| RH (a) | 75,687 | 27,640 | |
| TJX Companies, Inc. | 2,787,226 | 257,763 | |
| 460,786 | |||
| Textiles, Apparel & Luxury Goods - 0.8% | |||
| Brunello Cucinelli SpA | 1,210,391 | 100,274 | |
| LVMH Moet Hennessy Louis Vuitton SE | 43,663 | 36,924 | |
| Moncler SpA | 103,050 | 7,000 | |
| NIKE, Inc. Class B | 34,146 | 3,473 | |
| On Holding AG (a) | 53,478 | 1,542 | |
| Ralph Lauren Corp. | 270,199 | 31,513 | |
| Tapestry, Inc. | 327,872 | 10,925 | |
| Tory Burch LLC: | |||
| Class A (a)(d)(e)(f) | 702,741 | 22,722 | |
| Class B (a)(d)(e)(f) | 324,840 | 11,363 | |
| 225,736 | |||
TOTAL CONSUMER DISCRETIONARY | 1,844,185 | ||
| CONSUMER STAPLES - 1.5% | |||
| Beverages - 0.7% | |||
| Boston Beer Co., Inc. Class A (a) | 59,122 | 21,605 | |
| Monster Beverage Corp. | 2,979,795 | 171,070 | |
| 192,675 | |||
| Consumer Staples Distribution & Retail - 0.0% | |||
| Performance Food Group Co. (a) | 86,782 | 5,392 | |
| Household Products - 0.3% | |||
| The Clorox Co. | 513,636 | 80,358 | |
| Personal Care Products - 0.2% | |||
| Estee Lauder Companies, Inc. Class A | 163,800 | 26,295 | |
| Kenvue, Inc. | 1,346,877 | 31,046 | |
| L'Oreal SA (a) | 10,418 | 4,584 | |
| 61,925 | |||
| Tobacco - 0.3% | |||
| Philip Morris International, Inc. | 858,800 | 82,496 | |
TOTAL CONSUMER STAPLES | 422,846 | ||
| ENERGY - 3.0% | |||
| Energy Equipment & Services - 1.7% | |||
| Baker Hughes Co. Class A | 4,136,759 | 149,709 | |
| NOV, Inc. | 3,766,084 | 79,577 | |
| Schlumberger Ltd. | 3,024,433 | 178,321 | |
| TechnipFMC PLC | 3,707,313 | 70,587 | |
| Weatherford International PLC (a) | 49,890 | 4,416 | |
| 482,610 | |||
| Oil, Gas & Consumable Fuels - 1.3% | |||
| Antero Resources Corp. (a) | 621,246 | 17,190 | |
| Exxon Mobil Corp. | 1,199,737 | 133,399 | |
| Hess Corp. | 939,233 | 145,111 | |
| Range Resources Corp. | 1,644,870 | 53,261 | |
| 348,961 | |||
TOTAL ENERGY | 831,571 | ||
| FINANCIALS - 6.8% | |||
| Banks - 0.5% | |||
| JPMorgan Chase & Co. | 619,643 | 90,672 | |
| Starling Bank Ltd. Series D (a)(d)(e) | 7,254,400 | 29,775 | |
| 120,447 | |||
| Capital Markets - 2.3% | |||
| Ares Management Corp. | 960,205 | 99,324 | |
| BlackRock, Inc. Class A | 127,345 | 89,210 | |
| Cboe Global Markets, Inc. | 249,423 | 37,341 | |
| CME Group, Inc. | 233,856 | 47,398 | |
| Deutsche Borse AG | 157,536 | 27,966 | |
| Goldman Sachs Group, Inc. | 131,643 | 43,141 | |
| Intercontinental Exchange, Inc. | 680,534 | 80,296 | |
| KKR & Co. LP | 384,722 | 24,164 | |
| London Stock Exchange Group PLC | 116,976 | 12,102 | |
| Moody's Corp. | 66,986 | 22,561 | |
| Morgan Stanley | 1,131,737 | 96,367 | |
| Raymond James Financial, Inc. | 130,219 | 13,620 | |
| TulCo LLC (a)(d)(e)(f) | 42,857 | 35,091 | |
| 628,581 | |||
| Consumer Finance - 0.2% | |||
| American Express Co. | 260,875 | 41,216 | |
| Capital One Financial Corp. | 223,355 | 22,869 | |
| 64,085 | |||
| Financial Services - 2.7% | |||
| Berkshire Hathaway, Inc. Class B (a) | 199,181 | 71,745 | |
| Block, Inc. Class A (a) | 703,917 | 40,581 | |
| MasterCard, Inc. Class A | 1,123,277 | 463,509 | |
| New Moda LLC Class 1 (a)(d) | 62,880 | 45 | |
| Toast, Inc. (a) | 1,304,139 | 28,913 | |
| Visa, Inc. Class A | 614,793 | 151,042 | |
| 755,835 | |||
| Insurance - 1.1% | |||
| Arthur J. Gallagher & Co. | 456,172 | 105,139 | |
| Chubb Ltd. | 111,282 | 22,353 | |
| Globe Life, Inc. | 226,584 | 25,280 | |
| Hartford Financial Services Group, Inc. | 251,233 | 18,044 | |
| Marsh & McLennan Companies, Inc. | 418,040 | 81,514 | |
| The Travelers Companies, Inc. | 365,893 | 58,993 | |
| 311,323 | |||
TOTAL FINANCIALS | 1,880,271 | ||
| HEALTH CARE - 7.6% | |||
| Biotechnology - 1.5% | |||
| Argenx SE ADR (a) | 133,881 | 67,274 | |
| Exact Sciences Corp. (a) | 847,973 | 70,950 | |
| Karuna Therapeutics, Inc. (a) | 66,679 | 12,520 | |
| Legend Biotech Corp. ADR (a) | 962,760 | 66,777 | |
| Moderna, Inc. (a) | 265,315 | 29,999 | |
| Nuvalent, Inc. Class A (a) | 136,206 | 6,207 | |
| Prothena Corp. PLC (a) | 157,706 | 8,330 | |
| Regeneron Pharmaceuticals, Inc. (a) | 108,033 | 89,288 | |
| Vertex Pharmaceuticals, Inc. (a) | 196,688 | 68,514 | |
| 419,859 | |||
| Health Care Equipment & Supplies - 1.9% | |||
| Baxter International, Inc. | 172,865 | 7,018 | |
| Boston Scientific Corp. (a) | 5,254,152 | 283,409 | |
| Intuitive Surgical, Inc. (a) | 176,801 | 55,282 | |
| Penumbra, Inc. (a) | 11,798 | 3,121 | |
| Stryker Corp. | 624,623 | 177,112 | |
| 525,942 | |||
| Health Care Providers & Services - 1.6% | |||
| agilon health, Inc. (a) | 3,845,119 | 68,136 | |
| Cardinal Health, Inc. | 139,449 | 12,178 | |
| Cigna Group | 35,007 | 9,671 | |
| CVS Health Corp. | 815,934 | 53,174 | |
| UnitedHealth Group, Inc. | 616,054 | 293,599 | |
| 436,758 | |||
| Health Care Technology - 0.1% | |||
| Evolent Health, Inc. (e) | 976,600 | 23,667 | |
| Life Sciences Tools & Services - 0.2% | |||
| Agilent Technologies, Inc. | 241,902 | 29,287 | |
| Thermo Fisher Scientific, Inc. | 38,653 | 21,534 | |
| 50,821 | |||
| Pharmaceuticals - 2.3% | |||
| AstraZeneca PLC sponsored ADR | 99,126 | 6,723 | |
| Eli Lilly & Co. | 713,203 | 395,257 | |
| Merck & Co., Inc. | 1,833,043 | 199,765 | |
| Novo Nordisk A/S Series B | 203,959 | 37,621 | |
| 639,366 | |||
TOTAL HEALTH CARE | 2,096,413 | ||
| INDUSTRIALS - 9.1% | |||
| Aerospace & Defense - 2.4% | |||
| BWX Technologies, Inc. | 25,995 | 1,917 | |
| Howmet Aerospace, Inc. | 1,154,213 | 57,099 | |
| Lockheed Martin Corp. | 322,957 | 144,798 | |
| Space Exploration Technologies Corp.: | |||
| Class A (a)(d)(e) | 411,220 | 33,309 | |
| Class C (a)(d)(e) | 56,070 | 4,542 | |
| The Boeing Co. (a) | 1,702,487 | 381,408 | |
| TransDigm Group, Inc. | 40,185 | 36,321 | |
| 659,394 | |||
| Building Products - 0.7% | |||
| ASSA ABLOY AB (B Shares) | 179,923 | 4,049 | |
| Fortune Brands Home & Security, Inc. (b) | 415,423 | 28,672 | |
| Johnson Controls International PLC | 530,310 | 31,320 | |
| Trane Technologies PLC | 583,934 | 119,858 | |
| 183,899 | |||
| Commercial Services & Supplies - 0.3% | |||
| Cintas Corp. | 147,978 | 74,606 | |
| Copart, Inc. | 51,578 | 2,312 | |
| 76,918 | |||
| Construction & Engineering - 0.2% | |||
| Fluor Corp. (a) | 1,262,735 | 44,183 | |
| Willscot Mobile Mini Holdings (a) | 112,777 | 4,626 | |
| 48,809 | |||
| Electrical Equipment - 2.4% | |||
| Eaton Corp. PLC | 2,282,838 | 525,897 | |
| Hubbell, Inc. Class B | 152,555 | 49,741 | |
| Prysmian SpA | 396,837 | 16,261 | |
| Regal Rexnord Corp. | 33,483 | 5,431 | |
| Vertiv Holdings Co. | 1,676,313 | 66,030 | |
| 663,360 | |||
| Ground Transportation - 1.0% | |||
| Canadian Pacific Kansas City Ltd. | 156,925 | 12,457 | |
| Lyft, Inc. (a) | 1,474,270 | 17,367 | |
| Uber Technologies, Inc. (a) | 5,218,050 | 246,449 | |
| 276,273 | |||
| Industrial Conglomerates - 0.8% | |||
| General Electric Co. | 2,055,130 | 235,230 | |
| Machinery - 0.8% | |||
| Caterpillar, Inc. | 652,600 | 183,465 | |
| PACCAR, Inc. | 94,610 | 7,785 | |
| Parker Hannifin Corp. | 17,296 | 7,211 | |
| Pentair PLC | 287,877 | 20,226 | |
| 218,687 | |||
| Passenger Airlines - 0.2% | |||
| Copa Holdings SA Class A (b) | 414,319 | 42,136 | |
| Delta Air Lines, Inc. | 404,342 | 17,338 | |
| 59,474 | |||
| Professional Services - 0.2% | |||
| Equifax, Inc. | 263,459 | 54,457 | |
| Paycom Software, Inc. | 44,481 | 13,115 | |
| 67,572 | |||
| Trading Companies & Distributors - 0.1% | |||
| Bunzl PLC | 59,932 | 2,149 | |
| W.W. Grainger, Inc. | 39,183 | 27,982 | |
| 30,131 | |||
TOTAL INDUSTRIALS | 2,519,747 | ||
| INFORMATION TECHNOLOGY - 20.0% | |||
| Electronic Equipment, Instruments & Components - 0.4% | |||
| Amphenol Corp. Class A | 884,476 | 78,170 | |
| Flex Ltd. (a) | 1,341,113 | 37,001 | |
| 115,171 | |||
| IT Services - 1.4% | |||
| Accenture PLC Class A | 392,681 | 127,138 | |
| Shopify, Inc. Class A (a) | 3,536,603 | 235,149 | |
| Snowflake, Inc. (a) | 198,573 | 31,146 | |
| X Holdings Corp. Class A (d)(e) | 172,430 | 6,651 | |
| 400,084 | |||
| Semiconductors & Semiconductor Equipment - 8.1% | |||
| Advanced Micro Devices, Inc. (a) | 728,361 | 77,002 | |
| Analog Devices, Inc. | 816,197 | 148,368 | |
| Applied Materials, Inc. | 215,235 | 32,879 | |
| ASML Holding NV (depository receipt) | 89,081 | 58,841 | |
| First Solar, Inc. (a) | 331,333 | 62,662 | |
| GlobalFoundries, Inc. (a) | 1,170,500 | 64,670 | |
| Lam Research Corp. | 82,821 | 58,173 | |
| Lattice Semiconductor Corp. (a) | 235,683 | 22,923 | |
| Marvell Technology, Inc. | 5,899,991 | 343,674 | |
| Monolithic Power Systems, Inc. | 69,386 | 36,165 | |
| NVIDIA Corp. | 2,059,165 | 1,016,301 | |
| NXP Semiconductors NV | 353,728 | 72,769 | |
| ON Semiconductor Corp. (a) | 626,534 | 61,689 | |
| Taiwan Semiconductor Manufacturing Co. Ltd. sponsored ADR | 1,471,872 | 137,723 | |
| Universal Display Corp. | 220,743 | 35,884 | |
| 2,229,723 | |||
| Software - 8.3% | |||
| Adobe, Inc. (a) | 217,331 | 121,562 | |
| Atom Tickets LLC (a)(d)(e)(f) | 2,580,511 | 0 | |
| Autodesk, Inc. (a) | 77,776 | 17,262 | |
| Confluent, Inc. (a) | 256,248 | 8,479 | |
| Dynatrace, Inc. (a) | 1,936,913 | 93,359 | |
| Fair Isaac Corp. (a) | 16,298 | 14,743 | |
| HubSpot, Inc. (a) | 53,888 | 29,451 | |
| Microsoft Corp. | 4,911,038 | 1,609,639 | |
| Oracle Corp. | 1,152,210 | 138,715 | |
| Salesforce, Inc. (a) | 424,201 | 93,944 | |
| Synopsys, Inc. (a) | 142,288 | 65,295 | |
| Tenable Holdings, Inc. (a) | 101,460 | 4,603 | |
| UiPath, Inc. Class A (a) | 316,636 | 5,006 | |
| Workday, Inc. Class A (a) | 370,318 | 90,543 | |
| 2,292,601 | |||
| Technology Hardware, Storage & Peripherals - 1.8% | |||
| Apple, Inc. | 2,571,692 | 483,144 | |
| Samsung Electronics Co. Ltd. | 100,000 | 5,049 | |
| 488,193 | |||
TOTAL INFORMATION TECHNOLOGY | 5,525,772 | ||
| MATERIALS - 2.2% | |||
| Chemicals - 1.6% | |||
| Linde PLC | 551,275 | 213,365 | |
| Sherwin-Williams Co. | 825,635 | 224,342 | |
| 437,707 | |||
| Construction Materials - 0.0% | |||
| Martin Marietta Materials, Inc. | 12,297 | 5,490 | |
| Containers & Packaging - 0.1% | |||
| Aptargroup, Inc. | 14,694 | 1,948 | |
| Ball Corp. | 402,659 | 21,925 | |
| 23,873 | |||
| Metals & Mining - 0.5% | |||
| First Quantum Minerals Ltd. | 1,529,169 | 41,081 | |
| Franco-Nevada Corp. | 37,930 | 5,464 | |
| Freeport-McMoRan, Inc. | 87,751 | 3,502 | |
| Newcrest Mining Ltd. | 1,180,197 | 19,670 | |
| Newmont Corp. | 1,492,933 | 58,851 | |
| Nucor Corp. | 22,741 | 3,914 | |
| Wheaton Precious Metals Corp. | 236,299 | 10,307 | |
| 142,789 | |||
TOTAL MATERIALS | 609,859 | ||
| TOTAL COMMON STOCKS (Cost $11,466,456) | 17,638,051 | ||
| Preferred Stocks - 0.3% | |||
| Shares | Value ($) (000s) | ||
| Convertible Preferred Stocks - 0.3% | |||
| COMMUNICATION SERVICES - 0.1% | |||
| Interactive Media & Services - 0.1% | |||
| ByteDance Ltd. Series E1 (a)(d)(e) | 145,676 | 32,936 | |
| Reddit, Inc. Series E (a)(d)(e) | 28,500 | 1,019 | |
| 33,955 | |||
| CONSUMER DISCRETIONARY - 0.1% | |||
| Textiles, Apparel & Luxury Goods - 0.1% | |||
| Goop International Holdings, Inc.: | |||
| Series C(a)(d)(e) | 1,881,874 | 13,361 | |
| Series D(a)(d)(e) | 342,241 | 2,430 | |
| 15,791 | |||
| HEALTH CARE - 0.0% | |||
| Health Care Providers & Services - 0.0% | |||
| Get Heal, Inc. Series B (a)(d)(e) | 8,512,822 | 1 | |
| INDUSTRIALS - 0.1% | |||
| Aerospace & Defense - 0.1% | |||
| Space Exploration Technologies Corp. Series H (a)(d)(e) | 51,921 | 42,056 | |
| TOTAL CONVERTIBLE PREFERRED STOCKS | 91,803 | ||
| Nonconvertible Preferred Stocks - 0.0% | |||
| CONSUMER DISCRETIONARY - 0.0% | |||
| Automobiles - 0.0% | |||
| Neutron Holdings, Inc.: | |||
| Series 1C(a)(d)(e) | 38,589,900 | 1,108 | |
| Series 1D(a)(d)(e) | 40,824,742 | 1,172 | |
| 2,280 | |||
| TOTAL PREFERRED STOCKS (Cost $66,156) | 94,083 | ||
| Corporate Bonds - 0.0% | |||
Principal Amount (g) (000s) | Value ($) (000s) | ||
| Convertible Bonds - 0.0% | |||
| CONSUMER DISCRETIONARY - 0.0% | |||
| Automobiles - 0.0% | |||
| Neutron Holdings, Inc.: | |||
| 4% 5/22/27(d)(e) | 1,371 | 1,609 | |
| 4% 6/12/27(d)(e) | 354 | 416 | |
| 2,025 | |||
| Nonconvertible Bonds - 0.0% | |||
| FINANCIALS - 0.0% | |||
| Financial Services - 0.0% | |||
| Ant International Co. Ltd. 3.55% 8/14/24 (d)(e) | 3,617 | 3,599 | |
| TOTAL CORPORATE BONDS (Cost $5,342) | 5,624 | ||
| Fixed-Income Funds - 35.4% | |||
| Shares | Value ($) (000s) | ||
| Fidelity High Income Central Fund (h) | 12,201,623 | 1,251,032 | |
| Fidelity Investment Grade Bond Central Fund (h) | 88,606,556 | 8,540,786 | |
| TOTAL FIXED-INCOME FUNDS (Cost $10,957,775) | 9,791,818 | ||
| Other - 0.0% | |||
| Shares | Value ($) (000s) | ||
| Other - 0.0% | |||
Fidelity Private Credit Central Fund LLC (e) (Cost $5,439) | 543,678 | 5,469 | |
| Money Market Funds - 0.7% | |||
| Shares | Value ($) (000s) | ||
| Fidelity Cash Central Fund 5.43% (i) | 119,191,365 | 119,215 | |
| Fidelity Securities Lending Cash Central Fund 5.44% (i)(j) | 69,415,773 | 69,423 | |
| TOTAL MONEY MARKET FUNDS (Cost $188,638) | 188,638 | ||
| TOTAL INVESTMENT IN SECURITIES - 100.2% (Cost $22,689,806) | 27,723,683 |
NET OTHER ASSETS (LIABILITIES) - (0.2)% | (62,242) |
| NET ASSETS - 100.0% | 27,661,441 |
| (a) | Non-income producing |
| (b) | Security or a portion of the security is on loan at period end. |
| (c) | Affiliated company |
| (d) | Level 3 security |
| (e) | Restricted securities (including private placements) - Investment in securities not registered under the Securities Act of 1933 (excluding 144A issues). At the end of the period, the value of restricted securities (excluding 144A issues) amounted to $272,421,000 or 1.0% of net assets. |
| (f) | Investment is owned by a wholly-owned subsidiary (Subsidiary) that is treated as a corporation for U.S. tax purposes. |
| (g) | Amount is stated in United States dollars unless otherwise noted. |
| (h) | Affiliated fund that is generally available only to investment companies and other accounts managed by Fidelity Investments. A complete unaudited schedule of portfolio holdings for each Fidelity Central Fund is filed with the SEC for the first and third quarters of each fiscal year on Form N-PORT and is available upon request or at the SEC's website at www.sec.gov. An unaudited holdings listing for the Fund, which presents direct holdings as well as the pro-rata share of securities and other investments held indirectly through its investment in underlying non-money market Fidelity Central Funds, is available at fidelity.com and/or institutional.fidelity.com, as applicable. In addition, each Fidelity Central Fund's financial statements,which are not covered by the Fund's Report of Independent Registered Public Accounting Firm, are available on the SEC's website or upon request. |
| (i) | Affiliated fund that is generally available only to investment companies and other accounts managed by Fidelity Investments. The rate quoted is the annualized seven-day yield of the fund at period end. A complete unaudited listing of the fund's holdings as of its most recent quarter end is available upon request. In addition, each Fidelity Central Fund's financial statements, which are not covered by the Fund's Report of Independent Registered Public Accounting Firm, are available on the SEC's website or upon request. |
| (j) | Investment made with cash collateral received from securities on loan. |
| Additional information on each restricted holding is as follows: | ||
| Security | Acquisition Date | Acquisition Cost ($) (000s) |
| Ant International Co. Ltd. 3.55% 8/14/24 | 8/14/23 | 3,617 |
| Atom Tickets LLC | 8/15/17 | 15,000 |
| Blu Investments LLC | 5/21/20 | 26 |
| ByteDance Ltd. Series E1 | 11/18/20 | 15,962 |
| Evolent Health, Inc. | 3/28/23 | 28,321 |
| Fidelity Private Credit Central Fund LLC | 5/26/23 - 8/29/23 | 5,439 |
| Get Heal, Inc. Series B | 8/17/23 | 18 |
| Goop International Holdings, Inc. Series C | 12/15/17 | 20,000 |
| Goop International Holdings, Inc. Series D | 6/21/19 | 5,000 |
| Neutron Holdings, Inc. | 2/04/21 | 42 |
| Neutron Holdings, Inc. Series 1C | 7/03/18 - 1/25/19 | 7,056 |
| Neutron Holdings, Inc. Series 1D | 7/03/18 - 1/25/19 | 9,900 |
| Neutron Holdings, Inc. 4% 5/22/27 | 6/04/20 | 1,371 |
| Neutron Holdings, Inc. 4% 6/12/27 | 6/12/20 | 354 |
| Reddit, Inc. Series E | 5/18/21 | 1,211 |
| Space Exploration Technologies Corp. Class A | 9/11/17 | 5,551 |
| Space Exploration Technologies Corp. Class C | 9/11/17 | 757 |
| Space Exploration Technologies Corp. Series H | 8/04/17 | 7,009 |
| Starling Bank Ltd. Series D | 6/18/21 - 4/05/22 | 13,909 |
| Tory Burch LLC Class A | 5/14/15 | 50,000 |
| Tory Burch LLC Class B | 12/31/12 | 17,505 |
| TulCo LLC | 8/24/17 - 12/14/17 | 15,000 |
| X Holdings Corp. Class A | 10/25/22 | 17,243 |
| Affiliate (Amounts in thousands) | Value, beginning of period ($) | Purchases ($) | Sales Proceeds ($) | Dividend Income ($) | Realized Gain (loss) ($) | Change in Unrealized appreciation (depreciation) ($) | Value, end of period ($) | % ownership, end of period |
| Fidelity Cash Central Fund 5.43% | 642,362 | 5,174,596 | 5,697,743 | 12,041 | - | - | 119,215 | 0.3% |
| Fidelity High Income Central Fund | 1,577,613 | 104,176 | 425,436 | 104,177 | (31,806) | 26,485 | 1,251,032 | 85.0% |
| Fidelity Investment Grade Bond Central Fund | 8,577,708 | 312,325 | 5,004 | 312,325 | 102 | (344,345) | 8,540,786 | 22.7% |
| Fidelity Private Credit Central Fund LLC | - | 5,439 | - | 46 | - | 30 | 5,469 | 0.8% |
| Fidelity Securities Lending Cash Central Fund 5.44% | 117,626 | 878,367 | 926,570 | 284 | - | - | 69,423 | 0.2% |
| Total | 10,915,309 | 6,474,903 | 7,054,753 | 428,873 | (31,704) | (317,830) | 9,985,925 | |
| Affiliate (Amounts in thousands) | Value, beginning of period ($) | Purchases ($) | Sales Proceeds ($) | Dividend Income ($) | Realized Gain (loss) ($) | Change in Unrealized appreciation (depreciation) ($) | Value, end of period ($) |
| LiveOne, Inc. | 6,720 | - | 4 | - | (4) | 7,662 | 14,374 |
| Total | 6,720 | - | 4 | - | (4) | 7,662 | 14,374 |
| Valuation Inputs at Reporting Date: | ||||
Description (Amounts in thousands) | Total ($) | Level 1 ($) | Level 2 ($) | Level 3 ($) |
Investments in Securities: | ||||
| Equities: | ||||
Communication Services | 1,941,342 | 1,889,919 | 17,468 | 33,955 |
Consumer Discretionary | 1,862,256 | 1,745,371 | 64,604 | 52,281 |
Consumer Staples | 422,846 | 422,846 | - | - |
Energy | 831,571 | 831,571 | - | - |
Financials | 1,880,271 | 1,775,292 | 40,068 | 64,911 |
Health Care | 2,096,414 | 2,035,125 | 61,288 | 1 |
Industrials | 2,561,803 | 2,477,847 | 4,049 | 79,907 |
Information Technology | 5,525,772 | 5,519,121 | - | 6,651 |
Materials | 609,859 | 590,189 | 19,670 | - |
| Corporate Bonds | 5,624 | - | - | 5,624 |
| Fixed-Income Funds | 9,791,818 | 9,791,818 | - | - |
| Other | 5,469 | - | 5,469 | - |
| Money Market Funds | 188,638 | 188,638 | - | - |
| Total Investments in Securities: | 27,723,683 | 27,267,737 | 212,616 | 243,330 |
| Consolidated Statement of Assets and Liabilities | ||||
| Amounts in thousands (except per-share amounts) | August 31, 2023 | |||
| Assets | ||||
| Investment in securities, at value (including securities loaned of $66,822) - See accompanying schedule: | ||||
Unaffiliated issuers (cost $11,517,513) | $ | 17,723,384 | ||
Fidelity Central Funds (cost $11,151,852) | 9,985,925 | |||
Other affiliated issuers (cost $20,441) | 14,374 | |||
| Total Investment in Securities (cost $22,689,806) | $ | 27,723,683 | ||
| Cash | 32 | |||
| Restricted cash | 891 | |||
| Receivable for investments sold | 76,444 | |||
| Receivable for fund shares sold | 7,163 | |||
| Dividends receivable | 10,585 | |||
| Interest receivable | 228 | |||
| Distributions receivable from Fidelity Central Funds | 1,306 | |||
| Prepaid expenses | 47 | |||
| Other receivables | 1,387 | |||
Total assets | 27,821,766 | |||
| Liabilities | ||||
| Payable for investments purchased | $ | 65,306 | ||
| Payable for fund shares redeemed | 13,063 | |||
| Accrued management fee | 8,571 | |||
| Other affiliated payables | 2,734 | |||
| Other payables and accrued expenses | 1,218 | |||
| Collateral on securities loaned | 69,433 | |||
| Total Liabilities | 160,325 | |||
| Commitments and contingent liabilities (see Commitments note) | ||||
| Net Assets | $ | 27,661,441 | ||
| Net Assets consist of: | ||||
| Paid in capital | $ | 21,746,957 | ||
| Total accumulated earnings (loss) | 5,914,484 | |||
| Net Assets | $ | 27,661,441 | ||
| Net Asset Value and Maximum Offering Price | ||||
| Puritan : | ||||
Net Asset Value, offering price and redemption price per share ($23,958,959 ÷ 1,033,465 shares) | $ | 23.18 | ||
| Class K : | ||||
Net Asset Value, offering price and redemption price per share ($3,702,482 ÷ 159,855 shares) | $ | 23.16 | ||
| Consolidated Statement of Operations | ||||
| Amounts in thousands | Year ended August 31, 2023 | |||
| Investment Income | ||||
| Dividends | $ | 179,623 | ||
| Interest | 622 | |||
| Income from Fidelity Central Funds (including $284 from security lending) | 427,595 | |||
| Total Income | 607,840 | |||
| Expenses | ||||
| Management fee | $ | 100,725 | ||
| Transfer agent fees | 29,822 | |||
| Accounting fees | 2,151 | |||
| Custodian fees and expenses | 198 | |||
| Independent trustees' fees and expenses | 149 | |||
| Registration fees | 158 | |||
| Audit | 224 | |||
| Legal | 36 | |||
| Interest | 1 | |||
| Miscellaneous | 131 | |||
| Total expenses before reductions | 133,595 | |||
| Expense reductions | (1,352) | |||
| Total expenses after reductions | 132,243 | |||
| Net Investment income (loss) | 475,597 | |||
| Realized and Unrealized Gain (Loss) | ||||
| Net realized gain (loss) on: | ||||
| Investment Securities: | ||||
| Unaffiliated issuers | 918,114 | |||
| Redemptions in-kind | 4,410 | |||
| Fidelity Central Funds | (31,704) | |||
| Other affiliated issuers | (4) | |||
| Foreign currency transactions | (189) | |||
| Written options | 24,780 | |||
| Capital gain distributions from Fidelity Central Funds | 1,278 | |||
| Total net realized gain (loss) | 916,685 | |||
| Change in net unrealized appreciation (depreciation) on: | ||||
| Investment Securities: | ||||
| Investments | 1,940,265 | |||
| Fidelity Central Funds | (317,830) | |||
| Other affiliated issuers | 7,662 | |||
| Assets and liabilities in foreign currencies | 59 | |||
| Total change in net unrealized appreciation (depreciation) | 1,630,156 | |||
| Net gain (loss) | 2,546,841 | |||
| Net increase (decrease) in net assets resulting from operations | $ | 3,022,438 | ||
| Consolidated Statement of Changes in Net Assets | ||||
| Amount in thousands | Year ended August 31, 2023 | Year ended August 31, 2022 | ||
| Increase (Decrease) in Net Assets | ||||
| Operations | ||||
| Net investment income (loss) | $ | 475,597 | $ | 420,398 |
| Net realized gain (loss) | 916,685 | 2,620,374 | ||
| Change in net unrealized appreciation (depreciation) | 1,630,156 | (7,070,717) | ||
| Net increase (decrease) in net assets resulting from operations | 3,022,438 | (4,029,945) | ||
| Distributions to shareholders | (2,340,895) | (4,259,091) | ||
| Share transactions - net increase (decrease) | (699,333) | 1,462,727 | ||
| Total increase (decrease) in net assets | (17,790) | (6,826,309) | ||
| Net Assets | ||||
| Beginning of period | 27,679,231 | 34,505,540 | ||
| End of period | $ | 27,661,441 | $ | 27,679,231 |
| Fidelity® Puritan® Fund |
| Years ended August 31, | 2023 | 2022 | 2021 | 2020 | 2019 | |||||
Selected Per-Share Data | ||||||||||
| Net asset value, beginning of period | $ | 22.76 | $ | 29.62 | $ | 25.87 | $ | 22.17 | $ | 25.10 |
| Income from Investment Operations | ||||||||||
Net investment income (loss) A,B | .38 | .33 | .25 | .30 | .34 | |||||
| Net realized and unrealized gain (loss) | 1.98 | (3.57) | 4.79 | 4.35 | (.27) | |||||
| Total from investment operations | 2.36 | (3.24) | 5.04 | 4.65 | .07 | |||||
| Distributions from net investment income | (.35) | (.39) C | (.25) | (.32) | (.36) | |||||
| Distributions from net realized gain | (1.59) | (3.23) C | (1.04) | (.63) | (2.63) | |||||
| Total distributions | (1.94) | (3.62) | (1.29) | (.95) | (3.00) D | |||||
| Net asset value, end of period | $ | 23.18 | $ | 22.76 | $ | 29.62 | $ | 25.87 | $ | 22.17 |
Total Return E | 12.00% | (12.30)% | 20.33% | 21.84% | 1.17% | |||||
Ratios to Average Net Assets B,F,G | ||||||||||
| Expenses before reductions | .51% | .50% | .51% | .52% | .53% | |||||
| Expenses net of fee waivers, if any | .50% | .50% | .51% | .52% | .53% | |||||
| Expenses net of all reductions | .50% | .50% | .50% | .52% | .53% | |||||
| Net investment income (loss) | 1.76% | 1.31% | .93% | 1.33% | 1.58% | |||||
| Supplemental Data | ||||||||||
| Net assets, end of period (in millions) | $ | 23,959 | $ | 23,519 | $ | 28,846 | $ | 24,168 | $ | 21,319 |
Portfolio turnover rate H | 52% I | 62% I | 58% I | 55% I | 132% I |
| Fidelity® Puritan® Fund Class K |
| Years ended August 31, | 2023 | 2022 | 2021 | 2020 | 2019 | |||||
Selected Per-Share Data | ||||||||||
| Net asset value, beginning of period | $ | 22.74 | $ | 29.60 | $ | 25.85 | $ | 22.15 | $ | 25.09 |
| Income from Investment Operations | ||||||||||
Net investment income (loss) A,B | .40 | .35 | .27 | .32 | .36 | |||||
| Net realized and unrealized gain (loss) | 1.98 | (3.57) | 4.79 | 4.35 | (.28) | |||||
| Total from investment operations | 2.38 | (3.22) | 5.06 | 4.67 | .08 | |||||
| Distributions from net investment income | (.37) | (.41) C | (.27) | (.34) | (.38) | |||||
| Distributions from net realized gain | (1.59) | (3.23) C | (1.04) | (.63) | (2.63) | |||||
| Total distributions | (1.96) | (3.64) | (1.31) | (.97) | (3.02) D | |||||
| Net asset value, end of period | $ | 23.16 | $ | 22.74 | $ | 29.60 | $ | 25.85 | $ | 22.15 |
Total Return E | 12.10% | (12.24)% | 20.43% | 21.97% | 1.22% | |||||
Ratios to Average Net Assets B,F,G | ||||||||||
| Expenses before reductions | .43% | .43% | .43% | .44% | .45% | |||||
| Expenses net of fee waivers, if any | .42% | .42% | .43% | .44% | .45% | |||||
| Expenses net of all reductions | .42% | .42% | .43% | .43% | .44% | |||||
| Net investment income (loss) | 1.84% | 1.39% | 1.00% | 1.41% | 1.67% | |||||
| Supplemental Data | ||||||||||
| Net assets, end of period (in millions) | $ | 3,702 | $ | 4,160 | $ | 5,659 | $ | 5,478 | $ | 5,662 |
Portfolio turnover rate H | 52% I | 62% I | 58% I | 55% I | 132% I |
| Fidelity Central Fund | Investment Manager | Investment Objective | Investment Practices | Expense RatioA |
| Fidelity High Income Central Fund | Fidelity Management & Research Company LLC (FMR) | Seeks a high level of income and may also seek capital appreciation by investing primarily in debt securities, preferred stocks, and convertible securities, with an emphasis on lower-quality debt securities. | Loans & Direct Debt Instruments Restricted Securities | .03% |
| Fidelity Investment Grade Bond Central Fund | Fidelity Management & Research Company LLC (FMR) | Seeks a high level of income by normally investing in investment-grade debt securities. | Delayed Delivery & When Issued Securities Futures Options Restricted Securities Swaps | Less than .005% |
| Fidelity Money Market Central Funds | Fidelity Management & Research Company LLC (FMR) | Each fund seeks to obtain a high level of current income consistent with the preservation of capital and liquidity. | Short-term Investments | Less than .005% |
| Fidelity Puritan Fund | $1,042 |
| Gross unrealized appreciation | $6,483,005 |
| Gross unrealized depreciation | (1,480,466) |
| Net unrealized appreciation (depreciation) | $5,002,539 |
| Tax Cost | $22,721,145 |
| Undistributed ordinary income | $82,916 |
| Undistributed long-term capital gain | $829,045 |
| Net unrealized appreciation (depreciation) on securities and other investments | $5,002,523 |
| August 31, 2023 | August 31, 2022 | |
| Ordinary Income | $433,341 | $1,197,159 |
| Long-term Capital Gains | 1,907,554 | 3,061,932 |
| Total | $2,340,895 | $4,259,091 |
| Investment to be Acquired | Commitment Amount | |
| Fidelity Puritan Fund | Fidelity Private Credit Central Fund LLC | $52,407 |
| $ Amount | % of Net Assets | |
| Fidelity Puritan Fund | 70,067 | .25 |
| Equity Risk | Equity risk relates to the fluctuations in the value of financial instruments as a result of changes in market prices (other than those arising from interest rate risk or foreign exchange risk), whether caused by factors specific to an individual investment, its issuer, or all factors affecting all instruments traded in a market or market segment. |
| Purchases ($) | Sales ($) | |
| Fidelity Puritan Fund | 13,832,717 | 15,796,822 |
| Shares | Total net realized gain or loss ($) | Total Proceeds ($) | Participating classes | |
| Fidelity Puritan Fund | 710 | 4,410 | 15,422 | Class K |
| Shares | Total net realized gain or loss ($) | Total Proceeds ($) | Participating classes | |
| Fidelity Puritan Fund | 11,361 | 114,304 | 291,485 | Puritan and Class K |
| Amount | % of Class-Level Average Net Assets | |
| Puritan | $28,162 | .12 |
| Class K | 1,660 | .04 |
| $29,822 |
| % of Average Net Assets | |
| Fidelity Puritan Fund | .01 |
| Amount | |
| Fidelity Puritan Fund | $ 319 |
| Borrower or Lender | Average Loan Balance | Weighted Average Interest Rate | Interest Expense | |
| Fidelity Puritan Fund | Borrower | $6,684 | 3.32% | $1 |
| Purchases ($) | Sales ($) | Realized Gain (Loss) ($) | |
| Fidelity Puritan Fund | 630,251 | 908,915 | 83,544 |
| Amount | |
| Fidelity Puritan Fund | $50 |
| Total Security Lending Fees Paid to NFS | Security Lending Income From Securities Loaned to NFS | Value of Securities Loaned to NFS at Period End | |
| Fidelity Puritan Fund | $29 | $5 | $- |
Year ended August 31, 2023 | Year ended August 31, 2022 | |
| Fidelity Puritan Fund | ||
| Distributions to shareholders | ||
| Puritan | $ 1,987,615 | $3,565,291 |
| Class K | 353,280 | 693,800 |
Total | $2,340,895 | $4,259,091 |
| Shares | Shares | Dollars | Dollars | |
Year ended August 31, 2023 | Year ended August 31, 2022 | Year ended August 31, 2023 | Year ended August 31, 2022 | |
| Fidelity Puritan Fund | ||||
| Puritan | ||||
| Shares sold | 52,955 | 76,593 | $1,149,216 | $1,980,329 |
| Reinvestment of distributions | 94,555 | 128,760 | 1,862,907 | 3,364,271 |
| Shares redeemed | (147,229) | (145,883) | (3,168,970) | (3,687,223) |
| Net increase (decrease) | 281 | 59,470 | $(156,847) | $1,657,377 |
| Class K | ||||
| Shares sold | 17,434 | 18,873 | $375,693 | $482,080 |
| Reinvestment of distributions | 17,952 | 26,573 | 353,263 | 693,798 |
| Shares redeemed | (58,447) | (53,712) | (1,271,442) | (1,370,528) |
| Net increase (decrease) | (23,061) | (8,266) | $(542,486) | $(194,650) |
| The Example is based on an investment of $1,000 invested at the beginning of the period and held for the entire period (March 1, 2023 to August 31, 2023). |
Annualized Expense Ratio- A | Beginning Account Value March 1, 2023 | Ending Account Value August 31, 2023 | Expenses Paid During Period- C March 1, 2023 to August 31, 2023 | |||||||
| Fidelity® Puritan® Fund | ||||||||||
| Fidelity® Puritan® Fund | .50% | |||||||||
| Actual | $ 1,000 | $ 1,108.40 | $ 2.66 | |||||||
Hypothetical-B | $ 1,000 | $ 1,022.68 | $ 2.55 | |||||||
| Class K | .42% | |||||||||
| Actual | $ 1,000 | $ 1,109.00 | $ 2.23 | |||||||
Hypothetical-B | $ 1,000 | $ 1,023.09 | $ 2.14 | |||||||
 |


Contents
| Average Annual Total Returns | |||
Periods ended August 31, 2023 | Past 1 year | Past 5 years | Past 10 years |
| Fidelity® Balanced Fund | 11.60% | 8.64% | 9.53% |
| Class K | 11.72% | 8.74% | 9.63% |
| $10,000 Over 10 Years |
Let's say hypothetically that $10,000 was invested in Fidelity® Balanced Fund, a class of the fund, on August 31, 2013. The chart shows how the value of your investment would have changed, and also shows how the S&P 500® Index performed over the same period. |
 |
Top Holdings (% of Fund's net assets) | ||
| Microsoft Corp. | 4.7 | |
| Apple, Inc. | 3.8 | |
| Amazon.com, Inc. | 2.5 | |
| NVIDIA Corp. | 2.3 | |
| Alphabet, Inc. Class A | 1.6 | |
| Meta Platforms, Inc. Class A | 1.3 | |
| Exxon Mobil Corp. | 1.2 | |
| UnitedHealth Group, Inc. | 1.2 | |
| Eli Lilly & Co. | 1.1 | |
| Tesla, Inc. | 1.0 | |
| 20.7 | ||
| Top Bond Issuers (% of Fund's net assets) | ||
(with maturities greater than one year) | ||
| U.S. Treasury Obligations | 13.7 | |
| Fannie Mae | 2.6 | |
| Freddie Mac | 2.4 | |
| Ginnie Mae | 1.4 | |
| Uniform Mortgage Backed Securities | 1.1 | |
| JPMorgan Chase & Co. | 0.7 | |
| Morgan Stanley | 0.5 | |
| Citigroup, Inc. | 0.5 | |
| Bank of America Corp. | 0.3 | |
| Petroleos Mexicanos | 0.2 | |
| 23.4 | ||
| Market Sectors (% of Fund's net assets) | ||
| Information Technology | 16.8 | |
| Financials | 12.8 | |
| Health Care | 8.8 | |
| Consumer Discretionary | 6.9 | |
| Communication Services | 6.3 | |
| Industrials | 5.8 | |
| Consumer Staples | 4.8 | |
| Energy | 3.8 | |
| Real Estate | 2.5 | |
| Utilities | 1.9 | |
| Materials | 1.6 | |
Quality Diversification (% of Fund's net assets) |
 |
| We have used ratings from Moody's Investors Service, Inc. Where Moody's® ratings are not available, we have used S&P® ratings. All ratings are as of the date indicated and do not reflect subsequent changes. |
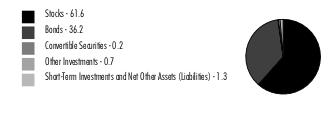
Asset Allocation (% of Fund's net assets) |
 |
Futures and Swaps - 1.7% |
| Common Stocks - 61.5% | |||
| Shares | Value ($) (000s) | ||
| COMMUNICATION SERVICES - 5.4% | |||
| Diversified Telecommunication Services - 0.4% | |||
| AT&T, Inc. | 8,167,840 | 120,802 | |
| Cellnex Telecom SA (a) | 398,400 | 15,250 | |
| Liberty Global PLC Class C (b) | 571,729 | 11,343 | |
| 147,395 | |||
| Entertainment - 0.8% | |||
| Cinemark Holdings, Inc. (b)(c) | 655,287 | 10,668 | |
| Netflix, Inc. (b) | 398,877 | 172,985 | |
| Sea Ltd. ADR (b) | 1,020,946 | 38,418 | |
| Take-Two Interactive Software, Inc. (b) | 238,937 | 33,977 | |
| The Walt Disney Co. (b) | 736,529 | 61,633 | |
| World Wrestling Entertainment, Inc. Class A (c) | 192,779 | 18,613 | |
| 336,294 | |||
| Interactive Media & Services - 3.5% | |||
| Alphabet, Inc.: | |||
| Class A (b) | 4,832,669 | 658,065 | |
| Class C (b) | 1,512,118 | 207,689 | |
| Epic Games, Inc. (b)(d)(e) | 12,272 | 7,643 | |
| Meta Platforms, Inc. Class A (b) | 1,781,209 | 527,042 | |
| Pinterest, Inc. Class A (b) | 554,540 | 15,244 | |
| Snap, Inc. Class A (b) | 3,368,610 | 34,865 | |
| 1,450,548 | |||
| Media - 0.5% | |||
| Altice U.S.A., Inc. Class A (b) | 897,635 | 2,756 | |
| Charter Communications, Inc. Class A (b) | 87,694 | 38,420 | |
| Comcast Corp. Class A | 1,750,000 | 81,830 | |
| Liberty Broadband Corp.: | |||
| Class A (b) | 513,718 | 48,105 | |
| Class C (b)(c) | 273,537 | 25,592 | |
| 196,703 | |||
| Wireless Telecommunication Services - 0.2% | |||
| T-Mobile U.S., Inc. (b) | 603,608 | 82,242 | |
TOTAL COMMUNICATION SERVICES | 2,213,182 | ||
| CONSUMER DISCRETIONARY - 6.6% | |||
| Automobile Components - 0.1% | |||
| Adient PLC (b) | 699,915 | 27,416 | |
| Automobiles - 1.1% | |||
| Ferrari NV | 84,361 | 26,805 | |
| Tesla, Inc. (b) | 1,595,474 | 411,760 | |
| 438,565 | |||
| Broadline Retail - 2.6% | |||
| Amazon.com, Inc. (b) | 7,355,489 | 1,015,131 | |
| eBay, Inc. | 1,138,456 | 50,980 | |
| 1,066,111 | |||
| Hotels, Restaurants & Leisure - 1.2% | |||
| Booking Holdings, Inc. (b) | 38,508 | 119,568 | |
| Caesars Entertainment, Inc. (b) | 571,600 | 31,587 | |
| Churchill Downs, Inc. | 406,853 | 50,971 | |
| Domino's Pizza, Inc. | 101,422 | 39,291 | |
| Marriott International, Inc. Class A | 555,023 | 112,953 | |
| McDonald's Corp. | 256,683 | 72,166 | |
| Penn Entertainment, Inc. (b) | 254,626 | 6,032 | |
| Red Rock Resorts, Inc. | 164,100 | 7,209 | |
| Sweetgreen, Inc. Class A (b) | 72,846 | 1,046 | |
| Yum! Brands, Inc. | 546,028 | 70,645 | |
| 511,468 | |||
| Household Durables - 0.0% | |||
| D.R. Horton, Inc. | 17,701 | 2,107 | |
| Mohawk Industries, Inc. (b) | 179,822 | 18,232 | |
| 20,339 | |||
| Specialty Retail - 1.3% | |||
| Cazoo Group Ltd. (b)(d) | 19,377 | 22 | |
| Fast Retailing Co. Ltd. | 82,428 | 18,968 | |
| Lowe's Companies, Inc. | 780,073 | 179,791 | |
| The Home Depot, Inc. | 359,648 | 118,792 | |
| TJX Companies, Inc. | 2,106,297 | 194,790 | |
| Valvoline, Inc. | 728,661 | 25,095 | |
| 537,458 | |||
| Textiles, Apparel & Luxury Goods - 0.3% | |||
| NIKE, Inc. Class B | 490,942 | 49,934 | |
| PVH Corp. | 378,554 | 31,647 | |
| Tapestry, Inc. | 981,086 | 32,690 | |
| 114,271 | |||
TOTAL CONSUMER DISCRETIONARY | 2,715,628 | ||
| CONSUMER STAPLES - 4.2% | |||
| Beverages - 1.5% | |||
| Boston Beer Co., Inc. Class A (b) | 45,983 | 16,804 | |
| Celsius Holdings, Inc. (b) | 170,017 | 33,330 | |
| Constellation Brands, Inc. Class A (sub. vtg.) | 272,173 | 70,917 | |
| Diageo PLC | 243,330 | 9,965 | |
| Duckhorn Portfolio, Inc. (b) | 627,767 | 7,809 | |
| Keurig Dr. Pepper, Inc. | 1,187,927 | 39,974 | |
| Monster Beverage Corp. | 1,223,507 | 70,242 | |
| PepsiCo, Inc. | 957,359 | 170,333 | |
| Pernod Ricard SA | 109,048 | 21,426 | |
| The Coca-Cola Co. | 3,088,116 | 184,762 | |
| The Vita Coco Co., Inc. (b) | 394,907 | 11,172 | |
| 636,734 | |||
| Consumer Staples Distribution & Retail - 1.2% | |||
| Alimentation Couche-Tard, Inc. Class A (multi-vtg.) | 491,379 | 25,696 | |
| BJ's Wholesale Club Holdings, Inc. (b) | 131,162 | 8,839 | |
| Costco Wholesale Corp. | 334,666 | 183,825 | |
| Dollar General Corp. | 113,489 | 15,718 | |
| Dollar Tree, Inc. (b) | 203,829 | 24,941 | |
| Target Corp. | 39,489 | 4,997 | |
| U.S. Foods Holding Corp. (b) | 723,119 | 29,236 | |
| Walmart, Inc. | 1,221,002 | 198,547 | |
| 491,799 | |||
| Food Products - 0.5% | |||
| Freshpet, Inc. (b)(c) | 226,377 | 17,094 | |
| Lamb Weston Holdings, Inc. | 186,774 | 18,194 | |
| McCormick & Co., Inc. (non-vtg.) | 346,145 | 28,412 | |
| Mondelez International, Inc. | 1,317,418 | 93,879 | |
| The Hershey Co. | 168,206 | 36,141 | |
| 193,720 | |||
| Household Products - 0.8% | |||
| Colgate-Palmolive Co. | 519,470 | 38,165 | |
| Energizer Holdings, Inc. | 210,139 | 7,218 | |
| Procter & Gamble Co. | 1,957,535 | 302,126 | |
| 347,509 | |||
| Personal Care Products - 0.2% | |||
| elf Beauty, Inc. (b) | 105,470 | 14,630 | |
| Estee Lauder Companies, Inc. Class A | 216,417 | 34,741 | |
| Kenvue, Inc. | 670,520 | 15,455 | |
| 64,826 | |||
TOTAL CONSUMER STAPLES | 1,734,588 | ||
| ENERGY - 2.8% | |||
| Energy Equipment & Services - 0.3% | |||
| Expro Group Holdings NV (b) | 1,350,652 | 31,754 | |
| Schlumberger Ltd. | 867,820 | 51,167 | |
| Weatherford International PLC (b) | 517,427 | 45,803 | |
| 128,724 | |||
| Oil, Gas & Consumable Fuels - 2.5% | |||
| Africa Oil Corp. | 11,280,022 | 27,131 | |
| Athabasca Oil Corp. (b) | 5,993,095 | 16,633 | |
| Canadian Natural Resources Ltd. | 701,452 | 45,383 | |
| Eco Atlantic Oil & Gas Ltd. (b) | 8,711,000 | 1,805 | |
| Exxon Mobil Corp. | 4,529,221 | 503,604 | |
| Hess Corp. | 698,350 | 107,895 | |
| Imperial Oil Ltd. | 1,553,717 | 88,230 | |
| Kosmos Energy Ltd. (b) | 3,812,970 | 27,758 | |
| MEG Energy Corp. (b) | 3,799,699 | 67,968 | |
| Phillips 66 Co. | 521,729 | 59,561 | |
| Valero Energy Corp. | 562,343 | 73,048 | |
| 1,019,016 | |||
TOTAL ENERGY | 1,147,740 | ||
| FINANCIALS - 8.0% | |||
| Banks - 2.5% | |||
| AIB Group PLC | 2,352,493 | 10,719 | |
| Bank of America Corp. | 4,263,589 | 122,237 | |
| BNP Paribas SA | 1,007,403 | 65,146 | |
| Citigroup, Inc. | 639,618 | 26,410 | |
| DNB Bank ASA | 1,027,993 | 20,320 | |
| Eurobank Ergasias Services and Holdings SA (b) | 17,624,956 | 30,636 | |
| JPMorgan Chase & Co. | 2,477,560 | 362,541 | |
| KBC Group NV | 177,684 | 11,668 | |
| KeyCorp | 3,878,578 | 43,944 | |
| M&T Bank Corp. | 212,484 | 26,571 | |
| Piraeus Financial Holdings SA (b) | 5,393,594 | 18,669 | |
| PNC Financial Services Group, Inc. | 422,996 | 51,068 | |
| Starling Bank Ltd. Series D (b)(d)(e) | 5,092,112 | 20,900 | |
| UniCredit SpA | 647,371 | 15,772 | |
| Wells Fargo & Co. | 4,670,866 | 192,860 | |
| Zions Bancorp NA | 266,487 | 9,460 | |
| 1,028,921 | |||
| Capital Markets - 1.4% | |||
| Bank of New York Mellon Corp. | 1,309,781 | 58,770 | |
| BlackRock, Inc. Class A | 136,429 | 95,574 | |
| Brookfield Corp. Class A | 556,465 | 18,981 | |
| Cboe Global Markets, Inc. | 175,461 | 26,268 | |
| CME Group, Inc. | 299,012 | 60,604 | |
| Interactive Brokers Group, Inc. | 345,098 | 31,432 | |
| MarketAxess Holdings, Inc. | 128,300 | 30,911 | |
| Morgan Stanley | 1,417,533 | 120,703 | |
| State Street Corp. | 548,510 | 37,705 | |
| StepStone Group, Inc. Class A | 576,556 | 17,798 | |
| UBS Group AG | 2,391,810 | 63,885 | |
| Virtu Financial, Inc. Class A | 561,600 | 10,524 | |
| 573,155 | |||
| Consumer Finance - 0.1% | |||
| OneMain Holdings, Inc. | 695,793 | 28,882 | |
| Shriram Transport Finance Co. Ltd. | 579,403 | 13,508 | |
| 42,390 | |||
| Financial Services - 2.3% | |||
| Apollo Global Management, Inc. | 1,093,819 | 95,534 | |
| Berkshire Hathaway, Inc.: | |||
| Class A (b) | 79 | 43,191 | |
| Class B (b) | 129,828 | 46,764 | |
| Block, Inc. Class A (b) | 857,409 | 49,430 | |
| Dlocal Ltd. (b) | 1,250,094 | 26,802 | |
| Fiserv, Inc. (b) | 752,309 | 91,323 | |
| FleetCor Technologies, Inc. (b) | 117,185 | 31,843 | |
| Global Payments, Inc. | 492,575 | 62,404 | |
| Jumo World Ltd. (b)(e) | 1,163 | 1,042 | |
| One97 Communications Ltd. (b) | 3,304,900 | 34,120 | |
| UWM Holdings Corp. Class A (c) | 1,129,641 | 6,733 | |
| Visa, Inc. Class A | 1,609,166 | 395,340 | |
| Voya Financial, Inc. | 265,724 | 18,516 | |
| Worldline SA (a)(b) | 570,002 | 18,592 | |
| 921,634 | |||
| Insurance - 1.7% | |||
| Arthur J. Gallagher & Co. | 401,716 | 92,588 | |
| Chubb Ltd. | 547,070 | 109,890 | |
| Direct Line Insurance Group PLC | 9,138,809 | 18,772 | |
| Everest Re Group Ltd. | 130,405 | 47,034 | |
| Fairfax Financial Holdings Ltd. (sub. vtg.) | 49,361 | 40,706 | |
| Globe Life, Inc. | 228,201 | 25,460 | |
| Hartford Financial Services Group, Inc. | 861,530 | 61,875 | |
| Marsh & McLennan Companies, Inc. | 532,997 | 103,929 | |
| Progressive Corp. | 631,919 | 84,342 | |
| Prudential PLC | 1,057,440 | 12,879 | |
| The Travelers Companies, Inc. | 463,927 | 74,799 | |
| Unum Group | 840,234 | 41,331 | |
| 713,605 | |||
TOTAL FINANCIALS | 3,279,705 | ||
| HEALTH CARE - 8.1% | |||
| Biotechnology - 1.4% | |||
| Biogen, Inc. (b) | 147,220 | 39,361 | |
| Exact Sciences Corp. (b) | 452,580 | 37,867 | |
| Gilead Sciences, Inc. | 2,576,104 | 197,020 | |
| Legend Biotech Corp. ADR (b) | 367,760 | 25,508 | |
| PTC Therapeutics, Inc. (b) | 404,842 | 15,991 | |
| Regeneron Pharmaceuticals, Inc. (b) | 60,147 | 49,711 | |
| Sarepta Therapeutics, Inc. (b) | 128,656 | 15,569 | |
| Vertex Pharmaceuticals, Inc. (b) | 554,726 | 193,233 | |
| 574,260 | |||
| Health Care Equipment & Supplies - 1.7% | |||
| Abbott Laboratories | 353,247 | 36,349 | |
| Boston Scientific Corp. (b) | 5,048,770 | 272,331 | |
| Intuitive Surgical, Inc. (b) | 397,273 | 124,219 | |
| Masimo Corp. (b) | 81,200 | 9,280 | |
| Penumbra, Inc. (b) | 176,052 | 46,566 | |
| PROCEPT BioRobotics Corp. (b) | 156,259 | 5,330 | |
| Stryker Corp. | 756,046 | 214,377 | |
| 708,452 | |||
| Health Care Providers & Services - 2.3% | |||
| agilon health, Inc. (b) | 1,815,720 | 32,175 | |
| Cencora, Inc. | 909,087 | 159,981 | |
| Cigna Group | 374,106 | 103,351 | |
| Humana, Inc. | 148,536 | 68,569 | |
| Surgery Partners, Inc. (b) | 2,880,648 | 104,452 | |
| UnitedHealth Group, Inc. | 1,011,444 | 482,034 | |
| 950,562 | |||
| Life Sciences Tools & Services - 0.6% | |||
| 10X Genomics, Inc. (b) | 409,881 | 21,252 | |
| Danaher Corp. | 253,015 | 67,049 | |
| Gerresheimer AG | 704,665 | 91,616 | |
| IQVIA Holdings, Inc. (b) | 105,201 | 23,421 | |
| Thermo Fisher Scientific, Inc. | 78,681 | 43,833 | |
| 247,171 | |||
| Pharmaceuticals - 2.1% | |||
| AstraZeneca PLC sponsored ADR | 2,048,253 | 138,913 | |
| Eli Lilly & Co. | 791,922 | 438,883 | |
| Indivior PLC (b) | 2,021,618 | 46,610 | |
| Merck & Co., Inc. | 1,525,060 | 166,201 | |
| Royalty Pharma PLC | 1,820,448 | 54,286 | |
| 844,893 | |||
TOTAL HEALTH CARE | 3,325,338 | ||
| INDUSTRIALS - 5.5% | |||
| Aerospace & Defense - 1.2% | |||
| Howmet Aerospace, Inc. | 1,063,049 | 52,589 | |
| Lockheed Martin Corp. | 311,590 | 139,701 | |
| Northrop Grumman Corp. | 111,457 | 48,271 | |
| RTX Corp. | 379,173 | 32,624 | |
| Space Exploration Technologies Corp. Class A (b)(d)(e) | 117,000 | 9,477 | |
| The Boeing Co. (b) | 657,843 | 147,377 | |
| TransDigm Group, Inc. | 73,235 | 66,193 | |
| 496,232 | |||
| Air Freight & Logistics - 0.1% | |||
| United Parcel Service, Inc. Class B | 179,756 | 30,451 | |
| Building Products - 0.4% | |||
| Trane Technologies PLC | 787,155 | 161,571 | |
| Electrical Equipment - 0.6% | |||
| AMETEK, Inc. | 1,027,130 | 163,838 | |
| Eaton Corp. PLC | 340,115 | 78,352 | |
| 242,190 | |||
| Ground Transportation - 0.9% | |||
| CSX Corp. | 2,629,426 | 79,409 | |
| Old Dominion Freight Lines, Inc. | 292,670 | 125,078 | |
| Uber Technologies, Inc. (b) | 1,449,629 | 68,466 | |
| Union Pacific Corp. | 402,084 | 88,688 | |
| 361,641 | |||
| Industrial Conglomerates - 0.4% | |||
| General Electric Co. | 1,412,778 | 161,707 | |
| Honeywell International, Inc. | 110,901 | 20,843 | |
| 182,550 | |||
| Machinery - 1.8% | |||
| Caterpillar, Inc. | 418,097 | 117,540 | |
| Deere & Co. | 100,468 | 41,286 | |
| Dover Corp. | 796,353 | 118,099 | |
| Fortive Corp. | 2,125,396 | 167,587 | |
| Ingersoll Rand, Inc. | 1,768,462 | 123,103 | |
| Parker Hannifin Corp. | 411,868 | 171,708 | |
| 739,323 | |||
| Passenger Airlines - 0.1% | |||
| Delta Air Lines, Inc. | 573,154 | 24,577 | |
| Professional Services - 0.0% | |||
| Dun & Bradstreet Holdings, Inc. | 1,810,831 | 19,738 | |
TOTAL INDUSTRIALS | 2,258,273 | ||
| INFORMATION TECHNOLOGY - 16.4% | |||
| Electronic Equipment, Instruments & Components - 0.2% | |||
| Amphenol Corp. Class A | 912,014 | 80,604 | |
| IT Services - 0.8% | |||
| Accenture PLC Class A | 139,526 | 45,174 | |
| Capgemini SA | 187,207 | 34,937 | |
| EPAM Systems, Inc. (b) | 182,477 | 47,260 | |
| MongoDB, Inc. Class A (b) | 214,372 | 81,740 | |
| Shopify, Inc. Class A (b) | 379,098 | 25,206 | |
| Snowflake, Inc. (b) | 219,618 | 34,447 | |
| Twilio, Inc. Class A (b) | 549,005 | 34,977 | |
| Wix.com Ltd. (b) | 319,372 | 31,544 | |
| 335,285 | |||
| Semiconductors & Semiconductor Equipment - 4.1% | |||
| Advanced Micro Devices, Inc. (b) | 901,733 | 95,331 | |
| ASML Holding NV (Netherlands) | 80,514 | 52,940 | |
| Lam Research Corp. | 143,562 | 100,838 | |
| Marvell Technology, Inc. | 1,191,746 | 69,419 | |
| Micron Technology, Inc. | 2,046,867 | 143,158 | |
| NVIDIA Corp. | 1,894,465 | 935,013 | |
| NXP Semiconductors NV | 411,707 | 84,696 | |
| Renesas Electronics Corp. (b) | 2,825,127 | 47,066 | |
| SolarEdge Technologies, Inc. (b) | 228,545 | 37,155 | |
| Taiwan Semiconductor Manufacturing Co. Ltd. | 5,593,000 | 96,055 | |
| 1,661,671 | |||
| Software - 7.4% | |||
| Adobe, Inc. (b) | 512,667 | 286,755 | |
| Autodesk, Inc. (b) | 385,116 | 85,473 | |
| CCC Intelligent Solutions Holdings, Inc. (b)(d) | 253,848 | 2,716 | |
| Elastic NV (b) | 397,069 | 24,571 | |
| Five9, Inc. (b) | 542,618 | 39,269 | |
| HubSpot, Inc. (b) | 162,220 | 88,656 | |
| Intuit, Inc. | 350,804 | 190,069 | |
| Microsoft Corp. | 5,868,167 | 1,923,353 | |
| Salesforce, Inc. (b) | 979,389 | 216,895 | |
| Stripe, Inc. Class B (b)(d)(e) | 110,500 | 2,051 | |
| Synopsys, Inc. (b) | 212,945 | 97,718 | |
| Tenable Holdings, Inc. (b) | 430,567 | 19,535 | |
| Workday, Inc. Class A (b) | 279,425 | 68,319 | |
| 3,045,380 | |||
| Technology Hardware, Storage & Peripherals - 3.9% | |||
| Apple, Inc. | 8,351,220 | 1,568,944 | |
| Samsung Electronics Co. Ltd. | 636,060 | 32,117 | |
| 1,601,061 | |||
TOTAL INFORMATION TECHNOLOGY | 6,724,001 | ||
| MATERIALS - 1.5% | |||
| Chemicals - 1.0% | |||
| Air Products & Chemicals, Inc. | 136,643 | 40,377 | |
| Cabot Corp. | 206,351 | 14,952 | |
| Celanese Corp. Class A | 243,408 | 30,757 | |
| Chemtrade Logistics Income Fund | 1,227,981 | 7,734 | |
| Corteva, Inc. | 610,041 | 30,813 | |
| DuPont de Nemours, Inc. | 396,786 | 30,509 | |
| Linde PLC | 438,188 | 169,596 | |
| LyondellBasell Industries NV Class A | 396,485 | 39,161 | |
| Nutrien Ltd. | 104,076 | 6,593 | |
| Olin Corp. | 239,355 | 13,887 | |
| The Chemours Co. LLC | 558,199 | 18,990 | |
| Tronox Holdings PLC | 998,364 | 13,618 | |
| Westlake Corp. | 64,458 | 8,443 | |
| 425,430 | |||
| Construction Materials - 0.1% | |||
| Martin Marietta Materials, Inc. | 46,140 | 20,597 | |
| Vulcan Materials Co. | 98,801 | 21,563 | |
| 42,160 | |||
| Containers & Packaging - 0.1% | |||
| Aptargroup, Inc. | 116,603 | 15,457 | |
| Greif, Inc. Class A | 203,765 | 14,791 | |
| 30,248 | |||
| Metals & Mining - 0.3% | |||
| First Quantum Minerals Ltd. | 1,341,203 | 36,031 | |
| Franco-Nevada Corp. | 116,597 | 16,797 | |
| Freeport-McMoRan, Inc. | 1,226,732 | 48,959 | |
| Horizonte Minerals PLC (b) | 2,358,192 | 3,899 | |
| Ivanhoe Mines Ltd. (b) | 914,987 | 8,140 | |
| Major Drilling Group International, Inc. (b) | 479,282 | 3,086 | |
| Reliance Steel & Aluminum Co. | 64,251 | 18,309 | |
| 135,221 | |||
TOTAL MATERIALS | 633,059 | ||
| REAL ESTATE - 1.5% | |||
| Equity Real Estate Investment Trusts (REITs) - 1.5% | |||
| American Tower Corp. | 351,953 | 63,816 | |
| Corporate Office Properties Trust (SBI) | 503,566 | 13,032 | |
| Crown Castle International Corp. | 334,225 | 33,590 | |
| CubeSmart | 80,732 | 3,367 | |
| Digital Realty Trust, Inc. | 386,276 | 50,880 | |
| Equinix, Inc. | 102,468 | 80,066 | |
| Equity Lifestyle Properties, Inc. | 597,760 | 40,026 | |
| Essex Property Trust, Inc. | 166,341 | 39,654 | |
| Extra Space Storage, Inc. | 12,031 | 1,548 | |
| Invitation Homes, Inc. | 1,046,250 | 35,667 | |
| Mid-America Apartment Communities, Inc. | 326,660 | 47,441 | |
| Prologis (REIT), Inc. | 721,073 | 89,557 | |
| Simon Property Group, Inc. | 259,127 | 29,408 | |
| Ventas, Inc. | 480,570 | 20,991 | |
| Welltower, Inc. | 655,728 | 54,347 | |
| 603,390 | |||
| UTILITIES - 1.5% | |||
| Electric Utilities - 1.1% | |||
| Constellation Energy Corp. | 586,059 | 61,044 | |
| Edison International | 458,363 | 31,558 | |
| Exelon Corp. | 503,576 | 20,203 | |
| FirstEnergy Corp. | 375,261 | 13,536 | |
| NextEra Energy, Inc. | 1,642,098 | 109,692 | |
| NRG Energy, Inc. | 206,028 | 7,736 | |
| PG&E Corp. (b) | 4,377,788 | 71,358 | |
| PPL Corp. | 1,180,232 | 29,411 | |
| Southern Co. | 1,573,955 | 106,604 | |
| 451,142 | |||
| Independent Power and Renewable Electricity Producers - 0.0% | |||
| The AES Corp. | 463,707 | 8,314 | |
| Multi-Utilities - 0.3% | |||
| Dominion Energy, Inc. | 799,009 | 38,784 | |
| NiSource, Inc. | 905,901 | 24,242 | |
| Sempra | 971,606 | 68,226 | |
| 131,252 | |||
| Water Utilities - 0.1% | |||
| American Water Works Co., Inc. | 220,811 | 30,635 | |
TOTAL UTILITIES | 621,343 | ||
| TOTAL COMMON STOCKS (Cost $15,693,705) | 25,256,247 | ||
| Preferred Stocks - 0.3% | |||
| Shares | Value ($) (000s) | ||
| Convertible Preferred Stocks - 0.2% | |||
| COMMUNICATION SERVICES - 0.1% | |||
| Interactive Media & Services - 0.1% | |||
| ByteDance Ltd. Series E1 (b)(d)(e) | 143,672 | 32,483 | |
| FINANCIALS - 0.0% | |||
| Financial Services - 0.0% | |||
| Circle Internet Financial Ltd. Series F (b)(d)(e) | 239,407 | 5,150 | |
| INDUSTRIALS - 0.0% | |||
| Aerospace & Defense - 0.0% | |||
| ABL Space Systems: | |||
| Series B(b)(d)(e) | 120,349 | 3,305 | |
| Series B2(b)(d)(e) | 54,288 | 1,454 | |
| 4,759 | |||
| Construction & Engineering - 0.0% | |||
| Beta Technologies, Inc. Series A (b)(d)(e) | 49,193 | 5,573 | |
TOTAL INDUSTRIALS | 10,332 | ||
| INFORMATION TECHNOLOGY - 0.1% | |||
| Communications Equipment - 0.0% | |||
| Astranis Space Technologies Corp. Series C (b)(d)(e) | 412,038 | 7,446 | |
| Semiconductors & Semiconductor Equipment - 0.0% | |||
| Astera Labs, Inc. Series C (b)(d)(e) | 947,200 | 8,979 | |
| GaN Systems, Inc.: | |||
| Series F1(b)(d)(e) | 97,586 | 1,080 | |
| Series F2(b)(d)(e) | 51,529 | 570 | |
| Xsight Labs Ltd. Series D (b)(d)(e) | 450,873 | 2,593 | |
| 13,222 | |||
| Software - 0.1% | |||
| Algolia, Inc. Series D (b)(d)(e) | 189,206 | 2,734 | |
| Bolt Technology OU Series E (b)(d)(e) | 41,382 | 5,343 | |
| Databricks, Inc.: | |||
| Series G(b)(d)(e) | 30,576 | 2,247 | |
| Series H(b)(d)(e) | 125,490 | 9,224 | |
| Skyryse, Inc. Series B (b)(d)(e) | 332,947 | 7,684 | |
| Stripe, Inc. Series H (b)(d)(e) | 135,605 | 2,517 | |
| 29,749 | |||
TOTAL INFORMATION TECHNOLOGY | 50,417 | ||
| TOTAL CONVERTIBLE PREFERRED STOCKS | 98,382 | ||
| Nonconvertible Preferred Stocks - 0.1% | |||
| FINANCIALS - 0.1% | |||
| Financial Services - 0.1% | |||
| Circle Internet Financial Ltd. Series E (b)(d)(e) | 467,381 | 10,053 | |
| INDUSTRIALS - 0.0% | |||
| Professional Services - 0.0% | |||
| Checkr, Inc. Series E (b)(e) | 588,051 | 5,675 | |
| INFORMATION TECHNOLOGY - 0.0% | |||
| IT Services - 0.0% | |||
| Gupshup, Inc. (b)(d)(e) | 403,701 | 5,046 | |
| TOTAL NONCONVERTIBLE PREFERRED STOCKS | 20,774 | ||
| TOTAL PREFERRED STOCKS (Cost $124,007) | 119,156 | ||
| Nonconvertible Bonds - 0.0% | |||
Principal Amount (f) (000s) | Value ($) (000s) | ||
| FINANCIALS - 0.0% | |||
| Financial Services - 0.0% | |||
Ant International Co. Ltd. 3.55% 8/14/24 (d)(e) (Cost $10,087) | 10,087 | 10,036 | |
| U.S. Treasury Obligations - 0.0% | |||
Principal Amount (f) (000s) | Value ($) (000s) | ||
U.S. Treasury Bills, yield at date of purchase 5.15% to 5.34% 9/14/23 to 10/26/23 (g) (Cost $17,044) | 17,170 | 17,043 | |
| Preferred Securities - 0.0% | |||
Principal Amount (f) (000s) | Value ($) (000s) | ||
| INFORMATION TECHNOLOGY - 0.0% | |||
| Semiconductors & Semiconductor Equipment - 0.0% | |||
GaN Systems, Inc. 0% (d)(e)(h) (Cost $2,287) | 2,287 | 2,815 | |
| Fixed-Income Funds - 36.7% | |||
| Shares | Value ($) (000s) | ||
Fidelity Investment Grade Bond Central Fund (i) (Cost $17,225,401) | 156,243,571 | 15,060,318 | |
| Money Market Funds - 1.5% | |||
| Shares | Value ($) (000s) | ||
| Fidelity Cash Central Fund 5.43% (j) | 564,482,660 | 564,596 | |
| Fidelity Securities Lending Cash Central Fund 5.44% (j)(k) | 36,229,077 | 36,233 | |
| TOTAL MONEY MARKET FUNDS (Cost $600,825) | 600,829 | ||
| TOTAL INVESTMENT IN SECURITIES - 100.0% (Cost $33,673,356) | 41,066,444 |
NET OTHER ASSETS (LIABILITIES) - 0.0% | (11,511) |
| NET ASSETS - 100.0% | 41,054,933 |
| Futures Contracts | |||||
Number of contracts | Expiration Date | Notional Amount ($) (000s) | Value ($) (000s) | Unrealized Appreciation/ (Depreciation) ($) (000s) | |
| Purchased | |||||
| Equity Index Contracts | |||||
| CME E-mini S&P 500 Index Contracts (United States) | 1,443 | Sep 2023 | 325,829 | 10,121 | 10,121 |
| The notional amount of futures purchased as a percentage of Net Assets is 0.8% | |||||
| (a) | Security exempt from registration under Rule 144A of the Securities Act of 1933. These securities may be resold in transactions exempt from registration, normally to qualified institutional buyers. At the end of the period, the value of these securities amounted to $33,842,000 or 0.1% of net assets. |
| (b) | Non-income producing |
| (c) | Security or a portion of the security is on loan at period end. |
| (d) | Restricted securities (including private placements) - Investment in securities not registered under the Securities Act of 1933 (excluding 144A issues). At the end of the period, the value of restricted securities (excluding 144A issues) amounted to $169,141,000 or 0.4% of net assets. |
| (e) | Level 3 security |
| (f) | Amount is stated in United States dollars unless otherwise noted. |
| (g) | Security or a portion of the security was pledged to cover margin requirements for futures contracts. At period end, the value of securities pledged amounted to $17,023,000. |
| (h) | Security is perpetual in nature with no stated maturity date. |
| (i) | Affiliated fund that is generally available only to investment companies and other accounts managed by Fidelity Investments. A complete unaudited schedule of portfolio holdings for each Fidelity Central Fund is filed with the SEC for the first and third quarters of each fiscal year on Form N-PORT and is available upon request or at the SEC's website at www.sec.gov. An unaudited holdings listing for the Fund, which presents direct holdings as well as the pro-rata share of securities and other investments held indirectly through its investment in underlying non-money market Fidelity Central Funds, is available at fidelity.com and/or institutional.fidelity.com, as applicable. In addition, each Fidelity Central Fund's financial statements,which are not covered by the Fund's Report of Independent Registered Public Accounting Firm, are available on the SEC's website or upon request. |
| (j) | Affiliated fund that is generally available only to investment companies and other accounts managed by Fidelity Investments. The rate quoted is the annualized seven-day yield of the fund at period end. A complete unaudited listing of the fund's holdings as of its most recent quarter end is available upon request. In addition, each Fidelity Central Fund's financial statements, which are not covered by the Fund's Report of Independent Registered Public Accounting Firm, are available on the SEC's website or upon request. |
| (k) | Investment made with cash collateral received from securities on loan. |
| Additional information on each restricted holding is as follows: | ||
| Security | Acquisition Date | Acquisition Cost ($) (000s) |
| ABL Space Systems Series B | 3/24/21 | 5,420 |
| ABL Space Systems Series B2 | 10/22/21 | 3,691 |
| Algolia, Inc. Series D | 7/23/21 | 5,533 |
| Ant International Co. Ltd. 3.55% 8/14/24 | 8/14/23 | 10,087 |
| Astera Labs, Inc. Series C | 8/24/21 | 3,184 |
| Astranis Space Technologies Corp. Series C | 3/19/21 | 9,032 |
| Beta Technologies, Inc. Series A | 4/09/21 | 3,604 |
| Bolt Technology OU Series E | 1/03/22 | 10,751 |
| ByteDance Ltd. Series E1 | 11/18/20 | 15,743 |
| Cazoo Group Ltd. | 3/28/21 | 3,875 |
| CCC Intelligent Solutions Holdings, Inc. | 2/02/21 | 2,538 |
| Circle Internet Financial Ltd. Series E | 5/11/21 | 7,586 |
| Circle Internet Financial Ltd. Series F | 5/09/22 | 10,089 |
| Databricks, Inc. Series G | 2/01/21 | 1,808 |
| Databricks, Inc. Series H | 8/31/21 | 9,222 |
| Epic Games, Inc. | 3/29/21 | 10,861 |
| GaN Systems, Inc. Series F1 | 11/30/21 | 828 |
| GaN Systems, Inc. Series F2 | 11/30/21 | 437 |
| GaN Systems, Inc. 0% | 11/30/21 | 2,287 |
| Gupshup, Inc. | 6/08/21 | 9,231 |
| Skyryse, Inc. Series B | 10/21/21 | 8,217 |
| Space Exploration Technologies Corp. Class A | 2/16/21 | 4,914 |
| Starling Bank Ltd. Series D | 6/18/21 | 9,104 |
| Stripe, Inc. Class B | 5/18/21 | 4,434 |
| Stripe, Inc. Series H | 3/15/21 - 5/25/23 | 5,441 |
| Xsight Labs Ltd. Series D | 2/16/21 | 3,605 |
| Affiliate (Amounts in thousands) | Value, beginning of period ($) | Purchases ($) | Sales Proceeds ($) | Dividend Income ($) | Realized Gain (loss) ($) | Change in Unrealized appreciation (depreciation) ($) | Value, end of period ($) | % ownership, end of period |
| Fidelity Cash Central Fund 5.43% | 300,528 | 8,219,742 | 7,955,674 | 17,295 | 11 | (11) | 564,596 | 1.4% |
| Fidelity Investment Grade Bond Central Fund | 12,494,979 | 3,223,209 | 107,385 | 505,556 | 1,867 | (552,352) | 15,060,318 | 40.1% |
| Fidelity Securities Lending Cash Central Fund 5.44% | 48,085 | 782,128 | 793,980 | 549 | - | - | 36,233 | 0.1% |
| Total | 12,843,592 | 12,225,079 | 8,857,039 | 523,400 | 1,878 | (552,363) | 15,661,147 | |
| Valuation Inputs at Reporting Date: | ||||
Description (Amounts in thousands) | Total ($) | Level 1 ($) | Level 2 ($) | Level 3 ($) |
Investments in Securities: | ||||
| Equities: | ||||
Communication Services | 2,245,665 | 2,205,539 | - | 40,126 |
Consumer Discretionary | 2,715,628 | 2,715,628 | - | - |
Consumer Staples | 1,734,588 | 1,724,623 | 9,965 | - |
Energy | 1,147,740 | 1,147,740 | - | - |
Financials | 3,294,908 | 3,143,646 | 114,117 | 37,145 |
Health Care | 3,325,338 | 3,325,338 | - | - |
Industrials | 2,274,280 | 2,248,796 | - | 25,484 |
Information Technology | 6,779,464 | 6,490,952 | 230,998 | 57,514 |
Materials | 633,059 | 633,059 | - | - |
Real Estate | 603,390 | 603,390 | - | - |
Utilities | 621,343 | 621,343 | - | - |
| Corporate Bonds | 10,036 | - | - | 10,036 |
| U.S. Government and Government Agency Obligations | 17,043 | - | 17,043 | - |
| Preferred Securities | 2,815 | - | - | 2,815 |
| Fixed-Income Funds | 15,060,318 | 15,060,318 | - | - |
| Money Market Funds | 600,829 | 600,829 | - | - |
| Total Investments in Securities: | 41,066,444 | 40,521,201 | 372,123 | 173,120 |
Derivative Instruments: | ||||
| Assets | ||||
Futures Contracts | 10,121 | 10,121 | - | - |
| Total Assets | 10,121 | 10,121 | - | - |
| Total Derivative Instruments: | 10,121 | 10,121 | - | - |
Primary Risk Exposure / Derivative Type | Value | |
| (Amounts in thousands) | Asset ($) | Liability ($) |
| Equity Risk | ||
Futures Contracts (a) | 10,121 | 0 |
| Total Equity Risk | 10,121 | 0 |
| Total Value of Derivatives | 10,121 | 0 |
| Statement of Assets and Liabilities | ||||
| Amounts in thousands (except per-share amounts) | August 31, 2023 | |||
| Assets | ||||
| Investment in securities, at value (including securities loaned of $33,956) - See accompanying schedule: | ||||
Unaffiliated issuers (cost $15,847,130) | $ | 25,405,297 | ||
Fidelity Central Funds (cost $17,826,226) | 15,661,147 | |||
| Total Investment in Securities (cost $33,673,356) | $ | 41,066,444 | ||
| Foreign currency held at value (cost $77) | 77 | |||
| Receivable for investments sold | 48,178 | |||
| Receivable for fund shares sold | 23,134 | |||
| Dividends receivable | 34,304 | |||
| Interest receivable | 14 | |||
| Distributions receivable from Fidelity Central Funds | 2,862 | |||
| Prepaid expenses | 69 | |||
| Other receivables | 1,554 | |||
Total assets | 41,176,636 | |||
| Liabilities | ||||
| Payable for investments purchased | $ | 44,225 | ||
| Payable for fund shares redeemed | 21,409 | |||
| Accrued management fee | 12,635 | |||
| Payable for daily variation margin on futures contracts | 595 | |||
| Other affiliated payables | 3,752 | |||
| Other payables and accrued expenses | 2,854 | |||
| Collateral on securities loaned | 36,233 | |||
| Total Liabilities | 121,703 | |||
| Net Assets | $ | 41,054,933 | ||
| Net Assets consist of: | ||||
| Paid in capital | $ | 33,167,632 | ||
| Total accumulated earnings (loss) | 7,887,301 | |||
| Net Assets | $ | 41,054,933 | ||
| Net Asset Value and Maximum Offering Price | ||||
| Balanced : | ||||
Net Asset Value, offering price and redemption price per share ($33,113,351 ÷ 1,265,723 shares) | $ | 26.16 | ||
| Class K : | ||||
Net Asset Value, offering price and redemption price per share ($7,941,582 ÷ 303,512 shares) | $ | 26.17 | ||
| Statement of Operations | ||||
| Amounts in thousands | Year ended August 31, 2023 | |||
| Investment Income | ||||
| Dividends | $ | 324,010 | ||
| Interest | 754 | |||
| Income from Fidelity Central Funds (including $549 from security lending) | 523,400 | |||
| Total Income | 848,164 | |||
| Expenses | ||||
| Management fee | $ | 144,714 | ||
| Transfer agent fees | 40,701 | |||
| Accounting fees | 2,374 | |||
| Custodian fees and expenses | 370 | |||
| Independent trustees' fees and expenses | 212 | |||
| Registration fees | 377 | |||
| Audit | 191 | |||
| Legal | 65 | |||
| Interest | 80 | |||
| Miscellaneous | 190 | |||
| Total expenses before reductions | 189,274 | |||
| Expense reductions | (1,934) | |||
| Total expenses after reductions | 187,340 | |||
| Net Investment income (loss) | 660,824 | |||
| Realized and Unrealized Gain (Loss) | ||||
| Net realized gain (loss) on: | ||||
| Investment Securities: | ||||
| Unaffiliated issuers (net of foreign taxes of $35) | 876,766 | |||
| Redemptions in-kind | 97,766 | |||
| Fidelity Central Funds | 1,878 | |||
| Foreign currency transactions | (184) | |||
| Futures contracts | 15,716 | |||
| Total net realized gain (loss) | 991,942 | |||
| Change in net unrealized appreciation (depreciation) on: | ||||
| Investment Securities: | ||||
| Unaffiliated issuers(net of increase in deferred foreign taxes of $455) | 3,120,713 | |||
| Fidelity Central Funds | (552,363) | |||
| Unfunded commitments | 726 | |||
| Assets and liabilities in foreign currencies | 196 | |||
| Futures contracts | 12,148 | |||
| Total change in net unrealized appreciation (depreciation) | 2,581,420 | |||
| Net gain (loss) | 3,573,362 | |||
| Net increase (decrease) in net assets resulting from operations | $ | 4,234,186 | ||
| Statement of Changes in Net Assets | ||||
| Amount in thousands | Year ended August 31, 2023 | Year ended August 31, 2022 | ||
| Increase (Decrease) in Net Assets | ||||
| Operations | ||||
| Net investment income (loss) | $ | 660,824 | $ | 475,512 |
| Net realized gain (loss) | 991,942 | 2,615,408 | ||
| Change in net unrealized appreciation (depreciation) | 2,581,420 | (9,077,818) | ||
| Net increase (decrease) in net assets resulting from operations | 4,234,186 | (5,986,898) | ||
| Distributions to shareholders | (2,942,116) | (4,444,353) | ||
| Share transactions - net increase (decrease) | 423,615 | 1,859,354 | ||
| Total increase (decrease) in net assets | 1,715,685 | (8,571,897) | ||
| Net Assets | ||||
| Beginning of period | 39,339,248 | 47,911,145 | ||
| End of period | $ | 41,054,933 | $ | 39,339,248 |
| Fidelity® Balanced Fund |
| Years ended August 31, | 2023 | 2022 | 2021 | 2020 | 2019 | |||||
Selected Per-Share Data | ||||||||||
| Net asset value, beginning of period | $ | 25.49 | $ | 32.24 | $ | 27.37 | $ | 23.54 | $ | 25.33 |
| Income from Investment Operations | ||||||||||
Net investment income (loss) A,B | .42 | .30 | .29 | .38 | .42 | |||||
| Net realized and unrealized gain (loss) | 2.17 | (4.09) | 6.17 | 4.49 | .08 | |||||
| Total from investment operations | 2.59 | (3.79) | 6.46 | 4.87 | .50 | |||||
| Distributions from net investment income | (.41) | (.29) | (.29) | (.41) | (.40) | |||||
| Distributions from net realized gain | (1.51) | (2.67) | (1.31) | (.62) | (1.89) | |||||
| Total distributions | (1.92) | (2.96) | (1.59) C | (1.04) C | (2.29) | |||||
| Net asset value, end of period | $ | 26.16 | $ | 25.49 | $ | 32.24 | $ | 27.37 | $ | 23.54 |
Total Return D | 11.60% | (12.80)% | 24.83% | 21.44% | 2.61% | |||||
Ratios to Average Net Assets B,E,F | ||||||||||
| Expenses before reductions | .51% | .50% | .51% | .52% | .53% | |||||
| Expenses net of fee waivers, if any | .50% | .50% | .50% | .52% | .53% | |||||
| Expenses net of all reductions | .50% | .50% | .50% | .51% | .53% | |||||
| Net investment income (loss) | 1.70% | 1.05% | .98% | 1.57% | 1.82% | |||||
| Supplemental Data | ||||||||||
| Net assets, end of period (in millions) | $ | 33,113 | $ | 31,647 | $ | 37,819 | $ | 28,805 | $ | 24,969 |
Portfolio turnover rate G | 29% H | 36% H | 40% H | 95% H | 60% |
| Fidelity® Balanced Fund Class K |
| Years ended August 31, | 2023 | 2022 | 2021 | 2020 | 2019 | |||||
Selected Per-Share Data | ||||||||||
| Net asset value, beginning of period | $ | 25.49 | $ | 32.24 | $ | 27.37 | $ | 23.55 | $ | 25.33 |
| Income from Investment Operations | ||||||||||
Net investment income (loss) A,B | .43 | .32 | .31 | .40 | .44 | |||||
| Net realized and unrealized gain (loss) | 2.19 | (4.09) | 6.17 | 4.48 | .09 | |||||
| Total from investment operations | 2.62 | (3.77) | 6.48 | 4.88 | .53 | |||||
| Distributions from net investment income | (.42) | (.31) | (.31) | (.43) | (.42) | |||||
| Distributions from net realized gain | (1.51) | (2.67) | (1.31) | (.62) | (1.89) | |||||
| Total distributions | (1.94) C | (2.98) | (1.61) C | (1.06) C | (2.31) | |||||
| Net asset value, end of period | $ | 26.17 | $ | 25.49 | $ | 32.24 | $ | 27.37 | $ | 23.55 |
Total Return D | 11.72% | (12.73)% | 24.92% | 21.49% | 2.74% | |||||
Ratios to Average Net Assets B,E,F | ||||||||||
| Expenses before reductions | .43% | .43% | .43% | .44% | .45% | |||||
| Expenses net of fee waivers, if any | .42% | .42% | .43% | .44% | .45% | |||||
| Expenses net of all reductions | .42% | .42% | .43% | .43% | .44% | |||||
| Net investment income (loss) | 1.78% | 1.12% | 1.06% | 1.65% | 1.91% | |||||
| Supplemental Data | ||||||||||
| Net assets, end of period (in millions) | $ | 7,942 | $ | 7,692 | $ | 10,092 | $ | 9,033 | $ | 8,429 |
Portfolio turnover rate G | 29% H | 36% H | 40% H | 95% H | 60% |
| Fidelity Central Fund | Investment Manager | Investment Objective | Investment Practices | Expense RatioA |
| Fidelity Investment Grade Bond Central Fund | Fidelity Management & Research Company LLC (FMR) | Seeks a high level of income by normally investing in investment-grade debt securities. | Delayed Delivery & When Issued Securities Futures Options Restricted Securities Swaps | Less than .005% |
| Fidelity Money Market Central Funds | Fidelity Management & Research Company LLC (FMR) | Each fund seeks to obtain a high level of current income consistent with the preservation of capital and liquidity. | Short-term Investments | Less than .005% |
| Fidelity Balanced Fund | $1,171 |
| Gross unrealized appreciation | $10,264,558 |
| Gross unrealized depreciation | (2,928,263) |
| Net unrealized appreciation (depreciation) | $7,336,295 |
| Tax Cost | $33,730,149 |
| Undistributed ordinary income | $136,624 |
| Undistributed long-term capital gain | $415,780 |
| Net unrealized appreciation (depreciation) on securities and other investments | $7,336,249 |
| August 31, 2023 | August 31, 2022 | |
| Ordinary Income | $640,900 | $1,821,812 |
| Long-term Capital Gains | 2,301,216 | 2,622,541 |
| Total | $2,942,116 | $4,444,353 |
| Equity Risk | Equity risk relates to the fluctuations in the value of financial instruments as a result of changes in market prices (other than those arising from interest rate risk or foreign exchange risk), whether caused by factors specific to an individual investment, its issuer, or all factors affecting all instruments traded in a market or market segment. |
| Purchases ($) | Sales ($) | |
| Fidelity Balanced Fund | 10,929,642 | 12,679,674 |
| Shares | Total net realized gain or loss ($) | Total Proceeds ($) | Participating classes | |
| Fidelity Balanced Fund | 13,857 | 97,766 | 327,304 | Balanced, Class K |
| Shares | Total net realized gain or loss ($) | Total Proceeds ($) | Participating classes | |
| Fidelity Balanced Fund | 7,482 | 79,467 | 216,180 | Balanced, Class K |
| Amount | % of Class-Level Average Net Assets | |
| Balanced | $ 37,518 | .12 |
| Class K | 3,183 | .04 |
| $40,701 |
| % of Average Net Assets | |
| Fidelity Balanced Fund | .01 |
| Amount | |
| Fidelity Balanced Fund | $ 157 |
| Borrower or Lender | Average Loan Balance | Weighted Average Interest Rate | Interest Expense | |
| Fidelity Balanced Fund | Borrower | $92,240 | 4.43% | $80 |
| Purchases ($) | Sales ($) | Realized Gain (Loss) ($) | |
| Fidelity Balanced Fund | 339,731 | 683,623 | 33,608 |
| Amount ($) | |
| Fidelity Balanced Fund | 105 |
| Amount | |
| Fidelity Balanced Fund | $71 |
| Total Security Lending Fees Paid to NFS | Security Lending Income From Securities Loaned to NFS | Value of Securities Loaned to NFS at Period End | |
| Fidelity Balanced Fund | $58 | $33 | $- |
Year ended August 31, 2023 | Year ended August 31, 2022 | |
| Fidelity Balanced Fund | ||
| Distributions to shareholders | ||
| Balanced | $ 2,360,180 | $3,513,610 |
| Class K | 581,936 | 930,743 |
Total | $2,942,116 | $4,444,353 |
| Shares | Shares | Dollars | Dollars | |
Year ended August 31, 2023 | Year ended August 31, 2022 | Year ended August 31, 2023 | Year ended August 31, 2022 | |
| Fidelity Balanced Fund | ||||
| Balanced | ||||
| Shares sold | 128,865 | 153,031 | $3,183,932 | $4,421,713 |
| Reinvestment of distributions | 98,805 | 113,479 | 2,193,993 | 3,307,115 |
| Shares redeemed | (203,664) | (197,918) | (4,945,165) | (5,573,068) |
| Net increase (decrease) | 24,006 | 68,592 | $432,760 | $2,155,760 |
| Class K | ||||
| Shares sold | 33,384 | 31,940 | $818,833 | $913,583 |
| Reinvestment of distributions | 26,192 | 31,940 | 581,936 | 930,743 |
| Shares redeemed | (57,853) | (75,095) | (1,409,914) | (2,140,732) |
| Net increase (decrease) | 1,723 | (11,215) | $(9,145) | $(296,406) |
| The Example is based on an investment of $1,000 invested at the beginning of the period and held for the entire period (March 1, 2023 to August 31, 2023). |
Annualized Expense Ratio- A | Beginning Account Value March 1, 2023 | Ending Account Value August 31, 2023 | Expenses Paid During Period- C March 1, 2023 to August 31, 2023 | |||||||
| Fidelity® Balanced Fund | ||||||||||
| Fidelity® Balanced Fund | .50% | |||||||||
| Actual | $ 1,000 | $ 1,106.40 | $ 2.65 | |||||||
Hypothetical-B | $ 1,000 | $ 1,022.68 | $ 2.55 | |||||||
| Class K | .42% | |||||||||
| Actual | $ 1,000 | $ 1,107.10 | $ 2.23 | |||||||
Hypothetical-B | $ 1,000 | $ 1,023.09 | $ 2.14 | |||||||
 |


Contents
| Average Annual Total Returns | |||
Periods ended August 31, 2023 | Past 1 year | Life of Fund A |
| Fidelity® Puritan® K6 Fund | 12.05% | 9.78% |
| $10,000 Over Life of Fund |
Let's say hypothetically that $10,000 was invested in Fidelity® Puritan® K6 Fund, on June 14, 2019, when the fund started. The chart shows how the value of your investment would have changed, and also shows how the S&P 500® Index performed over the same period. |
 |
Top Holdings (% of Fund's net assets) | ||
| Microsoft Corp. | 5.9 | |
| NVIDIA Corp. | 3.8 | |
| Alphabet, Inc. Class C | 3.5 | |
| Amazon.com, Inc. | 2.2 | |
| Meta Platforms, Inc. Class A | 2.2 | |
| Eaton Corp. PLC | 1.9 | |
| Apple, Inc. | 1.8 | |
| MasterCard, Inc. Class A | 1.7 | |
| Eli Lilly & Co. | 1.5 | |
| The Boeing Co. | 1.4 | |
| 25.9 | ||
| Top Bond Issuers (% of Fund's net assets) | ||
(with maturities greater than one year) | ||
| U.S. Treasury Obligations | 11.5 | |
| Fannie Mae | 2.2 | |
| Freddie Mac | 1.9 | |
| Ginnie Mae | 1.2 | |
| Uniform Mortgage Backed Securities | 1.0 | |
| JPMorgan Chase & Co. | 0.7 | |
| Morgan Stanley | 0.4 | |
| Bank of America Corp. | 0.4 | |
| Citigroup, Inc. | 0.3 | |
| Ally Financial, Inc. | 0.2 | |
| 19.8 | ||
| Market Sectors (% of Fund's net assets) | ||
| Information Technology | 20.4 | |
| Financials | 11.3 | |
| Industrials | 10.0 | |
| Health Care | 8.4 | |
| Communication Services | 8.4 | |
| Consumer Discretionary | 7.5 | |
| Energy | 4.6 | |
| Materials | 2.5 | |
| Consumer Staples | 2.2 | |
| Real Estate | 0.9 | |
| Utilities | 0.6 | |
Asset Allocation (% of Fund's net assets) |
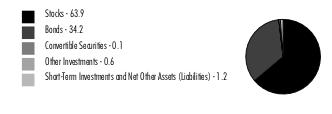 |
Futures and Swaps - 0.7% |
| Common Stocks - 63.7% | |||
| Shares | Value ($) | ||
| COMMUNICATION SERVICES - 7.0% | |||
| Entertainment - 0.8% | |||
| Electronic Arts, Inc. | 3,999 | 479,800 | |
| LiveOne, Inc. (a)(b) | 325,553 | 696,683 | |
| Netflix, Inc. (a) | 20,807 | 9,023,580 | |
| Spotify Technology SA (a) | 2,497 | 384,463 | |
| Universal Music Group NV | 35,670 | 884,373 | |
| 11,468,899 | |||
| Interactive Media & Services - 5.7% | |||
| Alphabet, Inc. Class C (a) | 348,489 | 47,864,964 | |
| Meta Platforms, Inc. Class A (a) | 102,166 | 30,229,898 | |
| 78,094,862 | |||
| Media - 0.5% | |||
| Comcast Corp. Class A | 152,277 | 7,120,473 | |
TOTAL COMMUNICATION SERVICES | 96,684,234 | ||
| CONSUMER DISCRETIONARY - 6.7% | |||
| Automobile Components - 0.1% | |||
| Aptiv PLC (a) | 8,551 | 867,499 | |
| Automobiles - 0.0% | |||
| Li Auto, Inc. ADR (a) | 4,558 | 189,841 | |
| Broadline Retail - 2.3% | |||
| Amazon.com, Inc. (a) | 223,195 | 30,803,142 | |
| Global-e Online Ltd. (a) | 37,533 | 1,487,433 | |
| 32,290,575 | |||
| Hotels, Restaurants & Leisure - 1.8% | |||
| Airbnb, Inc. Class A (a) | 33,119 | 4,356,804 | |
| Caesars Entertainment, Inc. (a) | 33,410 | 1,846,237 | |
| Compass Group PLC | 71,233 | 1,796,264 | |
| Domino's Pizza, Inc. | 7,087 | 2,745,504 | |
| Flutter Entertainment PLC (a) | 10,509 | 1,918,375 | |
| Hilton Worldwide Holdings, Inc. | 37,867 | 5,628,930 | |
| Marriott International, Inc. Class A | 15,388 | 3,131,612 | |
| McDonald's Corp. | 10,436 | 2,934,081 | |
| 24,357,807 | |||
| Household Durables - 0.1% | |||
| Chervon Holdings Ltd. | 287 | 948 | |
| D.R. Horton, Inc. | 12,457 | 1,482,632 | |
| 1,483,580 | |||
| Specialty Retail - 1.6% | |||
| Lowe's Companies, Inc. | 35,194 | 8,111,513 | |
| Revolve Group, Inc. (a) | 3,215 | 47,100 | |
| RH (a) | 3,854 | 1,407,442 | |
| TJX Companies, Inc. | 141,970 | 13,129,386 | |
| 22,695,441 | |||
| Textiles, Apparel & Luxury Goods - 0.8% | |||
| Brunello Cucinelli SpA | 61,463 | 5,091,862 | |
| LVMH Moet Hennessy Louis Vuitton SE | 3,588 | 3,034,220 | |
| Moncler SpA | 6,501 | 441,572 | |
| NIKE, Inc. Class B | 1,740 | 176,975 | |
| On Holding AG (a) | 2,478 | 71,441 | |
| Ralph Lauren Corp. | 14,322 | 1,670,375 | |
| Tapestry, Inc. | 22,064 | 735,172 | |
| 11,221,617 | |||
TOTAL CONSUMER DISCRETIONARY | 93,106,360 | ||
| CONSUMER STAPLES - 1.5% | |||
| Beverages - 0.7% | |||
| Boston Beer Co., Inc. Class A (a) | 2,556 | 934,039 | |
| Monster Beverage Corp. | 151,675 | 8,707,662 | |
| 9,641,701 | |||
| Consumer Staples Distribution & Retail - 0.0% | |||
| Performance Food Group Co. (a) | 4,421 | 274,677 | |
| Household Products - 0.3% | |||
| The Clorox Co. | 26,163 | 4,093,201 | |
| Personal Care Products - 0.2% | |||
| Estee Lauder Companies, Inc. Class A | 8,861 | 1,422,456 | |
| Kenvue, Inc. | 64,886 | 1,495,622 | |
| L'Oreal SA (a) | 182 | 80,085 | |
| 2,998,163 | |||
| Tobacco - 0.3% | |||
| Philip Morris International, Inc. | 43,730 | 4,200,704 | |
TOTAL CONSUMER STAPLES | 21,208,446 | ||
| ENERGY - 3.0% | |||
| Energy Equipment & Services - 1.8% | |||
| Baker Hughes Co. Class A | 212,269 | 7,682,015 | |
| NOV, Inc. | 182,457 | 3,855,316 | |
| Schlumberger Ltd. | 154,005 | 9,080,135 | |
| TechnipFMC PLC | 183,273 | 3,489,518 | |
| Weatherford International PLC (a) | 10 | 885 | |
| 24,107,869 | |||
| Oil, Gas & Consumable Fuels - 1.2% | |||
| Antero Resources Corp. (a) | 29,716 | 822,242 | |
| Exxon Mobil Corp. | 60,741 | 6,753,792 | |
| Hess Corp. | 47,240 | 7,298,580 | |
| Range Resources Corp. | 70,166 | 2,271,975 | |
| 17,146,589 | |||
TOTAL ENERGY | 41,254,458 | ||
| FINANCIALS - 6.7% | |||
| Banks - 0.4% | |||
| JPMorgan Chase & Co. | 33,864 | 4,955,319 | |
| Capital Markets - 2.2% | |||
| Ares Management Corp. | 48,909 | 5,059,147 | |
| BlackRock, Inc. Class A | 6,461 | 4,526,189 | |
| Cboe Global Markets, Inc. | 12,705 | 1,902,066 | |
| CME Group, Inc. | 11,908 | 2,413,513 | |
| Deutsche Borse AG | 7,990 | 1,418,417 | |
| Goldman Sachs Group, Inc. | 6,938 | 2,273,652 | |
| Intercontinental Exchange, Inc. | 34,469 | 4,066,997 | |
| KKR & Co. LP | 19,597 | 1,230,888 | |
| London Stock Exchange Group PLC | 6,881 | 711,868 | |
| Moody's Corp. | 3,363 | 1,132,658 | |
| Morgan Stanley | 57,509 | 4,896,891 | |
| Raymond James Financial, Inc. | 6,593 | 689,562 | |
| 30,321,848 | |||
| Consumer Finance - 0.2% | |||
| American Express Co. | 13,915 | 2,198,431 | |
| Capital One Financial Corp. | 12,080 | 1,236,871 | |
| 3,435,302 | |||
| Financial Services - 2.8% | |||
| Berkshire Hathaway, Inc. Class B (a) | 10,029 | 3,612,446 | |
| Block, Inc. Class A (a) | 35,701 | 2,058,163 | |
| MasterCard, Inc. Class A | 57,197 | 23,601,770 | |
| Toast, Inc. (a) | 66,103 | 1,465,504 | |
| Visa, Inc. Class A | 31,315 | 7,693,469 | |
| 38,431,352 | |||
| Insurance - 1.1% | |||
| Arthur J. Gallagher & Co. | 23,223 | 5,352,437 | |
| Chubb Ltd. | 5,635 | 1,131,902 | |
| Globe Life, Inc. | 11,472 | 1,279,931 | |
| Hartford Financial Services Group, Inc. | 12,720 | 913,550 | |
| Marsh & McLennan Companies, Inc. | 21,185 | 4,130,863 | |
| The Travelers Companies, Inc. | 18,405 | 2,967,438 | |
| 15,776,121 | |||
TOTAL FINANCIALS | 92,919,942 | ||
| HEALTH CARE - 7.5% | |||
| Biotechnology - 1.5% | |||
| Argenx SE ADR (a) | 6,759 | 3,396,330 | |
| Exact Sciences Corp. (a) | 42,860 | 3,586,096 | |
| Karuna Therapeutics, Inc. (a) | 21 | 3,943 | |
| Legend Biotech Corp. ADR (a) | 48,956 | 3,395,588 | |
| Moderna, Inc. (a) | 13,433 | 1,518,869 | |
| Nuvalent, Inc. Class A (a) | 5,530 | 252,002 | |
| Prothena Corp. PLC (a) | 6,178 | 326,322 | |
| Regeneron Pharmaceuticals, Inc. (a) | 5,501 | 4,546,521 | |
| Vertex Pharmaceuticals, Inc. (a) | 9,936 | 3,461,106 | |
| 20,486,777 | |||
| Health Care Equipment & Supplies - 1.9% | |||
| Baxter International, Inc. | 8,552 | 347,211 | |
| Boston Scientific Corp. (a) | 261,512 | 14,105,957 | |
| Intuitive Surgical, Inc. (a) | 9,262 | 2,896,042 | |
| Penumbra, Inc. (a) | 435 | 115,058 | |
| Stryker Corp. | 31,816 | 9,021,427 | |
| 26,485,695 | |||
| Health Care Providers & Services - 1.6% | |||
| agilon health, Inc. (a) | 143,356 | 2,540,268 | |
| Cardinal Health, Inc. | 6,375 | 556,729 | |
| Cigna Group | 2,751 | 759,991 | |
| CVS Health Corp. | 41,561 | 2,708,530 | |
| UnitedHealth Group, Inc. | 31,380 | 14,955,080 | |
| 21,520,598 | |||
| Life Sciences Tools & Services - 0.2% | |||
| Agilent Technologies, Inc. | 12,248 | 1,482,865 | |
| Thermo Fisher Scientific, Inc. | 1,961 | 1,092,473 | |
| 2,575,338 | |||
| Pharmaceuticals - 2.3% | |||
| AstraZeneca PLC sponsored ADR | 4,924 | 333,946 | |
| Eli Lilly & Co. | 36,328 | 20,132,978 | |
| Merck & Co., Inc. | 93,339 | 10,172,084 | |
| Novo Nordisk A/S Series B | 10,389 | 1,916,290 | |
| 32,555,298 | |||
TOTAL HEALTH CARE | 103,623,706 | ||
| INDUSTRIALS - 9.2% | |||
| Aerospace & Defense - 2.3% | |||
| BWX Technologies, Inc. | 5 | 369 | |
| Howmet Aerospace, Inc. | 60,400 | 2,987,988 | |
| Lockheed Martin Corp. | 16,602 | 7,443,507 | |
| The Boeing Co. (a) | 86,317 | 19,337,598 | |
| TransDigm Group, Inc. | 2,035 | 1,839,335 | |
| 31,608,797 | |||
| Building Products - 0.7% | |||
| ASSA ABLOY AB (B Shares) | 7,781 | 175,119 | |
| Fortune Brands Home & Security, Inc. (b) | 21,032 | 1,451,629 | |
| Johnson Controls International PLC | 27,012 | 1,595,329 | |
| Trane Technologies PLC | 28,737 | 5,898,557 | |
| 9,120,634 | |||
| Commercial Services & Supplies - 0.3% | |||
| Cintas Corp. | 7,538 | 3,800,433 | |
| Copart, Inc. | 1,792 | 80,335 | |
| 3,880,768 | |||
| Construction & Engineering - 0.2% | |||
| Fluor Corp. (a) | 63,335 | 2,216,092 | |
| Willscot Mobile Mini Holdings (a) | 4,094 | 167,936 | |
| 2,384,028 | |||
| Electrical Equipment - 2.5% | |||
| Eaton Corp. PLC | 116,243 | 26,778,900 | |
| Hubbell, Inc. Class B | 8,001 | 2,608,726 | |
| Prysmian SpA | 21,488 | 880,526 | |
| Regal Rexnord Corp. | 1,262 | 204,684 | |
| Vertiv Holdings Co. | 87,159 | 3,433,193 | |
| 33,906,029 | |||
| Ground Transportation - 1.0% | |||
| Canadian Pacific Kansas City Ltd. | 7,946 | 630,753 | |
| Lyft, Inc. (a) | 113,733 | 1,339,775 | |
| Uber Technologies, Inc. (a) | 265,705 | 12,549,247 | |
| 14,519,775 | |||
| Industrial Conglomerates - 0.9% | |||
| General Electric Co. | 104,127 | 11,918,376 | |
| Machinery - 0.8% | |||
| Caterpillar, Inc. | 33,241 | 9,345,042 | |
| PACCAR, Inc. | 5,879 | 483,783 | |
| Parker Hannifin Corp. | 881 | 367,289 | |
| Pentair PLC | 14,575 | 1,024,040 | |
| 11,220,154 | |||
| Passenger Airlines - 0.2% | |||
| Copa Holdings SA Class A (b) | 20,977 | 2,133,361 | |
| Delta Air Lines, Inc. | 20,596 | 883,156 | |
| 3,016,517 | |||
| Professional Services - 0.2% | |||
| Equifax, Inc. | 13,415 | 2,772,881 | |
| Paycom Software, Inc. | 2,252 | 663,980 | |
| 3,436,861 | |||
| Trading Companies & Distributors - 0.1% | |||
| Bunzl PLC | 2,082 | 74,641 | |
| W.W. Grainger, Inc. | 1,984 | 1,416,854 | |
| 1,491,495 | |||
TOTAL INDUSTRIALS | 126,503,434 | ||
| INFORMATION TECHNOLOGY - 19.9% | |||
| Electronic Equipment, Instruments & Components - 0.4% | |||
| Amphenol Corp. Class A | 44,858 | 3,964,550 | |
| Flex Ltd. (a) | 50,237 | 1,386,039 | |
| 5,350,589 | |||
| IT Services - 1.4% | |||
| Accenture PLC Class A | 20,270 | 6,562,818 | |
| Shopify, Inc. Class A (a) | 173,785 | 11,554,965 | |
| Snowflake, Inc. (a) | 10,111 | 1,585,910 | |
| X Holdings Corp. Class A (c)(e) | 4,690 | 180,893 | |
| 19,884,586 | |||
| Semiconductors & Semiconductor Equipment - 7.9% | |||
| Advanced Micro Devices, Inc. (a) | 37,050 | 3,916,926 | |
| Analog Devices, Inc. | 41,574 | 7,557,322 | |
| Applied Materials, Inc. | 10,915 | 1,667,375 | |
| ASML Holding NV (depository receipt) | 4,662 | 3,079,391 | |
| First Solar, Inc. (a) | 16,807 | 3,178,540 | |
| GlobalFoundries, Inc. (a) | 59,602 | 3,293,011 | |
| Lam Research Corp. | 4,217 | 2,962,021 | |
| Lattice Semiconductor Corp. (a) | 11,986 | 1,165,758 | |
| Marvell Technology, Inc. | 225,266 | 13,121,745 | |
| Monolithic Power Systems, Inc. | 3,521 | 1,835,180 | |
| NVIDIA Corp. | 104,853 | 51,750,198 | |
| NXP Semiconductors NV | 16,312 | 3,355,705 | |
| ON Semiconductor Corp. (a) | 31,914 | 3,142,252 | |
| Taiwan Semiconductor Manufacturing Co. Ltd. sponsored ADR | 74,971 | 7,015,036 | |
| Universal Display Corp. | 11,198 | 1,820,347 | |
| 108,860,807 | |||
| Software - 8.4% | |||
| Adobe, Inc. (a) | 11,070 | 6,191,894 | |
| Autodesk, Inc. (a) | 3,962 | 879,326 | |
| Confluent, Inc. (a) | 13,053 | 431,924 | |
| Dynatrace, Inc. (a) | 98,192 | 4,732,854 | |
| Fair Isaac Corp. (a) | 926 | 837,650 | |
| HubSpot, Inc. (a) | 2,729 | 1,491,453 | |
| Microsoft Corp. | 250,072 | 81,963,597 | |
| Oracle Corp. | 58,689 | 7,065,569 | |
| Salesforce, Inc. (a) | 21,608 | 4,785,308 | |
| Synopsys, Inc. (a) | 7,245 | 3,324,658 | |
| Tenable Holdings, Inc. (a) | 4,106 | 186,289 | |
| UiPath, Inc. Class A (a) | 15,876 | 251,000 | |
| Workday, Inc. Class A (a) | 18,793 | 4,594,889 | |
| 116,736,411 | |||
| Technology Hardware, Storage & Peripherals - 1.8% | |||
| Apple, Inc. | 130,992 | 24,609,467 | |
| Samsung Electronics Co. Ltd. | 3,738 | 188,746 | |
| 24,798,213 | |||
TOTAL INFORMATION TECHNOLOGY | 275,630,606 | ||
| MATERIALS - 2.2% | |||
| Chemicals - 1.6% | |||
| Linde PLC | 28,071 | 10,864,600 | |
| Sherwin-Williams Co. | 41,874 | 11,378,003 | |
| 22,242,603 | |||
| Construction Materials - 0.0% | |||
| Martin Marietta Materials, Inc. | 629 | 280,792 | |
| Containers & Packaging - 0.1% | |||
| Aptargroup, Inc. | 497 | 65,882 | |
| Ball Corp. | 20,482 | 1,115,245 | |
| 1,181,127 | |||
| Metals & Mining - 0.5% | |||
| First Quantum Minerals Ltd. | 77,497 | 2,081,958 | |
| Franco-Nevada Corp. | 1,675 | 241,308 | |
| Freeport-McMoRan, Inc. | 3,317 | 132,381 | |
| Newcrest Mining Ltd. | 59,867 | 997,783 | |
| Newmont Corp. | 75,884 | 2,991,347 | |
| Nucor Corp. | 1,157 | 199,120 | |
| Wheaton Precious Metals Corp. | 13,175 | 574,700 | |
| 7,218,597 | |||
TOTAL MATERIALS | 30,923,119 | ||
| TOTAL COMMON STOCKS (Cost $712,485,215) | 881,854,305 | ||
| Fixed-Income Funds - 35.7% | |||
| Shares | Value ($) | ||
| Fidelity High Income Central Fund (d) | 627,445 | 64,331,981 | |
| Fidelity Investment Grade Bond Central Fund (d) | 4,451,108 | 429,042,334 | |
| TOTAL FIXED-INCOME FUNDS (Cost $537,489,089) | 493,374,315 | ||
| Other - 0.0% | |||
| Shares | Value ($) | ||
| Other - 0.0% | |||
Fidelity Private Credit Central Fund LLC (e) (Cost $206,745) | 20,665 | 207,892 | |
| Money Market Funds - 1.1% | |||
| Shares | Value ($) | ||
| Fidelity Cash Central Fund 5.43% (f) | 11,331,939 | 11,334,206 | |
| Fidelity Securities Lending Cash Central Fund 5.44% (f)(g) | 3,700,680 | 3,701,050 | |
| TOTAL MONEY MARKET FUNDS (Cost $15,035,255) | 15,035,256 | ||
| TOTAL INVESTMENT IN SECURITIES - 100.5% (Cost $1,265,216,304) | 1,390,471,768 |
NET OTHER ASSETS (LIABILITIES) - (0.5)% | (6,607,311) |
| NET ASSETS - 100.0% | 1,383,864,457 |
| (a) | Non-income producing |
| (b) | Security or a portion of the security is on loan at period end. |
| (c) | Level 3 security |
| (d) | Affiliated fund that is generally available only to investment companies and other accounts managed by Fidelity Investments. A complete unaudited schedule of portfolio holdings for each Fidelity Central Fund is filed with the SEC for the first and third quarters of each fiscal year on Form N-PORT and is available upon request or at the SEC's website at www.sec.gov. An unaudited holdings listing for the Fund, which presents direct holdings as well as the pro-rata share of securities and other investments held indirectly through its investment in underlying non-money market Fidelity Central Funds, is available at fidelity.com and/or institutional.fidelity.com, as applicable. In addition, each Fidelity Central Fund's financial statements,which are not covered by the Fund's Report of Independent Registered Public Accounting Firm, are available on the SEC's website or upon request. |
| (e) | Restricted securities (including private placements) - Investment in securities not registered under the Securities Act of 1933 (excluding 144A issues). At the end of the period, the value of restricted securities (excluding 144A issues) amounted to $388,785 or 0.0% of net assets. |
| (f) | Affiliated fund that is generally available only to investment companies and other accounts managed by Fidelity Investments. The rate quoted is the annualized seven-day yield of the fund at period end. A complete unaudited listing of the fund's holdings as of its most recent quarter end is available upon request. In addition, each Fidelity Central Fund's financial statements, which are not covered by the Fund's Report of Independent Registered Public Accounting Firm, are available on the SEC's website or upon request. |
| (g) | Investment made with cash collateral received from securities on loan. |
| Additional information on each restricted holding is as follows: | ||
| Security | Acquisition Date | Acquisition Cost ($) |
| Fidelity Private Credit Central Fund LLC | 5/26/23 - 8/29/23 | 206,745 |
| X Holdings Corp. Class A | 10/25/22 | 469,000 |
| Affiliate | Value, beginning of period ($) | Purchases ($) | Sales Proceeds ($) | Dividend Income ($) | Realized Gain (loss) ($) | Change in Unrealized appreciation (depreciation) ($) | Value, end of period ($) | % ownership, end of period |
| Fidelity Cash Central Fund 5.43% | 19,963,778 | 576,388,258 | 585,017,830 | 594,870 | - | - | 11,334,206 | 0.0% |
| Fidelity High Income Central Fund | 46,460,925 | 22,190,118 | 4,005,602 | 3,660,297 | (471,666) | 158,206 | 64,331,981 | 4.4% |
| Fidelity Investment Grade Bond Central Fund | 252,910,330 | 189,120,466 | 596,201 | 11,083,800 | (99,458) | (12,292,803) | 429,042,334 | 1.1% |
| Fidelity Private Credit Central Fund LLC | - | 206,746 | - | 1,745 | - | 1,146 | 207,892 | 0.0% |
| Fidelity Securities Lending Cash Central Fund 5.44% | 496,200 | 11,317,994 | 8,113,144 | 12,553 | - | - | 3,701,050 | 0.0% |
| Total | 319,831,233 | 799,223,582 | 597,732,777 | 15,353,265 | (571,124) | (12,133,451) | 508,617,463 | |
| Valuation Inputs at Reporting Date: | ||||
| Description | Total ($) | Level 1 ($) | Level 2 ($) | Level 3 ($) |
Investments in Securities: | ||||
| Equities: | ||||
Communication Services | 96,684,234 | 95,799,861 | 884,373 | - |
Consumer Discretionary | 93,106,360 | 88,275,876 | 4,830,484 | - |
Consumer Staples | 21,208,446 | 21,208,446 | - | - |
Energy | 41,254,458 | 41,254,458 | - | - |
Financials | 92,919,942 | 90,789,657 | 2,130,285 | - |
Health Care | 103,623,706 | 101,707,416 | 1,916,290 | - |
Industrials | 126,503,434 | 126,328,315 | 175,119 | - |
Information Technology | 275,630,606 | 275,449,713 | - | 180,893 |
Materials | 30,923,119 | 29,925,336 | 997,783 | - |
| Fixed-Income Funds | 493,374,315 | 493,374,315 | - | - |
| Other | 207,892 | - | 207,892 | - |
| Money Market Funds | 15,035,256 | 15,035,256 | - | - |
| Total Investments in Securities: | 1,390,471,768 | 1,379,148,649 | 11,142,226 | 180,893 |
| Statement of Assets and Liabilities | ||||
| August 31, 2023 | ||||
| Assets | ||||
| Investment in securities, at value (including securities loaned of $3,569,916) - See accompanying schedule: | ||||
Unaffiliated issuers (cost $712,485,215) | $ | 881,854,305 | ||
Fidelity Central Funds (cost $552,731,089) | 508,617,463 | |||
| Total Investment in Securities (cost $1,265,216,304) | $ | 1,390,471,768 | ||
| Cash | 13,804 | |||
| Foreign currency held at value (cost $49) | 49 | |||
| Receivable for investments sold | 6,250,662 | |||
| Receivable for fund shares sold | 359,676 | |||
| Dividends receivable | 550,400 | |||
| Distributions receivable from Fidelity Central Funds | 67,546 | |||
| Other receivables | 4,514 | |||
Total assets | 1,397,718,419 | |||
| Liabilities | ||||
| Payable for investments purchased | $ | 8,836,052 | ||
| Payable for fund shares redeemed | 953,813 | |||
| Accrued management fee | 363,047 | |||
| Collateral on securities loaned | 3,701,050 | |||
| Total Liabilities | 13,853,962 | |||
| Commitments and contingent liabilities (see Commitments note) | ||||
| Net Assets | $ | 1,383,864,457 | ||
| Net Assets consist of: | ||||
| Paid in capital | $ | 1,286,663,086 | ||
| Total accumulated earnings (loss) | 97,201,371 | |||
| Net Assets | $ | 1,383,864,457 | ||
Net Asset Value, offering price and redemption price per share ($1,383,864,457 ÷ 102,420,767 shares) | $ | 13.51 | ||
| Statement of Operations | ||||
Year ended August 31, 2023 | ||||
| Investment Income | ||||
| Dividends | $ | 6,473,371 | ||
| Income from Fidelity Central Funds (including $12,553 from security lending) | 15,313,807 | |||
| Total Income | 21,787,178 | |||
| Expenses | ||||
| Management fee | $ | 3,065,575 | ||
| Independent trustees' fees and expenses | 4,841 | |||
| Total expenses before reductions | 3,070,416 | |||
| Expense reductions | (3,743) | |||
| Total expenses after reductions | 3,066,673 | |||
| Net Investment income (loss) | 18,720,505 | |||
| Realized and Unrealized Gain (Loss) | ||||
| Net realized gain (loss) on: | ||||
| Investment Securities: | ||||
| Unaffiliated issuers | (21,994,949) | |||
| Fidelity Central Funds | (571,124) | |||
| Foreign currency transactions | (680) | |||
| Written options | 807,175 | |||
| Capital gain distributions from Fidelity Central Funds | 39,458 | |||
| Total net realized gain (loss) | (21,720,120) | |||
| Change in net unrealized appreciation (depreciation) on: | ||||
| Investment Securities: | ||||
| Unaffiliated issuers | 125,618,970 | |||
| Fidelity Central Funds | (12,133,451) | |||
| Assets and liabilities in foreign currencies | 1,383 | |||
| Total change in net unrealized appreciation (depreciation) | 113,486,902 | |||
| Net gain (loss) | 91,766,782 | |||
| Net increase (decrease) in net assets resulting from operations | $ | 110,487,287 | ||
| Statement of Changes in Net Assets | ||||
Year ended August 31, 2023 | Year ended August 31, 2022 | |||
| Increase (Decrease) in Net Assets | ||||
| Operations | ||||
| Net investment income (loss) | $ | 18,720,505 | $ | 11,260,586 |
| Net realized gain (loss) | (21,720,120) | (6,122,323) | ||
| Change in net unrealized appreciation (depreciation) | 113,486,902 | (113,520,029) | ||
| Net increase (decrease) in net assets resulting from operations | 110,487,287 | (108,381,766) | ||
| Distributions to shareholders | (17,241,436) | (31,218,292) | ||
| Share transactions | ||||
| Proceeds from sales of shares | 590,724,615 | 432,759,445 | ||
| Reinvestment of distributions | 17,241,436 | 31,218,292 | ||
| Cost of shares redeemed | (148,653,415) | (143,613,464) | ||
Net increase (decrease) in net assets resulting from share transactions | 459,312,636 | 320,364,273 | ||
| Total increase (decrease) in net assets | 552,558,487 | 180,764,215 | ||
| Net Assets | ||||
| Beginning of period | 831,305,970 | 650,541,755 | ||
| End of period | $ | 1,383,864,457 | $ | 831,305,970 |
| Other Information | ||||
| Shares | ||||
| Sold | 45,291,468 | 31,710,032 | ||
| Issued in reinvestment of distributions | 1,403,797 | 2,257,174 | ||
| Redeemed | (11,910,163) | (10,625,081) | ||
| Net increase (decrease) | 34,785,102 | 23,342,125 | ||
| Fidelity® Puritan® K6 Fund |
| Years ended August 31, | 2023 | 2022 | 2021 | 2020 | 2019 A | |||||
Selected Per-Share Data | ||||||||||
| Net asset value, beginning of period | $ | 12.29 | $ | 14.69 | $ | 12.36 | $ | 10.26 | $ | 10.00 |
| Income from Investment Operations | ||||||||||
Net investment income (loss) B,C | .24 | .20 | .16 | .16 | .03 | |||||
| Net realized and unrealized gain (loss) | 1.22 | (1.94) | 2.36 | 2.07 | .24 | |||||
| Total from investment operations | 1.46 | (1.74) | 2.52 | 2.23 | .27 | |||||
| Distributions from net investment income | (.24) | (.18) | (.14) | (.13) | (.01) | |||||
| Distributions from net realized gain | - | (.47) | (.05) | - | - | |||||
| Total distributions | (.24) | (.66) D | (.19) | (.13) | (.01) | |||||
| Net asset value, end of period | $ | 13.51 | $ | 12.29 | $ | 14.69 | $ | 12.36 | $ | 10.26 |
Total Return E,F | 12.05% | (12.35)% | 20.55% | 21.95% | 2.65% | |||||
Ratios to Average Net Assets C,G,H | ||||||||||
| Expenses before reductions | .32% | .32% | .32% | .32% | .31% I,J | |||||
| Expenses net of fee waivers, if any | .32% | .32% | .32% | .32% | .31% I,J | |||||
| Expenses net of all reductions | .32% | .32% | .31% | .32% | .31% I,J | |||||
| Net investment income (loss) | 1.95% | 1.46% | 1.17% | 1.48% | 1.62% J | |||||
| Supplemental Data | ||||||||||
| Net assets, end of period (000 omitted) | $ | 1,383,864 | $ | 831,306 | $ | 650,542 | $ | 371,252 | $ | 83,185 |
Portfolio turnover rate K,L | 58% | 72% | 65% | 67% | 99% M |
| Fidelity Central Fund | Investment Manager | Investment Objective | Investment Practices | Expense RatioA |
| Fidelity High Income Central Fund | Fidelity Management & Research Company LLC (FMR) | Seeks a high level of income and may also seek capital appreciation by investing primarily in debt securities, preferred stocks, and convertible securities, with an emphasis on lower-quality debt securities. | Loans & Direct Debt Instruments Restricted Securities | .03% |
| Fidelity Investment Grade Bond Central Fund | Fidelity Management & Research Company LLC (FMR) | Seeks a high level of income by normally investing in investment-grade debt securities. | Delayed Delivery & When Issued Securities Futures Options Restricted Securities Swaps | Less than .005% |
| Fidelity Money Market Central Funds | Fidelity Management & Research Company LLC (FMR) | Each fund seeks to obtain a high level of current income consistent with the preservation of capital and liquidity. | Short-term Investments | Less than .005% |
| Gross unrealized appreciation | $176,164,957 |
| Gross unrealized depreciation | (55,784,565) |
| Net unrealized appreciation (depreciation) | $120,380,392 |
| Tax Cost | $1,270,091,376 |
| Undistributed ordinary income | $4,217,068 |
| Capital loss carryforward | $(27,396,104) |
| Net unrealized appreciation (depreciation) on securities and other investments | $120,380,408 |
Short-term | $(27,396,104) |
Long-term | (-) |
| Total capital loss carryforward | $(27,396,104) |
| August 31, 2023 | August 31, 2022 | |
| Ordinary Income | $17,241,436 | $10,863,052 |
| Long-term Capital Gains | - | 20,355,240 |
| Total | $17,241,436 | $31,218,292 |
| Investment to be Acquired | Commitment Amount | |
| Fidelity Puritan K6 Fund | Fidelity Private Credit Central Fund LLC | $1,995,000 |
| Equity Risk | Equity risk relates to the fluctuations in the value of financial instruments as a result of changes in market prices (other than those arising from interest rate risk or foreign exchange risk), whether caused by factors specific to an individual investment, its issuer, or all factors affecting all instruments traded in a market or market segment. |
| Purchases ($) | Sales ($) | |
| Fidelity Puritan K6 Fund | 1,018,305,251 | 559,939,588 |
| Shares | Total Proceeds ($) | ||
| Fidelity Puritan K6 Fund | 1,245,767 | 15,422,345 |
| Shares | Total Proceeds ($) | ||
| Fidelity Puritan K6 Fund | 21,090,269 | 291,484,955 |
| Amount | |
| Fidelity Puritan K6 Fund | $ 6,718 |
| Purchases ($) | Sales ($) | Realized Gain (Loss) ($) | |
| Fidelity Puritan K6 Fund | 19,748,335 | 27,097,545 | (50,151) |
| Total Security Lending Fees Paid to NFS | Security Lending Income From Securities Loaned to NFS | Value of Securities Loaned to NFS at Period End | |
| Fidelity Puritan K6 Fund | $1,254 | $ 499 | $5,136 |
| The Example is based on an investment of $1,000 invested at the beginning of the period and held for the entire period (March 1, 2023 to August 31, 2023). |
Annualized Expense Ratio- A | Beginning Account Value March 1, 2023 | Ending Account Value August 31, 2023 | Expenses Paid During Period- C March 1, 2023 to August 31, 2023 | |||||||
| Fidelity® Puritan® K6 Fund | .32% | |||||||||
| Actual | $ 1,000 | $ 1,110.60 | $ 1.70 | |||||||
Hypothetical-B | $ 1,000 | $ 1,023.59 | $ 1.63 | |||||||
 |


Contents
| Average Annual Total Returns | |||
Periods ended August 31, 2023 | Past 1 year | Life of Fund A |
| Fidelity® Balanced K6 Fund | 12.09% | 10.51% |
| $10,000 Over Life of Fund |
Let's say hypothetically that $10,000 was invested in Fidelity® Balanced K6 Fund, on June 14, 2019, when the fund started. The chart shows how the value of your investment would have changed, and also shows how the S&P 500® Index performed over the same period. |
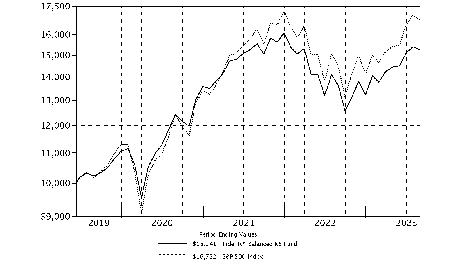 |
Top Holdings (% of Fund's net assets) | ||
| Microsoft Corp. | 4.7 | |
| Apple, Inc. | 3.9 | |
| Amazon.com, Inc. | 2.5 | |
| NVIDIA Corp. | 2.3 | |
| Alphabet, Inc. Class A | 1.5 | |
| Meta Platforms, Inc. Class A | 1.3 | |
| Exxon Mobil Corp. | 1.2 | |
| UnitedHealth Group, Inc. | 1.2 | |
| Eli Lilly & Co. | 1.1 | |
| Tesla, Inc. | 1.0 | |
| 20.7 | ||
| Top Bond Issuers (% of Fund's net assets) | ||
(with maturities greater than one year) | ||
| U.S. Treasury Obligations | 13.6 | |
| Fannie Mae | 2.6 | |
| Freddie Mac | 2.4 | |
| Ginnie Mae | 1.4 | |
| Uniform Mortgage Backed Securities | 1.1 | |
| JPMorgan Chase & Co. | 0.7 | |
| Morgan Stanley | 0.5 | |
| Citigroup, Inc. | 0.5 | |
| Bank of America Corp. | 0.3 | |
| Petroleos Mexicanos | 0.3 | |
| 23.4 | ||
| Market Sectors (% of Fund's net assets) | ||
| Information Technology | 17.0 | |
| Financials | 12.7 | |
| Health Care | 8.8 | |
| Consumer Discretionary | 6.9 | |
| Communication Services | 6.2 | |
| Industrials | 5.8 | |
| Consumer Staples | 4.8 | |
| Energy | 3.8 | |
| Real Estate | 2.5 | |
| Utilities | 1.9 | |
| Materials | 1.6 | |
Quality Diversification (% of Fund's net assets) |
 |
| We have used ratings from Moody's Investors Service, Inc. Where Moody's® ratings are not available, we have used S&P® ratings. All ratings are as of the date indicated and do not reflect subsequent changes. |
Asset Allocation (% of Fund's net assets) |
 |
Futures and Swaps - (2.4)% |
| Common Stocks - 61.7% | |||
| Shares | Value ($) | ||
| COMMUNICATION SERVICES - 5.4% | |||
| Diversified Telecommunication Services - 0.4% | |||
| AT&T, Inc. | 318,445 | 4,709,802 | |
| Cellnex Telecom SA (a) | 15,921 | 609,417 | |
| Liberty Global PLC Class C (b) | 22,239 | 441,222 | |
| 5,760,441 | |||
| Entertainment - 0.8% | |||
| Cinemark Holdings, Inc. (b)(c) | 25,524 | 415,531 | |
| Netflix, Inc. (b) | 15,536 | 6,737,652 | |
| Sea Ltd. ADR (b) | 39,611 | 1,490,562 | |
| Take-Two Interactive Software, Inc. (b) | 9,241 | 1,314,070 | |
| The Walt Disney Co. (b) | 28,773 | 2,407,725 | |
| World Wrestling Entertainment, Inc. Class A (c) | 7,509 | 724,994 | |
| 13,090,534 | |||
| Interactive Media & Services - 3.5% | |||
| Alphabet, Inc.: | |||
| Class A (b) | 178,089 | 24,250,379 | |
| Class C (b) | 69,602 | 9,559,835 | |
| Epic Games, Inc. (b)(d)(e) | 182 | 113,342 | |
| Meta Platforms, Inc. Class A (b) | 69,572 | 20,585,659 | |
| Pinterest, Inc. Class A (b) | 21,604 | 593,894 | |
| Snap, Inc. Class A (b) | 131,325 | 1,359,214 | |
| 56,462,323 | |||
| Media - 0.5% | |||
| Altice U.S.A., Inc. Class A (b) | 32,778 | 100,628 | |
| Charter Communications, Inc. Class A (b) | 3,444 | 1,508,885 | |
| Comcast Corp. Class A | 68,271 | 3,192,352 | |
| Liberty Broadband Corp.: | |||
| Class A (b) | 20,017 | 1,874,392 | |
| Class C (b) | 10,613 | 992,952 | |
| 7,669,209 | |||
| Wireless Telecommunication Services - 0.2% | |||
| T-Mobile U.S., Inc. (b) | 23,505 | 3,202,556 | |
TOTAL COMMUNICATION SERVICES | 86,185,063 | ||
| CONSUMER DISCRETIONARY - 6.6% | |||
| Automobile Components - 0.1% | |||
| Adient PLC (b) | 25,672 | 1,005,572 | |
| Automobiles - 1.1% | |||
| Ferrari NV | 3,292 | 1,046,000 | |
| Tesla, Inc. (b) | 62,231 | 16,060,576 | |
| 17,106,576 | |||
| Broadline Retail - 2.6% | |||
| Amazon.com, Inc. (b) | 286,879 | 39,592,171 | |
| eBay, Inc. | 44,408 | 1,988,590 | |
| 41,580,761 | |||
| Hotels, Restaurants & Leisure - 1.2% | |||
| Booking Holdings, Inc. (b) | 1,502 | 4,663,755 | |
| Caesars Entertainment, Inc. (b) | 22,295 | 1,232,022 | |
| Churchill Downs, Inc. | 15,868 | 1,987,943 | |
| Domino's Pizza, Inc. | 3,955 | 1,532,167 | |
| Marriott International, Inc. Class A | 21,648 | 4,405,584 | |
| McDonald's Corp. | 10,011 | 2,814,593 | |
| Penn Entertainment, Inc. (b) | 9,928 | 235,194 | |
| Red Rock Resorts, Inc. | 7,228 | 317,526 | |
| Sweetgreen, Inc. Class A (b) | 2,658 | 38,169 | |
| Yum! Brands, Inc. | 21,298 | 2,755,535 | |
| 19,982,488 | |||
| Household Durables - 0.0% | |||
| D.R. Horton, Inc. | 786 | 93,550 | |
| Mohawk Industries, Inc. (b) | 7,000 | 709,730 | |
| 803,280 | |||
| Specialty Retail - 1.3% | |||
| Cazoo Group Ltd. (b)(d) | 285 | 322 | |
| Fast Retailing Co. Ltd. | 3,211 | 738,886 | |
| Lowe's Companies, Inc. | 30,426 | 7,012,584 | |
| The Home Depot, Inc. | 14,028 | 4,633,448 | |
| TJX Companies, Inc. | 82,156 | 7,597,787 | |
| Valvoline, Inc. | 28,421 | 978,819 | |
| 20,961,846 | |||
| Textiles, Apparel & Luxury Goods - 0.3% | |||
| NIKE, Inc. Class B | 19,149 | 1,947,645 | |
| PVH Corp. | 14,766 | 1,234,438 | |
| Tapestry, Inc. | 38,266 | 1,275,023 | |
| 4,457,106 | |||
TOTAL CONSUMER DISCRETIONARY | 105,897,629 | ||
| CONSUMER STAPLES - 4.2% | |||
| Beverages - 1.5% | |||
| Boston Beer Co., Inc. Class A (b) | 1,840 | 672,391 | |
| Celsius Holdings, Inc. (b) | 6,687 | 1,310,919 | |
| Constellation Brands, Inc. Class A (sub. vtg.) | 10,626 | 2,768,711 | |
| Diageo PLC | 9,485 | 388,439 | |
| Duckhorn Portfolio, Inc. (b) | 24,498 | 304,755 | |
| Keurig Dr. Pepper, Inc. | 46,369 | 1,560,317 | |
| Monster Beverage Corp. | 47,766 | 2,742,246 | |
| PepsiCo, Inc. | 37,374 | 6,649,582 | |
| Pernod Ricard SA | 4,256 | 836,237 | |
| The Coca-Cola Co. | 120,537 | 7,211,729 | |
| The Vita Coco Co., Inc. (b) | 15,436 | 436,684 | |
| 24,882,010 | |||
| Consumer Staples Distribution & Retail - 1.2% | |||
| Alimentation Couche-Tard, Inc. Class A (multi-vtg.) | 19,166 | 1,002,272 | |
| BJ's Wholesale Club Holdings, Inc. (b) | 5,109 | 344,296 | |
| Costco Wholesale Corp. | 13,065 | 7,176,343 | |
| Dollar General Corp. | 4,472 | 619,372 | |
| Dollar Tree, Inc. (b) | 7,947 | 972,395 | |
| Target Corp. | 1,540 | 194,887 | |
| U.S. Foods Holding Corp. (b) | 28,205 | 1,140,328 | |
| Walmart, Inc. | 47,651 | 7,748,529 | |
| 19,198,422 | |||
| Food Products - 0.5% | |||
| Freshpet, Inc. (b)(c) | 8,766 | 661,921 | |
| Lamb Weston Holdings, Inc. | 7,291 | 710,216 | |
| McCormick & Co., Inc. (non-vtg.) | 13,513 | 1,109,147 | |
| Mondelez International, Inc. | 51,430 | 3,664,902 | |
| The Hershey Co. | 6,566 | 1,410,771 | |
| 7,556,957 | |||
| Household Products - 0.8% | |||
| Colgate-Palmolive Co. | 20,249 | 1,487,694 | |
| Energizer Holdings, Inc. | 8,192 | 281,395 | |
| Procter & Gamble Co. | 76,420 | 11,794,663 | |
| 13,563,752 | |||
| Personal Care Products - 0.2% | |||
| elf Beauty, Inc. (b) | 4,085 | 566,630 | |
| Estee Lauder Companies, Inc. Class A | 8,432 | 1,353,589 | |
| Kenvue, Inc. | 25,974 | 598,701 | |
| 2,518,920 | |||
TOTAL CONSUMER STAPLES | 67,720,061 | ||
| ENERGY - 2.8% | |||
| Energy Equipment & Services - 0.3% | |||
| Expro Group Holdings NV (b) | 51,996 | 1,222,426 | |
| Schlumberger Ltd. | 33,086 | 1,950,751 | |
| Weatherford International PLC (b) | 21,399 | 1,894,239 | |
| 5,067,416 | |||
| Oil, Gas & Consumable Fuels - 2.5% | |||
| Africa Oil Corp. | 438,761 | 1,055,338 | |
| Athabasca Oil Corp. (b) | 235,524 | 653,652 | |
| Canadian Natural Resources Ltd. | 26,751 | 1,730,737 | |
| Eco Atlantic Oil & Gas Ltd. (b) | 339,539 | 70,360 | |
| Exxon Mobil Corp. | 178,137 | 19,807,053 | |
| Hess Corp. | 27,010 | 4,173,045 | |
| Imperial Oil Ltd. | 59,848 | 3,398,562 | |
| Kosmos Energy Ltd. (b) | 146,795 | 1,068,668 | |
| MEG Energy Corp. (b) | 146,774 | 2,625,464 | |
| Phillips 66 Co. | 19,836 | 2,264,478 | |
| Valero Energy Corp. | 21,829 | 2,835,587 | |
| 39,682,944 | |||
TOTAL ENERGY | 44,750,360 | ||
| FINANCIALS - 8.0% | |||
| Banks - 2.5% | |||
| AIB Group PLC | 91,347 | 416,217 | |
| Bank of America Corp. | 157,895 | 4,526,850 | |
| BNP Paribas SA | 39,506 | 2,554,760 | |
| Citigroup, Inc. | 25,164 | 1,039,022 | |
| DNB Bank ASA | 39,605 | 782,854 | |
| Eurobank Ergasias Services and Holdings SA (b) | 682,199 | 1,185,807 | |
| JPMorgan Chase & Co. | 100,107 | 14,648,657 | |
| KBC Group NV | 6,923 | 454,621 | |
| KeyCorp | 151,689 | 1,718,636 | |
| M&T Bank Corp. | 8,355 | 1,044,793 | |
| Piraeus Financial Holdings SA (b) | 198,327 | 686,458 | |
| PNC Financial Services Group, Inc. | 16,599 | 2,003,997 | |
| Starling Bank Ltd. Series D (b)(d)(e) | 182,820 | 750,372 | |
| UniCredit SpA | 24,616 | 599,722 | |
| Wells Fargo & Co. | 174,265 | 7,195,402 | |
| Zions Bancorp NA | 10,562 | 374,951 | |
| 39,983,119 | |||
| Capital Markets - 1.4% | |||
| Bank of New York Mellon Corp. | 51,655 | 2,317,760 | |
| BlackRock, Inc. Class A | 5,381 | 3,769,606 | |
| Brookfield Corp. Class A | 21,704 | 740,323 | |
| Cboe Global Markets, Inc. | 6,897 | 1,032,550 | |
| CME Group, Inc. | 11,663 | 2,363,857 | |
| Interactive Brokers Group, Inc. | 13,454 | 1,225,390 | |
| MarketAxess Holdings, Inc. | 5,003 | 1,205,373 | |
| Morgan Stanley | 59,516 | 5,067,787 | |
| State Street Corp. | 18,921 | 1,300,630 | |
| StepStone Group, Inc. Class A | 22,015 | 679,603 | |
| UBS Group AG | 93,094 | 2,486,541 | |
| Virtu Financial, Inc. Class A | 21,234 | 397,925 | |
| 22,587,345 | |||
| Consumer Finance - 0.1% | |||
| OneMain Holdings, Inc. | 23,557 | 977,851 | |
| Shriram Transport Finance Co. Ltd. | 21,531 | 501,976 | |
| 1,479,827 | |||
| Financial Services - 2.3% | |||
| Apollo Global Management, Inc. | 42,933 | 3,749,768 | |
| Berkshire Hathaway, Inc.: | |||
| Class A (b) | 3 | 1,640,175 | |
| Class B (b) | 6,066 | 2,184,973 | |
| Block, Inc. Class A (b) | 33,906 | 1,954,681 | |
| Dlocal Ltd. (b) | 47,492 | 1,018,228 | |
| Fiserv, Inc. (b) | 29,543 | 3,586,225 | |
| FleetCor Technologies, Inc. (b) | 4,616 | 1,254,306 | |
| Global Payments, Inc. | 19,215 | 2,434,348 | |
| One97 Communications Ltd. (b) | 129,145 | 1,333,302 | |
| UWM Holdings Corp. Class A (c) | 47,008 | 280,168 | |
| Visa, Inc. Class A | 62,305 | 15,307,092 | |
| Voya Financial, Inc. | 10,273 | 715,823 | |
| Worldline SA (a)(b) | 22,508 | 734,149 | |
| 36,193,238 | |||
| Insurance - 1.7% | |||
| Arthur J. Gallagher & Co. | 17,320 | 3,991,914 | |
| Chubb Ltd. | 20,868 | 4,191,755 | |
| Direct Line Insurance Group PLC | 352,063 | 723,178 | |
| Everest Re Group Ltd. | 5,174 | 1,866,158 | |
| Fairfax Financial Holdings Ltd. (sub. vtg.) | 1,920 | 1,583,332 | |
| Globe Life, Inc. | 9,520 | 1,062,146 | |
| Hartford Financial Services Group, Inc. | 33,747 | 2,423,710 | |
| Marsh & McLennan Companies, Inc. | 20,672 | 4,030,833 | |
| Progressive Corp. | 24,442 | 3,262,274 | |
| Prudential PLC | 40,324 | 491,109 | |
| The Travelers Companies, Inc. | 17,284 | 2,786,699 | |
| Unum Group | 32,632 | 1,605,168 | |
| 28,018,276 | |||
TOTAL FINANCIALS | 128,261,805 | ||
| HEALTH CARE - 8.1% | |||
| Biotechnology - 1.4% | |||
| Biogen, Inc. (b) | 5,748 | 1,536,785 | |
| Exact Sciences Corp. (b) | 17,549 | 1,468,325 | |
| Gilead Sciences, Inc. | 100,447 | 7,682,187 | |
| Legend Biotech Corp. ADR (b) | 14,138 | 980,612 | |
| PTC Therapeutics, Inc. (b) | 15,393 | 608,024 | |
| Regeneron Pharmaceuticals, Inc. (b) | 2,346 | 1,938,946 | |
| Sarepta Therapeutics, Inc. (b) | 4,996 | 604,566 | |
| Vertex Pharmaceuticals, Inc. (b) | 21,631 | 7,534,943 | |
| 22,354,388 | |||
| Health Care Equipment & Supplies - 1.7% | |||
| Abbott Laboratories | 13,713 | 1,411,068 | |
| Boston Scientific Corp. (b) | 196,861 | 10,618,682 | |
| Intuitive Surgical, Inc. (b) | 15,448 | 4,830,281 | |
| Masimo Corp. (b) | 3,172 | 362,496 | |
| Penumbra, Inc. (b) | 6,865 | 1,815,793 | |
| PROCEPT BioRobotics Corp. (b) | 6,200 | 211,482 | |
| Stryker Corp. | 29,479 | 8,358,770 | |
| 27,608,572 | |||
| Health Care Providers & Services - 2.3% | |||
| agilon health, Inc. (b) | 70,878 | 1,255,958 | |
| Cencora, Inc. | 35,448 | 6,238,139 | |
| Cigna Group | 14,567 | 4,024,279 | |
| Humana, Inc. | 5,793 | 2,674,223 | |
| Surgery Partners, Inc. (b) | 112,324 | 4,072,868 | |
| UnitedHealth Group, Inc. | 39,431 | 18,792,026 | |
| 37,057,493 | |||
| Life Sciences Tools & Services - 0.6% | |||
| 10X Genomics, Inc. (b) | 15,978 | 828,459 | |
| Danaher Corp. | 9,860 | 2,612,900 | |
| Gerresheimer AG | 27,935 | 3,631,929 | |
| IQVIA Holdings, Inc. (b) | 4,103 | 913,451 | |
| Thermo Fisher Scientific, Inc. | 3,085 | 1,718,654 | |
| 9,705,393 | |||
| Pharmaceuticals - 2.1% | |||
| AstraZeneca PLC sponsored ADR | 79,882 | 5,417,597 | |
| Eli Lilly & Co. | 30,881 | 17,114,250 | |
| Indivior PLC (b) | 79,328 | 1,828,967 | |
| Merck & Co., Inc. | 59,468 | 6,480,823 | |
| Royalty Pharma PLC | 70,990 | 2,116,922 | |
| 32,958,559 | |||
TOTAL HEALTH CARE | 129,684,405 | ||
| INDUSTRIALS - 5.5% | |||
| Aerospace & Defense - 1.2% | |||
| Howmet Aerospace, Inc. | 41,445 | 2,050,284 | |
| Lockheed Martin Corp. | 12,153 | 5,448,798 | |
| Northrop Grumman Corp. | 4,349 | 1,883,508 | |
| RTX Corp. | 14,789 | 1,272,446 | |
| Space Exploration Technologies Corp. Class A (b)(d)(e) | 2,000 | 162,000 | |
| The Boeing Co. (b) | 25,648 | 5,745,921 | |
| TransDigm Group, Inc. | 2,853 | 2,578,684 | |
| 19,141,641 | |||
| Air Freight & Logistics - 0.1% | |||
| United Parcel Service, Inc. Class B | 7,007 | 1,186,986 | |
| Building Products - 0.4% | |||
| Trane Technologies PLC | 30,686 | 6,298,608 | |
| Electrical Equipment - 0.6% | |||
| AMETEK, Inc. | 40,043 | 6,387,259 | |
| Eaton Corp. PLC | 13,262 | 3,055,167 | |
| 9,442,426 | |||
| Ground Transportation - 0.9% | |||
| CSX Corp. | 102,517 | 3,096,013 | |
| Old Dominion Freight Lines, Inc. | 11,406 | 4,874,582 | |
| Uber Technologies, Inc. (b) | 56,544 | 2,670,573 | |
| Union Pacific Corp. | 15,682 | 3,458,979 | |
| 14,100,147 | |||
| Industrial Conglomerates - 0.4% | |||
| General Electric Co. | 55,084 | 6,304,915 | |
| Honeywell International, Inc. | 4,328 | 813,404 | |
| 7,118,319 | |||
| Machinery - 1.8% | |||
| Caterpillar, Inc. | 16,300 | 4,582,419 | |
| Deere & Co. | 3,912 | 1,607,597 | |
| Dover Corp. | 31,053 | 4,605,160 | |
| Fortive Corp. | 82,870 | 6,534,300 | |
| Ingersoll Rand, Inc. | 68,953 | 4,799,818 | |
| Parker Hannifin Corp. | 16,062 | 6,696,248 | |
| 28,825,542 | |||
| Passenger Airlines - 0.1% | |||
| Delta Air Lines, Inc. | 22,347 | 958,239 | |
| Professional Services - 0.0% | |||
| Dun & Bradstreet Holdings, Inc. | 69,651 | 759,196 | |
TOTAL INDUSTRIALS | 87,831,104 | ||
| INFORMATION TECHNOLOGY - 16.6% | |||
| Electronic Equipment, Instruments & Components - 0.2% | |||
| Amphenol Corp. Class A | 35,986 | 3,180,443 | |
| IT Services - 0.8% | |||
| Accenture PLC Class A | 5,237 | 1,695,583 | |
| Capgemini SA | 7,310 | 1,364,202 | |
| EPAM Systems, Inc. (b) | 7,176 | 1,858,512 | |
| MongoDB, Inc. Class A (b) | 8,432 | 3,215,122 | |
| Shopify, Inc. Class A (b) | 14,731 | 979,464 | |
| Snowflake, Inc. (b) | 8,394 | 1,316,599 | |
| Twilio, Inc. Class A (b) | 22,002 | 1,401,747 | |
| Wix.com Ltd. (b) | 12,671 | 1,251,515 | |
| 13,082,744 | |||
| Semiconductors & Semiconductor Equipment - 4.1% | |||
| Advanced Micro Devices, Inc. (b) | 35,574 | 3,760,883 | |
| ASML Holding NV (Netherlands) | 3,186 | 2,094,885 | |
| Lam Research Corp. | 5,684 | 3,992,442 | |
| Marvell Technology, Inc. | 44,823 | 2,610,940 | |
| Micron Technology, Inc. | 80,823 | 5,652,761 | |
| NVIDIA Corp. | 74,861 | 36,947,647 | |
| NXP Semiconductors NV | 16,210 | 3,334,721 | |
| Renesas Electronics Corp. (b) | 111,552 | 1,858,419 | |
| SolarEdge Technologies, Inc. (b) | 8,842 | 1,437,444 | |
| Taiwan Semiconductor Manufacturing Co. Ltd. | 218,506 | 3,752,635 | |
| 65,442,777 | |||
| Software - 7.5% | |||
| Adobe, Inc. (b) | 20,285 | 11,346,212 | |
| Autodesk, Inc. (b) | 15,184 | 3,369,937 | |
| CCC Intelligent Solutions Holdings, Inc. (b)(d) | 3,671 | 39,280 | |
| Elastic NV (b) | 15,357 | 950,291 | |
| Five9, Inc. (b) | 21,359 | 1,545,751 | |
| HubSpot, Inc. (b) | 6,495 | 3,549,647 | |
| Intuit, Inc. | 14,335 | 7,766,846 | |
| Microsoft Corp. | 231,685 | 75,937,080 | |
| Salesforce, Inc. (b) | 38,705 | 8,571,609 | |
| Stripe, Inc. Class B (b)(d)(e) | 1,800 | 33,408 | |
| Synopsys, Inc. (b) | 8,683 | 3,984,542 | |
| Tenable Holdings, Inc. (b) | 17,191 | 779,956 | |
| Workday, Inc. Class A (b) | 10,925 | 2,671,163 | |
| 120,545,722 | |||
| Technology Hardware, Storage & Peripherals - 4.0% | |||
| Apple, Inc. | 329,813 | 61,961,968 | |
| Samsung Electronics Co. Ltd. | 25,049 | 1,264,819 | |
| 63,226,787 | |||
TOTAL INFORMATION TECHNOLOGY | 265,478,473 | ||
| MATERIALS - 1.5% | |||
| Chemicals - 1.0% | |||
| Air Products & Chemicals, Inc. | 5,328 | 1,574,371 | |
| Cabot Corp. | 8,051 | 583,375 | |
| Celanese Corp. Class A | 9,501 | 1,200,546 | |
| Chemtrade Logistics Income Fund | 47,918 | 301,793 | |
| Corteva, Inc. | 23,804 | 1,202,340 | |
| DuPont de Nemours, Inc. | 15,484 | 1,190,565 | |
| Linde PLC | 17,088 | 6,613,740 | |
| LyondellBasell Industries NV Class A | 15,483 | 1,529,256 | |
| Nutrien Ltd. | 4,054 | 256,795 | |
| Olin Corp. | 9,344 | 542,139 | |
| The Chemours Co. LLC | 21,788 | 741,228 | |
| Tronox Holdings PLC | 39,552 | 539,489 | |
| Westlake Corp. | 2,518 | 329,808 | |
| 16,605,445 | |||
| Construction Materials - 0.1% | |||
| Martin Marietta Materials, Inc. | 1,800 | 803,538 | |
| Vulcan Materials Co. | 3,856 | 841,572 | |
| 1,645,110 | |||
| Containers & Packaging - 0.1% | |||
| Aptargroup, Inc. | 4,550 | 603,148 | |
| Greif, Inc. Class A | 7,951 | 577,163 | |
| 1,180,311 | |||
| Metals & Mining - 0.3% | |||
| First Quantum Minerals Ltd. | 51,542 | 1,384,676 | |
| Franco-Nevada Corp. | 4,550 | 655,494 | |
| Freeport-McMoRan, Inc. | 47,869 | 1,910,452 | |
| Horizonte Minerals PLC (b) | 91,660 | 151,530 | |
| Ivanhoe Mines Ltd. (b) | 35,711 | 317,678 | |
| Major Drilling Group International, Inc. (b) | 18,702 | 120,417 | |
| Reliance Steel & Aluminum Co. | 2,507 | 714,395 | |
| 5,254,642 | |||
TOTAL MATERIALS | 24,685,508 | ||
| REAL ESTATE - 1.5% | |||
| Equity Real Estate Investment Trusts (REITs) - 1.5% | |||
| Alexandria Real Estate Equities, Inc. | 565 | 65,732 | |
| American Tower Corp. | 14,129 | 2,561,870 | |
| Corporate Office Properties Trust (SBI) | 17,307 | 447,905 | |
| Crown Castle International Corp. | 13,608 | 1,367,604 | |
| CubeSmart | 3,760 | 156,830 | |
| Digital Realty Trust, Inc. | 14,949 | 1,969,082 | |
| Equinix, Inc. | 3,962 | 3,095,828 | |
| Equity Lifestyle Properties, Inc. | 23,506 | 1,573,962 | |
| Essex Property Trust, Inc. | 5,556 | 1,324,495 | |
| Extra Space Storage, Inc. | 537 | 69,101 | |
| Invitation Homes, Inc. | 40,605 | 1,384,224 | |
| Mid-America Apartment Communities, Inc. | 12,929 | 1,877,679 | |
| Prologis (REIT), Inc. | 28,520 | 3,542,184 | |
| Simon Property Group, Inc. | 9,986 | 1,133,311 | |
| Ventas, Inc. | 18,305 | 799,562 | |
| Welltower, Inc. | 22,646 | 1,876,900 | |
| 23,246,269 | |||
| UTILITIES - 1.5% | |||
| Electric Utilities - 1.1% | |||
| Constellation Energy Corp. | 25,450 | 2,650,872 | |
| Edison International | 17,248 | 1,187,525 | |
| Exelon Corp. | 29,683 | 1,190,882 | |
| FirstEnergy Corp. | 14,687 | 529,760 | |
| NextEra Energy, Inc. | 63,952 | 4,271,994 | |
| NRG Energy, Inc. | 8,375 | 314,481 | |
| PG&E Corp. (b) | 154,666 | 2,521,056 | |
| PPL Corp. | 43,813 | 1,091,820 | |
| Southern Co. | 61,575 | 4,170,475 | |
| 17,928,865 | |||
| Independent Power and Renewable Electricity Producers - 0.0% | |||
| The AES Corp. | 18,098 | 324,497 | |
| Multi-Utilities - 0.3% | |||
| Dominion Energy, Inc. | 31,110 | 1,510,079 | |
| NiSource, Inc. | 34,853 | 932,666 | |
| Sempra | 37,880 | 2,659,934 | |
| 5,102,679 | |||
| Water Utilities - 0.1% | |||
| American Water Works Co., Inc. | 8,502 | 1,179,567 | |
TOTAL UTILITIES | 24,535,608 | ||
| TOTAL COMMON STOCKS (Cost $770,302,081) | 988,276,285 | ||
| Preferred Stocks - 0.1% | |||
| Shares | Value ($) | ||
| Convertible Preferred Stocks - 0.1% | |||
| COMMUNICATION SERVICES - 0.0% | |||
| Interactive Media & Services - 0.0% | |||
| ByteDance Ltd. Series E1 (b)(d)(e) | 1,863 | 421,206 | |
| INDUSTRIALS - 0.0% | |||
| Aerospace & Defense - 0.0% | |||
| ABL Space Systems: | |||
| Series B(b)(d)(e) | 1,784 | 48,989 | |
| Series B2(b)(d)(e) | 1,176 | 31,505 | |
| 80,494 | |||
| Construction & Engineering - 0.0% | |||
| Beta Technologies, Inc. Series A (b)(d)(e) | 731 | 82,815 | |
TOTAL INDUSTRIALS | 163,309 | ||
| INFORMATION TECHNOLOGY - 0.1% | |||
| Communications Equipment - 0.0% | |||
| Astranis Space Technologies Corp. Series C (b)(d)(e) | 6,103 | 110,281 | |
| Semiconductors & Semiconductor Equipment - 0.0% | |||
| Astera Labs, Inc. Series C (b)(d)(e) | 18,600 | 176,328 | |
| GaN Systems, Inc.: | |||
| Series F1(b)(d)(e) | 2,171 | 24,033 | |
| Series F2(b)(d)(e) | 1,146 | 12,686 | |
| Xsight Labs Ltd. Series D (b)(d)(e) | 6,632 | 38,134 | |
| 251,181 | |||
| Software - 0.1% | |||
| Algolia, Inc. Series D (b)(d)(e) | 3,612 | 52,193 | |
| Bolt Technology OU Series E (b)(d)(e) | 957 | 123,551 | |
| Databricks, Inc.: | |||
| Series G(b)(d)(e) | 444 | 32,634 | |
| Series H(b)(d)(e) | 2,574 | 189,189 | |
| Skyryse, Inc. Series B (b)(d)(e) | 7,300 | 168,484 | |
| Stripe, Inc. Series H (b)(d)(e) | 2,037 | 37,807 | |
| 603,858 | |||
TOTAL INFORMATION TECHNOLOGY | 965,320 | ||
| TOTAL CONVERTIBLE PREFERRED STOCKS | 1,549,835 | ||
| Nonconvertible Preferred Stocks - 0.0% | |||
| INDUSTRIALS - 0.0% | |||
| Professional Services - 0.0% | |||
| Checkr, Inc. Series E (b)(e) | 12,063 | 116,408 | |
| INFORMATION TECHNOLOGY - 0.0% | |||
| IT Services - 0.0% | |||
| Gupshup, Inc. (b)(d)(e) | 3,298 | 41,225 | |
| TOTAL NONCONVERTIBLE PREFERRED STOCKS | 157,633 | ||
| TOTAL PREFERRED STOCKS (Cost $1,819,573) | 1,707,468 | ||
| U.S. Treasury Obligations - 0.0% | |||
Principal Amount (f) | Value ($) | ||
U.S. Treasury Bills, yield at date of purchase 5.14% to 5.39% 9/7/23 to 11/30/23 (g) (Cost $744,338) | 750,000 | 744,323 | |
| Preferred Securities - 0.0% | |||
Principal Amount (f) | Value ($) | ||
| INFORMATION TECHNOLOGY - 0.0% | |||
| Semiconductors & Semiconductor Equipment - 0.0% | |||
GaN Systems, Inc. 0% (d)(e)(h) (Cost $50,872) | 50,872 | 62,608 | |
| Fixed-Income Funds - 36.7% | |||
| Shares | Value ($) | ||
Fidelity Investment Grade Bond Central Fund (i) (Cost $646,128,890) | 6,089,917 | 587,007,125 | |
| Money Market Funds - 1.5% | |||
| Shares | Value ($) | ||
| Fidelity Cash Central Fund 5.43% (j) | 23,103,517 | 23,108,138 | |
| Fidelity Securities Lending Cash Central Fund 5.44% (j)(k) | 1,008,349 | 1,008,450 | |
| TOTAL MONEY MARKET FUNDS (Cost $24,116,588) | 24,116,588 | ||
| TOTAL INVESTMENT IN SECURITIES - 100.0% (Cost $1,443,162,342) | 1,601,914,397 |
NET OTHER ASSETS (LIABILITIES) - 0.0% | (318,362) |
| NET ASSETS - 100.0% | 1,601,596,035 |
| Futures Contracts | |||||
Number of contracts | Expiration Date | Notional Amount ($) | Value ($) | Unrealized Appreciation/ (Depreciation) ($) | |
| Purchased | |||||
| Equity Index Contracts | |||||
| CME E-mini S&P 500 Index Contracts (United States) | 61 | Sep 2023 | 13,773,800 | 495,853 | 495,853 |
| The notional amount of futures purchased as a percentage of Net Assets is 0.9% | |||||
| (a) | Security exempt from registration under Rule 144A of the Securities Act of 1933. These securities may be resold in transactions exempt from registration, normally to qualified institutional buyers. At the end of the period, the value of these securities amounted to $1,343,566 or 0.1% of net assets. |
| (b) | Non-income producing |
| (c) | Security or a portion of the security is on loan at period end. |
| (d) | Restricted securities (including private placements) - Investment in securities not registered under the Securities Act of 1933 (excluding 144A issues). At the end of the period, the value of restricted securities (excluding 144A issues) amounted to $2,752,392 or 0.2% of net assets. |
| (e) | Level 3 security |
| (f) | Amount is stated in United States dollars unless otherwise noted. |
| (g) | Security or a portion of the security was pledged to cover margin requirements for futures contracts. At period end, the value of securities pledged amounted to $744,323. |
| (h) | Security is perpetual in nature with no stated maturity date. |
| (i) | Affiliated fund that is generally available only to investment companies and other accounts managed by Fidelity Investments. A complete unaudited schedule of portfolio holdings for each Fidelity Central Fund is filed with the SEC for the first and third quarters of each fiscal year on Form N-PORT and is available upon request or at the SEC's website at www.sec.gov. An unaudited holdings listing for the Fund, which presents direct holdings as well as the pro-rata share of securities and other investments held indirectly through its investment in underlying non-money market Fidelity Central Funds, is available at fidelity.com and/or institutional.fidelity.com, as applicable. In addition, each Fidelity Central Fund's financial statements,which are not covered by the Fund's Report of Independent Registered Public Accounting Firm, are available on the SEC's website or upon request. |
| (j) | Affiliated fund that is generally available only to investment companies and other accounts managed by Fidelity Investments. The rate quoted is the annualized seven-day yield of the fund at period end. A complete unaudited listing of the fund's holdings as of its most recent quarter end is available upon request. In addition, each Fidelity Central Fund's financial statements, which are not covered by the Fund's Report of Independent Registered Public Accounting Firm, are available on the SEC's website or upon request. |
| (k) | Investment made with cash collateral received from securities on loan. |
| Additional information on each restricted holding is as follows: | ||
| Security | Acquisition Date | Acquisition Cost ($) |
| ABL Space Systems Series B | 3/24/21 | 80,344 |
| ABL Space Systems Series B2 | 10/22/21 | 79,963 |
| Algolia, Inc. Series D | 7/23/21 | 105,633 |
| Astera Labs, Inc. Series C | 8/24/21 | 62,529 |
| Astranis Space Technologies Corp. Series C | 3/19/21 | 133,783 |
| Beta Technologies, Inc. Series A | 4/09/21 | 53,560 |
| Bolt Technology OU Series E | 1/03/22 | 248,626 |
| ByteDance Ltd. Series E1 | 11/18/20 | 204,137 |
| Cazoo Group Ltd. | 3/28/21 | 57,000 |
| CCC Intelligent Solutions Holdings, Inc. | 2/02/21 | 36,710 |
| Databricks, Inc. Series G | 2/01/21 | 26,250 |
| Databricks, Inc. Series H | 8/31/21 | 189,148 |
| Epic Games, Inc. | 3/29/21 | 161,070 |
| GaN Systems, Inc. Series F1 | 11/30/21 | 18,410 |
| GaN Systems, Inc. Series F2 | 11/30/21 | 9,718 |
| GaN Systems, Inc. 0% | 11/30/21 | 50,872 |
| Gupshup, Inc. | 6/08/21 | 75,409 |
| Skyryse, Inc. Series B | 10/21/21 | 180,164 |
| Space Exploration Technologies Corp. Class A | 2/16/21 | 83,998 |
| Starling Bank Ltd. Series D | 6/18/21 | 326,861 |
| Stripe, Inc. Class B | 5/18/21 | 72,231 |
| Stripe, Inc. Series H | 3/15/21 - 5/25/23 | 81,735 |
| Xsight Labs Ltd. Series D | 2/16/21 | 53,029 |
| Affiliate | Value, beginning of period ($) | Purchases ($) | Sales Proceeds ($) | Dividend Income ($) | Realized Gain (loss) ($) | Change in Unrealized appreciation (depreciation) ($) | Value, end of period ($) | % ownership, end of period |
| Fidelity Cash Central Fund 5.43% | 22,110,015 | 405,619,486 | 404,621,363 | 1,063,547 | - | - | 23,108,138 | 0.1% |
| Fidelity High Income Central Fund | 6 | - | 5 | - | (1) | - | - | 0.0% |
| Fidelity Investment Grade Bond Central Fund | 356,998,527 | 260,167,015 | 12,465,881 | 18,260,819 | (2,035,816) | (15,656,720) | 587,007,125 | 1.6% |
| Fidelity Securities Lending Cash Central Fund 5.44% | 869,750 | 21,462,550 | 21,323,850 | 15,991 | - | - | 1,008,450 | 0.0% |
| Total | 379,978,298 | 687,249,051 | 438,411,099 | 19,340,357 | (2,035,817) | (15,656,720) | 611,123,713 | |
| Valuation Inputs at Reporting Date: | ||||
| Description | Total ($) | Level 1 ($) | Level 2 ($) | Level 3 ($) |
Investments in Securities: | ||||
| Equities: | ||||
Communication Services | 86,606,269 | 86,071,721 | - | 534,548 |
Consumer Discretionary | 105,897,629 | 105,897,629 | - | - |
Consumer Staples | 67,720,061 | 67,331,622 | 388,439 | - |
Energy | 44,750,360 | 44,750,360 | - | - |
Financials | 128,261,805 | 123,082,988 | 4,428,445 | 750,372 |
Health Care | 129,684,405 | 129,684,405 | - | - |
Industrials | 88,110,821 | 87,669,104 | - | 441,717 |
Information Technology | 266,485,018 | 256,374,924 | 9,070,141 | 1,039,953 |
Materials | 24,685,508 | 24,685,508 | - | - |
Real Estate | 23,246,269 | 23,246,269 | - | - |
Utilities | 24,535,608 | 24,535,608 | - | - |
| U.S. Government and Government Agency Obligations | 744,323 | - | 744,323 | - |
| Preferred Securities | 62,608 | - | - | 62,608 |
| Fixed-Income Funds | 587,007,125 | 587,007,125 | - | - |
| Money Market Funds | 24,116,588 | 24,116,588 | - | - |
| Total Investments in Securities: | 1,601,914,397 | 1,584,453,851 | 14,631,348 | 2,829,198 |
Derivative Instruments: | ||||
| Assets | ||||
Futures Contracts | 495,853 | 495,853 | - | - |
| Total Assets | 495,853 | 495,853 | - | - |
| Total Derivative Instruments: | 495,853 | 495,853 | - | - |
Primary Risk Exposure / Derivative Type | Value | |
| Asset ($) | Liability ($) | |
| Equity Risk | ||
Futures Contracts (a) | 495,853 | 0 |
| Total Equity Risk | 495,853 | 0 |
| Total Value of Derivatives | 495,853 | 0 |
| Statement of Assets and Liabilities | ||||
| August 31, 2023 | ||||
| Assets | ||||
| Investment in securities, at value (including securities loaned of $939,738) - See accompanying schedule: | ||||
Unaffiliated issuers (cost $772,916,864) | $ | 990,790,684 | ||
Fidelity Central Funds (cost $670,245,478) | 611,123,713 | |||
| Total Investment in Securities (cost $1,443,162,342) | $ | 1,601,914,397 | ||
| Cash | 42,207 | |||
| Foreign currency held at value (cost $20,957) | 20,954 | |||
| Receivable for investments sold | 1,848,739 | |||
| Receivable for fund shares sold | 880,053 | |||
| Dividends receivable | 1,309,048 | |||
| Distributions receivable from Fidelity Central Funds | 121,099 | |||
| Other receivables | 4,842 | |||
Total assets | 1,606,141,339 | |||
| Liabilities | ||||
| Payable for investments purchased | $ | 1,779,498 | ||
| Payable for fund shares redeemed | 1,266,147 | |||
| Accrued management fee | 421,064 | |||
| Payable for daily variation margin on futures contracts | 25,163 | |||
| Other payables and accrued expenses | 44,982 | |||
| Collateral on securities loaned | 1,008,450 | |||
| Total Liabilities | 4,545,304 | |||
| Net Assets | $ | 1,601,596,035 | ||
| Net Assets consist of: | ||||
| Paid in capital | $ | 1,480,898,514 | ||
| Total accumulated earnings (loss) | 120,697,521 | |||
| Net Assets | $ | 1,601,596,035 | ||
Net Asset Value, offering price and redemption price per share ($1,601,596,035 ÷ 118,657,458 shares) | $ | 13.50 | ||
| Statement of Operations | ||||
Year ended August 31, 2023 | ||||
| Investment Income | ||||
| Dividends | $ | 11,551,768 | ||
| Interest | 51,307 | |||
| Income from Fidelity Central Funds (including $15,991 from security lending) | 19,340,357 | |||
| Total Income | 30,943,432 | |||
| Expenses | ||||
| Management fee | $ | 4,446,186 | ||
| Independent trustees' fees and expenses | 7,164 | |||
| Interest | 1,079 | |||
| Total expenses before reductions | 4,454,429 | |||
| Expense reductions | (3,748) | |||
| Total expenses after reductions | 4,450,681 | |||
| Net Investment income (loss) | 26,492,751 | |||
| Realized and Unrealized Gain (Loss) | ||||
| Net realized gain (loss) on: | ||||
| Investment Securities: | ||||
| Unaffiliated issuers (net of foreign taxes of $2,209) | (24,110,790) | |||
| Fidelity Central Funds | (2,035,817) | |||
| Foreign currency transactions | (8,119) | |||
| Futures contracts | 1,475,448 | |||
| Total net realized gain (loss) | (24,679,278) | |||
| Change in net unrealized appreciation (depreciation) on: | ||||
| Investment Securities: | ||||
| Unaffiliated issuers(net of increase in deferred foreign taxes of $33,713) | 187,851,869 | |||
| Fidelity Central Funds | (15,656,720) | |||
| Unfunded commitments | 10,803 | |||
| Assets and liabilities in foreign currencies | 4,510 | |||
| Futures contracts | 437,177 | |||
| Total change in net unrealized appreciation (depreciation) | 172,647,639 | |||
| Net gain (loss) | 147,968,361 | |||
| Net increase (decrease) in net assets resulting from operations | $ | 174,461,112 | ||
| Statement of Changes in Net Assets | ||||
Year ended August 31, 2023 | Year ended August 31, 2022 | |||
| Increase (Decrease) in Net Assets | ||||
| Operations | ||||
| Net investment income (loss) | $ | 26,492,751 | $ | 13,741,174 |
| Net realized gain (loss) | (24,679,278) | 7,522,273 | ||
| Change in net unrealized appreciation (depreciation) | 172,647,639 | (176,784,241) | ||
| Net increase (decrease) in net assets resulting from operations | 174,461,112 | (155,520,794) | ||
| Distributions to shareholders | (46,423,529) | (45,520,342) | ||
| Share transactions | ||||
| Proceeds from sales of shares | 629,232,728 | 536,400,126 | ||
| Reinvestment of distributions | 43,706,343 | 45,520,342 | ||
| Cost of shares redeemed | (337,292,021) | (200,420,552) | ||
Net increase (decrease) in net assets resulting from share transactions | 335,647,050 | 381,499,916 | ||
| Total increase (decrease) in net assets | 463,684,633 | 180,458,780 | ||
| Net Assets | ||||
| Beginning of period | 1,137,911,402 | 957,452,622 | ||
| End of period | $ | 1,601,596,035 | $ | 1,137,911,402 |
| Other Information | ||||
| Shares | ||||
| Sold | 51,105,312 | 38,181,249 | ||
| Issued in reinvestment of distributions | 3,722,524 | 3,233,227 | ||
| Redeemed | (27,015,596) | (14,541,851) | ||
| Net increase (decrease) | 27,812,240 | 26,872,625 | ||
| Fidelity® Balanced K6 Fund |
| Years ended August 31, | 2023 | 2022 | 2021 | 2020 | 2019 A | |||||
Selected Per-Share Data | ||||||||||
| Net asset value, beginning of period | $ | 12.53 | $ | 14.97 | $ | 12.24 | $ | 10.23 | $ | 10.00 |
| Income from Investment Operations | ||||||||||
Net investment income (loss) B,C | .24 | .17 | .16 | .19 | .04 | |||||
| Net realized and unrealized gain (loss) | 1.20 | (1.98) | 2.87 | 1.97 | .20 | |||||
| Total from investment operations | 1.44 | (1.81) | 3.03 | 2.16 | .24 | |||||
| Distributions from net investment income | (.22) | (.16) | (.14) | (.14) | (.01) | |||||
| Distributions from net realized gain | (.24) | (.47) | (.16) | (.01) | - | |||||
| Total distributions | (.47) D | (.63) | (.30) | (.15) | (.01) | |||||
| Net asset value, end of period | $ | 13.50 | $ | 12.53 | $ | 14.97 | $ | 12.24 | $ | 10.23 |
Total Return E,F | 12.09% | (12.52)% | 25.14% | 21.36% | 2.35% | |||||
Ratios to Average Net Assets C,G,H | ||||||||||
| Expenses before reductions | .32% | .32% | .32% | .32% | .32% I | |||||
| Expenses net of fee waivers, if any | .32% | .32% | .32% | .32% | .32% I | |||||
| Expenses net of all reductions | .32% | .32% | .32% | .31% | .32% I | |||||
| Net investment income (loss) | 1.91% | 1.23% | 1.14% | 1.75% | 2.00% I | |||||
| Supplemental Data | ||||||||||
| Net assets, end of period (000 omitted) | $ | 1,601,596 | $ | 1,137,911 | $ | 957,453 | $ | 426,979 | $ | 1,629 |
Portfolio turnover rate J | 33% K | 38% K | 42% K | 76% K | 6% L |
| Fidelity Central Fund | Investment Manager | Investment Objective | Investment Practices | Expense RatioA | |||
| Fidelity High Income Central Fund | Fidelity Management & Research Company LLC (FMR) | Seeks a high level of income and may also seek capital appreciation by investing primarily in debt securities, preferred stocks, and convertible securities, with an emphasis on lower-quality debt securities. | Loans & Direct Debt Instruments Restricted Securities | .03% | |||
| Fidelity Investment Grade Bond Central Fund | Fidelity Management & Research Company LLC (FMR) | Seeks a high level of income by normally investing in investment-grade debt securities. | Delayed Delivery & When Issued Securities Futures Options Restricted Securities Swaps | Less than .005% | |||
| Fidelity Money Market Central Funds | Fidelity Management & Research Company LLC (FMR) | Each fund seeks to obtain a high level of current income consistent with the preservation of capital and liquidity. | Short-term Investments | Less than .005% | |||
| Gross unrealized appreciation | $244,576,844 |
| Gross unrealized depreciation | (90,960,140) |
| Net unrealized appreciation (depreciation) | $153,616,704 |
| Tax Cost | $1,448,297,693 |
| Undistributed ordinary income | $5,548,705 |
| Capital loss carryforward | $(38,423,880) |
| Net unrealized appreciation (depreciation) on securities and other investments | $153,617,679 |
Short-term | $(38,423,880) |
| August 31, 2023 | August 31, 2022 | |
| Ordinary Income | $24,493,428 | $ 29,293,650 |
| Long-term Capital Gains | 21,930,101 | 16,226,692 |
| Total | $46,423,529 | $ 45,520,342 |
| Equity Risk | Equity risk relates to the fluctuations in the value of financial instruments as a result of changes in market prices (other than those arising from interest rate risk or foreign exchange risk), whether caused by factors specific to an individual investment, its issuer, or all factors affecting all instruments traded in a market or market segment. |
| Purchases ($) | Sales ($) | |
| Fidelity Balanced K6 Fund | 448,667,779 | 453,761,957 |
| Shares | Total Proceeds ($) | |
| Fidelity Balanced K6 Fund | 26,952,681 | 327,304,143 |
| Shares | Total Proceeds ($) | |
| Fidelity Balanced K6 Fund | 15,411,272 | 216,180,050 |
| Amount | |
| Fidelity Balanced K6 Fund | $ 5,928 |
| Borrower or Lender | Average Loan Balance | Weighted Average Interest Rate | Interest Expense | |
| Fidelity Balanced K6 Fund | Borrower | $ 7,306,000 | 5.32% | $1,079 |
| Purchases ($) | Sales ($) | Realized Gain (Loss) ($) | |
| Fidelity Balanced K6 Fund | 19,273,160 | 25,774,726 | (1,580,290) |
| Amount ($) | |
| Fidelity Balanced K6 Fund | 4,293 |
| Total Security Lending Fees Paid to NFS | Security Lending Income From Securities Loaned to NFS | Value of Securities Loaned to NFS at Period End | |
| Fidelity Balanced K6 Fund | $1,667 | $2,710 | $- |
| The Example is based on an investment of $1,000 invested at the beginning of the period and held for the entire period (March 1, 2023 to August 31, 2023). |
Annualized Expense Ratio- A | Beginning Account Value March 1, 2023 | Ending Account Value August 31, 2023 | Expenses Paid During Period- C March 1, 2023 to August 31, 2023 | |||||||
| Fidelity® Balanced K6 Fund | .32% | |||||||||
| Actual | $ 1,000 | $ 1,108.20 | $ 1.70 | |||||||
Hypothetical-B | $ 1,000 | $ 1,023.59 | $ 1.63 | |||||||
 |
Item 2.
Code of Ethics
As of the end of the period, August 31, 2023, Fidelity Puritan Trust (the trust) has adopted a code of ethics, as defined in Item 2 of Form N-CSR, that applies to its President and Treasurer and its Chief Financial Officer. A copy of the code of ethics is filed as an exhibit to this Form N-CSR.
Item 3.
Audit Committee Financial Expert
The Board of Trustees of the trust has determined that Donald F. Donahue is an audit committee financial expert, as defined in Item 3 of Form N-CSR. Mr. Donahue is independent for purposes of Item 3 of Form N-CSR.
Item 4.
Principal Accountant Fees and Services
Fees and Services
The following table presents fees billed by PricewaterhouseCoopers LLP (“PwC”) in each of the last two fiscal years for services rendered to Fidelity Balanced Fund, Fidelity Balanced K6 Fund, Fidelity Puritan Fund, and Fidelity Puritan K6 Fund (the “Funds”):
Services Billed by PwC
August 31, 2023 FeesA
Audit Fees | Audit-Related Fees | Tax Fees | All Other Fees | |
Fidelity Balanced Fund | $108,600 | $7,200 | $43,900 | $2,400 |
Fidelity Balanced K6 Fund | $88,200 | $5,500 | $17,600 | $1,900 |
Fidelity Puritan Fund | $145,200 | $10,300 | $49,400 | $3,500 |
Fidelity Puritan K6 Fund | $86,200 | $5,800 | $17,200 | $2,000 |
August 31, 2022 FeesA
Audit Fees | Audit-Related Fees | Tax Fees | All Other Fees | |
Fidelity Balanced Fund | $94,300 | $7,000 | $44,300 | $2,400 |
Fidelity Balanced K6 Fund | $71,400 | $5,500 | $21,400 | $1,900 |
Fidelity Puritan Fund | $143,200 | $10,100 | $149,500 | $3,400 |
Fidelity Puritan K6 Fund | $66,000 | $5,900 | $20,700 | $2,000 |
A Amounts may reflect rounding.
The following table(s) present(s) fees billed by PwC that were required to be approved by the Audit Committee for services that relate directly to the operations and financial reporting of the Fund(s) and that are rendered on behalf of Fidelity Management & Research Company LLC ("FMR") and entities controlling, controlled by, or under common control with FMR (not including any sub-adviser whose role is primarily portfolio management and is subcontracted with or overseen by another investment adviser) that provide ongoing services to the Fund(s) (“Fund Service Providers”):
Services Billed by PwC
August 31, 2023A | August 31, 2022A | |
Audit-Related Fees | $8,284,200 | $7,914,600 |
Tax Fees | $1,000 | $353,200 |
All Other Fees | $- | $- |
A Amounts may reflect rounding.
“Audit-Related Fees” represent fees billed for assurance and related services that are reasonably related to the performance of the fund audit or the review of the fund's financial statements and that are not reported under Audit Fees.
“Tax Fees” represent fees billed for tax compliance, tax advice or tax planning that relate directly to the operations and financial reporting of the fund.
“All Other Fees” represent fees billed for services provided to the fund or Fund Service Provider, a significant portion of which are assurance related, that relate directly to the operations and financial reporting of the fund, excluding those services that are reported under Audit Fees, Audit-Related Fees or Tax Fees.
Assurance services must be performed by an independent public accountant.
* * *
The aggregate non-audit fees billed by PwC for services rendered to the Fund(s), FMR (not including any sub-adviser whose role is primarily portfolio management and is subcontracted with or overseen by another investment adviser), and any Fund Service Provider for each of the last two fiscal years of the Fund(s) are as follows:
Billed By | August 31, 2023A | August 31, 2022A |
PwC | $13,754,500 | $13,509,300 |
A Amounts may reflect rounding.
The trust's Audit Committee has considered non-audit services that were not pre-approved that were provided by PwC to Fund Service Providers to be compatible with maintaining the independence of PwC in its(their) audit of the Fund(s), taking into account representations from PwC, in accordance with Public Company Accounting Oversight Board rules, regarding its independence from the Fund(s) and its(their) related entities and FMR’s review of the appropriateness and permissibility under applicable law of such non-audit services prior to their provision to the Fund(s) Service Providers.
Audit Committee Pre-Approval Policies and Procedures
The trust’s Audit Committee must pre-approve all audit and non-audit services provided by a fund’s independent registered public accounting firm relating to the operations or
financial reporting of the fund. Prior to the commencement of any audit or non-audit services to a fund, the Audit Committee reviews the services to determine whether they are appropriate and permissible under applicable law.
The Audit Committee has adopted policies and procedures to, among other purposes, provide a framework for the Committee’s consideration of non-audit services by the audit firms that audit the Fidelity funds. The policies and procedures require that any non-audit service provided by a fund audit firm to a Fidelity fund and any non-audit service provided by a fund auditor to a Fund Service Provider that relates directly to the operations and financial reporting of a Fidelity fund (“Covered Service”) are subject to approval by the Audit Committee before such service is provided.
All Covered Services must be approved in advance of provision of the service either: (i) by formal resolution of the Audit Committee, or (ii) by oral or written approval of the service by the Chair of the Audit Committee (or if the Chair is unavailable, such other member of the Audit Committee as may be designated by the Chair to act in the Chair’s absence). The approval contemplated by (ii) above is permitted where the Treasurer determines that action on such an engagement is necessary before the next meeting of the Audit Committee.
Non-audit services provided by a fund audit firm to a Fund Service Provider that do not relate directly to the operations and financial reporting of a Fidelity fund are reported to the Audit Committee periodically.
Non-Audit Services Approved Pursuant to Rule 2-01(c)(7)(i)(C) and (ii) of Regulation S-X (“De Minimis Exception”)
There were no non-audit services approved or required to be approved by the Audit Committee pursuant to the De Minimis Exception during the Fund’s(s’) last two fiscal years relating to services provided to (i) the Fund(s) or (ii) any Fund Service Provider that relate directly to the operations and financial reporting of the Fund(s).
The Registrant has not retained, for the preparation of the audit report on the financial statements included in the Form N-CSR, a registered public accounting firm that has a branch or office that is located in a foreign jurisdiction and that the Public Company Accounting Oversight Board (the “PCAOB”) has determined that the PCAOB is unable to inspect or investigate completely because of a position taken by an authority in the foreign jurisdiction.
The Registrant is not a “foreign issuer,” as defined in 17 CFR 240.3b-4.
Item 5.
Audit Committee of Listed Registrants
Not applicable.
Item 6.
Investments
(a)
Not applicable.
(b)
Not applicable.
Item 7.
Disclosure of Proxy Voting Policies and Procedures for Closed-End Management Investment Companies
Not applicable.
Item 8.
Portfolio Managers of Closed-End Management Investment Companies
Not applicable.
Item 9.
Purchase of Equity Securities by Closed-End Management Investment Company and Affiliated Purchasers
Not applicable.
Item 10.
Submission of Matters to a Vote of Security Holders
There were no material changes to the procedures by which shareholders may recommend nominees to the trust’s Board of Trustees.
Item 11.
Controls and Procedures
(a)(i) The President and Treasurer and the Chief Financial Officer have concluded that the trust’s disclosure controls and procedures (as defined in Rule 30a-3(c) under the Investment Company Act) provide reasonable assurances that material information relating to the trust is made known to them by the appropriate persons, based on their evaluation of these controls and procedures as of a date within 90 days of the filing date of this report.
(a)(ii) There was no change in the trust’s internal control over financial reporting (as defined in Rule 30a-3(d) under the Investment Company Act) that occurred during the period covered by this report that has materially affected, or is reasonably likely to materially affect, the trust’s internal control over financial reporting.
Item 12.
Disclosure of Securities Lending Activities for Closed-End Management
Investment Companies
Not applicable.
Item 13.
Exhibits
(a) | (1) | Code of Ethics pursuant to Item 2 of Form N-CSR is filed and attached hereto as EX-99.CODE ETH. |
(a) | (2) | |
(a) | (3) | Not applicable. |
(b) |
SIGNATURES
Pursuant to the requirements of the Securities Exchange Act of 1934 and the Investment Company Act of 1940, the registrant has duly caused this report to be signed on its behalf by the undersigned, thereunto duly authorized.
Fidelity Puritan Trust
By: | /s/Stacie M. Smith |
Stacie M. Smith | |
President and Treasurer | |
Date: | October 23, 2023 |
Pursuant to the requirements of the Securities Exchange Act of 1934 and the Investment Company Act of 1940, this report has been signed below by the following persons on behalf of the registrant and in the capacities and on the dates indicated.
By: | /s/Stacie M. Smith |
Stacie M. Smith | |
President and Treasurer | |
Date: | October 23, 2023 |
By: | /s/John J. Burke III |
John J. Burke III | |
Chief Financial Officer | |
Date: | October 23, 2023 |