UNITED STATES
SECURITIES AND EXCHANGE COMMISSION
Washington, D.C. 20549
FORM N-CSR
CERTIFIED SHAREHOLDER REPORT OF REGISTERED
MANAGEMENT INVESTMENT COMPANIES
Investment Company Act file number 811-05201
| Thornburg Investment Trust |
(Exact name of registrant as specified in charter)
c/o Thornburg Investment Management, Inc. 2300 North Ridgetop Road, Santa Fe, New Mexico 87506 |
(Address of principal executive offices) (Zip code)
| Garrett Thornburg, 2300 North Ridgetop Road, Santa Fe, New Mexico 87506 |
(Name and address of agent for service)
Registrant’s telephone number, including area code: 505-984-0200
Date of fiscal year end: September 30, 2011
Date of reporting period: September 30, 2011
Item 1. Reports to Stockholders
The following annual reports are attached hereto, in order:
Thornburg Limited Term Municipal Fund
Thornburg Intermediate Municipal Fund
Thornburg Strategic Municipal Income Fund
Thornburg California Limited Term Municipal Fund
Thornburg New Mexico Intermediate Municipal Fund
Thornburg New York Intermediate Municipal Fund
Thornburg Limited Term Income Funds
Thornburg Strategic Income Fund
Thornburg Value Fund
Thornburg International Value Fund
Thornburg Core Growth Fund
Thornburg International Growth Fund
Thornburg Investment Income Builder Fund
Thornburg Global Opportunities Fund
Thornburg Developing World Fund

Important Information
The information presented on the following pages is current as of September 30, 2011. The managers’ views, portfolio holdings, and sector diversification are provided for the general information of the Fund’s shareholders; to the extent this information is historical, it should not be considered predictive of future circumstances. This material should not be deemed a recommendation to buy or sell any of the securities mentioned.
Investments in the Fund carry risks, including possible loss of principal. Bond funds have the same interest rate, inflation, and credit risks that are associated with the underlying bonds. The principal value of bonds will fluctuate relative to changes in interest rates, decreasing when interest rates rise. Unlike bonds, bond funds have ongoing fees and expenses. Please see the Fund’s Prospectus for a discussion of the risks associated with an investment in the Fund. Investments in the Fund are not FDIC insured, nor are they deposits of or guaranteed by a bank or any other entity. There is no guarantee that the Fund will meet its investment objectives. The laddering strategy does not assure or guarantee better performance and cannot eliminate the risk of investment losses.
Performance data given at net asset value (NAV) does not take into account applicable sales charges. If the sales charges had been included, the performance would have been lower.
Minimum investments for Class I shares are higher than those for other classes. Class I shares may not be available to all investors.
Share Class | NASDAQ Symbol | Cusip | ||
Class A | LTMFX | 885-215-459 | ||
Class C | LTMCX | 885-215-442 | ||
Class I | LTMIX | 885-215-434 |
Lipper Fund Award 2011
Thornburg Limited Term Municipal Fund, Class I Shares, was granted a Lipper Fund Award for the ten-year period ended 12/31/10, among 22 Short-Intermediate Municipal Debt Funds. Lipper Fund Awards are granted annually to the fund in each Lipper classification that consistently delivered the strongest risk-adjusted performance (calculated with dividends reinvested). Awards are given for three-year, five-year, and ten-year periods. The fund did not win the award for other time periods. Past performance does not guarantee future results.
Glossary
Barclays Capital Five-Year Municipal Bond Index – A rules-based, market-value-weighted index of the tax-exempt bond market. To be included in the index, bonds must have a minimum credit rating of Baa. The approximate maturity of the municipal bonds in the index is five years.
Barclays Capital Municipal Bond Index – The Municipal Index covers the USD-denominated, investment-grade, long-term, tax-exempt bond market. The index has four main sectors: state and local general obligation bonds, revenue bonds, insured bonds, and prerefunded bonds.
BofA Merrill Lynch 1-10 Year U.S. Municipal Securities Index – A subset of the BofA Merrill Lynch U.S. Municipal Securities Index including all securities with a remaining term to final maturity less than 10 years.
Unless otherwise noted, index returns reflect the reinvestment of income dividends and capital gains, if any, but do not reflect fees, brokerage commissions or other expenses of investing. Investors may not make direct investments into any index.
Alternative Minimum Tax (AMT) – A federal tax aimed at ensuring that high-income individuals, estates, trusts, and corporations pay a minimal level income tax. For individuals, the AMT is calculated by adding tax preference items to regular taxable income.
Annualized Distribution Yield – The distribution yield is calculated by taking the sum of the month’s total distribution factors and dividing this sum by a 30-day period and annualizing to a 360-day year. The value is then divided by the ending maximum offering price per share to arrive at the annualized distribution yield. The yield is calculated on a periodic basis and is subject to change.
Basis Point (bps) – A unit equal to 1/100th of 1%. 1% = 100 basis points (bps).
Bond Credit Ratings – A bond credit rating assesses the financial ability of a debt issuer to make timely payments of principal and interest. Ratings of AAA (the highest), AA, A, and BBB are investment-grade quality. Ratings of BB, B, CCC, CC, C, and D (the lowest) are considered below investment grade, speculative grade, or junk bonds. Unless otherwise noted, the ratings listed are from Municipal Market Data and are a combination of ratings from Standard and Poor’s, Moody’s Investors Service, and Fitch Ratings.
Build America Bonds (BAB) – Taxable municipal bonds that feature tax credits and/or federal subsidies for bondholders and state and local government bond issuers. Build America Bonds (BABs) were introduced in 2009 as part of President Obama’s American Recovery and Reinvestment Act to create jobs and stimulate the economy. BABs attempt to achieve this by lowering the cost of borrowing for state and local governments in financing new projects.
Consumer Price Index (CPI) – An index that measures prices of a fixed basket of goods bought by a typical consumer, including food, transportation, shelter, utilities, clothing, medical care, entertainment and other items. The CPI, published by the Bureau of Labor Statistics in the Department of Labor, is based at 100 in 1982 and is released monthly. It is widely used as a cost-of-living benchmark to adjust Social Security payments and other payment schedules, union contracts and tax brackets. The CPI is also known as the cost-of-living index.
This page is not part of the Annual Report. 3
| Important Information, | ||
Continued | ||
Core CPI – Consumer Price Index minus the energy and food components.
Duration – A bond’s sensitivity to interest rates. Bonds with longer durations experience greater price volatility than bonds with shorter durations.
Effective Duration – A bond’s sensitivity to interest rates, incorporating the embedded option features, such as call provisions. Bonds with longer durations experience greater price volatility than bonds with shorter durations.
Fed Funds Rate – The interest rate at which a depository institution lends immediately available funds (balances at the Federal Reserve) to another depository institution overnight.
General Obligation Bond – A municipal bond backed by the credit and “taxing power” of the issuing jurisdiction rather than the revenue from a given project.
M2 – The amount of money in circulation in notes and coin plus non-interest-bearing bank deposits, building-society deposits, and National Savings accounts.
Operation Twist – A monetary policy where, in an attempt to lower long-term interest rates, the Fed sold short-term Treasury bonds and bought long-term Treasury bonds, which pressured the long-term bond yields downward.
Quantitative Easing – The Federal Reserve’s monetary policy used to stimulate the U.S. economy following the recession that began in 2007/08.
SEC Yield – SEC Yield is computed in accordance with SEC standards measuring the net investment income per share over a specified 30-day period expressed as a percentage of the maximum offering price of the Fund’s shares at the end of the period.
Treasuries – U.S. Treasury securities, such as bills, notes and bonds, are negotiable debt obligations of the U.S. government. These debt obligations are backed by the “full faith and credit” of the government and issued at various schedules and maturities. Income from Treasury securities is exempt from state and local, but not federal, taxes.
4 This page is not part of the Annual Report.
Thornburg Limited Term Municipal Fund
At Thornburg, our approach to management of the Fund is based on the premise that investors in the Fund seek preservation of capital along with an attractive, relatively stable yield. While aggressive bond strategies may generate stronger returns when the market is turning a blind eye towards risk, they often fail to stack up over longer periods of time.
We apply time-tested techniques to manage risk and provide attractive returns. These include:
| • | Building a laddered portfolio. Laddering has been shown over time to mitigate reinvestment and interest rate risk. |
| • | Investing on a cash-only basis without using leverage. While leveraged strategies may enhance returns when market conditions are favorable, they can quickly compound losses when sentiment shifts. |
| • | Conducting in-depth fundamental research on each issue and actively monitoring positions for subsequent credit events. |
| • | Diversifying among a large number of generally high-quality bonds. |
CO-PORTFOLIO MANAGERS

Josh Gonze, Chris Ryon,CFA, and Chris Ihlefeld
IMPORTANT
PERFORMANCE INFORMATION
Performance data shown represents past performance and is no guarantee of future results. Investment return and principal value will fluctuate so shares, when redeemed, may be worth more or less than their original cost. Current performance may be lower or higher than quoted. For performance current to the most recent month end, visit thornburg.com or call 800.847.0200.
The maximum sales charge for the Fund’s Class A shares is 1.50% . The total annual fund operating expense of Class A shares is 0.78%, as disclosed in the most recent Prospectus.
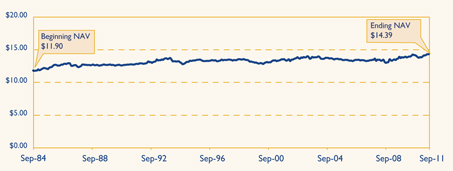
LONG-TERM STABILITY OF PRINCIPAL
Net asset value history of A shares from September 28, 1984 through September 30, 2011
AVERAGE ANNUAL TOTAL RETURNS
For periods ended September 30, 2011
| 1 Yr | 3 Yrs | 5 Yrs | 10 Yrs | Since Inception | ||||||||||||||||
A Shares (Incep: 9/28/84) | ||||||||||||||||||||
Without sales charge | 3.43 | % | 5.90 | % | 4.47 | % | 3.78 | % | 5.53 | % | ||||||||||
With sales charge | 1.86 | % | 5.37 | % | 4.15 | % | 3.62 | % | 5.47 | % | ||||||||||
30-DAY YIELDS, A SHARES
As of September 30, 2011
Annualized Distribution Yield | SEC Yield | |||
2.39% | 1.39 | % | ||
KEY PORTFOLIO ATTRIBUTES
As of September 30, 2011
Number of Bonds | 1,235 | |||
Effective Duration | 3.7 Yrs | |||
Average Maturity | 4.4 Yrs | |||
See the entire portfolio in the Schedule of Investments beginning on page 11.
This page is not part of the Annual Report. 5

Thornburg Limited Term Municipal Fund
September 30, 2011
Table of Contents | ||||
| 7 | ||||
| 11 | ||||
| 42 | ||||
| 43 | ||||
| 44 | ||||
| 45 | ||||
| 50 | ||||
| 52 | ||||
| 53 | ||||
| 54 | ||||
| 55 | ||||
| 58 |
This report is certified under the Sarbanes-Oxley Act of 2002, which requires that public companies, including mutual funds, affirm that the information provided in their annual and semiannual shareholder reports fully and fairly represents their financial position.
6 Certified Annual Report
Christopher Ihlefeld Co-Portfolio Manager
Christopher Ryon,CFA Co-Portfolio Manager
Josh Gonze Co-Portfolio Manager | October 14, 2011
Dear Fellow Shareholder:
We are pleased to present the annual report for the Thornburg Limited Term Municipal Fund. The net asset value (NAV) of the Class A shares increased by 12 cents to $14.39 per share for the fiscal year ended September 30, 2011. If you were with us for the entire period, you received dividends of 35.8 cents per share. If you reinvested your dividends, you received 36.2 cents per share. Dividends per share were lower for Class C shares and higher for Class I shares to account for varying class-specific expenses. The Class A shares of your Fund produced a total return of 3.43% at NAV over the fiscal year ended September 30, 2011, compared to 3.75% for the Barclays Capital Five-Year Municipal Bond Index. The main contributor to the difference in performance is that the Barclays Capital Five-Year Municipal Bond Index has all of its holdings in four- to six-year maturities. The Thornburg Limited Term Municipal Fund has holdings that span one- to ten-year maturities in a laddered structure.
The Economy and the Federal Reserve (the Fed)
As we started the fiscal year, beginning in October 2010, the Federal Reserve Board announced a new wrinkle to its already accommodative stance toward monetary policy. “Quantitative Easing” is a policy of buying bonds and other assets to boost demand and fight off deflation. As we close this fiscal year, the Fed has announced another extraordinary measure known as “Operation Twist.” This policy enhancement calls for the Fed to purchase, by the end of June 2012, $400 billion of Treasury securities with remaining maturities from 6 to 30 years and to sell an equal amount of Treasury securities with remaining maturities of 3 years or less. This is intended to cause the yield curve (a representation of the prevailing yields of Treasury securities by maturity) to flatten, reducing the yield difference between long-term and short-term Treasury securities. A typical measure of this phenomenon is the difference between the yield of a 10-year Treasury security and the yield of a 30-year Treasury security. The difference in yield between these two securities was 1.38% on September 1, 2011 (30-year Treasury securities yielded 1.38% more than 10-year Treasury securities). The formal announcement of the Fed’s new policy directive was on September 21, 2011, and by September 30, 2011, the difference had narrowed to 1.02%. The above change in the relationship between 10-year and 30-year Treasury securities means that longer maturity Treasury securities outperformed shorter maturity Treasury securities.
The Federal Open Market Committee, in its September 21, 2011 release, stated that “economic growth remains slow” and that there are “significant downside risks to the economic outlook, including strains in global financial markets.” These concerns explain why Treasury yields are lower by 0.17% to 1.59% since March 31, 2011. Longer maturity Treasury securities have |


Certified Annual Report 7
| Letter to Shareholders, | ||
Continued | ||
decreased in yield more than shorter maturity Treasury securities. The “strains in the global financial markets,” have led the Treasury market to experience a “flight to quality” in spite of a downgrade to AA+ by Standard and Poor’s on August 5, 2011. As one of our colleagues has stated, “the world views Treasury securities as the best house in a bad neighborhood.”
We share the Fed’s view that “economic growth remains low,” but there are some reasons for hope. June 2011 gross domestic product (GDP), a measure of a country’s overall economic output, recorded a 1.3% increase, higher than the 0.4% increase recorded in March of 2011. Capacity utilization, a measure of an economy’s usage of its productive resources, was running at 77.4% for the month ended August 31, 2011, slightly higher than the 75.7% recorded on September 30, 2011. Money supply as measured by M2, a broad measure of money and money substitutes, remains elevated. The velocity of M2, a measure of the rate at which money in circulation is used in transactions, continues to decline. Typically rising money supply is viewed as an inflationary threat, as long as velocity remains constant or increases. The combination of rising money supply and decreasing velocity is not inflationary. The one significant difference between this fiscal year end and last fiscal year end is that commercial and industrial loans and leases (loans to corporations, commercial enterprises, and joint ventures) have begun to increase, from a very low base. These loans have increased 7.98% over the 12 months ended September 30, 2011 versus a 10.57% decline for the 12 months ended September 30, 2010. These increases in loans to businesses may be laying the groundwork for a more robust expansion.
The employment picture is still a major concern; with so many Americans either unemployed or underemployed, it’s hard to fathom where demand for goods and services will come from. The unemployment rate is 9.1%, lower than the 9.8% registered in November 2010. In the 12 months ended September 2011, 1.49 million jobs have been created versus the 118,000 lost in the prior 12 months.
The economic picture is not as bleak as some in the media would paint it. The risks of a double-dip recession seem low, but so do the probabilities of a robust recovery. Our outlook for interest rates is much the same as it was last year with one exception; over the next 6–12 months, we believe the Fed will keep short-term interest rates low but long-term interest rates have and may continue to benefit from Operation Twist. Investors should ready themselves for increased periods of volatility as some of the exogenous forces impacting the United States play themselves out.
CHART I: BofA MERRILL LYNCH 1-10 YEAR MUNICIPAL INDEX
Periodic Returns During the Period from 9/30/2010 through 9/30/2011
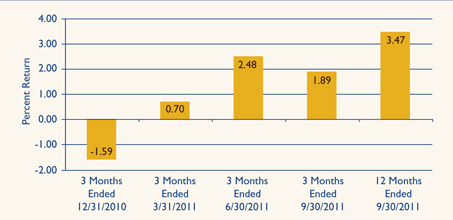
Source: Bloomberg
Past performance does not guarantee future results.
The Municipal Market
The calendar year began with various predictions of numerous defaults in the municipal bond market; the term “hundreds of billions of dollars” was used. For the nine
8 Certified Annual Report
months ended September 30, 2011, the municipal bond market experienced $1.1 billion in defaults, a relatively small amount. This means, if one uses $200 billion as the low end of the estimate, we have only $198.9 billion to go by December 31, 2011 for these dire predictions to be achieved. These estimates were overly dramatic but they did add to the volatility of returns experienced throughout fiscal 2011. Chart I shows the volatility of returns generated by the BofA Merrill Lynch 1–10 Year Municipal Index for the 12 months ended September 30, 2011.
Most, if not all, of the other predictions of doom proved equally false. Supply of new issue municipal bonds did not expand as the Build America Bond program expired on December 31, 2010. In fact, the supply of newly issued municipal debt is down 35% through September 30, 2011 versus the same period in 2010. On the credit side, the revenue picture for state and local governments is improving. Revenues are increasing, although they are still below peak levels. Also expenditures are being cut. One example of this is that state and local employment payrolls have been cut by in excess of 500,000 jobs nationwide since August 2008.
Chart II illustrates how yields have changed over the last 12 months. The largest declines occurred in the mid-range of Limited Term Fund’s investable universe. The general level of municipal bond yields appear to be moving in sympathy with the yields on Treasury securities, albeit at a different pace.
The major drivers of returns for the fiscal year have been duration (longer is better than shorter as rates declined) and yield curve exposure (allocation of assets to mid-range maturities versus shorter and longer maturities is better). The discipline of the laddered portfolio structure seeks to ensure that investors benefit from these opportunities.
Conclusion
Your Thornburg Limited Term Municipal Fund is a laddered portfolio of 1,235 municipal obligations from 49 states and territories. We ladder the maturity dates of the bonds in your portfolio so that some of the bonds are scheduled to mature during each of the coming years. Laddering short and intermediate bonds accomplishes two goals. First, the staggered bond maturities contained in a ladder reduce interest-rate risk and dampen the Fund’s price volatility. Second, laddering reduces reinvestment risk by giving the Fund a steady cash flow stream from maturing bonds to reinvest
CHART II: CHANGES IN AAA GENERAL OBLIGATION BOND YIELDS
9/30/2010 through 9/30/2011
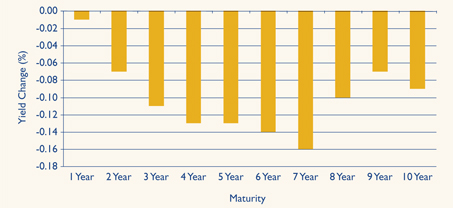
Source: Standard and Poor’s 09/30/2011
Past performance does not guarantee future results.
Certified Annual Report 9
| Letter to Shareholders, | ||
Continued | ||
toward the top of the ladder where yields are typically higher. Chart III describes the percentages of your Fund’s bond portfolio maturing in each of the coming years. The Fund’s adherence to the discipline of the laddered structure served investors well.
We plan to continue to search for opportunities in the municipal market, using our fundamental, bottom-up approach to portfolio management, and the discipline of the laddered structure. In closing, we would like to thank you for the trust you have placed with us. We continue to keep that foremost in our minds as we go forward into a new year.
CHART III: % OF PORTFOLIO MATURING
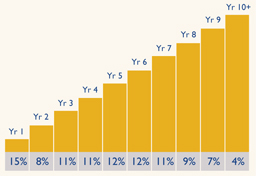
As of 9/30/11. Percentages vary over time.
Data may not add up to 100% due to rounding.
Sincerely,
 |  |  | ||
| Christopher Ihlefeld | Christopher Ryon,CFA | Josh Gonze | ||
| Co-Portfolio Manager | Co-Portfolio Manager | Co-Portfolio Manager | ||
| Managing Director | Managing Director | Managing Director |
The matters discussed in this report may constitute forward-looking statements made pursuant to the safe harbor provisions of the Securities Litigation Reform Act of 1995. These include any advisor or portfolio manager prediction, assessment, analysis or outlook for individual securities, industries, investment styles, market sectors and/or markets. These statements involve risks and uncertainties. In addition to the general risks described for each fund in its current prospectus, other factors bearing on these reports include the accuracy of the advisor’s or portfolio manager’s forecasts and predictions, the appropriateness of the investment strategies designed by the advisor or portfolio manager and the ability of the advisor or portfolio manager to implement their strategies efficiently and successfully. Any one or more of these factors, as well as other risks affecting the securities markets generally, could cause the actual results of any fund to differ materially as compared to its benchmarks.
10 Certified Annual Report
| SCHEDULE OF INVESTMENTS | ||
| Thornburg Limited Term Municipal Fund | September 30, 2011 | |

We have used ratings from Standard & Poor’s (S&P). Where S&P ratings are not available, we have used Moody’s Investors Service. Where neither rating is available, we have used ratings from Fitch Ratings. The category of investments identified as “AAA” in this graph includes investments which are pre-refunded or escrowed to maturity. Such investments are backed by an escrow or trust containing sufficient U.S. Government or U.S. Government agency securities to satisfy the timely payment of principal and interest and, therefore, are normally deemed to be equivalent to AAA-rated securities.
Issuer-Description | Credit Rating† S&P/ Moody’s | Principal Amount | Value | |||||||
ALABAMA — 1.91% | ||||||||||
Alabama State Public School & College Authority, 5.00% due 5/1/2012 | AA/Aa1 | $ | 2,000,000 | $ | 2,055,240 | |||||
Alabama State Public School & College Authority, 5.00% due 5/1/2013 | AA/Aa1 | 5,000,000 | 5,354,150 | |||||||
Alabama State Public School & College Authority, 5.00% due 5/1/2015 | NR/Aa1 | 8,530,000 | 9,775,721 | |||||||
Alabama State Public School & College Authority, 5.00% due 5/1/2016 | AA/Aa1 | 5,000,000 | 5,843,600 | |||||||
Birmingham GO, 5.00% due 10/1/2013 (Insured: Natl-Re) | AA/Aa2 | 2,500,000 | 2,705,600 | |||||||
Birmingham GO, 5.00% due 2/1/2015 | AA/Aa2 | 4,240,000 | 4,738,539 | |||||||
Birmingham GO, 4.00% due 8/1/2015 | AA/Aa2 | 3,005,000 | 3,290,355 | |||||||
Birmingham GO, 5.00% due 2/1/2016 | AA/Aa2 | 3,775,000 | 4,291,344 | |||||||
Birmingham GO, 4.00% due 8/1/2016 | AA/Aa2 | 3,645,000 | 3,977,971 | |||||||
Birmingham GO, 5.00% due 2/1/2017 | AA/Aa2 | 2,045,000 | 2,349,521 | |||||||
Birmingham GO, 4.00% due 8/1/2017 | AA/Aa2 | 2,760,000 | 2,997,526 | |||||||
Birmingham GO, 5.00% due 2/1/2018 | AA/Aa2 | 2,000,000 | 2,321,620 | |||||||
Courtland Solid Waste Disposal Revenue, 4.75% due 5/1/2017 (International Paper Company) | BBB/NR | 5,000,000 | 5,090,950 | |||||||
Huntsville GO, 5.50% due 11/1/2014 pre-refunded 5/1/2012 | AAA/Aaa | 3,425,000 | 3,599,058 | |||||||
Lake Martin Area IDA, 5.00% due 11/1/2011 | NR/NR | 3,000,000 | 3,006,720 | |||||||
Mobile GO Warrants, 5.25% due 8/1/2012 (Insured: AGM) | AA+/Aa2 | 1,025,000 | 1,067,230 | |||||||
Mobile GO Warrants, 4.50% due 8/15/2016 | NR/NR | 1,735,000 | 1,808,096 | |||||||
Mobile GO Warrants, 5.00% due 2/15/2019 | AA-/Aa2 | 2,000,000 | 2,274,460 | |||||||
Mobile Industrial Development PCR, 5.00% due 6/1/2034 put 3/19/2015 (Alabama Power Co.) | A/A2 | 6,000,000 | 6,733,080 | |||||||
Montgomery Waterworks & Sanitation, 5.00% due 9/1/2016 | AAA/Aa2 | 2,080,000 | 2,441,878 | |||||||
Montgomery Waterworks & Sanitation, 5.00% due 9/1/2019 | AAA/Aa2 | 3,375,000 | 3,939,030 | |||||||
University of Alabama at Birmingham Hospital Revenue, 5.25% due 9/1/2017 | A+/A1 | 2,500,000 | 2,831,475 | |||||||
University of Alabama at Birmingham Hospital Revenue, 5.00% due 9/1/2018 | A+/A1 | 1,500,000 | 1,679,205 | |||||||
ALASKA — 0.78% | ||||||||||
Alaska Energy Power Authority, 6.00% due 7/1/2013 (Bradley Lake Hydroelectric; Insured: AGM) | AA+/Aa2 | 1,600,000 | 1,728,992 | |||||||
Alaska Housing Finance Corp. GO, 5.00% due 12/1/2018 (Insured: Natl-Re) | AA+/Aa2 | 2,000,000 | 2,306,520 | |||||||
Alaska Industrial Development & Export Authority GO, 5.00% due 4/1/2014 | AA-/Aa3 | 2,000,000 | 2,184,900 | |||||||
Alaska Industrial Development & Export Authority GO, 5.00% due 4/1/2015 | AA-/Aa3 | 1,900,000 | 2,132,883 | |||||||
Alaska Industrial Development & Export Authority GO, 5.00% due 4/1/2016 | AA-/Aa3 | 1,000,000 | 1,140,740 | |||||||
Alaska Industrial Development & Export Authority GO, 5.00% due 4/1/2017 | AA-/Aa3 | 3,000,000 | 3,456,630 | |||||||
Alaska Industrial Development & Export Authority GO, 5.00% due 4/1/2018 | AA-/Aa3 | 2,455,000 | 2,848,095 | |||||||
Alaska Municipal Bond Bank, 5.00% due 6/1/2014 (Insured: Natl-Re) (State Aid Withholding) | A+/Aa2 | �� | 1,175,000 | 1,291,419 | ||||||
Alaska Student Loan Corp., 5.25% due 1/1/2012 (Insured: AGM) | AA+/NR | 3,000,000 | 3,034,230 | |||||||
North Slope Boro GO, 5.00% due 6/30/2015 (Insured: Natl-Re) | AA-/Aa3 | 3,250,000 | 3,740,230 | |||||||
North Slope Boro GO, 5.00% due 6/30/2017 (Insured: Natl-Re) | AA-/Aa3 | 8,800,000 | 10,427,032 | |||||||
ARIZONA — 3.45% | ||||||||||
Arizona Board of Regents COP, 5.00% due 7/1/2018 (Arizona State University; Insured: Natl-Re) | AA-/A1 | 1,285,000 | 1,439,637 | |||||||
Certified Annual Report 11
| SCHEDULE OF INVESTMENTS, CONTINUED | ||
| Thornburg Limited Term Municipal Fund | September 30, 2011 | |
Issuer-Description | Credit Rating† S&P/ Moody’s | Principal Amount | Value | |||||||
Arizona Board of Regents COP, 5.00% due 7/1/2019 (Arizona State University; Insured: Natl-Re) | AA-/A1 | $ | 3,735,000 | $ | 4,145,588 | |||||
Arizona HFA, 5.25% due 1/1/2018 (Banner Health) | AA-/NR | 3,500,000 | 4,069,205 | |||||||
Arizona HFA, 5.00% due 7/1/2018 (Catholic Health Care West) | A/A2 | 1,470,000 | 1,633,729 | |||||||
Arizona HFA, 5.00% due 7/1/2019 (Catholic Health Care West) | A/A2 | 1,365,000 | 1,509,731 | |||||||
Arizona HFA, 5.00% due 7/1/2020 (Catholic Health Care West) | A/A2 | 1,290,000 | 1,416,652 | |||||||
Arizona Lottery Revenue, 5.00% due 7/1/2018 (Insured: AGM) | AA+/Aa3 | 8,370,000 | 9,738,746 | |||||||
Arizona Lottery Revenue, 5.00% due 7/1/2020 (Insured: AGM) | AA+/Aa3 | 8,000,000 | 9,246,640 | |||||||
Arizona Transportation Board Highway Revenue, 5.25% due 7/1/2015 | AAA/Aa1 | 3,860,000 | 4,072,339 | |||||||
Chandler Street & Highway User Revenue, 3.00% due 7/1/2013 | AA/Aa2 | 1,905,000 | 1,984,248 | |||||||
Chandler Street & Highway User Revenue, 3.00% due 7/1/2014 | AA/Aa2 | 2,790,000 | 2,954,415 | |||||||
Gilbert Public Facilities Municipal Property Refunding, 3.00% due 7/1/2015 | AA/Aa2 | 1,080,000 | 1,148,245 | |||||||
Glendale IDA, 5.00% due 5/15/2015 (Midwestern University) | A-/NR | 1,000,000 | 1,100,800 | |||||||
Glendale IDA, 5.00% due 5/15/2016 (Midwestern University) | A-/NR | 1,325,000 | 1,480,462 | |||||||
Glendale IDA, 5.00% due 5/15/2017 (Midwestern University) | A-/NR | 1,440,000 | 1,618,920 | |||||||
Glendale Western Loop 101 Public Facilities Corp., 6.00% due 7/1/2019 | AA/A2 | 2,200,000 | 2,330,262 | |||||||
Maricopa County IDA Health Facilities Revenue, 4.125% due 7/1/2015 (Catholic Health Care West) | A/A2 | 1,000,000 | 1,064,490 | |||||||
Maricopa County IDA Health Facilities Revenue, 5.00% due 7/1/2038 put 7/1/2014 (Catholic Health Care West) | A/A2 | 7,500,000 | 8,190,225 | |||||||
Maricopa County Pollution Control Corp. PCR, 5.50% due 5/1/2029 put 5/1/2012 (Arizona Public Service Co.) | BBB/Baa2 | 10,000,000 | 10,227,800 | |||||||
Mesa Highway GO, 3.25% due 7/1/2016 | AA+/Aa3 | 10,000,000 | 10,493,600 | |||||||
Mohave County IDA, 5.00% due 4/1/2014 (Mohave Prison LLC) (ETM) | AA+/NR | 3,135,000 | 3,480,446 | |||||||
Mohave County IDA, 7.25% due 5/1/2015 (Mohave Prison LLC) | BBB+/NR | 12,100,000 | 12,530,276 | |||||||
Navajo County PCR, 5.50% due 6/1/2034 put 6/1/2014 (Arizona Public Service Co.) | BBB/Baa2 | 1,600,000 | 1,733,856 | |||||||
Navajo County PCR, 5.50% due 6/1/2034 put 6/1/2014 (Arizona Public Service Co.) | BBB/Baa2 | 2,600,000 | 2,817,516 | |||||||
Navajo County PCR, 5.75% due 6/1/2034 put 6/1/2016 (Arizona Public Service Co.) | BBB/Baa2 | 5,600,000 | 6,338,584 | |||||||
Northern Arizona University COP, 5.00% due 9/1/2019 (Insured: AMBAC) | A/A2 | 3,500,000 | 3,651,305 | |||||||
Pima County IDA, 6.40% due 7/1/2013 (Arizona Charter Schools) | NR/Baa3 | 410,000 | 411,591 | |||||||
Pima County IDA, 5.00% due 7/1/2016 (Metro Police Facility) | AA/Aa3 | 2,500,000 | 2,792,600 | |||||||
Pima County IDA, 5.00% due 7/1/2017 (Metro Police Facility) | AA/Aa3 | 3,000,000 | 3,366,960 | |||||||
Pima County IDA, 5.00% due 7/1/2018 (Metro Police Facility) | AA/Aa3 | 3,285,000 | 3,688,037 | |||||||
Pima County IDA, 5.00% due 7/1/2019 (Metro Police Facility) | AA/Aa3 | 2,000,000 | 2,232,260 | |||||||
Pima County Sewer Revenue, 4.50% due 7/1/2017 (Insured: AGM) | AA+/Aa3 | 5,000,000 | 5,708,050 | |||||||
Pima County Sewer Revenue, 5.00% due 7/1/2018 (Insured: AGM) | AA+/Aa3 | 5,000,000 | 5,870,450 | |||||||
Salt River Agricultural Improvement & Power District, 3.00% due 1/1/2014 | AA/Aa1 | 11,275,000 | 11,895,125 | |||||||
University Arizona Medical Center Corp. GO, 5.00% due 7/1/2014 | BBB+/Baa1 | 1,000,000 | 1,064,420 | |||||||
Yuma Property Corp. Utility Systems Revenue, 5.00% due 7/1/2016 (Insured: Syncora) | A+/A1 | 2,000,000 | 2,254,700 | |||||||
Yuma Property Corp. Utility Systems Revenue, 5.00% due 7/1/2018 (Insured: Syncora) | A+/A1 | 2,130,000 | 2,381,510 | |||||||
CALIFORNIA — 7.92% | ||||||||||
Alameda County COP, 5.00% due 12/1/2017 (Santa Rita Jail; Insured: AMBAC) | AA/NR | 1,000,000 | 1,157,550 | |||||||
Anaheim Public Financing Authority, 5.25% due 10/1/2018 (Electric Systems Generation; Insured: AGM) | AA+/Aa3 | 1,560,000 | 1,624,709 | |||||||
Calexico USD COP, 5.75% due 9/1/2013 | A-/NR | 1,155,000 | 1,214,598 | |||||||
California Educational Facilities, 5.00% due 4/1/2017 (Pitzer College) | NR/A3 | 1,460,000 | 1,643,361 | |||||||
aCalifornia Educational Facilities, 5.00% due 4/1/2021 (Chapman | NR/A2 | 4,870,000 | 5,433,264 | |||||||
California GO, 4.75% due 4/1/2018 | A-/A1 | 1,250,000 | 1,424,513 | |||||||
California GO, 5.00% due 9/1/2020 | NR/NR | 10,000,000 | 11,534,500 | |||||||
California GO, 5.00% due 9/1/2021 | A-/A1 | 5,000,000 | 5,756,450 | |||||||
California GO, 0.13% due 5/1/2034 put 10/3/2011 (LOC: Citibank N.A./California State Teachers’ Retirement System) (daily demand notes) | A+/Aa3 | 2,970,000 | 2,970,000 | |||||||
California HFA, 5.50% due 2/1/2017 (Community Program; Insured: California Mtg Insurance) | A-/NR | 2,575,000 | 2,867,031 | |||||||
12 Certified Annual Report
| SCHEDULE OF INVESTMENTS, CONTINUED | ||
| Thornburg Limited Term Municipal Fund | September 30, 2011 | |
Issuer-Description | Credit Rating† S&P/ Moody’s | Principal Amount | Value | |||||||
California HFA, 5.50% due 2/1/2019 (Community Program; Insured: California Mtg Insurance) | A-/NR | $ | 2,865,000 | $ | 3,192,756 | |||||
California HFA, 5.75% due 2/1/2020 (Community Program; Insured: California Mtg Insurance) | A-/NR | 1,975,000 | 2,232,342 | |||||||
California HFA, 5.75% due 2/1/2021 (Community Program; Insured: California Mtg Insurance) | A-/NR | 1,695,000 | 1,913,825 | |||||||
California HFA, 5.00% due 7/1/2027 put 7/1/2014 (Catholic Health Care West) | A/A2 | 3,500,000 | 3,804,325 | |||||||
California HFA, 5.00% due 7/1/2028 put 7/1/2014 (Catholic Health Care West) | A/A2 | 2,000,000 | 2,173,900 | |||||||
California State Department of Transportation COP, 5.25% due 3/1/2016 (Insured: Natl-Re) | BBB/A2 | 1,000,000 | 1,003,810 | |||||||
California State Department of Water Resources Power Supply, 5.50% due 5/1/2012 | AA-/Aa3 | 2,600,000 | 2,679,638 | |||||||
California State Department of Water Resources Power Supply, 6.00% due 5/1/2013 pre-refunded 5/1/2012 | AA-/Aa3 | 2,550,000 | 2,661,435 | |||||||
California State Department of Water Resources Power Supply, 5.00% due 5/1/2015 | AA-/Aa3 | 5,000,000 | 5,727,500 | |||||||
California State Department of Water Resources Power Supply, 5.00% due 5/1/2016 | AA-/Aa3 | 5,000,000 | 5,807,450 | |||||||
California State Economic Recovery GO, 5.00% due 7/1/2020 | A+/Aa3 | 4,200,000 | 4,884,264 | |||||||
California State Economic Recovery GO, 5.00% due 7/1/2016 | A+/Aa3 | 10,350,000 | 10,387,260 | |||||||
California State Economic Recovery GO, 5.00% due 7/1/2018 | A+/Aa3 | 4,000,000 | 4,710,360 | |||||||
California State Public Works Board, 5.00% due 9/1/2016 (Regents of University of California; Insured: Natl-Re/FGIC) | AA-/Aa2 | 3,000,000 | 3,472,950 | |||||||
California State Public Works Board, 5.00% due 9/1/2017 (Regents of University of California; Insured: Natl-Re/FGIC) | AA-/Aa2 | 3,000,000 | 3,512,820 | |||||||
California State Public Works Board, 5.00% due 11/1/2017 (California State University Trustees) | BBB+/Aa3 | 3,000,000 | 3,406,410 | |||||||
California State Public Works Board, 5.00% due 11/1/2018 (California State University Trustees) | BBB+/Aa3 | 2,700,000 | 3,058,560 | |||||||
California Statewide Community Development Authority, 5.00% due 6/15/2013 | A-/A1 | 9,500,000 | 10,157,495 | |||||||
California Statewide Community Development Authority, 5.00% due 5/15/2017 (Irvine LLC- UCI East Campus) | NR/Baa2 | 2,200,000 | 2,318,800 | |||||||
California Statewide Community Development Authority, 5.00% due 4/1/2019 (Kaiser Credit Group) | A+/NR | 27,000,000 | 31,491,180 | |||||||
California Statewide Community Development Authority, 5.00% due 7/1/2020 (Aspire Public Schools; Insured: College for Certain LLC) | NR/NR | 2,000,000 | 1,972,000 | |||||||
California Statewide Community Development Authority PCR, 4.10% due 4/1/2028 put 4/1/2013 (Southern California Edison Co.; Insured: Syncora) | A/A1 | 1,000,000 | 1,044,970 | |||||||
Castaic USD GO, 0% due 5/1/2018 (Insured: Natl-Re/FGIC) | A+/NR | 7,000,000 | 5,320,420 | |||||||
Centinela Valley Unified High School District GO, 4.00% due 12/1/2013 | SP-1+/NR | 5,665,000 | 5,950,573 | |||||||
Central Valley Financing Authority, 5.00% due 7/1/2017 (Carson Ice) | A+/A1 | 600,000 | 682,644 | |||||||
Central Valley Financing Authority, 5.00% due 7/1/2019 (Carson Ice) | A+/A1 | 1,750,000 | 1,995,612 | |||||||
Chula Vista COP, 5.25% due 3/1/2018 | A-/NR | 1,170,000 | 1,302,842 | |||||||
Chula Vista COP, 5.25% due 3/1/2019 | A-/NR | 1,235,000 | 1,369,245 | |||||||
Clovis USD GO, 0% due 8/1/2019 (Insured: Natl-Re/FGIC) | AA/NR | 2,685,000 | 1,978,174 | |||||||
Golden State Tobacco Securitization Corp., 5.50% due 6/1/2043 pre-refunded 6/1/2013 | AA+/Aaa | 2,000,000 | 2,168,380 | |||||||
Inland Valley Development Agency, 5.25% due 4/1/2013 (ETM) | A/NR | 2,000,000 | 2,143,000 | |||||||
Inland Valley Development Agency, 5.50% due 4/1/2014 (ETM) | A/NR | 2,000,000 | 2,245,200 | |||||||
Inland Valley Development Agency, 4.50% due 3/1/2041 put 3/1/2016 | A/NR | 8,000,000 | 8,415,120 | |||||||
Irvine USD, 5.25% due 9/1/2017 (Community Facilities District 86; | AA+/NR | 5,000,000 | 5,710,700 | |||||||
Irvine USD, 5.25% due 9/1/2018 (Community Facilities District 86; Insured: AGM) | AA+/NR | 3,000,000 | 3,432,990 | |||||||
Irvine USD, 5.25% due 9/1/2019 (Community Facilities District 86; Insured: AGM) | AA+/NR | 3,000,000 | 3,413,670 | |||||||
Kern Community College District COP, 4.00% due 4/1/2014 | SP-1+/NR | 2,000,000 | 2,074,820 | |||||||
Los Angeles Convention & Exhibition Center Authority, 5.00% due 8/15/2018 | A+/A2 | 2,095,000 | 2,334,060 | |||||||
Los Angeles County Public Works Financing Authority, 5.00% due 8/1/2019 (Multiple Capital Projects) | A+/A1 | 8,260,000 | 9,574,414 | |||||||
Los Angeles County Public Works Financing Authority, 5.00% due 8/1/2018 (Multiple Capital Projects) | A+/A1 | 4,000,000 | 4,647,600 | |||||||
Los Angeles USD COP, 5.00% due 10/1/2017 (Insured: AMBAC) | A+/A1 | 2,445,000 | 2,716,468 | |||||||
Los Angeles USD COP, 5.50% due 12/1/2018 (Capital Projects) | A+/A1 | 4,600,000 | 5,238,664 | |||||||
Los Angeles USD COP, 5.50% due 12/1/2019 | A+/A1 | 7,040,000 | 7,989,766 | |||||||
Los Angeles USD GO, 5.00% due 7/1/2018 (Insured: AGM) | AA+/Aa2 | 4,000,000 | 4,650,080 | |||||||
Monterey County COP, 5.00% due 8/1/2016 (Insured: AGM) | AA+/Aa3 | 1,435,000 | 1,614,963 | |||||||
Certified Annual Report 13
| SCHEDULE OF INVESTMENTS, CONTINUED | ||
| Thornburg Limited Term Municipal Fund | September 30, 2011 | |
Issuer-Description | Credit Rating† S&P/ Moody’s | Principal Amount | Value | |||||||
Monterey County COP, 5.00% due 8/1/2018 (Insured: AGM) | AA+/Aa3 | $ | 2,260,000 | $ | 2,558,297 | |||||
Mount San Antonio Community College GO, 0% due 8/1/2017 (Insured: Natl-Re) | AA/Aa2 | 5,000,000 | 4,216,900 | |||||||
Newport Beach Revenue, 5.00% due 12/1/2038 put 2/7/2013 (Hoag Memorial Hospital) | AA/Aa3 | 3,000,000 | 3,177,810 | |||||||
Northern California Power Agency Revenue, 5.00% due 7/1/2017 | A/A2 | 1,000,000 | 1,171,120 | |||||||
Northern California Power Agency Revenue, 5.00% due 6/1/2018 (Lodi Energy Center) | A-/A3 | 4,480,000 | 5,207,552 | |||||||
Northern California Power Agency Revenue, 5.00% due 7/1/2019 | A/A2 | 1,000,000 | 1,177,480 | |||||||
Northern California Power Agency Revenue, 5.00% due 7/1/2020 | A/A2 | 1,325,000 | 1,528,321 | |||||||
Orange County Public Financing Authority, 5.00% due 7/1/2017 (Insured: Natl-Re) | A+/Aa3 | 1,245,000 | 1,452,131 | |||||||
Palo Alto USD GO, 0% due 8/1/2019 | AAA/Aa1 | 1,000,000 | 773,950 | |||||||
Palomar Community College Capital Appreciation GO, 0% due 8/1/2021 | AA-/Aa2 | 2,560,000 | 1,630,080 | |||||||
Pittsburgh Redevelopment Agency, 5.00% due 8/1/2012 (Los Medanos Community Development; Insured: Natl-Re) | A+/Baa1 | 1,255,000 | 1,281,468 | |||||||
Pittsburgh Redevelopment Agency, 5.00% due 8/1/2018 (Los Medanos Community Development; Insured: Natl-Re) | A+/Baa1 | 5,150,000 | 5,276,999 | |||||||
Redding Electrical Systems Revenue COP, 5.00% due 6/1/2020 (Insured: AGM) | NR/Aa3 | 3,955,000 | 4,404,446 | |||||||
Sacramento Cogeneration Authority, 5.00% due 7/1/2017 (Procter & Gamble) | A+/A1 | 750,000 | 869,018 | |||||||
Sacramento Cogeneration Authority, 5.00% due 7/1/2017 (Insured: AMBAC) | BBB/NR | 8,290,000 | 8,846,591 | |||||||
Sacramento Municipal Utility District, 5.00% due 7/1/2016 (Cosumnes Project; Insured: Natl-Re) | BBB/Baa1 | 4,870,000 | 5,334,403 | |||||||
Sacramento Municipal Utility District, 5.00% due 7/1/2019 (Cosumnes Project; Insured: Natl-Re) | BBB/Baa1 | 5,000,000 | 5,260,600 | |||||||
Sacramento Municipal Utility District, 5.00% due 7/1/2020 (Cosumnes Project; Insured: Natl-Re) | BBB/Baa1 | 8,675,000 | 9,052,276 | |||||||
San Diego Redevelopment Agency, 4.50% due 9/1/2019 (Centre City Redevelopment; Insured: AMBAC) | NR/A2 | 1,240,000 | 1,265,184 | |||||||
San Diego USD GO, 5.50% due 7/1/2020 (Election 1998; Insured: Natl-Re) | AA/Aa1 | 10,000,000 | 11,822,800 | |||||||
San Joaquin Delta Community College District GO, 0% due 8/1/2019 (Insured: AGM) | AA+/Aa2 | 7,600,000 | 5,501,640 | |||||||
San Jose Redevelopment Agency Tax Allocation, 6.00% due 8/1/2015 (Insured: Natl-Re) | BBB/Baa1 | 2,780,000 | 3,038,373 | |||||||
San Luis & Delta-Mendota Water Authority, 4.50% due 3/1/2014 (Water Utility Improvements) | A+/NR | 3,900,000 | 4,181,970 | |||||||
Santa Ana USD GO, 0% due 8/1/2019 (Insured: Natl-Re/FGIC) | A+/NR | 3,425,000 | 2,523,369 | |||||||
Santa Clara County Financing Authority Lease Revenue, 4.00% due 5/15/2014 (Multiple Facilities) | AA/Aa2 | 4,245,000 | 4,531,835 | |||||||
Solano County COP, 5.00% due 11/15/2017 | AA-/A1 | 1,580,000 | 1,782,414 | |||||||
Southeast Resource Recovery Facilities Authority, 5.25% due 12/1/2017 (Insured: AMBAC) | A+/A1 | 2,000,000 | 2,112,320 | |||||||
Tuolumne Wind Project Authority, 5.00% due 1/1/2018 (Tuolumne Co.) | A+/A2 | 2,000,000 | 2,298,940 | |||||||
Tuolumne Wind Project Authority, 5.00% due 1/1/2019 (Tuolumne Co.) | A+/A2 | 2,000,000 | 2,299,660 | |||||||
Tustin Community Redevelopment Agency, 4.00% due 9/1/2017 (Tustin Redevelopment) | A/NR | 935,000 | 952,260 | |||||||
Tustin Community Redevelopment Agency, 4.00% due 9/1/2019 (Tustin Redevelopment) | A/NR | 1,010,000 | 993,143 | |||||||
Tustin Community Redevelopment Agency, 4.00% due 9/1/2020 | A/NR | 1,050,000 | 1,014,972 | |||||||
Twin Rivers USD GO, 0% due 4/1/2014 | SP-1+/NR | 3,490,000 | 3,281,228 | |||||||
Ventura County COP, 5.00% due 8/15/2016 | AA/Aa3 | 1,520,000 | 1,732,815 | |||||||
Ventura County COP, 5.25% due 8/15/2017 | AA/Aa3 | 1,635,000 | 1,893,248 | |||||||
COLORADO — 2.50% | ||||||||||
Adams County Platte Valley Medical Center, 5.00% due 2/1/2015 (Brighton Community Hospital Association; Insured: FHA/Natl-Re) | BBB/NR | 1,530,000 | 1,678,838 | |||||||
Adams County Platte Valley Medical Center, 5.00% due 8/1/2015 (Brighton Community Hospital Association; Insured: FHA/Natl-Re) | BBB/NR | 1,565,000 | 1,734,928 | |||||||
Beacon Point Metropolitan District, 4.375% due 12/1/2015 (LOC: Compass Bank) | A/NR | 1,335,000 | 1,335,254 | |||||||
Broomfield Water Activity Enterprise, 5.30% due 12/1/2014 (Insured: Natl-Re) | NR/Aa3 | 1,620,000 | 1,641,643 | |||||||
Colorado COP, 3.00% due 3/1/2013 (Colorado Penitentiary) | AA-/Aa2 | 1,205,000 | 1,230,920 | |||||||
Colorado COP, 4.00% due 3/1/2014 (Colorado Penitentiary) | AA-/Aa2 | 1,285,000 | 1,354,506 | |||||||
Colorado COP, 5.00% due 3/1/2016 (Colorado Penitentiary) | AA-/Aa2 | 2,000,000 | 2,229,660 | |||||||
Colorado COP, 5.00% due 3/1/2017 (Colorado Penitentiary) | AA-/Aa2 | 2,000,000 | 2,241,240 | |||||||
Colorado COP, 5.00% due 3/1/2018 (Colorado Penitentiary) | AA-/Aa2 | 1,500,000 | 1,688,790 | |||||||
Colorado Educational & Cultural Facilities, 4.00% due 6/1/2014 (NCSL) | A/A3 | 1,300,000 | 1,381,926 | |||||||
Colorado Educational & Cultural Facilities, 5.00% due 6/1/2016 (NCSL) | A/A3 | 1,475,000 | 1,652,959 | |||||||
14 Certified Annual Report
| SCHEDULE OF INVESTMENTS, CONTINUED | ||
| Thornburg Limited Term Municipal Fund | September 30, 2011 | |
Issuer-Description | Credit Rating† S&P/ Moody’s | Principal Amount | Value | |||||||
Colorado Educational & Cultural Facilities, 5.00% due 6/1/2018 (NCSL) | A/A3 | $ | 1,625,000 | $ | 1,846,991 | |||||
Colorado Educational & Cultural Facilities, 5.00% due 6/1/2020 (NCSL) | A/A3 | 1,805,000 | 2,041,906 | |||||||
Colorado Educational & Cultural Facilities, 5.00% due 6/1/2021 (NCSL) | A/A3 | 1,000,000 | 1,121,670 | |||||||
Colorado HFA, 5.00% due 11/15/2013 (Adventist Health/Sunbelt Group) | AA-/Aa3 | 2,840,000 | 3,088,926 | |||||||
Colorado HFA, 5.00% due 11/15/2015 (Adventist Health/Sunbelt Group) | AA-/Aa3 | 2,365,000 | 2,693,830 | |||||||
Colorado HFA, 5.25% due 5/15/2017 (Northern Colorado Medical Center; Insured: AGM) | AA+/NR | 1,185,000 | 1,359,124 | |||||||
Colorado HFA, 5.25% due 5/15/2019 (Northern Colorado Medical Center; Insured: AGM) | AA+/NR | 2,225,000 | 2,559,951 | |||||||
Colorado HFA, 5.50% due 10/1/2038 put 11/12/2015 (Catholic Health Initiatives) | AA/Aa2 | 1,000,000 | 1,170,620 | |||||||
Colorado HFA, 5.00% due 7/1/2039 put 11/8/2012 (Catholic Health Initiatives) | AA/Aa2 | 3,500,000 | 3,674,300 | |||||||
Colorado HFA, 5.00% due 7/1/2039 put 11/12/2013 (Catholic Health Initiatives) | AA/Aa2 | 7,255,000 | 7,905,266 | |||||||
Colorado HFA, 5.00% due 7/1/2039 put 11/11/2014 (Catholic Health Initiatives) | AA/Aa2 | 3,000,000 | 3,373,470 | |||||||
Colorado Higher Education COP, 5.00% due 11/1/2013 | AA-/Aa2 | 1,025,000 | 1,112,166 | |||||||
Denver City & County Airport System, 5.00% due 11/15/2016 (Insured: Natl-Re) | A+/A1 | 1,725,000 | 1,999,465 | |||||||
Denver City & County Airport System, 5.00% due 11/15/2017 (Insured: Natl-Re) | A+/A1 | 1,000,000 | 1,166,780 | |||||||
Denver City & County COP, 5.00% due 5/1/2013 (Insured: Natl-Re) | AA+/Aa1 | 3,890,000 | 4,145,923 | |||||||
Denver City & County COP, 5.00% due 5/1/2014 (Insured: Natl-Re) | AA+/Aa1 | 4,000,000 | 4,391,680 | |||||||
Denver City & County COP, 5.00% due 12/1/2016 (Buell Theatre/Jail Dormitory; Insured: Natl-Re) | AA+/Aa1 | 3,025,000 | 3,245,190 | |||||||
Denver City & County COP, 0.14% due 12/1/2029 put 10/3/2011 (SPA: JPMorgan Chase Bank) (daily demand notes) | AA+/Aa2 | 9,880,000 | 9,880,000 | |||||||
Denver Convention Center Hotel Authority, 5.25% due 12/1/2014 (Insured: Syncora) | BBB-/Baa3 | 3,450,000 | 3,624,190 | |||||||
Denver Convention Center Hotel Authority, 5.00% due 12/1/2019 pre-refunded 12/1/2013 (Insured: Syncora) | NR/NR | 5,000,000 | 5,448,100 | |||||||
Denver Convention Center Hotel Authority, 5.00% due 12/1/2022 pre-refunded 12/1/2013 (Insured: Syncora) | NR/NR | 2,000,000 | 2,179,240 | |||||||
E-470 Public Highway Authority Capital Appreciation, 0% due 9/1/2014 (Insured: Natl-Re) | BBB/Baa1 | 1,910,000 | 1,695,622 | |||||||
Longmont Sales & Use Tax, 6.00% due 5/15/2019 | AA+/NR | 3,215,000 | 3,934,646 | |||||||
Mesa County Residual Revenue, 0% due 12/1/2011 (ETM) | NR/Aaa | 1,250,000 | 1,249,425 | |||||||
Park Creek Metropolitan District, 5.00% due 12/1/2015 (Insured: AGM) | AA+/NR | 1,000,000 | 1,131,360 | |||||||
Park Creek Metropolitan District, 5.00% due 12/1/2016 (Insured: AGM) | AA+/NR | 1,035,000 | 1,182,477 | |||||||
Park Creek Metropolitan District, 5.00% due 12/1/2017 (Insured: AGM) | AA+/NR | 1,525,000 | 1,752,011 | |||||||
Park Creek Metropolitan District, 5.50% due 12/1/2018 (Insured: AGM) | AA+/NR | 1,200,000 | 1,420,980 | |||||||
Park Creek Metropolitan District, 5.50% due 12/1/2019 (Insured: AGM) | AA+/NR | 1,000,000 | 1,183,880 | |||||||
Regional Transportation District COP, 5.00% due 6/1/2018 | A-/Aa3 | 1,750,000 | 1,989,522 | |||||||
Regional Transportation District COP, 5.00% due 6/1/2019 | A-/Aa3 | 1,750,000 | 1,984,290 | |||||||
Regional Transportation District COP, 5.00% due 6/1/2020 | A-/Aa3 | 3,655,000 | 4,132,964 | |||||||
Regional Transportation District COP, 5.50% due 6/1/2021 | A-/Aa3 | 1,000,000 | 1,157,220 | |||||||
Southlands Metropolitan District GO, 6.75% due 12/1/2016 pre-refunded 12/1/2014 | AA+/NR | 840,000 | 952,358 | |||||||
CONNECTICUT — 0.07% | ||||||||||
Connecticut Development Authority PCR, 5.75% due 6/1/2026 put 2/1/2012 (United Illuminating Co.) | NR/Baa2 | 1,000,000 | 1,013,810 | |||||||
Connecticut Health & Educational Facilities, 3.50% due 11/15/2029 put 2/1/2012 (Ascension Health) | AA+/Aa1 | 1,860,000 | 1,879,939 | |||||||
DELAWARE — 0.02% | ||||||||||
Delaware EDA, 6.375% due 5/1/2027 pre-refunded 5/1/2012 (Peninsula | NR/NR | 1,000,000 | 1,044,430 | |||||||
DISTRICT OF COLUMBIA — 1.01% | ||||||||||
District of Columbia Convention Center Authority, 5.00% due 10/1/2013 (Washington Convention Center; Insured: AMBAC) | A/A1 | 3,000,000 | 3,213,060 | |||||||
District of Columbia COP, 5.25% due 1/1/2013 (Insured: AMBAC) | A/NR | 4,065,000 | 4,171,462 | |||||||
District of Columbia COP, 5.25% due 1/1/2015 (Insured: Natl-Re/FGIC) | A/Aa3 | 2,875,000 | 3,206,258 | |||||||
Certified Annual Report 15
| SCHEDULE OF INVESTMENTS, CONTINUED | ||
| Thornburg Limited Term Municipal Fund | September 30, 2011 | |
Issuer-Description | Credit Rating† S&P/ Moody’s | Principal Amount | Value | |||||||
District of Columbia COP, 5.25% due 1/1/2016 (Insured: Natl-Re/FGIC) | A/Aa3 | $ | 4,625,000 | $ | 5,224,677 | |||||
District of Columbia COP, 5.00% due 1/1/2019 (Insured: Natl-Re) | A/Aa3 | 5,000,000 | 5,383,800 | |||||||
District of Columbia GO, 6.00% due 6/1/2018 (Insured: Natl-Re) | A+/Aa2 | 5,000,000 | 6,093,400 | |||||||
District of Columbia Housing Finance Agency, 5.00% due 7/1/2014 (Insured: AGM HUD Loan) | AA+/Aa3 | 1,195,000 | 1,299,073 | |||||||
District of Columbia Housing Finance Agency, 5.00% due 7/1/2015 (Insured: AGM HUD Loan) | AA+/Aa3 | 1,480,000 | 1,640,565 | |||||||
District of Columbia Revenue, 4.00% due 4/1/2015 (National Public Radio) | AA-/Aa3 | 1,000,000 | 1,089,220 | |||||||
District of Columbia Revenue, 5.00% due 4/1/2016 (National Public Radio) | AA-/Aa3 | 500,000 | 571,535 | |||||||
District of Columbia Revenue, 4.00% due 4/1/2017 (National Public Radio) | AA-/Aa3 | 1,830,000 | 2,021,821 | |||||||
District of Columbia Revenue, 5.00% due 4/1/2018 (National Public Radio) | AA-/Aa3 | 1,195,000 | 1,392,605 | |||||||
District of Columbia Revenue, 5.00% due 4/1/2019 (National Public Radio) | AA-/Aa3 | 805,000 | 937,712 | |||||||
District of Columbia Revenue, 5.00% due 4/1/2020 (National Public Radio) | AA-/Aa3 | 1,250,000 | 1,453,000 | |||||||
District of Columbia Tax Increment, 0% due 7/1/2012 (Mandarin Oriental; Insured: AGM) | AA+/Aa3 | 1,580,000 | 1,568,419 | |||||||
Metropolitan Washington Airports Authority, 0% due 10/1/2014 (Dulles Toll Road; Insured: AGM) | AA+/Aa3 | 2,000,000 | 1,841,700 | |||||||
Metropolitan Washington Airports Authority, 0% due 10/1/2016 (Dulles Toll Road; Insured: AGM) | AA+/Aa3 | 4,000,000 | 3,379,520 | |||||||
FLORIDA — 9.23% | ||||||||||
Broward County Airport Systems, 5.00% due 10/1/2014 (Insured: AMBAC) | A+/A1 | 4,000,000 | 4,407,960 | |||||||
Broward County Port Facilities, 5.00% due 9/1/2013 | A-/A2 | 2,000,000 | 2,131,260 | |||||||
Broward County Port Facilities, 5.00% due 9/1/2017 | A-/A2 | 2,820,000 | 3,187,390 | |||||||
Broward County Port Facilities, 5.50% due 9/1/2018 | A-/A2 | 3,500,000 | 4,069,100 | |||||||
Broward County Port Facilities, 5.50% due 9/1/2019 | A-/A2 | 2,800,000 | 3,249,428 | |||||||
Broward County School Board COP, 5.25% due 7/1/2015 (Insured: AGM) | AA+/Aa3 | 3,035,000 | 3,401,507 | |||||||
Broward County School Board COP, 5.00% due 7/1/2016 (Insured: AGM) | AA+/Aa3 | 1,495,000 | 1,679,633 | |||||||
Broward County School Board COP, 5.25% due 7/1/2016 (Insured: AGM) | AA+/Aa3 | 7,630,000 | 8,657,837 | |||||||
Broward County School Board COP, 5.25% due 7/1/2016 (Insured: AGM) | AA+/Aa3 | 3,715,000 | 4,215,448 | |||||||
Broward County School Board COP, 5.00% due 7/1/2017 (Insured: Natl-Re/FGIC) | A/Aa3 | 1,000,000 | 1,125,150 | |||||||
Capital Projects Finance Authority, 5.50% due 10/1/2012 (Insured: Natl-Re) | BBB/Baa1 | 1,820,000 | 1,809,881 | |||||||
Capital Projects Finance Authority, 5.50% due 10/1/2015 (Insured: Natl-Re) | BBB/Baa1 | 2,660,000 | 2,596,719 | |||||||
Collier County Special Obligation Revenue, 4.00% due 10/1/2014 | AA/Aa2 | 1,410,000 | 1,523,801 | |||||||
Dade County Florida GO, 7.125% due 10/1/2011 (Insured: AMBAC) | NR/Aa2 | 1,000,000 | 1,000,190 | |||||||
Escambia County HFA, 5.25% due 11/15/2014 (Ascension Health Credit) | AA+/Aa1 | 1,650,000 | 1,869,021 | |||||||
Escambia County Utilities Authority, 6.25% due 1/1/2012 (Insured: Natl-Re/FGIC) | BBB/NR | 5,235,000 | 5,307,034 | |||||||
Flagler County School Board COP, 5.00% due 8/1/2014 (Insured: AGM) | AA+/Aa3 | 1,605,000 | 1,755,035 | |||||||
Flagler County School Board COP, 5.00% due 8/1/2015 (Insured: AGM) | AA+/Aa3 | 1,500,000 | 1,677,345 | |||||||
Florida Atlantic University Financing Corp. Capital Improvements Revenue, 5.00% due 7/1/2014 (Innovation Village) | A/A2 | 1,950,000 | 2,123,121 | |||||||
Florida Atlantic University Financing Corp. Capital Improvements Revenue, 5.00% due 7/1/2015 (Innovation Village) | A/A2 | 2,395,000 | 2,661,252 | |||||||
Florida Atlantic University Financing Corp. Capital Improvements Revenue, 5.00% due 7/1/2016 (Innovation Village) | A/A2 | 2,275,000 | 2,548,341 | |||||||
Florida Board of Education Lottery Revenue, 5.25% due 7/1/2016 (Insured: Natl-Re/FGIC) | AAA/A1 | 1,000,000 | 1,045,760 | |||||||
Florida Department of Management Services, 5.25% due 9/1/2016 (Insured: AGM) | AA+/Aa2 | 3,500,000 | 4,087,545 | |||||||
Florida Higher Educational Facilities Financing, 4.00% due 4/1/2013 (Nova Southeastern University) | BBB/Baa2 | 1,100,000 | 1,128,127 | |||||||
Florida Higher Educational Facilities Financing, 5.00% due 4/1/2014 (Nova Southeastern University) | BBB/Baa2 | 2,365,000 | 2,498,717 | |||||||
Florida Higher Educational Facilities Financing, 5.00% due 4/1/2015 (Nova Southeastern University) | BBB/Baa2 | 2,350,000 | 2,507,591 | |||||||
Florida Higher Educational Facilities Financing, 5.00% due 4/1/2016 (Nova Southeastern University) | BBB/Baa2 | 2,345,000 | 2,516,631 | |||||||
Florida Higher Educational Facilities Financing, 5.25% due 4/1/2017 (Nova Southeastern University) | BBB/Baa2 | 1,325,000 | 1,431,888 | |||||||
16 Certified Annual Report
| SCHEDULE OF INVESTMENTS, CONTINUED | ||
| Thornburg Limited Term Municipal Fund | September 30, 2011 | |
Issuer-Description | Credit Rating† S&P/ Moody’s | Principal Amount | Value | |||||||
Florida Higher Educational Facilities Financing, 5.25% due 4/1/2018 (Nova Southeastern University) | BBB/Baa2 | $ | 2,630,000 | $ | 2,840,032 | |||||
Florida Higher Educational Facilities Financing, 5.50% due 4/1/2019 (Nova Southeastern University) | BBB/Baa2 | 1,705,000 | 1,857,836 | |||||||
Florida Hurricane Catastrophe, 5.00% due 7/1/2014 | AA-/Aa3 | 11,000,000 | 11,965,690 | |||||||
Florida State Correctional Privatization Commission COP, 5.00% due 8/1/2015 (Insured: AMBAC) | AA+/Aa2 | 2,000,000 | 2,192,100 | |||||||
Florida State Department of Children & Families COP, 5.00% due 10/1/2012 | AA+/NR | 770,000 | 799,121 | |||||||
Florida State Department of Children & Families COP, 5.00% due 10/1/2014 | AA+/NR | 905,000 | 995,138 | |||||||
Florida State Department of Children & Families COP, 5.00% due 10/1/2015 | AA+/NR | 925,000 | 1,037,684 | |||||||
Florida State Department of Transportation GO, 5.375% due 7/1/2017 | AAA/Aa1 | 4,675,000 | 4,899,166 | |||||||
Florida State Department of Transportation GO, 5.00% due 7/1/2018 | AAA/Aa1 | 3,000,000 | 3,544,860 | |||||||
Florida Turnpike Authority, 5.00% due 7/1/2013 (Department of Transportation) | AA-/Aa3 | 4,875,000 | 5,251,984 | |||||||
Fort Myers Florida Improvement Revenue, 5.00% due 12/1/2018 (Insured: Natl-Re) | A+/Aa3 | 2,195,000 | 2,450,959 | |||||||
Gainesville Utilities Systems Revenue, 6.50% due 10/1/2013 | AA/Aa2 | 4,800,000 | 5,304,960 | |||||||
Gainesville Utilities Systems Revenue, 0.20% due 10/1/2026 put 10/3/2011 (SPA: Suntrust Bank) (daily demand notes) | AA/Aa2 | 6,315,000 | 6,315,000 | |||||||
Gainesville Utilities Systems Revenue, 0.22% due 10/1/2026 put 10/3/2011 (SPA: Suntrust Bank) (daily demand notes) | AA/Aa2 | 13,715,000 | 13,715,000 | |||||||
Highlands County HFA, 5.00% due 11/15/2015 (Adventist Health) | AA-/Aa3 | 1,000,000 | 1,137,030 | |||||||
Highlands County HFA, 5.00% due 11/15/2016 (Adventist Health) | AA-/Aa3 | 1,000,000 | 1,148,570 | |||||||
Highlands County HFA, 5.00% due 11/15/2017 (Adventist Health) | AA-/Aa3 | 3,200,000 | 3,710,720 | |||||||
Highlands County HFA, 5.00% due 11/15/2017 (Adventist Health) | AA-/Aa3 | 1,000,000 | 1,109,810 | |||||||
Highlands County HFA, 5.00% due 11/15/2019 (Adventist Health) | AA-/Aa3 | 3,000,000 | 3,488,400 | |||||||
Highlands County HFA, 3.95% due 11/15/2032 put 9/1/2012 (Adventist Health) | AA-/Aa3 | 2,500,000 | 2,577,375 | |||||||
Hillsborough County Assessment, 5.00% due 3/1/2015 (Insured: Natl-Re/FGIC) | A+/A1 | 5,000,000 | 5,468,850 | |||||||
Hillsborough County IDA PCR, 5.10% due 10/1/2013 (Tampa Electric Co.) | BBB+/Baa1 | 7,410,000 | 7,657,939 | |||||||
bHillsborough County IDA PCR, 5.00% due 12/1/2034 put 3/15/2012 (Tampa Electric Co.; Insured: AMBAC) | BBB+/Baa1 | 6,650,000 | 6,777,746 | |||||||
Hillsborough County Investment Tax Revenue, 5.00% due 11/1/2016 (Insured: AMBAC) | AA/Aa2 | 1,000,000 | 1,149,230 | |||||||
Hillsborough County School Board COP, 5.25% due 7/1/2017 (Insured: Natl-Re) | AA-/Aa2 | 1,000,000 | 1,154,570 | |||||||
Hollywood Community Redevelopment Agency, 5.00% due 3/1/2016 (Insured: Syncora) | NR/A3 | 2,000,000 | 2,187,240 | |||||||
Hollywood Community Redevelopment Agency, 5.00% due 3/1/2017 (Insured: Syncora) | NR/A3 | 2,000,000 | 2,191,000 | |||||||
Hollywood Water & Sewer Revenue, 5.00% due 10/1/2014 (Insured: AGM) | NR/Aa2 | 1,300,000 | 1,402,180 | |||||||
Jacksonville Economic Development Commission, 6.00% due 9/1/2017 (Florida Proton Therapy Institute) | NR/NR | 5,235,000 | 5,519,313 | |||||||
JEA, 5.25% due 10/1/2012 (St. John’s River Park Systems) | AA-/Aa2 | 5,500,000 | 5,522,110 | |||||||
JEA, 5.00% due 10/1/2014 (Electric Systems) | A+/Aa3 | 7,165,000 | 7,852,553 | |||||||
JEA, 4.00% due 10/1/2016 (Electric Systems) | A+/Aa3 | 3,540,000 | 3,912,231 | |||||||
JEA, 5.00% due 10/1/2017 (St. John’s River Park Systems) | AA-/Aa2 | 8,385,000 | 8,414,599 | |||||||
JEA Water & Sewer Systems Revenue, 3.50% due 10/1/2013 | AA-/Aa2 | 5,565,000 | 5,889,273 | |||||||
JEA Water & Sewer Systems Revenue, 5.00% due | AA-/Aa2 | 1,500,000 | 1,781,160 | |||||||
Kissimmee Utilities Authority Electrical Systems Revenue, 5.25% due 10/1/2016 (Insured: AGM) | NR/Aa3 | 1,700,000 | 1,977,355 | |||||||
Lakeland Florida Energy System Revenue, 5.00% due 10/1/2016 (Insured: AGM) | AA+/Aa3 | 9,780,000 | 11,304,800 | |||||||
Lakeland Florida Energy System Revenue, 5.00% due 10/1/2017 (Insured: AGM) | AA+/Aa3 | 7,105,000 | 8,287,556 | |||||||
Lakeland Florida Energy System Revenue, 5.00% due 10/1/2019 (Insured: AGM) | AA+/Aa3 | 5,000,000 | 5,850,150 | |||||||
Lakeland Florida Energy System Revenue, 5.00% due 10/1/2020 (Insured: AGM) | AA+/Aa3 | 1,695,000 | 1,976,285 | |||||||
Lakeland Florida Hospital System Revenue, 3.00% due 11/15/2013 (Lakeland Regional Health) | NR/NR | 1,000,000 | 1,027,750 | |||||||
Lakeland Florida Hospital System Revenue, 4.00% due 11/15/2014 (Lakeland Regional Health) | NR/NR | 1,000,000 | 1,058,810 | |||||||
Lakeland Florida Hospital System Revenue, 5.00% due 11/15/2019 (Lakeland Regional Health) | NR/A2 | 4,950,000 | 5,302,687 | |||||||
Marion County Hospital District, 5.00% due 10/1/2015 (Munroe Regional Health Systems) | NR/A3 | 1,000,000 | 1,084,340 | |||||||
Miami Dade County Educational Facilities Authority GO, 5.00% due 4/1/2016 (University of Miami; Insured: AMBAC) | A-/A3 | 3,000,000 | 3,321,960 | |||||||
Miami Dade County Expressway Authority, 5.00% due 7/1/2019 (Insured: Assured Guaranty) | AA+/Aa3 | 6,530,000 | 7,427,091 | |||||||
Certified Annual Report 17
| SCHEDULE OF INVESTMENTS, CONTINUED | ||
| Thornburg Limited Term Municipal Fund | September 30, 2011 | |
Issuer-Description | Credit Rating† S&P/ Moody’s | Principal Amount | Value | |||||||
Miami Dade County GO, 5.25% due 7/1/2018 (Building Better Communities) | AA-/Aa2 | $ | 4,540,000 | $ | 5,300,405 | |||||
Miami Dade County Professional Sports Franchise Facilities Tax, 0% due 10/1/2015 (Insured: AGM) | AA+/Aa3 | 3,845,000 | 3,420,397 | |||||||
Miami Dade County Professional Sports Franchise Facilities Tax, 0% due 10/1/2016 (Insured: AGM) | AA+/Aa3 | 3,535,000 | 3,002,841 | |||||||
Miami Dade County Professional Sports Franchise Facilities Tax, 0% due 10/1/2017 (Insured: AGM) | AA+/Aa3 | 2,435,000 | 1,963,219 | |||||||
Miami Dade County Professional Sports Franchise Facilities Tax, 0% due 10/1/2018 (Insured: AGM) | AA+/Aa3 | 5,385,000 | 4,124,964 | |||||||
Miami Dade County Professional Sports Franchise Facilities Tax, 0% due 10/1/2019 (Insured: AGM) | AA+/Aa3 | 2,170,000 | 1,567,955 | |||||||
Miami Dade County School Board COP, 5.00% due 5/1/2014 (Insured: Natl-Re) | A/A1 | 1,000,000 | 1,076,200 | |||||||
Miami Dade County School Board COP, 5.00% due 10/1/2015 (Insured: AMBAC) | A/A1 | 1,000,000 | 1,106,040 | |||||||
Miami Dade County School Board COP, 5.00% due 5/1/2016 (Insured: Natl-Re) | A/A1 | 4,015,000 | 4,447,295 | |||||||
Miami Dade County School Board COP, 5.00% due 10/1/2016 (Insured: AMBAC) | A/A1 | 1,000,000 | 1,113,740 | |||||||
Miami Dade County School Board COP, 5.00% due 5/1/2032 put 5/1/2016 | A/A1 | 6,000,000 | 6,604,200 | |||||||
Miami Dade County School District GO, 5.375% due 8/1/2015 (Insured: AGM) | AA+/Aa3 | 5,000,000 | 5,742,500 | |||||||
Miami Dade County Special Housing, 5.80% due 10/1/2012 (HUD Section 8) | NR/Baa3 | 625,000 | 636,075 | |||||||
Miami GO, 5.00% due 1/1/2017 (Homeland Defense/Neighborhood Capital Improvements) | BBB-/A3 | 1,245,000 | 1,315,467 | |||||||
Miami GO, 5.00% due 1/1/2018 (Homeland Defense/Neighborhood Capital Improvements) | BBB-/A3 | 2,040,000 | 2,139,083 | |||||||
Miami GO, 5.00% due 1/1/2019 (Homeland Defense/Neighborhood Capital Improvements) | BBB-/A3 | 1,325,000 | 1,376,317 | |||||||
Miami Special Obligation, 5.00% due 1/1/2018 (Insured: Natl-Re) | A-/A2 | 1,970,000 | 2,246,036 | |||||||
North Miami Educational Facilities Revenue, 5.00% due 4/1/2013 (Johnston & Wales University; Insured: Syncora) | NR/NR | 1,530,000 | 1,594,719 | |||||||
Orange County HFA, 5.00% due 10/1/2014 (Orlando Health) | A/A2 | 2,790,000 | 3,007,787 | |||||||
Orange County HFA, 5.00% due 10/1/2017 (Orlando Health) | A/A2 | 1,980,000 | 2,179,485 | |||||||
Orange County HFA, 5.25% due 10/1/2019 (Orlando Health) | A/A2 | 4,000,000 | 4,432,520 | |||||||
Orange County HFA, 6.25% due 10/1/2021 (Orlando Health; Insured: Natl-Re) | A/A2 | 1,870,000 | 2,196,857 | |||||||
Orlando & Orange County Expressway Authority, 5.00% due 7/1/2013 (Insured: AMBAC) | A/A1 | 5,845,000 | 6,272,445 | |||||||
Palm Beach County Public Improvement, 5.00% due 11/1/2030 put 11/1/2011 (Convention Center; Insured: Natl-Re/FGIC) | AA+/Aa1 | 3,000,000 | 3,011,790 | |||||||
Port Everglades Authority, 5.00% due 9/1/2016 (Insured: AGM) | AA+/Aa3 | 9,990,000 | 10,358,531 | |||||||
Putnam County Development Authority PCR, 5.35% due 3/15/2042 put 5/1/2018 (Seminole Project; Insured: AMBAC) | A-/A3 | 10,000,000 | 11,442,200 | |||||||
Putnam County Development Authority PCR, 5.35% due 3/15/2042 put 5/1/2018 (Seminole Project; Insured: AMBAC) | A-/A3 | 3,125,000 | 3,575,687 | |||||||
South Florida Water Management District COP, 5.00% due 10/1/2015 (Insured: AMBAC) | AA/Aa2 | 1,000,000 | 1,129,740 | |||||||
South Miami HFA, 5.00% due 8/15/2016 (Baptist Health) | AA/Aa2 | 1,560,000 | 1,792,752 | |||||||
South Miami HFA, 5.00% due 8/15/2017 (Baptist Health) | AA/Aa2 | 4,610,000 | 5,364,565 | |||||||
St. John’s County IDA, 5.50% due 8/1/2014 (Presbyterian Retirement) | NR/NR | 2,120,000 | 2,199,924 | |||||||
St. Petersburg HFA, 5.50% due 11/15/2016 (All Children’s Hospital; | NR/A1 | 1,980,000 | 2,050,250 | |||||||
Tampa Bay Regional Water Supply Authority, 5.00% due 10/1/2017 | AA+/Aa2 | 5,615,000 | 6,703,524 | |||||||
Tampa Bay Regional Water Supply Authority, 5.00% due 10/1/2018 | AA+/Aa2 | 2,890,000 | 3,477,566 | |||||||
Tampa Bay Regional Water Supply Authority, 5.00% due 10/1/2019 | AA+/Aa2 | 3,000,000 | 3,615,750 | |||||||
Tampa Baycare Health Systems, 5.00% due 11/15/2016 | NR/Aa3 | 2,855,000 | 3,258,954 | |||||||
Tampa Baycare Health Systems, 5.00% due 11/15/2017 | NR/Aa3 | 1,215,000 | 1,402,146 | |||||||
Tampa Sports Authority Revenue, 5.75% due 10/1/2015 (Tampa Bay Arena; Insured: Natl-Re) | BBB/ Baa1 | 1,235,000 | 1,286,043 | |||||||
University of Central Florida Athletics Association Inc. COP, 5.00% due 10/1/2016 (Insured: Natl-Re/FGIC) | BBB/NR | 1,640,000 | 1,762,852 | |||||||
Volusia County Educational Facility Authority, 4.00% due 10/15/2013 (Embry-Riddle; Insured: AGM) | AA+/Aa3 | 675,000 | 702,783 | |||||||
Volusia County Educational Facility Authority, 5.00% due 10/15/2016 (Embry-Riddle; Insured: AGM) | AA+/Aa3 | 2,320,000 | 2,575,919 | |||||||
Volusia County Educational Facility Authority, 4.00% due 10/15/2017 (Embry-Riddle; Insured: AGM) | AA+/Aa3 | 1,030,000 | 1,089,318 | |||||||
Volusia County Educational Facility Authority, 5.00% due 10/15/2018 (Embry-Riddle; Insured: AGM) | AA+/Aa3 | 2,075,000 | 2,299,411 | |||||||
18 Certified Annual Report
| SCHEDULE OF INVESTMENTS, CONTINUED | ||
| Thornburg Limited Term Municipal Fund | September 30, 2011 | |
Issuer-Description | Credit Rating† S&P/ Moody’s | Principal Amount | Value | |||||||
Volusia County Educational Facility Authority, 5.00% due 10/15/2019 (Embry-Riddle; Insured: AGM) | AA+/Aa3 | $ | 2,245,000 | $ | 2,468,490 | |||||
GEORGIA — 2.66% | ||||||||||
Atlanta Airport Passenger Facility Charge Revenue, 5.00% due 1/1/2018 | NR/A1 | 2,100,000 | 2,404,689 | |||||||
Atlanta Airport Passenger Facility Charge Revenue, 5.00% due 1/1/2020 | NR/A1 | 6,000,000 | 6,885,420 | |||||||
Atlanta Airport Passenger Facility Charge Revenue, 5.00% due 1/1/2021 | NR/A1 | 7,000,000 | 7,950,670 | |||||||
Atlanta Airport Revenue, 5.00% due 1/1/2019 | NR/A1 | 3,145,000 | 3,618,448 | |||||||
b Atlanta Airport Revenue, 5.25% due 1/1/2020 | NR/A1 | 5,000,000 | 5,832,700 | |||||||
Atlanta Airport Revenue, 5.50% due 1/1/2021 | NR/A1 | 3,525,000 | 4,197,711 | |||||||
Atlanta Tax Allocation, 5.25% due 12/1/2016 (Atlantic Station; Insured: AGM) | AA+/Aa3 | 3,850,000 | 4,319,007 | |||||||
Atlanta Water & Wastewater Revenue, 5.50% due 11/1/2014 (Insured: Natl-Re/FGIC) | A/A1 | 3,000,000 | 3,373,410 | |||||||
Atlanta Water & Wastewater Revenue, 5.50% due 11/1/2015 (Insured: Natl-Re/FGIC) | A/A1 | 4,000,000 | 4,615,960 | |||||||
Atlanta Water & Wastewater Revenue, 5.00% due 11/1/2016 (Insured: AGM) | AA+/Aa3 | 3,215,000 | 3,671,659 | |||||||
Atlanta Water & Wastewater Revenue, 5.50% due 11/1/2016 (Insured: Natl-Re/FGIC) | A/A1 | 8,215,000 | 9,618,286 | |||||||
Atlanta Water & Wastewater Revenue, 5.00% due 11/1/2017 (Insured: AGM) | AA+/Aa3 | 4,745,000 | 5,451,198 | |||||||
Atlanta Water & Wastewater Revenue, 6.00% due 11/1/2019 | A/A1 | 5,650,000 | 6,940,855 | |||||||
Burke County Development Authority PCR, 2.50% due 1/1/2040 put 3/1/2013 (Oglethorpe Power) | A/Baa1 | 7,000,000 | 7,119,420 | |||||||
Fulton County Facilities COP, 5.00% due 11/1/2017 | AA-/Aa3 | 8,400,000 | 9,609,180 | |||||||
Fulton County Facilities COP, 5.00% due 11/1/2019 | AA-/Aa3 | 6,600,000 | 7,521,558 | |||||||
Gainesville Water & Sewer Revenue, 6.00% due 11/15/2012 (Insured: Natl-Re/FGIC) | AA-/Aa3 | 1,160,000 | 1,188,838 | |||||||
Lagrange Troup County Hospital Authority, 5.00% due 7/1/2018 (West Georgia Health Foundation Inc.) | A+/Aa2 | 2,500,000 | 2,761,800 | |||||||
Main Street Natural Gas, Inc., 5.00% due 3/15/2013 (Georgia Gas) | A/Baa1 | 1,500,000 | 1,559,970 | |||||||
Main Street Natural Gas, Inc., 5.00% due 3/15/2014 (Georgia Gas) | A+/Aa3 | 3,000,000 | 3,207,000 | |||||||
Main Street Natural Gas, Inc., 5.00% due 3/15/2014 (Georgia Gas) | A/Baa1 | 3,590,000 | 3,781,455 | |||||||
Main Street Natural Gas, Inc., 5.00% due 3/15/2015 (Georgia Gas) | A/Baa1 | 2,000,000 | 2,116,460 | |||||||
Main Street Natural Gas, Inc., 5.00% due 3/15/2018 (Georgia Gas) | A/Baa1 | 5,000,000 | 5,054,900 | |||||||
Monroe County Development Authority PCR, 6.80% due 1/1/2012 (Oglethorpe Power; Insured: Natl-Re) | BBB/Baa1 | 1,000,000 | 1,015,490 | |||||||
Municipal Electric Authority of Georgia, 6.60% due 1/1/2018 (Insured: Natl-Re) | BBB/A1 | 2,990,000 | 3,429,859 | |||||||
GUAM — 0.31% | ||||||||||
Guam Government Limited Obligation Revenue, 5.25% due 12/1/2016 | BBB-/NR | 5,610,000 | 6,101,268 | |||||||
Guam Government Limited Obligation Revenue, 5.25% due 12/1/2017 | BBB-/NR | 2,000,000 | 2,185,520 | |||||||
Guam Government Limited Obligation Revenue, 5.50% due 12/1/2018 | BBB-/NR | 3,000,000 | 3,294,570 | |||||||
Guam Government Limited Obligation Revenue, 5.50% due 12/1/2019 | BBB-/NR | 2,000,000 | 2,182,440 | |||||||
HAWAII — 0.15% | ||||||||||
Hawaii Department of Budget & Finance, 6.40% due 7/1/2013 (Kapiolani Health Care; Insured: Natl-Re) | BBB/A3 | 610,000 | 627,422 | |||||||
Hawaii State Department of Budget & Finance, 4.95% due 4/1/2012 (Hawaiian Electric Company; Insured: Natl-Re) | BBB/Baa1 | 5,850,000 | 5,899,257 | |||||||
IDAHO — 0.35% | ||||||||||
Twin Falls Urban Renewal Agency, 4.95% due 8/1/2014 | NR/NR | 1,260,000 | 1,290,101 | |||||||
Twin Falls Urban Renewal Agency, 5.15% due 8/1/2017 | NR/NR | 1,455,000 | 1,472,547 | |||||||
University of Idaho, 5.25% due 4/1/2041 put 4/1/2021 | A+/Aa3 | 10,805,000 | 12,610,516 | |||||||
ILLINOIS — 7.59% | ||||||||||
Aurora GO, 4.25% due 12/30/2015 (Insured: AMBAC) | AA+/NR | 1,030,000 | 1,037,694 | |||||||
Certified Annual Report 19
| SCHEDULE OF INVESTMENTS, CONTINUED | ||
| Thornburg Limited Term Municipal Fund | September 30, 2011 | |
Issuer-Description | Credit Rating† S&P/ Moody’s | Principal Amount | Value | |||||||
Bolingbrook GO, 0% due 1/1/2016 (Insured: Natl-Re) | NR/Aa3 | $ | 1,500,000 | $ | 1,276,830 | |||||
Bolingbrook GO, 0% due 1/1/2017 (Insured: Natl-Re) | NR/Aa3 | 2,000,000 | 1,605,960 | |||||||
Broadview Tax Increment Revenue, 5.375% due 7/1/2015 | NR/NR | 3,400,000 | 3,401,292 | |||||||
Chicago Board of Education GO, 6.25% due 1/1/2015 (Insured: Natl-Re) | BBB/Aa2 | 1,700,000 | 1,811,775 | |||||||
Chicago Board of Education GO, 5.25% due 12/1/2017 (Chicago School Reform Board; Insured: Natl-Re/FGIC) | AA-/Aa2 | 4,100,000 | 4,680,314 | |||||||
Chicago Board of Education GO, 5.00% due 12/1/2018 (Insured: Natl-Re) | AA-/Aa2 | 1,000,000 | 1,116,560 | |||||||
Chicago GO, 6.125% due 1/1/2012 (Insured: AMBAC) (ETM) | A+/Aa3 | 775,000 | 786,656 | |||||||
Chicago GO, 6.125% due 1/1/2012 (Insured: AMBAC) | A+/Aa3 | 225,000 | 228,148 | |||||||
Chicago GO, 5.375% due 1/1/2013 (Insured: Natl-Re) | A+/Aa3 | 2,130,000 | 2,180,374 | |||||||
Chicago GO, 0% due 1/1/2016 (City Colleges; Insured: Natl-Re/FGIC) | A+/Aa3 | 2,670,000 | 2,357,343 | |||||||
Chicago GO, 5.40% due 1/1/2018 (Insured: AGM) | AA+/Aa3 | 3,000,000 | 3,010,530 | |||||||
Chicago GO, 5.44% due 1/1/2018 (Capital Appreciation; Insured: Natl-Re) | A+/Aa3 | 3,050,000 | 3,396,388 | |||||||
Chicago Housing Authority Capital Program, 5.00% due 7/1/2015 (Insured: AGM) | AA+/Aa3 | 8,460,000 | 9,355,153 | |||||||
Chicago Housing Authority Capital Program, 5.00% due 7/1/2016 (Insured: AGM) | AA+/Aa3 | 2,000,000 | 2,233,620 | |||||||
Chicago Illinois Board of Education GO, 5.00% due 12/1/2018 | AA-/Aa2 | 3,000,000 | 3,349,680 | |||||||
Chicago Illinois Board of Education GO, 5.00% due 12/1/2019 | AA-/Aa2 | 2,000,000 | 2,217,460 | |||||||
Chicago Illinois Board of Education GO, 0% due 12/1/2020 (Insured: BHAC/FGIC) | AA+/Aa1 | 12,000,000 | 8,242,080 | |||||||
Chicago Illinois Board of Education GO, 5.00% due 12/1/2020 | AA-/Aa2 | 2,500,000 | 2,756,575 | |||||||
Chicago Illinois Park District GO, 5.00% due 1/1/2018 (Personal Property Replacement) | AA+/Aa2 | 1,150,000 | 1,304,031 | |||||||
Chicago Illinois Public Building Commerce Building, 4.00% due 1/1/2012 | NR/Aa2 | 1,660,000 | 1,675,156 | |||||||
Chicago Illinois Public Building Commerce Building, 4.00% due 1/1/2013 | NR/Aa2 | 3,275,000 | 3,394,898 | |||||||
Chicago Illinois Transit Authority Capital Grant, 5.50% due 6/1/2018 (Federal Transit Administration) | A/A1 | 2,500,000 | 2,780,525 | |||||||
Chicago Midway Airport, 5.50% due 1/1/2013 (Insured: Natl-Re) | A/A2 | 1,180,000 | 1,239,850 | |||||||
Chicago Sales Tax Revenue, 0.14% due 1/1/2034 put 10/3/2011 (SPA: JPMorgan Chase Bank) (daily demand notes) | AAA/Aa2 | 2,735,000 | 2,735,000 | |||||||
Chicago Tax Increment, 6.75% due 6/1/2022 (Pilsen Redevelopment) | NR/NR | 5,000,000 | 5,090,700 | |||||||
Chicago Wastewater Transmission Revenue, 4.00% due 1/1/2018 | A+/Aa3 | 1,475,000 | 1,542,186 | |||||||
Chicago Water Revenue, 2.00% due 11/1/2011 | AA-/Aa3 | 2,360,000 | 2,362,690 | |||||||
Cicero Illinois GO, 5.25% due 1/1/2019 (Insured: Syncora) | NR/NR | 6,140,000 | 6,297,982 | |||||||
Cook County Community Consolidated School District GO, 0% due 12/1/2011 (Insured: AGM) (ETM) | NR/Aa3 | 2,370,000 | 2,369,005 | |||||||
Cook County Community Consolidated School District GO, 9.00% due 12/1/2016 (Tinley Park; Insured: Natl-Re/FGIC) | NR/Aa2 | 2,500,000 | 3,232,250 | |||||||
Cook County Community High School District, 5.00% due 12/15/2012 (Insured: Assured Guaranty) | AA+/NR | 3,180,000 | 3,340,876 | |||||||
Cook County Community High School District, 5.00% due 12/15/2013 (Insured: Assured Guaranty) | AA+/NR | 6,875,000 | 7,444,869 | |||||||
Cook County Community School District GO, 9.00% due 12/1/2013 (Oak Park; Insured: Natl-Re/FGIC) | NR/Aa2 | 2,250,000 | 2,599,177 | |||||||
Cook County GO, 3.25% due 11/15/2011 (ETM) | NR/NR | 220,000 | 220,849 | |||||||
Cook County GO, 3.25% due 11/15/2011 | AA/Aa3 | 1,030,000 | 1,033,533 | |||||||
Cook County GO, 5.00% due 11/15/2012 | AA/Aa3 | 6,000,000 | 6,277,380 | |||||||
Cook County GO, 6.25% due 11/15/2013 (Insured: Natl-Re) | AA/Aa3 | 3,995,000 | 4,414,315 | |||||||
De Kalb County USD GO, 0% due 1/1/2021 (Capital Appreciation) | AA-/Aa2 | 6,140,000 | 3,997,140 | |||||||
Illinois Educational Facilities, 4.75% due 3/1/2030 put 3/1/2017 (Art | A+/A1 | 3,030,000 | 3,364,876 | |||||||
Illinois Educational Facilities, 5.00% due 3/1/2030 put 3/1/2017 (Art Institute of Chicago) | NR/A1 | 3,000,000 | 3,356,400 | |||||||
Illinois Educational Facilities, 5.25% due 3/1/2034 put 3/1/2018 (Art Institute of Chicago) | NR/NR | 3,500,000 | 3,978,975 | |||||||
Illinois Educational Facilities, 3.40% due 11/1/2036 put 11/1/2017 (Medical Terminal Field Museum) | A/NR | 1,300,000 | 1,354,678 | |||||||
Illinois Educational Facilities, 4.15% due 11/1/2036 put 11/1/2012 (Field Museum) | A/A2 | 5,250,000 | 5,409,810 | |||||||
Illinois Educational Facilities, 4.30% due 11/1/2036 put 11/1/2013 (Field Museum) | A/A2 | 3,100,000 | 3,270,562 | |||||||
Illinois Finance Authority, 5.00% due 12/1/2012 (Columbia College) | BBB+/NR | 1,000,000 | 1,036,580 | |||||||
20 Certified Annual Report
| SCHEDULE OF INVESTMENTS, CONTINUED | ||
| Thornburg Limited Term Municipal Fund | September 30, 2011 | |
Issuer-Description | Credit Rating† S&P/ Moody’s | Principal Amount | Value | |||||||
Illinois Finance Authority, 4.00% due 2/15/2013 (Alexian Brothers Health Systems) | NR/A3 | $ | 1,500,000 | $ | 1,538,145 | |||||
Illinois Finance Authority, 5.00% due 2/15/2014 (Alexian Brothers Health Systems) | NR/A3 | 3,000,000 | 3,173,940 | |||||||
Illinois Finance Authority, 5.00% due 5/1/2014 | NR/Baa3 | 3,895,000 | 4,049,904 | |||||||
Illinois Finance Authority, 5.00% due 11/1/2014 (Central DuPage Health) | AA/NR | 5,000,000 | 5,524,650 | |||||||
Illinois Finance Authority, 4.00% due 4/1/2015 (Advocate Health Care) | AA/Aa2 | 3,000,000 | 3,233,130 | |||||||
Illinois Finance Authority, 5.00% due 10/1/2015 (DePaul University) | NR/A3 | 1,000,000 | 1,116,490 | |||||||
b Illinois Finance Authority, 5.00% due 11/1/2015 (Central DuPage Health) | AA/NR | 5,000,000 | 5,624,550 | |||||||
Illinois Finance Authority, 5.25% due 12/1/2015 (Columbia College) | BBB+/NR | 1,620,000 | 1,786,520 | |||||||
Illinois Finance Authority, 5.00% due 4/1/2016 (Advocate Health Care) | AA/Aa2 | 1,250,000 | 1,408,412 | |||||||
Illinois Finance Authority, 5.00% due 12/1/2016 (Columbia College) | BBB+/NR | 1,710,000 | 1,891,551 | |||||||
Illinois Finance Authority, 5.00% due 11/1/2017 (Rush University Medical Center; Insured: Natl-Re) | A-/A2 | 1,000,000 | 1,104,210 | |||||||
Illinois Finance Authority, 5.00% due 12/1/2017 (Columbia College) | BBB+/NR | 1,395,000 | 1,543,567 | |||||||
Illinois Finance Authority, 5.50% due 11/1/2018 (Advocate Health Care) | AA/Aa2 | 1,000,000 | 1,176,990 | |||||||
Illinois Finance Authority, 5.00% due 4/1/2020 (Advocate Health Care) | AA/Aa2 | 1,000,000 | 1,121,340 | |||||||
Illinois Finance Authority, 3.875% due 11/1/2030 put 5/1/2012 (Advocate Health Care) | AA/Aa2 | 2,000,000 | 2,041,600 | |||||||
Illinois Finance Authority, 2.625% due 2/1/2033 put 8/1/2015 (Peoples Gas Light & Coke Co.) | A-/A1 | 9,500,000 | 9,709,190 | |||||||
Illinois Finance Authority, 4.30% due 6/1/2035 put 6/1/2016 (Peoples Gas Light & Coke Co.; Insured: AMBAC) | A-/A1 | 2,550,000 | 2,795,590 | |||||||
Illinois Finance Authority, 3.00% due 7/1/2042 put 5/6/2014 (Prairie Power; Insured: National Rural UTI) | A/NR | 17,150,000 | 17,756,767 | |||||||
Illinois HFA, 5.00% due 11/15/2013 (Northwestern Medical Facility; Insured: Natl-Re) | NR/A1 | 2,470,000 | 2,474,619 | |||||||
Illinois HFA, 6.00% due 7/1/2017 (Lake Forest Hospital) | AA+/Aa2 | 1,500,000 | 1,545,360 | |||||||
Illinois Sales Tax, 3.50% due 6/15/2012 | AAA/A1 | 6,055,000 | 6,183,427 | |||||||
Illinois Sales Tax, 3.50% due 6/15/2013 | AAA/A1 | 6,455,000 | 6,756,126 | |||||||
Illinois Sales Tax, 3.50% due 6/15/2014 | AAA/A1 | 6,455,000 | 6,813,898 | |||||||
Illinois Sales Tax, 5.125% due 6/15/2015 pre-refunded 6/15/2013 | AAA/A1 | 5,000,000 | 5,401,250 | |||||||
Illinois Sales Tax, 5.00% due 6/15/2016 | AAA/NR | 3,500,000 | 4,007,080 | |||||||
Illinois Sales Tax, 5.50% due 6/15/2016 | AAA/A1 | 2,020,000 | 2,026,464 | |||||||
Illinois Toll Highway Authority, 5.50% due 1/1/2014 (Insured: AGM) | AA+/Aa3 | 17,190,000 | 18,679,170 | |||||||
Illinois Toll Highway Authority, 5.50% due 1/1/2015 (Insured: AGM) | AA+/Aa3 | 5,000,000 | 5,591,900 | |||||||
Kane & Dekalb Counties Community Capital Appreciation GO, 0% due 2/1/2021 (Insured: Natl-Re/FGIC) | NR/Aa3 | 3,165,000 | 2,089,375 | |||||||
Kane County Forest Preservation District GO, 4.00% due 12/15/2015 (Insured: AMBAC) | AA+/NR | 2,295,000 | 2,308,977 | |||||||
Kane County Forest Preservation District GO, 5.00% due 12/15/2015 (Insured: Natl-Re/FGIC) | AA+/NR | 2,780,000 | 3,211,845 | |||||||
Kane County Waubonsee Community College District GO, 0% due 12/15/2013 (Insured: Natl-Re/FGIC) | AA+/Aa2 | 3,000,000 | 2,718,240 | |||||||
Kane Mc Henry Cook & Dekalb Counties Capital Appreciation GO, 0% due 12/1/2021 (Insured: AMBAC) | NR/Aa3 | 2,000,000 | 1,275,420 | |||||||
Lake County Community High School District GO, 0% due 12/1/2011 (Insured: Natl-Re/FGIC) | NR/NR | 3,235,000 | 3,221,187 | |||||||
Lake County Community High School District GO, 9.00% due 2/1/2014 (Insured: AGM) | AAA/Aa3 | 1,925,000 | 2,260,566 | |||||||
Lake County Community High School District GO, 9.00% due 2/1/2015 (Insured: AGM) | AAA/Aa3 | 1,610,000 | 2,001,021 | |||||||
Lake County Community High School District GO, 9.00% due | AAA/Aa3 | 1,890,000 | 2,454,902 | |||||||
Lake County Community High School District GO, 9.00% due 2/1/2017 (Insured: AGM) | AAA/Aa3 | 2,025,000 | 2,743,369 | |||||||
McHenry & Kane Counties Community Consolidated School District GO, 0% due 1/1/2012 (Insured: Natl-Re/FGIC) | BBB/NR | 2,200,000 | 2,186,998 | |||||||
McHenry & Kane Counties Community Consolidated School District GO, 0% due 1/1/2017 (Insured: Natl-Re) | NR/Baa1 | 1,185,000 | 957,492 | |||||||
McLean & Woodford Counties United School District GO, 5.875% due 12/1/2013 (Insured: AGM) | NR/Aa2 | 1,175,000 | 1,185,446 | |||||||
McLean & Woodford Counties United School District GO, 6.25% due 12/1/2014 (Insured: AGM) | NR/Aa2 | 1,005,000 | 1,014,578 | |||||||
Melrose Park Water Revenue, 5.20% due 7/1/2018 (Insured: Natl-Re) | BBB/Baa1 | 1,190,000 | 1,201,638 | |||||||
Metropolitan Pier & Exposition Authority Dedicated State Tax, 0% due 6/15/2013 pre-refunded 10/18/2010 (Insured: Natl-Re) (ETM) | BBB/A2 | 485,000 | 479,442 | |||||||
Certified Annual Report 21
| SCHEDULE OF INVESTMENTS, CONTINUED | ||
| Thornburg Limited Term Municipal Fund | September 30, 2011 | |
Issuer-Description | Credit Rating† S&P/ Moody’s | Principal Amount | Value | |||||||||
Metropolitan Pier & Exposition Authority Dedicated State Tax, 0% due 6/15/2013 (Insured: Natl-Re) | AAA/A2 | $ | 560,000 | $ | 540,669 | |||||||
Metropolitan Pier & Exposition Authority Dedicated State Tax, 0% due 6/15/2016 (McCormick Place; Insured: Natl-Re/FGIC) | BBB/A2 | 11,295,000 | 9,814,225 | |||||||||
Peoria, Tazewell, Etc. Counties Community College District GO, 4.25% due 12/1/2015 | AA+/Aa2 | 2,360,000 | 2,612,331 | |||||||||
Quincy Illinois, 5.00% due 11/15/2014 (Blessing Hospital) | A-/A3 | 1,000,000 | 1,059,910 | |||||||||
Quincy Illinois, 5.00% due 11/15/2016 (Blessing Hospital) | A-/A3 | 1,000,000 | 1,075,360 | |||||||||
Railsplitter Tobacco Settlement Authority, 5.00% due 6/1/2019 | A/NR | 7,940,000 | 8,651,027 | |||||||||
Regional Transportation Authority, 6.25% due 7/1/2014 (Insured: Natl-Re; GO of Authority) | AA/Aa3 | 3,500,000 | 3,986,115 | |||||||||
Sangamon County Community Unit School District No. 5, 5.00% due 1/1/2015 (Insured: AGM) | AA+/NR | 2,210,000 | 2,483,863 | |||||||||
Southwestern Illinois Development Authority, 5.125% due 8/15/2016 (Anderson Hospital) | BBB/Baa2 | 1,450,000 | 1,549,006 | |||||||||
University of Illinois Board of Trustees COP, 5.00% due 10/1/2019 (Insured: AGM) | AA+/Aa2 | 2,000,000 | 2,189,260 | |||||||||
Will County Valley View Community Unit School District No. 365 GO, 0% due 11/1/2018 (Insured: AGM) | AA+/Aa2 | 3,370,000 | 2,585,295 | |||||||||
INDIANA — 4.56% | ||||||||||||
Allen County Economic Development, 5.00% due 12/30/2012 (Indiana Institute of Technology) | NR/NR | 1,370,000 | 1,396,537 | |||||||||
Allen County Jail Building Corp. First Mtg, 5.00% due 10/1/2014 (Insured: Syncora) | NR/Aa2 | 1,000,000 | 1,106,990 | |||||||||
Allen County Jail Building Corp. First Mtg, 5.00% due 10/1/2015 (Insured: Syncora) | NR/Aa2 | 1,480,000 | 1,678,231 | |||||||||
Allen County Jail Building Corp. First Mtg, 5.00% due 10/1/2016 (Insured: Syncora) | NR/Aa2 | 1,520,000 | 1,723,619 | |||||||||
Allen County Redevelopment District, 5.00% due 11/15/2016 | NR/A2 | 1,000,000 | 1,112,660 | |||||||||
Avon Community School Building Corp., 5.00% due 7/15/2017 (Insured: AMBAC) (State Aid Withholding) | A/NR | 2,500,000 | 2,888,325 | |||||||||
Ball State University Student Fee, 5.75% due 7/1/2012 (Insured: Natl-Re/FGIC) | AA-/Aa3 | 510,000 | 516,242 | |||||||||
Brownsburg 1999 School Building Corp., 5.00% due 7/15/2013 (Insured: AGM) (State Aid Withholding) | AA+/Aa3 | 1,000,000 | 1,075,780 | |||||||||
Brownsburg 1999 School Building Corp., 5.00% due 7/15/2018 (Insured: AGM) (State Aid Withholding) | AA+/NR | 3,430,000 | 3,745,389 | |||||||||
Brownsburg 1999 School Building Corp., 5.00% due 8/1/2018 (Insured: AGM) (State Aid Withholding) | AA+/Aa3 | 1,250,000 | 1,365,888 | |||||||||
Carmel Redevelopment Authority, 0% due 2/1/2015 (Performing Arts Center) | AA+/Aa1 | 1,575,000 | 1,483,902 | |||||||||
Carmel Redevelopment District COP, 5.75% due 7/15/2022 | NR/NR | 4,470,000 | 4,458,914 | |||||||||
Clay Multiple School Building Corp., 4.00% due 7/15/2015 (State Aid Withholding) | AA+/NR | 1,000,000 | 1,091,290 | |||||||||
Clay Multiple School Building Corp., 5.00% due 7/15/2016 (State Aid Withholding) | AA+/NR | 1,295,000 | 1,488,628 | |||||||||
Clay Multiple School Building Corp., 5.00% due 1/15/2017 (State Aid Withholding) | AA+/NR | 1,000,000 | 1,159,980 | |||||||||
Evansville Vanderburgh, 5.00% due 7/15/2014 (Insured: AMBAC) | A+/NR | 1,000,000 | 1,084,960 | |||||||||
Evansville Vanderburgh, 5.00% due 7/15/2015 (Insured: AMBAC) | A+/NR | 1,000,000 | 1,105,580 | |||||||||
Fort Wayne Sewer Works Improvement, 4.25% due 8/1/2013 | NR/Aa3 | 1,715,000 | 1,804,643 | |||||||||
Fort Wayne Sewer Works Improvement, 4.25% due 8/1/2014 | NR/Aa3 | 1,745,000 | 1,872,490 | |||||||||
Fort Wayne Sewer Works Improvement, 4.25% due 8/1/2015 | NR/Aa3 | 1,780,000 | 1,941,873 | |||||||||
Hammond Multi-School Building Corp., 5.00% due 1/15/2014 (Insured: Natl-Re/FGIC) (State Aid Withholding) | AA+/NR | 1,000,000 | 1,096,280 | |||||||||
Indiana Bond Bank, 5.25% due 10/15/2016 (Special Gas Program) | NR/Aa3 | 1,545,000 | 1,712,555 | |||||||||
Indiana Bond Bank, 5.00% due 10/15/2017 | NR/Aa3 | 5,000,000 | 5,469,350 | |||||||||
Indiana Finance Authority, 5.00% due 5/1/2015 (Parkview Health Systems) | A+/A1 | 1,500,000 | 1,640,625 | |||||||||
Indiana Finance Authority, 4.90% due 1/1/2016 (Indianapolis Power & Light Co.) | BBB/A3 | 11,650,000 | 12,766,070 | |||||||||
Indiana Finance Authority, 5.00% due 5/1/2016 (Parkview Health Systems) | A+/A1 | 3,090,000 | 3,415,223 | |||||||||
Indiana Finance Authority, 5.00% due 7/1/2016 (Forensic & Health Science; Insured: Natl-Re) | AA+/Aa1 | 1,030,000 | 1,181,235 | |||||||||
Indiana Finance Authority, 5.00% due 5/1/2017 (Parkview Health Systems) | A+/A1 | 1,000,000 | 1,109,900 | |||||||||
Indiana Finance Authority, 5.25% due 7/1/2018 (Wabash Correctional Facilities) | AA+/Aa1 | 1,000,000 | 1,183,150 | |||||||||
Indiana Finance Authority, 5.25% due 7/1/2018 (Rockville Correctional Facilities) | AA+/NR | 2,150,000 | 2,543,773 | |||||||||
Indiana Finance Authority, 5.00% due 11/1/2018 | AA+/Aa2 | 2,750,000 | 3,240,958 | |||||||||
22 Certified Annual Report
| SCHEDULE OF INVESTMENTS, CONTINUED | ||
| Thornburg Limited Term Municipal Fund | September 30, 2011 | |
Issuer-Description | Credit Rating† S&P/ Moody’s | Principal Amount | Value | |||||||
Indiana Finance Authority, 0.15% due 2/1/2035 put 10/3/2011 (Lease Appropriation; SPA: JPMorgan Chase Bank) (daily demand notes) | AA+/NR | $ | 5,800,000 | $ | 5,800,000 | |||||
Indiana Finance Authority, 0.13% due 2/1/2037 put 10/3/2011 (Lease Appropriation; SPA: JPMorgan Chase Bank) (daily demand notes) | AA+/Aa3 | 34,200,000 | 34,200,000 | |||||||
Indiana Finance Authority, 0.20% due 2/1/2037 put 10/3/2011 (Lease Appropriation; SPA: JPMorgan Chase Bank) (daily demand notes) | AA+/Aa2 | 14,150,000 | 14,150,000 | |||||||
Indiana Finance Authority, 0.20% due 3/28/2037 put 10/3/2011 (Lease Appropriation; SPA: JPMorgan Chase Bank) (daily demand notes) | AA+/Aa2 | 6,700,000 | 6,700,000 | |||||||
Indiana Health Facilities, 5.00% due 11/1/2014 (Sisters of St. Francis) | NR/Aa3 | 1,000,000 | 1,106,850 | |||||||
Indiana Health Facilities, 5.50% due 11/15/2015 (Ascension Health) | AA+/Aa1 | 510,000 | 539,544 | |||||||
Indiana Health Facilities, 5.50% due 11/15/2016 (Ascension Health) | AA+/Aa1 | 1,385,000 | 1,465,233 | |||||||
Indiana Health Facilities, 5.00% due 11/1/2018 (Sisters of St. Francis) | NR/Aa3 | 1,250,000 | 1,446,750 | |||||||
Indiana Health Facilities, 5.75% due 11/1/2021 pre-refunded 11/1/2011 (Sisters of St. Francis) | NR/Aa3 | 3,545,000 | 3,597,466 | |||||||
Indiana Health Facilities, 5.00% due 10/1/2027 put 6/1/2017 (Ascension Health) | NR/Aa2 | 7,000,000 | 8,047,970 | |||||||
Indiana Multi-School Building Corp. First Mtg, 5.00% due 7/15/2016 (Insured: Natl-Re) | AA/Baa1 | 5,000,000 | 5,789,800 | |||||||
Indianapolis Local Public Improvement Bond Bank, 6.75% due 2/1/2014 | AA/NR | 1,005,000 | 1,066,285 | |||||||
Indianapolis Local Public Improvement Bond Bank, 5.00% due 1/1/2015 (Waterworks; Insured: Natl-Re) | A+/A2 | 1,000,000 | 1,111,020 | |||||||
Indianapolis Local Public Improvement Bond Bank, 5.00% due 7/1/2015 (Waterworks; Insured: Natl-Re) | A+/A2 | 1,000,000 | 1,125,090 | |||||||
Indianapolis Local Public Improvement Bond Bank, 5.00% due 7/1/2016 (Insured: Natl-Re/FGIC) | AA+/Aa1 | 1,030,000 | 1,158,441 | |||||||
Indianapolis Multi-School Building Corp. First Mtg, 5.50% due 7/15/2015 (Insured: Natl-Re) | AA/Baa1 | 1,690,000 | 1,956,158 | |||||||
Ivy Tech Community College, 4.00% due 7/1/2013 | AA-/NR | 1,000,000 | 1,054,050 | |||||||
Ivy Tech Community College, 4.00% due 7/1/2014 | AA-/NR | 1,500,000 | 1,622,925 | |||||||
Ivy Tech State College Industry, 4.80% due 7/1/2016 (Student Fee; Insured: AMBAC) | AA-/NR | 2,565,000 | 2,626,688 | |||||||
Ivy Tech State College Industry, 4.90% due 7/1/2017 (Student Fee; Insured: AMBAC) | AA-/NR | 2,725,000 | 2,793,479 | |||||||
Knox Middle School Building Corp. First Mtg, 0% due 1/15/2020 (Insured: Natl-Re/FGIC) (State Aid Withholding) | BBB/NR | 1,295,000 | 903,068 | |||||||
Madison Schools Lydia Middleton Building Corp., 5.00% due 7/15/2014 (Insured: Natl-Re/ FGIC) (State Aid Withholding) | AA+/NR | 1,200,000 | 1,341,504 | |||||||
Madison Schools Lydia Middleton Building Corp., 5.00% due 7/15/2015 (Insured: Natl-Re/ FGIC) (State Aid Withholding) | AA+/NR | 1,250,000 | 1,436,313 | |||||||
Mount Vernon of Hancock County First Mtg, 5.00% due 7/15/2013 (Insured: Natl-Re) (State Aid Withholding) | A/Baa1 | 1,055,000 | 1,125,769 | |||||||
Mount Vernon of Hancock County First Mtg, 5.00% due 7/15/2014 (Insured: Natl-Re) (State Aid Withholding) | A/Baa1 | 1,135,000 | 1,245,515 | |||||||
Mount Vernon of Hancock County First Mtg, 5.00% due 7/15/2015 (Insured: Natl-Re) (State Aid Withholding) | A/Baa1 | 1,140,000 | 1,282,021 | |||||||
Noblesville Redevelopment Authority, 5.00% due 8/1/2016 (146th Street Extension A) | AA-/NR | 1,660,000 | 1,906,759 | |||||||
Perry Township-Multi School Building Corp., 5.00% due 7/10/2014 (Insured: AGM) (State Aid Withholding) | NR/Aa2 | 2,130,000 | 2,358,272 | |||||||
Plainfield Community High School Building Corp. First Mtg, 5.00% due 1/15/2015 (Insured: Natl-Re/FGIC) | A/NR | 1,445,000 | 1,599,687 | |||||||
Rockport PCR, 6.25% due 6/1/2025 put 6/2/2014 (Indiana Michigan Power Co.) | BBB/Baa2 | 4,100,000 | 4,567,318 | |||||||
Rockport PCR, 6.25% due 6/1/2025 put 6/2/2014 (Indiana Michigan Power Co.) | BBB/Baa2 | 1,000,000 | 1,113,980 | |||||||
South Bend Community School Building Corp., 4.00% due 1/15/2013 (State Aid Withholding) | AA+/NR | 1,545,000 | 1,604,730 | |||||||
South Bend Community School Building Corp., 4.00% due 1/15/2013 | AA+/NR | 1,400,000 | 1,454,124 | |||||||
South Bend Community School Building Corp., 4.00% due 7/15/2013 (State Aid Withholding) | AA+/NR | 1,000,000 | 1,053,400 | |||||||
South Bend Community School Building Corp., 5.00% due 7/15/2016 (Insured: Natl-Re/FGIC) (State Aid Withholding) | AA+/NR | 1,785,000 | 2,078,079 | |||||||
Vincennes University, 3.00% due 6/1/2014 | NR/Aa3 | 1,000,000 | 1,046,630 | |||||||
Vincennes University, 3.00% due 6/1/2015 | NR/Aa3 | 1,000,000 | 1,056,910 | |||||||
Vincennes University, 4.00% due 6/1/2018 | NR/Aa3 | 1,000,000 | 1,107,340 | |||||||
Certified Annual Report 23
| SCHEDULE OF INVESTMENTS, CONTINUED | ||
| Thornburg Limited Term Municipal Fund | September 30, 2011 | |
Issuer-Description | Credit Rating† S&P/ Moody’s | Principal Amount | Value | |||||||
Vincennes University, 5.00% due 6/1/2020 | NR/Aa3 | $ | 1,000,000 | $ | 1,178,550 | |||||
Warren Township Vision 2005, 5.00% due 7/10/2015 (Insured: Natl-Re/FGIC) (State Aid Withholding) | AA+/NR | 2,895,000 | 3,274,158 | |||||||
West Clark School Building Corp., 5.25% due 1/15/2014 (Insured: Natl-Re) | AA+/Baa1 | 1,335,000 | 1,472,679 | |||||||
IOWA — 0.38% | ||||||||||
Des Moines Limited Obligation, 4.40% due 12/1/2015 put 12/1/2011 (Des Moines Parking Associates; LOC: Wells Fargo Bank) | NR/NR | 1,980,000 | 1,984,871 | |||||||
Dubuque Community School District, 2.75% due 1/1/2012 | NR/NR | 1,500,000 | 1,504,455 | |||||||
Iowa Health Facilities Revenue, 5.00% due 2/15/2014 (Iowa Health System; Insured: AGM) | NR/Aa3 | 2,500,000 | 2,712,225 | |||||||
Iowa Health Facilities Revenue, 5.00% due 2/15/2015 (Iowa Health System; Insured: AGM) | NR/Aa3 | 2,300,000 | 2,559,509 | |||||||
Iowa Health Facilities Revenue, 5.00% due 2/15/2016 (Iowa Health System; Insured: AGM) | NR/Aa3 | 1,600,000 | 1,809,616 | |||||||
Iowa Health Facilities Revenue, 5.00% due 8/15/2016 (Iowa Health System; Insured: AGM) | NR/Aa3 | 1,500,000 | 1,712,715 | |||||||
Iowa Health Facilities Revenue, 5.00% due 2/15/2017 (Iowa Health System; Insured: AGM) | NR/Aa3 | 1,600,000 | 1,830,608 | |||||||
Iowa Health Facilities Revenue, 5.00% due 8/15/2017 (Iowa Health System; Insured: AGM) | NR/Aa3 | 990,000 | 1,141,312 | |||||||
Iowa Health Facilities Revenue, 5.00% due 2/15/2018 (Iowa Health System; Insured: AGM) | NR/Aa3 | 1,405,000 | 1,617,281 | |||||||
KANSAS — 0.67% | ||||||||||
Burlington Environmental Improvement, 5.25% due 12/1/2023 put 4/1/2013 (Kansas City Power & Light; Insured: Syncora) | BBB+/A3 | 5,000,000 | 5,289,500 | |||||||
Burlington Environmental Improvement, 5.375% due 9/1/2035 put 4/1/2013 (Kansas City Power & Light; Insured: Natl-Re/FGIC) | BBB/Baa2 | 12,500,000 | 13,246,875 | |||||||
Kansas Development Finance Authority, 5.00% due 11/1/2015 | AA/Aa2 | 2,605,000 | 3,009,817 | |||||||
Valdez Marine Terminal Revenue, 5.00% due 1/1/2021 (BP Pipelines Inc.) | NR/NR | 7,000,000 | 7,912,100 | |||||||
KENTUCKY — 0.36% | ||||||||||
Jefferson County School District, 5.25% due 1/1/2016 (Insured: AGM) | AA+/Aa2 | 2,145,000 | 2,497,295 | |||||||
Kentucky Economic DFA, 0% due 10/1/2019 (Norton Health Care; Insured: Natl-Re) | BBB/Baa1 | 5,000,000 | 3,465,900 | |||||||
Kentucky Economic DFA, 0% due 10/1/2021 (Norton Health Care; Insured: Natl-Re) | BBB/Baa1 | 2,100,000 | 1,284,276 | |||||||
Kentucky Economic DFA, 5.00% due 5/1/2039 put 11/11/2014 (Catholic Health) | AA/Aa2 | 5,000,000 | 5,589,700 | |||||||
Kentucky Municipal Power Agency, 4.00% due 9/1/2015 (Insured: Assured Guaranty) | AA+/Aa3 | 2,955,000 | 3,241,428 | |||||||
LOUISIANA — 3.55% | ||||||||||
Bossier City Louisiana Public Improvement, 4.00% due 12/1/2018 (Insured: AGM) | AA+/Aa3 | 2,020,000 | 2,247,432 | |||||||
Bossier City Louisiana Public Improvement, 4.50% due 12/1/2021 (Insured: AGM) | AA+/Aa3 | 2,240,000 | 2,519,350 | |||||||
East Baton Rouge Sewer, 4.00% due 2/1/2013 | AA-/Aa3 | 1,000,000 | 1,046,380 | |||||||
East Baton Rouge Sewer, 5.00% due 2/1/2014 | AA-/Aa3 | 1,000,000 | 1,098,250 | |||||||
East Baton Rouge Sewer, 5.00% due 2/1/2018 (Insured: AGM) | AA+/Aa3 | 3,000,000 | 3,409,380 | |||||||
East Baton Rouge Sewer Commission, 3.00% due 2/1/2012 | AA-/Aa3 | 1,000,000 | 1,009,070 | |||||||
Ernest N. Morial New Orleans Exhibit Hall, 5.00% due 7/15/2013 (Insured: AMBAC) | BBB/NR | 2,075,000 | 2,171,965 | |||||||
Jefferson Sales Tax, 5.00% due 12/1/2018 (Insured: AGM) | AA+/Aa3 | 2,000,000 | 2,342,280 | |||||||
Lafayette Utilities Revenue, 4.00% due 11/1/2016 | A+/A1 | 1,395,000 | 1,545,297 | |||||||
Lafayette Utilities Revenue, 5.00% due 11/1/2019 | A+/A1 | 1,000,000 | 1,170,810 | |||||||
Louisiana Citizens Property Insurance Corp., 5.00% due 6/1/2015 | A-/Baa1 | 10,265,000 | 11,050,272 | |||||||
Louisiana Environmental Facilities & Community Development Authority, 5.00% due 9/1/2012 (Bellemont Apartments) | NR/Ba3 | 190,000 | 190,245 | |||||||
Louisiana Environmental Facilities & Community Development Authority, 4.00% due 10/1/2013 (LCTCS Facilities Corp.) | AA-/A1 | 1,500,000 | 1,584,405 | |||||||
Louisiana Environmental Facilities & Community Development Authority, 4.00% due 10/1/2014 (LCTCS Facilities Corp.) | AA-/A1 | 1,500,000 | 1,615,575 | |||||||
Louisiana Environmental Facilities & Community Development Authority, 5.00% due 3/1/2015 (Independence Stadium) | A/NR | 1,000,000 | 1,098,210 | |||||||
24 Certified Annual Report
| SCHEDULE OF INVESTMENTS, CONTINUED | ||
| Thornburg Limited Term Municipal Fund | September 30, 2011 | |
Issuer-Description | Credit Rating† S&P/ Moody’s | Principal Amount | Value | |||||||
Louisiana Environmental Facilities & Community Development Authority, 5.00% due 3/1/2016 (Independence Stadium) | A/NR | $ | 1,000,000 | $ | 1,112,160 | |||||
Louisiana Environmental Facilities & Community Development Authority, 5.00% due 3/1/2017 (Independence Stadium) | A/NR | 1,265,000 | 1,415,548 | |||||||
Louisiana Environmental Facilities & Community Development Authority, 5.00% due 3/1/2018 (Independence Stadium) | A/NR | 1,000,000 | 1,124,730 | |||||||
Louisiana Offshore Terminal Authority, 5.00% due 10/1/2018 (Loop LLC) | NR/NR | 22,000,000 | 25,171,080 | |||||||
Louisiana Offshore Terminal Authority, 2.125% due 10/1/2037 put 10/1/2015 (Loop LLC) | A/NR | 5,000,000 | 4,994,550 | |||||||
Louisiana Public Facilities Authority Hospital Revenue, 5.75% due 7/1/2015 (Franciscan Missionaries; Insured: AGM) | AA+/Aa3 | 1,325,000 | 1,505,280 | |||||||
Louisiana Public Facilities Authority Revenue, 5.00% due 8/1/2012 (Department of Public Safety; Insured: AGM) | AA+/Aa3 | 1,250,000 | 1,291,725 | |||||||
Louisiana Public Facilities Authority Revenue, 5.00% due 8/1/2013 (Department of Public Safety; Insured: AGM) | AA+/Aa3 | 2,500,000 | 2,663,150 | |||||||
Louisiana Public Facilities Authority Revenue, 5.00% due 5/15/2014 (Ochsner Clinic Foundation) | NR/Baa1 | 1,000,000 | 1,064,180 | |||||||
Louisiana Public Facilities Authority Revenue, 5.00% due 5/15/2015 (Ochsner Clinic Foundation) | NR/Baa1 | 1,825,000 | 1,971,000 | |||||||
Louisiana Public Facilities Authority Revenue, 2.875% due 11/1/2015 (Entergy Gulf States) | BBB+/A3 | 2,500,000 | 2,554,350 | |||||||
Louisiana Public Facilities Authority Revenue, 5.00% due 5/15/2016 (Ochsner Clinic Foundation) | NR/Baa1 | 1,000,000 | 1,088,220 | |||||||
Louisiana Public Facilities Authority Revenue, 5.00% due 5/15/2017 (Ochsner Clinic Foundation) | NR/Baa1 | 1,035,000 | 1,127,560 | |||||||
Louisiana Public Facilities Authority Revenue, 5.00% due 5/15/2018 (Ochsner Clinic Foundation) | NR/Baa1 | 1,000,000 | 1,066,950 | |||||||
Louisiana Public Facilities Authority Revenue, 7.00% due 12/1/2038 put 12/1/2011 (Cleco Power LLC) | BBB/Baa2 | 9,000,000 | 9,079,290 | |||||||
Louisiana State GO, 5.00% due 8/1/2017 (Insured: Natl-Re) | AA/Aa2 | 4,000,000 | 4,557,160 | |||||||
Louisiana State Office Facilities Corp. Lease Revenue, 3.75% due 3/1/2015 (Capitol Complex) | AA-/Aa3 | 5,000,000 | 5,332,000 | |||||||
Louisiana State Office Facilities Corp. Lease Revenue, 5.00% due 5/1/2015 (State Capitol) | NR/Aa3 | 2,830,000 | 3,146,960 | |||||||
Louisiana State Office Facilities Corp. Lease Revenue, 5.00% due 5/1/2016 (State Capitol) | NR/Aa3 | 1,000,000 | 1,126,150 | |||||||
Louisiana State Office Facilities Corp. Lease Revenue, 5.00% due 5/1/2018 (State Capitol) | NR/Aa3 | 2,500,000 | 2,845,400 | |||||||
Louisiana State Office Facilities Corp. Lease Revenue, 5.00% due 5/1/2021 (State Capitol) | NR/Aa3 | 3,595,000 | 4,024,099 | |||||||
Monroe Sales Tax Increment Garrett Road Economic Development Area, 5.00% due 3/1/2017 pre-refunded 3/1/2015 (Insured: Radian) | NR/NR | 1,505,000 | 1,694,991 | |||||||
Morehouse Parish PCR, 5.25% due 11/15/2013 (International Paper Co.) | BBB/Baa3 | 2,400,000 | 2,544,504 | |||||||
New Orleans Audubon Commission GO, 5.00% due 10/1/2016 (Aquarium Tax) | A/NR | 2,380,000 | 2,676,881 | |||||||
New Orleans Audubon Commission GO, 4.00% due 10/1/2018 (Aquarium Tax; Insured: AGM) | AA+/NR | 1,110,000 | 1,176,755 | |||||||
Parishwide School District GO, 5.00% due 9/1/2016 (Insured: AGM) | AA+/Aa3 | 4,500,000 | 5,124,915 | |||||||
Parishwide School District GO, 5.00% due 9/1/2018 (Insured: AGM) | AA+/Aa3 | 4,800,000 | 5,519,568 | |||||||
Parishwide School District GO, 5.00% due 9/1/2020 (Insured: AGM) | AA+/Aa3 | 3,840,000 | 4,380,864 | |||||||
Plaquemines Parish Law Enforcement District GO, 5.00% due 9/1/2019 | BBB+/NR | 1,005,000 | 1,105,028 | |||||||
Plaquemines Parish Law Enforcement District GO, 5.00% due 9/1/2021 | BBB+/NR | 1,115,000 | 1,200,197 | |||||||
Regional Transit Authority, 8.00% due 12/1/2011 (Insured: Natl-Re/FGIC) | BBB/NR | 1,250,000 | 1,263,338 | |||||||
Regional Transit Authority, 0% due 12/1/2015 (Insured: Natl-Re/FGIC) | BBB/NR | 3,670,000 | 3,109,995 | |||||||
Regional Transit Authority Sales Tax, 5.00% due 12/1/2017 (Insured: AGM) | AA+/Aa3 | 755,000 | 882,957 | |||||||
Regional Transit Authority Sales Tax, 5.00% due 12/1/2019 (Insured: AGM) | AA+/Aa3 | 1,000,000 | 1,171,570 | |||||||
Regional Transit Authority Sales Tax, 5.00% due 12/1/2021 (Insured: AGM) | NR/NR | 1,000,000 | 1,153,880 | |||||||
Regional Transit Authority Sales Tax, 5.00% due 12/1/2022 (Insured: AGM) | AA+/Aa3 | 1,110,000 | 1,264,523 | |||||||
St. Tammany Parish, 5.00% due 6/1/2017 (Insured: CIFG) | A+/NR | 1,405,000 | 1,585,964 | |||||||
Terrebonne Parish Louisiana Hospital Service, 4.00% due 4/1/2014 (General Medical Center) | A/A2 | 800,000 | 835,376 | |||||||
Terrebonne Parish Louisiana Hospital Service, 4.00% due 4/1/2015 (General Medical Center) | A/A2 | 575,000 | 607,120 | |||||||
Terrebonne Parish Louisiana Hospital Service, 4.00% due 4/1/2017 (General Medical Center) | A/A2 | 1,000,000 | 1,055,320 | |||||||
Terrebonne Parish Louisiana Hospital Service, 5.00% due 4/1/2018 (General Medical Center) | A/A2 | 1,000,000 | 1,106,960 | |||||||
Terrebonne Parish Louisiana Hospital Service, 5.00% due 4/1/2019 (General Medical Center) | A/A2 | 1,810,000 | 1,995,326 | |||||||
Terrebonne Parish Louisiana Hospital Service, 5.00% due 4/1/2021 (General Medical Center) | A/A2 | 2,320,000 | 2,537,059 | |||||||
Certified Annual Report 25
| SCHEDULE OF INVESTMENTS, CONTINUED | ||
| Thornburg Limited Term Municipal Fund | September 30, 2011 | |
Issuer-Description | Credit Rating† S&P/ Moody’s | Principal Amount | Value | |||||||
MAINE — 0.08% | ||||||||||
Maine Finance Authority Solid Waste Disposal, 3.80% due 11/1/2015 (Waste Management, Inc.) | BBB/NR | $ | 3,440,000 | $ | 3,716,886 | |||||
MASSACHUSETTS — 2.01% | ||||||||||
Berkshire Wind Power Cooperative Corp., 5.00% due 7/1/2017 | A-/NR | 2,540,000 | 2,882,570 | |||||||
Berkshire Wind Power Cooperative Corp., 5.00% due 7/1/2018 | A-/NR | 2,825,000 | 3,219,765 | |||||||
Berkshire Wind Power Cooperative Corp., 5.00% due 7/1/2019 | A-/NR | 2,765,000 | 3,138,717 | |||||||
Berkshire Wind Power Cooperative Corp., 5.00% due 7/1/2020 | A-/NR | 2,965,000 | 3,327,560 | |||||||
Greater Lawrence Vocational Technical High School District GO, 2.00% due 3/1/2013 (State Aid Withholding) | NR/Aa2 | 1,470,000 | 1,497,092 | |||||||
Massachusetts DFA, 5.625% due 1/1/2015 (Semass Partnership; Insured: Natl-Re) | BBB/Baa1 | 1,025,000 | 1,041,872 | |||||||
Massachusetts DFA, 3.45% due 12/1/2015 (Carleton-Willard Village) | A-/NR | 2,760,000 | 2,777,830 | |||||||
Massachusetts DFA, 5.625% due 1/1/2016 (Semass Partnership; Insured: Natl-Re) | BBB/Baa1 | 1,970,000 | 2,001,599 | |||||||
Massachusetts DFA, 0.12% due 10/1/2042 put 10/3/2011 (Boston University; LOC: JPMorgan Chase Bank) (daily demand notes) | AAA/Aa1 | 3,700,000 | 3,700,000 | |||||||
Massachusetts Educational Financing Authority, 5.25% due 1/1/2016 | AA/NR | 2,450,000 | 2,727,462 | |||||||
Massachusetts Educational Financing Authority, 5.50% due 1/1/2017 | AA/NR | 1,700,000 | 1,934,260 | |||||||
Massachusetts Educational Financing Authority, 5.50% due 1/1/2018 | AA/NR | 11,170,000 | 12,716,598 | |||||||
Massachusetts Educational Financing Authority, 5.75% due 1/1/2020 | AA/NR | 7,500,000 | 8,729,250 | |||||||
Massachusetts Health & Educational Facilities Authority, 5.00% due 10/1/2011 (Berkshire Health Systems; Insured: AGM) | AA+/NR | 2,345,000 | 2,345,258 | |||||||
Massachusetts Health & Educational Facilities Authority, 5.375% due 5/15/2012 (New England Medical Center Hospital; Insured: Natl-Re/FGIC) (ETM) | NR/NR | 3,415,000 | 3,521,821 | |||||||
Massachusetts Health & Educational Facilities Authority, 5.00% due 10/1/2012 (Berkshire Health Systems; Insured: AGM) | AA+/NR | 2,330,000 | 2,415,488 | |||||||
Massachusetts Health & Educational Facilities Authority, 5.00% due 10/1/2013 (Berkshire Health Systems; Insured: AGM) | AA+/NR | 3,215,000 | 3,406,678 | |||||||
Massachusetts Health & Educational Facilities Authority, 5.00% due 7/1/2014 (UMass Memorial Health Care) | A-/Baa1 | 2,750,000 | 2,892,670 | |||||||
Massachusetts Health & Educational Facilities Authority, 5.00% due 7/1/2015 (UMass Memorial Health Care) | A-/Baa1 | 2,625,000 | 2,794,549 | |||||||
Massachusetts Health & Educational Facilities Authority, 5.00% due 7/1/2018 (UMass Memorial Health Care) | A-/Baa1 | 4,290,000 | 4,547,915 | |||||||
Massachusetts Health & Educational Facilities Authority, 5.00% due 10/1/2019 (Berkshire Health Systems; Insured: AGM) | AA+/NR | 1,750,000 | 1,854,633 | |||||||
Massachusetts Solid Waste Disposal Revenue, 5.75% due 12/1/2042 put 5/1/2019 (Dominion Energy Brayton) | A-/Baa2 | 2,000,000 | 2,298,480 | |||||||
Massachusetts Western Turnpike Revenue, 5.55% due 1/1/2017 (Insured: Natl-Re) | BBB/Aa3 | 11,400,000 | 11,450,046 | |||||||
Pioneer Valley Regional School District GO, 5.375% due 6/15/2019 (Insured: AMBAC) (State Aid Withholding) | NR/Aa2 | 1,230,000 | 1,276,248 | |||||||
MICHIGAN — 6.40% | ||||||||||
Battle Creek, 5.00% due 5/1/2020 (Insured: AMBAC) | AA-/Aa3 | 3,200,000 | 3,552,352 | |||||||
Byron Center Michigan Public Schools, 3.00% due 5/1/2013 (Insured: Q-SBLF) | AA-/NR | 1,745,000 | 1,800,439 | |||||||
Byron Center Michigan Public Schools, 4.00% due 5/1/2015 (Insured: Q-SBLF) | AA-/NR | 1,985,000 | 2,161,744 | |||||||
Byron Center Michigan Public Schools, 4.00% due 5/1/2017 (Insured: AGM/Q-SBLF) | AA+/NR | 1,305,000 | 1,431,924 | |||||||
Byron Center Michigan Public Schools, 4.00% due 5/1/2018 (Insured: AGM/Q-SBLF) | AA+/NR | 1,935,000 | 2,116,851 | |||||||
Byron Center Michigan Public Schools, 4.00% due 5/1/2020 (Insured: AGM/Q-SBLF) | AA+/NR | 1,000,000 | 1,075,960 | |||||||
Detroit Sewage Disposal Revenue, 5.00% due 7/1/2013 (Insured: AGM) | AA+/Aa3 | 1,590,000 | 1,680,185 | |||||||
Detroit Sewage Disposal Revenue, 5.00% due 7/1/2014 (Insured: Natl-Re) | A/A2 | 2,000,000 | 2,136,000 | |||||||
Detroit Sewage Disposal Revenue, 5.00% due 7/1/2015 (Insured: Natl-Re) | A/A2 | 3,000,000 | 3,256,860 | |||||||
Detroit Sewage Disposal Revenue, 5.50% due 7/1/2015 (Insured: AGM) | AA+/Aa3 | 3,920,000 | 4,380,365 | |||||||
26 Certified Annual Report
| SCHEDULE OF INVESTMENTS, CONTINUED | ||
| Thornburg Limited Term Municipal Fund | September 30, 2011 | |
Issuer-Description | Credit Rating† S&P/ Moody’s | Principal Amount | Value | |||||||
Detroit Sewage Disposal Revenue, 5.50% due 7/1/2016 (Insured: Natl-Re) | A+/A1 | $ | 375,000 | $ | 418,864 | |||||
Detroit Sewage Disposal Revenue, 5.50% due 7/1/2017 (Insured: AGM) | AA+/Aa3 | 825,000 | 949,179 | |||||||
Detroit Sewage Disposal Revenue, 5.25% due 7/1/2019 (Insured: Natl-Re) | A+/A1 | 3,900,000 | 4,233,567 | |||||||
Detroit Sewage Disposal Revenue, 5.25% due 7/1/2020 (Insured: Natl-Re) | A+/A1 | 3,415,000 | 3,672,184 | |||||||
Detroit Sewage Disposal Revenue, 5.25% due 7/1/2020 (Insured: Natl-Re) | A+/A1 | 4,305,000 | 4,629,210 | |||||||
Detroit Water Supply Systems, 5.00% due 7/1/2015 (Insured: Natl-Re; FGIC) | A+/A1 | 6,000,000 | 6,645,180 | |||||||
Detroit Water Supply Systems, 6.00% due 7/1/2015 (Insured: Natl-Re) | A+/A1 | 3,280,000 | 3,743,005 | |||||||
Detroit Water Supply Systems, 5.00% due 7/1/2016 (Insured: AGM) | AA+/Aa3 | 2,750,000 | 3,077,112 | |||||||
Dickinson County Economic Development Corp. Environmental Impact, 5.75% due 6/1/2016 (International Paper Co.) | BBB/Baa3 | 8,845,000 | 8,943,091 | |||||||
Dickinson County Health Care Systems, 5.50% due 11/1/2013 (Insured: ACA) | NR/NR | 3,140,000 | 3,143,988 | |||||||
Genesee County GO, 2.00% due 5/1/2012 | NR/A1 | 1,395,000 | 1,403,217 | |||||||
Genesee County GO, 2.00% due 5/1/2013 | NR/A1 | 1,000,000 | 1,011,170 | |||||||
Grand Haven Electric Revenue, 5.50% due 7/1/2016 (Insured: Natl-Re) | BBB/Baa1 | 3,890,000 | 4,303,040 | |||||||
Gull Lake Community School District GO, 0% due 5/1/2013 (Insured: Natl-Re/FGIC) | BBB/NR | 980,000 | 914,085 | |||||||
Kalamazoo Hospital Finance Authority Facilities Revenue, 4.00% due 5/15/2015 (Bronson Hospital; Insured: AGM) | NR/Aa3 | 1,735,000 | 1,861,135 | |||||||
Kalamazoo Hospital Finance Authority Facilities Revenue, 4.00% due 5/15/2016 (Bronson Hospital; Insured: AGM) | NR/Aa3 | 1,850,000 | 1,992,931 | |||||||
Kalamazoo Hospital Finance Authority Facilities Revenue, 4.50% due 5/15/2017 (Bronson Hospital; Insured: AGM) | NR/Aa3 | 1,830,000 | 2,021,107 | |||||||
Kalamazoo Hospital Finance Authority Facilities Revenue, 5.00% due 5/15/2018 (Bronson Hospital; Insured: AGM) | AA+/Aa3 | 1,520,000 | 1,733,499 | |||||||
Kalamazoo Hospital Finance Authority Facilities Revenue, 5.00% due 5/15/2018 (Bronson Hospital; Insured: AGM) | AA+/Aa3 | 2,500,000 | 2,851,150 | |||||||
Kalamazoo Hospital Finance Authority Facilities Revenue, 5.00% due 5/15/2020 (Bronson Hospital; Insured: AGM) | NR/Aa3 | 1,735,000 | 1,952,829 | |||||||
Kalamazoo Hospital Finance Authority Facilities Revenue, 5.00% due 5/15/2021 (Bronson Hospital; Insured: AGM) | NR/Aa3 | 2,350,000 | 2,613,529 | |||||||
Kent Hospital Finance Authority, 5.25% due 1/15/2047 put 1/15/2014 (Spectrum Health) | AA/Aa3 | 5,865,000 | 6,413,671 | |||||||
Kentwood Public Schools GO, 5.00% due 5/1/2015 (Insured: Natl-Re) | AA-/Aa2 | 4,050,000 | 4,282,267 | |||||||
Lansing Steam & Electric Utility Systems, 5.00% due 7/1/2016 (Insured: AMBAC) | AA-/Aa3 | 2,000,000 | 2,057,980 | |||||||
Michigan Finance Authority Revenue, 2.00% due 8/20/2012 (State Appropriation) | SP-1+/NR | 25,000,000 | 25,340,250 | |||||||
Michigan Housing Development Authority Rental Housing Revenue GO, 5.00% due 4/1/2016 | AA/NR | 4,505,000 | 4,662,179 | |||||||
Michigan State Building Authority, 5.25% due 10/15/2012 (Insured: AGM) | AA+/Aa3 | 4,285,000 | 4,490,937 | |||||||
Michigan State Building Authority, 5.25% due 10/15/2014 (Insured: AGM) | AA+/Aa3 | 4,300,000 | 4,663,393 | |||||||
Michigan State Building Authority, 5.00% due 10/15/2015 (Insured: AMBAC) | A+/Aa3 | 6,000,000 | 6,763,380 | |||||||
Michigan State Building Authority, 5.25% due 10/15/2015 (Insured: AGM) | AA+/Aa3 | 1,305,000 | 1,410,640 | |||||||
Michigan State Building Authority, 5.50% due 10/15/2017 | A+/Aa3 | 4,000,000 | 4,694,720 | |||||||
Michigan State HFA, 5.50% due 11/15/2015 (Henry Ford Health | A/A1 | 2,300,000 | 2,551,620 | |||||||
Michigan State HFA, 5.00% due 11/15/2017 (Sparrow Memorial Hospital) | A+/A1 | 1,500,000 | 1,678,515 | |||||||
Michigan State HFA, 5.50% due 11/15/2017 (Henry Ford Health System) | A/A1 | 1,530,000 | 1,726,345 | |||||||
Michigan State HFA, 5.50% due 11/15/2018 (Henry Ford Health System) | A/A1 | 3,500,000 | 3,955,315 | |||||||
Michigan State HFA, 5.75% due 12/1/2034 put 12/1/2015 (Trinity Health) | AA/Aa2 | 10,000,000 | 11,625,400 | |||||||
Michigan State Hospital Finance Authority, 5.00% due 11/15/2013 (Sparrow Hospital) | A+/A1 | 1,225,000 | 1,319,815 | |||||||
Michigan State Hospital Finance Authority, 5.00% due 7/15/2015 (Oakwood Obligation Group) | A/A2 | 2,500,000 | 2,710,800 | |||||||
Michigan State Hospital Finance Authority, 5.00% due 7/15/2016 (Oakwood Obligation Group) | A/A2 | 1,205,000 | 1,317,113 | |||||||
Michigan State Hospital Finance Authority, 5.00% due 11/15/2016 (Ascension Health) | AA+/Aa1 | 3,000,000 | 3,459,960 | |||||||
Michigan State Hospital Finance Authority, 5.50% due 11/1/2017 (Oakwood Obligation Group) | A/A2 | 5,000,000 | 5,227,350 | |||||||
Michigan State Hospital Finance Authority, 5.00% due 7/15/2018 (Oakwood Obligation Group) | A/A2 | 1,000,000 | 1,075,200 | |||||||
Michigan State Hospital Finance Authority, 6.00% due 12/1/2018 (Trinity Health) | AA/Aa2 | 2,000,000 | 2,426,340 | |||||||
Michigan State Hospital Finance Authority, 5.00% due 7/15/2019 (Oakwood Obligation Group) | A/A2 | 2,000,000 | 2,120,720 | |||||||
Michigan State Hospital Finance Authority, 5.00% due 10/1/2026 put 6/1/2017 (Ascension Health) | NR/Aa2 | 12,140,000 | 14,062,855 | |||||||
Certified Annual Report 27
| SCHEDULE OF INVESTMENTS, CONTINUED | ||
| Thornburg Limited Term Municipal Fund | September 30, 2011 | |
Issuer-Description | Credit Rating† S&P/ Moody’s | Principal Amount | Value | |||||||
Michigan State Strategic Fund, 4.75% due 8/1/2012 (NSF International) | A-/NR | $ | 2,345,000 | $ | 2,396,965 | |||||
Michigan State Strategic Fund, 5.00% due 10/15/2017 (Insured: AGM) | AA+/Aa3 | 2,000,000 | 2,249,480 | |||||||
Michigan State Strategic Fund, 5.25% due 6/1/2018 (Clark Retirement Community) | BB/NR | 1,615,000 | 1,537,157 | |||||||
Michigan State Strategic Fund, 5.25% due 10/15/2019 (Michigan House Republic Facilities; Insured: AGM) | AA+/Aa3 | 1,000,000 | 1,118,620 | |||||||
Michigan State Strategic Fund, 5.25% due 8/1/2029 put 8/1/2014 (Detroit Edison Co.) | A/NR | 7,500,000 | 8,271,300 | |||||||
Michigan State Strategic Fund, 5.50% due 8/1/2029 put 8/1/2016 (Detroit Edison Co.) | A/NR | 5,160,000 | 5,952,886 | |||||||
Michigan Strategic Fund Limited Michigan House Republic Facilities, 5.25% due 10/15/2020 (Insured: Assured Guaranty) | AA+/Aa3 | 4,025,000 | 4,446,095 | |||||||
Michigan Strategic Fund Solid Waste Disposal Revenue, 2.80% due 12/1/2013 (Waste Management, Inc.) | BBB/NR | 2,850,000 | 2,901,158 | |||||||
Rockford Public Schools GO, 4.80% due 5/1/2017 (Insured: Q-SBLF) | AA-/Aa2 | 1,130,000 | 1,147,379 | |||||||
Romeo Community School District GO, 5.00% due 5/1/2018 (Insured: Natl-Re/Q-SBLF) | AA-/Aa2 | 3,050,000 | 3,361,405 | |||||||
Royal Oak Hospital Finance Authority Hospital Revenue, 6.25% due 9/1/2014 (William Beaumont Hospital) | A/A1 | 1,000,000 | 1,108,290 | |||||||
Royal Oak Hospital Finance Authority Hospital Revenue, 5.25% due 8/1/2017 (William Beaumont Hospital) | A/A1 | 5,855,000 | 6,508,184 | |||||||
Wayne County Airport Authority, 5.00% due 12/1/2019 (Detroit Metropolitan Airport) | A/A2 | 12,645,000 | 13,775,589 | |||||||
Wayne County Airport Authority, 5.50% due 12/1/2019 (Detroit Metropolitan Airport) | A/A2 | 2,600,000 | 2,923,310 | |||||||
Wayne County Airport Authority, 5.50% due 12/1/2020 (Detroit Metropolitan Airport) | A/A2 | 4,395,000 | 4,914,181 | |||||||
Wayne County Airport Authority, 5.50% due 12/1/2020 (Detroit Metropolitan Airport) | A/A2 | 3,115,000 | 3,482,975 | |||||||
Western Townships Utilities Authority Sewage Disposal GO, 3.00% due 1/1/2012 | AA/NR | 655,000 | 659,264 | |||||||
Western Townships Utilities Authority Sewage Disposal GO, 4.00% due 1/1/2013 | AA/NR | 1,000,000 | 1,039,670 | |||||||
Western Townships Utilities Authority Sewage Disposal GO, 4.00% due 1/1/2014 | AA/NR | 1,000,000 | 1,064,800 | |||||||
Western Townships Utilities Authority Sewage Disposal GO, 5.00% due 1/1/2015 | AA/NR | 1,870,000 | 2,088,360 | |||||||
Western Townships Utilities Authority Sewage Disposal GO, 5.00% due 1/1/2016 | AA/NR | 1,670,000 | 1,901,028 | |||||||
Western Townships Utilities Authority Sewage Disposal GO, 5.00% due 1/1/2017 | AA/NR | 1,500,000 | 1,729,755 | |||||||
Western Townships Utilities Authority Sewage Disposal GO, 5.00% due 1/1/2018 | AA/NR | 1,500,000 | 1,740,255 | |||||||
MINNESOTA — 1.36% | ||||||||||
Minneapolis St. Paul Health Care Systems, 5.25% due 12/1/2012 (HealthPartners Obligated Group) | BBB+/A3 | 1,000,000 | 1,049,980 | |||||||
Minneapolis St. Paul Health Care Systems, 5.25% due 12/1/2013 (HealthPartners Obligated Group) | BBB+/A3 | 2,200,000 | 2,386,538 | |||||||
Minneapolis St. Paul Health Care Systems, 6.00% due 12/1/2019 (HealthPartners Obligated Group) | BBB+/A3 | 1,000,000 | 1,071,510 | |||||||
Minneapolis St. Paul Metropolitan Airports, 5.00% due 1/1/2017 (Insured: AMBAC) | AA-/NR | 8,005,000 | 9,218,158 | |||||||
Minnesota Agricultural & Economic Development Board, 4.00% due 2/15/2014 (Essential Health; Insured: Assured Guaranty) | AA+/NR | 3,460,000 | 3,665,628 | |||||||
Minnesota Agricultural & Economic Development Board, 5.00% due | AA+/NR | 1,335,000 | 1,480,502 | |||||||
Minnesota Agricultural & Economic Development Board, 5.00% due 2/15/2017 (Essential Health; Insured: Assured Guaranty) | AA+/NR | 2,500,000 | 2,845,350 | |||||||
Minnesota GO, 5.00% due 8/1/2016 pre-refunded 9/29/2010 | AA+/Aa1 | 3,200,000 | 3,326,880 | |||||||
Northern Municipal Power Agency Minnesota Electric, 5.00% due 1/1/2019 | A-/A2 | 5,000,000 | 5,831,500 | |||||||
Northern Municipal Power Agency Minnesota Electric, 5.00% due 1/1/2020 | A-/A2 | 3,500,000 | 4,019,260 | |||||||
St. Cloud Health Care Revenue, 5.00% due 5/1/2012 (Centracare Health Systems) | NR/A2 | 1,000,000 | 1,024,500 | |||||||
St. Cloud Health Care Revenue, 5.00% due 5/1/2013 (Centracare Health Systems) | NR/A2 | 1,000,000 | 1,058,810 | |||||||
St. Cloud Health Care Revenue, 5.00% due 5/1/2015 (Centracare Health Systems) | NR/A2 | 1,000,000 | 1,106,230 | |||||||
St. Cloud Health Care Revenue, 5.00% due 5/1/2016 (Centracare Health Systems) | NR/A2 | 1,250,000 | 1,405,525 | |||||||
St. Cloud Health Care Revenue, 5.00% due 5/1/2017 (Centracare Health Systems) | NR/A2 | 2,920,000 | 3,311,864 | |||||||
St. Cloud Health Care Revenue, 5.00% due 5/1/2017 (Centracare Health Systems) | NR/A2 | 1,000,000 | 1,134,200 | |||||||
St. Cloud Health Care Revenue, 5.00% due 5/1/2018 (Centracare Health Systems) | NR/A2 | 3,105,000 | 3,507,190 | |||||||
28 Certified Annual Report
| SCHEDULE OF INVESTMENTS, CONTINUED | ||
| Thornburg Limited Term Municipal Fund | September 30, 2011 | |
Issuer-Description | Credit Rating† S&P/ Moody’s | Principal Amount | Value | |||||||
St. Cloud Health Care Revenue, 5.00% due 5/1/2019 (Centracare Health Systems) | NR/A2 | $ | 3,495,000 | $ | 3,936,733 | |||||
St. Cloud Health Care Revenue, 5.00% due 5/1/2020 (Centracare Health Systems) | NR/A2 | 3,200,000 | 3,623,456 | |||||||
St. Paul Housing & Redevelopment Authority Health Care Revenue, 5.00% due 2/1/2018 (Gillette Children’s Specialty) | A-/NR | 1,255,000 | 1,381,077 | |||||||
St. Paul Housing & Redevelopment Authority Health Care Revenue, 5.25% due 2/1/2020 (Gillette Children’s Specialty) | A-/NR | 2,010,000 | 2,220,286 | |||||||
St. Paul Housing & Redevelopment Authority Health Care Revenue, 5.25% due 5/15/2021 (HealthPartners Obligated Group) | BBB+/A3 | 1,070,000 | 1,125,244 | |||||||
MISSISSIPPI — 0.33% | ||||||||||
Gautier Utility District Systems, 5.50% due 3/1/2012 (Insured: Natl-Re/FGIC) | NR/NR | 1,020,000 | 1,037,656 | |||||||
Medical Center Educational Building, 4.00% due 6/1/2015 (University of Mississippi Medical Center) | AA-/Aa2 | 2,325,000 | 2,540,086 | |||||||
Medical Center Educational Building, 4.00% due 6/1/2016 (University of Mississippi Medical Center) | AA-/Aa2 | 3,300,000 | 3,637,392 | |||||||
Mississippi Development Bank Canton Public Improvement GO, 4.75% due 7/1/2017 | NR/NR | 1,355,000 | 1,460,161 | |||||||
Mississippi Development Bank Special Obligation, 5.00% due 8/1/2018 (Department of Corrections) | AA-/NR | 4,910,000 | 5,688,137 | |||||||
MISSOURI — 1.28% | ||||||||||
Cass County COP, 3.00% due 5/1/2012 | A/NR | 1,015,000 | 1,027,576 | |||||||
Cass County COP, 3.00% due 5/1/2014 | A/NR | 1,425,000 | 1,472,182 | |||||||
Cass County COP, 4.00% due 5/1/2015 | A/NR | 1,000,000 | 1,072,600 | |||||||
Cass County COP, 4.00% due 5/1/2018 | A/NR | 2,255,000 | 2,401,304 | |||||||
Cass County COP, 4.50% due 5/1/2019 | A/NR | 1,270,000 | 1,374,165 | |||||||
Cass County COP, 5.00% due 5/1/2020 | A/NR | 2,255,000 | 2,517,031 | |||||||
Cass County COP, 5.00% due 5/1/2021 | A/NR | 1,750,000 | 1,925,053 | |||||||
Jackson County Special Obligation, 4.00% due 12/1/2014 (Truman Sports Complex) | NR/A1 | 2,580,000 | 2,763,051 | |||||||
Kansas City IDA, 4.00% due 9/1/2014 (NNSA National Security Campus) | NR/NR | 1,535,000 | 1,565,623 | |||||||
Missouri Development Finance Board, 4.80% due 11/1/2012 (Lutheran Home Aged; LOC: Commerce Bank) | NR/Aa2 | 545,000 | 546,504 | |||||||
Missouri Development Finance Board, 4.00% due 6/1/2014 (Electric Systems) | A-/NR | 3,930,000 | 4,179,477 | |||||||
Missouri Development Finance Board, 4.00% due 6/1/2015 (Electric Systems) | A-/NR | 1,000,000 | 1,074,740 | |||||||
Missouri Development Finance Board, 4.00% due 6/1/2016 (Electric Systems) | A-/NR | 1,560,000 | 1,688,248 | |||||||
Missouri Development Finance Board, 5.00% due 6/1/2017 (Electric Systems) | A-/NR | 1,525,000 | 1,737,417 | |||||||
Missouri Development Finance Board, 5.00% due 6/1/2018 (Electric Systems) | A-/NR | 1,705,000 | 1,947,519 | |||||||
Missouri Development Finance Board, 5.00% due 6/1/2019 (Electric Systems) | A-/NR | 1,790,000 | 2,044,108 | |||||||
Missouri Development Finance Board, 5.00% due 6/1/2020 (Electric Systems) | A-/NR | 1,000,000 | 1,142,610 | |||||||
Missouri Development Finance Board, 0.13% due 12/1/2033 put 10/3/2011 (Nelson Gallery Foundation; SPA: JPMorgan Chase Bank) (daily demand notes) | AAA/Aaa | 8,590,000 | 8,590,000 | |||||||
Missouri Development Finance Board, 0.14% due 12/1/2033 put 10/3/2011 (Nelson Gallery | ||||||||||
Foundation; SPA: JPMorgan Chase Bank) (daily demand notes) | AAA/Aaa | 15,000 | 15,000 | |||||||
Missouri Housing Development Commission, 2.00% due 1/1/2012 | AA/NR | 3,000,000 | 3,013,020 | |||||||
Missouri Regional Convention & Sports Complex, 5.25% due 8/15/2016 | AA+/Aa2 | 1,800,000 | 1,930,212 | |||||||
Missouri State Health & Educational Facilities Authority, 4.00% due 4/1/2015 (Webster University) | NR/A2 | 2,155,000 | 2,329,340 | |||||||
Missouri State Health & Educational Facilities Authority, 4.00% due 4/1/2016 (Webster University) | NR/A2 | 1,685,000 | 1,831,696 | |||||||
Missouri State Health & Educational Facilities Authority, 4.00% due 4/1/2017 (Webster University) | NR/A2 | 2,360,000 | 2,563,715 | |||||||
Missouri State Health & Educational Facilities Authority, 5.00% due 5/15/2017 (Children’s Mercy Hospital) | A+/NR | 1,000,000 | 1,116,100 | |||||||
Missouri State Health & Educational Facilities Authority, 5.00% due 5/15/2019 (Children’s Mercy Hospital) | A+/NR | 1,000,000 | 1,114,100 | |||||||
Missouri State Health & Educational Facilities Authority, 5.00% due 5/15/2020 (Children’s Mercy Hospital) | A+/NR | 1,000,000 | 1,100,640 | |||||||
Certified Annual Report 29
| SCHEDULE OF INVESTMENTS, CONTINUED | ||
| Thornburg Limited Term Municipal Fund | September 30, 2011 | |
Issuer-Description | Credit Rating† S&P/ Moody’s | Principal Amount | Value | |||||||
Springfield Public Utilities COP, 5.00% due 12/1/2013 (Insured: Natl-Re) | AA/A1 | $ | 2,000,000 | $ | 2,153,600 | |||||
NEBRASKA — 0.42% | ||||||||||
Madison County Hospital Authority, 5.50% due 7/1/2012 pre-refunded 1/1/2012 (Faith Regional Health Services; Insured: Radian) | NR/NR | 835,000 | 845,788 | |||||||
Omaha Public Power District Electric Systems, 5.00% due 2/1/2013 | AA/Aa1 | 5,000,000 | 5,250,400 | |||||||
Public Power Generation Agency, 5.00% due 1/1/2020 (Nebraska Whelan Energy Center; Insured: AMBAC) | A-/A2 | 9,930,000 | 10,638,506 | |||||||
Public Power Generation Agency, 5.00% due 1/1/2021 (Nebraska Whelan Energy Center; Insured: AMBAC) | A-/A2 | 1,860,000 | 1,978,928 | |||||||
NEVADA — 1.87% | ||||||||||
Clark County GO, 4.00% due 7/1/2012 | AA+/Aa1 | 3,570,000 | 3,661,142 | |||||||
Clark County GO, 5.00% due 11/1/2014 | AA+/Aa1 | 4,000,000 | 4,458,840 | |||||||
Clark County GO, 5.00% due 11/1/2017 (Insured: AMBAC) | AA+/Aa1 | 1,185,000 | 1,351,161 | |||||||
Clark County Improvement District, 5.00% due 12/1/2015 (Insured: AMBAC) | BBB+/NR | 1,775,000 | 1,896,570 | |||||||
Clark County School District GO, 5.00% due 6/15/2015 (Insured: Natl-Re) | AA/Aa2 | 1,000,000 | 1,077,180 | |||||||
Clark County School District GO, 5.50% due 6/15/2015 (Insured: AGM) | AA+/Aa2 | 5,470,000 | 5,907,436 | |||||||
Las Vegas Clark County Library District GO, 5.00% due 1/1/2018 | AA/Aa2 | 6,535,000 | 7,577,528 | |||||||
Las Vegas Clark County Library District GO, 5.00% due 1/1/2019 | AA/Aa2 | 3,000,000 | 3,479,460 | |||||||
Las Vegas Convention & Visitors Authority, 5.25% due 7/1/2013 (Insured: AMBAC) | A+/A1 | 1,530,000 | 1,614,089 | |||||||
Las Vegas Convention & Visitors Authority, 5.25% due 7/1/2014 (Insured: AMBAC) | A+/A1 | 2,680,000 | 2,891,854 | |||||||
Las Vegas Convention & Visitors Authority, 5.00% due 7/1/2019 (Insured: AMBAC) | A+/A1 | 6,000,000 | 6,289,920 | |||||||
Las Vegas COP, 5.00% due 9/1/2016 (City Hall) | AA-/Aa3 | 4,000,000 | 4,493,600 | |||||||
Las Vegas COP, 5.00% due 9/1/2017 (City Hall) | AA-/Aa3 | 4,300,000 | 4,847,648 | |||||||
Las Vegas COP, 5.00% due 9/1/2018 (City Hall) | AA-/Aa3 | 4,000,000 | 4,521,240 | |||||||
Las Vegas GO, 7.00% due 4/1/2017 (Performing Arts Center) | AA/Aa2 | 1,825,000 | 2,251,101 | |||||||
Las Vegas GO, 7.00% due 4/1/2018 (Performing Arts Center) | AA/Aa2 | 2,095,000 | 2,638,652 | |||||||
Las Vegas Special Local Improvement District 707, 5.375% due 6/1/2013 (Insured: AGM) | AA+/Aa3 | 1,020,000 | 1,025,416 | |||||||
Las Vegas Water District GO, 5.00% due 6/1/2017 | AA+/Aa2 | 1,050,000 | 1,224,142 | |||||||
Las Vegas Water District GO, 5.00% due 6/1/2019 | AA+/Aa2 | 1,000,000 | 1,174,220 | |||||||
a Las Vegas Water District GO, 5.00% due 6/1/2020 | AA+/Aa2 | 4,255,000 | 4,899,505 | |||||||
a Las Vegas Water District GO, 5.00% due 6/1/2020 | AA+/Aa2 | 5,080,000 | 5,849,468 | |||||||
a Las Vegas Water District GO, 5.00% due 6/1/2021 | AA+/Aa2 | 5,000,000 | 5,763,000 | |||||||
Reno Hospital Revenue, 5.25% due 6/1/2014 (Washoe Medical Center; Insured: AGM) | AA+/Aa3 | 1,000,000 | 1,084,860 | |||||||
Reno Hospital Revenue, 5.25% due 6/1/2016 (Washoe Medical Center; Insured: AGM) | AA+/Aa3 | 1,100,000 | 1,233,122 | |||||||
Reno Hospital Revenue, 5.25% due 6/1/2018 (Washoe Medical Center; Insured: AGM) | AA+/Aa3 | 1,000,000 | 1,131,300 | |||||||
NEW HAMPSHIRE — 0.26% | ||||||||||
New Hampshire Business Finance Authority PCR, 5.375% due 5/1/2014 (Central Maine Power Co.) | BBB+/NR | 1,365,000 | 1,468,699 | |||||||
New Hampshire Health & Educational Facilities, 5.00% due 10/1/2016 (Southern NH Health Systems) | A-/NR | 1,260,000 | 1,388,873 | |||||||
New Hampshire Health & Educational Facilities, 5.00% due 10/1/2017 (Southern NH Health Systems) | A-/NR | 1,000,000 | 1,105,940 | |||||||
New Hampshire Municipal Bond Bank, 5.00% due 8/15/2016 (Insured: Natl-Re) | AA/A1 | 2,985,000 | 3,528,748 | |||||||
New Hampshire Municipal Bond Bank, 5.00% due 8/15/2017 (Insured: | AA/A1 | 3,130,000 | 3,752,181 | |||||||
NEW JERSEY — 2.53% | ||||||||||
Camden County Improvement Authority, 5.00% due 7/1/2014 (Cooper Medical School) | A+/A2 | 2,845,000 | 3,095,957 | |||||||
Camden County Improvement Authority, 5.00% due 7/1/2015 (Cooper Medical School) | A+/A2 | 2,990,000 | 3,318,960 | |||||||
Camden County Improvement Authority, 5.00% due 7/1/2016 (Cooper Medical School) | A+/A2 | 3,040,000 | 3,412,522 | |||||||
30 Certified Annual Report
| SCHEDULE OF INVESTMENTS, CONTINUED | ||
| Thornburg Limited Term Municipal Fund | September 30, 2011 | |
Issuer-Description | Credit Rating † S&P/ Moody’s | Principal Amount | Value | |||||||
Hudson County COP, 7.00% due 12/1/2012 (Insured: Natl-Re) | BBB/Baa1 | $ | 1,610,000 | $ | 1,701,528 | |||||
Hudson County COP, 7.00% due 12/1/2013 (Insured: Natl-Re) | BBB/Baa1 | 710,000 | 777,216 | |||||||
Hudson County COP, 6.25% due 12/1/2014 (Insured: Natl-Re) | BBB/Baa1 | 1,500,000 | 1,664,115 | |||||||
Hudson County COP, 6.25% due 12/1/2016 (Insured: Natl-Re) | BBB/Baa1 | 550,000 | 631,460 | |||||||
Hudson County Improvement Authority, 5.25% due 10/1/2011 (Hudson County Lease; Insured: AGM) | AA+/Aa3 | 1,270,000 | 1,270,165 | |||||||
Hudson County Improvement Authority, 5.25% due 10/1/2014 (Hudson County Lease; Insured: AGM) | AA+/Aa3 | 3,000,000 | 3,320,700 | |||||||
Hudson County Improvement Authority, 4.75% due 10/1/2015 (Hudson County Lease; Insured: AGM) | AA+/Aa3 | 2,000,000 | 2,228,260 | |||||||
Hudson County Improvement Authority, 4.75% due 10/1/2016 (Hudson County Lease; Insured: AGM) | AA+/Aa3 | 3,155,000 | 3,543,223 | |||||||
Hudson County Improvement Authority, 4.75% due 10/1/2017 (Hudson County Lease; Insured: AGM) | AA+/Aa3 | 4,065,000 | 4,583,979 | |||||||
Hudson County Improvement Authority, 4.75% due 10/1/2018 (Hudson County Lease; Insured: AGM) | AA+/Aa3 | 2,000,000 | 2,255,920 | |||||||
Hudson County Improvement Authority, 4.75% due 10/1/2019 (Hudson County Lease; Insured: AGM) | AA+/Aa3 | 4,390,000 | 4,903,191 | |||||||
Hudson County Improvement Authority, 5.375% due 10/1/2020 (Hudson County Lease; Insured: AGM) | AA+/Aa3 | 1,955,000 | 2,264,946 | |||||||
Monmouth County Improvement Authority, 5.00% due 12/1/2016 (Insured: AMBAC) | NR/NR | 1,000,000 | 1,101,260 | |||||||
New Jersey EDA, 5.00% due 11/15/2011 (Seabrook Village) | NR/NR | 1,000,000 | 1,001,150 | |||||||
New Jersey EDA, 5.00% due 11/15/2014 (Seabrook Village) | NR/NR | 1,000,000 | 1,004,530 | |||||||
New Jersey EDA, 5.00% due 12/15/2016 (School Facilities Construction) | A+/A1 | 10,000,000 | 11,427,100 | |||||||
New Jersey EDA, 5.50% due 12/15/2019 (School Facilities Construction; Insured: AMBAC) | A+/A1 | 5,000,000 | 5,861,950 | |||||||
New Jersey EDA Cigarette Tax Revenue, 5.00% due 6/15/2012 (Insured: Natl-Re/FGIC) | BBB/Baa3 | 7,375,000 | 7,514,387 | |||||||
New Jersey Health Care Facilities, 5.00% due 7/1/2013 (St. Peter’s University Hospital) | NR/NR | 1,000,000 | 1,043,630 | |||||||
New Jersey Health Care Facilities, 5.00% due 7/1/2014 (St. Peter’s University Hospital) | BBB-/Baa3 | 3,575,000 | 3,777,917 | |||||||
New Jersey Health Care Facilities, 5.00% due 7/1/2015 (St. Peter’s University Hospital) | NR/NR | 3,020,000 | 3,207,361 | |||||||
New Jersey Higher Educational Assistance Authority, 5.00% due 12/1/2017 | AA/Aa2 | 1,500,000 | 1,691,160 | |||||||
New Jersey Higher Educational Assistance Authority, 5.00% due 12/1/2018 | AA/Aa2 | 3,000,000 | 3,378,180 | |||||||
New Jersey Higher Educational Assistance Authority, 5.25% due 12/1/2019 | AA/Aa2 | 5,000,000 | 5,654,750 | |||||||
New Jersey State Transit Corp. COP, 5.25% due 9/15/2013 (Insured: AMBAC) | A/Aa3 | 6,000,000 | 6,426,060 | |||||||
New Jersey State Transit Corp. COP, 5.50% due 9/15/2013 (Insured: AMBAC) | A/Aa3 | 7,650,000 | 8,229,946 | |||||||
Ocean Township Municipal Utility Authority, 6.00% due 8/1/2017 (Insured: Natl-Re) | BBB/Baa1 | 3,540,000 | 3,995,386 | |||||||
Passaic Valley Sewer Commissioners Sewer System GO, 5.625% due 12/1/2018 | NR/A2 | 1,210,000 | 1,399,196 | |||||||
Passaic Valley Sewer Commissioners Sewer System GO, 5.75% due 12/1/2019 | NR/A2 | 2,000,000 | 2,323,400 | |||||||
Passaic Valley Sewer Commissioners Sewer System GO, 5.75% due 12/1/2020 | NR/A2 | 2,800,000 | 3,249,596 | |||||||
NEW MEXICO — 1.05% | ||||||||||
Albuquerque Airport, 5.50% due 7/1/2013 | A/A1 | 1,820,000 | 1,947,928 | |||||||
Gallup PCR, 5.00% due 8/15/2016 (Insured: AMBAC) | A/A3 | 2,500,000 | 2,669,275 | |||||||
Los Alamos County Gross Receipts Tax, 5.50% due 6/1/2017 | AA+/Aa3 | 2,365,000 | 2,854,957 | |||||||
Los Alamos County Gross Receipts Tax, 5.50% due 6/1/2018 | AA+/Aa3 | 2,205,000 | 2,697,200 | |||||||
b New Mexico Educational Assistance Foundation, 5.00% due 12/1/2018 | AAA/Aaa | 5,000,000 | 5,873,350 | |||||||
New Mexico Educational Assistance Foundation, 5.00% due 12/1/2021 | AAA/Aaa | 3,000,000 | 3,461,640 | |||||||
New Mexico Severance Tax, 5.00% due 7/1/2014 | AA/Aa1 | 7,435,000 | 8,335,453 | |||||||
New Mexico Severance Tax, 5.00% due 7/1/2015 | AA/Aa1 | 5,500,000 | 6,358,880 | |||||||
New Mexico Severance Tax, 5.00% due 7/1/2016 | AA/Aa1 | 10,265,000 | 12,118,961 | |||||||
NEW YORK — 6.01% | ||||||||||
Amherst Development Corp., 5.00% due 10/1/2015 (Student Housing; Insured: AGM) | AA+/Aa3 | 1,535,000 | 1,720,858 | |||||||
Erie County Individual Development Agency, 5.00% due 5/1/2015 (Buffalo School District) | AA-/Aa3 | 3,000,000 | 3,400,860 | |||||||
Certified Annual Report 31
| SCHEDULE OF INVESTMENTS, CONTINUED | ||
| Thornburg Limited Term Municipal Fund | September 30, 2011 | |
Issuer-Description | Credit Rating † S&P/ Moody’s | Principal Amount | Value | |||||||
Erie County Individual Development Agency, 5.00% due 5/1/2016 (Buffalo School District) | AA-/Aa3 | $ | 8,795,000 | $ | 10,137,381 | |||||
Erie County Individual Development Agency, 5.00% due 5/1/2017 (Buffalo School District) | AA-/Aa3 | 7,265,000 | 8,465,686 | |||||||
Erie County Individual Development Agency, 5.00% due 5/1/2018 (Buffalo School District) | AA-/Aa3 | 5,000,000 | 5,836,250 | |||||||
Monroe County IDA, 5.375% due 6/1/2017 (St. John Fisher College; Insured: Radian) | NR/NR | 4,405,000 | 4,418,832 | |||||||
Nassau County Industrial Development Agency, 5.25% due 3/1/2018 (NY Institute of Technology) | BBB+/NR | 1,260,000 | 1,423,762 | |||||||
Nassau County Industrial Development Agency, 5.25% due 3/1/2020 (NY Institute of Technology) | BBB+/NR | 1,715,000 | 1,929,787 | |||||||
New York City Health & Hospital Corp. GO, 5.00% due 2/15/2013 | A+/Aa3 | 2,755,000 | 2,908,977 | |||||||
New York City Health & Hospital Corp. GO, 5.00% due 2/15/2019 | A+/Aa3 | 2,700,000 | 3,106,836 | |||||||
New York City Health & Hospital Corp. GO, 5.00% due 2/15/2020 | A+/Aa3 | 10,000,000 | 11,535,100 | |||||||
New York City Health & Hospital Corp. GO, 5.00% due 2/15/2021 | A+/Aa3 | 2,615,000 | 2,980,995 | |||||||
New York City IDA, 5.25% due 6/1/2012 (Lycee Francais de New York; Insured: ACA) | BBB/Baa1 | 2,330,000 | 2,398,059 | |||||||
New York City Municipal Water Financing Authority, 5.375% due 6/15/2017 pre-refunded 6/15/2012 | NR/NR | 1,070,000 | 1,109,012 | |||||||
New York City Municipal Water Financing Authority, 5.375% due 6/15/2017 | AAA/NR | 3,930,000 | 4,064,760 | |||||||
New York City Municipal Water Financing Authority, 0.25% due 6/15/2039 put 10/3/2011 (General Resolution; SPA: Landesbank Hessen-Thuringen) (daily demand notes) | AA+/Aa2 | 31,300,000 | 31,300,000 | |||||||
New York City Transitional Finance Authority, 5.00% due 11/1/2012 | AAA/Aaa | 5,000,000 | 5,256,850 | |||||||
New York City Transitional Finance Authority, 4.00% due 7/15/2014 (State Aid Withholding) | AA-/Aa3 | 2,000,000 | 2,166,880 | |||||||
New York City Transitional Finance Authority, 5.00% due 11/1/2014 | AAA/Aaa | 2,000,000 | 2,263,800 | |||||||
New York City Transitional Finance Authority, 5.00% due 7/15/2016 (State Aid Withholding) | AA-/Aa3 | 3,155,000 | 3,629,417 | |||||||
New York City Transitional Finance Authority, 5.00% due 1/15/2018 (State Aid Withholding) | AA-/Aa3 | 4,865,000 | 5,640,384 | |||||||
New York City Transitional Finance Authority, 0.21% due 8/1/2031 put 10/3/2011 (SPA: Landesbank Hessen-Thuringen) (daily demand notes) | AAA/Aaa | 12,000,000 | 12,000,010 | |||||||
New York Dormitory Authority, 5.00% due 7/1/2020 (NYSARC, Inc.) | NR/Aa3 | 1,000,000 | 1,142,570 | |||||||
New York Series H Sub Series H-2, 0.12% due 8/1/2013 put 10/3/2011 (Insured: Natl-Re; SPA: Wachovia Bank N.A.) (daily demand notes) | AA/Aa2 | 24,300,000 | 24,300,000 | |||||||
New York State Dormitory Authority, 5.50% due 7/1/2012 (Winthrop South Nassau University) | NR/Baa1 | 1,820,000 | 1,872,707 | |||||||
New York State Dormitory Authority, 5.00% due 11/1/2012 (Insured: SONYMA) | NR/Aa1 | 1,395,000 | 1,400,092 | |||||||
New York State Dormitory Authority, 5.50% due 7/1/2013 (Winthrop South Nassau University) | NR/Baa1 | 1,500,000 | 1,589,940 | |||||||
New York State Dormitory Authority, 5.25% due 8/15/2013 (Presbyterian Hospital; Insured: AGM/FHA) | AA+/Aa3 | 3,650,000 | 3,922,509 | |||||||
New York State Dormitory Authority, 5.00% due 11/1/2013 (Insured: SONYMA) | NR/Aa1 | 3,105,000 | 3,115,992 | |||||||
New York State Dormitory Authority, 5.25% due 2/15/2014 (Insured: AGM) | AA+/Aa3 | 2,405,000 | 2,604,976 | |||||||
New York State Dormitory Authority, 3.00% due 8/15/2014 (Mental Health Services) | AA-/NR | 2,640,000 | 2,772,501 | |||||||
New York State Dormitory Authority, 5.00% due 11/1/2014 (Insured: SONYMA) | NR/Aa1 | 1,010,000 | 1,013,505 | |||||||
New York State Dormitory Authority, 5.25% due 5/15/2015 (Insured: Natl-Re/IBC) | BBB/Aa3 | 10,000,000 | 11,042,800 | |||||||
New York State Dormitory Authority, 5.25% due 8/15/2015 (New York Presbyterian Hospital; Insured: AGM/FHA) | AA+/Aa3 | 5,305,000 | 5,790,301 | |||||||
New York State Dormitory Authority, 5.50% due 7/1/2016 (Brooklyn Law School; Insured: Radian) | BBB+/Baa1 | 1,220,000 | 1,299,361 | |||||||
New York State Dormitory Authority, 5.50% due 2/15/2017 (Mental Health Services) | AA-/NR | 5,000,000 | 5,945,050 | |||||||
New York State Dormitory Authority, 5.25% due 5/15/2017 (Court Facilities Lease; Insured: AMBAC) | AA-/Aa3 | 4,585,000 | 5,378,205 | |||||||
New York State Dormitory Authority, 5.50% due 7/1/2017 (Brooklyn Law School; Insured: Radian) | BBB+/Baa1 | 2,500,000 | 2,647,675 | |||||||
New York State Dormitory Authority, 5.50% due 10/1/2017 (School Districts Financing; Insured: Natl-Re) (State Aid Withholding) | A+/A2 | 1,570,000 | 1,630,994 | |||||||
b New York State Dormitory Authority, 5.50% due 2/15/2018 (Mental Health Services) | AA-/NR | 5,000,000 | 6,020,500 | |||||||
New York State Dormitory Authority, 5.25% due 11/15/2023 put 5/15/2012 (State University Educational Facilities) | AA-/Aa3 | 11,515,000 | 11,846,632 | |||||||
New York State Dormitory Authority, 6.00% due 11/15/2023 put 5/15/2012 (State University Educational Facilities; Insured: CIFG) | AA-/Aa3 | 1,000,000 | 1,033,270 | |||||||
New York State Dormitory Authority, 5.25% due 11/15/2026 put 5/15/2012 (Insured: AMBAC) | AA-/Aa3 | 4,000,000 | 4,115,200 | |||||||
New York State Dormitory Authority, 5.25% due 11/15/2029 put 5/15/2012 (Insured: Natl-Re/ FGIC) | AA-/Aa3 | 1,540,000 | 1,584,352 | |||||||
32 Certified Annual Report
| SCHEDULE OF INVESTMENTS, CONTINUED | ||
| Thornburg Limited Term Municipal Fund | September 30, 2011 | |
Issuer-Description | Credit Rating † S&P/ Moody’s | Principal Amount | Value | |||||||
New York State Energy Research & Development Authority PCR, 2.25% due 12/1/2015 (New York Electric & Gas Corp.) | NR/NR | $ | 5,000,000 | $ | 4,980,550 | |||||
New York State Thruway Authority Service Contract, 5.50% due 4/1/2013 (Local Highway & Bridge; Insured: Syncora) | AA-/Aa3 | 1,000,000 | 1,025,230 | |||||||
Port Authority 148th, 5.00% due 8/15/2017 (Insured: AGM; GO of Authority) | AA+/Aa2 | 4,725,000 | 5,548,426 | |||||||
Suffolk County Industrial Development Agency Civic Facilities GO, 5.25% due 3/1/2019 (NY Institute of Technology) | BBB+/Baa2 | 1,400,000 | 1,480,626 | |||||||
Tobacco Settlement Financing Corp., 5.00% due 6/1/2014 | NR/NR | 5,000,000 | 5,506,500 | |||||||
Tobacco Settlement Financing Corp., 5.00% due 6/1/2018 | NR/NR | 3,725,000 | 4,365,067 | |||||||
United Nations Development Corp., 5.00% due 7/1/2016 | NR/A1 | 3,400,000 | 3,934,548 | |||||||
United Nations Development Corp., 5.00% due 7/1/2017 | NR/A1 | 3,000,000 | 3,507,300 | |||||||
United Nations Development Corp., 5.00% due 7/1/2019 | NR/A1 | 4,000,000 | 4,700,640 | |||||||
NORTH CAROLINA — 1.14% | ||||||||||
Charlotte Mecklenburg Hospital Authority Health Care Systems, 5.00% due 1/15/2016 (Carolinas Health Network) | AA-/Aa3 | 3,420,000 | 3,876,604 | |||||||
Charlotte Mecklenburg Hospital Authority Health Care Systems, 5.00% due 1/15/2017 (Carolinas Health Network) | AA-/Aa3 | 2,000,000 | 2,291,140 | |||||||
North Carolina Eastern Municipal Power Agency, 5.25% due 1/1/2012 | A-/Baa1 | 650,000 | 657,820 | |||||||
North Carolina Eastern Municipal Power Agency, 5.50% due 1/1/2012 | A-/Baa1 | 1,100,000 | 1,113,750 | |||||||
North Carolina Eastern Municipal Power Agency, 5.25% due 1/1/2013 | A-/Baa1 | 1,055,000 | 1,112,846 | |||||||
North Carolina Eastern Municipal Power Agency, 7.00% due 1/1/2013 (Insured: Natl-Re/IBC) | BBB/Baa1 | 2,990,000 | 3,060,713 | |||||||
North Carolina Eastern Municipal Power Agency, 5.00% due 1/1/2016 (Insured: AMBAC) | A-/NR | 1,700,000 | 1,931,421 | |||||||
North Carolina Eastern Municipal Power Agency, 6.00% due 1/1/2018 (Insured: AMBAC) | NR/Baa1 | 7,500,000 | 9,063,525 | |||||||
North Carolina Eastern Municipal Power Agency, 6.00% due 1/1/2018 (Insured: BHAC/AMBAC) | AA+/Aa1 | 5,965,000 | 7,262,686 | |||||||
North Carolina Eastern Municipal Power Agency, 5.25% due 1/1/2019 (Insured: AGM) | AA+/Aa3 | 3,000,000 | 3,444,750 | |||||||
North Carolina Infrastructure Finance Corp. COP, 5.00% due 2/1/2017 (Correctional Facilities) | AA+/Aa1 | 2,400,000 | 2,588,520 | |||||||
North Carolina Medical Care Commission, 5.00% due 9/1/2013 (Rowan Regional Medical Center; Insured: AGM/FHA 242) | AA+/Aa3 | 1,000,000 | 1,065,570 | |||||||
North Carolina Municipal Power Agency, 5.50% due 1/1/2013 (Catawba Electric) (ETM) | NR/NR | 800,000 | 851,560 | |||||||
North Carolina Municipal Power Agency, 5.50% due 1/1/2013 (Catawba Electric) | A/A2 | 1,705,000 | 1,806,430 | |||||||
North Carolina Municipal Power Agency, 5.25% due 1/1/2017 (Catawba Electric) | A/A2 | 3,100,000 | 3,635,370 | |||||||
North Carolina State Infrastructure Finance Corp. COP, 5.00% due 2/1/2016 (Correctional Facilities) | AA+/Aa1 | 5,000,000 | 5,436,100 | |||||||
University of North Carolina Pool Revenue, 5.00% due 4/1/2012 (Insured: AMBAC) (ETM) | NR/NR | 305,000 | 311,835 | |||||||
University of North Carolina Pool Revenue, 5.00% due 4/1/2012 (Insured: AMBAC) | NR/NR | 725,000 | 740,037 | |||||||
NORTH DAKOTA — 0.04% | ||||||||||
Ward County Health Care Facilities, 5.00% due 7/1/2013 (Trinity Obligated Group) | BBB+/NR | 1,560,000 | 1,625,052 | |||||||
OHIO — 3.28% | ||||||||||
Akron COP, 5.00% due 12/1/2013 (Insured: AGM) | AA+/NR | 3,000,000 | 3,259,560 | |||||||
Akron COP, 5.00% due 12/1/2014 (Insured: AGM) | AA+/NR | 2,000,000 | 2,229,660 | |||||||
Akron GO, 5.00% due 12/1/2019 | AA-/NR | 1,685,000 | 1,954,095 | |||||||
Allen County Hospital Facilities, 5.00% due 9/1/2015 (Catholic Health Care Partners) | AA-/A1 | 10,000,000 | 11,036,300 | |||||||
Allen County Hospital Facilities, 5.00% due 9/1/2016 (Catholic Health Care Partners) | AA-/A1 | 10,000,000 | 11,169,900 | |||||||
American Municipal Power, 5.25% due 2/15/2018 (Hydroelectric) | A/A3 | 5,500,000 | 6,325,165 | |||||||
American Municipal Power, 5.25% due 2/15/2019 (Hydroelectric) | A/A3 | 5,015,000 | 5,775,725 | |||||||
Cleveland Cuyahoga County Cultural Facilities Revenue, 5.00% due 10/1/2019 (Cleveland Museum of Art) | AA+/NR | 2,000,000 | 2,327,520 | |||||||
Cleveland GO, 5.75% due 8/1/2012 (Insured: Natl-Re) | AA/A1 | 1,500,000 | 1,564,035 | |||||||
Cleveland Parking Facilities Revenue, 5.25% due 9/15/2021 (Insured: AGM) | AA+/Aa3 | 3,000,000 | 3,427,05 | |||||||
Certified Annual Report 33
| SCHEDULE OF INVESTMENTS, CONTINUED | ||
| Thornburg Limited Term Municipal Fund | September 30, 2011 | |
Issuer-Description | Credit Rating † S&P/ Moody’s | Principal Amount | Value | |||||||
Cuyahoga County Ohio Revenue, 6.00% due 1/1/2021 | AA-/Aa2 | $ | 5,000,000 | $ | 5,361,900 | |||||
Deerfield Township Tax Increment Revenue, 5.00% due 12/1/2017 | NR/A1 | 1,000,000 | 1,123,940 | |||||||
Garfield Heights City School Improvement GO, 5.375% due 12/15/2016 (Insured: Natl-Re) | NR/Aa3 | 1,625,000 | 1,868,636 | |||||||
Greater Cleveland Regional Transportation Authority GO, 5.00% due 12/1/2015 (Insured: Natl-Re) | NR/Aa2 | 1,000,000 | 1,145,730 | |||||||
Kent State University Revenues, 5.00% due 5/1/2020 (Insured: Assured Guaranty) | AA+/Aa3 | 1,000,000 | 1,148,660 | |||||||
Montgomery County, 5.25% due 10/1/2038 put 11/1/2013 (Catholic Health Initiatives) | AA/Aa2 | 2,500,000 | 2,726,100 | |||||||
Montgomery County, 4.10% due 10/1/2041 put 11/10/2011 (Catholic Health Initiatives) | AA/Aa2 | 2,500,000 | 2,510,450 | |||||||
Ohio State Air Quality Development Authority, 5.625% due 6/1/2018 (FirstEnergy Nuclear) | BBB-/Baa2 | 5,000,000 | 5,597,850 | |||||||
Ohio State Air Quality Development Authority, 5.75% due 6/1/2033 put 12/1/2011 (FirstEnergy Nuclear) | BBB-/Baa3 | 5,800,000 | 6,636,128 | |||||||
Ohio State Air Quality Development Authority, 3.375% due 1/1/2034 put 7/1/2015 (FirstEnergy Nuclear) | BBB-/NR | 7,200,000 | 7,434,576 | |||||||
Ohio State Air Quality Development Authority, 3.875% due 12/1/2038 put 6/1/2014 | ||||||||||
(Columbus Southern Power Co.) | BBB/A3 | 4,800,000 | 5,055,552 | |||||||
Ohio State Building Authority, 5.00% due 10/1/2015 (Insured: Natl-Re/FGIC) | AA/Aa2 | 4,600,000 | 5,253,062 | |||||||
Ohio State Building Authority, 5.00% due 10/1/2020 | AA/Aa2 | 1,700,000 | 1,971,762 | |||||||
Ohio State Cultural and Sports Capital Facilities, 5.00% due 10/1/2020 | AA/Aa2 | 3,845,000 | 4,436,284 | |||||||
Ohio State Department Administrative Services COP, 5.00% due 9/1/2015 (Insured: Natl-Re) | AA/Aa2 | 1,950,000 | 2,167,874 | |||||||
Ohio State GO, 4.00% due 10/1/2014 | AA-/Aa3 | 2,075,000 | 2,266,439 | |||||||
Ohio State Higher Educational Facilities, 5.05% due 7/1/2037 put 7/1/2016 (Kenyon College) | A+/A1 | 3,375,000 | 3,803,456 | |||||||
Ohio State Water Development Authority PCR, 5.875% due 6/1/2033 put 6/1/2016 (FirstEnergy Nuclear) | BBB-/Baa2 | 5,500,000 | 6,179,580 | |||||||
Ohio State Water Development Authority PCR, 3.375% due 1/1/2034 put 7/1/2015 (FirstEnergy Nuclear) | BBB-/NR | 24,400,000 | 24,913,376 | |||||||
University of Akron Ohio General Receipts, 5.00% due 1/1/2018 (Insured: AGM) | AA+/Aa3 | 3,415,000 | 3,940,432 | |||||||
OKLAHOMA — 1.62% | ||||||||||
Cleveland County ISD, 3.00% due 3/1/2012 | NR/Aa2 | 4,040,000 | 4,086,985 | |||||||
Cleveland County Public Facilities Authority, 4.00% due 6/1/2013 (Norman Public Schools) | A+/NR | 5,000,000 | 5,266,200 | |||||||
Comanche County Hospital Authority, 5.25% due 7/1/2015 (Insured: Radian) | BBB-/NR | 1,340,000 | 1,439,776 | |||||||
Oklahoma County Finance Authority Educational Facilities, 3.50% due 3/1/2012 (Putnam City Public Schools) | A/NR | 3,825,000 | 3,870,441 | |||||||
Oklahoma County Finance Authority Educational Facilities, 4.00% due 3/1/2013 (Putnam City Public Schools) | A/NR | 2,580,000 | 2,682,349 | |||||||
Oklahoma County Finance Authority Educational Facilities, 3.125% due 9/1/2013 (Western Heights Public Schools) | A+/NR | 2,525,000 | 2,612,213 | |||||||
Oklahoma County Finance Authority Educational Facilities, 5.00% due 9/1/2016 (Western Heights Public Schools) | A+/NR | 3,000,000 | 3,424,170 | |||||||
Oklahoma County Finance Authority Educational Facilities, 5.00% due 9/1/2017 (Western Heights Public Schools) | A+/NR | 4,075,000 | 4,695,174 | |||||||
Oklahoma County Finance Authority Educational Facilities, 5.00% due 9/1/2018 (Western Heights Public Schools) | A+/NR | 2,120,000 | 2,448,536 | |||||||
Oklahoma County ISD, 3.00% due 1/1/2012 | A+/NR | 3,880,000 | 3,904,754 | |||||||
Oklahoma County ISD, 3.00% due 1/1/2013 | A+/NR | 3,880,000 | 3,988,136 | |||||||
Oklahoma County ISD, 3.00% due 1/1/2014 | A+/NR | 2,880,000 | 3,019,162 | |||||||
Oklahoma DFA, 0.14% due 8/15/2033 put 10/3/2011 (Integris Health; Insured: AGM) (daily demand notes) | AA+/Aa3 | 11,470,000 | 11,470,000 | |||||||
bOklahoma DFA Health Facilities, 5.00% due 8/15/2017 (Integris Health) | AA-/Aa3 | 4,375,000 | 5,038,731 | |||||||
Oklahoma DFA Health Systems, 5.25% due 12/1/2011 (Duncan Regional Hospital) | A-/NR | 1,215,000 | 1,223,979 | |||||||
Oklahoma DFA Health Systems, 5.25% due 12/1/2012 (Duncan Regional Hospital) | A-/NR | 1,330,000 | 1,393,029 | |||||||
Oklahoma Municipal Power Authority, 5.00% due 1/1/2013 | A/A2 | 3,745,000 | 3,943,036 | |||||||
Oklahoma Municipal Power Authority, 5.00% due 1/1/2014 (Insured: AGM) | A/A2 | 4,005,000 | 4,355,277 | |||||||
Oklahoma State Industrial Authority, 5.00% due 7/1/2016 (Medical Research Foundation) | NR/A1 | 1,165,000 | 1,305,814 | |||||||
34 Certified Annual Report
| SCHEDULE OF INVESTMENTS, CONTINUED | ||
| Thornburg Limited Term Municipal Fund | September 30, 2011 | |
Issuer-Description | Credit Rating † S&P/ Moody’s | Principal Amount | Value | |||||||
Oklahoma State Industrial Authority, 5.25% due 7/1/2017 (Medical Research Foundation) | NR/A1 | $ | 1,075,000 | $ | 1,225,027 | |||||
OREGON — 0.29% | ||||||||||
Clackamas County Oregon Hospital Facilities, 5.00% due 7/15/2037 put 7/15/2014 (Legacy Health Systems) | A+/A2 | 6,000,000 | 6,588,360 | |||||||
Clackamas County Oregon Hospital Facilities, 5.00% due 7/15/2039 put 7/15/2012 (Legacy Health Systems) | A+/A2 | 2,000,000 | 2,065,900 | |||||||
Oregon Facilities Authority Revenue, 5.00% due 3/15/2015 (Legacy Health Systems) | A+/A2 | 1,635,000 | 1,795,344 | |||||||
Oregon Facilities Authority Revenue, 5.00% due 3/15/2016 (Legacy Health Systems) | A+/A2 | 1,000,000 | 1,113,060 | |||||||
Oregon State Department of Administrative Services COP, 5.00% due 11/1/2014 (Insured: Natl-Re/FGIC) | AA/Aa2 | 1,000,000 | 1,126,790 | |||||||
PENNSYLVANIA — 4.44% | ||||||||||
Adams County IDA, 5.00% due 8/15/2014 (Gettysburg College) | A/A2 | 1,000,000 | 1,098,170 | |||||||
Adams County IDA, 5.00% due 8/15/2016 (Gettysburg College) | A/A2 | 1,250,000 | 1,422,525 | |||||||
Adams County IDA, 5.00% due 8/15/2017 (Gettysburg College) | A/A2 | 1,340,000 | 1,534,957 | |||||||
Adams County IDA, 5.00% due 8/15/2019 (Gettysburg College) | A/A2 | 1,765,000 | 2,022,214 | |||||||
Allegheny County Hospital Development Authority, 5.00% due 6/15/2017 (UPMC Health Systems) | A+/Aa3 | 3,000,000 | 3,463,860 | |||||||
Allegheny County Hospital Development Authority, 5.00% due 9/1/2017 (UPMC Health Systems) | A+/Aa3 | 1,875,000 | 2,175,019 | |||||||
Allegheny County Hospital Development Authority, 5.00% due 5/15/2018 (UPMC Health Systems) | A+/Aa3 | 5,915,000 | 6,848,919 | |||||||
Allegheny County Hospital Development Authority, 5.00% due 6/15/2018 (UPMC Health Systems) | A+/Aa3 | 3,000,000 | 3,488,820 | |||||||
Allegheny County Hospital Development Authority, 5.00% due 9/1/2018 (Pittsburgh Medical Center) | A+/Aa3 | 2,000,000 | 2,312,700 | |||||||
Allegheny County Redevelopment Authority, 5.10% due 7/1/2014 (Pittsburgh Mills) | NR/NR | 1,280,000 | 1,316,070 | |||||||
Chester County School Authority, 5.00% due 4/1/2016 (Intermediate School; Insured: AMBAC) | A+/NR | 1,915,000 | 2,150,871 | |||||||
Geisinger Authority, 0.13% due 6/1/2041 put 10/3/2011 (Geisinger Health Systems; SPA: JPMorgan Chase Bank) (daily demand notes) | AA/Aa2 | 15,000,000 | 15,000,000 | |||||||
Lancaster County Solid Waste Management Authority, 5.00% due 12/15/2012 | AA-/A3 | 3,475,000 | 3,631,966 | |||||||
Montgomery County IDA, 5.00% due 8/1/2016 (Regional Medical Center; Insured: FHA) | AA/Aa2 | 1,000,000 | 1,140,580 | |||||||
Montgomery County IDA, 5.00% due 2/1/2017 (Regional Medical Center; Insured: FHA) | AA/Aa2 | 1,000,000 | 1,140,760 | |||||||
Montgomery County IDA, 5.00% due 2/1/2020 (Regional Medical Center; Insured: FHA) | AA/Aa2 | 1,000,000 | 1,143,330 | |||||||
Pennsylvania EDA, 3.70% due 11/1/2021 put 5/1/2015 (Waste Management, Inc.) | BBB/NR | 7,750,000 | 8,173,305 | |||||||
Pennsylvania EDA, 3.00% due 12/1/2037 put 9/1/2015 (PPL Energy Supply) | BBB/NR | 14,000,000 | 14,412,860 | |||||||
Pennsylvania EDA, 5.00% due 12/1/2042 put 6/1/2012 (Exelon Corp. Generation) | NR/A3 | 2,550,000 | 2,618,646 | |||||||
Pennsylvania Higher Educational Facilities Authority, 5.00% due 6/1/2015 (Philadelphia University) | BBB/Baa2 | 2,000,000 | 2,108,640 | |||||||
Pennsylvania Higher Educational Facilities Authority, 5.00% due 5/15/2019 (UPMC Health Systems) | A+/Aa3 | 5,600,000 | 6,511,400 | |||||||
Pennsylvania Higher Educational Facilities Authority, 5.00% due 5/15/2020 (UPMC Health Systems) | A+/Aa3 | 5,100,000 | 5,945,784 | |||||||
Pennsylvania Turnpike Commission Revenue, 0.68% due 12/1/2011 | A+/Aa3 | 2,500,000 | 2,499,750 | |||||||
Pennsylvania Turnpike Commission Revenue, 0.78% due 12/1/2012 | A+/Aa3 | 2,500,000 | 2,506,975 | |||||||
Philadelphia Authority for Industrial Development, 5.00% due 8/1/2020 (Mast Charter School) | BBB+/NR | 840,000 | 864,578 | |||||||
Philadelphia Gas Works, 5.375% due 7/1/2014 (Insured: AGM) | AA+/Aa3 | 7,280,000 | 7,986,014 | |||||||
Philadelphia Gas Works, 5.00% due 9/1/2014 (Insured: AGM) | AA+/Aa3 | 3,000,000 | 3,275,100 | |||||||
Philadelphia Gas Works, 5.00% due 10/1/2014 (Insured: AMBAC) | BBB+/Baa2 | 1,825,000 | 1,994,123 | |||||||
Philadelphia Gas Works, 5.00% due 9/1/2015 (Insured: AGM) | AA+/Aa3 | 3,315,000 | 3,617,991 | |||||||
Philadelphia Hospitals & Higher Educational Facilities Authority, 0.13% due 7/1/2022 put 10/3/2011 (The Children’s Hospital; SPA: JPMorgan Chase Bank) (daily demand notes) | AA/Aa2 | 3,500,000 | 3,500,000 | |||||||
Philadelphia Hospitals & Higher Educational Facilities Authority, 0.13% due 2/15/2024 put 10/3/2011 (The Children’s Hospital; SPA: JPMorgan Chase Bank) (daily demand notes) | AA/Aa2 | 2,800,000 | 2,800,000 | |||||||
Certified Annual Report 35
| SCHEDULE OF INVESTMENTS, CONTINUED | ||
| Thornburg Limited Term Municipal Fund | September 30, 2011 | |
Issuer-Description | Credit Rating † S&P/ Moody’s | Principal Amount | Value | |||||||
Philadelphia Parking Authority Revenue, 5.00% due 9/1/2016 | A-/A1 | $ | 1,500,000 | $ | 1,698,525 | |||||
Philadelphia Parking Authority Revenue, 5.00% due 9/1/2017 | A-/A1 | 1,020,000 | 1,160,678 | |||||||
Philadelphia School District GO, 5.00% due 9/1/2012 (State Aid Withholding) | A+/Aa2 | 5,000,000 | 5,188,600 | |||||||
Philadelphia School District GO, 5.00% due 9/1/2013 (State Aid Withholding) | A+/Aa2 | 2,000,000 | 2,138,900 | |||||||
Philadelphia School District GO, 4.50% due 9/1/2017 (State Aid Withholding) | A+/Aa2 | 2,270,000 | 2,507,805 | |||||||
Philadelphia School District GO, 5.00% due 9/1/2019 (State Aid Withholding) | A+/Aa2 | 18,000,000 | 20,331,000 | |||||||
Philadelphia School District GO, 5.00% due 9/1/2019 (State Aid Withholding) | A+/Aa2 | 4,210,000 | 4,755,195 | |||||||
Philadelphia School District GO, 5.25% due 9/1/2021 (State Aid Withholding) | A+/Aa2 | 2,000,000 | 2,250,280 | |||||||
Philadelphia Water & Wastewater Revenue, 5.00% due 6/15/2013 (Insured: AGM) | AA+/Aa3 | 7,020,000 | 7,554,643 | |||||||
Philadelphia Water & Wastewater Revenue, 5.00% due 6/15/2017 (Insured: AGM) | AA+/Aa3 | 5,570,000 | 6,426,722 | |||||||
Pittsburgh GO, 5.00% due 9/1/2012 (Insured: Natl-Re) | BBB/A1 | 3,415,000 | 3,535,618 | |||||||
Pittsburgh GO, 5.50% due 9/1/2014 (Insured: AMBAC) | BBB/A1 | 1,325,000 | 1,394,231 | |||||||
Pittsburgh GO, 5.50% due 9/1/2014 (Insured: AMBAC) | BBB/A1 | 1,750,000 | 1,776,180 | |||||||
Pittsburgh GO, 5.25% due 9/1/2016 (Insured: AGM) | AA+/Aa3 | 3,000,000 | 3,404,880 | |||||||
Pittsburgh GO, 5.25% due 9/1/2017 (Insured: AGM) | AA+/Aa3 | 1,910,000 | 2,144,147 | |||||||
Pittsburgh GO, 5.25% due 9/1/2018 (Insured: AGM) | AA+/Aa3 | 3,240,000 | 3,594,974 | |||||||
Pittsburgh School District GO, 3.00% due 9/1/2012 (Insured: AGM) | AA+/Aa3 | 1,670,000 | 1,705,488 | |||||||
Pittsburgh School District GO, 3.00% due 9/1/2013 (Insured: AGM) | AA+/Aa3 | 2,100,000 | 2,176,251 | |||||||
Pittsburgh Water & Sewer Authority Revenue, 2.625% due 9/1/2035 put 9/1/2012 (Insured: AGM) | AA+/NR | 2,000,000 | 2,024,800 | |||||||
Sayre HFA, 5.25% due 7/1/2012 (Latrobe Area Hospital; Insured: AMBAC) (ETM) | NR/NR | 1,000,000 | 1,036,720 | |||||||
RHODE ISLAND — 0.54% | ||||||||||
Convention Center Authority, 5.25% due 5/15/2015 (Insured: Natl-Re) | BBB/Baa1 | 1,450,000 | 1,525,516 | |||||||
Convention Center Authority, 5.00% due 5/15/2019 (Insured: AGM) | AA+/Aa3 | 10,000,000 | 10,473,600 | |||||||
Convention Center Authority, 5.00% due 5/15/2020 (Insured: AGM) | AA+/Aa3 | 6,830,000 | 7,137,009 | |||||||
Providence GO, 5.50% due 1/15/2012 (Insured: Natl-Re/FGIC) | BBB+/A3 | 1,880,000 | 1,902,710 | |||||||
Rhode Island COP, 5.00% due 10/1/2014 (Providence Plantations; Insured: Natl-Re) | AA-/Aa3 | 1,000,000 | 1,093,650 | |||||||
Rhode Island State Health & Education Building Corp., 5.25% due 7/1/2014 (Memorial | ||||||||||
Hospital; LOC: Fleet Bank) | NR/NR | 1,565,000 | 1,654,080 | |||||||
SOUTH CAROLINA — 0.88% | ||||||||||
Georgetown County Environmental Improvement, 5.70% due 4/1/2014 (International Paper Co.) | BBB/Baa3 | 7,975,000 | 8,644,980 | |||||||
Greenville County School District, 5.25% due 12/1/2015 (Building Equity Sooner Tomorrow) | AA/Aa2 | 1,000,000 | 1,087,150 | |||||||
Greenville County School District, 5.50% due 12/1/2016 (Building Equity Sooner Tomorrow) | AA/Aa2 | 3,500,000 | 4,163,460 | |||||||
Greenwood County Hospital Facilities, 5.00% due 10/1/2013 (Self Regional Health Care; Insured: AGM) | AA+/Aa3 | 2,000,000 | 2,142,940 | |||||||
Greenwood Fifty Facilities School District, 5.00% due 12/1/2015 (Insured: AGM) | AA+/Aa3 | 1,000,000 | 1,141,410 | |||||||
Greenwood Fifty Facilities School District, 5.00% due 12/1/2016 (Insured: AGM) | AA+/Aa3 | 1,000,000 | 1,155,230 | |||||||
Piedmont Municipal Power Agency, 6.75% due 1/1/2019 (Insured: Natl-Re/FGIC) | NR/Baa1 | 3,695,000 | 4,666,194 | |||||||
South Carolina Jobs Economic Development, 5.00% due 8/15/2014 (Care Alliance Health Services; Insured: AGM) | AA+/Aa3 | 4,000,000 | 4,350,520 | |||||||
South Carolina Jobs Economic Development, 5.00% due 8/15/2015 (Care Alliance Health Services; Insured: AGM) | AA+/Aa3 | 3,000,000 | 3,326,220 | |||||||
York County PCR, 0.45% due 12/1/2011 | NR/NR | 8,000,000 | 8,000,000 | |||||||
SOUTH DAKOTA — 0.23% | ||||||||||
South Dakota State Health & Educational Facilities Authority, 6.00% due 11/1/2014 (Sioux Valley Hospital & Health Systems) | AA-/A1 | 1,015,000 | 1,028,966 | |||||||
South Dakota State Health & Educational Facilities Authority, 5.00% due 11/1/2015 (Sanford Health) | AA-/A1 | 1,310,000 | 1,465,785 | |||||||
South Dakota State Health & Educational Facilities Authority, 5.00% due 4/1/2017 (Prairie Lakes Health) | A+/NR | 2,215,000 | 2,457,498 | |||||||
36 Certified Annual Report
| SCHEDULE OF INVESTMENTS, CONTINUED | ||
| Thornburg Limited Term Municipal Fund | September 30, 2011 | |
Issuer-Description | Credit Rating † S&P/ Moody’s | Principal Amount | Value | |||||||
South Dakota State Health & Educational Facilities Authority, 5.00% due 4/1/2018 (Prairie Lakes Health) | A+/NR | $ | 2,290,000 | $ | 2,547,030 | |||||
South Dakota State Health & Educational Facilities Authority, 5.00% due 4/1/2019 (Prairie Lakes Health) | A+/NR | 2,440,000 | 2,690,344 | |||||||
TENNESSEE — 0.88% | ||||||||||
Clarksville Natural Gas Acquisition Corp., 5.00% due 12/15/2014 | NR/Baa1 | 3,200,000 | 3,405,568 | |||||||
Clarksville Natural Gas Acquisition Corp., 5.00% due 12/15/2015 | NR/Baa1 | 3,500,000 | 3,709,615 | |||||||
Clarksville Natural Gas Acquisition Corp., 5.00% due 12/15/2019 | NR/Baa1 | 6,000,000 | 5,939,880 | |||||||
Tennessee Energy Acquisition Corp., 5.00% due 9/1/2015 | B/Ba3 | 3,000,000 | 3,165,300 | |||||||
Tennessee Energy Acquisition Corp., 5.00% due 2/1/2017 | BBB/Baa3 | 5,000,000 | 5,022,900 | |||||||
Tennessee Energy Acquisition Corp., 5.25% due 9/1/2017 | B/Ba3 | 11,000,000 | 11,311,080 | |||||||
Tennessee Energy Acquisition Corp., 5.25% due 9/1/2018 | B/Ba3 | 5,000,000 | 5,072,500 | |||||||
Tennessee Energy Acquisition Corp., 5.25% due 9/1/2020 | B/Ba3 | 1,190,000 | 1,185,764 | |||||||
TEXAS — 9.79% | ||||||||||
Amarillo Health Facilities Corp., 5.50% due 1/1/2012 (Baptist St. Anthony’s Hospital Corp.; Insured: AGM) | NR/Aa3 | 2,710,000 | 2,727,696 | |||||||
Amarillo Health Facilities Corp., 5.50% due 1/1/2015 (Baptist St. Anthony’s Hospital Corp.; Insured: AGM) | NR/Aa3 | 1,065,000 | 1,129,890 | |||||||
Austin Community College Public Facilities Corp., 5.25% due 8/1/2017 (Round Rock Campus) | AA/Aa2 | 1,500,000 | 1,778,775 | |||||||
Austin Electrical Utilities Systems, 5.50% due 11/15/2013 (Insured: AMBAC) | A+/A1 | 1,000,000 | 1,100,390 | |||||||
Austin Water & Wastewater, 5.00% due 5/15/2014 (Insured: AMBAC) | AA/Aa2 | 2,890,000 | 3,221,945 | |||||||
Austin Water & Wastewater, 5.00% due 5/15/2015 (Insured: AMBAC) | AA/Aa2 | 1,520,000 | 1,747,514 | |||||||
Bexar Metropolitan Water District Waterworks, 4.50% due 5/1/2021 (Insured: Natl-Re) | A/A1 | 1,200,000 | 1,249,212 | |||||||
Brazos River Authority, 4.90% due 10/1/2015 (Center Point Energy; Insured: Natl-Re) | BBB/Baa1 | 4,485,000 | 4,799,443 | |||||||
Bryan Electric Systems, 3.00% due 7/1/2012 | A+/A1 | 1,850,000 | 1,884,836 | |||||||
Bryan Electric Systems, 4.00% due 7/1/2014 | A+/A1 | 1,300,000 | 1,401,374 | |||||||
Bryan Electric Systems, 4.00% due 7/1/2014 | A+/A1 | 1,000,000 | 1,002,730 | |||||||
Bryan Electric Systems, 4.00% due 7/1/2015 | A+/A1 | 1,110,000 | 1,112,764 | |||||||
Bryan Electric Systems, 5.00% due 7/1/2015 | A+/A1 | 1,150,000 | 1,305,112 | |||||||
Bryan Electric Systems, 5.00% due 7/1/2016 | A+/A1 | 1,500,000 | 1,545,675 | |||||||
Bryan Electric Systems, 5.00% due 7/1/2017 | A+/A1 | 3,205,000 | 3,294,708 | |||||||
Bryan Electric Systems, 5.00% due 7/1/2019 | A+/A1 | 8,000,000 | 9,092,720 | |||||||
Capital Area Cultural Education Facilities, 5.00% due 4/1/2013 (Roman Catholic Diocese) | NR/NR | 670,000 | 699,916 | |||||||
Capital Area Cultural Education Facilities, 5.00% due 4/1/2014 (Roman Catholic Diocese) | NR/NR | 890,000 | 947,672 | |||||||
Capital Area Cultural Education Facilities, 5.00% due 4/1/2015 (Roman Catholic Diocese) | NR/NR | 1,100,000 | 1,190,145 | |||||||
Capital Area Cultural Education Facilities, 5.00% due 4/1/2018 (Roman Catholic Diocese) | NR/NR | 1,370,000 | 1,493,588 | |||||||
Collin County Limited Tax Improvement GO, 5.00% due 2/15/2016 | AAA/Aaa | 1,465,000 | 1,714,050 | |||||||
Corpus Christi Business & Job Development Corp., 5.00% due 9/1/2012 (Arena Project; Insured: AMBAC) | A/A2 | 1,025,000 | 1,062,413 | |||||||
Dallas Convention Center Hotel Development Corp., 0% due 1/1/2018 | A+/A1 | 5,240,000 | 4,163,180 | |||||||
Dallas Convention Center Hotel Development Corp., 5.00% due 1/1/2019 | A+/A1 | 5,200,000 | 5,880,368 | |||||||
Dallas County Utility & Reclamation District, 5.00% due 2/15/2017 (Insured: AMBAC) | BBB+/A3 | 1,160,000 | 1,289,734 | |||||||
Dallas County Utility & Reclamation District, 5.00% due 2/15/2017 | BBB+/A3 | 1,260,000 | 1,400,918 | |||||||
Dallas County Utility & Reclamation District, 5.00% due 2/15/2018 (Insured: AMBAC) | BBB+/A3 | 1,935,000 | 2,119,077 | |||||||
Dallas County Utility & Reclamation District, 5.00% due 2/15/2018 (Insured: AMBAC) | BBB+/A3 | 2,035,000 | 2,228,590 | |||||||
Dallas County Utility & Reclamation District, 5.00% due 2/15/2019 (Insured: AMBAC) | BBB+/A3 | 2,175,000 | 2,348,435 | |||||||
Dallas/Fort Worth International Airport, 4.00% due 11/1/2012 | A+/A1 | 1,000,000 | 1,036,540 | |||||||
Dallas/Fort Worth International Airport, 5.00% due 11/1/2013 | A+/A1 | 1,175,000 | 1,277,213 | |||||||
Dallas/Fort Worth International Airport, 5.00% due 11/1/2014 | A+/A1 | 1,300,000 | 1,453,751 | |||||||
Dallas/Fort Worth International Airport, 5.00% due 11/1/2015 | A+/A1 | 3,370,000 | 3,864,750 | |||||||
Denton GO, 2.00% due 2/15/2012 | AA/Aa2 | 3,115,000 | 3,135,995 | |||||||
Certified Annual Report 37
| SCHEDULE OF INVESTMENTS, CONTINUED | ||
| Thornburg Limited Term Municipal Fund | September 30, 2011 | |
Issuer-Description | Credit Rating † S&P/ Moody’s | Principal Amount | Value | |||||||
Denton GO, 3.00% due 2/15/2013 | AA/Aa2 | $ | 2,710,000 | $ | 2,806,639 | |||||
Denton GO, 3.00% due 2/15/2014 | AA/Aa2 | 3,325,000 | 3,511,100 | |||||||
Denton GO, 4.00% due 2/15/2015 | AA/Aa2 | 3,445,000 | 3,804,038 | |||||||
Denton GO, 4.00% due 2/15/2016 | AA/Aa2 | 3,535,000 | 3,959,306 | |||||||
Denton GO, 5.00% due 2/15/2017 | AA/Aa2 | 3,675,000 | 4,334,699 | |||||||
Denton GO, 5.00% due 2/15/2019 | AA/Aa2 | 3,990,000 | 4,753,806 | |||||||
Denton GO, 5.00% due 2/15/2020 | AA/Aa2 | 4,195,000 | 4,929,628 | |||||||
Duncanville ISD GO, 0% due 2/15/2012 (Guaranty: PSF) | AAA/Aaa | 1,245,000 | 1,243,668 | |||||||
Guadalupe-Blanco River Authority PCR, 5.625% due 10/1/2017 (AEP Texas Central Co.) | BBB/Baa2 | 5,000,000 | 5,553,650 | |||||||
Harris County Educational Facilities Finance Corp., 5.00% due 11/15/2015 (Teco Project) | AA/Aa3 | 1,450,000 | 1,682,841 | |||||||
Harris County Educational Facilities Finance Corp., 5.00% due 11/15/2018 (Teco Project) | AA/Aa3 | 1,365,000 | 1,635,447 | |||||||
Harris County Educational Facilities Finance Corp., 5.00% due 11/15/2019 (Teco Project) | AA/Aa3 | 1,000,000 | 1,193,800 | |||||||
Harris County Health Facilities Development Corp., 5.00% due 7/1/2016 (Christus Health; Insured: AGM) | AA+/Aa3 | 5,860,000 | 6,548,667 | |||||||
Harris County Health Facilities Development Corp. Thermal Utility, 5.00% due 11/15/2015 (Teco Project; Insured: Natl-Re) | AA/Aa3 | 1,500,000 | 1,622,055 | |||||||
Harris County Hospital District Senior Lien, 5.00% due 2/15/2014 (Insured: Natl-Re) | A/A1 | 1,275,000 | 1,377,472 | |||||||
Harris County Hospital District Senior Lien, 5.00% due 2/15/2017 (Insured: Natl-Re) | A/A1 | 1,500,000 | 1,697,550 | |||||||
Houston Airport Systems Revenue, 5.00% due 7/1/2015 | AA-/Aa3 | 2,600,000 | 2,941,484 | |||||||
Houston Airport Systems Revenue, 5.00% due 7/1/2017 | AA-/Aa3 | 1,600,000 | 1,860,512 | |||||||
Houston Airport Systems Revenue, 5.00% due 7/1/2018 | AA-/Aa3 | 1,000,000 | 1,166,920 | |||||||
Houston Higher Education Finance Corp., 5.875% due 5/15/2021 (Cosmos Foundation, Inc.) | BBB/NR | 1,000,000 | 1,066,140 | |||||||
Houston Hotel Occupancy Tax Revenue, 5.00% due 9/1/2014 | A-/A2 | 2,000,000 | 2,208,080 | |||||||
Houston Hotel Occupancy Tax Revenue, 5.00% due 9/1/2014 | A-/A2 | 1,300,000 | 1,435,252 | |||||||
Houston Hotel Occupancy Tax Revenue, 0% due 9/1/2020 (Insured: AGM/AMBAC) | AA+/Aa3 | 3,650,000 | 2,422,943 | |||||||
Houston Independent School District, 5.00% due 2/15/2014 (Limited Tax Schoolhouse) | AA+/Aaa | 2,000,000 | 2,210,460 | |||||||
Houston Independent School District, 5.00% due 2/15/2015 (Limited Tax Schoolhouse) | AA+/Aaa | 2,450,000 | 2,796,601 | |||||||
Houston ISD Public West Side, 0% due 9/15/2014 (Insured: AMBAC) | AA/Aa2 | 6,190,000 | 5,950,756 | |||||||
Houston Utilities System Revenue, 5.00% due 11/15/2013 (Insured: AGM) | AA+/Aa2 | 3,000,000 | 3,275,940 | |||||||
Houston Water Conveyance System COP, 6.25% due 12/15/2014 (Insured: AMBAC) | NR/NR | 2,850,000 | 3,150,760 | |||||||
Hutto ISD GO, 0% due 8/1/2017 (Guaranty: PSF) | AAA/NR | 2,170,000 | 1,860,667 | |||||||
Irving ISD GO, 0% due 2/15/2017 (Guaranty: PSF) | AAA/Aaa | 1,000,000 | 881,140 | |||||||
Keller ISD GO, 0% due 8/15/2012 (Guaranty: PSF) | AAA/Aaa | 1,250,000 | 1,246,400 | |||||||
Kerrville Health Facilities Development Corp. Hospital Revenue, 5.25% due 8/15/2021 (Sid Peterson Memorial Hospital) | BBB-/NR | 4,000,000 | 4,114,680 | |||||||
Laredo GO, 5.00% due 2/15/2018 (Insured: Natl-Re) | AA-/Aa2 | 2,000,000 | 2,276,180 | |||||||
Laredo Sports Venue Sales Refunding & Improvement, 5.00% due 3/15/2012 (Insured: AMBAC) | A+/A1 | 1,660,000 | 1,692,337 | |||||||
Laredo Sports Venue Sales Refunding & Improvement, 5.00% due 3/15/2013 (Insured: AMBAC) | A+/A1 | 1,745,000 | 1,841,446 | |||||||
Laredo Sports Venue Sales Refunding & Improvement, 5.00% due 3/15/2014 (Insured: AMBAC) | A+/A1 | 1,835,000 | 1,989,158 | |||||||
Laredo Sports Venue Sales Refunding & Improvement, 5.00% due | A+/A1 | 1,930,000 | 2,144,249 | |||||||
Lower Colorado River Authority, 5.875% due 5/15/2016 (Insured: BHAC/FSA) | NR/Aa1 | 2,210,000 | 2,219,238 | |||||||
Mission Economic Development Corp., 3.75% due 12/1/2018 put 5/1/2015 (Waste | ||||||||||
Management, Inc.) | BBB/NR | 8,500,000 | 8,989,515 | |||||||
North East ISD GO, 5.00% due 8/1/2016 (Guaranty: PSF) | AAA/Aaa | 2,000,000 | 2,366,140 | |||||||
North Texas University Revenue, 5.00% due 4/15/2014 | NR/Aa2 | 1,250,000 | 1,389,225 | |||||||
North Texas University Revenue, 5.00% due 4/15/2016 | NR/Aa2 | 2,250,000 | 2,632,252 | |||||||
Northside ISD GO, 1.75% due 6/1/2037 put 6/1/2013 (Various School Buildings; Guaranty: PSF) | AAA/NR | 19,595,000 | 19,618,710 | |||||||
Northside ISD GO, 1.50% due 8/1/2040 put 8/1/2012 (Guaranty: PSF) | AAA/Aaa | 4,000,000 | 4,034,760 | |||||||
Richardson Refunding & Improvement GO, 5.00% due 2/15/2014 (Insured: Natl-Re) | AAA/Aaa | 3,000,000 | 3,304,650 | |||||||
Sam Rayburn Municipal Power Agency, 5.50% due 10/1/2012 | NR/Baa2 | 6,000,000 | 6,230,340 | |||||||
Sam Rayburn Municipal Power Agency, 6.00% due 10/1/2021 | NR/Baa2 | 8,400,000 | 8,585,136 | |||||||
San Antonio Electric & Gas Revenue, 1.15% due 12/1/2027 put 12/3/2012 (SPA: BNP Paribas) | AA-/Aa2 | 21,000,000 | 21,092,610 | |||||||
San Juan Higher Education Finance Authority, 5.125% due 8/15/2020 (Idea Public Schools) | BBB/NR | 2,000,000 | 2,025,500 | |||||||
38 Certified Annual Report
| SCHEDULE OF INVESTMENTS, CONTINUED | ||
| Thornburg Limited Term Municipal Fund | September 30, 2011 | |
Issuer-Description | Credit Rating† S&P/ Moody’s | Principal Amount | Value | |||||||
Sherman ISD GO, 0.65% due 8/1/2036 put 8/1/2012 (School Building; Guaranty: PSF) | AAA/NR | $ | 3,360,000 | $ | 3,361,949 | |||||
Tarrant County Cultural Educational Facilities, 5.00% due 8/15/2016 (Scott & White Memorial Hospital) | A/A1 | 2,280,000 | 2,570,723 | |||||||
Tarrant County Cultural Educational Facilities, 5.00% due 8/15/2017 (Scott & White Memorial Hospital) | A/A1 | 2,000,000 | 2,267,820 | |||||||
Tarrant County Cultural Educational Facilities, 0.18% due 10/1/2041 put 10/3/2011 (Methodist Hospitals; LOC: JPMorgan Chase Bank) (daily demand notes) | AAA/Aa1 | 1,000,000 | 1,000,000 | |||||||
Texas Municipal Power Agency, 0% due 9/1/2013 (Insured: Natl-Re) | A+/A2 | 1,000,000 | 981,900 | |||||||
Texas Municipal Power Agency, 5.00% due 9/1/2017 (Insured: AGM) | AA+/Aa3 | 10,000,000 | 11,803,200 | |||||||
Texas Public Finance Authority Revenue, 5.00% due 7/1/2012 (Unemployment Compensation) | AAA/Aa1 | 14,630,000 | 15,153,315 | |||||||
Texas Public Finance Authority Revenue, 5.00% due 1/1/2014 (Unemployment Compensation) | AAA/Aa1 | 5,000,000 | 5,501,000 | |||||||
Texas Public Finance Authority Revenue, 5.00% due 7/1/2014 (Unemployment Compensation) | AAA/Aa1 | 5,000,000 | 5,602,600 | |||||||
Texas Public Finance Authority Revenue, 5.00% due 10/15/2014 (Stephen F. Austin State University; Insured: Natl-Re) | NR/A1 | 1,305,000 | 1,451,147 | |||||||
Texas Public Finance Authority Revenue, 5.00% due 10/15/2015 (Stephen F. Austin State University; Insured: Natl-Re) | NR/A1 | 1,450,000 | 1,654,842 | |||||||
Texas Public Finance Authority Revenue, 5.00% due 7/1/2017 (Unemployment Compensation) | AAA/Aa1 | 15,500,000 | 17,844,220 | |||||||
Texas State, 2.50% due 8/30/2012 (Tax & Revenue Anticipation Notes) | SP-1+/Mig1 | 85,000,000 | 86,767,150 | |||||||
Uptown Development Authority, 5.00% due 9/1/2015 (Infrastructure Improvements) | BBB/NR | 1,370,000 | 1,500,314 | |||||||
Uptown Development Authority, 5.00% due 9/1/2017 (Infrastructure Improvements) | BBB/NR | 1,580,000 | 1,722,437 | |||||||
Uptown Development Authority, 5.00% due 9/1/2018 (Infrastructure Improvements) | BBB/NR | 1,870,000 | 2,036,206 | |||||||
Uptown Development Authority, 5.00% due 9/1/2019 (Infrastructure Improvements) | BBB/NR | 1,945,000 | 2,104,646 | |||||||
Waco Health Facilities Development Corp., 4.00% due 9/1/2013 (Hillcrest Health System; Insured: Natl-Re) (ETM) | BBB/NR | 1,000,000 | 1,063,460 | |||||||
Washington County Health Facilities Development Corp., 5.75% due 6/1/2019 (Trinity Medical Center; Insured: ACA) | NR/NR | 3,840,000 | 3,829,056 | |||||||
Weslaco GO Waterworks & Sewer System, 5.25% due 2/15/2019 (Insured: Natl-Re) | BBB+/A2 | 2,835,000 | 3,225,521 | |||||||
West Harris County Regional Water, 5.25% due 12/15/2012 (Insured: AGM) | AA+/Aa3 | 2,435,000 | 2,568,998 | |||||||
U.S. VIRGIN ISLANDS — 0.28% | ||||||||||
Virgin Islands Public Finance Authority, 6.75% due 10/1/2019 (Diageo Project) | NR/Baa3 | 7,690,000 | 8,621,413 | |||||||
Virgin Islands Water & Power Authority, 4.75% due 7/1/2015 | BBB-/Baa2 | 1,000,000 | 1,071,180 | |||||||
Virgin Islands Water & Power Authority, 4.75% due 7/1/2016 | BBB-/Baa2 | 1,225,000 | 1,316,716 | |||||||
Virgin Islands Water & Power Authority, 4.75% due 7/1/2017 | BBB-/Baa2 | 1,300,000 | 1,401,504 | |||||||
UTAH — 1.06% | ||||||||||
Intermountain Power Agency Supply, 5.00% due 7/1/2012 (Insured: Natl-Re) (ETM) | NR/NR | 2,240,000 | 2,248,647 | |||||||
Intermountain Power Agency Supply, 5.00% due 7/1/2012 | A+/A1 | 15,000,000 | 15,526,800 | |||||||
Intermountain Power Agency Supply, 5.00% due 7/1/2013 | A+/A1 | 5,000,000 | 5,364,750 | |||||||
Intermountain Power Agency Supply, 5.25% due 7/1/2014 (Insured: Natl-Re) | BBB/Baa1 | 2,300,000 | 2,487,151 | |||||||
Nebo School District GO, 2.50% due 7/1/2012 | AAA/Aaa | 1,510,000 | 1,534,960 | |||||||
Weber County Hospital Revenue, 0.23% due 2/15/2031 put 10/3/2011 (IHC Health Services; SPA: Landesbank Hessen-Thuringen) (daily demand notes) | AA+/Aa1 | 4,320,000 | 4,320,000 | |||||||
Weber County Hospital Revenue, 0.23% due 2/15/2035 put 10/3/2011 (IHC Health Services) (daily demand notes) | AA+/Aa1 | 15,265,000 | 15,265,000 | |||||||
VERMONT — 0.46% | ||||||||||
Vermont Colleges Revenue GO, 4.00% due 7/1/2017 | A+/NR | 5,375,000 | 5,807,365 | |||||||
Vermont Economic Development Authority Revenue, 5.00% due 12/15/2020 (Vermont Public Service Corp.) | NR/Baa1 | 13,500,000 | 14,306,355 | |||||||
Certified Annual Report 39
| SCHEDULE OF INVESTMENTS, CONTINUED | ||
| Thornburg Limited Term Municipal Fund | September 30, 2011 | |
Issuer-Description | Credit Rating† S&P/ Moody’s | Principal Amount | Value | |||||||
VIRGINIA — 0.17% | ||||||||||
Fairfax County EDA, 5.00% due 8/1/2016 | AA+/Aa2 | $ | 2,600,000 | $ | 2,992,236 | |||||
Louisa IDA PCR, 5.00% due 11/1/2035 put 12/1/2011 (Virginia Electric & Power Company) | A-/NR | 3,000,000 | 3,021,090 | |||||||
Norton IDA Hospital Improvement, 5.75% due 12/1/2012 (Norton Community Hospital; Insured: ACA) | NR/NR | 1,460,000 | 1,466,818 | |||||||
WASHINGTON — 2.08% | ||||||||||
Energy Northwest Washington Electric, 5.50% due 7/1/2012 (Bonneville Power Administration Insured: Natl-Re) | AA-/Aa1 | 3,000,000 | 3,118,590 | |||||||
a Energy Northwest Washington Electric, 5.00% due 7/1/2013 (Bonneville Power Administration) | AA-/NR | 3,835,000 | 4,016,549 | |||||||
Energy Northwest Washington Electric, 5.00% due 7/1/2014 (Wind Project; Insured: AMBAC) | A/A3 | �� | 2,575,000 | 2,836,543 | ||||||
Energy Northwest Washington Electric, 6.00% due 7/1/2016 (Insured: AMBAC) | AA-/Aa1 | 2,415,000 | 2,514,281 | |||||||
Energy Northwest Washington Electric, 5.00% due 7/1/2017 (Bonneville Power Administration) | AA-/Aa1 | 5,470,000 | 6,498,032 | |||||||
a Energy Northwest Washington Electric, 5.00% due 7/1/2017 (Bonneville Power Administration) | AA-/NR | 5,000,000 | 5,721,950 | |||||||
King County Sewer, 5.50% due 1/1/2016 (Insured: AGM) | AA+/Aa2 | 7,205,000 | 7,300,682 | |||||||
Lewis County Public Utility District, 5.00% due 10/1/2011 (Cowlitz Falls Hydroelectric; Insured: Syncora) | AA-/Aa1 | 2,000,000 | 2,000,260 | |||||||
Port Seattle Washington Revenue, 5.50% due 9/1/2018 (Insured: Natl-Re/FGIC) | A/A1 | 5,000,000 | 5,924,200 | |||||||
Seattle Municipal Light & Power Revenue, 5.00% due 2/1/2016 | AA-/Aa2 | 1,000,000 | 1,162,740 | |||||||
Seattle Municipal Light & Power Revenue, 5.00% due 2/1/2017 | AA-/Aa2 | 2,000,000 | 2,361,920 | |||||||
Snohomish County Public Utilities District, 5.00% due 12/1/2015 (Insured: AGM) | AA+/Aa3 | 5,015,000 | 5,544,835 | |||||||
Washington State GO, 0% due 1/1/2018 (Insured: Natl-Re/FGIC) | AA+/Aa1 | 4,000,000 | 3,483,600 | |||||||
Washington State GO, 0% due 1/1/2019 (Insured: Natl-Re/FGIC) | AA+/Aa1 | 3,000,000 | 2,499,930 | |||||||
Washington State HFA, 5.00% due 7/1/2013 (Overlake Hospital; Insured: AGM) | AA+/Aa3 | 1,000,000 | 1,063,710 | |||||||
Washington State HFA, 5.00% due 8/15/2013 (Multicare Health Systems) | AA-/A1 | 1,250,000 | 1,320,262 | |||||||
Washington State HFA, 5.00% due 8/15/2014 (Multicare Health Systems) | AA-/A1 | 1,500,000 | 1,611,495 | |||||||
Washington State HFA, 5.625% due 10/1/2014 pre-refunded 10/1/2011 (Providence Health Systems; Insured: Natl-Re) | AA/Aa2 | 3,000,000 | 3,000,450 | |||||||
Washington State HFA, 5.00% due 8/15/2015 (Multicare Health Systems) | AA-/A1 | 2,000,000 | 2,179,100 | |||||||
Washington State HFA, 5.00% due 8/15/2016 (Multicare Health Systems) | AA-/A1 | 2,075,000 | 2,282,106 | |||||||
Washington State HFA, 5.375% due 12/1/2016 (Group Health Co-op of Puget Sound; Insured: AMBAC) | BBB/NR | 2,000,000 | 2,024,920 | |||||||
Washington State HFA, 5.00% due 7/1/2017 (Overlake Hospital Medical Center) | A-/A3 | 1,245,000 | 1,372,152 | |||||||
Washington State HFA, 5.00% due 8/15/2017 (Multicare Health Systems) | AA-/A1 | 1,000,000 | 1,102,320 | |||||||
Washington State HFA, 5.25% due 8/1/2018 (Highline Medical Center; Insured: AGM 242) | A+/NR | 7,995,000 | 9,032,111 | |||||||
Washington State HFA, 5.00% due 8/15/2018 (Multicare Health Systems) | AA-/A1 | 2,000,000 | 2,203,780 | |||||||
Washington State HFA, 5.00% due 7/1/2019 (Overlake Hospital Medical Center) | A-/A3 | 1,050,000 | 1,150,852 | |||||||
Washington State HFA, 4.75% due 7/1/2020 (Overlake Hospital Medical Center) | A-/A3 | 1,000,000 | 1,073,200 | |||||||
Washington State Public Power Supply Systems, 5.40% due 7/1/2012 (Insured: AGM) | AA+/Aa1 | 1,300,000 | 1,350,310 | |||||||
Washington State Public Power Supply Systems, 0% due 7/1/2013 (Insured: Natl-Re/IBC) | AA-/Aa1 | 1,760,000 | 1,736,451 | |||||||
Washington State Public Power Supply Systems, 0% due 7/1/2015 (Insured: Natl-Re/IBC) | AA-/Aa1 | 3,000,000 | 2,857,620 | |||||||
Yakima County School District, 5.00% due 12/1/2012 (Insured: Natl-Re) | NR/Aa1 | 1,270,000 | 1,338,250 | |||||||
WEST VIRGINIA — 0.24% | ||||||||||
Kanawha, Mercer, Nicholas Counties Single Family Mtg, 0% due 2/1/2015 pre-refunded 2/1/2014 | NR/Aaa | 2,260,000 | 1,991,173 | |||||||
Monongalia County Community Hospital, 5.25% due 7/1/2020 (Monongalia General Hospital) | A-/NR | 4,195,000 | 4,405,631 | |||||||
West Virginia EDA PCR, 4.85% due 5/1/2019 put 9/4/2013 (Appalachian Power Company) | BBB/Baa2 | 1,000,000 | 1,058,190 | |||||||
West Virginia EDA PCR, 4.85% due 5/1/2019 put 9/4/2013 (Appalachian Power Company) | BBB/Baa2 | 1,000,000 | 1,058,190 | |||||||
West Virginia University, 0% due 4/1/2013 (Insured: AMBAC) | A+/Aa3 | 2,000,000 | 1,959,820 | |||||||
WISCONSIN — 0.82% | ||||||||||
Wisconsin Health & Educational Facilities Authority, 5.00% due 7/15/2014 (Aurora Health Care, Inc.) | NR/A3 | 4,265,000 | 4,550,158 | |||||||
40 Certified Annual Report
| SCHEDULE OF INVESTMENTS, CONTINUED | ||
| Thornburg Limited Term Municipal Fund | September 30, 2011 | |
Issuer-Description | Credit Rating† S&P/ Moody’s | Principal Amount | Value | |||||||||
Wisconsin Health & Educational Facilities Authority, 5.00% due 7/15/2015 (Aurora Health Care, Inc.) | NR/A3 | $ | 4,100,000 | $ | 4,434,765 | |||||||
Wisconsin Health & Educational Facilities Authority, 5.00% due 7/15/2016 (Aurora Health Care, Inc.) | NR/A3 | 3,695,000 | 4,024,964 | |||||||||
Wisconsin Health & Educational Facilities Authority, 5.00% due 4/15/2017 (Aurora Health Care, Inc.) | NR/A3 | 1,295,000 | 1,407,963 | |||||||||
Wisconsin Health & Educational Facilities Authority, 5.00% due 7/1/2017 (Agnesian Health Care, Inc.) | A-/A3 | 1,000,000 | 1,095,500 | |||||||||
Wisconsin Health & Educational Facilities Authority, 5.00% due 7/15/2017 (Aurora Health Care, Inc.) | NR/A3 | 5,025,000 | 5,479,762 | |||||||||
Wisconsin Health & Educational Facilities Authority, 5.00% due 7/1/2018 (Agnesian Health Care, Inc.) | A-/A3 | 1,855,000 | 2,030,891 | |||||||||
Wisconsin Health & Educational Facilities Authority, 5.00% due 7/1/2019 (Agnesian Health Care, Inc.) | A-/A3 | 1,000,000 | 1,082,310 | |||||||||
Wisconsin Health & Educational Facilities Authority, 5.00% due 7/1/2020 (Agnesian Health Care, Inc.) | A-/A3 | 2,110,000 | 2,288,738 | |||||||||
Wisconsin Health & Educational Facilities Authority, 5.125% due 8/15/2027 put 8/15/2016 (Aurora Health Care, Inc.) | NR/A3 | 4,500,000 | 5,060,430 | |||||||||
Wisconsin Petroleum, 5.00% due 7/1/2015 | AA/Aa2 | 4,000,000 | 4,578,280 | |||||||||
|
| |||||||||||
TOTAL INVESTMENTS — 99.31% (Cost $4,184,123,042) | $ | 4,374,054,206 | ||||||||||
OTHER ASSETS LESS LIABILITIES — 0.69% | 30,251,684 | |||||||||||
|
| |||||||||||
NET ASSETS — 100.00% | $ | 4,404,305,890 | ||||||||||
|
| |||||||||||
Footnote Legend
| † | Credit ratings are unaudited. Rating changes may have occurred subsequent to the reporting period end. |
| a | When-issued security. |
| b | Segregated as collateral for a when-issued security. |
Portfolio Abbreviations
To simplify the listings of securities, abbreviations are used per the table below:
ACA | Insured by American Capital Access | |
AGM | Insured by Assured Guaranty Municipal Corp. | |
AMBAC | Insured by American Municipal Bond Assurance Corp. | |
BHAC | Insured by Berkshire Hathaway Assurance Corp. | |
CIFG | CIFG Assurance North America Inc. | |
COP | Certificates of Participation | |
DFA | Development Finance Authority | |
EDA | Economic Development Authority | |
ETM | Escrowed to Maturity | |
FGIC | Insured by Financial Guaranty Insurance Co. | |
FHA | Insured by Federal Housing Administration | |
FSA | Insured by Financial Security Assurance Co. | |
GO | General Obligation | |
HFA | Health Facilities Authority | |
HUD | Department of Housing & Urban Development | |
IBC | Insured Bond Certificate | |
IDA | Industrial Development Authority | |
ISD | Independent School District | |
JEA | Jacksonville Electric Authority | |
LOC | Letter of Credit | |
Mtg | Mortgage | |
NCSL | National Conference of State Legislature | |
Natl-Re | Insured by National Public Finance Guarantee Corp. | |
PCR | Pollution Control Revenue Bond | |
PSF | Guaranteed by Permanent School Fund | |
Q-SBLF | Qualified School Board Loan Fund | |
Radian | Insured by Radian Asset Assurance | |
SONYMA | State of New York Mortgage Authority | |
SPA | Stand-by Purchase Agreement | |
Syncora | Insured by Syncora Guarantee Inc. | |
UPMC | University of Pittsburgh Medical Center | |
USD | Unified School District |
See notes to financial statements.
Certified Annual Report 41
| STATEMENT OF ASSETS AND LIABILITIES | ||
| Thornburg Limited Term Municipal Fund | September 30, 2011 | |
ASSETS | ||||
Investments at value (cost $4,184,123,042) (Note 2) | $ | 4,374,054,206 | ||
Cash | 1,097,119 | |||
Receivable for investments sold | 18,080,067 | |||
Receivable for fund shares sold | 18,561,530 | |||
Interest receivable | 50,181,484 | |||
Prepaid expenses and other assets | 75,525 | |||
|
| |||
Total Assets | 4,462,049,931 | |||
|
| |||
LIABILITIES | ||||
Payable for investments purchased | 47,082,821 | |||
Payable for fund shares redeemed | 6,644,182 | |||
Payable to investment advisor and other affiliates (Note 3) | 1,891,716 | |||
Accounts payable and accrued expenses | 416,340 | |||
Dividends payable | 1,708,982 | |||
|
| |||
Total Liabilities | 57,744,041 | |||
|
| |||
NET ASSETS | $ | 4,404,305,890 | ||
|
| |||
NET ASSETS CONSIST OF: | ||||
Distribution in excess of net investment income | $ | (1,177,027 | ) | |
Net unrealized appreciation on investments | 189,931,164 | |||
Accumulated net realized gain (loss) | (2,838,764 | ) | ||
Net capital paid in on shares of beneficial interest | 4,218,390,517 | |||
|
| |||
| $ | 4,404,305,890 | |||
|
| |||
NET ASSET VALUE: | ||||
Class A Shares: | ||||
Net asset value and redemption price per share ($1,649,964,433 applicable to 114,690,017 shares of beneficial interest outstanding - Note 4) | $ | 14.39 | ||
Maximum sales charge, 1.50% of offering price | 0.22 | |||
|
| |||
Maximum offering price per share | $ | 14.61 | ||
|
| |||
Class C Shares: | ||||
Net asset value and offering price per share* ($525,923,214 applicable to 36,489,938 shares of beneficial interest outstanding - Note 4) | $ | 14.41 | ||
|
| |||
Class I Shares: | ||||
Net asset value, offering and redemption price per share ($2,228,418,243 applicable to 154,877,875 shares of beneficial interest outstanding - Note 4) | $ | 14.39 | ||
|
| |||
| * | Redemption price per share is equal to net asset value less any applicable contingent deferred sales charge. |
See notes to financial statements.
42 Certified Annual Report
| STATEMENT OF OPERATIONS | ||
| Thornburg Limited Term Municipal Fund | Year Ended September 30, 2011 | |
INVESTMENT INCOME: | ||||
Interest income (net of premium amortized of $40,982,467) | $ | 134,007,372 | ||
|
| |||
EXPENSES: | ||||
Investment advisory fees (Note 3) | 11,959,323 | |||
Administration fees (Note 3) | ||||
Class A Shares | 1,985,754 | |||
Class C Shares | 618,436 | |||
Class I Shares | 1,004,840 | |||
Distribution and service fees (Note 3) | ||||
Class A Shares | 3,971,509 | |||
Class C Shares | 2,469,825 | |||
Transfer agent fees | ||||
Class A Shares | 578,985 | |||
Class C Shares | 239,120 | |||
Class I Shares | 425,863 | |||
Registration and filing fees | ||||
Class A Shares | 82,967 | |||
Class C Shares | 38,300 | |||
Class I Shares | 155,445 | |||
Custodian fees (Note 3) | 499,859 | |||
Professional fees | 85,336 | |||
Accounting fees | 162,275 | |||
Trustee fees | 100,080 | |||
Other expenses | 399,521 | |||
|
| |||
Total Expenses | 24,777,438 | |||
Less: | ||||
Fees paid indirectly (Note 3) | (4,191 | ) | ||
|
| |||
Net Expenses | 24,773,247 | |||
|
| |||
Net Investment Income | 109,234,125 | |||
|
| |||
REALIZED AND UNREALIZED GAIN (LOSS) | ||||
Net realized gain (loss) on investments | 400,325 | |||
Net change in unrealized appreciation (depreciation) on investments | 33,955,135 | |||
|
| |||
Net Realized and Unrealized Gain | 34,355,460 | |||
|
| |||
Net Increase in Net Assets Resulting from Operations | $ | 143,589,585 | ||
|
| |||
See notes to financial statements.
Certified Annual Report 43
| STATEMENTS OF CHANGES IN NET ASSETS | ||
| Thornburg Limited Term Municipal Fund | ||
| Year Ended September 30, 2011 | Year Ended September 30, 2010 | |||||||
INCREASE (DECREASE) IN NET ASSETS FROM | ||||||||
OPERATIONS: | ||||||||
Net investment income | $ | 109,234,125 | $ | 82,291,902 | ||||
Net realized gain (loss) on investments | 400,325 | 425,081 | ||||||
Net unrealized appreciation (depreciation) on investments | 33,955,135 | 70,204,823 | ||||||
|
|
|
| |||||
Net Increase (Decrease) in Net Assets Resulting from Operations | 143,589,585 | 152,921,806 | ||||||
DIVIDENDS TO SHAREHOLDERS: | ||||||||
From net investment income | ||||||||
Class A Shares | (40,261,376 | ) | (35,403,295 | ) | ||||
Class C Shares | (11,239,321 | ) | (8,052,710 | ) | ||||
Class I Shares | (57,733,428 | ) | (38,835,897 | ) | ||||
FUND SHARE TRANSACTIONS (NOTE 4): | ||||||||
Class A Shares | 25,207,173 | 542,169,927 | ||||||
Class C Shares | 40,398,775 | 265,854,064 | ||||||
Class I Shares | 318,758,568 | 993,524,455 | ||||||
|
|
|
| |||||
Net Increase in Net Assets | 418,719,976 | 1,872,178,350 | ||||||
NET ASSETS: | ||||||||
Beginning of Year | 3,985,585,914 | 2,113,407,564 | ||||||
|
|
|
| |||||
End of Year | $ | 4,404,305,890 | $ | 3,985,585,914 | ||||
|
|
|
| |||||
See notes to financial statements.
44 Certified Annual Report
| NOTES TO FINANCIAL STATEMENTS | ||
| Thornburg Limited Term Municipal Fund | September 30, 2011 | |
NOTE 1 – ORGANIZATION
Thornburg Limited Term Municipal Fund (the “Fund”) is a diversified series of Thornburg Investment Trust (the “Trust”). The Trust is organized as a Massachusetts business trust under a Declaration of Trust dated June 3, 1987 and is registered as a diversified, open-end management investment company under the Investment Company Act of 1940, as amended. The Fund is currently one of sixteen separate series of the Trust. Each series is considered to be a separate entity for financial reporting and tax purposes and bears expenses directly attributable to it. The Fund’s primary investment objective is to obtain as high a level of current income exempt from federal individual income taxes as is consistent, in the view of the Fund’s investment advisor, with the preservation of capital. The Fund’s secondary objective is to reduce expected changes in its share price compared to longer intermediate and long-term bond portfolios.
The Fund currently offers three classes of shares of beneficial interest outstanding: Class A, Class C, and Institutional Class (Class I). Each class of shares of the Fund represents an interest in the same portfolio of investments, except that (i) Class A shares are sold subject to a front-end sales charge collected at the time the shares are purchased and bear a service fee, (ii) Class C shares are sold at net asset value without a sales charge at the time of purchase, but are subject to a contingent deferred sales charge upon redemption within one year of purchase, and bear both a service fee and a distribution fee, (iii) Class I shares are sold at net asset value without a sales charge at the time of purchase, and (iv) the respective classes may have different reinvestment privileges and conversion rights. Additionally, the Fund may allocate among its classes certain expenses, to the extent allowable to specific classes, including transfer agent fees, government registration fees, certain printing and postage costs, and administrative and legal expenses. Currently, class specific expenses of the Fund are limited to service and distribution fees, administration fees, and certain registration and transfer agent expenses.
NOTE 2 – SIGNIFICANT ACCOUNTING POLICIES
Significant accounting policies of the Trust are as follows:
Valuation of Investments: Debt obligations have a primary market over the counter and are valued by an independent pricing service approved by the Trustees of the Trust. The pricing service ordinarily values debt obligations at quoted bid prices. When quotations are not available, debt obligations are valued at evaluated prices determined by the pricing service using methods which include consideration of yields or prices of debt obligations of comparable quality, type of issue, coupon, maturity and rating, and indications as to value from dealers and general market conditions. Short-term obligations having remaining maturities of 60 days or less are ordinarily valued at amortized cost, which approximates market value.
In any case where a pricing service fails to provide a price for a debt obligation held by the Fund, the valuation and pricing committee determines a fair value for the obligation using procedures approved by the Trustees. Additionally, in any case where management believes that a price provided by a pricing service for a debt obligation may be unreliable, the valuation and pricing committee decides whether or not to use the pricing service’s valuation or to determine a fair value for the obligation.
In determining fair value for any portfolio security or other investment, the valuation and pricing committee seeks to determine the amount that an owner of the investment might reasonably expect to receive upon a sale of the investment. However, because fair value prices are estimated prices, the valuation and pricing committee’s determination of fair value for an investment may differ from the value that would be realized by the Fund upon a sale of the investment, and that difference could be material to the Fund’s financial statements. The valuation and pricing committee’s determination of fair value for an investment may also differ from the prices obtained by other persons (including other mutual funds) for the investment.
Valuation Measurements: Various inputs are used in determining the value of the Fund’s investments. These inputs are summarized in the three levels listed below:
Level 1: Quoted prices in active markets for identical investments.
Level 2: Other significant observable inputs (including quoted prices for similar investments, interest rates, prepayment rates, credit risk, etc.).
Level 3: Significant unobservable inputs (including the Fund’s own assumptions in determining the fair value of investments).
Certified Annual Report 45
| NOTES TO FINANCIAL STATEMENTS, CONTINUED | ||
| Thornburg Limited Term Municipal Fund | September 30, 2011 | |
The following table displays a summary of the inputs used to value the Fund’s net assets as of September 30, 2011. In any instance when valuation inputs from more than one level are used to determine the fair value of a specific investment, the investment is placed in the level of the table based upon the lowest level input that is significant in determining the fair value of the investment:
| Fair Value Measurements at September 30, 2011 | ||||||||||||||||
| Total | Level 1 | Level 2 | Level 3 | |||||||||||||
Assets | ||||||||||||||||
Investments in Securities | ||||||||||||||||
Municipal Bonds | $ | 4,374,054,206 | $ | — | $ | 4,374,054,206 | $ | — | ||||||||
|
|
|
|
|
|
|
| |||||||||
Total Investments in Securities | $ | 4,374,054,206 | $ | — | $ | 4,374,054,206 | $ | — | ||||||||
Other Notes: It is the policy of the Fund to recognize significant transfers between Levels 1, 2 and 3 and to disclose those transfers at the beginning of the reporting period. The Fund recognized no significant transfers between levels for the year ended September 30, 2011.
Federal Income Taxes: It is the policy of the Trust to comply with the provisions of the Internal Revenue Code applicable to “regulated investment companies,” and to distribute to shareholders substantially all taxable (if any) and tax exempt income of the Fund. Therefore, no provision for federal income tax is required.
Management reviews each uncertain tax position believed to be material to the preparation of the Fund’s financial statements, to assess if it is more likely than not that the position would be sustained upon examination, based upon the technical merits of the position. As of September 30, 2011, management has not identified any such position for which a liability must be reflected in the Statement of Assets and Liabilities. The Fund’s tax returns remain subject to examination for three years after filing.
When-Issued and Delayed Delivery Transactions: The Fund may engage in when-issued or delayed delivery transactions. To the extent the Fund engages in such transactions, it will do so for the purpose of acquiring portfolio securities consistent with the Fund’s investment objectives and not for the purpose of investment leverage or to speculate on interest rate and/or market changes. At the time the Fund makes a commitment to purchase a security on a when-issued or delayed delivery basis, the Fund will record the transaction and reflect the value in determining its net asset value. When effecting such transactions, assets of an amount sufficient to make payment for the portfolio securities to be purchased will be segregated on the Fund’s records on the trade date. Securities purchased on a when-issued or delayed delivery basis do not earn interest until the settlement date.
Dividends: Net investment income of the Fund is declared daily as a dividend on shares for which the Fund has received payment. Dividends are paid monthly and are reinvested in additional shares of the Fund at net asset value per share at the close of business on the dividend payment date, or at the shareholder’s option, paid in cash. Net realized capital gains, to the extent available, will be distributed at least annually.
General: Securities transactions are accounted for on a trade date basis. Interest income is accrued as earned. Premiums and discounts on securities purchased are amortized to call dates or maturity dates of the respective securities. Realized gains and losses from the sale of securities are recorded on an identified cost basis. Net investment income (other than class specific expenses) and realized and unrealized gains and losses are allocated daily to each class of shares based upon the relative net asset value of outstanding shares (or the value of the dividend-eligible shares, as appropriate) of each class of shares at the beginning of the day (after adjusting for the current capital shares activity of the respective class). Expenses common to all Funds are allocated among the Funds comprising the Trust based upon their relative net asset values or other appropriate allocation methods.
Guarantees and Indemnifications: Under the Trust’s organizational documents, its officers and Trustees are indemnified against certain liabilities arising out of the performance of their duties to the Fund. Additionally, in the normal course of business the Trust enters into contracts with service providers that contain general indemnification clauses. The Trust’s maximum exposure under these arrangements is unknown. However, based on experience, the Trust expects the risk of loss to be remote.
Use of Estimates: The preparation of financial statements, in conformity with generally accepted accounting principles, requires management to make estimates and assumptions that affect the reported amounts of assets and liabilities and the disclosure of contingent
46 Certified Annual Report
| NOTES TO FINANCIAL STATEMENTS, CONTINUED | ||
| Thornburg Limited Term Municipal Fund | September 30, 2011 | |
assets and liabilities at the date of the financial statements and the reported amounts of increases and decreases in net assets from operations during the reporting period. Actual results could differ from those estimates.
NOTE 3 – INVESTMENT ADVISORY FEE AND OTHER TRANSACTIONS WITH AFFILIATES
Pursuant to an investment advisory agreement, Thornburg Investment Management, Inc. (the “Advisor”) serves as the investment advisor and performs services to the Fund for which the fees are payable at the end of each month. For the year ended September 30, 2011, these fees were payable at annual rates ranging from .50 of 1% to .225 of 1% per annum of the average daily net assets of the Fund depending on the Fund’s asset size. The Trust also has entered into administrative services agreements with the Advisor, whereby the Advisor will perform certain administrative services for the shareholders of each class of the Fund’s shares, and for which fees will be payable at an annual rate of up to .125 of 1% per annum of the average daily net assets attributable to each class of shares.
The Trust has an underwriting agreement with Thornburg Securities Corporation (the “Distributor,” an affiliate of the Advisor), which acts as the distributor of the Fund’s shares. For the year ended September 30, 2011, the Distributor has advised the Fund that it earned commissions aggregating $21,576 from the sale of Class A shares, and collected contingent deferred sales charges aggregating $110,840 from redemptions of Class C shares of the Fund.
Pursuant to a service plan under Rule 12b-1 of the Investment Company Act of 1940, the Fund may reimburse to the Advisor an amount not to exceed .25 of 1% per annum of the average daily net assets attributable to each class of shares of the Fund for payments made by the Advisor to securities dealers and other financial institutions to obtain various shareholder and distribution related services. For the year ended September 30, 2011, there were no 12b-1 service plan fees charged for Class I shares. The Advisor may pay out of its own resources additional expenses for distribution of the Fund’s shares.
The Trust has also adopted a distribution plan pursuant to Rule 12b-1, applicable only to the Fund’s Class C shares under which the Fund compensates the Distributor for services in promoting the sale of Class C shares of the Fund at an annual rate of up to .25 of 1% per annum of the average daily net assets attributable to Class C shares. Total fees incurred by the Distributor for each class of shares of the Fund under their respective Service and Distribution Plans for the year ended September 30, 2011, are set forth in the Statement of Operations.
The Trust has an agreement with the custodian bank to indirectly pay a portion of the custodian’s fees through credits earned by the Fund’s cash on deposit with the bank. This deposit agreement is an alternative to overnight investments. Custodial fees have been adjusted to reflect amounts that would have been paid without this agreement, with a corresponding adjustment reflected as fees paid indirectly in the Statement of Operations. For the year ended September 30, 2011, fees paid indirectly were $4,191.
Certain officers and Trustees of the Trust are also officers or directors of the Advisor and Distributor. The compensation of independent Trustees is borne by the Trust.
NOTE 4 – SHARES OF BENEFICIAL INTEREST
At September 30, 2011, there were an unlimited number of shares of beneficial interest authorized. Transactions in shares of beneficial interest were as follows:
| Year Ended September 30, 2011 | Year Ended September 30, 2010 | |||||||||||||||
| Shares | Amount | Shares | Amount | |||||||||||||
Class A Shares | ||||||||||||||||
Shares sold | 34,018,460 | $ | 480,834,989 | 53,604,766 | $ | 750,685,059 | ||||||||||
Shares issued to shareholders in reinvestment of dividends | 2,121,045 | 29,967,195 | 1,789,662 | 25,116,212 | ||||||||||||
Shares repurchased | (34,515,435 | ) | (485,595,011 | ) | (16,674,431 | ) | (233,631,344 | ) | ||||||||
|
|
|
|
|
|
|
| |||||||||
Net increase (decrease) | 1,624,070 | $ | 25,207,173 | 38,719,997 | $ | 542,169,927 | ||||||||||
|
|
|
|
|
|
|
| |||||||||
Certified Annual Report 47
| NOTES TO FINANCIAL STATEMENTS, CONTINUED | ||
| Thornburg Limited Term Municipal Fund | September 30, 2011 | |
| Year Ended September 30, 2011 | Year Ended September 30, 2010 | |||||||||||||||
| Shares | Amount | Shares | Amount | |||||||||||||
Class C Shares | ||||||||||||||||
Shares sold | 10,957,730 | $ | 155,484,465 | 21,586,485 | $ | 303,022,953 | ||||||||||
Shares issued to shareholders in reinvestment of dividends | 556,994 | 7,884,261 | 376,882 | 5,304,297 | ||||||||||||
Shares repurchased | (8,723,778 | ) | (122,969,951 | ) | (3,022,783 | ) | (42,473,186 | ) | ||||||||
|
|
|
|
|
|
|
| |||||||||
Net increase (decrease) | 2,790,946 | $ | 40,398,775 | 18,940,584 | $ | 265,854,064 | ||||||||||
|
|
|
|
|
|
|
| |||||||||
Class I Shares | ||||||||||||||||
Shares sold | 68,377,616 | $ | 967,194,986 | 96,757,098 | $ | 1,360,539,987 | ||||||||||
Shares issued to shareholders in reinvestment of dividends | 3,399,837 | 48,048,652 | 2,281,105 | 32,036,218 | ||||||||||||
Shares repurchased | (49,330,992 | ) | (696,485,070 | ) | (28,455,767 | ) | (399,051,750 | ) | ||||||||
|
|
|
|
|
|
|
| |||||||||
Net increase (decrease) | 22,446,461 | $ | 318,758,568 | 70,582,436 | $ | 993,524,455 | ||||||||||
|
|
|
|
|
|
|
| |||||||||
NOTE 5 – SECURITIES TRANSACTIONS
For the year ended September 30, 2011, the Fund had purchase and sale transactions of investment securities (excluding short-term investments) of $1,257,146,746 and $629,263,899, respectively.
NOTE 6 – INCOME TAXES
At September 30, 2011, information on the tax components of capital is as follows:
Cost of investments for tax purposes | $ | 4,184,135,692 | ||
|
| |||
Gross unrealized appreciation on a tax basis | $ | 192,005,274 | ||
Gross unrealized depreciation on a tax basis | (2,086,760 | ) | ||
|
| |||
Net unrealized appreciation (depreciation) on investments (tax basis) | $ | 189,918,514 | ||
|
|
At September 30, 2011, the Fund did not have any undistributed net ordinary income or undistributed capital gains.
The Fund utilized $404,704 of capital loss carryforwards for the year ended September 30, 2011.
At September 30, 2011, the Fund had tax basis capital losses, which may be carried forward to offset future capital gains. To the extent such carryforwards are used, capital gain distributions may be reduced to the extent provided by regulations.
Such capital loss carryforwards expire as follows:
2015 | $ | 2,633,670 | ||
2016 | 192,444 | |||
|
| |||
| $ | 2,826,114 | |||
|
|
The Regulated Investment Company Modernization Act of 2010 (the “Act”) was signed into law on December 22, 2010. The Act makes changes to a number of tax rules impacting the Fund. Under the Act, future capital losses generated by the Fund may be carried over indefinitely, but these losses must be used prior to the utilization of any pre-enactment capital losses. Since pre-enactment capital losses may only be carried forward for eight years, there may be a greater likelihood that all or a portion of a Fund’s pre-enactment
48 Certified Annual Report
| NOTES TO FINANCIAL STATEMENTS, CONTINUED | ||
| Thornburg Limited Term Municipal Fund | September 30, 2011 | |
capital losses will expire unused. In general, the provisions of the Act will be effective for the Fund’s fiscal year ending September 30, 2012.
In order to account for permanent book/tax differences, the Fund decreased distribution in excess of net investment income by $3,565 and decreased net capital paid in on shares of beneficial interest by $3,565. This reclassification has no impact on the net asset value of the Fund. This reclassification resulted from non-deductible taxes paid.
The tax character of distributions paid for the years ended September 30, 2011, and September 30, 2010, was as follows:
| 2011 | 2010 | |||||||
Distributions from: | ||||||||
Tax exempt income | $ | 108,960,884 | $ | 82,067,857 | ||||
Ordinary income | 273,241 | 224,045 | ||||||
|
|
|
| |||||
Total Distributions | $ | 109,234,125 | $ | 82,291,902 | ||||
|
|
|
| |||||
OTHER NOTES:
Risks: The Fund’s investments subject it to risks including, but not limited to, credit risk, interest rate risk, management risk, market and economic risk, and liquidity risk. Please see the Fund’s prospectus for a discussion of the risks associated with an investment in the Fund.
Subsequent Events: Fund management believes no events have occurred between September 30, 2011 and the date of issuance of the financial statements, which require adjustment to, or disclosure in the accompanying financial statements.
Certified Annual Report 49
Thornburg Limited Term Municipal Fund
| PER SHARE PERFORMANCE (for a share outstanding throughout the Year)+ | RATIOS TO AVERAGE NET ASSETS | SUPPLEMENTAL DATA | ||||||||||||||||||||||||||||||||||||||||||||||||||||||||||
Unless | Net Asset Value Beginning of Year | Net Investment Income (Loss) | Net Realized & Unrealized Gain (Loss) on Investments | Total from Investment Operations | Dividends from Net Investment Income | Dividends from Net Realized Gains | Total Dividends | Net Asset Value End of Year | Net Investment Income (Loss) (%) | Expenses, After Expense Reductions (%) | Expenses, After Expense Reductions and Net of Custody Credits (%) | Expenses, Before Expense Reductions (%) | Total Return (%)(a) | Portfolio Turnover Rate (%) | Net Assets at End of Year (Thousands) | |||||||||||||||||||||||||||||||||||||||||||||
Class A Shares |
| |||||||||||||||||||||||||||||||||||||||||||||||||||||||||||
2011(b) | $ | 14.27 | 0.36 | 0.12 | 0.48 | (0.36 | ) | — | (0.36 | ) | $ | 14.39 | 2.53 | 0.74 | 0.74 | 0.74 | 3.43 | 16.15 | $ | 1,649,965 | ||||||||||||||||||||||||||||||||||||||||
2010(b) | $ | 14.00 | 0.37 | 0.28 | 0.65 | (0.38 | ) | — | (0.38 | ) | $ | 14.27 | 2.66 | 0.78 | 0.78 | 0.78 | 4.70 | 12.57 | $ | 1,613,582 | ||||||||||||||||||||||||||||||||||||||||
2009(b) | $ | 13.22 | 0.47 | 0.78 | 1.25 | (0.47 | ) | — | (0.47 | ) | $ | 14.00 | 3.50 | 0.86 | 0.86 | 0.86 | 9.67 | 12.18 | $ | 1,040,628 | ||||||||||||||||||||||||||||||||||||||||
2008(b) | $ | 13.49 | 0.48 | (0.27 | ) | 0.21 | (0.48 | ) | — | (0.48 | ) | $ | 13.22 | 3.54 | 0.89 | 0.88 | 0.89 | 1.54 | 17.78 | $ | 705,238 | |||||||||||||||||||||||||||||||||||||||
2007(b) | $ | 13.53 | 0.46 | (0.04 | ) | 0.42 | (0.46 | ) | — | (0.46 | ) | $ | 13.49 | 3.43 | 0.90 | 0.90 | 0.90 | 3.18 | 21.35 | $ | 696,717 | |||||||||||||||||||||||||||||||||||||||
Class C Shares |
| |||||||||||||||||||||||||||||||||||||||||||||||||||||||||||
2011 | $ | 14.30 | 0.32 | 0.11 | 0.43 | (0.32 | ) | — | (0.32 | ) | $ | 14.41 | 2.27 | 1.00 | 1.00 | 1.00 | 3.08 | 16.15 | $ | 525,923 | ||||||||||||||||||||||||||||||||||||||||
2010 | $ | 14.02 | 0.33 | 0.29 | 0.62 | (0.34 | ) | — | (0.34 | ) | $ | 14.30 | 2.36 | 1.05 | 1.05 | 1.55 | 4.48 | 12.57 | $ | 481,808 | ||||||||||||||||||||||||||||||||||||||||
2009 | $ | 13.24 | 0.43 | 0.79 | 1.22 | (0.44 | ) | — | (0.44 | ) | $ | 14.02 | 3.21 | 1.13 | 1.13 | 1.63 | 9.37 | 12.18 | $ | 206,952 | ||||||||||||||||||||||||||||||||||||||||
2008 | $ | 13.51 | 0.44 | (0.27 | ) | 0.17 | (0.44 | ) | — | (0.44 | ) | $ | 13.24 | 3.26 | 1.17 | 1.16 | 1.67 | 1.26 | 17.78 | $ | 99,972 | |||||||||||||||||||||||||||||||||||||||
2007 | $ | 13.55 | 0.43 | (0.04 | ) | 0.39 | (0.43 | ) | — | (0.43 | ) | $ | 13.51 | 3.15 | 1.19 | 1.18 | 1.68 | 2.90 | 21.35 | $ | 86,564 | |||||||||||||||||||||||||||||||||||||||
Class I Shares |
| |||||||||||||||||||||||||||||||||||||||||||||||||||||||||||
2011 | $ | 14.27 | 0.41 | 0.12 | 0.53 | (0.41 | ) | — | (0.41 | ) | $ | 14.39 | 2.87 | 0.40 | 0.40 | 0.40 | 3.78 | 16.15 | $ | 2,228,418 | ||||||||||||||||||||||||||||||||||||||||
2010 | $ | 14.00 | 0.41 | 0.28 | 0.69 | (0.42 | ) | — | (0.42 | ) | $ | 14.27 | 2.98 | 0.44 | 0.44 | 0.44 | 5.04 | 12.57 | $ | 1,890,196 | ||||||||||||||||||||||||||||||||||||||||
2009 | $ | 13.22 | 0.51 | 0.79 | 1.30 | (0.52 | ) | — | (0.52 | ) | $ | 14.00 | 3.81 | 0.53 | 0.53 | 0.53 | 10.03 | 12.18 | $ | 865,827 | ||||||||||||||||||||||||||||||||||||||||
2008 | $ | 13.49 | 0.52 | (0.27 | ) | 0.25 | (0.52 | ) | — | (0.52 | ) | $ | 13.22 | 3.88 | 0.55 | 0.55 | 0.55 | 1.88 | 17.78 | $ | 437,393 | |||||||||||||||||||||||||||||||||||||||
2007 | $ | 13.53 | 0.51 | (0.04 | ) | 0.47 | (0.51 | ) | — | (0.51 | ) | $ | 13.49 | 3.78 | 0.57 | 0.57 | 0.57 | 3.53 | 21.35 | $ | 303,716 | |||||||||||||||||||||||||||||||||||||||
| (a) | Not annualized for periods less than one year. |
| (b) | Sales loads are not reflected in computing total return. |
| + | Based on weighted average shares outstanding. |
See notes to financial statements.
| 50 Certified Annual Report | Certified Annual Report 51 |
REPORT OF INDEPENDENT REGISTERED PUBLIC ACCOUNTING FIRM
Thornburg Limited Term Municipal Fund
To the Trustees and Shareholders of
Thornburg Limited Term Municipal Fund
In our opinion, the accompanying statement of assets and liabilities, including the schedule of investments, and the related statements of operations and of changes in net assets and the financial highlights present fairly, in all material respects, the financial position of Thornburg Limited Term Municipal Fund (one of the portfolios constituting Thornburg Investment Trust, hereafter referred to as the “Fund”) at September 30, 2011, the results of its operations for the year then ended, the changes in its net assets for each of the two years in the period then ended and the financial highlights for each of the five years in the period then ended, in conformity with accounting principles generally accepted in the United States of America. These financial statements and financial highlights (hereafter referred to as “financial statements”) are the responsibility of the Fund’s management. Our responsibility is to express an opinion on these financial statements based on our audits. We conducted our audits of these financial statements in accordance with the standards of the Public Company Accounting Oversight Board (United States). Those standards require that we plan and perform the audit to obtain reasonable assurance about whether the financial statements are free of material misstatement. An audit includes examining, on a test basis, evidence supporting the amounts and disclosures in the financial statements, assessing the accounting principles used and significant estimates made by management, and evaluating the overall financial statement presentation. We believe that our audits, which included confirmation of securities at September 30, 2011 by correspondence with the custodian and brokers, provide a reasonable basis for our opinion.
PricewaterhouseCoopers LLP
New York, New York
November 21, 2011
52 Certified Annual Report
| EXPENSE EXAMPLE | ||
| Thornburg Limited Term Municipal Fund | September 30, 2011 (Unaudited) | |
As a shareholder of the Fund, you incur two types of costs:
| (1) | transaction costs, including |
(a) sales charges (loads) on purchase payments, for Class A shares;
(b) a deferred sales charge on redemptions of any part or all of a purchase of $1 million of Class A shares within 12 months of purchase;
(c) a deferred sales charge on redemptions of Class C shares within 12 months of purchase;
| (2) | ongoing costs, including management fees; distribution and/or service (12b-1) fees; and other Fund expenses. |
This example is intended to help you understand your ongoing costs (in dollars) of investing in the Fund and to compare these costs with the ongoing costs of investing in other mutual funds.
The example is based on a $1,000 investment beginning on April 1, 2011, and held until September 30, 2011.
ACTUAL EXPENSES
For each class of shares, the first line of the table at right provides information about actual account values and actual expenses. You may use the information in this line, together with the amount you invested, to estimate the expenses that you paid over the period. Simply divide your account value by $1,000 (for example, an $8,600 account value divided by $1,000 = 8.6), then multiply the result by the number in the first line for your class of shares under the heading entitled “Expenses Paid During Period” to estimate the expenses you paid on your account during this period.
HYPOTHETICAL EXAMPLE FOR COMPARISON PURPOSES
For each class of shares, the second line of the table at right provides information about hypothetical account values and hypothetical expenses based on the Fund’s actual expense ratio and an assumed rate of return of 5% per year before expenses, which is not the Fund’s actual return. The hypothetical account values and expenses may not be used to estimate the actual ending account balance or expenses you paid for the period. You may use this information to compare the ongoing costs of investing in the Fund and other funds. To do so, compare this 5% hypothetical example with the 5% hypothetical examples that appear in the shareholder reports of the other funds.
| Beginning Account Value 4/1/11 | Ending Account Value 9/30/11 | Expenses Paid During Period† 4/1/11–9/30/11 | ||||||||||
Class A Shares | ||||||||||||
Actual | $ | 1,000.00 | $ | 1,047.70 | $ | 3.81 | ||||||
Hypothetical* | $ | 1,000.00 | $ | 1,021.34 | $ | 3.76 | ||||||
Class C Shares | ||||||||||||
Actual | $ | 1,000.00 | $ | 1,045.50 | $ | 5.13 | ||||||
Hypothetical* | $ | 1,000.00 | $ | 1,020.05 | $ | 5.07 | ||||||
Class I Shares | ||||||||||||
Actual | $ | 1,000.00 | $ | 1,049.50 | $ | 2.07 | ||||||
Hypothetical* | $ | 1,000.00 | $ | 1,023.05 | $ | 2.05 | ||||||
| † | Expenses are equal to the annualized expense ratio for each class (A: 0.74%; C: 1.00%; I: 0.40%) multiplied by the average account value over the period, multiplied by 183/365 to reflect the one-half year period. |
| * | Hypothetical assumes a rate of return of 5% per year before expenses. |
Please note that the expenses shown in the table are meant to highlight your ongoing costs only and do not reflect any transactional costs, such as sales charges (loads), redemption fees, or exchange fees. Therefore, the second line of the table for each class of shares is useful in comparing ongoing costs only, and will not help you determine the relative total costs of owning different funds. In addition, if these transactional costs were included, your costs would have been higher.
Certified Annual Report 53
| INDEX COMPARISON | ||
| Thornburg Limited Term Municipal Fund | September 30, 2011 (Unaudited) | |
GROWTH OF A HYPOTHETICAL $10,000 INVESTMENT
Thornburg Limited Term Municipal Fund versus Barclays Capital Five Year Municipal Bond Index
and Consumer Price Index (September 28, 1984 to September 30, 2011)
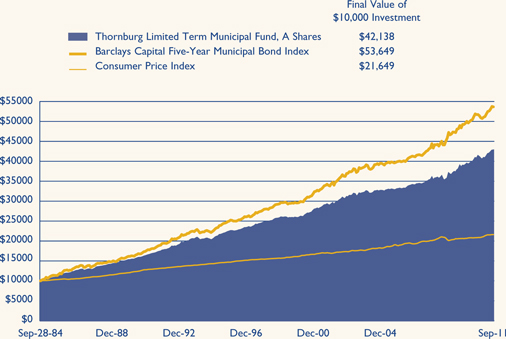
AVERAGE ANNUAL TOTAL RETURNS
For the periods ended September 30, 2011 (with sales charge)
| 1 Yr | 5 Yrs | 10 Yrs | Since Inception | |||||||||||||
A Shares (Incep: 9/28/84) | 1.86 | % | 4.15 | % | 3.62 | % | 5.47 | % | ||||||||
C Shares (Incep: 9/1/94) | 2.58 | % | 4.18 | % | 3.49 | % | 3.90 | % | ||||||||
I Shares (Incep: 7/5/96) | 3.78 | % | 4.82 | % | 4.13 | % | 4.57 | % | ||||||||
Performance data shown represents past performance and is no guarantee of future results. Investment return and principal value will fluctuate so shares, when redeemed, may be worth more or less than their original cost. Current performance may be lower or higher than quoted. For performance current to the most recent month end, visit thornburg.com or call 800.847.0200. The performance data and graph do not reflect the deduction of taxes that a shareholder would pay on distributions or the redemption of Fund shares. Returns reflect the reinvestment of dividends and capital gains as well as applicable sales charges. Class A shares are sold with a maximum sales charge of 1.50% . Class C shares assume deduction of a 0.50% contingent deferred sales charge (CDSC) for the first year only. There is no sales charge for Class I shares.
54 Certified Annual Report
| TRUSTEES AND OFFICERS | ||
| Thornburg Limited Term Municipal Fund | September 30, 2011 (Unaudited) | |
Name, Age, Position Held with Fund Year Elected | Principal Occupation(s) During Past Five Years | Other Directorships Held by Trustee | ||
INTERESTED TRUSTEES(1)(2)(4) | ||||
| Garrett Thornburg, 65 Chairman of Trustees, Trustee since 1987(3) | Chairman and controlling shareholder and, until 2008, CEO of Thornburg Investment Management, Inc. (investment advisor); Chairman, CEO, and controlling shareholder of Thornburg Securities Corporation (securities dealer); CEO until 2007 and Chairman until 2009 of TMST, Inc. (f/k/a Thornburg Mortgage, Inc.) (real estate investment trust); President and Sole Director of Thornburg Mortgage Advisory Corporation (investment manager to TMST, Inc.). | None | ||
Brian J. McMahon, 55 Trustee since 2001, Member of Governance & Nominating Committee & Operations Risk Oversight Committee, President since 1997(5)(6) | CEO since 2008, President, Managing Director, Chief Investment Officer, and Portfolio Manager of Thornburg Investment Management, Inc. | None | ||
INDEPENDENT TRUSTEES(1)(2)(4) | ||||
David A. Ater, 66 Trustee since 1994, Member of Audit Committee & Governance & Nominating Committee | Principal in Ater & Associates, Santa Fe, NM (developer, planner and broker of residential and commercial real estate); owner, developer and broker for various real estate projects. | None | ||
David D. Chase, 70 Trustee since 2000, Chairman of Audit Committee | Managing Member of Vestor Associates, LLC, Santa Fe, NM (private equity fund); Managing Member of CS Group, LLC, Santa Fe, NM (merchant bank). | None | ||
Eliot R. Cutler, 65 Trustee since 2004 & Nominating Committee, Chairman of Governance | Senior Counsel and, until 2009, Partner in Akin, Gump, Strauss, Hauer & Feld LLP (law firm) in Washington, D.C. and Beijing, China. | None | ||
Susan H. Dubin, 62 Trustee since 2004, Member of Audit Committee | President of Dubin Investments, Ltd., Greenwich, CT (private investment fund); Director and officer of various charitable organizations. | None | ||
Owen D. Van Essen, 57 Trustee since 2004, Member of Governance & Nominating Committee & Chairman of Operations Risk Oversight Committee | President of Dirks, Van Essen & Murray, Santa Fe, NM (newspaper mergers and acquisitions). | None | ||
Certified Annual Report 55
| TRUSTEES AND OFFICERS, CONTINUED | ||
| Thornburg Limited Term Municipal Fund | September 30, 2011 (Unaudited) | |
Name, Age, Position Held with Fund Year Elected | Principal Occupation(s) During Past Five Years | Other Directorships Held by Trustee | ||
James W. Weyhrauch, 52 Trustee since 1996, Member of Audit Committee & Operations Risk Oversight Committee | Real estate broker, Santa Fe Properties, Santa Fe, NM; Vice Chairman of Nambe LLC, Santa Fe, NM (manufacturing & design company). | None | ||
OFFICERS OF THE FUND (WHO ARE NOT TRUSTEES)(1)(6)(7) | ||||
| George T. Strickland, 48 Vice President since 1996, Treasurer since 2007(6) | Portfolio Manager, Vice President, and Managing Director of Thornburg Investment Management, Inc. | Not applicable | ||
William V. Fries, 72 Vice President since 1995 | Portfolio Manager, Vice President, and Managing Director of Thornburg Investment Management, Inc. | Not applicable | ||
Leigh Moiola, 44 Vice President since 2001 | Vice President, Managing Director, and Director of Marketing of Thornburg Investment Management, Inc. | Not applicable | ||
Alexander Motola, 41 Vice President since 2001 | Portfolio Manager, Vice President, and Managing Director of Thornburg Investment Management, Inc. | Not applicable | ||
Wendy Trevisani, 40 Vice President since 1999 | Portfolio Manager and Managing Director of Thornburg Investment Management, Inc. | Not applicable | ||
Joshua Gonze, 48 Vice President since 1999 | Portfolio Manager since 2007, Managing Director, and Associate Portfolio Manager until 2007 of Thornburg Investment Management, Inc. | Not applicable | ||
Christopher Ihlefeld, 41 Vice President since 2003 | Portfolio Manager since 2007, Managing Director, and Associate Portfolio Manager until 2007 of Thornburg Investment Management, Inc. | Not applicable | ||
Leon Sandersfeld, 45 Vice President since 2003 | Managing Director since 2007 and Fund Accounting Director of Thornburg Investment Management, Inc. | Not applicable | ||
Sasha Wilcoxon, 37 Vice President since 2003 Secretary since 2007(6) | Managing Director since 2007, Director of Operations, and Vice President of Thornburg Investment Management, Inc. | Not applicable | ||
Edward Maran, 53 Vice President since 2004 | Portfolio Manager and Managing Director of Thornburg Investment Management, Inc. | Not applicable | ||
Vinson Walden, 41 Vice President since 2004 | Portfolio Manager and Managing Director of Thornburg Investment Management, Inc. | Not applicable | ||
Thomas Garcia, 40 Vice President since 2006 | Vice President since 2011, Managing Director, Head Equity Trader, and Associate Portfolio Manager of Thornburg Investment Management, Inc. | Not applicable | ||
Lei Wang, 40 Vice President since 2006 | Portfolio Manager and Managing Director of Thornburg Investment Management, Inc. | Not applicable | ||
56 Certified Annual Report
| TRUSTEES AND OFFICERS, CONTINUED | ||
| Thornburg Limited Term Municipal Fund | September 30, 2011 (Unaudited) | |
Name, Age, Position Held with Fund Year Elected | Principal Occupation(s) During Past Five Years | Other Directorships Held by Trustee | ||
Connor Browne, 32 Vice President since 2006 | Portfolio Manager and Managing Director of Thornburg Investment Management, Inc. | Not applicable | ||
Jason Brady, 37 Vice President since 2007 | Vice President since 2011, Portfolio Manager since 2007, Managing Director since 2007, and Associate Portfolio Manager 2006–2007 of Thornburg Investment Management, Inc. | Not applicable | ||
Lewis Kaufman, 35 Vice President since 2007 | Portfolio Manager since 2007, Managing Director since 2007, and Associate Portfolio Manager until 2009 of Thornburg Investment Management, Inc. | Not applicable | ||
Christopher Ryon, 55 Vice President since 2008 | Portfolio Manager since 2009, Managing Director since 2009, and Associate Portfolio Manager 2008–2009 of Thornburg Investment Management, Inc.; Principal of Vanguard Funds until 2008. | Not applicable | ||
Lon Erickson, 36 Vice President since 2008 | Portfolio Manager since 2010, Managing Director since 2010, and Associate Portfolio Manager 2008–2010 of Thornburg Investment Management, Inc.; Senior Analyst of State Farm Insurance until 2008. | Not applicable | ||
Kathleen Brady, 51 Vice President since 2008 | Senior Tax Accountant since 2007 of Thornburg Investment Management, Inc.; Chief Financial Officer of Vestor Partners, LP (private equity fund) until 2007. | Not applicable | ||
Jack Gardner, 57 Vice President since 2008 | Managing Director since 2007 of Thornburg Investment Management, Inc.; President since 2008 and National Sales Director of Thornburg Securities Corporation. | Not applicable | ||
Laura Hillstrom, 44 Vice President since 2009 | Chief Administrative Officer since 2009, Vice President and Managing Director, and Director of Information Systems until 2009 of Thornburg Investment Management, Inc. | Not applicable | ||
| (1) | Each person’s address is 2300 North Ridgetop Road, Santa Fe, New Mexico 87506. |
| (2) | The Fund is one of sixteen separate investment “Funds” or “series” of Thornburg Investment Trust (the “Trust”), which comprises the Thornburg mutual fund complex and is organized as a Massachusetts business trust. Thornburg Investment Management, Inc. is the investment advisor to, and manages, the sixteen Funds of the Trust. Each Trustee oversees the sixteen Funds of the Trust. |
| (3) | Mr. Thornburg is considered an “interested” Trustee under the Investment Company Act of 1940 because he is the sole director and controlling shareholder of Thornburg Investment Management, Inc., the investment advisor to the sixteen active Funds of the Trust, and is the sole director and controlling shareholder of Thornburg Securities Corporation, the distributor of shares for the Trust. |
| (4) | Each Trustee serves in office until the election and qualification of a successor. |
| (5) | Mr. McMahon is considered an “interested” Trustee because he is the chief executive officer and president of Thornburg Investment Management, Inc. |
| (6) | The Trust’s president, secretary, and treasurer each serves a one-year term or until the election and qualification of a successor; each other officer serves at the pleasure of the Trustees. |
| (7) | Assistant vice presidents, assistant secretaries and assistant treasurers are not shown. |
The Statement of Additional Information for each Fund of the Trust includes additional information about the Trustees and is available, without charge and upon request, by calling 1-800-847-0200.
Certified Annual Report 57
| OTHER INFORMATION | ||
| Thornburg Limited Term Municipal Fund | September 30, 2011 (Unaudited) | |
PORTFOLIO PROXY VOTING
Policies and Procedures:
The Trust has delegated to Thornburg Investment Management, Inc. (the “Advisor”) voting decisions respecting proxies for the Fund’s voting securities. The Advisor makes voting decisions in accordance with its Proxy Voting Policy. A description of the Policy is available (i) without charge, upon request, by calling the Advisor toll-free at 1-800-847-0200, (ii) on the Thornburg website at www.thornburg. com, and (iii) on the Securities and Exchange Commission’s website at www.sec.gov.
Information regarding how proxies were voted is available on or before August 31 of each year for the twelve months ending the preceding June 30. This information is available (i) without charge, upon request by calling the Advisor toll-free at 1-800-847-0200, (ii) on the Thornburg website at www.thornburg.com, and (iii) on the Securities and Exchange Commission’s website at www.sec.gov.
TAX INFORMATION
For the tax year ended September 30, 2011, dividends paid by the Fund of $108,960,884 (or the maximum allowed) are tax exempt dividends for federal income tax purposes.
The information and distributions reported herein may differ from the information and distributions reported to the shareholders for the calendar year ending December 31, 2011. Complete information will be reported in conjunction with your 2011 Form 1099.
AVAILABILITY OF QUARTERLY PORTFOLIO SCHEDULE
The Fund files with the Securities and Exchange Commission schedules of its portfolio holdings on Form N-Q for the first and third quarters of each fiscal year. The Fund’s Forms N-Q are available on the Commission’s website at www.sec.gov, or may be reviewed and copied at the Commission’s Public Reference Room in Washington, D.C. Information on the operation of the Public Reference Room may be obtained by calling 1-800-SEC-0330. The Fund also makes this information available on its website at www.thornburg.com/ download or upon request by calling 1-800-847-0200.
STATEMENT RESPECTING RENEWAL OF INVESTMENT ADVISORY AGREEMENT
Thornburg Investment Management, Inc. (the “Advisor”) provides investment management services to Thornburg Limited Term Municipal Fund pursuant to an investment advisory agreement. The Trustees consider the renewal of this agreement annually, and most recently determined to renew the agreement on September 13, 2011.
In anticipation of their recent annual consideration of the advisory agreement’s renewal, the independent Trustees met in May 2011 to plan the Trustees’ evaluation of the Advisor’s performance and to specify the information the Advisor would present to the Trustees for their review. The Advisor’s chief investment officer subsequently reviewed portions of the specified information with the Trustees and addressed questions presented by the Trustees at a meeting session scheduled for that purpose, and the independent Trustees thereafter met in independent session to consider the Advisor’s presentation and various specific issues respecting their consideration of the advisory agreement’s renewal. Following these sessions, the Trustees met to consider a renewal of the agreement, and the independent Trustees voted unanimously at that meeting to renew the agreement for an additional term of one year.
The information below summarizes certain factors considered by the Trustees in connection with the determination to renew the advisory agreement. In determining to renew the agreement, the Trustees did not identify any single factor as controlling, and this summary does not describe all of the matters considered by the Trustees in making their determination.
Quality of Services; Fund Investment Performance. The Trustees evaluated the nature, extent and quality of services provided by the Advisor under the advisory agreement, and evaluated the investment performance of the Fund.
In connection with their general supervision of the Advisor, and as an important element of their annual consideration of a renewal of the advisory agreement, the Trustees received and considered reports from the Advisor throughout the year. These reports addressed a wide variety of topics, including particularly the Advisor’s selection of investments and execution of the Fund’s investment strategies. In addition, the Trustees considered information provided to them at their request in anticipation of their annual evaluation of the Advisor’s services, including (i) the Fund’s absolute investment performance and achievement of stated objectives, (ii) the Advisor’s commentary on the Fund’s performance in the context of the Fund’s objectives and reasonable expectations, and business, market and
58 Certified Annual Report
| OTHER INFORMATION, CONTINUED | ||
| Thornburg Limited Term Municipal Fund | September 30, 2011 (Unaudited) | |
economic conditions, (iii) measures of the Fund’s investment performance over different periods of time relative to two categories of municipal debt mutual funds selected by independent mutual fund analyst firms, and relative to a broad-based securities index, and (iv) comparative measures of portfolio volatility, risk and return.
The Trustees also considered their perceptions of portfolio management personnel developed in formal and informal meetings throughout the year, the Advisor’s staffing and other resources, the Advisor’s performance of accounting and other services, the Advisor’s observance of compliance and regulatory requirements, the Advisor’s responsiveness to the Trustees, and other factors.
In evaluating quantitative and performance data presented, the Trustees noted (among other aspects of the data) performance data for the eleven most recent calendar years, which showed that the Fund had produced positive returns in accordance with expectations in all years, that the Fund’s investment return had exceeded the average return in the most recent calendar year for the mutual fund category for which calendar year data was presented, and that the Fund’s returns had exceeded or had been comparable to the average returns of the category in all of the preceding ten years. Other noted quantitative data showed that the Fund’s investment returns fell within the top decile of the first fund category for the one-year, three-year and five-year periods ended with the second quarter of the current year, and that the Fund’s investment returns fell within the top decile of the second category for the same periods. Measures of portfolio volatility, risk and relative return considered by the Trustees demonstrated that the Fund’s performance relative to these measures had continued to fulfill expectations in current conditions.
The Trustees concluded, based upon these and other considerations, that the nature, extent and quality of the Advisor’s services were sufficient, and that the Advisor had satisfactorily pursued the Fund’s stated investment objectives. The Trustees further concluded that the investment performance of the Fund was satisfactory in the context of the Fund’s objectives and policies, and prevailing market conditions.
Fees and Expenses; Profitability of Advisor; Economies of Scale; Ancillary Benefits to Advisor. The Trustees evaluated the level of the management fee charged by the Advisor to the Fund, and in this connection, reviewed the profitability of the Advisor, economies of scale potentially available to the Fund and whether the Advisor received any ancillary benefits from its relationship with the Fund.
In evaluating the level of the management fee, the Trustees considered the fee charged by the Advisor and the other expenses charged to the Fund in light of the nature and quality of services provided, a comparison of the actual Advisor’s fee and Fund expenses to the statement of fees and expenses in the Fund’s prospectuses, and comparisons of the Advisor’s fee and other Fund expenses to average and median fees and expenses charged to two groups of municipal debt mutual funds assembled by independent mutual fund analyst firms. Comparative fee and expense data noted by the Trustees showed that the management fee charged to the Fund was comparable to the median and average fee levels for both fund groups, and that the overall expense ratio for the Fund was comparable to the median and average expense ratios for the first group and slightly higher than the median and comparable to the average ratios for the second group. The Trustees did not identify the differences as significant. The Trustees considered information about the fees charged by the Advisor to other investment management clients, together with information about fees charged by other advisors to different clients, and analysis of the differences between the requirements of institutional clients and mutual funds and the consequently different investment management services provided, respectively, to institutional clients and to mutual funds. The Trustees confirmed their previous observations that the differences between the fees charged by the Advisor to different types of clients did not appear exceptional, and that the fee rates charged by investment advisors to institutional clients had limited relevance to the evaluation of fee rates charged to mutual funds, because of the significant differences between the respective requirements of institutional clients and mutual funds, the differences between the respective services rendered to institutional clients and mutual funds, and the different circumstances in which the respective fees originate.
In reviewing the profitability of the Advisor, the Trustees considered costs incurred by the Advisor and data comparing the profitability of the Advisor to other investment management firms. The information provided did not indicate that the Advisor’s profitability was unusual, and the Trustees noted the adequacy of the Advisor’s resources and service capabilities. In reviewing the extent to which economies of scale would be realized by the Fund as it grows and whether fee levels reflect economies of scale, the Trustees considered the breakpoint structure for advisory fees chargeable to the Fund, the demonstrated economies of scale enjoyed by the Fund and other Funds of the Trust as they had grown in size, and economies of scale realized by other mutual funds. The information provided demonstrated to the Trustees that the Fund has realized economies of scale and may reasonably be expected to realize economies of scale as the Fund grows in size, due to the advisory agreement’s breakpoint fee structure and other factors. In reviewing potential benefits to the Advisor from its relationship to the Fund, the Trustees considered the Advisor’s receipt of certain research services from broker dealers, and the benefits to both the Fund and the Advisor of the Advisor’s expansion of its staffing, compliance and systems
Certified Annual Report 59
| OTHER INFORMATION, CONTINUED | ||
| Thornburg Limited Term Municipal Fund | September 30, 2011 (Unaudited) | |
capabilities and other resources to serve a broader variety of investment management clients. No unusual or unfair benefits to the Advisor from its relationship to the Fund were identified by the Trustees.
The Trustees concluded, based upon their consideration of these and other factors, that the management fee charged to the Fund by the Advisor was fair and reasonable in view of the nature, extent and quality of the services provided by the Advisor, the clear disclosure of fees and expenses in the Fund’s prospectuses, the investment performance of the Fund, and comparisons of fees and expenses charged to the Fund to fees and expenses charged to other mutual funds.
60 Certified Annual Report
This page intentionally left blank.
This page is not part of the Annual Report. 61
Trustees’ Statement to Shareholders
Not part of the Certified Annual Report
September 13, 2011
The Trustees believe current and prospective shareholders should know how we discharge our responsibilities in supervising the Funds’ investment advisor and in reviewing the advisor’s contract for renewal. Since 2005, we have issued a statement which sets out clearly the three principal guidelines that we follow in supervising the Trust’s investment advisor on your behalf. In accordance with our customary practice, in September of this year we again reviewed our statement and concluded we should reissue this statement outlining the principal features of our supervision of the advisor’s performance of investment management services for the Funds.
We begin with the premise that each shareholder selected his or her Fund because its investments are managed by the investment advisor identified in the prospectus and in accordance with the objective and policies described in the prospectus. We realize, as each of you do, that if you believe that your Fund’s stated objective and policies no longer serve your personal investment goals, you can sell your shares and leave the Fund.
Therefore, we believe that our primary supervisory task – our principal obligation to you – is to assess the nature and quality of the advisor’s services, and to confirm that the advisor actively and competently pursues the Fund’s objective, in accordance with the policies set out in the prospectus. To do this, we meet regularly with management to review your Fund’s portfolio and to discuss the advisor’s specific actions and judgments in pursuing the Fund’s objective. We do not substitute our own judgment for the advisor’s decisions in selecting investments; the advisor is paid to exercise its informed judgment on investment decisions, and we seek to confirm, in reviewing the advisor’s performance, that the advisor is doing just that.
Second, while we are conscious of costs and the effect that costs have on shareholders’ returns, we do not seek the lowest fees or expense ratio as our sole or primary objective. We try to make sure that your Fund’s fees and costs are reasonable in relationship to the services rendered and that they are generally in line with those charged by other expert investment advisors, consistent with our belief that the Fund’s investors searched for and expect that expertise and attention and have decided to pay a reasonable price for it. We do not put the management contract “out to bid” as a matter of course, and we would not do so unless we had concluded that the advisor materially had failed to pursue the Fund’s objectives in accordance with its policies, or for other equally important reasons. We believe that any other approach would be inconsistent with your interests and contrary to your expectations when you bought shares of the Fund in the first place.
Finally, because we believe that most Thornburg Fund shareholders have invested with a long-term perspective, we try not to focus too much on the fashions of the moment and on short-term performance. The market will not favor any specific investment objective or set of policies at all times and under all economic circumstances. A fund will experience periods of both high and low returns relative to other funds and other investments. Even if one of our Funds is not favored by the market at a particular time, we believe that the advisor is nonetheless obliged to remain true to the Fund’s objective and policies, and we watch to see that it does so.
62 This page is not part of the Annual Report.
Retirement and Education Accounts
Thornburg Investment Management offers retirement and education savings accounts that can help you meet a variety of planning challenges. For account applications or further information on any of the accounts below, please call 1-800-847-0200 or go to www.thornburg.com/ira. Your financial advisor can help you determine which plan is right for you.
Individual Retirement Accounts
Individual Retirement Accounts (IRAs) provide a tax-advantaged means to save money for the future. For a detailed outline of the difference between retirement accounts, see www.thornburg.com/ira. Rollovers are available. Call 1-800-847-0200 for more information.
Traditional IRAs – Contributions to Traditional IRAs are tax deductible for eligible individuals, and withdrawals are taxed as additional ordinary income. You may contribute to an IRA if you receive compensation and are under 70 1/2, even if you are covered by an employer retirement plan. Deductible contributions are subject to certain qualifications. Please consult your tax advisor.
Roth IRAs – Under a Roth IRA, there is no tax deduction for contributions, but there is no income tax on qualified withdrawals. For a more detailed comparison of Traditional and Roth IRAs, please see our web site at www.thornburg.com/ira.
SEP IRAs – Simplified Employee Pension (SEP) IRAs are established by employers. The employer is allowed a tax deduction for contributions made to the SEP Plan and makes contributions to each eligible employee’s SEP IRA on a discretionary basis.
SIMPLE IRAs – Savings Incentive Match Plan for Employees of Small Employers (SIMPLE) is designed to give small business owners a simplified method to establish and contribute to a retirement plan for employees. The employer is allowed a tax deduction for contributions and makes either matching or non-elective contributions to each eligible employee’s SIMPLE IRA. Employees may make salary deferral contributions.
Coverdell Education Savings Account
These savings accounts are designed to provide a way to save money for higher education expenses. In an Education Savings Account, earnings and interest grow tax-free, and qualified withdrawals used to pay for eligible higher-education expenses are tax- and penalty-free.
Funds Available
The following funds are available in the accounts listed above:
| • | Thornburg International Value Fund |
| • | Thornburg Value Fund |
| • | Thornburg Core Growth Fund |
| • | Thornburg Investment Income Builder Fund |
| • | Thornburg Global Opportunities Fund |
| • | Thornburg International Growth Fund |
| • | Thornburg Developing World Fund |
| • | Thornburg Limited Term U.S. Government Fund |
| • | Thornburg Limited Term Income Fund |
| • | Thornburg Strategic Income Fund |
This page is not part of the Annual Report. 63

Thornburg Equity Funds
Thornburg’s equity research uses a fundamental and comprehensive analytical approach. Thornburg equity funds focus on a limited number of securities so that each holding can impact performance. The equity team searches for firms believed to have a promising future and seeks to buy shares of those companies at a discount to their intrinsic value.
| • | Thornburg Value Fund |
| • | Thornburg International Value Fund |
| • | Thornburg Core Growth Fund |
| • | Thornburg Investment Income Builder Fund |
| • | Thornburg Global Opportunities Fund |
| • | Thornburg International Growth Fund |
| • | Thornburg Developing World Fund |
Thornburg Bond Funds
Thornburg Investment Management applies a disciplined philosophy to fixed-income management. Since the launch of our first fixed-income fund over 25 years ago, we have been conducting fundamental, bottom-up research in an effort to identify bonds which we believe provide the best return for a given level of risk. We are very organic in our approach, avoiding leverage or complex strategies which could backfire in periods of market uncertainty.
| • | Thornburg Limited Term Municipal Fund |
| • | Thornburg Intermediate Municipal Fund |
| • | Thornburg California Limited Term Municipal Fund |
| • | Thornburg New Mexico Intermediate Municipal Fund |
| • | Thornburg New York Intermediate Municipal Fund |
| • | Thornburg Strategic Municipal Income Fund |
| • | Thornburg Limited Term U.S. Government Fund |
| • | Thornburg Limited Term Income Fund |
| • | Thornburg Strategic Income Fund |
Before investing, carefully consider the Fund’s investment goals, risks, charges, and expenses. For a prospectus containing this and other information, contact your financial advisor or visit thornburg.com. Read it carefully before investing.
For additional information, please visit www.thornburg.com
Thornburg Investment Management, Inc. 2300 North Ridgetop Road, Santa Fe, NM 87506
This page is not part of the Annual Report. 65
This page intentionally left blank.
66 This page is not part of the Annual Report.
This page intentionally left blank.
This page is not part of the Annual Report. 67
 | Waste not, Wait not |  | ||||
| Get instant access to your shareholder reports. | ||||||
| This Annual Report is submitted for the general information of shareholders of the Fund. It is not authorized for distribution to prospective investors in the Fund unless preceded or accompanied by an effective prospectus. | By switching from your postal mailbox to your email inbox, you reduce paper clutter, improve record keeping access, and help conserve our natural resources. | |||||
 | Investment Advisor: Thornburg Investment Management® 800.847.0200 | Go to www.thornburg.com/edelivery and sign up to receive your shareholder reports, prospectuses, and proxy statements electronically. | ||||
Distributor: | ||||||
Thornburg Securities Corporation® 800.847.0200 | You invest in the future, without spending a dime. | |||||
| TH858 | ||||||

Important Information
The information presented on the following pages was current as of September 30, 2011. The managers’ views, portfolio holdings, and sector diversification are provided for the general information of the Fund’s shareholders; to the extent this information is historical, it should not be considered predictive of future circumstances. This material should not be deemed a recommendation to buy or sell any of the securities mentioned.
Investments in the Fund carry risks, including possible loss of principal. Bond funds have the same interest rate, inflation, and credit risks that are associated with the underlying bonds. The principal value of bonds will fluctuate relative to changes in interest rates, decreasing when interest rates rise. Unlike bonds, bond funds have ongoing fees and expenses. Please see the Fund’s Prospectus for a discussion of the risks associated with an investment in the Fund. Investments in the Fund are not FDIC insured, nor are they deposits of or guaranteed by a bank or any other entity. There is no guarantee that the Fund will meet its investment objectives. The laddering strategy does not assure or guarantee better performance and cannot eliminate the risk of investment losses.
Performance data given at net asset value (NAV) does not take into account applicable sales charges. If the sales charges had been included, the performance would have been lower. Minimum investments for Class I shares are higher than those for other classes. Class I shares may not be available to all investors.
Share Class | NASDAQ Symbol | Cusip | ||
Class A | THIMX | 885-215-202 | ||
Class C | THMCX | 885-215-780 | ||
Class I | THMIX | 885-215-673 |
Glossary
BofA Merrill Lynch 3-15 Year U.S. Municipal Securities Index – This index is a subset of the BofA Merrill Lynch U.S. Municipal Securities Index including all securities with a remaining term to final maturity greater than or equal to 3 years and less than 15 years.
BofA Merrill Lynch 7-12 Year U.S. Municipal Securities Index – This index is a subset of the BofA Merrill Lynch U.S. Municipal Securities Index including all securities with a remaining term to final maturity greater than or equal to 7 years and less than 12 years.
Unless otherwise noted, index returns reflect the reinvestment of income dividends and capital gains, if any, but do not reflect fees, brokerage commissions or other expenses of investing. Investors may not make direct investments into any index.
Alternative Minimum Tax (AMT) – A federal tax aimed at ensuring that high-income individuals, estates, trusts, and corporations pay a minimal level income tax. For individuals, the AMT is calculated by adding tax preference items to regular taxable income.
Annualized Distribution Yield – The distribution yield is calculated by taking the sum of the month’s total distribution factors and dividing this sum by a 30-day period and annualizing to a 360-day year. The value is then divided by the ending maximum offering price per share to arrive at the annualized distribution yield. The yield is calculated on a periodic basis and is subject to change.
Basis Point (bps) – A unit equal to 1/100th of 1%. 1% = 100 basis points (bps).
Bond Credit Ratings – A bond credit rating assesses the financial ability of a debt issuer to make timely payments of principal and interest. Ratings of AAA (the highest), AA, A, and BBB are investment-grade quality. Ratings of BB, B, CCC, CC, C, and D (the lowest) are considered below investment grade, speculative grade, or junk bonds. Unless otherwise noted, the ratings listed are from Municipal Market Data and are a combination of ratings from Standard and Poor’s, Moody’s Investors Service, and Fitch Ratings.
Build America Bonds (BAB) – Taxable municipal bonds that feature tax credits and/or federal subsidies for bondholders and state and local government bond issuers. Build America Bonds (BABs) were introduced in 2009 as part of President Obama’s American Recovery and Reinvestment Act to create jobs and stimulate the economy. BABs attempt to achieve this by lowering the cost of borrowing for state and local governments in financing new projects.
Consumer Price Index (CPI) – An index that measures prices of a fixed basket of goods bought by a typical consumer, including food, transportation, shelter, utilities, clothing, medical care, entertainment and other items. The CPI, published by the Bureau of Labor Statistics in the Department of Labor, is based at 100 in 1982 and is released monthly. It is widely used as a cost-of-living benchmark to adjust Social Security payments and other payment schedules, union contracts and tax brackets. The CPI is also known as the cost-of-living index.
Core CPI – Consumer Price Index minus the energy and food components.
This page is not part of the Annual Report. 3
| Important Information, | ||
Continued | ||
Duration – A bond’s sensitivity to interest rates. Bonds with longer durations experience greater price volatility than bonds with shorter durations.
Effective Duration – A bond’s sensitivity to interest rates, incorporating the embedded option features, such as call provisions. Bonds with longer durations experience greater price volatility than bonds with shorter durations.
Fed Funds Rate – The interest rate at which a depository institution lends immediately available funds (balances at the Federal Reserve) to another depository institution overnight.
General Obligation Bond – A municipal bond backed by the credit and “taxing power” of the issuing jurisdiction rather than the revenue from a given project.
M2 – The amount of money in circulation in notes and coin plus non-interest-bearing bank deposits, building-society deposits, and National Savings accounts.
Operation Twist – A monetary policy where, in an attempt to lower long-term interest rates, the Fed sold short-term Treasury bonds and bought long-term Treasury bonds, which pressured the long-term bond yields downward.
Quantitative Easing – The Federal Reserve’s monetary policy used to stimulate the U.S. economy following the recession that began in 2007/08.
SEC Yield – SEC Yield is computed in accordance with SEC standards measuring the net investment income per share over a specified 30-day period expressed as a percentage of the maximum offering price of the Fund’s shares at the end of the period.
Treasuries – U.S. Treasury securities, such as bills, notes and bonds, are negotiable debt obligations of the U.S. government. These debt obligations are backed by the “full faith and credit” of the government and issued at various schedules and maturities. Income from Treasury securities is exempt from state and local, but not federal, taxes.
4 This page is not part of the Annual Report.
Thornburg Intermediate Municipal Fund
At Thornburg, our approach to management of the Fund is based on the premise that investors in the Fund seek preservation of capital along with an attractive, relatively stable yield. While aggressive bond strategies may generate stronger returns when the market is turning a blind eye towards risk, they often fail to stack up over longer periods of time.
We apply time-tested techniques to manage risk and provide attractive returns. These include:
| • | Building a laddered portfolio. Laddering has been shown over time to mitigate reinvestment and interest-rate risk. |
| • | Investing on a cash-only basis without using leverage. While leveraged strategies may enhance returns when market conditions are favorable, they can quickly compound losses when sentiment shifts. |
| • | Conducting in-depth fundamental research on each issue and actively monitoring positions for subsequent credit events. |
| • | Diversifying among a large number of generally high-quality bonds. |
CO-PORTFOLIO MANAGERS

Josh Gonze, Chris Ryon,CFA, and Chris Ihlefeld
IMPORTANT
PERFORMANCE INFORMATION
Performance data shown represents past performance and is no guarantee of future results. Investment return and principal value will fluctuate so shares, when redeemed, may be worth more or less than their original cost. Current performance may be lower or higher than quoted. For performance current to the most recent month end, visit thornburg.com or call 800.847.0200.
The maximum sales charge for the Fund’s Class A shares is 2.00%. The total annual fund operating expense of Class A shares is 0.97%, as disclosed in the most recent Prospectus.
LONG-TERM STABILITY OF PRINCIPAL
Net asset value history of A shares from July 22, 1991 through September 30, 2011
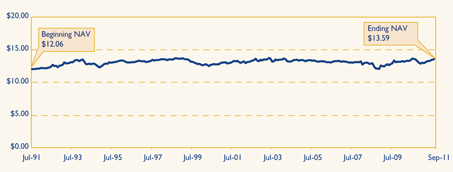
AVERAGE ANNUAL TOTAL RETURNS
For periods ended September 30, 2011
| 1 Yr | 3 Yrs | 5 Yrs | 10 Yrs | Since Inception | ||||||||||||||||
A Shares (Incep: 7/22/91) | ||||||||||||||||||||
Without sales charge | 3.27 | % | 6.93 | % | 4.39 | % | 4.18 | % | 5.24 | % | ||||||||||
With sales charge | 1.19 | % | 6.23 | % | 3.97 | % | 3.97 | % | 5.14 | % | ||||||||||
30-DAY YIELDS, A SHARES
As of September 30, 2011
Annualized Distribution Yield | SEC Yield | |||
3.24% | 2.42 | % | ||
KEY PORTFOLIO ATTRIBUTES
As of September 30, 2011
Number of Bonds | 356 | |||
Effective Duration | 5.8 Yrs | |||
Average Maturity | 8.5 Yrs | |||
See the entire portfolio in the Schedule of Investments beginning on page 11.
This page is not part of the Annual Report. 5

Thornburg Intermediate Municipal Fund
September 30, 2011
Table of Contents | ||||
| 7 | ||||
| 11 | ||||
| 22 | ||||
| 23 | ||||
| 24 | ||||
| 25 | ||||
| 30 | ||||
| 32 | ||||
| 33 | ||||
| 34 | ||||
| 35 | ||||
| 38 |
This report is certified under the Sarbanes-Oxley Act of 2002, which requires that public companies, including mutual funds, affirm that the information provided in their annual and semiannual shareholder reports fully and fairly represents their financial position.
6 Certified Annual Report
Christopher Ihlefeld Co-Portfolio Manager
Christopher Ryon,CFA Co-Portfolio Manager
Josh Gonze Co-Portfolio Manager | October 14, 2011
Dear Fellow Shareholder:
We are pleased to present the annual report for the Thornburg Intermediate Municipal Fund. The net asset value (NAV) of the Class A shares decreased by 5 cents to $13.59 per share for the fiscal year ended September 30, 2011. If you were with us for the entire period, you received dividends of 47.6 cents per share. If you reinvested your dividends, you received 48.4 cents per share. Dividends per share were lower for Class C shares and higher for Class I shares to account for varying class-specific expenses. The Class A shares of your Fund produced a total return of 3.27% at NAV over the fiscal year ended September 30, 2011, compared to 4.91% for the BofA Merrill Lynch 7–12 Year U.S. Municipal Securities Index. The main contributor to the difference in performance is that the BofA Merrill Lynch 7–12 Year U.S. Municipal Securities Index has a longer duration than the Thornburg Intermediate Municipal Fund. Duration is a measure of a fund’s price sensitivity to changes in interest rates. As interest rates decline, funds with longer durations will enjoy greater price appreciation and additional income. As interest rates increase, funds with longer durations will also incur greater price depreciation (losses).
The Economy and the Federal Reserve (the Fed)
As we started the fiscal year, beginning October 2010, the Federal Reserve Board announced a new wrinkle to its already accommodative stance toward monetary policy. “Quantitative Easing” is a policy of buying bonds and other assets to boost demand and fight off deflation. As we close this fiscal year, the Fed has announced another extraordinary measure known as “Operation Twist.” This policy enhancement calls for the Fed to purchase, by the end of June 2012, $400 billion of Treasury securities with remaining maturities from 6 to 30 years and to sell an equal amount of Treasury securities with remaining maturities of 3 years or less. This is intended to cause the yield curve (a representation of the prevailing yields of Treasury securities by maturity) to flatten, reducing the yield difference between long-term and short-term Treasury securities. A typical measure of this phenomenon is the difference between the yield of a 10-year Treasury security and the yield of a 30-year Treasury security. The difference in yield between these two securities was 1.38% on September 1, 2011 (30-year Treasury securities yielded 1.38% more than 10-year Treasury securities). The formal announcement of the Fed’s new policy directive was on September 21, 2011, and by September 30, 2011, the difference had narrowed to 1.02%. The above change in the relationship between 10-year and 30-year Treasury securities means that longer maturity Treasury securities outperformed shorter maturity Treasury securities.
The Federal Open Market Committee, in its September 21, 2011 release, stated that “economic growth remains slow” and that there are “significant downside risks to the economic outlook, including strains in global financial markets.” These concerns explain why Treasury yields are lower by 0.17% to 1.59% since March 31, 2011. Longer maturity Treasury securities have | |


Certified Annual Report 7
| Letter to Shareholders, | ||
Continued | ||
decreased in yield more than shorter maturity Treasury securities. The “strains in the global financial markets,” have led the Treasury market to experience a “flight to quality” in spite of a downgrade to AA+ by Standard and Poor’s on August 5, 2011. As one of our colleagues has stated, “the world views Treasury securities as the best house in a bad neighborhood.”
We share the Fed’s view that “economic growth remains low,” but there are some reasons for hope. June 2011 gross domestic product (GDP), a measure of a country’s overall economic output, recorded a 1.3% increase, higher than the 0.4% increase recorded in March of 2011. Capacity utilization, a measure of an economy’s usage of its productive resources, was running at 77.4% for the month ended August 31, 2011, slightly higher than the 75.7% recorded on September 30, 2011. Money supply as measured by M2, a broad measure of money and money substitutes, remains elevated. The velocity of M2, a measure of the rate at which money in circulation is used in transactions, continues to decline. Typically rising money supply is viewed as an inflationary threat, as long as velocity remains constant or increases. The combination of rising money supply and decreasing velocity is not inflationary. The one significant difference between this fiscal year end and last fiscal year end is that commercial and industrial loans and leases (loans to corporations, commercial enterprises, and joint ventures) have begun to increase, from a very low base. These loans have increased 7.98% over the 12 months ended September 30, 2011 versus a 10.57% decline for the 12 months ended September 30, 2010. These increases of loans to businesses may be laying the groundwork for a more robust expansion.
The employment picture is still a major concern; with so many Americans either unemployed or underemployed, it’s hard to fathom where demand for goods and service will come from. The unemployment rate is 9.1%, lower than the 9.8% registered in November 2010. In the 12 months ended September 2011, 1.49 million jobs have been created versus the 118,000 lost in the prior 12 months.
CHART I: BofA MERRILL LYNCH 3–15 YEAR MUNICIPAL INDEX
Periodic Returns during the Period from 9/30/2010 through 9/30/2011

Source: Bloomberg
Past performance does not guarantee future results.
The economic picture is not as bleak as some in the media would paint it. The risks of a double-dip recession seem low but so do the probabilities of a robust recovery. Our outlook for interest rates is much the same as it was last year with one exception; over the next 6–12 months, we believe the Fed will keep short-term interest rates low, but long-term interest rates have and may continue to benefit from Operation Twist. Investors should ready themselves for increased periods of volatility as some of the exogenous forces impacting the United States play themselves out.
8 Certified Annual Report
The Municipal Market
The calendar year began with various predictions of numerous defaults in the municipal bond market; the term “hundreds of billions of dollars” was used. For the nine months ended September 30, 2011, the municipal bond market experienced $1.1 billion in defaults, a relatively small amount. This means, if one uses $200 billion as the low end of the estimate, we have only $198.9 billion to go by December 31, 2011 for these dire predictions to be achieved. These estimates were overly dramatic but they did add to the volatility of returns experienced throughout fiscal 2011. Chart I shows the volatility of returns generated by the BofA Merrill Lynch 3–15 Year Municipal Index for the 12 months ended September 30, 2011.
Most, if not all, of the other predictions of doom proved equally false. Supply of new issue municipal bonds did not expand as the Build America Bond program expired on December 31, 2010. In fact, the supply of newly issued municipal debt is down 35% through September 30, 2011 versus the same period in 2010. On the credit side, the revenue picture for state and local governments is improving. Revenues are increasing, although they are still below peak levels. Also expenditures are being cut. One example of this is that state and local employment payrolls have been cut by in excess of 500,000 jobs nationwide since August 2008.
Chart II illustrates how yields have changed over the last 12 months. The largest declines occurred in the maturities shorter than 10 years. The general level of municipal bond yields appear to be moving in sympathy with the yields on Treasury securities, albeit at a different pace.
The major drivers of returns for the fiscal year have been duration (longer is better than shorter as rates declined) and yield curve exposure (allocation of assets to mid-range maturities versus shorter and longer maturities is better). The discipline of the laddered portfolio structure seeks to ensure that investors benefit from these opportunities.
Conclusion
Your Thornburg Intermediate Municipal Fund is a laddered portfolio of 356 municipal obligations from 42 states and territories. We ladder the maturity dates of the bonds in your portfolio so that some of the bonds are scheduled to mature during each of the coming years. Laddering short and intermediate bonds accomplishes two goals. First, the staggered bond maturities contained in a ladder reduce interest-rate risk and dampen the Fund’s price volatility. Second, laddering reduces reinvestment risk by giving the Fund a steady cash flow stream from maturing
CHART II: CHANGES IN AAA GENERAL OBLIGATION BOND YIELDS
9/30/2010 through 9/30/2011
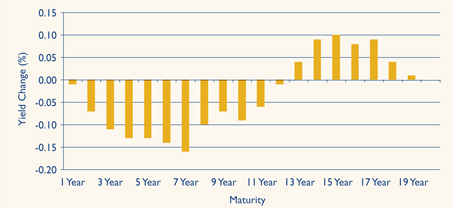
Source: Standard and Poor’s 09/30/2011
Past performance does not guarantee future results.
Certified Annual Report 9
| Letter to Shareholders, | ||
Continued | ||
bonds to reinvest toward the top of the ladder where yields are typically higher. Chart III describes the percentages of your Fund’s bond portfolio maturing in each of the coming years. The Fund’s adherence to the discipline of the laddered structure served investors well. As you saw in Chart II on the previous page, yields in the shorter segment of the 1– 20 year maturity range of the market decreased more than any other segment. By keeping with the discipline of the Fund’s laddered structure, we were able to capture a significant portion of that performance.
We plan to continue to search for opportunities in the municipal market, using our fundamental, bottom-up approach to portfolio management and the discipline of the laddered structure. In closing, we would like to thank you for the trust you have placed with us. We will continue to keep that foremost in our minds as we go forward into a new year.
CHART III: % OF PORTFOLIO MATURING
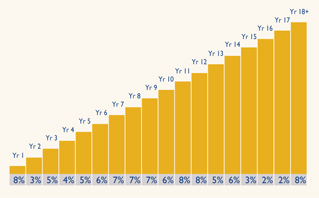
As of 9/30/11. Percentages vary over time.
Data may not add up to 100% due to rounding.
| Sincerely | ||||
 |  |  | ||
| Christopher Ihlefeld | Christopher Ryon,CFA | Josh Gonze | ||
| Co-Portfolio Manager | Co-Portfolio Manager | Co-Portfolio Manager | ||
| Managing Director | Managing Director | Managing Director | ||
The matters discussed in this report may constitute forward-looking statements made pursuant to the safe harbor provisions of the Securities Litigation Reform Act of 1995. These include any advisor or portfolio manager prediction, assessment, analysis or outlook for individual securities, industries, investment styles, market sectors and/or markets. These statements involve risks and uncertainties. In addition to the general risks described for each fund in its current prospectus, other factors bearing on these reports include the accuracy of the advisor’s or portfolio manager’s forecasts and predictions, the appropriateness of the investment strategies designed by the advisor or portfolio manager and the ability of the advisor or portfolio manager to implement their strategies efficiently and successfully. Any one or more of these factors, as well as other risks affecting the securities markets generally, could cause the actual results of any fund to differ materially as compared to its benchmarks.
10 Certified Annual Report
| SCHEDULE OF INVESTMENTS | ||
| Thornburg Intermediate Municipal Fund | September 30, 2011 | |
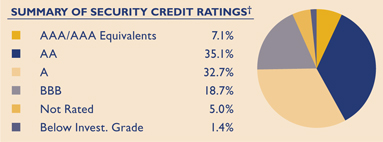
We have used ratings from Standard & Poor’s (S&P). Where S&P ratings are not available, we have used Moody’s Investors Service. Where neither rating is available, we have used ratings from Fitch Ratings. The category of investments identified as “AAA” in this graph includes investments which are pre-refunded or escrowed to maturity. Such investments are backed by an escrow or trust containing sufficient U.S. Government or U.S. Government agency securities to satisfy the timely payment of principal and interest and, therefore, are normally deemed to be equivalent to AAA-rated securities.
Issuer-Description | Credit Rating† | Principal Amount | Value | |||||||
ALABAMA — 1.30% | ||||||||||
Alabama Public School & College Authority, 5.00% due 5/1/2016 | NR/Aa1 | $ | 2,000,000 | $ | 2,339,380 | |||||
Montgomery Water Works & Sanitary Sewer Board, 4.00% due 9/1/2012 | AAA/Aa2 | 1,120,000 | 1,157,453 | |||||||
Montgomery Water Works & Sanitary Sewer Board, 4.00% due 9/1/2014 | AAA/Aa2 | 1,310,000 | 1,432,432 | |||||||
Montgomery Water Works & Sanitary Sewer Board, 5.00% due 9/1/2017 | AAA/Aa2 | 2,185,000 | 2,589,793 | |||||||
University of Alabama at Birmingham Hospital Revenue, 5.25% due 9/1/2025 | A+/A1 | 2,000,000 | 2,102,460 | |||||||
ALASKA — 0.69% | ||||||||||
Alaska Municipal Bond Bank, 5.00% due 10/1/2017 (Insured: Natl-Re/FGIC) | A+/Aa2 | 2,470,000 | 2,715,938 | |||||||
Anchorage GO, 6.00% due 10/1/2012 (Insured: Natl-Re/FGIC) | AA/NR | 125,000 | 127,761 | |||||||
Valdez Marine Terminal Revenue, 5.00% due 1/1/2021 (BP Pipelines Inc.) | NR/NR | 2,000,000 | 2,260,600 | |||||||
ARIZONA — 4.43% | ||||||||||
Arizona Health Facilities Authority, 5.00% due 7/1/2017 (Catholic Healthcare West) | A/A2 | 1,450,000 | 1,611,023 | |||||||
City of Mesa Utility System Revenue, 5.00% due 7/1/2023 (Insured: AGM) | AA+/Aa2 | 5,000,000 | 5,766,900 | |||||||
Mohave County IDA, 7.25% due 5/1/2015 (Mohave Prison LLC) | BBB+/NR | 4,640,000 | 4,804,998 | |||||||
Phoenix Civic Improvement Corp., 5.00% due 7/1/2017 (Insured: Natl-Re) | AA/Aa3 | 1,000,000 | 1,147,000 | |||||||
Pima County IDA, 6.70% due 7/1/2021 (Arizona Charter Schools) | NR/Baa3 | 2,570,000 | 2,570,540 | |||||||
Pima County IDA, 5.00% due 12/1/2030 (Providence Day School Project) | BBB+/NR | 2,000,000 | 1,844,440 | |||||||
Salt Verde Financial Corp. Gas Revenue, 5.25% due 12/1/2022 | A/A3 | 2,000,000 | 2,008,240 | |||||||
Salt Verde Financial Corp. Gas Revenue, 5.25% due 12/1/2028 | A/A3 | 735,000 | 710,730 | |||||||
State of Arizona, 5.00% due 7/1/2019 (Insured: AGM) | AA+/Aa3 | 7,280,000 | 8,454,992 | |||||||
Tucson GO, 9.75% due 7/1/2012 (ETM) | AA-/NR | 400,000 | 428,360 | |||||||
Tucson GO, 9.75% due 7/1/2013 (ETM) | AA-/NR | 500,000 | 580,585 | |||||||
University Medical Center Corp., 5.00% due 7/1/2015 (Insured: GO of Corp) | BBB+/Baa1 | 1,000,000 | 1,071,170 | |||||||
University of Arizona, 5.00% due 8/1/2024 | AA-/NR | 1,635,000 | 1,810,975 | |||||||
CALIFORNIA — 9.58% | ||||||||||
Brea Redevelopment Agency, 0% due 8/1/2023 (Tax Allocation-A) | AA-/NR | 3,320,000 | 1,638,088 | |||||||
California Educational Facilities Authority, 5.50% due 4/1/2029 (Pitzer College) | NR/A3 | 3,000,000 | 3,181,740 | |||||||
California HFA, 5.125% due 7/1/2022 (Catholic Healthcare West) | A/A2 | 3,435,000 | 3,663,050 | |||||||
California Housing Finance Agency, 0% due 8/1/2029 (Insured: AMBAC/FHA/VA) | BBB/Baa2 | 3,675,000 | 1,249,463 | |||||||
California Infrastructure & Economic Development Bank, 5.75% due 8/15/2029 (King City High School) | A-/NR | 1,500,000 | 1,577,160 | |||||||
California PCR Solid Waste Disposal, 5.25% due 6/1/2023 put 12/1/2017 (Republic Services, Inc.) (AMT) | BBB/Baa3 | 2,000,000 | 2,162,040 | |||||||
California State GO, 5.25% due 9/1/2026 | NR/NR | 5,000,000 | 5,485,950 | |||||||
California State Public Works Board Lease, 5.00% due 6/1/2017 (Regents of University of California; Insured: Natl-Re/FGIC) | AA-/Aa2 | 2,000,000 | 2,331,700 | |||||||
Certified Annual Report 11
| SCHEDULE OF INVESTMENTS, CONTINUED | ||
| Thornburg Intermediate Municipal Fund | September 30, 2011 | |
Issuer-Description | Credit Rating† | Principal Amount | Value | |||||||
California Statewide Community Development Authority, 6.25% due 8/15/2028 (Enloe Medical Center; Insured: California Mtg Insurance) | A-/NR | $ | 1,050,000 | $ | 1,143,314 | |||||
California Statewide Community Development Authority, 6.00% due 7/1/2030 (Aspire Public Schools) | NR/NR | 7,045,000 | 7,060,640 | |||||||
Carson Redevelopment Agency Tax Allocation, 6.25% due 10/1/2022 | A-/NR | 1,620,000 | 1,780,558 | |||||||
Carson Redevelopment Agency Tax Allocation, 6.375% due 10/1/2024 | A-/NR | 1,300,000 | 1,412,073 | |||||||
Chico Redevelopment Agency, 5.00% due 4/1/2030 (Chico Amended & Merged Redevelopment; Insured: AMBAC) | A+/NR | 4,000,000 | 3,716,960 | |||||||
Corona-Norco USD COP, 5.00% due 4/15/2018 (Insured: AGM) | AA+/Aa3 | 1,245,000 | 1,407,908 | |||||||
Corona-Norco USD COP, 5.00% due 4/15/2021 (Insured: AGM) | AA+/Aa3 | 1,000,000 | 1,105,320 | |||||||
El Camino Hospital District, 6.25% due 8/15/2017 (Insured: AMBAC) (ETM) | NR/NR | 795,000 | 924,410 | |||||||
Golden West Schools Financing Authority, 0% due 8/1/2018 (Insured: Natl-Re) | BBB/Baa1 | 2,140,000 | 1,432,837 | |||||||
Lee Lake Water District Community Facilities, 5.75% due 9/1/2023 | NR/NR | 3,000,000 | 2,877,510 | |||||||
Los Angeles Regional Airport Improvement Corp., 5.00% due 1/1/2017 (LAX Fuel Corp.; Insured: AGM) (AMT) | AA+/Aa3 | 1,120,000 | 1,192,453 | |||||||
M-S-R Energy Authority, 6.125% due 11/1/2029 | A/NR | 2,500,000 | 2,633,300 | |||||||
Merced Redevelopment Agency, 6.25% due 9/1/2029 (Gateways Redevelopment) | A-/NR | 1,500,000 | 1,560,630 | |||||||
Mojave USD COP, 0% due 9/1/2021 (Insured: AGM) | AA+/NR | 1,095,000 | 676,173 | |||||||
Mojave USD COP, 0% due 9/1/2023 (Insured: AGM) | AA+/NR | 1,100,000 | 584,023 | |||||||
Monterey County COP, 5.25% due 8/1/2021 (Refinancing Project; Insured: AGM) | AA+/Aa3 | 3,700,000 | 4,156,506 | |||||||
Redwood City Redevelopment Agency, 0% due 7/15/2023 (Redevelopment Area A-2; Insured: AMBAC) | A-/NR | 2,060,000 | 991,107 | |||||||
San Jose Redevelopment Agency, 5.25% due 8/1/2027 (Merged Area Redevelopment Project) | A/A2 | 2,400,000 | 2,334,456 | |||||||
San Jose Redevelopment Agency, 5.375% due 8/1/2028 (Merged Area Redevelopment Project) | A/A2 | 1,175,000 | 1,147,576 | |||||||
San Mateo Union High School District GO Unlimited, 0% due 9/1/2019 (Capital Appreciation- Election of 2000-B; Insured: Natl-Re/FGIC) | AA/Aa1 | 3,000,000 | 2,200,860 | |||||||
Southeast Resource Recovery Facilities Authority, 5.375% due 12/1/2013 (Insured: AMBAC) (AMT) | A+/A1 | 1,000,000 | 1,066,260 | |||||||
Tuolumne Wind Project Authority, 5.875% due 1/1/2029 (Tuolumne Co.) | A+/A2 | 3,000,000 | 3,342,900 | |||||||
Turlock Irrigation District, 5.00% due 1/1/2021 | A+/A2 | 1,750,000 | 1,998,605 | |||||||
Victor Elementary School District GO, 0% due 8/1/2025 (Insured: Natl-Re/FGIC) | A+/Aa3 | 1,535,000 | 696,644 | |||||||
Washington USD COP, 5.00% due 8/1/2022 (New High School; Insured: AMBAC) | A/NR | 2,010,000 | 2,116,590 | |||||||
COLORADO — 3.82% | ||||||||||
Adams County, 5.00% due 8/1/2014 (Platte Valley Medical Center; Insured: Natl-Re/FHA 242) | BBB/NR | 1,000,000 | 1,089,310 | |||||||
Adams County Communication Center COP, 5.75% due 12/1/2016 (Adams County Communication Center) | NR/A1 | 1,265,000 | 1,296,094 | |||||||
Colorado Educational & Cultural Facilities, 5.25% due 8/15/2019 (Peak to Peak Charter School; Insured: Syncora) | A/NR | 1,375,000 | 1,440,024 | |||||||
Colorado HFA, 5.75% due 1/15/2022 (Vail Valley Medical Center) | A-/NR | 1,380,000 | 1,385,920 | |||||||
Denver City & County Airport, 5.50% due 11/15/2015 (Insured: Natl-Re/FGIC) (AMT) | A+/A1 | 5,000,000 | 5,023,650 | |||||||
Denver City & County Housing Authority, 5.20% due 11/1/2027 (Three Towers Rehabilitation; Insured: AGM) (AMT) | NR/Aa3 | 2,555,000 | 2,643,684 | |||||||
Denver Convention Center Hotel Authority, 5.25% due 12/1/2023 (Insured: Syncora) | BBB-/Baa3 | 2,430,000 | 2,382,761 | |||||||
El Paso County School District GO, 7.10% due 12/1/2013 (State Aid Withholding) | AA-/Aa2 | 500,000 | 568,015 | |||||||
Madre Metropolitan District GO, 5.375% due 12/1/2026 | NR/NR | 2,215,000 | 1,529,103 | |||||||
North Range Metropolitan District GO, 5.00% due 12/15/2021 (Insured: ACA) | NR/NR | 1,500,000 | 1,301,415 | |||||||
Northwest Parkway Public Highway Authority, 5.20% due 6/15/2014 (Insured: AGM) (ETM) | AA+/Aa3 | 1,005,000 | 1,128,484 | |||||||
Park Creek Metropolitan District, 5.25% due 12/1/2020 (Insured: AGM) | AA+/NR | 1,120,000 | 1,288,112 | |||||||
Public Authority for Colorado Energy Gas Revenue, 6.125% due 11/15/2023 | A/Baa1 | 2,000,000 | 2,109,400 | |||||||
Regional Transportation District, 5.50% due 6/1/2022 | A-/Aa3 | 3,000,000 | 3,429,990 | |||||||
Southlands Metropolitan District GO, 7.00% due 12/1/2024 pre-refunded 12/1/2014 | AA+/NR | 1,370,000 | 1,644,466 | |||||||
12 Certified Annual Report
| SCHEDULE OF INVESTMENTS, CONTINUED | ||
| Thornburg Intermediate Municipal Fund | September 30, 2011 | |
Issuer-Description | Credit Rating† | Principal Amount | Value | |||||||
CONNECTICUT — 0.18% | ||||||||||
Connecticut Health & Educational Facility Authority, 5.75% due 7/1/2029 (Ethel Walker School) | BBB-/NR | $ | 1,350,000 | $ | 1,362,461 | |||||
DISTRICT OF COLUMBIA — 2.20% | ||||||||||
District of Columbia Association of American Medical Colleges, 5.00% due 2/15/2017 (Insured: AMBAC) (ETM) | Aa2 | 1,000,000 | 1,185,760 | |||||||
District of Columbia COP, 5.25% due 1/1/2014 (Insured: Natl-Re/FGIC) | A/Aa3 | 2,000,000 | 2,173,380 | |||||||
District of Columbia COP, 5.00% due 1/1/2020 (Insured: Natl-Re/FGIC) | A/Aa3 | 3,900,000 | 4,151,316 | |||||||
District of Columbia GO, 6.00% due 6/1/2015 (Insured: Natl-Re) | A+/Aa2 | 3,000,000 | 3,494,550 | |||||||
Metropolitan Airports Authority, 0% due 10/1/2023 (Dulles Toll Road; Insured: AGM) | AA+/Aa3 | 4,890,000 | 2,702,263 | |||||||
Metropolitan Airports Authority, 0% due 10/1/2024 (Dulles Toll Road; Insured: AGM) | AA+/Aa3 | 5,000,000 | 2,576,350 | |||||||
FLORIDA — 10.05% | ||||||||||
Broward County School Board COP, 5.00% due 7/1/2020 (Insured: AGM) | AA+/Aa3 | 1,000,000 | 1,081,250 | |||||||
Collier County Housing Finance Authority MFR, 4.90% due 2/15/2032 put 2/15/2012 (Goodlette Arms; Collateralized: FNMA) | NR/Aaa | 1,000,000 | 1,014,130 | |||||||
Crossings at Fleming Island Community Development, 5.60% due 5/1/2012 (Insured: Natl-Re) | BBB/Baa1 | 380,000 | 380,939 | |||||||
Escambia County HFA, 5.95% due 7/1/2020 (Florida Health Care Facility Loan; Insured: AMBAC) | NR/NR | 2,405,000 | 2,509,545 | |||||||
Flagler County School Board COP, 5.00% due 8/1/2020 (Insured: AGM) | AA+/Aa3 | 2,560,000 | 2,715,776 | |||||||
Florida Board of Education GO Capital Outlay, 9.125% due 6/1/2014 | AAA/Aa1 | 350,000 | 383,149 | |||||||
Florida Housing Finance Corp., 4.80% due 1/1/2016 (Homeowner Mtg; Insured: FHA) | AA+/Aa1 | 190,000 | 193,317 | |||||||
Florida Municipal Loan Council, 5.00% due 10/1/2020 (Insured: Natl-Re) | A-/Baa1 | 1,000,000 | 1,052,190 | |||||||
Florida Municipal Loan Council, 5.00% due 10/1/2024 (Insured: Natl-Re) | A-/Baa1 | 2,235,000 | 2,342,883 | |||||||
Florida State Department of Children & Families COP, 5.00% due 10/1/2018 (South Florida Evaluation Treatment) | AA+/NR | 2,090,000 | 2,281,590 | |||||||
Florida State Department of Children & Families COP, 5.00% due 10/1/2019 (South Florida Evaluation Treatment) | AA+/NR | 2,255,000 | 2,438,963 | |||||||
Florida State Department of Environmental Protection, 5.00% due 7/1/2017 (Florida Forever; Insured: Natl-Re/FGIC) | AA-/A1 | 1,000,000 | 1,067,510 | |||||||
Gainesville Utilities Systems Revenue, 0.22% due 10/1/2026 put 10/3/2011 (SPA: Suntrust Bank) (daily demand notes) | AA/Aa2 | 6,105,000 | 6,105,000 | |||||||
Highlands County HFA, 5.00% due 11/15/2019 (Adventist Health Hospital) | AA-/Aa3 | 1,100,000 | 1,195,865 | |||||||
Highlands County HFA, 5.00% due 11/15/2019 (Adventist Health Hospital) | AA-/Aa3 | 875,000 | 951,256 | |||||||
Hillsborough County Special Assessment, 5.00% due 3/1/2017 (Insured: Natl-Re/FGIC) | A+/A1 | 5,630,000 | 6,157,812 | |||||||
Hollywood Community Redevelopment Agency, 5.00% due 3/1/2021 (Insured: Syncora) | NR/A3 | 3,000,000 | 3,145,380 | |||||||
Lakeland Energy System Revenue, 5.00% due 10/1/2018 (Insured: AGM) | AA+/Aa3 | 2,000,000 | 2,345,020 | |||||||
Lakeland Energy System Revenue, 5.25% due 10/1/2036 | AA-/A1 | 2,770,000 | 3,129,408 | |||||||
Manatee County, 5.00% due 10/1/2016 (Insured: AMBAC) | AA-/Aa2 | 1,000,000 | 1,095,810 | |||||||
Marion County Hospital District, 5.00% due 10/1/2022 (Munroe Regional Health) | NR/A3 | 1,000,000 | 1,039,100 | |||||||
Miami Dade County GO, 6.25% due 7/1/2026 (Building Better Communities) | AA-/Aa2 | 2,130,000 | 2,423,408 | |||||||
Miami Dade County School Board COP, 5.00% due 10/1/2021 (Insured: AMBAC) | A/A1 | 3,035,000 | 3,337,043 | |||||||
Miami Dade County School Board COP, 5.25% due 5/1/2022 (Insured: AGM) | AA+/Aa3 | 2,600,000 | 2,878,382 | |||||||
Miami GO, 5.375% due 9/1/2015 (Insured: Natl-Re) | BBB/A2 | 1,000,000 | 1,024,870 | |||||||
Orange County HFA, 6.25% due 10/1/2013 (Orlando Regional Hospital; Insured: Natl-Re) | A/A2 | 440,000 | 474,681 | |||||||
Orange County HFA, 5.125% due 6/1/2014 (Mayflower Retirement; Insured: Radian) | NR/NR | 770,000 | 769,962 | |||||||
Orange County HFA, 6.25% due 10/1/2016 (Orlando Regional Hospital; Insured: Natl-Re) | A/A2 | 2,545,000 | 2,870,709 | |||||||
Orange County HFA, 5.125% due 10/1/2026 (Orlando Health) | A/A2 | 2,000,000 | 2,029,500 | |||||||
Palm Beach County School Board COP, 5.00% due 8/1/2032 put 8/1/2016 | NR/Aa3 | 1,500,000 | 1,696,200 | |||||||
Sarasota County Public Hospital Board, 7.212% due 10/1/2021 (Miles-Sarasota Memorial Hospital; Insured: Natl-Re) | BBB/A1 | 2,000,000 | 1,865,340 | |||||||
South Miami HFA, 5.00% due 8/15/2022 (Baptist Health Group) | AA/Aa2 | 1,500,000 | 1,628,700 | |||||||
St. Johns County IDA, 5.85% due 8/1/2024 (Presbyterian Retirement) | NR/NR | 4,885,000 | 4,968,289 | |||||||
Certified Annual Report 13
| SCHEDULE OF INVESTMENTS, CONTINUED | ||
| Thornburg Intermediate Municipal Fund | September 30, 2011 | |
Issuer-Description | Credit Rating† | Principal Amount | Value | |||||||
Tampa Bay Water Utilities System Revenue, 5.50% due 10/1/2022 (Insured: Natl-Re/FGIC) | AA+/Aa2 | $ | 2,750,000 | $ | 3,443,000 | |||||
Tampa Health Systems, 5.50% due 11/15/2013 (Catholic Health East Group; Insured: Natl-Re) | BBB/Aa3 | 1,050,000 | 1,135,775 | |||||||
University of Central Florida COP Convocation Corp., 5.00% due 10/1/2019 (Insured: Natl- Re/FGIC) | BBB/NR | 1,135,000 | 1,151,423 | |||||||
GEORGIA — 1.31% | ||||||||||
Atlanta Water and Wastewater, 5.50% due 11/1/2022 (Insured: Natl-Re/FGIC) | A/A1 | 530,000 | 614,328 | |||||||
Atlanta Water and Wastewater, 5.50% due 11/1/2024 (Insured: AGM) | AA+/Aa3 | 5,000,000 | 5,605,300 | |||||||
Municipal Electric Authority of Georgia, 6.60% due 1/1/2018 (Insured: Natl-Re) | BBB/A1 | 3,030,000 | 3,475,744 | |||||||
HAWAII — 0.12% | ||||||||||
Hawaii Department of Budget & Finance, 6.40% due 7/1/2013 (Kapiolani Health Care; Insured: Natl-Re) | BBB/A3 | 875,000 | 899,990 | |||||||
IDAHO — 0.25% | ||||||||||
Boise City IDRB Corp., 5.00% due 5/15/2020 (Western Trailer Co.; LOC: Wells Fargo) (AMT) | NR/Aa3 | 1,745,000 | 1,760,059 | |||||||
Madison County Hospital Revenue, 5.25% due 9/1/2030 | BB+/NR | 115,000 | 101,235 | |||||||
ILLINOIS — 7.42% | ||||||||||
Chicago Midway Airport Second Lien, 5.00% due 1/1/2019 (Insured: AMBAC) (AMT) | A-/A3 | 1,210,000 | 1,263,010 | |||||||
Chicago O’Hare International Airport Revenue Second Lien, 5.75% due 1/1/2018 (Insured: AMBAC) (AMT) | A-/A2 | 3,050,000 | 3,077,755 | |||||||
Chicago Tax Increment, 6.25% due 11/15/2013 (Near South Redevelopment; Insured: ACA) | NR/NR | 1,550,000 | 1,554,200 | |||||||
Chicago Tax Increment, 0% due 11/15/2014 (Near South Redevelopment; Insured: ACA) | NR/NR | 1,440,000 | 1,197,821 | |||||||
Chicago Tax Increment Allocation, 5.30% due 1/1/2014 (Lincoln Belmont; Insured: ACA) | NR/NR | 2,285,000 | 2,286,577 | |||||||
Chicago Transit Authority, 5.00% due 12/1/2018 | AA/Aa3 | 1,500,000 | 1,748,010 | |||||||
Chicago Wastewater Transmission Second Lien, 5.00% due 1/1/2014 | A+/Aa3 | 1,485,000 | 1,593,509 | |||||||
Cook County GO, 5.25% due 11/15/2024 | AA/Aa3 | 3,000,000 | 3,255,060 | |||||||
Cook County School District GO, 0% due 12/1/2022 (ETM) | NR/NR | 2,000,000 | 1,457,520 | |||||||
Illinois Educational Facilities Authority, 5.00% due 11/1/2016 (Rush University Medical Center) | A-/A2 | 1,000,000 | 1,104,390 | |||||||
Illinois Educational Facilities Authority, 5.75% due 11/1/2028 (Rush University Medical Center) | A-/A2 | 1,000,000 | 1,049,710 | |||||||
Illinois Finance Authority, 5.00% due 11/1/2016 (Central DuPage Health) | AA/NR | 2,000,000 | 2,281,480 | |||||||
Illinois Finance Authority, 5.00% due 11/1/2017 (Central DuPage Health) | AA/NR | 2,000,000 | 2,303,780 | |||||||
Illinois Finance Authority, 5.00% due 8/1/2022 (Bradley University; Insured: Syncora) | A/NR | 1,000,000 | 1,053,930 | |||||||
Illinois Finance Authority, 6.125% due 11/1/2023 (Advocate Health) | AA/Aa2 | 5,000,000 | 5,937,950 | |||||||
Illinois Finance Authority, 5.00% due 2/1/2027 (Newman Foundation; Insured: Radian) | NR/NR | 1,220,000 | 1,058,887 | |||||||
Illinois HFA, 6.00% due 7/1/2012 (Loyola University Health Systems; Insured: Natl-Re) (ETM) | BBB/NR | 230,000 | 239,994 | |||||||
Illinois HFA, 5.70% due 2/20/2021 (Midwest Care Center; Collateralized: GNMA) | NR/Aaa | 750,000 | 766,297 | |||||||
McHenry & Lake Counties Community Consolidated School District No. 15 GO, 0% due 1/1/2017 pre-refunded 1/1/2017 (Insured: AGM) (ETM) | NR/Aa2 | 45,000 | 41,495 | |||||||
McHenry & Lake Counties Community Consolidated School District No. 15 GO, 0% due 1/1/2017 (Insured: AGM) | NR/Aa2 | 955,000 | 802,486 | |||||||
Railsplitter Tobacco Settlement Authority, 5.50% due 6/1/2023 | A-/NR | 4,000,000 | 4,271,720 | |||||||
Sangamon County School District COP, 5.875% due 8/15/2018 (Hay Edwards; Insured: ACA) | NR/NR | 2,600,000 | 2,603,406 | |||||||
Southern Illinois University, 0% due 4/1/2014 (Insured: Natl-Re) | BBB/A2 | 1,425,000 | 1,308,720 | |||||||
Southern Illinois University, 5.00% due 4/1/2014 (Housing & Auxiliary Facilities System; Insured: Natl-Re) | A+/A2 | 1,350,000 | 1,439,518 | |||||||
Southern Illinois University, 5.25% due 4/1/2019 (Housing & Auxiliary Facilities System; Insured: Natl-Re) | A+/A2 | 1,000,000 | 1,109,030 | |||||||
Southwestern Illinois Development Authority, 0% due 12/1/2024 (Insured: AGM) | AA+/NR | 2,975,000 | 1,500,560 | |||||||
State of Illinois, 5.00% due 6/15/2018 (Build Illinois) | AAA/NR | 2,000,000 | 2,332,620 | |||||||
Tazewell County School District GO, 9.00% due 12/1/2024 (Insured: Natl-Re/FGIC) | NR/A1 | 1,205,000 | 1,809,862 | |||||||
University of Illinois, 0% due 4/1/2014 (Insured: Natl-Re) | BBB/Aa2 | 1,590,000 | 1,498,209 | |||||||
14 Certified Annual Report
| SCHEDULE OF INVESTMENTS, CONTINUED | ||
| Thornburg Intermediate Municipal Fund | September 30, 2011 | |
Issuer-Description | Credit Rating† | Principal Amount | Value | |||||||
Will County Valley View Community Unit School District No. 365 GO, 0% due 11/1/2011 pre-refunded 11/1/2011 (Insured: AGM) | AA+/NR | $ | 1,205,000 | $ | 1,204,723 | |||||
Will County Valley View Community Unit School District No. 365 GO, 0% due 11/1/2011 pre-refunded 11/1/2011 (ETM) | AA+/NR | 100,000 | 99,947 | |||||||
Will County Valley View Community Unit School District No. 365 GO, 0% due 11/1/2011 (Insured: AGM) | AA+/NR | 1,660,000 | 1,659,187 | |||||||
INDIANA — 5.93% | ||||||||||
Allen County Economic Development, 5.75% due 12/30/2015 (Indiana Institute of Technology) | NR/NR | 1,355,000 | 1,400,636 | |||||||
Allen County Jail Building Corp., 5.00% due 4/1/2018 (Insured: Syncora) | NR/Aa2 | 2,495,000 | 2,768,951 | |||||||
Allen County Redevelopment District, 5.00% due 11/15/2018 | NR/A2 | 1,560,000 | 1,701,773 | |||||||
Avon Community School Building Corp. First Mtg, 5.00% due 1/10/2012 (Insured: AMBAC) | A/NR | 1,330,000 | 1,346,213 | |||||||
Carmel Redevelopment Authority Lease, 0% due 2/1/2016 (Performing Arts Center) | AA+/Aa1 | 1,730,000 | 1,567,761 | |||||||
Carmel Redevelopment Authority Lease, 0% due 2/1/2021 (Performing Arts Center) | AA+/Aa1 | 2,000,000 | 1,399,880 | |||||||
Carmel Redevelopment District, 6.50% due 7/15/2035 | NR/NR | 2,730,000 | 2,690,661 | |||||||
Clay Multi-School Building Corp. First Mtg, 4.00% due 7/15/2013 (State Aid Withholding) | AA+/NR | 1,290,000 | 1,351,675 | |||||||
Clay Multi-School Building Corp. First Mtg, 5.00% due 1/15/2018 (State Aid Withholding) | AA+/NR | 1,735,000 | 2,039,215 | |||||||
Fort Wayne Redevelopment Authority, 5.00% due 8/1/2023 (Harrison Square; Insured: AGM) | NR/Aa2 | 2,290,000 | 2,497,566 | |||||||
Hobart Building Corp. First Mtg, 6.50% due 7/15/2019 (Insured: Natl-Re) (State Aid Withholding) | AA+/NR | 1,000,000 | 1,254,160 | |||||||
Indiana Bond Bank, 5.25% due 4/1/2023 (Hendricks Regional; Insured: AMBAC) | AA/NR | 2,000,000 | 2,329,080 | |||||||
Indiana Bond Bank Gas Program Revenue, 5.25% due 10/15/2020 | NR/Aa3 | 5,340,000 | 5,812,590 | |||||||
Indiana Finance Authority, 0.20% due 2/1/2037 put 10/3/2011 (Lease Appropriation; SPA: JPMorgan Chase Bank) (daily demand notes) | AA+/Aa2 | 4,700,000 | 4,700,000 | |||||||
Indiana Finance Authority, 4.10% due 11/15/2046 put 11/3/2016 (Ascension Health Credit Group) | AA+/Aa1 | 1,000,000 | 1,106,580 | |||||||
Indiana HFA, 5.75% due 9/1/2015 (Methodist Hospital) (ETM) | AA+/A3 | 575,000 | 586,948 | |||||||
Noblesville Redevelopment Authority, 5.00% due 8/1/2017 (146th Street Extension) | AA-/NR | 1,000,000 | 1,134,640 | |||||||
Noblesville Redevelopment Authority, 5.00% due 8/1/2020 (146th Street Extension) | AA-/NR | 1,000,000 | 1,093,420 | |||||||
South Bend Community School Corp. First Mtg, 4.00% due 1/15/2012 | AA+/NR | 1,260,000 | 1,272,348 | |||||||
South Bend Community School Corp. First Mtg, 4.00% due 7/15/2012 (State Aid Withholding) | AA+/NR | 1,510,000 | 1,548,792 | |||||||
South Bend Community School Corp. First Mtg, 4.00% due 7/15/2012 | AA+/NR | 1,490,000 | 1,528,278 | |||||||
Vincennes University, 5.375% due 6/1/2022 | NR/Aa3 | 895,000 | 1,058,194 | |||||||
West Clark School Building Corp. First Mtg, 5.75% due 7/15/2017 (Insured: Natl-Re/FGIC) (State Aid Withholding) | AA+/NR | 1,685,000 | 1,709,769 | |||||||
IOWA — 0.74% | ||||||||||
Coralville COP, 5.25% due 6/1/2022 | NR/A1 | 2,980,000 | 3,207,374 | |||||||
Iowa Finance Authority, 6.00% due 7/1/2012 (Trinity Regional Hospital; Insured: AGM) | AA+/Aa3 | 220,000 | 227,564 | |||||||
Iowa Finance Authority, 6.00% due 12/1/2018 (Catholic Health Initiatives) | AA/Aa2 | 2,000,000 | 2,005,980 | |||||||
KANSAS — 0.15% | ||||||||||
Wyandotte County School District GO, 5.00% due 9/1/2014 (Insured: Natl-Re/FGIC) | NR/A1 | 1,030,000 | 1,141,539 | |||||||
KENTUCKY — 0.85% | ||||||||||
Kentucky EDA, 5.85% due 10/1/2015 (Norton Healthcare; Insured: Natl-Re) | BBB/Baa1 | 2,665,000 | 2,849,604 | |||||||
Kentucky EDA, 0% due 10/1/2024 (Norton Healthcare; Insured: Natl-Re) | BBB/Baa1 | 3,630,000 | 1,798,411 | |||||||
Kentucky EDA, 5.75% due 12/1/2028 (Louisville Arena; Insured: AGM) | AA+/Aa3 | 1,500,000 | 1,613,160 | |||||||
LOUISIANA — 3.39% | ||||||||||
Louisiana Local Government Environment Facilities Authority, 5.00% due 3/1/2014 (Independence Stadium) | A/NR | 1,000,000 | 1,074,450 | |||||||
Louisiana Office Facilities Corp., 5.00% due 5/1/2014 (State Capitol) | NR/Aa3 | 1,000,000 | 1,085,890 | |||||||
Louisiana Offshore Terminal Authority, 2.125% due 10/1/2037 put 10/1/2015 | A/NR | 2,500,000 | 2,497,275 | |||||||
Certified Annual Report 15
| SCHEDULE OF INVESTMENTS, CONTINUED | ||
| Thornburg Intermediate Municipal Fund | September 30, 2011 | |
| Credit Rating† | Principal | |||||||||
Issuer-Description | S&P/ Moody’s | Amount | Value | |||||||
Louisiana Public Facilities Authority, 5.00% due 7/1/2022 (Black & Gold Facilities; Insured: CIFG) | AA+/Aa3 | $ | 1,590,000 | $ | 1,664,650 | |||||
Morehouse Parish PCR, 5.25% due 11/15/2013 (International Paper Co.) | BBB/Baa3 | 3,000,000 | 3,180,630 | |||||||
New Orleans Aviation Board, 5.25% due 1/1/2018 (Insured: AGM) (AMT) | AA+/Aa3 | 1,000,000 | 1,138,360 | |||||||
New Orleans Aviation Board, 5.25% due 1/1/2020 (Insured: AGM) | AA+/Aa3 | 2,000,000 | 2,191,400 | |||||||
Plaquemines Parish Law Enforcement District GO, 5.00% due 9/1/2023 | BBB+/NR | 1,230,000 | 1,291,439 | |||||||
Plaquemines Parish Law Enforcement District GO, 5.00% due 9/1/2025 | BBB+/NR | 1,350,000 | 1,397,237 | |||||||
Plaquemines Parish Law Enforcement District GO, 5.15% due 9/1/2027 | BBB+/NR | 1,490,000 | 1,540,824 | |||||||
Plaquemines Parish Law Enforcement District GO, 5.30% due 9/1/2029 | BBB+/NR | 1,650,000 | 1,702,651 | |||||||
Regional Transit Authority Sales Tax Revenue, 5.00% due 12/1/2023 (Insured: AGM) | AA+/Aa3 | 1,000,000 | 1,125,680 | |||||||
Regional Transit Authority Sales Tax Revenue, 5.00% due 12/1/2024 (Insured AGM) | AA+/Aa3 | 1,000,000 | 1,111,350 | |||||||
St. Tammany Parish Sales Tax Revenue, 5.00% due 6/1/2019 (Insured: CIFG) | A+/NR | 1,300,000 | 1,433,328 | |||||||
St. Tammany Parish Sales Tax Revenue, 5.00% due 6/1/2020 (Insured: CIFG) | A+/NR | 1,000,000 | 1,093,090 | |||||||
Terrebonne Parish Hospital Service District 1, 5.00% due 4/1/2028 (General Medical Center) | A/A2 | 1,500,000 | 1,532,295 | |||||||
MASSACHUSETTS — 0.03% | ||||||||||
Massachusetts Housing Finance Agency, 6.125% due 12/1/2011 (Insured: Natl-Re) (AMT) | NR/Baa1 | 240,000 | 240,838 | |||||||
MICHIGAN — 6.32% | ||||||||||
City of Troy Michigan GO, 5.00% due 10/1/2016 | AAA/NR | 1,060,000 | 1,233,437 | |||||||
Detroit School District GO, 5.25% due 5/1/2026 (School Building & Site Improvement; | ||||||||||
Insured: AGM/Q-SBLF) | AA+/Aa2 | 3,150,000 | 3,250,516 | |||||||
Detroit School District GO, 5.25% due 5/1/2027 (Insured: AGM/Q-SBLF) | AA+/Aa2 | 1,000,000 | 1,026,800 | |||||||
Detroit Sewage Disposal Revenue, 5.25% due 7/1/2020 (Insured: Natl-Re) | A+/A1 | 3,000,000 | 3,225,930 | |||||||
Detroit Sewage Disposal Revenue, 5.25% due 7/1/2020 (Insured: AGM) | AA+/Aa3 | 7,720,000 | 8,644,007 | |||||||
Detroit Water Supply Systems, 5.00% due 7/1/2015 (Insured: AGM) | AA+/Aa3 | 1,000,000 | 1,107,530 | |||||||
Detroit Water Supply Systems, 4.25% due 7/1/2016 (Insured: Natl-Re) | BBB/A1 | 1,100,000 | 1,163,437 | |||||||
Kalamazoo Hospital Finance Authority, 6.25% due 6/1/2014 (Borgess Medical Center; Insured: FGIC) (ETM) | AA+/Aaa | 650,000 | 741,936 | |||||||
Kalamazoo Hospital Finance Authority, 5.00% due 5/15/2019 (Bronson Hospital; Insured: AGM) | NR/Aa3 | 2,000,000 | 2,241,960 | |||||||
Kalamazoo Hospital Finance Authority, 5.00% due 5/15/2022 (Bronson Hospital; Insured: AGM) | NR/Aa3 | 2,470,000 | 2,712,999 | |||||||
Kent Hospital Finance Authority, 7.25% due 1/15/2013 (Butterworth Hospital; Insured: Natl-Re) (ETM) | AA/Aa3 | 295,000 | 305,611 | |||||||
Michigan Public Educational Facilities Authority, 5.50% due 9/1/2022 (Black River School) | NR/NR | 1,110,000 | 997,601 | |||||||
Michigan Public Educational Facilities Authority, 8.50% due 9/1/2029 (Bradford Academy) | BBB-/NR | 1,500,000 | 1,623,570 | |||||||
Michigan Public School Academy, 8.00% due 8/1/2035 (Will Carleton Charter School) | NR/NR | 990,000 | 944,430 | |||||||
Michigan State Building Authority, 5.25% due 10/15/2017 (Insured: AGM) | AA+/Aa3 | 2,450,000 | 2,640,586 | |||||||
Michigan State Building Authority, 0% due 10/15/2025 (Insured: Natl-Re/FGIC) | A+/Aa3 | 6,000,000 | 2,876,040 | |||||||
Michigan State Hospital Finance Authority, 5.10% due 6/1/2013 (McLaren Healthcare) | NR/Aa3 | 525,000 | 526,444 | |||||||
Michigan State Hospital Finance Authority, 5.00% due 11/15/2024 (Sparrow Obligated Group) | A+/A1 | 2,140,000 | 2,204,114 | |||||||
Michigan State Hospital Finance Authority, 5.00% due 7/15/2025 (Oakwood Obligated Group) | A/A2 | 3,000,000 | 3,022,710 | |||||||
Michigan Strategic Fund, 5.25% due 10/15/2023 (Michigan House of Representatives Facilities; Insured: AGM) | AA+/Aa3 | 1,000,000 | 1,077,500 | |||||||
Royal Oak Hospital Finance Authority, 5.25% due 8/1/2016 (William Beaumont Hospital) | A/A1 | 2,000,000 | 2,215,340 | |||||||
Royal Oak Hospital Finance Authority, 8.00% due 9/1/2029 (William Beaumont Hospital) | A/A1 | 2,540,000 | 3,003,779 | |||||||
MINNESOTA — 0.93% | ||||||||||
Minneapolis St. Paul Health, 6.00% due 12/1/2018 (Healthpartners Obligated Group) | BBB+/A3 | 1,000,000 | 1,071,510 | |||||||
Minnesota Agriculture & Economic Development Board, 5.50% due 2/15/2025 (Essential Healthcare; Insured: AGM) | AA+/NR | 2,500,000 | 2,786,750 | |||||||
St. Cloud Health Care Revenue, 5.00% due 5/1/2014 (Centracare Health System) | NR/A2 | 835,000 | 904,856 | |||||||
St. Paul Housing & Redevelopment Authority, 5.25% due 5/15/2020 (Healthpartners Obligated Group) | BBB+/A3 | 1,965,000 | 2,083,784 | |||||||
16 Certified Annual Report
| SCHEDULE OF INVESTMENTS, CONTINUED | ||
| Thornburg Intermediate Municipal Fund | September 30, 2011 | |
Issuer-Description | Credit Rating† | Principal Amount | Value | |||||||
MISSISSIPPI — 1.24% | ||||||||||
Medical Center Educational Building Corp., 4.00% due 6/1/2014 (University of Mississippi Medical Center) | AA-/Aa2 | $ | 1,240,000 | $ | 1,330,049 | |||||
Mississippi Development Bank Special Obligation, 5.00% due 3/1/2018 (Municipal Energy Agency Power Supply; Insured: Syncora) | NR/Baa2 | 1,920,000 | 2,040,960 | |||||||
Mississippi Development Bank Special Obligation, 5.00% due 7/1/2022 (Canton Public Improvement) | NR/NR | 1,935,000 | 2,046,127 | |||||||
Mississippi Development Bank Special Obligation, 5.25% due 8/1/2027 (Department of Corrections) | AA-/NR | 3,415,000 | 3,740,586 | |||||||
MISSOURI — 1.52% | ||||||||||
Kansas City Tax Increment Financing Commission, 5.00% due 3/1/2012 (Maincor Project) | NR/NR | 445,000 | 447,826 | |||||||
Missouri Development Finance Board, 5.00% due 4/1/2019 (Eastland Center) | A-/NR | 1,000,000 | 1,090,690 | |||||||
Missouri Development Finance Board, 5.00% due 4/1/2021 (Eastland Center) | A-/NR | 2,000,000 | 2,145,880 | |||||||
Missouri Development Finance Board, 5.125% due 4/1/2022 (Eastland Center) | A-/NR | 2,000,000 | 2,166,380 | |||||||
Missouri Health & Educational Facilities Authority, 5.00% due 4/1/2019 (Webster University) | NR/A2 | 2,235,000 | 2,528,500 | |||||||
Missouri Health & Educational Facilities Authority, 5.00% due 4/1/2021 (Webster University) | NR/A2 | 2,520,000 | 2,842,888 | |||||||
NEVADA — 0.15% | ||||||||||
Clark County School District GO, 5.50% due 6/15/2016 (Insured: AGM) | AA+/Aa2 | 1,000,000 | 1,077,950 | |||||||
NEW HAMPSHIRE — 1.44% | ||||||||||
Manchester Housing & Redevelopment Authority, 0% due 1/1/2016 (Insured: Radian/ACA) | NR/Caa1 | 4,990,000 | 3,343,599 | |||||||
New Hampshire Business Finance Authority, 7.125% due 7/1/2027 put 2/1/2012 (United Illuminating Co.) (AMT) | NR/Baa2 | 1,000,000 | 1,019,640 | |||||||
New Hampshire Business Finance Authority PCR, 5.375% due 5/1/2014 (Central Maine Power Co.) | BBB+/NR | 3,920,000 | 4,217,803 | |||||||
New Hampshire Health & Education Facilities, 5.25% due 10/1/2023 (Southern New Hampshire Medical Center) | A-/NR | 1,000,000 | 1,054,390 | |||||||
New Hampshire IDA PCR, 5.90% due 8/1/2018 (CT Light & Power) (AMT) | BBB+/Baa1 | 1,000,000 | 1,006,550 | |||||||
NEW JERSEY — 0.78% | ||||||||||
New Jersey EDA, 5.50% due 9/1/2026 (School Facilities Construction; Insured: AMBAC) | A+/A1 | 2,000,000 | 2,286,000 | |||||||
Passaic Valley Sewage Commissioners, 5.75% due 12/1/2022 (Sewer System; Insured: GO of Commissioners) | NR/A2 | 3,000,000 | 3,488,730 | |||||||
NEW MEXICO — 1.17% | ||||||||||
Farmington PCR, 4.70% due 9/1/2024 (Arizona Public Service Co.) | BBB/Baa2 | 3,000,000 | 3,071,910 | |||||||
Las Cruces Shared GRT, 5.00% due 6/1/2030 | NR/Aa3 | 2,040,000 | 2,219,275 | |||||||
Rio Rancho Public School District No. 94, 5.00% due 8/1/2015 (State Aid Withholding) | NR/Aa1 | 1,715,000 | 1,973,211 | |||||||
Santa Fe County Charter School Foundation, 6.50% due 1/15/2026 (ATC Foundation) | NR/NR | 1,455,000 | 1,384,709 | |||||||
NEW YORK — 1.80% | ||||||||||
Erie County IDA, 5.00% due 5/1/2019 (Buffalo City School District) | AA-/Aa3 | 3,000,000 | 3,486,030 | |||||||
New York City Municipal Water Financing Authority, 0.25% due 6/15/2039 put 10/3/2011 (General Resolution; SPA: Landesbank Hessen-Thuringen) (daily demand notes) | AA+/Aa2 | 4,300,000 | 4,300,000 | |||||||
New York Series H Sub Series H-2 GO, 0.12% due 8/1/2013 put 10/3/2011 (Insured: Natl-Re; SPA: Wachovia Bank N.A.) (daily demand notes) | AA/Aa2 | 1,000,000 | 1,000,000 | |||||||
New York State Dormitory Authority, 5.625% due 7/1/2016 (City University System) | AA-/Aa3 | 1,000,000 | 1,135,370 | |||||||
New York State Dormitory Authority, 5.00% due 7/1/2017 (Bishop Henry B. Hucles Nursing Home; Insured: SONYMA) | NR/Aa1 | 850,000 | 968,184 | |||||||
Certified Annual Report 17
| SCHEDULE OF INVESTMENTS, CONTINUED | ||
| Thornburg Intermediate Municipal Fund | September 30, 2011 | |
Issuer-Description | Credit Rating† | Principal Amount | Value | |||||||
New York State Dormitory Authority, 5.25% due 5/15/2021 (State University Educational Facilities) | AA-/Aa3 | $ | 500,000 | $ | 580,815 | |||||
United Nations Development Corp., 5.00% due 7/1/2025 | NR/A1 | 1,700,000 | 1,862,078 | |||||||
NORTH DAKOTA — 0.34% | ||||||||||
North Dakota Building Authority, 4.25% due 12/1/2015 (Insured: Natl-Re) | AA/Aa2 | 1,305,000 | 1,476,046 | |||||||
Ward County Health Care Facilities, 5.125% due 7/1/2021 (Trinity Obligated Group) | BBB+/NR | 1,000,000 | 1,032,670 | |||||||
OHIO — 2.85% | ||||||||||
Cleveland Cuyahoga County Port Authority, 6.25% due 5/15/2016 (LOC: FifthThird Bank) | BBB-/NR | 1,060,000 | 1,070,716 | |||||||
Cleveland Cuyahoga County Port Authority, 5.00% due 10/1/2021 (Cleveland Museum of Art) | AA+/NR | 1,330,000 | 1,525,497 | |||||||
Deerfield Township Tax Increment, 5.00% due 12/1/2016 | NR/A1 | 1,035,000 | 1,159,821 | |||||||
Deerfield Township Tax Increment, 5.00% due 12/1/2025 | NR/A1 | 1,000,000 | 1,034,230 | |||||||
Franklin County Convention Facilities Authority, 5.25% due 12/1/2015 (Tax & Lease Revenue Anticipation Bonds; Insured: AMBAC) | AA/Aaa | 1,000,000 | 1,052,560 | |||||||
Hamilton Wastewater Systems, 5.25% due 10/1/2017 (Insured: AGM) | NR/Aa3 | 1,500,000 | 1,714,290 | |||||||
Ohio State Air Quality Development Authority, 5.70% due 8/1/2020 (First Energy Generation) | BBB-/Baa3 | 3,000,000 | 3,280,470 | |||||||
Ohio State Air Quality Development Authority, 4.85% due 8/1/2040 put 5/1/2012 (Columbus Southern Power; Insured: Natl-Re) (AMT) | BBB/A3 | 1,500,000 | 1,531,605 | |||||||
Ohio State Air Quality Development Authority, 5.10% due 11/1/2042 put 5/1/2013 (Columbus Southern Power; Insured: Natl-Re) (AMT) | BBB/A3 | 3,000,000 | 3,165,420 | |||||||
Ohio State Higher Educational Facilities, 5.05% due 7/1/2037 put 7/1/2016 (Kenyon College) | A+/A1 | 1,200,000 | 1,352,340 | |||||||
Ohio State Water Development Authority PCR, 5.875% due 6/1/2033 put 6/1/2016 (FirstEnergy Corp.) | BBB-/Baa2 | 1,000,000 | 1,123,560 | |||||||
Ohio State Water Development Authority PCR, 3.375% due 7/1/2033 put 7/1/2015 (FirstEnergy Corp.) | BBB-/Baa3 | 3,000,000 | 3,063,120 | |||||||
OKLAHOMA — 1.29% | ||||||||||
Oklahoma City Municipal Water & Sewer, 0% due 7/1/2013 (Insured: AMBAC) | NR/NR | 1,485,000 | 1,438,831 | |||||||
Oklahoma DFA, 0.14% due 8/15/2033 put 10/3/2011 (Integris Health; Insured: AGM) (daily demand notes) | AA+/Aa3 | 1,665,000 | 1,665,000 | |||||||
Oklahoma State Industries Authority, 5.50% due 7/1/2023 (Oklahoma Medical Research Foundation) | NR/A1 | 3,730,000 | 4,105,499 | |||||||
Oklahoma State Power Authority, 5.00% due 1/1/2018 (Insured: AGM) | AA+/Aa3 | 1,000,000 | 1,173,550 | |||||||
Tulsa IDA, 5.00% due 12/15/2024 (St. Francis Health Systems) | AA+/Aa2 | 1,130,000 | 1,195,111 | |||||||
PENNSYLVANIA — 3.14% | ||||||||||
Allegheny County Hospital Development, 5.00% due 5/15/2019 (University of Pittsburgh Medical Center) | A+/Aa3 | 2,500,000 | 2,888,200 | |||||||
Allegheny County IDA, 5.90% due 8/15/2026 (School Facility Development, Inc.) | BBB-/NR | 1,200,000 | 1,169,796 | |||||||
Allegheny County IDA, 6.375% due 8/15/2035 (School Facility Development, Inc.) | BBB-/NR | 1,130,000 | 1,078,054 | |||||||
Chartiers Valley Industrial & Community Development Authority, 5.75% due 12/1/2022 (Asbury Health Center) | NR/NR | 900,000 | 870,075 | |||||||
Lancaster County GO, 0% due 5/1/2014 (Insured: Natl-Re/FGIC) | NR/Aa2 | 795,000 | 724,491 | |||||||
Lancaster County GO, 0% due 5/1/2015 (Insured: Natl-Re/FGIC) | NR/Aa2 | 800,000 | 689,744 | |||||||
Pennsylvania EDA, 4.625% due 12/1/2018 (Colver Project; Insured: AMBAC) (AMT) | BBB-/Ba1 | 5,000,000 | 4,717,550 | |||||||
Pennsylvania Higher Education Facilities Authority, 0% due 7/1/2020 (Insured: AMBAC) | NR/NR | 2,032,839 | 1,067,932 | |||||||
Pennsylvania Turnpike Commission, 0% due 12/1/2030 (Convertible Capital Appreciation) | A-/A3 | 4,000,000 | 3,280,560 | |||||||
Philadelphia Hospitals & Higher Educational Facilities Authority, 0.13% due 7/1/2022 put 10/3/2011 (The Children’s Hospital; SPA: JPMorgan Chase Bank) (daily demand notes) | AA/Aa2 | 1,100,000 | 1,100,000 | |||||||
Philadelphia School District GO, 5.00% due 9/1/2018 (State Aid Withholding) | A+/Aa2 | 5,000,000 | 5,671,650 | |||||||
18 Certified Annual Report
| SCHEDULE OF INVESTMENTS, CONTINUED | ||
| Thornburg Intermediate Municipal Fund | September 30, 2011 | |
Issuer-Description | Credit Rating† | Principal Amount | Value | |||||||
RHODE ISLAND — 0.33% | ||||||||||
Rhode Island Health & Education Building Corp., 5.00% due 3/15/2014 (Salve Regina University; Insured: Radian) | NR/NR | $ | 1,065,000 | $ | 1,083,489 | |||||
Rhode Island Health & Education Building Corp., 5.25% due 7/1/2015 (Memorial Hospital; LOC: Fleet Bank) | NR/NR | 1,325,000 | 1,394,072 | |||||||
SOUTH CAROLINA — 3.42% | ||||||||||
Berkeley County School District Installment Lease, 5.00% due 12/1/2019 | A/A1 | 2,000,000 | 2,184,140 | |||||||
Greenville County School District, 5.50% due 12/1/2021 (Building Equity Sooner) | AA/Aa2 | 5,000,000 | 6,096,700 | |||||||
Greenwood School Facilities, Inc., 5.00% due 12/1/2025 (Greenwood School District 50; Insured: AGM) | AA+/Aa3 | 2,400,000 | 2,561,016 | |||||||
Lexington One School Facilities Corp. School District 1, 5.00% due 12/1/2019 | NR/Aa3 | 1,000,000 | 1,097,580 | |||||||
Lexington One School Facilities Corp. School District 1, 5.25% due 12/1/2021 | NR/Aa3 | 1,700,000 | 1,895,143 | |||||||
Scago Educational Facilities Corp., 5.00% due 12/1/2017 (Colleton School District; Insured: AGM) | AA+/Aa3 | 1,000,000 | 1,132,940 | |||||||
Scago Educational Facilities Corp., 5.00% due 4/1/2019 (Spartanburg School District; Insured: AGM) | AA+/Aa3 | 2,740,000 | 2,974,325 | |||||||
Scago Educational Facilities Corp., 5.00% due 4/1/2021 (Spartanburg School District; Insured: AGM) | AA+/Aa3 | 1,000,000 | 1,072,370 | |||||||
South Carolina Housing Finance & Development Authority, 5.875% due 7/1/2022 (AMT) | NR/Aa1 | 2,085,000 | 2,194,316 | |||||||
South Carolina Housing Finance & Development Authority, 5.30% due 7/1/2023 (AMT) | NR/Aa1 | 980,000 | 1,026,864 | |||||||
Sumter School Facilities Inc. School District 2, 5.00% due 12/1/2021 (Insured: AGM) | AA+/Aa3 | 2,855,000 | 3,044,600 | |||||||
SOUTH DAKOTA — 0.25% | ||||||||||
South Dakota Health & Educational Facilities Authority, 5.00% due 11/1/2024 (Sanford Health) | AA-/A1 | 1,700,000 | 1,829,421 | |||||||
TENNESSEE — 1.41% | ||||||||||
Clarksville Natural Gas Acquisition Corp., 5.00% due 12/15/2014 | NR/Baa1 | 1,000,000 | 1,064,240 | |||||||
Tennessee Energy Acquisition Corp., 5.00% due 2/1/2023 | BBB/Baa3 | 2,500,000 | 2,453,200 | |||||||
Tennessee Energy Acquisition Corp., 5.25% due 9/1/2023 | B/Ba3 | 7,000,000 | 6,908,230 | |||||||
TEXAS — 12.00% | ||||||||||
Austin Community College District, 5.50% due 8/1/2023 (Round Rock Campus) | AA/Aa2 | 2,180,000 | 2,511,447 | |||||||
Bexar County Health Facilities Development Corp., 6.125% due 7/1/2022 pre-refunded 7/1/2012 (Army Retirement Residence) | NR/NR | 1,250,000 | 1,314,225 | |||||||
Bexar County Health Facilities Development Corp., 5.00% due 7/1/2027 (Army Retirement Residence) | BBB/NR | 2,000,000 | 1,942,520 | |||||||
Bexar Metropolitan Water District Waterworks, 5.00% due 5/1/2021 (Insured: Syncora) | A/A1 | 1,300,000 | 1,396,551 | |||||||
Bexar Metropolitan Water District Waterworks, 5.00% due 5/1/2022 (Insured: Syncora) | A/A1 | 2,300,000 | 2,454,353 | |||||||
Birdville ISD GO, 0% due 2/15/2012 (Guaranty: PSF) | AAA/Aaa | 2,800,000 | 2,797,004 | |||||||
Bryan Electric Systems, 3.00% due 7/1/2013 | A+/A1 | 1,000,000 | 1,038,560 | |||||||
Cedar Park Improvement District GO, 5.00% due 2/15/2016 (Insured: Natl-Re) | AA/Aa2 | 1,000,000 | 1,088,750 | |||||||
City of Houston, 5.00% due 9/1/2013 | A-/A2 | 1,500,000 | 1,614,255 | |||||||
City of Houston, 5.00% due 9/1/2013 | A-/A2 | 1,400,000 | 1,506,638 | |||||||
Dallas County Utilities & Reclamation District, 5.15% due 2/15/2022 (Insured: AMBAC) | BBB+/A3 | 3,000,000 | 3,193,440 | |||||||
Dallas/Fort Worth International Airport, 5.00% due 11/1/2015 | A+/A1 | 1,000,000 | 1,146,810 | |||||||
Duncanville ISD GO, 0% due 2/15/2016 pre-refunded 2/15/2012 (Guaranty: PSF) | AAA/Aaa | 2,985,000 | 2,371,403 | |||||||
Duncanville ISD GO, 0% due 2/15/2016 (Guaranty: PSF) | AAA/Aaa | 15,000 | 11,879 | |||||||
Eagle Mountain & Saginaw Texas Independent School District GO, 2.50% due 8/1/2050 put 8/1/2014 (School Improvements; Guaranty: PSF) | AAA/NR | 1,000,000 | 1,045,850 | |||||||
Gulf Coast Center, 6.75% due 9/1/2020 (Mental Health Retardation Center) | BBB/NR | 1,220,000 | 1,243,680 | |||||||
Certified Annual Report 19
| SCHEDULE OF INVESTMENTS, CONTINUED | ||
| Thornburg Intermediate Municipal Fund | September 30, 2011 | |
Issuer-Description | Credit Rating† S&P/ Moody’s | Principal Amount | Value | |||||||
Harris County Cultural Education Facilities Finance Corp., 0.13% due 9/1/2031 put 10/3/2011 Texas Medical Center; LOC: JPMorgan Chase & Co.) (daily demand notes) | AAA/Aa1 | $ | 2,000,000 | $ | 2,000,000 | |||||
Harris County Hospital District, 5.00% due 2/15/2015 (Insured: Natl-Re) | A/A1 | 2,075,000 | 2,297,627 | |||||||
Houston Airport System Revenue, 5.00% due 7/1/2014 | A/NR | 1,000,000 | 1,101,290 | |||||||
Houston Higher Education Finance Corp, 6.50% due 5/15/2031 (Cosmos Foundation, Inc.) | BBB/NR | 700,000 | 747,404 | |||||||
Kimble County Hospital District GO, 5.00% due 8/15/2017 | NR/NR | 510,000 | 554,860 | |||||||
Kimble County Hospital District GO, 5.00% due 8/15/2018 | NR/NR | 525,000 | 569,090 | |||||||
La Vernia Higher Education Finance Corp., 5.75% due 8/15/2024 (Kipp, Inc.) | BBB/NR | 3,000,000 | 3,138,840 | |||||||
Laredo Sports Venue Sales Tax, 5.00% due 3/15/2018 (Insured: AMBAC) | A+/A1 | 2,040,000 | 2,199,365 | |||||||
Lewisville Combination Contract Special Assessment District, 4.75% due 9/1/2012 (Insured: ACA) | NR/NR | 505,000 | 508,368 | |||||||
Mission EDA, 6.00% due 8/1/2020 put 8/1/2013 (Waste Management, Inc.) (AMT) | BBB/NR | 3,250,000 | 3,488,745 | |||||||
Northside ISD GO, 1.75% due 6/1/2037 put 6/1/2013 (Various School Buildings; Guaranty: PSF) | AAA/NR | 4,210,000 | 4,215,094 | |||||||
Pharr Higher Education Finance Authority, 5.75% due 8/15/2024 (Idea Public School) | BBB/NR | 5,050,000 | 5,142,364 | |||||||
Sam Rayburn Municipal Power Agency, 6.00% due 10/1/2016 | NR/Baa2 | 3,500,000 | 3,614,555 | |||||||
Sam Rayburn Municipal Power Agency, 6.00% due 10/1/2021 | NR/Baa2 | 2,575,000 | 2,631,753 | |||||||
San Juan Higher Education Finance Authority, 5.75% due 8/15/2024 (Idea Public Schools) | BBB/NR | 1,590,000 | 1,621,975 | |||||||
Stafford Economic Development, 6.00% due 9/1/2017 (Insured: Natl-Re/FGIC) | A+/A1 | 1,775,000 | 2,084,063 | |||||||
Texas City Industrial Development Corp., 7.375% due 10/1/2020 (Arco Pipe Line Company) | A/A2 | 2,450,000 | 3,092,659 | |||||||
Texas Public Finance Authority Charter School Finance Corp., 6.00% due 2/15/2030 (Cosmos Foundation, Inc.) | BBB/NR | 1,750,000 | 1,793,802 | |||||||
Texas Public Finance Authority Charter School Finance Corp., 5.00% due 8/15/2030 (Idea Public School; Insured: ACA) | BBB/NR | 2,000,000 | 1,796,580 | |||||||
Texas State, 2.50% due 8/30/2012 (Tax & Revenue Anticipation Notes) | SP-1+/Mig1 | 15,000,000 | 15,311,850 | |||||||
Texas State Public Finance Authority, 5.00% due 8/15/2023 (Idea Public School; Insured: ACA) | BBB/NR | 3,000,000 | 2,880,390 | |||||||
Uptown Development Authority, 5.50% due 9/1/2029 (Infrastructure Improvement) | BBB/NR | 1,250,000 | 1,292,888 | |||||||
U.S. VIRGIN ISLANDS — 0.72% | ||||||||||
Virgin Islands Public Finance Authority, 6.625% due 10/1/2029 | NR/Baa3 | 5,000,000 | 5,345,850 | |||||||
UTAH — 0.48% | ||||||||||
City of Herriman, 5.75% due 11/1/2027 (Towne Center Assessment Area) | A/NR | 1,000,000 | 1,085,940 | |||||||
Salt Lake Valley Fire Services, 5.25% due 4/1/2020 | NR/Aa2 | 1,250,000 | 1,444,012 | |||||||
Utah County Municipal Building Authority, 5.50% due 11/1/2016 pre-refunded 11/1/2011 (Insured: AMBAC) | NR/NR | 1,000,000 | 1,004,590 | |||||||
VIRGINIA — 0.67% | ||||||||||
Fauquier County IDRB, 5.50% due 10/1/2016 (Insured: Radian) | BBB+/NR | 1,000,000 | 1,047,040 | |||||||
Hanover County IDRB Medical Facilities, 6.00% due 10/1/2021 (FirstHealth Richmond Memorial Hospital) (ETM) | BBB/NR | 795,000 | 866,995 | |||||||
Mecklenburg County IDA, 6.50% due 10/15/2017 (Virginia Electric and Power Company) | NR/Baa1 | 2,000,000 | 2,010,280 | |||||||
Norton IDA, 6.00% due 12/1/2014 (Norton Community Hospital; Insured: ACA) | NR/NR | 1,000,000 | 1,005,950 | |||||||
WASHINGTON — 2.17% | ||||||||||
Seattle Municipal Power and Light, 5.00% due 2/1/2019 | AA-/Aa2 | 3,000,000 | 3,604,380 | |||||||
Skagit County Public Hospital District GO, 5.125% due 12/1/2015 (Insured: Natl-Re) | NR/A1 | 1,900,000 | 2,164,195 | |||||||
Washington Health Care Facilities, 6.00% due 12/1/2014 (Catholic Health Services; Insured: Natl-Re) | AA/Aa2 | 1,735,000 | 1,741,454 | |||||||
Washington Health Care Facilities, 6.00% due 12/1/2015 (Catholic Health Services; Insured: Natl-Re) | AA/Aa2 | 1,945,000 | 1,951,749 | |||||||
Washington Health Care Facilities, 5.25% due 8/15/2024 (Multicare Systems; Insured: AGM) | AA+/Aa3 | 1,000,000 | 1,085,010 | |||||||
Washington Health Care Facilities, 6.25% due 8/1/2028 (Highline Medical Centers; Insured: FHA 242) | A+/NR | 3,985,000 | 4,526,602 | |||||||
20 Certified Annual Report
| SCHEDULE OF INVESTMENTS, CONTINUED | ||
| Thornburg Intermediate Municipal Fund | September 30, 2011 | |
Issuer-Description | Credit Rating† S&P/ Moody’s | Principal Amount | Value | |||||||
Washington Housing Finance Commission, 5.875% due 7/1/2019 (Kline Galland Center; Insured: Radian) | NR/NR | $ | 1,000,000 | $ | 1,001,150 | |||||
WEST VIRGINIA — 0.22% | ||||||||||
West Virginia Hospital Finance Authority, 5.00% due 6/1/2020 (United Hospital Center; Insured: AMBAC) | A+/A2 | 1,530,000 | 1,614,028 | |||||||
WISCONSIN — 1.15% | ||||||||||
Wisconsin Health & Educational Facilities, 5.75% due 8/15/2020 (Eagle River Memorial Hospital Inc.; Insured: Radian) | NR/NR | 925,000 | 930,504 | |||||||
Wisconsin Health & Educational Facilities Authority, 5.00% due 7/1/2021 (Agnesian Healthcare) | A-/A3 | 2,170,000 | 2,303,259 | |||||||
Wisconsin Health & Educational Facilities Authority, 5.50% due 7/1/2025 (Agnesian Healthcare) | A-/A3 | 5,000,000 | 5,263,800 | |||||||
|
| |||||||||
TOTAL INVESTMENTS — 98.23% (Cost $697,370,276) | $ | 726,704,481 | ||||||||
OTHER ASSETS LESS LIABILITIES — 1.77% | 13,068,799 | |||||||||
|
| |||||||||
NET ASSETS — 100.00% | $ | 739,773,280 | ||||||||
|
| |||||||||
Footnote Legend
| † | Credit ratings are unaudited. Rating changes may have occurred subsequent to the reporting period end. |
Portfolio Abbreviations
To simplify the listings of securities, abbreviations are used per the table below:
| ACA | Insured by American Capital Access | |
| AGM | Insured by Assured Guaranty Municipal Corp. | |
| AMBAC | Insured by American Municipal Bond Assurance Corp. | |
| AMT | Alternative Minimum Tax | |
| CIFG | CIFG Assurance North America Inc. | |
| COP | Certificates of Participation | |
| DFA | Development Finance Authority | |
| EDA | Economic Development Authority | |
| ETM | Escrowed to Maturity | |
| FGIC | Insured by Financial Guaranty Insurance Co. | |
| FHA | Insured by Federal Housing Administration | |
| FNMA | Collateralized by Federal National Mortgage Association | |
| GNMA | Insured by Government National Mortgage Association | |
| GO | General Obligation | |
| GRT | Gross Receipts Tax | |
| HFA | Health Facilities Authority | |
| IDA | Industrial Development Authority | |
| IDRB | Industrial Development Revenue Bond | |
| ISD | Independent School District | |
| LOC | Letter of Credit | |
| Mtg | Mortgage | |
| MFR | Multi-Family Revenue | |
| Natl-Re | Insured by National Public Finance Guarantee Corp. | |
| PCR | Pollution Control Revenue Bond | |
| PSF | Guaranteed by Permanent School Fund | |
| Q-SBLF | Qualified School Board Loan Fund | |
| Radian | Insured by Radian Asset Assurance | |
| SONYMA | State of New York Mortgage Authority | |
| SPA | Stand-by Purchase Agreement | |
| Syncora | Insured by Syncora Guarantee Inc. | |
| VA | Veterans Affairs | |
| USD | Unified School District |
See notes to financial statements.
Certified Annual Report 21
| STATEMENT OF ASSETS AND LIABILITIES | ||
| Thornburg Intermediate Municipal Fund | September 30, 2011 | |
ASSETS | ||||
Investments at value (cost $697,370,276) (Note 2) | $ | 726,704,481 | ||
Cash | 1,195,537 | |||
Receivable for investments sold | 4,880,763 | |||
Receivable for fund shares sold | 2,082,670 | |||
Interest receivable | 9,401,406 | |||
Prepaid expenses and other assets | 31,276 | |||
|
| |||
Total Assets | 744,296,133 | |||
|
| |||
LIABILITIES | ||||
Payable for investments purchased | 2,500,000 | |||
Payable for fund shares redeemed | 819,921 | |||
Payable to investment advisor and other affiliates (Note 3) | 483,357 | |||
Accounts payable and accrued expenses | 115,144 | |||
Dividends payable | 604,431 | |||
|
| |||
Total Liabilities | 4,522,853 | |||
|
| |||
NET ASSETS | $ | 739,773,280 | ||
|
| |||
NET ASSETS CONSIST OF: | ||||
Distribution in excess of net investment income | $ | (3,781 | ) | |
Net unrealized appreciation on investments | 29,334,205 | |||
Accumulated net realized gain (loss) | (6,136,137 | ) | ||
Net capital paid in on shares of beneficial interest | 716,578,993 | |||
|
| |||
| $ | 739,773,280 | |||
|
| |||
NET ASSET VALUE: | ||||
Class A Shares: | ||||
Net asset value and redemption price per share ($381,839,197 applicable to 28,088,809 shares of beneficial interest outstanding - Note 4) | $ | 13.59 | ||
Maximum sales charge, 2.00% of offering price | 0.28 | |||
|
| |||
Maximum offering price per share | $ | 13.87 | ||
|
| |||
Class C Shares: | ||||
Net asset value and offering price per share* ($125,511,642 applicable to 9,221,123 shares of beneficial interest outstanding - Note 4) | $ | 13.61 | ||
|
| |||
Class I Shares: | ||||
Net asset value, offering and redemption price per share ($232,422,441 applicable to 17,119,919 shares of beneficial interest outstanding - Note 4) | $ | 13.58 | ||
|
| |||
| * | Redemption price per share is equal to net asset value less any applicable contingent deferred sales charge. |
See notes to financial statements.
22 Certified Annual Report
| STATEMENT OF OPERATIONS | ||
| Thornburg Intermediate Municipal Fund | Year Ended September 30, 2011 | |
INVESTMENT INCOME: | ||||
Interest income (net of premium amortized of $3,345,242) | $ | 32,164,706 | ||
|
| |||
EXPENSES: | ||||
Investment advisory fees (Note 3) | 3,444,777 | |||
Administration fees (Note 3) | ||||
Class A Shares | 476,270 | |||
Class C Shares | 150,898 | |||
Class I Shares | 104,108 | |||
Distribution and service fees (Note 3) | ||||
Class A Shares | 952,541 | |||
Class C Shares | 719,642 | |||
Transfer agent fees | ||||
Class A Shares | 143,173 | |||
Class C Shares | 59,048 | |||
Class I Shares | 84,730 | |||
Registration and filing fees | ||||
Class A Shares | 37,246 | |||
Class C Shares | 28,569 | |||
Class I Shares | 26,713 | |||
Custodian fees (Note 3) | 134,566 | |||
Professional fees | 42,571 | |||
Accounting fees | 28,705 | |||
Trustee fees | 16,152 | |||
Other expenses | 57,186 | |||
|
| |||
Total Expenses | 6,506,895 | |||
Less: | ||||
Expenses reimbursed by investment advisor (Note 3) | (100,214 | ) | ||
Fees paid indirectly (Note 3) | (1,404 | ) | ||
|
| |||
Net Expenses | 6,405,277 | |||
|
| |||
Net Investment Income | 25,759,429 | |||
|
| |||
REALIZED AND UNREALIZED GAIN (LOSS) | ||||
Net realized gain (loss) on investments | 347,891 | |||
Net change in unrealized appreciation (depreciation) on investments | (4,587,013 | ) | ||
|
| |||
Net Realized and Unrealized Loss | (4,239,122 | ) | ||
|
| |||
Net Increase in Net Assets Resulting from Operations | $ | 21,520,307 | ||
|
| |||
See notes to financial statements.
Certified Annual Report 23
| STATEMENTS OF CHANGES IN NET ASSETS |
| Thornburg Intermediate Municipal Fund |
| Year Ended September 30, 2011 | Year Ended September 30, 2010 | |||||||
INCREASE (DECREASE) IN NET ASSETS FROM | ||||||||
OPERATIONS: | ||||||||
Net investment income | $ | 25,759,429 | $ | 22,874,886 | ||||
Net realized gain (loss) on investments | 347,891 | (1,218,528 | ) | |||||
Net unrealized appreciation (depreciation) on investments | (4,587,013 | ) | 14,346,155 | |||||
|
|
|
| |||||
Net Increase (Decrease) in Net Assets Resulting from Operations | 21,520,307 | 36,002,513 | ||||||
DIVIDENDS TO SHAREHOLDERS: | ||||||||
From net investment income | ||||||||
Class A Shares | (13,661,413 | ) | (13,616,758 | ) | ||||
Class C Shares | (3,975,988 | ) | (3,446,376 | ) | ||||
Class I Shares | (8,122,028 | ) | (5,811,752 | ) | ||||
FUND SHARE TRANSACTIONS (NOTE 4): | ||||||||
Class A Shares | (25,338,872 | ) | 65,256,428 | |||||
Class C Shares | (2,034,648 | ) | 45,484,026 | |||||
Class I Shares | 30,234,435 | 73,966,608 | ||||||
|
|
|
| |||||
Net Increase (Decrease) in Net Assets | (1,378,207 | ) | 197,834,689 | |||||
NET ASSETS: | ||||||||
Beginning of Year | 741,151,487 | 543,316,798 | ||||||
|
|
|
| |||||
End of Year | $ | 739,773,280 | $ | 741,151,487 | ||||
|
|
|
| |||||
See notes to financial statements.
24 Certified Annual Report
| NOTES TO FINANCIAL STATEMENTS | ||
| Thornburg Intermediate Municipal Fund | September 30, 2011 | |
NOTE 1 – ORGANIZATION
Thornburg Intermediate Municipal Fund (the “Fund”) is a diversified series of Thornburg Investment Trust (the “Trust”). The Trust is organized as a Massachusetts business trust under a Declaration of Trust dated June 3, 1987 and is registered as a diversified, open-end management investment company under the Investment Company Act of 1940, as amended. The Fund is currently one of sixteen separate series of the Trust. Each series is considered to be a separate entity for financial reporting and tax purposes and bears expenses directly attributable to it. The Fund’s primary investment objective is to obtain as high a level of current income exempt from federal individual income taxes as is consistent, in the view of the Fund’s investment advisor, with the preservation of capital. The Fund’s secondary objective is to reduce expected changes in its share price compared to long-term bond portfolios.
The Fund currently offers three classes of shares of beneficial interest outstanding: Class A, Class C, and Institutional Class (Class I). Each class of shares of the Fund represents an interest in the same portfolio of investments, except that (i) Class A shares are sold subject to a front-end sales charge collected at the time the shares are purchased and bear a service fee, (ii) Class C shares are sold at net asset value without a sales charge at the time of purchase, but are subject to a contingent deferred sales charge upon redemption within one year of purchase, and bear both a service fee and a distribution fee, (iii) Class I shares are sold at net asset value without a sales charge at the time of purchase, and (iv) the respective classes may have different reinvestment privileges and conversion rights. Additionally, the Fund may allocate among its classes certain expenses, to the extent allowable to specific classes, including transfer agent fees, government registration fees, certain printing and postage costs, and administrative and legal expenses. Currently, class specific expenses of the Fund are limited to service and distribution fees, administration fees, and certain registration and transfer agent expenses.
NOTE 2 – SIGNIFICANT ACCOUNTING POLICIES
Significant accounting policies of the Trust are as follows:
Valuation of Investments: Debt obligations have a primary market over the counter and are valued by an independent pricing service approved by the Trustees of the Trust. The pricing service ordinarily values debt obligations at quoted bid prices. When quotations are not available, debt obligations are valued at evaluated prices determined by the pricing service using methods which include consideration of yields or prices of debt obligations of comparable quality, type of issue, coupon, maturity and rating, and indications as to value from dealers and general market conditions. Short-term obligations having remaining maturities of 60 days or less are ordinarily valued at amortized cost, which approximates market value.
In any case where a pricing service fails to provide a price for a debt obligation held by the Fund, the valuation and pricing committee determines a fair value for the obligation using procedures approved by the Trustees. Additionally, in any case where management believes that a price provided by a pricing service for a debt obligation may be unreliable, the valuation and pricing committee decides whether or not to use the pricing service’s valuation or to determine a fair value for the obligation.
In determining fair value for any portfolio security or other investment, the valuation and pricing committee seeks to determine the amount that an owner of the investment might reasonably expect to receive upon a sale of the investment. However, because fair value prices are estimated prices, the valuation and pricing committee’s determination of fair value for an investment may differ from the value that would be realized by the Fund upon a sale of the investment, and that difference could be material to the Fund’s financial statements. The valuation and pricing committee’s determination of fair value for an investment may also differ from the prices obtained by other persons (including other mutual funds) for the investment.
Valuation Measurements: Various inputs are used in determining the value of the Fund’s investments. These inputs are summarized in the three levels listed below:
Level 1: Quoted prices in active markets for identical investments.
Level 2: Other significant observable inputs (including quoted prices for similar investments, interest rates, prepayment rates, credit risk, etc.).
Level 3: Significant unobservable inputs (including the Fund’s own assumptions in determining the fair value of investments).
Certified Annual Report 25
| NOTES TO FINANCIAL STATEMENTS, CONTINUED | ||
| Thornburg Intermediate Municipal Fund | September 30, 2011 | |
The following table displays a summary of the inputs used to value the Fund’s net assets as of September 30, 2011. In any instance when valuation inputs from more than one level are used to determine the fair value of a specific investment, the investment is placed in the level of the table based upon the lowest level input that is significant in determining the fair value of the investment:
| Fair Value Measurements at September 30, 2011 | ||||||||||||||||
| Total | Level 1 | Level 2 | Level 3 | |||||||||||||
Assets | ||||||||||||||||
Investments in Securities | ||||||||||||||||
Municipal Bonds | $ | 726,704,481 | $ | — | $ | 726,704,481 | $ | — | ||||||||
|
|
|
|
|
|
|
| |||||||||
Total Investments in Securities | $ | 726,704,481 | $ | — | $ | 726,704,481 | $ | — | ||||||||
Other Notes: It is the policy of the Fund to recognize significant transfers between Levels 1, 2 and 3 and to disclose those transfers at the beginning of the reporting period. The Fund recognized no significant transfers between levels for the year ended September 30, 2011.
Federal Income Taxes: It is the policy of the Trust to comply with the provisions of the Internal Revenue Code applicable to “regulated investment companies,” and to distribute to shareholders substantially all taxable (if any) and tax exempt income of the Fund. Therefore, no provision for federal income tax is required.
Management reviews each uncertain tax position believed to be material to the preparation of the Fund’s financial statements, to assess if it is more likely than not that the position would be sustained upon examination, based upon the technical merits of the position. As of September 30, 2011, management has not identified any such position for which a liability must be reflected in the Statement of Assets and Liabilities. The Fund’s tax returns remain subject to examination for three years after filing.
When-Issued and Delayed Delivery Transactions: The Fund may engage in when-issued or delayed delivery transactions. To the extent the Fund engages in such transactions, it will do so for the purpose of acquiring portfolio securities consistent with the Fund’s investment objectives and not for the purpose of investment leverage or to speculate on interest rate and/or market changes. At the time the Fund makes a commitment to purchase a security on a when-issued or delayed delivery basis, the Fund will record the transaction and reflect the value in determining its net asset value. When effecting such transactions, assets of an amount sufficient to make payment for the portfolio securities to be purchased will be segregated on the Fund’s records on the trade date. Securities purchased on a when-issued or delayed delivery basis do not earn interest until the settlement date.
Dividends: Net investment income of the Fund is declared daily as a dividend on shares for which the Fund has received payment. Dividends are paid monthly and are reinvested in additional shares of the Fund at net asset value per share at the close of business on the dividend payment date, or at the shareholder’s option, paid in cash. Net realized capital gains, to the extent available, will be distributed at least annually.
General: Securities transactions are accounted for on a trade date basis. Interest income is accrued as earned. Premiums and discounts on securities purchased are amortized to call dates or maturity dates of the respective securities. Realized gains and losses from the sale of securities are recorded on an identified cost basis. Net investment income (other than class specific expenses) and realized and unrealized gains and losses are allocated daily to each class of shares based upon the relative net asset value of outstanding shares (or the value of the dividend-eligible shares, as appropriate) of each class of shares at the beginning of the day (after adjusting for the current capital shares activity of the respective class). Expenses common to all Funds are allocated among the Funds comprising the Trust based upon their relative net asset values or other appropriate allocation methods.
Guarantees and Indemnifications: Under the Trust’s organizational documents, its officers and Trustees are indemnified against certain liabilities arising out of the performance of their duties to the Fund. Additionally, in the normal course of business the Trust enters into contracts with service providers that contain general indemnification clauses. The Trust’s maximum exposure under these arrangements is unknown. However, based on experience, the Trust expects the risk of loss to be remote.
Use of Estimates: The preparation of financial statements, in conformity with generally accepted accounting principles, requires management to make estimates and assumptions that affect the reported amounts of assets and liabilities and the disclosure of contingent
26 Certified Annual Report
| NOTES TO FINANCIAL STATEMENTS, CONTINUED | ||
| Thornburg Intermediate Municipal Fund | September 30, 2011 | |
assets and liabilities at the date of the financial statements and the reported amounts of increases and decreases in net assets from operations during the reporting period. Actual results could differ from those estimates.
NOTE 3 – INVESTMENT ADVISORY FEE AND OTHER TRANSACTIONS WITH AFFILIATES
Pursuant to an investment advisory agreement, Thornburg Investment Management, Inc. (the “Advisor”) serves as the investment advisor and performs services to the Fund for which the fees are payable at the end of each month. For the year ended September 30, 2011, these fees were payable at annual rates ranging from .50 of 1% to .275 of 1% per annum of the average daily net assets of the Fund depending on the Fund’s asset size. The Trust also has entered into administrative services agreements with the Advisor, whereby the Advisor will perform certain administrative services for the shareholders of each class of the Fund’s shares, and for which fees will be payable at an annual rate of up to .125 of 1% per annum of the average daily net assets attributable to each class of shares. For the year ended September 30, 2011, the Advisor contractually reimbursed certain class specific expenses and administrative fees of $1,152 for Class A shares, and $99,062 for Class C shares.
The Trust has an underwriting agreement with Thornburg Securities Corporation (the “Distributor,” an affiliate of the Advisor), which acts as the distributor of the Fund’s shares. For the year ended September 30, 2011, the Distributor has advised the Fund that it earned net commissions aggregating $5,002 from the sale of Class A shares, and collected contingent deferred sales charges aggregating $20,975 from redemptions of Class C shares of the Fund.
Pursuant to a service plan under Rule 12b-1 of the Investment Company Act of 1940, the Fund may reimburse to the Advisor an amount not to exceed .25 of 1% per annum of the average daily net assets attributable to each class of shares of the Fund for payments made by the Advisor to securities dealers and other financial institutions to obtain various shareholder and distribution related services. For the year ended September 30, 2011, there were no 12b-1 service plan fees charged for Class I shares. The Advisor may pay out of its own resources additional expenses for distribution of the Fund’s shares.
The Trust has also adopted a distribution plan pursuant to Rule 12b-1, applicable only to the Fund’s Class C shares, under which the Fund compensates the Distributor for services in promoting the sale of Class C shares of the Fund at an annual rate of up to .35 of 1% per annum of the average daily net assets attributable to Class C shares. Total fees incurred by the Distributor for each class of shares of the Fund under their respective Service and Distribution Plans for the year ended September 30, 2011, are set forth in the Statement of Operations.
The Trust has an agreement with the custodian bank to indirectly pay a portion of the custodian’s fees through credits earned by the Fund’s cash on deposit with the bank. This deposit agreement is an alternative to overnight investments. Custodial fees have been adjusted to reflect amounts that would have been paid without this agreement, with a corresponding adjustment reflected as fees paid indirectly in the Statement of Operations. For the year ended September 30, 2011, fees paid indirectly were $1,404.
Certain officers and Trustees of the Trust are also officers or directors of the Advisor and Distributor. The compensation of independent Trustees is borne by the Trust.
NOTE 4 – SHARES OF BENEFICIAL INTEREST
At September 30, 2011, there were an unlimited number of shares of beneficial interest authorized. Transactions in shares of beneficial interest were as follows:
| Year Ended | Year Ended | |||||||||||||||
| September 30, 2011 | September 30, 2010 | |||||||||||||||
| Shares | Amount | Shares | Amount | |||||||||||||
Class A Shares | ||||||||||||||||
Shares sold | 5,028,226 | $ | 66,853,658 | 9,814,228 | $ | 131,038,400 | ||||||||||
Shares issued to shareholders in reinvestment of dividends | 685,893 | 9,091,944 | 646,545 | 8,623,256 | ||||||||||||
Shares repurchased | (7,682,668 | ) | (101,284,474 | ) | (5,551,397 | ) | (74,405,228 | ) | ||||||||
|
|
|
|
|
|
|
| |||||||||
Net increase (decrease) | (1,968,549 | ) | $ | (25,338,872 | ) | 4,909,376 | $ | 65,256,428 | ||||||||
|
|
|
|
|
|
|
| |||||||||
Certified Annual Report 27
| NOTES TO FINANCIAL STATEMENTS, CONTINUED | ||
| Thornburg Intermediate Municipal Fund | September 30, 2011 | |
| Year Ended September 30, 2011 | Year Ended September 30, 2010 | |||||||||||||||
| Shares | Amount | Shares | Amount | |||||||||||||
Class C Shares | ||||||||||||||||
Shares sold | 2,153,415 | $ | 28,743,629 | 4,194,765 | $ | 56,036,321 | ||||||||||
Shares issued to shareholders in reinvestment of dividends | 199,501 | 2,647,910 | 166,872 | 2,229,614 | ||||||||||||
Shares repurchased | (2,539,929 | ) | (33,426,187 | ) | (957,579 | ) | (12,781,909 | ) | ||||||||
|
|
|
|
|
|
|
| |||||||||
Net increase (decrease) | (187,013 | ) | $ | (2,034,648 | ) | 3,404,058 | $ | 45,484,026 | ||||||||
|
|
|
|
|
|
|
| |||||||||
Class I Shares | ||||||||||||||||
Shares sold | 7,875,098 | $ | 104,437,154 | 7,702,918 | $ | 103,259,087 | ||||||||||
Shares issued to shareholders in reinvestment of dividends | 389,907 | 5,164,406 | 314,775 | 4,195,091 | ||||||||||||
Shares repurchased | (6,042,219 | ) | (79,367,125 | ) | (2,512,352 | ) | (33,487,570 | ) | ||||||||
|
|
|
|
|
|
|
| |||||||||
Net increase (decrease) | 2,222,786 | $ | 30,234,435 | 5,505,341 | $ | 73,966,608 | ||||||||||
|
|
|
|
|
|
|
| |||||||||
NOTE 5 – SECURITIES TRANSACTIONS
For the year ended September 30, 2011, the Fund had purchase and sale transactions of investment securities (excluding short-term investments) of $133,989,715 and $126,415,737, respectively.
NOTE 6 – INCOME TAXES
At September 30, 2011, information on the tax components of capital is as follows:
Cost of investments for tax purposes | $ | 697,387,323 | ||
|
| |||
Gross unrealized appreciation on a tax basis | $ | 32,639,216 | ||
Gross unrealized depreciation on a tax basis | (3,322,058 | ) | ||
|
| |||
Net unrealized appreciation (depreciation) on investments (tax basis) | $ | 29,317,158 | ||
|
|
At September 30, 2011, the Fund did not have any undistributed net ordinary income or undistributed capital gains.
For the year ended September 30, 2011, $11,597 of capital loss carryforwards from prior years expired.
At September 30, 2011, the Fund had tax basis capital losses, which may be carried forward to offset future capital gains. To the extent such carryforwards are used, capital gain distributions may be reduced to the extent provided by regulations.
Such capital loss carryforwards expire as follows:
2012 | $ | 4,297,982 | ||
2013 | 39,577 | |||
2017 | 391,762 | |||
2018 | 533,767 | |||
2019 | 856,003 | |||
|
| |||
| $ | 6,119,091 | |||
|
|
28 Certified Annual Report
| NOTES TO FINANCIAL STATEMENTS, CONTINUED | ||
| Thornburg Intermediate Municipal Fund | September 30, 2011 | |
The Regulated Investment Company Modernization Act of 2010 (the “Act”) was signed into law on December 22, 2010. The Act makes changes to a number of tax rules impacting the Fund. Under the Act, future capital losses generated by the Fund may be carried over indefinitely, but these losses must be used prior to the utilization of any pre-enactment capital losses. Since pre-enactment capital losses may only be carried forward for eight years, there may be a greater likelihood that all or a portion of a Fund’s pre-enactment capital losses will expire unused. In general, the provisions of the Act will be effective for the Fund’s fiscal year ending September 30, 2012.
In order to account for book/tax differences, the Fund decreased accumulated net realized loss by $11,597, decreased net capital paid in on shares of beneficial interest by $13,052, and decreased distribution in excess of net investment income by $1,455. These reclassifications have no impact on the net asset value of the Fund. Reclassifications resulted from the expiration of capital loss carryforwards and non-deductible taxes paid.
The tax character of distributions paid for the years ended September 30, 2011, and September 30, 2010, was as follows:
| 2011 | 2010 | |||||||
Distributions from: | ||||||||
Tax exempt income | $ | 25,608,742 | $ | 22,755,331 | ||||
Ordinary income | 150,687 | 119,555 | ||||||
|
|
|
| |||||
Total Distributions | $ | 25,759,429 | $ | 22,874,886 | ||||
|
|
|
| |||||
OTHER NOTES:
Risks: The Fund’s investments subject it to risks including, but not limited to, credit risk, interest rate risk, management risk, market and economic risk, and liquidity risk. Please see the Fund’s prospectus for a discussion of the risks associated with an investment in the Fund.
Subsequent Events: Fund management believes no events have occurred between September 30, 2011 and the date of issuance of the financial statements, which require adjustment to, or disclosure in the accompanying financial statements.
Certified Annual Report 29
Thornburg Intermediate Municipal Fund
| PER SHARE PERFORMANCE (for a share outstanding throughout the Year)+ | RATIOS TO AVERAGE NET ASSETS | SUPPLEMENTAL DATA | ||||||||||||||||||||||||||||||||||||||||||||||||||||||||||
Unless | Net Asset Value Beginning of Year | Net Investment Income (Loss) | Net Realized & Unrealized Gain (Loss) on Investments | Total from Investment Operations | Dividends from Net Investment Income | Dividends from Net Realized Gains | Total Dividends | Net Asset Value End of Year | Net Investment Income (Loss) (%) | Expenses, After Expense Reductions (%) | Expenses, After Expense Reductions and Net of Custody Credits (%) | Expenses, Before Expense Reductions (%) | Total Return (%)(a) | Portfolio Turnover Rate (%) | Net Assets at End of Year (Thousands) | |||||||||||||||||||||||||||||||||||||||||||||
Class A Shares |
| |||||||||||||||||||||||||||||||||||||||||||||||||||||||||||
2011(b) | $ | 13.64 | 0.48 | (0.05 | ) | 0.43 | (0.48 | ) | — | (0.48 | ) | $ | 13.59 | 3.59 | 0.95 | 0.95 | 0.95 | 3.27 | 18.33 | $ | 381,839 | |||||||||||||||||||||||||||||||||||||||
2010(b) | $ | 13.40 | 0.49 | 0.24 | 0.73 | (0.49 | ) | — | (0.49 | ) | $ | 13.64 | 3.68 | 0.97 | 0.97 | 0.97 | 5.61 | 9.87 | $ | 409,844 | ||||||||||||||||||||||||||||||||||||||||
2009(b) | $ | 12.47 | 0.54 | 0.93 | 1.47 | (0.54 | ) | — | (0.54 | ) | $ | 13.40 | 4.26 | 0.98 | 0.98 | 0.98 | 12.12 | 15.15 | $ | 337,037 | ||||||||||||||||||||||||||||||||||||||||
2008(b) | $ | 13.15 | 0.52 | (0.68 | ) | (0.16 | ) | (0.52 | ) | — | (0.52 | ) | $ | 12.47 | 3.95 | 0.96 | 0.95 | 0.96 | (1.33 | ) | 22.00 | $ | 311,435 | |||||||||||||||||||||||||||||||||||||
2007(b) | $ | 13.30 | 0.51 | (0.15 | ) | 0.36 | (0.51 | ) | — | (0.51 | ) | $ | 13.15 | 3.84 | 0.99 | 0.98 | 0.99 | 2.74 | 22.55 | $ | 333,800 | |||||||||||||||||||||||||||||||||||||||
Class C Shares |
| |||||||||||||||||||||||||||||||||||||||||||||||||||||||||||
2011 | $ | 13.65 | 0.44 | (0.04 | ) | 0.40 | (0.44 | ) | — | (0.44 | ) | $ | 13.61 | 3.29 | 1.24 | 1.24 | 1.32 | 3.05 | 18.33 | $ | 125,512 | |||||||||||||||||||||||||||||||||||||||
2010 | $ | 13.42 | 0.45 | 0.24 | 0.69 | (0.46 | ) | — | (0.46 | ) | $ | 13.65 | 3.39 | 1.24 | 1.24 | 1.73 | 5.25 | 9.87 | $ | 128,449 | ||||||||||||||||||||||||||||||||||||||||
2009 | $ | 12.48 | 0.50 | 0.94 | 1.44 | (0.50 | ) | — | (0.50 | ) | $ | 13.42 | 3.99 | 1.24 | 1.24 | 1.76 | 11.90 | 15.15 | $ | 80,571 | ||||||||||||||||||||||||||||||||||||||||
2008 | $ | 13.16 | 0.48 | (0.68 | ) | (0.20 | ) | (0.48 | ) | — | (0.48 | ) | $ | 12.48 | 3.67 | 1.25 | 1.24 | 1.75 | (1.61 | ) | 22.00 | $ | 59,243 | |||||||||||||||||||||||||||||||||||||
2007 | $ | 13.31 | 0.47 | (0.15 | ) | 0.32 | (0.47 | ) | — | (0.47 | ) | $ | 13.16 | 3.59 | 1.24 | 1.24 | 1.78 | 2.48 | 22.55 | $ | 53,890 | |||||||||||||||||||||||||||||||||||||||
Class I Shares |
| |||||||||||||||||||||||||||||||||||||||||||||||||||||||||||
2011 | $ | 13.62 | 0.52 | (0.04 | ) | 0.48 | (0.52 | ) | — | (0.52 | ) | $ | 13.58 | 3.90 | 0.63 | 0.63 | 0.63 | 3.67 | 18.33 | $ | 232,422 | |||||||||||||||||||||||||||||||||||||||
2010 | $ | 13.39 | 0.53 | 0.23 | 0.76 | (0.53 | ) | — | (0.53 | ) | $ | 13.62 | 3.99 | 0.65 | 0.65 | 0.65 | 5.87 | 9.87 | $ | 202,859 | ||||||||||||||||||||||||||||||||||||||||
2009 | $ | 12.45 | 0.57 | 0.94 | 1.51 | (0.57 | ) | — | (0.57 | ) | $ | 13.39 | 4.59 | 0.66 | 0.66 | 0.68 | 12.56 | 15.15 | $ | 125,709 | ||||||||||||||||||||||||||||||||||||||||
2008 | $ | 13.13 | 0.56 | (0.68 | ) | (0.12 | ) | (0.56 | ) | — | (0.56 | ) | $ | 12.45 | 4.28 | 0.64 | 0.63 | 0.64 | (1.02 | ) | 22.00 | $ | 171,848 | |||||||||||||||||||||||||||||||||||||
2007 | $ | 13.28 | 0.55 | (0.15 | ) | 0.40 | (0.55 | ) | — | (0.55 | ) | $ | 13.13 | 4.16 | 0.67 | 0.67 | 0.73 | 3.06 | 22.55 | $ | 125,890 | |||||||||||||||||||||||||||||||||||||||
| (a) | Not annualized for periods less than one year. |
| (b) | Sales loads are not reflected in computing total return. |
| + | Based on weighted average shares outstanding. |
See notes to financial statements.
| 30 Certified Annual Report | Certified Annual Report 31 |
REPORT OF INDEPENDENT REGISTERED PUBLIC ACCOUNTING FIRM
Thornburg Intermediate Municipal Fund
To the Trustees and Shareholders of
Thornburg Intermediate Municipal Fund
In our opinion, the accompanying statement of assets and liabilities, including the schedule of investments, and the related statements of operations and of changes in net assets and the financial highlights present fairly, in all material respects, the financial position of Thornburg Intermediate Municipal Fund (one of the portfolios constituting Thornburg Investment Trust, hereafter referred to as the “Fund”) at September 30, 2011, the results of its operations for the year then ended, the changes in its net assets for each of the two years in the period then ended and the financial highlights for each of the five years in the period then ended, in conformity with accounting principles generally accepted in the United States of America. These financial statements and financial highlights (hereafter referred to as “financial statements”) are the responsibility of the Fund’s management. Our responsibility is to express an opinion on these financial statements based on our audits. We conducted our audits of these financial statements in accordance with the standards of the Public Company Accounting Oversight Board (United States). Those standards require that we plan and perform the audit to obtain reasonable assurance about whether the financial statements are free of material misstatement. An audit includes examining, on a test basis, evidence supporting the amounts and disclosures in the financial statements, assessing the accounting principles used and significant estimates made by management, and evaluating the overall financial statement presentation. We believe that our audits, which included confirmation of securities at September 30, 2011 by correspondence with the custodian and brokers, provide a reasonable basis for our opinion.
PricewaterhouseCoopers LLP
New York, New York
November 21, 2011
32 Certified Annual Report
| EXPENSE EXAMPLE | ||
| Thornburg Intermediate Municipal Fund | September 30, 2011 (Unaudited) | |
As a shareholder of the Fund, you incur two types of costs:
| (1) | transaction costs, including |
(a) sales charges (loads) on purchase payments, for Class A shares;
(b) a deferred sales charge on redemptions of any part or all of a purchase of $1 million of Class A shares within 12 months of purchase;
(c) a deferred sales charge on redemptions of Class C shares within 12 months of purchase;
| (2) | ongoing costs, including management fees; distribution and/or service (12b-1) fees; and other Fund expenses. |
This example is intended to help you understand your ongoing costs (in dollars) of investing in the Fund and to compare these costs with the ongoing costs of investing in other mutual funds.
The example is based on a $1,000 investment beginning on April 1, 2011, and held until September 30, 2011.
ACTUAL EXPENSES
For each class of shares, the first line of the table at right provides information about actual account values and actual expenses. You may use the information in this line, together with the amount you invested, to estimate the expenses that you paid over the period. Simply divide your account value by $1,000 (for example, an $8,600 account value divided by $1,000 = 8.6), then multiply the result by the number in the first line for your class of shares under the heading entitled “Expenses Paid During Period” to estimate the expenses you paid on your account during this period.
HYPOTHETICAL EXAMPLE FOR COMPARISON PURPOSES
For each class of shares, the second line of the table at right provides information about hypothetical account values and hypothetical expenses based on the Fund’s actual expense ratio and an assumed rate of return of 5% per year before expenses, which is not the Fund’s actual return. The hypothetical account values and expenses may not be used to estimate the actual ending account balance or expenses you paid for the period. You may use this information to compare the ongoing costs of investing in the Fund and other funds. To do so, compare this 5% hypothetical example with the 5% hypothetical examples that appear in the shareholder reports of the other funds.
| Beginning Account Value 4/1/11 | Ending Account Value 9/30/11 | Expenses Paid During Period† 4/1/11–9/30/11 | ||||||||||
Class A Shares | ||||||||||||
Actual | $ | 1,000.00 | $ | 1,064.90 | $ | 4.87 | ||||||
Hypothetical* | $ | 1,000.00 | $ | 1,020.35 | $ | 4.76 | ||||||
Class C Shares | ||||||||||||
Actual | $ | 1,000.00 | $ | 1,063.30 | $ | 6.41 | ||||||
Hypothetical* | $ | 1,000.00 | $ | 1,018.85 | $ | 6.28 | ||||||
Class I Shares | ||||||||||||
Actual | $ | 1,000.00 | $ | 1,067.40 | $ | 3.29 | ||||||
Hypothetical* | $ | 1,000.00 | $ | 1,021.89 | $ | 3.22 | ||||||
| † | Expenses are equal to the annualized expense ratio for each class (A: 0.94%; C: 1.24%; I: 0.64%) multiplied by the average accountvalue over the period, multiplied by 183/365 to reflect the one-half year period. |
| * | Hypothetical assumes a rate of return of 5% per year before expenses. |
Please note that the expenses shown in the table are meant to highlight your ongoing costs only and do not reflect any transactional costs, such as sales charges (loads), redemption fees, or exchange fees. Therefore, the second line of the table for each class of shares is useful in comparing ongoing costs only, and will not help you determine the relative total costs of owning different funds. In addition, if these transactional costs were included, your costs would have been higher.
Certified Annual Report 33
| INDEX COMPARISON | ||
| Thornburg Intermediate Municipal Fund | September 30, 2011 (Unaudited) | |
GROWTH OF A HYPOTHETICAL $10,000 INVESTMENT
Thornburg Intermediate Municipal Fund versus BofA Merrill Lynch 7-12 Year U.S. Municipal Securities Index
and Consumer Price Index (July 22, 1991 to September 30, 2011)
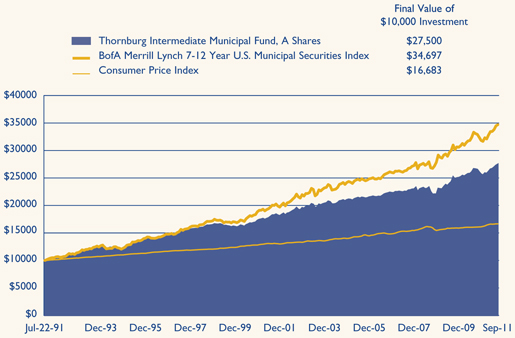
AVERAGE ANNUAL TOTAL RETURNS
For the periods ended September 30, 2011 (with sales charge)
| 1 Yr | 5 Yrs | 10 Yrs | Since Inception | |||||||||||||
A Shares (Incep: 7/22/91) | 1.19 | % | 3.97 | % | 3.97 | % | 5.14 | % | ||||||||
C Shares (Incep: 9/1/94) | 2.45 | % | 4.12 | % | 3.88 | % | 4.34 | % | ||||||||
I Shares (Incep: 7/5/96) | 3.67 | % | 4.73 | % | 4.53 | % | 4.89 | % | ||||||||
Performance data shown represents past performance and is no guarantee of future results. Investment return and principal value will fluctuate so shares, when redeemed, may be worth more or less than their original cost. Current performance may be lower or higher than quoted. For performance current to the most recent month end, visit thornburg.com or call 800.847.0200. The performance data and graph do not reflect the deduction of taxes that a shareholder would pay on distributions or the redemption of Fund shares. Returns reflect the reinvestment of dividends and capital gains as well as applicable sales charges. Class A shares are sold with a maximum sales charge of 2.00%. Class C shares assume deduction of a 0.60% contingent deferred sales charge (CDSC) for the first year only. There is no sales charge for Class I shares.
34 Certified Annual Report
| TRUSTEES AND OFFICERS | ||
| Thornburg Intermediate Municipal Fund | September 30, 2011 (Unaudited) | |
Name, Age, Position Held with Fund Year Elected | Principal Occupation(s) During Past Five Years | Other Directorships Held by Trustee | ||
INTERESTED TRUSTEES(1)(2)(4) | ||||
| Garrett Thornburg, 65 Chairman of Trustees, Trustee since 1987(3) | Chairman and controlling shareholder and, until 2008, CEO of Thornburg Investment Management, Inc. (investment advisor); Chairman, CEO, and controlling shareholder of Thornburg Securities Corporation (securities dealer); CEO until 2007 and Chairman until 2009 of TMST, Inc. (f/k/a Thornburg Mortgage, Inc.) (real estate investment trust); President and Sole Director of Thornburg Mortgage Advisory Corporation (investment manager to TMST, Inc.). | None | ||
Brian J. McMahon, 55 Trustee since 2001, Member of Governance & Nominating Committee & Operations Risk Oversight Committee, President since 1997(5)(6) | CEO since 2008, President, Managing Director, Chief Investment Officer, and Portfolio Manager of Thornburg Investment Management, Inc. | None | ||
INDEPENDENT TRUSTEES(1)(2)(4) | ||||
David A. Ater, 66 Trustee since 1994, Member of Audit Committee & Governance & Nominating Committee | Principal in Ater & Associates, Santa Fe, NM (developer, planner and broker of residential and commercial real estate); owner, developer and broker for various real estate projects. | None | ||
David D. Chase, 70 Trustee since 2000, Chairman of Audit Committee | Managing Member of Vestor Associates, LLC, Santa Fe, NM (private equity fund); Managing Member of CS Group, LLC, Santa Fe, NM (merchant bank). | None | ||
Eliot R. Cutler, 65 Trustee since 2004 & Nominating Committee, Chairman of Governance | Senior Counsel and, until 2009, Partner in Akin, Gump, Strauss, Hauer & Feld LLP (law firm) in Washington, D.C. and Beijing, China. | None | ||
Susan H. Dubin, 62 Trustee since 2004, Member of Audit Committee | President of Dubin Investments, Ltd., Greenwich, CT (private investment fund); Director and officer of various charitable organizations. | None | ||
Owen D. Van Essen, 57 Trustee since 2004, Member of Governance & Nominating Committee & Chairman of Operations Risk Oversight Committee | President of Dirks, Van Essen & Murray, Santa Fe, NM (newspaper mergers and acquisitions). | None | ||
Certified Annual Report 35
| TRUSTEES AND OFFICERS, CONTINUED | ||
| Thornburg Intermediate Municipal Fund | September 30, 2011 (Unaudited) | |
Name, Age, Position Held with Fund Year Elected | Principal Occupation(s) During Past Five Years | Other Directorships Held by Trustee | ||
| James W. Weyhrauch, 52 Trustee since 1996, Member of Audit Committee & Operations Risk Oversight Committee | Real estate broker, Santa Fe Properties, Santa Fe, NM; Vice Chairman of Nambe LLC, Santa Fe, NM (manufacturing & design company). | None | ||
OFFICERS OF THE FUND (WHO ARE NOT TRUSTEES)(1)(6)(7) | ||||
| George T. Strickland, 48 Vice President since 1996, Treasurer since 2007(6) | Portfolio Manager, Vice President, and Managing Director of Thornburg Investment Management, Inc. | Not applicable | ||
William V. Fries, 72 Vice President since 1995 | Portfolio Manager, Vice President, and Managing Director of Thornburg Investment Management, Inc. | Not applicable | ||
Leigh Moiola, 44 Vice President since 2001 | Vice President, Managing Director, and Director of Marketing of Thornburg Investment Management, Inc. | Not applicable | ||
Alexander Motola, 41 Vice President since 2001 | Portfolio Manager, Vice President, and Managing Director of Thornburg Investment Management, Inc. | Not applicable | ||
Wendy Trevisani, 40 Vice President since 1999 | Portfolio Manager and Managing Director of Thornburg Investment Management, Inc. | Not applicable | ||
Joshua Gonze, 48 Vice President since 1999 | Portfolio Manager since 2007, Managing Director, and Associate Portfolio Manager until 2007 of Thornburg Investment Management, Inc. | Not applicable | ||
Christopher Ihlefeld, 41 Vice President since 2003 | Portfolio Manager since 2007, Managing Director, and Associate Portfolio Manager until 2007 of Thornburg Investment Management, Inc. | Not applicable | ||
Leon Sandersfeld, 45 Vice President since 2003 | Managing Director since 2007 and Fund Accounting Director of Thornburg Investment Management, Inc. | Not applicable | ||
Sasha Wilcoxon, 37 Vice President since 2003 Secretary since 2007(6) | Managing Director since 2007, Director of Operations, and Vice President of Thornburg Investment Management, Inc. | Not applicable | ||
Edward Maran, 53 Vice President since 2004 | Portfolio Manager and Managing Director of Thornburg Investment Management, Inc. | Not applicable | ||
Vinson Walden, 41 Vice President since 2004 | Portfolio Manager and Managing Director of Thornburg Investment Management, Inc. | Not applicable | ||
Thomas Garcia, 40 Vice President since 2006 | Vice President since 2011, Managing Director, Head Equity Trader, and Associate Portfolio Manager of Thornburg Investment Management, Inc. | Not applicable | ||
Lei Wang, 40 Vice President since 2006 | Portfolio Manager and Managing Director of Thornburg Investment Management, Inc. | Not applicable | ||
36 Certified Annual Report
| TRUSTEES AND OFFICERS, CONTINUED | ||
| Thornburg Intermediate Municipal Fund | September 30, 2011 (Unaudited) | |
Name, Age, Position Held with Fund Year Elected | Principal Occupation(s) During Past Five Years | Other Directorships Held by Trustee | ||
Connor Browne, 32 Vice President since 2006 | Portfolio Manager and Managing Director of Thornburg Investment Management, Inc. | Not applicable | ||
Jason Brady, 37 Vice President since 2007 | Vice President since 2011, Portfolio Manager since 2007, Managing Director since 2007, and Associate Portfolio Manager 2006–2007 of Thornburg Investment Management, Inc. | Not applicable | ||
Lewis Kaufman, 35 Vice President since 2007 | Portfolio Manager since 2007, Managing Director since 2007, and Associate Portfolio Manager until 2009 of Thornburg Investment Management, Inc. | Not applicable | ||
Christopher Ryon, 55 Vice President since 2008 | Portfolio Manager since 2009, Managing Director since 2009, and Associate Portfolio Manager 2008–2009 of Thornburg Investment Management, Inc.; Principal of Vanguard Funds until 2008. | Not applicable | ||
Lon Erickson, 36 Vice President since 2008 | Portfolio Manager since 2010, Managing Director since 2010, and Associate Portfolio Manager 2008–2010 of Thornburg Investment Management, Inc.; Senior Analyst of State Farm Insurance until 2008. | Not applicable | ||
Kathleen Brady, 51 Vice President since 2008 | Senior Tax Accountant since 2007 of Thornburg Investment Management, Inc.; Chief Financial Officer of Vestor Partners, LP (private equity fund) until 2007. | Not applicable | ||
Jack Gardner, 57 Vice President since 2008 | Managing Director since 2007 of Thornburg Investment Management, Inc.; President since 2008 and National Sales Director of Thornburg Securities Corporation. | Not applicable | ||
Laura Hillstrom, 44 Vice President since 2009 | Chief Administrative Officer since 2009, Vice President and Managing Director, and Director of Information Systems until 2009 of Thornburg Investment Management, Inc. | Not applicable | ||
| (1) | Each person’s address is 2300 North Ridgetop Road, Santa Fe, New Mexico 87506. |
| (2) | The Fund is one of sixteen separate investment “Funds” or “series” of Thornburg Investment Trust (the “Trust”), which comprises the Thornburg mutual fund complex and is organized as a Massachusetts business trust. Thornburg Investment Management, Inc. is the investment advisor to, and manages, the sixteen Funds of the Trust. Each Trustee oversees the sixteen Funds of the Trust. |
| (3) | Mr. Thornburg is considered an “interested” Trustee under the Investment Company Act of 1940 because he is the sole director and controlling shareholder of Thornburg Investment Management, Inc., the investment advisor to the sixteen active Funds of the Trust, and is the sole director and controlling shareholder of Thornburg Securities Corporation, the distributor of shares for the Trust. |
| (4) | Each Trustee serves in office until the election and qualification of a successor. |
| (5) | Mr. McMahon is considered an “interested” Trustee because he is the chief executive officer and president of Thornburg Investment Management, Inc. |
| (6) | The Trust’s president, secretary, and treasurer each serves a one-year term or until the election and qualification of a successor; each other officer serves at the pleasure of the Trustees. |
| (7) | Assistant vice presidents, assistant secretaries and assistant treasurers are not shown. |
The Statement of Additional Information for each Fund of the Trust includes additional information about the Trustees and is available, without charge and upon request, by calling 1-800-847-0200.
Certified Annual Report 37
| OTHER INFORMATION | ||
| Thornburg Intermediate Municipal Fund | September 30, 2011 (Unaudited) | |
PORTFOLIO PROXY VOTING
Policies and Procedures:
The Trust has delegated to Thornburg Investment Management, Inc. (the “Advisor”) voting decisions respecting proxies for the Fund’s voting securities. The Advisor makes voting decisions in accordance with its Proxy Voting Policy. A description of the Policy is available (i) without charge, upon request, by calling the Advisor toll-free at 1-800-847-0200, (ii) on the Thornburg website at www.thornburg. com, and (iii) on the Securities and Exchange Commission’s website at www.sec.gov.
Information regarding how proxies were voted is available on or before August 31 of each year for the twelve months ending the preceding June 30. This information is available (i) without charge, upon request by calling the Advisor toll-free at 1-800-847-0200, (ii) on the Thornburg website at www.thornburg.com, and (iii) on the Securities and Exchange Commission’s website at www.sec.gov.
TAX INFORMATION
For the tax year ended September 30, 2011, dividends paid by the Fund of $25,608,742 (or the maximum allowed) are tax exempt dividends for federal income tax purposes.
The information and distributions reported herein may differ from the information and distributions reported to the shareholders for the calendar year ending December 31, 2011. Complete information will be reported in conjunction with your 2011 Form 1099.
AVAILABILITY OF QUARTERLY PORTFOLIO SCHEDULE
The Fund files with the Securities and Exchange Commission schedules of its portfolio holdings on Form N-Q for the first and third quarters of each fiscal year. The Fund’s Forms N-Q are available on the Commission’s website at www.sec.gov, or may be reviewed and copied at the Commission’s Public Reference Room in Washington, D.C. Information on the operation of the Public Reference Room may be obtained by calling 1-800-SEC-0330. The Fund also makes this information available on its website at www.thornburg.com/ download or upon request by calling 1-800-847-0200.
STATEMENT RESPECTING RENEWAL OF INVESTMENT ADVISORY AGREEMENT
Thornburg Investment Management, Inc. (the “Advisor”) provides investment management services to Thornburg Intermediate Municipal Fund pursuant to an investment advisory agreement. The Trustees consider the renewal of this agreement annually, and most recently determined to renew the agreement on September 13, 2011.
In anticipation of their recent consideration of the advisory agreement’s renewal, the independent Trustees met in May 2011 to discuss the Trustees’ evaluation of the Advisor’s performance and to specify the information the Advisor would present to the Trustees for their review. The Advisor’s chief investment officer subsequently reviewed portions of the information with the Trustees and addressed questions presented by the Trustees at a meeting session scheduled for that purpose, and the independent Trustees thereafter met in independent session to consider the Advisor’s presentation and various specific issues respecting their consideration of the advisory agreement’s renewal. Following these sessions, the Trustees met to consider a renewal of the agreement, and the independent Trustees voted unanimously at that meeting to renew the agreement for an additional term of one year.
The information below summarizes certain factors considered by the Trustees in connection with the determination to renew the advisory agreement. In determining to renew the agreement, the Trustees did not identify any single factor as controlling, and this summary does not describe all of the matters considered by the Trustees in making their determination.
Quality of Services; Fund Investment Performance. The Trustees evaluated the nature, extent and quality of services provided by the Advisor under the advisory agreement, and evaluated the investment performance of the Fund.
In connection with their general supervision of the Advisor, and as an important element of their annual consideration of a renewal of the advisory agreement, the Trustees received and considered reports from the Advisor throughout the year. These reports addressed a wide variety of topics, including particularly the Advisor’s selection of investments and execution of the Fund’s investment strategies. In addition, the Trustees considered information provided to them at their request in anticipation of their annual evaluation of the Advisor’s services, including (i) the Fund’s absolute investment performance and achievement of stated objectives, (ii) the Advisor’s commentary on the Fund’s investment performance in the context of the Fund’s objectives and reasonable expectations, and business,
38 Certified Annual Report
| OTHER INFORMATION, CONTINUED | ||
| Thornburg Intermediate Municipal Fund | September 30, 2011 (Unaudited) | |
market and economic conditions, (iii) measures of the Fund’s investment performance over various periods of time relative to two categories of municipal debt mutual funds selected by independent mutual fund analyst firms, and relative to a broad-based securities index, and (iv) comparative measures of portfolio volatility, risk and return.
The Trustees also considered their perceptions of portfolio management personnel developed in formal and informal meetings throughout the year, the Advisor’s staffing and other resources, the Advisor’s performance of accounting and other services, the Advisor’s observance of compliance and regulatory requirements, the Advisor’s responsiveness to the Trustees, and other factors.
In evaluating the quantitative and performance data presented, the Trustees noted (among other aspects of the data) performance data for the eleven most recent calendar years, which showed that the Fund had produced positive investment returns in accordance with expectations in ten of eleven years, that the Fund’s return for the most recent calendar year had exceeded the average return of the mutual fund category for which calendar year data was presented, and that the Fund’s returns had exceeded or had been comparable to the average returns of the category in most of the preceding ten calendar years. Other noted quantitative data showed that the Fund’s investment returns fell within the top third of performance for the first fund category for the one-year, three-year and five-year periods ended with the second quarter of the current year, and that the Fund’s returns fell within or near the top third of performance for the second fund category for the same periods. Measures of portfolio volatility, risk and relative return considered by the Trustees demonstrated that the Fund’s performance relative to these measures had continued to fulfill expectations in current conditions.
The Trustees concluded, based upon these and other considerations, that the nature, extent and quality of the Advisor’s services were sufficient and that the Advisor had satisfactorily pursued the Fund’s stated investment objectives. The Trustees further concluded that the investment performance of the Fund was satisfactory in the context of the Fund’s objectives and policies, and prevailing market conditions.
Fees and Expenses; Profitability of Advisor; Economies of Scale; Ancillary Benefits. The Trustees evaluated the level of the management fee charged by the Advisor to the Fund, and in this connection, reviewed the profitability of the Advisor, economies of scale potentially available to the Fund and whether the Advisor received any ancillary benefits from its relationship with the Fund.
In evaluating the level of the management fee, the Trustees considered the fees charged by the Advisor and the other expenses charged to the Fund in light of the nature and quality of services provided, comparison of the actual Advisor’s fee and Fund expenses to the statement of fees and expenses in the Fund’s prospectuses, and comparisons of the Advisor’s fee and other Fund expenses to median and average fees and expenses charged to two groups of municipal debt mutual funds assembled by independent mutual fund analyst firms. Comparative fee and expense data noted by the Trustees showed that the management fee charged to the Fund was comparable to the median and average fee levels for one fund group and was slightly higher than the median and average fee levels for the second group, and that the Fund’s expense ratio was somewhat higher than the median expense ratios and comparable to or slightly higher than the average expense ratios for the two groups. The Trustees did not identify these differences as significant. The Trustees considered information about the fees charged by the Advisor to other investment management clients, together with information about fees charged by other advisors to different clients, and analysis of the differences between the requirements of institutional clients and mutual funds and the consequently different investment management services rendered, respectively, to institutional clients and mutual funds. The Trustees confirmed their previous observations that the differences between the fees charged by the Advisor to different types of clients did not appear exceptional, and that the fee rates charged by investment advisors to institutional clients had limited relevance to the evaluation of fee rates charged to mutual funds, because of the significant differences between the respective requirements of institutional clients and mutual funds, the differences between the respective services rendered to institutional clients and mutual funds, and the different circumstances in which the respective fee levels are determined.
In reviewing the profitability of the Advisor, the Trustees considered costs incurred by the Advisor and data comparing the profitability of the Advisor to other investment management firms. The information provided did not indicate that the Advisor’s profitability was unusual, and the Trustees noted the adequacy of the Advisor’s resources and service capabilities. In reviewing the extent to which economies of scale would be realized by the Fund as it grows and whether fee levels reflect economies of scale, the Trustees considered the breakpoint structure for advisory fees chargeable to the Fund, the demonstrated economies of scale enjoyed by the Fund and other Funds of the Trust as they had grown in size, and economies of scale realized by other mutual funds. The information provided demonstrated to the Trustees that the Fund may reasonably be expected to realize economies of scale as the Fund grows in size, due to the advisory agreement’s breakpoint fee structure and other factors. In reviewing potential benefits to the Advisor because of its relationship to the Fund, the Trustees considered the Advisor’s receipt of certain research services from broker dealers, and the benefits to both the Fund and the Advisor of the Advisor’s expansion of its staffing, compliance and systems capabilities and other
Certified Annual Report 39
| OTHER INFORMATION, CONTINUED | ||
| Thornburg Intermediate Municipal Fund | September 30, 2011 (Unaudited) | |
resources to serve a broader variety of investment management clients. No unusual or unfair benefits to the Advisor from its relationship to the Fund were identified by the Trustees.
The Trustees concluded, based upon their consideration of these and other factors, that the management fee charged to the Fund by the Advisor was fair and reasonable in view of the nature, extent and quality of the services provided by the Advisor, the clear disclosure of fees and expenses in the Fund’s prospectuses, the investment performance of the Fund, and comparisons of fees and expenses charged to the Fund to fees and expenses charged to other mutual funds.
40 Certified Annual Report
This page intentionally left blank.
This page is not part of the Annual Report. 41
Trustees’ Statement to Shareholders
Not part of the Certified Annual Report
September 13, 2011
The Trustees believe current and prospective shareholders should know how we discharge our responsibilities in supervising the Funds’ investment advisor and in reviewing the advisor’s contract for renewal. Since 2005, we have issued a statement which sets out clearly the three principal guidelines that we follow in supervising the Trust’s investment advisor on your behalf. In accordance with our customary practice, in September of this year we again reviewed our statement and concluded we should reissue this statement outlining the principal features of our supervision of the advisor’s performance of investment management services for the Funds.
We begin with the premise that each shareholder selected his or her Fund because its investments are managed by the investment advisor identified in the prospectus and in accordance with the objective and policies described in the prospectus. We realize, as each of you do, that if you believe that your Fund’s stated objective and policies no longer serve your personal investment goals, you can sell your shares and leave the Fund.
Therefore, we believe that our primary supervisory task – our principal obligation to you – is to assess the nature and quality of the advisor’s services, and to confirm that the advisor actively and competently pursues the Fund’s objective, in accordance with the policies set out in the prospectus. To do this, we meet regularly with management to review your Fund’s portfolio and to discuss the advisor’s specific actions and judgments in pursuing the Fund’s objective. We do not substitute our own judgment for the advisor’s decisions in selecting investments; the advisor is paid to exercise its informed judgment on investment decisions, and we seek to confirm, in reviewing the advisor’s performance, that the advisor is doing just that.
Second, while we are conscious of costs and the effect that costs have on shareholders’ returns, we do not seek the lowest fees or expense ratio as our sole or primary objective. We try to make sure that your Fund’s fees and costs are reasonable in relationship to the services rendered and that they are generally in line with those charged by other expert investment advisors, consistent with our belief that the Fund’s investors searched for and expect that expertise and attention and have decided to pay a reasonable price for it. We do not put the management contract “out to bid” as a matter of course, and we would not do so unless we had concluded that the advisor materially had failed to pursue the Fund’s objectives in accordance with its policies, or for other equally important reasons. We believe that any other approach would be inconsistent with your interests and contrary to your expectations when you bought shares of the Fund in the first place.
Finally, because we believe that most Thornburg Fund shareholders have invested with a long-term perspective, we try not to focus too much on the fashions of the moment and on short-term performance. The market will not favor any specific investment objective or set of policies at all times and under all economic circumstances. A fund will experience periods of both high and low returns relative to other funds and other investments. Even if one of our Funds is not favored by the market at a particular time, we believe that the advisor is nonetheless obliged to remain true to the Fund’s objective and policies, and we watch to see that it does so.
42 This page is not part of the Annual Report.
Retirement and Education Accounts
Thornburg Investment Management offers retirement and education savings accounts that can help you meet a variety of planning challenges. For account applications or further information on any of the accounts below, please call 1-800-847-0200 or go to www.thornburg.com/ira. Your financial advisor can help you determine which plan is right for you.
Individual Retirement Accounts
Individual Retirement Accounts (IRAs) provide a tax-advantaged means to save money for the future. For a detailed outline of the difference between retirement accounts, see www.thornburg.com/ira. Rollovers are available. Call 1-800-847-0200 for more information.
Traditional IRAs – Contributions to Traditional IRAs are tax deductible for eligible individuals, and withdrawals are taxed as additional ordinary income. You may contribute to an IRA if you receive compensation and are under 70 1/2, even if you are covered by an employer retirement plan. Deductible contributions are subject to certain qualifications. Please consult your tax advisor.
Roth IRAs – Under a Roth IRA, there is no tax deduction for contributions, but there is no income tax on qualified withdrawals. For a more detailed comparison of Traditional and Roth IRAs, please see our web site at www.thornburg.com/ira.
SEP IRAs – Simplified Employee Pension (SEP) IRAs are established by employers. The employer is allowed a tax deduction for contributions made to the SEP Plan and makes contributions to each eligible employee’s SEP IRA on a discretionary basis.
SIMPLE IRAs – Savings Incentive Match Plan for Employees of Small Employers (SIMPLE) is designed to give small business owners a simplified method to establish and contribute to a retirement plan for employees. The employer is allowed a tax deduction for contributions and makes either matching or non-elective contributions to each eligible employee’s SIMPLE IRA. Employees may make salary deferral contributions.
Coverdell Education Savings Account
These savings accounts are designed to provide a way to save money for higher education expenses. In an Education Savings Account, earnings and interest grow tax-free, and qualified withdrawals used to pay for eligible higher-education expenses are tax- and penalty-free.
Funds Available
The following funds are available in the accounts listed above:
| • | Thornburg International Value Fund |
| • | Thornburg Value Fund |
| • | Thornburg Core Growth Fund |
| • | Thornburg Investment Income Builder Fund |
| • | Thornburg Global Opportunities Fund |
| • | Thornburg International Growth Fund |
| • | Thornburg Developing World Fund |
| • | Thornburg Limited Term U.S. Government Fund |
| • | Thornburg Limited Term Income Fund |
| • | Thornburg Strategic Income Fund |
This page is not part of the Annual Report. 43

Thornburg Equity Funds
Thornburg’s equity research uses a fundamental and comprehensive analytical approach. Thornburg equity funds focus on a limited number of securities so that each holding can impact performance. The equity team searches for firms believed to have a promising future and seeks to buy shares of those companies at a discount to their intrinsic value.
| • | Thornburg Value Fund |
| • | Thornburg International Value Fund |
| • | Thornburg Core Growth Fund |
| • | Thornburg Investment Income Builder Fund |
| • | Thornburg Global Opportunities Fund |
| • | Thornburg International Growth Fund |
| • | Thornburg Developing World Fund |
Thornburg Bond Funds
Thornburg Investment Management applies a disciplined philosophy to fixed-income management. Since the launch of our first fixed-income fund over 25 years ago, we have been conducting fundamental, bottom-up research in an effort to identify bonds which we believe provide the best return for a given level of risk. We are very organic in our approach, avoiding leverage or complex strategies which could backfire in periods of market uncertainty.
| • | Thornburg Limited Term Municipal Fund |
| • | Thornburg Intermediate Municipal Fund |
| • | Thornburg California Limited Term Municipal Fund |
| • | Thornburg New Mexico Intermediate Municipal Fund |
| • | Thornburg New York Intermediate Municipal Fund |
| • | Thornburg Strategic Municipal Income Fund |
| • | Thornburg Limited Term U.S. Government Fund |
| • | Thornburg Limited Term Income Fund |
| • | Thornburg Strategic Income Fund |
Before investing, carefully consider the Fund’s investment goals, risks, charges, and expenses. For a prospectus containing this and other information, contact your financial advisor or visit thornburg.com. Read it carefully before investing.
For additional information, please visit www.thornburg.com
Thornburg Investment Management, Inc. 2300 North Ridgetop Road, Santa Fe, NM 87506
This page is not part of the Annual Report. 45
This page intentionally left blank.
46 This page is not part of the Annual Report.
This page intentionally left blank.
This page is not part of the Annual Report. 47
 | Waste not, Wait not |  | ||||
| Get instant access to your shareholder reports. | ||||||
| This Annual Report is submitted for the general information of shareholders of the Fund. It is not authorized for distribution to prospective investors in the Fund unless preceded or accompanied by an effective prospectus. | By switching from your postal mailbox to your email inbox, you reduce paper clutter, improve record keeping access, and help conserve our natural resources. | |||||
 | Investment Advisor: Thornburg Investment Management® 800.847.0200 | Go to www.thornburg.com/edelivery and sign up to receive your shareholder reports, prospectuses, and proxy statements electronically. | ||||
Distributor: | ||||||
Thornburg Securities Corporation® 800.847.0200 | You invest in the future, without spending a dime. | |||||
| TH079 | ||||||

Important Information
The information presented on the following pages is current as of September 30, 2011. The managers’ views, portfolio holdings, and sector diversification are provided for the general information of the Fund’s shareholders; to the extent this information is historical, it should not be considered predictive of future circumstances. This material should not be deemed a recommendation to buy or sell any of the securities mentioned.
Investments in the Fund carry risks, including possible loss of principal. Bond funds have the same interest rate, inflation, and credit risks that are associated with the underlying bonds. The principal value of bonds will fluctuate relative to changes in interest rates, decreasing when interest rates rise. This effect is more pronounced for longer-term bonds. Unlike bonds, bond funds have ongoing fees and expenses. Investments in lower-rated and unrated bonds may be more sensitive to default, downgrades, and market volatility; these investments may also be less liquid than higher-rated bonds. Investments in derivatives are subject to the risks associated with the securities or other assets underlying the pool of securities, including illiquidity and difficulty in valuation. Please see the Fund’s Prospectus for a discussion of the risks associated with an investment in the Fund. Investments in the Fund are not FDIC insured, nor are they deposits of or guaranteed by a bank or any other entity. There is no guarantee that the Fund will meet its investment objectives.
Performance data shown represents past performance and is no guarantee of future results. Investment return and principal value will fluctuate so shares, when redeemed, may be worth more or less than their original cost. Current performance may be lower or higher than quoted. For performance current to the most recent month end, visit thornburg.com or call 800-847-0200.
Performance data given at net asset value (NAV) does not take into account applicable sales charges. If the sales charges had been included, the performance would have been lower.
Minimum investments for Class I shares are higher than those for other classes. Class I shares may not be available to all investors.
Share Class | NASDAQ Symbol | Cusip | ||
Class A | TSSAX | 885-216-101 | ||
Class C | TSSCX | 885-216-200 | ||
Class I | TSSIX | 885-216-309 |
Glossary
BofA Merrill Lynch Municipal Master Index – This index tracks the performance of the investment-grade U.S. tax-exempt bond market. Qualifying bonds must have at least one year remaining term to maturity, a fixed coupon schedule, and an investment grade rating (based on average of Moody’s, S&P, and Fitch).
Unless otherwise noted, index returns reflect the reinvestment of income dividends and capital gains, if any, but do not reflect fees, brokerage commissions or other expenses of investing. Investors may not make direct investments into any index.
Alternative Minimum Tax (AMT) – A federal tax aimed at ensuring that high-income individuals, estates, trusts, and corporations pay a minimal level income tax. For individuals, the AMT is calculated by adding tax preference items to regular taxable income.
Annualized Distribution Yield – The distribution yield is calculated by taking the sum of the month’s total distribution factors and dividing this sum by a 30-day period and annualizing to a 360-day year. The value is then divided by the ending maximum offering price per share to arrive at the annualized distribution yield. The yield is calculated on a periodic basis and is subject to change.
Basis Point (bps) – A unit equal to 1/100th of 1%. 1% = 100 basis points (bps).
Bond Credit Ratings – A bond credit rating assesses the financial ability of a debt issuer to make timely payments of principal and interest. Ratings of AAA (the highest), AA, A, and BBB are investment-grade quality. Ratings of BB, B, CCC, CC, C, and D (the lowest) are considered below investment grade, speculative grade, or junk bonds. Unless otherwise noted, the ratings listed are from Municipal Market Data and are a combination of ratings from Standard and Poor’s, Moody’s Investors Service, and Fitch Ratings.
Build America Bonds (BAB) – Taxable municipal bonds that feature tax credits and/or federal subsidies for bondholders and state and local government bond issuers. Build America Bonds (BABs) were introduced in 2009 as part of President Obama’s American Recovery and Reinvestment Act to create jobs and stimulate the economy. BABs attempt to achieve this by lowering the cost of borrowing for state and local governments in financing new projects.
Consumer Price Index (CPI) – An index that measures prices of a fixed basket of goods bought by a typical consumer, including food, transportation, shelter, utilities, clothing, medical care, entertainment and other items. The CPI, published by the Bureau of Labor Statistics in the Department of Labor, is based at 100 in 1982 and is released monthly. It is widely used as a cost-of-living benchmark to adjust Social Security payments and other payment schedules, union contracts and tax brackets. The CPI is also known as the cost-of-living index.
Core CPI – Consumer Price Index minus the energy and food components.
Duration – A bond’s sensitivity to interest rates. Bonds with longer durations experience greater price volatility than bonds with shorter durations.
This page is not part of the Annual Report. 3
Important Information, Continued
Effective Duration – A bond’s sensitivity to interest rates, incorporating the embedded option features, such as call provisions. Bonds with longer durations experience greater price volatility than bonds with shorter durations.
Fed Funds Rate – The interest rate at which a depository institution lends immediately available funds (balances at the Federal Reserve) to another depository institution overnight.
General Obligation Bond – A municipal bond backed by the credit and “taxing power” of the issuing jurisdiction rather than the revenue from a given project.
M2 – The amount of money in circulation in notes and coin plus non-interest-bearing bank deposits, building-society deposits, and National Savings accounts.
Operation Twist – A monetary policy where, in an attempt to lower long-term interest rates, the Fed sold short-term Treasury bonds and bought long-term Treasury bonds, which pressured the long-term bond yields downward.
Quantitative Easing – The Federal Reserve’s monetary policy used to stimulate the U.S. economy following the recession that began in 2007/08.
SEC Yield – SEC Yield is computed in accordance with SEC standards measuring the net investment income per share over a specified 30-day period expressed as a percentage of the maximum offering price of the Fund’s shares at the end of the period.
Treasuries – U.S. Treasury securities, such as bills, notes and bonds, are negotiable debt obligations of the U.S. government. These debt obligations are backed by the “full faith and credit” of the government and issued at various schedules and maturities. Income from Treasury securities is exempt from state and local, but not federal, taxes.
4 This page is not part of the Annual Report.

Thornburg Strategic Municipal Income Fund
September 30, 2011
Table of Contents | ||||
| 6 | ||||
| 10 | ||||
| 16 | ||||
| 17 | ||||
| 18 | ||||
| 19 | ||||
| 24 | ||||
| 26 | ||||
| 27 | ||||
| 28 | ||||
| 29 | ||||
| 32 |
This report is certified under the Sarbanes-Oxley Act of 2002, which requires that public companies, including mutual funds, affirm that the information provided in their annual and semiannual shareholder reports fully and fairly represents their financial position.
Certified Annual Report 5
Christopher Ihlefeld Co-Portfolio Manager
Christopher Ryon,CFA Co-Portfolio Manager
Josh Gonze Co-Portfolio Manager | October 14, 2011
Dear Fellow Shareholder:
We are pleased to present the annual report for the Thornburg Strategic Municipal Income
The Economy and the Federal Reserve (the Fed)
As we started the fiscal year, beginning October 2010, the Federal Reserve Board announced | |


6 Certified Annual Report
the Fed’s new policy directive was on September 21, 2011, and by September 30, 2011, the difference had narrowed to 1.02%. The above change in the relationship between 10-year and 30-year Treasury securities means that longer maturity Treasury securities outperformed shorter maturity Treasury securities.
The Federal Open Market Committee, in its September 21, 2011 release, stated that “economic growth remains slow” and that there are “significant downside risks to the economic outlook, including strains in global financial markets.” These concerns explain why Treasury yields are lower by 0.17% to 1.59% since March 31, 2011. Longer maturity Treasury securities have decreased in yield more than shorter maturity Treasury securities. The “strains in the global financial markets,” have led the Treasury market to experience a “flight to quality” in spite of a downgrade to AA+ by Standard and Poor’s on August 5, 2011. As one of our colleagues has stated, “the world views Treasury securities as the best house in a bad neighborhood.”
We share the Fed’s view that “economic growth remains low,” but there are some reasons for hope. June 2011 gross domestic product (GDP), a measure of a country’s overall economic output, recorded a 1.3% increase, higher than the 0.4% increase recorded in March of 2011. Capacity utilization, a measure of an economy’s usage of its productive resources, was running at 77.4% for the month ended August 31, 2011, slightly higher than the 75.7% recorded on September 30, 2011. Money supply as measured by M2, a broad measure of money and money substitutes, remains elevated. The velocity of M2, a measure of the rate at which money in circulation is used in transactions, continues to decline. Typically rising money supply is viewed as an inflationary threat, as long as velocity remains constant or increases. The combination of rising money supply and decreasing velocity is not inflationary. The one significant difference between this fiscal year end and last fiscal year end is that commercial and industrial loans and leases (loans to corporations, commercial enterprises, and joint ventures) have begun to increase, from a very low base. These loans have increased 7.98% over the 12 months ended September 30, 2011 versus a 10.57% decline for the 12 months ended September 30, 2010. These increases in loans to businesses may be laying the groundwork for a more robust expansion.
The employment picture is still a major concern; with so many Americans either unemployed or underemployed, it’s hard to fathom where demand for goods and services will come from. The unemployment rate is 9.1%, lower than the 9.8% registered in November 2010. In the 12 months ended September 2011, 1.49 million jobs have been created versus the 118,000 lost in the prior 12 months.
The economic picture is not as bleak as some in the media would paint it. The risks of a double-dip recession seem low, but so do the probabilities of a robust recovery. Our outlook for interest rates is much the same as it was last year with one exception; over the next 6-12 months, we believe the Fed will keep short-term interest rates low, but long-term interest rates have and may continue to benefit from Operation Twist. Investors should ready themselves for increased periods of volatility as some of the exogenous forces impacting the United States play themselves out.
Certified Annual Report 7
| Letter to Shareholders, | ||
Continued | ||
The Municipal Market
The calendar year began with various predictions of numerous defaults in the municipal bond market; the term “hundreds of billions of dollars” was used. For the nine months ended September 30, 2011, the municipal bond market experienced $1.1 billion in defaults, a relatively small amount. This means, if one uses $200 billion as the low end of the estimate, we have only $198.9 billion to go by December 31, 2011 for these dire predictions to be achieved. Needless to say, these estimates were overly dramatic but they did add to the volatility of returns experienced throughout fiscal 2011. Chart I shows the volatility of returns generated by the BofA Merrill Lynch Municipal Master Index for the 12 months ended September 30, 2011.
CHART I: BofA MERRILL LYNCH MUNICIPAL MASTER INDEX
Periodic Returns During the Period from 9/30/2010 through 9/30/2011
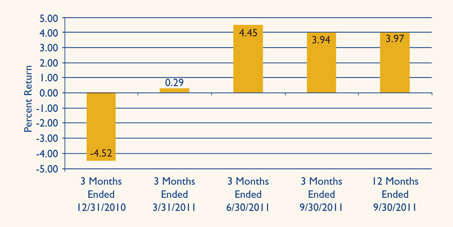
Source: Bloomberg
Past performance does not guarantee future results.
Most, if not all, of the other predictions of doom proved equally false. Supply of new issue municipal bonds did not expand as the Build America Bond program expired on December 31, 2010. In fact, the supply of newly issued municipal debt is down 35% through September 30, 2011 versus the same period in 2010. On the credit side, the revenue picture for state and local governments is improving. Revenues are increasing, although they are still below peak levels. Also expenditures are being cut. One example of this is that state and local employment payrolls have been cut by in excess of 500,000 jobs nationwide since August 2008.
CHART II: CHANGES IN AAA GENERAL OBLIGATION BOND YIELDS
9/30/2010 through 9/30/2011
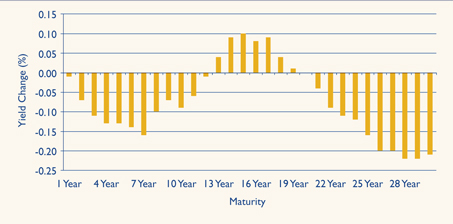
Source: Standard and Poor’s 09/30/2011
Past performance does not guarantee future results.
8 Certified Annual Report
Chart II illustrates how yields have changed over the last 12 months. The largest declines occurred in maturities greater than 21 years. The general level of municipal bond yields appear to be moving in sympathy with the yields on Treasury securities, albeit at a different pace.
Conclusion
Your Thornburg Strategic Municipal Income Fund will continue to search for value in the municipal bond market. We have identified two broad areas of value that we expect to continue to exploit. First, with the difference between long- and short-term yields being so great, we expect to continue to invest in longer maturity municipal bonds; currently approximately 44% of the portfolio is invested in maturities longer than 20 years. Second, with quality spreads (the incremental income an investor earns for investing in lower quality securities) being so wide, we expect to continue to pursue lower quality bonds for investment. Currently, 39% of the portfolio is invested in securities rated below single A or non-rated securities. In closing, we would like to thank you for the trust you have placed with us. We will continue to keep that foremost in our minds as we go forward into a new year.
Sincerely,
 |  |  | ||
| Christopher Ihlefeld | Christopher Ryon,CFA | Josh Gonze | ||
| Co-Portfolio Manager | Co-Portfolio Manager | Co-Portfolio Manager | ||
| Managing Director | Managing Director | Managing Director |
The matters discussed in this report may constitute forward-looking statements made pursuant to the safe harbor provisions of the Securities Litigation Reform Act of 1995. These include any advisor or portfolio manager prediction, assessment, analysis or outlook for individual securities, industries, investment styles, market sectors and/or markets. These statements involve risks and uncertainties. In addition to the general risks described for each fund in its current prospectus, other factors bearing on these reports include the accuracy of the advisor’s or portfolio manager’s forecasts and predictions, the appropriateness of the investment strategies designed by the advisor or portfolio manager and the ability of the advisor or portfolio manager to implement their strategies efficiently and successfully. Any one or more of these factors, as well as other risks affecting the securities markets generally, could cause the actual results of any fund to differ materially as compared to its benchmarks.
Certified Annual Report 9
| SCHEDULE OF INVESTMENTS | ||
| Thornburg Strategic Municipal Income Fund | September 30, 2011 | |
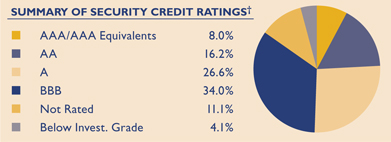
We have used ratings from Standard & Poor’s (S&P). Where S&P ratings are not available, we have used Moody’s Investors Service. Where neither rating is available, we have used ratings from Fitch Ratings. The category of investments identified as “AAA” in this graph includes investments which are pre-refunded or escrowed to maturity. Such investments are backed by an escrow or trust containing sufficient U.S. Government or U.S. Government agency securities to satisfy the timely payment of principal and interest and, therefore, are normally deemed to be equivalent to AAA-rated securities.
| Credit Rating† | Principal | |||||||||
Issuer-Description | S&P/ Moody’s | Amount | Value | |||||||
ARIZONA — 1.91% | ||||||||||
Maricopa County PCR, 6.00% due 5/1/2029 put 5/1/2014 (Arizona Public Service Co.) | BBB/Baa2 | $ | 500,000 | $ | 550,510 | |||||
Pima County Industrial Development Authority, 5.125% due 12/1/2040 (Providence Day School) | BBB+/NR | 710,000 | 622,216 | |||||||
Pima County Industrial Development Authority Education, 6.25% due 7/1/2013 (Arizona Charter Schools) | NR/Baa3 | 530,000 | 531,860 | |||||||
University Medical Center Corp., 6.25% due 7/1/2029 | BBB+/Baa1 | 100,000 | 104,800 | |||||||
University Medical Center Corp., 6.50% due 7/1/2039 | BBB+/Baa1 | 275,000 | 286,676 | |||||||
CALIFORNIA — 20.68% | ||||||||||
Brea Redevelopment Agency, 0% due 8/1/2032 (Capital Appreciation-Tax Allocation) | AA-/NR | 1,270,000 | 280,289 | |||||||
Brea Redevelopment Agency, 0% due 8/1/2034 (Capital Appreciation-Tax Allocation) | AA-/NR | 5,000,000 | 928,700 | |||||||
California Finance Authority, 8.50% due 11/1/2039 (Harbor Regulation Control) | NR/Baa1 | 1,000,000 | 1,110,220 | |||||||
California HFA, 6.25% due 2/1/2026 (Community Program; Insured: California Mtg Insurance) | A-/NR | 1,500,000 | 1,625,580 | |||||||
California HFA, 4.625% due 8/1/2026 | BBB/Baa2 | 560,000 | 501,256 | |||||||
California HFA, 0% due 8/1/2029 (Insured: AMBAC/FHA/VA) | BBB/Baa2 | 1,125,000 | 382,489 | |||||||
California Infrastructure & Economic Development Bank, 0.11% due 11/1/2026 put 10/3/2011 (Pacific Gas & Electric; Insured: Mizuho Corporate Bank) (daily demand notes) | AAA/Aa2 | 1,000,000 | 1,000,000 | |||||||
California State Public Works Board, 6.25% due 4/1/2034 | BBB+/A2 | 100,000 | 108,980 | |||||||
California Statewide Communities Development Authority, 6.125% due 7/1/2046 (Aspire Public Schools) | NR/NR | 1,000,000 | 975,320 | |||||||
Calipatria USD, 0% due 8/1/2025 (Capital Appreciation-Election 1995; Insured: ACA) | NR/NR | 2,425,000 | 893,249 | |||||||
Carson Redevelopment Agency Tax Allocation, 7.00% due 10/1/2036 (Project Area 1) | A-/NR | 500,000 | 557,615 | |||||||
Chico Redevelopment Agency, 5.00% due 4/1/2030 (Chico Amended & Merged Redevelopment; Insured: AMBAC) | A+/NR | 1,000,000 | 929,240 | |||||||
Corona-Norco USD COP, 5.00% due 4/15/2031 (Insured: AGM) | AA+/Aa3 | 1,750,000 | 1,800,190 | |||||||
Daly County Housing Development Finance Agency, 5.25% due 12/15/2023 (Franciscan Mobile Park) | A/NR | 650,000 | 651,651 | |||||||
Huntington Beach Union High School District, 0% due 8/1/2031 (Capital Appreciation- Election 2004; Insured: Natl-Re) | BBB/Aa2 | 5,000,000 | 1,532,900 | |||||||
Lee Lake Water District, 5.875% due 9/1/2027 | NR/NR | 500,000 | 463,650 | |||||||
M-S-R Energy Authority, 6.50% due 11/1/2039 | A/NR | 1,000,000 | 1,096,400 | |||||||
Merced Redevelopment Agency Tax Allocation, 6.50% due 9/1/2039 (Merced Gateways Redevelopment) | A-/NR | 300,000 | 315,693 | |||||||
Moorpark Mobile Home Park, 6.15% due 5/15/2031 (Villa Del Arroyo) | BBB/NR | 1,000,000 | 1,012,950 | |||||||
Newport Mesa USD, 0% due 8/1/2034 (Capital Appreciation-Election 2005) | AA/Aa1 | 5,000,000 | 1,349,000 | |||||||
Oak Park USD GO, 0% due 8/1/2030 (Insured: AGM) | AA+/Aa3 | 500,000 | 164,800 | |||||||
Pittsburg Redevelopment Agency Tax Allocation, 0% due 8/1/2027 (Los Medanos Community Development; Insured: AMBAC) | A+/NR | 1,220,000 | 428,989 | |||||||
10 Certified Annual Report
| SCHEDULE OF INVESTMENTS, CONTINUED | ||
| Thornburg Strategic Municipal Income Fund | September 30, 2011 | |
| Credit Rating† | Principal | |||||||||
Issuer-Description | S&P/ Moody’s | Amount | Value | |||||||
Redwood City Redevelopment Agency Tax Allocation, 0% due 7/15/2021 (Redevelopment Project Area 2; Insured: AMBAC) | A-/NR | $ | 1,285,000 | $ | 731,473 | |||||
Riverside County Asset Leasing Corp., 0% due 6/1/2021 (Riverside County Hospital; Insured: Natl-Re) | BBB/A1 | 535,000 | 301,012 | |||||||
San Diego USD, 0% due 7/1/2035 (Election 2008) | AA/Aa1 | 1,700,000 | 418,421 | |||||||
San Francisco City & County Redevelopment Financing Authority Tax Allocation, 0% due 8/1/2023 (Redevelopment Project; Insured: Natl-Re) | A/A1 | 925,000 | 474,451 | |||||||
San Francisco City & County Redevelopment Financing Authority Tax Allocation, 6.50% due 8/1/2039 (Mission Bay North Redevelopment) | A-/NR | 250,000 | 267,852 | |||||||
San Francisco City & County Redevelopment Financing Authority Tax Allocation, 6.75% due 8/1/2041 (Mission Bay North Redevelopment) | A-/NR | 500,000 | 543,360 | |||||||
San Jose Redevelopment Agency Tax, 4.25% due 8/1/2023 (Merged Area Redevelopment; Insured: Syncora) | BBB+/Baa2 | 500,000 | 433,875 | |||||||
San Jose Redevelopment Agency Tax, 5.50% due 8/1/2035 (Merged Area Redevelopment) | A/A2 | 1,000,000 | 977,840 | |||||||
Sonoma County Community Redevelopment Agency Tax Allocation, 6.50% due 8/1/2034 (The Springs Redevelopment; Insured: AGM) | AA+/NR | 100,000 | 104,034 | |||||||
Union Elementary School District, 0% due 9/1/2027 (Capital Appreciation-Election 1999; Insured: Natl-Re) | AA+/NR | 905,000 | 367,611 | |||||||
COLORADO — 7.12% | ||||||||||
Colorado Educational & Cultural Facilities Authority, 5.25% due 8/15/2019 (Peak to Peak Charter School; Insured: Syncora) | A/NR | 1,600,000 | 1,675,664 | |||||||
Denver Convention Center, 5.125% due 12/1/2026 (Insured: Syncora) | BBB-/Baa3 | 1,000,000 | 938,180 | |||||||
Denver Convention Center, 5.00% due 12/1/2030 (Insured: Syncora) | BBB-/Baa3 | 450,000 | 411,070 | |||||||
Denver Convention Center, 5.00% due 12/1/2035 (Insured: Syncora) | BBB-/Baa3 | 605,000 | 528,970 | |||||||
E-470 Public Highway Authority, 0% due 9/1/2037 (Capital Appreciation) | BBB-/Baa2 | 1,000,000 | 167,240 | |||||||
E-470 Public Highway Authority, 0% due 9/1/2040 (Capital Appreciation) | BBB-/Baa2 | 2,000,000 | 268,160 | |||||||
Eagle Bend Metropolitan District GO, 5.00% due 12/1/2020 (Insured: Radian) | A-/NR | 1,100,000 | 1,128,622 | |||||||
Eagle River Fire District, 6.625% due 12/1/2024 | NR/NR | 225,000 | 238,450 | |||||||
Eagle River Fire District, 6.875% due 12/1/2030 | NR/NR | 400,000 | 417,576 | |||||||
Pinery West Metropolitan District No. 2, 4.50% due 12/1/2032 (Insured: Radian) | NR/NR | 500,000 | 382,045 | |||||||
Public Authority for Colorado Energy, 5.75% due 11/15/2018 (Natural Gas Purchase Revenue) | A/Baa1 | 825,000 | 864,196 | |||||||
Public Authority for Colorado Energy, 6.50% due 11/15/2038 (Natural Gas Purchase Revenue) | A/Baa1 | 250,000 | 268,375 | |||||||
Regional Transportation District COP, 5.375% due 6/1/2031 | A-/Aa3 | 500,000 | 534,045 | |||||||
CONNECTICUT — 0.92% | ||||||||||
Connecticut Health & Educational Facilities Authority, 6.00% due 7/1/2039 (Ethel Walker School) | BBB-/NR | 1,000,000 | 1,009,750 | |||||||
DISTRICT OF COLUMBIA — 0.56% | ||||||||||
Metropolitan Washington Airports Authority, 0% due 10/1/2027 (Dulles Toll Road; Insured: AGM) | AA+/Aa3 | 1,500,000 | 619,785 | |||||||
FLORIDA — 4.41% | ||||||||||
Hollywood Community Redevelopment Agency, 5.625% due 3/1/2024 | NR/A3 | 340,000 | 352,084 | |||||||
Lakeland Energy System Revenue, 5.25% due 10/1/2036 | AA-/A1 | 2,000,000 | 2,259,500 | |||||||
Sarasota County Public Hospital Board, 7.212% due 10/1/2021 (Miles-Sarasota Memorial Hospital; Insured: Natl-Re) | BBB/A1 | 1,000,000 | 932,670 | |||||||
St. Johns County IDA, 5.625% due 8/1/2034 (Presbyterian Retirement) | NR/NR | 230,000 | 220,432 | |||||||
Tampa Sports Authority, 5.75% due 10/1/2020 (Tampa Bay Arena; Insured: Natl-Re) | BBB/Baa1 | 1,000,000 | 1,083,670 | |||||||
GEORGIA — 1.34% | ||||||||||
Atlanta Water & Waste Water, 6.25% due 11/1/2034 | A/A1 | 500,000 | 560,180 | |||||||
Certified Annual Report 11
| SCHEDULE OF INVESTMENTS, CONTINUED | ||
| Thornburg Strategic Municipal Income Fund | September 30, 2011 | |
| Credit Rating† | Principal | |||||||||
Issuer-Description | S&P/ Moody’s | Amount | Value | |||||||
Main Street Natural Gas, Inc., 5.00% due 3/15/2018 (Georgia Gas) | A+/Aa3 | $ | 515,000 | $ | 555,567 | |||||
Main Street Natural Gas, Inc., 5.50% due 9/15/2023 (Georgia Gas) | A/Baa1 | 350,000 | 351,512 | |||||||
GUAM — 1.89% | ||||||||||
Guam Government, 5.75% due 12/1/2034 (Section 30) | BBB-/NR | 500,000 | 512,720 | |||||||
Guam Government Department of Education COP, 6.875% due 12/1/2040 (John F. Kennedy High School) | B/NR | 1,000,000 | 1,022,500 | |||||||
Guam Government GO, 7.00% due 11/15/2039 | B+/NR | 520,000 | 542,386 | |||||||
HAWAII — 0.27% | ||||||||||
Hawaii State Department of Budget & Finance, 5.45% due 11/1/2023 (Hawaiian Electric Co.; Insured: Natl-Re) (AMT) | NR/Baa1 | 300,000 | 298,488 | |||||||
ILLINOIS — 8.27% | ||||||||||
Broadview Tax Increment, 5.25% due 7/1/2012 | NR/NR | 265,000 | 265,231 | |||||||
Chicago Tax Increment, 4.70% due 11/15/2013 (Near South Redevelopment; Insured: AMBAC) | NR/NR | 800,000 | 802,032 | |||||||
Chicago Tax Increment, 6.75% due 6/1/2022 (Pilsen Redevelopment) | NR/NR | 1,000,000 | 1,018,140 | |||||||
Cook County GO, 5.25% due 11/15/2033 | AA/Aa3 | 1,000,000 | 1,064,040 | |||||||
Illinois Civic Center, 5.375% due 12/15/2012 (Insured: AGM) | NR/Aa3 | 505,000 | 506,969 | |||||||
Illinois Finance Authority, 5.75% due 11/15/2037 (OSF Healthcare System) | A/A3 | 330,000 | 334,729 | |||||||
Illinois Finance Authority, 6.00% due 5/15/2039 (OSF Healthcare System) | A/A3 | 1,240,000 | 1,289,798 | |||||||
Melrose Park Tax Increment, 6.75% due 12/15/2016 (Insured: Natl-Re) | NR/Baa1 | 250,000 | 283,078 | |||||||
Melrose Park Tax Increment, 6.75% due 12/15/2021 (Insured: Natl-Re) | NR/Baa1 | 410,000 | 495,165 | |||||||
Metropolitan Pier & Exposition Authority, 5.00% due 6/15/2050 (McCormick Place) | AAA/A2 | 1,500,000 | 1,489,710 | |||||||
Railsplitter Tobacco Settlement Authority, 6.00% due 6/1/2028 | A-/NR | 1,000,000 | 1,036,260 | |||||||
Southwestern Illinois Development Authority, 5.50% due 8/15/2020 (Southwestern Illinois Health Facilities) | BBB/Baa2 | 500,000 | 500,375 | |||||||
INDIANA — 1.99% | ||||||||||
Carmel Redevelopment District, 6.50% due 7/15/2035 | NR/NR | 1,000,000 | 985,590 | |||||||
Indiana Finance Authority, 0.13% due 2/1/2037 put 10/3/2011 (Lease Appropriation; SPA: JPMorgan Chase Bank) (daily demand notes) | AA+/Aa3 | 1,200,000 | 1,200,000 | |||||||
KANSAS — 1.03% | ||||||||||
Wichita Multi-Family Housing, 5.90% due 12/1/2016 (Brentwood Apartments) | B/NR | 465,000 | 431,474 | |||||||
Wichita Multi-Family Housing, 5.85% due 12/1/2025 (Brentwood Apartments) | B/NR | 895,000 | 701,626 | |||||||
KENTUCKY — 1.98% | ||||||||||
Kentucky EDA, 0% due 10/1/2021 (Norton Healthcare, Inc.; Insured: Natl-Re) | BBB/Baa1 | 365,000 | 223,219 | |||||||
Kentucky EDA, 0% due 10/1/2022 (Norton Healthcare, Inc.; Insured: Natl-Re) | BBB/Baa1 | 2,490,000 | 1,426,571 | |||||||
Owen County Waterworks Systems, 6.25% due 6/1/2039 (American Water Co.) | BBB+/Baa2 | 500,000 | 527,960 | |||||||
LOUISIANA — 0.54% | ||||||||||
Louisiana Public Facilities Authority, 5.00% due 7/1/2032 (Black & Gold Facilities; Insured: CIFG) | AA+/Aa3 | 120,000 | 117,712 | |||||||
Louisiana Public Facilities Authority, 5.375% due 5/15/2043 (Ochsner Clinic Foundation) | NR/Baa1 | 500,000 | 474,875 | |||||||
MASSACHUSETTS — 0.46% | ||||||||||
Massachusetts Educational Financing Authority, 6.00% due 1/1/2028 | AA/NR | 460,000 | 506,428 | |||||||
12 Certified Annual Report
| SCHEDULE OF INVESTMENTS, CONTINUED | ||
| Thornburg Strategic Municipal Income Fund | September 30, 2011 | |
| Credit Rating† | Principal | |||||||||
Issuer-Description | S&P/ Moody’s | Amount | Value | |||||||
MICHIGAN — 7.92% | ||||||||||
Detroit School District, 5.25% due 5/1/2027 (Insured: AGM) | AA+/Aa2 | $ | 1,000,000 | $ | 1,026,800 | |||||
Detroit Water Supply Systems, 5.00% due 7/1/2018 (Insured: Natl-Re) | BBB/A1 | 350,000 | 377,717 | |||||||
Dickinson County Healthcare Systems, 5.80% due 11/1/2024 (Insured: ACA) | NR/NR | 270,000 | 270,440 | |||||||
Dickinson County Healthcare Systems, 5.80% due 11/1/2024 | NR/Baa3 | 1,000,000 | 1,001,630 | |||||||
Kalamazoo Hospital Finance Authority, 5.00% due 5/15/2036 (Bronson Methodist Hospital) | NR/A2 | 1,000,000 | 951,030 | |||||||
Michigan Financial Authority Limited Obligation, 8.125% due 4/1/2041 (Hope Academy) | NR/NR | 1,000,000 | 1,047,810 | |||||||
Michigan Public Educational Facilities Authority, 8.75% due 9/1/2039 (Bradford Academy) | BBB-/NR | 500,000 | 542,935 | |||||||
Michigan Public School Academy, 8.00% due 8/1/2035 (Will Carleton Charter School) | NR/NR | 1,085,000 | 1,035,057 | |||||||
Michigan State Hospital Finance Authority, 5.00% due 7/15/2025 (Oakwood Obligated Group) | A/A2 | 650,000 | 654,921 | |||||||
Michigan State Hospital Finance Authority, 5.75% due 4/1/2032 (Oakwood Obligated Group) | A/A2 | 150,000 | 151,242 | |||||||
Michigan State Hospital Finance Authority, 5.75% due 11/15/2039 (Henry Ford Health) | A/A1 | 1,000,000 | 1,021,390 | |||||||
Michigan State Strategic Fund, 5.00% due 8/1/2013 (NSF International) | A-/NR | 300,000 | 313,755 | |||||||
Michigan Strategic Fund, 7.00% due 5/1/2021 (The Detroit Edison Company; Insured: Natl-Re/ AMBAC) | NR/NR | 250,000 | 313,005 | |||||||
MINNESOTA — 0.43% | ||||||||||
St. Paul Housing & Redevelopment Authority, 5.25% due 5/15/2023 (Healthpartners Obligated Group) | BBB+/A3 | 100,000 | 103,477 | |||||||
Washington County Housing Redevelopment Authority, 5.625% due 6/1/2037 (Birchwood & Woodbury) | NR/NR | 415,000 | 371,566 | |||||||
MISSOURI — 5.09% | ||||||||||
Kansas City Tax Increment Financing Commission, 5.25% due 3/1/2018 (Maincor Project) | NR/NR | 700,000 | 692,468 | |||||||
Missouri Development Finance Board, 0.13% due 12/1/2033 put 10/3/2011 (Nelson Gallery Foundation; SPA: JPMorgan Chase Bank) (daily demand notes) | AAA/Aaa | 4,900,000 | 4,900,000 | |||||||
NEVADA — 0.76% | ||||||||||
Mesquite Redevelopment Agency Tax Increment, 7.125% due 6/1/2021 | A-/NR | 300,000 | 312,447 | |||||||
Mesquite Redevelopment Agency Tax Increment, 7.375% due 6/1/2024 | A-/NR | 500,000 | 519,935 | |||||||
NEW MEXICO — 1.33% | ||||||||||
Farmington PCR, 4.70% due 9/1/2024 (Arizona Public Service Co.) | BBB/Baa2 | 1,000,000 | 1,023,970 | |||||||
Santa Fe County Charter School Foundation, 6.625% due 1/15/2036 (ATC Foundation) | NR/NR | 485,000 | 442,422 | |||||||
NEW YORK — 2.00% | ||||||||||
New York City Transitional Finance Authority, 0.21% due 8/1/2031 put 10/3/2011 (SPA: Landesbank Hessen-Thuringen) (daily demand notes) | AAA/Aaa | 2,200,000 | 2,200,054 | |||||||
OHIO — 3.60% | ||||||||||
Cleveland Cuyahoga County Port Authority, 6.25% due 5/15/2016 (LOC: FifthThird Bank) | BBB-/NR | 395,000 | 398,993 | |||||||
Cleveland Cuyahoga County Port Authority, 7.00% due 5/15/2040 (Insured: City Appropriations) | BBB-/NR | 1,000,000 | 1,056,440 | |||||||
Ohio State Water Development Authority PCR, 5.875% due 6/1/2033 put 6/1/2016 (FirstEnergy) | BBB-/Baa2 | 1,000,000 | 1,123,560 | |||||||
Ohio State Water Development Authority PCR, 3.375% due 7/1/2033 put 7/1/2015 (FirstEnergy) | BBB-/Baa3 | 1,350,000 | 1,378,404 | |||||||
OREGON — 0.89% | ||||||||||
Western Generation Agency, 5.00% due 1/1/2016 (Wauna Cogeneration; Insured: ACA) | NR/NR | 1,000,000 | 979,330 | |||||||
PENNSYLVANIA — 5.76% | ||||||||||
Allegheny County IDA, 6.75% due 8/15/2035 (Propel Charter School) | BBB-/NR | 970,000 | 941,404 | |||||||
Certified Annual Report 13
| SCHEDULE OF INVESTMENTS, CONTINUED | ||
| Thornburg Strategic Municipal Income Fund | September 30, 2011 | |
| Credit Rating† | Principal | |||||||||
Issuer-Description | S&P/ Moody’s | Amount | Value | |||||||
Geisinger Authority, 0.13% due 6/1/2041 put 10/3/2011 (Geisinger Health System; SPA: JPMorgan Chase Bank) (daily demand notes) | AA/Aa2 | $ | 1,680,000 | $ | 1,680,000 | |||||
Pennsylvania EDA, 5.00% due 12/1/2014 (Colver Project; Insured: AMBAC) (AMT) | BBB-/Ba1 | 450,000 | 451,143 | |||||||
Pennsylvania EDA, 4.625% due 12/1/2018 (Colver Project; Insured: AMBAC) (AMT) | BBB-/Ba1 | 600,000 | 566,106 | |||||||
Pennsylvania Turnpike Commission, 0% due 12/1/2030 (Convertible Capital Appreciation) | A-/A3 | 2,000,000 | 1,640,280 | |||||||
Philadelphia IDA, 6.00% due 8/1/2035 (Mast Charter School) | BBB+/NR | 1,000,000 | 1,053,850 | |||||||
RHODE ISLAND — 0.70% | ||||||||||
Pawtucket Housing Authority Capital Funds Housing, 5.50% due 9/1/2022 | AA/NR | 315,000 | 366,125 | |||||||
Pawtucket Housing Authority Capital Funds Housing, 5.50% due 9/1/2024 | AA/NR | 350,000 | 398,415 | |||||||
SOUTH DAKOTA — 0.72% | ||||||||||
South Dakota Health & Educational Facilities Authority, 5.50% due 11/1/2040 (Sanford Health) | AA-/A1 | 750,000 | 785,835 | |||||||
TENNESSEE — 0.54% | ||||||||||
Tennessee Energy Acquisition Corp., 5.00% due 2/1/2015 | BBB/Baa3 | 100,000 | 104,417 | |||||||
Tennessee Energy Acquisition Corp., 5.25% due 9/1/2024 | B/Ba3 | 500,000 | 490,785 | |||||||
TEXAS — 11.09% | ||||||||||
Austin Convention Enterprises, Inc., 5.25% due 1/1/2024 (Austin Convention Center; Insured: Syncora) | BB+/Ba1 | 720,000 | 678,132 | |||||||
Austin Convention Enterprises, Inc., 5.00% due 1/1/2034 (Austin Convention Center; Insured: Syncora) | BB+/Ba1 | 665,000 | 556,099 | |||||||
Clifton Higher Education Finance Corp., 9.00% due 2/15/2038 (Tejano Center for Community Concerns, Inc.) | BBB-/NR | 1,000,000 | 1,106,170 | |||||||
Gulf Coast Waste Disposal Authority, 6.10% due 8/1/2024 (International Paper Co.) (AMT) | BBB/Baa3 | 100,000 | 101,415 | |||||||
Kimble County Hospital District, 6.25% due 8/15/2033 | NR/NR | 500,000 | 533,535 | |||||||
La Vernia Higher Education Finance Corp., 6.25% due 8/15/2039 (Kipp, Inc.) | BBB/NR | 1,000,000 | 1,040,860 | |||||||
Matagorda County Navigation District, 5.15% due 11/1/2029 (Houston Industries, Inc.; Insured: Natl-Re) | BBB/Baa1 | 280,000 | 279,978 | |||||||
San Antonio Energy Acquisition Public Facilities Corp., 5.50% due 8/1/2021 | A/Baa3 | 40,000 | 41,536 | |||||||
San Juan Higher Education Finance Authority, 6.70% due 8/15/2040 (Idea Public School) | BBB/NR | 1,000,000 | 1,050,620 | |||||||
Texas City Industrial Development Corp., 7.375% due 10/1/2020 (Arco Pipe Line Company) | A/A2 | 1,000,000 | 1,262,310 | |||||||
Texas Multi-Family Housing Corp., 7.00% due 7/1/2043 (HDSA Affordable Housing Pool) | A-/NR | 2,000,000 | 2,010,920 | |||||||
Texas Public Finance Authority Charter School Finance Corp., 4.15% due 8/15/2016 (Idea Public School; Insured: ACA) | BBB/NR | 100,000 | 99,996 | |||||||
Texas Public Finance Authority Charter School Finance Corp., 5.00% due 2/15/2018 (Cosmos Foundation, Inc.) | BBB/NR | 895,000 | 903,798 | |||||||
Texas Public Finance Authority Charter School Finance Corp., 5.00% due 8/15/2023 (Idea Public School; Insured: ACA) | BBB/NR | 155,000 | 148,820 | |||||||
Texas Public Finance Authority Charter School Finance Corp., 5.00% due 8/15/2030 (Idea Public School; Insured: ACA) | BBB/NR | 1,500,000 | 1,347,435 | |||||||
Texas Public Finance Authority Charter School Finance Corp., 6.20% due 2/15/2040 (Cosmos Foundation, Inc.) | BBB/NR | 1,000,000 | 1,022,830 | |||||||
U.S. VIRGIN ISLANDS — 0.63% | ||||||||||
Virgin Islands Public Finance Authority, 6.75% due 10/1/2037 | NR/Baa3 | 500,000 | 537,680 | |||||||
Virgin Islands Water & Power Authority, 5.50% due 7/1/2017 | NR/Baa3 | 150,000 | 150,272 | |||||||
14 Certified Annual Report
| SCHEDULE OF INVESTMENTS, CONTINUED | ||
| Thornburg Strategic Municipal Income Fund | September 30, 2011 | |
| Credit Rating† | Principal | |||||||||
Issuer-Description | S&P/ Moody’s | Amount | Value | |||||||
UTAH — 0.97% | ||||||||||
Herriman Utah Special Assessment, 4.75% due 11/1/2022 (Towne Center Assessment Area) | A/NR | $ | 1,000,000 | $ | 1,061,480 | |||||
VIRGINIA — 2.80% | ||||||||||
Lexington IDA Residential Care Facility, 5.375% due 1/1/2028 (Kendal at Lexington) | NR/NR | 1,000,000 | 909,200 | |||||||
Mecklenburg County IDA, 6.50% due 10/15/2017 (Virginia Electric and Power Company) | NR/Baa1 | 1,000,000 | 1,005,140 | |||||||
Norton IDA, 6.00% due 12/1/2014 (Norton Community Hospital; Insured: ACA) | NR/NR | 635,000 | 638,778 | |||||||
Virginia Small Business Financing Authority, 9.00% due 7/1/2039 (Hampton RDS Proton) | NR/NR | 500,000 | 528,325 | |||||||
WASHINGTON — 0.93% | ||||||||||
Washington HFA, 5.70% due 7/1/2038 (Overlake Hospital Medical Center) | A-/A3 | 1,000,000 | 1,022,710 | |||||||
|
| |||||||||
TOTAL INVESTMENTS — 99.53% (Cost $104,876,671) | $ | 109,377,168 | ||||||||
OTHER ASSETS LESS LIABILITIES — 0.47% | 511,256 | |||||||||
|
| |||||||||
NET ASSETS — 100.00% | $ | 109,888,424 | ||||||||
|
| |||||||||
Footnote Legend
| † | Credit ratings are unaudited. Rating changes may have occurred subsequent to the reporting period end. |
| Portfolio Abbreviations | ||
| To simplify the listings of securities, abbreviations are used per the table below: | ||
ACA | Insured by American Capital Access | |
AGM | Insured by Assured Guaranty Municipal Corp. | |
AMBAC | Insured by American Municipal Bond Assurance Corp. | |
AMT | Alternative Minimum Tax | |
CIFG | CIFG Assurance North America Inc. | |
COP | Certificates of Participation | |
EDA | Economic Development Authority | |
FHA | Insured by Federal Housing Administration | |
GO | General Obligation | |
HFA | Health Facilities Authority | |
IDA | Industrial Development Authority | |
LOC | Letter of Credit | |
Mtg | Mortgage | |
Natl-Re | Insured by National Public Finance Guarantee Corp. | |
PCR | Pollution Control Revenue Bond | |
Radian | Insured by Radian Asset Assurance | |
SPA | Stand-by Purchase Agreement | |
Syncora | Insured by Syncora Guarantee Inc. | |
VA | Veterans Affairs | |
USD | Unified School District | |
See notes to financial statements.
Certified Annual Report 15
| STATEMENT OF ASSETS AND LIABILITIES | ||||
| Thornburg Strategic Municipal Income Fund | September 30, 2011 | |||
ASSETS | ||||
Investments at value (cost $104,876,671) (Note 2) | $ | 109,377,168 | ||
Cash | 784,128 | |||
Receivable for investments sold | 50,000 | |||
Receivable for fund shares sold | 505,724 | |||
Interest receivable | 1,507,274 | |||
Prepaid expenses and other assets | 20,618 | |||
|
| |||
Total Assets | 112,244,912 | |||
|
| |||
LIABILITIES | ||||
Payable for investments purchased | 2,069,500 | |||
Payable for fund shares redeemed | 77,074 | |||
Payable to investment advisor and other affiliates (Note 3) | 67,663 | |||
Accounts payable and accrued expenses | 56,384 | |||
Dividends payable | 85,867 | |||
|
| |||
Total Liabilities | 2,356,488 | |||
|
| |||
NET ASSETS | $ | 109,888,424 | ||
|
| |||
NET ASSETS CONSIST OF: | ||||
Undistributed net investment income | $ | 3,622 | ||
Net unrealized appreciation on investments | 4,500,497 | |||
Accumulated net realized gain (loss) | 98,006 | |||
Net capital paid in on shares of beneficial interest | 105,286,299 | |||
|
| |||
| $ | 109,888,424 | |||
|
| |||
NET ASSET VALUE: | ||||
Class A Shares: | ||||
Net asset value and redemption price per share ($39,808,077 applicable to 2,831,256 shares of beneficial interest outstanding - Note 4) | $ | 14.06 | ||
Maximum sales charge, 2.00% of offering price | 0.29 | |||
|
| |||
Maximum offering price per share | $ | 14.35 | ||
|
| |||
Class C Shares: | ||||
Net asset value and offering price per share* ($15,343,872 applicable to 1,090,163 shares of beneficial interest outstanding - Note 4) | $ | 14.07 | ||
|
| |||
Class I Shares: | ||||
Net asset value, offering and redemption price per share ($54,736,475 applicable to 3,889,451 shares of beneficial interest outstanding - Note 4) | $ | 14.07 | ||
|
| |||
| * | Redemption price per share is equal to net asset value less any applicable contingent deferred sales charge. |
See notes to financial statements.
16 Certified Annual Report
| STATEMENT OF OPERATIONS | ||
| Thornburg Strategic Municipal Income Fund | Year Ended September 30, 2011 | |
INVESTMENT INCOME: | ||||
Interest income (net of premium amortized of $143,955) | $ | 4,977,705 | ||
|
| |||
EXPENSES: | ||||
Investment advisory fees (Note 3) | 664,709 | |||
Administration fees (Note 3) | ||||
Class A Shares | 41,284 | |||
Class C Shares | 18,391 | |||
Class I Shares | 20,444 | |||
Distribution and service fees (Note 3) | ||||
Class A Shares | 82,568 | |||
Class C Shares | 88,498 | |||
Transfer agent fees | ||||
Class A Shares | 18,412 | |||
Class C Shares | 12,279 | |||
Class I Shares | 17,664 | |||
Registration and filing fees | ||||
Class A Shares | 21,053 | |||
Class C Shares | 21,075 | |||
Class I Shares | 21,331 | |||
Custodian fees (Note 3) | 51,385 | |||
Professional fees | 41,827 | |||
Accounting fees | 3,787 | |||
Trustee fees | 2,281 | |||
Other expenses | 18,520 | |||
|
| |||
Total Expenses | 1,145,508 | |||
Less: | ||||
Expenses reimbursed by investment advisor (Note 3) | (100,276 | ) | ||
Fees paid indirectly (Note 3) | (804 | ) | ||
|
| |||
Net Expenses | 1,044,428 | |||
|
| |||
Net Investment Income | 3,933,277 | |||
|
| |||
REALIZED AND UNREALIZED GAIN (LOSS) | ||||
Net realized gain (loss) on investments | 98,722 | |||
Net change in unrealized appreciation (depreciation) on investments | (464,465 | ) | ||
|
| |||
Net Realized and Unrealized Loss | (365,743 | ) | ||
|
| |||
Net Increase in Net Assets Resulting from Operations | $ | 3,567,534 | ||
|
| |||
See notes to financial statements.
Certified Annual Report 17
| STATEMENTS OF CHANGES IN NET ASSETS |
| Thornburg Strategic Municipal Income Fund |
| Year Ended September 30, 2011 | Year Ended September 30, 2010 | |||||||
INCREASE (DECREASE) IN NET ASSETS FROM | ||||||||
OPERATIONS: | ||||||||
Net investment income | $ | 3,933,277 | $ | 2,268,325 | ||||
Net realized gain (loss) on investments | 98,722 | 377,353 | ||||||
Net unrealized appreciation (depreciation) on investments | (464,465 | ) | 2,052,352 | |||||
|
|
|
| |||||
Net Increase (Decrease) in Net Assets Resulting from Operations | 3,567,534 | 4,698,030 | ||||||
DIVIDENDS TO SHAREHOLDERS: | ||||||||
From net investment income | ||||||||
Class A Shares | (1,443,523 | ) | (779,270 | ) | ||||
Class C Shares | (599,513 | ) | (319,620 | ) | ||||
Class I Shares | (1,887,215 | ) | (1,169,435 | ) | ||||
From realized gains | ||||||||
Class A Shares | (48,451 | ) | (110,997 | ) | ||||
Class C Shares | (26,448 | ) | (40,025 | ) | ||||
Class I Shares | (67,868 | ) | (164,754 | ) | ||||
FUND SHARE TRANSACTIONS (NOTE 4): | ||||||||
Class A Shares | 11,532,230 | 15,636,797 | ||||||
Class C Shares | 401,837 | 11,167,420 | ||||||
Class I Shares | 12,899,113 | 22,636,138 | ||||||
|
|
|
| |||||
Net Increase in Net Assets | 24,327,696 | 51,554,284 | ||||||
NET ASSETS: | ||||||||
Beginning of Year | 85,560,728 | 34,006,444 | ||||||
|
|
|
| |||||
End of Year | $ | 109,888,424 | $ | 85,560,728 | ||||
|
|
|
| |||||
Undistributed net investment income | $ | 3,622 | $ | — | ||||
See notes to financial statements.
18 Certified Annual Report
| NOTES TO FINANCIAL STATEMENTS | ||
| Thornburg Strategic Municipal Income Fund | September 30, 2011 | |
NOTE 1 – ORGANIZATION
Thornburg Strategic Municipal Income Fund (the “Fund”) is a diversified series of Thornburg Investment Trust (the “Trust”). The Trust is organized as a Massachusetts business trust under a Declaration of Trust dated June 3, 1987 and is registered as a diversified, open-end management investment company under the Investment Company Act of 1940, as amended. The Fund is currently one of sixteen separate series of the Trust. Each series is considered to be a separate entity for financial reporting and tax purposes and bears expenses directly attributable to it. The Fund’s primary investment objective is to seek a high level of current income exempt from federal individual income tax.
The Fund currently offers three classes of shares of beneficial interest outstanding: Class A, Class C, and Institutional Class (Class I). Each class of shares of the Fund represents an interest in the same portfolio of investments, except that (i) Class A shares are sold subject to a front-end sales charge collected at the time the shares are purchased and bear a service fee, (ii) Class C shares are sold at net asset value without a sales charge at the time of purchase, but are subject to a contingent deferred sales charge upon redemption within one year of purchase, and bear both a service fee and a distribution fee, (iii) Class I shares are sold at net asset value without a sales charge at the time of purchase, and (iv) the respective classes may have different reinvestment privileges and conversion rights. Additionally, the Fund may allocate among its classes certain expenses, to the extent allowable to specific classes, including transfer agent fees, government registration fees, certain printing and postage costs, and administrative and legal expenses. Currently, class specific expenses of the Fund are limited to service and distribution fees, administration fees, and certain registration and transfer agent expenses.
NOTE 2 – SIGNIFICANT ACCOUNTING POLICIES
Significant accounting policies of the Trust are as follows:
Valuation of Investments: Debt obligations have a primary market over the counter and are valued by an independent pricing service approved by the Trustees of the Trust. The pricing service ordinarily values debt obligations at quoted bid prices. When quotations are not available, debt obligations are valued at evaluated prices determined by the pricing service using methods which include consideration of yields or prices of debt obligations of comparable quality, type of issue, coupon, maturity and rating, and indications as to value from dealers and general market conditions. Short-term obligations having remaining maturities of 60 days or less are ordinarily valued at amortized cost, which approximates market value.
In any case where a pricing service fails to provide a price for a debt obligation held by the Fund, the valuation and pricing committee determines a fair value for the obligation using procedures approved by the Trustees. Additionally, in any case where management believes that a price provided by a pricing service for a debt obligation may be unreliable, the valuation and pricing committee decides whether or not to use the pricing service’s valuation or to determine a fair value for the obligation.
In determining fair value for any portfolio security or other investment, the valuation and pricing committee seeks to determine the amount that an owner of the investment might reasonably expect to receive upon a sale of the investment. However, because fair value prices are estimated prices, the valuation and pricing committee’s determination of fair value for an investment may differ from the value that would be realized by the Fund upon a sale of the investment, and that difference could be material to the Fund’s financial statements. The valuation and pricing committee’s determination of fair value for an investment may also differ from the prices obtained by other persons (including other mutual funds) for the investment.
Valuation Measurements: Various inputs are used in determining the value of the Fund’s investments. These inputs are summarized in the three levels listed below:
Level 1: Quoted prices in active markets for identical investments.
Level 2: Other significant observable inputs (including quoted prices for similar investments, interest rates, prepayment rates, credit risk, etc.).
Level 3: Significant unobservable inputs (including the Fund’s own assumptions in determining the fair value of investments).
Certified Annual Report 19
| NOTES TO FINANCIAL STATEMENTS, CONTINUED | ||
| Thornburg Strategic Municipal Income Fund | September 30, 2011 | |
The following table displays a summary of the inputs used to value the Fund’s net assets as of September 30, 2011. In any instance when valuation inputs from more than one level are used to determine the fair value of a specific investment, the investment is placed in the level of the table based upon the lowest level input that is significant in determining the fair value of the investment:
| Fair Value Measurements at September 30, 2011 | ||||||||||||||||
| Total | Level 1 | Level 2 | Level 3 | |||||||||||||
Assets | ||||||||||||||||
Investments in Securities Municipal Bonds | $ | 109,377,168 | $ | — | $ | 109,377,168 | $ | — | ||||||||
|
|
|
|
|
|
|
| |||||||||
Total Investments in Securities | $ | 109,377,168 | $ | — | $ | 109,377,168 | $ | — | ||||||||
Other Notes: It is the policy of the Fund to recognize significant transfers between Levels 1, 2 and 3 and to disclose those transfers at the beginning of the reporting period. The Fund recognized no significant transfers between levels for the year ended September 30, 2011.
Federal Income Taxes: It is the policy of the Trust to comply with the provisions of the Internal Revenue Code applicable to “regulated investment companies,” and to distribute to shareholders substantially all taxable (if any) and tax exempt income of the Fund. Therefore, no provision for federal income tax is required.
Management reviews each uncertain tax position believed to be material to the preparation of the Fund’s financial statements, to assess if it is more likely than not that the position would be sustained upon examination, based upon the technical merits of the position. As of September 30, 2011, management has not identified any such position for which a liability must be reflected in the Statement of Assets and Liabilities. The Fund’s tax returns remain subject to examination for three years after filing.
When-Issued and Delayed Delivery Transactions: The Fund may engage in when-issued or delayed delivery transactions. To the extent the Fund engages in such transactions, it will do so for the purpose of acquiring portfolio securities consistent with the Fund’s investment objectives and not for the purpose of investment leverage or to speculate on interest rate and/or market changes. At the time the Fund makes a commitment to purchase a security on a when-issued or delayed delivery basis, the Fund will record the transaction and reflect the value in determining its net asset value. When effecting such transactions, assets of an amount sufficient to make payment for the portfolio securities to be purchased will be segregated on the Fund’s records on the trade date. Securities purchased on a when-issued or delayed delivery basis do not earn interest until the settlement date.
Dividends: Net investment income of the Fund is declared daily as a dividend on shares for which the Fund has received payment. Dividends are paid monthly and are reinvested in additional shares of the Fund at net asset value per share at the close of business on the dividend payment date, or at the shareholder’s option, paid in cash. Net realized capital gains, to the extent available, will be distributed at least annually.
General: Securities transactions are accounted for on a trade date basis. Interest income is accrued as earned. Premiums and discounts on securities purchased are amortized to call dates or maturity dates of the respective securities. Realized gains and losses from the sale of securities are recorded on an identified cost basis. Net investment income (other than class specific expenses) and realized and unrealized gains and losses are allocated daily to each class of shares based upon the relative net asset value of outstanding shares (or the value of the dividend-eligible shares, as appropriate) of each class of shares at the beginning of the day (after adjusting for the current capital shares activity of the respective class). Expenses common to all Funds are allocated among the Funds comprising the Trust based upon their relative net asset values or other appropriate allocation methods.
Guarantees and Indemnifications: Under the Trust’s organizational documents, its officers and Trustees are indemnified against certain liabilities arising out of the performance of their duties to the Fund. Additionally, in the normal course of business the Trust enters into contracts with service providers that contain general indemnification clauses. The Trust’s maximum exposure under these arrangements is unknown. However, based on experience, the Trust expects the risk of loss to be remote.
Use of Estimates: The preparation of financial statements, in conformity with generally accepted accounting principles, requires management to make estimates and assumptions that affect the reported amounts of assets and liabilities and the disclosure of contingent
20 Certified Annual Report
| NOTES TO FINANCIAL STATEMENTS, CONTINUED | ||
| Thornburg Strategic Municipal Income Fund | September 30, 2011 | |
assets and liabilities at the date of the financial statements and the reported amounts of increases and decreases in net assets from operations during the reporting period. Actual results could differ from those estimates.
NOTE 3 – INVESTMENT ADVISORY FEE AND OTHER TRANSACTIONS WITH AFFILIATES
Pursuant to an investment advisory agreement, Thornburg Investment Management, Inc. (the “Advisor”) serves as the investment advisor and performs services to the Fund for which the fees are payable at the end of each month. For the year ended September 30, 2011, these fees were payable at annual rates ranging from .75 of 1% to .50 of 1% per annum of the average daily net assets of the Fund depending on the Fund’s asset size. The Trust also has entered into administrative services agreements with the Advisor, whereby the Advisor will perform certain administrative services for the shareholders of each class of the Fund’s shares, and for which fees will be payable at an annual rate of up to .125 of 1% per annum of the average daily net assets attributable to each class of shares. For the year ended September 30, 2011, the Advisor contractually reimbursed certain class specific expenses and administrative fees of $41,917 for Class A shares, $41,786 for Class C shares and $16,573 for Class I shares.
The Trust has an underwriting agreement with Thornburg Securities Corporation (the “Distributor,” an affiliate of the Advisor), which acts as the distributor of the Fund’s shares. For the year ended September 30, 2011, the Distributor has advised the Fund that it earned net commissions aggregating $1,175 from the sale of Class A shares, and collected contingent deferred sales charges aggregating $4,541 from redemptions of Class C shares of the Fund.
Pursuant to a service plan under Rule 12b-1 of the Investment Company Act of 1940, the Fund may reimburse to the Advisor an amount not to exceed .25 of 1% per annum of the average daily net assets attributable to each class of shares of the Fund for payments made by the Advisor to securities dealers and other financial institutions to obtain various shareholder and distribution related services. For the year ended September 30, 2011, there were no 12b-1 service plan fees charged for Class I shares. The Advisor may pay out of its own resources additional expenses for distribution of the Fund’s shares.
The Trust has also adopted a distribution plan pursuant to Rule 12b-1, applicable only to the Fund’s Class C shares, under which the Fund compensates the Distributor for services in promoting the sale of Class C shares of the Fund at an annual rate of up to .35 of 1% per annum of the average daily net assets attributable to Class C shares. Total fees incurred by the Distributor for each class of shares of the Fund under their respective Service and Distribution Plans for the year ended September 30, 2011, are set forth in the Statement of Operations.
The Trust has an agreement with the custodian bank to indirectly pay a portion of the custodian’s fees through credits earned by the Fund’s cash on deposit with the bank. This deposit agreement is an alternative to overnight investments. Custodial fees have been adjusted to reflect amounts that would have been paid without this agreement, with a corresponding adjustment reflected as fees paid indirectly in the Statement of Operations. For the year ended September 30, 2011, fees paid indirectly were $804.
Certain officers and Trustees of the Trust are also officers or directors of the Advisor and Distributor. The compensation of independent Trustees is borne by the Trust.
NOTE 4 – SHARES OF BENEFICIAL INTEREST
At September 30, 2011, there were an unlimited number of shares of beneficial interest authorized. Transactions in shares of beneficial interest were as follows:
| Year Ended September 30, 2011 | Year Ended September 30, 2010 | |||||||||||||||
| Shares | Amount | Shares | Amount | |||||||||||||
Class A Shares | ||||||||||||||||
Shares sold | 1,515,491 | $ | 20,437,728 | 1,292,244 | $ | 17,833,733 | ||||||||||
Shares issued to shareholders in reinvestment of dividends | 83,263 | 1,126,525 | 53,595 | 735,252 | ||||||||||||
Shares repurchased | (748,444 | ) | (10,032,023 | ) | (213,606 | ) | (2,932,188 | ) | ||||||||
|
|
|
|
|
|
|
| |||||||||
Net increase (decrease) | 850,310 | $ | 11,532,230 | 1,132,233 | $ | 15,636,797 | ||||||||||
|
|
|
|
|
|
|
| |||||||||
Certified Annual Report 21
| NOTES TO FINANCIAL STATEMENTS, CONTINUED | ||
| Thornburg Strategic Municipal Income Fund | September 30, 2011 | |
| Year Ended September 30, 2011 | Year Ended September 30, 2010 | |||||||||||||||
| Shares | Amount | Shares | Amount | |||||||||||||
Class C Shares | ||||||||||||||||
Shares sold | 500,548 | $ | 6,822,609 | 893,854 | $ | 12,358,292 | ||||||||||
Shares issued to shareholders in reinvestment of dividends | 28,470 | 385,419 | 16,955 | 233,302 | ||||||||||||
Shares repurchased | (511,043 | ) | (6,806,191 | ) | (104,152 | ) | (1,424,174 | ) | ||||||||
|
|
|
|
|
|
|
| |||||||||
Net increase (decrease) | 17,975 | $ | 401,837 | 806,657 | $ | 11,167,420 | ||||||||||
|
|
|
|
|
|
|
| |||||||||
Class I Shares | ||||||||||||||||
Shares sold | 2,118,197 | $ | 28,788,268 | 1,714,923 | $ | 23,915,174 | ||||||||||
Shares issued to shareholders in reinvestment of dividends | 114,091 | 1,545,006 | 73,042 | 1,003,621 | ||||||||||||
Shares repurchased | (1,304,041 | ) | (17,434,161 | ) | (165,161 | ) | (2,282,657 | ) | ||||||||
|
|
|
|
|
|
|
| |||||||||
Net increase (decrease) | 928,247 | $ | 12,899,113 | 1,622,804 | $ | 22,636,138 | ||||||||||
|
|
|
|
|
|
|
| |||||||||
NOTE 5 – SECURITIES TRANSACTIONS
For the year ended September 30, 2011, the Fund had purchase and sale transactions of investment securities (excluding short-term investments) of $38,916,535 and $16,466,450, respectively.
NOTE 6 – INCOME TAXES
At September 30, 2011, information on the tax components of capital is as follows:
Cost of investments for tax purposes | $ | 104,876,671 | ||
|
| |||
Gross unrealized appreciation on a tax basis | $ | 4,820,761 | ||
Gross unrealized depreciation on a tax basis | (320,264 | ) | ||
|
| |||
Net unrealized appreciation (depreciation) on investments (tax basis) | $ | 4,500,497 | ||
|
| |||
Distributable capital gains (tax basis) | $ | 98,006 |
At September 30, 2011, the Fund did not have any undistributed net ordinary income.
The tax character of distributions paid for the years ended September 30, 2011, and September 30, 2010, was as follows:
| 2011 | 2010 | |||||||
Distributions from: | ||||||||
Tax exempt income | $ | 3,828,976 | $ | 2,190,183 | ||||
Ordinary income | 238,593 | 393,918 | ||||||
Capital gains | 5,449 | — | ||||||
|
|
|
| |||||
Total Distributions | $ | 4,073,018 | $ | 2,584,101 | ||||
|
|
|
| |||||
22 Certified Annual Report
| NOTES TO FINANCIAL STATEMENTS, CONTINUED | ||
| Thornburg Strategic Municipal Income Fund | September 30, 2011 | |
The Regulated Investment Company Modernization Act of 2010 (the “Act”) was signed into law on December 22, 2010. The Act makes changes to a number of tax rules impacting the Fund. Under the Act, future capital losses generated by the Fund may be carried over indefinitely, but these losses must be used prior to the utilization of any pre-enactment capital losses. Since pre-enactment capital losses may only be carried forward for eight years, there may be a greater likelihood that all or a portion of a Fund’s pre-enactment capital losses will expire unused. In general, the provisions of the Act will be effective for the Fund’s fiscal year ending September 30, 2012. As of September 30, 2011, the Fund had no pre-enactment capital loss carryforwards to offset future capital gains.
In order to account for permanent book/tax differences, the Fund increased undistributed net investment income by $3,622 and decreased net capital paid in on shares of beneficial interest by $3,622. This reclassification has no impact on the net asset value of the Fund. This reclassification resulted primarily from non-deductible expenses paid.
OTHER NOTES:
Risks: The Fund’s investments subject it to risks including, but not limited to, credit risk, interest rate risk, management risk, market and economic risk, liquidity risk, and the risks associated with investments in derivative instruments. Please see the Fund’s prospectus for a discussion of the risks associated with an investment in the Fund.
Subsequent Events: Fund management believes no events have occurred between September 30, 2011 and the date of issuance of the financial statements, which require adjustment to, or disclosure in the accompanying financial statements.
Certified Annual Report 23
Thornburg Strategic Municipal Income Fund
| PER SHARE PERFORMANCE (for a share outstanding throughout the Year)+ | RATIOS TO AVERAGE NET ASSETS | SUPPLEMENTAL DATA | ||||||||||||||||||||||||||||||||||||||||||||||||||||||||||
Unless | Net Asset Value Beginning of Year | Net Investment Income (Loss) | Net Realized & Unrealized Gain (Loss) on Investments | Total from Investment Operations | Dividends from Net Investment Income | Dividends from Net Realized Gains | Total Dividends | Net Asset Value End of Year | Net Investment Income (Loss) (%) | Expenses, After Expense Reductions (%) | Expenses, After Expense Reductions and Net of Custody Credits (%) | Expenses, Before Expense Reductions (%) | Total Return (%)(a) | Portfolio Turnover Rate (%) | Net Assets at End of Year (Thousands) | |||||||||||||||||||||||||||||||||||||||||||||
Class A Shares |
| |||||||||||||||||||||||||||||||||||||||||||||||||||||||||||
2011(b) | $ | 14.22 | 0.59 | (0.14 | ) | 0.45 | (0.59 | ) | (0.02 | ) | (0.61 | ) | $ | 14.06 | 4.37 | 1.25 | 1.25 | 1.38 | 3.47 | 19.45 | $ | 39,808 | ||||||||||||||||||||||||||||||||||||||
2010(b) | $ | 13.86 | 0.60 | 0.48 | 1.08 | (0.61 | ) | (0.11 | ) | (0.72 | ) | $ | 14.22 | 4.40 | 1.25 | 1.25 | 1.50 | 8.20 | 16.26 | $ | 28,166 | |||||||||||||||||||||||||||||||||||||||
2009(b)(c) | $ | 11.94 | 0.29 | 1.91 | 2.20 | (0.28 | ) | — | (0.28 | ) | $ | 13.86 | 4.71 | (d) | 1.25 | (d) | 1.25 | (d) | 2.92 | (d) | 18.65 | 14.37 | $ | 11,761 | ||||||||||||||||||||||||||||||||||||
Class C Shares |
| |||||||||||||||||||||||||||||||||||||||||||||||||||||||||||
2011 | $ | 14.23 | 0.55 | (0.14 | ) | 0.41 | (0.55 | ) | (0.02 | ) | (0.57 | ) | $ | 14.07 | 4.07 | 1.55 | 1.55 | 1.83 | 3.16 | 19.45 | $ | 15,344 | ||||||||||||||||||||||||||||||||||||||
2010 | $ | 13.87 | 0.55 | 0.49 | 1.04 | (0.57 | ) | (0.11 | ) | (0.68 | ) | $ | 14.23 | 4.05 | 1.55 | 1.55 | 2.36 | 7.88 | 16.26 | $ | 15,261 | |||||||||||||||||||||||||||||||||||||||
2009(c) | $ | 11.94 | 0.27 | 1.93 | 2.20 | (0.27 | ) | — | (0.27 | ) | $ | 13.87 | 4.40 | (d) | 1.55 | (d) | 1.55 | (d) | 6.40 | (d)(e) | 18.58 | 14.37 | $ | 3,684 | ||||||||||||||||||||||||||||||||||||
Class I Shares |
| |||||||||||||||||||||||||||||||||||||||||||||||||||||||||||
2011 | $ | 14.23 | 0.63 | (0.14 | ) | 0.49 | (0.63 | ) | (0.02 | ) | (0.65 | ) | $ | 14.07 | 4.62 | 0.99 | 0.99 | 1.03 | 3.74 | 19.45 | $ | 54,736 | ||||||||||||||||||||||||||||||||||||||
2010 | $ | 13.87 | 0.64 | 0.48 | 1.12 | (0.65 | ) | (0.11 | ) | (0.76 | ) | $ | 14.23 | 4.66 | 0.99 | 0.99 | 1.11 | 8.48 | 16.26 | $ | 42,134 | |||||||||||||||||||||||||||||||||||||||
2009(c) | $ | 11.94 | 0.31 | 1.92 | 2.23 | (0.30 | ) | — | (0.30 | ) | $ | 13.87 | 4.90 | (d) | 0.99 | (d) | 0.99 | (d) | 2.12 | (d) | 18.87 | 14.37 | $ | 18,561 | ||||||||||||||||||||||||||||||||||||
| (a) | Not annualized for periods less than one year. |
| (b) | Sales loads are not reflected in computing total return, which are not annualized for periods less than one year. |
| (c) | Fund commenced operations on April 1, 2009. |
| (d) | Annualized. |
| (e) | Due to the size of net assets and fixed expenses, ratios may appear disproportionate. |
| + | Based on weighted average shares outstanding. |
See notes to financial statements.
| 24 Certified Annual Report | Certified Annual Report 25 |
REPORT OF INDEPENDENT REGISTERED PUBLIC ACCOUNTING FIRM
Thornburg Strategic Municipal Income Fund
To the Trustees and Shareholders of
Thornburg Strategic Municipal Income Fund
In our opinion, the accompanying statement of assets and liabilities, including the schedule of investments, and the related statements of operations and of changes in net assets and the financial highlights present fairly, in all material respects, the financial position of Thornburg Strategic Municipal Income Fund (one of the portfolios constituting Thornburg Investment Trust, hereafter referred to as the “Fund”) at September 30, 2011, the results of its operations for the year then ended, the changes in its net assets for each of the two years in the period then ended and the financial highlights for each of the periods presented, in conformity with accounting principles generally accepted in the United States of America. These financial statements and financial highlights (hereafter referred to as “financial statements”) are the responsibility of the Fund’s management. Our responsibility is to express an opinion on these financial statements based on our audits. We conducted our audits of these financial statements in accordance with the standards of the Public Company Accounting Oversight Board (United States). Those standards require that we plan and perform the audit to obtain reasonable assurance about whether the financial statements are free of material misstatement. An audit includes examining, on a test basis, evidence supporting the amounts and disclosures in the financial statements, assessing the accounting principles used and significant estimates made by management, and evaluating the overall financial statement presentation. We believe that our audits, which included confirmation of securities at September 30, 2011 by correspondence with the custodian and brokers, provide a reasonable basis for our opinion.
PricewaterhouseCoopers LLP
New York, New York
November 21, 2011
26 Certified Annual Report
| EXPENSE EXAMPLE | ||
| Thornburg Strategic Municipal Income Fund | September 30, 2011 (Unaudited) | |
As a shareholder of the Fund, you incur two types of costs:
| (1) | transaction costs, including |
(a) sales charges (loads) on purchase payments, for Class A shares;
(b) a deferred sales charge on redemptions of any part or all of a purchase of $1 million of Class A shares within 12 months of purchase;
(c) a deferred sales charge on redemptions of Class C shares within 12 months of purchase;
| (2) | ongoing costs, including management fees; distribution and/or service (12b-1) fees; and other Fund expenses. |
This example is intended to help you understand your ongoing costs (in dollars) of investing in the Fund and to compare these costs with the ongoing costs of investing in other mutual funds.
The example is based on a $1,000 investment beginning on April 1, 2011, and held until September 30, 2011.
ACTUAL EXPENSES
For each class of shares, the first line of the table at right provides information about actual account values and actual expenses. You may use the information in this line, together with the amount you invested, to estimate the expenses that you paid over the period. Simply divide your account value by $1,000 (for example, an $8,600 account value divided by $1,000 = 8.6), then multiply the result by the number in the first line for your class of shares under the heading entitled “Expenses Paid During Period” to estimate the expenses you paid on your account during this period.
HYPOTHETICAL EXAMPLE FOR COMPARISON PURPOSES
For each class of shares, the second line of the table at right provides information about hypothetical account values and hypothetical expenses based on the Fund’s actual expense ratio and an assumed rate of return of 5% per year before expenses, which is not the Fund’s actual return. The hypothetical account values and expenses may not be used to estimate the actual ending account balance or expenses you paid for the period. You may use this information to compare the ongoing costs of investing in the Fund and other funds. To do so, compare this 5% hypothetical example with the 5% hypothetical examples that appear in the shareholder reports of the other funds.
| Beginning Account Value 4/1/11 | Ending Account Value 9/30/11 | Expenses Paid During Period† 4/1/11–9/30/11 | ||||||||||
Class A Shares | ||||||||||||
Actual | $ | 1,000.00 | $ | 1,095.00 | $ | 6.56 | ||||||
Hypothetical* | $ | 1,000.00 | $ | 1,018.80 | $ | 6.33 | ||||||
Class C Shares | ||||||||||||
Actual | $ | 1,000.00 | $ | 1,093.40 | $ | 8.13 | ||||||
Hypothetical* | $ | 1,000.00 | $ | 1,017.30 | $ | 7.84 | ||||||
Class I Shares | ||||||||||||
Actual | $ | 1,000.00 | $ | 1,096.40 | $ | 5.20 | ||||||
Hypothetical* | $ | 1,000.00 | $ | 1,020.11 | $ | 5.01 | ||||||
| † | Expenses are equal to the annualized expense ratio for each class (A: 1.25%; C: 1.55%; I: 0.99%) multiplied by the average account value over the period, multiplied by 183/365 to reflect the one-half year period. |
| * | Hypothetical assumes a rate of return of 5% per year before expenses. |
Please note that the expenses shown in the table are meant to highlight your ongoing costs only and do not reflect any transactional costs, such as sales charges (loads), redemption fees, or exchange fees. Therefore, the second line of the table for each class of shares is useful in comparing ongoing costs only, and will not help you determine the relative total costs of owning different funds. In addition, if these transactional costs were included, your costs would have been higher.
Certified Annual Report 27
| INDEX COMPARISON | ||
| Thornburg Strategic Municipal Income Fund | September 30, 2011 (Unaudited) | |
GROWTH OF A HYPOTHETICAL $10,000 INVESTMENT
Thornburg Strategic Municipal Income Fund versus BofA Merrill Lynch Municipal Master Index
and Consumer Price Index (April 1, 2009 to September 30, 2011)
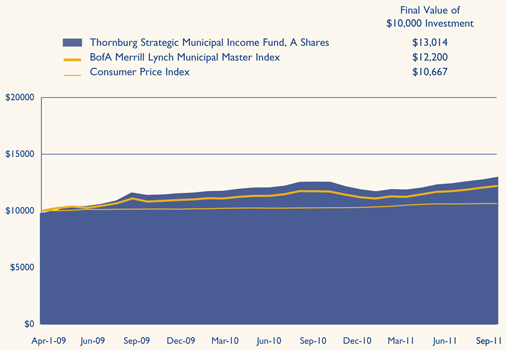
AVERAGE ANNUAL TOTAL RETURNS
For the periods ended September 30, 2011 (with sales charge)
| 1 Yr | 5 Yrs | 10 Yrs | Since Inception | |||||||||||||
A Shares (Incep: 4/1/09) | 1.40 | % | — | — | 11.14 | % | ||||||||||
C Shares (Incep: 4/1/09) | 2.57 | % | — | — | 11.74 | % | ||||||||||
I Shares (Incep: 4/1/09) | 3.74 | % | — | — | 12.35 | % | ||||||||||
Performance data shown represents past performance and is no guarantee of future results. Investment return and principal value will fluctuate so shares, when redeemed, may be worth more or less than their original cost. Current performance may be lower or higher than quoted. For performance current to the most recent month end, visit thornburg.com or call 800.847.0200. The performance data and graph do not reflect the deduction of taxes that a shareholder would pay on distributions or the redemption of Fund shares. Returns reflect the reinvestment of dividends and capital gains as well as applicable sales charges. Class A shares are sold with a maximum sales charge of 2.00%. Class C shares assume deduction of a 0.60% contingent deferred sales charge (CDSC) for the first year only. There is no sales charge for Class I shares.
28 Certified Annual Report
| TRUSTEES AND OFFICERS | ||
| Thornburg Strategic Municipal Income Fund | September 30, 2011 (Unaudited) | |
Name, Age, | Principal Occupation(s) During Past Five Years | Other Directorships Held by Trustee | ||
INTERESTED TRUSTEES(1)(2)(4) | ||||
Garrett Thornburg, 65 Chairman of Trustees, Trustee since 1987(3) | Chairman and controlling shareholder and, until 2008, CEO of Thornburg Investment Management, Inc. (investment advisor); Chairman, CEO, and controlling shareholder of Thornburg Securities Corporation (securities dealer); CEO until 2007 and Chairman until 2009 of TMST, Inc. (f/k/a Thornburg Mortgage, Inc.) (real estate investment trust); President and Sole Director of Thornburg Mortgage Advisory Corporation (investment manager to TMST, Inc.). | None | ||
Brian J. McMahon, 55 Trustee since 2001, Member of Governance & Nominating Committee & Operations Risk Oversight Committee, President since 1997(5)(6) | CEO since 2008, President, Managing Director, Chief Investment Officer, and Portfolio Manager of Thornburg Investment Management, Inc. | None | ||
INDEPENDENT TRUSTEES(1)(2)(4) | ||||
David A. Ater, 66 Trustee since 1994, Member of Audit Committee & Governance & Nominating Committee | Principal in Ater & Associates, Santa Fe, NM (developer, planner and broker of residential and commercial real estate); owner, developer and broker for various real estate projects. | None | ||
David D. Chase, 70 Trustee since 2000, Chairman of Audit Committee | Managing Member of Vestor Associates, LLC, Santa Fe, NM (private equity fund); Managing Member of CS Group, LLC, Santa Fe, NM (merchant bank). | None | ||
Eliot R. Cutler, 65 Trustee since 2004 & Nominating Committee, Chairman of Governance | Senior Counsel and, until 2009, Partner in Akin, Gump, Strauss, Hauer & Feld LLP (law firm) in Washington, D.C. and Beijing, China. | None | ||
Susan H. Dubin, 62 Trustee since 2004, Member of Audit Committee | President of Dubin Investments, Ltd., Greenwich, CT (private investment fund); Director and officer of various charitable organizations. | None | ||
Owen D. Van Essen, 57 Trustee since 2004, Member of Governance & Nominating Committee & Chairman of Operations Risk Oversight Committee | President of Dirks, Van Essen & Murray, Santa Fe, NM (newspaper mergers and acquisitions). | None | ||
James W. Weyhrauch, 52 Trustee since 1996, Member of Audit Committee & Operations Risk Oversight Committee | Real estate broker, Santa Fe Properties, Santa Fe, NM; Vice Chairman of Nambe LLC, Santa Fe, NM (manufacturing & design company). | None | ||
Certified Annual Report 29
| TRUSTEES AND OFFICERS, CONTINUED | ||
| Thornburg Strategic Municipal Income Fund | September 30, 2011 (Unaudited) | |
Name, Age, Position Held with Fund Year Elected | Principal Occupation(s) During Past Five Years | Other Directorships Held by Trustee | ||
OFFICERS OF THE FUND (WHO ARE NOT TRUSTEES)(1)(6)(7) | ||||
| George T. Strickland, 48 Vice President since 1996, Treasurer since 2007(6) | Portfolio Manager, Vice President, and Managing Director of Thornburg Investment Management, Inc. | Not applicable | ||
William V. Fries, 72 Vice President since 1995 | Portfolio Manager, Vice President, and Managing Director of Thornburg Investment Management, Inc. | Not applicable | ||
Leigh Moiola, 44 Vice President since 2001 | Vice President, Managing Director, and Director of Marketing of Thornburg Investment Management, Inc. | Not applicable | ||
Alexander Motola, 41 Vice President since 2001 | Portfolio Manager, Vice President, and Managing Director of Thornburg Investment Management, Inc. | Not applicable | ||
Wendy Trevisani, 40 Vice President since 1999 | Portfolio Manager and Managing Director of Thornburg Investment Management, Inc. | Not applicable | ||
Joshua Gonze, 48 Vice President since 1999 | Portfolio Manager since 2007, Managing Director, and Associate Portfolio Manager until 2007 of Thornburg Investment Management, Inc. | Not applicable | ||
Christopher Ihlefeld, 41 Vice President since 2003 | Portfolio Manager since 2007, Managing Director, and Associate Portfolio Manager until 2007 of Thornburg Investment Management, Inc. | Not applicable | ||
Leon Sandersfeld, 45 Vice President since 2003 | Managing Director since 2007 and Fund Accounting Director of Thornburg Investment Management, Inc. | Not applicable | ||
Sasha Wilcoxon, 37 Vice President since 2003 Secretary since 2007(6) | Managing Director since 2007, Director of Operations, and Vice President of Thornburg Investment Management, Inc. | Not applicable | ||
Edward Maran, 53 Vice President since 2004 | Portfolio Manager and Managing Director of Thornburg Investment Management, Inc. | Not applicable | ||
Vinson Walden, 41 Vice President since 2004 | Portfolio Manager and Managing Director of Thornburg Investment Management, Inc. | Not applicable | ||
Thomas Garcia, 40 Vice President since 2006 | Vice President since 2011, Managing Director, Head Equity Trader, and Associate Portfolio Manager of Thornburg Investment Management, Inc. | Not applicable | ||
Lei Wang, 40 Vice President since 2006 | Portfolio Manager and Managing Director of Thornburg Investment Management, Inc. | Not applicable | ||
Connor Browne, 32 Vice President since 2006 | Portfolio Manager and Managing Director of Thornburg Investment Management, Inc. | Not applicable | ||
Jason Brady, 37 Vice President since 2007 | Vice President since 2011, Portfolio Manager since 2007, Managing Director since 2007, and Associate Portfolio Manager 2006–2007 of Thornburg Investment Management, Inc. | Not applicable | ||
30 Certified Annual Report
| TRUSTEES AND OFFICERS, CONTINUED | ||
| Thornburg Strategic Municipal Income Fund | September 30, 2011 (Unaudited) | |
Name, Age, Position Held with Fund Year Elected | Principal Occupation(s) During Past Five Years | Other Directorships Held by Trustee | ||
Lewis Kaufman, 35 Vice President since 2007 | Portfolio Manager since 2007, Managing Director since 2007, and Associate Portfolio Manager until 2009 of Thornburg Investment Management, Inc. | Not applicable | ||
Christopher Ryon, 55 Vice President since 2008 | Portfolio Manager since 2009, Managing Director since 2009, and Associate Portfolio Manager 2008–2009 of Thornburg Investment Management, Inc.; Principal of Vanguard Funds until 2008. | Not applicable | ||
Lon Erickson, 36 Vice President since 2008 | Portfolio Manager since 2010, Managing Director since 2010, and Associate Portfolio Manager 2008–2010 of Thornburg Investment Management, Inc.; Senior Analyst of State Farm Insurance until 2008. | Not applicable | ||
Kathleen Brady, 51 Vice President since 2008 | Senior Tax Accountant since 2007 of Thornburg Investment Management, Inc.; Chief Financial Officer of Vestor Partners, LP (private equity fund) until 2007. | Not applicable | ||
Jack Gardner, 57 Vice President since 2008 | Managing Director since 2007 of Thornburg Investment Management, Inc.; President since 2008 and National Sales Director of Thornburg Securities Corporation. | Not applicable | ||
Laura Hillstrom, 44 Vice President since 2009 | Chief Administrative Officer since 2009, Vice President and Managing Director, and Director of Information Systems until 2009 of Thornburg Investment Management, Inc. | Not applicable | ||
| (1) | Each person’s address is 2300 North Ridgetop Road, Santa Fe, New Mexico 87506. |
| (2) | The Fund is one of sixteen separate investment “Funds” or “series” of Thornburg Investment Trust (the “Trust”), which comprises the Thornburg mutual fund complex and is organized as a Massachusetts business trust. Thornburg Investment Management, Inc. is the investment advisor to, and manages, the sixteen Funds of the Trust. Each Trustee oversees the sixteen Funds of the Trust. |
| (3) | Mr. Thornburg is considered an “interested” Trustee under the Investment Company Act of 1940 because he is the sole director and controlling shareholder of Thornburg Investment Management, Inc., the investment advisor to the sixteen active Funds of the Trust, and is the sole director and controlling shareholder of Thornburg Securities Corporation, the distributor of shares for the Trust. |
| (4) | Each Trustee serves in office until the election and qualification of a successor. |
| (5) | Mr. McMahon is considered an “interested” Trustee because he is the chief executive officer and president of Thornburg Investment Management, Inc. |
| (6) | The Trust’s president, secretary, and treasurer each serves a one-year term or until the election and qualification of a successor; each other officer serves at the pleasure of the Trustees. |
| (7) | Assistant vice presidents, assistant secretaries and assistant treasurers are not shown. |
The Statement of Additional Information for each Fund of the Trust includes additional information about the Trustees and is available, without charge and upon request, by calling 1-800-847-0200.
Certified Annual Report 31
| OTHER INFORMATION | ||
| Thornburg Strategic Municipal Income Fund | September 30, 2011 (Unaudited) | |
PORTFOLIO PROXY VOTING
Policies and Procedures:
The Trust has delegated to Thornburg Investment Management, Inc. (the “Advisor”) voting decisions respecting proxies for the Fund’s voting securities. The Advisor makes voting decisions in accordance with its Proxy Voting Policy. A description of the Policy is available (i) without charge, upon request, by calling the Advisor toll-free at 1-800-847-0200, (ii) on the Thornburg website at www.thornburg. com, and (iii) on the Securities and Exchange Commission’s website at www.sec.gov.
Information regarding how proxies were voted is available on or before August 31 of each year for the twelve months ending the preceding June 30. This information is available (i) without charge, upon request by calling the Advisor toll-free at 1-800-847-0200, (ii) on the Thornburg website at www.thornburg.com, and (iii) on the Securities and Exchange Commission’s website at www.sec.gov.
TAX INFORMATION
For the tax year ended September 30, 2011 dividends paid by the Fund of $3,828,976 (or the maximum allowed) are tax exempt dividends and $5,449 are designated as taxable long-term capital gain dividends for federal income tax purposes.
The information and distributions reported herein may differ from the information and distributions reported to the shareholders for the calendar year ending December 31, 2011. Complete information will be reported in conjunction with your 2011 Form 1099.
AVAILABILITY OF QUARTERLY PORTFOLIO SCHEDULE
The Fund files with the Securities and Exchange Commission schedules of its portfolio holdings on Form N-Q for the first and third quarters of each fiscal year. The Fund’s Forms N-Q are available on the Commission’s website at www.sec.gov, or may be reviewed and copied at the Commission’s Public Reference Room in Washington, D.C. Information on the operation of the Public Reference Room may be obtained by calling 1-800-SEC-0330. The Fund also makes this information available on its website at www.thornburg.com/ download or upon request by calling 1-800-847-0200.
STATEMENT RESPECTING RENEWAL OF INVESTMENT ADVISORY AGREEMENT
Thornburg Investment Management, Inc. (the “Advisor”) provides investment management services to Thornburg Strategic Municipal Income Fund pursuant to an investment advisory agreement. The Trustees consider the renewal of this agreement annually, and most recently determined to renew the agreement on September 13, 2011.
In anticipation of their recent consideration of the advisory agreement’s renewal, the independent Trustees met in May 2011 to plan the Trustees’ evaluation of the Advisor’s performance and to specify the information the Advisor would present to the Trustees for their review. The Advisor’s chief investment officer subsequently reviewed portions of the information with the Trustees at a meeting session scheduled for that purpose, and the independent Trustees thereafter met in independent session to consider the Advisor’s presentation and various specific issues respecting their consideration of the advisory agreement’s renewal. Following these sessions, the Trustees met to consider a renewal of the agreement, and the independent Trustees voted unanimously at that meeting to renew the agreement for an additional term of one year.
The information below summarizes certain factors considered by the Trustees in connection with the determination to renew the advisory agreement. In determining to renew the agreement, the Trustees did not identify any single factor as controlling, and this summary does not describe all of the matters considered by the Trustees in making their determination.
Quality of Services; Fund Investment Performance. The Trustees evaluated the nature, extent and quality of services provided by the Advisor under the advisory agreement, and evaluated the investment performance of the Fund.
In connection with their general supervision of the Advisor, and as an important element of their annual consideration of a renewal of the advisory agreement, the Trustees received and considered reports from the Advisor throughout the year. These reports addressed a wide variety of topics, including particularly the Advisor’s selection of investments and execution of the Fund’s investment strategies. In addition, the Trustees considered information provided to them at their request in anticipation of their annual evaluation of the Advisor’s services, including (i) the Fund’s absolute investment performance and achievement of stated objectives, (ii) the Advisor’s
32 Certified Annual Report
| OTHER INFORMATION, CONTINUED | ||
| Thornburg Strategic Municipal Income Fund | September 30, 2011 (Unaudited) | |
commentary on the Fund’s performance in the context of the Fund’s objectives and reasonable expectations, and business, market and economic conditions, and (iii) measures of the Fund’s investment performance since inception relative to two categories of municipal debt mutual funds selected by independent mutual fund analyst firms, and relative to a broad-based securities index.
The Trustees also considered their perceptions of portfolio management personnel developed in formal and informal meetings throughout the year, the Advisor’s staffing and other resources, trade execution, the Advisor’s performance of accounting and other services, the Advisor’s observance of compliance and regulatory requirements, the Advisor’s responsiveness to the Trustees, and other factors.
In evaluating quantitative and performance data presented, the Trustees noted (among other aspects of the data) performance data for the one full calendar year since the Fund’s inception, which showed that the Fund’s investment return for the year had exceeded the average return of the mutual fund category for which calendar year data was presented. Other noted quantitative data showed that the Fund’s investment returns fell within the top third of performance for the first fund category for the year-to-date period ended with the second quarter of the current year and within the top half of the same category for the one-year period, and that the Fund’s investment returns fell within the top quartile of performance for the second fund category for the year-to-date and one-year periods.
The Trustees concluded, based upon these and other considerations, that the nature, extent and quality of the Advisor’s services were sufficient and that the Advisor had satisfactorily pursued the Fund’s stated investment objectives. The Trustees further concluded that the investment performance of the Fund was satisfactory in the context of the Fund’s objectives and policies, and prevailing market conditions.
Fees and Expenses; Profitability of Advisor; Economies of Scale; Ancillary Benefits to Advisor. The Trustees evaluated the level of the management fee charged by the Advisor to the Fund, and in this connection, reviewed the profitability of the Advisor, economies of scale potentially available to the Fund and whether the Advisor received any ancillary benefits from its relationship with the Fund.
In evaluating the level of the management fee, the Trustees considered the fee charged by the Advisor and the other expenses charged to the Fund in light of the nature and quality of services provided, comparison of the actual Advisor’s fee and Fund expenses to the statement of fees and expenses in the Fund’s prospectuses, and comparisons of the Advisor’s fee and other Fund expenses to median and average fees and expenses charged to two groups of municipal debt mutual funds assembled by independent mutual fund analyst firms. Comparative fee and expense data noted by the Trustees showed that the management fee charged to the Fund was higher than the median and average fee levels for the two groups of mutual funds, and that the overall expense ratio of the Fund was higher than the median and average expense ratios for the first fund group and somewhat higher than the median expense ratio and slightly higher than the average expense ratio for the second group. The Trustees did not identify the differences as significant. The Trustees considered information about the fees charged by the Advisor to other investment management clients, together with information about fees charged by other advisors to different clients, and analysis of the differences between the requirements of institutional clients and mutual funds and the consequently different investment management services provided, respectively, to institutional clients and to mutual funds. The Trustees confirmed their previous observations that the differences between the fees charged by the Advisor to different types of clients did not appear exceptional, and that the fee rates charged by investment advisors to institutional clients had limited relevance to the evaluation of fee rates charged to mutual funds, because of the significant differences between the respective requirements of institutional clients and mutual funds, the differences between the respective services rendered to institutional clients and mutual funds, and the different circumstances in which the respective fees originate.
In reviewing the profitability of the Advisor, the Trustees considered costs incurred by the Advisor and data comparing the profitability of the Advisor to other investment management firms. The Trustees considered information from the Advisor respecting the effects of recent economic events on the Advisor and the Advisor’s responses to those events. The information provided did not indicate that the Advisor’s profitability was unusual, and the Trustees noted the adequacy of the Advisor’s resources and service capabilities. In reviewing the extent to which economies of scale would be realized by the Fund as it grows and whether fee levels reflect economies of scale, the Trustees considered the breakpoint structure for advisory fees chargeable to the Fund, the demonstrated economies of scale enjoyed by other Funds of the Trust as they had grown in size, and economies of scale realized by other mutual funds. The information provided demonstrated to the Trustees that the Fund may reasonably be expected to realize economies of scale as the Fund increases in size due to the breakpoint fee structure of the advisory agreement and other factors. In reviewing potential benefits to the Advisor because of its relationship to the Fund, the Trustees considered the Advisor’s receipt of research services from broker dealers, and the benefits to both the Fund and the Advisor of the Advisor’s expansion of its staffing, compliance and systems capabilities and other resources to serve a broader variety of investment management clients. No unusual or unfair benefits to the Advisor from its relationship to the Fund were identified by the Trustees.
Certified Annual Report 33
| OTHER INFORMATION, CONTINUED | ||
| Thornburg Strategic Municipal Income Fund | September 30, 2011 (Unaudited) | |
The Trustees concluded, based upon their consideration of these factors, that the management fee charged to the Fund by the Advisor was fair and reasonable in view of the nature and quality of the services provided by the Advisor, the clear disclosure of fees and expenses in the Fund’s prospectuses, the investment performance of the Fund, and comparisons of fees and costs charged to the Fund to fees and expenses charged to other mutual funds.
34 Certified Annual Report
This page intentionally left blank.
This page is not part of the Annual Report. 35
Trustees’ Statement to Shareholders
Not part of the Certified Annual Report
September 13, 2011
The Trustees believe current and prospective shareholders should know how we discharge our responsibilities in supervising the Funds’ investment advisor and in reviewing the advisor’s contract for renewal. Since 2005, we have issued a statement which sets out clearly the three principal guidelines that we follow in supervising the Trust’s investment advisor on your behalf. In accordance with our customary practice, in September of this year we again reviewed our statement and concluded we should reissue this statement outlining the principal features of our supervision of the advisor’s performance of investment management services for the Funds.
We begin with the premise that each shareholder selected his or her Fund because its investments are managed by the investment advisor identified in the prospectus and in accordance with the objective and policies described in the prospectus. We realize, as each of you do, that if you believe that your Fund’s stated objective and policies no longer serve your personal investment goals, you can sell your shares and leave the Fund.
Therefore, we believe that our primary supervisory task – our principal obligation to you – is to assess the nature and quality of the advisor’s services, and to confirm that the advisor actively and competently pursues the Fund’s objective, in accordance with the policies set out in the prospectus. To do this, we meet regularly with management to review your Fund’s portfolio and to discuss the advisor’s specific actions and judgments in pursuing the Fund’s objective. We do not substitute our own judgment for the advisor’s decisions in selecting investments; the advisor is paid to exercise its informed judgment on investment decisions, and we seek to confirm, in reviewing the advisor’s performance, that the advisor is doing just that.
Second, while we are conscious of costs and the effect that costs have on shareholders’ returns, we do not seek the lowest fees or expense ratio as our sole or primary objective. We try to make sure that your Fund’s fees and costs are reasonable in relationship to the services rendered and that they are generally in line with those charged by other expert investment advisors, consistent with our belief that the Fund’s investors searched for and expect that expertise and attention and have decided to pay a reasonable price for it. We do not put the management contract “out to bid” as a matter of course, and we would not do so unless we had concluded that the advisor materially had failed to pursue the Fund’s objectives in accordance with its policies, or for other equally important reasons. We believe that any other approach would be inconsistent with your interests and contrary to your expectations when you bought shares of the Fund in the first place.
Finally, because we believe that most Thornburg Fund shareholders have invested with a long-term perspective, we try not to focus too much on the fashions of the moment and on short-term performance. The market will not favor any specific investment objective or set of policies at all times and under all economic circumstances. A fund will experience periods of both high and low returns relative to other funds and other investments. Even if one of our Funds is not favored by the market at a particular time, we believe that the advisor is nonetheless obliged to remain true to the Fund’s objective and policies, and we watch to see that it does so.
36 This page is not part of the Annual Report.
Retirement and Education Accounts
Thornburg Investment Management offers retirement and education savings accounts that can help you meet a variety of planning challenges. For account applications or further information on any of the accounts below, please call 1-800-847-0200 or go to www.thornburg.com/ira. Your financial advisor can help you determine which plan is right for you.
Individual Retirement Accounts
Individual Retirement Accounts (IRAs) provide a tax-advantaged means to save money for the future. For a detailed outline of the difference between retirement accounts, see www.thornburg.com/ira. Rollovers are available. Call 1-800-847-0200 for more information.
Traditional IRAs – Contributions to Traditional IRAs are tax deductible for eligible individuals, and withdrawals are taxed as additional ordinary income. You may contribute to an IRA if you receive compensation and are under 70 1/2, even if you are covered by an employer retirement plan. Deductible contributions are subject to certain qualifications. Please consult your tax advisor.
Roth IRAs – Under a Roth IRA, there is no tax deduction for contributions, but there is no income tax on qualified withdrawals. For a more detailed comparison of Traditional and Roth IRAs, please see our web site at www.thornburg.com/ira.
SEP IRAs – Simplified Employee Pension (SEP) IRAs are established by employers. The employer is allowed a tax deduction for contributions made to the SEP Plan and makes contributions to each eligible employee’s SEP IRA on a discretionary basis.
SIMPLE IRAs – Savings Incentive Match Plan for Employees of Small Employers (SIMPLE) is designed to give small business owners a simplified method to establish and contribute to a retirement plan for employees. The employer is allowed a tax deduction for contributions and makes either matching or non-elective contributions to each eligible employee’s SIMPLE IRA. Employees may make salary deferral contributions.
Coverdell Education Savings Account
These savings accounts are designed to provide a way to save money for higher education expenses. In an Education Savings Account, earnings and interest grow tax-free, and qualified withdrawals used to pay for eligible higher-education expenses are tax- and penalty-free.
Funds Available
The following funds are available in the accounts listed above:
| • | Thornburg International Value Fund |
| • | Thornburg Value Fund |
| • | Thornburg Core Growth Fund |
| • | Thornburg Investment Income Builder Fund |
| • | Thornburg Global Opportunities Fund |
| • | Thornburg International Growth Fund |
| • | Thornburg Developing World Fund |
| • | Thornburg Limited Term U.S. Government Fund |
| • | Thornburg Limited Term Income Fund |
| • | Thornburg Strategic Income Fund |
This page is not part of the Annual Report. 37

Thornburg Equity Funds
Thornburg’s equity research uses a fundamental and comprehensive analytical approach. Thornburg equity funds focus on a limited number of securities so that each holding can impact performance. The equity team searches for firms believed to have a promising future and seeks to buy shares of those companies at a discount to their intrinsic value.
| • | Thornburg Value Fund |
| • | Thornburg International Value Fund |
| • | Thornburg Core Growth Fund |
| • | Thornburg Investment Income Builder Fund |
| • | Thornburg Global Opportunities Fund |
| • | Thornburg International Growth Fund |
| • | Thornburg Developing World Fund |
Thornburg Bond Funds
Thornburg Investment Management applies a disciplined philosophy to fixed-income management. Since the launch of our first fixed-income fund over 25 years ago, we have been conducting fundamental, bottom-up research in an effort to identify bonds which we believe provide the best return for a given level of risk. We are very organic in our approach, avoiding leverage or complex strategies which could backfire in periods of market uncertainty.
| • | Thornburg Limited Term Municipal Fund |
| • | Thornburg Intermediate Municipal Fund |
| • | Thornburg California Limited Term Municipal Fund |
| • | Thornburg New Mexico Intermediate Municipal Fund |
| • | Thornburg New York Intermediate Municipal Fund |
| • | Thornburg Strategic Municipal Income Fund |
| • | Thornburg Limited Term U.S. Government Fund |
| • | Thornburg Limited Term Income Fund |
| • | Thornburg Strategic Income Fund |
Before investing, carefully consider the Fund’s investment goals, risks, charges, and expenses. For a prospectus containing this and other information, contact your financial advisor or visit thornburg.com. Read it carefully before investing.
For additional information, please visit www.thornburg.com
Thornburg Investment Management, Inc. 2300 North Ridgetop Road, Santa Fe, NM 87506
This page is not part of the Annual Report. 39
 | Waste not, Wait not |  | ||||
| Get instant access to your shareholder reports. | ||||||
| This Annual Report is submitted for the general information of shareholders of the Fund. It is not authorized for distribution to prospective investors in the Fund unless preceded or accompanied by an effective prospectus. | By switching from your postal mailbox to your email inbox, you reduce paper clutter, improve record keeping access, and help conserve our natural resources. | |||||
 | Investment Advisor: Thornburg Investment Management® 800.847.0200 | Go to www.thornburg.com/edelivery and sign up to receive your shareholder reports, prospectuses, and proxy statements electronically. | ||||
Distributor: | ||||||
Thornburg Securities Corporation® 800.847.0200 | You invest in the future, without spending a dime. | |||||
| TH1978 | ||||||

Important Information
The information presented on the following pages is current as of September 30, 2011. The managers’ views, portfolio holdings, and sector diversification are provided for the general information of the Fund’s shareholders; to the extent this information is historical, it should not be considered predictive of future circumstances. This material should not be deemed a recommendation to buy or sell any of the securities mentioned.
Investments in the Fund carry risks, including possible loss of principal. Bond funds have the same interest rate, inflation, and credit risks that are associated with the underlying bonds. The principal value of bonds will fluctuate relative to changes in interest rates, decreasing when interest rates rise. Unlike bonds, bond funds have ongoing fees and expenses. Please see the Fund’s Prospectus for a discussion of the risks associated with an investment in the Fund. Investments in the Fund are not FDIC insured, nor are they deposits of or guaranteed by a bank or any other entity. There is no guarantee that the Fund will meet its investment objectives. The laddering strategy does not assure or guarantee better performance and cannot eliminate the risk of investment losses.
Performance data given at net asset value (NAV) does not take into account applicable sales charges. If the sales charges had been included, the performance would have been lower.
Minimum investments for Class I shares are higher than those for other classes. Class I shares may not be available to all investors.
Share Class | NASDAQ Symbol | Cusip | ||
Class A | LTCAX | 885-215-426 | ||
Class C | LTCCX | 885-215-418 | ||
Class I | LTCIX | 885-215-392 |
Glossary
Barclays Capital Five-Year Municipal Bond Index – A rules-based, market-value-weighted index of the tax-exempt bond market. To be included in the index, bonds must have a minimum credit rating of Baa. The approximate maturity of the municipal bonds in the index is five years.
BofA Merrill Lynch 1-10 Year Municipal Securities Index – This index is a subset of the BofA Merrill Lynch U.S. Municipal Securities Index including all securities with a remaining term to final maturity less than 10 years.
Unless otherwise noted, index returns reflect the reinvestment of income dividends and capital gains, if any, but do not reflect fees, brokerage commissions or other expenses of investing. Investors may not make direct investments into any index.
Alternative Minimum Tax (AMT) – A federal tax aimed at ensuring that high-income individuals, estates, trusts, and corporations pay a minimal level income tax. For individuals, the AMT is calculated by adding tax preference items to regular taxable income.
Annualized Distribution Yield – The distribution yield is calculated by taking the sum of the month’s total distribution factors and dividing this sum by a 30-day period and annualizing to a 360-day year. The value is then divided by the ending maximum offering price per share to arrive at the annualized distribution yield. The yield is calculated on a periodic basis and is subject to change.
Basis Point (bps) – A unit equal to 1/100th of 1%. 1% = 100 basis points (bps).
Bond Credit Ratings – A bond credit rating assesses the financial ability of a debt issuer to make timely payments of principal and interest. Ratings of AAA (the highest), AA, A, and BBB are investment-grade quality. Ratings of BB, B, CCC, CC, C, and D (the lowest) are considered below investment grade, speculative grade, or junk bonds. Unless otherwise noted, the ratings listed are from Municipal Market Data and are a combination of ratings from Standard and Poor’s, Moody’s Investors Service, and Fitch Ratings.
Build America Bonds (BAB) – Taxable municipal bonds that feature tax credits and/or federal subsidies for bondholders and state and local government bond issuers. Build America Bonds (BABs) were introduced in 2009 as part of President Obama’s American Recovery and Reinvestment Act to create jobs and stimulate the economy. BABs attempt to achieve this by lowering the cost of borrowing for state and local governments in financing new projects.
Consumer Price Index (CPI) – An index that measures prices of a fixed basket of goods bought by a typical consumer, including food, transportation, shelter, utilities, clothing, medical care, entertainment and other items. The CPI, published by the Bureau of Labor Statistics in the Department of Labor, is based at 100 in 1982 and is released monthly. It is widely used as a cost-of-living benchmark to adjust Social Security payments and other payment schedules, union contracts and tax brackets. The CPI is also known as the cost-of-living index.
Core CPI – Consumer Price Index minus the energy and food components.
This page is not part of the Annual Report. 3
| Important Information, | ||
Continued | ||
Duration – A bond’s sensitivity to interest rates. Bonds with longer durations experience greater price volatility than bonds with shorter durations.
Effective Duration – A bond’s sensitivity to interest rates, incorporating the embedded option features, such as call provisions. Bonds with longer durations experience greater price volatility than bonds with shorter durations.
Fed Funds Rate – The interest rate at which a depository institution lends immediately available funds (balances at the Federal Reserve) to another depository institution overnight.
General Obligation Bond – A municipal bond backed by the credit and “taxing power” of the issuing jurisdiction rather than the revenue from a given project.
M2 – The amount of money in circulation in notes and coin plus non-interest-bearing bank deposits, building-society deposits, and National Savings accounts.
Operation Twist – A monetary policy where, in an attempt to lower long-term interest rates, the Fed sold short-term Treasury bonds and bought long-term Treasury bonds, which pressured the long-term bond yields downward.
Quantitative Easing – The Federal Reserve’s monetary policy used to stimulate the U.S. economy following the recession that began in 2007/08.
SEC Yield – SEC Yield is computed in accordance with SEC standards measuring the net investment income per share over a specified 30-day period expressed as a percentage of the maximum offering price of the Fund’s shares at the end of the period.
Treasuries – U.S. Treasury securities, such as bills, notes and bonds, are negotiable debt obligations of the U.S. government. These debt obligations are backed by the “full faith and credit” of the government and issued at various schedules and maturities. Income from Treasury securities is exempt from state and local, but not federal, taxes.
4 This page is not part of the Annual Report.
Thornburg California Limited Term Municipal Fund
At Thornburg, our approach to management of the Fund is based on the premise that investors in the Fund seek preservation of capital along with an attractive, relatively stable yield. While aggressive bond strategies may generate stronger returns when the market is turning a blind eye towards risk, they often fail to stack up over longer periods of time.
We apply time-tested techniques to manage risk and provide attractive returns. These include:
| • | Building a laddered portfolio. Laddering has been shown over time to mitigate reinvestment and interest-rate risk. |
| • | Investing on a cash-only basis without using leverage. While leveraged strategies may enhance returns when market conditions are favorable, they can quickly compound losses when sentiment shifts. |
| • | Conducting in-depth fundamental research on each issue and actively monitoring positions for subsequent credit events. |
| • | Diversifying among a large number of generally high-quality bonds. |
CO-PORTFOLIO MANAGERS

Josh Gonze, Chris Ryon,CFA, and Chris Ihlefeld
IMPORTANT
PERFORMANCE INFORMATION
Performance data shown represents past performance and is no guarantee of future results. Investment return and principal value will fluctuate so shares, when redeemed, may be worth more or less than their original cost. Current performance may be lower or higher than quoted. For performance current to the most recent month end, visit thornburg.com or call 800.847.0200.
The maximum sales charge for the Fund’s Class A shares is 1.50%. The total annual fund operating expense of Class A shares is 0.97%, as disclosed in the most recent Prospectus.
LONG-TERM STABILITY OF PRINCIPAL
Net asset value history of A shares from February 19, 1987 through September 30, 2011
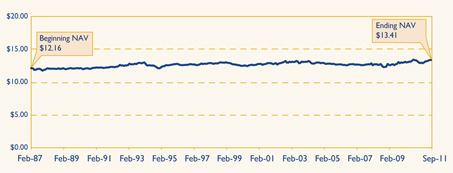
AVERAGE ANNUAL TOTAL RETURNS
For periods ended September 30, 2011
| 1 Yr | 3 Yrs | 5 Yrs | 10 Yrs | Since Inception | ||||||||||||||||
A Shares (Incep: 2/19/87) | ||||||||||||||||||||
Without sales charge | 2.98 | % | 5.56 | % | 4.23 | % | 3.49 | % | 4.77 | % | ||||||||||
With sales charge | 1.46 | % | 5.03 | % | 3.92 | % | 3.33 | % | 4.71 | % | ||||||||||
30-DAY YIELDS, A SHARES
As of September 30, 2011
Annualized Distribution Yield | SEC Yield | |||
2.52% | 1.60 | % | ||
KEY PORTFOLIO ATTRIBUTES
As of September 30, 2011
Number of Bonds | 188 | |||
Effective Duration | 3.9 Yrs | |||
Average Maturity | 4.9 Yrs | |||
See the entire portfolio in the Schedule of Investments beginning on page 11.
This page is not part of the Annual Report. 5

Thornburg California Limited Term Municipal Fund
September 30, 2011
Table of Contents | ||||
| 7 | ||||
| 11 | ||||
| 16 | ||||
| 17 | ||||
| 18 | ||||
| 19 | ||||
| 24 | ||||
| 26 | ||||
| 27 | ||||
| 28 | ||||
| 29 | ||||
| 32 |
This report is certified under the Sarbanes-Oxley Act of 2002, which requires that public companies, including mutual funds, affirm that the information provided in their annual and semiannual shareholder reports fully and fairly represents their financial position.
6 Certified Annual Report
Christopher Ihlefeld Co-Portfolio Manager
Christopher Ryon,CFA Co-Portfolio Manager
Josh Gonze Co-Portfolio Manager | October 14, 2011
Dear Shareholder:
We are pleased to present the annual report for the Thornburg California Limited Term Municipal Fund. The net asset value (NAV) of the Class A shares increased by 3 cents to $13.41 per share for the fiscal year ended September 30, 2011. If you were with us for the entire period, you received dividends of 35.8 cents per share. If you reinvested your dividends, you received 36.2 cents per share. Dividends per share were lower for Class C shares and higher for Class I shares to account for varying class-specific expenses. The Class A shares of your Fund produced a total return of 2.98% at NAV for the fiscal year ended September 30, 2011 compared to 3.75% for the Barclays Capital Five-Year Municipal Bond Index. The main contributor to the difference in performance is that the Barclays Capital Five-Year Municipal Bond Index has all of its holdings in four- to six-year maturities. The Thornburg California Limited Term Municipal Fund has holdings that span one- to ten-year maturities in a laddered structure. The California municipal bond market underperformed the general municipal bond market in the first six months of the fiscal year and rebounded in the second part of the fiscal year. The rebound was not enough to overcome the initial underperformance.
California’s Fiscal Condition
Credit spreads on California state general obligation (GO) bonds have remained fairly stable in the last nine months, in the range of 75 to 100 basis points, or 0.75% to 1.00%, indicating that the market perceives the state’s credit risk as moderate. The spread may reflect mixed news concerning fiscal conditions in California in recent periods. Broadly speaking, California’s revenue in 2011 is higher than it was in 2010, but is below the budgeted forecast. The Office of the State Controller (essentially the accountant for the state) reported that tax revenue in the third quarter was 3% higher than the same quarter in 2010, but is 3.5% below the budget estimate made by the Department of Finance early in the fiscal year. Fortunately the state has demonstrated ready access to capital during the fiscal year, having successfully come to market with several large and well-placed bond issues.
If revenues fail to arrive as projected in the $85.9 billion budget for the 2011–2012 fiscal year, spending cuts will be triggered at various stages, depending on the severity of the shortfall. It’s too early to know if any cuts will be triggered, but in any case, we think doomsday headlines in the media are prone to exaggeration of the actual risk.
The Economy and the Federal Reserve (the Fed)
As we started the fiscal year, beginning in October 2010, the Federal Reserve Board announced a new wrinkle to its already accommodative stance toward monetary policy. “Quantitative Easing” is a policy of buying bonds and other assets to boost demand and fight off deflation. As we close this fiscal year, the Fed has announced another extraordinary measure known as “Operation Twist.” This policy enhancement calls for the Fed to purchase, by the end of June 2012, $400 billion of Treasury |


Certified Annual Report 7
| Letter to Shareholders, | ||
Continued | ||
securities with remaining maturities from 6 to 30 years and to sell an equal amount of Treasury securities with remaining maturities of 3 years or less. This is intended to cause the yield curve (a representation of the prevailing yields of Treasury securities by maturity) to flatten, reducing the yield difference between long-term and short-term Treasury securities. A typical measure of this phenomenon is the difference between the yield of a 10-year Treasury security and the yield of a 30-year Treasury security. The difference in yield between these two securities was 1.38% on September 1, 2011 (30-year Treasury securities yielded 1.38% more than 10-year Treasury securities). The formal announcement of the Fed’s new policy directive was on September 21, 2011, and by September 30, 2011, the difference had narrowed to 1.02%. The above change in the relationship between 10-year and 30-year Treasury securities means that longer maturity Treasury securities outperformed shorter maturity Treasury securities.
The Federal Open Market Committee, in its September 21, 2011 release, stated that “economic growth remains slow” and that there are “significant downside risks to the economic outlook, including strains in global financial markets.” These concerns explain why Treasury yields are lower by 0.17% to 1.59% since March 31, 2011. Longer maturity Treasury securities have decreased in yield more than shorter maturity Treasury securities. The “strains in the global financial markets,” have led the Treasury market to experience a “flight to quality” in spite of a downgrade to AA+ by Standard and Poor’s on August 5, 2011. As one of our colleagues has stated, “the world views Treasury securities as the best house in a bad neighborhood.”
We share the Fed’s view that “economic growth remains low,” but there are some reasons for hope. June 2011 gross domestic product (GDP), a measure of a country’s overall economic output, recorded a 1.3% increase, higher than the 0.4% increase recorded in March of 2011. Capacity utilization, a measure of an economy’s usage of its productive resources, was running at 77.4% for the month ended August 31, 2011 slightly higher than the 75.7% recorded on September 30, 2011. Money supply as measured by M2, a broad measure of money and money substitutes remains elevated. The velocity of M2, a measure of the rate at which money in circulation is used in transactions, continues to decline. Typically rising money supply is viewed as an inflationary threat, as long as velocity remains constant or increases. The combination of rising money supply and decreasing velocity is not inflationary. The one significant difference between this fiscal year end and last fiscal year end is that commercial and industrial loans and leases (loans to corporations, commercial enterprises, and joint ventures) have begun to increase, from a very low base. These loans have increased 7.98% over the 12 months ended September 30, 2011 versus a 10.57% decline for the 12 months ended September 30, 2010. These increases of loans to businesses may be laying the groundwork for a more robust expansion.
CHART I: BofA MERRILL LYNCH 1-10 YEAR MUNICIPAL INDEX
Periodic Returns During the Period from 9/30/2010 through 9/30/2011
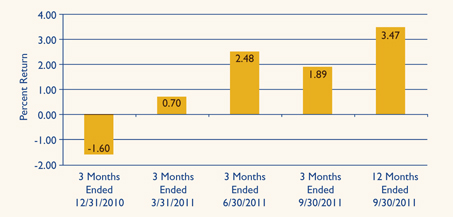
Source: Bloomberg
Past performance does not guarantee future results.
8 Certified Annual Report
The employment picture is still a major concern; with so many Americans either unemployed or underemployed, it’s hard to fathom where demand for goods and services will come from. The unemployment rate is 9.1%, lower than the 9.8% registered in November 2010. In the 12 months ended September 2011, 1.49 million jobs have been created versus the 118,000 lost in the prior 12 months.
The economic picture is not as bleak as some in the media would paint it. The risks of a double-dip recession seem low, but so to do the probabilities of a robust recovery. Our outlook for interest rates is much the same as it was last year with one exception; over the next 6–12 months, we believe the Fed will keep short-term interest rates low, but long-term interest rates have and may continue to benefit from Operation Twist. Investors should ready themselves for increased periods of volatility as some of the exogenous forces impacting the United States play themselves out.
The Municipal Market
The calendar year began with various predictions of numerous defaults in the municipal bond market; the term “hundreds of billions of dollars” was used. For the nine months ended September 30, 2011, the municipal bond market experienced $1.1 billion in defaults, a relatively small amount. This means, if one uses $200 billion as the low end of the estimate, we have only $198.9 billion to go by December 31, 2011 for these dire predictions to be achieved. These estimates were overly dramatic, but they did add to the volatility of returns experienced throughout fiscal 2011. Chart I shows the volatility of returns generated by the BofA Merrill Lynch 1–10 Year Municipal Index for the 12 months ended September 30, 2011.
Most, if not all, of the other predictions of doom proved equally false. Supply of new issue municipal bonds did not expand as the Build America Bond program expired on December 31, 2010. In fact, the supply of newly issued municipal debt is down 35% through September 30, 2011 versus the same period in 2010. On the credit side, the revenue picture for state and local governments is improving. Revenues are increasing, although they are still below peak levels. Also expenditures are being cut. One example of this is that state and local employment payrolls have been cut by in excess of 500,000 jobs nationwide since August 2008.
Chart II illustrates how yields have changed over the last 12 months. The largest declines occurred in the mid-range of California Limited Term’s investable universe. The general level of municipal bond yields appear to be moving in sympathy with the yields on Treasury securities, albeit at a different pace.
The major drivers of returns for the fiscal year have been duration
CHART II: CHANGES IN AAA GENERAL OBLIGATION BOND YIELDS
9/30/2010 through 9/30/2011
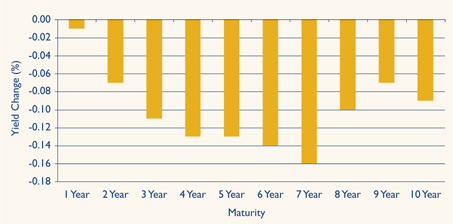
Source: Standard and Poor’s 09/30/2011
Past performance does not guarantee future results.
Certified Annual Report 9
| Letter to Shareholders, | ||
Continued | ||
(longer is better than shorter as rates declined) and yield curve exposure (allocation of assets to mid-range maturities versus shorter and longer maturities is better). The discipline of the laddered portfolio structure seeks to ensure that investors benefit from these opportunities.
Conclusion
Your Thornburg California Limited Term Municipal Fund is a laddered portfolio of 188 municipal obligations. We ladder the maturity dates of the bonds in your portfolio so that some of the bonds are scheduled to mature during each of the coming years. Laddering short and intermediate bonds accomplishes two goals. First, the staggered bond maturities contained in a ladder reduce interest-rate risk and dampen the Fund’s price volatility. Second, laddering reduces reinvestment risk by giving the Fund a steady cash flow stream from maturing bonds to reinvest toward the top of the ladder where yields are typically higher. Chart III describes the percentages of your Fund’s bond portfolio maturing in each of the coming years. The Fund’s adherence to the discipline of the laddered structure served investors well.
CHART III: % OF PORTFOLIO MATURING
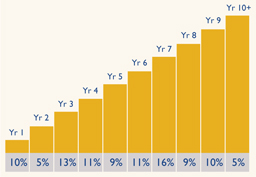
As of 9/30/11. Percentages vary over time.
Data may not add up to 100% due to rounding.
We plan to continue to search for opportunities in the municipal market, using our fundamental, bottom-up approach to portfolio management, and the discipline of the laddered structure. In closing, we would like to thank you for the trust you have placed with us. We continue to keep that foremost in our minds as we go forward into a new year.
| Sincerely, | ||||
 |  |  | ||
Christopher Ihlefeld Co-Portfolio Manager Managing Director | Christopher Ryon,CFA Co-Portfolio Manager Managing Director | Josh Gonze Co-Portfolio Manager Managing Director | ||
The matters discussed in this report may constitute forward-looking statements made pursuant to the safe harbor provisions of the Securities Litigation Reform Act of 1995. These include any advisor or portfolio manager prediction, assessment, analysis or outlook for individual securities, industries, investment styles, market sectors and/or markets. These statements involve risks and uncertainties. In addition to the general risks described for each fund in its current prospectus, other factors bearing on these reports include the accuracy of the advisor’s or portfolio manager’s forecasts and predictions, the appropriateness of the investment strategies designed by the advisor or portfolio manager and the ability of the advisor or portfolio manager to implement their strategies efficiently and successfully. Any one or more of these factors, as well as other risks affecting the securities markets generally, could cause the actual results of any fund to differ materially as compared to its benchmarks.
10 Certified Annual Report
| SCHEDULE OF INVESTMENTS | ||
| Thornburg California Limited Term Municipal Fund | September 30, 2011 | |
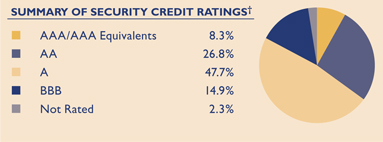
We have used ratings from Standard & Poor’s (S&P). Where S&P ratings are not available, we have used Moody’s Investors Service. Where neither rating is available, we have used ratings from Fitch Ratings. The category of investments identified as “AAA” in this graph includes investments which are pre-refunded or escrowed to maturity. Such investments are backed by an escrow or trust containing sufficient U.S. Government or U.S. Government agency securities to satisfy the timely payment of principal and interest and, therefore, are normally deemed to be equivalent to AAA-rated securities.
Issuer-Description | Credit Rating† S&P/ Moody’s | Principal Amount | Value | |||||||
ABAG Finance Authority, 4.75% due 10/1/2011 (California School of Mechanical Arts) | NR/A3 | $ | 435,000 | $ | 435,039 | |||||
ABAG Finance Authority, 4.75% due 10/1/2012 (California School of Mechanical Arts) | NR/A3 | 455,000 | 465,242 | |||||||
Alameda County COP, 5.625% due 12/1/2016 (Santa Rita Jail; Insured: AMBAC) | AA/NR | 1,830,000 | 2,159,327 | |||||||
Alvord USD GO, 5.25% due 2/1/2014 (Insured: Natl-Re) | A+/Baa1 | 1,150,000 | 1,226,716 | |||||||
Anaheim Public Financing Authority, 5.00% due 10/1/2020 (Electric System Distribution; Insured: AMBAC) | NR/NR | 445,000 | 472,755 | |||||||
Anaheim Public Financing Authority, 5.00% due 10/1/2021 (Electric System Distribution; Insured AMBAC) | NR/NR | 820,000 | 866,986 | |||||||
Bay Area Toll Authority, 5.00% due 4/1/2016 (San Francisco Bay Area) | AA/Aa3 | 2,075,000 | 2,420,114 | |||||||
Burbank Water & Power, 5.00% due 6/1/2015 | AA-/A1 | 750,000 | 852,638 | |||||||
Burbank Water & Power, 5.00% due 6/1/2016 | AA-/A1 | 500,000 | 580,290 | |||||||
Burbank Water & Power, 5.00% due 6/1/2017 | AA-/A1 | 1,000,000 | 1,172,600 | |||||||
Burbank Water & Power, 5.00% due 6/1/2018 | AA-/A1 | 360,000 | 425,826 | |||||||
Burbank Water & Power, 5.00% due 6/1/2020 | AA-/A1 | 625,000 | 740,200 | |||||||
Calexico USD GO, 6.75% due 9/1/2017 | A-/NR | 3,060,000 | 3,539,104 | |||||||
California Educational Facilities Authority, 5.00% due 4/1/2018 (Pitzer College) | NR/A3 | 1,540,000 | 1,738,198 | |||||||
California Educational Facilities Authority, 0% due 10/1/2019 (Loyola Marymount University; Insured: Natl-Re) | NR/A2 | 2,025,000 | 1,403,689 | |||||||
California Educational Facilities Authority, 5.00% due 4/1/2020 (Pitzer College) | NR/A3 | 1,445,000 | 1,619,354 | |||||||
aCalifornia Educational Facilities Authority, 5.00% due 4/1/2022 (Chapman University) | NR/A2 | 2,000,000 | 2,206,380 | |||||||
California GO, 0% due 5/1/2034 put 10/3/2011 (Kindergarten; LOC: Citibank N.A.) (daily demand notes) | AAA/Aa2 | 2,300,000 | 2,300,000 | |||||||
California Health Facilities Financing, 4.00% due 2/1/2013 (Community Program; Insured: California Mtg Insurance) | A-/NR | 1,665,000 | 1,710,388 | |||||||
California Housing Finance Agency, 5.00% due 11/15/2011 (Cedars-Sinai Medical Center) | NR/A2 | 1,500,000 | 1,507,980 | |||||||
California Housing Finance Agency, 3.70% due 8/1/2013 (Home Mtg; Insured: FGIC) | BBB/Baa2 | 1,270,000 | 1,298,169 | |||||||
California Housing Finance Agency, 5.25% due 10/1/2013 (Providence Health) | AA/Aa2 | 650,000 | 706,810 | |||||||
California Housing Finance Agency, 3.80% due 2/1/2014 (Home Mtg; Insured: FGIC) | BBB/Baa2 | 770,000 | 780,141 | |||||||
California Housing Finance Agency, 5.00% due 8/15/2014 (Cedars-Sinai Medical Center) | NR/A2 | 1,500,000 | 1,645,740 | |||||||
California Housing Finance Agency, 4.85% due 8/1/2016 (Insured: AGM) (AMT) | AA+/Aa3 | 1,000,000 | 1,029,490 | |||||||
California Housing Finance Agency, 5.00% due 8/1/2017 (Insured: AGM) (AMT) | AA+/Aa3 | 980,000 | 1,030,509 | |||||||
California Housing Finance Agency, 5.50% due 2/1/2018 (Community Program; Insured: California Mtg Insurance) | A-/NR | 2,715,000 | 3,027,089 | |||||||
California Housing Finance Agency, 5.125% due 8/1/2018 (Insured: AGM) (AMT) | AA+/Aa3 | 1,000,000 | 1,010,220 | |||||||
California Housing Finance Agency, 6.00% due 10/1/2018 (Providence Health) | AA/Aa2 | 1,000,000 | 1,236,960 | |||||||
California Housing Finance Agency, 5.10% due 2/1/2019 (Episcopal Home; Insured: California Mtg Insurance) | A-/NR | 1,840,000 | 1,978,018 | |||||||
California Housing Finance Agency, 5.00% due 7/1/2027 put 7/1/2014 (Catholic Health Care West) | A/A2 | 2,000,000 | 2,173,900 | |||||||
California Housing Finance Agency, 0% due 8/1/2029 (Insured: AMBAC/FHA/VA) | BBB/Baa2 | 1,925,000 | 654,481 | |||||||
California Infrastructure & Economic Development Bank, 5.25% due 8/15/2020 (King City High School) | A-/NR | 1,000,000 | 1,115,440 | |||||||
Certified Annual Report 11
| SCHEDULE OF INVESTMENTS, CONTINUED | ||
| Thornburg California Limited Term Municipal Fund | September 30, 2011 | |
Issuer-Description | Credit Rating† S&P/ Moody’s | Principal Amount | Value | |||||||
California Mobile Home Park Financing Authority, 5.00% due 11/15/2013 (Rancho Vallecitos; Insured: ACA) | NR/NR | $ | 570,000 | $ | 578,801 | |||||
California PCR, 5.90% due 6/1/2014 (San Diego Gas & Electric) | A/A2 | 2,500,000 | 2,794,325 | |||||||
California PCR Solid Waste Disposal, 5.25% due 6/1/2023 put 12/1/2017 (Republic Services, Inc.) (AMT) | BBB/Baa3 | 2,620,000 | 2,832,272 | |||||||
California State Department of Transportation COP, 5.25% due 3/1/2016 (Insured: Natl-Re) | BBB/A2 | 2,000,000 | 2,007,620 | |||||||
California State Department of Water Resources Power Supply, 6.00% due 5/1/2013 pre-refunded 5/1/2012 | AA-/Aa3 | 2,270,000 | 2,369,199 | |||||||
California State Department of Water Resources Power Supply, 5.00% due 5/1/2015 | AA-/Aa3 | 5,000,000 | 5,727,500 | |||||||
California State Economic Recovery GO, 5.00% due 7/1/2015 (Insured: Natl-Re) | A+/Aa3 | 500,000 | 556,910 | |||||||
California State Economic Recovery GO, 5.00% due 7/1/2018 | A+/Aa3 | 3,000,000 | 3,532,770 | |||||||
California State GO, 5.50% due 3/1/2012 (School Improvements; Insured: FGIC) | A-/A1 | 230,000 | 234,835 | |||||||
California State GO, 5.00% due 3/1/2017 (Insured: Syncora) | A-/A1 | 2,860,000 | 3,234,603 | |||||||
California State GO, 5.25% due 2/1/2018 | A-/A1 | 3,000,000 | 3,155,280 | |||||||
California State GO, 5.00% due 9/1/2020 | A-/A1 | 2,000,000 | 2,306,900 | |||||||
California State Public Works Board Lease, 5.25% due 10/1/2013 (California State University) | BBB+/Aa3 | 500,000 | 501,560 | |||||||
California State Public Works Board Lease, 5.25% due 12/1/2014 | BBB+/A2 | 1,525,000 | 1,529,346 | |||||||
California State Public Works Board Lease, 5.00% due 1/1/2015 (Department of Corrections; Insured: AMBAC) | BBB+/A2 | 2,000,000 | 2,196,600 | |||||||
California State Public Works Board Lease, 5.00% due 11/1/2015 (Various Universities) | AA-/Aa2 | 1,000,000 | 1,095,660 | |||||||
California State Public Works Board Lease, 5.00% due 11/1/2016 (California State University) | BBB+/Aa3 | 1,000,000 | 1,127,910 | |||||||
California State Public Works Board Lease, 5.00% due 6/1/2020 (Regents of University of California; Insured: Natl-Re/FGIC) | AA-/Aa2 | 1,185,000 | 1,384,791 | |||||||
California Statewide Community Development Authority, 5.25% due 8/1/2014 (East Campus Apartments; Insured: ACA) | NR/Baa1 | 1,715,000 | 1,751,855 | |||||||
California Statewide Community Development Authority, 5.50% due 8/15/2014 (Enloe Medical Center; Insured: California Mtg Insurance) | A-/NR | 750,000 | 826,245 | |||||||
California Statewide Community Development Authority, 5.00% due 5/15/2015 (Irvine LLC-UCI East Campus) | NR/Baa2 | 2,300,000 | 2,435,700 | |||||||
California Statewide Community Development Authority, 5.00% due 5/15/2017 (Irvine LLC-UCI East Campus) | NR/Baa2 | 1,000,000 | 1,054,000 | |||||||
California Statewide Community Development Authority, 5.00% due 4/1/2019 (Kaiser Credit Group) | A+/NR | 3,600,000 | 4,198,824 | |||||||
California Statewide Community Development Authority, 5.00% due 7/1/2020 (Aspire Public Schools; Insured: College for Certain LLC) | NR/NR | 1,350,000 | 1,331,100 | |||||||
California Statewide Community Development Authority, 3.85% due 11/1/2029 put 6/1/2012 (Kaiser Credit Group) | A+/NR | 975,000 | 998,078 | |||||||
California Statewide Community Development Authority COP, 6.50% due 8/1/2012 (Cedars- Sinai Center Hospital; Insured: Natl-Re) | BBB/A2 | 155,000 | 159,780 | |||||||
California Statewide Community Development Authority PCR, 4.10% due 4/1/2028 put 4/1/2013 (Southern California Edison Co.; Insured: Syncora) | A/A1 | 2,575,000 | 2,690,798 | |||||||
Calipatria USD, 0% due 8/1/2025 (Capital Appreciation-Election 1995; Insured: ACA) | NR/NR | 5,000,000 | 1,841,750 | |||||||
Carson Redevelopment Agency Tax Allocation, 6.00% due 10/1/2019 (Project Area 1) | A-/NR | 1,050,000 | 1,172,042 | |||||||
Castaic USD GO, 0% due 5/1/2018 (Insured: Natl-Re/FGIC) | A+/NR | 3,200,000 | 2,432,192 | |||||||
Centinela Valley Unified High School District GO, 4.00% due 12/1/2013 | SP-1+/NR | 3,000,000 | 3,151,230 | |||||||
Central Union High School District Imperial County, 5.00% due 8/1/2012 (Insured: Natl-Re/FGIC) | A+/NR | 830,000 | 858,303 | |||||||
Central Valley Financing Authority, 5.00% due 7/1/2015 (Carson Ice) | A+/A1 | 1,000,000 | 1,117,330 | |||||||
Central Valley Financing Authority, 5.25% due 7/1/2020 (Carson Ice) | A+/A1 | 500,000 | 577,270 | |||||||
Cerritos Public Financing Authority Tax Allocation, 5.00% due 11/1/2014 (Insured: AMBAC) | A-/NR | 1,260,000 | 1,340,224 | |||||||
Chabot-Las Positas Community College District GO, 0% due 8/1/2018 (Election 2004-B; Insured: AMBAC) | AA-/Aa1 | 2,465,000 | 1,888,658 | |||||||
Chula Vista COP, 5.25% due 3/1/2020 | A-/NR | 1,300,000 | 1,433,913 | |||||||
City of Folsom, 4.00% due 12/1/2014 (Community Facilities District No. 2) | A+/NR | 755,000 | 795,491 | |||||||
City of Folsom, 5.00% due 12/1/2016 (Community Facilities District No. 2) | A+/NR | 1,100,000 | 1,218,074 | |||||||
12 Certified Annual Report
| SCHEDULE OF INVESTMENTS, CONTINUED | ||
| Thornburg California Limited Term Municipal Fund | September 30, 2011 | |
Issuer-Description | Credit Rating† S&P/ Moody’s | Principal Amount | Value | |||||||
City of Folsom, 5.00% due 12/1/2018 (Community Facilities District No. 2) | A+/NR | $ | 965,000 | $ | 1,063,237 | |||||
City of Los Angeles COP, 3.00% due 11/1/2030 (American Academy of Dramatic Arts; LOC: TD Bank N.A.) | NR/Aa2 | 3,000,000 | 3,079,530 | |||||||
City of Torrance, 5.00% due 9/1/2020 (Torrance Memorial Medical Center) | A/A2 | 1,155,000 | 1,275,825 | |||||||
City of Torrance Hospital Revenue, 6.00% due 6/1/2022 (Torrance Memorial Medical Center) | A/A2 | 2,600,000 | 2,634,008 | |||||||
Contra Costa Water District, 2.50% due 10/1/2013 | AA+/NR | 2,000,000 | 2,078,600 | |||||||
Corona-Norco USD GO, 0% due 9/1/2017 (Insured: AGM) | AA+/Aa2 | 1,595,000 | 1,322,510 | |||||||
County of Stanislaus, 5.75% due 5/1/2015 (Insured: Natl-Re) | A+/Baa1 | 1,815,000 | 1,988,441 | |||||||
Delano Financing Authority, 5.00% due 12/1/2017 (Police Station and Capital Improvements) | A/NR | 1,085,000 | 1,183,985 | |||||||
Delano Financing Authority, 5.00% due 12/1/2018 (Police Station and Capital Improvements) | A/NR | 1,135,000 | 1,233,302 | |||||||
Delano Financing Authority, 5.00% due 12/1/2019 (Police Station and Capital Improvements) | A/NR | 1,195,000 | 1,283,466 | |||||||
Escondido USD GO, 6.10% due 11/1/2011 (Insured: Natl-Re) | BBB/Baa1 | 500,000 | 502,430 | |||||||
Fillmore Public Financing Authority, 5.00% due 5/1/2016 (Water Recycling; Insured: CIFG) | AA+/Aa3 | 735,000 | 814,476 | |||||||
Fullerton Public Financing Authority, 5.00% due 9/1/2016 (Insured: AMBAC) | A/NR | 1,775,000 | 1,888,405 | |||||||
Inland Valley Development Agency, 5.25% due 4/1/2012 (ETM) | A/NR | 1,490,000 | 1,526,877 | |||||||
Inland Valley Development Agency, 4.50% due 3/1/2041 put 3/1/2016 | A/NR | 2,000,000 | 2,103,780 | |||||||
Kern Community College District COP, 4.00% due 4/1/2014 | SP-1+/NR | 2,000,000 | 2,074,820 | |||||||
Lindsay USD COP, 5.75% due 10/1/2017 (Insured: AGM) | AA+/NR | 1,160,000 | 1,267,184 | |||||||
Lindsay USD COP, 6.00% due 10/1/2018 (Insured: AGM) | AA+/NR | 680,000 | 751,862 | |||||||
Los Alamitos USD GO, 0% due 9/1/2016 (School Facilities Improvement Anticipation Notes) | SP-1+/NR | 2,000,000 | 1,793,120 | |||||||
Los Angeles Convention & Exhibition Center Authority, 5.00% due 8/15/2016 | A+/A2 | 2,000,000 | 2,224,880 | |||||||
Los Angeles Convention & Exhibition Center Authority, 5.00% due 8/15/2017 | A+/A2 | 1,660,000 | 1,853,954 | |||||||
Los Angeles COP, 5.00% due 2/1/2012 (Insured: Natl-Re) | A+/A2 | 1,400,000 | 1,420,454 | |||||||
Los Angeles County Public Works Financing Authority, 5.00% due 9/1/2014 (Insured: Natl-Re/ FGIC) | BBB/NR | 2,990,000 | 3,243,103 | |||||||
Los Angeles County Public Works Financing Authority, 4.25% due 6/1/2016 (Calabasas Landfill; Insured: AMBAC) | A+/A1 | 1,000,000 | 1,059,810 | |||||||
Los Angeles County Public Works Financing Authority, 5.00% due 8/1/2018 (Multiple Capital Projects) | A+/A1 | 2,060,000 | 2,393,514 | |||||||
Los Angeles County Schools, 5.00% due 6/1/2016 (Insured: Natl-Re) | BBB/Baa1 | 1,000,000 | 1,056,990 | |||||||
Los Angeles County Schools, 5.00% due 6/1/2017 (Insured: Natl-Re) | BBB/Baa1 | 1,010,000 | 1,058,642 | |||||||
Los Angeles County Schools Regionalized Business Services Corp. COP, 0% due 8/1/2021 (Pooled Financing; Insured: AMBAC) | NR/NR | 2,135,000 | 1,211,762 | |||||||
bLos Angeles Department of Airports, 5.50% due 5/15/2018 (Los Angeles International Airport) | AA/Aa3 | 2,000,000 | 2,332,560 | |||||||
Los Angeles Municipal Improvement Corp., 5.00% due 11/1/2017 (Capital Equipment) | A+/A3 | 3,235,000 | 3,673,245 | |||||||
Los Angeles Solid Waste, 4.00% due 2/1/2012 | AA/Aa2 | 850,000 | 860,532 | |||||||
Los Angeles USD COP, 5.00% due 10/1/2015 (Insured: AMBAC) | A+/A1 | 1,500,000 | 1,653,120 | |||||||
Los Angeles USD COP, 5.50% due 12/1/2018 (Capital Projects) | A+/A1 | 2,000,000 | 2,277,680 | |||||||
Los Angeles USD GO, 5.50% due 7/1/2012 (Insured: Natl-Re) | AA-/Aa2 | 2,500,000 | 2,598,050 | |||||||
Merced Redevelopment Agency Tax Allocation, 5.25% due 9/1/2020 | A-/NR | 1,190,000 | 1,237,850 | |||||||
Milpitas Redevelopment Agency Tax Allocation, 5.00% due 9/1/2015 (Insured: Natl-Re) | A/Baa1 | 2,000,000 | 2,065,320 | |||||||
Mojave USD COP, 0% due 9/1/2017 (Insured: AGM) | AA+/NR | 1,045,000 | 860,443 | |||||||
Mojave USD COP, 0% due 9/1/2018 (Insured: AGM) | AA+/NR | 1,095,000 | 845,570 | |||||||
Monterey County COP, 5.00% due 8/1/2014 (Refinancing Project; Insured: AGM) | AA+/Aa3 | 2,000,000 | 2,181,540 | |||||||
Moorpark California Mobile Home Park, 4.90% due 5/15/2017 (Villa Del Arroyo) | BBB/NR | 1,160,000 | 1,175,068 | |||||||
Mount Diablo USD Community Facilities District, 4.60% due 8/1/2017 (Insured: AMBAC) | NR/Aa3 | 1,000,000 | 1,005,310 | |||||||
Northern California Power Agency, 4.00% due 7/1/2015 | A/A2 | 500,000 | 544,770 | |||||||
Northern California Power Agency, 5.00% due 7/1/2016 | A/A2 | 500,000 | 578,360 | |||||||
Northern California Power Agency, 5.00% due 7/1/2017 | A/A2 | 100,000 | 117,112 | |||||||
Northern California Power Agency, 5.00% due 7/1/2018 | A/A2 | 1,250,000 | 1,476,637 | |||||||
Northern California Power Agency, 5.00% due 6/1/2019 (Lodi Energy Center) | NR/NR | 2,340,000 | 2,715,781 | |||||||
Norwalk Redevelopment Agency Tax Allocation, 5.00% due 10/1/2014 (Insured: Natl-Re) | BBB/Baa1 | 625,000 | 654,956 | |||||||
Certified Annual Report 13
| SCHEDULE OF INVESTMENTS, CONTINUED | ||
| Thornburg California Limited Term Municipal Fund | September 30, 2011 | |
Issuer-Description | Credit Rating† S&P/ Moody’s | Principal Amount | Value | |||||||
Orange County Public Finance Authority, 5.375% due 6/1/2015 (Juvenile Justice Center; | ||||||||||
Insured: AMBAC) | A+/Aa3 | $ | 1,000,000 | $ | 1,039,700 | |||||
Oxnard Financing Authority Solid Waste, 5.25% due 6/1/2014 (Insured: Natl-Re/FGIC) | A+/NR | 1,000,000 | 1,063,010 | |||||||
Oxnard Financing Authority Waste Water, 5.00% due 5/1/2013 (Insured: AMBAC) (AMT) | A-/NR | 2,115,000 | 2,204,211 | |||||||
Palomar Pomerado Health GO, 0% due 8/1/2019 (Insured: AGM) | AA+/Aa3 | 2,000,000 | 1,424,560 | |||||||
Palomar Pomerado Health GO, 0% due 8/1/2021 (Insured: Natl-Re) | A+/A1 | 2,635,000 | 1,625,505 | |||||||
Pittsburg Redevelopment Agency Tax Allocation, 5.00% due 8/1/2020 (Los Medanos | ||||||||||
Community Development Project; Insured: Natl-Re) | A+/Baa1 | 1,205,000 | 1,224,485 | |||||||
Redding Electrical Systems Revenue COP, 5.00% due 6/1/2020 (Insured: AGM) | NR/Aa3 | 2,500,000 | 2,784,100 | |||||||
Richmond Joint Powers Financing Authority, 5.25% due 5/15/2013 (Lease & Gas Tax) | A/NR | 205,000 | 205,324 | |||||||
Ridgecrest Redevelopment Agency, 5.00% due 6/30/2016 (Ridgecrest Redevelopment Project) | A-/Baa1 | 1,055,000 | 1,129,610 | |||||||
Ridgecrest Redevelopment Agency, 5.00% due 6/30/2017 (Ridgecrest Redevelopment Project) | A-/Baa1 | 1,055,000 | 1,127,700 | |||||||
Ridgecrest Redevelopment Agency, 5.25% due 6/30/2018 (Ridgecrest Redevelopment Project) | A-/Baa1 | 1,050,000 | 1,126,650 | |||||||
Ridgecrest Redevelopment Agency, 5.50% due 6/30/2019 (Ridgecrest Redevelopment Project) | A-/Baa1 | 1,050,000 | 1,133,738 | |||||||
Ridgecrest Redevelopment Agency, 5.50% due 6/30/2020 (Ridgecrest Redevelopment Project) | A-/Baa1 | 1,040,000 | 1,113,684 | |||||||
Riverside County Palm Desert Financing Authority, 5.00% due 5/1/2013 | AA-/A1 | 1,000,000 | 1,040,590 | |||||||
Rosemead Community Development Commission, 5.00% due 10/1/2015 (Redevelopment | ||||||||||
Project Area No. 1; Insured: AMBAC) | A+/NR | 1,015,000 | 1,085,177 | |||||||
Roseville Natural Gas Financing Authority, 5.00% due 2/15/2017 | A/Baa1 | 1,390,000 | 1,439,609 | |||||||
Sacramento City Financing Authority, 0% due 11/1/2014 (Insured: Natl-Re) | BBB/Baa1 | 3,385,000 | 3,026,562 | |||||||
Sacramento Cogeneration Authority, 5.00% due 7/1/2015 (Procter & Gamble) | A+/A1 | 1,100,000 | 1,242,318 | |||||||
Sacramento Cogeneration Authority, 5.00% due 7/1/2019 (Procter & Gamble) | A+/A1 | 625,000 | 725,875 | |||||||
Sacramento Municipal Utility District, 5.00% due 7/1/2020 (Cosumnes Project; Insured: Natl-Re) | BBB/Baa1 | 3,000,000 | 3,130,470 | |||||||
San Bernardino County Community Facilities District, 5.20% due 9/1/2012 | NR/NR | 205,000 | 210,373 | |||||||
San Bernardino County Community Facilities District, 5.30% due 9/1/2013 | NR/NR | 300,000 | 312,738 | |||||||
San Bernardino County Multi-Family Housing, 4.75% due 12/15/2031 put 12/15/2011 (Rolling Ridge LLC; Collateralized: FNMA) | NR/Aaa | 3,100,000 | 3,124,707 | |||||||
San Diego Redevelopment Agency, 5.25% due 9/1/2015 (Centre City Redevelopment; Insured: AGM) | AA+/Aa3 | 1,375,000 | 1,393,727 | |||||||
San Diego Redevelopment Agency, 5.00% due 9/1/2018 (Centre City Redevelopment; Insured: AMBAC) | NR/A2 | 3,215,000 | 3,453,682 | |||||||
San Diego USD GO, 5.50% due 7/1/2020 (Election 1998; Insured: Natl-Re) | AA/Aa1 | 1,390,000 | 1,643,369 | |||||||
San Francisco City & County Airports Commission, 4.00% due 5/1/2013 | A+/A1 | 500,000 | 522,360 | |||||||
San Francisco City & County Airports Commission, 5.25% due 5/1/2016 pre-refunded 5/1/2012 (Insured: Syncora) | A+/A1 | 1,500,000 | 1,573,200 | |||||||
San Francisco City & County Redevelopment Agency, 0% due 7/1/2013 (George R. Moscone) | AA-/Aa3 | 1,200,000 | 1,177,968 | |||||||
San Joaquin County COP, 5.50% due 11/15/2013 (Capital Facilities; Insured: Natl-Re) | BBB/Baa1 | 1,000,000 | 1,023,690 | |||||||
San Joaquin Delta Community College District GO, 0% due 8/1/2019 (Insured: AGM) | AA+/Aa2 | 5,000,000 | 3,619,500 | |||||||
San Jose Financing Authority Lease, 5.25% due 6/1/2016 (Civic Center Project; Insured: AMBAC) | AA+/Aa2 | 500,000 | 513,055 | |||||||
San Jose Redevelopment Agency Tax Allocation, 5.25% due 8/1/2012 (Merged Area Redevelopment; Insured: Natl-Re) | BBB+/ Baa1 | 1,000,000 | 1,018,230 | |||||||
San Luis & Delta-Mendota Water Authority, 4.50% due 3/1/2014 (Water Utility Improvements) | A+/NR | 2,000,000 | 2,144,600 | |||||||
San Mateo Flood Control District COP, 5.25% due 8/1/2017 (Colma Creek; Insured: Natl-Re) | BBB/Baa1 | 1,000,000 | 1,000,930 | |||||||
San Mateo Union High School District GO Unlimited, 0% due 9/1/2019 (Capital Appreciation- Election of 2000-B; Insured: Natl-Re/FGIC) | AA/Aa1 | 2,000,000 | 1,467,240 | |||||||
Santa Ana USD GO, 0% due 8/1/2020 (Election of 1999; Insured: Natl-Re/FGIC) | A+/NR | 2,035,000 | 1,402,664 | |||||||
Santa Barbara County, 5.25% due 12/1/2014 (Insured: AMBAC) | AA+/Aa3 | 1,145,000 | 1,176,751 | |||||||
Santa Barbara County COP, 5.00% due 12/1/2017 (Insured: AMBAC) | AA+/Aa3 | 1,000,000 | 1,025,160 | |||||||
Santa Clara County Financing Authority, 5.00% due 5/15/2012 (Multiple Facilities) | AA/Aa2 | 1,000,000 | 1,028,660 | |||||||
Santa Clara County Financing Authority, 4.00% due 5/15/2017 (Multiple Facilities) | AA/Aa2 | 1,000,000 | 1,093,400 | |||||||
Santa Margarita-Dana Point Authority, 7.25% due 8/1/2013 (Improvement Districts 3-3A, 4-4A; Insured: Natl-Re) | BBB/Baa1 | 2,000,000 | 2,176,640 | |||||||
Seal Beach Redevelopment Agency Mobile Home Park, 5.20% due 12/15/2013 (Insured: ACA) | NR/NR | 360,000 | 367,326 | |||||||
Solano County COP, 5.00% due 11/15/2013 | AA-/A1 | 1,780,000 | 1,905,294 | |||||||
14 Certified Annual Report
| SCHEDULE OF INVESTMENTS, CONTINUED | ||
| Thornburg California Limited Term Municipal Fund | September 30, 2011 | |
Issuer-Description | Credit Rating† S&P/ Moody’s | Principal Amount | Value | |||||||
Solano County COP, 5.00% due 11/15/2016 | AA-/A1 | $ | 1,000,000 | $ | 1,124,650 | |||||
Southeast Resource Recovery Facilities Authority, 5.375% due 12/1/2013 (Insured: AMBAC) (AMT) | A+/A1 | 1,060,000 | 1,130,236 | |||||||
Southeast Resource Recovery Facilities Authority, 5.25% due 12/1/2017 (Insured: AMBAC) | A+/A1 | 1,000,000 | 1,056,160 | |||||||
Southern California Public Power Authority, 6.75% due 7/1/2012 (Multiple Projects; Insured: AGM) | AA+/Aa3 | 2,315,000 | 2,421,120 | |||||||
Southern California Public Power Authority, 5.00% due 11/1/2013 (Project No. 1) | BBB/Baa1 | 1,000,000 | 1,063,090 | |||||||
Southern California Public Power Authority, 5.15% due 7/1/2015 (Insured: AMBAC) | NR/Aa3 | 450,000 | 499,518 | |||||||
Southern California Public Power Authority, 5.15% due 7/1/2015 (Insured: AMBAC) | NR/Aa3 | 250,000 | 277,583 | |||||||
Southern California Public Power Authority, 5.00% due 7/1/2016 (Southern Transmission Project) | AA-/NR | 2,000,000 | 2,318,420 | |||||||
Sweetwater Union High School District COP, 4.00% due 9/1/2014 (Insured: Natl-Re) | BBB/Baa1 | 1,020,000 | 1,058,709 | |||||||
Sweetwater Union High School District COP, 5.00% due 9/1/2021 (Insured: AGM) | AA+/Aa3 | 2,250,000 | 2,300,625 | |||||||
Tracy Area Public Facilities Financing Agency Special Tax, 5.875% due 10/1/2019 (Community Facilities District No. 87) | BBB/Baa1 | 590,000 | 594,455 | |||||||
Tuolumne Wind Project Authority, 5.00% due 1/1/2015 (Tuolumne Co.) | A+/A2 | 500,000 | 556,185 | |||||||
Tuolumne Wind Project Authority, 5.00% due 1/1/2018 (Tuolumne Co.) | A+/A2 | 1,690,000 | 1,942,604 | |||||||
Turlock Irrigation District, 5.00% due 1/1/2015 | A+/A2 | 1,125,000 | 1,260,956 | |||||||
Turlock Irrigation District, 5.00% due 1/1/2019 | A+/A2 | 1,000,000 | 1,159,820 | |||||||
Twin Rivers USD GO, 0% due 4/1/2014 | SP-1+/NR | 1,000,000 | 940,180 | |||||||
Ukiah USD GO, 0% due 8/1/2019 (Insured: Natl-Re) | A/A1 | 2,000,000 | 1,396,980 | |||||||
University of California, 4.00% due 5/15/2017 (Limited Project) | AA-/Aa2 | 1,250,000 | 1,410,600 | |||||||
Upper Lake Union High School District GO, 0% due 8/1/2020 (Capital Appreciation; Insured: Natl-Re) | NR/Baa1 | 1,050,000 | 658,938 | |||||||
Val Verde USD COP, 5.00% due 1/1/2014 (Insured: Natl-Re/FGIC) (ETM) | NR/NR | 445,000 | 489,273 | |||||||
Washington USD COP, 5.00% due 8/1/2017 (New High School; Insured: AMBAC) | A/NR | 725,000 | 807,824 | |||||||
Washington USD Yolo County, 5.00% due 8/1/2021 (New High School; Insured: AMBAC) | A/NR | 910,000 | 965,264 | |||||||
West Contra Costa USD GO, 3.00% due 8/1/2012 (Insured: AGM) | AA+/Aa3 | 750,000 | 763,673 | |||||||
West Contra Costa USD GO, 4.00% due 8/1/2013 (Insured: AGM) | AA+/Aa3 | 500,000 | 524,810 | |||||||
Whittier Solid Waste, 5.375% due 8/1/2014 (Insured: AMBAC) | NR/NR | 540,000 | 540,799 | |||||||
|
| |||||||||
TOTAL INVESTMENTS — 96.64% (Cost $270,257,307) | $ | 280,743,017 | ||||||||
OTHER ASSETS LESS LIABILITIES — 3.36% | 9,756,729 | |||||||||
|
| |||||||||
NET ASSETS — 100.00% | $ | 290,499,746 | ||||||||
|
| |||||||||
Footnote Legend
| † | Credit ratings are unaudited. Rating changes may have occurred subsequent to the reporting period end. |
| a | When-issued security. |
| b | Segregated as collateral for a when-issued security. |
Portfolio Abbreviations
To simplify the listings of securities, abbreviations are used per the table below:
ABAG | Association of Bay Area Governments | |
ACA | Insured by American Capital Access | |
AGM | Insured by Assured Guaranty Municipal Corp. | |
AMBAC | Insured by American Municipal Bond Assurance Corp. | |
AMT | Alternative Minimum Tax | |
CIFG | CIFG Assurance North America Inc. | |
COP | Certificates of Participation | |
ETM | Escrowed to Maturity | |
FGIC | Insured by Financial Guaranty Insurance Co. | |
FHA | Insured by Federal Housing Administration | |
FNMA | Collateralized by Federal National Mortgage Association | |
| GO | General Obligation | |
| LOC | Letter of Credit | |
| Mtg | Mortgage | |
| Natl-Re | Insured by National Public Finance Guarantee Corp. | |
| PCR | Pollution Control Revenue Bond | |
| Syncora | Insured by Syncora Guarantee Inc. | |
| VA | Veterans Affairs | |
| USD | Unified School District |
See notes to financial statements.
Certified Annual Report 15
| STATEMENT OF ASSETS AND LIABILITIES | ||
| Thornburg California Limited Term Municipal Fund | September 30, 2011 | |
ASSETS | ||||
Investments at value (cost $270,257,307) (Note 2) | $ | 280,743,017 | ||
Cash | 8,437,690 | |||
Receivable for fund shares sold | 1,064,197 | |||
Interest receivable | 3,203,287 | |||
Prepaid expenses and other assets | 454 | |||
|
| |||
Total Assets | 293,448,645 | |||
|
| |||
LIABILITIES | ||||
Payable for investments purchased | 2,240,560 | |||
Payable for fund shares redeemed | 260,332 | |||
Payable to investment advisor and other affiliates (Note 3) | 184,515 | |||
Accounts payable and accrued expenses | 49,073 | |||
Dividends payable | 214,419 | |||
|
| |||
Total Liabilities | 2,948,899 | |||
|
| |||
NET ASSETS | $ | 290,499,746 | ||
|
| |||
NET ASSETS CONSIST OF: | ||||
Undistributed net investment income | $ | 88 | ||
Net unrealized appreciation on investments | 10,485,710 | |||
Net capital paid in on shares of beneficial interest | 280,013,948 | |||
|
| |||
| $ | 290,499,746 | |||
|
| |||
NET ASSET VALUE: | ||||
Class A Shares: | ||||
Net asset value and redemption price per share ($123,909,679 applicable to 9,241,241 shares of beneficial interest outstanding - Note 4) | $ | 13.41 | ||
Maximum sales charge, 1.50% of offering price | 0.20 | |||
|
| |||
Maximum offering price per share | $ | 13.61 | ||
|
| |||
Class C Shares: | ||||
Net asset value and offering price per share * ($45,897,142 applicable to 3,420,095 shares of beneficial interest outstanding - Note 4) | $ | 13.42 | ||
|
| |||
Class I Shares: | ||||
Net asset value, offering and redemption price per share ($120,692,925 applicable to 8,992,647 shares of beneficial interest outstanding - Note 4) | $ | 13.42 | ||
|
| |||
| * | Redemption price per share is equal to net asset value less any applicable contingent deferred sales charge. |
See notes to financial statements.
16 Certified Annual Report
| STATEMENT OF OPERATIONS | ||
| Thornburg California Limited Term Municipal Fund | Year Ended September 30, 2011 | |
INVESTMENT INCOME: | ||||
Interest income (net of premium amortized of $2,140,023) | $ | 9,399,085 | ||
|
| |||
EXPENSES: | ||||
Investment advisory fees (Note 3) | 1,282,672 | |||
Administration fees (Note 3) | ||||
Class A Shares | 148,736 | |||
Class C Shares | 52,823 | |||
Class I Shares | 47,644 | |||
Distribution and service fees (Note 3) | ||||
Class A Shares | 297,471 | |||
Class C Shares | 210,461 | |||
Transfer agent fees | ||||
Class A Shares | 32,817 | |||
Class C Shares | 18,778 | |||
Class I Shares | 20,493 | |||
Registration and filing fees | ||||
Class A Shares | 39 | |||
Class C Shares | 38 | |||
Class I Shares | 39 | |||
Custodian fees (Note 3) | 69,166 | |||
Professional fees | 26,426 | |||
Accounting fees | 9,743 | |||
Trustee fees | 5,853 | |||
Other expenses | 26,544 | |||
|
| |||
Total Expenses | 2,249,743 | |||
Less: | ||||
Expenses reimbursed by investment advisor (Note 3) | (1,580 | ) | ||
Fees paid indirectly (Note 3) | (1,544 | ) | ||
|
| |||
Net Expenses | 2,246,619 | |||
|
| |||
Net Investment Income | 7,152,466 | |||
|
| |||
REALIZED AND UNREALIZED GAIN (LOSS) | ||||
Net realized gain (loss) on investments | 230,108 | |||
Net change in unrealized appreciation (depreciation) on investments | 752,244 | |||
|
| |||
Net Realized and Unrealized Gain | 982,352 | |||
|
| |||
Net Increase in Net Assets Resulting from Operations | $ | 8,134,818 | ||
|
| |||
See notes to financial statements.
Certified Annual Report 17
| STATEMENTS OF CHANGES IN NET ASSETS |
| Thornburg California Limited Term Municipal Fund |
| Year Ended September 30, 2011 | Year Ended September 30, 2010 | |||||||
INCREASE (DECREASE) IN NET ASSETS FROM | ||||||||
OPERATIONS: | ||||||||
Net investment income | $ | 7,152,466 | $ | 5,633,467 | ||||
Net realized gain (loss) on investments | 230,108 | 68,938 | ||||||
Net unrealized appreciation (depreciation) on investments | 752,244 | 4,863,894 | ||||||
|
|
|
| |||||
Net Increase (Decrease) in Net Assets Resulting from Operations | 8,134,818 | 10,566,299 | ||||||
DIVIDENDS TO SHAREHOLDERS: | ||||||||
From net investment income | ||||||||
Class A Shares | (3,228,051 | ) | (2,846,029 | ) | ||||
Class C Shares | (1,034,416 | ) | (895,557 | ) | ||||
Class I Shares | (2,889,999 | ) | (1,891,881 | ) | ||||
FUND SHARE TRANSACTIONS (NOTE 4): | ||||||||
Class A Shares | 8,719,932 | 32,843,700 | ||||||
Class C Shares | 3,784,147 | 15,149,787 | ||||||
Class I Shares | 41,213,163 | 36,228,843 | ||||||
|
|
|
| |||||
Net Increase in Net Assets | 54,699,594 | 89,155,162 | ||||||
NET ASSETS: | ||||||||
Beginning of Year | 235,800,152 | 146,644,990 | ||||||
|
|
|
| |||||
End of Year | $ | 290,499,746 | $ | 235,800,152 | ||||
|
|
|
| |||||
Undistributed net investment income | $ | 88 | $ | — | ||||
See notes to financial statements.
18 Certified Annual Report
| NOTES TO FINANCIAL STATEMENTS | ||
| Thornburg California Limited Term Municipal Fund | September 30, 2011 | |
NOTE 1 – ORGANIZATION
Thornburg California Limited Term Municipal Fund (the “Fund”) is a diversified series of Thornburg Investment Trust (the “Trust”). The Trust is organized as a Massachusetts business trust under a Declaration of Trust dated June 3, 1987 and is registered as a diversified, open-end management investment company under the Investment Company Act of 1940, as amended. The Fund is currently one of sixteen separate series of the Trust. Each series is considered to be a separate entity for financial reporting and tax purposes and bears expenses directly attributable to it. The Fund’s primary investment objective is to obtain as high a level of current income exempt from federal and California state individual income tax as is consistent, in the view of the Fund’s investment advisor, with the preservation of capital. The Fund’s secondary objective is to reduce expected changes in its share price compared to longer intermediate and long-term bond portfolios.
The Fund currently offers three classes of shares of beneficial interest outstanding: Class A, Class C, and Institutional Class (Class I). Each class of shares of the Fund represents an interest in the same portfolio of investments, except that (i) Class A shares are sold subject to a front-end sales charge collected at the time the shares are purchased and bear a service fee, (ii) Class C shares are sold at net asset value without a sales charge at the time of purchase, but are subject to a contingent deferred sales charge upon redemption within one year of purchase, and bear both a service fee and a distribution fee, (iii) Class I shares are sold at net asset value without a sales charge at the time of purchase, and (iv) the respective classes may have different reinvestment privileges and conversion rights. Additionally, the Fund may allocate among its classes certain expenses, to the extent allowable to specific classes, including transfer agent fees, government registration fees, certain printing and postage costs, and administrative and legal expenses. Currently, class specific expenses of the Fund are limited to service and distribution fees, administration fees, and certain registration and transfer agent expenses.
NOTE 2 – SIGNIFICANT ACCOUNTING POLICIES
Significant accounting policies of the Trust are as follows:
Valuation of Investments: Debt obligations have a primary market over the counter and are valued by an independent pricing service approved by the Trustees of the Trust. The pricing service ordinarily values debt obligations at quoted bid prices. When quotations are not available, debt obligations are valued at evaluated prices determined by the pricing service using methods which include consideration of yields or prices of debt obligations of comparable quality, type of issue, coupon, maturity and rating, and indications as to value from dealers and general market conditions. Short-term obligations having remaining maturities of 60 days or less are ordinarily valued at amortized cost, which approximates market value.
In any case where a pricing service fails to provide a price for a debt obligation held by the Fund, the valuation and pricing committee determines a fair value for the obligation using procedures approved by the Trustees. Additionally, in any case where management believes that a price provided by a pricing service for a debt obligation may be unreliable, the valuation and pricing committee decides whether or not to use the pricing service’s valuation or to determine a fair value for the obligation.
In determining fair value for any portfolio security or other investment, the valuation and pricing committee seeks to determine the amount that an owner of the investment might reasonably expect to receive upon a sale of the investment. However, because fair value prices are estimated prices, the valuation and pricing committee’s determination of fair value for an investment may differ from the value that would be realized by the Fund upon a sale of the investment, and that difference could be material to the Fund’s financial statements. The valuation and pricing committee’s determination of fair value for an investment may also differ from the prices obtained by other persons (including other mutual funds) for the investment.
Valuation Measurements: Various inputs are used in determining the value of the Fund’s investments. These inputs are summarized in the three levels listed below:
Level 1: Quoted prices in active markets for identical investments.
Level 2: Other significant observable inputs (including quoted prices for similar investments, interest rates, prepayment rates, credit risk, etc.).
Level 3: Significant unobservable inputs (including the Fund’s own assumptions in determining the fair value of investments).
Certified Annual Report 19
| NOTES TO FINANCIAL STATEMENTS, CONTINUED | ||
| Thornburg California Limited Term Municipal Fund | September 30, 2011 | |
The following table displays a summary of the inputs used to value the Fund’s net assets as of September 30, 2011. In any instance when valuation inputs from more than one level are used to determine the fair value of a specific investment, the investment is placed in the level of the table based upon the lowest level input that is significant in determining the fair value of the investment:
| Fair Value Measurements at September 30, 2011 | ||||||||||||||||
| Total | Level 1 | Level 2 | Level 3 | |||||||||||||
Assets | ||||||||||||||||
Investments in Securities Municipal Bonds | $ | 280,743,017 | $ | — | $ | 280,743,017 | $ | — | ||||||||
|
|
|
|
|
|
|
| |||||||||
Total Investments in Securities | $ | 280,743,017 | $ | — | $ | 280,743,017 | $ | — | ||||||||
Other Notes: It is the policy of the Fund to recognize significant transfers between Levels 1, 2 and 3 and to disclose those transfers at the beginning of the reporting period. The Fund recognized no significant transfers between levels for the year ended September 30, 2011.
Federal Income Taxes: It is the policy of the Trust to comply with the provisions of the Internal Revenue Code applicable to “regulated investment companies,” and to distribute to shareholders substantially all taxable (if any) and tax exempt income of the Fund. Therefore, no provision for federal income tax is required.
Management reviews each uncertain tax position believed to be material to the preparation of the Fund’s financial statements, to assess if it is more likely than not that the position would be sustained upon examination, based upon the technical merits of the position. As of September 30, 2011, management has not identified any such position for which a liability must be reflected in the Statement of Assets and Liabilities. The Fund’s tax returns remain subject to examination for three years after filing.
When-Issued and Delayed Delivery Transactions: The Fund may engage in when-issued or delayed delivery transactions. To the extent the Fund engages in such transactions, it will do so for the purpose of acquiring portfolio securities consistent with the Fund’s investment objectives and not for the purpose of investment leverage or to speculate on interest rate and/or market changes. At the time the Fund makes a commitment to purchase a security on a when-issued or delayed delivery basis, the Fund will record the transaction and reflect the value in determining its net asset value. When effecting such transactions, assets of an amount sufficient to make payment for the portfolio securities to be purchased will be segregated on the Fund’s records on the trade date. Securities purchased on a when-issued or delayed delivery basis do not earn interest until the settlement date.
Dividends: Net investment income of the Fund is declared daily as a dividend on shares for which the Fund has received payment. Dividends are paid monthly and are reinvested in additional shares of the Fund at net asset value per share at the close of business on the dividend payment date, or at the shareholder’s option, paid in cash. Net realized capital gains, to the extent available, will be distributed at least annually.
General: Securities transactions are accounted for on a trade date basis. Interest income is accrued as earned. Premiums and discounts on securities purchased are amortized to call dates or maturity dates of the respective securities. Realized gains and losses from the sale of securities are recorded on an identified cost basis. Net investment income (other than class specific expenses) and realized and unrealized gains and losses are allocated daily to each class of shares based upon the relative net asset value of outstanding shares (or the value of the dividend-eligible shares, as appropriate) of each class of shares at the beginning of the day (after adjusting for the current capital shares activity of the respective class). Expenses common to all Funds are allocated among the Funds comprising the Trust based upon their relative net asset values or other appropriate allocation methods.
Guarantees and Indemnifications: Under the Trust’s organizational documents, its officers and Trustees are indemnified against certain liabilities arising out of the performance of their duties to the Fund. Additionally, in the normal course of business the Trust enters into contracts with service providers that contain general indemnification clauses. The Trust’s maximum exposure under these arrangements is unknown. However, based on experience, the Trust expects the risk of loss to be remote.
Use of Estimates: The preparation of financial statements, in conformity with generally accepted accounting principles, requires management to make estimates and assumptions that affect the reported amounts of assets and liabilities and the disclosure of contingent
20 Certified Annual Report
| NOTES TO FINANCIAL STATEMENTS, CONTINUED | ||
| Thornburg California Limited Term Municipal Fund | September 30, 2011 | |
assets and liabilities at the date of the financial statements and the reported amounts of increases and decreases in net assets from operations during the reporting period. Actual results could differ from those estimates.
NOTE 3 – INVESTMENT ADVISORY FEE AND OTHER TRANSACTIONS WITH AFFILIATES
Pursuant to an investment advisory agreement, Thornburg Investment Management, Inc. (the “Advisor”) serves as the investment advisor and performs services to the Fund for which the fees are payable at the end of each month. For the year ended September 30, 2011, these fees were payable at annual rates ranging from .50 of 1% to .225 of 1% per annum of the average daily net assets of the Fund depending on the Fund’s asset size. The Trust also has entered into administrative services agreements with the Advisor, whereby the Advisor will perform certain administrative services for the shareholders of each class of the Fund’s shares, and for which fees will be payable at an annual rate of up to .125 of 1% per annum of the average daily net assets attributable to each class of shares. For the year ended September 30, 2011, the Advisor contractually reimbursed certain class specific expenses and administrative fees of $1,580 for Class C shares.
The Trust has an underwriting agreement with Thornburg Securities Corporation (the “Distributor,” an affiliate of the Advisor), which acts as the distributor of the Fund’s shares. For the year ended September 30, 2011, the Distributor has advised the Fund that it earned commissions aggregating $2,443 from the sale of Class A shares, and collected contingent deferred sales charges aggregating $5,738 from redemptions of Class C shares of the Fund.
Pursuant to a service plan under Rule 12b-1 of the Investment Company Act of 1940, the Fund may reimburse to the Advisor an amount not to exceed .25 of 1% per annum of the average daily net assets attributable to each class of shares of the Fund for payments made by the Advisor to securities dealers and other financial institutions to obtain various shareholder and distribution related services. For the year ended September 30, 2011, there were no 12b-1 service plan fees charged for Class I shares. The Advisor may pay out of its own resources additional expenses for distribution of the Fund’s shares.
The Trust has also adopted a distribution plan pursuant to Rule 12b-1, applicable only to the Fund’s Class C shares, under which the Fund compensates the Distributor for services in promoting the sale of Class C shares of the Fund at an annual rate of up to .25 of 1% per annum of the average daily net assets attributable to Class C shares. Total fees incurred by the Distributor for each class of shares of the Fund under their respective Service and Distribution Plans for the year ended September 30, 2011, are set forth in the Statement of Operations.
The Trust has an agreement with the custodian bank to indirectly pay a portion of the custodian’s fees through credits earned by the Fund’s cash on deposit with the bank. This deposit agreement is an alternative to overnight investments. Custodial fees have been adjusted to reflect amounts that would have been paid without this agreement, with a corresponding adjustment reflected as fees paid indirectly in the Statement of Operations. For the year ended September 30, 2011, fees paid indirectly were $1,544.
Certain officers and Trustees of the Trust are also officers or directors of the Advisor and Distributor. The compensation of independent Trustees is borne by the Trust.
NOTE 4 – SHARES OF BENEFICIAL INTEREST
At September 30, 2011, there were an unlimited number of shares of beneficial interest authorized. Transactions in shares of beneficial interest were as follows:
| Year Ended September 30, 2011 | Year Ended September 30, 2010 | |||||||||||||||
| Shares | Amount | Shares | Amount | |||||||||||||
Class A Shares | ||||||||||||||||
Shares sold | 2,623,333 | $ | 34,563,347 | 3,682,819 | $ | 48,257,610 | ||||||||||
Shares issued to shareholders in reinvestment of dividends | 155,786 | 2,053,355 | 120,579 | 1,584,678 | ||||||||||||
Shares repurchased | (2,115,963 | ) | (27,896,770 | ) | (1,296,692 | ) | (16,998,588 | ) | ||||||||
|
|
|
|
|
|
|
| |||||||||
Net increase (decrease) | 663,156 | $ | 8,719,932 | 2,506,706 | $ | 32,843,700 | ||||||||||
|
|
|
|
|
|
|
| |||||||||
Certified Annual Report 21
| NOTES TO FINANCIAL STATEMENTS, CONTINUED | ||
| Thornburg California Limited Term Municipal Fund | September 30, 2011 | |
| Year Ended September 30, 2011 | Year Ended September 30, 2010 | |||||||||||||||
| Shares | Amount | Shares | Amount | |||||||||||||
Class C Shares | ||||||||||||||||
Shares sold | 995,972 | $ | 13,168,906 | 1,487,118 | $ | 19,552,458 | ||||||||||
Shares issued to shareholders in reinvestment of dividends | 51,658 | 681,227 | 45,232 | 595,327 | ||||||||||||
Shares repurchased | (765,757 | ) | (10,065,986 | ) | (379,476 | ) | (4,997,998 | ) | ||||||||
|
|
|
|
|
|
|
| |||||||||
Net increase (decrease) | 281,873 | $ | 3,784,147 | 1,152,874 | $ | 15,149,787 | ||||||||||
|
|
|
|
|
|
|
| |||||||||
Class I Shares | ||||||||||||||||
Shares sold | 5,116,896 | $ | 67,639,490 | 3,723,169 | $ | 49,022,751 | ||||||||||
Shares issued to shareholders in reinvestment of dividends | 119,897 | 1,582,985 | 80,780 | 1,063,454 | ||||||||||||
Shares repurchased | (2,136,868 | ) | (28,009,312 | ) | (1,055,277 | ) | (13,857,362 | ) | ||||||||
|
|
|
|
|
|
|
| |||||||||
Net increase (decrease) | 3,099,925 | $ | 41,213,163 | 2,748,672 | $ | 36,228,843 | ||||||||||
|
|
|
|
|
|
|
| |||||||||
NOTE 5 – SECURITIES TRANSACTIONS
For the year ended September 30, 2011, the Fund had purchase and sale transactions of investment securities (excluding short-term investments) of $96,268,933 and $32,322,291, respectively.
NOTE 6 – INCOME TAXES
At September 30, 2011, information on the tax components of capital is as follows:
Cost of investments for tax purposes | $ | 270,257,307 | ||
|
| |||
Gross unrealized appreciation on a tax basis | $ | 10,857,740 | ||
Gross unrealized depreciation on a tax basis | (372,030 | ) | ||
|
| |||
Net unrealized appreciation (depreciation) on investments (tax basis) | $ | 10,485,710 | ||
|
|
At September 30, 2011, the Fund did not have any undistributed net ordinary income, or undistributed capital gains.
The Fund utilized $207,914 of capital loss carryforwards for the year ended September 30, 2011 and has no remaining capital loss carryforwards to offset future capital gains.
The Regulated Investment Company Modernization Act of 2010 (the “Act”) was signed into law on December 22, 2010. The Act makes changes to a number of tax rules impacting the Fund. Under the Act, future capital losses generated by the Fund may be carried over indefinitely, but these losses must be used prior to the utilization of any pre-enactment capital losses. Since pre-enactment capital losses may only be carried forward for eight years, there may be a greater likelihood that all or a portion of a Fund’s pre-enactment capital losses will expire unused. In general, the provisions of the Act will be effective for the Fund’s fiscal year ending September 30, 2012.
In order to account for permanent book/tax differences, the Fund increased undistributed net investment income by $88, decreased accumulated net realized gains by $6,616 and increased net capital paid in on shares of beneficial interest by $6,528. This reclassification has no impact on the net asset value of the Fund. This reclassification resulted primarily from undistributed taxable income and non-deductible taxes paid.
22 Certified Annual Report
| NOTES TO FINANCIAL STATEMENTS, CONTINUED | ||
| Thornburg California Limited Term Municipal Fund | September 30, 2011 | |
The tax character of distributions paid for the years ended September 30, 2011, and September 30, 2010, was as follows:
| 2011 | 2010 | |||||||
Distributions from: | ||||||||
Tax exempt income | $ | 7,145,306 | $ | 5,626,927 | ||||
Ordinary income | 7,160 | 6,540 | ||||||
|
|
|
| |||||
Total Distributions | $ | 7,152,466 | $ | 5,633,467 | ||||
|
|
|
| |||||
OTHER NOTES:
Risks: The Fund’s investments subject it to risks including, but not limited to, credit risk, interest rate risk, management risk, market and economic risk, liquidity risk, and the risks of investing primarily in the obligations of a single state. Please see the Fund’s prospectus for a discussion of the risks associated with an investment in the Fund.
Subsequent Events: Fund management believes no events have occurred between September 30, 2011 and the date of issuance of the financial statements, which require adjustment to, or disclosure in the accompanying financial statements.
Certified Annual Report 23
Thornburg California Limited Term Municipal Fund
| PER SHARE PERFORMANCE (for a share outstanding throughout the Year)+ | RATIOS TO AVERAGE NET ASSETS | SUPPLEMENTAL DATA | ||||||||||||||||||||||||||||||||||||||||||||||||||||||||||
Unless | Net Asset Value Beginning of Year | Net Investment Income (Loss) | Net Realized & Unrealized Gain (Loss) on Investments | Total from Investment Operations | Dividends from Net Investment Income | Dividends from Net Realized Gains | Total Dividends | Net Asset Value End of Year | Net Investment Income (Loss) (%) | Expenses, After Expense Reductions (%) | Expenses, After Expense Reductions and Net of Custody Credits (%) | Expenses, Before Expense Reductions (%) | Total Return (%)(a) | Portfolio Turnover Rate (%) | Net Assets at End of Year (Thousands) | |||||||||||||||||||||||||||||||||||||||||||||
Class A Shares |
| |||||||||||||||||||||||||||||||||||||||||||||||||||||||||||
2011(b) | $ | 13.38 | 0.36 | 0.03 | 0.39 | (0.36 | ) | — | (0.36 | ) | $ | 13.41 | 2.71 | 0.96 | 0.96 | 0.96 | 2.98 | 13.33 | $ | 123,910 | ||||||||||||||||||||||||||||||||||||||||
2010(b) | $ | 13.09 | 0.39 | 0.29 | 0.68 | (0.39 | ) | — | (0.39 | ) | $ | 13.38 | 2.94 | 0.97 | 0.97 | 0.97 | 5.29 | 13.69 | $ | 114,813 | ||||||||||||||||||||||||||||||||||||||||
2009(b) | $ | 12.49 | 0.44 | 0.60 | 1.04 | (0.44 | ) | — | (0.44 | ) | $ | 13.09 | 3.48 | 0.98 | 0.98 | 0.99 | 8.50 | 44.06 | $ | 79,455 | ||||||||||||||||||||||||||||||||||||||||
2008(b) | $ | 12.73 | 0.42 | (0.24 | ) | 0.18 | (0.42 | ) | — | (0.42 | ) | $ | 12.49 | 3.32 | 1.00 | 0.98 | 1.00 | 1.42 | 34.88 | $ | 66,023 | |||||||||||||||||||||||||||||||||||||||
2007(b) | $ | 12.77 | 0.43 | (0.04 | ) | 0.39 | (0.43 | ) | — | (0.43 | ) | $ | 12.73 | 3.37 | 0.99 | 0.99 | 1.01 | 3.10 | 22.71 | $ | 67,183 | |||||||||||||||||||||||||||||||||||||||
Class C Shares |
| |||||||||||||||||||||||||||||||||||||||||||||||||||||||||||
2011 | $ | 13.40 | 0.32 | 0.02 | 0.34 | (0.32 | ) | — | (0.32 | ) | $ | 13.42 | 2.45 | 1.22 | 1.22 | 1.22 | 2.63 | 13.33 | $ | 45,897 | ||||||||||||||||||||||||||||||||||||||||
2010 | $ | 13.10 | 0.35 | 0.30 | 0.65 | (0.35 | ) | — | (0.35 | ) | $ | 13.40 | 2.67 | 1.23 | 1.23 | 1.74 | 5.09 | 13.69 | $ | 42,039 | ||||||||||||||||||||||||||||||||||||||||
2009 | $ | 12.50 | 0.41 | 0.60 | 1.01 | (0.41 | ) | — | (0.41 | ) | $ | 13.10 | 3.23 | 1.24 | 1.24 | 1.76 | 8.22 | 44.06 | $ | 26,004 | ||||||||||||||||||||||||||||||||||||||||
2008 | $ | 12.74 | 0.39 | (0.24 | ) | 0.15 | (0.39 | ) | — | (0.39 | ) | $ | 12.50 | 3.06 | 1.26 | 1.24 | 1.78 | 1.16 | 34.88 | $ | 15,963 | |||||||||||||||||||||||||||||||||||||||
2007 | $ | 12.78 | 0.40 | (0.04 | ) | 0.36 | (0.40 | ) | — | (0.40 | ) | $ | 12.74 | 3.13 | 1.24 | 1.23 | 1.79 | 2.85 | 22.71 | $ | 14,449 | |||||||||||||||||||||||||||||||||||||||
Class I Shares |
| |||||||||||||||||||||||||||||||||||||||||||||||||||||||||||
2011 | $ | 13.40 | 0.40 | 0.02 | 0.42 | (0.40 | ) | — | (0.40 | ) | $ | 13.42 | 3.03 | 0.63 | 0.62 | 0.63 | 3.24 | 13.33 | $ | 120,693 | ||||||||||||||||||||||||||||||||||||||||
2010 | $ | 13.10 | 0.43 | 0.30 | 0.73 | (0.43 | ) | — | (0.43 | ) | $ | 13.40 | 3.27 | 0.63 | 0.63 | 0.63 | 5.72 | 13.69 | $ | 78,948 | ||||||||||||||||||||||||||||||||||||||||
2009 | $ | 12.50 | 0.48 | 0.60 | 1.08 | (0.48 | ) | — | (0.48 | ) | $ | 13.10 | 3.81 | 0.65 | 0.65 | 0.65 | 8.86 | 44.06 | $ | 41,186 | ||||||||||||||||||||||||||||||||||||||||
2008 | $ | 12.74 | 0.47 | (0.24 | ) | 0.23 | (0.47 | ) | — | (0.47 | ) | $ | 12.50 | 3.66 | 0.65 | 0.63 | 0.65 | 1.77 | 34.88 | $ | 41,814 | |||||||||||||||||||||||||||||||||||||||
2007 | $ | 12.78 | 0.47 | (0.04 | ) | 0.43 | (0.47 | ) | — | (0.47 | ) | $ | 12.74 | 3.71 | 0.66 | 0.65 | 0.68 | 3.44 | 22.71 | $ | 31,918 | |||||||||||||||||||||||||||||||||||||||
| (a) | Not annualized for periods less than one year. |
| (b) | Sales loads are not reflected in computing total return. |
| + | Based on weighted average shares outstanding. |
See notes to financial statements.
| 24 Certified Annual Report | Certified Annual Report 25 |
REPORT OF INDEPENDENT REGISTERED PUBLIC ACCOUNTING FIRM
Thornburg California Limited Term Municipal Fund
To the Trustees and Shareholders of
Thornburg California Limited Term Municipal Fund
In our opinion, the accompanying statement of assets and liabilities, including the schedule of investments, and the related statements of operations and of changes in net assets and the financial highlights present fairly, in all material respects, the financial position of Thornburg California Limited Term Municipal Fund (one of the portfolios constituting Thornburg Investment Trust, hereafter referred to as the “Fund”) at September 30, 2011, the results of its operations for the year then ended, the changes in its net assets for each of the two years in the period then ended and the financial highlights for each of the five years in the period then ended, in conformity with accounting principles generally accepted in the United States of America. These financial statements and financial highlights (hereafter referred to as “financial statements”) are the responsibility of the Fund’s management. Our responsibility is to express an opinion on these financial statements based on our audits. We conducted our audits of these financial statements in accordance with the standards of the Public Company Accounting Oversight Board (United States). Those standards require that we plan and perform the audit to obtain reasonable assurance about whether the financial statements are free of material misstatement. An audit includes examining, on a test basis, evidence supporting the amounts and disclosures in the financial statements, assessing the accounting principles used and significant estimates made by management, and evaluating the overall financial statement presentation. We believe that our audits, which included confirmation of securities at September 30, 2011 by correspondence with the custodian and brokers, provide a reasonable basis for our opinion.
PricewaterhouseCoopers LLP
New York, New York
November 21, 2011
26 Certified Annual Report
| EXPENSE EXAMPLE | ||
| Thornburg California Limited Term Municipal Fund | September 30, 2011 (Unaudited) | |
As a shareholder of the Fund, you incur two types of costs:
| (1) | transaction costs, including |
(a) sales charges (loads) on purchase payments, for Class A shares;
(b) a deferred sales charge on redemptions of any part or all of a purchase of $1 million of Class A shares within 12 months of purchase;
(c) a deferred sales charge on redemptions of Class C shares within 12 months of purchase;
| (2) | ongoing costs, including management fees; distribution and/or service (12b-1) fees; and other Fund expenses. |
This example is intended to help you understand your ongoing costs (in dollars) of investing in the Fund and to compare these costs with the ongoing costs of investing in other mutual funds.
The example is based on a $1,000 investment beginning on April 1, 2011, and held until September 30, 2011.
ACTUAL EXPENSES
For each class of shares, the first line of the table at right provides information about actual account values and actual expenses. You may use the information in this line, together with the amount you invested, to estimate the expenses that you paid over the period. Simply divide your account value by $1,000 (for example, an $8,600 account value divided by $1,000 = 8.6), then multiply the result by the number in the first line for your class of shares under the heading entitled “Expenses Paid During Period” to estimate the expenses you paid on your account during this period.
HYPOTHETICAL EXAMPLE FOR COMPARISON PURPOSES
For each class of shares, the second line of the table at right provides information about hypothetical account values and hypothetical expenses based on the Fund’s actual expense ratio and an assumed rate of return of 5% per year before expenses, which is not the Fund’s actual return. The hypothetical account values and expenses may not be used to estimate the actual ending account balance or expenses you paid for the period. You may use this information to compare the ongoing costs of investing in the Fund and other funds. To do so, compare this 5% hypothetical example with the 5% hypothetical examples that appear in the shareholder reports of the other funds.
| Beginning Account Value 4/1/11 | Ending Account Value 9/30/11 | Expenses Paid During Period† 4/1/11–9/30/11 | ||||||||||
Class A Shares | ||||||||||||
Actual | $ | 1,000.00 | $ | 1,051.10 | $ | 4.91 | ||||||
Hypothetical* | $ | 1,000.00 | $ | 1,020.28 | $ | 4.84 | ||||||
Class C Shares | ||||||||||||
Actual | $ | 1,000.00 | $ | 1,049.60 | $ | 6.27 | ||||||
Hypothetical* | $ | 1,000.00 | $ | 1,018.95 | $ | 6.18 | ||||||
Class I Shares | ||||||||||||
Actual | $ | 1,000.00 | $ | 1,052.70 | $ | 3.23 | ||||||
Hypothetical* | $ | 1,000.00 | $ | 1,021.92 | $ | 3.18 | ||||||
| † | Expenses are equal to the annualized expense ratio for each class (A: 0.95%; C: 1.22%; I: 0.63%) multiplied by the average account value over the period, multiplied by 183/365 to reflect the one-half year period. |
| * | Hypothetical assumes a rate of return of 5% per year before expenses. |
Please note that the expenses shown in the table are meant to highlight your ongoing costs only and do not reflect any transactional costs, such as sales charges (loads), redemption fees, or exchange fees. Therefore, the second line of the table for each class of shares is useful in comparing ongoing costs only, and will not help you determine the relative total costs of owning different funds. In addition, if these transactional costs were included, your costs would have been higher.
Certified Annual Report 27
| INDEX COMPARISON | ||
| Thornburg California Limited Term Municipal Fund | September 30, 2011 (Unaudited) | |
GROWTH OF A HYPOTHETICAL $10,000 INVESTMENT
Thornburg California Limited Term Municipal Fund versus Barclays Capital Five Year Municipal Bond Index
and Consumer Price Index (February 19, 1987 to September 30, 2011)
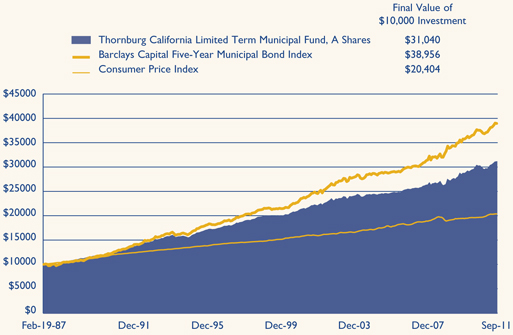
AVERAGE ANNUAL TOTAL RETURNS
For the periods ended September 30, 2011 (with sales charge)
| 1 Yr | 5 Yrs | 10 Yrs | Since Inception | |||||||||||||
A Shares (Incep: 2/19/87) | 1.46 | % | 3.92 | % | 3.33 | % | 4.71 | % | ||||||||
C Shares (Incep: 9/1/94) | 2.13 | % | 3.96 | % | 3.21 | % | 3.71 | % | ||||||||
I Shares (Incep: 4/1/97) | 3.24 | % | 4.58 | % | 3.83 | % | 4.25 | % | ||||||||
Performance data shown represents past performance and is no guarantee of future results. Investment return and principal value will fluctuate so shares, when redeemed, may be worth more or less than their original cost. Current performance may be lower or higher than quoted. For performance current to the most recent month end, visit thornburg.com or call 800.847.0200. The performance data and graph do not reflect the deduction of taxes that a shareholder would pay on distributions or the redemption of Fund shares. Returns reflect the reinvestment of dividends and capital gains as well as applicable sales charges. Class A shares are sold with a maximum sales charge of 1.50%. Class C shares assume deduction of a 0.50% contingent deferred sales charge (CDSC) for the first year only. There is no sales charge for Class I shares.
28 Certified Annual Report
| TRUSTEES AND OFFICERS | ||
| Thornburg California Limited Term Municipal Fund | September 30, 2011 (Unaudited) | |
Name, Age, Position Held with Fund Year Elected | Principal Occupation(s) During Past Five Years | Other Directorships Held by Trustee | ||
INTERESTED TRUSTEES(1)(2)(4) | ||||
| Garrett Thornburg, 65 Chairman of Trustees, Trustee since 1987(3) | Chairman and controlling shareholder and, until 2008, CEO of Thornburg Investment Management, Inc. (investment advisor); Chairman, CEO, and controlling shareholder of Thornburg Securities Corporation (securities dealer); CEO until 2007 and Chairman until 2009 of TMST, Inc. (f/k/a Thornburg Mortgage, Inc.) (real estate investment trust); President and Sole Director of Thornburg Mortgage Advisory Corporation (investment manager to TMST, Inc.). | None | ||
Brian J. McMahon, 55 Member of Governance | CEO since 2008, President, Managing Director, Chief Investment Officer, and Portfolio Manager of Thornburg Investment Management, Inc. | None | ||
INDEPENDENT TRUSTEES(1)(2)(4) | ||||
David A. Ater, 66 Trustee since 1994, Member of Audit Committee | Principal in Ater & Associates, Santa Fe, NM (developer, planner and broker of residential and commercial real estate); owner, developer and broker for various real estate projects. | None | ||
David D. Chase, 70 Trustee since 2000, Chairman of Audit Committee | Managing Member of Vestor Associates, LLC, Santa Fe, NM (private equity fund); Managing Member of CS Group, LLC, Santa Fe, NM (merchant bank). | None | ||
Eliot R. Cutler, 65 Trustee since 2004 Chairman of Governance | Senior Counsel and, until 2009, Partner in Akin, Gump, Strauss, Hauer & Feld LLP (law firm) in Washington, D.C. and Beijing, China. | None | ||
Susan H. Dubin, 62 Trustee since 2004, Member of Audit Committee | President of Dubin Investments, Ltd., Greenwich, CT (private investment fund); Director and officer of various charitable organizations. | None | ||
Owen D. Van Essen, 57 Member of Governance & | President of Dirks, Van Essen & Murray, Santa Fe, NM (newspaper mergers and acquisitions). | None | ||
James W. Weyhrauch, 52 Trustee since 1996, Member of Audit Committee & | Real estate broker, Santa Fe Properties, Santa Fe, NM; Vice Chairman of Nambe LLC, Santa Fe, NM (manufacturing & design company). | None | ||
Certified Annual Report 29
| TRUSTEES AND OFFICERS, CONTINUED | ||
| Thornburg California Limited Term Municipal Fund | September 30, 2011 (Unaudited) | |
Name, Age, Position Held with Fund Year Elected | Principal Occupation(s) During Past Five Years | Other Directorships Held by Trustee | ||
OFFICERS OF THE FUND (WHO ARE NOT TRUSTEES)(1)(6)(7) | ||||
| George T. Strickland, 48 Vice President since 1996, Treasurer since 2007(6) | Portfolio Manager, Vice President, and Managing Director of Thornburg Investment Management, Inc. | Not applicable | ||
William V. Fries, 72 Vice President since 1995 | Portfolio Manager, Vice President, and Managing Director of Thornburg Investment Management, Inc. | Not applicable | ||
Leigh Moiola, 44 Vice President since 2001 | Vice President, Managing Director, and Director of Marketing of Thornburg Investment Management, Inc. | Not applicable | ||
Alexander Motola, 41 Vice President since 2001 | Portfolio Manager, Vice President, and Managing Director of Thornburg Investment Management, Inc. | Not applicable | ||
Wendy Trevisani, 40 Vice President since 1999 | Portfolio Manager and Managing Director of Thornburg Investment Management, Inc. | Not applicable | ||
Joshua Gonze, 48 Vice President since 1999 | Portfolio Manager since 2007, Managing Director, and Associate Portfolio Manager until 2007 of Thornburg Investment Management, Inc. | Not applicable | ||
Christopher Ihlefeld, 41 Vice President since 2003 | Portfolio Manager since 2007, Managing Director, and Associate Portfolio Manager until 2007 of Thornburg Investment Management, Inc. | Not applicable | ||
Leon Sandersfeld, 45 Vice President since 2003 | Managing Director since 2007 and Fund Accounting Director of Thornburg Investment Management, Inc. | Not applicable | ||
Sasha Wilcoxon, 37 Vice President since 2003 Secretary since 2007(6) | Managing Director since 2007, Director of Operations, and Vice President of Thornburg Investment Management, Inc. | Not applicable | ||
Edward Maran, 53 Vice President since 2004 | Portfolio Manager and Managing Director of Thornburg Investment Management, Inc. | Not applicable | ||
Vinson Walden, 41 Vice President since 2004 | Portfolio Manager and Managing Director of Thornburg Investment Management, Inc. | Not applicable | ||
Thomas Garcia, 40 Vice President since 2006 | Vice President since 2011, Managing Director, Head Equity Trader, and Associate Portfolio Manager of Thornburg Investment Management, Inc. | Not applicable | ||
Lei Wang, 40 Vice President since 2006 | Portfolio Manager and Managing Director of Thornburg Investment Management, Inc. | Not applicable | ||
Connor Browne, 32 Vice President since 2006 | Portfolio Manager and Managing Director of Thornburg Investment Management, Inc. | Not applicable | ||
Jason Brady, 37 Vice President since 2007 | Vice President since 2011, Portfolio Manager since 2007, Managing Director since 2007, and Associate Portfolio Manager 2006–2007 of Thornburg Investment Management, Inc. | Not applicable | ||
30 Certified Annual Report
| TRUSTEES AND OFFICERS, CONTINUED | ||
| Thornburg California Limited Term Municipal Fund | September 30, 2011 (Unaudited) | |
Name, Age, Position Held with Fund Year Elected | Principal Occupation(s) During Past Five Years | Other Directorships Held by Trustee | ||
Lewis Kaufman, 35 Vice President since 2007 | Portfolio Manager since 2007, Managing Director since 2007, and Associate Portfolio Manager until 2009 of Thornburg Investment Management, Inc. | Not applicable | ||
Christopher Ryon, 55 Vice President since 2008 | Portfolio Manager since 2009, Managing Director since 2009, and Associate Portfolio Manager 2008–2009 of Thornburg Investment Management, Inc.; Principal of Vanguard Funds until 2008. | Not applicable | ||
Lon Erickson, 36 Vice President since 2008 | Portfolio Manager since 2010, Managing Director since 2010, and Associate Portfolio Manager 2008–2010 of Thornburg Investment Management, Inc.; Senior Analyst of State Farm Insurance until 2008. | Not applicable | ||
Kathleen Brady, 51 Vice President since 2008 | Senior Tax Accountant since 2007 of Thornburg Investment Management, Inc.; Chief Financial Officer of Vestor Partners, LP (private equity fund) until 2007. | Not applicable | ||
Jack Gardner, 57 Vice President since 2008 | Managing Director since 2007 of Thornburg Investment Management, Inc.; President since 2008 and National Sales Director of Thornburg Securities Corporation. | Not applicable | ||
Laura Hillstrom, 44 Vice President since 2009 | Chief Administrative Officer since 2009, Vice President and Managing Director, and Director of Information Systems until 2009 of Thornburg Investment Management, Inc. | Not applicable | ||
| (1) | Each person’s address is 2300 North Ridgetop Road, Santa Fe, New Mexico 87506. |
| (2) | The Fund is one of sixteen separate investment “Funds” or “series” of Thornburg Investment Trust (the “Trust”), which comprises the Thornburg mutual fund complex and is organized as a Massachusetts business trust. Thornburg Investment Management, Inc. is the investment advisor to, and manages, the sixteen Funds of the Trust. Each Trustee oversees the sixteen Funds of the Trust. |
| (3) | Mr. Thornburg is considered an “interested” Trustee under the Investment Company Act of 1940 because he is the sole director and controlling shareholder of Thornburg Investment Management, Inc., the investment advisor to the sixteen active Funds of the Trust, and is the sole director and controlling shareholder of Thornburg Securities Corporation, the distributor of shares for the Trust. |
| (4) | Each Trustee serves in office until the election and qualification of a successor. |
| (5) | Mr. McMahon is considered an “interested” Trustee because he is the chief executive officer and president of Thornburg Investment Management, Inc. |
| (6) | The Trust’s president, secretary, and treasurer each serves a one-year term or until the election and qualification of a successor; each other officer serves at the pleasure of the Trustees. |
| (7) | Assistant vice presidents, assistant secretaries and assistant treasurers are not shown. |
The Statement of Additional Information for each Fund of the Trust includes additional information about the Trustees and is available, without charge and upon request, by calling 1-800-847-0200.
Certified Annual Report 31
| OTHER INFORMATION | ||
| Thornburg California Limited Term Municipal Fund | September 30, 2011 (Unaudited) | |
PORTFOLIO PROXY VOTING
Policies and Procedures:
The Trust has delegated to Thornburg Investment Management, Inc. (the “Advisor”) voting decisions respecting proxies for the Fund’s voting securities. The Advisor makes voting decisions in accordance with its Proxy Voting Policy. A description of the Policy is available (i) without charge, upon request, by calling the Advisor toll-free at 1-800-847-0200, (ii) on the Thornburg website at www.thornburg. com, and (iii) on the Securities and Exchange Commission’s website at www.sec.gov.
Information regarding how proxies were voted is available on or before August 31 of each year for the twelve months ending the preceding June 30. This information is available (i) without charge, upon request by calling the Advisor toll-free at 1-800-847-0200, (ii) on the Thornburg website at www.thornburg.com, and (iii) on the Securities and Exchange Commission’s website at www.sec.gov.
TAX INFORMATION
For the tax year ended September 30, 2011, dividends paid by the Fund of $7,145,306 (or the maximum allowed) are tax exempt dividends for federal income tax purposes.
The information and distributions reported herein may differ from the information and distributions reported to the shareholders for the calendar year ending December 31, 2011. Complete information will be reported in conjunction with your 2011 Form 1099.
AVAILABILITY OF QUARTERLY PORTFOLIO SCHEDULE
The Fund files with the Securities and Exchange Commission schedules of its portfolio holdings on Form N-Q for the first and third quarters of each fiscal year. The Fund’s Forms N-Q are available on the Commission’s website at www.sec.gov, or may be reviewed and copied at the Commission’s Public Reference Room in Washington, D.C. Information on the operation of the Public Reference Room may be obtained by calling 1-800-SEC-0330. The Fund also makes this information available on its website at www.thornburg.com/ download or upon request by calling 1-800-847-0200.
STATEMENT RESPECTING RENEWAL OF INVESTMENT ADVISORY AGREEMENT
Thornburg Investment Management, Inc. (the “Advisor”) provides investment management services to Thornburg California Limited Term Municipal Fund pursuant to an investment advisory agreement. The Trustees consider the renewal of this agreement annually, and most recently determined to renew the agreement on September 13, 2011.
In anticipation of their recent consideration of the advisory agreement’s renewal, the independent Trustees met in May 2011 to plan the Trustees’ evaluation of the Advisor’s performance and to specify the information the Advisor would present to the Trustees for their review. The Advisor’s chief investment officer subsequently reviewed portions of the specified information with the Trustees and addressed questions presented by the Trustees at a meeting session scheduled for that purpose, and the independent Trustees thereafter met in independent session to consider the Advisor’s presentation and various specific issues respecting their consideration of the advisory agreement’s renewal. Following these sessions, the Trustees met to consider a renewal of the agreement, and the independent Trustees unanimously voted at that meeting to renew the agreement for an additional term of one year.
The information below summarizes certain factors considered by the Trustees in connection with the determination to renew the advisory agreement. In determining to renew the agreement, the Trustees did not identify any single factor as controlling, and this summary does not describe all of the matters considered by the Trustees in making their determination.
Quality of Services; Fund Investment Performance. The Trustees evaluated the nature, extent and quality of services provided by the Advisor under the advisory agreement, and evaluated the investment performance of the Fund.
In connection with their general supervision of the Advisor, and as an important element of their annual consideration of a renewal of the advisory agreement, the Trustees received and considered reports from the Advisor throughout the year. These reports addressed a wide variety of topics, including particularly the Advisor’s selection of investments and execution of the Fund’s investment strategies. In addition, the Trustees considered information provided to them at their request in anticipation of their annual evaluation of the Advisor’s services, including (i) the Fund’s absolute investment performance and achievement of stated objectives, (ii) the Advisor’s commentary on the Fund’s investment performance in the context of the Fund’s objectives and reasonable expectations, and business,
32 Certified Annual Report
| OTHER INFORMATION, CONTINUED | ||
| Thornburg California Limited Term Municipal Fund | September 30, 2011 (Unaudited) | |
market and economic conditions, (iii), measures of the Fund’s investment performance over different periods of time relative to two categories of California municipal debt mutual funds selected by independent mutual fund analyst firms, and relative to a broad-based securities index, and (iv) comparative measures of portfolio volatility, risk and return.
The Trustees also considered their perceptions of portfolio management personnel developed in formal and informal meetings throughout the year, the Advisor’s staffing and other resources, the Advisor’s performance of accounting and other services, the Advisor’s observance of compliance and regulatory requirements, the Advisor’s responsiveness to the Trustees, and other factors.
In evaluating quantitative and comparative performance data presented, the Trustees noted (among other aspects of the data) performance data for the eleven most recent calendar years, which showed that the Fund had produced positive returns in accordance with expectations in all years, that the Fund’s investment return for the most recent calendar year had exceeded the average return of the mutual fund category for which calendar year data was presented, and that the Fund’s returns had exceeded or had been comparable to the average returns of the category in nine of the preceding ten years. Noted quantitative data further showed that the Fund’s investment returns fell within the top decile of performance for the first fund category for the one-year, three-year and five-year periods ended with the second quarter of the current year, and that the Fund’s investment returns fell at or within the top decile of the second category for the same periods. Measures of portfolio volatility, risk and return considered by the Trustees demonstrated that the Fund’s performance relative to these measures had continued to fulfill expectations in current conditions.
The Trustees concluded, based upon these and other considerations, that the nature, extent and quality of the Advisor’s services were sufficient and that the Advisor had satisfactorily pursued the Fund’s stated investment objectives. The Trustees further concluded that the investment performance of the Fund was satisfactory in the context of the Fund’s objectives and policies.
Fees and Expenses; Profitability of Advisor; Economies of Scale; Ancillary Benefits to Advisor. The Trustees evaluated the level of the management fee charged by the Advisor to the Fund, and in this connection, also considered the profitability of the Advisor, economies of scale potentially available to the Fund and whether the Advisor received any ancillary benefits from its relationship with the Fund.
In evaluating the level of the management fee, the Trustees considered the fee charged by the Advisor and the other expenses charged to the Fund in light of the nature and quality of services provided, comparison of the actual Advisor’s fee and Fund expenses to the statement of fees and expenses in the Fund’s prospectuses, and comparisons of the Advisor’s fee and other Fund expenses to median and average fees and expenses charged to two groups of municipal debt mutual funds assembled by independent mutual fund analyst firms. Comparative fee and expense data noted by the Trustees showed that the management fee charged to the Fund was comparable to the median and average fee levels for one fund group and slightly higher than the median and average levels for the second group, and that the overall expense ratio for the Fund was somewhat higher than the median expense ratios for both groups and slightly higher than the average ratios for both groups. The Trustees did not identify these differences as significant. The Trustees considered information about the fees charged by the Advisor to other investment management clients, together with information about fees charged by other advisors to different clients, and analysis of the differences between the requirements of institutional clients and mutual funds and the consequently different investment management services rendered, respectively, to institutional clients and mutual funds. The Trustees confirmed their previous observations that differences between the fees charged by the Advisor to different types of clients did not appear exceptional, and that the fee rates charged by investment advisors to institutional clients had limited relevance to the evaluation of fee rates charged to mutual funds, because of the significant differences between the respective requirements of institutional clients and mutual funds, the differences between the respective services rendered to institutional clients and mutual funds, and the different circumstances in which the respective fees originate.
In reviewing the profitability of the Advisor, the Trustees considered costs incurred by the Advisor and data comparing the profitability of the Advisor to other investment management firms. The information provided did not indicate that the Advisor’s profitability was unusual, and the Trustees noted the adequacy of the Advisor’s resources and service capabilities. In reviewing the extent to which economies of scale would be realized by the Fund as it grows and whether fee levels reflect economies of scale, the Trustees considered the breakpoint structure for advisory fees chargeable to the Fund, the demonstrated economies of scale enjoyed by other Funds of the Trust as they had grown in size, and economies of scale realized by other mutual funds. The information provided demonstrated to the Trustees that the Fund may reasonably be expected to realize economies of scale as it grows in size, due to the breakpoint fee structure of the advisory agreement and other factors. In reviewing potential benefits to the Advisor because of its relationship to the Fund, the Trustees considered the Advisor’s receipt of research services from broker dealer firms, and the benefits to both the Fund and the Advisor of the Advisor’s expansion of its staffing, compliance and systems capabilities and other resources to serve a broader
Certified Annual Report 33
| OTHER INFORMATION, CONTINUED | ||
| Thornburg California Limited Term Municipal Fund | September 30, 2011 (Unaudited) | |
variety of investment management clients. No unusual or unfair benefits to the Advisor from its relationship to the Fund were identified by the Trustees.
The Trustees concluded, based upon their consideration of these and other factors, that the management fee charged to the Fund by the Advisor was fair and reasonable in view of the nature, extent and quality of the services provided by the Advisor, the clear disclosure of fees and expenses in the Fund’s prospectuses, the investment performance of the Fund, and comparisons of fees and expenses charged to the Fund to fees and expenses charged to other mutual funds.
34 Certified Annual Report
This page intentionally left blank.
This page is not part of the Annual Report. 35
Trustees’ Statement to Shareholders
Not part of the Certified Annual Report
September 13, 2011
The Trustees believe current and prospective shareholders should know how we discharge our responsibilities in supervising the Funds’ investment advisor and in reviewing the advisor’s contract for renewal. Since 2005, we have issued a statement which sets out clearly the three principal guidelines that we follow in supervising the Trust’s investment advisor on your behalf. In accordance with our customary practice, in September of this year we again reviewed our statement and concluded we should reissue this statement outlining the principal features of our supervision of the advisor’s performance of investment management services for the Funds.
We begin with the premise that each shareholder selected his or her Fund because its investments are managed by the investment advisor identified in the prospectus and in accordance with the objective and policies described in the prospectus. We realize, as each of you do, that if you believe that your Fund’s stated objective and policies no longer serve your personal investment goals, you can sell your shares and leave the Fund.
Therefore, we believe that our primary supervisory task – our principal obligation to you – is to assess the nature and quality of the advisor’s services, and to confirm that the advisor actively and competently pursues the Fund’s objective, in accordance with the policies set out in the prospectus. To do this, we meet regularly with management to review your Fund’s portfolio and to discuss the advisor’s specific actions and judgments in pursuing the Fund’s objective. We do not substitute our own judgment for the advisor’s decisions in selecting investments; the advisor is paid to exercise its informed judgment on investment decisions, and we seek to confirm, in reviewing the advisor’s performance, that the advisor is doing just that.
Second, while we are conscious of costs and the effect that costs have on shareholders’ returns, we do not seek the lowest fees or expense ratio as our sole or primary objective. We try to make sure that your Fund’s fees and costs are reasonable in relationship to the services rendered and that they are generally in line with those charged by other expert investment advisors, consistent with our belief that the Fund’s investors searched for and expect that expertise and attention and have decided to pay a reasonable price for it. We do not put the management contract “out to bid” as a matter of course, and we would not do so unless we had concluded that the advisor materially had failed to pursue the Fund’s objectives in accordance with its policies, or for other equally important reasons. We believe that any other approach would be inconsistent with your interests and contrary to your expectations when you bought shares of the Fund in the first place.
Finally, because we believe that most Thornburg Fund shareholders have invested with a long-term perspective, we try not to focus too much on the fashions of the moment and on short-term performance. The market will not favor any specific investment objective or set of policies at all times and under all economic circumstances. A fund will experience periods of both high and low returns relative to other funds and other investments. Even if one of our Funds is not favored by the market at a particular time, we believe that the advisor is nonetheless obliged to remain true to the Fund’s objective and policies, and we watch to see that it does so.
36 This page is not part of the Annual Report.
Retirement and Education Accounts
Thornburg Investment Management offers retirement and education savings accounts that can help you meet a variety of planning challenges. For account applications or further information on any of the accounts below, please call 1-800-847-0200 or go to www.thornburg.com/ira. Your financial advisor can help you determine which plan is right for you.
Individual Retirement Accounts
Individual Retirement Accounts (IRAs) provide a tax-advantaged means to save money for the future. For a detailed outline of the difference between retirement accounts, see www.thornburg.com/ira. Rollovers are available. Call 1-800-847-0200 for more information.
Traditional IRAs – Contributions to Traditional IRAs are tax deductible for eligible individuals, and withdrawals are taxed as additional ordinary income. You may contribute to an IRA if you receive compensation and are under 70 1/2, even if you are covered by an employer retirement plan. Deductible contributions are subject to certain qualifications. Please consult your tax advisor.
Roth IRAs – Under a Roth IRA, there is no tax deduction for contributions, but there is no income tax on qualified withdrawals. For a more detailed comparison of Traditional and Roth IRAs, please see our web site at www.thornburg.com/ira.
SEP IRAs – Simplified Employee Pension (SEP) IRAs are established by employers. The employer is allowed a tax deduction for contributions made to the SEP Plan and makes contributions to each eligible employee’s SEP IRA on a discretionary basis.
SIMPLE IRAs – Savings Incentive Match Plan for Employees of Small Employers (SIMPLE) is designed to give small business owners a simplified method to establish and contribute to a retirement plan for employees. The employer is allowed a tax deduction for contributions and makes either matching or non-elective contributions to each eligible employee’s SIMPLE IRA. Employees may make salary deferral contributions.
Coverdell Education Savings Account
These savings accounts are designed to provide a way to save money for higher education expenses. In an Education Savings Account, earnings and interest grow tax-free, and qualified withdrawals used to pay for eligible higher-education expenses are tax- and penalty-free.
Funds Available
The following funds are available in the accounts listed above:
| • | Thornburg International Value Fund |
| • | Thornburg Value Fund |
| • | Thornburg Core Growth Fund |
| • | Thornburg Investment Income Builder Fund |
| • | Thornburg Global Opportunities Fund |
| • | Thornburg International Growth Fund |
| • | Thornburg Developing World Fund |
| • | Thornburg Limited Term U.S. Government Fund |
| • | Thornburg Limited Term Income Fund |
| • | Thornburg Strategic Income Fund |
This page is not part of the Annual Report. 37

Thornburg Equity Funds
Thornburg’s equity research uses a fundamental and comprehensive analytical approach. Thornburg equity funds focus on a limited number of securities so that each holding can impact performance. The equity team searches for firms believed to have a promising future and seeks to buy shares of those companies at a discount to their intrinsic value.
| • | Thornburg Value Fund |
| • | Thornburg International Value Fund |
| • | Thornburg Core Growth Fund |
| • | Thornburg Investment Income Builder Fund |
| • | Thornburg Global Opportunities Fund |
| • | Thornburg International Growth Fund |
| • | Thornburg Developing World Fund |
Thornburg Bond Funds
Thornburg Investment Management applies a disciplined philosophy to fixed-income management. Since the launch of our first fixed-income fund over 25 years ago, we have been conducting fundamental, bottom-up research in an effort to identify bonds which we believe provide the best return for a given level of risk. We are very organic in our approach, avoiding leverage or complex strategies which could backfire in periods of market uncertainty.
| • | Thornburg Limited Term Municipal Fund |
| • | Thornburg Intermediate Municipal Fund |
| • | Thornburg California Limited Term Municipal Fund |
| • | Thornburg New Mexico Intermediate Municipal Fund |
| • | Thornburg New York Intermediate Municipal Fund |
| • | Thornburg Strategic Municipal Income Fund |
| • | Thornburg Limited Term U.S. Government Fund |
| • | Thornburg Limited Term Income Fund |
| • | Thornburg Strategic Income Fund |
Before investing, carefully consider the Fund’s investment goals, risks, charges, and expenses. For a prospectus containing this and other information, contact your financial advisor or visit thornburg.com. Read it carefully before investing.
For additional information, please visit www.thornburg.com
Thornburg Investment Management, Inc. 2300 North Ridgetop Road, Santa Fe, NM 87506
This page is not part of the Annual Report. 39
 | Waste not, Wait not |  | ||||
| Get instant access to your shareholder reports. | ||||||
| This Annual Report is submitted for the general information of shareholders of the Fund. It is not authorized for distribution to prospective investors in the Fund unless preceded or accompanied by an effective prospectus. | By switching from your postal mailbox to your email inbox, you reduce paper clutter, improve record keeping access, and help conserve our natural resources. | |||||
 | Investment Advisor: Thornburg Investment Management® 800.847.0200 | Go to www.thornburg.com/edelivery and sign up to receive your shareholder reports, prospectuses, and proxy statements electronically. | ||||
Distributor: | ||||||
Thornburg Securities Corporation® 800.847.0200 | You invest in the future, without spending a dime. | |||||
| TH859 | ||||||

Important Information
The information presented on the following pages was current as of September 30, 2011. The managers’ views, portfolio holdings, and sector diversification are provided for the general information of the Fund’s shareholders; to the extent this information is historical, it should not be considered predictive of future circumstances. This material should not be deemed a recommendation to buy or sell any of the securities mentioned.
Investments in the Fund carry risks, including possible loss of principal. Bond funds have the same interest rate, inflation, and credit risks that are associated with the underlying bonds. The principal value of bonds will fluctuate relative to changes in interest rates, decreasing when interest rates rise. Unlike bonds, bond funds have ongoing fees and expenses. Please see the Fund’s Prospectus for a discussion of the risks associated with an investment in the Fund. Investments in the Fund are not FDIC insured, nor are they deposits of or guaranteed by a bank or any other entity. There is no guarantee that the Fund will meet its investment objectives. The laddering strategy does not assure or guarantee better performance and cannot eliminate the risk of investment losses.
Performance data given at net asset value (NAV) does not take into account the applicable sales charges. If the sales charges had been included, the performance would have been lower.
Minimum investments for Class I shares are higher than those for other classes. Class I shares may not be available to all investors.
Share Class | NASDAQ Symbol | Cusip | ||
Class A | THNMX | 885-215-301 | ||
Class D | THNDX | 885-215-624 | ||
Class I | THNIX | 885-215-285 |
Glossary
BofA Merrill Lynch 3-15 Year U.S. Municipal Securities Index – This index is a subset of the BofA Merrill Lynch U.S. Municipal Securities Index including all securities with a remaining term to final maturity greater than or equal to 3 years and less than 15 years.
BofA Merrill Lynch 7-12 Year U.S. Municipal Securities Index – This index is a subset of the BofA Merrill Lynch U.S. Municipal Securities Index including all securities with a remaining term to final maturity greater than or equal to 7 years and less than 12 years.
Unless otherwise noted, index returns reflect the reinvestment of income dividends and capital gains, if any, but do not reflect fees, brokerage commissions or other expenses of investing. Investors may not make direct investments into any index.
Alternative Minimum Tax (AMT) – A federal tax aimed at ensuring that high-income individuals, estates, trusts, and corporations pay a minimal level income tax. For individuals, the AMT is calculated by adding tax preference items to regular taxable income.
Annualized Distribution Yield – The distribution yield is calculated by taking the sum of the month’s total distribution factors and dividing this sum by a 30-day period and annualizing to a 360-day year. The value is then divided by the ending maximum offering price per share to arrive at the annualized distribution yield. The yield is calculated on a periodic basis and is subject to change.
Basis Point (bps) – A unit equal to 1/100th of 1%. 1% = 100 basis points (bps).
Bond Credit Ratings – A bond credit rating assesses the financial ability of a debt issuer to make timely payments of principal and interest. Ratings of AAA (the highest), AA, A, and BBB are investment-grade quality. Ratings of BB, B, CCC, CC, C, and D (the lowest) are considered below investment grade, speculative grade, or junk bonds. Unless otherwise noted, the ratings listed are from Municipal Market Data and are a combination of ratings from Standard and Poor’s, Moody’s Investors Service, and Fitch Ratings.
Build America Bonds (BAB) – Taxable municipal bonds that feature tax credits and/or federal subsidies for bondholders and state and local government bond issuers. Build America Bonds (BABs) were introduced in 2009 as part of President Obama’s American Recovery and Reinvestment Act to create jobs and stimulate the economy. BABs attempt to achieve this by lowering the cost of borrowing for state and local governments in financing new projects.
Consumer Price Index (CPI) – An index that measures prices of a fixed basket of goods bought by a typical consumer, including food, transportation, shelter, utilities, clothing, medical care, entertainment and other items. The CPI, published by the Bureau of Labor Statistics in the Department of Labor, is based at 100 in 1982 and is released monthly. It is widely used as a cost-of-living benchmark to adjust Social Security payments and other payment schedules, union contracts and tax brackets. The CPI is also known as the cost-of-living index.
Core CPI – Consumer Price Index minus the energy and food components.
This page is not part of the Annual Report. 3
| Important Information, | ||
Continued | ||
Duration – A bond’s sensitivity to interest rates. Bonds with longer durations experience greater price volatility than bonds with shorter durations.
Effective Duration – A bond’s sensitivity to interest rates, incorporating the embedded option features, such as call provisions. Bonds with longer durations experience greater price volatility than bonds with shorter durations.
Fed Funds Rate – The interest rate at which a depository institution lends immediately available funds (balances at the Federal Reserve) to another depository institution overnight.
General Obligation Bond – A municipal bond backed by the credit and “taxing power” of the issuing jurisdiction rather than the revenue from a given project.
M2 – The amount of money in circulation in notes and coin plus non-interest-bearing bank deposits, building-society deposits, and National Savings accounts.
Operation Twist – A monetary policy where, in an attempt to lower long-term interest rates, the Fed sold short-term Treasury bonds and bought long-term Treasury bonds, which pressured the long-term bond yields downward.
Quantitative Easing – The Federal Reserve’s monetary policy used to stimulate the U.S. economy following the recession that began in 2007/08.
SEC Yield – SEC Yield is computed in accordance with SEC standards measuring the net investment income per share over a specified 30-day period expressed as a percentage of the maximum offering price of the Fund’s shares at the end of the period.
Treasuries – U.S. Treasury securities, such as bills, notes and bonds, are negotiable debt obligations of the U.S. government. These debt obligations are backed by the “full faith and credit” of the government and issued at various schedules and maturities. Income from Treasury securities is exempt from state and local, but not federal, taxes.
4 This page is not part of the Annual Report.
Thornburg New Mexico Intermediate Municipal Fund
At Thornburg, our approach to management of the Fund is based on the premise that investors in the Fund seek preservation of capital along with an attractive, relatively stable yield. While aggressive bond strategies may generate stronger returns when the market is turning a blind eye towards risk, they often fail to stack up over longer periods of time.
We apply time-tested techniques to manage risk and provide attractive returns. These include:
| • | Building a laddered portfolio. Laddering has been shown over time to mitigate reinvestment and interest-rate risk. |
| • | Investing on a cash-only basis without using leverage. While leveraged strategies may enhance returns when market conditions are favorable, they can quickly compound losses when sentiment shifts. |
| • | Conducting in-depth fundamental research on each issue and actively monitoring positions for subsequent credit events. |
| • | Diversifying among a large number of generally high-quality bonds. |
CO-PORTFOLIO MANAGERS

Josh Gonze, Chris Ryon,CFA, and Chris Ihlefeld
IMPORTANT
PERFORMANCE INFORMATION
Performance data shown represents past performance and is no guarantee of future results. Investment return and principal value will fluctuate so shares, when redeemed, may be worth more or less than their original cost. Current performance may be lower or higher than quoted. For performance current to the most recent month end, visit thornburg.com or call 800.847.0200.
The maximum sales charge for the Fund’s Class A shares is 2.00%. The total annual fund operating expense of Class A shares is 0.96%, as disclosed in the most recent Prospectus.
LONG-TERM STABILITY OF PRINCIPAL
Net asset value history of A shares from June 18, 1991 through September 30, 2011
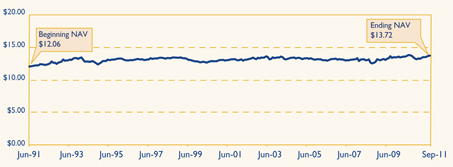
AVERAGE ANNUAL TOTAL RETURNS
For periods ended September 30, 2011
| 1 Yr | 3 Yrs | 5 Yrs | 10 Yrs | Since Inception | ||||||||||||||||
A Shares (Incep: 6/18/91) | ||||||||||||||||||||
Without sales charge | 2.93 | % | 6.30 | % | 4.31 | % | 3.98 | % | 4.95 | % | ||||||||||
With sales charge | 0.88 | % | 5.58 | % | 3.89 | % | 3.77 | % | 4.85 | % | ||||||||||
30-DAY YIELDS, A SHARES
As of September 30, 2011
Annualized Distribution Yield | SEC Yield | |||
2.97% | 1.64 | % | ||
KEY PORTFOLIO ATTRIBUTES
As of September 30, 2011
Number of Bonds | 124 | |||
Effective Duration | 5.3 Yrs | |||
Average Maturity | 9.2 Yrs | |||
See the entire portfolio in the Schedule of Investments beginning on page 11.
This page is not part of the Annual Report. 5

Thornburg New Mexico Intermediate Municipal Fund
September 30, 2011
Table of Contents | ||||
| 7 | ||||
| 11 | ||||
| 15 | ||||
| 16 | ||||
| 17 | ||||
| 18 | ||||
| 24 | ||||
| 26 | ||||
| 27 | ||||
| 28 | ||||
| 29 | ||||
| 32 |
This report is certified under the Sarbanes-Oxley Act of 2002, which requires that public companies, including mutual funds, affirm that the information provided in their annual and semiannual shareholder reports fully and fairly represents their financial position.
6 Certified Annual Report
Christopher Ihlefeld Co-Portfolio Manager
Christopher Ryon,CFA Co-Portfolio Manager
Josh Gonze Co-Portfolio Manager | October 14, 2011
Dear Shareholder:
We are pleased to present the annual report for the Thornburg New Mexico Intermediate Municipal Fund. The net asset value (NAV) of the Class A shares decreased by 6 cents to $13.72 per share for the fiscal year ended September 30, 2011. If you were with us for the entire period, you received dividends of 43.5 cents per share. If you reinvested your dividends, you received 44.2 cents per share. Dividends per share were lower for Class D shares and higher for Class I shares to account for varying class-specific expenses. The Class A shares of your Fund produced a total return of 2.93% at NAV over the fiscal year ended September 30, 2011, compared to 4.91% for the BofA Merrill Lynch 7–12 Year U.S. Municipal Securities Index. The main contributor to the difference in performance is that the BofA Merrill Lynch 7–12 Year U.S. Municipal Securities Index has a longer duration than the Thornburg New Mexico Intermediate Municipal Fund. Duration is a measure of a fund’s price sensitivity to changes in interest rates. As interest rates decline, funds with longer durations will enjoy greater price appreciation and additional income. As interest rates increase, funds with longer durations will also incur greater price depreciation (losses).
New Mexico Fiscal Conditions
New Mexico has remained in relatively healthy condition over the last several years of national economic weakness, though state revenues remain pressured. A broad recovery, anchored by high oil and gas prices, has slowly assisted state and local governments to regain their footing. The general fund is projected to collect $5.4 billion in fiscal year 2011-2012, just slightly higher than in the prior year. Ending balances in the general fund were a respectable 5.2% last year and are budgeted to finish this fiscal year at 5.0%. According to the Rockefeller Institute, New Mexico reported revenue growth of 7.5% in the second quarter of 2011, reflecting improvements in both personal income tax and sales tax revenue. Major local governments, such as the cities of Albuquerque, Santa Fe, Rio Rancho, and Las Cruces, are also in satisfactory fiscal shape.
The Economy and the Federal Reserve (the Fed)
As we started the fiscal year, beginning October 2010, the Federal Reserve Board announced a new wrinkle to its already accommodative stance toward monetary policy. “Quantitative Easing” is a policy of buying bonds and other assets to boost demand and fight off deflation. As we close this fiscal year, the Fed has announced another extraordinary measure known as “Operation Twist.” This policy enhancement calls for the Fed to purchase, by the end of June 2012, $400 billion of Treasury securities with remaining maturities from 6 to 30 years and to sell an equal amount of Treasury securities with remaining maturities of 3 years or less. This is intended to cause the yield curve (a representation of the prevailing yields of Treasury securities by maturity) to flatten, reducing the yield difference between long-term and short-term Treasury securities. A typical measure of this phenomenon is the difference between the yield of a 10-year Treasury security and the |


Certified Annual Report 7
| Letter to Shareholders, | ||
Continued | ||
yield of a 30-year Treasury security. The difference in yield between these two securities was 1.38% on September 1, 2011 (30-year Treasury securities yielded 1.38% more than 10-year Treasury securities). The formal announcement of the Fed’s new policy directive was on September 21, 2011, and by September 30, 2011, the difference had narrowed to 1.02%. The above change in the relationship between 10-year and 30-year Treasury securities means that longer maturity Treasury securities outperformed shorter maturity Treasury securities.
The Federal Open Market Committee, in its September 21, 2011 release, stated that “economic growth remains slow” and that there are “significant downside risks to the economic outlook, including strains in global financial markets.” These concerns explain why Treasury yields are lower by 0.17% to 1.59% since March 31, 2011. Longer maturity Treasury securities have decreased in yield more than shorter maturity Treasury securities. The “strains in the global financial markets.” have led the Treasury market to experience a “flight to quality” in spite of a downgrade to AA+ by Standard and Poor’s on August 5, 2011. As one of our colleagues has stated, “the world views Treasury securities as the best house in a bad neighborhood.”
We share the Fed’s view that “economic growth remains low,” but there are some reasons for hope. June 2011 gross domestic product (GDP), a measure of a country’s overall economic output, recorded a 1.3% increase, higher than the 0.4% increase recorded in March of 2011. Capacity utilization, a measure of an economy’s usage of its productive resources, was running at 77.4% for the month ended August 31, 2011, slightly higher than the 75.7% recorded on September 30, 2011. Money supply as measured by M2, a broad measure of money and money substitutes, remains elevated. The velocity of M2, a measure of the rate at which money in circulation is used in transactions, continues to decline. Typically rising money supply is viewed as an inflationary threat, as long as velocity remains constant or increases. The combination of rising money supply and decreasing velocity is not inflationary. The one significant difference between this fiscal year end and last fiscal year end is that commercial and industrial loans and leases (loans to corporations, commercial enterprises, and joint ventures) have begun to increase, from a very low base. These loans have increased 7.98% over the 12 months ended September 30, 2011 versus a 10.57% decline for the 12 months ended September 30, 2010. These increases of loans to businesses may be laying the groundwork for a more robust expansion.
CHART I: BofA MERRILL LYNCH 3–15 YEAR MUNICIPAL INDEX
Periodic Returns During the Period from 9/30/2010 through 9/30/2011
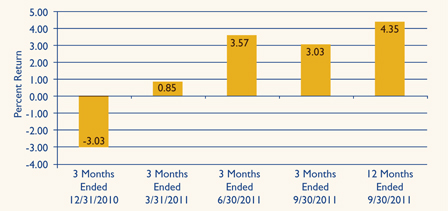
Source: Bloomberg
Past performance does not guarantee future results.
The employment picture is still a major concern; with so many Americans either unemployed or underemployed, it’s hard to fathom where demand for goods and services will come from. The unemployment rate is 9.1%, lower than the 9.8% registered in
8 Certified Annual Report
November 2010. In the 12 months ended September 2011, 1.49 million jobs have been created versus the 118,000 lost in the prior 12 months.
The economic picture is not as bleak as some in the media would paint it. The risks of a double-dip recession seem low, but so to do the probabilities of a robust recovery. Our outlook for interest rates is much the same as it was last year with one exception; over the next 6-12 months, we believe the Fed will keep short-term interest rates low, but long-term interest rates have and may continue to benefit from Operation Twist. Investors should ready themselves for increased periods of volatility as some of the exogenous forces impacting the United States play themselves out.
The Municipal Market
The calendar year began with various predictions of numerous defaults in the municipal bond market; the term “hundreds of billions of dollars” was used. For the nine months ended September 30, 2011, the municipal bond market experienced $1.1 billion in defaults, a relatively small amount. This means, if one uses $200 billion as the low end of the estimate, we have only $198.9 billion to go by December 31, 2011 for these dire predictions to be achieved. Needless to say, these estimates were overly dramatic but they did add to the volatility of returns experienced throughout fiscal 2011. Chart I shows the volatility of returns generated by the BofA Merrill Lynch 3-15 Year Municipal Index for the 12 months ended September 30, 2011.
Most, if not all, of the other predictions of doom proved equally false. Supply of new issue municipal bonds did not expand as the Build America Bond program expired on December 31, 2010. In fact, the supply of newly issued municipal debt is down 35% through September 30, 2011 versus the same period in 2010. On the credit side, the revenue picture for state and local governments is improving. Revenues are increasing, although they are still below peak levels. Also expenditures are being cut. One example of this is that state and local employment payrolls have been cut by in excess of 500,000 jobs nationwide since August 2008.
Chart II illustrates how yields have changed over the last 12 months. The largest declines occurred in maturities shorter than 10 years. The general level of municipal bond yields appear to be moving in sympathy with the yields on Treasury securities, albeit at a slower rate.
The major drivers of returns for the fiscal year have been duration (longer is better than shorter as rates declined) and yield curve exposure (allocation of assets to mid-range maturities versus shorter and longer maturities is better). The discipline of the laddered portfolio structure
CHART II: CHANGES IN AAA GENERAL OBLIGATION BOND YIELDS
9/30/2010 through 9/30/2011
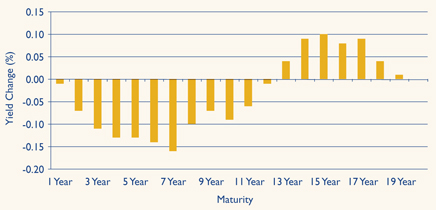
Source: Standard and Poor’s 09/30/2011
Past performance does not guarantee future results.
Certified Annual Report 9
| Letter to Shareholders, | ||
Continued | ||
seeks to ensure that investors benefit from these opportunities.
Conclusion
Your Thornburg New Mexico Intermediate Municipal Fund is a laddered portfolio of 124 municipal obligations. We ladder the maturity dates of the bonds in your portfolio so that some of the bonds are scheduled to mature during each of the coming years. Laddering short and intermediate bonds accomplishes two goals. First, the staggered bond maturities contained in a ladder reduce interest-rate risk and dampen the Fund’s price volatility. Second, laddering reduces reinvestment risk by giving the Fund a steady cash flow stream from maturing bonds to reinvest toward the top of the ladder where yields are typically higher. Chart III describes the percentages of your Fund’s bond portfolio maturing in each of the coming years. The Fund’s adherence to the discipline of the laddered structure served investors well. As you saw in Chart II on the previous page, yields in the shorter segment of the 1– 20 year maturity range of the market decreased more than any other segment. By keeping with the discipline of the Fund’s laddered structure, we were able to capture a significant portion of that performance.
CHART III: % OF PORTFOLIO MATURING
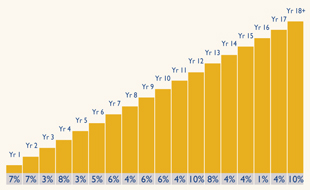
As of 9/30/11. Percentages vary over time.
Data may not add up to 100% due to rounding.
We plan to continue to search for opportunities in the municipal market, using our fundamental, bottom-up approach to portfolio management, and the discipline of the laddered structure. In closing, we would like to thank you for the trust you have placed with us. We will continue to keep that foremost in our minds as we go forward into a new year.
| Sincerely, | ||||
 |  |  | ||
| Christopher Ihlefeld | Christopher Ryon,CFA | Josh Gonze | ||
| Co-Portfolio Manager | Co-Portfolio Manager | Co-Portfolio Manager | ||
| Managing Director | Managing Director | Managing Director | ||
The matters discussed in this report may constitute forward-looking statements made pursuant to the safe harbor provisions of the Securities Litigation Reform Act of 1995. These include any advisor or portfolio manager prediction, assessment, analysis or outlook for individual securities, industries, investment styles, market sectors and/or markets. These statements involve risks and uncertainties. In addition to the general risks described for each fund in its current prospectus, other factors bearing on these reports include the accuracy of the advisor’s or portfolio manager’s forecasts and predictions, the appropriateness of the investment strategies designed by the advisor or portfolio manager and the ability of the advisor or portfolio manager to implement their strategies efficiently and successfully. Any one or more of these factors, as well as other risks affecting the securities markets generally, could cause the actual results of any fund to differ materially as compared to its benchmarks.
10 Certified Annual Report
| SCHEDULE OF INVESTMENTS | ||
| Thornburg New Mexico Intermediate Municipal Fund | September 30, 2011 | |
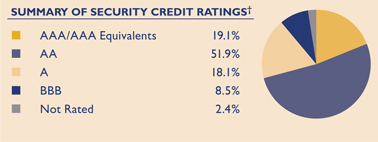
We have used ratings from Standard & Poor’s (S&P). Where S&P ratings are not available, we have used Moody’s Investors Service. Where neither rating is available, we have used ratings from Fitch Ratings. The category of investments identified as “AAA” in this graph includes investments which are pre-refunded or escrowed to maturity. Such investments are backed by an escrow or trust containing sufficient U.S. Government or U.S. Government agency securities to satisfy the timely payment of principal and interest and, therefore, are normally deemed to be equivalent to AAA-rated securities.
Issuer-Description | Credit Rating† S&P/ Moody’s | Principal Amount | Value | |||||||
Albuquerque Airport, 5.50% due 7/1/2013 | A/A1 | $ | 4,000,000 | $ | 4,281,160 | |||||
Albuquerque GRT, 5.00% due 7/1/2021 | AAA/Aa2 | 1,340,000 | 1,554,748 | |||||||
Albuquerque GRT, 5.00% due 7/1/2021 | AAA/Aa2 | 3,000,000 | 3,480,780 | |||||||
Albuquerque IDRB, 5.15% due 4/1/2016 (MCT Industries Inc.; LOC: Bank of the West) (AMT) | NR/A1 | 1,000,000 | 1,040,680 | |||||||
Albuquerque IDRB, 5.25% due 4/1/2017 (MCT Industries Inc.; LOC: Bank of the West) (AMT) | NR/A1 | 2,140,000 | 2,219,287 | |||||||
Bernalillo County GRT, 5.25% due 10/1/2012 | AAA/Aa2 | 1,000,000 | 1,049,270 | |||||||
Bernalillo County GRT, 5.00% due 4/1/2021 (Insured: Natl-Re) | AAA/Aa2 | 3,000,000 | 3,464,250 | |||||||
Bernalillo County GRT, 5.25% due 10/1/2022 (Insured: AMBAC) | AAA/Aa2 | 3,170,000 | 3,924,809 | |||||||
Bernalillo County GRT, 5.25% due 10/1/2023 (Insured: AMBAC) | AAA/Aa2 | 1,275,000 | 1,586,125 | |||||||
Bernalillo County GRT, 5.25% due 10/1/2025 (Insured: AMBAC) | AAA/Aa2 | 3,850,000 | 4,778,543 | |||||||
Bernalillo County Water Utility Authority, 5.00% due 7/1/2021 | AAA/Aa1 | 1,760,000 | 2,085,318 | |||||||
Bernalillo County Water Utility Authority, 5.50% due 7/1/2025 | AAA/Aa1 | 1,000,000 | 1,181,980 | |||||||
Bernalillo County Water Utility Authority, 5.00% due 7/1/2026 | AAA/Aa1 | 1,420,000 | 1,588,682 | |||||||
Colfax County GRT, 5.00% due 9/1/2019 | A-/NR | 845,000 | 935,863 | |||||||
Colfax County GRT, 5.50% due 9/1/2029 | A-/NR | 2,510,000 | 2,705,027 | |||||||
Dona Ana County Pilot Revenue, 5.50% due 12/1/2014 (County Administrative Facilities; Insured: Radian) | A-/NR | 460,000 | 507,996 | |||||||
Farmington Hospital, 5.00% due 6/1/2017 (San Juan Regional Medical Center) | NR/A3 | 1,035,000 | 1,154,832 | |||||||
Farmington Hospital, 5.125% due 6/1/2018 (San Juan Regional Medical Center) | NR/A3 | 570,000 | 600,199 | |||||||
Farmington Hospital, 5.125% due 6/1/2019 (San Juan Regional Medical Center) | NR/A3 | 645,000 | 674,528 | |||||||
Farmington Hospital, 5.00% due 6/1/2022 (San Juan Regional Medical Center) | NR/A3 | 2,825,000 | 3,002,975 | |||||||
Farmington PCR, 4.70% due 9/1/2024 (Arizona Public Service Co.) | BBB/Baa2 | 4,000,000 | 4,095,880 | |||||||
Farmington PCR, 4.00% due 6/1/2032 put 8/1/2012 (El Paso Electric Co.; Insured: Natl-Re/FGIC) | BBB/NR | 2,000,000 | 2,037,180 | |||||||
Farmington Utility Systems, 5.00% due 5/15/2012 (Insured: AGM) | AA+/Aa3 | 6,095,000 | 6,118,649 | |||||||
Gallup PCR Tri-State Generation, 5.00% due 8/15/2012 (Insured: AMBAC) | A/A3 | 3,345,000 | 3,431,368 | |||||||
aGallup PCR Tri-State Generation, 5.00% due 8/15/2013 (Insured: AMBAC) | A/A3 | 2,110,000 | 2,208,073 | |||||||
Gallup PCR Tri-State Generation, 5.00% due 8/15/2017 (Insured: AMBAC) | A/A3 | 3,540,000 | 3,736,364 | |||||||
Grant County Department of Health, 5.50% due 7/1/2020 (Ft. Bayard) | AA/Aa1 | 1,565,000 | 1,771,298 | |||||||
Grant County Department of Health, 5.50% due 7/1/2021 (Ft. Bayard) | AA/Aa1 | 1,655,000 | 1,862,504 | |||||||
Grant County Department of Health, 5.50% due 7/1/2022 (Ft. Bayard) | AA/Aa1 | 1,745,000 | 1,949,287 | |||||||
Guam Government Ltd. Obligation, 5.375% due 12/1/2024 | BBB-/NR | 2,000,000 | 2,054,780 | |||||||
Las Cruces Shared GRT, 5.00% due 6/1/2021 | NR/Aa3 | 730,000 | 860,400 | |||||||
Las Cruces Shared GRT, 5.00% due 6/1/2022 | NR/Aa3 | 765,000 | 891,608 | |||||||
Las Cruces Shared GRT, 5.00% due 6/1/2023 | NR/Aa3 | 800,000 | 922,696 | |||||||
Las Cruces Shared GRT, 5.00% due 6/1/2024 | NR/Aa3 | 840,000 | 960,137 | |||||||
Las Cruces Shared GRT, 5.00% due 6/1/2030 | NR/Aa3 | 2,000,000 | 2,175,760 | |||||||
Las Cruces Shared GRT, 5.00% due 6/1/2037 | NR/Aa3 | 5,000,000 | 5,347,850 | |||||||
Los Alamos County GRT Improvement, 5.75% due 6/1/2016 | AA+/Aa3 | 1,000,000 | 1,201,560 | |||||||
Los Alamos County GRT Improvement, 5.625% due 6/1/2023 | AA+/Aa3 | 1,000,000 | 1,159,590 | |||||||
Los Alamos County GRT Improvement, 5.75% due 6/1/2024 | AA+/Aa3 | 3,000,000 | 3,472,590 | |||||||
Los Alamos County GRT Improvement, 5.75% due 6/1/2025 | AA+/Aa3 | 1,000,000 | 1,148,900 | |||||||
Certified Annual Report 11
| SCHEDULE OF INVESTMENTS, CONTINUED | ||
| Thornburg New Mexico Intermediate Municipal Fund | September 30, 2011 | |
Issuer-Description | Credit Rating† S&P/ Moody’s | Principal Amount | Value | |||||||
Los Alamos County Utility Systems, 5.00% due 7/1/2013 (Insured: AGM) | AA+/Aa3 | $ | 1,265,000 | $ | 1,362,822 | |||||
Los Ranchos De Albuquerque Educational Facilities, 4.50% due 9/1/2040 (Albuquerque Academy) | AA-/NR | 3,000,000 | 3,017,430 | |||||||
New Mexico Educational Assistance Foundation, 4.10% due 9/1/2015 (Insured: Fitch) (AMT) | NR/Aaa | 2,000,000 | 2,163,600 | |||||||
New Mexico Educational Assistance Foundation, 5.00% due 12/1/2019 | AAA/Aaa | 1,000,000 | 1,171,570 | |||||||
New Mexico Educational Assistance Foundation, 5.00% due 12/1/2022 | AAA/Aaa | 3,000,000 | 3,417,630 | |||||||
New Mexico Finance Authority, 5.00% due 6/15/2013 (Insured: AMBAC) | NR/Aa2 | 2,280,000 | 2,452,414 | |||||||
New Mexico Finance Authority, 5.00% due 6/1/2014 (Insured: Natl-Re) | AAA/Aa1 | 2,660,000 | 2,851,786 | |||||||
New Mexico Finance Authority, 5.25% due 6/1/2015 (Insured: AMBAC) | AAA/Aa1 | 1,000,000 | 1,115,600 | |||||||
New Mexico Finance Authority, 5.00% due 6/15/2015 (Insured: AMBAC) | NR/Aa2 | 2,360,000 | 2,690,825 | |||||||
New Mexico Finance Authority, 5.00% due 6/15/2018 (Insured: AMBAC) | NR/Aa2 | 2,915,000 | 3,245,328 | |||||||
New Mexico Finance Authority, 5.00% due 6/15/2019 (Insured: Natl-Re) | NR/Aa2 | 1,215,000 | 1,355,916 | |||||||
New Mexico Finance Authority, 5.00% due 6/1/2020 (Insured: AMBAC) | AAA/Aa1 | 365,000 | 408,249 | |||||||
New Mexico Finance Authority, 5.00% due 6/15/2022 (Insured: Natl-Re) | AA/Aa2 | 1,300,000 | 1,453,790 | |||||||
New Mexico Finance Authority, 5.00% due 6/15/2024 (Insured: Natl-Re) | AA/Aa2 | 7,000,000 | 7,722,610 | |||||||
New Mexico Hospital Equipment Loan Council, 5.00% due 7/1/2017 pre-refunded 7/1/2015 (St. Vincent Hospital; Insured: Radian) | NR/NR | 1,730,000 | 1,980,106 | |||||||
New Mexico Hospital Equipment Loan Council, 5.00% due 7/1/2019 pre-refunded 7/1/2015 (St. Vincent Hospital; Insured: Radian) | NR/NR | 1,000,000 | 1,144,570 | |||||||
New Mexico Hospital Equipment Loan Council, 5.00% due 7/1/2021 pre-refunded 7/1/2015 (St. Vincent Hospital; Insured: Radian) | NR/NR | 1,185,000 | 1,356,315 | |||||||
New Mexico Hospital Equipment Loan Council, 6.00% due 8/1/2023 (Presbyterian Healthcare Services) | AA-/Aa3 | 6,000,000 | 6,842,040 | |||||||
New Mexico Hospital Equipment Loan Council, 5.25% due 7/1/2025 pre-refunded 7/1/2015 (St. Vincent Hospital; Insured: Radian) | NR/NR | 1,000,000 | 1,153,740 | |||||||
New Mexico Hospital Equipment Loan Council, 5.00% due 8/1/2039 (Presbyterian Healthcare Services) | AA-/Aa3 | 3,000,000 | 3,072,060 | |||||||
New Mexico Housing Authority MFR, 5.30% due 12/1/2022 (El Paseo Apartments; Insured: AMBAC) (AMT) | NR/NR | 905,000 | 836,537 | |||||||
New Mexico Institute of Mining & Technology, 5.00% due 7/1/2015 | A+/A1 | 490,000 | 547,869 | |||||||
New Mexico Institute of Mining & Technology, 5.00% due 7/1/2020 | A+/A1 | 590,000 | 668,081 | |||||||
New Mexico Institute of Mining & Technology, 5.00% due 7/1/2023 | A+/A1 | 685,000 | 749,089 | |||||||
New Mexico Institute of Mining & Technology, 5.00% due 7/1/2024 | A+/A1 | 525,000 | 567,021 | |||||||
New Mexico Institute of Mining & Technology, 5.00% due 7/1/2025 | A+/A1 | 505,000 | 541,203 | |||||||
New Mexico Institute of Mining & Technology, 5.00% due 7/1/2028 | A+/A1 | 1,500,000 | 1,577,940 | |||||||
New Mexico Institute of Mining & Technology, 5.00% due 7/1/2031 | A+/A1 | 1,700,000 | 1,754,179 | |||||||
New Mexico MFA MFR, 1.75% due 9/1/2012 (Villa Alegre; Insured: FHA) | AA+/NR | 675,000 | 680,771 | |||||||
New Mexico MFA MFR, 6.05% due 7/1/2028 (Sandpiper Apartments; Insured: FHA) (AMT) | AA-/NR | 2,335,000 | 2,442,994 | |||||||
New Mexico MFA SFMR, 5.25% due 7/1/2023 (Collateralized: GNMA/FNMA/FHLMC) (AMT) | AA+/NR | 1,010,000 | 1,057,824 | |||||||
New Mexico MFA SFMR, 5.375% due 7/1/2023 (Collateralized: GNMA/FNMA/FHLMC) (AMT) | AA+/NR | 1,350,000 | 1,375,528 | |||||||
bNew Mexico MFA SFMR, 4.625% due 3/1/2028 (Collateralized: GNMA/FNMA/FHLMC) | AA+/NR | 2,000,000 | 2,095,660 | |||||||
New Mexico MFA SFMR, 5.50% due 7/1/2028 (Collateralized: GNMA/FNMA/FHLMC) (AMT) | AA+/NR | 2,205,000 | 2,278,934 | |||||||
New Mexico MFA SFMR, 5.60% due 7/1/2028 (Collateralized: GNMA/FNMA/FHLMC) (AMT) | AA+/NR | 1,210,000 | 1,263,385 | |||||||
New Mexico MFA SFMR, 5.40% due 9/1/2029 (Collateralized: GNMA/FNMA/FHLMC) | AA+/NR | 915,000 | 964,886 | |||||||
New Mexico Severance Tax, 4.00% due 7/1/2016 pre-refunded 7/1/2012 | AA/Aa1 | 500,000 | 514,245 | |||||||
New Mexico State University, 5.00% due 4/1/2013 (Insured: AGM) | AA+/Aa2 | 1,000,000 | 1,067,830 | |||||||
Rio Rancho GRT, 5.00% due 6/1/2014 (Insured: Natl-Re/FGIC) | AA-/Aa2 | 955,000 | 1,052,544 | |||||||
Rio Rancho GRT, 5.00% due 6/1/2016 (Insured: Natl-Re/FGIC) | AA-/Aa2 | 555,000 | 627,661 | |||||||
Rio Rancho GRT, 5.00% due 6/1/2022 (Insured: Natl-Re/FGIC) | AA-/Aa2 | 1,000,000 | 1,078,460 | |||||||
Rio Rancho Public School District GO, 3.00% due 8/1/2012 (State Aid Withholding) | NR/Aa1 | 1,240,000 | 1,267,602 | |||||||
Rio Rancho Public School District GO, 4.00% due 8/1/2013 (State Aid Withholding) | NR/Aa1 | 1,210,000 | 1,286,835 | |||||||
Rio Rancho Public School District GO, 4.00% due 8/1/2014 (State Aid Withholding) | NR/Aa1 | 1,715,000 | 1,871,717 | |||||||
San Juan County Gasoline Tax/Motor Vehicle Improvement, 5.25% due 5/15/2014 | NR/Aa3 | 400,000 | 413,960 | |||||||
San Juan County Gasoline Tax/Motor Vehicle Improvement, 5.25% due 5/15/2022 | NR/Aa3 | 1,725,000 | 1,764,002 | |||||||
12 Certified Annual Report
| SCHEDULE OF INVESTMENTS, CONTINUED | ||
| Thornburg New Mexico Intermediate Municipal Fund | September 30, 2011 | |
Issuer-Description | Credit Rating† S&P/ Moody’s | Principal Amount | Value | |||||||
San Juan County GRT, 5.00% due 6/15/2014 (Insured: Natl-Re) | A+/Aa3 | $ | 1,225,000 | $ | 1,348,664 | |||||
Sandoval County Incentive Payment, 4.00% due 6/1/2015 (Intel Corp.) | A+/NR | 815,000 | 841,854 | |||||||
Sandoval County Incentive Payment, 5.00% due 6/1/2020 (Intel Corp.) | A+/NR | 6,390,000 | 6,872,125 | |||||||
Sandoval County Landfill Improvement, 5.50% due 8/15/2015 | NR/Baa2 | 1,420,000 | 1,494,436 | |||||||
Sandoval County Landfill Improvement, 5.75% due 8/15/2018 | NR/Baa2 | 1,335,000 | 1,389,121 | |||||||
Santa Fe County, 5.50% due 5/15/2015 (El Castillo Retirement) | BBB-/NR | 771,000 | 771,825 | |||||||
Santa Fe County, 5.80% due 5/15/2018 (El Castillo Retirement) | BBB-/NR | 1,835,000 | 1,836,119 | |||||||
Santa Fe County, 5.625% due 5/15/2025 (El Castillo Retirement) | BBB-/NR | 1,250,000 | 1,201,075 | |||||||
Santa Fe County, 7.25% due 7/1/2029 (Rancho Viejo Improvement District) | NR/NR | 820,000 | 817,032 | |||||||
Santa Fe County Charter School Foundation, 6.50% due 1/15/2026 (ATC Foundation) | NR/NR | 960,000 | 913,622 | |||||||
Santa Fe County Charter School Foundation, 6.625% due 1/15/2036 (ATC Foundation) | NR/NR | 1,030,000 | 939,576 | |||||||
Santa Fe County Correctional Systems, 5.00% due 2/1/2018 (Insured: AGM) | AA+/Aa3 | 1,000,000 | 1,113,870 | |||||||
Santa Fe County Correctional Systems, 6.00% due 2/1/2027 (Insured: AGM) | AA+/Aa3 | 1,520,000 | 1,826,022 | |||||||
Santa Fe County GRT, 5.00% due 6/1/2025 | AA+/Aa1 | 1,400,000 | 1,543,318 | |||||||
Santa Fe County GRT, 5.00% due 6/1/2026 | AA+/Aa1 | 1,535,000 | 1,680,380 | |||||||
Santa Fe GRT, 5.25% due 6/1/2014 pre-refunded 6/1/2012 (Insured: AMBAC) | AA+/Aa3 | 1,025,000 | 1,059,542 | |||||||
Taos County GRT, 4.75% due 10/1/2012 (ETM) | NR/A3 | 1,500,000 | 1,566,630 | |||||||
University of New Mexico, 5.25% due 6/1/2013 | AA/Aa2 | 665,000 | 685,821 | |||||||
University of New Mexico, 5.25% due 6/1/2014 | AA/Aa2 | 335,000 | 345,258 | |||||||
University of New Mexico, 5.00% due 6/1/2015 (Insured: AMBAC) | AA/Aa2 | 1,590,000 | 1,821,234 | |||||||
University of New Mexico, 5.25% due 6/1/2015 | AA/Aa2 | 1,195,000 | 1,278,387 | |||||||
University of New Mexico, 5.25% due 6/1/2016 | AA/Aa2 | 645,000 | 663,821 | |||||||
University of New Mexico, 5.25% due 6/1/2017 | AA/Aa2 | 1,730,000 | 1,780,481 | |||||||
University of New Mexico, 5.25% due 6/1/2018 | AA/Aa2 | 1,825,000 | 1,875,516 | |||||||
University of New Mexico, 5.25% due 6/1/2018 | AA/Aa2 | 1,200,000 | 1,283,736 | |||||||
University of New Mexico, 5.25% due 6/1/2021 | AA/Aa2 | 1,000,000 | 1,026,450 | |||||||
University of New Mexico, 6.00% due 6/1/2021 | AA/Aa2 | 610,000 | 732,366 | |||||||
University of New Mexico Hospital Mtg Bonds, 5.00% due 1/1/2016 (Insured: AGM/FHA) | AA+/Aa3 | 2,920,000 | 3,162,389 | |||||||
University of New Mexico Hospital Mtg Bonds, 5.00% due 1/1/2017 (Insured: AGM/FHA) | AA+/Aa3 | 2,000,000 | 2,158,180 | |||||||
University of New Mexico Hospital Mtg Bonds, 5.00% due 1/1/2018 (Insured: AGM/FHA) | AA+/Aa3 | 2,000,000 | 2,143,180 | |||||||
University of New Mexico Hospital Mtg Bonds, 5.00% due 1/1/2019 (Insured: AGM/FHA) | AA+/Aa3 | 3,000,000 | 3,188,310 | |||||||
University of New Mexico Hospital Mtg Bonds, 5.00% due 7/1/2019 (Insured: AGM/FHA) | AA+/Aa3 | 3,000,000 | 3,183,390 | |||||||
University of New Mexico Hospital Mtg Bonds, 5.00% due 1/1/2020 (Insured: AGM/FHA) | AA+/Aa3 | 2,310,000 | 2,438,621 | |||||||
University of New Mexico Hospital Mtg Bonds, 5.00% due 7/1/2020 (Insured: AGM/FHA) | AA+/Aa3 | 500,000 | 527,090 | |||||||
Ventana West Public Improvement District Special Tax, 6.625% due 8/1/2023 | NR/NR | 2,000,000 | 1,987,640 | |||||||
Virgin Islands Public Finance Authority, 6.625% due 10/1/2029 | NR/Baa3 | 2,500,000 | 2,672,925 | |||||||
Virgin Islands Water & Power Authority Electric System, 5.00% due 7/1/2025 | BBB-/Baa3 | 990,000 | 1,006,741 | |||||||
Virgin Islands Water & Power Authority Electric System, 5.00% due 7/1/2026 | BBB-/Baa3 | 1,090,000 | 1,101,859 | |||||||
|
| |||||||||
TOTAL INVESTMENTS — 92.33% (Cost $218,686,243) | $ | 231,827,290 | ||||||||
OTHER ASSETS LESS LIABILITIES — 7.67% | 19,254,046 | |||||||||
|
| |||||||||
NET ASSETS — 100.00% | $ | 251,081,336 | ||||||||
|
| |||||||||
Footnote Legend
| † | Credit ratings are unaudited. Rating changes may have occurred subsequent to the reporting period end. |
| a | Segregated as collateral for a when-issued security. |
| b | When-issued security. |
Certified Annual Report 13
| SCHEDULE OF INVESTMENTS, CONTINUED | ||
| Thornburg New Mexico Intermediate Municipal Fund | September 30, 2011 | |
Portfolio Abbreviations
To simplify the listings of securities, abbreviations are used per the table below:
| AGM | Insured by Assured Guaranty Municipal Corp. | |
| AMBAC | Insured by American Municipal Bond Assurance Corp. | |
| AMT | Alternative Minimum Tax | |
| ETM | Escrowed to Maturity | |
| FGIC | Insured by Financial Guaranty Insurance Co. | |
| FHA | Insured by Federal Housing Administration | |
| FHLMC | Insured by Federal Home Loan Mortgage Corp. | |
| FNMA | Collateralized by Federal National Mortgage Association | |
| GNMA | Insured by Government National Mortgage Association | |
| GO | General Obligation | |
| GRT | Gross Receipts Tax | |
| IDRB | Industrial Development Revenue Bond | |
| LOC | Letter of Credit | |
| MFA | Mortgage Finance Authority | |
| Mtg | Mortgage | |
| MFR | Multi-Family Revenue | |
| Natl-Re | Insured by National Public Finance Guarantee Corp. | |
| PCR | Pollution Control Revenue Bond | |
| Radian | Insured by Radian Asset Assurance | |
| SFMR | Single Family Mortgage Revenue Bond |
See notes to financial statements.
14 Certified Annual Report
| STATEMENT OF ASSETS AND LIABILITIES | ||
| Thornburg New Mexico Intermediate Municipal Fund | September 30, 2011 | |
ASSETS | ||||
Investments at value (cost $218,686,243) (Note 2) | $ | 231,827,290 | ||
Cash | 18,331,298 | |||
Receivable for investments sold | 120,979 | |||
Receivable for fund shares sold | 352,476 | |||
Interest receivable | 3,153,983 | |||
Prepaid expenses and other assets | 1,155 | |||
|
| |||
Total Assets | 253,787,181 | |||
|
| |||
LIABILITIES | ||||
Payable for investments purchased | 2,106,460 | |||
Payable for fund shares redeemed | 251,504 | |||
Payable to investment advisor and other affiliates (Note 3) | 172,372 | |||
Accounts payable and accrued expenses | 48,761 | |||
Dividends payable | 126,748 | |||
|
| |||
Total Liabilities | 2,705,845 | |||
|
| |||
NET ASSETS | $ | 251,081,336 | ||
|
| |||
NET ASSETS CONSIST OF: | ||||
Distribution in excess of net investment income | $ | (25,824 | ) | |
Net unrealized appreciation on investments | 13,141,047 | |||
Accumulated net realized gain (loss) | 193,790 | |||
Net capital paid in on shares of beneficial interest | 237,772,323 | |||
|
| |||
| $ | 251,081,336 | |||
|
| |||
NET ASSET VALUE: | ||||
Class A Shares: | ||||
Net asset value and redemption price per share ($185,208,454 applicable to 13,502,325 shares of beneficial interest outstanding - Note 4) | $ | 13.72 | ||
Maximum sales charge, 2.00% of offering price | 0.28 | |||
|
| |||
Maximum offering price per share | $ | 14.00 | ||
|
| |||
Class D Shares: | ||||
Net asset value, offering and redemption price per share ($24,228,423 applicable to 1,765,546 shares of beneficial interest outstanding - Note 4) | $ | 13.72 | ||
|
| |||
Class I Shares: | ||||
Net asset value, offering and redemption price per share ($41,644,459 applicable to 3,037,551 shares of beneficial interest outstanding - Note 4) | $ | 13.71 | ||
|
| |||
See notes to financial statements.
Certified Annual Report 15
| STATEMENT OF OPERATIONS | ||
| Thornburg New Mexico Intermediate Municipal Fund | Year Ended September 30, 2011 | |
INVESTMENT INCOME: | ||||
Interest income (net of premium amortized of $1,212,955) | $ | 10,023,220 | ||
|
| |||
EXPENSES: | ||||
Investment advisory fees (Note 3) | 1,196,476 | |||
Administration fees (Note 3) | ||||
Class A Shares | 234,802 | |||
Class D Shares | 28,889 | |||
Class I Shares | 14,171 | |||
Distribution and service fees (Note 3) | ||||
Class A Shares | 469,604 | |||
Class D Shares | 113,993 | |||
Transfer agent fees | ||||
Class A Shares | 53,353 | |||
Class D Shares | 10,730 | |||
Class I Shares | 3,182 | |||
Registration and filing fees | ||||
Class A Shares | 528 | |||
Class D Shares | 525 | |||
Class I Shares | 526 | |||
Custodian fees (Note 3) | 62,135 | |||
Professional fees | 26,067 | |||
Accounting fees | 9,067 | |||
Trustee fees | 5,762 | |||
Other expenses | 22,971 | |||
|
| |||
Total Expenses | 2,252,781 | |||
Less: | ||||
Expenses reimbursed by investment advisor (Note 3) | (789 | ) | ||
Fees paid indirectly (Note 3) | (3,009 | ) | ||
|
| |||
Net Expenses | 2,248,983 | |||
|
| |||
Net Investment Income | 7,774,237 | |||
|
| |||
REALIZED AND UNREALIZED GAIN (LOSS) | ||||
Net realized gain (loss) on investments | 421,555 | |||
Net change in unrealized appreciation (depreciation) on investments | (1,832,064 | ) | ||
|
| |||
Net Realized and Unrealized Loss | (1,410,509 | ) | ||
|
| |||
Net Increase in Net Assets Resulting from Operations | $ | 6,363,728 | ||
|
| |||
See notes to financial statements.
16 Certified Annual Report
| STATEMENTS OF CHANGES IN NET ASSETS | ||
| Thornburg New Mexico Intermediate Municipal Fund | ||
| Year Ended September 30, 2011 | Year Ended September 30, 2010 | |||||||
INCREASE (DECREASE) IN NET ASSETS FROM | ||||||||
OPERATIONS: | ||||||||
Net investment income | $ | 7,774,237 | $ | 7,701,095 | ||||
Net realized gain (loss) on investments | 421,555 | 290,642 | ||||||
Net unrealized appreciation (depreciation) on investments | (1,832,064 | ) | 2,643,615 | |||||
|
|
|
| |||||
Net Increase (Decrease) in Net Assets Resulting from Operations | 6,363,728 | 10,635,352 | ||||||
DIVIDENDS TO SHAREHOLDERS: | ||||||||
From net investment income | ||||||||
Class A Shares | (6,076,310 | ) | (6,116,479 | ) | ||||
Class D Shares | (687,399 | ) | (587,742 | ) | ||||
Class I Shares | (1,010,528 | ) | (996,874 | ) | ||||
From realized gains | ||||||||
Class A Shares | (168,225 | ) | — | |||||
Class D Shares | (20,580 | ) | — | |||||
Class I Shares | (22,438 | ) | — | |||||
FUND SHARE TRANSACTIONS (NOTE 4): | ||||||||
Class A Shares | (16,253,032 | ) | 12,659,410 | |||||
Class D Shares | 322,750 | 6,475,741 | ||||||
Class I Shares | 14,724,089 | (909,152 | ) | |||||
|
|
|
| |||||
Net Increase (Decrease) in Net Assets | (2,827,945 | ) | 21,160,256 | |||||
NET ASSETS: | ||||||||
Beginning of Year | 253,909,281 | 232,749,025 | ||||||
|
|
|
| |||||
End of Year | $ | 251,081,336 | $ | 253,909,281 | ||||
|
|
|
| |||||
See notes to financial statements.
Certified Annual Report 17
| NOTES TO FINANCIAL STATEMENTS | ||
| Thornburg New Mexico Intermediate Municipal Fund | September 30, 2011 | |
NOTE 1 – ORGANIZATION
Thornburg New Mexico Intermediate Municipal Fund (the “Fund”) is a non-diversified series of Thornburg Investment Trust (the “Trust”). The Trust is organized as a Massachusetts business trust under a Declaration of Trust dated June 3, 1987 and is registered as a diversified, open-end management investment company under the Investment Company Act of 1940, as amended. The Fund is currently one of sixteen separate series of the Trust. Each series is considered to be a separate entity for financial reporting and tax purposes and bears expenses directly attributable to it. The Fund’s primary investment objective is to obtain as high a level of current income exempt from federal and New Mexico state individual income tax as is consistent, in the view of the Fund’s investment advisor, with the preservation of capital. The Fund’s secondary objective is to reduce expected changes in its share price compared to long-term bond portfolios.
The Fund currently offers three classes of shares of beneficial interest outstanding: Class A, Class D, and Institutional Class (Class I). Each class of shares of the Fund represents an interest in the same portfolio of investments, except that (i) Class A shares are sold subject to a front-end sales charge collected at the time the shares are purchased and bear a service fee, (ii) Class D shares are sold at net asset value without a sales charge at the time of purchase or redemption, and bear both a service fee and a distribution fee, (iii) Class I shares are sold at net asset value without a sales charge at the time of purchase, and (iv) the respective classes may have different reinvestment privileges and conversion rights. Additionally, the Fund may allocate among its classes certain expenses, to the extent allowable to specific classes, including transfer agent fees, government registration fees, certain printing and postage costs, and administrative and legal expenses. Currently, class specific expenses of the Fund are limited to service and distribution fees, administration fees, and certain registration and transfer agent expenses.
NOTE 2 – SIGNIFICANT ACCOUNTING POLICIES
Significant accounting policies of the Trust are as follows:
Valuation of Investments: Debt obligations have a primary market over the counter and are valued by an independent pricing service approved by the Trustees of the Trust. The pricing service ordinarily values debt obligations at quoted bid prices. When quotations are not available, debt obligations are valued at evaluated prices determined by the pricing service using methods which include consideration of yields or prices of debt obligations of comparable quality, type of issue, coupon, maturity and rating, and indications as to value from dealers and general market conditions. Short-term obligations having remaining maturities of 60 days or less are ordinarily valued at amortized cost, which approximates market value.
In any case where a pricing service fails to provide a price for a debt obligation held by the Fund, the valuation and pricing committee determines a fair value for the obligation using procedures approved by the Trustees. Additionally, in any case where management believes that a price provided by a pricing service for a debt obligation may be unreliable, the valuation and pricing committee decides whether or not to use the pricing service’s valuation or to determine a fair value for the obligation.
In determining fair value for any portfolio security or other investment, the valuation and pricing committee seeks to determine the amount that an owner of the investment might reasonably expect to receive upon a sale of the investment. However, because fair value prices are estimated prices, the valuation and pricing committee’s determination of fair value for an investment may differ from the value that would be realized by the Fund upon a sale of the investment, and that difference could be material to the Fund’s financial statements. The valuation and pricing committee’s determination of fair value for an investment may also differ from the prices obtained by other persons (including other mutual funds) for the investment.
Valuation Measurements: Various inputs are used in determining the value of the Fund’s investments. These inputs are summarized in the three levels listed below:
Level 1: Quoted prices in active markets for identical investments.
Level 2: Other significant observable inputs (including quoted prices for similar investments, interest rates, prepayment rates, credit risk, etc.).
Level 3: Significant unobservable inputs (including the Fund’s own assumptions in determining the fair value of investments).
18 Certified Annual Report
| NOTES TO FINANCIAL STATEMENTS, CONTINUED | ||
| Thornburg New Mexico Intermediate Municipal Fund | September 30, 2011 | |
The following table displays a summary of the inputs used to value the Fund’s net assets as of September 30, 2011. In any instance when valuation inputs from more than one level are used to determine the fair value of a specific investment, the investment is placed in the level of the table based upon the lowest level input that is significant in determining the fair value of the investment:
| Fair Value Measurements at September 30, 2011 | ||||||||||||||||
| Total | Level 1 | Level 2 | Level 3 | |||||||||||||
Assets | ||||||||||||||||
Investments in Securities | ||||||||||||||||
Municipal Bonds | $ | 231,827,290 | $ | — | $ | 231,827,290 | $ | — | ||||||||
|
|
|
|
|
|
|
| |||||||||
Total Investments in Securities | $ | 231,827,290 | $ | — | $ | 231,827,290 | $ | — | ||||||||
Other Notes: It is the policy of the Fund to recognize significant transfers between Levels 1, 2 and 3 and to disclose those transfers at the beginning of the reporting period. The Fund recognized no significant transfers between levels for the year ended September 30, 2011.
Federal Income Taxes: It is the policy of the Trust to comply with the provisions of the Internal Revenue Code applicable to “regulated investment companies,” and to distribute to shareholders substantially all taxable (if any) and tax exempt income of the Fund. Therefore, no provision for federal income tax is required.
Management reviews each uncertain tax position believed to be material to the preparation of the Fund’s financial statements, to assess if it is more likely than not that the position would be sustained upon examination, based upon the technical merits of the position. As of September 30, 2011, management has not identified any such position for which a liability must be reflected in the Statement of Assets and Liabilities. The Fund’s tax returns remain subject to examination for three years after filing.
When-Issued and Delayed Delivery Transactions: The Fund may engage in when-issued or delayed delivery transactions. To the extent the Fund engages in such transactions, it will do so for the purpose of acquiring portfolio securities consistent with the Fund’s investment objectives and not for the purpose of investment leverage or to speculate on interest rate and/or market changes. At the time the Fund makes a commitment to purchase a security on a when-issued or delayed delivery basis, the Fund will record the transaction and reflect the value in determining its net asset value. When effecting such transactions, assets of an amount sufficient to make payment for the portfolio securities to be purchased will be segregated on the Fund’s records on the trade date. Securities purchased on a when-issued or delayed delivery basis do not earn interest until the settlement date.
Dividends: Net investment income of the Fund is declared daily as a dividend on shares for which the Fund has received payment. Dividends are paid monthly and are reinvested in additional shares of the Fund at net asset value per share at the close of business on the dividend payment date, or at the shareholder’s option, paid in cash. Net realized capital gains, to the extent available, will be distributed at least annually.
General: Securities transactions are accounted for on a trade date basis. Interest income is accrued as earned. Premiums and discounts on securities purchased are amortized to call dates or maturity dates of the respective securities. Realized gains and losses from the sale of securities are recorded on an identified cost basis. Net investment income (other than class specific expenses) and realized and unrealized gains and losses are allocated daily to each class of shares based upon the relative net asset value of outstanding shares (or the value of the dividend-eligible shares, as appropriate) of each class of shares at the beginning of the day (after adjusting for the current capital shares activity of the respective class). Expenses common to all Funds are allocated among the Funds comprising the Trust based upon their relative net asset values or other appropriate allocation methods.
Guarantees and Indemnifications: Under the Trust’s organizational documents, its officers and Trustees are indemnified against certain liabilities arising out of the performance of their duties to the Fund. Additionally, in the normal course of business the Trust enters into contracts with service providers that contain general indemnification clauses. The Trust’s maximum exposure under these arrangements is unknown. However, based on experience, the Trust expects the risk of loss to be remote.
Use of Estimates: The preparation of financial statements, in conformity with generally accepted accounting principles, requires management to make estimates and assumptions that affect the reported amounts of assets and liabilities and the disclosure of contingent
Certified Annual Report 19
| NOTES TO FINANCIAL STATEMENTS, CONTINUED | ||
| Thornburg New Mexico Intermediate Municipal Fund | September 30, 2011 | |
assets and liabilities at the date of the financial statements and the reported amounts of increases and decreases in net assets from operations during the reporting period. Actual results could differ from those estimates.
NOTE 3 – INVESTMENT ADVISORY FEE AND OTHER TRANSACTIONS WITH AFFILIATES
Pursuant to an investment advisory agreement, Thornburg Investment Management, Inc. (the “Advisor”) serves as the investment advisor and performs services to the Fund for which the fees are payable at the end of each month. For the year ended September 30, 2011, these fees were payable at annual rates ranging from .50 of 1% to .275 of 1% per annum of the average daily net assets of the Fund depending on the Fund’s asset size. The Trust also has entered into administrative services agreements with the Advisor, whereby the Advisor will perform certain administrative services for the shareholders of each class of the Fund’s shares, and for which fees will be payable at an annual rate of up to .125 of 1% per annum of the average daily net assets attributable to each class of shares. For the year ended September 30, 2011, the Advisor contractually reimbursed certain class specific expenses and administrative fees of $789 for Class D Shares.
The Trust has an underwriting agreement with Thornburg Securities Corporation (the “Distributor,” an affiliate of the Advisor), which acts as the distributor of the Fund’s shares. For the year ended September 30, 2011, the Distributor has advised the Fund that it earned net commissions aggregating $1,941 from the sale of Class A shares.
Pursuant to a service plan under Rule 12b-1 of the Investment Company Act of 1940, the Fund may reimburse to the Advisor an amount not to exceed .25 of 1% per annum of the average daily net assets attributable to each class of shares of the Fund for payments made by the Advisor to securities dealers and other financial institutions to obtain various shareholder and distribution related services. For the year ended September 30, 2011, there were no 12b-1 service plan fees charged for Class I shares. The Advisor may pay out of its own resources additional expenses for distribution of the Fund’s shares.
The Trust has also adopted a distribution plan pursuant to Rule 12b-1, applicable only to the Fund’s Class D shares, under which the Fund compensates the Distributor for services in promoting the sale of Class D shares of the Fund at an annual rate of up to .25 of 1% per annum of the average daily net assets attributable to Class D shares. Total fees incurred by the Distributor for each class of shares of the Fund under their respective Service and Distribution Plans for the year ended September 30, 2011, are set forth in the Statement of Operations.
The Trust has an agreement with the custodian bank to indirectly pay a portion of the custodian’s fees through credits earned by the Fund’s cash on deposit with the bank. This deposit agreement is an alternative to overnight investments. Custodial fees have been adjusted to reflect amounts that would have been paid without this agreement, with a corresponding adjustment reflected as fees paid indirectly in the Statement of Operations. For the year ended September 30, 2011, fees paid indirectly were $3,009.
Certain officers and Trustees of the Trust are also officers or directors of the Advisor and Distributor. The compensation of independent Trustees is borne by the Trust.
NOTE 4 – SHARES OF BENEFICIAL INTEREST
At September 30, 2011, there were an unlimited number of shares of beneficial interest authorized. Transactions in shares of beneficial interest were as follows:
| Year Ended September 30, 2011 | Year Ended September 30, 2010 | |||||||||||||||
| Shares | Amount | Shares | Amount | |||||||||||||
Class A Shares | ||||||||||||||||
Shares sold | 1,168,293 | $ | 15,776,655 | 2,128,410 | $ | 28,865,038 | ||||||||||
Shares issued to shareholders in reinvestment of dividends | 330,856 | 4,448,456 | 279,226 | 3,785,910 | ||||||||||||
Shares repurchased | (2,720,968 | ) | (36,478,143 | ) | (1,475,832 | ) | (19,991,538 | ) | ||||||||
|
|
|
|
|
|
|
| |||||||||
Net increase (decrease) | (1,221,819 | ) | $ | (16,253,032 | ) | 931,804 | $ | 12,659,410 | ||||||||
|
|
|
|
|
|
|
| |||||||||
20 Certified Annual Report
| NOTES TO FINANCIAL STATEMENTS, CONTINUED | ||
| Thornburg New Mexico Intermediate Municipal Fund | September 30, 2011 | |
| Year Ended September 30, 2011 | Year Ended September 30, 2010 | |||||||||||||||
| Shares | Amount | Shares | Amount | |||||||||||||
Class D Shares | ||||||||||||||||
Shares sold | 452,641 | $ | 6,130,011 | 695,376 | $ | 9,431,570 | ||||||||||
Shares issued to shareholders in reinvestment of dividends | 45,105 | 606,858 | 33,430 | 453,643 | ||||||||||||
Shares repurchased | (478,285 | ) | (6,414,119 | ) | (251,759 | ) | (3,409,472 | ) | ||||||||
|
|
|
|
|
|
|
| |||||||||
Net increase (decrease) | 19,461 | $ | 322,750 | 477,047 | $ | 6,475,741 | ||||||||||
|
|
|
|
|
|
|
| |||||||||
Class I Shares | ||||||||||||||||
Shares sold | 1,123,761 | $ | 15,329,793 | 857,456 | $ | 11,590,412 | ||||||||||
Shares issued to shareholders in reinvestment of dividends | 59,248 | 797,322 | 53,486 | 724,088 | ||||||||||||
Shares repurchased | (103,888 | ) | (1,403,026 | ) | (972,175 | ) | (13,223,652 | ) | ||||||||
|
|
|
|
|
|
|
| |||||||||
Net increase (decrease) | 1,079,121 | $ | 14,724,089 | (61,233 | ) | $ | (909,152 | ) | ||||||||
|
|
|
|
|
|
|
| |||||||||
NOTE 5 – SECURITIES TRANSACTIONS
For the year ended September 30, 2011, the Fund had purchase and sale transactions of investment securities (excluding short-term investments) of $24,631,131 and $39,467,260, respectively.
NOTE 6 – INCOME TAXES
At September 30, 2011, information on the tax components of capital is as follows:
Cost of investments for tax purposes | $ | 218,686,243 | ||
|
| |||
Gross unrealized appreciation on a tax basis | $ | 13,374,783 | ||
Gross unrealized depreciation on a tax basis | (233,736 | ) | ||
|
| |||
Net unrealized appreciation (depreciation) on investments (tax basis) | $ | 13,141,047 | ||
|
| |||
Distributable ordinary income | $ | 55,740 | ||
Distributable capital gains (tax basis) | $ | 138,050 |
The Fund utilized $16,522 of capital loss carryforwards for the year ended September 30, 2011, and has no remaining capital loss carryforwards to offset against future capital gains.
The Regulated Investment Company Modernization Act of 2010 (the “Act”) was signed into law on December 22, 2010. The Act makes changes to a number of tax rules impacting the Fund. Under the Act, future capital losses generated by the Fund may be carried over indefinitely, but these losses must be used prior to the utilization of any pre-enactment capital losses. Since pre-enactment capital losses may only be carried forward for eight years, there may be a greater likelihood that all or a portion of a Fund’s pre-enactment capital losses will expire unused. In general, the provisions of the Act will be effective for the Fund’s fiscal year ending September 30, 2012.
Certified Annual Report 21
| NOTES TO FINANCIAL STATEMENTS, CONTINUED | ||
| Thornburg New Mexico Intermediate Municipal Fund | September 30, 2011 | |
The tax character of distributions paid for the years ended September 30, 2011, and September 30, 2010, was as follows:
| 2011 | 2010 | |||||||
Distributions from: | ||||||||
Tax exempt income | $ | 7,767,483 | $ | 7,695,324 | ||||
Ordinary income | 6,754 | 5,771 | ||||||
Capital gains | 211,243 | — | ||||||
|
|
|
| |||||
Total Distributions | $ | 7,985,480 | $ | 7,701,095 | ||||
|
|
|
| |||||
OTHER NOTES:
Risks: The Fund’s investments subject it to risks including, but not limited to, credit risk, interest rate risk, management risk, market and economic risk, liquidity risk, and the risks of investing primarily in the obligations of a single state. Please see the Fund’s prospectus for a discussion of the risks associated with an investment in the Fund.
Subsequent Events: Fund management believes no events have occurred between September 30, 2011 and the date of issuance of the financial statements, which require adjustment to, or disclosure in the accompanying financial statements.
22 Certified Annual Report
This page intentionally left blank.
Certified Annual Report 23
Thornburg New Mexico Intermediate Municipal Fund
| PER SHARE PERFORMANCE (for a share outstanding throughout the Year)+ | RATIOS TO AVERAGE NET ASSETS | SUPPLEMENTAL DATA | ||||||||||||||||||||||||||||||||||||||||||||||||||||||||||
Unless Periods Fiscal Years Sept. 30, | Net Asset Value Beginning of Year | Net Investment Income (Loss) | Net Realized & Unrealized Gain (Loss) on Investments | Total from Investment Operations | Dividends from Net Investment Income | Dividends from Net Realized Gains | Total Dividends | Net Asset Value End of Year | Net Investment Income (Loss) (%) | Expenses, After Expense Reductions (%) | Expenses, After Expense Reductions and Net of Custody Credits (%) | Expenses, Before Expense Reductions (%) | Total Return (%)(a) | Portfolio Turnover Rate (%) | Net Assets at End of Year (Thousands) | |||||||||||||||||||||||||||||||||||||||||||||
Class A Shares |
| |||||||||||||||||||||||||||||||||||||||||||||||||||||||||||
2011(b) | $ | 13.78 | 0.44 | (0.05 | ) | 0.39 | (0.44 | ) | (0.01 | ) | (0.45 | ) | $ | 13.72 | 3.23 | 0.96 | 0.96 | 0.96 | 2.93 | 10.64 | $ | 185,208 | ||||||||||||||||||||||||||||||||||||||
2010(b) | $ | 13.63 | 0.43 | 0.15 | 0.58 | (0.43 | ) | — | (0.43 | ) | $ | 13.78 | 3.19 | 0.96 | 0.96 | 0.96 | 4.38 | 7.70 | $ | 202,870 | ||||||||||||||||||||||||||||||||||||||||
2009(b) | $ | 12.64 | 0.47 | 0.99 | 1.46 | (0.47 | ) | — | (0.47 | ) | $ | 13.63 | 3.62 | 0.96 | 0.96 | 0.96 | 11.79 | 14.12 | $ | 187,940 | ||||||||||||||||||||||||||||||||||||||||
2008(b) | $ | 13.10 | 0.47 | (0.46 | ) | 0.01 | (0.47 | ) | — | (0.47 | ) | $ | 12.64 | 3.56 | 0.97 | 0.95 | 0.97 | — | (c) | 13.48 | $ | 163,928 | ||||||||||||||||||||||||||||||||||||||
2007(b) | $ | 13.20 | 0.47 | (0.10 | ) | 0.37 | (0.47 | ) | — | (0.47 | ) | $ | 13.10 | 3.55 | 0.98 | 0.97 | 0.98 | 2.82 | 17.38 | $ | 169,130 | |||||||||||||||||||||||||||||||||||||||
Class D Shares |
| |||||||||||||||||||||||||||||||||||||||||||||||||||||||||||
2011 | $ | 13.78 | 0.40 | (0.05 | ) | 0.35 | (0.40 | ) | (0.01 | ) | (0.41 | ) | $ | 13.72 | 2.97 | 1.22 | 1.21 | 1.22 | 2.66 | 10.64 | $ | 24,228 | ||||||||||||||||||||||||||||||||||||||
2010 | $ | 13.63 | 0.28 | 0.27 | 0.55 | (0.40 | ) | — | (0.40 | ) | $ | 13.78 | 2.92 | 1.22 | 1.22 | 1.71 | 4.11 | 7.70 | $ | 24,068 | ||||||||||||||||||||||||||||||||||||||||
2009 | $ | 12.64 | 0.44 | 0.99 | 1.43 | (0.44 | ) | — | (0.44 | ) | $ | 13.63 | 3.35 | 1.23 | 1.23 | 1.73 | 11.50 | 14.12 | $ | 17,301 | ||||||||||||||||||||||||||||||||||||||||
2008 | $ | 13.11 | 0.43 | (0.47 | ) | (0.04 | ) | (0.43 | ) | — | (0.43 | ) | $ | 12.64 | 3.29 | 1.24 | 1.22 | 1.74 | (0.35 | ) | 13.48 | $ | 15,525 | |||||||||||||||||||||||||||||||||||||
2007 | $ | 13.21 | 0.43 | (0.10 | ) | 0.33 | (0.43 | ) | — | (0.43 | ) | $ | 13.11 | 3.30 | 1.23 | 1.23 | 1.77 | 2.57 | 17.38 | $ | 13,524 | |||||||||||||||||||||||||||||||||||||||
Class I Shares |
| |||||||||||||||||||||||||||||||||||||||||||||||||||||||||||
2011 | $ | 13.77 | 0.48 | (0.05 | ) | 0.43 | (0.48 | ) | (0.01 | ) | (0.49 | ) | $ | 13.71 | 3.57 | 0.62 | 0.61 | 0.62 | 3.28 | 10.64 | $ | 41,645 | ||||||||||||||||||||||||||||||||||||||
2010 | $ | 13.62 | 0.67 | (0.04 | ) | 0.63 | (0.48 | ) | — | (0.48 | ) | $ | 13.77 | 3.53 | 0.61 | 0.61 | 0.61 | 4.74 | 7.70 | $ | 26,971 | |||||||||||||||||||||||||||||||||||||||
2009 | $ | 12.63 | 0.52 | 0.99 | 1.51 | (0.52 | ) | — | (0.52 | ) | $ | 13.62 | 3.96 | 0.62 | 0.62 | 0.62 | 12.18 | 14.12 | $ | 27,508 | ||||||||||||||||||||||||||||||||||||||||
2008 | $ | 13.10 | 0.51 | (0.47 | ) | 0.04 | (0.51 | ) | — | (0.51 | ) | $ | 12.63 | 3.90 | 0.63 | 0.61 | 0.63 | 0.26 | 13.48 | $ | 23,728 | |||||||||||||||||||||||||||||||||||||||
2007(d) | $ | 13.10 | 0.34 | — | 0.34 | (0.34 | ) | — | (0.34 | ) | $ | 13.10 | 3.95 | (e) | 0.63 | (e) | 0.62 | (e) | 0.63 | (e) | 2.64 | 17.38 | $ | 19,427 | ||||||||||||||||||||||||||||||||||||
| (a) | Not annualized for periods less than one year. |
| (b) | Sales loads are not reflected in computing total return. |
| (c) | Total return figure was less than 0.01%. |
| (d) | Effective date of this class of shares was February 1, 2007. |
| (e) | Annualized. |
| + | Based on weighted average shares outstanding. |
See notes to financial statements.
| 24 Certified Annual Report | Certified Annual Report 25 |
REPORT OF INDEPENDENT REGISTERED PUBLIC ACCOUNTING FIRM
Thornburg New Mexico Intermediate Municipal Fund
To the Trustees and Shareholders of
Thornburg New Mexico Intermediate Municipal Fund
In our opinion, the accompanying statement of assets and liabilities, including the schedule of investments, and the related statements of operations and of changes in net assets and the financial highlights present fairly, in all material respects, the financial position of Thornburg New Mexico Intermediate Municipal Fund (one of the portfolios constituting Thornburg Investment Trust, hereafter referred to as the “Fund”) at September 30, 2011, the results of its operations for the year then ended, the changes in its net assets for each of the two years in the period then ended and the financial highlights for each of the periods presented, in conformity with accounting principles generally accepted in the United States of America. These financial statements and financial highlights (hereafter referred to as “financial statements”) are the responsibility of the Fund’s management. Our responsibility is to express an opinion on these financial statements based on our audits. We conducted our audits of these financial statements in accordance with the standards of the Public Company Accounting Oversight Board (United States). Those standards require that we plan and perform the audit to obtain reasonable assurance about whether the financial statements are free of material misstatement. An audit includes examining, on a test basis, evidence supporting the amounts and disclosures in the financial statements, assessing the accounting principles used and significant estimates made by management, and evaluating the overall financial statement presentation. We believe that our audits, which included confirmation of securities at September 30, 2011 by correspondence with the custodian and brokers, provide a reasonable basis for our opinion.
PricewaterhouseCoopers LLP
New York, New York
November 21, 2011
26 Certified Annual Report
| EXPENSE EXAMPLE | ||
| Thornburg New Mexico Intermediate Municipal Fund | September 30, 2011 (Unaudited) | |
As a shareholder of the Fund, you incur two types of costs:
| (1) | transaction costs, including |
(a) sales charges (loads) on purchase payments, for Class A shares;
(b) a deferred sales charge on redemptions of any part or all of a purchase of $1 million of Class A shares within 12 months of purchase;
| (2) | ongoing costs, including management fees; distribution and/or service (12b-1) fees; and other Fund expenses. |
This example is intended to help you understand your ongoing costs (in dollars) of investing in the Fund and to compare these costs with the ongoing costs of investing in other mutual funds.
The example is based on a $1,000 investment beginning on April 1, 2011, and held until September 30, 2011.
ACTUAL EXPENSES
For each class of shares, the first line of the table at right provides information about actual account values and actual expenses. You may use the information in this line, together with the amount you invested, to estimate the expenses that you paid over the period. Simply divide your account value by $1,000 (for example, an $8,600 account value divided by $1,000 = 8.6), then multiply the result by the number in the first line for your class of shares under the heading entitled “Expenses Paid During Period” to estimate the expenses you paid on your account during this period.
HYPOTHETICAL EXAMPLE FOR COMPARISON PURPOSES
For each class of shares, the second line of the table at right provides information about hypothetical account values and hypothetical expenses based on the Fund’s actual expense ratio and an assumed rate of return of 5% per year before expenses, which is not the Fund’s actual return. The hypothetical account values and expenses may not be used to estimate the actual ending account balance or expenses you paid for the period. You may use this information to compare the ongoing costs of investing in the Fund and other funds. To do so, compare this 5% hypothetical example with the 5% hypothetical examples that appear in the shareholder reports of the other funds.
| Beginning Account Value 4/1/11 | Ending Account Value 9/30/11 | Expenses Paid During Period† 4/1/11–9/30/11 | ||||||||||
Class A Shares | ||||||||||||
Actual | $ | 1,000.00 | $ | 1,053.80 | $ | 4.93 | ||||||
Hypothetical* | $ | 1,000.00 | $ | 1,020.26 | $ | 4.85 | ||||||
Class D Shares | ||||||||||||
Actual | $ | 1,000.00 | $ | 1,052.50 | $ | 6.21 | ||||||
Hypothetical* | $ | 1,000.00 | $ | 1,019.02 | $ | 6.11 | ||||||
Class I Shares | ||||||||||||
Actual | $ | 1,000.00 | $ | 1,055.60 | $ | 3.19 | ||||||
Hypothetical* | $ | 1,000.00 | $ | 1,021.97 | $ | 3.14 | ||||||
| † | Expenses are equal to the annualized expense ratio for each class (A: 0.96%; D: 1.21%; I: 0.62%) multiplied by the average account value over the period, multiplied by 183/365 to reflect the one-half year period. |
| * | Hypothetical assumes a rate of return of 5% per year before expenses. |
Please note that the expenses shown in the table are meant to highlight your ongoing costs only and do not reflect any transactional costs, such as sales charges (loads), redemption fees, or exchange fees. Therefore, the second line of the table for each class of shares is useful in comparing ongoing costs only, and will not help you determine the relative total costs of owning different funds. In addition, if these transactional costs were included, your costs would have been higher.
Certified Annual Report 27
| INDEX COMPARISON | ||
| Thornburg New Mexico Intermediate Municipal Fund | September 30, 2011 (Unaudited) | |
GROWTH OF A HYPOTHETICAL $10,000 INVESTMENT
Thornburg New Mexico Intermediate Municipal Fund versus BofA Merrill Lynch 7-12 Year U.S. Municipal Securities Index and Consumer Price Index (June 18, 1991 to September 30, 2011)
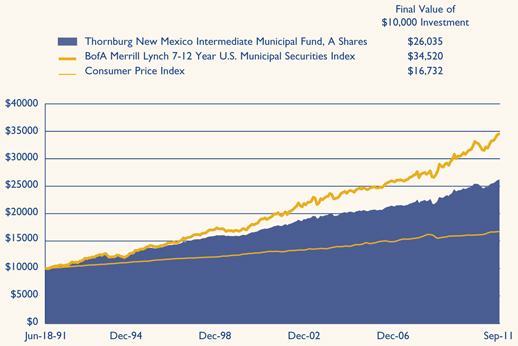
AVERAGE ANNUAL TOTAL RETURNS
For the periods ended September 30, 2011 (with sales charge)
| 1 Yr | 5 Yrs | 10 Yrs | Since Inception | |||||||||||||
A Shares (Incep: 6/18/91) | 0.88 | % | 3.89 | % | 3.77 | % | 4.85 | % | ||||||||
D Shares (Incep: 6/1/99) | 2.66 | % | 4.02 | % | 3.70 | % | 3.82 | % | ||||||||
I Shares (Incep: 2/1/07) | 3.28 | % | — | — | 4.88 | % | ||||||||||
Performance data shown represents past performance and is no guarantee of future results. Investment return and principal value will fluctuate so shares, when redeemed, may be worth more or less than their original cost. Current performance may be lower or higher than quoted. For performance current to the most recent month end, visit thornburg.com or call 800.847.0200. The performance data and graph do not reflect the deduction of taxes that a shareholder would pay on distributions or the redemption of Fund shares. Returns reflect the reinvestment of dividends and capital gains as well as applicable sales charges. Class A shares are sold with a maximum sales charge of 2.00%. For Class D shares and Class I shares there is no sales charge and no contingent deferred sales charge (CDSC).
28 Certified Annual Report
| TRUSTEES AND OFFICERS | ||
| Thornburg New Mexico Intermediate Municipal Fund | September 30, 2011 (Unaudited) | |
Name, Age, | Principal Occupation(s) During Past Five Years | Other Directorships Held by Trustee | ||
INTERESTED TRUSTEES(1)(2)(4) | ||||
Garrett Thornburg, 65 Chairman of Trustees, Trustee since 1987(3) | Chairman and controlling shareholder and, until 2008, CEO of Thornburg Investment Management, Inc. (investment advisor); Chairman, CEO, and controlling shareholder of Thornburg Securities Corporation (securities dealer); CEO until 2007 and Chairman until 2009 of TMST, Inc. (f/k/a Thornburg Mortgage, Inc.) (real estate investment trust); President and Sole Director of Thornburg Mortgage Advisory Corporation (investment manager to TMST, Inc.). | None | ||
Brian J. McMahon, 55 Trustee since 2001, Member of Governance & Nominating Committee & Operations Risk Oversight Committee, President since 1997(5)(6) | CEO since 2008, President, Managing Director, Chief Investment Officer, and Portfolio Manager of Thornburg Investment Management, Inc. | None | ||
INDEPENDENT TRUSTEES(1)(2)(4) | ||||
David A. Ater, 66 Trustee since 1994, Member of Audit Committee & Governance & Nominating Committee | Principal in Ater & Associates, Santa Fe, NM (developer, planner and broker of residential and commercial real estate); owner, developer and broker for various real estate projects. | None | ||
David D. Chase, 70 Trustee since 2000, Chairman of Audit Committee | Managing Member of Vestor Associates, LLC, Santa Fe, NM (private equity fund); Managing Member of CS Group, LLC, Santa Fe, NM (merchant bank). | None | ||
Eliot R. Cutler, 65 Trustee since 2004 & Nominating Committee, Chairman of Governance | Senior Counsel and, until 2009, Partner in Akin, Gump, Strauss, Hauer & Feld LLP (law firm) in Washington, D.C. and Beijing, China. | None | ||
Susan H. Dubin, 62 Trustee since 2004, Member of Audit Committee | President of Dubin Investments, Ltd., Greenwich, CT (private investment fund); Director and officer of various charitable organizations. | None | ||
Owen D. Van Essen, 57 Trustee since 2004, Member of Governance & Nominating Committee & Chairman of Operations Risk Oversight Committee | President of Dirks, Van Essen & Murray, Santa Fe, NM (newspaper mergers and acquisitions). | None | ||
James W. Weyhrauch, 52 Trustee since 1996, Member of Audit Committee & Operations Risk Oversight Committee | Real estate broker, Santa Fe Properties, Santa Fe, NM; Vice Chairman of Nambe LLC, Santa Fe, NM (manufacturing & design company). | None | ||
Certified Annual Report 29
| TRUSTEES AND OFFICERS, CONTINUED | ||
| Thornburg New Mexico Intermediate Municipal Fund | September 30, 2011 (Unaudited) | |
Name, Age, | Principal Occupation(s) During Past Five Years | Other Directorships Held by Trustee | ||
OFFICERS OF THE FUND (WHO ARE NOT TRUSTEES)(1)(6)(7) | ||||
George T. Strickland, 48 Vice President since 1996, Treasurer since 2007(6) | Portfolio Manager, Vice President, and Managing Director of Thornburg Investment Management, Inc. | Not applicable | ||
William V. Fries, 72 Vice President since 1995 | Portfolio Manager, Vice President, and Managing Director of Thornburg Investment Management, Inc. | Not applicable | ||
Leigh Moiola, 44 Vice President since 2001 | Vice President, Managing Director, and Director of Marketing of Thornburg Investment Management, Inc. | Not applicable | ||
Alexander Motola, 41 Vice President since 2001 | Portfolio Manager, Vice President, and Managing Director of Thornburg Investment Management, Inc. | Not applicable | ||
Wendy Trevisani, 40 Vice President since 1999 | Portfolio Manager and Managing Director of Thornburg Investment Management, Inc. | Not applicable | ||
Joshua Gonze, 48 Vice President since 1999 | Portfolio Manager since 2007, Managing Director, and Associate Portfolio Manager until 2007 of Thornburg Investment Management, Inc. | Not applicable | ||
Christopher Ihlefeld, 41 Vice President since 2003 | Portfolio Manager since 2007, Managing Director, and Associate Portfolio Manager until 2007 of Thornburg Investment Management, Inc. | Not applicable | ||
Leon Sandersfeld, 45 Vice President since 2003 | Managing Director since 2007 and Fund Accounting Director of Thornburg Investment Management, Inc. | Not applicable | ||
Sasha Wilcoxon, 37 Vice President since 2003 Secretary since 2007(6) | Managing Director since 2007, Director of Operations, and Vice President of Thornburg Investment Management, Inc. | Not applicable | ||
Edward Maran, 53 Vice President since 2004 | Portfolio Manager and Managing Director of Thornburg Investment Management, Inc. | Not applicable | ||
Vinson Walden, 41 Vice President since 2004 | Portfolio Manager and Managing Director of Thornburg Investment Management, Inc. | Not applicable | ||
Thomas Garcia, 40 Vice President since 2006 | Vice President since 2011, Managing Director, Head Equity Trader, and Associate Portfolio Manager of Thornburg Investment Management, Inc. | Not applicable | ||
Lei Wang, 40 Vice President since 2006 | Portfolio Manager and Managing Director of Thornburg Investment Management, Inc. | Not applicable | ||
Connor Browne, 32 Vice President since 2006 | Portfolio Manager and Managing Director of Thornburg Investment Management, Inc. | Not applicable | ||
Jason Brady, 37 Vice President since 2007 | Vice President since 2011, Portfolio Manager since 2007, Managing Director since 2007, and Associate Portfolio Manager 2006–2007 of Thornburg Investment Management, Inc. | Not applicable | ||
30 Certified Annual Report
| TRUSTEES AND OFFICERS, CONTINUED | ||
| Thornburg New Mexico Intermediate Municipal Fund | September 30, 2011 (Unaudited) | |
Name, Age, | Principal Occupation(s) During Past Five Years | Other Directorships Held by Trustee | ||
Lewis Kaufman, 35 Vice President since 2007 | Portfolio Manager since 2007, Managing Director since 2007, and Associate Portfolio Manager until 2009 of Thornburg Investment Management, Inc. | Not applicable | ||
Christopher Ryon, 55 Vice President since 2008 | Portfolio Manager since 2009, Managing Director since 2009, and Associate Portfolio Manager 2008–2009 of Thornburg Investment Management, Inc.; Principal of Vanguard Funds until 2008. | Not applicable | ||
Lon Erickson, 36 Vice President since 2008 | Portfolio Manager since 2010, Managing Director since 2010, and Associate Portfolio Manager 2008–2010 of Thornburg Investment Management, Inc.; Senior Analyst of State Farm Insurance until 2008. | Not applicable | ||
Kathleen Brady, 51 Vice President since 2008 | Senior Tax Accountant since 2007 of Thornburg Investment Management, Inc.; Chief Financial Officer of Vestor Partners, LP (private equity fund) until 2007. | Not applicable | ||
Jack Gardner, 57 Vice President since 2008 | Managing Director since 2007 of Thornburg Investment Management, Inc.; President since 2008 and National Sales Director of Thornburg Securities Corporation. | Not applicable | ||
Laura Hillstrom, 44 Vice President since 2009 | Chief Administrative Officer since 2009, Vice President and Managing Director, and Director of Information Systems until 2009 of Thornburg Investment Management, Inc. | Not applicable | ||
| (1) | Each person’s address is 2300 North Ridgetop Road, Santa Fe, New Mexico 87506. |
| (2) | The Fund is one of sixteen separate investment “Funds” or “series” of Thornburg Investment Trust (the “Trust”), which comprises the Thornburg mutual fund complex and is organized as a Massachusetts business trust. Thornburg Investment Management, Inc. is the investment advisor to, and manages, the sixteen Funds of the Trust. Each Trustee oversees the sixteen Funds of the Trust. |
| (3) | Mr. Thornburg is considered an “interested” Trustee under the Investment Company Act of 1940 because he is the sole director and controlling shareholder of Thornburg Investment Management, Inc., the investment advisor to the sixteen active Funds of the Trust, and is the sole director and controlling shareholder of Thornburg Securities Corporation, the distributor of shares for the Trust. |
| (4) | Each Trustee serves in office until the election and qualification of a successor. |
| (5) | Mr. McMahon is considered an “interested” Trustee because he is the chief executive officer and president of Thornburg Investment Management, Inc. |
| (6) | The Trust’s president, secretary, and treasurer each serves a one-year term or until the election and qualification of a successor; each other officer serves at the pleasure of the Trustees. |
| (7) | Assistant vice presidents, assistant secretaries and assistant treasurers are not shown. |
The Statement of Additional Information for each Fund of the Trust includes additional information about the Trustees and is available, without charge and upon request, by calling 1-800-847-0200.
Certified Annual Report 31
| OTHER INFORMATION | ||
| Thornburg New Mexico Intermediate Municipal Fund | September 30, 2011 (Unaudited) | |
PORTFOLIO PROXY VOTING
Policies and Procedures:
The Trust has delegated to Thornburg Investment Management, Inc. (the “Advisor”) voting decisions respecting proxies for the Fund’s voting securities. The Advisor makes voting decisions in accordance with its Proxy Voting Policy. A description of the Policy is available (i) without charge, upon request, by calling the Advisor toll-free at 1-800-847-0200, (ii) on the Thornburg website at www.thornburg. com, and (iii) on the Securities and Exchange Commission’s website at www.sec.gov.
Information regarding how proxies were voted is available on or before August 31 of each year for the twelve months ending the preceding June 30. This information is available (i) without charge, upon request by calling the Advisor toll-free at 1-800-847-0200, (ii) on the Thornburg website at www.thornburg.com, and (iii) on the Securities and Exchange Commission’s website at www.sec.gov.
TAX INFORMATION
For the tax year ended September 30, 2011, dividends paid by the Fund of $7,767,483 (or the maximum allowed) are tax exempt dividends and $211,243 are designated as taxable long-term capital gain dividends for federal income tax purposes.
The information and distributions reported herein may differ from the information and distributions reported to the shareholders for the calendar year ending December 31, 2011. Complete information will be reported in conjunction with your 2011 Form 1099.
AVAILABILITY OF QUARTERLY PORTFOLIO SCHEDULE
The Fund files with the Securities and Exchange Commission schedules of its portfolio holdings on Form N-Q for the first and third quarters of each fiscal year. The Fund’s Forms N-Q are available on the Commission’s website at www.sec.gov, or may be reviewed and copied at the Commission’s Public Reference Room in Washington, D.C. Information on the operation of the Public Reference Room may be obtained by calling 1-800-SEC-0330. The Fund also makes this information available on its website at www.thornburg.com/ download or upon request by calling 1-800-847-0200.
STATEMENT RESPECTING RENEWAL OF INVESTMENT ADVISORY AGREEMENT
Thornburg Investment Management, Inc. (the “Advisor”) provides investment management services to Thornburg New Mexico Intermediate Municipal Fund pursuant to an investment advisory agreement. The Trustees consider the renewal of this agreement annually, and most recently determined to renew the agreement on September 13, 2011.
In anticipation of their recent consideration of the advisory agreement’s renewal, the independent Trustees met in May 2011 to plan for the Trustees’ evaluation of the Advisor’s performance and to specify the information the Advisor would present to the Trustees for their review. The Advisor’s chief investment officer subsequently reviewed portions of the specified information with the Trustees and addressed questions by the Trustees at a meeting session scheduled for that purpose, and the independent Trustees thereafter met in independent session to consider the Advisor’s presentation and various specific issues respecting their consideration of the advisory agreement’s renewal. Following these sessions, the Trustees met to consider a renewal of the agreement, and the independent Trustees voted unanimously at that meeting to renew the agreement for an additional term of one year.
The information below summarizes certain factors considered by the Trustees in connection with the determination to renew the advisory agreement. In determining to renew the agreement, the Trustees did not identify any single factor as controlling, and this summary does not describe all of the matters considered by the Trustees in making their determination.
Quality of Services; Fund Investment Performance. The Trustees evaluated the nature, extent and quality of services provided by the Advisor under the advisory agreement, and evaluated the investment performance of the Fund.
In connection with their general supervision of the Advisor, and as an important element of their annual consideration of a renewal of the advisory agreement, the Trustees received and considered reports from the Advisor throughout the year. These reports addressed a wide variety of topics, including particularly the Advisor’s selection of investments and execution of the Fund’s investment strategies. In addition, the Trustees considered information provided to them at their request in anticipation of their annual evaluation of the Advisor’s services, including (i) the Fund’s absolute investment performance and achievement of stated objectives, (ii) the Advisor’s commentary on the Fund’s investment performance in the context of the Fund’s objectives and reasonable expectations, and business,
32 Certified Annual Report
| OTHER INFORMATION, CONTINUED | ||
| Thornburg New Mexico Intermediate Municipal Fund | September 30, 2011 (Unaudited) | |
market and economic conditions, (iii) measures of the Fund’s investment performance over various periods of time relative to two categories of single-state municipal debt mutual funds selected by independent mutual fund analyst firms, and relative to a broad-based securities index, and (iv) comparative measures of portfolio volatility, risk, and return.
The Trustees also considered their perceptions of portfolio management personnel developed in formal and informal meetings throughout the year, the Advisor’s staffing and other resources, the Advisor’s performance of accounting and other services, the Advisor’s observance of compliance and regulatory requirements, the Advisor’s responsiveness to the Trustees, and other factors.
In evaluating the quantitative and performance data presented, the Trustees noted (among other aspects of the data) performance data for the eleven most recent calendar years, which showed that the Fund had produced positive investment returns in accordance with expectations in all years, that the Fund’s return for the most recent calendar year had been comparable to the average return of the mutual fund category for which calendar year data was presented, and that the Fund’s returns had exceeded or had been comparable to the average returns of the category in a majority of the preceding ten calendar years. Other noted quantitative data showed that the Fund’s investment returns fell at or near the midpoint of performance for the first fund category for the one-year and three-year periods ended with the second quarter of the current year and within the top quartile in the five-year period, and that the Fund’s investment returns fell at or near the midpoint of performance for the second fund category for the same periods. Measures of portfolio volatility, risk and relative return considered by the Trustees demonstrated that the Fund’s performance relative to those measures had continued to fulfill expectations in current conditions.
The Trustees concluded, based upon these and other considerations, that the nature, extent and quality of the Advisor’s services were sufficient and that the Advisor had satisfactorily pursued the Fund’s stated investment objectives. The Trustees further concluded that the investment performance of the Fund was satisfactory in the context of the Fund’s objectives and policies, and prevailing market conditions.
Fees and Expenses; Profitability of Advisor; Economies of Scale; Ancillary Benefits to Advisor. The Trustees evaluated the level of the management fee charged by the Advisor to the Fund, and in this connection, reviewed the profitability of the Advisor, economies of scale potentially available to the Fund and whether the Advisor received any ancillary benefits from its relationship with the Fund.
In evaluating the level of the management fee, the Trustees considered the fee charged by the Advisor and the other expenses charged to the Fund in light of the nature and quality of services provided, comparison of the actual Advisor’s fee and Fund expenses to the statement of fees and expenses in the Fund’s prospectuses, and comparisons of the Advisor’s fee and other Fund expenses to median and average fees and expenses charged to two groups of fixed income mutual funds assembled by independent mutual fund analyst firms. Comparative fee and expense data noted by the Trustees showed that the management fee charged to the Fund was comparable to the median and average fee levels for one fund group and slightly higher than the median and average fee levels for the second group, and that the overall expense ratio of the Fund was slightly higher than the median expense ratios and comparable to the average ratios for both mutual fund groups. The Trustees did not identify the differences as significant. The Trustees considered information about the fees charged by the Advisor to other investment management clients, together with information about fees charged by other advisors to different clients, and analysis of the differences between the requirements of institutional clients and mutual funds and the consequently different investment management services provided, respectively, to institutional clients and to mutual funds. The Trustees confirmed their previous observations that the differences between the fees charged by the Advisor to different types of clients did not appear exceptional, and that the fee rates charged by investment advisors to institutional clients had limited relevance to the evaluation of fee rates charged to mutual funds, because of the significant differences between the respective requirements of institutional clients and mutual funds, the differences between the respective services rendered to institutional clients and mutual funds, and the differences in the circumstances in which the respective fees originate.
In reviewing the profitability of the Advisor, the Trustees considered costs incurred by the Advisor and data comparing the profitability of the Advisor to other investment management firms. The information provided did not indicate that the Advisor’s profitability was unusual, and the Trustees noted the adequacy of the Advisor’s resources and service capabilities. In reviewing the extent to which economies of scale would be realized by the Fund as it grows and whether fee levels reflect economies of scale, the Trustees considered the breakpoint structure for advisory fees chargeable to the Fund, the demonstrated economies of scale enjoyed by other Funds of the Trust as they had grown in size, and economies of scale realized by other mutual funds. The information provided demonstrated to the Trustees that the Fund may reasonably be expected to realize economies of scale as it grows in size, due to the breakpoint fee structure of the advisory agreement and other factors. In reviewing potential benefits to the Advisor because of its relationship to the Fund, the Trustees considered the Advisor’s receipt of certain research services from broker dealers, and the benefits to both the Fund
Certified Annual Report 33
| OTHER INFORMATION, CONTINUED | ||
| Thornburg New Mexico Intermediate Municipal Fund | September 30, 2011 (Unaudited) | |
and the Advisor of the Advisor’s expansion of its staffing, compliance and systems capabilities and other resources to serve a broader variety of investment management clients. No unusual or unfair benefits to the Advisor from its relationship to the Fund were identified by the Trustees.
The Trustees concluded, based upon their consideration of these and other factors, that the management fee charged to the Fund by the Advisor was fair and reasonable in view of the nature, extent and quality of the services provided by the Advisor, the clear disclosure of fees and expenses in the Fund’s prospectuses, the investment performance of the Fund, and comparisons of fees and expenses charged to the Fund to fees and expenses charged to other mutual funds.
34 Certified Annual Report
This page intentionally left blank.
This page is not part of the Annual Report. 35
Trustees’ Statement to Shareholders
Not part of the Certified Annual Report
September 13, 2011
The Trustees believe current and prospective shareholders should know how we discharge our responsibilities in supervising the Funds’ investment advisor and in reviewing the advisor’s contract for renewal. Since 2005, we have issued a statement which sets out clearly the three principal guidelines that we follow in supervising the Trust’s investment advisor on your behalf. In accordance with our customary practice, in September of this year we again reviewed our statement and concluded we should reissue this statement outlining the principal features of our supervision of the advisor’s performance of investment management services for the Funds.
We begin with the premise that each shareholder selected his or her Fund because its investments are managed by the investment advisor identified in the prospectus and in accordance with the objective and policies described in the prospectus. We realize, as each of you do, that if you believe that your Fund’s stated objective and policies no longer serve your personal investment goals, you can sell your shares and leave the Fund.
Therefore, we believe that our primary supervisory task – our principal obligation to you – is to assess the nature and quality of the advisor’s services, and to confirm that the advisor actively and competently pursues the Fund’s objective, in accordance with the policies set out in the prospectus. To do this, we meet regularly with management to review your Fund’s portfolio and to discuss the advisor’s specific actions and judgments in pursuing the Fund’s objective. We do not substitute our own judgment for the advisor’s decisions in selecting investments; the advisor is paid to exercise its informed judgment on investment decisions, and we seek to confirm, in reviewing the advisor’s performance, that the advisor is doing just that.
Second, while we are conscious of costs and the effect that costs have on shareholders’ returns, we do not seek the lowest fees or expense ratio as our sole or primary objective. We try to make sure that your Fund’s fees and costs are reasonable in relationship to the services rendered and that they are generally in line with those charged by other expert investment advisors, consistent with our belief that the Fund’s investors searched for and expect that expertise and attention and have decided to pay a reasonable price for it. We do not put the management contract “out to bid” as a matter of course, and we would not do so unless we had concluded that the advisor materially had failed to pursue the Fund’s objectives in accordance with its policies, or for other equally important reasons. We believe that any other approach would be inconsistent with your interests and contrary to your expectations when you bought shares of the Fund in the first place.
Finally, because we believe that most Thornburg Fund shareholders have invested with a long-term perspective, we try not to focus too much on the fashions of the moment and on short-term performance. The market will not favor any specific investment objective or set of policies at all times and under all economic circumstances. A fund will experience periods of both high and low returns relative to other funds and other investments. Even if one of our Funds is not favored by the market at a particular time, we believe that the advisor is nonetheless obliged to remain true to the Fund’s objective and policies, and we watch to see that it does so.
36 This page is not part of the Annual Report.
Retirement and Education Accounts
Thornburg Investment Management offers retirement and education savings accounts that can help you meet a variety of planning challenges. For account applications or further information on any of the accounts below, please call 1-800-847-0200 or go to www.thornburg.com/ira. Your financial advisor can help you determine which plan is right for you.
Individual Retirement Accounts
Individual Retirement Accounts (IRAs) provide a tax-advantaged means to save money for the future. For a detailed outline of the difference between retirement accounts, see www.thornburg.com/ira. Rollovers are available. Call 1-800-847-0200 for more information.
Traditional IRAs – Contributions to Traditional IRAs are tax deductible for eligible individuals, and withdrawals are taxed as additional ordinary income. You may contribute to an IRA if you receive compensation and are under 70 1/2, even if you are covered by an employer retirement plan. Deductible contributions are subject to certain qualifications. Please consult your tax advisor.
Roth IRAs – Under a Roth IRA, there is no tax deduction for contributions, but there is no income tax on qualified withdrawals. For a more detailed comparison of Traditional and Roth IRAs, please see our web site at www.thornburg.com/ira.
SEP IRAs – Simplified Employee Pension (SEP) IRAs are established by employers. The employer is allowed a tax deduction for contributions made to the SEP Plan and makes contributions to each eligible employee’s SEP IRA on a discretionary basis.
SIMPLE IRAs – Savings Incentive Match Plan for Employees of Small Employers (SIMPLE) is designed to give small business owners a simplified method to establish and contribute to a retirement plan for employees. The employer is allowed a tax deduction for contributions and makes either matching or non-elective contributions to each eligible employee’s SIMPLE IRA. Employees may make salary deferral contributions.
Coverdell Education Savings Account
These savings accounts are designed to provide a way to save money for higher education expenses. In an Education Savings Account, earnings and interest grow tax-free, and qualified withdrawals used to pay for eligible higher-education expenses are tax- and penalty-free.
Funds Available
The following funds are available in the accounts listed above:
| • | Thornburg International Value Fund |
| • | Thornburg Value Fund |
| • | Thornburg Core Growth Fund |
| • | Thornburg Investment Income Builder Fund |
| • | Thornburg Global Opportunities Fund |
| • | Thornburg International Growth Fund |
| • | Thornburg Developing World Fund |
| • | Thornburg Limited Term U.S. Government Fund |
| • | Thornburg Limited Term Income Fund |
| • | Thornburg Strategic Income Fund |
This page is not part of the Annual Report. 37

Thornburg Equity Funds
Thornburg’s equity research uses a fundamental and comprehensive analytical approach. Thornburg equity funds focus on a limited number of securities so that each holding can impact performance. The equity team searches for firms believed to have a promising future and seeks to buy shares of those companies at a discount to their intrinsic value.
| • | Thornburg Value Fund |
| • | Thornburg International Value Fund |
| • | Thornburg Core Growth Fund |
| • | Thornburg Investment Income Builder Fund |
| • | Thornburg Global Opportunities Fund |
| • | Thornburg International Growth Fund |
| • | Thornburg Developing World Fund |
Thornburg Bond Funds
Thornburg Investment Management applies a disciplined philosophy to fixed-income management. Since the launch of our first fixed-income fund over 25 years ago, we have been conducting fundamental, bottom-up research in an effort to identify bonds which we believe provide the best return for a given level of risk. We are very organic in our approach, avoiding leverage or complex strategies which could backfire in periods of market uncertainty.
| • | Thornburg Limited Term Municipal Fund |
| • | Thornburg Intermediate Municipal Fund |
| • | Thornburg California Limited Term Municipal Fund |
| • | Thornburg New Mexico Intermediate Municipal Fund |
| • | Thornburg New York Intermediate Municipal Fund |
| • | Thornburg Strategic Municipal Income Fund |
| • | Thornburg Limited Term U.S. Government Fund |
| • | Thornburg Limited Term Income Fund |
| • | Thornburg Strategic Income Fund |
Before investing, carefully consider the Fund’s investment goals, risks, charges, and expenses. For a prospectus containing this and other information, contact your financial advisor or visit thornburg.com. Read it carefully before investing.
For additional information, please visit www.thornburg.com
Thornburg Investment Management, Inc. 2300 North Ridgetop Road, Santa Fe, NM 87506
This page is not part of the Annual Report. 39
 | Waste not, Wait not |  | ||||
| Get instant access to your shareholder reports. | ||||||
| This Annual Report is submitted for the general information of shareholders of the Fund. It is not authorized for distribution to prospective investors in the Fund unless preceded or accompanied by an effective prospectus. | By switching from your postal mailbox to your email inbox, you reduce paper clutter, improve record keeping access, and help conserve our natural resources. | |||||
 | Investment Advisor: Thornburg Investment Management® 800.847.0200
| Go to www.thornburg.com/edelivery and sign up to receive your shareholder reports, prospectuses, and proxy statements electronically. | ||||
| Distributor: | ||||||
Thornburg Securities Corporation® 800.847.0200 | You invest in the future, without spending a dime. | |||||
| TH080 | ||||||
Important Information
The information presented on the following pages is current as of September 30, 2011. The managers’ views, portfolio holdings, and sector diversification are provided for the general information of the Fund’s shareholders; to the extent this information is historical, it should not be considered predictive of future circumstances. This material should not be deemed a recommendation to buy or sell any of the securities mentioned.
Investments in the Fund carry risks, including possible loss of principal. Bond funds have the same interest rate, inflation, and credit risks that are associated with the underlying bonds. The principal value of bonds will fluctuate relative to changes in interest rates, decreasing when interest rates rise. Unlike bonds, bond funds have ongoing fees and expenses. Please see the Fund’s Prospectus for a discussion of the risks associated with an investment in the Fund. Investments in the Fund are not FDIC insured, nor are they deposits of or guaranteed by a bank or any other entity. There is no guarantee that the Fund will meet its investment objectives. The laddering strategy does not assure or guarantee better performance and cannot eliminate the risk of investment losses.
Performance data given at net asset value (NAV) does not take into account applicable sales charges. If the sales charges had been included, the performance would have been lower.
Minimum investments for Class I shares are higher than those for other classes. Class I shares may not be available to all investors.
Share Class | NASDAQ Symbol | Cusip | ||
Class A | THNYX | 885-215-665 | ||
Class I | TNYIX | 885-216-705 |
Glossary
BofA Merrill Lynch 3-15 Year U.S. Municipal Securities Index – This index is a subset of the BofA Merrill Lynch U.S. Municipal Securities Index including all securities with a remaining term to final maturity greater than or equal to 3 years and less than 15 years.
BofA Merrill Lynch 7-12 Year U.S. Municipal Securities Index – This index is a subset of the BofA Merrill Lynch U.S. Municipal Securities Index including all securities with a remaining term to final maturity greater than or equal to 7 years and less than 12 years.
Unless otherwise noted, index returns reflect the reinvestment of income dividends and capital gains, if any, but do not reflect fees, brokerage commissions or other expenses of investing. Investors may not make direct investments into any index.
Alternative Minimum Tax (AMT) – A federal tax aimed at ensuring that high-income individuals, estates, trusts, and corporations pay a minimal level income tax. For individuals, the AMT is calculated by adding tax preference items to regular taxable income.
Annualized Distribution Yield – The distribution yield is calculated by taking the sum of the month’s total distribution factors and dividing this sum by a 30-day period and annualizing to a 360-day year. The value is then divided by the ending maximum offering price per share to arrive at the annualized distribution yield. The yield is calculated on a periodic basis and is subject to change.
Basis Point (bps) – A unit equal to 1/100th of 1%. 1% = 100 basis points (bps).
Bond Credit Ratings – A bond credit rating assesses the financial ability of a debt issuer to make timely payments of principal and interest. Ratings of AAA (the highest), AA, A, and BBB are investment-grade quality. Ratings of BB, B, CCC, CC, C, and D (the lowest) are considered below investment grade, speculative grade, or junk bonds. Unless otherwise noted, the ratings listed are from Municipal Market Data and are a combination of ratings from Standard and Poor’s, Moody’s Investors Service, and Fitch Ratings.
Build America Bonds (BAB) – Taxable municipal bonds that feature tax credits and/or federal subsidies for bondholders and state and local government bond issuers. Build America Bonds (BABs) were introduced in 2009 as part of President Obama’s American Recovery and Reinvestment Act to create jobs and stimulate the economy. BABs attempt to achieve this by lowering the cost of borrowing for state and local governments in financing new projects.
Consumer Price Index (CPI) – An index that measures prices of a fixed basket of goods bought by a typical consumer, including food, transportation, shelter, utilities, clothing, medical care, entertainment and other items. The CPI, published by the Bureau of Labor Statistics in the Department of Labor, is based at 100 in 1982 and is released monthly. It is widely used as a cost-of-living benchmark to adjust Social Security payments and other payment schedules, union contracts and tax brackets. The CPI is also known as the cost-of-living index.
Core CPI – Consumer Price Index minus the energy and food components.
This page is not part of the Annual Report. 3
| Important Information, Continued |
Duration – A bond’s sensitivity to interest rates. Bonds with longer durations experience greater price volatility than bonds with shorter durations.
Effective Duration – A bond’s sensitivity to interest rates, incorporating the embedded option features, such as call provisions. Bonds with longer durations experience greater price volatility than bonds with shorter durations.
Fed Funds Rate – The interest rate at which a depository institution lends immediately available funds (balances at the Federal Reserve) to another depository institution overnight.
General Obligation Bond – A municipal bond backed by the credit and “taxing power” of the issuing jurisdiction rather than the revenue from a given project.
M2 – The amount of money in circulation in notes and coin plus non-interest-bearing bank deposits, building-society deposits, and National Savings accounts.
Operation Twist – A monetary policy where, in an attempt to lower long-term interest rates, the Fed sold short-term Treasury bonds and bought long-term Treasury bonds, which pressured the long-term bond yields downward.
Quantitative Easing – The Federal Reserve’s monetary policy used to stimulate the U.S. economy following the recession that began in 2007/08.
SEC Yield – SEC Yield is computed in accordance with SEC standards measuring the net investment income per share over a specified 30-day period expressed as a percentage of the maximum offering price of the Fund’s shares at the end of the period.
Treasuries – U.S. Treasury securities, such as bills, notes and bonds, are negotiable debt obligations of the U.S. government. These debt obligations are backed by the “full faith and credit” of the government and issued at various schedules and maturities. Income from Treasury securities is exempt from state and local, but not federal, taxes.
4 This page is not part of the Annual Report.
Thornburg New York Intermediate Municipal Fund
At Thornburg, our approach to management of the Fund is based on the premise that investors in the Fund seek preservation of capital along with an attractive, relatively stable yield. While aggressive bond strategies may generate stronger returns when the market is turning a blind eye towards risk, they often fail to stack up over longer periods of time.
We apply time-tested techniques to manage risk and provide attractive returns. These include:
| • | Building a laddered portfolio. Laddering has been shown over time to mitigate reinvestment and interest-rate risk. |
| • | Investing on a cash-only basis without using leverage. While leveraged strategies may enhance returns when market conditions are favorable, they can quickly compound losses when sentiment shifts. |
| • | Conducting in-depth fundamental research on each issue and actively monitoring positions for subsequent credit events. |
| • | Diversifying among a large number of generally high-quality bonds. |
CO-PORTFOLIO MANAGERS

Josh Gonze, Chris Ryon,CFA, and Chris Ihlefeld
IMPORTANT
PERFORMANCE INFORMATION
Performance data shown represents past performance and is no guarantee of future results. Investment return and principal value will fluctuate so shares, when redeemed, may be worth more or less than their original cost. Current performance may be lower or higher than quoted. For performance current to the most recent month end, visit thornburg.com or call 800.847.0200.
The maximum sales charge for the Fund’s Class A shares is 2.00% . The total annual operating expenses of Class A shares are 1.07% as disclosed in the most recent Prospectus. Thornburg Investment Management and Thornburg Securities Corporation have contractually agreed to waive fees and reimburse expenses through at least February 1, 2012, so that actual expenses, for Class A shares, do not exceed 0.99% .
LONG-TERM STABILITY OF PRINCIPAL
Net asset value history of A shares from September 5, 1997 through September 30, 2011
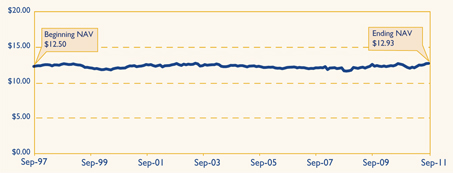
AVERAGE ANNUAL TOTAL RETURNS
For periods ended September 30, 2011
| 1 Yr | 3 Yrs | 5 Yrs | 10 Yrs | Since Inception | ||||||||||||||||
A Shares (Incep: 9/5/97) | ||||||||||||||||||||
Without sales charge | 4.20 | % | 6.49 | % | 4.50 | % | 3.87 | % | 4.37 | % | ||||||||||
With sales charge | 2.13 | % | 5.78 | % | 4.08 | % | 3.66 | % | 4.22 | % | ||||||||||
30-DAY YIELDS, A SHARES
As of September 30, 2011
Annualized Distribution Yield | SEC Yield | |||
3.10% | 1.72 | % | ||
Without fee waivers and expense reimbursements, the 30-day SEC Yield would have been 1.52% and the Annualized Distribution Yield would have been 2.90%.
KEY PORTFOLIO ATTRIBUTES
As of September 30, 2011
Number of Bonds | 49 | |||
Effective Duration | 5.5 Yrs | |||
Average Maturity | 8.8 Yrs |
See the entire portfolio in the Schedule of Investments beginning on page 11.
This page is not part of the Annual Report. 5

Thornburg New York Intermediate Municipal Fund
September 30, 2011
Table of Contents | ||||
| 7 | ||||
| 11 | ||||
| 13 | ||||
| 14 | ||||
| 15 | ||||
| 16 | ||||
| 20 | ||||
| 22 | ||||
| 23 | ||||
| 24 | ||||
| 25 | ||||
| 28 |
This report is certified under the Sarbanes-Oxley Act of 2002, which requires that public companies, including mutual funds, affirm that the information provided in their annual and semiannual shareholder reports fully and fairly represents their financial position.
6 Certified Annual Report
Christopher Ihlefeld Co-Portfolio Manager
Christopher Ryon,CFA Co-Portfolio Manager
Josh Gonze Co-Portfolio Manager | October 14, 2011
Dear Shareholder:
We are pleased to present the annual report for the Thornburg New York Intermediate Municipal Fund. The net asset value (NAV) of the Class A shares increased by 11 cents to $12.93 per share for the fiscal year ended September 30, 2011. If you were with us for the entire period, you received dividends of 41.0 cents per share. If you reinvested your dividends, you received 41.7 cents per share. Dividends per share were lower for Class C shares and higher for Class I shares to account for varying class-specific expenses. The Class A shares of your Fund produced a total return of 4.20% at NAV over the fiscal year ended September 30, 2011, compared to 4.91% for the BofA Merrill Lynch 7–12 Year U.S. Municipal Securities Index. The main contributor to the difference in performance is that the BofA Merrill Lynch 7–12 Year U.S. Municipal Securities Index has a longer duration than the Thornburg New York Intermediate Municipal Fund. Duration is a measure of a fund’s price sensitivity to changes in interest rates. As interest rates decline, funds with longer durations will enjoy greater price appreciation and additional income. As interest rates increase, funds with longer durations will also incur greater price depreciation (losses).
New York Fiscal Conditions
When New York Governor Andrew Cuomo took office in November 2010, he faced a legislature plagued by corruption and a history of late budgets. He quickly achieved an on-time budget and placed a cap on local property tax rates. The 2011–2012 budget calls for $132.5 billion in spending, which is notable as it represents a reduction in spending. Since that date, the state’s revenue has grown considerably, as data from the Rockefeller Institute show a 21% jump in tax revenue in the second quarter of 2011, compared with the same quarter of the prior year. The state also claims to have fully funded state pension plans. However, the state continues to struggle with high unemployment and layoffs in the critical financial sector.
The Economy and the Federal Reserve (the Fed)
As we started the fiscal year, beginning October 2010, the Federal Reserve Board announced a new wrinkle to its already accommodative stance toward monetary policy. “Quantitative Easing” is a policy of buying bonds and other assets to boost demand and fight off deflation. As we close this fiscal year, the Fed has announced another extraordinary measure known as “Operation Twist.” This policy enhancement calls for the Fed to purchase, by the end of June 2012, $400 billion of Treasury securities with remaining maturities from 6 to 30 years and to sell an equal amount of Treasury securities with remaining maturities of 3 years or less. This is intended to cause the yield curve (a representation of the prevailing yields of Treasury securities by maturity) to flatten; reducing the yield difference between long-term and short-term Treasury securities. A typical measure of this phenomenon is the difference between the yield of a 10-year Treasury security and the yield of a 30-year Treasury security. The difference in yield between these two securities was 1.38% |


Certified Annual Report 7
| Letter to Shareholders, | ||
Continued | ||
on September 1, 2011 (30-year Treasury securities yielded 1.38% more than 10-year Treasury securities). The formal announcement of the Fed’s new policy directive was on September 21, 2011, and by September 30, 2011, the difference had narrowed to 1.02%. The above change in the relationship between 10-year and 30-year Treasury securities means that longer maturity Treasury securities outperformed shorter maturity Treasury securities.
The Federal Open Market Committee, in its September 21, 2011 release, stated that “economic growth remains slow” and that there are “significant downside risks to the economic outlook, including strains in global financial markets.” These concerns explain why Treasury yields are lower by 0.17% to 1.59% since March 31, 2011. Longer maturity Treasury securities have decreased in yield more than shorter maturity Treasury securities. The “strains in the global financial markets,” have led the Treasury market to experience a “flight to quality” in spite of a downgrade to AA+ by Standard and Poor’s on August 5, 2011. As one of our colleagues has stated, “the world views Treasury securities as the best house in a bad neighborhood.”
We share the Fed’s view that “economic growth remains low,” but there are some reasons for hope. June 2011 gross domestic product (GDP), a measure of a country’s overall economic output, recorded a 1.3% increase, higher than the 0.4% increase recorded in March of 2011. Capacity utilization, a measure of an economy’s usage of its productive resources, was running at 77.4% for the month ended August 31, 2011, slightly higher than the 75.7% recorded on September 30, 2011. Money supply as measured by M2, a broad measure of money and money substitutes, remains elevated. The velocity of M2, a measure of the rate at which money in circulation is used in transactions, continues to decline. Typically rising money supply is viewed as an inflationary threat, as long as velocity remains constant or increases. The combination of rising money supply and decreasing velocity is not inflationary. The one significant difference between this fiscal year end and last fiscal year end is that commercial and industrial loans and leases (loans to corporations, commercial enterprises, and joint ventures) have begun to increase, from a very low base. These loans have increased 7.98% over the 12 months ended September 30, 2011 versus a 10.57% decline for the 12 months ended September 30, 2010. These increases of loans to businesses may be laying the groundwork for a more robust expansion.
CHART I: BofA MERRILL LYNCH 3–15 YEAR MUNICIPAL INDEX
Periodic Returns During the Period from 9/30/2010 through 9/30/2011
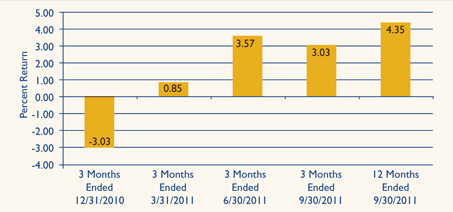
Source: Bloomberg
Past Performance does not guarantee future results.
The employment picture is still a major concern; with so many Americans either unemployed or underemployed, it’s hard to fathom where demand for goods and services will come from. The unemployment rate is 9.1%, lower than the 9.8% registered in
8 Certified Annual Report
November 2010. In the 12 months ended September 2011, 1.49 million jobs have been created versus the 118,000 lost in the prior 12 months.
The economic picture is not as bleak as some in the media would paint it. The risks of a double-dip recession seem low, but so to do the probabilities of a robust recovery. Our outlook for interest rates is much the same as it was last year with one exception; over the next 6–12 months, we believe the Fed will keep short-term interest rates low, but long-term interest rates have and may continue to benefit from Operation Twist. Investors should ready themselves for increased periods of volatility as some of the exogenous forces impacting the United States play themselves out.
The Municipal Market
The calendar year began with various predictions of numerous defaults in the municipal bond market; the term “hundreds of billions of dollars” was used. For the nine months ended September 30, 2011, the municipal bond market experienced $1.1 billion in defaults, a relatively small amount. This means, if one uses $200 billion as the low end of the estimate, we have only $198.9 billion to go by December 31, 2011 for these dire predictions to be achieved. Needless to say, these estimates were overly dramatic but they did add to the volatility of returns experienced throughout fiscal 2011. Chart I shows the volatility of returns generated by the BofA Merrill Lynch 3–15 Year Municipal Index for the 12 months ended September 30, 2011.
Most, if not all, of the other predictions of doom proved equally false. Supply of new issue municipal bonds did not expand as the Build America Bond program expired on December 31, 2010. In fact, the supply of newly issued municipal debt is down 35% through September 30, 2011 versus the same period in 2010. On the credit side, the revenue picture for state and local governments is improving. Revenues are increasing, although they are still below peak levels. Also expenditures are being cut. One example of this is that state and local employment payrolls have been cut by in excess of 500,000 jobs nationwide since August 2008.
CHART II: CHANGES IN AAA GENERAL OBLIGATION BOND YIELDS
9/30/2010 through 9/30/2011
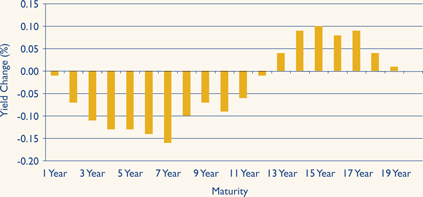
Source: Standard and Poor’s 09/30/2011
Past performance does not guarantee future results.
Chart II illustrates how yields have changed over the last 12 months. The largest declines occurred in the maturities shorter than 10 years. The general level of municipal bond yields appear to be moving in sympathy with the yields on Treasury securities, albeit at a different pace.
The major drivers of returns for the fiscal year have been duration (longer is better than shorter as rates declined) and yield curve exposure (allocation of assets to mid-range maturities versus shorter and longer maturities is better). The discipline of the laddered portfolio
Certified Annual Report 9
| Letter to Shareholders, | ||
Continued | ||
structure seeks to ensure that investors benefit from these opportunities.
CHART III: % OF PORTFOLIO MATURING

As of 9/30/11. Percentages vary over time.
Data may not add up to 100% due to rounding.
Conclusion
Your Thornburg New York Intermediate Municipal Fund is a laddered portfolio of 49 municipal obligations. We ladder the maturity dates of the bonds in your portfolio so that some of the bonds are scheduled to mature during each of the coming years. Laddering short and intermediate bonds accomplishes two goals. First, the staggered bond maturities contained in a ladder reduce interest-rate risk and dampen the Fund’s price volatility. Second, laddering reduces reinvestment risk by giving the Fund a steady cash flow stream from maturing bonds to reinvest toward the top of the ladder where yields are typically higher. Chart III describes the percentages of your Fund’s bond portfolio maturing in each of the coming years. The Fund’s adherence to the discipline of the laddered structure served investors well. As you saw in Chart II on the previous page, yields in the shorter segment of the 1– 20 year maturity range of the market decreased more than any other segment. By keeping with the discipline of the Fund’s laddered structure, we were able to capture a significant portion of that performance.
We plan to continue to search for opportunities in the municipal market, using our fundamental, bottom-up approach to portfolio management, and the discipline of the laddered structure. In closing, we would like to thank you for the trust you have placed with us. We will continue to keep that foremost in our minds as we go forward into a new year.
| Sincerely, | ||||
 |  |  | ||
| Christopher Ihlefeld | Christopher Ryon,CFA | Josh Gonze | ||
| Co-Portfolio Manager | Co-Portfolio Manager | Co-Portfolio Manager | ||
| Managing Director | Managing Director | Managing Director | ||
The matters discussed in this report may constitute forward-looking statements made pursuant to the safe harbor provisions of the Securities Litigation Reform Act of 1995. These include any advisor or portfolio manager prediction, assessment, analysis or outlook for individual securities, industries, investment styles, market sectors and/or markets. These statements involve risks and uncertainties. In addition to the general risks described for each fund in its current prospectus, other factors bearing on these reports include the accuracy of the advisor’s or portfolio manager’s forecasts and predictions, the appropriateness of the investment strategies designed by the advisor or portfolio manager and the ability of the advisor or portfolio manager to implement their strategies efficiently and successfully. Any one or more of these factors, as well as other risks affecting the securities markets generally, could cause the actual results of any fund to differ materially as compared to its benchmarks.
10 Certified Annual Report
| SCHEDULE OF INVESTMENTS | ||
| Thornburg New York Intermediate Municipal Fund | September 30, 2011 | |
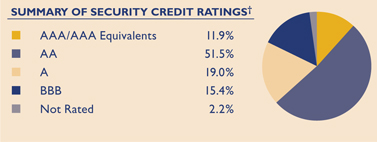
We have used ratings from Standard & Poor’s (S&P). Where S&P ratings are not available, we have used Moody’s Investors Service. Where neither rating is available, we have used ratings from Fitch Ratings. The category of investments identified as “AAA” in this graph includes investments which are pre-refunded or escrowed to maturity. Such investments are backed by an escrow or trust containing sufficient U.S. Government or U.S. Government agency securities to satisfy the timely payment of principal and interest and, therefore, are normally deemed to be equivalent to AAA-rated securities.
Issuer-Description | Credit Rating† S&P/ Moody’s | Principal Amount | Value | |||||||
Amherst Development Corp., 5.00% due 10/1/2020 (University at Buffalo Foundation Facility- Student Housing; Insured: AGM) | AA+/Aa3 | $ | 1,000,000 | $ | 1,131,230 | |||||
Amherst IDA Civic Facility, 5.75% due 4/1/2015 (Insured: ACA) | NR/NR | 465,000 | 472,570 | |||||||
Babylon New York GO, 5.00% due 9/1/2015 (Insured: AMBAC) | NR/NR | 465,000 | 517,326 | |||||||
Brookhaven IDA Civic Facility Revenue, 4.25% due 11/1/2037 put 11/1/2011 (LOC: North Fork Bank) | BBB+/NR | 1,745,000 | 1,747,129 | |||||||
Dutchess County IDA, 5.00% due 8/1/2021 (Bard College) | NR/Baa1 | 1,100,000 | 1,167,276 | |||||||
Erie County IDA School Facilities Revenue, 5.25% due 5/1/2025 (Buffalo City School District) | AA-/Aa3 | 1,000,000 | 1,110,050 | |||||||
Guam Government Ltd. Obligation, 5.375% due 12/1/2024 | BBB-/NR | 1,000,000 | 1,027,390 | |||||||
Long Island Power Authority, 5.25% due 9/1/2029 | NR/A3 | 645,000 | 725,309 | |||||||
Nassau County IDA, 4.75% due 3/1/2026 (NY Institute of Technology) | BBB+/NR | 1,000,000 | 1,030,050 | |||||||
New York City GO, 0.10% due 8/1/2015 put 10/3/2011 (Subseries E5; LOC: JPMorgan Chase Bank) (daily demand notes) | AAA/Aa1 | 700,000 | 700,000 | |||||||
New York City GO, 5.00% due 8/1/2025 | AA/Aa2 | 400,000 | 437,300 | |||||||
New York City Health & Hospital Corp. GO, 5.00% due 2/15/2025 | A+/Aa3 | 1,000,000 | 1,082,360 | |||||||
New York City Metropolitan Transportation Authority, 6.25% due 11/15/2023 | A/A2 | 1,000,000 | 1,186,040 | |||||||
New York City Municipal Water Finance Authority, 5.75% due 6/15/2013 (Insured: Natl-Re) (ETM) | AAA/A2 | 1,000,000 | 1,040,100 | |||||||
New York City Transitional Finance Authority, 5.25% due 8/1/2016 pre-refunded 8/1/2012 (Insured: AMBAC) | AA+/Aaa | 135,000 | 140,658 | |||||||
New York City Transitional Finance Authority, 5.00% due 1/15/2020 (State Aid Withholding) | AA-/Aa3 | 1,000,000 | 1,143,940 | |||||||
New York City Transitional Finance Authority, 5.00% due 11/1/2020 | AAA/Aaa | 1,000,000 | 1,137,610 | |||||||
New York Convention Center Development Corp. Hotel Unit Fee, 5.00% due 11/15/2017 (Insured: AMBAC) | NR/A1 | 1,000,000 | 1,103,780 | |||||||
New York Dormitory Authority, 5.25% due 2/15/2014 (Presbyterian Hospital; Insured: AGM) | AA+/Aa3 | 500,000 | 541,575 | |||||||
New York Dormitory Authority, 5.00% due 10/1/2014 (School District Financing Program; Insured: AGM)(State Aid Withholding) | AA+/Aa3 | 1,000,000 | 1,107,930 | |||||||
New York Dormitory Authority, 5.00% due 2/15/2015 (Mental Health Services; Insured: AMBAC) | AA-/NR | 1,000,000 | 1,126,510 | |||||||
New York Dormitory Authority, 5.00% due 7/1/2016 (Bishop Henry B. Hucles Nursing Home; Insured: SONYMA) | NR/Aa1 | 600,000 | 693,138 | |||||||
New York Dormitory Authority, 5.00% due 10/1/2018 (School District Revenue; Insured: AGM) | AA+/Aa3 | 1,000,000 | 1,148,060 | |||||||
New York Dormitory Authority, 5.50% due 7/1/2019 (Brooklyn Law School; Insured: Radian) | BBB+/Baa1 | 1,400,000 | 1,469,804 | |||||||
New York Dormitory Authority, 6.10% due 7/1/2019 (Ryan Clinton Community Health Center; Insured: SONYMA) | NR/Aa1 | 845,000 | 852,597 | |||||||
New York Dormitory Authority, 5.00% due 7/1/2020 (NYSARC, Inc.) | NR/Aa3 | 1,175,000 | 1,342,520 | |||||||
New York Dormitory Authority, 5.25% due 7/1/2022 (St. John’s University; Insured: Natl-Re) | A-/A3 | 1,000,000 | 1,171,800 | |||||||
New York Dormitory Authority, 5.00% due 1/15/2023 (Municipal Health Facilities) | AA-/Aa3 | 1,000,000 | 1,091,490 | |||||||
New York Dormitory Authority, 5.00% due 7/1/2024 (Bishop Henry B. Hucles Nursing Home; Insured: SONYMA) | NR/Aa1 | 1,000,000 | 1,068,490 | |||||||
New York Dormitory Authority, 5.25% due 7/1/2027 (Health Quest Systems; Insured: AGM) | AA+/Aa3 | 500,000 | 528,120 | |||||||
New York Dormitory Authority, 5.25% due 5/1/2030 (North Shore Long Island Jewish Medical) | A-/A3 | 1,000,000 | 1,030,210 | |||||||
New York Dormitory Authority Personal Income Tax, 5.50% due 3/15/2012 | AAA/Aa2 | 1,000,000 | 1,024,280 | |||||||
New York Dormitory Authority Personal Income Tax, 5.00% due 3/15/2019 (Insured: AGM) | AAA/Aa3 | 1,000,000 | 1,119,320 | |||||||
Certified Annual Report 11
| SCHEDULE OF INVESTMENTS, CONTINUED | ||
| Thornburg New York Intermediate Municipal Fund | September 30, 2011 | |
Issuer-Description | Credit Rating† S&P/ Moody’s | Principal Amount | Value | |||||||
New York Environmental Facilities Corp., 6.875% due 6/15/2014 (State Revolving Fund) | AAA/Aaa | $ | 310,000 | $ | 311,674 | |||||
New York Municipal Bond Bank Agency, 5.00% due 4/15/2018 (Sub Series B1; Insured: AGM) | AA+/Aa3 | 1,000,000 | 1,154,760 | |||||||
New York State Energy Research & Development Authority, 2.25% due 12/1/2015 (New York Electric & Gas Corp.) | NR/NR | 1,000,000 | 996,110 | |||||||
New York State Housing Finance Agency, 1.60% due 5/1/2012 (Affordable Housing) | NR/Aa2 | 525,000 | 525,425 | |||||||
New York State Thruway Authority Highway & Bridge Trust Fund, 5.00% due 4/1/2022 | AA/NR | 1,000,000 | 1,120,670 | |||||||
New York State Urban Development Corp., 5.25% due 1/1/2021 | AA-/NR | 1,000,000 | 1,156,210 | |||||||
Oneida County IDA, 6.10% due 6/1/2020 (Presbyterian Home for Central NY; LOC: HSBC Bank USA) | NR/Aa3 | 450,000 | 451,211 | |||||||
Onondaga Civic Development Corp., 5.00% due 7/1/2021 (Le Moyne College Project) | NR/Baa2 | 1,000,000 | 1,072,790 | |||||||
Port Authority New York & New Jersey, 5.00% due 8/15/2022 (Insured: AGM) | AA+/Aa2 | 1,000,000 | 1,114,770 | |||||||
Syracuse Industrial Development Agency, 5.25% due 5/1/2026 (Syracuse City School District) | AA-/Aa3 | 2,150,000 | 2,414,987 | |||||||
Tobacco Settlement Funding Corp., 5.50% due 6/1/2021 | AA-/Aa3 | 1,000,000 | 1,073,610 | |||||||
Triborough Bridge & Tunnel Authority, 5.00% due 11/15/2025 | AA-/Aa2 | 1,410,000 | 1,549,280 | |||||||
United Nations Development Corp., 5.00% due 7/1/2025 | NR/A1 | 710,000 | 777,691 | |||||||
Utica IDA, 5.375% due 7/15/2019 (Munson Williams Proctor Institute) | NR/A2 | 525,000 | 526,848 | |||||||
Utica IDA Civic Facility, 5.25% due 7/15/2016 (Munson Williams Proctor Institute) | NR/A2 | 210,000 | 212,925 | |||||||
Virgin Islands Water & Power Authority, 5.50% due 7/1/2017 | NR/Baa3 | 1,350,000 | 1,352,444 | |||||||
|
| |||||||||
TOTAL INVESTMENTS — 97.88% (Cost $45,314,842) | $ | 48,027,367 | ||||||||
OTHER ASSETS LESS LIABILITIES — 2.12% | 1,037,938 | |||||||||
|
| |||||||||
NET ASSETS — 100.00% | $ | 49,065,305 | ||||||||
|
| |||||||||
Footnote Legend
| † | Credit ratings are unaudited. Rating changes may have occurred subsequent to the reporting period end. |
Portfolio Abbreviations
To simplify the listings of securities, abbreviations are used per the table below:
| ACA | Insured by American Capital Access | |
| AGM | Insured by Assured Guaranty Municipal Corp. | |
| AMBAC | Insured by American Municipal Bond Assurance Corp. | |
| ETM | Escrowed to Maturity | |
| GO | General Obligation | |
| IDA | Industrial Development Authority | |
| LOC | Letter of Credit | |
| Natl-Re | Insured by National Public Finance Guarantee Corp. | |
| Radian | Insured by Radian Asset Assurance | |
| SONYMA | State of New York Mortgage Authority |
See notes to financial statements.
12 Certified Annual Report
| STATEMENT OF ASSETS AND LIABILITIES | ||
| Thornburg New York Intermediate Municipal Fund | September 30, 2011 | |
ASSETS | ||||
Investments at value (cost $45,314,842) (Note 2) | $ | 48,027,367 | ||
Cash | 918,133 | |||
Receivable for investments sold | 15,000 | |||
Receivable for fund shares sold | 132,697 | |||
Interest receivable | 639,588 | |||
Prepaid expenses and other assets | 672 | |||
|
| |||
Total Assets | 49,733,457 | |||
|
| |||
LIABILITIES | ||||
Payable for investments purchased | 545,996 | |||
Payable for fund shares redeemed | 28,860 | |||
Payable to investment advisor and other affiliates (Note 3) | 25,829 | |||
Accounts payable and accrued expenses | 29,543 | |||
Dividends payable | 37,924 | |||
|
| |||
Total Liabilities | 668,152 | |||
|
| |||
NET ASSETS | $ | 49,065,305 | ||
|
| |||
NET ASSETS CONSIST OF: | ||||
Distribution in excess of net investment income | $ | (16,847 | ) | |
Net unrealized appreciation on investments | 2,712,525 | |||
Accumulated net realized gain (loss) | (131,387 | ) | ||
Net capital paid in on shares of beneficial interest | 46,501,014 | |||
|
| |||
| $ | 49,065,305 | |||
|
| |||
NET ASSET VALUE: | ||||
Class A Shares: | ||||
Net asset value and redemption price per share ($45,550,933 applicable to 3,524,235 shares of beneficial interest outstanding - Note 4) | $ | 12.93 | ||
Maximum sales charge, 2.00% of offering price | 0.26 | |||
|
| |||
Maximum offering price per share | $ | 13.19 | ||
|
| |||
| Class I Shares: | ||||
Net asset value, offering and redemption price per share ($3,514,372 applicable to 271,909 shares of beneficial interest outstanding - Note 4) | $ | 12.92 | ||
|
| |||
See notes to financial statements.
Certified Annual Report 13
| STATEMENT OF OPERATIONS | ||
| Thornburg New York Intermediate Municipal Fund | Year Ended September 30, 2011 | |
INVESTMENT INCOME: | ||||
Interest income (net of premium amortized of $250,821) | $ | 1,973,921 | ||
|
| |||
EXPENSES: | ||||
Investment advisory fees (Note 3) | 232,410 | |||
Administration fees (Note 3) | ||||
Class A Shares | 55,657 | |||
Class I Shares | 978 | |||
Distribution and service fees (Note 3) | ||||
Class A Shares | 111,313 | |||
Transfer agent fees | ||||
Class A Shares | 20,548 | |||
Class I Shares | 134 | |||
Registration and filing fees | ||||
Class A Shares | 292 | |||
Custodian fees (Note 3) | 27,856 | |||
Professional fees | 24,744 | |||
Accounting fees | 1,732 | |||
Trustee fees | 1,096 | |||
Other expenses | 11,912 | |||
|
| |||
Total Expenses | 488,672 | |||
Less: | ||||
Expenses reimbursed by investment advisor (Note 3) | (34,192 | ) | ||
Fees paid indirectly (Note 3) | (598 | ) | ||
|
| |||
Net Expenses | 453,882 | |||
|
| |||
Net Investment Income | 1,520,039 | |||
|
| |||
REALIZED AND UNREALIZED GAIN (LOSS) | ||||
Net realized gain (loss) on investments | (98,557 | ) | ||
Net change in unrealized appreciation (depreciation) on investments | 195,166 | |||
|
| |||
Net Realized and Unrealized Gain | 96,609 | |||
|
| |||
Net Increase in Net Assets Resulting from Operations | $ | 1,616,648 | ||
|
| |||
See notes to financial statements.
14 Certified Annual Report
STATEMENTS OF CHANGES IN NET ASSETS
Thornburg New York Intermediate Municipal Fund
| Year Ended September 30, 2011 | Year Ended September 30, 2010 | |||||||
INCREASE (DECREASE) IN NET ASSETS FROM | ||||||||
OPERATIONS: | ||||||||
Net investment income | $ | 1,520,039 | $ | 1,498,974 | ||||
Net realized gain (loss) on investments | (98,557 | ) | 6,049 | |||||
Net unrealized appreciation (depreciation) on investments | 195,166 | 252,625 | ||||||
|
|
|
| |||||
Net Increase (Decrease) in Net Assets Resulting from Operations | 1,616,648 | 1,757,648 | ||||||
DIVIDENDS TO SHAREHOLDERS: | ||||||||
From net investment income | ||||||||
Class A Shares | (1,450,725 | ) | (1,473,778 | ) | ||||
Class I Shares | (69,314 | ) | (25,196 | ) | ||||
FUND SHARE TRANSACTIONS (NOTE 4): | ||||||||
Class A Shares | (2,726,714 | ) | 7,862,026 | |||||
Class I Shares | 1,720,642 | 1,738,988 | ||||||
|
|
|
| |||||
Net Increase (Decrease) in Net Assets | (909,463 | ) | 9,859,688 | |||||
NET ASSETS: | ||||||||
Beginning of Year | 49,974,768 | 40,115,080 | ||||||
|
|
|
| |||||
End of Year | $ | 49,065,305 | $ | 49,974,768 | ||||
|
|
|
| |||||
See notes to financial statements.
Certified Annual Report 15
| NOTES TO FINANCIAL STATEMENTS | ||
| Thornburg New York Intermediate Municipal Fund | September 30, 2011 | |
NOTE 1 – ORGANIZATION
Thornburg New York Intermediate Municipal Fund (the “Fund”) is a non-diversified series of Thornburg Investment Trust (the “Trust”). The Trust is organized as a Massachusetts business trust under a Declaration of Trust dated June 3, 1987 and is registered as a diversified, open-end management investment company under the Investment Company Act of 1940, as amended. The Fund is currently one of sixteen separate series of the Trust. Each series is considered to be a separate entity for financial reporting and tax purposes and bears expenses directly attributable to it. The Fund’s primary investment objective is to obtain as high a level of current income exempt from federal, New York State, and New York City individual income tax as is consistent, in the view of the Fund’s investment advisor, with the preservation of capital. The Fund’s secondary objective is to reduce expected changes in its share price compared to long-term bond portfolios. The Fund will invest primarily in municipal obligations within the state of New York.
The Fund currently offers two classes of shares of beneficial interest outstanding: Class A and Class I shares. Each class of shares of the Fund represents an interest in the same portfolio of investments, except that (i) Class A shares are sold subject to a front-end sales charge collected at the time the shares are purchased and bear a service fee and (ii) Class I shares are sold at net asset value without a sales charge at the time of purchase, and (iii) the respective classes may have different reinvestment privileges and conversion rights. Additionally, the Fund may allocate among its classes certain expenses, to the extent allowable to specific classes, including transfer agent fees, government registration fees, certain printing and postage costs, and administrative and legal expenses. Currently, class specific expenses of the Fund are limited to service and distribution fees, administration fees, and certain registration and transfer agent expenses.
NOTE 2 – SIGNIFICANT ACCOUNTING POLICIES
Significant accounting policies of the Trust are as follows:
Valuation of Investments: Debt obligations have a primary market over the counter and are valued by an independent pricing service approved by the Trustees of the Trust. The pricing service ordinarily values debt obligations at quoted bid prices. When quotations are not available, debt obligations are valued at evaluated prices determined by the pricing service using methods which include consideration of yields or prices of debt obligations of comparable quality, type of issue, coupon, maturity and rating, and indications as to value from dealers and general market conditions. Short-term obligations having remaining maturities of 60 days or less are ordinarily valued at amortized cost, which approximates market value.
In any case where a pricing service fails to provide a price for a debt obligation held by the Fund, the valuation and pricing committee determines a fair value for the obligation using procedures approved by the Trustees. Additionally, in any case where management believes that a price provided by a pricing service for a debt obligation may be unreliable, the valuation and pricing committee decides whether or not to use the pricing service’s valuation or to determine a fair value for the obligation.
In determining fair value for any portfolio security or other investment, the valuation and pricing committee seeks to determine the amount that an owner of the investment might reasonably expect to receive upon a sale of the investment. However, because fair value prices are estimated prices, the valuation and pricing committee’s determination of fair value for an investment may differ from the value that would be realized by the Fund upon a sale of the investment, and that difference could be material to the Fund’s financial statements. The valuation and pricing committee’s determination of fair value for an investment may also differ from the prices obtained by other persons (including other mutual funds) for the investment.
Valuation Measurements: Various inputs are used in determining the value of the Fund’s investments. These inputs are summarized in the three levels listed below:
Level 1: Quoted prices in active markets for identical investments.
Level 2: Other significant observable inputs (including quoted prices for similar investments, interest rates, prepayment rates, credit risk, etc.).
Level 3: Significant unobservable inputs (including the Fund’s own assumptions in determining the fair value of investments).
16 Certified Annual Report
| NOTES TO FINANCIAL STATEMENTS, CONTINUED | ||
| Thornburg New York Intermediate Municipal Fund | September 30, 2011 | |
The following table displays a summary of the inputs used to value the Fund’s net assets as of September 30, 2011. In any instance when valuation inputs from more than one level are used to determine the fair value of a specific investment, the investment is placed in the level of the table based upon the lowest level input that is significant in determining the fair value of the investment:
| Fair Value Measurements at September 30, 2011 | ||||||||||||||||
| Total | Level 1 | Level 2 | Level 3 | |||||||||||||
Assets | ||||||||||||||||
Investments in Securities Municipal Bonds | $ | 48,027,367 | $ | — | $ | 48,027,367 | $ | — | ||||||||
|
|
|
|
|
|
|
| |||||||||
Total Investments in Securities | $ | 48,027,367 | $ | — | $ | 48,027,367 | $ | — | ||||||||
Other Notes: It is the policy of the Fund to recognize significant transfers between Levels 1, 2 and 3 and to disclose those transfers at the beginning of the reporting period. The Fund recognized no significant transfers between levels for the year ended September 30, 2011.
Federal Income Taxes: It is the policy of the Trust to comply with the provisions of the Internal Revenue Code applicable to “regulated investment companies,” and to distribute to shareholders substantially all taxable (if any) and tax exempt income of the Fund. Therefore, no provision for federal income tax is required.
Management reviews each uncertain tax position believed to be material to the preparation of the Fund’s financial statements, to assess if it is more likely than not that the position would be sustained upon examination, based upon the technical merits of the position. As of September 30, 2011, management has not identified any such position for which a liability must be reflected in the Statement of Assets and Liabilities. The Fund’s tax returns remain subject to examination for three years after filing.
When-Issued and Delayed Delivery Transactions: The Fund may engage in when-issued or delayed delivery transactions. To the extent the Fund engages in such transactions, it will do so for the purpose of acquiring portfolio securities consistent with the Fund’s investment objectives and not for the purpose of investment leverage or to speculate on interest rate and/or market changes. At the time the Fund makes a commitment to purchase a security on a when-issued or delayed delivery basis, the Fund will record the transaction and reflect the value in determining its net asset value. When effecting such transactions, assets of an amount sufficient to make payment for the portfolio securities to be purchased will be segregated on the Fund’s records on the trade date. Securities purchased on a when-issued or delayed delivery basis do not earn interest until the settlement date.
Dividends: Net investment income of the Fund is declared daily as a dividend on shares for which the Fund has received payment. Dividends are paid monthly and are reinvested in additional shares of the Fund at net asset value per share at the close of business on the dividend payment date, or at the shareholder’s option, paid in cash. Net realized capital gains, to the extent available, will be distributed at least annually.
General: Securities transactions are accounted for on a trade date basis. Interest income is accrued as earned. Premiums and discounts on securities purchased are amortized to call dates or maturity dates of the respective securities. Realized gains and losses from the sale of securities are recorded on an identified cost basis. Net investment income (other than class specific expenses) and realized and unrealized gains and losses are allocated daily to each class of shares based upon the relative net asset value of outstanding shares (or the value of the dividend-eligible shares, as appropriate) of each class of shares at the beginning of the day (after adjusting for the current capital shares activity of the respective class). Expenses common to all Funds are allocated among the Funds comprising the Trust based upon their relative net asset values or other appropriate allocation methods.
Guarantees and Indemnifications: Under the Trust’s organizational documents, its officers and Trustees are indemnified against certain liabilities arising out of the performance of their duties to the Fund. Additionally, in the normal course of business the Trust enters into contracts with service providers that contain general indemnification clauses. The Trust’s maximum exposure under these arrangements is unknown. However, based on experience, the Trust expects the risk of loss to be remote.
Use of Estimates: The preparation of financial statements, in conformity with generally accepted accounting principles, requires management to make estimates and assumptions that affect the reported amounts of assets and liabilities and the disclosure of contingent
Certified Annual Report 17
| NOTES TO FINANCIAL STATEMENTS, CONTINUED | ||
| Thornburg New York Intermediate Municipal Fund | September 30, 2011 | |
assets and liabilities at the date of the financial statements and the reported amounts of increases and decreases in net assets from operations during the reporting period. Actual results could differ from those estimates.
NOTE 3 – INVESTMENT ADVISORY FEE AND OTHER TRANSACTIONS WITH AFFILIATES
Pursuant to an investment advisory agreement, Thornburg Investment Management, Inc. (the “Advisor”) serves as the investment advisor and performs services to the Fund for which the fees are payable at the end of each month. For the year ended September 30, 2011, these fees were payable at annual rates ranging from .50 of 1% to .275 of 1% per annum of the average daily net assets of the Fund depending on the Fund’s asset size. The Trust also has entered into administrative services agreements with the Advisor, whereby the Advisor will perform certain administrative services for the shareholders of each class of the fund shares, and for which fees will be payable at an annual rate of up to .125 of 1% per annum of the average daily net assets attributable to each class of shares. For the year ended September 30, 2011, the Advisor contractually reimbursed certain class specific expenses and administrative fees of $33,429 for Class A shares and $763 for Class I shares.
The Trust has an underwriting agreement with Thornburg Securities Corporation (the “Distributor,” an affiliate of the Advisor), which acts as the distributor of the Fund’s shares. For the year ended September 30, 2011, the Distributor has advised the Fund that it earned net commissions aggregating $976 from the sale of Class A shares.
Pursuant to a service plan under Rule 12b-1 of the Investment Company Act of 1940, the Fund may reimburse to the Advisor an amount not to exceed .25 of 1% per annum of the average daily net assets attributable to each class of shares of the Fund for payments made by the Advisor to securities dealers and other financial institutions to obtain various shareholder and distribution related services. For the year ended September 30, 2011, there were no 12b-1 service plan fees charged for Class I shares. The Advisor may pay out of its own resources additional expenses for distribution of the Fund’s shares.
The Trust has an agreement with the custodian bank to indirectly pay a portion of the custodian’s fees through credits earned by the Fund’s cash on deposit with the bank. This deposit agreement is an alternative to overnight investments. Custodial fees have been adjusted to reflect amounts that would have been paid without this agreement, with a corresponding adjustment reflected as fees paid indirectly in the Statement of Operations. For the year ended September 30, 2011, fees paid indirectly were $598.
Certain officers and Trustees of the Trust are also officers or directors of the Advisor and Distributor. The compensation of independent Trustees is borne by the Trust.
NOTE 4 – SHARES OF BENEFICIAL INTEREST
At September 30, 2011, there were an unlimited number of shares of beneficial interest authorized. Transactions in shares of beneficial interest were as follows:
| Year Ended September 30, 2011 | Year Ended September 30, 2010 | |||||||||||||||
| Shares | Amount | Shares | Amount | |||||||||||||
Class A Shares | ||||||||||||||||
Shares sold | 807,669 | $ | 10,231,983 | 1,220,966 | $ | 15,381,956 | ||||||||||
Shares issued to shareholders in reinvestment of dividends | 79,211 | 995,815 | 81,263 | 1,024,581 | ||||||||||||
Shares repurchased | (1,122,823 | ) | (13,954,512 | ) | (678,311 | ) | (8,544,511 | ) | ||||||||
|
|
|
|
|
|
|
| |||||||||
Net increase (decrease) | (235,943 | ) | $ | (2,726,714 | ) | 623,918 | $ | 7,862,026 | ||||||||
|
|
|
|
|
|
|
| |||||||||
Class I Shares* | ||||||||||||||||
Shares sold | 200,446 | $ | 2,554,922 | 137,346 | $ | 1,727,927 | ||||||||||
Shares issued to shareholders in reinvestment of dividends | 4,201 | 53,168 | 1,412 | 17,935 | ||||||||||||
Shares repurchased | (70,956 | ) | (887,448 | ) | (540 | ) | (6,874 | ) | ||||||||
|
|
|
|
|
|
|
| |||||||||
Net increase (decrease) | 133,691 | $ | 1,720,642 | 138,218 | $ | 1,738,988 | ||||||||||
|
|
|
|
|
|
|
| |||||||||
| * | The effective date of this class of shares was February 1, 2010. |
18 Certified Annual Report
| NOTES TO FINANCIAL STATEMENTS, CONTINUED | ||
| Thornburg New York Intermediate Municipal Fund | September 30, 2011 | |
NOTE 5 – SECURITIES TRANSACTIONS
For the year ended September 30, 2011, the Fund had purchase and sale transactions of investment securities (excluding short-term investments) of $11,918,507 and $12,381,075, respectively.
NOTE 6 – INCOME TAXES
At September 30, 2011, information on the tax components of capital is as follows:
Cost of investments for tax purposes | $ | 45,314,842 | ||
|
| |||
Gross unrealized appreciation on a tax basis | $ | 2,717,190 | ||
Gross unrealized depreciation on a tax basis | (4,665 | ) | ||
|
| |||
Net unrealized appreciation (depreciation) on investments (tax basis) | $ | 2,712,525 | ||
|
|
At September 30, 2011, the Fund did not have any undistributed net ordinary income or undistributed capital gains.
At September 30, 2011, the Fund had deferred tax basis capital losses occurring subsequent to October 31, 2010 of $98,557. For tax purposes, such losses will be reflected in the year ending September 30, 2012.
At September 30, 2011, the Fund had tax basis capital losses of $32,830, which may be carried forward to offset future capital gains. To the extent such carryforwards are used, capital gain distributions may be reduced to the extent provided by regulations. Such capital loss carryforwards expire September 30, 2014.
The Regulated Investment Company Modernization Act of 2010 (the “Act”) was signed into law on December 22, 2010. The Act makes changes to a number of tax rules impacting the Fund. Under the Act, future capital losses generated by the Fund may be carried over indefinitely, but these losses must be used prior to the utilization of any pre-enactment capital losses. Since pre-enactment capital losses may only be carried forward for eight years, there may be a greater likelihood that all or a portion of a Fund’s pre-enactment capital losses will expire unused. In general, the provisions of the Act will be effective for the Fund’s fiscal year ending September 30, 2012.
The tax character of distributions paid for the years ended September 30, 2011 and September 30, 2010, was as follows:
| 2011 | 2010 | |||||||
Distributions from: | ||||||||
Tax exempt income | $ | 1,519,692 | $ | 1,497,309 | ||||
Ordinary income | 347 | 1,665 | ||||||
|
|
|
| |||||
Total Distributions | $ | 1,520,039 | $ | 1,498,974 | ||||
|
|
|
| |||||
OTHER NOTES:
Risks: The Fund’s investments subject it to risks including, but not limited to, credit risk, interest rate risk, management risk, market and economic risk, liquidity risk, and the risks of investing primarily in the obligations of a single state. Please see the Fund’s prospectus for a discussion of the risks associated with an investment in the Fund.
Subsequent Events: Fund management believes no events have occurred between September 30, 2011 and the date of issuance of the financial statements, which require adjustment to, or disclosure in the accompanying financial statements.
Certified Annual Report 19
Thornburg New York Intermediate Municipal Fund
| PER SHARE PERFORMANCE (for a share outstanding throughout the Year)+ | RATIOS TO AVERAGE NET ASSETS | SUPPLEMENTAL DATA | ||||||||||||||||||||||||||||||||||||||||||||||||||||||||||
Unless Otherwise Noted, are Ended | Net Asset Value Beginning of Year | Net Investment Income (Loss) | Net Realized & Unrealized Gain (Loss) on Investments | Total from Investment Operations | Dividends from Net Investment Income | Dividends from Net Realized Gains | Total Dividends | Net Asset Value End of Year | Net Investment Income (Loss) (%) | Expenses, After Expense Reductions (%) | Expenses, After Expense Reductions and Net of Custody Credits (%) | Expenses, Before Expense Reductions (%) | Total Return (%)(a) | Portfolio Turnover Rate (%) | Net Assets at End of Year (Thousands) | |||||||||||||||||||||||||||||||||||||||||||||
Class A Shares |
| |||||||||||||||||||||||||||||||||||||||||||||||||||||||||||
2011(b) | $ | 12.82 | 0.41 | 0.11 | 0.52 | (0.41 | ) | — | (0.41 | ) | $ | 12.93 | 3.26 | 0.99 | 0.99 | 1.07 | 4.20 | 26.39 | $ | 45,551 | ||||||||||||||||||||||||||||||||||||||||
2010(b) | $ | 12.79 | 0.42 | 0.04 | 0.46 | (0.43 | ) | — | (0.43 | ) | $ | 12.82 | 3.38 | 0.99 | 0.99 | 1.07 | 3.68 | 11.79 | $ | 48,203 | ||||||||||||||||||||||||||||||||||||||||
2009(b) | $ | 11.87 | 0.45 | 0.92 | 1.37 | (0.45 | ) | — | (0.45 | ) | $ | 12.79 | 3.67 | 0.99 | 0.99 | 1.07 | 11.77 | 13.00 | $ | 40,115 | ||||||||||||||||||||||||||||||||||||||||
2008(b) | $ | 12.30 | 0.44 | (0.43 | ) | 0.01 | (0.44 | ) | — | (0.44 | ) | $ | 11.87 | 3.61 | 1.01 | 0.99 | 1.08 | 0.07 | 13.42 | $ | 30,685 | |||||||||||||||||||||||||||||||||||||||
2007(b) | $ | 12.38 | 0.46 | (0.08 | ) | 0.38 | (0.46 | ) | — | (0.46 | ) | $ | 12.30 | 3.74 | 1.01 | 0.99 | 1.11 | 3.13 | 14.91 | $ | 33,016 | |||||||||||||||||||||||||||||||||||||||
Class I Shares |
| |||||||||||||||||||||||||||||||||||||||||||||||||||||||||||
2011 | $ | 12.82 | 0.45 | 0.10 | 0.55 | (0.45 | ) | — | (0.45 | ) | $ | 12.92 | 3.54 | 0.67 | 0.67 | 0.71 | 4.45 | 26.39 | $ | 3,514 | ||||||||||||||||||||||||||||||||||||||||
2010(c) | $ | 12.48 | 0.29 | 0.35 | 0.64 | (0.30 | ) | — | (0.30 | ) | $ | 12.82 | 3.53 | (d) | 0.67 | (d) | 0.67 | (d) | 1.32 | (d) | 5.22 | 11.79 | $ | 1,772 | ||||||||||||||||||||||||||||||||||||
| (a) | Not annualized for periods less than one year. |
| (b) | Sales loads are not reflected in computing total return. |
| (c) | Effective date of this class of shares was February 1, 2010. |
| (d) | Annualized. |
| + | Based on weighted average shares outstanding. |
See notes to financial statements.
| 20 Certified Annual Report | Certified Annual Report 21 |
REPORT OF INDEPENDENT REGISTERED PUBLIC ACCOUNTING FIRM
Thornburg New York Intermediate Municipal Fund
To the Trustees and Shareholders of
Thornburg New York Intermediate Municipal Fund
In our opinion, the accompanying statement of assets and liabilities, including the schedule of investments, and the related statements of operations and of changes in net assets and the financial highlights present fairly, in all material respects, the financial position of Thornburg New York Intermediate Municipal Fund (one of the portfolios constituting Thornburg Investment Trust, hereafter referred to as the “Fund”) at September 30, 2011, the results of its operations for the year then ended, the changes in its net assets for each of the two years in the period then ended and the financial highlights for each of the periods presented, in conformity with accounting principles generally accepted in the United States of America. These financial statements and financial highlights (hereafter referred to as “financial statements”) are the responsibility of the Fund’s management. Our responsibility is to express an opinion on these financial statements based on our audits. We conducted our audits of these financial statements in accordance with the standards of the Public Company Accounting Oversight Board (United States). Those standards require that we plan and perform the audit to obtain reasonable assurance about whether the financial statements are free of material misstatement. An audit includes examining, on a test basis, evidence supporting the amounts and disclosures in the financial statements, assessing the accounting principles used and significant estimates made by management, and evaluating the overall financial statement presentation. We believe that our audits, which included confirmation of securities at September 30, 2011 by correspondence with the custodian and brokers, provide a reasonable basis for our opinion.
PricewaterhouseCoopers LLP
New York, New York
November 21, 2011
22 Certified Annual Report
| EXPENSE EXAMPLE | ||
| Thornburg New York Intermediate Municipal Fund | September 30, 2011 (Unaudited) | |
As a shareholder of the Fund, you incur two types of costs:
| (1) | transaction costs, including |
(a) sales charges (loads) on purchase payments, for Class A shares;
(b) a deferred sales charge on redemptions of any part or all of a purchase of $1 million of Class A shares within 12 months of purchase;
| (2) | ongoing costs, including management fees; distribution and/or service (12b-1) fees; and other Fund expenses. |
This example is intended to help you understand your ongoing costs (in dollars) of investing in the Fund and to compare these costs with the ongoing costs of investing in other mutual funds.
The example is based on a $1,000 investment beginning on April 1, 2011, and held until September 30, 2011.
ACTUAL EXPENSES
The first line of the table at right provides information about actual account values and actual expenses. You may use the information in this line, together with the amount you invested, to estimate the expenses that you paid over the period. Simply divide your account value by $1,000 (for example, an $8,600 account value divided by $1,000 = 8.6), then multiply the result by the number in the first line under the heading entitled “Expenses Paid During Period” to estimate the expenses you paid on your account during this period.
HYPOTHETICAL EXAMPLE FOR COMPARISON PURPOSES
The second line of the table at right provides information about hypothetical account values and hypothetical expenses based on the Fund’s actual expense ratio and an assumed rate of return of 5% per year before expenses, which is not the Fund’s actual return. The hypothetical account values and expenses may not be used to estimate the actual ending account balance or expenses you paid for the period. You may use this information to compare the ongoing costs of investing in the Fund and other funds. To do so, compare this 5% hypothetical example with the 5% hypothetical examples that appear in the shareholder reports of the other funds.
| Beginning Account Value 4/1/11 | Ending Account Value 9/30/11 | Expenses Paid During Period† 4/1/11–9/30/11 | ||||||||||
Class A Shares | ||||||||||||
Actual | $ | 1,000.00 | $ | 1,068.20 | $ | 5.13 | ||||||
Hypothetical* | $ | 1,000.00 | $ | 1,020.11 | $ | 5.01 | ||||||
Class I Shares | ||||||||||||
Actual | $ | 1,000.00 | $ | 1,069.10 | $ | 3.47 | ||||||
Hypothetical* | $ | 1,000.00 | $ | 1,021.71 | $ | 3.39 | ||||||
| † | Expenses are equal to the annualized expense ratio for each class (A: 0.99%; I: 0.67%) multiplied by the average account value over the period, multiplied by 183/365 to reflect the one-half year period. |
| * | Hypothetical assumes a rate of return of 5% per year before expenses. |
Please note that the expenses shown in the table are meant to highlight your ongoing costs only and do not reflect any transactional costs, such as sales charges (loads), redemption fees, or exchange fees. Therefore, the second line of the table is useful in comparing ongoing costs only, and will not help you determine the relative total costs of owning different funds. In addition, if these transactional costs were included, your costs would have been higher.
Certified Annual Report 23
| INDEX COMPARISON | ||
| Thornburg New York Intermediate Municipal Fund | September 30, 2011 (Unaudited) | |
GROWTH OF A HYPOTHETICAL $10,000 INVESTMENT
Thornburg New York Intermediate Municipal Fund versus BofA Merrill Lynch 7-12 Year U.S. Municipal Securities Index and Consumer Price Index (September 5, 1997 to September 30, 2011)
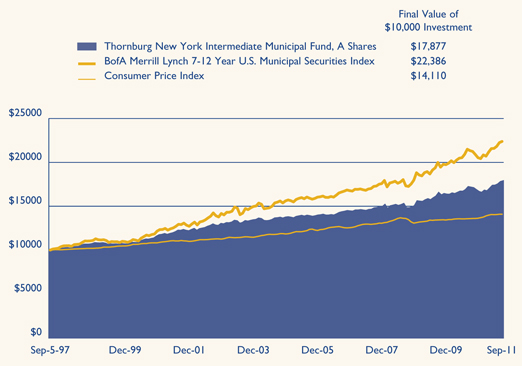
AVERAGE ANNUAL TOTAL RETURNS
For the periods ended September 30, 2011 (with sales charge)
| 1 Yr | 5 Yrs | 10 Yrs | Since Inception | |||||||||||||
A Shares (Incep: 9/5/97) | 2.13 | % | 4.08 | % | 3.66 | % | 4.22 | % | ||||||||
I Shares (Incep: 2/1/10) | 4.45 | % | — | — | 5.86 | % | ||||||||||
Performance data shown represents past performance and is no guarantee of future results. Investment return and principal value will fluctuate so shares, when redeemed, may be worth more or less than their original cost. Current performance may be lower or higher than quoted. For performance current to the most recent month end, visit thornburg.com or call 800.847.0200. The performance data and graph do not reflect the deduction of taxes that a shareholder would pay on distributions or the redemption of Fund shares. Returns reflect the reinvestment of dividends and capital gains as well as applicable sales charge. Class A shares are sold with a maximum sales charge of 2.00% .
24 Certified Annual Report
| TRUSTEES AND OFFICERS | ||
| Thornburg New York Intermediate Muncipal Fund | September 30, 2011 (Unaudited) | |
Name, Age, Position Held with Fund Year Elected | Principal Occupation(s) During Past Five Years | Other Directorships Held by Trustee | ||
INTERESTED TRUSTEES(1)(2)(4) | ||||
| Garrett Thornburg, 65 Chairman of Trustees, Trustee since 1987(3) | Chairman and controlling shareholder and, until 2008, CEO of Thornburg Investment Management, Inc. (investment advisor); Chairman, CEO, and controlling shareholder of Thornburg Securities Corporation (securities dealer); CEO until 2007 and Chairman until 2009 of TMST, Inc. (f/k/a Thornburg Mortgage, Inc.) (real estate investment trust); President and Sole Director of Thornburg Mortgage Advisory Corporation (investment manager to TMST, Inc.). | None | ||
| Brian J. McMahon, 55 Trustee since 2001, Member of Governance & Nominating Committee & Operations Risk Oversight Committee, President since 1997(5)(6) | CEO since 2008, President, Managing Director, Chief Investment Officer, and Portfolio Manager of Thornburg Investment Management, Inc. | None | ||
INDEPENDENT TRUSTEES(1)(2)(4) | ||||
David A. Ater, 66 Trustee since 1994, Member of Audit Committee & Governance & Nominating Committee | Principal in Ater & Associates, Santa Fe, NM (developer, planner and broker of residential and commercial real estate); owner, developer and broker for various real estate projects. | None | ||
David D. Chase, 70 Trustee since 2000, Chairman of Audit Committee | Managing Member of Vestor Associates, LLC, Santa Fe, NM (private equity fund); Managing Member of CS Group, LLC, Santa Fe, NM (merchant bank). | None | ||
Eliot R. Cutler, 65 Trustee since 2004 & Nominating Committee, Chairman of Governance | Senior Counsel and, until 2009, Partner in Akin, Gump, Strauss, Hauer & Feld LLP (law firm) in Washington, D.C. and Beijing, China. | None | ||
Susan H. Dubin, 62 Trustee since 2004, Member of Audit Committee | President of Dubin Investments, Ltd., Greenwich, CT (private investment fund); Director and officer of various charitable organizations. | None | ||
Owen D. Van Essen, 57 Trustee since 2004, Member of Governance & Nominating Committee & Chairman of Operations Risk Oversight Committee | President of Dirks, Van Essen & Murray, Santa Fe, NM (newspaper mergers and acquisitions). | None | ||
Certified Annual Report 25
| TRUSTEES AND OFFICERS, CONTINUED | ||
| Thornburg New York Intermediate Municipal Fund | September 30, 2011 (Unaudited) | |
Name, Age, Position Held with Fund Year Elected | Principal Occupation(s) During Past Five Years | Other Directorships Held by Trustee | ||
James W. Weyhrauch, 52 Trustee since 1996, Member of Audit Committee & Operations Risk Oversight Committee | Real estate broker, Santa Fe Properties, Santa Fe, NM; Vice Chairman of Nambe LLC, Santa Fe, NM (manufacturing & design company). | None | ||
OFFICERS OF THE FUND (WHO ARE NOT TRUSTEES)(1)(6)(7) | ||||
| George T. Strickland, 48 Vice President since 1996, Treasurer since 2007(6) | Portfolio Manager, Vice President, and Managing Director of Thornburg Investment Management, Inc. | Not applicable | ||
William V. Fries, 72 Vice President since 1995 | Portfolio Manager, Vice President, and Managing Director of Thornburg Investment Management, Inc. | Not applicable | ||
Leigh Moiola, 44 Vice President since 2001 | Vice President, Managing Director, and Director of Marketing of Thornburg Investment Management, Inc. | Not applicable | ||
Alexander Motola, 41 Vice President since 2001 | Portfolio Manager, Vice President, and Managing Director of Thornburg Investment Management, Inc. | Not applicable | ||
Wendy Trevisani, 40 Vice President since 1999 | Portfolio Manager and Managing Director of Thornburg Investment Management, Inc. | Not applicable | ||
Joshua Gonze, 48 Vice President since 1999 | Portfolio Manager since 2007, Managing Director, and Associate Portfolio Manager until 2007 of Thornburg Investment Management, Inc. | Not applicable | ||
Christopher Ihlefeld, 41 Vice President since 2003 | Portfolio Manager since 2007, Managing Director, and Associate Portfolio Manager until 2007 of Thornburg Investment Management, Inc. | Not applicable | ||
Leon Sandersfeld, 45 Vice President since 2003 | Managing Director since 2007 and Fund Accounting Director of Thornburg Investment Management, Inc. | Not applicable | ||
Sasha Wilcoxon, 37 Vice President since 2003 Secretary since 2007(6) | Managing Director since 2007, Director of Operations, and Vice President of Thornburg Investment Management, Inc. | Not applicable | ||
Edward Maran, 53 Vice President since 2004 | Portfolio Manager and Managing Director of Thornburg Investment Management, Inc. | Not applicable | ||
Vinson Walden, 41 Vice President since 2004 | Portfolio Manager and Managing Director of Thornburg Investment Management, Inc. | Not applicable | ||
Thomas Garcia, 40 Vice President since 2006 | Vice President since 2011, Managing Director, Head Equity Trader, and Associate Portfolio Manager of Thornburg Investment Management, Inc. | Not applicable | ||
Lei Wang, 40 Vice President since 2006 | Portfolio Manager and Managing Director of Thornburg Investment Management, Inc. | Not applicable | ||
26 Certified Annual Report
| TRUSTEES AND OFFICERS, CONTINUED | ||
| Thornburg New York Intermediate Municipal Fund | September 30, 2011 (Unaudited) | |
Name, Age, Position Held with Fund Year Elected | Principal Occupation(s) During Past Five Years | Other Directorships Held by Trustee | ||
Connor Browne, 32 Vice President since 2006 | Portfolio Manager and Managing Director of Thornburg Investment Management, Inc. | Not applicable | ||
Jason Brady, 37 Vice President since 2007 | Vice President since 2011, Portfolio Manager since 2007, Managing Director since 2007, and Associate Portfolio Manager 2006–2007 of Thornburg Investment Management, Inc. | Not applicable | ||
Lewis Kaufman, 35 Vice President since 2007 | Portfolio Manager since 2007, Managing Director since 2007, and Associate Portfolio Manager until 2009 of Thornburg Investment Management, Inc. | Not applicable | ||
Christopher Ryon, 55 Vice President since 2008 | Portfolio Manager since 2009, Managing Director since 2009, and Associate Portfolio Manager 2008–2009 of Thornburg Investment Management, Inc.; Principal of Vanguard Funds until 2008. | Not applicable | ||
Lon Erickson, 36 Vice President since 2008 | Portfolio Manager since 2010, Managing Director since 2010, and Associate Portfolio Manager 2008–2010 of Thornburg Investment Management, Inc.; Senior Analyst of State Farm Insurance until 2008. | Not applicable | ||
Kathleen Brady, 51 Vice President since 2008 | Senior Tax Accountant since 2007 of Thornburg Investment Management, Inc.; Chief Financial Officer of Vestor Partners, LP (private equity fund) until 2007. | Not applicable | ||
Jack Gardner, 57 Vice President since 2008 | Managing Director since 2007 of Thornburg Investment Management, Inc.; President since 2008 and National Sales Director of Thornburg Securities Corporation. | Not applicable | ||
Laura Hillstrom, 44 Vice President since 2009 | Chief Administrative Officer since 2009, Vice President and Managing Director, and Director of Information Systems until 2009 of Thornburg Investment Management, Inc. | Not applicable | ||
| (1) | Each person’s address is 2300 North Ridgetop Road, Santa Fe, New Mexico 87506. |
| (2) | The Fund is one of sixteen separate investment “Funds” or “series” of Thornburg Investment Trust (the “Trust”), which comprises the Thornburg mutual fund complex and is organized as a Massachusetts business trust. Thornburg Investment Management, Inc. is the investment advisor to, and manages, the sixteen Funds of the Trust. Each Trustee oversees the sixteen Funds of the Trust. |
| (3) | Mr. Thornburg is considered an “interested” Trustee under the Investment Company Act of 1940 because he is the sole director and controlling shareholder of Thornburg Investment Management, Inc., the investment advisor to the sixteen active Funds of the Trust, and is the sole director and controlling shareholder of Thornburg Securities Corporation, the distributor of shares for the Trust. |
| (4) | Each Trustee serves in office until the election and qualification of a successor. |
| (5) | Mr. McMahon is considered an “interested” Trustee because he is the chief executive officer and president of Thornburg Investment Management, Inc. |
| (6) | The Trust’s president, secretary, and treasurer each serves a one-year term or until the election and qualification of a successor; each other officer serves at the pleasure of the Trustees. |
| (7) | Assistant vice presidents, assistant secretaries and assistant treasurers are not shown. |
The Statement of Additional Information for each Fund of the Trust includes additional information about the Trustees and is available, without charge and upon request, by calling 1-800-847-0200.
Certified Annual Report 27
| OTHER INFORMATION | ||
| Thornburg New York Intermediate Municipal Fund | September 30, 2011 (Unaudited) | |
PORTFOLIO PROXY VOTING
Policies and Procedures:
The Trust has delegated to Thornburg Investment Management, Inc. (the “Advisor”) voting decisions respecting proxies for the Fund’s voting securities. The Advisor makes voting decisions in accordance with its Proxy Voting Policy. A description of the Policy is available (i) without charge, upon request, by calling the Advisor toll-free at 1-800-847-0200, (ii) on the Thornburg website at www.thornburg. com, and (iii) on the Securities and Exchange Commission’s website at www.sec.gov.
Information regarding how proxies were voted is available on or before August 31 of each year for the twelve months ending the preceding June 30. This information is available (i) without charge, upon request by calling the Advisor toll-free at 1-800-847-0200, (ii) on the Thornburg website at www.thornburg.com, and (iii) on the Securities and Exchange Commission’s website at www.sec.gov.
TAX INFORMATION
For the tax year ended September 30, 2011 dividends paid by the Fund of $1,519,692 (or the maximum allowed) are tax exempt dividends for federal income tax purposes.
The information and distributions reported herein may differ from the information and distributions reported to the shareholders for the calendar year ending December 31, 2011. Complete information will be reported in conjunction with your 2011 Form 1099.
AVAILABILITY OF QUARTERLY PORTFOLIO SCHEDULE
The Fund files with the Securities and Exchange Commission schedules of its portfolio holdings on Form N-Q for the first and third quarters of each fiscal year. The Fund’s Forms N-Q are available on the Commission’s website at www.sec.gov, or may be reviewed and copied at the Commission’s Public Reference Room in Washington, D.C. Information on the operation of the Public Reference Room may be obtained by calling 1-800-SEC-0330. The Fund also makes this information available on its website at www.thornburg.com/ download or upon request by calling 1-800-847-0200.
STATEMENT RESPECTING RENEWAL OF INVESTMENT ADVISORY AGREEMENT
Thornburg Investment Management, Inc. (the “Advisor”) provides investment management services to Thornburg New York Intermediate Municipal Fund pursuant to an investment advisory agreement. The Trustees consider the renewal of this agreement annually, and most recently determined to renew the agreement on September 13, 2011.
In anticipation of their recent consideration of the advisory agreement’s renewal, the independent Trustees met in May 2011 to plan the Trustees’ evaluation of the Advisor’s performance and to specify the information the Advisor would present to the Trustees for their review. The Advisor’s chief investment officer subsequently reviewed portions of the information with the Trustees and addressed questions presented by the Trustees at a meeting session scheduled for that purpose, and the independent Trustees thereafter met in independent session to consider the Advisor’s presentation and various specific issues respecting their consideration of the advisory agreement’s renewal. Following these sessions, the Trustees met to consider a renewal of the agreement, and the independent Trustees voted unanimously at that meeting to renew the agreement for an additional term of one year.
The information below summarizes certain factors considered by the Trustees in connection with the determination to renew the advisory agreement. In determining to renew the agreement, the Trustees did not identify any single factor as controlling, and this summary does not describe all of the matters considered by the Trustees in making their determination.
Quality of Services; Fund Investment Performance. The Trustees evaluated the nature, extent and quality of services provided by the Advisor under the advisory agreement, and evaluated the investment performance of the Fund.
In connection with their general supervision of the Advisor, and as an important element of their annual consideration of a renewal of the advisory agreement, the Trustees received and considered reports from the Advisor throughout the year. These reports addressed a wide variety of topics, including particularly the Advisor’s selection of investments and execution of the Fund’s investment strategies. In addition, The Trustees considered information provided to them at their request in anticipation of their annual evaluation of the Advisor’s services, including (i) the Fund’s absolute investment performance and achievement of stated objectives, (ii) the Advisor’s commentary on the Fund’s performance in the context of the Fund’s objectives and reasonable expectations, and business, market
28 Certified Annual Report
| OTHER INFORMATION, CONTINUED | ||
| Thornburg New York Intermediate Municipal Fund | September 30, 2011 (Unaudited) | |
and economic conditions, (iii) measures of the Fund’s investment performance over various periods of time relative to two categories of New York municipal debt mutual funds selected by independent mutual fund analyst firms, and relative to a broad-based securities index, and (iv) comparative measures of portfolio volatility, risk and return.
The Trustees also considered their perceptions of portfolio management personnel developed in formal and informal meetings throughout the year, the Advisor’s staffing and other resources, the Advisor’s performance of accounting and other services, the Advisor’s observance of compliance and regulatory requirements, the Advisor’s responsiveness to the Trustees, and other factors.
In evaluating quantitative and performance data presented, the Trustees noted (among other aspects of the data) performance data for the eleven most recent calendar years, which showed that the Fund had produced positive investment returns in accordance with expectations in the years considered, that the Fund’s return for the most recent calendar year had been comparable to the average return of the mutual fund category for which calendar year data was presented, and that the Fund’s returns had exceeded or had been comparable to the average returns of the category in a majority of the preceding ten calendar years. Other noted quantitative data showed that the Fund’s investment return fell within the top decile of performance for the fund category for the one-year period ended with the second quarter of the current year and within the top third of the same category for the three-year and five-year periods, and that the Fund’s investment returns similarly fell within the top decile of performance for the second fund category for the one-year period and within or near the top third of the same category for the three-year and five-year periods. Measures of portfolio volatility, risk and relative return considered by the Trustees demonstrated that the Fund’s performance relative to those measures continued to fulfill expectations in current conditions.
The Trustees concluded, based upon these and other considerations, that the nature, extent and quality of services were sufficient and that the Advisor had satisfactorily pursued the Fund’s stated investment objectives. The Trustees further concluded that the investment performance of the Fund was satisfactory in the context of the Fund’s objectives and policies, and prevailing market conditions.
Fees and Expenses; Profitability of Advisor; Economies of Scale; Ancillary Benefits to Advisor. The Trustees evaluated the level of the management fee charged by the Advisor to the Fund, and in this connection, reviewed the profitability of the Advisor, economies of scale potentially available to the Fund and whether the Advisor received any ancillary benefits from its relationship with the Fund.
In evaluating the level of the management fee, the Trustees considered the fees charged by the Advisor and the other expenses charged to the Fund in light of the nature and quality of services provided, comparison of the actual Advisor’s fee and Fund expenses to the statement of fees and expenses in the Fund’s prospectus, and comparisons of the Advisor’s fee and other Fund expenses to median and average fees and expenses charged to two groups of municipal debt mutual funds assembled by independent mutual fund analyst firms. Comparative fee and expense data noted by the Trustees showed that the management fee charged to the Fund was comparable to the median and average management fee levels for one group of mutual funds and slightly higher than the median and average fee levels for the second group, and that the overall expense ratio of the Fund was somewhat higher than the median expense ratio and comparable to the average ratio for the first mutual fund group and slightly higher than the median expense ratio and comparable to the average ratio for the second group. The Trustees did not identify the differences as significant. The Trustees considered information about the fees charged by the Advisor to other investment management clients, together with information about fees charged by other advisors to different clients, and analysis of the differences between the requirements of institutional clients and mutual funds and the consequently different investment management services rendered, respectively, to institutional clients and mutual funds. The Trustees confirmed their previous observations that the differences between the fees charged by the Advisor to different types of clients did not appear exceptional, and that the fee rates charged by investment advisors to institutional clients had limited relevance to the evaluation of fee rates charged to mutual funds, because of the significant differences between the respective requirements of institutional clients and mutual funds, the differences between the respective services rendered to institutional clients and mutual funds, and the different circumstances in which the respective fees originate.
In reviewing the profitability of the Advisor, the Trustees considered costs incurred by the Advisor and data comparing the profitability of the Advisor to other investment management firms. The information provided did not indicate that the Advisor’s profitability was unusual, and the Trustees noted the adequacy of the Advisor’s resources and service capabilities. In reviewing the extent to which economies of scale would be realized by the Fund as it grows and whether fee levels reflect economies of scale, the Trustees considered the breakpoint structure for advisory fees chargeable to the Fund, the demonstrated economies of scale enjoyed by other Funds of the Trust as they had grown in size, and economies of scale realized by other mutual funds. The information provided demonstrated to the Trustees that the Fund may reasonably be expected to realize economies of scale as the Fund grows in size, due to the advisory agreement’s breakpoint fee structure and other factors. In reviewing potential benefits to the Advisor because of its relationship to the
Certified Annual Report 29
| OTHER INFORMATION, CONTINUED | ||
| Thornburg New York Intermediate Municipal Fund | September 30, 2011 (Unaudited) | |
Fund, the Trustees considered the Advisor’s receipt of certain research services from broker dealers, and the benefits to both the Fund and the Advisor of the Advisor’s expansion of its staffing, compliance and systems capabilities and other resources to serve a broader variety of investment management clients. No unusual or unfair benefits to the Advisor from its relationship to the Fund were identified by the Trustees.
The Trustees concluded, based upon their consideration of these and other factors, that the management fee charged to the Fund by the Advisor was fair and reasonable in view of the nature, extent and quality of the services provided by the Advisor, the clear disclosure of fees and expenses in the Fund’s prospectus, the investment performance of the Fund, and comparisons of fees and expenses charged to the Fund to fees and expenses charged to other mutual funds.
30 Certified Annual Report
This page intentionally left blank.
This page is not part of the Annual Report. 31
Trustees’ Statement to Shareholders
Not part of the Certified Annual Report
September 13, 2011
The Trustees believe current and prospective shareholders should know how we discharge our responsibilities in supervising the Funds’ investment advisor and in reviewing the advisor’s contract for renewal. Since 2005, we have issued a statement which sets out clearly the three principal guidelines that we follow in supervising the Trust’s investment advisor on your behalf. In accordance with our customary practice, in September of this year we again reviewed our statement and concluded we should reissue this statement outlining the principal features of our supervision of the advisor’s performance of investment management services for the Funds.
We begin with the premise that each shareholder selected his or her Fund because its investments are managed by the investment advisor identified in the prospectus and in accordance with the objective and policies described in the prospectus. We realize, as each of you do, that if you believe that your Fund’s stated objective and policies no longer serve your personal investment goals, you can sell your shares and leave the Fund.
Therefore, we believe that our primary supervisory task – our principal obligation to you – is to assess the nature and quality of the advisor’s services, and to confirm that the advisor actively and competently pursues the Fund’s objective, in accordance with the policies set out in the prospectus. To do this, we meet regularly with management to review your Fund’s portfolio and to discuss the advisor’s specific actions and judgments in pursuing the Fund’s objective. We do not substitute our own judgment for the advisor’s decisions in selecting investments; the advisor is paid to exercise its informed judgment on investment decisions, and we seek to confirm, in reviewing the advisor’s performance, that the advisor is doing just that.
Second, while we are conscious of costs and the effect that costs have on shareholders’ returns, we do not seek the lowest fees or expense ratio as our sole or primary objective. We try to make sure that your Fund’s fees and costs are reasonable in relationship to the services rendered and that they are generally in line with those charged by other expert investment advisors, consistent with our belief that the Fund’s investors searched for and expect that expertise and attention and have decided to pay a reasonable price for it. We do not put the management contract “out to bid” as a matter of course, and we would not do so unless we had concluded that the advisor materially had failed to pursue the Fund’s objectives in accordance with its policies, or for other equally important reasons. We believe that any other approach would be inconsistent with your interests and contrary to your expectations when you bought shares of the Fund in the first place.
Finally, because we believe that most Thornburg Fund shareholders have invested with a long-term perspective, we try not to focus too much on the fashions of the moment and on short-term performance. The market will not favor any specific investment objective or set of policies at all times and under all economic circumstances. A fund will experience periods of both high and low returns relative to other funds and other investments. Even if one of our Funds is not favored by the market at a particular time, we believe that the advisor is nonetheless obliged to remain true to the Fund’s objective and policies, and we watch to see that it does so.
32 This page is not part of the Annual Report.
Retirement and Education Accounts
Thornburg Investment Management offers retirement and education savings accounts that can help you meet a variety of planning challenges. For account applications or further information on any of the accounts below, please call 1-800-847-0200 or go to www.thornburg.com/ira. Your financial advisor can help you determine which plan is right for you.
Individual Retirement Accounts
Individual Retirement Accounts (IRAs) provide a tax-advantaged means to save money for the future. For a detailed outline of the difference between retirement accounts, see www.thornburg.com/ira. Rollovers are available. Call 1-800-847-0200 for more information.
Traditional IRAs – Contributions to Traditional IRAs are tax deductible for eligible individuals, and withdrawals are taxed as additional ordinary income. You may contribute to an IRA if you receive compensation and are under 70 1/2, even if you are covered by an employer retirement plan. Deductible contributions are subject to certain qualifications. Please consult your tax advisor.
Roth IRAs – Under a Roth IRA, there is no tax deduction for contributions, but there is no income tax on qualified withdrawals. For a more detailed comparison of Traditional and Roth IRAs, please see our web site at www.thornburg.com/ira.
SEP IRAs – Simplified Employee Pension (SEP) IRAs are established by employers. The employer is allowed a tax deduction for contributions made to the SEP Plan and makes contributions to each eligible employee’s SEP IRA on a discretionary basis.
SIMPLE IRAs – Savings Incentive Match Plan for Employees of Small Employers (SIMPLE) is designed to give small business owners a simplified method to establish and contribute to a retirement plan for employees. The employer is allowed a tax deduction for contributions and makes either matching or non-elective contributions to each eligible employee’s SIMPLE IRA. Employees may make salary deferral contributions.
Coverdell Education Savings Account
These savings accounts are designed to provide a way to save money for higher education expenses. In an Education Savings Account, earnings and interest grow tax-free, and qualified withdrawals used to pay for eligible higher-education expenses are tax- and penalty-free.
Funds Available
The following funds are available in the accounts listed above:
| • | Thornburg International Value Fund |
| • | Thornburg Value Fund |
| • | Thornburg Core Growth Fund |
| • | Thornburg Investment Income Builder Fund |
| • | Thornburg Global Opportunities Fund |
| • | Thornburg International Growth Fund |
| • | Thornburg Developing World Fund |
| • | Thornburg Limited Term U.S. Government Fund |
| • | Thornburg Limited Term Income Fund |
| • | Thornburg Strategic Income Fund |
This page is not part of the Annual Report. 33

Thornburg Equity Funds
Thornburg’s equity research uses a fundamental and comprehensive analytical approach. Thornburg equity funds focus on a limited number of securities so that each holding can impact performance. The equity team searches for firms believed to have a promising future and seeks to buy shares of those companies at a discount to their intrinsic value.
| • | Thornburg Value Fund |
| • | Thornburg International Value Fund |
| • | Thornburg Core Growth Fund |
| • | Thornburg Investment Income Builder Fund |
| • | Thornburg Global Opportunities Fund |
| • | Thornburg International Growth Fund |
| • | Thornburg Developing World Fund |
Thornburg Bond Funds
Thornburg Investment Management applies a disciplined philosophy to fixed-income management. Since the launch of our first fixed-income fund over 25 years ago, we have been conducting fundamental, bottom-up research in an effort to identify bonds which we believe provide the best return for a given level of risk. We are very organic in our approach, avoiding leverage or complex strategies which could backfire in periods of market uncertainty.
| • | Thornburg Limited Term Municipal Fund |
| • | Thornburg Intermediate Municipal Fund |
| • | Thornburg California Limited Term Municipal Fund |
| • | Thornburg New Mexico Intermediate Municipal Fund |
| • | Thornburg New York Intermediate Municipal Fund |
| • | Thornburg Strategic Municipal Income Fund |
| • | Thornburg Limited Term U.S. Government Fund |
| • | Thornburg Limited Term Income Fund |
| • | Thornburg Strategic Income Fund |
Before investing, carefully consider the Fund’s investment goals, risks, charges, and expenses. For a prospectus containing this and other information, contact your financial advisor or visit thornburg.com. Read it carefully before investing.
For additional information, please visit www.thornburg.com
Thornburg Investment Management, Inc. 2300 North Ridgetop Road, Santa Fe, NM 87506
This page is not part of the Annual Report. 35
 | Waste not, Wait not |  | ||||
| Get instant access to your shareholder reports. | ||||||
| This Annual Report is submitted for the general information of shareholders of the Fund. It is not authorized for distribution to prospective investors in the Fund unless preceded or accompanied by an effective prospectus. | By switching from your postal mailbox to your email inbox, you reduce paper clutter, improve record keeping access, and help conserve our natural resources. | |||||
 | Investment Advisor: Thornburg Investment Management® 800.847.0200 | Go to www.thornburg.com/edelivery and sign up to receive your shareholder reports, prospectuses, and proxy statements electronically. | ||||
Distributor: | ||||||
Thornburg Securities Corporation® 800.847.0200 | You invest in the future, without spending a dime. | |||||
| TH860 | ||||||

Important Information
The information presented on the following pages was current as of September 30, 2011. The managers’ views, portfolio holdings, and sector diversification are provided for the general information of the Funds’ shareholders; to the extent this information is historical, it should not be considered predictive of future circumstances. This material should not be deemed a recommendation to buy or sell any of the securities mentioned.
Investments in the Funds carry risks, including possible loss of principal. Bond funds have the same interest rate, inflation, and credit risks that are associated with the underlying bonds. The principal value of a bond will fluctuate relative to changes in interest rates, decreasing when interest rates rise. Unlike bonds, bond funds have ongoing fees and expenses. Funds invested in mortgage backed securities may bear additional risk. Please see each Fund’s Prospectus for a discussion of the risks associated with an investment in either Fund. Investments in the Funds are not FDIC insured, nor are they deposits of or guaranteed by a bank or any other entity. There is no guarantee that the Funds will meet their investment objectives. The laddering strategy does not assure or guarantee better performance and cannot eliminate the risk of investment losses.
Performance data given at net asset value (NAV) does not take into account applicable sales charges. If the sales charges had been included, the performance would have been lower. Minimum investments for Class I shares are higher than those for other classes. Class I and R3 shares may not be available to all investors.
Limited Term U.S. Government Fund | NASDAQ SYMBOLS | CUSIPS | ||
Class A | LTUSX | 885-215-103 | ||
Class B | LTUBX | 885-215-848 | ||
Class C | LTUCX | 885-215-830 | ||
Class I | LTUIX | 885-215-699 | ||
Class R3 | LTURX | 885-215-491 | ||
Limited Term Income Fund | ||||
Class A | THIFX | 885-215-509 | ||
Class C | THICX | 885-215-764 | ||
Class I | THIIX | 885-215-681 | ||
Class R3 | THIRX | 885-215-483 | ||
Lipper Fund Award 2011
Thornburg Limited Term Income Fund, Class I Shares, was granted a Lipper Fund Award for the ten-year period ended 12/31/10, among 82 Short-Intermediate Investment Grade Debt Funds. Lipper Fund Awards are granted annually to the fund in each Lipper classification that consistently delivered the strongest risk-adjusted performance (calculated with dividends reinvested). Awards are given for three-year, five-year, and ten-year periods. The fund did not win the awards for other time periods. Past Performance does not guarantee future results.
Glossary
Barclays Capital Intermediate Government/Credit Bond Index – An unmanaged, market-weighted index generally representative of intermediate government and investment-grade corporate debt securities having maturities from one up to ten years.
Barclays Capital Intermediate Government Bond Index – An unmanaged, market-weighted index generally representative of all public obligations of the U.S. Government, its agencies and instrumentalities having maturities from one up to ten years.
Barclays Capital U.S. Corporate Index – The U.S. Corporate Index covers USD-denominated, investment-grade, fixed-rate, taxable securities sold by industrial, utility and financial issuers. It includes publicly issued U.S. corporate and foreign debentures and secured notes that meet specified maturity, liquidity, and quality requirements.
Unless otherwise noted, index returns reflect the reinvestment of income dividends and capital gains, if any, but do not reflect fees, brokerage commissions or other expenses of investing. Investors may not make direct investments into any index.
Annualized Distribution Yield – The distribution yield is calculated by taking the sum of the month’s total distribution factors and dividing this sum by a 30-day period and annualizing to a 360-day year. The value is then divided by the ending maximum offering price per share to arrive at the annualized distribution yield. The yield is calculated on a periodic basis and is subject to change.
Bond Credit Ratings – A bond credit rating assesses the financial ability of a debt issuer to make timely payments of principal and interest. Ratings of AAA (the highest), AA, A, and BBB are investment-grade quality. Ratings of BB, B, CCC, CC, C, and D (the lowest) are considered below investment grade, speculative grade, or junk bonds. Unless otherwise noted, the ratings listed are from Bloomberg Market Data and are a combination of ratings from Standard and Poor’s, Moody’s Investors Service, and/or Fitch Ratings.
Duration – A bond’s sensitivity to interest rates. Bonds with longer durations experience greater price volatility than bonds with shorter durations.
Government Sponsored Enterprises (GSE) – Privately held corporations with public purposes created by the U.S. Congress to reduce the cost of capital for certain borrowing sectors of the economy. Members of these sectors include students, farmers, and homeowners.
Lipper Short-Intermediate Investment Grade Category – Funds that invest at least 65% of their assets in investment grade debt issues (rated in top four grades) with dollar-weighted average maturities of one to five years.
Lipper Short-Intermediate U.S. Government Bond Category – Funds that invest at least 65% of assets in securities issued or guaranteed by the U.S. government, its agencies, or its instrumentalities, with dollar weighted average maturities of one to five years.
Operation Twist – A monetary policy where, in an attempt to lower long-term interest rates, the Fed sold short-term Treasury bonds and bought long-term Treasury bonds, which pressured the long-term bond yields downward.
This page is not part of the Annual Report. 3
Important Information,
Continued
Quantitative Easing – The Federal Reserve’s monetary policy used to stimulate the U.S. economy following the recession that began in 2007/08.
SEC Yield – SEC Yield is computed in accordance with SEC standards measuring the net investment income per share over a specified 30-day period expressed as a percentage of the maximum offering price of the Fund’s shares at the end of the period.
U.S. Treasury Securities – U.S. Treasury securities, such as bills, notes and bonds, are negotiable debt obligations of the U.S. government. These debt obligations are backed by the “full faith and credit” of the government and issued at various schedules and maturities. Income from Treasury securities is exempt from state and local, but not federal income taxes.
4 This page is not part of the Annual Report.
This page intentionally left blank.
This page is not part of the Annual Report. 5
Thornburg Limited Term U.S. Government Fund
At Thornburg, our approach to management of the Fund is based on the premise that investors in the Fund seek preservation of capital along with an attractive, relatively stable yield. While aggressive bond strategies may generate stronger returns when the market is turning a blind eye towards risk, they often fail to stack up over longer periods of time.
We apply time-tested techniques to manage risk and provide attractive returns. These include:
| • | Building a laddered portfolio. Laddering has been shown over time to mitigate reinvestment and interest-rate risk. |
| • | Investing on a cash-only basis without using leverage. While leveraged strategies may enhance returns when market conditions are favorable, they can quickly compound losses when sentiment shifts. |
| • | Conducting careful research to invest where we see the best relative value among government and agency sectors. |
IMPORTANT
PERFORMANCE INFORMATION
Performance data shown represents past performance and is no guarantee of future results. Investment return and principal value will fluctuate so shares, when redeemed, may be worth more or less than their original cost. Current performance may be lower or higher than quoted. For performance current to the most recent month end, visit thornburg.com or call 800-847-0200.
The maximum sales charge for the Limited Term U.S. Government Fund’s Class A shares is 1.50% . The total annual fund operating expense of Class A shares is 0.92% , as disclosed in the most recent Prospectus.
LONG-TERM STABILITY OF PRINCIPAL
Net asset value history of A shares from November 16, 1987 through September 30, 2011
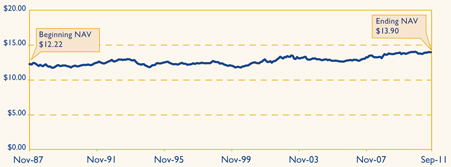
AVERAGE ANNUAL TOTAL RETURNS
For periods ended September 30, 2011
| 1 Yr | 3 Yrs | 5 Yrs | 10 Yrs | Since Inception | ||||||||||||||||
A Shares (Incep: 11/16/87) | ||||||||||||||||||||
Without sales charge | 2.66 | % | 4.84 | % | 5.06 | % | 4.17 | % | 5.84 | % | ||||||||||
With sales charge | 1.14 | % | 4.32 | % | 4.75 | % | 4.01 | % | 5.77 | % | ||||||||||
PORTFOLIO LADDER
As of September 30, 2011

30-DAY YIELDS
As of September 30, 2011
| Annualized Distribution Yield | SEC Yield | |||||||
A Shares | 2.22 | % | 1.28 | % | ||||
KEY PORTFOLIO ATTRIBUTES
As of September 30, 2011
Number of Bonds | 164 | |||
Effective Duration | 2.7 Yrs | |||
Average Maturity | 3.3 Yrs | |||
See the entire portfolio in the Schedule of Investments beginning on page 12.
6 This page is not part of the Annual Report.
Thornburg Limited Term Income Fund
The Thornburg Limited Term Income Fund takes the laddering strategy to the broader fixed-income market. Expanding beyond government and agency securities brings additional risks – as well as potentially higher returns. Our team addresses these uncertainties by employing a comprehensive approach to risk management. While utilizing the ladder to balance interest-rate and reinvestment risk, the team also:
| • | Invests on a cash-only basis. While leveraged strategies may enhance returns when market conditions are favorable, they can quickly compound losses when sentiment shifts. |
| • | Conducts in-depth fundamental research on each credit issue under consideration. The goal of this research is identification of bonds which provide a reasonable return for their given level of risk. |
| • | Maintains a portfolio of high-quality bonds and diversifies among a large number of bonds to minimize the potential impact of default by any single issuer. |
Class I Shares
Ten-Year Period, as of 12/31/10 Among 82 Short-Intermediate Investment Grade Debt Funds, based on risk-adjusted returns.
IMPORTANT
PERFORMANCE INFORMATION
Performance data shown represents past performance and is no guarantee of future results. Investment return and principal value will fluctuate so shares, when redeemed, may be worth more or less than their original cost. Current performance may be lower or higher than quoted. For performance current to the most recent month end, visit thornburg.com or call 800-847-0200.
The maximum sales charge for the Limited Term Income Fund’s Class A shares is 1.50% . The total annual operating expenses of Class A shares are 1.01% as disclosed in the most recent Prospectus. Thornburg Investment Management and Thornburg Securities Corporation have contractually agreed to waive fees and reimburse expenses through at least February 1, 2012, so that actual expenses, for Class A shares, do not exceed 0.99% .
LONG-TERM STABILITY OF PRINCIPAL
Net asset value history of A shares from October 1, 1992 through September 30, 2011
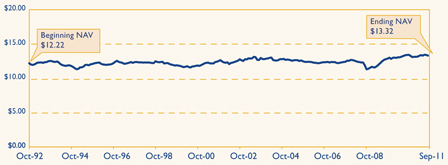
AVERAGE ANNUAL TOTAL RETURNS
For periods ended September 30, 2011
| 1 Yr | 3 Yrs | 5 Yrs | 10 Yrs | Since Inception | ||||||||||||||||
A Shares (Incep: 10/1/92) | ||||||||||||||||||||
Without sales charge | 3.19 | % | 8.31 | % | 5.91 | % | 4.84 | % | 5.65 | % | ||||||||||
With sales charge | 1.67 | % | 7.77 | % | 5.59 | % | 4.68 | % | 5.57 | % | ||||||||||
PORTFOLIO LADDER
As of September 30, 2011
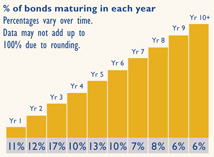
30-DAY YIELDS
As of September 30, 2011
| Annualized Distribution Yield | SEC Yield | |||||||
A Shares | 3.38 | % | 2.56 | % | ||||
KEY PORTFOLIO ATTRIBUTES
As of September 30, 2011
Number of Bonds | 402 | |||
Effective Duration | 3.4Yrs | |||
Average Maturity | 4.3Yrs | |||
See the entire portfolio in the Schedule of Investments beginning on page 16.
This page is not part of the Annual Report. 7

Thornburg Limited Term Income Funds
September 30, 2011
Table of Contents | ||||
| 9 | ||||
| 12 | ||||
| 16 | ||||
| 28 | ||||
| 30 | ||||
| 32 | ||||
| 33 | ||||
| 34 | ||||
| 42 | ||||
| 44 | ||||
| 46 | ||||
| 47 | ||||
| 48 | ||||
| 49 | ||||
| 50 | ||||
| 53 |
This report is certified under the Sarbanes-Oxley Act of 2002, which requires that public companies, including mutual funds, affirm that the information provided in their annual and semiannual shareholder reports fully and fairly represents their financial position.
8 Certified Annual Report
Jason Brady,CFA Portfolio Manager, Thornburg Limited Term U.S. Government Fund
Co-Portfolio Manager Thornburg Limited Term Income Fund
Lon Erickson,CFA Co-Portfolio Manager Thornburg Limited Term Income Fund | October 17, 2011
Dear Fellow Shareholders:
We are very pleased to present the Annual Report for the Thornburg Limited Term U.S. Government Fund and the Thornburg Limited Term Income Fund for the twelve months ended September 30, 2011. The net asset value of a Class A share of the Thornburg Limited Term U.S. Government Fund decreased 4 cents in the period to $13.90. If you were invested for the entire period, you received dividends of 40.3 cents per share. If you reinvested your dividends, you received 40.9 cents per share. The net asset value of a Class A share of the Thornburg Limited Term Income Fund decreased 9 cents in the period to $13.32. This decrease includes capital gain distributions of 4 cents per share, paid to the shareholders in November 2010. If you were invested for the entire period, you received additional dividends of 46.7 cents per share. If you reinvested your dividends, you received 47.4 cents per share. Dividends per share were lower for Class B, C, and R3 shares and higher for Class I shares to account for varying class-specific expenses. Please examine the balance of this Annual Report for more detailed information.
The yields on U.S. Treasuries were volatile over the course of the past year, with a change in the shape of the yield curve as well as general price appreciation in U.S. Treasuries driving returns in that sector. This appreciation and the income received from the Funds’ investments, were the sources of fair investor returns across both Funds. The two-year U.S. Treasury moved from a 0.43% yield to a 0.25% yield over the course of the past year, while the ten-year U.S. Treasury moved from a 2.51% yield to a 1.92% yield. In both cases, these moves occurred with significant volatility. For example, the high yield on ten-year Treasuries was 3.74% on February 8, 2011 and the low yield was 1.72% on September 22, 2011. Nevertheless, shorter-term securities decreased less in yield than longer-term securities over the course of the year. This “flattening” of the yield curve was primarily the result of a sluggish U.S. economy and the Federal Reserve’s (the Fed) purchase of further securities for its balance sheet in a second round of “quantitative easing.” In addition, the Fed’s initiation of “Operation Twist,” wherein they sold front-end securities to buy longer-term securities further exacerbated this move.
The aforementioned policy actions were largely due to a continued stagnation in the global economy. Unlike last year, this stagnation resulted in market concerns spreading to credit spreads, which widened notably, especially in August and September. The Barclays Capital U.S. Corporate Index, as an example, returned 4.40% over the course of one year ending on September 30, 2011, whereas U.S. Treasuries of the same duration returned 6.91%. The additional spread that investors were paid in yield to invest in the average corporate bond moved from 1.75% on September 30, 2010 to 2.38% on September 30, 2011. |


Certified Annual Report 9
| Letter to Shareholders, | ||
Continued | ||
While the total return of both funds have outperformed their yield over the past three years, the math of fixed income securities is inexorable: this cannot continue. (Of course, we wrote the same thing last year.) It is still important for you as a shareholder to understand that while yield is a terrible measure of year-to-year returns (just look at the last three years as an example), over the life of each individual security, the best case scenario for return is the initially promised income. Furthermore, that yield is not just the income you will likely receive over time, but is also the cushion these securities provide on a year-to-year basis against negative events. In early 2009, we could discuss the difficult economic environment, but at the same time note that many classes of fixed income securities were providing a tremendous amount of income that was likely to significantly cushion the blow of future negative surprises. Now that cushion has eroded (and accrued to you, as the investor, in the form of income as well as price appreciation). Still, recent credit spread movements have significantly brightened the prospects for investments in the corporate bond arena compared with U.S. Treasuries.
Putting income and change in price together, the Class A shares of the Thornburg Limited Term U.S. Government Fund produced a total return of 2.66% over the twelve-month period, assuming a beginning-of-period investment at the net asset value. The Barclays Capital Intermediate Government Bond Index produced a 3.72% total return over the same time period. The average return for the Lipper Short-Intermediate U.S. Government Bond category was 2.08%. The Class A shares of the Thornburg Limited Term Income Fund produced a total return of 3.19% over the twelve-month period, assuming a beginning-of-period investment at the net asset value. The Barclays Intermediate Government/Credit Bond Index produced a 3.40% total return over the same time period. The average return for the Lipper Short-Intermediate Investment Grade category was 2.20%. Both Barclays indices reflect no deduction for fees, expenses, or taxes.
The Funds kept their durations somewhat shorter than the indices during much of the past year and as a result underperformed due to the yield curve flattening and the fact that longer-duration securities outperformed. At the same time, Thornburg’s corporate bond overweight (within the Income Fund) put that Fund at an additional disadvantage given spread widening over the last couple months of the fiscal year. We nevertheless increased this overweight recently as prices fell. In a time of widening credit spreads, U.S. Treasuries outperform any other fixed income security; the inverse is also true. Similarly, while the Thornburg Limited Term U.S. Government Fund continues to hold only instruments guaranteed by the U.S. Government or Government Sponsored Enterprises, the Fund’s holdings in non-Treasury securities including Agency Debentures and Mortgages (which we continue to hold as a notable overweight) underperformed duration matched U.S. Treasuries. We remain quite comfortable with our holdings and believe that over time each investment will yield satisfactory results and in aggregate position the Funds well for solid returns.
Looking forward, we believe that the scope for further price appreciation in fixed income remains limited, though the potential for credit spread tightening could mitigate future increases in U.S. Treasury yields. Though the economic environment appears to have stabilized, we continue to have some significant misgivings. Unemployment continues to be high and is stubbornly refusing to go down. Though the financial system continues to survive due to significant government intervention, the distance between mere survival and significant
10 Certified Annual Report
growth remains large. We are working hard to position the Funds in a prudent way such that you can remain comfortable holding them as a part of your overall asset allocation.
In this as in any environment, high-quality bond funds should represent a safer haven. Thornburg Investment Management will continue to strive to give you, the bond investor, a consistent income stream and a set of funds which are not highly correlated to equity markets’ returns. We believe that the store of value in your bond portfolio should benefit you through economic cycles and we strive to invest with that in mind. That said, we continue to look for market opportunities with the goal of trying to give you, the investor, a compelling risk/ reward tradeoff. Indeed, we believe the added income from a good opportunity will help cushion the volatility which is likely to be a part of the investment landscape going forward.
No matter the direction of interest rates or credit spreads in the near-term, we believe your Funds are well positioned to achieve their longer-term goals of principal stability. The Thornburg Limited Term U.S. Government Fund and the Thornburg Limited Term Income Fund are laddered portfolios of short-to-intermediate bonds. This strategy balances duration and yield in a way which is designed to provide the best risk-adjusted bond returns over time. We feel that the Thornburg Limited Term U.S. Government Fund and the Thornburg Limited Term Income Fund continue to be appropriate vehicles for those looking for core bond investments.
Thank you very much for investing in our Funds.
Sincerely,
 |  | |
| Jason H. Brady,CFA | Lon R. Erickson,CFA | |
| Co-Portfolio Manager | Co-Portfolio Manager | |
| Managing Director | Managing Director |
The matters discussed in this report may constitute forward-looking statements made pursuant to the safe harbor provisions of the Securities Litigation Reform Act of 1995. These include any advisor or portfolio manager prediction, assessment, analysis or outlook for individual securities, industries, investment styles, market sectors and/or markets. These statements involve risks and uncertainties. In addition to the general risks described for each fund in its current prospectus, other factors bearing on these reports include the accuracy of the advisor’s or portfolio manager’s forecasts and predictions, the appropriateness of the investment strategies designed by the advisor or portfolio manager and the ability of the advisor or portfolio manager to implement their strategies efficiently and successfully. Any one or more of these factors, as well as other risks affecting the securities markets generally, could cause the actual results of any fund to differ materially as compared to its benchmarks.
Certified Annual Report 11
| SCHEDULE OF INVESTMENTS | ||
| Thornburg Limited Term U.S. Government Fund | September 30, 2011 | |
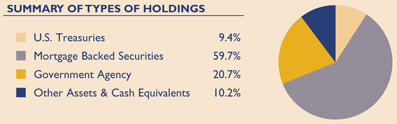
Issuer-Description | Principal Amount | Value | ||||||
U.S. TREASURY SECURITIES — 9.39% | ||||||||
United States Treasury Notes, 4.625%, 10/31/2011 | $ | 2,000,000 | $ | 2,007,031 | ||||
United States Treasury Notes, 4.875%, 6/30/2012 | 4,000,000 | 4,139,531 | ||||||
United States Treasury Notes, 2.625%, 2/29/2016 | 2,000,000 | 2,157,422 | ||||||
United States Treasury Notes, 4.875%, 8/15/2016 | 5,000,000 | 5,945,508 | ||||||
United States Treasury Notes, 4.625%, 2/15/2017 | 4,000,000 | 4,746,719 | ||||||
United States Treasury Notes, 2.25%, 11/30/2017 | 3,500,000 | 3,708,633 | ||||||
United States Treasury Notes, 3.625%, 2/15/2020 | 1,000,000 | 1,154,531 | ||||||
United States Treasury Notes Inflationary Index, 2.00%, 7/15/2014 | 2,397,020 | 2,581,478 | ||||||
United States Treasury Notes Inflationary Index, 1.875%, 7/15/2015 | 4,645,840 | 5,106,976 | ||||||
United States Treasury Notes Inflationary Index, 2.00%, 1/15/2016 | 5,691,200 | 6,331,460 | ||||||
|
| |||||||
TOTAL U.S. TREASURY SECURITIES (Cost $34,412,999) | 37,879,289 | |||||||
|
| |||||||
U.S. GOVERNMENT AGENCIES — 20.68% | ||||||||
EJM Airport LLC GSA Lease Revenue Bond, 6.271%, 5/15/2020 | 2,404,816 | 2,741,875 | ||||||
Federal Agricultural Mtg Corp., 6.71%, 7/28/2014 | 200,000 | 231,454 | ||||||
Federal Farm Credit Bank, 6.06%, 5/28/2013 | 240,000 | 262,247 | ||||||
Federal Farm Credit Bank, 3.98%, 1/22/2015 | 1,000,000 | 1,105,162 | ||||||
Federal Home Loan Bank, 5.375%, 6/13/2014 | 2,000,000 | 2,256,030 | ||||||
Federal Home Loan Bank, 5.00%, 12/8/2017 | 3,000,000 | 3,581,278 | ||||||
Federal Home Loan Bank, 2.25%, 3/26/2018 | 3,000,000 | 3,069,381 | ||||||
Federal Home Loan Bank, 2.00%, 12/13/2019 | 4,250,000 | 4,219,635 | ||||||
Federal Home Loan Mtg Corp., 4.50%, 1/15/2015 | 5,000,000 | 5,612,968 | ||||||
Federal Home Loan Mtg Corp., 4.875%, 6/13/2018 | 3,000,000 | 3,578,221 | ||||||
Federal National Mtg Assoc., 4.40%, 2/19/2015 | 1,585,000 | 1,777,045 | ||||||
Federal National Mtg Assoc., 2.00%, 3/26/2015 | 3,000,000 | 3,044,759 | ||||||
New Valley Generation I, Tennessee Valley Authority, 7.299%, 3/15/2019 | 3,069,642 | 3,849,370 | ||||||
Overseas Private Investment Corp., 4.10%, 11/15/2014 | 878,400 | 880,499 | ||||||
Private Export Funding Corp., 5.685%, 5/15/2012 | 5,000,000 | 5,166,855 | ||||||
Private Export Funding Corp., 4.974%, 8/15/2013 | 2,700,000 | 2,917,420 | ||||||
Private Export Funding Corp., 5.45%, 9/15/2017 | 3,000,000 | 3,646,995 | ||||||
Small Business Administration Participation Certificates, Series 2001-20D Class 1, 6.35%, 4/1/2021 | 4,817,609 | 5,306,969 | ||||||
Small Business Administration Participation Certificates, Series 2001-20F Class 1, 6.44%, 6/1/2021 | 2,964,509 | 3,279,106 | ||||||
Small Business Administration Participation Certificates, Series 2002-20A Class 1, 6.14%, 1/1/2022 | 1,929,533 | 2,139,650 | ||||||
Small Business Administration Participation Certificates, Series 2002-20K Class 1, 5.08%, 11/1/2022 | 1,850,147 | 2,012,650 | ||||||
Small Business Administration Participation Certificates, Series 2005-20H Class 1, 5.11%, 8/1/2025 | 1,022,357 | 1,123,888 | ||||||
Small Business Administration Participation Certificates, Series 2007-20D Class 1, 5.32%, 4/1/2027 | 1,923,965 | 2,129,693 | ||||||
Small Business Administration Participation Certificates, Series 2007-20F Class 1, 5.71%, 6/1/2027 | 1,066,292 | 1,192,133 | ||||||
Small Business Administration Participation Certificates, Series 2007-20I Class 1, 5.56%, 9/1/2027 | 3,512,719 | 3,911,090 | ||||||
Small Business Administration Participation Certificates, Series 2007-20K Class 1, 5.51%, 11/1/2027 | 2,078,316 | 2,308,742 | ||||||
12 Certified Annual Report
| SCHEDULE OF INVESTMENTS, CONTINUED | ||
| Thornburg Limited Term U.S. Government Fund | September 30, 2011 | |
Issuer-Description | Principal Amount | Value | ||||||
Small Business Administration Participation Certificates, Series 2008-20G Class 1, 5.87%, 7/1/2028 | $ | 5,255,163 | $ | 5,934,730 | ||||
Tennessee Valley Authority, 4.75%, 8/1/2013 | 3,000,000 | 3,238,157 | ||||||
a,bU.S. Department of Transportation Headquarters, Series 2004 Class A-2, 5.594%, 12/7/2021 | 2,593,596 | 2,852,955 | ||||||
|
| |||||||
TOTAL U.S. GOVERNMENT AGENCIES (Cost $78,710,032) | 83,370,957 | |||||||
|
| |||||||
MORTGAGE BACKED — 59.70% | ||||||||
Federal Home Loan Mtg Corp., CMO Series 1321 Class TE, 7.00%, 8/15/2022 | 416,857 | 462,302 | ||||||
Federal Home Loan Mtg Corp., CMO Series 2420 Class MC, 6.00%, 2/15/2017 | 566,387 | 614,718 | ||||||
Federal Home Loan Mtg Corp., CMO Series 2509 Class TV, 5.50%, 4/15/2022 | 2,216,038 | 2,292,228 | ||||||
Federal Home Loan Mtg Corp., CMO Series 2527 Class BP, 5.00%, 11/15/2017 | 1,443,977 | 1,545,355 | ||||||
Federal Home Loan Mtg Corp., CMO Series 2529 Class MB, 5.00%, 11/15/2017 | 1,367,173 | 1,467,104 | ||||||
Federal Home Loan Mtg Corp., CMO Series 2553 Class GB, 5.00%, 1/15/2018 | 1,000,000 | 1,073,354 | ||||||
Federal Home Loan Mtg Corp., CMO Series 2558 Class BD, 5.00%, 1/15/2018 | 4,185,535 | 4,550,563 | ||||||
Federal Home Loan Mtg Corp., CMO Series 2622 Class PE, 4.50%, 5/15/2018 | 2,500,000 | 2,660,766 | ||||||
Federal Home Loan Mtg Corp., CMO Series 2628 Class DQ, 3.00%, 11/15/2017 | 267,427 | 272,973 | ||||||
Federal Home Loan Mtg Corp., CMO Series 2640 Class G, 4.50%, 7/15/2018 | 1,085,006 | 1,135,886 | ||||||
Federal Home Loan Mtg Corp., CMO Series 2641 Class WE, 4.50%, 1/15/2033 | 460,082 | 490,498 | ||||||
Federal Home Loan Mtg Corp., CMO Series 2642 Class JE, 5.00%, 9/15/2032 | 2,000,000 | 2,179,737 | ||||||
Federal Home Loan Mtg Corp., CMO Series 2649 Class QH, 4.50%, 7/15/2018 | 1,000,000 | 1,076,683 | ||||||
Federal Home Loan Mtg Corp., CMO Series 2692 Class QD, 5.00%, 12/15/2022 | 2,575,000 | 2,761,946 | ||||||
Federal Home Loan Mtg Corp., CMO Series 2731 Class Vl, 5.50%, 12/15/2014 | 1,590,955 | 1,698,276 | ||||||
Federal Home Loan Mtg Corp., CMO Series 2770 Class UD, 4.50%, 5/15/2017 | 1,520,542 | 1,560,333 | ||||||
Federal Home Loan Mtg Corp., CMO Series 2808 Class VA, 5.50%, 5/15/2015 | 4,737,566 | 5,097,241 | ||||||
Federal Home Loan Mtg Corp., CMO Series 2814 Class GB, 5.00%, 6/15/2019 | 546,355 | 570,150 | ||||||
Federal Home Loan Mtg Corp., CMO Series 2825 Class VP, 5.50%, 6/15/2015 | 3,238,422 | 3,484,177 | ||||||
Federal Home Loan Mtg Corp., CMO Series 2827 Class BU, 3.50%, 7/15/2019 | 2,500,000 | 2,628,505 | ||||||
Federal Home Loan Mtg Corp., CMO Series 3020 Class VA, 5.50%, 11/15/2014 | 795,434 | 830,810 | ||||||
Federal Home Loan Mtg Corp., CMO Series 3067 Class PJ, 5.50%, 7/15/2031 | 3,000,000 | 3,105,707 | ||||||
Federal Home Loan Mtg Corp., CMO Series 3068 Class VA, 5.50%, 10/15/2016 | 640,733 | 644,676 | ||||||
Federal Home Loan Mtg Corp., CMO Series 3178 Class MC, 6.00%, 4/15/2032 | 3,900,718 | 3,974,176 | ||||||
Federal Home Loan Mtg Corp., CMO Series 3184 Class PC, 5.50%, 8/15/2032 | 3,059,215 | 3,118,998 | ||||||
Federal Home Loan Mtg Corp., CMO Series 3187 Class LA, 5.50%, 4/15/2031 | 309,164 | 311,301 | ||||||
Federal Home Loan Mtg Corp., CMO Series 3192 Class GB, 6.00%, 1/15/2031 | 76,393 | 76,314 | ||||||
Federal Home Loan Mtg Corp., CMO Series 3271 Class LU, 5.50%, 1/15/2018 | 2,125,476 | 2,246,977 | ||||||
Federal Home Loan Mtg Corp., CMO Series 3291 Class BY, 4.50%, 3/15/2022 | 3,000,000 | 3,298,318 | ||||||
Federal Home Loan Mtg Corp., CMO Series 3319 Class PA, 5.50%, 8/15/2030 | 212,054 | 214,629 | ||||||
Federal Home Loan Mtg Corp., CMO Series 3320 Class TC, 5.50%, 10/15/2032 | 2,000,000 | 2,059,577 | ||||||
Federal Home Loan Mtg Corp., CMO Series 3331 Class PB, 6.00%, 1/15/2031 | 2,000,000 | 2,068,509 | ||||||
Federal Home Loan Mtg Corp., CMO Series 3351 Class PK, 5.50%, 1/15/2032 | 1,771,463 | 1,820,250 | ||||||
Federal Home Loan Mtg Corp., CMO Series 3456 Class KV, 5.50%, 9/15/2017 | 2,109,805 | 2,254,850 | ||||||
Federal Home Loan Mtg Corp., CMO Series 3477, Class VA, 5.50%, 7/15/2019 | 3,873,384 | 4,240,387 | ||||||
Federal Home Loan Mtg Corp., CMO Series 3480 Class VA, 6.00%, 6/15/2019 | 2,332,178 | 2,618,223 | ||||||
Federal Home Loan Mtg Corp., CMO Series 3563 Class BC, 4.00%, 6/15/2022 | 910,056 | 947,015 | ||||||
Federal Home Loan Mtg Corp., CMO Series 3589 Class CA, 4.00%, 10/15/2021 | 1,470,813 | 1,546,154 | ||||||
Federal Home Loan Mtg Corp., CMO Series 3640 Class EL, 4.00%, 3/15/2020 | 2,894,179 | 3,051,203 | ||||||
Federal Home Loan Mtg Corp., CMO Series 3678 Class AL, 4.50%, 10/15/2027 | 2,270,866 | 2,412,526 | ||||||
Federal Home Loan Mtg Corp., CMO Series 3704 Class DC, 4.00%, 11/15/2036 | 1,014,340 | 1,082,248 | ||||||
Federal Home Loan Mtg Corp., CMO Series 3872 Class DT, 4.00%, 6/15/2026 | 2,382,745 | 2,572,083 | ||||||
Federal Home Loan Mtg Corp., CMO Series R003 Class VA, 5.50%, 8/15/2016 | 928,855 | 985,714 | ||||||
Federal Home Loan Mtg Corp., CMO Series R012 Class AB, 5.50%, 12/15/2020 | 725,350 | 747,959 | ||||||
Federal Home Loan Mtg Corp., Pool 1N1736, 5.355%, 4/1/2037 | 484,688 | 509,714 | ||||||
Federal Home Loan Mtg Corp., Pool B14155, 3.50%, 5/1/2019 | 875,856 | 923,549 | ||||||
Certified Annual Report 13
| SCHEDULE OF INVESTMENTS, CONTINUED | ||
| Thornburg Limited Term U.S. Government Fund | September 30, 2011 | |
Issuer-Description | Principal Amount | Value | ||||||
Federal Home Loan Mtg Corp., Pool C90041, 6.50%, 11/1/2013 | $ | 5,372 | $ | 5,583 | ||||
Federal Home Loan Mtg Corp., Pool D37120, 7.00%, 7/1/2023 | 13,077 | 14,817 | ||||||
Federal Home Loan Mtg Corp., Pool E96575, 4.50%, 6/1/2018 | 2,541,165 | 2,705,525 | ||||||
Federal Home Loan Mtg Corp., Pool G12140, 4.00%, 2/1/2020 | 630,007 | 668,644 | ||||||
Federal Home Loan Mtg Corp., Pool G13517, 4.00%, 5/1/2024 | 1,835,293 | 1,935,230 | ||||||
Federal Home Loan Mtg Corp., Pool J11371, 4.50%, 12/1/2024 | 3,389,598 | 3,597,741 | ||||||
Federal Home Loan Mtg Corp., REMIC Series 3626 Class AV, 5.50%, 10/15/2020 | 2,642,380 | 2,829,638 | ||||||
Federal National Mtg Assoc., CMO Series 1993-32 Class H, 6.00%, 3/25/2023 | 50,339 | 56,160 | ||||||
Federal National Mtg Assoc., CMO Series 2002-18 Class PC, 5.50%, 4/25/2017 | 526,648 | 545,464 | ||||||
Federal National Mtg Assoc., CMO Series 2003-15 Class CY, 5.00%, 3/25/2018 | 877,107 | 937,828 | ||||||
Federal National Mtg Assoc., CMO Series 2003-4 Class PE, 5.00%, 2/25/2018 | 1,981,782 | 2,134,203 | ||||||
Federal National Mtg Assoc., CMO Series 2003-49 Class YD, 5.50%, 6/25/2023 | 891,667 | 959,075 | ||||||
Federal National Mtg Assoc., CMO Series 2003-66 Class PA, 3.50%, 2/25/2033 | 380,823 | 398,300 | ||||||
Federal National Mtg Assoc., CMO Series 2003-89 Class XC, 6.00%, 9/25/2014 | 773,807 | 811,693 | ||||||
Federal National Mtg Assoc., CMO Series 2003-9 Class DB, 5.00%, 2/25/2018 | 969,348 | 1,038,658 | ||||||
Federal National Mtg Assoc., CMO Series 2003-92 Class KH, 5.00%, 3/25/2032 | 2,000,000 | 2,139,245 | ||||||
Federal National Mtg Assoc., CMO Series 2003-W3 Class 1A2, 7.00%, 8/25/2042 | 3,662,461 | 4,222,463 | ||||||
Federal National Mtg Assoc., CMO Series 2004-2 Class QL, 4.00%, 2/25/2019 | 2,000,000 | 2,147,898 | ||||||
Federal National Mtg Assoc., CMO Series 2004-33 Class MW, 4.50%, 1/25/2030 | 2,734,530 | 2,893,317 | ||||||
Federal National Mtg Assoc., CMO Series 2004-35 Class CA, 4.00%, 12/25/2017 | 458,703 | 468,556 | ||||||
Federal National Mtg Assoc., CMO Series 2005-26 Class G, 5.00%, 6/25/2032 | 1,869,983 | 1,991,155 | ||||||
Federal National Mtg Assoc., CMO Series 2005-99 Class VA, 5.50%, 11/25/2016 | 1,260,949 | 1,379,805 | ||||||
Federal National Mtg Assoc., CMO Series 2006-121 Class VA, 5.50%, 3/25/2017 | 892,549 | 956,262 | ||||||
Federal National Mtg Assoc., CMO Series 2007-60 Class VA, 6.00%, 12/25/2017 | 3,310,336 | 3,554,033 | ||||||
Federal National Mtg Assoc., CMO Series 2007-65 Class PB, 6.00%, 10/25/2032 | 2,916,000 | 2,994,233 | ||||||
Federal National Mtg Assoc., CMO Series 2007-79 Class MB, 5.50%, 12/25/2030 | 1,000,000 | 1,024,543 | ||||||
Federal National Mtg Assoc., CMO Series 2008-54 Class EA, 5.00%, 7/25/2019 | 2,272,574 | 2,456,459 | ||||||
Federal National Mtg Assoc., CMO Series 2008-77 Class VA, 6.00%, 7/25/2019 | 3,142,543 | 3,501,782 | ||||||
Federal National Mtg Assoc., CMO Series 2009-111 Class VB, 4.50%, 2/25/2021 | 1,744,613 | 1,907,097 | ||||||
Federal National Mtg Assoc., CMO Series 2009-17 Class AH, 2.923%, 3/25/2039 | 2,076,136 | 2,026,830 | ||||||
Federal National Mtg Assoc., CMO Series 2009-49 Class KA, 5.00%, 2/25/2024 | 704,915 | 751,676 | ||||||
Federal National Mtg Assoc., CMO Series 2009-52 Class AJ, 4.00%, 7/25/2024 | 1,600,107 | 1,683,259 | ||||||
Federal National Mtg Assoc., CMO Series 2009-70 Class NK, 4.50%, 8/25/2019 | 1,060,488 | 1,122,350 | ||||||
Federal National Mtg Assoc., CMO Series 2009-78 Class A, 4.50%, 8/25/2019 | 1,515,291 | 1,604,624 | ||||||
Federal National Mtg Assoc., CMO Series 2010-46 Class VM, 5.00%, 5/25/2021 | 2,697,437 | 2,987,674 | ||||||
Federal National Mtg Assoc., CMO Series 2010-6 Class VA, 5.00%, 2/25/2021 | 3,028,718 | 3,364,111 | ||||||
Federal National Mtg Assoc., CMO Series 2010-69 Class EJ, 2.50%, 7/25/2024 | 2,940,253 | 3,005,396 | ||||||
Federal National Mtg Assoc., CMO Series 2011-24 Class VH, 4.00%, 6/25/2022 | 4,040,138 | 4,362,514 | ||||||
Federal National Mtg Assoc., CMO Series 2011-63 Class MV, 3.50%, 7/25/2024 | 3,938,678 | 4,160,169 | ||||||
Federal National Mtg Assoc., CMO Series 2011-70 Class CA, 3.00%, 8/25/2026 | 7,588,093 | 7,926,478 | ||||||
Federal National Mtg Assoc., CMO Series 2011-72 Class KV, 3.50%, 11/25/2022 | 2,363,963 | 2,513,362 | ||||||
Federal National Mtg Assoc., Pool 044003, 8.00%, 6/1/2017 | 7,935 | 8,708 | ||||||
Federal National Mtg Assoc., Pool 050811, 7.50%, 12/1/2012 | 4,043 | 4,155 | ||||||
Federal National Mtg Assoc., Pool 050832, 7.50%, 6/1/2013 | 2,630 | 2,708 | ||||||
Federal National Mtg Assoc., Pool 076388, 9.25%, 9/1/2018 | 42,932 | 47,815 | ||||||
Federal National Mtg Assoc., Pool 190555, 7.00%, 1/1/2014 | 5,832 | 6,082 | ||||||
Federal National Mtg Assoc., Pool 251759, 6.00%, 5/1/2013 | 7,160 | 7,718 | ||||||
Federal National Mtg Assoc., Pool 252648, 6.50%, 5/1/2022 | 55,846 | 61,608 | ||||||
Federal National Mtg Assoc., Pool 342947, 7.25%, 4/1/2024 | 158,600 | 177,617 | ||||||
Federal National Mtg Assoc., Pool 384243, 6.10%, 10/1/2011 | 562,293 | 561,899 | ||||||
Federal National Mtg Assoc., Pool 443909, 6.50%, 9/1/2018 | 40,957 | 45,215 | ||||||
Federal National Mtg Assoc., Pool 555207, 7.00%, 11/1/2017 | 14,131 | 16,161 | ||||||
14 Certified Annual Report
| SCHEDULE OF INVESTMENTS, CONTINUED | ||
| Thornburg Limited Term U.S. Government Fund | September 30, 2011 | |
Issuer-Description | Principal Amount | Value | ||||||
Federal National Mtg Assoc., Pool 725866, 4.50%, 9/1/2034 | $ | 4,563,638 | $ | 4,869,723 | ||||
Federal National Mtg Assoc., Pool 726308, 4.00%, 7/1/2018 | 1,311,026 | 1,389,580 | ||||||
Federal National Mtg Assoc., Pool 889906, 4.00%, 7/1/2023 | 1,379,514 | 1,460,184 | ||||||
Federal National Mtg Assoc., Pool 895572, 2.695%, 6/1/2036 | 849,131 | 891,042 | ||||||
Federal National Mtg Assoc., Pool 930986, 4.50%, 4/1/2019 | 2,365,087 | 2,522,975 | ||||||
Federal National Mtg Assoc., Pool AA2870, 4.00%, 3/1/2024 | 2,739,122 | 2,895,873 | ||||||
Federal National Mtg Assoc., Pool AD8191, 4.00%, 9/1/2025 | 2,747,563 | 2,919,393 | ||||||
Federal National Mtg Assoc., Pool MA0045, 4.00%, 4/1/2019 | 1,803,976 | 1,908,339 | ||||||
Federal National Mtg Assoc., Pool MA0071, 4.50%, 5/1/2019 | 1,391,827 | 1,484,743 | ||||||
Federal National Mtg Assoc., Pool MA0125, 4.50%, 7/1/2019 | 879,897 | 938,637 | ||||||
Federal National Mtg Assoc., Pool MA0380, 4.00%, 4/1/2020 | 2,197,793 | 2,324,939 | ||||||
Federal National Mtg Assoc., REMIC Series 2002-59 Class B, 5.50%, 9/25/2017 | 944,159 | 1,012,841 | ||||||
Federal National Mtg Assoc., REMIC Series 2006-B1 Class AB, 6.00%, 6/25/2016 | 226,183 | 227,532 | ||||||
Government National Mtg Assoc., CMO Series 2008-56 Class CH, 5.00%, 5/20/2035 | 1,690,080 | 1,707,941 | ||||||
Government National Mtg Assoc., CMO Series 2009-92 Class VA, 5.00%, 10/20/2020 | 1,356,926 | 1,500,906 | ||||||
Government National Mtg Assoc., Pool 000623, 8.00%, 9/20/2016 | 16,023 | 17,460 | ||||||
Government National Mtg Assoc., Pool 003550, 5.00%, 5/20/2019 | 800,401 | 875,283 | ||||||
Government National Mtg Assoc., Pool 453928, 7.00%, 7/15/2017 | 14,970 | 16,085 | ||||||
Government National Mtg Assoc., Pool 714631, 5.691%, 10/20/2059 | 2,167,948 | 2,375,353 | ||||||
Government National Mtg Assoc., Pool 721652, 5.044%, 5/20/2061 | 4,067,660 | 4,478,112 | ||||||
Government National Mtg Assoc., Pool 730345, 5.585%, 11/20/2059 | 5,161,003 | 5,666,435 | ||||||
Government National Mtg Assoc., Pool 731491, 5.156%, 12/20/2060 | 4,296,055 | 4,776,893 | ||||||
Government National Mtg Assoc., Pool 751388, 5.307%, 1/20/2061 | 3,516,611 | 3,927,690 | ||||||
Government National Mtg Assoc., Pool 751392, 5.00%, 2/20/2061 | 5,363,768 | 5,960,527 | ||||||
Government National Mtg Assoc., Pool 757313, 4.307%, 12/20/2060 | 5,736,863 | 6,156,351 | ||||||
Government National Mtg Assoc., Pool 765151, 4.692%, 7/20/2061 | 3,023,014 | 3,309,327 | ||||||
Government National Mtg Assoc., Pool 894205, 4.00%, 8/20/2039 | 2,938,557 | 3,124,137 | ||||||
|
| |||||||
TOTAL MORTGAGE BACKED (Cost $235,734,200) | 240,746,499 | |||||||
|
| |||||||
TOTAL INVESTMENTS — 89.77% (Cost $348,857,231) | $ | 361,996,745 | ||||||
OTHER ASSETS LESS LIABILITIES — 10.23% | 41,236,684 | |||||||
|
| |||||||
NET ASSETS — 100.00% | $ | 403,233,429 | ||||||
|
| |||||||
Footnote Legend
| a | Security currently fair valued by the valuation and pricing committee using procedures approved by the Trustees. |
| b | Securities exempt from registration under Rule 144A of the Securities Act of 1933, as amended. These securities may only be resold in the ordinary course of business in transactions exempt from registration, normally to qualified institutional buyers. As of September 30, 2011, the aggregate value of these securities in the Fund’s portfolio was $2,852,955, representing 0.71% of the Fund’s net assets. |
Portfolio Abbreviations
To simplify the listings of securities, abbreviations are used per the table below:
| CMO | Collateralized Mortgage Obligation | |
| Mtg | Mortgage | |
| REMIC | Real Estate Mortgage Investment Conduit | |
| VA | Veterans Affairs |
See notes to financial statements.
Certified Annual Report 15
| SCHEDULE OF INVESTMENTS | ||
| Thornburg Limited Term Income Fund | September 30, 2011 | |
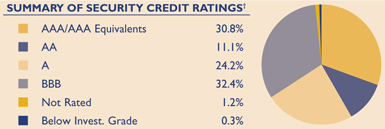
We have used ratings from Moody’s Investors Service. Where Moody’s ratings are not available, we have used Standard & Poor’s ratings.
Issuer-Description | Credit Rating† S&P/Moody’s | Principal Amount | Value | |||||||
U.S. TREASURY SECURITIES — 1.25% | ||||||||||
aUnited States Treasury Notes, 1.00% due 4/30/2012 | NR/NR | $ | 2,500,000 | $ | 2,512,891 | |||||
United States Treasury Notes, 1.75% due 4/15/2013 | NR/NR | 2,500,000 | 2,557,178 | |||||||
United States Treasury Notes, 2.50% due 3/31/2015 | NR/NR | 6,500,000 | 6,938,496 | |||||||
United States Treasury Notes, 5.125% due 5/15/2016 | NR/NR | 1,000,000 | 1,193,867 | |||||||
United States Treasury Notes, 4.875% due 8/15/2016 | NR/NR | 2,000,000 | 2,378,203 | |||||||
United States Treasury Notes, 3.00% due 2/28/2017 | NR/NR | 2,000,000 | 2,203,828 | |||||||
|
| |||||||||
TOTAL U.S. TREASURY SECURITIES (Cost $16,584,184) | 17,784,463 | |||||||||
|
| |||||||||
U.S. GOVERNMENT AGENCIES — 2.83% | ||||||||||
Agfirst Farm Credit Bank, 8.393% due 12/15/2016 | A/NR | 5,000,000 | 4,875,000 | |||||||
bAgribank FCB, 9.125% due 7/15/2019 | A/NR | 9,185,000 | 12,175,627 | |||||||
EJM Airport LLC GSA Lease Revenue Bond, 6.271% due 5/15/2020 | NR/NR | 6,012,041 | 6,854,688 | |||||||
Federal National Mtg Assoc., 7.491% due 8/1/2014 | AA+/Aaa | 15,254 | 15,254 | |||||||
Federal National Mtg Assoc., 2.00% due 3/26/2015 | AA+/Aaa | 3,000,000 | 3,044,759 | |||||||
Private Export Funding Corp., 5.45% due 9/15/2017 | AA+/Aaa | 3,000,000 | 3,646,995 | |||||||
Small Business Administration Participation Certificates, Series 2001-20J Class 1, 5.76% due 10/1/2021 | NR/NR | 2,007,073 | 2,197,960 | |||||||
Small Business Administration Participation Certificates, Series 2008-20D Class 1, 5.37% due 4/1/2028 | NR/NR | 2,973,956 | 3,285,226 | |||||||
Small Business Administration, Series 2005-P10A Class I, 4.638% due 2/10/2015 | NR/NR | 1,460,216 | 1,557,609 | |||||||
b,cU.S. Department of Transportation Headquarters, Series 2004 Class A-2, 5.594% due 12/7/2021 | NR/NR | 2,377,463 | 2,615,209 | |||||||
|
| |||||||||
TOTAL U.S. GOVERNMENT AGENCIES (Cost $37,307,801) | 40,268,327 | |||||||||
|
| |||||||||
OTHER GOVERNMENT — 2.54% | ||||||||||
b,dEmirate of Abu Dhabi, 5.50% due 4/8/2014 | AA/Aa2 | 1,000,000 | 1,097,500 | |||||||
dExport-Import Bank of Korea, 8.125% due 1/21/2014 | A/A1 | 1,250,000 | 1,395,244 | |||||||
dExport-Import Bank of Korea, 5.875% due 1/14/2015 | A/A1 | 3,000,000 | 3,189,990 | |||||||
c,dGovernment of Aruba, 6.80% due 4/2/2014 | A-/NR | 5,616,000 | 5,952,960 | |||||||
b,dGovernment of Bermuda, 5.603% due 7/20/2020 | AA/Aa2 | 3,000,000 | 3,240,000 | |||||||
b,dKorea Housing Finance Co., 3.50% due 12/15/2016 | NR/NR | 6,000,000 | 5,972,304 | |||||||
b,dNorthern Rock Asset Management, 5.625% due 6/22/2017 | AAA/NR | 10,000,000 | 10,562,090 | |||||||
dProvince of Nova Scotia Canada, 5.75% due 2/27/2012 | A+/Aa2 | 500,000 | 510,269 | |||||||
dProvince of Ontario Canada, 4.10% due 6/16/2014 | AA-/Aa1 | 4,000,000 | 4,329,203 | |||||||
|
| |||||||||
TOTAL OTHER GOVERNMENT (Cost $35,243,118) | 36,249,560 | |||||||||
|
| |||||||||
MORTGAGE BACKED — 12.64% | ||||||||||
Commercial Mtg Pass-Through Certificates, Series 2011-THL Class A, 3.376% due 6/9/2028 | NR/Aaa | 5,000,000 | 4,954,450 | |||||||
Commercial Mtg Pass-Through Certificates, Series 2011-THL Class B, 4.554% due 6/9/2028 | NR/Aa2 | 1,500,000 | 1,433,067 | |||||||
DBUBS Mtg Trust CMO Series 2011-LC1A Class A1, 3.742% due 6/1/2017 | NR/Aaa | 5,433,595 | 5,584,967 | |||||||
DBUBS Mtg Trust CMO Series 2011-LC2A Class A1FL, 1.576% due 7/12/2044 | NR/Aaa | 1,471,576 | 1,432,290 | |||||||
16 Certified Annual Report
| SCHEDULE OF INVESTMENTS, CONTINUED | ||
| Thornburg Limited Term Income Fund | September 30, 2011 | |
Issuer-Description | Credit Rating† S&P/Moody’s | Principal Amount | Value | |||||||
DBUBS Mtg Trust CMO Series 2011-LC3A Class A2, 3.642% due 8/10/2044 | NR/NR | $ | 3,000,000 | $ | 3,093,722 | |||||
Federal Home Loan Mtg Corp., CMO Series 2528 Class HN, 5.00% due 11/15/2017 | AA+/Aaa | 911,944 | 970,241 | |||||||
Federal Home Loan Mtg Corp., CMO Series 2627 Class GY, 4.50% due 6/15/2018 | AA+/Aaa | 4,636,624 | 4,920,408 | |||||||
Federal Home Loan Mtg Corp., CMO Series 2628 Class AB, 4.50% due 6/15/2018 | AA+/Aaa | 1,398,809 | 1,467,670 | |||||||
Federal Home Loan Mtg Corp., CMO Series 2640 Class G, 4.50% due 7/15/2018 | AA+/Aaa | 1,844,511 | 1,931,006 | |||||||
Federal Home Loan Mtg Corp., CMO Series 2654 Class OG, 5.00% due 2/15/2032 | AA+/Aaa | 1,000,000 | 1,063,876 | |||||||
Federal Home Loan Mtg Corp., CMO Series 2682 Class JG, 4.50% due 10/15/2023 | AA+/Aaa | 4,053,340 | 4,352,311 | |||||||
Federal Home Loan Mtg Corp., CMO Series 2778 Class JD, 5.00% due 12/15/2032 | AA+/Aaa | 4,000,000 | 4,264,780 | |||||||
Federal Home Loan Mtg Corp., CMO Series 2780 Class VJ, 5.00% due 4/15/2015 | AA+/Aaa | 965,668 | 1,008,996 | |||||||
Federal Home Loan Mtg Corp., CMO Series 2808 Class VA, 5.50% due 5/15/2015 | AA+/Aaa | 2,128,477 | 2,290,071 | |||||||
Federal Home Loan Mtg Corp., CMO Series 2814 Class GB, 5.00% due 6/15/2019 | AA+/Aaa | 546,355 | 570,150 | |||||||
Federal Home Loan Mtg Corp., CMO Series 2825 Class VP, 5.50% due 6/15/2015 | AA+/Aaa | 2,392,811 | 2,574,395 | |||||||
Federal Home Loan Mtg Corp., CMO Series 2827 Class BU, 3.50% due 7/15/2019 | AA+/Aaa | 3,000,000 | 3,154,206 | |||||||
Federal Home Loan Mtg Corp., CMO Series 2943 Class BV, 5.00% due 3/15/2016 | AA+/Aaa | 2,327,955 | 2,506,667 | |||||||
Federal Home Loan Mtg Corp., CMO Series 3083 Class U, 4.50% due 1/15/2017 | AA+/Aaa | 2,702,738 | 2,849,167 | |||||||
Federal Home Loan Mtg Corp., CMO Series 3138 Class PC, 5.50% due 6/15/2032 | AA+/Aaa | 4,032,823 | 4,112,742 | |||||||
Federal Home Loan Mtg Corp., CMO Series 3192 Class GB, 6.00% due 1/15/2031 | AA+/Aaa | 152,785 | 152,628 | |||||||
Federal Home Loan Mtg Corp., CMO Series 3195 Class PD, 6.50% due 7/15/2036 | NR/NR | 5,268,017 | 5,870,895 | |||||||
Federal Home Loan Mtg Corp., CMO Series 3291 Class BY, 4.50% due 3/15/2022 | AA+/Aaa | 4,000,000 | 4,389,825 | |||||||
Federal Home Loan Mtg Corp., CMO Series 3504 Class PC, 4.00% due 1/15/2039 | AA+/Aaa | 1,198,708 | 1,250,124 | |||||||
Federal Home Loan Mtg Corp., CMO Series 3563 Class BC, 4.00% due 6/15/2022 | AA+/Aaa | 1,820,112 | 1,894,030 | |||||||
Federal Home Loan Mtg Corp., CMO Series 3589 Class CA, 4.00% due 10/15/2021 | AA+/Aaa | 2,206,219 | 2,319,232 | |||||||
Federal Home Loan Mtg Corp., CMO Series 3872 Class DT, 4.00% due 6/15/2026 | NR/NR | 1,787,059 | 1,904,669 | |||||||
Federal Home Loan Mtg Corp., Pool P10039, 5.00% due 4/1/2013 | AA+/Aaa | 542,596 | 560,875 | |||||||
Federal Home Loan Mtg Corp., REMIC Series 3626 Class AV, 5.50% due 10/15/2020 | AA+/Aaa | 4,403,967 | 4,716,064 | |||||||
Federal National Mtg Assoc., CMO Series 2003-4 Class PE, 5.00% due 2/25/2018 | AA+/Aaa | 1,997,092 | 2,150,691 | |||||||
Federal National Mtg Assoc., CMO Series 2003-74 Class KN, 4.50% due 8/25/2018 | AA+/Aaa | 1,009,427 | 1,057,407 | |||||||
Federal National Mtg Assoc., CMO Series 2003-92 Class VG, 5.00% due 9/25/2014 | AA+/Aaa | 629,995 | 662,299 | |||||||
Federal National Mtg Assoc., CMO Series 2003-W3 Class I A2, 7.00% due 8/25/2042 | AA+/Aaa | 2,097,102 | 2,449,930 | |||||||
Federal National Mtg Assoc., CMO Series 2004-33 Class MW, 4.50% due 1/25/2030 | AA+/Aaa | 2,831,753 | 2,996,186 | |||||||
Federal National Mtg Assoc., CMO Series 2005-35 VG, 5.00% due 4/25/2016 | AA+/Aaa | 1,022,034 | 1,079,650 | |||||||
Federal National Mtg Assoc., CMO Series 2005-48 Class AR, 5.50% due 2/25/2035 | AA+/Aaa | 1,652,216 | 1,809,531 | |||||||
Federal National Mtg Assoc., CMO Series 2007-26 Class VH, 5.50% due 2/25/2018 | AA+/Aaa | 4,124,828 | 4,496,455 | |||||||
Federal National Mtg Assoc., CMO Series 2007-42 Class PA, 5.50% due 4/25/2037 | AA+/Aaa | 2,750,727 | 2,969,178 | |||||||
Federal National Mtg Assoc., CMO Series 2007-65 Class PB, 6.00% due 10/25/2032 | AA+/Aaa | 3,000,000 | 3,080,486 | |||||||
Federal National Mtg Assoc., CMO Series 2008-54 Class EA, 5.00% due 7/25/2019 | AA+/Aaa | 3,030,099 | 3,267,394 | |||||||
Federal National Mtg Assoc., CMO Series 2008-55 Class VA, 5.00% due 7/25/2019 | AA+/Aaa | 3,786,954 | 4,058,722 | |||||||
Federal National Mtg Assoc., CMO Series 2009-111 Class VB, 4.50% due 2/25/2021 | AA+/Aaa | 1,744,613 | 1,894,738 | |||||||
Federal National Mtg Assoc., CMO Series 2009-17 Class AH, 2.923% due 3/25/2039 | AA+/Aaa | 3,460,227 | 3,378,051 | |||||||
Federal National Mtg Assoc., CMO Series 2009-49 Class KA, 5.00% due 2/25/2024 | AA+/Aaa | 1,644,802 | 1,753,910 | |||||||
Federal National Mtg Assoc., CMO Series 2009-5 Class A, 4.50% due 12/25/2023 | AA+/Aaa | 4,774,314 | 5,101,537 | |||||||
Federal National Mtg Assoc., CMO Series 2009-52 Class AJ, 4.00% due 7/25/2024 | AA+/Aaa | 2,666,845 | 2,805,432 | |||||||
Federal National Mtg Assoc., CMO Series 2009-65 Class GA, 4.50% due 11/25/2023 | AA+/Aaa | 1,337,382 | 1,412,507 | |||||||
Federal National Mtg Assoc., CMO Series 2009-70 Class NK, 4.50% due 8/25/2019 | AA+/Aaa | 2,651,220 | 2,847,161 | |||||||
Federal National Mtg Assoc., CMO Series 2009-70 Class PA, 5.00% due 8/25/2035 | AA+/Aaa | 2,388,819 | 2,486,971 | |||||||
Federal National Mtg Assoc., CMO Series 2009-89 Class BV, 4.50% due 12/25/2020 | AA+/Aaa | 2,578,845 | 2,749,140 | |||||||
Federal National Mtg Assoc., CMO Series 2011-15 Class VA, 4.00% due 4/25/2022 | AA+/Aaa | 1,915,217 | 2,088,728 | |||||||
Federal National Mtg Assoc., CMO Series 2011-24 Class VH, 4.00% due 6/25/2022 | NR/NR | 4,819,343 | 5,243,570 | |||||||
Federal National Mtg Assoc., Pool 357384, 4.50% due 5/1/2018 | AA+/Aaa | 721,322 | 767,899 | |||||||
Federal National Mtg Assoc., Pool 897936, 5.50% due 8/1/2021 | AA+/Aaa | 3,136,211 | 3,403,093 | |||||||
Government National Mtg Assoc., CMO Series 2009-35 Series KV, 4.50% due 6/20/2020 | AA+/Aaa | 4,139,185 | 4,519,759 | |||||||
Government National Mtg Assoc., CMO Series 2009-68 Class DP, 4.50% due 11/16/2038 | AA+/Aaa | 2,662,564 | 2,857,654 | |||||||
Government National Mtg Assoc., Pool 003007, 8.50% due 11/20/2015 | AA+/Aaa | 13,924 | 15,127 | |||||||
Certified Annual Report 17
| SCHEDULE OF INVESTMENTS, CONTINUED | ||
| Thornburg Limited Term Income Fund | September 30, 2011 | |
Issuer-Description | Credit Rating† S&P/Moody’s | Principal Amount | Value | |||||||
Government National Mtg Assoc., Pool 714631, 5.691% due 10/20/2059 | AA+/Aaa | $ | 5,853,459 | $ | 6,413,454 | |||||
Government National Mtg Assoc., Pool 721652, 5.044% due 5/20/2061 | AA+/Aaa | 5,930,463 | 6,528,883 | |||||||
Government National Mtg Assoc., Pool 731491, 5.156% due 12/20/2060 | AA+/Aaa | 4,114,136 | 4,574,612 | |||||||
Government National Mtg Assoc., Pool 751388, 5.307% due 1/20/2061 | AA+/Aaa | 5,526,104 | 6,172,085 | |||||||
Government National Mtg Assoc., Pool 765151, 4.692% due 7/20/2061 | AA+/Aaa | 4,887,206 | 5,350,079 | |||||||
Government National Mtg Assoc., Pool 827148, 2.375% due 2/20/2024 | AA+/Aaa | 31,143 | 31,950 | |||||||
|
| |||||||||
TOTAL MORTGAGE BACKED (Cost $177,167,561) | 180,067,793 | |||||||||
|
| |||||||||
ASSET BACKED SECURITIES — 8.58% | ||||||||||
BANKS — 0.12% | ||||||||||
COMMERCIAL BANKS — 0.12% | ||||||||||
Wells Fargo Asset Securities Corp., Series 2005-AR2 Class B1, 2.739% due 2/25/2035 | CC/C | 950,703 | 110,008 | |||||||
Wells Fargo Asset Securities Corp., Series 2005-AR2 Class B1, 3.523% due 3/25/2035 | NR/NR | 1,030,755 | 143,198 | |||||||
Wells Fargo Mortgage Backed Securities, CMO Series 2003-7 Class A2, 4.50% due 8/25/2018 | AAA/Baa2 | 1,467,277 | 1,491,383 | |||||||
|
| |||||||||
| 1,744,589 | ||||||||||
|
| |||||||||
CONSUMER SERVICES — 0.35% | ||||||||||
HOTELS, RESTAURANTS & LEISURE — 0.35% | ||||||||||
Sonic Capital LLC, 5.438% due 5/20/2041 | NR/NR | 4,950,000 | 5,036,625 | |||||||
|
| |||||||||
| 5,036,625 | ||||||||||
|
| |||||||||
DIVERSIFIED FINANCIALS — 7.83% | ||||||||||
CAPITAL MARKETS — 5.31% | ||||||||||
AH Mtg Advance Trust, Series SART-1 Class A2, 3.37% due 5/10/2043 | AA+/Aaa | 5,000,000 | 4,980,000 | |||||||
cAH Mtg Advance Trust, Series SART-2 Class B1, 6.90% due 9/15/2043 | BBB/NR | 10,000,000 | 10,032,000 | |||||||
Arran Residential Mtgs Funding plc, Series 2011-1A Class A2C, 1.746% due 11/19/2047 | NR/Aaa | 5,000,000 | 4,988,427 | |||||||
Banc of America Commercial Mtg Inc., Series 2002-PB2 Class C, 6.349% due 6/11/2035 | AAA/Aa1 | 3,045,000 | 3,050,858 | |||||||
Banc of America Commercial Mtg Inc., Series 2006-6 Class A3, 5.369% due 10/10/2045 | AAA/Aaa | 3,000,000 | 3,138,390 | |||||||
Banc of America Mtg Securities, Inc., Series 2005 A Class B1 Floating Rate Note, 3.246% due 2/25/2035 | NR/NR | 2,769,050 | 1,113,383 | |||||||
Bear Stearns Mtg, Series 2004-3 Class 1-A2, 2.803% due 7/25/2034 | BBB+/B1 | 304,364 | 237,779 | |||||||
b,dCie Financement Foncier, 2.50% due 9/16/2015 | AAA/Aaa | 6,000,000 | 5,924,634 | |||||||
Citigroup Commercial Mtg Trust, Series 2004-HYB2 Class B1, 2.887% due 3/25/2034 | AA/Caa2 | 402,439 | 325,690 | |||||||
Countrywide Home Loan, Series 2004 Class 1-A, 2.683% due 7/20/2034 | A/Ba3 | 486,276 | 410,243 | |||||||
Credit Suisse Commercial Mtg Capital Certificates, Series 2007-C2 Class A2, 5.448% due 1/15/2049 | AAA/Aaa | 2,969,276 | 2,979,297 | |||||||
Home Equity Asset Trust Series 2006-3 Class 2A, 0.415% due 7/25/2036 | AAA/A1 | 2,631,550 | 2,499,843 | |||||||
JPMorgan Chase Commercial Mtg, Series 2004-C3 Class A-5, 4.878% due 1/15/2042 | NR/Aaa | 5,000,000 | 5,338,541 | |||||||
Merrill Lynch Mtg Investors, Series 2003 E Class B3, 2.485% due 10/25/2028 | A+/B3 | 1,111,665 | 421,175 | |||||||
Merrill Lynch Mtg Investors, Series 2004 A4 Class M1, 2.611% due 8/25/2034 | CCC/NR | 835,992 | 644,452 | |||||||
Morgan Stanley Re-REMIC Trust Series 2009-GG10 Class A4A, 5.984% due 8/12/2045 | NR/Aaa | 2,838,000 | 3,095,143 | |||||||
Nomura Asset Securities Corp., Series 1998-D6 Class A2, 7.313% due 3/15/2030 | AAA/Aaa | 5,683,000 | 6,004,737 | |||||||
Option One Mtg Loan Trust, Series 2005-5 Class A3 Floating Rate Note, 0.445% due 12/25/2035 | AAA/Baa2 | 2,068,456 | 1,641,659 | |||||||
Popular ABS Mtg Pass-Through Trust Series 2005-4 Class AF5, 5.537% due 9/25/2035 | AAA/Baa1 | 7,000,000 | 6,849,983 | |||||||
Residential Asset Mtg Products, Inc., 0.535% due 3/25/2035 | NR/Aa3 | 1,216,165 | 1,088,060 | |||||||
dSilverstone Master Issuer, Series 2010-1A Class A1 Floating Rate Note, 1.652% due 1/21/2055 | AAA/Aaa | 5,000,000 | 4,987,805 | |||||||
Wachovia Bank Commercial Mtg Trust, Series 2004-C10 Class C, 4.842% due 2/15/2041 | AA+/Aaa | 4,000,000 | 3,903,536 | |||||||
Washington Mutual Mtg Series 2003-S13 Class 21-A1, 4.50% due 12/25/2018 | AAA/NR | 1,844,467 | 1,912,812 | |||||||
CONSUMER FINANCE — 2.45% | ||||||||||
First Financial Bank USA, Series 2010-C Class B, 5.19% due 9/17/2018 | AA/NR | 2,000,000 | 2,015,172 | |||||||
First Financial Bank USA, Series 2010-D Class A, 3.72% due 6/17/2019 | AAA/NR | 5,000,000 | 5,115,078 | |||||||
GSAF Series 2011-1A Class A, 3.72% due 2/15/2023 | NR/Aaa | 3,000,000 | 3,024,000 | |||||||
18 Certified Annual Report
| SCHEDULE OF INVESTMENTS, CONTINUED | ||
| Thornburg Limited Term Income Fund | September 30, 2011 | |
Issuer-Description | Credit Rating† S&P/Moody’s | Principal Amount | Value | |||||||
Santander Drive Auto Receivables Trust, 2.86% due 6/15/2017 | A/NR | $ | 1,502,045 | $ | 1,498,215 | |||||
SLM Student Loan Trust Series 2003-C Class A2 Floating Rate Bond, 0.737% due 9/15/2020 | AA-/Aa2 | 4,155,324 | 3,963,556 | |||||||
SLM Student Loan Trust Series 2004-B Class A3 Floating Rate Bond, 0.677% due 3/15/2024 | A+/Aaa | 8,000,000 | 6,380,994 | |||||||
SLM Student Loan Trust Series 2006-B Class A3 Floating Rate Bond, 0.487% due 12/15/2022 | A/Aaa | 5,442,329 | 5,382,225 | |||||||
SLM Student Loan Trust Series 2011-B Class A2, 3.74% due 2/15/2029 | AAA/Aaa | 5,000,000 | 5,141,608 | |||||||
Structured Asset Securities Corp. Series 2004-3 Class 3-A1, 5.50% due 3/25/2019 | AAA/Baa2 | 2,292,897 | 2,374,405 | |||||||
DIVERSIFIED FINANCIAL SERVICES — 0.07% | ||||||||||
FNBC Trust, Series 1993 A, 8.08% due 1/5/2018 | AA-/Aa1 | 921,442 | 1,076,012 | |||||||
|
| |||||||||
| 111,539,712 | ||||||||||
|
| |||||||||
INSURANCE — 0.28% | ||||||||||
INSURANCE — 0.28% | ||||||||||
Northwind Holdings LLC, Floating Rate Bond, 1.106% due 12/1/2037 | A/Baa1 | 5,031,250 | 3,907,822 | |||||||
|
| |||||||||
| 3,907,822 | ||||||||||
|
| |||||||||
TOTAL ASSET BACKED SECURITIES (Cost $127,214,837) | 122,228,748 | |||||||||
|
| |||||||||
CORPORATE BONDS — 54.12% | ||||||||||
AUTOMOBILES & COMPONENTS — 1.37% | ||||||||||
AUTOMOBILES — 1.37% | ||||||||||
bAmerican Honda Finance, 2.60% due 9/20/2016 | NR/NR | 5,000,000 | 5,021,290 | |||||||
bHarley-Davidson Funding Corp., 5.75% due 12/15/2014 | BBB/Baa1 | 5,000,000 | 5,452,615 | |||||||
bHarley-Davidson Funding Corp., 5.25% due 12/15/2012 | BBB/Baa1 | 3,000,000 | 3,108,846 | |||||||
bHyundai Capital America, 3.75% due 4/6/2016 | BBB/Baa2 | 500,000 | 493,922 | |||||||
dHyundai Capital Services, Inc., 6.00% due 5/5/2015 | BBB+/Baa2 | 5,000,000 | 5,400,220 | |||||||
|
| |||||||||
| 19,476,893 | ||||||||||
|
| |||||||||
BANKS — 9.20% | ||||||||||
COMMERCIAL BANKS — 9.20% | ||||||||||
b,dANZ National International Ltd., 6.20% due 7/19/2013 | AA/Aa3 | 1,000,000 | 1,067,853 | |||||||
b,dANZ National International Ltd., 3.125% due 8/10/2015 | AA/Aa3 | 4,000,000 | 4,018,232 | |||||||
Associated Banc Corp., 5.125% due 3/28/2016 | BBB-/Baa1 | 3,000,000 | 3,121,665 | |||||||
b,dBanco Santander Brasil, 4.25% due 1/14/2016 | BBB-/Baa1 | 6,000,000 | 5,617,200 | |||||||
b,dBarclays Bank plc, 2.50% due 9/21/2015 | AAA/Aaa | 5,000,000 | 4,960,415 | |||||||
b,dBNP Paribas Home Loan Covered Bonds SA, 2.20% due 11/2/2015 | AAA/Aaa | 10,000,000 | 9,714,730 | |||||||
dCorp. Andina de Fomento, 3.75% due 1/15/2016 | A+/A1 | 11,000,000 | 11,130,647 | |||||||
b,dCredit Agricole London, 1.702% due 1/21/2014 | A+/Aa2 | 7,000,000 | 6,585,670 | |||||||
b,dDanske Bank A/S, 3.75% due 4/1/2015 | A/A2 | 4,000,000 | 3,891,784 | |||||||
dExport-Import Bank of Korea, 4.375% due 9/15/2021 | A/A1 | 4,500,000 | 4,238,807 | |||||||
b,dHSBC Bank plc, 3.50% due 6/28/2015 | AA/Aa2 | 2,000,000 | 2,029,466 | |||||||
HSBC Bank USA, N.A., 4.875% due 8/24/2020 | AA-/A1 | 1,000,000 | 937,864 | |||||||
b,dIntesa Sanpaolo SpA, 2.708% due 2/24/2014 | A/Aa3 | 5,000,000 | 4,502,520 | |||||||
b,dKookmin Bank, 7.25% due 5/14/2014 | AA/Aa1 | 5,000,000 | 5,561,855 | |||||||
National City Bank Floating Rate Note, 0.703% due 6/7/2017 | A/A3 | 4,000,000 | 3,662,516 | |||||||
Nations Bank Corp., 7.23% due 8/15/2012 | A/Baa1 | 250,000 | 250,089 | |||||||
North Fork Bancorp, Inc., 5.875% due 8/15/2012 | BBB-/Baa2 | 2,000,000 | 2,031,864 | |||||||
dRoyal Bank of Scotland plc, 3.95% due 9/21/2015 | A+/Aa3 | 4,000,000 | 3,761,840 | |||||||
dRoyal Bank of Scotland plc, 4.875% due 3/16/2015 | A+/Aa3 | 1,600,000 | 1,566,582 | |||||||
b,dRoyal Bank of Scotland plc, 4.875% due 8/25/2014 | A+/Aa3 | 5,000,000 | 5,034,145 | |||||||
b,dSantander Issuances, 6.50% due 8/11/2019 | AA-/Aa3 | 5,000,000 | 4,613,440 | |||||||
b,dSociete Generale, 3.10% due 9/14/2015 | A+/Aa3 | 6,000,000 | 5,407,224 | |||||||
Sovereign Bank, 5.125% due 3/15/2013 | A-/A3 | 4,000,000 | 4,035,368 | |||||||
Certified Annual Report 19
| SCHEDULE OF INVESTMENTS, CONTINUED | ||
| Thornburg Limited Term Income Fund | September 30, 2011 | |
Issuer-Description | Credit Rating† S&P/Moody’s | Principal Amount | Value | |||||||
bSovereign Bank Lease Pass-Through Trust, 12.18% due 6/30/2020 | A/A2 | $ | 5,920,404 | $ | 7,578,117 | |||||
dStandard Chartered plc, 3.20% due 5/12/2016 | A/A2 | 5,000,000 | 4,958,035 | |||||||
dSvenska Handelsbanken AB, 3.125% due 7/12/2016 | AA-/Aa2 | 6,000,000 | 6,033,456 | |||||||
dToronto-Dominion Bank, 2.20% due 7/29/2015 | NR/Aaa | 3,000,000 | 3,093,429 | |||||||
Webster Bank, 5.875% due 1/15/2013 | BBB-/Baa1 | 3,000,000 | 3,063,387 | |||||||
dWestpac Banking Corp., 3.00% due 8/4/2015 | AA/Aa2 | 2,000,000 | 2,036,418 | |||||||
Whitney National Bank, 5.875% due 4/1/2017 | NR/Baa1 | 1,500,000 | 1,584,542 | |||||||
dWoori Bank, 4.75% due 1/20/2016 | A-/A1 | 5,000,000 | 4,970,299 | |||||||
|
| |||||||||
| 131,059,459 | ||||||||||
|
| |||||||||
CAPITAL GOODS — 1.81% | ||||||||||
AEROSPACE & DEFENSE — 0.11% | ||||||||||
Boeing Co., 5.00% due 3/15/2014 | A/A2 | 1,500,000 | 1,645,747 | |||||||
ELECTRICAL EQUIPMENT — 0.06% | ||||||||||
Emerson Electric Co., 5.75% due 11/1/2011 | A/A2 | 800,000 | 802,933 | |||||||
INDUSTRIAL CONGLOMERATES — 0.94% | ||||||||||
General Electric Capital Corp. Floating Rate Note, 0.491% due 6/20/2014 | AA+/Aa2 | 4,000,000 | 3,832,296 | |||||||
General Electric Co., 5.25% due 12/6/2017 | AA+/Aa2 | 2,500,000 | 2,777,660 | |||||||
b,dSmiths Group plc, 7.20% due 5/15/2019 | BBB+/Baa2 | 3,000,000 | 3,596,520 | |||||||
b,dSmiths Group plc, 6.05% due 5/15/2014 | BBB+/Baa2 | 3,000,000 | 3,242,331 | |||||||
MACHINERY — 0.70% | ||||||||||
bITW CUPIDS Finance Trust I, 6.55% due 12/31/2011 | NR/A1 | 5,000,000 | 5,011,015 | |||||||
John Deere Capital Corp., 5.25% due 10/1/2012 | A/A2 | 1,600,000 | 1,671,939 | |||||||
dVolvo Treasury AB, 5.95% due 4/1/2015 | BBB/Baa2 | 3,000,000 | 3,244,740 | |||||||
|
| |||||||||
| 25,825,181 | ||||||||||
|
| |||||||||
COMMERCIAL & PROFESSIONAL SERVICES — 0.37% | ||||||||||
COMMERCIAL SERVICES & SUPPLIES — 0.37% | ||||||||||
Allied Waste North America, Inc., 6.875% due 6/1/2017 | BBB/Baa3 | 4,000,000 | 4,275,000 | |||||||
Science Applications International Corp., 6.25% due 7/1/2012 | A-/A3 | 1,000,000 | 1,035,266 | |||||||
|
| |||||||||
| 5,310,266 | ||||||||||
|
| |||||||||
CONSUMER DURABLES & APPAREL — 0.26% | ||||||||||
HOUSEHOLD DURABLES — 0.07% | ||||||||||
Fortune Brands, Inc., 6.375% due 6/15/2014 | BBB-/Baa3 | 970,000 | 1,074,138 | |||||||
TEXTILES, APPAREL & LUXURY GOODS — 0.19% | ||||||||||
Nike, Inc., 5.15% due 10/15/2015 | A+/A1 | 2,315,000 | 2,644,249 | |||||||
|
| |||||||||
| 3,718,387 | ||||||||||
|
| |||||||||
DIVERSIFIED FINANCIALS — 6.56% | ||||||||||
CAPITAL MARKETS — 3.05% | ||||||||||
dAMVESCAP plc, 5.375% due 2/27/2013 | A-/A3 | 5,606,000 | 5,879,545 | |||||||
b,dCDP Financial, Inc., 3.00% due 11/25/2014 | AAA/Aaa | 4,000,000 | 4,180,996 | |||||||
bFMR LLC, 4.75% due 3/1/2013 | A+/A2 | 5,000,000 | 5,180,075 | |||||||
Goldman Sachs Group, Inc. Floating Rate Note, 1.269% due 2/7/2014 | A/A1 | 3,000,000 | 2,874,618 | |||||||
b,dGruposura Finance, 5.70% due 5/18/2021 | BBB-/NR | 1,500,000 | 1,455,000 | |||||||
b,dIPIC GMTN Ltd., 3.125% due 11/15/2015 | AA/Aa3 | 1,000,000 | 1,010,000 | |||||||
b,dIPIC GMTN Ltd., 5.00% due 11/15/2020 | AA/Aa3 | 1,000,000 | 1,025,000 | |||||||
b,dMacquarie Group Ltd., 6.00% due 1/14/2020 | A-/A2 | 1,000,000 | 948,184 | |||||||
b,dMacquarie Group Ltd., 4.875% due 8/10/2017 | A-/A2 | 3,000,000 | 2,957,562 | |||||||
b,dMacquarie Group Ltd., 7.30% due 8/1/2014 | A-/A2 | 3,000,000 | 3,248,322 | |||||||
b,dMacquarie Group Ltd., 7.625% due 8/13/2019 | NR/NR | 1,000,000 | 1,053,977 | |||||||
20 Certified Annual Report
| SCHEDULE OF INVESTMENTS, CONTINUED | ||
| Thornburg Limited Term Income Fund | September 30, 2011 | |
Issuer-Description | Credit Rating† S&P/Moody’s | Principal Amount | Value | |||||||
dMan Group plc, 6.50% due 8/1/2013 | NR/Baa2 | $ | 5,000,000 | $ | 5,191,905 | |||||
Merrill Lynch & Co., Inc., 6.875% due 4/25/2018 | A/Baa1 | 2,000,000 | 2,000,718 | |||||||
Morgan Stanley Floating Rate Note, 2.786% due 5/14/2013 | A/A2 | 5,000,000 | 4,834,860 | |||||||
dNomura Holdings, Inc., 5.00% due 3/4/2015 | BBB+/Baa2 | 1,500,000 | 1,571,863 | |||||||
CONSUMER FINANCE — 1.13% | ||||||||||
American Express Credit Co., 2.80% due 9/19/2016 | BBB+/A2 | 4,000,000 | 3,980,164 | |||||||
American Express Credit Co., 5.125% due 8/25/2014 | BBB+/A2 | 3,000,000 | 3,247,047 | |||||||
b,dBanque PSA Finance, 2.146% due 4/4/2014 | BBB/Baa1 | 7,000,000 | 6,599,824 | |||||||
Capital One Bank, 6.50% due 6/13/2013 | BBB/Baa1 | 300,000 | 320,153 | |||||||
Western Union Co., 3.65% due 8/22/2018 | A-/A3 | 2,000,000 | 2,018,390 | |||||||
DIVERSIFIED FINANCIAL SERVICES — 2.38% | ||||||||||
Bank of America Corp., 4.50% due 4/1/2015 | A/Baa1 | 1,000,000 | 947,744 | |||||||
Bank of America Corp., 5.875% due 1/5/2021 | A/Baa1 | 2,000,000 | 1,869,316 | |||||||
bBank of America Covered Bond Issuer, 5.50% due 6/14/2012 | AA/Aa2 | 3,000,000 | 3,089,610 | |||||||
b,dBM&F Bovespa SA, 5.50% due 7/16/2020 | BBB+/Baa1 | 1,000,000 | 983,750 | |||||||
Citigroup, Inc., 6.00% due 12/13/2013 | A/A3 | 2,000,000 | 2,100,738 | |||||||
Citigroup, Inc., 6.50% due 8/19/2013 | A/A3 | 1,000,000 | 1,052,296 | |||||||
Citigroup, Inc., 5.00% due 9/15/2014 | A-/Baa1 | 3,000,000 | 2,942,277 | |||||||
bCME Group Index Services, 4.40% due 3/15/2018 | AA/Aa3 | 4,000,000 | 4,323,924 | |||||||
JPMorgan Chase & Co., 3.15% due 7/5/2016 | A+/Aa3 | 5,000,000 | 4,967,530 | |||||||
JPMorgan Chase & Co., 4.35% due 8/15/2021 | A+/Aa3 | 2,000,000 | 2,021,010 | |||||||
dKorea Development Bank, 8.00% due 1/23/2014 | A/A1 | 3,000,000 | 3,332,526 | |||||||
MBNA Corp., 6.125% due 3/1/2013 | A/Baa1 | 1,305,000 | 1,306,313 | |||||||
b,dNational Agricultural Cooperative Federation, 5.00% due 9/30/2014 | A/A1 | 2,000,000 | 2,089,896 | |||||||
National Rural Utilities CFC, 10.375% due 11/1/2018 | A+/A1 | 2,000,000 | 2,873,724 | |||||||
|
| |||||||||
| 93,478,857 | ||||||||||
|
| |||||||||
ENERGY — 4.41% | ||||||||||
ENERGY EQUIPMENT & SERVICES — 1.09% | ||||||||||
Detroit Edison Corporate Senior Note Series D, 5.40% due 8/1/2014 | A/A2 | 2,000,000 | 2,210,724 | |||||||
Nabors Industries, Inc., 9.25% due 1/15/2019 | BBB/Baa2 | 4,000,000 | 5,060,060 | |||||||
Rowan Companies, Inc., 7.875% due 8/1/2019 | BBB-/Baa3 | 7,000,000 | 8,265,110 | |||||||
OIL, GAS & CONSUMABLE FUELS — 3.32% | ||||||||||
dBP Capital Markets plc, 3.875% due 3/10/2015 | A/A2 | 2,000,000 | 2,120,432 | |||||||
ConocoPhillips, 4.75% due 2/1/2014 | A/A1 | 1,000,000 | 1,088,172 | |||||||
bDCP Midstream LLC, 9.75% due 3/15/2019 | BBB/Baa2 | 6,500,000 | 8,648,861 | |||||||
dEnbridge, Inc., 5.80% due 6/15/2014 | A-/Baa1 | 2,000,000 | 2,200,098 | |||||||
Energy Transfer Partners LP, 6.00% due 7/1/2013 | BBB-/Baa3 | 1,000,000 | 1,057,674 | |||||||
Energy Transfer Partners LP, 9.70% due 3/15/2019 | BBB-/Baa3 | 3,856,000 | 4,773,504 | |||||||
bFlorida Gas Transmission, 4.00% due 7/15/2015 | BBB/Baa2 | 2,000,000 | 2,114,938 | |||||||
Murphy Oil Corp., 6.375% due 5/1/2012 | BBB/Baa3 | 750,000 | 770,626 | |||||||
dNorsk Hydro A/S, 6.70% due 1/15/2018 | AA-/Aa2 | 1,000,000 | 1,237,455 | |||||||
bNorthern Natural Gas Co., 5.75% due 7/15/2018 | A/A2 | 50,000 | 59,461 | |||||||
b,dOdebrecht Drill VIII/IX, 6.35% due 6/30/2021 | NR/Baa3 | 6,000,000 | 5,940,000 | |||||||
bSemco Energy, Inc., 5.15% due 4/21/2020 | BBB+/A3 | 3,000,000 | 3,367,980 | |||||||
dShell International Finance, 3.10% due 6/28/2015 | AA/Aa1 | 3,000,000 | 3,184,932 | |||||||
Sunoco Logistics, 8.75% due 2/15/2014 | NR/Baa2 | 5,000,000 | 5,657,155 | |||||||
Valero Logistics, 6.875% due 7/15/2012 | BBB-/Baa3 | 2,700,000 | 2,787,010 | |||||||
dWoodside Finance Ltd., 8.125% due 3/1/2014 | BBB+/Baa1 | 2,000,000 | 2,262,596 | |||||||
|
| |||||||||
| 62,806,788 | ||||||||||
|
| |||||||||
Certified Annual Report 21
| SCHEDULE OF INVESTMENTS, CONTINUED | ||
| Thornburg Limited Term Income Fund | September 30, 2011 | |
Issuer-Description | Credit Rating† S&P/Moody’s | Principal Amount | Value | |||||||
FOOD, BEVERAGE & TOBACCO — 2.10% | ||||||||||
BEVERAGES — 0.71% | ||||||||||
Anheuser-Busch Cos., Inc., 4.70% due 4/15/2012 | A-/Baa1 | $ | 1,000,000 | $ | 1,020,727 | |||||
Anheuser-Busch Cos., Inc., 4.375% due 1/15/2013 | A-/Baa1 | 2,000,000 | 2,077,738 | |||||||
dCoca Cola HBC Finance BV, 5.125% due 9/17/2013 | A-/A3 | 6,524,000 | 6,976,237 | |||||||
FOOD PRODUCTS — 0.15% | ||||||||||
Corn Products International, Inc., 3.20% due 11/1/2015 | BBB/Baa2 | 1,000,000 | 1,025,056 | |||||||
Kraft Foods, Inc., 6.00% due 2/11/2013 | BBB-/Baa2 | 1,000,000 | 1,059,283 | |||||||
TOBACCO — 1.24% | ||||||||||
Altria Group, Inc., 8.50% due 11/10/2013 | BBB/Baa1 | 1,000,000 | 1,140,516 | |||||||
Altria Group, Inc., 9.70% due 11/10/2018 | BBB/Baa1 | 3,000,000 | 3,975,573 | |||||||
Lorillard Tobacco Co., 8.125% due 6/23/2019 | BBB-/Baa2 | 5,000,000 | 5,857,535 | |||||||
Lorillard Tobacco Co., 6.875% due 5/1/2020 | BBB-/Baa2 | 5,000,000 | 5,544,640 | |||||||
UST, Inc., 5.75% due 3/1/2018 | BBB/NR | 1,000,000 | 1,149,847 | |||||||
|
| |||||||||
| 29,827,152 | ||||||||||
|
| |||||||||
HEALTH CARE EQUIPMENT & SERVICES — 0.08% | ||||||||||
HEALTH CARE PROVIDERS & SERVICES — 0.08% | ||||||||||
Wellpoint, Inc., 6.00% due 2/15/2014 | A-/Baa1 | 1,000,000 | 1,105,118 | |||||||
|
| |||||||||
| 1,105,118 | ||||||||||
|
| |||||||||
HOTELS RESTAURANTS & LEISURE — 0.34% | ||||||||||
HOTELS, RESTAURANTS & LEISURE — 0.34% | ||||||||||
bHyatt Hotels Corps., 5.75% due 8/15/2015 | BBB/Baa2 | 2,500,000 | 2,664,255 | |||||||
dTDIC Finance Ltd., 6.50% due 7/2/2014 | AA/A1 | 2,000,000 | 2,175,000 | |||||||
|
| |||||||||
| 4,839,255 | ||||||||||
|
| |||||||||
INSURANCE — 4.91% | ||||||||||
INSURANCE — 4.91% | ||||||||||
Aflac, Inc., 8.50% due 5/15/2019 | A-/A3 | 3,000,000 | 3,651,738 | |||||||
Alterra Finance LLC, 6.25% due 9/30/2020 | BBB/Baa2 | 3,000,000 | 3,262,428 | |||||||
Aon Corp., 3.50% due 9/30/2015 | BBB+/Baa2 | 1,000,000 | 1,032,027 | |||||||
CNA Financial Corp., 6.50% due 8/15/2016 | BBB-/Baa3 | 2,035,000 | 2,186,176 | |||||||
CNA Financial Corp., 7.35% due 11/15/2019 | BBB-/Baa3 | 2,507,000 | 2,776,234 | |||||||
Fidelity National Financial, 6.60% due 5/15/2017 | BBB-/Baa3 | 6,000,000 | 6,320,994 | |||||||
bForethought Financial Group, Inc., 8.625% due 4/15/2021 | BBB-/Baa3 | 5,700,000 | 5,868,902 | |||||||
bGenworth Life Institutional Fund, 5.875% due 5/3/2013 | A/A2 | 1,000,000 | 1,015,131 | |||||||
Hanover Insurance Group, 6.375% due 6/15/2021 | BBB-/Baa3 | 2,000,000 | 2,096,554 | |||||||
Hartford Financial Services Group, Inc., 4.625% due 7/15/2013 | BBB/Baa3 | 5,370,000 | 5,458,691 | |||||||
bLiberty Mutual Group, Inc., 5.75% due 3/15/2014 | BBB-/Baa2 | 1,000,000 | 1,041,789 | |||||||
Lincoln National Corp., 4.75% due 2/15/2014 | A-/Baa2 | 1,000,000 | 1,054,688 | |||||||
bMet Life Global Funding I, 0.996% due 1/10/2014 | AA-/Aa3 | 6,000,000 | 5,993,238 | |||||||
dMontpelier Re Holdings Ltd., 6.125% due 8/15/2013 | BBB/NR | 7,035,000 | 7,200,548 | |||||||
bPacific Life Global Funding CPI Floating Rate Note, 5.74% due 2/6/2016 | A+/A1 | 8,000,000 | 8,075,120 | |||||||
Progressive Corp., 3.75% due 8/23/2021 | A+/A1 | 1,000,000 | 1,020,035 | |||||||
b,dQBE Insurance Group Ltd., 5.647% due 7/1/2023 | BBB+/Baa1 | 7,000,000 | 6,575,226 | |||||||
Unitrin, Inc., 6.00% due 11/30/2015 | BBB-/Baa3 | 5,000,000 | 5,252,280 | |||||||
|
| |||||||||
| 69,881,799 | ||||||||||
|
| |||||||||
MATERIALS — 2.37% | ||||||||||
CHEMICALS — 0.94% | ||||||||||
bChevron Phillips Chemical, 7.00% due 6/15/2014 | BBB/Baa1 | 5,000,000 | 5,586,950 | |||||||
22 Certified Annual Report
| SCHEDULE OF INVESTMENTS, CONTINUED | ||
| Thornburg Limited Term Income Fund | September 30, 2011 | |
Issuer-Description | Credit Rating† S&P/Moody’s | Principal Amount | Value | |||||||
E.I. du Pont de Nemours & Co., 4.125% due 3/6/2013 | A/A2 | $ | 325,000 | $ | 338,693 | |||||
bIncitec Pivot Ltd., 4.00% due 12/7/2015 | NR/NR | 3,000,000 | 3,057,876 | |||||||
RPM International, Inc., 6.125% due 10/15/2019 | BBB-/Baa3 | 4,000,000 | 4,319,728 | |||||||
CONSTRUCTION MATERIALS — 0.34% | ||||||||||
CRH America, Inc., 8.125% due 7/15/2018 | BBB+/Baa1 | 4,150,000 | 4,854,039 | |||||||
CONTAINERS & PACKAGING — 0.14% | ||||||||||
eBemis Company, Inc., 4.50% due 10/15/2021 | BBB/Baa1 | 2,000,000 | 2,024,052 | |||||||
METALS & MINING — 0.95% | ||||||||||
b,dAnglo American Capital, 9.375% due 4/8/2014 | BBB+/Baa1 | 1,000,000 | 1,161,683 | |||||||
dArcelormittal, 9.85% due 6/1/2019 | BBB-/Baa3 | 4,100,000 | 4,645,591 | |||||||
dArcelormittal, 3.75% due 8/5/2015 | BBB-/Baa3 | 3,000,000 | 2,801,103 | |||||||
b,dKinross Gold Corp., 3.625% due 9/1/2016 | BBB-/Baa3 | 5,000,000 | 4,939,380 | |||||||
|
| |||||||||
| 33,729,095 | ||||||||||
|
| |||||||||
MEDIA — 0.87% | ||||||||||
MEDIA — 0.87% | ||||||||||
DIRECTV Holdings LLC/DIRECTV Financing Co., Inc., 7.625% due 5/15/2016 | BBB/Baa2 | 5,000,000 | 5,375,000 | |||||||
Time Warner Cable, Inc., 4.00% due 9/1/2021 | BBB/Baa2 | 2,000,000 | 1,955,836 | |||||||
Time Warner Cable, Inc., 5.40% due 7/2/2012 | BBB/Baa2 | 3,000,000 | 3,096,471 | |||||||
Time Warner Cable, Inc., 7.50% due 4/1/2014 | BBB/Baa2 | 1,500,000 | 1,696,668 | |||||||
Time Warner Cable, Inc., 8.05% due 1/15/2016 | BBB/Baa2 | 200,000 | 236,213 | |||||||
|
| |||||||||
| 12,360,188 | ||||||||||
|
| |||||||||
PHARMACEUTICALS, BIOTECHNOLOGY & LIFE SCIENCES — 1.30% | ||||||||||
BIOTECHNOLOGY — 1.16% | ||||||||||
Biogen Idec, Inc., 6.875% due 3/1/2018 | BBB+/Baa3 | 10,000,000 | 12,250,460 | |||||||
Genzyme Corp., 3.625% due 6/15/2015 | AA-/A2 | 3,000,000 | 3,208,341 | |||||||
aGenzyme Corp., 5.00% due 6/15/2020 | AA-/A2 | 1,000,000 | 1,153,013 | |||||||
PHARMACEUTICALS — 0.14% | ||||||||||
cTiers Inflation Linked Trust Series Wyeth 2004-21 Trust Certificate CPI Floating Rate Note, 5.409% due 2/1/2014 | AA/A1 | 2,000,000 | 1,962,160 | |||||||
|
| |||||||||
| 18,573,974 | ||||||||||
|
| |||||||||
REAL ESTATE — 0.30% | ||||||||||
REAL ESTATE INVESTMENT TRUSTS — 0.30% | ||||||||||
Commonwealth REIT (HRPT Properties), 6.25% due 6/15/2017 | BBB/Baa2 | 4,000,000 | 4,301,596 | |||||||
|
| |||||||||
| 4,301,596 | ||||||||||
|
| |||||||||
RETAILING — 1.24% | ||||||||||
MULTILINE RETAIL — 0.55% | ||||||||||
Family Dollar Stores, Inc., 5.00% due 2/1/2021 | BBB-/Baa3 | 8,000,000 | 7,837,304 | |||||||
SPECIALTY RETAIL — 0.69% | ||||||||||
Best Buy Co., Inc., 3.75% due 3/15/2016 | BBB-/Baa2 | 5,000,000 | 4,846,830 | |||||||
Best Buy Co., Inc., 6.75% due 7/15/2013 | BBB-/Baa2 | 3,000,000 | 3,218,898 | |||||||
Staples, Inc., 9.75% due 1/15/2014 | BBB/Baa2 | 1,500,000 | 1,738,571 | |||||||
|
| |||||||||
| 17,641,603 | ||||||||||
|
| |||||||||
SEMICONDUCTORS & SEMICONDUCTOR EQUIPMENT — 1.46% | ||||||||||
SEMICONDUCTORS & SEMICONDUCTOR EQUIPMENT — 1.46% | ||||||||||
Intel Corp., 3.30% due 10/1/2021 | A+/A1 | 1,725,000 | 1,762,160 | |||||||
Intel Corp., 1.95% due 10/1/2016 | A+/A1 | 2,700,000 | 2,719,481 | |||||||
Certified Annual Report 23
| SCHEDULE OF INVESTMENTS, CONTINUED | ||
| Thornburg Limited Term Income Fund | September 30, 2011 | |
Issuer-Description | Credit Rating† S&P/Moody’s | Principal Amount | Value | |||||||||
KLA Tencor Corp., 6.90% due 5/1/2018 | BBB/Baa1 | $ | 14,314,000 | $ | 16,355,863 | |||||||
|
| |||||||||||
| 20,837,504 | ||||||||||||
|
| |||||||||||
SOFTWARE & SERVICES — 1.17% | ||||||||||||
INFORMATION TECHNOLOGY SERVICES — 0.83% | ||||||||||||
Computer Sciences Corp., 6.50% due 3/15/2018 | A-/Baa1 | 6,000,000 | 6,480,822 | |||||||||
Computer Sciences Corp., 5.50% due 3/15/2013 | A-/Baa1 | 1,000,000 | 1,047,322 | |||||||||
Electronic Data Systems Corp., 6.00% due 8/1/2013 | A/A2 | 1,000,000 | 1,072,238 | |||||||||
bSAIC, Inc., 4.45% due 12/1/2020 | A-/A3 | 2,000,000 | 2,167,558 | |||||||||
Western Union Co., 6.50% due 2/26/2014 | A-/A3 | 1,000,000 | 1,102,331 | |||||||||
SOFTWARE — 0.34% | ||||||||||||
BMC Software, Inc., 7.25% due 6/1/2018 | BBB+/Baa2 | 4,000,000 | 4,797,244 | |||||||||
|
| |||||||||||
| 16,667,515 | ||||||||||||
|
| |||||||||||
TECHNOLOGY HARDWARE & EQUIPMENT — 0.04% | ||||||||||||
COMPUTERS & PERIPHERALS — 0.04% | ||||||||||||
Dell, Inc., 5.625% due 4/15/2014 | A-/A2 | 500,000 | 543,681 | |||||||||
|
| |||||||||||
| 543,681 | ||||||||||||
|
| |||||||||||
TELECOMMUNICATION SERVICES — 3.35% | ||||||||||||
DIVERSIFIED TELECOMMUNICATION SERVICES — 2.32% | ||||||||||||
AT&T, Inc., 4.85% due 2/15/2014 | A-/A2 | 1,000,000 | 1,075,040 | |||||||||
dFrance Telecom, 4.125% due 9/14/2021 | A-/A3 | 3,000,000 | 2,982,282 | |||||||||
dFrance Telecom, 2.75% due 9/14/2016 | A-/A3 | 3,000,000 | 2,976,933 | |||||||||
bHidden Ridge Facility, 5.65% due 1/1/2022 | NR/Baa1 | 4,472,178 | 4,473,744 | |||||||||
Michigan Bell Telephone Co., 7.85% due 1/15/2022 | A-/NR | 3,000,000 | 3,783,192 | |||||||||
b,dQtel International Finance Ltd., 3.375% due 10/14/2016 | A/A2 | 500,000 | 500,312 | |||||||||
b,dQtel International Finance Ltd., 6.50% due 6/10/2014 | A/A2 | 1,000,000 | 1,088,125 | |||||||||
eQwest Corp., 6.75% due 12/1/2021 | BBB-/Baa3 | 3,000,000 | 2,932,500 | |||||||||
dTelecom Italia Capital SA, 6.175% due 6/18/2014 | BBB/Baa2 | 3,000,000 | 2,985,480 | |||||||||
dTelefonica Emisiones SAU, 6.421% due 6/20/2016 | BBB+/Baa1 | 10,000,000 | 10,252,400 | |||||||||
WIRELESS TELECOMMUNICATION SERVICES — 1.03% | ||||||||||||
dAmerica Movil S.A.B. de C.V., 2.375% due 9/8/2016 | A-/A2 | 2,500,000 | 2,417,500 | |||||||||
dAmerica Movil S.A.B. de C.V., 5.00% due 10/16/2019 | A-/A2 | 5,000,000 | 5,320,000 | |||||||||
bCrown Castle Towers LLC, 6.113% due 1/15/2040 | NR/A2 | 3,795,000 | 4,265,576 | |||||||||
b,cRichland Towers, 4.606% due 3/15/2016 | NR/NR | 2,675,127 | 2,618,896 | |||||||||
|
| |||||||||||
| 47,671,980 | ||||||||||||
|
| |||||||||||
TRANSPORTATION — 2.51% | ||||||||||||
AIR FREIGHT & LOGISTICS — 0.06% | ||||||||||||
FedEx Corp., 8.76% due 5/22/2015 | BBB/Baa1 | 795,917 | 890,798 | |||||||||
AIRLINES — 1.67% | ||||||||||||
eAmerican Airlines Pass Through Trust, 8.625% due 10/15/2021 | NR/NR | 2,000,000 | 2,000,000 | |||||||||
bAviation Capital Group, 6.75% due 4/6/2021 | BBB-/NR | 3,000,000 | 2,886,330 | |||||||||
bAviation Capital Group, 7.125% due 10/15/2020 | BBB-/NR | 6,912,000 | 6,850,760 | |||||||||
Continental Airlines, 6.90% due 1/2/2018 | BBB+/Baa2 | 131,042 | 133,663 | |||||||||
Delta Air Lines, Inc., 6.20% due 7/2/2018 | A-/Baa2 | 2,358,164 | 2,428,909 | |||||||||
c,dIberbond plc, 4.826% due 12/24/2017 | NR/NR | 7,783,148 | 7,510,738 | |||||||||
United Airlines, Inc. Pass Through Certificates, 10.40% due 5/1/2018 | BBB+/Baa2 | 1,818,241 | 1,963,700 | |||||||||
ROAD & RAIL — 0.78% | ||||||||||||
b,dAsciano Finance, 5.00% due 4/7/2018 | BBB-/Baa2 | 2,000,000 | 2,044,958 | |||||||||
b,dAsciano Finance, 4.625% due 9/23/2020 | BBB-/Baa2 | 5,000,000 | 4,872,505 | |||||||||
24 Certified Annual Report
| SCHEDULE OF INVESTMENTS, CONTINUED | ||
| Thornburg Limited Term Income Fund | September 30, 2011 | |
Issuer-Description | Credit Rating† S&P/Moody’s | Principal Amount | Value | |||||||
Ryder System, Inc., 3.50% due 6/1/2017 | BBB+/Baa1 | $ | 4,000,000 | $ | 4,145,824 | |||||
|
| |||||||||
| 35,728,185 | ||||||||||
|
| |||||||||
UTILITIES — 8.10% | ||||||||||
ELECTRIC UTILITIES — 5.98% | ||||||||||
Centerpoint Energy, 7.00% due 3/1/2014 | BBB+/A3 | 2,000,000 | 2,252,914 | |||||||
Commonwealth Edison Co., 6.15% due 3/15/2012 | A-/Baa1 | 910,000 | 931,063 | |||||||
b,dE.ON International Finance BV, 5.80% due 4/30/2018 | A/A2 | 2,000,000 | 2,293,754 | |||||||
b,dElectricite de France SA, 5.50% due 1/26/2014 | AA-/Aa3 | 1,250,000 | 1,338,854 | |||||||
Empire District Electric Co., 4.65% due 5/28/2020 | BBB+/A3 | 3,000,000 | 3,272,439 | |||||||
b,dEnel Finance International S.A., 6.25% due 9/15/2017 | A-/A2 | 5,000,000 | 5,049,580 | |||||||
Entergy Louisiana LLC, 4.80% due 5/1/2021 | A-/A3 | 4,300,000 | 4,650,080 | |||||||
Entergy Texas, Inc., 3.60% due 6/1/2015 | BBB+/Baa2 | 3,000,000 | 3,130,773 | |||||||
Entergy Texas, Inc., 7.125% due 2/1/2019 | BBB+/Baa2 | 2,000,000 | 2,424,572 | |||||||
bGreat River Energy Series 2007-A, 5.829% due 7/1/2017 | A-/A3 | 2,738,456 | 3,054,556 | |||||||
Gulf Power Co., 4.35% due 7/15/2013 | A/A3 | 925,000 | 966,830 | |||||||
b,dIberdrola Finance Ireland Ltd., 3.80% due 9/11/2014 | A-/A3 | 6,000,000 | 5,988,660 | |||||||
Idaho Power Corp., 6.025% due 7/15/2018 | A-/A2 | 1,000,000 | 1,206,150 | |||||||
bKincaid Generation LLC, 7.33% due 6/15/2020 | BBB-/Baa3 | 7,895,565 | 9,336,348 | |||||||
b,dKorea Hydro & Nuclear Power Co., Ltd., 4.75% due 7/13/2021 | A/A1 | 7,000,000 | 6,984,894 | |||||||
b,dKorea Southern Power Co., 5.375% due 4/18/2013 | A/NR | 1,000,000 | 1,039,420 | |||||||
Metropolitan Edison Co., 7.70% due 1/15/2019 | BBB-/Baa2 | 2,250,000 | 2,847,710 | |||||||
b,cMidland Cogen Venture, 6.00% due 3/15/2025 | BBB-/NR | 8,000,000 | 8,080,000 | |||||||
a,bMonongahela Power Co., 5.70% due 3/15/2017 | BBB+/Baa1 | 2,200,000 | 2,473,003 | |||||||
MP Environmental, 4.982% due 7/1/2014 | AAA/Aaa | 2,202,963 | 2,320,409 | |||||||
bRochester Gas & Electric, 5.90% due 7/15/2019 | A-/A3 | 7,382,000 | 8,218,204 | |||||||
Steelriver Transmission Co. LLC, 4.71% due 6/30/2017 | NR/Baa2 | 3,861,658 | 3,989,904 | |||||||
Toledo Edison Co., 7.25% due 5/1/2020 | BBB/Baa1 | 1,000,000 | 1,264,762 | |||||||
dTransAlta Corp., 4.75% due 1/15/2015 | BBB/Baa2 | 2,000,000 | 2,124,608 | |||||||
GAS UTILITIES — 0.48% | ||||||||||
b,dENN Energy Holdings Ltd., 6.00% due 5/13/2021 | BBB-/Baa3 | 5,000,000 | 4,834,110 | |||||||
bMaritimes & North East Pipeline, 7.50% due 5/31/2014 | BBB/Baa3 | 1,837,600 | 1,986,335 | |||||||
MULTI-UTILITIES — 1.64% | ||||||||||
Ameren Energy Generating Co., 7.00% due 4/15/2018 | BBB-/Ba1 | 2,000,000 | 2,025,000 | |||||||
Black Hills Corp., 5.875% due 7/15/2020 | BBB-/Baa3 | 5,000,000 | 5,676,800 | |||||||
bEnogex LLC, 6.875% due 7/15/2014 | BBB+/Baa3 | 4,000,000 | 4,391,060 | |||||||
bEnogex LLC, 6.25% due 3/15/2020 | BBB+/Baa3 | 2,500,000 | 2,836,782 | |||||||
bPower Receivables Financing LLC, 6.29% due 1/1/2012 | NR/NR | 978,077 | 979,036 | |||||||
b,dTaqa Abu Dhabi National Energy Co., 6.60% due 8/1/2013 | NR/A3 | 5,000,000 | 5,325,000 | |||||||
Union Electric Co., 4.65% due 10/1/2013 | BBB+/A3 | 2,000,000 | 2,126,884 | |||||||
|
| |||||||||
| 115,420,494 | ||||||||||
|
| |||||||||
TOTAL CORPORATE BONDS (Cost $751,514,162) | 770,804,970 | |||||||||
|
| |||||||||
CONVERTIBLE BONDS — 0.53% | ||||||||||
DIVERSIFIED FINANCIALS — 0.53% | ||||||||||
CAPITAL MARKETS — 0.53% | ||||||||||
bApollo Investment Corp., 5.75% due 1/15/2016 | BBB/NR | 8,500,000 | 7,480,000 | |||||||
|
| |||||||||
TOTAL CONVERTIBLE BONDS (Cost $8,387,918) | 7,480,000 | |||||||||
|
| |||||||||
MUNICIPAL BONDS — 9.54% | ||||||||||
American Campus Properties Student Housing, 7.38% due 9/1/2012 (Insured: Natl-Re) | BBB/Baa1 | 685,000 | 691,295 | |||||||
Certified Annual Report 25
| SCHEDULE OF INVESTMENTS, CONTINUED | ||
| Thornburg Limited Term Income Fund | September 30, 2011 | |
Issuer-Description | Credit Rating† S&P/Moody’s | Principal Amount | Value | |||||||
American Fork City Utah Sales, 5.07% due 3/1/2013 (Insured: AGM) | AA+/Aa3 | $ | 120,000 | $ | 125,752 | |||||
American Municipal Power Ohio, Inc., 5.072% due 2/15/2018 | A/A3 | 5,000,000 | 5,402,100 | |||||||
Anaheim California Public Financing Authority, 5.316% due 9/1/2017 (Insured: Natl Re/FGIC) | BBB+/A1 | 2,095,000 | 2,092,486 | |||||||
Anaheim California Public Financing Authority, 5.486% due 9/1/2020 (Insured: Natl-Re/FGIC) | BBB+/A1 | 3,270,000 | 3,359,402 | |||||||
Brentwood California Infrastructure Financing Authority, 6.16% due 10/1/2019 | AA-/NR | 2,110,000 | 2,362,757 | |||||||
California Health Facilities Financing Authority, 6.76% due 2/1/2019 | A-/NR | 3,905,000 | 4,518,788 | |||||||
California School Finance Authority, 5.041% due 7/1/2020 (LOC: City National Bank) | AA+/NR | 4,000,000 | 4,295,560 | |||||||
Camden County New Jersey, 5.47% due 7/1/2018 | A+/A2 | 2,140,000 | 2,298,210 | |||||||
Camden County New Jersey, 5.62% due 7/1/2019 | A+/A2 | 3,025,000 | 3,244,433 | |||||||
Carson California Redevelopment Agency, 4.511% due 10/1/2016 | A-/NR | 5,000,000 | 4,995,000 | |||||||
Cleveland Cuyahoga County Ohio, 6.10% due 5/15/2013 | BBB-/NR | 555,000 | 558,330 | |||||||
Connecticut Housing Finance Authority, 5.071% due 11/15/2019 | AAA/Aaa | 3,775,000 | 3,937,363 | |||||||
Cook County Illinois School District 083, 4.875% due 12/1/2011 (Insured: AGM) | NR/Aa3 | 150,000 | 151,175 | |||||||
Florida State Board of Education, 3.60% due 6/1/2015 | AAA/Aa1 | 3,000,000 | 3,241,950 | |||||||
Fort Collins Colorado Electric Utility, 4.92% due 12/1/2020 | AA-/NR | 2,250,000 | 2,423,587 | |||||||
George Washington University, 4.411% due 9/15/2017 | A+/A1 | 1,750,000 | 1,869,735 | |||||||
Hanover Pennsylvania Area School District Notes, 4.47% due 3/15/2013 (Insured: AGM) | AA+/Aa3 | 1,385,000 | 1,455,192 | |||||||
Illinois Finance Authority Revenue Bonds, 5.629% due 7/1/2016 (Insured: Syncora) | A+/NR | 1,735,000 | 1,780,787 | |||||||
Los Angeles California Department of Airports, 5.175% due 5/15/2017 | AA-/A1 | 4,000,000 | 4,303,960 | |||||||
Los Angeles California Municipal Improvement Corp., 6.165% due 11/1/2020 | A+/A3 | 10,000,000 | 11,463,000 | |||||||
Los Angeles County California Public Works Financing Authority, 5.591% due 8/1/2020 | A+/A1 | 3,000,000 | 3,261,330 | |||||||
Louisiana Public Facilities Authority, 5.72% due 7/1/2015 (Insured: CIFG) | AA+/Aa3 | 1,795,000 | 1,781,699 | |||||||
Maine Finance Authority Waste Motor Oil, 4.55% due 10/1/2014 | A/NR | 1,125,000 | 1,180,327 | |||||||
Menomonee Falls Wisconsin GO, 4.25% due 11/1/2014 | NR/Aa2 | 3,350,000 | 3,507,148 | |||||||
bMidwest Family Housing, 5.168% due 7/1/2016 (Insured: CIFG) | NR/NR | 1,185,000 | 1,174,939 | |||||||
Mississippi Development Bank Special Obligation, 5.21% due 7/1/2013 (Insured: AGM) | AA+/NR | 1,200,000 | 1,280,376 | |||||||
aNew York City Transitional Finance Authority Revenue, 4.075% due 11/1/2020 | AAA/Aa1 | 2,500,000 | 2,708,150 | |||||||
New York State Urban Development Corp., 4.75% due 12/15/2011 | AAA/NR | 1,400,000 | 1,413,174 | |||||||
New York, New York GO, 3.48% due 10/1/2018 | AA/Aa2 | 3,500,000 | 3,678,430 | |||||||
North Carolina Eastern Municipal Power, 4.43% due 1/1/2014 | A-/Baa1 | 2,000,000 | 2,078,620 | |||||||
Oakland California Redevelopment Agency, 8.00% due 9/1/2016 | A-/NR | 4,200,000 | 4,540,536 | |||||||
Ohio Housing Financing Agency Mtg, 5.20% due 9/1/2014 (GNMA/FNMA) | NR/Aaa | 2,395,000 | 2,564,734 | |||||||
Ohio State Taxable Development Assistance, 4.88% due 10/1/2011 (Insured: Natl-Re) | AA/Aa2 | 550,000 | 550,061 | |||||||
Oklahoma Development Finance Authority, 8.00% due 5/1/2020 | NR/NR | 8,500,000 | 8,628,435 | |||||||
Port St. Lucie Florida Lease Revenue, 4.457% due 9/1/2014 (Wyndcrest) | A/Aa3 | 1,470,000 | 1,502,943 | |||||||
Redlands California Redevelopment Agency, 5.818% due 8/1/2022 (Insured: AMBAC) | A-/NR | 2,415,000 | 2,453,205 | |||||||
Riverside California Sewer Revenue, 5.61% due 8/1/2017 | AA/Aa2 | 2,000,000 | 2,298,600 | |||||||
San Bernardino County California San Sevaine Redevelopment Agency, 7.135% due 9/1/2020 | BBB/NR | 2,005,000 | 2,085,882 | |||||||
San Francisco California City and County Redevelopment Financing Authority, 8.00% due 8/1/2019 | A/A1 | 6,500,000 | 7,471,425 | |||||||
San Jose California Redevelopment Agency Tax Allocation, 3.447% due 8/1/2013 | A/A2 | 1,000,000 | 1,023,320 | |||||||
San Jose California Redevelopment Agency Tax Allocation, 4.281% due 8/1/2014 | A/A2 | 750,000 | 787,590 | |||||||
San Luis Obispo County California, 7.45% due 9/1/2019 | AA-/NR | 3,950,000 | 4,695,720 | |||||||
San Marcos California Redevelopment Agency, 6.125% due 10/1/2018 | AA-/NR | 5,000,000 | 5,252,100 | |||||||
Springfield Ohio City School District Tax Anticipation Notes, 6.40% due 12/1/2011 (Insured: AMBAC) | NR/NR | 1,500,000 | 1,509,255 | |||||||
Tazewell County Illinois Community High School, 5.20% due 12/1/2011 (Insured: AGM) | NR/Aa3 | 355,000 | 357,698 | |||||||
Victor New York, 9.20% due 5/1/2014 | NR/NR | 710,000 | 740,125 | |||||||
Wisconsin State Health and Educational Facilities, 7.08% due 6/1/2016 (Insured: ACA) | NR/NR | 1,680,000 | 1,649,945 | |||||||
Yuba California Levee Financing Authority, 6.375% due 9/1/2021 | AA+/NR | 1,000,000 | 1,076,980 | |||||||
|
| |||||||||
TOTAL MUNICIPAL BONDS (Cost $127,568,817) | 135,823,609 | |||||||||
|
| |||||||||
26 Certified Annual Report
| SCHEDULE OF INVESTMENTS, CONTINUED | ||
| Thornburg Limited Term Income Fund | September 30, 2011 | |
Issuer-Description | Credit Rating† S&P/Moody’s | Principal Amount | Value | |||||||
SHORT TERM INVESTMENTS — 7.23% | ||||||||||
McCormick & Co., 0.10% due 10/3/2011 | NR/NR | $ | 40,000,000 | $ | 39,999,777 | |||||
Northern Illinois Gas Corp, 0.10% due 10/3/2011 | NR/NR | 63,000,000 | 62,999,650 | |||||||
|
| |||||||||
TOTAL SHORT TERM INVESTMENTS (Cost $102,999,426) | 102,999,427 | |||||||||
|
| |||||||||
TOTAL INVESTMENTS — 99.26% (Cost $1,383,987,824) | $ | 1,413,706,897 | ||||||||
OTHER ASSETS LESS LIABILITIES — 0.74% | 10,537,097 | |||||||||
|
| |||||||||
NET ASSETS — 100.00% | $ | 1,424,243,994 | ||||||||
|
| |||||||||
Footnote Legend
| † | Credit ratings are unaudited. Rating changes may have occurred subsequent to the reporting period end. |
| a | Segregated as collateral for a when-issued security. |
| b | Securities exempt from registration under Rule 144A of the Securities Act of 1933, as amended. These securities may only be resold in the ordinary course of business in transactions exempt from registration, normally to qualified institutional buyers. As of September 30, 2011, the aggregate value of these securities in the Fund’s portfolio was $356,986,763, representing 25.07% of the Fund’s net assets. |
| c | Security currently fair valued by the valuation and pricing committee using procedures approved by the Trustees. |
| d | Yankee Bond - Denominated in U.S. dollars and is issued in the U.S. by foreign banks and corporations. |
| e | When-issued security. |
Portfolio Abbreviations
To simplify the listings of securities, abbreviations are used per the table below:
| ACA | Insured by American Capital Access | |
| AGM | Insured by Assured Guaranty Municipal Corp. | |
| AMBAC | Insured by American Municipal Bond Assurance Corp. | |
| CIFG | CIFG Assurance North America Inc. | |
| CMO | Collateralized Mortgage Obligation | |
| CPI | Consumer Price Index | |
| CUPIDS | Cumulative Undivided Preferred Interests in Debt Securities | |
| FCB | Farm Credit Bank | |
| FGIC | Insured by Financial Guaranty Insurance Co. | |
| FNMA | Collateralized by Federal National Mortgage Association | |
| GNMA | Insured by Government National Mortgage Association | |
| GO | General Obligation | |
| LOC | Letter of Credit | |
| Mtg | Mortgage | |
| Natl-Re | Insured by National Public Finance Guarantee Corp. | |
| REIT | Real Estate Investment Trust | |
| REMIC | Real Estate Mortgage Investment Conduit | |
| Syncora | Insured by Syncora Guarantee Inc. | |
| VA | Veterans Affairs |
See notes to financial statements.
Certified Annual Report 27
| STATEMENTS OF ASSETS AND LIABILITIES | ||
| Thornburg Limited Term Income Funds | September 30, 2011 | |
| Thornburg Limited Term U.S. Government Fund | Thornburg Limited Term Income Fund | |||||||
ASSETS | ||||||||
Investments at value (cost $348,857,231 and $1,383,987,824) (Note 2) | $ | 361,996,745 | $ | 1,413,706,897 | ||||
Cash | 43,228,059 | 804,919 | ||||||
Receivable for investments sold | — | 1,498,597 | ||||||
Receivable for fund shares sold | 4,518,118 | 13,526,994 | ||||||
Interest receivable | 2,260,628 | 13,459,683 | ||||||
Prepaid expenses and other assets | 36,776 | 49,204 | ||||||
|
|
|
| |||||
Total Assets | 412,040,326 | 1,443,046,294 | ||||||
|
|
|
| |||||
LIABILITIES | ||||||||
Payable for investments purchased | 7,944,694 | 13,268,360 | ||||||
Payable for fund shares redeemed | 357,306 | 3,630,533 | ||||||
Payable to investment advisor and other affiliates (Note 3) | 241,127 | 894,293 | ||||||
Accounts payable and accrued expenses | 105,949 | 250,154 | ||||||
Dividends payable | 157,821 | 758,960 | ||||||
|
|
|
| |||||
Total Liabilities | 8,806,897 | 18,802,300 | ||||||
|
|
|
| |||||
NET ASSETS | $ | 403,233,429 | $ | 1,424,243,994 | ||||
|
|
|
| |||||
NET ASSETS CONSIST OF: | ||||||||
Undistributed net investment income | $ | 715,121 | $ | 1,167,161 | ||||
Net unrealized appreciation on investments | 13,139,514 | 29,719,073 | ||||||
Accumulated net realized gain (loss) | (991,582 | ) | 9,833,764 | |||||
Net capital paid in on shares of beneficial interest | 390,370,376 | 1,383,523,996 | ||||||
|
|
|
| |||||
| $ | 403,233,429 | $ | 1,424,243,994 | |||||
|
|
|
| |||||
28 Certified Annual Report
| STATEMENTS OF ASSETS AND LIABILITIES, CONTINUED | ||
| Thornburg Limited Term Income Funds | September 30, 2011 | |
| Thornburg Limited Term U.S. Government Fund | Thornburg Limited Term Income Fund | |||||||
NET ASSET VALUE: | ||||||||
Class A Shares: | ||||||||
Net asset value and redemption price per share ($202,910,305 and $578,730,681 applicable to 14,598,004 and 43,439,586 shares of beneficial interest outstanding - Note 4) | $ | 13.90 | $ | 13.32 | ||||
Maximum sales charge, 1.50% of offering price | 0.21 | 0.20 | ||||||
|
|
|
| |||||
Maximum offering price per share | $ | 14.11 | $ | 13.52 | ||||
|
|
|
| |||||
Class B Shares: | ||||||||
Net asset value and offering price per share * ($4,367,900 applicable to 314,957 shares of beneficial interest outstanding - Note 4) | $ | 13.87 | $ | — | ||||
|
|
|
| |||||
Class C Shares: | ||||||||
Net asset value and offering price per share * ($100,212,235 and $366,822,215 applicable to 7,166,143 and 27,578,627 shares of beneficial interest outstanding - Note 4) | $ | 13.98 | $ | 13.30 | ||||
|
|
|
| |||||
Class I Shares: | ||||||||
Net asset value, offering and redemption price per share ($82,994,042 and $448,669,451 applicable to 5,971,197 and 33,671,609 shares of beneficial interest outstanding - Note 4) | $ | 13.90 | $ | 13.32 | ||||
|
|
|
| |||||
Class R3 Shares: | ||||||||
Net asset value, offering and redemption price per share ($12,748,947 and $30,021,647 applicable to 916,673 and 2,251,947 shares of beneficial interest outstanding - Note 4) | $ | 13.91 | $ | 13.33 | ||||
|
|
|
| |||||
| * | Redemption price per share is equal to net asset value less any applicable contingent deferred sales charge. |
See notes to financial statements.
Certified Annual Report 29
| STATEMENTS OF OPERATIONS | ||
| Thornburg Limited Term Income Funds | Year Ended September 30, 2011 | |
| Thornburg Limited Term U.S. Government Fund | Thornburg Limited Term Income Fund | |||||||
INVESTMENT INCOME: | ||||||||
Interest income (net of premium amortized of $1,407,101 and $4,031,727 and net of paydown losses of $1,821,465 and $1,096,289) | $ | 11,744,279 | $ | 50,192,610 | ||||
|
|
|
| |||||
EXPENSES: | ||||||||
Investment advisory fees (Note 3) | 1,331,383 | 5,295,749 | ||||||
Administration fees (Note 3) | ||||||||
Class A Shares | 230,566 | 593,296 | ||||||
Class B Shares | 5,345 | — | ||||||
Class C Shares | 119,074 | 372,160 | ||||||
Class I Shares | 29,361 | 170,565 | ||||||
Class R3 Shares | 15,405 | 28,679 | ||||||
Distribution and service fees (Note 3) | ||||||||
Class A Shares | 461,133 | 1,186,590 | ||||||
Class B Shares | 42,310 | — | ||||||
Class C Shares | 475,060 | 1,493,298 | ||||||
Class R3 Shares | 61,548 | 114,976 | ||||||
Transfer agent fees | ||||||||
Class A Shares | 152,441 | 427,470 | ||||||
Class B Shares | 9,531 | — | ||||||
Class C Shares | 94,941 | 252,149 | ||||||
Class I Shares | 32,832 | 205,122 | ||||||
Class R3 Shares | 13,506 | 16,761 | ||||||
Registration and filing fees | ||||||||
Class A Shares | 23,925 | 48,924 | ||||||
Class B Shares | 18,551 | — | ||||||
Class C Shares | 20,903 | 39,018 | ||||||
Class I Shares | 24,215 | 42,872 | ||||||
Class R3 Shares | 19,340 | 20,915 | ||||||
Custodian fees (Note 3) | 79,068 | 157,778 | ||||||
Professional fees | 36,097 | 48,082 | ||||||
Accounting fees | 14,319 | 43,263 | ||||||
Trustee fees | 9,048 | 25,770 | ||||||
Other expenses | 45,389 | 145,903 | ||||||
|
|
|
| |||||
Total Expenses | 3,365,291 | 10,729,340 | ||||||
Less: | ||||||||
Expenses reimbursed by investment advisor (Note 3) | (39,446 | ) | (95,373 | ) | ||||
Fees paid indirectly (Note 3) | (27,167 | ) | (2,642 | ) | ||||
|
|
|
| |||||
Net Expenses | 3,298,678 | 10,631,325 | ||||||
|
|
|
| |||||
Net Investment Income | $ | 8,445,601 | $ | 39,561,285 | ||||
|
|
|
| |||||
30 Certified Annual Report
| STATEMENTS OF OPERATIONS, CONTINUED | ||
| Thornburg Limited Term Income Funds | Year Ended September 30, 2011 | |
| Thornburg Limited Term U.S. Government Fund | Thornburg Limited Term Income Fund | |||||||
REALIZED AND UNREALIZED GAIN (LOSS) | ||||||||
Net realized gain (loss) on investments | $ | 1,221,494 | $ | 11,878,682 | ||||
Net change in unrealized appreciation (depreciation) on investments | (931,450 | ) | (16,707,685 | ) | ||||
|
|
|
| |||||
Net Realized and Unrealized Gain (Loss) | 290,044 | (4,829,003 | ) | |||||
|
|
|
| |||||
Net Increase in Net Assets Resulting from Operations | $ | 8,735,645 | $ | 34,732,282 | ||||
|
|
|
| |||||
See notes to financial statements.
Certified Annual Report 31
STATEMENTS OF CHANGES IN NET ASSETS
Thornburg Limited Term U.S. Government Fund
| Year Ended September 30, 2011 | Year Ended September 30, 2010 | |||||||
INCREASE (DECREASE) IN NET ASSETS FROM | ||||||||
OPERATIONS: | ||||||||
Net investment income | $ | 8,445,601 | $ | 8,134,424 | ||||
Net realized gain (loss) on investments | 1,221,494 | 399,593 | ||||||
Net unrealized appreciation (depreciation) on investments | (931,450 | ) | 4,944,595 | |||||
|
|
|
| |||||
Net Increase (Decrease) in Net Assets Resulting from Operations | 8,735,645 | 13,478,612 | ||||||
DIVIDENDS TO SHAREHOLDERS: | ||||||||
From net investment income | ||||||||
Class A Shares | (5,372,127 | ) | (4,787,505 | ) | ||||
Class B Shares | (69,647 | ) | (93,775 | ) | ||||
Class C Shares | (2,517,254 | ) | (2,336,691 | ) | ||||
Class I Shares | (1,872,821 | ) | (1,098,052 | ) | ||||
Class R3 Shares | (347,035 | ) | (281,351 | ) | ||||
From realized gains | ||||||||
Class A Shares | — | (656,646 | ) | |||||
Class B Shares | — | (24,928 | ) | |||||
Class C Shares | — | (362,681 | ) | |||||
Class I Shares | — | (121,390 | ) | |||||
Class R3 Shares | — | (36,511 | ) | |||||
FUND SHARE TRANSACTIONS (NOTE 4): | ||||||||
Class A Shares | 14,142,048 | 44,591,116 | ||||||
Class B Shares | (816,910 | ) | (791,168 | ) | ||||
Class C Shares | 1,254,589 | 18,334,888 | ||||||
Class I Shares | 27,792,691 | 30,071,156 | ||||||
Class R3 Shares | 165,396 | 4,880,471 | ||||||
|
|
|
| |||||
Net Increase in Net Assets | 41,094,575 | 100,765,545 | ||||||
NET ASSETS: | ||||||||
Beginning of Year | 362,138,854 | 261,373,309 | ||||||
|
|
|
| |||||
End of Year | $ | 403,233,429 | $ | 362,138,854 | ||||
|
|
|
| |||||
Undistributed net investment income | $ | 715,121 | $ | 505,476 | ||||
See notes to financial statements.
32 Certified Annual Report
STATEMENTS OF CHANGES IN NET ASSETS
Thornburg Limited Term Income Fund
| Year Ended September 30, 2011 | Year Ended September 30, 2010 | |||||||
INCREASE (DECREASE) IN NET ASSETS FROM | ||||||||
OPERATIONS: | ||||||||
Net investment income | $ | 39,561,285 | $ | 29,111,142 | ||||
Net realized gain (loss) on investments | 11,878,682 | 6,846,697 | ||||||
Net unrealized appreciation (depreciation) on investments | (16,707,685 | ) | 29,472,905 | |||||
|
|
|
| |||||
Net Increase (Decrease) in Net Assets Resulting from Operations | 34,732,282 | 65,430,744 | ||||||
DIVIDENDS TO SHAREHOLDERS: | ||||||||
From net investment income | ||||||||
Class A Shares | (16,646,234 | ) | (13,393,395 | ) | ||||
Class C Shares | (9,679,993 | ) | (6,421,751 | ) | ||||
Class I Shares | (13,126,192 | ) | (8,976,616 | ) | ||||
Class R3 Shares | (797,810 | ) | (570,120 | ) | ||||
From realized gains | ||||||||
Class A Shares | (1,414,228 | ) | — | |||||
Class C Shares | (830,699 | ) | — | |||||
Class I Shares | (945,122 | ) | — | |||||
Class R3 Shares | (55,975 | ) | — | |||||
FUND SHARE TRANSACTIONS (NOTE 4): | ||||||||
Class A Shares | 123,252,312 | 199,893,182 | ||||||
Class C Shares | 110,921,477 | 131,265,249 | ||||||
Class I Shares | 155,891,117 | 139,106,146 | ||||||
Class R3 Shares | 11,342,497 | 7,986,395 | ||||||
|
|
|
| |||||
Net Increase in Net Assets | 392,643,432 | 514,319,834 | ||||||
NET ASSETS: | ||||||||
Beginning of Year | 1,031,600,562 | 517,280,728 | ||||||
|
|
|
| |||||
End of Year | $ | 1,424,243,994 | $ | 1,031,600,562 | ||||
|
|
|
| |||||
Undistributed net investment income | $ | 1,167,161 | $ | 469,534 | ||||
See notes to financial statements.
Certified Annual Report 33
| NOTES TO FINANCIAL STATEMENTS | ||
| Thornburg Limited Term Income Funds | September 30, 2011 | |
NOTE 1 – ORGANIZATION
Thornburg Limited Term U.S. Government Fund (the “Government Fund”) and Thornburg Limited Term Income Fund (the “Income Fund”), hereafter referred to collectively as the “Funds,” are diversified series of Thornburg Investment Trust (the “Trust”). The Trust is organized as a Massachusetts business trust under a Declaration of Trust dated June 3, 1987 and is registered as a diversified, open-end management investment company under the Investment Company Act of 1940, as amended. The Funds are currently two of sixteen separate series of the Trust. Each series is considered to be a separate entity for financial reporting and tax purposes and bears expenses directly attributable to it. The Funds’ primary objectives are to obtain as high a level of current income as is consistent, in the view of the Funds’ investment advisor, with the safety of capital. As a secondary objective, the Funds seek to reduce changes in their share prices compared to longer term portfolios.
The Government Fund currently has five classes of shares of beneficial interest outstanding: Class A, Class B, Class C, Institutional Class (Class I), and Retirement Class (Class R3). The Fund no longer offers Class B shares for sale. The Income Fund currently offers four classes of shares of beneficial interest outstanding, Class A, Class C, Institutional Class (Class I), and Retirement Class (Class R3). Each class of shares of the Funds represents an interest in the same portfolio of investments, except that (i) Class A shares are sold subject to a front-end sales charge collected at the time the shares are purchased and bear a service fee, (ii) Class B shares are sold at net asset value without a sales charge at the time of purchase, but are subject to a contingent deferred sales charge upon redemption and bear both a service fee and distribution fee, (iii) Class C shares are sold at net asset value without a sales charge at the time of purchase, but are subject to a contingent deferred sales charge upon redemption within one year of purchase, and bear both a service fee and a distribution fee, (iv) Class I shares are sold at net asset value without a sales charge at the time of purchase, (v) Class R3 shares are sold at net asset value without a sales charge, but bear both a service fee and a distribution fee, and (vi) the respective classes may have different reinvestment privileges and conversion rights. Additionally, each Fund may allocate among its classes certain expenses, to the extent allowable to specific classes, including transfer agent fees, government registration fees, certain printing and postage costs, and administrative and legal expenses. Currently, class specific expenses of the Funds are limited to distribution and service fees, administration fees, and certain registration and transfer agent expenses. Class B shares of the Government Fund outstanding for eight years will convert to Class A shares of the Government Fund.
NOTE 2 – SIGNIFICANT ACCOUNTING POLICIES
Significant accounting policies of the Trust are as follows:
Valuation of Investments: Debt obligations have a primary market over the counter and are valued by an independent pricing service approved by the Trustees of the Trust. The pricing service ordinarily values debt obligations at quoted bid prices. Quotations for any foreign debt obligations in foreign currencies are converted to U.S. dollar equivalents using the foreign exchange quotation in effect at the time of valuation. When quotations are not available, debt obligations are valued at evaluated prices determined by the pricing service using methods which include consideration of yields or prices of debt obligations of comparable quality, type of issue, coupon, maturity and rating, and indications as to value from dealers and general market conditions. Short-term obligations having remaining maturities of 60 days or less are ordinarily valued at amortized cost, which approximates market value.
In any case where a pricing service fails to provide a price for a debt obligation held by the Funds, the valuation and pricing committee determines a fair value for the obligation using procedures approved by the Trustees. Additionally, in any case where management believes that a price provided by a pricing service for a debt obligation may be unreliable, the valuation and pricing committee decides whether or not to use the pricing service’s valuation or to determine a fair value for the obligation.
In determining fair value for any portfolio security or other investment, the valuation and pricing committee seeks to determine the amount that an owner of the investment might reasonably expect to receive upon a sale of the investment. However, because fair value prices are estimated prices, the valuation and pricing committee’s determination of fair value for an investment may differ from the value that would be realized by a Fund upon a sale of the investment, and that difference could be material to the Fund’s financial statements. The valuation and pricing committee’s determination of fair value for an investment may also differ from the prices obtained by other persons (including other mutual funds) for the investment.
34 Certified Annual Report
| NOTES TO FINANCIAL STATEMENTS, CONTINUED | ||
| Thornburg Limited Term Income Funds | September 30, 2011 | |
Valuation Measurements: Various inputs are used in determining the value of each Fund’s investments. These inputs are summarized in the three levels listed below:
Level 1: Quoted prices in active markets for identical investments.
Level 2: Other significant observable inputs (including quoted prices for similar investments, interest rates, prepayment rates, credit risk, etc.).
Level 3: Significant unobservable inputs (including each Fund’s own assumptions in determining the fair value of investments).
GOVERNMENT FUND
The following table displays a summary of the inputs used to value the Fund’s net assets as of September 30, 2011. In any instance when valuation inputs from more than one level are used to determine the fair value of a specific investment, the investment is placed in the level of the table based upon the lowest level input that is significant in determining the fair value of the investment:
| Fair Value Measurements at September 30, 2011 | ||||||||||||||||
| Total | Level 1 | Level 2 | Level 3 | |||||||||||||
Assets | ||||||||||||||||
Investments in Securities | ||||||||||||||||
U.S. Treasury Securities | $ | 37,879,289 | $ | 37,879,289 | $ | — | $ | — | ||||||||
U.S. Government Agencies | 83,370,957 | — | 80,518,002 | 2,852,955 | ||||||||||||
Mortgage Backed | 240,746,499 | — | 240,746,499 | — | ||||||||||||
|
|
|
|
|
|
|
| |||||||||
Total Investments in Securities | $ | 361,996,745 | $ | 37,879,289 | $ | 321,264,501 | $ | 2,852,955 | ||||||||
A rollforward of fair value measurements using significant unobservable inputs (Level 3) for the year ended September 30, 2011, is as follows:
Beginning Balance 9/30/2010 | $ | 7,171,456 | ||
Accrued Discounts (Premiums) | 2,890 | |||
Net Realized Gain (Loss) | 1,701 | |||
Gross Purchases | — | |||
Gross Sales | (102,854 | ) | ||
Change in Unrealized Appreciation (Depreciation) | (41,841 | ) | ||
Transfers into Level 3(a) | — | |||
Transfers out of Level 3(a) | (4,178,397 | ) | ||
|
| |||
Ending Balance 9/30/2011(b) | $ | 2,852,955 |
| (a) | Transfers into and/or out of Level 3 were to/from Level 2, and were due to changes in other significant observable inputs available during the year ended September 30, 2011. Transfers into or out of Level 3 are based on the beginning market value of the period in which they occurred. |
| (b) | Level 3 Securities represent 0.71% of Total Net Assets at the period ended September 30, 2011. |
Certified Annual Report 35
| NOTES TO FINANCIAL STATEMENTS, CONTINUED | ||
| Thornburg Limited Term Income Funds | September 30, 2011 | |
INCOME FUND
The following table displays a summary of the inputs used to value the Fund’s net assets as of September 30, 2011. In any instance when valuation inputs from more than one level are used to determine the fair value of a specific investment, the investment is placed in the level of the table based upon the lowest level input that is significant in determining the fair value of the investment:
| Fair Value Measurements at September 30, 2011 | ||||||||||||||||
| Total | Level 1 | Level 2 | Level 3 | |||||||||||||
Assets | ||||||||||||||||
Investments in Securities | ||||||||||||||||
U.S. Treasury Securities | $ | 17,784,463 | $ | 17,784,463 | $ | — | $ | — | ||||||||
U.S. Government Agencies | 40,268,327 | — | 37,653,118 | 2,615,209 | ||||||||||||
Other Government | 36,249,560 | — | 30,296,600 | 5,952,960 | ||||||||||||
Mortgage Backed | 180,067,793 | — | 180,067,793 | — | ||||||||||||
Asset Backed Securities | 122,228,748 | — | 112,196,748 | 10,032,000 | ||||||||||||
Corporate Bonds | 770,804,970 | — | 750,633,176 | 20,171,794 | ||||||||||||
Convertible Bonds | 7,480,000 | — | 7,480,000 | — | ||||||||||||
Municipal Bonds | 135,823,609 | — | 135,823,609 | — | ||||||||||||
Short Term Investments | 102,999,427 | — | 102,999,427 | — | ||||||||||||
|
|
|
|
|
|
|
| |||||||||
Total Investments in Securities | $ | 1,413,706,897 | $ | 17,784,463 | $ | 1,357,150,471 | $ | 38,771,963 | ||||||||
A rollforward of fair value measurements using significant unobservable inputs (Level 3) for the year ended September 30, 2011, is as follows:
| Asset Backed | Corp. Bond | Other | Total | |||||||||||||
Beginning Balance 9/30/2010 | $ | — | $ | 12,470,892 | $ | 2,743,637 | $ | 15,214,529 | ||||||||
Accrued Discounts (Premiums) | — | 3,915 | (63,897 | ) | (59,982 | ) | ||||||||||
Net Realized Gain (Loss) | — | 6,867 | 1,574 | 8,441 | ||||||||||||
Gross Purchases | 9,999,884 | 19,178,115 | 6,009,120 | 35,187,119 | ||||||||||||
Gross Sales | — | (895,029 | ) | (94,282 | ) | (989,311 | ) | |||||||||
Change in Unrealized Appreciation (Depreciation) | 32,116 | (118,774 | ) | (27,983 | ) | (114,641 | ) | |||||||||
Transfers into Level 3(a) | — | 1,996,700 | — | 1,996,700 | ||||||||||||
Transfers out of Level 3(a) | — | (12,470,892 | ) | — | (12,470,892 | ) | ||||||||||
|
|
|
|
|
|
|
| |||||||||
Ending Balance 9/30/2011(b) | $ | 10,032,000 | $ | 20,171,794 | $ | 8,568,169 | $ | 38,771,963 | ||||||||
| (a) | Transfers into and/or out of Level 3 were to/from Level 2, and were due to changes in other significant observable inputs available during the year ended September 30, 2011. Transfers into or out of Level 3 are based on the beginning market value of the period in which they occurred. |
| (b) | Level 3 Securities represent 2.72% of Total Net Assets at the period ended September 30, 2011. |
Other Notes: It is the policy of the Funds to recognize significant transfers between Levels 1, 2 and 3 and to disclose those transfers at the beginning of the reporting period. The Funds recognized no significant transfers between Levels 1 and 2 for the year ended September 30, 2011.
Federal Income Taxes: It is the policy of the Trust to comply with the provisions of the Internal Revenue Code applicable to “regulated investment companies,” and to distribute to shareholders substantially all taxable income, including any net realized gain on investments of the Funds. Therefore, no provision for federal income taxes is required.
Management reviews each uncertain tax position believed to be material to the preparation of each Funds financial statements, to assess if it is more likely than not that the position would be sustained upon examination, based upon the technical merits of the position. As of September 30, 2011, management has not identified any such position for which a liability must be reflected in the Statement of Assets and Liabilities. The Funds tax returns remain subject to examination for three years after filing.
36 Certified Annual Report
| NOTES TO FINANCIAL STATEMENTS, CONTINUED | ||
| Thornburg Limited Term Income Funds | September 30, 2011 | |
When-Issued and Delayed Delivery Transactions: The Funds may engage in when-issued or delayed delivery transactions. To the extent a Fund engages in such transactions, it will do so for the purpose of acquiring portfolio securities consistent with the Fund’s investment objectives and not for the purpose of investment leverage or to speculate on interest rate and/or market changes. At the time a Fund makes a commitment to purchase a security on a when-issued or delayed delivery basis, the Fund will record the transaction and reflect the value in determining the Fund’s net asset value. When effecting such transactions, assets of an amount sufficient to make payment for the portfolio securities to be purchased will be segregated on the Fund’s records at the trade date. Securities purchased on a when-issued or delayed delivery basis do not earn interest until the settlement date.
Dividends: Net investment income of the Funds is declared daily as a dividend on shares for which the Funds have received payment. Dividends are paid monthly and are reinvested in additional shares of the Funds at net asset value per share at the close of business on the dividend payment date, or at the shareholder’s option, paid in cash. Net realized capital gains, to the extent available, will be distributed at least annually.
General: Securities transactions are accounted for on a trade date basis. Interest income is accrued as earned. Premiums and discounts on securities purchased are amortized over the life of the respective securities. Realized gains and losses from the sale of securities are recorded on an identified cost basis. The Funds invest in various mortgage-backed securities. Such securities pay interest and a portion of principal each month, which is then available for investment in securities at prevailing prices. Paydown gains and losses on these securities are included in interest income. Net investment income (other than class specific expenses) and realized and unrealized gains and losses are allocated daily to each class of shares based upon the relative net asset value of outstanding shares (or the value of the dividend eligible shares, as appropriate) of each class of shares at the beginning of the day (after adjusting for the current share activity of the respective class). Expenses common to all Funds are allocated among the Funds comprising the Trust based upon their relative net asset values or other appropriate allocation methods.
Foreign Currency Translation: With respect to the Income Fund, portfolio securities and other assets and liabilities denominated in foreign currencies are translated into U.S. dollars based on the rate of exchange of such currencies against U.S. dollars on the date of valuation. Purchases and sales of portfolio securities and interest denominated in foreign currencies are translated into U.S. dollar amounts on the respective dates of such transactions. Such spot contracts are included in Receivable for investments sold and Payable for investments purchased on the Statement of Assets and Liabilities.
The Income Fund does not isolate that portion of the results of operations resulting from changes in foreign exchange rates on investments from the fluctuations arising from changes in market prices of securities held. Such fluctuations are included with the net realized and unrealized gain or loss from investments.
Reported net realized foreign exchange gains or losses arise from purchases and sales of foreign currencies, currency gains or losses realized between the trade and settlement dates on securities transactions, and the difference between the amount of interest recorded on the Income Fund’s books and the U.S. dollar equivalent of the amounts actually received or paid.
Guarantees and Indemnifications: Under the Trust’s organizational documents, its officers and Trustees are indemnified against certain liabilities arising out of the performance of their duties to the Funds. Additionally, in the normal course of business the Trust enters into contracts with service providers that contain general indemnification clauses. The Trust’s maximum exposure under these arrangements is unknown. However, based on experience, the Trust expects the risk of loss to be remote.
Use of Estimates: The preparation of financial statements, in conformity with generally accepted accounting principles, requires management to make estimates and assumptions that affect the reported amounts of assets and liabilities and the disclosure of contingent assets and liabilities at the date of the financial statements and the reported amounts of increases and decreases in net assets from operations during the reporting period. Actual results could differ from those estimates.
NOTE 3 – INVESTMENT ADVISORY FEE AND OTHER TRANSACTIONS WITH AFFILIATES
Pursuant to an investment advisory agreement, Thornburg Investment Management, Inc. (the “Advisor”) serves as the investment advisor and performs services to the Funds for which the fees are payable at the end of each month. For the year ended September 30, 2011, these fees were payable at annual rates ranging from .375 of 1% to .275 of 1% per annum of the average daily net assets of the
Certified Annual Report 37
| NOTES TO FINANCIAL STATEMENTS, CONTINUED | ||
| Thornburg Limited Term Income Funds | September 30, 2011 | |
Government Fund and .50 of 1% to .275 of 1% per annum of the average daily net assets of the Income Fund depending on each Fund’s asset size. The Trust also has entered into administrative services agreements with the Advisor, whereby the Advisor will perform certain administrative services for the shareholders of each class of each Fund’s shares, and for which fees will be payable at an annual rate of up to .125 of 1% per annum of the average daily net assets attributable to Class A, Class B, Class C, and Class R3 shares, and up to .05 of 1% per annum of the average daily net assets attributable to Class I shares. For the year ended September 30, 2011, the Advisor contractually reimbursed certain class specific expenses and administrative fees of $39,446 for the Class R3 shares, of the Government Fund and $15,384, $10,249, $213 and $69,527 for the Class A, C, I and R3 shares, respectively, of the Income Fund.
The Trust has an underwriting agreement with Thornburg Securities Corporation (the “Distributor,” an affiliate of the Advisor), which acts as the distributor of each Fund’s shares. For the year ended September 30, 2011, the Distributor has advised the Funds that they earned net commissions of $0 and $1,527 from the sale of Class A shares of the Government Fund and Income Fund, and collected contingent deferred sales charges aggregating $16,670 and $62,144 from redemptions of Class C shares of the Government Fund and Income Fund, respectively.
Pursuant to a service plan under Rule 12b-1 of the Investment Company Act of 1940, the Funds may reimburse to the Advisor an amount not to exceed .25 of 1% per annum of the average daily net assets attributable to the Class A, Class B, Class C, Class I, and Class R3 shares of the Funds for payments made by the Advisor to securities dealers and other financial institutions to obtain various shareholder and distribution related services. For the year ended September 30, 2011, there were no 12b-1 service plan fees charged for Class I shares. The Advisor may pay out of its own resources additional expenses for distribution of each Fund’s shares.
The Trust has also adopted distribution plans pursuant to Rule 12b-1, applicable to each Fund’s Class C, and Class R3, and also applicable to Government Fund’s Class B shares, under which the Funds compensate the Distributor for services in promoting the sale of Class B, C, and R3 shares of the Funds at an annual rate of up to .75 of 1% per annum of the average daily net assets attributable to Class B shares, and an annual rate of up to .25 of 1% per annum of the average daily net assets attributable to Class C and Class R3 shares. Total fees incurred by the Distributor for each class of shares of the Funds under their respective Service and Distribution Plans for the year ended September 30, 2011, are set forth in the Statements of Operations.
The Trust has an agreement with the custodian bank to indirectly pay a portion of the custodian’s fees through credits earned by each Fund’s cash on deposit with the bank. This deposit agreement is an alternative to overnight investments. Custodial fees have been adjusted to reflect amounts that would have been paid without this agreement, with a corresponding adjustment reflected as fees paid indirectly in the Statements of Operations. For the year ended September 30, 2011, fees paid indirectly were $27,167 for the Government Fund and $2,642 for the Income Fund.
Certain officers and Trustees of the Trust are also officers or directors of the Advisor and Distributor. The compensation of independent Trustees is borne by the Trust.
NOTE 4 – SHARES OF BENEFICIAL INTEREST
At September 30, 2011, there were an unlimited number of shares of beneficial interest authorized. Transactions in shares of beneficial interest were as follows:
GOVERNMENT FUND
| Year Ended September 30, 2011 | Year Ended September 30, 2010 | |||||||||||||||
| Shares | Amount | Shares | Amount | |||||||||||||
Class A Shares | ||||||||||||||||
Shares sold | 6,089,014 | $ | 84,261,899 | 6,863,872 | $ | 94,820,720 | ||||||||||
Shares issued to shareholders in reinvestment of dividends | 296,937 | 4,103,217 | 312,811 | 4,320,057 | ||||||||||||
Shares repurchased | (5,376,288 | ) | (74,223,068 | ) | (3,954,815 | ) | (54,549,661 | ) | ||||||||
|
|
|
|
|
|
|
| |||||||||
Net increase (decrease) | 1,009,663 | $ | 14,142,048 | 3,221,868 | $ | 44,591,116 | ||||||||||
|
|
|
|
|
|
|
| |||||||||
38 Certified Annual Report
| NOTES TO FINANCIAL STATEMENTS, CONTINUED | ||
| Thornburg Limited Term Income Funds | September 30, 2011 | |
GOVERNMENT FUND
| $131,265,249 | $131,265,249 | $131,265,249 | $131,265,249 | |||||||||||||
| Year Ended September 30, 2011 | Year Ended September 30, 2010 | |||||||||||||||
| Shares | Amount | Shares | Amount | |||||||||||||
Class B Shares | ||||||||||||||||
Shares sold | 92,757 | $ | 1,288,851 | 112,354 | $ | 1,549,558 | ||||||||||
Shares issued to shareholders in reinvestment of dividends | 4,432 | 61,084 | 7,093 | 97,704 | ||||||||||||
Shares repurchased | (157,102 | ) | (2,166,845 | ) | (177,244 | ) | (2,438,430 | ) | ||||||||
|
|
|
|
|
|
|
| |||||||||
Net increase (decrease) | (59,913 | ) | $ | (816,910 | ) | (57,797 | ) | $ | (791,168 | ) | ||||||
|
|
|
|
|
|
|
| |||||||||
Class C Shares | ||||||||||||||||
Shares sold | 3,263,009 | $ | 45,521,197 | 3,854,657 | $ | 53,551,771 | ||||||||||
Shares issued to shareholders in reinvestment of dividends | 132,767 | 1,845,636 | 140,523 | 1,952,489 | ||||||||||||
Shares repurchased | (3,317,720 | ) | (46,112,244 | ) | (2,679,800 | ) | (37,169,372 | ) | ||||||||
|
|
|
|
|
|
|
| |||||||||
Net increase (decrease) | 78,056 | $ | 1,254,589 | 1,315,380 | $ | 18,334,888 | ||||||||||
|
|
|
|
|
|
|
| |||||||||
Class I Shares | ||||||||||||||||
Shares sold | 3,547,628 | $ | 49,190,355 | 3,198,552 | $ | 44,258,618 | ||||||||||
Shares issued to shareholders in reinvestment of dividends | 104,011 | 1,438,003 | 56,148 | 776,441 | ||||||||||||
Shares repurchased | (1,653,928 | ) | (22,835,667 | ) | (1,087,186 | ) | (14,963,903 | ) | ||||||||
|
|
|
|
|
|
|
| |||||||||
Net increase (decrease) | 1,997,711 | $ | 27,792,691 | 2,167,514 | $ | 30,071,156 | ||||||||||
|
|
|
|
|
|
|
| |||||||||
Class R3 Shares | ||||||||||||||||
Shares sold | 323,070 | $ | 4,463,372 | 565,861 | $ | 7,827,234 | ||||||||||
Shares issued to shareholders in reinvestment of dividends | 24,162 | 333,959 | 22,746 | 314,344 | ||||||||||||
Shares repurchased | (335,949 | ) | (4,631,935 | ) | (236,222 | ) | (3,261,107 | ) | ||||||||
|
|
|
|
|
|
|
| |||||||||
Net increase (decrease) | 11,283 | $ | 165,396 | 352,385 | $ | 4,880,471 | ||||||||||
|
|
|
|
|
|
|
| |||||||||
INCOME FUND
| $131,265,249 | $131,265,249 | $131,265,249 | $131,265,249 | |||||||||||||
| Year Ended September 30, 2011 | Year Ended September 30, 2010 | |||||||||||||||
| Shares | Amount | Shares | Amount | |||||||||||||
Class A Shares | ||||||||||||||||
Shares sold | 20,710,535 | $ | 276,339,436 | 21,879,703 | $ | 285,979,591 | ||||||||||
Shares issued to shareholders in reinvestment of dividends | 1,106,507 | 14,704,071 | 831,439 | 10,905,086 | ||||||||||||
Shares repurchased | (12,648,538 | ) | (167,791,195 | ) | (7,414,765 | ) | (96,991,495 | ) | ||||||||
|
|
|
|
|
|
|
| |||||||||
Net increase (decrease) | 9,168,504 | $ | 123,252,312 | 15,296,377 | $ | 199,893,182 | ||||||||||
|
|
|
|
|
|
|
| |||||||||
Class C Shares | ||||||||||||||||
Shares sold | 13,049,288 | $ | 173,595,727 | 12,001,955 | $ | 156,815,343 | ||||||||||
Shares issued to shareholders in reinvestment of dividends | 570,537 | 7,571,261 | 339,961 | 4,453,016 | ||||||||||||
Shares repurchased | (5,303,599 | ) | (70,245,511 | ) | (2,299,042 | ) | (30,003,110 | ) | ||||||||
|
|
|
|
|
|
|
| |||||||||
Net increase (decrease) | 8,316,226 | $ | 110,921,477 | 10,042,874 | $ | 131,265,249 | ||||||||||
|
|
|
|
|
|
|
| |||||||||
Certified Annual Report 39
| NOTES TO FINANCIAL STATEMENTS, CONTINUED | ||
| Thornburg Limited Term Income Funds | September 30, 2011 | |
INCOME FUND
| Year Ended September 30, 2011 | Year Ended September 30, 2010 | |||||||||||||||
| Shares | Amount | Shares | Amount | |||||||||||||
Class I Shares | ||||||||||||||||
Shares sold | 21,300,995 | $ | 284,000,634 | 15,971,676 | $ | 209,108,311 | ||||||||||
Shares issued to shareholders in reinvestment of dividends | 854,816 | 11,362,919 | 538,856 | 7,069,519 | ||||||||||||
Shares repurchased | (10,513,149 | ) | (139,472,436 | ) | (5,881,124 | ) | (77,071,684 | ) | ||||||||
|
|
|
|
|
|
|
| |||||||||
Net increase (decrease) | 11,642,662 | $ | 155,891,117 | 10,629,408 | $ | 139,106,146 | ||||||||||
|
|
|
|
|
|
|
| |||||||||
Class R3 Shares | ||||||||||||||||
Shares sold | 1,524,111 | $ | 20,253,169 | 1,088,310 | $ | 14,252,821 | ||||||||||
Shares issued to shareholders in reinvestment of dividends | 60,933 | 810,560 | 41,086 | 538,934 | ||||||||||||
Shares repurchased | (731,735 | ) | (9,721,232 | ) | (517,688 | ) | (6,805,360 | ) | ||||||||
|
|
|
|
|
|
|
| |||||||||
Net increase (decrease) | 853,309 | $ | 11,342,497 | 611,708 | $ | 7,986,395 | ||||||||||
|
|
|
|
|
|
|
| |||||||||
NOTE 5 – SECURITIES TRANSACTIONS
For the year ended September 30, 2011, the Government Fund had purchase and sale transactions of investment securities (excluding short-term investments) of $135,739,611 and $48,039,277, respectively, while the Income Fund had purchase and sale transactions of investment securities (excluding short-term investments and U.S. Government obligations) of $611,157,595 and $250,404,398, respectively.
NOTE 6 – INCOME TAXES
At September 30, 2011, information on the tax components of capital is as follows:
| Government Fund | Income Fund | |||||||
Cost of investments for tax purposes | $ | 348,857,231 | $ | 1,384,011,719 | ||||
|
|
|
| |||||
Gross unrealized appreciation on a tax basis | $ | 13,601,049 | $ | 45,657,406 | ||||
Gross unrealized depreciation on a tax basis | (461,535 | ) | (15,962,228 | ) | ||||
|
|
|
| |||||
Net unrealized appreciation (depreciation) on investments (tax basis) | $ | 13,139,514 | $ | 29,695,178 | ||||
|
|
|
| |||||
Distributable ordinary income (tax basis) | $ | 872,943 | $ | 3,860,028 | ||||
Distributable capital gains (tax basis) | $ | — | $ | 7,923,752 | ||||
At September 30, 2011, the Government Fund had deferred tax basis capital losses occurring subsequent to October 31, 2010 of $868,115. For tax purposes, such losses will be reflected in the year ending September 30, 2012.
40 Certified Annual Report
| NOTES TO FINANCIAL STATEMENTS, CONTINUED | ||
| Thornburg Limited Term Income Funds | September 30, 2011 | |
At September 30, 2011, the Government Fund had tax basis capital losses, which may be carried forward to offset future capital gains. To the extent such carryforwards are used, capital gain distributions may be reduced to the extent provided by regulations. Such capital loss carryforwards expire as follows:
2018 | $ | 17,316 | ||
2019 | 106,151 | |||
|
| |||
| $ | 123,467 | |||
|
|
As of September 30, 2011, the Income Fund had no capital loss carryforwards to offset future capital gains.
The Regulated Investment Company Modernization Act of 2010 (the “Act”) was signed into law on December 22, 2010. The Act makes changes to a number of tax rules impacting the Funds. Under the Act, future capital losses generated by the Funds, may be carried over indefinitely, but these losses must be used prior to the utilization of any pre-enactment capital losses. Since pre-enactment capital losses may only be carried forward for eight years, there may be a greater likelihood that all or a portion of each Fund’s pre-enactment capital losses will expire unused. In general, the provisions of the Act will be effective for each Fund’s fiscal year ending September 30, 2012.
In order to account for book/tax differences, the Government Fund decreased undistributed net investment loss by $1,942,928, decreased accumulated net realized gain by $1,942,363 and decreased net capital paid in on shares of beneficial interest by $565. Reclassifications result primarily from paydown gains (losses), which are recorded as an adjustment to interest income in the financial statements and as realized gains (losses) in the tax returns.
The Income Fund decreased distribution in excess of net investment loss by $1,386,571 and decreased accumulated net realized gain by $1,386,571. This reclassification has no impact on the net asset value of the Fund. Reclassifications result primarily from paydown gains (losses), which are recorded as an adjustment to interest income in the financial statements and as realized gains (losses) in the tax returns.
The tax character of distributions paid by the Government Fund for the years ended September 30, 2011, and September 30, 2010, was as follows:
| 2011 | 2010 | |||||||
Distributions from: | ||||||||
Ordinary income | $ | 10,178,884 | $ | 8,597,413 | ||||
Capital gains | — | 1,202,117 | ||||||
|
|
|
| |||||
Total Distributions | $ | 10,178,884 | $ | 9,799,530 | ||||
|
|
|
| |||||
The tax character of the distributions paid by the Income Fund for the years ended September 30, 2011 and September 30, 2010, was as follows:
| 2011 | 2010 | |||||||
Distributions from: | ||||||||
Ordinary income | $ | 40,250,229 | $ | 29,361,882 | ||||
Capital gains | 3,246,024 | — | ||||||
|
|
|
| |||||
Total Distributions | $ | 43,496,253 | $ | 29,361,882 | ||||
|
|
|
| |||||
OTHER NOTES:
Risks: Each Fund’s investments subject it to risks including, but not limited to, credit risk, interest rate risk, prepayment risk, management risk, market and economic risk, liquidity risk and, in the case of Income Fund, the risks associated with investments in non-U.S. issuers. Please see the Funds’ prospectus for a discussion of the risks associated with an investment in the Funds.
Subsequent Events: Fund management believes no events have occurred between September 30, 2011 and the date of issuance of the financial statements, which require adjustment to, or disclosure in the accompanying financial statements.
Certified Annual Report 41
Thornburg Limited Term U.S. Government Fund
| Unless Otherwise Noted, Periods are Fiscal Years Ended Sept. 30, | PER SHARE PERFORMANCE (for a share outstanding throughout the Year)+ | RATIOS TO AVERAGE NET ASSETS | SUPPLEMENTAL DATA | |||||||||||||||||||||||||||||||||||||||||||||||||||||||||
| Net Asset Value Beginning of Year | Net Investment Income (Loss) | Net Realized & Unrealized Gain (Loss) on Investments | Total from Investment Operations | Dividends from Net Investment Income | Dividends from Net Realized Gains | Total Dividends | Net Asset Value End of Year | Net Investment Income (Loss) (%) | Expenses, After Expense Reductions (%) | Expenses, After Expense Reductions and Net of Custody Credits (%) | Expenses, Before Expense Reductions (%) | Total Return (%)(a) | Portfolio Turnover Rate (%) | Net Assets at End of Year (Thousands) | ||||||||||||||||||||||||||||||||||||||||||||||
Class A Shares |
| |||||||||||||||||||||||||||||||||||||||||||||||||||||||||||
2011(b) | $ | 13.94 | 0.33 | 0.03 | 0.36 | (0.40 | ) | — | (0.40 | ) | $ | 13.90 | 2.42 | 0.90 | 0.89 | 0.90 | 2.66 | 14.62 | $ | 202,910 | ||||||||||||||||||||||||||||||||||||||||
2010(b) | $ | 13.78 | 0.39 | 0.80 | 1.19 | (0.41 | ) | (0.62 | ) | (1.03 | ) | $ | 13.94 | 2.81 | 0.93 | 0.92 | 0.93 | 4.69 | 16.01 | $ | 189,465 | |||||||||||||||||||||||||||||||||||||||
2009(b) | $ | 13.26 | 0.41 | 0.54 | 0.95 | (0.43 | ) | — | (0.43 | ) | $ | 13.78 | 3.04 | 0.94 | 0.93 | 0.94 | 7.21 | 39.42 | $ | 142,872 | ||||||||||||||||||||||||||||||||||||||||
2008(b) | $ | 12.97 | 0.45 | 0.29 | 0.74 | (0.45 | ) | — | (0.45 | ) | $ | 13.26 | 3.39 | 0.95 | 0.93 | 0.95 | 5.75 | 19.61 | $ | 123,625 | ||||||||||||||||||||||||||||||||||||||||
2007(b) | $ | 12.75 | 0.40 | 0.23 | 0.63 | (0.41 | ) | — | (0.41 | ) | $ | 12.97 | 3.13 | 0.98 | 0.97 | 0.99 | 5.03 | 43.35 | $ | 91,561 | ||||||||||||||||||||||||||||||||||||||||
Class B Shares |
| |||||||||||||||||||||||||||||||||||||||||||||||||||||||||||
2011 | $ | 13.91 | 0.16 | 0.02 | 0.18 | (0.22 | ) | — | (0.22 | ) | $ | 13.87 | 1.13 | 2.20 | 2.19 | 2.20 | 1.33 | 14.62 | $ | 4,368 | ||||||||||||||||||||||||||||||||||||||||
2010 | $ | 13.75 | 0.23 | 0.80 | 1.03 | (0.25 | ) | (0.62 | ) | (0.87 | ) | $ | 13.91 | 1.65 | 2.11 | 2.11 | 2.11 | 3.46 | 16.01 | $ | 5,215 | |||||||||||||||||||||||||||||||||||||||
2009 | $ | 13.23 | 0.27 | 0.53 | 0.80 | (0.28 | ) | — | (0.28 | ) | $ | 13.75 | 1.96 | 2.01 | 2.01 | 2.04 | 6.08 | 39.42 | $ | 5,950 | ||||||||||||||||||||||||||||||||||||||||
2008 | $ | 12.94 | 0.28 | 0.28 | 0.56 | (0.27 | ) | — | (0.27 | ) | $ | 13.23 | 2.08 | 2.26 | 2.25 | 2.26 | 4.37 | 19.61 | $ | 5,147 | ||||||||||||||||||||||||||||||||||||||||
2007 | $ | 12.72 | 0.22 | 0.23 | 0.45 | (0.23 | ) | — | (0.23 | ) | $ | 12.94 | 1.73 | 2.40 | 2.39 | 2.63 | 3.55 | 43.35 | $ | 2,586 | ||||||||||||||||||||||||||||||||||||||||
Class C Shares |
| |||||||||||||||||||||||||||||||||||||||||||||||||||||||||||
2011 | $ | 14.03 | 0.30 | 0.02 | 0.32 | (0.37 | ) | — | (0.37 | ) | $ | 13.98 | 2.15 | 1.17 | 1.16 | 1.17 | 2.31 | 14.62 | $ | 100,212 | ||||||||||||||||||||||||||||||||||||||||
2010 | $ | 13.87 | 0.35 | 0.81 | 1.16 | (0.38 | ) | (0.62 | ) | (1.00 | ) | $ | 14.03 | 2.53 | 1.21 | 1.20 | 1.71 | 4.39 | 16.01 | $ | 99,430 | |||||||||||||||||||||||||||||||||||||||
2009 | $ | 13.34 | 0.37 | 0.55 | 0.92 | (0.39 | ) | — | (0.39 | ) | $ | 13.87 | 2.74 | 1.22 | 1.21 | 1.72 | 6.97 | 39.42 | $ | 80,039 | ||||||||||||||||||||||||||||||||||||||||
2008 | $ | 13.04 | 0.41 | 0.30 | 0.71 | (0.41 | ) | — | (0.41 | ) | $ | 13.34 | 3.10 | 1.24 | 1.22 | 1.75 | 5.51 | 19.61 | $ | 63,998 | ||||||||||||||||||||||||||||||||||||||||
2007 | $ | 12.83 | 0.37 | 0.22 | 0.59 | (0.38 | ) | — | (0.38 | ) | $ | 13.04 | 2.88 | 1.25 | 1.24 | 1.80 | 4.66 | 43.35 | $ | 25,566 | ||||||||||||||||||||||||||||||||||||||||
Class I Shares |
| |||||||||||||||||||||||||||||||||||||||||||||||||||||||||||
2011 | $ | 13.94 | 0.37 | 0.04 | 0.41 | (0.45 | ) | — | (0.45 | ) | $ | 13.90 | 2.71 | 0.57 | 0.57 | 0.57 | 2.99 | 14.62 | $ | 82,994 | ||||||||||||||||||||||||||||||||||||||||
2010 | $ | 13.78 | 0.42 | 0.82 | 1.24 | (0.46 | ) | (0.62 | ) | (1.08 | ) | $ | 13.94 | 3.09 | 0.60 | 0.59 | 0.60 | 5.03 | 16.01 | $ | 55,398 | |||||||||||||||||||||||||||||||||||||||
2009 | $ | 13.26 | 0.45 | 0.53 | 0.98 | (0.46 | ) | — | (0.46 | ) | $ | 13.78 | 3.31 | 0.66 | 0.66 | 0.67 | 7.51 | 39.42 | $ | 24,887 | ||||||||||||||||||||||||||||||||||||||||
2008 | $ | 12.97 | 0.49 | 0.29 | 0.78 | (0.49 | ) | — | (0.49 | ) | $ | 13.26 | 3.68 | 0.66 | 0.64 | 0.67 | 6.06 | 19.61 | $ | 21,275 | ||||||||||||||||||||||||||||||||||||||||
2007 | $ | 12.75 | 0.44 | 0.23 | 0.67 | (0.45 | ) | — | (0.45 | ) | $ | 12.97 | 3.45 | 0.68 | 0.67 | 0.74 | 5.35 | 43.35 | $ | 15,963 | ||||||||||||||||||||||||||||||||||||||||
Class R3 Shares |
| |||||||||||||||||||||||||||||||||||||||||||||||||||||||||||
2011 | $ | 13.95 | 0.32 | 0.03 | 0.35 | (0.39 | ) | — | (0.39 | ) | $ | 13.91 | 2.33 | 1.00 | 0.99 | 1.32 | 2.56 | 14.62 | $ | 12,749 | ||||||||||||||||||||||||||||||||||||||||
2010 | $ | 13.79 | 0.38 | 0.80 | 1.18 | (0.40 | ) | (0.62 | ) | (1.02 | ) | $ | 13.95 | 2.73 | 0.99 | 0.99 | 1.31 | 4.62 | 16.01 | $ | 12,631 | |||||||||||||||||||||||||||||||||||||||
2009 | $ | 13.27 | 0.41 | 0.53 | 0.94 | (0.42 | ) | — | (0.42 | ) | $ | 13.79 | 3.00 | 1.00 | 0.99 | 1.40 | 7.15 | 39.42 | $ | 7,625 | ||||||||||||||||||||||||||||||||||||||||
2008 | $ | 12.97 | 0.44 | 0.30 | 0.74 | (0.44 | ) | — | (0.44 | ) | $ | 13.27 | 3.33 | 1.01 | 0.99 | 1.47 | 5.77 | 19.61 | $ | 6,367 | ||||||||||||||||||||||||||||||||||||||||
2007 | $ | 12.76 | 0.40 | 0.22 | 0.62 | (0.41 | ) | — | (0.41 | ) | $ | 12.97 | 3.15 | 1.00 | 0.99 | 1.64 | 4.93 | 43.35 | $ | 4,398 | ||||||||||||||||||||||||||||||||||||||||
| (a) | Not annualized for periods less than one year. |
| (b) | Sales loads are not reflected in computing total return. |
| + | Based on weighted average shares outstanding. |
See notes to financial statements.
| 42 Certified Annual Report | Certified Annual Report 43 |
Thornburg Limited Term Income Fund
| Unless Otherwise Noted, Periods are Fiscal Years Ended Sept. 30, | PER SHARE PERFORMANCE (for a share outstanding throughout the Year)+ | RATIOS TO AVERAGE NET ASSETS | SUPPLEMENTAL DATA | |||||||||||||||||||||||||||||||||||||||||||||||||||||||||
| Net Asset Value Beginning of Year | Net Investment Income (Loss) | Net Realized & Unrealized Gain (Loss) on Investments | Total from Investment Operations | Dividends from Net Investment Income | Dividends from Net Realized Gains | Total Dividends | Net Asset Value End of Year | Net Investment Income (Loss) (%) | Expenses, After Expense Reductions (%) | Expenses, After Expense Reductions and Net of Custody Credits (%) | Expenses, Before Expense Reductions (%) | Total Return (%)(a) | Portfolio Turnover Rate (%) | Net Assets at End of Year (Thousands) | ||||||||||||||||||||||||||||||||||||||||||||||
Class A Shares |
| |||||||||||||||||||||||||||||||||||||||||||||||||||||||||||
2011(b) | $ | 13.41 | 0.46 | (0.04 | ) | 0.42 | (0.47 | ) | (0.04 | ) | (0.51 | ) | $ | 13.32 | 3.44 | 0.98 | 0.97 | 0.98 | 3.19 | 24.86 | $ | 578,731 | ||||||||||||||||||||||||||||||||||||||
2010(b) | $ | 12.81 | 0.51 | 0.61 | 1.12 | (0.52 | ) | — | (0.52 | ) | $ | 13.41 | 3.88 | 0.99 | 0.99 | 1.01 | 8.91 | 16.35 | $ | 459,532 | ||||||||||||||||||||||||||||||||||||||||
2009(b) | $ | 11.92 | 0.60 | 0.90 | 1.50 | (0.61 | ) | — | (0.61 | ) | $ | 12.81 | 5.04 | 0.99 | 0.99 | 1.04 | 13.05 | 45.31 | $ | 243,141 | ||||||||||||||||||||||||||||||||||||||||
2008(b) | $ | 12.40 | 0.55 | (0.48 | ) | 0.07 | (0.55 | ) | — | (0.55 | ) | $ | 11.92 | 4.38 | 0.99 | 0.99 | 1.03 | 0.44 | 42.84 | $ | 134,372 | |||||||||||||||||||||||||||||||||||||||
2007(b) | $ | 12.37 | 0.50 | 0.04 | 0.54 | (0.51 | ) | — | (0.51 | ) | $ | 12.40 | 4.07 | 1.00 | 0.99 | 1.08 | 4.43 | 41.55 | $ | 155,021 | ||||||||||||||||||||||||||||||||||||||||
Class C Shares |
| |||||||||||||||||||||||||||||||||||||||||||||||||||||||||||
2011 | $ | 13.39 | 0.42 | (0.04 | ) | 0.38 | (0.43 | ) | (0.04 | ) | (0.47 | ) | $ | 13.30 | 3.19 | 1.22 | 1.22 | 1.23 | 2.93 | 24.86 | $ | 366,822 | ||||||||||||||||||||||||||||||||||||||
2010 | $ | 12.79 | 0.47 | 0.61 | 1.08 | (0.48 | ) | — | (0.48 | ) | $ | 13.39 | 3.62 | 1.24 | 1.24 | 1.77 | 8.64 | 16.35 | $ | 257,869 | ||||||||||||||||||||||||||||||||||||||||
2009 | $ | 11.90 | 0.57 | 0.90 | 1.47 | (0.58 | ) | — | (0.58 | ) | $ | 12.79 | 4.79 | 1.24 | 1.24 | 1.82 | 12.78 | 45.31 | $ | 117,950 | ||||||||||||||||||||||||||||||||||||||||
2008 | $ | 12.38 | 0.52 | (0.49 | ) | 0.03 | (0.51 | ) | — | (0.51 | ) | $ | 11.90 | 4.15 | 1.24 | 1.24 | 1.83 | 0.18 | 42.84 | $ | 57,114 | |||||||||||||||||||||||||||||||||||||||
2007 | $ | 12.35 | 0.47 | 0.03 | 0.50 | (0.47 | ) | — | (0.47 | ) | $ | 12.38 | 3.82 | 1.24 | 1.24 | 1.89 | 4.17 | 41.55 | $ | 40,769 | ||||||||||||||||||||||||||||||||||||||||
Class I Shares |
| |||||||||||||||||||||||||||||||||||||||||||||||||||||||||||
2011 | $ | 13.41 | 0.50 | (0.04 | ) | 0.46 | (0.51 | ) | (0.04 | ) | (0.55 | ) | $ | 13.32 | 3.79 | 0.63 | 0.63 | 0.63 | 3.55 | 24.86 | $ | 448,669 | ||||||||||||||||||||||||||||||||||||||
2010 | $ | 12.82 | 0.55 | 0.60 | 1.15 | (0.56 | ) | — | (0.56 | ) | $ | 13.41 | 4.22 | 0.64 | 0.64 | 0.64 | 9.20 | 16.35 | $ | 295,433 | ||||||||||||||||||||||||||||||||||||||||
2009 | $ | 11.92 | 0.64 | 0.90 | 1.54 | (0.64 | ) | — | (0.64 | ) | $ | 12.82 | 5.39 | 0.66 | 0.66 | 0.68 | 13.50 | 45.31 | $ | 146,099 | ||||||||||||||||||||||||||||||||||||||||
2008 | $ | 12.40 | 0.59 | (0.48 | ) | 0.11 | (0.59 | ) | — | (0.59 | ) | $ | 11.92 | 4.72 | 0.66 | 0.66 | 0.67 | 0.77 | 42.84 | $ | 118,222 | |||||||||||||||||||||||||||||||||||||||
2007 | $ | 12.37 | 0.54 | 0.04 | 0.58 | (0.55 | ) | — | (0.55 | ) | $ | 12.40 | 4.39 | 0.67 | 0.67 | 0.72 | 4.76 | 41.55 | $ | 103,530 | ||||||||||||||||||||||||||||||||||||||||
Class R3 Shares |
| |||||||||||||||||||||||||||||||||||||||||||||||||||||||||||
2011 | $ | 13.42 | 0.45 | (0.03 | ) | 0.42 | (0.47 | ) | (0.04 | ) | (0.51 | ) | $ | 13.33 | 3.42 | 0.99 | 0.99 | 1.29 | 3.17 | 24.86 | $ | 30,022 | ||||||||||||||||||||||||||||||||||||||
2010 | $ | 12.82 | 0.51 | 0.61 | 1.12 | (0.52 | ) | — | (0.52 | ) | $ | 13.42 | 3.89 | 0.99 | 0.99 | 1.35 | 8.90 | 16.35 | $ | 18,767 | ||||||||||||||||||||||||||||||||||||||||
2009 | $ | 11.92 | 0.61 | 0.90 | 1.51 | (0.61 | ) | — | (0.61 | ) | $ | 12.82 | 5.08 | 0.99 | 0.99 | 1.48 | 13.13 | 45.31 | $ | 10,091 | ||||||||||||||||||||||||||||||||||||||||
2008 | $ | 12.40 | 0.55 | (0.48 | ) | 0.07 | (0.55 | ) | — | (0.55 | ) | $ | 11.92 | 4.42 | 0.99 | 0.99 | 1.52 | 0.44 | 42.84 | $ | 9,712 | |||||||||||||||||||||||||||||||||||||||
2007 | $ | 12.38 | 0.50 | 0.03 | 0.53 | (0.51 | ) | — | (0.51 | ) | $ | 12.40 | 4.09 | 0.99 | 0.99 | 1.71 | 4.34 | 41.55 | $ | 6,191 | ||||||||||||||||||||||||||||||||||||||||
| (a) | Not annualized for periods less than one year. |
| (b) | Sales loads are not reflected in computing total return. |
| + | Based on weighted average shares outstanding. |
See notes to financial statements.
| 44 Certified Annual Report | Certified Annual Report 45 |
REPORT OF INDEPENDENT REGISTERED PUBLIC ACCOUNTING FIRM
Thornburg Limited Term Income Funds
To the Trustees and Shareholders of
Thornburg Limited Term U.S. Government Fund
Thornburg Limited Term Income Fund
In our opinion, the accompanying statements of assets and liabilities, including the schedules of investments, and the related statements of operations and of changes in net assets and the financial highlights present fairly, in all material respects, the financial position of Thornburg Limited Term U.S. Government Fund and Thornburg Limited Term Income Fund (separate portfolios of Thornburg Investment Trust, hereafter referred to as the “Funds”) at September 30, 2011, the results of each of their operations for the year then ended, the changes in each of their net assets for each of the two years in the period then ended and the financial highlights for each of the five years in the period then ended, in conformity with accounting principles generally accepted in the United States of America. These financial statements and financial highlights (hereafter referred to as “financial statements”) are the responsibility of the Funds’ management. Our responsibility is to express an opinion on these financial statements based on our audits. We conducted our audits of these financial statements in accordance with the standards of the Public Company Accounting Oversight Board (United States). Those standards require that we plan and perform the audit to obtain reasonable assurance about whether the financial statements are free of material misstatement. An audit includes examining, on a test basis, evidence supporting the amounts and disclosures in the financial statements, assessing the accounting principles used and significant estimates made by management, and evaluating the overall financial statement presentation. We believe that our audits, which included confirmation of securities at September 30, 2011 by correspondence with the custodian and brokers, provide a reasonable basis for our opinion.
PricewaterhouseCoopers LLP
New York, New York
November 21, 2011
46 Certified Annual Report
| EXPENSE EXAMPLE | ||
| Thornburg Limited Term Income Funds | September 30, 2011 (Unaudited) | |
As a shareholder of the Funds, you incur two types of costs:
| (1) | transaction costs, including |
(a) sales charges (loads) on purchase payments, for Class A shares;
(b) a deferred sales charge on redemptions of any part or all of a purchase of $1 million of Class A shares within 12 months of purchase;
(c) a deferred sales charge on redemptions of Class B shares within eight years of purchase;
(d) a deferred sales charge on redemptions of Class C shares within 12 months of purchase;
| (2) | ongoing costs, including management fees; distribution and/ or service (12b-1) fees; and other Fund expenses. |
This example is intended to help you understand your ongoing costs (in dollars) of investing in the Funds and to compare these costs with the ongoing costs of investing in other mutual funds.
The example is based on a $1,000 investment beginning on April 1, 2011, and held until September 30, 2011.
ACTUAL EXPENSES
For each class of shares, the first line of the table at right provides information about actual account values and actual expenses. You may use the information in this line, together with the amount you invested, to estimate the expenses that you paid over the period. Simply divide your account value by $1,000 (for example, an $8,600 account value divided by $1,000 = 8.6), then multiply the result by the number in the first line for your class of shares under the heading entitled “Expenses Paid During Period” to estimate the expenses you paid on your account during this period.
HYPOTHETICAL EXAMPLE FOR COMPARISON PURPOSES
For each class of shares, the second line of the table at right provides information about hypothetical account values and hypothetical expenses based on the Funds’ actual expense ratio and an assumed rate of return of 5% per year before expenses, which is not the Funds’ actual return. The hypothetical account values and expenses may not be used to estimate the actual ending account balance or expenses you paid for the period. You may use this information to compare the ongoing costs of investing in the Funds and other funds. To do so, compare this 5% hypothetical example with the 5% hypothetical examples that appear in the shareholder reports of the other funds.
| Beginning Account Value 4/1/11 | Ending Account Value 9/30/11 | Expenses Paid During Period 4/1/11–9/30/11 | ||||||||||
| Limited Term U.S. Government Fund | ||||||||||||
Class A Shares | ||||||||||||
Actual | $ | 1,000.00 | $ | 1,030.70 | $ | 4.53 | ||||||
Hypothetical* | $ | 1,000.00 | $ | 1,020.60 | $ | 4.51 | ||||||
Class B Shares | ||||||||||||
Actual | $ | 1,000.00 | $ | 1,023.80 | $ | 11.37 | ||||||
Hypothetical* | $ | 1,000.00 | $ | 1,013.83 | $ | 11.31 | ||||||
Class C Shares | ||||||||||||
Actual | $ | 1,000.00 | $ | 1,028.50 | $ | 5.94 | ||||||
Hypothetical* | $ | 1,000.00 | $ | 1,019.22 | $ | 5.91 | ||||||
Class I Shares | ||||||||||||
Actual | $ | 1,000.00 | $ | 1,032.50 | $ | 2.85 | ||||||
Hypothetical* | $ | 1,000.00 | $ | 1,022.26 | $ | 2.84 | ||||||
Class R3 Shares | ||||||||||||
Actual | $ | 1,000.00 | $ | 1,030.20 | $ | 5.04 | ||||||
Hypothetical* | $ | 1,000.00 | $ | 1,020.10 | $ | 5.01 | ||||||
| Limited Term Income Fund | ||||||||||||
Class A Shares | ||||||||||||
Actual | $ | 1,000.00 | $ | 1,029.30 | $ | 5.00 | ||||||
Hypothetical* | $ | 1,000.00 | $ | 1,020.14 | $ | 4.98 | ||||||
Class C Shares | ||||||||||||
Actual | $ | 1,000.00 | $ | 1,028.10 | $ | 6.26 | ||||||
Hypothetical* | $ | 1,000.00 | $ | 1,018.90 | $ | 6.23 | ||||||
Class I Shares | ||||||||||||
Actual | $ | 1,000.00 | $ | 1,031.20 | $ | 3.19 | ||||||
Hypothetical* | $ | 1,000.00 | $ | 1,021.93 | $ | 3.18 | ||||||
Class R3 Shares | ||||||||||||
Actual | $ | 1,000.00 | $ | 1,029.30 | $ | 5.04 | ||||||
Hypothetical* | $ | 1,000.00 | $ | 1,020.11 | $ | 5.01 | ||||||
| † | Thornburg Limited Term U.S. Government Fund expenses are equal to the annualized expense ratio for each class (A: 0.89%; B: 2.24%; C: 1.17%; I: 0.56%; R3: 0.99%) multiplied by the average account value over the period, multiplied by 183/365 to reflect the one-half year period. |
| † | Thornburg Limited Term Income Fund expenses are equal to the annualized expense ratio for each class (A: 0.98%; C: 1.23%; I: 0.63%; R3: 0.99%) multiplied by the average account value over the period, multiplied by 183/365 to reflect the one-half year period. |
| * | Hypothetical assumes a rate of return of 5% per year before expenses. |
Please note that the expenses shown in the table are meant to highlight your ongoing costs only and do not reflect any transactional costs, such as sales charges (loads), redemption fees, or exchange fees. Therefore, the second line of the table for each class of shares is useful in comparing ongoing costs only, and will not help you determine the relative total costs of owning different funds. In addition, if these transactional costs were included, your costs would have been higher.
Certified Annual Report 47
| INDEX COMPARISON | ||
| Thornburg Limited Term U.S. Government Fund | September 30, 2011 (Unaudited) | |
GROWTH OF A HYPOTHETICAL $10,000 INVESTMENT
Thornburg Limited Term U.S. Government Fund versus Barclays Capital Intermediate Government Bond Index
and Consumer Price Index (November 16, 1987 to September 30, 2011)
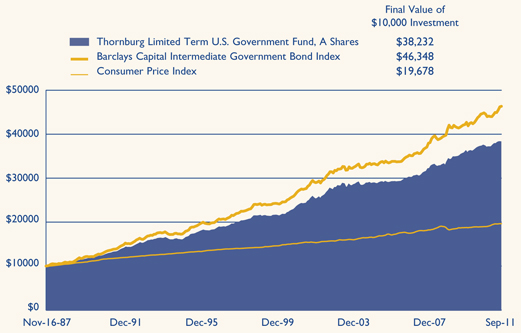
AVERAGE ANNUAL TOTAL RETURNS
For the periods ended September 30, 2011 (with sales charge)
| 1 Yr | 5 Yrs | 10 Yrs | Since Inception | |||||||||||||
A Shares (11/16/87) | 1.14 | % | 4.75 | % | 4.01 | % | 5.77 | % | ||||||||
B Shares (11/1/02) | -3.66 | % | 3.40 | % | — | 2.66 | % | |||||||||
C Shares (9/1/94) | 1.81 | % | 4.76 | % | 3.86 | % | 4.84 | % | ||||||||
I Shares (7/5/96) | 2.99 | % | 5.38 | % | 4.48 | % | 5.41 | % | ||||||||
R3 Shares (7/1/03) | 2.56 | % | 4.99 | % | — | 3.62 | % | |||||||||
Performance data shown represents past performance and is no guarantee of future results. Investment return and principal value will fluctuate so shares, when redeemed, may be worth more or less than their original cost. Current performance may be lower or higher than quoted. For performance current to the most recent month end, visit thornburg.com or call 800-847-0200. The performance data and graph do not reflect the deduction of taxes that a shareholder would pay on distributions or the redemption of Fund shares. For the U.S. Government Fund, returns reflect the reinvestment of dividends and capital gains as well as applicable sales charges. Class A shares are sold with a maximum sales charge of 1.50% . Class B shares carry a contingent deferred sales charge (CDSC) that declines from 5.00% to 0% depending upon the period of time the shares are held. Class B shares will automatically convert to Class A shares on a quarterly basis approximately eight years after purchase. Class C shares include a 0.50% CDSC for the first year only. There is no sales charge for Class I shares or Class R3 shares.
48 Certified Annual Report
| INDEX COMPARISON | ||
| Thornburg Limited Term Income Fund | September 30, 2011 (Unaudited) | |
GROWTH OF A HYPOTHETICAL $10,000 INVESTMENT
Thornburg Limited Term Income Fund versus Barclays Capital Intermediate Government/Credit Bond Index
and Consumer Price Index (October 1, 1992 to September 30, 2011)
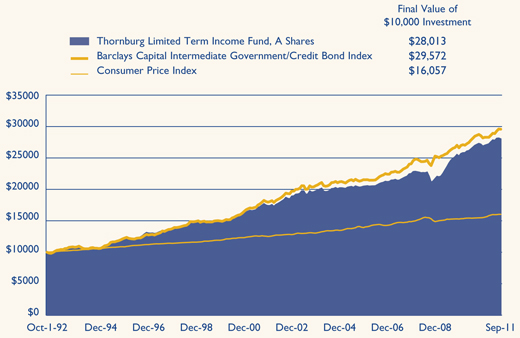
AVERAGE ANNUAL TOTAL RETURNS
For the periods ended September 30, 2011 (with sales charge)
| 1 Yr | 5 Yrs | 10 Yrs | Since Inception | |||||||||||||
A Shares (10/1/92) | 1.67 | % | 5.59 | % | 4.68 | % | 5.57 | % | ||||||||
C Shares (9/1/94) | 2.44 | % | 5.65 | % | 4.55 | % | 5.39 | % | ||||||||
I Shares (7/5/96) | 3.55 | % | 6.26 | % | 5.18 | % | 5.96 | % | ||||||||
R3 Shares (7/1/03) | 3.17 | % | 5.90 | % | — | 4.41 | % | |||||||||
Performance data shown represents past performance and is no guarantee of future results. Investment return and principal value will fluctuate so shares, when redeemed, may be worth more or less than their original cost. Current performance may be lower or higher than quoted. For performance current to the most recent month end, visit thornburg.com or call 800-847-0200. The performance data and graph do not reflect the deduction of taxes that a shareholder would pay on distributions or the redemption of Fund shares. For the Limited Term Income Fund, returns reflect the reinvestment of dividends and capital gains as well as applicable sales charges. Class A shares is 1.50% . Class C shares include a 0.50% contingent deferred sales charge (CDSC) for the first year only. There is no sales charge for Class I shares or Class R3 shares.
Certified Annual Report 49
| TRUSTEES AND OFFICERS | ||
| Thornburg Limited Term Income Funds | September 30, 2011 (Unaudited) | |
Name, Age, Position Held with Fund Year Elected | Principal Occupation(s) During Past Five Years | Other Directorships Held by Trustee | ||
INTERESTED TRUSTEES(1)(2)(4) | ||||
| Garrett Thornburg, 65 Chairman of Trustees, Trustee since 1987(3) | Chairman and controlling shareholder and, until 2008, CEO of Thornburg Investment Management, Inc. (investment advisor); Chairman, CEO, and controlling shareholder of Thornburg Securities Corporation (securities dealer); CEO until 2007 and Chairman until 2009 of TMST, Inc. (f/k/a Thornburg Mortgage, Inc.) (real estate investment trust); President and Sole Director of Thornburg Mortgage Advisory Corporation (investment manager to TMST, Inc.). | None | ||
| Brian J. McMahon, 55 Trustee since 2001, Member of Governance & Nominating Committee & Operations Risk Oversight Committee, President since 1997(5)(6) | CEO since 2008, President, Managing Director, Chief Investment Officer, and Portfolio Manager of Thornburg Investment Management, Inc. | None | ||
INDEPENDENT TRUSTEES(1)(2)(4) | ||||
| David A. Ater, 66 Trustee since 1994, Member of Audit Committee & Governance & Nominating Committee | Principal in Ater & Associates, Santa Fe, NM (developer, planner and broker of residential and commercial real estate); owner, developer and broker for various real estate projects. | None | ||
| David D. Chase, 70 Trustee since 2000, Chairman of Audit Committee | Managing Member of Vestor Associates, LLC, Santa Fe, NM (private equity fund); Managing Member of CS Group, LLC, Santa Fe, NM (merchant bank). | None | ||
| Eliot R. Cutler, 65 Trustee since 2004 & Nominating Committee, Chairman of Governance | Senior Counsel and, until 2009, Partner in Akin, Gump, Strauss, Hauer & Feld LLP (law firm) in Washington, D.C. and Beijing, China. | None | ||
| Susan H. Dubin, 62 Trustee since 2004, Member of Audit Committee | President of Dubin Investments, Ltd., Greenwich, CT (private investment fund); Director and officer of various charitable organizations. | None | ||
| Owen D. Van Essen, 57 Trustee since 2004, Member of Governance & Nominating Committee & Chairman of Operations Risk Oversight Committee | President of Dirks, Van Essen & Murray, Santa Fe, NM (newspaper mergers and acquisitions). | None | ||
50 Certified Annual Report
| TRUSTEES AND OFFICERS, CONTINUED | ||
| Thornburg Limited Term Income Funds | September 30, 2011 (Unaudited) | |
Name, Age, | Principal Occupation(s) During Past Five Years | Other Directorships Held by Trustee | ||
| James W. Weyhrauch, 52 Trustee since 1996, Member of Audit Committee & Operations Risk Oversight Committee | Real estate broker, Santa Fe Properties, Santa Fe, NM; Vice Chairman of Nambe LLC, Santa Fe, NM (manufacturing & design company). | None | ||
OFFICERS OF THE FUND (WHO ARE NOT TRUSTEES)(1)(6)(7) | ||||
| George T. Strickland, 48 Vice President since 1996, Treasurer since 2007(6) | Portfolio Manager, Vice President, and Managing Director of Thornburg Investment Management, Inc. | Not applicable | ||
| William V. Fries, 72 Vice President since 1995 | Portfolio Manager, Vice President, and Managing Director of Thornburg Investment Management, Inc. | Not applicable | ||
| Leigh Moiola, 44 Vice President since 2001 | Vice President, Managing Director, and Director of Marketing of Thornburg Investment Management, Inc. | Not applicable | ||
| Alexander Motola, 41 Vice President since 2001 | Portfolio Manager, Vice President, and Managing Director of Thornburg Investment Management, Inc. | Not applicable | ||
| Wendy Trevisani, 40 Vice President since 1999 | Portfolio Manager and Managing Director of Thornburg Investment Management, Inc. | Not applicable | ||
| Joshua Gonze, 48 Vice President since 1999 | Portfolio Manager since 2007, Managing Director, and Associate Portfolio Manager until 2007 of Thornburg Investment Management, Inc. | Not applicable | ||
| Christopher Ihlefeld, 41 Vice President since 2003 | Portfolio Manager since 2007, Managing Director, and Associate Portfolio Manager until 2007 of Thornburg Investment Management, Inc. | Not applicable | ||
| Leon Sandersfeld, 45 Vice President since 2003 | Managing Director since 2007 and Fund Accounting Director of Thornburg Investment Management, Inc. | Not applicable | ||
Sasha Wilcoxon, 37 Secretary since 2007(6) | Managing Director since 2007, Director of Operations, and Vice President of Thornburg Investment Management, Inc. | Not applicable | ||
Edward Maran, 53 Vice President since 2004 | Portfolio Manager and Managing Director of Thornburg Investment Management, Inc. | Not applicable | ||
Vinson Walden, 41 Vice President since 2004 | Portfolio Manager and Managing Director of Thornburg Investment Management, Inc. | Not applicable | ||
| Thomas Garcia, 40 Vice President since 2006 | Vice President since 2011, Managing Director, Head Equity Trader, and Associate Portfolio Manager of Thornburg Investment Management, Inc. | Not applicable | ||
| Lei Wang, 40 Vice President since 2006 | Portfolio Manager and Managing Director of Thornburg Investment Management, Inc. | Not applicable | ||
Certified Annual Report 51
| TRUSTEES AND OFFICERS, CONTINUED | ||
| Thornburg Limited Term Income Funds | September 30, 2011 (Unaudited) | |
Name, Age, | Principal Occupation(s) During Past Five Years | Other Directorships Held by Trustee | ||
| Connor Browne, 32 Vice President since 2006 | Portfolio Manager and Managing Director of Thornburg Investment Management, Inc. | Not applicable | ||
| Jason Brady, 37 Vice President since 2007 | Vice President since 2011, Portfolio Manager since 2007, Managing Director since 2007, and Associate Portfolio Manager 2006–2007 of Thornburg Investment Management, Inc. | Not applicable | ||
| Lewis Kaufman, 35 Vice President since 2007 | Portfolio Manager since 2007, Managing Director since 2007, and Associate Portfolio Manager until 2009 of Thornburg Investment Management, Inc. | Not applicable | ||
| Christopher Ryon, 55 Vice President since 2008 | Portfolio Manager since 2009, Managing Director since 2009, and Associate Portfolio Manager 2008–2009 of Thornburg Investment Management, Inc.; Principal of Vanguard Funds until 2008. | Not applicable | ||
| Lon Erickson, 36 Vice President since 2008 | Portfolio Manager since 2010, Managing Director since 2010, and Associate Portfolio Manager 2008–2010 of Thornburg Investment Management, Inc.; Senior Analyst of State Farm Insurance until 2008. | Not applicable | ||
| Kathleen Brady, 51 Vice President since 2008 | Senior Tax Accountant since 2007 of Thornburg Investment Management, Inc.; Chief Financial Officer of Vestor Partners, LP (private equity fund) until 2007. | Not applicable | ||
| Jack Gardner, 57 Vice President since 2008 | Managing Director since 2007 of Thornburg Investment Management, Inc.; President since 2008 and National Sales Director of Thornburg Securities Corporation. | Not applicable | ||
| Laura Hillstrom, 44 Vice President since 2009 | Chief Administrative Officer since 2009, Vice President and Managing Director, and Director of Information Systems until 2009 of Thornburg Investment Management, Inc. | Not applicable | ||
| (1) | Each person’s address is 2300 North Ridgetop Road, Santa Fe, New Mexico 87506. |
| (2) | The Funds are two of sixteen separate investment “Funds” or “series” of Thornburg Investment Trust (the “Trust”), which comprises the Thornburg mutual fund complex and is organized as a Massachusetts business trust. Thornburg Investment Management, Inc. is the investment advisor to, and manages, the sixteen Funds of the Trust. Each Trustee oversees the sixteen Funds of the Trust. |
| (3) | Mr. Thornburg is considered an “interested” Trustee under the Investment Company Act of 1940 because he is the sole director and controlling shareholder of Thornburg Investment Management, Inc., the investment advisor to the sixteen active Funds of the Trust, and is the sole director and controlling shareholder of Thornburg Securities Corporation, the distributor of shares for the Trust. |
| (4) | Each Trustee serves in office until the election and qualification of a successor. |
| (5) | Mr. McMahon is considered an “interested” Trustee because he is the chief executive officer and president of Thornburg Investment Management, Inc. |
| (6) | The Trust’s president, secretary, and treasurer each serves a one-year term or until the election and qualification of a successor; each other officer serves at the pleasure of the Trustees. |
| (7) | Assistant vice presidents, assistant secretaries and assistant treasurers are not shown. |
The Statement of Additional Information for each Fund of the Trust includes additional information about the Trustees and is available, without charge and upon request, by calling 1-800-847-0200.
52 Certified Annual Report
| OTHER INFORMATION | ||
| Thornburg Limited Term Income Funds | September 30, 2011 (Unaudited) | |
PORTFOLIO PROXY VOTING
Policies and Procedures:
The Trust has delegated to Thornburg Investment Management, Inc. (the “Advisor”) voting decisions respecting proxies for each of the Fund’s voting securities. The Advisor makes voting decisions in accordance with its Proxy Voting Policy. A description of the Policy is available (i) without charge, upon request, by calling the Advisor toll-free at 1-800-847-0200, (ii) on the Thornburg website at www.thornburg. com, and (iii) on the Securities and Exchange Commission’s website at www.sec.gov.
Information regarding how proxies were voted is available on or before August 31 of each year for the twelve months ending the preceding June 30. This information is available (i) without charge, upon request by calling the Advisor toll-free at 1-800-847-0200, (ii) on the Thornburg website at www.thornburg.com, and (iii) on the Securities and Exchange Commission’s website at www.sec.gov.
TAX INFORMATION
For the tax year ended September 30, 2011, dividends paid by the Thornburg Limited Term Income Fund of $3,246,024 are designated as long-term capital gain dividends for federal income tax purposes.
The information and distributions reported herein may differ from the information and distributions reported to the shareholders for the calendar year ending December 31, 2011. Complete information will be reported in conjunction with your 2011 Form 1099-DIV.
AVAILABILITY OF QUARTERLY PORTFOLIO SCHEDULE
The Funds file with the Securities and Exchange Commission schedules of their portfolio holdings on Form N-Q for the first and third quarters of each fiscal year. The Funds’ Forms N-Q are available on the Commission’s website at www.sec.gov, or may be reviewed and copied at the Commission’s Public Reference Room in Washington, D.C. Information on the operation of the Public Reference Room may be obtained by calling 1-800-SEC-0330. The Funds also make this information available on their website at www.thornburg.com/download or upon request by calling 1-800-847-0200.
STATEMENT RESPECTING RENEWAL OF INVESTMENT ADVISORY AGREEMENT FOR LIMITED TERM U.S. GOVERNMENT FUND
Thornburg Investment Management, Inc. (the “Advisor”) provides investment management services to Thornburg Limited Term U.S. Government Fund pursuant to an investment advisory agreement. The Trustees consider the renewal of this agreement annually, and most recently determined to renew the agreement on September 13, 2011.
In anticipation of their recent consideration of the advisory agreement’s renewal, the independent Trustees met in May 2011 to plan the Trustees’ evaluation of the Advisor’s services and to specify the information the Advisor would present to the Trustees for their review. The Advisor’s chief investment officer subsequently reviewed portions of the specified information with the Trustees and addressed questions presented by the Trustees at a meeting session scheduled for that purpose, and the independent Trustees thereafter met in independent session to consider the Advisor’s presentation and various specific issues respecting their consideration of the advisory agreement’s renewal. Following these sessions, the Trustees met to consider a renewal of the agreement, and the independent Trustees unanimously voted at that meeting to renew the agreement for an additional term of one year.
The information below summarizes certain factors considered by the Trustees in connection with the determination to renew the advisory agreement. In determining to renew the agreement, the Trustees did not identify any single factor as controlling, and this summary does not describe all of the matters considered by the Trustees in making their determination.
Quality of Services; Fund Investment Performance. The Trustees evaluated the nature, extent and quality of services provided by the Advisor under the advisory agreement, and evaluated the Fund’s investment performance.
In connection with their general supervision of the Advisor, and as an important element of their annual consideration of a renewal of the advisory agreement, the Trustees received and considered reports from the Advisor throughout the year. These reports addressed a wide variety of topics, including particularly the Advisor’s selection of investments and execution of the Fund’s investment strategies. In addition, the Trustees reviewed information provided to them at their request in anticipation of their annual evaluation of the Advisor’s services, including (i) the Fund’s absolute investment performance and achievement of stated objectives, (ii) the Advisor’s commentary on the Fund’s
Certified Annual Report 53
| OTHER INFORMATION, CONTINUED | ||
| Thornburg Limited Term Income Funds | September 30, 2011 (Unaudited) | |
performance in the context of the Fund’s objectives and reasonable expectations, and business, market and economic conditions, (iii) measures of the Fund’s investment performance over different periods of time relative to two categories of U.S. government obligation mutual funds selected by independent mutual fund analyst firms, and relative to a broad-based securities index, and (iv) comparative measures of portfolio volatility, risk and return.
The Trustees also considered their perceptions of portfolio management personnel developed in formal and informal meetings throughout the year, the Advisor’s staffing and other resources, the Advisor’s performance of accounting and other services, the Advisor’s observance of compliance and regulatory requirements, the Advisor’s responsiveness to the Trustees, and other factors.
In evaluating quantitative and performance data presented, the Trustees noted (among other aspects of the data) performance data for the eleven most recent calendar years, which showed that the Fund had produced positive returns in accordance with expectations in all years, that the Fund’s investment return for the most recent calendar year had exceeded the average return of the mutual fund category for which calendar year data was presented, and that the Fund’s returns had exceeded or were comparable to the average returns of the category in all of the preceding ten calendar years. Other noted quantitative data showed that the Fund’s investment returns fell at or within the top decile of performance for the first fund category for the one-year, three-year and five-year periods ended with the second quarter of the current year, and that the Fund’s investment returns fell in the top decile for the one-year period and within the top quintile of the second category for the three-year and five-year periods. Measures of portfolio volatility, risk and relative return considered by the Trustees demonstrated that the Fund’s performance relative to these measures had continued to fulfill expectations in current conditions.
The Trustees concluded, based upon these and other considerations, that the nature, extent and quality of the Advisor’s services were sufficient and that the Advisor had satisfactorily pursued the Fund’s stated investment objectives. The Trustees further concluded that the investment performance of the Fund was satisfactory in the context of the Fund’s objectives and policies, and prevailing market conditions.
Fees and Expenses; Profitability of Advisor; Economies of Scale; Ancillary Benefits to Advisor. The Trustees evaluated the level of the management fee charged by the Advisor to the Fund, and in this connection, reviewed the profitability of the Advisor, economies of scale potentially available to the Fund and whether the Advisor had received any ancillary benefits from its relationship with the Fund.
In evaluating the level of the management fee, the Trustees considered the fee charged by the Advisor and the other expenses charged to the Fund in light of the nature and quality of services provided, comparison of the actual Advisor’s fee and Fund expenses to the statement of fees and expenses in the Fund’s prospectuses, and comparisons of the Advisor’s fee and other Fund expenses to median and average fees and expenses charged to two groups of U.S. government obligation mutual funds assembled by independent mutual fund analyst firms. Comparative fee and expense data noted by the Trustees showed that the management charged to the Fund was comparable to the median and average fee levels for one fund group and also comparable to the median and average levels for the second group, and that the overall expense ratio for the Fund was comparable to the median and average expense ratio for the first group and slightly higher than the median and comparable to the average ratios for the second group. The Trustees did not identify the differences as significant. The Trustees considered information about the fees charged by the Advisor to other investment management clients, together with information about fees charged by other advisors to different clients, and analysis of the differences between the requirements of institutional clients and mutual funds and the consequently different investment management services provided, respectively, to institutional clients and to mutual funds. The Trustees confirmed their previous observations that the differences between the fees charged by the Advisor to different types of clients did not appear exceptional, and that the fee rates charged by investment advisors to institutional clients had limited relevance to the evaluation of fee rates charged to mutual funds, because of the significant differences between the respective requirements of institutional clients and mutual funds, the differences between the respective services rendered to institutional clients and mutual funds, and the different circumstances in which the respective fees originate.
In reviewing the profitability of the Advisor, the Trustees considered costs incurred by the Advisor and data comparing the profitability of the Advisor to other investment management firms. The information provided did not indicate that the Advisor’s profitability was unusual, and the Trustees noted the adequacy of the Advisor’s resources and service capabilities. In reviewing the extent to which economies of scale would be realized by the Fund as it grows and whether fee levels reflect economies of scale, the Trustees considered the breakpoint structure for advisory fees chargeable to the Fund, the demonstrated economies of scale enjoyed by the other Funds of the Trust as they had grown in size, and economies of scale realized by other mutual funds. The information provided demonstrated to the Trustees that the Fund may reasonably be expected to realize economies of scale as it grows, due to the advisory agreement’s breakpoint fee structure and other factors. In reviewing potential benefits to the Advisor because of its relationship to the Fund, the Trustees considered the Advisor’s receipt of certain research services from broker dealers, and the benefits to both the Fund and the Advisor of the Advisor’s expansion
54 Certified Annual Report
| OTHER INFORMATION, CONTINUED | ||
| Thornburg Limited Term Income Funds | September 30, 2011 (Unaudited) | |
of its staffing, compliance and systems capabilities and other resources to serve a broader variety of investment management clients. No unusual or unfair benefits to the Advisor from its relationship to the Fund were identified by the Trustees.
The Trustees concluded, based upon their consideration of these and other factors, that the management fee charged to the Fund by the Advisor was fair and reasonable in view of the nature, extent and quality of the services provided by the Advisor, the clear disclosure of fees and expenses in the Fund’s prospectuses, the investment performance of the Fund, and comparisons of fees and expenses charged to the Fund to fees and expenses charged to other mutual funds.
STATEMENT RESPECTING RENEWAL OF INVESTMENT ADVISORY AGREEMENT FOR LIMITED TERM INCOME FUND
Thornburg Investment Management, Inc. (the “Advisor”) provides investment management services to Thornburg Limited Term Income Fund pursuant to an investment advisory agreement. The Trustees consider the renewal of this agreement annually, and most recently determined to renew the agreement on September 13, 2011.
In anticipation of their recent consideration of the advisory agreement’s renewal, the independent Trustees met in May 2010 to plan the Trustees’ evaluation of the Advisor’s performance and to specify the information the Advisor would present to the Trustees for their review. The Advisor’s chief investment officer subsequently reviewed portions of the specified information with the Trustees and addressed questions presented by the Trustees at a meeting session scheduled for that purpose, and the independent Trustees thereafter met in independent session to consider the Advisor’s presentation and various specific issues respecting their consideration of the advisory agreement’s renewal. Following these sessions, the Trustees met to consider a renewal of the agreement, and the independent Trustees voted unanimously at that meeting to renew the agreement for an additional term of one year.
The information below summarizes certain factors considered by the Trustees in connection with the determination to renew the advisory agreement. In determining to renew the agreement, the Trustees did not identify any single factor as controlling, and this summary does not describe all of the matters considered by the Trustees in making their determination.
Quality of Services; Fund Investment Performance. The Trustees evaluated the nature, extent and quality of services provided by the Advisor under the advisory agreement, and evaluated the investment performance of the Fund.
In connection with their general supervision of the Advisor, and as an important element of their annual consideration of a renewal of the advisory agreement, the Trustees received and considered reports from the Advisor throughout the year. These reports addressed a wide variety of topics, including particularly the Advisor’s selection of investments and execution of the Fund’s investment strategies. In addition, the Trustees considered the information provided to them at their request in anticipation of their annual evaluation of the Advisor’s services, including (i) the Fund’s absolute investment performance and achievement of stated objectives, (ii) the Advisor’s commentary on the Fund’s investment performance in the context of the Fund’s objectives and reasonable expectations, and business, market and economic conditions, (iii) measures of the Fund’s investment performance over different periods of time, relative to two categories of taxable fixed-income mutual funds selected by independent mutual fund analyst firms, and relative to a broad-based securities index, and (iv) comparative measures of portfolio volatility, risk and return.
The Trustees also considered their perceptions of portfolio management personnel developed in formal and informal meetings throughout the year, the Advisor’s staffing and other resources, the Advisor’s performance of accounting and other services, the Advisor’s observance of compliance and regulatory requirements, the Advisor’s responsiveness to the Trustees, and other factors.
In evaluating quantitative and performance data presented, the Trustees noted (among other aspects of the data) performance data for the eleven most recent calendar years, which showed that the Fund had produced positive returns in accordance with expectations in most years, that the Fund’s investment return for the most recent calendar year had exceeded the average return of the mutual fund category for which calendar year data was presented, and that the Fund’s return had exceeded or been comparable to the average return of the category in all of the preceding ten calendar years. Noted quantitative data further showed that the Fund’s investment returns fell within the top decile of performance for the first fund category for the one-year, three-year and five-year periods ended with the second quarter of the current year, and that the Fund’s investment returns fell within or near the top decile of the second category for the same periods. Measures of portfolio volatility, risk and relative return considered by the Trustees demonstrated that the Fund’s performance relative to these measures had continued to fulfill expectations in current conditions.
Certified Annual Report 55
| OTHER INFORMATION, CONTINUED | ||
| Thornburg Limited Term Income Funds | September 30, 2011 (Unaudited) | |
The Trustees concluded, based upon these and other considerations, that the nature, extent and quality of the Advisor’s services were sufficient and that the Advisor had satisfactorily pursued the Fund’s stated investment objectives. The Trustees further concluded that the investment performance of the Fund was satisfactory in the context of the Fund’s objectives and policies, and prevailing market conditions.
Fees and Expenses; Profitability of Advisor; Economies of Scale; Ancillary Benefits. The Trustees evaluated the level of the management fee charged by the Advisor to the Fund, and in this connection reviewed the profitability of the Advisor, economies of scale potentially available to the Fund and whether the Advisor received any ancillary benefits from its relationship with the Fund.
In evaluating the level of the management fee, the Trustees considered the fee charged by the Advisor and the other expenses charged to the Fund in light of the nature and quality of services provided, comparison of the actual Advisor’s fee and Fund expenses to the statement of fees and expenses in the Fund’s prospectuses, and comparisons of the Advisor’s fee and other Fund expenses to median and average fees and expenses charged to two groups of fixed income mutual funds assembled by independent mutual fund analyst firms. Comparative fee and expense data noted by the Trustees showed that the management fee charged to the Fund was comparable to the median and average fee levels for one fund group and slightly higher than the median and average levels for the second group, and that the overall expense ratio for the Fund was slightly higher than the median expense ratios for both groups and comparable to the average ratios for the groups. The Trustees did not identify the differences as significant. The Trustees considered information about the fees charged by the Advisor to other investment management clients, together with information about fees charged by other advisors to different clients, and analysis of the differences between the requirements of institutional clients and mutual funds and the consequently different investment management services rendered, respectively, to institutional clients and mutual funds. The Trustees confirmed their previous observations that the differences between the fees charged by the Advisor to different types of clients did not appear exceptional, and that the fee rates charged by investment advisors to institutional clients had limited relevance to the evaluation of fee rates charged to mutual funds, because of the significant differences between the respective requirements of institutional clients and mutual funds, the differences between the respective services rendered to institutional clients and mutual funds, and the different circumstances in which the respective fees originate.
In reviewing the profitability of the Advisor, the Trustees considered costs incurred by the Advisor and data comparing the profitability of the Advisor to other investment management firms. The information provided did not indicate that the Advisor’s profitability was unusual, and the Trustees noted the adequacy of the Advisor’s resources and service capabilities. In reviewing the extent to which economies of scale would be realized by the Fund as it grows and whether fee levels reflect economies of scale, the Trustees considered the breakpoint structure for advisory fees chargeable to the Fund, the demonstrated economies of scale enjoyed by other Funds of the Trust as they had grown in size, and economies of scale realized by other mutual funds. The information provided demonstrated to the Trustees that the Fund may reasonably be expected to realize economies of scale as it grows in size, due to the breakpoint fee structure of the advisory agreement and other factors. In reviewing potential benefits to the Advisor because of its relationship to the Fund, the Trustees considered the Advisor’s receipt of certain research services from broker dealers, and the benefits to both the Fund and the Advisor of the Advisor’s expansion of its staffing, compliance and systems capabilities and other resources to serve a broader variety of investment management clients. No unusual or unfair benefits to the Advisor from its relationship to the Fund were identified by the Trustees.
The Trustees concluded, based upon their consideration of these and other factors, that the management fee charged to the Fund by the Advisor was fair and reasonable in view of the nature, extent and quality of the services provided by the Advisor, the clear disclosure of fees and expenses in the Fund’s prospectuses, the investment performance of the Fund, and comparisons of fees and expenses charged to the Fund to fees and expenses charged to other mutual funds.
56 Certified Annual Report
This page intentionally left blank.
Certified Annual Report 57
Trustees’ Statement to Shareholders
Not part of the Certified Annual Report
September 13, 2011
The Trustees believe current and prospective shareholders should know how we discharge our responsibilities in supervising the Funds’ investment advisor and in reviewing the advisor’s contract for renewal. Since 2005, we have issued a statement which sets out clearly the three principal guidelines that we follow in supervising the Trust’s investment advisor on your behalf. In accordance with our customary practice, in September of this year we again reviewed our statement and concluded we should reissue this statement outlining the principal features of our supervision of the advisor’s performance of investment management services for the Funds.
We begin with the premise that each shareholder selected his or her Fund because its investments are managed by the investment advisor identified in the prospectus and in accordance with the objective and policies described in the prospectus. We realize, as each of you do, that if you believe that your Fund’s stated objective and policies no longer serve your personal investment goals, you can sell your shares and leave the Fund.
Therefore, we believe that our primary supervisory task – our principal obligation to you – is to assess the nature and quality of the advisor’s services, and to confirm that the advisor actively and competently pursues the Fund’s objective, in accordance with the policies set out in the prospectus. To do this, we meet regularly with management to review your Fund’s portfolio and to discuss the advisor’s specific actions and judgments in pursuing the Fund’s objective. We do not substitute our own judgment for the advisor’s decisions in selecting investments; the advisor is paid to exercise its informed judgment on investment decisions, and we seek to confirm, in reviewing the advisor’s performance, that the advisor is doing just that.
Second, while we are conscious of costs and the effect that costs have on shareholders’ returns, we do not seek the lowest fees or expense ratio as our sole or primary objective. We try to make sure that your Fund’s fees and costs are reasonable in relationship to the services rendered and that they are generally in line with those charged by other expert investment advisors, consistent with our belief that the Fund’s investors searched for and expect that expertise and attention and have decided to pay a reasonable price for it. We do not put the management contract “out to bid” as a matter of course, and we would not do so unless we had concluded that the advisor materially had failed to pursue the Fund’s objectives in accordance with its policies, or for other equally important reasons. We believe that any other approach would be inconsistent with your interests and contrary to your expectations when you bought shares of the Fund in the first place.
Finally, because we believe that most Thornburg Fund shareholders have invested with a long-term perspective, we try not to focus too much on the fashions of the moment and on short-term performance. The market will not favor any specific investment objective or set of policies at all times and under all economic circumstances. A fund will experience periods of both high and low returns relative to other funds and other investments. Even if one of our Funds is not favored by the market at a particular time, we believe that the advisor is nonetheless obliged to remain true to the Fund’s objective and policies, and we watch to see that it does so.
58 This page is not part of the Annual Report.
Retirement and Education Accounts
Thornburg Investment Management offers retirement and education savings accounts that can help you meet a variety of planning challenges. For account applications or further information on any of the accounts below, please call 1-800-847-0200 or go to www.thornburg.com/ira. Your financial advisor can help you determine which plan is right for you.
Individual Retirement Accounts
Individual Retirement Accounts (IRAs) provide a tax-advantaged means to save money for the future. For a detailed outline of the difference between retirement accounts, see www.thornburg.com/ira. Rollovers are available. Call 1-800-847-0200 for more information.
Traditional IRAs – Contributions to Traditional IRAs are tax deductible for eligible individuals, and withdrawals are taxed as additional ordinary income. You may contribute to an IRA if you receive compensation and are under 70 1/2, even if you are covered by an employer retirement plan. Deductible contributions are subject to certain qualifications. Please consult your tax advisor.
Roth IRAs – Under a Roth IRA, there is no tax deduction for contributions, but there is no income tax on qualified withdrawals. For a more detailed comparison of Traditional and Roth IRAs, please see our web site at www.thornburg.com/ira.
SEP IRAs – Simplified Employee Pension (SEP) IRAs are established by employers. The employer is allowed a tax deduction for contributions made to the SEP Plan and makes contributions to each eligible employee’s SEP IRA on a discretionary basis.
SIMPLE IRAs – Savings Incentive Match Plan for Employees of Small Employers (SIMPLE) is designed to give small business owners a simplified method to establish and contribute to a retirement plan for employees. The employer is allowed a tax deduction for contributions and makes either matching or non-elective contributions to each eligible employee’s SIMPLE IRA. Employees may make salary deferral contributions.
Coverdell Education Savings Account
These savings accounts are designed to provide a way to save money for higher education expenses. In an Education Savings Account, earnings and interest grow tax-free, and qualified withdrawals used to pay for eligible higher-education expenses are tax- and penalty-free.
Funds Available
The following funds are available in the accounts listed above:
| • | Thornburg International Value Fund |
| • | Thornburg Value Fund |
| • | Thornburg Core Growth Fund |
| • | Thornburg Investment Income Builder Fund |
| • | Thornburg Global Opportunities Fund |
| • | Thornburg International Growth Fund |
| • | Thornburg Developing World Fund |
| • | Thornburg Limited Term U.S. Government Fund |
| • | Thornburg Limited Term Income Fund |
| • | Thornburg Strategic Income Fund |
This page is not part of the Annual Report. 59

Thornburg Equity Funds
Thornburg’s equity research uses a fundamental and comprehensive analytical approach. Thornburg equity funds focus on a limited number of securities so that each holding can impact performance. The equity team searches for firms believed to have a promising future and seeks to buy shares of those companies at a discount to their intrinsic value.
| • | Thornburg Value Fund |
| • | Thornburg International Value Fund |
| • | Thornburg Core Growth Fund |
| • | Thornburg Investment Income Builder Fund |
| • | Thornburg Global Opportunities Fund |
| • | Thornburg International Growth Fund |
| • | Thornburg Developing World Fund |
Thornburg Bond Funds
Thornburg Investment Management applies a disciplined philosophy to fixed-income management. Since the launch of our first fixed-income fund over 25 years ago, we have been conducting fundamental, bottom-up research in an effort to identify bonds which we believe provide the best return for a given level of risk. We are very organic in our approach, avoiding leverage or complex strategies which could backfire in periods of market uncertainty.
| • | Thornburg Limited Term Municipal Fund |
| • | Thornburg Intermediate Municipal Fund |
| • | Thornburg California Limited Term Municipal Fund |
| • | Thornburg New Mexico Intermediate Municipal Fund |
| • | Thornburg New York Intermediate Municipal Fund |
| • | Thornburg Strategic Municipal Income Fund |
| • | Thornburg Limited Term U.S. Government Fund |
| • | Thornburg Limited Term Income Fund |
| • | Thornburg Strategic Income Fund |
Before investing, carefully consider the Fund’s investment goals, risks, charges, and expenses. For a prospectus containing this and other information, contact your financial advisor or visit thornburg.com. Read it carefully before investing.
For additional information, please visit www.thornburg.com
Thornburg Investment Management, Inc. 2300 North Ridgetop Road, Santa Fe, NM 87506
This page is not part of the Annual Report. 61
This page intentionally left blank.
62 This page is not part of the Annual Report.
This page intentionally left blank.
This page is not part of the Annual Report. 63
 | Waste not, Wait not |  | ||||
| Get instant access to your shareholder reports. | ||||||
| This Annual Report is submitted for the general information of shareholders of the Fund. It is not authorized for distribution to prospective investors in the Fund unless preceded or accompanied by an effective prospectus. | By switching from your postal mailbox to your email inbox, you reduce paper clutter, improve record keeping access, and help conserve our natural resources. | |||||
 | Investment Advisor: Thornburg Investment Management® 800.847.0200 | Go to www.thornburg.com/edelivery and sign up to receive your shareholder reports, prospectuses, and proxy statements electronically. | ||||
Distributor: | ||||||
Thornburg Securities Corporation® 800.847.0200 | You invest in the future, without spending a dime. | |||||
| TH076 | ||||||

Important Information
The information presented on the following pages was current as of September 30, 2011. The managers’ views, portfolio holdings, and sector and country diversification are provided for the general information of the Fund’s shareholders; to the extent this information is historical, it should not be considered predictive of future circumstances. This material should not be deemed a recommendation to buy or sell any of the securities mentioned.
Investments in the Fund carry risks, including possible loss of principal. Bond funds have the same interest rate, inflation, and credit risks that are associated with the underlying bonds. The principal value of bonds will fluctuate relative to changes in interest rates, decreasing when interest rates rise. Unlike bonds, bond funds have ongoing fees and expenses. Funds invested in mortgage-backed securities may bear additional risk. Investments in lower-rated and unrated bonds may be more sensitive to default, downgrades, and market volatility; these investments may also be less liquid than higher-rated bonds. Investments in structured finance arrangements and other types of derivatives are subject to the risks associated with the securities or other assets underlying the pool of securities including illiquidity and difficulty in valuation. Investments in equity securities are subject to additional risks, such as greater market fluctuations. Special risks may be associated with investments outside the United States, especially in emerging markets, including currency fluctuations, illiquidity and volatility. Please see the Fund’s Prospectus for a discussion of the risks associated with an investment in the Fund. Investments in the Fund are not FDIC insured, nor are they deposits of or guaranteed by a bank or any other entity. There is no guarantee that the Fund will meet its investment objectives.
Performance data given at net asset value (NAV) does not take into account the applicable sales charges. If the sales charges had been included, the performance would have been lower.
Class I shares may not be available to all investors. Minimum investments for Class I shares may be higher than those for other classes.
Share Class | NASDAQ Symbol | Cusip | ||
Class A | TSIAX | 885-215-228 | ||
Class C | TSICX | 885-215-210 | ||
Class I | TSIIX | 885-215-194 |
Glossary
Blended Index – The Blended Index is composed of 80% Barclays Capital Aggregate Bond Index and 20% MSCI World Index. The Barclays Capital Aggregate Bond Index is composed of approximately 8,000 publicly traded bonds including U.S. government, mortgage-backed, corporate and Yankee bonds. The index is weighted by the market value of the bonds included in the index. The MSCI World Index is an unmanaged market-weighted index that consists of securities traded in 24 of the world’s most developed countries. Securities are listed on exchanges in the U.S., Europe, Canada, Australia, New Zealand, and the Far East. The index is calculated with net dividends reinvested, in U.S. dollars.
Barclays Capital U.S. Corporate High-Yield Index – This index measures the market of USD-denominated, non-investment grade, fixed-rate, taxable corporate bonds. Securities are classified as high yield if the middle rating of Moody’s, Fitch, and S&P is Ba1/BB+/BB+ or below. The index excludes emerging market debt.
Barclays Capital U.S. Universal Index – This index represents the union of the U.S. Aggregate Index, U.S. Corporate High-Yield, Investment Grade 144A Index, Eurodollar Index, U.S. Emerging Markets Index, and the non-ERISA eligible portion of the CMBS Index. The index covers USD denominated, taxable bonds that are rated either investment-grade or below investment-grade.
Unless otherwise noted, index returns reflect the reinvestment of income dividends and capital gains, if any, but do not reflect fees, brokerage commissions or other expenses of investing. Investors may not make direct investments into any index. The performance of any index is not indicative of the performance of any particular investment.
Bond Credit Ratings – A bond credit rating assesses the financial ability of a debt issuer to make timely payments of principal and interest. Ratings of AAA (the highest), AA, A, and BBB are investment-grade quality. Ratings of BB, B, CCC, CC, C, and D (the lowest) are considered below investment grade, speculative grade, or junk bonds. Unless otherwise noted, the ratings listed are from Bloomberg Market Data and are a combination of ratings from Standard and Poor’s, Moody’s Investors Service, and Fitch Ratings.
Coupon – The interest rate stated on a bond when its issued. The coupon is typically paid semi-annually.
Effective Duration – A bond’s sensitivity to interest rates, incorporating the embedded option features, such as call provisions. Bonds with longer durations experience greater price volatility than bonds with shorter durations.
Median Market Capitalization – Market capitalization (market cap) is the total value of a company’s stock, calculated by multiplying the number of outstanding common shares by the current share price. The company whose market cap is in the middle of the portfolio is the median market cap. Half the companies in the portfolio have values greater than the median and half have values that are less.
Price to Earnings Ratio (P/E) – A valuation ratio equaling a company’s market value per share divided by earnings per share.
U.S. Treasury Securities – U.S. Treasury securities, such as bills, notes and bonds, are negotiable debt obligations of the U.S. government. These debt obligations are backed by the “full faith and credit” of the government and issued at various schedules and maturities. Income from Treasury securities is exempt from state and local, but not federal income taxes.
This page is not part of the Annual Report. 3
Portfolio Overview
Thornburg Strategic Income Fund
CO-PORTFOLIO MANAGERS

Jason Brady,CFA, and George Strickland
IMPORTANT
PERFORMANCE INFORMATION
Performance data shown represents past performance and is no guarantee of future results. Investment return and principal value will fluctuate so shares, when redeemed, may be worth more or less than their original cost. Current performance may be lower or higher than quoted. For performance current to the most recent month end, visit thornburg. com or call 800-847-0200.
The maximum sales charge for Class A shares is 4.50%. The total annual fund operating expense of Class A shares is 1.35% , as disclosed in the most recent Prospectus. Thornburg Investment Management and Thornburg Securities Corporation have contractually agreed to waive fees and reimburse expenses through at least February 1, 2012, so that actual expenses, for Class A shares, do not exceed 1.25%.
Many investors are in need of significant income and typically turn to “high yield” funds to find notable dividends. The simple yield statistic is potentially quite misleading. At Thornburg Investment Management, we believe we have a better income-generation mousetrap in the form of our Strategic Income Fund, which has a goal of high income, without resorting solely to the below investment grade portion of the taxable fixed income universe.
The idea behind this fund is that “high-yield,” in the context of a fund type, is not an investment goal but an asset type. Most taxable high-yield funds are solely focused on below investment grade corporate bonds. This focus ultimately makes these funds less flexible and correspondingly less capable of succeeding in multiple investment climates. Below investment grade corporate bonds represent less than 2% of the total taxable investment universe. There is no reason to ignore huge chunks of the market merely because they do not have a very low credit quality; in fact, quite the opposite. By sifting
QUARTERLY DIVIDEND HISTORY
Class A
Year | Q1 | Q2 | Q3 | Q4 | Total | |||||||||||||||
2008 | 15.2 | ¢ | 18.3 | ¢ | 19.0 | ¢ | 20.5 | ¢ | 73.0 | ¢ | ||||||||||
2009 | 17.0 | ¢ | 19.0 | ¢ | 20.7 | ¢ | 22.0 | ¢ | 78.7 | ¢ | ||||||||||
2010 | 18.8 | ¢ | 20.5 | ¢ | 19.8 | ¢ | 22.0 | ¢ | 81.1 | ¢ | ||||||||||
2011 | 17.8 | ¢ | 19.0 | ¢ | 20.3 | ¢ | ||||||||||||||
30-DAY YIELDS, Class A
As of 9/30/11
| SEC Yield | 6.20 | % | ||
| Annualized Distribution Yield | 6.81 | % |
Without fee waivers and expense reimbursements, the 30-day SEC Yield would have been 5.50% and the Annualized Distribution Yield would have been 6.13%.
AVERAGE ANNUAL TOTAL RETURNS
FOR PERIODS ENDED 9/30/11
| 1 Yr | 3 Yrs | Since Inception | ||||||||||
A Shares (Incep: 12/19/07) | ||||||||||||
Without sales charge | 4.78 | % | 12.36 | % | 7.54 | % | ||||||
With sales charge | 0.08 | % | 10.64 | % | 6.25 | % | ||||||
Barclays U.S. Universal Index (Since 12/19/07) | 4.77 | % | 8.17 | % | 6.43 | % | ||||||
Blended Index (Since 12/19/07) | 3.52 | % | 6.76 | % | 4.21 | % | ||||||
Blended Index: 80% Barclays Capital Aggregate Bond Index/20% MSCI World Index
4 This page is not part of the Annual Report.
through the available choices across many sub-asset classes, we are able to generate an interesting income stream from a variety of different sources. We believe this is likely to lead to a more stable fund with a robust yield.
This is the reason that our Strategic Income Fund has a much larger purview than a typical “high-yield” fund. Though we are currently focused on corporate bonds, that focus is a result of our belief that corporate balance sheets are currently the most attractive bond investment. Given the choice between government bonds, asset-backed bonds (mortgages, commercial mortgage, auto loans, etc.) and corporate bonds, we’re skewing towards corporates.
The Thornburg Strategic Income Fund even has a small allocation to equity securities. As such, the occasional “bond-like equity,” which typically exhibits little growth but potentially terrific income generation, is attractive. While adding equities to what is primarily a bond fund can add volatility (which we work hard to mitigate), we can find no good reason why we should ignore an asset class that can potentially be another diverse source of income for the Fund. Thornburg Investment Management has always tried to “go where the value is.” It is a mantra of ours across our Funds, regardless of the asset classes in which we invest.
KEY PORTFOLIO ATTRIBUTES
As of 9/30/11
Fixed Income Statistics | Equity Statistics | |||||||||
Weighted Average Coupon | 7.1 | % | Portfolio P/E (12-mo. trailing) | 6.2 | ||||||
Average Maturity | 7.1 yrs | Median Market Cap | $ | 13.1 B | ||||||
Effective Duration | 3.3 yrs | Equity & Pref. Equity Holdings | 24 | |||||||
Bond Holdings | 234 | |||||||||
PORTFOLIO COMPOSITION
As of 9/30/11
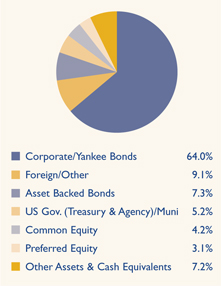
CREDIT QUALITY SUMMARY
As of 9/30/11
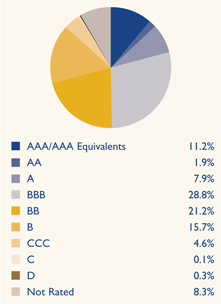
We have used ratings from Moody’s Investors Service. Where Moody’s ratings are not available, we have used Standard & Poor’s ratings.
This page is not part of the Annual Report. 5

Thornburg Strategic Income Fund
September 30, 2011
Table of Contents | ||||
| 7 | ||||
| 9 | ||||
| 22 | ||||
| 24 | ||||
| 26 | ||||
| 27 | ||||
| 34 | ||||
| 36 | ||||
| 37 | ||||
| 38 | ||||
| 39 | ||||
| 42 |
This report is certified under the Sarbanes-Oxley Act of 2002, which requires that public companies, including mutual funds, affirm that the information provided in their annual and semiannual shareholder reports fully and fairly represents their financial position.
6 Certified Annual Report
Jason H. Brady,CFA Co-Portfolio Manager | October 17, 2011
Dear Fellow Shareholder:
We are happy to present the Annual Report for the Thornburg Strategic Income Fund for the | |
George Strickland Co-Portfolio Manager | Since the Fund’s inception nearly four years ago, we have been navigating an environment of very high volatility in both the global fixed income and equity marketplaces. In spite of that, the Fund has continued to achieve its primary goal: a high income stream. Going forward, we will continue to strive to achieve that goal through our investments in a diverse variety of assets across the globe, despite, or perhaps because of, our belief that market volatility will continue.
Including income and price change together, the Class A shares of the Thornburg Strategic Income Fund produced a total return of 4.78% (at NAV) over the course of the past year. A blended index of 80% of the Barclays Capital Aggregate Bond Index and 20% of the MSCI World Index produced a 3.52% total return over the same time period. The Barclays U.S. Universal Index and the Barclays U.S. Corporate High-Yield Index produced a 4.77% and 1.79% total return respectively. These indices reflect no deduction for fees, expenses, or taxes.
The total return of the Fund was largely driven by the income from our investments in corporate bonds, and to a lesser extent income producing equities, currency movements and other fixed income instruments. Credit spread tightening occurred early in the year but was more than undone in August and September. This has provided additional opportunity in “risk assets” (defined as anything other than U.S. Treasuries, interestingly). As an example, we had been cautious about the market’s sanguinity around the potential for a stronger dollar and the most recent dollar strength has given us a good entry point for a few non-dollar investments. Even so, the fund has only about 10% invested in assets denominated in something other than the U.S. dollar. | |


Certified Annual Report 7
| Letter to Shareholders, | ||
Continued | ||
The current economic environment is still difficult, with continued uncertainty around the shape of any potential recovery. We have been believers in a slow, halting recovery, mostly due to the large debt burdens of most developed market economies. These debt burdens, while at record lows within the corporate sector, and increasingly under control for many individuals, remain quite daunting for many governments. The global investment scope of the Fund does give us freedom to pursue many different types of opportunity, though similar challenges to the ones that exist in the U.S. remain in many areas such as the U.K., developed Europe and Japan. Emerging markets may provide an engine for global growth, but those economies still remain tied to developed markets.
Last year we wrote, “Because we believe that spread tightening is largely at an end, performance from fixed income will continue to come from the income qualities of those investments versus a potential for capital appreciation.” This largely turned out to be the case, but there has recently been some risk aversion that has widened spreads to a notable degree. We have added to a variety of investments and remain opportunistic on market weakness.
We believe that income producing assets will continue to be in high demand going forward, and we are happy to be in a position to provide that income. The Fund’s strategy to achieve income from a variety of different sources we believe will be a source of strength and total return over time. In short, selectively investing in a range of interesting global assets while keeping an eye on income production is a mindset that we believe will serve our shareholders well.
Thank you very much for investing in our Fund. We believe that the Thornburg Strategic Income Fund continues to be an appropriate investment for those looking for an attractive, sustainable yield from a variety of instruments.
Regards,
 |  | |
| Jason H. Brady,CFA | George Strickland | |
| Co-Portfolio Manager | Co-Portfolio Manager | |
| Managing Director | Managing Director |
The matters discussed in this report may constitute forward-looking statements made pursuant to the safe harbor provisions of the Securities Litigation Reform Act of 1995. These include any advisor or portfolio manager prediction, assessment, analysis or outlook for individual securities, industries, investment styles, market sectors and/or markets. These statements involve risks and uncertainties. In addition to the general risks described for each fund in its current prospectus, other factors bearing on these reports include the accuracy of the advisor’s or portfolio manager’s forecasts and predictions, the appropriateness of the investment strategies designed by the advisor or portfolio manager, and the ability of the advisor or portfolio manager to implement their strategies efficiently and successfully. Any one or more of these factors, as well as other risks affecting the securities markets generally, could cause the actual results of any fund to differ materially as compared to its benchmarks.
8 Certified Annual Report
| SCHEDULE OF INVESTMENTS | ||
| Thornburg Strategic Income Fund | September 30, 2011 | |
SUMMARY OF INDUSTRY EXPOSURE
As of 9/30/11
Utilities | 11.5 | % | Semiconductors & Semiconductor Equipment | 0.9 | % | |||||
Energy | 9.4 | % | Pharmaceuticals, Biotechnology & Life Sciences | 0.7 | % | |||||
Transportation | 7.6 | % | Consumer Services | 0.7 | % | |||||
Insurance | 7.2 | % | Consumer Durables & Apparel | 0.6 | % | |||||
Telecommunication Services | 6.3 | % | Retailing | 0.5 | % | |||||
Banks | 6.1 | % | Food & Staples Retailing | 0.4 | % | |||||
Diversified Financials | 5.2 | % | Commercial & Professional Services | 0.3 | % | |||||
Capital Goods | 3.7 | % | Other Non-Classified Securities: | |||||||
Food, Beverage & Tobacco | 3.1 | % | Asset Backed Securities | 7.3 | % | |||||
Media | 2.8 | % | Municipal Bonds | 4.1 | % | |||||
Software & Services | 2.7 | % | Other Securities | 0.8 | % | |||||
Miscellaneous | 2.5 | % | U.S. Treasury Securities | 0.7 | % | |||||
Real Estate | 2.1 | % | U.S. Government Agencies | 0.4 | % | |||||
Materials | 2.1 | % | Other Government | 0.3 | % | |||||
Health Care Equipment & Services | 1.9 | % | Other Assets & Cash Equivalents | 7.2 | % | |||||
Technology Hardware & Equipment | 0.9 | % |
SUMMARY OF COUNTRY EXPOSURE
As of 9/30/11
United States | 70.1 | % | Russia | 0.5 | % | |||||
Australia | 3.1 | % | Italy | 0.4 | % | |||||
Canada | 2.3 | % | Czech Republic | 0.4 | % | |||||
Bermuda | 2.0 | % | Trinidad and Tobago | 0.4 | % | |||||
Brazil | 1.9 | % | Germany | 0.4 | % | |||||
Cayman Islands | 1.9 | % | Iceland | 0.3 | % | |||||
United Kingdom | 1.5 | % | Indonesia | 0.3 | % | |||||
Spain | 1.5 | % | Belgium | 0.1 | % | |||||
Netherlands | 1.0 | % | Chile | 0.1 | % | |||||
Norway | 1.0 | % | Switzerland | 0.1 | % | |||||
Luxembourg | 0.9 | % | Singapore | 0.1 | % | |||||
Japan | 0.7 | % | China* | 0.0 | % | |||||
South Korea | 0.7 | % | Greece* | 0.0 | % | |||||
United Arab Emirates | 0.6 | % | Other Assets & Cash Equivalents | 7.2 | % | |||||
Mexico | 0.5 | % |
| * | Country percentages were less than 0.1% |
Certified Annual Report 9
| SCHEDULE OF INVESTMENTS, CONTINUED | ||
| Thornburg Strategic Income Fund | September 30, 2011 | |
| Shares/ Principal Amount | Value | |||||||
COMMON STOCK — 4.16% | ||||||||
CONSUMER SERVICES — 0.03% | ||||||||
HOTELS, RESTAURANTS & LEISURE — 0.03% | ||||||||
OPAP SA | 8,300 | $ | 84,511 | |||||
|
| |||||||
| 84,511 | ||||||||
|
| |||||||
DIVERSIFIED FINANCIALS — 0.56% | ||||||||
CAPITAL MARKETS — 0.39% | ||||||||
Apollo Investment Corp. | 168,060 | 1,263,811 | ||||||
DIVERSIFIED FINANCIAL SERVICES — 0.17% | ||||||||
KKR Financial Holdings LLC | 73,000 | 542,390 | ||||||
|
| |||||||
| 1,806,201 | ||||||||
|
| |||||||
ENERGY — 0.72% | ||||||||
ENERGY EQUIPMENT & SERVICES — 0.40% | ||||||||
Seadrill Ltd. | 46,100 | 1,291,092 | ||||||
OIL, GAS & CONSUMABLE FUELS — 0.32% | ||||||||
Eni S.p.A. | 58,500 | 1,036,123 | ||||||
|
| |||||||
| 2,327,215 | ||||||||
|
| |||||||
INSURANCE — 0.07% | ||||||||
INSURANCE — 0.07% | ||||||||
Swiss Re Ltd. | 4,400 | 206,408 | ||||||
|
| |||||||
| 206,408 | ||||||||
|
| |||||||
REAL ESTATE — 1.73% | ||||||||
REAL ESTATE INVESTMENT TRUSTS — 1.73% | ||||||||
Annaly Capital Management, Inc. | 101,900 | 1,694,597 | ||||||
Chimera Investment Corp. | 770,900 | 2,135,393 | ||||||
Invesco Mortgage Capital, Inc. | 123,500 | 1,745,055 | ||||||
|
| |||||||
| 5,575,045 | ||||||||
|
| |||||||
TELECOMMUNICATION SERVICES — 0.84% | ||||||||
DIVERSIFIED TELECOMMUNICATION SERVICES — 0.72% | ||||||||
France Telecom SA | 26,900 | 443,283 | ||||||
Telefonica SA | 21,500 | 415,507 | ||||||
Telstra Corp. Ltd. | 483,000 | 1,448,937 | ||||||
WIRELESS TELECOMMUNICATION SERVICES — 0.12% | ||||||||
Mobistar SA | 7,000 | 402,796 | ||||||
|
| |||||||
| 2,710,523 | ||||||||
|
| |||||||
UTILITIES — 0.21% | ||||||||
ELECTRIC UTILITIES — 0.21% | ||||||||
E.ON AG | 13,100 | 287,042 | ||||||
Enel S.p.A. | 87,856 | 391,016 | ||||||
|
| |||||||
| 678,058 | ||||||||
|
| |||||||
TOTAL COMMON STOCK (Cost $16,368,710) | 13,387,961 | |||||||
|
| |||||||
10 Certified Annual Report
| SCHEDULE OF INVESTMENTS, CONTINUED | ||
| Thornburg Strategic Income Fund | September 30, 2011 | |
| Shares/ Principal Amount | Value | |||||||
PREFERRED STOCK — 3.10% | ||||||||
BANKS — 1.23% | ||||||||
COMMERCIAL BANKS — 0.25% | ||||||||
Huntington Bancshares Pfd, 8.50% | 750 | $ | 797,625 | |||||
Webster Financial Corp. Pfd Series A, 8.50% | 15 | 15,094 | ||||||
THRIFTS & MORTGAGE FINANCE — 0.98% | ||||||||
Falcons Funding Trust I Pfd, 8.875% | 3,000 | 3,138,750 | ||||||
|
| |||||||
| 3,951,469 | ||||||||
|
| |||||||
DIVERSIFIED FINANCIALS — 0.20% | ||||||||
DIVERSIFIED FINANCIAL SERVICES — 0.20% | ||||||||
Bank of America Corp. Pfd, 8.00% | 750,000 | 637,612 | ||||||
|
| |||||||
| 637,612 | ||||||||
|
| |||||||
FOOD, BEVERAGE & TOBACCO — 0.17% | ||||||||
FOOD PRODUCTS — 0.17% | ||||||||
H.J. Heinz Finance Co. Pfd, 8.00% | 5 | 535,938 | ||||||
|
| |||||||
| 535,938 | ||||||||
|
| |||||||
MISCELLANEOUS — 0.36% | ||||||||
U.S. GOVERNMENT AGENCIES — 0.36% | ||||||||
Farm Credit Bank of Texas Pfd, 10.00% | 1,000 | 1,154,687 | ||||||
|
| |||||||
| 1,154,687 | ||||||||
|
| |||||||
REAL ESTATE — 0.38% | ||||||||
REAL ESTATE INVESTMENT TRUSTS — 0.38% | ||||||||
Alexandria Real Estate Pfd, 7.00% | 50,000 | 1,212,500 | ||||||
|
| |||||||
| 1,212,500 | ||||||||
|
| |||||||
TECHNOLOGY HARDWARE & EQUIPMENT — 0.25% | ||||||||
COMMUNICATIONS EQUIPMENT — 0.25% | ||||||||
Lucent Technologies Capital Trust I Pfd, 7.75% | 1,000 | 825,000 | ||||||
|
| |||||||
| 825,000 | ||||||||
|
| |||||||
UTILITIES — 0.51% | ||||||||
MULTI-UTILITIES — 0.51% | ||||||||
Centerpoint Energy, Inc. Pfd, 7.5% | 50,000 | 1,650,000 | ||||||
|
| |||||||
| 1,650,000 | ||||||||
|
| |||||||
TOTAL PREFERRED STOCK (Cost $9,661,614) | 9,967,206 | |||||||
|
| |||||||
ASSET BACKED SECURITIES — 7.28% | ||||||||
BANKS — 0.60% | ||||||||
COMMERCIAL BANKS — 0.60% | ||||||||
Wells Fargo Asset Securities Corp. Series 2005-AR1 Class B1, 2.739%, 2/25/2035 | $ | 380,282 | 44,004 | |||||
Wells Fargo Asset Securities Corp. Series 2005-AR2 Class B1, 3.523%, 3/25/2035 | 381,761 | 53,036 | ||||||
Wells Fargo MBS Series 2003-7 Class A2, 4.50%, 8/25/2018 | 1,793,338 | 1,822,801 | ||||||
|
| |||||||
| 1,919,841 | ||||||||
|
| |||||||
DIVERSIFIED FINANCIALS — 2.24% | ||||||||
CAPITAL MARKETS — 0.66% | ||||||||
Bear Stearns ARM Mtg Series 2003-6 Class 2B-1, 2.60%, 8/25/2033 | 571,113 | 408,501 | ||||||
Certified Annual Report 11
| SCHEDULE OF INVESTMENTS, CONTINUED | ||
| Thornburg Strategic Income Fund | September 30, 2011 | |
| Shares/ Principal Amount | Value | |||||||
Bear Stearns Commercial Mtg Securities Series 2007-T26 Class A1, 5.145%, 1/12/2045 | $ | 21,437 | $ | 21,526 | ||||
Bear Stearns Commercial Mtg Securities Series 2007-T28 Class A1, 5.422%, 9/11/2042 | 1,258 | 1,260 | ||||||
LB-UBS Commercial Mtg Trust Series 2007-C1 Class A1, 5.391%, 2/15/2040 | 2,023 | 2,023 | ||||||
Merrill Lynch Mtg Investors Trust, 2.611%, 8/25/2034 | 334,397 | 257,781 | ||||||
Merrill Lynch/Countrywide Commercial Mtg Trust Series 2007-6 Class A1, 5.175%, 3/12/2051 | 1,717 | 1,718 | ||||||
Morgan Stanley Capital I Series 2007-IQ13 Class A1, 5.05%, 3/15/2044 | 9,240 | 9,246 | ||||||
Morgan Stanley Capital I Series 2007-T25 Class A1, 5.391%, 11/12/2049 | 12,057 | 12,082 | ||||||
Morgan Stanley Capital, Inc. Series 2005-HE7 Class A2C, 0.555%, 11/25/2035 | 1,797,544 | 1,411,142 | ||||||
CONSUMER FINANCE — 0.50% | ||||||||
SLM Student Loan Trust Series 2004-B Class A3, 0.677%, 3/15/2024 | 2,000,000 | 1,595,249 | ||||||
DIVERSIFIED FINANCIAL SERVICES — 1.08% | ||||||||
Banc of America Funding Corp. Series 2006-I Class SB1, 3.139%, 12/20/2036 | 955,890 | 170,539 | ||||||
Banc of America Mtg Services Series 2005-A Class B1, 3.246%, 2/25/2035 | 923,017 | 371,128 | ||||||
Citigroup Commercial Mtg Trust Series 2004-HYB2 Class B1, 2.887%, 3/25/2034 | 181,279 | 146,707 | ||||||
Citigroup Commercial Mtg Trust Series 2007-C6 Class A1, 5.622%, 12/10/2049 | 47,386 | 47,315 | ||||||
Countrywide Series 2005-11 Class AF3, 4.778%, 2/25/2036 | 921,753 | 720,454 | ||||||
Countrywide Series 2006-15 Class A6, 5.826%, 10/25/2046 | 399,624 | 281,472 | ||||||
JPMorgan Mortgage Acquisition Corp. Series 2006-CH1 Class A4, 0.375%, 7/25/2036 | 1,645,000 | 1,195,515 | ||||||
JPMorgan Series 2007-CH5 Class A2, 0.285%, 5/25/2037 | 577,176 | 552,502 | ||||||
|
| |||||||
| 7,206,160 | ||||||||
|
| |||||||
PHARMACEUTICALS, BIOTECHNOLOGY & LIFE SCIENCES — 0.80% | ||||||||
BIOTECHNOLOGY — 0.62% | ||||||||
aJPR Royalty LLC, 14.00%, 12/1/2020 | 2,000,000 | 2,000,000 | ||||||
PHARMACEUTICALS — 0.18% | ||||||||
bQHP PhaRMA, 10.25%, 3/15/2015 | 576,339 | 586,166 | ||||||
|
| |||||||
| 2,586,166 | ||||||||
|
| |||||||
REAL ESTATE — 3.01% | ||||||||
REAL ESTATE INVESTMENT TRUSTS — 3.01% | ||||||||
Residential Asset Securities Corporation, 0.385%, 6/25/2036 | 2,258,150 | 1,974,393 | ||||||
Bayview Financial Acquisition Trust, 0.917%, 4/28/2039 | 4,000,000 | 2,533,420 | ||||||
New Century Home Equity Loan Trust, 0.665%, 6/25/2035 | 2,000,000 | 1,607,782 | ||||||
Structured Asset Investment Loan Trust, 1.195%, 8/25/2033 | 1,828,512 | 1,569,701 | ||||||
aAH Mortgage Advance Trust, 6.90%, 9/15/2043 | 2,000,000 | 2,006,400 | ||||||
|
| |||||||
| 9,691,696 | ||||||||
|
| |||||||
TECHNOLOGY HARDWARE & EQUIPMENT — 0.63% | ||||||||
COMMUNICATIONS EQUIPMENT — 0.63% | ||||||||
bRichland Towers, 7.87%, 3/15/2041 | 2,000,000 | 2,046,578 | ||||||
|
| |||||||
| 2,046,578 | ||||||||
|
| |||||||
TOTAL ASSET BACKED SECURITIES (Cost $25,571,411) | 23,450,441 | |||||||
|
| |||||||
CORPORATE BONDS — 59.98% | ||||||||
BANKS — 4.28% | ||||||||
COMMERCIAL BANKS — 3.30% | ||||||||
b,cBanco do Brasil SA, 5.875%, 1/26/2022 | 1,000,000 | 952,500 | ||||||
b,cBanco Industrial e Comercial S.A., 6.25%, 1/20/2013 | 1,000,000 | 1,007,500 | ||||||
b,cDBS Bank Ltd., 5.125%, 5/16/2017 | 200,000 | 203,538 | ||||||
b,c,d,eIslandsbanki, 4.41%, 10/15/2008 | 60,000 | 15,600 | ||||||
b,c,d,eLandsbanki Islands HF, 5.73%, 8/25/2009 | 175,000 | 12,250 | ||||||
National City Bank Floating Rate Note, 0.703%, 6/7/2017 | 1,000,000 | 915,629 | ||||||
12 Certified Annual Report
| SCHEDULE OF INVESTMENTS, CONTINUED | ||
| Thornburg Strategic Income Fund | September 30, 2011 | |
| Shares/ Principal Amount | Value | |||||||
bPNC Preferred Funding Trust III Floating Rate Note, 8.70%, 12/31/2049 | $ | 500,000 | $ | 514,800 | ||||
Provident Bank of Maryland, 9.50%, 5/1/2018 | 1,500,000 | 1,748,971 | ||||||
b,cSantander Issuances, 6.50%, 8/11/2019 | 1,000,000 | 922,688 | ||||||
cShinhan Bank, 6.819%, 9/20/2036 | 100,000 | 92,864 | ||||||
Sovereign Bank, 5.125%, 3/15/2013 | 100,000 | 100,884 | ||||||
Susquehanna Capital II, 11.00%, 3/23/2040 | 1,000,000 | 1,025,000 | ||||||
bWebster Bank, 5.875%, 1/15/2013 | 2,000,000 | 2,042,258 | ||||||
Whitney National Bank, 5.875%, 4/1/2017 | 1,000,000 | 1,056,361 | ||||||
THRIFTS & MORTGAGE FINANCE — 0.98% | ||||||||
b,cNorthern Rock Asset Management plc, 5.625%, 6/22/2017 | 3,000,000 | 3,168,627 | ||||||
|
| |||||||
| 13,779,470 | ||||||||
|
| |||||||
CAPITAL GOODS — 3.65% | ||||||||
BUILDING PRODUCTS — 0.37% | ||||||||
Owens Corning, Inc., 9.00%, 6/15/2019 | 1,000,000 | 1,180,685 | ||||||
INDUSTRIAL CONGLOMERATES — 1.89% | ||||||||
General Electric Capital Corp., 0.491%, 6/20/2014 | 1,000,000 | 958,074 | ||||||
b,cHutchison Whampoa International (10) Ltd., 6.00%, 12/29/2049 | 2,000,000 | 1,915,000 | ||||||
Otter Tail Corp., 9.00%, 12/15/2016 | 3,000,000 | 3,232,500 | ||||||
MACHINERY — 0.64% | ||||||||
Case New Holland, Inc., 7.75%, 9/1/2013 | 1,000,000 | 1,042,500 | ||||||
SPX Corp., 6.875%, 9/1/2017 | 1,000,000 | 1,025,000 | ||||||
TRADING COMPANIES & DISTRIBUTORS — 0.75% | ||||||||
b,fAviation Capital Group, 6.75%, 4/6/2021 | 2,500,000 | 2,405,275 | ||||||
|
| |||||||
| 11,759,034 | ||||||||
|
| |||||||
COMMERCIAL & PROFESSIONAL SERVICES — 0.31% | ||||||||
COMMERCIAL SERVICES & SUPPLIES — 0.31% | ||||||||
Corrections Corp. of America, 6.25%, 3/15/2013 | 1,000,000 | 1,000,000 | ||||||
|
| |||||||
| 1,000,000 | ||||||||
|
| |||||||
CONSUMER DURABLES & APPAREL — 0.58% | ||||||||
HOUSEHOLD DURABLES — 0.58% | ||||||||
fFGI Operating Co., Inc., 10.25%, 8/1/2015 | 1,800,000 | 1,872,000 | ||||||
|
| |||||||
| 1,872,000 | ||||||||
|
| |||||||
CONSUMER SERVICES — 0.61% | ||||||||
HOTELS, RESTAURANTS & LEISURE — 0.61% | ||||||||
bSizzling Platter LLC, 12.25%, 4/15/2016 | 2,000,000 | 1,970,000 | ||||||
|
| |||||||
| 1,970,000 | ||||||||
|
| |||||||
DIVERSIFIED FINANCIALS — 2.45% | ||||||||
CAPITAL MARKETS — 0.64% | ||||||||
b,cMacquarie Group Ltd., 7.30%, 8/1/2014 | 1,000,000 | 1,082,774 | ||||||
Oppenheimer Holdings, Inc., 8.75%, 4/15/2018 | 1,000,000 | 975,000 | ||||||
CONSUMER FINANCE — 1.37% | ||||||||
North Fork Bancorp, Inc., 5.875%, 8/15/2012 | 1,000,000 | 1,015,932 | ||||||
SLM Corp., 6.25%, 1/25/2016 | 1,000,000 | 981,534 | ||||||
TMX Finance LLC, 13.25%, 7/15/2015 | 1,000,000 | 1,075,000 | ||||||
bTMX Finance LLC/TitleMax Finance, 13.25%, 7/15/2015 | 1,250,000 | 1,343,750 | ||||||
Certified Annual Report 13
| SCHEDULE OF INVESTMENTS, CONTINUED | ||
| Thornburg Strategic Income Fund | September 30, 2011 | |
| Shares/ Principal Amount | Value | |||||||
DIVERSIFIED FINANCIAL SERVICES — 0.44% | ||||||||
bCiticorp, 8.04%, 12/15/2019 | $ | 250,000 | $ | 286,469 | ||||
Citigroup, Inc., 5.00%, 9/15/2014 | 750,000 | 735,569 | ||||||
aCounts Series 1998 II-A, 6.67%, 2/15/2018 | 190,040 | 179,778 | ||||||
cKorea Development Bank, 5.30%, 1/17/2013 | 200,000 | 206,883 | ||||||
|
| |||||||
| 7,882,689 | ||||||||
|
| |||||||
ENERGY — 8.16% | ||||||||
ENERGY EQUIPMENT & SERVICES — 0.99% | ||||||||
b,cRDS Ultra-Deepwater Ltd., 11.875%, 3/15/2017 | 2,000,000 | 2,095,000 | ||||||
Seacor Holdings, Inc., 7.375%, 10/1/2019 | 1,000,000 | 1,081,117 | ||||||
OIL, GAS & CONSUMABLE FUELS — 7.17% | ||||||||
Black Elk Energy Offshore, 13.75%, 12/1/2015 | 2,000,000 | 1,990,000 | ||||||
b,cBumi Capital PTE Ltd., 12.00%, 11/10/2016 | 1,000,000 | 970,000 | ||||||
bDCP Midstream LLC, 9.75%, 3/15/2019 | 500,000 | 665,297 | ||||||
Energy Transfer Partners LP, 8.50%, 4/15/2014 | 500,000 | 567,318 | ||||||
Energy Transfer Partners LP, 9.70%, 3/15/2019 | 1,500,000 | 1,856,913 | ||||||
Enterprise Products Operating LP, 7.034%, 1/15/2068 | 2,000,000 | 2,027,500 | ||||||
b,cGaz Capital SA, 7.51%, 7/31/2013 | 1,000,000 | 1,044,967 | ||||||
bMaritimes & Northeast Pipeline LLC, 7.50%, 5/31/2014 | 918,800 | 993,168 | ||||||
Niska Gas Storage, 8.875%, 3/15/2018 | 2,000,000 | 1,980,000 | ||||||
bNorthern Tier Energy LLC, 10.50%, 12/1/2017 | 1,500,000 | 1,560,000 | ||||||
b,cOdebrecht Drill VIII/IX, 6.35%, 6/30/2021 | 2,000,000 | 1,980,000 | ||||||
b,cPetro Co. Trinidad Tobago Ltd., 9.75%, 8/14/2019 | 1,000,000 | 1,182,500 | ||||||
Plains All American Pipeline LP, 8.75%, 5/1/2019 | 1,000,000 | 1,276,179 | ||||||
bQGOG Atlantic/Alaskan Rigs Ltd., 5.25%, 7/30/2018 | 2,000,000 | 1,800,000 | ||||||
Raam Global Energy Co., 12.50%, 10/1/2015 | 2,000,000 | 2,040,000 | ||||||
Tennessee Gas Pipeline Co., 8.00%, 2/1/2016 | 1,000,000 | 1,161,636 | ||||||
|
| |||||||
| 26,271,595 | ||||||||
|
| |||||||
FOOD, BEVERAGE & TOBACCO — 1.25% | ||||||||
BEVERAGES — 0.17% | ||||||||
Constellation Brands, Inc., 8.375%, 12/15/2014 | 500,000 | 548,750 | ||||||
FOOD PRODUCTS — 0.72% | ||||||||
Bunge Ltd. Finance Co., 5.10%, 7/15/2015 | 321,000 | 333,612 | ||||||
bHarmony Foods Corp., 10.00%, 5/1/2016 | 2,000,000 | 1,990,000 | ||||||
TOBACCO — 0.36% | ||||||||
Lorillard Tobacco Co, 8.125%, 6/23/2019 | 1,000,000 | 1,171,507 | ||||||
|
| |||||||
| 4,043,869 | ||||||||
|
| |||||||
HEALTH CARE EQUIPMENT & SERVICES — 1.90% | ||||||||
HEALTH CARE PROVIDERS & SERVICES — 1.27% | ||||||||
bAurora Diagnostics Holdings LLC, 10.75%, 1/15/2018 | 1,000,000 | 970,000 | ||||||
bFresenius Medical Care, 6.50%, 9/15/2018 | 500,000 | 507,500 | ||||||
Prospect Medical Holdings, Inc., 12.75%, 7/15/2014 | 2,500,000 | 2,625,000 | ||||||
HEALTH CARE TECHNOLOGY — 0.63% | ||||||||
Merge Healthcare, Inc., 11.75%, 5/1/2015 | 2,000,000 | 2,030,000 | ||||||
|
| |||||||
| 6,132,500 | ||||||||
|
| |||||||
INSURANCE — 6.71% | ||||||||
INSURANCE — 6.71% | ||||||||
bForethought Financial Group, 8.625%, 4/15/2021 | 2,000,000 | 2,059,264 | ||||||
14 Certified Annual Report
| SCHEDULE OF INVESTMENTS, CONTINUED | ||
| Thornburg Strategic Income Fund | September 30, 2011 | |
| Shares/ Principal Amount | Value | |||||||
bInternational Lease Finance Corp., 6.50%, 9/1/2014 | $ | 2,000,000 | $ | 2,000,000 | ||||
International Lease Finance Corp., 5.75%, 5/15/2016 | 500,000 | 444,407 | ||||||
bNational Life Insurance of Vermont, 10.50%, 9/15/2039 | 1,000,000 | 1,356,282 | ||||||
Northwind Holdings LLC, 1.106%, 12/1/2037 | 1,437,500 | 1,116,521 | ||||||
b,cOil Casualty Insurance, 8.00%, 9/15/2034 | 1,934,000 | 2,076,807 | ||||||
bOil Insurance Ltd., 3.351%, 12/29/2049 | 1,000,000 | 937,400 | ||||||
bPrudential Holdings LLC, 8.695%, 12/18/2023 | 585,000 | 738,217 | ||||||
b,cQBE Insurance Group Ltd., 9.75%, 3/14/2014 | 780,000 | 903,682 | ||||||
b,cQBE Insurance Group Ltd., 5.647%, 7/1/2023 | 2,500,000 | 2,348,295 | ||||||
b,cSwiss Re Capital I LP, 6.854%, 5/29/2049 | 2,000,000 | 1,818,960 | ||||||
Unum Group, 7.125%, 9/30/2016 | 500,000 | 576,141 | ||||||
b,cWhite Mountains RE Group, 7.506%, 5/29/2049 | 2,150,000 | 1,972,990 | ||||||
Willis North America, Inc., 7.00%, 9/29/2019 | 1,286,000 | 1,487,654 | ||||||
bZFS Finance USA Trust II, 6.45%, 12/15/2065 | 2,000,000 | 1,760,000 | ||||||
|
| |||||||
| 21,596,620 | ||||||||
|
| |||||||
MATERIALS — 1.35% | ||||||||
CONTAINERS & PACKAGING — 0.63% | ||||||||
b,gSealed Air Corp., 8.125%, 9/15/2019 | 2,000,000 | 2,020,000 | ||||||
METALS & MINING — 0.54% | ||||||||
cArcelorMittal, 9.85%, 6/1/2019 | 1,000,000 | 1,133,071 | ||||||
b,cPosco, 8.75%, 3/26/2014 | 500,000 | 565,002 | ||||||
cRio Tinto Alcan, Inc., 5.00%, 6/1/2015 | 50,000 | 54,161 | ||||||
MISCELLANEOUS — 0.18% | ||||||||
b,cAnglo American Capital, 9.375%, 4/8/2014 | 500,000 | 580,841 | ||||||
|
| |||||||
| 4,353,075 | ||||||||
|
| |||||||
MEDIA — 2.17% | ||||||||
MEDIA — 2.17% | ||||||||
DISH DBS Corp., 6.625%, 10/1/2014 | 2,000,000 | 2,022,500 | ||||||
bFriendfinder Networks, 14.00%, 9/30/2013 | 578,685 | 578,685 | ||||||
bProquest LLC, 9.00%, 10/15/2018 | 2,000,000 | 1,835,000 | ||||||
Washington Post Co., 7.25%, 2/1/2019 | 500,000 | 608,322 | ||||||
bWM Finance Corp., 9.50%, 6/15/2016 | 1,000,000 | 1,012,500 | ||||||
bWM Finance Corp., 11.50%, 10/1/2018 | 1,000,000 | 920,000 | ||||||
|
| |||||||
| 6,977,007 | ||||||||
|
| |||||||
PHARMACEUTICALS, BIOTECHNOLOGY & LIFE SCIENCES — 0.74% | ||||||||
PHARMACEUTICALS — 0.74% | ||||||||
Axcan Intermediate Holdings, Inc., 12.75%, 3/1/2016 | 1,000,000 | 1,010,000 | ||||||
KV Pharmaceutical Co., 12.00%, 3/15/2015 | 2,000,000 | 1,370,000 | ||||||
|
| |||||||
| 2,380,000 | ||||||||
|
| |||||||
RETAILING — 0.47% | ||||||||
INTERNET & CATALOG RETAIL — 0.16% | ||||||||
Ticketmaster, 10.75%, 8/1/2016 | 500,000 | 525,000 | ||||||
MULTILINE RETAIL — 0.31% | ||||||||
b,cGrupo Famsa S.A.B. de C.V., 11.00%, 7/20/2015 | 1,000,000 | 985,000 | ||||||
|
| |||||||
| 1,510,000 | ||||||||
|
| |||||||
Certified Annual Report 15
| SCHEDULE OF INVESTMENTS, CONTINUED | ||
| Thornburg Strategic Income Fund | September 30, 2011 | |
| Shares/ Principal Amount | Value | |||||||
SEMICONDUCTORS & SEMICONDUCTOR EQUIPMENT — 0.89% | ||||||||
SEMICONDUCTORS & SEMICONDUCTOR EQUIPMENT — 0.89% | ||||||||
KLA Tencor Corp., 6.90%, 5/1/2018 | $ | 1,000,000 | $ | 1,142,648 | ||||
MEMC Electronics Materials, Inc., 7.75%, 4/1/2019 | 2,000,000 | 1,710,000 | ||||||
|
| |||||||
| 2,852,648 | ||||||||
|
| |||||||
SOFTWARE & SERVICES — 1.74% | ||||||||
INFORMATION TECHNOLOGY SERVICES — 0.29% | ||||||||
bIgate Corp., 9.00%, 5/1/2016 | 1,000,000 | 930,000 | ||||||
INTERNET SOFTWARE & SERVICES — 1.14% | ||||||||
b,cEAccess Ltd., 8.25%, 4/1/2018 | 1,000,000 | 915,000 | ||||||
EarthLink, Inc., 8.875%, 5/15/2019 | 2,000,000 | 1,755,000 | ||||||
SSI Investment II/CP-ISSR LLC, 11.125%, 6/1/2018 | 1,000,000 | 995,000 | ||||||
SOFTWARE — 0.31% | ||||||||
Aspect Software, Inc., 10.625%, 5/15/2017 | 1,000,000 | 1,005,000 | ||||||
|
| |||||||
| 5,600,000 | ||||||||
|
| |||||||
TECHNOLOGY HARDWARE & EQUIPMENT — 0.65% | ||||||||
COMMUNICATIONS EQUIPMENT — 0.32% | ||||||||
bBrightstar Corp., 9.50%, 12/1/2016 | 1,000,000 | 1,020,000 | ||||||
ELECTRONIC EQUIPMENT, INSTRUMENTS & COMPONENTS — 0.33% | ||||||||
Avnet, Inc., 5.875%, 6/15/2020 | 1,000,000 | 1,077,223 | ||||||
|
| |||||||
| 2,097,223 | ||||||||
|
| |||||||
TELECOMMUNICATION SERVICES — 5.41% | ||||||||
DIVERSIFIED TELECOMMUNICATION SERVICES — 3.29% | ||||||||
Centurylink, Inc., 6.45%, 6/15/2021 | 2,000,000 | 1,853,232 | ||||||
Frontier Communications, 8.25%, 4/15/2017 | 1,000,000 | 970,000 | ||||||
Global Crossing Ltd., 12.00%, 9/15/2015 | 1,000,000 | 1,133,750 | ||||||
bLevel 3 Communications, Inc., 11.875%, 2/1/2019 | 1,000,000 | 950,000 | ||||||
Level 3 Financing, Inc., 9.25%, 11/1/2014 | 1,500,000 | 1,481,250 | ||||||
gQwest Corp., 6.75%, 12/1/2021 | 2,000,000 | 1,955,000 | ||||||
Qwest Corp., 8.875%, 3/15/2012 | 633,000 | 654,364 | ||||||
Qwest Corp., 8.375%, 5/1/2016 | 500,000 | 548,750 | ||||||
cTelefonica Emisiones SAU, 6.421%, 6/20/2016 | 1,000,000 | 1,025,240 | ||||||
WIRELESS TELECOMMUNICATION SERVICES — 2.12% | ||||||||
bCC Holdings GS V LLC/Crown Castle Intl. Corp., 7.75%, 5/1/2017 | 1,500,000 | 1,597,500 | ||||||
b,cDigicel SA, 12.00%, 4/1/2014 | 500,000 | 547,500 | ||||||
b,cVimpelcom, 8.25%, 5/23/2016 | 500,000 | 478,750 | ||||||
b,cVimpelcom Holdings, 7.504%, 3/1/2022 | 2,000,000 | 1,610,000 | ||||||
bWCP Wireless Site Fund, 6.829%, 11/15/2040 | 2,500,000 | 2,602,685 | ||||||
|
| |||||||
| 17,408,021 | ||||||||
|
| |||||||
TRANSPORTATION — 6.19% | ||||||||
AIRLINES — 5.92% | ||||||||
b,cAir Canada, 9.25%, 8/1/2015 | 2,000,000 | 1,900,000 | ||||||
American Airlines, 10.375%, 7/2/2019 | 1,275,581 | 1,390,383 | ||||||
American Airlines, Inc., 13.00%, 8/1/2016 | 745,498 | 775,318 | ||||||
American Airlines, Inc., 10.50%, 10/15/2012 | 2,000,000 | 2,022,500 | ||||||
Continental Airlines, 6.90%, 7/2/2018 | 1,488,087 | 1,443,445 | ||||||
Continental Airlines, 7.02%, 5/1/2017 | 1,338,923 | 1,301,018 | ||||||
16 Certified Annual Report
| SCHEDULE OF INVESTMENTS, CONTINUED | ||
| Thornburg Strategic Income Fund | September 30, 2011 | |
| Shares/ Principal Amount | Value | |||||||
bJet Equipment Trust, 9.41%, 12/15/2013 | $ | 1,431,681 | $ | 1,288,513 | ||||
aJetBlue Airways Corp., 0.476%, 1/2/2014 | 2,000,000 | 1,830,000 | ||||||
United Airlines, Inc., 12.75%, 7/15/2012 | 491,040 | 514,364 | ||||||
bUnited Airlines, Inc., 9.875%, 8/1/2013 | 1,800,000 | 1,840,500 | ||||||
United Airlines, Inc., 10.40%, 5/1/2018 | 1,818,241 | 1,963,700 | ||||||
US Airways, 6.25%, 4/22/2023 | 2,000,000 | 1,800,000 | ||||||
US Airways, 7.076%, 9/20/2022 | 1,071,305 | 1,007,027 | ||||||
MARINE — 0.27% | ||||||||
bWindsor Petroleum Transport Corp., 7.84%, 1/15/2021 | 937,056 | 860,573 | ||||||
|
| |||||||
| 19,937,341 | ||||||||
|
| |||||||
UTILITIES — 10.47% | ||||||||
ELECTRIC UTILITIES — 5.18% | ||||||||
Alabama Power Capital Trust V, 3.346%, 10/1/2042 | 700,000 | 690,872 | ||||||
b,cCentrais Eletricas DO PA, 10.50%, 6/3/2016 | 2,000,000 | 1,990,000 | ||||||
Comed Financing III, 6.35%, 3/15/2033 | 1,500,000 | 1,266,302 | ||||||
Commonwealth Edison, 6.15%, 3/15/2012 | 300,000 | 306,944 | ||||||
b,cDubai Electricity & Water, 6.375%, 10/21/2016 | 1,000,000 | 1,027,500 | ||||||
bDuquesne Light Holdings, 6.40%, 9/15/2020 | 2,000,000 | 2,071,734 | ||||||
b,cEnel Finance International S.A., 6.25%, 9/15/2017 | 1,000,000 | 1,009,916 | ||||||
Metropolitan Edison, 7.70%, 1/15/2019 | 250,000 | 316,412 | ||||||
PNM Resources, Inc., 9.25%, 5/15/2015 | 3,070,000 | 3,384,675 | ||||||
Public Service Co. of New Mexico, 7.95%, 5/15/2018 | 1,325,000 | 1,520,322 | ||||||
Puget Energy, Inc., 6.50%, 12/15/2020 | 2,000,000 | 2,039,940 | ||||||
b,cTaqa Abu Dhabi National Energy Co., 6.60%, 8/1/2013 | 1,000,000 | 1,065,000 | ||||||
GAS UTILITIES — 0.85% | ||||||||
bSource Gas LLC., 5.90%, 4/1/2017 | 1,000,000 | 1,040,620 | ||||||
Southern Union Co., 7.20%, 11/1/2066 | 2,000,000 | 1,690,000 | ||||||
INDEPENDENT POWER PRODUCERS & ENERGY TRADERS — 1.96% | ||||||||
b,cInkia Energy Ltd., 8.375%, 4/4/2021 | 2,000,000 | 1,960,000 | ||||||
bIpalco Enterprises, Inc., 5.00%, 5/1/2018 | 2,000,000 | 1,830,000 | ||||||
a,bMidland Cogen Venture, 6.00%, 3/15/2025 | 2,000,000 | 2,020,000 | ||||||
RRI Energy, Inc., 7.625%, 6/15/2014 | 500,000 | 488,750 | ||||||
MULTI-UTILITIES — 2.48% | ||||||||
Amerenenergy Generating Co., 7.00%, 4/15/2018 | 1,000,000 | 1,012,500 | ||||||
Black Hills Corp., 9.00%, 5/15/2014 | 500,000 | 575,894 | ||||||
CMS Energy Corp., 8.75%, 6/15/2019 | 2,000,000 | 2,331,088 | ||||||
bEnogex LLC, 6.875%, 7/15/2014 | 1,000,000 | 1,097,765 | ||||||
NiSource Finance Corp., 6.40%, 3/15/2018 | 1,130,000 | 1,315,589 | ||||||
Sempra Energy, 9.80%, 2/15/2019 | 250,000 | 349,864 | ||||||
bTexas-New Mexico Power, 9.50%, 4/1/2019 | 1,000,000 | 1,312,949 | ||||||
|
| |||||||
| 33,714,636 | ||||||||
|
| |||||||
TOTAL CORPORATE BONDS (Cost $186,106,602) | 193,137,728 | |||||||
|
| |||||||
Certified Annual Report 17
| SCHEDULE OF INVESTMENTS, CONTINUED | ||
| Thornburg Strategic Income Fund | September 30, 2011 | |
| Shares/ Principal Amount | Value | |||||||
CONVERTIBLE BONDS — 4.00% | ||||||||
DIVERSIFIED FINANCIALS — 1.41% | ||||||||
CAPITAL MARKETS — 0.68% | ||||||||
bApollo Investment Corp., 5.75%, 1/15/2016 | $ | 1,500,000 | $ | 1,320,000 | ||||
bHercules Technology, 6.00%, 4/15/2016 | 1,000,000 | 866,250 | ||||||
DIVERSIFIED FINANCIAL SERVICES — 0.73% | ||||||||
bICAHN Enterprise LP, 4.00%, 8/15/2013 | 2,000,000 | 1,857,600 | ||||||
KKR Financial Holdings LLC, 7.00%, 7/15/2012 | 475,000 | 486,875 | ||||||
|
| |||||||
| 4,530,725 | ||||||||
|
| |||||||
ENERGY — 0.54% | ||||||||
OIL, GAS & CONSUMABLE FUELS — 0.54% | ||||||||
SunPower Corp., 4.75%, 4/15/2014 | 2,000,000 | 1,740,000 | ||||||
|
| |||||||
| 1,740,000 | ||||||||
|
| |||||||
FOOD, BEVERAGE & TOBACCO — 0.53% | ||||||||
BEVERAGES — 0.53% | ||||||||
Central European Distribution Corp., 3.00%, 3/15/2013 | 2,500,000 | 1,712,500 | ||||||
|
| |||||||
| 1,712,500 | ||||||||
|
| |||||||
MATERIALS — 0.72% | ||||||||
CONSTRUCTION MATERIALS — 0.22% | ||||||||
cCemex SAB de CV, 4.875%, 3/15/2015 | 1,500,000 | 710,625 | ||||||
METALS & MINING — 0.50% | ||||||||
b,cJaguar Mining, Inc., 4.50%, 11/1/2014 | 2,000,000 | 1,625,000 | ||||||
|
| |||||||
| 2,335,625 | ||||||||
|
| |||||||
SOFTWARE & SERVICES — 0.54% | ||||||||
SOFTWARE — 0.54% | ||||||||
THQ, Inc., 5.00%, 8/15/2014 | 2,000,000 | 1,727,500 | ||||||
|
| |||||||
| 1,727,500 | ||||||||
|
| |||||||
TRANSPORTATION — 0.26% | ||||||||
MARINE — 0.26% | ||||||||
b,fUltrapetrol Bahamas Ltd., 7.25%, 1/15/2017 | 1,000,000 | 837,500 | ||||||
|
| |||||||
| 837,500 | ||||||||
|
| |||||||
TOTAL CONVERTIBLE BONDS (Cost $14,518,500) | 12,883,850 | |||||||
|
| |||||||
MUNICIPAL BONDS — 4.12% | ||||||||
California Health Facilities Financing Authority (Developmental Disabilities-B), 7.875%, 2/1/2026 | 1,940,000 | 2,282,022 | ||||||
Los Angeles California Municipal Improvement Corp. Lease Revenue (Build America Bonds), 6.165%, 11/1/2020 | 1,885,000 | 2,160,775 | ||||||
Louisiana Public Facilities Authority Revenue (Black & Gold Facilities Project C), 5.15%, 4/1/2012 | 90,000 | 90,146 | ||||||
bMidwest Family Housing, 5.168%, 7/1/2016 | 770,000 | 763,463 | ||||||
Oakland California Redevelopment Agency, 8.00%, 9/1/2016 | 1,000,000 | 1,081,080 | ||||||
Ohio State Solid Waste (Republic Services Project), 4.25%, 4/1/2033 | 900,000 | 924,300 | ||||||
Oklahoma Development Finance Authority, 8.00%, 5/1/2020 | 1,500,000 | 1,522,665 | ||||||
San Bernardino County California Redevelopment Agency (San Sevaine), 8.45%, 9/1/2030 | 2,000,000 | 2,140,540 | ||||||
San Marcos California Redevelopment Agency Tax Allocation, 6.125%, 10/1/2018 | 1,000,000 | 1,050,420 | ||||||
18 Certified Annual Report
| SCHEDULE OF INVESTMENTS, CONTINUED | ||
| Thornburg Strategic Income Fund | September 30, 2011 | |
| Shares/ Principal Amount | Value | |||||||
Texas State Public Finance Authority Charter School Finance Corp. (ED-New Frontiers Series Q), 8.75%, 8/15/2027 | $ | 750,000 | $ | 776,482 | ||||
Wisconsin State Health & Educational Facilities (Richland Hospital), 7.08%, 6/1/2016 | 470,000 | 461,592 | ||||||
|
| |||||||
TOTAL MUNICIPAL BONDS (Cost $11,962,925) | 13,253,485 | |||||||
|
| |||||||
U.S. TREASURY SECURITIES — 0.66% | ||||||||
U.S. Treasury, 2.25%, 1/31/2015 | 2,000,000 | 2,114,375 | ||||||
|
| |||||||
TOTAL U.S. TREASURY SECURITIES (Cost $1,994,277) | 2,114,375 | |||||||
|
| |||||||
U.S. GOVERNMENT AGENCIES — 0.41% | ||||||||
bAgribank FCB, 9.125%, 7/15/2019 | 1,000,000 | 1,325,599 | ||||||
|
| |||||||
TOTAL U.S. GOVERNMENT AGENCIES (Cost $1,043,262) | 1,325,599 | |||||||
|
| |||||||
OTHER GOVERNMENT — 0.31% | ||||||||
b,cRepublic of Iceland, 4.875%, 6/16/2016 | 1,000,000 | 979,943 | ||||||
|
| |||||||
TOTAL OTHER GOVERNMENT (Cost $995,109) | 979,943 | |||||||
|
| |||||||
MORTGAGE BACKED — 0.00% | ||||||||
Federal National Mtg Assoc. CMO Series 1994-37 Class L, 6.50%, 3/25/2024 | 9,619 | 10,785 | ||||||
|
| |||||||
TOTAL MORTGAGE BACKED (Cost $9,656) | 10,785 | |||||||
|
| |||||||
FOREIGN BONDS — 8.00% | ||||||||
BANKS — 0.63% | ||||||||
COMMERCIAL BANKS — 0.63% | ||||||||
Banco Santander Chile (CHL), 6.50%, 9/22/2020 | 125,000,000 | 234,533 | ||||||
NRW Bank (NOK), 3.50%, 5/21/2013 | 5,000,000 | 864,546 | ||||||
Royal Bank of Scotland Group plc (CAD), 5.875%, 5/12/2016 | 1,000,000 | 940,290 | ||||||
|
| |||||||
| 2,039,369 | ||||||||
|
| |||||||
CONSUMER SERVICES — 0.03% | ||||||||
HOTELS, RESTAURANTS & LEISURE — 0.03% | ||||||||
a,d,eFU JI Food (HKD), 0%, 10/18/2010 | 7,000,000 | 89,889 | ||||||
|
| |||||||
| 89,889 | ||||||||
|
| |||||||
DIVERSIFIED FINANCIALS — 0.60% | ||||||||
CAPITAL MARKETS — 0.60% | ||||||||
Morgan Stanley (AUD), 5.187%, 3/1/2013 | 1,000,000 | 937,359 | ||||||
Morgan Stanley (BRL), 10.09%, 5/3/2017 | 2,000,000 | 989,230 | ||||||
|
| |||||||
| 1,926,589 | ||||||||
|
| |||||||
FOOD & STAPLES RETAILING — 0.40% | ||||||||
FOOD & STAPLES RETAILING — 0.40% | ||||||||
Wesfarmers Ltd. (AUD), 7.47%, 9/11/2014 | 1,300,000 | 1,296,951 | ||||||
|
| |||||||
| 1,296,951 | ||||||||
|
| |||||||
Certified Annual Report 19
| SCHEDULE OF INVESTMENTS, CONTINUED | ||
| Thornburg Strategic Income Fund | September 30, 2011 | |
| Shares/ Principal Amount | Value | |||||||
FOOD, BEVERAGE & TOBACCO — 1.14% | ||||||||
BEVERAGES — 0.67% | ||||||||
Ambev International Finance Co., Ltd. (BRL), 9.50%, 7/24/2017 | $ | 2,000,000 | $ | 1,084,962 | ||||
Anheuser-Busch InBev (BRL), 9.75%, 11/17/2015 | 2,000,000 | 1,074,325 | ||||||
FOOD PRODUCTS — 0.47% | ||||||||
Viterra, Inc. (CAD), 8.50%, 8/1/2017 | 1,500,000 | 1,524,478 | ||||||
|
| |||||||
| 3,683,765 | ||||||||
|
| |||||||
INSURANCE — 0.47% | ||||||||
INSURANCE — 0.47% | ||||||||
ELM BV (AUD), 7.635%, 12/31/2049 | 1,000,000 | 778,437 | ||||||
ELM BV (AUD), 6.35%, 12/27/2049 | 1,000,000 | 721,730 | ||||||
|
| |||||||
| 1,500,167 | ||||||||
|
| |||||||
MEDIA — 0.68% | ||||||||
MEDIA — 0.68% | ||||||||
bCorus Entertainment (CAD), 7.25%, 2/10/2017 | 1,000,000 | 973,375 | ||||||
CET 21 SPOL S.R.O. (EUR), 9.00%, 11/1/2017 | 1,000,000 | 1,205,775 | ||||||
|
| |||||||
| 2,179,150 | ||||||||
|
| |||||||
MISCELLANEOUS — 2.12% | ||||||||
MISCELLANEOUS — 2.12% | ||||||||
BK Nederlandse Gemeenten N.V. (NOK), 4.00%, 5/15/2015 | 5,000,000 | 898,393 | ||||||
aInternational Bank for Reconstruction and Development (BRL), 9.00%, 4/28/2014 | 1,000,000 | 543,587 | ||||||
International Finance Corp. (KRW), 1.75%, 8/23/2013 | 1,450,000,000 | 1,233,655 | ||||||
Kommunalbanken AS (NOK), 4.00%, 1/26/2015 | 5,000,000 | 886,154 | ||||||
New South Wales Treasury Corp. (AUD), 4.008%, 11/20/2020 | 1,000,000 | 1,158,231 | ||||||
Republic of Brazil (BRL), 12.50%, 1/5/2016 | 3,525,000 | 2,090,347 | ||||||
|
| |||||||
| 6,810,367 | ||||||||
|
| |||||||
SOFTWARE & SERVICES — 0.37% | ||||||||
INTERNET SOFTWARE & SERVICES — 0.37% | ||||||||
EAccess Ltd. (EUR), 8.375%, 4/1/2018 | 1,000,000 | 1,205,775 | ||||||
|
| |||||||
| 1,205,775 | ||||||||
|
| |||||||
TELECOMMUNICATION SERVICES — 0.09% | ||||||||
DIVERSIFIED TELECOMMUNICATION SERVICES — 0.09% | ||||||||
Wind Acquisition Finance SA (EUR), 11.75%, 7/15/2017 | 250,000 | 274,649 | ||||||
|
| |||||||
| 274,649 | ||||||||
|
| |||||||
TRANSPORTATION — 1.18% | ||||||||
AIR FREIGHT & LOGISTICS — 0.45% | ||||||||
Livingston International (CAD), 10.125%, 11/9/2015 | 1,500,000 | 1,469,983 | ||||||
AIRLINES — 0.73% | ||||||||
aIberbond 2004 plc (EUR), 4.235%, 12/24/2017 | 2,000,000 | 2,344,562 | ||||||
|
| |||||||
| 3,814,545 | ||||||||
|
| |||||||
UTILITIES — 0.29% | ||||||||
INDUSTRIAL POWER PRODUCTION/ENERGY TRADING — 0.29% | ||||||||
Alinta Networks Holdings (AUD), 5.013%, 9/21/2012 | 1,000,000 | 947,635 | ||||||
|
| |||||||
| 947,635 | ||||||||
|
| |||||||
TOTAL FOREIGN BONDS (Cost $26,393,009) | 25,768,851 | |||||||
|
| |||||||
20 Certified Annual Report
| SCHEDULE OF INVESTMENTS, CONTINUED | ||
| Thornburg Strategic Income Fund | September 30, 2011 | |
| Shares/ Principal Amount | Value | |||||||
OTHER SECURITIES — 0.77% | ||||||||
LOAN PARTICIPATIONS — 0.77% | ||||||||
aMerisant Co. Term Loan B, 7.50%, 1/31/2014 | $ | 1,572,232 | $ | 1,525,066 | ||||
Ocwen Financial Corp., 1.00%, 6/6/2016 | 1,000,000 | 966,250 | ||||||
|
| |||||||
TOTAL OTHER SECURITIES (Cost $2,481,379) | 2,491,316 | |||||||
|
| |||||||
SHORT TERM INVESTMENTS — 6.06% | ||||||||
Darden Restaurants, Inc., 0.23%, 10/3/2011 | 9,500,000 | 9,499,879 | ||||||
Devon Energy Corp., 0.17%, 10/3/2011 | 10,000,000 | 9,999,905 | ||||||
|
| |||||||
TOTAL SHORT TERM INVESTMENTS (Cost $19,499,784) | 19,499,784 | |||||||
|
| |||||||
TOTAL INVESTMENTS — 98.85% (Cost $316,606,238) | $ | 318,271,324 | ||||||
OTHER ASSETS LESS LIABILITIES — 1.15% | 3,710,333 | |||||||
|
| |||||||
NET ASSETS — 100.00% | $ | 321,981,657 | ||||||
|
| |||||||
Footnote Legend
| a | Security currently fair valued by the valuation and pricing committee using procedures approved by the Trustees. |
| b | Securities exempt from registration under Rule 144A of the Securities Act of 1933, as amended. These securities may only be resold in the ordinary course of business in transactions exempt from registration, normally to qualified institutional buyers. As of September 30, 2011, the aggregate value of these securities in the Fund’s portfolio was $106,218,365, representing 32.99% of the Fund’s net assets. |
| c | Yankee Bond - Denominated in U.S. dollars and is issued in the U.S. by foreign banks and corporations. |
| d | Bond in default. |
| e | Non-income producing. |
| f | Segregated as collateral for a when-issued security. |
| g | When-issued security. |
Portfolio Abbreviations
To simplify the listings of securities, abbreviations are used per the table below:
| ARM | Adjustable Rate Mortgage | |
| AUD | Denominated in Australian Dollars | |
BRL | Denominated in Brazilian Real | |
CAD | Denominated in Canadian Dollars | |
CHL | Denominated in Chilean Peso | |
CMO | Collateralized Mortgage Obligation | |
EUR | Denominated in Euros | |
FCB | Farm Credit Bank | |
HKD | Denominated in Hong Kong Dollars | |
KRW | Denominated in Korean Won | |
Mtg | Mortgage | |
NOK | Denominated in Norwegian Krone | |
Pfd | Preferred Stock |
See notes to financial statements.
Certified Annual Report 21
| STATEMENT OF ASSETS AND LIABILITIES | ||
| Thornburg Strategic Income Fund | September 30, 2011 | |
ASSETS | ||||
Investments at value (cost $316,606,238) (Note 2) | $ | 318,271,324 | ||
Cash | 2,684,658 | |||
Receivable for investments sold | 883,162 | |||
Receivable for fund shares sold | 1,947,016 | |||
Unrealized appreciation on forward currency contracts (Note 7) | 197,860 | |||
Dividends receivable | 344,778 | |||
Dividend and interest reclaim receivable | 3,243 | |||
Interest receivable | 5,218,814 | |||
Prepaid expenses and other assets | 31,057 | |||
|
| |||
Total Assets | 329,581,912 | |||
|
| |||
LIABILITIES | ||||
Payable for investments purchased | 6,414,605 | |||
Payable for fund shares redeemed | 596,459 | |||
Payable to investment advisor and other affiliates (Note 3) | 232,012 | |||
Accounts payable and accrued expenses | 112,417 | |||
Dividends payable | 244,762 | |||
|
| |||
Total Liabilities | 7,600,255 | |||
|
| |||
NET ASSETS | $ | 321,981,657 | ||
|
| |||
NET ASSETS CONSIST OF: | ||||
Undistributed net investment income | $ | 396,704 | ||
Net unrealized appreciation on investments and foreign currency translations | 1,810,458 | |||
Accumulated net realized gain (loss) | 8,123,636 | |||
Net capital paid in on shares of beneficial interest | 311,650,859 | |||
|
| |||
| $ | 321,981,657 | |||
|
| |||
22 Certified Annual Report
| STATEMENT OF ASSETS AND LIABILITIES, CONTINUED | ||
| Thornburg Strategic Income Fund | September 30, 2011 | |
NET ASSET VALUE: | ||||
Class A Shares: | ||||
Net asset value and redemption price per share ($115,703,414 applicable to 9,759,180 shares of beneficial interest outstanding - Note 4) | $ | 11.86 | ||
Maximum sales charge, 4.50% of offering price | 0.56 | |||
|
| |||
Maximum offering price per share | $ | 12.42 | ||
|
| |||
Class C Shares: | ||||
Net asset value and offering price per share* ($106,684,306 applicable to 9,009,726 shares of beneficial interest outstanding - Note 4) | $ | 11.84 | ||
|
| |||
Class I Shares: | ||||
Net asset value, offering and redemption price per share ($99,593,937 applicable to 8,418,193 shares of beneficial interest outstanding - Note 4) | $ | 11.83 | ||
|
| |||
| * | Redemption price per share is equal to net asset value less any applicable contingent deferred sales charge. |
See notes to financial statements.
Certified Annual Report 23
| STATEMENT OF OPERATIONS | ||
| Thornburg Strategic Income Fund | Year Ended September 30, 2011 | |
INVESTMENT INCOME: | ||||
Dividend income (net of foreign taxes withheld of $42,798) | $ | 2,387,875 | ||
Interest income (net of premium amortized of $455,574) | 17,153,156 | |||
Other income | 401,114 | |||
|
| |||
Total Income | 19,942,145 | |||
|
| |||
EXPENSES: | ||||
Investment advisory fees (Note 3) | 1,950,692 | |||
Administration fees (Note 3) | ||||
Class A Shares | 118,186 | |||
Class C Shares | 115,697 | |||
Class I Shares | 36,493 | |||
Distribution and service fees (Note 3) | ||||
Class A Shares | 237,612 | |||
Class C Shares | 926,933 | |||
Transfer agent fees | ||||
Class A Shares | 84,338 | |||
Class C Shares | 79,892 | |||
Class I Shares | 39,337 | |||
Registration and filing fees | ||||
Class A Shares | 23,950 | |||
Class C Shares | 27,347 | |||
Class I Shares | 32,132 | |||
Custodian fees (Note 3) | 87,695 | |||
Professional fees | 68,694 | |||
Accounting fees | 9,441 | |||
Trustee fees | 6,069 | |||
Other expenses | 39,989 | |||
|
| |||
Total Expenses | 3,884,497 | |||
Less: | ||||
Expenses reimbursed by investment advisor (Note 3) | (379,394 | ) | ||
Fees paid indirectly (Note 3) | (188 | ) | ||
|
| |||
Net Expenses | 3,504,915 | |||
|
| |||
Net Investment Income | $ | 16,437,230 | ||
|
| |||
24 Certified Annual Report
| STATEMENT OF OPERATIONS, CONTINUED | ||
| Thornburg Strategic Income Fund | Year Ended September 30, 2011 | |
REALIZED AND UNREALIZED GAIN (LOSS) | ||||
Net realized gain (loss) from: | ||||
Investments | $ | 8,600,651 | ||
Forward currency contracts (Note 7) | (195,320 | ) | ||
Foreign currency transactions | 34,848 | |||
|
| |||
| 8,440,179 | ||||
|
| |||
Net change in unrealized appreciation (depreciation) on: | ||||
Investments | (16,049,769 | ) | ||
Forward currency contracts (Note 7) | 304,410 | |||
Foreign currency translations | (66,105 | ) | ||
|
| |||
| (15,811,464 | ) | |||
|
| |||
Net Realized and Unrealized Loss | (7,371,285 | ) | ||
|
| |||
Net Increase in Net Assets Resulting from Operations | $ | 9,065,945 | ||
|
|
See notes to financial statements.
Certified Annual Report 25
| STATEMENTS OF CHANGES IN NET ASSETS | ||
| Thornburg Strategic Income Fund | ||
| Year Ended September 30, 2011 | Year Ended September 30, 2010 | |||||||
INCREASE (DECREASE) IN NET ASSETS FROM | ||||||||
OPERATIONS: | ||||||||
Net investment income | $ | 16,437,230 | $ | 12,599,926 | ||||
Net realized gain (loss) on investments, forward currency contracts and foreign currency transactions | 8,440,179 | 5,885,277 | ||||||
Net unrealized appreciation (depreciation) on investments, forward currency contracts, and foreign currency translations | (15,811,464 | ) | 6,866,540 | |||||
|
|
|
| |||||
Net Increase (Decrease) in Net Assets Resulting from Operations | 9,065,945 | 25,351,743 | ||||||
DIVIDENDS TO SHAREHOLDERS: | ||||||||
From net investment income | ||||||||
Class A Shares | (6,071,158 | ) | (4,807,279 | ) | ||||
Class C Shares | (5,413,401 | ) | (4,024,693 | ) | ||||
Class I Shares | (5,124,836 | ) | (3,652,715 | ) | ||||
From realized gains | ||||||||
Class A Shares | (1,920,858 | ) | (274,801 | ) | ||||
Class C Shares | (1,933,399 | ) | (238,982 | ) | ||||
Class I Shares | (1,595,561 | ) | (197,906 | ) | ||||
FUND SHARE TRANSACTIONS (NOTE 4): | ||||||||
Class A Shares | 36,566,623 | 21,481,084 | ||||||
Class C Shares | 29,275,505 | 25,873,288 | ||||||
Class I Shares | 30,458,308 | 25,203,621 | ||||||
|
|
|
| |||||
Net Increase in Net Assets | 83,307,168 | 84,713,360 | ||||||
NET ASSETS: | ||||||||
Beginning of Year | 238,674,489 | 153,961,129 | ||||||
|
|
|
| |||||
End of Year | $ | 321,981,657 | $ | 238,674,489 | ||||
|
|
|
| |||||
Undistributed net investment income | $ | 396,704 | $ | 257,757 | ||||
See notes to financial statements.
26 Certified Annual Report
| NOTES TO FINANCIAL STATEMENTS | ||
| Thornburg Strategic Income Fund | September 30, 2011 | |
NOTE 1 – ORGANIZATION
Thornburg Strategic Income Fund, hereinafter referred to as the “Fund,” is a diversified series of Thornburg Investment Trust (the “Trust”). The Fund commenced operations on December 19, 2007. The Trust was organized as a Massachusetts business trust under a Declaration of Trust dated June 3, 1987 and is registered as a diversified, open-end management investment company under the Investment Company Act of 1940, as amended. The Fund is currently one of sixteen separate series of the Trust. Each series is considered to be a separate entity for financial reporting and tax purposes and bears expenses directly attributable to it. The Fund’s primary investment goal is to seek a high level of current income. The Fund’s secondary investment goal is some long-term capital appreciation.
The Fund currently offers three classes of shares of beneficial interest outstanding: Class A, Class C, and Institutional Class (Class I). Each class of shares of the Fund represents an interest in the same portfolio of investments, except that (i) Class A shares are sold subject to a front-end sales charge collected at the time the shares are purchased and bear a service fee, (ii) Class C shares are sold at net asset value without a sales charge at the time of purchase, but are subject to a contingent deferred sales charge upon redemption within one year of purchase, and bear both a service fee and a distribution fee, (iii) Class I shares are sold at net asset value without a sales charge at the time of purchase, and (iv) the respective classes may have different reinvestment privileges and conversion rights. Additionally, the Fund may allocate among its classes certain expenses, to the extent allowable to specific classes, including transfer agent fees, government registration fees, certain printing and postage costs, and administrative and legal expenses. Currently, class specific expenses of the Fund are limited to service and distribution fees, administration fees, and certain registration and transfer agent expenses.
NOTE 2 – SIGNIFICANT ACCOUNTING POLICIES
Significant accounting policies of the Trust are as follows:
Valuation of Investments: Portfolio securities listed or traded on a national securities exchange are valued on the valuation date at the last reported sale price on the exchange that is the primary market for the security. Portfolio securities traded on an exchange for which there has been no sale that day and other equity securities traded in the over-the-counter market are valued at the mean between the last reported bid and asked prices. Portfolio securities reported by NASDAQ are valued at the NASDAQ official closing price. Any foreign security traded on exchanges outside the United States is valued at the price of the security on the exchange that is normally the security’s primary market, as of the close of that exchange preceding the time of the Fund’s valuation.
Debt obligations held by the Fund have a primary market over the counter and are valued by an independent pricing service approved by the Trustees of the Trust. The pricing service ordinarily values debt obligations at quoted bid prices. When quotations are not available, debt obligations held by the Fund are valued at evaluated prices determined by the pricing service using methods which include consideration of yields or prices of debt obligations of comparable quality, type of issue, coupon, maturity and rating, and indications as to value from dealers and general market conditions. Short-term obligations having remaining maturities of 60 days or less are ordinarily valued at amortized cost, which approximates market value.
Quotations in foreign currencies for foreign portfolio investments are converted to U.S. dollar equivalents using the foreign exchange quotation in effect at the time of valuation.
In any case where the market value of an equity security held by the Fund is not readily available, the Trust’s valuation and pricing committee determines a fair value for the security using procedures approved by the Trustees, which may include the use of a price obtained from an independent pricing service. The pricing service ordinarily values equity securities in these instances using multi-factor models to adjust market prices based upon various inputs, including exchange data, depository receipt prices, futures and index data and other data. A security’s market value is deemed not readily available whenever the exchange or market on which the security is primarily traded is closed for the entire scheduled day of trading. Additionally, a security’s market value may be deemed not readily available under other circumstances identified by the Trustees, including when developments occurring after the most recent close of the security’s primary exchange or market, but before the most recent close of trading in Fund shares, or an unusual event or significant period of time occurring since the availability of a market quotation, create a question about the reliability of the security’s market value.
In any case where a pricing service fails to provide a price for a debt obligation held by the Fund, the valuation and pricing committee determines a fair value for the debt obligation using procedures approved by the Trustees. Additionally, in any case where management
Certified Annual Report 27
| NOTES TO FINANCIAL STATEMENTS, CONTINUED | ||
| Thornburg Strategic Income Fund | September 30, 2011 | |
believes that a price provided by a pricing service for a debt obligation held by the Fund may be unreliable, the valuation and pricing committee decides whether or not to use the pricing service’s valuation or to determine a fair value for the debt obligation.
In determining fair value for any portfolio security or other investment, the valuation and pricing committee seeks to determine the amount that an owner of the investment might reasonably expect to receive upon a sale of the investment. However, because fair value prices are estimated prices, the valuation and pricing committee’s determination of fair value for an investment may differ from the value that would be realized by the Fund upon a sale of the investment, and that difference could be material to the Fund’s financial statements. The valuation and pricing committee’s determination of fair value for an investment may also differ from the prices obtained by other persons (including other mutual funds) for the investment.
Valuation Measurements: Various inputs are used in determining the value of the Fund’s investments. These inputs are summarized in the three levels listed below:
Level 1: Quoted prices in active markets for identical investments.
Level 2: Other significant observable inputs (including quoted prices for similar investments, interest rates, prepayment rates, credit risk, etc.).
Level 3: Significant unobservable inputs (including the Fund’s own assumptions in determining the fair value of investments).
The following table displays a summary of the inputs used to value the Fund’s net assets as of September 30, 2011. In any instance when valuation inputs from more than one level are used to determine the fair value of a specific investment, the investment is placed in the level of the table based upon the lowest level input that is significant in determining the fair value of the investment:
| Fair Value Measurements at September 30, 2011 | ||||||||||||||||
| Total | Level 1 | Level 2 | Level 3 | |||||||||||||
Assets | ||||||||||||||||
Investments in Securities* | ||||||||||||||||
Common Stock | $ | 13,387,961 | $ | 13,387,961 | $ | — | $ | — | ||||||||
Preferred Stock(a) | 9,967,206 | 2,835,125 | 7,132,081 | — | ||||||||||||
Asset Backed Securities | 23,450,441 | — | 19,444,041 | 4,006,400 | ||||||||||||
Corporate Bonds | 193,137,728 | — | 189,107,950 | 4,029,778 | ||||||||||||
Convertible Bonds | 12,883,850 | — | 12,883,850 | — | ||||||||||||
Municipal Bonds | 13,253,485 | — | 13,253,485 | — | ||||||||||||
U.S. Treasury Securities | 2,114,375 | 2,114,375 | — | — | ||||||||||||
U.S. Government Agencies | 1,325,599 | — | 1,325,599 | — | ||||||||||||
Other Government | 979,943 | — | 979,943 | — | ||||||||||||
Mortgage Backed | 10,785 | — | 10,785 | — | ||||||||||||
Foreign Bonds | 25,768,851 | — | 22,790,813 | 2,978,038 | ||||||||||||
Other Securities | 2,491,316 | — | 966,250 | 1,525,066 | ||||||||||||
Short Term Investments | 19,499,784 | — | 19,499,784 | — | ||||||||||||
|
|
|
|
|
|
|
| |||||||||
Total Investments in Securities | $ | 318,271,324 | $ | 18,337,461 | $ | 287,394,581 | $ | 12,539,282 | ||||||||
Other Financial Instruments** | ||||||||||||||||
Forward Currency Contracts | $ | 197,860 | $ | — | $ | 197,860 | $ | — | ||||||||
| (a) | At September 30, 2011, industry classifications for Preferred Stock in Level 2 consist of $3,153,844 in Banks, $637,612 in Diversified Financials, $535,938 in Food, Beverage and Tobacco, $1,154,687 in Miscellaneous, and $1,650,000 in Utilities. |
| * | See Schedule of Investments for a summary of the industry exposure as grouped according to the Global Industry Classification Standard (GICS), which is an industry taxonomy developed by MSCI, Inc. and Standard & Poor’s (S&P). |
| ** | Other Financial Instruments include investments not reflected in the Schedule of Investments, such as futures, forwards and swap contracts, which are valued at the unrealized appreciation (depreciation) on the investment. |
28 Certified Annual Report
| NOTES TO FINANCIAL STATEMENTS, CONTINUED | ||
| Thornburg Strategic Income Fund | September 30, 2011 | |
A rollforward of fair value measurements using significant unobservable inputs (Level 3) for the year ended September 30, 2011, is as follows:
| Asset Backed | Corp. Bond | Foreign Bond | Other | Total | ||||||||||||||||
Beginning Balance 9/30/2010 | $ | — | $ | 7,717,142 | $ | — | $ | 1,995,814 | $ | 9,712,956 | ||||||||||
Accrued Discounts (Premiums) | — | 87,460 | 12,782 | 32,633 | 132,875 | |||||||||||||||
Net Realized Gain (Loss) | — | 35,496 | — | 278,723 | 314,219 | |||||||||||||||
Gross Purchases | 3,999,977 | 2,000,000 | 3,292,940 | 1,880,000 | 11,172,917 | |||||||||||||||
Gross Sales | — | (3,026,146 | ) | — | (2,454,344 | ) | (5,480,490 | ) | ||||||||||||
Change in Unrealized Appreciation (Depreciation) | 6,423 | (87,744 | ) | (599,683 | ) | (207,761 | ) | (888,765 | ) | |||||||||||
Transfers into Level 3(a) | — | — | 271,999 | — | 271,999 | |||||||||||||||
Transfers out of Level 3(a) | — | (2,696,429 | ) | — | — | (2,696,429 | ) | |||||||||||||
|
|
|
|
|
|
|
|
|
| |||||||||||
Ending Balance 9/30/2011(b) | $ | 4,006,400 | $ | 4,029,779 | $ | 2,978,038 | $ | 1,525,065 | $ | 12,539,282 | ||||||||||
The change in unrealized appreciation (depreciation) on investments still held at September 30, 2011, was $(602,113).
| (a) | Transfers into and/or out of Level 3 were to/from Level 2, and were due to changes in other significant observable inputs existing during the year ended September 30, 2011. Transfers into or out of Level 3 are based on the beginning market value of the period in which they occurred. |
| (b) | Level 3 Securities represent 3.89% of Total Net Assets at the year ended September 30, 2011. |
Other Notes: It is the policy of the Fund to recognize significant transfers between Levels 1, 2 and 3 and to disclose those transfers at the beginning of the reporting period. The Fund recognized no significant transfers between Levels 1 and 2 for the year ended September 30, 2011.
Foreign Currency Translation: Portfolio securities and other assets and liabilities denominated in foreign currencies are translated into U.S. dollars based on the exchange rate of such currencies against the U.S. dollar on the date of valuation. Purchases and sales of securities and income items denominated in foreign currencies are translated into U.S. dollars at the exchange rate in effect on the translation date. When the Fund purchases or sells foreign securities, it will customarily enter into a foreign exchange contract to minimize foreign exchange risk from the trade date to the settlement date of such transactions. Such spot contracts are included in Receivable for investments sold and Payable for investments purchased on the Statement of Assets and Liabilities.
The Fund does not separately report the effect of changes in foreign exchange rates from changes in market prices on securities held. Such changes are included in net realized and unrealized gain or loss from investments.
Reported net realized foreign exchange gains or losses arise from sales of foreign currencies, currency gains or losses realized between the trade and settlement dates on securities transactions and the difference between the amounts of dividends, interest, and foreign withholding taxes recorded on the Fund’s books, and the U.S. dollar equivalent of the amounts actually received or paid.
Net unrealized foreign exchange gains and losses arise from changes in the fair value of assets and liabilities, other than investments in securities at fiscal period end, resulting from changes in exchange rates.
Deferred Taxes: The Fund is subject to a tax imposed on net realized gains of securities of certain foreign countries. The Fund records an estimated deferred tax liability for net unrealized gains on these securities as reflected in the accompanying financial statements.
Federal Income Taxes: It is the policy of the Trust to comply with the provisions of the Internal Revenue Code applicable to “regulated investment companies,” and to distribute to shareholders substantially all taxable income, including any net realized gain on investments of the Fund. Therefore, no provision for federal income taxes is required.
Management reviews each uncertain tax position believed to be material to the preparation of the Fund’s financial statements, to assess if it is more likely than not that the position would be sustained upon examination, based upon the technical merits of the position.
Certified Annual Report 29
| NOTES TO FINANCIAL STATEMENTS, CONTINUED | ||
| Thornburg Strategic Income Fund | September 30, 2011 | |
As of September 30, 2011, management has not identified any such position for which a liability must be reflected in the Statement of Assets and Liabilities. The Fund’s tax returns remain subject to examination for three years after filing.
When-Issued and Delayed Delivery Transactions: The Fund may engage in when-issued or delayed delivery transactions. To the extent the Fund engages in such transactions, it will do so for the purpose of acquiring portfolio securities consistent with the Fund’s investment objectives and not for the purpose of investment leverage or to speculate on interest rate and/or market changes. At the time the Fund makes a commitment to purchase a security on a when-issued or delayed delivery basis, the Fund will record the transaction and reflect the value in determining its net asset value. When effecting such transactions, assets of an amount sufficient to make payment for the portfolio securities to be purchased will be segregated on the Fund’s records on the trade date. Securities purchased on a when-issued or delayed delivery basis do not earn interest until the settlement date.
Dividends: Net investment income of the Fund is declared daily as a dividend on shares for which the Fund has received payment. Dividends are paid quarterly and are reinvested in additional shares of the Fund at net asset value per share at the close of business on the dividend payment date, or at the shareholder’s option, paid in cash. Net realized capital gains, to the extent available, will be distributed at least annually. Distributions to shareholders are based on income tax regulations and therefore, their characteristics may differ for financial statement and tax purposes.
General: Securities transactions are accounted for on a trade date basis. Interest income is accrued as earned and dividend income is recorded on the ex-dividend date. Certain income from foreign securities is recognized as soon as information is available to the Fund. Realized gains and losses from the sale of securities are recorded on an identified cost basis. Net investment income (other than class specific expenses) and realized and unrealized gains and losses are allocated daily to each class of shares based upon the relative net asset value of outstanding shares of each class of shares at the beginning of the day (after adjusting for the current share activity of the respective class). Expenses common to all Funds are allocated among the Funds comprising the Trust based upon their relative net asset values or other appropriate allocation methods.
Guarantees and Indemnifications: Under the Trust’s organizational documents, its officers and Trustees are indemnified against certain liabilities arising out of the performance of their duties to the Fund. Additionally, in the normal course of business the Trust enters into contracts with service providers that contain general indemnification clauses. The Trust’s maximum exposure under these arrangements is unknown. However, based on experience, the Trust expects the risk of loss to be remote.
Use of Estimates: The preparation of financial statements, in conformity with generally accepted accounting principles, requires management to make estimates and assumptions that affect the reported amounts of assets and liabilities and the disclosure of contingent assets and liabilities at the date of the financial statements and the reported amounts of increases and decreases in net assets from operations during the reporting period. Actual results could differ from those estimates.
NOTE 3 – INVESTMENT ADVISORY FEE AND OTHER TRANSACTIONS WITH AFFILIATES
Pursuant to an investment advisory agreement, Thornburg Investment Management, Inc. (the “Advisor”) serves as the investment advisor and performs services to the Fund for which the fees are payable at the end of each month. For the year ended September 30, 2011, these fees were payable at annual rates ranging from .75 of 1% to .50 of 1% per annum of the average daily net assets of the Fund depending on the Fund’s asset size. The Trust also has entered into administrative services agreements with the Advisor, whereby the Advisor will perform certain administrative services for the shareholders of each class of the Fund’s shares, and for which fees will be payable at an annual rate of up to .125 of 1% per annum of the average daily net assets attributable to each class of shares. For the year ended September 30, 2011, the Advisor contractually reimbursed certain class specific expenses, administrative fees, and distribution fees of $114,377 for Class A shares, $254,610 for Class C shares, and $10,407 for Class I shares.
The Trust has an underwriting agreement with Thornburg Securities Corporation (the “Distributor,” an affiliate of the Advisor), which acts as the distributor of the Fund’s shares. For the year ended September 30, 2011, the Distributor has advised the Fund that it earned commissions aggregating $70,666 from the sale of Class A shares, and collected contingent deferred sales charges aggregating $11,395 from redemptions of Class C shares of the Fund.
30 Certified Annual Report
| NOTES TO FINANCIAL STATEMENTS, CONTINUED | ||
| Thornburg Strategic Income Fund | September 30, 2011 | |
Pursuant to a service plan under Rule 12b-1 of the Investment Company Act of 1940, the Fund may reimburse to the Advisor an amount not to exceed .25 of 1% per annum of the average daily net assets attributable to each class of shares of the Fund for payments made by the Advisor to securities dealers and other financial institutions to obtain various shareholder and distribution related services. For the year ended September 30, 2011, there were no 12b-1 service plan fees charged for Class I shares. The Advisor may pay out of its own resources additional expenses for distribution of the Fund’s shares.
The Trust has also adopted a distribution plan pursuant to Rule 12b-1, applicable only to the Fund’s Class C shares, under which the Fund compensates the Distributor for services in promoting the sale of Class C shares of the Fund at an annual rate of up to .75 of 1% per annum of the average daily net assets attributable to Class C shares. Total fees incurred by the Distributor for each class of shares of the Fund under their respective Service and Distribution Plans for the year ended September 30, 2011, are set forth in the Statement of Operations.
The Trust has an agreement with the custodian bank to indirectly pay a portion of the custodian’s fees through credits earned by the Fund’s cash on deposit with the bank. This deposit agreement is an alternative to overnight investments. Custodial fees have been adjusted to reflect amounts that would have been paid without this agreement, with a corresponding adjustment reflected as fees paid indirectly in the Statement of Operations. For the year ended September 30, 2011, fees paid indirectly were $188.
Certain officers and Trustees of the Trust are also officers or directors of the Advisor and Distributor. The compensation of independent Trustees is borne by the Trust.
NOTE 4 – SHARES OF BENEFICIAL INTEREST
At September 30, 2011, there were an unlimited number of shares of beneficial interest authorized. Transactions in shares of beneficial interest were as follows:
| Year Ended September 30, 2011 | Year Ended September 30, 2010 | |||||||||||||||
| Shares | Amount | Shares | Amount | |||||||||||||
Class��A Shares | ||||||||||||||||
Shares sold | 5,977,653 | $ | 73,696,140 | 3,856,708 | $ | 45,792,994 | ||||||||||
Shares issued to shareholders in reinvestment of dividends | 468,268 | 5,700,033 | 293,662 | 3,506,242 | ||||||||||||
Shares repurchased | (3,475,444 | ) | (42,829,550 | ) | (2,334,960 | ) | (27,818,152 | ) | ||||||||
Redemption fees received | — | — | — | — | ||||||||||||
|
|
|
|
|
|
|
| |||||||||
Net increase (decrease) | 2,970,477 | $ | 36,566,623 | 1,815,410 | $ | 21,481,084 | ||||||||||
|
|
|
|
|
|
|
| |||||||||
Class C Shares | ||||||||||||||||
Shares sold | 3,644,725 | $ | 44,913,099 | 2,960,710 | $ | 35,190,787 | ||||||||||
Shares issued to shareholders in reinvestment of dividends | 408,684 | 4,971,988 | 231,359 | 2,762,178 | ||||||||||||
Shares repurchased | (1,678,284 | ) | (20,609,582 | ) | (1,013,608 | ) | (12,079,677 | ) | ||||||||
Redemption fees received | — | — | — | — | ||||||||||||
|
|
|
|
|
|
|
| |||||||||
Net increase (decrease) | 2,375,125 | $ | 29,275,505 | 2,178,461 | $ | 25,873,288 | ||||||||||
|
|
|
|
|
|
|
| |||||||||
Class I Shares | ||||||||||||||||
Shares sold | 5,860,149 | $ | 71,847,585 | 3,284,125 | $ | 39,301,651 | ||||||||||
Shares issued to shareholders in reinvestment of dividends | 430,504 | 5,242,513 | 258,669 | 3,095,659 | ||||||||||||
Shares repurchased | (3,782,241 | ) | (46,631,790 | ) | (1,441,646 | ) | (17,193,689 | ) | ||||||||
Redemption fees received | — | — | — | — | ||||||||||||
|
|
|
|
|
|
|
| |||||||||
Net increase (decrease) | 2,508,412 | $ | 30,458,308 | 2,101,148 | $ | 25,203,621 | ||||||||||
|
|
|
|
|
|
|
| |||||||||
Certified Annual Report 31
| NOTES TO FINANCIAL STATEMENTS, CONTINUED | ||
| Thornburg Strategic Income Fund | September 30, 2011 | |
NOTE 5 – SECURITIES TRANSACTIONS
For the year ended September 30, 2011, the Fund had purchase and sale transactions of investment securities (excluding short-term investments and U. S. Government obligations) of $198,784,149 and $120,176,742, respectively.
NOTE 6 – INCOME TAXES
At September 30, 2011, information on the tax components of capital is as follows:
Cost of investments for tax purposes | $ | 316,290,580 | ||
|
| |||
Gross unrealized appreciation on a tax basis | $ | 15,160,312 | ||
Gross unrealized depreciation on a tax basis | (13,179,568 | ) | ||
|
| |||
Net unrealized appreciation (depreciation) on investments (tax basis) | $ | 1,980,744 | ||
|
| |||
Distributable earnings – ordinary income (tax basis) | $ | 2,678,939 | ||
Distributable capital gains (tax basis) | $ | 5,968,365 |
The Regulated Investment Company Modernization Act of 2010 (the “Act”) was signed into law on December 22, 2010. The Act makes changes to a number of tax rules impacting the Fund. Under the Act, future capital losses generated by the Fund may be carried over indefinitely, but these losses must be used prior to the utilization of any pre-enactment capital losses. Since pre-enactment capital losses may only be carried forward for eight years, there may be a greater likelihood that all or a portion of a Fund’s pre-enactment capital losses will expire unused. In general, the provisions of the Act will be effective for the Fund’s fiscal year ending September 30, 2012. As of September 30, 2011, the Fund had no pre-enactment capital loss carryforwards to offset future capital gains.
In order to account for permanent book/tax differences, the Fund decreased accumulated net realized gain by $342,366 and increased undistributed net investment income by $342,366. This reclassification has no impact on the net asset value of the Fund. Reclassifications result primarily from foreign currency gains (losses) and foreign bond gains (losses).
The tax character of distributions paid for the years ended September 30, 2011, and September 30, 2010, was as follows:
| 2011 | 2010 | |||||||
Distributions from: | ||||||||
Ordinary income | $ | 19,951,912 | $ | 13,135,555 | ||||
Capital gains | 2,107,301 | 60,821 | ||||||
|
|
|
| |||||
Total Distributions | $ | 22,059,213 | $ | 13,196,376 | ||||
|
|
|
| |||||
NOTE 7 – DERIVATIVE FINANCIAL INSTRUMENTS WITH OFF-BALANCE SHEET RISK AND FOREIGN INVESTMENT RISK
The Fund may use a variety of derivative financial instruments to hedge or adjust the risks affecting its investment portfolio or to enhance investment returns. Provisions of FASB Accounting Standards Codification ASC 815-10-50 (“ASC 815”), require certain disclosures. The disclosures are intended to provide users of financial statements with an understanding of the use of derivative instruments by the Fund and how these derivatives affect the financial position, financial performance and cash flows of the Fund. The Fund does not designate any derivative instruments as hedging instruments under ASC 815. During the year ended September 30, 2011, the Fund’s principal exposure to derivative financial instruments of the type addressed by ASC 815 was investment in foreign exchange contracts. A foreign exchange contract is an agreement between two parties to exchange different currencies at a specified rate of exchange at an agreed upon future date. Foreign exchange contracts involve risks to the Fund, including the risk that a contract counterparty will not meet its obligations to the Fund, the risk that a change in a contract’s value may not correlate perfectly with the currency the contract was intended to track, and the risk that the Fund’s advisor is unable to correctly implement its strategy in using a contract. In any such
32 Certified Annual Report
| NOTES TO FINANCIAL STATEMENTS, CONTINUED | ||
| Thornburg Strategic Income Fund | September 30, 2011 | |
instance, the Fund may not achieve the intended benefit of entering into a contract, and may experience a loss. Additionally, the Fund’s risk of loss may exceed the amounts recognized on the Statement of Assets and Liabilities.
The Fund entered into forward currency contracts during the year ended September 30, 2011 in the normal course of pursuing its investment objectives, in anticipation of purchasing foreign investments or with the intent of reducing the risk to the value of the Fund’s foreign investments from adverse changes in the relationship between the U.S. dollar and foreign currencies. In each case these contracts have been initiated in conjunction with foreign investment transactions.
These contracts are accounted for by the Fund under ASC 815. Unrealized gains and unrealized losses on outstanding contracts are reported in the Fund’s Statement of Assets and Liabilities at the Fund’s net equity, as measured by the difference between the forward exchange rates at the reporting date and the forward exchange rates at each contract’s inception date. Net realized gain (loss) on contracts closed during the period, and changes in net unrealized appreciation (depreciation) on outstanding contracts are recognized in the Fund’s Statement of Operations. Values of open currency contracts are indicative of the activity for the year ended September 30, 2011.
The following table displays the outstanding forward currency contracts at September 30, 2011:
Outstanding Forward Currency Contracts
to Buy or Sell at September 30, 2011
Contract Description | Buy/Sell | Contract Amount | Contract Value Date | Value USD | Unrealized Appreciation | Unrealized Depreciation | ||||||||||||||||
Euro | Sell | 2,087,000 | 02/21/2012 | 2,795,107 | $ | 197,860 | $ | — | ||||||||||||||
|
|
|
| |||||||||||||||||||
Total | $ | 197,860 | $ | — | ||||||||||||||||||
|
|
|
| |||||||||||||||||||
The unrealized appreciation (depreciation) of the outstanding forward currency contracts recognized in the Fund’s Statement of Assets and Liabilities at September 30, 2011 is disclosed in the following table:
Fair Values of Derivative Financial Instruments
at September 30, 2011
Asset Derivatives | Balance Sheet Location | Fair Value | ||||
Foreign exchange contracts | Assets - Unrealized appreciation on forward currency contracts | $ | 197,860 | |||
The realized gains (losses) from forward currency contracts, and the change in unrealized appreciation (depreciation) of outstanding forward currency contracts recognized in the Fund’s Statement of Operations for the year ended September 30, 2011 are disclosed in the following tables:
Amount of Realized Gain (Loss)
on Derivative Financial Instruments Recognized in
Income for the Year Ended September 30, 2011
| Total | Forward Currency Contracts | |||||||
Foreign exchange contracts | $ | (195,320 | ) | $ | (195,320 | ) | ||
Change in Unrealized Appreciation (Depreciation)
of Derivative Financial Instruments Recognized in
Income for the Year Ended September 30, 2011
| Total | Forward Currency Contracts | |||||||
Foreign exchange contracts | $ | 304,410 | $ | 304,410 | ||||
OTHER NOTES:
Risks: The Fund’s investments subject it to risks including, but not limited to, credit risk, interest rate risk, prepayment risk, management risk, market and economic risk, liquidity risk, risks affecting specific issuers, and the risks associated with investments in derivative instruments, smaller companies, non-U.S. issuers, real estate investment trusts, and structured finance arrangements. Please see the Fund’s prospectus for a discussion of the risks associated with an investment in the Fund.
Subsequent Events: Fund management believes no events have occurred between September 30, 2011 and the date of issuance of the financial statements, which require adjustment to, or disclosure in the accompanying financial statements.
Certified Annual Report 33
Thornburg Strategic Income Fund
| PER SHARE PERFORMANCE (for a share outstanding throughout the Year)+ | RATIOS TO AVERAGE NET ASSETS | SUPPLEMENTAL DATA | ||||||||||||||||||||||||||||||||||||||||||||||||||||||||||
Unless Otherwise Noted, Periods are Fiscal Years Ended Sept. 30, | Net Asset Value Beginning of Year | Net Investment Income (Loss) | Net Realized & Unrealized Gain (Loss) on Investments | Total from Investment Operations | Dividends from Net Investment Income | Dividends from Net Realized Gains | Total Dividends | Net Asset Value End of Year | Net Investment Income (Loss) (%) | Expenses, After Expense Reductions (%) | Expenses, After Expense Reductions and Net of Custody Credits (%) | Expenses, Before Expense Reductions (%) | Total Return (%)(a) | Portfolio Turnover Rate (%) | Net Assets at End of Year (Thousands) | |||||||||||||||||||||||||||||||||||||||||||||
Class A Shares |
| |||||||||||||||||||||||||||||||||||||||||||||||||||||||||||
2011(b) | $ | 12.35 | 0.79 | (0.21 | ) | 0.58 | (0.79 | ) | (0.28 | ) | (1.07 | ) | $ | 11.86 | 6.47 | 1.20 | 1.20 | 1.32 | 4.78 | 48.09 | $ | 115,704 | ||||||||||||||||||||||||||||||||||||||
2010(b) | $ | 11.63 | 0.81 | 0.77 | 1.58 | (0.81 | ) | (0.05 | ) | (0.86 | ) | $ | 12.35 | 6.86 | 1.25 | 1.25 | 1.35 | 14.07 | 38.87 | $ | 83,822 | |||||||||||||||||||||||||||||||||||||||
2009(b) | $ | 10.57 | 0.78 | 1.06 | 1.84 | (0.78 | ) | — | (0.78 | ) | $ | 11.63 | 7.66 | 1.25 | 1.25 | 1.49 | 18.67 | 47.88 | $ | 57,853 | ||||||||||||||||||||||||||||||||||||||||
2008(b)(c) | $ | 11.94 | 0.59 | (1.41 | ) | (0.82 | ) | (0.55 | ) | — | (0.55 | ) | $ | 10.57 | 6.51 | (d) | 1.27 | (d) | 1.25 | (d) | 1.79 | (d) | (7.18 | ) | 36.22 | $ | 18,538 | |||||||||||||||||||||||||||||||||
Class C Shares |
| |||||||||||||||||||||||||||||||||||||||||||||||||||||||||||
2011 | $ | 12.34 | 0.72 | (0.22 | ) | 0.50 | (0.72 | ) | (0.28 | ) | (1.00 | ) | $ | 11.84 | 5.86 | 1.80 | 1.80 | 2.07 | 4.11 | 48.09 | $ | 106,684 | ||||||||||||||||||||||||||||||||||||||
2010 | $ | 11.62 | 0.75 | 0.77 | 1.52 | (0.75 | ) | (0.05 | ) | (0.80 | ) | $ | 12.34 | 6.31 | 1.80 | 1.80 | 2.12 | 13.48 | 38.87 | $ | 81,841 | |||||||||||||||||||||||||||||||||||||||
2009 | $ | 10.57 | 0.73 | 1.04 | 1.77 | (0.72 | ) | — | (0.72 | ) | $ | 11.62 | 7.13 | 1.79 | 1.79 | 2.29 | 17.95 | 47.88 | $ | 51,789 | ||||||||||||||||||||||||||||||||||||||||
2008(c) | $ | 11.94 | 0.55 | (1.42 | ) | (0.87 | ) | (0.50 | ) | — | (0.50 | ) | $ | 10.57 | 5.96 | (d) | 1.82 | (d) | 1.80 | (d) | 2.65 | (d) | (7.57 | ) | 36.22 | $ | 13,829 | |||||||||||||||||||||||||||||||||
Class I Shares |
| |||||||||||||||||||||||||||||||||||||||||||||||||||||||||||
2011 | $ | 12.35 | 0.83 | (0.20 | ) | 0.63 | (0.87 | ) | (0.28 | ) | (1.15 | ) | $ | 11.83 | 6.71 | 0.97 | 0.97 | 0.98 | 5.16 | 48.09 | $ | 99,594 | ||||||||||||||||||||||||||||||||||||||
2010 | $ | 11.64 | 0.85 | 0.75 | 1.60 | (0.84 | ) | (0.05 | ) | (0.89 | ) | $ | 12.35 | 7.13 | 0.98 | 0.98 | 1.00 | 14.27 | 38.87 | $ | 73,011 | |||||||||||||||||||||||||||||||||||||||
2009 | $ | 10.58 | 0.81 | 1.05 | 1.86 | (0.80 | ) | — | (0.80 | ) | $ | 11.64 | 7.94 | 0.99 | 0.99 | 1.12 | 18.95 | 47.88 | $ | 44,319 | ||||||||||||||||||||||||||||||||||||||||
2008(c) | $ | 11.94 | 0.63 | (1.42 | ) | (0.79 | ) | (0.57 | ) | — | (0.57 | ) | $ | 10.58 | 6.81 | (d) | 1.01 | (d) | 0.99 | (d) | 1.44 | (d) | (6.90 | ) | 36.22 | $ | 15,145 | |||||||||||||||||||||||||||||||||
| (a) | Not annualized for periods less than one year. |
| (b) | Sales loads are not reflected in computing total return. |
| (c) | Fund commenced operations on December 19, 2007. |
| (d) | Annualized. |
| + | Based on weighted average shares outstanding. |
See notes to financial statements.
| 34 Certified Annual Report | Certified Annual Report 35 |
REPORT OF INDEPENDENT REGISTERED PUBLIC ACCOUNTING FIRM
Thornburg Strategic Income Fund
To the Trustees and Shareholders of
Thornburg Strategic Income Fund
In our opinion, the accompanying statement of assets and liabilities, including the schedule of investments, and the related statements of operations and of changes in net assets and the financial highlights present fairly, in all material respects, the financial position of Thornburg Strategic Income Fund (one of the portfolios constituting Thornburg Investment Trust, hereafter referred to as the “Fund”) at September 30, 2011, the results of its operations for the year then ended, the changes in its net assets for each of the two years in the period then ended and the financial highlights for each of the periods presented, in conformity with accounting principles generally accepted in the United States of America. These financial statements and financial highlights (hereafter referred to as “financial statements”) are the responsibility of the Fund’s management. Our responsibility is to express an opinion on these financial statements based on our audits. We conducted our audits of these financial statements in accordance with the standards of the Public Company Accounting Oversight Board (United States). Those standards require that we plan and perform the audit to obtain reasonable assurance about whether the financial statements are free of material misstatement. An audit includes examining, on a test basis, evidence supporting the amounts and disclosures in the financial statements, assessing the accounting principles used and significant estimates made by management, and evaluating the overall financial statement presentation. We believe that our audits, which included confirmation of securities at September 30, 2011 by correspondence with the custodian and brokers, provide a reasonable basis for our opinion.
PricewaterhouseCoopers LLP
New York, New York
November 21, 2011
36 Certified Annual Report
| EXPENSE EXAMPLE | ||
| Thornburg Strategic Income Fund | September 30, 2011 (Unaudited) | |
As a shareholder of the Fund, you incur two types of costs:
| (1) | transaction costs, including |
(a) sales charges (loads) on purchase payments for Class A shares;
(b) a deferred sales charge on redemptions of any part or all of a purchase of $1 million of Class A shares within 12 months of purchase;
(c) a deferred sales charge on redemptions of Class C shares within 12 months of purchase;
| (2) | ongoing costs, including management fees; distribution and/or service (12b-1) fees; and other Fund expenses. |
This example is intended to help you understand your ongoing costs (in dollars) of investing in the Fund and to compare these costs with the ongoing costs of investing in other mutual funds.
The example is based on a $1,000 investment beginning on April 1, 2011, and held until September 30, 2011.
ACTUAL EXPENSES
For each class of shares, the first line of the table at right provides information about actual account values and actual expenses. You may use the information in this line, together with the amount you invested, to estimate the expenses that you paid over the period. Simply divide your account value by $1,000 (for example, an $8,600 account value divided by $1,000 = 8.6), then multiply the result by the number in the first line for your class of shares under the heading entitled “Expenses Paid During Period” to estimate the expenses you paid on your account during this period.
HYPOTHETICAL EXAMPLE FOR COMPARISON PURPOSES
For each class of shares, the second line of the table at right provides information about hypothetical account values and hypothetical expenses based on the Fund’s actual expense ratio and an assumed rate of return of 5% per year before expenses, which is not the Fund’s actual return. The hypothetical account values and expenses may not be used to estimate the actual ending account balance or expenses you paid for the period. You may use this information to compare the ongoing costs of investing in the Fund and other funds. To do so, compare this 5% hypothetical example with the 5% hypothetical examples that appear in the shareholder reports of the other funds.
| Beginning Account Value 4/1/11 | Ending Account Value 9/30/11 | Expenses Paid During Period† 4/1/11–9/30/11 | ||||||||||
Class A Shares | ||||||||||||
Actual | $ | 1,000.00 | $ | 989.20 | $ | 5.79 | ||||||
Hypothetical* | $ | 1,000.00 | $ | 1,019.25 | $ | 5.88 | ||||||
Class C Shares | ||||||||||||
Actual | $ | 1,000.00 | $ | 985.40 | $ | 8.96 | ||||||
Hypothetical* | $ | 1,000.00 | $ | 1,016.04 | $ | 9.10 | ||||||
Class I Shares | ||||||||||||
Actual | $ | 1,000.00 | $ | 990.80 | $ | 4.86 | ||||||
Hypothetical* | $ | 1,000.00 | $ | 1,020.19 | $ | 4.93 | ||||||
| † | Expenses are equal to the annualized expense ratio for each class (A: 1.16%; C: 1.80%; I: 0.97%) multiplied by the average account value over the period, multiplied by 183/365 to reflect the one-half year period. |
| * | Hypothetical assumes a rate of return of 5% per year before expenses. |
Please note that the expenses shown in the table are meant to highlight your ongoing costs only and do not reflect any transactional costs, such as sales charges (loads), redemption fees, or exchange fees. Therefore, the second line of the table for each class of shares is useful in comparing ongoing costs only, and will not help you determine the relative total costs of owning different funds. In addition, if these transactional costs were included, your costs would have been higher.
Certified Annual Report 37
| INDEX COMPARISON | ||
| Thornburg Strategic Income Fund | September 30, 2011 (Unaudited) | |
GROWTH OF A HYPOTHETICAL $10,000 INVESTMENT
Thornburg Strategic Income Fund versus Barclays Capital U.S. Universal Index & Blended Index
(December 19, 2007 to September 30, 2011)
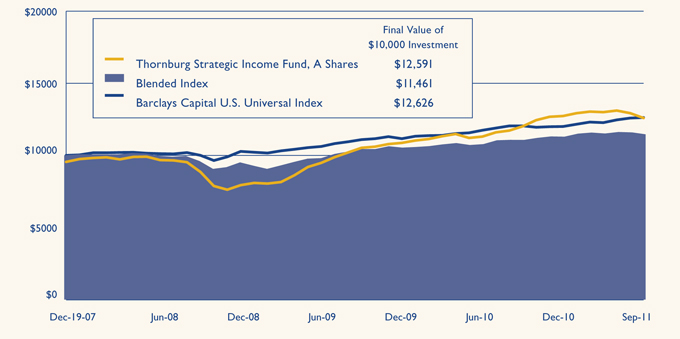
AVERAGE ANNUAL TOTAL RETURNS
For periods ended September 30, 2011 (with sales charge)
| 1 Yr | 3 Yrs | Since Inception | ||||||||||
A Shares (Incep: 12/19/07) | 0.08 | % | 10.64 | % | 6.25 | % | ||||||
C Shares (Incep: 12/19/07) | 3.15 | % | 11.69 | % | 6.92 | % | ||||||
I Shares (Incep: 12/19/07) | 5.16 | % | 12.64 | % | 7.85 | % | ||||||
Barclays U.S. Universal Index | 4.77 | % | 8.17 | % | 6.43 | % | ||||||
Blended Index | 3.52 | % | 6.76 | % | 4.21 | % | ||||||
Performance data shown represents past performance and is no guarantee of future results. Investment return and principal value will fluctuate so shares, when redeemed, may be worth more or less than their original cost. Current performance may be lower or higher than quoted. For performance current to the most recent month end, visit thornburg.com or call 800-847-0200. Investment return and principal value will fluctuate so shares, when redeemed, may be worth more or less than their original cost. Current performance may be lower or higher than quoted. For performance current to the most recent month end, visit thornburg.com or call 800-847-0200. The performance data and graph do not reflect the deduction of taxes that a shareholder would pay on distributions or the redemption of Fund shares. Returns reflect the reinvestment of dividends and capital gains as well as applicable sales charges. Class A shares are sold with a maximum sales charge of 4.50%. Class C shares are subject to a 1% CDSC for the first year only. There is no up-front sales charge for Class I shares.
38 Certified Annual Report
| TRUSTEES AND OFFICERS | ||
| Thornburg Strategic Income Fund | September 30, 2011 (Unaudited) | |
Name, Age, Position Held with Fund Year Elected | Principal Occupation(s) During Past Five Years | Other Directorships Held by Trustee | ||
INTERESTED TRUSTEES(1)(2)(4) | ||||
Garrett Thornburg, 65 Chairman of Trustees, Trustee since 1987(3) | Chairman and controlling shareholder and, until 2008, CEO of Thornburg Investment Management, Inc. (investment advisor); Chairman, CEO, and controlling shareholder of Thornburg Securities Corporation (securities dealer); CEO until 2007 and Chairman until 2009 of TMST, Inc. (f/k/a Thornburg Mortgage, Inc.) (real estate investment trust); President and Sole Director of Thornburg Mortgage Advisory Corporation (investment manager to TMST, Inc.). | None | ||
Brian J. McMahon, 55 Trustee since 2001, Member of Governance & Nominating Committee & Operations Risk Oversight Committee, President since 1997(5)(6) | CEO since 2008, President, Managing Director, Chief Investment Officer, and Portfolio Manager of Thornburg Investment Management, Inc. | None | ||
INDEPENDENT TRUSTEES(1)(2)(4) | ||||
David A. Ater, 66 Trustee since 1994, Member of Audit Committee & Governance & Nominating Committee | Principal in Ater & Associates, Santa Fe, NM (developer, planner and broker of residential and commercial real estate); owner, developer and broker for various real estate projects. | None | ||
David D. Chase, 70 Trustee since 2000, Chairman of Audit Committee | Managing Member of Vestor Associates, LLC, Santa Fe, NM (private equity fund); Managing Member of CS Group, LLC, Santa Fe, NM (merchant bank). | None | ||
Eliot R. Cutler, 65 Trustee since 2004 & Nominating Committee, Chairman of Governance | Senior Counsel and, until 2009, Partner in Akin, Gump, Strauss, Hauer & Feld LLP (law firm) in Washington, D.C. and Beijing, China. | None | ||
Susan H. Dubin, 62 Trustee since 2004, Member of Audit Committee | President of Dubin Investments, Ltd., Greenwich, CT (private investment fund); Director and officer of various charitable organizations. | None | ||
Owen D. Van Essen, 57 Trustee since 2004, Member of Governance & Nominating Committee & Chairman of Operations Risk Oversight Committee | President of Dirks, Van Essen & Murray, Santa Fe, NM (newspaper mergers and acquisitions). | None | ||
Certified Annual Report 39
| TRUSTEES AND OFFICERS, CONTINUED | ||
| Thornburg Strategic Income Fund | September 30, 2011 (Unaudited) | |
Name, Age, | Principal Occupation(s) During Past Five Years | Other Directorships Held by Trustee | ||
James W. Weyhrauch, 52 Trustee since 1996, Member of Audit Committee & Operations Risk Oversight Committee | Real estate broker, Santa Fe Properties, Santa Fe, NM; Vice Chairman of Nambe LLC, Santa Fe, NM (manufacturing & design company). | None | ||
OFFICERS OF THE FUND (WHO ARE NOT TRUSTEES)(1)(6)(7) | ||||
George T. Strickland, 48 Vice President since 1996, Treasurer since 2007(6) | Portfolio Manager, Vice President, and Managing Director of Thornburg Investment Management, Inc. | Not applicable | ||
William V. Fries, 72 Vice President since 1995 | Portfolio Manager, Vice President, and Managing Director of Thornburg Investment Management, Inc. | Not applicable | ||
Leigh Moiola, 44 Vice President since 2001 | Vice President, Managing Director, and Director of Marketing of Thornburg Investment Management, Inc. | Not applicable | ||
Alexander Motola, 41 Vice President since 2001 | Portfolio Manager, Vice President, and Managing Director of Thornburg Investment Management, Inc. | Not applicable | ||
Wendy Trevisani, 40 Vice President since 1999 | Portfolio Manager and Managing Director of Thornburg Investment Management, Inc. | Not applicable | ||
Joshua Gonze, 48 Vice President since 1999 | Portfolio Manager since 2007, Managing Director, and Associate Portfolio Manager until 2007 of Thornburg Investment Management, Inc. | Not applicable | ||
Christopher Ihlefeld, 41 Vice President since 2003 | Portfolio Manager since 2007, Managing Director, and Associate Portfolio Manager until 2007 of Thornburg Investment Management, Inc. | Not applicable | ||
Leon Sandersfeld, 45 Vice President since 2003 | Managing Director since 2007 and Fund Accounting Director of Thornburg Investment Management, Inc. | Not applicable | ||
Sasha Wilcoxon, 37 Vice President since 2003 Secretary since 2007(6) | Managing Director since 2007, Director of Operations, and Vice President of Thornburg Investment Management, Inc. | Not applicable | ||
Edward Maran, 53 Vice President since 2004 | Portfolio Manager and Managing Director of Thornburg Investment Management, Inc. | Not applicable | ||
Vinson Walden, 41 Vice President since 2004 | Portfolio Manager and Managing Director of Thornburg Investment Management, Inc. | Not applicable | ||
Thomas Garcia, 40 Vice President since 2006 | Vice President since 2011, Managing Director, Head Equity Trader, and Associate Portfolio Manager of Thornburg Investment Management, Inc. | Not applicable | ||
Lei Wang, 40 Vice President since 2006 | Portfolio Manager and Managing Director of Thornburg Investment Management, Inc. | Not applicable | ||
40 Certified Annual Report
| TRUSTEES AND OFFICERS, CONTINUED | ||
| Thornburg Strategic Income Fund | September 30, 2011 (Unaudited) | |
Name, Age, | Principal Occupation(s) During Past Five Years | Other Directorships Held by Trustee | ||
Connor Browne, 32 Vice President since 2006 | Portfolio Manager and Managing Director of Thornburg Investment Management, Inc. | Not applicable | ||
Jason Brady, 37 Vice President since 2007 | Vice President since 2011, Portfolio Manager since 2007, Managing Director since 2007, and Associate Portfolio Manager 2006–2007 of Thornburg Investment Management, Inc. | Not applicable | ||
Lewis Kaufman, 35 Vice President since 2007 | Portfolio Manager since 2007, Managing Director since 2007, and Associate Portfolio Manager until 2009 of Thornburg Investment Management, Inc. | Not applicable | ||
Christopher Ryon, 55 Vice President since 2008 | Portfolio Manager since 2009, Managing Director since 2009, and Associate Portfolio Manager 2008–2009 of Thornburg Investment Management, Inc.; Principal of Vanguard Funds until 2008. | Not applicable | ||
Lon Erickson, 36 Vice President since 2008 | Portfolio Manager since 2010, Managing Director since 2010, and Associate Portfolio Manager 2008–2010 of Thornburg Investment Management, Inc.; Senior Analyst of State Farm Insurance until 2008. | Not applicable | ||
Kathleen Brady, 51 Vice President since 2008 | Senior Tax Accountant since 2007 of Thornburg Investment Management, Inc.; Chief Financial Officer of Vestor Partners, LP (private equity fund) until 2007. | Not applicable | ||
Jack Gardner, 57 Vice President since 2008 | Managing Director since 2007 of Thornburg Investment Management, Inc.; President since 2008 and National Sales Director of Thornburg Securities Corporation. | Not applicable | ||
Laura Hillstrom, 44 Vice President since 2009 | Chief Administrative Officer since 2009, Vice President and Managing Director, and Director of Information Systems until 2009 of Thornburg Investment Management, Inc. | Not applicable | ||
| (1) | Each person’s address is 2300 North Ridgetop Road, Santa Fe, New Mexico 87506. |
| (2) | The Fund is one of sixteen separate investment “Funds” or “series” of Thornburg Investment Trust (the “Trust”), which comprises the Thornburg mutual fund complex and is organized as a Massachusetts business trust. Thornburg Investment Management, Inc. is the investment advisor to, and manages, the sixteen Funds of the Trust. Each Trustee oversees the sixteen Funds of the Trust. |
| (3) | Mr. Thornburg is considered an “interested” Trustee under the Investment Company Act of 1940 because he is the sole director and controlling shareholder of Thornburg Investment Management, Inc., the investment advisor to the sixteen active Funds of the Trust, and is the sole director and controlling shareholder of Thornburg Securities Corporation, the distributor of shares for the Trust. |
| (4) | Each Trustee serves in office until the election and qualification of a successor. |
| (5) | Mr. McMahon is considered an “interested” Trustee because he is the chief executive officer and president of Thornburg Investment Management, Inc. |
| (6) | The Trust’s president, secretary, and treasurer each serves a one-year term or until the election and qualification of a successor; each other officer serves at the pleasure of the Trustees. |
| (7) | Assistant vice presidents, assistant secretaries and assistant treasurers are not shown. |
The Statement of Additional Information for each Fund of the Trust includes additional information about the Trustees and is available, without charge and upon request, by calling 1-800-847-0200.
Certified Annual Report 41
| OTHER INFORMATION | ||
| Thornburg Strategic Income Fund | September 30, 2011 (Unaudited) | |
PORTFOLIO PROXY VOTING
Policies and Procedures:
The Trust has delegated to Thornburg Investment Management, Inc. (the “Advisor”) voting decisions respecting proxies for the Fund’s voting securities. The Advisor makes voting decisions in accordance with its Proxy Voting Policy. A description of the Policy is available (i) without charge, upon request, by calling the Advisor toll-free at 1-800-847-0200, (ii) on the Thornburg website at www.thornburg. com, and (iii) on the Securities and Exchange Commission’s website at www.sec.gov.
Information regarding how proxies were voted is available on or before August 31 of each year for the twelve months ending the preceding June 30. This information is available (i) without charge, upon request by calling the Advisor toll-free at 1-800-847-0200, (ii) on the Thornburg website at www.thornburg.com, and (iii) on the Securities and Exchange Commission’s website at www.sec.gov.
TAX INFORMATION
For the tax year ended September 30, 2011, dividends paid by the Thornburg Strategic Income Fund of $2,107,301 are designated as long-term capital gain dividends for federal income tax purposes.
For the tax year ended September 30, 2011, the Thornburg Strategic Income Fund designates 5.31% (or the maximum allowed) of the dividends paid from tax basis net ordinary income as qualifying for the reduced rate under the Jobs and Growth Tax Relief and Reconciliation Act of 2003.
2.86% (or the maximum allowed) of the ordinary income distributions paid by the Fund for the year ended September 30, 2011 qualified for the corporate dividends received deduction.
The information and distributions reported herein may differ from the information and distributions reported to the shareholders for the calendar year ending December 31, 2011. Complete information will be reported in conjunction with your 2011 Form 1099-DIV.
AVAILABILITY OF QUARTERLY PORTFOLIO SCHEDULE
The Fund files with the Securities and Exchange Commission schedules of its portfolio holdings on Form N-Q for the first and third quarters of each fiscal year. The Fund’s Forms N-Q are available on the Commission’s website at www.sec.gov, or may be reviewed and copied at the Commission’s Public Reference Room in Washington, D.C. Information on the operation of the Public Reference Room may be obtained by calling 1-800-SEC-0330. The Fund also makes this information available on its website at www.thornburg.com/ download or upon request by calling 1-800-847-0200.
STATEMENT RESPECTING RENEWAL OF INVESTMENT ADVISORY AGREEMENT
Thornburg Investment Management, Inc. (the “Advisor”) provides investment management services to Thornburg Strategic Income Fund pursuant to an investment advisory agreement. The Trustees consider the renewal of this agreement annually, and most recently determined to renew the agreement on September 13, 2011.
In anticipation of their recent consideration of the advisory agreement’s renewal, the independent Trustees met in May 2011 to plan the Trustees’ evaluation of the Advisor’s performance and to specify the information the Advisor would present to the Trustees for their review. The Advisor’s chief investment officer subsequently reviewed portions of the specified information with the Trustees and addressed questions presented by the Trustees at a meeting session scheduled for the purpose, and the independent Trustees thereafter met in independent session to consider the Advisor’s presentation and various specific issues respecting their consideration of the advisory agreement’s renewal. Following these sessions, the Trustees met to consider a renewal of the agreement, and the independent Trustees unanimously voted at that meeting to renew the agreement for an additional term of one year.
The information below summarizes certain factors considered by the Trustees in connection with the determination to renew the advisory agreement. In determining to renew the agreement, the Trustees did not identify any single factor as controlling, and this summary does not describe all of the matters considered by the Trustees in making their determination.
Quality of Services; Fund Investment Performance. The Trustees evaluated the nature, extent and quality of services provided by the Advisor under the advisory agreement, and evaluated the investment performance of the Fund.
42 Certified Annual Report
| OTHER INFORMATION, CONTINUED | ||
| Thornburg Strategic Income Fund | September 30, 2011 (Unaudited) | |
In connection with their general supervision of the Advisor, and as an important element of their annual consideration of a renewal of the advisory agreement, the Trustees received and considered reports from the Advisor throughout the year. These reports addressed a wide variety of topics, including particularly the Advisor’s selection of investments and execution of the Fund’s investment strategies. In addition, the Trustees considered information provided to them at their request in anticipation of their annual evaluation of the Advisor’s services, including (i) the Fund’s absolute investment performance and achievement of stated objectives, (ii) the Advisor’s commentary on the Fund’s performance in the context of the Fund’s objectives and reasonable expectations, and business, market and economic conditions, (iii) measures of the Fund’s investment returns since the Fund’s inception relative to a broad-based securities index, a blended benchmark comprised of two securities indices, and two categories of multi-sector fixed income mutual funds assembled by independent mutual fund analyst firms, and (iv) comparative measures of portfolio volatility, risk and return.
The Trustees also considered their perceptions of portfolio management personnel developed in formal and informal meetings throughout the year, the Advisor’s staffing and other resources, trade execution, the Advisor’s performance of accounting and other services, the Advisor’s observance of compliance and regulatory requirements, the Advisor’s responsiveness to the Trustees, and other factors.
In evaluating quantitative and performance data presented, the Trustees noted (among other aspects of the data) performance data for the three calendar years since the Fund’s inception, which showed that the Fund’s investment return for the most recent calendar year had exceeded the average return of the mutual fund category for which calendar year data was presented, and that the Fund’s returns had exceeded the average return of the category in one of the two preceding calendar years. Other noted quantitative data showed that the Fund’s investment returns fell within the top decile of performance for the first fund category for the three-month and year-to-date periods ended with the second quarter of the current year and fell within the top quintile of the category for the one-year and three-year periods, and that the Fund’s investment returns fell within the top decile of performance for the second fund category for the three-month, year-to-date and one-year periods and within the top quintile for the three-year period.
The Trustees concluded, based upon these and other considerations, that the nature, extent and quality of the Advisor’s services were sufficient and that the Advisor had satisfactorily pursued the Fund’s stated investment objectives. The Trustees further concluded that the investment performance of the Fund was satisfactory in the context of the Fund’s objectives and policies, and prevailing market conditions.
Fees and Expenses; Profitability of Advisor; Economies of Scale; Ancillary Benefits to Advisor. The Trustees evaluated the level of the management fee charged by the Advisor to the Fund, and in this connection, reviewed the profitability of the Advisor, economies of scale potentially available to the Fund and whether the Advisor had received any ancillary benefits from its relationship with the Fund.
In evaluating the level of the management fee, the Trustees considered the fee charged by the Advisor and the other expenses charged to the Fund in light of the nature and quality of services provided, comparison of the actual Advisor’s fee and Fund expenses to the statement of fees and expenses in the Fund’s prospectuses, and comparisons of the Advisor’s fee and other Fund expenses to median and average fees and expenses charged to two groups of mutual funds assembled by independent mutual fund analyst firms. Comparative fee and expense data noted by the Trustees showed that the management fee for the Fund was slightly higher than the median and average fee levels for one mutual fund group and somewhat higher than the median and average rates for the second group, and that the overall expense ratio for the Fund was comparable to the median and average expense ratios for the first fund group and slightly higher than the median expense ratio and comparable to the average ratio of the second group. The Trustees did not identify the differences as significant. The Trustees considered information about the fees charged by the Advisor to other investment management clients, together with information about fees charged by other advisors to different clients, and analysis of the differences between the requirements of institutional clients and mutual funds and the consequently different investment management services rendered, respectively, to institutional clients and mutual funds. The Trustees confirmed their previous observations that the differences between the fees charged by the Advisor to different types of clients did not appear exceptional, and observed that the fee rates charged by investment advisors to institutional clients had limited relevance to the evaluation of fee rates charged to mutual funds, because of the significant differences between the respective requirements of institutional clients and mutual funds, the differences between the respective services rendered to institutional clients and mutual funds, and the different circumstances in which the respective fees originate.
In reviewing the profitability of the Advisor, the Trustees considered costs incurred by the Advisor and data comparing the profitability of the Advisor to other investment management firms. The information provided did not indicate that the Advisor’s profitability was unusual, and the Trustees noted the adequacy of the Advisor’s resources and service capabilities. In reviewing the extent to which economies of scale would be realized by the Fund as it grows and whether fee levels reflect economies of scale, the Trustees consid-
Certified Annual Report 43
| OTHER INFORMATION, CONTINUED | ||
| Thornburg Strategic Income Fund | September 30, 2011 (Unaudited) | |
ered the breakpoint structure for advisory fees chargeable to the Fund, the demonstrated economies of scale enjoyed by other Funds of the Trust as they had grown in size, and economies of scale realized by other mutual funds. The information provided demonstrated to the Trustees that the Fund may reasonably be expected to realize economies of scale as the Fund grows in size, due to the breakpoint fee structure of the advisory agreement and other factors. In reviewing potential benefits to the Advisor because of its relationship to the Fund, the Trustees considered the Advisor’s receipt of certain research services from broker dealers, and the benefits to both the Fund and the Advisor of the Advisor’s expansion of its staffing, compliance and systems capabilities and other resources to serve a broader variety of investment management clients. No unusual or unfair benefits to the Advisor from its relationship to the Fund were identified by the Trustees.
The Trustees concluded, based upon their consideration of these and other factors, that the management fee charged to the Fund by the Advisor was fair and reasonable in view of the nature, extent and quality of the services provided by the Advisor, the clear disclosure of fees and expenses in the Fund’s prospectuses, the investment performance of the Fund, and comparisons of fees and expenses charged to the Fund to fees and expenses charged to other mutual funds.
44 Certified Annual Report
This page intentionally left blank.
This page is not part of the Annual Report. 45
Trustees’ Statement to Shareholders
Not part of the Certified Annual Report
September 13, 2011
The Trustees believe current and prospective shareholders should know how we discharge our responsibilities in supervising the Funds’ investment advisor and in reviewing the advisor’s contract for renewal. Since 2005, we have issued a statement which sets out clearly the three principal guidelines that we follow in supervising the Trust’s investment advisor on your behalf. In accordance with our customary practice, in September of this year we again reviewed our statement and concluded we should reissue this statement outlining the principal features of our supervision of the advisor’s performance of investment management services for the Funds.
We begin with the premise that each shareholder selected his or her Fund because its investments are managed by the investment advisor identified in the prospectus and in accordance with the objective and policies described in the prospectus. We realize, as each of you do, that if you believe that your Fund’s stated objective and policies no longer serve your personal investment goals, you can sell your shares and leave the Fund.
Therefore, we believe that our primary supervisory task – our principal obligation to you – is to assess the nature and quality of the advisor’s services, and to confirm that the advisor actively and competently pursues the Fund’s objective, in accordance with the policies set out in the prospectus. To do this, we meet regularly with management to review your Fund’s portfolio and to discuss the advisor’s specific actions and judgments in pursuing the Fund’s objective. We do not substitute our own judgment for the advisor’s decisions in selecting investments; the advisor is paid to exercise its informed judgment on investment decisions, and we seek to confirm, in reviewing the advisor’s performance, that the advisor is doing just that.
Second, while we are conscious of costs and the effect that costs have on shareholders’ returns, we do not seek the lowest fees or expense ratio as our sole or primary objective. We try to make sure that your Fund’s fees and costs are reasonable in relationship to the services rendered and that they are generally in line with those charged by other expert investment advisors, consistent with our belief that the Fund’s investors searched for and expect that expertise and attention and have decided to pay a reasonable price for it. We do not put the management contract “out to bid” as a matter of course, and we would not do so unless we had concluded that the advisor materially had failed to pursue the Fund’s objectives in accordance with its policies, or for other equally important reasons. We believe that any other approach would be inconsistent with your interests and contrary to your expectations when you bought shares of the Fund in the first place.
Finally, because we believe that most Thornburg Fund shareholders have invested with a long-term perspective, we try not to focus too much on the fashions of the moment and on short-term performance. The market will not favor any specific investment objective or set of policies at all times and under all economic circumstances. A fund will experience periods of both high and low returns relative to other funds and other investments. Even if one of our Funds is not favored by the market at a particular time, we believe that the advisor is nonetheless obliged to remain true to the Fund’s objective and policies, and we watch to see that it does so.
46 This page is not part of the Annual Report.
Retirement and Education Accounts
Thornburg Investment Management offers retirement and education savings accounts that can help you meet a variety of planning challenges. For account applications or further information on any of the accounts below, please call 1-800-847-0200 or go to www.thornburg.com/ira. Your financial advisor can help you determine which plan is right for you.
Individual Retirement Accounts
Individual Retirement Accounts (IRAs) provide a tax-advantaged means to save money for the future. For a detailed outline of the difference between retirement accounts, see www.thornburg.com/ira. Rollovers are available. Call 1-800-847-0200 for more information.
Traditional IRAs – Contributions to Traditional IRAs are tax deductible for eligible individuals, and withdrawals are taxed as additional ordinary income. You may contribute to an IRA if you receive compensation and are under 70 1/2, even if you are covered by an employer retirement plan. Deductible contributions are subject to certain qualifications. Please consult your tax advisor.
Roth IRAs – Under a Roth IRA, there is no tax deduction for contributions, but there is no income tax on qualified withdrawals. For a more detailed comparison of Traditional and Roth IRAs, please see our web site at www.thornburg.com/ira.
SEP IRAs – Simplified Employee Pension (SEP) IRAs are established by employers. The employer is allowed a tax deduction for contributions made to the SEP Plan and makes contributions to each eligible employee’s SEP IRA on a discretionary basis.
SIMPLE IRAs – Savings Incentive Match Plan for Employees of Small Employers (SIMPLE) is designed to give small business owners a simplified method to establish and contribute to a retirement plan for employees. The employer is allowed a tax deduction for contributions and makes either matching or non-elective contributions to each eligible employee’s SIMPLE IRA. Employees may make salary deferral contributions.
Coverdell Education Savings Account
These savings accounts are designed to provide a way to save money for higher education expenses. In an Education Savings Account, earnings and interest grow tax-free, and qualified withdrawals used to pay for eligible higher-education expenses are tax- and penalty-free.
Funds Available
The following funds are available in the accounts listed above:
| • | Thornburg International Value Fund |
| • | Thornburg Value Fund |
| • | Thornburg Core Growth Fund |
| • | Thornburg Investment Income Builder Fund |
| • | Thornburg Global Opportunities Fund |
| • | Thornburg International Growth Fund |
| • | Thornburg Developing World Fund |
| • | Thornburg Limited Term U.S. Government Fund |
| • | Thornburg Limited Term Income Fund |
| • | Thornburg Strategic Income Fund |
This page is not part of the Annual Report. 47

Thornburg Equity Funds
Thornburg’s equity research uses a fundamental and comprehensive analytical approach. Thornburg equity funds focus on a limited number of securities so that each holding can impact performance. The equity team searches for firms believed to have a promising future and seeks to buy shares of those companies at a discount to their intrinsic value.
| • | Thornburg Value Fund |
| • | Thornburg International Value Fund |
| • | Thornburg Core Growth Fund |
| • | Thornburg Investment Income Builder Fund |
| • | Thornburg Global Opportunities Fund |
| • | Thornburg International Growth Fund |
| • | Thornburg Developing World Fund |
Thornburg Bond Funds
Thornburg Investment Management applies a disciplined philosophy to fixed-income management. Since the launch of our first fixed-income fund over 25 years ago, we have been conducting fundamental, bottom-up research in an effort to identify bonds which we believe provide the best return for a given level of risk. We are very organic in our approach, avoiding leverage or complex strategies which could backfire in periods of market uncertainty.
| • | Thornburg Limited Term Municipal Fund |
| • | Thornburg Intermediate Municipal Fund |
| • | Thornburg California Limited Term Municipal Fund |
| • | Thornburg New Mexico Intermediate Municipal Fund |
| • | Thornburg New York Intermediate Municipal Fund |
| • | Thornburg Strategic Municipal Income Fund |
| • | Thornburg Limited Term U.S. Government Fund |
| • | Thornburg Limited Term Income Fund |
| • | Thornburg Strategic Income Fund |
Before investing, carefully consider the Fund’s investment goals, risks, charges, and expenses. For a prospectus containing this and other information, contact your financial advisor or visit thornburg.com. Read it carefully before investing.
For additional information, please visit www.thornburg.com
Thornburg Investment Management, Inc. 2300 North Ridgetop Road, Santa Fe, NM 87506
This page is not part of the Annual Report. 49
This page intentionally left blank.
50 This page is not part of the Annual Report.
This page intentionally left blank.
This page is not part of the Annual Report. 51
 | Waste not, Wait not |  | ||||
| Get instant access to your shareholder reports. | ||||||
| This Annual Report is submitted for the general information of shareholders of the Fund. It is not authorized for distribution to prospective investors in the Fund unless preceded or accompanied by an effective prospectus. | By switching from your postal mailbox to your email inbox, you reduce paper clutter, improve record keeping access, and help conserve our natural resources. | |||||
| Investment Advisor: Thornburg Investment Management®
800.847.0200 | Go to www.thornburg.com/edelivery and sign up to receive your shareholder reports, prospectuses, and proxy statements electronically. | ||||
| Distributor: | ||||||
| Thornburg Securities Corporation® 800.847.0200 | You invest in the future, without spending a dime. | |||||
| TH1784 | ||||||


Important Information
The information presented on the following pages was current as of September 30, 2011. The managers’ views, portfolio holdings, and sector diversification are provided for the general information of the Fund’s shareholders; to the extent this information is historical, it should not be considered predictive of future circumstances. This material should not be deemed a recommendation to buy or sell any of the securities mentioned.
Investments in the Fund carry risks, including possible loss of principal. Special risks may be associated with investments outside the United States, especially in emerging markets, including currency fluctuations, illiquidity and volatility. Investments in small capitalization companies may increase the risk of greater price fluctuations. Please see the Fund’s Prospectus for a discussion of the risks associated with an investment in the Fund. Investments in the Fund are not FDIC insured, nor are they deposits of or guaranteed by a bank or any other entity. There is no guarantee that the Fund will meet its investment objectives. Funds invested in a limited number of holdings may expose an investor to greater volatility.
Performance data given at net asset value (NAV) does not take into account the applicable sales charges. If the sales charges had been included, the performance would have been lower.
Class I, R3, R4, and R5 shares may not be available to all investors. Minimum investments for Class I shares may be higher than those for other classes.
Share Class | NASDAQ Symbol | Cusip | ||
Class A | TVAFX | 885-215-731 | ||
Class B | TVBFX | 885-215-590 | ||
Class C | TVCFX | 885-215-715 | ||
Class I | TVIFX | 885-215-632 | ||
Class R3 | TVRFX | 885-215-533 | ||
Class R4 | TVIRX | 885-215-277 | ||
Class R5 | TVRRX | 885-215-376 |
Glossary
S&P 500 Index – The S&P 500 Index is a broad measure of the U.S. stock market.
Unless otherwise noted, index returns reflect the reinvestment of income dividends and capital gains, if any, but do not reflect fees, brokerage commissions or other expenses of investing. Investors may not make direct investments into any index. The performance of any index is not indicative of the performance of any particular investment.
Alpha – A measure of the difference between a fund’s actual returns and its expected performance, given its level of risk as measured by beta.
Beta – A measure of market-related risk. Less than one means the portfolio is less volatile than the index, while greater than one indicates more volatility than the index.
Earnings per Share (EPS) – The total earnings divided by the number of shares outstanding.
Forward P/E – Price to earnings ratio, using earnings estimates for the next four quarters.
Median Market Capitalization – Market capitalization (market cap) is the total value of a company’s stock, calculated by multiplying the number of outstanding common shares by the current share price. The company whose market cap is in the middle of the portfolio is the median market cap. Half the companies in the portfolio have values greater than the median and half have values that are less.
Price to Book Value (P/B) – A ratio used to compare a stock’s market value to its book value. It is calculated by dividing the current closing price of the stock by the latest quarter’s book value (book value is simply assets minus liabilities).
Price to Cash Flow Ratio – A measure of the market’s expectations of a firm’s future financial health. It is calculated by dividing the price per share by cash flow per share.
Price to Earnings Ratio (P/E) – A valuation ratio equaling a company’s market value per share divided by earnings per share.
This page is not part of the Annual Report. 3
Thornburg Value Fund
CO-PORTFOLIO MANAGERS

Connor Browne,CFA, and Edward Maran,CFA.
IMPORTANT
PERFORMANCE INFORMATION
Performance data shown represents past performance and is no guarantee of future results. Investment return and principal value will fluctuate so shares, when redeemed, may be worth more or less than their original cost. Current performance may be lower or higher than quoted. For performance current to the most recent month end, visit thornburg.com or call 800.847.0200.
The maximum sales charge for Class A shares is 4.50%. Class A shares are subject to a 1% 30-day redemption fee. The total annual fund operating expense of Class A shares is 1.31%, as disclosed in the most recent Prospectus.
Finding Promising Companies at a Discount
The Thornburg Value Fund seeks to find promising companies at a discounted valuation. It differs from many other equity funds in two key ways. First, it focuses on a limited number of stocks, and second, it takes a more comprehensive approach to value investing.
Our team is dedicated to providing value to shareholders. We strive to accomplish this through the application of seasoned investment principles with hands-on, company-oriented research. We use a collaborative research approach in identifying and analyzing investment ideas. Our focus is on finding promising companies available at a discount to our estimate of their intrinsic value.
In managing the Thornburg Value Fund, we take a bottom-up approach to stock selection. The Fund is not predisposed to an industry or sector. We use a combination of financial analysis, collaborative research, and business evaluation in an effort to gauge the intrinsic value of a company based on its past record and future potential. The continuum of process moves from screens and idea generation, through conventional “Wall Street” research and documentation, to company contact, the last often including on-site visits. The focus of the analysis is on what’s behind the numbers, its revenue and cash-generating model. We make an effort to get to know the company’s reputation in the industry, its people and its corporate culture.
AVERAGE ANNUAL TOTAL RETURNS
FOR PERIODS ENDED 9/30/11
| 1 Yr | 3 Yrs | 5 Yrs | 10 Yrs | Since Inception | ||||||||||||||||
A Shares (Incep: 10/2/95) | ||||||||||||||||||||
Without sales charge | -8.97 | % | 0.38 | % | -2.72 | % | 2.58 | % | 8.03 | % | ||||||||||
With sales charge | -13.05 | % | -1.15 | % | -3.61 | % | 2.11 | % | 7.72 | % | ||||||||||
S&P 500 Index | ||||||||||||||||||||
(Since 10/2/95) | 1.14 | % | 1.23 | % | -1.18 | % | 2.82 | % | 6.15 | % | ||||||||||
4 This page is not part of the Annual Report.
The current posture is to maintain a portfolio of 40–55 companies diversified by sector, industry, market capitalization, and our three categories of stocks: Basic Value, Consistent Earners and Emerging Franchises. Because of the limited number of stocks in the portfolio, every holding counts. At the time of purchase, we set a 12–18 month price target for each stock. The target is reviewed as the fundamentals of the stock change during the course of ownership.
The bottom line? Engendering a wide-open, collegial environment fosters information flow and critical thinking intended to benefit portfolio decision making. We do not view our location in Santa Fe, New Mexico, as a disadvantage. While we have access to the best of Wall Street’s analysis, we are not ruled by it. Distance from the crowd serves to fortify independent and objective thinking.
STOCKS CONTRIBUTING AND DETRACTING
FOR THE YEAR ENDED 9/30/11
Top Contributors | Top Detractors | |
| Baker Hughes, Inc. | Bank of America Corp. | |
| Monsanto Co. | United States Steel Corp. | |
| Comcast Corp. Cl A Special | Genworth Financial, Inc. (Cl A) | |
| Inpex Corp. | Goldman Sachs Group, Inc. | |
| Gazprom OAO ADS | MEMC Electronic Materials, Inc. | |
| Source: FactSet | ||
KEY PORTFOLIO ATTRIBUTES
As of 9/30/11
Portfolio P/E Trailing 12-months* | 10.3x | |||
Portfolio Price to Cash Flow* | 4.9x | |||
Portfolio Price to Book Value* | 1.0x | |||
Median Market Cap* | $ | 8.5 B | ||
7-Year Beta (A Shares vs. S&P 500)* | 1.11 | |||
Number of Companies | 43 | |||
| * | Source: FactSet |
MARKET CAPITALIZATION EXPOSURE
As of 9/30/11
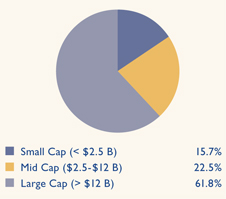
BASKET STRUCTURE
As of 9/30/11
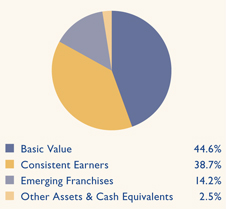
This page is not part of the Annual Report. 5

Thornburg Value Fund
September 30, 2011
Table of Contents | ||||
| 7 | ||||
| 10 | ||||
| 14 | ||||
| 16 | ||||
| 18 | ||||
| 19 | ||||
| 28 | ||||
| 30 | ||||
| 31 | ||||
| 32 | ||||
| 33 | ||||
| 36 |
This report is certified under the Sarbanes-Oxley Act of 2002, which requires that public companies, including mutual funds, affirm that the information provided in their annual and semiannual shareholder reports fully and fairly represents their financial position.
6 Certified Annual Report
Connor Browne,CFA Co-Portfolio Manager
Edward E. Maran,CFA Co-Portfolio Manager | October 19, 2011
Dear Fellow Shareholders,
The Thornburg Value Fund had a disappointing fiscal year ended September 30, 2011.
As mentioned, much of the relative underperformance of the Fund occurred during the last
While the chances that the United States will fall into a double-dip recession are greater today
Among our worst performers for the fiscal year were The Hartford, Bank of America,
The Hartford, Bank of America, and Genworth are each priced as though they are in imminent |


Certified Annual Report 7
| Letter to Shareholders, | ||
Continued | ||
Management at around forty cents on the dollar. As the crisis unfolded, our debt positions increased in price, even as it became clear that The Hartford might need to raise capital. We proposed to senior management a debt-for-equity swap at seventy cents on the dollar for the debt we purchased. This would have increased the Hartford’s capital levels in two ways – retiring debt for less than par is accounted for as a gain, and the additional capital that came in through the equity issuance would add further capital. The Hartford management did not take us up on our offer, but all’s well that ends well – we sold our debt for higher prices in the market and bought equity anyway. Our point being that we know The Hartford very well; we’ve been through a similar situation before, and we believe that The Hartford is in a much stronger financial position today than it was during the late-2008 to early-2009 period.
The same can be said for Bank of America. We believe their balance sheet is much cleaner today than it was during the financial crisis. While Bank of America will have further settlements to come on representation and warranty claims from counterparties (the mortgage-related lawsuits that you’ve likely read about in the press), we have run very pessimistic scenarios, in terms of loss levels for loans on their balance sheet and future mortgage settlements, and even in those scenarios, we believe Bank of America has adequate capital levels. Part of the equation is the strong pre-tax, pre-provision earnings that Bank of America’s leading deposit banking franchise generates in the U.S.; close to $40 billion per year. This serves as a tremendous buffer to absorb losses as they may crop up in the future. We believe that time is on Bank of America’s side.
Genworth offers mortgage insurance, as well as other specialty insurance products including Long-Term Care insurance. Mortgage insurance bridges the gap between a homeowner’s down payment and the required 20%. This puts mortgage insurance in a first loss position, behind only the initial equity loss of the homeowner. While mortgage insurance results have been very weak industry-wide over the last few years, we believe you can estimate future losses based on current new delinquency trends and the existing pipeline of non-performing loans. Given our current loss estimates in Genworth’s mortgage insurance businesses, especially considering it accounts for just one-sixth of their overall operations, we believe Genworth to be adequately reserved and capitalized.
In each of these companies (The Hartford, Bank of America, and Genworth), current market valuations are less than 50% of book value. In each case, we believe the company can grow book value over the next few years and eventually trade at a premium to book value.
U.S. Steel has been very challenging over the last few months. Over the latest business cycle, U.S. Steel earned $17 per share in EPS and approached a peak price of $200 per share. We initially purchased U.S. Steel at $40, had trimmed our stake above $60, and added again to our position at much lower levels. From there, the stock has been cut nearly in half. We believe U.S. Steel’s competitive position has improved over the last few years as the U.S. dollar has weakened against currencies in developing markets, such as Brazil and China. Additionally, wage rates are increasing in those countries relative to the company’s U.S. labor costs. As the relative cost of making steel in the United States declines, U.S. Steel should be better suited to compete against steel imports.
MEMC Electronics installs solar panels and manufactures silicon wafers for the semiconductor and solar industries. While the company’s end markets are currently experiencing a period of oversupply, the solar installation and semiconductor wafering businesses are holding up relatively well. It appears to us that fears of excess capacity have led to a stock valuation that is at a dramatic discount to our sum of the parts calculation.
Transocean is the leading deepwater drilling contractor globally. It has been plagued by concerns about potential legal liability associated with the Macondo drilling disaster. The rig downtime associated with upgrading rigs to meet tighter
8 Certified Annual Report
regulatory standards has also been a headwind for the company. The stock tends to move with oil prices and perceptions of the economic outlook. The price of crude oil declined by $10 per barrel during the quarter and investor pessimism increased. The price of most oil sensitive energy companies declined during the quarter and Transocean was no exception.
While, in many cases, the stock prices of the companies that we own have declined dramatically, our calculated worth of these businesses has not moved nearly as dramatically, if at all. Today, there is a much greater discount to intrinsic value embedded in the portfolio because of these dramatic price movements.
Top contributors over the year included energy-related holdings Baker Hughes and Inpex, as well as Monsanto, Comcast and KDDI, a mobile service provider in Japan. Of these five, three were sold during the year (Baker Hughes, Monsanto and Comcast) at satisfying valuations. Inpex and KDDI remain appealing investment opportunities. Inpex is the largest oil company in Japan and is currently working on two Liquefied Natural Gas (LNG) projects that will deliver LNG for electricity production in its home country. Given the tragedy during the year regarding the Fukushima Daiichi Nuclear Power Plant, natural gas will be a more important part of the power generation equation in Japan moving forward. KDDI is one of three large mobile operators in Japan, and stands to benefit as the Japanese consumer adopts smart phones.
Fund performance has been negatively impacted in the recent stock market turmoil, but we remain confident in our investing approach. While market volatility can be unsettling in the short term, we believe that it is a source of great investment opportunity over time. Our investment process has successfully navigated the market gyrations of the last 16 years, and although past performance does not guarantee future results, we remain confident in its potential to deliver strong results in the future as well. As has been the case for the last few years, there will be no capital gain distribution this year. At September 30, 2011, the Fund had tax basis realized capital losses of approximately $445 million, which may be carried forward to offset future capital gains to the extent permitted by regulations. We invite you to visit our website at www.thornburg.com where you will find useful information on the Thornburg Value Fund as well as our other funds and investment topics.
Thank you for your trust and confidence.
| Sincerely, | ||
 |  | |
| Connor Browne,CFA | Edward E. Maran,CFA | |
| Co-Portfolio Manager | Co-Portfolio Manager | |
| Managing Director | Managing Director | |
The matters discussed in this report may constitute forward-looking statements made pursuant to the safe harbor provisions of the Securities Litigation Reform Act of 1995. These include any advisor or portfolio manager prediction, assessment, analysis or outlook for individual securities, industries, investment styles, market sectors and/or markets. These statements involve risks and uncertainties. In addition to the general risks described for each fund in its current prospectus, other factors bearing on these reports include the accuracy of the advisor’s or portfolio manager’s forecasts and predictions, the appropriateness of the investment strategies designed by the advisor or portfolio manager, and the ability of the advisor or portfolio manager to implement their strategies efficiently and successfully. Any one or more of these factors, as well as other risks affecting the securities markets generally, could cause the actual results of any fund to differ materially as compared to its benchmarks.
Certified Annual Report 9
| SCHEDULE OF INVESTMENTS | ||
| Thornburg Value Fund | September 30, 2011 | |
TOP TEN HOLDINGS
As of 9/30/11
Gilead Sciences, Inc. | 5.3 | % | Transocean Ltd. | 3.9 | % | |||||
Inpex Corp. | 4.9 | % | General Electric Co. | 3.9 | % | |||||
Google, Inc. | 4.8 | % | Dell, Inc. | 3.7 | % | |||||
Exxon Mobil Corp. | 4.2 | % | Thermo Fisher Scientific, Inc. | 3.6 | % | |||||
Microsoft Corp. | 4.1 | % | Tokyo Steel Mfg. | 3.0 | % |
SUMMARY OF INDUSTRY EXPOSURE
As of 9/30/11
Energy | 14.4 | % | Banks | 4.6 | % | |||||
Software & Services | 13.9 | % | Health Care Equipment & Services | 4.4 | % | |||||
Diversified Financials | 9.8 | % | Insurance | 4.3 | % | |||||
Pharmaceuticals, Biotechnology & Life Sciences | 9.0 | % | Semiconductors & Semiconductor Equipment | 2.5 | % | |||||
Retailing | 8.8 | % | Consumer Services | 1.8 | % | |||||
Materials | 6.5 | % | Consumer Durables & Apparel | 0.8 | % | |||||
Technology Hardware & Equipment | 6.2 | % | Other Assets & Cash Equivalents | 2.5 | % | |||||
Telecommunication Services | 5.8 | % | ||||||||
Capital Goods | 4.7 | % |
| Shares/ Principal Amount | Value | |||||||
COMMON STOCK — 96.24% | ||||||||
BANKS — 4.54% | ||||||||
COMMERCIAL BANKS — 4.54% | ||||||||
aSterling Financial Corp. | 2,272,729 | $ | 28,136,385 | |||||
Turkiye Garanti Bankasi A.S. | 10,567,300 | 41,168,345 | ||||||
U.S. Bancorp | 3,801,758 | 89,493,383 | ||||||
|
| |||||||
| 158,798,113 | ||||||||
|
| |||||||
CAPITAL GOODS — 4.69% | ||||||||
INDUSTRIAL CONGLOMERATES — 3.86% | ||||||||
General Electric Co. | 8,851,600 | 134,898,384 | ||||||
MACHINERY — 0.83% | ||||||||
aOshkosh Corp. | 1,850,241 | 29,122,793 | ||||||
|
| |||||||
| 164,021,177 | ||||||||
|
| |||||||
CONSUMER DURABLES & APPAREL — 0.83% | ||||||||
HOUSEHOLD DURABLES — 0.83% | ||||||||
aPulte Group, Inc. | 7,364,100 | 29,088,195 | ||||||
|
| |||||||
| 29,088,195 | ||||||||
|
| |||||||
10 Certified Annual Report
| SCHEDULE OF INVESTMENTS, CONTINUED | ||
| Thornburg Value Fund | September 30, 2011 | |
| Shares/ Principal Amount | Value | |||||||
CONSUMER SERVICES — 1.84% | ||||||||
HOTELS, RESTAURANTS & LEISURE — 1.84% | ||||||||
aLife Time Fitness, Inc. | 1,746,636 | $ | 64,363,537 | |||||
|
| |||||||
| 64,363,537 | ||||||||
|
| |||||||
DIVERSIFIED FINANCIALS — 9.79% | ||||||||
CAPITAL MARKETS — 5.20% | ||||||||
AllianceBernstein Holding LP | 1,079,195 | 14,731,012 | ||||||
Charles Schwab Corp. | 6,284,700 | 70,828,569 | ||||||
Goldman Sachs Group, Inc. | 1,019,800 | 96,422,090 | ||||||
DIVERSIFIED FINANCIAL SERVICES — 4.59% | ||||||||
Bank of America Corp. | 13,382,100 | 81,898,452 | ||||||
JPMorgan Chase & Co. | 2,606,525 | 78,508,533 | ||||||
|
| |||||||
| 342,388,656 | ||||||||
|
| |||||||
ENERGY — 14.41% | ||||||||
ENERGY EQUIPMENT & SERVICES — 3.93% | ||||||||
Transocean Ltd. | 2,878,670 | 137,427,706 | ||||||
OIL, GAS & CONSUMABLE FUELS — 10.48% | ||||||||
Exxon Mobil Corp. | 2,039,500 | 148,128,885 | ||||||
Inpex Corp. | 27,060 | 169,804,745 | ||||||
aSandridge Energy, Inc. | 8,749,415 | 48,646,747 | ||||||
|
| |||||||
| 504,008,083 | ||||||||
|
| |||||||
HEALTH CARE EQUIPMENT & SERVICES — 4.42% | ||||||||
HEALTH CARE EQUIPMENT & SUPPLIES — 3.39% | ||||||||
aAlere, Inc. | 2,191,900 | 43,070,835 | ||||||
aVarian Medical Systems, Inc. | 1,449,090 | 75,584,534 | ||||||
HEALTH CARE PROVIDERS & SERVICES — 1.03% | ||||||||
aCommunity Health Systems, Inc. | 2,161,873 | 35,973,567 | ||||||
|
| |||||||
| 154,628,936 | ||||||||
|
| |||||||
INSURANCE — 4.32% | ||||||||
INSURANCE — 4.32% | ||||||||
aGenworth Financial, Inc. | 12,009,195 | 68,932,779 | ||||||
Hartford Financial Services Group, Inc. | 5,094,940 | 82,232,332 | ||||||
|
| |||||||
| 151,165,111 | ||||||||
|
| |||||||
MATERIALS — 5.73% | ||||||||
METALS & MINING — 5.73% | ||||||||
bTokyo Steel Mfg. | 10,800,400 | 103,901,164 | ||||||
United States Steel Corp. | 4,384,800 | 96,509,448 | ||||||
|
| |||||||
| 200,410,612 | ||||||||
|
| |||||||
PHARMACEUTICALS, BIOTECHNOLOGY & LIFE SCIENCES — 8.97% | ||||||||
BIOTECHNOLOGY — 5.32% | ||||||||
aGilead Sciences, Inc. | 4,797,905 | 186,158,714 | ||||||
LIFE SCIENCES TOOLS & SERVICES — 3.65% | ||||||||
aThermo Fisher Scientific, Inc. | 2,519,293 | 127,576,998 | ||||||
|
| |||||||
| 313,735,712 | ||||||||
|
| |||||||
Certified Annual Report 11
| SCHEDULE OF INVESTMENTS, CONTINUED | ||
| Thornburg Value Fund | September 30, 2011 | |
| Shares/ Principal Amount | Value | |||||||
RETAILING — 8.83% | ||||||||
SPECIALTY RETAIL — 8.83% | ||||||||
Best Buy Co., Inc. | 2,940,100 | $ | 68,504,330 | |||||
a,bOffice Depot, Inc. | 14,539,100 | 29,950,546 | ||||||
a,bOfficeMax, Inc. | 4,617,314 | 22,393,973 | ||||||
Staples, Inc. | 7,585,200 | 100,883,160 | ||||||
The Gap, Inc. | 5,349,500 | 86,875,880 | ||||||
|
| |||||||
| 308,607,889 | ||||||||
|
| |||||||
SEMICONDUCTORS & SEMICONDUCTOR EQUIPMENT — 2.48% | ||||||||
SEMICONDUCTORS & SEMICONDUCTOR EQUIPMENT — 2.48% | ||||||||
aMEMC Electronic Materials, Inc. | 10,926,751 | 57,256,175 | ||||||
aON Semiconductor Corp. | 4,126,527 | 29,587,199 | ||||||
|
| |||||||
| 86,843,374 | ||||||||
|
| |||||||
SOFTWARE & SERVICES — 13.89% | ||||||||
INFORMATION TECHNOLOGY SERVICES — 2.52% | ||||||||
aAmdocs Ltd. | 3,245,948 | 88,030,110 | ||||||
INTERNET SOFTWARE & SERVICES — 7.31% | ||||||||
aGoogle, Inc. | 326,789 | 168,093,726 | ||||||
aYahoo!, Inc. | 6,648,600 | 87,495,576 | ||||||
SOFTWARE — 4.06% | ||||||||
Microsoft Corp. | 5,702,400 | 141,932,736 | ||||||
|
| |||||||
| 485,552,148 | ||||||||
|
| |||||||
TECHNOLOGY HARDWARE & EQUIPMENT — 6.24% | ||||||||
COMPUTERS & PERIPHERALS — 5.65% | ||||||||
aDell, Inc. | 9,193,600 | 130,089,440 | ||||||
Hewlett-Packard Co. | 3,007,819 | 67,525,536 | ||||||
ELECTRONIC EQUIPMENT, INSTRUMENTS & COMPONENTS — 0.59% | ||||||||
Corning, Inc. | 1,650,735 | 20,403,085 | ||||||
|
| |||||||
| 218,018,061 | ||||||||
|
| |||||||
TELECOMMUNICATION SERVICES — 5.26% | ||||||||
DIVERSIFIED TELECOMMUNICATION SERVICES — 2.33% | ||||||||
aGlobal Crossing Ltd. | 936,677 | 22,395,947 | ||||||
aLevel 3 Communications, Inc. | 39,653,356 | 59,083,500 | ||||||
WIRELESS TELECOMMUNICATION SERVICES — 2.93% | ||||||||
KDDI Corp. | 14,762 | 102,585,660 | ||||||
|
| |||||||
| 184,065,107 | ||||||||
|
| |||||||
TOTAL COMMON STOCK (Cost $4,151,530,947) | 3,365,694,711 | |||||||
|
| |||||||
CONVERTIBLE BONDS — 1.26% | ||||||||
MATERIALS — 0.77% | ||||||||
METALS & MINING — 0.77% | ||||||||
Anglogold Holdings Ltd., 3.50%, 5/22/2014 | $ | 24,000,000 | 27,030,000 | |||||
|
| |||||||
| 27,030,000 | ||||||||
|
| |||||||
12 Certified Annual Report
| SCHEDULE OF INVESTMENTS, CONTINUED | ||
| Thornburg Value Fund | September 30, 2011 | |
| Shares/ Principal Amount | Value | |||||||
TELECOMMUNICATION SERVICES — 0.49% | ||||||||
DIVERSIFIED TELECOMMUNICATION SERVICES — 0.49% | ||||||||
Level 3 Communications, Inc., 6.50%, 10/1/2016 | $ | 12,049,000 | $ | 17,109,580 | ||||
|
| |||||||
| 17,109,580 | ||||||||
|
| |||||||
TOTAL CONVERTIBLE BONDS (Cost $36,045,468) | 44,139,580 | |||||||
|
| |||||||
SHORT TERM INVESTMENTS — 0.97% | ||||||||
Devon Energy Corp., 0.17%, 10/3/2011 | 33,700,000 | 33,699,682 | ||||||
|
| |||||||
TOTAL SHORT TERM INVESTMENTS (Cost $33,699,682) | 33,699,682 | |||||||
|
| |||||||
TOTAL INVESTMENTS — 98.47% (Cost $4,221,276,097) | $ | 3,443,533,973 | ||||||
OTHER ASSETS LESS LIABILITIES — 1.53% | 53,525,808 | |||||||
|
| |||||||
NET ASSETS — 100.00% | $ | 3,497,059,781 | ||||||
|
| |||||||
Footnote Legend
| a | Non-income producing. |
| b | Investment in Affiliates - Holdings of voting securities of each portfolio company which is considered “affiliated” to the Fund under the Investment Company Act of 1940 because the Fund’s holding represented 5% or more of the company’s voting securities during the period, are shown below: |
Issuer | Shares/Principal September 30, 2010 | Gross Additions | Gross Reductions | Shares/Principal September 30, 2011 | Market Value September 30, 2011 | Investment Income | ||||||||||||||||||
Office Depot, Inc.* | — | 14,539,100 | — | 14,539,100 | $ | 29,950,546 | $ | — | ||||||||||||||||
OfficeMax, Inc.* | — | 4,617,314 | — | 4,617,314 | 22,393,973 | — | ||||||||||||||||||
Tokyo Steel Mfg.* | 7,435,600 | 3,364,800 | — | 10,800,400 | 103,901,164 | 743,234 | ||||||||||||||||||
|
|
|
| |||||||||||||||||||||
Total non-controlled affiliated issuers – 4.47% of net assets |
| $ | 156,245,683 | $ | 743,234 | |||||||||||||||||||
|
|
|
| |||||||||||||||||||||
| * | Issuers not affiliated at September 30, 2010. |
See notes to financial statements.
Certified Annual Report 13
| STATEMENT OF ASSETS AND LIABILITIES | ||
| Thornburg Value Fund | September 30, 2011 | |
ASSETS | ||||
Investments at value | ||||
Non-affiliated issuers (cost $4,001,401,513) (Note 2) | $ | 3,287,288,290 | ||
Non-controlled affiliated issuers (cost $219,874,584) (Note 2) | 156,245,683 | |||
Cash | 606,261 | |||
Receivable for investments sold | 59,077,012 | |||
Receivable for fund shares sold | 5,634,983 | |||
Unrealized appreciation on forward currency contracts (Note 7) | 2,504,809 | |||
Dividends receivable | 6,914,007 | |||
Dividend and interest reclaim receivable | 713,230 | |||
Interest receivable | 692,396 | |||
Prepaid expenses and other assets | 76,739 | |||
|
| |||
Total Assets | 3,519,753,410 | |||
|
| |||
LIABILITIES | ||||
Payable for investments purchased | 8,903,137 | |||
Payable for fund shares redeemed | 9,490,774 | |||
Payable to investment advisor and other affiliates (Note 3) | 2,851,913 | |||
Accounts payable and accrued expenses | 1,429,550 | |||
Dividends payable | 18,255 | |||
|
| |||
Total Liabilities | 22,693,629 | |||
|
| |||
NET ASSETS | $ | 3,497,059,781 | ||
|
| |||
NET ASSETS CONSIST OF: | ||||
Undistributed net investment income | $ | 3,088,447 | ||
Net unrealized depreciation on investments and foreign currency translations | (775,176,685 | ) | ||
Accumulated net realized gain (loss) | (455,489,683 | ) | ||
Net capital paid in on shares of beneficial interest | 4,724,637,702 | |||
|
| |||
| $ | 3,497,059,781 | |||
|
| |||
14 Certified Annual Report
| STATEMENT OF ASSETS AND LIABILITIES, CONTINUED | ||||
| Thornburg Value Fund | September 30, 2011 | |||
NET ASSET VALUE: | ||||
Class A Shares: | ||||
Net asset value and redemption price per share ($825,699,569 applicable to 29,800,363 shares of beneficial interest outstanding - Note 4) | $ | 27.71 | ||
Maximum sales charge, 4.50% of offering price | 1.31 | |||
|
| |||
Maximum offering price per share | $ | 29.02 | ||
|
| |||
Class B Shares: | ||||
Net asset value and offering price per share* ($13,615,810 applicable to 523,950 shares of beneficial interest outstanding - Note 4) | $ | 25.99 | ||
|
| |||
Class C Shares: | ||||
Net asset value and offering price per share* ($253,064,767 applicable to 9,599,985 shares of beneficial interest | $ | 26.36 | ||
|
| |||
Class I Shares: | ||||
Net asset value, offering and redemption price per share ($1,968,180,938 applicable to 69,639,112 shares of beneficial interest outstanding - Note 4) | $ | 28.26 | ||
|
| |||
Class R3 Shares: | ||||
Net asset value, offering and redemption price per share ($169,234,432 applicable to 6,151,471 shares of beneficial interest outstanding - Note 4) | $ | 27.51 | ||
|
| |||
Class R4 Shares: | ||||
Net asset value, offering and redemption price per share ($51,899,904 applicable to 1,875,334 shares of beneficial interest outstanding - Note 4) | $ | 27.68 | ||
|
| |||
Class R5 Shares: | ||||
Net asset value, offering and redemption price per share ($215,364,361 applicable to 7,632,083 shares of beneficial interest outstanding - Note 4) | $ | 28.22 | ||
|
| |||
| * | Redemption price per share is equal to net asset value less any applicable contingent deferred sales charge. |
See notes to financial statements.
Certified Annual Report 15
| STATEMENT OF OPERATIONS | ||
| Thornburg Value Fund | Year Ended September 30, 2011 | |
INVESTMENT INCOME: | ||||
Dividend income | ||||
Non-affiliated issuers (net of foreign taxes withheld of $1,744,695) | $ | 46,896,491 | ||
Non-controlled affiliated issuers (net of foreign taxes withheld $55,943) | 743,234 | |||
Interest income | 4,694,579 | |||
|
| |||
Total Income | 52,334,304 | |||
|
| |||
EXPENSES: | ||||
Investment advisory fees (Note 3) | 32,389,033 | |||
Administration fees (Note 3) | ||||
Class A Shares | 1,419,889 | |||
Class B Shares | 25,784 | |||
Class C Shares | 422,560 | |||
Class I Shares | 1,194,405 | |||
Class R3 Shares | 274,944 | |||
Class R4 Shares | 77,759 | |||
Class R5 Shares | 131,224 | |||
Distribution and service fees (Note 3) | ||||
Class A Shares | 2,832,812 | |||
Class B Shares | 205,841 | |||
Class C Shares | 3,368,166 | |||
Class R3 Shares | 1,099,424 | |||
Class R4 Shares | 154,938 | |||
Transfer agent fees | ||||
Class A Shares | 1,519,365 | |||
Class B Shares | 44,908 | |||
Class C Shares | 457,718 | |||
Class I Shares | 2,212,235 | |||
Class R3 Shares | 536,155 | |||
Class R4 Shares | 179,101 | |||
Class R5 Shares | 688,317 | |||
Registration and filing fees | ||||
Class A Shares | 27,920 | |||
Class B Shares | 18,207 | |||
Class C Shares | 21,190 | |||
Class I Shares | 76,652 | |||
Class R3 Shares | 20,257 | |||
Class R4 Shares | 25,857 | |||
Class R5 Shares | 25,817 | |||
Custodian fees (Note 3) | 637,465 | |||
Professional fees | 115,480 | |||
Accounting fees | 147,927 | |||
Trustee fees | 102,673 | |||
Other expenses | 518,213 | |||
|
| |||
Total Expenses | 50,972,236 | |||
Less: | ||||
Expenses reimbursed by investment advisor (Note 3) | (1,053,512 | ) | ||
|
| |||
Net Expenses | 49,918,724 | |||
|
| |||
Net Investment Income | $ | 2,415,580 | ||
|
| |||
16 Certified Annual Report
| STATEMENT OF OPERATIONS, CONTINUED | ||
| Thornburg Value Fund | Year Ended September 30, 2011 | |
REALIZED AND UNREALIZED GAIN (LOSS) | ||||
Net realized gain (loss) from: | ||||
Investments | $ | 375,638,219 | ||
Forward currency contracts (Note 7) | (55,314,657 | ) | ||
Foreign currency transactions | 39,596 | |||
|
| |||
| 320,363,158 | ||||
|
| |||
Net change in unrealized appreciation (depreciation) on: | ||||
Investments | ||||
Non-affiliated issuers | (602,600,173 | ) | ||
Non-controlled affiliated issuers | (63,628,901 | ) | ||
Forward currency contracts (Note 7) | 18,261,676 | |||
Foreign currency translations | (14,536 | ) | ||
|
| |||
| (647,981,934 | ) | |||
|
| |||
Net Realized and Unrealized Loss | (327,618,776 | ) | ||
�� |
| |||
Net Decrease in Net Assets Resulting from Operations | $ | (325,203,196 | ) | |
|
|
See notes to financial statements.
Certified Annual Report 17
| STATEMENTS OF CHANGES IN NET ASSETS |
| Thornburg Value Fund |
| Year Ended September 30, 2011 | Year Ended September 30, 2010 | |||||||
INCREASE (DECREASE) IN NET ASSETS FROM | ||||||||
OPERATIONS: | ||||||||
Net investment income | $ | 2,415,580 | $ | 29,268,526 | ||||
Net realized gain (loss) on investments, forward currency contracts, and foreign currency transactions | 320,363,158 | 394,072,848 | ||||||
Net unrealized appreciation (depreciation) on investments, forward currency contracts and foreign currency translations | (647,981,934 | ) | (318,877,004 | ) | ||||
|
|
|
| |||||
Net Increase (Decrease) in Net Assets Resulting from Operations | (325,203,196 | ) | 104,464,370 | |||||
DIVIDENDS TO SHAREHOLDERS: | ||||||||
From net investment income | ||||||||
Class A Shares | — | (7,120,379 | ) | |||||
Class B Shares | — | (57,103 | ) | |||||
Class C Shares | — | (815,194 | ) | |||||
Class I Shares | (1,083,639 | ) | (17,633,649 | ) | ||||
Class R3 Shares | — | (1,025,249 | ) | |||||
Class R4 Shares | — | (339,423 | ) | |||||
Class R5 Shares | (98,243 | ) | (1,893,225 | ) | ||||
FUND SHARE TRANSACTIONS (NOTE 4): | ||||||||
Class A Shares | (245,975,542 | ) | (100,540,665 | ) | ||||
Class B Shares | (7,564,011 | ) | (17,635,969 | ) | ||||
Class C Shares | (53,791,108 | ) | (40,055,751 | ) | ||||
Class I Shares | 80,664,857 | 479,233,524 | ||||||
Class R3 Shares | (14,721,836 | ) | 34,129,445 | |||||
Class R4 Shares | 3,094,266 | 10,529,029 | ||||||
Class R5 Shares | 7,376,378 | 60,623,632 | ||||||
|
|
|
| |||||
Net Increase (Decrease) in Net Assets | (557,302,074 | ) | 501,863,393 | |||||
NET ASSETS: | ||||||||
Beginning of Year | 4,054,361,855 | 3,552,498,462 | ||||||
|
|
|
| |||||
End of Year | $ | 3,497,059,781 | $ | 4,054,361,855 | ||||
|
|
|
| |||||
Undistributed net investment income | $ | 3,088,447 | $ | 1,815,153 | ||||
See notes to financial statements.
18 Certified Annual Report
| NOTES TO FINANCIAL STATEMENTS | ||
| Thornburg Value Fund | September 30, 2011 | |
NOTE 1 – ORGANIZATION
Thornburg Value Fund, hereinafter referred to as the “Fund,” is a diversified series of Thornburg Investment Trust (the “Trust”). The Trust is organized as a Massachusetts business trust under a Declaration of Trust dated June 3, 1987 and is registered as a diversified, open-end management investment company under the Investment Company Act of 1940, as amended. The Fund is currently one of sixteen separate series of the Trust. Each series is considered to be a separate entity for financial reporting and tax purposes and bears expenses directly attributable to it. The Fund seeks long-term capital appreciation by investing in equity and debt securities of all types. As a secondary objective, the Fund also seeks some current income.
The Fund currently has seven classes of shares of beneficial interest outstanding: Class A, Class B, Class C, Institutional Class (Class I), and Retirement Classes (Class R3, Class R4, and Class R5). The Fund no longer offers Class B shares for sale. Each class of shares of the Fund represents an interest in the same portfolio of investments, except that (i) Class A shares are sold subject to a front-end sales charge collected at the time the shares are purchased and bear a service fee, (ii) Class B shares are sold at net asset value without a sales charge at the time of purchase, but are subject to a contingent deferred sales charge upon redemption and bear both a service fee and distribution fee, (iii) Class C shares are sold at net asset value without a sales charge at the time of purchase, but are subject to a contingent deferred sales charge upon redemption within one year of purchase, and bear both a service fee and a distribution fee, (iv) Class I shares are sold at net asset value without a sales charge at the time of purchase, (v) Class R3 shares are sold at net asset value without a sales charge at the time of purchase, but bear both a service fee and distribution fee, (vi) Class R4 shares are sold at net asset value without a sales charge at the time of purchase, but bear a service fee, (vii) Class R5 shares are sold at net asset value without a sales charge at the time of purchase, and (viii) the respective classes may have different reinvestment privileges and conversion rights. Additionally, the Fund may allocate among its classes certain expenses, to the extent allowable to specific classes, including transfer agent fees, government registration fees, certain printing and postage costs, and administrative and legal expenses. Currently, class specific expenses of the Fund are limited to service and distribution fees, administration fees, and certain registration and transfer agent expenses. Class B shares of the Fund outstanding for eight years will convert to Class A shares of the Fund.
NOTE 2 – SIGNIFICANT ACCOUNTING POLICIES
Significant accounting policies of the Trust are as follows:
Valuation of Investments: Portfolio securities listed or traded on a national securities exchange are valued on the valuation date at the last reported sale price on the exchange that is the primary market for the security. Portfolio securities traded on an exchange for which there has been no sale that day and other equity securities traded in the over-the-counter market are valued at the mean between the last reported bid and asked prices. Portfolio securities reported by NASDAQ are valued at the NASDAQ official closing price. Any foreign security traded on exchanges outside the United States is valued at the price of the security on the exchange that is normally the security’s primary market, as of the close of that exchange preceding the time of the Fund’s valuation.
Debt obligations held by the Fund have a primary market over the counter and are valued by an independent pricing service approved by the Trustees of the Trust. The pricing service ordinarily values debt obligations at quoted bid prices. When quotations are not available, debt obligations held by the Fund are valued at evaluated prices determined by the pricing service using methods which include consideration of yields or prices of debt obligations of comparable quality, type of issue, coupon, maturity and rating, and indications as to value from dealers and general market conditions. Short-term obligations having remaining maturities of 60 days or less are ordinarily valued at amortized cost, which approximates market value.
Quotations in foreign currencies for foreign portfolio investments are converted to U.S. dollar equivalents using the foreign exchange quotation in effect at the time of valuation.
In any case where the market value of an equity security held by the Fund is not readily available, the Trust’s valuation and pricing committee determines a fair value for the security using procedures approved by the Trustees, which may include the use of a price obtained from an independent pricing service. The pricing service ordinarily values equity securities in these instances using multi-factor models to adjust market prices based upon various inputs, including exchange data, depository receipt prices, futures and index data and other data. A security’s market value is deemed not readily available whenever the exchange or market on which the security is primarily traded is closed for the entire scheduled day of trading. Additionally, a security’s market value may be deemed not readily available under other circumstances identified by the Trustees, including when developments occurring after the most recent close of
Certified Annual Report 19
| NOTES TO FINANCIAL STATEMENTS, CONTINUED | ||
| Thornburg Value Fund | September 30, 2011 | |
the security’s primary exchange or market, but before the most recent close of trading in Fund shares, or an unusual event or significant period of time occurring since the availability of a market quotation, create a question about the reliability of the security’s market value.
In any case where a pricing service fails to provide a price for a debt obligation held by the Fund, the valuation and pricing committee determines a fair value for the debt obligation using procedures approved by the Trustees. Additionally, in any case where management believes that a price provided by a pricing service for a debt obligation held by the Fund may be unreliable, the valuation and pricing committee decides whether or not to use the pricing service’s valuation or to determine a fair value for the debt obligation.
In determining fair value for any portfolio security or other investment, the valuation and pricing committee seeks to determine the amount that an owner of the investment might reasonably expect to receive upon a sale of the investment. However, because fair value prices are estimated prices, the valuation and pricing committee’s determination of fair value for an investment may differ from the value that would be realized by the Fund upon a sale of the investment, and that difference could be material to the Fund’s financial statements. The valuation and pricing committee’s determination of fair value for an investment may also differ from the prices obtained by other persons (including other mutual funds) for the investment.
Valuation Measurements: Various inputs are used in determining the value of the Fund’s investments. These inputs are summarized in the three levels listed below:
Level 1: Quoted prices in active markets for identical investments.
Level 2: Other significant observable inputs (including quoted prices for similar investments, interest rates, prepayment rates, credit risk, etc.).
Level 3: Significant unobservable inputs (including the Fund’s own assumptions in determining the fair value of investments).
The following table displays a summary of the inputs used to value the Fund’s net assets as of September 30, 2011. In any instance when valuation inputs from more than one level are used to determine the fair value of a specific investment, the investment is placed in the level of the table based upon the lowest level input that is significant in determining the fair value of the investment:
| Fair Value Measurements at September 30, 2011 | ||||||||||||||||
| Total | Level 1 | Level 2 | Level 3 | |||||||||||||
Assets | ||||||||||||||||
Investments in Securities* | ||||||||||||||||
Common Stock | $ | 3,365,694,711 | $ | 3,365,694,711 | $ | — | $ | — | ||||||||
Convertible Bonds | 44,139,580 | — | 44,139,580 | — | ||||||||||||
Short Term Investments | 33,699,682 | — | 33,699,682 | — | ||||||||||||
|
|
|
|
|
|
|
| |||||||||
Total Investments in Securities | $ | 3,443,533,973 | $ | 3,365,694,711 | $ | 77,839,262 | $ | — | ||||||||
Other Financial Instruments** | ||||||||||||||||
Forward Currency Contracts | $ | 2,504,809 | $ | — | $ | 2,504,809 | $ | — | ||||||||
Spot Currency | $ | 44,548 | $ | 44,548 | $ | — | $ | — | ||||||||
| * | See Schedule of Investments for a summary of the industry exposure as grouped according to the Global Industry Classification Standard (GICS), which is an industry taxonomy developed by MSCI, Inc. and Standard & Poor’s (S&P). |
| ** | Other Financial Instruments include investments not reflected in the Schedule of Investments, such as futures, forwards and swap contracts, which are valued at the unrealized appreciation (depreciation) on the investment. |
20 Certified Annual Report
| NOTES TO FINANCIAL STATEMENTS, CONTINUED | ||
| Thornburg Value Fund | September 30, 2011 | |
A rollforward of fair value measurements using significant unobservable inputs (Level 3) for the year ended September 30, 2011, is as follows:
Beginning Balance 9/30/2010 | $ | 30,000,000 | ||
Accrued Discounts (Premiums) | — | |||
Net Realized Gain (Loss) | — | |||
Gross Purchases | — | |||
Gross Sales | — | |||
Change in Unrealized Appreciation (Depreciation) | — | |||
Transfers into Level 3(a) | — | |||
Transfers out of Level 3(a) | (30,000,000 | ) | ||
|
| |||
Ending Balance 9/30/2011(b) | $ | — |
| (a) | Transfers out of Level 3 were to Level 1, and were due to the availability of changes in quoted prices in active markets for identical investments during the year ended September 30, 2011. Transfers into or out of Level 3 are based on the beginning market value of the period in which they occurred. |
| (b) | Level 3 Securities represent 0.00% of Total Net Assets at September 30, 2011. |
Other Notes: It is the policy of the Fund to recognize significant transfers between Levels 1, 2 and 3 and to disclose those transfers at the beginning of the reporting period. The Fund recognized no significant transfers between Levels 1 and 2 for the year ended September 30, 2011.
Foreign Currency Translation: Portfolio securities and other assets and liabilities denominated in foreign currencies are translated into U.S. dollars based on the exchange rate of such currencies against the U.S. dollar on the date of valuation. Purchases and sales of securities and income items denominated in foreign currencies are translated into U.S. dollars at the exchange rate in effect on the translation date. When the Fund purchases or sells foreign securities, it will customarily enter into a foreign exchange contract to minimize foreign exchange risk from the trade date to the settlement date of such transactions. Such spot contracts are included in Receivable for investments sold and Payable for investments purchased on the Statement of Assets and Liabilities.
The Fund does not separately report the effect of changes in foreign exchange rates from changes in market prices on securities held. Such changes are included in net realized and unrealized gain or loss from investments.
Reported net realized foreign exchange gains or losses arise from purchases and sales of foreign currencies, currency gains or losses realized between the trade and settlement dates on securities transactions and the difference between the amounts of dividends, interest, and foreign withholding taxes recorded on the Fund’s books, and the U.S. dollar equivalent of the amounts actually received or paid.
Net unrealized foreign exchange gains and losses arise from changes in the fair value of assets and liabilities, other than investments in securities at fiscal period end, resulting from changes in exchange rates.
Federal Income Taxes: It is the policy of the Trust to comply with the provisions of the Internal Revenue Code applicable to “regulated investment companies,” and to distribute to shareholders substantially all taxable income, including any net realized gain on investments of the Fund. Therefore, no provision for federal income taxes is required.
Management reviews each uncertain tax position believed to be material to the preparation of the Fund’s financial statements, to assess if it is more likely than not that the position would be sustained upon examination, based upon the technical merits of the position. As of September 30, 2011, management has not identified any such position for which a liability must be reflected in the Statement of Assets and Liabilities. The Fund’s tax returns remain subject to examination for three years after filing.
When-Issued and Delayed Delivery Transactions: The Fund may engage in when-issued or delayed delivery transactions. To the extent the Fund engages in such transactions, it will do so for the purpose of acquiring portfolio securities consistent with the Fund’s
Certified Annual Report 21
| NOTES TO FINANCIAL STATEMENTS, CONTINUED | ||
| Thornburg Value Fund | September 30, 2011 | |
investment objectives and not for the purpose of investment leverage or to speculate on interest rate and/or market changes. At the time the Fund makes a commitment to purchase a security on a when-issued or delayed delivery basis, the Fund will record the transaction and reflect the value in determining its net asset value. When effecting such transactions, assets of an amount sufficient to make payment for the portfolio securities to be purchased will be segregated on the Fund’s records on the trade date. Securities purchased on a when-issued or delayed delivery basis do not earn interest until the settlement date.
Dividends: Dividends to shareholders, if any, are generally paid quarterly and are reinvested in additional shares of the Fund at net asset value per share at the close of business on the dividend payment date or, at the shareholder’s option, paid in cash. Net realized capital gains, to the extent available, will be distributed at least annually. Distributions to shareholders are based on income tax regulations and therefore, their characteristics may differ for financial statement and tax purposes.
General: Securities transactions are accounted for on a trade date basis. Interest income is accrued as earned and dividend income is recorded on the ex-dividend date. Certain income from foreign securities is recognized as soon as information is available to the Fund. Realized gains and losses from the sale of securities are recorded on an identified cost basis. Net investment income (other than class specific expenses) and realized and unrealized gains and losses are allocated daily to each class of shares based upon the relative net asset value of outstanding shares of each class of shares at the beginning of the day (after adjusting for the current share activity of the respective class). Expenses common to all Funds are allocated among the Funds comprising the Trust based upon their relative net asset values or other appropriate allocation methods.
Guarantees and Indemnifications: Under the Trust’s organizational documents, its officers and Trustees are indemnified against certain liabilities arising out of the performance of their duties to the Fund. Additionally, in the normal course of business the Trust enters into contracts with service providers that contain general indemnification clauses. The Trust’s maximum exposure under these arrangements is unknown. However, based on experience, the Trust expects the risk of loss to be remote.
Use of Estimates: The preparation of financial statements, in conformity with generally accepted accounting principles, requires management to make estimates and assumptions that affect the reported amounts of assets and liabilities and the disclosure of contingent assets and liabilities at the date of the financial statements and the reported amounts of increases and decreases in net assets from operations during the reporting period. Actual results could differ from those estimates.
NOTE 3 – INVESTMENT ADVISORY FEE AND OTHER TRANSACTIONS WITH AFFILIATES
Pursuant to an investment advisory agreement, Thornburg Investment Management, Inc. (the “Advisor”) serves as the investment advisor and performs services to the Fund for which the fees are payable at the end of each month. For the year ended September 30, 2011, these fees were payable at annual rates ranging from .875 of 1% to .675 of 1% per annum of the average daily net assets of the Fund depending on the Fund’s asset size. The Trust also has entered into administrative services agreements with the Advisor, whereby the Advisor will perform certain administrative services for the shareholders of each class of the Fund’s shares, and for which fees will be payable at an annual rate of up to .125 of 1% per annum of the average daily net assets attributable to each class of shares. For the year ended September 30, 2011, the Advisor contractually reimbursed certain class specific expenses, administrative fees, and distribution fees of $646,447 for Class R3 shares, $137,193 for Class R4 Shares, and $269,872 for Class R5 shares.
The Trust has an underwriting agreement with Thornburg Securities Corporation (the “Distributor,” an affiliate of the Advisor), which acts as the distributor of the Fund’s shares. For the year ended September 30, 2011, the Distributor has advised the Fund that it earned net commissions aggregating $44,033 from the sale of Class A shares, and collected contingent deferred sales charges aggregating $14,520 from redemptions of Class C shares of the Fund.
Pursuant to a service plan under Rule 12b-1 of the Investment Company Act of 1940, the Fund may reimburse to the Advisor an amount not to exceed .25 of 1% per annum of the average daily net assets attributable to each class of shares of the Fund for payments made by the Advisor to securities dealers and other financial institutions to obtain various shareholder and distribution related services. For the year ended September 30, 2011, there were no 12b-1 service plan fees charged for Class I and R5 shares. The Advisor may pay out of its own resources additional expenses for distribution of the Fund’s shares.
The Trust has also adopted distribution plans pursuant to Rule 12b-1, applicable only to the Fund’s Class B, Class C, and Class R3 shares, under which the Fund compensates the Distributor for services in promoting the sale of Class B, Class C, and Class R3 shares
22 Certified Annual Report
| NOTES TO FINANCIAL STATEMENTS, CONTINUED | ||
| Thornburg Value Fund | September 30, 2011 | |
of the Fund at an annual rate of up to .75 of 1% per annum of the average daily net assets attributable to Class B and Class C shares, and an annual rate of up to .25 of 1% per annum of the average daily net assets attributable to Class R3 shares. Total fees incurred by the Distributor for each class of shares of the Fund under their respective Service and Distribution Plans for the year ended September 30, 2011, are set forth in the Statement of Operations.
The Trust has an agreement with the custodian bank to indirectly pay a portion of the custodian’s fees through credits earned by the Fund’s cash on deposit with the bank. This deposit agreement is an alternative to overnight investments. Custodial fees have been adjusted to reflect amounts that would have been paid without this agreement, with a corresponding adjustment reflected as fees paid indirectly in the Statement of Operations. For the year ended September 30, 2011, there were no custodial fees paid indirectly.
Certain officers and Trustees of the Trust are also officers or directors of the Advisor and Distributor. The compensation of independent Trustees is borne by the Trust.
NOTE 4 – SHARES OF BENEFICIAL INTEREST
At September 30, 2011, there were an unlimited number of shares of beneficial interest authorized. Transactions in shares of beneficial interest were as follows:
| Year Ended September 30, 2011 | Year Ended September 30, 2010 | |||||||||||||||
| Shares | Amount | Shares | Amount | |||||||||||||
Class A Shares | ||||||||||||||||
Shares sold | 3,820,004 | $ | 131,182,658 | 8,919,655 | $ | 275,295,386 | ||||||||||
Shares issued to shareholders inreinvestment of dividends | — | — | 185,067 | 5,782,360 | ||||||||||||
Shares repurchased | (11,195,671 | ) | (377,165,665 | ) | (12,535,727 | ) | (381,632,085 | ) | ||||||||
Redemption fees received* | — | 7,465 | — | 13,674 | ||||||||||||
|
|
|
|
|
|
|
| |||||||||
Net increase (decrease) | (7,375,667 | ) | $ | (245,975,542 | ) | (3,431,005 | ) | $ | (100,540,665 | ) | ||||||
|
|
|
|
|
|
|
| |||||||||
Class B Shares | ||||||||||||||||
Shares sold | 22,294 | $ | 708,643 | 33,963 | $ | 1,007,852 | ||||||||||
Shares issued to shareholders inreinvestment of dividends | — | — | 1,560 | 46,442 | ||||||||||||
Shares repurchased | (263,171 | ) | (8,272,792 | ) | (640,143 | ) | (18,690,579 | ) | ||||||||
Redemption fees received* | — | 138 | — | 316 | ||||||||||||
|
|
|
|
|
|
|
| |||||||||
Net increase (decrease) | (240,877 | ) | $ | (7,564,011 | ) | (604,620 | ) | $ | (17,635,969 | ) | ||||||
|
|
|
|
|
|
|
| |||||||||
Class C Shares | ||||||||||||||||
Shares sold | 636,748 | $ | 21,058,206 | 1,160,118 | $ | 34,417,962 | ||||||||||
Shares issued to shareholders inreinvestment of dividends | — | — | 23,192 | 698,534 | ||||||||||||
Shares repurchased | (2,338,535 | ) | (74,851,535 | ) | (2,561,879 | ) | (75,176,179 | ) | ||||||||
Redemption fees received* | — | 2,221 | — | 3,932 | ||||||||||||
|
|
|
|
|
|
|
| |||||||||
Net increase (decrease) | (1,701,787 | ) | $ | (53,791,108 | ) | (1,378,569 | ) | $ | (40,055,751 | ) | ||||||
|
|
|
|
|
|
|
| |||||||||
Class I Shares | ||||||||||||||||
Shares sold | 24,496,289 | $ | 847,217,485 | 33,481,948 | $ | 1,049,288,699 | ||||||||||
Shares issued to shareholders inreinvestment of dividends | 22,978 | 860,513 | 436,183 | 13,744,602 | ||||||||||||
Shares repurchased | (22,329,324 | ) | (767,428,563 | ) | (18,718,597 | ) | (583,820,763 | ) | ||||||||
Redemption fees received* | — | 15,422 | — | 20,986 | ||||||||||||
|
|
|
|
|
|
|
| |||||||||
Net increase (decrease) | 2,189,943 | $ | 80,664,857 | 15,199,534 | $ | 479,233,524 | ||||||||||
|
|
|
|
|
|
|
| |||||||||
Certified Annual Report 23
| NOTES TO FINANCIAL STATEMENTS, CONTINUED | ||
| Thornburg Value Fund | September 30, 2011 | |
| Year Ended September 30, 2011 | Year Ended September 30, 2010 | |||||||||||||||
| Shares | Amount | Shares | Amount | |||||||||||||
Class R3 Shares | ||||||||||||||||
Shares sold | 1,565,821 | $ | 52,864,246 | 3,017,720 | $ | 92,556,011 | ||||||||||
Shares issued to shareholders in reinvestment of dividends | — | — | 31,966 | 989,285 | ||||||||||||
Shares repurchased | (2,039,207 | ) | (67,587,509 | ) | (1,927,763 | ) | (59,417,965 | ) | ||||||||
Redemption fees received* | — | 1,427 | — | 2,114 | ||||||||||||
|
|
|
|
|
|
|
| |||||||||
Net increase (decrease) | (473,386 | ) | $ | (14,721,836 | ) | 1,121,923 | $ | 34,129,445 | ||||||||
|
|
|
|
|
|
|
| |||||||||
Class R4 Shares | ||||||||||||||||
Shares sold | 739,587 | $ | 25,201,045 | 1,194,182 | $ | 37,191,449 | ||||||||||
Shares issued to shareholders in reinvestment of dividends | — | — | 9,282 | 288,552 | ||||||||||||
Shares repurchased | (656,134 | ) | (22,107,183 | ) | (898,513 | ) | (26,951,640 | ) | ||||||||
Redemption fees received* | — | 404 | — | 668 | ||||||||||||
|
|
|
|
|
|
|
| |||||||||
Net increase (decrease) | 83,453 | $ | 3,094,266 | 304,951 | $ | 10,529,029 | ||||||||||
|
|
|
|
|
|
|
| |||||||||
Class R5 Shares | ||||||||||||||||
Shares sold | 2,401,766 | $ | 83,473,333 | 3,281,252 | $ | 103,225,130 | ||||||||||
Shares issued to shareholders in reinvestment of dividends | 2,591 | 96,926 | 59,336 | 1,869,704 | ||||||||||||
Shares repurchased | (2,171,290 | ) | (76,195,579 | ) | (1,440,353 | ) | (44,473,586 | ) | ||||||||
Redemption fees received* | — | 1,698 | — | 2,384 | ||||||||||||
|
|
|
|
|
|
|
| |||||||||
Net increase (decrease) | 233,067 | $ | 7,376,378 | 1,900,235 | $ | 60,623,632 | ||||||||||
|
|
|
|
|
|
|
| |||||||||
| * | The Fund charges a redemption fee of 1% of the Class A and Class I shares redeemed or exchanged within 30 days of purchase. Redemption fees charged to any class are allocated to all classes upon receipt of payment based on relative net asset values of each class or other appropriate allocation methods. |
NOTE 5 – SECURITIES TRANSACTIONS
For the year ended September 30, 2011, the Fund had purchase and sale transactions of investment securities (excluding short-term investments) of $2,779,284,397 and $3,104,885,271, respectively.
NOTE 6 – INCOME TAXES
At September 30, 2011, information on the tax components of capital is as follows:
Cost of investments for tax purposes | $ | 4,226,036,420 | ||
|
| |||
Gross unrealized appreciation on a tax basis | $ | 157,711,254 | ||
Gross unrealized depreciation on a tax basis | (940,213,701 | ) | ||
|
| |||
Net unrealized appreciation (depreciation) on investments (tax basis) | $ | (782,502,447 | ) | |
|
| |||
Distributable earnings – ordinary income (tax basis) | $ | 1,643,590 |
The Fund utilized $322,841,509 of capital loss carryforwards for the year ended September 30, 2011.
24 Certified Annual Report
| NOTES TO FINANCIAL STATEMENTS, CONTINUED | ||
| Thornburg Value Fund | September 30, 2011 | |
At September 30, 2011, the Fund had tax basis capital losses, which may be carried forward to offset future capital gains. To the extent such carryforwards are used, capital gain distributions may be reduced to the extent provided by regulations.
Such capital loss carryforwards expire as follows:
2017 | $ | 204,425,697 | ||
2018 | 242,353,997 | |||
|
| |||
| $ | 446,779,694 | |||
|
|
The Regulated Investment Company Modernization Act of 2010 (the “Act”) was signed into law on December 22, 2010. The Act makes changes to a number of tax rules impacting the Fund. Under the Act, future capital losses generated by the Fund may be carried over indefinitely, but these losses must be used prior to the utilization of any pre-enactment capital losses. Since pre-enactment capital losses may only be carried forward for eight years, there may be a greater likelihood that all or a portion of a Fund’s pre-enactment capital losses will expire unused. In general, the provisions of the Act will be effective for the Fund’s fiscal year ending September 30, 2012.
In order to account for permanent book/tax differences, the Fund increased undistributed net investment income by $39,596 and increased accumulated net realized loss by $39,596. This reclassification has no impact on the net asset value of the Fund. Reclassifications result primarily from foreign currency gains.
The tax character of distributions paid for the years ended September 30, 2011, and September 30, 2010, was as follows:
| 2011 | 2010 | |||||||
Distributions from: | ||||||||
Ordinary income | $ | 1,181,882 | $ | 28,884,222 | ||||
Capital gains | — | — | ||||||
|
|
|
| |||||
Total Distributions | $ | 1,181,882 | $ | 28,884,222 | ||||
|
|
|
| |||||
NOTE 7 – DERIVATIVE FINANCIAL INSTRUMENTS WITH OFF-BALANCE SHEET RISK AND FOREIGN INVESTMENT RISK
The Fund may use a variety of derivative financial instruments to hedge or adjust the risks affecting its investment portfolio or to enhance investment returns. Provisions of FASB Accounting Standards Codification ASC 815-10-50 (“ASC 815”), require certain disclosures. The disclosures are intended to provide users of financial statements with an understanding of the use of derivative instruments by the Fund and how these derivatives affect the financial position, financial performance and cash flows of the Fund. The Fund does not designate any derivative instruments as hedging instruments under ASC 815. During the year ended September 30, 2011, the Fund’s principal exposure to derivative financial instruments of the type addressed by ASC 815 was investment in foreign exchange contracts. A foreign exchange contract is an agreement between two parties to exchange different currencies at a specified rate of exchange at an agreed upon future date. Foreign exchange contracts involve risks to the Fund, including the risk that a contract counterparty will not meet its obligations to the Fund, the risk that a change in a contract’s value may not correlate perfectly with the currency the contract was intended to track, and the risk that the Fund’s advisor is unable to correctly implement its strategy in using a contract. In any such instance, the Fund may not achieve the intended benefit of entering into a contract, and may experience a loss. Additionally, the Fund’s risk of loss may exceed the amounts recognized on the Statement of Assets and Liabilities.
The Fund entered into forward currency contracts during the year ended September 30, 2011 in the normal course of pursuing its investment objectives, in anticipation of purchasing foreign investments or with the intent of reducing the risk to the value of the Fund’s foreign investments from adverse changes in the relationship between the U.S. dollar and foreign currencies. In each case these contracts have been initiated in conjunction with foreign investment transactions.
These contracts are accounted for by the Fund under ASC 815. Unrealized gains and unrealized losses on outstanding contracts are reported in the Fund’s Statement of Assets and Liabilities at the Fund’s net equity, as measured by the difference between the forward
Certified Annual Report 25
| NOTES TO FINANCIAL STATEMENTS, CONTINUED | ||
| Thornburg Value Fund | September 30, 2011 | |
exchange rates at the reporting date and the forward exchange rates at each contract’s inception date. Net realized gain (loss) on contracts closed during the period, and changes in net unrealized appreciation (depreciation) on outstanding contracts are recognized in the Fund’s Statement of Operations. Values of open currency contracts are indicative of the activity for the year ended September 30, 2011.
The following table displays the outstanding forward currency contracts at September 30, 2011:
Outstanding Forward Currency Contracts
to Buy or Sell at September 30, 2011
Contract Description | Buy/Sell | Contract Amount | Contract Value Date | Value USD | Unrealized Appreciation | Unrealized Depreciation | ||||||||||||||||
Japanese Yen | Sell | 28,575,004,400 | 02/28/2012 | 371,356,982 | $ | 2,504,809 | $ | — | ||||||||||||||
|
|
|
| |||||||||||||||||||
Total | $ | 2,504,809 | $ | — | ||||||||||||||||||
|
|
|
| |||||||||||||||||||
The unrealized appreciation (depreciation) of the outstanding forward currency contracts recognized in the Fund’s Statement of Assets and Liabilities at September 30, 2011 is disclosed in the following table:
Fair Values of Derivative Financial Instruments
at September 30, 2011
Asset Derivatives | Balance Sheet Location | Fair Value | ||||
Foreign exchange contracts | Assets - Unrealized appreciation on forward currency contracts | $ | 2,504,809 | |||
The realized gains (losses) from forward currency contracts, and the change in unrealized appreciation (depreciation) of outstanding forward currency contracts recognized in the Fund’s Statement of Operations for the year ended September 30, 2011 are disclosed in the following tables:
Amount of Realized Gain (Loss)
on Derivative Financial Instruments Recognized in
Income for the Year Ended September 30, 2011
| Total | Forward Currency Contracts | |||||||
Foreign exchange contracts | $ | (55,314,657 | ) | $ | (55,314,657 | ) | ||
Change in Unrealized Appreciation (Depreciation)
of Derivative Financial Instruments Recognized in
Income for the Year Ended September 30, 2011
| Total | Forward Currency Contracts | |||||||
Foreign exchange contracts | $ | 18,261,676 | $ | 18,261,676 | ||||
OTHER NOTES:
Risks: The Fund’s investments subject it to risks including, but not limited to, management risk, market and economic risk, risks affecting specific issuers, liquidity risk, the risks associated with investments in smaller companies and non-U.S. issuers, credit risk, and interest rate risk. Please see the Fund’s prospectus for a discussion of the risks associated with an investment in the Fund.
Subsequent Events: Fund management believes no events have occurred between September 30, 2011 and the date of issuance of the financial statements, which require adjustment to, or disclosure in the accompanying financial statements.
26 Certified Annual Report
This page intentionally left blank
Certified Annual Report 27
Thornburg Value Fund
| PER SHARE PERFORMANCE (for a share outstanding throughout the Year)+ | RATIOS TO AVERAGE NET ASSETS | SUPPLEMENTAL DATA | ||||||||||||||||||||||||||||||||||||||||||||||||||||||||
Unless | Net Asset Value Beginning of Year | Net Investment Income (Loss) | Net Realized & Unrealized Gain (Loss) on Investments | Total from Investment Operations | Dividends from Net Investment Income | Dividends from Net Realized Gains | Total Dividends | Net | Net Investment Income (Loss) (%) | Expenses, After Expense Reductions (%) | Expenses, After Expense Reductions and Net of Custody Credits (%) | Expenses, Before Expense Reductions (%) | Total Return (%)(a) | Portfolio Turnover Rate (%) | Net Assets at End of Year (Thousands) | |||||||||||||||||||||||||||||||||||||||||||
Class A Shares |
| |||||||||||||||||||||||||||||||||||||||||||||||||||||||||
2011(b) | $ | 30.44 | (0.03 | ) | (2.70 | ) | (2.73 | ) | — | — | — | $27.71 | (0.10 | ) | 1.28 | 1.28 | 1.28 | (8.97 | ) | 64.14 | $ | 825,700 | ||||||||||||||||||||||||||||||||||||
2010(b) | $ | 29.66 | 0.20 | 0.76 | 0.96 | (0.18 | ) | — | (0.18 | ) | $30.44 | 0.65 | 1.31 | 1.31 | 1.31 | 3.21 | 72.75 | $ | 1,131,594 | |||||||||||||||||||||||||||||||||||||||
2009(b) | $ | 28.02 | 0.37 | 1.67 | 2.04 | (0.40 | ) | — | (0.40 | ) | $29.66 | 1.58 | 1.34 | 1.34 | 1.34 | 7.65 | 83.00 | $ | 1,204,450 | |||||||||||||||||||||||||||||||||||||||
2008(b) | $ | 44.17 | 0.18 | (12.26 | ) | (12.08 | ) | (0.14 | ) | (3.93 | ) | (4.07 | ) | $28.02 | 0.52 | 1.27 | 1.27 | 1.27 | (29.52 | ) | 70.65 | $ | 1,088,766 | |||||||||||||||||||||||||||||||||||
2007(b) | $ | 37.59 | 0.29 | 7.86 | 8.15 | (0.27 | ) | (1.30 | ) | (1.57 | ) | $44.17 | 0.70 | 1.27 | 1.27 | 1.27 | 22.23 | 79.29 | $ | 1,599,976 | ||||||||||||||||||||||||||||||||||||||
Class B Shares |
| |||||||||||||||||||||||||||||||||||||||||||||||||||||||||
2011 | $ | 28.81 | (0.33 | ) | (2.49 | ) | (2.82 | ) | — | — | — | $25.99 | (1.03 | ) | 2.19 | 2.19 | 2.19 | (9.79 | ) | 64.14 | $ | 13,616 | ||||||||||||||||||||||||||||||||||||
2010 | $ | 28.21 | (0.04 | ) | 0.69 | 0.65 | (0.05 | ) | — | (0.05 | ) | $28.81 | (0.13 | ) | 2.18 | 2.18 | 2.18 | 2.29 | 72.75 | $ | 22,036 | |||||||||||||||||||||||||||||||||||||
2009 | $ | 26.66 | 0.16 | 1.58 | 1.74 | (0.19 | ) | — | (0.19 | ) | $28.21 | 0.74 | 2.22 | 2.22 | 2.22 | 6.72 | 83.00 | $ | 38,630 | |||||||||||||||||||||||||||||||||||||||
2008 | $ | 42.36 | (0.09 | ) | (11.68 | ) | (11.77 | ) | — | (c) | (3.93 | ) | (3.93 | ) | $26.66 | (0.28 | ) | 2.05 | 2.05 | 2.05 | (30.05 | ) | 70.65 | $ | 64,287 | |||||||||||||||||||||||||||||||||
2007 | $ | 36.17 | (0.04 | ) | 7.55 | 7.51 | (0.02 | ) | (1.30 | ) | (1.32 | ) | $42.36 | (0.09 | ) | 2.07 | 2.07 | 2.07 | 21.26 | 79.29 | $ | 113,299 | ||||||||||||||||||||||||||||||||||||
Class C Shares |
| |||||||||||||||||||||||||||||||||||||||||||||||||||||||||
2011 | $ | 29.18 | (0.28 | ) | (2.54 | ) | (2.82 | ) | — | — | — | $26.36 | (0.85 | ) | 2.03 | 2.03 | 2.03 | (9.66 | ) | 64.14 | $ | 253,065 | ||||||||||||||||||||||||||||||||||||
2010 | $ | 28.55 | (0.03 | ) | 0.73 | 0.70 | (0.07 | ) | — | (0.07 | ) | $29.18 | (0.09 | ) | 2.06 | 2.06 | 2.06 | 2.43 | 72.75 | $ | 329,761 | |||||||||||||||||||||||||||||||||||||
2009 | $ | 26.99 | 0.18 | 1.61 | 1.79 | (0.23 | ) | — | (0.23 | ) | $28.55 | 0.81 | 2.12 | 2.12 | 2.12 | 6.83 | 83.00 | $ | 361,966 | |||||||||||||||||||||||||||||||||||||||
2008 | $ | 42.82 | (0.08 | ) | (11.81 | ) | (11.89 | ) | (0.01 | ) | (3.93 | ) | (3.94 | ) | $26.99 | (0.23 | ) | 2.02 | 2.01 | 2.02 | (30.03 | ) | 70.65 | $ | 401,880 | |||||||||||||||||||||||||||||||||
2007 | $ | 36.55 | (0.02 | ) | 7.62 | 7.60 | (0.03 | ) | (1.30 | ) | (1.33 | ) | $42.82 | (0.05 | ) | 2.03 | 2.03 | 2.03 | 21.29 | 79.29 | $ | 621,687 | ||||||||||||||||||||||||||||||||||||
Class I Shares |
| |||||||||||||||||||||||||||||||||||||||||||||||||||||||||
2011 | $ | 30.95 | 0.09 | (2.76 | ) | (2.67 | ) | (0.02 | ) | — | (0.02 | ) | $28.26 | 0.27 | 0.91 | 0.91 | 0.91 | (8.65 | ) | 64.14 | $ | 1,968,181 | ||||||||||||||||||||||||||||||||||||
2010 | $ | 30.15 | 0.30 | 0.80 | 1.10 | (0.30 | ) | — | (0.30 | ) | $30.95 | 0.97 | 0.94 | 0.94 | 0.94 | 3.62 | 72.75 | $ | 2,087,380 | |||||||||||||||||||||||||||||||||||||||
2009 | $ | 28.47 | 0.46 | 1.70 | 2.16 | (0.48 | ) | — | (0.48 | ) | $30.15 | 1.94 | 0.98 | 0.97 | 1.00 | 8.04 | 83.00 | $ | 1,575,522 | |||||||||||||||||||||||||||||||||||||||
2008 | $ | 44.80 | 0.32 | (12.45 | ) | (12.13 | ) | (0.27 | ) | (3.93 | ) | (4.20 | ) | $28.47 | 0.92 | 0.91 | 0.90 | 0.91 | (29.24 | ) | 70.65 | $ | 1,961,495 | |||||||||||||||||||||||||||||||||||
2007 | $ | 38.11 | 0.44 | 7.96 | 8.40 | (0.41 | ) | (1.30 | ) | (1.71 | ) | $44.80 | 1.05 | 0.93 | 0.92 | 0.93 | 22.62 | 79.29 | $ | 2,401,473 | ||||||||||||||||||||||||||||||||||||||
Class R3 Shares |
| |||||||||||||||||||||||||||||||||||||||||||||||||||||||||
2011 | $ | 30.24 | (0.06 | ) | (2.67 | ) | (2.73 | ) | — | — | — | $27.51 | (0.17 | ) | 1.35 | 1.35 | 1.64 | (9.03 | ) | 64.14 | $ | 169,234 | ||||||||||||||||||||||||||||||||||||
2010 | $ | 29.48 | 0.17 | 0.76 | 0.93 | (0.17 | ) | — | (0.17 | ) | $30.24 | 0.57 | 1.35 | 1.35 | 1.66 | 3.14 | 72.75 | $ | 200,362 | |||||||||||||||||||||||||||||||||||||||
2009 | $ | 27.86 | 0.36 | 1.66 | 2.02 | (0.40 | ) | — | (0.40 | ) | $29.48 | 1.57 | 1.35 | 1.35 | 1.72 | 7.62 | 83.00 | $ | 162,231 | |||||||||||||||||||||||||||||||||||||||
2008 | $ | 43.94 | 0.17 | (12.19 | ) | (12.02 | ) | (0.13 | ) | (3.93 | ) | (4.06 | ) | $27.86 | 0.50 | 1.35 | 1.35 | 1.66 | (29.54 | ) | 70.65 | $ | 161,517 | |||||||||||||||||||||||||||||||||||
2007 | $ | 37.43 | 0.26 | 7.81 | 8.07 | (0.26 | ) | (1.30 | ) | (1.56 | ) | $43.94 | 0.63 | 1.35 | 1.35 | 1.63 | 22.11 | 79.29 | $ | 151,260 | ||||||||||||||||||||||||||||||||||||||
Class R4 Shares |
| |||||||||||||||||||||||||||||||||||||||||||||||||||||||||
2011 | $ | 30.39 | (0.02 | ) | (2.69 | ) | (2.71 | ) | — | — | — | $27.68 | (0.06 | ) | 1.25 | 1.25 | 1.47 | (8.92 | ) | 64.14 | $ | 51,900 | ||||||||||||||||||||||||||||||||||||
2010 | $ | 29.62 | 0.19 | 0.78 | 0.97 | (0.20 | ) | — | (0.20 | ) | $30.39 | 0.63 | 1.25 | 1.25 | 1.49 | 3.25 | 72.75 | $ | 54,461 | |||||||||||||||||||||||||||||||||||||||
2009 | $ | 27.99 | 0.39 | 1.67 | 2.06 | (0.43 | ) | — | (0.43 | ) | $29.62 | 1.65 | 1.25 | 1.25 | 1.54 | 7.74 | 83.00 | $ | 44,037 | |||||||||||||||||||||||||||||||||||||||
2008 | $ | 44.14 | 0.19 | (12.23 | ) | (12.04 | ) | (0.18 | ) | (3.93 | ) | (4.11 | ) | $27.99 | 0.58 | 1.24 | 1.24 | 1.48 | (29.47 | ) | 70.65 | $ | 29,462 | |||||||||||||||||||||||||||||||||||
2007(d) | $ | 41.00 | 0.20 | 3.12 | 3.32 | (0.18 | ) | — | (0.18 | ) | $44.14 | 0.70 | (e) | 1.25 | (e) | 1.25 | (e) | 2.34 | (e) | 8.09 | 79.29 | $ | 7,038 | |||||||||||||||||||||||||||||||||||
Class R5 Shares |
| |||||||||||||||||||||||||||||||||||||||||||||||||||||||||
2011 | $ | 30.92 | 0.07 | (2.76 | ) | (2.69 | ) | (0.01 | ) | — | (0.01 | ) | $28.22 | 0.20 | 0.98 | 0.99 | 1.09 | (8.70 | ) | 64.14 | $ | 215,364 | ||||||||||||||||||||||||||||||||||||
2010 | $ | 30.13 | 0.28 | 0.79 | 1.07 | (0.28 | ) | — | (0.28 | ) | $30.92 | 0.91 | 0.99 | 0.99 | 1.12 | 3.54 | 72.75 | $ | 228,768 | |||||||||||||||||||||||||||||||||||||||
2009 | $ | 28.45 | 0.46 | 1.71 | 2.17 | (0.49 | ) | — | (0.49 | ) | $30.13 | 1.93 | 0.98 | 0.98 | 1.18 | 8.05 | 83.00 | $ | 165,663 | |||||||||||||||||||||||||||||||||||||||
2008 | $ | 44.78 | 0.32 | (12.47 | ) | (12.15 | ) | (0.25 | ) | (3.93 | ) | (4.18 | ) | $28.45 | 0.92 | 0.98 | 0.98 | 1.03 | (29.30 | ) | 70.65 | $ | 135,173 | |||||||||||||||||||||||||||||||||||
2007 | $ | 38.09 | 0.49 | 7.91 | 8.40 | (0.41 | ) | (1.30 | ) | (1.71 | ) | $44.78 | 1.14 | 0.91 | 0.91 | 0.93 | 22.63 | 79.29 | $ | 106,906 | ||||||||||||||||||||||||||||||||||||||
| (a) | Not annualized for periods less than one year. |
| (b) | Sales loads are not reflected in computing total return. |
| (c) | Dividends from net investment income per share were less than $(0.01). |
| (d) | Effective date of this class of shares was February 1, 2007. |
| (e) | Annualized. |
| + | Based on weighted average shares outstanding. |
See notes to financial statements.
| 28 Certified Annual Report | Certified Annual Report 29 |
REPORT OF INDEPENDENT REGISTERED PUBLIC ACCOUNTING FIRM
Thornburg Value Fund
To the Trustees and Shareholders of
Thornburg Value Fund
In our opinion, the accompanying statement of assets and liabilities, including the schedule of investments, and the related statements of operations and of changes in net assets and the financial highlights present fairly, in all material respects, the financial position of Thornburg Value Fund (one of the portfolios constituting Thornburg Investment Trust, hereafter referred to as the “Fund”) at September 30, 2011, the results of its operations for the year then ended, the changes in its net assets for each of the two years in the period then ended and the financial highlights for each of the periods presented, in conformity with accounting principles generally accepted in the United States of America. These financial statements and financial highlights (hereafter referred to as “financial statements”) are the responsibility of the Fund’s management. Our responsibility is to express an opinion on these financial statements based on our audits. We conducted our audits of these financial statements in accordance with the standards of the Public Company Accounting Oversight Board (United States). Those standards require that we plan and perform the audit to obtain reasonable assurance about whether the financial statements are free of material misstatement. An audit includes examining, on a test basis, evidence supporting the amounts and disclosures in the financial statements, assessing the accounting principles used and significant estimates made by management, and evaluating the overall financial statement presentation. We believe that our audits, which included confirmation of securities at September 30, 2011 by correspondence with the custodian and brokers, provide a reasonable basis for our opinion.
PricewaterhouseCoopers LLP
New York, New York
November 21, 2011
30 Certified Annual Report
| EXPENSE EXAMPLE | ||
| Thornburg Value Fund | September 30, 2011 (Unaudited) | |
As a shareholder of the Fund, you incur two types of costs:
| (1) | transaction costs, including |
(a) sales charges (loads) on purchase payments for Class A shares;
(b) a deferred sales charge on redemptions of any part or all of a purchase of $1 million of Class A shares within 12 months of purchase;
(c) a deferred sales charge on redemptions of Class B shares within eight years of purchase;
(d) a deferred sales charge on redemptions of Class C shares within 12 months of purchase;
(e) a 30-day redemption fee on Class A and Class I shares;
| (2) | ongoing costs, including management fees; distribution and/or service (12b-1) fees; and other Fund expenses. |
This example is intended to help you understand your ongoing costs (in dollars) of investing in the Fund and to compare these costs with the ongoing costs of investing in other mutual funds.
The example is based on a $1,000 investment beginning on April 1, 2011, and held until September 30, 2011.
ACTUAL EXPENSES
For each class of shares, the first line of the table at right provides information about actual account values and actual expenses. You may use the information in this line, together with the amount you invested, to estimate the expenses that you paid over the period. Simply divide your account value by $1,000 (for example, an $8,600 account value divided by $1,000 = 8.6), then multiply the result by the number in the first line for your class of shares under the heading entitled “Expenses Paid During Period” to estimate the expenses you paid on your account during this period.
HYPOTHETICAL EXAMPLE FOR COMPARISON PURPOSES
For each class of shares, the second line of the table at right provides information about hypothetical account values and hypothetical expenses based on the Fund’s actual expense ratio and an assumed rate of return of 5% per year before expenses, which is not the Fund’s actual return. The hypothetical account values and expenses may not be used to estimate the actual ending account balance or expenses you paid for the period. You may use this information to compare the ongoing costs of investing in the Fund and other funds. To do so, compare this 5% hypothetical example with the 5% hypothetical examples that appear in the shareholder reports of the other funds.
| Beginning Account Value 4/1/11 | Ending Account Value 9/30/11 | Expenses Paid During Period† 4/1/11–9/30/11 | ||||||||||
Class A Shares | ||||||||||||
Actual | $ | 1,000.00 | $ | 750.70 | $ | 5.62 | ||||||
Hypothetical* | $ | 1,000.00 | $ | 1,018.65 | $ | 6.48 | ||||||
Class B Shares | ||||||||||||
Actual | $ | 1,000.00 | $ | 747.30 | $ | 9.77 | ||||||
Hypothetical* | $ | 1,000.00 | $ | 1,013.89 | $ | 11.26 | ||||||
Class C Shares | ||||||||||||
Actual | $ | 1,000.00 | $ | 747.80 | $ | 8.91 | ||||||
Hypothetical* | $ | 1,000.00 | $ | 1,014.87 | $ | 10.27 | ||||||
Class I Shares | ||||||||||||
Actual | $ | 1,000.00 | $ | 752.00 | $ | 4.04 | ||||||
Hypothetical* | $ | 1,000.00 | $ | 1,020.46 | $ | 4.66 | ||||||
Class R3 Shares | ||||||||||||
Actual | $ | 1,000.00 | $ | 750.40 | $ | 5.92 | ||||||
Hypothetical* | $ | 1,000.00 | $ | 1,018.30 | $ | 6.83 | ||||||
Class R4 Shares | ||||||||||||
Actual | $ | 1,000.00 | $ | 751.00 | $ | 5.49 | ||||||
Hypothetical* | $ | 1,000.00 | $ | 1,018.80 | $ | 6.33 | ||||||
Class R5 Shares | ||||||||||||
Actual | $ | 1,000.00 | $ | 751.90 | $ | 4.35 | ||||||
Hypothetical* | $ | 1,000.00 | $ | 1,020.10 | $ | 5.01 | ||||||
| † | Expenses are equal to the annualized expense ratio for each class (A: 1.28%; B: 2.23%; C: 2.03%; I: 0.92%; R3: 1.35%; R4: 1.25%; R5: 0.99%) multiplied by the average account value over the period, multiplied by 183/365 to reflect the one-half year period. |
| * | Hypothetical assumes a rate of return of 5% per year before expenses. |
Please note that the expenses shown in the table are meant to highlight your ongoing costs only and do not reflect any transactional costs, such as sales charges (loads), redemption fees, or exchange fees. Therefore, the second line of the table for each class of shares is useful in comparing ongoing costs only, and will not help you determine the relative total costs of owning different funds. In addition, if these transactional costs were included, your costs would have been higher.
Certified Annual Report 31
| INDEX COMPARISON | ||
| Thornburg Value Fund | September 30, 2011 (Unaudited) | |
GROWTH OF A HYPOTHETICAL $10,000 INVESTMENT
Thornburg Value Fund versus S&P 500 Index (October 2, 1995 to September 30, 2011)
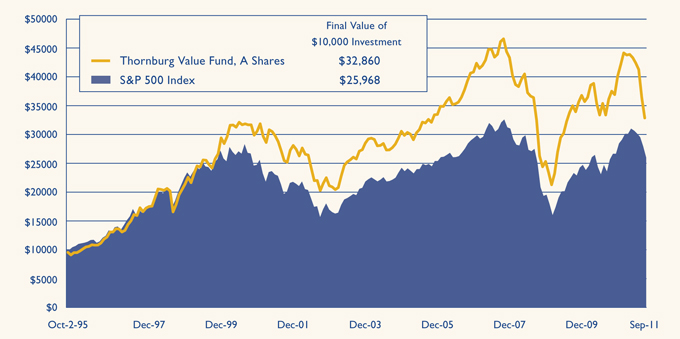
AVERAGE ANNUAL TOTAL RETURNS
For periods ended September 30, 2011 (with sales charge)
| 1 Yr | 5 Yrs | 10 Yrs | Since Inception | |||||||||||||
A Shares (Incep: 10/2/95) | -13.05 | % | -3.61 | % | 2.11 | % | 7.72 | % | ||||||||
B Shares (Incep: 4/3/00) | -14.30 | % | -3.87 | % | 1.92 | % | -0.20 | % | ||||||||
C Shares (Incep: 10/2/95) | -10.57 | % | -3.45 | % | 1.80 | % | 7.20 | % | ||||||||
I Shares (Incep: 11/2/98) | -8.65 | % | -2.36 | % | 2.99 | % | 4.35 | % | ||||||||
R3 Shares (Incep: 7/1/03) | -9.03 | % | -2.77 | % | — | 3.17 | % | |||||||||
R4 Shares (Incep: 2/1/07) | -8.92 | % | — | — | -5.39 | % | ||||||||||
R5 Shares (Incep: 2/1/05) | -8.70 | % | -2.40 | % | — | 1.71 | % | |||||||||
S&P 500 Index (Since 10/2/95) | 1.14 | % | -1.18 | % | 2.82 | % | 6.15 | % | ||||||||
Performance data shown represents past performance and is no guarantee of future results. Investment return and principal value will fluctuate so shares, when redeemed, may be worth more or less than their original cost. Current performance may be lower or higher than quoted. For performance current to the most recent month end, visit thornburg.com or call 800-847-0200. The performance data and graph do not reflect the deduction of taxes that a shareholder would pay on distributions or the redemption of Fund shares. Returns reflect the reinvestment of dividends and capital gains as well as applicable sales charges. Class A shares are sold with a maximum sales charge of 4.50% . Class B shares carry a contingent deferred sales charge (CDSC) that declines from 5.00% to 0% depending upon the period of time the shares are held. Class B shares will automatically convert to Class A shares on a quarterly basis approximately eight years after purchase. Class C shares are subject to a 1% CDSC for the first year only. There is no up-front sales charge for Class I, R3, R4 and R5 shares. Class A and I shares are subject to a 1% 30-day redemption fee.
32 Certified Annual Report
| TRUSTEES AND OFFICERS | ||
| Thornburg Value Fund | September 30, 2011 (Unaudited) | |
Name, Age, Position Held with Fund Year Elected | Principal Occupation(s) During Past Five Years | Other Directorships Held by Trustee | ||
INTERESTED TRUSTEES(1)(2)(4) | ||||
| Garrett Thornburg, 65 Chairman of Trustees, Trustee since 1987(3) | Chairman and controlling shareholder and, until 2008, CEO of Thornburg Investment Management, Inc. (investment advisor); Chairman, CEO, and controlling shareholder of Thornburg Securities Corporation (securities dealer); CEO until 2007 and Chairman until 2009 of TMST, Inc. (f/k/a Thornburg Mortgage, Inc.) (real estate investment trust); President and Sole Director of Thornburg Mortgage Advisory Corporation (investment manager to TMST, Inc.). | None | ||
Brian J. McMahon, 55 Trustee since 2001, Member of Governance & Nominating Committee & Operations Risk Oversight Committee, President since 1997(5)(6) | CEO since 2008, President, Managing Director, Chief Investment Officer, and Portfolio Manager of Thornburg Investment Management, Inc. | None | ||
INDEPENDENT TRUSTEES(1)(2)(4) | ||||
David A. Ater, 66 Trustee since 1994, Member of Audit Committee & Governance & Nominating Committee | Principal in Ater & Associates, Santa Fe, NM (developer, planner and broker of residential and commercial real estate); owner, developer and broker for various real estate projects. | None | ||
David D. Chase, 70 Trustee since 2000, Chairman of Audit Committee | Managing Member of Vestor Associates, LLC, Santa Fe, NM (private equity fund); Managing Member of CS Group, LLC, Santa Fe, NM (merchant bank). | None | ||
Eliot R. Cutler, 65 Trustee since 2004 & Nominating Committee, Chairman of Governance | Senior Counsel and, until 2009, Partner in Akin, Gump, Strauss, Hauer & Feld LLP (law firm) in Washington, D.C. and Beijing, China. | None | ||
Susan H. Dubin, 62 Trustee since 2004, Member of Audit Committee | President of Dubin Investments, Ltd., Greenwich, CT (private investment fund); Director and officer of various charitable organizations. | None | ||
Owen D. Van Essen, 57 Trustee since 2004, Member of Governance & Nominating Committee & Chairman of Operations Risk Oversight Committee | President of Dirks, Van Essen & Murray, Santa Fe, NM (newspaper mergers and acquisitions). | None | ||
Certified Annual Report 33
| TRUSTEES AND OFFICERS, CONTINUED | ||
| Thornburg Value Fund | September 30, 2011 (Unaudited) | |
Name, Age, Position Held with Fund Year Elected | Principal Occupation(s) During Past Five Years | Other Directorships Held by Trustee | ||
James W. Weyhrauch, 52 Trustee since 1996, Member of Audit Committee & Operations Risk Oversight Committee | Real estate broker, Santa Fe Properties, Santa Fe, NM; Vice Chairman of Nambe LLC, Santa Fe, NM (manufacturing & design company). | None | ||
OFFICERS OF THE FUND (WHO ARE NOT TRUSTEES)(1)(6)(7) | ||||
George T. Strickland, 48 Vice President since 1996, Treasurer since 2007(6) | Portfolio Manager, Vice President, and Managing Director of Thornburg Investment Management, Inc. | Not applicable | ||
William V. Fries, 72 Vice President since 1995 | Portfolio Manager, Vice President, and Managing Director of Thornburg Investment Management, Inc. | Not applicable | ||
Leigh Moiola, 44 Vice President since 2001 | Vice President, Managing Director, and Director of Marketing of Thornburg Investment Management, Inc. | Not applicable | ||
Alexander Motola, 41 Vice President since 2001 | Portfolio Manager, Vice President, and Managing Director of Thornburg Investment Management, Inc. | Not applicable | ||
Wendy Trevisani, 40 Vice President since 1999 | Portfolio Manager and Managing Director of Thornburg Investment Management, Inc. | Not applicable | ||
Joshua Gonze, 48 Vice President since 1999 | Portfolio Manager since 2007, Managing Director, and Associate Portfolio Manager until 2007 of Thornburg Investment Management, Inc. | Not applicable | ||
Christopher Ihlefeld, 41 Vice President since 2003 | Portfolio Manager since 2007, Managing Director, and Associate Portfolio Manager until 2007 of Thornburg Investment Management, Inc. | Not applicable | ||
Leon Sandersfeld, 45 Vice President since 2003 | Managing Director since 2007 and Fund Accounting Director of Thornburg Investment Management, Inc. | Not applicable | ||
Sasha Wilcoxon, 37 Vice President since 2003 Secretary since 2007(6) | Managing Director since 2007, Director of Operations, and Vice President of Thornburg Investment Management, Inc. | Not applicable | ||
Edward Maran, 53 Vice President since 2004 | Portfolio Manager and Managing Director of Thornburg Investment Management, Inc. | Not applicable | ||
Vinson Walden, 41 Vice President since 2004 | Portfolio Manager and Managing Director of Thornburg Investment Management, Inc. | Not applicable | ||
Thomas Garcia, 40 Vice President since 2006 | Vice President since 2011, Managing Director, Head Equity Trader, and Associate Portfolio Manager of Thornburg Investment Management, Inc. | Not applicable | ||
Lei Wang, 40 Vice President since 2006 | Portfolio Manager and Managing Director of Thornburg Investment Management, Inc. | Not applicable | ||
34 Certified Annual Report
| TRUSTEES AND OFFICERS, CONTINUED | ||
| Thornburg Value Fund | September 30, 2011 (Unaudited) | |
Name, Age, Position Held with Fund Year Elected | Principal Occupation(s) During Past Five Years | Other Directorships Held by Trustee | ||
Connor Browne, 32 Vice President since 2006 | Portfolio Manager and Managing Director of Thornburg Investment Management, Inc. | Not applicable | ||
Jason Brady, 37 Vice President since 2007 | Vice President since 2011, Portfolio Manager since 2007, Managing Director since 2007, and Associate Portfolio Manager 2006–2007 of Thornburg Investment Management, Inc. | Not applicable | ||
Lewis Kaufman, 35 Vice President since 2007 | Portfolio Manager since 2007, Managing Director since 2007, and Associate Portfolio Manager until 2009 of Thornburg Investment Management, Inc. | Not applicable | ||
Christopher Ryon, 55 Vice President since 2008 | Portfolio Manager since 2009, Managing Director since 2009, and Associate Portfolio Manager 2008–2009 of Thornburg Investment Management, Inc.; Principal of Vanguard Funds until 2008. | Not applicable | ||
Lon Erickson, 36 Vice President since 2008 | Portfolio Manager since 2010, Managing Director since 2010, and Associate Portfolio Manager 2008–2010 of Thornburg Investment Management, Inc.; Senior Analyst of State Farm Insurance until 2008. | Not applicable | ||
Kathleen Brady, 51 Vice President since 2008 | Senior Tax Accountant since 2007 of Thornburg Investment Management, Inc.; Chief Financial Officer of Vestor Partners, LP (private equity fund) until 2007. | Not applicable | ||
Jack Gardner, 57 Vice President since 2008 | Managing Director since 2007 of Thornburg Investment Management, Inc.; President since 2008 and National Sales Director of Thornburg Securities Corporation. | Not applicable | ||
Laura Hillstrom, 44 Vice President since 2009 | Chief Administrative Officer since 2009, Vice President and Managing Director, and Director of Information Systems until 2009 of Thornburg Investment Management, Inc. | Not applicable | ||
| (1) | Each person’s address is 2300 North Ridgetop Road, Santa Fe, New Mexico 87506. |
| (2) | The Fund is one of sixteen separate investment “Funds” or “series” of Thornburg Investment Trust (the “Trust”), which comprises the Thornburg mutual fund complex and is organized as a Massachusetts business trust. Thornburg Investment Management, Inc. is the investment advisor to, and manages, the sixteen Funds of the Trust. Each Trustee oversees the sixteen Funds of the Trust. |
| (3) | Mr. Thornburg is considered an “interested” Trustee under the Investment Company Act of 1940 because he is the sole director and controlling shareholder of Thornburg Investment Management, Inc., the investment advisor to the sixteen active Funds of the Trust, and is the sole director and controlling shareholder of Thornburg Securities Corporation, the distributor of shares for the Trust. |
| (4) | Each Trustee serves in office until the election and qualification of a successor. |
| (5) | Mr. McMahon is considered an “interested” Trustee because he is the chief executive officer and president of Thornburg Investment Management, Inc. |
| (6) | The Trust’s president, secretary, and treasurer each serves a one-year term or until the election and qualification of a successor; each other officer serves at the pleasure of the Trustees. |
| (7) | Assistant vice presidents, assistant secretaries and assistant treasurers are not shown. |
The Statement of Additional Information for each Fund of the Trust includes additional information about the Trustees and is available, without charge and upon request, by calling 1-800-847-0200.
Certified Annual Report 35
| OTHER INFORMATION | ||
| Thornburg Value Fund | September 30, 2011 (Unaudited) | |
PORTFOLIO PROXY VOTING
Policies and Procedures:
The Trust has delegated to Thornburg Investment Management, Inc. (the “Advisor”) voting decisions respecting proxies for the Fund’s voting securities. The Advisor makes voting decisions in accordance with its Proxy Voting Policy. A description of the Policy is available (i) without charge, upon request, by calling the Advisor toll-free at 1-800-847-0200, (ii) on the Thornburg website at www.thornburg. com, and (iii) on the Securities and Exchange Commission’s website at www.sec.gov.
Information regarding how proxies were voted is available on or before August 31 of each year for the twelve months ending the preceding June 30. This information is available (i) without charge, upon request by calling the Advisor toll-free at 1-800-847-0200, (ii) on the Thornburg website at www.thornburg.com, and (iii) on the Securities and Exchange Commission’s website at www.sec.gov.
TAX INFORMATION
For the tax year ended September 30, 2011, the Thornburg Value Fund designates 100.00% (or the maximum allowed) of the dividends paid from tax basis net ordinary income as qualifying for the reduced rate under the Jobs and Growth Tax Relief and Reconciliation Act of 2003.
100.00% (or the maximum allowed) of the ordinary income distributions paid by the Fund for the year ended September 30, 2011 qualified for the corporate dividends received deduction.
The information and distributions reported herein may differ from the information and distributions reported to the shareholders for the calendar year ending December 31, 2011. Complete information will be reported in conjunction with your 2011 Form 1099-DIV.
AVAILABILITY OF QUARTERLY PORTFOLIO SCHEDULE
The Fund files with the Securities and Exchange Commission schedules of its portfolio holdings on Form N-Q for the first and third quarters of each fiscal year. The Fund’s Forms N-Q are available on the Commission’s website at www.sec.gov, or may be reviewed and copied at the Commission’s Public Reference Room in Washington, D.C. Information on the operation of the Public Reference Room may be obtained by calling 1-800-SEC-0330. The Fund also makes this information available on its website at www.thornburg.com/ download or upon request by calling 1-800-847-0200.
STATEMENT RESPECTING RENEWAL OF INVESTMENT ADVISORY AGREEMENT
Thornburg Investment Management, Inc. (the “Advisor”) provides investment management services to Thornburg Value Fund pursuant to an investment advisory agreement. The Trustees consider the renewal of this agreement annually, and most recently determined to renew the agreement on September 13, 2011.
In anticipation of their recent consideration of the advisory agreement’s renewal, the independent Trustees met in May 2011 to plan the Trustees’ evaluation of the Advisor’s performance and to specify the information the Advisor would present to the Trustees for their review. The Advisor’s chief investment officer subsequently reviewed portions of that information with the Trustees and addressed questions presented by the Trustees at a meeting session scheduled for that purpose, and the independent Trustees thereafter met in independent session to consider the Advisor’s presentation and various specific issues respecting their consideration of the advisory agreement’s renewal. Following these sessions, the Trustees met to consider a renewal of the agreement, and the independent Trustees unanimously voted at that meeting to renew the agreement for an additional term of one year.
The information below summarizes certain factors considered by the Trustees in connection with the determination to renew the advisory agreement. In determining to renew the agreement, the Trustees did not identify any single factor as controlling, and this summary does not describe all of the matters considered by the Trustees in making their determination.
Quality of Services; Fund Investment Performance. The Trustees evaluated the nature, extent and quality of services provided by the Advisor under the advisory agreement, and evaluated the investment performance of the Fund.
In connection with their general supervision of the Advisor, and as an important element of their annual consideration of a renewal of the advisory agreement, the Trustees received and considered reports from the Advisor throughout the year. These reports addressed
36 Certified Annual Report
| OTHER INFORMATION, CONTINUED | ||
| Thornburg Value Fund | September 30, 2011 (Unaudited) | |
a wide variety of topics, including particularly the Advisor’s selection of investments and execution of the Fund’s investment strategies. In addition, the Trustees considered the information provided to them at their request in anticipation of their annual evaluation of the Advisor’s services, including (i) the Fund’s absolute investment performance and achievement of stated objectives, (ii) the Advisor’s commentary on the Fund’s performance in the context of the Fund’s objectives and reasonable expectations, and business, market and economic conditions, (iii) measures of the Fund’s investment performance over different periods of time relative to a category of equity mutual funds selected by an independent mutual fund analyst firm, and relative to two broad-based securities indices, (iv) the Fund’s cumulative investment return since inception relative to a broad-based securities index, and (v) and comparative measures of estimated earnings growth, portfolio volatility, risk and return.
The Trustees also considered their perceptions of portfolio management personnel developed in formal and informal meetings throughout the year, the Advisor’s staffing and other resources, trade execution, the Advisor’s performance of accounting and other services, the Advisor’s observance of compliance and regulatory requirements, the Advisor’s responsiveness to the Trustees, and other factors.
In evaluating quantitative and performance data presented, the Trustees noted (among other aspects of the data) comparative performance data for the ten most recent calendar years, which showed that the Fund’s investment return for the most recent calendar year was lower than the average return for the mutual fund category and the returns for the two indices, and that the Fund’s returns for the preceding nine calendar years had exceeded or been comparable to the average returns of the category in a majority of years, exceeded the returns of the first index in six of nine years, and had exceeded or been comparable to the returns of the second index in six of nine years. Other noted quantitative data showed that the Fund’s investment returns fell in the lowest decile of the fund category for the three-month period ended with the second quarter of the current year, but that the Fund’s investment returns fell within the top half of the category for the year-to-date period, within the third quartile for the one-year period, and within the top quintile for the three-year and five-year periods. The Trustees also noted the Fund’s higher cumulative investment return (net of expenses) relative to the Fund’s benchmark index.
The Trustees concluded, based upon these and other considerations, that the nature, extent and quality of the Advisor’s services were sufficient and that the Advisor had satisfactorily pursued the Fund’s stated investment objectives. The Trustees further concluded that the investment performance of the Fund was satisfactory in the context of the Fund’s objectives and policies, and prevailing market conditions.
Fees and Expenses; Profitability of Advisor; Economies of Scale; Ancillary Benefits. The Trustees evaluated the level of the management fee charged by the Advisor to the Fund, and in this connection, reviewed the profitability of the Advisor, economies of scale potentially available to the Fund and whether the Advisor received any ancillary benefits from its relationship with the Fund.
In evaluating the level of the management fee, the Trustees considered the fee charged by the Advisor and the other expenses charged to the Fund in light of the nature and quality of services provided, comparison of the actual Advisor’s fee and Fund expenses to the statement of fees and expenses in the Fund’s prospectuses, and comparisons of the Advisor’s fee and other Fund expenses to median and average fees and expenses charged to two groups of equity mutual funds assembled by independent mutual fund analyst firms. Comparative fee and expense data noted by the Trustees showed that the management fee charged to the Fund was slightly higher than the median and average fee levels for each of the two mutual fund groups, and that the overall expense ratio of the Fund was comparable to the median and average expense ratios for each of the mutual fund groups. The Trustees did not identify the differences as significant. The Trustees considered information about the fees charged by the Advisor to other investment management clients, together with information about fees charged by other advisors to different clients, and analysis of the differences between the requirements of institutional clients and mutual funds and the consequently different investment management services provided, respectively, to institutional clients and to mutual funds. The Trustees confirmed their previous observations that the differences between the fees charged by the Advisor to different types of clients did not appear exceptional, and that the fee rates charged by investment advisors to institutional clients had limited relevance to the evaluation of fee rates charged to mutual funds, because of the significant differences between the respective requirements of institutional clients and mutual funds, the differences between the respective services rendered to institutional clients and mutual funds, and the different circumstances in which the respective fees originate.
In reviewing the profitability of the Advisor, the Trustees considered costs incurred by the Advisor and data comparing the profitability of the Advisor to other investment management firms. The information provided did not indicate that the Advisor’s profitability was unusual, and the Trustees noted the adequacy of the Advisor’s resources and service capabilities. In reviewing the extent to which economies of scale would be realized by the Fund as it grows and whether fee levels reflect economies of scale, the Trustees considered the breakpoint structure for advisory fees chargeable to the Fund, the demonstrated economies of scale enjoyed by the Fund and
Certified Annual Report 37
| OTHER INFORMATION, CONTINUED | ||
| Thornburg Value Fund | September 30, 2011 (Unaudited) | |
other Funds of the Trust as they had grown in size, and economies of scale realized by other mutual funds. The information provided demonstrated to the Trustees that the Fund has realized economies of scale and may reasonably be expected to realize economies of scale as the Fund’s assets increase, due to the advisory agreement’s breakpoint fee structure and other factors. In reviewing potential benefits to the Advisor because of its relationship to the Fund, the Trustees considered the Advisor’s receipt of certain research services from broker dealers, and the benefits to both the Fund and the Advisor of the Advisor’s expansion of its staffing, compliance and systems capabilities and other resources to serve a broader variety of investment management clients. No unusual or unfair benefits to the Advisor from its relationship to the Fund were identified by the Trustees.
The Trustees concluded, based upon their consideration of these and other factors, that the management fee charged to the Fund by the Advisor was fair and reasonable in view of the nature, extent and quality of the services provided by the Advisor, the clear disclosure of fees and expenses in the Fund’s prospectuses, the investment performance of the Fund, and comparisons of fees and expenses charged to the Fund to fees and expenses charged to other mutual funds.
38 Certified Annual Report
This page intentionally left blank.
This page is not part of the Annual Report. 39
Trustees’ Statement to Shareholders
Not part of the Certified Annual Report
September 13, 2011
The Trustees believe current and prospective shareholders should know how we discharge our responsibilities in supervising the Funds’ investment advisor and in reviewing the advisor’s contract for renewal. Since 2005, we have issued a statement which sets out clearly the three principal guidelines that we follow in supervising the Trust’s investment advisor on your behalf. In accordance with our customary practice, in September of this year we again reviewed our statement and concluded we should reissue this statement outlining the principal features of our supervision of the advisor’s performance of investment management services for the Funds.
We begin with the premise that each shareholder selected his or her Fund because its investments are managed by the investment advisor identified in the prospectus and in accordance with the objective and policies described in the prospectus. We realize, as each of you do, that if you believe that your Fund’s stated objective and policies no longer serve your personal investment goals, you can sell your shares and leave the Fund.
Therefore, we believe that our primary supervisory task – our principal obligation to you – is to assess the nature and quality of the advisor’s services, and to confirm that the advisor actively and competently pursues the Fund’s objective, in accordance with the policies set out in the prospectus. To do this, we meet regularly with management to review your Fund’s portfolio and to discuss the advisor’s specific actions and judgments in pursuing the Fund’s objective. We do not substitute our own judgment for the advisor’s decisions in selecting investments; the advisor is paid to exercise its informed judgment on investment decisions, and we seek to confirm, in reviewing the advisor’s performance, that the advisor is doing just that.
Second, while we are conscious of costs and the effect that costs have on shareholders’ returns, we do not seek the lowest fees or expense ratio as our sole or primary objective. We try to make sure that your Fund’s fees and costs are reasonable in relationship to the services rendered and that they are generally in line with those charged by other expert investment advisors, consistent with our belief that the Fund’s investors searched for and expect that expertise and attention and have decided to pay a reasonable price for it. We do not put the management contract “out to bid” as a matter of course, and we would not do so unless we had concluded that the advisor materially had failed to pursue the Fund’s objectives in accordance with its policies, or for other equally important reasons. We believe that any other approach would be inconsistent with your interests and contrary to your expectations when you bought shares of the Fund in the first place.
Finally, because we believe that most Thornburg Fund shareholders have invested with a long-term perspective, we try not to focus too much on the fashions of the moment and on short-term performance. The market will not favor any specific investment objective or set of policies at all times and under all economic circumstances. A fund will experience periods of both high and low returns relative to other funds and other investments. Even if one of our Funds is not favored by the market at a particular time, we believe that the advisor is nonetheless obliged to remain true to the Fund’s objective and policies, and we watch to see that it does so.
40 This page is not part of the Annual Report.
Retirement and Education Accounts
Thornburg Investment Management offers retirement and education savings accounts that can help you meet a variety of planning challenges. For account applications or further information on any of the accounts below, please call 1-800-847-0200 or go to www.thornburg.com/ira. Your financial advisor can help you determine which plan is right for you.
Individual Retirement Accounts
Individual Retirement Accounts (IRAs) provide a tax-advantaged means to save money for the future. For a detailed outline of the difference between retirement accounts, see www.thornburg.com/ira. Rollovers are available. Call 1-800-847-0200 for more information.
Traditional IRAs – Contributions to Traditional IRAs are tax deductible for eligible individuals, and withdrawals are taxed as additional ordinary income. You may contribute to an IRA if you receive compensation and are under 70 1/2, even if you are covered by an employer retirement plan. Deductible contributions are subject to certain qualifications. Please consult your tax advisor.
Roth IRAs – Under a Roth IRA, there is no tax deduction for contributions, but there is no income tax on qualified withdrawals. For a more detailed comparison of Traditional and Roth IRAs, please see our web site at www.thornburg.com/ira.
SEP IRAs – Simplified Employee Pension (SEP) IRAs are established by employers. The employer is allowed a tax deduction for contributions made to the SEP Plan and makes contributions to each eligible employee’s SEP IRA on a discretionary basis.
SIMPLE IRAs – Savings Incentive Match Plan for Employees of Small Employers (SIMPLE) is designed to give small business owners a simplified method to establish and contribute to a retirement plan for employees. The employer is allowed a tax deduction for contributions and makes either matching or non-elective contributions to each eligible employee’s SIMPLE IRA. Employees may make salary deferral contributions.
Coverdell Education Savings Account
These savings accounts are designed to provide a way to save money for higher education expenses. In an Education Savings Account, earnings and interest grow tax-free, and qualified withdrawals used to pay for eligible higher-education expenses are tax- and penalty-free.
Funds Available
The following funds are available in the accounts listed above:
| • | Thornburg International Value Fund |
| • | Thornburg Value Fund |
| • | Thornburg Core Growth Fund |
| • | Thornburg Investment Income Builder Fund |
| • | Thornburg Global Opportunities Fund |
| • | Thornburg International Growth Fund |
| • | Thornburg Developing World Fund |
| • | Thornburg Limited Term U.S. Government Fund |
| • | Thornburg Limited Term Income Fund |
| • | Thornburg Strategic Income Fund |
This page is not part of the Annual Report. 41

Thornburg Equity Funds
Thornburg’s equity research uses a fundamental and comprehensive analytical approach. Thornburg equity funds focus on a limited number of securities so that each holding can impact performance. The equity team searches for firms believed to have a promising future and seeks to buy shares of those companies at a discount to their intrinsic value.
| • | Thornburg Value Fund |
| • | Thornburg International Value Fund |
| • | Thornburg Core Growth Fund |
| • | Thornburg Investment Income Builder Fund |
| • | Thornburg Global Opportunities Fund |
| • | Thornburg International Growth Fund |
| • | Thornburg Developing World Fund |
Thornburg Bond Funds
Thornburg Investment Management applies a disciplined philosophy to fixed-income management. Since the launch of our first fixed-income fund over 25 years ago, we have been conducting fundamental, bottom-up research in an effort to identify bonds which we believe provide the best return for a given level of risk. We are very organic in our approach, avoiding leverage or complex strategies which could backfire in periods of market uncertainty.
| • | Thornburg Limited Term Municipal Fund |
| • | Thornburg Intermediate Municipal Fund |
| • | Thornburg California Limited Term Municipal Fund |
| • | Thornburg New Mexico Intermediate Municipal Fund |
| • | Thornburg New York Intermediate Municipal Fund |
| • | Thornburg Strategic Municipal Income Fund |
| • | Thornburg Limited Term U.S. Government Fund |
| • | Thornburg Limited Term Income Fund |
| • | Thornburg Strategic Income Fund |
Before investing, carefully consider the Fund’s investment goals, risks, charges, and expenses. For a prospectus containing this and other information, contact your financial advisor or visit thornburg. com. Read it carefully before investing.
For additional information, please visit www.thornburg.com
Thornburg Investment Management, Inc. 2300 North Ridgetop Road, Santa Fe, NM 87506
This page is not part of the Annual Report. 43
 | Waste not, Wait not |  | ||||
| Get instant access to your shareholder reports. | ||||||
| This Annual Report is submitted for the general information of shareholders of the Fund. It is not authorized for distribution to prospective investors in the Fund unless preceded or accompanied by an effective prospectus. | By switching from your postal mailbox to your email inbox, you reduce paper clutter, improve record keeping access, and help conserve our natural resources. | |||||
 | Investment Advisor: Thornburg Investment Management® 800.847.0200 | Go to www.thornburg.com/edelivery and sign up to receive your shareholder reports, prospectuses, and proxy statements electronically. | ||||
Distributor: | ||||||
Thornburg Securities Corporation® 800.847.0200 | You invest in the future, without spending a dime. | |||||
| TH077 | ||||||

Important Information
The information presented on the following pages was current as of September 30, 2011. The managers’ views, portfolio holdings, and sector and country diversification are provided for the general information of the Fund’s shareholders; to the extent this information is historical, it should not be considered predictive of future circumstances. This material should not be deemed a recommendation to buy or sell any of the securities mentioned.
Investments in the Fund carry risks, including possible loss of principal. Special risks may be associated with investments outside the United States, especially in emerging markets, including currency fluctuations, illiquidity and volatility. Investments in small capitalization companies may increase the risk of declines in value and greater price fluctuations. Please see the Fund’s Prospectus for a discussion of the risks associated with an investment in the Fund. Investments in the Fund are not FDIC insured, nor are they deposits of or guaranteed by a bank or any other entity. There is no guarantee that the Fund will meet its investment objectives. Funds invested in a limited number of holdings may expose an investor to greater volatility.
Performance data given at net asset value (NAV) does not take into account applicable sales charges. If the sales charges had been included, the performance would have been lower.
Class I, R3, R4, and R5 shares may not be available to all investors. Minimum investments for Class I shares may be higher than those for other classes.
Share Class | NASDAQ Symbol | Cusip | ||
Class A | TGVAX | 885-215-657 | ||
Class B | THGBX | 885-215-616 | ||
Class C | THGCX | 885-215-640 | ||
Class I | TGVIX | 885-215-566 | ||
Class R3 | TGVRX | 885-215-525 | ||
Class R4 | THVRX | 885-215-269 | ||
Class R5 | TIVRX | 885-215-368 |
Glossary
MSCI EAFE (Europe, Australasia, Far East) Index – An unmanaged, market capitalization weighted index that is the common benchmark for international portfolio performance. The index is calculated with net dividends reinvested in U.S. dollars.
MSCI All Country (AC) World ex-U.S. Index – A market capitalization weighted index representative of the market structure of 44 developed and emerging market countries in North and South America, Europe, Africa, and the Pacific Rim, excluding securities of United States’ issuers. The index is calculated with gross dividends reinvested in U.S. dollars.
Unless otherwise noted, index returns reflect the reinvestment of income dividends and capital gains, if any, but do not reflect fees, brokerage commissions or other expenses of investing. Investors may not make direct investments into any index. The performance of any index is not indicative of the performance of any particular investment.
Beta – A measure of market-related risk. Less than one means the portfolio is less volatile than the index, while greater than one indicates more volatility than the index.
Median Market Capitalization – Market capitalization (market cap) is the total value of a company’s stock, calculated by multiplying the number of outstanding common shares by the current share price. The company whose market cap is in the middle of the portfolio is the median market cap. Half the companies in the portfolio have values greater than the median and half have values that are less.
Price to Book Value (P/B) – A ratio used to compare a stock’s market value to its book value. It is calculated by dividing the current closing price of the stock by the latest quarter’s book value (book value is simply assets minus liabilities).
Price to Cash Flow Ratio – A measure of the market’s expectations of a firm’s future financial health. It is calculated by dividing the price per share by cash flow per share.
Price to Earnings Ratio (P/E) – A valuation ratio equaling a company’s market value per share divided by earnings per share.
This page is not part of the Annual Report. 3
Thornburg International Value Fund
CO-PORTFOLIO MANAGERS

Left to right:
Lei Wang,CFA, Wendy Trevisani, Bill Fries,CFA
IMPORTANT
PERFORMANCE INFORMATION
Performance data shown represents past performance and is no guarantee of future results. Investment return and principal value will fluctuate so shares, when redeemed, may be worth more or less than their original cost. Current performance may be lower or higher than quoted. For performance current to the most recent month end, visit thornburg.com or call 800.847.0200.
The maximum sales charge for Class A shares is 4.50%. Class A shares are subject to a 1% 30-day redemption fee. The total annual fund operating expense of Class A shares is 1.33%, as disclosed in the most recent Prospectus.
Finding Promising Companies at a Discount
The Thornburg International Value Fund seeks to find value in overseas markets. It differs from many other international equity funds in two key ways. First, it focuses on a limited number of stocks, and second, it takes a more comprehensive approach to value investing.
Our team is dedicated to providing value to shareholders. We accomplish this through the application of seasoned investment principles with hands-on, company-oriented research. We use a collaborative approach in implementing our investment research process. Our focus is on finding promising companies available at a discount to our estimate of their intrinsic value, no matter where they are located outside the United States. Geographic location is secondary to individual stock merit.
In managing the Thornburg International Value Fund, we take a bottom-up approach to stock selection. The Fund is not predisposed to a particular geographic region or industry. We use a variety of valuation methods and business evaluations in an effort to gauge the intrinsic value of a company based on its past record and future potential. The continuum of process moves from screens and idea generation, through conventional “Wall Street” research and documentation, to company contact, the latter often including on-site visits. The focus of the analysis is on what’s behind the numbers:
AVERAGE ANNUAL TOTAL RETURNS
FOR PERIODS ENDED 9/30/11
| 1 Yr | 3 Yrs | 5 Yrs | 10 Yrs | Since Inception | ||||||||||||||||
A Shares (Incep: 5/28/98) | ||||||||||||||||||||
Without sales charge | -10.10 | % | 0.13 | % | 0.40 | % | 8.51 | % | 7.52 | % | ||||||||||
With sales charge | -14.16 | % | -1.40 | % | -0.53 | % | 8.01 | % | 7.16 | % | ||||||||||
MSCI EAFE Index | ||||||||||||||||||||
(Since 5/28/98) | -9.36 | % | -1.13 | % | -3.46 | % | 5.03 | % | 2.35 | % | ||||||||||
MSCI AC World ex-U.S. Index | ||||||||||||||||||||
(Since 5/28/98) | -10.42 | % | 0.98 | % | -1.12 | % | 7.27 | % | 4.01 | % | ||||||||||
4 This page is not part of the Annual Report.
its revenue and cash-generating model. We make an effort to get to know the company’s reputation in the industry, its people and its corporate culture.
The current posture is to maintain a portfolio of 50–75 companies diversified by country, sector, industry, market capitalization, and our three categories of stocks: Basic Value, Consistent Earners and Emerging Franchises. Because of the limited number of stocks in the portfolio, every holding counts. At the time of purchase, we set a 12–18 month price target for each stock. The target is reviewed as the fundamentals of the stock change during the course of ownership.
The bottom line? Engendering a wide-open, collegial environment fosters information flows and critical thinking intended to benefit portfolio decision making. We do not view our location in Santa Fe, NM, as a disadvantage. While we have access to the best of Wall Street’s analysis, we are not ruled by it. Distance from the crowd serves to fortify independent and objective thinking.
STOCKS CONTRIBUTING AND DETRACTING
FOR THE YEAR ENDED 9/30/11
Top Contributors | Top Detractors | |
| Volkswagen AG (Pfd Non-Vtg) | BNP Paribas S.A. | |
| Hyundai Motor Co. Ltd. | Credit Suisse Group AG | |
| ARM Holdings plc | ArcelorMittal | |
| British American Tobacco plc | Teva Pharmaceutical Ind., Ltd. ADR | |
| Pearson plc | Standard Chartered plc | |
| Source: FactSet | ||
KEY PORTFOLIO ATTRIBUTES
As of 9/30/11
Portfolio P/E Trailing 12-months* | 12.3x | |||
Portfolio Price to Cash Flow* | 5.7x | |||
Portfolio Price to Book Value* | 1.8x | |||
Median Market Cap* | $ | 32.4B | ||
7-Year Beta (A Shares vs. MSCI EAFE)* | 0.9 | |||
Number of Companies | 64 | |||
| * | Source: FactSet |
MARKET CAPITALIZATION EXPOSURE
As of 9/30/11
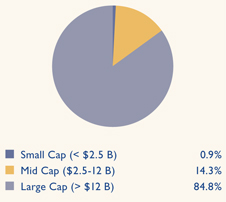
BASKET STRUCTURE
As of 9/30/11
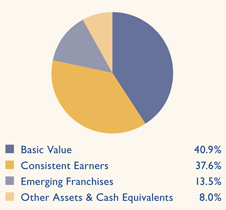
This page is not part of the Annual Report. 5

Thornburg International Value Fund
September 30, 2011
Table of Contents | ||||
| 7 | ||||
| 10 | ||||
| 16 | ||||
| 18 | ||||
| 20 | ||||
| 21 | ||||
| 30 | ||||
| 32 | ||||
| 33 | ||||
| 34 | ||||
| 35 | ||||
| 38 |
This report is certified under the Sarbanes-Oxley Act of 2002, which requires that public companies, including mutual funds, affirm that the information provided in their annual and semiannual shareholder reports fully and fairly represents their financial position.
6 Certified Annual Report
William V. Fries,CFA Co-Portfolio Manager
Wendy Trevisani Co-Portfolio Manager
Lei Wang,CFA Co-Portfolio Manager | October 15, 2011
Dear Fellow Shareholder:
The fiscal year ended September 30, 2011 began with reasonable optimism, evidenced by our strong first-half, double-digit return. After a difficult summer, markets had begun to recover on alleviation of concerns related to stubbornly high unemployment in the United States. Monetary stimulus served to allay these fears early in the fiscal year. With hindsight, the market seemed to be ignoring the sovereign debt situation in Europe, inflation in the faster growing emerging markets, and the disruptive ripple effect on manufacturing caused by the earthquake and tsunami in Japan. Ultimately, these factors worked to undermine confidence in the sustainability of global economic expansion, and the ability of corporations to continue to provide healthy sales and profit growth. Uncertainty about the future was pronounced in the extreme volatility experienced during the fiscal year, not only in the equity markets, but in global bond and currency markets as well.
For the twelve months ended September 30, 2011, the Thornburg International Value Fund (Class A shares at NAV) total return was negative 10.1%, in line with a negative 9.4% for the MSCI EAFE Index and a negative 10.4% for the MSCI AC World ex-U.S. Index. A correction in the emerging markets, particularly in China and Brazil, negatively impacted our returns in both absolute and relative terms, affecting holdings such as China Merchants Bank, ICBC, and Sinopharm in China as well as BM&F Bovespa, Natura, and Petrobras in Brazil. Within the developed markets, our Japan underweight hurt, as views of the region as a safe haven and the support of a strong yen led to the MSCI EAFE Index achieving outperformance. Additionally, the European financial crisis and its impact on confidence surrounding the value of sovereign debt held by banks resulted in a sharp decline of European financial stocks, most pronounced in BNP, which we have sold. Credit Suisse and Standard Chartered were similarly not immune, though the latter operates predominantly in Asia, the Middle East, and Africa. Other notable detractors to performance included ArcelorMittal, which suffered from fears of a global economic contraction, and Teva, which declined on concerns regarding the competitive environment for profitable multiple sclerosis drug Copaxone. |


Certified Annual Report 7
| Letter to Shareholders, | ||
Continued | ||
Despite the disappointing performance, we believe the stocks in our portfolio exhibit strong business models with the ability to manage through economic cyclicality. Interestingly, our top two performers for the period were the automobile companies, Volkswagen and Hyundai. These companies continue to gain market share through penetration of faster growing emerging markets as well as improving reputations in places like the United States, helped by improvements in production facilities and innovative high-quality product. Not surprisingly, three of our largest detractors were in the European financial space – BNP, Credit Suisse, and Standard Chartered. We no longer hold BNP; Credit Suisse is domiciled in Switzerland and has minimal exposure to Eurozone sovereign debt; and Standard Chartered, while domiciled in the U.K., operates primarily in Asia, the Middle East, and Africa.
Our top ten holdings as of September 30, 2011, (shown below) are skewed toward our Consistent Earner basket which tends to be less volatile in nature, normally exhibiting steady earnings growth, cash flow characteristics, and dividend growth. This is logically the area of the market that outperforms in times of uncertainty. Upon review of these holdings, we feel confident that our investment theses remain sound, as these companies are largely blue chip in nature, with broad geographic exposure and healthy balance sheets.
Top 10 Holdings
as of 9/30/11
COMPANY | % | INDUSTRY | COUNTRY | |||||
Nestlé SA | 2.4 | % | Food, Beverage & Tobacco | Switzerland | ||||
British American Tobacco plc | 2.4 | % | Food, Beverage & Tobacco | United Kingdom | ||||
SAP AG | 2.4 | % | Software & Services | Germany | ||||
Tesco plc | 2.3 | % | Food & Staples Retailing | United Kingdom | ||||
Novo Nordisk A/S | 2.3 | % | Pharmaceuticals, Biotechnology & Life Sciences | Denmark | ||||
Novartis AG | 2.3 | % | Pharmaceuticals, Biotechnology & Life Sciences | Switzerland | ||||
Reckitt Benckiser plc | 2.2 | % | Household & Personal Products | United Kingdom | ||||
LVMH Moët Hennessy Louis Vuitton SA | 2.1 | % | Consumer Durables & Apparel | France | ||||
adidas AG | 2.1 | % | Consumer Durables & Apparel | Germany | ||||
Standard Chartered plc | 2.1 | % | Banks | United Kingdom | ||||
The dislocation in the market has provided us with the opportunity to selectively acquire new positions. Given the backdrop, we have focused on maintaining what we believe is a rather cautious risk profile, evident in the composition of our three baskets. Our exposure to financial stocks in particular has diminished, especially those more vulnerable to write downs or other interruptions in the Eurozone. Nonetheless, we recognize the
8 Certified Annual Report
poor performance of stocks in this sector may result in a rebound upon resolution of the European sovereign debt crisis.
To end this letter on a positive note, the short time since the end of the fiscal year has provided us with some relief regarding potential future action by the European authorities to support Eurozone constituents and extend financial assistance to avoid a worst case scenario. The market has responded positively, with a broad-based recovery in the markets. While headlines may continue to be unnerving, we believe that corporate balance sheets are broadly healthy, inventory levels are in decent shape, and in many cases valuations and dividend yields are increasingly compelling, especially given the backdrop of ensuing low interest rates. We strive to own a diversified portfolio of companies with sound growth and income prospects, pricing power, and manageable exposure to regulatory and competitive pressures. Although the recent period has been disappointing, we believe the portfolio is well positioned to deal with difficult market conditions. As has been the case for some time now, there will be no capital gain distribution this year. At September 30, 2011, the Fund had tax basis realized capital losses of approximately $4 billion, which may be carried forward to offset future capital gains to the extent permitted by regulations.
Thank you for your continued trust and confidence. To learn more about your portfolio’s holdings, please visit www.thornburg.com/funds.
| Sincerely, | ||||
 |  |  | ||
| William V. Fries,CFA | Wendy Q. Trevisani | Lei Wang,CFA | ||
| Co-Portfolio Manager | Co-Portfolio Manager | Co-Portfolio Manager | ||
| Managing Director | Managing Director | Managing Director | ||
The matters discussed in this report may constitute forward-looking statements made pursuant to the safe harbor provisions of the Securities Litigation Reform Act of 1995. These include any advisor or portfolio manager prediction, assessment, analysis or outlook for individual securities, industries, investment styles, market sectors and/or markets. These statements involve risks and uncertainties. In addition to the general risks described for each fund in its current prospectus, other factors bearing on these reports include the accuracy of the advisor’s or portfolio manager’s forecasts and predictions, the appropriateness of the investment strategies designed by the advisor or portfolio manager, and the ability of the advisor or portfolio manager to implement their strategies efficiently and successfully. Any one or more of these factors, as well as other risks affecting the securities markets generally, could cause the actual results of any fund to differ materially as compared to its benchmarks.
Certified Annual Report 9
| SCHEDULE OF INVESTMENTS | ||
| Thornburg International Value Fund | September 30, 2011 | |
TOP TEN HOLDINGS
As of 9/30/11
Nestlé SA | 2.4 | % | Novartis AG | 2.3 | % | |||||
British American Tobacco plc | 2.4 | % | Reckitt Benckiser plc | 2.2 | % | |||||
SAP AG | 2.4 | % | LVMH Moët Hennessy Louis Vuitton SA | 2.1 | % | |||||
Tesco plc | 2.3 | % | adidas AG | 2.1 | % | |||||
Novo Nordisk A/S | 2.3 | % | Standard Chartered plc | 2.1 | % |
SUMMARY OF INDUSTRY EXPOSURE
As of 9/30/11
Energy | 8.8 | % | Food & Staples Retailing | 3.6 | % | |||||
Pharmaceuticals, Biotechnology & Life Sciences | 7.2 | % | Technology Hardware & Equipment | 3.5 | % | |||||
Banks | 7.1 | % | Telecommunication Services | 3.3 | % | |||||
Capital Goods | 6.9 | % | Retailing | 3.2 | % | |||||
Food, Beverage & Tobacco | 6.0 | % | Household & Personal Products | 3.0 | % | |||||
Automobiles & Components | 5.9 | % | Insurance | 2.8 | % | |||||
Diversified Financials | 5.4 | % | Media | 2.5 | % | |||||
Software & Services | 5.1 | % | Transportation | 1.6 | % | |||||
Consumer Durables & Apparel | 4.8 | % | Consumer Services | 1.5 | % | |||||
Materials | 4.8 | % | Semiconductors & Semiconductor Equipment | 1.1 | % | |||||
Health Care Equipment & Services | 3.9 | % | Other Assets & Cash Equivalents | 8.0 | % |
SUMMARY OF COUNTRY EXPOSURE
As of 9/30/11 (percent of equity holdings)
United Kingdom | 19.9 | % | South Korea | 2.2 | % | |||||
Germany | 13.5 | % | Taiwan | 1.9 | % | |||||
Japan | 12.1 | % | Spain | 1.8 | % | |||||
Switzerland | 8.3 | % | Sweden | 1.8 | % | |||||
China | 7.1 | % | Hong Kong | 1.7 | % | |||||
France | 6.7 | % | Australia | 1.6 | % | |||||
Canada | 5.4 | % | Mexico | 1.4 | % | |||||
Israel | 3.3 | % | Turkey | 1.2 | % | |||||
Netherlands | 2.7 | % | Ireland | 1.1 | % | |||||
Denmark | 2.5 | % | India | 0.9 | % | |||||
Brazil | 2.3 | % | Russia | 0.6 | % |
10 Certified Annual Report
| SCHEDULE OF INVESTMENTS, CONTINUED | ||
| Thornburg International Value Fund | September 30, 2011 | |
| Shares/ Principal Amount | Value | |||||||
COMMON STOCK — 90.23% | ||||||||
AUTOMOBILES & COMPONENTS — 4.14% | ||||||||
AUTOMOBILES — 4.14% | ||||||||
Hyundai Motor Co. | 2,820,953 | $ | 505,259,609 | |||||
Toyota Motor Corp. | 14,729,026 | 513,310,280 | ||||||
|
| |||||||
| 1,018,569,889 | ||||||||
|
| |||||||
BANKS — 7.14% | ||||||||
COMMERCIAL BANKS — 7.14% | ||||||||
China Merchants Bank Co. Ltd. | 161,970,732 | 249,172,942 | ||||||
Industrial & Commercial Bank of China Ltd. | 482,819,400 | 236,840,294 | ||||||
Mitsubishi UFJ Financial Group, Inc. | 107,819,900 | 494,856,017 | ||||||
Standard Chartered plc | 25,782,006 | 517,431,632 | ||||||
Turkiye Garanti Bankasi A.S. | 66,352,768 | 258,498,730 | ||||||
|
| |||||||
| 1,756,799,615 | ||||||||
|
| |||||||
CAPITAL GOODS — 6.91% | ||||||||
AEROSPACE & DEFENSE — 1.21% | ||||||||
Embraer S.A. | 5,421,345 | 137,539,523 | ||||||
Rolls-Royce Holdings plc | 17,206,482 | 159,649,209 | ||||||
INDUSTRIAL CONGLOMERATES — 2.04% | ||||||||
Siemens AG | 5,491,000 | 501,129,302 | ||||||
MACHINERY — 3.66% | ||||||||
Fanuc Ltd. | 1,889,082 | 265,250,332 | ||||||
Komatsu Ltd. | 22,586,693 | 497,533,922 | ||||||
Vallourec SA | 2,372,900 | 138,290,519 | ||||||
|
| |||||||
| 1,699,392,807 | ||||||||
|
| |||||||
CONSUMER DURABLES & APPAREL — 4.81% | ||||||||
TEXTILES, APPAREL & LUXURY GOODS — 4.81% | ||||||||
adidas AG | 8,530,124 | 523,127,333 | ||||||
LVMH Moët Hennessy Louis Vuitton SA | 3,940,056 | 526,021,399 | ||||||
Swatch Group AG | 400,680 | 133,633,676 | ||||||
|
| |||||||
| 1,182,782,408 | ||||||||
|
| |||||||
CONSUMER SERVICES — 1.54% | ||||||||
HOTELS, RESTAURANTS & LEISURE — 1.54% | ||||||||
aCarnival plc | 12,085,525 | 379,750,447 | ||||||
|
| |||||||
| 379,750,447 | ||||||||
|
| |||||||
DIVERSIFIED FINANCIALS — 5.42% | ||||||||
CAPITAL MARKETS — 2.44% | ||||||||
bCitic Securities Co. Ltd. | 11,476,300 | 19,797,795 | ||||||
Credit Suisse Group AG | 14,536,138 | 384,893,328 | ||||||
Julius Baer Group Ltd. | 5,777,758 | 195,694,142 | ||||||
DIVERSIFIED FINANCIAL SERVICES — 2.98% | ||||||||
BM&F Bovespa SA | 40,721,200 | 190,367,955 | ||||||
Hong Kong Exchanges & Clearing Ltd. | 26,157,400 | 385,942,068 | ||||||
bING Groep N.V. | 21,993,500 | 157,141,048 | ||||||
|
| |||||||
| 1,333,836,336 | ||||||||
|
| |||||||
Certified Annual Report 11
| SCHEDULE OF INVESTMENTS, CONTINUED | ||
| Thornburg International Value Fund | September 30, 2011 | |
| Shares/ Principal Amount | Value | |||||||
ENERGY — 8.74% | ||||||||
ENERGY EQUIPMENT & SERVICES — 1.88% | ||||||||
Schlumberger Ltd. | 7,730,184 | $ | 461,723,890 | |||||
OIL, GAS & CONSUMABLE FUELS — 6.86% | ||||||||
bBG Group plc | 26,546,992 | 513,948,692 | ||||||
Canadian Natural Resources Ltd. | 9,894,900 | 290,548,786 | ||||||
Cenovus Energy, Inc. | 7,442,913 | 229,203,934 | ||||||
CNOOC Ltd. | 268,418,070 | 446,708,554 | ||||||
Coal India Ltd. | 30,625,664 | 207,923,089 | ||||||
|
| |||||||
| 2,150,056,945 | ||||||||
|
| |||||||
FOOD & STAPLES RETAILING — 3.62% | ||||||||
FOOD & STAPLES RETAILING — 3.62% | ||||||||
Tesco plc | 97,762,618 | 576,265,135 | ||||||
Wal-Mart de Mexico SAB de C.V. | 137,062,200 | 314,280,108 | ||||||
|
| |||||||
| 890,545,243 | ||||||||
|
| |||||||
FOOD, BEVERAGE & TOBACCO — 5.99% | ||||||||
BEVERAGES — 1.15% | ||||||||
Sabmiller plc | 8,615,750 | 283,151,192 | ||||||
FOOD PRODUCTS — 2.43% | ||||||||
Nestlé SA | 10,790,500 | 596,429,888 | ||||||
TOBACCO — 2.41% | ||||||||
British American Tobacco plc | 13,926,446 | 592,545,876 | ||||||
|
| |||||||
| 1,472,126,956 | ||||||||
|
| |||||||
HEALTH CARE EQUIPMENT & SERVICES — 3.86% | ||||||||
HEALTH CARE EQUIPMENT & SUPPLIES — 1.02% | ||||||||
Covidien plc | 5,658,498 | 249,539,762 | ||||||
HEALTH CARE PROVIDERS & SERVICES — 2.84% | ||||||||
Fresenius Medical Care AG & Co. | 7,344,894 | 502,053,156 | ||||||
Sinopharm Group Co. H | 74,602,800 | 197,346,698 | ||||||
|
| |||||||
| 948,939,616 | ||||||||
|
| |||||||
HOUSEHOLD & PERSONAL PRODUCTS — 3.00% | ||||||||
HOUSEHOLD PRODUCTS — 2.21% | ||||||||
Reckitt Benckiser plc | 10,635,620 | 542,833,373 | ||||||
PERSONAL PRODUCTS — 0.79% | ||||||||
Natura Cosmeticos SA | 11,460,500 | 195,046,403 | ||||||
|
| |||||||
| 737,879,776 | ||||||||
|
| |||||||
INSURANCE — 2.79% | ||||||||
INSURANCE — 2.79% | ||||||||
Allianz SE | 3,508,807 | 333,107,448 | ||||||
China Life Insurance Co. | 83,335,910 | 202,256,042 | ||||||
Dai-ichi Life Insurance Co. | 144,257 | 151,869,161 | ||||||
|
| |||||||
| 687,232,651 | ||||||||
|
| |||||||
12 Certified Annual Report
| SCHEDULE OF INVESTMENTS, CONTINUED | ||
| Thornburg International Value Fund | September 30, 2011 | |
| Shares/ Principal Amount | Value | |||||||
MATERIALS — 4.74% | ||||||||
CHEMICALS — 3.29% | ||||||||
Air Liquide SA | 4,264,540 | $ | 502,666,409 | |||||
Potash Corp. of Saskatchewan, Inc. | 7,098,500 | 306,797,170 | ||||||
METALS & MINING — 1.45% | ||||||||
BHP Billiton Ltd. | 10,477,762 | 355,079,386 | ||||||
|
| |||||||
| 1,164,542,965 | ||||||||
|
| |||||||
MEDIA — 2.53% | ||||||||
MEDIA — 2.53% | ||||||||
Pearson plc | 16,108,031 | 286,103,983 | ||||||
Publicis Groupe | 7,975,402 | 335,617,218 | ||||||
|
| |||||||
| 621,721,201 | ||||||||
|
| |||||||
PHARMACEUTICALS, BIOTECHNOLOGY & LIFE SCIENCES — 7.19% | ||||||||
PHARMACEUTICALS — 7.19% | ||||||||
Bayer AG | 3,159,800 | 175,472,007 | ||||||
Novartis AG | 10,081,996 | 565,054,498 | ||||||
Novo Nordisk A/S | 5,735,512 | 574,124,292 | ||||||
Teva Pharmaceutical Industries Ltd. ADR | 12,164,900 | 452,777,578 | ||||||
|
| |||||||
| 1,767,428,375 | ||||||||
|
| |||||||
RETAILING — 3.20% | ||||||||
SPECIALTY RETAIL — 3.20% | ||||||||
Hennes & Mauritz AB | 13,523,874 | 407,410,314 | ||||||
Kingfisher plc | 98,103,317 | 380,161,215 | ||||||
|
| |||||||
| 787,571,529 | ||||||||
|
| |||||||
SEMICONDUCTORS & SEMICONDUCTOR EQUIPMENT — 1.13% | ||||||||
SEMICONDUCTORS & SEMICONDUCTOR EQUIPMENT — 1.13% | ||||||||
ARM Holdings plc | 31,717,000 | 278,951,646 | ||||||
|
| |||||||
| 278,951,646 | ||||||||
|
| |||||||
SOFTWARE & SERVICES — 5.11% | ||||||||
INTERNET SOFTWARE & SERVICES — 1.57% | ||||||||
Tencent Holdings Ltd. | 11,958,157 | 251,527,611 | ||||||
a,bYandex NV | 6,633,900 | 135,397,899 | ||||||
SOFTWARE — 3.54% | ||||||||
bCheck Point Software Technologies Ltd. | 5,340,600 | 281,770,056 | ||||||
SAP AG | 11,460,205 | 588,281,147 | ||||||
|
| |||||||
| 1,256,976,713 | ||||||||
|
| |||||||
TECHNOLOGY HARDWARE & EQUIPMENT — 3.50% | ||||||||
COMMUNICATIONS EQUIPMENT — 1.77% | ||||||||
HTC Corp. | 19,418,354 | 436,474,897 | ||||||
OFFICE ELECTRONICS — 1.73% | ||||||||
Canon, Inc. | 9,227,138 | 424,690,003 | ||||||
|
| |||||||
| 861,164,900 | ||||||||
|
| |||||||
TELECOMMUNICATION SERVICES — 3.27% | ||||||||
DIVERSIFIED TELECOMMUNICATION SERVICES — 1.68% | ||||||||
Telefonica SA | 21,332,753 | 412,274,469 | ||||||
Certified Annual Report 13
| SCHEDULE OF INVESTMENTS, CONTINUED | ||
| Thornburg International Value Fund | September 30, 2011 | |
| Shares/ Principal Amount | Value | |||||||
WIRELESS TELECOMMUNICATION SERVICES — 1.59% | ||||||||
KDDI Corp. | 56,492 | $ | 392,580,215 | |||||
|
| |||||||
| 804,854,684 | ||||||||
|
| |||||||
TRANSPORTATION — 1.60% | ||||||||
ROAD & RAIL — 1.60% | ||||||||
Canadian National Railway Co. | 5,889,800 | 393,608,831 | ||||||
|
| |||||||
| 393,608,831 | ||||||||
|
| |||||||
TOTAL COMMON STOCK (Cost $21,501,120,315) | 22,194,733,533 | |||||||
|
| |||||||
PREFERRED STOCK — 1.73% | ||||||||
AUTOMOBILES & COMPONENTS — 1.73% | ||||||||
AUTOMOBILES — 1.73% | ||||||||
Volkswagen AG Pfd | 3,186,075 | 427,067,775 | ||||||
|
| |||||||
TOTAL PREFERRED STOCK (Cost $281,726,582) | 427,067,775 | |||||||
|
| |||||||
SHORT TERM INVESTMENTS — 7.49% | ||||||||
Atmos Energy Corp., 0.22%, 10/3/2011 | $ | 90,000,000 | 89,998,900 | |||||
Atmos Energy Corp., 0.20%, 10/4/2011 | 93,400,000 | 93,398,443 | ||||||
Autozone, Inc., 0.30%, 10/3/2011 | 44,997,000 | 44,996,250 | ||||||
Centerpoint Energy, 0.27%, 10/3/2011 | 50,000,000 | 49,999,250 | ||||||
Centerpoint Energy, 0.30%, 10/7/2011 | 40,000,000 | 39,998,000 | ||||||
CVS Corp., 0.23%, 10/3/2011 | 190,000,000 | 189,997,572 | ||||||
Dairy Farmers of America, 0.30%, 10/3/2011 | 40,000,000 | 39,999,333 | ||||||
Darden Restaurants, Inc., 0.23%, 10/3/2011 | 68,300,000 | 68,299,127 | ||||||
Darden Restaurants, Inc., 0.25%, 10/4/2011 | 25,000,000 | 24,999,479 | ||||||
Darden Restaurants, Inc., 0.25%, 10/6/2011 | 75,000,000 | 74,997,396 | ||||||
DCP Midstream LLC, 0.28%, 10/3/2011 | 28,000,000 | 27,999,565 | ||||||
Devon Energy Corp., 0.17%, 10/3/2011 | 184,300,000 | 184,298,259 | ||||||
Devon Energy Corp., 0.19%, 10/3/2011 | 100,000,000 | 99,998,944 | ||||||
Devon Energy Corp., 0.17%, 10/4/2011 | 25,000,000 | 24,999,646 | ||||||
Devon Energy Corp., 0.19%, 10/4/2011 | 50,000,000 | 49,999,208 | ||||||
Devon Energy Corp., 0.20%, 10/5/2011 | 100,000,000 | 99,997,778 | ||||||
Harris Corp., 0.27%, 10/6/2011 | 23,000,000 | 22,999,138 | ||||||
Kinder Morgan Energy Partners L.P., 0.26%, 10/3/2011 | 35,000,000 | 34,999,495 | ||||||
Kinder Morgan Energy Partners L.P., 0.26%, 10/5/2011 | 30,000,000 | 29,999,133 | ||||||
Kinder Morgan Energy Partners L.P., 0.26%, 10/6/2011 | 15,000,000 | 14,999,458 | ||||||
Kinder Morgan Energy Partners L.P., 0.26%, 10/7/2011 | 30,000,000 | 29,998,700 | ||||||
Marriott International, Inc., 0.26%, 10/6/2011 | 61,400,000 | 61,397,783 | ||||||
McCormick & Co., 0.11%, 10/3/2011 | 16,000,000 | 15,999,902 | ||||||
McCormick & Co., 0.11%, 10/4/2011 | 35,000,000 | 34,999,679 | ||||||
New York City Municipal Water Finance, put 10/3/2011 (SPA: Landesbank Hessen- Thuringen) (daily demand notes), 0.25%, 6/15/2039 | 10,000,000 | 10,000,000 | ||||||
Northern Illinois Gas Corp., 0.10%, 10/3/2011 | 10,571,000 | 10,570,941 | ||||||
Oglethorpe Power Corp., 0.14%, 10/3/2011 | 23,407,000 | 23,406,818 | ||||||
Pepco Holdings, Inc., 0.50%, 10/3/2011 | 25,000,000 | 24,999,306 | ||||||
Pepco Holdings, Inc., 0.45%, 10/6/2011 | 62,300,000 | 62,296,106 | ||||||
Pepco Holdings, Inc., 0.45%, 10/7/2011 | 29,100,000 | 29,097,818 | ||||||
Questar Corp., 0.17%, 10/5/2011 | 31,000,000 | 30,999,415 | ||||||
Sherwin Williams Co., 0.14%, 10/7/2011 | 60,000,000 | 59,998,600 | ||||||
Southern California Edison, 0.28%, 10/4/2011 | 35,000,000 | 34,999,183 | ||||||
14 Certified Annual Report
| SCHEDULE OF INVESTMENTS, CONTINUED | ||
| Thornburg International Value Fund | September 30, 2011 | |
| Shares/ Principal Amount | Value | |||||||
Southern California Edison, 0.29%, 10/6/2011 | $ | 30,000,000 | $ | 29,998,792 | ||||
Southern California Edison, 0.28%, 10/3/2011 | 45,000,000 | 44,999,300 | ||||||
Spectra Energy Capital LLC, 0.25%, 10/7/2011 | 30,800,000 | 30,798,717 | ||||||
|
| |||||||
TOTAL SHORT TERM INVESTMENTS (Cost $1,841,535,434) | 1,841,535,434 | |||||||
|
| |||||||
TOTAL INVESTMENTS — 99.45% (Cost $23,624,382,331) | $ | 24,463,336,742 | ||||||
OTHER ASSETS LESS LIABILITIES — 0.55% | 135,317,525 | |||||||
|
| |||||||
NET ASSETS — 100.00% | $ | 24,598,654,267 | ||||||
|
| |||||||
Footnote Legend
| a | Investment in Affiliates - Holdings of voting securities of each portfolio company which is considered “affiliated” to the Fund under the Investment Company Act of 1940 because the Fund’s holding represented 5% or more of the company’s voting securities during the period, are shown below: |
Issuer | Shares/Principal September 30, 2010 | Gross Additions | Gross Reductions | Shares/Principal September 30, 2011 | Market Value September 30, 2011 | Investment Income | ||||||||||||||||||
Carnival plc | 11,352,925 | 732,600 | — | 12,085,525 | $ | 379,750,447 | $ | 9,969,482 | ||||||||||||||||
Sinopharm Group Co. H* | 67,089,500 | — | — | — | — | — | ||||||||||||||||||
Yandex NV** | — | 6,633,900 | — | 6,633,900 | 135,397,899 | — | ||||||||||||||||||
|
|
|
| |||||||||||||||||||||
Total non-controlled affiliated issuers – 2.09% of net assets |
| $ | 515,148,346 | $ | 9,969,482 | |||||||||||||||||||
|
|
|
| |||||||||||||||||||||
| * | Issuer not affiliated at September 30, 2011. |
| ** | Issuer not affiliated at September 30, 2010. |
| b | Non-income producing. |
Portfolio Abbreviations
To simplify the listings of securities, abbreviations are used per the table below:
| ADR | American Depository Receipt | |
| Pfd | Preferred Stock | |
| SPA | Stand-by Purchase Agreement |
See notes to financial statements.
Certified Annual Report 15
| STATEMENT OF ASSETS AND LIABILITIES | ||
| Thornburg International Value Fund | September 30, 2011 | |
ASSETS | ||||
Investments at value | ||||
Non-affiliated issuers (cost $22,894,636,724) (Note 2) | $ | 23,948,188,396 | ||
Non-controlled affiliated issuers (cost $729,745,607) (Note 2) | 515,148,346 | |||
Cash | 32,980,127 | |||
Cash denominated in foreign currency (cost $33,339,522) | 32,357,947 | |||
Receivable for fund shares sold | 88,770,227 | |||
Unrealized appreciation on forward currency contracts (Note 7) | 97,845,503 | |||
Dividends receivable | 58,542,006 | |||
Dividend and interest reclaim receivable | 17,204,281 | |||
Interest receivable | 977 | |||
Prepaid expenses and other assets | 186,924 | |||
|
| |||
Total Assets | 24,791,224,734 | |||
|
| |||
LIABILITIES | ||||
Payable for investments purchased | 102,341,604 | |||
Payable for fund shares redeemed | 61,958,308 | |||
Payable to investment advisor and other affiliates (Note 3) | 18,004,183 | |||
Deferred tax payable | 804,343 | |||
Accounts payable and accrued expenses | 6,048,798 | |||
Foreign dividend withholding tax payable | 3,393,330 | |||
Dividends payable | 19,901 | |||
|
| |||
Total Liabilities | 192,570,467 | |||
|
| |||
NET ASSETS | $ | 24,598,654,267 | ||
|
| |||
NET ASSETS CONSIST OF: | ||||
Undistributed net investment income | $ | 26,528,333 | ||
Net unrealized appreciation on investments and foreign currency translations | 933,549,981 | |||
Accumulated net realized gain (loss) | (4,289,945,893 | ) | ||
Net capital paid in on shares of beneficial interest | 27,928,521,846 | |||
|
| |||
| $ | 24,598,654,267 | |||
|
| |||
16 Certified Annual Report
| STATEMENT OF ASSETS AND LIABILITIES, CONTINUED | ||
| Thornburg International Value Fund | September 30, 2011 | |
NET ASSET VALUE: | ||||
Class A Shares: | ||||
Net asset value and redemption price per share ($5,932,896,553 applicable to 256,336,982 shares of beneficial interest outstanding - Note 4) | $ | 23.14 | ||
Maximum sales charge, 4.50% of offering price | 1.09 | |||
|
| |||
Maximum offering price per share | $ | 24.23 | ||
|
| |||
Class B Shares: | ||||
Net asset value and offering price per share* ($56,001,634 applicable to 2,584,638 shares of beneficial interest outstanding - Note 4) | $ | 21.67 | ||
|
| |||
Class C Shares: | ||||
Net asset value and offering price per share* ($1,391,173,082 applicable to 63,897,125 shares of beneficial interest outstanding - Note 4) | $ | 21.77 | ||
|
| |||
Class I Shares: | ||||
Net asset value, offering and redemption price per share ($10,942,111,784 applicable to 462,639,273 shares of beneficial interest outstanding - Note 4) | $ | 23.65 | ||
|
| |||
Class R3 Shares: | ||||
Net asset value, offering and redemption price per share ($1,270,000,211 applicable to 54,810,136 shares of beneficial interest outstanding - Note 4) | $ | 23.17 | ||
|
| |||
Class R4 Shares: | ||||
Net asset value, offering and redemption price per share ($1,296,493,021 applicable to 56,267,884 shares of beneficial interest outstanding - Note 4) | $ | 23.04 | ||
|
| |||
Class R5 Shares: | ||||
Net asset value, offering and redemption price per share ($3,709,977,982 applicable to 157,120,776 shares of beneficial interest outstanding - Note 4) | $ | 23.61 | ||
|
| |||
| * | Redemption price per share is equal to net asset value less any applicable contingent deferred sales charge. |
See notes to financial statements.
Certified Annual Report 17
| STATEMENT OF OPERATIONS | ||
| Thornburg International Value Fund | Year Ended September 30, 2011 | |
INVESTMENT INCOME: | ||||
Dividend income | ||||
Non-affiliated issuers (net of foreign taxes withheld of $60,396,660) | $ | 622,401,900 | ||
Non-controlled affiliated issuers | 9,969,482 | |||
Interest income | 2,756,196 | |||
|
| |||
Total Income | 635,127,578 | |||
|
| |||
EXPENSES: | ||||
Investment advisory fees (Note 3) | 186,543,819 | |||
Administration fees (Note 3) | ||||
Class A Shares | 9,104,986 | |||
Class B Shares | 92,437 | |||
Class C Shares | 2,177,468 | |||
Class I Shares | 5,861,270 | |||
Class R3 Shares | 1,844,806 | |||
Class R4 Shares | 1,520,822 | |||
Class R5 Shares | 1,875,398 | |||
Distribution and service fees (Note 3) | ||||
Class A Shares | 17,949,732 | |||
Class B Shares | 738,604 | |||
Class C Shares | 17,366,676 | |||
Class R3 Shares | 7,379,033 | |||
Class R4 Shares | 3,040,119 | |||
Transfer agent fees | ||||
Class A Shares | 9,956,850 | |||
Class B Shares | 122,880 | |||
Class C Shares | 2,158,570 | |||
Class I Shares | 10,092,200 | |||
Class R3 Shares | 3,206,430 | |||
Class R4 Shares | 3,583,623 | |||
Class R5 Shares | 9,325,140 | |||
Registration and filing fees | ||||
Class A Shares | 132,139 | |||
Class B Shares | 28,007 | |||
Class C Shares | 80,141 | |||
Class I Shares | 809,915 | |||
Class R3 Shares | 34,509 | |||
Class R4 Shares | 71,803 | |||
Class R5 Shares | 170,668 | |||
Custodian fees (Note 3) | 9,913,020 | |||
Professional fees | 336,140 | |||
Accounting fees | 867,565 | |||
Trustee fees | 617,550 | |||
Other expenses | 2,546,963 | |||
|
| |||
Total Expenses | 309,549,283 | |||
Less: | ||||
Expenses reimbursed by investment advisor (Note 3) | (5,754,822 | ) | ||
Fees paid indirectly (Note 3) | (31,419 | ) | ||
|
| |||
Net Expenses | 303,763,042 | |||
|
| |||
Net Investment Income | $ | 331,364,536 | ||
|
| |||
18 Certified Annual Report
| STATEMENT OF OPERATIONS, CONTINUED | ||
| Thornburg International Value Fund | Year Ended September 30, 2011 | |
REALIZED AND UNREALIZED GAIN (LOSS) | ||||
Net realized gain (loss) from: | ||||
Investments (net of foreign capital gains tax paid of $747,254) | $ | (629,117,773 | ) | |
Forward currency contracts (Note 7) | (194,146,515 | ) | ||
Foreign currency transactions | 2,682,010 | |||
|
| |||
| (820,582,278 | ) | |||
|
| |||
Net change in unrealized appreciation (depreciation) on: | ||||
Investments | ||||
Non-affiliated issuers (net of change in deferred taxes payable of $804,343) | (2,643,467,796 | ) | ||
Non-controlled affiliated issuers | (162,080,353 | ) | ||
Forward currency contracts (Note 7) | 220,597,901 | |||
Foreign currency translations | (4,542,541 | ) | ||
|
| |||
| (2,589,492,789 | ) | |||
|
| |||
Net Realized and Unrealized Loss | (3,410,075,067 | ) | ||
|
| |||
Net Decrease in Net Assets Resulting from Operations | $ | (3,078,710,531 | ) | |
|
|
See notes to financial statements.
Certified Annual Report 19
| STATEMENTS OF CHANGES IN NET ASSETS |
| Thornburg International Value Fund |
| Year Ended September 30, 2011 | Year Ended September 30, 2010 | |||||||
INCREASE (DECREASE) IN NET ASSETS FROM | ||||||||
OPERATIONS: | ||||||||
Net investment income | $ | 331,364,536 | $ | 167,111,665 | ||||
Net realized gain (loss) on investments, forward currency contracts and foreign currency transactions | (820,582,278 | ) | (658,847,770 | ) | ||||
Net unrealized appreciation (depreciation) on investments, forward currency contracts, foreign currency translations, and deferred taxes | (2,589,492,789 | ) | 2,357,581,186 | |||||
|
|
|
| |||||
Net Increase (Decrease) in Net Assets Resulting from Operations | (3,078,710,531 | ) | 1,865,845,081 | |||||
DIVIDENDS TO SHAREHOLDERS: | ||||||||
From net investment income | ||||||||
Class A Shares | (69,407,594 | ) | (38,456,122 | ) | ||||
Class B Shares | (378,403 | ) | (198,599 | ) | ||||
Class C Shares | (9,501,615 | ) | (4,699,975 | ) | ||||
Class I Shares | (161,485,921 | ) | (87,399,958 | ) | ||||
Class R3 Shares | (12,042,820 | ) | (6,932,653 | ) | ||||
Class R4 Shares | (13,798,685 | ) | (5,643,833 | ) | ||||
Class R5 Shares | (49,035,862 | ) | (20,695,344 | ) | ||||
FUND SHARE TRANSACTIONS (NOTE 4): | ||||||||
Class A Shares | (27,083,080 | ) | 889,589,596 | |||||
Class B Shares | (11,564,128 | ) | (12,642,863 | ) | ||||
Class C Shares | (77,646,803 | ) | (31,967,736 | ) | ||||
Class I Shares | 2,800,593,247 | 2,642,039,493 | ||||||
Class R3 Shares | 124,874,376 | 168,532,316 | ||||||
Class R4 Shares | 614,382,031 | 285,485,092 | ||||||
Class R5 Shares | 1,808,444,762 | 867,059,993 | ||||||
|
|
|
| |||||
Net Increase in Net Assets | 1,837,638,974 | 6,509,914,488 | ||||||
NET ASSETS: | ||||||||
Beginning of Year | 22,761,015,293 | 16,251,100,805 | ||||||
|
|
|
| |||||
End of Year | $ | 24,598,654,267 | $ | 22,761,015,293 | ||||
|
|
|
| |||||
Undistributed net investment income | $ | 26,528,333 | $ | 8,879,941 | ||||
See notes to financial statements.
20 Certified Annual Report
| NOTES TO FINANCIAL STATEMENTS | ||
| Thornburg International Value Fund | September 30, 2011 | |
NOTE 1 – ORGANIZATION
Thornburg International Value Fund, hereinafter referred to as the “Fund,” is a diversified series of Thornburg Investment Trust (the “Trust”). The Trust was organized as a Massachusetts business trust under a Declaration of Trust dated June 3, 1987 and is registered as a diversified, open-end management investment company under the Investment Company Act of 1940, as amended. The Fund is currently one of sixteen separate series of the Trust. Each series is considered to be a separate entity for financial reporting and tax purposes and bears expenses directly attributable to it. The Fund seeks long-term capital appreciation by investing in equity and debt securities of all types. As a secondary objective, the Fund also seeks some current income.
The Fund currently has seven classes of shares of beneficial interest outstanding: Class A, Class B, Class C, Institutional Class (Class I), and Retirement Classes (Class R3, Class R4, and Class R5). The Fund no longer offers Class B shares for sale. Each class of shares of the Fund represents an interest in the same portfolio of investments, except that (i) Class A shares are sold subject to a front-end sales charge collected at the time the shares are purchased and bear a service fee, (ii) Class B shares are sold at net asset value without a sales charge at the time of purchase, but are subject to a contingent deferred sales charge upon redemption and bear both a service fee and distribution fee, (iii) Class C shares are sold at net asset value without a sales charge at the time of purchase, but are subject to a contingent deferred sales charge upon redemption within one year of purchase, and bear both a service fee and a distribution fee, (iv) Class I shares are sold at net asset value without a sales charge at the time of purchase, (v) Class R3 shares are sold at net asset value without a sales charge at the time of purchase, but bear both a service fee and distribution fee, (vi) Class R4 shares are sold at net asset value without a sales charge at the time of purchase, but bear a service fee, (vii) Class R5 shares are sold at net asset value without a sales charge at the time of purchase, and (viii) the respective classes may have different reinvestment privileges and conversion rights. Additionally, the Fund may allocate among its classes certain expenses, to the extent allowable to specific classes, including transfer agent fees, government registration fees, certain printing and postage costs, and administrative and legal expenses. Currently, class specific expenses of the Fund are limited to service and distribution fees, administration fees, and certain registration and transfer agent expenses. Class B shares of the Fund outstanding for eight years will convert to Class A shares of the Fund.
NOTE 2 – SIGNIFICANT ACCOUNTING POLICIES
Significant accounting policies of the Trust are as follows:
Valuation of Investments: Portfolio securities listed or traded on a national securities exchange are valued on the valuation date at the last reported sale price on the exchange that is the primary market for the security. Portfolio securities traded on an exchange for which there has been no sale that day and other equity securities traded in the over-the-counter market are valued at the mean between the last reported bid and asked prices. Portfolio securities reported by NASDAQ are valued at the NASDAQ official closing price. Any foreign security traded on exchanges outside the United States is valued at the price of the security on the exchange that is normally the security’s primary market, as of the close of that exchange preceding the time of the Fund’s valuation.
Debt obligations held by the Fund have a primary market over the counter and are valued by an independent pricing service approved by the Trustees of the Trust. The pricing service ordinarily values debt obligations at quoted bid prices. When quotations are not available, debt obligations held by the Fund are valued at evaluated prices determined by the pricing service using methods which include consideration of yields or prices of debt obligations of comparable quality, type of issue, coupon, maturity and rating, and indications as to value from dealers and general market conditions. Short-term obligations having remaining maturities of 60 days or less are ordinarily valued at amortized cost, which approximates market value.
Quotations in foreign currencies for foreign portfolio investments are converted to U.S. dollar equivalents using the foreign exchange quotation in effect at the time of valuation.
In any case where the market value of an equity security held by the Fund is not readily available, the Trust’s valuation and pricing committee determines a fair value for the security using procedures approved by the Trustees, which may include the use of a price obtained from an independent pricing service. The pricing service ordinarily values equity securities in these instances using multi-factor models to adjust market prices based upon various inputs, including exchange data, depository receipt prices, futures and index data and other data. A security’s market value is deemed not readily available whenever the exchange or market on which the security is primarily traded is closed for the entire scheduled day of trading. Additionally, a security’s market value may be deemed not readily available under other circumstances identified by the Trustees, including when developments occurring after the most recent close of
Certified Annual Report 21
| NOTES TO FINANCIAL STATEMENTS, CONTINUED | ||
| Thornburg International Value Fund | September 30, 2011 | |
the security’s primary exchange or market, but before the most recent close of trading in Fund shares, or an unusual event or significant period of time occurring since the availability of a market quotation, create a question about the reliability of the security’s market value.
In any case where a pricing service fails to provide a price for a debt obligation held by the Fund, the valuation and pricing committee determines a fair value for the debt obligation using procedures approved by the Trustees. Additionally, in any case where management believes that a price provided by a pricing service for a debt obligation held by the Fund may be unreliable, the valuation and pricing committee decides whether or not to use the pricing service’s valuation or to determine a fair value for the debt obligation.
In determining fair value for any portfolio security or other investment, the valuation and pricing committee seeks to determine the amount that an owner of the investment might reasonably expect to receive upon a sale of the investment. However, because fair value prices are estimated prices, the valuation and pricing committee’s determination of fair value for an investment may differ from the value that would be realized by the Fund upon a sale of the investment, and that difference could be material to the Fund’s financial statements. The valuation and pricing committee’s determination of fair value for an investment may also differ from the prices obtained by other persons (including other mutual funds) for the investment.
Valuation Measurements: Various inputs are used in determining the value of the Fund’s investments. These inputs are summarized in the three levels listed below:
Level 1: Quoted prices in active markets for identical investments.
Level 2: Other significant observable inputs (including quoted prices for similar investments, interest rates, prepayment rates, credit risk, etc.).
Level 3: Significant unobservable inputs (including the Fund’s own assumptions in determining the fair value of investments).
The following table displays a summary of the inputs used to value the Fund’s net assets as of September 30, 2011. In any instance when valuation inputs from more than one level are used to determine the fair value of a specific investment, the investment is placed in the level of the table based upon the lowest level input that is significant in determining the fair value of the investment:
| Fair Value Measurements at September 30, 2011 | ||||||||||||||||
| Total | Level 1 | Level 2 | Level 3 | |||||||||||||
Assets | ||||||||||||||||
Investments in Securities* | ||||||||||||||||
Common Stock | $ | 22,194,733,533 | $ | 22,194,733,533 | $ | — | $ | — | ||||||||
Preferred Stock | 427,067,775 | 427,067,775 | — | — | ||||||||||||
Short Term Investments | 1,841,535,434 | — | 1,841,535,434 | — | ||||||||||||
|
|
|
|
|
|
|
| |||||||||
Total Investments in Securities | $ | 24,463,336,742 | $ | 22,621,801,308 | $ | 1,841,535,434 | $ | — | ||||||||
Other Financial Instruments** | ||||||||||||||||
Forward Currency Contracts | $ | 97,845,503 | $ | — | $ | 97,845,503 | $ | — | ||||||||
Liabilities | ||||||||||||||||
Other Financial Instruments** | ||||||||||||||||
Spot Currency | $ | (306,396 | ) | $ | (306,396 | ) | $ | — | $ | — | ||||||
| * | See Schedule of Investments for a summary of the industry exposure as grouped according to the Global Industry Classification Standard (GICS), which is an industry taxonomy developed by MSCI, Inc. and Standard & Poor’s (S&P). |
| ** | Other Financial Instruments include investments not reflected in the Schedule of Investments, such as futures, forwards and swap contracts, which are valued at the unrealized appreciation (depreciation) on the investment. |
22 Certified Annual Report
| NOTES TO FINANCIAL STATEMENTS, CONTINUED | ||
| Thornburg International Value Fund | September 30, 2011 | |
Other Notes: It is the policy of the Fund to recognize significant transfers between Levels 1, 2 and 3 and to disclose those transfers at the beginning of the reporting period. The Fund recognized no significant transfers between Levels for the year ended September 30, 2011.
Foreign Currency Translation: Portfolio securities and other assets and liabilities denominated in foreign currencies are translated into U.S. dollars based on the exchange rate of such currencies against the U.S. dollar on the date of valuation. Purchases and sales of securities and income items denominated in foreign currencies are translated into U.S. dollars at the exchange rate in effect on the translation date. When the Fund purchases or sells foreign securities, it will customarily enter into a foreign exchange contract to minimize foreign exchange risk from the trade date to the settlement date of such transactions. Such spot contracts are included in Receivable for investments sold and Payable for investments purchased on the Statement of Assets and Liabilities.
The Fund does not separately report the effect of changes in foreign exchange rates from changes in market prices on securities held. Such changes are included in net realized and unrealized gain or loss from investments.
Reported net realized foreign exchange gains or losses arise from purchases and sales of foreign currencies, currency gains or losses realized between the trade and settlement dates on securities transactions and the difference between the amounts of dividends, interest, and foreign withholding taxes recorded on the Fund’s books, and the U.S. dollar equivalent of the amounts actually received or paid.
Net unrealized foreign exchange gains and losses arise from changes in the fair value of assets and liabilities, other than investments in securities at fiscal period end, resulting from changes in exchange rates.
Deferred Taxes: The Fund is subject to a tax imposed on net realized gains of securities of certain foreign countries. The Fund records an estimated deferred tax liability for net unrealized gains on these securities as reflected in the accompanying financial statements.
Federal Income Taxes: It is the policy of the Trust to comply with the provisions of the Internal Revenue Code applicable to “regulated investment companies,” and to distribute to shareholders substantially all taxable income, including any net realized gain on investments of the Fund. Therefore, no provision for federal income taxes is required.
Management reviews each uncertain tax position believed to be material to the preparation of the Fund’s financial statements, to assess if it is more likely than not that the position would be sustained upon examination, based upon the technical merits of the position. As of September 30, 2011, management has not identified any such position for which a liability must be reflected in the Statement of Assets and Liabilities. The Fund’s tax returns remain subject to examination for three years after filing.
When-Issued and Delayed Delivery Transactions: The Fund may engage in when-issued or delayed delivery transactions. To the extent the Fund engages in such transactions, it will do so for the purpose of acquiring portfolio securities consistent with the Fund’s investment objectives and not for the purpose of investment leverage or to speculate on interest rate and/or market changes. At the time the Fund makes a commitment to purchase a security on a when-issued or delayed delivery basis, the Fund will record the transaction and reflect the value in determining its net asset value. When effecting such transactions, assets of an amount sufficient to make payment for the portfolio securities to be purchased will be segregated on the Fund’s records on the trade date. Securities purchased on a when-issued or delayed delivery basis do not earn interest until the settlement date.
Dividends: Dividends to shareholders, if any, are generally paid quarterly and are reinvested in additional shares of the Fund at net asset value per share at the close of business on the dividend payment date or, at the shareholder’s option, paid in cash. Net realized capital gains, to the extent available, will be distributed at least annually. Distributions to shareholders are based on income tax regulations and therefore, their characteristics may differ for financial statement and tax purposes.
General: Securities transactions are accounted for on a trade date basis. Interest income is accrued as earned and dividend income is recorded on the ex-dividend date. Certain income from foreign securities is recognized as soon as information is available to the Fund. Realized gains and losses from the sale of securities are recorded on an identified cost basis. Net investment income (other than class specific expenses) and realized and unrealized gains and losses are allocated daily to each class of shares based upon the relative net asset value of outstanding shares of each class of shares at the beginning of the day (after adjusting for the current share activity of
Certified Annual Report 23
| NOTES TO FINANCIAL STATEMENTS, CONTINUED | ||
| Thornburg International Value Fund | September 30, 2011 | |
the respective class). Expenses common to all Funds are allocated among the Funds comprising the Trust based upon their relative net asset values or other appropriate allocation methods.
Guarantees and Indemnifications: Under the Trust’s organizational documents, its officers and Trustees are indemnified against certain liabilities arising out of the performance of their duties to the Fund. Additionally, in the normal course of business the Trust enters into contracts with service providers that contain general indemnification clauses. The Trust’s maximum exposure under these arrangements is unknown. However, based on experience, the Trust expects the risk of loss to be remote.
Use of Estimates: The preparation of financial statements, in conformity with generally accepted accounting principles, requires management to make estimates and assumptions that affect the reported amounts of assets and liabilities and the disclosure of contingent assets and liabilities at the date of the financial statements and the reported amounts of increases and decreases in net assets from operations during the reporting period. Actual results could differ from those estimates.
NOTE 3 – INVESTMENT ADVISORY FEE AND OTHER TRANSACTIONS WITH AFFILIATES
Pursuant to an investment advisory agreement, Thornburg Investment Management, Inc. (the “Advisor”) serves as the investment advisor and performs services to the Fund for which the fees are payable at the end of each month. For the year ended September 30, 2011, these fees were payable at annual rates ranging from .875 of 1% to .675 of 1% per annum of the average daily net assets of the Fund depending on the Fund’s asset size. The Trust also has entered into administrative services agreements with the Advisor, whereby the Advisor will perform certain administrative services for the shareholders of each class of the Fund’s shares, and for which fees will be payable at an annual rate of up to .125 of 1% per annum of the average daily net assets attributable to each class of shares. For the year ended September 30, 2011, the Advisor contractually reimbursed certain class specific expenses, administrative fees, and distribution fees of $1,939,788 for Class R3 shares, $1,971,397 for Class R4 shares, and $1,843,637 for Class R5 shares.
The Trust has an underwriting agreement with Thornburg Securities Corporation (the “Distributor,” an affiliate of the Advisor), which acts as the distributor of the Fund’s shares. For the year ended September 30, 2011, the Distributor has advised the Fund that it earned net commissions aggregating $361,300 from the sale of Class A shares, and collected contingent deferred sales charges aggregating $135,244 from redemptions of Class C shares of the Fund.
Pursuant to a service plan under Rule 12b-1 of the Investment Company Act of 1940, the Fund may reimburse to the Advisor an amount not to exceed .25 of 1% per annum of the average daily net assets attributable to each class of shares of the Fund for payments made by the Advisor to securities dealers and other financial institutions to obtain various shareholder and distribution related services. For the year ended September 30, 2011, there were no 12b-1 service plan fees charged for Class I and R5 shares. The Advisor may pay out of its own resources additional expenses for distribution of the Fund’s shares.
The Trust has also adopted distribution plans pursuant to Rule 12b-1, applicable only to the Fund’s Class B, Class C, and Class R3 shares, under which the Fund compensates the Distributor for services in promoting the sale of Class B, Class C, and Class R3 shares of the Fund at an annual rate of up to .75 of 1% per annum of the average daily net assets attributable to Class B and Class C shares, and an annual rate of up to .25 of 1% per annum of the average daily net assets attributable to Class R3 shares. Total fees incurred by the Distributor for each class of shares of the Fund under their respective Service and Distribution Plans for the year ended September 30, 2011, are set forth in the Statement of Operations.
The Trust has an agreement with the custodian bank to indirectly pay a portion of the custodian’s fees through credits earned by the Fund’s cash on deposit with the bank. This deposit agreement is an alternative to overnight investments. Custodial fees have been adjusted to reflect amounts that would have been paid without this agreement, with a corresponding adjustment reflected as fees paid indirectly in the Statement of Operations. For the year ended September 30, 2011, fees paid indirectly were $31,419.
Certain officers and Trustees of the Trust are also officers or directors of the Advisor and Distributor. The compensation of independent Trustees is borne by the Trust.
24 Certified Annual Report
| NOTES TO FINANCIAL STATEMENTS, CONTINUED | ||
| Thornburg International Value Fund | September 30, 2011 | |
NOTE 4 – SHARES OF BENEFICIAL INTEREST
At September 30, 2011, there were an unlimited number of shares of beneficial interest authorized. Transactions in shares of beneficial interest were as follows:
| Year Ended September 30, 2011 | Year Ended September 30, 2010 | |||||||||||||||
| Shares | Amount | Shares | Amount | |||||||||||||
Class A Shares | ||||||||||||||||
Shares sold | 73,641,249 | $ | 2,053,810,641 | 98,256,291 | $ | 2,406,532,000 | ||||||||||
Shares issued to shareholders in reinvestment of dividends | 2,281,219 | 60,621,181 | 1,284,114 | 31,575,504 | ||||||||||||
Shares repurchased | (77,421,500 | ) | (2,141,570,376 | ) | (63,800,486 | ) | (1,548,569,721 | ) | ||||||||
Redemption fees received* | — | 55,474 | — | 51,813 | ||||||||||||
|
|
|
|
|
|
|
| |||||||||
Net increase (decrease) | (1,499,032 | ) | $ | (27,083,080 | ) | 35,739,919 | $ | 889,589,596 | ||||||||
|
|
|
|
|
|
|
| |||||||||
Class B Shares | ||||||||||||||||
Shares sold | 24,956 | $ | 650,315 | 49,186 | $ | 1,143,298 | ||||||||||
Shares issued to shareholders in reinvestment of dividends | 10,266 | 258,925 | 5,827 | 132,783 | ||||||||||||
Shares repurchased | (482,497 | ) | (12,473,928 | ) | (609,378 | ) | (13,919,631 | ) | ||||||||
Redemption fees received* | — | 560 | — | 687 | ||||||||||||
|
|
|
|
|
|
|
| |||||||||
Net increase (decrease) | (447,275 | ) | $ | (11,564,128 | ) | (554,365 | ) | $ | (12,642,863 | ) | ||||||
|
|
|
|
|
|
|
| |||||||||
Class C Shares | ||||||||||||||||
Shares sold | 10,625,165 | $ | 281,685,590 | 12,441,045 | $ | 288,168,162 | ||||||||||
Shares issued to shareholders in reinvestment of dividends | 251,558 | 6,347,965 | 134,652 | 3,080,176 | ||||||||||||
Shares repurchased | (13,969,796 | ) | (365,693,606 | ) | (14,084,287 | ) | (323,230,328 | ) | ||||||||
Redemption fees received* | — | 13,248 | — | 14,254 | ||||||||||||
|
|
|
|
|
|
|
| |||||||||
Net increase (decrease) | (3,093,073 | ) | $ | (77,646,803 | ) | (1,508,590 | ) | $ | (31,967,736 | ) | ||||||
|
|
|
|
|
|
|
| |||||||||
Class I Shares | ||||||||||||||||
Shares sold | 194,033,971 | $ | 5,513,907,653 | 170,443,043 | $ | 4,255,830,103 | ||||||||||
Shares issued to shareholders in reinvestment of dividends | 3,752,040 | 101,301,163 | 2,095,554 | 52,935,805 | ||||||||||||
Shares repurchased | (99,981,535 | ) | (2,814,706,076 | ) | (66,945,828 | ) | (1,666,796,964 | ) | ||||||||
Redemption fees received* | — | 90,507 | — | 70,549 | ||||||||||||
|
|
|
|
|
|
|
| |||||||||
Net increase (decrease) | 97,804,476 | $ | 2,800,593,247 | 105,592,769 | $ | 2,642,039,493 | ||||||||||
|
|
|
|
|
|
|
| |||||||||
Class R3 Shares | ||||||||||||||||
Shares sold | 21,235,494 | $ | 595,512,797 | 20,220,086 | $ | 495,436,244 | ||||||||||
Shares issued to shareholders in reinvestment of dividends | 419,283 | 11,084,705 | 252,563 | 6,217,484 | ||||||||||||
Shares repurchased | (17,189,759 | ) | (481,734,413 | ) | (13,635,248 | ) | (333,131,790 | ) | ||||||||
Redemption fees received* | — | 11,287 | — | 10,378 | ||||||||||||
|
|
|
|
|
|
|
| |||||||||
Net increase (decrease) | 4,465,018 | $ | 124,874,376 | 6,837,401 | $ | 168,532,316 | ||||||||||
|
|
|
|
|
|
|
| |||||||||
Certified Annual Report 25
| NOTES TO FINANCIAL STATEMENTS, CONTINUED | ||
| Thornburg International Value Fund | September 30, 2011 | |
| Year Ended September 30, 2011 | Year Ended September 30, 2010 | |||||||||||||||
| Shares | Amount | Shares | Amount | |||||||||||||
Class R4 Shares | ||||||||||||||||
Shares sold | 33,293,650 | $ | 912,509,372 | 20,306,284 | $ | 494,190,744 | ||||||||||
Shares issued to shareholders in reinvestment of dividends | 411,028 | 10,732,605 | 166,103 | 4,086,982 | ||||||||||||
Shares repurchased | (11,111,297 | ) | (308,869,392 | ) | (8,731,380 | ) | (212,798,772 | ) | ||||||||
Redemption fees received* | — | 9,446 | — | 6,138 | ||||||||||||
|
|
|
|
|
|
|
| |||||||||
Net increase (decrease) | 22,593,381 | $ | 614,382,031 | 11,741,007 | $ | 285,485,092 | ||||||||||
|
|
|
|
|
|
|
| |||||||||
Class R5 Shares | ||||||||||||||||
Shares sold | 86,461,533 | $ | 2,440,528,039 | 47,990,020 | $ | 1,194,175,209 | ||||||||||
Shares issued to shareholders in reinvestment of dividends | 1,721,328 | 46,512,270 | 768,879 | 19,399,053 | ||||||||||||
Shares repurchased | (23,871,556 | ) | (678,624,509 | ) | (13,949,845 | ) | (346,531,210 | ) | ||||||||
Redemption fees received* | — | 28,962 | — | 16,941 | ||||||||||||
|
|
|
|
|
|
|
| |||||||||
Net increase (decrease) | 64,311,305 | $ | 1,808,444,762 | 34,809,054 | $ | 867,059,993 | ||||||||||
|
|
|
|
|
|
|
| |||||||||
| * | The Fund charges a redemption fee of 1% of the Class A and Class I shares redeemed or exchanged within 30 days of purchase. Redemption fees charged to any class are allocated to all classes upon receipt of payment based on relative net asset values of each class or other appropriate allocation methods. |
NOTE 5 – SECURITIES TRANSACTIONS
For the year ended September 30, 2011, the Fund had purchase and sale transactions of investment securities (excluding short-term investments) of $9,425,445,246 and $5,374,126,813, respectively.
NOTE 6 – INCOME TAXES
At September 30, 2011, information on the tax components of capital is as follows:
Cost of investments for tax purposes | $ | 23,663,338,074 | ||
|
| |||
Gross unrealized appreciation on a tax basis | $ | 2,948,563,575 | ||
Gross unrealized depreciation on a tax basis | (2,148,564,907 | ) | ||
|
| |||
Net unrealized appreciation (depreciation) on investments (tax basis) | $ | 799,998,668 | ||
|
| |||
Distributable earnings - ordinary income (tax basis) | $ | 26,294,183 |
At September 30, 2011, the Fund had deferred tax basis capital losses occurring subsequent to October 31, 2010 of $554,714,247. For tax purposes, such losses will be reflected in the year ending September 30, 2012.
26 Certified Annual Report
| NOTES TO FINANCIAL STATEMENTS, CONTINUED | ||
| Thornburg International Value Fund | September 30, 2011 | |
At September 30, 2011, the Fund had tax basis capital losses, which may be carried forward to offset future capital gains. To the extent such carryforwards are used, capital gain distributions may be reduced to the extent provided by regulations.
Such capital loss carryforwards expire as follows:
2017 | $ | 1,052,728,465 | ||
2018 | 1,792,171,182 | |||
2019 | 753,530,754 | |||
|
| |||
| $ | 3,598,430,401 | |||
|
|
The Regulated Investment Company Modernization Act of 2010 (the “Act”) was signed into law on December 22, 2010. The Act makes changes to a number of tax rules impacting the Fund. Under the Act, future capital losses generated by the Fund may be carried over indefinitely, but these losses must be used prior to the utilization of any pre-enactment capital losses. Since pre-enactment capital losses may only be carried forward for eight years, there may be a greater likelihood that all or a portion of a Fund’s pre-enactment capital losses will expire unused. In general, the provisions of the Act will be effective for the Fund’s fiscal year ending September 30, 2012.
In order to account for permanent book/tax differences, the Fund increased undistributed net investment income by $1,934,756 and increased accumulated net realized loss by $1,934,756. This reclassification has no impact on the net asset value of the Fund. Reclassifications result primarily from foreign currency gains (losses) and foreign capital gain taxes paid.
The tax character of distributions paid for the years ended September 30, 2011, and September 30, 2010, was as follows:
| 2011 | 2010 | |||||||
Distributions from: | ||||||||
Ordinary income | $ | 315,650,900 | $ | 164,026,484 | ||||
Capital gains | — | — | ||||||
|
|
|
| |||||
Total Distributions | $ | 315,650,900 | $ | 164,026,484 | ||||
|
|
|
| |||||
NOTE 7 – DERIVATIVE FINANCIAL INSTRUMENTS WITH OFF-BALANCE SHEET RISK AND FOREIGN INVESTMENT RISK
The Fund may use a variety of derivative financial instruments to hedge or adjust the risks affecting its investment portfolio or to enhance investment returns. Provisions of FASB Accounting Standards Codification ASC 815-10-50 (“ASC 815”), require certain disclosures. The disclosures are intended to provide users of financial statements with an understanding of the use of derivative instruments by the Fund and how these derivatives affect the financial position, financial performance and cash flows of the Fund. The Fund does not designate any derivative instruments as hedging instruments under ASC 815. During the year ended September 30, 2011, the Fund’s principal exposure to derivative financial instruments of the type addressed by ASC 815 was investment in foreign exchange contracts. A foreign exchange contract is an agreement between two parties to exchange different currencies at a specified rate of exchange at an agreed upon future date. Foreign exchange contracts involve risks to the Fund, including the risk that a contract counterparty will not meet its obligations to the Fund, the risk that a change in a contract’s value may not correlate perfectly with the currency the contract was intended to track, and the risk that the Fund’s advisor is unable to correctly implement its strategy in using a contract. In any such instance, the Fund may not achieve the intended benefit of entering into a contract, and may experience a loss. Additionally, the Fund’s risk of loss may exceed the amounts recognized on the Statement of Assets and Liabilities.
The Fund entered into forward currency contracts during the year ended September 30, 2011 in the normal course of pursuing its investment objectives, in anticipation of purchasing foreign investments or with the intent of reducing the risk to the value of the Fund’s foreign investments from adverse changes in the relationship between the U.S. dollar and foreign currencies. In each case these contracts have been initiated in conjunction with foreign investment transactions.
Certified Annual Report 27
| NOTES TO FINANCIAL STATEMENTS, CONTINUED | ||
| Thornburg International Value Fund | September 30, 2011 | |
These contracts are accounted for by the Fund under ASC 815. Unrealized gains and unrealized losses on outstanding contracts are reported in the Fund’s Statement of Assets and Liabilities at the Fund’s net equity, as measured by the difference between the forward exchange rates at the reporting date and the forward exchange rates at each contract’s inception date. Net realized gain (loss) on contracts closed during the period, and changes in net unrealized appreciation (depreciation) on outstanding contracts are recognized in the Fund’s Statement of Operations. Values of open currency contracts are indicative of the activity for the year ended September 30, 2011.
The following table displays the outstanding forward currency contracts at September 30, 2011:
Outstanding Forward Currency Contracts
to Buy or Sell at September 30, 2011
Contract Description | Buy/Sell | Contract Amount | Contract Value Date | Value USD | Unrealized Appreciation | Unrealized Depreciation | ||||||||||||||||
Euro | Sell | 552,269,300 | 11/09/2011 | 739,719,923 | $ | 51,748,256 | $ | — | ||||||||||||||
Euro | Sell | 475,076,900 | 11/09/2011 | 636,326,966 | 46,097,247 | — | ||||||||||||||||
|
|
|
| |||||||||||||||||||
Total | $ | 97,845,503 | $ | — | ||||||||||||||||||
|
|
|
| |||||||||||||||||||
The unrealized appreciation (depreciation) of the outstanding forward currency contracts recognized in the Fund’s Statement of Assets and Liabilities at September 30, 2011 is disclosed in the following table:
Fair Values of Derivative Financial Instruments
at September 30, 2011
Asset Derivatives | Balance Sheet Location | Fair Value | ||||
Foreign exchange contracts | Assets - Unrealized appreciation on forward currency contracts | $ | 97,845,503 | |||
The realized gains (losses) from forward currency contracts, and the change in unrealized appreciation (depreciation) of outstanding forward currency contracts recognized in the Fund’s Statement of Operations for the year ended September 30, 2011 are disclosed in the following tables:
Amount of Realized Gain (Loss)
on Derivative Financial Instruments Recognized in
Income for the Year Ended September 30, 2011
| Total | Forward Currency Contracts | |||||||
Foreign exchange contracts | $ | (194,146,515 | ) | $ | (194,146,515 | ) | ||
Change in Unrealized Appreciation (Depreciation)
of Derivative Financial Instruments Recognized in
Income for the Year Ended September 30, 2011
| Total | Forward Currency Contracts | |||||||
Foreign exchange contracts | $ | 220,597,901 | $ | 220,597,901 | ||||
OTHER NOTES:
Risks: The Fund’s investments subject it to risks including, but not limited to, management risk, market and economic risk, risks affecting specific issuers, liquidity risk, the risks associated with investments in smaller companies and non-U.S. issuers, credit risk, and interest rate risk. Please see the Fund’s prospectus for a discussion of the risks associated with an investment in the Fund.
Subsequent Events: Fund management believes no events have occurred between September 30, 2011 and the date of issuance of the financial statements, which require adjustment to, or disclosure in the accompanying financial statements.
28 Certified Annual Report
This page intentionally left blank.
Certified Annual Report 29
Thornburg International Value Fund
| PER SHARE PERFORMANCE (for a share outstanding throughout the Year)+ | RATIOS TO AVERAGE NET ASSETS | SUPPLEMENTAL DATA | ||||||||||||||||||||||||||||||||||||||||||||||||||||||||||
Unless | Net Asset Value Beginning of Year | Net Investment Income (Loss) | Net Realized & Unrealized Gain (Loss) on Investments | Total from Investment Operations | Dividends from Net Investment Income | Dividends from Net Realized Gains | Total Dividends | Net Asset Value End of Year | Net Investment Income (Loss) (%) | Expenses, After Expense Reductions (%) | Expenses, After Expense Reductions and Net of Custody Credits (%) | Expenses, Before Expense Reductions (%) | Total Return (%)(a) | Portfolio Turnover Rate (%) | Net Assets at End of Year (Thousands) | |||||||||||||||||||||||||||||||||||||||||||||
Class A Shares |
| |||||||||||||||||||||||||||||||||||||||||||||||||||||||||||
2011(b) | $ | 26.00 | 0.30 | (2.89 | ) | (2.59 | ) | (0.27 | ) | — | (0.27 | ) | $ | 23.14 | 1.06 | 1.25 | 1.25 | 1.25 | (10.10 | ) | 20.78 | $ | 5,932,896 | |||||||||||||||||||||||||||||||||||||
2010(b) | $ | 23.91 | 0.18 | 2.07 | 2.25 | (0.16 | ) | — | (0.16 | ) | $ | 26.00 | 0.72 | 1.33 | 1.33 | 1.33 | 9.43 | 22.26 | $ | 6,704,550 | ||||||||||||||||||||||||||||||||||||||||
2009(b) | $ | 23.68 | 0.21 | 0.24 | 0.45 | (0.22 | ) | — | (0.22 | ) | $ | 23.91 | 1.09 | 1.34 | 1.34 | 1.34 | 2.05 | 32.76 | $ | 5,309,704 | ||||||||||||||||||||||||||||||||||||||||
2008(b) | $ | 36.09 | 0.37 | (9.59 | ) | (9.22 | ) | (0.31 | ) | (2.88 | ) | (3.19 | ) | $ | 23.68 | 1.23 | 1.28 | 1.28 | 1.28 | (27.77 | ) | 27.31 | $ | 5,510,070 | ||||||||||||||||||||||||||||||||||||
2007(b) | $ | 26.51 | 0.27 | 10.25 | 10.52 | (0.29 | ) | (0.65 | ) | (0.94 | ) | $ | 36.09 | 0.88 | 1.29 | 1.29 | 1.29 | 40.64 | 64.77 | $ | 7,111,205 | |||||||||||||||||||||||||||||||||||||||
Class B Shares |
| |||||||||||||||||||||||||||||||||||||||||||||||||||||||||||
2011 | $ | 24.43 | 0.05 | (2.67 | ) | (2.62 | ) | (0.14 | ) | — | (0.14 | ) | $ | 21.67 | 0.21 | 2.06 | 2.06 | 2.06 | (10.80 | ) | 20.78 | $ | 56,002 | |||||||||||||||||||||||||||||||||||||
2010 | $ | 22.56 | (0.02 | ) | 1.95 | 1.93 | (0.06 | ) | — | (0.06 | ) | $ | 24.43 | (0.10 | ) | 2.10 | 2.10 | 2.10 | 8.59 | 22.26 | $ | 74,083 | ||||||||||||||||||||||||||||||||||||||
2009 | $ | 22.37 | 0.05 | 0.22 | 0.27 | (0.08 | ) | — | (0.08 | ) | $ | 22.56 | 0.29 | 2.13 | 2.13 | 2.13 | 1.24 | 32.76 | $ | 80,908 | ||||||||||||||||||||||||||||||||||||||||
2008 | $ | 34.33 | 0.13 | (9.06 | ) | (8.93 | ) | (0.15 | ) | (2.88 | ) | (3.03 | ) | $ | 22.37 | 0.44 | 2.04 | 2.04 | 2.04 | (28.33 | ) | 27.31 | $ | 98,541 | ||||||||||||||||||||||||||||||||||||
2007 | $ | 25.28 | 0.03 | 9.75 | 9.78 | (0.08 | ) | (0.65 | ) | (0.73 | ) | $ | 34.33 | 0.11 | 2.06 | 2.06 | 2.06 | 39.55 | 64.77 | $ | 135,486 | |||||||||||||||||||||||||||||||||||||||
Class C Shares |
| |||||||||||||||||||||||||||||||||||||||||||||||||||||||||||
2011 | $ | 24.54 | 0.08 | (2.70 | ) | (2.62 | ) | (0.15 | ) | — | (0.15 | ) | $ | 21.77 | 0.31 | 1.99 | 1.99 | 1.99 | (10.78 | ) | 20.78 | $ | 1,391,173 | |||||||||||||||||||||||||||||||||||||
2010 | $ | 22.65 | (0.01 | ) | 1.97 | 1.96 | (0.07 | ) | — | (0.07 | ) | $ | 24.54 | (0.03 | ) | 2.06 | 2.06 | 2.06 | 8.67 | 22.26 | $ | 1,643,753 | ||||||||||||||||||||||||||||||||||||||
2009 | $ | 22.46 | 0.06 | 0.22 | 0.28 | (0.09 | ) | — | (0.09 | ) | $ | 22.65 | 0.34 | 2.06 | 2.06 | 2.06 | 1.31 | 32.76 | $ | 1,551,488 | ||||||||||||||||||||||||||||||||||||||||
2008 | $ | 34.45 | 0.15 | (9.10 | ) | (8.95 | ) | (0.16 | ) | (2.88 | ) | (3.04 | ) | $ | 22.46 | 0.50 | 2.00 | 2.00 | 2.00 | (28.28 | ) | 27.31 | $ | 1,852,185 | ||||||||||||||||||||||||||||||||||||
2007 | $ | 25.37 | 0.05 | 9.78 | 9.83 | (0.10 | ) | (0.65 | ) | (0.75 | ) | $ | 34.45 | 0.17 | 2.01 | 2.01 | 2.01 | 39.63 | 64.77 | $ | 2,309,487 | |||||||||||||||||||||||||||||||||||||||
Class I Shares |
| |||||||||||||||||||||||||||||||||||||||||||||||||||||||||||
2011 | $ | 26.57 | 0.41 | (2.96 | ) | (2.55 | ) | (0.37 | ) | — | (0.37 | ) | $ | 23.65 | 1.45 | 0.88 | 0.88 | 0.88 | (9.77 | ) | 20.78 | $ | 10,942,112 | |||||||||||||||||||||||||||||||||||||
2010 | $ | 24.42 | 0.29 | 2.11 | 2.40 | (0.25 | ) | — | (0.25 | ) | $ | 26.57 | 1.17 | 0.92 | 0.92 | 0.92 | 9.90 | 22.26 | $ | 9,693,445 | ||||||||||||||||||||||||||||||||||||||||
2009 | $ | 24.18 | 0.31 | 0.24 | 0.55 | (0.31 | ) | — | (0.31 | ) | $ | 24.42 | 1.54 | 0.92 | 0.92 | 0.92 | 2.46 | 32.76 | $ | 6,330,268 | ||||||||||||||||||||||||||||||||||||||||
2008 | $ | 36.77 | 0.51 | (9.79 | ) | (9.28 | ) | (0.43 | ) | (2.88 | ) | (3.31 | ) | $ | 24.18 | 1.64 | 0.89 | 0.89 | 0.89 | (27.45 | ) | 27.31 | $ | 5,152,506 | ||||||||||||||||||||||||||||||||||||
2007 | $ | 26.99 | 0.41 | 10.42 | 10.83 | (0.40 | ) | (0.65 | ) | (1.05 | ) | $ | 36.77 | 1.32 | 0.90 | 0.90 | 0.90 | 41.17 | 64.77 | $ | 5,113,109 | |||||||||||||||||||||||||||||||||||||||
Class R3 Shares |
| |||||||||||||||||||||||||||||||||||||||||||||||||||||||||||
2011 | $ | 26.04 | 0.24 | (2.89 | ) | (2.65 | ) | (0.22 | ) | — | (0.22 | ) | $ | 23.17 | 0.86 | 1.45 | 1.45 | 1.58 | (10.27 | ) | 20.78 | $ | 1,270,000 | |||||||||||||||||||||||||||||||||||||
2010 | $ | 23.96 | 0.15 | 2.07 | 2.22 | (0.14 | ) | — | (0.14 | ) | $ | 26.04 | 0.61 | 1.45 | 1.45 | 1.63 | 9.30 | 22.26 | $ | 1,311,041 | ||||||||||||||||||||||||||||||||||||||||
2009 | $ | 23.73 | 0.20 | 0.23 | 0.43 | (0.20 | ) | — | (0.20 | ) | $ | 23.96 | 1.02 | 1.45 | 1.45 | 1.64 | 1.96 | 32.76 | $ | 1,042,248 | ||||||||||||||||||||||||||||||||||||||||
2008 | $ | 36.18 | 0.33 | (9.63 | ) | (9.30 | ) | (0.27 | ) | (2.88 | ) | (3.15 | ) | $ | 23.73 | 1.07 | 1.45 | 1.45 | 1.62 | (27.90 | ) | 27.31 | $ | 902,150 | ||||||||||||||||||||||||||||||||||||
2007 | $ | 26.58 | 0.23 | 10.26 | 10.49 | (0.24 | ) | (0.65 | ) | (0.89 | ) | $ | 36.18 | 0.75 | 1.45 | 1.45 | 1.61 | 40.43 | 64.77 | $ | 984,587 | |||||||||||||||||||||||||||||||||||||||
Class R4 Shares |
| |||||||||||||||||||||||||||||||||||||||||||||||||||||||||||
2011 | $ | 25.90 | 0.31 | (2.89 | ) | (2.58 | ) | (0.28 | ) | — | (0.28 | ) | $ | 23.04 | 1.12 | 1.25 | 1.25 | 1.41 | (10.11 | ) | 20.78 | $ | 1,296,493 | |||||||||||||||||||||||||||||||||||||
2010 | $ | 23.82 | 0.21 | 2.05 | 2.26 | (0.18 | ) | — | (0.18 | ) | $ | 25.90 | 0.85 | 1.25 | 1.25 | 1.49 | 9.53 | 22.26 | $ | 872,122 | ||||||||||||||||||||||||||||||||||||||||
2009 | $ | 23.60 | 0.26 | 0.21 | 0.47 | (0.25 | ) | — | (0.25 | ) | $ | 23.82 | 1.29 | 1.25 | 1.25 | 1.50 | 2.16 | 32.76 | $ | 522,363 | ||||||||||||||||||||||||||||||||||||||||
2008 | $ | 36.02 | 0.44 | (9.62 | ) | (9.18 | ) | (0.36 | ) | (2.88 | ) | (3.24 | ) | $ | 23.60 | 1.51 | 1.25 | 1.25 | 1.40 | (27.73 | ) | 27.31 | $ | 231,960 | ||||||||||||||||||||||||||||||||||||
2007(c) | $ | 28.86 | 0.09 | 7.36 | 7.45 | (0.29 | ) | — | (0.29 | ) | $ | 36.02 | 0.42 | (d) | 1.25 | (d) | 1.25 | (d) | 1.70 | (d) | 25.90 | 64.77 | $ | 39,217 | ||||||||||||||||||||||||||||||||||||
Class R5 Shares |
| |||||||||||||||||||||||||||||||||||||||||||||||||||||||||||
2011 | $ | 26.53 | 0.40 | (2.98 | ) | (2.58 | ) | (0.34 | ) | — | (0.34 | ) | $ | 23.61 | 1.39 | 0.99 | 0.99 | 1.04 | (9.88 | ) | 20.78 | $ | 3,709,978 | |||||||||||||||||||||||||||||||||||||
2010 | $ | 24.38 | 0.28 | 2.11 | 2.39 | (0.24 | ) | — | (0.24 | ) | $ | 26.53 | 1.11 | 0.99 | 0.99 | 1.08 | 9.86 | 22.26 | $ | 2,462,021 | ||||||||||||||||||||||||||||||||||||||||
2009 | $ | 24.14 | 0.30 | 0.23 | 0.53 | (0.29 | ) | — | (0.29 | ) | $ | 24.38 | 1.51 | 0.99 | 0.99 | 1.08 | 2.40 | 32.76 | $ | 1,414,122 | ||||||||||||||||||||||||||||||||||||||||
2008 | $ | 36.74 | 0.50 | (9.81 | ) | (9.31 | ) | (0.41 | ) | (2.88 | ) | (3.29 | ) | $ | 24.14 | 1.65 | 0.99 | 0.99 | 1.01 | (27.54 | ) | 27.31 | $ | 944,582 | ||||||||||||||||||||||||||||||||||||
2007 | $ | 26.97 | 0.43 | 10.39 | 10.82 | (0.40 | ) | (0.65 | ) | (1.05 | ) | $ | 36.74 | 1.33 | 0.94 | 0.94 | 0.95 | 41.13 | 64.77 | $ | 450,944 | |||||||||||||||||||||||||||||||||||||||
| (a) | Not annualized for periods less than one year. |
| (b) | Sales loads are not reflected in computing total return. |
| (c) | Effective date of this class of shares was February 1, 2007. |
| (d) | Annualized. |
| + | Based on weighted average shares outstanding. |
See notes to financial statements.
| 30 Certified Annual Report | Certified Annual Report 31 |
REPORT OF INDEPENDENT REGISTERED PUBLIC ACCOUNTING FIRM
Thornburg International Value Fund
To the Trustees and Shareholders of
Thornburg International Value Fund
In our opinion, the accompanying statement of assets and liabilities, including the schedule of investments, and the related statements of operations and of changes in net assets and the financial highlights present fairly, in all material respects, the financial position of Thornburg International Value Fund (one of the portfolios constituting Thornburg Investment Trust, hereafter referred to as the “Fund”) at September 30, 2011, the results of its operations for the year then ended, the changes in its net assets for each of the two years in the period then ended and the financial highlights for each of the periods presented, in conformity with accounting principles generally accepted in the United States of America. These financial statements and financial highlights (hereafter referred to as “financial statements”) are the responsibility of the Fund’s management. Our responsibility is to express an opinion on these financial statements based on our audits. We conducted our audits of these financial statements in accordance with the standards of the Public Company Accounting Oversight Board (United States). Those standards require that we plan and perform the audit to obtain reasonable assurance about whether the financial statements are free of material misstatement. An audit includes examining, on a test basis, evidence supporting the amounts and disclosures in the financial statements, assessing the accounting principles used and significant estimates made by management, and evaluating the overall financial statement presentation. We believe that our audits, which included confirmation of securities at September 30, 2011 by correspondence with the custodian and brokers, provide a reasonable basis for our opinion.
PricewaterhouseCoopers LLP
New York, New York
November 21, 2011
32 Certified Annual Report
| EXPENSE EXAMPLE | ||
| Thornburg International Value Fund | September 30, 2011 (Unaudited) | |
As a shareholder of the Fund, you incur two types of costs:
| (1) | transaction costs, including |
(a) sales charges (loads) on purchase payments for Class A shares;
(b) a deferred sales charge on redemptions of any part or all of a purchase of $1 million of Class A shares within 12 months of purchase;
(c) a deferred sales charge on redemptions of Class B shares within eight years of purchase;
(d) a deferred sales charge on redemptions of Class C shares within 12 months of purchase;
(e) a 30-day redemption fee on Class A and Class I shares;
| (2) | ongoing costs, including management fees; distribution and/or service (12b-1) fees; and other Fund expenses. |
This example is intended to help you understand your ongoing costs (in dollars) of investing in the Fund and to compare these costs with the ongoing costs of investing in other mutual funds.
The example is based on a $1,000 investment beginning on April 1, 2011, and held until September 30, 2011.
ACTUAL EXPENSES
For each class of shares, the first line of the table at right provides information about actual account values and actual expenses. You may use the information in this line, together with the amount you invested, to estimate the expenses that you paid over the period. Simply divide your account value by $1,000 (for example, an $8,600 account value divided by $1,000 = 8.6), then multiply the result by the number in the first line for your class of shares under the heading entitled “Expenses Paid During Period” to estimate the expenses you paid on your account during this period.
HYPOTHETICAL EXAMPLE FOR COMPARISON PURPOSES
For each class of shares, the second line of the table at right provides information about hypothetical account values and hypothetical expenses based on the Fund’s actual expense ratio and an assumed rate of return of 5% per year before expenses, which is not the Fund’s actual return. The hypothetical account values and expenses may not be used to estimate the actual ending account balance or expenses you paid for the period. You may use this information to compare the ongoing costs of investing in the Fund and other funds. To do so, compare this 5% hypothetical example with the 5% hypothetical examples that appear in the shareholder reports of the other funds.
| Beginning Account Value 4/1/11 | Ending Account Value 9/30/11 | Expenses Paid During Period† 4/1/11–9/30/11 | ||||||||||
Class A Shares | ||||||||||||
Actual | $ | 1,000.00 | $ | 799.40 | $ | 5.63 | ||||||
Hypothetical* | $ | 1,000.00 | $ | 1,018.82 | $ | 6.31 | ||||||
Class B Shares | ||||||||||||
Actual | $ | 1,000.00 | $ | 796.40 | $ | 9.31 | ||||||
Hypothetical* | $ | 1,000.00 | $ | 1,014.70 | $ | 10.44 | ||||||
Class C Shares | ||||||||||||
Actual | $ | 1,000.00 | $ | 796.80 | $ | 8.98 | ||||||
Hypothetical* | $ | 1,000.00 | $ | 1,015.08 | $ | 10.07 | ||||||
Class I Shares | ||||||||||||
Actual | $ | 1,000.00 | $ | 801.20 | $ | 4.01 | ||||||
Hypothetical* | $ | 1,000.00 | $ | 1,020.62 | $ | 4.49 | ||||||
Class R3 Shares | ||||||||||||
Actual | $ | 1,000.00 | $ | 798.80 | $ | 6.54 | ||||||
Hypothetical* | $ | 1,000.00 | $ | 1,017.80 | $ | 7.34 | ||||||
Class R4 Shares | ||||||||||||
Actual | $ | 1,000.00 | $ | 799.80 | $ | 5.64 | ||||||
Hypothetical* | $ | 1,000.00 | $ | 1,018.80 | $ | 6.33 | ||||||
Class R5 Shares | ||||||||||||
Actual | $ | 1,000.00 | $ | 800.50 | $ | 4.52 | ||||||
Hypothetical* | $ | 1,000.00 | $ | 1,020.05 | $ | 5.07 | ||||||
| † | Expenses are equal to the annualized expense ratio for each class (A: 1.25%; B: 2.07%; C: 1.99%; I: 0.89%; R3: 1.45%; R4: 1.25%; R5: 1.00%) multiplied by the average account value over the period, multiplied by 183/365 to reflect the one-half year period. |
| * | Hypothetical assumes a rate of return of 5% per year before expenses. |
Please note that the expenses shown in the table are meant to highlight your ongoing costs only and do not reflect any transactional costs, such as sales charges (loads), redemption fees, or exchange fees. Therefore, the second line of the table for each class of shares is useful in comparing ongoing costs only, and will not help you determine the relative total costs of owning different funds. In addition, if these transactional costs were included, your costs would have been higher.
Certified Annual Report 33
| INDEX COMPARISON | ||
| Thornburg International Value Fund | September 30, 2011 (Unaudited) | |
GROWTH OF A HYPOTHETICAL $10,000 INVESTMENT
Thornburg International Value Fund versus
MSCI EAFE Index and MSCI AC World ex-U.S. Index (May 28, 1998 to September 30, 2011)
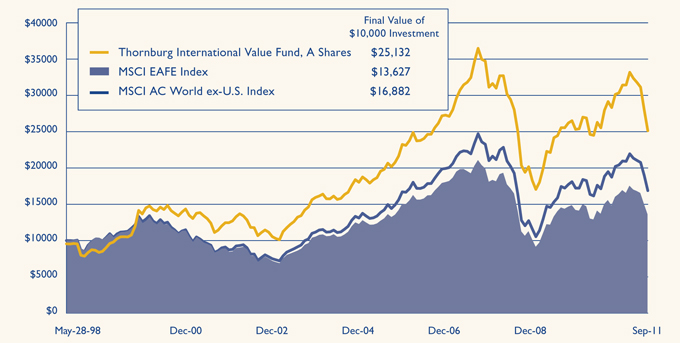
AVERAGE ANNUAL TOTAL RETURNS
For periods ended September 30, 2011 (with sales charge)
| 1 Yr | 5 Yrs | 10 Yrs | Since Inception | |||||||||||||
A Shares (Incep: 5/28/98) | -14.16 | % | -0.53 | % | 8.01 | % | 7.16 | % | ||||||||
B Shares (Incep: 4/3/00) | -15.24 | % | -0.74 | % | 7.79 | % | 4.24 | % | ||||||||
C Shares (Incep: 5/28/98) | -11.66 | % | -0.33 | % | 7.68 | % | 6.67 | % | ||||||||
I Shares (Incep: 3/30/01) | -9.77 | % | 0.80 | % | 8.97 | % | 6.92 | % | ||||||||
R3 Shares (Incep: 7/1/03) | -10.27 | % | 0.25 | % | — | 9.11 | % | |||||||||
R4 Shares (Incep: 2/1/07) | -10.11 | % | — | — | -1.88 | % | ||||||||||
R5 Shares (Incep: 2/1/05) | -9.88 | % | 0.72 | % | — | 5.45 | % | |||||||||
MSCI EAFE Index (Since 5/28/98) | -9.36 | % | -3.46 | % | 5.03 | % | 2.35 | % | ||||||||
MSCI AC World ex-U.S. Index (Since 5/28/98) | -10.42 | % | -1.12 | % | 7.27 | % | 4.01 | % | ||||||||
Performance data shown represents past performance and is no guarantee of future results. Investment return and principal value will fluctuate so shares, when redeemed, may be worth more or less than their original cost. Current performance may be lower or higher than quoted. For performance current to the most recent month end, visit thornburg.com or call 800.847.0200. The performance data and graph do not reflect the deduction of taxes that a shareholder would pay on distributions or the redemption of Fund shares. Returns reflect the reinvestment of dividends and capital gains as well as applicable sales charges. Class A shares are sold with a maximum sales charge of 4.50%. Class B shares carry a contingent deferred sales charge (CDSC) that declines from 5.00% to 0% depending upon the period of time the shares are held. Class B shares will automatically convert to Class A shares on a quarterly basis approximately eight years after purchase. Class C shares are subject to a 1% CDSC for the first year only. There is no up-front sales charge for Class I, R3, R4 and R5 shares. Class A and I shares are subject to a 1% 30-day redemption fee.
34 Certified Annual Report
| TRUSTEES AND OFFICERS | ||
| Thornburg International Value Fund | September 30, 2011 (Unaudited) | |
Name, Age, Position Held with Fund Year Elected | Principal Occupation(s) During Past Five Years | Other Directorships Held by Trustee | ||
INTERESTED TRUSTEES(1)(2)(4) | ||||
Garrett Thornburg, 65 Chairman of Trustees, Trustee since 1987(3) | Chairman and controlling shareholder and, until 2008, CEO of Thornburg Investment Management, Inc. (investment advisor); Chairman, CEO, and controlling shareholder of Thornburg Securities Corporation (securities dealer); CEO until 2007 and Chairman until 2009 of TMST, Inc. (f/k/a Thornburg Mortgage, Inc.) (real estate investment trust); President and Sole Director of Thornburg Mortgage Advisory Corporation (investment manager to TMST, Inc.). | None | ||
Brian J. McMahon, 55 Trustee since 2001, Member of Governance & Nominating Committee & Operations Risk Oversight Committee, President since 1997(5)(6) | CEO since 2008, President, Managing Director, Chief Investment Officer, and Portfolio Manager of Thornburg Investment Management, Inc. | None | ||
INDEPENDENT TRUSTEES(1)(2)(4) | ||||
David A. Ater, 66 Trustee since 1994, Member of Audit Committee & Governance & Nominating Committee | Principal in Ater & Associates, Santa Fe, NM (developer, planner and broker of residential and commercial real estate); owner, developer and broker for various real estate projects. | None | ||
David D. Chase, 70 Trustee since 2000, Chairman of Audit Committee | Managing Member of Vestor Associates, LLC, Santa Fe, NM (private equity fund); Managing Member of CS Group, LLC, Santa Fe, NM (merchant bank). | None | ||
Eliot R. Cutler, 65 Trustee since 2004 & Nominating Committee, Chairman of Governance | Senior Counsel and, until 2009, Partner in Akin, Gump, Strauss, Hauer & Feld LLP (law firm) in Washington, D.C. and Beijing, China. | None | ||
Susan H. Dubin, 62 Trustee since 2004, Member of Audit Committee | President of Dubin Investments, Ltd., Greenwich, CT (private investment fund); Director and officer of various charitable organizations. | None | ||
Owen D. Van Essen, 57 Trustee since 2004, Member of Governance & Nominating Committee & Chairman of Operations Risk Oversight Committee | President of Dirks, Van Essen & Murray, Santa Fe, NM (newspaper mergers and acquisitions). | None | ||
Certified Annual Report 35
| TRUSTEES AND OFFICERS, CONTINUED | ||
| Thornburg International Value Fund | September 30, 2011 (Unaudited) | |
Name, Age, Position Held with Fund Year Elected | Principal Occupation(s) During Past Five Years | Other Directorships Held by Trustee | ||
James W. Weyhrauch, 52 Trustee since 1996, Member of Audit Committee & Operations Risk Oversight Committee | Real estate broker, Santa Fe Properties, Santa Fe, NM; Vice Chairman of Nambe LLC, Santa Fe, NM (manufacturing & design company). | None | ||
OFFICERS OF THE FUND (WHO ARE NOT TRUSTEES)(1)(6)(7) | ||||
George T. Strickland, 48 Vice President since 1996, Treasurer since 2007(6) | Portfolio Manager, Vice President, and Managing Director of Thornburg Investment Management, Inc. | Not applicable | ||
William V. Fries, 72 Vice President since 1995 | Portfolio Manager, Vice President, and Managing Director of Thornburg Investment Management, Inc. | Not applicable | ||
Leigh Moiola, 44 Vice President since 2001 | Vice President, Managing Director, and Director of Marketing of Thornburg Investment Management, Inc. | Not applicable | ||
Alexander Motola, 41 Vice President since 2001 | Portfolio Manager, Vice President, and Managing Director of Thornburg Investment Management, Inc. | Not applicable | ||
Wendy Trevisani, 40 Vice President since 1999 | Portfolio Manager and Managing Director of Thornburg Investment Management, Inc. | Not applicable | ||
Joshua Gonze, 48 Vice President since 1999 | Portfolio Manager since 2007, Managing Director, and Associate Portfolio Manager until 2007 of Thornburg Investment Management, Inc. | Not applicable | ||
Christopher Ihlefeld, 41 Vice President since 2003 | Portfolio Manager since 2007, Managing Director, and Associate Portfolio Manager until 2007 of Thornburg Investment Management, Inc. | Not applicable | ||
Leon Sandersfeld, 45 Vice President since 2003 | Managing Director since 2007 and Fund Accounting Director of Thornburg Investment Management, Inc. | Not applicable | ||
Sasha Wilcoxon, 37 Vice President since 2003 Secretary since 2007(6) | Managing Director since 2007, Director of Operations, and Vice President of Thornburg Investment Management, Inc. | Not applicable | ||
Edward Maran, 53 Vice President since 2004 | Portfolio Manager and Managing Director of Thornburg Investment Management, Inc. | Not applicable | ||
Vinson Walden, 41 Vice President since 2004 | Portfolio Manager and Managing Director of Thornburg Investment Management, Inc. | Not applicable | ||
Thomas Garcia, 40 Vice President since 2006 | Vice President since 2011, Managing Director, Head Equity Trader, and Associate Portfolio Manager of Thornburg Investment Management, Inc. | Not applicable | ||
Lei Wang, 40 Vice President since 2006 | Portfolio Manager and Managing Director of Thornburg Investment Management, Inc. | Not applicable | ||
36 Certified Annual Report
| TRUSTEES AND OFFICERS, CONTINUED | ||
| Thornburg International Value Fund | September 30, 2011 (Unaudited) | |
Name, Age, Position Held with Fund Year Elected | Principal Occupation(s) During Past Five Years | Other Directorships Held by Trustee | ||
Connor Browne, 32 Vice President since 2006 | Portfolio Manager and Managing Director of Thornburg Investment Management, Inc. | Not applicable | ||
Jason Brady, 37 Vice President since 2007 | Vice President since 2011, Portfolio Manager since 2007, Managing Director since 2007, and Associate Portfolio Manager 2006–2007 of Thornburg Investment Management, Inc. | Not applicable | ||
Lewis Kaufman, 35 Vice President since 2007 | Portfolio Manager since 2007, Managing Director since 2007, and Associate Portfolio Manager until 2009 of Thornburg Investment Management, Inc. | Not applicable | ||
Christopher Ryon, 55 Vice President since 2008 | Portfolio Manager since 2009, Managing Director since 2009, and Associate Portfolio Manager 2008–2009 of Thornburg Investment Management, Inc.; Principal of Vanguard Funds until 2008. | Not applicable | ||
Lon Erickson, 36 Vice President since 2008 | Portfolio Manager since 2010, Managing Director since 2010, and Associate Portfolio Manager 2008–2010 of Thornburg Investment Management, Inc.; Senior Analyst of State Farm Insurance until 2008. | Not applicable | ||
Kathleen Brady, 51 Vice President since 2008 | Senior Tax Accountant since 2007 of Thornburg Investment Management, Inc.; Chief Financial Officer of Vestor Partners, LP (private equity fund) until 2007. | Not applicable | ||
Jack Gardner, 57 Vice President since 2008 | Managing Director since 2007 of Thornburg Investment Management, Inc.; President since 2008 and National Sales Director of Thornburg Securities Corporation. | Not applicable | ||
Laura Hillstrom, 44 Vice President since 2009 | Chief Administrative Officer since 2009, Vice President and Managing Director, and Director of Information Systems until 2009 of Thornburg Investment Management, Inc. | Not applicable | ||
| (1) | Each person’s address is 2300 North Ridgetop Road, Santa Fe, New Mexico 87506. |
| (2) | The Fund is one of sixteen separate investment “Funds” or “series” of Thornburg Investment Trust (the “Trust”), which comprises the Thornburg mutual fund complex and is organized as a Massachusetts business trust. Thornburg Investment Management, Inc. is the investment advisor to, and manages, the sixteen Funds of the Trust. Each Trustee oversees the sixteen Funds of the Trust. |
| (3) | Mr. Thornburg is considered an “interested” Trustee under the Investment Company Act of 1940 because he is the sole director and controlling shareholder of Thornburg Investment Management, Inc., the investment advisor to the sixteen active Funds of the Trust, and is the sole director and controlling shareholder of Thornburg Securities Corporation, the distributor of shares for the Trust. |
| (4) | Each Trustee serves in office until the election and qualification of a successor. |
| (5) | Mr. McMahon is considered an “interested” Trustee because he is the chief executive officer and president of Thornburg Investment Management, Inc. |
| (6) | The Trust’s president, secretary, and treasurer each serves a one-year term or until the election and qualification of a successor; each other officer serves at the pleasure of the Trustees. |
| (7) | Assistant vice presidents, assistant secretaries and assistant treasurers are not shown. |
The Statement of Additional Information for each Fund of the Trust includes additional information about the Trustees and is available, without charge and upon request, by calling 1-800-847-0200.
Certified Annual Report 37
| OTHER INFORMATION | ||
| Thornburg International Value Fund | September 30, 2011 (Unaudited) | |
PORTFOLIO PROXY VOTING
Policies and Procedures:
The Trust has delegated to Thornburg Investment Management, Inc. (the “Advisor”) voting decisions respecting proxies for the Fund’s voting securities. The Advisor makes voting decisions in accordance with its Proxy Voting Policy and Procedures. A description of the Policy and Procedures is available (i) without charge, upon request, by calling the Advisor toll-free at 1-800-847-0200, (ii) on the Thornburg website at www.thornburg.com, and (iii) on the Securities and Exchange Commission’s website at www.sec.gov.
Information regarding how proxies were voted is available on or before August 31 of each year for the twelve months ending the preceding June 30. This information is available (i) without charge, upon request by calling the Advisor toll-free at 1-800-847-0200, (ii) on the Thornburg website at www.thornburg.com, and (iii) on the Securities and Exchange Commission’s website at www.sec.gov.
TAX INFORMATION
For the tax year ended September 30, 2011, the Thornburg International Value Fund designates 100.00% (or the maximum allowed) of the dividends paid from tax basis net ordinary income as qualifying for the reduced rate under the Jobs and Growth Tax Relief and Reconciliation Act of 2003.
For the year ended September 30, 2011, foreign source income and foreign taxes paid is $616,437,064, and $62,677,286 respectively.
The information and distributions reported herein may differ from the information and distributions reported to the shareholders for the calendar year ending December 31, 2011. Complete information will be reported in conjunction with your 2011 Form 1099-DIV.
AVAILABILITY OF QUARTERLY PORTFOLIO SCHEDULE
The Fund files with the Securities and Exchange Commission schedules of its portfolio holdings on Form N-Q for the first and third quarters of each fiscal year. The Fund’s Forms N-Q are available on the Commission’s website at www.sec.gov, or may be reviewed and copied at the Commission’s Public Reference Room in Washington, D.C. Information on the operation of the Public Reference Room may be obtained by calling 1-800-SEC-0330. The Fund also makes this information available on its website at www.thornburg.com/ download or upon request by calling 1-800-847-0200.
STATEMENT RESPECTING RENEWAL OF INVESTMENT ADVISORY AGREEMENT
Thornburg Investment Management, Inc. (the “Advisor”) provides investment management services to Thornburg International Value Fund pursuant to an investment advisory agreement. The Trustees consider the renewal of this agreement annually, and most recently determined to renew the agreement on September 13, 2011.
In anticipation of their recent consideration of the advisory agreement’s renewal, the independent Trustees met in May 2011 to plan the annual evaluation of the Advisor’s performance and to specify the information the Advisor would present to the Trustees for their review. The Advisor’s chief investment officer subsequently reviewed portions of the specified information with the Trustees and addressed questions from the Trustees at a meeting session scheduled for that purpose, and the independent Trustees thereafter met in independent session to consider the Advisor’s presentation and various specific issues respecting their consideration of the advisory agreement’s renewal. Following these sessions, the Trustees met to consider renewal of the agreement, and the independent Trustees voted unanimously at that meeting to renew the agreement for an additional term of one year.
The information below summarizes certain factors considered by the Trustees in connection with the determination to renew the advisory agreement. In determining to renew the agreement, the Trustees did not identify any single factor as controlling, and this summary does not describe all of the matters considered by the Trustees in making their determination.
Quality of Services; Fund Investment Performance. The Trustees evaluated the nature, extent and quality of services provided by the Advisor under the advisory agreement, and evaluated the investment performance of the Fund.
In connection with their general supervision of the Advisor, and as an important element of their annual consideration of a renewal of the advisory agreement, the Trustees received and considered reports throughout the year from the Advisor. These reports addressed a wide variety of topics, including particularly the Advisor’s selection of investments and execution of the Fund’s investment strategies.
38 Certified Annual Report
| OTHER INFORMATION, CONTINUED | ||
| Thornburg International Value Fund | September 30, 2011 (Unaudited) | |
In addition, the Trustees considered information provided to them at their request in anticipation of their annual evaluation of the Advisor’s services, including (i) the Fund’s absolute investment performance and achievement of stated objectives, (ii) the Advisor’s commentary on the Fund’s investment performance in the context of the Fund’s objectives and reasonable expectations, and business, market and economic conditions, (iii) measures of the Fund’s investment performance over different periods of time relative to a category of foreign equity mutual funds selected by an independent mutual fund analyst firm, and relative to broad-based securities indices, (iv) the Fund’s cumulative investment return since inception relative to a broad-based securities index, and (v) comparative measures of estimated earnings growth, portfolio volatility, risk and return.
The Trustees also considered their perceptions of portfolio management personnel developed in formal and informal meetings throughout the year, the Advisor’s staffing and other resources, the Advisor’s performance of accounting and other services, the Advisor’s observance of compliance and regulatory requirements, the Advisor’s responsiveness to the Trustees, and other factors.
In evaluating quantitative and performance data presented, the Trustees noted (among other aspects of the data) comparative performance data for the ten most recent calendar years, which showed that the Fund’s investment return for the most recent calendar year was higher than the returns for the two securities indices considered and comparable to the average return of the fund category, and that the Fund’s returns for the preceding nine calendar years had exceeded or had been comparable to the returns of one index in eight of nine years, exceeded the returns of the second index in five of nine years, and had exceeded the average returns of the fund category in eight of nine years. Noted quantitative data further showed that the Fund’s investment returns fell within the third quartile of the fund category for the three-month and one-year periods ended with the second quarter of the current year, close to the top quartile in the year-to-date and three-year periods, and within the top decile in the five-year period. The Trustees also considered in this regard the Fund’s higher cumulative return (net of expenses) relative to the Fund’s benchmark index.
The Trustees concluded, based upon these and other considerations, that the nature, extent and quality of the Advisor’s services were sufficient and that the Advisor had satisfactorily pursued the Fund’s stated investment objectives. The Trustees further concluded that the investment performance of the Fund was satisfactory in the context of the Fund’s objectives and policies, and prevailing market conditions.
Fees and Expenses; Profitability of Advisor; Economies of Scale; Ancillary Benefits to Advisor. The Trustees evaluated the level of the management fee charged by the Advisor to the Fund, and in this connection, reviewed the profitability of the Advisor, economies of scale potentially available to the Fund and whether the Advisor received any ancillary benefits from its relationship with the Fund.
In evaluating the level of the management fee, the Trustees considered the fees charged by the Advisor and the other expenses charged to the Fund in light of the nature and quality of services provided, comparison of the actual Advisor’s fee and Fund expenses to the statement of fees and expenses in the Fund’s prospectuses, and comparisons of the Advisor’s fee and other Fund expenses to median and average fees and expenses charged to two groups of equity mutual funds assembled by independent mutual fund analyst firms. Comparative fee and expense data noted by the Trustees showed that the management fee charged to the Fund was slightly lower than the median and comparable to the average fee levels of the two groups of mutual funds, and that the overall expense ratio for the Fund was slightly lower than the median ratios of both groups and somewhat lower than the average ratios of the groups. The Trustees considered information about the fees charged by the Advisor to other investment management clients, together with information about fees charged by other advisors to different clients, and analysis of the differences between the requirements of institutional clients and mutual funds and the consequently different investment management services rendered, respectively, to institutional clients and mutual funds. The Trustees confirmed their previous observations that the differences between the fees charged by the Advisor to different types of clients did not appear exceptional, and that the fee rates charged by investment advisors to institutional clients had limited relevance to the evaluation of fee rates charged to mutual funds, because of the significant differences between the respective requirements of institutional clients and mutual funds, the differences between the respective services rendered to institutional clients and mutual funds, and the different circumstances in which the respective fees originate.
In reviewing the profitability of the Advisor, the Trustees considered costs incurred by the Advisor and data comparing the profitability of the Advisor to other investment management firms. The information provided did not indicate that the Advisor’s profitability was unusual, and the Trustees noted the adequacy of the Advisor’s resources and service capabilities. In reviewing the extent to which economies of scale would be realized by the Fund as it grows and whether fee levels reflect economies of scale, the Trustees considered the breakpoint structure for advisory fees chargeable to the Fund, the demonstrated economies of scale enjoyed by the Fund and other Funds of the Trust as they had grown in size, and economies of scale realized by other mutual funds. The information provided demonstrated to the Trustees that the Fund has realized economies of scale and may reasonably be expected to realize economies
Certified Annual Report 39
| OTHER INFORMATION, CONTINUED | ||
| Thornburg International Value Fund | September 30, 2011 (Unaudited) | |
of scale as the Fund grows in size, due to the advisory agreement’s breakpoint fee structure and other factors. In reviewing potential benefits to the Advisor because of its relationship to the Fund, the Trustees considered the Advisor’s receipt of certain research services from broker dealers, and the benefits to both the Fund and the Advisor of the Advisor’s expansion of its staffing, compliance and systems capabilities and other resources to serve a broader variety of investment management clients. No unusual or unfair benefits to the Advisor from its relationship to the Fund were identified by the Trustees.
The Trustees concluded, based upon their consideration of these factors, that the management fee charged to the Fund by the Advisor was fair and reasonable in view of the nature, extent and quality of the services provided by the Advisor, the clear disclosure of fees and expenses in the Fund’s prospectuses, the investment performance of the Fund, and comparisons of fees and expenses charged to the Fund to fees and expenses charged to other mutual funds.
40 Certified Annual Report
This page intentionally left blank.
This page is not part of the Annual Report. 41
Trustees’ Statement to Shareholders
Not part of the Certified Annual Report
September 13, 2011
The Trustees believe current and prospective shareholders should know how we discharge our responsibilities in supervising the Funds’ investment advisor and in reviewing the advisor’s contract for renewal. Since 2005, we have issued a statement which sets out clearly the three principal guidelines that we follow in supervising the Trust’s investment advisor on your behalf. In accordance with our customary practice, in September of this year we again reviewed our statement and concluded we should reissue this statement outlining the principal features of our supervision of the advisor’s performance of investment management services for the Funds.
We begin with the premise that each shareholder selected his or her Fund because its investments are managed by the investment advisor identified in the prospectus and in accordance with the objective and policies described in the prospectus. We realize, as each of you do, that if you believe that your Fund’s stated objective and policies no longer serve your personal investment goals, you can sell your shares and leave the Fund.
Therefore, we believe that our primary supervisory task – our principal obligation to you – is to assess the nature and quality of the advisor’s services, and to confirm that the advisor actively and competently pursues the Fund’s objective, in accordance with the policies set out in the prospectus. To do this, we meet regularly with management to review your Fund’s portfolio and to discuss the advisor’s specific actions and judgments in pursuing the Fund’s objective. We do not substitute our own judgment for the advisor’s decisions in selecting investments; the advisor is paid to exercise its informed judgment on investment decisions, and we seek to confirm, in reviewing the advisor’s performance, that the advisor is doing just that.
Second, while we are conscious of costs and the effect that costs have on shareholders’ returns, we do not seek the lowest fees or expense ratio as our sole or primary objective. We try to make sure that your Fund’s fees and costs are reasonable in relationship to the services rendered and that they are generally in line with those charged by other expert investment advisors, consistent with our belief that the Fund’s investors searched for and expect that expertise and attention and have decided to pay a reasonable price for it. We do not put the management contract “out to bid” as a matter of course, and we would not do so unless we had concluded that the advisor materially had failed to pursue the Fund’s objectives in accordance with its policies, or for other equally important reasons. We believe that any other approach would be inconsistent with your interests and contrary to your expectations when you bought shares of the Fund in the first place.
Finally, because we believe that most Thornburg Fund shareholders have invested with a long-term perspective, we try not to focus too much on the fashions of the moment and on short-term performance. The market will not favor any specific investment objective or set of policies at all times and under all economic circumstances. A fund will experience periods of both high and low returns relative to other funds and other investments. Even if one of our Funds is not favored by the market at a particular time, we believe that the advisor is nonetheless obliged to remain true to the Fund’s objective and policies, and we watch to see that it does so.
42 This page is not part of the Annual Report.
Retirement and Education Accounts
Thornburg Investment Management offers retirement and education savings accounts that can help you meet a variety of planning challenges. For account applications or further information on any of the accounts below, please call 1-800-847-0200 or go to www.thornburg.com/ira. Your financial advisor can help you determine which plan is right for you.
Individual Retirement Accounts
Individual Retirement Accounts (IRAs) provide a tax-advantaged means to save money for the future. For a detailed outline of the difference between retirement accounts, see www.thornburg.com/ira. Rollovers are available. Call 1-800-847-0200 for more information.
Traditional IRAs – Contributions to Traditional IRAs are tax deductible for eligible individuals, and withdrawals are taxed as additional ordinary income. You may contribute to an IRA if you receive compensation and are under 70 1/2, even if you are covered by an employer retirement plan. Deductible contributions are subject to certain qualifications. Please consult your tax advisor.
Roth IRAs – Under a Roth IRA, there is no tax deduction for contributions, but there is no income tax on qualified withdrawals. For a more detailed comparison of Traditional and Roth IRAs, please see our web site at www.thornburg.com/ira.
SEP IRAs – Simplified Employee Pension (SEP) IRAs are established by employers. The employer is allowed a tax deduction for contributions made to the SEP Plan and makes contributions to each eligible employee’s SEP IRA on a discretionary basis.
SIMPLE IRAs – Savings Incentive Match Plan for Employees of Small Employers (SIMPLE) is designed to give small business owners a simplified method to establish and contribute to a retirement plan for employees. The employer is allowed a tax deduction for contributions and makes either matching or non-elective contributions to each eligible employee’s SIMPLE IRA. Employees may make salary deferral contributions.
Coverdell Education Savings Account
These savings accounts are designed to provide a way to save money for higher education expenses. In an Education Savings Account, earnings and interest grow tax-free, and qualified withdrawals used to pay for eligible higher-education expenses are tax- and penalty-free.
Funds Available
The following funds are available in the accounts listed above:
| • | Thornburg International Value Fund |
| • | Thornburg Value Fund |
| • | Thornburg Core Growth Fund |
| • | Thornburg Investment Income Builder Fund |
| • | Thornburg Global Opportunities Fund |
| • | Thornburg International Growth Fund |
| • | Thornburg Developing World Fund |
| • | Thornburg Limited Term U.S. Government Fund |
| • | Thornburg Limited Term Income Fund |
| • | Thornburg Strategic Income Fund |
This page is not part of the Annual Report. 43

Thornburg Equity Funds
Thornburg’s equity research uses a fundamental and comprehensive analytical approach. Thornburg equity funds focus on a limited number of securities so that each holding can impact performance. The equity team searches for firms believed to have a promising future and seeks to buy shares of those companies at a discount to their intrinsic value.
| • | Thornburg Value Fund |
| • | Thornburg International Value Fund |
| • | Thornburg Core Growth Fund |
| • | Thornburg Investment Income Builder Fund |
| • | Thornburg Global Opportunities Fund |
| • | Thornburg International Growth Fund |
| • | Thornburg Developing World Fund |
Thornburg Bond Funds
Thornburg Investment Management applies a disciplined philosophy to fixed-income management. Since the launch of our first fixed-income fund over 25 years ago, we have been conducting fundamental, bottom-up research in an effort to identify bonds which we believe provide the best return for a given level of risk. We are very organic in our approach, avoiding leverage or complex strategies which could backfire in periods of market uncertainty.
| • | Thornburg Limited Term Municipal Fund |
| • | Thornburg Intermediate Municipal Fund |
| • | Thornburg California Limited Term Municipal Fund |
| • | Thornburg New Mexico Intermediate Municipal Fund |
| • | Thornburg New York Intermediate Municipal Fund |
| • | Thornburg Strategic Municipal Income Fund |
| • | Thornburg Limited Term U.S. Government Fund |
| • | Thornburg Limited Term Income Fund |
| • | Thornburg Strategic Income Fund |
Before investing, carefully consider the Fund’s investment goals, risks, charges, and expenses. For a prospectus containing this and other information, contact your financial advisor or visit thornburg.com. Read it carefully before investing.
For additional information, please visit www.thornburg.com
Thornburg Investment Management, Inc. 2300 North Ridgetop Road, Santa Fe, NM 87506
This page is not part of the Annual Report. 45
This page intentionally left blank.
46 This page is not part of the Annual Report.
This page intentionally left blank.
This page is not part of the Annual Report. 47
 | Waste not, Wait not |  | ||||
| Get instant access to your shareholder reports. | ||||||
| This Annual Report is submitted for the general information of shareholders of the Fund. It is not authorized for distribution to prospective investors in the Fund unless preceded or accompanied by an effective prospectus. | By switching from your postal mailbox to your email inbox, you reduce paper clutter, improve record keeping access, and help conserve our natural resources. | |||||
 | Investment Advisor: Thornburg Investment Management® 800.847.0200 | Go to www.thornburg.com/edelivery and sign up to receive your shareholder reports, prospectuses, and proxy statements electronically. | ||||
Distributor: | ||||||
Thornburg Securities Corporation® 800.847.0200 | You invest in the future, without spending a dime. | |||||
| TH078 | ||||||

Important Information
The information presented on the following pages was current as of September 30, 2011. The managers’ views, portfolio holdings, and sector and country diversification are provided for the general information of the Fund’s shareholders; to the extent this information is historical, it should not be considered predictive of future circumstances. This material should not be deemed a recommendation to buy or sell any of the securities mentioned.
Investments in the Fund carry risks, including possible loss of principal. Special risks may be associated with investments outside the United States, especially in emerging markets, including currency fluctuations, illiquidity and volatility. Investments in small capitalization companies may increase the risk of greater price fluctuations. Please see the Fund’s Prospectus for a discussion of the risks associated with an investment in the Fund. Investments in the Fund are not FDIC insured, nor are they deposits of or guaranteed by a bank or any other entity. There is no guarantee that the Fund will meet its investment objectives. Funds invested in a limited number of holdings may expose an investor to greater volatility.
Performance data given at net asset value (NAV) does not take into account the applicable sales charges. If the sales charges had been included, the performance would have been lower.
Class I, R3, R4, and R5 shares may not be available to all investors. Minimum investments for Class I shares may be higher than those for other classes.
Share Class | NASDAQ Symbol | Cusip | ||
Class A | THCGX | 885-215-582 | ||
Class C | TCGCX | 885-215-574 | ||
Class I | THIGX | 885-215-475 | ||
Class R3 | THCRX | 885-215-517 | ||
Class R4 | TCGRX | 885-215-251 | ||
Class R5 | THGRX | 885-215-350 |
Glossary
Russell 3000 Growth Index – The Russell 3000 Growth Index (Russell 3K G) is an unmanaged index comprised of those Russell 3000 companies with higher price-to-book ratios and higher forecasted growth values.
Unless otherwise noted, index returns reflect the reinvestment of income dividends and capital gains, if any, but do not reflect fees, brokerage commissions or other expenses of investing. Investors may not make direct investments into any index. The performance of any index is not indicative of the performance of any particular investment.
Basis Point (bps) – Unit equal to 1/100th of 1%. A 1% change = 100 basis points (bps).
Beta – Beta is a measure of market-related risk. Less than one means the portfolio is less volatile than the index, while greater than one indicates more volatility than the index.
Median Market Capitalization – Market capitalization (market cap) is the total value of a company’s stock, calculated by multiplying the number of outstanding common shares by the current share price. The company whose market cap is in the middle of the portfolio is the median market cap. Half the companies in the portfolio have values greater than the median, and half have values that are less.
Price to Book Value (P/B) – A ratio used to compare a stock’s market value to its book value. It is calculated by dividing the current closing price of the stock by the latest quarter’s book value (book value is simply assets minus liabilities).
Price to Cash Flow Ratio – A measure of the market’s expectations of a firm’s future financial health. It is calculated by dividing the price per share by cash flow per share.
Price to Earnings Ratio (P/E) – A valuation ratio equaling a company’s market value per share divided by earnings per share.
This page is not part of the Annual Report. 3
Thornburg Core Growth Fund
MANAGEMENT TEAM

Tim Cunningham,CFA, Alexander M.V. Motola,CFA,
and Greg Dunn
IMPORTANT
PERFORMANCE INFORMATION
Performance data shown represents past performance and is no guarantee of future results. Investment return and principal value will fluctuate so shares, when redeemed, may be worth more or less than their original cost. Current performance may be lower or higher than quoted. For performance current to the most recent month end, visit thornburg.com or call 800.847.0200.
The maximum sales charge for Class A shares is 4.50%. Class A shares are subject to a 1% 30-day redemption fee. The total annual fund operating expense of Class A shares is 1.48%, as disclosed in the most recent Prospectus.
Continually Evaluating the Risk Equation
Growth stocks are often referred to as “glamour” stocks, and it is easy to understand why. Growth stocks generate excitement. These are stocks whose rapid earnings growth is expected to be followed by rapid price appreciation. Growth stocks capture the imagination, and investing in them may potentially offer considerable opportunities for reward.
But growth stocks can also be volatile. Identifying which companies will succeed takes work. It takes digging down to the nuts and bolts of companies. The management team of Thornburg Core Growth Fund understands this. They know that it is grit, not glamour, that creates a successful growth fund.
Portfolio manager Alex Motola and his team apply a rigorous stock selection process to the investments that comprise the Thornburg Core Growth Fund. This is a portfolio run on common sense, not on abstract theory. Motola’s overarching philosophy is to create a fund that generates good performance over the long term, while reducing volatility in the interim. Intensive, hands-on, independent research is the central theme. While many other growth funds rely on broad portfolio diversification to temper volatility, the Thornburg Core Growth Fund focuses on a limited number of stocks and diversifies those investments among three segments of the growth fund universe: Consistent Growth Companies, Growth Industry Leaders, and Emerging Growth Companies. By limiting the number of securities, the Fund’s managers can evaluate each stock in greater depth. We believe that diversifying among three growth baskets further mitigates risk because each of these segments typically reacts differently than the equity markets as a whole.
How does the stock selection process work? Before adding a stock to the Fund’s portfolio, Motola and his team drill down into the company and its business. The team believes that an intimate understanding of
AVERAGE ANNUAL TOTAL RETURNS
FOR PERIODS ENDED 9/30/11
| 1 Yr | 3 Yrs | 5 Yrs | 10 Yrs | Since Inception | ||||||||||||||||
A Shares (Incep: 12/27/00) | ||||||||||||||||||||
Without sales charge | -3.48 | % | -0.07 | % | -4.03 | % | 5.69 | % | 1.19 | % | ||||||||||
With sales charge | -7.81 | % | -1.60 | % | -4.90 | % | 5.20 | % | 0.76 | % | ||||||||||
Russell 3000 Growth Index | ||||||||||||||||||||
(Since: 12/27/00) | 3.39 | % | 4.49 | % | 1.56 | % | 3.18 | % | -0.62 | % | ||||||||||
4 This page is not part of the Annual Report.
the companies in the portfolio is one of the most effective forms of risk management.
Companies are initially screened using a variety of quantitative factors. Most are rejected and logged as a screening rejection. Only those with the most appealing opportunities to expand margins and grow earnings move on to the next step – the construction of a company-specific model. The goal is to cut to the quick and scrutinize the underlying business. The team uses SEC filings to construct proprietary income statement, balance sheet and cash flow statement models for each remaining company. From these they analyze historical data, monitor current conditions, identify red flags, and estimate future growth potential.
Motola, a former historian who has been at the Fund’s helm since its inception, is not one to go along with the crowd. He and his team are not tied to “mainstream thinking.” While they have access to the best of Wall Street’s analysis, they are not ruled by it.
The team test the strength of a company’s underlying business model against a variety of what-if screens. Besides conducting site visits and interviewing company management, they also check in with a company’s major customers, suppliers, and distributors to get a complete picture of a company before investing. Revenue and cost of goods sold are given particular attention. All data points are broken down in as many ways as possible before reaching an investment decision.
STOCKS CONTRIBUTING AND DETRACTING
FOR THE YEAR ENDED 9/30/11
Top Contributors | Top Detractors | |
| Frontier Oil | RSC Holdings, Inc. | |
| Covidien plc | Baker Hughes, Inc. | |
| Gentex Corp. | Yandex N.V. Cl A | |
| Amazon.com, Inc. | FedEx Corp. | |
| Alexion Pharmaceuticals, Inc. | Grand Canyon Education, Inc. | |
| Source: FactSet | ||
KEY PORTFOLIO ATTRIBUTES
As of 9/30/11
Portfolio P/E Trailing 12-months* | 19.7x | |||
Portfolio Price to Cash Flow* | 11.3x | |||
Portfolio Price to Book Value* | 3.3x | |||
Median Market Cap* | $ | 3.5 B | ||
7-Year Beta (A Shares vs. Russell 3K G)* | 1.14 | |||
Number of Companies | 37 | |||
| * | Source: FactSet |
MARKET CAPITALIZATION EXPOSURE
As of 9/30/11
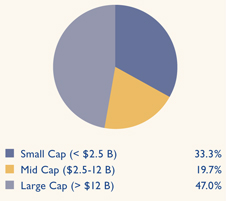
BASKET STRUCTURE
As of 9/30/11
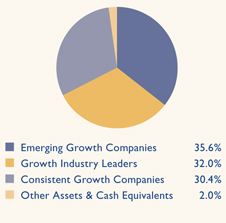
This page is not part of the Annual Report. 5

Thornburg Core Growth Fund
September 30, 2011
Table of Contents | ||||
| 7 | ||||
| 10 | ||||
| 14 | ||||
| 16 | ||||
| 18 | ||||
| 19 | ||||
| 26 | ||||
| 28 | ||||
| 29 | ||||
| 30 | ||||
| 31 | ||||
| 34 |
This report is certified under the Sarbanes-Oxley Act of 2002, which requires that public companies, including mutual funds, affirm that the information provided in their annual and semiannual shareholder reports fully and fairly represents their financial position.
6 Certified Annual Report
Alexander M.V. Motola,CFA Portfolio Manager | October 18, 2011
Dear Fellow Shareholder:
Equity investors have had quite a bit to digest over the past twelve months. Optimism towards the end of 2010 that a sustainable economic recovery could be taking hold gave way to concerns about political gridlock in our nation’s capital, sovereign debt issues in Europe, the possibility of a slowdown in economic growth worldwide, and the battle against inflation in emerging markets. Global headlines quickly overwhelmed company specific fundamentals and investors abandoned equities in a flight-to-quality. Over the summer, in a relatively short period of time, global bourses quickly erased many of the gains generated earlier in the fiscal year.
Returns for the Thornburg Core Growth Fund were disappointing on both an absolute and relative basis. On September 30, 2010, the net asset value (NAV) for the Class A shares was $13.81. At the end of the fiscal year, the Fund’s NAV was $13.33. The Fund’s Class A shares (at NAV) returned negative 3.48% over the past twelve months, materially behind the Russell 3000 Growth Index return of 3.39%. As has been the case for the last few years, there will be no capital gain distribution this year. At September 30, 2011, the Fund had tax basis realized capital losses of approximately $680 million, which may be carried forward to offset future capital gains to the extent permitted by regulations.
Stock selection, as holders of the Fund have heard from us repeatedly over the years, was the primary driver of performance this period. The Thornburg Core Growth Fund is invested in a relatively small number of names that we believe can perform well, regardless of industry group or market environment. Unfortunately, our selection effect within information technology was broadly negative. We’re disappointed, both because it was the largest weight in the Fund, but also due to the success we’ve had in that industry in the past. Yandex, a Russian internet search provider, led the IT detractors. It sold off in sympathy with equities domiciled in emerging markets. We remain invested based on the low but growing internet penetration rates in Russia, as well as the strength of their competitive position and balance sheet. Another detractor from the IT sector, Riverbed Technologies, also remains in the Fund. As is sometimes the case, performance measurement can be an exercise in timing; Riverbed was purchased after it had corrected more then 35% from its highs, but it still declined another 30% as markets rerated in August and September. Overall, we continue to be optimistic about the prospects for our IT holdings, as valuations appear to be relatively modest. |

Certified Annual Report 7
| Letter to Shareholders, | ||
Continued | ||
More encouraging was the success we had in the health care sector. While not universally positive, we did benefit from strong performance from our biotechnology and health care services holdings. Alexion Pharmaceuticals beat revenue estimates and optimism rose about its pipeline of new products; we sold the stock at a price target late in the fiscal year. Covidien was another contributor that was sold during the first half of 2011; the company is exhibiting growth in a number of business segments and its stock price was augmented by a share buyback.
IT and health care have often, together, made up a large percentage of the holdings of the Core Growth Fund. In retrospect, this should come as no surprise, as these two sectors have provided a disproportionate share of domestic economic growth over the past few decades. In addition, our process tends to be geared towards companies with secular, as opposed to cyclical, growth drivers. We find that these two areas provide more opportunities to identify disruptive technologies or services than the materials and energy sectors, where the stock price is often driven by the price of an underlying commodity. We do not make fundamental changes to our philosophy or process; however, we are today casting a wider-than-ever net in our search for promising growth companies trading at a discount to intrinsic value. While not a huge focus of the Fund on a percentage basis, we’ve often done well in unconventional growth areas. The past twelve months were no exception as Frontier Oil, a petroleum refiner, was the strongest single contributor to Fund performance.
Diversification continues to be a critical element to our management of the Fund. When we launched the Core Growth Fund in late 2000, we wanted a vehicle which would have exposure across the universe of growth investing styles and market capitalizations. We borrowed the “basket” approach of our Value and International Value siblings, and modified those baskets for growth investing. The portfolio we share as investors contains a broad mix of stocks including some of the largest capitalization IT stocks such as Microsoft and Google. We view these companies as high-quality growth stories, generating massive cash flows that are currently trading at historically low valuations. While those stocks have been out-of-favor for some time, we believe that the market will recognize the value that we see in these franchises. At the other side of the growth spectrum is our position in Zoll Medical, a fast-growing provider of defibrillator products, currently trading at a market capitalization of under $1 billion.
At the time of this writing, we cannot help but feel that we are at a fundamentally different place than when we were entering the Great Recession. Investors no doubt feel a great deal of anxiety as we enter a new fiscal year. However, the balance sheets of domestic financial institutions and corporate America are in much better shape than they were three years ago. Near-term earnings expectations may need to be adjusted for slower growth in the coming months; however, multiples do not appear to be stretched.
We continue to be confident in our approach and personnel. Jim Gassman joined our team as a senior equity analyst during the period. Jim has a solid background in growth investing, fits well into our collaborative approach to research, and quickly brought to our attention names which he had covered in previous duties. Tamara Manoukian has transitioned her focus to our International Value Fund, however, given Thornburg Investment Management’s global generalist approach
8 Certified Annual Report
to research and the collegial nature of our equity team, she continues to cover stocks within the Core Growth Fund and will continue to be a source of new idea contribution (as are all analysts at Thornburg).
We continue to focus on identifying promising growth companies trading at a discount to their long-term value. Regardless of the economic environment, we believe that our disciplined, bottom-up approach will lead us to attractive growth companies. We encourage you to learn more about your portfolio. Quarterly updates, as well as descriptions of each holding can be found at www.thornburg.com/funds. Thank you for your investment in the Thornburg Core Growth Fund.
| Sincerely, |
 |
| Alexander M.V. Motola,CFA |
| Managing Director |
| Portfolio Manager |
The matters discussed in this report may constitute forward-looking statements made pursuant to the safe harbor provisions of the Securities Litigation Reform Act of 1995. These include any advisor or portfolio manager prediction, assessment, analysis or outlook for individual securities, industries, investment styles, market sectors and/or markets. These statements involve risks and uncertainties. In addition to the general risks described for each fund in its current prospectus, other factors bearing on these reports include the accuracy of the advisor’s or portfolio manager’s forecasts and predictions, the appropriateness of the investment strategies designed by the advisor or portfolio manager, and the ability of the advisor or portfolio manager to implement their strategies efficiently and successfully. Any one or more of these factors, as well as other risks affecting the securities markets generally, could cause the actual results of any fund to differ materially as compared to its benchmarks.
Certified Annual Report 9
| SCHEDULE OF INVESTMENTS | ||
| Thornburg Core Growth Fund | September 30, 2011 | |
TOP TEN HOLDINGS
As of 9/30/11
Charles Schwab Corp. | 4.7 | % | Qualcomm, Inc. | 3.8 | % | |||||
Amazon.com, Inc. | 4.2 | % | Intuit, Inc. | 3.6 | % | |||||
Gilead Sciences, Inc. | 4.1 | % | Microsoft Corp. | 3.4 | % | |||||
Visa, Inc. | 4.0 | % | Medco Health Solutions, Inc. | 3.4 | % | |||||
Google, Inc. | 4.0 | % | Affiliated Managers Group, Inc. | 3.3 | % |
SUMMARY OF INDUSTRY EXPOSURE
As of 9/30/11
Software & Services | 29.9 | % | Transportation | 3.0 | % | |||||
Diversified Financials | 14.3 | % | Telecommunication Services | 2.6 | % | |||||
Technology Hardware & Equipment | 11.3 | % | Capital Goods | 2.5 | % | |||||
Health Care Equipment & Services | 9.0 | % | Semiconductors & Semiconductor Equipment | 2.2 | % | |||||
Retailing | 8.2 | % | Banks | 2.2 | % | |||||
Pharmaceuticals, Biotechnology & Life Sciences | 4.1 | % | Automobiles & Components | 1.7 | % | |||||
Energy | 4.0 | % | Other Assets & Cash Equivalents | 2.0 | % | |||||
Consumer Durables & Apparel | 3.0 | % |
SUMMARY OF COUNTRY EXPOSURE
As of 9/30/11 (% of equity holdings)
United States | 88.6 | % | China | 2.1 | % | |||||
United Kingdom | 5.6 | % | Russia | 1.6 | % | |||||
Argentina | 2.1 | % |
10 Certified Annual Report
| SCHEDULE OF INVESTMENTS, CONTINUED | ||
| Thornburg Core Growth Fund | September 30, 2011 | |
| Shares/ Principal Amount | Value | |||||||
COMMON STOCK — 98.00% | ||||||||
AUTOMOBILES & COMPONENTS — 1.66% | ||||||||
AUTO COMPONENTS — 1.66% | ||||||||
Gentex Corp. | 445,527 | $ | 10,714,924 | |||||
|
| |||||||
| 10,714,924 | ||||||||
|
| |||||||
BANKS — 2.19% | ||||||||
COMMERCIAL BANKS — 2.19% | ||||||||
aSVB Financial Group | 383,806 | 14,200,822 | ||||||
|
| |||||||
| 14,200,822 | ||||||||
|
| |||||||
CAPITAL GOODS — 2.47% | ||||||||
TRADING COMPANIES & DISTRIBUTORS — 2.47% | ||||||||
aRSC Holdings, Inc. | 2,238,211 | 15,958,444 | ||||||
|
| |||||||
| 15,958,444 | ||||||||
|
| |||||||
CONSUMER DURABLES & APPAREL — 3.05% | ||||||||
TEXTILES, APPAREL & LUXURY GOODS — 3.05% | ||||||||
aVera Bradley, Inc. | 546,700 | 19,708,535 | ||||||
|
| |||||||
| 19,708,535 | ||||||||
|
| |||||||
DIVERSIFIED FINANCIALS — 14.35% | ||||||||
CAPITAL MARKETS — 10.78% | ||||||||
aAffiliated Managers Group, Inc. | 269,587 | 21,041,265 | ||||||
Charles Schwab Corp. | 2,701,535 | 30,446,300 | ||||||
Hargreaves Lansdown plc | 2,600,000 | 18,244,988 | ||||||
DIVERSIFIED FINANCIAL SERVICES — 3.57% | ||||||||
aEncore Capital Group, Inc. | 705,448 | 15,414,039 | ||||||
aPortfolio Recovery Associates, Inc. | 123,547 | 7,687,094 | ||||||
|
| |||||||
| 92,833,686 | ||||||||
|
| |||||||
ENERGY — 3.97% | ||||||||
ENERGY EQUIPMENT & SERVICES — 2.48% | ||||||||
Baker Hughes, Inc. | 348,300 | 16,077,528 | ||||||
OIL, GAS & CONSUMABLE FUELS — 1.49% | ||||||||
aContinental Resources, Inc. | 198,900 | 9,620,793 | ||||||
|
| |||||||
| 25,698,321 | ||||||||
|
| |||||||
HEALTH CARE EQUIPMENT & SERVICES — 9.03% | ||||||||
HEALTH CARE EQUIPMENT & SUPPLIES — 2.46% | ||||||||
aZoll Medical Corp. | 421,663 | 15,913,562 | ||||||
HEALTH CARE PROVIDERS & SERVICES — 6.57% | ||||||||
aHMS Holdings Corp. | 852,070 | 20,781,987 | ||||||
aMedco Health Solutions, Inc. | 463,100 | 21,714,759 | ||||||
|
| |||||||
| 58,410,308 | ||||||||
|
| |||||||
PHARMACEUTICALS, BIOTECHNOLOGY & LIFE SCIENCES — 4.10% | ||||||||
BIOTECHNOLOGY — 4.10% | ||||||||
aGilead Sciences, Inc. | 684,179 | 26,546,145 | ||||||
|
| |||||||
| 26,546,145 | ||||||||
|
| |||||||
Certified Annual Report 11
| SCHEDULE OF INVESTMENTS, CONTINUED | ||
| Thornburg Core Growth Fund | September 30, 2011 | |
| Shares/ Principal Amount | Value | |||||||
RETAILING — 8.20% | ||||||||
INTERNET & CATALOG RETAIL — 4.22% | ||||||||
aAmazon.com, Inc. | 126,215 | $ | 27,291,469 | |||||
SPECIALTY RETAIL — 3.98% | ||||||||
aSuperGroup plc | 1,057,370 | 17,148,181 | ||||||
aUrban Outfitters, Inc. | 385,000 | 8,593,200 | ||||||
|
| |||||||
| 53,032,850 | ||||||||
|
| |||||||
SEMICONDUCTORS & SEMICONDUCTOR EQUIPMENT — 2.21% | ||||||||
SEMICONDUCTORS & SEMICONDUCTOR EQUIPMENT — 2.21% | ||||||||
aON Semiconductor Corp. | 1,994,598 | 14,301,268 | ||||||
|
| |||||||
| 14,301,268 | ||||||||
|
| |||||||
SOFTWARE & SERVICES — 29.85% | ||||||||
INFORMATION TECHNOLOGY SERVICES — 4.02% | ||||||||
Visa, Inc. | 303,156 | 25,986,533 | ||||||
INTERNET SOFTWARE & SERVICES — 12.29% | ||||||||
aBaidu, Inc. ADR | 126,400 | 13,513,424 | ||||||
aConstant Contact, Inc. | 189,015 | 3,268,069 | ||||||
aGoogle, Inc. | 49,939 | 25,687,623 | ||||||
MercadoLibre, Inc. | 249,386 | 13,404,498 | ||||||
aRightNow Technologies, Inc. | 415,250 | 13,724,012 | ||||||
aYandex NV | 487,500 | 9,949,875 | ||||||
SOFTWARE — 13.54% | ||||||||
a BroadSoft, Inc. | 642,144 | 19,489,070 | ||||||
Intuit, Inc. | 495,300 | 23,497,032 | ||||||
Microsoft Corp. | 888,338 | 22,110,733 | ||||||
aSolarWinds, Inc. | 636,153 | 14,008,089 | ||||||
aSuccessFactors, Inc. | 369,300 | 8,490,207 | ||||||
|
| |||||||
| 193,129,165 | ||||||||
|
| |||||||
TECHNOLOGY HARDWARE & EQUIPMENT — 11.34% | ||||||||
COMMUNICATIONS EQUIPMENT — 6.27% | ||||||||
Qualcomm, Inc. | 509,800 | 24,791,574 | ||||||
aRiverbed Technology, Inc. | 790,200 | 15,772,392 | ||||||
COMPUTERS & PERIPHERALS — 5.07% | ||||||||
aEMC Corp. | 993,700 | 20,857,763 | ||||||
aFusion-Io, Inc. | 630,700 | 11,983,300 | ||||||
|
| |||||||
| 73,405,029 | ||||||||
|
| |||||||
TELECOMMUNICATION SERVICES — 2.62% | ||||||||
WIRELESS TELECOMMUNICATION SERVICES — 2.62% | ||||||||
aSBA Communications Corp. | 491,931 | 16,961,781 | ||||||
|
| |||||||
| 16,961,781 | ||||||||
|
| |||||||
TRANSPORTATION — 2.96% | ||||||||
AIR FREIGHT & LOGISTICS — 2.96% | ||||||||
FedEx Corp. | 283,527 | 19,189,107 | ||||||
|
| |||||||
| 19,189,107 | ||||||||
|
| |||||||
TOTAL COMMON STOCK (Cost $627,878,814) | 634,090,385 | |||||||
|
| |||||||
12 Certified Annual Report
| SCHEDULE OF INVESTMENTS, CONTINUED | ||
| Thornburg Core Growth Fund | September 30, 2011 | |
| Shares/ Principal Amount | Value | |||||||
SHORT TERM INVESTMENTS — 0.46% | ||||||||
Devon Energy Corp., 0.17%, 10/3/2011 | $ | 3,000,000 | $ | 2,999,972 | ||||
|
| |||||||
TOTAL SHORT TERM INVESTMENTS (Cost $2,999,972) | 2,999,972 | |||||||
|
| |||||||
TOTAL INVESTMENTS — 98.46% (Cost $630,878,786) | $ | 637,090,357 | ||||||
OTHER ASSETS LESS LIABILITIES — 1.54% | 9,973,353 | |||||||
|
| |||||||
NET ASSETS — 100.00% | $ | 647,063,710 | ||||||
|
| |||||||
Footnote Legend
| a | Non-income producing. |
Portfolio Abbreviations
To simplify the listings of securities, abbreviations are used per the table below:
| ADR | American Depository Receipt |
See notes to financial statements.
Certified Annual Report 13
| STATEMENT OF ASSETS AND LIABILITIES | ||
| Thornburg Core Growth Fund | September 30, 2011 | |
ASSETS | ||||
Investments at value (cost $630,878,786) (Note 2) | $ | 637,090,357 | ||
Cash | 462,147 | |||
Cash denominated in foreign currency (cost $414,341) | 413,770 | |||
Receivable for investments sold | 12,140,483 | |||
Receivable for fund shares sold | 592,055 | |||
Dividends receivable | 58,853 | |||
Prepaid expenses and other assets | 41,241 | |||
|
| |||
Total Assets | 650,798,906 | |||
|
| |||
LIABILITIES | ||||
Payable for fund shares redeemed | 2,380,492 | |||
Payable to investment advisor and other affiliates (Note 3) | 717,324 | |||
Accounts payable and accrued expenses | 637,311 | |||
Dividends payable | 69 | |||
|
| |||
Total Liabilities | 3,735,196 | |||
|
| |||
NET ASSETS | $ | 647,063,710 | ||
|
| |||
NET ASSETS CONSIST OF: | ||||
Net unrealized appreciation on investments and foreign currency translations | $ | 6,210,955 | ||
Accumulated net realized gain (loss) | (685,554,287 | ) | ||
Net capital paid in on shares of beneficial interest | 1,326,407,042 | |||
|
| |||
| $ | 647,063,710 | |||
|
| |||
14 Certified Annual Report
| STATEMENT OF ASSETS AND LIABILITIES, CONTINUED | ||
| Thornburg Core Growth Fund | September 30, 2011 | |
NET ASSET VALUE: | ||||
Class A Shares: | ||||
Net asset value and redemption price per share ($208,134,817 applicable to 15,611,612 shares of beneficial interest outstanding - Note 4) | $ | 13.33 | ||
Maximum sales charge, 4.50% of offering price | 0.63 | |||
|
| |||
Maximum offering price per share | $ | 13.96 | ||
|
| |||
Class C Shares: | ||||
Net asset value and offering price per share* ($137,799,429 applicable to 11,280,208 shares of beneficial interest outstanding - Note 4) | $ | 12.22 | ||
|
| |||
Class I Shares: | ||||
Net asset value, offering and redemption price per share ($114,678,575 applicable to 8,264,255 shares of beneficial interest outstanding - Note 4) | $ | 13.88 | ||
|
| |||
Class R3 Shares: | ||||
Net asset value, offering and redemption price per share ($109,126,517 applicable to 8,187,121 shares of beneficial interest outstanding - Note 4) | $ | 13.33 | ||
|
| |||
Class R4 Shares: | ||||
Net asset value, offering and redemption price per share ($10,423,042 applicable to 779,751 shares of beneficial interest outstanding - Note 4) | $ | 13.37 | ||
|
| |||
Class R5 Shares: | ||||
Net asset value, offering and redemption price per share ($66,901,330 applicable to 4,826,708 shares of beneficial interest outstanding - Note 4) | $ | 13.86 | ||
|
| |||
| * | Redemption price per share is equal to net asset value less any applicable contingent deferred sales charge. |
See notes to financial statements.
Certified Annual Report 15
| STATEMENT OF OPERATIONS | ||
| Thornburg Core Growth Fund | Year Ended September 30, 2011 | |
INVESTMENT INCOME: | ||||
Dividend income (net of foreign taxes withheld of $41,129) | $ | 5,499,678 | ||
Interest income | 62,553 | |||
|
| |||
Total Income | 5,562,231 | |||
|
| |||
EXPENSES: | ||||
Investment advisory fees (Note 3) | 9,512,879 | |||
Administration fees (Note 3) | ||||
Class A Shares | 400,257 | |||
Class C Shares | 241,513 | |||
Class I Shares | 78,223 | |||
Class R3 Shares | 228,011 | |||
Class R4 Shares | 21,424 | |||
Class R5 Shares | 131,835 | |||
Distribution and service fees (Note 3) | ||||
Class A Shares | 799,466 | |||
Class C Shares | 1,925,327 | |||
Class R3 Shares | 910,977 | |||
Class R4 Shares | 42,544 | |||
Transfer agent fees | ||||
Class A Shares | 611,148 | |||
Class C Shares | 366,822 | |||
Class I Shares | 204,952 | |||
Class R3 Shares | 438,284 | |||
Class R4 Shares | 64,581 | |||
Class R5 Shares | 751,356 | |||
Registration and filing fees | ||||
Class A Shares | 24,419 | |||
Class C Shares | 21,584 | |||
Class I Shares | 21,229 | |||
Class R3 Shares | 42,413 | |||
Class R4 Shares | 21,722 | |||
Class R5 Shares | 22,889 | |||
Custodian fees (Note 3) | 207,360 | |||
Professional fees | 68,924 | |||
Accounting fees | 40,416 | |||
Trustee fees | 24,898 | |||
Other expenses | 110,631 | |||
|
| |||
Total Expenses | 17,336,084 | |||
Less: | ||||
Expenses reimbursed by investment advisor (Note 3) | (1,297,460 | ) | ||
|
| |||
Net Expenses | 16,038,624 | |||
|
| |||
Net Investment Loss | $ | (10,476,393 | ) | |
|
| |||
16 Certified Annual Report
| STATEMENT OF OPERATIONS, CONTINUED | ||
| Thornburg Core Growth Fund | Year Ended September 30, 2011 | |
REALIZED AND UNREALIZED GAIN (LOSS) | ||||
Net realized gain (loss) from: | ||||
Investments | $ | 228,389,431 | ||
Foreign currency transactions | 66,933 | |||
|
| |||
| 228,456,364 | ||||
|
| |||
Net change in unrealized appreciation (depreciation) on: | ||||
Investments | (168,137,098 | ) | ||
Foreign currency translations | (616 | ) | ||
|
| |||
| (168,137,714 | ) | |||
|
| |||
Net Realized and Unrealized Gain | 60,318,650 | |||
|
| |||
Net Increase in Net Assets Resulting from Operations | $ | 49,842,257 | ||
|
|
See notes to financial statements.
Certified Annual Report 17
| STATEMENTS OF CHANGES IN NET ASSETS |
| Thornburg Core Growth Fund |
| Year Ended September 30, 2011 | Year Ended September 30, 2010 | |||||||
INCREASE (DECREASE) IN NET ASSETS FROM | ||||||||
OPERATIONS: | ||||||||
Net investment income (loss) | $ | (10,476,393 | ) | $ | (16,110,454 | ) | ||
Net realized gain (loss) on investments and foreign currency transactions | 228,456,364 | 118,279,325 | ||||||
Net unrealized appreciation (depreciation) on investments and foreign currency translations | (168,137,714 | ) | (84,200,086 | ) | ||||
|
|
|
| |||||
Net Increase (Decrease) in Net Assets Resulting from Operations | 49,842,257 | 17,968,785 | ||||||
FUND SHARE TRANSACTIONS (NOTE 4): | ||||||||
Class A Shares | (175,820,842 | ) | (143,803,748 | ) | ||||
Class C Shares | (79,773,991 | ) | (75,171,959 | ) | ||||
Class I Shares | (59,949,918 | ) | (48,814,392 | ) | ||||
Class R3 Shares | (110,226,931 | ) | (69,273,239 | ) | ||||
Class R4 Shares | (15,430,363 | ) | (5,941,399 | ) | ||||
Class R5 Shares | (284,360,787 | ) | (3,484,259 | ) | ||||
|
|
|
| |||||
Net Decrease in Net Assets | (675,720,575 | ) | (328,520,211 | ) | ||||
NET ASSETS: | ||||||||
Beginning of Year | 1,322,784,285 | 1,651,304,496 | ||||||
|
|
|
| |||||
End of Year | $ | 647,063,710 | $ | 1,322,784,285 | ||||
|
|
|
| |||||
See notes to financial statements.
18 Certified Annual Report
| NOTES TO FINANCIAL STATEMENTS | ||
| Thornburg Core Growth Fund | September 30, 2011 | |
NOTE 1 – ORGANIZATION
Thornburg Core Growth Fund, hereinafter referred to as the “Fund,” is a diversified series of Thornburg Investment Trust (the “Trust”). The Trust was organized as a Massachusetts business trust under a Declaration of Trust dated June 3, 1987 and is registered as a diversified, open-end management investment company under the Investment Company Act of 1940, as amended. The Fund is currently one of sixteen separate series of the Trust. Each series is considered to be a separate entity for financial reporting and tax purposes and bears expenses directly attributable to it. The Fund seeks long-term capital appreciation by investing in equity securities selected for their growth potential.
The Fund currently offers six classes of shares of beneficial interest outstanding: Class A, Class C, Institutional Class (Class I), and Retirement Classes (Class R3, Class R4, and Class R5). Each class of shares of the Fund represents an interest in the same portfolio of investments, except that (i) Class A shares are sold subject to a front-end sales charge collected at the time the shares are purchased and bear a service fee, (ii) Class C shares are sold at net asset value without a sales charge at the time of purchase, but are subject to a contingent deferred sales charge upon redemption within one year of purchase, and bear both a service fee and a distribution fee, (iii) Class I shares are sold at net asset value without a sales charge at the time of purchase, (iv) Class R3 shares are sold at net asset value without a sales charge at the time of purchase, but bear both a service fee and distribution fee, (v) Class R4 shares are sold at net asset value without sales charge at the time of purchase, but bear a service fee, (vi) Class R5 shares are sold at net asset value without a sales charge at the time of purchase, and (vii) the respective classes may have different reinvestment privileges and conversion rights. Additionally, the Fund may allocate among its classes certain expenses, to the extent allowable to specific classes, including transfer agent fees, government registration fees, certain printing and postage costs, and administrative and legal expenses. Currently, class specific expenses of the Fund are limited to service and distribution fees, administration fees, and certain registration and transfer agent expenses.
NOTE 2 – SIGNIFICANT ACCOUNTING POLICIES
Significant accounting policies of the Trust are as follows:
Valuation of Investments: Portfolio securities listed or traded on a national securities exchange are valued on the valuation date at the last reported sale price on the exchange that is the primary market for the security. Portfolio securities traded on an exchange for which there has been no sale that day and other equity securities traded in the over-the-counter market are valued at the mean between the last reported bid and asked prices. Portfolio securities reported by NASDAQ are valued at the NASDAQ official closing price. Any foreign security traded on exchanges outside the United States is valued at the price of the security on the exchange that is normally the security’s primary market, as of the close of that exchange preceding the time of the Fund’s valuation.
Debt obligations held by the Fund have a primary market over the counter and are valued by an independent pricing service approved by the Trustees of the Trust. The pricing service ordinarily values debt obligations at quoted bid prices. When quotations are not available, debt obligations held by the Fund are valued at evaluated prices determined by the pricing service using methods which include consideration of yields or prices of debt obligations of comparable quality, type of issue, coupon, maturity and rating, and indications as to value from dealers and general market conditions. Short-term obligations having remaining maturities of 60 days or less are ordinarily valued at amortized cost, which approximates market value.
Quotations in foreign currencies for foreign portfolio investments are converted to U.S. dollar equivalents using the foreign exchange quotation in effect at the time of valuation.
In any case where the market value of an equity security held by the Fund is not readily available, the Trust’s valuation and pricing committee determines a fair value for the security using procedures approved by the Trustees, which may include the use of a price obtained from an independent pricing service. The pricing service ordinarily values equity securities in these instances using multi-factor models to adjust market prices based upon various inputs, including exchange data, depository receipt prices, futures and index data and other data. A security’s market value is deemed not readily available whenever the exchange or market on which the security is primarily traded is closed for the entire scheduled day of trading. Additionally, a security’s market value may be deemed not readily available under other circumstances identified by the Trustees, including when developments occurring after the most recent close of the security’s primary exchange or market, but before the most recent close of trading in Fund shares, or an unusual event or significant period of time occurring since the availability of a market quotation, create a question about the reliability of the security’s market value.
Certified Annual Report 19
| NOTES TO FINANCIAL STATEMENTS, CONTINUED | ||
| Thornburg Core Growth Fund | September 30, 2011 | |
In any case where a pricing service fails to provide a price for a debt obligation held by the Fund, the valuation and pricing committee determines a fair value for the debt obligation using procedures approved by the Trustees. Additionally, in any case where management believes that a price provided by a pricing service for a debt obligation held by the Fund may be unreliable, the valuation and pricing committee decides whether or not to use the pricing service’s valuation or to determine a fair value for the debt obligation.
In determining fair value for any portfolio security or other investment, the valuation and pricing committee seeks to determine the amount that an owner of the investment might reasonably expect to receive upon a sale of the investment. However, because fair value prices are estimated prices, the valuation and pricing committee’s determination of fair value for an investment may differ from the value that would be realized by the Fund upon a sale of the investment, and that difference could be material to the Fund’s financial statements. The valuation and pricing committee’s determination of fair value for an investment may also differ from the prices obtained by other persons (including other mutual funds) for the investment.
Valuation Measurements: Various inputs are used in determining the value of the Fund’s investments. These inputs are summarized in the three levels listed below:
Level 1: Quoted prices in active markets for identical investments.
Level 2: Other significant observable inputs (including quoted prices for similar investments, interest rates, prepayment rates, credit risk, etc.).
Level 3: Significant unobservable inputs (including the Fund’s own assumptions in determining the fair value of investments).
The following table displays a summary of the inputs used to value the Fund’s net assets as of September 30, 2011. In any instance when valuation inputs from more than one level are used to determine the fair value of a specific investment, the investment is placed in the level of the table based upon the lowest level input that is significant in determining the fair value of the investment:
| Fair Value Measurements at September 30, 2011 | ||||||||||||||||
| Total | Level 1 | Level 2 | Level 3 | |||||||||||||
Assets | ||||||||||||||||
Investments in Securities* | ||||||||||||||||
Common Stock | $ | 634,090,385 | $ | 634,090,385 | $ | — | $ | — | ||||||||
Short Term Investments | 2,999,972 | — | 2,999,972 | — | ||||||||||||
|
|
|
|
|
|
|
| |||||||||
Total Investments in Securities | $ | 637,090,357 | $ | 634,090,385 | $ | 2,999,972 | $ | — | ||||||||
| * | See Schedule of Investments for a summary of the industry exposure as grouped according to the Global Industry Classification Standard (GICS), which is an industry taxonomy developed by MSCI, Inc. and Standard & Poor’s (S&P). |
Other Notes: It is the policy of the Fund to recognize significant transfers between Levels 1, 2 and 3 and to disclose those transfers at the beginning of the reporting period. The Fund recognized no significant transfers between levels for the year ended September 30, 2011.
Foreign Currency Translation: Portfolio securities and other assets and liabilities denominated in foreign currencies are translated into U.S. dollars based on the exchange rate of such currencies against the U.S. dollar on the date of valuation. Purchases and sales of securities and income items denominated in foreign currencies are translated into U.S. dollars at the exchange rate in effect on the translation date. When the Fund purchases or sells foreign securities, it will customarily enter into a foreign exchange contract to minimize foreign exchange risk from the trade date to the settlement date of such transactions. Such spot contracts are included in Receivable for investments sold and Payable for investments purchased on the Statement of Assets and Liabilities.
The Fund does not separately report the effect of changes in foreign exchange rates from changes in market prices on securities held. Such changes are included in net realized and unrealized gain or loss from investments.
20 Certified Annual Report
| NOTES TO FINANCIAL STATEMENTS, CONTINUED | ||
| Thornburg Core Growth Fund | September 30, 2011 | |
Reported net realized foreign exchange gains or losses arise from purchases and sales of foreign currencies, currency gains or losses realized between the trade and settlement dates on securities transactions and the difference between the amounts of dividends, interest, and foreign withholding taxes recorded on the Fund’s books, and the U.S. dollar equivalent of the amounts actually received or paid.
Net unrealized foreign exchange gains and losses arise from changes in the fair value of assets and liabilities, other than investments in securities at fiscal period end, resulting from changes in exchange rates.
Deferred Taxes: The Fund is subject to a tax imposed on net realized gains of securities of certain foreign countries. The Fund records an estimated deferred tax liability for net unrealized gains on these securities as reflected in the accompanying financial statements.
Federal Income Taxes: It is the policy of the Trust to comply with the provisions of the Internal Revenue Code applicable to “regulated investment companies,” and to distribute to shareholders substantially all taxable income, including any net realized gain on investments of the Fund. Therefore, no provision for federal income taxes is required.
Management reviews each uncertain tax position believed to be material to the preparation of the Fund’s financial statements, to assess if it is more likely than not that the position would be sustained upon examination, based upon the technical merits of the position. As of September 30, 2011, management has not identified any such position for which a liability must be reflected in the Statement of Assets and Liabilities. The Fund’s tax returns remain subject to examination for three years after filing.
When-Issued and Delayed Delivery Transactions: The Fund may engage in when-issued or delayed delivery transactions. To the extent the Fund engages in such transactions, it will do so for the purpose of acquiring portfolio securities consistent with the Fund’s investment objectives and not for the purpose of investment leverage or to speculate on interest rate and/or market changes. At the time the Fund makes a commitment to purchase a security on a when-issued or delayed delivery basis, the Fund will record the transaction and reflect the value in determining its net asset value. When effecting such transactions, assets of an amount sufficient to make payment for the portfolio securities to be purchased will be segregated on the Fund’s records on the trade date. Securities purchased on a when-issued or delayed delivery basis do not earn interest until the settlement date.
Dividends: Dividends to shareholders, if any, are generally paid quarterly and are reinvested in additional shares of the Fund at net asset value per share at the close of business on the dividend payment date or, at the shareholder’s option, paid in cash. Net realized capital gains, to the extent available, will be distributed at least annually. Distributions to shareholders are based on income tax regulations and therefore, their characteristics may differ for financial statement and tax purposes.
General: Securities transactions are accounted for on a trade date basis. Interest income is accrued as earned and dividend income is recorded on the ex-dividend date. Certain income from foreign securities is recognized as soon as information is available to the Fund. Realized gains and losses from the sale of securities are recorded on an identified cost basis. Net investment income (other than class specific expenses) and realized and unrealized gains and losses are allocated daily to each class of shares based upon the relative net asset value of outstanding shares of each class of shares at the beginning of the day (after adjusting for the current share activity of the respective class). Expenses common to all Funds are allocated among the Funds comprising the Trust based upon their relative net asset values or other appropriate allocation methods.
Guarantees and Indemnifications: Under the Trust’s organizational documents, its officers and Trustees are indemnified against certain liabilities arising out of the performance of their duties to the Fund. Additionally, in the normal course of business the Trust enters into contracts with service providers that contain general indemnification clauses. The Trust’s maximum exposure under these arrangements is unknown. However, based on experience, the Trust expects the risk of loss to be remote.
Use of Estimates: The preparation of financial statements, in conformity with generally accepted accounting principles, requires management to make estimates and assumptions that affect the reported amounts of assets and liabilities and the disclosure of contingent assets and liabilities at the date of the financial statements and the reported amounts of increases and decreases in net assets from operations during the reporting period. Actual results could differ from those estimates.
Certified Annual Report 21
| NOTES TO FINANCIAL STATEMENTS, CONTINUED | ||
| Thornburg Core Growth Fund | September 30, 2011 | |
NOTE 3 – INVESTMENT ADVISORY FEE AND OTHER TRANSACTIONS WITH AFFILIATES
Pursuant to an investment advisory agreement, Thornburg Investment Management, Inc. (the “Advisor”) serves as the investment advisor and performs services to the Fund for which the fees are payable at the end of each month. For the year ended September 30, 2011, these fees were payable at annual rates ranging from .875 of 1% to .675 of 1% per annum of the average daily net assets of the Fund depending on the Fund’s asset size. The Trust also has entered into administrative services agreements with the Advisor, whereby the Advisor will perform certain administrative services for the shareholders of each class of the Fund’s shares, and for which fees will be payable at an annual rate of up to .125 of 1% per annum of the average daily net assets attributable to each class of shares. For the year ended September 30, 2011, the Advisor contractually reimbursed certain class specific expenses, administrative fees, and distribution fees of $3,324 for Class A shares, $133,142 for Class I shares, $488,803 for Class R3 shares, $61,370 for Class R4 shares, and $610,821 for Class R5 shares.
The Trust has an underwriting agreement with Thornburg Securities Corporation (the “Distributor,” an affiliate of the Advisor), which acts as the distributor of the Fund’s shares. For the year ended September 30, 2011, the Distributor has advised the Fund that it earned commissions aggregating $14,664 from the sale of Class A shares, and collected contingent deferred sales charges aggregating $9,854 from redemptions of Class C shares of the Fund.
Pursuant to a service plan under Rule 12b-1 of the Investment Company Act of 1940, the Fund may reimburse to the Advisor an amount not to exceed .25 of 1% per annum of the average daily net assets attributable to each class of shares of the Fund for payments made by the Advisor to securities dealers and other financial institutions to obtain various shareholder and distribution related services. For the year ended September 30, 2011, there were no 12b-1 service plan fees charged for Class I and R5 shares. The Advisor may pay out of its own resources additional expenses for distribution of the Fund’s shares.
The Trust has also adopted distribution plans pursuant to Rule 12b-1, applicable only to the Fund’s Class C and Class R3 shares, under which the Fund compensates the Distributor for services in promoting the sale of Class C and Class R3 shares of the Fund at an annual rate of up to .75 of 1% per annum of the average daily net assets attributable to Class C shares, and an annual rate of up to .25 of 1% per annum of the average daily net assets attributable to Class R3 shares. Total fees incurred by the Distributor for each class of shares of the Fund under their respective Service and Distribution Plans for the year ended September 30, 2011, are set forth in the Statement of Operations.
The Trust has an agreement with the custodian bank to indirectly pay a portion of the custodian’s fees through credits earned by the Fund’s cash on deposit with the bank. This deposit agreement is an alternative to overnight investments. Custodial fees have been adjusted to reflect amounts that would have been paid without this agreement, with a corresponding adjustment reflected as fees paid indirectly in the Statement of Operations. For the year ended September 30, 2011, there were no fees paid indirectly.
Certain officers and Trustees of the Trust are also officers or directors of the Advisor and Distributor. The compensation of independent Trustees is borne by the Trust.
NOTE 4 – SHARES OF BENEFICIAL INTEREST
At September 30, 2011, there were an unlimited number of shares of beneficial interest authorized. Transactions in shares of beneficial interest were as follows:
| Year Ended September 30, 2011 | Year Ended September 30, 2010 | |||||||||||||||
| Shares | Amount | Shares | Amount | |||||||||||||
Class A Shares | ||||||||||||||||
Shares sold | 1,523,774 | $ | 23,528,867 | 3,895,692 | $ | 53,800,051 | ||||||||||
Shares issued to shareholders in reinvestment of dividends | — | — | — | — | ||||||||||||
Shares repurchased | (12,914,624 | ) | (199,351,773 | ) | (14,432,625 | ) | (197,604,891 | ) | ||||||||
Redemption fees received* | — | 2,064 | — | 1,092 | ||||||||||||
|
|
|
|
|
|
|
| |||||||||
Net increase (decrease) | (11,390,850 | ) | $ | (175,820,842 | ) | (10,536,933 | ) | $ | (143,803,748 | ) | ||||||
|
|
|
|
|
|
|
| |||||||||
22 Certified Annual Report
| NOTES TO FINANCIAL STATEMENTS, CONTINUED | ||
| Thornburg Core Growth Fund | September 30, 2011 | |
| Year Ended September 30, 2011 | Year Ended September 30, 2010 | |||||||||||||||
| Shares | Amount | Shares | Amount | |||||||||||||
Class C Shares | ||||||||||||||||
Shares sold | 660,446 | $ | 9,280,741 | 1,070,092 | $ | 13,715,365 | ||||||||||
Shares issued to shareholders in reinvestment of dividends | — | — | — | — | ||||||||||||
Shares repurchased | (6,273,338 | ) | (89,056,037 | ) | (7,016,592 | ) | (88,887,938 | ) | ||||||||
Redemption fees received* | — | 1,305 | — | 614 | ||||||||||||
|
|
|
|
|
|
|
| |||||||||
Net increase (decrease) | (5,612,892 | ) | $ | (79,773,991 | ) | (5,946,500 | ) | $ | (75,171,959 | ) | ||||||
|
|
|
|
|
|
|
| |||||||||
Class I Shares | ||||||||||||||||
Shares sold | 2,621,591 | $ | 41,975,065 | 3,751,437 | $ | 53,348,009 | ||||||||||
Shares issued to shareholders in reinvestment of dividends | — | — | — | — | ||||||||||||
Shares repurchased | (6,385,486 | ) | (101,926,048 | ) | (7,276,584 | ) | (102,162,877 | ) | ||||||||
Redemption fees received* | — | 1,065 | — | 476 | ||||||||||||
|
|
|
|
|
|
|
| |||||||||
Net increase (decrease) | (3,763,895 | ) | $ | (59,949,918 | ) | (3,525,147 | ) | $ | (48,814,392 | ) | ||||||
|
|
|
|
|
|
|
| |||||||||
Class R3 Shares | ||||||||||||||||
Shares sold | 1,804,561 | $ | 27,972,861 | 4,447,347 | $ | 61,659,930 | ||||||||||
Shares issued to shareholders in reinvestment of dividends | — | — | — | — | ||||||||||||
Shares repurchased | (8,987,536 | ) | (138,200,925 | ) | (9,529,774 | ) | (130,933,778 | ) | ||||||||
Redemption fees received* | — | 1,133 | — | 609 | �� | |||||||||||
|
|
|
|
|
|
|
| |||||||||
Net increase (decrease) | (7,182,975 | ) | $ | (110,226,931 | ) | (5,082,427 | ) | $ | (69,273,239 | ) | ||||||
|
|
|
|
|
|
|
| |||||||||
Class R4 Shares | ||||||||||||||||
Shares sold | 489,460 | $ | 7,637,091 | 686,300 | $ | 9,351,159 | ||||||||||
Shares issued to shareholders in reinvestment of dividends | — | — | — | — | ||||||||||||
Shares repurchased | (1,513,646 | ) | (23,067,562 | ) | (1,147,030 | ) | (15,292,633 | ) | ||||||||
Redemption fees received* | — | 108 | — | 75 | ||||||||||||
|
|
|
|
|
|
|
| |||||||||
Net increase (decrease) | (1,024,186 | ) | $ | (15,430,363 | ) | (460,730 | ) | $ | (5,941,399 | ) | ||||||
|
|
|
|
|
|
|
| |||||||||
Class R5 Shares | ||||||||||||||||
Shares sold | 2,048,486 | $ | 33,073,276 | 6,078,290 | $ | 86,903,397 | ||||||||||
Shares issued to shareholders in reinvestment of dividends | — | — | — | — | ||||||||||||
Shares repurchased | (19,949,793 | ) | (317,435,221 | ) | (6,402,491 | ) | (90,388,466 | ) | ||||||||
Redemption fees received* | — | 1,158 | — | 810 | ||||||||||||
|
|
|
|
|
|
|
| |||||||||
Net increase (decrease) | (17,901,307 | ) | $ | (284,360,787 | ) | (324,201 | ) | $ | (3,484,259 | ) | ||||||
|
|
|
|
|
|
|
| |||||||||
| * | The Fund charges a redemption fee of 1% of the Class A and Class I shares redeemed or exchanged within 30 days of purchase. Redemption fees charged to any class are allocated to all classes upon receipt of payment based on relative net asset values of each class or other appropriate allocation methods. |
NOTE 5 – SECURITIES TRANSACTIONS
For the year ended September 30, 2011, the Fund had purchase and sale transactions of investment securities (excluding short-term investments) of $885,195,763 and $1,603,704,718, respectively.
Certified Annual Report 23
| NOTES TO FINANCIAL STATEMENTS, CONTINUED | ||
| Thornburg Core Growth Fund | September 30, 2011 | |
NOTE 6 – INCOME TAXES
At September 30, 2011, information on the tax components of capital is as follows:
Cost of investments for tax purposes | $ | 631,744,641 | ||
|
| |||
Gross unrealized appreciation on a tax basis | $ | 83,300,951 | ||
Gross unrealized depreciation on a tax basis | (77,955,235 | ) | ||
|
| |||
Net unrealized appreciation (depreciation) on investments (tax basis) | $ | 5,345,716 | ||
|
|
At September 30, 2011, the Fund did not have any undistributed ordinary income or distributable capital gains.
For the fiscal year ended September 30, 2011, the Fund utilized $228,824,572 of capital loss carryforwards.
At September 30, 2011, the Fund had tax basis capital losses, which may be carried forward to offset future capital gains. To the extent such carryforwards are used, capital gain distributions may be reduced to the extent provided by regulations.
Such capital loss carryforwards expire as follows:
2017 | $ | 431,330,022 | ||
2018 | 253,358,410 | |||
|
| |||
| $ | 684,688,432 | |||
|
|
The Regulated Investment Company Modernization Act of 2010 (the “Act”) was signed into law on December 22, 2010. The Act makes changes to a number of tax rules impacting the Fund. Under the Act, future capital losses generated by the Fund may be carried over indefinitely, but these losses must be used prior to the utilization of any pre-enactment capital losses. Since pre-enactment capital losses may only be carried forward for eight years, there may be a greater likelihood that all or a portion of a Fund’s pre-enactment capital losses will expire unused. In general, the provisions of the Act will be effective for the Fund’s fiscal year ending September 30, 2012.
In order to account for permanent book/tax differences, the Fund decreased net capital paid in on shares of beneficial interest by $10,505,777, increased accumulated net realized loss by $66,933, and decreased net investment loss by $10,572,710. This reclassification has no impact on the net asset value of the Fund. Reclassifications result primarily from nondeductible net operating losses and foreign currency losses.
NOTE 7 – FINANCIAL INSTRUMENTS WITH OFF-BALANCE SHEET RISK AND FOREIGN INVESTMENT RISK
The Fund may use a variety of derivative financial instruments to hedge or adjust the risks affecting its investment portfolio or to enhance investment returns. Provisions of FASB Accounting Standards Codification ASC 815-10-50 (“ASC 815”), require certain disclosures. The disclosures are intended to provide users of financial statements with an understanding of the use of derivative instruments by the Fund and how these derivatives affect the financial position, financial performance and cash flows of the Fund. The Fund does not designate any derivative instruments as hedging instruments under ASC 815. Additionally, the Fund’s risk of loss may exceed the amounts recognized on the Statement of Assets and Liabilities.
For the year ended September 30, 2011, the Fund did not invest in any derivative financial instruments of the type addressed by ASC 815.
24 Certified Annual Report
| NOTES TO FINANCIAL STATEMENTS, CONTINUED | ||
| Thornburg Core Growth Fund | September 30, 2011 | |
OTHER NOTES:
Risks: The Fund’s investments subject it to risks including, but not limited to, management risk, market and economic risk, risks affecting specific issuers, liquidity risk, the risks associated with investments in smaller companies and non-U.S. issuers, credit risk, and interest rate risk. Please see the Fund’s prospectus for a discussion of the risks associated with an investment in the Fund.
Subsequent Events: Fund management believes no events have occurred between September 30, 2011 and the date of issuance of the financial statements, which require adjustment to, or disclosure in the accompanying financial statements.
Certified Annual Report 25
Thornburg Core Growth Fund
| PER SHARE PERFORMANCE (for a share outstanding throughout the Year)+ | RATIOS TO AVERAGE NET ASSETS | SUPPLEMENTAL DATA | ||||||||||||||||||||||||||||||||||||||||||||||||||||||||||
Unless | Net Asset Value Beginning of Year | Net Investment Income (Loss) | Net Realized & Unrealized Gain (Loss) on Investments | Total from Investment Operations | Dividends from Net Investment Income | Dividends from Net Realized Gains | Total Dividends | Net Asset Value End of Year | Net Investment Income (Loss) (%) | Expenses, After Expense Reductions (%) | Expenses, After Expense Reductions and Net of Custody Credits (%) | Expenses, Before Expense Reductions (%) | Total Return (%)(a) | Portfolio Turnover Rate (%) | Net Assets at End of Year (Thousands) | |||||||||||||||||||||||||||||||||||||||||||||
Class A Shares |
| |||||||||||||||||||||||||||||||||||||||||||||||||||||||||||
2011(b) | $ | 13.81 | (0.15 | ) | (0.33 | ) | (0.48 | ) | — | — | — | $ | 13.33 | (0.96 | ) | 1.45 | 1.45 | 1.45 | (3.48 | ) | 80.53 | $ | 208,135 | |||||||||||||||||||||||||||||||||||||
2010(b) | $ | 13.61 | (0.15 | ) | 0.35 | 0.20 | .— | — | — | $ | 13.81 | (1.09 | ) | 1.48 | 1.48 | 1.48 | 1.47 | 75.06 | $ | 372,954 | ||||||||||||||||||||||||||||||||||||||||
2009(b) | $ | 13.36 | (0.09 | ) | 0.34 | 0.25 | — | — | — | $ | 13.61 | (0.81 | ) | 1.48 | 1.48 | 1.49 | 1.87 | 82.86 | $ | 511,065 | ||||||||||||||||||||||||||||||||||||||||
2008(b) | $ | 20.72 | (0.10 | ) | (7.25 | ) | (7.35 | ) | — | (0.01 | ) | (0.01 | ) | $ | 13.36 | (0.58 | ) | 1.38 | 1.38 | 1.38 | (35.48 | ) | 79.73 | $ | 738,457 | |||||||||||||||||||||||||||||||||||
2007(b) | $ | 16.38 | (0.15 | ) | 4.49 | 4.34 | — | — | — | $ | 20.72 | (0.78 | ) | 1.37 | 1.36 | 1.37 | 26.50 | 82.37 | $ | 1,470,020 | ||||||||||||||||||||||||||||||||||||||||
Class C Shares |
| |||||||||||||||||||||||||||||||||||||||||||||||||||||||||||
2011 | $ | 12.75 | (0.24 | ) | (0.29 | ) | (0.53 | ) | — | — | — | $ | 12.22 | (1.71 | ) | 2.20 | 2.20 | 2.20 | (4.16 | ) | 80.53 | $ | 137,799 | |||||||||||||||||||||||||||||||||||||
2010 | $ | 12.66 | (0.23 | ) | 0.32 | 0.09 | — | — | — | $ | 12.75 | (1.84 | ) | 2.23 | 2.23 | 2.23 | 0.71 | 75.06 | $ | 215,413 | ||||||||||||||||||||||||||||||||||||||||
2009 | $ | 12.53 | (0.16 | ) | 0.29 | 0.13 | — | — | — | $ | 12.66 | (1.59 | ) | 2.26 | 2.26 | 2.26 | 1.04 | 82.86 | $ | 289,224 | ||||||||||||||||||||||||||||||||||||||||
2008 | $ | 19.57 | (0.22 | ) | (6.81 | ) | (7.03 | ) | — | (0.01 | ) | (0.01 | ) | $ | 12.53 | (1.34 | ) | 2.13 | 2.13 | 2.13 | (35.93 | ) | 79.73 | $ | 385,110 | |||||||||||||||||||||||||||||||||||
2007 | $ | 15.59 | (0.28 | ) | 4.26 | 3.98 | — | — | — | $ | 19.57 | (1.53 | ) | 2.12 | 2.11 | 2.12 | 25.53 | 82.37 | $ | 664,252 | ||||||||||||||||||||||||||||||||||||||||
Class I Shares |
| |||||||||||||||||||||||||||||||||||||||||||||||||||||||||||
2011 | $ | 14.31 | (0.08 | ) | (0.35 | ) | (0.43 | ) | — | — | — | $ | 13.88 | (0.49 | ) | 0.99 | 0.99 | 1.07 | (3.00 | ) | 80.53 | $ | 114,679 | |||||||||||||||||||||||||||||||||||||
2010 | $ | 14.04 | (0.09 | ) | 0.36 | 0.27 | — | — | — | $ | 14.31 | (0.60 | ) | 0.99 | 0.99 | 1.08 | 1.92 | 75.06 | $ | 172,126 | ||||||||||||||||||||||||||||||||||||||||
2009 | $ | 13.71 | (0.03 | ) | 0.36 | 0.33 | — | — | — | $ | 14.04 | (0.29 | ) | 0.97 | 0.97 | 1.08 | 2.41 | 82.86 | $ | 218,300 | ||||||||||||||||||||||||||||||||||||||||
2008 | $ | 21.16 | (0.03 | ) | (7.41 | ) | (7.44 | ) | — | (0.01 | ) | (0.01 | ) | $ | 13.71 | (0.17 | ) | 0.96 | 0.96 | 0.96 | (35.17 | ) | 79.73 | $ | 346,497 | |||||||||||||||||||||||||||||||||||
2007 | $ | 16.66 | (0.08 | ) | 4.58 | 4.50 | — | — | — | $ | 21.16 | (0.39 | ) | 0.98 | 0.97 | 0.98 | 27.01 | 82.37 | $ | 642,143 | ||||||||||||||||||||||||||||||||||||||||
Class R3 Shares |
| |||||||||||||||||||||||||||||||||||||||||||||||||||||||||||
2011 | $ | 13.82 | (0.16 | ) | (0.33 | ) | (0.49 | ) | — | — | — | $ | 13.33 | (1.01 | ) | 1.50 | 1.50 | 1.77 | (3.55 | ) | 80.53 | $ | 109,127 | |||||||||||||||||||||||||||||||||||||
2010 | $ | 13.62 | (0.15 | ) | 0.35 | 0.20 | — | — | — | $ | 13.82 | (1.11 | ) | 1.50 | 1.50 | 1.79 | 1.47 | 75.06 | $ | 212,360 | ||||||||||||||||||||||||||||||||||||||||
2009 | $ | 13.37 | (0.09 | ) | 0.34 | 0.25 | — | — | — | $ | 13.62 | (0.84 | ) | 1.49 | 1.49 | 1.76 | 1.87 | 82.86 | $ | 278,576 | ||||||||||||||||||||||||||||||||||||||||
2008 | $ | 20.75 | (0.13 | ) | (7.24 | ) | (7.37 | ) | — | (0.01 | ) | (0.01 | ) | $ | 13.37 | (0.74 | ) | 1.50 | 1.50 | 1.72 | (35.53 | ) | 79.73 | $ | 289,500 | |||||||||||||||||||||||||||||||||||
2007 | $ | 16.43 | (0.18 | ) | 4.50 | 4.32 | — | — | — | $ | 20.75 | (0.91 | ) | 1.51 | 1.50 | 1.64 | 26.29 | 82.37 | $ | 414,267 | ||||||||||||||||||||||||||||||||||||||||
Class R4 Shares |
| |||||||||||||||||||||||||||||||||||||||||||||||||||||||||||
2011 | $ | 13.84 | (0.14 | ) | (0.33 | ) | (0.47 | ) | — | — | — | $ | 13.37 | (0.91 | ) | 1.40 | 1.40 | 1.76 | (3.40 | ) | 80.53 | $ | 10,423 | |||||||||||||||||||||||||||||||||||||
2010 | $ | 13.63 | (0.14 | ) | 0.35 | 0.21 | — | — | — | $ | 13.84 | (1.01 | ) | 1.40 | 1.40 | 1.73 | 1.54 | 75.06 | $ | 24,968 | ||||||||||||||||||||||||||||||||||||||||
2009 | $ | 13.37 | (0.08 | ) | 0.34 | 0.26 | — | — | — | $ | 13.63 | (0.77 | ) | 1.40 | 1.40 | 1.83 | 1.94 | 82.86 | $ | 30,871 | ||||||||||||||||||||||||||||||||||||||||
2008 | $ | 20.73 | (0.13 | ) | (7.22 | ) | (7.35 | ) | — | (0.01 | ) | (0.01 | ) | $ | 13.37 | (0.78 | ) | 1.40 | 1.40 | 1.73 | (35.47 | ) | 79.73 | $ | 21,047 | |||||||||||||||||||||||||||||||||||
2007(c) | $ | 18.90 | (0.12 | ) | 1.95 | 1.83 | — | — | — | $ | 20.73 | (0.93 | )(d) | 1.41 | (d) | 1.40 | (d) | 8.74 | (d)(e) | 9.68 | 82.37 | $ | 3,508 | |||||||||||||||||||||||||||||||||||||
Class R5 Shares |
| |||||||||||||||||||||||||||||||||||||||||||||||||||||||||||
2011 | $ | 14.30 | (0.08 | ) | (0.36 | ) | (0.44 | ) | — | — | — | $ | 13.86 | (0.51 | ) | 0.99 | 0.99 | 1.22 | (3.08 | ) | 80.53 | $ | 66,901 | |||||||||||||||||||||||||||||||||||||
2010 | $ | 14.02 | (0.08 | ) | 0.36 | 0.28 | — | — | — | $ | 14.30 | (0.60 | ) | 0.99 | 0.99 | 1.18 | 2.00 | 75.06 | $ | 324,963 | ||||||||||||||||||||||||||||||||||||||||
2009 | $ | 13.70 | (0.04 | ) | 0.36 | 0.32 | — | — | — | $ | 14.02 | (0.34 | ) | 0.99 | 0.99 | 1.27 | 2.34 | 82.86 | $ | 323,268 | ||||||||||||||||||||||||||||||||||||||||
2008 | $ | 21.15 | (0.05 | ) | (7.39 | ) | (7.44 | ) | — | (0.01 | ) | (0.01 | ) | $ | 13.70 | (0.30 | ) | 0.99 | 0.99 | 1.18 | (35.19 | ) | 79.73 | $ | 251,299 | |||||||||||||||||||||||||||||||||||
2007 | $ | 16.65 | (0.07 | ) | 4.57 | 4.50 | — | — | — | $ | 21.15 | (0.37 | ) | 0.95 | 0.95 | 0.97 | 27.03 | 82.37 | $ | 158,084 | ||||||||||||||||||||||||||||||||||||||||
| (a) | Not annualized for periods less than one year. |
| (b) | Sales loads are not reflected in computing total return. |
| (c) | Effective date of this class of shares was February 1, 2007. |
| (d) | Annualized. |
| (e) | Due to the size of net assets and fixed expenses, ratios may appear disproportionate. |
| + | Based on weighted average shares outstanding. |
See notes to financial statements.
| 26 Certified Annual Report | Certified Annual Report 27 |
REPORT OF INDEPENDENT REGISTERED PUBLIC ACCOUNTING FIRM
Thornburg Core Growth Fund
To the Trustees and Shareholders of
Thornburg Core Growth Fund
In our opinion, the accompanying statement of assets and liabilities, including the schedule of investments, and the related statements of operations and of changes in net assets and the financial highlights present fairly, in all material respects, the financial position of Thornburg Core Growth Fund (one of the portfolios constituting Thornburg Investment Trust, hereafter referred to as the “Fund”) at September 30, 2011, the results of its operations for the year then ended, the changes in its net assets for each of the two years in the period then ended and the financial highlights for each of the periods presented, in conformity with accounting principles generally accepted in the United States of America. These financial statements and financial highlights (hereafter referred to as “financial statements”) are the responsibility of the Fund’s management. Our responsibility is to express an opinion on these financial statements based on our audits. We conducted our audits of these financial statements in accordance with the standards of the Public Company Accounting Oversight Board (United States). Those standards require that we plan and perform the audit to obtain reasonable assurance about whether the financial statements are free of material misstatement. An audit includes examining, on a test basis, evidence supporting the amounts and disclosures in the financial statements, assessing the accounting principles used and significant estimates made by management, and evaluating the overall financial statement presentation. We believe that our audits, which included confirmation of securities at September 30, 2011 by correspondence with the custodian and brokers, provide a reasonable basis for our opinion.
PricewaterhouseCoopers LLP
New York, New York
November 21, 2011
28 Certified Annual Report
| EXPENSE EXAMPLE | ||
| Thornburg Core Growth Fund | September 30, 2011 (Unaudited) | |
As a shareholder of the Fund, you incur two types of costs:
| (1) | transaction costs, including |
(a) sales charges (loads) on purchase payments for Class A shares;
(b) a deferred sales charge on redemptions of any part or all of a purchase of $1 million of Class A shares within 12 months of purchase;
(c) a deferred sales charge on redemptions of Class C shares within 12 months of purchase;
(d) a 30-day redemption fee on Class A and Class I shares;
| (2) | ongoing costs, including management fees; distribution and/or service (12b-1) fees; and other Fund expenses. |
This example is intended to help you understand your ongoing costs (in dollars) of investing in the Fund and to compare these costs with the ongoing costs of investing in other mutual funds.
The example is based on a $1,000 investment beginning on April 1, 2011, and held until September 30, 2011.
ACTUAL EXPENSES
For each class of shares, the first line of the table at right provides information about actual account values and actual expenses. You may use the information in this line, together with the amount you invested, to estimate the expenses that you paid over the period. Simply divide your account value by $1,000 (for example, an $8,600 account value divided by $1,000 = 8.6), then multiply the result by the number in the first line for your class of shares under the heading entitled “Expenses Paid During Period” to estimate the expenses you paid on your account during this period.
HYPOTHETICAL EXAMPLE FOR COMPARISON PURPOSES
For each class of shares, the second line of the table at right provides information about hypothetical account values and hypothetical expenses based on the Fund’s actual expense ratio and an assumed rate of return of 5% per year before expenses, which is not the Fund’s actual return. The hypothetical account values and expenses may not be used to estimate the actual ending account balance or expenses you paid for the period. You may use this information to compare the ongoing costs of investing in the Fund and other funds. To do so, compare this 5% hypothetical example with the 5% hypothetical examples that appear in the shareholder reports of the other funds.
| Beginning Account Value 4/1/11 | Ending Account Value 9/30/11 | Expenses Paid During Period† 4/1/11–9/30/11 | ||||||||||
Class A Shares | ||||||||||||
Actual | $ | 1,000.00 | $ | 817.30 | $ | 6.50 | ||||||
Hypothetical* | $ | 1,000.00 | $ | 1,017.92 | $ | 7.21 | ||||||
Class C Shares | ||||||||||||
Actual | $ | 1,000.00 | $ | 814.10 | $ | 9.91 | ||||||
Hypothetical* | $ | 1,000.00 | $ | 1,014.14 | $ | 11.00 | ||||||
Class I Shares | ||||||||||||
Actual | $ | 1,000.00 | $ | 819.40 | $ | 4.52 | ||||||
Hypothetical* | $ | 1,000.00 | $ | 1,020.10 | $ | 5.01 | ||||||
Class R3 Shares | ||||||||||||
Actual | $ | 1,000.00 | $ | 816.80 | $ | 6.83 | ||||||
Hypothetical* | $ | 1,000.00 | $ | 1,017.55 | $ | 7.59 | ||||||
Class R4 Shares | ||||||||||||
Actual | $ | 1,000.00 | $ | 817.70 | $ | 6.38 | ||||||
Hypothetical* | $ | 1,000.00 | $ | 1,018.05 | $ | 7.08 | ||||||
Class R5 Shares | ||||||||||||
Actual | $ | 1,000.00 | $ | 818.70 | $ | 4.51 | ||||||
Hypothetical* | $ | 1,000.00 | $ | 1,020.10 | $ | 5.01 | ||||||
| † | Expenses are equal to the annualized expense ratio for each class (A: 1.43%; C: 2.18%; I: 0.99%; R3: 1.50%; R4: 1.40%; R5: 0.99%) multiplied by the average account value over the period, multiplied by 183/365 to reflect the one-half year period. |
| * | Hypothetical assumes a rate of return of 5% per year before expenses. |
Please note that the expenses shown in the table are meant to highlight your ongoing costs only and do not reflect any transactional costs, such as sales charges (loads), redemption fees, or exchange fees. Therefore, the second line of the table for each class of shares is useful in comparing ongoing costs only, and will not help you determine the relative total costs of owning different funds. In addition, if these transactional costs were included, your costs would have been higher.
Certified Annual Report 29
| INDEX COMPARISON | ||
| Thornburg Core Growth Fund | September 30, 2011 (Unaudited) | |
GROWTH OF A HYPOTHETICAL $10,000 INVESTMENT
Thornburg Core Growth Fund versus Russell 3000 Growth Index (December 27, 2000 to September 30, 2011)
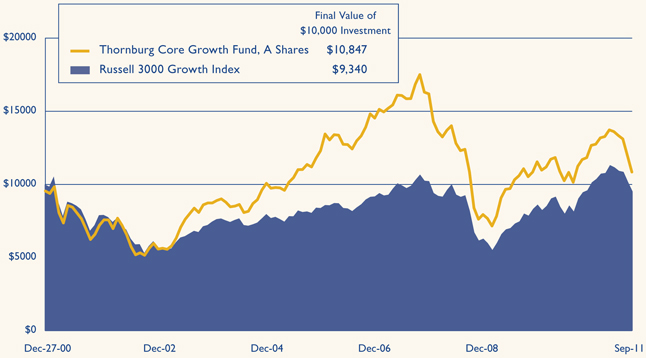
AVERAGE ANNUAL TOTAL RETURNS
For periods ended September 30, 2011 (with sales charge)
| 1 Yr | 5 Yrs | 10 Yrs | Since Inception | |||||||||||||
A Shares (Incep: 12/27/00) | -7.81 | % | -4.90 | % | 5.20 | % | 0.76 | % | ||||||||
C Shares (Incep: 12/27/00) | -5.12 | % | -4.74 | % | 4.83 | % | 0.38 | % | ||||||||
I Shares (Incep: 11/1/03) | -3.00 | % | -3.57 | % | — | 3.36 | % | |||||||||
R3 Shares (Incep: 7/1/03) | -3.55 | % | -4.08 | % | — | 4.29 | % | |||||||||
R4 Shares (Incep: 2/1/07) | -3.40 | % | — | — | -7.15 | % | ||||||||||
R5 Shares (Incep: 10/3/05) | -3.08 | % | -3.59 | % | — | -0.39 | % | |||||||||
Russell 3000 Growth Index (Since: 12/27/00) | 3.39 | % | 1.56 | % | 3.18 | % | -0.62 | % | ||||||||
Performance data shown represents past performance and is no guarantee of future results. Investment return and principal value will fluctuate so shares, when redeemed, may be worth more or less than their original cost. Current performance may be lower or higher than quoted. For performance current to the most recent month end, visit thornburg.com or call 800.847.0200. The performance data and graph do not reflect the deduction of taxes that a shareholder would pay on distributions or the redemption of Fund shares. Returns reflect the reinvestment of dividends and capital gains as well as applicable sales charges. Class A shares are sold with a maximum sales charge of 4.50%. Class C shares are subject to a 1% contingent deferred sales charge (CDSC) for the first year only. There is no up-front sales charge for Class I, R3, R4, and R5 shares. Class A and I shares are subject to a 1% 30-day redemption fee.
30 Certified Annual Report
| TRUSTEES AND OFFICERS | ||
| Thornburg Core Growth Fund | September 30, 2011 (Unaudited) | |
Name, Age, | Principal Occupation(s) During Past Five Years | Other Directorships Held by Trustee | ||
INTERESTED TRUSTEES(1)(2)(4) | ||||
Garrett Thornburg, 65 Chairman of Trustees, Trustee since 1987(3) | Chairman and controlling shareholder and, until 2008, CEO of Thornburg Investment Management, Inc. (investment advisor); Chairman, CEO, and controlling shareholder of Thornburg Securities Corporation (securities dealer); CEO until 2007 and Chairman until 2009 of TMST, Inc. (f/k/a Thornburg Mortgage, Inc.) (real estate investment trust); President and Sole Director of Thornburg Mortgage Advisory Corporation (investment manager to TMST, Inc.). | None | ||
Brian J. McMahon, 55 Trustee since 2001, Member of Governance & Nominating Committee & Operations Risk Oversight Committee, President since 1997(5)(6) | CEO since 2008, President, Managing Director, Chief Investment Officer, and Portfolio Manager of Thornburg Investment Management, Inc. | None | ||
INDEPENDENT TRUSTEES(1)(2)(4) | ||||
David A. Ater, 66 Trustee since 1994, Member of Audit Committee & Governance & Nominating Committee | Principal in Ater & Associates, Santa Fe, NM (developer, planner and broker of residential and commercial real estate); owner, developer and broker for various real estate projects. | None | ||
David D. Chase, 70 Trustee since 2000, Chairman of Audit Committee | Managing Member of Vestor Associates, LLC, Santa Fe, NM (private equity fund); Managing Member of CS Group, LLC, Santa Fe, NM (merchant bank). | None | ||
Eliot R. Cutler, 65 Trustee since 2004 & Nominating Committee, Chairman of Governance | Senior Counsel and, until 2009, Partner in Akin, Gump, Strauss, Hauer & Feld LLP (law firm) in Washington, D.C. and Beijing, China. | None | ||
Susan H. Dubin, 62 Trustee since 2004, Member of Audit Committee | President of Dubin Investments, Ltd., Greenwich, CT (private investment fund); Director and officer of various charitable organizations. | None | ||
Owen D. Van Essen, 57 Trustee since 2004, Member of Governance & Nominating Committee & Chairman of Operations Risk Oversight Committee | President of Dirks, Van Essen & Murray, Santa Fe, NM (newspaper mergers and acquisitions). | None | ||
James W. Weyhrauch, 52 Trustee since 1996, Member of Audit Committee & Operations Risk Oversight Committee | Real estate broker, Santa Fe Properties, Santa Fe, NM; Vice Chairman of Nambe LLC, Santa Fe, NM (manufacturing & design company). | None | ||
Certified Annual Report 31
| TRUSTEES AND OFFICERS, CONTINUED | ||
| Thornburg Core Growth Fund | September 30, 2011 (Unaudited) | |
Name, Age, | Principal Occupation(s) During Past Five Years | Other Directorships Held by Trustee | ||
OFFICERS OF THE FUND (WHO ARE NOT TRUSTEES)(1)(6)(7) | ||||
George T. Strickland, 48 Vice President since 1996, Treasurer since 2007(6) | Portfolio Manager, Vice President, and Managing Director of Thornburg Investment Management, Inc. | Not applicable | ||
William V. Fries, 72 Vice President since 1995 | Portfolio Manager, Vice President, and Managing Director of Thornburg Investment Management, Inc. | Not applicable | ||
Leigh Moiola, 44 Vice President since 2001 | Vice President, Managing Director, and Director of Marketing of Thornburg Investment Management, Inc. | Not applicable | ||
Alexander Motola, 41 Vice President since 2001 | Portfolio Manager, Vice President, and Managing Director of Thornburg Investment Management, Inc. | Not applicable | ||
Wendy Trevisani, 40 Vice President since 1999 | Portfolio Manager and Managing Director of Thornburg Investment Management, Inc. | Not applicable | ||
Joshua Gonze, 48 Vice President since 1999 | Portfolio Manager since 2007, Managing Director, and Associate Portfolio Manager until 2007 of Thornburg Investment Management, Inc. | Not applicable | ||
Christopher Ihlefeld, 41 Vice President since 2003 | Portfolio Manager since 2007, Managing Director, and Associate Portfolio Manager until 2007 of Thornburg Investment Management, Inc. | Not applicable | ||
Leon Sandersfeld, 45 Vice President since 2003 | Managing Director since 2007 and Fund Accounting Director of Thornburg Investment Management, Inc. | Not applicable | ||
Sasha Wilcoxon, 37 Vice President since 2003 Secretary since 2007(6) | Managing Director since 2007, Director of Operations, and Vice President of Thornburg Investment Management, Inc. | Not applicable | ||
Edward Maran, 53 Vice President since 2004 | Portfolio Manager and Managing Director of Thornburg Investment Management, Inc. | Not applicable | ||
Vinson Walden, 41 Vice President since 2004 | Portfolio Manager and Managing Director of Thornburg Investment Management, Inc. | Not applicable | ||
Thomas Garcia, 40 Vice President since 2006 | Vice President since 2011, Managing Director, Head Equity Trader, and Associate Portfolio Manager of Thornburg Investment Management, Inc. | Not applicable | ||
Lei Wang, 40 Vice President since 2006 | Portfolio Manager and Managing Director of Thornburg Investment Management, Inc. | Not applicable | ||
Connor Browne, 32 Vice President since 2006 | Portfolio Manager and Managing Director of Thornburg Investment Management, Inc. | Not applicable | ||
Jason Brady, 37 Vice President since 2007 | Vice President since 2011, Portfolio Manager since 2007, Managing Director since 2007, and Associate Portfolio Manager 2006–2007 of Thornburg Investment Management, Inc. | Not applicable | ||
32 Certified Annual Report
| TRUSTEES AND OFFICERS, CONTINUED | ||
| Thornburg Core Growth Fund | September 30, 2011 (Unaudited) | |
Name, Age, | Principal Occupation(s) During Past Five Years | Other Directorships Held by Trustee | ||
| Lewis Kaufman, 35 Vice President since 2007 | Portfolio Manager since 2007, Managing Director since 2007, and Associate Portfolio Manager until 2009 of Thornburg Investment Management, Inc. | Not applicable | ||
| Christopher Ryon, 55 Vice President since 2008 | Portfolio Manager since 2009, Managing Director since 2009, and Associate Portfolio Manager 2008–2009 of Thornburg Investment Management, Inc.; Principal of Vanguard Funds until 2008. | Not applicable | ||
| Lon Erickson, 36 Vice President since 2008 | Portfolio Manager since 2010, Managing Director since 2010, and Associate Portfolio Manager 2008–2010 of Thornburg Investment Management, Inc.; Senior Analyst of State Farm Insurance until 2008. | Not applicable | ||
| Kathleen Brady, 51 Vice President since 2008 | Senior Tax Accountant since 2007 of Thornburg Investment Management, Inc.; Chief Financial Officer of Vestor Partners, LP (private equity fund) until 2007. | Not applicable | ||
| Jack Gardner, 57 Vice President since 2008 | Managing Director since 2007 of Thornburg Investment Management, Inc.; President since 2008 and National Sales Director of Thornburg Securities Corporation. | Not applicable | ||
| Laura Hillstrom, 44 Vice President since 2009 | Chief Administrative Officer since 2009, Vice President and Managing Director, and Director of Information Systems until 2009 of Thornburg Investment Management, Inc. | Not applicable | ||
| (1) | Each person’s address is 2300 North Ridgetop Road, Santa Fe, New Mexico 87506. |
| (2) | The Fund is one of sixteen separate investment “Funds” or “series” of Thornburg Investment Trust (the “Trust”), which comprises the Thornburg mutual fund complex and is organized as a Massachusetts business trust. Thornburg Investment Management, Inc. is the investment advisor to, and manages, the sixteen Funds of the Trust. Each Trustee oversees the sixteen Funds of the Trust. |
| (3) | Mr. Thornburg is considered an “interested” Trustee under the Investment Company Act of 1940 because he is the sole director and controlling shareholder of Thornburg Investment Management, Inc., the investment advisor to the sixteen active Funds of the Trust, and is the sole director and controlling shareholder of Thornburg Securities Corporation, the distributor of shares for the Trust. |
| (4) | Each Trustee serves in office until the election and qualification of a successor. |
| (5) | Mr. McMahon is considered an “interested” Trustee because he is the chief executive officer and president of Thornburg Investment Management, Inc. |
| (6) | The Trust’s president, secretary, and treasurer each serves a one-year term or until the election and qualification of a successor; each other officer serves at the pleasure of the Trustees. |
| (7) | Assistant vice presidents, assistant secretaries and assistant treasurers are not shown. |
The Statement of Additional Information for each Fund of the Trust includes additional information about the Trustees and is available, without charge and upon request, by calling 1-800-847-0200.
Certified Annual Report 33
| OTHER INFORMATION | ||
| Thornburg Core Growth Fund | September 30, 2011 (Unaudited) | |
PORTFOLIO PROXY VOTING
Policies and Procedures:
The Trust has delegated to Thornburg Investment Management, Inc. (the “Advisor”) voting decisions respecting proxies for the Fund’s voting securities. The Advisor makes voting decisions in accordance with its Proxy Voting Policy. A description of the Policy is available (i) without charge, upon request, by calling the Advisor toll-free at 1-800-847-0200, (ii) on the Thornburg website at www.thornburg. com, and (iii) on the Securities and Exchange Commission’s website at www.sec.gov.
Information regarding how proxies were voted is available on or before August 31 of each year for the twelve months ending the preceding June 30. This information is available (i) without charge, upon request by calling the Advisor toll-free at 1-800-847-0200, (ii) on the Thornburg website at www.thornburg.com, and (iii) on the Securities and Exchange Commission’s website at www.sec.gov.
AVAILABILITY OF QUARTERLY PORTFOLIO SCHEDULE
The Fund files with the Securities and Exchange Commission schedules of its portfolio holdings on Form N-Q for the first and third quarters of each fiscal year. The Fund’s Forms N-Q are available on the Commission’s website at www.sec.gov, or may be reviewed and copied at the Commission’s Public Reference Room in Washington, D.C. Information on the operation of the Public Reference Room may be obtained by calling 1-800-SEC-0330. The Fund also makes this information available on its website at www.thornburg.com/ download or upon request by calling 1-800-847-0200.
STATEMENT RESPECTING RENEWAL OF INVESTMENT ADVISORY AGREEMENT
Thornburg Investment Management, Inc. (the “Advisor”) provides investment management services to Thornburg Core Growth Fund pursuant to an investment advisory agreement. The Trustees consider the renewal of this agreement annually, and most recently determined to renew the agreement on September 13, 2011.
In anticipation of their recent annual consideration of the advisory agreement’s renewal, the independent Trustees met in May 2011 to plan the annual evaluation of the Advisor’s performance and to specify the information the Advisor would present to the Trustees for their review. The Advisor’s chief investment officer subsequently reviewed portions of this information with the Trustees and addressed questions presented by the Trustees at a meeting session scheduled for that purpose, and the independent Trustees thereafter met in independent session to consider the Advisor’s presentation and various specific issues respecting their consideration of the advisory agreement’s renewal. Following these sessions, the Trustees met to consider a renewal of the agreement, and the independent Trustees voted unanimously at that meeting to renew the agreement for an additional term of one year.
The information below summarizes certain factors considered by the Trustees in connection with the determination to renew the advisory agreement. In determining to renew the agreement, the Trustees did not identify any single factor as controlling, and this summary does not describe all of the matters considered by the Trustees in making their determination.
Quality of Services; Fund Investment Performance. The Trustees evaluated the nature, extent and quality of services provided by the Advisor under the advisory agreement, and evaluated the investment performance of the Fund.
In connection with their general supervision of the Advisor, and as an important element of their annual consideration of a renewal of the advisory agreement, the Trustees received and considered reports from the Advisor throughout the year. These reports addressed a wide range of topics, including particularly the Advisor’s selection of investments and execution of the Fund’s investment strategies. In addition, the Trustees considered information provided to them at their request in anticipation of their annual evaluation of the Advisor’s services, including (i) the Fund’s absolute investment performance and achievement of stated objectives, (ii) the Advisor’s commentary on the Fund’s performance in the context of the Fund’s objectives and reasonable expectations, and business, market and economic conditions, (iii) measures of the Fund’s investment returns over different periods of time, relative to a category of equity mutual funds selected by an independent mutual fund analyst firm, and relative to broad-based securities indices, (iv) the Fund’s cumulative investment return since inception relative to the securities index, and (v) comparative measures of estimated earnings growth, portfolio volatility, risk and return.
The Trustees also considered their perceptions of portfolio management personnel developed in formal and informal meetings throughout the year, the Advisor’s staffing and other resources, trade execution, the Advisor’s performance of accounting and other services, the Advisor’s observance of compliance and regulatory requirements, the Advisor’s responsiveness to the Trustees, and other factors.
34 Certified Annual Report
| OTHER INFORMATION, CONTINUED | ||
| Thornburg Core Growth Fund | September 30, 2011 (Unaudited) | |
In reviewing quantitative and performance data presented, the Trustees noted (among other aspects of the data) comparative performance data for the ten most recent calendar years, which showed the Fund’s investment return for the most recent calendar year was lower than the average return for the mutual fund category and the returns for the two indices, and that the Fund’s returns for the preceding nine calendar years had exceeded the average returns of the category in seven of the nine years, exceeded the returns of the first index in eight of the nine years, and had exceeded or been comparable to the returns of the second index in eight of the nine years. Other noted quantitative data showed that the Fund’s investment returns fell within or close to the top half of performance for the mutual fund category for the three-month and year-to-date periods ended with the second quarter of the current year, fell within the third quartile of performance for the category for the one-year and three-year periods, and fell near the lowest decile for the five-year period. The Trustees noted that the Fund’s returns over a ten-year period fell within the top decile of the performance for the category, and also noted in this regard the Fund’s higher cumulative return since inception (net of expenses) relative to the Fund’s benchmark Russell 3000 Growth Index.
The Trustees concluded, based upon these and other considerations, that the nature, extent and quality of the Advisor’s services were sufficient and that the Advisor had satisfactorily pursued the Fund’s stated investment objectives. The Trustees further concluded that the investment performance of the Fund was satisfactory in the context of the Fund’s objectives and policies, and prevailing market conditions.
Fees and Expenses; Profitability of Advisor; Economies of Scale; Ancillary Benefits to Advisor. The Trustees evaluated the level of the management fee charged by the Advisor to the Fund, and in this connection, reviewed the profitability of the Advisor, economies of scale potentially available to the Fund and whether the Advisor received any ancillary benefits from its relationship with the Fund.
In evaluating the level of the management fee charged by the Advisor to the Fund, the Trustees considered the fee charged by the Advisor and the other expenses charged to the Fund in light of the nature and quality of services provided, comparison of the actual Advisor’s fee and Fund expenses to the statement of fees and expenses in the Fund’s prospectuses, and comparisons of the Advisor’s fee and other Fund expenses to median and average fees and expenses charged to two groups of equity mutual funds assembled by independent mutual fund analyst firms. Comparative fee and expense data noted by the Trustees showed that the management fee charged by the Advisor was somewhat higher than the median and average fee rates charged to the groups of mutual funds assembled by the mutual fund analyst firms, and that the overall expense ratio of the Fund was slightly higher than the median and average expense ratios for the same fund groups. The Trustees did not identify these differences as significant. The Trustees considered information about the fees charged by the Advisor to other investment management clients, together with information about fees charged by other advisors to different clients, and analysis of the differences between the requirements of institutional clients and mutual funds and the consequently different investment management services rendered, respectively, to institutional clients and mutual funds. The Trustees confirmed their previous observations that the differences between the fees charged by the Advisor to different types of clients did not appear exceptional, and that the fee rates charged by investment advisors to institutional clients had limited relevance to the evaluation of fee rates charged to mutual funds, because of the significant differences between the respective requirements of institutional clients and mutual funds, the differences between the respective services rendered to institutional clients and mutual funds, and the different circumstances in which the respective fees originate.
In reviewing the profitability of the Advisor, the Trustees considered costs incurred by the Advisor and data comparing the profitability of the Advisor to other investment management firms. The information provided did not indicate that the Advisor’s profitability was unusual, and the Trustees noted the adequacy of the Advisor’s resources and service capabilities. In reviewing the extent to which economies of scale would be realized by the Fund as it grows and whether fee levels reflect economies of scale, the Trustees considered the breakpoint structure for advisory fees chargeable to the Fund, the demonstrated economies of scale enjoyed by the Fund and other Funds of the Trust as they had grown in size, and economies of scale realized by other mutual funds. The information provided demonstrated to the Trustees that the Fund has realized economies of scale and may reasonably be expected to realize economies of scale as the Fund grows in size, due to the breakpoint fee structure of the advisory agreement and other factors. In reviewing potential benefits to the Advisor because of its relationship to the Fund, the Trustees considered the Advisor’s receipt of certain research services from broker dealers, and the benefits to both the Fund and the Advisor of the Advisor’s expansion of its staffing, compliance and systems capabilities and other resources to serve a broader variety of investment management clients. No unusual or unfair benefits to the Advisor from its relationship to the Fund were identified by the Trustees.
The Trustees concluded, based upon their consideration of these and other factors, that the management fee charged to the Fund by the Advisor was fair and reasonable in view of the nature, extent and quality of the services provided by the Advisor, the clear disclosure
Certified Annual Report 35
| OTHER INFORMATION, CONTINUED | ||
| Thornburg Core Growth Fund | September 30, 2011 (Unaudited) | |
of fees and expenses in the Fund’s prospectuses, the investment performance of the Fund, and comparisons of fees and expenses charged to the Fund to fees and expenses charged to other mutual funds.
36 Certified Annual Report
This page intentionally left blank.
This page is not part of the Annual Report. 37
Trustees’ Statement to Shareholders
Not part of the Certified Annual Report
September 13, 2011
The Trustees believe current and prospective shareholders should know how we discharge our responsibilities in supervising the Funds’ investment advisor and in reviewing the advisor’s contract for renewal. Since 2005, we have issued a statement which sets out clearly the three principal guidelines that we follow in supervising the Trust’s investment advisor on your behalf. In accordance with our customary practice, in September of this year we again reviewed our statement and concluded we should reissue this statement outlining the principal features of our supervision of the advisor’s performance of investment management services for the Funds.
We begin with the premise that each shareholder selected his or her Fund because its investments are managed by the investment advisor identified in the prospectus and in accordance with the objective and policies described in the prospectus. We realize, as each of you do, that if you believe that your Fund’s stated objective and policies no longer serve your personal investment goals, you can sell your shares and leave the Fund.
Therefore, we believe that our primary supervisory task – our principal obligation to you – is to assess the nature and quality of the advisor’s services, and to confirm that the advisor actively and competently pursues the Fund’s objective, in accordance with the policies set out in the prospectus. To do this, we meet regularly with management to review your Fund’s portfolio and to discuss the advisor’s specific actions and judgments in pursuing the Fund’s objective. We do not substitute our own judgment for the advisor’s decisions in selecting investments; the advisor is paid to exercise its informed judgment on investment decisions, and we seek to confirm, in reviewing the advisor’s performance, that the advisor is doing just that.
Second, while we are conscious of costs and the effect that costs have on shareholders’ returns, we do not seek the lowest fees or expense ratio as our sole or primary objective. We try to make sure that your Fund’s fees and costs are reasonable in relationship to the services rendered and that they are generally in line with those charged by other expert investment advisors, consistent with our belief that the Fund’s investors searched for and expect that expertise and attention and have decided to pay a reasonable price for it. We do not put the management contract “out to bid” as a matter of course, and we would not do so unless we had concluded that the advisor materially had failed to pursue the Fund’s objectives in accordance with its policies, or for other equally important reasons. We believe that any other approach would be inconsistent with your interests and contrary to your expectations when you bought shares of the Fund in the first place.
Finally, because we believe that most Thornburg Fund shareholders have invested with a long-term perspective, we try not to focus too much on the fashions of the moment and on short-term performance. The market will not favor any specific investment objective or set of policies at all times and under all economic circumstances. A fund will experience periods of both high and low returns relative to other funds and other investments. Even if one of our Funds is not favored by the market at a particular time, we believe that the advisor is nonetheless obliged to remain true to the Fund’s objective and policies, and we watch to see that it does so.
38 This page is not part of the Annual Report.
Retirement and Education Accounts
Thornburg Investment Management offers retirement and education savings accounts that can help you meet a variety of planning challenges. For account applications or further information on any of the accounts below, please call 1-800-847-0200 or go to www.thornburg.com/ira. Your financial advisor can help you determine which plan is right for you.
Individual Retirement Accounts
Individual Retirement Accounts (IRAs) provide a tax-advantaged means to save money for the future. For a detailed outline of the difference between retirement accounts, see www.thornburg.com/ira. Rollovers are available. Call 1-800-847-0200 for more information.
Traditional IRAs – Contributions to Traditional IRAs are tax deductible for eligible individuals, and withdrawals are taxed as additional ordinary income. You may contribute to an IRA if you receive compensation and are under 70 1/2, even if you are covered by an employer retirement plan. Deductible contributions are subject to certain qualifications. Please consult your tax advisor.
Roth IRAs – Under a Roth IRA, there is no tax deduction for contributions, but there is no income tax on qualified withdrawals. For a more detailed comparison of Traditional and Roth IRAs, please see our web site at www.thornburg.com/ira.
SEP IRAs – Simplified Employee Pension (SEP) IRAs are established by employers. The employer is allowed a tax deduction for contributions made to the SEP Plan and makes contributions to each eligible employee’s SEP IRA on a discretionary basis.
SIMPLE IRAs – Savings Incentive Match Plan for Employees of Small Employers (SIMPLE) is designed to give small business owners a simplified method to establish and contribute to a retirement plan for employees. The employer is allowed a tax deduction for contributions and makes either matching or non-elective contributions to each eligible employee’s SIMPLE IRA. Employees may make salary deferral contributions.
Coverdell Education Savings Account
These savings accounts are designed to provide a way to save money for higher education expenses. In an Education Savings Account, earnings and interest grow tax-free, and qualified withdrawals used to pay for eligible higher-education expenses are tax- and penalty-free.
Funds Available
The following funds are available in the accounts listed above:
| • | Thornburg International Value Fund |
| • | Thornburg Value Fund |
| • | Thornburg Core Growth Fund |
| • | Thornburg Investment Income Builder Fund |
| • | Thornburg Global Opportunities Fund |
| • | Thornburg International Growth Fund |
| • | Thornburg Developing World Fund |
| • | Thornburg Limited Term U.S. Government Fund |
| • | Thornburg Limited Term Income Fund |
| • | Thornburg Strategic Income Fund |
This page is not part of the Annual Report. 39

Thornburg Equity Funds
Thornburg’s equity research uses a fundamental and comprehensive analytical approach. Thornburg equity funds focus on a limited number of securities so that each holding can impact performance. The equity team searches for firms believed to have a promising future and seeks to buy shares of those companies at a discount to their intrinsic value.
| • | Thornburg Value Fund |
| • | Thornburg International Value Fund |
| • | Thornburg Core Growth Fund |
| • | Thornburg Investment Income Builder Fund |
| • | Thornburg Global Opportunities Fund |
| • | Thornburg International Growth Fund |
| • | Thornburg Developing World Fund |
Thornburg Bond Funds
Thornburg Investment Management applies a disciplined philosophy to fixed-income management. Since the launch of our first fixed-income fund over 25 years ago, we have been conducting fundamental, bottom-up research in an effort to identify bonds which we believe provide the best return for a given level of risk. We are very organic in our approach, avoiding leverage or complex strategies which could backfire in periods of market uncertainty.
| • | Thornburg Limited Term Municipal Fund |
| • | Thornburg Intermediate Municipal Fund |
| • | Thornburg California Limited Term Municipal Fund |
| • | Thornburg New Mexico Intermediate Municipal Fund |
| • | Thornburg New York Intermediate Municipal Fund |
| • | Thornburg Strategic Municipal Income Fund |
| • | Thornburg Limited Term U.S. Government Fund |
| • | Thornburg Limited Term Income Fund |
| • | Thornburg Strategic Income Fund |
Before investing, carefully consider the Fund’s investment goals, risks, charges, and expenses. For a prospectus containing this and other information, contact your financial advisor or visit thornburg.com. Read it carefully before investing.
For additional information, please visit www.thornburg.com
Thornburg Investment Management, Inc. 2300 North Ridgetop Road, Santa Fe, NM 87506
This page is not part of the Annual Report. 41
This page intentionally left blank.
42 This page is not part of the Annual Report.
This page intentionally left blank.
This page is not part of the Annual Report. 43
 | Waste not, Wait not |  | ||||
| Get instant access to your shareholder reports. | ||||||
| This Annual Report is submitted for the general information of shareholders of the Fund. It is not authorized for distribution to prospective investors in the Fund unless preceded or accompanied by an effective prospectus. | By switching from your postal mailbox to your email inbox, you reduce paper clutter, improve record keeping access, and help conserve our natural resources. | |||||
 | Investment Advisor: Thornburg Investment Management® 800.847.0200 | Go to www.thornburg.com/edelivery and sign up to receive your shareholder reports, prospectuses, and proxy statements electronically. | ||||
Distributor: | ||||||
Thornburg Securities Corporation® 800.847.0200 | You invest in the future, without spending a dime. | |||||
| TH082 | ||||||

Important Information
The information presented on the following pages was current as of September 30, 2011. The managers’ views, portfolio holdings, and sector and country diversification are provided for the general information of the Fund’s shareholders; to the extent this information is historical, it should not be considered predictive of future circumstances. This material should not be deemed a recommendation to buy or sell any of the securities mentioned.
Investments in the Fund carry risks, including possible loss of principal. Special risks may be associated with investments outside the United States, especially in emerging markets, including currency fluctuations, illiquidity and volatility. Investments in small capitalization companies may increase the risk of greater price fluctuations. Please see the Fund’s Prospectus for a discussion of the risks associated with an investment in the Fund. Investments in the Fund are not FDIC insured, nor are they deposits of or guaranteed by a bank or any other entity. There is no guarantee that the Fund will meet its investment objectives. Funds invested in a limited number of holdings may expose an investor to greater volatility.
Performance data given at net asset value (NAV) does not take into account the applicable sales charges. If the sales charges had been included, the performance would have been lower.
Class I, R3, R4, and R5 shares may not be available to all investors. Minimum investments for Class I shares may be higher than those for other classes.
From time to time, the Fund may invest in shares of companies through initial public offerings (IPOs). IPOs have the potential to produce substantial gains for the Fund. There is no assurance that the Fund will have continued access to profitable IPOs and, as the Fund’s assets grow, the impact of IPO investments may decline. Therefore, investors should not rely on these past gains as an indication of future performance.
Impact to performance of IPOs, as disclosed in the following letter to shareholders, is calculated using the performance on the first day of the IPO, assuming that the acquired shares are held to the end of the first day.
Share Class | NASDAQ Symbol | Cusip | ||
Class A | TIGAX | 885-215-319 | ||
Class C | TIGCX | 885-215-293 | ||
Class I | TINGX | 885-215-244 | ||
Class R3 | TIGVX | 885-215-178 | ||
Class R4 | TINVX | 885-215-160 | ||
Class R5 | TINFX | 885-215-152 |
Glossary
MSCI All Country (AC) World ex-U.S. Growth Index – A market capitalization weighted index that includes growth companies in developed and emerging markets throughout the world, excluding the United States.
Unless otherwise noted, index returns reflect the reinvestment of income dividends and capital gains, if any, but do not reflect fees, brokerage commissions or other expenses of investing. Investors may not make direct investments into any index. The performance of any index is not indicative of the performance of any particular investment.
Allocation Effect – The portion of portfolio excess return attributed to taking different group (e.g. sector, industry) decisions from the benchmark.
Basis Point (bps) – A unit equal to 1/100th of 1%. 1% = 100 basis points (bps).
Median Market Capitalization – Market capitalization (market cap) is the total value of a company’s stock, calculated by multiplying the number of outstanding common shares by the current share price. The company whose market cap is in the middle of the portfolio is the median market cap. Half the companies in the portfolio have values greater than the median, and half have values that are less.
Price to Book Value (P/B) – A ratio used to compare a stock’s market value to its book value. It is calculated by dividing the current closing price of the stock by the latest quarter’s book value. Book value is simply assets minus liabilities.
Price to Cash Flow Ratio – A measure of the market’s expectations of a firm’s future financial health. It is calculated by dividing the price per share by cash flow per share.
Price to Earnings Ratio (P/E) – A valuation ratio equaling a company’s market value per share divided by earnings per share.
Selection Effect – The portion of portfolio excess return attributed to choosing different securities within groups compared to the benchmark.
This page is not part of the Annual Report. 3
Thornburg International Growth Fund
MANAGEMENT TEAM

Tim Cunningham,CFA, Alexander M.V. Motola,CFA, and Greg Dunn
IMPORTANT
PERFORMANCE INFORMATION
Performance data shown represents past performance and is no guarantee of future results. Investment return and principal value will fluctuate so shares, when redeemed, may be worth more or less than their original cost. Current performance may be lower or higher than quoted. For performance current to the most recent month end, visit thornburg.com or call 800.847.0200.
The maximum sales charge for Class A shares is 4.50%. Class A shares are subject to a 1% 30-day redemption fee. The total annual operating expenses of Class A shares are 1.70% as disclosed in the most recent Prospectus. Thornburg Investment Management and Thornburg Securities Corporation have contractually agreed to waive fees and reimburse expenses through at least February 1, 2012, so that actual expenses, for Class A shares, do not exceed 1.63%.
Comprehensive International Growth Investing
A major benefit of an interconnected global economy is the ability to tap into a country or region’s comparative advantages. Some countries have abundant natural resources, while others excel at manufacturing or engineering. The ability to allocate capital across borders allows the entire globe to benefit from these advantages. In an effort to capture these opportunities, Thornburg Investment Management launched the Thornburg International Growth Fund in 2007.
The Fund’s process is centered on identifying attractively valued international growth companies from the bottom up. The management team will leave it to others to make broad-based calls on the direction of the market. Instead, portfolio manager Alex Motola and his team will employ a comprehensive, “go-everywhere” approach to growth investing. The team classifies stocks into various growth baskets: Growth Industry Leaders, Consistent Growers, or Emerging Growth Companies. From those baskets, the team will build a portfolio of 30–55 stocks, which they believe provides the best long-term prospects for investors. While stocks are analyzed on their individual merits, their role as part of a diversified portfolio is also taken into account.
Equity investing, especially disciplines focused on growing companies, can bring volatility. The Thornburg International Growth Fund team recognizes this and strives to balance the aims of generating a strong long-term record while attempting to manage downside volatility. Portfolio construction and geographic diversification provide part of the answer, but fundamental analysis can often play a more important role. While other growth funds limit volatility by diversifying across a large number of names, the team managing the Thornburg International Growth Fund believes that a more robust understanding of a smaller
AVERAGE ANNUAL TOTAL RETURNS
FOR PERIODS ENDED 9/30/11
| 1 Yr | 3 Yrs | Since Inception | ||||||||||
A Shares (Incep: 2/1/07) | ||||||||||||
Without sales charge | 9.43 | % | 9.83 | % | 3.53 | % | ||||||
With sales charge | 4.48 | % | 8.15 | % | 2.52 | % | ||||||
MSCI AC World ex-U.S. Growth Index | ||||||||||||
(Since 2/1/07) | -10.88 | % | 0.47 | % | -3.54 | % | ||||||
4 This page is not part of the Annual Report.
number of portfolio holdings is one of the most effective forms of risk management.
Much of the research process is focused on identifying how the overall market came to price a security. Many of the ideas are sourced through a quantitative screening process of the universe of international companies. Only those with the most appealing growth and valuation characteristics pass on to the step of having a complex financial model built. Thornburg’s growth investment team scours regulatory filings, visits company management, and interviews suppliers and customers. By doing this work, they develop their own view of the intrinsic value of the company. Only if their view is materially higher than the market do they make an investment.
Others may question how the team manages a growth portfolio, especially an international one, from Santa Fe, New Mexico. At Thornburg Investment Management, we embrace our location, away from the ancillary noise of the major money centers. We have access to Wall Street research, but prefer to come to our own conclusions about the value of an investment. The investment process allows the team to take a very broad view of what an attractively valued, international growth company looks like, and invest in those few companies that they believe provide the most attractive risk-reward trade-off. The result is a portfolio which at any given time will look quite unlike the MSCI AC World ex-U.S. Growth Index or the competition. All of this is done with a goal of providing attractive, consistent returns over the long term.
STOCKS CONTRIBUTING AND DETRACTING
FOR THE YEAR ENDED 9/30/11
Top Contributors | Top Detractors | |
| Start Today Co. Ltd. | CPPGroup plc | |
| Infineon Technologies AG | 7 Days Group Holdings Ltd. | |
| SodaStream International Ltd. | MercadoLibre, Inc. | |
| PriceSmart, Inc. | Yandex N.V. Cl A | |
| Check Point Software Technologies Ltd. | SEEK Ltd. | |
| Source: FactSet |
KEY PORTFOLIO ATTRIBUTES
As of 9/30/11
Portfolio P/E Trailing 12-months* | 22.8x | |||
Portfolio Price to Cash Flow* | 13.5x | |||
Portfolio Price to Book Value* | 3.6x | |||
Median Market Cap* | $ | 2.4 B | ||
Number of Companies | 41 | |||
| * | Source: FactSet |
MARKET CAPITALIZATION EXPOSURE
As of 9/30/11
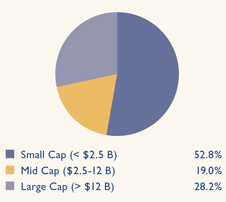
BASKET STRUCTURE
As of 9/30/11
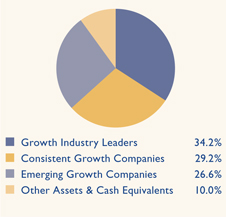
This page is not part of the Annual Report. 5

Thornburg International Growth Fund
September 30, 2011
Table of Contents | ||||
| 7 | ||||
| 12 | ||||
| 16 | ||||
| 18 | ||||
| 20 | ||||
| 21 | ||||
| 30 | ||||
| 32 | ||||
| 33 | ||||
| 34 | ||||
| 35 | ||||
| 38 |
This report is certified under the Sarbanes-Oxley Act of 2002, which requires that public companies, including mutual funds, affirm that the information provided in their annual and semiannual shareholder reports fully and fairly represents their financial position.
6 Certified Annual Report
Alexander M.V. Motola,CFA Portfolio Manager | October 18, 2011
Dear Fellow Shareholder:
For the fiscal year ended September 30, 2011, the Thornburg International Growth Fund returned a positive 9.43% for the Class A shares at net asset value (NAV), materially outperforming its benchmark, the MSCI AC World ex-US Growth Index, which returned a negative 10.88%. This represents outperformance of over 20% compared to the index in a period when many equity markets were down. On September 30, 2010, the NAV per Class A share of the Fund was $12.25. On September 30, 2011, the NAV of the Class A shares was $13.37. Investments in initial public offerings by the Fund contributed 5.32% to the return for the fiscal year.
Equity investors had a number of issues to contend with over the past twelve months, including concerns about a slowdown in global economic growth, political gridlock in the United States, a sovereign debt crisis in Europe, and persistent inflation in emerging markets.
In managing the International Growth Fund, we employ an unconstrained approach that allows us to scour a universe of roughly 15,000 stocks in an effort to find what we believe are the best growth opportunities regardless of geography or sector. The relative focused nature of our portfolio (the International Growth Fund will hold between 30 and 55 names at any given time) amplifies the impact of our stock picking. During the past twelve months, the impact of our stock selection was both positive and significant, accounting for more than 75% of the Fund’s outperformance. Particularly rewarding to us as bottom-up investors was the fact that we had positive selection effect in six of the eight sectors in which the Fund was invested (we had no investments in materials or utilities). Most significant was our selection effect in the consumer discretionary and information technology sectors.
Within these sectors, we had notable success in internet retailing and e-commerce stocks. Each of these stocks has its own unique story; however, they generally share a combination of what we believe to be great business models, stout balance sheets and good cash flow generation. They are also beneficiaries of secular trends around increasing smartphone and broadband penetration, rising global discretionary incomes, and increased comfort levels with online transactions. An example is Start Today, a Japanese e-commerce company specializing in apparel. Start Today was the top contributor to Fund performance for the fiscal year. The company has seen strong growth and issued solid guidance for 2012, yet still trades at a discount to its global |

Certified Annual Report 7
| Letter to Shareholders, | ||
Continued | ||
online peers. Fortunately for the Fund and our shareholders, the initial success we’ve had in this space has fed on itself. The research we conducted when making an investment in ASOS (a U.K. online fashion retailer) led us to Yoox (a Milan-based retailing partner of the leading fashion and design brands), which was a top contributor to performance in 2011. Subsequent research on the industry led to investments in Start Today and zooplus (a U.K. online retailer of pet supplies).
These successes also underscore the importance of letting our bottom-up process lead us to what we believe are the best investments available, regardless of location. While investors have shown concern for slower growth and sovereign debt issues in Europe, we had success during the period in names such as Covidien (Irish-based global health-care product provider), Kabel Deutschland (German-based cable company), Infineon (German-based semiconductor company), and Grifols SA (Spanish-based pharmaceutical company). We don’t make a top-down forecast when building the portfolio, but instead focus on the individual companies and the investment opportunity. We’ve found that where a business is headquartered is often much less important than what they do and where their customers are located.
Investing in international markets adds additional risks. We think that vigorous research of the business model, local cultures and accounting conventions, and political situations can mitigate some of these risks; however, diversification remains an important element in our process. At the end of the fiscal year, the Fund was invested across 22 markets. We continue to gain exposure to different segments of the growth market by using the basket approach originally developed by the Fund’s domestic sibling over 10 years ago. As of September 30, 2011, the top ten holdings accounted for a relatively modest 28% of assets, with a number of distinct business models represented.
Activity over the past twelve months has been significant, as turmoil has created opportunities for valuation-conscious growth investors. Importantly, we view activity as broadly positive, as the uncovering of new investment ideas causes us to reevaluate our investment theses for holding our existing names. It essentially forces us to push out the weakest names to make room for new and hopefully better ideas.
The cash position of the Fund as of September 30, 2011 was relatively high; however, we caution against extrapolating this to our view of the market. In a portfolio with a limited number of holdings, the sale of two or three positions can cause cash positions to rise, and after having a few names hit price targets, we simply have yet to put the money to work in new ideas.
We continue to be confident in our approach and personnel. James Gassman joined our team as a senior equity analyst during the period. Jim has a solid background in growth investing, fits well into our collaborative approach to research, and he quickly brought to our attention names which he had covered in previous duties.
8 Certified Annual Report
Tamara Manoukian has transitioned her focus to our International Value Fund, but, given Thornburg Investment Management’s global generalist approach to research and the collegial nature of our equity team, she continues to cover stocks within the International Growth Fund.
We are certainly pleased with performance generated over the past fiscal year, as well as over the life of the Fund. As we reflect on our upcoming five-year anniversary, it seems appropriate to dig up an installment from the first commentary written when we started this Fund:
Thomas Edison was an interesting man. Edison and his associates developed and tested at least 3,000 different theories for the commercialization of an incandescent lamp (contrary to popular American belief, the incandescent bulb was invented over a half century earlier than Edison’s patent in the U.S.). Once they developed the correct theory, Edison tested “thousands and thousands” of filament materials to get a sustainable light source. Ultimately, he succeeded, not just in developing the correct filament, but his team created all the peripheral components to commercialize electricity.
Edison had a lot of opinions, and many of his quotes can be applied to stock picking:
| • | “Opportunity is missed by most people because it is dressed in overalls and looks like work.” |
| • | “The first requisite for success is to develop the ability to focus and apply your mental and physical energies to the problem at hand – without growing weary. Because such thinking is often difficult, there seems to be no limit to which some people will go to avoid the effort and labor that is associated with it...” |
| • | “We should remember that good fortune often happens when opportunity meets with preparation.” |
But of all of Edison’s quotes, we’ve found two most applicable:
| • | “Results? Why, man, I have gotten lots of results! If I find 10,000 ways something won’t work, I haven’t failed.” |
| • | “Genius is one per cent inspiration and ninety-nine per cent perspiration. Accordingly, a ‘genius’ is often merely a talented person who has done all of his or her homework” |
We think a lot about the quote (“Results?”) while we source ideas and research companies. The fact remains that many securities are appropriately priced. The “good” securities that are correctly priced are the ones that make it apparent very quickly. Others hide the fact they are correctly priced, and that takes time to discover, and can be discouraging because it usually means the security value is lower at the end of the process than you thought going in. But each “reject” of research or screening isn’t a failure, it is a result. In Edison’s case, if it
Certified Annual Report 9
| Letter to Shareholders, | ||
Continued | ||
was a negative result, nothing would change that (not entirely true, since he thought tungsten would be a great filament – and he was right – but at his time he lacked the technology to appropriately work the metal). For us, a bad result from past research could prove to be a great idea today or in the future. Nothing is wasted, and the results change everyday.
Englishman Sir Humphrey Davy is one of about 20 innovators credited with helping to invent the incandescent lamp before Edison got involved. Edison was clearly a great inventor, and he focused on doing things that really changed people’s lives. German and Russian inventors were also involved. Edison had a keen eye for intellectual property and value of patents: he actually purchased a lightbulb patent from Woodward and Evans. The light over your head was truly a global development – something that started in England over 200 years ago, and improved by many different people in many different places.
Globalization has been occurring for a very long time, it is just recently that the rate of change has materially sped up. Things are invented all over the world, businesses are started, things are commercialized, and patents are filed, bought, and sold. Our core investing competencies revolve around security selection, securities analysis, and information-based fundamental research. These skills have a broad range of applicability in equity investing, and we plan on using a very similar approach to international growth investing as we do to domestic growth investing.
We encourage you to learn more about your portfolio. Descriptions of each holding and links to company websites can be found at www.thornburg.com/funds. Thank you for investing in the Thornburg International Growth Fund.
Sincerely,

Alexander M.V. Motola,CFA
Managing Director
Portfolio Manager
The matters discussed in this report may constitute forward-looking statements made pursuant to the safe harbor provisions of the Securities Litigation Reform Act of 1995. These include any advisor or portfolio manager prediction, assessment, analysis or outlook for individual securities, industries, investment styles, market sectors and/or markets. These statements involve risks and uncertainties. In addition to the general risks described for each fund in its current prospectus, other factors bearing on these reports include the accuracy of the advisor’s or portfolio manager’s forecasts and predictions, the appropriateness of the investment strategies designed by the advisor or portfolio manager, and the ability of the advisor or portfolio manager to implement their strategies efficiently and successfully. Any one or more of these factors, as well as other risks affecting the securities markets generally, could cause the actual results of any fund to differ materially as compared to its benchmarks.
10 Certified Annual Report
This page intentionally left blank.
Certified Annual Report 11
| SCHEDULE OF INVESTMENTS | ||
| Thornburg International Growth Fund | September 30, 2011 | |
TOP TEN HOLDINGS
As of 9/30/11
Kabel Deutschland Holding AG | 3.2 | % | Experian plc | 2.7 | % | |||||
CNOOC Ltd. | 3.0 | % | Kakaku.com, Inc. | 2.7 | % | |||||
Covidien plc | 2.9 | % | MakeMyTrip Ltd. | 2.7 | % | |||||
Hargreaves Lansdown plc | 2.8 | % | Xing AG | 2.7 | % | |||||
Check Point Software Technologies Ltd. | 2.8 | % | Telecity Group plc | 2.6 | % |
SUMMARY OF INDUSTRY EXPOSURE
As of 9/30/11
Software & Services | 19.5 | % | Telecommunication Services | 3.7 | % | |||||
Retailing | 14.6 | % | Technology Hardware & Equipment | 3.6 | % | |||||
Consumer Services | 10.6 | % | Media | 3.2 | % | |||||
Energy | 7.5 | % | Diversified Financials | 2.8 | % | |||||
Pharmaceuticals, Biotechnology & Life Sciences | 5.6 | % | Capital Goods | 2.1 | % | |||||
Health Care Equipment & Services | 5.3 | % | Consumer Durables & Apparel | 1.9 | % | |||||
Commercial & Professional Services | 5.2 | % | Other Assets & Cash Equivalents | 10.0 | % | |||||
Food & Staples Retailing | 4.4 | % |
SUMMARY OF COUNTRY EXPOSURE
As of 9/30/11 (percent of equity holdings)
United Kingdom | 22.2 | % | Luxembourg | 2.7 | % | |||||
China | 10.1 | % | Spain | 2.6 | % | |||||
Germany | 8.3 | % | Indonesia | 2.3 | % | |||||
Japan | 8.2 | % | Italy | 2.2 | % | |||||
Ireland | 6.2 | % | Taiwan | 2.2 | % | |||||
United States | 5.4 | % | Costa Rica | 2.1 | % | |||||
India | 5.2 | % | South Africa | 2.1 | % | |||||
Israel | 3.1 | % | Switzerland | 2.1 | % | |||||
Canada | 2.9 | % | Mexico | 1.9 | % | |||||
Argentina | 2.7 | % | Russia | 1.5 | % | |||||
France | 2.7 | % | Hong Kong | 1.3 | % |
12 Certified Annual Report
| SCHEDULE OF INVESTMENTS, CONTINUED | ||
| Thornburg International Growth Fund | September 30, 2011 | |
| Shares/ Principal Amount | Value | |||||||
COMMON STOCK — 89.99% | ||||||||
CAPITAL GOODS — 2.09% | ||||||||
CONSTRUCTION & ENGINEERING — 2.09% | ||||||||
Tower Bersama Infrastructure | 20,068,500 | $ | 4,566,212 | |||||
|
| |||||||
| 4,566,212 | ||||||||
|
| |||||||
COMMERCIAL & PROFESSIONAL SERVICES — 5.16% | ||||||||
COMMERCIAL SERVICES & SUPPLIES — 2.43% | ||||||||
Regus plc | 4,631,200 | 5,322,538 | ||||||
PROFESSIONAL SERVICES — 2.73% | ||||||||
Experian plc | 528,100 | 5,970,516 | ||||||
|
| |||||||
| 11,293,054 | ||||||||
|
| |||||||
CONSUMER DURABLES & APPAREL — 1.85% | ||||||||
TEXTILES, APPAREL & LUXURY GOODS — 1.85% | ||||||||
Compagnie Financiere Richemont SA | 89,500 | 4,043,496 | ||||||
|
| |||||||
| 4,043,496 | ||||||||
|
| |||||||
CONSUMER SERVICES — 10.64% | ||||||||
DIVERSIFIED CONSUMER SERVICES — 1.88% | 179,040 | 4,112,549 | ||||||
aNew Oriental Education & Technology Group, Inc. ADR | ||||||||
HOTELS, RESTAURANTS & LEISURE — 8.76% | ||||||||
a7 Days Group Holdings Ltd. ADR | 315,731 | 3,997,155 | ||||||
Domino’s Pizza UK & IRL plc | 754,600 | 5,242,304 | ||||||
aJubilant Foodworks Ltd. | 266,749 | 4,346,416 | ||||||
aLas Vegas Sands Corp. | 75,800 | 2,906,172 | ||||||
Wynn Macau Ltd. | 1,109,600 | 2,661,649 | ||||||
|
| |||||||
| 23,266,245 | ||||||||
|
| |||||||
DIVERSIFIED FINANCIALS — 2.84% | ||||||||
CAPITAL MARKETS — 2.84% | ||||||||
Hargreaves Lansdown plc | 884,500 | 6,206,805 | ||||||
|
| |||||||
| 6,206,805 | ||||||||
|
| |||||||
ENERGY — 7.46% | ||||||||
ENERGY EQUIPMENT & SERVICES — 1.89% | ||||||||
Transocean Ltd. | 86,600 | 4,134,284 | ||||||
OIL, GAS & CONSUMABLE FUELS — 5.57% | ||||||||
Cenovus Energy, Inc. | 184,900 | 5,693,981 | ||||||
CNOOC Ltd. | 3,889,000 | 6,472,178 | ||||||
|
| |||||||
| 16,300,443 | ||||||||
|
| |||||||
FOOD & STAPLES RETAILING — 4.35% | ||||||||
FOOD & STAPLES RETAILING — 4.35% | ||||||||
PriceSmart, Inc. | 65,439 | 4,078,158 | ||||||
Tesco plc | 922,200 | 5,435,940 | ||||||
|
| |||||||
| 9,514,098 | ||||||||
|
| |||||||
Certified Annual Report 13
| SCHEDULE OF INVESTMENTS, CONTINUED | ||
| Thornburg International Growth Fund | September 30, 2011 | |
| Shares/ Principal Amount | Value | |||||||
HEALTH CARE EQUIPMENT & SERVICES — 5.31% | ||||||||
HEALTH CARE EQUIPMENT & SUPPLIES — 2.86% | ||||||||
Covidien plc | 141,762 | $ | 6,251,704 | |||||
HEALTH CARE PROVIDERS & SERVICES — 2.45% | ||||||||
Orpea | 131,814 | 5,365,041 | ||||||
|
| |||||||
| 11,616,745 | ||||||||
|
| |||||||
MEDIA — 3.18% | ||||||||
MEDIA — 3.18% | ||||||||
aKabel Deutschland Holding AG | 128,400 | 6,946,324 | ||||||
|
| |||||||
| 6,946,324 | ||||||||
|
| |||||||
PHARMACEUTICALS, BIOTECHNOLOGY & LIFE SCIENCES — 5.61% | ||||||||
BIOTECHNOLOGY — 3.91% | ||||||||
Abcam plc | 620,050 | 3,505,035 | ||||||
aGrifols SA | 267,683 | 5,035,141 | ||||||
PHARMACEUTICALS — 1.70% | ||||||||
aGenomma Lab Internacional SA | 2,256,000 | 3,720,295 | ||||||
|
| |||||||
| 12,260,471 | ||||||||
|
| |||||||
RETAILING — 14.64% | ||||||||
INTERNET & CATALOG RETAIL — 10.15% | 118,200 | 2,807,211 | ||||||
aASOS plc | ||||||||
aMakeMyTrip Ltd. | 265,771 | 5,868,224 | ||||||
Start Today Co. Ltd. | 251,300 | 5,571,412 | ||||||
aYOOX S.p.A | 334,950 | 4,355,111 | ||||||
azooplus AG | 59,680 | 3,579,642 | ||||||
MULTILINE RETAIL — 1.88% | ||||||||
Clicks Group Ltd. | 884,100 | 4,121,311 | ||||||
SPECIALTY RETAIL — 2.61% | ||||||||
aSuperGroup plc | 352,290 | 5,713,357 | ||||||
|
| |||||||
| 32,016,268 | ||||||||
|
| |||||||
SOFTWARE & SERVICES — 19.52% | ||||||||
INTERNET SOFTWARE & SERVICES — 16.75% | ||||||||
aBaidu, Inc. ADR | 50,100 | 5,356,191 | ||||||
aBlinkx plc | 2,362,400 | 5,452,214 | ||||||
Kakaku.com, Inc. | 143,000 | 5,960,651 | ||||||
MercadoLibre, Inc. | 98,400 | 5,289,000 | ||||||
aTelecity Group plc | 657,780 | 5,728,772 | ||||||
aXing AG | 79,572 | 5,821,785 | ||||||
aYandex NV | 147,550 | 3,011,495 | ||||||
SOFTWARE — 2.77% | ||||||||
aCheck Point Software Technologies Ltd. | 114,800 | 6,056,848 | ||||||
|
| |||||||
| 42,676,956 | ||||||||
|
| |||||||
TECHNOLOGY HARDWARE & EQUIPMENT — 3.61% | ||||||||
COMMUNICATIONS EQUIPMENT — 3.61% | ||||||||
aEXFO, Inc. | 576,370 | 3,527,385 | ||||||
HTC Corp. | 194,050 | 4,361,747 | ||||||
|
| |||||||
| 7,889,132 | ||||||||
|
| |||||||
14 Certified Annual Report
| SCHEDULE OF INVESTMENTS, CONTINUED | ||
| Thornburg International Growth Fund | September 30, 2011 | |
| Shares/ Principal Amount | Value | |||||||
TELECOMMUNICATION SERVICES — 3.73% | ||||||||
WIRELESS TELECOMMUNICATION SERVICES — 3.73% | ||||||||
KDDI Corp. | 667 | $ | 4,635,187 | |||||
Vodafone Group plc | 1,355,400 | 3,513,880 | ||||||
|
| |||||||
| 8,149,067 | ||||||||
|
| |||||||
TOTAL COMMON STOCK (Cost $207,237,277) | 196,745,316 | |||||||
|
| |||||||
SHORT TERM INVESTMENTS — 6.59% | ||||||||
Darden Restaurants, Inc., 0.23%, 10/3/2011 | $ | 4,400,000 | 4,399,944 | |||||
Devon Energy Corp., 0.17%, 10/3/2011 | 10,000,000 | 9,999,905 | ||||||
|
| |||||||
TOTAL SHORT TERM INVESTMENTS (Cost $14,399,849) | 14,399,849 | |||||||
|
| |||||||
TOTAL INVESTMENTS — 96.58% (Cost $221,637,126) | $ | 211,145,165 | ||||||
OTHER ASSETS LESS LIABILITIES — 3.42% | 7,481,266 | |||||||
|
| |||||||
NET ASSETS — 100.00% | $ | 218,626,431 | ||||||
|
| |||||||
Footnote Legend
| a | Non-income producing. |
Portfolio Abbreviations
To simplify the listings of securities, abbreviations are used per the table below:
| ADR | American Depository Receipt |
See notes to financial statements.
Certified Annual Report 15
| STATEMENT OF ASSETS AND LIABILITIES | ||
| Thornburg International Growth Fund | September 30, 2011 | |
ASSETS | ||||
Investments at value (cost $221,637,126) (Note 2) | $ | 211,145,165 | ||
Cash | 588,883 | |||
Cash denominated in foreign currency (cost $11,640,380) | 10,505,487 | |||
Receivable for fund shares sold | 1,831,618 | |||
Unrealized appreciation on forward currency contracts (Note 7) | 1,028,589 | |||
Dividends receivable | 532,096 | |||
Dividend and interest reclaim receivable | 18,799 | |||
Prepaid expenses and other assets | 33,713 | |||
|
| |||
Total Assets | 225,684,350 | |||
|
| |||
LIABILITIES | ||||
Payable for investments purchased | 3,969,952 | |||
Payable for fund shares redeemed | 2,250,166 | |||
Unrealized depreciation on forward currency contracts (Note 7) | 517,804 | |||
Payable to investment advisor and other affiliates (Note 3) | 217,505 | |||
Accounts payable and accrued expenses | 102,492 | |||
|
| |||
Total Liabilities | 7,057,919 | |||
|
| |||
NET ASSETS | $ | 218,626,431 | ||
|
| |||
NET ASSETS CONSIST OF: | ||||
Undistributed net investment income | $ | 302,690 | ||
Net unrealized depreciation on investments and foreign currency translations | (11,147,373 | ) | ||
Accumulated net realized gain (loss) | (13,215,547 | ) | ||
Net capital paid in on shares of beneficial interest | 242,686,661 | |||
|
| |||
| $ | 218,626,431 | |||
|
| |||
16 Certified Annual Report
| STATEMENT OF ASSETS AND LIABILITIES, CONTINUED | ||||
| Thornburg International Growth Fund | September 30, 2011 | |||
NET ASSET VALUE: | ||||
Class A Shares: | ||||
Net asset value and redemption price per share ($104,918,141 applicable to 7,844,677 shares of beneficial interest outstanding - Note 4) | $ | 13.37 | ||
Maximum sales charge, 4.50% of offering price | 0.63 | |||
|
| |||
Maximum offering price per share | $ | 14.00 | ||
|
| |||
Class C Shares: | ||||
Net asset value and offering price per share* ($35,705,872 applicable to 2,699,720 shares of beneficial interest | $ | 13.23 | ||
|
| |||
Class I Shares: | ||||
Net asset value, offering and redemption price per share ($75,537,987 applicable to 5,576,780 shares of beneficial interest outstanding - Note 4) | $ | 13.55 | ||
|
| |||
Class R3 Shares: | ||||
Net asset value, offering and redemption price per share ($1,925,352 applicable to 144,369 shares of beneficial interest outstanding - Note 4) | $ | 13.34 | ||
|
| |||
Class R4 Shares: | ||||
Net asset value, offering and redemption price per share ($145,678 applicable to 10,943 shares of beneficial interest outstanding - Note 4) | $ | 13.31 | ||
|
| |||
Class R5 Shares: | ||||
Net asset value, offering and redemption price per share ($393,401 applicable to 28,978 shares of beneficial interest outstanding - Note 4) | $ | 13.58 | ||
|
| |||
| * | Redemption price per share is equal to net asset value less any applicable contingent deferred sales charge. |
See notes to financial statements.
Certified Annual Report 17
| STATEMENT OF OPERATIONS | ||
| Thornburg International Growth Fund | Year Ended September 30, 2011 | |
INVESTMENT INCOME: | ||||
Dividend income (net of foreign taxes withheld of $173,240) | $ | 2,661,592 | ||
Interest income | 16,603 | |||
|
| |||
Total Income | 2,678,195 | |||
|
| |||
EXPENSES: | ||||
Investment advisory fees (Note 3) | 1,428,890 | |||
Administration fees (Note 3) | ||||
Class A Shares | 83,217 | |||
Class C Shares | 40,574 | |||
Class I Shares | 31,262 | |||
Class R3 Shares | 1,813 | |||
Class R4 Shares | 86 | |||
Class R5 Shares | 113 | |||
Distribution and service fees (Note 3) | ||||
Class A Shares | 167,013 | |||
Class C Shares | 324,827 | |||
Class R3 Shares | 7,135 | |||
Class R4 Shares | 153 | |||
Transfer agent fees | ||||
Class A Shares | 65,157 | |||
Class C Shares | 36,735 | |||
Class I Shares | 25,186 | |||
Class R3 Shares | 4,127 | |||
Class R4 Shares | 1,932 | |||
Class R5 Shares | 2,014 | |||
Registration and filing fees | ||||
Class A Shares | 24,295 | |||
Class C Shares | 23,043 | |||
Class I Shares | 26,486 | |||
Class R3 Shares | 19,428 | |||
Class R4 Shares | 19,428 | |||
Class R5 Shares | 19,428 | |||
Custodian fees (Note 3) | 148,762 | |||
Professional fees | 53,306 | |||
Accounting fees | 4,526 | |||
Trustee fees | 3,505 | |||
Other expenses | 36,669 | |||
|
| |||
Total Expenses | 2,599,110 | |||
Less: | ||||
Expenses reimbursed by investment advisor (Note 3) | (150,898 | ) | ||
Investment advisory fees waived by investment advisor (Note 3) | (58,325 | ) | ||
Fees paid indirectly (Note 3) | (1,636 | ) | ||
|
| |||
Net Expenses | 2,388,251 | |||
|
| |||
Net Investment Income | $ | 289,944 | ||
|
| |||
18 Certified Annual Report
| STATEMENT OF OPERATIONS, CONTINUED | ||
| Thornburg International Growth Fund | Year Ended September 30, 2011 | |
REALIZED AND UNREALIZED GAIN (LOSS) | ||||
Net realized gain (loss) from: | ||||
Investments | $ | 22,714,364 | ||
Forward currency contracts (Note 7) | (628,514 | ) | ||
Foreign currency transactions | 240,691 | |||
|
| |||
| 22,326,541 | ||||
|
| |||
Net change in unrealized appreciation (depreciation) on: | ||||
Investments | (24,260,682 | ) | ||
Forward currency contracts (Note 7) | 2,025,985 | |||
Foreign currency translations | (1,271,951 | ) | ||
|
| |||
| (23,506,648 | ) | |||
|
| |||
Net Realized and Unrealized Loss | (1,180,107 | ) | ||
|
| |||
Net Decrease in Net Assets Resulting from Operations | $ | (890,163 | ) | |
|
|
See notes to financial statements.
Certified Annual Report 19
STATEMENTS OF CHANGES IN NET ASSETS
Thornburg International Growth Fund
| Year Ended September 30, 2011 | Year Ended September 30, 2010 | |||||||
INCREASE (DECREASE) IN NET ASSETS FROM | ||||||||
OPERATIONS: | ||||||||
Net investment income (loss) | $ | 289,944 | $ | (11,261 | ) | |||
Net realized gain (loss) on investments, forward currency contracts and foreign currency transactions | 22,326,541 | 6,318,159 | ||||||
Net unrealized appreciation (depreciation) on investments, forward currency contracts, and foreign currency translations | (23,506,648 | ) | 7,914,881 | |||||
|
|
|
| |||||
Net Increase (Decrease) in Net Assets Resulting from Operations | (890,163 | ) | 14,221,779 | |||||
DIVIDENDS TO SHAREHOLDERS: | ||||||||
From net investment income | ||||||||
Class A Shares | (125,932 | ) | (129,435 | ) | ||||
Class I Shares | (269,792 | ) | (222,424 | ) | ||||
Class R3 Shares | (3,181 | ) | (4,168 | ) | ||||
Class R4 Shares | (10 | ) | (16 | ) | ||||
Class R5 Shares | (991 | ) | (83 | ) | ||||
FUND SHARE TRANSACTIONS (NOTE 4): | ||||||||
Class A Shares | 71,401,549 | 7,623,208 | ||||||
Class C Shares | 9,489,209 | 1,984,070 | ||||||
Class I Shares | 36,053,441 | 9,475,126 | ||||||
Class R3 Shares | 801,199 | 200,963 | ||||||
Class R4 Shares | 163,213 | 19 | ||||||
Class R5 Shares | 214,537 | 324,084 | ||||||
|
|
|
| |||||
Net Increase in Net Assets | 116,833,079 | 33,473,123 | ||||||
NET ASSETS: | ||||||||
Beginning of Year | 101,793,352 | 68,320,229 | ||||||
|
|
|
| |||||
End of Year | $ | 218,626,431 | $ | 101,793,352 | ||||
|
|
|
| |||||
Undistributed net investment income | $ | 302,690 | $ | 144,293 | ||||
See notes to financial statements.
20 Certified Annual Report
| NOTES TO FINANCIAL STATEMENTS | ||
| Thornburg International Growth Fund | September 30, 2011 | |
NOTE 1 – ORGANIZATION
Thornburg International Growth Fund, hereinafter referred to as the “Fund,” is a diversified series of Thornburg Investment Trust (the “Trust”). The Fund commenced operations on February 1, 2007. The Trust was organized as a Massachusetts business trust under a Declaration of Trust dated June 3, 1987 and is registered as a diversified, open-end management investment company under the Investment Company Act of 1940, as amended. The Fund is currently one of sixteen separate series of the Trust. Each series is considered to be a separate entity for financial reporting and tax purposes and bears expenses directly attributable to it. The Fund seeks long-term capital appreciation by investing in equity securities selected for their growth potential.
The Fund currently offers six classes of shares of beneficial interest outstanding: Class A, Class C, Institutional Class (Class I), and Retirement Classes (Class R3, Class R4, and Class R5). Each class of shares of the Fund represents an interest in the same portfolio of investments, except that (i) Class A shares are sold subject to a front-end sales charge collected at the time the shares are purchased and bear a service fee, (ii) Class C shares are sold at net asset value without a sales charge at the time of purchase, but are subject to a contingent deferred sales charge upon redemption within one year of purchase, and bear both a service fee and a distribution fee, (iii) Class I shares are sold at net asset value without a sales charge at the time of purchase, (iv) Class R3 shares are sold at net asset value without a sales charge at the time of purchase, but bear both a service fee and distribution fee, (v) Class R4 shares are sold at net asset value without a sales charge at the time of purchase, but bear a service fee, (vi) Class R5 shares are sold at net asset value without a sales charge at the time of purchase, and (vii) the respective classes may have different reinvestment privileges and conversion rights. Additionally, the Fund may allocate among its classes certain expenses, to the extent allowable to specific classes, including transfer agent fees, government registration fees, certain printing and postage costs, and administrative and legal expenses. Currently, class specific expenses of the Fund are limited to service and distribution fees, administration fees, and certain registration and transfer agent expenses.
NOTE 2 – SIGNIFICANT ACCOUNTING POLICIES
Significant accounting policies of the Trust are as follows:
Valuation of Investments: Portfolio securities listed or traded on a national securities exchange are valued on the valuation date at the last reported sale price on the exchange that is the primary market for the security. Portfolio securities traded on an exchange for which there has been no sale that day and other equity securities traded in the over-the-counter market are valued at the mean between the last reported bid and asked prices. Portfolio securities reported by NASDAQ are valued at the NASDAQ official closing price. Any foreign security traded on exchanges outside the United States is valued at the price of the security on the exchange that is normally the security’s primary market, as of the close of that exchange preceding the time of the Fund’s valuation.
Debt obligations held by the Fund have a primary market over the counter and are valued by an independent pricing service approved by the Trustees of the Trust. The pricing service ordinarily values debt obligations at quoted bid prices. When quotations are not available, debt obligations held by the Fund are valued at evaluated prices determined by the pricing service using methods which include consideration of yields or prices of debt obligations of comparable quality, type of issue, coupon, maturity and rating, and indications as to value from dealers and general market conditions. Short-term obligations having remaining maturities of 60 days or less are ordinarily valued at amortized cost, which approximates market value.
Quotations in foreign currencies for foreign portfolio investments are converted to U.S. dollar equivalents using the foreign exchange quotation in effect at the time of valuation.
In any case where the market value of an equity security held by the Fund is not readily available, the Trust’s valuation and pricing committee determines a fair value for the security using procedures approved by the Trustees, which may include the use of a price obtained from an independent pricing service. The pricing service ordinarily values equity securities in these instances using multi-factor models to adjust market prices based upon various inputs, including exchange data, depository receipt prices, futures and index data and other data. A security’s market value is deemed not readily available whenever the exchange or market on which the security is primarily traded is closed for the entire scheduled day of trading. Additionally, a security’s market value may be deemed not readily available under other circumstances identified by the Trustees, including when developments occurring after the most recent close of the security’s primary exchange or market, but before the most recent close of trading in Fund shares, or an unusual event or
Certified Annual Report 21
| NOTES TO FINANCIAL STATEMENTS, CONTINUED | ||
| Thornburg International Growth Fund | September 30, 2011 | |
significant period of time occurring since the availability of a market quotation, create a question about the reliability of the security’s market value.
In any case where a pricing service fails to provide a price for a debt obligation held by the Fund, the valuation and pricing committee determines a fair value for the debt obligation using procedures approved by the Trustees. Additionally, in any case where management believes that a price provided by a pricing service for a debt obligation held by the Fund may be unreliable, the valuation and pricing committee decides whether or not to use the pricing service’s valuation or to determine a fair value for the debt obligation.
In determining fair value for any portfolio security or other investment, the valuation and pricing committee seeks to determine the amount that an owner of the investment might reasonably expect to receive upon a sale of the investment. However, because fair value prices are estimated prices, the valuation and pricing committee’s determination of fair value for an investment may differ from the value that would be realized by the Fund upon a sale of the investment, and that difference could be material to the Fund’s financial statements. The valuation and pricing committee’s determination of fair value for an investment may also differ from the prices obtained by other persons (including other mutual funds) for the investment.
Valuation Measurements: Various inputs are used in determining the value of the Fund’s investments. These inputs are summarized in the three levels listed below:
Level 1: Quoted prices in active markets for identical investments.
Level 2: Other significant observable inputs (including quoted prices for similar investments, interest rates, prepayment rates, credit risk, etc.).
Level 3: Significant unobservable inputs (including the Fund’s own assumptions in determining the fair value of investments).
The following table displays a summary of the inputs used to value the Fund’s net assets as of September 30, 2011. In any instance when valuation inputs from more than one level are used to determine the fair value of a specific investment, the investment is placed in the level of the table based upon the lowest level input that is significant in determining the fair value of the investment:
| Fair Value Measurements at September 30, 2011 | ||||||||||||||||
| Total | Level 1 | Level 2 | Level 3 | |||||||||||||
Assets | ||||||||||||||||
Investments in Securities* | ||||||||||||||||
Common Stock | $ | 196,745,316 | $ | 196,745,316 | $ | — | $ | — | ||||||||
Short Term Investments | 14,399,849 | — | 14,399,849 | — | ||||||||||||
|
|
|
|
|
|
|
| |||||||||
Total Investments in Securities | $ | 211,145,165 | $ | 196,745,316 | $ | 14,399,849 | $ | — | ||||||||
Other Financial Instruments** | ||||||||||||||||
Forward Currency Contracts | $ | 1,028,589 | $ | — | $ | 1,028,589 | $ | — | ||||||||
Liabilities | ||||||||||||||||
Other Financial Instruments** | ||||||||||||||||
Forward Currency Contracts | $ | (517,804 | ) | $ | — | $ | (517,804 | ) | $ | — | ||||||
Spot Currency | $ | (20,522 | ) | $ | (20,522 | ) | $ | — | $ | — | ||||||
| * | See Schedule of Investments for a summary of the industry exposure as grouped according to the Global Industry Classification Standard (GICS), which is an industry taxonomy developed by MSCI, Inc. and Standard & Poor’s (S&P). |
| ** | Other Financial Instruments include investments not reflected in the Schedule of Investments, such as futures, forwards and swap contracts, which are valued at the unrealized appreciation (depreciation) on the investment. |
22 Certified Annual Report
| NOTES TO FINANCIAL STATEMENTS, CONTINUED | ||
| Thornburg International Growth Fund | September 30, 2011 | |
Other Notes: It is the policy of the Fund to recognize significant transfers between Levels 1, 2 and 3 and to disclose those transfers at the beginning of the reporting period. The Fund recognized no significant transfers between levels for the year ended September 30, 2011.
Foreign Currency Translation: Portfolio securities and other assets and liabilities denominated in foreign currencies are translated into U.S. dollars based on the exchange rate of such currencies against the U.S. dollar on the date of valuation. Purchases and sales of securities and income items denominated in foreign currencies are translated into U.S. dollars at the exchange rate in effect on the translation date. When the Fund purchases or sells foreign securities, it will customarily enter into a foreign exchange contract to minimize foreign exchange risk from the trade date to the settlement date of such transactions. Such spot contracts are included in Receivable for investments sold and Payable for investments purchased on the Statement of Assets and Liabilities.
The Fund does not separately report the effect of changes in foreign exchange rates from changes in market prices on securities held. Such changes are included in net realized and unrealized gain or loss from investments.
Reported net realized foreign exchange gains or losses arise from purchases and sales of foreign currencies, currency gains or losses realized between the trade and settlement dates on securities transactions and the difference between the amounts of dividends, interest, and foreign withholding taxes recorded on the Fund’s books, and the U.S. dollar equivalent of the amounts actually received or paid.
Net unrealized foreign exchange gains and losses arise from changes in the fair value of assets and liabilities, other than investments in securities at fiscal period end, resulting from changes in exchange rates.
Deferred Taxes: The Fund is subject to a tax imposed on net realized gains of securities of certain foreign countries. The Fund records an estimated deferred tax liability for net unrealized gains on these securities as reflected in the accompanying financial statements.
Federal Income Taxes: It is the policy of the Trust to comply with the provisions of the Internal Revenue Code applicable to “regulated investment companies,” and to distribute to shareholders substantially all taxable income, including any net realized gain on investments of the Fund. Therefore, no provision for federal income taxes is required.
Management reviews each uncertain tax position believed to be material to the preparation of the Fund’s financial statements, to assess if it is more likely than not that the position would be sustained upon examination, based upon the technical merits of the position. As of September 30, 2011, management has not identified any such position for which a liability must be reflected in the Statement of Assets and Liabilities. The Fund’s tax returns remain subject to examination for three years after filing.
When-Issued and Delayed Delivery Transactions: The Fund may engage in when-issued or delayed delivery transactions. To the extent the Fund engages in such transactions, it will do so for the purpose of acquiring portfolio securities consistent with the Fund’s investment objectives and not for the purpose of investment leverage or to speculate on interest rate and/or market changes. At the time the Fund makes a commitment to purchase a security on a when-issued or delayed delivery basis, the Fund will record the transaction and reflect the value in determining its net asset value. When effecting such transactions, assets of an amount sufficient to make payment for the portfolio securities to be purchased will be segregated on the Fund’s records on the trade date. Securities purchased on a when-issued or delayed delivery basis do not earn interest until the settlement date.
Dividends: Dividends to shareholders, if any, are generally paid quarterly and are reinvested in additional shares of the Fund at net asset value per share at the close of business on the dividend payment date or, at the shareholder’s option, paid in cash. Net realized capital gains, to the extent available, will be distributed at least annually. Distributions to shareholders are based on income tax regulations and therefore, their characteristics may differ for financial statement and tax purposes.
General: Securities transactions are accounted for on a trade date basis. Interest income is accrued as earned and dividend income is recorded on the ex-dividend date. Certain income from foreign securities is recognized as soon as information is available to the Fund. Realized gains and losses from the sale of securities are recorded on an identified cost basis. Net investment income (other than class specific expenses) and realized and unrealized gains and losses are allocated daily to each class of shares based upon the relative net asset value of outstanding shares of each class of shares at the beginning of the day (after adjusting for the current share activity of
Certified Annual Report 23
| NOTES TO FINANCIAL STATEMENTS, CONTINUED | ||
| Thornburg International Growth Fund | September 30, 2011 | |
the respective class). Expenses common to all Funds are allocated among the Funds comprising the Trust based upon their relative net asset values or other appropriate allocation methods.
Guarantees and Indemnifications: Under the Trust’s organizational documents, its officers and Trustees are indemnified against certain liabilities arising out of the performance of their duties to the Fund. Additionally, in the normal course of business the Trust enters into contracts with service providers that contain general indemnification clauses. The Trust’s maximum exposure under these arrangements is unknown. However, based on experience, the Trust expects the risk of loss to be remote.
Use of Estimates: The preparation of financial statements, in conformity with generally accepted accounting principles, requires management to make estimates and assumptions that affect the reported amounts of assets and liabilities and the disclosure of contingent assets and liabilities at the date of the financial statements and the reported amounts of increases and decreases in net assets from operations during the reporting period. Actual results could differ from those estimates.
NOTE 3 – INVESTMENT ADVISORY FEE AND OTHER TRANSACTIONS WITH AFFILIATES
Pursuant to an investment advisory agreement, Thornburg Investment Management, Inc. (the “Advisor”) serves as the investment advisor and performs services to the Fund for which the fees are payable at the end of each month. For the year ended September 30, 2011, these fees were payable at annual rates ranging from .875 of 1% to .675 of 1% per annum of the average daily net assets of the Fund depending on the Fund’s asset size. For the year ended September 30, 2011, the Advisor contractually waived investment advisory fees of $58,325. The Trust has also entered into administrative services agreements with the Advisor, whereby the Advisor will perform certain administrative services for the shareholders of each class of the Fund’s shares, and for which fees will be payable at an annual rate of up to .125 of 1% per annum of the average daily net assets attributable to each class of shares. For the year ended September 30, 2011, the Advisor contractually reimbursed certain class specific expenses, administrative fees, and distribution fees of $82,934 for Class I shares, $25,101 for Class R3 shares, $21,313 for Class R4 shares, and $21,550 for Class R5 shares.
The Trust has an underwriting agreement with Thornburg Securities Corporation (the “Distributor,” an affiliate of the Advisor), which acts as the distributor of the Fund’s shares. For the year ended September 30, 2011, the Distributor has advised the Fund that it earned commissions aggregating $24,419 from the sale of Class A shares, and collected contingent deferred sales charges aggregating $6,496 from redemptions of Class C shares of the Fund.
Pursuant to a service plan under Rule 12b-1 of the Investment Company Act of 1940, the Fund may reimburse to the Advisor an amount not to exceed .25 of 1% per annum of the average daily net assets attributable to each class of shares of the Fund for payments made by the Advisor to securities dealers and other financial institutions to obtain various shareholder and distribution related services. For the year ended September 30, 2011, there were no 12b-1 service plan fees charged for Class I and R5 shares. The Advisor may pay out of its own resources additional expenses for distribution of the Fund’s shares.
The Trust has also adopted distribution plans pursuant to Rule 12b-1, applicable only to the Fund’s Class C and Class R3 shares, under which the Fund compensates the Distributor for services in promoting the sale of Class C and Class R3 shares of the Fund at an annual rate of up to .75 of 1% per annum of the average daily net assets attributable to Class C shares, and an annual rate of up to .25 of 1% per annum of the average daily net assets attributable to Class R3 shares. Total fees incurred by the Distributor for each class of shares of the Fund under their respective Service and Distribution Plans for the year ended September 30, 2011, are set forth in the Statement of Operations.
The Trust has an agreement with the custodian bank to indirectly pay a portion of the custodian’s fees through credits earned by the Fund’s cash on deposit with the bank. This deposit agreement is an alternative to overnight investments. Custodial fees have been adjusted to reflect amounts that would have been paid without this agreement, with a corresponding adjustment reflected as fees paid indirectly in the Statement of Operations. For the year ended September 30, 2011, fees paid indirectly were $1,636.
Certain officers and Trustees of the Trust are also officers or directors of the Advisor and Distributor. The compensation of independent Trustees is borne by the Trust.
24 Certified Annual Report
| NOTES TO FINANCIAL STATEMENTS, CONTINUED | ||
| Thornburg International Growth Fund | September 30, 2011 | |
NOTE 4 – SHARES OF BENEFICIAL INTEREST
At September 30, 2011, there were an unlimited number of shares of beneficial interest authorized. Transactions in shares of beneficial interest were as follows:
| Year Ended September 30, 2011 | Year Ended September 30, 2010 | |||||||||||||||
| Shares | Amount | Shares | Amount | |||||||||||||
Class A Shares | ||||||||||||||||
Shares sold | 6,155,661 | $ | 89,652,304 | 1,295,491 | $ | 14,607,416 | ||||||||||
Shares issued to shareholders in reinvestment of dividends | 8,126 | 111,333 | 10,856 | 117,457 | ||||||||||||
Shares repurchased | (1,300,594 | ) | (18,367,562 | ) | (643,507 | ) | (7,102,453 | ) | ||||||||
Redemption fees received* | — | 5,474 | — | 788 | ||||||||||||
|
|
|
|
|
|
|
| |||||||||
Net increase (decrease) | 4,863,193 | $ | 71,401,549 | 662,840 | $ | 7,623,208 | ||||||||||
|
|
|
|
|
|
|
| |||||||||
Class C Shares | ||||||||||||||||
Shares sold | 1,070,622 | $ | 15,291,607 | 618,259 | $ | 6,834,000 | ||||||||||
Shares issued to shareholders in reinvestment of dividends | — | — | — | — | ||||||||||||
Shares repurchased | (409,267 | ) | (5,804,582 | ) | (442,078 | ) | (4,850,518 | ) | ||||||||
Redemption fees received* | — | 2,184 | — | 588 | ||||||||||||
|
|
|
|
|
|
|
| |||||||||
Net increase (decrease) | 661,355 | $ | 9,489,209 | 176,181 | $ | 1,984,070 | ||||||||||
|
|
|
|
|
|
|
| |||||||||
Class I Shares | ||||||||||||||||
Shares sold | 5,109,347 | $ | 74,394,059 | 1,240,075 | $ | 14,043,843 | ||||||||||
Shares issued to shareholders in reinvestment of dividends | 16,332 | 225,702 | 18,921 | 206,051 | ||||||||||||
Shares repurchased | (2,713,559 | ) | (38,570,995 | ) | (423,456 | ) | (4,775,568 | ) | ||||||||
Redemption fees received* | — | 4,675 | — | 800 | ||||||||||||
|
|
|
|
|
|
|
| |||||||||
Net increase (decrease) | 2,412,120 | $ | 36,053,441 | 835,540 | $ | 9,475,126 | ||||||||||
|
|
|
|
|
|
|
| |||||||||
Class R3 Shares | ||||||||||||||||
Shares sold | 84,069 | $ | 1,212,823 | 33,942 | $ | 385,167 | ||||||||||
Shares issued to shareholders in reinvestment of dividends | 230 | 3,141 | 386 | 4,168 | ||||||||||||
Shares repurchased | (29,493 | ) | (414,869 | ) | (17,232 | ) | (188,395 | ) | ||||||||
Redemption fees received* | — | 104 | — | 23 | ||||||||||||
|
|
|
|
|
|
|
| |||||||||
Net increase (decrease) | 54,806 | $ | 801,199 | 17,096 | $ | 200,963 | ||||||||||
|
|
|
|
|
|
|
| |||||||||
Class R4 Shares | ||||||||||||||||
Shares sold | 44,069 | $ | 659,533 | — | $ | 3 | ||||||||||
Shares issued to shareholders in reinvestment of dividends | 1 | 10 | 2 | 16 | ||||||||||||
Shares repurchased | (33,366 | ) | (496,336 | ) | — | — | ||||||||||
Redemption fees received* | — | 6 | — | — | ||||||||||||
|
|
|
|
|
|
|
| |||||||||
Net increase (decrease) | 10,704 | $ | 163,213 | 2 | $ | 19 | ||||||||||
|
|
|
|
|
|
|
| |||||||||
Certified Annual Report 25
| NOTES TO FINANCIAL STATEMENTS, CONTINUED | ||
| Thornburg International Growth Fund | September 30, 2011 | |
| Year Ended September 30, 2011 | Year Ended September 30, 2010 | |||||||||||||||
| Shares | Amount | Shares | Amount | |||||||||||||
Class R5 Shares | ||||||||||||||||
Shares sold | 18,219 | $ | 259,606 | 613,212 | $ | 6,687,310 | ||||||||||
Shares issued to shareholders in reinvestment of dividends | 71 | 991 | 7 | 83 | ||||||||||||
Shares repurchased | (3,113 | ) | (46,079 | ) | (600,288 | ) | (6,363,309 | ) | ||||||||
Redemption fees received* | — | 19 | — | — | ||||||||||||
|
|
|
|
|
|
|
| |||||||||
Net increase (decrease) | 15,177 | $ | 214,537 | 12,931 | $ | 324,084 | ||||||||||
|
|
|
|
|
|
|
| |||||||||
| * | The Fund charges a redemption fee of 1% of the Class A and Class I shares redeemed or exchanged within 30 days of purchase. Redemption fees charged to any class are allocated to all classes upon receipt of payment based on relative net asset values of each class or other appropriate allocation methods. |
NOTE 5 – SECURITIES TRANSACTIONS
For the year ended September 30, 2011, the Fund had purchase and sale transactions of investment securities (excluding short-term investments) of $321,850,531 and $216,879,322, respectively.
NOTE 6 – INCOME TAXES
At September 30, 2011, information on the tax components of capital is as follows:
Cost of investments for tax purposes | $ | 221,768,740 | ||
|
| |||
Gross unrealized appreciation on a tax basis | $ | 12,436,182 | ||
Gross unrealized depreciation on a tax basis | (23,059,757 | ) | ||
|
| |||
Net unrealized appreciation (depreciation) on investments (tax basis) | $ | (10,623,575 | ) | |
|
| |||
Distributable earnings – ordinary income (tax basis) | $ | 282,168 |
The Fund utilized $22,109,815 of capital loss carryforwards for the year ended September 30, 2011.
At September 30, 2011, the Fund had tax basis capital losses of 12,573,148, which may be carried forward to offset future capital gains. To the extent such carryforwards are used, capital gain distributions may be reduced to the extent provided by regulations. Such capital loss carryforwards expire in the year ending September 30, 2018.
The Regulated Investment Company Modernization Act of 2010 (the “Act”) was signed into law on December 22, 2010. The Act makes changes to a number of tax rules impacting the Fund. Under the Act, future capital losses generated by the Fund may be carried over indefinitely, but these losses must be used prior to the utilization of any pre-enactment capital losses. Since pre-enactment capital losses may only be carried forward for eight years, there may be a greater likelihood that all or a portion of a Fund’s pre-enactment capital losses will expire unused. In general, the provisions of the Act will be effective for the Fund’s fiscal year ending September 30, 2012.
In order to account for permanent book/tax differences, the Fund increased net capital paid in on shares of beneficial interest by $6, increased accumulated net realized investment loss by $268,365, and increased undistributed net investment income by $268,359. This reclassification has no impact on the net asset value of the Fund. Reclassifications result primarily from investments in passive foreign investment companies (PFIC) and foreign currency gains (losses).
26 Certified Annual Report
| NOTES TO FINANCIAL STATEMENTS, CONTINUED | ||
| Thornburg International Growth Fund | September 30, 2011 | |
The tax character of distributions paid for the years ended September 30, 2011, and September 30, 2010, was as follows:
| 2011 | 2010 | |||||||
Distributions from: | ||||||||
Ordinary income | $ | 399,906 | $ | 356,126 | ||||
Capital gains | — | — | ||||||
|
|
|
| |||||
Total Distributions | $ | 399,906 | $ | 356,126 | ||||
|
|
|
| |||||
NOTE 7 – DERIVATIVE FINANCIAL INSTRUMENTS WITH OFF-BALANCE SHEET RISK AND FOREIGN INVESTMENT RISK
The Fund may use a variety of derivative financial instruments to hedge or adjust the risks affecting its investment portfolio or to enhance investment returns. Provisions of FASB Accounting Standards Codification ASC 815-10-50 (“ASC 815”), require certain disclosures. The disclosures are intended to provide users of financial statements with an understanding of the use of derivative instruments by the Fund and how these derivatives affect the financial position, financial performance and cash flows of the Fund. The Fund does not designate any derivative instruments as hedging instruments under ASC 815. During the year ended September 30, 2011, the Fund’s principal exposure to derivative financial instruments of the type addressed by ASC 815 was investment in foreign exchange contracts. A foreign exchange contract is an agreement between two parties to exchange different currencies at a specified rate of exchange at an agreed upon future date. Foreign exchange contracts involve risks to the Fund, including the risk that a contract counterparty will not meet its obligations to the Fund, the risk that a change in a contract’s value may not correlate perfectly with the currency the contract was intended to track, and the risk that the Fund’s advisor is unable to correctly implement its strategy in using a contract. In any such instance, the Fund may not achieve the intended benefit of entering into a contract, and may experience a loss. Additionally, the Fund's risk of loss may exceed the amounts recognized on the Statement of Assets and Liabilities.
The Fund entered into forward currency contracts during the year ended September 30, 2011 in the normal course of pursuing its investment objectives, in anticipation of purchasing foreign investments or with the intent of reducing the risk to the value of the Fund’s foreign investments from adverse changes in the relationship between the U.S. dollar and foreign currencies. In each case these contracts have been initiated in conjunction with foreign investment transactions.
These contracts are accounted for by the Fund under ASC 815. Unrealized gains and unrealized losses on outstanding contracts are reported in the Fund’s Statement of Assets and Liabilities at the Fund’s net equity, as measured by the difference between the forward exchange rates at the reporting date and the forward exchange rates at each contract’s inception date. Net realized gain (loss) on contracts closed during the period, and changes in net unrealized appreciation (depreciation) on outstanding contracts are recognized in the Fund’s Statement of Operations. Values of open currency contracts are indicative of the activity for the year ended September 30, 2011.
The following table displays the outstanding forward currency contracts at September 30, 2011:
Outstanding Forward Currency Contracts
to Buy or Sell at September 30, 2011
Contract Description | Buy/Sell | Contract Amount | Contract Value Date | Value USD | Unrealized Appreciation | Unrealized Depreciation | ||||||||||||||||
Euro | Sell | 18,633,200 | 03/20/2012 | 24,955,161 | $ | 454,002 | $ | — | ||||||||||||||
Great Britain Pound | Sell | 25,789,900 | 03/21/2012 | 40,155,881 | 281,392 | — | ||||||||||||||||
Japanese Yen | Sell | 808,500,000 | 01/10/2012 | 10,498,053 | — | (517,804 | ) | |||||||||||||||
South African Rand | Sell | 13,435,200 | 12/08/2011 | 1,648,589 | 293,195 | — | ||||||||||||||||
|
|
|
| |||||||||||||||||||
Total | $ | 1,028,589 | $ | (517,804 | ) | |||||||||||||||||
|
|
|
| |||||||||||||||||||
Certified Annual Report 27
| NOTES TO FINANCIAL STATEMENTS, CONTINUED | ||
| Thornburg International Growth Fund | September 30, 2011 | |
The unrealized appreciation (depreciation) of the outstanding forward currency contracts recognized in the Fund’s Statement of Assets and Liabilities at September 30, 2011 is disclosed in the following table:
Fair Values of Derivative Financial Instruments
at September 30, 2011
Asset Derivatives | Balance Sheet Location | Fair Value | ||||
Foreign exchange contracts | Assets - Unrealized appreciation on forward currency contracts | $ | 1,028,589 | |||
Liability Derivatives | Balance Sheet Location | Fair Value | ||||
Foreign exchange contracts | Liabilities - Unrealized depreciation on forward currency contracts | $ | (517,804) | |||
The realized gains (losses) from forward currency contracts, and the change in unrealized appreciation (depreciation) of outstanding forward currency contracts recognized in the Fund’s Statement of Operations for the year ended September 30, 2011 are disclosed in the following tables:
Amount of Realized Gain (Loss)
on Derivative Financial Instruments Recognized in
Income for the Year Ended September 30, 2011
| Total | Forward Currency Contracts | |||||||
Foreign exchange contracts | $ | (628,514 | ) | $ | (628,514 | ) | ||
Change in Unrealized Appreciation (Depreciation)
of Derivative Financial Instruments Recognized in
Income for the Year Ended September 30, 2011
| Total | Forward Currency Contracts | |||||||
Foreign exchange contracts | $ | 2,025,985 | $ | 2,025,985 | ||||
OTHER NOTES:
Risks: The Fund’s investments subject it to risks including, but not limited to, management risk, market and economic risk, risks affecting specific issuers, liquidity risk, the risks associated with investments in smaller companies and non-U.S. issuers, credit risk, and interest rate risk. Please see the Fund’s prospectus for a discussion of the risks associated with an investment in the Fund.
Subsequent Events: Fund management believes no events have occurred between September 30, 2011 and the date of issuance of the financial statements, which require adjustment to, or disclosure in the accompanying financial statements.
28 Certified Annual Report
This page intentionally left blank.
Certified Annual Report 29
Thornburg International Growth Fund
| PER SHARE PERFORMANCE (for a share outstanding throughout the Year)+ | RATIOS TO AVERAGE NET ASSETS | SUPPLEMENTAL DATA | ||||||||||||||||||||||||||||||||||||||||||||||||||||||||||
Unless | Net Asset Value Beginning of Year | Net Invest- ment Income (Loss) | Net Realized & Unrealized Gain (Loss) on Investments | Total from Investment Operations | Dividends from Net Investment Income | Dividends from Net Realized Gains | Total Divid- ends | Net Asset Value End of Year | Net Investment Income (Loss) (%) | Expenses, After Expense Reductions (%) | Expenses, After Expense Reductions and Net of Custody Credits (%) | Expenses, Before Expense Reductions (%) | Total Return (%)(a) | Portfolio Turnover Rate (%) | Net Assets at End of Year (Thousands) | |||||||||||||||||||||||||||||||||||||||||||||
Class A Shares |
| |||||||||||||||||||||||||||||||||||||||||||||||||||||||||||
2011(b) | $ | 12.25 | 0.03 | 1.13 | 1.16 | (0.04 | ) | — | (0.04 | ) | $ | 13.37 | 0.19 | 1.51 | 1.50 | 1.54 | 9.43 | 142.59 | $ | 104,918 | ||||||||||||||||||||||||||||||||||||||||
2010(b) | $ | 10.36 | — | (c) | 1.94 | 1.94 | (0.05 | ) | — | (0.05 | ) | $ | 12.25 | (0.02 | ) | 1.61 | 1.60 | 1.70 | 18.82 | 128.86 | $ | 36,527 | ||||||||||||||||||||||||||||||||||||||
2009(b) | $ | 10.35 | 0.04 | 0.10 | 0.14 | (0.13 | ) | — | (0.13 | ) | $ | 10.36 | 0.52 | 1.62 | 1.61 | 1.95 | 1.89 | 103.57 | $ | 24,015 | ||||||||||||||||||||||||||||||||||||||||
2008(b) | $ | 14.92 | 0.07 | (4.27 | ) | (4.20 | ) | — | (0.37 | ) | (0.37 | ) | $ | 10.35 | 0.53 | 1.56 | 1.55 | 1.63 | (28.98 | ) | 54.31 | $ | 28,414 | |||||||||||||||||||||||||||||||||||||
2007(b)(d) | $ | 11.94 | (0.03 | ) | 3.01 | 2.98 | — | — | — | $ | 14.92 | (0.29 | )(e) | 1.64 | (e) | 1.62 | (e) | 2.10 | (e) | 24.96 | 113.34 | $ | 25,145 | |||||||||||||||||||||||||||||||||||||
Class C Shares |
| |||||||||||||||||||||||||||||||||||||||||||||||||||||||||||
2011 | $ | 12.18 | (0.11 | ) | 1.16 | 1.05 | — | — | — | $ | 13.23 | (0.77 | ) | 2.30 | 2.30 | 2.34 | 8.62 | 142.59 | $ | 35,706 | ||||||||||||||||||||||||||||||||||||||||
2010 | $ | 10.33 | (0.09 | ) | 1.94 | 1.85 | — | — | — | $ | 12.18 | (0.81 | ) | 2.38 | 2.38 | 2.51 | 17.91 | 128.86 | $ | 24,829 | ||||||||||||||||||||||||||||||||||||||||
2009 | $ | 10.22 | (0.02 | ) | 0.18 | 0.16 | (0.05 | ) | — | (0.05 | ) | $ | 10.33 | (0.21 | ) | 2.37 | 2.37 | 2.72 | 1.76 | 103.57 | $ | 19,233 | ||||||||||||||||||||||||||||||||||||||
2008 | $ | 14.85 | (0.03 | ) | (4.23 | ) | (4.26 | ) | — | (0.37 | ) | (0.37 | ) | $ | 10.22 | (0.23 | ) | 2.32 | 2.32 | 2.45 | (29.53 | ) | 54.31 | $ | 23,638 | |||||||||||||||||||||||||||||||||||
2007(d) | $ | 11.94 | (0.10 | ) | 3.01 | 2.91 | — | — | — | $ | 14.85 | (1.13 | )(e) | 2.39 | (e) | 2.38 | (e) | 3.23 | (e) | 24.37 | 113.34 | $ | 12,376 | |||||||||||||||||||||||||||||||||||||
Class I Shares |
| |||||||||||||||||||||||||||||||||||||||||||||||||||||||||||
2011 | $ | 12.38 | 0.10 | 1.14 | 1.24 | (0.07 | ) | — | (0.07 | ) | $ | 13.55 | 0.66 | 0.99 | 0.98 | 1.16 | 10.03 | 142.59 | $ | 75,538 | ||||||||||||||||||||||||||||||||||||||||
2010 | $ | 10.44 | 0.07 | 1.96 | 2.03 | (0.09 | ) | — | (0.09 | ) | $ | 12.38 | 0.58 | 0.99 | 0.99 | 1.25 | 19.60 | 128.86 | $ | 39,169 | ||||||||||||||||||||||||||||||||||||||||
2009 | $ | 10.46 | 0.10 | 0.08 | 0.18 | (0.20 | ) | — | (0.20 | ) | $ | 10.44 | 1.17 | 0.99 | 0.99 | 1.42 | 2.56 | 103.57 | $ | 24,313 | ||||||||||||||||||||||||||||||||||||||||
2008 | $ | 14.99 | 0.14 | (4.30 | ) | (4.16 | ) | — | (0.37 | ) | (0.37 | ) | $ | 10.46 | 1.03 | 1.00 | 0.99 | 1.25 | (28.57 | ) | 54.31 | $ | 28,164 | |||||||||||||||||||||||||||||||||||||
2007(d) | $ | 11.94 | 0.05 | 3.00 | 3.05 | — | — | — | $ | 14.99 | 0.52 | (e) | 1.01 | (e) | 0.99 | (e) | 1.64 | (e) | 25.54 | 113.34 | $ | 27,659 | ||||||||||||||||||||||||||||||||||||||
Class R3 Shares |
| |||||||||||||||||||||||||||||||||||||||||||||||||||||||||||
2011 | $ | 12.22 | 0.01 | 1.15 | 1.16 | (0.04 | ) | — | (0.04 | ) | $ | 13.34 | 0.06 | 1.50 | 1.49 | 3.27 | 9.46 | 142.59 | $ | 1,925 | ||||||||||||||||||||||||||||||||||||||||
2010 | $ | 10.33 | 0.01 | 1.94 | 1.95 | (0.06 | ) | — | (0.06 | ) | $ | 12.22 | 0.07 | 1.50 | 1.50 | 4.34 | 18.98 | 128.86 | $ | 1,094 | ||||||||||||||||||||||||||||||||||||||||
2009 | $ | 10.36 | 0.08 | 0.06 | 0.14 | (0.17 | ) | — | (0.17 | ) | $ | 10.33 | 0.94 | 1.46 | 1.46 | 6.14 | (f) | 2.09 | 103.57 | $ | 748 | |||||||||||||||||||||||||||||||||||||||
2008(g) | $ | 13.94 | 0.09 | (3.67 | ) | (3.58 | ) | — | — | — | $ | 10.36 | 1.08 | (e) | 1.50 | (e) | 1.49 | (e) | 26.47 | (e)(f) | (25.68 | ) | 54.31 | $ | 113 | |||||||||||||||||||||||||||||||||||
Class R4 Shares |
| |||||||||||||||||||||||||||||||||||||||||||||||||||||||||||
2011 | $ | 12.18 | 0.07 | 1.10 | 1.17 | (0.04 | ) | — | (0.04 | ) | $ | 13.31 | 0.46 | 1.40 | 1.40 | 32.23 | (f) | 9.62 | 142.59 | $ | 146 | |||||||||||||||||||||||||||||||||||||||
2010 | $ | 10.29 | 0.02 | 1.94 | 1.96 | (0.07 | ) | — | (0.07 | ) | $ | 12.18 | 0.15 | 1.42 | 1.40 | 738.92 | (f) | 19.11 | 128.86 | $ | 3 | |||||||||||||||||||||||||||||||||||||||
2009 | $ | 10.36 | 0.07 | 0.06 | 0.13 | (0.20 | ) | — | (0.20 | ) | $ | 10.29 | 0.82 | 1.40 | 1.40 | 980.09 | (f) | 2.10 | 103.57 | $ | 2 | |||||||||||||||||||||||||||||||||||||||
2008(g) | $ | 13.94 | 0.10 | (3.68 | ) | (3.58 | ) | — | — | — | $ | 10.36 | 1.16 | (e) | 1.40 | (e) | 1.40 | (e) | 861.94 | (e)(f) | (25.68 | ) | 54.31 | $ | 2 | |||||||||||||||||||||||||||||||||||
Class R5 Shares |
| |||||||||||||||||||||||||||||||||||||||||||||||||||||||||||
2011 | $ | 12.40 | 0.08 | 1.17 | 1.25 | (0.07 | ) | — | (0.07 | ) | $ | 13.58 | 0.55 | 0.99 | 0.99 | 10.60 | (f) | 10.09 | 142.59 | $ | 393 | |||||||||||||||||||||||||||||||||||||||
2010 | $ | 10.46 | (0.09 | ) | 2.12 | 2.03 | (0.09 | ) | — | (0.09 | ) | $ | 12.40 | (0.83 | ) | 0.99 | 0.99 | 17.58 | (f) | 19.56 | 128.86 | $ | 171 | |||||||||||||||||||||||||||||||||||||
2009 | $ | 10.46 | 0.08 | 0.11 | 0.19 | (0.19 | ) | — | (0.19 | ) | $ | 10.46 | 0.92 | 0.97 | 0.97 | 522.27 | (f) | 2.53 | 103.57 | $ | 9 | |||||||||||||||||||||||||||||||||||||||
2008(g) | $ | 14.03 | 0.14 | (3.71 | ) | (3.57 | ) | — | — | — | $ | 10.46 | 1.57 | (e) | 0.96 | (e) | 0.95 | (e) | 851.43 | (e)(f) | (25.45 | ) | 54.31 | $ | 2 | |||||||||||||||||||||||||||||||||||
| (a) | Not annualized for periods less than one year. |
| (b) | Sales loads are not reflected in computing total return. |
| (c) | Net investment income (loss) was less than $0.01 per share. |
| (d) | Fund commenced operations on February 1, 2007. |
| (e) | Annualized. |
| (f) | Due to the size of net assets and fixed expenses, ratios may appear disproportionate. |
| (g) | Effective date of this class of shares was February 1, 2008. |
| + | Based on weighted average shares outstanding. |
See notes to financial statements.
| 30 Certified Annual Report | Certified Annual Report 31 |
REPORT OF INDEPENDENT REGISTERED PUBLIC ACCOUNTING FIRM
Thornburg International Growth Fund
To the Trustees and Shareholders of
Thornburg International Growth Fund
In our opinion, the accompanying statement of assets and liabilities, including the schedule of investments, and the related statements of operations and of changes in net assets and the financial highlights present fairly, in all material respects, the financial position of Thornburg International Growth Fund (one of the portfolios constituting Thornburg Investment Trust, hereafter referred to as the “Fund”) at September 30, 2011, the results of its operations for the year then ended, the changes in its net assets for each of the two years in the period then ended and the financial highlights for each of the periods presented, in conformity with accounting principles generally accepted in the United States of America. These financial statements and financial highlights (hereafter referred to as “financial statements”) are the responsibility of the Fund’s management. Our responsibility is to express an opinion on these financial statements based on our audits. We conducted our audits of these financial statements in accordance with the standards of the Public Company Accounting Oversight Board (United States). Those standards require that we plan and perform the audit to obtain reasonable assurance about whether the financial statements are free of material misstatement. An audit includes examining, on a test basis, evidence supporting the amounts and disclosures in the financial statements, assessing the accounting principles used and significant estimates made by management, and evaluating the overall financial statement presentation. We believe that our audits, which included confirmation of securities at September 30, 2011 by correspondence with the custodian and brokers, provide a reasonable basis for our opinion.
PricewaterhouseCoopers LLP
New York, New York
November 21, 2011
32 Certified Annual Report
| EXPENSE EXAMPLE | ||
| Thornburg International Growth Fund | September 30, 2011 (Unaudited) | |
As a shareholder of the Fund, you incur two types of costs:
| (1) | transaction costs, including |
(a) sales charges (loads) on purchase payments for Class A shares;
(b) a deferred sales charge on redemptions of any part or all of a purchase of $1 million of Class A shares within 12 months of purchase;
(c) a deferred sales charge on redemptions of Class C shares within 12 months of purchase;
(d) a 30-day redemption fee on Class A and Class I shares;
| (2) | ongoing costs, including management fees; distribution and/or service (12b-1) fees; and other Fund expenses. |
This example is intended to help you understand your ongoing costs (in dollars) of investing in the Fund and to compare these costs with the ongoing costs of investing in other mutual funds.
The example is based on a $1,000 investment beginning on April 1, 2011, and held until September 30, 2011.
ACTUAL EXPENSES
For each class of shares, the first line of the table at right provides information about actual account values and actual expenses. You may use the information in this line, together with the amount you invested, to estimate the expenses that you paid over the period. Simply divide your account value by $1,000 (for example, an $8,600 account value divided by $1,000 = 8.6), then multiply the result by the number in the first line for your class of shares under the heading entitled “Expenses Paid During Period” to estimate the expenses you paid on your account during this period.
HYPOTHETICAL EXAMPLE FOR COMPARISON PURPOSES
For each class of shares, the second line of the table at right provides information about hypothetical account values and hypothetical expenses based on the Fund’s actual expense ratio and an assumed rate of return of 5% per year before expenses, which is not the Fund’s actual return. The hypothetical account values and expenses may not be used to estimate the actual ending account balance or expenses you paid for the period. You may use this information to compare the ongoing costs of investing in the Fund and other funds. To do so, compare this 5% hypothetical example with the 5% hypothetical examples that appear in the shareholder reports of the other funds.
| Beginning Account Value 4/1/11 | Ending Account Value 9/30/11 | Expenses Paid During Period† 4/1/11–9/30/11 | ||||||||||
Class A Shares | ||||||||||||
Actual | $ | 1,000.00 | $ | 931.10 | $ | 7.26 | ||||||
Hypothetical* | $ | 1,000.00 | $ | 1,017.55 | $ | 7.59 | ||||||
Class C Shares | ||||||||||||
Actual | $ | 1,000.00 | $ | 927.80 | $ | 11.06 | ||||||
Hypothetical* | $ | 1,000.00 | $ | 1,013.59 | $ | 11.55 | ||||||
Class I Shares | ||||||||||||
Actual | $ | 1,000.00 | $ | 933.80 | $ | 4.75 | ||||||
Hypothetical* | $ | 1,000.00 | $ | 1,020.15 | $ | 4.97 | ||||||
Class R3 Shares | ||||||||||||
Actual | $ | 1,000.00 | $ | 931.60 | $ | 7.22 | ||||||
Hypothetical* | $ | 1,000.00 | $ | 1,017.59 | $ | 7.54 | ||||||
Class R4 Shares | ||||||||||||
Actual | $ | 1,000.00 | $ | 932.70 | $ | 6.79 | ||||||
Hypothetical* | $ | 1,000.00 | $ | 1,018.04 | $ | 7.09 | ||||||
Class R5 Shares | ||||||||||||
Actual | $ | 1,000.00 | $ | 934.00 | $ | 4.80 | ||||||
Hypothetical* | $ | 1,000.00 | $ | 1,020.11 | $ | 5.01 | ||||||
| † | Expenses are equal to the annualized expense ratio for each class (A: 1.50%; C: 2.29%; I: 0.98%; R3: 1.49%; R4: 1.40%; R5: 0.99%) multiplied by the average account value over the period, multiplied by 183/365 to reflect the one-half year period. |
| * | Hypothetical assumes a rate of return of 5% per year before expenses. |
Please note that the expenses shown in the table are meant to highlight your ongoing costs only and do not reflect any transactional costs, such as sales charges (loads), redemption fees, or exchange fees. Therefore, the second line of the table for each class of shares is useful in comparing ongoing costs only, and will not help you determine the relative total costs of owning different funds. In addition, if these transactional costs were included, your costs would have been higher.
Certified Annual Report 33
| INDEX COMPARISON | ||
| Thornburg International Growth Fund | September 30, 2011 (Unaudited) | |
GROWTH OF A HYPOTHETICAL $10,000 INVESTMENT
Thornburg International Growth Fund versus MSCI AC World ex-U.S. Growth Index
(February 1, 2007 to September 30, 2011)
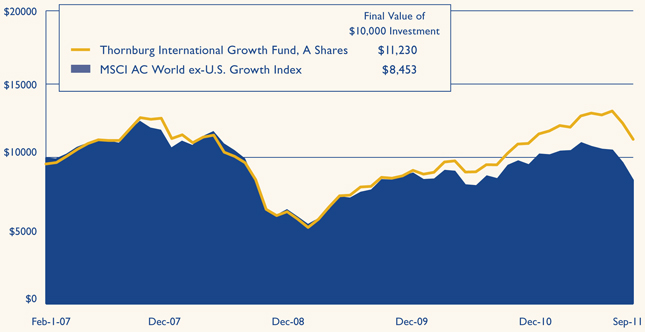
AVERAGE ANNUAL TOTAL RETURNS
For periods ended September 30, 2011 (with sales charge)
| 1 Yr | 3 Yrs | Since Inception | ||||||||||
A Shares (Incep: 2/1/07) | 4.48 | % | 8.15 | % | 2.52 | % | ||||||
C Shares (Incep: 2/1/07) | 7.62 | % | 9.23 | % | 2.90 | % | ||||||
I Shares (Incep: 2/1/07) | 10.03 | % | 10.51 | % | 4.18 | % | ||||||
R3 Shares (Incep: 2/1/08) | 9.46 | % | 9.96 | % | -0.33 | % | ||||||
R4 Shares (Incep: 2/1/08) | 9.62 | % | 10.06 | % | -0.25 | % | ||||||
R5 Shares (Incep: 2/1/08) | 10.09 | % | 10.51 | % | 0.17 | % | ||||||
MSCI AC World ex-U.S. Growth Index (Since 2/1/07) | -10.88 | % | 0.47 | % | -3.54 | % | ||||||
Performance data shown represents past performance and is no guarantee of future results. Investment return and principal value will fluctuate so shares, when redeemed, may be worth more or less than their original cost. Current performance may be lower or higher than quoted. For performance current to the most recent month end, visit thornburg.com or call 800.847.0200. The performance data and graph do not reflect the deduction of taxes that a shareholder would pay on distributions or the redemption of Fund shares. Returns reflect the reinvestment of dividends and capital gains as well as applicable sales charges. Class A shares are sold with a maximum sales charge of 4.50%. Class C shares are subject to a 1% CDSC for the first year only. There is no up-front sales charge for Class I, R3, R4 and R5 shares. Class A and I shares are subject to a 1% 30-day redemption fee.
34 Certified Annual Report
| TRUSTEES AND OFFICERS | ||
| Thornburg International Growth Fund | September 30, 2011 (Unaudited) | |
Name, Age, Position Held with Fund Year Elected | Principal Occupation(s) During Past Five Years | Other Directorships Held by Trustee | ||
INTERESTED TRUSTEES(1)(2)(4) | ||||
Garrett Thornburg, 65 Chairman of Trustees, Trustee since 1987(3) | Chairman and controlling shareholder and, until 2008, CEO of Thornburg Investment Management, Inc. (investment advisor); Chairman, CEO, and controlling shareholder of Thornburg Securities Corporation (securities dealer); CEO until 2007 and Chairman until 2009 of TMST, Inc. (f/k/a Thornburg Mortgage, Inc.) (real estate investment trust); President and Sole Director of Thornburg Mortgage Advisory Corporation (investment manager to TMST, Inc.). | None | ||
Brian J. McMahon, 55 Trustee since 2001, Member of Governance & Nominating Committee & Operations Risk Oversight Committee, President since 1997(5)(6) | CEO since 2008, President, Managing Director, Chief Investment Officer, and Portfolio Manager of Thornburg Investment Management, Inc. | None | ||
INDEPENDENT TRUSTEES(1)(2)(4) | ||||
David A. Ater, 66 Trustee since 1994, Member of Audit Committee & Governance & Nominating Committee | Principal in Ater & Associates, Santa Fe, NM (developer, planner and broker of residential and commercial real estate); owner, developer and broker for various real estate projects. | None | ||
David D. Chase, 70 Trustee since 2000, Chairman of Audit Committee | Managing Member of Vestor Associates, LLC, Santa Fe, NM (private equity fund); Managing Member of CS Group, LLC, Santa Fe, NM (merchant bank). | None | ||
Eliot R. Cutler, 65 Trustee since 2004 & Nominating Committee, Chairman of Governance | Senior Counsel and, until 2009, Partner in Akin, Gump, Strauss, Hauer & Feld LLP (law firm) in Washington, D.C. and Beijing, China. | None | ||
Susan H. Dubin, 62 Trustee since 2004, Member of Audit Committee | President of Dubin Investments, Ltd., Greenwich, CT (private investment fund); Director and officer of various charitable organizations. | None | ||
Owen D. Van Essen, 57 Trustee since 2004, Member of Governance & Nominating Committee & Chairman of Operations Risk Oversight Committee | President of Dirks, Van Essen & Murray, Santa Fe, NM (newspaper mergers and acquisitions). | None | ||
Certified Annual Report 35
| TRUSTEES AND OFFICERS, CONTINUED | ||
| Thornburg International Growth Fund | September 30, 2011 (Unaudited) | |
Name, Age, Position Held with Fund Year Elected | Principal Occupation(s) During Past Five Years | Other Directorships Held by Trustee | ||
James W. Weyhrauch, 52 Trustee since 1996, Member of Audit Committee & Operations Risk Oversight Committee | Real estate broker, Santa Fe Properties, Santa Fe, NM; Vice Chairman of Nambe LLC, Santa Fe, NM (manufacturing & design company). | None | ||
OFFICERS OF THE FUND (WHO ARE NOT TRUSTEES)(1)(6)(7) | ||||
| George T. Strickland, 48 Vice President since 1996, Treasurer since 2007(6) | Portfolio Manager, Vice President, and Managing Director of Thornburg Investment Management, Inc. | Not applicable | ||
William V. Fries, 72 Vice President since 1995 | Portfolio Manager, Vice President, and Managing Director of Thornburg Investment Management, Inc. | Not applicable | ||
Leigh Moiola, 44 Vice President since 2001 | Vice President, Managing Director, and Director of Marketing of Thornburg Investment Management, Inc. | Not applicable | ||
Alexander Motola, 41 Vice President since 2001 | Portfolio Manager, Vice President, and Managing Director of Thornburg Investment Management, Inc. | Not applicable | ||
Wendy Trevisani, 40 Vice President since 1999 | Portfolio Manager and Managing Director of Thornburg Investment Management, Inc. | Not applicable | ||
Joshua Gonze, 48 Vice President since 1999 | Portfolio Manager since 2007, Managing Director, and Associate Portfolio Manager until 2007 of Thornburg Investment Management, Inc. | Not applicable | ||
Christopher Ihlefeld, 41 Vice President since 2003 | Portfolio Manager since 2007, Managing Director, and Associate Portfolio Manager until 2007 of Thornburg Investment Management, Inc. | Not applicable | ||
Leon Sandersfeld, 45 Vice President since 2003 | Managing Director since 2007 and Fund Accounting Director of Thornburg Investment Management, Inc. | Not applicable | ||
Sasha Wilcoxon, 37 Vice President since 2003 Secretary since 2007(6) | Managing Director since 2007, Director of Operations, and Vice President of Thornburg Investment Management, Inc. | Not applicable | ||
Edward Maran, 53 Vice President since 2004 | Portfolio Manager and Managing Director of Thornburg Investment Management, Inc. | Not applicable | ||
Vinson Walden, 41 Vice President since 2004 | Portfolio Manager and Managing Director of Thornburg Investment Management, Inc. | Not applicable | ||
Thomas Garcia, 40 Vice President since 2006 | Vice President since 2011, Managing Director, Head Equity Trader, and Associate Portfolio Manager of Thornburg Investment Management, Inc. | Not applicable | ||
Lei Wang, 40 Vice President since 2006 | Portfolio Manager and Managing Director of Thornburg Investment Management, Inc. | Not applicable | ||
36 Certified Annual Report
| TRUSTEES AND OFFICERS, CONTINUED | ||
| Thornburg International Growth Fund | September 30, 2011 (Unaudited) | |
Name, Age, Position Held with Fund Year Elected | Principal Occupation(s) During Past Five Years | Other Directorships Held by Trustee | ||
Connor Browne, 32 Vice President since 2006 | Portfolio Manager and Managing Director of Thornburg Investment Management, Inc. | Not applicable | ||
Jason Brady, 37 Vice President since 2007 | Vice President since 2011, Portfolio Manager since 2007, Managing Director since 2007, and Associate Portfolio Manager 2006–2007 of Thornburg Investment Management, Inc. | Not applicable | ||
Lewis Kaufman, 35 Vice President since 2007 | Portfolio Manager since 2007, Managing Director since 2007, and Associate Portfolio Manager until 2009 of Thornburg Investment Management, Inc. | Not applicable | ||
Christopher Ryon, 55 Vice President since 2008 | Portfolio Manager since 2009, Managing Director since 2009, and Associate Portfolio Manager 2008–2009 of Thornburg Investment Management, Inc.; Principal of Vanguard Funds until 2008. | Not applicable | ||
Lon Erickson, 36 Vice President since 2008 | Portfolio Manager since 2010, Managing Director since 2010, and Associate Portfolio Manager 2008–2010 of Thornburg Investment Management, Inc.; Senior Analyst of State Farm Insurance until 2008. | Not applicable | ||
Kathleen Brady, 51 Vice President since 2008 | Senior Tax Accountant since 2007 of Thornburg Investment Management, Inc.; Chief Financial Officer of Vestor Partners, LP (private equity fund) until 2007. | Not applicable | ||
Jack Gardner, 57 Vice President since 2008 | Managing Director since 2007 of Thornburg Investment Management, Inc.; President since 2008 and National Sales Director of Thornburg Securities Corporation. | Not applicable | ||
Laura Hillstrom, 44 Vice President since 2009 | Chief Administrative Officer since 2009, Vice President and Managing Director, and Director of Information Systems until 2009 of Thornburg Investment Management, Inc. | Not applicable | ||
| (1) | Each person’s address is 2300 North Ridgetop Road, Santa Fe, New Mexico 87506. |
| (2) | The Fund is one of sixteen separate investment “Funds” or “series” of Thornburg Investment Trust (the “Trust”), which comprises the Thornburg mutual fund complex and is organized as a Massachusetts business trust. Thornburg Investment Management, Inc. is the investment advisor to, and manages, the sixteen Funds of the Trust. Each Trustee oversees the sixteen Funds of the Trust. |
| (3) | Mr. Thornburg is considered an “interested” Trustee under the Investment Company Act of 1940 because he is the sole director and controlling shareholder of Thornburg Investment Management, Inc., the investment advisor to the sixteen active Funds of the Trust, and is the sole director and controlling shareholder of Thornburg Securities Corporation, the distributor of shares for the Trust. |
| (4) | Each Trustee serves in office until the election and qualification of a successor. |
| (5) | Mr. McMahon is considered an “interested” Trustee because he is the chief executive officer and president of Thornburg Investment Management, Inc. |
| (6) | The Trust’s president, secretary, and treasurer each serves a one-year term or until the election and qualification of a successor; each other officer serves at the pleasure of the Trustees. |
| (7) | Assistant vice presidents, assistant secretaries and assistant treasurers are not shown. |
The Statement of Additional Information for each Fund of the Trust includes additional information about the Trustees and is available, without charge and upon request, by calling 1-800-847-0200.
Certified Annual Report 37
| OTHER INFORMATION | ||
| Thornburg International Growth Fund | September 30, 2011 (Unaudited) | |
PORTFOLIO PROXY VOTING
Policies and Procedures:
The Trust has delegated to Thornburg Investment Management, Inc. (the “Advisor”) voting decisions respecting proxies for the Fund’s voting securities. The Advisor makes voting decisions in accordance with its Proxy Voting Policy. A description of the Policy is available (i) without charge, upon request, by calling the Advisor toll-free at 1-800-847-0200, (ii) on the Thornburg website at www.thornburg. com, and (iii) on the Securities and Exchange Commission’s website at www.sec.gov.
Information regarding how proxies were voted is available on or before August 31 of each year for the twelve months ending the preceding June 30. This information is available (i) without charge, upon request by calling the Advisor toll-free at 1-800-847-0200, (ii) on the Thornburg website at www.thornburg.com, and (iii) on the Securities and Exchange Commission’s website at www.sec.gov.
TAX INFORMATION
For the tax year ended September 30, 2011, the Thornburg International Growth Fund designates 100.00% (or the maximum allowed) of the dividends paid from tax basis net ordinary income as qualifying for the reduced rate under the Jobs and Growth Tax Relief and Reconciliation Act of 2003.
5.09% (or the maximum allowed) of the ordinary income distributions paid by the Fund for the tax year ended September 30, 2011, qualified for the corporate dividends received deduction.
For the year ended September 30, 2011, foreign source income and foreign taxes paid are $2,662,397 and $147,740, respectively.
The information and distributions reported herein may differ from the information and distributions reported to the shareholders for the calendar year ending December 31, 2011. Complete information will be reported in conjunction with your 2011 Form 1099-DIV.
AVAILABILITY OF QUARTERLY PORTFOLIO SCHEDULE
The Fund files with the Securities and Exchange Commission schedules of its portfolio holdings on Form N-Q for the first and third quarters of each fiscal year. The Fund’s Forms N-Q are available on the Commission’s website at www.sec.gov, or may be reviewed and copied at the Commission’s Public Reference Room in Washington, D.C. Information on the operation of the Public Reference Room may be obtained by calling 1-800-SEC-0330. The Fund also makes this information available on its website at www.thornburg.com/ download or upon request by calling 1-800-847-0200.
STATEMENT RESPECTING RENEWAL OF INVESTMENT ADVISORY AGREEMENT
Thornburg Investment Management, Inc. (the “Advisor”) provides investment management services to Thornburg International Growth Fund pursuant to an investment advisory agreement. The Trustees consider the renewal of this agreement annually, and most recently determined to renew the agreement on September 13, 2011.
In anticipation of their recent consideration of the advisory agreement’s renewal, the independent Trustees met in May 2011 to plan the Trustees’ evaluation of the Advisor’s performance and to specify the information the Advisor would present to the Trustees for their review. The Advisor’s chief investment officer subsequently reviewed portions of the specified information with the Trustees and addressed questions presented by the Trustees at a meeting session scheduled for that purpose, and the independent Trustees thereafter met in independent session to consider the Advisor’s presentation and various specific issues respecting their consideration of the advisory agreement’s renewal. Following these sessions, the Trustees met to consider a renewal of the agreement, and the independent Trustees unanimously voted at that meeting to renew the agreement for an additional term of one year.
The information below summarizes certain factors considered by the Trustees in connection with the determination to renew the advisory agreement. In determining to renew the agreement, the Trustees did not identify any single factor as controlling, and this summary does not describe all of the matters considered by the Trustees in making their determination.
Quality of Services; Fund Investment Performance. The Trustees evaluated the nature, extent and quality of services provided by the Advisor under the advisory agreement, and evaluated the investment performance of the Fund.
38 Certified Annual Report
| OTHER INFORMATION, CONTINUED | ||
| Thornburg International Growth Fund | September 30, 2011 (Unaudited) | |
In connection with their general supervision of the Advisor, and as an important element of their annual consideration of a renewal of the advisory agreement, the Trustees received and considered reports from the Advisor throughout the year. These reports addressed a wide variety of topics, including particularly the Advisor’s selection of investments and execution of the Fund’s investment strategies. In addition, the Trustees considered information provided to them at their request in anticipation of their annual evaluation of the Advisor’s services, including (i) the Fund’s absolute investment performance and achievement of stated objectives, (ii) the Advisor’s commentary on the Fund’s performance in the context of the Fund’s objectives and reasonable expectations, and business, market and economic conditions, (iii) measures of the Fund’s investment returns over different periods of time relative to a category of mutual funds selected by an independent mutual fund analyst firm that invest primarily in foreign growth stocks, and relative to a broad-based securities index, (iv) the Fund’s cumulative investment return since inception relative to the securities index, and (v) comparative measures of estimated earnings growth, portfolio volatility, risk and return.
The Trustees also considered their perceptions of portfolio management personnel developed in formal and informal meetings throughout the year, the Advisor's staffing and other resources, trade execution, the Advisor's performance of accounting and other services, the Advisor's observance of compliance and regulatory requirements, the Advisor's responsiveness to the Trustees, and other factors.
In evaluating quantitative and performance data presented, the Trustees noted (among other aspects of the data) comparative performance data for the three calendar years since the Fund’s inception, which showed that the Fund’s investment return in calendar year 2008 was lower than the average return for the index and the return of the foreign growth fund category, but that the Fund’s return was higher than the return of the index and the average return of the fund category for calendar years 2009 and 2010. Other noted quantitative data showed that the Fund’s investment returns fell within the highest decile of performance for the fund category for the three-month, year-to-date, one-year and three-year periods ended with the second quarter of the current year. The Trustees also noted the Fund’s higher cumulative return (net of expenses) relative to the its benchmark index.
The Trustees concluded, based upon these and other considerations, that the nature, extent and quality of the Advisor’s services were sufficient and that the Advisor had satisfactorily pursued the Fund’s stated investment objective. The Trustees further concluded that the investment performance of the Fund was satisfactory in the context of the Fund’s objectives and policies, and prevailing market conditions.
Fees and Expenses; Profitability of Advisor; Economies of Scale; Ancillary Benefits to Advisor. The Trustees evaluated the level of the management fee charged by the Advisor to the Fund, and in this connection, reviewed the profitability of the Advisor, economies of scale potentially available to the Fund and whether the Advisor received any ancillary benefits from its relationship with the Fund.
In evaluating the level of the management fee, the Trustees considered the fee charged by the Advisor and the other expenses charged to the Fund in light of the nature and quality of services provided, comparison of the actual Advisor’s fee and Fund expenses to the statement of fees and expenses in the Fund’s prospectuses, the Advisor's waiver of a portion of its management fee, and comparisons of the Advisor’s fee and other Fund expenses to median and average fees and expenses charged to two groups of foreign equity mutual funds assembled by independent mutual fund analyst firms. Comparative fee and expense data noted by the Trustees showed that the management fee charged to the Fund (net of fee waivers by the Advisor) was slightly higher than the median and average fee levels for the first mutual fund group and comparable to the median and average fee levels for the second group, and that the overall expense ratio of the Fund was slightly higher than the median expense ratios for the two groups and comparable to the average ratios for the two groups. The Trustees did not identify the differences as significant. The Trustees considered information about the fees charged by the Advisor to other investment management clients, together with information about fees charged by other advisors to different clients, and analysis of the differences between the requirements of institutional clients and mutual funds and the consequently different investment management services rendered, respectively, to institutional clients and mutual funds. The Trustees confirmed their previous observations that the differences between the fees charged by the Advisor to different types of clients did not appear exceptional, and that the fee rates charged by investment advisors to institutional clients had limited relevance to the evaluation of fee rates charged to mutual funds, because of the significant differences between the respective requirements of institutional clients and mutual funds, the differences between the respective services rendered to institutional clients and mutual funds, and the different circumstances in which the respective fees originate.
In reviewing the profitability of the Advisor, the Trustees considered costs incurred by the Advisor and data comparing the profitability of the Advisor to other investment management firms. The information provided did not indicate that the Advisor’s profitability was unusual, and the Trustees noted the adequacy of the Advisor’s resources and service capabilities. In reviewing the extent to which economies of scale would be realized by the Fund as it grows and whether fee levels reflect economies of scale, the Trustees
Certified Annual Report 39
| OTHER INFORMATION, CONTINUED | ||
| Thornburg International Growth Fund | September 30, 2011 (Unaudited) | |
considered the breakpoint structure for advisory fees chargeable to the Fund, the demonstrated economies of scale enjoyed by other Funds of the Trust as they had grown in size, and economies of scale realized by other mutual funds. The information provided demonstrated to the Trustees that the Fund may reasonably be expected to realize economies of scale as the Fund increases in size due to the breakpoint fee structure of the advisory agreement and other factors. In reviewing potential benefits to the Advisor because of its relationship to the Fund, the Trustees considered the Advisor's receipt of research services from broker dealers, and the benefits to both the Fund and the Advisor of the Advisor's expansion of its staffing, compliance and systems capabilities and other resources to serve a broader variety of investment management clients. No unusual or unfair benefits to the Advisor from its relationship to the Fund were identified by the Trustees.
The Trustees concluded, based upon their consideration of these and other factors, that the management fee charged to the Fund by the Advisor was fair and reasonable in view of the nature, extent and quality of the services provided by the Advisor, the clear disclosure of fees and expenses in the Fund's prospectuses, the investment performance of the Fund, and comparisons of fees and expenses charged to the Fund to fees and expenses charged to other mutual funds.
40 Certified Annual Report
This page intentionally left blank.
This page is not part of the Annual Report. 41
Trustees’ Statement to Shareholders
Not part of the Certified Annual Report
September 13, 2011
The Trustees believe current and prospective shareholders should know how we discharge our responsibilities in supervising the Funds’ investment advisor and in reviewing the advisor’s contract for renewal. Since 2005, we have issued a statement which sets out clearly the three principal guidelines that we follow in supervising the Trust’s investment advisor on your behalf. In accordance with our customary practice, in September of this year we again reviewed our statement and concluded we should reissue this statement outlining the principal features of our supervision of the advisor’s performance of investment management services for the Funds.
We begin with the premise that each shareholder selected his or her Fund because its investments are managed by the investment advisor identified in the prospectus and in accordance with the objective and policies described in the prospectus. We realize, as each of you do, that if you believe that your Fund’s stated objective and policies no longer serve your personal investment goals, you can sell your shares and leave the Fund.
Therefore, we believe that our primary supervisory task – our principal obligation to you – is to assess the nature and quality of the advisor’s services, and to confirm that the advisor actively and competently pursues the Fund’s objective, in accordance with the policies set out in the prospectus. To do this, we meet regularly with management to review your Fund’s portfolio and to discuss the advisor’s specific actions and judgments in pursuing the Fund’s objective. We do not substitute our own judgment for the advisor’s decisions in selecting investments; the advisor is paid to exercise its informed judgment on investment decisions, and we seek to confirm, in reviewing the advisor’s performance, that the advisor is doing just that.
Second, while we are conscious of costs and the effect that costs have on shareholders’ returns, we do not seek the lowest fees or expense ratio as our sole or primary objective. We try to make sure that your Fund’s fees and costs are reasonable in relationship to the services rendered and that they are generally in line with those charged by other expert investment advisors, consistent with our belief that the Fund’s investors searched for and expect that expertise and attention and have decided to pay a reasonable price for it. We do not put the management contract “out to bid” as a matter of course, and we would not do so unless we had concluded that the advisor materially had failed to pursue the Fund’s objectives in accordance with its policies, or for other equally important reasons. We believe that any other approach would be inconsistent with your interests and contrary to your expectations when you bought shares of the Fund in the first place.
Finally, because we believe that most Thornburg Fund shareholders have invested with a long-term perspective, we try not to focus too much on the fashions of the moment and on short-term performance. The market will not favor any specific investment objective or set of policies at all times and under all economic circumstances. A fund will experience periods of both high and low returns relative to other funds and other investments. Even if one of our Funds is not favored by the market at a particular time, we believe that the advisor is nonetheless obliged to remain true to the Fund’s objective and policies, and we watch to see that it does so.
42 This page is not part of the Annual Report.
Retirement and Education Accounts
Thornburg Investment Management offers retirement and education savings accounts that can help you meet a variety of planning challenges. For account applications or further information on any of the accounts below, please call 1-800-847-0200 or go to www.thornburg.com/ira. Your financial advisor can help you determine which plan is right for you.
Individual Retirement Accounts
Individual Retirement Accounts (IRAs) provide a tax-advantaged means to save money for the future. For a detailed outline of the difference between retirement accounts, see www.thornburg.com/ira. Rollovers are available. Call 1-800-847-0200 for more information.
Traditional IRAs – Contributions to Traditional IRAs are tax deductible for eligible individuals, and withdrawals are taxed as additional ordinary income. You may contribute to an IRA if you receive compensation and are under 70 1/2, even if you are covered by an employer retirement plan. Deductible contributions are subject to certain qualifications. Please consult your tax advisor.
Roth IRAs – Under a Roth IRA, there is no tax deduction for contributions, but there is no income tax on qualified withdrawals. For a more detailed comparison of Traditional and Roth IRAs, please see our web site at www.thornburg.com/ira.
SEP IRAs – Simplified Employee Pension (SEP) IRAs are established by employers. The employer is allowed a tax deduction for contributions made to the SEP Plan and makes contributions to each eligible employee’s SEP IRA on a discretionary basis.
SIMPLE IRAs – Savings Incentive Match Plan for Employees of Small Employers (SIMPLE) is designed to give small business owners a simplified method to establish and contribute to a retirement plan for employees. The employer is allowed a tax deduction for contributions and makes either matching or non-elective contributions to each eligible employee’s SIMPLE IRA. Employees may make salary deferral contributions.
Coverdell Education Savings Account
These savings accounts are designed to provide a way to save money for higher education expenses. In an Education Savings Account, earnings and interest grow tax-free, and qualified withdrawals used to pay for eligible higher-education expenses are tax- and penalty-free.
Funds Available
The following funds are available in the accounts listed above:
| • | Thornburg International Value Fund |
| • | Thornburg Value Fund |
| • | Thornburg Core Growth Fund |
| • | Thornburg Investment Income Builder Fund |
| • | Thornburg Global Opportunities Fund |
| • | Thornburg International Growth Fund |
| • | Thornburg Developing World Fund |
| • | Thornburg Limited Term U.S. Government Fund |
| • | Thornburg Limited Term Income Fund |
| • | Thornburg Strategic Income Fund |
This page is not part of the Annual Report. 43

Thornburg Equity Funds
Thornburg’s equity research uses a fundamental and comprehensive analytical approach. Thornburg equity funds focus on a limited number of securities so that each holding can impact performance. The equity team searches for firms believed to have a promising future and seeks to buy shares of those companies at a discount to their intrinsic value.
| • | Thornburg Value Fund |
| • | Thornburg International Value Fund |
| • | Thornburg Core Growth Fund |
| • | Thornburg Investment Income Builder Fund |
| • | Thornburg Global Opportunities Fund |
| • | Thornburg International Growth Fund |
| • | Thornburg Developing World Fund |
Thornburg Bond Funds
Thornburg Investment Management applies a disciplined philosophy to fixed-income management. Since the launch of our first fixed-income fund over 25 years ago, we have been conducting fundamental, bottom-up research in an effort to identify bonds which we believe provide the best return for a given level of risk. We are very organic in our approach, avoiding leverage or complex strategies which could backfire in periods of market uncertainty.
| • | Thornburg Limited Term Municipal Fund |
| • | Thornburg Intermediate Municipal Fund |
| • | Thornburg California Limited Term Municipal Fund |
| • | Thornburg New Mexico Intermediate Municipal Fund |
| • | Thornburg New York Intermediate Municipal Fund |
| • | Thornburg Strategic Municipal Income Fund |
| • | Thornburg Limited Term U.S. Government Fund |
| • | Thornburg Limited Term Income Fund |
| • | Thornburg Strategic Income Fund |
Before investing, carefully consider the Fund’s investment goals, risks, charges, and expenses. For a prospectus containing this and other information, contact your financial advisor or visit thornburg.com. Read it carefully before investing.
For additional information, please visit www.thornburg.com
Thornburg Investment Management, Inc. 2300 North Ridgetop Road, Santa Fe, NM 87506
This page is not part of the Annual Report. 45
This page intentionally left blank.
46 This page is not part of the Annual Report.
This page intentionally left blank.
This page is not part of the Annual Report. 47
 | Waste not, Wait not |  | ||||
| Get instant access to your shareholder reports. | ||||||
| This Annual Report is submitted for the general information of shareholders of the Fund. It is not authorized for distribution to prospective investors in the Fund unless preceded or accompanied by an effective prospectus. | By switching from your postal mailbox to your email inbox, you reduce paper clutter, improve record keeping access, and help conserve our natural resources. | |||||
 | Investment Advisor: Thornburg Investment Management® 800.847.0200
| Go to www.thornburg.com/edelivery and sign up to receive your shareholder reports, prospectuses, and proxy statements electronically. | ||||
| Distributor: | ||||||
Thornburg Securities Corporation® 800.847.0200 | You invest in the future, without spending a dime. | |||||
| TH1539 | ||||||

Important Information
The information presented on the following pages was current as of September 30, 2011. The managers’ views, portfolio holdings, and sector and country diversification are provided for the general information of the Fund’s shareholders; to the extent this information is historical, it should not be considered predictive of future circumstances. This material should not be deemed a recommendation to buy or sell any of the securities mentioned.
Investments in the Fund carry risks including possible loss of principal. Investing outside the United States involves additional risks, such as currency fluctuations. Additionally, the Fund may invest a portion of the assets in small capitalization companies, which may increase the risk of greater price fluctuations. As with direct bond ownership, funds that invest in bonds are subject to certain risks including interest-rate risk, credit risk, and inflation risk. The principal value of bonds will fluctuate relative to changes in interest rates, decreasing when interest rates rise. Please see the Fund’s Prospectus for a discussion of the risks associated with an investment in the Fund. Investments in the Fund are not deposits or obligations of, or guaranteed or endorsed by, any bank, the Federal Deposit Insurance Corporation, the Federal Reserve Board or any government agency. There is no guarantee that the Fund will meet its investment objectives.
Performance data given at net asset value (NAV) does not take into account the applicable sales charges. If the sales charges had been included, the performance would have been lower.
Class I, R3, R4, and R5 shares may not be available to all investors. Minimum investments for Class I shares may be higher than those for other classes.
Share Class | NASDAQ Symbol | Cusip | ||
Class A | TIBAX | 885-215-558 | ||
Class C | TIBCX | 885-215-541 | ||
Class I | TIBIX | 885-215-467 | ||
Class R3 | TIBRX | 885-215-384 | ||
Class R4 | TIBGX | 885-215-186 | ||
Class R5 | TIBMX | 885-215-236 |
Glossary
Blended Index – The Blended Index is composed of 25% Barclays Capital Aggregate Bond Index and 75% MSCI World Index. The Barclays Capital Aggregate Bond Index is composed of approximately 8,000 publicly traded bonds including U.S. government, mortgage-backed, corporate and Yankee bonds. The index is weighted by the market value of the bonds included in the index. The MSCI World Index is an unmanaged market-weighted index that consists of securities traded in 24 of the world’s most developed countries. Securities are listed on exchanges in the U.S., Europe, Canada, Australia, New Zealand, and the Far East. The index is calculated with net dividends reinvested, in U.S. dollars.
Russell 1000 Index – An index that measures the performance of the large-cap segment of the U.S. equity universe. It is a subset of the Russell 3000 Index and includes approximately 1,000 of the largest securities based on a combination of their market cap and current index membership.
Russell 2000 Index – An index that measures the performance of the small-cap segment of the U.S. equity universe. The Russell 2000 Index is a subset of the Russell 3000 Index including approximately 2,000 of the smallest securities based on a combination of their market cap and current index membership.
S&P 500 Stock Index – An unmanaged index generally representative of the U.S. stock market.
Unless otherwise noted, index returns reflect the reinvestment of income dividends and capital gains, if any, but do not reflect fees, brokerage commissions or other expenses of investing. Investors may not make direct investments into any index. The performance of any index is not indicative of the performance of any particular investment.
Bond Credit Ratings – A bond credit rating assesses the financial ability of a debt issuer to make timely payments of principal and interest. Ratings of AAA (the highest), AA, A, and BBB are investment-grade quality. Ratings of BB, B, CCC, CC, C, and D (the lowest) are considered below investment grade, speculative grade, or junk bonds. Unless otherwise noted, the ratings listed are from Bloomberg Market Data and are a combination of ratings from Standard and Poor’s, Moody’s Investors Service, and Fitch Ratings.
Coupon – The interest rate stated on a bond when it’s issued. The coupon is typically paid semi-annually.
Effective Duration – A bond’s sensitivity to interest rates, incorporating the embedded option features, such as call provisions. Bonds with longer durations experience greater price volatility than bonds with shorter durations.
Indicated Yield – The yield that a share of stock would return based on the most recent dividend payment. Indicated yield is calculated by dividing the indicated dividend by the current share price. It is usually quoted as a percentage.
Median Market Capitalization – Market capitalization (market cap) is the total value of a company’s stock, calculated by multiplying the number of outstanding common shares by the current share price. The company whose market cap is in the middle of the portfolio is the median market cap. Half the companies in the portfolio have values greater than the median, and half have values that are less.
Price to Earnings Ratio (P/E) – A valuation ratio equaling a company’s market value per share divided by earnings per share.
U.S. Treasury Securities – U.S. Treasury securities, such as bills, notes and bonds, are negotiable debt obligations of the U.S. government. These debt obligations are backed by the “full faith and credit” of the government and issued at various schedules and maturities. Income from Treasury securities is exempt from state and local, but not federal income taxes.
This page is not part of the Annual Report. 3
The Dividend Landscape
To appreciate the investment environment in which Thornburg Investment Income Builder Fund operates, you may wish to review these highlights of the “dividend landscape.”
The S&P 500 Index Payout Ratio — A Historical Perspective
The dividend payout ratio is a fraction that expresses dividend payments as a percentage of per-share earnings. As the economy slowed in the recent downturn, earnings-per-share on average declined, causing the payout ratio to climb, even as dividends paid by the S&P 500 portfolio declined by more than ten percent in 2010. Earnings have since materially improved, bringing the payout ratio back in line with the overall recent trend.
S&P 500 Index Payout Ratio
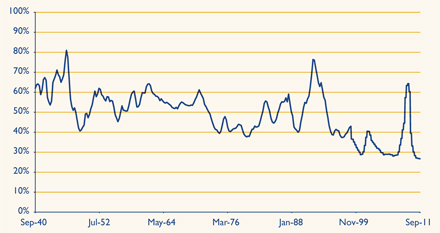
Sources: Standard & Poor’s, beginning in 1999 (uses operating earnings); “Irrational Exuberance” by Robert J. Shiller, through 1998 (uses reported earnings).
Corporate Willingness to Pay Dividends is Key to the Fund’s Investment Process
The Russell 1000 Index includes approximately 1000 public companies that are supposed to be generally representative of corporate America. Between 1980 and 1993, at least 75% of these firms paid some dividend. Between 1994 and 2001, the percentage of Russell 1000 companies paying dividends sank to just over 50%, indicating a preference towards reinvesting retained earnings in growth initiatives. Dividends returned to fashion between 2002 and 2008. A reduction in the number of Russell 1000 firms paying dividends followed the 2008 recession, however, an upward trend may be emerging.
Percentage of Companies Paying Dividends
in Russell 1000 Index
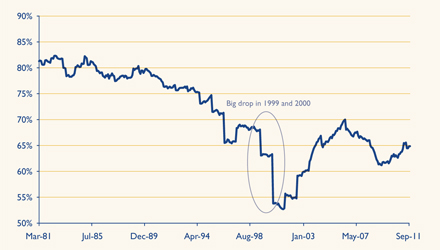
Source: CSFB Quantitative and Equity Derivatives Strategy, Baseline & FactSet.
4 This page is not part of the Annual Report.
Rising Dividend Payments Despite Decreasing Dividend Yields
S&P 500 Index Average Yield vs. Annual Dividends from a
Hypothetical $10,000 Investment (Dividends not Reinvested)

Source: Bloomberg and FactSet.
Over time, the dollar dividend per unit of the S&P 500 Index has generally increased. Because the price of the index itself has increased even more, the yield on the S&P 500 Index, as a percentage of the current index price, has generally decreased in recent decades. You should note, however, that the yield on an original investment made at a fixed point in time (say, 1970 or 1989) has increased, even without reinvestment of dividends.
Hypothetical chart is for illustration purposes only and is not indicative of an investment in any particular security. Investors may not invest directly in an index.
A Truly Diversified Dividend-Paying Portfolio Must Look Beyond the Obvious High-Yield Stocks!
The Top 100 Dividend Yields
| Russell 1000 Index | Russell 2000 Index | |||||||
Financials | 39 | % | 76 | % | ||||
Utilities | 25 | % | 1 | % | ||||
Consumer Discretionary | 6 | % | 2 | % | ||||
Consumer Staples | 6 | % | 2 | % | ||||
Materials | 6 | % | 0 | % | ||||
Telecommunication Services | 5 | % | 3 | % | ||||
Energy | 4 | % | 6 | % | ||||
Health Care | 3 | % | 1 | % | ||||
Industrials | 3 | % | 7 | % | ||||
Information Technology | 3 | % | 2 | % | ||||
Source: FactSet, as of September 30, 2011
In the (large cap) Russell 1000 Index, 64% of the top 100 dividend payers are in the financials and utilities sectors. In the (small cap) Russell 2000 Index, 76% of the top 100 dividend-yielding stocks are financial companies. In order to construct a diversified portfolio of attractive yielding stocks, one must look beyond these two sectors. We do!
Dividend yield is a ratio that shows how much a company pays out in dividends each year relative to its share price.
This page is not part of the Annual Report. 5
The Dividend Landscape, Continued
Global Diversification Can Improve the Portfolio Yield
Since firms outside the U.S. tend to pay higher dividends than U.S. firms, particularly outside the real estate and utility sectors, we maintain the ability to diversify the Thornburg Investment Income Builder Fund into foreign dividend-paying stocks to try to take advantage of these opportunities.
Average Dividend Yields
of Markets Around the Globe
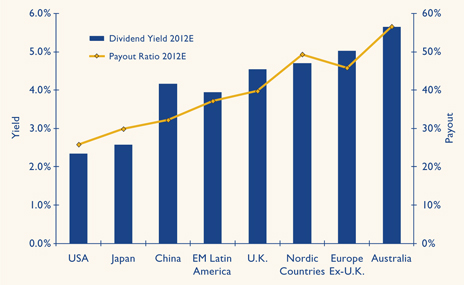
Source: Bloomberg and Thornburg Investment Management, as of September 30, 2011; Includes all stocks in a given country with market capitalizations greater than $500mm USD to eliminate microcap stocks.
6 This page is not part of the Annual Report.
Portfolio Overview
Thornburg Investment Income Builder Fund
MANAGEMENT TEAM

Left to right:
Jason Brady,CFA, and Brian McMahon
IMPORTANT
PERFORMANCE INFORMATION
Performance data shown represents past performance and is no guarantee of future results. Investment return and principal value will fluctuate so shares, when redeemed, may be worth more or less than their original cost. Current performance may be lower or higher than quoted. For performance current to the most recent month end, visit thornburg.com or call 800.847.0200.
The maximum sales charge for Class A shares is 4.50%. Class A shares are subject to a 1% 30-day redemption fee. The total annual fund operating expense of Class A shares is 1.25% , as disclosed in the most recent Prospectus.
We do not expect each sequential quarter’s dividend to increase over that of the prior quarter, since dividend payments outside the United States tend to be seasonal. Rather, the Fund aspires to increase the dividend paid on an annual basis.
QUARTERLY DIVIDEND HISTORY, CLASS A
Year | Q1 | Q2 | Q3 | Q4 | Total | |||||||||||||||
2003 | 9.2 | ¢ | 11.2 | ¢ | 12.4 | ¢ | 17.5 | ¢ | 50.3 | ¢ | ||||||||||
2004 | 10.2 | ¢ | 12.5 | ¢ | 15.0 | ¢ | 21.8 | ¢ | 59.5 | ¢ | ||||||||||
2005 | 11.0 | ¢ | 13.6 | ¢ | 17.4 | ¢ | 29.0 | ¢ | 71.0 | ¢ | ||||||||||
2006 | 12.5 | ¢ | 16.0 | ¢ | 19.2 | ¢ | 33.0 | ¢ | 80.7 | ¢ | ||||||||||
2007 | 14.2 | ¢ | 18.5 | ¢ | 21.5 | ¢ | 36.8 | ¢ | 91.0 | ¢ | ||||||||||
2008 | 17.9 | ¢ | 21.8 | ¢ | 26.0 | ¢ | 36.8 | ¢ | 102.5 | ¢ | ||||||||||
2009 | 18.0 | ¢ | 24.2 | ¢ | 28.0 | ¢ | 34.5 | ¢ | 104.7 | ¢ | ||||||||||
2010 | 19.8 | ¢ | 25.0 | ¢ | 32.0 | ¢ | 36.0 | ¢ | 112.8 | ¢ | ||||||||||
2011 | 21.0 | ¢ | 26.0 | ¢ | 32.0 | ¢ | ||||||||||||||
30-day SEC Yield as of 9/30/11 (A Shares): 5.53%
KEY PORTFOLIO ATTRIBUTES
As of 9/30/11
Equity Statistics | ||||
Portfolio P/E (12-mo. trailing) | 9.3x | |||
Median Market Cap | $ | 11.0 B | ||
Equity & Pref. Equity Holdings | 88 | |||
Fixed Income Statistics
Weighted Average Coupon | 7.9 | % | ||
Average Maturity | 11.02 yrs | |||
Effective Duration | 3.69 yrs | |||
Bond Holdings | 208 | |||
PORTFOLIO COMPOSITION
As of 9/30/11
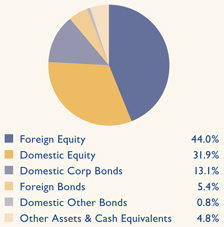
AVERAGE ANNUAL TOTAL RETURNS
FOR PERIODS ENDED 9/30/11
| 1 Yr | 3 Yrs | 5 Yrs | Since Inception | |||||||||||||
A Shares (Incep: 12/24/02) | ||||||||||||||||
Without sales charge | 0.42 | % | 7.66 | % | 4.27 | % | 10.33 | % | ||||||||
With sales charge | -4.09 | % | 6.03 | % | 3.32 | % | 9.76 | % | ||||||||
Blended Index (Since 12/24/02) | -1.75 | % | 2.39 | % | 0.28 | % | 6.00 | % | ||||||||
S&P 500 Index (Since 12/24/02) | 1.14 | % | 1.23 | % | -1.18 | % | 4.81 | % | ||||||||
Blended Index: 25% Barclays Capital Aggregate Bond Index/75% MSCI World Index
This page is not part of the Annual Report. 7
| Portfolio Overview, | ||
Continued | ||
The primary investment objective of Thornburg Investment Income Builder Fund is to provide a level of current income which exceeds the average yield on U.S. stocks, and which will generally grow, subject to periodic fluctuations, over the years on a per share basis. The Fund’s secondary objective is long-term capital appreciation. These objectives remain constant over time. However, the specific investments we have used to try to reach our objectives have changed over time. There is no guarantee the Fund will meet its investment objectives.
Business conditions for various industries and operating effectiveness at individual firms change over time. Investor preferences, expressed as both absolute and relative prices, also change over time. In the view of your portfolio management team, “some doors close and others open.” As shown in the tables below, the percentage industry allocations of your Fund evolve to reflect these changing conditions.
TOP TEN INDUSTRIES
As of 9/30/11
Telecommunication Services | 18.0 | % | ||
Energy | 11.9 | % | ||
Utilities | 10.4 | % | ||
Diversified Financials | 7.5 | % | ||
Real Estate | 6.9 | % | ||
Pharmaceuticals, Biotechnology & Life Sciences | 6.8 | % | ||
Insurance | 5.4 | % | ||
Banks | 4.9 | % | ||
Food, Beverage & Tobacco | 4.6 | % | ||
Semiconductors & Semiconductor Equipment | 3.4 | % |
TOP TEN INDUSTRIES
As of 3/31/11
Telecommunication Services | 17.4 | % | ||
Energy | 13.2 | % | ||
Diversified Financials | 9.0 | % | ||
Utilities | 8.3 | % | ||
Food, Beverage & Tobacco | 7.3 | % | ||
Banks | 6.2 | % | ||
Insurance | 6.1 | % | ||
Pharmaceuticals, Biotechnology & Life Sciences | 6.1 | % | ||
Real Estate | 5.8 | % | ||
Semiconductors & Semiconductor Equipment | 3.0 | % |
TOP TEN INDUSTRIES
As of 6/30/11
Telecommunication Services | 22.8 | % | ||
Energy | 12.1 | % | ||
Utilities | 9.3 | % | ||
Real Estate | 7.8 | % | ||
Pharmaceuticals, Biotechnology & Life Sciences | 7.6 | % | ||
Food, Beverage & Tobacco | 7.1 | % | ||
Diversified Financials | 6.6 | % | ||
Banks | 6.2 | % | ||
Semiconductors & Semiconductor Equipment | 4.2 | % | ||
Insurance | 3.7 | % |
TOP TEN INDUSTRIES
As of 12/31/10
Telecommunication Services | 18.9 | % | ||
Energy | 13.6 | % | ||
Diversified Financials | 9.2 | % | ||
Utilities | 7.0 | % | ||
Banks | 6.9 | % | ||
Food, Beverage & Tobacco | 6.6 | % | ||
Real Estate | 5.6 | % | ||
Insurance | 4.8 | % | ||
Semiconductors & Semiconductor Equipment | 3.7 | % | ||
Pharmaceuticals, Biotechnology & Life Sciences | 3.4 | % |
8 This page is not part of the Annual Report.

Thornburg Investment Income Builder Fund
September 30, 2011
Table of Contents | ||||
| 10 | ||||
| 14 | ||||
| 30 | ||||
| 32 | ||||
| 34 | ||||
| 35 | ||||
| 44 | ||||
| 46 | ||||
| 47 | ||||
| 48 | ||||
| 49 | ||||
| 52 |
This report is certified under the Sarbanes-Oxley Act of 2002, which requires that public companies, including mutual funds, affirm that the information provided in their annual and semi-annual shareholder reports fully and fairly represents their financial position.
Certified Annual Report 9
October 18, 2011
Dear Fellow Shareholder:
This letter will highlight the results of Thornburg Investment Income Builder Fund’s investment activities for the six- and twelve-month periods ended September 30, 2011.
For the fiscal year ended September 30, 2011, the Fund’s net asset value per share decreased by $1.02 or 5.57%. Total return for the Class A shares for the fiscal year was 0.42%, taking into account income dividends paid of $1.15 per share, reinvested in Fund shares. The $1.15 income dividend per Class A share in the twelve-month period ended September 30, 2011 was up 3.5% from $1.11 in twelve months ended September 30, 2010. The dividends per share were higher for Class I and R5 shares, and lower for the Class C, R3, and R4 shares, to account for varying class specific expenses. In the six-months ended September 30, 2011, Thornburg Investment Income Builder Fund’s net asset value per Class A share decreased 11.83% from $19.61 to $17.29. The Fund paid dividends of 58¢ per share to give a total return for the period of negative 8.87%.
Thornburg Investment Income Builder Fund outperformed the negative 1.75% return of its own Blended Benchmark Index (75% MSCI World Index and 25% Barclays Capital Aggregate Bond Index) during the fiscal year ended September 30, 2011. However, it underperformed the 1.14% recorded by the S&P 500 Index for this period. Performance comparisons of Thornburg Investment Income Builder Fund to each of these benchmarks over various periods are shown on page 7. Reviewing these, you will see that the performance of the Fund has compared very well to both benchmarks over various periods, though Thornburg Investment Income Builder Fund has not outperformed over every shorter measurement period. For all multi-year measurement periods shown since the Fund’s inception, Investment Income Builder has outperformed both of these benchmarks. | Performance data shown represents past performance and is no guarantee of future results. Investment return and principal value will fluctuate so shares, when redeemed, may be worth more or less than their original cost. Current performance may be lower or higher than quoted. For performance current to the most recent month end, visit thornburg.com or call 800.847.0200.
The maximum sales charge for Class A shares is 4.50%. Class A shares are subject to a 1% 30-day redemption fee. The total annual fund operating expense of Class A shares is 1.25%, as disclosed in the most recent Prospectus. |
The quarter ended September 30, 2011 was the 35th full calendar quarter since the inception of Thornburg Investment Income Builder in December 2002. In 26 of these quarters the Fund delivered a positive total return. In nine of these quarters, including the September quarter of 2011, the Fund delivered a negative total return.
We do not expect to pay any capital gain dividends for 2011. At September 30, 2011, the Fund had tax basis realized capital losses of approximately $725 million, which may be carried forward to offset future capital gains to the extent permitted by regulations.
In assessing the performance of Thornburg Investment Income Builder Fund, it is constructive to consider the performance in U.S. dollars of the sector components of the MSCI World Index over the 12-month period ended September 30, 2011. The MSCI World Index comprises 75%, and the entire equity portion, of the Fund’s global performance benchmark:
10 Certified Annual Report
| 1. | Five sectors showed positive total returns, with a range of greater than 5% (consumer staples and health care) to less than 1.3% (telecommunications, technology, energy). |
| 2. | Five sectors (financials, consumer discretionary, materials, industrials, and utilities) showed negative total returns, ranging from just below zero (consumer discretionary and utilities) to worse than negative 16% (financials). |
| 3. | In the Thornburg Investment Income Builder portfolio, returns from 48 of our equity investments were positive during the year ended September 30, 2011, 48 were negative, and several were flat. |
| 4. | Investment Income Builder Fund investments in firms in the financials (24.5% average Fund weighting), telecommunications (18%), energy (12%), and consumer staples (9%) comprised the largest sector weightings in the Fund portfolio. |
| 5. | Your Fund’s negative 3.8% average return from its investments in the financials sector was well above the negative 16.7% performance of the equities in the financials sector of the MSCI World Index. Fund investments in Norwegian insurer Gjensidige Forsikring and preferred stocks of Midwestern regional banks Fifth Third Bancorp and Huntington Bancshares were among the best positive performers in the Fund from this sector. Negative contributors, particularly in the September quarter of the fiscal year, included Invesco Mortgage Capital, Och-Ziff Capital Management, and Italy’s Intesa San Paolo. At this point, many of the Fund’s financial sector investments are valued in the public markets at multiples of book value that are significantly below historic averages. Each has above normal uncertainty regarding one or more issues such as litigation risk, possible loan or investment portfolio losses, reduced customer activity levels, and regulatory burdens. |
| 6. | Your Fund’s holdings in the telecommunications sector, led by Australia’s services leader Telstra, multi-national mobile communications firm Vodafone, Verizon, and Thailand’s Advanced Information Service were the strongest positive contributors to outperformance of the Fund’s portfolio holdings in this sector during the fiscal year. Your Fund’s average 18% weighting far exceeded the 4% weighting of telecommunications firms in the index portfolio, and this aided comparative performance. Among the Fund’s telecom sector investments, Telefonica and France Telecom detracted from overall performance. |
| 7. | The Fund’s holdings in the energy sector underperformed those of the index during the fiscal year, showing particular weakness in the September quarter. Among these, Canadian Oil Sands Ltd. and European oil giants Eni SpA and Total SA all showed double-digit percentage share price declines for the period. Positive contributions from Royal Dutch Shell and Norwegian deep sea drillship owner Seadrill were insufficient to offset the damage. |
| 8. | Among the Fund’s investments in the consumer staples sector, well known firms such as Coca-Cola, Philip Morris International, Kraft Foods, Kimberly Clark, and Nestlé aided portfolio performance relative to the index, while Norwegian fish farm operator Marine Harvest was a modest drag. Fund returns from its investments in this sector performed well in absolute terms, and relative to the index. |
| 9. | The Fund’s investments in the utilities sector did not perform well, particularly the electricity generators based in Europe. Italy’s Enel SpA, Germany’s E.ON, and Franco-Belgian firm GDF-Suez each delivered double-digit share price declines for the period, while Czech Republic’s Cez A.S. was nearly that negative. With most of these, new tax charges levied by revenue hungry governments spooked investors. A positive return from Dominion Resources, which reached our price target and was sold, was insufficient to offset the negative returns from abroad. |
Certified Annual Report 11
| Letter to Shareholders, | ||
Continued | ||
| 10. | In addition to those investments already noted, the portfolio had positive contributions from investments in Swiss pharmaceutical firm Roche Holding, Taiwan Semiconductor Manufacturing, McDonald’s Corporation, Intel, Pfizer, and Australian airport operator MAp Group. Southern Copper Corporation, Australian retailer David Jones Ltd., and mortgage REIT Chimera Investment each delivered significant negative returns during the year, mostly due to large September quarter price declines. |
Within its bond portfolio, the Fund owned significantly fewer U.S. government and agency bonds than the Barclays Capital Aggregate Bond Index. This was not harmful, since the performance of corporate bonds was solid during the period under review. Readers of this letter who are long-time shareholders of Income Builder will recall that the interest bearing debt portion of the Fund’s portfolio fell well below 20% during the “yield drought” between 2004 and 2007. We rebuilt the bond portfolio at low prices and attractive yields during the chaotic period from mid–2008 to mid–2009. Investment Income Builder’s portfolio weighting in cash and interest bearing debt declined from approximately 41% at September 30, 2009 to below 25% at September 30, 2011, mostly because we invested a substantial majority of cash flows from portfolio income and new share sales in dividend paying stocks over the course of the fiscal year.
As of September 30, 2011, the Fund portfolio included more than 200 bonds and hybrid securities, with an average expected yield to maturity of approximately 6.8%. On average, secondary market prices of these bonds were flat during the fiscal year, so that their aggregate market value on September 30, 2011 was slightly below the sum of their maturity values.
For the fiscal year ended September 30, 2011, approximately 77% of Income Builder’s income was derived from stock dividends, with the remaining 23% coming from interest.
At September 30, 2011, domestic stocks comprised approximately 32% of your portfolio; foreign stocks around 44%; and cash and interest bearing debt the remaining 24%. We have hedged more than 50% of the currency risk associated with your Fund’s euro denominated equity holdings. Approximately 18% of the portfolio was invested in companies based in European Monetary Union countries. For now, we do not hedge the currency risk of our Australian dollar, Canadian dollar, and non-yen Asian currency denominated equity holdings, and we retain a hedge of around 50% with respect to your Fund’s Swiss holdings.
The average price/earnings multiple of the 74 common/convertible stocks in your portfolio on September 30, 2011 was 9x on an estimated forward basis, down from 10.4x at September 30, 2010. This multiple incorporates estimates provided by FactSet and IBES. For comparative reference, the forward price/earnings multiples of the MSCI World Index at September 30, 2011 was approximately 11.5x, again using estimates compiled by FactSet and IBES. Industry weightings, country weightings, and the top equity holdings of Investment Income Builder Fund are summarized beginning on page 14.
Investors have experienced well-above-average financial market volatility over the last two years. Investment bank Credit Suisse points out that the average number of quarters with a return of greater than 10% or less than negative 10% in each of the last six decades is just below eight per decade. There are 40 quarters per decade, so the incidences of “highly volatile” quarters have been slightly less than 20% of the time over these six decades. The last three years have been different. In eight of the last twelve calendar quarters, the returns to the S&P 500 Index have been either less than negative 10%, or greater than 10%. If you feel a bit of motion sickness, it’s justified.
12 Certified Annual Report
This commentary will not include a rehash of macro-economic news that surrounds us each day. Investors understandably seek additional clarity on how European governments (and financial institutions) will manage through a debt contraction and at least one likely state default. In addition, investors have questions about whether China can transition from an investment led economy to a consumer led economy, and how the success or failure of that transition will impact the rest of the world. Finally, there are legitimate questions about whether the United States government can implement a reasonable framework of pro-growth policies while also reining in public sector borrowing.
We do not expect clear answers to these questions to emerge during the coming months. There will be news bits from day to day that will feed hopes or fan despair, thereby moving the prices of financial assets by significant percentages. We believe that the stock price declines resulting from large numbers of investors selling equities have created very attractive valuations so long as the global economy does not enter into some kind of broad collapse. We do not foresee such a collapse, but rather grinding transitions to various new economic foundations in the different regions of the world.
Over the last eight years, the annual dividends paid by Thornburg Investment Income Builder Fund from net investment income have increased at an average annual rate of 9.6%, from 55¢ per Class A share for the year ended September 30, 2004 to $1.15 for the fiscal year just ended. We do not expect to be able to continue to increase the annual dividends at this rate, given the present backdrop of low interest rates, economic uncertainty, and overall stinginess about paying out retained earnings by corporate boards. We do believe that the income generators in the Thornburg Investment Income Builder’s portfolio have considerable intrinsic value, especially in an environment where there is a noticeable shortage of visible investment income.
Thank you for being a shareholder of Thornburg Investment Income Builder Fund. Remember that you can review descriptions of many of the stocks in your portfolio at your leisure by going to our internet site, www.thornburg.com/ funds. Best wishes for a wonderful holiday season, and New Year.
Sincerely,
 |  | |
| Brian McMahon | Jason Brady,CFA | |
| Co-Portfolio Manager | Co-Portfolio Manager | |
| CEO & Chief Investment Officer | Managing Director |
The matters discussed in this report may constitute forward-looking statements made pursuant to the safe harbor provisions of the Securities Litigation Reform Act of 1995. These include any advisor or portfolio manager prediction, assessment, analysis or outlook for individual securities, industries, investment styles, market sectors and/or markets. These statements involve risks and uncertainties. In addition to the general risks described for each fund in its current prospectus, other factors bearing on these reports include the accuracy of the advisor’s or portfolio manager’s forecasts and predictions, the appropriateness of the investment strategies designed by the advisor or portfolio manager, and the ability of the advisor or portfolio manager to implement their strategies efficiently and successfully. Any one or more of these factors, as well as other risks affecting the securities markets generally, could cause the actual results of any fund to differ materially as compared to its benchmarks.
Certified Annual Report 13
| SCHEDULE OF INVESTMENTS | ||
| Thornburg Investment Income Builder Fund | September 30, 2011 | |
SUMMARY OF INDUSTRY EXPOSURE
As of 9/30/11
Telecommunication Services | 18.1 | % | Household & Personal Products | 0.7 | % | |||||
Energy | 11.9 | % | Media | 0.7 | % | |||||
Utilities | 10.4 | % | Health Care Equipment & Services | 0.6 | % | |||||
Diversified Financials | 7.5 | % | Retailing | 0.6 | % | |||||
Real Estate | 6.9 | % | Miscellaneous | 0.6 | % | |||||
Pharmaceuticals, Biotechnology & Life Sciences | 6.8 | % | Capital Goods | 0.5 | % | |||||
Insurance | 5.4 | % | Technology Hardware & Equipment | 0.3 | % | |||||
Banks | 4.9 | % | Automobiles & Components | 0.1 | % | |||||
Food, Beverage & Tobacco | 4.6 | % | Other Non-Classified Securities: | |||||||
Semiconductors & Semiconductor Equipment | 3.4 | % | Other Securities | 0.3 | % | |||||
Software & Services | 3.0 | % | Asset Backed Securities | 0.2 | % | |||||
Transportation | 2.6 | % | U.S. Government Agencies | 0.1 | % | |||||
Consumer Services | 2.1 | % | Municipal Bonds* | 0.0 | % | |||||
Materials | 1.9 | % | Other Assets & Cash Equivalents | 4.8 | % | |||||
Food & Staples Retailing | 1.0 | % |
| * | Percentage was less than 0.1%. |
TOP TEN EQUITY HOLDINGS
As of 9/30/11
Telstra Corp. Ltd. | 3.3 | % | GDF Suez | 2.4 | % | |||||
Eni SpA | 2.6 | % | Koninklijke KPN N.V. | 2.2 | % | |||||
Enel S.p.A. | 2.5 | % | Vodafone Group plc | 2.1 | % | |||||
Total SA | 2.4 | % | Pfizer, Inc. | 2.0 | % | |||||
Microsoft Corp. | 2.4 | % | China Mobile Ltd. | 2.0 | % |
14 Certified Annual Report
| SCHEDULE OF INVESTMENTS, CONTINUED | ||
| Thornburg Investment Income Builder Fund | September 30, 2011 | |
SUMMARY OF COUNTRY EXPOSURE
As of 9/30/11
United States | 46.0 | % | Brazil | 0.8 | % | |||||
Australia | 6.1 | % | South Korea | 0.8 | % | |||||
Italy | 5.9 | % | Bermuda | 0.7 | % | |||||
Switzerland | 5.7 | % | Luxembourg | 0.5 | % | |||||
France | 5.1 | % | Germany | 0.4 | % | |||||
Netherlands | 4.6 | % | Greece | 0.4 | % | |||||
United Kingdom | 3.1 | % | Cayman Islands | 0.3 | % | |||||
China | 2.2 | % | South Africa | 0.3 | % | |||||
Canada | 1.9 | % | Japan | 0.2 | % | |||||
Norway | 1.8 | % | Malaysia | 0.1 | % | |||||
Spain | 1.7 | % | Russia | 0.1 | % | |||||
Taiwan | 1.2 | % | Trinidad and Tobago | 0.1 | % | |||||
Singapore | 1.1 | % | Indonesia* | 0.0 | % | |||||
Hong Kong | 1.1 | % | Chile* | 0.0 | % | |||||
Denmark | 1.0 | % | Other Assets & Cash Equivalents | 4.8 | % | |||||
Czech Republic | 1.0 | % | ||||||||
Mexico | 1.0 | % |
| * | Country percentage was less than 0.1%. |
| Shares/ Principal Amount | Value | |||||||
COMMON STOCK — 72.12% | ||||||||
BANKS — 2.12% | ||||||||
COMMERCIAL BANKS — 1.74% | ||||||||
Banque Cantonale Vaudoise | 55,100 | $ | 28,556,073 | |||||
Intesa Sanpaolo | 5,141,942 | 8,197,810 | ||||||
Intesa Sanpaolo-RSP | 17,996,800 | 23,460,207 | ||||||
Liechtensteinische Landesbank AG | 1,150,000 | 65,467,785 | ||||||
St. Galler Kantonalbank | 63,124 | 28,083,355 | ||||||
THRIFTS & MORTGAGE FINANCE — 0.38% | ||||||||
Capitol Federal Financial, Inc. | 3,200,000 | 33,792,000 | ||||||
|
| |||||||
| 187,557,230 | ||||||||
|
| |||||||
CAPITAL GOODS — 0.21% | ||||||||
INDUSTRIAL CONGLOMERATES — 0.21% | ||||||||
NWS Holdings Ltd. | 13,821,000 | 18,528,808 | ||||||
|
| |||||||
| 18,528,808 | ||||||||
|
| |||||||
CONSUMER SERVICES — 1.95% | ||||||||
HOTELS, RESTAURANTS & LEISURE — 1.95% | ||||||||
Berjaya Sports Toto Berhad | 7,564,300 | 10,069,937 | ||||||
McDonald’s Corp. | 1,461,500 | 128,348,930 | ||||||
OPAP SA | 3,345,800 | 34,067,266 | ||||||
|
| |||||||
| 172,486,133 | ||||||||
|
| |||||||
Certified Annual Report 15
| SCHEDULE OF INVESTMENTS, CONTINUED | ||
| Thornburg Investment Income Builder Fund | September 30, 2011 | |
| Shares/ Principal Amount | Value | |||||||
DIVERSIFIED FINANCIALS — 4.66% | ||||||||
CAPITAL MARKETS — 3.27% | ||||||||
AllianceBernstein Holdings LP | 1,200,000 | $ | 16,380,000 | |||||
aApollo Investment Corp. | 10,000,000 | 75,200,000 | ||||||
Ares Capital Corp. | 6,457,700 | 88,922,529 | ||||||
Och-Ziff Capital Management Group, LLC | 3,550,000 | 32,411,500 | ||||||
aSolar Capital Ltd. | 3,600,000 | 72,468,000 | ||||||
aSolar Capital Ltd. | 150,000 | 3,019,500 | ||||||
DIVERSIFIED FINANCIAL SERVICES — 1.39% | ||||||||
Hong Kong Exchanges & Clearing Ltd. | 2,317,300 | 34,190,843 | ||||||
aKKR Financial Holdings, LLC | 11,900,000 | 88,417,000 | ||||||
|
| |||||||
| 411,009,372 | ||||||||
|
| |||||||
ENERGY — 9.28% | ||||||||
ENERGY EQUIPMENT & SERVICES — 0.90% | ||||||||
Seadrill Ltd. | 2,826,094 | 79,148,541 | ||||||
OIL, GAS & CONSUMABLE FUELS — 8.38% | ||||||||
Canadian Oil Sands Ltd. | 6,755,000 | 131,438,544 | ||||||
Eni SpA | 12,852,300 | 227,633,420 | ||||||
Origin Energy Ltd. | 37,076 | 480,771 | ||||||
Royal Dutch Shell plc ADR | 2,698,200 | 165,993,264 | ||||||
Total SA | 4,813,300 | 214,319,817 | ||||||
|
| |||||||
| 819,014,357 | ||||||||
|
| |||||||
FOOD & STAPLES RETAILING — 0.90% | ||||||||
FOOD & STAPLES RETAILING — 0.90% | ||||||||
Sysco Corp. | 1,957,300 | 50,694,070 | ||||||
Walgreen Co. | 870,400 | 28,627,456 | ||||||
|
| |||||||
| 79,321,526 | ||||||||
|
| |||||||
FOOD, BEVERAGE & TOBACCO — 3.94% | ||||||||
BEVERAGES — 1.88% | ||||||||
Coca Cola Co. | 2,462,400 | 166,359,744 | ||||||
FOOD PRODUCTS — 0.49% | ||||||||
Nestlé SA | 786,900 | 43,494,804 | ||||||
TOBACCO — 1.57% | ||||||||
Philip Morris International, Inc. | 2,216,500 | 138,265,270 | ||||||
|
| |||||||
| 348,119,818 | ||||||||
|
| |||||||
HOUSEHOLD & PERSONAL PRODUCTS — 0.71% | ||||||||
HOUSEHOLD PRODUCTS — 0.71% | ||||||||
Kimberly-Clark Corp. | 886,400 | 62,943,264 | ||||||
|
| |||||||
| 62,943,264 | ||||||||
|
| |||||||
INSURANCE — 2.98% | ||||||||
INSURANCE — 2.98% | ||||||||
Allianz SE | 416,600 | 39,549,785 | ||||||
Gjensidige Forsikring ASA | 7,406,701 | 77,093,990 | ||||||
Legal & General Group plc | 32,365,400 | 48,779,861 | ||||||
Scor SE | 858,800 | 18,691,126 | ||||||
Zurich Financial Services AG | 375,000 | 79,021,404 | ||||||
|
| |||||||
| 263,136,166 | ||||||||
|
| |||||||
16 Certified Annual Report
| SCHEDULE OF INVESTMENTS, CONTINUED | ||
| Thornburg Investment Income Builder Fund | September 30, 2011 | |
| Shares/ Principal Amount | Value | |||||||
MATERIALS — 1.23% | ||||||||
METALS & MINING — 1.23% | ||||||||
Impala Platinum Holdings Ltd. | 1,349,900 | $ | 27,459,419 | |||||
Southern Copper Corp. | 3,250,000 | 81,217,500 | ||||||
|
| |||||||
| 108,676,919 | ||||||||
|
| |||||||
PHARMACEUTICALS, BIOTECHNOLOGY & LIFE SCIENCES — 6.58% | ||||||||
PHARMACEUTICALS — 6.58% | ||||||||
Merck & Co. | 4,300,000 | 140,653,000 | ||||||
Novartis AG | 2,246,900 | 125,929,523 | ||||||
Pfizer, Inc. | 10,186,200 | 180,092,016 | ||||||
Roche Holding AG | 829,400 | 134,603,641 | ||||||
|
| |||||||
| 581,278,180 | ||||||||
|
| |||||||
REAL ESTATE — 6.60% | ||||||||
REAL ESTATE INVESTMENT TRUSTS — 6.01% | ||||||||
Annaly Capital Management, Inc. | 5,570,640 | 92,639,743 | ||||||
Anworth Mortgage Asset Corp. | 3,067,800 | 20,861,040 | ||||||
Capstead Mortgage Corp. | 2,537,544 | 29,283,258 | ||||||
Chimera Investment Corp. | 32,900,000 | 91,133,000 | ||||||
aDynex Capital, Inc. | 2,860,000 | 23,051,600 | ||||||
Invesco Mortgage Capital, Inc. | 5,414,300 | 76,504,059 | ||||||
aMFA Financial, Inc. | 18,000,000 | 126,360,000 | ||||||
Two Harbors Investment Corp. | 2,450,000 | 21,633,500 | ||||||
Washington REIT | 1,727,539 | 48,682,049 | ||||||
REAL ESTATE MANAGEMENT & DEVELOPMENT — 0.59% | ||||||||
Hopewell Holdings Ltd. | 18,171,840 | 52,386,908 | ||||||
|
| |||||||
| 582,535,157 | ||||||||
|
| |||||||
RETAILING — 0.54% | ||||||||
MULTILINE RETAIL — 0.54% | ||||||||
David Jones Ltd. | 16,164,303 | 47,239,437 | ||||||
|
| |||||||
| 47,239,437 | ||||||||
|
| |||||||
SEMICONDUCTORS & SEMICONDUCTOR EQUIPMENT — 3.00% | ||||||||
SEMICONDUCTORS & SEMICONDUCTOR EQUIPMENT — 3.00% | ||||||||
Intel Corp. | 7,388,870 | 157,604,597 | ||||||
Taiwan Semiconductor Manufacturing Co. Ltd. | 46,726,000 | 107,327,974 | ||||||
|
| |||||||
| 264,932,571 | ||||||||
|
| |||||||
SOFTWARE & SERVICES — 2.52% | ||||||||
INFORMATION TECHNOLOGY SERVICES — 0.11% | ||||||||
Paychex, Inc. | 374,300 | 9,870,291 | ||||||
SOFTWARE — 2.41% | ||||||||
Microsoft Corp. | 8,552,500 | 212,871,725 | ||||||
|
| |||||||
| 222,742,016 | ||||||||
|
| |||||||
TELECOMMUNICATION SERVICES — 16.60% | ||||||||
DIVERSIFIED TELECOMMUNICATION SERVICES — 11.83% | ||||||||
AT&T, Inc. | 6,000,000 | 171,120,000 | ||||||
Cable & Wireless Communications plc | 43,098,800 | 25,035,091 | ||||||
Koninklijke KPN N.V. | 14,353,900 | 190,402,520 | ||||||
Singapore Telecommunications Ltd. | 40,036,164 | 97,343,070 | ||||||
Certified Annual Report 17
| SCHEDULE OF INVESTMENTS, CONTINUED | ||
| Thornburg Investment Income Builder Fund | September 30, 2011 | |
| Shares/ Principal Amount | Value | |||||||
TDC A/S | 11,257,717 | $ | 92,279,858 | |||||
Telecom Italia S.p.A. | 24,150,500 | 26,515,438 | ||||||
Telecom Italia-RSP S.p.A. | 12,230,500 | 12,010,799 | ||||||
Telefonica SA | 7,145,774 | 138,098,453 | ||||||
Telstra Corp. Ltd. | 97,218,275 | 291,642,218 | ||||||
WIRELESS TELECOMMUNICATION SERVICES — 4.77% | ||||||||
China Mobile Ltd. | 17,558,707 | 173,954,625 | ||||||
SK Telecom Co. Ltd. | 463,500 | 58,820,296 | ||||||
Vodafone Group plc | 72,880,200 | 188,942,184 | ||||||
|
| |||||||
| 1,466,164,552 | ||||||||
|
| |||||||
TRANSPORTATION — 1.15% | ||||||||
TRANSPORTATION INFRASTRUCTURE — 1.15% | ||||||||
Hopewell Highway Infrastructure Ltd. | 15,722,341 | 9,610,184 | ||||||
MAp Airports | 29,371,709 | 91,806,309 | ||||||
|
| |||||||
| 101,416,493 | ||||||||
|
| |||||||
UTILITIES — 7.15% | ||||||||
ELECTRIC UTILITIES — 4.80% | ||||||||
CEZ AS | 2,377,600 | 91,621,356 | ||||||
Enel S.p.A. | 49,496,400 | 220,291,102 | ||||||
Entergy Corp. | 1,685,900 | 111,758,311 | ||||||
MULTI-UTILITIES — 2.35% | ||||||||
GDF Suez | 6,913,596 | 207,850,256 | ||||||
|
| |||||||
| 631,521,025 | ||||||||
|
| |||||||
TOTAL COMMON STOCK (Cost $6,812,442,467) | 6,368,623,024 | |||||||
|
| |||||||
PREFERRED STOCK — 3.80% | ||||||||
BANKS — 2.20% | ||||||||
COMMERCIAL BANKS — 2.20% | ||||||||
Barclays Bank plc Pfd, 7.10% | 200,000 | 4,228,000 | ||||||
Fifth Third Bancorp Pfd, 8.50% | 637,000 | 81,478,670 | ||||||
First Tennessee Bank Pfd, 3.75% | 12,000 | 7,620,000 | ||||||
Huntington Bancshares Pfd, 8.50% | 95,087 | 101,125,024 | ||||||
|
| |||||||
| 194,451,694 | ||||||||
|
| |||||||
DIVERSIFIED FINANCIALS — 0.30% | ||||||||
CAPITAL MARKETS — 0.02% | ||||||||
Morgan Stanley Pfd, 4.00% | 120,000 | 1,902,000 | ||||||
DIVERSIFIED FINANCIAL SERVICES — 0.28% | ||||||||
Bank of America Corp. Pfd, 3.00% | 420,000 | 4,951,800 | ||||||
Bank of America Corp. Pfd, 8.00% | 5,250,000 | 4,463,287 | ||||||
Citigroup Capital XII Pfd, 8.50% | 600,000 | 15,060,000 | ||||||
|
| |||||||
| 26,377,087 | ||||||||
|
| |||||||
INSURANCE — 0.26% | ||||||||
INSURANCE — 0.26% | ||||||||
Principal Financial Group Pfd, 5.563% | 234,400 | 22,810,050 | ||||||
|
| |||||||
| 22,810,050 | ||||||||
|
| |||||||
18 Certified Annual Report
| SCHEDULE OF INVESTMENTS, CONTINUED | ||
| Thornburg Investment Income Builder Fund | September 30, 2011 | |
| Shares/ Principal Amount | Value | |||||||
MISCELLANEOUS — 0.12% | ||||||||
U.S. GOVERNMENT AGENCIES — 0.12% | ||||||||
Farm Credit Bank of Texas Pfd, 10.00% | 9,000 | $ | 10,392,188 | |||||
|
| |||||||
| 10,392,188 | ||||||||
|
| |||||||
REAL ESTATE — 0.13% | ||||||||
REAL ESTATE INVESTMENT TRUSTS — 0.13% | ||||||||
Alexandria Real Estate Pfd, 7.00% | 463,500 | 11,239,875 | ||||||
|
| |||||||
| 11,239,875 | ||||||||
|
| |||||||
TECHNOLOGY HARDWARE & EQUIPMENT — 0.20% | ||||||||
COMMUNICATIONS EQUIPMENT — 0.20% | ||||||||
Lucent Technologies Capital Trust I Pfd, 7.75% | 22,000 | 18,150,000 | ||||||
|
| |||||||
| 18,150,000 | ||||||||
|
| |||||||
TELECOMMUNICATION SERVICES — 0.20% | ||||||||
WIRELESS TELECOMMUNICATION SERVICES — 0.20% | ||||||||
Centaur Funding Corp. Pfd, 9.08% | 15,000 | 17,329,688 | ||||||
|
| |||||||
| 17,329,688 | ||||||||
|
| |||||||
UTILITIES — 0.39% | ||||||||
MULTI-UTILITIES — 0.39% | ||||||||
Centerpoint Energy, Inc. Pfd, 7.5% | 1,050,000 | 34,650,000 | ||||||
|
| |||||||
| 34,650,000 | ||||||||
|
| |||||||
TOTAL PREFERRED STOCK (Cost $299,840,496) | 335,400,582 | |||||||
|
| |||||||
ASSET BACKED SECURITIES — 0.24% | ||||||||
BANKS — 0.03% | ||||||||
COMMERCIAL BANKS — 0.03% | ||||||||
Wells Fargo Asset Securities Corp., Series 2005-AR2 Class B1, 2.739%, 2/25/2035 | $ | 10,086,957 | 1,167,190 | |||||
Wells Fargo Asset Securities Corp., Series 2005-AR2 Class B1, 3.523%, 3/25/2035 | 9,544,027 | 1,325,911 | ||||||
|
| |||||||
| 2,493,101 | ||||||||
|
| |||||||
DIVERSIFIED FINANCIALS — 0.19% | ||||||||
CAPITAL MARKETS — 0.14% | ||||||||
Bear Stearns ARM Mtg Series 2003-6 Class 2B-1, 2.60%, 8/25/2033 | 571,113 | 408,501 | ||||||
Merrill Lynch Mtg Investors Trust, 2.611% , 8/25/2034 | 6,152,897 | 4,743,163 | ||||||
Morgan Stanley Capital, Inc. Series 2005-HE7 Class A2C, 0.555%, 11/25/2035 | 9,571,593 | 7,582,581 | ||||||
DIVERSIFIED FINANCIAL SERVICES — 0.05% | ||||||||
Banc of America Funding Corp. Series 2006-I Class SB1, 3.139%, 12/20/2036 | 3,211,312 | 572,925 | ||||||
Banc of America Mtg Securities Series 2005-A Class B1, 3.246%, 2/25/2035 | 5,153,203 | 2,072,006 | ||||||
Citigroup Mtg Loan Trust, Inc., 2.887% , 3/25/2034 | 1,450,231 | 1,173,658 | ||||||
Structured Asset Security Corp. Series 2002-27A Class B1, 2.478%, 1/25/2033 | 2,417,548 | 485,862 | ||||||
|
| |||||||
| 17,038,696 | ||||||||
|
| |||||||
PHARMACEUTICALS, BIOTECHNOLOGY & LIFE SCIENCES — 0.02% | ||||||||
PHARMACEUTICALS — 0.02% | ||||||||
bQHP PhaRMA, 10.25%, 3/15/2015 | 1,729,018 | 1,758,497 | ||||||
|
| |||||||
| 1,758,497 | ||||||||
|
| |||||||
TOTAL ASSET BACKED SECURITIES (Cost $45,125,275) | 21,290,294 | |||||||
|
| |||||||
Certified Annual Report 19
| SCHEDULE OF INVESTMENTS, CONTINUED | ||
| Thornburg Investment Income Builder Fund | September 30, 2011 | |
| Shares/ Principal Amount | Value | |||||||
CORPORATE BONDS — 14.69% | ||||||||
AUTOMOBILES & COMPONENTS — 0.07% | ||||||||
AUTOMOBILES — 0.07% | ||||||||
bAmerican Honda Finance, 7.625%, 10/1/2018 | $ | 5,000,000 | $ | 6,244,970 | ||||
|
| |||||||
| 6,244,970 | ||||||||
|
| |||||||
BANKS — 0.55% | ||||||||
COMMERCIAL BANKS — 0.55% | ||||||||
b,cAlfa Diversified, 2.347%, 3/15/2012 | 875,000 | 874,956 | ||||||
b,cBanco Industrial e Comercial S.A., 6.25%, 1/20/2013 | 9,000,000 | 9,067,500 | ||||||
Fifth Third Bancorp, 6.25%, 5/1/2013 | 2,750,000 | 2,911,725 | ||||||
b,cGroupe BPCE, 12.50%, 8/29/2049 | 10,211,000 | 9,907,733 | ||||||
b,c,d,e,f Landsbanki Islands HF, 7.431%, 12/31/2049 | 5,000,000 | 0 | ||||||
National City Preferred Capital Trust I, 12.00%, 12/29/2049 | 3,250,000 | 3,366,415 | ||||||
PNC Financial Services Group, Inc., 8.25%, 5/29/2049 | 10,000,000 | 10,085,940 | ||||||
bPNC Preferred Funding Trust III, 8.70%, 12/31/2049 | 4,500,000 | 4,633,200 | ||||||
Provident Bank of Maryland, 9.50%, 5/1/2018 | 5,600,000 | 6,529,494 | ||||||
cShinhan Bank, 6.819%, 9/20/2036 | 900,000 | 835,775 | ||||||
|
| |||||||
| 48,212,738 | ||||||||
|
| |||||||
CAPITAL GOODS — 0.32% | ||||||||
INDUSTRIAL CONGLOMERATES — 0.20% | ||||||||
Otter Tail Corp., 9.00%, 12/15/2016 | 17,000,000 | 18,317,500 | ||||||
TRADING COMPANIES & DISTRIBUTORS — 0.12% | ||||||||
bInternational Lease Finance Corp. E-Capital Trust I, 4.75%, 12/21/2065 | 15,000,000 | 10,428,000 | ||||||
|
| |||||||
| 28,745,500 | ||||||||
|
| |||||||
CONSUMER SERVICES — 0.11% | ||||||||
HOTELS, RESTAURANTS & LEISURE — 0.11% | ||||||||
bSeneca Nation Indians Capital Improvements Authority, 6.75%, 12/1/2013 | 2,480,000 | 2,476,999 | ||||||
b,gSizzling Platter, LLC, 12.25%, 4/15/2016 | 7,000,000 | 6,895,000 | ||||||
|
| |||||||
| 9,371,999 | ||||||||
|
| |||||||
DIVERSIFIED FINANCIALS — 1.18% | ||||||||
CAPITAL MARKETS — 0.09% | ||||||||
Goldman Sachs Group, Inc., 5.625%, 1/15/2017 | 8,000,000 | 7,760,536 | ||||||
CONSUMER FINANCE — 0.53% | ||||||||
American Express Credit Co., 5.875%, 5/2/2013 | 5,000,000 | 5,302,530 | ||||||
Capital One Capital IV, 6.745%, 2/17/2037 | 6,400,000 | 6,112,000 | ||||||
Capital One Financial Corp., 6.15%, 9/1/2016 | 25,000,000 | 26,482,900 | ||||||
SLM Corp., 4.00%, 7/25/2014 | 2,000,000 | 1,910,820 | ||||||
SLM Corp. LIBOR Floating Rate Note, 0.553%, 1/27/2014 | 5,000,000 | 4,589,525 | ||||||
TMX Finance LLC/TitleMax Finance Corp., 13.25%, 7/15/2015 | 2,500,000 | 2,687,500 | ||||||
DIVERSIFIED FINANCIAL SERVICES — 0.56% | ||||||||
Citigroup, Inc., 5.00%, 9/15/2014 | 16,250,000 | 15,937,334 | ||||||
cExport-Import Bank of Korea, 8.125%, 1/21/2014 | 2,750,000 | 3,069,536 | ||||||
JPMorgan Chase & Co., 7.90%, 4/29/2049 | 15,000,000 | 15,450,150 | ||||||
cKorea Development Bank, 5.30%, 1/17/2013 | 800,000 | 827,530 | ||||||
MBNA Corp., 6.125%, 3/1/2013 | 2,000,000 | 2,002,012 | ||||||
National Rural Utilities CFC, 10.375%, 11/1/2018 | 5,000,000 | 7,184,310 | ||||||
SquareTwo Financial Corp., 11.625%, 4/1/2017 | 5,000,000 | 4,750,000 | ||||||
|
| |||||||
| 104,066,683 | ||||||||
|
| |||||||
20 Certified Annual Report
| SCHEDULE OF INVESTMENTS, CONTINUED | ||
| Thornburg Investment Income Builder Fund | September 30, 2011 | |
| Shares/ Principal Amount | Value | |||||||
ENERGY — 2.59% | ||||||||
ENERGY EQUIPMENT & SERVICES — 0.30% | ||||||||
Nabors Industries, Inc., 9.25%, 1/15/2019 | $ | 10,500,000 | $ | 13,282,657 | ||||
b,cRDS Ultra-Deepwater Ltd., 11.875%, 3/15/2017 | 10,400,000 | 10,894,000 | ||||||
Seacor Holdings, Inc., 7.375%, 10/1/2019 | 2,000,000 | 2,162,234 | ||||||
OIL, GAS & CONSUMABLE FUELS — 2.29% | ||||||||
Black Elk Energy Offshore, 13.75%, 12/1/2015 | 16,750,000 | 16,666,250 | ||||||
b,cBumi Capital PTE Ltd., 12.00%, 11/10/2016 | 3,000,000 | 2,910,000 | ||||||
bDCP Midstream, LLC, 9.75%, 3/15/2019 | 5,000,000 | 6,652,970 | ||||||
Enbridge Energy Partners LP, 9.875%, 3/1/2019 | 9,750,000 | 12,926,014 | ||||||
b,gEnogex, LLC, 6.875%, 7/15/2014 | 2,000,000 | 2,195,530 | ||||||
bEnogex, LLC, 6.25%, 3/15/2020 | 2,500,000 | 2,836,782 | ||||||
Enterprise Products Operating LP, 7.034%, 1/15/2068 | 20,880,000 | 21,167,100 | ||||||
bGaz Capital SA, 8.146%, 4/11/2018 | 2,000,000 | 2,195,000 | ||||||
bGS Caltex Corp., 7.25%, 7/2/2013 | 7,000,000 | 7,531,440 | ||||||
Kinder Morgan Energy Partners LP, 9.00%, 2/1/2019 | 8,000,000 | 10,219,160 | ||||||
bMaritimes & Northeast Pipeline, LLC, 7.50%, 5/31/2014 | 6,891,000 | 7,448,758 | ||||||
Murphy Oil Corp., 6.375%, 5/1/2012 | 5,000,000 | 5,137,505 | ||||||
Niska Gas Storage, 8.875%, 3/15/2018 | 8,739,000 | 8,651,610 | ||||||
NuStar Logistics, 7.65%, 4/15/2018 | 18,000,000 | 21,470,148 | ||||||
Oneok Partners LP, 8.625%, 3/1/2019 | 8,000,000 | 10,304,512 | ||||||
Oneok Partners LP, 5.90%, 4/1/2012 | 3,000,000 | 3,066,222 | ||||||
b,cPetro Co. Trinidad Tobago Ltd., 9.75%, 8/14/2019 | 4,000,000 | 4,730,000 | ||||||
b,cPetroplus Finance Ltd., 6.75%, 5/1/2014 | 5,000,000 | 4,350,000 | ||||||
Plains Exploration & Production Co., 7.625%, 6/1/2018 | 1,000,000 | 1,025,000 | ||||||
RAAM Global Energy Co., 12.50%, 10/1/2015 | 15,000,000 | 15,300,000 | ||||||
Southern Union Co., 7.20%, 11/1/2066 | 23,020,000 | 19,451,900 | ||||||
Teppco Partners LP, 7.00%, 6/1/2067 | 7,000,000 | 6,737,500 | ||||||
bWoodside Financial Ltd., 8.125%, 3/1/2014 | 8,000,000 | 9,050,384 | ||||||
|
| |||||||
| 228,362,676 | ||||||||
|
| |||||||
FOOD & STAPLES RETAILING — 0.12% | ||||||||
FOOD & STAPLES RETAILING — 0.12% | ||||||||
Rite Aid Corp., 9.375%, 12/15/2015 | 9,500,000 | 8,170,000 | ||||||
Rite Aid Corp., 8.625%, 3/1/2015 | 3,000,000 | 2,662,500 | ||||||
|
| |||||||
| 10,832,500 | ||||||||
|
| |||||||
FOOD, BEVERAGE & TOBACCO — 0.44% | ||||||||
BEVERAGES — 0.04% | ||||||||
Anheuser Busch Cos., Inc., 4.70%, 4/15/2012 | 3,000,000 | 3,062,181 | ||||||
FOOD PRODUCTS — 0.11% | ||||||||
bHarmony Foods Corp, 10.00%, 5/1/2016 | 9,900,000 | 9,850,500 | ||||||
TOBACCO — 0.29% | ||||||||
gAltria Group, Inc., 8.50%, 11/10/2013 | 4,000,000 | 4,562,064 | ||||||
Altria Group, Inc., 9.70%, 11/10/2018 | 10,750,000 | 14,245,803 | ||||||
b,cB.A.T. International Finance, plc, 9.50%, 11/15/2018 | 5,000,000 | 6,787,870 | ||||||
|
| |||||||
| 38,508,418 | ||||||||
|
| |||||||
HEALTH CARE EQUIPMENT & SERVICES — 0.63% | ||||||||
HEALTH CARE EQUIPMENT & SUPPLIES — 0.05% | ||||||||
Alere, Inc., 8.625%, 10/1/2018 | 5,000,000 | 4,525,000 | ||||||
Certified Annual Report 21
| SCHEDULE OF INVESTMENTS, CONTINUED | ||
| Thornburg Investment Income Builder Fund | September 30, 2011 | |
| Shares/ Principal Amount | Value | |||||||
HEALTH CARE PROVIDERS & SERVICES — 0.39% | ||||||||
bAurora Diagnostics Holdings, LLC, 10.75%, 1/15/2018 | $ | 11,000,000 | $ | 10,670,000 | ||||
Prospect Medical Holdings, Inc., 12.75%, 7/15/2014 | 23,000,000 | 24,150,000 | ||||||
HEALTH CARE TECHNOLOGY — 0.19% | ||||||||
Merge Healthcare, Inc., 11.75%, 5/1/2015 | 16,400,000 | 16,646,000 | ||||||
|
| |||||||
| 55,991,000 | ||||||||
|
| |||||||
INSURANCE — 2.02% | ||||||||
INSURANCE — 2.02% | ||||||||
American General Finance Corp., 4.875%, 7/15/2012 | 1,000,000 | 935,000 | ||||||
b,cDai Ichi Mutual Life, 7.25%, 12/31/2049 | 9,000,000 | 8,851,140 | ||||||
Hartford Financial Services Group, 8.125%, 6/15/2038 | 9,650,000 | 9,071,000 | ||||||
bLiberty Mutual Group, Inc., 5.75%, 3/15/2014 | 1,000,000 | 1,041,789 | ||||||
bMetlife Capital Trust X, 9.25%, 4/8/2068 | 12,000,000 | 13,500,000 | ||||||
Metlife, Inc. Series A, 6.817%, 8/15/2018 | 4,000,000 | 4,691,496 | ||||||
bNational Life Insurance of Vermont, 10.50%, 9/15/2039 | 2,000,000 | 2,712,564 | ||||||
Northwind Holdings, LLC Series 2007-1A Class A1, 1.106%, 12/1/2037 | 5,031,250 | 3,907,822 | ||||||
b,cOil Insurance Ltd., 3.351%, 12/29/2049 | 4,000,000 | 3,749,600 | ||||||
bPacific Life Global Funding CPI Floating Rate Note, 5.74%, 2/6/2016 | 2,000,000 | 2,018,780 | ||||||
bPrudential Holdings, LLC, 8.695%, 12/18/2023 | 4,500,000 | 5,678,595 | ||||||
b,cQBE Capital Funding III Ltd., 7.25%, 5/24/2041 | 10,000,000 | 9,039,090 | ||||||
b,cQBE Insurance Group Ltd., 5.647%, 7/1/2023 | 10,613,000 | 9,968,982 | ||||||
Swiss Re Capital I LP, 6.854%, 5/29/2049 | 40,865,000 | 37,165,900 | ||||||
Transatlantic Holdings, Inc., 5.75%, 12/14/2015 | 14,647,000 | 15,627,382 | ||||||
White Mountains Re Group Ltd., 7.506%, 5/29/2049 | 20,940,000 | 19,216,010 | ||||||
ZFS Finance USA Trust II, 6.45%, 12/15/2065 | 34,208,000 | 30,103,040 | ||||||
ZFS Finance USA Trust V, 6.50%, 5/9/2037 | 1,260,000 | 1,089,900 | ||||||
|
| |||||||
| 178,368,090 | ||||||||
|
| |||||||
MATERIALS — 0.54% | ||||||||
CONSTRUCTION MATERIALS — 0.25% | ||||||||
b,cC8 Capital Ltd., 6.64%, 12/31/2049 | 2,000,000 | 900,000 | ||||||
bCEMEX Finance, LLC, 9.50%, 12/14/2016 | 10,000,000 | 7,250,000 | ||||||
CRH America, Inc., 8.125%, 7/15/2018 | 12,000,000 | 14,035,776 | ||||||
CONTAINERS & PACKAGING — 0.05% | ||||||||
bPlastipak Holdings, Inc., 10.625%, 8/15/2019 | 2,250,000 | 2,340,000 | ||||||
b,hSealed Air Corp., 8.375%, 9/15/2021 | 2,000,000 | 2,020,000 | ||||||
METALS & MINING — 0.24% | ||||||||
b,cAnglo American Capital, 9.375%, 4/8/2014 | 3,500,000 | 4,065,891 | ||||||
b,cBemax Resources Ltd., 9.375%, 7/15/2014 | 5,000,000 | 4,600,000 | ||||||
Freeport-McMoRan Copper & Gold, 8.375%, 4/1/2017 | 4,965,000 | 5,324,962 | ||||||
bGTL Trade Finance, Inc., 7.25%, 10/20/2017 | 7,000,000 | 7,315,000 | ||||||
|
| |||||||
| 47,851,629 | ||||||||
|
| |||||||
MEDIA — 0.61% | ||||||||
MEDIA — 0.61% | ||||||||
Comcast Cable Communications, 8.875%, 5/1/2017 | 5,000,000 | 6,385,185 | ||||||
DIRECTV Holdings, LLC, 7.625%, 5/15/2016 | 3,000,000 | 3,225,000 | ||||||
Time Warner Cable, Inc., 8.75%, 2/14/2019 | 14,000,000 | 17,915,422 | ||||||
Time Warner Cable, Inc., 8.25%, 2/14/2014 | 4,000,000 | 4,546,276 | ||||||
WM Finance Corp., 11.50%, 10/1/2018 | 23,500,000 | 21,620,000 | ||||||
|
| |||||||
| 53,691,883 | ||||||||
|
| |||||||
22 Certified Annual Report
| SCHEDULE OF INVESTMENTS, CONTINUED | ||
| Thornburg Investment Income Builder Fund | September 30, 2011 | |
| Shares/ Principal Amount | Value | |||||||
PHARMACEUTICALS, BIOTECHNOLOGY & LIFE SCIENCES — 0.23% | ||||||||
BIOTECHNOLOGY — 0.09% | ||||||||
dJPR Royalty, LLC, 14.00%, 12/1/2020 | $ | 5,000,000 | $ | 5,000,000 | ||||
dTiers Inflation Linked Trust Series Wyeth 2004 21 Trust Certificate CPI Floating Rate Note, 5.409%, 2/1/2014 | 3,000,000 | 2,943,240 | ||||||
PHARMACEUTICALS — 0.14% | ||||||||
Axcan Intermediate Holdings, Inc., 12.75%, 3/1/2016 | 4,250,000 | 4,292,500 | ||||||
KV Pharmaceutical Co., 12.00%, 3/15/2015 | 12,000,000 | 8,220,000 | ||||||
|
| |||||||
| 20,455,740 | ||||||||
|
| |||||||
REAL ESTATE — 0.09% | ||||||||
REAL ESTATE INVESTMENT TRUSTS — 0.09% | ||||||||
Residential Asset Securities Corp., 0.385%, 6/25/2036 | 9,150,667 | 8,000,804 | ||||||
|
| |||||||
| 8,000,804 | ||||||||
|
| |||||||
RETAILING — 0.08% | ||||||||
INTERNET & CATALOG RETAIL — 0.02% | ||||||||
Ticketmaster, 10.75%, 8/1/2016 | 1,500,000 | 1,575,000 | ||||||
MULTILINE RETAIL — 0.01% | ||||||||
b,c,gGrupo Famsa S.A.B. de C.V., 11.00%, 7/20/2015 | 1,500,000 | 1,477,500 | ||||||
SPECIALTY RETAIL — 0.05% | ||||||||
Best Buy, Inc., 6.75%, 7/15/2013 | 4,000,000 | 4,291,864 | ||||||
|
| |||||||
| 7,344,364 | ||||||||
|
| |||||||
SEMICONDUCTORS & SEMICONDUCTOR EQUIPMENT — 0.37% | ||||||||
SEMICONDUCTORS & SEMICONDUCTOR EQUIPMENT — 0.37% | ||||||||
KLA Tencor Corp., 6.90%, 5/1/2018 | 10,000,000 | 11,426,480 | ||||||
MEMC Electronics Materials, Inc., 7.75%, 4/1/2019 | 23,000,000 | 19,665,000 | ||||||
National Semiconductor Corp., 6.15%, 6/15/2012 | 2,000,000 | 2,056,828 | ||||||
|
| |||||||
| 33,148,308 | ||||||||
|
| |||||||
SOFTWARE & SERVICES — 0.35% | ||||||||
INFORMATION TECHNOLOGY SERVICES — 0.05% | ||||||||
bIgate Corp., 9.00%, 5/1/2016 | 5,000,000 | 4,650,000 | ||||||
INTERNET SOFTWARE & SERVICES — 0.28% | ||||||||
b,cEAccess Ltd., 8.25%, 4/1/2018 | 4,000,000 | 3,660,000 | ||||||
EarthLink, Inc., 8.875%, 5/15/2019 | 12,000,000 | 10,530,000 | ||||||
SSI Investments II/CO-ISSR, LLC, 11.125%, 6/1/2018 | 3,000,000 | 2,985,000 | ||||||
dYahoo!, Inc., 6.65%, 8/10/2026 | 8,112,276 | 7,301,048 | ||||||
SOFTWARE — 0.02% | ||||||||
Aspect Software, Inc., 10.625%, 5/15/2017 | 2,000,000 | 2,010,000 | ||||||
|
| |||||||
| 31,136,048 | ||||||||
|
| |||||||
TECHNOLOGY HARDWARE & EQUIPMENT — 0.06% | ||||||||
COMMUNICATIONS EQUIPMENT — 0.06% | ||||||||
bBrightstar Corp., 9.50%, 12/1/2016 | 5,000,000 | 5,100,000 | ||||||
|
| |||||||
| 5,100,000 | ||||||||
|
| |||||||
TELECOMMUNICATION SERVICES — 1.18% | ||||||||
DIVERSIFIED TELECOMMUNICATION SERVICES — 1.11% | ||||||||
cDeutsche Telekom International Finance B.V., 8.75%, 6/15/2030 | 26,150,000 | 34,879,158 | ||||||
cGlobal Crossing Ltd., 12.00%, 9/15/2015 | 4,000,000 | 4,535,000 | ||||||
b,cGlobal Crossing Ltd., 9.00%, 11/15/2019 | 8,000,000 | 9,480,000 | ||||||
Certified Annual Report 23
| SCHEDULE OF INVESTMENTS, CONTINUED | ||
| Thornburg Investment Income Builder Fund | September 30, 2011 | |
| Shares/ Principal Amount | Value | |||||||
bLevel 3 Communications, Inc., 11.875%, 2/1/2019 | $ | 6,000,000 | $ | 5,700,000 | ||||
Level 3 Financing, Inc., 9.25%, 11/1/2014 | 21,821,000 | 21,548,237 | ||||||
hQwest Corp., 6.75%, 12/1/2021 | 9,000,000 | 8,797,500 | ||||||
cTelecom Italia Capital SA, 5.25%, 10/1/2015 | 4,190,000 | 3,994,675 | ||||||
cTelemar Norte Leste SA, 5.50%, 10/23/2020 | 9,065,000 | 8,611,750 | ||||||
WIRELESS TELECOMMUNICATION SERVICES — 0.07% | ||||||||
b,cDigicel SA, 12.00%, 4/1/2014 | 2,000,000 | 2,190,000 | ||||||
cVimpelcom, 8.25%, 5/23/2016 | 4,500,000 | 4,308,750 | ||||||
|
| |||||||
| 104,045,070 | ||||||||
|
| |||||||
TRANSPORTATION — 0.49% | ||||||||
AIRLINES — 0.36% | ||||||||
b,cAir Canada, 9.25%, 8/1/2015 | 17,000,000 | 16,150,000 | ||||||
American Airlines, Inc., 13.00%, 8/1/2016 | 3,727,490 | 3,876,590 | ||||||
hAmerican Airllines, Inc., 8.625%, 10/15/2021 | 9,000,000 | 9,000,000 | ||||||
US Airways, 6.25%, 4/22/2023 | 3,000,000 | 2,700,000 | ||||||
MARINE — 0.13% | ||||||||
United Maritime, LLC, 11.75%, 6/15/2015 | 3,500,000 | 3,535,000 | ||||||
Windsor Petroleum Transport Corp., 7.84%, 1/15/2021 | 8,380,089 | 7,696,105 | ||||||
|
| |||||||
| 42,957,695 | ||||||||
|
| |||||||
UTILITIES — 2.66% | ||||||||
ELECTRIC UTILITIES — 1.31% | ||||||||
Alabama Power Capital Trust V, 3.346%, 10/1/2042 | 4,000,000 | 3,947,840 | ||||||
Arizona Public Service Co., 5.50%, 9/1/2035 | 4,000,000 | 4,335,624 | ||||||
Arizona Public Service Co., 8.75%, 3/1/2019 | 6,500,000 | 8,163,311 | ||||||
b,cCentrais Eletricas DO PA, 10.50%, 6/3/2016 | 16,000,000 | 15,920,000 | ||||||
Comed Financing III, 6.35%, 3/15/2033 | 2,961,000 | 2,499,679 | ||||||
b,cE. CL SA, 5.625%, 1/15/2021 | 2,000,000 | 2,087,646 | ||||||
b,cEnel Finance International S.A., 6.25%, 9/15/2017 | 40,000,000 | 40,396,640 | ||||||
Entergy Gulf States Louisiana, LLC, 6.00%, 5/1/2018 | 8,000,000 | 9,226,808 | ||||||
bGreat River Energy, 5.829%, 7/1/2017 | 1,580,089 | 1,762,479 | ||||||
bMonongahela Power Co., 7.95%, 12/15/2013 | 2,000,000 | 2,270,196 | ||||||
Texas-New Mexico Power, 9.50%, 4/1/2019 | 19,000,000 | 24,946,031 | ||||||
GAS UTILITIES — 0.11% | ||||||||
Southwest Gas Corp., 7.625%, 5/15/2012 | 9,465,000 | 9,830,586 | ||||||
INDEPENDENT POWER PRODUCERS & ENERGY TRADERS — 0.20% | ||||||||
b,cInkia Energy Ltd., 8.375%, 4/4/2021 | 18,000,000 | 17,640,000 | ||||||
MULTI-UTILITIES — 1.04% | ||||||||
Ameren Illinois Co., 9.75%, 11/15/2018 | 5,000,000 | 6,735,000 | ||||||
AmerenEnergy Generating Co., 7.00%, 4/15/2018 | 9,050,000 | 9,163,125 | ||||||
Black Hills Corp., 9.00%, 5/15/2014 | 4,500,000 | 5,183,050 | ||||||
Dominion Resources, Inc., 8.875%, 1/15/2019 | 13,750,000 | 18,327,114 | ||||||
NiSource Finance Corp., 6.15%, 3/1/2013 | 12,237,000 | 12,953,978 | ||||||
NiSource Finance Corp., 6.40%, 3/15/2018 | 20,000,000 | 23,284,760 | ||||||
Sempra Energy, 9.80%, 2/15/2019 | 7,750,000 | 10,845,776 | ||||||
Sempra Energy, 8.90%, 11/15/2013 | 2,000,000 | 2,281,386 | ||||||
Union Electric Co., 6.70%, 2/1/2019 | 2,500,000 | 3,071,033 | ||||||
|
| |||||||
| 234,872,062 | ||||||||
|
| |||||||
TOTAL CORPORATE BONDS (Cost $1,157,036,558) | 1,297,308,177 | |||||||
|
| |||||||
24 Certified Annual Report
| SCHEDULE OF INVESTMENTS, CONTINUED | ||
| Thornburg Investment Income Builder Fund | September 30, 2011 | |
| Shares/ Principal Amount | Value | |||||||
CONVERTIBLE BONDS — 1.86% | ||||||||
DIVERSIFIED FINANCIALS — 1.25% | ||||||||
CAPITAL MARKETS — 0.12% | ||||||||
a,bApollo Investment Corp., 5.75%, 1/15/2016 | $ | 5,000,000 | $ | 4,400,000 | ||||
bHercules Technology Growth Capital, Inc., 6.00%, 4/15/2016 | 7,000,000 | 6,063,750 | ||||||
DIVERSIFIED FINANCIAL SERVICES — 1.13% | ||||||||
bICAHN Enterprise LP, 4.00%, 8/15/2013 | 10,000,000 | 9,288,000 | ||||||
aKKR Financial Holdings, LLC, 7.00%, 7/15/2012 | 61,600,000 | 63,140,000 | ||||||
aKKR Financial Holdings, LLC, 7.50%, 1/15/2017 | 22,750,000 | 27,783,438 | ||||||
|
| |||||||
| 110,675,188 | ||||||||
|
| |||||||
ENERGY — 0.05% | ||||||||
OIL, GAS & CONSUMABLE FUELS — 0.05% | ||||||||
SunPower Corp., 4.50%, 3/15/2015 | 5,000,000 | 4,231,250 | ||||||
|
| |||||||
| 4,231,250 | ||||||||
|
| |||||||
FOOD, BEVERAGE & TOBACCO — 0.14% | ||||||||
BEVERAGES — 0.14% | ||||||||
Central European Distribution Corp., 3.00%, 3/15/2013 | 18,239,000 | 12,493,715 | ||||||
|
| |||||||
| 12,493,715 | ||||||||
|
| |||||||
MATERIALS — 0.15% | ||||||||
CONSTRUCTION MATERIALS — 0.05% | ||||||||
cCemex SAB de CV, 4.875%, 3/15/2015 | 8,500,000 | 4,026,875 | ||||||
METALS & MINING — 0.10% | ||||||||
b,cJaguar Mining, Inc., 4.50%, 11/1/2014 | 11,000,000 | 8,937,500 | ||||||
|
| |||||||
| 12,964,375 | ||||||||
|
| |||||||
PHARMACEUTICALS, BIOTECHNOLOGY & LIFE SCIENCES — 0.01% | ||||||||
PHARMACEUTICALS — 0.01% | ||||||||
KV Pharmaceutical Co., 2.50%, 5/16/2033 | 4,000,000 | 1,000,000 | ||||||
|
| |||||||
| 1,000,000 | ||||||||
|
| |||||||
REAL ESTATE — 0.11% | ||||||||
REAL ESTATE INVESTMENT TRUSTS — 0.11% | ||||||||
bExtra Space Storage LP, 3.625%, 4/1/2027 | 10,000,000 | 9,937,500 | ||||||
|
| |||||||
| 9,937,500 | ||||||||
|
| |||||||
SOFTWARE & SERVICES — 0.09% | ||||||||
SOFTWARE — 0.09% | ||||||||
THQ, Inc., 5.00%, 8/15/2014 | 9,136,000 | 7,891,220 | ||||||
|
| |||||||
| 7,891,220 | ||||||||
|
| |||||||
TELECOMMUNICATION SERVICES — 0.03% | ||||||||
DIVERSIFIED TELECOMMUNICATION SERVICES — 0.03% | ||||||||
gLevel 3 Communications, Inc., 7.00%, 3/15/2015 | 2,000,000 | 2,390,000 | ||||||
|
| |||||||
| 2,390,000 | ||||||||
|
| |||||||
Certified Annual Report 25
| SCHEDULE OF INVESTMENTS, CONTINUED | ||
| Thornburg Investment Income Builder Fund | September 30, 2011 | |
| Shares/ Principal Amount | Value | |||||||
TRANSPORTATION — 0.03% | ||||||||
MARINE — 0.03% | ||||||||
Ultrapetrol Bahamas Ltd., 7.25%, 1/15/2017 | $ | 2,750,000 | $ | 2,303,125 | ||||
|
| |||||||
| 2,303,125 | ||||||||
|
| |||||||
TOTAL CONVERTIBLE BONDS (Cost $164,057,679) | 163,886,373 | |||||||
|
| |||||||
MUNICIPAL BONDS — 0.05% | ||||||||
San Bernardino County California, 8.45%, 9/1/2030 | 2,555,000 | 2,734,540 | ||||||
Victor New York, 9.20%, 5/1/2014 | 1,130,000 | 1,177,946 | ||||||
|
| |||||||
TOTAL MUNICIPAL BONDS (Cost $3,663,194) | 3,912,486 | |||||||
|
| |||||||
U.S. GOVERNMENT AGENCIES — 0.11% | ||||||||
bAgribank FCB, 9.125%, 7/15/2019 | 6,750,000 | 8,947,793 | ||||||
Federal National Mtg Association REMIC Series 2006-B1 Class AB, 6.00%, 6/25/2016 | 1,130,915 | 1,137,660 | ||||||
|
| |||||||
TOTAL U.S. GOVERNMENT AGENCIES (Cost $7,878,461) | 10,085,453 | |||||||
|
| |||||||
FOREIGN BONDS — 2.11% | ||||||||
CONSUMER SERVICES — 0.00% | ||||||||
HOTELS, RESTAURANTS & LEISURE — 0.00% | ||||||||
d,e,fFU JI Food and Catering (HKD), 0%, 10/18/2010 | 17,500,000 | 224,722 | ||||||
|
| |||||||
| 224,722 | ||||||||
|
| |||||||
DIVERSIFIED FINANCIALS — 0.13% | ||||||||
CAPITAL MARKETS — 0.07% | ||||||||
Morgan Stanley (AUD), 5.187%, 3/1/2013 | 4,000,000 | 3,749,435 | ||||||
Morgan Stanley (BRL), 10.09%, 5/3/2017 | 4,560,000 | 2,255,445 | ||||||
DIVERSIFIED FINANCIAL SERVICES — 0.06% | ||||||||
dBank of America Corp. (BRL), 10.00%, 11/19/2014 | 6,500,000 | 3,197,713 | ||||||
dBank of America Corp. (BRL), 10.75%, 8/20/2018 | 5,000,000 | 2,366,707 | ||||||
|
| |||||||
| 11,569,300 | ||||||||
|
| |||||||
FOOD & STAPLES RETAILING — 0.02% | ||||||||
FOOD & STAPLES RETAILING — 0.02% | ||||||||
Wesfarmers Ltd. (AUD), 7.47%, 9/11/2014 | 2,000,000 | 1,995,309 | ||||||
|
| |||||||
| 1,995,309 | ||||||||
|
| |||||||
FOOD, BEVERAGE & TOBACCO — 0.11% | ||||||||
BEVERAGES — 0.11% | ||||||||
Ambev International Finance Co. Ltd. (BRL), 9.50%, 7/24/2017 | 7,669,000 | 4,160,287 | ||||||
Anheuser-Busch InBev (BRL), 9.75%, 11/17/2015 | 10,000,000 | 5,371,626 | ||||||
|
| |||||||
| 9,531,913 | ||||||||
|
| |||||||
INSURANCE — 0.16% | ||||||||
INSURANCE — 0.16% | ||||||||
ELM BV (AUD), 7.635%, 12/31/2049 | 10,500,000 | 8,173,592 | ||||||
ELM BV (AUD), 6.35%, 12/27/2049 | 8,000,000 | 5,773,841 | ||||||
|
| |||||||
| 13,947,433 | ||||||||
|
| |||||||
26 Certified Annual Report
| SCHEDULE OF INVESTMENTS, CONTINUED | ||
| Thornburg Investment Income Builder Fund | September 30, 2011 | |
| Shares/ Principal Amount | Value | |||||||
MEDIA — 0.07% | ||||||||
MEDIA — 0.07% | ||||||||
bCorus Entertainment (CAD), 7.25%, 2/10/2017 | $ | 2,000,000 | $ | 1,946,750 | ||||
News America Holdings (AUD), 8.625%, 2/7/2014 | 4,000,000 | 4,110,376 | ||||||
|
| |||||||
| 6,057,126 | ||||||||
|
| |||||||
MISCELLANEOUS — 0.45% | ||||||||
MISCELLANEOUS — 0.45% | ||||||||
New South Wales Treasury Corp. (AUD), 4.008%, 11/20/2020 | 8,500,000 | 9,844,960 | ||||||
Republic of Brazil (BRL), 12.50%, 1/5/2016 | 29,750,000 | 17,641,936 | ||||||
Republic of Brazil (BRL), 12.50%, 1/5/2022 | 20,000,000 | 12,498,338 | ||||||
|
| |||||||
| 39,985,234 | ||||||||
|
| |||||||
SOFTWARE & SERVICES — 0.05% | ||||||||
INTERNET SOFTWARE & SERVICES — 0.05% | ||||||||
EAccess Ltd. (EUR), 8.375%, 4/1/2018 | 4,000,000 | 4,823,099 | ||||||
|
| |||||||
| 4,823,099 | ||||||||
|
| |||||||
TELECOMMUNICATION SERVICES — 0.04% | ||||||||
DIVERSIFIED TELECOMMUNICATION SERVICES — 0.04% | ||||||||
Wind Acquisition Finance SA (EUR), 11.75%, 7/15/2017 | 3,000,000 | 3,295,785 | ||||||
|
| |||||||
| 3,295,785 | ||||||||
|
| |||||||
TRANSPORTATION — 0.88% | ||||||||
AIRLINES — 0.11% | ||||||||
d Iberbond 2004 plc (EUR), 4.235%, 12/24/2017 | 8,000,000 | 9,378,249 | ||||||
TRANSPORTATION INFRASTRUCTURE — 0.77% | ||||||||
Southern Cross Air Corp. (AUD), 6.777%, 12/20/2016 | 69,711,900 | 68,101,085 | ||||||
|
| |||||||
| 77,479,334 | ||||||||
|
| |||||||
UTILITIES — 0.20% | ||||||||
ELECTRIC UTILITIES — 0.07% | ||||||||
Cia De Ele Do E Da Bahia (BRL), 11.75%, 4/27/2016 | 12,000,000 | 6,445,951 | ||||||
MULTI-UTILITIES — 0.13% | ||||||||
Ville De Montreal (CAD), 5.45%, 12/1/2019 | 10,000,000 | 10,920,603 | ||||||
|
| |||||||
| 17,366,554 | ||||||||
|
| |||||||
TOTAL FOREIGN BONDS (Cost $166,801,576) | 186,275,809 | |||||||
|
| |||||||
OTHER SECURITIES — 0.24% | ||||||||
LOAN PARTICIPATIONS — 0.24% | ||||||||
Crown Castle Operating Co., 1.721%, 3/6/2014 | 2,916,244 | 2,812,717 | ||||||
dMerisant Co. Term Loan B, 7.50%, 1/31/2014 | 2,199,864 | 2,133,868 | ||||||
Mylan Laboratories, Inc., 3.625%, 10/2/2014 | 1,956,182 | 1,951,291 | ||||||
Texas Comp Electric Holdings, LLC, 3.706%, 10/10/2014 | 25,236 | 17,744 | ||||||
Texas Comp Electric Holdings, LLC, 3.726%, 10/10/2014 | 20,644,625 | 14,515,855 | ||||||
|
| |||||||
TOTAL OTHER SECURITIES (Cost $24,083,934) | 21,431,475 | |||||||
|
| |||||||
Certified Annual Report 27
| SCHEDULE OF INVESTMENTS, CONTINUED | ||
| Thornburg Investment Income Builder Fund | September 30, 2011 | |
| Shares/ Principal Amount | Value | |||||||
SHORT TERM INVESTMENTS — 2.99% | ||||||||
Bank of New York Tri-Party Repurchase Agreement 0.28% dated 9/30/2011 due 10/3/11, repurchase price collateralized by 19 corporate debt securities, having an average coupon of 4.07%, a minimum credit weighting of BBB-, maturity dates from 10/3/2011 to 9/1/2041 and having an aggregate market value of $235,195,747 at 9/30/2011 | $ | 225,000,000 | $ | 225,000,000 | ||||
Devon Energy Corp., 0.17%, 10/3/2011 | 39,000,000 | 38,999,632 | ||||||
|
| |||||||
TOTAL SHORT TERM INVESTMENTS (Cost $263,999,632) | 263,999,632 | |||||||
|
| |||||||
TOTAL INVESTMENTS — 98.21% (Cost $8,944,929,272) | $ | 8,672,213,305 | ||||||
OTHER ASSETS LESS LIABILITIES — 1.79% | 158,358,154 | |||||||
|
| |||||||
NET ASSETS — 100.00% | $ | 8,830,571,459 | ||||||
|
| |||||||
Footnote Legend
| a | Investment in Affiliates - Holdings of voting securities of each portfolio company which are considered “affiliated” to the Fund under the Investment Company Act of 1940 because the Fund’s holding represented 5% or more of the company’s voting securities during the period, are shown below: |
Issuer | Shares/Principal September 30, 2010 | Gross Additions | Gross Reductions | Shares/Principal September 30, 2011 | Market Value September 30, 2011 | Investment Income | ||||||||||||||||||
Apollo Investment Corp.* | 8,579,600 | 1,420,400 | — | 10,000,000 | $ | 75,200,000 | $ | 10,129,000 | ||||||||||||||||
Apollo Investment Corp., 5.75%, 1/15/2016* | — | 5,000,000 | — | 5,000,000 | 4,400,000 | 2,686 | ||||||||||||||||||
Dynex Capital, Inc.* | — | 2,860,000 | — | 2,860,000 | 23,051,600 | 1,704,019 | ||||||||||||||||||
KKR Financial Holdings, LLC* | 6,450,000 | 5,450,000 | — | 11,900,000 | 88,417,000 | 5,578,000 | ||||||||||||||||||
KKR Financial Holdings, LLC, 7.0%, 7/15/2012* | 61,600,000 | — | — | 61,600,000 | 63,140,000 | 8,205,909 | ||||||||||||||||||
KKR Financial Holdings, LLC, 7.5%, 1/15/2017* | 21,750,000 | 1,000,000 | — | 22,750,000 | 27,783,437 | 598,106 | ||||||||||||||||||
MFA Financial, Inc.* | 7,800,500 | 10,199,500 | — | 18,000,000 | 126,360,000 | 10,761,357 | ||||||||||||||||||
Solar Capital Ltd.* | 1,901,000 | 1,852,599 | 3,599 | 3,750,000 | 75,487,500 | 8,512,020 | ||||||||||||||||||
Invesco Mortgage Capital, Inc.** | 1,915,165 | — | — | — | — | — | ||||||||||||||||||
|
|
|
| |||||||||||||||||||||
| $ | 483,839,537 | $ | 45,491,097 | |||||||||||||||||||||
|
|
|
| |||||||||||||||||||||
Total non-controlled affiliated issuers – 5.48% of net assets at September 30, 2011.
| * | Issuer not affiliated at September 30, 2010. |
| ** | Issuer not affiliated at September 30, 2011. |
| b | Securities exempt from registration under Rule 144A of the Securities Act of 1933, as amended. These securities may only be resold in the ordinary course of business in transactions exempt from registration, normally to qualified institutional buyers. As of September 30, 2011, the aggregate value of these securities in the Fund’s portfolio was $403,447,274, representing 4.57% of the Fund’s net assets. |
| c | Yankee Bond - Denominated in U.S. dollars and is issued in the U.S. by foreign banks and corporations. |
| d | Non-income producing. |
| e | Security currently fair valued by the valuation and pricing committee using procedures approved by the Trustees. |
| f | Bond in default. |
| g | Segregated as collateral for a when-issued security. |
| h | When-issued security. |
28 Certified Annual Report
| SCHEDULE OF INVESTMENTS, CONTINUED | ||
| Thornburg Investment Income Builder Fund | September 30, 2011 | |
Portfolio Abbreviations
To simplify the listings of securities, abbreviations are used per the table below:
ADR | American Depository Receipts | |
ARM | Adjustable Rate Mortgage | |
AUD | Denominated in Australian Dollars | |
BRL | Denominated in Brazilian Real | |
CAD | Denominated in Canadian Dollars | |
CPI | Consumer Price Index | |
EUR | Denominated in Euros | |
FCB | Farm Credit Bank | |
HKD | Denominated in Hong Kong Dollars | |
LIBOR | London Interbank Offered Rate | |
MFA | Mortgage Finance Authority | |
Mtg | Mortgage | |
Pfd | Preferred Stock | |
REIT | Real Estate Investment Trust | |
REMIC | Real Estate Mortgage Investment Conduit |
See notes to financial statements.
Certified Annual Report 29
| STATEMENT OF ASSETS AND LIABILITIES | ||
| Thornburg Investment Income Builder Fund | September 30, 2011 | |
ASSETS | ||||
Investments at value | ||||
Non-affiliated issuers (cost $8,411,029,637) (Note 2) | $ | 8,188,373,768 | ||
Non-controlled affiliated issuers (cost $533,899,635) (Note 2) | 483,839,537 | |||
Cash | 1,407,436 | |||
Cash denominated in foreign currency (cost $44,025,603) | 41,844,292 | |||
Receivable for investments sold | 61,125,269 | |||
Receivable for fund shares sold | 40,834,681 | |||
Unrealized appreciation on forward currency contracts (Note 7) | 93,753,638 | |||
Dividends receivable | 33,899,261 | |||
Dividend and interest reclaim receivable | 8,193,314 | |||
Interest receivable | 34,984,680 | |||
Prepaid expenses and other assets | 72,781 | |||
|
| |||
Total Assets | 8,988,328,657 | |||
|
| |||
LIABILITIES | ||||
Payable for investments purchased | 120,597,510 | |||
Payable for fund shares redeemed | 12,636,549 | |||
Unrealized depreciation on forward currency contracts (Note 7) | 5,996,819 | |||
Payable to investment advisor and other affiliates (Note 3) | 8,864,428 | |||
Accounts payable and accrued expenses | 1,843,879 | |||
Dividends payable | 7,818,013 | |||
|
| |||
Total Liabilities | 157,757,198 | |||
|
| |||
NET ASSETS | $ | 8,830,571,459 | ||
|
| |||
NET ASSETS CONSIST OF: | ||||
Undistributed net investment income | $ | 34,187,394 | ||
Net unrealized depreciation on investments and foreign currency translations | (187,724,769 | ) | ||
Accumulated net realized gain (loss) | (828,770,894 | ) | ||
Net capital paid in on shares of beneficial interest | 9,812,879,728 | |||
|
| |||
| $ | 8,830,571,459 | |||
|
| |||
30 Certified Annual Report
| STATEMENT OF ASSETS AND LIABILITIES, CONTINUED | ||||
| Thornburg Investment Income Builder Fund | September 30, 2011 | |||
NET ASSET VALUE: | ||||
Class A Shares: | ||||
Net asset value and redemption price per share ($2,734,844,570 applicable to 158,220,010 shares of beneficial interest outstanding - Note 4) | $ | 17.29 | ||
Maximum sales charge, 4.50% of offering price | 0.81 | |||
|
| |||
Maximum offering price per share | $ | 18.10 | ||
|
| |||
Class C Shares: | ||||
Net asset value and offering price per share* ($3,167,624,142 applicable to 183,241,460 shares of beneficial interest outstanding - Note 4) | $ | 17.29 | ||
|
| |||
Class I Shares: | ||||
Net asset value, offering and redemption price per share ($2,878,654,917 applicable to 165,410,898 shares of beneficial interest outstanding - Note 4) | $ | 17.40 | ||
|
| |||
Class R3 Shares: | ||||
Net asset value, offering and redemption price per share ($34,861,346 applicable to 2,017,065 shares of beneficial interest outstanding - Note 4) | $ | 17.28 | ||
|
| |||
Class R4 Shares: | ||||
Net asset value, offering and redemption price per share ($10,162,427 applicable to 586,938 shares of beneficial interest outstanding - Note 4) | $ | 17.31 | ||
|
| |||
Class R5 Shares: | ||||
Net asset value, offering and redemption price per share ($4,424,057 applicable to 254,326 shares of beneficial interest outstanding - Note 4) | $ | 17.40 | ||
|
| |||
| * | Redemption price per share is equal to net asset value less any applicable contingent deferred sales charge. |
See notes to financial statements.
Certified Annual Report 31
| STATEMENT OF OPERATIONS | ||
| Thornburg Investment Income Builder Fund | Year Ended September 30, 2011 | |
INVESTMENT INCOME: | ||||
Dividend income | ||||
Non-affiliated issuers (net of foreign taxes withheld of $31,351,392) | $ | 408,899,352 | ||
Non-controlled affiliated issuers | 36,684,397 | |||
Interest income (net of premium amortized of $1,396,222) | ||||
Non-affiliated issuers | 123,914,794 | |||
Non-controlled affiliated issuers | 8,806,701 | |||
|
| |||
Total Income | 578,305,244 | |||
|
| |||
EXPENSES: | ||||
Investment advisory fees (Note 3) | 57,141,355 | |||
Administration fees (Note 3) | ||||
Class A Shares | 3,236,484 | |||
Class C Shares | 3,676,734 | |||
Class I Shares | 1,260,253 | |||
Class R3 Shares | 40,875 | |||
Class R4 Shares | 7,962 | |||
Class R5 Shares | 2,431 | |||
Distribution and service fees (Note 3) | ||||
Class A Shares | 6,508,918 | |||
Class C Shares | 29,405,957 | |||
Class R3 Shares | 163,442 | |||
Class R4 Shares | 15,981 | |||
Transfer agent fees | ||||
Class A Shares | 1,985,960 | |||
Class C Shares | 2,335,305 | |||
Class I Shares | 1,572,860 | |||
Class R3 Shares | 47,126 | |||
Class R4 Shares | 13,657 | |||
Class R5 Shares | 11,146 | |||
Registration and filing fees | ||||
Class A Shares | 162,279 | |||
Class C Shares | 130,212 | |||
Class I Shares | 156,690 | |||
Class R3 Shares | 19,482 | |||
Class R4 Shares | 19,743 | |||
Class R5 Shares | 23,448 | |||
Custodian fees (Note 3) | 1,890,330 | |||
Professional fees | 170,450 | |||
Accounting fees | 259,085 | |||
Trustee fees | 198,795 | |||
Other expenses | 1,101,631 | |||
|
| |||
Total Expenses | 111,558,591 | |||
Less: | ||||
Expenses reimbursed by investment advisor (Note 3) | (1,808,830 | ) | ||
|
| |||
Net Expenses | 109,749,761 | |||
|
| |||
Net Investment Income | $ | 468,555,483 | ||
|
| |||
32 Certified Annual Report
| STATEMENT OF OPERATIONS, CONTINUED | ||
| Thornburg Investment Income Builder Fund | Year Ended September 30, 2011 | |
REALIZED AND UNREALIZED GAIN (LOSS) | ||||
Net realized gain (loss) from: | ||||
Investments | ||||
Non-affiliated issuers (net of foreign capital gains tax paid of $2,523,198) | $ | 88,129,922 | ||
Non-controlled affiliated issuers | (1,767 | ) | ||
Forward currency contracts (Note 7) | (103,315,178 | ) | ||
Foreign currency transactions | (3,827,699 | ) | ||
|
| |||
| (19,014,722 | ) | |||
|
| |||
Net change in unrealized appreciation (depreciation) on: | ||||
Investments | ||||
Non-affiliated issuers | (681,657,580 | ) | ||
Non-controlled affiliated issuers | (74,028,366 | ) | ||
Forward currency contracts (Note 7) | 117,085,682 | |||
Foreign currency translations | (3,465,957 | ) | ||
|
| |||
| (642,066,221 | ) | |||
|
| |||
Net Realized and Unrealized Loss | (661,080,943 | ) | ||
|
| |||
Net Decrease in Net Assets Resulting from Operations | $ | (192,525,460 | ) | |
|
|
See notes to financial statements.
Certified Annual Report 33
| STATEMENTS OF CHANGES IN NET ASSETS |
| Thornburg Investment Income Builder Fund |
| Year Ended September 30, 2011 | Year Ended September 30, 2010 | |||||||
INCREASE (DECREASE) IN NET ASSETS FROM | ||||||||
OPERATIONS: | ||||||||
Net investment income | $ | 468,555,483 | $ | 298,606,872 | ||||
Net realized gain (loss) on investments, forward currency contracts and foreign currency transactions, net of foreign capital gain taxes | (19,014,722 | ) | (58,389,099 | ) | ||||
Net unrealized appreciation (depreciation) on investments, forward currency contracts and foreign currency translations | (642,066,221 | ) | 297,073,577 | |||||
|
|
|
| |||||
Net Increase (Decrease) in Net Assets Resulting from Operations | (192,525,460 | ) | 537,291,350 | |||||
DIVIDENDS TO SHAREHOLDERS: | ||||||||
From net investment income | ||||||||
Class A Shares | (156,072,470 | ) | (105,095,569 | ) | ||||
Class C Shares | (157,547,088 | ) | (100,021,633 | ) | ||||
Class I Shares | (160,430,480 | ) | (82,223,032 | ) | ||||
Class R3 Shares | (1,872,389 | ) | (1,088,290 | ) | ||||
Class R4 Shares | (371,383 | ) | (59,426 | ) | ||||
Class R5 Shares | (302,648 | ) | (114,390 | ) | ||||
FUND SHARE TRANSACTIONS (NOTE 4): | ||||||||
Class A Shares | 913,176,735 | 529,891,266 | ||||||
Class C Shares | 1,170,437,918 | 715,272,973 | ||||||
Class I Shares | 1,426,933,566 | 707,722,464 | ||||||
Class R3 Shares | 13,878,035 | 7,823,039 | ||||||
Class R4 Shares | 9,181,603 | 1,799,483 | ||||||
Class R5 Shares | 1,448,645 | 2,943,638 | ||||||
|
|
|
| |||||
Net Increase in Net Assets | 2,865,934,584 | 2,214,141,873 | ||||||
NET ASSETS: | ||||||||
Beginning of Year | 5,964,636,875 | 3,750,495,002 | ||||||
|
|
|
| |||||
End of Year | $ | 8,830,571,459 | $ | 5,964,636,875 | ||||
|
|
|
| |||||
Undistributed net investment income | $ | 34,187,394 | $ | 29,915,619 | ||||
See notes to financial statements.
34 Certified Annual Report
| NOTES TO FINANCIAL STATEMENTS | ||
| Thornburg Investment Income Builder Fund | September 30, 2011 | |
NOTE 1 – ORGANIZATION
Thornburg Investment Income Builder Fund, hereinafter referred to as the “Fund,” is a diversified series of Thornburg Investment Trust (the “Trust”). The Trust was organized as a Massachusetts business trust under a Declaration of Trust dated June 3, 1987 and is registered as a diversified, open-end management investment company under the Investment Company Act of 1940, as amended. The Fund is currently one of sixteen separate series of the Trust. Each series is considered to be a separate entity for financial reporting and tax purposes and bears expenses directly attributable to it. The Fund’s primary investment goal is to provide a level of current income which exceeds the average yield on U.S. stocks generally, and which will generally grow, subject to periodic fluctuations, over the years on a per share basis. The Fund’s secondary investment goal is long-term capital appreciation.
The Fund currently offers six classes of shares of beneficial interest outstanding: Class A, Class C, Institutional Class (Class I), and Retirement Classes (Class R3, Class R4, and Class R5). Each class of shares of the Fund represents an interest in the same portfolio of investments, except that (i) Class A shares are sold subject to a front-end sales charge collected at the time the shares are purchased and bear a service fee, (ii) Class C shares are sold at net asset value without a sales charge at the time of purchase, but are subject to a contingent deferred sales charge upon redemption within one year of purchase, and bear both a service fee and a distribution fee, (iii) Class I shares are sold at net asset value without a sales charge at the time of purchase, (iv) Class R3 shares are sold at net asset value without a sales charge at the time of purchase, but bear both a service fee and distribution fee, (v) Class R4 shares are sold at net asset value without sales charge at the time of purchase, but bear a service fee, (vi) Class R5 shares are sold at net asset value without a sales charge at the time of purchase, and (vii) the respective classes may have different reinvestment privileges and conversion rights. Additionally, the Fund may allocate among its classes certain expenses, to the extent allowable to specific classes, including transfer agent fees, government registration fees, certain printing and postage costs, and administrative and legal expenses. Currently, class specific expenses of the Fund are limited to service and distribution fees, administration fees, and certain registration and transfer agent expenses.
NOTE 2 – SIGNIFICANT ACCOUNTING POLICIES
Significant accounting policies of the Trust are as follows:
Valuation of Investments: Portfolio securities listed or traded on a national securities exchange are valued on the valuation date at the last reported sale price on the exchange that is the primary market for the security. Portfolio securities traded on an exchange for which there has been no sale that day and other equity securities traded in the over-the-counter market are valued at the mean between the last reported bid and asked prices. Portfolio securities reported by NASDAQ are valued at the NASDAQ official closing price. Any foreign security traded on exchanges outside the United States is valued at the price of the security on the exchange that is normally the security’s primary market, as of the close of that exchange preceding the time of the Fund’s valuation.
Debt obligations held by the Fund have a primary market over the counter and are valued by an independent pricing service approved by the Trustees of the Trust. The pricing service ordinarily values debt obligations at quoted bid prices. When quotations are not available, debt obligations held by the Fund are valued at evaluated prices determined by the pricing service using methods which include consideration of yields or prices of debt obligations of comparable quality, type of issue, coupon, maturity and rating, and indications as to value from dealers and general market conditions. Short-term obligations having remaining maturities of 60 days or less are ordinarily valued at amortized cost, which approximates market value.
Quotations in foreign currencies for foreign portfolio investments are converted to U.S. dollar equivalents using the foreign exchange quotation in effect at the time of valuation.
In any case where the market value of an equity security held by the Fund is not readily available, the Trust’s valuation and pricing committee determines a fair value for the security using procedures approved by the Trustees, which may include the use of a price obtained from an independent pricing service. The pricing service ordinarily values equity securities in these instances using multi-factor models to adjust market prices based upon various inputs, including exchange data, depository receipt prices, futures and index data and other data. A security’s market value is deemed not readily available whenever the exchange or market on which the security is primarily traded is closed for the entire scheduled day of trading. Additionally, a security’s market value may be deemed not readily available under other circumstances identified by the Trustees, including when developments occurring after the most recent close of the security’s primary exchange or market, but before the most recent close of trading in Fund shares, or an unusual event or significant
Certified Annual Report 35
| NOTES TO FINANCIAL STATEMENTS, CONTINUED | ||
| Thornburg Investment Income Builder Fund | September 30, 2011 | |
period of time occurring since the availability of a market quotation, create a question about the reliability of the security’s market value.
In any case where a pricing service fails to provide a price for a debt obligation held by the Fund, the valuation and pricing committee determines a fair value for the debt obligation using procedures approved by the Trustees. Additionally, in any case where management believes that a price provided by a pricing service for a debt obligation held by the Fund may be unreliable, the valuation and pricing committee decides whether or not to use the pricing service’s valuation or to determine a fair value for the debt obligation.
In determining fair value for any portfolio security or other investment, the valuation and pricing committee seeks to determine the amount that an owner of the investment might reasonably expect to receive upon a sale of the investment. However, because fair value prices are estimated prices, the valuation and pricing committee’s determination of fair value for an investment may differ from the value that would be realized by the Fund upon a sale of the investment, and that difference could be material to the Fund’s financial statements. The valuation and pricing committee’s determination of fair value for an investment may also differ from the prices obtained by other persons (including other mutual funds) for the investment.
Valuation Measurements: Various inputs are used in determining the value of the Fund’s investments. These inputs are summarized in the three levels listed below:
Level 1: Quoted prices in active markets for identical investments.
Level 2: Other significant observable inputs (including quoted prices for similar investments, interest rates, prepayment rates, credit risk, etc.).
Level 3: Significant unobservable inputs (including the Fund’s own assumptions in determining the fair value of investments).
The following table displays a summary of the inputs used to value the Fund’s net assets as of September 30, 2011. In any instance when valuation inputs from more than one level are used to determine the fair value of a specific investment, the investment is placed in the level of the table based upon the lowest level input that is significant in determining the fair value of the investment:
| Fair Value Measurements at September 30, 2011 | ||||||||||||||||
| Total | Level 1 | Level 2 | Level 3 | |||||||||||||
Assets | ||||||||||||||||
Investments in Securities* | ||||||||||||||||
Common Stock | $ | 6,368,623,024 | $ | 6,368,623,024 | $ | — | $ | — | ||||||||
Preferred Stock(a) | 335,400,582 | 260,945,419 | 74,455,163 | — | ||||||||||||
Asset Backed Securities | 21,290,294 | — | 21,290,294 | — | ||||||||||||
Corporate Bonds | 1,297,308,177 | — | 1,282,063,889 | 15,244,288 | ||||||||||||
Convertible Bonds | 163,886,373 | — | 163,886,373 | — | ||||||||||||
Municipal Bonds | 3,912,486 | — | 3,912,486 | — | ||||||||||||
U.S. Government Agencies | 10,085,453 | — | 10,085,453 | — | ||||||||||||
Foreign Bonds | 186,275,809 | — | 171,108,418 | 15,167,391 | ||||||||||||
Other Securities | 21,431,475 | — | 19,297,607 | 2,133,868 | ||||||||||||
Short Term Investments | 263,999,632 | — | 263,999,632 | — | ||||||||||||
|
|
|
|
|
|
|
| |||||||||
Total Investments in Securities | $ | 8,672,213,305 | $ | 6,629,568,443 | $ | 2,010,099,315 | $ | 32,545,547 | ||||||||
Other Financial Instruments** | ||||||||||||||||
Forward Currency Contracts | $ | 93,753,638 | $ | — | $ | 93,753,638 | $ | — | ||||||||
Spot Currency | $ | 592,085 | $ | 592,085 | $ | — | $ | — | ||||||||
Liabilities | ||||||||||||||||
Other Financial Instruments** | ||||||||||||||||
Forward Currency Contracts | $ | (5,996,819 | ) | $ | — | $ | (5,996,819 | ) | $ | — | ||||||
Spot Currency | $ | (86,854 | ) | $ | (86,854 | ) | $ | — | $ | — | ||||||
36 Certified Annual Report
| NOTES TO FINANCIAL STATEMENTS, CONTINUED | ||
| Thornburg Investment Income Builder Fund | September 30, 2011 | |
| (a) | At September 30, 2011, industry classifications for Preferred Stock in Level 2 consist of $34,650,000 in Utilities, $17,329,688 in Telecommunication Services, $10,392,188 in Miscellaneous, $7,620,000 in Banks, and $4,463,287 in Diversified Financials. |
| * | See Schedule of Investments for a summary of the industry exposure as grouped according to the Global Industry Classification Standard (GICS), which is an industry taxonomy developed by MSCI, Inc. and Standard & Poor’s (S&P). |
| ** | Other Financial Instruments include investments not reflected in the Schedule of Investments, such as futures, forwards and swap contracts, which are valued at the unrealized appreciation (depreciation) on the investment. |
A rollforward of fair value measurements using significant unobservable inputs (Level 3) for the year ended September 30, 2011, is as follows:
Beginning Balance 9/30/2010 | $ | 31,312,142 | ||
Accrued Discounts (Premiums) | 168,302 | |||
Net Realized Gain (Loss) | 43,261 | |||
Gross Purchases | 22,084,056 | |||
Gross Sales | (12,622,569 | ) | ||
Change in Unrealized Appreciation (Depreciation) | (4,258,542 | ) | ||
Transfers into Level 3(a) | 3,675,048 | |||
Transfers out of Level 3(a) | (7,856,151 | ) | ||
|
| |||
Ending Balance 9/30/2011(b) | $ | 32,545,547 |
The change in unrealized appreciation (depreciation) on investments still held at September 30, 2011, was $(3,909,174).
| (a) | Transfers into and/or out of Level 3 were to/from Level 2, and were due to changes in the availability of other significant observable inputs during the year ended September 30, 2011. Transfers into or out of Level 3 are based on the beginning market value of the period in which they occurred. |
| (b) | Level 3 Securities represent 0.37% of Total Net Assets at the period ended September 30, 2011. |
Other Notes: It is the policy of the Fund to recognize significant transfers between Levels 1, 2 and 3 and to disclose those transfers at the beginning of the reporting period. The Fund recognized no significant transfers between Levels 1 and 2 for the year ended September 30, 2011.
Foreign Currency Translation: Portfolio securities and other assets and liabilities denominated in foreign currencies are translated into U.S. dollars based on the exchange rate of such currencies against the U.S. dollar on the date of valuation. Purchases and sales of securities and income items denominated in foreign currencies are translated into U.S. dollars at the exchange rate in effect on the translation date. When the Fund purchases or sells foreign securities, it will customarily enter into a foreign exchange contract to minimize foreign exchange risk from the trade date to the settlement date of such transactions. Such spot contracts are included in Receivable for investments sold and Payable for investments purchased on the Statement of Assets and Liabilities.
The Fund does not separately report the effect of changes in foreign exchange rates from changes in market prices on securities held. Such changes are included in net realized and unrealized gain or loss from investments.
Reported net realized foreign exchange gains or losses arise from purchases and sales of foreign currencies, currency gains or losses realized between the trade and settlement dates on securities transactions and the difference between the amounts of dividends, interest, and foreign withholding taxes recorded on the Fund’s books, and the U.S. dollar equivalent of the amounts actually received or paid.
Net unrealized foreign exchange gains and losses arise from changes in the fair value of assets and liabilities, other than investments in securities at fiscal period end, resulting from changes in exchange rates.
Certified Annual Report 37
| NOTES TO FINANCIAL STATEMENTS, CONTINUED | ||
| Thornburg Investment Income Builder Fund | September 30, 2011 | |
Deferred Taxes: The Fund is subject to a tax imposed on net realized gains of securities of certain foreign countries. The Fund records an estimated deferred tax liability for net unrealized gains on these securities as reflected in the accompanying financial statements.
Federal Income Taxes: It is the policy of the Trust to comply with the provisions of the Internal Revenue Code applicable to “regulated investment companies,” and to distribute to shareholders substantially all taxable income, including any net realized gain on investments of the Fund. Therefore, no provision for federal income taxes is required.
Management reviews each uncertain tax position believed to be material to the preparation of the Fund’s financial statements, to assess if it is more likely than not that the position would be sustained upon examination, based upon the technical merits of the position. As of September 30, 2011, management has not identified any such position for which a liability must be reflected in the Statement of Assets and Liabilities. The Fund’s tax returns remain subject to examination for three years after filing.
When-Issued and Delayed Delivery Transactions: The Fund may engage in when-issued or delayed delivery transactions. To the extent the Fund engages in such transactions, it will do so for the purpose of acquiring portfolio securities consistent with the Fund’s investment objectives and not for the purpose of investment leverage or to speculate on interest rate and/or market changes. At the time the Fund makes a commitment to purchase a security on a when-issued or delayed delivery basis, the Fund will record the transaction and reflect the value in determining its net asset value. When effecting such transactions, assets of an amount sufficient to make payment for the portfolio securities to be purchased will be segregated on the Fund’s records on the trade date. Securities purchased on a when-issued or delayed delivery basis do not earn interest until the settlement date.
Dividends: Net investment income of the Fund is declared daily as a dividend on shares for which the Fund has received payment. Dividends are paid quarterly and are reinvested in additional shares of the Fund at net asset value per share at the close of business on the dividend payment date, or at the shareholder’s option, paid in cash. Net realized capital gains, to the extent available, will be distributed at least annually. Distributions to shareholders are based on income tax regulations, and therefore, their characteristics may differ for financial statement and tax purposes.
Repurchase Agreements: The Fund may invest excess cash in repurchase agreements whereby the Fund purchases securities, which serve as collateral, with an agreement to resell such collateral at the maturity date of the repurchase agreement. Securities pledged as collateral for repurchase agreements are held by the Fund’s custodian bank until maturity of the repurchase agreement. Provisions in the agreements require that the market value of the collateral is at least equal to the repurchase value in the event of default. In the event of default, the Fund has the right to liquidate the collateral and apply the proceeds in satisfaction of the obligation. Under certain circumstances, in the event of default or bankruptcy by the other party to the agreement, realization and/or retention of the collateral may be subject to legal proceedings.
General: Securities transactions are accounted for on a trade date basis. Interest income is accrued as earned and dividend income is recorded on the ex-dividend date. Certain income from foreign securities is recognized as soon as information is available to the Fund. Realized gains and losses from the sale of securities are recorded on an identified cost basis. Net investment income (other than class specific expenses) and realized and unrealized gains and losses are allocated daily to each class of shares based upon the relative net asset value of outstanding shares of each class of shares at the beginning of the day (after adjusting for the current share activity of the respective class). Expenses common to all Funds are allocated among the Funds comprising the Trust based upon their relative net asset values or other appropriate allocation methods.
Guarantees and Indemnifications: Under the Trust’s organizational documents, its officers and Trustees are indemnified against certain liabilities arising out of the performance of their duties to the Fund. Additionally, in the normal course of business the Trust enters into contracts with service providers that contain general indemnification clauses. The Trust’s maximum exposure under these arrangements is unknown. However, based on experience, the Trust expects the risk of loss to be remote.
Use of Estimates: The preparation of financial statements, in conformity with generally accepted accounting principles, requires management to make estimates and assumptions that affect the reported amounts of assets and liabilities and the disclosure of contingent assets and liabilities at the date of the financial statements and the reported amounts of increases and decreases in net assets from operations during the reporting period. Actual results could differ from those estimates.
38 Certified Annual Report
| NOTES TO FINANCIAL STATEMENTS, CONTINUED | ||
| Thornburg Investment Income Builder Fund | September 30, 2011 | |
NOTE 3 – INVESTMENT ADVISORY FEE AND OTHER TRANSACTIONS WITH AFFILIATES
Pursuant to an investment advisory agreement, Thornburg Investment Management, Inc. (the “Advisor”) serves as the investment advisor and performs services to the Fund for which the fees are payable at the end of each month. For the year ended September 30, 2011, these fees were payable at annual rates ranging from .875 of 1% to .675 of 1% per annum of the average daily net assets of the Fund depending on the Fund’s asset size. The Trust also has entered into administrative services agreements with the Advisor, whereby the Advisor will perform certain administrative services for the shareholders of each class of the Fund’s shares, and for which fees will be payable at an annual rate of up to .125 of 1% per annum of the average daily net assets attributable to each class of shares. For the year ended September 30, 2011, the Advisor contractually reimbursed certain class specific expenses, administrative fees, and distribution fees of $1,740,638 for Class C shares, $495 for Class I shares, $26,059 for Class R3 shares, $16,264 for Class R4 shares, and $25,374 for Class R5 shares.
The Trust has an underwriting agreement with Thornburg Securities Corporation (the “Distributor,” an affiliate of the Advisor), which acts as the distributor of the Fund’s shares. For the year ended September 30, 2011, the Distributor has advised the Fund that it earned commissions aggregating $2,293,618 from the sale of Class A shares, and collected contingent deferred sales charges aggregating $454,291 from redemptions of Class C shares of the Fund.
Pursuant to a service plan under Rule 12b-1 of the Investment Company Act of 1940, the Fund may reimburse to the Advisor an amount not to exceed .25 of 1% per annum of the average daily net assets attributable to each class of shares of the Fund for payments made by the Advisor to securities dealers and other financial institutions to obtain various shareholder and distribution related services. For the year ended September 30, 2011, there were no 12b-1 service plan fees charged for Class I and R5 shares. The Advisor may pay out of its own resources additional expenses for distribution of the Fund’s shares.
The Trust has also adopted distribution plans pursuant to Rule 12b-1, applicable only to the Fund’s Class C and Class R3 shares, under which the Fund compensates the Distributor for services in promoting the sale of Class C and Class R3 shares of the Fund at an annual rate of up to .75 of 1% per annum of the average daily net assets attributable to Class C shares, and an annual rate of up to .25 of 1% per annum of the average daily net assets attributable to Class R3 shares. Total fees incurred by the Distributor for each class of shares of the Fund under their respective Service and Distribution Plans for the year ended September 30, 2011, are set forth in the Statement of Operations.
The Trust has an agreement with the custodian bank to indirectly pay a portion of the custodian’s fees through credits earned by the Fund’s cash on deposit with the bank. This deposit agreement is an alternative to overnight investments. Custodial fees have been adjusted to reflect amounts that would have been paid without this agreement, with a corresponding adjustment reflected as fees paid indirectly in the Statement of Operations. For the year ended September 30, 2011, there were no custodial fees paid indirectly.
Certain officers and Trustees of the Trust are also officers or directors of the Advisor and Distributor. The compensation of independent Trustees is borne by the Trust.
NOTE 4 – SHARES OF BENEFICIAL INTEREST
At September 30, 2011, there were an unlimited number of shares of beneficial interest authorized. Transactions in shares of beneficial interest were as follows:
| Year Ended September 30, 2011 | Year Ended September 30, 2010 | |||||||||||||||
| Shares | Amount | Shares | Amount | |||||||||||||
Class A Shares | ||||||||||||||||
Shares sold | 66,659,959 | $ | 1,269,837,423 | 43,283,964 | $ | 770,088,645 | ||||||||||
Shares issued to shareholders in reinvestment of dividends | 6,426,882 | 118,738,328 | 4,439,224 | 79,354,477 | ||||||||||||
Shares repurchased | (25,120,651 | ) | (475,421,839 | ) | (18,042,158 | ) | (319,573,633 | ) | ||||||||
Redemption fees received* | — | 22,823 | — | 21,777 | ||||||||||||
|
|
|
|
|
|
|
| |||||||||
Net increase (decrease) | 47,966,190 | $ | 913,176,735 | 29,681,030 | $ | 529,891,266 | ||||||||||
|
|
|
|
|
|
|
| |||||||||
Certified Annual Report 39
| NOTES TO FINANCIAL STATEMENTS, CONTINUED | ||
| Thornburg Investment Income Builder Fund | September 30, 2011 | |
| Year Ended September 30, 2011 | Year Ended September 30, 2010 | |||||||||||||||
| Shares | Amount | Shares | Amount | |||||||||||||
Class C Shares | ||||||||||||||||
Shares sold | 75,008,220 | $ | 1,434,355,675 | 49,564,535 | $ | 883,762,048 | ||||||||||
Shares issued to shareholders in reinvestment of dividends | 6,023,434 | 111,069,630 | 3,972,825 | 71,048,461 | ||||||||||||
Shares repurchased | (19,855,761 | ) | (375,013,316 | ) | (13,520,528 | ) | (239,560,490 | ) | ||||||||
Redemption fees received* | — | 25,929 | — | 22,954 | ||||||||||||
|
|
|
|
|
|
|
| |||||||||
Net increase (decrease) | 61,175,893 | $ | 1,170,437,918 | 40,016,832 | $ | 715,272,973 | ||||||||||
|
|
|
|
|
|
|
| |||||||||
Class I Shares | ||||||||||||||||
Shares sold | 94,540,995 | $ | 1,813,011,672 | 54,684,137 | $ | 981,032,227 | ||||||||||
Shares issued to shareholders in reinvestment of dividends | 6,544,281 | 121,547,620 | 3,466,124 | 62,410,241 | ||||||||||||
Shares repurchased | (26,969,127 | ) | (507,647,985 | ) | (18,750,557 | ) | (335,736,228 | ) | ||||||||
Redemption fees received* | — | 22,259 | — | 16,224 | ||||||||||||
|
|
|
|
|
|
|
| |||||||||
Net increase (decrease) | 74,116,149 | $ | 1,426,933,566 | 39,399,704 | $ | 707,722,464 | ||||||||||
|
|
|
|
|
|
|
| |||||||||
Class R3 Shares | ||||||||||||||||
Shares sold | 1,105,342 | $ | 21,102,445 | 746,503 | $ | 13,383,203 | ||||||||||
Shares issued to shareholders in reinvestment of dividends | 90,089 | 1,663,483 | 55,329 | 988,963 | ||||||||||||
Shares repurchased | (465,040 | ) | (8,888,180 | ) | (368,316 | ) | (6,549,359 | ) | ||||||||
Redemption fees received* | — | 287 | — | 232 | ||||||||||||
|
|
|
|
|
|
|
| |||||||||
Net increase (decrease) | 730,391 | $ | 13,878,035 | 433,516 | $ | 7,823,039 | ||||||||||
|
|
|
|
|
|
|
| |||||||||
Class R4 Shares | ||||||||||||||||
Shares sold | 583,010 | $ | 11,071,807 | 105,112 | $ | 1,826,925 | ||||||||||
Shares issued to shareholders in reinvestment of dividends | 13,403 | 245,178 | 1,635 | 29,296 | ||||||||||||
Shares repurchased | (115,790 | ) | (2,135,440 | ) | (3,165 | ) | (56,750 | ) | ||||||||
Redemption fees received* | — | 58 | — | 12 | ||||||||||||
|
|
|
|
|
|
|
| |||||||||
Net increase (decrease) | 480,623 | $ | 9,181,603 | 103,582 | $ | 1,799,483 | ||||||||||
|
|
|
|
|
|
|
| |||||||||
Class R5 Shares | ||||||||||||||||
Shares sold | 165,122 | $ | 3,175,755 | 302,943 | $ | 5,496,684 | ||||||||||
Shares issued to shareholders in reinvestment of dividends | 13,662 | 255,898 | 6,243 | 111,969 | ||||||||||||
Shares repurchased | (107,125 | ) | (1,983,050 | ) | (150,901 | ) | (2,665,036 | ) | ||||||||
Redemption fees received* | — | 42 | — | 21 | ||||||||||||
|
|
|
|
|
|
|
| |||||||||
Net increase (decrease) | 71,659 | $ | 1,448,645 | 158,285 | $ | 2,943,638 | ||||||||||
|
|
|
|
|
|
|
| |||||||||
| * | The Fund charges a redemption fee of 1% of the Class A and Class I shares redeemed or exchanged within 30 days of purchase. Redemption fees charged to any class are allocated to all classes upon receipt of payment based on relative net asset values of each class or other appropriate allocation methods. |
NOTE 5 – SECURITIES TRANSACTIONS
For the year ended September 30, 2011, the Fund had purchase and sale transactions of investment securities (excluding short-term investments and U.S. Government obligations) of $5,596,078,046 and $2,410,172,176, respectively.
40 Certified Annual Report
| NOTES TO FINANCIAL STATEMENTS, CONTINUED | ||
| Thornburg Investment Income Builder Fund | September 30, 2011 | |
NOTE 6 – INCOME TAXES
At September 30, 2011, information on the tax components of capital is as follows:
Cost of investments for tax purposes | $ | 8,952,547,203 | ||
|
| |||
Gross unrealized appreciation on a tax basis | $ | 516,856,179 | ||
Gross unrealized depreciation on a tax basis | (797,190,077 | ) | ||
|
| |||
Net unrealized appreciation (depreciation) on investments (tax basis) | $ | (280,333,898 | ) | |
|
| |||
Distributable earnings - ordinary income (tax basis) | $ | 35,926,456 |
The Fund utilized $53,233,709 of capital loss carryforwards for the year ended September 30, 2011.
At September 30, 2011, the Fund had deferred tax basis currency losses occurring subsequent to October 31, 2010 of $1,625,459. For tax purposes, such losses will be reflected in the year ending September 30, 2012.
At September 30, 2011, the Fund had tax basis capital losses, which may be carried forward to offset future capital gains. To the extent such carryforwards are used, capital gain distributions may be reduced to the extent provided by regulations.
Such capital loss carryforwards expire as follows:
2017 | $ | 231,480,499 | ||
2018 | 493,662,779 | |||
|
| |||
| $ | 725,143,278 | |||
|
|
The Regulated Investment Company Modernization Act of 2010 (the “Act”) was signed into law on December 22, 2010. The Act makes changes to a number of tax rules impacting the Fund. Under the Act, future capital losses generated by the Fund may be carried over indefinitely, but these losses must be used prior to the utilization of any pre-enactment capital losses. Since pre-enactment capital losses may only be carried forward for eight years, there may be a greater likelihood that all or a portion of a Fund’s pre-enactment capital losses will expire unused. In general, the provisions of the Act will be effective for the Fund’s fiscal year ending September 30, 2012.
In order to account for permanent book/tax differences, the Fund increased undistributed net investment income by $13,474,705 and increased accumulated net realized loss by $13,474,705. This reclassification has no impact on the net asset value of the Fund. Reclassifications result primarily from foreign currency transactions, foreign capital gains tax, investments in REITs, passive foreign investment companies, partnerships, and recharacterization of income received.
The tax character of distributions paid for the years ended September 30, 2011, and September 30, 2010, was as follows:
| 2011 | 2010 | |||||||
Distributions from: | ||||||||
Ordinary income | $ | 476,596,458 | $ | 288,602,340 | ||||
Capital gains | — | — | ||||||
|
|
|
| |||||
Total Distributions | $ | 476,596,458 | $ | 288,602,340 | ||||
|
|
|
| |||||
Certified Annual Report 41
| NOTES TO FINANCIAL STATEMENTS, CONTINUED | ||
| Thornburg Investment Income Builder Fund | September 30, 2011 | |
NOTE 7 – DERIVATIVE FINANCIAL INSTRUMENTS WITH OFF-BALANCE SHEET RISK AND FOREIGN INVESTMENT RISK
The Fund may use a variety of derivative financial instruments to hedge or adjust the risks affecting its investment portfolio or to enhance investment returns. Provisions of FASB Accounting Standards Codification ASC 815-10-50 (“ASC 815”), require certain disclosures. The disclosures are intended to provide users of financial statements with an understanding of the use of derivative instruments by the Fund and how these derivatives affect the financial position, financial performance and cash flows of the Fund. The Fund does not designate any derivative instruments as hedging instruments under ASC 815. During the year ended September 30, 2011, the Fund’s principal exposure to derivative financial instruments of the type addressed by ASC 815 was investment in foreign exchange contracts. A foreign exchange contract is an agreement between two parties to exchange different currencies at a specified rate of exchange at an agreed upon future date. Foreign exchange contracts involve risks to the Fund, including the risk that a contract counterparty will not meet its obligations to the Fund, the risk that a change in a contract’s value may not correlate perfectly with the currency the contract was intended to track, and the risk that the Fund’s advisor is unable to correctly implement its strategy in using a contract. In any such instance, the Fund may not achieve the intended benefit of entering into a contract, and may experience a loss. Additionally, the Fund’s risk of loss may exceed the amounts recognized on the Statement of Assets and Liabilities.
The Fund entered into forward currency contracts during the year ended September 30, 2011 in the normal course of pursuing its investment objectives, in anticipation of purchasing foreign investments or with the intent of reducing the risk to the value of the Fund’s foreign investments from adverse changes in the relationship between the U.S. dollar and foreign currencies. In each case these contracts have been initiated in conjunction with foreign investment transactions.
These contracts are accounted for by the Fund under ASC 815. Unrealized gains and unrealized losses on outstanding contracts are reported in the Fund’s Statement of Assets and Liabilities at the Fund’s net equity, as measured by the difference between the forward exchange rates at the reporting date and the forward exchange rates at each contract’s inception date. Net realized gain (loss) on contracts closed during the period, and changes in net unrealized appreciation (depreciation) on outstanding contracts are recognized in the Fund’s Statement of Operations. Values of open currency contracts are indicative of the activity for the year ended September 30, 2011.
The following table displays the outstanding forward currency contracts at September 30, 2011:
Outstanding Forward Currency Contracts
to Buy or Sell at September 30, 2011
Contract Description | Buy/Sell | Contract Amount | Contract Value Date | Value USD | Unrealized Appreciation | Unrealized Depreciation | ||||||||||||||||
Euro | Sell | 883,126,300 | 02/29/2012 | 1,182,763,441 | $ | 87,788,600 | $ | — | ||||||||||||||
Great Britain Pound | Sell | 73,563,500 | 10/06/2011 | 114,712,694 | 3,844,450 | — | ||||||||||||||||
Great Britain Pound | Sell | 19,954,800 | 10/06/2011 | 31,116,911 | 1,352,941 | — | ||||||||||||||||
Swiss Franc | Buy | 30,199,500 | 10/06/2011 | 33,319,328 | — | (2,571,358 | ) | |||||||||||||||
Swiss Franc | Sell | 148,116,700 | 10/06/2011 | 163,418,235 | — | (2,701,329 | ) | |||||||||||||||
Thai Baht | Sell | 624,564,000 | 11/25/2011 | 20,026,201 | 767,647 | — | ||||||||||||||||
Thai Baht | Buy | 36,484,700 | 11/25/2011 | 1,169,856 | — | (43,470 | ) | |||||||||||||||
Thai Baht | Buy | 59,900,800 | 11/25/2011 | 1,920,677 | — | (69,317 | ) | |||||||||||||||
Thai Baht | Buy | 117,752,300 | 11/25/2011 | 3,775,644 | — | (135,093 | ) | |||||||||||||||
Thai Baht | Buy | 123,654,900 | 11/25/2011 | 3,964,906 | — | (154,178 | ) | |||||||||||||||
Thai Baht | Buy | 137,769,300 | 11/25/2011 | 4,417,475 | — | (154,414 | ) | |||||||||||||||
Thai Baht | Buy | 149,002,000 | 11/25/2011 | 4,777,643 | — | (167,660 | ) | |||||||||||||||
|
|
|
| |||||||||||||||||||
Total | $ | 93,753,638 | $ | (5,996,819 | ) | |||||||||||||||||
|
|
|
| |||||||||||||||||||
42 Certified Annual Report
| NOTES TO FINANCIAL STATEMENTS, CONTINUED | ||
| Thornburg Investment Income Builder Fund | September 30, 2011 | |
The unrealized appreciation (depreciation) of the outstanding forward currency contracts recognized in the Fund’s Statement of Assets and Liabilities at September 30, 2011 is disclosed in the following table:
Fair Values of Derivative Financial Instruments
at September 30, 2011
Asset Derivatives | Balance Sheet Location | Fair Value | ||||
Foreign exchange contracts | Assets - Unrealized appreciation on forward currency contracts | $ | 93,753,638 | |||
Liability Derivatives | Balance Sheet Location | Fair Value | ||||
Foreign exchange contracts | Liabilities - Unrealized depreciation on forward currency contracts | $ | (5,996,819 | ) | ||
The realized gains (losses) from forward currency contracts, and the change in unrealized appreciation (depreciation) of outstanding forward currency contracts recognized in the Fund’s Statement of Operations for the year ended September 30, 2011 are disclosed in the following tables:
Amount of Net Realized Gain (Loss)
on Derivative Financial Instruments Recognized in
Income for the Year Ended September 30, 2011
| Total | Forward Currency Contracts | |||||||
Foreign exchange contracts | $ | (103,315,178 | ) | $ | (103,315,178 | ) | ||
Net Change in Unrealized Appreciation (Depreciation)
of Derivative Financial Instruments Recognized in
Income for the Year Ended September 30, 2011
| Total | Forward Currency Contracts | |||||||
Foreign exchange contracts | $ | 117,085,682 | $ | 117,085,682 | ||||
OTHER NOTES:
Risks: The Fund’s investments subject it to risks including, but not limited to, management risk, market and economic risk, risks affecting specific issuers, credit risk, interest rate risk, prepayment risk, liquidity risk, and the risks associated with investments in smaller companies, non-U.S. issuers, and real estate investment trusts. Please see the Fund’s prospectus for a discussion of the risks associated with an investment in the Fund.
Subsequent Events: Fund management believes no events have occurred between September 30, 2011 and the date of issuance of the financial statements, which require adjustment to, or disclosure in the accompanying financial statements.
Certified Annual Report 43
| FINANCIAL HIGHLIGHTS | ||
| Thornburg Investment Income Builder Fund | ||
| PER SHARE PERFORMANCE (for a share outstanding throughout the Year)+ | RATIOS TO AVERAGE NET ASSETS | SUPPLEMENTAL DATA | ||||||||||||||||||||||||||||||||||||||||||||||||||||||||||
Unless | Net Asset Value Beginning of Year | Net Investment Income (Loss) | Net Realized & Unrealized Gain (Loss) on Investments | Total from Investment Operations | Dividends from Net Investment Income | Dividends from Net Realized Gains | Total Dividends | Net Asset Value End of Year | Net Investment Income (Loss) (%) | Expenses, After Expense Reductions (%) | Expenses, After Expense Reductions and Net of Custody Credits (%) | Expenses, Before Expense Reductions (%) | Total Return (%)(a) | Portfolio Turnover Rate (%) | Net Assets at End of Year (Thousands) | |||||||||||||||||||||||||||||||||||||||||||||
Class A Shares |
| |||||||||||||||||||||||||||||||||||||||||||||||||||||||||||
2011(b) | $ | 18.31 | 1.12 | (0.99 | ) | 0.13 | (1.15 | ) | — | (1.15 | ) | $ | 17.29 | 5.91 | 1.21 | 1.21 | 1.21 | 0.42 | 30.34 | $ | 2,734,845 | |||||||||||||||||||||||||||||||||||||||
2010(b) | $ | 17.38 | 1.14 | 0.90 | 2.04 | (1.11 | ) | — | (1.11 | ) | $ | 18.31 | 6.47 | 1.25 | 1.25 | 1.25 | 12.08 | 35.50 | $ | 2,018,202 | ||||||||||||||||||||||||||||||||||||||||
2009(b) | $ | 16.86 | 1.01 | 0.58 | 1.59 | (1.07 | ) | — | (1.07 | ) | $ | 17.38 | 7.03 | 1.30 | 1.30 | 1.30 | 10.89 | 63.05 | $ | 1,400,454 | ||||||||||||||||||||||||||||||||||||||||
2008(b) | $ | 23.35 | 1.04 | (6.04 | ) | (5.00 | ) | (1.02 | ) | (0.47 | ) | (1.49 | ) | $ | 16.86 | 5.01 | 1.25 | 1.25 | 1.25 | (22.48 | ) | 46.07 | $ | 1,393,268 | ||||||||||||||||||||||||||||||||||||
2007(b) | $ | 19.58 | 0.93 | 4.23 | 5.16 | (0.88 | ) | (0.51 | ) | (1.39 | ) | $ | 23.35 | 4.39 | 1.30 | 1.30 | 1.30 | 27.40 | 62.60 | $ | 1,697,061 | |||||||||||||||||||||||||||||||||||||||
Class C Shares |
| |||||||||||||||||||||||||||||||||||||||||||||||||||||||||||
2011 | $ | 18.31 | 0.99 | (0.99 | ) | — | (1.02 | ) | — | (1.02 | ) | $ | 17.29 | 5.23 | 1.90 | 1.90 | 1.96 | (0.26 | ) | 30.34 | $ | 3,167,624 | ||||||||||||||||||||||||||||||||||||||
2010 | $ | 17.39 | 1.03 | 0.89 | 1.92 | (1.00 | ) | — | (1.00 | ) | $ | 18.31 | 5.86 | 1.90 | 1.90 | 2.02 | 11.32 | 35.50 | $ | 2,234,953 | ||||||||||||||||||||||||||||||||||||||||
2009 | $ | 16.87 | 0.92 | 0.59 | 1.51 | (0.99 | ) | — | (0.99 | ) | $ | 17.39 | 6.44 | 1.90 | 1.90 | 2.08 | 10.27 | 63.05 | $ | 1,426,613 | ||||||||||||||||||||||||||||||||||||||||
2008 | $ | 23.37 | 0.90 | (6.04 | ) | (5.14 | ) | (0.89 | ) | (0.47 | ) | (1.36 | ) | $ | 16.87 | 4.36 | 1.90 | 1.90 | 2.03 | (23.02 | ) | 46.07 | $ | 1,399,947 | ||||||||||||||||||||||||||||||||||||
2007 | $ | 19.60 | 0.81 | 4.22 | 5.03 | (0.75 | ) | (0.51 | ) | (1.26 | ) | $ | 23.37 | 3.79 | 1.90 | 1.89 | 2.06 | 26.64 | 62.60 | $ | 1,535,532 | |||||||||||||||||||||||||||||||||||||||
Class I Shares |
| |||||||||||||||||||||||||||||||||||||||||||||||||||||||||||
2011 | $ | 18.43 | 1.21 | (1.02 | ) | 0.19 | (1.22 | ) | — | (1.22 | ) | $ | 17.40 | 6.31 | 0.87 | 0.87 | 0.87 | 0.74 | 30.34 | $ | 2,878,655 | |||||||||||||||||||||||||||||||||||||||
2010 | $ | 17.50 | 1.22 | 0.89 | 2.11 | (1.18 | ) | — | (1.18 | ) | $ | 18.43 | 6.87 | 0.93 | 0.93 | 0.93 | 12.39 | 35.50 | $ | 1,682,616 | ||||||||||||||||||||||||||||||||||||||||
2009 | $ | 16.97 | 1.07 | 0.59 | 1.66 | (1.13 | ) | — | (1.13 | ) | $ | 17.50 | 7.39 | 0.97 | 0.97 | 0.97 | 11.29 | 63.05 | $ | 908,126 | ||||||||||||||||||||||||||||||||||||||||
2008 | $ | 23.50 | 1.10 | (6.06 | ) | (4.96 | ) | (1.10 | ) | (0.47 | ) | (1.57 | ) | $ | 16.97 | 5.34 | 0.89 | 0.89 | 0.89 | (22.20 | ) | 46.07 | $ | 766,772 | ||||||||||||||||||||||||||||||||||||
2007 | $ | 19.71 | 1.02 | 4.24 | 5.26 | (0.96 | ) | (0.51 | ) | (1.47 | ) | $ | 23.50 | 4.74 | 0.95 | 0.94 | 0.95 | 27.80 | 62.60 | $ | 644,294 | |||||||||||||||||||||||||||||||||||||||
Class R3 Shares |
| |||||||||||||||||||||||||||||||||||||||||||||||||||||||||||
2011 | $ | 18.30 | 1.08 | (1.00 | ) | 0.08 | (1.10 | ) | — | (1.10 | ) | $ | 17.28 | 5.67 | 1.50 | 1.50 | 1.58 | 0.13 | 30.34 | $ | 34,861 | |||||||||||||||||||||||||||||||||||||||
2010 | $ | 17.38 | 1.11 | 0.88 | 1.99 | (1.07 | ) | — | (1.07 | ) | $ | 18.30 | 6.27 | 1.50 | 1.50 | 1.69 | 11.75 | 35.50 | $ | 23,550 | ||||||||||||||||||||||||||||||||||||||||
2009 | $ | 16.85 | 1.00 | 0.58 | 1.58 | (1.05 | ) | — | (1.05 | ) | $ | 17.38 | 6.93 | 1.50 | 1.50 | 1.87 | 10.74 | 63.05 | $ | 14,828 | ||||||||||||||||||||||||||||||||||||||||
2008 | $ | 23.34 | 1.00 | (6.05 | ) | (5.05 | ) | (0.97 | ) | (0.47 | ) | (1.44 | ) | $ | 16.85 | 4.89 | 1.49 | 1.49 | 1.77 | (22.69 | ) | 46.07 | $ | 11,848 | ||||||||||||||||||||||||||||||||||||
2007 | $ | 19.58 | 0.86 | 4.24 | 5.10 | (0.83 | ) | (0.51 | ) | (1.34 | ) | $ | 23.34 | 4.00 | 1.50 | 1.50 | 2.16 | 27.10 | 62.60 | $ | 7,544 | |||||||||||||||||||||||||||||||||||||||
Class R4 Shares |
| |||||||||||||||||||||||||||||||||||||||||||||||||||||||||||
2011 | $ | 18.34 | 1.15 | (1.06 | ) | 0.09 | (1.12 | ) | — | (1.12 | ) | $ | 17.31 | 6.02 | 1.40 | 1.40 | 1.65 | 0.19 | 30.34 | $ | 10,162 | |||||||||||||||||||||||||||||||||||||||
2010 | $ | 17.47 | 1.22 | 0.74 | 1.96 | (1.09 | ) | — | (1.09 | ) | $ | 18.34 | 6.89 | 1.40 | 1.40 | 3.60 | 11.52 | 35.50 | $ | 1,950 | ||||||||||||||||||||||||||||||||||||||||
2009 | $ | 16.94 | 1.01 | 0.59 | 1.60 | (1.07 | ) | — | (1.07 | ) | $ | 17.47 | 7.02 | 1.40 | 1.40 | 9.54 | (c) | 10.83 | 63.05 | $ | 48 | |||||||||||||||||||||||||||||||||||||||
2008(d) | $ | 21.22 | 0.66 | (4.39 | ) | (3.73 | ) | (0.55 | ) | — | (0.55 | ) | $ | 16.94 | 5.28 | (e) | 1.40 | (e) | 1.40 | (e) | 16.97 | (c)(e) | (17.79 | ) | 46.07 | $ | 251 | |||||||||||||||||||||||||||||||||
Class R5 Shares |
| |||||||||||||||||||||||||||||||||||||||||||||||||||||||||||
2011 | $ | 18.42 | 1.18 | (1.00 | ) | 0.18 | (1.20 | ) | — | (1.20 | ) | $ | 17.40 | 6.16 | 0.99 | 0.99 | 1.51 | 0.68 | 30.34 | $ | 4,424 | |||||||||||||||||||||||||||||||||||||||
2010 | $ | 17.50 | 1.36 | 0.74 | 2.10 | (1.18 | ) | — | (1.18 | ) | $ | 18.42 | 7.67 | 0.99 | 0.99 | 2.35 | 12.31 | 35.50 | $ | 3,366 | ||||||||||||||||||||||||||||||||||||||||
2009 | $ | 16.98 | 1.04 | 0.61 | 1.65 | (1.13 | ) | — | (1.13 | ) | $ | 17.50 | 7.14 | 0.99 | 0.99 | 9.20 | (c) | 11.19 | 63.05 | $ | 427 | |||||||||||||||||||||||||||||||||||||||
2008 | $ | 23.51 | 1.11 | (6.09 | ) | (4.98 | ) | (1.08 | ) | (0.47 | ) | (1.55 | ) | $ | 16.98 | 5.48 | 0.99 | 0.99 | 11.77 | (c) | (22.27 | ) | 46.07 | $ | 221 | |||||||||||||||||||||||||||||||||||
2007(f) | $ | 20.74 | 0.46 | 2.87 | 3.33 | (0.56 | ) | — | (0.56 | ) | $ | 23.51 | 3.17 | (e) | 0.99 | (e) | 0.98 | (e) | 278.77 | (c)(e) | 16.19 | 62.60 | $ | 72 | ||||||||||||||||||||||||||||||||||||
| (a) | Not annualized for periods less than one year. |
| (b) | Sales loads are not reflected in computing total return. |
| (c) | Due to the size of net assets and fixed expenses, ratios may appear disproportionate. |
| (d) | Effective date of this class of shares was February 1, 2008. |
| (e) | Annualized. |
| (f) | Effective date of this class of shares was February 1, 2007. |
| + | Based on weighted average shares outstanding. |
See notes to financial statements.
| 44 Certified Annual Report | Certified Annual Report 45 |
| REPORT OF INDEPENDENT REGISTERED PUBLIC ACCOUNTING FIRM | ||
| Thornburg Investment Income Builder Fund | September 30, 2011 | |
To the Trustees and Shareholders of
Thornburg Investment Income Builder Fund
In our opinion, the accompanying statement of assets and liabilities, including the schedule of investments, and the related statements of operations and of changes in net assets and the financial highlights present fairly, in all material respects, the financial position of Thornburg Investment Income Builder Fund (one of the portfolios constituting Thornburg Investment Trust, hereafter referred to as the “Fund”) at September 30, 2011, the results of its operations for the year then ended, the changes in its net assets for each of the two years in the period then ended and the financial highlights for each of the periods presented, in conformity with accounting principles generally accepted in the United States of America. These financial statements and financial highlights (hereafter referred to as “financial statements”) are the responsibility of the Fund’s management. Our responsibility is to express an opinion on these financial statements based on our audits. We conducted our audits of these financial statements in accordance with the standards of the Public Company Accounting Oversight Board (United States). Those standards require that we plan and perform the audit to obtain reasonable assurance about whether the financial statements are free of material misstatement. An audit includes examining, on a test basis, evidence supporting the amounts and disclosures in the financial statements, assessing the accounting principles used and significant estimates made by management, and evaluating the overall financial statement presentation. We believe that our audits, which included confirmation of securities at September 30, 2011 by correspondence with the custodian and brokers, provide a reasonable basis for our opinion.
PricewaterhouseCoopers LLP
New York, New York
November 21, 2011
46 Certified Annual Report
| EXPENSE EXAMPLE | ||
| Thornburg Investment Income Builder Fund | September 30, 2011 (Unaudited) | |
As a shareholder of the Fund, you incur two types of costs:
| (1) | transaction costs, including |
(a) sales charges (loads) on purchase payments for Class A shares;
(b) a deferred sales charge on redemptions of any part or all of a purchase of $1 million of Class A shares within 12 months of purchase;
(c) a deferred sales charge on redemptions of Class C shares within 12 months of purchase;
(d) a 30-day redemption fee on Class A and Class I shares;
| (2) | ongoing costs, including management fees; distribution and/or service (12b-1) fees; and other Fund expenses. |
This example is intended to help you understand your ongoing costs (in dollars) of investing in the Fund and to compare these costs with the ongoing costs of investing in other mutual funds.
The example is based on a $1,000 investment beginning on April 1, 2011, and held until September 30, 2011.
ACTUAL EXPENSES
For each class of shares, the first line of the table at right provides information about actual account values and actual expenses. You may use the information in this line, together with the amount you invested, to estimate the expenses that you paid over the period. Simply divide your account value by $1,000 (for example, an $8,600 account value divided by $1,000 = 8.6), then multiply the result by the number in the first line for your class of shares under the heading entitled “Expenses Paid During Period” to estimate the expenses you paid on your account during this period.
HYPOTHETICAL EXAMPLE FOR COMPARISON PURPOSES
For each class of shares, the second line of the table at right provides information about hypothetical account values and hypothetical expenses based on the Fund’s actual expense ratio and an assumed rate of return of 5% per year before expenses, which is not the Fund’s actual return. The hypothetical account values and expenses may not be used to estimate the actual ending account balance or expenses you paid for the period. You may use this information to compare the ongoing costs of investing in the Fund and other funds. To do so, compare this 5% hypothetical example with the 5% hypothetical examples that appear in the shareholder reports of the other funds.
| Beginning Account Value 4/1/11 | Ending Account Value 9/30/11 | Expenses Paid During Period† 4/1/11–9/30/11 | ||||||||||
Class A Shares | ||||||||||||
Actual | $ | 1,000.00 | $ | 910.50 | $ | 5.82 | ||||||
Hypothetical* | $ | 1,000.00 | $ | 1,018.97 | $ | 6.15 | ||||||
Class C Shares | ||||||||||||
Actual | $ | 1,000.00 | $ | 907.30 | $ | 9.08 | ||||||
Hypothetical* | $ | 1,000.00 | $ | 1,015.54 | $ | 9.60 | ||||||
Class I Shares | ||||||||||||
Actual | $ | 1,000.00 | $ | 911.90 | $ | 4.20 | ||||||
Hypothetical* | $ | 1,000.00 | $ | 1,020.68 | $ | 4.43 | ||||||
Class R3 Shares | ||||||||||||
Actual | $ | 1,000.00 | $ | 908.60 | $ | 7.18 | ||||||
Hypothetical* | $ | 1,000.00 | $ | 1,017.55 | $ | 7.59 | ||||||
Class R4 Shares | ||||||||||||
Actual | $ | 1,000.00 | $ | 909.40 | $ | 6.70 | ||||||
Hypothetical* | $ | 1,000.00 | $ | 1,018.05 | $ | 7.08 | ||||||
Class R5 Shares | ||||||||||||
Actual | $ | 1,000.00 | $ | 911.30 | $ | 4.74 | ||||||
Hypothetical* | $ | 1,000.00 | $ | 1,020.10 | $ | 5.01 | ||||||
| † | Expenses are equal to the annualized expense ratio for each class (A: 1.22%; C: 1.90%; I: 0.88%; R3: 1.50%; R4: 1.40%; R5: 0.99%) multiplied by the average account value over the period, multiplied by 183/365 to reflect the one-half year period. |
| * | Hypothetical assumes a rate of return of 5% per year before expenses. |
Please note that the expenses shown in the table are meant to highlight your ongoing costs only and do not reflect any transactional costs, such as sales charges (loads), redemption fees, or exchange fees. Therefore, the second line of the table for each class of shares is useful in comparing ongoing costs only, and will not help you determine the relative total costs of owning different funds. In addition, if these transactional costs were included, your costs would have been higher.
Certified Annual Report 47
| INDEX COMPARISON | ||
| Thornburg Investment Income Builder Fund | September 30, 2011 (Unaudited) | |
GROWTH OF A HYPOTHETICAL $10,000 INVESTMENT
Thornburg Investment Income Builder Fund versus S&P 500 Index and Blended Index
(December 24, 2002 to September 30, 2011)
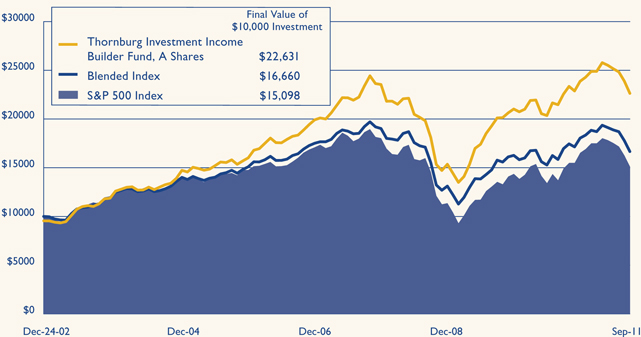
AVERAGE ANNUAL TOTAL RETURNS
For periods ended September 30, 2011 (with sales charge)
| 1 Yr | 5 Yrs | Since Inception | ||||||||||
A Shares (Incep: 12/24/02) | -4.09 | % | 3.32 | % | 9.76 | % | ||||||
C Shares (Incep: 12/24/02) | -1.20 | % | 3.60 | % | 9.73 | % | ||||||
I Shares (Incep: 11/3/03) | 0.74 | % | 4.61 | % | 8.89 | % | ||||||
R3 Shares (Incep: 2/1/05) | 0.13 | % | 4.02 | % | 6.48 | % | ||||||
R4 Shares (Incep: 2/1/08) | 0.19 | % | — | 0.49 | % | |||||||
R5 Shares (Incep: 2/1/07) | 0.68 | % | — | 2.77 | % | |||||||
Blended Index (Since 12/24/02) | -1.75 | % | 0.28 | % | 6.00 | % | ||||||
S&P 500 Index (Since 12/24/02) | 1.14 | % | -1.18 | % | 4.81 | % | ||||||
Performance data shown represents past performance and is no guarantee of future results. Investment return and principal value will fluctuate so shares, when redeemed, may be worth more or less than their original cost. Current performance may be lower or higher than quoted. For performance current to the most recent month end, visit thornburg.com or call 800-847-0200. The performance data and graph do not reflect the deduction of taxes that a shareholder would pay on distributions or the redemption of Fund shares. Returns reflect the reinvestment of dividends and capital gains as well as applicable sales charges. Class A shares are sold with a maximum sales charge of 4.50% . Class C shares are subject to a 1% CDSC for the first year only. There is no up-front sales charge for Class I, R3, R4 and R5 shares. Class A and I shares are subject to a 1% 30-day redemption fee.
48 Certified Annual Report
| TRUSTEES AND OFFICERS | ||
| Thornburg Investment Income Builder Fund | September 30, 2011 (Unaudited) | |
Name, Age, | Principal Occupation(s) During Past Five Years | Other Directorships Held by Trustee | ||
INTERESTED TRUSTEES(1)(2)(4) | ||||
| Garrett Thornburg, 65 Chairman of Trustees, Trustee since 1987(3) | Chairman and controlling shareholder and, until 2008, CEO of Thornburg Investment Management, Inc. (investment advisor); Chairman, CEO, and controlling shareholder of Thornburg Securities Corporation (securities dealer); CEO until 2007 and Chairman until 2009 of TMST, Inc. (f/k/a Thornburg Mortgage, Inc.) (real estate investment trust); President and Sole Director of Thornburg Mortgage Advisory Corporation (investment manager to TMST, Inc.). | None | ||
| Brian J. McMahon, 55 Trustee since 2001, Member of Governance & Nominating Committee & Operations Risk Oversight Committee, President since 1997(5)(6) | CEO since 2008, President, Managing Director, Chief Investment Officer, and Portfolio Manager of Thornburg Investment Management, Inc. | None | ||
INDEPENDENT TRUSTEES(1)(2)(4) | ||||
| David A. Ater, 66 Trustee since 1994, Member of Audit Committee & Governance & Nominating Committee | Principal in Ater & Associates, Santa Fe, NM (developer, planner and broker of residential and commercial real estate); owner, developer and broker for various real estate projects. | None | ||
| David D. Chase, 70 Trustee since 2000, Chairman of Audit Committee | Managing Member of Vestor Associates, LLC, Santa Fe, NM (private equity fund); Managing Member of CS Group, LLC, Santa Fe, NM (merchant bank). | None | ||
| Eliot R. Cutler, 65 Trustee since 2004 & Nominating Committee, Chairman of Governance | Senior Counsel and, until 2009, Partner in Akin, Gump, Strauss, Hauer & Feld LLP (law firm) in Washington, D.C. and Beijing, China. | None | ||
| Susan H. Dubin, 62 Trustee since 2004, Member of Audit Committee | President of Dubin Investments, Ltd., Greenwich, CT (private investment fund); Director and officer of various charitable organizations. | None | ||
| Owen D. Van Essen, 57 Trustee since 2004, Member of Governance & Nominating Committee & Chairman of Operations Risk Oversight Committee | President of Dirks, Van Essen & Murray, Santa Fe, NM (newspaper mergers and acquisitions). | None | ||
Certified Annual Report 49
| TRUSTEES AND OFFICERS, CONTINUED | ||
| Thornburg Investment Income Builder Fund | September 30, 2011 (Unaudited) | |
Name, Age, | Principal Occupation(s) During Past Five Years | Other Directorships Held by Trustee | ||
| James W. Weyhrauch, 52 Trustee since 1996, Member of Audit Committee & Operations Risk Oversight Committee | Real estate broker, Santa Fe Properties, Santa Fe, NM; Vice Chairman of Nambe LLC, Santa Fe, NM (manufacturing & design company). | None | ||
OFFICERS OF THE FUND (WHO ARE NOT TRUSTEES)(1)(6)(7) | ||||
| George T. Strickland, 48 Vice President since 1996, Treasurer since 2007(6) | Portfolio Manager, Vice President, and Managing Director of Thornburg Investment Management, Inc. | Not applicable | ||
| William V. Fries, 72 Vice President since 1995 | Portfolio Manager, Vice President, and Managing Director of Thornburg Investment Management, Inc. | Not applicable | ||
| Leigh Moiola, 44 Vice President since 2001 | Vice President, Managing Director, and Director of Marketing of Thornburg Investment Management, Inc. | Not applicable | ||
| Alexander Motola, 41 Vice President since 2001 | Portfolio Manager, Vice President, and Managing Director of Thornburg Investment Management, Inc. | Not applicable | ||
| Wendy Trevisani, 40 Vice President since 1999 | Portfolio Manager and Managing Director of Thornburg Investment Management, Inc. | Not applicable | ||
| Joshua Gonze, 48 Vice President since 1999 | Portfolio Manager since 2007, Managing Director, and Associate Portfolio Manager until 2007 of Thornburg Investment Management, Inc. | Not applicable | ||
| Christopher Ihlefeld, 41 Vice President since 2003 | Portfolio Manager since 2007, Managing Director, and Associate Portfolio Manager until 2007 of Thornburg Investment Management, Inc. | Not applicable | ||
| Leon Sandersfeld, 45 Vice President since 2003 | Managing Director since 2007 and Fund Accounting Director of Thornburg Investment Management, Inc. | Not applicable | ||
| Sasha Wilcoxon, 37 Vice President since 2003 Secretary since 2007(6) | Managing Director since 2007, Director of Operations, and Vice President of Thornburg Investment Management, Inc. | Not applicable | ||
| Edward Maran, 53 Vice President since 2004 | Portfolio Manager and Managing Director of Thornburg Investment Management, Inc. | Not applicable | ||
| Vinson Walden, 41 Vice President since 2004 | Portfolio Manager and Managing Director of Thornburg Investment Management, Inc. | Not applicable | ||
| Thomas Garcia, 40 Vice President since 2006 | Vice President since 2011, Managing Director, Head Equity Trader, and Associate Portfolio Manager of Thornburg Investment Management, Inc. | Not applicable | ||
| Lei Wang, 40 Vice President since 2006 | Portfolio Manager and Managing Director of Thornburg Investment Management, Inc. | Not applicable | ||
50 Certified Annual Report
| TRUSTEES AND OFFICERS, CONTINUED | ||
| Thornburg Investment Income Builder Fund | September 30, 2011 (Unaudited) | |
Name, Age, | Principal Occupation(s) During Past Five Years | Other Directorships Held by Trustee | ||
| Connor Browne, 32 Vice President since 2006 | Portfolio Manager and Managing Director of Thornburg Investment Management, Inc. | Not applicable | ||
| Jason Brady, 37 Vice President since 2007 | Vice President since 2011, Portfolio Manager since 2007, Managing Director since 2007, and Associate Portfolio Manager 2006–2007 of Thornburg Investment Management, Inc. | Not applicable | ||
| Lewis Kaufman, 35 Vice President since 2007 | Portfolio Manager since 2007, Managing Director since 2007, and Associate Portfolio Manager until 2009 of Thornburg Investment Management, Inc. | Not applicable | ||
| Christopher Ryon, 55 Vice President since 2008 | Portfolio Manager since 2009, Managing Director since 2009, and Associate Portfolio Manager 2008–2009 of Thornburg Investment Management, Inc.; Principal of Vanguard Funds until 2008. | Not applicable | ||
| Lon Erickson, 36 Vice President since 2008 | Portfolio Manager since 2010, Managing Director since 2010, and Associate Portfolio Manager 2008–2010 of Thornburg Investment Management, Inc.; Senior Analyst of State Farm Insurance until 2008. | Not applicable | ||
| Kathleen Brady, 51 Vice President since 2008 | Senior Tax Accountant since 2007 of Thornburg Investment Management, Inc.; Chief Financial Officer of Vestor Partners, LP (private equity fund) until 2007. | Not applicable | ||
| Jack Gardner, 57 Vice President since 2008 | Managing Director since 2007 of Thornburg Investment Management, Inc.; President since 2008 and National Sales Director of Thornburg Securities Corporation. | Not applicable | ||
| Laura Hillstrom, 44 Vice President since 2009 | Chief Administrative Officer since 2009, Vice President and Managing Director, and Director of Information Systems until 2009 of Thornburg Investment Management, Inc. | Not applicable | ||
| (1) | Each person’s address is 2300 North Ridgetop Road, Santa Fe, New Mexico 87506. |
| (2) | The Fund is one of sixteen separate investment “Funds” or “series” of Thornburg Investment Trust (the “Trust”), which comprises the Thornburg mutual fund complex and is organized as a Massachusetts business trust. Thornburg Investment Management, Inc. is the investment advisor to, and manages, the sixteen Funds of the Trust. Each Trustee oversees the sixteen Funds of the Trust. |
| (3) | Mr. Thornburg is considered an “interested” Trustee under the Investment Company Act of 1940 because he is the sole director and controlling shareholder of Thornburg Investment Management, Inc., the investment advisor to the sixteen active Funds of the Trust, and is the sole director and controlling shareholder of Thornburg Securities Corporation, the distributor of shares for the Trust. |
| (4) | Each Trustee serves in office until the election and qualification of a successor. |
| (5) | Mr. McMahon is considered an “interested” Trustee because he is the chief executive officer and president of Thornburg Investment Management, Inc. |
| (6) | The Trust’s president, secretary, and treasurer each serves a one-year term or until the election and qualification of a successor; each other officer serves at the pleasure of the Trustees. |
| (7) | Assistant vice presidents, assistant secretaries and assistant treasurers are not shown. |
The Statement of Additional Information for each Fund of the Trust includes additional information about the Trustees and is available, without charge and upon request, by calling 1-800-847-0200.
Certified Annual Report 51
| OTHER INFORMATION | ||
| Thornburg Investment Income Builder Fund | September 30, 2011 (Unaudited) | |
PORTFOLIO PROXY VOTING
Policies and Procedures:
The Trust has delegated to Thornburg Investment Management, Inc. (the “Advisor”) voting decisions respecting proxies for the Fund’s voting securities. The Advisor makes voting decisions in accordance with its Proxy Voting Policy. A description of the Policy is available (i) without charge, upon request, by calling the Advisor toll-free at 1-800-847-0200, (ii) on the Thornburg website at www.thornburg. com, and (iii) on the Securities and Exchange Commission’s website at www.sec.gov.
Information regarding how proxies were voted is available on or before August 31 of each year for the twelve months ending the preceding June 30. This information is available (i) without charge, upon request by calling the Advisor toll-free at 1-800-847-0200, (ii) on the Thornburg website at www.thornburg.com, and (iii) on the Securities and Exchange Commission’s website at www.sec.gov.
TAX INFORMATION
For the tax year ended September 30, 2011, the Thornburg Investment Income Builder Fund designates 70.36% (or the maximum allowed) of the dividends paid from tax basis net ordinary income as qualifying for the reduced rate under the Jobs and Growth Tax Relief and Reconciliation Act of 2003.
17.71% (or the maximum allowed) of the ordinary income distributions paid by the Fund for the fiscal year ended September 30, 2011 qualified for the corporate dividends received deduction.
The information and distributions reported herein may differ from the information and distributions reported to the shareholders for the calendar year ending December 31, 2011. Complete information will be reported in conjunction with your 2011 Form 1099-DIV.
AVAILABILITY OF QUARTERLY PORTFOLIO SCHEDULE
The Fund files with the Securities and Exchange Commission schedules of its portfolio holdings on Form N-Q for the first and third quarters of each fiscal year. The Fund’s Forms N-Q are available on the Commission’s website at www.sec.gov, or may be reviewed and copied at the Commission’s Public Reference Room in Washington, D.C. Information on the operation of the Public Reference Room may be obtained by calling 1-800-SEC-0330. The Fund also makes this information available on its website at www.thornburg.com/ download or upon request by calling 1-800-847-0200.
STATEMENT RESPECTING RENEWAL OF INVESTMENT ADVISORY AGREEMENT
Thornburg Investment Management, Inc. (the “Advisor”) provides investment management services to Thornburg Investment Income Builder Fund pursuant to an investment advisory agreement. The Trustees consider the renewal of this agreement annually, and most recently determined to renew the agreement on September 13, 2011.
In anticipation of their recent consideration of the advisory agreement’s renewal, the independent Trustees met in May 2011 to plan the Trustees’ evaluation of the Advisor’s performance and to specify the information the Advisor would present to the Trustees for their review. The Advisor’s chief investment officer subsequently reviewed portions of the specified information with the Trustees and addressed questions presented by the Trustees at a meeting session scheduled for the purpose, and the independent Trustees thereafter met in independent session to consider the Advisor’s presentation and various specific issues respecting their consideration of the advisory agreement’s renewal. Following these sessions, the Trustees met to consider a renewal of the agreement, and the independent Trustees unanimously voted at that meeting to renew the agreement for an additional term of one year.
The information below summarizes certain factors considered by the Trustees in connection with the determination to renew the advisory agreement. In determining to renew the agreement, the Trustees did not identify any single factor as controlling, and this summary does not describe all of the matters considered by the Trustees in making their determination.
Quality of Services; Fund Investment Performance. The Trustees evaluated the nature, extent and quality of services provided by the Advisor under the advisory agreement, and evaluated the investment performance of the Fund.
In connection with their general supervision of the Advisor, and as an important element of their annual consideration of a renewal of the advisory agreement, the Trustees received and considered reports from the Advisor throughout the year. These reports addressed
52 Certified Annual Report
| OTHER INFORMATION, CONTINUED | ||
| Thornburg Investment Income Builder Fund | September 30, 2011 (Unaudited) | |
a wide variety of topics, including particularly the Advisor’s selection of investments and execution of the Fund’s investment strategies. In addition, the Trustees considered the information provided to them at their request in anticipation of their annual evaluation of the Advisor’s services, including (i) the Fund’s absolute investment performance and achievement of stated objectives, (ii) the Advisor’s commentary on the Fund’s performance in the context of the Fund’s objectives and reasonable expectations, and business, market and economic conditions, (iii) measures of the Fund’s investment performance over different periods of time relative to a “world allocation” category of mutual funds having income and capital appreciation objectives, selected by an independent mutual fund analyst firm, relative to a broad-based securities index, and relative to a blended performance benchmark comprised of two broad-based securities indices, (iv) the Fund’s cumulative investment return since inception relative to a broad-based securities index, (v) comparative dividend payment data, and (vi) comparative measures of portfolio volatility, risk and return.
The Trustees also considered their perceptions of portfolio management personnel developed in formal and informal meetings throughout the year, the Advisor’s staffing and other resources, trade execution, the Advisor’s performance of accounting and other services, the Advisor’s observance of compliance and regulatory requirements, the Advisor’s responsiveness to the Trustees, and other factors.
In evaluating quantitative and performance data presented, the Trustees noted (among other aspects of the data) comparative performance data for the seven calendar years since the Fund’s inception, which showed that the Fund’s investment return for the most recent calendar year was lower than the return for the index and exceeded the return of the Fund’s blended benchmark and the average return for the fund category, and that the Fund’s returns for the preceding six calendar years had exceeded the returns of the benchmark in five of six years, exceeded the returns of the index in all six years, and had exceeded or had been comparable to the average returns of the category in five of six years. Noted quantitative data also showed that the Fund’s investment returns fell within or near the top third of performance for the fund category for the three-month and one-year periods ended with the second quarter of the current year, and fell within or near the top decile of the category for the year-to-date, three-year and five-year periods. The Trustees also noted their consideration of increasing levels of the Fund’s quarterly dividend payments since the Fund’s inception together with the annual increase in the Fund’s dividend in each year, and the Fund’s higher historical cumulative return (net of expenses) relative to the Fund’s blended benchmark since the Fund’s inception.
The Trustees concluded, based upon these and other considerations, that the nature, extent and quality of the Advisor’s services were sufficient and that the Advisor had satisfactorily pursued the Fund’s stated investment objectives. The Trustees further concluded that the investment performance of the Fund was satisfactory in the context of the Fund’s objectives and policies, and prevailing market conditions.
Fees and Expenses; Profitability of Advisor; Economies of Scale; Ancillary Benefits to Advisor. The Trustees evaluated the level of the management fee charged by the Advisor to the Fund, and in this connection, reviewed the profitability of the Advisor, economies of scale potentially available to the Fund and whether the Advisor had received any ancillary benefits from its relationship with the Fund.
In evaluating the level of the management fee, the Trustees considered the fee charged by the Advisor and the other expenses charged to the Fund in light of the nature and quality of services provided, comparison of the actual Advisor’s fee and Fund expenses to the statement of fees and expenses in the Fund’s prospectuses, and comparisons of the Advisor’s fee and other Fund expenses to median and average fees and expenses charged to two groups of mutual funds assembled by independent mutual fund analyst firms. Comparative fee and expense data noted by the Trustees showed that the management fee charged to the Fund was somewhat higher than the median and average fee levels for one group of equity income mutual funds and comparable to the median level and slightly higher than the average level for the second group, and that the overall expense ratio for the Fund was slightly higher than the median and average ratios for the first group and slightly lower than the median and average ratios for the second group. The Trustees did not identify the differences as significant. The Trustees considered information about the fees charged by the Advisor to other investment management clients, together with information about fees charged by other advisors to different clients, and analysis of the differences between the requirements of institutional clients and mutual funds and the consequently different investment management services rendered, respectively, to institutional clients and mutual funds. The Trustees confirmed their previous observations that the differences between the fees charged by the Advisor to different types of clients did not appear exceptional, and that the fee rates charged by investment advisors to institutional clients had limited relevance to the evaluation of fee rates charged to mutual funds, because of the significant differences between the respective requirements of institutional clients and mutual funds, the differences between the respective services rendered to institutional clients and mutual funds, and the different circumstances in which the respective fees originate.
Certified Annual Report 53
| OTHER INFORMATION, CONTINUED | ||
| Thornburg Investment Income Builder Fund | September 30, 2011 (Unaudited) | |
In reviewing the profitability of the Advisor, the Trustees considered costs incurred by the Advisor and data comparing the profitability of the Advisor to other investment management firms. The information provided did not indicate that the Advisor’s profitability was unusual, and the Trustees noted the adequacy of the Advisor’s resources and service capabilities. In reviewing the extent to which economies of scale would be realized by the Fund as it grows and whether fee levels reflect economies of scale, the Trustees considered the breakpoint structure for advisory fees chargeable to the Fund, the demonstrated economies of scale enjoyed by the Fund and other Funds of the Trust as they had grown in size, and economies of scale realized by other mutual funds. The information provided demonstrated to the Trustees that the Fund has realized economies of scale and may reasonably be expected to realize economies of scale as the Fund grows in size, due to the breakpoint fee structure of the advisory agreement and other factors. In reviewing potential benefits to the Advisor because of its relationship to the Fund, the Trustees considered the Advisor’s receipt of certain research services from broker dealers, and the benefits to both the Fund and the Advisor of the Advisor’s expansion of its staffing, compliance and systems capabilities and other resources to serve a broader variety of investment management clients. No unusual or unfair benefits to the Advisor from its relationship to the Fund were identified by the Trustees.
The Trustees concluded, based upon their consideration of these and other factors, that the management fee charged to the Fund by the Advisor was fair and reasonable in view of the nature, extent and quality of the services provided by the Advisor, the clear disclosure of fees and expenses in the Fund’s prospectuses, the investment performance of the Fund, and comparisons of fees and expenses charged to the Fund to fees and expenses charged to other mutual funds.
54 Certified Annual Report
This page intentionally left blank.
This page is not part of the Annual Report. 55
Trustees’ Statement to Shareholders
Not part of the Certified Annual Report
September 13, 2011
The Trustees believe current and prospective shareholders should know how we discharge our responsibilities in supervising the Funds’ investment advisor and in reviewing the advisor’s contract for renewal. Since 2005, we have issued a statement which sets out clearly the three principal guidelines that we follow in supervising the Trust’s investment advisor on your behalf. In accordance with our customary practice, in September of this year we again reviewed our statement and concluded we should reissue this statement outlining the principal features of our supervision of the advisor’s performance of investment management services for the Funds.
We begin with the premise that each shareholder selected his or her Fund because its investments are managed by the investment advisor identified in the prospectus and in accordance with the objective and policies described in the prospectus. We realize, as each of you do, that if you believe that your Fund’s stated objective and policies no longer serve your personal investment goals, you can sell your shares and leave the Fund.
Therefore, we believe that our primary supervisory task – our principal obligation to you – is to assess the nature and quality of the advisor’s services, and to confirm that the advisor actively and competently pursues the Fund’s objective, in accordance with the policies set out in the prospectus. To do this, we meet regularly with management to review your Fund’s portfolio and to discuss the advisor’s specific actions and judgments in pursuing the Fund’s objective. We do not substitute our own judgment for the advisor’s decisions in selecting investments; the advisor is paid to exercise its informed judgment on investment decisions, and we seek to confirm, in reviewing the advisor’s performance, that the advisor is doing just that.
Second, while we are conscious of costs and the effect that costs have on shareholders’ returns, we do not seek the lowest fees or expense ratio as our sole or primary objective. We try to make sure that your Fund’s fees and costs are reasonable in relationship to the services rendered and that they are generally in line with those charged by other expert investment advisors, consistent with our belief that the Fund’s investors searched for and expect that expertise and attention and have decided to pay a reasonable price for it. We do not put the management contract “out to bid” as a matter of course, and we would not do so unless we had concluded that the advisor materially had failed to pursue the Fund’s objectives in accordance with its policies, or for other equally important reasons. We believe that any other approach would be inconsistent with your interests and contrary to your expectations when you bought shares of the Fund in the first place.
Finally, because we believe that most Thornburg Fund shareholders have invested with a long-term perspective, we try not to focus too much on the fashions of the moment and on short-term performance. The market will not favor any specific investment objective or set of policies at all times and under all economic circumstances. A fund will experience periods of both high and low returns relative to other funds and other investments. Even if one of our Funds is not favored by the market at a particular time, we believe that the advisor is nonetheless obliged to remain true to the Fund’s objective and policies, and we watch to see that it does so.
56 This page is not part of the Annual Report.
Retirement and Education Accounts
Thornburg Investment Management offers retirement and education savings accounts that can help you meet a variety of planning challenges. For account applications or further information on any of the accounts below, please call 1-800-847-0200 or go to www.thornburg.com/ira. Your financial advisor can help you determine which plan is right for you.
Individual Retirement Accounts
Individual Retirement Accounts (IRAs) provide a tax-advantaged means to save money for the future. For a detailed outline of the difference between retirement accounts, see www.thornburg.com/ira. Rollovers are available. Call 1-800-847-0200 for more information.
Traditional IRAs – Contributions to Traditional_IRAs are tax deductible for eligible individuals, and withdrawals are taxed as additional ordinary income. You may contribute to an IRA if you receive compensation and are under 70 1/2, even if you are covered by an employer retirement plan. Deductible contributions are subject to certain qualifications. Please consult your tax advisor.
Roth IRAs – Under a Roth IRA, there is no tax deduction for contributions, but there is no income tax on qualified withdrawals. For a more detailed comparison of Traditional and Roth IRAs, please see our web site at www.thornburg.com/ira.
SEP IRAs – Simplified Employee Pension (SEP) IRAs are established by employers. The employer is allowed a tax deduction for contributions made to the SEP Plan and makes contributions to each eligible employee’s SEP IRA on a discretionary basis.
SIMPLE IRAs – Savings Incentive Match Plan for Employees of Small Employers (SIMPLE) is designed to give small business owners a simplified method to establish and contribute to a retirement plan for employees. The employer is allowed a tax deduction for contributions and makes either matching or non-elective contributions to each eligible employee’s SIMPLE IRA. Employees may make salary deferral contributions.
Coverdell Education Savings Account
These savings accounts are designed to provide a way to save money for higher education expenses. In an Education Savings Account, earnings and interest grow tax-free, and qualified withdrawals used to pay for eligible_higher-education expenses are tax- and penalty-free.
Funds Available
The following funds are available in the accounts listed above:
| • | Thornburg International Value Fund |
| • | Thornburg Value Fund |
| • | Thornburg Core Growth Fund |
| • | Thornburg Investment Income Builder Fund |
| • | Thornburg Global Opportunities Fund |
| • | Thornburg International Growth Fund |
| • | Thornburg Developing World Fund |
| • | Thornburg Limited Term U.S. Government Fund |
| • | Thornburg Limited Term Income Fund |
| • | Thornburg Strategic Income Fund |
This page is not part of the Annual Report. 57

Thornburg Equity Funds
Thornburg’s equity research uses a fundamental and comprehensive analytical approach. Thornburg equity funds focus on a limited number of securities so that each holding can impact performance. The equity team searches for firms believed to have a promising future and seeks to buy shares of those companies at a discount to their intrinsic value.
| • | Thornburg Value Fund |
| • | Thornburg International Value Fund |
| • | Thornburg Core Growth Fund |
| • | Thornburg Investment Income Builder Fund |
| • | Thornburg Global Opportunities Fund |
| • | Thornburg International Growth Fund |
| • | Thornburg Developing World Fund |
Thornburg Bond Funds
Thornburg Investment Management applies a disciplined philosophy to fixed-income management. Since the launch of our first fixed-income fund over 25 years ago, we have been conducting fundamental, bottom-up research in an effort to identify bonds which we believe provide the best return for a given level of risk. We are very organic in our approach, avoiding leverage or complex strategies which could backfire in periods of market uncertainty.
| • | Thornburg Limited Term Municipal Fund |
| • | Thornburg Intermediate Municipal Fund |
| • | Thornburg California Limited Term Municipal Fund |
| • | Thornburg New Mexico Intermediate Municipal Fund |
| • | Thornburg New York Intermediate Municipal Fund |
| • | Thornburg Strategic Municipal Income Fund |
| • | Thornburg Limited Term U.S. Government Fund |
| • | Thornburg Limited Term Income Fund |
| • | Thornburg Strategic Income Fund |
Before investing, carefully consider the Fund’s investment goals, risks, charges, and expenses. For a prospectus containing this and other information, contact your financial advisor or visit thornburg.com. Read it carefully before investing.
For additional information, please visit www.thornburg.com
Thornburg Investment Management, Inc. 2300 North Ridgetop Road, Santa Fe, NM 87506
This page is not part of the Annual Report. 59
 | Waste not, Wait not |  | ||||
| Get instant access to your shareholder reports. | ||||||
| This Annual Report is submitted for the general information of shareholders of the Fund. It is not authorized for distribution to prospective investors in the Fund unless preceded or accompanied by an effective prospectus. | By switching from your postal mailbox to your email inbox, you reduce paper clutter, improve record keeping access, and help conserve our natural resources. | |||||
 | Investment Advisor: Thornburg Investment Management® 800.847.0200 | Go to www.thornburg.com/edelivery and sign up to receive your shareholder reports, prospectuses, and proxy statements electronically. | ||||
Distributor: | ||||||
Thornburg Securities Corporation® 800.847.0200 | You invest in the future, without spending a dime. | |||||
| TH857 | ||||||

Important Information
The information presented on the following pages was current as of September 30, 2011. The managers’ views, portfolio holdings, and sector and country diversification are provided for the general information of the Fund’s shareholders; to the extent this information is historical, it should not be considered predictive of future circumstances. This material should not be deemed a recommendation to buy or sell any of the securities mentioned.
Investments in the Fund carry risks, including possible loss of principal. Special risks may be associated with investments outside the United States, especially in emerging markets, including currency fluctuations, illiquidity and volatility. Investments in small capitalization companies may increase the risk of greater price fluctuations. Please see the Fund’s Prospectus for a discussion of the risks associated with an investment in the Fund. Investments in the Fund are not FDIC insured, nor are they deposits of or guaranteed by a bank or any other entity. There is no guarantee that the Fund will meet its investment objectives. Funds invested in a limited number of holdings may expose an investor to greater volatility.
Performance data given at net asset value (NAV) does not take into account the applicable sales charges. If the sales charges had been included, the performance would have been lower.
Class I, R3, R4, and R5 shares may not be available to all investors. Minimum investments for Class I shares may be higher than those for other classes.
From time to time, the Fund may invest in shares of companies through initial public offerings (IPOs). IPOs have the potential to produce substantial gains for the Fund. There is no assurance that the Fund will have continued access to profitable IPOs and as the Fund’s assets grow, the impact of IPO investment may decline. Therefore, investors should not rely on these past gains as an indication of future performance.
Share Class | NASDAQ Symbol | Cusip | ||
Class A | THOAX | 885-215-343 | ||
Class C | THOCX | 885-215-335 | ||
Class I | THOIX | 885-215-327 | ||
Class R3 | THORX | 885-215-145 | ||
Class R4 | THOVX | 885-215-137 | ||
Class R5 | THOFX | 885-215-129 |
Glossary
MSCI All Country (AC) World Index – A market capitalization weighted index that is representative of the market structure of 45 developed and emerging market countries in North and South America, Europe, Africa, and the Pacific Rim. The index is calculated with net dividends reinvested in U.S. dollars.
S&P 500 Index – An unmanaged broad measure of the U.S. stock market.
Unless otherwise noted, index returns reflect the reinvestment of income dividends and capital gains, if any, but do not reflect fees, brokerage commissions or other expenses of investing. Investors may not make direct investments into any index. The performance of any index is not indicative of the performance of any particular investment.
Beta – A measure of market-related risk. Less than one means the portfolio is less volatile than the index, while greater than one indicates more volatility than the index.
Earnings Per Share (EPS) – The total earnings divided by the number of shares outstanding.
Median Market Capitalization – Market capitalization (market cap) is the total value of a company’s stock, calculated by multiplying the number of outstanding common shares by the current share price. The company whose market cap is in the middle of the portfolio is the median market cap. Half the companies in the portfolio have values greater than the median, and half have values that are less.
Price to Book Value (P/B) – A ratio used to compare a stock’s market value to its book value. It is calculated by dividing the current closing price of the stock by the latest quarter’s book value (book value is simply assets minus liabilities).
Price to Cash Flow Ratio – A measure of the market’s expectations of a firm’s future financial health. It is calculated by dividing the price per share by cash flow per share.
Price to Earnings Ratio (P/E) – A valuation ratio equaling a company’s market value per share divided by earnings per share.
This page is not part of the Annual Report. 3
Thornburg Global Opportunities Fund
CO-PORTFOLIO MANAGERS

W. Vinson Walden,CFA, and Brian McMahon
IMPORTANT
PERFORMANCE INFORMATION
Performance data shown represents past performance and is no guarantee of future results. Investment return and principal value will fluctuate so shares, when redeemed, may be worth more or less than their original cost. Current performance may be lower or higher than quoted. For performance current to the most recent month end, visit thornburg.com or call 800.847.0200.
The maximum sales charge for Class A shares is 4.50%. Class A shares are subject to a 1% 30-day redemption fee. The total annual fund operating expense of Class A shares is 1.47%, as disclosed in the most recent Prospectus.
Investment fads come and go, and the landscape is littered with funds that generated an avalanche of interest for a brief period of time, then fell by the wayside when the market turned its attention to the next hot trend. At Thornburg Investment Management, we believe that the soundest investments over the long term are conceptually simple and grounded in common sense. It is with this mindset that we created the Thornburg Global Opportunities Fund.
The Fund was launched in 2006 to capitalize on what Thornburg Investment Management is known for — solid, bottom-up research based on a team-oriented, flexible approach to uncovering value. The goal in creating the Fund was to leverage the research of the Thornburg equity investment team, while employing a broad mandate to pursue companies across the globe. Once identified, a focused number of stocks are combined into a compact, yet diversified portfolio.
The philosophy of Thornburg Global Opportunities Fund is straightforward — to invest in promising companies that we feel are trading at a discount to their intrinsic value. As the balance sheets of global companies become more complex, it is increasingly difficult to see how some companies actually make money. These companies are not the ones pursued in the Global Opportunities Fund. Rather, we believe that straightforward business models executed by capable management teams make the best investments.
AVERAGE ANNUAL TOTAL RETURNS
FOR PERIODS ENDED 9/30/11
| 1 Yr | 3 Yrs | 5 Yrs | Since Inception | |||||||||||||
A Shares (Incep: 7/28/06) | ||||||||||||||||
Without sales charge | -4.81 | % | 2.12 | % | 3.04 | % | 4.42 | % | ||||||||
With sales charge | -9.10 | % | 0.56 | % | 2.09 | % | 3.50 | % | ||||||||
MSCI AC World Index | ||||||||||||||||
(Since: 7/28/06) | -6.02 | % | 0.59 | % | -1.59 | % | -0.84 | % | ||||||||
4 This page is not part of the Annual Report.
The Thornburg Global Opportunities Fund is unique in the marketplace. Currently, assets in the global stock fund universe are concentrated in a few very large funds. Based on size alone, these funds must focus on the largest capitalization stocks, or alternatively, spread their assets across many names. In fact, about 70% of category assets are concentrated in ten funds, and the average world stock fund holds approximately 174 stocks (as of 9/30/11).
Thornburg Global Opportunities Fund is different, in that it will typically be focused in 30–40 stocks which the management team feels have the best combination of promise and discount. Each stock is analyzed on its own merits, and the team then combines them into a portfolio of stocks, with what we view as attractive long-term prospects. The result is a Fund which looks quite unlike either the MSCI AC World Index or its peers.
Thornburg Global Opportunities Fund is grounded in common sense principles, which we think resonate well with investors and can be effective over the long term.
STOCKS CONTRIBUTING AND DETRACTING
FOR THE YEAR ENDED 9/30/11
Top Contributors | Top Detractors | |
| Global Crossing Ltd. | Bankers Petroleum Ltd. | |
| Arcos Dorados Holdings, Inc. Cl A | Bank of America Corp. | |
| Telstra Corp. Ltd. | Cable & Wireless Worldwide plc | |
| Swiss Re Ltd. | Cyrela Brazil Realty S.A. | |
| Ensign Energy Services, Inc. | Oshkosh Corp. | |
| Source: FactSet | ||
KEY PORTFOLIO ATTRIBUTES
As of 9/30/11
Portfolio P/E Trailing 12-months* | 10.3x | |||
Portfolio Price to Cash Flow* | 4.9x | |||
Portfolio Price to Book Value* | 1.2x | |||
Median Market Cap* | $ | 6.0 B | ||
5-Year Beta (A Shares vs. MSCI AC World)* | 1.15 | |||
Number of Holdings | 33 | |||
| * | Source: FactSet |
MARKET CAPITALIZATION EXPOSURE
As of 9/30/11
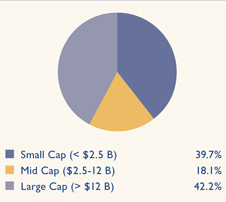
PORTFOLIO COMPOSITION
As of 9/30/11
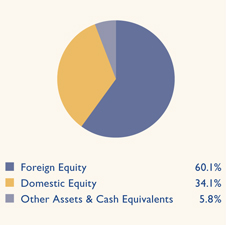
This page is not part of the Annual Report. 5

Thornburg Global Opportunities Fund
September 30, 2011
Table of Contents | ||||
| 7 | ||||
| 11 | ||||
| 15 | ||||
| 17 | ||||
| 19 | ||||
| 20 | ||||
| 28 | ||||
| 30 | ||||
| 31 | ||||
| 32 | ||||
| 33 | ||||
| 36 |
This report is certified under the Sarbanes-Oxley Act of 2002, which requires that public companies, including mutual funds, affirm that the information provided in their annual and semiannual shareholder reports fully and fairly represents their financial position.
6 Certified Annual Report
October 18, 2011
Dear Fellow Shareholder:
This letter will highlight the results of Thornburg Global Opportunities Fund’s investment activities for the six and twelve month periods ended September 30, 2011.
For the fiscal year ended September 30, 2011, the Fund’s net asset value (NAV) per share decreased by 83 cents or 5.94%. Total return for the Class A shares, at NAV for the fiscal year, was negative 4.81%, taking into account income dividends paid of 19 cents per share, reinvested in Fund shares. The dividends per share were higher for Class I and R5 shares, and lower on the Class C, R3, and R4 shares, to account for varying class specific expenses. In the six months ended September 30, 2011, Thornburg Global Opportunities Fund NAV per Class A share decreased 18.98% from $16.23 to $13.15. The Fund paid dividends of 5 cents per share to give a total return for the period of negative 18.75% (Class A shares at NAV).
Performance comparisons of Global Opportunities Fund to the MSCI All Country World Index over various time periods are shown on page 32 of this annual report. The performance of the Fund has compared well to its benchmark over most time periods since its inception on July 28, 2006. The cumulative return for the Fund, Class A shares at NAV since inception through September 30, 2011, is 25.10% vs negative 1.71% for the MSCI Index. Recently, we outperformed the MSCI Index by 1.21% for the 12-month period ended September 30, 2011, jumping out to a large lead against the Index over the first nine months of the fiscal year before underperforming it by more than 4.2% in the difficult July-September quarter. Since its inception, Thornburg Global Opportunities Fund, Class A shares at NAV, have outperformed the same Index by an average annualized margin of 5.26%. On a quarterly basis, your Fund’s performance versus the Index is unpredictable: the Fund has outperformed the Index in 12 out of 20 full calendar quarters since inception. | Performance data shown represents past performance and is no guarantee of future results. Investment return and principal value will fluctuate so shares, when redeemed, may be worth more or less than their original cost. Current performance may be lower or higher than quoted. For performance current to the most recent month end, visit thornburg.com or call 800.847.0200.
The maximum sales charge for Class A shares is 4.50%. Class A shares are subject to a 1% 30-day redemption fee. The total annual fund operating expense of Class A shares is 1.47%, as disclosed in the most recent Prospectus. |
We do not expect to pay any capital gain distributions for 2011. At September 30, 2011, the Fund had tax basis realized capital losses of approximately $180 million, which may be carried forward to offset future capital gains to the extent permitted by regulations.
In assessing the performance of your Fund, it is constructive to consider the performance in U.S. dollars of the sector components of the MSCI All Country World Index over the fiscal year ended September 30, 2011, because this is our global performance benchmark:
| 1. | Two sectors showed positive total returns, consumer staples and health care. |
| 2. | Eight sectors (financials, consumer discretionary, materials, industrials, energy, information technology, telecommunications, and utilities) showed negative total returns, ranging from just below 0% (information technology) to worse than negative 17% (financials). |
Certified Annual Report 7
| Letter to Shareholders, | ||
Continued | ||
| 3. | In the Global Opportunities portfolio, returns from 26 of our investments were positive for the fiscal year ended September 30, 2011, and 22 were negative. |
| 4. | Global Opportunities Fund investments in financials (35% Fund weighting), energy (13%), telecommunications (10%) and information technology (10%) comprised the largest sector weightings in the Fund portfolio. |
| 5. | Your Fund’s holdings in the telecommunications sector, led by infrastructure provider Global Crossing and Australia’s services leader Telstra, were the strongest positive contributors to outperformance during the fiscal year. Global Crossing was acquired by Colorado-based Level 3 Communications, and delivered overall price appreciation of more than 80% by the time of the early October 2011 transaction closing date. |
| 6. | Your Fund’s average return from its investments in the financials sector was slightly better than the negative 18% performance of the equities in the finance sector of the MSCI All Country World Index. Our investments in the financial sector were the most negative driver of performance vis-a-vis the benchmark for the fiscal year ended September 30, 2011. The Fund’s investments in Bank of America Corp., ING Group, China Merchant’s Bank, and UBS were among the negative performers in the portfolio, particularly in the September quarter of the fiscal year when your Fund’s relative performance lagged the MSCI Index. A growing expectation that interest rates will remain “lower for longer” in the United States and Europe caused near-term earnings estimates for several of our financial holdings to be reduced during the September quarter. At this point, each of these investments is valued in the public markets at multiples of book value that are significantly below normal. However, each has above-normal uncertainty regarding one or more issues such as litigation risk, possible abnormal loan or investment portfolio losses, reduced customer activity levels, and regulatory burdens. Modest positive contributions from insurance broker Willis Group, Swiss Re Ltd., and our convertible preferred stock investment in Fifth Third Bancorp were unable to offset the price declines previously noted. |
| 7. | Your Fund’s holdings in the energy sector underperformed those of the Index during fiscal year 2011, showing particular weakness in the September quarter. Among these, Canadian exploration and production firm Bankers Petroleum was the Fund’s worst performer, while offshore drillers Ensco and Transocean each delivered price declines. A positive contribution from Ensign Energy Services was insufficient to offset the damage. |
| 8. | Among our information technology investments, Dell and Microsoft modestly aided portfolio performance relative to the Index, while Google was a modest drag. Interestingly, each of these had modest upward revisions in current year earnings estimates over the course of your Fund’s fiscal year ended September 30, 2011. |
| 9. | Among other portfolio holdings, Brazilian food company BRF Brasil Foods was one of your Fund’s best performers. The portfolio also got positive contributions from several positions that were either reduced or sold prior to the onset of the summer bear market: Verwaltungs & Privat Bank AG, Arcos Dorados Holdings, |
8 Certified Annual Report
| Roche Holding, Apollo Investment Corp., Trinity Industries, and Walgreens. Brazilian homebuilder Cyrela Brazil Realty, U.K.-based communications firm Cable & Wireless Worldwide plc, transportation equipment manufacturer Oshkosh Corporation, and Australian mining services firm Mineral Resources each delivered significant negative returns during the fiscal year, mostly due to price declines in the final September quarter. |
| 10. | At September 30, 2011, domestic stocks comprised approximately 34% of your portfolio; foreign stocks about 60%; and cash and interest bearing debt the remaining 6%. We have hedged more than 50% of the currency risk associated with your Fund’s euro equity holdings (~11% of the portfolio invested in companies based in European Monetary Union countries). For now, we do not hedge the currency risk of our Australian dollar, Canadian dollar, and non-yen Asian currency denominated equity holdings, and we retain a hedge of less than 50% with respect to your Fund’s Swiss holdings. |
The average price/earnings multiple of the 33 stocks in your portfolio on September 30, 2011, was 9.4x on an estimated forward basis, down from 10.8x at September 30, 2010, using estimates provided by FactSet and IBES. For comparative reference, the forward price/earnings multiples of the MSCI All Country World Index at September 30, 2011, was approximately 10.5x, also using estimates compiled by FactSet and IBES. Industry weightings, country weightings, and the top equity holdings of Global Opportunities Fund are summarized on page 11 of this report.
We have experienced well-above-average financial market volatility over the last three years. Investment bank Credit Suisse points out that the average number of quarters with an equity market return of greater than 10% or less than negative 10% in each of the last six decades is just below 8 per decade. In other words, just under 20% of all quarters over the last six decades could be characterized as “highly volatile.” However most recently, in eight of the last twelve calendar quarters – or 66% of those quarters – the returns of the S&P 500 Index have been either less than negative 10% or greater than 10%.
This commentary will not include a rehash of macro-economic news that surrounds us each day. Investors understandably seek additional clarity on how European governments (and financial institutions) will manage through a debt contraction and at least one state default. In addition, investors have questions about whether China can transition from an investment-led economy to a consumer-led economy, and whether the United States government can implement a reasonable framework of pro-growth policies while also reining in public sector borrowing.
We do not expect to see clear answers on these questions during the coming months. There will be news bits from day to day that will feed hopes or fan despair, thereby moving the prices of financial assets materially. We do believe that the stock price declines resulting from large numbers of investors selling equities have created very attractive valuations, so long as the global economy does not enter into some kind of broad collapse. We do not foresee such a collapse, but rather a grinding transition to various new foundations for future growth in the different regions of the world.
Certified Annual Report 9
| Letter to Shareholders, | ||
Continued | ||
Thank you for being a shareholder of Thornburg Global Opportunities Fund. We believe that your portfolio businesses carry low enough valuations to set the stage for future price appreciation, provided that they come through the current economic challenges with their competitive positions intact or improved.
Remember that you can review descriptions of many of the stocks in your portfolio on our internet site, www. thornburg.com/funds. Best wishes for a wonderful holiday season and New Year.
| Sincerely, | ||
 |  | |
| Brian McMahon | W. Vinson Walden,CFA | |
Co-Portfolio Manager | Co-Portfolio Manager | |
| CEO & Chief Investment Officer | Managing Director | |
The matters discussed in this report may constitute forward-looking statements made pursuant to the safe harbor provisions of the Securities Litigation Reform Act of 1995. These include any advisor or portfolio manager prediction, assessment, analysis or outlook for individual securities, industries, investment styles, market sectors and/or markets. These statements involve risks and uncertainties. In addition to the general risks described for each fund in its current prospectus, other factors bearing on these reports include the accuracy of the advisor’s or portfolio manager’s forecasts and predictions, the appropriateness of the investment strategies designed by the advisor or portfolio manager, and the ability of the advisor or portfolio manager to implement their strategies efficiently and successfully. Any one or more of these factors, as well as other risks affecting the securities markets generally, could cause the actual results of any fund to differ materially as compared to its benchmarks.
10 Certified Annual Report
| SCHEDULE OF INVESTMENTS | ||
| Thornburg Global Opportunities Fund | September 30, 2011 | |
TOP TEN HOLDINGS
As of 9/30/11
Google, Inc. | 5.3 | % | SPDR Gold Trust | 4.4 | % | |||||
Microsoft Corp. | 4.9 | % | BRF-Brasil Foods SA | 4.2 | % | |||||
KKR Financial Holdings LLC | 4.9 | % | Swiss Re Ltd. | 4.2 | % | |||||
Willis Group Holdings plc | 4.6 | % | Transocean Ltd. | 3.6 | % | |||||
Kabel Deutschland Holding AG | 4.6 | % | Fly Leasing Ltd. ADR | 3.6 | % |
SUMMARY OF INDUSTRY EXPOSURE
As of 9/30/11
Diversified Financials | 12.4 | % | Retailing | 3.3 | % | |||||
Energy | 12.2 | % | Commercial & Professional Services | 2.8 | % | |||||
Software & Services | 10.2 | % | Consumer Durables & Apparel | 2.8 | % | |||||
Insurance | 8.8 | % | Pharmaceuticals, Biotechnology & Life Sciences | 1.8 | % | |||||
Telecommunication Services | 8.3 | % | Technology Hardware & Equipment | 0.8 | % | |||||
Media | 7.2 | % | Food & Staples Retailing | 0.6 | % | |||||
Capital Goods | 7.2 | % | Other Non-Classified Securities: | |||||||
Banks | 7.2 | % | Exchange Traded Funds | 4.4 | % | |||||
Food, Beverage & Tobacco | 4.2 | % | Other Assets & Cash Equivalents | 5.8 | % |
SUMMARY OF COUNTRY EXPOSURE
As of 9/30/11 (percent of equity holdings)
United States | 36.2 | % | Ireland | 3.8 | % | |||||
United Kingdom | 14.5 | % | Netherlands | 3.1 | % | |||||
Switzerland | 10.8 | % | Hong Kong | 2.8 | % | |||||
Brazil | 7.4 | % | Bermuda | 2.4 | % | |||||
Australia | 6.8 | % | Israel | 1.2 | % | |||||
Canada | 5.6 | % | China | 0.5 | % | |||||
Germany | 4.9 | % |
Certified Annual Report 11
| SCHEDULE OF INVESTMENTS, CONTINUED | ||
| Thornburg Global Opportunities Fund | September 30, 2011 | |
| Shares/ Principal Amount | Value | |||||||
COMMON STOCK — 86.30% | ||||||||
BANKS — 3.68% | ||||||||
COMMERCIAL BANKS — 3.68% | ||||||||
BancorpSouth, Inc. | 152,500 | $ | 1,338,950 | |||||
China Merchants Bank Co., Ltd. | 895,541 | 1,377,685 | ||||||
Liechtensteinische Landesbank AG | 141,678 | 8,065,517 | ||||||
|
| |||||||
| 10,782,152 | ||||||||
|
| |||||||
CAPITAL GOODS — 7.19% | ||||||||
MACHINERY — 3.61% | ||||||||
aOshkosh Corp. | 487,100 | 7,666,954 | ||||||
Trinity Industries, Inc. | 136,621 | 2,925,056 | ||||||
TRADING COMPANIES & DISTRIBUTORS — 3.58% | ||||||||
Fly Leasing Ltd. ADR | 925,113 | 10,500,032 | ||||||
|
| |||||||
| 21,092,042 | ||||||||
|
| |||||||
COMMERCIAL & PROFESSIONAL SERVICES — 2.83% | ||||||||
COMMERCIAL SERVICES & SUPPLIES — 2.83% | ||||||||
Mineral Resources Ltd. | 846,100 | 8,310,526 | ||||||
|
| |||||||
| 8,310,526 | ||||||||
|
| |||||||
CONSUMER DURABLES & APPAREL — 2.75% | ||||||||
HOUSEHOLD DURABLES — 2.75% | ||||||||
Cyrela Brazil Realty S.A. | 1,296,300 | 8,073,221 | ||||||
|
| |||||||
| 8,073,221 | ||||||||
|
| |||||||
DIVERSIFIED FINANCIALS — 12.42% | ||||||||
CAPITAL MARKETS — 2.50% | ||||||||
aUBS AG | 629,046 | 7,314,811 | ||||||
DIVERSIFIED FINANCIAL SERVICES — 9.92% | ||||||||
Bank of America Corp. | 970,500 | 5,939,460 | ||||||
aING Groep N.V. | 1,215,200 | 8,682,466 | ||||||
KKR Financial Holdings LLC | 1,947,700 | 14,471,411 | ||||||
|
| |||||||
| 36,408,148 | ||||||||
|
| |||||||
ENERGY — 12.15% | ||||||||
ENERGY EQUIPMENT & SERVICES — 10.19% | ||||||||
Ensco plc ADR | 234,700 | 9,488,921 | ||||||
Ensign Energy Services, Inc. | 746,200 | 9,791,249 | ||||||
Transocean Ltd. | 221,600 | 10,579,184 | ||||||
OIL, GAS & CONSUMABLE FUELS — 1.96% | ||||||||
aBankers Petroleum Ltd. | 1,722,200 | 5,752,171 | ||||||
|
| |||||||
| 35,611,525 | ||||||||
|
| |||||||
FOOD & STAPLES RETAILING — 0.56% | ||||||||
FOOD & STAPLES RETAILING — 0.56% | ||||||||
Walgreen Co. | 49,700 | 1,634,633 | ||||||
|
| |||||||
| 1,634,633 | ||||||||
|
| |||||||
12 Certified Annual Report
| SCHEDULE OF INVESTMENTS, CONTINUED | ||
| Thornburg Global Opportunities Fund | September 30, 2011 | |
| Shares/ Principal Amount | Value | |||||||
FOOD, BEVERAGE & TOBACCO — 4.24% | ||||||||
FOOD PRODUCTS — 4.24% | ||||||||
BRF-Brasil Foods SA | 726,000 | $ | 12,425,305 | |||||
|
| |||||||
| 12,425,305 | ||||||||
|
| |||||||
INSURANCE — 8.78% | ||||||||
INSURANCE — 8.78% | ||||||||
Swiss Re Ltd. | 262,350 | 12,307,063 | ||||||
Willis Group Holdings plc | 390,900 | 13,435,233 | ||||||
|
| |||||||
| 25,742,296 | ||||||||
|
| |||||||
MEDIA — 7.23% | ||||||||
MEDIA — 7.23% | ||||||||
aKabel Deutschland Holding AG | 248,000 | 13,416,576 | ||||||
Television Broadcasts Ltd. | 1,415,470 | 7,779,505 | ||||||
|
| |||||||
| 21,196,081 | ||||||||
|
| |||||||
PHARMACEUTICALS, BIOTECHNOLOGY & LIFE SCIENCES — 1.80% | ||||||||
PHARMACEUTICALS — 1.80% | ||||||||
Roche Holding AG | 12,300 | 1,996,172 | ||||||
Teva Pharmaceutical Industries Ltd. ADR | 88,030 | 3,276,476 | ||||||
|
| |||||||
| 5,272,648 | ||||||||
|
| |||||||
RETAILING — 3.33% | ||||||||
SPECIALTY RETAIL — 3.33% | ||||||||
Carphone Warehouse Group plc | 1,840,400 | 9,757,732 | ||||||
|
| |||||||
| 9,757,732 | ||||||||
|
| |||||||
SOFTWARE & SERVICES — 10.19% | ||||||||
INTERNET SOFTWARE & SERVICES — 5.25% | ||||||||
aGoogle, Inc. | 29,955 | 15,408,253 | ||||||
SOFTWARE — 4.94% | ||||||||
Microsoft Corp. | 581,500 | 14,473,535 | ||||||
|
| |||||||
| 29,881,788 | ||||||||
|
| |||||||
TECHNOLOGY HARDWARE & EQUIPMENT — 0.81% | ||||||||
COMPUTERS & PERIPHERALS — 0.81% | ||||||||
aDell, Inc. | 167,600 | 2,371,540 | ||||||
|
| |||||||
| 2,371,540 | ||||||||
|
| |||||||
TELECOMMUNICATION SERVICES — 8.34% | ||||||||
DIVERSIFIED TELECOMMUNICATION SERVICES — 8.34% | ||||||||
Cable & Wireless Worldwide plc | 15,146,800 | 7,322,178 | ||||||
aGlobal Crossing Ltd. | 279,869 | 6,691,668 | ||||||
Telstra Corp. Ltd. | 3,484,263 | 10,452,337 | ||||||
|
| |||||||
| 24,466,183 | ||||||||
|
| |||||||
TOTAL COMMON STOCK (Cost $282,817,926) | 253,025,820 | |||||||
|
| |||||||
Certified Annual Report �� 13
| SCHEDULE OF INVESTMENTS, CONTINUED | ||
| Thornburg Global Opportunities Fund | September 30, 2011 | |
| Shares/ Principal Amount | Value | |||||||
PREFERRED STOCK — 3.51% | ||||||||
BANKS — 3.51% | ||||||||
COMMERCIAL BANKS — 3.51% | ||||||||
Fifth Third Bancorp Pfd, 8.50% | 80,500 | $ | 10,296,755 | |||||
|
| |||||||
TOTAL PREFERRED STOCK (Cost $2,079,829) | 10,296,755 | |||||||
|
| |||||||
EXCHANGE TRADED FUNDS — 4.35% | ||||||||
aSPDR Gold Trust | 80,700 | 12,757,056 | ||||||
|
| |||||||
TOTAL EXCHANGE TRADED FUNDS (Cost $13,094,592) | 12,757,056 | |||||||
|
| |||||||
SHORT TERM INVESTMENTS — 3.41% | ||||||||
Devon Energy Corp., 0.17%, 10/3/2011 | $ | 10,000,000 | 9,999,906 | |||||
|
| |||||||
TOTAL SHORT TERM INVESTMENTS (Cost $9,999,906) | 9,999,906 | |||||||
|
| |||||||
TOTAL INVESTMENTS — 97.57% (Cost $307,992,253) | $ | 286,079,537 | ||||||
OTHER ASSETS LESS LIABILITIES — 2.43% | 7,136,720 | |||||||
|
| |||||||
NET ASSETS — 100.00% | $ | 293,216,257 | ||||||
|
| |||||||
Footnote Legend
| a | Non-income producing. |
Portfolio Abbreviations
To simplify the listings of securities, abbreviations are used per the table below:
| ADR | American Depository Receipt | |
| Pfd | Preferred Stock |
See notes to financial statements.
14 Certified Annual Report
| STATEMENT OF ASSETS AND LIABILITIES | ||
| Thornburg Global Opportunities Fund | September 30, 2011 | |
ASSETS | ||||
Investments at value (cost $307,992,253) (Note 2) | $ | 286,079,537 | ||
Cash | 385,107 | |||
Cash denominated in foreign currency (cost $6,993,087) | 6,167,271 | |||
Receivable for investments sold | 1,058,028 | |||
Receivable for fund shares sold | 324,233 | |||
Unrealized appreciation on forward currency contracts (Note 7) | 1,542,531 | |||
Dividends receivable | 475,899 | |||
Dividend and interest reclaim receivable | 54,133 | |||
Prepaid expenses and other assets | 42,400 | |||
|
| |||
Total Assets | 296,129,139 | |||
|
| |||
LIABILITIES | ||||
Payable for fund shares redeemed | 343,427 | |||
Unrealized depreciation on forward currency contracts (Note 7) | 2,109,184 | |||
Payable to investment advisor and other affiliates (Note 3) | 307,777 | |||
Accounts payable and accrued expenses | 150,104 | |||
Dividends payable | 2,390 | |||
|
| |||
Total Liabilities | 2,912,882 | |||
|
| |||
NET ASSETS | $ | 293,216,257 | ||
|
| |||
NET ASSETS CONSIST OF: | ||||
Distribution in excess of net investment income | $ | (2,732,736 | ) | |
Net unrealized depreciation on investments and foreign currency translations | (23,323,133 | ) | ||
Accumulated net realized gain (loss) | (187,097,584 | ) | ||
Net capital paid in on shares of beneficial interest | 506,369,710 | |||
|
| |||
| $ | 293,216,257 | |||
|
| |||
Certified Annual Report 15
| STATEMENT OF ASSETS AND LIABILITIES, CONTINUED | ||
| Thornburg Global Opportunities Fund | September 30, 2011 | |
NET ASSET VALUE: | ||||
Class A Shares: | ||||
Net asset value and redemption price per share ($73,537,706 applicable to 5,590,581 shares of beneficial interest outstanding - Note 4) | $ | 13.15 | ||
Maximum sales charge, 4.50% of offering price | 0.62 | |||
|
| |||
Maximum offering price per share | $ | 13.77 | ||
|
| |||
Class C Shares: | ||||
Net asset value and offering price per share* ($70,643,552 applicable to 5,444,219 shares of beneficial interest | $ | 12.98 | ||
|
| |||
Class I Shares: | ||||
Net asset value, offering and redemption price per share ($115,837,298 applicable to 8,773,591 shares of beneficial interest outstanding - Note 4) | $ | 13.20 | ||
|
| |||
Class R3 Shares: | ||||
Net asset value, offering and redemption price per share ($75,101 applicable to 5,728 shares of beneficial interest outstanding - Note 4) | $ | 13.11 | ||
|
| |||
Class R4 Shares: | ||||
Net asset value, offering and redemption price per share ($899,928 applicable to 68,734 shares of beneficial interest outstanding - Note 4) | $ | 13.09 | ||
|
| |||
Class R5 Shares: | ||||
Net asset value, offering and redemption price per share ($32,222,672 applicable to 2,438,867 shares of beneficial interest outstanding - Note 4) | $ | 13.21 | ||
|
| |||
| * | Redemption price per share is equal to net asset value less any applicable contingent deferred sales charge. |
See notes to financial statements.
16 Certified Annual Report
| STATEMENT OF OPERATIONS | ||
| Thornburg Global Opportunities Fund | Year Ended September 30, 2011 | |
INVESTMENT INCOME: | ||||
Dividend income (net of foreign taxes withheld of $220,891) | $ | 9,434,027 | ||
Interest income | 34,670 | |||
|
| |||
Total Income | 9,468,697 | |||
|
| |||
EXPENSES: | ||||
Investment advisory fees (Note 3) | 3,133,541 | |||
Administration fees (Note 3) | ||||
Class A Shares | 120,702 | |||
Class C Shares | 109,577 | |||
Class I Shares | 72,799 | |||
Class R3 Shares | 211 | |||
Class R4 Shares | 1,668 | |||
Class R5 Shares | 13,397 | |||
Distribution and service fees (Note 3) | ||||
Class A Shares | 241,410 | |||
Class C Shares | 876,415 | |||
Class R3 Shares | 798 | |||
Class R4 Shares | 3,334 | |||
Transfer agent fees | ||||
Class A Shares | 127,457 | |||
Class C Shares | 107,708 | |||
Class I Shares | 131,564 | |||
Class R3 Shares | 1,953 | |||
Class R4 Shares | 4,758 | |||
Class R5 Shares | 42,218 | |||
Registration and filing fees | ||||
Class A Shares | 21,436 | |||
Class C Shares | 20,355 | |||
Class I Shares | 21,766 | |||
Class R3 Shares | 19,445 | |||
Class R4 Shares | 19,646 | |||
Class R5 Shares | 19,545 | |||
Custodian fees (Note 3) | 150,660 | |||
Professional fees | 63,064 | |||
Accounting fees | 11,809 | |||
Trustee fees | 8,761 | |||
Other expenses | 56,382 | |||
|
| |||
Total Expenses | 5,402,379 | |||
Less: | ||||
Expenses reimbursed by investment advisor (Note 3) | (288,538 | ) | ||
Fees paid indirectly (Note 3) | (831 | ) | ||
|
| |||
Net Expenses | 5,113,010 | |||
|
| |||
Net Investment Income | $ | 4,355,687 | ||
|
| |||
Certified Annual Report 17
| STATEMENT OF OPERATIONS, CONTINUED | ||
| Thornburg Global Opportunities Fund | Year Ended September 30, 2011 | |
REALIZED AND UNREALIZED GAIN (LOSS) | ||||
Net realized gain (loss) from: | ||||
Investments | $ | 28,715,350 | ||
Forward currency contracts (Note 7) | (3,580,398 | ) | ||
Foreign currency transactions | (343,266 | ) | ||
|
| |||
| 24,791,686 | ||||
|
| |||
Net change in unrealized appreciation (depreciation) on: | ||||
Investments | (46,187,398 | ) | ||
Forward currency contracts (Note 7) | 1,695,059 | |||
Foreign currency translations | (853,632 | ) | ||
|
| |||
| (45,345,971 | ) | |||
|
| |||
Net Realized and Unrealized Loss | (20,554,285 | ) | ||
|
| |||
Net Decrease in Net Assets Resulting from Operations | $ | (16,198,598 | ) | |
|
|
See notes to financial statements.
18 Certified Annual Report
| STATEMENTS OF CHANGES IN NET ASSETS |
| Thornburg Global Opportunities Fund |
| Year Ended September 30, 2011 | Year Ended September 30, 2010 | |||||||
INCREASE (DECREASE) IN NET ASSETS FROM | ||||||||
OPERATIONS: | ||||||||
Net investment income | $ | 4,355,687 | $ | 3,869,663 | ||||
Net realized gain (loss) on investments, forward currency contracts and foreign currency transactions | 24,791,686 | 38,105,914 | ||||||
Net unrealized appreciation (depreciation) on investments, forward currency contracts and foreign currency translations | (45,345,971 | ) | (21,260,073 | ) | ||||
|
|
|
| |||||
Net Increase (Decrease) in Net Assets Resulting from Operations | (16,198,598 | ) | 20,715,504 | |||||
DIVIDENDS TO SHAREHOLDERS: | ||||||||
From net investment income | ||||||||
Class A Shares | (1,157,718 | ) | (1,057,336 | ) | ||||
Class C Shares | (645,237 | ) | (302,170 | ) | ||||
Class I Shares | (2,212,943 | ) | (2,033,417 | ) | ||||
Class R3 Shares | (2,094 | ) | (1,467 | ) | ||||
Class R4 Shares | (16,535 | ) | (16,293 | ) | ||||
Class R5 Shares | (374,849 | ) | (178,405 | ) | ||||
FUND SHARE TRANSACTIONS (NOTE 4): | ||||||||
Class A Shares | (16,331,866 | ) | 5,589,247 | |||||
Class C Shares | (7,627,935 | ) | (4,319,558 | ) | ||||
Class I Shares | (7,493,930 | ) | 18,072,732 | |||||
Class R3 Shares | (86,609 | ) | 127,094 | |||||
Class R4 Shares | (468,511 | ) | 21,801 | |||||
Class R5 Shares | 20,998,920 | 16,091,131 | ||||||
|
|
|
| |||||
Net Increase (Decrease) in Net Assets | (31,617,905 | ) | 52,708,863 | |||||
NET ASSETS: | ||||||||
Beginning of Year | 324,834,162 | 272,125,299 | ||||||
|
|
|
| |||||
End of Year | $ | 293,216,257 | $ | 324,834,162 | ||||
|
|
|
| |||||
See notes to financial statements.
Certified Annual Report 19
| NOTES TO FINANCIAL STATEMENTS | ||
| Thornburg Global Opportunities Fund | September 30, 2011 | |
NOTE 1 – ORGANIZATION
Thornburg Global Opportunities Fund, hereinafter referred to as the “Fund,” is a diversified series of Thornburg Investment Trust (the “Trust”). The Trust was organized as a Massachusetts business trust under a Declaration of Trust dated June 3, 1987 and is registered as a diversified, open-end management investment company under the Investment Company Act of 1940, as amended. The Fund is currently one of sixteen separate series of the Trust. Each series is considered to be a separate entity for financial reporting and tax purposes and bears expenses directly attributable to it. The Fund seeks long-term capital appreciation by investing in equity and debt securities of all types from issuers around the world.
The Fund currently offers six classes of shares of beneficial interest outstanding: Class A, Class C, Institutional Class (Class I), and Retirement Classes (Class R3, Class R4, and Class R5). Each class of shares of the Fund represents an interest in the same portfolio of investments, except that (i) Class A shares are sold subject to a front-end sales charge collected at the time the shares are purchased and bear a service fee, (ii) Class C shares are sold at net asset value without a sales charge at the time of purchase, but are subject to a contingent deferred sales charge upon redemption within one year of purchase, and bear both a service fee and a distribution fee, (iii) Class I shares are sold at net asset value without a sales charge at the time of purchase, (iv) Class R3 shares are sold at net asset value without a sales charge at the time of purchase, but bear both a service fee and distribution fee, (v) Class R4 shares are sold at net asset value without a sales charge at the time of purchase, but bear a service fee, (vi) Class R5 shares are sold at net asset value without a sales charge at the time of purchase, and (vii) the respective classes may have different reinvestment privileges and conversion rights. Additionally, the Fund may allocate among its classes certain expenses, to the extent allowable to specific classes, including transfer agent fees, government registration fees, certain printing and postage costs, and administrative and legal expenses. Currently, class specific expenses of the Fund are limited to service and distribution fees, administration fees, and certain registration and transfer agent expenses.
NOTE 2 – SIGNIFICANT ACCOUNTING POLICIES
Significant accounting policies of the Trust are as follows:
Valuation of Investments: Portfolio securities listed or traded on a national securities exchange are valued on the valuation date at the last reported sale price on the exchange that is the primary market for the security. Portfolio securities traded on an exchange for which there has been no sale that day and other equity securities traded in the over-the-counter market are valued at the mean between the last reported bid and asked prices. Portfolio securities reported by NASDAQ are valued at the NASDAQ official closing price. Any foreign security traded on exchanges outside the United States is valued at the price of the security on the exchange that is normally the security’s primary market, as of the close of that exchange preceding the time of the Fund’s valuation.
Debt obligations held by the Fund have a primary market over the counter and are valued by an independent pricing service approved by the Trustees of the Trust. The pricing service ordinarily values debt obligations at quoted bid prices. When quotations are not available, debt obligations held by the Fund are valued at evaluated prices determined by the pricing service using methods which include consideration of yields or prices of debt obligations of comparable quality, type of issue, coupon, maturity and rating, and indications as to value from dealers and general market conditions. Short-term obligations having remaining maturities of 60 days or less are ordinarily valued at amortized cost, which approximates market value.
Quotations in foreign currencies for foreign portfolio investments are converted to U.S. dollar equivalents using the foreign exchange quotation in effect at the time of valuation.
In any case where the market value of an equity security held by the Fund is not readily available, the Trust’s valuation and pricing committee determines a fair value for the security using procedures approved by the Trustees, which may include the use of a price obtained from an independent pricing service. The pricing service ordinarily values equity securities in these instances using multi-factor models to adjust market prices based upon various inputs, including exchange data, depository receipt prices, futures and index data and other data. A security’s market value is deemed not readily available whenever the exchange or market on which the security is primarily traded is closed for the entire scheduled day of trading. Additionally, a security’s market value may be deemed not readily available under other circumstances identified by the Trustees, including when developments occurring after the most recent close of the security’s primary exchange or market, but before the most recent close of trading in Fund shares, or an unusual event or significant
20 Certified Annual Report
| NOTES TO FINANCIAL STATEMENTS, CONTINUED | ||
| Thornburg Global Opportunities Fund | September 30, 2011 | |
period of time occurring since the availability of a market quotation, create a question about the reliability of the security’s market value.
In any case where a pricing service fails to provide a price for a debt obligation held by the Fund, the valuation and pricing committee determines a fair value for the debt obligation using procedures approved by the Trustees. Additionally, in any case where management believes that a price provided by a pricing service for a debt obligation held by the Fund may be unreliable, the valuation and pricing committee decides whether or not to use the pricing service’s valuation or to determine a fair value for the debt obligation.
In determining fair value for any portfolio security or other investment, the valuation and pricing committee seeks to determine the amount that an owner of the investment might reasonably expect to receive upon a sale of the investment. However, because fair value prices are estimated prices, the valuation and pricing committee’s determination of fair value for an investment may differ from the value that would be realized by the Fund upon a sale of the investment, and that difference could be material to the Fund’s financial statements. The valuation and pricing committee’s determination of fair value for an investment may also differ from the prices obtained by other persons (including other mutual funds) for the investment.
Valuation Measurements: Various inputs are used in determining the value of the Fund’s investments. These inputs are summarized in the three levels listed below:
Level 1: Quoted prices in active markets for identical investments.
Level 2: Other significant observable inputs (including quoted prices for similar investments, interest rates, prepayment rates, credit risk, etc.).
Level 3: Significant unobservable inputs (including the Fund’s own assumptions in determining the fair value of investments).
The following table displays a summary of the inputs used to value the Fund’s net assets as of September 30, 2011. In any instance when valuation inputs from more than one level are used to determine the fair value of a specific investment, the investment is placed in the level of the table based upon the lowest level input that is significant in determining the fair value of the investment:
| Fair Value Measurements at September 30, 2011 | ||||||||||||||||
| Total | Level 1 | Level 2 | Level 3 | |||||||||||||
Assets | ||||||||||||||||
Investments in Securities* | ||||||||||||||||
Common Stock | $ | 253,025,820 | $ | 253,025,820 | $ | — | $ | — | ||||||||
Preferred Stock | 10,296,755 | 10,296,755 | — | — | ||||||||||||
Exchange Traded Funds | 12,757,056 | 12,757,056 | — | — | ||||||||||||
Short Term Investments | 9,999,906 | — | 9,999,906 | — | ||||||||||||
|
|
|
|
|
|
|
| |||||||||
Total Investments in Securities | $ | 286,079,537 | $ | 276,079,631 | $ | 9,999,906 | $ | — | ||||||||
Other Financial Instruments** | ||||||||||||||||
Forward Currency Contracts | $ | 1,542,531 | $ | — | $ | 1,542,531 | $ | — | ||||||||
Liabilities | ||||||||||||||||
Other Financial Instruments** | ||||||||||||||||
Forward Currency Contracts | $ | (2,109,184 | ) | $ | — | $ | (2,109,184 | ) | $ | — | ||||||
| * | See Schedule of Investments for a summary of the industry exposure as grouped according to the Global Industry Classification Standard (GICS), which is an industry taxonomy developed by MSCI, Inc. and Standard & Poor’s (S&P). |
| ** | Other Financial Instruments include investments not reflected in the Schedule of Investments, such as futures, forwards and swap contracts, which are valued at the unrealized appreciation (depreciation) on the investment. |
Certified Annual Report 21
| NOTES TO FINANCIAL STATEMENTS, CONTINUED | ||
| Thornburg Global Opportunities Fund | September 30, 2011 | |
A rollforward of fair value measurements using significant unobservable inputs (Level 3) for the year ended September 30, 2011, is as follows:
Beginning Balance 9/30/2010 | $ | 6,000,000 | ||
Accrued Discounts (Premiums) | — | |||
Net Realized Gain (Loss) | — | |||
Gross Purchases | — | |||
Gross Sales | — | |||
Change in Unrealized Appreciation (Depreciation) | — | |||
Transfers into Level 3(a) | — | |||
Transfers out of Level 3(a) | (6,000,000 | ) | ||
|
| |||
Ending Balance 9/30/2011(b) | $ | — |
| (a) | Transfers into and/or out of Level 3 were to/from Level 1, and were due to the availability of quoted prices in active markets for identical investments during the year ended September 30, 2011. Transfers into or out of Level 3 are based on the beginning market value of the period in which they occurred. |
| (b) | Level 3 Securities represent 0.00% of Total Net Assets at September 30, 2011. |
Other Notes: It is the policy of the Fund to recognize significant transfers between Levels 1, 2 and 3 and to disclose those transfers at the beginning of the reporting period. The Fund recognized no significant transfers between Levels 1 and 2 for the year ended September 30, 2011.
Foreign Currency Translation: Portfolio securities and other assets and liabilities denominated in foreign currencies are translated into U.S. dollars based on the exchange rate of such currencies against the U.S. dollar on the date of valuation. Purchases and sales of securities and income items denominated in foreign currencies are translated into U.S. dollars at the exchange rate in effect on the translation date. When the Fund purchases or sells foreign securities, it will customarily enter into a foreign exchange contract to minimize foreign exchange risk from the trade date to the settlement date of such transactions. Such spot contracts are included in Receivable for investments sold and Payable for investments purchased on the Statement of Assets and Liabilities.
The Fund does not separately report the effect of changes in foreign exchange rates from changes in market prices on securities held. Such changes are included in net realized and unrealized gain or loss from investments.
Reported net realized foreign exchange gains or losses arise from purchases and sales of foreign currencies, currency gains or losses realized between the trade and settlement dates on securities transactions and the difference between the amounts of dividends, interest, and foreign withholding taxes recorded on the Fund’s books, and the U.S. dollar equivalent of the amounts actually received or paid.
Net unrealized foreign exchange gains and losses arise from changes in the fair value of assets and liabilities, other than investments in securities at fiscal period end, resulting from changes in exchange rates.
Deferred Taxes: The Fund is subject to a tax imposed on net realized gains of securities of certain foreign countries. The Fund records an estimated deferred tax liability for net unrealized gains on these securities as reflected in the accompanying financial statements.
Federal Income Taxes: It is the policy of the Trust to comply with the provisions of the Internal Revenue Code applicable to “regulated investment companies,” and to distribute to shareholders substantially all taxable income, including any net realized gain on investments of the Fund. Therefore, no provision for federal income taxes is required.
Management reviews each uncertain tax position believed to be material to the preparation of the Fund’s financial statements, to assess if it is more likely than not that the position would be sustained upon examination, based upon the technical merits of the position. As of September 30, 2011, management has not identified any such position for which a liability must be reflected in the Statement of Assets and Liabilities. The Fund’s tax returns remain subject to examination for three years after filing.
22 Certified Annual Report
| NOTES TO FINANCIAL STATEMENTS, CONTINUED | ||
| Thornburg Global Opportunities Fund | September 30, 2011 | |
When-Issued and Delayed Delivery Transactions: The Fund may engage in when-issued or delayed delivery transactions. To the extent the Fund engages in such transactions, it will do so for the purpose of acquiring portfolio securities consistent with the Fund’s investment objectives and not for the purpose of investment leverage or to speculate on interest rate and/or market changes. At the time the Fund makes a commitment to purchase a security on a when-issued or delayed delivery basis, the Fund will record the transaction and reflect the value in determining its net asset value. When effecting such transactions, assets of an amount sufficient to make payment for the portfolio securities to be purchased will be segregated on the Fund’s records on the trade date. Securities purchased on a when-issued or delayed delivery basis do not earn interest until the settlement date.
Dividends: Dividends to shareholders, if any, are generally paid quarterly and are reinvested in additional shares of the Fund at net asset value per share at the close of business on the dividend payment date or, at the shareholder’s option, paid in cash. Net realized capital gains, to the extent available, will be distributed at least annually. Distributions to shareholders are based on income tax regulations and therefore, their characteristics may differ for financial statement and tax purposes.
General: Securities transactions are accounted for on a trade date basis. Interest income is accrued as earned and dividend income is recorded on the ex-dividend date. Certain income from foreign securities is recognized as soon as information is available to the Fund. Realized gains and losses from the sale of securities are recorded on an identified cost basis. Net investment income (other than class specific expenses) and realized and unrealized gains and losses are allocated daily to each class of shares based upon the relative net asset value of outstanding shares of each class of shares at the beginning of the day (after adjusting for the current share activity of the respective class). Expenses common to all Funds are allocated among the Funds comprising the Trust based upon their relative net asset values or other appropriate allocation methods.
Guarantees and Indemnifications: Under the Trust’s organizational documents, its officers and Trustees are indemnified against certain liabilities arising out of the performance of their duties to the Fund. Additionally, in the normal course of business the Trust enters into contracts with service providers that contain general indemnification clauses. The Trust’s maximum exposure under these arrangements is unknown. However, based on experience, the Trust expects the risk of loss to be remote.
Use of Estimates: The preparation of financial statements, in conformity with generally accepted accounting principles, requires management to make estimates and assumptions that affect the reported amounts of assets and liabilities and the disclosure of contingent assets and liabilities at the date of the financial statements and the reported amounts of increases and decreases in net assets from operations during the reporting period. Actual results could differ from those estimates.
NOTE 3 – INVESTMENT ADVISORY FEE AND OTHER TRANSACTIONS WITH AFFILIATES
Pursuant to an investment advisory agreement, Thornburg Investment Management, Inc. (the “Advisor”) serves as the investment advisor and performs services to the Fund for which the fees are payable at the end of each month. For the year ended September 30, 2011, these fees were payable at annual rates ranging from .875 of 1% to .675 of 1% per annum of the average daily net assets of the Fund depending on the Fund’s asset size. The Trust also has entered into administrative services agreements with the Advisor, whereby the Advisor will perform certain administrative services for the shareholders of each class of the Fund’s shares, and for which fees will be payable at an annual rate of up to .125 of 1% per annum of the average daily net assets attributable to each class of shares. For the year ended September 30, 2011, the Advisor contractually reimbursed certain class specific expenses, administrative fees, and distribution fees of $176,639 for Class I shares, $21,491 for Class R3 shares, $23,451 for Class R4 shares, and $66,957 for Class R5 shares.
The Trust has an underwriting agreement with Thornburg Securities Corporation (the “Distributor,” an affiliate of the Advisor), which acts as the distributor of the Fund’s shares. For the year ended September 30, 2011, the Distributor has advised the Fund that it earned commissions aggregating $15,323 from the sale of Class A shares, and collected contingent deferred sales charges aggregating $4,329 from redemptions of Class C shares of the Fund.
Pursuant to a service plan under Rule 12b-1 of the Investment Company Act of 1940, the Fund may reimburse to the Advisor an amount not to exceed .25 of 1% per annum of the average daily net assets attributable to each class of shares of the Fund for payments made by the Advisor to securities dealers and other financial institutions to obtain various shareholder and distribution related services. For the year ended September 30, 2011, there were no 12b-1 service plan fees charged for Class I shares and Class R5 shares. The Advisor may pay out of its own resources additional expenses for distribution of the Fund’s shares.
Certified Annual Report 23
| NOTES TO FINANCIAL STATEMENTS, CONTINUED | ||
| Thornburg Global Opportunities Fund | September 30, 2011 | |
The Trust has also adopted distribution plans pursuant to Rule 12b-1, applicable only to the Fund’s Class C and Class R3 shares, under which the Fund compensates the Distributor for services in promoting the sale of Class C and Class R3 shares of the Fund at an annual rate of up to .75 of 1% per annum of the average daily net assets attributable to Class C shares, and an annual rate of up to .25 of 1% per annum of the average daily net assets attributable to Class R3 shares. Total fees incurred by the Distributor for each class of shares of the Fund under their respective Service and Distribution Plans for the year ended September 30, 2011, are set forth in the Statement of Operations.
The Trust has an agreement with the custodian bank to indirectly pay a portion of the custodian’s fees through credits earned by the Fund’s cash on deposit with the bank. This deposit agreement is an alternative to overnight investments. Custodial fees have been adjusted to reflect amounts that would have been paid without this agreement, with a corresponding adjustment reflected as fees paid indirectly in the Statement of Operations. For the year ended September 30, 2011, fees paid indirectly were $831.
Certain officers and Trustees of the Trust are also officers or directors of the Advisor and Distributor. The compensation of independent Trustees is borne by the Trust.
NOTE 4 – SHARES OF BENEFICIAL INTEREST
At September 30, 2011, there were an unlimited number of shares of beneficial interest authorized. Transactions in shares of beneficial interest were as follows:
| Year Ended September 30, 2011 | Year Ended September 30, 2010 | |||||||||||||||
| Shares | Amount | Shares | Amount | |||||||||||||
Class A Shares | ||||||||||||||||
Shares sold | 1,213,749 | $ | 19,050,548 | 1,932,225 | $ | 26,869,017 | ||||||||||
Shares issued to shareholders in reinvestment of dividends | 65,489 | 1,009,001 | 64,470 | 884,066 | ||||||||||||
Shares repurchased | (2,337,595 | ) | (36,392,274 | ) | (1,630,246 | ) | (22,166,671 | ) | ||||||||
Redemption fees received* | — | 859 | — | 2,835 | ||||||||||||
|
|
|
|
|
|
|
| |||||||||
Net increase (decrease) | (1,058,357 | ) | $ | (16,331,866 | ) | 366,449 | $ | 5,589,247 | ||||||||
|
|
|
|
|
|
|
| |||||||||
Class C Shares | ||||||||||||||||
Shares sold | 484,330 | $ | 7,505,708 | 896,157 | $ | 12,294,052 | ||||||||||
Shares issued to shareholders in reinvestment of dividends | 35,338 | 530,417 | 18,260 | 245,234 | ||||||||||||
Shares repurchased | (1,015,605 | ) | (15,664,857 | ) | (1,248,317 | ) | (16,861,356 | ) | ||||||||
Redemption fees received* | — | 797 | — | 2,512 | ||||||||||||
|
|
|
|
|
|
|
| |||||||||
Net increase (decrease) | (495,937 | ) | $ | (7,627,935 | ) | (333,900 | ) | $ | (4,319,558 | ) | ||||||
|
|
|
|
|
|
|
| |||||||||
Class I Shares | ||||||||||||||||
Shares sold | 2,881,752 | $ | 45,325,074 | 3,274,574 | $ | 45,532,091 | ||||||||||
Shares issued to shareholders in reinvestment of dividends | 128,855 | 2,006,584 | 133,385 | 1,837,387 | ||||||||||||
Shares repurchased | (3,651,130 | ) | (54,826,948 | ) | (2,151,068 | ) | (29,300,502 | ) | ||||||||
Redemption fees received* | — | 1,360 | — | 3,756 | ||||||||||||
|
|
|
|
|
|
|
| |||||||||
Net increase (decrease) | (640,523 | ) | $ | (7,493,930 | ) | 1,256,891 | $ | 18,072,732 | ||||||||
|
|
|
|
|
|
|
| |||||||||
24 Certified Annual Report
| NOTES TO FINANCIAL STATEMENTS, CONTINUED | ||
| Thornburg Global Opportunities Fund | September 30, 2011 | |
| Year Ended September 30, 2011 | Year Ended September 30, 2010 | |||||||||||||||
| Shares | Amount | Shares | Amount | |||||||||||||
Class R3 Shares | ||||||||||||||||
Shares sold | 6,732 | $ | 109,304 | 9,552 | $ | 130,546 | ||||||||||
Shares issued to shareholders in reinvestment of dividends | 129 | 1,980 | 98 | 1,351 | ||||||||||||
Shares repurchased | (12,006 | ) | (197,894 | ) | (328 | ) | (4,806 | ) | ||||||||
Redemption fees received* | — | 1 | — | 3 | ||||||||||||
|
|
|
|
|
|
|
| |||||||||
Net increase (decrease) | (5,145 | ) | $ | (86,609 | ) | 9,322 | $ | 127,094 | ||||||||
|
|
|
|
|
|
|
| |||||||||
Class R4 Shares | ||||||||||||||||
Shares sold | 21,139 | $ | 330,995 | 11,897 | $ | 163,293 | ||||||||||
Shares issued to shareholders in reinvestment of dividends | 1,080 | 16,534 | 1,193 | 16,293 | ||||||||||||
Shares repurchased | (50,230 | ) | (816,051 | ) | (11,780 | ) | (157,823 | ) | ||||||||
Redemption fees received* | — | 11 | — | 38 | ||||||||||||
|
|
|
|
|
|
|
| |||||||||
Net increase (decrease) | (28,011 | ) | $ | (468,511 | ) | 1,310 | $ | 21,801 | ||||||||
|
|
|
|
|
|
|
| |||||||||
Class R5 Shares | ||||||||||||||||
Shares sold | 1,372,588 | $ | 22,550,663 | 1,156,994 | $ | 16,024,177 | ||||||||||
Shares issued to shareholders in reinvestment of dividends | 23,791 | 374,849 | 12,827 | 178,404 | ||||||||||||
Shares repurchased | (125,826 | ) | (1,926,900 | ) | (8,074 | ) | (111,608 | ) | ||||||||
Redemption fees received* | — | 308 | — | 158 | ||||||||||||
|
|
|
|
|
|
|
| |||||||||
Net increase (decrease) | 1,270,553 | $ | 20,998,920 | 1,161,747 | $ | 16,091,131 | ||||||||||
|
|
|
|
|
|
|
| |||||||||
| * | The Fund charges a redemption fee of 1% of the Class A and Class I shares redeemed or exchanged within 30 days of purchase. Redemption fees charged to any class are allocated to all classes upon receipt of payment based on relative net asset values of each class or other appropriate allocation methods. |
NOTE 5 – SECURITIES TRANSACTIONS
For the year ended September 30, 2011, the Fund had purchase and sale transactions of investment securities (excluding short-term investments) of $238,060,103 and $264,077,667, respectively.
NOTE 6 – INCOME TAXES
At September 30, 2011, information on the tax components of capital is as follows:
Cost of investments for tax purposes | $ | 315,645,497 | ||
|
| |||
Gross unrealized appreciation on a tax basis | $ | 26,596,186 | ||
Gross unrealized depreciation on a tax basis | (56,162,146 | ) | ||
|
| |||
Net unrealized appreciation (depreciation) on investments (tax basis) | $ | (29,565,960 | ) | |
|
| |||
Distributable earnings – ordinary income (tax basis) | $ | 281,899 |
At September 30, 2011, the Fund had deferred tax basis currency losses occurring subsequent to October 31, 2010 of $325,997. For tax purposes, such losses will be reflected in the year ending September 30, 2012.
The Fund utilized $26,824,403 of capital loss carryforwards for the year ended September 30, 2011.
Certified Annual Report 25
| NOTES TO FINANCIAL STATEMENTS, CONTINUED | ||
| Thornburg Global Opportunities Fund | September 30, 2011 | |
At September 30, 2011, the Fund had tax basis capital losses, which may be carried forward to offset future capital gains. To the extent such carryforwards are used, capital gain distributions may be reduced to the extent provided by regulations.
Such capital loss carryforwards expire as follows:
2017 | $ | 41,960,421 | ||
2018 | 140,739,212 | |||
|
| |||
| $ | 182,699,633 | |||
|
|
The Regulated Investment Company Modernization Act of 2010 (the “Act”) was signed into law on December 22, 2010. The Act makes changes to a number of tax rules impacting the Fund. Under the Act, future capital losses generated by the Fund may be carried over indefinitely, but these losses must be used prior to the utilization of any pre-enactment capital losses. Since pre-enactment capital losses may only be carried forward for eight years, there may be a greater likelihood that all or a portion of a Fund’s pre-enactment capital losses will expire unused. In general, the provisions of the Act will be effective for the Fund’s fiscal year ending September 30, 2012.
In order to account for permanent book/tax differences, the Fund decreased accumulated net realized loss by $343,266 and increased distribution in excess of net investment income by $343,266. This reclassification has no impact on the net asset value of the Fund. This reclassification results primarily from foreign currency gains (losses).
The tax character of distributions paid for the years ended September 30, 2011, and September 30, 2010, was as follows:
| 2011 | 2010 | |||||||
Distributions from: | ||||||||
Ordinary income | $ | 4,409,376 | $ | 3,589,088 | ||||
Capital gains | — | — | ||||||
|
|
|
| |||||
Total Distributions | $ | 4,409,376 | $ | 3,589,088 | ||||
|
|
|
| |||||
NOTE 7 – DERIVATIVE FINANCIAL INSTRUMENTS WITH OFF-BALANCE SHEET RISK AND FOREIGN INVESTMENT RISK
The Fund may use a variety of derivative financial instruments to hedge or adjust the risks affecting its investment portfolio or to enhance investment returns. Provisions of FASB Accounting Standards Codification ASC 815-10-50 (“ASC 815”), require certain disclosures. The disclosures are intended to provide users of financial statements with an understanding of the use of derivative instruments by the Fund and how these derivatives affect the financial position, financial performance and cash flows of the Fund. The Fund does not designate any derivative instruments as hedging instruments under ASC 815. During the year ended September 30, 2011, the Fund’s principal exposure to derivative financial instruments of the type addressed by ASC 815 was investment in foreign exchange contracts. A foreign exchange contract is an agreement between two parties to exchange different currencies at a specified rate of exchange at an agreed upon future date. Foreign exchange contracts involve risks to the Fund, including the risk that a contract counterparty will not meet its obligations to the Fund, the risk that a change in a contract’s value may not correlate perfectly with the currency the contract was intended to track, and the risk that the Fund’s advisor is unable to correctly implement its strategy in using a contract. In any such instance, the Fund may not achieve the intended benefit of entering into a contract, and may experience a loss. Additionally, the Fund’s risk of loss may exceed the amounts recognized on the Statement of Assets and Liabilities.
The Fund entered into forward currency contracts during the year ended September 30, 2011 in the normal course of pursuing its investment objectives, in anticipation of purchasing foreign investments or with the intent of reducing the risk to the value of the Fund’s foreign investments from adverse changes in the relationship between the U.S. dollar and foreign currencies. In each case these contracts have been initiated in conjunction with foreign investment transactions.
These contracts are accounted for by the Fund under ASC 815. Unrealized gains and unrealized losses on outstanding contracts are reported in the Fund’s Statement of Assets and Liabilities at the Fund’s net equity, as measured by the difference between the forward
26 Certified Annual Report
| NOTES TO FINANCIAL STATEMENTS, CONTINUED | ||
| Thornburg Global Opportunities Fund | September 30, 2011 | |
exchange rates at the reporting date and the forward exchange rates at each contract’s inception date. Net realized gain (loss) on contracts closed during the period, and changes in net unrealized appreciation (depreciation) on outstanding contracts are recognized in the Fund’s Statement of Operations. Values of open currency contracts are indicative of the activity for the year ended September 30, 2011.
The following table displays the outstanding forward currency contracts at September 30, 2011:
Outstanding Forward Currency Contracts
to Buy or Sell at September 30, 2011
Contract Description | Buy/Sell | Contract Amount | Contract Value Date | Value USD | Unrealized Appreciation | Unrealized Depreciation | ||||||||||||||||||
Euro | Sell | 12,765,200 | 02/08/2012 | 17,096,411 | $ | 872,906 | $ | — | ||||||||||||||||
Euro | Sell | 2,362,300 | 02/08/2012 | 3,163,824 | 241,077 | — | ||||||||||||||||||
Euro | Buy | 1,718,000 | 02/08/2012 | 2,300,914 | — | (139,109 | ) | |||||||||||||||||
Great Britain Pound | Sell | 12,306,000 | 12/16/2011 | 19,176,509 | 428,548 | — | ||||||||||||||||||
Great Britain Pound | Buy | 1,680,200 | 12/16/2011 | 2,618,265 | — | (145,950 | ) | |||||||||||||||||
Great Britain Pound | Buy | 2,011,700 | 12/16/2011 | 3,134,844 | — | (155,996 | ) | |||||||||||||||||
Swiss Franc | Sell | 12,624,300 | 10/05/2011 | 13,928,219 | — | (279,442 | ) | |||||||||||||||||
Swiss Franc | Buy | 6,790,600 | 10/05/2011 | 7,491,977 | — | (1,388,687 | ) | |||||||||||||||||
|
|
|
| |||||||||||||||||||||
Total | $ | 1,542,531 | $ | (2,109,184 | ) | |||||||||||||||||||
|
|
|
| |||||||||||||||||||||
The unrealized appreciation (depreciation) of the outstanding forward currency contracts recognized in the Fund’s Statement of Assets and Liabilities at September 30, 2011 is disclosed in the following table:
Fair Values of Derivative Financial Instruments
at September 30, 2011
Asset Derivatives | Balance Sheet Location | Fair Value | ||||
Foreign exchange contracts | Assets - Unrealized appreciation on forward currency contracts | $ | 1,542,531 | |||
Liability Derivatives | Balance Sheet Location | Fair Value | ||||
Foreign exchange contracts | Liabilities - Unrealized depreciation on forward currency contracts | $ | (2,109,184 | ) | ||
The realized gains (losses) from forward currency contracts, and the change in unrealized appreciation (depreciation) of outstanding forward currency contracts recognized in the Fund’s Statement of Operations for the year ended September 30, 2011 are disclosed in the following tables:
Amount of Realized Gain (Loss)
on Derivative Financial Instruments Recognized in
Income for the Year Ended September 30, 2011
| Total | Forward Currency Contracts | |||||||
Foreign exchange contracts | $ | (3,580,398 | ) | $ | (3,580,398 | ) | ||
Change in Unrealized Appreciation (Depreciation)
of Derivative Financial Instruments Recognized in
Income for the Year Ended September 30, 2011
| Total | Forward Currency Contracts | |||||||
Foreign exchange contracts | $ | 1,695,059 | $ | 1,695,059 | ||||
OTHER NOTES:
Risks: The Fund’s investments subject it to risks including, but not limited to, management risk, market and economic risk, risks affecting specific issuers, liquidity risk, the risks associated with investments in smaller companies, non-U.S. issuers, and real estate investment trusts, credit risk, and interest rate risk. Please see the Fund’s prospectus for a discussion of the risks associated with an investment in the Fund.
Subsequent Events: Fund management believes no events have occurred between September 30, 2011 and the date of issuance of the financial statements, which require adjustment to, or disclosure in the accompanying financial statements.
Certified Annual Report 27
Thornburg Global Opportunities Fund
| PER SHARE PERFORMANCE (for a share outstanding throughout the Year)+ | RATIOS TO AVERAGE NET ASSETS | SUPPLEMENTAL DATA | ||||||||||||||||||||||||||||||||||||||||||||||||||||||||||
Unless | Net Asset Value Beginning of Year | Net Investment Income (Loss) | Net Realized & Unrealized Gain (Loss) on Investments | Total from Investment Operations | Dividends from Net Investment Income | Dividends from Net Realized Gains | Total Dividends | Net Asset Value End of Year | Net Investment Income (Loss) (%) | Expenses, After Expense Reductions (%) | Expenses, After Expense Reductions and Net of Custody Credits (%) | Expenses, Before Expense Reductions (%) | Total Return (%)(a) | Portfolio Turnover Rate (%) | Net Assets at End of Year (Thousands) | |||||||||||||||||||||||||||||||||||||||||||||
Class A Shares |
| |||||||||||||||||||||||||||||||||||||||||||||||||||||||||||
2011(b) | $ | 13.98 | 0.18 | (0.82 | ) | (0.64 | ) | (0.19 | ) | — | (0.19 | ) | $ | 13.15 | 1.13 | 1.48 | 1.48 | 1.48 | (4.81 | ) | 70.33 | $ | 73,538 | |||||||||||||||||||||||||||||||||||||
2010(b) | $ | 13.10 | 0.18 | 0.86 | 1.04 | (0.16 | ) | — | (0.16 | ) | $ | 13.98 | 1.29 | 1.47 | 1.47 | 1.47 | 7.98 | 66.27 | $ | 92,927 | ||||||||||||||||||||||||||||||||||||||||
2009(b) | $ | 13.38 | 0.29 | 0.03 | 0.32 | (0.60 | ) | — | (0.60 | ) | $ | 13.10 | 2.96 | 1.53 | 1.52 | 1.55 | 3.60 | 103.02 | $ | 82,309 | ||||||||||||||||||||||||||||||||||||||||
2008(b) | $ | 20.06 | 0.30 | (6.30 | ) | (6.00 | ) | (0.14 | ) | (0.54 | ) | (0.68 | ) | $ | 13.38 | 1.68 | 1.50 | 1.49 | 1.50 | (30.85 | ) | 83.70 | $ | 159,996 | ||||||||||||||||||||||||||||||||||||
2007(b) | $ | 12.86 | 0.07 | 7.29 | 7.36 | — | (c) | (0.16 | ) | (0.16 | ) | $ | 20.06 | 0.41 | 1.51 | 1.50 | 1.55 | 57.75 | 91.02 | $ | 262,475 | |||||||||||||||||||||||||||||||||||||||
Class C Shares |
| |||||||||||||||||||||||||||||||||||||||||||||||||||||||||||
2011 | $ | 13.83 | 0.06 | (0.80 | ) | (0.74 | ) | (0.11 | ) | — | (0.11 | ) | $ | 12.98 | 0.40 | 2.23 | 2.23 | 2.23 | (5.45 | ) | 70.33 | $ | 70,643 | |||||||||||||||||||||||||||||||||||||
2010 | $ | 12.96 | 0.07 | 0.85 | 0.92 | (0.05 | ) | — | (0.05 | ) | $ | 13.83 | 0.48 | 2.28 | 2.28 | 2.28 | 7.10 | 66.27 | $ | 82,139 | ||||||||||||||||||||||||||||||||||||||||
2009 | $ | 13.22 | 0.23 | 0.01 | 0.24 | (0.50 | ) | — | (0.50 | ) | $ | 12.96 | 2.36 | 2.31 | 2.31 | 2.35 | 2.79 | 103.02 | $ | 81,334 | ||||||||||||||||||||||||||||||||||||||||
2008 | $ | 19.87 | 0.17 | (6.24 | ) | (6.07 | ) | (0.04 | ) | (0.54 | ) | (0.58 | ) | $ | 13.22 | 0.97 | 2.25 | 2.24 | 2.25 | (31.38 | ) | 83.70 | $ | 101,908 | ||||||||||||||||||||||||||||||||||||
2007 | $ | 12.84 | (0.06 | ) | 7.25 | 7.19 | .— | (0.16 | ) | (0.16 | ) | $ | 19.87 | (0.34 | ) | 2.28 | 2.28 | 2.33 | 56.48 | 91.02 | $ | 107,298 | ||||||||||||||||||||||||||||||||||||||
Class I Shares |
| |||||||||||||||||||||||||||||||||||||||||||||||||||||||||||
2011 | $ | 14.01 | 0.26 | (0.83 | ) | (0.57 | ) | (0.24 | ) | — | (0.24 | ) | $ | 13.20 | 1.65 | 0.99 | 0.99 | 1.11 | (4.30 | ) | 70.33 | $ | 115,837 | |||||||||||||||||||||||||||||||||||||
2010 | $ | 13.13 | 0.24 | 0.87 | 1.11 | (0.23 | ) | — | (0.23 | ) | $ | 14.01 | 1.78 | 0.99 | 0.99 | 1.19 | 8.48 | 66.27 | $ | 131,892 | ||||||||||||||||||||||||||||||||||||||||
2009 | $ | 13.45 | 0.37 | (0.01 | ) | 0.36 | (0.68 | ) | — | (0.68 | ) | $ | 13.13 | 3.65 | 0.99 | 0.99 | 1.33 | 4.16 | 103.02 | $ | 107,132 | |||||||||||||||||||||||||||||||||||||||
2008 | $ | 20.16 | 0.40 | (6.34 | ) | (5.94 | ) | (0.23 | ) | (0.54 | ) | (0.77 | ) | $ | 13.45 | 2.25 | 0.99 | 0.99 | 1.10 | (30.49 | ) | 83.70 | $ | 154,102 | ||||||||||||||||||||||||||||||||||||
2007 | $ | 12.87 | 0.17 | 7.29 | 7.46 | (0.01 | ) | (0.16 | ) | (0.17 | ) | $ | 20.16 | 0.97 | 1.00 | 0.99 | 1.20 | 58.51 | 91.02 | $ | 108,461 | |||||||||||||||||||||||||||||||||||||||
Class R3 Shares |
| |||||||||||||||||||||||||||||||||||||||||||||||||||||||||||
2011 | $ | 13.93 | 0.18 | (0.82 | ) | (0.64 | ) | (0.18 | ) | — | (0.18 | ) | $ | 13.11 | 1.12 | 1.49 | 1.49 | 14.23 | (d) | (4.77 | ) | 70.33 | $ | 75 | ||||||||||||||||||||||||||||||||||||
2010 | $ | 13.08 | 0.17 | 0.87 | 1.04 | (0.19 | ) | — | (0.19 | ) | $ | 13.93 | 1.28 | 1.46 | 1.46 | 32.05 | (d) | 7.97 | 66.27 | $ | 151 | |||||||||||||||||||||||||||||||||||||||
2009 | $ | 13.37 | 0.26 | 0.05 | 0.31 | (0.60 | ) | — | (0.60 | ) | $ | 13.08 | 2.57 | 1.50 | 1.49 | 116.95 | (d) | 3.61 | 103.02 | $ | 20 | |||||||||||||||||||||||||||||||||||||||
2008(e) | $ | 17.91 | 0.29 | (4.70 | ) | (4.41 | ) | (0.13 | ) | — | (0.13 | ) | $ | 13.37 | 2.61 | (f) | 1.49 | (f) | 1.49 | (f) | 67.47 | (d)(f) | (24.78 | ) | 83.70 | $ | 35 | |||||||||||||||||||||||||||||||||
Class R4 Shares |
| |||||||||||||||||||||||||||||||||||||||||||||||||||||||||||
2011 | $ | 13.90 | 0.19 | (0.81 | ) | (0.62 | ) | (0.19 | ) | — | (0.19 | ) | $ | 13.09 | 1.23 | 1.40 | 1.40 | 3.16 | (4.66 | ) | 70.33 | $ | 900 | |||||||||||||||||||||||||||||||||||||
2010 | $ | 13.04 | 0.19 | 0.84 | 1.03 | (0.17 | ) | — | (0.17 | ) | $ | 13.90 | 1.38 | 1.40 | 1.40 | 3.29 | 7.96 | 66.27 | $ | 1,345 | ||||||||||||||||||||||||||||||||||||||||
2009 | $ | 13.38 | 0.40 | (0.08 | ) | 0.32 | (0.66 | ) | — | (0.66 | ) | $ | 13.04 | 3.19 | 1.40 | 1.40 | 14.73 | (d) | 3.73 | 103.02 | $ | 1,244 | ||||||||||||||||||||||||||||||||||||||
2008(e) | $ | 17.91 | 0.28 | (4.69 | ) | (4.41 | ) | (0.12 | ) | — | (0.12 | ) | $ | 13.38 | 2.48 | (f) | 1.41 | (f) | 1.40 | (f) | 864.00 | (d)(f) | (24.74 | ) | 83.70 | $ | 3 | |||||||||||||||||||||||||||||||||
Class R5 Shares |
| |||||||||||||||||||||||||||||||||||||||||||||||||||||||||||
2011 | $ | 14.02 | 0.29 | (0.86 | ) | (0.57 | ) | (0.24 | ) | — | (0.24 | ) | $ | 13.21 | 1.84 | 0.99 | 0.99 | 1.24 | (4.29 | ) | 70.33 | $ | 32,223 | |||||||||||||||||||||||||||||||||||||
2010 | $ | 13.15 | 0.34 | 0.76 | 1.10 | (0.23 | ) | — | (0.23 | ) | $ | 14.02 | 2.46 | 0.99 | 0.99 | 1.64 | 8.41 | 66.27 | $ | 16,380 | ||||||||||||||||||||||||||||||||||||||||
2009 | $ | 13.46 | 0.53 | (0.15 | ) | 0.38 | (0.69 | ) | — | (0.69 | ) | $ | 13.15 | 4.36 | 0.97 | 0.97 | 239.11 | (d) | 4.25 | 103.02 | $ | 86 | ||||||||||||||||||||||||||||||||||||||
2008(e) | $ | 17.98 | 0.33 | (4.70 | ) | (4.37 | ) | (0.15 | ) | — | (0.15 | ) | $ | 13.46 | 2.97 | (f) | 0.92 | (f) | 0.92 | (f) | 850.59 | (d)(f) | (24.47 | ) | 83.70 | $ | 2 | |||||||||||||||||||||||||||||||||
| (a) | Not annualized for periods less than one year. |
| (b) | Sales loads are not reflected in computing total return. |
| (c) | Dividends from net investment income per share were less than $(0.01). |
| (d) | Due to the size of net assets and fixed expenses, ratios may appear disproportionate. |
| (e) | Effective date of this class of shares was February 1, 2008. |
| (f) | Annualized. |
| + | Based on weighted average shares outstanding. |
See notes to financial statements.
| 28 Certified Annual Report | Certified Annual Report 29 |
REPORT OF INDEPENDENT REGISTERED PUBLIC ACCOUNTING FIRM
Thornburg Global Opportunities Fund
To the Trustees and Shareholders of
Thornburg Global Opportunities Fund
In our opinion, the accompanying statement of assets and liabilities, including the schedule of investments, and the related statements of operations and of changes in net assets and the financial highlights present fairly, in all material respects, the financial position of Thornburg Global Opportunities Fund (one of the portfolios constituting Thornburg Investment Trust, hereafter referred to as the “Fund”) at September 30, 2011, the results of its operations for the year then ended, the changes in its net assets for each of the two years in the period then ended and the financial highlights for each of the periods presented, in conformity with accounting principles generally accepted in the United States of America. These financial statements and financial highlights (hereafter referred to as “financial statements”) are the responsibility of the Fund’s management. Our responsibility is to express an opinion on these financial statements based on our audits. We conducted our audits of these financial statements in accordance with the standards of the Public Company Accounting Oversight Board (United States). Those standards require that we plan and perform the audit to obtain reasonable assurance about whether the financial statements are free of material misstatement. An audit includes examining, on a test basis, evidence supporting the amounts and disclosures in the financial statements, assessing the accounting principles used and significant estimates made by management, and evaluating the overall financial statement presentation. We believe that our audits, which included confirmation of securities at September 30, 2011 by correspondence with the custodian and brokers, provide a reasonable basis for our opinion.
PricewaterhouseCoopers LLP
New York, New York
November 21, 2011
30 Certified Annual Report
| EXPENSE EXAMPLE | ||
| Thornburg Global Opportunities Fund | September 30, 2011 (Unaudited) | |
As a shareholder of the Fund, you incur two types of costs:
| (1) | transaction costs, including |
(a) sales charges (loads) on purchase payments for Class A shares;
(b) a deferred sales charge on redemptions of any part or all of a purchase of $1 million of Class A shares within 12 months of purchase;
(c) a deferred sales charge on redemptions of Class C shares within 12 months of purchase;
(d) a 30-day redemption fee on Class A and Class I shares;
| (2) | ongoing costs, including management fees; distribution and/or service (12b-1) fees; and other Fund expenses. |
This example is intended to help you understand your ongoing costs (in dollars) of investing in the Fund and to compare these costs with the ongoing costs of investing in other mutual funds.
The example is based on a $1,000 investment beginning on April 1, 2011, and held until September 30, 2011.
ACTUAL EXPENSES
For each class of shares, the first line of the table at right provides information about actual account values and actual expenses. You may use the information in this line, together with the amount you invested, to estimate the expenses that you paid over the period. Simply divide your account value by $1,000 (for example, an $8,600 account value divided by $1,000 = 8.6), then multiply the result by the number in the first line for your class of shares under the heading entitled “Expenses Paid During Period” to estimate the expenses you paid on your account during this period.
HYPOTHETICAL EXAMPLE FOR COMPARISON PURPOSES
For each class of shares, the second line of the table at right provides information about hypothetical account values and hypothetical expenses based on the Fund’s actual expense ratio and an assumed rate of return of 5% per year before expenses, which is not the Fund’s actual return. The hypothetical account values and expenses may not be used to estimate the actual ending account balance or expenses you paid for the period. You may use this information to compare the ongoing costs of investing in the Fund and other funds. To do so, compare this 5% hypothetical example with the 5% hypothetical examples that appear in the shareholder reports of the other funds.
| Beginning Account Value 4/1/11 | Ending Account Value 9/30/11 | Expenses Paid During Period† 4/1/11–9/30/11 | ||||||||||
Class A Shares | ||||||||||||
Actual | $ | 1,000.00 | $ | 812.50 | $ | 6.82 | ||||||
Hypothetical* | $ | 1,000.00 | $ | 1,017.54 | $ | 7.59 | ||||||
Class C Shares | ||||||||||||
Actual | $ | 1,000.00 | $ | 810.20 | $ | 10.10 | ||||||
Hypothetical* | $ | 1,000.00 | $ | 1,013.91 | $ | 11.24 | ||||||
Class I Shares | ||||||||||||
Actual | $ | 1,000.00 | $ | 814.50 | $ | 4.50 | ||||||
Hypothetical* | $ | 1,000.00 | $ | 1,020.10 | $ | 5.01 | ||||||
Class R3 Shares | ||||||||||||
Actual | $ | 1,000.00 | $ | 812.90 | $ | 6.82 | ||||||
Hypothetical* | $ | 1,000.00 | $ | 1,017.55 | $ | 7.59 | ||||||
Class R4 Shares | ||||||||||||
Actual | $ | 1,000.00 | $ | 813.30 | $ | 6.37 | ||||||
Hypothetical* | $ | 1,000.00 | $ | 1,018.05 | $ | 7.08 | ||||||
Class R5 Shares | ||||||||||||
Actual | $ | 1,000.00 | $ | 814.70 | $ | 4.51 | ||||||
Hypothetical* | $ | 1,000.00 | $ | 1,020.10 | $ | 5.01 | ||||||
| † | Expenses are equal to the annualized expense ratio for each class (A: 1.50%; C: 2.23%; I: 0.99%; R3: 1.50%; R4: 1.40%; R5: 0.99%) multiplied by the average account value over the period, multiplied by 183/365 to reflect the one-half year period. |
| * | Hypothetical assumes a rate of return of 5% per year before expenses. |
Please note that the expenses shown in the table are meant to highlight your ongoing costs only and do not reflect any transactional costs, such as sales charges (loads), redemption fees, or exchange fees. Therefore, the second line of the table for each class of shares is useful in comparing ongoing costs only, and will not help you determine the relative total costs of owning different funds. In addition, if these transactional costs were included, your costs would have been higher.
Certified Annual Report 31
| INDEX COMPARISON | ||
| Thornburg Global Opportunities Fund | September 30, 2011 (Unaudited) | |
GROWTH OF A HYPOTHETICAL $10,000 INVESTMENT
Thornburg Global Opportunities Fund versus MSCI AC World Index (July 28, 2006 to September 30, 2011)
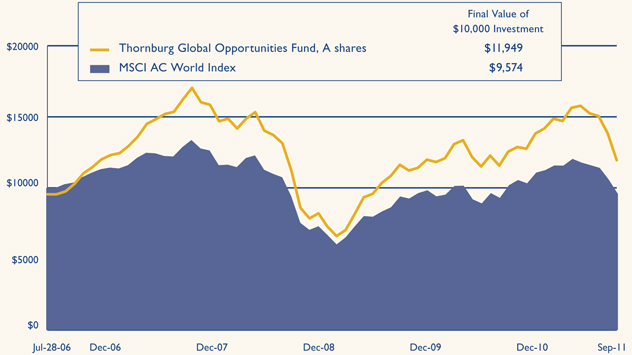
AVERAGE ANNUAL TOTAL RETURNS
For periods ended September 30, 2011 (with sales charge)
| 1 Yr | 3 Yrs | 5 Yrs | Since Inception | |||||||||||||
A Shares (Incep: 7/28/06) | -9.10 | % | 0.56 | % | 2.09 | % | 3.50 | % | ||||||||
C Shares (Incep: 7/28/06) | -6.38 | % | 1.35 | % | 2.25 | % | 3.62 | % | ||||||||
I Shares (Incep: 7/28/06) | -4.30 | % | 2.64 | % | 3.56 | % | 4.95 | % | ||||||||
R3 Shares (Incep: 2/1/08) | -4.77 | % | 2.13 | % | — | -5.87 | % | |||||||||
R4 Shares (Incep: 2/1/08) | -4.66 | % | 2.20 | % | — | -5.80 | % | |||||||||
R5 Shares (Incep: 2/1/08) | -4.29 | % | 2.65 | % | — | -5.37 | % | |||||||||
MSCI AC World Index (Since: 7/28/06) | -6.02 | % | 0.59 | % | -1.59 | % | -0.84 | % | ||||||||
Performance data shown represents past performance and is no guarantee of future results. Investment return and principal value will fluctuate so shares, when redeemed, may be worth more or less than their original cost. Current performance may be lower or higher than quoted. For performance current to the most recent month end, visit thornburg.com or call 800.847.0200. The performance data and graph do not reflect the deduction of taxes that a shareholder would pay on distributions or the redemption of Fund shares. Returns reflect the reinvestment of dividends and capital gains as well as applicable sales charges. Class A shares are sold with a maximum sales charge of 4.50% . Class C shares are subject to a 1% CDSC for the first year only. There is no up-front sales charge for Class I, R3, R4 and R5 shares. Class A and I shares are subject to a 1% 30-day redemption fee.
32 Certified Annual Report
| TRUSTEES AND OFFICERS | ||
| Thornburg Global Opportunities Fund | September 30, 2011 (Unaudited) | |
Name, Age, | Principal Occupation(s) During Past Five Years | Other Directorships Held by Trustee | ||
INTERESTED TRUSTEES(1)(2)(4) | ||||
| Garrett Thornburg, 65 Chairman of Trustees, Trustee since 1987(3) | Chairman and controlling shareholder and, until 2008, CEO of Thornburg Investment Management, Inc. (investment advisor); Chairman, CEO, and controlling shareholder of Thornburg Securities Corporation (securities dealer); CEO until 2007 and Chairman until 2009 of TMST, Inc. (f/k/a Thornburg Mortgage, Inc.) (real estate investment trust); President and Sole Director of Thornburg Mortgage Advisory Corporation (investment manager to TMST, Inc.). | None | ||
Brian J. McMahon, 55 Trustee since 2001, | CEO since 2008, President, Managing Director, Chief Investment Officer, and Portfolio Manager of Thornburg Investment Management, Inc. | None | ||
INDEPENDENT TRUSTEES(1)(2)(4) | ||||
| David A. Ater, 66 Trustee since 1994, Member of Audit Committee & Governance & Nominating Committee | Principal in Ater & Associates, Santa Fe, NM (developer, planner and broker of residential and commercial real estate); owner, developer and broker for various real estate projects. | None | ||
David D. Chase, 70 | Managing Member of Vestor Associates, LLC, Santa Fe, NM (private equity fund); Managing Member of CS Group, LLC, Santa Fe, NM (merchant bank). | None | ||
| Eliot R. Cutler, 65 Trustee since 2004 & Nominating Committee, Chairman of Governance | Senior Counsel and, until 2009, Partner in Akin, Gump, Strauss, Hauer & Feld LLP (law firm) in Washington, D.C. and Beijing, China. | None | ||
| Susan H. Dubin, 62 Trustee since 2004, Member of Audit Committee | President of Dubin Investments, Ltd., Greenwich, CT (private investment fund); Director and officer of various charitable organizations. | None | ||
| Owen D. Van Essen, 57 Trustee since 2004, Member of Governance & Nominating Committee & Chairman of Operations Risk Oversight Committee | President of Dirks, Van Essen & Murray, Santa Fe, NM (newspaper mergers and acquisitions). | None | ||
| James W. Weyhrauch, 52 Trustee since 1996, Member of Audit Committee & Operations Risk Oversight Committee | Real estate broker, Santa Fe Properties, Santa Fe, NM; Vice Chairman of Nambe LLC, Santa Fe, NM (manufacturing & design company). | None | ||
Certified Annual Report 33
| TRUSTEES AND OFFICERS, CONTINUED | ||
| Thornburg Global Opportunities Fund | September 30, 2011 (Unaudited) | |
Name, Age, | Principal Occupation(s) During Past Five Years | Other Directorships Held by Trustee | ||
OFFICERS OF THE FUND (WHO ARE NOT TRUSTEES)(1)(6)(7) | ||||
| George T. Strickland, 48 Vice President since 1996, Treasurer since 2007(6) | Portfolio Manager, Vice President, and Managing Director of Thornburg Investment Management, Inc. | Not applicable | ||
| William V. Fries, 72 Vice President since 1995 | Portfolio Manager, Vice President, and Managing Director of Thornburg Investment Management, Inc. | Not applicable | ||
| Leigh Moiola, 44 Vice President since 2001 | Vice President, Managing Director, and Director of Marketing of Thornburg Investment Management, Inc. | Not applicable | ||
| Alexander Motola, 41 Vice President since 2001 | Portfolio Manager, Vice President, and Managing Director of Thornburg Investment Management, Inc. | Not applicable | ||
| Wendy Trevisani, 40 Vice President since 1999 | Portfolio Manager and Managing Director of Thornburg Investment Management, Inc. | Not applicable | ||
| Joshua Gonze, 48 Vice President since 1999 | Portfolio Manager since 2007, Managing Director, and Associate Portfolio Manager until 2007 of Thornburg Investment Management, Inc. | Not applicable | ||
| Christopher Ihlefeld, 41 Vice President since 2003 | Portfolio Manager since 2007, Managing Director, and Associate Portfolio Manager until 2007 of Thornburg Investment Management, Inc. | Not applicable | ||
| Leon Sandersfeld, 45 Vice President since 2003 | Managing Director since 2007 and Fund Accounting Director of Thornburg Investment Management, Inc. | Not applicable | ||
| Sasha Wilcoxon, 37 Vice President since 2003 Secretary since 2007(6) | Managing Director since 2007, Director of Operations, and Vice President of Thornburg Investment Management, Inc. | Not applicable | ||
| Edward Maran, 53 Vice President since 2004 | Portfolio Manager and Managing Director of Thornburg Investment Management, Inc. | Not applicable | ||
| Vinson Walden, 41 Vice President since 2004 | Portfolio Manager and Managing Director of Thornburg Investment Management, Inc. | Not applicable | ||
| Thomas Garcia, 40 Vice President since 2006 | Vice President since 2011, Managing Director, Head Equity Trader, and Associate Portfolio Manager of Thornburg Investment Management, Inc. | Not applicable | ||
| Lei Wang, 40 Vice President since 2006 | Portfolio Manager and Managing Director of Thornburg Investment Management, Inc. | Not applicable | ||
| Connor Browne, 32 Vice President since 2006 | Portfolio Manager and Managing Director of Thornburg Investment Management, Inc. | Not applicable | ||
| Jason Brady, 37 Vice President since 2007 | Vice President since 2011, Portfolio Manager since 2007, Managing Director since 2007, and Associate Portfolio Manager 2006–2007 of Thornburg Investment Management, Inc. | Not applicable | ||
34 Certified Annual Report
| TRUSTEES AND OFFICERS, CONTINUED | ||
| Thornburg Global Opportunities Fund | September 30, 2011 (Unaudited) | |
Name, Age, | Principal Occupation(s) During Past Five Years | Other Directorships Held by Trustee | ||
| Lewis Kaufman, 35 Vice President since 2007 | Portfolio Manager since 2007, Managing Director since 2007, and Associate Portfolio Manager until 2009 of Thornburg Investment Management, Inc. | Not applicable | ||
| Christopher Ryon, 55 Vice President since 2008 | Portfolio Manager since 2009, Managing Director since 2009, and Associate Portfolio Manager 2008–2009 of Thornburg Investment Management, Inc.; Principal of Vanguard Funds until 2008. | Not applicable | ||
| Lon Erickson, 36 Vice President since 2008 | Portfolio Manager since 2010, Managing Director since 2010, and Associate Portfolio Manager 2008–2010 of Thornburg Investment Management, Inc.; Senior Analyst of State Farm Insurance until 2008. | Not applicable | ||
| Kathleen Brady, 51 Vice President since 2008 | Senior Tax Accountant since 2007 of Thornburg Investment Management, Inc.; Chief Financial Officer of Vestor Partners, LP (private equity fund) until 2007. | Not applicable | ||
| Jack Gardner, 57 Vice President since 2008 | Managing Director since 2007 of Thornburg Investment Management, Inc.; President since 2008 and National Sales Director of Thornburg Securities Corporation. | Not applicable | ||
| Laura Hillstrom, 44 Vice President since 2009 | Chief Administrative Officer since 2009, Vice President and Managing Director, and Director of Information Systems until 2009 of Thornburg Investment Management, Inc. | Not applicable | ||
| (1) | Each person’s address is 2300 North Ridgetop Road, Santa Fe, New Mexico 87506. |
| (2) | The Fund is one of sixteen separate investment “Funds” or “series” of Thornburg Investment Trust (the “Trust”), which comprises the Thornburg mutual fund complex and is organized as a Massachusetts business trust. Thornburg Investment Management, Inc. is the investment advisor to, and manages, the sixteen Funds of the Trust. Each Trustee oversees the sixteen Funds of the Trust. |
| (3) | Mr. Thornburg is considered an “interested” Trustee under the Investment Company Act of 1940 because he is the sole director and controlling shareholder of Thornburg Investment Management, Inc., the investment advisor to the sixteen active Funds of the Trust, and is the sole director and controlling shareholder of Thornburg Securities Corporation, the distributor of shares for the Trust. |
| (4) | Each Trustee serves in office until the election and qualification of a successor. |
| (5) | Mr. McMahon is considered an “interested” Trustee because he is the chief executive officer and president of Thornburg Investment Management, Inc. |
| (6) | The Trust’s president, secretary, and treasurer each serves a one-year term or until the election and qualification of a successor; each other officer serves at the pleasure of the Trustees. |
| (7) | Assistant vice presidents, assistant secretaries and assistant treasurers are not shown. |
The Statement of Additional Information for each Fund of the Trust includes additional information about the Trustees and is available, without charge and upon request, by calling 1-800-847-0200.
Certified Annual Report 35
| OTHER INFORMATION | ||
| Thornburg Global Opportunities Fund | September 30, 2011 (Unaudited) | |
PORTFOLIO PROXY VOTING
Policies and Procedures:
The Trust has delegated to Thornburg Investment Management, Inc. (the “Advisor”) voting decisions respecting proxies for the Fund’s voting securities. The Advisor makes voting decisions in accordance with its Proxy Voting Policy. A description of the Policy is available (i) without charge, upon request, by calling the Advisor toll-free at 1-800-847-0200, (ii) on the Thornburg website at www.thornburg. com, and (iii) on the Securities and Exchange Commission’s website at www.sec.gov.
Information regarding how proxies were voted is available on or before August 31 of each year for the twelve months ending the preceding June 30. This information is available (i) without charge, upon request by calling the Advisor toll-free at 1-800-847-0200, (ii) on the Thornburg website at www.thornburg.com, and (iii) on the Securities and Exchange Commission’s website at www.sec.gov.
TAX INFORMATION
For the tax year ended September 30, 2011, the Thornburg Global Opportunities Fund designates 95.40% (or the maximum allowed) of the dividends paid from tax basis net ordinary income as qualifying for the reduced rate under the Jobs and Growth Tax Relief and Reconciliation Act of 2003.
41.96% (or the maximum allowed) of the ordinary income distributions paid by the Fund for the tax year ended September 30, 2011 qualified for the corporate dividends received deduction.
For the tax year ended September 30, 2011, foreign source income and foreign taxes paid is $4,707,402 and $245,369, respectively.
The information and distributions reported herein may differ from the information and distributions reported to the shareholders for the calendar year ending December 31, 2011. Complete information will be reported in conjunction with your 2011 Form 1099-DIV.
AVAILABILITY OF QUARTERLY PORTFOLIO SCHEDULE
The Fund files with the Securities and Exchange Commission schedules of its portfolio holdings on Form N-Q for the first and third quarters of each fiscal year. The Fund’s Forms N-Q are available on the Commission’s website at www.sec.gov, or may be reviewed and copied at the Commission’s Public Reference Room in Washington, D.C. Information on the operation of the Public Reference Room may be obtained by calling 1-800-SEC-0330. The Fund also makes this information available on its website at www.thornburg.com/ download or upon request by calling 1-800-847-0200.
STATEMENT RESPECTING RENEWAL OF INVESTMENT ADVISORY AGREEMENT
Thornburg Investment Management, Inc. (the “Advisor”) provides investment management services to Thornburg Global Opportunities Fund pursuant to an investment advisory agreement. The Trustees consider the renewal of this agreement annually, and most recently determined to renew the agreement on September 13, 2011.
In anticipation of their recent consideration of the advisory agreement’s renewal, the independent Trustees met in May 2011 to discuss the Trustees’ evaluation of the Advisor’s performance and to specify the information the Advisor would present to the Trustees for their review. The Advisor’s chief investment officer subsequently reviewed portions of the specified information with the Trustees and addressed questions presented by the Trustees at a meeting session scheduled for that purpose, and the independent Trustees thereafter met in independent session to consider the Advisor’s presentation and various specific issues respecting their consideration of the advisory agreement’s renewal. Following these sessions, the Trustees met to consider renewal of the agreement, and the independent Trustees unanimously voted at that meeting to renew the agreement for an additional term of one year.
The information below summarizes certain factors considered by the Trustees in connection with the determination to renew the advisory agreement. In determining to renew the agreement, the Trustees did not identify any single factor as controlling, and this summary does not describe all of the matters considered by the Trustees in making their determination.
Quality of Services; Fund Investment Performance. The Trustees evaluated the nature, extent and quality of services provided by the Advisor under the advisory agreement, and evaluated the investment performance of the Fund.
36 Certified Annual Report
| OTHER INFORMATION, CONTINUED | ||
| Thornburg Global Opportunities Fund | September 30, 2011 (Unaudited) | |
In connection with their general supervision of the Advisor, and as an important element of their annual consideration of a renewal of the advisory agreement, the Trustees received and considered reports from the Advisor throughout the year. These reports addressed a wide variety of topics, including particularly the Advisor’s selection of investments and execution of the Fund’s investment strategies. In addition, the Trustees considered information provided to them at their request in anticipation of their annual evaluation of the Advisor’s services, including (i) the Fund’s absolute investment performance and achievement of stated objectives, (ii) the Advisor’s commentary on the Fund’s investment performance in the context of the Fund’s objectives and reasonable expectations, and business, market and economic conditions, (iii) measures of the Fund’s investment returns over various periods of time relative to a category of equity mutual funds selected by an independent mutual fund analyst firm, and relative to a broad-based securities index, (iv) the Fund’s cumulative investment return since inception relative to the securities index, and (v) comparative measures of estimated earnings growth, portfolio risk and return.
The Trustees also considered their perceptions of portfolio management personnel developed in formal and informal meetings throughout the year, the Advisor’s staffing and other resources, trade execution, performance of accounting and other services, the Advisor’s observance of compliance and regulatory requirements, the Advisor’s responsiveness to the Trustees, and other factors.
In reviewing quantitative and performance data presented, the Trustees noted (among other aspects of the data) comparative performance data for the four calendar years since the Fund’s inception, which showed that the Fund’s investment return for the most recent calendar year exceeded the average return for the fund category and the return for the index, and that the Fund’s investment returns exceeded the average returns for the category in two of the preceding three years and exceeded the returns for the index in two of three years. Other noted quantitative data showed that the Fund’s investment returns fell within the top decile of the fund category for the three-month and year-to-date periods ended with the second quarter of the current year and fell at or within the top third of the category for the one-year and three-year periods. The Trustees also noted the Fund’s higher cumulative investment return (net of expenses) relative to the Fund’s benchmark index.
The Trustees concluded, based upon these and other considerations, that the nature, extent and quality of the Advisor’s services were sufficient and that the Advisor had satisfactorily pursued the Fund’s stated investment objectives. The Trustees further concluded that the investment performance of the Fund was satisfactory in the context of the Fund’s objectives and policies, and prevailing market conditions.
Fees and Expenses; Profitability of Advisor; Economies of Scale; Ancillary Benefits to Advisor. The Trustees evaluated the level of the management fee charged by the Advisor to the Fund, and in this connection, reviewed the profitability of the Advisor, economies of scale potentially available to the Fund and whether the Advisor received any ancillary benefits from its relationship with the Fund.
In evaluating the level of the management fee, the Trustees considered the fee charged by the Advisor and the other expenses charged to the Fund in light of the nature and quality of services provided, comparison of the actual Advisor’s fee and Fund expenses to the statement of fees and expenses in the Fund’s prospectuses, and comparisons of the Advisor’s fee and other Fund expenses to median and average fees and expenses charged to two groups of equity mutual funds assembled by independent mutual fund analyst firms. Comparative fee and expense data noted by the Trustees showed that the management fee charged to the Fund was slightly higher than the median and average fee rates charged to the two groups of mutual funds, and that the Fund’s overall expense ratio was slightly higher than the median and average expense ratios for one fund group and comparable to the median expense ratio and slightly lower than the average expense ratio for the second fund group. The Trustees did not identify the differences as significant. The Trustees considered information about the fees charged by the Advisor to other investment management clients, together with information about fees charged by other advisors to different clients, and analysis of the differences between the requirements of institutional clients and mutual funds and the consequently different investment management services rendered, respectively, to institutional clients and mutual funds. The Trustees confirmed their previous observations that the differences between the fees charged by the Advisor to different types of clients did not appear exceptional, and that the fee rates charged by investment advisors to institutional clients had limited relevance to the evaluation of fee rates charged to mutual funds, because of the significant differences between the respective requirements of institutional clients and mutual funds, the differences between the respective services rendered to institutional clients and mutual funds, and the different circumstances in which the respective fees originate.
In reviewing the profitability of the Advisor, the Trustees considered costs incurred by the Advisor and data comparing the profitability of the Advisor to other investment management firms. The information provided did not indicate that the Advisor’s profitability was unusual, and the Trustees noted the adequacy of the Advisor’s resources and service capabilities. In reviewing the extent to which economies of scale would be realized by the Fund as it grows and whether fee levels reflect economies of scale, the Trustees considered
Certified Annual Report 37
| OTHER INFORMATION, CONTINUED | ||
| Thornburg Global Opportunities Fund | September 30, 2011 (Unaudited) | |
the breakpoint structure for advisory fees chargeable to the Fund, the demonstrated economies of scale enjoyed by other Funds of the Trust as they had grown in size, and economies of scale realized by other mutual funds. The information provided demonstrated to the Trustees that the Fund may reasonably be expected to realize economies of scale as it grows in size, due to the breakpoint fee structure of the advisory agreement and other factors. In reviewing potential benefits to the Advisor because of its relationship to the Fund, the Trustees considered the Advisor’s receipt of certain research services, and the benefits to both the Fund and the Advisor of the Advisor’s expansion of its staffing, compliance and systems capabilities and other resources to serve a broader variety of investment management clients. No unusual or unfair benefits to the Advisor from its relationship to the Fund were identified by the Trustees.
The Trustees concluded, based upon their consideration of these and other factors, that the management fee charged to the Fund by the Advisor was fair and reasonable in view of the nature and quality of the services provided by the Advisor, the clear disclosure of fees and expenses in the Fund’s prospectuses, the investment performance of the Fund, and comparisons of fees and costs charged to the Fund to fees and expenses charged to other mutual funds.
38 Certified Annual Report
This page intentionally left blank.
This page is not part of the Annual Report. 39
Trustees’ Statement to Shareholders
Not part of the Certified Annual Report
September 13, 2011
The Trustees believe current and prospective shareholders should know how we discharge our responsibilities in supervising the Funds’ investment advisor and in reviewing the advisor’s contract for renewal. Since 2005, we have issued a statement which sets out clearly the three principal guidelines that we follow in supervising the Trust’s investment advisor on your behalf. In accordance with our customary practice, in September of this year we again reviewed our statement and concluded we should reissue this statement outlining the principal features of our supervision of the advisor’s performance of investment management services for the Funds.
We begin with the premise that each shareholder selected his or her Fund because its investments are managed by the investment advisor identified in the prospectus and in accordance with the objective and policies described in the prospectus. We realize, as each of you do, that if you believe that your Fund’s stated objective and policies no longer serve your personal investment goals, you can sell your shares and leave the Fund.
Therefore, we believe that our primary supervisory task – our principal obligation to you – is to assess the nature and quality of the advisor’s services, and to confirm that the advisor actively and competently pursues the Fund’s objective, in accordance with the policies set out in the prospectus. To do this, we meet regularly with management to review your Fund’s portfolio and to discuss the advisor’s specific actions and judgments in pursuing the Fund’s objective. We do not substitute our own judgment for the advisor’s decisions in selecting investments; the advisor is paid to exercise its informed judgment on investment decisions, and we seek to confirm, in reviewing the advisor’s performance, that the advisor is doing just that.
Second, while we are conscious of costs and the effect that costs have on shareholders’ returns, we do not seek the lowest fees or expense ratio as our sole or primary objective. We try to make sure that your Fund’s fees and costs are reasonable in relationship to the services rendered and that they are generally in line with those charged by other expert investment advisors, consistent with our belief that the Fund’s investors searched for and expect that expertise and attention and have decided to pay a reasonable price for it. We do not put the management contract “out to bid” as a matter of course, and we would not do so unless we had concluded that the advisor materially had failed to pursue the Fund’s objectives in accordance with its policies, or for other equally important reasons. We believe that any other approach would be inconsistent with your interests and contrary to your expectations when you bought shares of the Fund in the first place.
Finally, because we believe that most Thornburg Fund shareholders have invested with a long-term perspective, we try not to focus too much on the fashions of the moment and on short-term performance. The market will not favor any specific investment objective or set of policies at all times and under all economic circumstances. A fund will experience periods of both high and low returns relative to other funds and other investments. Even if one of our Funds is not favored by the market at a particular time, we believe that the advisor is nonetheless obliged to remain true to the Fund’s objective and policies, and we watch to see that it does so.
40 This page is not part of the Annual Report.
Retirement and Education Accounts
Thornburg Investment Management offers retirement and education savings accounts that can help you meet a variety of planning challenges. For account applications or further information on any of the accounts below, please call 1-800-847-0200 or go to www.thornburg.com/ira. Your financial advisor can help you determine which plan is right for you.
Individual Retirement Accounts
Individual Retirement Accounts (IRAs) provide a tax-advantaged means to save money for the future. For a detailed outline of the difference between retirement accounts, see www.thornburg.com/ira. Rollovers are available. Call 1-800-847-0200 for more information.
Traditional IRAs – Contributions to Traditional IRAs are tax deductible for eligible individuals, and withdrawals are taxed as additional ordinary income. You may contribute to an IRA if you receive compensation and are under 70 1/2, even if you are covered by an employer retirement plan. Deductible contributions are subject to certain qualifications. Please consult your tax advisor.
Roth IRAs – Under a Roth IRA, there is no tax deduction for contributions, but there is no income tax on qualified withdrawals. For a more detailed comparison of Traditional and Roth IRAs, please see our web site at www.thornburg.com/ira.
SEP IRAs – Simplified Employee Pension (SEP) IRAs are established by employers. The employer is allowed a tax deduction for contributions made to the SEP Plan and makes contributions to each eligible employee’s SEP IRA on a discretionary basis.
SIMPLE IRAs – Savings Incentive Match Plan for Employees of Small Employers (SIMPLE) is designed to give small business owners a simplified method to establish and contribute to a retirement plan for employees. The employer is allowed a tax deduction for contributions and makes either matching or non-elective contributions to each eligible employee’s SIMPLE IRA. Employees may make salary deferral contributions.
Coverdell Education Savings Account
These savings accounts are designed to provide a way to save money for higher education expenses. In an Education Savings Account, earnings and interest grow tax-free, and qualified withdrawals used to pay for eligible higher-education expenses are tax- and penalty-free.
Funds Available
The following funds are available in the accounts listed above:
| • | Thornburg International Value Fund |
| • | Thornburg Value Fund |
| • | Thornburg Core Growth Fund |
| • | Thornburg Investment Income Builder Fund |
| • | Thornburg Global Opportunities Fund |
| • | Thornburg International Growth Fund |
| • | Thornburg Developing World Fund |
| • | Thornburg Limited Term U.S. Government Fund |
| • | Thornburg Limited Term Income Fund |
| • | Thornburg Strategic Income Fund |
This page is not part of the Annual Report. 41

Thornburg Equity Funds
Thornburg’s equity research uses a fundamental and comprehensive analytical approach. Thornburg equity funds focus on a limited number of securities so that each holding can impact performance. The equity team searches for firms believed to have a promising future and seeks to buy shares of those companies at a discount to their intrinsic value.
| • | Thornburg Value Fund |
| • | Thornburg International Value Fund |
| • | Thornburg Core Growth Fund |
| • | Thornburg Investment Income Builder Fund |
| • | Thornburg Global Opportunities Fund |
| • | Thornburg International Growth Fund |
| • | Thornburg Developing World Fund |
Thornburg Bond Funds
Thornburg Investment Management applies a disciplined philosophy to fixed-income management. Since the launch of our first fixed-income fund over 25 years ago, we have been conducting fundamental, bottom-up research in an effort to identify bonds which we believe provide the best return for a given level of risk. We are very organic in our approach, avoiding leverage or complex strategies which could backfire in periods of market uncertainty.
| • | Thornburg Limited Term Municipal Fund |
| • | Thornburg Intermediate Municipal Fund |
| • | Thornburg California Limited Term Municipal Fund |
| • | Thornburg New Mexico Intermediate Municipal Fund |
| • | Thornburg New York Intermediate Municipal Fund |
| • | Thornburg Strategic Municipal Income Fund |
| • | Thornburg Limited Term U.S. Government Fund |
| • | Thornburg Limited Term Income Fund |
| • | Thornburg Strategic Income Fund |
Before investing, carefully consider the Fund’s investment goals, risks, charges, and expenses. For a prospectus containing this and other information, contact your financial advisor or visit thornburg.com. Read it carefully before investing.
For additional information, please visit www.thornburg.com
Thornburg Investment Management, Inc. 2300 North Ridgetop Road, Santa Fe, NM 87506
This page is not part of the Annual Report. 43
 | Waste not, Wait not |  | ||||
| Get instant access to your shareholder reports. | ||||||
| This Annual Report is submitted for the general information of shareholders of the Fund. It is not authorized for distribution to prospective investors in the Fund unless preceded or accompanied by an effective prospectus. | By switching from your postal mailbox to your email inbox, you reduce paper clutter, improve record keeping access, and help conserve our natural resources. | |||||
 | Investment Advisor: Thornburg Investment Management® 800.847.0200 | Go to www.thornburg.com/edelivery and sign up to receive your shareholder reports, prospectuses, and proxy statements electronically. | ||||
Distributor: | ||||||
Thornburg Securities Corporation® 800.847.0200 | You invest in the future, without spending a dime. | |||||
| TH1245 | ||||||

Important Information
The information presented on the following pages was current as of September 30, 2011. The manager’s views, portfolio holdings, and sector and country diversification are provided for the general information of the Fund’s shareholders; to the extent this information is historical, it should not be considered predictive of future circumstances. This material should not be deemed a recommendation to buy or sell any of the securities mentioned.
Investments in the Fund carry risks, including possible loss of principal. Special risks may be associated with investments outside the United States, especially in developing countries, including currency fluctuations, illiquidity and volatility. Investments in small capitalization companies may increase the risk of greater price fluctuations. Please see the Fund’s Prospectus for a discussion of the risks associated with an investment in the Fund. Investments in the Fund are not FDIC insured, nor are they deposits of or guaranteed by a bank or any other entity. There is no guarantee that the Fund will meet its investment objectives. Funds invested in a limited number of holdings may expose an investor to greater volatility.
Performance data given at net asset value (NAV) does not take into account the applicable sales charges. If the sales charges had been included, the performance would have been lower.
Minimum investments for Class I shares are higher than those for other classes. Class I shares may not be available to all investors.
From time to time, the Fund may invest in shares of companies through initial public offerings (IPOs). IPOs have the potential to produce substantial gains for the Fund. There is no assurance that the Fund will have continued access to profitable IPOs and, as the Fund’s assets grow, the impact of IPO investments may decline. Therefore, investors should not rely on these past gains as an indication of future performance.
Impact to performance of IPOs, as disclosed in the following letter to shareholders, is calculated using the performance on the first day of the IPO, assuming that the acquired shares are held to the end of the first day.
Share Class | NASDAQ Symbol | Cusip | ||
Class A | THDAX | 885-216-408 | ||
Class C | THDCX | 885-216-507 | ||
Class I | THDIX | 885-216-606 |
Glossary
MSCI Emerging Markets Index – A free float-adjusted market capitalization index that is designed to measure equity market performance of emerging markets. The MSCI Emerging Markets Index consists of the following 21 emerging market country indices: Brazil, Chile, China, Colombia, Czech Republic, Egypt, Hungary, India, Indonesia, Korea, Malaysia, Mexico, Morocco, Peru, Philippines, Poland, Russia, South Africa, Taiwan, Thailand, and Turkey.
MSCI Country Indices (India and Indonesia) – Free float-adjusted market capitalization indices that are designed to measure equity market performance in that specific country.
Unless otherwise noted, index returns reflect the reinvestment of income dividends and capital gains, if any, but do not reflect fees, brokerage commissions or other expenses of investing. Investors may not make direct investments into any index.
Consumer Price Index (CPI) – Measures prices of a fixed basket of goods bought by a typical consumer, including food, transportation, shelter, utilities, clothing, medical care, entertainment and other items. The CPI, published by the Bureau of Labor Statistics in the Department of Labor, is based at 100 in 1982 and is released monthly. It is widely used as a cost-of-living benchmark to adjust Social Security payments and other payment schedules, union contracts and tax brackets. The CPI is also known as the cost-of-living index.
Debt-to-Capital Ratio (debt-to-cap) – A measurement of a company’s financial leverage, calculated as the company’s debt divided by its total capital.
Leverage – The amount of debt used to finance a firm’s assets. A firm with significantly more debt than equity is considered to be highly leveraged.
Price/Earnings Ratio (P/E) – A valuation ratio of a company’s current share price compared to its per-share earnings. P/E equals a company’s market value per share divided by earnings per share.
This page is not part of the Annual Report. 3

Thornburg Developing World Fund
September 30, 2011
Table of Contents | ||||
| 5 | ||||
| 8 | ||||
| 12 | ||||
| 13 | ||||
| 15 | ||||
| 16 | ||||
| 22 | ||||
| 24 | ||||
| 25 | ||||
| 26 | ||||
| 27 | ||||
| 30 |
This report is certified under the Sarbanes-Oxley Act of 2002, which requires that public companies, including mutual funds, affirm that the information provided in their annual and semiannual shareholder reports fully and fairly represents their financial position.
4 Certified Annual Report
Lewis Kaufman,CFA Portfolio Manager
Performance data shown represents past performance and is no guarantee of future results. Investment return and principal value will fluctuate so shares, when redeemed, may be worth more or less than their original cost. Current performance may be lower or higher than quoted. For performance current to the most recent month end, visit thornburg.com or call 800-847-0200.
The maximum sales charge for Class A shares is 4.50%. Class A shares are subject to a 1% 30-day redemption fee. The total annual fund operating expense of Class A shares is 3.29%, as disclosed in the most recent Prospectus. Thornburg Investment Management and Thornburg Securities Corporation have contractually agreed to waive fees and reimburse expenses through at least February 1, 2012, so that actual expenses, for Class A shares, do not exceed 1.83%. | October 14, 2011
Dear Fellow Shareholder:
We are pleased to present the second annual report for the Thornburg Developing World Fund for the fiscal year ended September 30, 2011. The net asset value (NAV) of a Class A share of the Fund decreased $1.94 to $12.50 per share in the past 12 months, representing a total return, including dividends, of negative 13.34% versus negative 16.15% for the MSCI Emerging Markets Index. Negative absolute returns reflect a dramatic deterioration in the European sovereign debt crisis, and a corresponding decline in emerging markets equities and currencies. Notably, the MSCI Emerging Markets Index declined just 11.99% in local currency terms, suggesting that currency contributed an additional 4.16% to index declines during the period. On a longer-term basis, absolute returns for the Thornburg Developing World Fund remain positive despite a decline in the market over the same period. Since inception on December 16, 2009, the Fund has returned positive 2.66% versus negative 3.14% for the MSCI Emerging Markets Index. Investments in initial public offerings with the Fund contributed 2.87% to performance for the fiscal year.
One year ago in our annual letter, we acknowledged that with higher asset prices comes the potential for a more volatile market environment. Since then, most major emerging markets currencies have declined, and the median forward P/E multiple for the Developing World Fund has decreased to 15.6x compared to 18.4x one year ago. While our focus on financially-sound, free cash generative companies has not proven protective in an absolute sense, it has aided in capital preservation on a relative basis. Perhaps more importantly, our intrinsic value estimates for companies in the Developing World Fund are largely unchanged. Specifically, while the companies we own may experience share price volatility along with the broader market, we believe they are less likely to permanently destroy value on a per-share basis – something more highly levered companies are likely to do in periods of capital markets duress. As of September 30, 2011, of the 39 non-bank companies in the portfolio, 24 were in net cash positions and the median debt-to-cap ratio was negative 10.5% (i.e., 10.5% of total capital in cash). In addition, of our 39 non-bank holdings, just four generated negative free cash flow in the last year.
A brief discussion of top portfolio holdings is instructive. Our top five holdings as of September 30, 2011 were Mexican over-the-counter and personal care company Genomma Labs, South African drug store chain Clicks, U.S.-based toothpaste company Colgate-Palmolive, Chinese luxury clothing retailer Trinity, and Indonesian cement company Indocement. Consistent with the characteristics described above, these five holdings have a median debt-to-cap ratio of negative 1.5%, and a median free cash flow yield of 5.4%. Moreover, they are generally growing in a durable manner at rates significantly in excess of GDP growth. Genomma Labs continues to explore underpenetrated consumer health segments in Mexico and South America. Clicks is leading the consolidation of the informal drug retailing sector in South Africa, where access to healthcare benefits is gradually improving. Colgate is introducing toothpaste to rural populations such as that in India, where just |

Certified Annual Report 5
| Letter to Shareholders, | ||
Continued | ||
45% of the rural population brushes its teeth. Trinity continues to benefit from luxury consumption trends in China, which may be supported by an appreciating Chinese renminbi over time. Indocement is growing volumes at high single-digit rates in a relatively benign competitive environment, and could benefit from medium-term reforms surrounding land acquisition and government investment. Consistent with these opportunities, based on consensus analyst estimates for next year, median sales growth for the Developing World Fund is 16.1% and we estimate median earnings per share growth 23.5%. The median P/E multiple for the Fund based on calendar 2012 consensus estimates is 16.2x.
The continued opportunities for long-term capital appreciation in our investment universe reflect a supportive macroeconomic backdrop in most major emerging markets economies. One distinguishing characteristic then, of recent equity market declines, is the high correlation among asset prices. Peripheral European countries including Greece continue to struggle to meet austerity targets, and lack self-correcting mechanisms such as weaker currencies or country-specific monetary policies required to place their economies on firmer footing. These challenges come against a backdrop of government debt-to-GDP ratios in the developed world in the range of 90%. By contrast, Brazil’s debt-to-GDP level is about 62%, Russia’s 9%, India’s 72%, and China’s 55%, inclusive of local government debt. Combined with faster-growing economies, the major emerging markets should have the capacity to incur additional indebtedness and support their economies – even as developed market economies deleverage. The currency picture also favors emerging markets. Major emerging markets continue to benefit from trade surpluses reflecting labor cost advantages and natural resource endowments, and from capital inflows in the form of stock and bond flows and foreign direct investment. Reflecting this dynamic, most major emerging markets’ central banks maintain foreign exchange reserves in the hundreds of billions – balances which are now being deployed to support currencies during a period of heightened risk aversion.
It is worth noting that China’s economic outlook has emerged as a key point of contention in recent months. While the Chinese government continues to harbor $3 trillion in foreign exchange reserves, the market has grown increasingly concerned about the remnants of Chinese stimulus past – namely, the sustainability and quality of fixed asset investment, local government debt levels, bank lending caps which have resulted in the growth of the shadow banking system, and real estate prices. While we are not dismissive of these issues, most appear manageable. Fixed asset investment can be gradually replaced by policy measures aimed at domestic consumption including renminbi appreciation and increased social spending, thereby helping to sustain GDP growth rates at high levels. Local governments continue to be backed by the tax base of the national government. Shadow banking remains a single-digit percentage of the existing stock of bank loans. Real estate prices could prove elevated in Tier 1 and 2 cities, but are less likely in other parts of the country. In the final analysis, Beijing has great firepower, which may be used in its pursuit of economic growth and social stability. The greatest risks to China’s economy are external in our judgment.
6 Certified Annual Report
Ultimately, it is difficult to forecast market movements with precision, and we remain focused on what we believe we can control. Namely, we continue to make risk-adjusted improvements to the portfolio. That said, if the market multiple simply remains unchanged in the next year, our portfolio may represent a vehicle for capital appreciation at a rate consistent with the earnings per share growth we expect for our portfolio. Emerging markets currencies arguably also offer some potential for recovery in the coming year, which should be a consideration for U.S.-based emerging markets investors broadly. Ultimately, it is our hope that our dual emphasis on capital appreciation and risk management will be a distinguishing characteristic of the Thornburg Developing World Fund over time. If capital market conditions in the developing world erode, companies with stable and self-funding businesses can reduce the need for external financing when it might be least available, thereby setting the stage for potential continued business development in the medium term.
Sincerely,

Lewis Kaufman,CFA
Portfolio Manager
Managing Director
The matters discussed in this report may constitute forward-looking statements made pursuant to the safe harbor provisions of the Securities Litigation Reform Act of 1995. These include any advisor or portfolio manager prediction, assessment, analysis or outlook for individual securities, industries, investment styles, market sectors and/or markets. These statements involve risks and uncertainties. In addition to the general risks described for each fund in its current prospectus, other factors bearing on these reports include the accuracy of the advisor’s or portfolio manager’s forecasts and predictions, the appropriateness of the investment strategies designed by the advisor or portfolio manager, and the ability of the advisor or portfolio manager to implement their strategies efficiently and successfully. Any one or more of these factors, as well as other risks affecting the securities markets generally, could cause the actual results of any fund to differ materially as compared to its benchmarks.
Certified Annual Report 7
| SCHEDULE OF INVESTMENTS | ||
| Thornburg Developing World Fund | September 30, 2011 | |
TOP TEN HOLDINGS
As of 9/30/11
Genomma Lab Internacional SA | 3.3 | % | Cia Hering | 3.0 | % | |||||
Clicks Group Ltd. | 3.3 | % | Schlumberger Ltd. | 3.0 | % | |||||
Colgate Palmolive Co. | 3.2 | % | Credicorp Ltd. | 3.0 | % | |||||
Trinity Ltd. | 3.1 | % | Totvs SA | 3.0 | % | |||||
PT Indocement Tunggal Prakarsa Tbk | 3.0 | % | Hengan International Group Co. Ltd. | 2.9 | % |
SUMMARY OF INDUSTRY EXPOSURE
As of 9/30/11
Software & Services | 18.3 | % | Food & Staples Retailing | 6.0 | % | |||||
Banks | 11.3 | % | Food, Beverage & Tobacco | 5.1 | % | |||||
Materials | 10.5 | % | Pharmaceuticals, Biotechnology & Life Sciences | 3.3 | % | |||||
Energy | 9.0 | % | Consumer Durables & Apparel | 3.1 | % | |||||
Retailing | 8.4 | % | Capital Goods | 1.7 | % | |||||
Health Care Equipment & Services | 7.7 | % | Technology Hardware & Equipment | 1.6 | % | |||||
Household & Personal Products | 6.2 | % | Diversified Financials | 1.0 | % | |||||
Consumer Services | 6.1 | % | Other Assets & Cash Equivalents | 0.7 | % |
SUMMARY OF COUNTRY EXPOSURE
As of 9/30/11 (percent of equity holdings)
China | 17.7 | % | Turkey | 4.5 | % | |||||
Brazil | 11.3 | % | Argentina | 3.6 | % | |||||
Indonesia | 9.7 | % | South Africa | 3.3 | % | |||||
India | 8.7 | % | Netherlands | 3.0 | % | |||||
Russia | 7.2 | % | Peru | 3.0 | % | |||||
United States | 5.5 | % | Canada | 2.9 | % | |||||
Taiwan | 5.4 | % | Poland | 1.9 | % | |||||
Mexico | 5.3 | % | Thailand | 1.8 | % | |||||
Hong Kong | 5.2 | % |
8 Certified Annual Report
| SCHEDULE OF INVESTMENTS, CONTINUED | ||
| Thornburg Developing World Fund | September 30, 2011 | |
| Shares/ Principal Amount | Value | |||||||
COMMON STOCK — 99.26% | ||||||||
BANKS — 11.28% | ||||||||
COMMERCIAL BANKS — 11.28% | ||||||||
Credicorp Ltd. | 19,197 | $ | 1,769,963 | |||||
PT Bank Mandiri | 2,172,000 | 1,556,724 | ||||||
Sberbank of Russia | 783,900 | 1,716,741 | ||||||
Turkiye Garanti Bankasi A.S. | 419,500 | 1,634,298 | ||||||
|
| |||||||
| 6,677,726 | ||||||||
|
| |||||||
CAPITAL GOODS — 1.72% | ||||||||
MACHINERY — 1.72% | ||||||||
Turk Traktor Ve Ziraat Makineleri AS | 52,974 | 1,020,485 | ||||||
|
| |||||||
| 1,020,485 | ||||||||
|
| |||||||
CONSUMER DURABLES & APPAREL — 3.06% | ||||||||
TEXTILES, APPAREL & LUXURY GOODS — 3.06% | ||||||||
Trinity Ltd. | 2,266,000 | 1,812,823 | ||||||
|
| |||||||
| 1,812,823 | ||||||||
|
| |||||||
CONSUMER SERVICES — 6.10% | ||||||||
DIVERSIFIED CONSUMER SERVICES — 1.83% | ||||||||
aNew Oriental Education & Technology Group, Inc. ADR | 47,113 | 1,082,185 | ||||||
HOTELS, RESTAURANTS & LEISURE — 4.27% | ||||||||
Arcos Dorados Holdings, Inc. | 27,218 | 631,186 | ||||||
aJubilant Foodworks Ltd. | 39,343 | 641,056 | ||||||
Wynn Macau Ltd. | 523,200 | 1,255,024 | ||||||
|
| |||||||
| 3,609,451 | ||||||||
|
| |||||||
DIVERSIFIED FINANCIALS — 1.00% | ||||||||
CAPITAL MARKETS — 1.00% | ||||||||
aNoah Holdings Ltd. ADR | 64,280 | 591,376 | ||||||
|
| |||||||
| 591,376 | ||||||||
|
| |||||||
ENERGY — 9.02% | ||||||||
ENERGY EQUIPMENT & SERVICES — 3.00% | ||||||||
Schlumberger Ltd. | 29,804 | 1,780,193 | ||||||
OIL, GAS & CONSUMABLE FUELS — 6.02% | ||||||||
CNOOC Ltd. | 938,000 | 1,561,045 | ||||||
Coal India Ltd. | 152,900 | 1,038,065 | ||||||
Novatek OAO GDR | 8,300 | 964,460 | ||||||
|
| |||||||
| 5,343,763 | ||||||||
|
| |||||||
FOOD & STAPLES RETAILING — 6.03% | ||||||||
FOOD & STAPLES RETAILING — 6.03% | ||||||||
CP All plc | 681,900 | 1,052,958 | ||||||
Drogasil S.A. | 234,067 | 1,400,481 | ||||||
Eurocash SA | 155,806 | 1,114,865 | ||||||
|
| |||||||
| 3,568,304 | ||||||||
|
| |||||||
FOOD, BEVERAGE & TOBACCO — 5.13% | ||||||||
BEVERAGES — 2.23% | ||||||||
Coca Cola Co. | 19,585 | 1,323,163 | ||||||
Certified Annual Report 9
| SCHEDULE OF INVESTMENTS, CONTINUED | ||
| Thornburg Developing World Fund | September 30, 2011 | |
| Shares/ Principal Amount | Value | |||||||
FOOD PRODUCTS — 2.90% | ||||||||
Mayora Indah | 1,184,000 | $ | 1,717,406 | |||||
|
| |||||||
| 3,040,569 | ||||||||
|
| |||||||
HEALTH CARE EQUIPMENT & SERVICES — 7.74% | ||||||||
HEALTH CARE EQUIPMENT & SUPPLIES — 2.74% | ||||||||
St. Shine Optical Co. Ltd. | 131,644 | 1,619,902 | ||||||
HEALTH CARE PROVIDERS & SERVICES — 5.00% | ||||||||
Diagnosticos da America SA | 198,900 | 1,691,483 | ||||||
Sinopharm Group Co. H | 479,700 | 1,268,950 | ||||||
|
| |||||||
| 4,580,335 | ||||||||
|
| |||||||
HOUSEHOLD & PERSONAL PRODUCTS — 6.15% | ||||||||
HOUSEHOLD PRODUCTS — 3.24% | ||||||||
Colgate Palmolive Co. | 21,596 | 1,915,133 | ||||||
PERSONAL PRODUCTS — 2.91% | ||||||||
Hengan International Group Co. Ltd. | 214,500 | 1,725,663 | ||||||
|
| |||||||
| 3,640,796 | ||||||||
|
| |||||||
MATERIALS — 10.47% | ||||||||
CHEMICALS — 5.50% | ||||||||
Asian Paints Ltd. | 24,118 | 1,555,666 | ||||||
Potash Corp. of Saskatchewan, Inc. | 39,295 | 1,698,330 | ||||||
CONSTRUCTION MATERIALS — 3.05% | ||||||||
PT Indocement Tunggal Prakarsa Tbk | 1,133,200 | 1,804,869 | ||||||
METALS & MINING — 1.92% | ||||||||
Southern Copper Corp. | 45,530 | 1,137,795 | ||||||
|
| |||||||
| 6,196,660 | ||||||||
|
| |||||||
PHARMACEUTICALS, BIOTECHNOLOGY & LIFE SCIENCES — 3.34% | ||||||||
PHARMACEUTICALS — 3.34% | ||||||||
aGenomma Lab Internacional SA | 1,198,800 | 1,976,901 | ||||||
|
| |||||||
| 1,976,901 | ||||||||
|
| |||||||
RETAILING — 8.35% | ||||||||
INTERNET & CATALOG RETAIL — 1.04% | ||||||||
aMakemytrip Ltd. | 27,869 | 615,347 | ||||||
MULTILINE RETAIL — 4.27% | ||||||||
Clicks Group Ltd. | 413,315 | 1,926,705 | ||||||
PT Mitra Adiperkasa Tbk | 1,224,500 | 599,016 | ||||||
SPECIALTY RETAIL — 3.04% | ||||||||
Cia Hering | 107,900 | 1,802,494 | ||||||
|
| |||||||
| 4,943,562 | ||||||||
|
| |||||||
SOFTWARE & SERVICES — 18.30% | ||||||||
INFORMATION TECHNOLOGY SERVICES — 2.12% | ||||||||
Infosys Technologies Ltd. ADR | 24,587 | 1,255,658 | ||||||
INTERNET SOFTWARE & SERVICES — 13.23% | ||||||||
Alibaba.com Ltd. | 1,017,500 | 952,510 | ||||||
Mercadolibre, Inc. | 27,260 | 1,465,225 | ||||||
PChome Online, Inc. | 108,000 | 637,900 | ||||||
aQihoo 360 Technology Co. Ltd. ADR | 92,942 | 1,518,672 | ||||||
10 Certified Annual Report
| SCHEDULE OF INVESTMENTS, CONTINUED | ||
| Thornburg Developing World Fund | September 30, 2011 | |
| Shares/ Principal Amount | Value | |||||||
Tencent Holdings Ltd. | 81,800 | $ | 1,720,579 | |||||
aYandex NV | 75,346 | 1,537,812 | ||||||
SOFTWARE — 2.95% | ||||||||
Totvs SA | 102,655 | 1,747,087 | ||||||
|
| |||||||
| 10,835,443 | ||||||||
|
| |||||||
TECHNOLOGY HARDWARE & EQUIPMENT — 1.57% | ||||||||
COMMUNICATIONS EQUIPMENT — 1.57% | ||||||||
HTC Corp. | 41,350 | 929,443 | ||||||
|
| |||||||
| 929,443 | ||||||||
|
| |||||||
TOTAL COMMON STOCK (Cost $64,834,530) | 58,767,637 | |||||||
|
| |||||||
TOTAL INVESTMENTS — 99.26% (Cost $64,834,530) | $ | 58,767,637 | ||||||
OTHER ASSETS LESS LIABILITIES — 0.74% | 438,091 | |||||||
|
| |||||||
NET ASSETS — 100.00% | $ | 59,205,728 | ||||||
|
| |||||||
Footnote Legend
| a | Non-income producing. |
Portfolio Abbreviations
To simplify the listings of securities, abbreviations are used per the table below:
| ADR | American Depository Receipt | |
| GDR | Global Depository Receipt |
See notes to financial statements.
Certified Annual Report 11
| STATEMENT OF ASSETS AND LIABILITIES | ||
| Thornburg Developing World Fund | September 30, 2011 | |
ASSETS | ||||
Investments at value (cost $64,834,530) (Note 2) | $ | 58,767,637 | ||
Cash denominated in foreign currency (cost $431,946) | 419,540 | |||
Receivable for investments sold | 869,293 | |||
Receivable for fund shares sold | 286,658 | |||
Dividends receivable | 94,810 | |||
Dividend and interest reclaim receivable | 749 | |||
Prepaid expenses and other assets | 10,622 | |||
|
| |||
Total Assets | 60,449,309 | |||
|
| |||
LIABILITIES | ||||
Payable for investments purchased | 807,910 | |||
Payable for fund shares redeemed | 140,655 | |||
Payable to investment advisor and other affiliates (Note 3) | 36,600 | |||
Payable to custodian | 127,063 | |||
Deferred tax payable | 54,123 | |||
Accounts payable and accrued expenses | 77,230 | |||
|
| |||
Total Liabilities | 1,243,581 | |||
|
| |||
NET ASSETS | $ | 59,205,728 | ||
|
| |||
NET ASSETS CONSIST OF: | ||||
Distribution in excess of net investment income | $ | (95,717 | ) | |
Net unrealized depreciation on investments and foreign currency translations | (6,137,303 | ) | ||
Accumulated net realized gain (loss) | (2,630,612 | ) | ||
Net capital paid in on shares of beneficial interest | 68,069,360 | |||
|
| |||
| $ | 59,205,728 | |||
|
| |||
NET ASSET VALUE: | ||||
Class A Shares: | ||||
Net asset value and redemption price per share ($24,929,278 applicable to 1,995,111 shares of beneficial interest outstanding - Note 4) | $ | 12.50 | ||
Maximum sales charge, 4.50% of offering price | 0.59 | |||
|
| |||
Maximum offering price per share | $ | 13.09 | ||
|
| |||
Class C Shares: | ||||
Net asset value and offering price per share ($7,257,395 applicable to 586,743 shares of beneficial interest outstanding - Note 4)* | $ | 12.37 | ||
|
| |||
Class I Shares: | ||||
Net asset value, offering and redemption price per share ($27,019,055 applicable to 2,140,416 shares of beneficial interest outstanding - Note 4) | $ | 12.62 | ||
|
| |||
| * | Redemption price per share is equal to net asset value less any applicable contingent deferred sales charge. |
See notes to financial statements.
12 Certified Annual Report
| STATEMENT OF OPERATIONS | ||
| Thornburg Developing World Fund | Year Ended September 30, 2011 | |
INVESTMENT INCOME: | ||||
Dividend income (net of foreign taxes withheld of $104,403) | $ | 1,042,966 | ||
Interest income | 339 | |||
|
| |||
Total Income | 1,043,305 | |||
|
| |||
EXPENSES: | ||||
Investment advisory fees (Note 3) | 641,564 | |||
Administration fees (Note 3) | ||||
Class A Shares | 34,165 | |||
Class C Shares | 9,778 | |||
Class I Shares | 15,324 | |||
Distribution and service fees (Note 3) | ||||
Class A Shares | 68,546 | |||
Class C Shares | 78,416 | |||
Transfer agent fees | ||||
Class A Shares | 40,201 | |||
Class C Shares | 16,763 | |||
Class I Shares | 18,049 | |||
Registration and filing fees | ||||
Class A Shares | 21,311 | |||
Class C Shares | 20,268 | |||
Class I Shares | 20,772 | |||
Custodian fees (Note 3) | 133,653 | |||
Professional fees | 44,342 | |||
Accounting fees | 1,669 | |||
Trustee fees | 1,735 | |||
Other expenses | 27,030 | |||
|
| |||
Total Expenses | 1,193,586 | |||
Less: | ||||
Expenses reimbursed by investment advisor (Note 3) | (82,967 | ) | ||
Investment advisory fees waived by investment advisor (Note 3) | (163,041 | ) | ||
Fees paid indirectly (Note 3) | (1,481 | ) | ||
|
| |||
Net Expenses | 946,097 | |||
|
| |||
Net Investment Income | $ | 97,208 | ||
|
| |||
Certified Annual Report 13
| STATEMENT OF OPERATIONS, CONTINUED | ||
| Thornburg Developing World Fund | Year Ended September 30, 2011 | |
REALIZED AND UNREALIZED GAIN (LOSS) | ||||
Net realized gain (loss) from: | ||||
Investments | $ | (2,272,526 | ) | |
Foreign currency transactions | (213,072 | ) | ||
|
| |||
| (2,485,598 | ) | |||
|
| |||
Net change in unrealized appreciation (depreciation) on: | ||||
Investments (net of change in deferred taxes payable of $38,015) | (10,535,960 | ) | ||
Foreign currency translations | (16,022 | ) | ||
|
| |||
| (10,551,982 | ) | |||
|
| |||
Net Realized and Unrealized Loss | (13,037,580 | ) | ||
|
| |||
Net Decrease in Net Assets Resulting from Operations | $ | (12,940,372 | ) | |
|
|
See notes to financial statements.
14 Certified Annual Report
STATEMENTS OF CHANGES IN NET ASSETS
Thornburg Developing World Fund
| Year Ended September 30, 2011 | Period Ended* September 30, 2010 | |||||||
INCREASE (DECREASE) IN NET ASSETS FROM | ||||||||
OPERATIONS: | ||||||||
Net investment income | $ | 97,208 | $ | 90,914 | ||||
Net realized gain (loss) on investments and foreign currency transactions, net of foreign capital gain taxes | (2,485,598 | ) | (342,739 | ) | ||||
Net unrealized appreciation (depreciation) on investments, foreign currency translations, and deferred taxes | (10,551,982 | ) | 4,414,679 | |||||
|
|
|
| |||||
Net Increase (Decrease) in Net Assets Resulting from Operations | (12,940,372 | ) | 4,162,854 | |||||
DIVIDENDS TO SHAREHOLDERS: | ||||||||
From net investment income | ||||||||
Class A Shares | (28,522 | ) | — | |||||
Class C Shares | (6,288 | ) | — | |||||
Class I Shares | (51,293 | ) | — | |||||
FUND SHARE TRANSACTIONS (NOTE 4): | ||||||||
Class A Shares | 16,379,807 | 12,579,326 | ||||||
Class C Shares | 5,862,947 | 2,603,666 | ||||||
Class I Shares | 15,403,407 | 15,240,196 | ||||||
|
|
|
| |||||
Net Increase in Net Assets | 24,619,686 | 34,586,042 | ||||||
NET ASSETS: | ||||||||
Beginning of Period | 34,586,042 | — | ||||||
|
|
|
| |||||
End of Period | $ | 59,205,728 | $ | 34,586,042 | ||||
|
|
|
| |||||
Undistributed net investment income | $ | — | $ | 11,955 | ||||
| * | For the period from commencement of operations on December 16, 2009 through September 30, 2010. |
See notes to financial statements.
Certified Annual Report 15
| NOTES TO FINANCIAL STATEMENTS | ||
| Thornburg Developing World Fund | September 30, 2011 | |
NOTE 1 – ORGANIZATION
Thornburg Developing World Fund, hereinafter referred to as the “Fund,” is a diversified series of Thornburg Investment Trust (the “Trust”). The Fund commenced operations on December 16, 2009. The Trust was organized as a Massachusetts business trust under a Declaration of Trust dated June 3, 1987 and is registered as a diversified, open-end management investment company under the Investment Company Act of 1940, as amended. The Fund is currently one of sixteen separate series of the Trust. Each series is considered to be a separate entity for financial reporting and tax purposes and bears expenses directly attributable to it. The Fund seeks long-term capital appreciation.
The Fund currently offers three classes of shares of beneficial interest outstanding: Class A, Class C, and Institutional Class (Class I). Each class of shares of the Fund represents an interest in the same portfolio of investments, except that (i) Class A shares are sold subject to a front-end sales charge collected at the time the shares are purchased and bear a service fee, (ii) Class C shares are sold at net asset value without a sales charge at the time of purchase, but are subject to a contingent deferred sales charge upon redemption within one year of purchase, and bear both a service fee and a distribution fee, and (iii) Class I shares are sold at net asset value without a sales charge at the time of purchase, and (iv) the respective classes may have different reinvestment privileges and conversion rights. Additionally, the Fund may allocate among its classes certain expenses, to the extent allowable to specific classes, including transfer agent fees, government registration fees, certain printing and postage costs, and administrative and legal expenses. Currently, class specific expenses of the Fund are limited to service and distribution fees, administration fees, and certain registration and transfer agent expenses.
NOTE 2 – SIGNIFICANT ACCOUNTING POLICIES
Significant accounting policies of the Trust are as follows:
Valuation of Investments: Portfolio securities listed or traded on a national securities exchange are valued on the valuation date at the last reported sale price on the exchange that is the primary market for the security. Portfolio securities traded on an exchange for which there has been no sale that day and other equity securities traded in the over-the-counter market are valued at the mean between the last reported bid and asked prices. Portfolio securities reported by NASDAQ are valued at the NASDAQ official closing price. Any foreign security traded on exchanges outside the United States is valued at the price of the security on the exchange that is normally the security’s primary market, as of the close of that exchange preceding the time of the Fund’s valuation.
Debt obligations held by the Fund have a primary market over the counter and are valued by an independent pricing service approved by the Trustees of the Trust. The pricing service ordinarily values debt obligations at quoted bid prices. When quotations are not available, debt obligations held by the Fund are valued at evaluated prices determined by the pricing service using methods which include consideration of yields or prices of debt obligations of comparable quality, type of issue, coupon, maturity and rating, and indications as to value from dealers and general market conditions. Short-term obligations having remaining maturities of 60 days or less are ordinarily valued at amortized cost, which approximates market value.
Quotations in foreign currencies for foreign portfolio investments are converted to U.S. dollar equivalents using the foreign exchange quotation in effect at the time of valuation.
In any case where the market value of an equity security held by the Fund is not readily available, the Trust’s valuation and pricing committee determines a fair value for the security using procedures approved by the Trustees, which may include the use of a price obtained from an independent pricing service. The pricing service ordinarily values equity securities in these instances using multi-factor models to adjust market prices based upon various inputs, including exchange data, depository receipt prices, futures and index data and other data. A security’s market value is deemed not readily available whenever the exchange or market on which the security is primarily traded is closed for the entire scheduled day of trading. Additionally, a security’s market value may be deemed not readily available under other circumstances identified by the Trustees, including when developments occurring after the most recent close of the security’s primary exchange or market, but before the most recent close of trading in Fund shares, or an unusual event or significant period of time occurring since the availability of a market quotation, create a question about the reliability of the security’s market value.
16 Certified Annual Report
| NOTES TO FINANCIAL STATEMENTS, CONTINUED | ||
| Thornburg Developing World Fund | September 30, 2011 | |
In any case where a pricing service fails to provide a price for a debt obligation held by the Fund, the valuation and pricing committee determines a fair value for the debt obligation using procedures approved by the Trustees. Additionally, in any case where management believes that a price provided by a pricing service for a debt obligation held by the Fund may be unreliable, the valuation and pricing committee decides whether or not to use the pricing service’s valuation or to determine a fair value for the debt obligation.
In determining fair value for any portfolio security or other investment, the valuation and pricing committee seeks to determine the amount that an owner of the investment might reasonably expect to receive upon a sale of the investment. However, because fair value prices are estimated prices, the valuation and pricing committee’s determination of fair value for an investment may differ from the value that would be realized by the Fund upon a sale of the investment, and that difference could be material to the Fund’s financial statements. The valuation and pricing committee’s determination of fair value for an investment may also differ from the prices obtained by other persons (including other mutual funds) for the investment.
Valuation Measurements: Various inputs are used in determining the value of the Fund’s investments. These inputs are summarized in the three levels listed below:
Level 1: Quoted prices in active markets for identical investments.
Level 2: Other significant observable inputs (including quoted prices for similar investments, interest rates, prepayment rates, credit risk, etc.).
Level 3: Significant unobservable inputs (including the Fund’s own assumptions in determining the fair value of investments).
The following table displays a summary of the inputs used to value the Fund’s net assets as of September 30, 2011. In any instance when valuation inputs from more than one level are used to determine the fair value of a specific investment, the investment is placed in the level of the table based upon the lowest level input that is significant in determining the fair value of the investment:
| Fair Value Measurements at September 30, 2011 | ||||||||||||||||
| Total | Level 1 | Level 2 | Level 3 | |||||||||||||
Assets | ||||||||||||||||
Investments in Securities* | ||||||||||||||||
Common Stock | $ | 58,767,637 | $ | 58,767,637 | $ | — | $ | — | ||||||||
|
|
|
|
|
|
|
| |||||||||
Total Investments in Securities | $ | 58,767,637 | $ | 58,767,637 | $ | — | $ | — | ||||||||
| * | See Schedule of Investments for a summary of the industry exposure as grouped according to the Global Industry Classification Standard (GICS), which is an industry taxonomy developed by MSCI, Inc. and Standard & Poor’s (S&P). |
Other Notes: It is the policy of the Fund to recognize significant transfers between Levels 1, 2 and 3 and to disclose those transfers at the beginning of the reporting period. The Fund recognized no significant transfers between levels for the year ended September 30, 2011.
Foreign Currency Translation: Portfolio securities and other assets and liabilities denominated in foreign currencies are translated into U.S. dollars based on the exchange rate of such currencies against the U.S. dollar on the date of valuation. Purchases and sales of securities and income items denominated in foreign currencies are translated into U.S. dollars at the exchange rate in effect on the translation date. When the Fund purchases or sells foreign securities, it will customarily enter into a foreign exchange contract to minimize foreign exchange risk from the trade date to the settlement date of such transactions. Such spot contracts are included in Receivable for investments sold and Payable for investments purchased on the Statement of Assets and Liabilities.
The Fund does not separately report the effect of changes in foreign exchange rates from changes in market prices on securities held. Such changes are included in net realized and unrealized gain or loss from investments.
Reported net realized foreign exchange gains or losses arise from purchases and sales of foreign currencies, currency gains or losses realized between the trade and settlement dates on securities transactions and the difference between the amounts of dividends,
Certified Annual Report 17
| NOTES TO FINANCIAL STATEMENTS, CONTINUED | ||
| Thornburg Developing World Fund | September 30, 2011 | |
interest, and foreign withholding taxes recorded on the Fund’s books, and the U.S. dollar equivalent of the amounts actually received or paid.
Net unrealized foreign exchange gains and losses arise from changes in the fair value of assets and liabilities, other than investments in securities at fiscal period end, resulting from changes in exchange rates.
Deferred Taxes: The Fund is subject to a tax imposed on net realized gains of securities of certain foreign countries. The Fund records an estimated deferred tax liability for net unrealized gains on these securities as reflected in the accompanying financial statements.
Federal Income Taxes: It is the policy of the Trust to comply with the provisions of the Internal Revenue Code applicable to “regulated investment companies,” and to distribute to shareholders substantially all taxable income, including any net realized gain on investments of the Fund. Therefore, no provision for federal income taxes is required.
Management reviews each uncertain tax position believed to be material to the preparation of the Fund’s financial statements, to assess if it is more likely than not that the position would be sustained upon examination, based upon the technical merits of the position. As of September 30, 2011, management has not identified any such position for which a liability must be reflected in the Statement of Assets and Liabilities. The Fund’s tax returns remain subject to examination for three years after filing.
When-Issued and Delayed Delivery Transactions: The Fund may engage in when-issued or delayed delivery transactions. To the extent the Fund engages in such transactions, it will do so for the purpose of acquiring portfolio securities consistent with the Fund’s investment objectives and not for the purpose of investment leverage or to speculate on interest rate and/or market changes. At the time the Fund makes a commitment to purchase a security on a when-issued or delayed delivery basis, the Fund will record the transaction and reflect the value in determining its net asset value. When effecting such transactions, assets of an amount sufficient to make payment for the portfolio securities to be purchased will be segregated on the Fund’s records on the trade date. Securities purchased on a when-issued or delayed delivery basis do not earn interest until the settlement date.
Dividends: Dividends to shareholders, if any, are generally paid quarterly and are reinvested in additional shares of the Fund at net asset value per share at the close of business on the dividend payment date or, at the shareholder’s option, paid in cash. Net realized capital gains, to the extent available, will be distributed at least annually. Distributions to shareholders are based on income tax regulations and therefore, their characteristics may differ for financial statement and tax purposes.
General: Securities transactions are accounted for on a trade date basis. Interest income is accrued as earned and dividend income is recorded on the ex-dividend date. Certain income from foreign securities is recognized as soon as information is available to the Fund. Realized gains and losses from the sale of securities are recorded on an identified cost basis. Net investment income (other than class specific expenses) and realized and unrealized gains and losses are allocated daily to each class of shares based upon the relative net asset value of outstanding shares of each class of shares at the beginning of the day (after adjusting for the current share activity of the respective class). Expenses common to all Funds are allocated among the Funds comprising the Trust based upon their relative net asset values or other appropriate allocation methods.
Guarantees and Indemnifications: Under the Trust’s organizational documents, its officers and Trustees are indemnified against certain liabilities arising out of the performance of their duties to the Fund. Additionally, in the normal course of business the Trust enters into contracts with service providers that contain general indemnification clauses. The Trust’s maximum exposure under these arrangements is unknown. However, based on experience, the Trust expects the risk of loss to be remote.
Use of Estimates: The preparation of financial statements, in conformity with generally accepted accounting principles, requires management to make estimates and assumptions that affect the reported amounts of assets and liabilities and the disclosure of contingent assets and liabilities at the date of the financial statements and the reported amounts of increases and decreases in net assets from operations during the reporting period. Actual results could differ from those estimates.
18 Certified Annual Report
| NOTES TO FINANCIAL STATEMENTS, CONTINUED | ||
| Thornburg Developing World Fund | September 30, 2011 | |
NOTE 3 – INVESTMENT ADVISORY FEE AND OTHER TRANSACTIONS WITH AFFILIATES
Pursuant to an investment advisory agreement, Thornburg Investment Management, Inc. (the “Advisor”) serves as the investment advisor and performs services to the Fund for which the fees are payable at the end of each month. For the year ended September 30, 2011, these fees were payable at annual rates ranging from .975 of 1% to .775 of 1% per annum of the average daily net assets of the Fund depending on the Fund’s asset size. For the period ended September 30, 2011, the Advisor voluntarily and contractually waived investment advisory fees of $163,041. The Trust also has entered into administrative services agreements with the Advisor, whereby the Advisor will perform certain administrative services for the shareholders of each class of the Fund’s shares, and for which fees will be payable at an annual rate of up to .125 of 1% per annum of the average daily net assets attributable to each class of shares. For the year ended September 30, 2011, the Advisor contractually reimbursed certain class specific expenses, administrative fees, and distribution fees of $4,891 for Class A shares, $23,931 for Class C shares, and $54,145 for Class I shares.
The Trust has an underwriting agreement with Thornburg Securities Corporation (the “Distributor,” an affiliate of the Advisor), which acts as the distributor of the Fund’s shares. For the year ended September 30, 2011, the Distributor has advised the Fund that it earned commissions aggregating $23,640 from the sale of Class A shares, and collected contingent deferred sales charges aggregating $3,080 from redemptions of Class C shares of the Fund.
Pursuant to a service plan under Rule 12b-1 of the Investment Company Act of 1940, the Fund may reimburse to the Advisor an amount not to exceed .25 of 1% per annum of the average daily net assets attributable to each class of shares of the Fund for payments made by the Advisor to securities dealers and other financial institutions to obtain various shareholder and distribution related services. For the year ended September 30, 2011, there were no 12b-1 service plan fees charged for Class I shares. The Advisor may pay out of its own resources additional expenses for distribution of the Fund’s shares.
The Trust has also adopted a distribution plan pursuant to Rule 12b-1, applicable only to the Fund’s Class C shares under which the Fund compensates the Distributor for services in promoting the sale of Class C shares of the Fund at an annual rate of up to .75 of 1% per annum of the average daily net assets attributable to Class C shares. Total fees incurred by the Distributor for each class of shares of the Fund under their respective Service and Distribution Plans for the year ended September 30, 2011, are set forth in the Statement of Operations.
The Trust has an agreement with the custodian bank to indirectly pay a portion of the custodian’s fees through credits earned by the Fund’s cash on deposit with the bank. This deposit agreement is an alternative to overnight investments. Custodial fees have been adjusted to reflect amounts that would have been paid without this agreement, with a corresponding adjustment reflected as fees paid indirectly in the Statement of Operations. For the year ended September 30, 2011, fees paid indirectly were $1,481.
Certain officers and Trustees of the Trust are also officers or directors of the Advisor and Distributor. The compensation of independent Trustees is borne by the Trust.
NOTE 4 – SHARES OF BENEFICIAL INTEREST
At September 30, 2011, there were an unlimited number of shares of beneficial interest authorized. Transactions in shares of beneficial interest were as follows:
| Year Ended September 30, 2011 | Period Ended September 30, 2010* | |||||||||||||||
| Shares | Amount | Shares | Amount | |||||||||||||
Class A Shares | ||||||||||||||||
Shares sold | 1,982,581 | $ | 30,656,908 | 1,023,348 | $ | 13,148,906 | ||||||||||
Shares issued to shareholders in reinvestment of dividends | 1,639 | 25,513 | — | — | ||||||||||||
Shares repurchased | (966,885 | ) | (14,303,463 | ) | (45,572 | ) | (569,655 | ) | ||||||||
Redemption fees received** | — | 849 | — | 75 | ||||||||||||
|
|
|
|
|
|
|
| |||||||||
Net increase (decrease) | 1,017,335 | $ | 16,379,807 | 977,776 | $ | 12,579,326 | ||||||||||
|
|
|
|
|
|
|
| |||||||||
Certified Annual Report 19
| NOTES TO FINANCIAL STATEMENTS, CONTINUED | ||
| Thornburg Developing World Fund | September 30, 2011 | |
| Year Ended September 30, 2011 | Period Ended September 30, 2010* | |||||||||||||||
| Shares | Amount | Shares | Amount | |||||||||||||
Class C Shares | ||||||||||||||||
Shares sold | 559,204 | $ | 8,559,013 | 207,298 | $ | 2,690,788 | ||||||||||
Shares issued to shareholders in reinvestment of dividends | 359 | 5,563 | — | — | ||||||||||||
Shares repurchased | (173,608 | ) | (2,701,877 | ) | (6,510 | ) | (87,135 | ) | ||||||||
Redemption fees received** | — | 248 | — | 13 | ||||||||||||
|
|
|
|
|
|
|
| |||||||||
Net increase (decrease) | 385,955 | $ | 5,862,947 | 200,788 | $ | 2,603,666 | ||||||||||
|
|
|
|
|
|
|
| |||||||||
Class I Shares | ||||||||||||||||
Shares sold | 1,732,916 | $ | 27,280,362 | 1,219,783 | $ | 15,347,231 | ||||||||||
Shares issued to shareholders in reinvestment of dividends | 2,828 | 44,294 | — | — | ||||||||||||
Shares repurchased | (806,467 | ) | (11,922,242 | ) | (8,644 | ) | (107,188 | ) | ||||||||
Redemption fees received** | — | 993 | — | 153 | ||||||||||||
|
|
|
|
|
|
|
| |||||||||
Net increase (decrease) | 929,277 | $ | 15,403,407 | 1,211,139 | $ | 15,240,196 | ||||||||||
|
|
|
|
|
|
|
| |||||||||
| * | The Fund commenced operations on December 16, 2009. |
| ** | The Fund charges a redemption fee of 1% of the Class A and Class I shares redeemed or exchanged within 30 days of purchase. Redemption fees charged to any class are allocated to all classes upon receipt of payment based on relative net asset values of each class or other appropriate allocation methods. |
NOTE 5 – SECURITIES TRANSACTIONS
For the year ended September 30, 2011, the Fund had purchase and sale transactions of investment securities (excluding short-term investments) of $121,087,005 and $80,443,643, respectively.
NOTE 6 – INCOME TAXES
At September 30, 2011, information on the tax components of capital is as follows:
Cost of investments for tax purposes | $ | 65,672,336 | ||
|
| |||
Gross unrealized appreciation on a tax basis | $ | 1,662,909 | ||
Gross unrealized depreciation on a tax basis | (8,567,608 | ) | ||
|
| |||
Net unrealized appreciation (depreciation) on investments (tax basis) | $ | (6,904,699 | ) | |
|
|
At September 30, 2011, the Fund did not have any undistributed ordinary income or distributable capital gains.
At September 30, 2011, the Fund had deferred tax basis currency and capital losses occurring subsequent to October 31, 2010 of $95,718 and $1,792,806, respectively. For tax purposes, such losses will be reflected in the year ending September 30, 2012.
The Regulated Investment Company Modernization Act of 2010 (the “Act”) was signed into law on December 22, 2010. The Act makes changes to a number of tax rules impacting the Fund. Under the Act, future capital losses generated by the Fund may be carried over indefinitely, but these losses must be used prior to the utilization of any pre-enactment capital losses. Since pre-enactment capital losses may only be carried forward for eight years, there may be a greater likelihood that all or a portion of a Fund’s pre-enactment
20 Certified Annual Report
| NOTES TO FINANCIAL STATEMENTS, CONTINUED | ||
| Thornburg Developing World Fund | September 30, 2011 | |
capital losses will expire unused. In general, the provisions of the Act will be effective for the Fund’s fiscal year ending September 30, 2012. As of September 30, 2011, the Fund had no pre-enactment capital loss carryforwards to offset future capital gains.
The tax character of distributions paid for the year and period ended September 30, 2011, and September 30, 2010, respectively, was as follows:
| 2011 | 2010 | |||||||
Distributions from: | ||||||||
Ordinary income | $ | 86,103 | $ | — | ||||
Capital gains | — | — | ||||||
|
|
|
| |||||
Total Distributions | $ | 86,103 | $ | — | ||||
|
|
|
| |||||
In order to account for permanent book/tax differences, the Fund increased net capital paid in on shares of beneficial interest by $11, decreased accumulated net realized loss by $118,766, and increased distribution in excess of net investment income by $118,777. This reclassification has no impact on the net asset value of the Fund. Reclassifications result primarily from foreign currency gains (losses), foreign capital gains taxes paid and net operating losses.
NOTE 7 – FINANCIAL INSTRUMENTS WITH OFF-BALANCE SHEET RISK AND FOREIGN INVESTMENT RISK
The Fund may use a variety of derivative financial instruments to hedge or adjust the risks affecting its investment portfolio or to enhance investment returns. Provisions of FASB Accounting Standards Codification ASC 815-10-50 (“ASC 815”), require certain disclosures. The disclosures are intended to provide users of financial statements with an understanding of the use of derivative instruments by the Fund and how these derivatives affect the financial position, financial performance and cash flows of the Fund. The Fund does not designate any derivative instruments as hedging instruments under ASC 815. Additionally, the Fund’s risk of loss may exceed the amounts recognized on the Statement of Assets and Liabilities.
For the year ended September 30, 2011, the Fund did not invest in any derivative financial instruments of the type addressed by ASC 815.
OTHER NOTES:
Risks: The Fund’s investments subject it to risks including, but not limited to, management risk, market and economic risk, risks affecting specific issuers, liquidity risk, the risks associated with investments in smaller companies and non-U.S. issuers (including developing country issuers), credit risk, and interest rate risk. Please see the Fund’s prospectus for a discussion of the risks associated with an investment in the Fund.
Subsequent Events: Fund management believes no events have occurred between September 30, 2011 and the date of issuance of the financial statements, which require adjustment to, or disclosure in the accompanying financial statements.
Certified Annual Report 21
Thornburg Developing World Fund
| PER SHARE PERFORMANCE (for a share outstanding throughout the Year)+ | RATIOS TO AVERAGE NET ASSETS | SUPPLEMENTAL DATA | ||||||||||||||||||||||||||||||||||||||||||||||||||||||||||
Unless | Net Asset Value Beginning of Year | Net Investment Income (Loss) | Net Realized & Unrealized Gain (Loss) on Investments | Total from Investment Operations | Dividends from Net Investment Income | Dividends from Net Realized Gains | Total Dividends | Net Asset Value End of Year | Net Investment Income (Loss) (%) | Expenses, After Expense Reductions (%) | Expenses, After Expense Reductions and Net of Custody Credits (%) | Expenses, Before Expense Reductions (%) | Total Return (%)(a) | Portfolio Turnover Rate (%) | Net Assets at End of Year (Thousands) | |||||||||||||||||||||||||||||||||||||||||||||
Class A Shares |
| |||||||||||||||||||||||||||||||||||||||||||||||||||||||||||
2011(b) | $ | 14.44 | (0.01 | ) | (1.91 | ) | (1.92 | ) | (0.02 | ) | — | (0.02 | ) | $ | 12.50 | (0.05 | ) | 1.63 | 1.62 | 1.89 | (13.34 | ) | 129.15 | $ | 24,929 | |||||||||||||||||||||||||||||||||||
2010(b)(c) | $ | 11.94 | 0.06 | 2.44 | 2.50 | — | — | — | $ | 14.44 | 0.55 | (d) | 1.83 | (d) | 1.82 | (d) | 3.30 | (d) | 20.94 | 47.37 | $ | 14,116 | ||||||||||||||||||||||||||||||||||||||
Class C Shares |
| |||||||||||||||||||||||||||||||||||||||||||||||||||||||||||
2011 | $ | 14.39 | (0.11 | ) | (1.90 | ) | (2.01 | ) | (0.01 | ) | — | (0.01 | ) | $ | 12.37 | (0.74 | ) | 2.34 | 2.34 | 2.89 | (13.96 | ) | 129.15 | $ | 7,258 | |||||||||||||||||||||||||||||||||||
2010(c) | $ | 11.94 | (0.01 | ) | 2.46 | 2.45 | — | — | — | $ | 14.39 | (0.11 | )(d) | 2.39 | (d) | 2.38 | (d) | 6.89 | (d) | 20.52 | 47.37 | $ | 2,889 | |||||||||||||||||||||||||||||||||||||
Class I Shares |
| |||||||||||||||||||||||||||||||||||||||||||||||||||||||||||
2011 | $ | 14.52 | 0.09 | (1.96 | ) | (1.87 | ) | (0.03 | ) | — | (0.03 | ) | $ | 12.62 | 0.55 | 1.04 | 1.04 | 1.47 | (12.89 | ) | 129.15 | $ | 27,019 | |||||||||||||||||||||||||||||||||||||
2010(c) | $ | 11.94 | 0.11 | 2.47 | 2.58 | — | — | — | $ | 14.52 | 1.09 | (d) | 1.10 | (d) | 1.09 | (d) | 2.63 | (d) | 21.61 | 47.37 | $ | 17,581 | ||||||||||||||||||||||||||||||||||||||
| (a) | Not annualized for periods less than one year. |
| (b) | Sales loads are not reflected in computing total return. |
| (c) | Fund commenced operations on December 16, 2009. |
| (d) | Annualized. |
| + | Based on weighted average shares outstanding. |
See notes to financial statements.
| 22 Certified Annual Report | Certified Annual Report 23 |
REPORT OF INDEPENDENT REGISTERED PUBLIC ACCOUNTING FIRM
Thornburg Developing World Fund
To the Trustees and Shareholders of
Thornburg Developing World Fund
In our opinion, the accompanying statement of assets and liabilities, including the schedule of investments, and the related statements of operations and of changes in net assets and the financial highlights present fairly, in all material respects, the financial position of Thornburg Developing World Fund (one of the portfolios constituting Thornburg Investment Trust, hereafter referred to as the “Fund”) at September 30, 2011, and the results of its operations for the year then ended, the changes in net assets and the financial highlights for the year then ended and for the period December 16, 2009 (commencement of operations) through September 30, 2010, in conformity with accounting principles generally accepted in the United States of America. These financial statements and financial highlights (hereafter referred to as “financial statements”) are the responsibility of the Fund’s management. Our responsibility is to express an opinion on these financial statements based on our audits. We conducted our audits of these financial statements in accordance with the standards of the Public Company Accounting Oversight Board (United States). Those standards require that we plan and perform the audit to obtain reasonable assurance about whether the financial statements are free of material misstatement. An audit includes examining, on a test basis, evidence supporting the amounts and disclosures in the financial statements, assessing the accounting principles used and significant estimates made by management, and evaluating the overall financial statement presentation. We believe that our audits, which included confirmation of securities at September 30, 2011 by correspondence with the custodian and brokers, provide a reasonable basis for our opinion.
PricewaterhouseCoopers LLP
New York, New York
November 21, 2011
24 Certified Annual Report
| EXPENSE EXAMPLE | ||
| Thornburg Developing World Fund | September 30, 2011 (Unaudited) | |
As a shareholder of the Fund, you incur two types of costs:
| (1) | transaction costs, including |
(a) sales charges (loads) on purchase payments for Class A shares;
(b) a deferred sales charge on redemptions of any part or all of a purchase of $1 million of Class A shares within 12 months of purchase;
(c) a deferred sales charge on redemptions of Class C shares within 12 months of purchase;
(d) a 30-day redemption fee on Class A and Class I shares;
| (2) | ongoing costs, including management fees; distribution and/or service (12b-1) fees; and other Fund expenses. |
This example is intended to help you understand your ongoing costs (in dollars) of investing in the Fund and to compare these costs with the ongoing costs of investing in other mutual funds.
The example is based on a $1,000 investment beginning on April 1, 2011, and held until September 30, 2011.
ACTUAL EXPENSES
For each class of shares, the first line of the table at right provides information about actual account values and actual expenses. You may use the information in this line, together with the amount you invested, to estimate the expenses that you paid over the period. Simply divide your account value by $1,000 (for example, an $8,600 account value divided by $1,000 = 8.6), then multiply the result by the number in the first line for your class of shares under the heading entitled “Expenses Paid During Period” to estimate the expenses you paid on your account during this period.
HYPOTHETICAL EXAMPLE FOR COMPARISON PURPOSES
For each class of shares, the second line of the table at right provides information about hypothetical account values and hypothetical expenses based on the Fund’s actual expense ratio and an assumed rate of return of 5% per year before expenses, which is not the Fund’s actual return. The hypothetical account values and expenses may not be used to estimate the actual ending account balance or expenses you paid for the period. You may use this information to compare the ongoing costs of investing in the Fund and other funds. To do so, compare this 5% hypothetical example with the 5% hypothetical examples that appear in the shareholder reports of the other funds.
| Beginning Account Value 4/1/11 | Ending Account Value 9/30/11 | Expenses Paid During Period† 4/1/11–9/30/11 | ||||||||||
Class A Shares | ||||||||||||
Actual | $ | 1,000.00 | $ | 791.10 | $ | 7.20 | ||||||
Hypothetical* | $ | 1,000.00 | $ | 1,017.03 | $ | 8.11 | ||||||
Class C Shares | ||||||||||||
Actual | $ | 1,000.00 | $ | 788.40 | $ | 10.34 | ||||||
Hypothetical* | $ | 1,000.00 | $ | 1,013.51 | $ | 11.64 | ||||||
Class I Shares | ||||||||||||
Actual | $ | 1,000.00 | $ | 793.20 | $ | 4.54 | ||||||
Hypothetical* | $ | 1,000.00 | $ | 1,020.00 | $ | 5.11 | ||||||
| † | Expenses are equal to the annualized expense ratio for each class (A: 1.60%; C: 2.31%; I: 1.01%) multiplied by the average account value over the period, multiplied by 183/365 to reflect the one-half year period. |
| * | Hypothetical assumes a rate of return of 5% per year before expenses. |
Please note that the expenses shown in the table are meant to highlight your ongoing costs only and do not reflect any transactional costs, such as sales charges (loads), redemption fees, or exchange fees. Therefore, the second line of the table for each class of shares is useful in comparing ongoing costs only, and will not help you determine the relative total costs of owning different funds. In addition, if these transactional costs were included, your costs would have been higher.
Certified Annual Report 25
| INDEX COMPARISON | ||
| Thornburg Developing World Fund | September 30, 2011 (Unaudited) | |
GROWTH OF A HYPOTHETICAL $10,000 INVESTMENT
Thornburg Developing World Fund versus MSCI Emerging Markets Index (December 16, 2009 to September 30, 2011)
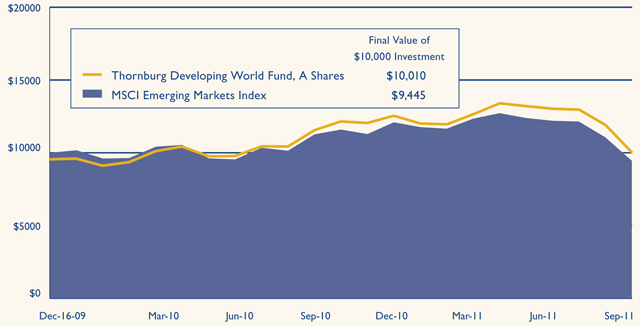
AVERAGE ANNUAL TOTAL RETURNS
For periods ended September 30, 2011 (with sales charge)
| 1 Yr | 5 Yrs | 10 Yrs | Since Inception | |||||||||||||
A Shares (Incep: 12/16/09) | -17.24 | % | — | — | 0.06 | % | ||||||||||
C Shares (Incep: 12/16/09) | -14.82 | % | — | — | 2.05 | % | ||||||||||
I Shares (Incep: 12/16/09) | -12.89 | % | — | — | 3.27 | % | ||||||||||
MSCI Emerging Markets Index (Since 12/16/09) | -16.15 | % | — | — | -3.14 | % | ||||||||||
Performance data shown represents past performance and is no guarantee of future results. Investment return and principal value will fluctuate so shares, when redeemed, may be worth more or less than their original cost. Current performance may be lower or higher than quoted. For performance current to the most recent month end, visit thornburg.com or call 800.847.0200. The performance data and graph do not reflect the deduction of taxes that a shareholder would pay on distributions or the redemption of Fund shares. Returns reflect the reinvestment of dividends and capital gains as well as applicable sales charges. Class A shares are sold with a maximum sales charge of 4.50%. Class C shares are subject to a 1% CDSC for the first year only. There is no up-front sales charge for Class I shares. Class A and I shares are subject to a 1% 30-day redemption fee.
26 Certified Annual Report
| TRUSTEES AND OFFICERS | ||
| Thornburg Developing World Fund | September 30, 2011 (Unaudited) | |
Name, Age, | Principal Occupation(s) During Past Five Years | Other Directorships Held by Trustee | ||
INTERESTED TRUSTEES(1)(2)(4) | ||||
Garrett Thornburg, 65 Chairman of Trustees, Trustee since 1987(3) | Chairman and controlling shareholder and, until 2008, CEO of Thornburg Investment Management, Inc. (investment advisor); Chairman, CEO, and controlling shareholder of Thornburg Securities Corporation (securities dealer); CEO until 2007 and Chairman until 2009 of TMST, Inc. (f/k/a Thornburg Mortgage, Inc.) (real estate investment trust); President and Sole Director of Thornburg Mortgage Advisory Corporation (investment manager to TMST, Inc.). | None | ||
Brian J. McMahon, 55 Trustee since 2001, Member of Governance & Nominating Committee & Operations Risk Oversight Committee, President since 1997(5)(6) | CEO since 2008, President, Managing Director, Chief Investment Officer, and Portfolio Manager of Thornburg Investment Management, Inc. | None | ||
INDEPENDENT TRUSTEES(1)(2)(4) | ||||
David A. Ater, 66 Trustee since 1994, Member of Audit Committee & Governance & Nominating Committee | Principal in Ater & Associates, Santa Fe, NM (developer, planner and broker of residential and commercial real estate); owner, developer and broker for various real estate projects. | None | ||
David D. Chase, 70 Trustee since 2000, Chairman of Audit Committee | Managing Member of Vestor Associates, LLC, Santa Fe, NM (private equity fund); Managing Member of CS Group, LLC, Santa Fe, NM (merchant bank). | None | ||
Eliot R. Cutler, 65 Trustee since 2004 & Nominating Committee, Chairman of Governance | Senior Counsel and, until 2009, Partner in Akin, Gump, Strauss, Hauer & Feld LLP (law firm) in Washington, D.C. and Beijing, China. | None | ||
Susan H. Dubin, 62 Trustee since 2004, Member of Audit Committee | President of Dubin Investments, Ltd., Greenwich, CT (private investment fund); Director and officer of various charitable organizations. | None | ||
Owen D. Van Essen, 57 Trustee since 2004, Member of Governance & Nominating Committee & Chairman of Operations Risk Oversight Committee | President of Dirks, Van Essen & Murray, Santa Fe, NM (newspaper mergers and acquisitions). | None | ||
Certified Annual Report 27
| TRUSTEES AND OFFICERS, CONTINUED | ||
| Thornburg Developing World Fund | September 30, 2011 (Unaudited) | |
Name, Age, | Principal Occupation(s) During Past Five Years | Other Directorships Held by Trustee | ||
James W. Weyhrauch, 52 Trustee since 1996, Member of Audit Committee & Operations Risk Oversight Committee | Real estate broker, Santa Fe Properties, Santa Fe, NM; Vice Chairman of Nambe LLC, Santa Fe, NM (manufacturing & design company). | None | ||
OFFICERS OF THE FUND (WHO ARE NOT TRUSTEES)(1)(6)(7) | ||||
George T. Strickland, 48 Vice President since 1996, Treasurer since 2007(6) | Portfolio Manager, Vice President, and Managing Director of Thornburg Investment Management, Inc. | Not applicable | ||
William V. Fries, 72 Vice President since 1995 | Portfolio Manager, Vice President, and Managing Director of Thornburg Investment Management, Inc. | Not applicable | ||
Leigh Moiola, 44 Vice President since 2001 | Vice President, Managing Director, and Director of Marketing of Thornburg Investment Management, Inc. | Not applicable | ||
Alexander Motola, 41 Vice President since 2001 | Portfolio Manager, Vice President, and Managing Director of Thornburg Investment Management, Inc. | Not applicable | ||
Wendy Trevisani, 40 Vice President since 1999 | Portfolio Manager and Managing Director of Thornburg Investment Management, Inc. | Not applicable | ||
Joshua Gonze, 48 Vice President since 1999 | Portfolio Manager since 2007, Managing Director, and Associate Portfolio Manager until 2007 of Thornburg Investment Management, Inc. | Not applicable | ||
Christopher Ihlefeld, 41 Vice President since 2003 | Portfolio Manager since 2007, Managing Director, and Associate Portfolio Manager until 2007 of Thornburg Investment Management, Inc. | Not applicable | ||
Leon Sandersfeld, 45 Vice President since 2003 | Managing Director since 2007 and Fund Accounting Director of Thornburg Investment Management, Inc. | Not applicable | ||
Sasha Wilcoxon, 37 Vice President since 2003 Secretary since 2007(6) | Managing Director since 2007, Director of Operations, and Vice President of Thornburg Investment Management, Inc. | Not applicable | ||
Edward Maran, 53 Vice President since 2004 | Portfolio Manager and Managing Director of Thornburg Investment Management, Inc. | Not applicable | ||
Vinson Walden, 41 Vice President since 2004 | Portfolio Manager and Managing Director of Thornburg Investment Management, Inc. | Not applicable | ||
Thomas Garcia, 40 Vice President since 2006 | Vice President since 2011, Managing Director, Head Equity Trader, and Associate Portfolio Manager of Thornburg Investment Management, Inc. | Not applicable | ||
Lei Wang, 40 Vice President since 2006 | Portfolio Manager and Managing Director of Thornburg Investment Management, Inc. | Not applicable | ||
28 Certified Annual Report
| TRUSTEES AND OFFICERS, CONTINUED | ||
| Thornburg Developing World Fund | September 30, 2011 (Unaudited) | |
Name, Age, | Principal Occupation(s) During Past Five Years | Other Directorships Held by Trustee | ||
Connor Browne, 32 Vice President since 2006 | Portfolio Manager and Managing Director of Thornburg Investment Management, Inc. | Not applicable | ||
Jason Brady, 37 Vice President since 2007 | Vice President since 2011, Portfolio Manager since 2007, Managing Director since 2007, and Associate Portfolio Manager 2006–2007 of Thornburg Investment Management, Inc. | Not applicable | ||
Lewis Kaufman, 35 Vice President since 2007 | Portfolio Manager since 2007, Managing Director since 2007, and Associate Portfolio Manager until 2009 of Thornburg Investment Management, Inc. | Not applicable | ||
Christopher Ryon, 55 Vice President since 2008 | Portfolio Manager since 2009, Managing Director since 2009, and Associate Portfolio Manager 2008–2009 of Thornburg Investment Management, Inc.; Principal of Vanguard Funds until 2008. | Not applicable | ||
Lon Erickson, 36 Vice President since 2008 | Portfolio Manager since 2010, Managing Director since 2010, and Associate Portfolio Manager 2008–2010 of Thornburg Investment Management, Inc.; Senior Analyst of State Farm Insurance until 2008. | Not applicable | ||
Kathleen Brady, 51 Vice President since 2008 | Senior Tax Accountant since 2007 of Thornburg Investment Management, Inc.; Chief Financial Officer of Vestor Partners, LP (private equity fund) until 2007. | Not applicable | ||
Jack Gardner, 57 Vice President since 2008 | Managing Director since 2007 of Thornburg Investment Management, Inc.; President since 2008 and National Sales Director of Thornburg Securities Corporation. | Not applicable | ||
Laura Hillstrom, 44 Vice President since 2009 | Chief Administrative Officer since 2009, Vice President and Managing Director, and Director of Information Systems until 2009 of Thornburg Investment Management, Inc. | Not applicable | ||
| (1) | Each person’s address is 2300 North Ridgetop Road, Santa Fe, New Mexico 87506. |
| (2) | The Fund is one of sixteen separate investment “Funds” or “series” of Thornburg Investment Trust (the “Trust”), which comprises the Thornburg mutual fund complex and is organized as a Massachusetts business trust. Thornburg Investment Management, Inc. is the investment advisor to, and manages, the sixteen Funds of the Trust. Each Trustee oversees the sixteen Funds of the Trust. |
| (3) | Mr. Thornburg is considered an “interested” Trustee under the Investment Company Act of 1940 because he is the sole director and controlling shareholder of Thornburg Investment Management, Inc., the investment advisor to the sixteen active Funds of the Trust, and is the sole director and controlling shareholder of Thornburg Securities Corporation, the distributor of shares for the Trust. |
| (4) | Each Trustee serves in office until the election and qualification of a successor. |
| (5) | Mr. McMahon is considered an “interested” Trustee because he is the chief executive officer and president of Thornburg Investment Management, Inc. |
| (6) | The Trust’s president, secretary, and treasurer each serves a one-year term or until the election and qualification of a successor; each other officer serves at the pleasure of the Trustees. |
| (7) | Assistant vice presidents, assistant secretaries and assistant treasurers are not shown. |
The Statement of Additional Information for each Fund of the Trust includes additional information about the Trustees and is available, without charge and upon request, by calling 1-800-847-0200.
Certified Annual Report 29
| OTHER INFORMATION | ||
| Thornburg Developing World Fund | September 30, 2011 (Unaudited) | |
PORTFOLIO PROXY VOTING
Policies and Procedures:
The Trust has delegated to Thornburg Investment Management, Inc. (the “Advisor”) voting decisions respecting proxies for the Fund’s voting securities. The Advisor makes voting decisions in accordance with its Proxy Voting Policy. A description of the Policy is available (i) without charge, upon request, by calling the Advisor toll-free at 1-800-847-0200, (ii) on the Thornburg website at www.thornburg. com, and (iii) on the Securities and Exchange Commission’s website at www.sec.gov.
Information regarding how proxies were voted is available on or before August 31 of each year for the twelve months ending the preceding June 30. This information is available (i) without charge, upon request by calling the Advisor toll-free at 1-800-847-0200, (ii) on the Thornburg website at www.thornburg.com, and (iii) on the Securities and Exchange Commission’s website at www.sec.gov.
TAX INFORMATION
For the tax year ended September 30, 2011, the Thornburg Developing World Fund designates 100.00% (or the maximum allowed) of the dividends paid from tax basis net ordinary income as qualifying for the reduced rate under the Jobs and Growth Tax Relief and Reconciliation Act of 2003.
10.73% (or the maximum allowed) of the ordinary income distributions paid by the Fund for the tax year ended September 30, 2011, qualified for the corporate dividends received deduction.
The information and distributions reported herein may differ from the information and distributions reported to the shareholders for the calendar year ending December 31, 2011. Complete information will be reported in conjunction with your 2011 Form 1099-DIV.
AVAILABILITY OF QUARTERLY PORTFOLIO SCHEDULE
The Fund files with the Securities and Exchange Commission schedules of its portfolio holdings on Form N-Q for the first and third quarters of each fiscal year. The Fund’s Forms N-Q are available on the Commission’s website at www.sec.gov, or may be reviewed and copied at the Commission’s Public Reference Room in Washington, D.C. Information on the operation of the Public Reference Room may be obtained by calling 1-800-SEC-0330. The Fund also makes this information available on its website at www.thornburg.com/ download or upon request by calling 1-800-847-0200.
STATEMENT RESPECTING RENEWAL OF INVESTMENT ADVISORY AGREEMENT
Thornburg Investment Management, Inc. (the “Advisor”) provides investment management services to Thornburg Developing World Fund pursuant to an investment advisory agreement. The Trustees consider the renewal of this agreement annually, and most recently determined to renew the agreement on September 13, 2011.
In anticipation of their recent annual consideration of the advisory agreement’s renewal, the independent Trustees met in May 2011 to plan the annual evaluation of the Advisor’s performance and to specify the information the Advisor would present to the Trustees for their review. The Advisor’s chief investment officer subsequently reviewed portions of the information with the Trustees and addressed questions presented by the Trustees at a meeting session scheduled for that purpose, and the independent Trustees thereafter met in independent session to consider the Advisor’s presentation and various specific issues respecting their consideration of the advisory agreement’s renewal. Following these sessions, the Trustees met to consider a renewal of the agreement, and the independent Trustees voted unanimously at that meeting to renew the agreement for an additional term of one year.
The information below summarizes certain factors considered by the Trustees in connection with the determination to renew the advisory agreement. In determining to renew the agreement, the Trustees did not identify any single factor as controlling, and this summary does not describe all of the matters considered by the Trustees in making their determination.
Quality of Services; Fund Investment Performance. The Trustees evaluated the nature, extent and quality of services provided by the Advisor under the advisory agreement, and evaluated the investment performance of the Fund.
30 Certified Annual Report
| OTHER INFORMATION, CONTINUED | ||
| Thornburg Developing World Fund | September 30, 2011 (Unaudited) | |
In connection with their general supervision of the Advisor, and as an important element of their annual consideration of a renewal of the advisory agreement, the Trustees received and considered reports from the Advisor throughout the year. These reports addressed a wide variety of topics, including particularly the Advisor’s selection of investments and execution of the Fund’s investment strategies. In addition, the Trustees considered information provided to them at their request in anticipation of their annual evaluation of the Advisor’s services, including (i) the Fund’s absolute investment performance and achievement of stated objectives, (ii) the Advisor’s commentary on the Fund’s performance in the context of the Fund’s objectives and reasonable expectations, and business, market and economic conditions, (iii) measures of the Fund’s investment returns over different periods of time relative to a “diversified emerging markets” category of mutual funds selected by an independent mutual fund analyst firm, and relative to a broad-based securities index, (iv) the Fund’s cumulative investment return since inception relative to the securities index, and (v) comparative measures of estimated earnings growth, portfolio risk and return.
In evaluating quantitative and performance data presented, the Trustees noted (among other aspects of the data) comparative performance data for the one full calendar year since the Fund’s inception, which showed that the Fund’s investment return for the year exceeded the average return of the mutual fund category and the return of the index. Other noted quantitative data showed that the Fund’s investment returns fell within the top decile of performance for the fund category for the three-month, year-to-date and one-year periods ended with the second quarter of the current year. The Trustees also noted the Fund’s higher cumulative return since inception (net of expenses) relative to the Fund’s benchmark index.
The Trustees concluded, based upon these and other considerations, that the nature, extent and quality of the Advisor’s services were sufficient and that the Advisor had satisfactorily pursued the Fund’s stated investment objectives. The Trustees further concluded that the investment performance of the Fund was satisfactory in the context of the Fund’s objective and policies, and prevailing market conditions.
Fees and Expenses; Profitability of Advisor; Economies of Scale; Ancillary Benefits to Advisor. The Trustees evaluated the level of the management fee charged by the Advisor to the Fund, and in this connection, reviewed the profitability of the Advisor, economies of scale potentially available to the Fund and whether the Advisor received any ancillary benefits from its relationship with the Fund.
In evaluating the level of the management fee, the Trustees considered the fees charged by the Advisor and the other expenses charged to the Fund in light of the nature and quality of services provided, comparison of the actual Advisor’s fee and Fund expenses to the statement of fees and expenses in the Fund’s prospectuses, the Advisor’s waiver of a portion of its management fee, and comparisons of the Advisor’s fee and other Fund expenses to median and average fees and expenses charged to two groups of equity mutual funds assembled by independent mutual fund analyst firms. Comparative fee and expense data noted by the Trustees showed that the management fee for the Fund (after fee waivers) was lower than the median and average fee rates for the two mutual fund groups, and that the overall expense ratio of the Fund (net of fee waivers by the Advisor) was comparable to the median and average expense ratios for one group of mutual funds and somewhat higher than the median and average expense ratios for the other group of funds. The Trustees did not identify these differences as significant. The Trustees considered information about the fees charged by the Advisor to other investment management clients, together with information about fees charged by other advisors to different clients, and analysis of the differences between the requirements of institutional clients and mutual funds and the consequently different investment management services provided, respectively, to institutional clients and to mutual funds. The Trustees confirmed their previous observations that the differences between the fees charged by the Advisor to different types of clients did not appear exceptional, and that the fee rates charged by investment advisors to institutional clients had limited relevance to the evaluation of fee rates charged to mutual funds, because of the significant differences between the respective requirements of institutional clients and mutual funds, the differences between the respective services rendered to institutional clients and mutual funds, and the different circumstances in which the respective fees originate.
In reviewing the profitability of the Advisor, the Trustees considered costs incurred by the Advisor and data comparing the profitability of the Advisor to other investment management firms. The information provided did not indicate that the Advisor’s profitability was unusual, and the Trustees noted the adequacy of the Advisor’s resources and service capabilities. In reviewing the extent to which economies of scale would be realized by the Fund as it grows and whether fee levels reflect economies of scale, the Trustees considered the breakpoint structure for advisory fees chargeable to the Fund, the demonstrated economies of scale enjoyed by other Funds of the Trust as they had grown in size, and economies of scale realized by other mutual funds. The information provided demonstrated to the Trustees that the Fund may reasonably be expected to realize economies of scale as the Fund grows in size, due to the breakpoint fee structure of the advisory agreement and other factors. In reviewing potential benefits to the Advisor because of its relationship to the Fund, the Trustees considered the Advisor’s receipt of research services from broker dealers, and the benefits to both the
Certified Annual Report 31
| OTHER INFORMATION, CONTINUED | ||
| Thornburg Developing World Fund | September 30, 2011 (Unaudited) | |
Fund and the Advisor of the Advisor’s expansion of its staffing, compliance and systems capabilities and other resources to serve a broader variety of investment management clients. No unusual or unfair benefits to the Advisor from its relationship to the Fund were identified by the Trustees.
The Trustees concluded, based upon their consideration of these factors, that the management fee charged to the Fund by the Advisor was fair and reasonable in view of the nature and quality of the services provided by the Advisor, the clear disclosure of fees and expenses in the Fund’s prospectuses, the investment performance of the Fund, and comparisons of fees and costs charged to the Fund to fees and expenses charged to other mutual funds.
32 Certified Annual Report
This page intentionally left blank.
This page is not part of the Annual Report. 33
Trustees’ Statement to Shareholders
Not part of the Certified Annual Report
September 13, 2011
The Trustees believe current and prospective shareholders should know how we discharge our responsibilities in supervising the Funds’ investment advisor and in reviewing the advisor’s contract for renewal. Since 2005, we have issued a statement which sets out clearly the three principal guidelines that we follow in supervising the Trust’s investment advisor on your behalf. In accordance with our customary practice, in September of this year we again reviewed our statement and concluded we should reissue this statement outlining the principal features of our supervision of the advisor’s performance of investment management services for the Funds.
We begin with the premise that each shareholder selected his or her Fund because its investments are managed by the investment advisor identified in the prospectus and in accordance with the objective and policies described in the prospectus. We realize, as each of you do, that if you believe that your Fund’s stated objective and policies no longer serve your personal investment goals, you can sell your shares and leave the Fund.
Therefore, we believe that our primary supervisory task – our principal obligation to you – is to assess the nature and quality of the advisor’s services, and to confirm that the advisor actively and competently pursues the Fund’s objective, in accordance with the policies set out in the prospectus. To do this, we meet regularly with management to review your Fund’s portfolio and to discuss the advisor’s specific actions and judgments in pursuing the Fund’s objective. We do not substitute our own judgment for the advisor’s decisions in selecting investments; the advisor is paid to exercise its informed judgment on investment decisions, and we seek to confirm, in reviewing the advisor’s performance, that the advisor is doing just that.
Second, while we are conscious of costs and the effect that costs have on shareholders’ returns, we do not seek the lowest fees or expense ratio as our sole or primary objective. We try to make sure that your Fund’s fees and costs are reasonable in relationship to the services rendered and that they are generally in line with those charged by other expert investment advisors, consistent with our belief that the Fund’s investors searched for and expect that expertise and attention and have decided to pay a reasonable price for it. We do not put the management contract “out to bid” as a matter of course, and we would not do so unless we had concluded that the advisor materially had failed to pursue the Fund’s objectives in accordance with its policies, or for other equally important reasons. We believe that any other approach would be inconsistent with your interests and contrary to your expectations when you bought shares of the Fund in the first place.
Finally, because we believe that most Thornburg Fund shareholders have invested with a long-term perspective, we try not to focus too much on the fashions of the moment and on short-term performance. The market will not favor any specific investment objective or set of policies at all times and under all economic circumstances. A fund will experience periods of both high and low returns relative to other funds and other investments. Even if one of our Funds is not favored by the market at a particular time, we believe that the advisor is nonetheless obliged to remain true to the Fund’s objective and policies, and we watch to see that it does so.
34 This page is not part of the Annual Report.
Retirement and Education Accounts
Thornburg Investment Management offers retirement and education savings accounts that can help you meet a variety of planning challenges. For account applications or further information on any of the accounts below, please call 1-800-847-0200 or go to www.thornburg.com/ira. Your financial advisor can help you determine which plan is right for you.
Individual Retirement Accounts
Individual Retirement Accounts (IRAs) provide a tax-advantaged means to save money for the future. For a detailed outline of the difference between retirement accounts, see www.thornburg.com/ira. Rollovers are available. Call 1-800-847-0200 for more information.
Traditional IRAs – Contributions to Traditional IRAs are tax deductible for eligible individuals, and withdrawals are taxed as additional ordinary income. You may contribute to an IRA if you receive compensation and are under 70 1/2, even if you are covered by an employer retirement plan. Deductible contributions are subject to certain qualifications. Please consult your tax advisor.
Roth IRAs – Under a Roth IRA, there is no tax deduction for contributions, but there is no income tax on qualified withdrawals. For a more detailed comparison of Traditional and Roth IRAs, please see our web site at www.thornburg.com/ira.
SEP IRAs – Simplified Employee Pension (SEP) IRAs are established by employers. The employer is allowed a tax deduction for contributions made to the SEP Plan and makes contributions to each eligible employee’s SEP IRA on a discretionary basis.
SIMPLE IRAs – Savings Incentive Match Plan for Employees of Small Employers (SIMPLE) is designed to give small business owners a simplified method to establish and contribute to a retirement plan for employees. The employer is allowed a tax deduction for contributions and makes either matching or non-elective contributions to each eligible employee’s SIMPLE IRA. Employees may make salary deferral contributions.
Coverdell Education Savings Account
These savings accounts are designed to provide a way to save money for higher education expenses. In an Education Savings Account, earnings and interest grow tax-free, and qualified withdrawals used to pay for eligible higher-education expenses are tax- and penalty-free.
Funds Available
The following funds are available in the accounts listed above:
| • | Thornburg International Value Fund |
| • | Thornburg Value Fund |
| • | Thornburg Core Growth Fund |
| • | Thornburg Investment Income Builder Fund |
| • | Thornburg Global Opportunities Fund |
| • | Thornburg International Growth Fund |
| • | Thornburg Developing World Fund |
| • | Thornburg Limited Term U.S. Government Fund |
| • | Thornburg Limited Term Income Fund |
| • | Thornburg Strategic Income Fund |
This page is not part of the Annual Report. 35

Thornburg Equity Funds
Thornburg’s equity research uses a fundamental and comprehensive analytical approach. Thornburg equity funds focus on a limited number of securities so that each holding can impact performance. The equity team searches for firms believed to have a promising future and seeks to buy shares of those companies at a discount to their intrinsic value.
| • | Thornburg Value Fund |
| • | Thornburg International Value Fund |
| • | Thornburg Core Growth Fund |
| • | Thornburg Investment Income Builder Fund |
| • | Thornburg Global Opportunities Fund |
| • | Thornburg International Growth Fund |
| • | Thornburg Developing World Fund |
Thornburg Bond Funds
Thornburg Investment Management applies a disciplined philosophy to fixed-income management. Since the launch of our first fixed-income fund over 25 years ago, we have been conducting fundamental, bottom-up research in an effort to identify bonds which we believe provide the best return for a given level of risk. We are very organic in our approach, avoiding leverage or complex strategies which could backfire in periods of market uncertainty.
| • | Thornburg Limited Term Municipal Fund |
| • | Thornburg Intermediate Municipal Fund |
| • | Thornburg California Limited Term Municipal Fund |
| • | Thornburg New Mexico Intermediate Municipal Fund |
| • | Thornburg New York Intermediate Municipal Fund |
| • | Thornburg Strategic Municipal Income Fund |
| • | Thornburg Limited Term U.S. Government Fund |
| • | Thornburg Limited Term Income Fund |
| • | Thornburg Strategic Income Fund |
Before investing, carefully consider the Fund’s investment goals, risks, charges, and expenses. For a prospectus containing this and other information, contact your financial advisor or visit thornburg.com. Read it carefully before investing.
For additional information, please visit www.thornburg.com
Thornburg Investment Management, Inc. 2300 North Ridgetop Road, Santa Fe, NM 87506
This page is not part of the Annual Report. 37
This page intentionally left blank.
38 This page is not part of the Annual Report.
This page intentionally left blank.
This page is not part of the Annual Report. 39
 | Waste not, Wait not |  | ||||
| Get instant access to your shareholder reports. | ||||||
| This Annual Report is submitted for the general information of shareholders of the Fund. It is not authorized for distribution to prospective investors in the Fund unless preceded or accompanied by an effective prospectus. | By switching from your postal mailbox to your email inbox, you reduce paper clutter, improve record keeping access, and help conserve our natural resources. | |||||
 | Investment Advisor: Thornburg Investment Management® 800.847.0200
| Go to www.thornburg.com/edelivery and sign up to receive your shareholder reports, prospectuses, and proxy statements electronically. | ||||
| Distributor: | ||||||
Thornburg Securities Corporation® 800.847.0200 | You invest in the future, without spending a dime. | |||||
| TH2149 | ||||||
Item 2. Code of Ethics
Thornburg Investment Trust (the “Trust”) has adopted a code of ethics described in Item 2 of Form N-CSR. A copy of the code of ethics is filed as an exhibit to this Form N-CSR.
Item 3. Audit Committee Financial Expert
The Trustees of Thornburg Investment Trust have determined that two members of the Trust’s audit committee, David A. Ater and David D. Chase, are each audit committee financial experts as defined in Item 3 of Form N-CSR. Mr. Ater and Mr. Chase are each independent for purposes of Item 3 of Form N-CSR. The Trustees’ determinations in this regard were based upon their current understandings of the definition of “audit committee financial expert” and current interpretations of the definition. The Trustees call attention to the lack of clarity in the definition, and that shareholders and prospective investors may wish to evaluate independently this definition and the qualifications of the Trust’s audit committee. The definition of “audit committee financial expert,” together with comments on the definition, is set forth in the Securities and Exchange Commission’s website (www.sec.gov).
Item 4. Principal Accountant Fees and Services
Audit Fees
The aggregate fees billed to Thornburg Investment Trust in each of the last two fiscal years for the audit of the Trust’s financial statements and for services that are normally provided by PricewaterhouseCoopers LLP, registered independent public accounting firm (“PWC”) in connection with statutory and regulatory filings or requirements for those fiscal years are set out below.
| Year Ended September 30, 2010 | Year Ended September 30, 2011 | |||||||
Thornburg Investment Trust | $ | 561,750 | $ | 603,000 | ||||
Audit-Related Fees
The fees billed to Thornburg Investment Trust by PWC in each of the last two fiscal years for assurance and related services that are reasonably related to the audit or review of the Trust’s financial statements (and that are not reflected in “Audit Fees,” above) are set out below.
| Year Ended September 30, 2010 | Year Ended September 30, 2011 | |||||||
Thornburg Investment Trust | $ | -0- | $ | -0- | ||||
Tax Fees
The fees billed to Thornburg Investment Trust by PWC in each of the last two fiscal years for professional services rendered by PWC for tax compliance, tax advice or tax planning are set out below.
| Year Ended September 30, 2010 | Year Ended September 30, 2011 | |||||||
Thornburg Investment Trust | $ | 165,290 | $ | 184,100 | ||||
All Other Fees
The fees billed to Thornburg Investment Trust by PWC in each of the last two fiscal years for all other services rendered by PWC to the Trust are set out below.
| Year Ended September 30, 2010 | Year Ended September 30, 2011 | |||||||
Thornburg Investment Trust | $ | -0- | $ | -0- | ||||
PWC performs no services for the investment advisor, the Funds’ principal underwriter or any other person controlling, controlled by, or under common control with the investment advisor which provides ongoing services to the Funds.
Audit Committee Pre-Approval Policies and Procedures
As of September 30, 2011, the Trust’s Audit Committee has not adopted pre-approval policies and procedures.
Item 5. Audit Committee of Listed Registrants
Not applicable.
Item 6. Schedule of Investments
Filed as part of the reports to shareholders filed under item 1 of this Form.
Item 7. Disclosure of Proxy Voting Policies and Procedures for Closed-End Management Investment Companies
Not applicable.
Item 8. Portfolio Managers of Closed-End Management Investment Companies
Not applicable.
Item 9. Purchases of Equity Securities by Closed-End Management Investment Companies and Affiliated Purchasers.
Not applicable.
Item 10. Submission of Matters to a Vote of Security Holders
The authority to consider candidates recommended by the shareholders in accordance with the Trust’s Procedures for Shareholder Communications is committed to the Governance and Nominating Committee.
Item 11. Controls and Procedures
(a) The principal executive officer and the principal financial officer have concluded that Thornburg Investment Trust’s disclosure controls and procedures provide reasonable assurance that material information relating to Thornburg Investment Trust is made known to them by the appropriate persons, based on their evaluation of these controls and procedures as of a date within 90 days prior to the filing date of this report.
(b) There was no change in Thornburg Investment Trust’s internal control over financial reporting that occurred during the registrant’s second fiscal quarter of the period covered by this report (that is, the registrant’s fourth fiscal quarter) that has materially affected, or is reasonably likely to materially affect, the registrant’s internal control over financial reporting.
Item 12. Exhibits
| (a)(1) | Code of Business Conduct and Ethics. | |
| (a)(2) | Certifications pursuant to Rule 30a-2(a) under the Investment Company Act of 1940 (17 CFR 70.30a-2(a)) attached hereto as Exhibit 99.CERT. | |
| (a)(3) | Not Applicable | |
| (b) | Certification pursuant to Section 906 of the Sarbanes-Oxley Act of 2002 and Rule 30a-2(b) under the Investment Company Act of 1940 (17 CFR 70.30a-2(b)) attached hereto as Exhibit 99.906CERT. | |
SIGNATURES
Pursuant to the requirements of the Securities Exchange Act of 1934 and the Investment Company Act of 1940, the registrant has duly caused this report to be signed on its behalf by the undersigned, thereunto duly authorized.
Thornburg Investment Trust, in respect of the following Thornburg Funds: Limited Term Municipal Fund, California Limited Term Municipal Fund, Intermediate Municipal Fund, New Mexico Intermediate Municipal Fund, New York Intermediate Municipal Fund, Limited Term U.S. Government Fund, Limited Term Income Fund, Value Fund, International Value Fund, Core Growth Fund, Investment Income Builder Fund, Global Opportunities Fund, International Growth Fund, Strategic Income Fund, Strategic Municipal Income Fund, and Developing World Fund.
| By: | /s/ Brian J. McMahon | |
| Brian J. McMahon | ||
| President and principal executive officer |
Date: November 23, 2011
Pursuant to the requirements of the Securities Exchange Act of 1934 and the Investment Company Act of 1940, this report has been signed below by the following persons on behalf of the registrant and in the capacities and on the dates indicated.
| By: | /s/ Brian J. McMahon | |
| Brian J. McMahon | ||
| President and principal executive officer |
Date: November 23, 2011
| By: | /s/ George T. Strickland | |
| George T. Strickland | ||
| Treasurer and principal financial officer |
Date: November 23, 2011