UNITED STATES
SECURITIES AND EXCHANGE COMMISSION
Washington, D.C. 20549
FORM N-CSR
CERTIFIED SHAREHOLDER REPORT OF REGISTERED
MANAGEMENT INVESTMENT COMPANIES
Investment Company Act file number 811-05201
Thornburg Investment Trust
(Exact name of registrant as specified in charter)
c/o Thornburg Investment Management, Inc.
2300 North Ridgetop Road, Santa Fe, New Mexico 87506
(Address of principal executive offices) (Zip code)
Garrett Thornburg, 2300 North Ridgetop Road, Santa Fe, New Mexico 87506
(Name and address of agent for service)
Registrant’s telephone number, including area code: 505-984-0200
Date of fiscal year end: September 30, 2012
Date of reporting period: September 30, 2012
Explanatory Note: The Registrant is filing this amendment to its Form N-CSR for the period ended September 30, 2012, originally filed with the Securities and Exchange Commission on November 28, 2012, to correct information about the NASDAQ symbols and CUSIP numbers for the share classes of Thornburg Strategic Municipal Income Fund. This amendment does not modify in any way information for any other Fund of the Registrant
Item 1. Reports to Stockholders
The following annual report is attached hereto:
Thornburg Strategic Municipal Income Fund

IMPORTANT INFORMATION
The information presented on the following pages is current as of September 30, 2012. The managers’ views, portfolio holdings, and sector diversification are provided for the general information of the Fund’s shareholders; to the extent this information is historical, it should not be considered predictive of future circumstances. This material should not be deemed a recommendation to buy or sell any of the securities mentioned.
Investments in the Fund carry risks, including possible loss of principal. Bond funds have the same interest rate, inflation, and credit risks that are associated with the underlying bonds. The principal value of bonds will fluctuate relative to changes in interest rates, decreasing when interest rates rise. This effect is more pronounced for longer-term bonds. Unlike bonds, bond funds have ongoing fees and expenses. Investments in lower-rated and unrated bonds may be more sensitive to default, downgrades, and market volatility; these investments may also be less liquid than higher-rated bonds. Investments in derivatives are subject to counterparty risk and the risks associated with the securities or other assets underlying the pool of securities, including illiquidity and difficulty in valuation. Please see the Fund’s Prospectus for a discussion of the risks associated with an investment in the Fund. Investments in the Fund are not FDIC insured, nor are they deposits of or guaranteed by a bank or any other entity. There is no guarantee that the Fund will meet its investment objectives.
Performance data given at net asset value (NAV) does not take into account applicable sales charges. If the sales charges had been included, the performance would have been lower.
Minimum investments for Class I shares are higher than those for other classes. Class I shares may not be available to all investors.
Share Class | NASDAQ Symbol | CUSIP | ||
Class A | TSSAX | 885-216-101 | ||
Class C | TSSCX | 885-216-200 | ||
Class I | TSSIX | 885-216-309 |

Lipper’s 2012 Best Fixed Income Funds Manager
Thornburg Investment Management ranked #1 out of 41 eligible firms in Lipper, Inc.’s fixed income Large Company universe for the three-year period ended 11/30/11, based on risk-adjusted returns. Lipper’s Large Company universe is comprised of fund families with more than $40 billion in total net assets. Only fund families with at least five bond funds were eligible for the fixed income funds manager award. Asset Class Group Awards are given for the three-year period only.
Glossary
BofA Merrill Lynch Municipal Master Index – This index tracks the performance of the investment-grade U.S. tax-exempt bond market. Qualifying bonds must have at least one year remaining term to maturity, a fixed coupon schedule, and an investment grade rating (based on an average of Moody’s, S&P, and Fitch).
Unless otherwise noted, index returns reflect the reinvestment of income dividends and capital gains, if any, but do not reflect fees, brokerage commissions or other expenses of investing. Investors may not make direct investments into any index.
Alternative Minimum Tax (AMT) – A federal tax aimed at ensuring that high-income individuals, estates, trusts, and corporations pay a minimal level income tax. For individuals, the AMT is calculated by adding tax preference items to regular taxable income.
Annualized Distribution Yield – The distribution yield reflects actual distributions made to shareholders. The annualized distribution yield is calculated by summing the last 30 days of income at a given month end and annualizing to a 360-day year. The result is divided by the ending maximum offering price.
Basis Point (bps) – A unit equal to 1/100th of 1%. 1% = 100 basis points (bps).
Bond Credit Ratings – A bond credit rating assesses the financial ability of a debt issuer to make timely payments of principal and interest. Ratings of AAA (the highest), AA, A, and BBB are investment-grade quality. Ratings of BB, B, CCC, CC, C, and D (the lowest) are considered below investment grade, speculative grade, or junk bonds. Unless otherwise noted, the ratings listed are from Municipal Market Data and are a combination of ratings from Standard and Poor’s, Moody’s Investors Service, and Fitch Ratings.
Consumer Price Index (CPI) – Index that measures prices of a fixed basket of goods bought by a typical consumer, including food, transportation, shelter, utilities, clothing, medical care, entertainment and other items. The CPI, published by the Bureau of Labor Statistics in the Department of Labor, is based at 100 in 1982 and is released monthly. It is widely used as a cost-of-living benchmark to adjust Social Security payments and other payment schedules, union contracts and tax brackets. Also known as the cost-of-living index.
This page is not part of the Annual Report. 3
IMPORTANT INFORMATION, CONTINUED
Core CPI – Consumer Price Index minus the energy and food components.
Core PCE Price Index – Personal Consumption Expenditures (PCE) prices excluding food and energy.
Duration – A bond’s sensitivity to interest rates. Bonds with longer durations experience greater price volatility than bonds with shorter durations.
Effective Duration – A bond’s sensitivity to interest rates, incorporating the embedded option features, such as call provisions. Bonds with longer durations experience greater price volatility than bonds with shorter durations.
Fed Funds Rate – The interest rate at which a depository institution lends immediately available funds (balances at the Federal Reserve) to another depository institution overnight.
General Obligation Bond – A municipal bond backed by the credit and “taxing power” of the issuing jurisdiction rather than the revenue from a given project.
Gross Domestic Product (GDP) – A country’s income minus foreign investments: the total value of all goods and services produced within a country in a year, minus net income from investments in other countries.
Quantitative Easing – The Federal Reserve’s monetary policy used to stimulate the U.S. economy following the recession that began in 2007/08.
SEC Yield – SEC yield is computed in accordance with SEC standards measuring the net investment income per share over a specified 30-day period expressed as a percentage of the maximum offering price of the Fund’s shares at the end of the period.
4 This page is not part of the Annual Report.
THORNBURG STRATEGIC MUNICIPAL INCOME FUND
The Thornburg Strategic Municipal Income Fund differentiates itself in four ways from other high-yield municipal funds.
| Ÿ | First, it has a more flexible mandate; we go where we perceive value. This allows us to search various sectors, issuers, credit qualities, geographic areas, and segments of the yield curve. |
| Ÿ | Second, we don’t have a legacy of bonds purchased prior to the credit meltdown of 2007–2008. |
| Ÿ | Third, the Fund does not use leverage, as do many other high-yield muni funds. |
| Ÿ | Finally, we believe that we can apply some of the risk-management skills we have demonstrated in our investment grade funds. Our portfolio managers have over 55 years of combined experience in the municipal market. |
Portfolio Managers

Josh Gonze, Chris Ryon, CFA, and Chris Ihlefeld
Average Annual Total Returns
For Periods Ended September 30, 2012
| 1 Yr | 3 Yrs | Since Inception | ||||||||||
A Shares (Incep: 4/1/09) | ||||||||||||
Without sales charge | 11.71 | % | 7.74 | % | 11.94 | % | ||||||
With sales charge | 9.45 | % | 7.02 | % | 11.31 | % | ||||||
Important
Performance Information
Performance data shown represents past performance and is no guarantee of future results. Investment return and principal value will fluctuate so shares, when redeemed, may be worth more or less than their original cost. Current performance may be lower or higher than quoted. For performance current to the most recent month end, visit thorn-burg.com or call 800.847.0200.
The maximum sales charge for the Fund’s Class A shares is 2.00%. The total annual fund operating expense of Class A shares is 1.38%, as disclosed in the most recent Prospectus. Thornburg Investment Management and Thornburg Securities Corporation have contractually agreed to waive fees and reimburse expenses through at least February 1, 2013, so that actual expenses for Class A shares do not exceed 1.25%.
30-Day Yields, A Shares
As of September 30, 2012
| Annualized | SEC | |
Distribution Yield | Yield | |
2.80% | 2.09% |
Without fee waivers and expense reimbursements, the 30-day SEC Yield would have been 1.98% and the Annualized Distribution Yield would have been 2.69%.
Key Portfolio Attributes
As of September 30, 2012
Number of Bonds | 180 | |||
Effective Duration | 7.6 Yrs | |||
Average Maturity | 14.1 Yrs |
See the entire portfolio in the Schedule of Investments beginning on page 13.
This page is not part of the Annual Report 5

Thornburg Strategic Municipal Income Fund — September 30, 2012
Table of Contents | ||||
| 7 | ||||
| 13 | ||||
| 20 | ||||
| 21 | ||||
| 22 | ||||
| 23 | ||||
| 28 | ||||
| 30 | ||||
| 31 | ||||
| 32 | ||||
| 33 | ||||
| 36 |
This report is certified under the Sarbanes-Oxley Act of 2002, which requires that public companies, including mutual funds, affirm that the information provided in their annual and semiannual shareholder reports fully and fairly represents their financial position.
6 Certified Annual Report
October 18, 2012
Dear Fellow Shareholder:
We are pleased to present the annual report for the Thornburg Strategic Municipal Income Fund. The net asset value (NAV) of the Class A shares increased by $1.11 to $15.17 per share during the fiscal year ended September 30, 2012. If you were with us for the entire period, you received dividends of 49.7 cents per share. If you reinvested your dividends, you received 50.5 cents per share. Dividends per share were lower for Class C shares and higher for Class I shares to account for varying class-specific expenses. The Class A shares of your Fund outperformed the index with a total return of 11.71% at NAV for the fiscal year ended September 30, 2012, compared to the 8.96% for the BofA Merrill Lynch Municipal Master Index. The Fund generated 3.73% more price appreciation, but 0.98% less income.
The markets’ positive returns were primarily due to declining interest rates and narrowing credit spreads. Interest rates declined more for longer maturities and consequently longer maturity bonds outperformed shorter maturity bonds. As credit spreads compressed, lower-quality bonds outperformed higher-quality bonds. The Fund’s additional price appreciation is due to several factors. Our interest rate sensitivity as measured by the Fund’s duration and differing allocations along the yield curve added 0.79% of relative price appreciation. Our overweight to the insured and revenue sectors added 2.08%. We underweighted the general obligation and pre-refunded sectors, which added 0.50% of relative price performance. Our overweight to lower credit quality securities added 1.35% of performance relative to its benchmark. Our allocations to bonds of varying dollars prices cost the Fund 1.33% of relative price performance. Other risk factors accounted for an additional 0.34%.
The Economy and the Federal Reserve
During the first quarter of the fiscal year, economic activity looked to be picking up. The December 2011 gross domestic product (GDP) reading was a strong 4.1%. The pickup in activity proved to be an illusion as the March and June 2012 GDP readings were 2.0% and 1.3% respectively. Non-farm payrolls continued to grow, but at rather anemic rates. The unemployment rate began the fiscal year at 9.0% and decreased to 7.8% by the end of the fiscal year.
Inflation as measured by the Consumer Price Index (CPI) is running in the 2.0% range. If one takes out the food and energy components (Core CPI), the trend is declining with the last reading of 2.0%. Inflation as measured by the Personal Consumption Expenditure Index (PCE), the Federal Reserve Board’s (the Fed) favorite inflation measure, is running at a core level of 1.6%. All of these economic indicators and others point to an economy that is on shaky footing.
In addition to these fundamental factors, many investors are concerned about the impact of the “fiscal cliff”, which The Washington Post described as follows:
The “ fiscal cliff” is a term coined by Federal Reserve Chairman Ben S. Bernanke. It refers to a collection of changes in current law that are all set to strike in January, triggering the sharpest reduction in the federal budget deficit in more than 40 years.
Certified Annual Report 7
LETTER TO SHAREHOLDERS,
CONTINUED
The Washington Post goes on to say that taxes would also increase:
For most taxpayers, the bulk of the increase would be triggered by the expiration of tax cuts enacted in 2001 and 2003 during the George W. Bush administration. The expiration of President Obama’s payroll tax holiday, which shaved two percentage points off the 6.2 percent Social Security tax, comes in a close second. If these issues are not addressed many analysts think the United States will be pushed into another recession.
On top of all this, Europe is still a mess but the fixed income markets seem not to be as headline sensitive to news coming out of Europe as they were last year. The Fed, at its last meeting, decided to enter into its third round of quantitative easing, known as QE3. In this round, the Fed will concentrate its security purchases to the mortgage market in an effort to lower borrowing costs for homebuyers, which should spur the housing market. As anyone who has recently applied for a mortgage knows, it is not the interest cost of the product that stands as a borrower’s major roadblock. The fixed income market’s initial reaction to the latest Fed move was an increase in inflation expectations and a decrease in bond prices, though this fear has subsided in recent weeks.
The Presidential Election and Tax Policy
Tax policy and the federal deficit have proven to be key election season issues. Both candidates have put forward their respective plans for deficit reduction; both could influence the municipal bond market. Below, in Table I is a side-by-side analysis based on a recent article in the Bond Buyer, a leading publication about the municipal bond market.
Table I
| Obama | Romney | |
| Extends the 2001 and 2003 tax cuts for individuals earning under $200,000 and families earning under $250,000. | Permanently extend all the 2001 and 2003 tax cuts. Eliminate taxation of investment income for individuals earning less than $200,000. | |
Returns to the Clinton Era highest marginal tax rate of 39.6%. | Lowers marginal rates across the board by 20%, eliminates the alternative minimum tax. | |
| In a jobs bill he floated last October and his 2013 budget, Obama proposed to place a 28% cap on the value of tax-exempt interest for the wealthy. | Announced he would cap individual tax deductions at $17,000. Not clear if he would cap exclusions, like tax exemption, as well as deductions. | |
| Bruce Bartlett, former policy adviser to President Ronald Reagan and Treasury official under President George H. W. Bush, said without a doubt Obama’s tax proposals would be more beneficial to the municipal market primarily because he wants to impose higher tax rates on the wealthy, which would make tax-exempt bonds more attractive. | While Romney has not specifically mentioned capping tax exemption, in a Wall Street Journal editorial in August, Glenn Hubbard, his senior economic adviser, said the exclusion of interest on tax-exempt municipal bonds is “on the table” for the Republican candidate. | |
8 Certified Annual Report
One can see that both candidates’ potential tax policies, as known today, could influence the municipal bond market. However, as with most election rhetoric the eventual legislation may look nothing like the original thoughts. There are two things that people should never watch being made, sausage and legislation!
The Municipal Market
The demand picture in the municipal market improved during the fiscal year. Investors poured $56 billion into municipal bond mutual funds over the last twelve months. The total assets in municipal bond mutual funds were $562 billion according to the Investment Company Institute, a mutual fund industry advocacy group. Assets in municipal bond mutual funds on November 30, 2010, just before the six-month period of investor exodus, were $497 billion. On the other side of the ledger, the supply picture improved. The supply of new issue municipal bonds was $379 billion for the 12 months ending September 30, 2012. This exceeded the $329 billion for the twelve months ending September 30, 2011, by $50 billion, or a 15% increase.
The trend towards lower interest rates continued throughout this fiscal year. With short-term yields anchored near zero, investors moved out along the yield curve in search of more income. This caused long-term maturities to decrease in yield much more than short-term maturities. The average change in yield for the Thornburg Strategic Municipal Income Fund’s investment universe (1-30 years) as measured by the average change in yield of a AAA general obligation bond, was negative 0.17% for the first half of the fiscal year. In the second half of the fiscal year the same measure of average yield change decreased 0.45%. This change in average yields was almost double that of the 1-10 year maturity range of the municipal market. See Graph I.
Graph I: AAA General Obligation Municipal Yield Changes for 9/30/2011 through 9/30/2012
Past performance does not guarantee future results.
Certified Annual Report 9
LETTER TO SHAREHOLDERS,
CONTINUED
Graph II: BofA Merrill Lynch Municipal Master Index
Quarterly and Cumulative Total Returns
Past performance does not guarantee future results.
Investors, again in a search for income, have been willing to pay much more for lower quality securities than any time since 2008. This caused quality spreads to narrow and lower quality securities to out-perform higher quality securities. On December 30, 2011, the incremental yield an investor picked up for buying a BBB security versus an AAA security with a 10-year maturity was 3.00%. On September 30, 2012, that incremental yield equaled 2.08%, a 0.92% decrease. Graph II shows the quarter by quarter and cumulative total return performance of the BofA Merrill Lynch Municipal Master Index for the fiscal year.
The credit picture in the municipal market is still mixed. At the state level, revenues continue to increase. At the local level, which has a heavy reliance on real estate taxes, the continued decline of assessed values has put pressure on local finances. Pension funding levels continue to decline due to poor investment returns and cutbacks in annual pension contributions. Several state and local pension plans, recognizing the folly of this condition, have begun to reform their pension system calling for higher participant contributions, higher retirement ages or both. These measures and others have caused us to forsake investments in the state of Illinois and Puerto Rico general obligation debt.
In the last semi-annual letter to shareholders, we noted the risks of rising interest rates. As bond portfolio managers, we are always worried. If bonds are doing well, the economy is probably doing poorly, and we worry. If the economy is doing well, we worry because yields are probably rising and bond prices are declining. This is the life we chose.
The level of real yields (yield less inflation) is a measure of value for fixed income products. Real yield levels are at record lows across all fixed income products. Relative to other fixed income products, municipal bonds appear to be attractive. Graph III illustrates this measure.
Real yield levels for a 30-year AAA general obligation municipal bond using Core PCE as an inflation measure are near 20-year lows, and we worry. At the same time, we are reminded of a famous quote by John Maynard Keynes, “The market can stay irrational longer than you can stay solvent.” Not that solvency is an issue but Graph III would suggest rationality is. This state of affairs can continue for some time, but it is still a risk.
10 Certified Annual Report
Graph III: 30 Year AAA Muni Real Yield Using Core PCE
Past performance does not guarantee future results.
The long-term average real yield for a 30-year AAA municipal general obligation bond is 3.03%. This means that since May 1991, investors have demanded 3.03% above the Core PCE inflation rate to invest in 30-year AAA general obligation bonds. The current yield on a 30-year AAA municipal general obligation bond is 3.35% and Core PCE inflation is 1.60% as of August 31, 2012 (last data point available). If this relationship were to return back to the average long-term real yield level one of three things must happen. First, 30-year interest rates need to increase approximately 1.25%. Second, inflation must decrease by 1.25%. Neither of these two outcomes will be pleasant. Third, some combination of the two prior outcomes could occur, which also promises to be unpleasant. Investors should use this information to recognize the risk inherent in fixed income products at these historically low yield levels. They should take this opportunity to review their portfolios and determine if these portfolios are properly diversified. In addition, they should ask themselves if they have an appropriate time horizon in mind for their investments; we suggest two to three years from the point you ask yourself that question.
Conclusion
Your Thornburg Strategic Municipal Income Fund continues to traverse the municipal market looking for undervalued securities. We do not maintain a laddered portfolio structure for this Fund as we do for the “core” funds (Limited and Intermediate). This Fund strives to offer its shareholders a durable income stream and as such purchases securities with longer durations (market risk) and lower credit quality when valuations are attractive. We would like to thank you for the trust you have placed with us and will continue to keep that foremost in our minds.
Certified Annual Report 11
LETTER TO SHAREHOLDERS,
CONTINUED
Sincerely, | ||||
|
|
| ||
Christopher Ihlefeld | Christopher Ryon, CFA | Josh Gonze | ||
Portfolio Manager | Portfolio Manager | Portfolio Manager | ||
Managing Director | Managing Director | Managing Director | ||


The matters discussed in this report may constitute forward-looking statements made pursuant to the safe harbor provisions of the Securities Litigation Reform Act of 1995. These include any advisor or portfolio manager prediction, assessment, analysis or outlook for individual securities, industries, investment styles, market sectors and/or markets. These statements involve risks and uncertainties. In addition to the general risks described for each fund in its current prospectus, other factors bearing on these reports include the accuracy of the advisor’s or portfolio manager’s forecasts and predictions, the appropriateness of the investment strategies designed by the advisor or portfolio manager and the ability of the advisor or portfolio manager to implement their strategies efficiently and successfully. Any one or more of these factors, as well as other risks affecting the securities markets generally, could cause the actual results of any fund to differ materially as compared to its benchmarks.
12 Certified Annual Report
| SCHEDULE OF INVESTMENTS | ||
| Thornburg Strategic Municipal Income Fund | September 30, 2012 | |
SUMMARY OF SECURITY CREDIT RATINGS†
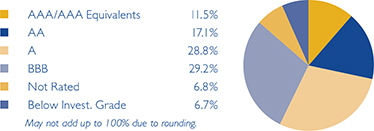
We have used ratings from Standard & Poor’s (S&P). Where S&P ratings are not available, we have used Moody’s Investors Service. Where neither rating is available, we have used ratings from Fitch Ratings. The category of investments identified as “AAA” in this graph includes investments which are pre-refunded or escrowed to maturity. Such investments are backed by an escrow or trust containing sufficient U.S. Government or U.S. Government agency securities to satisfy the timely payment of principal and interest and, therefore, are normally deemed to be equivalent to AAA-rated securities.
Issuer-Description | Credit Rating† S&P/ Moody’s | Principal Amount | Value | |||||||
ALABAMA — 0.56% | ||||||||||
City of Mobile Industrial Development Board PCR, 1.65% due 6/1/2034 put 3/20/2017 (Alabama Power Company Barry Plant Project) | A/A2 | $ | 1,000,000 | $ | 1,021,650 | |||||
ARIZONA — 1.04% | ||||||||||
Maricopa County PCR, 6.00% due 5/1/2029 put 5/1/2014 (Arizona Public Service Co.) | BBB/Baa1 | 500,000 | 534,815 | |||||||
Pima County IDA, 6.25% due 7/1/2013 (Arizona Charter Schools) | NR/Baa3 | 185,000 | 185,736 | |||||||
Pima County IDA, 5.875% due 4/1/2022 (Cambridge Academy) | NR/NR | 435,000 | 454,706 | |||||||
Pima County IDA, 5.125% due 12/1/2040 (Providence Day School) | BBB+/NR | 710,000 | 716,319 | |||||||
CALIFORNIA — 21.30% | ||||||||||
Brea Redevelopment Agency, 0% due 8/1/2032 (Redevelopment Project AB) | AA-/NR | 1,370,000 | 372,613 | |||||||
Brea Redevelopment Agency, 0% due 8/1/2034 (Redevelopment Project AB) | AA-/NR | 5,000,000 | 1,141,700 | |||||||
California HFFA, 6.25% due 2/1/2026 (Community Program Developmental Disabilities; Insured: California Mtg Insurance) | A-/NR | 1,500,000 | 1,766,400 | |||||||
California HFFA, 5.00% due 11/15/2034 (Children’s Hospital Los Angeles) | BBB+/Baa2 | 420,000 | 451,781 | |||||||
California Housing Finance Agency, 4.625% due 8/1/2016 (Low-Moderate Income Housing Loans; Insured: FGIC) (AMT) | BBB/Baa2 | 1,175,000 | 1,222,576 | |||||||
California Housing Finance Agency, 4.625% due 8/1/2026 (Low-Moderate Income Housing Loans; Insured: FGIC) (AMT) | BBB/Baa2 | 560,000 | 544,846 | |||||||
California Municipal Finance Authority, 8.50% due 11/1/2039 (Harbor Regional Center) | NR/Baa1 | 1,000,000 | 1,205,420 | |||||||
California State Public Works Board, 5.00% due 4/1/2028 (Corrections & Rehabilitation and Judicial Council) | BBB+/A2 | 1,000,000 | 1,137,770 | |||||||
California State Public Works Board, 6.25% due 4/1/2034 (Department of General Services-Offices Renovation) | BBB+/A2 | 100,000 | 118,825 | |||||||
California Statewide Communities Development Authority, 5.00% due 8/15/2039 (Children’s Hospital of Los Angeles; Insured: Natl-Re) | BBB/Baa2 | 1,185,000 | 1,217,433 | |||||||
California Statewide Communities Development Authority, 6.125% due 7/1/2046 (Aspire Public Schools) | NR/NR | 1,000,000 | 1,033,150 | |||||||
Calipatria USD, 0% due 8/1/2025 (Educational Facilities Improvements; Insured: ACA) | NR/NR | 2,425,000 | 1,120,980 | |||||||
Carson Redevelopment Agency, 7.00% due 10/1/2036 (Project Area 1) | A-/NR | 500,000 | 586,885 | |||||||
Chico Redevelopment Agency, 5.00% due 4/1/2030 (Chico Amended & Merged Redevelopment; Insured: AMBAC) | A+/NR | 1,000,000 | 1,032,430 | |||||||
City of Los Angeles, 5.00% due 6/1/2027 (Insured: MBIA) (Wastewater System) | AA/Aa3 | 600,000 | 616,686 | |||||||
Corona-Norco USD COP, 5.00% due 4/15/2031 (Insured: AGM) | AA-/Aa3 | 1,750,000 | 1,937,442 | |||||||
County of El Dorado, 5.00% due 9/1/2026 (El Dorado Hills Development-Community Facilities) | A/NR | 630,000 | 706,583 | |||||||
Daly County Housing Development Finance Agency, 5.25% due 12/15/2023 (Franciscan Mobile Park) | A/NR | 650,000 | 701,174 | |||||||
Kern Community College District COP, 4.00% due 4/1/2014 | SP-1+/NR | 2,500,000 | 2,612,000 | |||||||
M-S-R Energy Authority, 6.50% due 11/1/2039 | A-/NR | 1,000,000 | 1,318,890 | |||||||
Merced Redevelopment Agency, 6.50% due 9/1/2039 (Merced Gateways Redevelopment) | BB+/NR | 300,000 | 320,445 | |||||||
Certified Annual Report 13
| SCHEDULE OF INVESTMENTS, CONTINUED | ||
| Thornburg Strategic Municipal Income Fund | September 30, 2012 | |
Issuer-Description | Credit Rating† S&P/ Moody’s | Principal Amount | Value | |||||||
Moorpark Mobile Home Park, 6.15% due 5/15/2031 (Villa Del Arroyo) | BBB/NR | $ | 1,000,000 | $ | 1,099,600 | |||||
Newport-Mesa USD, 0% due 8/1/2034 (Orange County District Schools) | AA/Aa1 | 5,000,000 | 1,882,450 | |||||||
Oak Park USD GO, 0% due 8/1/2030 (Insured: AGM) | AA-/Aa3 | 500,000 | 206,080 | |||||||
Pittsburg Redevelopment Agency, 0% due 8/1/2027 (Los Medanos Community Development; Insured: AMBAC) | BBB+/NR | 1,275,000 | 548,097 | |||||||
Pittsburg Redevelopment Agency, 0% due 8/1/2028 (Los Medanos Community Development; Insured: AMBAC) | BBB+/NR | 5,000,000 | 2,011,900 | |||||||
Placentia-Yorba Linda USD COP, 5.00% due 10/1/2030 (Educational Facilities Construction; Insured: Natl-Re/FGIC) | A+/A1 | 1,500,000 | 1,567,635 | |||||||
Redwood City Redevelopment Agency, 0% due 7/15/2021 (Redevelopment Project Area 2; Insured: AMBAC) | A-/NR | 1,285,000 | 839,825 | |||||||
Riverside County Asset Leasing Corp., 0% due 6/1/2021 (Riverside County Hospital; Insured: Natl-Re) | BBB/A2 | 535,000 | 350,602 | |||||||
San Diego USD, 0% due 7/1/2035 | AA-/Aa2 | 1,700,000 | 569,551 | |||||||
San Francisco City & County Redevelopment Financing Authority, 0% due 8/1/2023 (Redevelopment Project; Insured: Natl-Re) | A/Baa2 | 925,000 | 564,898 | |||||||
San Francisco City & County Redevelopment Financing Authority, 6.50% due 8/1/2039 (Mission Bay North Redevelopment) | A-/NR | 250,000 | 290,643 | |||||||
San Francisco City & County Redevelopment Financing Authority, 6.75% due 8/1/2041 (Mission Bay North Redevelopment) | A-/NR | 500,000 | 585,610 | |||||||
San Jose Redevelopment Agency, 5.50% due 8/1/2035 (Merged Area Redevelopment) | A/Ba1 | 1,000,000 | 1,017,110 | |||||||
Sonoma County Community Redevelopment Agency, 6.50% due 8/1/2034 (The Springs Redevelopment; Insured: AGM) | AA-/NR | 100,000 | 104,206 | |||||||
State of California, 2.50% due 6/20/2013 (General Fund Cash Management) | SP-1+/Mig1 | 1,050,000 | 1,066,873 | |||||||
State of California GO, 0.17% due 5/1/2034 put 10/1/2012 (Kindergarten University Facilities; LOC: Citibank N.A.) (daily demand notes) | AAA/Aa2 | 400,000 | 400,000 | |||||||
State of California GO, 0.20% due 5/1/2034 put 10/1/2012 (Kindergarten University Facilities; LOC: Citibank N.A./California State Teachers’ Retirement System) (daily demand notes) | A/Aa3 | 1,430,000 | 1,430,000 | |||||||
State of California GO, 0.22% due 5/1/2034 put 10/1/2012(Kindergarten University Facilities; LOC: Citibank N.A./California State Teachers’ Retirement System) (daily demand notes) | A/Aa3 | 1,000,000 | 1,000,000 | |||||||
Union Elementary School District, 0% due 9/1/2027 (Santa Clara County District Schools; Insured: Natl-Re) | AA+/NR | 905,000 | 490,239 | |||||||
Whittier Public Financing Authority, 5.00% due 11/1/2030 (Whittier Boulevard Redevelopment Project; Insured: AMBAC) | A-/NR | 1,425,000 | 1,438,951 | |||||||
COLORADO — 4.90% | ||||||||||
Denver City & County COP, 0.20% due 12/1/2029 put 10/1/2012 (Wellington E. Webb Municipal Office Building; SPA: JPMorgan Chase Bank) (daily demand notes) | AA+/Aa2 | 3,225,000 | 3,225,000 | |||||||
Denver Convention Center Hotel Authority, 5.125% due 12/1/2026 (Insured: Syncora) | BBB-/Baa3 | 1,000,000 | 1,034,780 | |||||||
Denver Convention Center Hotel Authority, 5.00% due 12/1/2030 (Insured: Syncora) | BBB-/Baa3 | 450,000 | 466,128 | |||||||
Denver Convention Center Hotel Authority, 5.00% due 12/1/2035 (Insured: Syncora) | BBB-/Baa3 | 605,000 | 621,625 | |||||||
Eagle Bend Metropolitan District GO, 5.00% due 12/1/2020 (Insured: Radian) | A-/NR | 1,010,000 | 1,053,814 | |||||||
Eagle River Fire District, 6.625% due 12/1/2024 | NR/NR | 225,000 | 249,118 | |||||||
Eagle River Fire District, 6.875% due 12/1/2030 | NR/NR | 400,000 | 443,192 | |||||||
Public Authority for Colorado Energy, 5.75% due 11/15/2018 (Natural Gas Purchase) | A-/Baa2 | 770,000 | 885,092 | |||||||
Public Authority for Colorado Energy, 6.50% due 11/15/2038 (Natural Gas Purchase) | A-/Baa2 | 260,000 | 331,835 | |||||||
Regional Transportation District COP, 5.375% due 6/1/2031 | A-/Aa3 | 500,000 | 573,280 | |||||||
CONNECTICUT — 1.16% | ||||||||||
Connecticut Health & Educational Facilities Authority, 6.00% due 7/1/2039 (Ethel Walker School) | BBB-/NR | 1,000,000 | 1,096,870 | |||||||
a State of Connecticut GO, 0.68% due 9/15/2017 (Public Improvements) Floating Rate Note | AA/Aa3 | 1,000,000 | 1,003,600 | |||||||
14 Certified Annual Report
| SCHEDULE OF INVESTMENTS, CONTINUED | ||
| Thornburg Strategic Municipal Income Fund | September 30, 2012 | |
Issuer-Description | Credit Rating† | Principal Amount | Value | |||||||
DISTRICT OF COLUMBIA — 0.42% | ||||||||||
Metropolitan Washington Airports Authority, 0% due 10/1/2027 (Dulles Toll Road; Insured: AGM) | AA-/Aa3 | $ | 1,500,000 | $ | 755,760 | |||||
FLORIDA — 7.26% | ||||||||||
Florida Higher Educational Facilities Financing Authority, 5.00% due 4/1/2027 (Nova Southeastern University) | BBB/Baa2 | 1,000,000 | 1,098,780 | |||||||
Gainesville Utilities Systems, 0.21% due 10/1/2026 put 10/1/2012 (SPA: SunTrust Bank) (daily demand notes) | AA/Aa2 | 865,000 | 865,000 | |||||||
Hollywood Community Redevelopment Agency, 5.625% due 3/1/2024 | NR/A3 | 340,000 | 351,893 | |||||||
Lakeland Energy System, 5.25% due 10/1/2036 | AA/A1 | 2,000,000 | 2,623,420 | |||||||
Miami GO, 5.00% due 1/1/2017 (Homeland Defense/Neighborhood Capital Improvements) | BBB-/A3 | 1,245,000 | 1,355,743 | |||||||
Miami GO, 5.00% due 1/1/2018 (Homeland Defense/Neighborhood Capital Improvements) | BBB-/A3 | 1,790,000 | 1,959,226 | |||||||
Miami-Dade County School Board COP, 5.00% due 8/1/2027 (District School Facilities and Infrastructure) | A/A1 | 1,100,000 | 1,232,275 | |||||||
Pinellas County Educational Facilities Authority, 5.25% due 10/1/2030 (Barry University) | BBB/NR | 500,000 | 547,245 | |||||||
Sarasota County Public Hospital Board, 4.202% due 10/1/2021 (Sarasota Memorial Hospital; Insured: Natl-Re) | BBB/A1 | 1,000,000 | 993,530 | |||||||
Sarasota County Public Hospital Board, 5.50% due 7/1/2028 (Sarasota Memorial Hospital; Insured: Natl-Re) | BBB/A1 | 665,000 | 792,820 | |||||||
St. Johns County IDA, 5.625% due 8/1/2034 (Presbyterian Retirement) | NR/NR | 230,000 | 238,324 | |||||||
Tampa Sports Authority, 5.75% due 10/1/2020 (Tampa Bay Arena; Insured: Natl-Re) | BBB/Baa2 | 1,000,000 | 1,115,740 | |||||||
GEORGIA — 1.55% | ||||||||||
City of Atlanta, 6.25% due 11/1/2034 (Water and Wastewater Capital Improvement Program) | A/A1 | 500,000 | 608,265 | |||||||
Fulton County Development Authority, 5.00% due 10/1/2019 (Georgia Tech Athletic Association) | NR/A2 | 1,000,000 | 1,213,850 | |||||||
Main Street Natural Gas, Inc., 5.00% due 3/15/2018 (Georgia Gas) | A/A2 | 515,000 | 590,679 | |||||||
Main Street Natural Gas, Inc., 5.50% due 9/15/2023 (Georgia Gas) | A-/Baa2 | 350,000 | 404,303 | |||||||
GUAM — 1.24% | ||||||||||
Guam Government, 5.75% due 12/1/2034 (Layon Solid Waste Disposal Facility) | BBB+/NR | 500,000 | 562,370 | |||||||
Guam Government Department of Education COP, 6.875% due 12/1/2040 (John F. Kennedy High School) | B/NR | 1,000,000 | 1,098,950 | |||||||
Guam Government GO, 7.00% due 11/15/2039 | B+/NR | 520,000 | 587,850 | |||||||
ILLINOIS — 5.70% | ||||||||||
City of Chicago, 4.70% due 11/15/2013 (Near South Redevelopment; Insured: AMBAC) | NR/NR | 800,000 | 802,336 | |||||||
City of Chicago, 6.75% due 6/1/2022 (Pilsen Redevelopment) | NR/NR | 1,000,000 | 1,043,230 | |||||||
City of Chicago, 5.00% due 1/1/2035 (Midway Airport Development Plan; Insured: Natl-Re) | A/A2 | 1,055,000 | 1,057,996 | |||||||
Cook County GO, 5.25% due 11/15/2033 | AA/Aa3 | 1,000,000 | 1,139,560 | |||||||
Illinois Civic Center, 5.375% due 12/15/2012 (Insured: AGM) | NR/Aa3 | 505,000 | 507,086 | |||||||
Illinois Finance Authority, 5.75% due 11/15/2037 (OSF Healthcare System) | A/A3 | 330,000 | 361,010 | |||||||
Illinois Finance Authority, 6.00% due 5/15/2039 (OSF Healthcare System) | A/A3 | 1,565,000 | 1,815,854 | |||||||
Metropolitan Pier & Exposition Authority, 5.00% due 6/15/2050 (McCormick Place) | AAA/A3 | 1,500,000 | 1,632,885 | |||||||
Railsplitter Tobacco Settlement Authority, 6.00% due 6/1/2028 | A-/NR | 1,000,000 | 1,178,220 | |||||||
Village of Melrose Park GO, 6.75% due 12/15/2016 (Redevelopment Project Costs; Insured: Natl-Re) | NR/Baa2 | 250,000 | 279,685 | |||||||
Village of Melrose Park GO, 6.75% due 12/15/2021 (Redevelopment Project Costs; Insured: Natl-Re) | NR/Baa2 | 410,000 | 519,913 | |||||||
Certified Annual Report 15
| SCHEDULE OF INVESTMENTS, CONTINUED | ||
| Thornburg Strategic Municipal Income Fund | September 30, 2012 | |
Issuer-Description | Credit Rating† | Principal Amount | Value | |||||||
INDIANA — 5.66% | ||||||||||
Carmel Redevelopment District COP, 6.50% due 7/15/2035 (Performing Arts Center) | NR/NR | $ | 1,000,000 | $ | 1,065,800 | |||||
Indiana Finance Authority, 6.00% due 12/1/2019 (U.S. Steel Corp.) | BB/B1 | 2,500,000 | 2,789,225 | |||||||
Indiana Finance Authority, 0.23% due 2/1/2035 put 10/1/2012 (Lease Appropriation; SPA: | ||||||||||
JPMorgan Chase Bank) (daily demand notes) | AA+/NR | 2,800,000 | 2,800,000 | |||||||
Indiana Finance Authority, 0.20% due 2/1/2037 put 10/1/2012 (Lease Appropriation; SPA: JPMorgan Chase Bank) (daily demand notes) | AA+/Aa2 | 2,500,000 | 2,500,000 | |||||||
b Indiana Finance Authority, 6.375% due 9/15/2041 (Marian University) | BBB-/NR | 1,000,000 | 1,108,630 | |||||||
KANSAS — 2.76% | ||||||||||
City of Wichita GO, 0.30% due 8/15/2013 (Norris Training Systems) | SP-1+/Mig1 | 3,900,000 | 3,900,390 | |||||||
City of Wichita MFR, 5.90% due 12/1/2016 (Brentwood Apartments) | B/NR | 400,000 | 379,556 | |||||||
City of Wichita MFR, 5.85% due 12/1/2025 (Brentwood Apartments) | B/NR | 895,000 | 732,352 | |||||||
KENTUCKY — 1.49% | ||||||||||
Kentucky EDA, 0% due 10/1/2021 (Norton Healthcare, Inc.; Insured: Natl-Re) | BBB/Baa2 | 715,000 | 496,703 | |||||||
Kentucky EDA, 0% due 10/1/2022 (Norton Healthcare, Inc.; Insured: Natl-Re) | BBB/Baa2 | 2,490,000 | 1,636,578 | |||||||
Owen County Waterworks Systems, 6.25% due 6/1/2039 (American Water Co.) | BBB+/Baa2 | 500,000 | 564,055 | |||||||
LOUISIANA — 1.56% | ||||||||||
Louisiana Public Facilities Authority, 5.00% due 7/1/2032 (Black & Gold Facilities; Insured: CIFG) | AA-/Aa3 | 120,000 | 126,101 | |||||||
Louisiana Public Facilities Authority, 5.375% due 5/15/2043 (Ochsner Clinic Foundation) | NR/Baa1 | 500,000 | 523,390 | |||||||
Parish of St. Charles, 4.00% due 12/1/2040 put 6/1/2022 (Valero Energy Corp. Refinery) | BBB/Baa2 | 2,000,000 | 2,172,060 | |||||||
MASSACHUSETTS — 0.27% | ||||||||||
Massachusetts Educational Financing Authority, 6.00% due 1/1/2028 | AA/NR | 420,000 | 490,573 | |||||||
MICHIGAN — 7.72% | ||||||||||
Charter County of Wayne, 5.00% due 12/1/2030 (Airport Hotel; Insured: Natl-Re) | BBB+/Baa2 | 805,000 | 805,354 | |||||||
Detroit School District, 5.00% due 5/1/2025 (School Building & Site; Insured: Q-SBLF) | AA-/Aa2 | 1,000,000 | 1,159,890 | |||||||
Detroit School District, 5.25% due 5/1/2027 (School Building & Site; Insured: AGM) | AA-/Aa2 | 1,000,000 | 1,234,840 | |||||||
Detroit Water and Sewerage Department, 5.25% due 7/1/2039 (Sewage Disposal System; Insured: AGM) | A+/Baa2 | 1,250,000 | 1,337,575 | |||||||
Detroit Water Supply Systems, 5.00% due 7/1/2018 (Insured: Natl-Re) | BBB/Baa2 | 350,000 | 384,090 | |||||||
Kalamazoo Hospital Finance Authority, 5.00% due 5/15/2036 (Bronson Methodist Hospital) | NR/A2 | 1,000,000 | 1,072,630 | |||||||
Kalamazoo Hospital Finance Authority, 5.25% due 5/15/2041 (Bronson Healthcare Group) | NR/A2 | 1,000,000 | 1,102,700 | |||||||
Michigan Finance Authority, 5.00% due 4/1/2031 (Local Government Loan Program) | A+/NR | 1,000,000 | 1,090,020 | |||||||
Michigan Finance Authority, 8.125% due 4/1/2041 (Hope Academy) | NR/NR | 1,000,000 | 1,170,900 | |||||||
Michigan Hospital Finance Authority, 5.00% due 7/15/2025 (Oakwood Southshore Medical Center) | A/A2 | 650,000 | 700,102 | |||||||
Michigan Hospital Finance Authority, 5.75% due 4/1/2032 pre-refunded 4/1/2013 (Various Hospital Facility Improvements) | AA+/A2 | 150,000 | 154,205 | |||||||
Michigan Hospital Finance Authority, 5.75% due 11/15/2039 (Henry Ford Health) | A/A1 | 1,000,000 | 1,151,750 | |||||||
Michigan Housing Development Authority, 3.375% due 11/1/2016 (AMT) | AA/NR | 865,000 | 891,607 | |||||||
Michigan Public School Academy, 8.00% due 8/1/2035 (Will Carleton Charter School) | NR/NR | 1,070,000 | 1,115,903 | |||||||
Michigan Strategic Fund, 5.00% due 8/1/2013 (NSF International) | A-/NR | 300,000 | 308,457 | |||||||
Michigan Strategic Fund, 7.00% due 5/1/2021 (The Detroit Edison Company; Insured: Natl- Re/AMBAC) | NR/NR | 250,000 | 326,717 | |||||||
MINNESOTA — 0.29% | ||||||||||
St. Paul Housing & Redevelopment Authority, 5.25% due 5/15/2023 | A-/A3 | 100,000 | 106,797 | |||||||
16 Certified Annual Report
| SCHEDULE OF INVESTMENTS, CONTINUED | ||
| Thornburg Strategic Municipal Income Fund | September 30, 2012 | |
Issuer-Description | Credit Rating† | Principal Amount | Value | |||||||
Washington County Housing Redevelopment Authority, 5.625% due 6/1/2037 (Birchwood & Woodbury) | NR/NR | $ | 415,000 | $ | 422,462 | |||||
MISSOURI — 1.23% | ||||||||||
Kansas City Tax Increment Financing Commission, 5.25% due 3/1/2018 (Maincor Project- Public Improvements) | NR/NR | 1,265,000 | 1,331,311 | |||||||
Missouri Development Finance Board, 0.20% due 12/1/2033 put 10/1/2012 (Nelson Gallery Foundation; SPA: JPMorgan Chase Bank) (daily demand notes) | AAA/Aaa | 900,000 | 900,000 | |||||||
NEVADA — 1.61% | ||||||||||
Carson City, 5.00% due 9/1/2033 (Carson Tahoe Regional Healthcare Project) | BBB+/NR | 1,250,000 | 1,345,162 | |||||||
Redevelopment Agency of the City of Mesquite, 7.00% due 6/1/2019 (Public Facility and Redevelopment Projects) | BBB+/NR | 700,000 | 733,229 | |||||||
Redevelopment Agency of the City of Mesquite, 7.125% due 6/1/2021 (Public Facility and Redevelopment Projects) | BBB+/NR | 300,000 | 312,738 | |||||||
Redevelopment Agency of the City of Mesquite, 7.375% due 6/1/2024 (Public Facility and Redevelopment Projects) | BBB+/NR | 500,000 | 520,610 | |||||||
NEW JERSEY — 0.43% | ||||||||||
Higher Education Student Assistance Authority, 5.75% due 12/1/2039 (NJCLASS Student Loan Program) (AMT) | A/A2 | 750,000 | 775,672 | |||||||
NEW MEXICO — 0.61% | ||||||||||
City of Farmington PCR, 4.70% due 9/1/2024 (Arizona Public Service Co.) | BBB/Baa1 | 1,000,000 | 1,113,940 | |||||||
NEW YORK — 2.62% | ||||||||||
New York State Dormitory Authority, 5.00% due 6/15/2031 (Metropolitan Transportation Authority and Urban Development Corp.) | AAA/NR | 3,000,000 | 3,621,150 | |||||||
New York Thruway Authority, 5.00% due 1/1/2037 (Governor Thomas E. Dewey Thruway) | A+/A1 | 1,000,000 | 1,135,480 | |||||||
OHIO — 2.83% | ||||||||||
American Municipal Power, Inc., 5.00% due 2/15/2037 (AMP Fremont Energy Center) | A/A1 | 1,000,000 | 1,114,790 | |||||||
Cleveland Cuyahoga County Port Authority, 6.25% due 5/15/2016 (LOC: FifthThird Bank) | BBB/NR | 345,000 | 348,981 | |||||||
Cleveland Cuyahoga County Port Authority, 7.00% due 5/15/2040 (Insured: City Appropriations) | BBB/NR | 1,000,000 | 1,131,840 | |||||||
Ohio State Water Development Authority PCR, 5.875% due 6/1/2033 put 6/1/2016 (FirstEnergy Nuclear Generation Corp.) | BBB-/Baa2 | 1,000,000 | 1,131,920 | |||||||
Ohio State Water Development Authority PCR, 3.375% due 7/1/2033 put 7/1/2015 (FirstEnergy Nuclear Generation Corp.) | BBB-/Baa3 | 1,350,000 | 1,396,238 | |||||||
OREGON — 0.84% | ||||||||||
Oregon MFR Pass-Through Certificates, 6.05% due 11/1/2034 (AMT) | NR/Baa1 | 500,000 | 500,490 | |||||||
Western Generation Agency, 5.00% due 1/1/2016 (Wauna Cogeneration; Insured: ACA) | NR/NR | 1,000,000 | 1,027,900 | |||||||
PENNSYLVANIA — 5.33% | ||||||||||
Allegheny County IDA, 6.75% due 8/15/2035 (Propel Charter School) | BBB-/NR | 950,000 | 1,056,542 | |||||||
Hospitals and Higher Educational Facilities Authority of Philadelphia, 0.20% due 7/1/2025 put 10/1/2012 (The Children’s Hospital of Philadelphia; SPA: JPMorgan Chase Bank) (daily demand notes) | AA/Aa2 | 1,000,000 | 1,000,000 | |||||||
Pennsylvania Economic Development Financing Authority, 5.00% due 12/1/2014 (Colver Project; Insured: AMBAC) (AMT) | BBB-/Ba1 | 450,000 | 459,261 | |||||||
Certified Annual Report 17
| SCHEDULE OF INVESTMENTS, CONTINUED | ||
| Thornburg Strategic Municipal Income Fund | September 30, 2012 | |
Issuer-Description | Credit Rating† | Principal Amount | Value | |||||||
Pennsylvania Economic Development Financing Authority, 4.625% due 12/1/2018 (Colver Project; Insured: AMBAC) (AMT) | BBB-/Ba1 | $ | 1,800,000 | $ | 1,826,694 | |||||
Pennsylvania Turnpike Commission, 0% due 12/1/2030 (Convertible Capital Appreciation) | A-/A3 | 2,000,000 | 1,959,800 | |||||||
Philadelphia Airport, 5.00% due 6/15/2027 (AMT) | A+/A2 | 2,000,000 | 2,238,040 | |||||||
Philadelphia IDA, 6.00% due 8/1/2035 (Mast Charter School) | BBB+/NR | 1,000,000 | 1,132,700 | |||||||
RHODE ISLAND — 0.45% | ||||||||||
Housing Authority of the City of Pawtucket, 5.50% due 9/1/2022 (Public Housing Development) | AA-/NR | 315,000 | 384,502 | |||||||
Housing Authority of the City of Pawtucket, 5.50% due 9/1/2024 (Public Housing Development) | AA-/NR | 350,000 | 421,438 | |||||||
SOUTH DAKOTA — 0.47% | ||||||||||
South Dakota Health & Educational Facilities Authority, 5.50% due 11/1/2040 (Sanford Health) | A+/A1 | 750,000 | 845,460 | |||||||
TENNESSEE — 0.37% | ||||||||||
Tennessee Energy Acquisition Corp., 5.00% due 2/1/2015 | BBB/Baa3 | 100,000 | 106,621 | |||||||
Tennessee Energy Acquisition Corp., 5.25% due 9/1/2024 | A-/Baa2 | 500,000 | 554,790 | |||||||
TEXAS — 11.13% | ||||||||||
Austin Convention Enterprises, Inc., 5.25% due 1/1/2024 (Austin Convention Center; Insured: Syncora) | BB+/Ba1 | 720,000 | 769,111 | |||||||
Austin Convention Enterprises, Inc., 5.00% due 1/1/2034 (Austin Convention Center; Insured: Syncora) | BB+/Ba1 | 665,000 | 687,863 | |||||||
Clifton Higher Education Finance Corp., 9.00% due 2/15/2038 (Tejano Center for Community Concerns, Inc.) | BBB-/NR | 1,000,000 | 1,194,380 | |||||||
Gulf Coast Waste Disposal Authority, 6.10% due 8/1/2024 (International Paper Co.) (AMT) | BBB/Baa3 | 100,000 | 100,351 | |||||||
Houston Higher Education Finance Corp., 0.18% due 5/15/2048 put 10/1/2012 (William Marsh Rice University) (daily demand notes) | AAA/Aaa | 780,000 | 780,000 | |||||||
Kimble County Hospital District, 6.25% due 8/15/2033 | NR/NR | 500,000 | 555,000 | |||||||
La Vernia Higher Education Finance Corp., 6.25% due 8/15/2039 (Kipp, Inc.) | BBB/NR | 1,000,000 | 1,166,150 | |||||||
San Antonio Energy Acquisition Public Facilities Corp., 5.50% due 8/1/2021 | A-/Baa3 | 40,000 | 45,392 | |||||||
San Juan Higher Education Finance Authority, 6.70% due 8/15/2040 (IDEA Public School) | BBB/NR | 1,000,000 | 1,161,830 | |||||||
State of Texas, 2.50% due 8/30/2013 (General Revenue Fund Cash Management) | SP-1+/Mig1 | 3,500,000 | 3,572,765 | |||||||
Tarrant County Cultural Educational Facilities Finance Corp., 0.20% due 10/1/2041 put 10/1/2012 (Methodist Hospitals of Dallas; LOC: JPMorgan Chase Bank) (daily demand notes) | AAA/Aa1 | 1,955,000 | 1,955,000 | |||||||
Texas City Industrial Development Corp., 7.375% due 10/1/2020 (BP Pipelines N.A., Inc.) | A/A2 | 1,000,000 | 1,370,350 | |||||||
Texas Multi-Family Housing Corp., 7.00% due 7/1/2043 (HDSA Affordable Housing Pool) | BB/NR | 3,000,000 | 3,022,950 | |||||||
Texas Public Finance Authority Charter School Finance Corp., 4.15% due 8/15/2016 (IDEA Public Schools; Insured: ACA) | BBB/NR | 100,000 | 107,097 | |||||||
Texas Public Finance Authority Charter School Finance Corp., 5.00% due 2/15/2018 (Cosmos Foundation, Inc.) | BBB/NR | 785,000 | 826,895 | |||||||
Texas Public Finance Authority Charter School Finance Corp., 5.00% due 8/15/2023 (IDEA Public Schools; Insured: ACA) | BBB/NR | 155,000 | 164,912 | |||||||
Texas Public Finance Authority Charter School Finance Corp., 5.00% due 8/15/2030 (IDEA Public Schools; Insured: ACA) | BBB/NR | 1,500,000 | 1,562,460 | |||||||
Texas Public Finance Authority Charter School Finance Corp., 6.20% due 2/15/2040 (Cosmos Foundation, Inc.) | BBB/NR | 1,000,000 | 1,148,990 | |||||||
U.S. VIRGIN ISLANDS — 0.41% | ||||||||||
Virgin Islands Public Finance Authority, 6.75% due 10/1/2037 | NR/Baa3 | 500,000 | 591,625 | |||||||
Virgin Islands Water & Power Authority, 5.50% due 7/1/2017 | NR/NR | 150,000 | 150,360 | |||||||
UTAH — 1.06% | ||||||||||
Herriman City, 4.75% due 11/1/2022 (Towne Center Access and Utility Improvements) | A/NR | 1,000,000 | 1,115,710 | |||||||
18 Certified Annual Report
| SCHEDULE OF INVESTMENTS, CONTINUED | ||
| Thornburg Strategic Municipal Income Fund | September 30, 2012 | |
Issuer-Description | Credit Rating† | Principal Amount | Value | |||||||
Murray City, 0.20% due 5/15/2037 put 10/1/2012 (IHC Health Services, Inc.; SPA: JPMorgan Chase Bank) (daily demand notes) | AA+/Aa1 | $ | 800,000 | $ | 800,000 | |||||
VERMONT — 0.44% | ||||||||||
Vermont Student Assistance Corp., 5.10% due 6/15/2032 (Student Loan Program) (AMT) | A/NR | 760,000 | 789,184 | |||||||
VIRGINIA — 0.86% | ||||||||||
Lexington IDA Residential Care Facility, 5.375% due 1/1/2028 (Kendal at Lexington) | NR/NR | 1,000,000 | 1,018,750 | |||||||
Virginia Small Business Financing Authority, 9.00% due 7/1/2039 (Hampton RDS Proton) | NR/NR | 500,000 | 540,250 | |||||||
WASHINGTON — 0.61% | ||||||||||
Washington Health Care Facilities Authority, 5.70% due 7/1/2038 (Overlake Hospital Medical Center) | A-/A3 | 1,000,000 | 1,111,240 | |||||||
WISCONSIN — 2.01% | ||||||||||
Wisconsin Health & Educational Facilities Authority, 5.00% due 8/15/2027 (ProHealth Care, Inc.) | A+/A1 | 3,300,000 | 3,644,091 | |||||||
|
| |||||||||
TOTAL INVESTMENTS — 98.19% (Cost $163,320,885) | $ | 178,063,074 | ||||||||
OTHER ASSETS LESS LIABILITIES — 1.81% | 3,290,248 | |||||||||
|
| |||||||||
NET ASSETS — 100.00% | $ | 181,353,322 | ||||||||
|
| |||||||||
Footnote Legend
| † | Credit ratings are unaudited. Rating changes may have occurred subsequent to the reporting period end. Bonds issued with a maturity of one year or less are assigned Moody’s ratings from MIG-1 to MIG-4 and Standard and Poor’s ratings from SP-1+ to SP-3 with MIG-1 and SP-1+ being the strongest ratings. |
| a | When-issued security. |
| b | Segregated as collateral for a when-issued security. |
Portfolio Abbreviations
To simplify the listings of securities, abbreviations are used per the table below:
| ACA | Insured by American Capital Access | |
| AGM | Insured by Assured Guaranty Municipal Corp. | |
| AMBAC | Insured by American Municipal Bond Assurance Corp. | |
| AMT | Alternative Minimum Tax | |
| CIFG | CIFG Assurance North America Inc. | |
| COP | Certificates of Participation | |
| EDA | Economic Development Authority | |
| FGIC | Insured by Financial Guaranty Insurance Co. | |
| GO | General Obligation | |
| HFFA | Health Facilities Financing Authority | |
| IDA | Industrial Development Authority | |
| LOC | Letter of Credit | |
| MBIA | Insured by Municipal Bond Investors Assurance | |
| Mtg | Mortgage | |
| MFR | Multi-Family Revenue | |
| Natl-Re | Insured by National Public Finance Guarantee Corp. | |
| PCR | Pollution Control Revenue Bond | |
| Q-SBLF | Qualified School Bond Loan Fund | |
| Radian | Insured by Radian Asset Assurance | |
| SPA | Stand-by Purchase Agreement | |
| Syncora | Insured by Syncora Guarantee Inc. | |
| USD | Unified School District |
See notes to financial statements.
Certified Annual Report 19
| STATEMENT OF ASSETS AND LIABILITIES | ||
| Thornburg Strategic Municipal Income Fund | September 30, 2012 | |
ASSETS | ||||
Investments at value (cost $163,320,885) (Note 2) | $ | 178,063,074 | ||
Cash | 254,611 | |||
Receivable for investments sold | 1,165,000 | |||
Receivable for fund shares sold | 1,096,312 | |||
Interest receivable | 2,098,131 | |||
Prepaid expenses and other assets | 23,003 | |||
|
| |||
Total Assets | 182,700,131 | |||
|
| |||
LIABILITIES | ||||
Payable for investments purchased | 1,000,000 | |||
Payable for fund shares redeemed | 80,743 | |||
Payable to investment advisor and other affiliates (Note 3) | 136,215 | |||
Accounts payable and accrued expenses | 49,516 | |||
Dividends payable | 80,335 | |||
|
| |||
Total Liabilities | 1,346,809 | |||
|
| |||
NET ASSETS | $ | 181,353,322 | ||
|
| |||
NET ASSETS CONSIST OF: | ||||
Undistributed net investment income | $ | 3,622 | ||
Net unrealized appreciation on investments | 14,742,189 | |||
Accumulated net realized gain (loss) | 431,429 | |||
Net capital paid in on shares of beneficial interest | 166,176,082 | |||
|
| |||
| $ | 181,353,322 | |||
|
| |||
NET ASSET VALUE: | ||||
Class A Shares: | ||||
Net asset value and redemption price per share ($65,445,781 applicable to 4,315,010 shares of beneficial interest outstanding—Note 4) | $ | 15.17 | ||
Maximum sales charge, 2.00% of offering price | 0.31 | |||
|
| |||
Maximum offering price per share | $ | 15.48 | ||
|
| |||
Class C Shares: | ||||
Net asset value and offering price per share* ($23,521,020 applicable to 1,549,180 shares of beneficial interest outstanding—Note 4) | $ | 15.18 | ||
|
| |||
Class I Shares: | ||||
Net asset value, offering and redemption price per share ($92,386,521 applicable to 6,085,721 shares of beneficial interest outstanding—Note 4) | $ | 15.18 | ||
|
| |||
| * | Redemption price per share is equal to net asset value less any applicable contingent deferred sales charge. |
See notes to financial statements.
20 Certified Annual Report
| STATEMENT OF OPERATIONS | ||
| Thornburg Strategic Municipal Income Fund | Year Ended September 30, 2012 | |
INVESTMENT INCOME: | ||||
Interest income (net of premium amortized of $280,708) | $ | 6,586,471 | ||
|
| |||
EXPENSES: | ||||
Investment advisory fees (Note 3) | 1,078,438 | |||
Administration fees (Note 3) | ||||
Class A Shares | 68,243 | |||
Class C Shares | 23,706 | |||
Class I Shares | 35,116 | |||
Distribution and service fees (Note 3) | ||||
Class A Shares | 136,486 | |||
Class C Shares | 113,792 | |||
Transfer agent fees | ||||
Class A Shares | 29,199 | |||
Class C Shares | 14,637 | |||
Class I Shares | 25,065 | |||
Registration and filing fees | ||||
Class A Shares | 22,370 | |||
Class C Shares | 27,495 | |||
Class I Shares | 22,278 | |||
Custodian fees (Note 3) | 55,880 | |||
Professional fees | 41,068 | |||
Accounting fees | 3,108 | |||
Trustee fees | 4,008 | |||
Other expenses | 21,700 | |||
|
| |||
Total Expenses | 1,722,589 | |||
Less: | ||||
Expenses reimbursed by investment advisor (Note 3) | (76,228 | ) | ||
Fees paid indirectly (Note 3) | (357 | ) | ||
|
| |||
Net Expenses | 1,646,004 | |||
|
| |||
Net Investment Income | 4,940,467 | |||
|
| |||
REALIZED AND UNREALIZED GAIN (LOSS) | ||||
Net realized gain (loss) on investments | 431,431 | |||
Net change in unrealized appreciation (depreciation) on investments | 10,241,692 | |||
|
| |||
Net Realized and Unrealized Gain | 10,673,123 | |||
|
| |||
Net Increase in Net Assets Resulting from Operations | $ | 15,613,590 | ||
|
| |||
See notes to financial statements.
Certified Annual Report 21
| STATEMENTS OF CHANGES IN NET ASSETS |
| Thornburg Strategic Municipal Income Fund |
| Year Ended September 30, 2012 | Year Ended September 30, 2011 | |||||||
INCREASE (DECREASE) IN NET ASSETS FROM | ||||||||
OPERATIONS: | ||||||||
Net investment income | $ | 4,940,467 | $ | 3,933,277 | ||||
Net realized gain (loss) on investments | 431,431 | 98,722 | ||||||
Net unrealized appreciation (depreciation) on investments | 10,241,692 | (464,465 | ) | |||||
|
|
|
| |||||
Net Increase (Decrease) in Net Assets Resulting from Operations | 15,613,590 | 3,567,534 | ||||||
DIVIDENDS TO SHAREHOLDERS: | ||||||||
From net investment income | ||||||||
Class A Shares | (1,821,624 | ) | (1,443,523 | ) | ||||
Class C Shares | (577,455 | ) | (599,513 | ) | ||||
Class I Shares | (2,541,388 | ) | (1,887,215 | ) | ||||
From realized gains | ||||||||
Class A Shares | (35,959 | ) | (48,451 | ) | ||||
Class C Shares | (13,233 | ) | (26,448 | ) | ||||
Class I Shares | (48,816 | ) | (67,868 | ) | ||||
FUND SHARE TRANSACTIONS (NOTE 4): | ||||||||
Class A Shares | 21,540,065 | 11,532,230 | ||||||
Class C Shares | 6,778,829 | 401,837 | ||||||
Class I Shares | 32,570,889 | 12,899,113 | ||||||
|
|
|
| |||||
Net Increase in Net Assets | 71,464,898 | 24,327,696 | ||||||
NET ASSETS: | ||||||||
Beginning of Year | 109,888,424 | 85,560,728 | ||||||
|
|
|
| |||||
End of Year | $ | 181,353,322 | $ | 109,888,424 | ||||
|
|
|
| |||||
Undistributed net investment income | $ | 3,622 | $ | 3,622 | ||||
See notes to financial statements.
22 Certified Annual Report
| NOTES TO FINANCIAL STATEMENTS, | ||
| Thornburg Strategic Municipal Income Fund | September 30, 2012 | |
NOTE 1 – ORGANIZATION
Thornburg Strategic Municipal Income Fund (the “Fund”) is a diversified series of Thornburg Investment Trust (the “Trust”). The Trust is organized as a Massachusetts business trust under a Declaration of Trust dated June 3, 1987 and is registered as a diversified, open-end management investment company under the Investment Company Act of 1940, as amended. The Fund is currently one of sixteen separate series of the Trust. Each series is considered to be a separate entity for financial reporting and tax purposes and bears expenses directly attributable to it. The Fund’s primary investment objective is to seek a high level of current income exempt from federal individual income tax.
The Fund currently has three classes of shares of beneficial interest outstanding: Class A, Class C, and Institutional Class (Class I). Each class of shares of the Fund represents an interest in the same portfolio of investments, except that (i) Class A shares are sold subject to a front-end sales charge collected at the time the shares are purchased and bear a service fee, (ii) Class C shares are sold at net asset value without a sales charge at the time of purchase, but are subject to a contingent deferred sales charge upon redemption within one year of purchase, and bear both a service fee and a distribution fee, (iii) Class I shares are sold at net asset value without a sales charge at the time of purchase and may be subject to a service fee, and (iv) the respective classes may have different reinvestment privileges and conversion rights. Additionally, the Fund may allocate among its classes certain expenses, to the extent allowable to specific classes, including transfer agent fees, government registration fees, certain printing and postage costs, and administrative and legal expenses. Currently, class specific expenses of the Fund are limited to service and distribution fees, administration fees, and certain registration and transfer agent expenses.
NOTE 2 – SIGNIFICANT ACCOUNTING POLICIES
Significant accounting policies of the Trust are as follows:
Valuation Policy and Procedures: The Fund’s Trustees of the Trust (the “Trustees”) have authorized employees of the Fund’s investment advisor, acting as the Valuation and Pricing Committee (the “Committee”), to make certain valuation determinations, subject to oversight and review by the Trustees and the Audit Committee of the Trustees. The Committee and other employees of the Fund’s investment advisor administer and implement the valuation process and make fair value decisions. The Committee regularly reviews its own fair value decisions, as well as valuations, valuation techniques and services furnished by pricing services, considers circumstances in the markets which may require valuation determinations by the Committee and reviews previous valuation determinations. The Committee also reports on its activities, the performance of the pricing services, and other matters to the Trustees and the Audit Committee of the Trustees.
In determining a fair value for a portfolio investment, the Committee seeks to determine the price that the Fund would reasonably expect to receive upon a sale of the investment in an orderly transaction between market participants at the measurement date. Typically, the fair value process employs standing instructions to use quoted prices in active markets or the use of independent pricing services. Less frequently, the Committee may make a fair value determination using other methods. However, because fair value prices are estimated prices, the determination of fair value for an investment may differ from the value that would be realized by the Fund upon a sale of the investment, and that difference could be material to the Fund’s financial statements. The Committee’s determination of fair value for an investment may also differ from the prices obtained by other persons (including other mutual funds) for the investment.
Valuation of Investments: Debt obligations held by the Fund have a primary market over-the-counter and are valued by an independent pricing service approved by the Trustees. The pricing service ordinarily values debt obligations at quoted bid prices. When quotations are not available, debt obligations held by the Fund are valued at evaluated prices determined by the pricing service using methods which include consideration of yields or prices of debt obligations of comparable quality, type of issue, coupon, maturity, and rating, and indications as to value from dealers and general market conditions. Short-term obligations having remaining maturities of 60 days or less are ordinarily valued at amortized cost, which approximates market value.
In any case where the market value of a debt obligation held by the Fund is not readily available, a determination of a fair value for the investment is made by the Committee. In any case where a pricing service fails to provide a price for a debt obligation held by the Fund, the Committee determines a fair value for the debt obligation using procedures in accordance with a policy approved by the Trustees, which may include the use of a price obtained from a different independent pricing service. Additionally, in any case where management believes that a price provided by a pricing service for a debt obligation held by the Fund may be unreliable, the Committee decides whether or not to use the pricing service’s valuation or to use an alternative method to determine a fair value for the debt obligation.
Certified Annual Report 23
| NOTES TO FINANCIAL STATEMENTS, CONTINUED | ||
| Thornburg Strategic Municipal Income Fund | September 30, 2012 | |
Valuation Measurements: The Fund categorizes its investments based upon the inputs used in valuing those investments, according to a three-level hierarchy established by guidance by the Financial Accounting Standards Board (the “FASB”). Categorization of investments using this hierarchy is intended by the FASB to maximize the use of observable inputs and minimize the use of unobservable inputs by prioritizing that the most observable input be used when available. Observable inputs are those that market participants would use in valuing an investment based on available market data. Unobservable inputs are those that reflect assumptions about the information market participants would use in valuing an investment. An investment’s level within the hierarchy is based on the lowest level input that is deemed significant to the fair value measurement. The methodologies and relative inputs used to value investments are not necessarily indications of the risk or liquidity associated with investing in those investments.
Various inputs are used in determining the fair value measurement of the Fund’s investments. These inputs are generally summarized according to the three-level hierarchy below:
Level 1: Quoted prices in active markets for identical investments.
Level 2: Other direct or indirect significant observable inputs (including quoted prices for similar investments in active markets and other observable inputs, such as interest rates, prepayment rates, credit risk, etc.).
Level 3: Significant unobservable inputs, (including the Committee’s own assumptions in determining the fair value of investments), are generally applicable to investments fair valued with single broker quotes and other investments.
Portfolio investments with minimal, if any, market activity are characterized as Level 3 and are valued using significant unobservable inputs, typically including single broker quotes, which may be adjusted or unadjusted, related or comparable investments, recent transactions, and other relevant information. Valuations may also be based upon current market prices of investments that are comparable in coupon, rating, maturity and industry, as applicable. An income based valuation approach would consider discounted anticipated future cash flows of the investment. Discounts may also be applied due to the nature or duration of any restrictions on the disposition of the investment. The derived value of a Level 3 investment may not represent the value which is received upon disposition.
The following table displays a summary of the fair value hierarchy measurements of the Fund’s investments as of September 30, 2012. In any instance when valuation inputs from more than one level are used to determine the fair value of a specific investment, the investment is placed in the level of the table based upon the lowest level input that is significant in determining the fair value of the investment:
| Fair Value Measurements at September 30, 2012 | ||||||||||||||||
| Total | Level 1 | Level 2 | Level 3 | |||||||||||||
Assets | ||||||||||||||||
Investments in Securities Municipal Bonds | $ | 178,063,074 | $ | — | $ | 178,063,074 | $ | — | ||||||||
Total Investments in Securities | $ | 178,063,074 | $ | — | $ | 178,063,074 | $ | — | ||||||||
In accordance with the guidance prescribed in Accounting Standards Update No. 2011-04, amending Topic 820 Fair Value Measurements and Disclosures, it is the policy of the Fund to recognize transfers between Levels 1, 2 and 3 and to disclose those transfers due to the underlying event which caused the movement. The Fund recognized no transfers between levels for the year ended September 30, 2012.
24 Certified Annual Report
| NOTES TO FINANCIAL STATEMENTS, CONTINUED | ||
| Thornburg Strategic Municipal Income Fund | September 30, 2012 | |
Federal Income Taxes: It is the policy of the Trust to comply with the provisions of the Internal Revenue Code applicable to “regulated investment companies” and to distribute to shareholders substantially all taxable (if any) and tax exempt income of the Fund. Therefore, no provision for federal income tax is required.
Management reviews each uncertain tax position believed to be material to the preparation of the Fund’s financial statements, to assess if it is more likely than not that the position would be sustained upon examination, based upon the technical merits of the position. As of September 30, 2012, management has not identified any such position for which a liability must be reflected in the Statement of Assets and Liabilities. The Fund’s tax returns remain subject to examination for three years after filing.
When-Issued and Delayed Delivery Transactions: The Fund may engage in when-issued or delayed delivery transactions. To the extent the Fund engages in such transactions, it will do so for the purpose of acquiring portfolio investments consistent with the Fund’s investment objectives and not for the purpose of investment leverage or to speculate on interest rate and/or market changes. At the time the Fund makes a commitment to purchase an investment on a when-issued or delayed delivery basis, the Fund will record the transaction and reflect the value in determining its net asset value. When effecting such transactions, assets of an amount sufficient to make payment for the portfolio investments to be purchased will be segregated on the Fund’s records on the trade date. Investments purchased on a when-issued or delayed delivery basis do not earn interest until the settlement date.
Dividends: Net investment income of the Fund is declared daily as a dividend on shares for which the Fund has received payment. Dividends are paid monthly and are reinvested in additional shares of the Fund at net asset value per share at the close of business on the dividend payment date, or at the shareholder’s option, paid in cash. Net realized capital gains, to the extent available, will be distributed at least annually.
General: Investment transactions are accounted for on a trade date basis. Interest income is accrued as earned. Premiums and discounts on investments purchased are amortized to call dates or maturity dates of the respective investments. Realized gains and losses from the sale of investments are recorded on an identified cost basis. Net investment income (other than class specific expenses) and realized and unrealized gains and losses are allocated daily to each class of shares based upon the relative net asset value of outstanding shares (or the value of the dividend-eligible shares, as appropriate) of each class of shares at the beginning of the day (after adjusting for the current capital shares activity of the respective class). Expenses common to all Funds are allocated among the Funds comprising the Trust based upon their relative net asset values or other appropriate allocation methods.
Guarantees and Indemnifications: Under the Trust’s organizational documents (and under a separate agreement with the Trustees), its officers and Trustees are indemnified against certain liabilities arising out of the performance of their duties to the Fund. Additionally, in the normal course of business the Trust enters into contracts with service providers that contain general indemnification clauses. The Trust’s maximum exposure under these arrangements is unknown. However, based on experience, the Trust expects the risk of loss to be remote.
Use of Estimates: The preparation of financial statements, in conformity with United States generally accepted accounting principles, requires management to make estimates and assumptions that affect the reported amounts of assets and liabilities and the disclosure of contingent assets and liabilities at the date of the financial statements and the reported amounts of increases and decreases in net assets from operations during the reporting period. Actual amounts could differ from those estimates.
NOTE 3 – INVESTMENT ADVISORY FEE AND OTHER TRANSACTIONS WITH AFFILIATES
Pursuant to an investment advisory agreement, Thornburg Investment Management, Inc. (the “Advisor”) serves as the investment advisor and performs services to the Fund for which the fees are payable at the end of each month. For the year ended September 30, 2012, these fees were payable at annual rates ranging from .75 of 1% to .50 of 1% per annum of the average daily net assets of the Fund depending on the Fund’s asset size. The Trust also has entered into administrative services agreements with the Advisor, whereby the Advisor will perform certain administrative services for the shareholders of each class of the Fund’s shares, and for which fees will be payable at an annual rate of up to .125 of 1% per annum of the average daily net assets attributable to each class of shares. For the year ended September 30, 2012, the Advisor contractually reimbursed certain class specific expenses and administrative fees of $31,039 for Class A shares and $45,189 for Class C shares.
Certified Annual Report 25
| NOTES TO FINANCIAL STATEMENTS, CONTINUED | ||
| Thornburg Strategic Municipal Income Fund | September 30, 2012 | |
The Trust has an underwriting agreement with Thornburg Securities Corporation (the “Distributor,” an affiliate of the Advisor), which acts as the distributor of the Fund’s shares. For the year ended September 30, 2012, the Distributor has advised the Fund that it earned net commissions aggregating $1,085 from the sale of Class A shares, and collected contingent deferred sales charges aggregating $1,384 from redemptions of Class C shares of the Fund.
Pursuant to a service plan under Rule 12b-1 of the Investment Company Act of 1940, the Fund may reimburse to the Advisor an amount not to exceed .25 of 1% per annum of the average daily net assets attributable to each class of shares of the Fund for payments made by the Advisor to securities dealers and other financial institutions to obtain various shareholder and distribution related services. For the year ended September 30, 2012, there were no 12b-1 service plan fees charged for Class I shares. The Advisor may pay out of its own resources additional expenses for distribution of the Fund’s shares.
The Trust has also adopted a distribution plan pursuant to Rule 12b-1, applicable only to the Fund’s Class C shares, under which the Fund compensates the Distributor for services in promoting the sale of Class C shares of the Fund at an annual rate of up to .35 of 1% per annum of the average daily net assets attributable to Class C shares. Total fees incurred by each class of shares of the Fund under their respective Service and Distribution Plans for the year ended September 30, 2012, are set forth in the Statement of Operations.
The Trust has an agreement with the custodian bank to indirectly pay a portion of the custodian’s fees through credits earned by the Fund’s cash on deposit with the bank. This deposit agreement is an alternative to overnight investments. Custodial fees are adjusted to reflect amounts that would have been paid without this agreement, with a corresponding adjustment reflected as fees paid indirectly in the Statement of Operations. For the year ended September 30, 2012, fees paid indirectly were $357.
Certain officers and Trustees of the Trust are also officers or directors of the Advisor and Distributor. The compensation of independent Trustees is borne by the Trust.
NOTE 4 – SHARES OF BENEFICIAL INTEREST
At September 30, 2012, there were an unlimited number of shares of beneficial interest authorized. Transactions in shares of beneficial interest were as follows:
| Year Ended September 30, 2012 | Year Ended September 30, 2011 | |||||||||||||||
| Shares | Amount | Shares | Amount | |||||||||||||
Class A Shares | ||||||||||||||||
Shares sold | 2,136,532 | $ | 31,110,750 | 1,515,491 | $ | 20,437,728 | ||||||||||
Shares issued to shareholders in reinvestment of dividends | 97,853 | 1,436,857 | 83,263 | 1,126,525 | ||||||||||||
Shares repurchased | (750,631 | ) | (11,007,542 | ) | (748,444 | ) | (10,032,023 | ) | ||||||||
|
|
|
|
|
|
|
| |||||||||
Net increase (decrease) | 1,483,754 | $ | 21,540,065 | 850,310 | $ | 11,532,230 | ||||||||||
|
|
|
|
|
|
|
| |||||||||
Class C Shares | ||||||||||||||||
Shares sold | 727,947 | $ | 10,720,340 | 500,548 | $ | 6,822,609 | ||||||||||
Shares issued to shareholders in reinvestment of dividends | 28,039 | 412,028 | 28,470 | 385,419 | ||||||||||||
Shares repurchased | (296,969 | ) | (4,353,539 | ) | (511,043 | ) | (6,806,191 | ) | ||||||||
|
|
|
|
|
|
|
| |||||||||
Net increase (decrease) | 459,017 | $ | 6,778,829 | 17,975 | $ | 401,837 | ||||||||||
|
|
|
|
|
|
|
| |||||||||
26 Certified Annual Report
| NOTES TO FINANCIAL STATEMENTS, CONTINUED | ||
| Thornburg Strategic Municipal Income Fund | September 30, 2012 | |
| Year Ended September 30, 2012 | Year Ended September 30, 2011 | |||||||||||||||
| Shares | Amount | Shares | Amount | |||||||||||||
Class I Shares | ||||||||||||||||
Shares sold | 3,079,352 | $ | 45,330,018 | 2,118,197 | $ | 28,788,268 | ||||||||||
Shares issued to shareholders in reinvestment of dividends | 144,496 | 2,125,272 | 114,091 | 1,545,006 | ||||||||||||
Shares repurchased | (1,027,578 | ) | (14,884,401 | ) | (1,304,041 | ) | (17,434,161 | ) | ||||||||
|
|
|
|
|
|
|
| |||||||||
Net increase (decrease) | 2,196,270 | $ | 32,570,889 | 928,247 | $ | 12,899,113 | ||||||||||
|
|
|
|
|
|
|
| |||||||||
NOTE 5 – SECURITIES TRANSACTIONS
For the year ended September 30, 2012, the Fund had purchase and sale transactions of investments (excluding short-term investments) of $66,852,176 and $16,156,631, respectively.
NOTE 6 – INCOME TAXES
At September 30, 2012, information on the tax components of capital was as follows:
Cost of investments for tax purposes | $ | 163,320,885 | ||
|
| |||
Gross unrealized appreciation on a tax basis | $ | 14,759,883 | ||
Gross unrealized depreciation on a tax basis | (17,694 | ) | ||
|
| |||
Net unrealized appreciation (depreciation) on investments (tax basis) | $ | 14,742,189 | ||
|
|
At September 30, 2012, the Fund had distributable tax basis net ordinary income of $388,000 and capital gains of $43,428.
Distributions from tax exempt income paid by the Fund for the years ended September 30, 2012 and September 30, 2011 are excludable by shareholders from gross income for Federal income tax purposes.
The tax character of distributions paid during the years ended September 30, 2012, and September 30, 2011, was as follows:
| 2012 | 2011 | |||||||
Distributions from: | ||||||||
Tax exempt income | $ | 4,841,870 | $ | 3,828,976 | ||||
Ordinary income | 98,597 | 238,593 | ||||||
Capital gains | 98,008 | 5,449 | ||||||
|
|
|
| |||||
Total | $ | 5,038,475 | $ | 4,073,018 | ||||
|
|
|
| |||||
OTHER NOTES:
Risks: The Fund’s investments subject it to risks including, but not limited to, credit risk, interest rate risk, management risk, market and economic risk, and liquidity risk. Please see the Fund’s prospectus for a discussion of the risks associated with an investment in the Fund.
Subsequent Events: Fund management believes no events have occurred between September 30, 2012 and the date of issuance of the financial statements, which require adjustment to, or disclosure in the accompanying financial statements.
Certified Annual Report 27
Thornburg Strategic Municipal Income Fund
| PER SHARE PERFORMANCE (for a share outstanding throughout the year)+ | RATIOS TO AVERAGE NET ASSETS | SUPPLEMENTAL DATA | ||||||||||||||||||||||||||||||||||||||||||||||||||||||||||
Unless Periods are Fiscal Years Sept. 30, | Net Asset Value Beginning of Year | Net Investment Income (Loss) | Net Realized & Unrealized Gain (Loss) on Investments | Total from Investment Operations | Dividends from Net Investment Income | Dividends from Net Realized Gains | Total Dividends | Net Asset Value End of Year | Net Investment Income (Loss) (%) | Expenses, After Expense Reductions (%) | Expenses, After Expense Reductions and Net of Custody Credits (%) | Expenses, Before Expense Reductions (%) | Total Return (%)(a) | Portfolio Turnover Rate (%) | Net Assets at End of Year (Thousands) | |||||||||||||||||||||||||||||||||||||||||||||
Class A Shares |
| |||||||||||||||||||||||||||||||||||||||||||||||||||||||||||
2012(b) | $ | 14.06 | 0.49 | 1.13 | 1.62 | (0.50 | ) | (0.01 | ) | (0.51 | ) | $ | 15.17 | 3.34 | 1.25 | 1.25 | 1.31 | 11.71 | 12.52 | $ | 65,446 | |||||||||||||||||||||||||||||||||||||||
2011(b) | $ | 14.22 | 0.59 | (0.14 | ) | 0.45 | (0.59 | ) | (0.02 | ) | (0.61 | ) | $ | 14.06 | 4.37 | 1.25 | 1.25 | 1.38 | 3.47 | 19.45 | $ | 39,808 | ||||||||||||||||||||||||||||||||||||||
2010(b) | $ | 13.86 | 0.60 | 0.48 | 1.08 | (0.61 | ) | (0.11 | ) | (0.72 | ) | $ | 14.22 | 4.40 | 1.25 | 1.25 | 1.50 | 8.20 | 16.26 | $ | 28,166 | |||||||||||||||||||||||||||||||||||||||
2009(b)(c) | $ | 11.94 | 0.29 | 1.91 | 2.20 | (0.28 | ) | — | (0.28 | ) | $ | 13.86 | 4.71 | (d) | 1.25 | (d) | 1.25 | (d) | 2.92 | (d) | 18.65 | 14.37 | $ | 11,761 | ||||||||||||||||||||||||||||||||||||
Class C Shares |
| |||||||||||||||||||||||||||||||||||||||||||||||||||||||||||
2012 | $ | 14.07 | 0.45 | 1.12 | 1.57 | (0.45 | ) | (0.01 | ) | (0.46 | ) | $ | 15.18 | 3.04 | 1.55 | 1.55 | 1.78 | 11.38 | 12.52 | $ | 23,521 | |||||||||||||||||||||||||||||||||||||||
2011 | $ | 14.23 | 0.55 | (0.14 | ) | 0.41 | (0.55 | ) | (0.02 | ) | (0.57 | ) | $ | 14.07 | 4.07 | 1.55 | 1.55 | 1.83 | 3.16 | 19.45 | $ | 15,344 | ||||||||||||||||||||||||||||||||||||||
2010 | $ | 13.87 | 0.55 | 0.49 | 1.04 | (0.57 | ) | (0.11 | ) | (0.68 | ) | $ | 14.23 | 4.05 | 1.55 | 1.55 | 2.36 | 7.88 | 16.26 | $ | 15,261 | |||||||||||||||||||||||||||||||||||||||
2009(c) | $ | 11.94 | 0.27 | 1.93 | 2.20 | (0.27 | ) | — | (0.27 | ) | $ | 13.87 | 4.40 | (d) | 1.55 | (d) | 1.55 | (d) | 6.40 | (d)(e) | 18.58 | 14.37 | $ | 3,684 | ||||||||||||||||||||||||||||||||||||
Class I Shares |
| |||||||||||||||||||||||||||||||||||||||||||||||||||||||||||
2012 | $ | 14.07 | 0.53 | 1.13 | 1.66 | (0.54 | ) | (0.01 | ) | (0.55 | ) | $ | 15.18 | 3.62 | 0.95 | 0.95 | 0.95 | 12.03 | 12.52 | $ | 92,386 | |||||||||||||||||||||||||||||||||||||||
2011 | $ | 14.23 | 0.63 | (0.14 | ) | 0.49 | (0.63 | ) | (0.02 | ) | (0.65 | ) | $ | 14.07 | 4.62 | 0.99 | 0.99 | 1.03 | 3.74 | 19.45 | $ | 54,736 | ||||||||||||||||||||||||||||||||||||||
2010 | $ | 13.87 | 0.64 | 0.48 | 1.12 | (0.65 | ) | (0.11 | ) | (0.76 | ) | $ | 14.23 | 4.66 | 0.99 | 0.99 | 1.11 | 8.48 | 16.26 | $ | 42,134 | |||||||||||||||||||||||||||||||||||||||
2009(c) | $ | 11.94 | 0.31 | 1.92 | 2.23 | (0.30 | ) | — | (0.30 | ) | $ | 13.87 | 4.90 | (d) | 0.99 | (d) | 0.99 | (d) | 2.12 | (d) | 18.87 | 14.37 | $ | 18,561 | ||||||||||||||||||||||||||||||||||||
| (a) | Not annualized for periods less than one year. |
| (b) | Sales loads are not reflected in computing total return. |
| (c) | Fund commenced operations on April 1, 2009. |
| (d) | Annualized. |
| (e) | Due to the size of net assets and fixed expenses, ratios may appear disproportionate. |
| + | Based on weighted average shares outstanding, except for Dividends from Net Investment Income and Net Realized Gains, which are actual amounts per share. |
See notes to financial statements.
| 28 Certified Annual Report | Certified Annual Report 29 |
REPORT OF INDEPENDENT REGISTERED PUBLIC ACCOUNTING FIRM
Thornburg Strategic Municipal Income Fund
To the Trustees and Shareholders of
Thornburg Strategic Municipal Income Fund
In our opinion, the accompanying statement of assets and liabilities, including the schedule of investments, and the related statements of operations and of changes in net assets and the financial highlights present fairly, in all material respects, the financial position of Thornburg Strategic Municipal Income Fund (one of the portfolios constituting Thornburg Investment Trust, hereafter referred to as the “Fund”) at September 30, 2012, the results of its operations for the year then ended, the changes in its net assets for each of the two years in the period then ended and the financial highlights for each of the periods presented, in conformity with accounting principles generally accepted in the United States of America. These financial statements and financial highlights (hereafter referred to as “financial statements”) are the responsibility of the Fund’s management. Our responsibility is to express an opinion on these financial statements based on our audits. We conducted our audits of these financial statements in accordance with the standards of the Public Company Accounting Oversight Board (United States). Those standards require that we plan and perform the audit to obtain reasonable assurance about whether the financial statements are free of material misstatement. An audit includes examining, on a test basis, evidence supporting the amounts and disclosures in the financial statements, assessing the accounting principles used and significant estimates made by management, and evaluating the overall financial statement presentation.
We believe that our audits, which included confirmation of securities at September 30, 2012 by correspondence with the custodian and brokers, provide a reasonable basis for our opinion.
PricewaterhouseCoopers LLP
New York, New York
November 26, 2012
30 Certified Annual Report
| ||
| Thornburg Strategic Municipal Income Fund | September 30, 2012 (Unaudited) |
As a shareholder of the Fund, you incur two types of costs:
| (1) | transaction costs, including |
(a) sales charges (loads) on purchase payments, for Class A shares;
(b) a deferred sales charge on redemptions of any part or all of a purchase of $1 million of Class A shares within 12 months of purchase;
(c) a deferred sales charge on redemptions of Class C shares within 12 months of purchase;
| (2) | ongoing costs, including management fees; distribution and/or service (12b-1) fees; and other Fund expenses. |
This example is intended to help you understand your ongoing costs (in dollars) of investing in the Fund and to compare these costs with the ongoing costs of investing in other mutual funds.
The example is based on a $1,000 investment beginning on April 1, 2012, and held until September 30, 2012.
| Beginning | Ending | Expenses Paid | ||||||||||
| Account Value | Account Value | During Period† | ||||||||||
| 4/1/12 | 9/30/12 | 4/1/12–9/30/12 | ||||||||||
Class A Shares | ||||||||||||
Actual | $ | 1,000.00 | $ | 1,051.00 | $ | 6.41 | ||||||
Hypothetical* | $ | 1,000.00 | $ | 1,018.75 | $ | 6.31 | ||||||
Class C Shares | ||||||||||||
Actual | $ | 1,000.00 | $ | 1,048.70 | $ | 7.90 | ||||||
Hypothetical* | $ | 1,000.00 | $ | 1,017.28 | $ | 7.78 | ||||||
Class I Shares | ||||||||||||
Actual | $ | 1,000.00 | $ | 1,052.50 | $ | 4.88 | ||||||
Hypothetical* | $ | 1,000.00 | $ | 1,020.24 | $ | 4.81 | ||||||
| † | Expenses are equal to the annualized expense ratio for each class (A: 1.25%; C: 1.54%; I: 0.95%) multiplied by the average account value over the period, multiplied by 183/366 to reflect the one-half year period. |
| * | Hypothetical assumes a rate of return of 5% per year before expenses. |
ACTUAL EXPENSES
For each class of shares, the first line of the table above provides information about actual account values and actual expenses. You may use the information in this line, together with the amount you invested, to estimate the expenses that you paid over the period. Simply divide your account value by $1,000 (for example, an $8,600 account value divided by $1,000 = 8.6), then multiply the result by the number in the first line for your class of shares under the heading entitled “Expenses Paid During Period” to estimate the expenses you paid on your account during this period.
HYPOTHETICAL EXAMPLE FOR COMPARISON PURPOSES
For each class of shares, the second line of the table above provides information about hypothetical account values and hypothetical expenses based on the Fund’s actual expense ratio and an assumed rate of return of 5% per year before expenses, which is not the Fund’s actual return. The hypothetical account values and expenses may not be used to estimate the actual ending account balance or expenses you paid for the period. You may use this information to compare the ongoing costs of investing in the Fund and other funds. To do so, compare this 5% hypothetical example with the 5% hypothetical examples that appear in the shareholder reports of the other funds.
Please note that the expenses shown in the table are meant to highlight your ongoing costs only and do not reflect any transactional costs, such as sales charges (loads), redemption fees, or exchange fees. Therefore, the second line of the table for each class of shares is useful in comparing ongoing costs only, and will not help you determine the relative total costs of owning different funds. In addition, if these transactional costs were included, your costs would have been higher.
Certified Annual Report 31
| ||
| Thornburg Strategic Municipal Income Fund | September 30, 2012 (Unaudited) |
Growth of a Hypothetical $10,000 Investment
Thornburg Strategic Municipal Income Fund versus BofA Merrill Lynch Municipal Master Index and Consumer Price Index (April 1, 2009 to September 30, 2012)
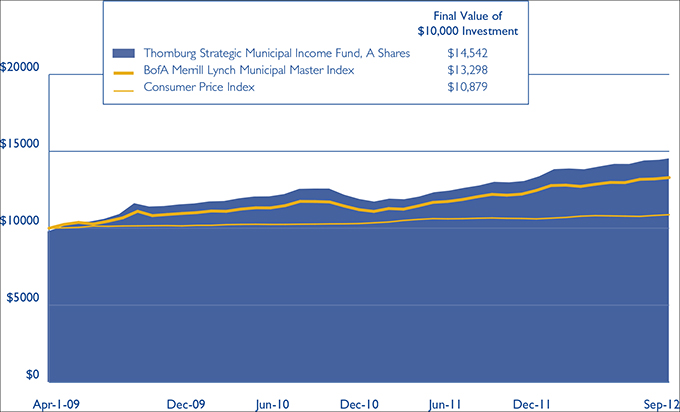
Average Annual Total Returns
For Periods Ended September 30, 2012 (with sales charge)
| Since | ||||||||||||
| 1 Yr | 3 Yrs | Inception | ||||||||||
A Shares (Incep: 4/1/09) | 9.45 | % | 7.02 | % | 11.31 | % | ||||||
C Shares (Incep: 4/1/09) | 10.78 | % | 7.42 | % | 11.63 | % | ||||||
I Shares (Incep: 4/1/09) | 12.03 | % | 8.03 | % | 12.26 | % | ||||||
Performance data shown represents past performance and is no guarantee of future results. Investment return and principal value will fluctuate so shares, when redeemed, may be worth more or less than their original cost. Current performance may be lower or higher than quoted. For performance current to the most recent month end, visit thornburg.com or call 800.847.0200. The performance data and graph do not reflect the deduction of taxes that a shareholder would pay on distributions or the redemption of Fund shares. Returns reflect the reinvestment of dividends and capital gains as well as applicable sales charges. Class A shares are sold with a maximum sales charge of 2.00%. Class C shares assume deduction of a 0.60% contingent deferred sales charge (CDSC) for the first year only. There is no sales charge for Class I shares.
32 Certified Annual Report
| TRUSTEES AND OFFICERS | ||
| Thornburg Strategic Municipal Income Fund | September 30, 2012 (Unaudited) | |
Name, Age, Position Held with Fund Year Elected | Principal Occupation(s) During Past Five Years | Other Directorships Held by Trustee | ||
| INTERESTED TRUSTEES (1)(2)(4) | ||||
Garrett Thornburg, 66 Chairman of Trustees, Trustee since 1987(3) | Chairman and controlling shareholder and, until 2008, CEO of Thornburg Investment Management, Inc. (investment advisor); Chairman, CEO, and controlling shareholder of Thornburg Securities Corporation (securities dealer); CEO until 2007 and Chairman until 2009 of TMST, Inc. (f/k/a Thornburg Mortgage, Inc.) (real estate investment trust); President and Sole Director of Thornburg Mortgage Advisory Corporation (investment manager to TMST, Inc.). | None | ||
Brian J. McMahon, 56 Trustee since 2001, Member of Governance & Nominating Committee & Operations Risk Oversight Committee, President since 1997(5)(6) | CEO since 2008, President, Managing Director, Chief Investment Officer, and Portfolio Manager of Thornburg Investment Management, Inc. | None | ||
| INDEPENDENT TRUSTEES (1)(2)(4) | ||||
David A. Ater, 67 Trustee since 1994, Member of Audit Committee & Chairman of Governance & Nominating Committee | Principal in Ater & Associates, Santa Fe, NM (developer, planner and broker of residential and commercial real estate); owner, developer and broker for various real estate projects. | None | ||
David D. Chase, 71 Trustee since 2000, Chairman of Audit Committee | Managing Member of Vestor Associates, LLC, Santa Fe, NM (private equity fund); Managing Member of CS Group, LLC, Santa Fe, NM (private investment fund). | None | ||
Susan H. Dubin, 63 Trustee since 2004, Member of Audit Committee & Governance and Nominating Committee | President of Dubin Investments, Ltd., Greenwich, CT (private investment fund); Director and officer of various charitable organizations. | None | ||
Sally Corning, 51 Trustee since 2012, Member of Operations Risk Oversight Committee | Partner in Sun Mountain Capital, Santa Fe, NM (private equity and venture capital investment firm). | None | ||
Owen D. Van Essen, 58 Trustee since 2004, Member of Governance & Nominating Committee & Chairman of Operations Risk Oversight Committee | President of Dirks, Van Essen & Murray, Santa Fe, NM (newspaper mergers and acquisitions). | None | ||
Certified Annual Report 33
| TRUSTEES AND OFFICERS, CONTINUED | ||
| Thornburg Strategic Municipal Income Fund | September 30, 2012 (Unaudited) | |
Name, Age, Position Held with Fund Year Elected | Principal Occupation(s) During Past Five Years | Other Directorships Held by Trustee | ||
James W. Weyhrauch, 53 Trustee since 1996, Member of Audit Committee & Operations Risk Oversight Committee | Real estate broker, Santa Fe Properties, Santa Fe, NM; Vice Chairman of Nambe LLC, Santa Fe, NM (manufacturing & design company). | None | ||
| EMERITUS TRUSTEE (1)(2)(4) | ||||
Eliot R. Cutler, 66 Emeritus Trustee since 2012 | Chairman, MaineAsia LLC; Principal, Chamisa Energy, LLC; Senior Counsel and, until 2009, partner in Akin, Gump, Strauss, Hauer & Feld, LLP (law firm), Washington, D.C. and Beijing, China.(7) | Not Applicable | ||
| OFFICERS OF THE FUND (WHO ARE NOT TRUSTEES)(1)(8) | ||||
George T. Strickland, 49 Vice President since 1996, Treasurer since 2007(6) | Portfolio Manager, Vice President, and Managing Director of Thornburg Investment Management, Inc. | Not applicable | ||
William V. Fries, 73 Vice President since 1995 | Portfolio Manager, Vice President, and Managing Director of Thornburg Investment Management, Inc. | Not applicable | ||
Leigh Moiola, 45 Vice President since 2001 | Vice President, Managing Director, and Director of Marketing of Thornburg Investment Management, Inc. | Not applicable | ||
Wendy Trevisani, 41 Vice President since 1999 | Portfolio Manager and Managing Director of Thornburg Investment Management, Inc. | Not applicable | ||
Joshua Gonze, 49 Vice President since 1999 | Portfolio Manager and Managing Director of Thornburg Investment Management, Inc. | Not applicable | ||
Christopher Ihlefeld, 42 Vice President since 2003 | Portfolio Manager and Managing Director of Thornburg Investment Management, Inc. | Not applicable | ||
Leon Sandersfeld, 46 Vice President since 2003 | Managing Director and Fund Accounting Director of Thornburg Investment Management, Inc. | Not applicable | ||
Sasha Wilcoxon, 38 Vice President since 2003 Secretary since 2007(6) | Managing Director, Director of Operations, and Vice President of Thornburg Investment Management, Inc. | Not applicable | ||
Edward Maran, 54 Vice President since 2004 | Portfolio Manager and Managing Director of Thornburg Investment Management, Inc. | Not applicable | ||
Vinson Walden, 42 Vice President since 2004 | Portfolio Manager and Managing Director of Thornburg Investment Management, Inc. | Not applicable | ||
Thomas Garcia, 41 Vice President since 2006 | Vice President since 2011, Managing Director, Head Equity Trader, and Associate Portfolio Manager of Thornburg Investment Management, Inc. | Not applicable | ||
34 Certified Annual Report
| TRUSTEES AND OFFICERS, CONTINUED | ||
| Thornburg Strategic Municipal Income Fund | September 30, 2012 (Unaudited) | |
Name, Age, Position Held with Fund Year Elected | Principal Occupation(s) During Past Five Years | Other Directorships Held by Trustee | ||
Lei Wang, 41 Vice President since 2006 | Portfolio Manager and Managing Director of Thornburg Investment Management, Inc. | Not applicable | ||
Connor Browne, 33 Vice President since 2006 | Portfolio Manager and Managing Director of Thornburg Investment Management, Inc. | Not applicable | ||
Jason Brady, 38 Vice President since 2007 | Vice President since 2011, Portfolio Manager and Managing Director of Thornburg Investment Management, Inc. | Not applicable | ||
Lewis Kaufman, 36 Vice President since 2007 | Portfolio Manager and Managing Director and, until 2009, an Associate Portfolio Manager of Thornburg Investment Management, Inc. | Not applicable | ||
Christopher Ryon, 56 Vice President since 2008 | Portfolio Manager and Managing Director since 2009, and Associate Portfolio Manager from 2008–2009 of Thornburg Investment Management, Inc.; Principal of Vanguard Funds until 2008. | Not applicable | ||
Lon Erickson, 37 Vice President since 2008 | Portfolio Manager and Managing Director since 2010, and Associate Portfolio Manager from 2008–2010 of Thornburg Investment Management, Inc.; Senior Analyst of State Farm Insurance until 2008. | Not applicable | ||
Kathleen Brady, 52 Vice President since 2008 | Senior Tax Accountant of Thornburg Investment Management, Inc. | Not applicable | ||
| (1) | Each person’s address is 2300 North Ridgetop Road, Santa Fe, New Mexico 87506. |
| (2) | The Fund is one of sixteen separate investment “Funds” or “series” of Thornburg Investment Trust (the “Trust”), which comprises the Thornburg mutual fund complex and is organized as a Massachusetts business trust. Thornburg Investment Management, Inc. is the investment advisor to, and manages, the sixteen Funds of the Trust. Each Trustee oversees the sixteen Funds of the Trust. |
| (3) | Mr. Thornburg is considered an “interested” Trustee under the Investment Company Act of 1940 because he is the sole director and controlling shareholder of Thornburg Investment Management, Inc., the investment advisor to the sixteen active Funds of the Trust, and is the sole director and controlling shareholder of Thornburg Securities Corporation, the distributor of shares for the Trust. |
| (4) | The Bylaws of the Trust currently require that each Trustee shall retire upon his having reached the age of 75 years. Otherwise each Trustee serves in office until the election and qualification of a successor or until the Trustee sooner dies, resigns, retires or is removed. |
| (5) | Mr. McMahon is considered an “interested” Trustee under the Investment Company Act of 1940 because he is the chief executive officer and president of Thornburg Investment Management, Inc. |
| (6) | The Trust’s president, secretary, and treasurer each serves a one-year term or until the election and qualification of a successor; each other officer serves at the pleasure of the Trustees. |
| (7) | Mr. Cutler was a Trustee of the Trust through December 31, 2011, and was appointed as an Emeritus Trustee effective January 1, 2012. |
| (8) | Assistant vice presidents, assistant secretaries and assistant treasurers are not shown. |
The Statement of Additional Information for each Fund of the Trust includes additional information about the Trustees and is available, without charge and upon request, by calling 1-800-847-0200.
Certified Annual Report 35
| OTHER INFORMATION | ||
| Thornburg Strategic Municipal Income Fund | September 30, 2012 (Unaudited) | |
PORTFOLIO PROXY VOTING
Policies and Procedures:
The Trust has delegated to Thornburg Investment Management, Inc. (the “Advisor”) voting decisions respecting proxies for the Fund’s voting securities. The Advisor makes voting decisions in accordance with its Proxy Voting Policy. A description of the Policy is available (i) without charge, upon request, by calling the Advisor toll-free at 1-800-847-0200, (ii) on the Thornburg website at www.thornburg.com, and (iii) on the Securities and Exchange Commission’s website at www.sec.gov.
Information regarding how proxies were voted is available on or before August 31 of each year for the twelve months ending the preceding June 30. This information is available (i) without charge, upon request by calling the Advisor toll-free at 1-800-847-0200, (ii) on the Thornburg website at www.thornburg.com, and (iii) on the Securities and Exchange Commission’s website at www.sec.gov.
TAX INFORMATION
For the tax year ended September 30, 2012 dividends paid by the Fund of $4,841,870 (or the maximum allowed) are tax exempt dividends and $98,008 are designated as taxable long-term capital gain dividends for federal income tax purposes.
The information and distributions reported herein may differ from the information and distributions reported to the shareholders for the calendar year ending December 31, 2012. Complete information will be reported in conjunction with your 2012 Form 1099.
AVAILABILITY OF QUARTERLY PORTFOLIO SCHEDULE
The Fund files with the Securities and Exchange Commission schedules of its portfolio holdings on Form N-Q for the first and third quarters of each fiscal year. The Fund’s Forms N-Q are available on the Commission’s website at www.sec.gov, or may be reviewed and copied at the Commission’s Public Reference Room in Washington, D.C. Information on the operation of the Public Reference Room may be obtained by calling 1-800-SEC-0330. The Fund also makes this information available on its website at www.thornburg.com/download or upon request by calling 1-800-847-0200.
STATEMENT RESPECTING RENEWAL OF INVESTMENT ADVISORY AGREEMENT
Thornburg Investment Management, Inc. (the “Advisor”) provides investment management services to Thornburg Strategic Municipal Income Fund pursuant to an investment advisory agreement. The Trustees consider the renewal of this agreement annually, and most recently determined to renew the agreement on September 11, 2012.
In anticipation of their recent consideration of the advisory agreement’s renewal, the independent Trustees met in May 2012 to plan the Trustees’ evaluation of the Advisor’s performance and to specify the information the Advisor would present to the Trustees for their review. The Advisor’s chief investment officer subsequently reviewed portions of the information with the Trustees at a meeting session scheduled for that purpose, and the independent Trustees thereafter met in independent session to consider the Advisor’s presentation and various specific issues respecting their consideration of the advisory agreement’s renewal. Following these sessions, the Trustees met to consider a renewal of the agreement, and the independent Trustees voted unanimously at that meeting to renew the agreement for an additional term of one year.
The information below summarizes certain factors considered by the Trustees in connection with the determination to renew the advisory agreement. In determining to renew the agreement, the Trustees did not identify any single factor as controlling, and this summary does not describe all of the matters considered by the Trustees in making their determination.
Quality of Services; Fund Investment Performance. The Trustees evaluated the nature, extent and quality of services provided by the Advisor under the advisory agreement, and evaluated the investment performance of the Fund.
36 Certified Annual Report
| OTHER INFORMATION, CONTINUED | ||
| Thornburg Strategic Municipal Income Fund | September 30, 2012 (Unaudited) | |
In connection with their general supervision of the Advisor, and as an important element of their annual consideration of a renewal of the advisory agreement, the Trustees received and considered reports from the Advisor throughout the year. These reports addressed a wide variety of topics, including particularly the Advisor’s selection of investments and execution of the Fund’s investment strategies. In addition, the Trustees considered information provided to them at their request in anticipation of their annual evaluation of the Advisor’s services, including (i) the Fund’s absolute investment performance and achievement of stated objectives, (ii) the Advisor’s commentary on the Fund’s performance in the context of the Fund’s objectives and reasonable expectations, and business, market and economic conditions, and (iii) measures of the Fund’s investment performance since inception relative to two categories of municipal debt mutual funds selected by independent mutual fund analyst firms, and relative to a broad-based securities index.
The Trustees also considered their perceptions of portfolio management personnel developed in formal and informal meetings throughout the year, the Advisor’s staffing and other resources, the Advisor’s performance of accounting and other services, the Advisor’s observance of compliance and regulatory requirements, the Advisor’s responsiveness to the Trustees, and other factors.
In evaluating quantitative and performance data presented, the Trustees considered (among other aspects of the data) performance data for the two full calendar years since the Fund’s inception, which showed that the Fund’s investment return for the most recent year exceeded the average return of the mutual fund category for which calendar year data was presented and was comparable to the average return of the category for the preceding year. Other noted quantitative data showed that the Fund’s investment returns fell at the third quartile of performance for the first fund category for the three-month period ended with the second quarter of the current year, fell in the bottom quartile for the year-to-date period and fell near or above the midpoint of performance for the category for the one-year and three-year periods, and that the Fund’s investment returns fell within the top quartile of performance for the second fund category for the three-month and year-to-date periods ended with the second quarter and fell within the top decile of performance for the one-year and three-year periods.
The Trustees concluded, based upon these and other considerations, that the nature, extent and quality of the Advisor’s services were sufficient and that the Advisor had satisfactorily pursued the Fund’s stated investment objectives. The Trustees further concluded that the investment performance of the Fund was satisfactory in the context of the Fund’s objectives and policies, and prevailing market conditions.
Fees and Expenses; Profitability of Advisor; Economies of Scale; Ancillary Benefits to Advisor. The Trustees evaluated the level of the management fee charged by the Advisor to the Fund, and in this connection, reviewed the profitability of the Advisor, economies of scale potentially available to the Fund and whether the Advisor received any ancillary benefits from its relationship with the Fund.
In evaluating the level of the management fee, the Trustees considered the fee charged by the Advisor and the other expenses charged to the Fund in light of the nature and quality of services provided and the Fund’s investment performance, comparison of the actual Advisor’s fee and Fund expenses to the statement of fees and expenses in the Fund’s prospectuses, and comparisons of the Advisor’s fee and overall Fund expenses to median and average fees and expenses charged to a category of municipal debt mutual funds selected by an independent mutual fund analyst firm. Comparative fee and expense data considered by the Trustees showed that the management fee charged to the Fund was slightly higher than the median and average fee levels for the fund category, and that the overall expense ratio for a reference share class of the Fund was higher than the median and slightly higher than the average expense ratios for the fund category. The Trustees did not find the differences significant in view of the other factors considered. The Trustees considered information about the fees charged by the Advisor to other investment management clients, together with information about fees charged by other advisors to different clients, and analysis of the differences between the requirements of institutional clients and mutual funds and the consequently different investment management services provided, respectively, to institutional clients and to mutual funds. The Trustees confirmed their previous observations that the differences between the fees charged by the Advisor to different types of clients did not appear exceptional, and that the fee rates charged by investment advisors to institutional clients had limited relevance to the evaluation of fee rates charged to mutual funds, because of the significant differences between the respective requirements of institutional clients and mutual funds, the differences between the respective services rendered to institutional clients and mutual funds, and the different circumstances in which the respective fees originate.
Certified Annual Report 37
| OTHER INFORMATION, CONTINUED | ||
| Thornburg Strategic Municipal Income Fund | September 30, 2012 (Unaudited) | |
In reviewing the profitability of the Advisor, the Trustees considered data comparing the profitability of the Advisor to other investment management firms. The information provided did not indicate that the Advisor’s profitability was unusual, and the Trustees also considered in this regard the Advisor’s management of its costs and investment of resources to increase its capabilities. In reviewing the extent to which economies of scale would be realized by the Fund as it grows and whether fee levels reflect economies of scale, the Trustees considered the breakpoint structure for advisory fees chargeable to the Fund, the demonstrated economies of scale enjoyed by other Funds of the Trust as they had grown in size, and economies of scale realized by other mutual funds. The information provided demonstrated to the Trustees that the Fund may reasonably be expected to realize economies of scale as the Fund increases in size due to the breakpoint fee structure of the advisory agreement and other factors. In reviewing potential benefits to the Advisor because of its relationship to the Fund, the Trustees considered the Advisor’s receipt of research services from broker dealers, and the benefits to both the Fund and the Advisor of the Advisor’s expansion of its staffing, compliance and systems capabilities and other resources to serve a broader variety of investment management clients. No unusual or unfair benefits to the Advisor from its relationship to the Fund were identified by the Trustees.
The Trustees concluded, based upon their consideration of these factors, that the management fee charged to the Fund by the Advisor was fair and reasonable in view of the nature and quality of the services provided by the Advisor, the clear disclosure of fees and expenses in the Fund’s prospectuses, the investment performance of the Fund, and comparisons of fees and costs charged to the Fund to fees and expenses charged to other mutual funds.
38 Certified Annual Report
This page intentionally left blank.
This page is not part of the Annual Report. 39
TRUSTEES’ STATEMENT TO SHAREHOLDERS
Not part of the Certified Annual Report
Reissued September 10, 2012
The Trustees believe current and prospective shareholders should know how we discharge our responsibilities in supervising the Funds’ investment advisor and in reviewing the advisor’s contract for renewal. Since 2005, we have issued a statement which sets out clearly the three principal guidelines that we follow in supervising the Trust’s investment advisor on your behalf. In accordance with our customary practice, in September of this year we again reviewed our statement and concluded we should reissue this statement outlining the principal features of our supervision of the advisor’s performance of investment management services for the Funds.
We begin with the premise that each shareholder selected his or her Fund because its investments are managed by the investment advisor identified in the prospectus and in accordance with the objective and policies described in the prospectus. We realize, as each of you do, that if you believe that your Fund’s stated objective and policies no longer serve your personal investment goals, you can sell your shares and leave the Fund.
Therefore, we believe that our primary supervisory task – our principal obligation to you – is to assess the nature and quality of the advisor’s services, and to confirm that the advisor actively and competently pursues the Fund’s objective, in accordance with the policies set out in the prospectus. To do this, we meet regularly with management to review your Fund’s portfolio and to discuss the advisor’s specific actions and judgments in pursuing the Fund’s objective. We do not substitute our own judgment for the advisor’s decisions in selecting investments; the advisor is paid to exercise its informed judgment on investment decisions, and we seek to confirm, in reviewing the advisor’s performance, that the advisor is doing just that.
Second, while we are conscious of costs and the effect that costs have on shareholders’ returns, we do not seek the lowest fees or expense ratio as our sole or primary objective. We try to make sure that your Fund’s fees and costs are reasonable in relationship to the services rendered and that they are generally in line with those charged by other expert investment advisors, consistent with our belief that the Fund’s investors searched for and expect that expertise and attention and have decided to pay a reasonable price for it. We do not put the management contract “out to bid” as a matter of course, and we would not do so unless we had concluded that the advisor materially had failed to pursue the Fund’s objectives in accordance with its policies, or for other equally important reasons. We believe that any other approach would be inconsistent with your interests and contrary to your expectations when you bought shares of the Fund in the first place.
Finally, because we believe that most Thornburg Fund shareholders have invested with a long-term perspective, we try not to focus too much on the fashions of the moment and on short-term performance. The market will not favor any specific investment objective or set of policies at all times and under all economic circumstances. A fund will experience periods of both high and low returns relative to other funds and other investments. Even if one of our Funds is not favored by the market at a particular time, we believe that the advisor is nonetheless obliged to remain true to the Fund’s objective and policies, and we watch to see that it does so.
40 This page is not part of the Annual Report.
RETIREMENT AND EDUCATION ACCOUNTS
Thornburg Investment Management offers retirement and education savings accounts that can help you meet a variety of planning challenges. For account applications or further information on any of the accounts below, please call 1-800-847-0200 or go to www.thornburg.com/ira. Your financial advisor can help you determine which plan is right for you.
Individual Retirement Accounts
Individual Retirement Accounts (IRAs) provide a tax-advantaged means to save money for the future. For a detailed outline of the difference between retirement accounts, see www.thornburg.com/ira. Rollovers are available. Call 1-800-847-0200 for more information.
Traditional IRAs – Contributions to Traditional IRAs are tax deductible for eligible individuals, and withdrawals are taxed as additional ordinary income. You may contribute to an IRA if you receive compensation and are under 70 1/2, even if you are covered by an employer retirement plan. Deductible contributions are subject to certain qualifications. Please consult your tax advisor.
Roth IRAs – Under a Roth IRA, there is no tax deduction for contributions, but there is no income tax on qualified withdrawals. For a more detailed comparison of Traditional and Roth IRAs, please see our website at www.thornburg.com/ira.
SEP IRAs – Simplified Employee Pension (SEP) IRAs are established by employers. The employer is allowed a tax deduction for contributions made to the SEP Plan and makes contributions to each eligible employee’s SEP IRA on a discretionary basis.
SIMPLE IRAs – Savings Incentive Match Plan for Employees of Small Employers (SIMPLE) is designed to give small business owners a simplified method to establish and contribute to a retirement plan for employees. The employer is allowed a tax deduction for contributions and makes either matching or non-elective contributions to each eligible employee’s SIMPLE IRA. Employees may make salary deferral contributions.
Coverdell Education Savings Account
These savings accounts are designed to provide a way to save money for higher education expenses. In an Education Savings Account, earnings and interest grow tax-free, and qualified withdrawals used to pay for eligible higher-education expenses are tax- and penalty-free.
Funds Available
The following funds are available in the accounts listed above:
| • | Thornburg Value Fund |
| • | Thornburg International Value Fund |
| • | Thornburg Core Growth Fund |
| • | Thornburg Investment Income Builder Fund |
| • | Thornburg Global Opportunities Fund |
| • | Thornburg International Growth Fund |
| • | Thornburg Developing World Fund |
| • | Thornburg Limited Term U.S. Government Fund |
| • | Thornburg Limited Term Income Fund |
| • | Thornburg Strategic Income Fund |
This page is not part of the Annual Report. 41

THORNBURG FUND FAMILY
Thornburg Equity Funds
Thornburg’s equity research uses a fundamental and comprehensive analytical approach. Thornburg equity funds focus on a limited number of securities so that each holding can impact performance. The equity team searches for firms believed to have a promising future and seeks to buy shares of those companies at a discount to their intrinsic value.
| Ÿ | Thornburg Value Fund |
| Ÿ | Thornburg International Value Fund |
| Ÿ | Thornburg Core Growth Fund |
| Ÿ | Thornburg Investment Income Builder Fund |
| Ÿ | Thornburg Global Opportunities Fund |
| Ÿ | Thornburg International Growth Fund |
| Ÿ | Thornburg Developing World Fund |
Thornburg Bond Funds
Thornburg Investment Management applies a disciplined philosophy to fixed-income management. Since the launch of our first fixed-income fund over 25 years ago, we have been conducting fundamental, bottom-up research in an effort to identify bonds which we believe provide the best return for a given level of risk. We are very organic in our approach, avoiding leverage or complex strategies which could backfire in periods of market uncertainty.
| Ÿ | Thornburg Limited Term Municipal Fund |
| Ÿ | Thornburg Intermediate Municipal Fund |
| Ÿ | Thornburg California Limited Term Municipal Fund |
| Ÿ | Thornburg New Mexico Intermediate Municipal Fund |
| Ÿ | Thornburg New York Intermediate Municipal Fund |
| Ÿ | Thornburg Strategic Municipal Income Fund |
| Ÿ | Thornburg Limited Term U.S. Government Fund |
| Ÿ | Thornburg Limited Term Income Fund |
| Ÿ | Thornburg Strategic Income Fund |
Before investing, carefully consider the Fund’s investment goals, risks, charges, and expenses. For a prospectus containing this and other information, contact your financial advisor or visit thornburg.com. Read it carefully before investing.
For additional information, please visit thornburg.com
Thornburg Investment Management, Inc. 2300 North Ridgetop Road, Santa Fe, NM 87506
This page is not part of the Annual Report. 43
 | Waste not, Wait not |  | ||||
| Get instant access to your shareholder reports. | ||||||
| This Annual Report is submitted for the general information of shareholders of the Fund. It is not authorized for distribution to prospective investors in the Fund unless preceded or accompanied by an effective prospectus. | By switching from your postal mailbox to your email inbox, you reduce paper clutter, improve record keeping access, and help conserve our natural resources. | |||||
 | Investment Advisor: Thornburg Investment Management® 800.847.0200 | Go to www.thornburg.com/edelivery and sign up to receive your shareholder reports, prospectuses, and proxy statements electronically. | ||||
Distributor: | ||||||
Thornburg Securities Corporation® 800.847.0200 | You invest in the future, without spending a dime. | |||||
| TH1978 | ||||||
Item 2. Code of Ethics
Thornburg Investment Trust (the “Trust”) has adopted a code of ethics described in Item 2 of Form N-CSR. A copy of the code of ethics is filed as an exhibit to this Form N-CSR.
Item 3. Audit Committee Financial Expert
The Trustees of Thornburg Investment Trust have determined that two members of the Trust’s audit committee, David A. Ater and David D. Chase, are each audit committee financial experts as defined in Item 3 of Form N-CSR. Mr. Ater and Mr. Chase are each independent for purposes of Item 3 of Form N-CSR. The Trustees’ determinations in this regard were based upon their current understandings of the definition of “audit committee financial expert” and current interpretations of the definition. The Trustees call attention to the lack of clarity in the definition, and that shareholders and prospective investors may wish to evaluate independently this definition and the qualifications of the Trust’s audit committee. The definition of “audit committee financial expert,” together with comments on the definition, is set forth in the Securities and Exchange Commission’s website (www.sec.gov).
Item 4. Principal Accountant Fees and Services
Audit Fees
The aggregate fees billed to Thornburg Investment Trust in each of the last two fiscal years for the audit of the Trust’s financial statements and for services that are normally provided by PricewaterhouseCoopers LLP, registered independent public accounting firm (“PWC”) in connection with statutory and regulatory filings or requirements for those fiscal years are set out below.
| Year Ended September 30, 2011 | Year Ended September 30, 2012 | |||||||
Thornburg Investment Trust | $ | 603,000 | $ | 826,950 | ||||
Audit-Related Fees
The fees billed to Thornburg Investment Trust by PWC in each of the last two fiscal years for assurance and related services that are reasonably related to the audit or review of the Trust’s financial statements (and that are not reflected in “Audit Fees,” above) are set out below.
| Year Ended September 30, 2011 | Year Ended September 30, 2012 | |||||||
Thornburg Investment Trust | $ | -0 | - | $ | -0 | - | ||
Tax Fees
The fees billed to Thornburg Investment Trust by PWC in each of the last two fiscal years for professional services rendered by PWC for tax compliance, tax advice or tax planning are set out below.
| Year Ended September 30, 2011 | Year Ended September 30, 2012 | |||||||
Thornburg Investment Trust | $ | 184,100 | $ | 210,200 | ||||
All Other Fees
The fees billed to Thornburg Investment Trust by PWC in each of the last two fiscal years for all other services rendered by PWC to the Trust are set out below.
| Year Ended September 30, 2011 | Year Ended September 30, 2012 | |||||||
Thornburg Investment Trust | $ | -0 | - | $ | 12,000 | |||
The figure shown under All Other Fees for the year ended September 30, 2012, includes amounts from out of pocket expenses during the 2011 annual audit as well as a consent fee pertaining to a closing agreement with the IRS during the fiscal year ended September 30, 2012.
PWC performs no services for the investment advisor, the Funds’ principal underwriter or any other person controlling, controlled by, or under common control with the investment advisor which provides ongoing services to the Funds.
Audit Committee Pre-Approval Policies and Procedures
As of September 30, 2012, the Trust’s Audit Committee has not adopted pre-approval policies and procedures.
Item 5. Audit Committee of Listed Registrants
Not applicable.
Item 6. Schedule of Investments
Filed as part of the reports to shareholders filed under item 1 of this Form.
Item 7. Disclosure of Proxy Voting Policies and Procedures for Closed-End Management Investment Companies
Not applicable.
Item 8. Portfolio Managers of Closed-End Management Investment Companies
Not applicable.
Item 9. Purchases of Equity Securities by Closed-End Management Investment Companies and Affiliated Purchasers.
Not applicable.
Item 10. Submission of Matters to a Vote of Security Holders
The authority to consider candidates recommended by the shareholders in accordance with the Trust’s Procedures for Shareholder Communications is committed to the Governance and Nominating Committee.
Item 11. Controls and Procedures
(a) The principal executive officer and the principal financial officer have concluded that Thornburg Investment Trust’s disclosure controls and procedures provide reasonable assurance that material information relating to Thornburg Investment Trust is made known to them by the appropriate persons, based on their evaluation of these controls and procedures as of a date within 90 days prior to the filing date of this report.
(b) There was no change in Thornburg Investment Trust’s internal control over financial reporting that occurred during the registrant’s second fiscal quarter of the period covered by this report (that is, the registrant’s fourth fiscal quarter) that has materially affected, or is reasonably likely to materially affect, the registrant’s internal control over financial reporting.
Item 12. Exhibits
| (a) (1) | Code of Business Conduct and Ethics. |
| (a) (2) | Certifications pursuant to Rule 30a-2(a) under the Investment Company Act of 1940 (17 CFR 70.30a-2(a)) attached hereto as Exhibit 99.CERT. |
| (a) (3) | Not Applicable |
| (b) | Certification pursuant to Section 906 of the Sarbanes-Oxley Act of 2002 and Rule 30a-2(b) under the Investment Company Act of 1940 (17 CFR 70.30a-2(b)) attached hereto as Exhibit 99.906CERT. |
SIGNATURES
Pursuant to the requirements of the Securities Exchange Act of 1934 and the Investment Company Act of 1940, the registrant has duly caused this report to be signed on its behalf by the undersigned, thereunto duly authorized.
Thornburg Investment Trust, in respect of Thornburg Strategic Municipal Income Fund.
| By: | /s/ Brian J. McMahon | |
| Brian J. McMahon | ||
| President and principal executive officer | ||
| Date: | December 6, 2012 | |
Pursuant to the requirements of the Securities Exchange Act of 1934 and the Investment Company Act of 1940, this report has been signed below by the following persons on behalf of the registrant and in the capacities and on the dates indicated.
| By: | /s/ Brian J. McMahon | |
| Brian J. McMahon | ||
| President and principal executive officer | ||
| Date: | December 6, 2012 | |
| By: | /s/ George T. Strickland | |
| George T. Strickland | ||
| Treasurer and principal financial officer | ||
| Date: | December 6, 2012 | |