
PROVIDENT BANKSHARES CORPORATION
Provident Bankshares Corporation and Southern Financial Bancorp, Inc. have filed a joint proxy statement/prospectus and other relevant documents concerning the merger with the United States Securities and Exchange Commission (the “SEC”).
WE URGE INVESTORS TO READ THE JOINT PROXY STATEMENT/PROSPECTUS AND ANY OTHER RELEVANT DOCUMENTS TO BE FILED WITH THE SEC, BECAUSE THEY CONTAIN IMPORTANT INFORMATION.
Investors will be able to obtain these documents free of charge at the SEC’s web site (www.sec.gov). In addition, documents filed with the SEC by Provident Bankshares Corporation will be available free of charge from the Investor Relations Department at Provident Bankshares Corporation, 114 East Lexington Street, Baltimore, Maryland 21202. Documents filed with the SEC by Southern Financial Bancorp, Inc. will be available free of charge from the Investor Relations Department at Southern Financial Bancorp, Inc., 37 East Main Street, Warrenton, Virginia 20186.
The directors, executive officers, and certain other members of management of Provident Bankshares Corporation and Southern Financial Bancorp, Inc. may be soliciting proxies in favor of the merger from the companies’ respective shareholders. For information about these directors, executive officers, and members of management, shareholders are asked to refer to the most recent proxy statements issued by the respective companies, which are available on their web sites and at the addresses provided in the preceding paragraph.
FORWARD-LOOKING STATEMENTS AND ASSOCIATED RISK FACTORS
This release, and the associated conference call, web cast, other written materials, and statements management may make, may contain certain forward-looking statements regarding the Company’s prospective performance and strategies within the meaning of Section 27A of the Securities Act of 1933, as amended, and Section 21E of the Securities Exchange Act of 1934, as amended. The Company intends such forward-looking statements to be covered by the safe harbor provisions for forward-looking statements contained in the Private Securities Litigation Reform Act of 1995, and is including this statement for purposes of said safe harbor provisions.
Forward-looking statements, which are based on certain assumptions and describe future plans, strategies, and expectations of the Company, are generally identified by use of the words “plan,” “believe,” “expect,” “intend,” “anticipate,” “estimate,” “project,” or other similar expressions. The Company’s ability to predict results or the actual effects of its plans and strategies is inherently uncertain. Accordingly, actual results may differ materially from anticipated results.
The following factors, among others, could cause the actual results of the merger to differ materially from the expectations stated in this release and the associated conference call and web cast: the ability of the companies to obtain the required shareholder or regulatory approvals of the merger; the ability of the companies to consummate the merger; the ability of Southern Financial to timely complete its acquisition of Essex Bancorp, Inc.; the ability to successfully integrate the companies following the merger; a materially adverse change in the financial condition of either company; the ability to fully realize the expected cost savings and revenues; and the ability to realize the expected cost savings and revenues on a timely basis.
Other factors that could cause the actual results of the merger to differ materially from current expectations include a change in economic conditions; changes in interest rates, deposit flows, loan demand, real estate values, and competition; changes in accounting principles, policies, or guidelines; changes in legislation and regulation; and other economic, competitive, governmental, regulatory, geopolitical, and technological factors affecting the companies’ operations, pricing, and services.
The Company undertakes no obligation to update these forward-looking statements to reflect events or circumstances that occur after the date on which such statements were made.

AGENDA
HISTORY
THE PROVIDENT DISTINCTION
KEY STRATEGIES
SOUTHERN FINANCIAL MERGER
IMPROVE FINANCIAL FUNDAMENTALS
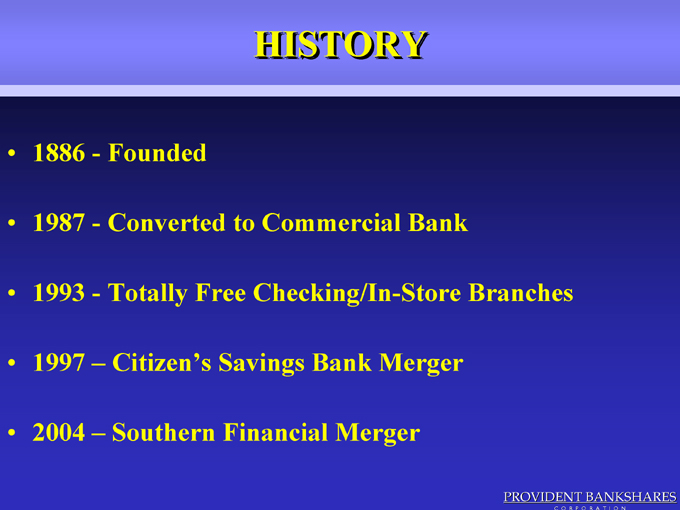
HISTORY
• 1886—Founded
• 1987—Converted to Commercial Bank
• 1993—Totally Free Checking/In-Store Branches
• 1997 – Citizen’s Savings Bank Merger
• 2004 – Southern Financial Merger

THE PROVIDENT
DISTINCTION
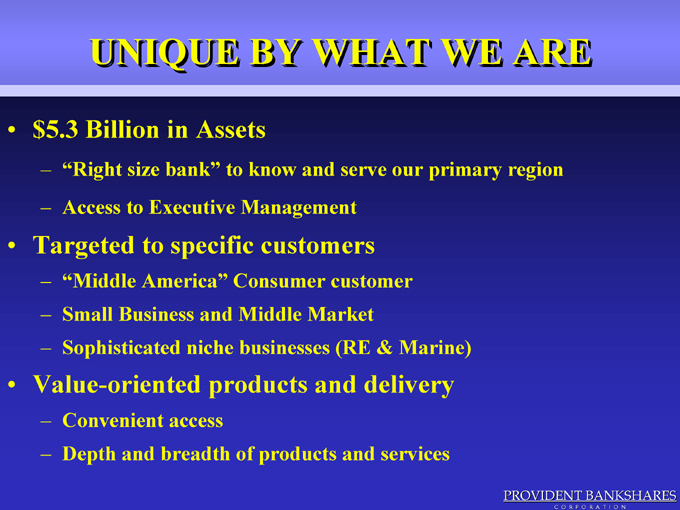
UNIQUE BY WHAT WE ARE
•$ 5.3 Billion in Assets
– “Right size bank” to know and serve our primary region
– Access to Executive Management
• Targeted to specific customers
– “Middle America” Consumer customer
– Small Business and Middle Market
– Sophisticated niche businesses (RE & Marine)
• Value-oriented products and delivery
– Convenient access
– Depth and breadth of products and services

KEY STRATEGIES
• Broaden Presence and Customer Base in Washington Metro and Virginia
• Grow Commercial Banking Market Share in the Maryland and Virginia Markets
• Focus Resources on Growth in Core Business Lines
• Improve Financial Fundamentals

BROADEN PRESENCE AND
CUSTOMER BASE IN WASHINGTON METRO AND
VIRGINIA
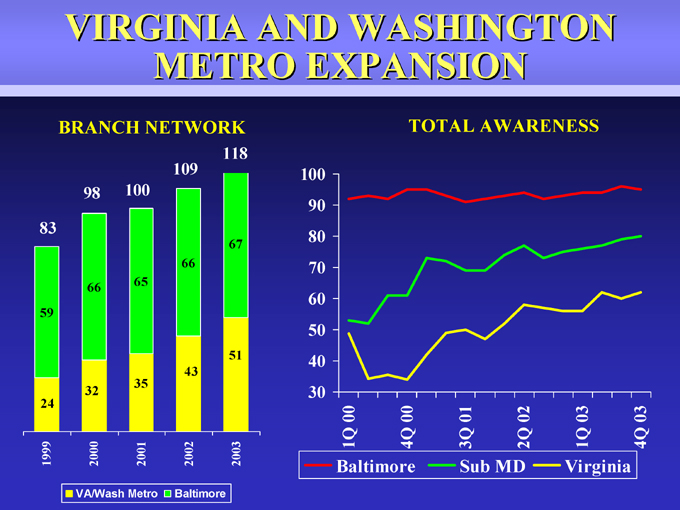
VIRGINIA AND WASHINGTON
METRO EXPANSION
BRANCH NETWORK
118
109
98 100
83
67
66
66 65
59
51
43
35
32
24
1999 2000 2001 2002 2003
VA/Wash Metro Baltimore
TOTAL AWARENESS
Baltimore Sub MD Virginia
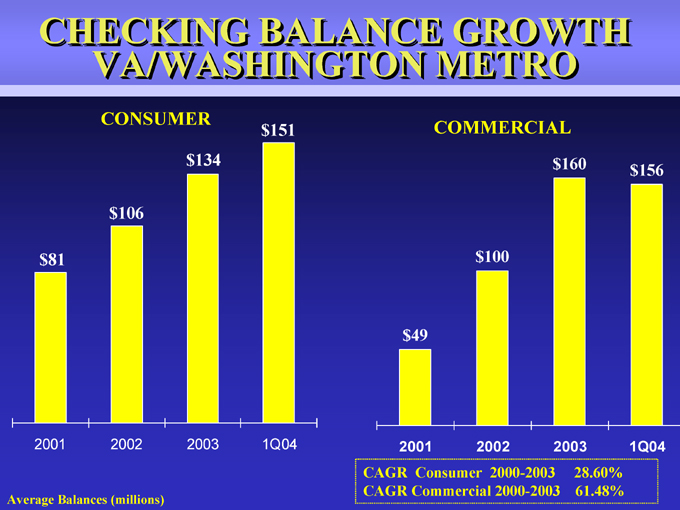
CHECKING BALANCE GROWTH VA/WASHINGTON METRO
CONSUMER
$ 81
2001
$ 106
2002
$ 134
2003
$ 151
1Q04
Average Balances (millions)
COMMERCIAL
$ 49
2001
$ 100
2002
$ 160
2003
$ 156
1Q04
CAGR Consumer 2000-2003 28.60% CAGR Commercial 2000-2003 61.48%

GROW COMMERCIAL BANKING
MARKET SHARE IN THE MARYLAND AND VIRGINIA
MARKETS
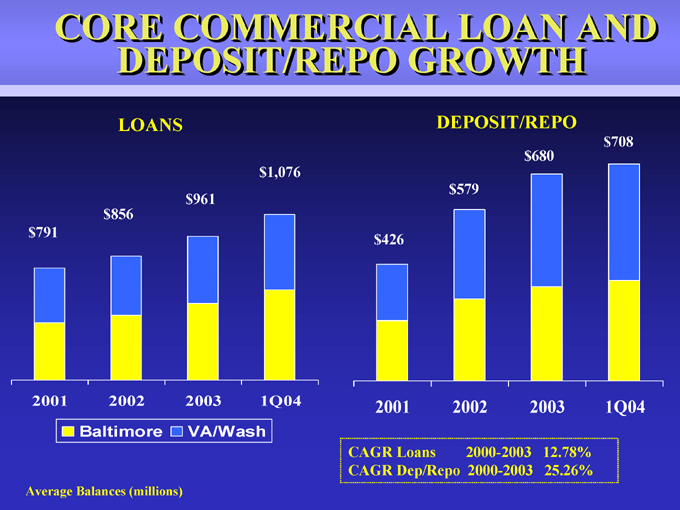
CORE COMMERCIAL LOAN AND DEPOSIT/REPO GROWTH
LOANS
$ 1,076
$ 961
$ 856
$ 791
2001 2002 2003 1Q04
Baltimore VA/Wash
Average Balances (millions)
DEPOSIT/REPO
$ 426
2001
$ 579
2002
$ 680
2003
$ 708
1Q04
CAGR Loans 2000-2003 12.78% CAGR Dep/Repo 2000-2003 25.26%

FOCUS RESOURCES ON GROWTH IN CORE BUSINESS
LINES
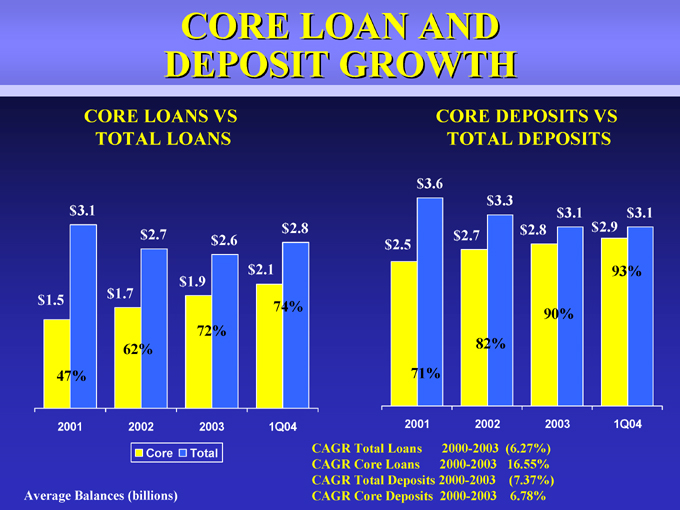
CORE LOAN AND DEPOSIT GROWTH
CORE LOANS VS
TOTAL LOANS
$ 3.1
$ 2.7 $ 2.8
$ 2.6
$ 2.1
$ 1.9 $ 1.5 $ 1.7
74%
72%
62%
47%
2001 2002 2003 1Q04
Core Total
Average Balances (billions)
CORE DEPOSITS VS
TOTAL DEPOSITS
$ 3.6
$ 3.3
$ 3.1 $ 3.1
$ 2.8 $ 2.9
$ 2.7
$ 2.5
93%
90%
82%
71%
2001 2002 2003 1Q04
CAGR Total Loans 2000-2003 (6.27%)
CAGR Core Loans 2000-2003 16.55%
CAGR Total Deposits 2000-2003 (7.37%)
CAGR Core Deposits 2000-2003 6.78%

STRATEGIC MERGER
Southern Financial Bank
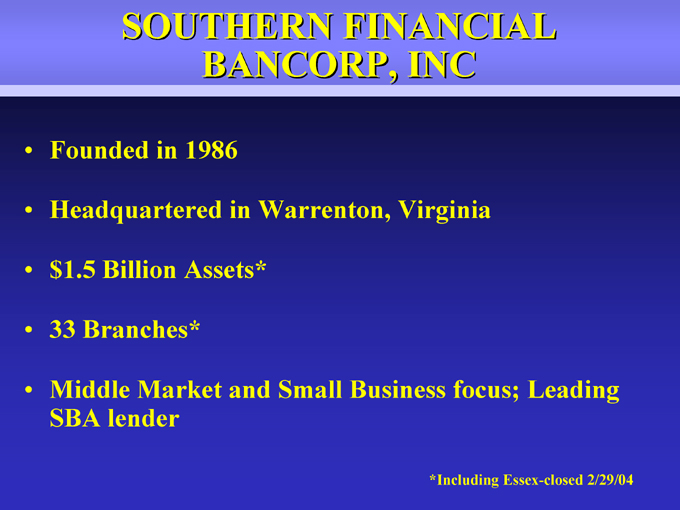
SOUTHERN FINANCIAL
BANCORP, INC
• Founded in 1986
• Headquartered in Warrenton, Virginia
•$ 1.5 Billion Assets*
• 33 Branches*
• Middle Market and Small Business focus; Leading SBA lender
*Including Essex-closed 2/29/04

TRANSACTION STRENGTHS
Strategic Fit
Cultural Compatibility
Financial Opportunity

STRATEGIC FIT
Continues Provident’s market share expansion in the high growth markets of Virginia
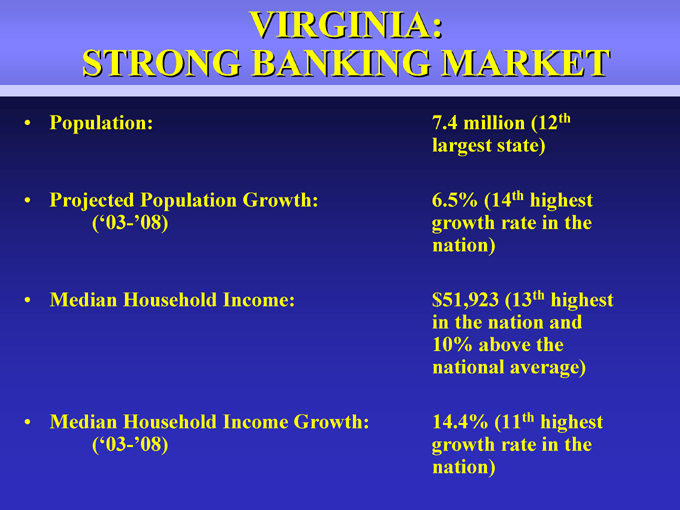
VIRGINIA:
STRONG BANKING MARKET
• Population: 7.4 million (12th
largest state)
• Projected Population Growth: 6.5% (14th highest
(‘03-’08) growth rate in the
nation)
• Median Household Income: $51,923 (13th highest
in the nation and
10% above the
national average)
• Median Household Income Growth: 14.4% (11th highest
(‘03-’08) growth rate in the
nation)

PRO FORMA FRANCHISE
Branches located in Maryland and Virginia’s best markets
PBKS Branches
SFFB Branches*
4—8% Projected Growth
+8% Projected Growth
* Southern Financial Bancorp, Inc. is pro forma for the pending acquisition of Essex Bancorp
County Demographics
STRATEGIC FIT
Adds significant competitive advantage for business banking companies with a powerful integrated suite of online banking services

CULTURAL COMPATABILITY
Customer oriented
Employee focused
Community supporter
Excellent credit quality
FINANCIAL OPPORTUNITY
• Accretive to GAAP and cash EPS in first full year of combined operations
• Identified, achievable cost savings
• Combined loan composition well-balanced
• Significant potential for retail loan and deposit growth

DEAL STRUCTURE
• Shares Issued: 7,747,395
• Seller Ownership: 29.9%
• Goodwill: $247 Million
• Cost Savings: 24.6%
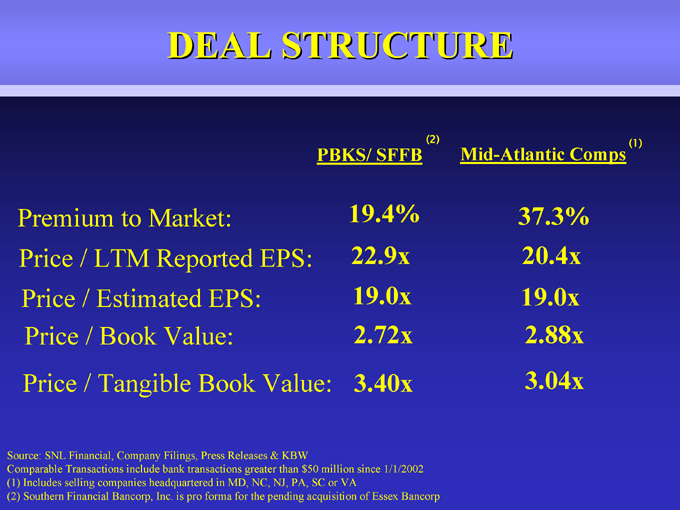
DEAL STRUCTURE
(2) (1)
PBKS/ SFFB Mid-Atlantic Comps
Premium to Market: 19.4% 37.3%
Price / LTM Reported EPS: 22.9x 20.4x
Price / Estimated EPS: 19.0x 19.0x
Price / Book Value: 2.72x 2.88x
Price / Tangible Book Value: 3.40x 3.04x
Source: SNL Financial, Company Filings, Press Releases & KBW
Comparable Transactions include bank transactions greater than $50 million since 1/1/2002
(1) Includes selling companies headquartered in MD, NC, NJ, PA, SC or VA
(2) Southern Financial Bancorp, Inc. is pro forma for the pending acquisition of Essex Bancorp
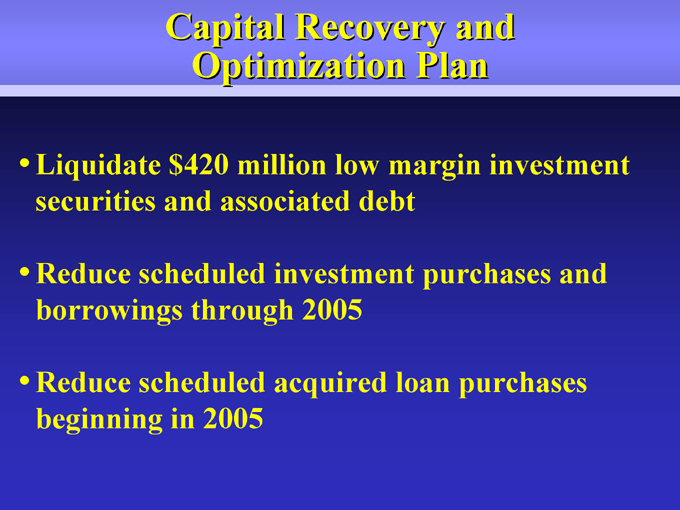
Capital Recovery and Optimization Plan
• Liquidate $420 million low margin investment securities and associated debt
• Reduce scheduled investment purchases and borrowings through 2005
• Reduce scheduled acquired loan purchases beginning in 2005
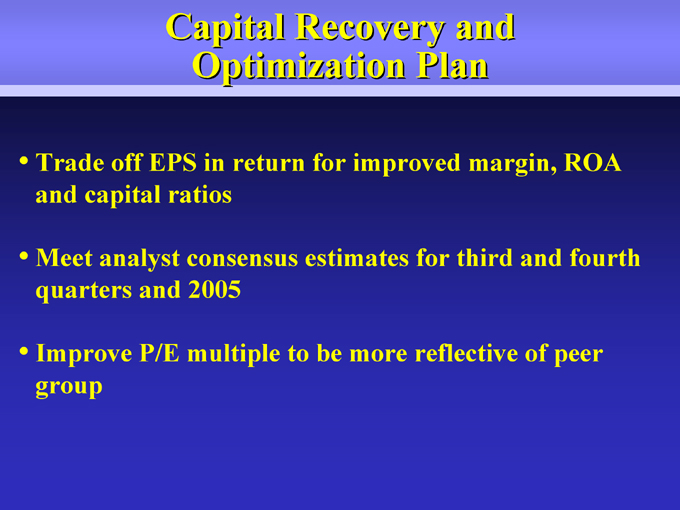
Capital Recovery and Optimization Plan
• Trade off EPS in return for improved margin, ROA and capital ratios
• Meet analyst consensus estimates for third and fourth quarters and 2005
• Improve P/E multiple to be more reflective of peer group
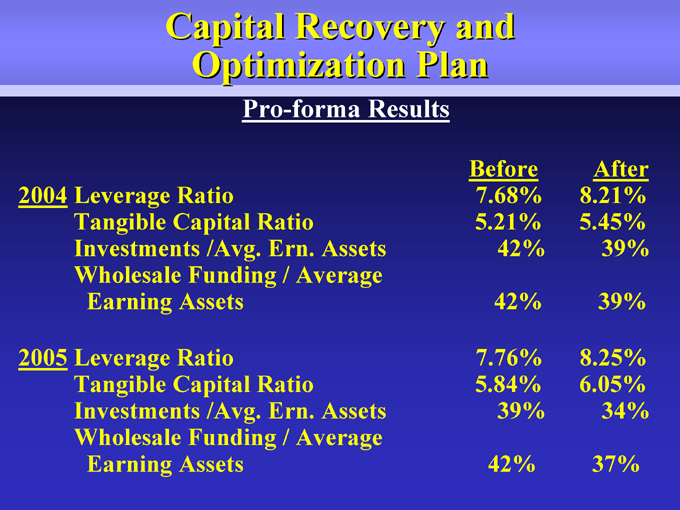
Capital Recovery and Optimization Plan
Pro-forma Results
Before After
2004 Leverage Ratio 7.68% 8.21%
Tangible Capital Ratio 5.21% 5.45%
Investments /Avg. Ern. Assets 42% 39%
Wholesale Funding / Average
Earning Assets 42% 39%
2005 Leverage Ratio 7.76% 8.25%
Tangible Capital Ratio 5.84% 6.05%
Investments /Avg. Ern. Assets 39% 34%
Wholesale Funding / Average
Earning Assets 42% 37%
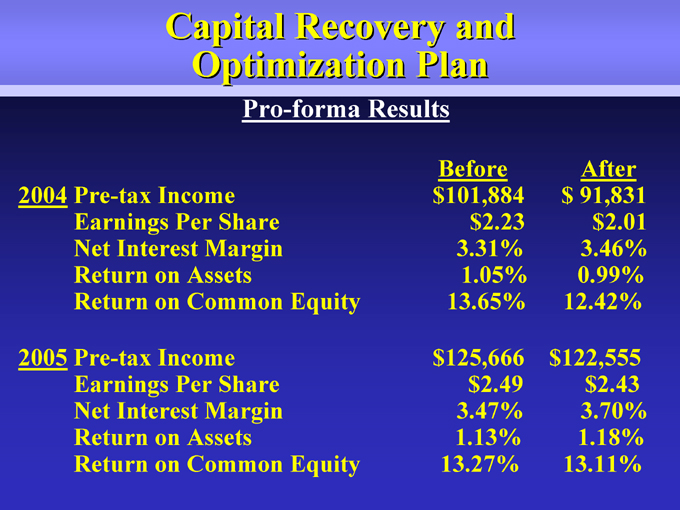
Capital Recovery and Optimization Plan
Pro-forma Results
Before After
2004 Pre-tax Income $ 101,884 $ 91,831
Earnings Per Share $ 2.23 $ 2.01
Net Interest Margin 3.31% 3.46%
Return on Assets 1.05% 0.99%
Return on Common Equity 13.65% 12.42%
2005 Pre-tax Income $ 125,666 $ 122,555
Earnings Per Share $ 2.49 $ 2.43
Net Interest Margin 3.47% 3.70%
Return on Assets 1.13% 1.18%
Return on Common Equity 13.27% 13.11%

IMPROVE FINANCIAL
FUNDAMENTALS

IMPROVE FINANCIAL
FUNDAMENTALS
CORE LOANS VS
TOTAL LOANS
$ 3.1
$ 2.7
$ 2.8
$ 2.6
$ 2.1
$ 1.9
$ 1.5 $ 1.7
74%
72%
62%
47%
2001 2002 2003 1Q04
Core Total
Average Balances (billions)
CORE DEPOSITS VS
TOTAL DEPOSITS
$ 3.6
$ 3.3
$ 3.1 $ 3.1
$ 2.8 $ 2.9
$ 2.7 $ 2.5 93%
90%
82%
71 % 2001 2002 2003 1Q04
CAGR Total Loans 2000-2003 (6.27%)
CAGR Core Loans 2000-2003 16.55%
CAGR Total Deposits 2000-2003 (7.37%)
CAGR Core Deposits 2000-2003 6.78%
IMPROVE FINANCIAL
FUNDAMENTALS
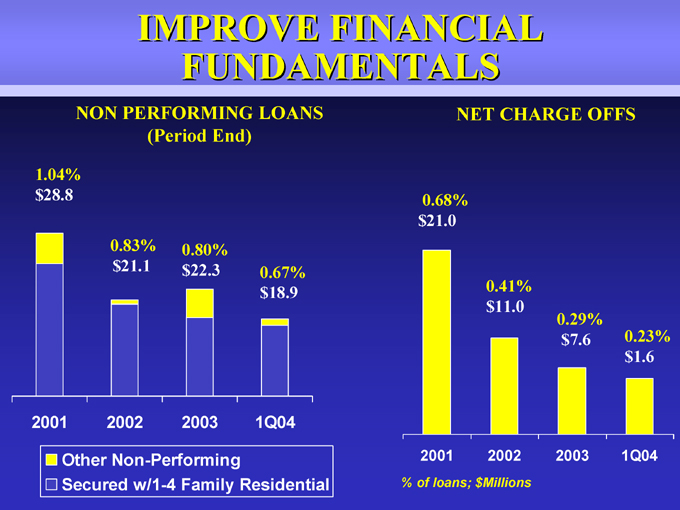
NON PERFORMING LOANS
(Period End)
1.04%
$ 28.8
0.83% 0.80%
$ 21.1 $ 22.3 0.67%
$ 18.9
2001 2002 2003 1Q04
Other Non-Performing
Secured w/1-4 Family Residential
NET CHARGE OFFS
0.68%
$ 21.0
0.41%
$ 11.0
0.29%
$ 7.6 0.23%
$ 1.6
2001 2002 2003 1Q04
% of loans; $Millions
IMPROVE FINANCIAL
FUNDAMENTALS
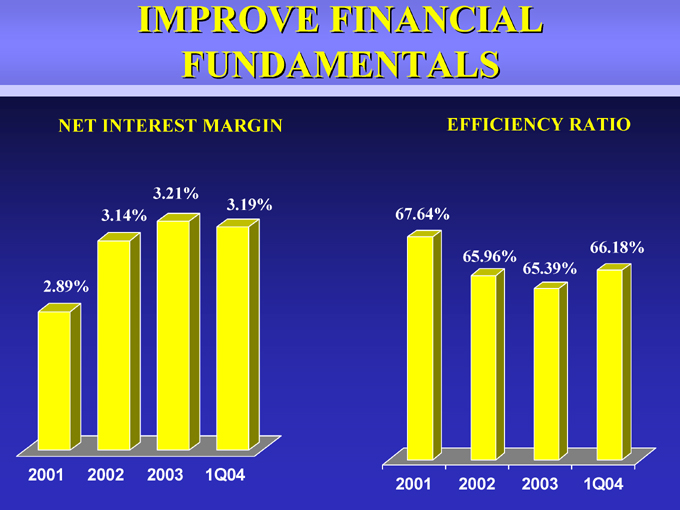
NET INTEREST MARGIN
3.21%
3.19%
3.14%
2.89%
2001 2002 2003 1Q04
EFFICIENCY RATIO
67.64%
66.18%
65.96% 65.39%
2001 2002 2003 1Q04
IMPROVE FINANCIAL
FUNDAMENTALS
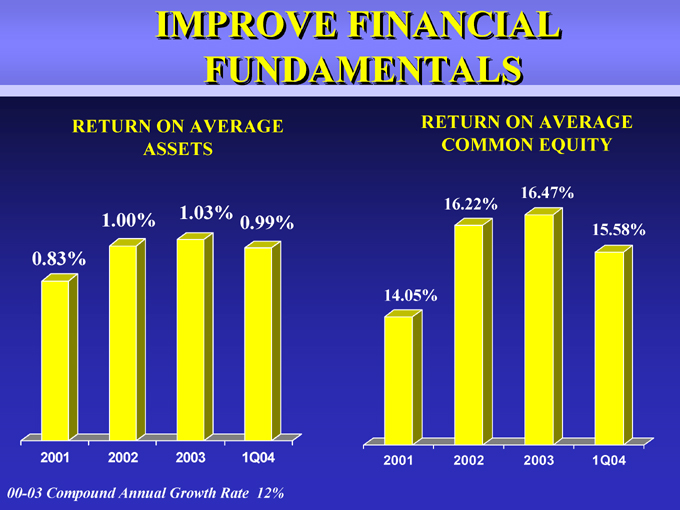
RETURN ON AVERAGE
ASSETS
1.00% 1.03% 0.99%
0.83%
2001 2002 2003 1Q04
00-03 Compound Annual Growth Rate 12%
RETURN ON AVERAGE
COMMON EQUITY
16.47%
16.22%
15.58%
14.05%
2001 2002 2003 1Q04
IMPROVE FINANCIAL
FUNDAMENTALS
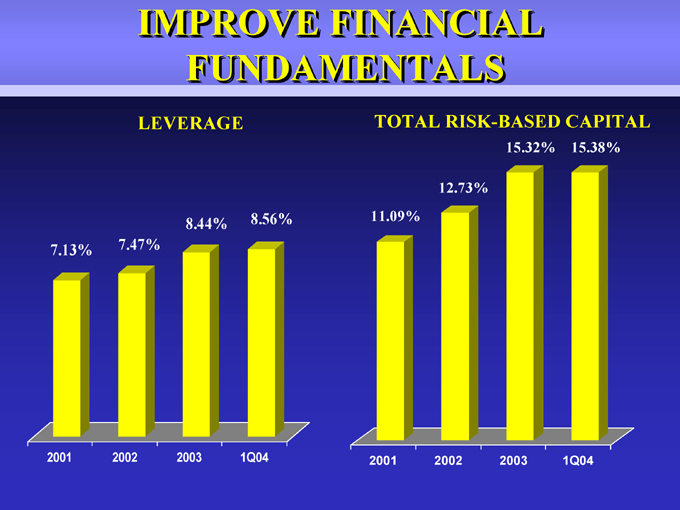
LEVERAGE
8.44% 8.56%
7.13% 7.47%
2001 2002 2003 1Q04
TOTAL RISK-BASED CAPITAL
15.32% 15.38%
12.73%
11.09%
2001 2002 2003 1Q04
IMPROVE FINANCIAL
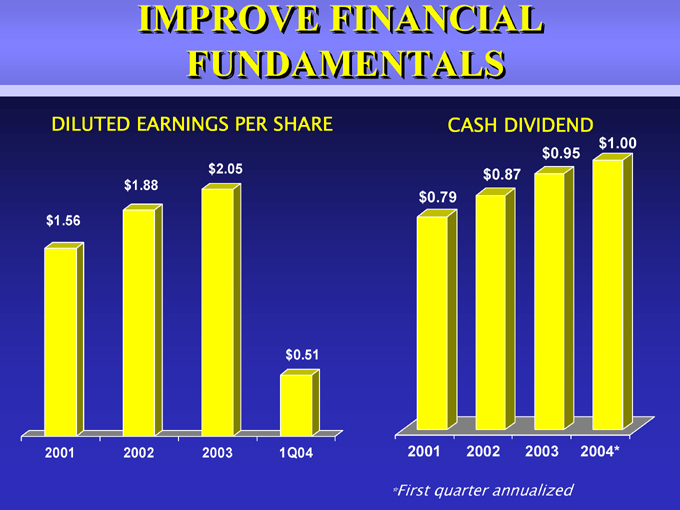
FUNDAMENTALS
DILUTED EARNINGS PER SHARE
$ 2.05
$ 1.88
$ 1.56
$ 0.51
2001 2002 2003 1Q04
CASH DIVIDEND
$ 0.79
2001
$ 1.00
$ 0.95
$ 0.87
2002 2003 2004*
*First quarter annualized
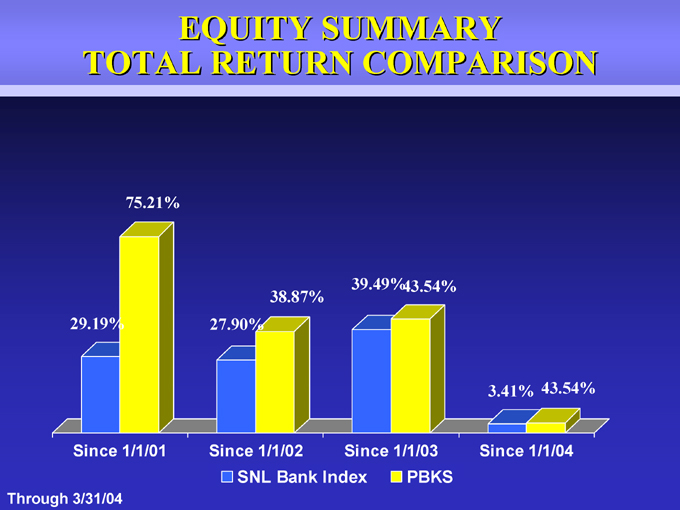
EQUITY SUMMARY TOTAL RETURN COMPARISON
75.21%
39.49% 43.54%
38.87%
29.19% 27.90%
3.41% 43.54%
Since 1/1/01 Since 1/1/02 Since 1/1/03 Since 1/1/04
SNL Bank Index PBKS
Through 3/31/04

INVESTMENT ATTRIBUTES
• Core balance sheet momentum
• Effective expansion strategy
• Growing market share in attractive markets
• Stable and improving credit quality
• Experienced management team

PROVIDENT BANKSHARES
CORPORATION
(www.provbank.com)
Contact:
Media: Lillian Kilroy: (410) 277-2833
Investment Community: Trish Ferrick: (540) 341-8073