Exhibit 99.1

PROVIDENT BANKSHARES CORPORATION
FORWARD-LOOKING STATEMENTS AND RISK FACTORS
This presentation, and other written materials and oral statements made by management, may contain certain forward-looking statements, including those regarding the Company’s prospective performance, plans, strategies and expectations, within the meaning of Section 27A of the Securities Act of 1933, as amended, and Section 21E of the Securities Exchange Act of 1934, as amended. The Company intends such forward-looking statements to be covered by the safe harbor provisions for forward-looking statements contained in the Private Securities Litigation Reform Act of 1995, and is including this statement for purposes of said harbor provisions.
Forward-looking statements, which are based on certain assumptions and describe future events, plans, strategies, and expectations of the Company, are generally identified by use of the words “plan,” “believe,” “expect,” “intend,” “anticipate,” “estimate,” “project,” or other similar expressions. The Company’s ability to predict results or the actual effects of its performance, plans, strategies and expectations, including those with respect to its merger with Southern Financial Bancorp, Inc., is inherently uncertain. Accordingly, actual results may differ materially from anticipated results.
The following factors, among others, could cause the actual results of the merger to differ materially from the expectations stated in this presentation: the ability to successfully integrate the companies following the merger, including the retention of key personnel; the ability to effect the proposed capital recovery and optimization plan; the ability to fully realize the expected cost savings and revenues; and the ability to realize the expected cost savings and revenues on a timely basis.
Factors that could have a material adverse effect on the operations of the Company and its subsidiaries include, but are not limited to: changes in general economic conditions, interest rates, deposit flows, loan demand, real estate values, competition, and the demand for financial services and loan, deposit, and investment products in the Company’s local markets; changes in the quality or composition of the loan or investment portfolios; inability to successfully carry out marketing and/or expansion plans; changes in accounting principles, policies, or guidelines; changes in legislation and regulation; changes in the monetary and fiscal policies of the U.S. Government, including policies of the U.S. Treasury and the Federal Reserve Board; war or terrorist activities; and other economic, competitive, governmental, regulatory, geopolitical, and technological factors affecting the Company’s operations, pricing, and services.
The Company undertakes no obligation to update these forward-looking statements to reflect events or circumstances that occur after the date on which such statements were made.
2

AGENDA
HISTORY
THE PROVIDENT DISTINCTION
KEY STRATEGIES
SOUTHERN FINANCIAL MERGER
IMPROVE FINANCIALFUNDAMENTALS
3
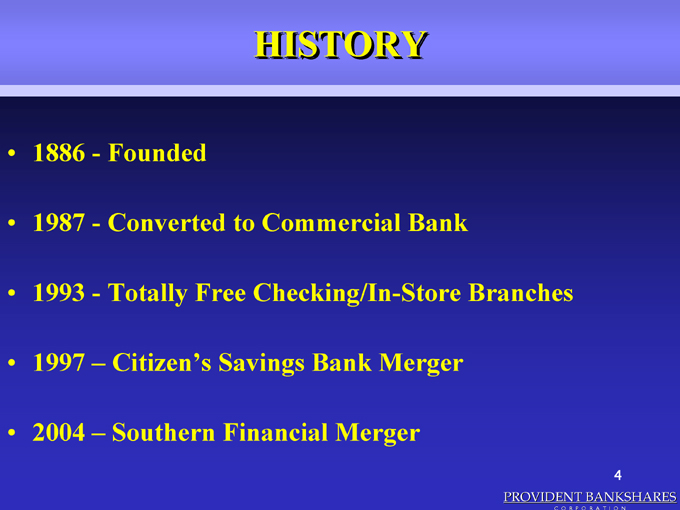
HISTORY
• 1886—Founded
• 1987—Converted to Commercial Bank
• 1993—Totally Free Checking/In-Store Branches
• 1997 – Citizen’s Savings Bank Merger
• 2004 – Southern Financial Merger
4
PROVIDENT BANKSHARES
C O R P O R A T I O N

THE PROVIDENT
DISTINCTION
5
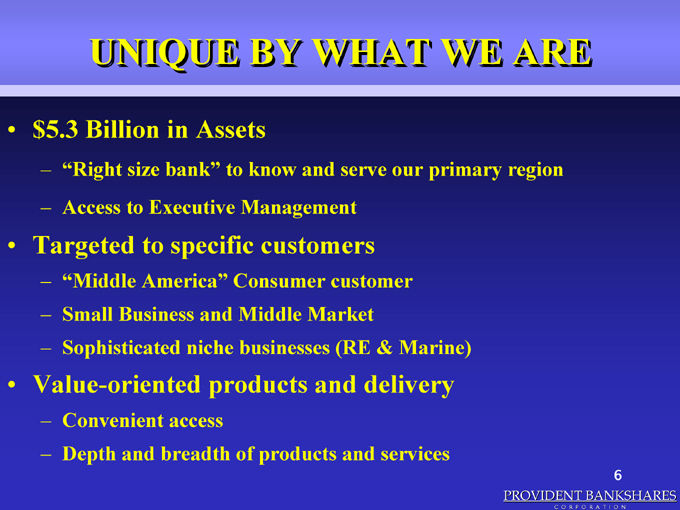
UNIQUE BY WHAT WE ARE
•$ 5.3 Billion in Assets
– “Right size bank” to know and serve our primary region
– Access to Executive Management
• Targeted to specific customers
– “Middle America” Consumer customer
– Small Business and Middle Market
– Sophisticated niche businesses (RE & Marine)
• Value-oriented products and delivery
– Convenient access
– Depth and breadth of products and services
6
PROVIDENT BANKSHARES
C O R P O R A T I O N

KEY STRATEGIES
• Broaden Presence and Customer Base in Washington Metro and Virginia
• Grow Commercial Banking Market Share in the Maryland and Virginia Markets
• Focus Resources on Growth in Core
Business Lines
• Improve Financial Fundamentals
7
PROVIDENT BANKSHARES
C O R P O R A T I O N

BROADEN PRESENCE AND
CUSTOMER BASE IN WASHINGTON METRO AND
8
PROVIDENT BANKSHARES
C O R P O R A T I O N
VIRGINIA
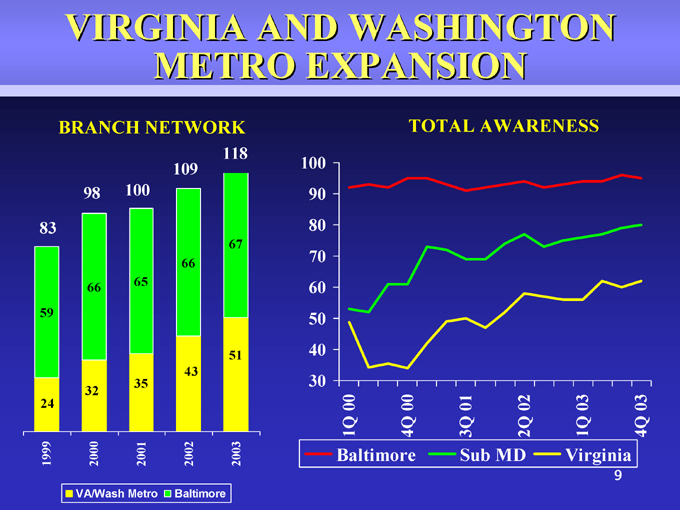
VIRGINIA AND WASHINGTON
METRO EXPANSION
BRANCH NETWORK
118 109 98 100 67 66 65
TOTAL AWARENESS
100
[Graphic Appears Here]
83 59 51 43 32 2001 35 2002 1999 24 2000 1Q 00 4Q 00 3Q 01 2Q 02 1Q 03
9 Virginia 4Q 03 2003 Baltimore Sub MD VA/Wash Metro Baltimore
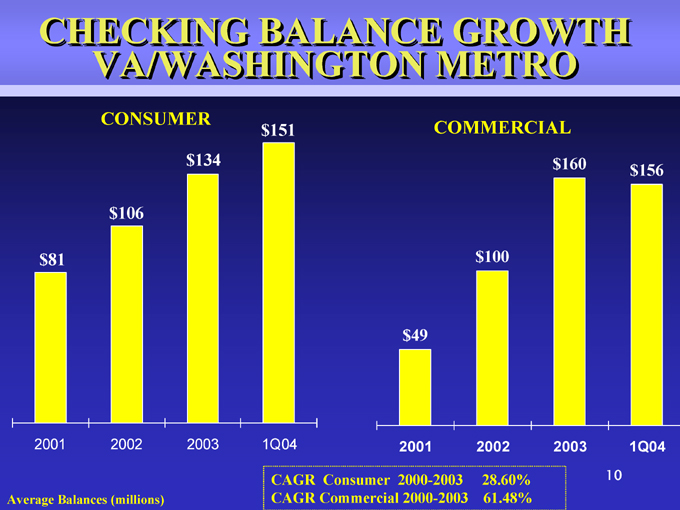
CHECKING BALANCE GROWTH VA/WASHINGTON METRO
CONSUMER $134 $106 $151 COMMERCIAL $160 $156 $100 $81 $49 2001 2002
Average Balances (millions) 2003 1Q04
2001 2002 2003 1Q04
10
CAGR Consumer 2000-2003 28.60% CAGR Commercial 2000-2003 61.48%

GROW COMMERCIAL BANKING
MARKET SHARE IN THE MARYLAND AND VIRGINIA
MARKETS
11
PROVIDENT BANKSHARES
C O R P O R A T I O N
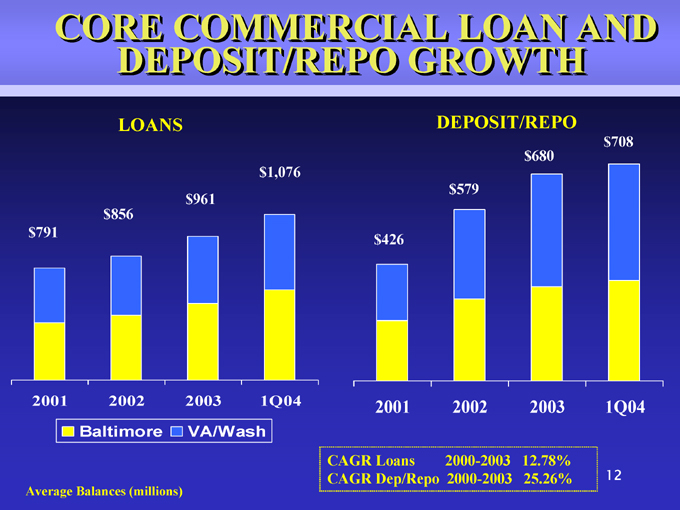
CORE COMMERCIAL LOAN AND DEPOSIT/REPO GROWTH
LOANS
DEPOSIT/REPO
$680
$579 $708 $1,076 $961 $856 $791 $426
2001 2002
2003 1Q04
2001 2002
2003 1Q04
Baltimore VA/Wash
Average Balances (millions)
CAGR Loans 2000-2003 12.78% CAGR Dep/Repo 2000-2003 25.26% 12

FOCUS RESOURCES ON GROWTH IN CORE BUSINESS
13
PROVIDENT BANKSHARES
C O R P O R A T I O N
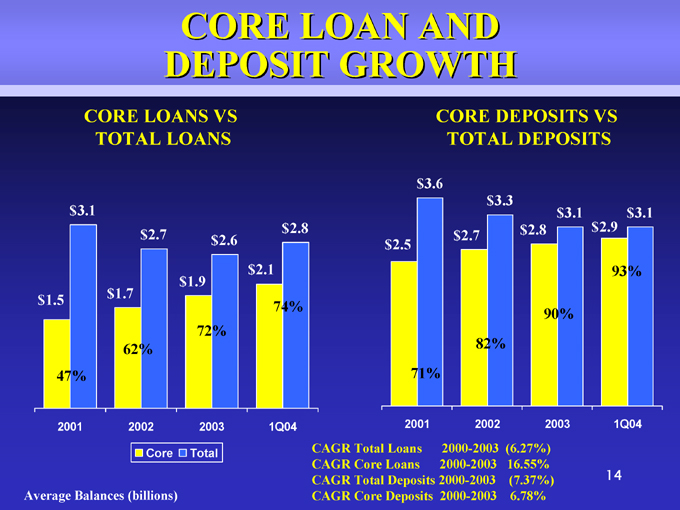
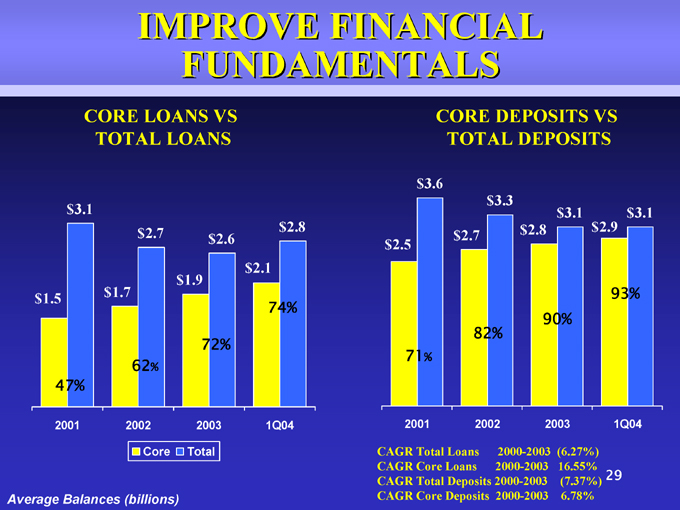
CORE LOAN AND DEPOSIT GROWTH
CORE LOANS VS
TOTAL LOANS
$3.1 $2.7 $2.6
CORE DEPOSITS VS
TOTAL DEPOSITS
$3.6 $3.3 $3.1 $3.1 $2.8 $2.9
93%
90% $2.8 $2.7 $2.5 $2.1
74% $1.9
72% $1.5 $1.7
62% 47%
2001 2002
82%
71%
2001 2002
2003 1Q04
2003 1Q04
Core Total
Average Balances (billions)
CAGR Total Loans 2000-2003 (6.27%)
CAGR Core Loans 2000-2003
16.55%
CAGR Total Deposits 2000-2003 (7.37%) CAGR Core Deposits 2000-2003 6.78%
14

*PEOPLE* *PARTNERS
PROVIDENT’S IN-STORE DIFFERENCE *PRODUCT* *PROGRAM*
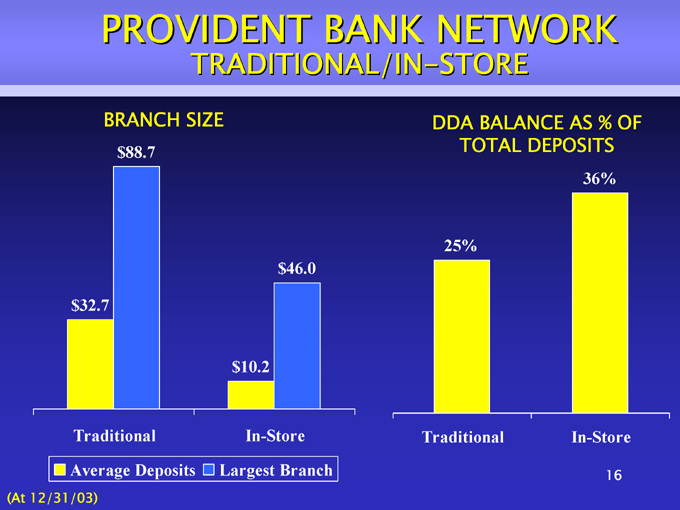
PROVIDENT BANK NETWORK
TRADITIONAL/IN-STORE
BRANCH SIZE $88.7
DDA BALANCE AS % OF
TOTAL DEPOSITS
36% 25% $46.0 $32.7 $10.2
In-Store
Traditional
Traditional
In-Store
16
[Graphic Appears Here]
Average Deposits Largest Branch
(At 12/31/03)
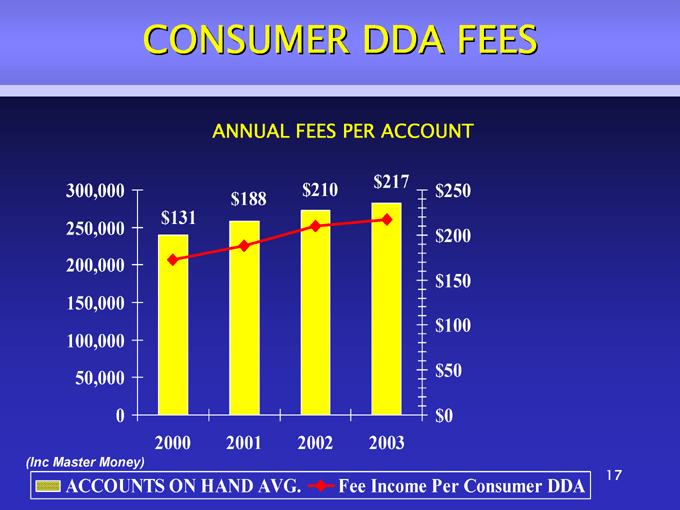
CONSUMER DDA FEES
ANNUAL FEES PER ACCOUNT
[Graphic Appears Here]
(Inc Master Money)
17
ACCOUNTS ON HAND AVG. Fee Income Per Consumer DDA
ANNUAL FEES PER ACCOUNT

STRATEGIC MERGER
Southern Financial Bank
18

SOUTHERN FINANCIAL
BANCORP, INC
• Founded in 1986
• Headquartered in Warrenton, Virginia
•$ 1.5 Billion Assets*
• 30 Branches*
• Middle Market and Small Business focus; Leading SBA lender
*Excludes Essex Tidewater Branches pending sale to Gateway
19

STRATEGIC FIT
Continues Provident’s market share expansion in the high growth markets of Virginia
20
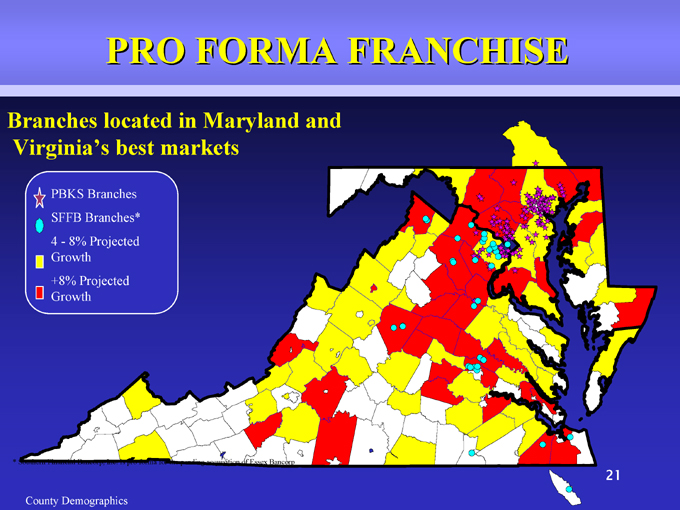
PRO FORMA FRANCHISE
Branches located in Maryland and Virginia’s best markets
PBKS Branches SFFB Branches* 4—8% Projected Growth +8% Projected Growth
* Southern Financial Bancorp, Inc. is pro forma for the pending acquisition of Essex Bancorp
21
County Demographics
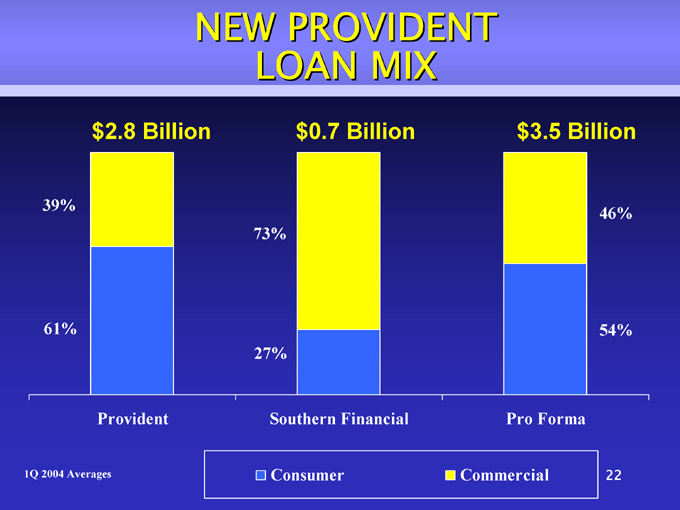
NEW PROVIDENT LOAN MIX
$2.8 Billion $0.7 Billion $3.5 Billion
46%39% 73% 61% 54% 27%
Southern Financial
Consumer Provident
1Q 2004 Averages
Pro Forma
Commercial
22
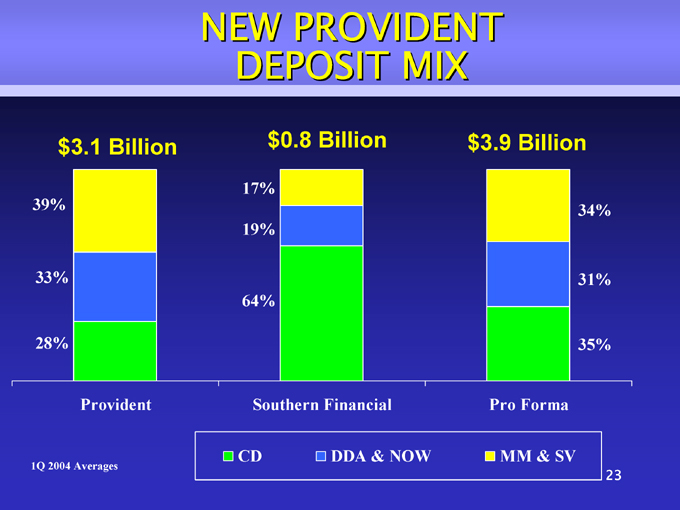
NEW PROVIDENT DEPOSIT MIX
$3.1 Billion $0.8 Billion
17% 39% 19% 33% 64% 28% $3.9 Billion
34% 31% 35% Provident
Southern Financial CD DDA & NOW MM & SV
1Q 2004 Averages
CULTURAL COMPATABILITY
Customer oriented Employee focused Community supporter Excellent credit quality
24
FINANCIAL OPPORTUNITY
• Accretive to GAAP and cash EPS in first full year of combined operations
• Deal costs and expense savings on target
• Combined loan composition well-balanced
• Significant potential for retail loan and deposit growth
25
Capital Recovery and Optimization Plan
• Liquidate $420 million low margin investment securities and associated debt
• Reduce scheduled investment purchases and borrowings through 2005
• Reduce scheduled acquired loan purchases beginning in 2005
26
Capital Recovery and Optimization Plan
• Return to pre-merger leverage and tangible capital levels –2005
• Use opportunity to reduce wholesale investments and funding
• Meet analyst consensus estimates for third and fourth quarters of 2004 and 2005
• Improve P/E multiple to be more reflective of peer group
27

IMPROVE FINANCIAL FUNDAMENTALS
28
PROVIDENT BANKSHARES
C O R P O R A T I O N
IMPROVE FINANCIAL
FUNDAMENTALS
CORE LOANS VS
TOTAL LOANS
$3.1 $2.7 $2.6
CORE DEPOSITS VS
TOTAL DEPOSITS
$3.6 $3.3 $3.1 $3.1 $2.8 $2.9
93% 90% $2.8 $2.7 $2.5 $2.1
74% $1.9 72% $1.5 $1.7 47% 82%
62 %
71 %
2001 2002
2003 1Q04
2001 2002
2003 1Q04
Core Total
Average Balances (billions)
CAGR Total Loans 2000-2003 (6.27%)
CAGR Core Loans 2000-2003 16.55%
CAGR Total Deposits 2000-2003 (7.37%) CAGR Core Deposits 2000-2003 6.78%
29
IMPROVE FINANCIAL
FUNDAMENTALS
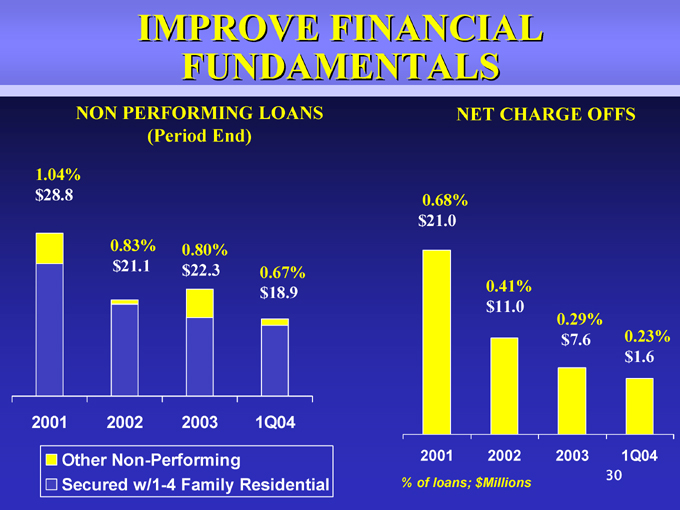
NON PERFORMING LOANS
(Period End)
1.04% $28.8
NET CHARGE OFFS
0.68% $21.0
0.41%
0.83% $21.1
0.80% $22.3 0.67% $18.9
[Graphic Appears Here]
[Graphic Appears Here]
$11.0
0.29% $7.6 0.23% $1.6
2001 2002
2003 1Q04
[Graphic Appears Here]
Other Non-Performing
Secured w/1-4 Family Residential
2001 2002
% of loans; $Millions
2003 1Q04 30
IMPROVE FINANCIAL
FUNDAMENTALS
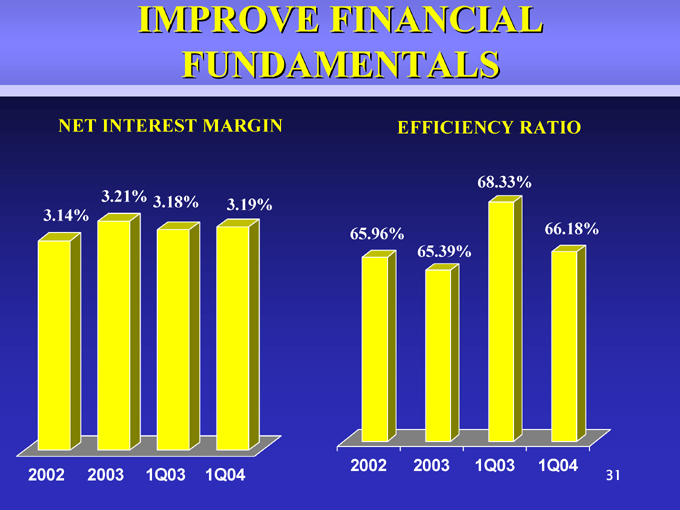
NET INTEREST MARGIN
3.21% 3.18% 3.19% 3.14%
2002 2003 1Q03 1Q04
EFFICIENCY RATIO
68.33% 65.96% 66.18% 65.39%
2002 2003 1Q03 1Q04
31
IMPROVE FINANCIAL
FUNDAMENTALS
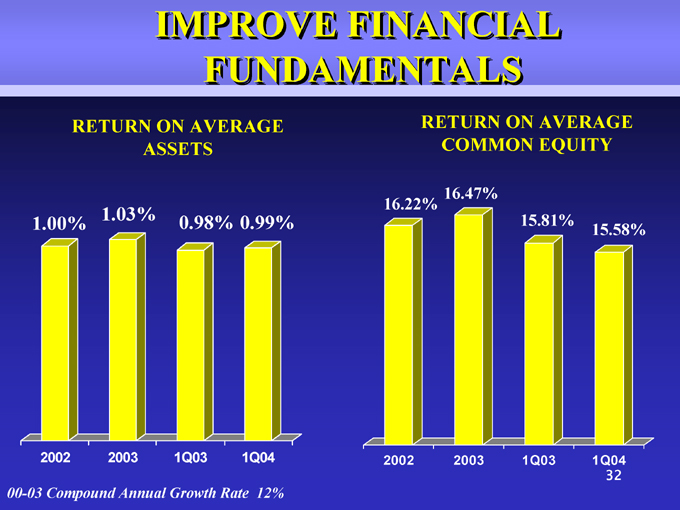
RETURN ON AVERAGE
ASSETS
1.00% 1.03% 0.98% 0.99%
2002 2003 1Q03 1Q04
00-03 Compound Annual Growth Rate 12%
RETURN ON AVERAGE
COMMON EQUITY
16.22% 16.47% 15.81% 15.58%
2002 2003 1Q03 1Q04
32
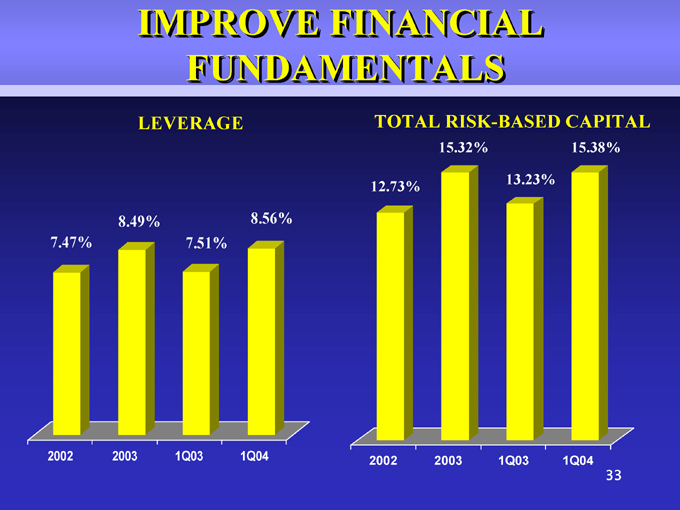
IMPROVE FINANCIAL
FUNDAMENTALS
LEVERAGE
TOTAL RISK-BASED CAPITAL
15.32% 15.38% 13.23% 12.73%
2002 2003 1Q03 1Q04
33
8.49% 8.56% 7.47% 7.51%
2002 2003 1Q03 1Q04
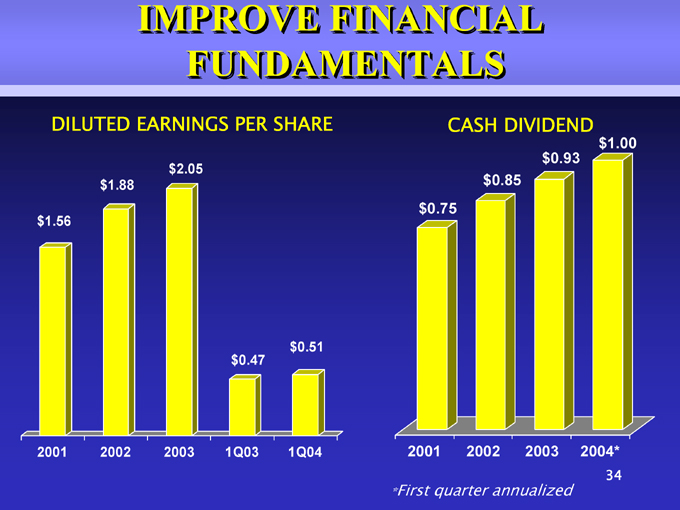
IMPROVE FINANCIAL
FUNDAMENTALS
DILUTED EARNINGS PER SHARE
CASH DIVIDEND
$1.00 $0.93 $0.85 $0.75
2001 2002 2003 2004*
34
*First quarter annualized
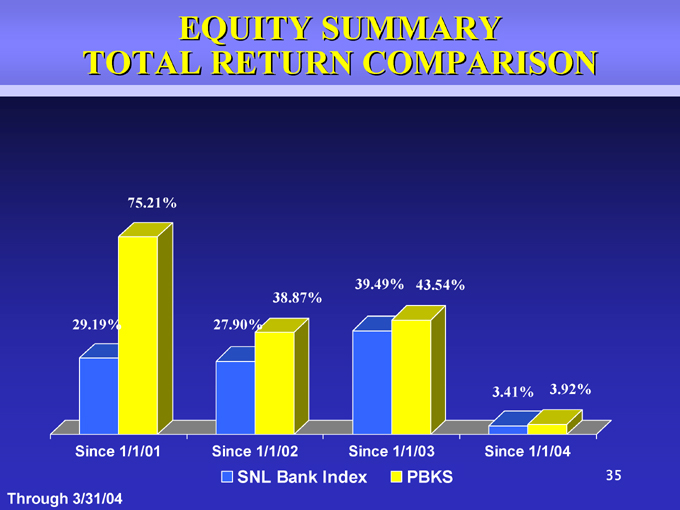
EQUITY SUMMARY TOTAL RETURN COMPARISON
SNL Bank Index PBKS
35
Through 3/31/04
75.21% 39.49% 43.54% 38.87% 29.19% 27.90% 3.41% 3.92%

INVESTMENT ATTRIBUTES
• Core balance sheet momentum
• Effective expansion strategy
• Growing market share in attractive markets
• Stable and improving credit quality
• Experienced management team
36

PROVIDENT BANKSHARES
C O R P O R A T I O N
PROVIDENT BANKSHARES
CORPORATION
(www.provbank.com)
Contact:
Media: Lillian Kilroy: (410) 277-2833
Investment Community: Tricia Ferrick: (540) 341-8073
37
PROVIDENT BANKSHARES
C O R P O R A T I O N