
PROVIDENT BANKSHARES CORPORATION
Ryan Beck & Co. Financial Institutions’ Investor Conference October 27, 2004
FORWARD-LOOKING STATEMENTS AND RISK FACTORS
This presentation, and other written materials and oral statements made by management, may contain certain forward-looking statements, including those regarding the Company’s prospective performance, plans, strategies and expectations, within the meaning of Section 27A of the Securities Act of 1933, as amended, and Section 21E of the Securities Exchange Act of 1934, as amended. The Company intends such forward-looking statements to be covered by the safe harbor provisions for forward-looking statements contained in the Private Securities Litigation Reform Act of 1995, and is including this statement for purposes of said harbor provisions.
Forward-looking statements, which are based on certain assumptions and describe future events, plans, strategies, and expectations of the Company, are generally identified by use of the words “plan,” “believe,” “expect,” “intend,” “anticipate,” “estimate,” “project,” or other similar expressions. The Company’s ability to predict results or the actual effects of its performance, plans, strategies and expectations, including those with respect to its merger with Southern Financial Bancorp, Inc., is inherently uncertain. Accordingly, actual results may differ materially from anticipated results.
The following factors, among others, could cause the actual results of the merger to differ materially from the expectations stated in this presentation: the ability to successfully integrate the companies following the merger, including the retention of key personnel; the ability to effect the proposed capital recovery and optimization plan; the ability to fully realize the expected cost savings and revenues; and the ability to realize the expected cost savings and revenues on a timely basis.
Factors that could have a material adverse effect on the operations of the Company and its subsidiaries include, but are not limited to: changes in general economic conditions, interest rates, deposit flows, loan demand, real estate values, competition, and the demand for financial services and loan, deposit, and investment products in the Company’s local markets; changes in the quality or composition of the loan or investment portfolios; inability to successfully carry out marketing and/or expansion plans; changes in accounting principles, policies, or guidelines; changes in legislation and regulation; changes in the monetary and fiscal policies of the U.S. Government, including policies of the U.S. Treasury and the Federal Reserve Board; war or terrorist activities; and other economic, competitive, governmental, regulatory, geopolitical, and technological factors affecting the Company’s operations, pricing, and services.
The Company undertakes no obligation to update these forward-looking statements to reflect events or circumstances that occur after the date on which such statements were made.
2

HIGH PERFORMANCE CHECKING
HISTORY
1886 - Founded as a Mutual Thrift 1987 - Converted to Commercial Bank 1990 - Change in Leadership
4
PROVIDENT BANKSHARES
CORPORATION
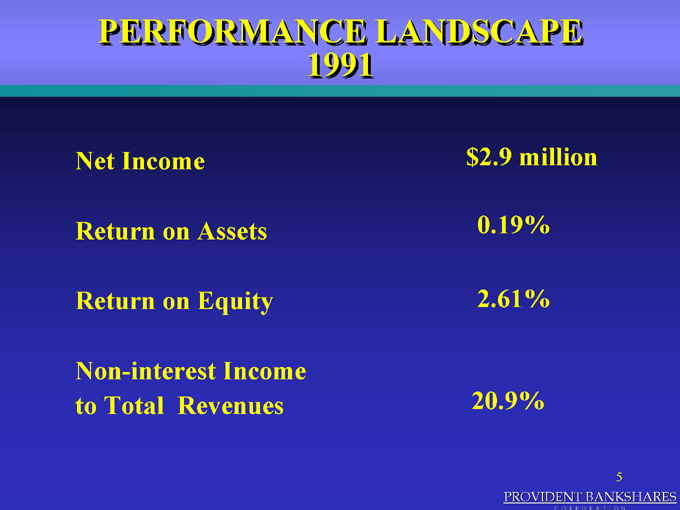
PERFORMANCE LANDSCAPE
1991
Net Income $2.9 million
Return on Assets 0.19%
Return on Equity 2.61%
Non-interest Income to Total Revenues 20.9%
5
PROVIDENT BANKSHARES
CORPORATION

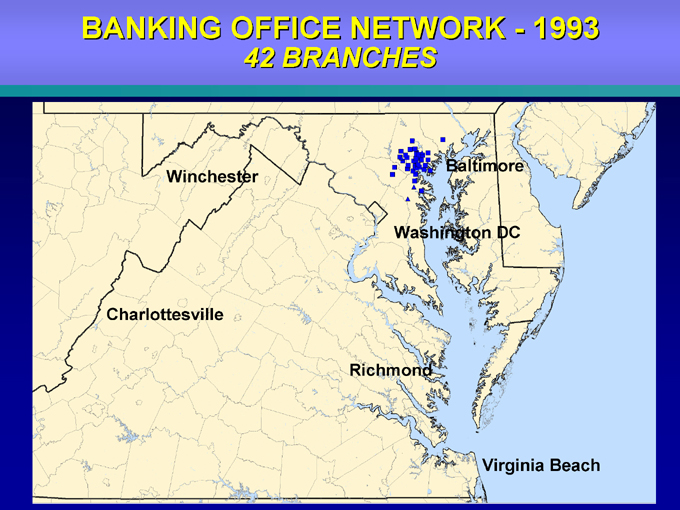
BANKING OFFICE NETWORK - 1993
42 BRANCHES
Winchester
Charlottesville
Baltimore
Washington DC
Richmond
Virginia Beach
RETAIL EXPANSION STRATEGY
Launch High Performance Checking Campaign
Delivery through Spoke and Hub Branch Network Finance with Leverage Capital
Strategic Alliances
7
PROVIDENT BANKSHARES
CORPORATION
HIGH PERFORMANCE CHECKING
Lead with Totally Free Checking
Deliver through In-Store/Traditional Branching
Intense Marketing Initiative
8
PROVIDENT BANKSHARES
CORPORATION
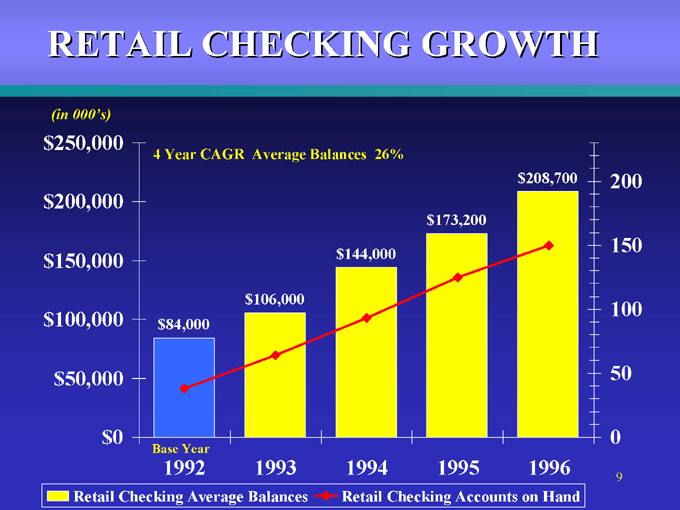
RETAIL CHECKING GROWTH
(in 000’s)
$250,000 $200,000 $150,000 $100,000 $50,000 $0
4 Year CAGR Average Balances 26%
$84,000 $106,000 $144,000 $173,200 $208,700
Base Year
1992 1993 1994 1995 1996
200 150 100 50 0
Retail Checking Average Balances Retail Checking Accounts on Hand
9
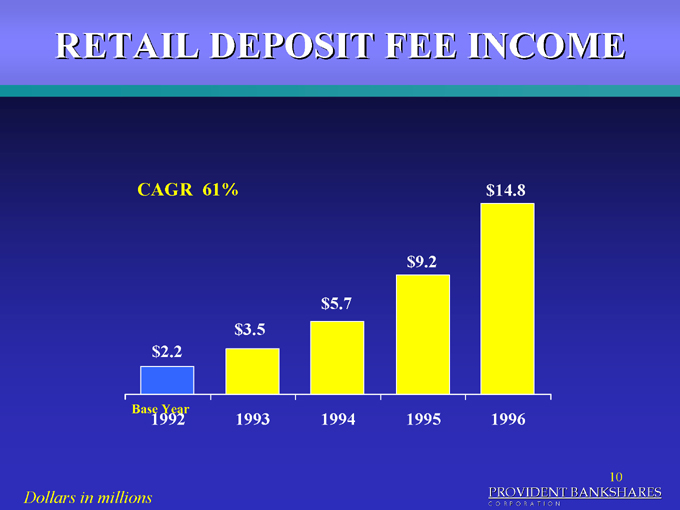
RETAIL DEPOSIT FEE INCOME
CAGR 61%
$2.2 $3.5 $5.7 $9.2 $14.8
Base Year
1992 1993 1994 1995 1996
Dollars in millions
10
PROVIDENT BANKSHARES
CORPORATION
IN-STORE STRATEGY
High Performance Checking Delivery Spoke and Hub Approach Provident In-Store Distinction
Product Partners
People Program
11
PROVIDENT BANKSHARES
CORPORATION

MAKING PROGRESS PERFORMANCE LANDSCAPE
1991 1997
Net Income $2.9 million $25 million
Return on Assets 0.19% 0.68%
Return on Equity 2.61% 9.91%
Non-interest Income to Total Revenues 20.9% 25.4%
12
PROVIDENT BANKSHARES
CORPORATION

STRATEGIC ALLIANCES
1997
Expansion into Washington Metro Area
Merger with First Citizens Financial Corporation
Partnership with Shoppers Food
13
PROVIDENT BANKSHARES
CORPORATION
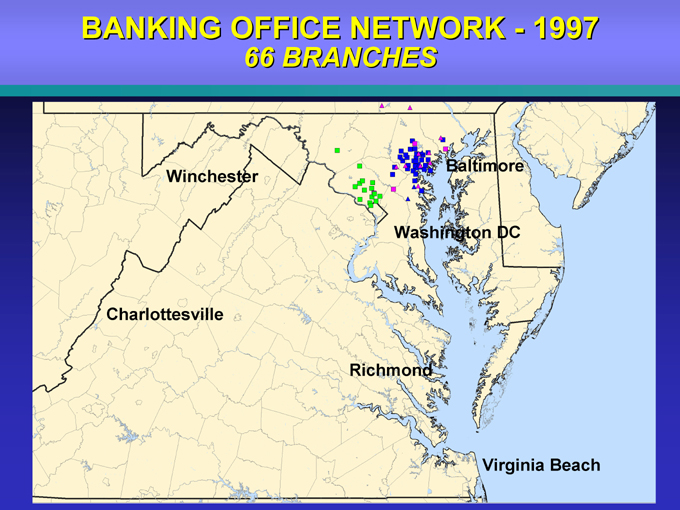
BANKING OFFICE NETWORK - 1997 66 BRANCHES
Winchester
Charlottesville
Baltimore
Washington DC
Richmond
Virginia Beach
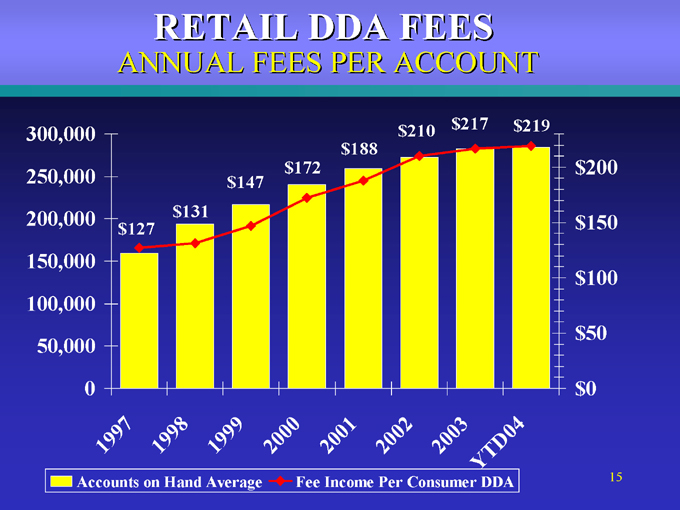
RETAIL DDA FEES
ANNUAL FEES PER ACCOUNT
300,000 250,000 200,000 150,000 100,000 50,000 0
1997 1998 1999 2000 2001 2002 2003 YTD04
$200 $150 $100 $50 $0
$210 $217 $219 $188 $172 $147 $131 $127
Accounts on Hand Average Fee Income Per Consumer DDA 15

RETAIL DDA FEES
ANNUAL FEES PER ACCOUNT
300,000 250,000 200,000 150,000 100,000 50,000 0
1993 1994 1995 1996 1997 1998 1999 2000 2001 2002 2003 YTD04
$200 $150 $100 $50 $0
Accounts on Hand Average Fee Income Per Consumer DDA
16
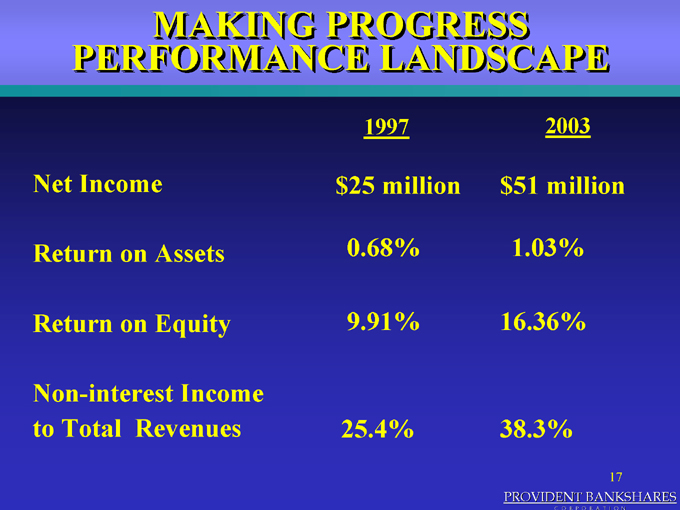
MAKING PROGRESS PERFORMANCE LANDSCAPE
1997 2003
Net Income $25 million $51 million
Return on Assets 0.68% 1.03%
Return on Equity 9.91% 16.36%
Non-interest Income
to Total Revenues 25.4% 38.3%
17
PROVIDENT BANKSHARES
CORPORATION
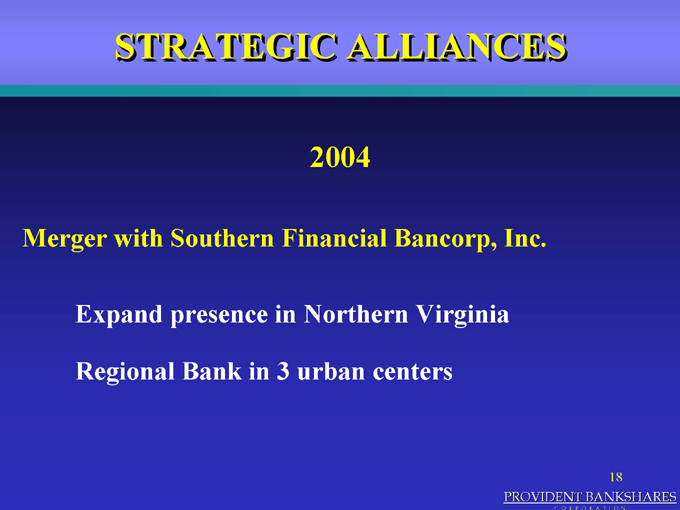
STRATEGIC ALLIANCES
2004
Merger with Southern Financial Bancorp, Inc.
Expand presence in Northern Virginia
Regional Bank in 3 urban centers
18
PROVIDENT BANKSHARES
CORPORATION
BANKING OFFICE NETWORK - 1993 42 BRANCHES
Winchester
Charlottesville
Baltimore
Washington DC
Richmond
Virginia Beach
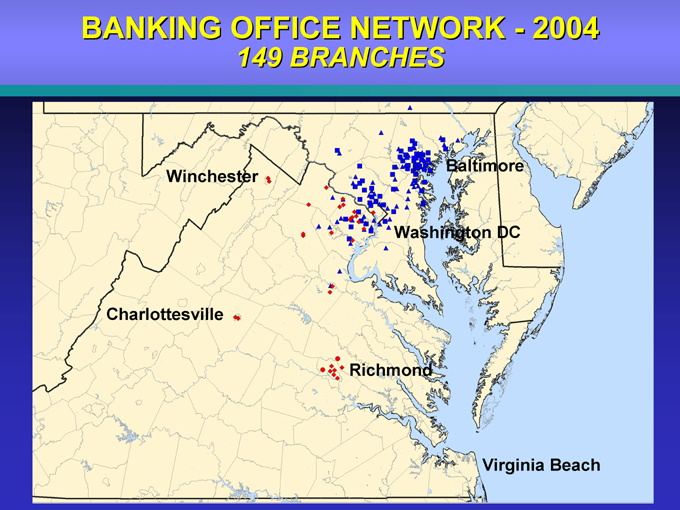
BANKING OFFICE NETWORK - 2004 149 BRANCHES
Winchester
Charlottesville
Baltimore
Washington DC
Richmond
Virginia Beach
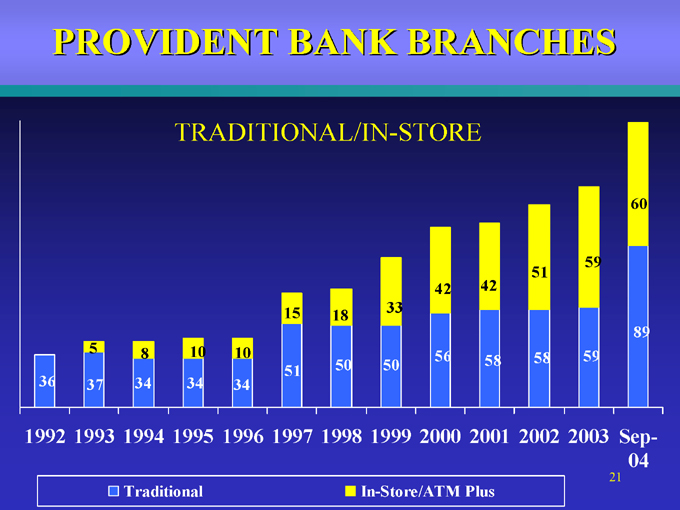
PROVIDENT BANK BRANCHES
TRADITIONAL/IN-STORE
1992 1993 1994 1995 1996 1997 1998 1999 2000 2001 2002 2003 Sep-04
60
59 51
42 42
15 33 18
89
5 8 10 10
56 58 58 59
51 50 50
36 37 34 34 34
Traditional In-Store/ATM Plus
21
SOUTHERN FINANCIAL RETAIL OPPORTUNITY
Retail Growth
No consumer focus
Branch network
Checking /Home Equity penetration
22
PROVIDENT BANKSHARES
CORPORATION
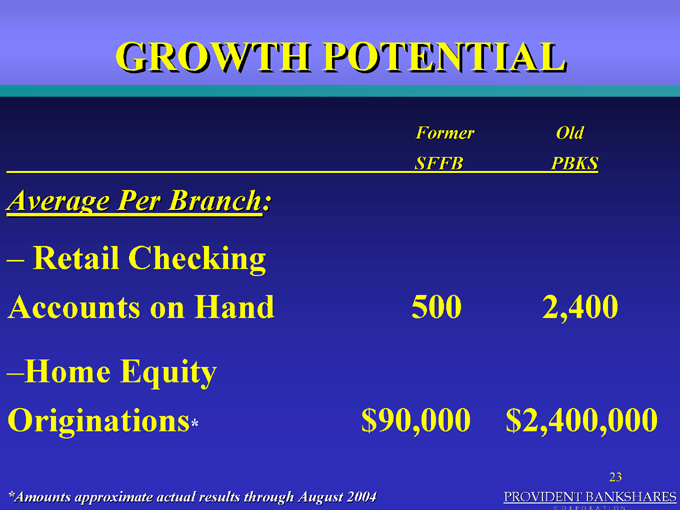
GROWTH POTENTIAL
Former SFFB Old PBKS
Average Per Branch:
Retail Checking
Accounts on Hand 500 2,400
Home Equity
Originations* $90,000 $2,400,000
23
*Amounts approximate actual results through August 2004 PROVIDENT BANKSHARES
CORPORATION
CURRENT INITIATIVES
SMALL BUSINESS
SEGMENTATION
CROSS - SELL INITIATIVE
24
PROVIDENT BANKSHARES
CORPORATION
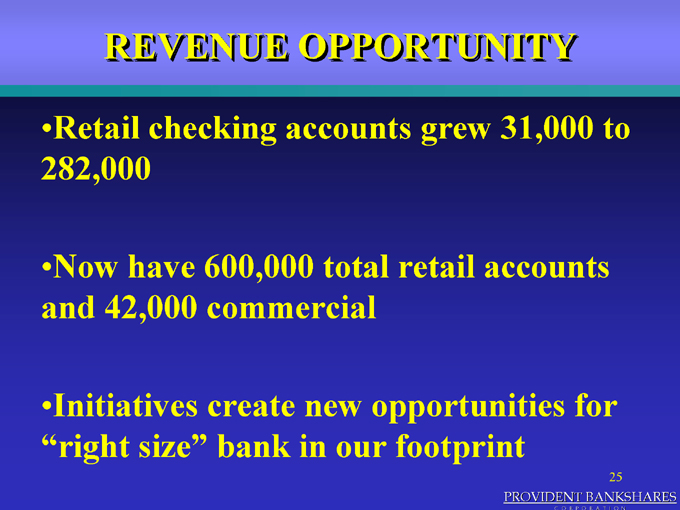
REVENUE OPPORTUNITY
Retail checking accounts grew 31,000 to 282,000
Now have 600,000 total retail accounts and 42,000 commercial
Initiatives create new opportunities for “right size” bank in our footprint
25
PROVIDENT BANKSHARES
CORPORATION

PROVIDENT BANKSHARES
CORPORATION
(www.provbank.com)
Contact:
Media: Lillian Kilroy: (410) 277-2833
Investment Community: Tricia Ferrick: (703) 352-2583
26