
PROVIDENT BANKSHARES CORPORATION
Sandler O’Neill & Partners, L.P.
Financial Services Conference November 11, 2004

FORWARD-LOOKING STATEMENTS AND RISK FACTORS
This presentation, and other written materials and oral statements made by management, may contain certain forward-looking statements, including those regarding the Company’s prospective performance, plans, strategies and expectations, within the meaning of Section 27A of the Securities Act of 1933, as amended, and Section 21E of the Securities Exchange Act of 1934, as amended. The Company intends such forward-looking statements to be covered by the safe harbor provisions for forward-looking statements contained in the Private Securities Litigation Reform Act of 1995, and is including this statement for purposes of said harbor provisions.
Forward-looking statements, which are based on certain assumptions and describe future events, plans, strategies, and expectations of the Company, are generally identified by use of the words “plan,” “believe,” “expect,” “intend,” “anticipate,” “estimate,” “project,” or other similar expressions. The Company’s ability to predict results or the actual effects of its performance, plans, strategies and expectations, including those with respect to its merger with Southern Financial Bancorp, Inc., is inherently uncertain. Accordingly, actual results may differ materially from anticipated results. The following factors, among others, could cause the actual results of the merger to differ materially from the expectations stated in this presentation: the ability to successfully integrate the companies following the merger, including the retention of key personnel; the ability to effect the proposed capital recovery and optimization plan; the ability to fully realize the expected cost savings and revenues; and the ability to realize the expected cost savings and revenues on a timely basis.
Factors that could have a material adverse effect on the operations of the Company and its subsidiaries include, but are not limited to: changes in general economic conditions, interest rates, deposit flows, loan demand, real estate values, competition, and the demand for financial services and loan, deposit, and investment products in the Company’s local markets; changes in the quality or composition of the loan or investment portfolios; inability to successfully carry out marketing and/or expansion plans; changes in accounting principles, policies, or guidelines; changes in legislation and regulation; changes in the monetary and fiscal policies of the U.S. Government, including policies of the U.S. Treasury and the Federal Reserve Board; war or terrorist activities; and other economic, competitive, governmental, regulatory, geopolitical, and technological factors affecting the Company’s operations, pricing, and services.
The Company undertakes no obligation to update these forward-looking statements to reflect events or circumstances that occur after the date on which such statements were made.
2

AGENDA
HISTORY ‘THE NEW PROVIDENT’ KEY STRATEGIES
INVESTMENT ATTRIBUTES
3
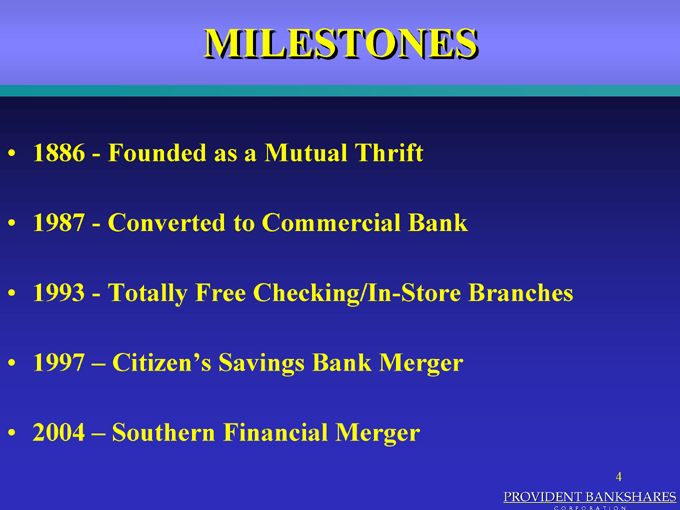
MILESTONES
1886—Founded as a Mutual Thrift
1987—Converted to Commercial Bank
1993—Totally Free Checking/In-Store Branches
1997 – Citizen’s Savings Bank Merger
2004 – Southern Financial Merger
4

THE NEW PROVIDENT What We Are
Consumer and Commercial Banking Focus Access to Executive Management 430,000 Customer Relationships
149 Branches in the Key Urban Metropolitan areas of Baltimore, Washington and Richmond
The “Right Size” Bank
5
THE “RIGHT SIZE” BANK
“We will continue to provide the products and services of our largest competitors, while delivering the level of service found in only the best community banks.”
6
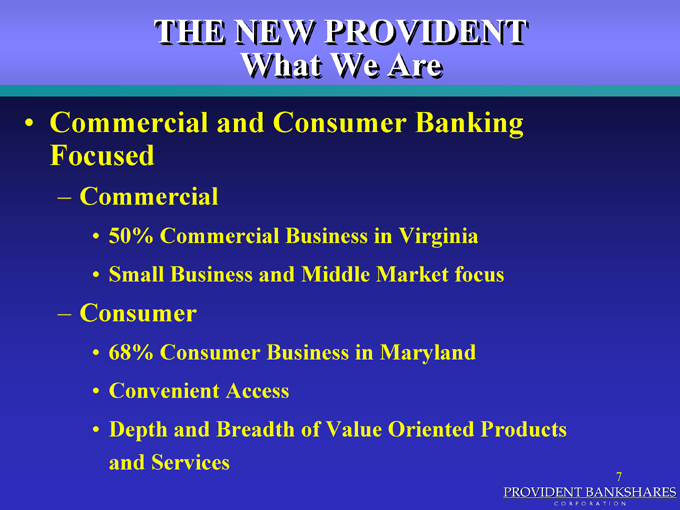
THE NEW PROVIDENT
What We Are
Commercial and Consumer Banking Focused
– Commercial
50% Commercial Business in Virginia
Small Business and Middle Market focus
– Consumer
68% Consumer Business in Maryland
Convenient Access
Depth and Breadth of Value Oriented Products and Services
7
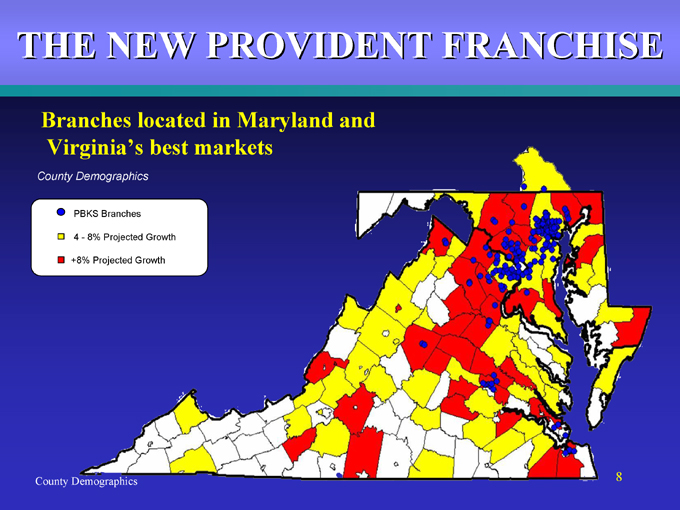
THE NEW PROVIDENT FRANCHISE
Branches located in Maryland and Virginia’s best markets
County Demographics
PBKS Branches
4—8% Projected Growth
+8% Projected Growth
County Demographics
8
WHAT WE ARE NOT
Trust Department
Mortgage Banking
Large Corporate Banking
International Banking
9

KEY STRATEGIES
Broaden Presence and Customer Base in Washington Metro and Virginia Grow Commercial Banking Franchise in the Maryland and Virginia Markets
Grow Consumer Banking Franchise in the Maryland and Virginia Markets
Improve Financial Fundamentals
10

BROADEN PRESENCE AND
CUSTOMER BASE IN WASHINGTON METRO AND
VIRGINIA
11
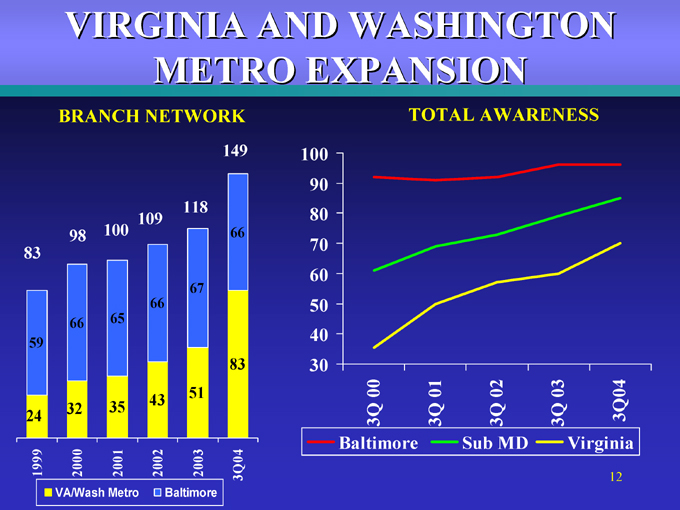
VIRGINIA AND WASHINGTON
METRO EXPANSION
BRANCH NETWORK
83 98 100 109 118 149 59 66 65 66 67 66 24 32 35 43 51 83
1999 2000 2001 2002 2003 3Q04
VA/Wash Metro Baltimore
TOTAL AWARENESS
100 90 80 70 60 50 40 30
3Q 00 3Q 01 3Q 02 3Q 03 3Q04
Baltimore Sub MD Virginia
12
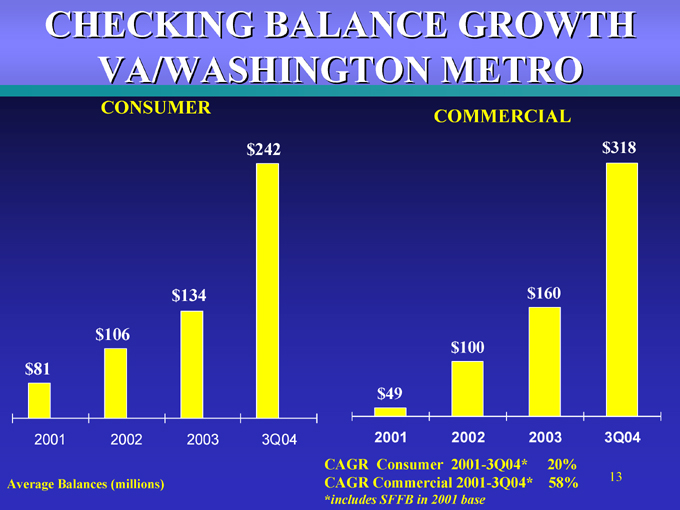
CHECKING BALANCE GROWTH
VA/WASHINGTON METRO
CONSUMER
$81 $106 $134 $242
2001 2002 2003 3Q04
Average Balances (millions)
COMMERCIAL
$318 $49 $100 $160
2001 2002 2003 3Q04
CAGR Consumer 2001-3Q04* 20% CAGR Commercial 2001-3Q04* 58% 13
*includes SFFB in 2001 base

GROW COMMERCIAL BANKING FRANCHISE IN THE MARYLAND
AND VIRGINIA MARKETS
14
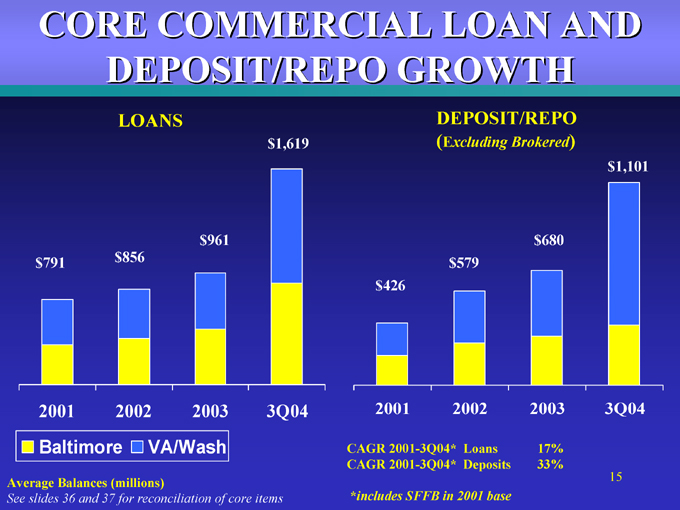
CORE COMMERCIAL LOAN AND
DEPOSIT/REPO GROWTH
LOANS
$791 $856 $961 $1,619
2001 2002 2003 3Q04
Baltimore VA/Wash
Average Balances (millions)
See slides 36 and 37 for reconciliation of core items
DEPOSIT/REPO
(Excluding Brokered) $426 $579 $680 $1,101
2001 2002 2003 3Q04
CAGR 2001-3Q04* Loans 17% CAGR 2001-3Q04* Deposits 33%
15
*includes SFFB in 2001 base
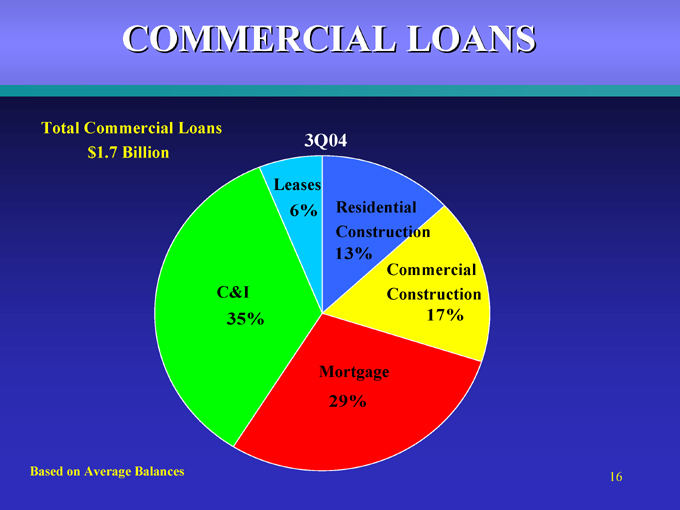
COMMERCIAL LOANS
Total Commercial Loans $1.7 Billion
3Q04
Leases
6%
Residential Construction
13%
Commercial Construction
17%
Mortgage
29%
C&I
35%
Based on Average Balances
16

GROW CONSUMER BANKING
FRANCHISE IN MARYLAND AND VIRGINIA MARKETS
17
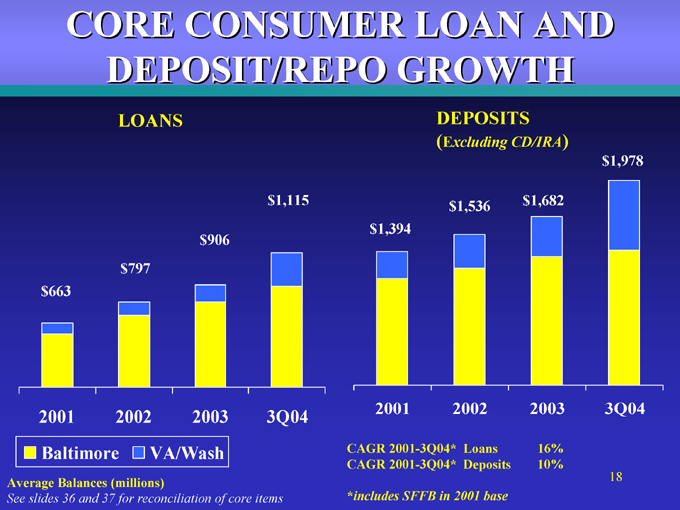
CORE CONSUMER LOAN AND
DEPOSIT/REPO GROWTH
LOANS
$663 $797 $906 $1,115
2001 2002 2003 3Q04
Baltimore VA/Wash
Average Balances (millions)
See slides 36 and 37 for reconciliation of core items
DEPOSITS
(Excluding CD/IRA) $1,394 $1,536 $1,682 $1,978
2001 2002 2003 3Q04
CAGR 2001-3Q04* Loans 16% CAGR 2001-3Q04* Deposits 10%
18
*includes SFFB in 2001 base
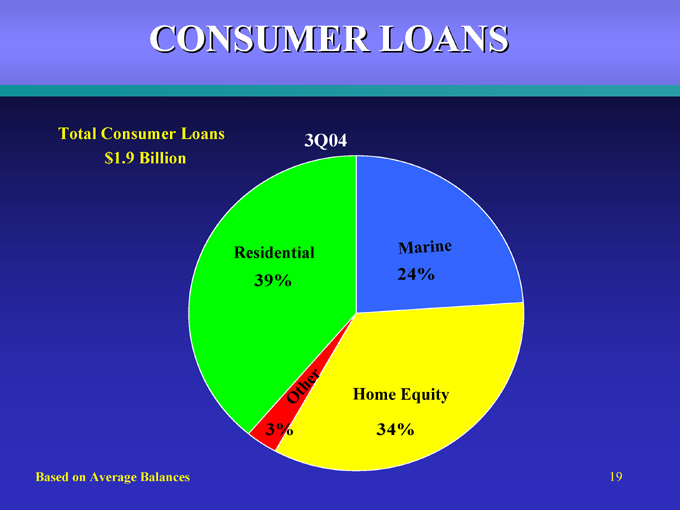
CONSUMER LOANS
Total Consumer Loans $1.9 Billion
3Q04
Residential
39%
Marine 24%
Home Equity 34%
3% Other
19
Based on Average Balances

PROVIDENT’S IN-STORE
DIFFERENCE
*PEOPLE* *PRODUCT*
*PARTNERS *PROGRAM
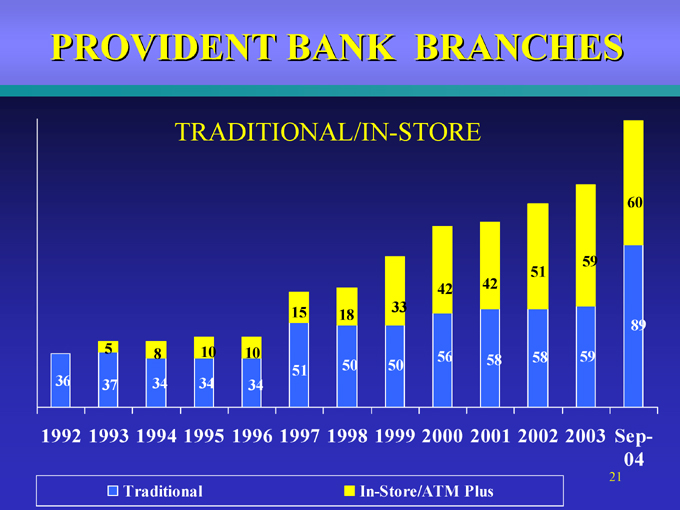
PROVIDENT BANK BRANCHES
TRADITIONAL/IN-STORE
1992 1993 1994 1995 1996 1997 1998 1999 2000 2001 2002 2003 Sep-04
Traditional
In-Store/ATM Plus
36 5 37 8 34 10 34 10 34 15 51 18 50 33 50 42 56 42 58 51 58 59 59 60 89
21
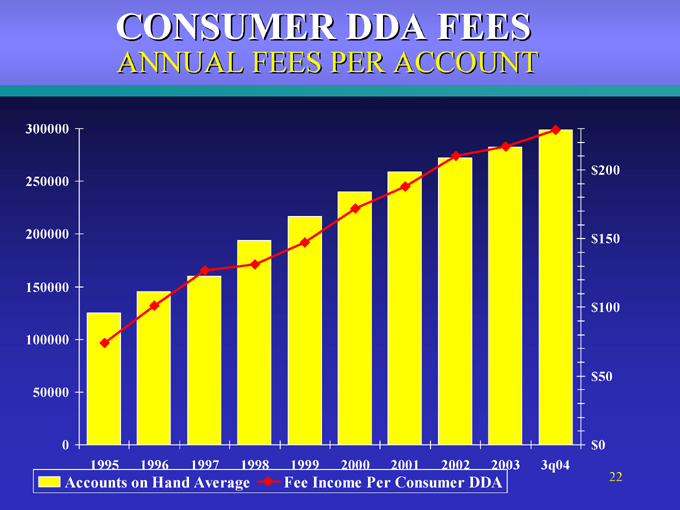
CONSUMER DDA FEES
ANNUAL FEES PER ACCOUNT
300000 250000 200000 150000 100000 50000 0
1995 1996 1997 1998 1999 2000 2001 2002 2003 3q04
Accounts on Hand Average
Fee Income Per Consumer DDA
$200 $150 $100 $50 $0
22

IMPROVE FINANCIAL
FUNDAMENTALS
23

THE NEW PROVIDENT
TRANSFORMED BALANCE SHEET HIGHER ABSOLUTE EARNINGS IMPROVED EARNINGS QUALITY
24
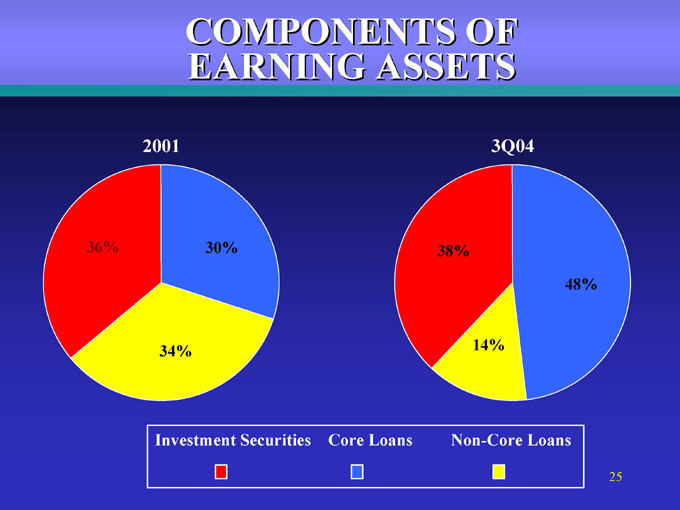
COMPONENTS OF EARNING ASSETS
2001
36%
30%
34%
3Q04
38%
48%
14%
Investment Securities Core Loans Non-Core Loans
25
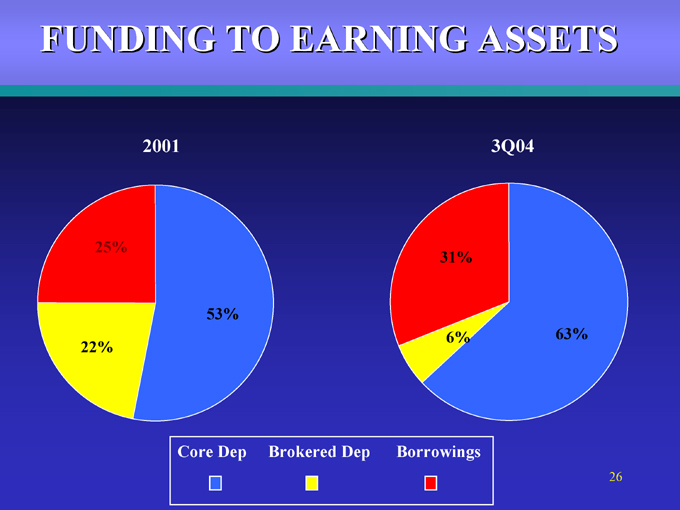
FUNDING TO EARNING ASSETS
2001
25%
22%
53%
3Q04
31%
6%
63%
Core Dep Brokered Dep Borrowings
26
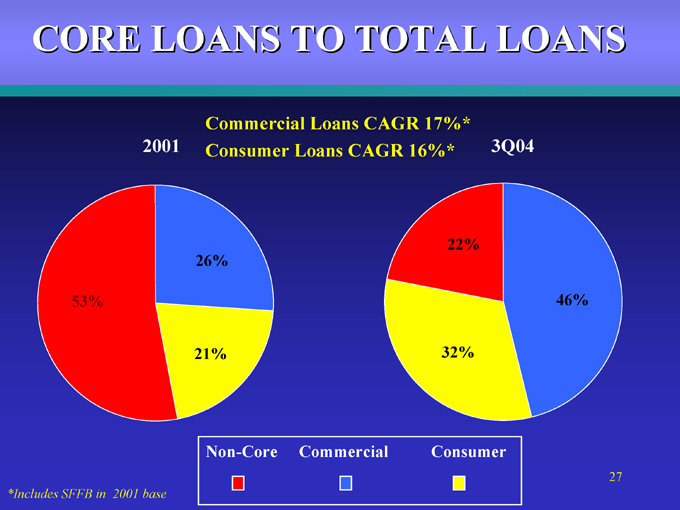
CORE LOANS TO TOTAL LOANS
Commercial Loans CAGR 17%* 2001 Consumer Loans CAGR 16%* 3Q04
53%
26%
21%
22%
32%
46%
*Includes SFFB in 2001 base
Non-Core Commercial Consumer
27
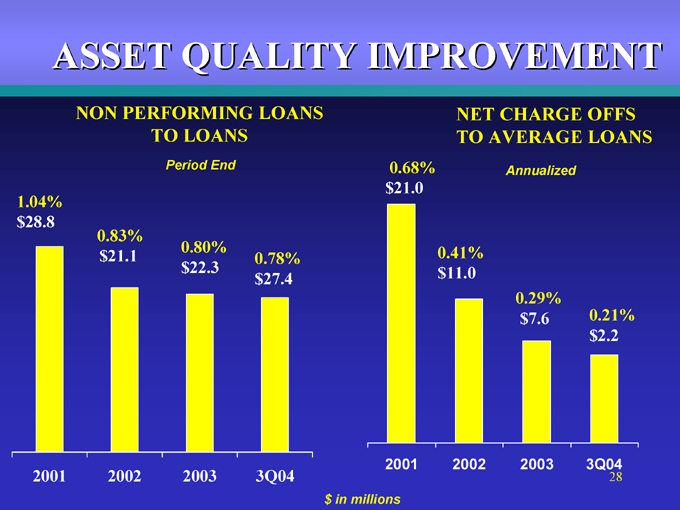
ASSET QUALITY IMPROVEMENT
NON PERFORMING LOANS
TO LOANS
Period End
1.04% $28.8
0.83% $21.1
0.80% $22.3
0.78% $27.4
2001 2002 2003 3Q04
NET CHARGE OFFS TO AVERAGE LOANS
Annualized
0.68% $21.0
0.41% $11.0
0.29% $7.6
0.21% $2.2
2001 2002 2003 3Q04
28 $ in millions
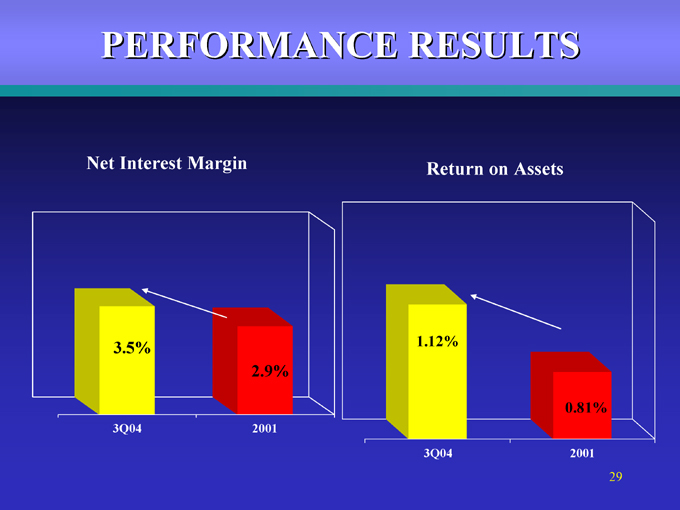
PERFORMANCE RESULTS
Net Interest Margin Return on Assets
3.5%
2.9%
3Q04
2001
1.12%
0.81%
3Q04
2001
29
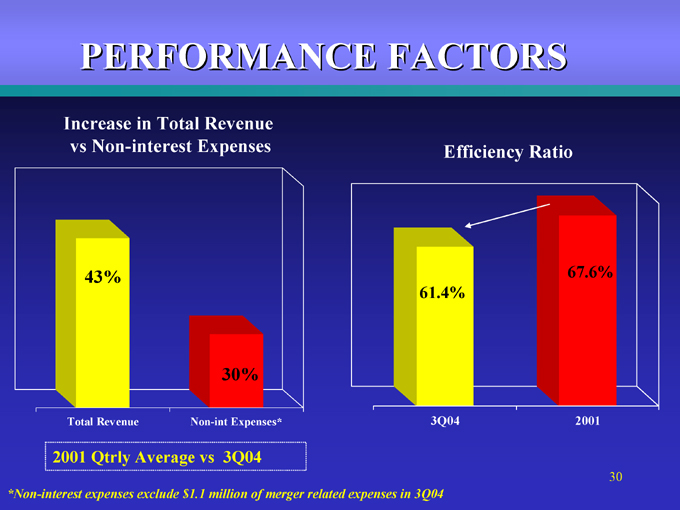
PERFORMANCE FACTORS
Increase in Total Revenue vs Non-interest Expenses
Efficiency Ratio
43%
30%
61.4%
67.6%
Total Revenue Non-int Expenses*
2001 Qtrly Average vs 3Q04
3Q04 2001
*Non-interest expenses exclude $1.1 million of merger related expenses in 3Q04
30
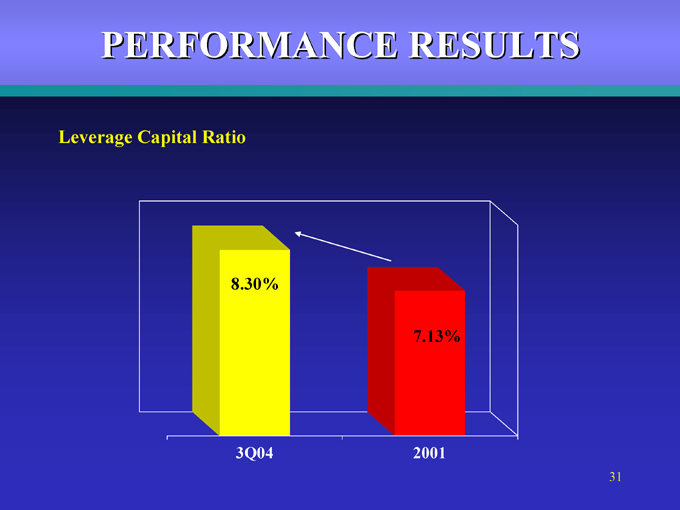
PERFORMANCE RESULTS
Leverage Capital Ratio
8.30%
7.13%
3Q04 2001
31
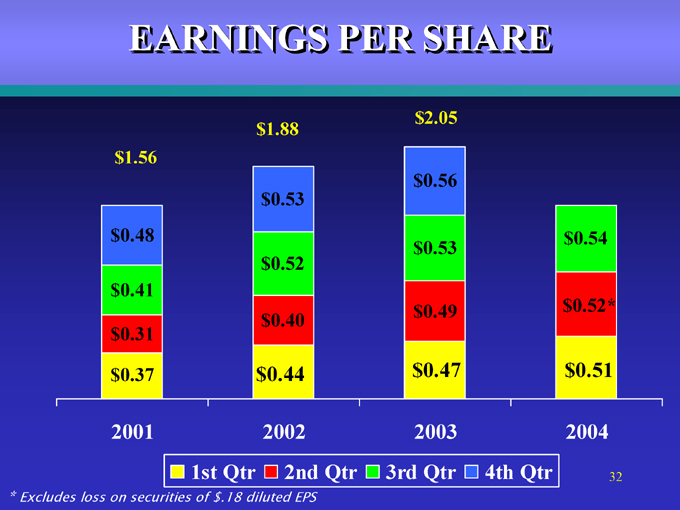
EARNINGS PER SHARE
$1.56 $1.88 $2.05 $0.48
$0.41 $0.31 $0.37 $0.53 $0.52 $0.40
$0.44 $0.56 $0.53 $0.49
$0.47 $0.54
$0.52*
$0.51
2001 2002 2003 2004
1st Qtr 2nd Qtr 3rd Qtr 4th Qtr
* Excludes loss on securities of $.18 diluted EPS
32
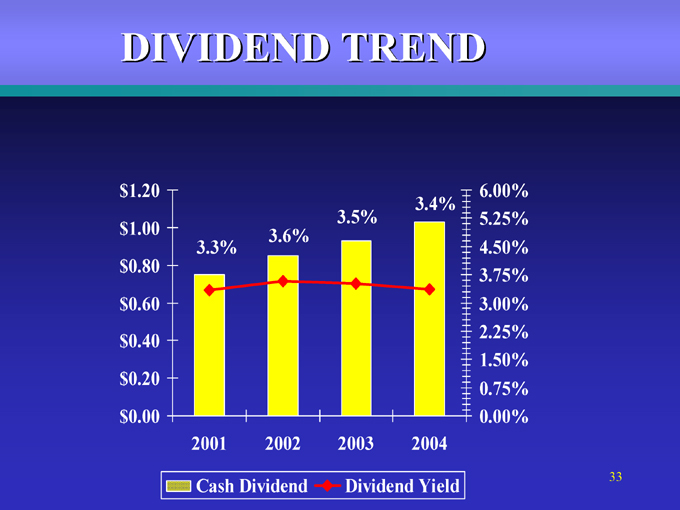
DIVIDEND TREND
$1.20 $1.00 $0.80 $0.60 $0.40 $0.20 $0.00
2001 2002 2003 2004
6.00% 5.25% 4.50% 3.75% 3.00% 2.25% 1.50% 0.75% 0.00%
3.3%
3.6%
3.5%
3.4%
Cash Dividend Dividend Yield
33
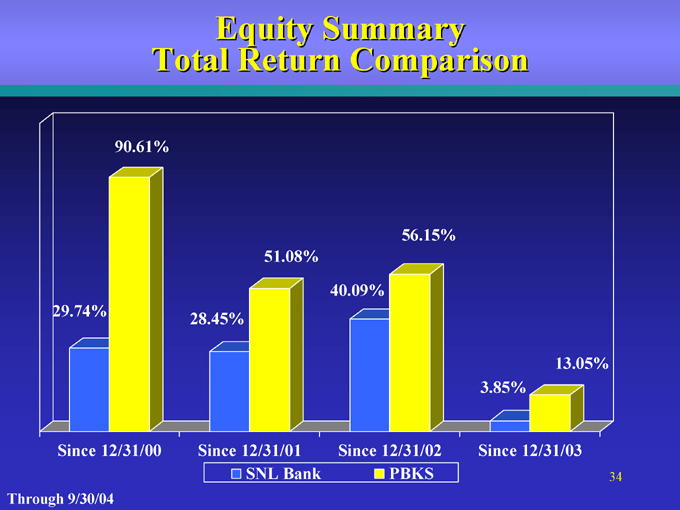
Equity Summary Total Return Comparison
90.61%
29.74%
28.45%
51.08%
40.09%
56.15%
3.85%
13.05%
Since 12/31/00 Since 12/31/01 Since 12/31/02 Since 12/31/03
SNL Bank PBKS
34
Through 9/30/04

INVESTMENT ATTRIBUTES
Core balance sheet momentum
Effective expansion strategy
Growing market share in attractive markets
Stable and improving credit quality
Experienced management team
35

DEFINITIONS
Core Loans
– Originated by Provident; participations in our defined market area
– Core Consumer includes home equity loans and lines, marine, other installment loans
– Core Commercial includes real estate, commercial loans and lines and leases
Non-Core Loans
– Purchased loans; participations outside our defined market area; discontinued product lines
Core Deposits
– All deposits except brokered deposits 36
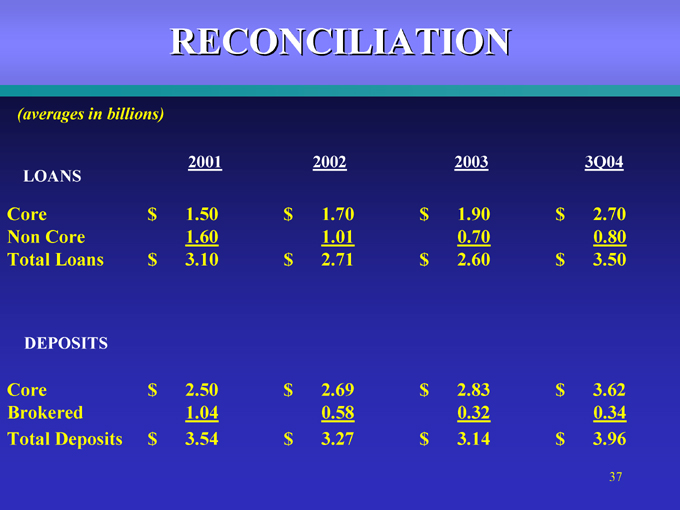
RECONCILIATION
(averages in billions)
2001 2002 2003 3Q04
LOANS
Core $1.50 $1.70 $1.90 $2.70
Non Core 1.60 1.01 0.70 0.80
Total Loans $3.10 $2.71 $2.60 $3.50
DEPOSITS
Core $2.50 $2.69 $2.83 $3.62
Brokered 1.04 0.58 0.32 0.34
Total Deposits $3.54 $3.27 $3.14 $3.96
37

PROVIDENT BANKSHARES
CORPORATION
(www.provbank.com)
Contact:
Media: Lillian Kilroy: (410) 277-2833
Investment Community: Tricia Ferrick: (703) 352-2583
38