
PROVIDENT BANKSHARES CORPORATION
Keefe, Bruyette & Woods Regional Bank Conference March 2, 2005
FORWARD-LOOKING STATEMENTS AND RISK FACTORS
This presentation, and other written materials and oral statements made by management, may contain certain forward-looking statements, including those regarding the Company’s prospective performance, plans, strategies and expectations, within the meaning of Section 27A of the Securities Act of 1933, as amended, and Section 21E of the Securities Exchange Act of 1934, as amended. The Company intends such forward-looking statements to be covered by the safe harbor provisions for forward-looking statements contained in the Private Securities Litigation Reform Act of 1995, and is including this statement for purposes of said harbor provisions.
Forward-looking statements, which are based on certain assumptions and describe future events, plans, strategies, and expectations of the Company, are generally identified by use of the words “plan,” “believe,” “expect,” “intend,” “anticipate,” “estimate,” “project,” or other similar expressions. The Company’s ability to predict results or the actual effects of its performance, plans, strategies and expectations, including those with respect to its merger with Southern Financial Bancorp, Inc., is inherently uncertain. Accordingly, actual results may differ materially from anticipated results. The following factors, among others, could cause the actual results of the merger to differ materially from the expectations stated in this presentation: the ability to successfully integrate the companies following the merger, including the retention of key personnel; the ability to effect the proposed capital recovery and optimization plan; the ability to fully realize the expected cost savings and revenues; and the ability to realize the expected cost savings and revenues on a timely basis.
Factors that could have a material adverse effect on the operations of the Company and its subsidiaries include, but are not limited to: changes in general economic conditions, interest rates, deposit flows, loan demand, real estate values, competition, and the demand for financial services and loan, deposit, and investment products in the Company’s local markets; changes in the quality or composition of the loan or investment portfolios; inability to successfully carry out marketing and/or expansion plans; changes in accounting principles, policies, or guidelines; changes in legislation and regulation; changes in the monetary and fiscal policies of the U.S. Government, including policies of the U.S. Treasury and the Federal Reserve Board; war or terrorist activities; and other economic, competitive, governmental, regulatory, geopolitical, and technological factors affecting the Company’s operations, pricing, and services.
The Company undertakes no obligation to update these forward-looking statements to reflect events or circumstances that occur after the date on which such statements were made.
2

AGENDA
COMPANY BACKGROUND PROVIDENT - ‘YESTERDAY’ PROVIDENT - ‘TODAY’ KEY STRATEGIES - ‘TOMORROW’ FINANCIAL PERFORMANCE
3
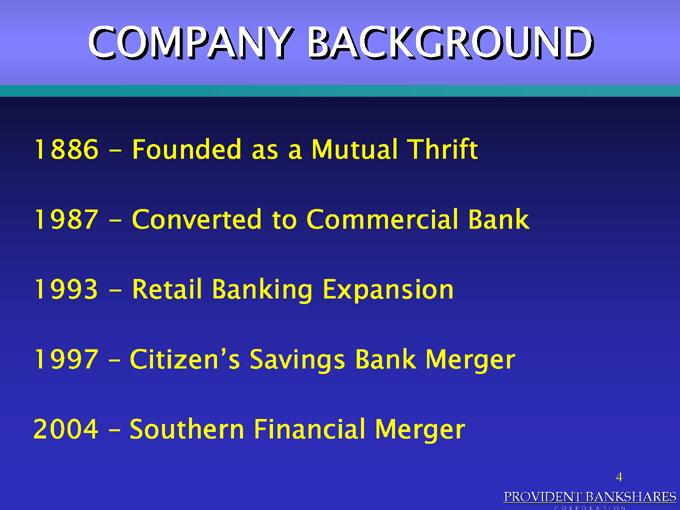
COMPANY BACKGROUND
1886 - Founded as a Mutual Thrift 1987 - Converted to Commercial Bank 1993 - Retail Banking Expansion 1997 - Citizen’s Savings Bank Merger
2004 - Southern Financial Merger
4
PROVIDENT BANKSHARES
CORPORATION
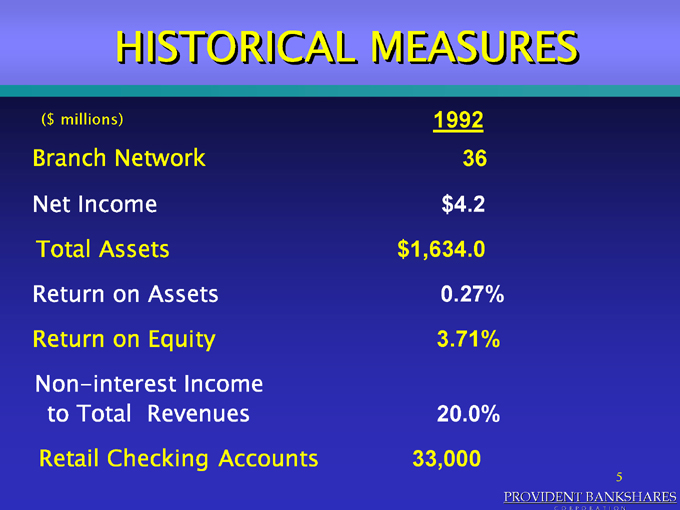
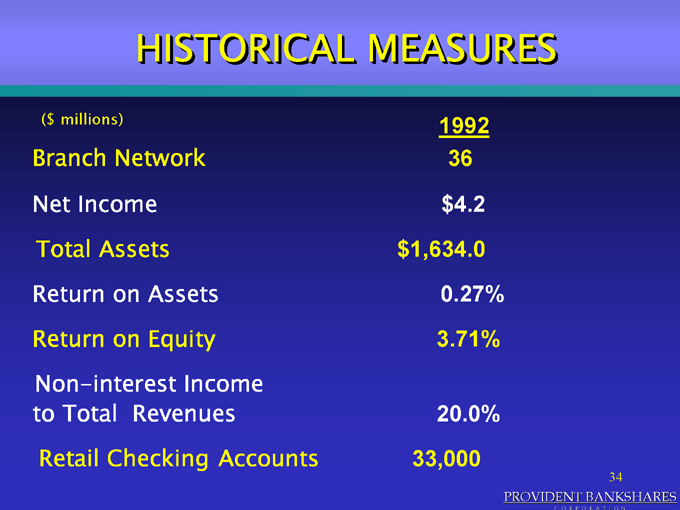
HISTORICAL MEASURES
($ millions) 1992
Branch Network 36 Net Income $4.2 Total Assets $1,634.0 Return on Assets 0.27% Return on Equity 3.71% Non-interest Income to Total Revenues 20.0% Retail Checking Accounts 33,000
5
RETAIL EXPANSION STRATEGY
High Performance Checking
In-Store Branch Network
6
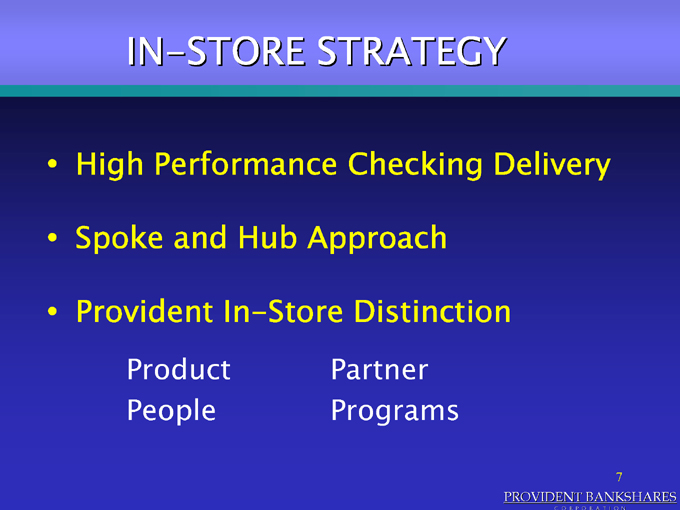
IN-STORE STRATEGY
High Performance Checking Delivery Spoke and Hub Approach Provident In-Store Distinction
Product Partner People Programs
7

*PEOPLE* *PARTNERS*
PROVIDENT’S IN-STORE DIFFERENCE *PRODUCT* *PROGRAM*
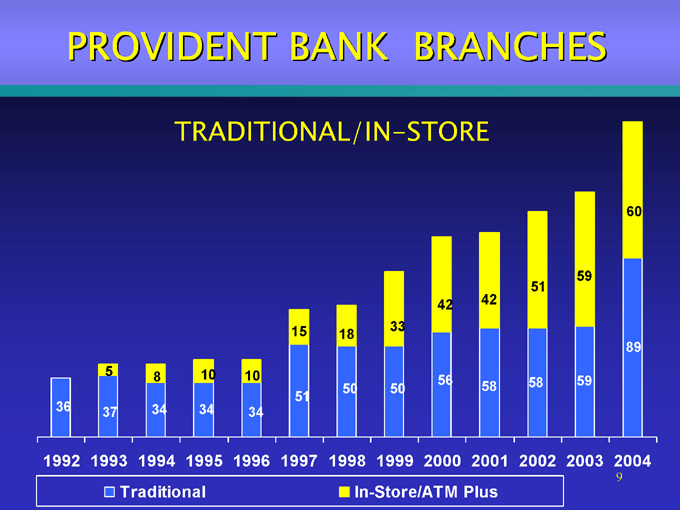
PROVIDENT BANK BRANCHES
TRADITIONAL/IN-STORE
60
59 51
42 42
15 33 18
89
5 8 10 10
56 58 58 59
50 50 51
36 37 34 34 34
1992 1993 1994 1995 1996 1997 1998 1999 2000 2001 2002 2003 2004
9
Traditional In-Store/ATM Plus
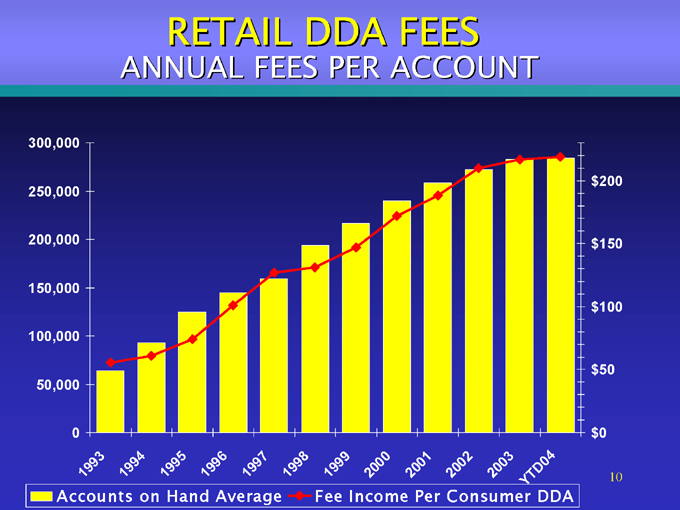
RETAIL DDA FEES
ANNUAL FEES PER ACCOUNT
300,000
$200 250,000
200,000 $150
150,000 $100
100,000
$50 50,000
0 $0
1993 1994 1995 1996 1997 1998 1999 2000 2001 YTD04 10
Accounts on Hand Average Fee Income Per Consumer DDA
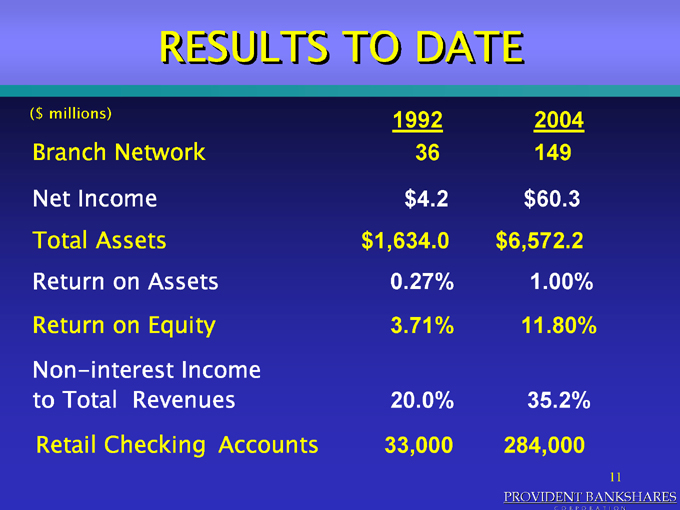
RESULTS TO DATE
($ millions) 1992 2004
Branch Network 36 149 Net Income $4.2 $60.3
Total Assets $1,634.0 $6,572.2
Return on Assets 0.27% 1.00% Return on Equity 3.71% 11.80% Non-interest Income to Total Revenues 20.0% 35.2% Retail Checking Accounts 33,000 284,000
11

HISTORICAL MEASURES
($ millions) 1996
Branch Network 44 Net Income $23.0 Total Assets $2,798.8 Return on Assets 0.86% Return on Equity 12.24% Non-interest Income to Total Revenues 30.5% Retail Checking Accounts 145,000
12
PROVIDENT BANKSHARES
C O R P O R A T I O N

STRATEGIC ALLIANCES
1997
Expansion into VA/Washington Metro Area
Merger with First Citizens Financial Corporation Partnership with Shoppers Food
13
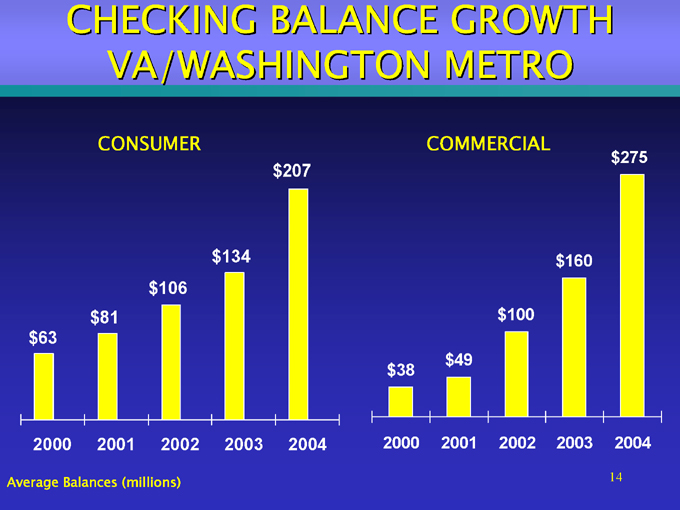
CHECKING BALANCE GROWTH
VA/WASHINGTON METRO
CONSUMER COMMERCIAL $275 $207
$134 $160 $106
$81 $100 $63 $49 $38
2000 2001 2002 2003 2004 2000 2001 2002 2003 2004
Average Balances (millions) 14
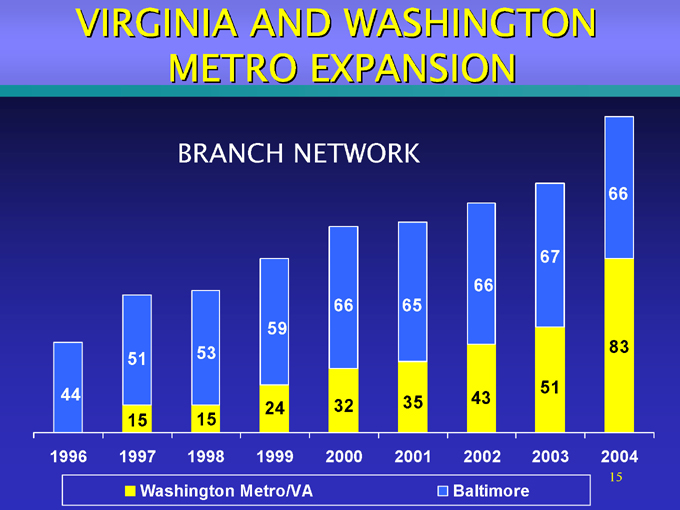
VIRGINIA AND WASHINGTON
METRO EXPANSION
BRANCH NETWORK
66
67 66
66 65 59
53 83 51
44 51
32 35 43 24
15 15
1996 1997 1998 1999 2000 2001 2002 2003 2004
15
Washington Metro/VA Baltimore

VIRGINIA AND WASHINGTON
METRO EXPANSION
TOTAL AWARENESS
100 90 80 70 60 50 40 30
4Q97 4Q98 4Q99 4Q 00 4Q 01 4Q 02 4Q 03 4Q04 Baltimore Sub MD Virginia
16
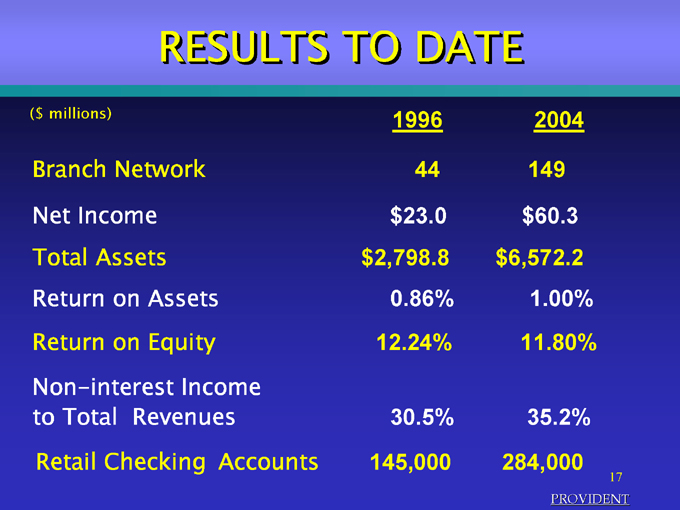
RESULTS TO DATE
($ millions) 1996 2004
Branch Network 44 149 Net Income $23.0 $60.3
Total Assets $2,798.8 $6,572.2
Return on Assets 0.86% 1.00% Return on Equity 12.24% 11.80% Non-interest Income to Total Revenues 30.5% 35.2% Retail Checking Accounts 145,000 284,000
17

WHERE WE ARE TODAY
Consumer, Small Business and Commercial Banking Focus 430,000 Customer Relationships 149 Branches in the Key Urban Metropolitan Areas of Baltimore, Washington and Richmond
18
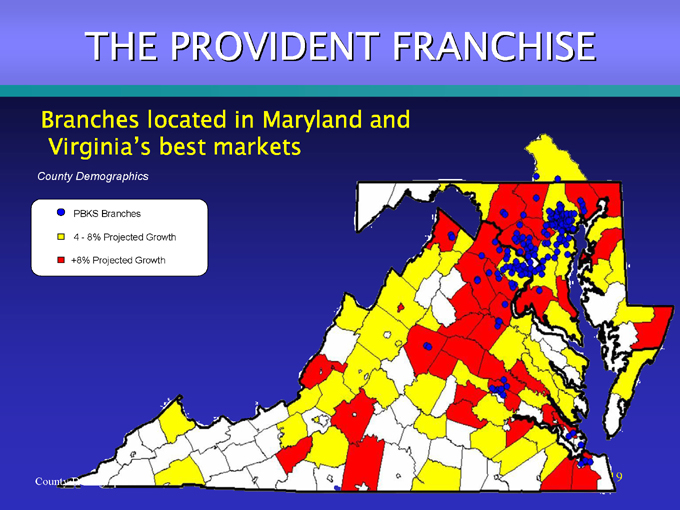
THE PROVIDENT FRANCHISE
Branches located in Maryland and Virginia’s best markets
County Demographics
PBKS Branches
4 - 8% Projected Growth
+8% Projected Growth
19
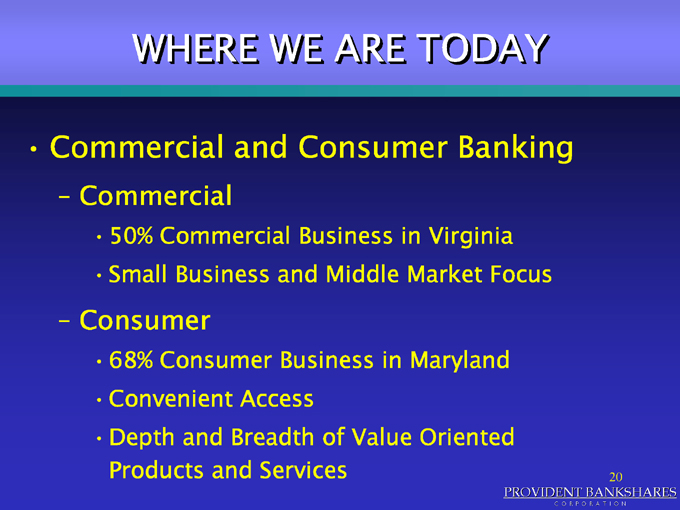
WHERE WE ARE TODAY
Commercial and Consumer Banking
Commercial
50% Commercial Business in Virginia Small Business and Middle Market Focus
Consumer
68% Consumer Business in Maryland Convenient Access Depth and Breadth of Value Oriented
Products and Services 20

KEY STRATEGIES
Maximize Provident’s Position as the “Right Size” Bank in the Marketplace Grow and Deepen Consumer and Small Business Relationships in Maryland and Virginia Grow and Deepen Commercial and Real Estate Relationships in Maryland and Virginia Move from a Product Driven Organization to a Customer Relationship Focused Sales Culture Create a High Performance Culture that Focuses on Employee Development and Retention Improve Financial Fundamentals 21
THE “RIGHT SIZE” BANK
“We will continue to provide the products and services of our largest competitors, while delivering the level of service found in only the best community banks.”
22

GROW AND DEEPEN CONSUMER
AND SMALL BUSINESS
RELATIONSHIPS IN MARYLAND
AND VIRGINIA
23
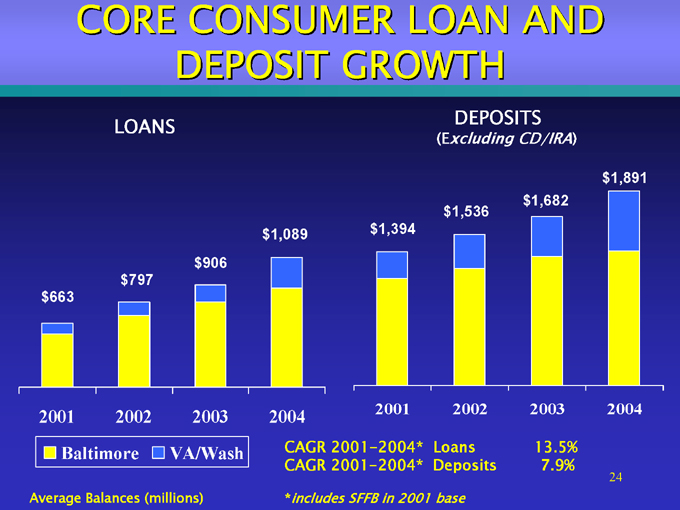
CORE CONSUMER LOAN AND
DEPOSIT GROWTH
LOANS DEPOSITS
(Excluding CD/IRA)
$1,891 $1,682 $1,536 $1,089 $1,394 $906 $797 $663
2001 2002 2003 2004 2001 2002 2003 2004
Baltimore VA/Wash CAGR 2001-2004* Loans 13.5% CAGR 2001-2004* Deposits 7.9%
24
Average Balances (millions) *includes SFFB in 2001 base
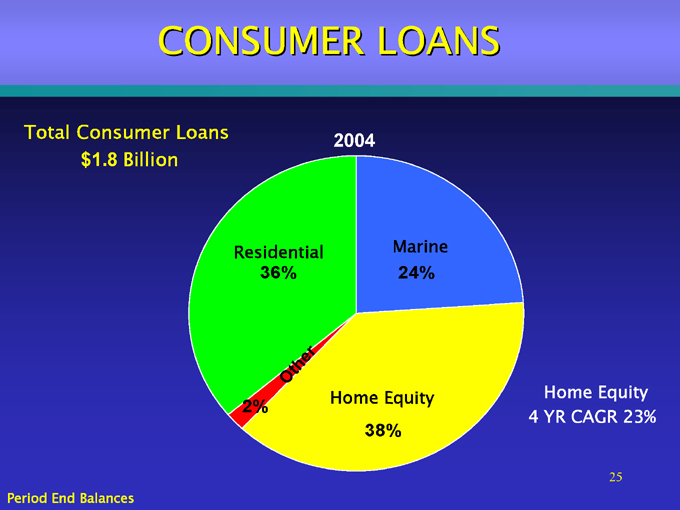
CONSUMER LOANS
Total Consumer Loans 2004 $1.8 Billion
Residential Marine
36% 24%
other
Home Equity
Home Eqiuty
2% 4 YR CAGR 23%
38%
25
Period End Balances
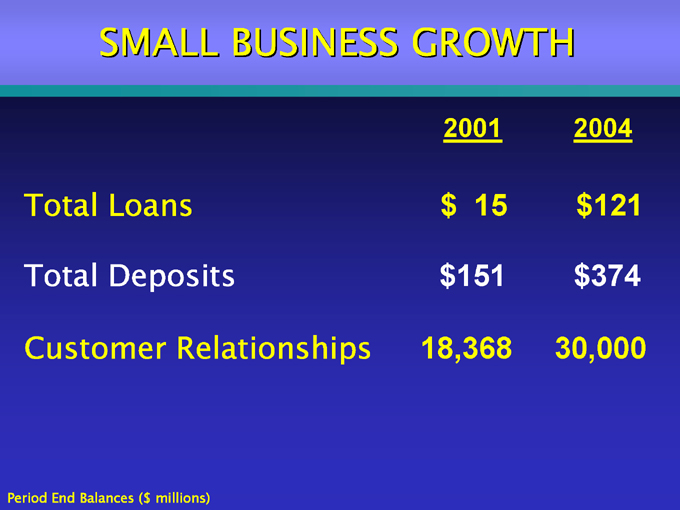
SMALL BUSINESS GROWTH
2001 2004
Total Loans $ 15 $121 Total Deposits $151 $374 Customer Relationships 18,368 30,000
26
Period End Balances ($ millions)

GROW AND DEEPEN COMMERCIAL
AND REAL ESTATE
RELATIONSIONSHIPS IN
MARYLAND AND VIRGINIA
PROVIDENT BANKSHARES
CORPORATION
27
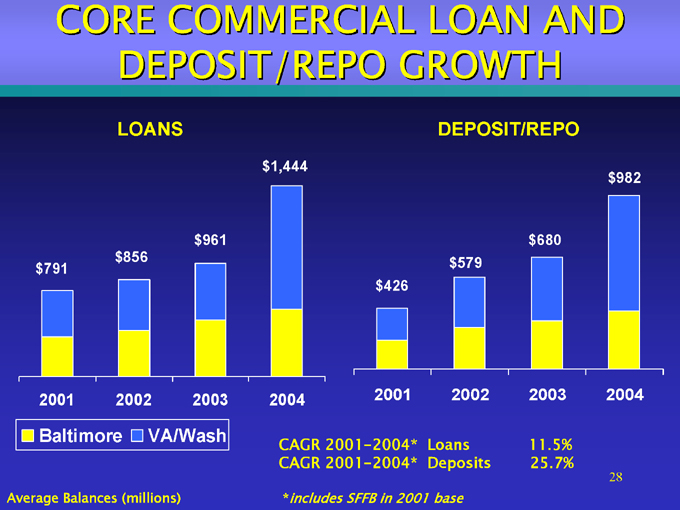
CORE COMMERCIAL LOAN AND
DEPOSIT/REPO GROWTH
LOANS DEPOSIT/REPO
$1,444 $982
$961 $680 $856 $579 $791 $426
2001 2002 2003 2004 2001 2002 2003 2004
Baltimore VA/Wash CAGR 2001-2004* Loans 11.5% CAGR 2001-2004* Deposits 25.7%
28
Average Balances (millions) *includes SFFB in 2001 base
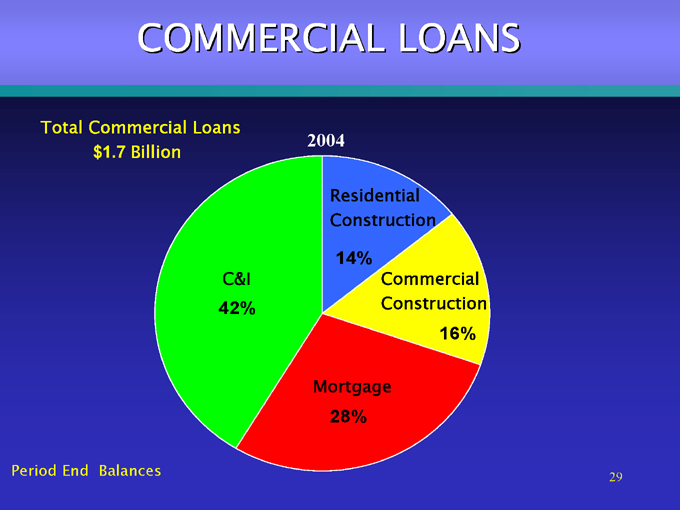
COMMERCIAL LOANS
Total Commercial Loans
2004 $1.7 Billion
Residential Construction
14%
C&I Commercial 42% Construction
16%
Mortgage
28%
Period End Balances 29
CUSTOMER RELATIONSHIP FOCUSED SALES CULTURE
Segmented Customer Base Retention of Valued Customers Cross-sell
Success Centers on Executing “Right Size” Bank Commitment
30

HIGH PERFORMANCE CULTUREFOCUSED ON EMPLOYEE
Continued High Priority on Employee Development and Retention
Focus on Employee’s Development and their Approach with Our Customers
Employee Development Critical to Successful Execution of “Right Size” Bank Strategy
31

IMPROVE FINANCIAL
FUNDAMENTALS
32

IMPROVED FUNDAMENTALS
Transformed Balance Sheet Higher Absolute Earnings Improved Earnings Quality
33
HISTORICAL MEASURES
($ millions) 1992
Branch Network 36 Net Income $4.2 Total Assets $1,634.0 Return on Assets 0.27% Return on Equity 3.71% Non-interest Income to Total Revenues 20.0% Retail Checking Accounts 33,000
34
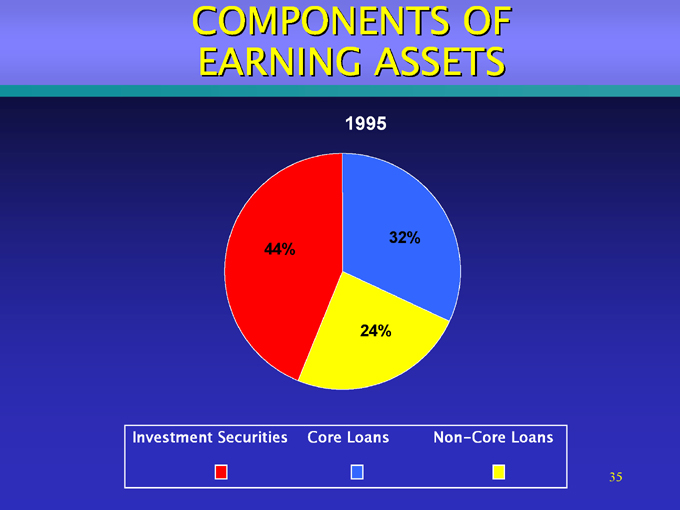
COMPONENTS OF
EARNING ASSETS
Investment Securities Core Loans Non-Core Loans
1995
32%
24%
44%
35
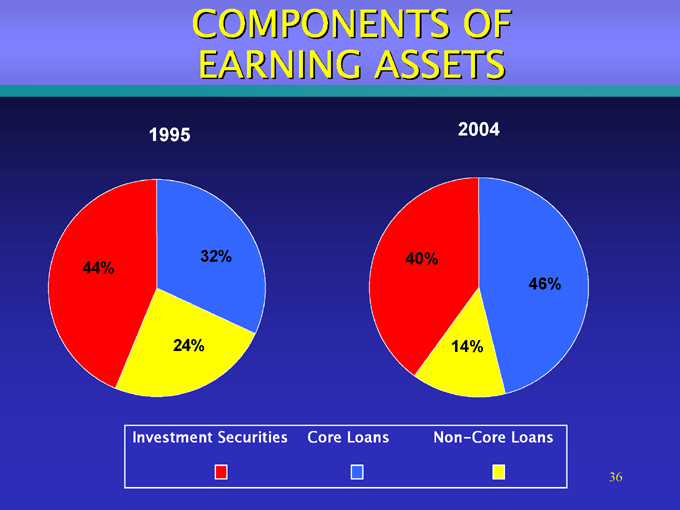
COMPONENTS OFEARNING ASSETS
1995 2004
32% 40% 44%
46%
24% 14%
Investment Securities Core Loans Non-Core Loans
36

CORE LOANS AND DEPOSITS
CORE LOANS/ CORE DEPOSITS/ EARNING ASSETS FUNDING $3,345
$2,533 61% $2,693 $2,825 46% $2,547 60% 61% $1,867 53% $1,653 40% $1,454 36% 30%
2001 2002 2003 2004 2001 2002 2003 2004
CAGR 2001-2004* Loans 12.3% CAGR 2001-2004* Deposits 12.8% 37
Average Balances (millions) *includes SFFB in 2001 base
37
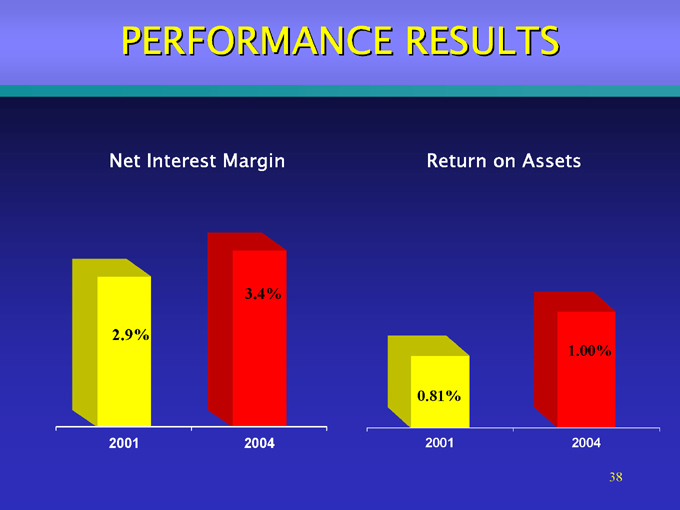
PERFORMANCE RESULTS
Net Interest Margin Return on Assets
3.4%
2.9%
1.00%
0.81%
2001 2004 2001 2004
38
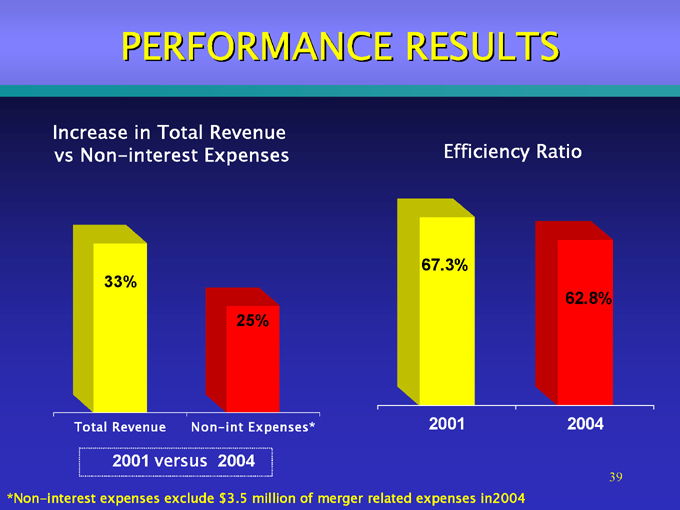
PERFORMANCE RESULTS
Increase in Total Revenue vs Non-interest Expenses Efficiency Ratio
67.3%
33%
62.8%
25%
Total Revenue Non-int Expenses* 2001 2004
2001 versus 2004
39
*Non-interest expenses exclude $3.5 million of merger related expenses in2004
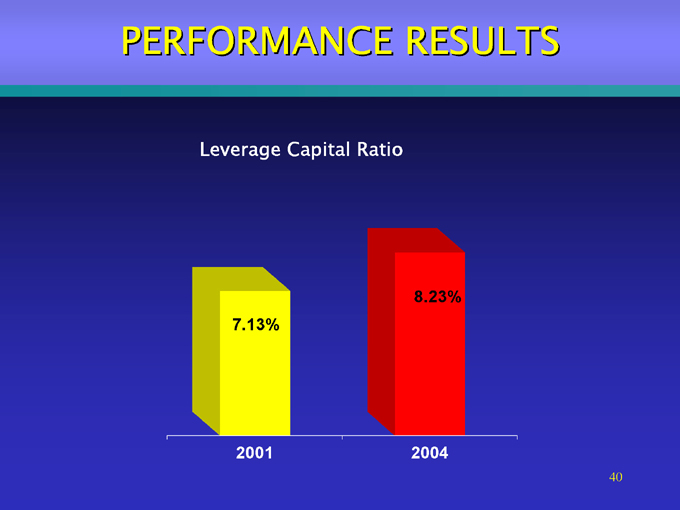
PERFORMANCE RESULTS
Leverage Capital Ratio
8.23% 7.13%
2001 2004
40
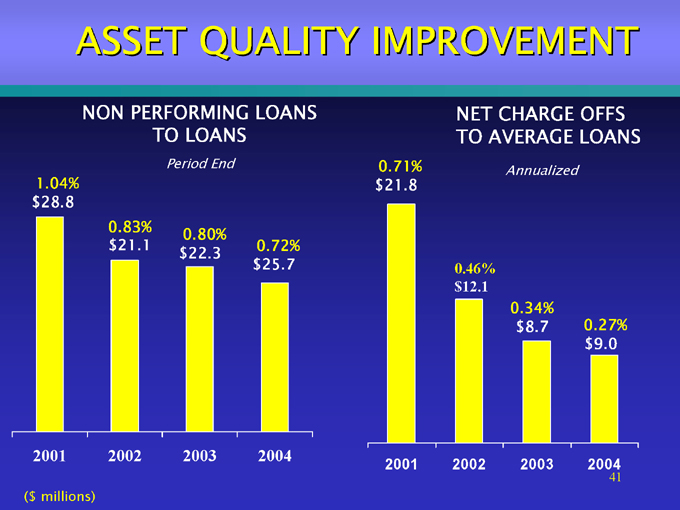
ASSET QUALITY IMPROVEMENT
NON PERFORMING LOANS NET CHARGE OFFS
TO LOANS TO AVERAGE LOANS
Period End 0.71% Annualized
1.04% $21.8 $28.8 0.83% 0.80% $21.1 $22.3 0.72% $25.7 0.46% $12.1
0.34% $8.7 0.27% $9.0 0.11%
2001 2002 2003 2004
2001 2002 2003 2004
41
($ millions)
INTEREST RATE RISK
Asset Sensitivity Low Equity Duration Floating Rate Investments
42
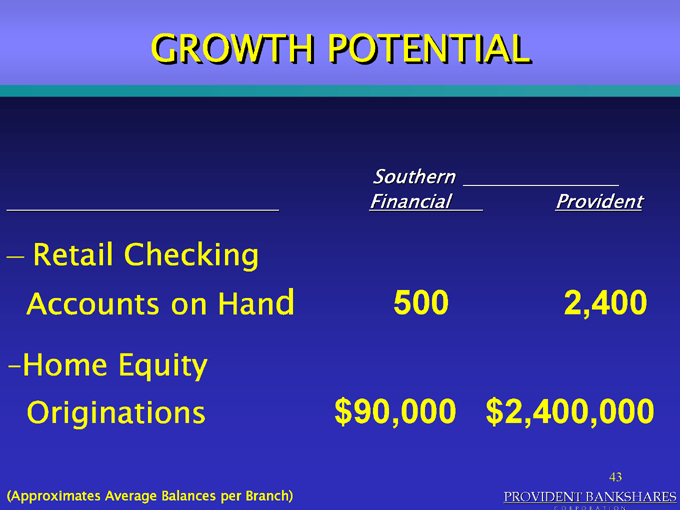
GROWTH POTENTIAL
Southern
Financial Provident
Retail Checking
Accounts on Hand 500 2,400 Home Equity
Originations $90,000 $2,400,000
(Approximates Average Balances per Branch)
43
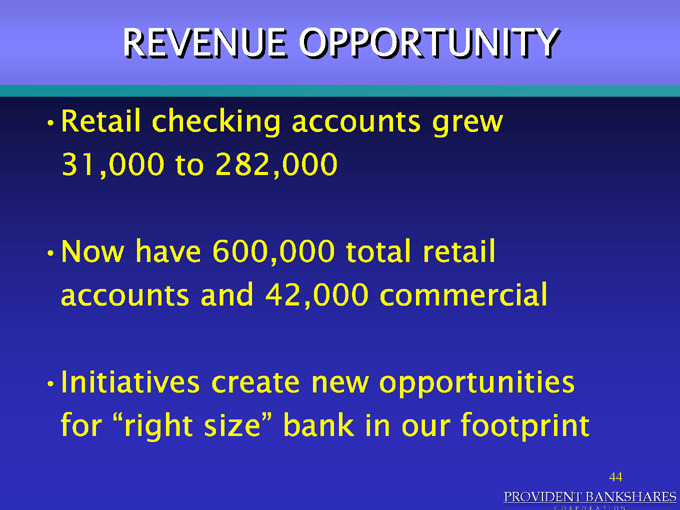
REVENUE OPPORTUNITY
Retail checking accounts grew 31,000 to 282,000
Now have 600,000 total retail accounts and 42,000 commercial
Initiatives create new opportunities for “right size” bank in our footprint
44
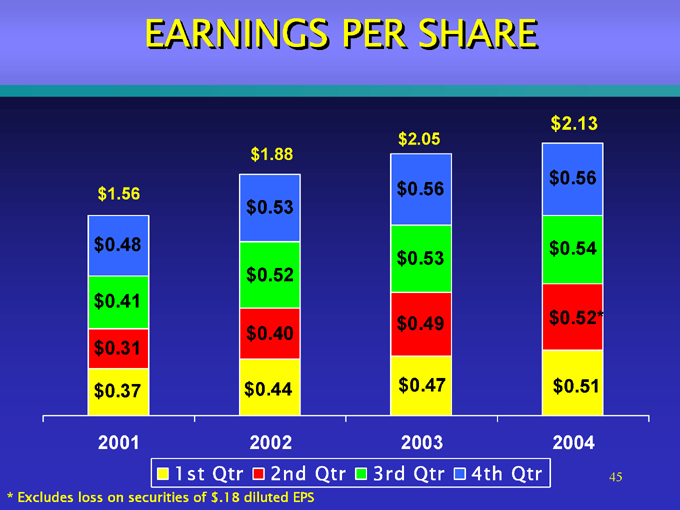
EARNINGS PER SHARE
$2.13 $2.05 $1.88 $0.56 $1.56 $0.56 $0.53 $0.48 $0.54 $0.53 $0.52 $0.41 $0.49 $0.52* $0.40 $0.31 $0.37 $0.44 $0.47 $0.51
2001 2002 2003 2004
1st Qtr 2nd Qtr 3rd Qtr 4th Qtr 45
* Excludes loss on securities of $.18 diluted EPS
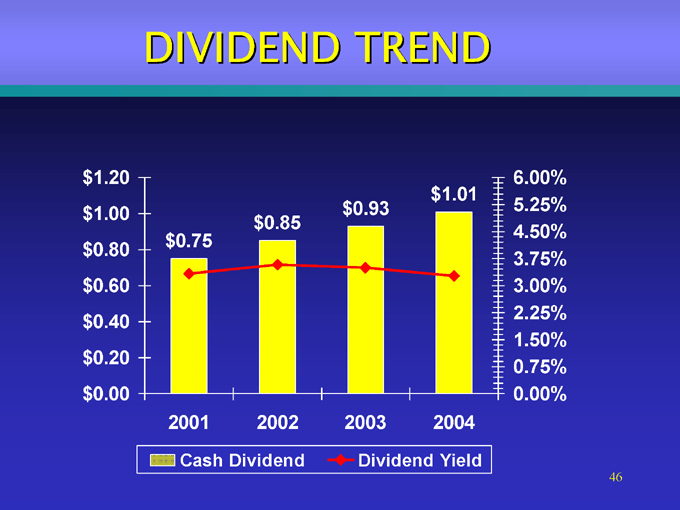
DIVIDEND TREND
$1.20 6.00% $1.01 $0.93 5.25% $1.00 $0.85 4.50% $0.75 $0.80 3.75% $0.60 3.00% 2.25% $0.40 1.50% $0.20 0.75% $0.00 0.00% 2001 2002 2003 2004
Cash Dividend Dividend Yield
46
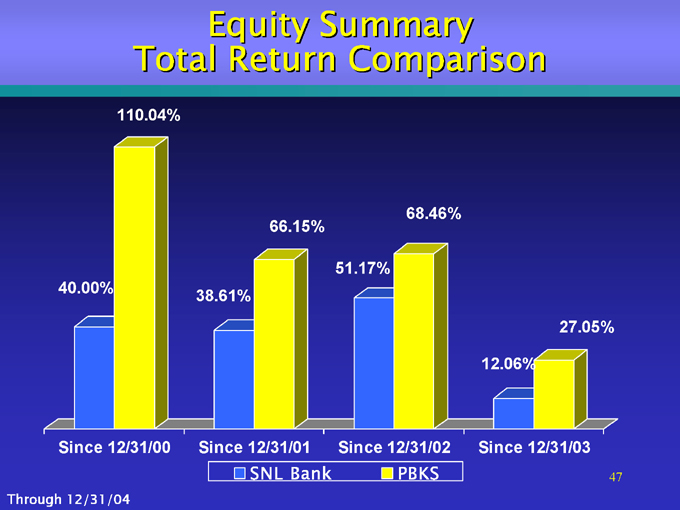
Equity Summary Total Return Comparison
110.04%
68.46% 66.15%
51.17% 40.00% 38.61%
27.05%
12.06%
Since 12/31/00 Since 12/31/01 Since 12/31/02 Since 12/31/03
SNL Bank PBKS 47
Through 12/31/04
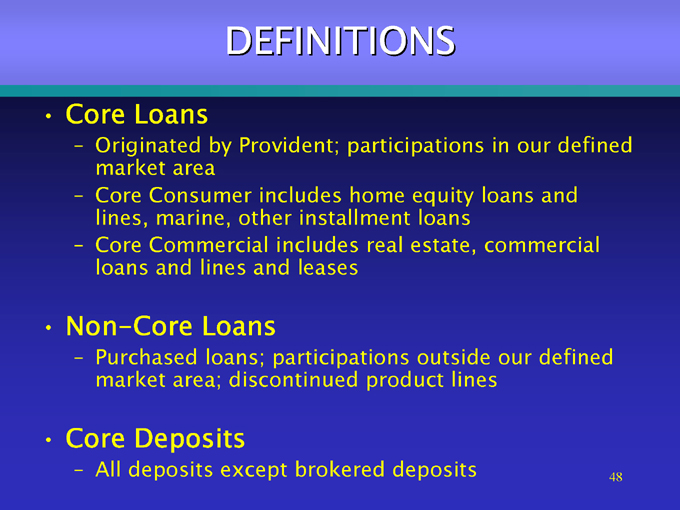
DEFINITIONS
Core Loans
Originated by Provident; participations in our defined market area Core Consumer includes home equity loans and lines, marine, other installment loans Core Commercial includes real estate, commercial loans and lines and leases
Non-Core Loans
Purchased loans; participations outside our defined market area; discontinued product lines
Core Deposits
All deposits except brokered deposits
48
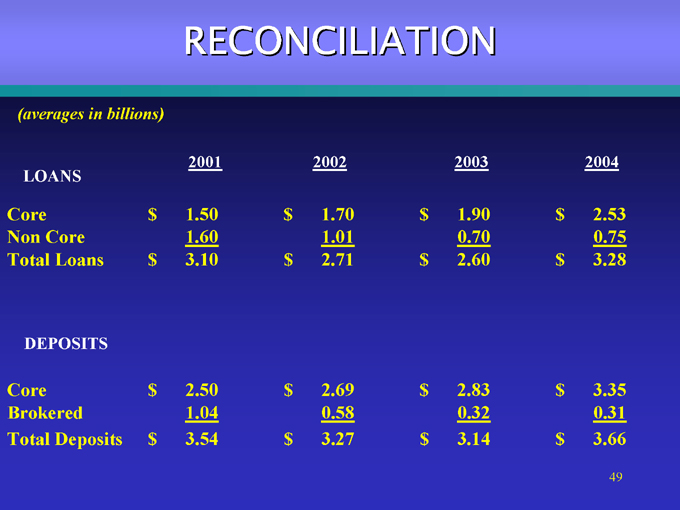
RECONCILIATION
(averages in billions)
2001 2002 2003 2004 LOANS
Core $ 1.50 $ 1.70 $ 1.90 $ 2.53 Non Core 1.60 1.01 0.70 0.75 Total Loans $ 3.10 $ 2.71 $ 2.60 $ 3.28
DEPOSITS
Core $ 2.50 $ 2.69 $ 2.83 $ 3.35 Brokered 1.04 0.58 0.32 0.31 Total Deposits $ 3.54 $ 3.27 $ 3.14 $ 3.66
49

PROVIDENT BANKSHARES
CORPORATION
(www.provbank.com)
Contact:
Media: Lillian Kilroy: (410) 277-2833
Investment Community: Tricia Ferrick: (703) 352-2583
50