UNITED STATES SECURITIES AND EXCHANGE COMMISSION |
| Washington, D.C. 20549 |
| |
| FORM 10-K |
| (Mark One) |
x ANNUAL REPORT PURSUANT TO SECTION 13 OR 15(d) OF THE SECURITIES EXCHANGE ACT OF 1934 |
For the fiscal year ended DECEMBER 31, 2009 |
| Or |
¨ TRANSITION REPORT PURSUANT TO SECTION 13 OR 15(d) OF THE SECURITIES EXCHANGE ACT OF 1934 |
| For the transition period from _________________________ to _________________________________ |
| |
Commission file number 001-11252 |
| Hallmark Financial Services, Inc. |
| (Exact name of registrant as specified in its charter) |
| | |
| Nevada | 87-0447375 |
| (State or Other Jurisdiction of Incorporation or Organization) | (I.R.S. Employer Identification No.) |
| | |
| 777 Main Street, Suite 1000, Fort Worth, Texas | 76102 |
| (Address of Principal Executive Offices) | (Zip Code) |
| |
Registrant's Telephone Number, Including Area Code: (817) 348-1600 |
| |
| Securities registered pursuant to Section 12(b) of the Act: |
| | |
| Title of Each Class | Name of Each Exchange on Which Registered |
| Common Stock $.18 par value | Nasdaq Global Market |
Securities registered pursuant to Section 12(g) of the Act: None |
| |
Indicate by check mark if the registrant is a well-known seasoned issuer, as defined in Rule 405 of the Securities Act. Yes ¨ No x |
| |
Indicate by check mark if the registrant is not required to file reports pursuant to Section 13 or Section 15(d) of the Act. Yes ¨ No x |
| |
Indicate by check mark whether the registrant has submitted electronically and posted on its corporate Web site, if any, every Interactive Data File required to be submitted and posted pursuant to Rule 405 of Regulation S-T (§232.405 of this chapter) during the preceding 12 months (or for such shorter period that the registrant was required to submit and post such files). Yes ¨ No ¨ |
| |
Indicate by check mark whether the registrant (1) has filed all reports required to be filed by Section 13 or 15(d) of the Securities Exchange Act of 1934 during the preceding 12 months (or for such shorter period that the registrant was required to file such reports), and (2) has been subject to such filing requirements for the past 90 days. Yes x No ¨ |
| |
Indicate by check mark if disclosure of delinquent filers pursuant to Item 405 of Regulation S-K is not contained herein, and will not be contained, to the best of the registrant's knowledge, in definitive proxy or information statements incorporated by reference in Part III of this Form 10-K or any amendment to this Form 10-K. ¨ |
| |
Indicate by check mark whether the registrant is a large accelerated filer, an accelerated filer, a non-accelerated filer or a smaller reporting company. See definition of “accelerated filer”, “large accelerated filer” and “smaller reporting company” in Rule 12b-2 of the Exchange Act. (Check one): Large accelerated filer ¨ Accelerated filer ¨ Non-accelerated filer ¨ Smaller reporting company x |
| |
Indicate by check mark whether the registrant is a shell company (as defined in Rule 12b-2 of the Exchange Act). Yes ¨ No x |
| |
| State the aggregate market value of the voting and non-voting common equity held by non-affiliates computed by reference to the price at which the common equity was last sold, or the average bid and asked price of such common equity, as of the last business day of the registrant’s most recently completed second fiscal quarter. $67,409,850 |
| |
| Indicate the number of shares outstanding of each of the registrant's classes of common stock, as of the latest practicable date. 20,123,336 shares of common stock, $.18 par value per share, outstanding as of March 19, 2010. |
DOCUMENTS INCORPORATED BY REFERENCE
The information required by Part III is incorporated by reference from the Registrant's definitive proxy statement to be filed with the Commission pursuant to Regulation 14A not later than 120 days after the end of the fiscal year covered by this report.
Unless the context requires otherwise, in this Form 10-K the term “Hallmark” refers solely to Hallmark Financial Services, Inc. and the terms “we,” “our,” and “us” refer to Hallmark and its subsidiaries. The direct and indirect subsidiaries of Hallmark are referred to in this Form 10-K in the manner identified in the chart under “Item 1. Business – Operational Structure.”
Risks Associated with Forward-Looking Statements Included in this Form 10-K
This Form 10-K contains certain forward-looking statements within the meaning of the Private Securities Litigation Reform Act of 1995, which are intended to be covered by the safe harbors created thereby. Forward-looking statements include statements which are predictive in nature, which depend upon or refer to future events or conditions, or which include words such as “expect,” “anticipate,” “intend,” “plan,” “believe,” “estimate” or similar expressions. These statements include the plans and objectives of management for future operations, including plans and objectives relating to future growth of our business activities and availability of funds. Statements regarding the following subjects are forward-looking by their nature:
• our business and growth strategies;
• our performance goals;
• our projected financial condition and operating results;
• our understanding of our competition;
• industry and market trends;
• the impact of technology on our products, operations and business; and
• any other statements or assumptions that are not historical facts.
The forward-looking statements included in this Form 10-K are based on current expectations that involve numerous risks and uncertainties. Assumptions relating to these forward-looking statements involve judgments with respect to, among other things, future economic, competitive and market conditions, legislative initiatives, regulatory framework, weather-related events and future business decisions, all of which are difficult or impossible to predict accurately and many of which are beyond our control. Although we believe that the assumptions underlying these forward-looking statements are reasonable, any of the assumptions could be inaccurate and, therefore, there can be no assurance that the forward-looking statements included in this Form 10-K will prove to be accurate. In light of the significant uncertainties inherent in these forward-looking statements, the inclusion of such information should not be regarded as a representation that our objectives and plans will be achieved.
PART I
Item 1. Business.
Who We Are
We are a diversified property/casualty insurance group that serves businesses and individuals in specialty and niche markets. We offer standard commercial insurance, specialty commercial insurance and personal insurance in selected market subcategories that are characteristically low-severity and short-tailed risks. We focus on marketing, distributing, underwriting and servicing property/casualty insurance products that require specialized underwriting expertise or market knowledge. We believe this approach provides us the best opportunity to achieve favorable policy terms and pricing. The insurance policies we produce are written by our four insurance company subsidiaries as well as unaffiliated insurers.
We market, distribute, underwrite and service our property/casualty insurance products through five operating units, each of which has a specific focus. Our AHIS Operating Unit primarily handles standard commercial insurance, our TGA Operating Unit concentrates on excess and surplus lines commercial insurance, our Aerospace Operating Unit specializes in general aviation insurance, our Heath XS Operating Unit handles excess commercial automobile and commercial umbrella risks on both an admitted and non-admitted basis and our Personal Lines Operating Unit focuses on non-standard personal automobile insurance and complementary personal insurance products and services. The subsidiaries comprising our Heath XS Operating Unit were acquired effective August 29, 2008.
Each operating unit has its own management team with significant experience in distributing products to its target markets and proven success in achieving underwriting profitability and providing efficient claims management. Each operating unit is responsible for marketing, distribution, underwriting and claims management while we provide capital management, reinsurance, actuarial, investment, financial reporting, technology and legal services and back office support at the parent level. We believe this approach optimizes our operating results by allowing us to effectively penetrate our selected specialty and niche markets while maintaining operational controls, managing risks, controlling overhead and efficiently allocating our capital across operating units.
We expect future growth to be derived from organic growth in the premium production of our existing operating units and selected opportunistic acquisitions that meet our criteria. For the year ended December 31, 2009, approximately 91% of the total premium we produced was retained by our insurance company subsidiaries, while the remaining 9% was written for or ceded to unaffiliated insurers.
What We Do
We market standard commercial, specialty commercial and personal property/casualty insurance products which are tailored to the risks and coverages required by the insured. We believe that most of our target markets are underserved by larger property/casualty underwriters because of the specialized nature of the underwriting required. We are able to offer these products profitably as a result of the expertise of our experienced underwriters. We also believe our long-standing relationships with independent general agencies and retail agents and the service we provide differentiate us from larger property/casualty underwriters.
Our AHIS Operating Unit primarily underwrites low-severity, short-tailed commercial property/casualty insurance products in the standard market. These products have historically produced stable loss results and include general liability, commercial automobile, commercial property and umbrella coverages. Our AHIS Operating Unit currently markets its products through a network of 234 independent agents primarily serving businesses in the non-urban areas of Texas, New Mexico, Oregon, Idaho, Montana, Washington, Utah, and Wyoming.
Our TGA Operating Unit primarily offers commercial property/casualty insurance products in the excess and surplus lines market. Excess and surplus lines insurance provides coverage for difficult to place risks that do not fit the underwriting criteria of insurers operating in the standard market. Our TGA Operating Unit focuses on small- to medium-sized commercial businesses that do not meet the underwriting requirements of standard insurers due to factors such as loss history, number of years in business, minimum premium size and types of business operation. Our TGA Operating Unit primarily writes general liability, commercial automobile and commercial property policies. Our TGA Operating Unit markets its products through 64 general agency offices in Texas, Louisiana, Oklahoma, Arkansas, and Missouri, as well as 651 independent retail agents in Texas and Oregon.
Our Aerospace Operating Unit offers general aviation property/casualty insurance primarily for private and small commercial aircraft and airports. The aircraft liability and hull insurance products underwritten by our Aerospace Operating Unit are targeted to transitional or non-standard pilots who may have difficulty obtaining insurance from a standard carrier. Airport liability insurance is marketed to smaller, regional airports. Our Aerospace Operating Unit markets these general aviation insurance products through 194 independent specialty brokers in 47 states.
Our Heath XS Operating Unit offers small and middle market commercial umbrella and excess liability insurance on both an admitted and non-admitted basis focusing primarily on trucking, specialty automobile, and non-fleet automobile coverage. Typical risks range from one power unit to fleets of up to 200 power units. Our Heath XS Operating Unit markets its products through 112 wholesale brokers in all 50 states.
Our Personal Lines Operating Unit offers non-standard personal automobile policies which generally provide the minimum limits of liability coverage mandated by state law to drivers who find it difficult to obtain insurance from standard carriers due to various factors including age, driving record, claims history or limited financial resources. Our Personal Lines Operating Unit also provides personal products complementary to non-standard personal automobile such as low value dwelling/homeowners, renters and motorcycle policies. Our Personal Lines Operating Unit markets these policies through 3,463 independent retail agents in 23 states.
Our insurance company subsidiaries are American Hallmark Insurance Company of Texas (“AHIC”), Hallmark Insurance Company (“HIC”), Hallmark Specialty Insurance Company (“HSIC”) and Hallmark County Mutual Insurance Company “HCM”). AHIC, HIC, and HSIC have entered into a pooling arrangement, pursuant to which AHIC retains 46.0% of the net premiums written, HIC retains 34.1% of the net premiums written and HSIC retains 19.9% of the net premiums written. A.M. Best Company (“A.M. Best”), a nationally recognized insurance industry rating service and publisher, has pooled its ratings of these three insurance company subsidiaries and assigned a financial strength rating of “A–” (Excellent) and an issuer credit rating of “a-” to each of these individual insurance company subsidiaries and to the pool formed by these three insurance company subsidiaries. Also, A.M. Best has assigned HCM a financial strength rating of “A–” (Excellent) and an issuer credit rating of “a-”.
Our five operating units are segregated into three reportable industry segments for financial accounting purposes. The Standard Commercial Segment presently consists solely of the AHIS Operating Unit and the Personal Segment presently consists solely of our Personal Lines Operating Unit. The Specialty Commercial Segment includes our TGA Operating Unit, Aerospace Operating Unit, and Heath XS Operating Unit. The following table displays the gross premiums produced by these reportable segments for affiliated and unaffiliated insurers for the years ended December 31, 2009, 2008 and 2007, as well as the gross premiums written and net premiums written by our insurance subsidiaries for these reportable segments for the same periods.
| | | Year Ended December 31, | |
| | | 2009 | | | 2008 | | | 2007 | |
| | | (dollars in thousands) | |
| | | | | | | | | | |
| Gross Premiums Produced (1): | | | | | | | | | |
| Standard Commercial Segment | | $ | 72,512 | | | $ | 80,193 | | | $ | 90,985 | |
| Specialty Commercial Segment (2) | | | 144,230 | | | | 146,054 | | | | 151,003 | |
| Personal Segment | | | 71,708 | | | | 60,834 | | | | 55,916 | |
| Total | | $ | 288,450 | | | $ | 287,081 | | | $ | 297,904 | |
| | | | | | | | | | | | | |
| Gross Premiums Written: | | | | | | | | | | | | |
| Standard Commercial Segment | | $ | 72,512 | | | $ | 80,190 | | | $ | 90,868 | |
| Specialty Commercial Segment (2) | | | 143,338 | | | | 102,825 | | | | 102,688 | |
| Personal Segment | | | 71,708 | | | | 60,834 | | | | 55,916 | |
| Total | | $ | 287,558 | | | $ | 243,849 | | | $ | 249,472 | |
| | | | | | | | | | | | | |
| Net Premiums Written: | | | | | | | | | | | | |
| Standard Commercial Segment | | $ | 68,082 | | | $ | 75,361 | | | $ | 84,595 | |
| Specialty Commercial Segment (2) | | | 121,950 | | | | 98,732 | | | | 98,300 | |
| Personal Segment | | | 71,708 | | | | 60,834 | | | | 55,916 | |
| Total | | $ | 261,740 | | | $ | 234,927 | | | $ | 238,811 | |
| | (1) Produced premium is a non-GAAP measurement that management uses to track total premium produced by our operations. Produced premium excludes unaffiliated third party premium fronted on our recently acquired HCM subsidiary. We believe this is a useful tool for users of our financial statements to measure our premium production whether retained by our insurance company subsidiaries or assumed by third party insurance carriers who pay us commission revenue. |
| | (2) The Heath XS Operating Unit included in the Specialty Commercial Segment was acquired effective August 29, 2008 and, therefore, is not included in the year ended December 31, 2007. |
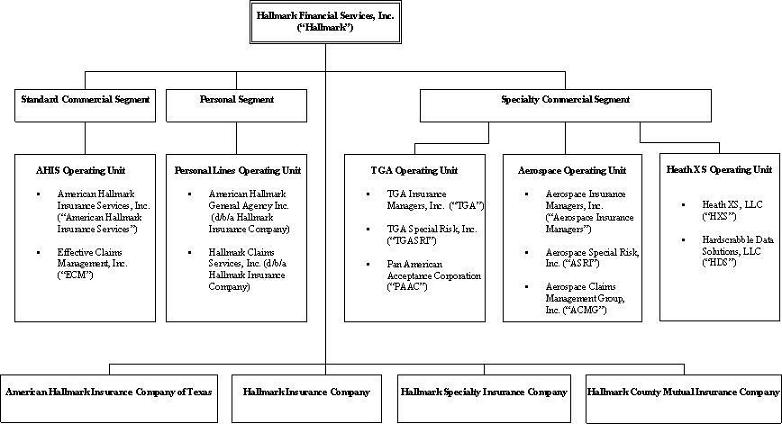
Operational Structure
Our insurance company subsidiaries retain a portion of the premiums produced by our operating units. The following chart reflects the operational structure of our organization, the subsidiaries comprising our operating units and the operating units included in each reportable segment as of December 31, 2009.
Standard Commercial Segment / AHIS Operating Unit
The Standard Commercial Segment of our business presently consists solely of our AHIS Operating Unit. Our AHIS Operating Unit markets, underwrites and services standard commercial lines insurance primarily in the non-urban areas of Texas, New Mexico, Idaho, Oregon, Montana, Washington, Utah, and Wyoming. The subsidiaries comprising our AHIS Operating Unit include American Hallmark Insurance Services, a regional managing general agency, and ECM, a claims administration company. American Hallmark Insurance Services targets customers that are in low-severity classifications in the standard commercial market, which as a group have relatively stable loss results. The typical customer is a small- to medium-sized business with a policy that covers property, general liability and automobile exposures. Our AHIS Operating Unit underwriting criteria exclude lines of business and classes of risks that are considered to be high-severity or volatile, or which involve significant latent injury potential or other long-tailed liability exposures. ECM administers the claims on the insurance policies produced by American Hallmark Insurance Services. Products offered by our AHIS Operating Unit include the following:
| | l | Commercial automobile. Commercial automobile insurance provides third-party bodily injury and property damage coverage and first-party property damage coverage against losses resulting from the ownership, maintenance or use of automobiles and trucks in connection with an insured’s business. |
| | | General liability. General liability insurance provides coverage for third-party bodily injury and property damage claims arising from accidents occurring on the insured’s premises or from their general business operations. |
| | | Umbrella. Umbrella insurance provides coverage for third-party liability claims where the loss amount exceeds coverage limits provided by the insured’s underlying general liability and commercial automobile policies. |
| | | Commercial property. Commercial property insurance provides first-party coverage for the insured’s real property, business personal property, and business interruption losses caused by fire, wind, hail, water damage, theft, vandalism and other insured perils. |
| | | Commercial multi-peril. Commercial multi-peril insurance provides a combination of property and liability coverage that can include commercial automobile coverage on a single policy. |
| | | Business owner’s. Business owner’s insurance provides a package of coverage designed for small- to medium-sized businesses with homogeneous risk profiles. Coverage includes general liability, commercial property and commercial automobile. |
Our AHIS Operating Unit markets its property/casualty insurance products through 234 independent agencies operating in its target markets. Our AHIS Operating Unit applies a strict agent selection process and seeks to provide its independent agents some degree of non-contractual geographic exclusivity. Our AHIS Operating Unit also strives to provide its independent agents with convenient access to product information and personalized service. As a result, the Standard Commercial Segment has historically maintained excellent relationships with its producing agents, as evidenced by the 23-year average tenure of the 15 agency groups which each produced more than $1.0 million in premium during the year ended December 31, 2009. During 2009, the top ten agency groups produced approximately 37%, and no individual agency group produced more than 8%, of the total premium volume of our AHIS Operating Unit.
Our AHIS Operating Unit writes most risks on a package basis using a commercial multi-peril policy or a business owner’s policy. Umbrella policies are written only when our AHIS Operating Unit also writes the insured’s underlying general liability and commercial automobile coverage. Through December 31, 2005, our AHIS Operating Unit marketed policies on behalf of Clarendon National Insurance Company (“Clarendon”), a third-party insurer. Our AHIS Operating Unit earns a commission based on a percentage of the earned premium it produced for Clarendon. The commission percentage is determined by the underwriting results of the policies produced. ECM receives a claim servicing fee based on a percentage of the earned premium produced, with a portion deferred over claim payment period for casualty claims. On July 1, 2005, our AHIS Operating Unit began marketing new policies for AHIC and presently markets all new and renewal policies exclusively for AHIC.
All of the commercial policies written by our AHIS Operating Unit are for a term of 12 months. If the insured is unable or unwilling to pay for the entire premium in advance, we provide an installment payment plan that allows the insured to pay 20% down and the remaining payments over eight months. We charge a flat $7.50 installment fee per payment for the installment payment plan.
Specialty Commercial Segment
The Specialty Commercial Segment of our business includes our TGA Operating Unit, our Aerospace Operating Unit, and our Heath XS Operating Unit. The subsidiaries comprising our Heath XS Operating Unit were acquired effective August 29, 2008. During 2009, our TGA Operating Unit accounted for approximately 66% of the aggregate premiums produced by the Specialty Commercial Segment, with our Heath XS Operating Unit and Aerospace Operating Unit accounting for 17% and 17%, respectively.
TGA Operating Unit. Our TGA Operating Unit markets, underwrites, finances and services commercial lines insurance in Texas, Louisiana, Arkansas, Oklahoma, Missouri and Oregon with a particular emphasis on commercial automobile, general liability and commercial property risks produced on an excess and surplus lines basis. Excess and surplus lines insurance provides coverage for difficult to place risks that do not fit the underwriting criteria of insurers operating in the standard market. The subsidiaries comprising our TGA Operating Unit include TGA, which is a regional managing general agency, TGASRI and PAAC, which provides premium financing for policies marketed by TGA and certain unaffiliated general and retail agents. TGA accounts for approximately 98% of the premium volume financed by PAAC.
Our TGA Operating Unit focuses on small- to medium-sized commercial businesses that do not meet the underwriting requirements of traditional standard insurers due to issues such as loss history, number of years in business, minimum premium size and types of business operation. During 2009, commercial automobile and general liability approximated 63% and 29%, respectively, of the premiums produced by our TGA Operating Unit. Target risks for commercial automobile insurance are small- to medium-sized businesses with ten or fewer vehicles which include artisan contractors, local light- to medium-service vehicles and retail delivery vehicles. Target risks for general liability insurance are small business risk exposures including artisan contractors, sales and service organizations, and building and premiums exposures. Target risks for commercial property insurance are low- to mid-value structures including office buildings, mercantile shops, restaurants and rental dwellings, in each case with aggregate property limits of less than $500,000. The commercial insurance products offered by our TGA Operating Unit include the following:
| | | Commercial automobile. Commercial automobile insurance provides third-party bodily injury and property damage coverage and first-party property damage coverage against losses resulting from the ownership, maintenance or use of automobiles and trucks in connection with an insured’s business. |
| | | General liability. General liability insurance provides coverage for third-party bodily injury and property damage claims arising from accidents occurring on the insured’s premises or from their general business operations. |
| | | Commercial property. Commercial property insurance provides first-party coverage for the insured’s real property, business personal property, theft and business interruption losses caused by fire, wind, hail, water damage, vandalism and other insured perils. Windstorm, hurricane and hail are generally excluded in coastal areas. |
Our TGA Operating Unit produces business through a network of 64 general agency offices in Texas, Louisiana, Oklahoma, Arkansas, and Missouri, as well as through 651 independent retail agents in Texas and Oregon. Our TGA Operating Unit strives to simplify the placement of its excess and surplus lines policies by providing prompt quotes and signature-ready applications to its independent agents. During 2009, general agents accounted for approximately 78% of total premiums produced by our TGA Operating Unit, with the remaining 22% being produced by retail agents. During 2009, the top ten general agents produced approximately 37%, and no general agent produced more than 7%, of the total premium volume of our TGA Operating Unit. During the same period, the top ten retail agents produced approximately 5%, and no retail agent produced more than 1%, of the total premium volume of our TGA Operating Unit.
Through 2008, all business of our TGA Operating Unit was produced under a fronting agreement with member companies of the Republic Group (“Republic”) which granted our TGA Operating Unit the authority to develop underwriting programs, set rates, appoint retail and general agents, underwrite risks, issue policies and adjust and pay claims. During 2007, 2008 and 2009 AHIC assumed 60%, 70% and 100%, respectively, of the premium written under this fronting agreement pursuant to a reinsurance agreement with Republic which expired on December 31, 2009. Commission revenue was generated under the fronting agreement on the portion of premiums not assumed by AHIC. An additional commission may be earned if certain loss ratio targets are met. Additional revenue was generated from fully earned policy fees and installment billing fees charged on the legacy personal lines products. During the fourth quarter of 2009, HCM began fronting the coverages previously written through Republic.
The majority of the commercial policies written by our TGA Operating Unit are for a term of 12 months. Exceptions include a few commercial automobile policies that are written for a term that coincides with the annual harvest of crops and special event general liability policies that are written for the term of the event, which is generally one to two days. Commercial lines policies are paid in full up front or financed with various premium finance companies, including PAAC.
Aerospace Operating Unit. Our Aerospace Operating Unit markets, underwrites and services general aviation property/casualty insurance in 47 states. The subsidiaries comprising our Aerospace Operating Unit include Aerospace Insurance Managers, which markets standard aviation coverages, ASRI, which markets excess and surplus lines aviation coverages, and ACMG, which handles claims management. Aerospace Insurance Managers is one of only a few similar entities in the U.S. and has focused on developing a well-defined niche centering on transitional pilots, older aircraft and small airports and aviation-related businesses. Products offered by our Aerospace Operating Unit include the following:
| | | Aircraft. Aircraft insurance provides third-party bodily injury and property damage coverage and first-party hull damage coverage against losses resulting from the ownership, maintenance or use of aircraft. |
| | | Airport liability. Airport liability insurance provides coverage for third-party bodily injury and property damage claims arising from accidents occurring on airport premises or from their operations. |
Our Aerospace Operating Unit generates its business through 194 aviation specialty brokers. These specialty brokers submit to Aerospace Insurance Managers requests for aviation insurance quotations received from the states in which we operate and our Aerospace Operating Unit selectively determines the risks fitting its target niche for which it will prepare a quote. During 2009, the top ten independent specialty brokers produced approximately 31%, and no broker produced more than 7%, of the total premium volume of our Aerospace Operating Unit.
Our Aerospace Operating Unit independently develops, underwrites and prices each coverage written. We target pilots who may lack experience in the type of aircraft they have acquired or are transitioning between types of aircraft. We also target pilots who may be over the age limits of other insurers. We do not accept aircraft that are used for hazardous purposes such as crop dusting or heli-skiing. Liability limits are controlled, with approximately 95% of the aircraft written in 2009 bearing per-occurrence limits of $1,000,000 and per-passenger limits of $100,000 or less. The average insured aircraft hull value for aircraft written in 2009 was approximately $161,900.
Prior to July 1, 2006, our Aerospace Operating Unit produced policies for American National Property & Casualty Insurance Company (“ANPAC”) under a reinsurance program which ceded 100% of the business to several reinsurers. Under this arrangement, revenue was generated primarily from commissions based on written premiums net of cancellations and endorsement return premiums. An additional commission may be earned based upon the profitability of the business to the reinsurers. Beginning July 1, 2006, we began issuing general aviation policies through our insurance companies and currently 40 of the 48 states are written through our insurance companies with the remaining eight states written under a fronting arrangement with ANPAC and reinsured by AHIC.
Heath XS Operating Unit. Our Heath XS Operating Unit markets, underwrites and services small and middle market commercial umbrella and excess liability insurance on both an admitted and non-admitted basis in all 50 states. Limits of liability offered are from $1,000,000 to $5,000,000 in coverage in excess of the primary carrier’s limits of liability. The principal focus of the Heath XS Operating Unit is transportation, specifically trucking for hire, specialty automobile and non-fleet automobile coverage. The Heath XS Operating Unit also provides umbrella and excess liability coverage for small to midsize businesses in class categories such as contracting, manufacturing, hospitality and service.
The majority of insurance policies written by our Heath XS Operating Unit are on an annual basis, however exceptions are common in an attempt to have policy effective dates coincide with those of the primary insurance policies. Policy premiums are collected in full and are due 30 days from the inception date of the policy.
Our Heath XS Operating Unit markets its products through 112 wholesale brokers covering all 50 states. During 2009, the top ten wholesale brokers accounted for 52% of our Heath XS Operating Units premium volume with no single wholesale broker accounting for more than 15%. During 2009, excess commercial liability accounted for 96% of the premiums produced by our Heath XS Operating Unit, with the remaining 4% coming from commercial umbrella risks. The commercial insurance products offered by our Heath XS Operating Unit include the following:
| | · | Commercial excess liability risks. Liability insurance designed to provide an extra layer of protection for bodily injury, personal and advertising injury, or property damage losses above the primary layer of automobile, general liability and employers liability insurance. The excess insurance does not begin until the limits of liability in the primary layer have been exhausted. The excess layer provides not only higher limits, but catastrophic protection from large losses. |
| | · | Commercial umbrella risks. Liability insurance protecting businesses for bodily injury, personal and advertising injury, or property damage claims in excess of the limits of their primary commercial automobile, general liability and employers liability policies, and for some claims excluded by their primary policies (subject to a deductible). Umbrella liability provides not only higher limits, but catastrophic protection for large losses. |
Through June 30, 2009, our Heath XS Operating Unit wrote policies under a fronting arrangement pursuant to which we assumed 35% of the risk. Effective July 1, 2009, in states where we are admitted, we directly insure policies written by our Heath XS Operating Unit and reinsure a portion of the risk with third party carriers. In states where we are not admitted, our Heath XS Operating Unit writes policies under fronting arrangements pursuant to which we assume all of the risk and then retrocede a portion of the risk to third party reinsurers. We presently reinsure or retrocede 79% of the risk on policies written by our Heath XS Operating Unit.
Personal Segment / Personal Lines Operating Unit
The Personal Segment of our business presently consists solely of our Personal Lines Operating Unit. Our Personal Lines Operating Unit markets and services non-standard personal automobile policies and low value dwelling/homeowners, renters and motorcycle coverage in 23 states. We conduct this business under the name Hallmark Insurance Company. Hallmark Insurance Company provides management, policy and claims administration services to HIC and includes the operations of American Hallmark General Agency, Inc. and Hallmark Claims Services, Inc. Our non-standard personal automobile insurance generally provides for the minimum limits of liability coverage mandated by state laws to drivers who find it difficult to purchase automobile insurance from standard carriers as a result of various factors, including driving record, vehicle, age, claims history, or limited financial resources. Products offered by our Personal Lines Operating Unit include the following:
| | | Personal automobile liability. Personal automobile liability insurance provides coverage primarily at the minimum limits required by law for automobile liability exposures, including bodily injury and property damage, arising from accidents involving the insured. |
| | | Personal automobile physical damage. Personal automobile physical damage insurance provides collision and comprehensive coverage for physical damage exposure to the insured vehicle as a result of an accident or as a result of causes other than collision such as vandalism, theft, wind, hail or water. |
| | | Low value dwelling/homeowners. Low value dwelling/homeowners insurance provides coverage against insured’s property being destroyed or damaged by various perils and coverage for liability exposure of the insured. |
| | | Renters. Renters insurance provides coverage for the contents of a renter’s home or apartment and for liability. Renter’s policies are similar to homeowners insurance, except they do not cover the structure. |
| | | Motorcycle. Motorcycle insurance provides coverage similar to the personal automobile products. A motorcycle policy is generally utilized for vehicles that do not qualify for a personal automobile policy because they have fewer than four wheels. Passenger liability may be included or excluded depending on customer choice or regulatory requirements. |
Our Personal Lines Operating Unit markets its non-standard personal automobile, motorcycle and property policies through 3,463 independent agents operating in its target geographic markets. Non-standard automobile represented 96% of the premiums produced during 2009. Subject to certain criteria, our Personal Lines Operating Unit seeks to maximize the number of agents appointed in each geographic area in order to more effectively penetrate its highly competitive markets. However, our Personal Lines Operating Unit periodically evaluates its independent agents and discontinues the appointment of agents whose production history does not satisfy certain standards. During 2009, the top ten independent agency groups produced approximately 14%, and no individual agency group produced more than 3%, of the total premium volume of our Personal Lines Operating Unit.
During 2009, personal automobile liability coverage accounted for approximately 78% and personal automobile physical damage coverage accounted for the remaining 22% of the total non-standard automobile premiums produced by our Personal Lines Operating Unit. American Hallmark General Agency, Inc. currently offers one-, two-, three-, six- and twelve-month policies. Our typical non-standard personal automobile customer is unable or unwilling to pay a full or half year's premium in advance. Accordingly, we currently offer a direct bill program where the premiums are directly billed to the insured on a monthly basis. We charge installment fees for each payment under the direct bill program.
Our Personal Lines Operating Unit markets non-standard personal automobile, low value/dwelling homeowners, renters and motorcycle policies in 23 states directly for HIC and AHIC. In Texas, our Personal Lines Operating Unit markets its policies both through reinsurance arrangements with unaffiliated companies and directly for HIC. We provide non-standard personal automobile coverage in Texas through a reinsurance arrangement with Old American County Mutual Fire Insurance Company (“OACM”). American Hallmark General Agency, Inc. holds a managing general agency appointment from OACM to manage the sale and servicing of OACM policies. HIC reinsures 100% of the OACM policies produced by American Hallmark General Agency, Inc. under these reinsurance arrangements. During the third quarter of 2009, HCM began fronting business previously written through OACM.
Our Competitive Strengths
We believe that we enjoy the following competitive strengths:
| | · | Specialized market knowledge and underwriting expertise. All of our operating units possess extensive knowledge of the specialty and niche markets in which they operate, which we believe allows them to effectively structure and market their property/casualty insurance products. Our Personal Lines Operating Unit has a thorough understanding of the unique characteristics of the non-standard personal automobile market. Our AHIS Operating Unit has significant underwriting experience in its target markets for standard commercial property/casualty insurance products. In addition, our TGA Operating Unit, Aerospace Operating Unit, and Heath XS Operating Unit have developed specialized underwriting expertise which enhances their ability to profitably underwrite non-standard property/casualty insurance coverages. |
| | · | Tailored market strategies. Each of our operating units has developed its own customized strategy for penetrating the specialty or niche markets in which it operates. These strategies include distinctive product structuring, marketing, distribution, underwriting and servicing approaches by each operating unit. As a result, we are able to structure our property/casualty insurance products to serve the unique risk and coverage needs of our insureds. We believe that these market-specific strategies enable us to provide policies tailored to the target customer which are appropriately priced and fit our risk profile. |
| | · | Superior agent and customer service. We believe that performing the underwriting, billing, customer service and claims management functions at the operating unit level allows us to provide superior service to both our independent agents and insured customers. The easy-to-use interfaces and responsiveness of our operating units enhance their relationships with the independent agents who sell our policies. We also believe that our consistency in offering our insurance products through hard and soft markets helps to build and maintain the loyalty of our independent agents. Our customized products, flexible payment plans and prompt claims processing are similarly beneficial to our insureds. |
| | · | Market diversification. We believe that operating in various specialty and niche segments of the property/casualty insurance market diversifies both our revenues and our risks. We also believe our operating units generally operate on different market cycles, producing more earnings stability than if we focused entirely on one product. As a result of the pooling arrangement among our insurance company subsidiaries, we are able to efficiently allocate our capital among these various specialty and niche markets in response to market conditions and expansion opportunities. We believe that this market diversification reduces our risk profile and enhances our profitability. |
| | · | Experienced management team. Our senior corporate management has an average of over 20 years of insurance experience. In addition, our operating units have strong management teams, with an average of more than 25 years of insurance industry experience for the heads of our operating units and an average of more than 15 years of underwriting experience for our underwriters. Our management has significant experience in all aspects of property/casualty insurance, including underwriting, claims management, actuarial analysis, reinsurance and regulatory compliance. In addition, Hallmark’s senior management has a strong track record of acquiring businesses that expand our product offerings and improve our profitability profile. |
Our Strategy
We are striving to become a “Best in Class” specialty insurance company offering products in specialty and niche markets through the following strategies:
| | · | Focusing on underwriting discipline and operational efficiency. We seek to consistently generate an underwriting profit on the business we write in hard and soft markets. Our operating units have a strong track record of underwriting discipline and operational efficiency which we seek to continue. We believe that in soft markets our competitors often offer policies at a low or negative underwriting profit in order to maintain or increase their premium volume and market share. In contrast, we seek to write business based on its profitability rather than focusing solely on premium production. To that end, we provide financial incentives to many of our underwriters and independent agents based on underwriting profitability. |
| | · | Achieving organic growth in our existing business lines. We believe that we can achieve organic growth in our existing business lines by consistently providing our insurance products through market cycles, expanding geographically, expanding our product offerings, expanding our agency relationships and further penetrating our existing customer base. We believe that our extensive market knowledge and strong agency relationships position us to compete effectively in our various specialty and niche markets. We also believe there is a significant opportunity to expand some of our existing business lines into new geographical areas and through new agency relationships while maintaining our underwriting discipline and operational efficiency. In addition, we believe there is an opportunity for some of our operating units to further penetrate their existing customer bases with additional products offered by other operating units. |
| | · | Pursuing selected, opportunistic acquisitions. We seek to opportunistically acquire insurance organizations that operate in specialty or niche property/casualty insurance markets that are complementary to our existing operations. We seek to acquire companies with experienced management teams, stable loss results and strong track records of underwriting profitability and operational efficiency. Where appropriate, we intend to ultimately retain profitable business produced by the acquired companies that would otherwise be retained by unaffiliated insurers. Our management has significant experience in evaluating potential acquisition targets, structuring transactions to ensure continued success and integrating acquired companies into our operational structure. |
Distribution
We market our property/casualty insurance products solely through independent general agents, retail agents and specialty brokers. Therefore, our relationships with independent agents and brokers are critical to our ability to identify, attract and retain profitable business. Each of our operating units has developed its own tailored approach to establishing and maintaining its relationships with these independent distributors of our products. These strategies focus on providing excellent service to our agents and brokers, maintaining a consistent presence in our target niche and specialty markets through hard and soft market cycles and fairly compensating the agents and brokers who market our products. Our operating units also regularly evaluate independent general and retail agents based on the underwriting profitability of the business they produce and their performance in relation to our objectives.
Except for the products of our Aerospace Operating Unit and our Heath XS Operating Unit, the distribution of property/casualty insurance products by our business segments is geographically concentrated. For the twelve months ended December 31, 2009, five states accounted for approximately 70% of the gross premiums retained by our insurance subsidiaries. The following table reflects the geographic distribution of our insured risks, as represented by direct and assumed premiums written by our business segments for the twelve months ended December 31, 2009.
| | | Standard | | | Specialty | | | | | | | | | | |
| | | Commercial | | | Commercial | | | Personal | | | | | | Percent of | |
| State | | Segment | | | Segment | | | Segment | | | Total | | | Total | |
| | | (dollars in thousands) | | | | |
| | | | | | | | | | | | | | | | |
| Texas | | $ | 23,991 | | | $ | 91,490 | | | $ | 16,229 | | | $ | 131,710 | | | | 45.8 | % |
| Oregon | | | 18,863 | | | | 676 | | | | 1,393 | | | | 20,932 | | | | 7.3 | % |
| New Mexico | | | 10,598 | | | | 630 | | | | 9,316 | | | | 20,544 | | | | 7.1 | % |
| Louisiana | | | - | | | | 13,773 | | | | 4,759 | | | | 18,532 | | | | 6.4 | % |
| Arizona | | | - | | | | 938 | | | | 11,102 | | | | 12,040 | | | | 4.2 | % |
| All other states | | | 19,060 | | | | 35,831 | | | | 28,909 | | | | 83,800 | | | | 29.2 | % |
| | | | | | | | | | | | | | | | | | | | | |
| Total gross premiums written | | $ | 72,512 | | | $ | 143,338 | | | $ | 71,708 | | | $ | 287,558 | | | | | |
| Percent of total | | | 25.2 | % | | | 49.9 | % | | | 24.9 | % | | | 100.0 | % | | | | |
Underwriting
The underwriting process employed by our operating units involves securing an adequate level of underwriting information, identifying and evaluating risk exposures and then pricing the risks we choose to accept. Each of our operating units offering commercial or aviation insurance products employs its own underwriters with in-depth knowledge of the specific niche and specialty markets targeted by that operating unit. We employ a disciplined underwriting approach that seeks to provide policies appropriately tailored to the specified risks and to adopt price structures that will be supported in the applicable market. Our experienced commercial and aviation underwriters have developed underwriting principles and processes appropriate to the coverages offered by their respective operating units.
We believe that managing the underwriting process through our operating units capitalizes on the knowledge and expertise of their personnel in specific markets and results in better underwriting decisions. All of our underwriters have established limits of underwriting authority based on their level of experience. We also provide financial incentives to many of our underwriters based on underwriting profitability.
To better diversify our revenue sources and manage our risk, we seek to maintain an appropriate business mix among our operating units. At the beginning of each year, we establish a target net loss ratio for each operating unit. We then monitor the actual net loss ratio on a monthly basis. If any line of business fails to meet its target net loss ratio, we seek input from our underwriting, actuarial and claims management personnel to develop a corrective action plan. Depending on the particular circumstances, that plan may involve tightening underwriting guidelines, increasing rates, modifying product structure, re-evaluating independent agency relationships or discontinuing unprofitable coverages or classes of risk.
An insurance company's underwriting performance is traditionally measured by its statutory loss and loss adjustment expense ratio, its statutory expense ratio and its statutory combined ratio. The statutory loss and loss adjustment expense ratio, which is calculated as the ratio of net losses and loss adjustment expenses (“LAE”) incurred to net premiums earned, helps to assess the adequacy of the insurer’s rates, the propriety of its underwriting guidelines and the performance of its claims department. The statutory expense ratio, which is calculated as the ratio of underwriting and operating expenses to net premiums written, assists in measuring the insurer’s cost of processing and managing the business. The statutory combined ratio, which is the sum of the statutory loss and LAE ratio and the statutory expense ratio, is indicative of the overall profitability of an insurer’s underwriting activities, with a combined ratio of less than 100% indicating profitable underwriting results.
The following table shows, for the periods indicated, (i) our gross premiums written (in thousands); and (ii) our underwriting results as measured by the net statutory loss and LAE ratio, the statutory expense ratio, and the statutory combined ratio.
| | | Year Ended December 31, | |
| | | 2009 | | | 2008 | | | 2007 | |
| Gross premiums written | | $ | 287,558 | | | $ | 243,849 | | | $ | 249,472 | |
| | | | | | | | | | | | | |
| Statutory loss & LAE ratio | | | 63.6 | % | | | 63.4 | % | | | 61.5 | % |
| Statutory expense ratio | | | 32.2 | % | | | 30.9 | % | | | 30.0 | % |
| Statutory combined ratio | | | 95.8 | % | | | 94.3 | % | | | 91.5 | % |
These statutory ratios do not reflect the deferral of policy acquisition costs, investment income, premium finance revenues, or the elimination of inter-company transactions required by U.S. generally accepted accounting principles (“GAAP”).
The premium-to-surplus percentage measures the relationship between net premiums written in a given period (premiums written, less returned premiums and reinsurance ceded to other carriers) to policyholders surplus (admitted assets less liabilities), determined on the basis of statutory accounting practices prescribed or permitted by insurance regulatory authorities. Insurance companies are expected to maintain a premium-to-surplus percentage of not more than 300%. For the years ended December 31, 2009, 2008 and 2007, our consolidated premium-to-surplus ratios were 150%, 170% and 181%, respectively. .
Claims Management and Administration
We believe that effective claims management is critical to our success and that our claims management process is cost-effective, delivers the appropriate level of claims service and produces superior claims results. Our claims management philosophy emphasizes the delivery of courteous, prompt and effective claims handling and embraces responsiveness to policyholders and agents. Our claims strategy focuses on thorough investigation, timely evaluation and fair settlement of covered claims while consistently maintaining appropriate case reserves. We seek to compress the cycle time of claim resolution in order to control both loss and claim handling cost. We also strive to control legal expenses by negotiating competitive rates with defense counsel and vendors, establishing litigation budgets and monitoring invoices.
Each of our operating units maintains its own dedicated staff of specialized claims personnel to manage and administer claims arising under policies produced through their respective operations. The claims process is managed through a combination of experienced claims managers, seasoned claims supervisors, trained staff adjusters and independent adjustment or appraisal services, when appropriate. All adjusters are licensed in those jurisdictions for which they handle claims that require licensing. Limits on settlement authority are established for each claims supervisor and staff adjuster based on their level of experience. Independent adjusters have no claim settlement authority. Claim exposures are periodically and systematically reviewed by claim supervisors and managers as a method of quality and loss control. Large loss exposures are reviewed at least quarterly with senior management of the operating unit and monitored by Hallmark senior management.
Claims personnel receive in-house training and are required to attend various continuing education courses pertaining to topics such as best practices, fraud awareness, legal environment, legislative changes and litigation management. Depending on the criteria of each operating unit, our claims adjusters are assigned a variety of claims to enhance their knowledge and ensure their continued development in efficiently handling claims. As of December 31, 2009, our operating units had a total of 57 claims managers, supervisors and adjusters with an average of approximately 15 years experience.
Analysis of Losses and LAE
Our consolidated financial statements include an estimated reserve for unpaid losses and LAE. We estimate our reserve for unpaid losses and LAE by using case-basis evaluations and statistical projections, which include inferences from both losses paid and losses incurred. We also use recent historical cost data and periodic reviews of underwriting standards and claims management practices to modify the statistical projections. We give consideration to the impact of inflation in determining our loss reserves, but do not discount reserve balances.
The amount of reserves represents our estimate of the ultimate cost of all unpaid losses and LAE incurred. These estimates are subject to the effect of trends in claim severity and frequency. We regularly review the estimates and adjust them as claims experience develops and new information becomes known. Such adjustments are included in current operations, including increases and decreases, net of reinsurance, in the estimate of ultimate liabilities for insured events of prior years.
Changes in loss development patterns and claim payments can significantly affect the ability of insurers to estimate reserves for unpaid losses and related expenses. We seek to continually improve our loss estimation process by refining our ability to analyze loss development patterns, claim payments and other information within a legal and regulatory environment which affects development of ultimate liabilities. Future changes in estimates of claim costs may adversely affect future period operating results. However, such effects cannot be reasonably estimated currently.
Reconciliation of reserve for unpaid losses and LAE. The following table provides a reconciliation of our beginning and ending reserve balances on a net-of-reinsurance basis for the years ended December 31, 2009, 2008 and 2007, to the gross-of-reinsurance amounts reported in our balance sheets at December 31, 2009, 2008 and 2007.
| | | As of and for Year Ended December 31, | |
| | | | | | | | | | |
| | | (dollars in thousands) | |
| | | | | | | | | | |
| Reserve for unpaid losses and LAE, net of reinsurance recoverables, January 1 | | $ | 150,025 | | | $ | 120,849 | | | $ | 72,801 | |
| | | | | | | | | | | | | |
| Provision for losses and LAE for claims occurring in the current period | | | 151,999 | | | | 146,059 | | | | 139,332 | |
| | | | | | | | | | | | | |
| Increase (decrease) in reserve for unpaid losses and LAE for claims occurring in prior periods | | | 1,620 | | | | (1,815 | ) | | | (6,414 | ) |
| | | | | | | | | | | | | |
| Payments for losses and LAE, net of reinsurance: | | | | | | | | | | | | |
| Current period | | | (62,584 | ) | | | (64,610 | ) | | | (54,809 | ) |
| Prior periods | | | (64,810 | ) | | | (50,458 | ) | | | (30,061 | ) |
| | | | | | | | | | | | | |
| Reserve for unpaid losses and LAE at December 31, net of reinsurance recoverable | | $ | 176,250 | | | $ | 150,025 | | | $ | 120,849 | |
| | | | | | | | | | | | | |
| Reinsurance recoverable on unpaid losses and LAE at December 31 | | | 8,412 | | | | 6,338 | | | | 4,489 | |
| | | | | | | | | | | | | |
| Reserve for unpaid losses and LAE at December 31, gross of reinsurance | | $ | 184,662 | | | $ | 156,363 | | | $ | 125,338 | |
The $1.6 million unfavorable development and $1.8 million and $6.4 million favorable development in prior accident years recognized in 2009, 2008 and 2007, respectively, represent normal changes in our loss reserve estimates. In 2009, the aggregate loss reserve estimates for prior years were increased to reflect unfavorable loss development when the available information indicated a reasonable likelihood that the ultimate losses would be more than the previous estimates. In 2008 and 2007 the aggregate loss reserve estimates for prior years were decreased to reflect favorable loss development when the available information indicated a reasonable likelihood that the ultimate losses would be less than the previous estimates. Generally, changes in reserves are caused by variations between actual experience and previous expectations and by reduced emphasis on the Bornhuetter-Ferguson method due to the aging of the accident years. (See, “Item 7. Management’s Discussion and Analysis of Financial Condition and Results of Operations - Critical Accounting Estimates and Judgments - Reserves for unpaid losses and loss adjustment expenses.”)
The $1.6 million increase in reserves for unpaid losses and LAE recognized in 2009 was attributable to $2.0 million unfavorable development on claims incurred in the 2008 accident year, $0.7 million favorable development on claims incurred in the 2007 accident year and $0.3 million unfavorable development on claims incurred in the 2006 and prior accident years. Our TGA Operating Unit and Aerospace Operating Unit accounted for $4.1 million and $0.3 million of the increase in reserves recognized during 2009, partially offset by a $1.8 million and $1.0 million decrease in reserves for our AHIS Operating Unit and Personal Lines Operating Unit. The increase in reserves for our TGA Operating Unit is driven by the development on a small number of commercial auto liability claims in which later reporting of medical information resulted in TGA increasing case reserves on claims with similar fact patterns. The decrease in reserves for our AHIS Operating Unit was primarily the result of favorable claims development in the 2006-2008 accident years with respect to general liability, partially offset by a commercial package liability claim in accident year 2005. The decrease in reserves for our Personal Lines Operating Unit was primarily the result of favorable claims development in accident years 2007 and 2008 as well as a loss recovery from the 2002 accident year.
The $1.8 million decrease in reserves for unpaid losses and LAE recognized in 2008 was attributable to $0.7 million favorable development on claims incurred in the 2007 accident year, $0.9 million favorable development on claims incurred in the 2006 accident year and $0.2 million favorable development on claims incurred in the 2005 and prior accident years. Our AHIS Operating Unit and Personal Lines Operating Unit accounted for $2.4 million and $0.7 million, respectively, of the decrease in reserves recognized in 2008, partially offset by a $1.5 million increase in reserves in our TGA Operating Unit. The decrease in reserves for our AHIS Operating Unit was primarily the result of favorable claims development in the 2007 accident year with respect to the commercial automobile physical damage and commercial property lines of business, offset somewhat by unfavorable development in accident year 2005 with respect to commercial package liability coverage. The decrease in reserves for our Personal Lines Operating Unit was primarily the result of favorable claims development in accident year 2006. The increase in reserves for our TGA Operating Unit was primarily the result of unfavorable claims development in accident years 2006 and 2007 attributable to a small number of larger than normal commercial automobile liability claims, partially offset by favorable claims development on the general liability line of business in accident years 2005 through 2007.
The $6.4 million decrease in reserves for unpaid losses and LAE recognized in 2007 was attributable to $3.2 million favorable development on claims incurred in the 2006 accident year, $1.8 million favorable development on claims incurred in the 2005 accident year and $1.4 million favorable development on claims incurred in the 2004 and prior accident years. Our TGA Operating Unit and AHIS Operating Unit accounted for $3.7 million and $1.7 million, respectively, of the decrease in reserves for unpaid losses and LAE recognized in 2007. Loss experience data accumulated since our acquisition of the TGA Operating Unit in January, 2006, were lower than the outside actuary’s estimate initially used to establish loss reserves. In late 2006, our AHIS Operating Unit experienced a small number of large, late reported general liability losses from earlier accident years. As a result of this unexpected claim development, we increased our loss reserve estimates for this business at the end of 2006. However, subsequent experience suggested that the impact of these types of claims would be less significant in more recent accident years than originally anticipated due in part to coverage restrictions previously implemented.
SAP/GAAP reserve reconciliation. The differences between the reserves for unpaid losses and LAE reported in our consolidated financial statements prepared in accordance with GAAP and those reported in our annual statements filed with the Texas Department of Insurance, the Arizona Department of Insurance and the Oklahoma Insurance Department in accordance with statutory accounting practices (“SAP”) as of December 31, 2009 and 2008 are summarized below.
| | | As of December 31, | |
| | | | | | | |
| | | (in thousands) | |
| Reserve for unpaid losses and LAE on a SAP basis (net of reinsurance recoverables on unpaid losses) | | $ | 176,250 | | | $ | 150,024 | |
| | | | | | | | | |
| Estimated future unallocated LAE reserve for claim service subsidiaries | | | - | | | | 1 | |
| | | | | | | | | |
| Reserve for unpaid losses and LAE on a GAAP basis (net of reinsurance recoverables on unpaid losses) | | $ | 176,250 | | | $ | 150,025 | |
Analysis of loss and LAE reserve development. The following table shows the development of our loss reserves, net of reinsurance, for years ended December 31, 1999 through 2009. Section A of the table shows the estimated liability for unpaid losses and LAE, net of reinsurance, recorded at the balance sheet date for each of the indicated years. This liability represents the estimated amount of losses and LAE for claims arising in prior years that are unpaid at the balance sheet date, including losses that have been incurred but not yet reported to us. Section B of the table shows the re-estimated amount of the previously recorded liability, based on experience as of the end of each succeeding year. The estimate is increased or decreased as more information becomes known about the frequency and severity of claims.
Cumulative Redundancy/Deficiency (Section C of the table) represents the aggregate change in the estimates over all prior years. Thus, changes in ultimate development estimates are included in operations over a number of years, minimizing the significance of such changes in any one year.
ANALYSIS OF LOSS AND LAE DEVELOPMENT
As of and for Year Ended December 31
| | | 1999 | | | 2000 | | | 2001 | | | 2002 | | | 2003 | | | 2004 | | | 2005 | | | 2006 | | | 2007 | | | 2008 | | | 2009 | |
| | | (dollars in thousands) | |
| A. Reserve for Unpaid Losses & LAE, Net of Reinsurance Recoverables | | $ | 5,409 | | | $ | 7,451 | | | $ | 7,919 | | | $ | 8,411 | | | $ | 21,197 | | | $ | 17,700 | | | $ | 25,997 | | | $ | 72,801 | | | $ | 120,849 | | | $ | 150,025 | | | $ | 176,250 | |
| | | | | | | | | | | | | | | | | | | | | | | | | | | | | | | | | | | | | | | | | | | | | |
| B. Net Reserve Re-estimated as of : | | | | | | | | | | | | | | | | | | | | | | | | | | | | | | | | | | | | | | | | | | | | |
| One year later | | | 5,506 | | | | 7,974 | | | | 8,096 | | | | 8,875 | | | | 20,003 | | | | 15,300 | | | | 24,820 | | | | 66,387 | | | | 119,034 | | | | 151,645 | | | | | |
| Two years later | | | 5,277 | | | | 7,863 | | | | 8,620 | | | | 8,881 | | | | 19,065 | | | | 15,473 | | | | 24,903 | | | | 68,490 | | | | 118,646 | | | | | | | | | |
| Three years later | | | 5,216 | | | | 7,773 | | | | 8,856 | | | | 8,508 | | | | 19,698 | | | | 13,962 | | | | 23,144 | | | | 68,809 | | | | | | | | | | | | | |
| Four years later | | | 5,095 | | | | 7,901 | | | | 8,860 | | | | 8,446 | | | | 18,551 | | | | 14,166 | | | | 23,455 | | | | | | | | | | | | | | | | | |
| Five years later | | | 5,028 | | | | 7,997 | | | | 8,855 | | | | 8,478 | | | | 18,769 | | | | 13,163 | | | | | | | | | | | | | | | | | | | | | |
| Six years later | | | 5,153 | | | | 7,999 | | | | 8,884 | | | | 8,461 | | | | 17,784 | | | | | | | | | | | | | | | | | | | | | | | | | |
| Seven years later | | | 5,153 | | | | 8,026 | | | | 8,669 | | | | 7,949 | | | | | | | | | | | | | | | | | | | | | | | | | | | | | |
| Eight years later | | | 5,182 | | | | 8,014 | | | | 8,855 | | | | | | | | | | | | | | | | | | | | | | | | | | | | | | | | | |
| Nine years later | | | 5,170 | | | | 8,007 | | | | | | | | | | | | | | | | | | | | | | | | | | | | | | | | | | | | | |
| Ten years later | | | 5,163 | | | | | | | | | | | | | | | | | | | | | | | | | | | | | | | | | | | | | | | | | |
| | | | | | | | | | | | | | | | | | | | | | | | | | | | | | | | | | | | | | | | | | | | | |
| C. Net Cumulative Redundancy (Deficiency) | | | 246 | | | | (556 | ) | | | (936 | ) | | | 462 | | | | 3,413 | | | | 4,537 | | | | 2,542 | | | | 3,992 | | | | 2,203 | | | | (1,620 | ) | | | | |
| | | | | | | | | | | | | | | | | | | | | | | | | | | | | | | | | | | | | | | | | | | | | |
| D. Cumulative Amount of Claims Paid, Net of Reinsurance Recoveries, through: | | | | | | | | | | | | | | | | | | | | | | | | | | | | | | | | | | | | | | | | | | | | |
| One year later | | | 3.229 | | | | 5,377 | | | | 5,691 | | | | 5,845 | | | | 12,217 | | | | 8,073 | | | | 16,721 | | | | 30,061 | | | | 50,458 | | | | 64,810 | | | | | |
| Two years later | | | 4,436 | | | | 7,070 | | | | 7,905 | | | | 7,663 | | | | 15,814 | | | | 12,004 | | | | 22,990 | | | | 46,860 | | | | 78,314 | | | | | | | | | |
| Three years later | | | 4,909 | | | | 7,584 | | | | 8,603 | | | | 8,228 | | | | 18,162 | | | | 13,113 | | | | 24,562 | | | | 58,322 | | | | | | | | | | | | | |
| Four years later | | | 5,014 | | | | 7,810 | | | | 8,798 | | | | 8,374 | | | | 17,997 | | | | 13,750 | | | | 9,014 | | | | | | | | | | | | | | | | | |
| Five years later | | | 4,966 | | | | 7,960 | | | | 8,821 | | | | 8,417 | | | | 18,415 | | | | 13,102 | | | | | | | | | | | | | | | | | | | | | |
| Six years later | | | 5,116 | | | | 7,970 | | | | 8,853 | | | | 8,439 | | | | 17,735 | | | | | | | | | | | | | | | | | | | | | | | | | |
| Seven years later | | | 5,124 | | | | 7,995 | | | | 8,869 | | | | 7,949 | | | | | | | | | | | | | | | | | | | | | | | | | | | | | |
| Eight years later | | | 5,151 | | | | 8,014 | | | | 8,855 | | | | | | | | | | | | | | | | | | | | | | | | | | | | | | | | | |
| Nine years later | | | 5,170 | | | | 8,007 | | | | | | | | | | | | | | | | | | | | | | | | | | | | | | | | | | | | | |
| Ten years later | | | 5,163 | | | | | | | | | | | | | | | | | | | | | | | | | | | | | | | | | | | | | | | | | |
| | | 2009 | | | 2008 | |
| | | | | | | |
| Net Reserve, December 31 | | $ | 176,250 | | | $ | 150,025 | |
| Reinsurance Recoverables | | | 8,412 | | | | 6,338 | |
| Gross Reserve, December 31 | | $ | 184,662 | | | $ | 156,363 | |
| | | | | | | | | |
| Net Re-estimated Reserve | | | | | | $ | 151,645 | |
| Re-estimated Reinsurance Recoverable | | | | | | | 8,703 | |
| Gross Re-estimated Reserve | | | | | | $ | 160,348 | |
| | | | | | | | | |
| Gross Cumulative Deficiency | | | | | | $ | (3,985 | ) |
Reinsurance
We reinsure a portion of the risk we underwrite in order to control our exposure to losses and to protect our capital resources. We cede to reinsurers a portion of these risks and pay premiums based upon the risk and exposure of the policies subject to such reinsurance. Ceded reinsurance involves credit risk and is generally subject to aggregate loss limits. Although the reinsurer is liable to us to the extent of the reinsurance ceded, we are ultimately liable as the direct insurer on all risks reinsured. Reinsurance recoverables are reported after allowances for uncollectible amounts. We monitor the financial condition of reinsurers on an ongoing basis and review our reinsurance arrangements periodically. Reinsurers are selected based on their financial condition, business practices and the price of their product offerings. Our reinsurance facilities are subject to annual renewal.
The following table presents our gross and net premiums written and earned and reinsurance recoveries for each of the last three years.
| | | | |
| | | Year Ended December 31, | |
| | | 2009 | | | 2008 | | | 2007 | |
| | | | | | | | | | |
| Gross premiums written | | $ | 287,558 | | | $ | 243,849 | | | $ | 249,472 | |
| Ceded premiums written | | | (25,818 | ) | | | (8,922 | ) | | | (10,661 | ) |
| Net premiums written | | $ | 261,740 | | | $ | 234,927 | | | $ | 238,811 | |
| | | | | | | | | | | | | |
| Gross premiums earned | | $ | 269,474 | | | $ | 244,656 | | | $ | 238,080 | |
| Ceded premiums earned | | | (18,402 | ) | | | (8,336 | ) | | | (12,109 | ) |
| Net premiums earned | | $ | 251,072 | | | $ | 236,320 | | | $ | 225,971 | |
| | | | | | | | | | | | | |
| Reinsurance recoveries | | $ | 8,975 | | | $ | 11,994 | | | $ | 3,862 | |
We presently retain 100% of the risk associated with all policies marketed by our Personal Lines Operating Unit. We currently reinsure the following exposures on business generated by our AHIS Operating Unit, our TGA Operating Unit, our Heath XS Operating Unit, and our Aerospace Operating Unit:
| | · | Property catastrophe. Our property catastrophe reinsurance reduces the financial impact a catastrophe could have on our commercial and personal property insurance lines. Catastrophes might include multiple claims and policyholders. Catastrophes include hurricanes, windstorms, earthquakes, hailstorms, explosions, severe winter weather and fires. Our property catastrophe reinsurance is excess-of-loss reinsurance, which provides us reinsurance coverage for losses in excess of an agreed-upon amount. We utilize catastrophe models to assist in determining appropriate retention and limits to purchase. The terms of our property catastrophe reinsurance are: |
| | o | We retain the first $3.0 million of property catastrophe losses; and |
| | o | Our reinsurers reimburse us 100% for any loss in excess of our $3.0 million retention up to $35.0 million for each catastrophic occurrence, subject to an aggregate limit of $64.0 million. |
| | · | Commercial property. Our commercial property reinsurance is excess-of-loss coverage intended to reduce the financial impact a single-event or catastrophic loss may have on our results. The terms of our commercial property reinsurance are: |
| | o | We retain the first $1.0 million of loss for each commercial property risk; |
| | o | Our reinsurers reimburse us for the next $5.0 million for each commercial property risk, and $10.0 million for all commercial property risk involved in any one occurrence, in all cases subject to an aggregate limit of $30.0 million for all commercial property losses occurring during the treaty period; and |
| | o | Individual risk facultative reinsurance is purchased on any commercial property with limits above $6.0 million. |
| | · | Commercial casualty. Our commercial casualty reinsurance is excess-of-loss coverage intended to reduce the financial impact a single-event loss may have on our results. The terms of our commercial casualty reinsurance are: |
| | o | We retain the first $1.0 million of any commercial liability risk: and |
| | o | Our reinsurers reimburse us for the next $5.0 million for each commercial liability risk. |
| | · | Aviation. We purchase reinsurance specific to the aviation risks underwritten by our Aerospace Operating Unit. This reinsurance provides aircraft hull and liability coverage and airport liability coverage on a per occurrence basis on the following terms: |
| | o | We retain the first $350,000 of each aircraft hull or liability loss or airport liability loss; |
| | o | Our reinsurers reimburse us for the next $3.3 million of each combined aircraft hull and liability loss and for the next $650,000 of each airport liability loss; and |
| | o | Other risks with liability limits greater than $1.0 million are placed in a quota share treaty where we retain 20% of incurred losses. |
| | · | Heath XS. Effective July 1, 2009, in states where we are admitted, we directly insure policies written by our Heath XS Operating Unit and reinsure a portion of the risk with third party carriers. In states where we are not admitted, our Heath XS Operating Unit writes policies under fronting arrangements pursuant to which we assume all of the risk and then retrocede a portion of the risk to third party reinsurers. We reinsure or retrocede 79% of the risk on policies written by our Heath XS Operating Unit. Through June 30, 2009, our Heath XS Operating Unit wrote policies under a fronting arrangement pursuant to which we assumed 35% of the risk. |
| | · | Hallmark County Mutual. HCM is used to front certain lines of business in our Specialty Commercial and Personal Segments in Texas where we previously produced policies for third party county mutual insurance companies and reinsured 100% for a fronting fee. In addition HCM is used to front business produced by unaffiliated third parties. HCM does not retain any business. |
Investment Portfolio
Our investment objective is to maximize current yield while maintaining safety of capital together with sufficient liquidity for ongoing insurance operations. Our investment portfolio is composed of fixed-income and equity securities. As of December 31, 2009, we had total invested assets of $327.7 million. If market rates were to increase by 1%, the fair value of our fixed-income securities as of December 31, 2009 would decrease by approximately $5.5 million. The following table shows the fair values of various categories of fixed-income securities, the percentage of the total fair value of our invested assets represented by each category and the tax equivalent book yield based on fair value of each category of invested assets as of December 31, 2009 and 2008.
| | | As of December 31, 2009 | | | As of December 31, 2008 | |
| | | Fair | | | Percent of | | | | | | Fair | | | Percent of | | | | |
| | | Value | | | Total | | | Yield | | | Value | | | Total | | | Yield | |
| | | (in thousands) | | | | | | | | | (in thousands) | | | | | | | |
| | | | | | | | | | | | | | | | | | | |
| Category | | | | | | | | | | | | | | | | | | |
| Corporate bonds | | $ | 99,549 | | | | 34.1 | % | | | 6.2 | % | | $ | 60,547 | | | | 22.5 | % | | | 7.4 | % |
| Municipal bonds | | | 184,793 | | | | 63.3 | % | | | 8.2 | % | | | 203,791 | | | | 75.9 | % | | | 8.6 | % |
| US Treasury bonds | | | 6,836 | | | | 2.4 | % | | | 2.5 | % | | | 4,175 | | | | 1.6 | % | | | 3.8 | % |
| Mortgage backed securities | | | 698 | | | | 0.2 | % | | | 5.6 | % | | | - | | | | 0.0 | % | | | 0.0 | % |
| | | | | | | | | | | | | | | | | | | | | | | | | |
| Total | | $ | 291,876 | | | | 100.0 | % | | | 7.4 | % | | $ | 268,513 | | | | 100.0 | % | | | 8.3 | % |
The weighted average credit rating for our fixed-income portfolio, using ratings assigned by Standard and Poor’s Rating Services (a division of the McGraw-Hill Companies, Inc.), was A- at December 31, 2009. The following table shows the distribution of our fixed-income portfolio by Standard and Poor’s rating as a percentage of total market value as of December 31, 2009 and 2008:
| | | As of | | | As of | |
| | | December 31, 2009 | | | December 31, 2008 | |
| Rating: | | | | | | |
| "AAA" | | | 15.8 | % | | | 16.5 | % |
| "AA" | | | 15.5 | % | | | 42.5 | % |
| "A" | | | 34.0 | % | | | 20.7 | % |
| "BBB" | | | 22.6 | % | | | 9.1 | % |
| "BB" | | | 9.0 | % | | | 8.7 | % |
| "B" | | | 1.2 | % | | | 1.2 | % |
| "CCC" | | | 1.9 | % | | | 1.3 | % |
| Total | | | 100.0 | % | | | 100.0 | % |
The following table shows the composition of our fixed-income portfolio by remaining time to maturity as of December 31, 2009 and 2008.
| | | As of December 31, 2009 | | | As of December 31, 2008 | |
| | | | | | Percentage of | | | | | | Percentage of | |
| | | | | | Total | | | | | | Total | |
| | | Fair Value | | | Fair Value | | | Fair Value | | | Fair Value | |
| | | (in thousands) | | | | | | (in thousands) | | | | |
| Remaining time to maturity: | | | | | | | | | | | | |
| Less than one year | | $ | 36,563 | | | | 12.5 | % | | $ | 59,964 | | | | 22.3 | % |
| One to five years | | | 138,179 | | | | 47.4 | % | | | 87,142 | | | | 32.4 | % |
| Five to ten years | | | 46,335 | | | | 15.9 | % | | | 55,206 | | | | 20.6 | % |
| More than ten years | | | 70,101 | | | | 24.0 | % | | | 66,201 | | | | 24.7 | % |
| Mortgage-backed securities | | | 698 | | | | 0.2 | % | | | - | | | | 0.0 | % |
| Total | | $ | 291,876 | | | | 100.0 | % | | $ | 268,513 | | | | 100.0 | % |
Our investment strategy is to conservatively manage our investment portfolio by investing primarily in readily marketable, investment-grade fixed-income securities. As of December 31, 2009, 10.9% of our investment portfolio was invested in equity securities. Our investment portfolio is managed internally. We regularly review our portfolio for declines in value. If a decline in value is deemed temporary, we record the decline as an unrealized loss in other comprehensive income on our consolidated statement of stockholders’ equity and comprehensive income and accumulated other comprehensive income on our consolidated balance sheet. If the decline is deemed other-than -temporary, we write down the carrying value of the investment and record a realized loss in our consolidated statements of operations. As of December 31, 2009, we had a net unrealized gain of $13.3 million on our investments. The following table details the net unrealized gain (loss) balance by invested asset category as of December 31, 2009.
| | | Net Unrealized | |
| Category | | Gain (Loss) Balance | |
| | | (in thousands) | |
| | | | |
| Corporate debt securities | | $ | 4,989 | |
| Municipal bonds | | | (243 | ) |
| Equity securities | | | 8,550 | |
| U.S. Treasury securities and obligations of | | | | |
| U.S. government corporations and agencies | | | 6 | |
| Mortgage-backed securities | | | 16 | |
| | | $ | 13,318 | |
As part of our overall investment strategy, we also maintain an integrated cash management system utilizing on-line banking services and daily overnight investment accounts to maximize investment earnings on all available cash.
Technology
The majority of our technology systems are based on products licensed from insurance-specific technology vendors which have been substantially customized to meet the unique needs of our various operating units. Our technology systems primarily consist of integrated central processing computers, a series of server-based computer networks and various communications systems that allow our branch offices to share systems solutions and communicate to the home office in a timely, secure and consistent manner. We maintain backup facilities and systems through a contract with a leading provider of computer disaster recovery services. Each operating unit bears the information services expenses specific to its operations as well as a portion of the corporate services expenses. Increases to vendor license and service fees are capped per annum.
We believe the implementation of our various technology systems has increased our efficiency in the processing of our business, resulting in lower operating costs. Additionally, our systems enable us to provide a high level of service to our agents and policyholders by processing our business in a timely and efficient manner, communicating and sharing data with our agents and providing a variety of methods for the payment of premiums. We believe these systems have also improved the accumulation and analysis of information for our management.
Ratings
Many insurance buyers, agents and brokers use the ratings assigned by A.M. Best and other rating agencies to assist them in assessing the financial strength and overall quality of the companies from which they are considering purchasing insurance. A.M. Best has pooled its ratings of our AHIC, HIC, and HSIC subsidiaries and assigned a financial strength rating of “A-” (Excellent) and an issuer credit rating of “a-” to each of our individual insurance company subsidiaries and to the pool formed by our insurance company subsidiaries. A.M. Best has also assigned a financial strength rating of “A-” (Excellent) and an issuer credit rating of “a-” to HCM. An “A–” rating is the fourth highest of 15 rating categories used by A.M. Best. In evaluating an insurer’s financial and operating performance, A.M. Best reviews the company’s profitability, indebtedness and liquidity, as well as its book of business, the adequacy and soundness of its reinsurance, the quality and estimated market value of its assets, the adequacy of its loss reserves, the adequacy of its surplus, its capital structure, the experience and competence of its management and its market presence. A.M. Best’s ratings reflect its opinion of an insurer’s financial strength, operating performance and ability to meet its obligations to policyholders and are not an evaluation directed at investors or recommendations to buy, sell or hold an insurer’s stock.
Competition
The property/casualty insurance market, our primary source of revenue, is highly competitive and, except for regulatory considerations, has very few barriers to entry. According to A.M. Best, there were 3,303 property/casualty insurance companies and 2,122 property/casualty insurance groups operating in North America as of July 20, 2009. Our AHIS Operating Unit competes with a variety of large national standard commercial lines carriers such as The Hartford, Zurich North America, Travelers and Liberty Mutual, as well as numerous smaller regional companies. The primary competition for our TGA Operating Unit’s excess and surplus lines products includes such carriers as Dallas National Insurance Company, Atlantic Casualty Insurance Company, Colony Insurance Company, Burlington Insurance Company, Scottsdale Insurance Company, Markel Group and, to a lesser extent, a number of national standard lines carriers such as Travelers and The Hartford. Our Aerospace Operating Unit considers its primary competitors to be Houston Casualty Corp., Starr Aviation, Global Aerospace, Phoenix Aviation, W. Brown & Company, AIG and London Aviation Underwriters. The primary competition for our Heath XS Operating Unit includes such carriers as Axis Insurance Company, First Mercury Insurance Company, Gemini Insurance Company, General Star Insurance Company and Lexington Insurance Company. Although our Personal Lines Operating Unit competes with large national insurers such as Allstate, State Farm and Progressive, as a participant in the non-standard personal automobile marketplace its competition is most directly associated with numerous regional and mono-line insurance companies and managing general agencies. Our competitors include entities which have, or are affiliated with entities which have, greater financial and other resources than we have.
Generally, we compete on price, customer service, coverages offered, claims handling, financial stability, agent commission and support, customer recognition and geographic coverage. We compete with companies who use independent agents, captive agent networks, direct marketing channels or a combination thereof.
Insurance Regulation
AHIC and HCM are domiciled in Texas, HIC is domiciled in Arizona and HSIC is domiciled in Oklahoma. Therefore, our insurance operations are regulated by the Texas Department of Insurance, the Arizona Department of Insurance and the Oklahoma Insurance Department, as well as the applicable insurance department of each state in which we issue policies. AHIC, HIC, HSIC and HCM are required to file quarterly and annual statements of their financial condition prepared in accordance with statutory accounting practices with the insurance departments of their respective states of domicile and the applicable insurance department of each state in which they write business. The financial conditions of AHIC, HIC, HSIC and HCM, including the adequacy of surplus, loss reserves and investments, are subject to review by the insurance department of their respective states of domicile.
Periodic financial and market conduct examinations. The Texas Department of Insurance, the Arizona Department of Insurance and the Oklahoma Insurance Department have broad authority to enforce insurance laws and regulations through examinations, administrative orders, civil and criminal enforcement proceedings, and suspension or revocation of an insurer’s certificate of authority or an agent’s license. The state insurance departments that have jurisdiction over our insurance company subsidiaries may conduct on-site visits and examinations of the insurance companies' affairs, especially as to their financial condition, ability to fulfill their obligations to policyholders, market conduct, claims practices and compliance with other laws and applicable regulations. Typically, these examinations are conducted every three to five years. In addition, if circumstances dictate, regulators are authorized to conduct special or target examinations of insurance companies to address particular concerns or issues. The results of these examinations can give rise to regulatory orders requiring remedial, injunctive or other corrective action on the part of the company that is the subject of the examination, assessment of fines or other penalties against that company. In extreme cases, including actual or pending insolvency, the insurance department may take over, or appoint a receiver to take over, the management or operations of an insurer or an agent’s business or assets.
Guaranty funds. All insurance companies are subject to assessments for state-administered funds which cover the claims and expenses of insolvent or impaired insurers. The size of the assessment is determined each year by the total claims on the fund that year. Each insurer is assessed a pro rata share based on its direct premiums written in that state. Payments to the fund may be recovered by the insurer through deductions from its premium taxes over a specified period of years.
Transactions between insurance companies and their affiliates. Hallmark is also regulated as an insurance holding company by the Texas Department of Insurance, the Arizona Department of Insurance and the Oklahoma Insurance Department. Financial transactions between Hallmark or any of its affiliates and AHIC, HIC, HSIC, or HCM are subject to regulation. Transactions between our insurance company subsidiaries and their affiliates generally must be disclosed to state regulators, and prior regulatory approval generally is required before any material or extraordinary transaction may be consummated or any management agreement, services agreement, expense sharing arrangement or other contract providing for the rendering of services on a regular, systematic basis is implemented. State regulators may refuse to approve or may delay approval of such a transaction, which may impact our ability to innovate or operate efficiently.
Dividends. Dividends and distributions to Hallmark by AHIC, HIC or HSIC are restricted by the insurance regulations of the respective state in which each insurance company subsidiary is domiciled. As a property/casualty insurance company domiciled in the State of Texas, AHIC is limited in the payment of dividends to the amount of surplus profits arising from its business. In estimating such profits, AHIC must exclude all unexpired risks, all unpaid losses and all other debts due and payable or to become due and payable by AHIC. In addition, AHIC must obtain the approval of the Texas Department of Insurance before the payment of extraordinary dividends, which are defined as dividends or distributions of cash or other property the fair market value of which combined with the fair market value of each other dividend or distribution made in the preceding 12 months exceeds the greater of: (1) statutory net income as of the prior December 31st or (2) 10% of statutory policyholders' surplus as of the prior December 31st. HIC, domiciled in Arizona, may pay dividends out of that part of its available surplus funds which is derived from realized net profits on its business. Without prior written approval from the Arizona Department of Insurance, HIC may not pay extraordinary dividends, which are defined as dividends or distributions of cash or other property the fair market value of which combined with the fair market value of each other dividend or distribution made in the preceding 12 months exceeds the lesser of: (1) 10% of statutory policyholders’ surplus as of the prior December 31st or (2) net investment income as of the prior December 31st. HSIC, domiciled in Oklahoma, may only pay dividends out of that part of its available surplus funds which is derived from realized net profits on its business. Without prior written approval from the Oklahoma Insurance Department, HSIC may not pay extraordinary dividends, which are defined as dividends or distributions of cash or other property the fair market value of which combined with the fair market value of each other dividend or distribution made in the preceding 12 months exceeds the greater of: (1) 10% of statutory policyholders’ surplus as of the prior December 31st or (2) statutory net income as of the prior December 31st, not including realized capital gains. As a county mutual, dividends from HCM are payable to policyholders.
Risk-based capital requirements. The National Association of Insurance Commissioners requires property/casualty insurers to file a risk-based capital calculation according to a specified formula. The purpose of the formula is twofold: (1) to assess the adequacy of an insurer’s statutory capital and surplus based upon a variety of factors such as potential risks related to investment portfolio, ceded reinsurance and product mix; and (2) to assist state regulators under the RBC for Insurers Model Act by providing thresholds at which a state commissioner is authorized and expected to take regulatory action. As of December 31, 2009, the adjusted capital under the risk-based capital calculation of each of our insurance company subsidiaries substantially exceeded the minimum requirements.
Required licensing. American Hallmark Insurance Services, TGA Insurance Managers, American Hallmark General Agency, Inc., Hallmark Claims Services, Inc., Effective Claims Managers, HXS, Aerospace Claims Management Group and Aerospace Insurance Managers are each subject to and in compliance with the licensing requirements of the department of insurance in each state in which they produce business. These licenses govern, among other things, the types of insurance coverages, agency and claims services and products that we may offer consumers in these states. Such licenses typically are issued only after we file an appropriate application and satisfy prescribed criteria. Generally, each state requires one officer to maintain an agent license. Claims adjusters employed by us are also subject to the licensing requirements of each state in which they conduct business. Each employed claim adjuster either holds or has applied for the required licenses. Our premium finance subsidiaries are subject to licensing, financial reporting and certain financial requirements imposed by the Texas Department of Insurance, as well as regulations promulgated by the Texas Office of Consumer Credit Commissioner.
Regulation of insurance rates and approval of policy forms. The insurance laws of most states in which our subsidiaries operate require insurance companies to file insurance rate schedules and insurance policy forms for review and approval. State insurance regulators have broad discretion in judging whether our rates are adequate, not excessive and not unfairly discriminatory and whether our policy forms comply with law. The speed at which we can change our rates depends, in part, on the method by which the applicable state's rating laws are administered. Generally, state insurance regulators have the authority to disapprove our rates or request changes in our rates.
Restrictions on cancellation, non-renewal or withdrawal. Many states have laws and regulations that limit an insurance company's ability to exit a market. For example, certain states limit an automobile insurance company’s ability to cancel or not renew policies. Some states prohibit an insurance company from withdrawing from one or more lines of business in the state, except pursuant to a plan approved by the state insurance department. In some states, this applies to significant reductions in the amount of insurance written, not just to a complete withdrawal. State insurance departments may disapprove a plan that may lead to market disruption.
Investment restrictions. We are subject to state laws and regulations that require diversification of our investment portfolios and that limit the amount of investments in certain categories. Failure to comply with these laws and regulations would cause non-conforming investments to be treated as non-admitted assets for purposes of measuring statutory surplus and, in some instances, would require divestiture.
Trade practices. The manner in which we conduct the business of insurance is regulated by state statutes in an effort to prohibit practices that constitute unfair methods of competition or unfair or deceptive acts or practices. Prohibited practices include disseminating false information or advertising; defamation; boycotting, coercion and intimidation; false statements or entries; unfair discrimination; rebating; improper tie-ins with lenders and the extension of credit; failure to maintain proper records; failure to maintain proper complaint handling procedures; and making false statements in connection with insurance applications for the purpose of obtaining a fee, commission or other benefit.
Unfair claims practices. Generally, insurance companies, adjusting companies and individual claims adjusters are prohibited by state statutes from engaging in unfair claims practices on a flagrant basis or with such frequency to indicate a general business practice. Examples of unfair claims practices include:
| | · | misrepresenting pertinent facts or insurance policy provisions relating to coverages at issue; |
| | · | failing to acknowledge and act reasonably promptly upon communications with respect to claims arising under insurance policies; |
| | · | failing to adopt and implement reasonable standards for the prompt investigation and settlement of claims arising under insurance policies; |
| | · | failing to affirm or deny coverage of claims within a reasonable time after proof of loss statements have been completed; |
| | · | attempting to settle a claim for less than the amount to which a reasonable person would have believed such person was entitled; |
| | · | attempting to settle claims on the basis of an application that was altered without notice to, or knowledge and consent of, the insured; |
| | · | compelling insureds to institute suits to recover amounts due under policies by offering substantially less than the amounts ultimately recovered in suits brought by them; |
| | · | refusing to pay claims without conducting a reasonable investigation; |
| | · | making claim payments to an insured without indicating the coverage under which each payment is being made; |
| | · | delaying the investigation or payment of claims by requiring an insured, claimant or the physician of either to submit a preliminary claim report and then requiring the subsequent submission of formal proof of loss forms, both of which submissions contain substantially the same information; |
| | · | failing, in the case of claim denials or offers of compromise or settlement, to promptly provide a reasonable and accurate explanation of the basis for such actions; and |
| | · | not attempting in good faith to effectuate prompt, fair and equitable settlements of claims in which liability has become reasonably clear. |
Employees
As of December 31, 2009, we employed 321 people on a full-time basis. None of our employees are represented by labor unions. We consider our employee relations to be good.
Item 1A. Risk Factors.
Not applicable to smaller reporting company.
Item 1B. Unresolved Staff Comments.
Not applicable
Item 2. Properties.
Our corporate headquarters and AHIS Operating Unit are located at 777 Main Street, Suite 1000, Fort Worth, Texas. The suite is located in a high-rise office building and contains 27,808 square feet of space. The rent is currently $34,644 per month pursuant to a lease which expires June 30, 2011. Our corporate headquarters also occupies ten offices in an executive suite located in the same building for $10,200 per month under a lease which expires September 30, 2010.
Our TGA Operating Unit is presently located at 7411 John Smith, San Antonio, Texas. The suite is located in a high-rise office building and contains 18,904 square feet of space. The rent is currently $30,829 per month pursuant to a lease which expires June 30, 2010. Commencing June 1, 2010, the TGA Operating Unit will move to a high-rise office building located at 7550 IH-10 West, San Antonio, Texas. These leased premises consist of a 16,599 square foot office suite and 800 square feet of storage space. After a six month rent abatement, the initial rent will be $21,749 per month pursuant to a lease which expires November 30, 2020. Our TGA Operating Unit also maintains a small branch office in Lubbock, Texas. Rent on this branch office is currently $1,000 per month under a lease which expires April 30, 2012.
Our Aerospace Operating Unit is located at 14990 Landmark Boulevard, Suite 300, Addison, Texas. The suite is located in a low-rise office building and contains 8,925 square feet of space. The rent is currently $14,736 per month pursuant to a lease which expires September 30, 2010. Our Aerospace Operating Unit also maintains a branch office in Glendale, California. Rent on the 1,196 square foot suite is currently $2,452 per month pursuant to a lease which expires July 31, 2012.
Our Heath XS Operating Unit is located at 59 South Finley Avenue, Basking Ridge, New Jersey. The suite is located in a low-rise office building and contains 2,285 square feet of space. The rent is currently $3,606 per month pursuant to a lease which expires April 30, 2013.
Our Personal Lines Operating Unit is located at 6500 Pinecrest, Suite 100, Plano, Texas. The suite is located in a one story office building and contains 16,814 square feet of space. The rent is currently $19,897 per month pursuant to a lease which expires January 31, 2016.
Item 3. Legal Proceedings.
We are engaged in various legal proceedings which are routine in nature and incidental to our business. None of these proceedings, either individually or in the aggregate, are believed, in our opinion, to have a material adverse effect on our consolidated financial position or our results of operations.
Item 4. Submission of Matters to a Vote of Security Holders.
During the fourth quarter of 2009, we did not submit any matter to a vote of our security holders.
PART II
Item 5. Market for Registrant’s Common Equity, Related Stockholder Matters and Issuer Purchases of Equity Securities.
Market for Common Stock
Our common stock is currently traded on the Nasdaq Global Market under the symbol “HALL.” The following table shows the high and low sales prices of our common stock on the Nasdaq Global Market for each quarter since January 1, 2008.
| Period | | High Sale | | | Low Sale | |
| | | | | | | |
| Year Ended December 31, 2009: | | | | | | |
| First quarter | | $ | 9.51 | | | $ | 5.98 | |
| Second quarter | | | 7.49 | | | | 6.45 | |
| Third quarter | | | 8.45 | | | | 6.55 | |
| Fourth quarter | | | 8.75 | | | | 6.93 | |
| | | | | | | | | |
| Year Ended December 31, 2008: | | | | | | | | |
| First quarter | | $ | 16.76 | | | $ | 10.35 | |
| Second quarter | | | 12.88 | | | | 8.55 | |
| Third quarter | | | 10.71 | | | | 8.40 | |
| Fourth quarter | | | 9.91 | | | | 5.05 | |
Holders
As of March 10, 2010, there were 1,841 shareholders of record of our common stock.
Dividends
Hallmark has never paid dividends on its common stock. Our board of directors intends to continue this policy for the foreseeable future in order to retain earnings for development of our business.
Hallmark is a holding company and a legal entity separate and distinct from its subsidiaries. As a holding company, Hallmark is dependent on dividend payments and management fees from its subsidiaries to pay dividends and make other payments. State insurance laws limit the ability of our insurance company subsidiaries to pay dividends to Hallmark. As a property/casualty insurance company domiciled in the State of Texas, AHIC is limited in the payment of dividends to Hallmark in any 12-month period, without the prior written consent of the Texas Department of Insurance, to the greater of statutory net income for the prior calendar year or 10% of statutory policyholders surplus as of the prior year end. Dividends may only be paid from unassigned surplus funds. HIC, domiciled in Arizona, is limited in the payment of dividends to the lesser of 10% of prior year policyholders surplus or prior year's net investment income, without prior written approval from the Arizona Department of Insurance. HSIC, domiciled in Oklahoma, is limited in the payment of dividends to the greater of 10% of prior year policyholders surplus or prior year's statutory net income, not including realized capital gains, without prior written approval from the Oklahoma Insurance Department. As a county mutual, dividends from HCM are payable to policyholders.
Equity Compensation Plan Information
The following table sets forth information regarding shares of our common stock authorized for issuance under our equity compensation plans as of December 31, 2009.
| | | | | | | | | Number of securities | |
| | | Number of securities | | | | | | remaining available | |
| | | to be issued upon | | | Weighted-average | | | for future issuance | |
| | | exercise of outstanding | | | exercise price of | | | under equity compensation | |
| | | options, warrants and | | | outstanding options, | | | plans [excluding securities | |
| Plan Category | | rights | | | warrants and rights | | | reflected in column (a)] | |
| | | (a) | | | (b) | | | (c) | |
| | | | | | | | | | |
Equity compensation plans approved by security holders1 | | | 1,605,833 | | | $ | 9.65 | | | | 417,501 | |
| | | | | | | | | | | | | |
Equity compensation plans not approved by security holders2 | | | 8,333 | | | $ | 2.25 | | | | - 0 - | |
| | | | | | | | | | | | | |
| Total | | | 1,614,166 | | | $ | 9.62 | | | | 417,501 | |
| 1 | Includes shares of our common stock authorized for issuance under our 2005 Long Term Incentive Plan, as well as shares of our common stock issuable upon exercise of options outstanding under our 1994 Key Employee Long Term Incentive Plan and our 1994 Non-Employee Director Stock Option Plan, both of which terminated in accordance with their terms in 2004. |
| 2 | Represents shares of our common stock issuable upon exercise of non-qualified stock options granted to our non-employee directors in lieu of cash compensation for their service on the board of directors during fiscal 1999. The options became fully exercisable on August 16, 2000, and terminate on March 15, 2010, to the extent not previously exercised. |
Issuer Repurchases
We did not repurchase any shares of our common stock during the fourth quarter of 2009.
Item 6. Selected Financial Data
Not applicable to smaller reporting company.
Item 7. Management’s Discussion and Analysis of Financial Condition and Results of Operations.
The following discussion should be read together with our consolidated financial statements and the notes thereto. This discussion contains forward-looking statements. Please see “Risks Associated with Forward-Looking Statements in this Form 10-K” for a discussion of some of the uncertainties, risks and assumptions associated with these statements.
Overview
Hallmark is an insurance holding company which, through its subsidiaries, engages in the sale of property/casualty insurance products to businesses and individuals. Our business involves marketing, distributing, underwriting and servicing our insurance products, as well as providing other insurance related services. We pursue our business activities through subsidiaries whose operations are organized into operating units and are supported by our insurance carrier subsidiaries.
Our non-carrier insurance activities are organized by operating units into the following reportable segments:
| | · | Standard Commercial Segment. The Standard Commercial Segment includes the standard lines commercial property/casualty insurance products and services handled by our AHIS Operating Unit which is comprised of our American Hallmark Insurance Services and ECM subsidiaries. |
| | · | Specialty Commercial Segment. The Specialty Commercial Segment primarily includes the excess and surplus lines commercial property/casualty insurance products and services handled by our TGA Operating Unit, the general aviation insurance products and services handled by our Aerospace Operating Unit and the commercial excess liability and umbrella products handled by our Heath XS Operating Unit. Our TGA Operating Unit is comprised of our TGA, PAAC and TGARSI subsidiaries. Our Aerospace Operating Unit is comprised of our Aerospace Insurance Managers, ASRI and ACMG subsidiaries. Our Heath XS Operating Unit is compromised of our HXS and HDS subsidiaries. The Heath XS Operating Unit was acquired August 29, 2008. |
| | · | Personal Segment. The Personal Segment includes the non-standard personal automobile, low value dwelling/homeowners, renters and motorcycle insurance products and services handled by our Personal Lines Operating Unit which is comprised of American Hallmark General Agency, Inc. and Hallmark Claims Services, Inc., both of which do business as Hallmark Insurance Company. |
The retained premium produced by these reportable segments is supported by the following insurance company subsidiaries:
| | · | American Hallmark Insurance Company of Texas presently retains all of the risks on the commercial property/casualty policies marketed within the Standard Commercial Segment, retains a portion of the risks on personal policies marketed within the Personal Lines Operating Unit and assumes a portion of the risks on the commercial and aviation property/casualty policies marketed within the Specialty Commercial Segment. |
| | · | Hallmark Specialty Insurance Company presently retains a portion of the risks on the commercial property/casualty policies marketed within the Specialty Commercial Segment. |
| | · | Hallmark Insurance Company presently retains a portion of the risks on both the personal policies marketed within the Personal Lines Operating Unit and the aviation property/casualty products marketed within the Specialty Commercial Segment. |
| | · | Hallmark County Mutual Insurance Company control and management was acquired effective June 5, 2009 through the acquisition of all of the issued and outstanding shares of CYR Insurance Management Company (“CYR”). CYR has as its primary asset a management agreement with HCM which provides for CYR to have management and control of HCM. HCM is used to front certain lines of business in our Specialty Commercial and Personal Segments in Texas where we previously produced policies for third party county mutual insurance companies and reinsured 100% for a fronting fee. HCM does not retain any business. |
AHIC, HIC, and HSIC have entered into a pooling arrangement pursuant to which AHIC retains 46.0% of the total net premiums written, HIC retains 34.1% of our total net premiums written and HSIC retains 19.9% of our total net premiums written. HCM is not a party to the intercompany pooling arrangement.
Critical Accounting Estimates and Judgments
The significant accounting policies requiring our estimates and judgments are discussed below. Such estimates and judgments are based on historical experience, changes in laws and regulations, observance of industry trends and information received from third parties. While the estimates and judgments associated with the application of these accounting policies may be affected by different assumptions or conditions, we believe the estimates and judgments associated with the reported consolidated financial statement amounts are appropriate in the circumstances. For additional discussion of our accounting policies, see Note 1 to the audited consolidated financial statements included in this report.
Valuation of investments. We complete a detailed analysis each quarter to assess whether any decline in the fair value of any investment below cost is deemed other-than-temporary. All securities with an unrealized loss are reviewed. We recognize an impairment loss when an investment's value declines below cost, adjusted for accretion, amortization and previous other-than-temporary impairments and it is determined that the decline is other-than-temporary.
Equity Investments: Some of the factors considered in evaluating whether a decline in fair value for an equity investment is other-than-temporary include: (1) our ability and intent to retain the investment for a period of time sufficient to allow for an anticipated recovery in value; (2) the recoverability of cost; (3) the length of time and extent to which the fair value has been less than cost; and (4) the financial condition and near-term and long-term prospects for the issuer, including the relevant industry conditions and trends, and implications of rating agency actions and offering prices. When it is determined that an equity investment is other-than-temporarily impaired, the security is written down to fair value, and the amount of the impairment is included in earnings as a realized investment loss. The fair value then becomes the new cost basis of the investment, and any subsequent recoveries in fair value are recognized at disposition. We recognize a realized loss when impairment is deemed to be other-than-temporary even if a decision to sell an equity investment has not been made. When we decide to sell a temporarily impaired available-for-sale equity investment and we do not expect the fair value of the equity investment to fully recover prior to the expected time of sale, the investment is deemed to be other-than-temporarily impaired in the period in which the decision to sell is made.
Fixed Maturity Investments: We assess whether we intend to sell, or it is more likely than not that we will be required to sell, a fixed maturity investment before recovery of its amortized cost basis less any current period credit losses. For fixed maturity investments that are considered other-than-temporarily impaired and that we do not intend to sell and will not be required to sell, we separate the amount of the impairment into the amount that is credit related (credit loss component) and the amount due to all other factors. The credit loss component is recognized in earnings and is the difference between the investment’s amortized cost basis and the present value of its expected future cash flows. The remaining difference between the investment’s fair value and the present value of future expected cash flows is recognized in other comprehensive income.
Deferred policy acquisition costs. Policy acquisition costs (mainly commission, underwriting and marketing expenses) that vary with and are primarily related to the production of new and renewal business are deferred and charged to operations over periods in which the related premiums are earned. Ceding commissions from reinsurers, which include expense allowances, are deferred and recognized over the period premiums are earned for the underlying policies reinsured.
The method followed in computing deferred policy acquisition costs limits the amount of such deferred costs to their estimated realizable value. A premium deficiency exists if the sum of expected claim costs and claim adjustment expenses, unamortized acquisition costs, and maintenance costs exceeds related unearned premiums and expected investment income on those unearned premiums, as computed on a product line basis. We routinely evaluate the realizability of deferred policy acquisition costs. At December 31, 2009 and 2008, there was no premium deficiency related to deferred policy acquisition costs.
Goodwill. Our consolidated balance sheet as of December 31, 2009 includes goodwill of acquired businesses of $41.1 million which is assigned to our operating units as follows: AHIS Operating Unit - $2.1 million; TGA Operating Unit - $18.8 million; Aerospace Operating Unit - $9.7 million; Personal Lines Operating Unit - $2.8 million; and Heath XS Operating Unit - $7.7 million. This amount has been recorded as a result of prior business acquisitions accounted for under the purchase method of accounting. Under FASB Accounting Standards Codification (“ASC”) Topic 350, “Intangibles- Goodwill and Other” (“FASB ASC 350”) goodwill is tested for impairment annually. We completed our last annual test for impairment during the fourth quarter of 2009 and determined that there was no impairment.
A significant amount of judgment is required in performing goodwill impairment tests. Such tests include estimating the fair value of our reporting units. As required by FASB ASC 350, we compare the estimated fair value of each reporting unit with its carrying amount, including goodwill. Under FASB ASC 350, fair value refers to the amount for which the entire reporting unit may be bought or sold.
The determination of fair value was based on multiple valuation approaches including an income approach utilizing discounted cash flows and a market approach utilizing observable key ratios of peer companies. The valuation methodologies utilized are subject to key judgments and assumptions. Estimates of fair value are inherently uncertain and represent management’s reasonable expectation regarding future developments. These estimates and the judgments and assumptions upon which the estimates are based will, in all likelihood, differ in some respects from actual future results. Declines in estimated fair value could result in goodwill impairments in future periods which could materially adversely affect the Company’s results of operations or financial position.
The income approach to determining fair value computes the projections of the cash flows that the reporting unit is expected to generate converted into a present value equivalent through discounting. Significant assumptions in the income approach model include income projections, discount rates and terminal growth values. The discount rate was based on a risk free rate plus a beta adjusted equity risk premium and specific company risk premium. The assumptions are based on historical experience, expectations of future performance, expected market conditions and other factors requiring judgment and estimates. While we believe the assumptions used in these models are reasonable, the inherent uncertainty in predicting future performance and market conditions may change over time and influence the outcome of future testing.
The market approach to determining fair value utilized observable key metrics of similar peer companies such as price to earnings ratios for current year earnings and forecasted 2010 earnings. Additionally, the direct capitalization of earnings method was utilized.
The fair values of each of our operating units were in excess of their respective carrying values, including goodwill, as a result of our last annual step one test for impairment during the fourth quarter 2009. However, a 12% decline in the fair value of our AHIS Operating Unit, a 9% decline in the fair value of our TGA Operating Unit, a 31% decline in the fair value of our Personal Lines Operating Unit, a 3% decline in the fair value of our Aerospace Operating Unit, or a 5% decline in the fair value of our Heath XS Operating Unit would have caused the carry value of the respective operating unit to be in excess of its fair value, resulting in the need to perform the second step of impairment testing prescribed by FASB ASC 350 which could have resulted in a material impairment to our goodwill.
The market capitalization of our stock has been below book value during 2009. We consider our market capitalization in assessing the reasonableness of the fair values estimated for our reporting units in connection with our goodwill impairment testing. We believe the current market displacement caused by global financial market conditions, including the credit crisis, as well as the limited daily trading volume of Hallmark shares has resulted in a decrease in our market capitalization that is not representative of a long-term decrease in value. The valuation analysis discussed above supports our view that goodwill is not impaired at December 31, 2009.
While we believe the estimates and assumptions used in determining the fair value of the operating units are reasonable, actual results could vary materially. If our actual results are not consistent with our estimates and assumptions used to calculate fair value, we may be required to perform the second step in future periods and impairment of goodwill could result. We cannot predict future events that might impact the fair value of our operating units and goodwill impairment. Such events include, but are not limited to, increased competition in insurance markets and global economic changes.
Deferred tax assets. We file a consolidated federal income tax return. Deferred federal income taxes reflect the future tax consequences of differences between the tax bases of assets and liabilities and their financial reporting amounts at each year end. Deferred taxes are recognized using the liability method, whereby tax rates are applied to cumulative temporary differences based on when and how they are expected to affect the tax return. Deferred tax assets and liabilities are adjusted for tax rate changes. A valuation allowance is provided against our deferred tax assets to the extent that we do not believe it is more likely than not that future taxable income will be adequate to realize these future tax benefits.
Reserves for unpaid losses and LAE . Reserves for unpaid losses and LAE are established for claims which have already been incurred by the policyholder but which we have not yet paid. Unpaid losses and LAE represent the estimated ultimate net cost of all reported and unreported losses incurred through each balance sheet date. The reserves for unpaid losses and LAE are estimated using individual case-basis valuations and statistical analyses. These reserves are revised periodically and are subject to the effects of trends in loss severity and frequency. (See, “Item 1. Business – Analysis of Losses and LAE” and “-Analysis of Loss and LAE Reserve Development.”)
Although considerable variability is inherent in such estimates, we believe that our reserves for unpaid losses and LAE are adequate. Due to the inherent uncertainty in estimating unpaid losses and LAE, the actual ultimate amounts may differ from the recorded amounts. A small percentage change could result in a material effect on reported earnings. For example, a 1% change in December 31, 2009 reserves for unpaid losses and LAE would have produced a $1.8 million change to pretax earnings. The estimates are continually reviewed and adjusted as experience develops or new information becomes known. Such adjustments are included in current operations.
An actuarial range of ultimate unpaid losses and LAE is developed independent of management’s best estimate and is only used to assess the reasonableness of that estimate. There is no exclusive method for determining this range, and judgment enters into the process. The primary actuarial technique utilized is a loss development analysis in which ultimate losses are projected based upon historical development patterns. The primary assumption underlying this loss development analysis is that the historical development patterns will be a reasonable predictor of the future development of losses for accident years which are less mature. An alternate actuarial technique, known as the Bornhuetter-Ferguson method, combines an analysis of loss development patterns with an initial estimate of expected losses or loss ratios. This approach is most useful for recent accident years. In addition to assuming the stability of loss development patterns, this technique is heavily dependent on the accuracy of the initial estimate of expected losses or loss ratios. Consequently, the Bornhuetter-Ferguson method is primarily used to confirm the results derived from the loss development analysis.
The range of unpaid losses and LAE estimated by our actuary as of December 31, 2009 was $148.4 million to $196.0 million. Our best estimate of unpaid losses and LAE as of December 31, 2009 is $184.7 million. Our carried reserve for unpaid losses and LAE as of December 31, 2009 is comprised of $91.1 million in case reserves and $93.6 million in incurred but not reported reserves. In setting this estimate of unpaid losses and LAE, we have assumed, among other things, that current trends in loss frequency and severity will continue and that the actuarial analysis was empirically valid. We have established a best estimate of unpaid losses and LAE which is approximately $12.5 million higher than the midpoint or 94.2% of the high end of the actuarial range at December 31, 2009 as compared to $8.1 million above the midpoint or 92.5% of the high end of the actuarial range at December 31, 2008. We expect our best estimate to move within the actuarial range from year to year due to changes in our operations and changes within the marketplace. Due to the inherent uncertainty in reserve estimates, there can be no assurance that the actual losses ultimately experienced will fall within the actuarial range. However, because of the breadth of the actuarial range, we believe that it is reasonably likely that actual losses will fall within such range.
Our reserve requirements are also interrelated with product pricing and profitability. We must price our products at a level sufficient to fund our policyholder benefits and still remain profitable. Because claim expenses represent the single largest category of our expenses, inaccuracies in the assumptions used to estimate the amount of such benefits can result in our failing to price our products appropriately and to generate sufficient premiums to fund our operations.
Recognition of profit sharing commissions. Profit sharing commission is calculated and recognized when the loss ratio, as determined by a qualified actuary, deviates from contractual targets. We receive a provisional commission as policies are produced as an advance against the later determination of the profit sharing commission actually earned. The profit sharing commission is an estimate that varies with the estimated loss ratio and is sensitive to changes in that estimate.
The following table details the profit sharing commission revenue sensitivity of the Standard Commercial Segment to the actual ultimate loss ratio for each effective quota share treaty at 5.0% above and below the current estimate, which we believe is a reasonably likely range of variance ($ in thousands).
| | | Treaty Effective Dates | |
| | | 7/1/01 | | | 7/1/02 | | | 7/1/03 | | | 7/1/04 | |
| Provisional loss ratio | | | 60.0 | % | | | 59.0 | % | | | 59.0 | % | | | 64.2 | % |
| Estimated ultimate loss ratio booked to at December 31, 2009 | | | 63.5 | % | | | 64.5 | % | | | 67.0 | % | | | 57.8 | % |
| | | | | | | | | | | | | | | | | |
| Effect of actual 5.0% above estimated loss ratio at December 31, 2009 | | | - | | | | - | | | | - | | | $ | (2,793 | ) |
| Effect of actual 5.0% below estimated loss ratio at December 31, 2009 | | $ | 1,850 | | | $ | 3,055 | | | $ | 3,360 | | | $ | 2,793 | |
The following table details the profit sharing commission revenue sensitivity of the Specialty Commercial Segment for each effective quota share treaty at 5.0% above and below the current estimate, which we believe is a reasonably likely range of variance ($ in thousands).
| | | Treaty Effective Dates | |
| | | 1/1/06 | | | 1/1/07 | | | 1/1/08 | |
| Provisional loss ratio | | | 65.0 | % | | | 65.0 | % | | | 65.0 | % |
| Estimated ultimate loss ratio booked to at December 31, 2009 | | | 57.1 | % | | | 60.7 | % | | | 58.0 | % |
| | | | | | | | | | | | | |
| Effect of actual 5.0% above estimated loss ratio at December 31, 2009 | | $ | (3,096 | ) | | $ | (2,022 | ) | | $ | (1,619 | ) |
| Effect of actual 5.0% below estimated loss ratio at December 31, 2009 | | $ | 1,920 | | | $ | 2,352 | | | $ | 1,295 | |
Effective January 1, 2009 the Company assumed 100% of the premiums in the Specialty Commercial Segment for this treaty and, therefore there is no profit sharing commission revenue for the 2009 policies written.
Results of Operations
Comparison of Years ended December 31, 2009 and December 31, 2008
Management overview. During fiscal 2009, our total revenues were $287.0 million, representing an approximately 7% increase over the $268.7 million in total revenues for fiscal 2008. This increase in revenue was primarily attributable to increased earned premium due to increased retention of business in our Specialty Commercial Segment, the acquisition of our Heath XS Operating Unit in the third quarter of 2008 and increased production by our Personal Lines Segment. Further contributing to this increase in revenue was recognized gains on our investment portfolio of $3.0 million for fiscal year 2009 as compared to recognized losses of $11.3 million for fiscal year 2008. Increased revenue was partially offset by reduced earned premium in our Standard Commercial Segment due to the deterioration of the general economic environment in our major markets and by lower commission and fee income in our Specialty Commercial Segment due primarily to increased retention of premium.
We reported net income of $24.6 million for the year ended December 31, 2009, compared to $12.9 million for the year ended December 31, 2008. On a diluted per share basis, net income was $1.19 for fiscal 2009 as compared to $0.62 for fiscal 2008. The increase in net income was primarily attributable to increased revenue discussed above offset by increased loss and LAE due mostly to increased net premiums written in both the Specialty Commercial and Personal Lines segments, as discussed above, as well as unfavorable prior year development of $1.6 million for fiscal year 2009 as compared to favorable development of $1.8 million during 2008.
Segment information. The following is additional business segment information for the years ended December 31, 2009 and 2008 (in thousands):
| | | Year Ended December 31, 2009 | |
| | | Standard | | | Specialty | | | | | | | | | | |
| | | Commercial | | | Commercial | | | Personal | | | | | | | |
| | | Segment | | | Segment | | | Segment | | | Corporate | | | Consolidated | |
| | | | |
| Produced premium (1) | | $ | 72,512 | | | $ | 144,230 | | | $ | 71,708 | | | $ | - | | | $ | 288,450 | |
| | | | | | | | | | | | | | | | | | | | | |
| Gross premiums written | | | 72,512 | | | | 143,338 | | | | 71,708 | | | | - | | | | 287,558 | |
| Ceded premiums written | | | (4,430 | ) | | | (21,388 | ) | | | - | | | | - | | | | (25,818 | ) |
| Net premiums written | | | 68,082 | | | | 121,950 | | | | 71,708 | | | | - | | | | 261,740 | |
| Change in unearned premiums | | | 3,208 | | | | (9,680 | ) | | | (4,196 | ) | | | - | | | | (10,668 | ) |
| Net premiums earned | | | 71,290 | | | | 112,270 | | | | 67,512 | | | | - | | | | 251,072 | |
| | | | | | | | | | | | | | | | | | | | | |
| Total revenues | | | 76,496 | | | | 131,504 | | | | 73,785 | | | | 5,254 | | | | 287,039 | |
| | | | | | | | | | | | | | | | | | | | | |
| Losses and loss adjustment expenses | | | 44,372 | | | | 65,453 | | | | 43,794 | | | | - | | | | 153,619 | |
| | | | | | | | | | | | | | | | | | | | | |
| Pre-tax income (loss), net of non-controlling interest | | | 9,266 | | | | 20,883 | | | | 11,000 | | | | (7,944 | ) | | | 33,205 | |
| | | | | | | | | | | | | | | | | | | | | |
| Net loss ratio (2) | | | 62.2 | % | | | 58.3 | % | | | 64.9 | % | | | | | | | 61.2 | % |
| Net expense ratio (2) | | | 31.3 | % | | | 30.1 | % | | | 21.6 | % | | | | | | | 30.5 | % |
| Net combined ratio (2) | | | 93.5 | % | | | 88.4 | % | | | 86.5 | % | | | | | | | 91.7 | % |
| | | | | | | | | | | | | | | | | | | | | |
| | | Year Ended December 31, 2008 | |
| | | Standard | | | Specialty | | | | | | | | | | | | | |
| | | Commercial | | | Commercial | | | Personal | | | | | | | | | |
| | | Segment | | | Segment | | | Segment | | | Corporate | | | Consolidated | |
| | | | |
| Produced premium (1) | | $ | 80,193 | | | $ | 146,054 | | | $ | 60,834 | | | $ | - | | | $ | 287,081 | |
| | | | | | | | | | | | | | | | | | | | | |
| Gross premiums written | | | 80,190 | | | | 102,825 | | | | 60,834 | | | | - | | | | 243,849 | |
| Ceded premiums written | | | (4,829 | ) | | | (4,093 | ) | | | - | | | | - | | | | (8,922 | ) |
| Net premiums written | | | 75,361 | | | | 98,732 | | | | 60,834 | | | | - | | | | 234,927 | |
| Change in unearned premiums | | | 4,434 | | | | (1,226 | ) | | | (1,815 | ) | | | - | | | | 1,393 | |
| Net premiums earned | | | 79,795 | | | | 97,506 | | | | 59,019 | | | | - | | | | 236,320 | |
| | | | | | | | | | | | | | | | | | | | | |
| Total revenues | | | 84,075 | | | | 127,882 | | | | 64,475 | | | | (7,742 | ) | | | 268,690 | |
| | | | | | | | | | | | | | | | | | | | | |
| Losses and loss adjustment expenses | | | 49,270 | | | | 55,933 | | | | 39,042 | | | | (1 | ) | | | 144,244 | |
| | | | | | | | | | | | | | | | | | | | | |
| Pre-tax income (loss), net of non-controlling interest | | | 9,683 | | | | 21,328 | | | | 8,989 | | | | (18,926 | ) | | | 21,074 | |
| | | | | | | | | | | | | | | | | | | | | |
| Net loss ratio (2) | | | 61.7 | % | | | 57.4 | % | | | 66.2 | % | | | | | | | 61.0 | % |
| Net expense ratio (2) | | | 30.8 | % | | | 30.7 | % | | | 22.0 | % | | | | | | | 30.6 | % |
| Net combined ratio (2) | | | 92.5 | % | | | 88.1 | % | | | 88.2 | % | | | | | | | 91.6 | % |
| 1 | Produced premium is a non-GAAP measurement that management uses to track total premium produced by our operations. Produced premium excludes unaffiliated third party premium fronted on our recently acquired HCM subsidiary. We believe this is a useful tool for users of our financial statements to measure our premium production whether retained by our insurance company subsidiaries or assumed by third party insurance carriers who pay us commission revenue. |
| 2 | The net loss ratio is calculated as incurred losses and LAE divided by net premiums earned, each determined in accordance with GAAP. During the second quarter of 2009 we changed the method in which the net expense ratio is calculated. The net expense ratio is now calculated for our operating units that retain 100% of produced premium as total operating expenses for the unit offset by agency fee income, divided by net premiums earned, each determined in accordance with GAAP. For the operating units that do not retain 100% of the produced premium, the net expense ratio is calculated as underwriting expenses of the insurance company subsidiaries for the unit offset by agency fee income, divided by net premiums earned, each determined in accordance with GAAP. Net combined ratio is calculated as the sum of the net loss ratio and the net expense ratio. All prior periods have been restated to conform to the new method, resulting in an increase to the consolidated net expense ratio of 1.7% for the twelve months ended December 31, 2008. |
Standard Commercial Segment. Gross premiums written for the Standard Commercial Segment were $72.5 million for the year ended December 31, 2009, which was $7.7 million, or approximately 10%, less than the $80.2 million reported for the same period in 2008. Net premiums written were $68.1 million for the year ended December 31, 2009 as compared to $75.4 million reported for the same period in 2008. The decrease in premium volume was predominately due to the deterioration of the general economic environment, particularly in the construction industry, reducing the available insured exposures.
Total revenue for the Standard Commercial Segment of $76.5 million for the year ended December 31, 2009 was $7.6 million less than the $84.1 million reported during the year ended December 31, 2008. This approximately 9% decrease in total revenue was primarily due to decreased net premiums earned of $8.5 million and lower net investment income of $0.6 million during 2009. Lower processing and services fees of $0.1 million further contributed to this decrease in revenue. These decreases in revenue were partially offset by profit sharing commission adjustments of $0.3 million recognized for the year ended December 31, 2009 as compared to profit sharing commission adjustments of $1.9 million recognized for the year ended December 31, 2008. The profit sharing commission adjustments related to adverse loss development on prior accident years.
Pre-tax income for our Standard Commercial Segment of $9.3 million for the year ended December 31, 2009 decreased $0.4 million, or approximately 4%, from the $9.7 million reported for the same period of 2008. Decreased revenue as discussed above was the primary reason for the decrease in pre-tax income, offset by lower losses and LAE of $4.9 million and lower operating expenses of $2.3 million primarily due to lower production related expenses during 2009 as a result of lower produced premium.
The net loss ratio for the year ended December 31, 2009 was 62.2% as compared to the 61.7% reported for the same period of 2008. The gross loss ratio before reinsurance was 62.1% for the year ended December 31, 2009 as compared to 67.4% for the same period the prior year. The gross loss results for the year ended December 31, 2009 and 2008 included $1.8 million and $2.4 million of favorable prior year development, respectively. The gross loss results for fiscal 2008 also included $10.9 million of hurricane related losses ($4.4 million net of reinsurance recoveries). The Standard Commercial Segment reported net expense ratios of 31.3% and 30.8% for the years ended December 31, 2009 and 2008, respectively.
Specialty Commercial Segment. The $131.5 million of total revenue for the year ended December 31, 2009 was $3.6 million higher than the $127.9 million reported for 2008. This increase in revenue was largely due to increased net premiums earned of $14.8 million as a result of the increased retention of business and the acquisition of the Heath XS Operating Unit during the third quarter of 2008. Increased net investment income contributed an additional $0.7 million to the increase in revenue for fiscal 2009. These increases were partially offset by (a) lower commission income of $8.6 million due primarily to increased retention of premium, (b) lower profit sharing commission income of $3.0 million due to higher retention of premium in the more recent treaty periods as well as adverse loss development on the earlier treaty periods, and (c) reduced finance charges of $0.3 million.
Pre-tax income for the Specialty Commercial Segment of $20.9 million was $0.4 million lower than the $21.3 million reported in 2008. Increased revenue, discussed above, was offset by increased losses and LAE of $9.5 million. Increased revenue was complemented by lower expenses of $5.5 million. These lower operating expenses for fiscal 2009 were primarily the combined result of (a) a $1.2 million premium receivable write-off due to the default of a producer in our TGA Operating Unit during the third quarter of 2008, lower production related expenses of $4.1 million due to lower produced premium, and lower operating expenses of $2.0 million in our Aerospace Operating Unit and TGA Operating Unit, partially offset by (b) increased operating expenses of $1.4 million and increased amortization of intangible assets of $0.4 million, in both cases related to the acquisition of our Heath XS Operating Unit effective August 29, 2008.
The Specialty Commercial Segment reported a net loss ratio of 58.3% for 2009 as compared to 57.4% for 2008. The gross loss ratio before reinsurance was 57.8% for the year ended December 31, 2009 as compared to 59.5% for the same period the prior year. The gross loss results for the years ended December 31, 2009 and 2008 included $4.4 million and $1.2 million of unfavorable prior year development, respectively. The gross loss results for fiscal 2008 also included $3.5 million of hurricane related losses ($1.6 million net of reinsurance recoveries). The Specialty Commercial Segment reported a net expense ratio of 30.1% for 2009 as compared to 30.7% for 2008.
Personal Segment. Net premium written for our Personal Segment increased $10.9 million during the year ended December 31, 2009 to $71.7 million compared to $60.8 million in the year ended December 31, 2008. The increase in premium was due mostly to continued geographic expansion.
Total revenue for the Personal Segment increased approximately 14% to $73.8 million for the year ended December 31, 2009 from $64.5 million the prior year. Higher earned premium of $8.5 million was the primary reason for the increase in revenue for the period. Increased finance charges of $0.9 million and net investment income of $0.1 million further contributed to this increase in revenue, offset by lower third party commission revenue of $0.2 million.
Pre-tax income for the Personal Segment was $11.0 million for the year ended December 31, 2009 as compared to $9.0 million the prior year. The increased revenue, as discussed above, was offset by increased losses and LAE of $4.8 million and increased operating expenses of $2.5 million due mostly to production related expenses attributable to the increased earned premium. The Personal Segment reported a net loss ratio of 64.9% for the year ended December 31, 2009 as compared to 66.2% for the prior year. The decline in the net loss ratio is primarily a result of the maturing of the new business impact associated with geographic expansion. The Personal Segment recognized $1.0 million of favorable prior accident year development during the year ended December 31, 2009 as compared to favorable prior accident year development of $0.6 million during the year ended December 31, 2008. The Personal Segment reported a net expense ratio of 21.6% for the year ended December 31, 2009 as compared to 22.0% for the prior year.
Corporate. Total revenue for corporate increased by $13.0 million for the year ended December 31, 2009 as compared to the prior year. Recognized gains of $3.0 million on our investment portfolio during 2009 as compared to recognized losses of $11.3 million on our investment portfolio during the same period in 2008 were partially offset by decreased investment income of $1.3 million primarily due to lower yields.
Corporate pre-tax loss was $7.9 million for the year ended December 31, 2009 as compared to $18.9 million for the prior year. The decreased loss was mostly due to the increased revenues discussed above partially offset by increased non-cash operating expenses of $0.6 million related to stock option grants and higher periodic pension costs, increased other compensation expense of $0.4 million and increased other operating expenses of $0.6 million of which $0.3 million related to a proxy contest. In addition, increased intangible amortization of $0.4 million related to our acquisition of CYR during the second quarter of 2009 further offset the increased revenue.
Comparison of Years ended December 31, 2008 and December 31, 2007
Management overview. During fiscal 2008, our total revenues were $268.7 million, representing an approximately 2% decrease over the $275.2 million in total revenues for fiscal 2007. The decrease in total revenue during 2008 was primarily due to recognized losses on our investment portfolio and lower commission income partially offset by higher earned premium and investment income. Standard Commercial Segment revenues decreased $2.4 million during 2008 due primarily to lower earned premium as a result of increased competition, rate pressure, and deterioration of the economic environment in the United States. Increased retention of business and the acquisition of our Heath XS Operating Unit in 2008 drove the $1.3 million increase in revenue by our Specialty Commercial Segment during 2008 compared to 2007. Revenues from our Personal Segment increased $6.2 million during 2008, due largely to geographic expansion into new states. Corporate revenue decreased $11.6 million during 2008 as compared to 2007 primarily due to recognized losses on our investment portfolio of $11.3 million as compared to recognized gains of $2.6 million during 2007, partially offset by increased investment income of $2.3 million for the period ended December 31, 2008, as compared to the same period during 2007.
We reported net income of $12.9 million for the year ended December 31, 2008, compared to $27.9 million for the year ended December 31, 2007. On a diluted per share basis, net income was $0.62 for fiscal 2008 as compared to $1.34 for fiscal 2007. The decrease in net income was primarily attributable to decreased revenue discussed above and higher loss and LAE due to hurricane related losses during 2008.
Segment information. The following is additional business segment information for the years ended December 31, 2008 and 2007 (in thousands):
| | | Year Ended December 31, 2008 | |
| | | Standard | | | Specialty | | | | | | | | | | |
| | | Commercial | | | Commercial | | | Personal | | | | | | | |
| | | Segment | | | Segment | | | Segment | | | Corporate | | | Consolidated | |
| | | | |
| Produced premium (1) | | $ | 80,193 | | | $ | 146,054 | | | $ | 60,834 | | | $ | - | | | $ | 287,081 | |
| | | | | | | | | | | | | | | | | | | | | |
| Gross premiums written | | | 80,190 | | | | 102,825 | | | | 60,834 | | | | - | | | | 243,849 | |
| Ceded premiums written | | | (4,829 | ) | | | (4,093 | ) | | | - | | | | - | | | | (8,922 | ) |
| Net premiums written | | | 75,361 | | | | 98,732 | | | | 60,834 | | | | - | | | | 234,927 | |
| Change in unearned premiums | | | 4,434 | | | | (1,226 | ) | | | (1,815 | ) | | | - | | | | 1,393 | |
| Net premiums earned | | | 79,795 | | | | 97,506 | | | | 59,019 | | | | - | | | | 236,320 | |
| | | | | | | | | | | | | | | | | | | | | |
| Total revenues | | | 84,075 | | | | 127,882 | | | | 64,475 | | | | (7,742 | ) | | | 268,690 | |
| | | | | | | | | | | | | | | | | | | | | |
| Losses and loss adjustment expenses | | | 49,270 | | | | 55,933 | | | | 39,042 | | | | (1 | ) | | | 144,244 | |
| | �� | | | | | | | | | | | | | | | | | | | |
| Pre-tax income (loss), net of non-controlling interest | | | 9,683 | | | | 21,328 | | | | 8,989 | | | | (18,926 | ) | | | 21,074 | |
| | | | | | | | | | | | | | | | | | | | | |
| Net loss ratio (2) | | | 61.7 | % | | | 57.4 | % | | | 66.2 | % | | | | | | | 61.0 | % |
| Net expense ratio (2) | | | 30.8 | % | | | 30.7 | % | | | 22.0 | % | | | | | | | 30.6 | % |
| Net combined ratio (2) | | | 92.5 | % | | | 88.1 | % | | | 88.2 | % | | | | | | | 91.6 | % |
| | | | | | | | | | | | | | | | | | | | | |
| | | Year Ended December 31, 2007 | |
| | | Standard | | | Specialty | | | | | | | | | | | | | |
| | | Commercial | | | Commercial | | | Personal | | | | | | | | | |
| | | Segment | | | Segment | | | Segment | | | Corporate | | | Consolidated | |
| | | | |
| Produced premium (1) | | $ | 90,985 | | | $ | 151,003 | | | $ | 55,916 | | | $ | - | | | $ | 297,904 | |
| | | | | | | | | | | | | | | | | | | | | |
| Gross premiums written | | | 90,868 | | | | 102,688 | | | | 55,916 | | | | - | | | | 249,472 | |
| Ceded premiums written | | | (6,273 | ) | | | (4,388 | ) | | | - | | | | - | | | | (10,661 | ) |
| Net premiums written | | | 84,595 | | | | 98,300 | | | | 55,916 | | | | - | | | | 238,811 | |
| Change in unearned premiums | | | (840 | ) | | | (9,589 | ) | | | (2,411 | ) | | | - | | | | (12,840 | ) |
| Net premiums earned | | | 83,755 | | | | 88,711 | | | | 53,505 | | | | - | | | | 225,971 | |
| | | | | | | | | | | | | | | | | | | | | |
| Total revenues | | | 86,512 | | | | 126,550 | | | | 58,268 | | | | 3,836 | | | | 275,166 | |
| | | | | | | | | | | | | | | | | | | | | |
| Losses and loss adjustment expenses | | | 48,480 | | | | 48,484 | | | | 35,969 | | | | (15 | ) | | | 132,918 | |
| | | | | | | | | | | | | | | | | | | | | |
| Pre-tax income (loss) | | | 12,415 | | | | 28,338 | | | | 7,523 | | | | (6,507 | ) | | | 41,769 | |
| | | | | | | | | | | | | | | | | | | | | |
| Net loss ratio (2) | | | 57.9 | % | | | 54.7 | % | | | 67.2 | % | | | | | | | 58.8 | % |
| Net expense ratio (2) | | | 29.9 | % | | | 31.1 | % | | | 22.2 | % | | | | | | | 29.1 | % |
| Net combined ratio (2) | | | 87.8 | % | | | 85.8 | % | | | 89.4 | % | | | | | | | 87.9 | % |
| 1 | Produced premium is a non-GAAP measurement that management uses to track total premium produced by our operations. Produced premium excludes unaffiliated third party premium fronted on our recently acquired HCM subsidiary. We believe this is a useful tool for users of our financial statements to measure our premium production whether retained by our insurance company subsidiaries or assumed by third party insurance carriers who pay us commission revenue. |
| The net loss ratio is calculated as incurred losses and LAE divided by net premiums earned, each determined in accordance with GAAP. During the second quarter of 2009 we changed the method in which the net expense ratio is calculated. The net expense ratio is now calculated for our operating units that retain 100% of produced premium as total operating expenses for the unit offset by agency fee income divided by net premiums earned, each determined in accordance with GAAP. For the operating units that do not retain 100% of the produced premium, the net expense ratio is calculated as underwriting expenses of the insurance company subsidiaries for the unit offset by agency fee income, divided by net premiums earned, each determined in accordance with GAAP. Net combined ratio is calculated as the sum of the net loss ratio and the net expense ratio. All prior periods have been restated to conform to the new method, resulting in an increase to the consolidated net expense ratio of 1.7% and 1.3% for the twelve months ended December 31, 2008 and 2007, respectively. |
Standard Commercial Segment. Gross premiums written for the Standard Commercial Segment were $80.2 million for the year ended December 31, 2008, which was $10.7 million or approximately 12% less than the $90.9 million reported for the same period in 2007. Net premiums written were $75.4 million for the year ended December 31, 2008 as compared to $84.6 million reported for the same period in 2007. Increased competition, rate pressure and the deterioration of the general economic environment challenged premium volume growth by the Standard Commercial Segment throughout 2008.
Total revenue for the Standard Commercial Segment of $84.1 million for the year ended December 31, 2008 was $2.4 million less than the $86.5 million reported during the year ended December 31, 2007. This approximately 3% decrease in total revenue was primarily due to decreased net premiums earned of $4.0 million and lower processing and service fees of $0.4 million due to the shift from a third party agency structure to an insurance underwriting structure. These decreases in revenue were partially offset by a contingent commission adjustment reducing revenue by $1.9 million in 2008 as compared to a $3.5 million reduction in 2007. The contingent commission adjustments related to adverse loss development on prior accident years. Increased net investment income of $0.3 million during 2008 also partially offset the decreases in revenue discussed above.
Pre-tax income for our Standard Commercial Segment of $9.7 million for the year ended December 31, 2008 decreased $2.7 million, or approximately 22%, from the $12.4 million reported for the same period of 2007. Decreased revenue as discussed above was the primary reason for the decrease in pre-tax income, as well as higher losses and LAE of $0.8 million, offset by lower operating expenses of $0.5 million, mostly due to lower production related expenses during 2008 as a result of lower premium production.
The net loss ratio for the year ended December 31, 2008 was 61.7% as compared to the 57.9% reported for the same period of 2007. The net loss ratio was unfavorably impacted by hurricane related losses net of reinsurance recoveries of $4.4 million for the year ended December 31, 2008. The gross loss ratio before reinsurance was 67.4% for the year ended December 31, 2008 as compared to 56.0% for the same period the prior year. The gross loss results for the year ended December 31, 2008 included $10.9 million of hurricane related losses and $2.4 million of favorable prior year development as compared to $1.7 million of favorable prior year development for the year ended December 31, 2007. The Standard Commercial Segment reported net expense ratios of 30.8% and 29.9% for the year ended December 31, 2008 and 2007, respectively.
Specialty Commercial Segment. The $127.9 million of total revenue for the year ended December 31, 2008 was $1.3 million higher than the $126.6 million reported for 2007. This increase in revenue was largely due to increased net premiums earned of $8.8 million as a result of the increased retention of business and increased net investment income of $0.3 million. These increases were offset by lower commission income of $7.6 million due primarily to the shift from a third party agency structure to an insurance underwriting structure partially offset by increased commission income in our newly acquired Heath XS Operating Unit.
Pre-tax income for the Specialty Commercial Segment of $21.3 million was $7.0 million lower than the $28.3 million reported in 2007. Increased revenue, discussed above, was offset by increased losses and LAE of $7.4 million and increased operating expenses of $0.7 million due mostly to increased production related expenses related to the acquisition of our Heath XS Operating Unit partially offset by reduced premium production in our TGA and Aerospace Operating Units. Amortization of intangible assets of $0.2 million related to our acquisition of the Heath XS Operating Unit during 2008 also contributed to the decline in pre-tax income.
The Specialty Commercial Segment reported a net loss ratio of 57.4% for 2008 as compared to 54.7% for 2007. The net loss ratio was unfavorably impacted by hurricane related losses net of reinsurance recoveries of $1.6 million for the year ended December 31, 2008. The gross loss ratio before reinsurance was 59.5% for the year ended December 31, 2008 as compared to 53.2% for the same period the prior year. The gross loss results for the year ended December 31, 2008 included $3.5 million of hurricane related losses and $1.2 million of adverse prior year development as compared to $3.8 million of favorable prior year development for the year ended December 31, 2007. The Specialty Commercial Segment reported a net expense ratio of 30.7% for 2008 as compared to 31.1% for 2007.
Personal Segment. Net premium written for our Personal Segment increased $4.9 million during the year ended December 31, 2008 to $60.8 million compared to $55.9 million in the year ended December 31, 2007. The increase in premium was due mostly to continued geographic expansion that began in 2006.
Total revenue for the Personal Segment increased approximately 11% to $64.5 million for the year ended December 31, 2008 from $58.3 million the prior year. Higher earned premium of $5.5 million was the primary reason for the increase in revenue for the period. Increased finance charges of $0.6 million and higher commissions and processing fee revenue of $0.1 million further contributed to this increase in revenue during 2008.
Pre-tax income for the Personal Segment was $9.0 million for the year ended December 31, 2008 as compared to $7.5 million the prior year. The increased revenue, as discussed above, was offset by increased losses and LAE of $3.1 million and increased operating expenses of $1.7 million due mostly to production related expenses attributable to the increased earned premium.
The Personal Segment reported a net loss ratio of 66.2% for the year ended December 31, 2008 as compared to 67.2% for the prior year. The decline in the net loss is a result of the maturing of the new business impact associated with geographic expansion. We recognized $0.6 million of favorable prior accident year development during the year ended December 31, 2008 as compared to $0.9 million during 2007. The Personal Segment reported a net expense ratio of 22.0% for the year ended December 31, 2008 as compared to 22.2% for the prior year.
Corporate. Total revenue for corporate decreased by $11.6 million for the year ended December 31, 2008 as compared to the prior year. Recognized losses of $11.3 million on our investment portfolio as compared to recognized gains of $2.6 million during the same period in 2007 was partially offset by increased investment income of $2.3 million primarily due to changes in capital allocation.
Corporate pre-tax loss was $18.9 million for the year ended December 31, 2008 as compared to $6.5 million for the prior year. The increased loss was mostly due to the decreased revenues discussed above as well as increased interest expense of $0.9 million due to the issuance of trust preferred securities during the fourth quarter of 2007 partially offset by lower operating expenses of $0.1 million.
Liquidity and Capital Resources
Sources and Uses of Funds
Our sources of funds are from insurance-related operations, financing activities and investing activities. Major sources of funds from operations include premiums collected (net of policy cancellations and premiums ceded), commissions and processing and service fees. As a holding company, Hallmark is dependent on dividend payments and management fees from its subsidiaries to meet operating expenses and debt obligations. As of December 31, 2009, Hallmark had $10.6 million in unrestricted cash and invested assets. Unrestricted cash and invested assets of our non-insurance subsidiaries were $7.0 million as of December 31, 2009.
AHIC, domiciled in Texas, is limited in the payment of dividends to their stockholders in any 12-month period, without the prior written consent of the Texas Department of Insurance, to the greater of statutory net income for the prior calendar year or 10% of statutory policyholders surplus as of the prior year end. Dividends may only be paid from unassigned surplus funds. HIC, domiciled in Arizona, is limited in the payment of dividends to the lesser of 10% of prior year policyholders surplus or prior year's net investment income, without prior written approval from the Arizona Department of Insurance. HSIC, domiciled in Oklahoma, is limited in the payment of dividends to the greater of 10% of prior year policyholders surplus or prior year's statutory net income, not including realized capital gains, without prior written approval from the Oklahoma Insurance Department. During 2010, the aggregate ordinary dividend capacity of these subsidiaries is $19.4 million, of which $15.9 million is available to Hallmark. As a county mutual, dividends from HCM are payable to policyholders. None of our insurance company subsidiaries paid a dividend during the years ended December 31, 2009 or 2008.
The state insurance departments also regulate financial transactions between our insurance subsidiaries and their affiliated companies. Applicable regulations require approval of management fees, expense sharing contracts and similar transactions. American Hallmark General Agency, Inc. paid $5.6 million, $4.5 million and $1.9 million in management fees to Hallmark during 2009, 2008 and 2007, respectively. HIC paid $1.2 million in management fees to American Hallmark General Agency, Inc. during each of 2009, 2008 and 2007. AHIC paid $4.5 million and $3.3 million in management fees to American Hallmark General Agency, Inc. during 2009 and 2008, respectively. AHIC did not pay any management fees during 2007. HSIC paid $60,000 in management fees to TGA during each of 2009, 2008, and 2007.
Statutory capital and surplus is calculated as statutory assets less statutory liabilities. The various state insurance departments that regulate our insurance company subsidiaries require us to maintain a minimum statutory capital and surplus. As of December 31, 2009, our insurance company subsidiaries reported statutory capital and surplus of $174.9 million, substantially greater than the minimum requirements for each state. Each of our insurance company subsidiaries is also required to satisfy certain risk-based capital requirements. (See, “Item 1. Business – Insurance Regulation – Risk-based Capital Requirements.”) As of December 31, 2009, the adjusted capital under the risk-based capital calculation of each of our insurance company subsidiaries substantially exceeded the minimum requirements. Our total statutory premium-to-surplus percentage for the years ended December 31, 2009 and 2008 was 150% and 170%, respectively.
Comparison of December 31, 2009 to December 31, 2008
On a consolidated basis, our cash and investments, excluding restricted cash and investments, at December 31, 2009 were $439.9 million compared to $352.7 million at December 31, 2008. Increases in market value of our investment portfolio for the period and cash from operating activities were the primary reasons for this increase.
Comparison of Years Ended December 31, 2009 and December 31, 2008
Net cash provided by our consolidated operating activities was $61.7 million for the year ended December 31, 2009 compared to $48.7 million for the year ended December 31, 2008. The increase in operating cash flow was primarily due to increased collected premium as a result of increased retention of business.
Cash used by investing activities during the year ended December 31, 2009 was $2.0 million as compared to $126.1 million for the prior year. Contributing to the decrease in cash used in investing activities was a decrease of $594.3 million in purchases of debt and equity securities and a $7.6 million reduction in payments for acquisitions of subsidiaries, net of cash received, partially offset by (i) a $4.1 million reduction in the change in restricted cash, (ii) a $473.5 million reduction in maturities, sales and redemptions of investment securities and (iii) a $0.1 million increase in purchases of property and equipment. The change in payments for acquisitions of subsidiaries resulted from the combined impact of a net cash payment of $3.9 million, net of cash acquired, for the acquisition of a management agreement controlling HCM and a $3.3 million payment of contingent consideration to the sellers of the subsidiaries comprising our TGA Operating Unit in 2009, compared to a net cash payment of $14.8 million, net of cash acquired for the acquisition of our Heath XS Operating Unit in 2008.
Cash used in financing activities during the year ended December 31, 2009 was $6.6 million as compared to $9.7 million for the same period of 2008. The cash used during 2009 was primarily for repayment of bank debt and the repurchase of the Company’s common stock during the third quarter of 2009. The cash used during 2008 was primarily for the payment of consideration to the sellers of the subsidiaries comprising our TGA Operating Unit. As of December 31, 2009 we had fully repaid our obligation to the sellers.
Credit Facilities
We have a credit facility with The Frost National Bank which was amended and restated on January 27, 2006 to provide a $20 million revolving credit facility with a $5 million letter of credit sub-facility. The credit facility was further amended effective May 31, 2007 to increase the revolving credit facility to $25 million and establish a new $5 million revolving credit sub-facility for the premium finance operations of PAAC. This $5 million credit sub-facility replaced PAAC’s $5 million revolving credit facility with JP Morgan Chase Bank which terminated June 30, 2007. The credit agreement was again amended effective February 20, 2008 to extend the termination to January 27, 2010, revise various affirmative and negative covenants and decrease the interest rate in most instances to the three month Eurodollar rate plus 1.90 percentage points, payable quarterly in arrears. The credit agreement was again amended January 21, 2010 in order to extend certain expiration, maturity, and termination dates for a period of 120 days. We pay letter of credit fees at the rate of 1.00% per annum. Our obligations under the revolving credit facility are secured by a security interest in the capital stock of all of our subsidiaries, guaranties of all of our subsidiaries and the pledge of all of our non-insurance company assets. The revolving credit facility contains covenants which, among other things, require us to maintain certain financial and operating ratios and restrict certain distributions, transactions and organizational changes. As of December 31, 2009, we were in compliance with all of our covenants. As of December 31, 2009 we had $2.8 million outstanding under this facility.
Trust Preferred Securities
On June 21, 2005, an unconsolidated trust subsidiary completed a private placement of $30 million of 30-year floating-rate trust preferred securities. Simultaneously, we borrowed $30.9 million from the trust subsidiary and contributed $30 million to AHIC in order to increase policyholder surplus. The note bears an initial interest rate of 7.725% until June 15, 2015, at which time interest will adjust quarterly to the three-month LIBOR rate plus 3.25 percentage points. As of December 31, 2009, the note balance was $30.9 million.
On August 23, 2007, an unconsolidated trust subsidiary completed a private placement of $25 million of 30-year floating trust preferred securities. Simultaneously, we borrowed $25.8 million from the trust subsidiary for working capital and general corporate purposes. The note bears an initial interest rate at 8.28% until September 15, 2017, at which time interest will adjust quarterly to the three-month LIBOR rate plus 2.90 percentage points. As of December 31, 2009 the note balance was $25.8 million.
Long-Term Contractual Obligations
Set forth below is a summary of long-term contractual obligations as of December 31, 2009. Amounts represent estimates of gross undiscounted amounts payable over time. In addition, certain unpaid losses and LAE are ceded to others under reinsurance contracts and are, therefore, recoverable. Such potential recoverables are not reflected in the table.
| | | Estimated Payments by Period (in thousands) | |
| | | Total | | | 2010 | | | | 2011-2012 | | | | 2013-2014 | | | After 2014 | |
| | | | | | | | | | | | | | | | | | |
| Notes payable | | $ | 59,502 | | | $ | 280 | | | $ | 1,120 | | | $ | 1,400 | | | $ | 56,702 | |
| Interest on notes payable | | | 116,591 | | | | 4,445 | | | | 8,856 | | | | 8,775 | | | | 94,515 | |
| Unpaid losses and loss adjustment expenses (1) | | | 184,662 | | | | 81,788 | | | | 67,706 | | | | 25,590 | | | | 9,578 | |
| Operating leases | | | 2,954 | | | | 1,194 | | | | 967 | | | | 531 | | | | 262 | |
| Purchase obligations | | | 629 | | | | 120 | | | | 232 | | | | 194 | | | | 83 | |
(1) The payout pattern for unpaid losses and loss adjustment expenses is based upon historical payment patterns and does not represent actual contractual obligations. The timing and amount ultimately paid will likely vary from these estimates.
Based on 2010 budgeted and year-to-date cash flow information, we believe that we have sufficient liquidity to meet our projected insurance obligations, operational expenses and capital expenditure requirements for the next 12 months.
Effects of Inflation
We do not believe that inflation has a material effect on our results of operations, except for the effect that inflation may have on interest rates and claim costs. The effects of inflation are considered in pricing and estimating reserves for unpaid losses and LAE. The actual effects of inflation on results of operations are not known until claims are ultimately settled. In addition to general price inflation, we are exposed to the upward trend in the judicial awards for damages. We attempt to mitigate the effects of inflation in the pricing of policies and establishing reserves for losses and LAE.
Item 7A. Quantitative and Qualitative Disclosures About Market Risk.
Not applicable to smaller reporting company.
Item 8. Financial Statements and Supplementary Data.
The following consolidated financial statements of the Company and its subsidiaries are filed as part of this report.
| Description | | Page Number |
| | | |
| Report of Independent Registered Public Accounting Firm | | F-2 |
| | | |
| Consolidated Balance Sheets at December 31, 2009 and 2008 | | F-3 |
| | | |
| Consolidated Statements of Operations for the Years Ended | | F-4 |
| December 31, 2009, 2008 and 2007 | | |
| | | |
| Consolidated Statements of Stockholders’ Equity and Comprehensive Income (Loss) | | F-5 |
| for the Years Ended December 31, 2009, 2008 and 2007 | | |
| | | |
| Consolidated Statements of Cash Flows for the Years Ended | | F-7 |
| December 31, 2009, 2008 and 2007 | | |
| | | |
| Notes to Consolidated Financial Statements | | F-8 |
| | | |
| Financial Statement Schedules | | F-45 |
Item 9. Changes in and Disagreements with Accountants on Accounting and Financial Disclosure.
None.
Item 9A(T). Controls and Procedures.
Evaluation of Disclosure Controls and Procedures
The principal executive officer and principal financial officer of Hallmark have evaluated our disclosure controls and procedures and have concluded that, as of the end of the period covered by this report, such disclosure controls and procedures were effective in ensuring that information required to be disclosed by us in the reports that we file or submit under the Securities Exchange Act of 1934 is timely recorded, processed, summarized and reported. The principal executive officer and principal financial officer also concluded that such disclosure controls and procedures were effective in ensuring that information required to be disclosed by us in the reports that we file or submit under such Act is accumulated and communicated to our management, including our principal executive officer and principal financial officer, as appropriate, to allow timely decisions regarding required disclosure.
Management’s Report on Internal Control over Financial Reporting
Our management is responsible for establishing and maintaining adequate “internal control over financial reporting”, as such phrase is defined in Exchange Act Rule 13a-15(f). Under the supervision and with the participation of management, including our Chief Executive Officer and Chief Accounting Officer, an evaluation of the effectiveness of our internal control over financial reporting was conducted based upon the framework in Internal Control-Integrated Framework issued by the Committee of Sponsoring Organizations of the Treadway Commission. Based upon that evaluation, management has concluded that our internal control over financial reporting was effective as of December 31, 2009. During the most recent fiscal quarter, there have been no changes in our internal controls over financial reporting that have materially affected, or are reasonably likely to materially affect, our internal control over financial reporting.
This report does not include an attestation report of our registered public accounting firm regarding internal control over financial reporting. Management’s report was not subject to attestation by our registered public accounting firm pursuant to temporary rules of the Securities and Exchange Commission that permit us to provide only management’s report in this annual report.
Item 9B. Other Information.
None.
PART III
Item 10. Directors, Executive Officers and Corporate Governance.
The information required by Item 10 is incorporated by reference from the Registrant’s definitive proxy statement to be filed with the Securities and Exchange Commission pursuant to Regulation 14A not later than 120 days after the end of the fiscal year covered by this report.
Item 11. Executive Compensation.
The information required by Item 11 is incorporated by reference from the Registrant’s definitive proxy statement to be filed with the Securities and Exchange Commission pursuant to Regulation 14A not later than 120 days after the end of the fiscal year covered by this report.
Item 12. Security Ownership of Certain Beneficial Owners and Management and Related Stockholder Matters.
The information required by Item 12 is incorporated by reference from the Registrant’s definitive proxy statement to be filed with the Securities and Exchange Commission pursuant to Regulation 14A not later than 120 days after the end of the fiscal year covered by this report.
Item 13. Certain Relationships and Related Transactions, and Director Independence.
The information required by Item 13 is incorporated by reference from the Registrant’s definitive proxy statement to be filed with the Securities and Exchange Commission pursuant to Regulation 14A not later than 120 days after the end of the fiscal year covered by this report.
Item 14. Principal Accounting Fees and Services.
The information required by Item 14 is incorporated by reference from the Registrant's definitive proxy statement to be filed with the Securities and Exchange Commission pursuant to Regulation 14A not later than 120 days after the end of the fiscal year covered by this report.
PART IV
Item 15. Exhibits, Financial Statement Schedules.
| (a)(1) | | Financial Statements |
| | | |
| | | The following consolidated financial statements, notes thereto and related information are included in Item 8 of this report: |
| | | |
| | | Report of Independent Registered Public Accounting Firm |
| | | Consolidated Balance Sheets at December 31, 2009 and 2008 |
| | | Consolidated Statements of Operations for the Years Ended December 31, 2009, 2008 and 2007 |
| | | Consolidated Statements of Stockholders’ Equity and Comprehensive Income (Loss) for the Years Ended December 31, 2009, 2008 and 2007 |
| | | Consolidated Statements of Cash Flows for the Years Ended December 31, 2009, 2008 and 2007 |
| | | Notes to Consolidated Financial Statements |
| | | |
| (a)(2) | | Financial Statement Schedules |
| | | |
| | | The following financial statement schedules are included in this report: |
| | | |
| | | Schedule II – Condensed Financial Information of Registrant (Parent Company Only) |
| | | Schedule III – Supplemental Insurance Information |
| | | Schedule IV – Reinsurance |
| | | Schedule VI – Supplemental Information Concerning Property-Casualty Insurance Operations |
| | | |
| (a)(3) | | Exhibit Index |
The following exhibits are either filed with this report or incorporated by reference:
Exhibit Number | | Description |
| | | |
| 3.1 | | Restated Articles of Incorporation of the registrant (incorporated by reference to Exhibit 3.1 to Amendment No. 1 to the registrant’s Registration Statement on Form S-1 [Registration No. 333-136414] filed September 8, 2006). |
| | | |
| 3.2 | | Amended and Restated By-Laws of the registrant (incorporated by reference to Exhibit 3.1 to the registrant’s Current Report on Form 8-K filed October 1, 2007). |
| | | |
| 4.1 | | Specimen certificate for common stock, $0.18 par value, of the registrant (incorporated by reference to Exhibit 4.1 to Amendment No. 1 to the registrant’s Registration Statement on Form S-1 [Registration No. 333-136414] filed September 8, 2006). |
| | | |
| 4.2 | | Indenture dated June 21, 2005, between Hallmark Financial Services, Inc. and JPMorgan Chase Bank, National Association (incorporated by reference to Exhibit 4.1 to the registrant’s Current Report on Form 8-K filed June 27, 2005). |
| | | |
| 4.3 | | Amended and Restated Declaration of Trust of Hallmark Statutory Trust I dated as of June 21, 2005, among Hallmark Financial Services, Inc., as sponsor, Chase Bank USA, National Association, as Delaware trustee, and JPMorgan Chase Bank, National Association, as institutional trustee, and Mark Schwarz and Mark Morrison, as administrators (incorporated by reference to Exhibit 4.2 to the registrant’s Current Report on Form 8-K filed June 27, 2005). |
| | | |
| 4.4 | | Form of Junior Subordinated Debt Security Due 2035 (included in Exhibit 4.2 above). |
| | | |
| 4.5 | | Form of Capital Security Certificate (included in Exhibit 4.3 above). |
| | | |
| 4.6 | | First Restated Credit Agreement dated January 27, 2006, between Hallmark Financial Services, Inc. and The Frost National Bank (incorporated by reference to Exhibit 4.1 to the registrant’s Current Report on Form 8-K filed February 2, 2006). |
| 4.7 | | Form of Registration Rights Agreement dated January 27, 2006, between Hallmark Financial Services, Inc. and Newcastle Special Opportunity Fund I, Ltd. and Newcastle Special Opportunity Fund II, L.P. (incorporated by reference to Exhibit 4.1 to the registrant’s Current Report on Form 8-K filed February 2, 2006). |
| | | |
| 4.8 | | Indenture dated as of August 23, 2007, between Hallmark Financial Services, Inc. and The Bank of New York Trust Company, National Association (incorporated by reference to Exhibit 4.1 to the registrant’s Current Report on Form 8-K filed August 24, 2007). |
| | | |
| 4.9 | | Amended and Restated Declaration of Trust of Hallmark Statutory Trust II dated as of August 23, 2007, among Hallmark Financial Services, Inc., as sponsor, The Bank of New York (Delaware), as Delaware trustee, and The Bank of New York Trust Company, National Association, as institutional trustee, and Mark Schwarz and Mark Morrison, as administrators (incorporated by reference to Exhibit 4.2 to the registrant’s Current Report on Form 8-K filed August 24, 2007). |
| | | |
| 4.10 | | Form of Junior Subordinated Debt Security Due 2037 (included in Exhibit 4.8 above). |
| | | |
| 4.11 | | Form of Capital Security Certificate (included in Exhibit 4.9 above). |
| | | |
| 4.12 | | Fifth Amendment to First Restated Credit Agreement among Hallmark Financial Services, Inc. and its subsidiaries and The Frost National Bank dated February 20, 2008 (incorporated by reference to Exhibit 99.1 to the registrant’s Current Report on Form 8-K filed February 25, 2009). |
| 4.13 | | Sixth Amendment to First Restated Credit Agreement among Hallmark Financial Services, Inc. and its subsidiaries and The Frost National Bank dated January 21, 2010 (incorporated by reference to Exhibit 99.1 to the registrant’s Current Report on Form 8-K filed January 25, 2010). |
| | | |
| 10.1 | | Office Lease for 6500 Pinecrest, Plano, Texas, dated July 22, 2008, between Hallmark Financial Services, Inc. and Legacy Tech IV Associates, Limited Partnership (incorporated by reference to Exhibit 99.1 to the registrant’s Current Report on Form 8-K filed July 29, 2008). |
| | | |
| 10.2 | | Lease Agreement for 777 Main Street, Fort Worth, Texas, dated June 12, 2003 between Hallmark Financial Services, Inc. and Crescent Real Estate Funding I, L.P. (incorporated by reference to Exhibit 10(a) to the registrant’s Quarterly Report on Form 10-QSB for the quarter ended June 30, 2003). |
| | | |
| 10.3 | | Lease Agreement for 7411 John Smith Drive, San Antonio, Texas, dated February 18, 1997, between Pan American Acceptance Corporation and Medical Plaza Partners, Ltd. (incorporated by reference to Exhibit 10.4 to the registrant’s Registration Statement on Form S-1 [Registration No. 333-136414] filed August 8, 2006). |
| | | |
| 10.4 | | Amendment No. 1 to Lease Agreement for 7411 John Smith Drive, San Antonio, Texas, dated June 10, 2002, between Pan American Acceptance Corporation and San Antonio Technology Center Corporation, as successor to Medical Plaza Partners, Ltd. (incorporated by reference to Exhibit 10.5 to the registrant’s Registration Statement on Form S-1 [Registration No. 333-136414] filed August 8, 2006). |
| | | |
| 10.5 | | Amendment No. 2 to Lease Agreement for 7411 John Smith Drive, San Antonio, Texas, dated February 27, 2003, between Pan American Acceptance Corporation and San Antonio Technology Center Corporation, as successor to Medical Plaza Partners, Ltd. (incorporated by reference to Exhibit 10.6 to the registrant’s Registration Statement on Form S-1 [Registration No. 333-136414] filed August 8, 2006). |
| | | |
| 10.6 | | Amendment No. 3 to Lease Agreement for 7411 John Smith Drive, San Antonio, Texas, dated November 10, 2004, between Pan American Acceptance Corporation and San Antonio Technology Center Corporation, as successor to Medical Plaza Partners, Ltd. (incorporated by reference to Exhibit 10.7 to the registrant’s Registration Statement on Form S-1 [Registration No. 333-136414] filed August 8, 2006). |
| | | |
| 10.7 | | Amended and Restated Lease Agreement for 14990 Landmark Boulevard, Addison, Texas, dated December 13, 2005, between Aerospace Managers, Inc. and Donnell Investments, L.L.C. (incorporated by reference to Exhibit 10.8 to the registrant’s Registration Statement on Form S-1 [Registration No. 333-136414] filed August 8, 2006). |
| 10.8 | | Office Lease by and between SAOP Northwest Center, L.P. and TGA Insurance Managers, Inc. dated January 29, 2010 (incorporated by reference to Exhibit 10.1 to the registrant’s Current Report on Form 8-K filed February 2, 2010). |
| | | |
| 10.9* | | 1994 Key Employee Long Term Incentive Plan (incorporated by reference to Exhibit 10(f) to the registrant’s Annual Report on Form 10-KSB for the fiscal year ended December 31, 1994). |
| | | |
| 10.10* | | First Amendment to Hallmark Financial Services, Inc. 1994 Key Employee Long Term Incentive Plan (incorporated by reference to Exhibit 10(bm) to the registrant’s Annual Report on Form 10-KSB for the fiscal year ended December 31, 2002). |
| | | |
| 10.11* | | 1994 Non-Employee Director Stock Option Plan (incorporated by reference to Exhibit 10(g) to the registrant’s Annual Report on Form 10-KSB for the fiscal year ended December 31, 1994). |
| | | |
| 10.12* | | First Amendment to Hallmark Financial Services, Inc. 1994 Non-Employee Director Stock Option Plan (incorporated by reference to Exhibit 10(bn) to the registrant’s Annual Report on Form 10-KSB for the fiscal year ended December 31, 2002). |
| | | |
| 10.13* | | Second Amendment to Hallmark Financial Services, Inc. 1994 Non-Employee Director Stock Option Plan (incorporated by reference to Exhibit 10(e) to the registrant’s Quarterly Report on Form 10-QSB for the quarter ended September 30, 2001). |
| | | |
| 10.14* | | Form of Indemnification Agreement between Hallmark Financial Services, Inc. and its officers and directors, adopted July 19, 2002 (incorporated by reference to Exhibit 10(c) to the registrant’s Quarterly Report on Form 10-QSB for the quarter ended September 30, 2002). |
| | | |
| 10.15* | | Hallmark Financial Services, Inc. 2005 Long Term Incentive Plan (incorporated by reference to Exhibit 10.1 to the registrant’s Current Report on Form 8-K filed June 3, 2005). |
| | | |
| 10.16* | | Form of Incentive Stock Option Grant Agreement (incorporated by reference to Exhibit 10.2 to the registrant’s Current Report on Form 8-K filed June 3, 2005). |
| | | |
| 10.17* | | Form of Non-qualified Stock Option Agreement (incorporated by reference to Exhibit 10.3 to the registrant’s Current Report on Form 8-K filed June 3, 2005). |
| | | |
| 10.18* | | Employment Agreement dated as of February 1, 2006, between Texas General Agency, Inc. and Donald E. Meyer (incorporated by reference to Exhibit 10.19 to the registrant’s Registration Statement on Form S-1 [Registration No. 333-136414] filed August 8, 2006). |
| | | |
| 10.19 | | Guarantee Agreement dated as of June 21, 2005, by Hallmark Financial Services, Inc. for the benefit of the holders of trust preferred securities (incorporated by reference to Exhibit 10.1 to the registrant’s Current Report on Form 8-K filed June 27, 2005). |
| | | |
| 10.20 | | Guarantee Agreement dated as of August 23, 2007, by Hallmark Financial Services, Inc. for the benefit of the holders of trust preferred securities (incorporated by reference to Exhibit 10.1 to the registrant’s Current Report on Form 8-K filed August 24, 2007). |
| | | |
| 10.21 | | Purchase Agreement dated November 9, 2005, by and among Hallmark Financial Services, Inc. and Samuel M. Cangelosi, Donate A. Cangelosi and Donald E. Meyer (incorporated by reference to Exhibit 4.1 to the registrant’s Current Report on Form 8-K filed November 14, 2005). |
| | | |
| 10.22 | | Quota Share Reinsurance Treaty Attaching January 1, 2006 by and among American Hallmark Insurance Company, Phoenix Indemnity Insurance Company (n/k/a Hallmark Insurance Company) and Gulf States Insurance Company (n/k/a Hallmark Specialty Insurance Company) (incorporated by reference to Exhibit 10.25 to the registrant’s Registration Statement on Form S-1 [Registration No. 333-136414] filed August 8, 2006). |
| | | |
| 10.23 | | Amendment No. 1 to Quota Share Reinsurance Treaty Attaching January 1, 2006 by and among American Hallmark Insurance Company, Phoenix Indemnity Insurance Company (n/k/a Hallmark Insurance Company) and Gulf States Insurance Company (n/k/a Hallmark Specialty Insurance Company) (incorporated by reference to Exhibit 10.26 to the registrant’s Registration Statement on Form S-1 [Registration No. 333-136414] filed August 8, 2006). |
| 10.24 | | Amendment No. 2 to Quota Share Reinsurance Treaty Attaching January 1, 2006 by and among American Hallmark Insurance Company, Phoenix Indemnity Insurance Company and Gulf States Insurance Company (n/k/a Hallmark Specialty Insurance Company) (incorporated by reference to Exhibit 10.27 to the registrant’s Registration Statement on Form S-1 [Registration No. 333-136414] filed August 8, 2006). |
| | | |
| 10.25 | | Amendment No. 3 to Quota Share Reinsurance Treaty attaching January 1, 2006 by and among American Hallmark Insurance Company, Phoenix Indemnity Insurance Company (n/k/a Hallmark Insurance Company) and Gulf States Insurance Company (n/k/a Hallmark Specialty Insurance Company) (incorporated by reference to Exhibit 10.28 to the registrant’s Annual Report on Form 10-K for the fiscal year ended December 31, 2006). |
| 10.26 | | Purchase Agreement dated August 29, 2008 by and among Hallmark Financial Services, Inc. and Jeffrey L. Heath (incorporated by reference to Exhibit 10.1 to the registrants Current Report on Form 8-K filed September 4, 2008). |
| | | |
| 10.27* | | Employment Agreement dated as of August 29, 2008, between Heath XS, LLC and Jeffrey L. Heath (incorporated by reference to Exhibit 10.4 to the registrant’s Current Report on Form 8-K filed September 4, 2008). |
| | | |
| 10.28 | | Second Amendment to the Purchase Agreement dated December 18, 2008, between Hallmark Financial Services, Inc. and Samuel M. Cangelosi, Donate A. Cangelosi, and Donald E. Meyer (incorporated by reference to Exhibit 10.1 to the registrant’s Current Report on Form 8-K filed December 23, 2008). |
| | | |
| 10.29 | | Stock Purchase Agreement dated February 13, 2009 between American Hallmark Insurance Company and T.B.A. Insurance Group, Ltd. (incorporated by reference to the registrant’s Current Report on Form 8-K filed February 18, 2009). |
| | | |
| 21+ | | List of subsidiaries of the registrant. |
| | | |
| 23+ | | Consent of Independent Registered Public Accounting Firm. |
| | | |
| 31(a)+ | | Certification of principal executive officer required by Rule 13a-14(a) or Rule 15d-14(b). |
| | | |
| 31(b)+ | | Certification of principal financial officer required by Rule 13a-14(a) or Rule 15d-14(b). |
| | | |
| 32(a)+ | | Certification of principal executive officer pursuant to 18 U.S.C. 1350. |
| | | |
| 32(b)+ | | Certification of principal financial officer pursuant to 18 U.S.C. 1350. |
| | | |
| | | *Management contract or compensatory plan or arrangement. |
| | | |
| | | |
SIGNATURES
Pursuant to the requirements of Section 13 or 15(d) of the Securities Exchange Act of 1934, the registrant has duly caused this report to be signed on its behalf by the undersigned, thereunto duly authorized.
| | | | HALLMARK FINANCIAL SERVICES, INC. |
| | | | (Registrant) |
| | | | |
| Date: | March 25, 2010 | | /s/ Mark J. Morrison |
| | | | Mark J. Morrison, Chief Executive Officer and President |
| | | | (Principal Executive Officer) |
| | | | |
| Date: | March 25, 2010 | | /s/ Jeffrey R. Passmore |
| | | | Jeffrey R. Passmore, Chief Accounting Officer and Senior Vice President |
| | | | (Principal Financial Officer and Principal Accounting Officer) |
Pursuant to the requirements of the Securities Exchange Act of 1934, this report has been signed below by the following persons on behalf of the registrant and in the capacities and on the dates indicated.
| Date: | March 25, 2010 | | /s/ Mark E. Schwarz |
| | | | Mark E. Schwarz, Executive Chairman |
| | | | |
| Date: | March 25, 2010 | | /s/ James H. Graves |
| | | | James H. Graves, Director |
| | | | |
| Date: | March 25, 2010 | | /s/ Jim W. Henderson |
| | | | Jim W. Henderson, Director |
| | | | |
| Date: | March 25, 2010 | | /s/ Scott T. Berlin |
| | | | Scott T. Berlin, Director |
| | | | |
| Date: | March 25, 2010 | | /s/ George R. Manser |
| | | | George R. Manser, Director |
HALLMARK FINANCIAL SERVICES, INC. AND SUBSIDIARIES
INDEX TO CONSOLIDATED FINANCIAL STATEMENTS
| Description | | Page Number |
| | | |
| Report of Independent Registered Public Accounting Firm | | F-2 |
| | | |
| Consolidated Balance Sheets at December 31, 2009 and 2008 | | F-3 |
| | | |
| Consolidated Statements of Operations for the Years Ended | | F-4 |
| December 31, 2009, 2008 and 2007 | | |
| | | |
| Consolidated Statements of Stockholders’ Equity and Comprehensive Income | | F-5 |
| (Loss) for the Years Ended December 31, 2009, 2008 and 2007 | | |
| | | |
| Consolidated Statements of Cash Flows for the Years Ended | | F-7 |
| December 31, 2009, 2008 and 2007 | | |
| | | |
| Notes to Consolidated Financial Statements | | F-8 |
| | | |
| Financial Statement Schedules | | F-45 |
REPORT OF INDEPENDENT REGISTERED PUBLIC ACCOUNTING FIRM
The Board of Directors and Stockholders
Hallmark Financial Services, Inc.:
We have audited the accompanying consolidated balance sheets of Hallmark Financial Services, Inc. and subsidiaries (the Company) as of December 31, 2009 and 2008, and the related consolidated statements of operations, stockholders’ equity and comprehensive income (loss), and cash flows for each of the years in the three-year period ended December 31, 2009. In connection with our audits of the consolidated financial statements, we also have audited the financial statement schedules II, III, IV and VI. These consolidated financial statements and financial statement schedules are the responsibility of the Company’s management. Our responsibility is to express an opinion on these consolidated financial statements and financial statement schedules based on our audits.
We conducted our audits in accordance with the auditing standards of the Public Company Accounting Oversight Board (United States). Those standards require that we plan and perform the audit to obtain reasonable assurance about whether the financial statements are free of material misstatement. An audit includes examining, on a test basis, evidence supporting the amounts and disclosures in the financial statements. An audit also includes assessing the accounting principles used and significant estimates made by management, as well as evaluating the overall financial statement presentation. We believe that our audits provide a reasonable basis for our opinion.
In our opinion, the consolidated financial statements referred to above present fairly, in all material respects, the consolidated financial position of Hallmark Financial Services, Inc. and subsidiaries as of December 31, 2009 and 2008, and the results of their operations and their cash flows for each of the years in the three-year period ended December 31, 2009, in conformity with U.S. generally accepted accounting principles. Also, in our opinion, the related financial statement schedules, when considered in relation to the basic consolidated financial statements taken as a whole, present fairly, in all material respects, the information set forth therein.
As described in note 1 to the consolidated financial statements, in 2009 the Company changed its method of evaluating other-than-temporary impairments of debt securities due to the adoption of new accounting requirements issued by the Financial Accounting Standards Board, as of April 1, 2009.
Dallas, Texas
March 25, 2010
HALLMARK FINANCIAL SERVICES, INC. AND SUBSIDIARIES
CONSOLIDATED BALANCE SHEETS
December 31, 2009 and 2008
(In thousands, except share amounts)
| | | 2009 | | | 2008 | |
| ASSETS | | | | | | |
| Investments: | | | | | | |
| Debt securities, available-for-sale, at fair value | | $ | 291,876 | | | $ | 268,513 | |
| Equity securities, available-for-sale, at fair value | | | 35,801 | | | | 25,003 | |
| | | | | | | | | |
| Total investments | | | 327,677 | | | | 293,516 | |
| | | | | | | | | |
| Cash and cash equivalents | | | 112,270 | | | | 59,134 | |
| Restricted cash and cash equivalents | | | 5,458 | | | | 8,033 | |
| Prepaid reinsurance premiums | | | 12,997 | | | | 1,349 | |
| Premiums receivable | | | 46,635 | | | | 44,032 | |
| Accounts receivable | | | 3,377 | | | | 4,531 | |
| Receivable for securities | | | - | | | | 1,031 | |
| Reinsurance recoverable | | | 10,008 | | | | 8,218 | |
| Deferred policy acquisition costs | | | 20,792 | | | | 19,524 | |
| Excess of cost over fair value of net assets acquired | | | 41,080 | | | | 41,080 | |
| Intangible assets | | | 28,873 | | | | 28,969 | |
| Federal income tax recoverable | | | - | | | | 696 | |
| Deferred federal income taxes | | | - | | | | 6,696 | |
| Prepaid expenses | | | 923 | | | | 1,007 | |
| Other assets | | | 18,779 | | | | 20,582 | |
| | | | | | | | | |
| | | $ | 628,869 | | | $ | 538,398 | |
| | | | | | | | | |
| LIABILITIES AND STOCKHOLDERS’ EQUITY | | | | | | | | |
| Liabilities: | | | | | | | | |
| Notes payable | | $ | 59,502 | | | $ | 60,919 | |
| Reserves for unpaid losses and loss adjustment expenses | | | 184,662 | | | | 156,363 | |
| Unearned premiums | | | 125,089 | | | | 102,192 | |
| Unearned revenue | | | 191 | | | | 2,037 | |
| Reinsurance balances payable | | | 3,281 | | | | - | |
| Accrued agent profit sharing | | | 1,790 | | | | 2,151 | |
| Accrued ceding commission payable | | | 8,600 | | | | 8,605 | |
| Pension liability | | | 2,628 | | | | 4,309 | |
| Payable for securities | | | 19 | | | | 3,606 | |
| Deferred federal income taxes | | | 942 | | | | - | |
| Federal income tax payable | | | 1,266 | | | | - | |
| Accounts payable and other accrued expenses | | | 13,258 | | | | 18,067 | |
| | | | | | | | | |
| | | | 401,228 | | | | 358,249 | |
| Commitments and contingencies (Note 15) | | | | | | | | |
| | | | | | | | | |
| Redeemable non-controlling interest | | | 1,124 | | | | 737 | |
| | | | | | | | | |
| Stockholders’ equity: | | | | | | | | |
| Common stock, $.18 par value, authorized 33,333,333 shares in 2009 and 2008; issued 20,872,831 shares in 2009 and 20,841,782 shares in 2008 | | | 3,757 | | | | 3,751 | |
| Capital in excess of par value | | | 121,016 | | | | 119,928 | |
| Retained earnings | | | 98,482 | | | | 72,242 | |
| Accumulated other comprehensive income (loss) | | | 8,589 | | | | (16,432 | ) |
| Treasury stock, (757,828 shares in 2009 and 7,828 in 2008), at cost | | | (5,327 | ) | | | (77 | ) |
| | | | | | | | | |
| Total stockholders’ equity | | | 226,517 | | | | 179,412 | |
| | | | | | | | | |
| | | $ | 628,869 | | | $ | 538,398 | |
The accompanying notes are an integral
part of the consolidated financial statements
HALLMARK FINANCIAL SERVICES, INC. AND SUBSIDIARIES
CONSOLIDATED STATEMENTS OF OPERATIONS
For the years ended December 31, 2009, 2008 and 2007
(In thousands, except per share amounts)
| | | 2009 | | | 2008 | | | 2007 | |
| Gross premiums written | | $ | 287,558 | | | $ | 243,849 | | | $ | 249,472 | |
| Ceded premiums written | | | (25,818 | ) | | | (8,922 | ) | | | (10,661 | ) |
| Net premiums written | | | 261,740 | | | | 234,927 | | | | 238,811 | |
| Change in unearned premiums | | | (10,668 | ) | | | 1,393 | | | | (12,840 | ) |
| Net premiums earned | | | 251,072 | | | | 236,320 | | | | 225,971 | |
| | | | | | | | | | | | | |
| Investment income, net of expenses | | | 14,947 | | | | 16,049 | | | | 13,180 | |
| Gain (loss) on investments | | | 3,032 | | | | (11,261 | ) | | | 2,586 | |
| Finance charges | | | 5,874 | | | | 5,174 | | | | 4,702 | |
| Commission and fees | | | 12,011 | | | | 22,280 | | | | 28,054 | |
| Processing and service fees | | | 39 | | | | 114 | | | | 657 | |
| Other income | | | 64 | | | | 14 | | | | 16 | |
| | | | | | | | | | | | | |
| Total revenues | | | 287,039 | | | | 268,690 | | | | 275,166 | |
| | | | | | | | | | | | | |
| Losses and loss adjustment expenses | | | 153,619 | | | | 144,244 | | | | 132,918 | |
| Other operating expenses | | | 92,233 | | | | 96,096 | | | | 94,272 | |
| Interest expense | | | 4,602 | | | | 4,745 | | | | 3,914 | |
| Amortization of intangible asset | | | 3,328 | | | | 2,481 | | | | 2,293 | |
| | | | | | | | | | | | | |
| Total expenses | | | 253,782 | | | | 247,566 | | | | 233,397 | |
| | | | | | | | | | | | | |
| Income before tax | | | 33,257 | | | | 21,124 | | | | 41,769 | |
| Income tax expense | | | 8,630 | | | | 8,175 | | | | 13,906 | |
| Net income | | | 24,627 | | | | 12,949 | | | | 27,863 | |
| Less: Net income attributable to non-controlling interest | | | 52 | | | | 50 | | | | - | |
| | | | | | | | | | | | | |
| Net income attributable to Hallmark Financial Services, Inc. | | $ | 24,575 | | | $ | 12,899 | | | $ | 27,863 | |
| | | | | | | | | | | | | |
| Net income per share attributable to | | | | | | | | | | | | |
| Hallmark Financial Services, Inc common stockholders: | | | | | | | | | | | | |
| Basic | | $ | 1.19 | | | $ | 0.62 | | | $ | 1.34 | |
| Diluted | | $ | 1.19 | | | $ | 0.62 | | | $ | 1.34 | |
The accompanying notes are an integral part
of the consolidated financial statements
HALLMARK FINANCIAL SERVICES, INC. AND SUBSIDIARIES
CONSOLIDATED STATEMENTS OF STOCKHOLDERS’ EQUITY AND COMPREHENSIVE INCOME (LOSS)
For the years ended December 31, 2009, 2008 and 2007
(In thousands)
| | | Number | | | | | | Capital In | | | | | | Accumulated Other | | | | | | Number | | | Total | | | Comprehensive | |
| | | of | | | Par | | | Excess of | | | Retained | | | Comprehensive | | | Treasury | | | of | | | Stockholders' | | | Income | |
| | | Shares | | | Value | | | Par Value | | | Earnings | | | Income (Loss) | | | Stock | | | Shares | | | Equity | | | (Loss) | |
| | | | | | | | | | | | | | | | | | | | | | | | | | | | |
| Balance at December 31, 2006 | | | 20,776 | | | $ | 3,740 | | | $ | 117,932 | | | $ | 31,480 | | | $ | (2,344 | ) | | $ | (77 | ) | | | 8 | | | $ | 150,731 | | | | |
| | | | | | | | | | | | | | | | | | | | | | | | | | | | | | | | | | | | |
| Amortization of fair value of stock options granted | | | - | | | | - | | | | 527 | | | | - | | | | - | | | | - | | | | - | | | | 527 | | | | |
| | | | | | | | | | | | | | | | | | | | | | | | | | | | | | | | | | | | |
| Comprehensive income: | | | | | | | | | | | | | | | | | | | | | | | | | | | | | | | | | | | |
| Net income | | | - | | | | - | | | | - | | | | 27,863 | | | | - | | | | - | | | | - | | | | 27,863 | | | $ | 27,863 | |
| | | | | | | | | | | | | | | | | | | | | | | | | | | | | | | | | | | | | |
| Other comprehensive income: | | | | | | | | | | | | | | | | | | | | | | | | | | | | | | | | | | | | |
| Change in net actuarial loss | | | - | | | | - | | | | - | | | | - | | | | 1,378 | | | | - | | | | - | | | | 1,378 | | | | 1,378 | |
| Net unrealized holding losses arising during period | | | - | | | | - | | | | - | | | | - | | | | (339 | ) | | | - | | | | - | | | | (339 | ) | | | (339 | ) |
| Reclassification adjustment for losses included in net income | | | - | | | | - | | | | - | | | | - | | | | (270 | ) | | | - | | | | - | | | | (270 | ) | | | (270 | ) |
| Net unrealized losses on securities | | | | | | | | | | | | | | | | | | | (609 | ) | | | | | | | | | | | (609 | ) | | | (609 | ) |
| Total other comprehensive income before tax | | | | | | | | | | | | | | | | | | | 769 | | | | | | | | | | | | 769 | | | | 769 | |
| Tax effect on other comprehensive income | | | | | | | | | | | | | | | | | | | (269 | ) | | | | | | | | | | | (269 | ) | | | (269 | ) |
| Other comprehensive income after tax | | | | | | | | | | | | | | | | | | | 500 | | | | | | | | | | | | 500 | | | | 500 | |
| Comprehensive income | | | | | | | | | | | | | | | | | | | | | | | | | | | | | | | | | | $ | 28,363 | |
| Balance at December 31, 2007 | | | 20,776 | | | $ | 3,740 | | | $ | 118,459 | | | $ | 59,343 | | | $ | (1,844 | ) | | $ | (77 | ) | | | 8 | | | $ | 179,621 | | | | | |
| | | | | | | | | | | | | | | | | | | | | | | | | | | | | | | | | | | | | |
| Amortization of fair value of stock options granted | | | - | | | | - | | | | 1,368 | | | | - | | | | - | | | | - | | | | - | | | | 1,368 | | | | | |
| | | | | | | | | | | | | | | | | | | | | | | | | | | | | | | | | | | | | |
| Stock options exercised | | | 66 | | | | 11 | | | | 208 | | | | - | | | | - | | | | - | | | | - | | | | 219 | | | | | |
| | | | | | | | | | | | | | | | | | | | | | | | | | | | | | | | | | | | | |
| Accretion of redeemable non-controlling interest | | | - | | | | - | | | | (107 | ) | | | - | | | | - | | | | - | | | | - | | | | (107 | ) | | | | |
| Comprehensive loss: | | | | | | | | | | | | | | | | | | | | | | | | | | | | | | | | | | | | |
| Net income | | | - | | | | - | | | | - | | | | 12,899 | | | | - | | | | - | | | | - | | | | 12,899 | | | $ | 12,899 | |
| | | | | | | | | | | | | | | | | | | | | | | | | | | | | | | | | | | | | |
| Other comprehensive loss: | | | | | | | | | | | | | | | | | | | | | | | | | | | | | | | | | | | | |
| Change in net actuarial loss | | | - | | | | - | | | | - | | | | - | | | | (3,380 | ) | | | - | | | | - | | | | (3,380 | ) | | | (3,380 | ) |
| Net unrealized holding loss arising during period | | | - | | | | - | | | | - | | | | - | | | | (15,605 | ) | | | - | | | | - | | | | (15,605 | ) | | | (15,605 | ) |
| Reclassification adjustment for losses included in net income | | | - | | | | - | | | | - | | | | - | | | | (1,083 | ) | | | - | | | | - | | | | (1,083 | ) | | | (1,083 | ) |
| Net unrealized losses on securities | | | | | | | | | | | | | | | | | | | (16,688 | ) | | | | | | | | | | | (16,688 | ) | | | (16,688 | ) |
| Total other comprehensive loss before tax | | | | | | | | | | | | | | | | | | | (20,068 | ) | | | | | | | | | | | (20,068 | ) | | | (20,068 | ) |
| Tax effect on other comprehensive loss | | | | | | | | | | | | | | | | | | | 5,480 | | | | | | | | | | | | 5,480 | | | | 5,480 | |
| Other comprehensive loss after tax | | | | | | | | | | | | | | | | | | | (14,588 | ) | | | | | | | | | | | (14,588 | ) | | | (14,588 | ) |
| Comprehensive loss | | | | | | | | | | | | | | | | | | | | | | | | | | | | | | | | | | $ | (1,689 | ) |
| | | | | | | | | | | | | | | | | | | | | | | | | | | | | | | | | | | | | |
| Balance at December 31, 2008 | | | 20,842 | | | $ | 3,751 | | | $ | 119,928 | | | $ | 72,242 | | | $ | (16,432 | ) | | $ | (77 | ) | | | 8 | | | $ | 179,412 | | | | | |
HALLMARK FINANCIAL SERVICES, INC. AND SUBSIDIARIES
CONSOLIDATED STATEMENTS OF STOCKHOLDERS’ EQUITY AND COMPREHENSIVE INCOME (LOSS) (Continued)
For the years ended December 31, 2009, 2008 and 2007
(In thousands)
| | | | | | | | | Capital | | | | | | Accumlated | | | | | | | | | | | | | |
| | | Number | | | | | | In | | | | | | Other | | | | | | Number | | | Total | | | Comprehensive | |
| | | of | | | Par | | | Excess of | | | Retained | | | Comprehensive | | | Treasury | | | of | | | Stockholders' | | | Income | |
| | | Shares | | | Value | | | Par Value | | | Earnings | | | Income (Loss) | | | Stock | | | Shares | | | Equity | | | (Loss) | |
| | | | | | | | | | | | | | | | | | | | | | | | | | | | |
| Balance at December 31, 2008 | | | 20,842 | | | $ | 3,751 | | | $ | 119,928 | | | $ | 72,242 | | | $ | (16,432 | ) | | $ | (77 | ) | | | 8 | | | $ | 179,412 | | | | |
| | | | | | | | | | | | | | | | | | | | | | | | | | | | | | | | | | | | |
| Cumulative effect of adjustments resulting from adoption of change in accounting principle, net of tax (note 1) | | | - | | | | - | | | | - | | | | 1,665 | | | | (1,665 | ) | | | - | | | | - | | | | - | | | | |
| | | | | | | | | | | | | | | | | | | | | | | | | | | | | | | | | | | | |
| Acquisition of treasury shares | | | - | | | | - | | | | - | | | | - | | | | - | | | | (5,250 | ) | | | 750 | | | | (5,250 | ) | | | |
| | | | | | | | | | | | | | | | | | | | | | | | | | | | | | | | | | | | |
| Amortization of fair value of stock options granted | | | - | | | | - | | | | 1,334 | | | | - | | | | - | | | | - | | | | - | | | | 1,334 | | | | |
| | | | | | | | | | | | | | | | | | | | | | | | | | | | | | | | | | | | |
| Stock options exercised | | | 31 | | | | 6 | | | | 109 | | | | - | | | | - | | | | - | | | | - | | | | 115 | | | | |
| | | | | | | | | | | | | | | | | | | | | | | | | | | | | | | | | | | | |
| Accretion of redeemable non-controlling interest | | | - | | | | - | | | | (355 | ) | | | - | | | | - | | | | - | | | | - | | | | (355 | ) | | | |
| | | | | | | | | | | | | | | | | | | | | | | | | | | | | | | | | | | | |
| Comprehensive income: | | | | | | | | | | | | | | | | | | | | | | | | | | | | | | | | | | | |
| Net income | | | - | | | | - | | | | - | | | | 24,575 | | | | - | | | | - | | | | - | | | | 24,575 | | | $ | 24,575 | |
| | | | | | | | | | | | | | | | | | | | | | | | | | | | | | | | | | | | | |
| Other comprehensive income: | | | | | | | | | | | | | | | | | | | | | | | | | | | | | | | | | | | | |
| | | | | | | | | | | | | | | | | | | | - | | | | | | | | | | | | | | | | | |
| Change in net actuarial loss | | | - | | | | - | | | | - | | | | - | | | | 2,327 | | | | - | | | | - | | | | 2,327 | | | | 2,327 | |
| Net unrealized holding gains arising during period | | | - | | | | - | | | | - | | | | - | | | | 42,299 | | | | - | | | | - | | | | 42,299 | | | | 42,299 | |
| Reclassification adjustment for losses included in net income | | | - | | | | - | | | | - | | | | - | | | | (3,571 | ) | | | - | | | | - | | | | (3,571 | ) | | | (3,571 | ) |
| Net unrealized gains on securities | | | | | | | | | | | | | | | | | | | 38,728 | | | | | | | | | | | | 38,728 | | | | 38,728 | |
| | | | | | | | | | | | | | | | | | | | | | | | | | | | | | | | | | | | | |
| Total other comprehensive income before tax | | | | | | | | | | | | | | | | | | | 41,055 | | | | | | | | | | | | 41,055 | | | | 41,055 | |
| Tax effect on other comprehensive income | | | | | | | | | | | | | | | | | | | (14,369 | ) | | | | | | | | | | | (14,369 | ) | | | (14,369 | ) |
| Other comprehensive income after tax | | | | | | | | | | | | | | | | | | | 26,686 | | | | | | | | | | | | 26,686 | | | | 26,686 | |
| | | | | | | | | | | | | | | | | | | | | | | | | | | | | | | | | | | | | |
| Comprehensive income | | | | | | | | | | | | | | | | | | | | | | | | | | | | | | | | | | $ | 51,261 | |
| | | | | | | | | | | | | | | | | | | | | | | | | | | | | | | | | | | | | |
| Balance at December 31, 2009 | | | 20,873 | | | $ | 3,757 | | | $ | 121,016 | | | $ | 98,482 | | | $ | 8,589 | | | $ | (5,327 | ) | | | 758 | | | $ | 226,517 | | | | | |
The accompanying notes are an integral
part of the consolidated financial statements
HALLMARK FINANCIAL SERVICES, INC. AND SUBSIDIARIES
CONSOLIDATED STATEMENTS OF CASH FLOWS
For the years ended December 31, 2009, 2008 and 2007
(In thousands)
| | | 2009 | | | 2008 | | | 2007 | |
| Cash flows from operating activities: | | | | | | | | | |
| Net income | | $ | 24,627 | | | $ | 12,949 | | | $ | 27,863 | |
| | | | | | | | | | | | | |
| Adjustments to reconcile net income to cash provided by operating activities: | | | | | | | | | | | | |
| Depreciation and amortization expense | | | 4,105 | | | | 3,219 | | | | 3,119 | |
| Amortization of discount on structured settlement | | | - | | | | - | | | | 413 | |
| Deferred income tax benefit | | | (1,535 | ) | | | (912 | ) | | | (1,481 | ) |
| Realized (gain) loss on investments | | | (3,032 | ) | | | 11,261 | | | | (2,586 | ) |
| Change in prepaid reinsurance premiums | | | (6,835 | ) | | | (407 | ) | | | 687 | |
| Change in premiums receivable | | | (2,628 | ) | | | 1,994 | | | | (1,382 | ) |
| Change in prepaid commissions | | | - | | | | - | | | | 487 | |
| Change in accounts receivable | | | 1,215 | | | | 688 | | | | 2,632 | |
| Change in deferred policy acquisition costs | | | (1,268 | ) | | | 233 | | | | (2,612 | ) |
| Change in unpaid losses and loss adjustment expenses | | | 19,735 | | | | 31,025 | | | | 47,774 | |
| Change in unearned premiums | | | 18,084 | | | | (806 | ) | | | 11,392 | |
| Change in unearned revenue | | | (1,846 | ) | | | (912 | ) | | | (2,785 | ) |
| Change in accrued agent profit sharing | | | (361 | ) | | | (693 | ) | | | 1,060 | |
| Change in reinsurance recoverable | | | 6,774 | | | | (3,266 | ) | | | 978 | |
| Change in reinsurance balances payable | | | 3,281 | | | | - | | | | (1,060 | ) |
| Change in current federal income tax payable/recoverable | | | 1,962 | | | | (1,560 | ) | | | (1,268 | ) |
| Change in accrued ceding commission payable | | | (5 | ) | | | (3,494 | ) | | | 8,143 | |
| Change in all other liabilities | | | (5,783 | ) | | | 977 | | | | (673 | ) |
| Change in all other assets | | | 5,208 | | | | (1,584 | ) | | | (5,017 | ) |
| Net cash provided by operating activities | | | 61,698 | | | | 48,712 | | | | 85,684 | |
| | | | | | | | | | | | | |
| Cash flows from investing activities: | | | | | | | | | | | | |
| Purchases of property and equipment | | | (1,263 | ) | | | (1,119 | ) | | | (455 | ) |
| Acquisitions of subsidiaries, net of cash received | | | (7,246 | ) | | | (14,799 | ) | | | - | |
| Change in restricted cash | | | 3,930 | | | | 8,010 | | | | 8,526 | |
| Purchases of debt and equity securities | | | (109,959 | ) | | | (704,247 | ) | | | (290,765 | ) |
| Proceeds from maturities and redemptions of securities | | | 112,548 | | | | 586,034 | | | | 252,043 | |
| Net cash used in investing activities | | | (1,990 | ) | | | (126,121 | ) | | | (30,651 | ) |
| | | | | | | | | | | | | |
| Cash flows from financing activities: | | | | | | | | | | | | |
| Proceeds from borrowings | | | - | | | | - | | | | 25,774 | |
| Net borrowings (repayment) of note payable | | | (1,417 | ) | | | 105 | | | | (723 | ) |
| Debt issuance costs | | | - | | | | - | | | | (674 | ) |
| Distribution to non-controlling interest | | | (20 | ) | | | - | | | | - | |
| Proceeds from exercise of employee stock options | | | 115 | | | | 219 | | | | - | |
| Purchase of treasury shares | | | (5,250 | ) | | | - | | | | - | |
| Repayment of borrowings | | | - | | | | (10,000 | ) | | | (15,000 | ) |
| Net cash (used in) provided by financing activities | | | (6,572 | ) | | | (9,676 | ) | | | 9,377 | |
| | | | | | | | | | | | | |
| Increase (Decrease) in cash and cash equivalents | | | 53,136 | | | | (87,085 | ) | | | 64,410 | |
| Cash and cash equivalents at beginning of year | | | 59,134 | | | | 146,219 | | | | 81,809 | |
| Cash and cash equivalents at end of year | | $ | 112,270 | | | $ | 59,134 | | | $ | 146,219 | |
| | | | | | | | | | | | | |
| Supplemental cash flow information: | | | | | | | | | | | | |
| Interest paid | | $ | (4,641 | ) | | $ | (4,759 | ) | | $ | (3,402 | ) |
| Income taxes paid | | $ | (8,202 | ) | | $ | (10,649 | ) | | $ | (16,655 | ) |
| | | | | | | | | | | | | |
| Supplemental disclosure of noncash activities: | | | | | | | | | | | | |
| Change in receivable for securities related to investment disposals that settled after the balance sheet date | | $ | 983 | | | $ | 26,364 | | | $ | (22,024 | ) |
| | | | | | | | | | | | | |
| Change in payable for securities related to investment purchases that settled after the balance sheet date | | $ | (3,587 | ) | | $ | (87,795 | ) | | $ | 91,401 | |
The accompanying notes are an integral part
of the consolidated financial statements
HALLMARK FINANCIAL SERVICES, INC. AND SUBSIDIARIES
NOTES TO CONSOLIDATED FINANCIAL STATEMENTS
Years ended December 31, 2009, 2008, and 2007
General
Hallmark Financial Services, Inc. (“Hallmark” and, together with subsidiaries, “we,” “us” or “our”) is an insurance holding company engaged in the sale of property/casualty insurance products to businesses and individuals. Our business involves marketing, distributing, underwriting and servicing our insurance products, as well as providing other insurance related services.
We pursue our business activities through subsidiaries whose operations are organized into five operating units which are supported by our four insurance company subsidiaries. Our AHIS Operating Unit handles commercial insurance products and services and is comprised of American Hallmark Insurance Services, Inc. (“American Hallmark Insurance Services”) and Effective Claims Management, Inc. (“ECM”). Our TGA Operating Unit handles primarily commercial insurance products and services and is comprised of TGA Insurance Managers, Inc. (“TGA”), Pan American Acceptance Corporation (“PAAC”) and TGA Special Risk, Inc. (“TGASRI”). Our Aerospace Operating Unit handles general aviation insurance products and services and is comprised of Aerospace Insurance Managers, Inc. (“Aerospace Insurance Managers”), Aerospace Special Risk, Inc. (“ASRI”) and Aerospace Claims Management Group, Inc. (“ACMG”). Our Heath XS Operating Unit offers low and middle market commercial umbrella and excess liability insurance on both an admitted and non-admitted basis focusing primarily on trucking, specialty automobile, and non-fleet automobile coverage. Our Heath XS Operating Unit is compromised of Heath XS, LLC (“HXS”) and Hardscrabble Data Solutions, LLC (“HDS”), both of which were acquired effective August 29, 2008. Our Personal Lines Operating Unit handles personal insurance products and services and is comprised of American Hallmark General Agency, Inc. and Hallmark Claims Services, Inc. (both of which do business as Hallmark Insurance Company). Our insurance company subsidiaries supporting these operating units are American Hallmark Insurance Company of Texas (“AHIC”), Hallmark Insurance Company (“HIC”), Hallmark Specialty Insurance Company (“HSIC”) and Hallmark County Mutual Insurance Company (“HCM”).
These five operating units are segregated into three reportable industry segments for financial accounting purposes. The Standard Commercial Segment presently consists solely of the AHIS Operating Unit and the Personal Segment presently consists solely of our Personal Lines Operating Unit. The Specialty Commercial Segment includes our TGA Operating Unit, our Aerospace Operating Unit and our Heath XS Operating Unit.
Basis of Presentation
The accompanying consolidated financial statements include the accounts and operations of Hallmark and its subsidiaries. Intercompany accounts and transactions have been eliminated. The accompanying consolidated financial statements have been prepared in conformity with U.S. generally accepted accounting principles (“GAAP”) which, as to AHIC, HIC, HSIC and HCM differ from statutory accounting practices prescribed or permitted for insurance companies by insurance regulatory authorities.
Redeemable non-controlling interest
We are accreting redeemable non-controlling interest to its redemption value from the date of issuance to the earliest redemption date, August 29, 2012, using the interest method. Changes in redemption value are considered a change in accounting estimate. We follow the two class method of computing earnings per share. We treat only the portion of the periodic adjustment to the redeemable minority interest carrying amount that reflects a redemption in excess of fair value as being akin to an actual dividend.
HALLMARK FINANCIAL SERVICES, INC. AND SUBSIDIARIES
NOTES TO CONSOLIDATED FINANCIAL STATEMENTS
Years ended December 31, 2009, 2008, and 2007
Activity related to non-controlling interest for the years ended December 31, 2009 and 2008 is as follows (in thousands):
| | | 2009 | | | 2008 | |
| | | | | | | |
| Beginning balance | | $ | 737 | | | $ | - | |
| | | | | | | | | |
| Acquistion of Heath XS Operating Unit | | | - | | | | 580 | |
| | | | | | | | | |
| Accretion of redeemable non-controlling interest | | | 355 | | | | 107 | |
| | | | | | | | | |
| Net income attributable to non-controlling interest | | | 52 | | | | 50 | |
| | | | | | | | | |
| Distribution to non-controlling interest | | | (20 | ) | | | - | |
| | | | | | | | | |
| Ending balance | | $ | 1,124 | | | $ | 737 | |
Immaterial Correction of an Error
We maintain catastrophe reinsurance for business produced by both our AHIS and TGA Operating Units. Prior to July 1, 2007, the subject premium for our catastrophe reinsurance contracts was based on all business produced by both operating units. The subject premium for our catastrophe reinsurance contract which became effective July 1, 2007 is based only on business produced in Texas. However in error, we continued to record ceded premium for this coverage as if the subject premium was based on all business produced by the AHIS and TGA Operating Units. This understated our earned premium for each quarter from July 1, 2007 through June 30, 2008.
We have corrected our prior period’s financial statements and notes for the year ended December 31, 2007 to reflect the reduction of ceded premium. Because the error was not material to any prior year financial statements, the corrections to prior interim periods will be reflected in future filings, pursuant to SEC Staff Accounting Bulletin No. 108, “Considering the Effects of Prior Year Misstatements when Quantifying Misstatements in Current Year Financial Statements.”
The following table presents the effect of the correction on our previously reported consolidated statements of operations for the year ended December 31, 2007.
HALLMARK FINANCIAL SERVICES, INC. AND SUBSIDIARIES
NOTES TO CONSOLIDATED FINANCIAL STATEMENTS
Years ended December 31, 2009, 2008, and 2007
| | | For the Year | |
| | | Ended | |
| | | December 31, | |
| | | 2007 | |
| As previously reported: | | | |
| Ceded premiums written | | $ | (11,329 | ) |
| Net premiums written | | | 238,143 | |
| Net premiums earned | | | 225,303 | |
| Total revenues | | | 274,498 | |
| | | | | |
| Income before tax | | | 41,101 | |
| Income tax expense | | | 13,672 | |
| Net income | | $ | 27,429 | |
| | | | | |
| Common stockholders net income per share: | | | | |
| Basic | | $ | 1.32 | |
| Diluted | | $ | 1.32 | |
| | | | | |
| Adjustments: | | | | |
| Ceded premiums written | | $ | 668 | |
| Income tax expense | | | 234 | |
| Net income impact | | $ | 434 | |
| | | | | |
| As revised: | | | | |
| Ceded premiums written | | $ | (10,661 | ) |
| Net premiums written | | | 238,811 | |
| Net premiums earned | | | 225,971 | |
| Total revenues | | | 275,166 | |
| | | | | |
| Income before tax | | | 41,769 | |
| Income tax expense | | | 13,906 | |
| Net income | | $ | 27,863 | |
| | | | | |
| Common stockholders net income per share: | | | | |
| Basic | | $ | 1.34 | |
| Diluted | | $ | 1.34 | |
HALLMARK FINANCIAL SERVICES, INC. AND SUBSIDIARIES
NOTES TO CONSOLIDATED FINANCIAL STATEMENTS
Years ended December 31, 2009, 2008, and 2007
The following table presents the effect of the correction on our previously reported consolidated statements of cash flows for the year ended December 31, 2007.
| | | For the Year | |
| | | Ended | |
| | | December 31, | |
| | | 2007 | |
| As previously reported: | | | |
| Net income | | $ | 27,429 | |
| Change in prepaid reinsurance premiums | | | 1,355 | |
| Change in current federal income tax payable | | | (1,502 | ) |
| Net cash provided by operating activities | | | 79,563 | |
| | | | | |
| Adjustments: | | | | |
| Net income | | $ | 434 | |
| Change in prepaid reinsurance premiums | | | (668 | ) |
| Change in current federal income tax payable | | | 234 | |
| Net cash provided by operating activities | | | - | |
| | | | | |
| As revised: | | | | |
| Net income | | $ | 27,863 | |
| Change in prepaid reinsurance premiums | | | 687 | |
| Change in current federal income tax payable | | | (1,268 | ) |
| Net cash provided by operating activities | | | 79,563 | |
Investments
Debt and equity securities available for sale are reported at fair value. Unrealized gains and losses are recorded as a component of stockholders’ equity, net of related tax effects. Equity securities that are determined to have other- than-temporary impairment are recognized as a loss on investments in the consolidated statement of operations. Debt securities that are determined to have other-than-temporary impairment are recognized as a loss on investments in the consolidated statement of operations for the portion that is related to credit deterioration with the remaining portion recognized in other comprehensive income. Debt security premiums and discounts are amortized into earnings using the effective interest method. Maturities of debt securities and sales of equity securities are recorded in receivable for securities until the cash is settled. Purchases of debt and equity securities are recorded in payable for securities until the cash is settled.
Realized investment gains and losses are recognized in operations on the specific identification method.
Cash Equivalents
We consider all highly liquid investments with an original maturity of three months or less to be cash equivalents.
HALLMARK FINANCIAL SERVICES, INC. AND SUBSIDIARIES
NOTES TO CONSOLIDATED FINANCIAL STATEMENTS
Years ended December 31, 2009, 2008, and 2007
Recognition of Premium Revenues
Insurance premiums are earned pro rata over the terms of the policies. Insurance policy fees are earned as of the effective date of the policy. Upon cancellation, any unearned premium is refunded to the insured. Insurance premiums written include gross policy fees of $7.1 million, $5.1 million and $4.9 million for the years ended December 31, 2009, 2008, and 2007, respectively.
Relationship with Third Party Insurers
Through December 31, 2005, our AHIS Operating Unit marketed policies on behalf of Clarendon National Insurance Company (“Clarendon”), a third-party insurer. Through December 31, 2008, all business of our TGA Operating Unit was produced under a fronting agreement with member companies of the Republic Group (“Republic”), a third-party insurer. These insurance contracts on third party paper are accounted for under agency accounting. Ceding commissions and other fees received under these arrangements are classified as unearned revenue until earned pro rata over the terms of the policies. Effective July 1, 2009, in states where our insurance companies are not admitted, our Heath XS Operating Unit writes policies under fronting arrangements pursuant to which we assume all of the risk and retrocede a portion of the risk to third party reinsurers. Through June 30, 2009, our Heath XS Operating Unit wrote policies under a fronting arrangement pursuant to which we assumed 35% of the risk from a third-party insurer. Ceding commissions and other fees received under this arrangement are recognized as of the effective date of the policy.
Recognition of Commission Revenues of Our Standard and Specialty Commercial Segments
Commission revenues and commission expenses related to insurance policies issued by American Hallmark Insurance Services and TGA on behalf of Clarendon and Republic, respectively, are recognized pro rata during the period covered by the policy. Profit sharing commission is calculated and recognized when the loss ratio, as determined by a qualified actuary, deviates from contractual targets. We receive a provisional commission as policies are produced as an advance against the later determination of the profit sharing commission actually earned. The profit sharing commission is an estimate that varies with the estimated loss ratio and is sensitive to changes in that estimate. Commission revenues and commission expenses related to insurance policies issued by our Heath XS Operating Unit and not retained by AHIC are recognized as of the effective date of the policy.
The following table details the profit sharing commission provisional loss ratio compared to the estimated ultimate loss ratio for each effective quota share treaty between the Standard Commercial Segment and Clarendon.
| | | Treaty Effective Dates | |
| | | 7/1/01 | | | 7/1/02 | | | 7/1/03 | | | 7/1/04 | |
| Provisional loss ratio | | | 60.0 | % | | | 59.0 | % | | | 59.0 | % | | | 64.2 | % |
| Estimated ultimate loss ratio booked to at December 31, 2009 | | | 63.5 | % | | | 64.5 | % | | | 67.0 | % | | | 57.8 | % |
As of December 31, 2009, we recorded a $1.8 million profit sharing payable for the quota share treaty effective July 1, 2001, a $1.5 million payable on the quota share treaty effective July 1, 2002, a $5.4 million payable on the quota share treaty effective July 1, 2003 and a $3.6 million receivable on the quota share treaty effective July 1, 2004. The payable or receivable is the difference between the cash received to date and the recognized commission revenue based on the estimated ultimate loss ratio.
HALLMARK FINANCIAL SERVICES, INC. AND SUBSIDIARIES
NOTES TO CONSOLIDATED FINANCIAL STATEMENTS
Years ended December 31, 2009, 2008, and 2007
The following table details the profit sharing commission revenue provisional loss ratio compared to the estimated ultimate loss ratio for the effective quota share treaty between the Specialty Commercial Segment and Republic.
| | | Treaty Effective Dates | |
| | | 01/01/06 | | | 01/01/07 | | | 01/01/08 | |
| | | | | | | | | | |
| Provisional loss ratio | | | 65.0 | % | | | 65.0 | % | | | 65.0 | % |
| Ultimate loss ratio booked to at December 31, 2009 | | | 57.1 | % | | | 60.7 | % | | | 58.0 | % |
As of December 31, 2009 we recorded a $1.7 million profit share receivable for the quota share treaty effective January 1, 2006, a $2.0 million profit share receivable for the quota share treaty effective January 1, 2007 and a $2.3 million profit share receivable for the quota share treaty effective January 1, 2008. The receivable is the difference between the cash received to date and the recognized commission revenue based on the estimated ultimate loss ratio.
Effective January 1, 2009 the Company assumed 100% of the premiums in the Specialty Commercial Segment for this treaty, therefore there is no profit sharing commission revenue for the 2009 policies written.
Recognition of Claim Servicing Fees
Claim servicing fees are recognized in proportion to the historical trends of the claim cycle. We use historical claim count data that measures the close rate of claims in relation to the policy period covered to substantiate the service period. The following table summarizes the year in which claim servicing fee is recognized by type of business.
| | | Year Claim Servicing Fee Recognized | |
| | | 1st | | | 2nd | | | 3rd | | | 4th | |
| Commercial property fees | | | 80 | % | | | 20 | % | | | - | | | | - | |
| Commercial liability fees | | | 60 | % | | | 30 | % | | | 10 | % | | | - | |
| Personal property fees | | | 90 | % | | | 10 | % | | | - | | | | - | |
| Personal liability fees | | | 49 | % | | | 33 | % | | | 12 | % | | | 6 | % |
Finance Charges
PAAC provides premium financing for policies produced by TGA and certain unaffiliated general and retail agents. Interest earned on the premium finance notes issued by PAAC for the financing of insurance premiums are recorded as finance charges. This interest is earned on the Rule of 78’s method which approximates the interest method for such short-term notes.
We receive premium installment fees for each direct bill payment from policyholders. Installment fee income is classified as finance charges on the consolidated statement of operations and is recognized as the fee is invoiced.
Property and Equipment
Property and equipment (including leasehold improvements), aggregating $10.1 million and $8.8 million, at December 31, 2009 and 2008, respectively, which is included in other assets, is recorded at cost and is depreciated using the straight-line method over the estimated useful lives of the assets (three to ten years). Depreciation expense for 2009, 2008 and 2007 was $0.8 million, $0.7 million and $0.8 million, respectively. Accumulated depreciation was $8.0 million and $7.2 million at December 31, 2009 and 2008, respectively.
HALLMARK FINANCIAL SERVICES, INC. AND SUBSIDIARIES
NOTES TO CONSOLIDATED FINANCIAL STATEMENTS
Years ended December 31, 2009, 2008, and 2007
Premiums Receivable
Premiums receivable represent amounts due from policyholders or independent agents for premiums written and uncollected. These balances are carried at net realizable value.
Deferred Policy Acquisition Costs
Policy acquisition costs (mainly commission, underwriting and marketing expenses) that vary with and are primarily related to the production of new and renewal business are deferred and charged to operations over periods in which the related premiums are earned. The method followed in computing deferred policy acquisition costs limits the amount of such deferred costs to their estimated realizable value. In determining estimated realizable value, the computation gives effect to the premium to be earned, related investment income, losses and loss adjustment expenses and certain other costs expected to be incurred as the premiums are earned. If the computation results in an estimated net realizable value less than zero, a liability will be accrued for the premium deficiency. During 2009, 2008 and 2007, we deferred $53.6 million, $54.9 million and $57.7 million of policy acquisition costs and amortized $52.3 million, $55.1 million and $55.1 million of deferred policy acquisition costs, respectively. Therefore, the net deferrals of policy acquisition costs were $1.3 million, ($0.2) million and $2.6 million for 2009, 2008 and 2007, respectively.
Losses and Loss Adjustment Expenses
Losses and loss adjustment expenses (“LAE”) represent the estimated ultimate net cost of all reported and unreported losses incurred through December 31, 2009, 2008 and 2007. The reserves for unpaid losses and LAE are estimated using individual case-basis valuations and statistical analyses. These estimates are subject to the effects of trends in loss severity and frequency. Although considerable variability is inherent in such estimates, we believe that the reserves for unpaid losses and LAE are adequate. The estimates are continually reviewed and adjusted as experience develops or new information becomes known. Such adjustments are included in current operations.
Retail Agent Commissions
We pay monthly commissions to retail agents based on written premium produced but generally recognize the expense pro rata over the term of the policy. If the policy is cancelled prior to its expiration, the unearned portion of the agent commission is refundable to us. The unearned portion of commissions paid to retail agents is included in deferred policy acquisition costs. Commission expenses related to the insurance policies issued by our Heath XS Operating Unit and not retained by AHIC are recognized as of the effective date of the policy.
Agent Profit Sharing Commissions
We annually pay a profit sharing commission to our independent agency force based upon the results of the business produced by each agent. We estimate and accrue this liability to commission expense in the year the business is produced. Commission expense is classified as other operating expenses in the consolidated statement of operations.
Reinsurance
We are routinely involved in reinsurance transactions with other companies. Reinsurance premiums, losses and LAE are accounted for on bases consistent with those used in accounting for the original policies issued and the terms of the reinsurance contracts. (See Note 6.)
Leases
We have several leases, primarily for office facilities and computer equipment, which expire in various years through 2020. Some of these leases include rent escalation provisions throughout the term of the lease. We expense the average annual cost of the lease with the difference to the actual rent invoices recorded as deferred rent which is classified in accounts payable and other accrued expenses on our consolidated balance sheets.
Income Taxes
We file a consolidated federal income tax return. Deferred federal income taxes reflect the future tax consequences of differences between the tax bases of assets and liabilities and their financial reporting amounts at each year end. Deferred taxes are recognized using the liability method, whereby tax rates are applied to cumulative temporary differences based on when and how they are expected to affect the tax return. Deferred tax assets and liabilities are adjusted for tax rate changes in effect for the year in which these temporary differences are expected to be recovered or settled.
HALLMARK FINANCIAL SERVICES, INC. AND SUBSIDIARIES
NOTES TO CONSOLIDATED FINANCIAL STATEMENTS
Years ended December 31, 2009, 2008, and 2007
Earnings Per Share
The computation of earnings per share is based upon the weighted average number of common shares outstanding during the period plus (in periods in which they have a dilutive effect) the effect of common shares potentially issuable, primarily from stock options. (See Notes 10 and 12.)
Business Combinations
We account for business combinations using the purchase method of accounting pursuant to Financial Accounting Standards Board (“FASB”) Accounting Standards Codification (“ASC”) Topic 805, “Business Combinations”, (“FASB ASC 805”) The cost of an acquired entity is allocated to the assets acquired (including identified intangible assets) and liabilities assumed based on their estimated fair values. The excess of the cost of an acquired entity over the net of the amounts assigned to assets acquired and liabilities assumed is an asset referred to as “excess of cost over net assets acquired” or “goodwill.” Indirect and general expenses related to business combinations are expensed as incurred for acquisitions in 2009 and after. Prior to 2009, indirect and general expenses were capitalized..
Effective August 29, 2008, we acquired 80% of the issued and outstanding membership interests in the subsidiaries now comprising the Heath XS Operating Unit for consideration of $15.0 million. In connection with the acquisition of its membership interests in the subsidiaries comprising the Heath XS Operating Unit, we executed an operating agreement for each subsidiary. The operating agreements grant us the right to purchase the remaining 20% membership interests in the subsidiaries comprising the Heath XS Operating Unit and grant to an affiliate of the seller the right to require us to purchase such remaining membership interests (the “Put/Call Option”). The Put/Call Option becomes exercisable by either us or the affiliate of the seller upon the earlier of August 29, 2012, the termination of the employment of the seller or a change of control of Hallmark. If the Put/Call Option is exercised, we would have the right or obligation to purchase the remaining 20% membership interests in the Heath XS Operating Unit for an amount equal to nine times the average Pre-Tax Income (as defined in the operating agreements) for the previous 12 fiscal quarters. We estimate the ultimate redemption value of the Put/Call Option to be $2.2 million at December 31, 2009.
The fair value of the amortizable intangible assets acquired and respective amortization periods are as follows ($ in thousands):
| Tradename | | $ | 757 | | 15 years |
| Non-compete agreement | | $ | 526 | | 6 years |
| Agency relationships | | $ | 6,385 | | 15 years |
HALLMARK FINANCIAL SERVICES, INC. AND SUBSIDIARIES
NOTES TO CONSOLIDATED FINANCIAL STATEMENTS
Years ended December 31, 2009, 2008, and 2007
In conjunction with the acquisition, cash and cash equivalents were used as follows (in thousands):
| Fair value of tangible assets excluding cash and cash equivalents | | $ | (3 | ) |
| Fair value of intangible assets acquired, net of deferred taxes | | | 15,381 | |
| Redeemable non-controlling interest assumed | | | (579 | ) |
| Cash and cash equivalents used in acquisitions, | | | | |
| net of $201 thousand cash and cash equivalents acquired | | $ | 14,799 | |
Effective June 5, 2009, we acquired all of the issued and outstanding shares of CYR Insurance Management Company (“CYR”). CYR has as its primary asset a management agreement with State and County Mutual Fire Insurance Company (subsequently renamed Hallmark County Mutual Insurance Company, “HCM”) which provides for CYR to have management and control of HCM. We acquired all of the issued and outstanding shares of CYR for consideration of a base purchase price of $4.0 million paid at closing plus an override commission in an amount equal to 1% of the net premiums and net policy fees of HCM for the years 2010 and 2011 subject to a maximum of $1.25 million. The override commission will be paid monthly as the subject premiums and policy fees are written. The fair value of the management agreement acquired is $3.2 million and will be amortized over 4 years. HCM is used to front certain lines of business in our Specialty Commercial and Personal Segments in Texas where we previously produced policies for third party county mutual insurance companies and reinsured 100% for a fronting fee.
Intangible Assets
We account for our intangible assets according to FASB ASC Topic 350, “Intangibles - - Goodwill and Other” (“FASB ASC 350”). FASB ASC 350 (1) prohibits the amortization of goodwill and indefinite-lived intangible assets, (2) requires testing of goodwill and indefinite-lived intangible assets on an annual basis for impairment (and more frequently if the occurrence of an event or circumstance indicates an impairment), (3) requires that reporting units be identified for the purpose of assessing potential future impairments of goodwill, and (4) removes the forty-year limitation on the amortization period of intangible assets that have finite lives.
Pursuant to FASB ASC 350, we have identified the components of goodwill and assigned the carrying value of these components among our five operating units, as follows: AHIS Operating Unit - $2.1 million; TGA Operating Unit - $18.8 million; Aerospace Operating Unit - $9.7 million; Personal Lines Operating Unit - $2.8 million; and Heath XS Operating Unit - $7.7 million. The determination of fair value was based on multiple valuation approaches including an income approach utilizing discounted cash flows and a market approach utilizing observable key ratios of peer companies. The valuation methodologies utilized are subject to key judgments and assumptions. Estimates of fair value are inherently uncertain and represent management’s reasonable expectation regarding future developments. These estimates and the judgments and assumptions upon which the estimates are based will, in all likelihood, differ in some respects from actual future results. Declines in estimated fair value could result in goodwill impairments in future periods which could materially adversely affect the Company’s results of operations or financial position.
The income approach to determining fair value computes the projections of the cash flows that the reporting unit is expected to generate converted into a present value equivalent through discounting. Significant assumptions in the income approach model include income projections, discount rates and terminal growth values. The discount rate was based on a risk free rate plus a beta adjusted equity risk premium and specific company risk premium. The assumptions are based on historical experience, expectations of future performance, expected market conditions and other factors requiring judgment and estimates. While we believe the assumptions used in these models are reasonable, the inherent uncertainty in predicting future performance and market conditions may change over time and influence the outcome of future testing.
The market approach to determining fair value utilized observable key metrics of similar peer companies such as price to earnings ratios for current year earnings and forecasted 2010 earnings. Additionally the direct capitalization of earnings method was utilized.
During 2009, 2008 and 2007, we completed the first step prescribed by FASB ASC 350 for testing for impairment and determined that there was no impairment.
HALLMARK FINANCIAL SERVICES, INC. AND SUBSIDIARIES
NOTES TO CONSOLIDATED FINANCIAL STATEMENTS
Years ended December 31, 2009, 2008, and 2007
We have obtained various amortizable intangible assets from several acquisitions since 2002. The table below details the gross and net carrying amounts of these assets by major category (in thousands):
| | | December 31, | |
| | | 2009 | | | 2008 | |
| Gross Carrying Amount: | | | | | | |
| Customer/agent relationships | | $ | 29,114 | | | $ | 29,114 | |
| Tradename | | | 3,440 | | | | 3,440 | |
| Management agreement | | | 3,232 | | | | - | |
| Non-compete & employment agreements | | | 3,565 | | | | 3,565 | |
| Total gross carrying amount | | | 39,351 | | | | 36,119 | |
| | | | | | | | | |
| Accumulated Amortization: | | | | | | | | |
| Customer/agent relationships | | | (6,676 | ) | | | (4,744 | ) |
| Tradename | | | (782 | ) | | | (553 | ) |
| Management agreement | | | (471 | ) | | | - | |
| Non-compete & employment agreements | | | (2,549 | ) | | | (1,853 | ) |
| Total accumulated amortization | | | (10,478 | ) | | | (7,150 | ) |
| | | | | | | | | |
| Total net carrying amount | | $ | 28,873 | | | $ | 28,969 | |
We amortize these intangible assets straight line over their respective lives. The estimated aggregate amortization expense for these assets for the next five years is as follows (in thousands):
| 2010 | | $ | 3,665 | |
| 2011 | | $ | 3,057 | |
| 2012 | | $ | 3,057 | |
| 2013 | | $ | 2,585 | |
| 2014 | | $ | 2,220 | |
The weighted average amortization period for all intangible assets by major class is as follows:
| | | Years | |
| Tradename | | | 15 | |
| Customer relationships | | | 15 | |
| Management agreement | | | 4 | |
| Non-compete agreements | | | 5 | |
The aggregate weighted average period to amortize the above captioned assets is approximately 14 years.
Use of Estimates in the Preparation of Financial Statements
The preparation of financial statements in conformity with GAAP requires management to make estimates and assumptions that affect the reported amounts of assets and liabilities at the dates of the financial statements and the reported amounts of revenues and expenses during the reporting periods. Management evaluates its estimates and assumptions on an ongoing basis using historical experience and other factors, including the current economic environment, which management believes to be reasonable under the circumstances. We adjust such estimates and assumptions when facts and circumstances dictate. As future events and their effects cannot be determined with precision, actual results could differ significantly from these estimates. Changes in those estimates resulting from continuing changes in the economic environment may be reflected in the financial statements in future periods.
HALLMARK FINANCIAL SERVICES, INC. AND SUBSIDIARIES
NOTES TO CONSOLIDATED FINANCIAL STATEMENTS
Years ended December 31, 2009, 2008, and 2007
Fair Value of Financial Instruments
Fair value estimates are made at a point in time, based on relevant market data as well as the best information available about the financial instruments. Fair value estimates for financial instruments for which no or limited observable market data is available are based on judgments regarding current economic conditions, credit and interest rate risk. These estimates involve significant uncertainties and judgments and cannot be determined with precision. As a result, such calculated fair value estimates may not be realizable in a current sale or immediate settlement of the instrument. In addition, changes in the underlying assumptions used in the fair value measurement technique, including discount rate and estimates of future cash flows, could significantly affect these fair value estimates.
Investment Securities: Fair values for fixed income securities and equity securities are obtained from an independent pricing service or based on quoted market prices. (See Notes 2 and 3.)
Cash and Cash Equivalents: The carrying amounts reported in the balance sheet for these instruments approximate their fair values.
Restricted Cash : The carrying amount for restricted cash reported in the balance sheet approximates the fair value.
Notes Payable: The carrying value of our bank credit facility of $2.8 million approximates the fair value based on the current interest rate. Our trust preferred securities had a carried value of $56.7 million and $56.7 million and a fair value of $54.4 million and $38.2 million as of December 31, 2009 and 2008, respectively. The fair value of our trust preferred securities is based on discounted cash flows using current yields to maturity of 8.5% and 11.0% as of December 31, 2009 and 2008, respectively, which are based on similar issues to discount future cash flows.
For accrued investment income, amounts recoverable from reinsurers, federal income tax payable and receivable and other liabilities, the carrying amounts approximate fair value because of the short maturity of such financial instruments.
Recent Accounting Pronouncements
In June 2009, the FASB issued Statement of Financial Accounting Standards No. 168, “The FASB Accounting Standards Codification and the Hierarchy of Generally Accepted Accounting Principles” — a replacement of FASB Statement No. 162 (the “Codification”). The Codification reorganized existing U.S. accounting and reporting standards issued by the FASB and other related private sector standard setters into a single source of authoritative accounting principles arranged by topic. The Codification supersedes all existing U.S. accounting standards. All other accounting literature not included in the Codification (other than SEC guidance for publicly-traded companies) is considered non-authoritative. The Codification was effective on a prospective basis for interim and annual reporting periods ending after September 15, 2009. The adoption of the Codification changed our references to U.S. GAAP accounting standards but did not impact our results of operations, financial position or liquidity.
In September 2006, FASB issued Statement of Financial Accounting Standards No. 157, “Fair Value Measurements,” which was codified in the FASB ASC Topic 820, “Fair Value Measurements and Disclosures (“FASB ASC 820”). FASB ASC 820 establishes a separate framework for determining fair values of assets and liabilities that are required by other authoritative GAAP pronouncements to be measured at fair value. In addition, FASB ASC 820 incorporates and clarifies the guidance in FASB Concepts Statement 7 regarding the use of present value techniques in measuring fair value. FASB ASC 820 does not require any new fair value measurements. FASB ASC 820 is effective for financial statements issued for fiscal years beginning after November 15, 2007. The adoption of FASB ASC 820 had no impact on our financial statements or results of operations but did require additional disclosures. (See Note 4, “Fair Value.”)
In February 2007, FASB issued Statement of Financial Accounting Standards No. 159, “The Fair Value Option for Financial Assets and Liabilities”, which was codified into FASB ASC Topic 825, “Financial Instruments” (“FASB ASC 825”). FASB ASC 825 permits entities to choose to measure many financial instruments and certain other items at fair value with changes in fair value included in current earnings. The election is made on specified election dates, can be made on an instrument–by- instrument basis, and is irrevocable. FASB ASC 825 is effective for financial statements issued for fiscal years beginning after November 15, 2007. The adoption of FASB ASC 825 had no impact on our financial statements or results of operations as we did not elect to apply FASB ASC 825 to any eligible items.
HALLMARK FINANCIAL SERVICES, INC. AND SUBSIDIARIES
NOTES TO CONSOLIDATED FINANCIAL STATEMENTS
Years ended December 31, 2009, 2008, and 2007
In December 2007, the FASB issued Revised Statement of Financial Accounting Standards No. 141R, “Business Combinations”, which was codified into FASB ASC Topic 805, “Business Combinations”, (“FASB ASC 805”). FASB ASC 805 provides revised guidance on how an acquirer recognizes and measures in its financial statements the identifiable assets acquired, the liabilities assumed, and any non-controlling interest in the acquired entity. In addition, it provides revised guidance on the recognition and measurement of goodwill acquired in the business combination. FASB ASC 805 also provides guidance specific to the recognition, classification, and measurement of assets and liabilities related to insurance and reinsurance contracts acquired in a business combination. FASB ASC 805 applies to business combinations for acquisitions occurring on or after January 1, 2009. The adoption of FASB ASC 805 did not have a material effect on our results of operations or liquidity.
In December 2007, the FASB issued Statement of Financial Accounting Standards No. 160, “Non-controlling Interests in Consolidated Financial Statements—an amendment of Accounting Research Bulletin No. 51”, which was codified into FASB ASC Topic 810, “Non-controlling Interests” (“FASB ASC 810”). FASB ASC 810 amends Accounting Research Bulletin No. 51 to establish accounting and reporting standards for the non-controlling interest in a subsidiary and for the deconsolidation of a subsidiary. In addition, it clarifies that a non-controlling interest in a subsidiary is an ownership interest in the consolidated entity that should be reported as a component of equity in the consolidated financial statements. FASB ASC 810 is effective on a prospective basis beginning January 1, 2009, except for the presentation and disclosure requirements which are applied on a retrospective basis for all periods presented. The adoption of FASB ASC 810 did not have a significant impact on our consolidated financial statements.
In April 2009, FASB issued FASB Staff Position No. FAS 157-4, “Determining Fair Value When the Volume and Level of Activity for the Asset or Liability Have Significantly Decreased and Identifying Transactions That Are Not Orderly”, which was codified into FASB ASC Topic 820. FASB ASC 820 provides guidance for estimating fair value when the volume and level of activity for the asset or liability have significantly decreased and identifying circumstances that may indicate that a transaction is not orderly. FASB ASC 820 is effective for interim and annual reporting periods ending after June 15, 2009, and is applied prospectively. The adoption of this guidance did not have a significant impact on our consolidated financial statements.
In April 2009, FASB issued FASB Staff Position No. FAS 115-2 and FAS 124-2, “Recognition and Presentation of Other-Than-Temporary Impairments”, which was codified into FASB ASC Topic 320, “Investment Securities” (“FASB ASC 320”), amending prior other-than-temporary impairment guidance for debt in order to make the guidance more operational and improve the presentation and disclosure of other-than-temporary impairments in the financial statements. FASB ASC 320 does not amend existing recognition and measurement guidance related to other-than-temporary impairments of equity securities. The provisions of FASB ASC 320 are effective for interim periods ending after June 15, 2009. We adopted FASB ASC 320 effective April 1, 2009 which resulted in a cumulative effect adjustment to the beginning balances of retained earnings and accumulated other comprehensive income (loss) of approximately $2.6 million before tax and $1.7 million net of tax.
In April 2009, FASB issued FASB Staff Position No. FAS 107-1 and APB Opinion No. 28-1, “Interim Disclosures about Fair Value of Financial Instruments”, which was codified into FASB ASC 825. FASB ASC 825 requires disclosures about fair value of financial instruments for interim reporting periods as well as in annual financial statements. This guidance is effective for interim periods ending after June 15, 2009 but did not impact our consolidated financial statements. However, additional footnote disclosures to our interim and annual financial statements were required.
In May 2009, FASB issued Statement of Financial Accounting Standard No. 165, “Subsequent Events”, which was codified into FASB ASC Topic 855, “Subsequent Events” (“FASB ASC 855”), which provides authoritative accounting literature for a topic previously addressed only in the auditing literature (AICPA AU Section 560, Subsequent Events). The provisions of FASB ASC 855 are effective for interim financial periods ending after June 15, 2009. The adoption of FASB ASC 855 did not have a significant impact on our consolidated financial statements.
HALLMARK FINANCIAL SERVICES, INC. AND SUBSIDIARIES
NOTES TO CONSOLIDATED FINANCIAL STATEMENTS
Years ended December 31, 2009, 2008, and 2007
In June 2009, FASB issued Statement of Financial Accounting Standards No. 167, “Amendments to FASB Interpretation No. 46(R)” (“SFAS 167”), which has not yet been codified in the Codification. SFAS 167 addresses the effects of eliminating the qualifying special-purpose entity concept and responds to concerns about the application of certain key provisions of FASB Interpretation No. 46(R), “Consolidation of Variable Interest Entities”, including concerns over the transparency of enterprises’ involvement with variable interest entities. SFAS 167 is effective for calendar year end companies beginning on January 1, 2010 with earlier application prohibited. We do not expect adopting SFAS 167 to have a material impact on our consolidated financial statements.
In April 2008, FASB issued FASB Staff Position No. 142-3, “Determination of the Useful Life of Intangible Assets”, which was codified into FASB ASC Topic 350 and amends the factors that should be considered in developing renewal or extension assumptions used to determine the useful life of a recognized intangible assets. This guidance did not have any impact on our consolidated financial statements.
In December 2008, FASB issued FAS 132 (R)-1 “Employers’ Disclosure about Postretirement Benefit Plan Assets”, which amends FASB Statement No. 132. FAS 132 (R)-1 was codified into FASB ASC Topic 715 “Compensation-Retirement Benefits” (“FASB ASC Topic 715”). FASB ASC Topic 715 addresses an employer’s disclosures about plan assets of a defined benefit pension or other postretirement plan. This guidance is effective for fiscal years ending after December 15, 2009 but did not impact our consolidated financial statements. However, additional footnote disclosures to our annual financial statements were required.
Reclassification
Certain previously reported amounts have been reclassified in order to conform to our current year presentation. Such reclassification had no effect on net income or stockholders’ equity.
2. Investments
We complete a detailed analysis each quarter to assess whether any decline in the fair value of any investment below cost is deemed other-than-temporary. All securities with an unrealized loss are reviewed. We recognize an impairment loss when an investment's value declines below cost, adjusted for accretion, amortization and previous other-than-temporary impairments and it is determined that the decline is other-than-temporary.
Equity Investments: Some of the factors considered in evaluating whether a decline in fair value for an equity investment is other-than-temporary include: (1) our ability and intent to retain the investment for a period of time sufficient to allow for an anticipated recovery in value; (2) the recoverability of cost; (3) the length of time and extent to which the fair value has been less than cost; and (4) the financial condition and near-term and long-term prospects for the issuer, including the relevant industry conditions and trends, and implications of rating agency actions and offering prices. When it is determined that an equity investment is other-than-temporarily impaired, the security is written down to fair value, and the amount of the impairment is included in earnings as a realized investment loss. The fair value then becomes the new cost basis of the investment, and any subsequent recoveries in fair value are recognized at disposition. We recognize a realized loss when impairment is deemed to be other-than-temporary even if a decision to sell an equity investment has not been made. When we decide to sell a temporarily impaired available-for-sale equity investment and we do not expect the fair value of the equity investment to fully recover prior to the expected time of sale, the investment is deemed to be other-than-temporarily impaired in the period in which the decision to sell is made.
Fixed Maturity Investments: We assess whether we intend to sell, or it is more likely than not that we will be required to sell, a fixed maturity investment before recovery of its amortized cost basis less any current period credit losses. For fixed maturity investments that are considered other-than-temporarily impaired and that we do not intend to sell and will not be required to sell, we separate the amount of the impairment into the amount that is credit related (credit loss component) and the amount due to all other factors. The credit loss component is recognized in earnings and is the difference between the investment’s amortized cost basis and the present value of its expected future cash flows. The remaining difference between the investment’s fair value and the present value of future expected cash flows is recognized in other comprehensive income.
HALLMARK FINANCIAL SERVICES, INC. AND SUBSIDIARIES
NOTES TO CONSOLIDATED FINANCIAL STATEMENTS
Years ended December 31, 2009, 2008, and 2007
Major categories of net investment income are summarized as follows (in thousands):
| | | 2009 | | | 2008 | | | 2007 | |
| | | | | | | | | | |
| U.S. Treasury securities and obligations of U.S. government | | $ | 169 | | | $ | 918 | | | $ | 3,392 | |
| Corporate debt securities | | | 7,118 | | | | 3,195 | | | | 2,829 | |
| Municipal bonds | | | 6,486 | | | | 10,101 | | | | 2,980 | |
| Assets backed | | | 15 | | | | - | | | | - | |
| Equity securities-financial services | | | 941 | | | | 647 | | | | 28 | |
| Equity securities- all other | | | 420 | | | | 327 | | | | 272 | |
| Cash and cash equivalents | | | 216 | | | | 1,255 | | | | 3,890 | |
| | | | 15,365 | | | | 16,443 | | | | 13,391 | |
| Investment expenses | | | (418 | ) | | | (394 | ) | | | (211 | ) |
| Net investment income | | $ | 14,947 | | | $ | 16,049 | | | $ | 13,180 | |
No investments in any entity or its affiliates exceeded 10% of stockholders’ equity at December 31, 2009 or 2008.
Major categories of recognized gains (losses) on investments are summarized as follows (in thousands):
| | | Twelve Months Ended | |
| | | December 31 | |
| | | 2009 | | | 2008 | | | 2007 | |
| | | | | | | | | | |
| U.S. Treasury securities and obligations of U.S. government | | $ | - | | | $ | 1,217 | | | $ | 103 | |
| Corporate debt securities | | | 1,544 | | | | (3,032 | ) | | | 70 | |
| Municipal bonds | | | (41 | ) | | | 233 | | | | 1 | |
| Equity securities-financial services | | | 1,862 | | | | 157 | | | | 843 | |
| Equity securities- all other | | | 205 | | | | (991 | ) | | | 2,045 | |
| Net realized gain (loss) | | | 3,570 | | | | (2,416 | ) | | | 3,062 | |
| Other-than-temporary impairments | | | (538 | ) | | | (8,845 | ) | | | (476 | ) |
| Gain (loss) on investments | | $ | 3,032 | | | $ | (11,261 | ) | | $ | 2,586 | |
We realized gross gains on investments of $5.0 million, $3.3 million, and $4.9 million during the years ended December 31, 2009, 2008 and 2007, respectively. We realized gross losses on investments of $1.4 million, $5.7 million and $1.8 million during the years ended December 31, 2009, 2008 and 2007, respectively. We recorded proceeds from the sale of investment securities of $111.6 million, $559.7 million and $274.1 million during the years ended December 31, 2009, 2008 and 2007, respectively. Realized investment gains and losses are recognized in operations on the specific identification method.
HALLMARK FINANCIAL SERVICES, INC. AND SUBSIDIARIES
NOTES TO CONSOLIDATED FINANCIAL STATEMENTS
Years ended December 31, 2009, 2008, and 2007
The amortized cost and estimated fair value of investments in debt and equity securities (in thousands) by category is as follows:
| | | | | | Gross | | | Gross | | | | |
| | | Amortized | | | Unrealized | | | Unrealized | | | Fair | |
| | Cost | | | Gains | | | Losses | | | Value | |
| As of December 31, 2009 | | | | | | | | | | | | |
| | | | | | | | | | | | | |
| U.S. Treasury securities and obligations of U.S. government | | $ | 6,830 | | | $ | 23 | | | $ | (17 | ) | | $ | 6,836 | |
| Corporate debt securities | | | 94,560 | | | | 7,190 | | | | (2,201 | ) | | | 99,549 | |
| Municipal bonds | | | 185,036 | | | | 2,543 | | | | (2,786 | ) | | | 184,793 | |
| Asset backed | | | 682 | | | | 17 | | | | (1 | ) | | | 698 | |
| | | | | | | | | | | | | | | | | |
| Total debt securities | | | 287,108 | | | | 9,773 | | | | (5,005 | ) | | | 291,876 | |
| | | | | | | | | | | | | | | | | |
| Financial services | | | 17,156 | | | | 5,008 | | | | (232 | ) | | | 21,932 | |
| All other | | | 10,095 | | | | 3,790 | | | | (16 | ) | | | 13,869 | |
| | | | | | | | | | | | | | | | | |
| Total equity securities | | | 27,251 | | | | 8,798 | | | | (248 | ) | | | 35,801 | |
| | | | | | | | | | | | | | | | | |
| Total debt and equity securities | | $ | 314,359 | | | $ | 18,571 | | | $ | (5,253 | ) | | $ | 327,677 | |
| | | | | | | | | | | | | | | | | |
| As of December 31, 2008 | | | | | | | | | | | | | | | | |
| | | | | | | | | | | | | | | | | |
U.S. Treasury securities and obligations of U.S. government | | $ | 3,996 | | | $ | 179 | | | $ | - | | | $ | 4,175 | |
| Corporate debt securities | | | 67,157 | | | | 395 | | | | (7,005 | ) | | | 60,547 | |
| Municipal bonds | | | 211,083 | | | | 631 | | | | (7,923 | ) | | | 203,791 | |
| | | | | | | | | | | | | | | | | |
| Total debt securities | | | 282,236 | | | | 1,205 | | | | (14,928 | ) | | | 268,513 | |
| | | | | | | | | | | | | | | | | |
| Financial services | | | 24,761 | | | | 332 | | | | (3,618 | ) | | | 21,475 | |
| All other | | | 4,292 | | | | 29 | | | | (793 | ) | | | 3,528 | |
| | | | | | | | | | | | | | | | | |
| Total equity securities | | | 29,053 | | | | 361 | | | | (4,411 | ) | | | 25,003 | |
| | | | | | | | | | | | | | | | | |
| Total debt and equity securities | | $ | 311,289 | | | $ | 1,566 | | | $ | (19,339 | ) | | $ | 293,516 | |
HALLMARK FINANCIAL SERVICES, INC. AND SUBSIDIARIES
NOTES TO CONSOLIDATED FINANCIAL STATEMENTS
Years ended December 31, 2009, 2008, and 2007
The following schedules summarize the gross unrealized losses showing the length of time that investments have been continuously in an unrealized loss position as of December 31, 2009 and December 31, 2008 (in thousands):
| | | As of December 31, 2009 | |
| | | | |
| | | 12 months or less | | | Longer than 12 months | | | Total | |
| | | | | | | | | | | | | | | | | | | |
| | | | | | Unrealized | | | | | | Unrealized | | | | | | Unrealized | |
| | | Fair Value | | | Losses | | | Fair Value | | | Losses | | | Fair Value | | | Losses | |
| | | | | | | | | | | | | | | | | | | |
| U.S. Treasury securities and obligations of U.S. government | | $ | 3,202 | | | $ | (17 | ) | | $ | - | | | $ | - | | | $ | 3,202 | | | $ | (17 | ) |
| Corporate debt securities | | | 18,924 | | | | (166 | ) | | | 9,642 | | | | (2,035 | ) | | | 28,566 | | | | (2,201 | ) |
| Municipal bonds | | | 28,940 | | | | (1,524 | ) | | | 42,183 | | | | (1,262 | ) | | | 71,123 | | | | (2,786 | ) |
| Asset backed | | | 51 | | | | (1 | ) | | | - | | | | - | | | | 51 | | | | (1 | ) |
| Total debt securities | | | 51,117 | | | | (1,708 | ) | | | 51,825 | | | | (3,297 | ) | | | 102,942 | | | | (5,005 | ) |
| | | | | | | | | | | | | | | | | | | | | | | | | |
| Financial services | | | 1,417 | | | | (232 | ) | | | - | | | | - | | | | 1,417 | | | | (232 | ) |
| All other | | | 658 | | | | (16 | ) | | | - | | | | - | | | | 658 | | | | (16 | ) |
| Total equity securities | | | 2,075 | | | | (248 | ) | | | - | | | | - | | | | 2,075 | | | | (248 | ) |
| | | | | | | | | | | | | | | | | | | | | | | | | |
| Total debt and equity securities | | $ | 53,192 | | | $ | (1,956 | ) | | $ | 51,825 | | | $ | (3,297 | ) | | $ | 105,017 | | | $ | (5,253 | ) |
| | | As of December 31, 2008 | |
| | | | |
| | | 12 months or less | | | Longer than 12 months | | | Total | |
| | | | | | | | | | | | | | | | | | | |
| | | | | | Unrealized | | | | | | Unrealized | | | | | | Unrealized | |
| | | Fair Value | | | Losses | | | Fair Value | | | Losses | | | Fair Value | | | Losses | |
| | | | | | | | | | | | | | | | | | | |
| Corporate debt securities | | $ | 34,314 | | | $ | (5,175 | ) | | $ | 9,786 | | | $ | (1,830 | ) | | $ | 44,100 | | | $ | (7,005 | ) |
| Municipal bonds | | | 106,175 | | | | (7,258 | ) | | | 10,295 | | | | (665 | ) | | | 116,470 | | | | (7,923 | ) |
| Total debt securities | | | 140,489 | | | | (12,433 | ) | | | 20,081 | | | | (2,495 | ) | | | 160,570 | | | | (14,928 | ) |
| | | | | | | | | | | | | | | | | | | | | | | | | |
| Financial services | | | 7,110 | | | | (3,618 | ) | | | - | | | | - | | | | 7,110 | | | | (3,618 | ) |
| All other | | | 1,822 | | | | (793 | ) | | | - | | | | - | | | | 1,822 | | | | (793 | ) |
| Equity securities | | | 8,932 | | | | (4,411 | ) | | | - | | | | - | | | | 8,932 | | | | (4,411 | ) |
| | | | | | | | | | | | | | | | | | | | | | | | | |
| Total debt and equity securities | | $ | 149,421 | | | $ | (16,844 | ) | | $ | 20,081 | | | $ | (2,495 | ) | | $ | 169,502 | | | $ | (19,339 | ) |
At December 31, 2009, the gross unrealized losses more than twelve months old were attributable to 60 bond positions. At December 31, 2008, the gross unrealized losses more than twelve months old were attributable to 15 bond positions. We consider these losses as a temporary decline in value as they are predominately on bonds that we do not intend to sell and do not believe we will be required to sell prior to recovery of our amortized cost basis. We see no other indications that the decline in values of these securities is other-than-temporary.
Based on evidence gathered through our normal credit evaluation process, we presently expect that all debt securities held in our investment portfolio will be paid in accordance with their contractual terms. Nonetheless, it is at least reasonably possible that the performance of certain issuers of these debt securities will be worse than currently expected resulting in future write-downs within our portfolio of debt securities.
HALLMARK FINANCIAL SERVICES, INC. AND SUBSIDIARIES
NOTES TO CONSOLIDATED FINANCIAL STATEMENTS
Years ended December 31, 2009, 2008, and 2007
Also, as a result of the challenging market conditions, we expect the volatility in the valuation of our equity securities to continue in the foreseeable future. This volatility may lead to impairments on our equity securities portfolio or changes regarding retention strategies for certain equity securities.
The amortized cost and estimated fair value of debt securities at December 31, 2009 by contractual maturity are as follows. Expected maturities may differ from contractual maturities because certain borrowers may have the right to call or prepay obligations with or without penalties.
| | | Amortized | | | Fair | |
| | | Cost | | | Value | |
| | | (in thousands) | |
| | | | | | | |
| Due in one year or less | | $ | 35,138 | | | $ | 36,563 | |
| Due after one year through five years | | | 132,759 | | | | 138,179 | |
| Due after five years through ten years | | | 46,910 | | | | 46,335 | |
| Due after ten years | | | 71,620 | | | | 70,101 | |
| Asset backed | | | 681 | | | | 698 | |
| | | $ | 287,108 | | | $ | 291,876 | |
Activity related to the credit component recognized in earnings on debt securities held by us for which a portion of other-than-temporary impairment was recognized in other comprehensive income for the year ended December 31, 2009 is as follows (in thousands):
| Balance, January 1, 2009 | | $ | - | |
| | | | | |
| Credit componment of other-than-temporary impairment not reclassified to OCI in conjuction with the cumulative effect transition adjustment (1) | | | 1,168 | |
| | | | | |
| Additions for the credit component on debt securities in which other-than-temporary impairment was not previously recognized | | | - | |
| | | | | |
| Balance, December 31, 2009 | | $ | 1,168 | |
(1) As of April 1, 2009, the Company had securities with $3.7 million of other-than-temporary impairment previously recognized in earnings of which $1.1 million represented the credit component and $2.6 million represented the noncredit component which was reclassified back to accumulated other comprehensive income through a cumulative-effect adjustment.
Accumulated other comprehensive income includes $0.7 million, net of tax, of noncredit related impairments as of December 31, 2009.
HALLMARK FINANCIAL SERVICES, INC. AND SUBSIDIARIES
NOTES TO CONSOLIDATED FINANCIAL STATEMENTS
Years ended December 31, 2009, 2008, and 2007
We have certain of our securities pledged for the benefit of various state insurance departments and reinsurers. These securities are included with our available-for-sale debt securities because we have the ability to trade these securities. We retain the interest earned on these securities. These securities had a carrying value of $29.7 million at December 31, 2009 and a carrying value of $26.4 million at December 31, 2008.
3. Fair Value:
FASB ASC 820 defines fair value, establishes a consistent framework for measuring fair value and expands disclosure requirements about fair value measurements. FASB ASC 820, among other things, requires us to maximize the use of observable inputs and minimize the use of unobservable inputs when measuring fair value. In addition, FASB ASC 820 precludes the use of block discounts when measuring the fair value of instruments traded in an active market, which were previously applied to large holdings of publicly traded equity securities.
Effective January 1, 2008, we determine the fair value of our financial instruments based on the fair value hierarchy established in FASB ASC 820. In accordance with FASB ASC 820, we utilize the following fair value hierarchy:
| | · | Level 1: quoted prices in active markets for identical assets; |
| | · | Level 2: inputs to the valuation methodology include quoted prices for similar assets and liabilities in active markets, inputs of identical assets for less active markets, and inputs that are observable for the asset or liability, either directly or indirectly, for substantially the full term of the instrument; and |
| | · | Level 3: inputs to the valuation methodology that are unobservable for the asset or liability. |
This hierarchy requires the use of observable market data when available.
Under FASB ASC 820, we determine fair value based on the price that would be received for an asset or paid to transfer a liability in an orderly transaction between market participants on the measurement date. It is our policy to maximize the use of observable inputs and minimize the use of unobservable inputs when developing fair value measurements, in accordance with the fair value hierarchy described above. Fair value measurements for assets and liabilities where there exists limited or no observable market data are calculated based upon our pricing policy, the economic and competitive environment, the characteristics of the asset or liability and other factors as appropriate. These estimated fair values may not be realized upon actual sale or immediate settlement of the asset or liability.
Where quoted prices are available on active exchanges for identical instruments, investment securities are classified within Level 1 of the valuation hierarchy. Level 1 investment securities include common and preferred stock. If quoted prices are not available from active exchanges for identical instruments, then fair values are estimated using quoted prices from less active markets, quoted prices of securities with similar characteristics or by pricing models utilizing other significant observable inputs. Examples of such instruments, which would generally be classified within Level 2 of the valuation hierarchy, include corporate bonds, municipal bonds and U.S. Treasury securities. In cases where there is limited activity or less transparency around inputs to the valuation, investment securities are classified within Level 3 of the valuation hierarchy. Level 3 investments are valued based on the best available data in order to approximate fair value. This data may be internally developed and consider risk premiums that a market participant would require. Investment securities classified within Level 3 include other less liquid investment securities.
��
HALLMARK FINANCIAL SERVICES, INC. AND SUBSIDIARIES
NOTES TO CONSOLIDATED FINANCIAL STATEMENTS
Years ended December 31, 2009, 2008, and 2007
The following table presents for each of the fair value hierarchy levels, our assets that are measured at fair value on a recurring basis at December 31, 2009 and December 31, 2008 (in thousands).
| | | As of December 31, 2009 | |
| | | | | | | | | | | | | |
| | | Quoted Prices in | | | Other | | | | | | | |
| | | Active Markets for | | | Observable | | | Unobservable | | | | |
| | | Identical Assets | | | Inputs | | | Inputs | | | | |
| | | (Level 1) | | | (Level 2) | | | (Level 3) | | | Total | |
| | | | | | | | | | | | | |
| U.S. Treasury securities and obligations of U.S. government | | $ | - | | | $ | 6,836 | | | $ | - | | | $ | 6,836 | |
| Corporate debt securities | | | - | | | | 99,549 | | | | - | | | | 99,549 | |
| Municipal bonds | | | - | | | | 159,521 | | | | 25,272 | | | | 184,793 | |
| Asset backed | | | - | | | | 698 | | | | - | | | | 698 | |
| Total debt securities | | | - | | | | 266,604 | | | | 25,272 | | | | 291,876 | |
| | | | | | | | | | | | | | | | | |
| Financial services | | | 21,932 | | | | - | | | | - | | | | 21,932 | |
| All other | | | 13,869 | | | | - | | | | - | | | | 13,869 | |
| Total equity securities | | | 35,801 | | | | - | | | | - | | | | 35,801 | |
| | | | | | | | | | | | | | | | | |
| Total debt and equity securities | | $ | 35,801 | | | $ | 266,604 | | | $ | 25,272 | | | $ | 327,677 | |
HALLMARK FINANCIAL SERVICES, INC. AND SUBSIDIARIES
NOTES TO CONSOLIDATED FINANCIAL STATEMENTS
Years ended December 31, 2009, 2008, and 2007
| | | As of December 31, 2008 | |
| | | | | | | | | | | | | |
| | | Quoted Prices in | | | Other | | | | | | | |
| | | Active Markets for | | | Observable | | | Unobservable | | | | |
| | | Identical Assets | | | Inputs | | | Inputs | | | | |
| | | (Level 1) | | | (Level 2) | | | (Level 3) | | | Total | |
| | | | | | | | | | | | | |
| U.S. Treasury securities and obligations of U.S. government | | $ | - | | | $ | 4,175 | | | $ | - | | | $ | 4,175 | |
| Corporate debt securities | | | - | | | | 60,546 | | | | - | | | | 60,546 | |
| Municipal bonds | | | - | | | | 157,688 | | | | 46,104 | | | | 203,792 | |
| Asset backed | | | - | | | | - | | | | - | | | | - | |
| Total debt securities | | | - | | | | 222,409 | | | | 46,104 | | | | 268,513 | |
| | | | | | | | | | | | | | | | | |
| Financial services | | | 21,474 | | | | - | | | | - | | | | 21,474 | |
| All other | | | 3,529 | | | | - | | | | - | | | | 3,529 | |
| Total equity securities | | | 25,003 | | | | - | | | | - | | | | 25,003 | |
| | | | | | | | | | | | | | | | | |
| Total debt and equity securities | | $ | 25,003 | | | $ | 222,409 | | | $ | 46,104 | | | $ | 293,516 | |
Due to significant unobservable inputs into the valuation model for certain municipal bonds in illiquid markets, we classified these as level 3 in the fair value hierarchy. We used an income approach in order to derive an estimated fair value of such securities, which included inputs such as expected holding period, benchmark swap rate, benchmark discount rate and a discount rate premium for illiquidity.
The following table summarizes the changes in fair value for all financial assets measured at fair value on a recurring basis using significant unobservable inputs (Level 3) during the year ended December 31, 2009 and 2008 (in thousands).
| Beginning balance as of January 1, 2009 | | $ | 46,104 | |
| | | | | |
| Net purchases, issuances, sales and settlements | | | (20,525 | ) |
| Total realized/unrealized gains included in net income | | | - | |
| Net gains or (losses) included in other comprehensive income | | | (307 | ) |
| Transfers in and/or out of Level 3 | | | - | |
| | | | | |
| Ending balance as of December 31, 2009 | | $ | 25,272 | |
HALLMARK FINANCIAL SERVICES, INC. AND SUBSIDIARIES
NOTES TO CONSOLIDATED FINANCIAL STATEMENTS
Years ended December 31, 2009, 2008, and 2007
| Beginning balance as of January 1, 2008 | | $ | 4,000 | |
| | | | | |
| Net purchases, issuances, sales and settlements | | | 43,200 | |
| Total realized/unrealized gains included in net income | | | - | |
| Net gains or (losses) included in other comprehensive income | | | (1,096 | ) |
| Transfers in and/or out of Level 3 | | | - | |
| | | | | |
| Ending balance as of December 31, 2008 | | $ | 46,104 | |
4. Other Assets:
The following table details our other assets as of December 31, 2009 and 2008 (in thousands):
| | | 2009 | | | 2008 | |
| Profit sharing commission receivable | | $ | 9,561 | | | $ | 12,445 | |
| Accrued investment income | | | 3,611 | | | | 2,954 | |
| Debt issuance costs | | | 1,362 | | | | 1,414 | |
| Investment in unconsolidated trust subsidiaries | | | 1,702 | | | | 1,702 | |
| Fixed assets | | | 2,140 | | | | 1,654 | |
| Other assets | | | 403 | | | | 413 | |
| | | $ | 18,779 | | | $ | 20,582 | |
HALLMARK FINANCIAL SERVICES, INC. AND SUBSIDIARIES
NOTES TO CONSOLIDATED FINANCIAL STATEMENTS
Years ended December 31, 2009, 2008, and 2007
5. Reserves for Unpaid Losses and Loss Adjustment Expenses:
Activity in the reserves for unpaid losses and LAE (in thousands) is summarized as follows:
| | | 2009 | | | 2008 | | | 2007 | |
| | | | | | | | | | |
| Balance at January 1 | | $ | 156,363 | | | $ | 125,338 | | | $ | 77,564 | |
| Less reinsurance recoverable | | | 6,338 | | | | 4,489 | | | | 4,763 | |
| Net Balance at January 1 | | | 150,025 | | | | 120,849 | | | | 72,801 | |
| | | | | | | | | | | | | |
| Incurred related to: | | | | | | | | | | | | |
| Current year | | | 151,999 | | | | 146,059 | | | | 139,332 | |
| Prior years | | | 1,620 | | | | (1,815 | ) | | | (6,414 | ) |
| Total incurred | | | 153,619 | | | | 144,244 | | | | 132,918 | |
| | | | | | | | | | | | | |
| Paid related to: | | | | | | | | | | | | |
| Current year | | | 62,584 | | | | 64,610 | | | | 54,809 | |
| Prior years | | | 64,810 | | | | 50,458 | | | | 30,061 | |
| Total paid | | | 127,394 | | | | 115,068 | | | | 84,870 | |
| | | | | | | | | | | | | |
| Net Balance at December 31 | | | 176,250 | | | | 150,025 | | | | 120,849 | |
| Plus reinsurance recoverable | | | 8,412 | | | | 6,338 | | | | 4,489 | |
| Balance at December 31 | | $ | 184,662 | | | $ | 156,363 | | | $ | 125,338 | |
The $1.6 million unfavorable development and $1.8 million and $6.4 million favorable development in prior accident years recognized in 2009, 2008 and 2007, respectively, represent normal changes in our loss reserve estimates. In 2009, the aggregate loss reserve estimates for prior years were increased to reflect unfavorable loss development when the available information indicated a reasonable likelihood that the ultimate losses would be more than the previous estimates. In 2008 and 2007 the aggregate loss reserve estimates for prior years were decreased to reflect favorable loss development when the available information indicated a reasonable likelihood that the ultimate losses would be less than the previous estimates. Generally, changes in reserves are caused by variations between actual experience and previous expectations and by reduced emphasis on the Bornhuetter-Ferguson method due to the aging of the accident years.
The $1.6 million increase in reserves for unpaid losses and LAE recognized in 2009 was attributable to $2.0 million unfavorable development on claims incurred in the 2008 accident year, $0.7 million favorable development on claims incurred in the 2007 accident year and $0.3 million unfavorable development on claims incurred in the 2006 and prior accident years. Our TGA Operating Unit and Aerospace Operating Unit accounted for $4.1 million and $0.3 million of the increase in reserves recognized during 2009, partially offset by a $1.8 million and $1.0 million decrease in reserves for our AHIS Operating Unit and Personal Lines Operating Unit. The increase in reserves for our TGA Operating Unit is driven by the development on a small number of commercial auto liability claims in which later reporting of medical information resulted in TGA increasing case reserves on claims with similar fact patterns. The decrease in reserves for our AHIS Operating Unit was primarily the result of favorable claims development in the 2006-2008 accident years with respect to general liability, partially offset by a commercial package liability claim in accident year 2005. The decrease in reserves for our Personal Lines Operating Unit was primarily the result of favorable claims development in accident years 2007 and 2008 as well as a loss recovery from the 2002 accident year.
HALLMARK FINANCIAL SERVICES, INC. AND SUBSIDIARIES
NOTES TO CONSOLIDATED FINANCIAL STATEMENTS
Years ended December 31, 2009, 2008, and 2007
The $1.8 million decrease in reserves for unpaid losses and LAE recognized in 2008 was attributable to $0.7 million favorable development on claims incurred in the 2007 accident year, $0.9 million favorable development on claims incurred in the 2006 accident year and $0.2 million favorable development on claims incurred in the 2005 and prior accident years. Our AHIS Operating Unit and Personal Lines Operating Unit accounted for $2.4 million and $0.7 million, respectively, of the decrease in reserves recognized in 2008, partially offset by a $1.5 million increase in reserves in our TGA Operating Unit. The decrease in reserves for our AHIS Operating Unit was primarily the result of favorable claims development in the 2007 accident year with respect to the commercial automobile physical damage and commercial property lines of business, offset somewhat by unfavorable development in accident year 2005 with respect to commercial package liability coverage. The decrease in reserves for our Personal Lines Operating Unit was primarily the result of favorable claims development in accident year 2006. The increase in reserves for our TGA Operating Unit was primarily the result of unfavorable claims development in accident years 2006 and 2007 attributable to a small number of larger than normal commercial automobile liability claims, partially offset by favorable claims development on the general liability line of business in accident years 2005 through 2007.
The $6.4 million decrease in reserves for unpaid losses and LAE recognized in 2007 was attributable to $3.2 million favorable development on claims incurred in the 2006 accident year, $1.8 million favorable development on claims incurred in the 2005 accident year and $1.4 million favorable development on claims incurred in the 2004 and prior accident years. Our TGA Operating Unit and AHIS Operating Unit accounted for $3.7 million and $1.7 million, respectively, of the decrease in reserves for unpaid losses and LAE recognized in 2007. Loss experience data accumulated since our acquisition of the TGA Operating Unit in January, 2006, were lower than the outside actuary’s estimate initially used to establish loss reserves. In late 2006, our AHIS Operating Unit experienced a small number of large, late reported general liability losses from earlier accident years. As a result of this unexpected claim development, we increased our loss reserve estimates for this business at the end of 2006. However, subsequent experience suggested that the impact of these types of claims would be less significant in more recent accident years than originally anticipated due in part to coverage restrictions previously implemented.
We reinsure a portion of the risk we underwrite in order to control the exposure to losses and to protect capital resources. We cede to reinsurers a portion of these risks and pay premiums based upon the risk and exposure of the policies subject to such reinsurance. Ceded reinsurance involves credit risk and is generally subject to aggregate loss limits. Although the reinsurer is liable to us to the extent of the reinsurance ceded, we are ultimately liable as the direct insurer on all risks reinsured. Reinsurance recoverables are reported after allowances for uncollectible amounts. We monitor the financial condition of reinsurers on an ongoing basis and review our reinsurance arrangements periodically. Reinsurers are selected based on their financial condition, business practices and the price of their product offerings.
The following table presents our gross and net premiums written and earned and reinsurance recoveries for each of the last three years:
| | | 2009 | | | 2008 | | | 2007 | |
| Premium Written : | | | | | | | | | |
| Direct | | $ | 214,074 | | | $ | 152,156 | | | $ | 157,202 | |
| Assumed | | | 73,484 | | | | 91,693 | | | | 92,270 | |
| Ceded | | | (25,818 | ) | | | (8,922 | ) | | | (10,661 | ) |
| | | $ | 261,740 | | | $ | 234,927 | | | $ | 238,811 | |
| | | | | | | | | | | | | |
| Premium Earned: | | | | | | | | | | | | |
| Direct | | $ | 185,727 | | | $ | 155,616 | | | $ | 151,276 | |
| Assumed | | | 83,747 | | | | 89,040 | | | | 86,804 | |
| Ceded | | | (18,402 | ) | | | (8,336 | ) | | | (12,109 | ) |
| | | $ | 251,072 | | | $ | 236,320 | | | $ | 225,971 | |
| | | | | | | | | | | | | |
| Reinsurance recoveries | | $ | 8,975 | | | $ | 11,994 | | | $ | 3,862 | |
HALLMARK FINANCIAL SERVICES, INC. AND SUBSIDIARIES
NOTES TO CONSOLIDATED FINANCIAL STATEMENTS
Years ended December 31, 2009, 2008, and 2007
We presently retain 100% of the risk associated with all policies marketed by our Personal Lines Operating Unit. We currently reinsure the following exposures on business generated by our AHIS Operating Unit, our TGA Operating Unit, our Heath XS Operating Unit, and our Aerospace Operating Unit:
| | · | Property catastrophe. Our property catastrophe reinsurance reduces the financial impact a catastrophe could have on our commercial and personal property insurance lines. Catastrophes might include multiple claims and policyholders. Catastrophes include hurricanes, windstorms, earthquakes, hailstorms, explosions, severe winter weather and fires. Our property catastrophe reinsurance is excess-of-loss reinsurance, which provides us reinsurance coverage for losses in excess of an agreed-upon amount. We utilize catastrophe models to assist in determining appropriate retention and limits to purchase. The terms of our property catastrophe reinsurance are: |
| | o | We retain the first $3.0 million of property catastrophe losses; and |
| | o | Our reinsurers reimburse us 100% for any loss in excess of our $3.0 million retention up to $35.0 million for each catastrophic occurrence, subject to an aggregate limit of $64.0 million. |
| | · | Commercial property. Our commercial property reinsurance is excess-of-loss coverage intended to reduce the financial impact a single-event or catastrophic loss may have on our results. The terms of our commercial property reinsurance are: |
| | o | We retain the first $1.0 million of loss for each commercial property risk; |
| | o | Our reinsurers reimburse us for the next $5.0 million for each commercial property risk, and $10.0 million for all commercial property risk involved in any one occurrence, in all cases subject to an aggregate limit of $30.0 million for all commercial property losses occurring during the treaty period; and |
| | o | Individual risk facultative reinsurance is purchased on any commercial property with limits above $6.0 million. |
| | · | Commercial casualty. Our commercial casualty reinsurance is excess-of-loss coverage intended to reduce the financial impact a single-event loss may have on our results. The terms of our commercial casualty reinsurance are: |
| | o | We retain the first $1.0 million of any commercial liability risk: and |
| | o | Our reinsurers reimburse us for the next $5.0 million for each commercial liability risk. |
| | · | Aviation. We purchase reinsurance specific to the aviation risks underwritten by our Aerospace Operating Unit. This reinsurance provides aircraft hull and liability coverage and airport liability coverage on a per occurrence basis on the following terms: |
| | o | We retain the first $350,000 of each aircraft hull or liability loss or airport liability loss; |
| | o | Our reinsurers reimburse us for the next $3.3 million of each combined aircraft hull and liability loss and for the next $650,000 of each airport liability loss; and |
| | o | Other risks with liability limits greater than $1.0 million are placed in a quota share treaty where we retain 20% of incurred losses. |
| | · | Heath XS. Effective July 1, 2009, in states where we are admitted, we directly insure policies written by our Heath XS Operating Unit and reinsure a portion of the risk with third party carriers. In states where we are not admitted, our Heath XS Operating Unit writes policies under fronting arrangements pursuant to which we assume all of the risk and then retrocede a portion of the risk to third party reinsurers. We reinsure or retrocede 79% of the risk on policies written by our Heath XS Operating Unit. Through June 30, 2009, our Heath XS Operating Unit wrote policies under a fronting arrangement pursuant to which we assumed 35% of the risk. |
| | · | Hallmark County Mutual. HCM is used to front certain lines of business in our Specialty Commercial and Personal Segments in Texas where we previously produced policies for third party county mutual insurance companies and reinsured 100% for a fronting fee. In addition HCM is used to front business produced by unaffiliated third parties. HCM does not retain any business. |
HALLMARK FINANCIAL SERVICES, INC. AND SUBSIDIARIES
NOTES TO CONSOLIDATED FINANCIAL STATEMENTS
Years ended December 31, 2009, 2008, and 2007
On June 21, 2005, an unconsolidated trust subsidiary completed a private placement of $30.0 million of 30-year floating rate trust preferred securities. Simultaneously, we borrowed $30.9 million from the trust subsidiary and contributed $30.0 million to one of our insurance company subsidiaries in order to increase policyholder surplus. The note bears an initial interest rate of 7.725% until June 15, 2015, at which time interest will adjust quarterly to the three month LIBOR rate plus 3.25 percentage points. Under the terms of the note, we pay interest only each quarter and the principal of the note at maturity. As of December 31, 2009 and 2008, the note balance was $30.9 million.
On January 27, 2006, we borrowed $15.0 million under our revolving credit facility to fund the cash required to close the acquisition of the subsidiaries now comprising our TGA Operating Unit. As of December 31, 2009 and 2008, the balance on the revolving note was $2.8 million and $4.2 million, respectively, which currently bears interest at 2.15% per annum. (See Note 8.)
On August 23, 2007, an unconsolidated trust subsidiary completed a private placement of $25.0 million of 30-year floating trust preferred securities. Simultaneously, we borrowed $25.8 million from the trust subsidiary for working capital and general corporate purposes. The note bears an initial interest rate at 8.28% until September 15, 2017, at which time interest will adjust quarterly to the three-month LIBOR rate plus 2.90 percentage points. Under the terms of the note, we pay interest only each quarter and the principal of the note at maturity. As of December 31, 2009 and 2008 the note balance was $25.8 million.
We have a credit facility with The Frost National Bank which was amended and restated on January 27, 2006 to provide a $20 million revolving credit facility with a $5 million letter of credit sub-facility. The credit facility was further amended effective May 31, 2007 to increase the revolving credit facility to $25 million and establish a new $5 million revolving credit sub-facility for the premium finance operations of PAAC. This $5 million credit sub-facility replaced PAAC’s $5 million revolving credit facility with JP Morgan Chase Bank which terminated June 30, 2007. The credit agreement was again amended effective February 20, 2008 to extend the termination to January 27, 2010, revise various affirmative and negative covenants and decrease the interest rate in most instances to the three month Eurodollar rate plus 1.90 percentage points, payable quarterly in arrears. The credit agreement was again amended January 21, 2010 in order to extend certain expiration, maturity, and termination dates for a period of 120 days. We pay letter of credit fees at the rate of 1.00% per annum. Our obligations under the revolving credit facility are secured by a security interest in the capital stock of all of our subsidiaries, guaranties of all of our subsidiaries and the pledge of all of our non-insurance company assets. The revolving credit facility contains covenants which, among other things, require us to maintain certain financial and operating ratios and restrict certain distributions, transactions and organizational changes. As of December 31, 2009, we were in compliance with all of our covenants. As of December 31, 2009 we had $2.8 million outstanding under this facility.
We pursue our business activities through subsidiaries whose operations are organized into producing units and are supported by our insurance carrier subsidiaries. Our non-carrier insurance activities are organized by producing units into the following reportable segments:
| | · | Standard Commercial Segment. The Standard Commercial Segment includes the standard lines commercial property/casualty insurance products and services handled by our AHIS Operating Unit which is comprised of our American Hallmark Insurance Services and ECM subsidiaries. |
HALLMARK FINANCIAL SERVICES, INC. AND SUBSIDIARIES
NOTES TO CONSOLIDATED FINANCIAL STATEMENTS
Years ended December 31, 2009, 2008, and 2007
| | · | Specialty Commercial Segment. The Specialty Commercial Segment primarily includes the excess and surplus lines commercial property/casualty insurance products and services handled by our TGA Operating Unit, the general aviation insurance products and services handled by our Aerospace Operating Unit and the commercial umbrella and excess liability risks handled by our Heath XS Operating Unit. The Specialty Commercial Segment also includes a relatively small amount of non-strategic legacy personal lines insurance products handled by our TGA Operating Unit. Our TGA Operating Unit is comprised of our TGA, PAAC and TGARSI subsidiaries. Our Aerospace Operating Unit is comprised of our Aerospace Insurance Managers, ASRI and ACMG subsidiaries. Our Heath XS Operating Unit is comprised of HXS and HDS which were both acquired August 29, 2008. |
| | · | Personal Segment. The Personal Segment includes the non-standard personal automobile insurance products and services handled by our Personal Lines Operating Unit which is comprised of American Hallmark General Agency, Inc. and Hallmark Claims Services, Inc., both of which do business as Hallmark Insurance Company. |
The retained premium produced by these reportable segments is supported by the following insurance company subsidiaries:
| | · | American Hallmark Insurance Company of Texas presently retains all of the risks on the commercial property/casualty policies marketed within the Standard Commercial Segment, retains a portion of risks on the personal policies marketed within the Personal Lines Operating Unit and assumes a portion of the risks on the commercial and aviation property/casualty policies marketed within the Specialty Commercial Segment. |
| | · | Hallmark Specialty Insurance Company presently retains a portion of the risks on the commercial property/casualty policies marketed within the Specialty Commercial Segment. |
| | · | Hallmark Insurance Company presently retains a portion of the risks on both the personal policies marketed within the Personal Lines Operating Unit and on the aviation property/casualty products marketed within the Specialty Commercial Segment. |
| | · | Hallmark County Mutual Insurance Company control and management was acquired effective June 5, 2009 through the acquisition of all of the issued and outstanding shares of CYR Insurance Management Company (“CYR”). CYR has as its primary asset a management agreement with HCM which provides for CYR to have management and control of HCM. HCM is used to front certain lines of business in our Specialty Commercial and Personal Segments in Texas where we previously produced policies for third party county mutual insurance companies and reinsured 100% for a fronting fee. HCM does not retain any business. |
AHIC, HIC, and HSIC have entered into a pooling arrangement pursuant to which AHIC retains 46.0% of the total net premiums written, HIC retains 34.1% of our total net premiums written and HSIC retains 19.9% of our total net premiums written. HCM is not a party to the intercompany pooling arrangement. This pooling arrangement had no impact on our consolidated financial statements under GAAP.
HALLMARK FINANCIAL SERVICES, INC. AND SUBSIDIARIES
NOTES TO CONSOLIDATED FINANCIAL STATEMENTS
Years ended December 31, 2009, 2008, and 2007
The following is additional business segment information for the twelve months ended December 31, 2009, 2008, and 2007 (in thousands):
| | | 2009 | | | 2008 | | | 2007 | |
| Revenues | | | | | | | | | |
| Standard Commercial Segment | | $ | 76,496 | | | $ | 84,075 | | | $ | 86,512 | |
| Speciality Commercial Segment | | | 131,504 | | | | 127,882 | | | | 126,550 | |
| Personal Segment | | | 73,785 | | | | 64,475 | | | | 58,268 | |
| Corporate | | | 5,254 | | | | (7,742 | ) | | | 3,836 | |
| Consolidated | | $ | 287,039 | | | $ | 268,690 | | | $ | 275,166 | |
| | | | | | | | | | | | | |
| Depreciation and Amortization Expense | | | | | | | | | | | | |
| Standard Commercial Segment | | $ | 87 | | | $ | 173 | | | $ | 215 | |
| Speciality Commercial Segment | | | 3,075 | | | | 2,718 | | | | 2,608 | |
| Personal Segment | | | 494 | | | | 255 | | | | 222 | |
| Corporate | | | 449 | | | | 73 | | | | 74 | |
| Consolidated | | $ | 4,105 | | | $ | 3,219 | | | $ | 3,119 | |
| | | | | | | | | | | | | |
| Interest Expense | | | | | | | | | | | | |
| Standard Commercial Segment | | $ | - | | | $ | - | | | $ | - | |
| Speciality Commercial Segment | | | 30 | | | | 96 | | | | 151 | |
| Personal Segment | | | - | | | | - | | | | 1 | |
| Corporate | | | 4,572 | | | | 4,649 | | | | 3,762 | |
| Consolidated | | $ | 4,602 | | | $ | 4,745 | | | $ | 3,914 | |
| | | | | | | | | | | | | |
| Tax Expense | | | | | | | | | | | | |
| Standard Commercial Segment | | $ | 1,905 | | | $ | 1,763 | | | $ | 3,341 | |
| Speciality Commercial Segment | | | 5,151 | | | | 5,116 | | | | 8,530 | |
| Personal Segment | | | 2,482 | | | | 1,993 | | | | 1,956 | |
| Corporate | | | (908 | ) | | | (697 | ) | | | 79 | |
| Consolidated | | $ | 8,630 | | | $ | 8,175 | | | $ | 13,906 | |
| | | | | | | | | | | | | |
| Pre-tax Income, net of non-controlling interest | | | | | | | | | |
| Standard Commercial Segment | | $ | 9,266 | | | $ | 9,683 | | | $ | 12,415 | |
| Speciality Commercial Segment | | | 20,883 | | | | 21,328 | | | | 28,338 | |
| Personal Segment | | | 11,000 | | | | 8,989 | | | | 7,523 | |
| Corporate | | | (7,944 | ) | | | (18,926 | ) | | | (6,507 | ) |
| Consolidated | | $ | 33,205 | | | $ | 21,074 | | | $ | 41,769 | |
HALLMARK FINANCIAL SERVICES, INC. AND SUBSIDIARIES
NOTES TO CONSOLIDATED FINANCIAL STATEMENTS
Years ended December 31, 2009, 2008, and 2007
| 9. | Segment Information, continued |
The following is additional business segment information as of the following dates (in thousands):
| | | December 31, | |
| | | 2009 | | | 2008 | |
| Assets | | | | | | |
| Standard Commercial Segment | | $ | 136,745 | | | $ | 146,415 | |
| Specialty Commercial Segment | | | 280,970 | | | | 230,130 | |
| Personal Segment | | | 109,844 | | | | 84,456 | |
| Corporate | | | 101,310 | | | | 77,397 | |
| Consolidated | | $ | 628,869 | | | $ | 538,398 | |
We have adopted the provisions of Statement of Financial Accounting Standards No. 128, “Earnings per Share,” (“SFAS 128”), which was codified into FASB ASC Topic 260, “Earnings Per Share”, requiring presentation of both basic and diluted earnings per share. A reconciliation of the numerators and denominators of the basic and diluted per share calculations (in thousands, except per share amounts) is presented below:
| | | 2009 | | | 2008 | | | 2007 | |
| Numerator for both basic and diluted earnings per share: | | | | | | | | | |
| Net income attributable to Hallmark Financial Services, Inc. | | $ | 24,575 | | | $ | 12,899 | | | $ | 27,863 | |
| | | | | | | | | | | | | |
| Denominator, basic shares | | | 20,620 | | | | 20,803 | | | | 20,768 | |
| Effect of dilutive securities: | | | | | | | | | | | | |
| Stock options | | | 13 | | | | 74 | | | | - | |
| Denominator, diluted shares | | | 20,633 | | | | 20,877 | | | | 20,768 | |
| | | | | | | | | | | | | |
| Basic earnings per share: | | $ | 1.19 | | | $ | 0.62 | | | $ | 1.34 | |
| | | | | | | | | | | | | |
| Diluted earnings per share: | | $ | 1.19 | | | $ | 0.62 | | | $ | 1.34 | |
For the years ended December 31, 2009 and 2008 we had 899,166 shares of common stock potentially issuable upon exercise of employee stock options that were excluded from the weighted average number of shares outstanding on a diluted basis because the effect of such options would be anti-dilutive. There were no shares of common stock potentially issuable upon exercise of employee stock options that were excluded from the weighted average number of shares outstanding on a diluted basis for the year ended December 31, 2007.
| 11. | Regulatory Capital Restrictions: |
AHIC, domiciled in Texas, is limited in the payment of dividends to their stockholders in any 12-month period, without the prior written consent of the Texas Department of Insurance, to the greater of statutory net income for the prior calendar year or 10% of statutory policyholders surplus as of the prior year end. Dividends may only be paid from unassigned surplus funds. HIC, domiciled in Arizona, is limited in the payment of dividends to the lesser of 10% of prior year policyholders surplus or prior year's net investment income, without prior written approval from the Arizona Department of Insurance. HSIC, domiciled in Oklahoma, is limited in the payment of dividends to the greater of 10% of prior year policyholders surplus or prior year's statutory net income, without prior written approval from the Oklahoma Insurance Department. During 2010, the aggregate ordinary dividend capacity of these subsidiaries is $19.4 million, of which $15.9 million is available to Hallmark. As a county mutual, dividends from HCM are payable to policyholders. None of our insurance company subsidiaries paid a dividend during the year ended December 31, 2009 or 2008.
HALLMARK FINANCIAL SERVICES, INC. AND SUBSIDIARIES
NOTES TO CONSOLIDATED FINANCIAL STATEMENTS
Years ended December 31, 2009, 2008, and 2007
The state insurance departments also regulate financial transactions between our insurance subsidiaries and their affiliated companies. Applicable regulations require approval of management fees, expense sharing contracts and similar transactions. American Hallmark General Agency, Inc. paid $5.6 million, $4.5 million and $1.9 million in management fees to Hallmark during 2009, 2008 and 2007, respectively. HIC paid $1.2 million in management fees to American Hallmark General Agency, Inc. during each of 2009, 2008 and 2007. AHIC paid $4.5 million and $3.3 million in management fees to American Hallmark General Agency, Inc. during 2009 and 2008, respectively. AHIC did not pay any management fees during 2007. HSIC paid $60,000 in management fees to TGA Insurance Managers during each of 2009, 2008, and 2007.
Statutory capital and surplus is calculated as statutory assets less statutory liabilities. The various state insurance departments that regulate our insurance company subsidiaries require us to maintain a minimum statutory capital and surplus. As of December 31, 2009, our insurance company subsidiaries reported statutory capital and surplus of $174.9 million, substantially greater than the minimum requirements for each state. For the year ended December 31, 2009, our insurance company subsidiaries reported statutory net income of $22.1 million.
The National Association of Insurance Commissioners requires property/casualty insurers to file a risk-based capital calculation according to a specified formula. The purpose of the formula is twofold: (1) to assess the adequacy of an insurer’s statutory capital and surplus based upon a variety of factors such as potential risks related to investment portfolio, ceded reinsurance and product mix; and (2) to assist state regulators under the RBC for Insurers Model Act by providing thresholds at which a state commissioner is authorized and expected to take regulatory action. As of December 31, 2009, the adjusted capital under the risk-based capital calculation of each of our insurance company subsidiaries substantially exceeded the minimum requirements.
| 12. | Share-based Payment Arrangements: |
Our 2005 Long Term Incentive Plan (“2005 LTIP”) is a stock compensation plan for key employees and non-employee directors that was approved by the shareholders on May 26, 2005. There are 2,000,000 shares authorized for issuance under the 2005 LTIP. Our 1994 Key Employee Long Term Incentive Plan (the “1994 Employee Plan”) and 1994 Non-Employee Director Stock Option Plan (the “1994 Director Plan”) both expired in 2004 but have unexercised options outstanding.
As of December 31, 2009, there were incentive stock options to purchase 1,262,499 shares of our common stock outstanding and non-qualified stock options to purchase 320,000 shares of our common stock outstanding under the 2005 LTIP, leaving 417,501 shares reserved for future issuance. As of December 31, 2009, there were incentive stock options to purchase 2,500 shares outstanding under the 1994 Employee Plan and non-qualified stock options to purchase 20,834 shares outstanding under the 1994 Director Plan. In addition, as of December 31, 2009, there were outstanding non-qualified stock options to purchase 8,333 shares of our common stock granted to certain non-employee directors outside the 1994 Director Plan in lieu of fees for service on our board of directors in 1999. The exercise price of all such outstanding stock options is equal to the fair market value of our common stock on the date of grant.
Options granted under the 1994 Employee Plan prior to October 31, 2003, vest 40% six months from the date of grant and an additional 20% on each of the first three anniversary dates of the grant and terminate ten years from the date of grant. Incentive stock options granted under the 2005 LTIP prior to 2009 and the 1994 Employee Plan after October 31, 2003, vest 10%, 20%, 30% and 40% on the first, second, third and fourth anniversary dates of the grant, respectively, and terminate five to ten years from the date of grant. Incentive stock options granted in 2009 under the 2005 LTIP vest in equal annual increments on each of the first seven anniversary dates and terminate ten years from the date of grant. Non-qualified stock options granted under the 2005 LTIP generally vest 100% six months after the date of grant and terminate ten years from the date of grant. There was one grant of 200,000 non-qualified stock options in 2009 under the 2005 LTIP that vest in equal annual increments on each of the first seven anniversary dates and terminate ten years from the date of grant. All non-qualified stock options granted under the 1994 Director Plan vested 40% six months from the date of grant and an additional 10% on each of the first six anniversary dates of the grant and terminate ten years from the date of grant. The options granted to non-employee directors outside the 1994 Director Plan fully vested six months after the date of grant and terminate ten years from the date of grant.
HALLMARK FINANCIAL SERVICES, INC. AND SUBSIDIARIES
NOTES TO CONSOLIDATED FINANCIAL STATEMENTS
Years ended December 31, 2009, 2008, and 2007
A summary of the status of our stock options as of and changes during the year ended December 31, 2009 is presented below:
| | | | | | Average | | | Contractual | | | Intrinsic | |
| | | Number of | | | Exercise | | | Term | | | Value | |
| | | Shares | | | Price | | | (Years) | | | ($000) | |
| | | | | | | | | | | | | |
| Outstanding at January 1, 2009 | | | 1,052,298 | | | $ | 11.12 | | | | | | | |
| Granted | | | 595,000 | | | $ | 6.62 | | | | | | | |
| Exercised | | | (31,049 | ) | | $ | 3.66 | | | | | | | |
| Forfeited or expired | | | (2,083 | ) | | $ | 2.63 | | | | | | | |
| Outstanding at December 31, 2009 | | | 1,614,166 | | | $ | 9.62 | | | | 7.9 | | | $ | 1,013 | |
| Exercisable at December 31, 2009 | | | 474,500 | | | $ | 9.91 | | | | 6.8 | | | $ | 291 | |
The following table details the intrinsic value of options exercised, total cost of share-based payments charged against income before income tax benefit and the amount of related income tax benefit recognized in income for the periods indicated (in thousands):
| | | 2009 | | | 2008 | | | 2007 | |
| | | | | | | | | | |
| Intrinsic value of options exercised | | $ | 113 | | | $ | 415 | | | $ | - | |
| | | | | | | | | | | | | |
| Cost of share-based payments (non-cash) | | $ | 1,334 | | | $ | 1,368 | | | $ | 527 | |
| | | | | | | | | | | | | |
| Income tax benefit of share-based payments recognized in income | | $ | 78 | | | $ | 30 | | | $ | 53 | |
As of December 31, 2009 there was $2.9 million of total unrecognized compensation cost related to non-vested share-based compensation arrangements granted under our plans, of which $1.1 million is expected to be recognized in 2010, $0.7 million is expected to be recognized in 2011, $0.4 million is expected to be recognized in 2012, $0.2 million is expected to be recognized each year from 2013 through 2015 and $0.1 million is expected to be recognized in 2016.
The fair value of each stock option granted is estimated on the date of grant using the Black-Scholes option pricing model. Expected volatilities are based on the historical volatility of similar companies’ common stock for a period equal to the expected term. The risk-free interest rates for periods within the contractual term of the options are based on rates for U.S. Treasury Notes with maturity dates corresponding to the options’ expected term of the grant. Expected term is determined base on the simplified method as the Company does not have sufficient historical exercise data to provide a basis for estimating the expected term.
HALLMARK FINANCIAL SERVICES, INC. AND SUBSIDIARIES
NOTES TO CONSOLIDATED FINANCIAL STATEMENTS
Years ended December 31, 2009, 2008, and 2007
The following table details the weighted average grant date fair value and related assumptions for the periods indicated.
| | | 2009 | | | 2008 | | | 2007 | |
| | | | | | | | | | |
| Grant date fair value per share | | $ | 3.00 | | | $ | 4.74 | | | $ | 4.04 | |
| | | | | | | | | | | | | |
| Expected term (in years) | | | 6.8 | | | | 6.4 | | | | 6.4 | |
| Expected volatility | | | 40.0 | % | | | 35.0 | % | | | 19.4 | % |
| Risk free interest rate | | | 2.7 | % | | | 3.4 | % | | | 4.5 | % |
Certain employees of the Standard Commercial Segment were participants in a defined cash balance plan covering all full-time employees who had completed at least 1,000 hours of service. This plan was frozen in March 2001 in anticipation of distribution of plan assets to members upon plan termination. All participants were vested when the plan was frozen.
The following tables provide detail of the changes in benefit obligations, components of benefit costs, weighted-average assumptions, and plan assets for the retirement plan as of and for the twelve months ending December 31, 2009, 2008 and 2007 (in thousands) using a measurement date of December 31.
HALLMARK FINANCIAL SERVICES, INC. AND SUBSIDIARIES
NOTES TO CONSOLIDATED FINANCIAL STATEMENTS
Years ended December 31, 2009, 2008, and 2007
| | | 2009 | | | 2008 | | | 2007 | |
| | | | | | | | | | |
| Assumptions (end of period): | | | | | | | | | |
| Discount rate used in determining benefit obligation | | | 6.00 | % | | | 5.50 | % | | | 5.75 | % |
| Rate of compensation increase | | | N/A | | | | N/A | | | | N/A | |
| | | | | | | | | | | | | |
| Reconciliation of funded status (end of period): | | | | | | | | | | | | |
| Accumulated benefit obligation | | $ | (11,301 | ) | | $ | (12,159 | ) | | $ | (12,053 | ) |
| | | | | | | | | | | | | |
| Projected benefit obligation | | $ | (11,301 | ) | | $ | (12,159 | ) | | $ | (12,053 | ) |
| Fair value of plan assets | | | 8,673 | | | | 7,850 | | | | 10,384 | |
| Funded status | | $ | (2,628 | ) | | $ | (4,309 | ) | | $ | (1,669 | ) |
| | | | | | | | | | | | | |
| Net actuarial loss | | | (2,805 | ) | | | (5,132 | ) | | | (1,752 | ) |
| Accumulated other comprehensive loss | | | (2,805 | ) | | | (5,132 | ) | | | (1,752 | ) |
| Prepaid/(accrued) pension cost | | | 177 | | | | 823 | | | | 83 | |
| Net amount recognized as of December 31 | | $ | (2,628 | ) | | $ | (4,309 | ) | | $ | (1,669 | ) |
| | | | | | | | | | | | | |
| Changes in projected benefit obligation: | | | | | | | | | | | | |
| Benefit obligation as of beginning of period | | $ | 12,159 | | | $ | 12,053 | | | $ | 12,994 | |
| Interest cost | | | 643 | | | | 667 | | | | 720 | |
| Actuarial liability (gain)/loss | | | (631 | ) | | | 327 | | | | (749 | ) |
| Benefits paid | | | (870 | ) | | | (888 | ) | | | (912 | ) |
| Benefit obligation as of end of period | | $ | 11,301 | | | $ | 12,159 | | | $ | 12,053 | |
| | | | | | | | | | | | | |
| Change in plan assets: | | | | | | | | | | | | |
| Fair value of plan assets as of beginning of period | | $ | 7,850 | | | $ | 10,384 | | | $ | 9,868 | |
| Actual return on plan assets (net of expenses) | | | 1,693 | | | | (2,448 | ) | | | 1,073 | |
| Employer contributions | | | - | | | | 802 | | | | 355 | |
| Benefits paid | | | (870 | ) | | | (888 | ) | | | (912 | ) |
| Fair value of plan assets as of end of period | | $ | 8,673 | | | $ | 7,850 | | | $ | 10,384 | |
| | | | | | | | | | | | | |
| Net periodic pension cost: | | | | | | | | | | | | |
| Service cost - benefits earned during the period | | $ | - | | | $ | - | | | $ | - | |
| Interest cost on projected benefit obligation | | | 643 | | | | 667 | | | | 720 | |
| Expected return on plan assets | | | (485 | ) | | | (670 | ) | | | (642 | ) |
| Recognized actuarial loss | | | 489 | | | | 64 | | | | 199 | |
| Net periodic pension cost | | $ | 647 | | | $ | 61 | | | $ | 277 | |
| | | | | | | | | | | | | |
| Discount rate | | | 5.50 | % | | | 5.75 | % | | | 5.75 | % |
| Expected return on plan assets | | | 6.50 | % | | | 6.50 | % | | | 6.50 | % |
| Rate of compensation increase | | | N/A | | | | N/A | | | | N/A | |
HALLMARK FINANCIAL SERVICES, INC. AND SUBSIDIARIES
NOTES TO CONSOLIDATED FINANCIAL STATEMENTS
Years ended December 31, 2009, 2008, and 2007
Estimated future benefit payments by fiscal year (in thousands):
| 2010 | | $ | 913 | |
| 2011 | | $ | 917 | |
| 2012 | | $ | 926 | |
| 2013 | | $ | 921 | |
| 2014 | | $ | 909 | |
| 2015-2019 | | $ | 4,360 | |
As of December 31, 2009, the fair value of the plan assets was composed of cash and cash equivalents of $0.3 million, bonds and notes of $2.8 million and equity securities of $5.6 million.
Our investment objectives are to preserve capital and to achieve long-term growth through a favorable rate of return equal to or greater than 5% over the long-term (60 year) average inflation rate as measured by the consumer price index. The objective of the equity portion of the portfolio is to achieve a return in excess of the Standard & Poor’s 500 index. The objective of the fixed income portion of the portfolio is to add stability, consistency, safety and total return to the total fund portfolio.
We prohibit investments in options, futures, precious metals, short sales and purchase on margin. We also restrict the investment in fixed income securities to “A” rated or better by Moody’s or Standard & Poor’s rating services and restrict investments in common stocks to only those that are listed and actively traded on one or more of the major United States stock exchanges, including NASDAQ. We manage to an asset allocation of 45% to 75% in equity securities. An investment in any single stock issue is restricted to 5% of the total portfolio value and 90% of the securities held in mutual or commingled funds must meet the criteria for common stocks.
To develop the expected long-term rate of return on assets assumption, we consider the historical returns and the future expectations for returns for each asset class, as well as the target asset allocation of the pension portfolio. This resulted in the selection of the 6.5% long-term rate of return on assets assumption. To develop the discount rate used in determining the benefit obligation we used the Citigroup Pension Liability Index at the measurement date to match the timing and amounts of projected future benefits.
We estimate contributing $0.4 million to the defined benefit cash balance plan during 2010. We expect our 2010 periodic pension cost to be $0.3 million, the components of which are interest cost of $0.6 million, expected return on plan assets of ($0.5) million and amortization of actuarial loss of $0.2 million.
The following table shows the weighted-average asset allocation for the defined benefit cash balance plan held as of December 31, 2009 and 2008.
| | | 12/31/09 | | | 12/31/08 | |
| Asset Category: | | | | | | |
| Fixed income securities | | | 32 | % | | | 36 | % |
| Equity securities | | | 65 | % | | | 62 | % |
| Other | | | 3 | % | | | 2 | % |
| Total | | | 100 | % | | | 100 | % |
We determine the fair value of our plan assets based on the fair value hierarchy established in FASB ASC 820 which requires an entity to maximize the use of observable inputs and minimize the use of unobservable inputs.
HALLMARK FINANCIAL SERVICES, INC. AND SUBSIDIARIES
NOTES TO CONSOLIDATED FINANCIAL STATEMENTS
Years ended December 31, 2009, 2008, and 2007
The following table presents for each of the fair value hierarchy levels, our plan assets that are measured at fair value on a recurring basis at December 31, 2009 (in thousands).
| | | Quoted Prices in | | | Other | | | | | | | |
| | | Active Markets for | | | Observable | | | Unobservable | | | | |
| | | Identical Assets | | | Inputs | | | Inputs | | | | |
| | | (Level 1) | | | (Level 2) | | | (Level 3) | | | Total | |
| | | | | | | | | | | | | |
| Debt securities | | $ | - | | | $ | 2,794 | | | $ | - | | | $ | 2,794 | |
| Equity securities | | $ | 5,625 | | | $ | - | | | $ | - | | | | 5,625 | |
| Cash and equivalents | | | 254 | | | | - | | | | - | | | | 254 | |
| Total | | $ | 5,879 | | | $ | 2,794 | | | $ | - | | | $ | 8,673 | |
We sponsor two defined contribution plans. Under these plans, employees may contribute a portion of their compensation on a tax-deferred basis, and we may contribute a discretionary amount each year. We contributed $0.2 million, $0.2 million and $0.2 million for each of the years ended December 31, 2009, 2008 and 2007, respectively.
HALLMARK FINANCIAL SERVICES, INC. AND SUBSIDIARIES
NOTES TO CONSOLIDATED FINANCIAL STATEMENTS
Years ended December 31, 2009, 2008, and 2007
The composition of deferred tax assets and liabilities and the related tax effects (in thousands) as of December 31, 2009 and 2008, are as follows:
| | | 2009 | | | 2008 | |
| Deferred tax liabilities: | | | | | | |
| Deferred policy acquisition costs | | $ | (7,277 | ) | | $ | (6,833 | ) |
| Net unrealized holding gain on investments | | | (4,661 | ) | | | - | |
| Agency relationship | | | (123 | ) | | | (132 | ) |
| Intangible assets | | | (6,811 | ) | | | (7,442 | ) |
| Fixed assets | | | (344 | ) | | | (210 | ) |
| Other | | | (477 | ) | | | (155 | ) |
| Total deferred tax liabilities | | $ | (19,693 | ) | | $ | (14,772 | ) |
| Deferred tax assets: | | | | | | | | |
| Unearned premiums | | $ | 7,846 | | | $ | 7,100 | |
| Deferred ceding commissions | | | 22 | | | | 653 | |
| Amortization of non-compete agreements | | | 655 | | | | 714 | |
| Pension liability | | | 982 | | | | 1,796 | |
| Net operating loss carry-forward | | | 990 | | | | 1,104 | |
| Net unrealized holding losses on investments | | | - | | | | 6,221 | |
| Unpaid loss and loss adjustment expense | | | 5,149 | | | | 4,052 | |
| Goodwill | | | 511 | | | | 720 | |
| Rent reserve | | | 22 | | | | 33 | |
| Investment impairments | | | 2,416 | | | | 3,227 | |
| Capital loss | | | 9 | | | | 290 | |
| Other | | | 149 | | | | 71 | |
| Total deferred tax assets | | $ | 18,751 | | | $ | 25,981 | |
| | | | | | | | | |
| Net deferred tax asset before valuation allowance | | $ | (942 | ) | | $ | 11,209 | |
| Valuation allowance | | | - | | | | 4,513 | |
| Net deferred tax asset (liability) | | $ | (942 | ) | | $ | 6,696 | |
The change in valuation allowance attributable to continuing operations and other comprehensive income is presented below:
| | | 2009 | | | 2008 | | | 2007 | |
| | | | | | | | | | |
| Continuing operations | | $ | (1,213 | ) | | $ | 2,969 | | | $ | (203 | ) |
| Changes in other comprehensive income | | | (3,300 | ) | | | 1,544 | | | | - | |
| | | $ | (4,513 | ) | | $ | 4,513 | | | $ | (203 | ) |
HALLMARK FINANCIAL SERVICES, INC. AND SUBSIDIARIES
NOTES TO CONSOLIDATED FINANCIAL STATEMENTS
Years ended December 31, 2009, 2008, and 2007
| 14. | Income Taxes, continued: |
A reconciliation of the income tax provisions (in thousands) based on the statutory tax rate to the provision reflected in the consolidated financial statements for the years ended December 31, 2009, 2008 and 2007, is as follows:
| | | 2009 | | | 2008 | | | 2007 | |
| Computed expected income tax expense at statutory regulatory tax rate | | $ | 11,640 | | | $ | 7,394 | | | $ | 14,619 | |
| Meals and entertainment | | | 14 | | | | 18 | | | | 23 | |
| Tax exempt interest | | | (2,157 | ) | | | (2,883 | ) | | | (813 | ) |
| Dividends received deduction | | | (253 | ) | | | (147 | ) | | | (43 | ) |
| State taxes (net of federal benefit) | | | 159 | | | | 269 | | | | 194 | |
| Valuation allowance | | | (1,213 | ) | | | 2,969 | | | | (203 | ) |
| Other | | | 440 | | | | 555 | | | | 129 | |
| Income tax expense | | $ | 8,630 | | | $ | 8,175 | | | $ | 13,906 | |
| | | | | | | | | | | | | |
| Current income tax expense | | $ | 10,165 | | | $ | 9,087 | | | $ | 15,387 | |
| Deferred tax benefit | | | (1,535 | ) | | | (912 | ) | | | (1,481 | ) |
| Income tax expense | | $ | 8,630 | | | $ | 8,175 | | | $ | 13,906 | |
We have available, for federal income tax purposes, unused net operating loss of approximately $2.8 million at December 31, 2009. The losses were acquired as part of the HIC acquisition and may be used to offset future taxable income. Utilization of the losses is limited under Internal Revenue Code Section 382. The Internal Revenue Code has provided that effective with tax years beginning September 1997, the carry-back and carry-forward periods are 2 years and 20 years, respectively, with respect to newly generated operating losses. The net operating losses (in thousands) will expire, if unused, as follows:
| Year | | | |
| 2021 | | $ | 1,950 | |
| 2022 | | | 878 | |
| | | $ | 2,828 | |
We are no longer subject to U.S. federal, state, local or non – U.S. income tax examinations by tax authorities for years prior to 2005.
| 15. | Commitments and Contingencies: |
We have several leases, primarily for office facilities and computer equipment, which expire in various years through 2016. Certain of these leases contain renewal options. Rental expense amounted to $1.8 million, $2.1 million and $2.1 million for the years ended December 31, 2009, 2008 and 2007, respectively.
Future minimum lease payments (in thousands) under non-cancelable operating leases as of December 31, 2009 are as follows:
| Year | | | |
| | | | |
| 2010 | | $ | 1,194 | |
| 2011 | | | 637 | |
| 2012 | | | 330 | |
| 2013 | | | 280 | |
| 2014 | | | 251 | |
| 2015 and thereafter | | | 262 | |
| | | | | |
| Total minimum lease payments | | $ | 2,954 | |
From time to time, assessments are levied on us by the guaranty association of the State of Texas. Such assessments are made primarily to cover the losses of policyholders of insolvent or rehabilitated insurers. Since these assessments can be recovered through a reduction in future premium taxes paid, we capitalize the assessments as they are paid and amortize the capitalized balance against our premium tax expense. There were no assessments during 2009, 2008 or 2007.
HALLMARK FINANCIAL SERVICES, INC. AND SUBSIDIARIES
NOTES TO CONSOLIDATED FINANCIAL STATEMENTS
Years ended December 31, 2009, 2008, and 2007
We are engaged in legal proceedings in the ordinary course of business, none of which, either individually or in the aggregate, are believed likely to have a material adverse effect on our consolidated financial position or results of operations, in the opinion of management. The various legal proceedings to which we are a party are routine in nature and incidental to our business.
| 16. | Concentrations of Credit Risk: |
We maintain cash and cash equivalents in accounts with seven financial institutions in excess of the amount insured by the Federal Deposit Insurance Corporation. We monitor the financial stability of the depository institutions regularly and do not believe excessive risk of depository institution failure existed at December 31, 2009.
We are also subject to credit risk with respect to reinsurers to whom we have ceded underwriting risk. Although a reinsurer is liable for losses to the extent of the coverage it assumes, we remain obligated to our policyholders in the event that the reinsurers do not meet their obligations under the reinsurance agreements. In order to mitigate credit risk to reinsurance companies, we monitor the financial condition of reinsurers on an ongoing basis and review our reinsurance arrangements periodically. Most of our reinsurance recoverable balance as of December 31, 2009 are with reinsurers that have an A.M. Best rating of “A-“ or better.
| 17. | Unaudited Selected Quarterly Financial Information: |
Following is a summary of the unaudited interim results of operations for the years ended December 31, 2009 and 2008:
| | | 2009 | | | 2008 | |
| | | Q1 | | | Q2 | | | Q3 | | | Q4 | | | Q1 | | | Q2 | | | Q3 | | | Q4 | |
| Total revenue | | $ | 70,910 | | | $ | 70,744 | | | $ | 71,903 | | | $ | 73,482 | | | $ | 71,521 | | | $ | 71,984 | | | $ | 64,989 | | | $ | 60,196 | |
| Total expense | | | 62,465 | | | | 63,941 | | | | 66,070 | | | | 61,306 | | | | 60,727 | | | | 61,396 | | | | 64,828 | | | | 60,615 | |
| Income (loss) before tax | | | 8,445 | | | | 6,803 | | | | 5,833 | | | | 12,176 | | | | 10,794 | | | | 10,588 | | | | 161 | | | | (419 | ) |
| Income tax expense (benefit) | | | 1,662 | | | | 2,519 | | | | 1,585 | | | | 2,864 | | | | 3,529 | | | | 3,178 | | | | (485 | ) | | | 1,953 | |
| Net income (loss) | | | 6,783 | | | | 4,284 | | | | 4,248 | | | | 9,312 | | | | 7,265 | | | | 7,410 | | | | 646 | | | | (2,372 | ) |
| Net income (loss) attributable to non-controlling interest | | | (7 | ) | | | 9 | | | | 34 | | | | 16 | | | | - | | | | - | | | | 15 | | | | 35 | |
| Net income (loss) attributable to Hallmark Financial Services, Inc. | | $ | 6,790 | | | $ | 4,275 | | | $ | 4,214 | | | $ | 9,296 | | | $ | 7,265 | | | $ | 7,410 | | | $ | 631 | | | $ | (2,407 | ) |
| | | | | | | | | | | | | | | | | | | | | | | | | | | | | | | | | |
| Basic earnings (loss) per share: | | $ | 0.33 | | | $ | 0.20 | | | $ | 0.20 | | | $ | 0.46 | | | $ | 0.35 | | | $ | 0.36 | | | $ | 0.03 | | | $ | (0.12 | ) |
| Diluted earnings (loss) per share: | | $ | 0.33 | | | $ | 0.20 | | | $ | 0.20 | | | $ | 0.46 | | | $ | 0.35 | | | $ | 0.35 | | | $ | 0.03 | | | $ | (0.12 | ) |
FINANCIAL STATEMENT SCHEDULES
Schedule II – Condensed Financial Information of Registrant (Parent Company Only)
HALLMARK FINANCIAL SERVICES, INC.
BALANCE SHEETS
December 31, 2009 and 2008
(In thousands)
| | | 2009 | | | 2008 | |
| ASSETS | | | | | | |
| Equity securities, available-for-sale, at fair value | | $ | 944 | | | $ | 2,014 | |
| Cash and cash equivalents | | | 9,646 | | | | 7,337 | |
| Accounts receivable | | | - | | | | 640 | |
| Investment in subsidiaries | | | 287,566 | | | | 232,391 | |
| Deferred federal income taxes | | | 154 | | | | 261 | |
| Other assets | | | 3,590 | | | | 4,396 | |
| | | | | | | | | |
| | | $ | 301,900 | | | $ | 247,039 | |
| | | | | | | | | |
| LIABILITIES AND STOCKHOLDERS’ EQUITY | | | | | | | | |
| Liabilities: | | | | | | | | |
| Notes payable | | $ | 59,502 | | | $ | 59,820 | |
| Current federal income tax payable | | | 8,555 | | | | 3,417 | |
| Accounts payable and other accrued expenses | | | 7,326 | | | | 4,390 | |
| | | | | | | | | |
| | | | 75,383 | | | | 67,627 | |
| | | | | | | | | |
| Stockholders’ equity: | | | | | | | | |
| Common stock, $.18 par value, authorized 33,333,333 shares; | | | | | | | | |
| issued 20,872,831 shares in 2009 and 20,841,782 shares in 2008 | | | 3,757 | | | | 3,751 | |
| Capital in excess of par value | | | 121,016 | | | | 119,928 | |
| Retained earnings | | | 98,482 | | | | 72,242 | |
| Accumulated other comprehensive income (loss) | | | 8,589 | | | | (16,432 | ) |
| Treasury stock, (757,828 shares in 2009 and 7,828 in 2008), at cost | | | (5,327 | ) | | | (77 | ) |
| | | | | | | | | |
| Total stockholders’ equity | | | 226,517 | | | | 179,412 | |
| | | | | | | | | |
| Total liabilities and stockholders’ equity | | $ | 301,900 | | | $ | 247,039 | |
See accompanying report of independent registered public accounting firm.
FINANCIAL STATEMENT SCHEDULES
Schedule II (Continued) – Condensed Financial Information of Registrant (Parent Company Only)
HALLMARK FINANCIAL SERVICES, INC.
STATEMENTS OF OPERATIONS
For the years ended December 31, 2009, 2008 and 2007
(In thousands)
| | | 2009 | | | 2008 | | | 2007 | |
| Investment income (loss), net of expenses | | $ | (166 | ) | | $ | 127 | | | $ | 457 | |
| Realized gain (loss) | | | 313 | | | | (1,056 | ) | | | 508 | |
| Management fee income | | | 7,127 | | | | 6,044 | | | | 7,205 | |
| | | | | | | | | | | | | |
| | | | 7,274 | | | | 5,115 | | | | 8,170 | |
| | | | | | | | | | | | | |
| Losses and loss adjustment expenses | | | - | | | | (1 | ) | | | (15 | ) |
| Other operating costs and expenses | | | 8,190 | | | | 6,537 | | | | 6,596 | |
| Interest expense | | | 4,572 | | | | 4,649 | | | | 3,762 | |
| Amortization of intangible asset | | | 379 | | | | - | | | | - | |
| | | | | | | | | | | | | |
| | | | 13,141 | | | | 11,185 | | | | 10,343 | |
| | | | | | | | | | | | | |
| Loss before equity in undistributed earnings of subsidiaries and income tax expense | | | (5,867 | ) | | | (6,070 | ) | | | (2,173 | ) |
| | | | | | | | | | | | | |
| Income tax benefit | | | (1,609 | ) | | | (1,567 | ) | | | (653 | ) |
| | | | | | | | | | | | | |
| Loss before equity in undistributed earnings of subsidiaries | | | (4,258 | ) | | | (4,503 | ) | | | (1,520 | ) |
| Equity in undistributed share of earnings in subsidiaries | | | 28,833 | | | | 17,402 | | | | 29,383 | |
| | | | | | | | | | | | | |
| Net income | | $ | 24,575 | | | $ | 12,899 | | | $ | 27,863 | |
See accompanying report of independent registered public accounting firm.
FINANCIAL STATEMENT SCHEDULES
Schedule II (Continued) – Condensed Financial Information of Registrant (Parent Company Only)
HALLMARK FINANCIAL SERVICES, INC.
STATEMENTS OF CASH FLOWS
For the years ended December 31, 2009, 2008 and 2007
(In thousands)
| | | 2009 | | | 2008 | | | 2007 | |
| Cash flows from operating activities: | | | | | | | | | |
| Net income | | $ | 24,575 | | | $ | 12,899 | | | $ | 27,863 | |
| | | | | | | | | | | | | |
| Adjustments to reconcile net income to cash provided by (used in) operating activities: | | | | | | | | | | | | |
| Depreciation and amortization expense | | | 448 | | | | 74 | | | | 486 | |
| Deferred income tax expense (benefit) | | | 112 | | | | (17 | ) | | | 170 | |
| Change in unpaid losses and loss adjustment expenses | | | - | | | | (1 | ) | | | (15 | ) |
| Undistributed share of earnings of subsidiaries | | | (28,833 | ) | | | (17,402 | ) | | | (29,383 | ) |
| Realized gain (loss) | | | (313 | ) | | | 1,056 | | | | (508 | ) |
| Change in accounts receivable | | | - | | | | - | | | | 184 | |
| Change in current federal income tax payable | | | 5,138 | | | | 2,693 | | | | 2,644 | |
| Change in all other liabilities | | | 2,557 | | | | 193 | | | | (5,475 | ) |
| Change in all other assets | | | 2,406 | | | | 381 | | | | 209 | |
| | | | | | | | | | | | | |
| Net cash provided by (used in) operating activities | | | 6,090 | | | | (124 | ) | | | (3,825 | ) |
| | | | | | | | | | | | | |
| Cash flows from investing activities: | | | | | | | | | | | | |
| Purchases of property and equipment | | | (22 | ) | | | (60 | ) | | | (50 | ) |
| Acquisition of subsidiaries | | | - | | | | (15,000 | ) | | | - | |
| Change in restricted cash | | | - | | | | 10,644 | | | | 10,218 | |
| Purchase of fixed maturity and equity securities | | | (10,957 | ) | | | (84,870 | ) | | | (60,580 | ) |
| Maturities and redemptions of investment securities | | | 12,651 | | | | 91,985 | | | | 55,453 | |
| | | | | | | | | | | | | |
| Net cash provided by investing activities | | | 1,672 | | | | 2,699 | | | | 5,041 | |
| | | | | | | | | | | | | |
| Cash flows from financing activities: | | | | | | | | | | | | |
| Proceeds from exercise of employee stock options | | | 115 | | | | 219 | | | | - | |
| Proceeds from borrowings | | | - | | | | - | | | | 25,774 | |
| Debt issuance costs | | | - | | | | - | | | | (674 | ) |
| Purchase of treasury shares | | | (5,250 | ) | | | - | | | | - | |
| Repayment of borrowings | | | (318 | ) | | | (9,683 | ) | | | (15,000 | ) |
| Net cash (used in) provided by financing activities | | | (5,453 | ) | | | (9,464 | ) | | | 10,100 | |
| | | | | | | | | | | | | |
| Increase (Decrease) in cash and cash equivalents | | | 2,309 | | | | (6,889 | ) | | | 11,316 | |
| Cash and cash equivalents at beginning of year | | | 7,337 | | | | 14,226 | | | | 2,910 | |
| Cash and cash equivalents at end of year | | $ | 9,646 | | | $ | 7,337 | | | $ | 14,226 | |
| | | | | | | | | | | | | |
| Supplemental cash flow information: | | | | | | | | | | | | |
| Interest paid | | $ | (4,612 | ) | | $ | (4,662 | ) | | $ | (3,250 | ) |
| | | | | | | | | | | | | |
| Income taxes recovered | | $ | 6,860 | | | $ | 4,242 | | | $ | 2,957 | |
See accompanying report of independent registered public accounting firm.
FINANCIAL STATEMENT SCHEDULES
Hallmark Financial Services
Schedule III - Supplementary Insurance Information
(In thousands)
Column A | | Column B | | | Column C | | | Column D | | | Column E | | | Column F | | | Column G | | | Column H | | | Column I | | | Column J | | | Column K | |
| | | | | | Future | | | | | | | | | | | | | | | | | | | | | | | | | |
| | | | | | Policy | | | | | | | | | | | | | | | | | | | | | | | | | |
| | | | | | Benefits, | | | | | | | | | | | | | | | | | | | | | | | | | |
| | | | | | Losses, | | | | | | Other | | | | | | | | | | | | Amortization | | | | | | | |
| | | Deferred | | | Claims and | | | | | | Policy | | | | | | | | | Benefits, | | | of Deferred | | | | | | | |
| | | Policy | | | Loss | | | | | | Claims | | | | | | Net | | | Claims, Losses | | | Policy | | | Other | | | Net | |
| | | Acquisition | | | Adjustment | | | Unearned | | | and Benefits | | | Premium | | | Investment | | | and Settlement | | | Acquisition | | | Operating | | | Premiums | |
| Segment | | Cost | | | Expenses | | | Premiums | | | Payable | | | Revenue | | | Income | | | Expenses | | | Costs | | | Expenses | | | Written | |
2009 | | | | | | | | | | | | | | | | | | | | | | | | | | | | | | |
| Personal Segment | | $ | 3,760 | | | $ | 24,808 | | | $ | 17,001 | | | $ | - | | | $ | 67,512 | | | $ | 1,809 | | | $ | 43,794 | | | $ | 15,027 | | | $ | 19,915 | | | $ | 71,708 | |
| Standard Commercial Segment | | | 6,532 | | | | 79,429 | | | | 35,098 | | | | - | | | | 71,290 | | | | 5,009 | | | | 44,372 | | | | 14,456 | | | | 22,196 | | | | 68,082 | |
| Specialty Commercial Segment | | | 10,500 | | | | 80,425 | | | | 72,990 | | | | - | | | | 112,270 | | | | 5,907 | | | | 65,453 | | | | 22,848 | | | | 43,143 | | | | 121,950 | |
| Corporate | | | - | | | | - | | | | - | | | | - | | | | - | | | | 2,222 | | | | - | | | | - | | | | 8,246 | | | | - | |
| | | | | | | | | | | | | | | | | | | | | | | | | | | | | | | | | | | | | | | | | |
| Consolidated | | $ | 20,792 | | | $ | 184,662 | | | $ | 125,089 | | | $ | - | | | $ | 251,072 | | | $ | 14,947 | | | $ | 153,619 | | | $ | 52,331 | | | $ | 93,500 | | | $ | 261,740 | |
| | | | | | | | | | | | | | | | | | | | | | | | | | | | | | | | | | | | | | | | | |
2008 | | | | | | | | | | | | | | | | | | | | | | | | | | | | | | | | | | | | | | | | |
| Personal Segment | | $ | 2,826 | | | $ | 22,621 | | | $ | 12,806 | | | $ | - | | | $ | 59,019 | | | $ | 1,699 | | | $ | 39,042 | | | $ | 12,711 | | | $ | 16,836 | | | $ | 60,834 | |
| Standard Commercial Segment | | | 7,169 | | | | 77,407 | | | | 38,257 | | | | - | | | | 79,795 | | | | 5,599 | | | | 49,270 | | | | 22,917 | | | | 24,244 | | | | 75,361 | |
| Specialty Commercial Segment | | | 9,529 | | | | 56,335 | | | | 51,129 | | | | - | | | | 97,506 | | | | 5,232 | | | | 55,933 | | | | 19,520 | | | | 48,247 | | | | 98,732 | |
| Corporate | | | - | | | | - | | | | - | | | | - | | | | - | | | | 3,519 | | | | (1 | ) | | | - | | | | 6,537 | | | | - | |
| | | | | | | | | | | | | | | | | | | | | | | | | | | | | | | | | | | | | | | | | |
| Consolidated | | $ | 19,524 | | | $ | 156,363 | | | $ | 102,192 | | | $ | - | | | $ | 236,320 | | | $ | 16,049 | | | $ | 144,244 | | | $ | 55,148 | | | $ | 95,864 | | | $ | 234,927 | |
| | | | | | | | | | | | | | | | | | | | | | | | | | | | | | | | | | | | | | | | | |
2007 | | | | | | | | | | | | | | | | | | | | | | | | | | | | | | | | | | | | | | | | |
| Personal Segment | | $ | 2,436 | | | $ | 19,939 | | | $ | 10,991 | | | $ | - | | | $ | 53,505 | | | $ | 1,717 | | | $ | 35,969 | | | $ | 11,459 | | | $ | 15,291 | | | $ | 55,916 | |
| Standard Commercial Segment | | | 8,019 | | | | 81,417 | | | | 42,664 | | | | - | | | | 83,755 | | | | 5,304 | | | | 48,480 | | | | 23,006 | | | | 25,869 | | | | 84,595 | |
| Specialty Commercial Segment | | | 9,302 | | | | 23,981 | | | | 49,343 | | | | - | | | | 88,711 | | | | 4,911 | | | | 48,484 | | | | 20,642 | | | | 49,128 | | | | 98,300 | |
| Corporate | | | - | | | | 1 | | | | - | | | | - | | | | - | | | | 1,248 | | | | (15 | ) | | | - | | | | 6,596 | | | | - | |
| | | | | | | | | | | | | | | | | | | | | | | | | | | | | | | | | | | | | | | | | |
| Consolidated | | $ | 19,757 | | | $ | 125,338 | | | $ | 102,998 | | | $ | - | | | $ | 225,971 | | | $ | 13,180 | | | $ | 132,918 | | | $ | 55,107 | | | $ | 96,884 | | | $ | 238,811 | |
See accompanying report of independent registered public accounting firm.
FINANCIAL STATEMENT SCHEDULES
Hallmark Financial Services
Schedule IV - Reinsurance
(In thousands)
| Column A | | Column B | | | Column C | | | Column D | | | Column E | | | Column F | |
| | | | | | | | | | | | | | | Percentage | |
| | | | | | Ceded to | | | Assumed | | | | | | of Amount | |
| | | Gross | | | Other | | | From Other | | | Net | | | Assumed to | |
| | | Amount | | | Companies | | | Companies | | | Amount | | | Net | |
| Year Ended December 31, 2009 | | | | | | | | | | | | | | | |
| Life insurance in force | | $ | - | | | $ | - | | | $ | - | | | $ | - | | | | |
| | | | | | | | | | | | | | | | | | | | |
| Premiums | | | | | | | | | | | | | | | | | | | |
| Life insurance | | $ | | | | $ | | | | $ | | | | $ | | | | | | |
| Accident and health insurance | | | - | | | | - | | | | - | | | | - | | | | | |
| Property and liability insurance | | | 185,727 | | | | 18,402 | | | | 83,747 | | | | 251,072 | | | | 33.4 | % |
| Title Insurance | | | - | | | | - | | | | - | | | | - | | | | | |
| | | | | | | | | | | | | | | | | | | | | |
| Total premiums | | $ | 185,727 | | | $ | 18,402 | | | $ | 83,747 | | | $ | 251,072 | | | | 33.4 | % |
| | | | | | | | | | | | | | | | | | | | | |
| Year Ended December 31, 2008 | | | | | | | | | | | | | | | | | | | | |
| Life insurance in force | | $ | - | | | $ | - | | | $ | - | | | $ | - | | | | | |
| | | | | | | | | | | | | | | | | | | | | |
| Premiums | | | | | | | | | | | | | | | | | | | | |
| Life insurance | | $ | | | | $ | | | | $ | | | | $ | | | | | | |
| Accident and health insurance | | | - | | | | - | | | | - | | | | - | | | | | |
| Property and liability insurance | | | 155,616 | | | | 8,336 | | | | 89,040 | | | | 236,320 | | | | 37.7 | % |
| Title Insurance | | | - | | | | - | | | | - | | | | - | | | | | |
| | | | | | | | | | | | | | | | | | | | | |
| Total premiums | | $ | 155,616 | | | $ | 8,336 | | | $ | 89,040 | | | $ | 236,320 | | | | 37.7 | % |
| | | | | | | | | | | | | | | | | | | | | |
| Year Ended December 31, 2007 | | | | | | | | | | | | | | | | | | | | |
| Life insurance in force | | $ | - | | | $ | - | | | $ | - | | | $ | - | | | | | |
| | | | | | | | | | | | | | | | | | | | | |
| Premiums | | | | | | | | | | | | | | | | | | | | |
| Life insurance | | $ | | | | $ | | | | $ | | | | $ | | | | | | |
| Accident and health insurance | | | - | | | | - | | | | - | | | | - | | | | | |
| Property and liability insurance | | | 151,276 | | | | 12,109 | | | | 86,804 | | | | 225,971 | | | | 38.4 | % |
| Title Insurance | | | - | | | | - | | | | - | | | | - | | | | | |
| | | | | | | | | | | | | | | | | | | | | |
| Total premiums | | $ | 151,276 | | | $ | 12,109 | | | $ | 86,804 | | | $ | 225,971 | | | | 38.4 | % |
See accompanying report of independent registered public accounting firm.
FINANCIAL STATEMENT SCHEDULES
Hallmark Financial Services
Schedule VI - Supplemental Information Concerning Property-Casualty Insurance Operations
(In thousands)
| Column A | | Column B | | | Column C | | | Column D | | | Column E | | | Column F | | | Column G | | | Column H | | | Column I | | | Column J | | | Column K | |
| | | | | | Reserves | | | | | | | | | | | | | | | Claims and Claim | | | | | | | | | | |
| | | | | | for Unpaid | | | | | | | | | | | | | | | | | | | | | | | | | |
| | | | | | Claims and | | | | | | | | | | | | | | | Expenses Incurred Related to | | | | | | | | | | |
| | | | | Claim | | | | | | | | | | | | | | | | | | | | | | | | | | | | |
| With | | Acquisition | | | Adjustment | | | In | | | Unearned | | | Earned | | | Investment | | | Current | | | Prior | | | Acquisition | | | Adjustment | | | Premiums | |
| Registrant | | Costs | | | Expenses | | | Column C | | | Premiums | | | Premiums | | | Income | | | Year | | | Years | | | Costs | | | Expenses | | | Written | |
| | | | | | | | | | | | | | | | | | | | | | | | | | | | | | | | | | | | |
| (a) Consolidated property-casualty Entities | | | | | | | | | | | | | | | | | | | | | | | | | | | | | | | | | | | |
| | | | | | | | | | | | | | | | | | | | | | | | | | | | | | | | | | | | |
| 2009 | | $ | 20,792 | | | $ | 184,662 | | | $ | - | | | $ | 125,089 | | | $ | 251,072 | | | $ | 14,947 | | | $ | 151,999 | | | $ | 1,620 | | | $ | 52,331 | | | $ | 127,394 | | | $ | 261,740 | |
| | | | | | | | | | | | | | | | | | | | | | | | | | | | | | | | | | | | | | | | | | | | | |
| 2008 | | $ | 19,524 | | | $ | 156,363 | | | $ | - | | | $ | 102,192 | | | $ | 236,320 | | | $ | 16,049 | | | $ | 146,059 | | | $ | (1,815 | ) | | $ | 55,148 | | | $ | 115,068 | | | $ | 234,927 | |
| | | | | | | | | | | | | | | | | | | | | | | | | | | | | | | | | | | | | | | | | | | | | |
| 2007 | | $ | 19,757 | | | $ | 125,338 | | | $ | - | | | $ | 102,998 | | | $ | 225,971 | | | $ | 13,180 | | | $ | 139,332 | | | $ | (6,414 | ) | | $ | 55,107 | | | $ | 84,870 | | | $ | 238,811 | |
See accompanying report of independent registered public accounting firm.