| | OMB APPROVAL |
| | OMB Number: 3235-0570 |
| | Expires: November 30, 2005 |
| | Estimated average burden
hours per response. . . . 5.0 |
UNITED STATES
SECURITIES AND EXCHANGE COMMISSION
Washington, D.C. 20549
FORM N-CSR
CERTIFIED SHAREHOLDER REPORT OF REGISTERED
MANAGEMENT INVESTMENT COMPANIES
Investment Company Act file number 811-05309
First American Investment Funds, Inc.
(Exact name of registrant as specified in charter)
800 Nicollet Mall, Minneapolis, MN | | 55402 |
(Address of principal executive offices) | | (Zip code) |
Charles D. Gariboldi 800 Nicollet Mall, Minneapolis, MN 55402
(Name and address of agent for service)
Registrant’s telephone number, including area code: 800-677-3863
Date of fiscal year end: September 30
Date of reporting period: September 30, 2004
Form N-CSR is to be used by management investment companies to file reports with the Commission not later than 10 days after the transmission to stockholders of any report that is required to be transmitted to stockholders under Rule 30e-1 under the Investment Company Act of 1940 (17 CFR 270.30e-1). The Commission may use the information provided on Form N-CSR in its regulatory, disclosure review, inspection, and policymaking roles.
A registrant is required to disclose the information specified by Form N-CSR, and the Commission will make this information public. A registrant is not required to respond to the collection of information contained in Form N-CSR unless the Form displays a currently valid Office of Management and Budget (“OMB”) control number. Please direct comments concerning the accuracy of the information collection burden estimate and any suggestions for reducing the burden to Secretary, Securities and Exchange Commission, 450 Fifth Street, NW, Washington, DC 20549-0609. The OMB has reviewed this collection of information under the clearance requirements of 44 U.S.C. Section 3507.
Item 1. Report to Shareholders

| 2004
Annual Report |
| |
| INDEX
FUNDS |
First American Index Funds
An index fund is a mutual fund that seeks to mirror, as closely as possible, the returns of a market index. It does so by purchasing almost all of the holdings in the index in roughly the same percentages. An equity index measures the collective value of a group of stocks in a specific segment of the marketplace. The most commonly known market index is the S&P 500 Index.
TABLE OF CONTENTS
Message to Shareholders | |
Report of Independent Registered Public Accounting Firm | |
Schedule of Investments | |
Statements of Assets and Liabilities | |
Statements of Operations | |
Statements of Changes in Net Assets | |
Financial Highlights | |
Notes to Financial Statements | |
Notice to Shareholders | |
Mutual fund investing involves risk; principal loss is possible. |
| |
NOT FDIC INSURED NO BANK GUARANTEE MAY LOSE VALUE |
Message to SHAREHOLDERS November 15, 2004
Dear Shareholders:
We invite you to take a few minutes to review the results of the fiscal year ended September 30, 2004.
This report includes comparative performance graphs and tables, portfolio commentaries, complete listings of portfolio holdings, and additional fund information. We hope you will find this helpful in monitoring your investment portfolio.
Also, through our website, firstamericanfunds.com, we provide quarterly performance fact sheets on all First American funds, the economic outlook as viewed by our senior investment officers, and other information about fund investments and portfolio strategies.
Please contact your financial professional if you have questions about First American Funds or contact First American Investor Services at 800.677.FUND.
We appreciate your investment with First American Funds and look forward to serving your financial needs in the future.
Sincerely,
/s/ Virginia L. Stringer | | /s/ Thomas S. Schreier | |
Virginia L. Stringer | Thomas S. Schreier, Jr. |
Chairperson of the Board | President |
First American Investment Funds, Inc. | First American Investment Funds, Inc. |
1
Equity Index fund
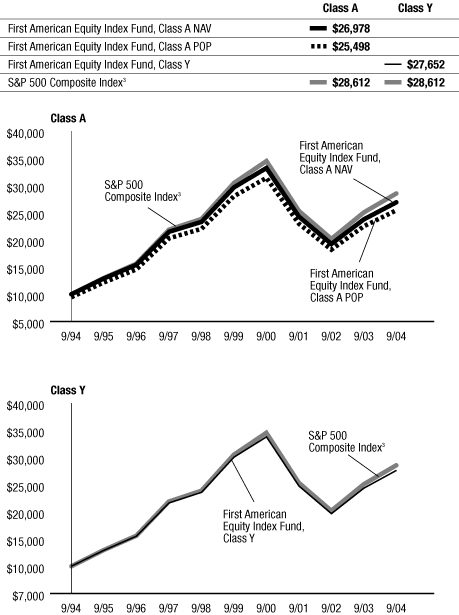
Investment Objective: to provide investment results that correspond to the performance of the Standard & Poor's 500 Composite Index (S&P 500 Composite Index)
How did the Fund perform for the fiscal year ended September 30, 2004?
The First American Equity Index Fund, Class Y shares, returned 13.45% for the fiscal year ended September 30, 2004 (Class A shares returned 13.12% at net asset value). By comparison, the Fund's benchmark, the Standard and Poor's 500 Composite Index*, returned 13.87% for the same period.
How did general economic and market conditions affect performance?
The fiscal year saw the continuation of a rising economic tide. While stocks in general were up in excess of their long-term historical averages, small- and mid- capitalization stocks generally outperformed large- capitalization stocks as they were more leveraged to the improving economy. The same held true for value strategies vs. growth strategies. The Standard and Poor's 500 Composite Index, constructed of large-cap stocks, lagged slightly behind the mid- and small-cap indexes, but still experienced positive returns of more than 13%. Because the Index reflects nearly a 50% value, 50% growth split, the Index maintains steadier performance during outperformance in either style.
As the year progressed, increasing oil prices and hints of wider-spread inflation started to weigh on the market and led the Federal Reserve to increase interest rates for the first time since May 2000. During the second half of the year, election rhetoric and the uncertainty of the election's outcome, coupled with decelerating company earnings growth rates, caused the market to "move sideways" – to neither grow nor decline much.
| Top 10 Companies as of September 30, 20041 (% of net assets) | |
| General Electric | | | 3.4 | % | |
| Exxon Mobil | | | 3.0 | % | |
| Microsoft | | | 2.9 | % | |
| Pfizer | | | 2.2 | % | |
| Citigroup | | | 2.2 | % | |
| Wal-Mart Stores | | | 2.2 | % | |
| Bank of America | | | 1.7 | % | |
| American International Group | | | 1.7 | % | |
| Johnson & Johnson | | | 1.6 | % | |
| IBM | | | 1.4 | % | |
Fund Overview
The Fund is invested to replicate the Standard and Poor's 500 Stock Index as closely as possible with consideration to turnover costs and fees. As a result, the Fund performed very similarly to that Index. The Index includes 500 leading companies in the leading industries of the U.S. economy and covers about 80% of the dollar value of stocks in the U.S. market. The Fund strives to reflect the changes to the Index with sensitivity to turnover costs.
Like the Index, the Fund benefited from a 3% allocation to the materials sector as the demand for products produced by the companies in this sector grew with the surging economy. A 7% weighting in the energy sector was also a contributor to performance as the demand for energy outstripped the normal supply during increased construction over the last year and increased production of goods and services. As consumers spent more money and companies grew, the Fund benefited from its 11% position in the consumer discretionary sector. The Fund had a 12% position in industrials, which also had a positive effect on performance.
The technology sector for large-capitalization companies was weaker than investors hoped for. The Fund had a 16% weighting in that sector, in line with the benchmark, which detracted from the Fund's performance. For the next fiscal year, we believe that large-cap stocks will continue to be an important part of a diversified portfolio.
*Unlike mutual funds, index returns do not reflect any expenses, transaction costs, or cash flow effects.
| Sector Allocation as of September 30, 20041 (% of net assets) | |
| Sector | | Fund2 | | S&P 500 Composite Index3 | |
| Financials | | | 20.5 | % | | | 20.6 | % | |
| Information Technology | | | 16.3 | % | | | 15.7 | % | |
| Healthcare | | | 12.9 | % | | | 13.1 | % | |
| Industrials | | | 11.5 | % | | | 11.7 | % | |
| Consumer Staples | | | 10.6 | % | | | 10.7 | % | |
| Consumer Discretionary | | | 10.4 | % | | | 11.1 | % | |
| Energy | | | 7.3 | % | | | 7.4 | % | |
| Telecommunication Services | | | 3.7 | % | | | 3.7 | % | |
| Materials | | | 3.1 | % | | | 3.1 | % | |
| Utilities | | | 2.8 | % | | | 2.9 | % | |
1Fund holdings and sector allocations are subject to change at any time and are not recommendations to buy or sell any security.
2The percentages shown represent the allocation by industry as a percent of net assets of the Fund.
3The percentages shown represent the percent allocation by industry of the index.
FIRST AMERICAN FUNDS Annual Report 2004
2
Equity Index fund continued
Annualized Performance1 as of September 30, 2004
| | | | | | | | | Since Inception | |
| | | 1 year | | 5 years | | 10 years | | 2/1/1999 | | 9/24/2001 | |
| Average annual return with sales charge (POP) | | | |
| Class A | | | 6.89 | % | | | (3.04 | %) | | | 9.81 | % | | | - | | | | - | | |
| Class B | | | 7.31 | % | | | (3.03 | %) | | | 9.61 | % | | | - | | | | - | | |
| Class C | | | 11.28 | % | | | (2.66 | %) | | | - | | | | (2.23 | %) | | | - | | |
| Average annual return without sales charge (NAV) | | | |
| Class A | | | 13.12 | % | | | (1.93 | %) | | | 10.43 | % | | | - | | | | - | | |
| Class B | | | 12.31 | % | | | (2.66 | %) | | | 9.61 | % | | | - | | | | - | | |
| Class C | | | 12.28 | % | | | (2.66 | %) | | | - | | | | (2.23 | %) | | | - | | |
| Class R4 | | | 13.00 | % | | | - | | | | - | | | | - | | | | 4.68 | % | |
| Class Y | | | 13.45 | % | | | (1.68 | %) | | | 10.71 | % | | | - | | | | - | | |
| S&P 500 Composite Index3 | | | 13.87 | % | | | (1.31 | %) | | | 11.08 | % | | | (0.87 | %) | | | 5.31 | % | |
Value of a $10,000 Investment1, 2 as of September 30, 2004
The performance data quoted on this page represents past performance and does not guarantee future results. The investment return and principal value of an investment will fluctuate so that an investor's shares, when redeemed, may be worth more or less than their original cost. Current performance of the Fund may be lower or higher than the performance data quoted. Performance data current to the most recent month-end may be obtained by calling 800.677.FUND.
1 Performance does not reflect the deduction of taxes that a shareholder would pay on fund distributions or redemption of fund shares. Performance reflects voluntary fee waivers in effect. In the absence of such fee waivers, total returns would be reduced. Index performance is for illustrative purposes only and does not reflect any expenses, transaction costs, or cash flow effects. Direct investment in the index is not available.
Total returns at net asset value ("NAV") reflect performance over the time period indicated without including the Fund's maximum sales charge and assume reinvestment of all distributions at NAV.
Total returns at public offering price ("POP") reflect performance over the time period indicated including a maximum front-end sales charge of 5.50% for Class A shares and the maximum contingent deferred sales charge ("CDSC") for Class B and Class C shares for the relevant period. Maximum CDSC is 5.00% for Class B shares, decreasing annually to 0% in the seventh year following purchase, and 1.00% for Class C shares. Total returns assume reinvestment of all distributions at NAV.
2 Performance for Class B, Class C, and Class R shares is not presented. Performance for these classes will vary due to different expense structures.
3 An unmanaged index of large-capitalization stocks that includes a representative sample of 500 leading companies in leading industries of the U.S. economy. Although the S&P 500 focuses on the large-cap segment of the market, with over 80% coverage of U.S. equities, it also serves as a proxy for the total market.
4 Prior to July 1, 2004, Class R shares were designated Class S shares, which had lower fees and expenses. Performance information prior to that date is based on the performance of the Class S shares. If current fees and expenses had been in effect for the entire period presented, performance would have been lower. Please refer to the prospectus for details.
FIRST AMERICAN FUNDS Annual Report 2004
3
Equity Index fund continued
Expense Example
As a shareholder of the Equity Index Fund, you incur two types of costs: (1) transaction costs, including sales charges (loads) on purchase payments; and (2) ongoing costs, including management fees; distribution and/or service (12b-1) fees; and other Fund expenses. This example is intended to help you understand your ongoing costs (in dollars) of investing in the Fund and to compare these costs with the ongoing costs of investing in other mutual funds. The example is based on an investment of $1,000 invested at the beginning of the period and held for the entire period from April 1, 2004, to September 30, 2004.
Actual Expenses
For each class, the first line of the table below provides information about actual account values and actual expenses. You may use the information in this line, together with the amount you invested, to estimate the expenses that you paid over the period. Simply divide your account value by $1,000 (for example, an $8,600 account value divided by $1,000 = 8.6), then multiply the result by the number in the first line under the heading entitled "Expenses Paid During Period" to estimate the expenses you paid on your account during this period.
Hypothetical Example for Comparison Purposes
For each class, the second line of the table below provides information about hypothetical account values and hypothetical expenses based on the Fund's actual expense ratio and an assumed rate of return of 5% per year before expenses, which is not the Fund's actual return. The hypothetical account values and expenses may not be used to estimate the actual ending account balance or expenses you paid for the period. You may use this information to compare the ongoing costs of investing in the Fund and other funds. To do so, compare this 5% hypothetical example with the 5% hypothetical examples that appear in the shareholder reports of the other funds.
Please note that the expenses shown in the table are meant to highlight your ongoing costs only and do not reflect any transactional costs, such as sales charges (loads). Therefore, the second line of the table for each class is useful in comparing ongoing costs only, and will not help you determine the relative total costs of owning different funds. In addition, if these transactional costs were included, your costs would have been higher.
Expense Examples
| | | Beginning Account
Value (4/1/2004) | | Ending Account
Value (9/30/2004) | | Expenses Paid During
Period1 (4/1/2004 to
9/30/2004) | |
| Class A Actual | | $ | 1,000.00 | | | $ | 994.80 | | | $ | 3.09 | | |
| Class A Hypothetical (5% return before expenses) | | $ | 1,000.00 | | | $ | 1,021.90 | | | $ | 3.13 | | |
| Class B Actual | | $ | 1,000.00 | | | $ | 991.50 | | | $ | 6.82 | | |
| Class B Hypothetical (5% return before expenses) | | $ | 1,000.00 | | | $ | 1,018.15 | | | $ | 6.91 | | |
| Class C Actual | | $ | 1,000.00 | | | $ | 991.50 | | | $ | 6.82 | | |
| Class C Hypothetical (5% return before expenses) | | $ | 1,000.00 | | | $ | 1,018.15 | | | $ | 6.91 | | |
| Class R Actual2 | | $ | 1,000.00 | | | $ | 994.20 | | | $ | 3.72 | | |
| Class R Hypothetical (5% return before expenses)2 | | $ | 1,000.00 | | | $ | 1,021.27 | | | $ | 3.77 | | |
| Class Y Actual | | $ | 1,000.00 | | | $ | 996.50 | | | $ | 1.85 | | |
| Class Y Hypothetical (5% return before expenses) | | $ | 1,000.00 | | | $ | 1,023.15 | | | $ | 1.87 | | |
1Expenses are equal to the Fund's annualized expense ratio of 0.62%, 1.37%, 1.37%, 0.75%, and 0.37% for Class A, Class B, Class C, Class R, and Class Y, respectively, multiplied by the average account value over the period, multiplied by the number of days in the most recent half-year/366 days (to reflect the one-half year period).
2Prior to July 1, 2004, Class R had a different expense ratio. Had the current expense ratio been in place for the most recent one-half year, the actual and hypothetical expenses would have been $4.34 and $4.39, respectively.
FIRST AMERICAN FUNDS Annual Report 2004
4
Mid Cap Index fund
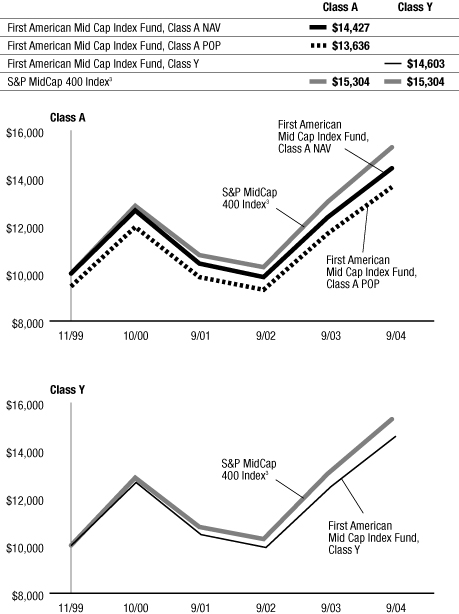
Investment Objective: to provide investment results that correspond to the performance of the Standard & Poor's MidCap 400 Composite Index (S&P MidCap 400 Index)
How did the Fund perform for the fiscal year ended September 30, 2004?
The First American Mid Cap Index Fund, Class Y shares, returned 16.97% for the fiscal year ended September 30, 2004 (Class A shares returned 16.80% at net asset value). By comparison, the Fund's benchmark, the Standard and Poor's MidCap 400 Index*, returned 17.55% for the same period.
How did general economic and market conditions affect performance?
The fiscal year saw the continuation of a rising economic tide. While stocks in general were up in excess of their long-term historical averages, small- and mid- capitalization stocks generally outperformed large- capitalization stocks as they were more leveraged to the improving economy. The Standard and Poor's MidCap 400 Index, constructed of stocks in the middle range of company size (companies with market capitalizations roughly in the range of $1 billion to $5 billion) reflected this as it returned more than 17% for the fiscal year. The same outperformance held true for value strategies vs. growth strategies. However, this did not add, or detract from the Index significantly, as it is positioned closely to a 50% growth, 50% value split.
As the year progressed, increasing oil prices and hints of wider-spread inflation started to weigh on the market and led the Federal Reserve to increase interest rates for the first time since May 2000. During the second half of the year, election rhetoric and the uncertainty of the election's outcome, coupled with decelerating company earnings growth rates, caused the market to "move sideways" – to neither grow nor decline much.
Fund Overview
The Fund is invested to replicate the Standard and Poor's MidCap 400 Index as closely as possible with consideration to turnover costs and fees. As a result, the Fund performed very similarly to the Index. The Index includes stocks that reflect the risk and return characteristics of the broader mid-cap universe. Mid-cap stocks are now being recognized as an independent asset class and this Index covers approximately 7% of the U.S. equities market.
Over the fiscal year, the largest contributor to performance for the Fund and the Index was the financials sector. Another contributor to performance was the consumer discretionary sector, which enjoyed strong returns as the economy expanded and consumers spent more money than they had in the last few years. Also, the Fund's allocation to the energy sector experienced a surge in returns as the demand for energy outstripped the supply.
The Fund's third largest sector allocation was to the information technology sector, which posted the least amount of return compared to the rest of the sectors. The telecommunications sector, which the Fund had a small position in, also experienced smaller returns compared to the other sectors in the Index. For the next fiscal year, we believe that mid-cap stocks will continue to be an important part of a diversified portfolio.
*Unlike mutual funds, index returns do not reflect any expenses, transaction costs, or cash flow effects.
| Top 10 Companies as of September 30, 20041 (% of net assets) | |
| Washington Post, Cl B | | | 0.9 | % | |
| XTO Energy | | | 0.9 | % | |
| Murphy Oil | | | 0.8 | % | |
| D.R. Horton | | | 0.8 | % | |
| Lennar | | | 0.8 | % | |
| Harmon International Industries | | | 0.7 | % | |
| L-3 Communications Holdings | | | 0.7 | % | |
| National Commerce Financial | | | 0.7 | % | |
| Weatherford International | | | 0.7 | % | |
| Fidelity National Financial | | | 0.7 | % | |
| Sector Allocation as of September 30, 20041 (% of net assets) | |
| Sector | | Fund2 | | S&P MidCap 400 Index3 | |
| Financials | | | 18.8 | % | | | 19.4 | % | |
| Consumer Discretionary | | | 18.2 | % | | | 18.5 | % | |
| Information Technology | | | 14.1 | % | | | 14.0 | % | |
| Industrials | | | 12.5 | % | | | 12.7 | % | |
| Healthcare | | | 10.0 | % | | | 10.2 | % | |
| Energy | | | 8.1 | % | | | 8.3 | % | |
| Utilities | | | 6.7 | % | | | 6.9 | % | |
| Materials | | | 4.8 | % | | | 4.9 | % | |
| Consumer Staples | | | 4.4 | % | | | 4.5 | % | |
| Telecommunication Services | | | 0.6 | % | | | 0.6 | % | |
1Fund holdings and sector allocations are subject to change at any time and are not recommendations to buy or sell any security.
2The percentages shown represent the allocation by industry as a percent of net assets of the Fund.
3The percentages shown represent the percent allocation by industry of the index.
FIRST AMERICAN FUNDS Annual Report 2004
5
Mid Cap Index fund continued
Annualized Performance1 as of September 30, 2004
| | | | | Since Inception | |
| | | 1 year | | 11/4/1999 | | 11/27/2000 | | 9/24/2001 | |
| Average annual return with sales charge (POP) | | | |
| Class A | | | 10.41 | % | | | 6.54 | % | | | - | | | | - | | |
| Class B | | | 10.88 | % | | | 6.71 | % | | | - | | | | - | | |
| Class C | | | 14.83 | % | | | - | | | | - | | | | 11.78 | % | |
| Average annual return without sales charge (NAV) | | | |
| Class A | | | 16.80 | % | | | 7.77 | % | | | - | | | | - | | |
| Class B | | | 15.88 | % | | | 7.02 | % | | | - | | | | - | | |
| Class C | | | 15.83 | % | | | - | | | | - | | | | 11.78 | % | |
| Class R4 | | | 16.62 | % | | | - | | | | 4.38 | % | | | - | | |
| Class Y | | | 16.97 | % | | | 8.02 | % | | | - | | | | - | | |
| S&P MidCap 400 Index3 | | | 17.55 | % | | | 9.06 | % | | | 5.49 | % | | | 13.62 | % | |
Value of a $10,000 Investment1, 2 as of September 30, 2004
The performance data quoted on this page represents past performance and does not guarantee future results. The investment return and principal value of an investment will fluctuate so that an investor's shares, when redeemed, may be worth more or less than their original cost. Current performance of the Fund may be lower or higher than the performance data quoted. Performance data current to the most recent month-end may be obtained by calling 800.677.FUND.
1 Performance does not reflect the deduction of taxes that a shareholder would pay on fund distributions or redemption of fund shares. Performance reflects voluntary fee waivers in effect. In the absence of such fee waivers, total returns would be reduced. Index performance is for illustrative purposes only and does not reflect any expenses, transaction costs, or cash flow effects. Direct investment in the index is not available.
Stocks of mid-capitalization companies may be slightly less volatile than those of small-capitalization companies, but they still involve substantial risk and may be subject to increased volatility and more price fluctuation than large-capitalization companies.
Total returns at net asset value ("NAV") reflect performance over the time period indicated without including the Fund's maximum sales charge and assume reinvestment of all distributions at NAV.
Total returns at public offering price ("POP") reflect performance over the time period indicated including a maximum front-end sales charge of 5.50% for Class A shares and the maximum contingent deferred sales charge ("CDSC") for Class B and Class C shares for the relevant period. Maximum CDSC is 5.00% for Class B shares, decreasing annually to 0% in the seventh year following purchase, and 1.00% for Class C shares. Total returns assume reinvestment of all distributions at NAV.
On September 24, 2001, the Mid Cap Index Fund became the successor fund by merging with the Firstar MidCap Index Fund, a series of the Firstar Funds, Inc. Prior to the merger, the First American Fund had no assets or liabilities. Performance presented prior to September 24, 2001, represents that of the Firstar MidCap Index Fund.
2 Performance for Class B, Class C, and Class R shares is not presented. Performance for these classes will vary due to different expense structures.
3 An unmanaged, capitalization-weighted index that represents the aggregate market value of the common equity of 400 companies chosen by Standard & Poor's with a median capitalization of approximately $700 million to measure the performance of the mid-range sector of the U.S. stock market.
4 Prior to July 1, 2004, Class R shares were designated Class S shares, which had lower fees and expenses. Performance information prior to that date is based on the performance of the Class S shares. If current fees and expenses had been in effect for the entire period presented, performance would have been lower. Please refer to the prospectus for details.
FIRST AMERICAN FUNDS Annual Report 2004
6
Mid Cap Index fund continued
Expense Example
As a shareholder of the Mid Cap Index Fund, you incur two types of costs: (1) transaction costs, including sales charges (loads) on purchase payments; and (2) ongoing costs, including management fees; distribution and/or service (12b-1) fees; and other Fund expenses. This example is intended to help you understand your ongoing costs (in dollars) of investing in the Fund and to compare these costs with the ongoing costs of investing in other mutual funds. The example is based on an investment of $1,000 invested at the beginning of the period and held for the entire period from April 1, 2004, to September 30, 2004.
Actual Expenses
For each class, the first line of the table below provides information about actual account values and actual expenses. You may use the information in this line, together with the amount you invested, to estimate the expenses that you paid over the period. Simply divide your account value by $1,000 (for example, an $8,600 account value divided by $1,000 = 8.6), then multiply the result by the number in the first line under the heading entitled "Expenses Paid During Period" to estimate the expenses you paid on your account during this period.
Hypothetical Example for Comparison Purposes
For each class, the second line of the table below provides information about hypothetical account values and hypothetical expenses based on the Fund's actual expense ratio and an assumed rate of return of 5% per year before expenses, which is not the Fund's actual return. The hypothetical account values and expenses may not be used to estimate the actual ending account balance or expenses you paid for the period. You may use this information to compare the ongoing costs of investing in the Fund and other funds. To do so, compare this 5% hypothetical example with the 5% hypothetical examples that appear in the shareholder reports of the other funds.
Please note that the expenses shown in the table are meant to highlight your ongoing costs only and do not reflect any transactional costs, such as sales charges (loads). Therefore, the second line of the table for each class is useful in comparing ongoing costs only, and will not help you determine the relative total costs of owning different funds. In addition, if these transactional costs were included, your costs would have been higher.
Expense Examples
| | | Beginning Account
Value (4/1/2004) | | Ending Account
Value (9/30/2004) | | Expenses Paid During
Period1 (4/1/2004 to
9/30/2004) | |
| Class A Actual | | $ | 1,000.00 | | | $ | 985.80 | | | $ | 3.72 | | |
| Class A Hypothetical (5% return before expenses) | | $ | 1,000.00 | | | $ | 1,021.25 | | | $ | 3.79 | | |
| Class B Actual | | $ | 1,000.00 | | | $ | 981.80 | | | $ | 7.43 | | |
| Class B Hypothetical (5% return before expenses) | | $ | 1,000.00 | | | $ | 1,017.50 | | | $ | 7.57 | | |
| Class C Actual | | $ | 1,000.00 | | | $ | 981.90 | | | $ | 7.43 | | |
| Class C Hypothetical (5% return before expenses) | | $ | 1,000.00 | | | $ | 1,017.50 | | | $ | 7.57 | | |
| Class R Actual2 | | $ | 1,000.00 | | | $ | 984.20 | | | $ | 4.34 | | |
| Class R Hypothetical (5% return before expenses)2 | | $ | 1,000.00 | | | $ | 1,020.62 | | | $ | 4.42 | | |
| Class Y Actual | | $ | 1,000.00 | | | $ | 986.20 | | | $ | 2.48 | | |
| Class Y Hypothetical (5% return before expenses) | | $ | 1,000.00 | | | $ | 1,022.50 | | | $ | 2.53 | | |
1Expenses are equal to the Fund's annualized expense ratio of 0.75%, 1.50%, 1.50%, 0.88%, and 0.50% for Class A, Class B, Class C, Class R, and Class Y, respectively, multiplied by the average account value over the period, multiplied by the number of days in the most recent half-year/366 days (to reflect the one-half year period).
2Prior to July 1, 2004, Class R had a different expense ratio. Had the current expense ratio been in place for the most recent one-half year, the actual and hypothetical expenses would have been $4.96 and $5.05, respectively.
FIRST AMERICAN FUNDS Annual Report 2004
7
Small Cap Index fund
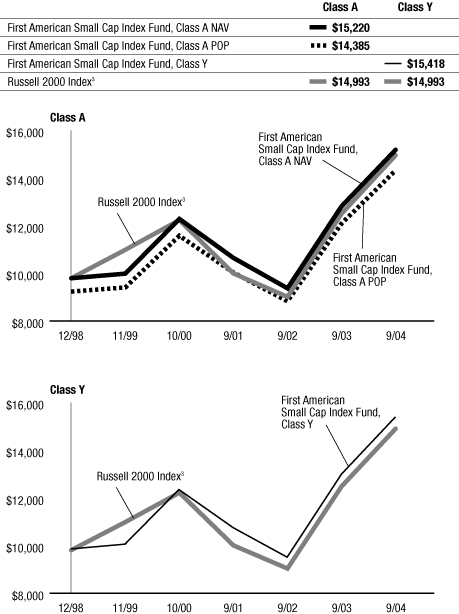
Investment Objective: to provide investment results that correspond to the performance of the Russell 2000 Index
How did the Fund perform for the fiscal year ended September 30, 2004?
The First American Small Cap Index Fund, Class Y shares, returned 18.02% for the fiscal year ended September 30, 2004 (Class A shares returned 17.71% at net asset value). By comparison, the Fund's benchmark, the Russell 2000 Index*, returned 18.77% for the same period.
How did general economic and market conditions affect performance?
The fiscal year saw the continuation of a rising economic tide. While stocks in general were up in excess of their long-term historical averages, small- and mid- capitalization stocks generally outperformed large- capitalization stocks as they were more leveraged to the improving economy. The Russell 2000 Index, constructed of small-capitalization stocks, reflected this as it returned more than 18% for the year. The same outperformance held true for value strategies vs. growth. However, this did not add or detract from the Index significantly because every June the Index rebalances back to a 50% growth stocks and 50% value stocks strategy.
As the year progressed, increasing oil prices and hints of wider-spread inflation started to weigh on the market and led the Federal Reserve to increase interest rates for the first time since May 2000. During the second half of the year, election rhetoric and the uncertainty of the election's outcome, coupled with decelerating company earnings growth rates, caused the market to "move sideways" – to neither grow nor decline much. Regardless, the small-capitalization companies saw a surge in profits as the demand for materials and energy rose and the economy expanded.
| Top 10 Companies as of September 30, 20041 (% of net assets) | |
| Terex | | | 0.2 | % | |
| Valeant Pharmaceuticals International | | | 0.2 | % | |
| IMC Global | | | 0.2 | % | |
| Tesoro Petroleum | | | 0.2 | % | |
| Cytec Industries | | | 0.2 | % | |
| Energen | | | 0.2 | % | |
| Plains Exploration & Production | | | 0.2 | % | |
| Healthcare Realty Trust (REIT) | | | 0.2 | % | |
| BancorpSouth | | | 0.2 | % | |
| FMC | | | 0.2 | % | |
Fund Overview
The Fund is invested to mirror the stocks of the Russell 2000 Index as closely as possible with sensitivity to turnover costs. As a result, the overall total return of the Fund for the fiscal year was very similar to that of the Index. Like the Index, the Fund benefited from its 15% weighting in the consumer discretionary sector as the economy was expanding and consumers spent more money during the fiscal year than they had in each of the past several years. In addition, the Fund's exposure to materials, with a 6% weighting, and to energy, with a 6% weighting, added to the positive return of the Fund during a time when the demand for materials and energy outstripped the supply. The largest contributor to performance was the financials sector. It was also the Fund's largest sector weighting at 22%.
The largest detractor from performance was the information technology sector. The Fund held a 17% position as the sector posted disappointing results across the market. (The small-cap stocks in that sector did fare better than the large-caps.) Another detractor was the telecommunication services sector, which returned slightly negative results. The Fund only held a 1% position in that sector. We believe that as the economy rolls into its next phase small-cap stocks will continue to be an important part of a diversified portfolio.
*Unlike mutual funds, index returns do not reflect any expenses, transaction costs, or cash flow effects.
| Sector Allocation as of September 30, 20041 (% of net assets) | |
| Sector | | Fund2 | | Russell 2000 Index3 | |
| Financials | | | 22.2 | % | | | 22.5 | % | |
| Information Technology | | | 16.8 | % | | | 17.0 | % | |
| Consumer Discretionary | | | 14.7 | % | | | 14.8 | % | |
| Industrials | | | 13.7 | % | | | 14.0 | % | |
| Healthcare | | | 12.8 | % | | | 12.9 | % | |
| Materials | | | 6.2 | % | | | 6.3 | % | |
| Energy | | | 5.5 | % | | | 5.5 | % | |
| Utilities | | | 3.3 | % | | | 3.3 | % | |
| Consumer Staples | | | 2.7 | % | | | 2.7 | % | |
| Telecommunication Services | | | 0.9 | % | | | 0.9 | % | |
1Fund holdings and sector allocations are subject to change at any time and are not recommendations to buy or sell any security.
2The percentages shown represent the allocation by industry as a percent of net assets of the Fund.
3The percentages shown represent the percent allocation by industry of the index.
FIRST AMERICAN FUNDS Annual Report 2004
8
Small Cap Index fund continued
Annualized Performance1 as of September 30, 2004
| | | | | | | Since Inception | |
| | | 1 year | | 5 years | | 12/30/1998 | | 12/11/2000 | | 9/24/2001 | |
| Average annual return with sales charge (POP) | |
| Class A | | | 11.21 | % | | | 7.96 | % | | | 6.53 | % | | | - | | | | - | | |
| Class B | | | 11.83 | % | | | - | | | | - | | | | 4.40 | % | | | - | | |
| Class C | | | 15.77 | % | | | - | | | | - | | | | - | | | | 12.02 | % | |
| Average annual return without sales charge (NAV) | |
| Class A | | | 17.71 | % | | | 9.19 | % | | | 7.58 | % | | | - | | | | - | | |
| Class B | | | 16.83 | % | | | - | | | | - | | | | 5.10 | % | | | - | | |
| Class C | | | 16.77 | % | | | - | | | | - | | | | - | | | | 12.02 | % | |
| Class R4 | | | 17.65 | % | | | 9.09 | % | | | 7.47 | % | | | - | | | | - | | |
| Class Y | | | 18.02 | % | | | 9.44 | % | | | 7.82 | % | | | - | | | | - | | |
| Russell 2000 Index3 | | | 18.77 | % | | | 7.41 | % | | | 7.30 | % | | | 5.75 | % | | | 14.71 | % | |
Value of a $10,000 Investment1, 2 as of September 30, 2004
The performance data quoted on this page represents past performance and does not guarantee future results. The investment return and principal value of an investment will fluctuate so that an investor's shares, when redeemed, may be worth more or less than their original cost. Current performance of the Fund may be lower or higher than the performance data quoted. Performance data current to the most recent month-end may be obtained by calling 800.677.FUND.
1 Performance does not reflect the deduction of taxes that a shareholder would pay on fund distributions or redemption of fund shares. Performance reflects voluntary fee waivers in effect. In the absence of such fee waivers, total returns would be reduced. Index performance is for illustrative purposes only and does not reflect any expenses, transaction costs, or cash flow effects. Direct investment in the index is not available.
Stocks of small-capitalization companies involve substantial risk. These stocks historically have experienced greater price volatility than stocks of larger companies, and they may be expected to do so in the future.
Total returns at net asset value ("NAV") reflect performance over the time period indicated without including the Fund's maximum sales charge and assume reinvestment of all distributions at NAV.
Total returns at public offering price ("POP") reflect performance over the time period indicated including a maximum front-end sales charge of 5.50% for Class A shares and the maximum contingent deferred sales charge ("CDSC") for Class B and Class C shares for the relevant period. Maximum CDSC is 5.00% for Class B shares, decreasing annually to 0% in the seventh year following purchase, and 1.00% for Class C shares. Total returns assume reinvestment of all distributions at NAV.
On September 24, 2001, the Small Cap Index Fund became the successor fund by merging with the Firstar Small Cap Index Fund, a series of the Firstar Funds, Inc. Prior to the merger, the First American Fund had no assets or liabilities. Performance presented prior to September 24, 2001, represents that of the Firstar Small Cap Index Fund. The Firstar Small Cap Index Fund was organized on December 11, 2000, and, prior to that, was a separate series of Mercantile Mutual Funds, Inc.
2 Performance for Class B, Class C, and Class R shares is not presented. Performance for these classes will vary due to different expense structures.
3 An unmanaged index that measures the performance of the 2,000 smallest companies in the Russell 3000 Index. The Russell 3000 Index measures the performance of the 3,000 largest U.S. companies based on total market capitalization, which represents approximately 98% of the investable U.S. equity market.
4 Prior to July 1, 2004, Class R shares were designated Class S shares, which had lower fees and expenses. Performance information prior to that date is based on the performance of the Class S shares. If current fees and expenses had been in effect for the entire period presented, performance would have been lower. Please refer to the prospectus for details.
FIRST AMERICAN FUNDS Annual Report 2004
9
Small Cap Index fund continued
Expense Example
As a shareholder of the Small Cap Index Fund, you incur two types of costs: (1) transaction costs, including sales charges (loads) on purchase payments; and (2) ongoing costs, including management fees; distribution and/or service (12b-1) fees; and other Fund expenses. This example is intended to help you understand your ongoing costs (in dollars) of investing in the Fund and to compare these costs with the ongoing costs of investing in other mutual funds. The example is based on an investment of $1,000 invested at the beginning of the period and held for the entire period from April 1, 2004, to September 30, 2004.
Actual Expenses
For each class, the first line of the table below provides information about actual account values and actual expenses. You may use the information in this line, together with the amount you invested, to estimate the expenses that you paid over the period. Simply divide your account value by $1,000 (for example, an $8,600 account value divided by $1,000 = 8.6), then multiply the result by the number in the first line under the heading entitled "Expenses Paid During Period" to estimate the expenses you paid on your account during this period.
Hypothetical Example for Comparison Purposes
For each class, the second line of the table below provides information about hypothetical account values and hypothetical expenses based on the Fund's actual expense ratio and an assumed rate of return of 5% per year before expenses, which is not the Fund's actual return. The hypothetical account values and expenses may not be used to estimate the actual ending account balance or expenses you paid for the period. You may use this information to compare the ongoing costs of investing in the Fund and other funds. To do so, compare this 5% hypothetical example with the 5% hypothetical examples that appear in the shareholder reports of the other funds.
Please note that the expenses shown in the table are meant to highlight your ongoing costs only and do not reflect any transactional costs, such as sales charges (loads). Therefore, the second line of the table for each class is useful in comparing ongoing costs only, and will not help you determine the relative total costs of owning different funds. In addition, if these transactional costs were included, your costs would have been higher.
Expense Examples
| | | Beginning Account
Value (4/1/2004) | | Ending Account
Value (9/30/2004) | | Expenses Paid During
Period1 (4/1/2004 to
9/30/2004) | |
| Class A Actual | | $ | 1,000.00 | | | $ | 971.40 | | | $ | 4.58 | | |
| Class A Hypothetical (5% return before expenses) | | $ | 1,000.00 | | | $ | 1,020.35 | | | $ | 4.70 | | |
| Class B Actual | | $ | 1,000.00 | | | $ | 967.60 | | | $ | 8.26 | | |
| Class B Hypothetical (5% return before expenses) | | $ | 1,000.00 | | | $ | 1,016.60 | | | $ | 8.47 | | |
| Class C Actual | | $ | 1,000.00 | | | $ | 967.90 | | | $ | 8.27 | | |
| Class C Hypothetical (5% return before expenses) | | $ | 1,000.00 | | | $ | 1,016.60 | | | $ | 8.47 | | |
| Class R Actual2 | | $ | 1,000.00 | | | $ | 970.70 | | | $ | 5.20 | | |
| Class R Hypothetical (5% return before expenses)2 | | $ | 1,000.00 | | | $ | 1,019.72 | | | $ | 5.33 | | |
| Class Y Actual | | $ | 1,000.00 | | | $ | 972.70 | | | $ | 3.35 | | |
| Class Y Hypothetical (5% return before expenses) | | $ | 1,000.00 | | | $ | 1,021.60 | | | $ | 3.44 | | |
1Expenses are equal to the Fund's annualized expense ratio of 0.93%, 1.68%, 1.68%, 1.06%, and 0.68% for Class A, Class B, Class C, Class R, and Class Y, respectively, multiplied by the average account value over the period, multiplied by the number of days in the most recent half-year/366 days (to reflect the one-half year period).
2Prior to July 1, 2004, Class R had a different expense ratio. Had the current expense ratio been in place for the most recent one-half year, the actual and hypothetical expenses would have been $5.81 and $5.96, respectively.
FIRST AMERICAN FUNDS Annual Report 2004
10
Report of Independent Registered Public Accounting Firm
To the Shareholders and Board of Directors
First American Investment Funds, Inc.
We have audited the accompanying statements of assets and liabilities, including the schedules of investments, of the Equity Index, Mid Cap Index, and Small Cap Index Funds (constituting First American Investment Funds, Inc.) (the "Funds") as of September 30, 2004, and the related statements of operations, statements of changes in net assets and the financial highlights for each of the periods indicated therein, except as noted below. These financial statements and financial highlights are the responsibility of the Funds' management. Our responsibility is to express an opinion on these financial statements and financial highlights based on our audits. The financial highlights of the Mid Cap Index and Small Cap Index Funds for the periods presented through October 31, 2000, were audited by other auditors whose reports dated December 29, 2000, and January 21, 2000, expressed unqualified opin ions on those financial highlights.
We conducted our audits in accordance with the standards of the Public Company Accounting Oversight Board (United States). Those standards require that we plan and perform the audit to obtain reasonable assurance about whether the financial statements and financial highlights are free of material misstatement. An audit includes examining, on a test basis, evidence supporting the amounts and disclosures in the financial statements and financial highlights. Our procedures included confirmation of securities owned as of September 30, 2004, by correspondence with the custodian and brokers or by other appropriate auditing procedures where replies from brokers were not received. An audit also includes assessing the accounting principles used and significant estimates made by management, as well as evaluating t he overall financial statement presentation. We believe that our audits provide a reasonable basis for our opinion.
In our opinion, the financial statements and financial highlights audited by us as referred to above present fairly, in all material respects, the financial position of the funds listed above of the First American Investment Funds, Inc. at September 30, 2004, the results of their operations for the year then ended, the changes in their net assets for each of the two years in the period then ended and their financial highlights for each of the periods indicated herein in conformity with U.S. generally accepted accounting principles.

Minneapolis, Minnesota
November 12, 2004
FIRST AMERICAN FUNDS Annual Report 2004
11
Schedule of Investments September 30, 2004
Equity Index Fund
| DESCRIPTION | | SHARES | | VALUE (000) | |
| Common Stocks – 99.1% | |
| Consumer Discretionary – 10.4% | |
| AutoNation* (a) | | | 63,170 | | | $ | 1,079 | | |
| Autozone* (a) | | | 18,994 | | | | 1,467 | | |
| Bed Bath & Beyond* (a) | | | 65,823 | | | | 2,443 | | |
| Best Buy | | | 71,623 | | | | 3,885 | | |
| Big Lots* (a) | | | 25,598 | | | | 313 | | |
| Black & Decker (a) | | | 17,429 | | | | 1,350 | | |
| Boise Cascade | | | 19,245 | | | | 640 | | |
| Brunswick | | | 20,653 | | | | 945 | | |
| Carnival (a) | | | 138,973 | | | | 6,572 | | |
| Centex (a) | | | 27,084 | | | | 1,367 | | |
| Circuit City Stores | | | 45,805 | | | | 703 | | |
| Clear Channel Communications | | | 132,595 | | | | 4,133 | | |
| Coach* | | | 40,358 | | | | 1,712 | | |
| Comcast, Cl A* (a) | | | 494,865 | | | | 13,975 | | |
| Cooper Tire & Rubber | | | 16,239 | | | | 328 | | |
| Dana | | | 32,596 | | | | 577 | | |
| Darden Restaurants | | | 36,139 | | | | 843 | | |
| Delphi | | | 122,883 | | | | 1,142 | | |
| Dillards, Cl A | | | 18,202 | | | | 359 | | |
| Dollar General | | | 74,345 | | | | 1,498 | | |
| Dow Jones & Company (a) | | | 17,862 | | | | 725 | | |
| Eastman Kodak (a) | | | 62,841 | | | | 2,025 | | |
| Family Dollar Stores | | | 36,938 | | | | 1,001 | | |
| Federated Department Stores | | | 40,655 | | | | 1,847 | | |
| Ford Motor (a) | | | 401,796 | | | | 5,645 | | |
| Fortune Brands (a) | | | 31,855 | | | | 2,360 | | |
| Gannett (a) | | | 59,794 | | | | 5,008 | | |
| Gap (a) | | | 197,891 | | | | 3,701 | | |
| General Motors (a) | | | 124,250 | | | | 5,278 | | |
| Genuine Parts | | | 38,378 | | | | 1,473 | | |
| Goodyear Tire & Rubber* (a) | | | 38,453 | | | | 413 | | |
| Harley-Davidson (a) | | | 65,012 | | | | 3,864 | | |
| Harrah's Entertainment (a) | | | 24,552 | | | | 1,301 | | |
| Hasbro (a) | | | 38,097 | | | | 716 | | |
| Hilton Hotels | | | 83,688 | | | | 1,577 | | |
| Home Depot (a) | | | 484,706 | | | | 19,000 | | |
| International Game Technology | | | 76,500 | | | | 2,750 | | |
| Interpublic Group of Companies* (a) | | | 86,061 | | | | 911 | | |
| J.C. Penney | | | 60,912 | | | | 2,149 | | |
| Johnson Controls (a) | | | 41,596 | | | | 2,363 | | |
| Jones Apparel Group (a) | | | 27,759 | | | | 994 | | |
| KB HOME (a) | | | 10,313 | | | | 871 | | |
| Knight-Ridder | | | 17,633 | | | | 1,154 | | |
| Kohl's* (a) | | | 74,453 | | | | 3,588 | | |
| Leggett & Platt (a) | | | 42,197 | | | | 1,186 | | |
| Limited (a) | | | 103,812 | | | | 2,314 | | |
| Liz Claiborne (a) | | | 24,074 | | | | 908 | | |
| Lowe's (a) | | | 172,551 | | | | 9,378 | | |
| Marriott International, Cl A (a) | | | 49,831 | | | | 2,589 | | |
| Mattel (a) | | | 93,045 | | | | 1,687 | | |
| May Department Stores | | | 61,940 | | | | 1,588 | | |
| Maytag (a) | | | 17,062 | | | | 313 | | |
| McDonald's | | | 277,698 | | | | 7,784 | | |
| McGraw-Hill (a) | | | 41,936 | | | | 3,342 | | |
| Meredith | | | 9,157 | | | | 471 | | |
| New York Times, Cl A | | | 32,775 | | | | 1,282 | | |
| Newell Rubbermaid (a) | | | 60,178 | | | | 1,206 | | |
| Nike, Cl B (a) | | | 57,849 | | | | 4,559 | | |
| Nordstrom | | | 30,318 | | | | 1,159 | | |
| Office Depot* (a) | | | 67,954 | | | | 1,021 | | |
| Omnicom Group (a) | | | 41,681 | | | | 3,045 | | |
| Pulte | | | 29,870 | | | | 1,833 | | |
| RadioShack | | | 36,313 | | | | 1,040 | | |
| Reebok International | | | 13,213 | | | | 485 | | |
| Sears Roebuck and Company (a) | | | 55,066 | | | | 2,194 | | |
Equity Index Fund (continued)
| DESCRIPTION | | SHARES | | VALUE (000) | |
| Sherwin Williams | | | 32,012 | | | $ | 1,407 | | |
| Snap-On | | | 12,798 | | | | 353 | | |
| Stanley Works (a) | | | 18,659 | | | | 794 | | |
| Staples (a) | | | 110,151 | | | | 3,285 | | |
| Starbucks* (a) | | | 87,386 | | | | 3,973 | | |
| Starwood Hotels & Resorts Worldwide (a) | | | 45,200 | | | | 2,098 | | |
| Target (a) | | | 198,945 | | | | 9,002 | | |
| Tiffany & Company (a) | | | 32,351 | | | | 994 | | |
| Time Warner* (a) | | | 1,005,238 | | | | 16,225 | | |
| TJX (a) | | | 109,024 | | | | 2,403 | | |
| Toys 'R' Us* (a) | | | 46,791 | | | | 830 | | |
| Tribune (a) | | | 72,831 | | | | 2,997 | | |
| Univision Communications, Cl A* (a) | | | 70,413 | | | | 2,226 | | |
| V.F. (a) | | | 24,208 | | | | 1,197 | | |
| Viacom, Cl B (a) | | | 385,878 | | | | 12,950 | | |
| Visteon (a) | | | 28,607 | | | | 229 | | |
| Walt Disney* (a) | | | 448,223 | | | | 10,107 | | |
| Wendy's International | | | 24,887 | | | | 836 | | |
| Whirlpool (a) | | | 15,098 | | | | 907 | | |
| Yum! Brands (a) | | | 63,754 | | | | 2,592 | | |
| | | | 240,834 | | |
| Consumer Staples – 10.6% | | | |
| Adolph Coors | | | 7,976 | | | | 542 | | |
| Alberto-Culver, Cl B | | | 19,336 | | | | 841 | | |
| Albertson's (a) | | | 80,472 | | | | 1,926 | | |
| Altria Group | | | 447,691 | | | | 21,059 | | |
| Anheuser-Busch (a) | | | 178,390 | | | | 8,911 | | |
| Archer-Daniels-Midland | | | 142,943 | | | | 2,427 | | |
| Avon Products (a) | | | 103,606 | | | | 4,526 | | |
| Brown-Forman, Cl B | | | 26,616 | | | | 1,219 | | |
| Campbell Soup | | | 90,034 | | | | 2,367 | | |
| Clorox | | | 46,733 | | | | 2,491 | | |
| Coca-Cola | | | 537,731 | | | | 21,536 | | |
| Coca-Cola Enterprises | | | 101,237 | | | | 1,913 | | |
| Colgate-Palmolive | | | 117,202 | | | | 5,295 | | |
| ConAgra Foods (a) | | | 117,773 | | | | 3,028 | | |
| Costco Wholesale (a) | | | 100,250 | | | | 4,166 | | |
| CVS | | | 87,445 | | | | 3,684 | | |
| General Mills (a) | | | 82,685 | | | | 3,713 | | |
| Gillette (a) | | | 221,040 | | | | 9,226 | | |
| H.J. Heinz | | | 77,130 | | | | 2,778 | | |
| Hershey Foods (a) | | | 57,294 | | | | 2,676 | | |
| Kellogg (a) | | | 90,972 | | | | 3,881 | | |
| Kimberly-Clark | | | 110,627 | | | | 7,145 | | |
| Kroger* (a) | | | 164,798 | | | | 2,558 | | |
| McCormick | | | 30,590 | | | | 1,050 | | |
| Pepsi Bottling | | | 58,873 | | | | 1,598 | | |
| PepsiCo | | | 376,580 | | | | 18,321 | | |
| Procter & Gamble | | | 562,578 | | | | 30,447 | | |
| Reynolds American (a) | | | 34,110 | | | | 2,321 | | |
| Safeway* (a) | | | 98,365 | | | | 1,899 | | |
| Sara Lee | | | 174,534 | | | | 3,990 | | |
| SUPERVALU | | | 29,361 | | | | 809 | | |
| Sysco | | | 142,480 | | | | 4,263 | | |
| UST (a) | | | 35,826 | | | | 1,442 | | |
| Walgreen (a) | | | 221,602 | | | | 7,940 | | |
| Wal-Mart Stores | | | 935,567 | | | | 49,772 | | |
| Winn-Dixie Stores* (a) | | | 30,883 | | | | 95 | | |
| Wrigley, William Jr. (a) | | | 49,363 | | | | 3,125 | | |
| | | | 244,980 | | |
| Energy – 7.3% | | | |
| Amerada Hess (a) | | | 19,730 | | | | 1,756 | | |
| Anadarko Petroleum | | | 54,724 | | | | 3,631 | | |
| Apache | | | 70,968 | | | | 3,556 | | |
| Ashland | | | 14,969 | | | | 839 | | |
| Baker Hughes (a) | | | 73,406 | | | | 3,209 | | |
The accompanying notes are an integral part of the financial statements.
FIRST AMERICAN FUNDS Annual Report 2004
12
Equity Index Fund (continued)
| DESCRIPTION | | SHARES | | VALUE (000) | |
| BJ Services (a) | | | 36,113 | | | $ | 1,893 | | |
| Burlington Resources (a) | | | 88,044 | | | | 3,592 | | |
| ChevronTexaco | | | 464,154 | | | | 24,897 | | |
| ConocoPhillips | | | 150,924 | | | | 12,504 | | |
| Devon Energy | | | 51,651 | | | | 3,668 | | |
| El Paso (a) | | | 153,577 | | | | 1,411 | | |
| EOG Resources (a) | | | 25,821 | | | | 1,700 | | |
| Exxon Mobil (a) | | | 1,444,462 | | | | 69,811 | | |
| Halliburton | | | 96,045 | | | | 3,236 | | |
| Kerr-McGee (a) | | | 31,706 | | | | 1,815 | | |
| Kinder Morgan | | | 27,036 | | | | 1,698 | | |
| Marathon Oil | | | 74,934 | | | | 3,093 | | |
| Nabors Industries* (a) | | | 32,780 | | | | 1,552 | | |
| Noble* (a) | | | 29,313 | | | | 1,318 | | |
| Occidental Petroleum | | | 85,544 | | | | 4,784 | | |
| Rowan* (a) | | | 22,973 | | | | 607 | | |
| Schlumberger (a) | | | 129,674 | | | | 8,729 | | |
| Sunoco (a) | | | 16,876 | | | | 1,249 | | |
| Transocean* (a) | | | 75,972 | | | | 2,718 | | |
| Unocal | | | 56,664 | | | | 2,437 | | |
| Valero Energy | | | 27,530 | | | | 2,208 | | |
| Williams (a) | | | 113,602 | | | | 1,375 | | |
| | | | 169,286 | | |
| Financials – 20.5% | | | |
| ACE | | | 62,060 | | | | 2,486 | | |
| AFLAC | | | 112,037 | | | | 4,393 | | |
| Allstate (a) | | | 154,867 | | | | 7,432 | | |
| Ambac Financial Group (a) | | | 23,879 | | | | 1,909 | | |
| American Express (a) | | | 280,947 | | | | 14,458 | | |
| American International Group | | | 575,040 | | | | 39,097 | | |
| AmSouth Bancorp (a) | | | 76,916 | | | | 1,877 | | |
| AON (a) | | | 68,617 | | | | 1,972 | | |
| Apartment Investment & Management | | | 20,738 | | | | 721 | | |
| Bank of America (a) | | | 912,272 | | | | 39,529 | | |
| Bank of New York | | | 170,289 | | | | 4,967 | | |
| BB&T (a) | | | 119,746 | | | | 4,753 | | |
| Bear Stearns (a) | | | 23,961 | | | | 2,304 | | |
| Capital One Financial (a) | | | 52,683 | | | | 3,893 | | |
| Charles Schwab (a) | | | 299,254 | | | | 2,750 | | |
| Chubb | | | 41,118 | | | | 2,890 | | |
| Cincinnati Financial | | | 36,940 | | | | 1,523 | | |
| Citigroup | | | 1,137,334 | | | | 50,179 | | |
| Comerica | | | 38,440 | | | | 2,281 | | |
| Countrywide Financial (a) | | | 121,458 | | | | 4,784 | | |
| E*TRADE Financial* | | | 80,500 | | | | 919 | | |
| Equity Office Properties Trust (REIT) | | | 88,187 | | | | 2,403 | | |
| Equity Residential Properties Trust (REIT) | | | 59,846 | | | | 1,855 | | |
| Fannie Mae (a) | | | 213,582 | | | | 13,541 | | |
| Federated Investors, Cl B | | | 23,820 | | | | 677 | | |
| Fifth Third Bancorp | | | 124,965 | | | | 6,151 | | |
| First Horizon National (a) | | | 27,595 | | | | 1,197 | | |
| Franklin Resources | | | 55,045 | | | | 3,069 | | |
| Freddie Mac (a) | | | 151,657 | | | | 9,894 | | |
| Golden West Financial (a) | | | 33,622 | | | | 3,730 | | |
| Goldman Sachs Group (a) | | | 106,620 | | | | 9,941 | | |
| Hartford Financial Services Group (a) | | | 64,269 | | | | 3,980 | | |
| Huntington Bancshares | | | 50,162 | | | | 1,250 | | |
| J. P. Morgan Chase | | | 779,931 | | | | 30,987 | | |
| Janus Capital Group (a) | | | 52,481 | | | | 714 | | |
| Jefferson-Pilot | | | 31,093 | | | | 1,544 | | |
| KeyCorp | | | 90,776 | | | | 2,869 | | |
| Lehman Brothers Holdings (a) | | | 61,157 | | | | 4,875 | | |
| Lincoln National | | | 38,985 | | | | 1,832 | | |
| Loew's | | | 40,676 | | | | 2,380 | | |
| M & T Bank | | | 25,810 | | | | 2,470 | | |
| Marsh & McLennan (a) | | | 116,762 | | | | 5,343 | | |
| Marshall & Ilsley | | | 49,857 | | | | 2,009 | | |
Equity Index Fund (continued)
| DESCRIPTION | | SHARES | | VALUE (000) | |
| MBIA | | | 31,789 | | | $ | 1,850 | | |
| MBNA (a) | | | 280,223 | | | | 7,062 | | |
| Mellon Financial | | | 94,446 | | | | 2,615 | | |
| Merrill Lynch (a) | | | 210,966 | | | | 10,489 | | |
| Metlife | | | 167,143 | | | | 6,460 | | |
| MGIC Investment (a) | | | 21,758 | | | | 1,448 | | |
| Moody's (a) | | | 32,559 | | | | 2,385 | | |
| Morgan Stanley | | | 241,983 | | | | 11,930 | | |
| National City | | | 148,105 | | | | 5,720 | | |
| North Fork Bancorp (a) | | | 49,755 | | | | 2,212 | | |
| Northern Trust | | | 48,426 | | | | 1,976 | | |
| Plum Creek Timber (a) | | | 39,206 | | | | 1,373 | | |
| PNC Financial Services | | | 61,431 | | | | 3,323 | | |
| Principal Financial Group (a) | | | 70,990 | | | | 2,554 | | |
| Progressive (a) | | | 47,650 | | | | 4,038 | | |
| Prologis | | | 39,350 | | | | 1,387 | | |
| Providian Financial* (a) | | | 63,639 | | | | 989 | | |
| Prudential Financial | | | 116,880 | | | | 5,498 | | |
| Regions Financial (a) | | | 102,922 | | | | 3,403 | | |
| SAFECO | | | 27,495 | | | | 1,255 | | |
| Simon Property Group (REIT) (a) | | | 43,080 | | | | 2,310 | | |
| SLM (a) | | | 96,690 | | | | 4,312 | | |
| SouthTrust | | | 74,031 | | | | 3,084 | | |
| Sovereign Bancorp | | | 75,782 | | | | 1,653 | | |
| St. Paul Travelers Companies (a) | | | 145,686 | | | | 4,816 | | |
| State Street | | | 73,985 | | | | 3,160 | | |
| SunTrust Banks (a) | | | 61,734 | | | | 4,347 | | |
| Synovus Financial | | | 66,109 | | | | 1,729 | | |
| T. Rowe Price Group | | | 27,766 | | | | 1,414 | | |
| Torchmark | | | 24,517 | | | | 1,304 | | |
| U.S. Bancorp (b) | | | 423,524 | | | | 12,240 | | |
| UnumProvident (a) | | | 66,337 | | | | 1,041 | | |
| Wachovia | | | 288,820 | | | | 13,560 | | |
| Washington Mutual | | | 195,326 | | | | 7,633 | | |
| Wells Fargo | | | 368,358 | | | | 21,965 | | |
| XL Capital Limited, Cl A | | | 29,959 | | | | 2,217 | | |
| Zions Bancorporation | | | 19,680 | | | | 1,201 | | |
| | | | 473,781 | | |
| Health Care – 12.9% | | | |
| Abbott Laboratories | | | 342,708 | | | | 14,517 | | |
| Aetna (a) | | | 33,747 | | | | 3,372 | | |
| Allergan (a) | | | 28,636 | | | | 2,078 | | |
| AmerisourceBergen (a) | | | 24,544 | | | | 1,318 | | |
| Amgen* (a) | | | 282,203 | | | | 15,995 | | |
| Anthem* (a) | | | 30,406 | | | | 2,653 | | |
| Applied Biosystems Group – Applera | | | 45,828 | | | | 865 | | |
| Bausch & Lomb (a) | | | 11,422 | | | | 759 | | |
| Baxter International (a) | | | 134,633 | | | | 4,330 | | |
| Becton, Dickinson & Company | | | 55,693 | | | | 2,879 | | |
| Biogen IDEC* (a) | | | 74,622 | | | | 4,565 | | |
| Biomet (a) | | | 55,397 | | | | 2,597 | | |
| Boston Scientific* (a) | | | 184,244 | | | | 7,320 | | |
| Bristol-Myers Squibb | | | 427,404 | | | | 10,117 | | |
| C.R. Bard | | | 21,220 | | | | 1,202 | | |
| Cardinal Health | | | 97,603 | | | | 4,272 | | |
| Caremark Rx* (a) | | | 98,300 | | | | 3,153 | | |
| Chiron* (a) | | | 41,370 | | | | 1,829 | | |
| CIGNA | | | 31,178 | | | | 2,171 | | |
| Eli Lilly (a) | | | 246,594 | | �� | | 14,808 | | |
| Express Scripts* (a) | | | 16,900 | | | | 1,104 | | |
| Fisher Scientific International* (a) | | | 25,083 | | | | 1,463 | | |
| Forest Laboratories, Cl A* (a) | | | 81,603 | | | | 3,671 | | |
| Genzyme* (a) | | | 49,447 | | | | 2,690 | | |
| Gilead Sciences* (a) | | | 94,320 | | | | 3,526 | | |
| Guidant (a) | | | 68,714 | | | | 4,538 | | |
| HCA | | | 109,341 | | | | 4,171 | | |
| Health Management Associates, Cl A (a) | | | 52,601 | | | | 1,075 | | |
FIRST AMERICAN FUNDS Annual Report 2004
13
Schedule of Investments September 30, 2004
Equity Index Fund (continued)
| DESCRIPTION | | SHARES | | VALUE (000) | |
| Hospira* | | | 34,270 | | | $ | 1,049 | | |
| Humana* | | | 35,458 | | | | 708 | | |
| IMS Health | | | 55,643 | | | | 1,331 | | |
| Johnson & Johnson (a) | | | 650,959 | | | | 36,669 | | |
| King Pharmaceuticals* (a) | | | 52,869 | | | | 631 | | |
| Manor Care | | | 19,538 | | | | 585 | | |
| McKesson HBOC (a) | | | 64,598 | | | | 1,657 | | |
| Medco Health Solutions* | | | 59,313 | | | | 1,833 | | |
| MedImmune* (a) | | | 54,798 | | | | 1,299 | | |
| Medtronic | | | 267,408 | | | | 13,878 | | |
| Merck | | | 491,033 | | | | 16,204 | | |
| Millipore* | | | 10,677 | | | | 511 | | |
| Mylan Laboratories | | | 59,250 | | | | 1,067 | | |
| PerkinElmer | | | 27,078 | | | | 466 | | |
| Pfizer | | | 1,675,135 | | | | 51,259 | | |
| Quest Diagnostics | | | 23,068 | | | | 2,035 | | |
| Schering-Plough (a) | | | 322,233 | | | | 6,142 | | |
| St. Jude Medical* (a) | | | 38,634 | | | | 2,908 | | |
| Stryker (a) | | | 87,358 | | | | 4,200 | | |
| Tenet Healthcare* (a) | | | 101,728 | | | | 1,098 | | |
| UnitedHealth Group (a) | | | 146,499 | | | | 10,803 | | |
| Watson Pharmaceuticals* (a) | | | 24,017 | | | | 708 | | |
| Wellpoint Health Networks* | | | 34,215 | | | | 3,596 | | |
| Wyeth Pharmaceuticals | | | 291,982 | | | | 10,920 | | |
| Zimmer Holdings* (a) | | | 53,346 | | | | 4,216 | | |
| | | | 298,811 | | |
| Industrials – 11.5% | | | |
| 3M (a) | | | 172,860 | | | | 13,824 | | |
| Allied Waste Industries* (a) | | | 71,125 | | | | 629 | | |
| American Power Conversion (a) | | | 44,161 | | | | 768 | | |
| American Standard* | | | 47,547 | | | | 1,850 | | |
| Apollo Group, Cl A* (a) | | | 41,693 | | | | 3,059 | | |
| Avery Dennison (a) | | | 24,225 | | | | 1,594 | | |
| Boeing (a) | | | 184,455 | | | | 9,522 | | |
| Burlington Northern Santa Fe | | | 79,498 | | | | 3,046 | | |
| Caterpillar (a) | | | 75,317 | | | | 6,059 | | |
| Cendant (a) | | | 224,878 | | | | 4,857 | | |
| Cintas | | | 37,706 | | | | 1,585 | | |
| Cooper Industries | | | 22,720 | | | | 1,340 | | |
| Crane | | | 12,732 | | | | 368 | | |
| CSX | | | 46,924 | | | | 1,558 | | |
| Cummins | | | 9,100 | | | | 672 | | |
| Danaher (a) | | | 67,892 | | | | 3,482 | | |
| Deere & Company | | | 54,885 | | | | 3,543 | | |
| Delta Air Lines* (a) | | | 27,733 | | | | 91 | | |
| Deluxe | | | 10,649 | | | | 437 | | |
| Dover | | | 44,432 | | | | 1,727 | | |
| Eaton | | | 32,946 | | | | 2,089 | | |
| Emerson Electric | | | 93,041 | | | | 5,758 | | |
| Equifax | | | 30,777 | | | | 811 | | |
| FedEx (a) | | | 65,591 | | | | 5,620 | | |
| Fluor | | | 17,911 | | | | 797 | | |
| General Dynamics | | | 43,253 | | | | 4,416 | | |
| General Electric (a) | | | 2,325,551 | | | | 78,092 | | |
| Goodrich | | | 25,785 | | | | 809 | | |
| H & R Block (a) | | | 39,403 | | | | 1,947 | | |
| Honeywell International | | | 188,632 | | | | 6,764 | | |
| Illinois Tool Works | | | 67,973 | | | | 6,333 | | |
| Ingersoll-Rand, Cl A | | | 38,684 | | | | 2,629 | | |
| ITT Industries | | | 20,256 | | | | 1,620 | | |
| Lockheed Martin | | | 98,103 | | | | 5,472 | | |
| Masco | | | 103,086 | | | | 3,560 | | |
| Monster Worldwide* (a) | | | 24,625 | | | | 607 | | |
| Navistar International* (a) | | | 14,992 | | | | 558 | | |
| Norfolk Southern (a) | | | 85,578 | | | | 2,545 | | |
Equity Index Fund (continued)
| DESCRIPTION | | SHARES | | VALUE (000) | |
| Northrop Grumman (a) | | | 77,244 | | | $ | 4,119 | | |
| Paccar (a) | | | 38,352 | | | | 2,651 | | |
| Pall | | | 27,225 | | | | 666 | | |
| Parker Hannifin (a) | | | 25,913 | | | | 1,525 | | |
| Pitney Bowes | | | 47,097 | | | | 2,077 | | |
| Power-One* | | | 18,220 | | | | 118 | | |
| R. R. Donnelley & Sons (a) | | | 47,261 | | | | 1,480 | | |
| Raytheon | | | 95,461 | | | | 3,626 | | |
| Robert Half International (a) | | | 37,380 | | | | 963 | | |
| Rockwell Automation (a) | | | 40,666 | | | | 1,574 | | |
| Rockwell Collins | | | 38,099 | | | | 1,415 | | |
| Ryder System (a) | | | 13,871 | | | | 653 | | |
| Southwest Airlines (a) | | | 173,186 | | | | 2,359 | | |
| Textron | | | 30,036 | | | | 1,930 | | |
| Tyco International | | | 442,155 | | | | 13,556 | | |
| Union Pacific | | | 57,096 | | | | 3,346 | | |
| United Parcel Service, Cl B (a) | | | 245,931 | | | | 18,671 | | |
| United Technologies | | | 113,753 | | | | 10,622 | | |
| W W Grainger | | | 19,973 | | | | 1,151 | | |
| Waste Management | | | 127,880 | | | | 3,496 | | |
| | | | 266,436 | | |
| Information Technology – 16.3% | | | |
| ADC Telecommunications* (a) | | | 176,367 | | | | 319 | | |
| Adobe Systems (a) | | | 52,937 | | | | 2,619 | | |
| Advanced Micro Devices* (a) | | | 78,006 | | | | 1,014 | | |
| Affiliated Computer Services, Cl A* (a) | | | 28,840 | | | | 1,606 | | |
| Agilent Technologies* | | | 106,927 | | | | 2,307 | | |
| Altera* (a) | | | 83,872 | | | | 1,641 | | |
| Analog Devices (a) | | | 82,453 | | | | 3,198 | | |
| Andrew* (a) | | | 35,035 | | | | 429 | | |
| Apple Computer* (a) | | | 82,807 | | | | 3,208 | | |
| Applied Materials* | | | 370,928 | | | | 6,117 | | |
| Applied Micro Circuits* (a) | | | 67,342 | | | | 211 | | |
| Autodesk (a) | | | 24,881 | | | | 1,210 | | |
| Automatic Data Processing | | | 131,161 | | | | 5,420 | | |
| Avaya* (a) | | | 99,118 | | | | 1,382 | | |
| BMC Software* | | | 50,094 | | | | 792 | | |
| Broadcom, Cl A* (a) | | | 70,990 | | | | 1,937 | | |
| CIENA* | | | 125,249 | | | | 248 | | |
| Cisco Systems* (a) | | | 1,492,679 | | | | 27,017 | | |
| Citrix Systems* | | | 37,333 | | | | 654 | | |
| Computer Associates International (a) | | | 126,712 | | | | 3,333 | | |
| Computer Sciences* (a) | | | 41,041 | | | | 1,933 | | |
| Compuware* | | | 83,936 | | | | 432 | | |
| Comverse Technology* (a) | | | 43,089 | | | | 811 | | |
| Convergys* | | | 35,570 | | | | 478 | | |
| Corning* (a) | | | 307,683 | | | | 3,409 | | |
| Dell* (a) | | | 551,430 | | | | 19,631 | | |
| eBay* (a) | | | 145,938 | | | | 13,418 | | |
| Electronic Arts* (a) | | | 64,578 | | | | 2,970 | | |
| Electronic Data Systems (a) | | | 106,698 | | | | 2,069 | | |
| EMC* | | | 538,810 | | | | 6,218 | | |
| First Data | | | 196,799 | | | | 8,561 | | |
| Fiserv* (a) | | | 42,456 | | | | 1,480 | | |
| Gateway* (a) | | | 82,601 | | | | 409 | | |
| Hewlett-Packard (a) | | | 669,984 | | | | 12,562 | | |
| IBM | | | 371,249 | | | | 31,831 | | |
| Intel | | | 1,432,850 | | | | 28,743 | | |
| Intuit* (a) | | | 45,013 | | | | 2,044 | | |
| Jabil Circuit* (a) | | | 43,617 | | | | 1,003 | | |
| JDS Uniphase* (a) | | | 317,739 | | | | 1,071 | | |
| KLA-Tencor* (a) | | | 42,714 | | | | 1,772 | | |
| Lexmark International Group, Cl A* (a) | | | 28,345 | | | | 2,381 | | |
| Linear Technology (a) | | | 68,529 | | | | 2,484 | | |
| LSI Logic* (a) | | | 83,068 | | | | 358 | | |
The accompanying notes are an integral part of the financial statements.
FIRST AMERICAN FUNDS Annual Report 2004
14
Equity Index Fund (continued)
| DESCRIPTION | | SHARES | | VALUE (000) | |
| Lucent Technologies* (a) | | | 945,513 | | | $ | 2,997 | | |
| Maxim Integrated Products (a) | | | 72,078 | | | | 3,048 | | |
| Mercury Interactive* (a) | | | 19,862 | | | | 693 | | |
| Micron Technology* (a) | | | 133,761 | | | | 1,609 | | |
| Microsoft | | | 2,387,642 | | | | 66,018 | | |
| Molex | | | 41,916 | | | | 1,250 | | |
| Motorola (a) | | | 521,558 | | | | 9,409 | | |
| National Semiconductor* (a) | | | 81,318 | | | | 1,260 | | |
| NCR* (a) | | | 20,738 | | | | 1,028 | | |
| Network Appliance* (a) | | | 78,965 | | | | 1,816 | | |
| Novell* (a) | | | 85,309 | | | | 538 | | |
| Novellus Systems* (a) | | | 33,200 | | | | 883 | | |
| NVIDIA* (a) | | | 36,771 | | | | 534 | | |
| Oracle* | | | 1,153,179 | | | | 13,008 | | |
| Parametric Technology* | | | 59,419 | | | | 314 | | |
| Paychex | | | 82,635 | | | | 2,491 | | |
| PeopleSoft* | | | 79,845 | | | | 1,585 | | |
| PMC-Sierra* (a) | | | 37,841 | | | | 333 | | |
| QLogic* (a) | | | 20,673 | | | | 612 | | |
| QUALCOMM (a) | | | 359,374 | | | | 14,030 | | |
| Sabre Holdings, Cl A (a) | | | 31,490 | | | | 772 | | |
| Sanmina – SCI* | | | 114,452 | | | | 807 | | |
| Scientific-Atlanta | | | 33,645 | | | | 872 | | |
| Siebel Systems* (a) | | | 110,885 | | | | 836 | | |
| Solectron* (a) | | | 212,113 | | | | 1,050 | | |
| Sun Microsystems* (a) | | | 734,274 | | | | 2,966 | | |
| SunGard Data Systems* | | | 62,591 | | | | 1,488 | | |
| Symantec* (a) | | | 69,574 | | | | 3,818 | | |
| Symbol Technologies | | | 48,673 | | | | 615 | | |
| Tektronix | | | 18,610 | | | | 619 | | |
| Tellabs* (a) | | | 91,586 | | | | 842 | | |
| Teradyne* (a) | | | 42,856 | | | | 575 | | |
| Texas Instruments (a) | | | 382,160 | | | | 8,132 | | |
| Thermo Electron* | | | 35,595 | | | | 962 | | |
| Unisys* (a) | | | 73,187 | | | | 755 | | |
| VERITAS Software* (a) | | | 95,272 | | | | 1,696 | | |
| Waters* (a) | | | 26,609 | | | | 1,173 | | |
| Xerox* (a) | | | 175,971 | | | | 2,478 | | |
| Xilinx (a) | | | 76,051 | | | | 2,053 | | |
| Yahoo!* (a) | | | 305,036 | | | | 10,344 | | |
| | | | 377,039 | | |
| Materials – 3.1% | | | |
| Air Products and Chemicals | | | 49,846 | | | | 2,711 | | |
| Alcoa | | | 191,984 | | | | 6,449 | | |
| Allegheny Technologies | | | 21,036 | | | | 384 | | |
| Ball | | | 24,632 | | | | 922 | | |
| Bemis (a) | | | 23,440 | | | | 623 | | |
| Dow Chemical | | | 203,420 | | | | 9,191 | | |
| E.I. DuPont de Nemours | | | 219,659 | | | | 9,401 | | |
| Eastman Chemical (a) | | | 16,717 | | | | 795 | | |
| Ecolab (a) | | | 56,966 | | | | 1,791 | | |
| Engelhard | | | 27,473 | | | | 779 | | |
| Freeport-McMoran Copper & Gold, Cl B (a) | | | 40,531 | | | | 1,642 | | |
| Georgia-Pacific (a) | | | 56,996 | | | | 2,049 | | |
| Great Lakes Chemical | | | 10,789 | | | | 276 | | |
| Hercules* (a) | | | 24,318 | | | | 347 | | |
| International Flavors & Fragrances (a) | | | 20,659 | | | | 789 | | |
| International Paper (a) | | | 107,350 | | | | 4,338 | | |
| Louisiana Pacific | | | 24,005 | | | | 623 | | |
| MeadWestvaco | | | 43,950 | | | | 1,402 | | |
| Monsanto | | | 58,193 | | | | 2,119 | | |
| Newmont Mining (a) | | | 96,073 | | | | 4,374 | | |
| NuCor | | | 17,340 | | | | 1,584 | | |
| Pactiv* | | | 34,539 | | | | 803 | | |
Equity Index Fund (continued)
| DESCRIPTION | | SHARES | | VALUE (000) | |
| Phelps Dodge (a) | | | 20,756 | | | $ | 1,911 | | |
| PPG Industries | | | 37,777 | | | | 2,315 | | |
| Praxair | | | 71,480 | | | | 3,055 | | |
| Rohm & Haas (a) | | | 48,773 | | | | 2,096 | | |
| Sealed Air* (a) | | | 18,616 | | | | 863 | | |
| Sigma-Aldrich (a) | | | 15,523 | | | | 900 | | |
| Temple-Inland | | | 11,879 | | | | 798 | | |
| United States Steel (a) | | | 24,964 | | | | 939 | | |
| Vulcan Materials (a) | | | 22,282 | | | | 1,135 | | |
| Weyerhaeuser (a) | | | 52,278 | | | | 3,476 | | |
| Worthington Industries | | | 16,779 | | | | 358 | | |
| | | | 71,238 | | |
| Telecommunication Services – 3.7% | | | |
| ALLTEL | | | 66,082 | | | | 3,629 | | |
| AT&T | | | 175,052 | | | | 2,507 | | |
| AT&T Wireless Services* | | | 600,985 | | | | 8,883 | | |
| BellSouth | | | 405,174 | | | | 10,988 | | |
| CenturyTel | | | 31,563 | | | | 1,081 | | |
| Citizens Communications (a) | | | 71,721 | | | | 961 | | |
| Nextel Communications, Cl A* (a) | | | 243,113 | | | | 5,796 | | |
| Qwest Communications International* (a) | | | 400,728 | | | | 1,334 | | |
| SBC Communications (a) | | | 731,526 | | | | 18,983 | | |
| Sprint (a) | | | 312,946 | | | | 6,300 | | |
| Verizon Communications (a) | | | 610,767 | | | | 24,052 | | |
| | | | 84,514 | | |
| Utilities – 2.8% | | | |
| AES* | | | 142,714 | | | | 1,426 | | |
| Allegheny Energy* (a) | | | 27,570 | | | | 440 | | |
| Ameren (a) | | | 42,347 | | | | 1,954 | | |
| American Electric Power (a) | | | 86,631 | | | | 2,769 | | |
| Calpine* (a) | | | 110,653 | | | | 321 | | |
| CenterPoint Energy (a) | | | 67,063 | | | | 695 | | |
| Cinergy (a) | | | 37,804 | | | | 1,497 | | |
| CMS Energy* (a) | | | 35,349 | | | | 337 | | |
| Consolidated Edison (a) | | | 50,495 | | | | 2,123 | | |
| Constellation Energy (a) | | | 36,608 | | | | 1,458 | | |
| Dominion Resources (a) | | | 70,923 | | | | 4,628 | | |
| DTE Energy (a) | | | 36,900 | | | | 1,557 | | |
| Duke Energy (a) | | | 201,707 | | | | 4,617 | | |
| Dynegy* (a) | | | 82,166 | | | | 410 | | |
| Edison International | | | 71,457 | | | | 1,894 | | |
| Entergy | | | 49,993 | | | | 3,030 | | |
| Exelon (a) | | | 142,934 | | | | 5,244 | | |
| FirstEnergy (a) | | | 72,348 | | | | 2,972 | | |
| FPL Group (a) | | | 39,890 | | | | 2,725 | | |
| KeySpan | | | 34,766 | | | | 1,363 | | |
| NICOR | | | 10,118 | | | | 371 | | |
| NiSource (a) | | | 57,637 | | | | 1,211 | | |
| People's Energy | | | 6,740 | | | | 281 | | |
| PG&E* (a) | | | 92,424 | | | | 2,810 | | |
| Pinnacle West Capital | | | 20,022 | | | | 831 | | |
| PPL | | | 38,754 | | | | 1,828 | | |
| Progress Energy (a) | | | 54,061 | | | | 2,289 | | |
| Progress Energy-CVO (c) | | | 8,576 | | | | 1 | | |
| Public Service Enterprises (a) | | | 52,101 | | | | 2,220 | | |
| Sempra Energy | | | 50,125 | | | | 1,814 | | |
| Southern (a) | | | 159,782 | | | | 4,790 | | |
| TECO Energy (a) | | | 41,162 | | | | 557 | | |
| TXU (a) | | | 71,452 | | | | 3,424 | | |
| Xcel Energy | | | 85,260 | | | | 1,477 | | |
| | | | 65,364 | | |
Total Common Stocks
(Cost $1,794,369) | | | | | | | 2,292,283 | | |
FIRST AMERICAN FUNDS Annual Report 2004
15
Schedule of Investments September 30, 2004
Equity Index Fund (continued)
| DESCRIPTION | | PAR (000)/SHARES | | VALUE (000) | |
| Short-Term Investments – 2.1% | | | |
| U.S. Treasury Obligation – 0.3% | | | |
U. S. Treasury Bill (d)
1.895%, 03/03/05 | | $ | 8,000 | | | $ | 7,935 | | |
| Total U.S. Treasury Obligation | | | | | | | 7,935 | | |
| Affiliated Money Market Fund – 1.8% | | | |
First American Prime
Obligations Fund, Cl Z (b) (e) | | | 40,705,632 | | | | 40,706 | | |
| Total Affiliated Money Market Fund | | | | | | | 40,706 | | |
Total Short-Term Investments
(Cost $48,641) | | | | | | | 48,641 | | |
| Investments Purchased with Proceeds from Securities Lending – 36.9% | | | |
| Commercial Paper – 11.9% | | | |
Bluegrass
1.881%, 5/18/05 | | $ | 3,597 | | | | 3,597 | | |
| 1.891%, 8/18/05 | | | 2,858 | | | | 2,858 | | |
Concord Minutemen Capital
1.650%, 10/01/04 | | | 5,905 | | | | 5,905 | | |
| 1.680%, 10/05/04 | | | 13,122 | | | | 13,122 | | |
| 1.720%, 10/06/04 | | | 9,696 | | | | 9,696 | | |
| 1.740%, 10/14/04 | | | 6,488 | | | | 6,488 | | |
Descartes Funding Trust
1.760%, 11/15/04 | | | 7,290 | | | | 7,290 | | |
Ford Credit Floor Plan
1.622%, 10/05/04 | | | 14,576 | | | | 14,576 | | |
| 1.526%, 10/06/04 | | | 10,206 | | | | 10,206 | | |
| 1.655%, 10/22/04 | | | 3,204 | | | | 3,204 | | |
Goldman Sachs
1.975%, 1/18/05 | | | 7,290 | | | | 7,290 | | |
Independence
1.830%, 4/15/05 | | | 9,010 | | | | 9,010 | | |
Jupiter Securities Corp
1.793%, 10/21/04 | | | 27,710 | | | | 27,710 | | |
Lakeside Funding
1.790%, 10/08/04 | | | 15,455 | | | | 15,455 | | |
Landesbank Baden
1.480%, 11/12/04 | | | 2,910 | | | | 2,910 | | |
Leaf's LLC
1.821%, 4/20/05 | | | 8,019 | | | | 8,019 | | |
Liquid Funding Ltd
1.743%, 10/13/04 | | | 10,199 | | | | 10,199 | | |
| 1.830%, 5/25/05 | | | 7,290 | | | | 7,290 | | |
MBNA Credit
1.683%, 10/12/04 | | | 7,085 | | | | 7,085 | | |
| 1.764%, 10/26/04 | | | 3,932 | | | | 3,932 | | |
Main Street Warehouse
1.742%, 10/04/04 | | | 9,621 | | | | 9,621 | | |
| 1.683%, 10/04/04 | | | 11,882 | | | | 11,882 | | |
| 1.742%, 10/08/04 | | | 7,287 | | | | 7,287 | | |
| 1.742%, 10/08/04 | | | 7,290 | | | | 7,290 | | |
Mortgage Interest Network
1.752%, 10/12/04 | | | 4,809 | | | | 4,809 | | |
| 1.763%, 10/14/04 | | | 5,099 | | | | 5,099 | | |
Netexis Banques
1.700%, 12/16/04 | | | 7,260 | | | | 7,260 | | |
Orchard Park
1.796%, 4/06/05 | | | 7,290 | | | | 7,290 | | |
| 1.766%, 7/06/05 | | | 15,046 | | | | 15,046 | | |
Park Granada LLC
1.622%, 10/01/04 | | | 12,830 | | | | 12,830 | | |
| 1.743%, 10/13/04 | | | 8,305 | | | | 8,305 | | |
Sigma Finance Inc
1.512%, 11/29/04 | | | 3,634 | | | | 3,634 | | |
| Total Commercial Paper | | | | | | | 276,195 | | |
Equity Index Fund (continued)
| DESCRIPTION | | PAR (000) | | VALUE (000) | |
| Corporate Obligations – 9.9% | |
Allstate Life Global
1.780%, 10/14/05 | | $ | 14,580 | | | $ | 14,580 | | |
| 1.750%, 10/14/05 | | | 3,645 | | | | 3,645 | | |
Bayer Landbank NY
1.830%, 6/24/05 | | | 13,850 | | | | 13,850 | | |
Blue Heron Fdg Ltd
1.850%, 5/18/05 | | | 4,082 | | | | 4,082 | | |
Castle Hill III
1.910%, 9/15/15 | | | 4,374 | | | | 4,374 | | |
Depfa Bank PLC
1.860%, 6/15/05 | | | 7,287 | | | | 7,287 | | |
Duke Funding VI
1.320%, 4/08/05 | | | 8,821 | | | | 8,821 | | |
General Electric Capital Corporation
1.838%, 10/07/05 | | | 7,298 | | | | 7,298 | | |
Jackson National Life
1.760%, 4/15/05 | | | 7,290 | | | | 7,290 | | |
Jefferson Pilot Co
1.788%, 8/17/05 | | | 7,290 | | | | 7,290 | | |
Liquid Funding Ltd
1.840%, 6/28/05 | | | 6,560 | | | | 6,560 | | |
Merrill Lynch
1.696%, 10/01/05 | | | 14,581 | | | | 14,581 | | |
Metlife Global Funding
1.800%, 10/14/05 8,748 8,748
1.880%, 10/28/05 | | | 6,125 | | | | 6,125 | | |
Morgan Stanley
1.850%, 12/26/08 | | | 7,290 | | | | 7,290 | | |
Natexis Banq NY
1.920%, 7/12/05 | | | 8,019 | | | | 8,019 | | |
Northlake CDO Ltd
1.895%, 3/07/05 | | | 4,374 | | | | 4,374 | | |
Premium Asset Trust
1.848%, 12/22/04 | | | 5,467 | | | | 5,467 | | |
| 1.760%, 5/13/05 | | | 10,205 | | | | 10,205 | | |
| 1.740%, 6/01/05 | | | 21,724 | | | | 21,724 | | |
| 1.770%, 10/14/05 | | | 5,832 | | | | 5,832 | | |
REMAC
1.840%, 9/29/05 | | | 8,019 | | | | 8,019 | | |
RMAC
1.740%, 6/12/05 | | | 8,411 | | | | 8,411 | | |
SMM Trust 2004
1.833%, 9/23/05 | | | 13,559 | | | | 13,559 | | |
Societe Generale NYC
1.960%, 12/08/04 | | | 14,580 | | | | 14,580 | | |
Svenska Handl
1.170%, 10/21/04 | | | 7,290 | | | | 7,290 | | |
| Total Corporate Obligations | | | | | | | 229,301 | | |
| Other Short-Term Investments – 2.6% | |
ARLO III Ltd
2.000%, 9/28/05 | | | 21,870 | | | | 21,870 | | |
Commonwealth Life
2.115%, 12/31/04 (f) | | | 7,361 | | | | 7,361 | | |
General Electric Capital Assurance
1.980%, 1/19/05 | | | 2,916 | | | | 2,916 | | |
HBOS Treasury Services
1.640%, 11/01/05 | | | 8,016 | | | | 8,016 | | |
Security Life Denver
1.900%, 12/30/04 | | | 18,954 | | | | 18,954 | | |
| Total Other Short-Term Investments | | | | | | | 59,117 | | |
The accompanying notes are an integral part of the financial statements.
FIRST AMERICAN FUNDS Annual Report 2004
16
Equity Index Fund (continued)
| DESCRIPTION | | PAR | | VALUE (000) | |
| Repurchase Agreements – 12.5% | | | |
Bear Stearns
2.045%, dated 9/30/04, matures 10/01/04,
repurchase price $14,580,772
(collateralized by various securities:
Total market value $14,879,672) | | $ | 14,580 | | | $ | 14,580 | | |
Bear Stearns
2.060%, dated 9/30/04, matures 12/23/04,
repurchase price $4,395,007
(collateralized by various securities:
Total market value $4,463,024) | | | 4,374 | | | | 4,374 | | |
Citibank
1.945%, dated 9/30/04, matures 10/01/04,
repurchase price $29,161,463
(collateralized by corporate securities:
Total market value $30,878,907) | | | 29,160 | | | | 29,160 | | |
Citibank
1.925%, dated 9/30/04, matures 10/01/04,
repurchase price $7,290,362
(collateralized by various securities:
Total market value $7,452,290) | | | 7,290 | | | | 7,290 | | |
Citibank
1.925%, dated 9/30/04, matures 10/01/04,
repurchase price $7,290,362
(collateralized by various securities:
Total market value $7,435,871) | | | 7,290 | | | | 7,290 | | |
Greenwich Capital Markets
1.950%, dated 9/30/04, matures 10/01/04,
repurchase price $43,742,200
(collateralized by U.S. government securities:
Total market value $44,615,197) | | | 43,740 | | | | 43,740 | | |
Goldman Sachs
2.025%, dated 9/30/04, matures 10/01/04,
repurchase price $10,206,535
(collateralized by various securities:
Total market value $10,521,625) | | | 10,206 | | | | 10,206 | | |
Goldman Sachs
2.025%, dated 9/30/04, matures 10/01/04,
repurchase price $4,374,229
(collateralized by various securities:
Total market value $4,509,375) | | | 4,374 | | | | 4,374 | | |
Goldman Sachs
2.025%, dated 9/30/04, matures 10/01/04,
repurchase price $4,374,229
(collateralized by various securities:
Total market value $4,509,373) | | | 4,374 | | | | 4,374 | | |
Goldman Sachs
2.025%, dated 9/30/04, matures 10/01/04,
repurchase price $10,935,573
(collateralized by corporate securities:
Total market value $11,273,210) | | | 10,935 | | | | 10,935 | | |
Goldman Sachs
1.425%, dated 9/30/04, matures 10/18/04,
repurchase price $18,237,915
(collateralized by corporate securities:
Total market value $18,596,977) | | | 18,225 | | | | 18,225 | | |
Goldman Sachs
1.480%, dated 9/30/04, matures 10/18/04,
repurchase price $10,943,050
(collateralized by various securities:
Total market value $11,273,212) | | | 10,935 | | | | 10,935 | | |
Goldman Sachs
2.205%, dated 9/30/04, matures 3/07/05,
repurchase price $7,360,521
(collateralized by corporate securities:
Total market value $7,438,846) | | | 7,290 | | | | 7,290 | | |
Equity Index Fund (continued)
| DESCRIPTION | | PAR | | VALUE (000) | |
Lehman Brothers
2.055%, dated 9/30/04, matures 10/01/04,
repurchase price $29,161,552
(collateralized by collateralized
mortgage obligations:
Total market value $29,743,085) | | $ | 29,160 | | | $ | 29,160 | | |
Lehman Brothers
1.910%, dated 9/30/04, matures 10/01/04,
repurchase price $43,742,151
(collateralized by U.S. government securities:
Total market value $44,615,331) | | | 43,740 | | | | 43,740 | | |
Lehman Brothers
1.935%, dated 9/30/04, matures 10/01/04,
repurchase price $29,161,455
(collateralized by collateralized
mortgage obligations:
Total market value $32,063,699) | | | 29,160 | | | | 29,160 | | |
Merrill Lynch
1.925%, dated 9/30/04, matures 10/01/04,
repurchase price $14,580,723
(collateralized by corporate securities:
Total market value $15,309,257) | | | 14,579 | | | | 14,579 | | |
Total Repurchase Agreements
(Cost $289,412) | | | | | | | 289,412 | | |
Total Investments Purchased with
Proceeds from Securities Lending
(Cost $854,025) | | | | | | | 854,025 | | |
Total Investments – 138.1%
(Cost $2,697,035) | | | | | | | 3,194,949 | | |
| Other Assets and Liabilities, Net – (38.1)% | | | | | | | (881,130 | ) | |
| Total Net Assets – 100.0% | | | | | | $ | 2,313,819 | | |
* Non-income producing security
(a) This security or a portion of this security is out on loan at September 30, 2004. Total loaned securities had a market value of $824,435,100 at September 30, 2004. See note 2 in Notes to Financial Statements.
(b) Investments in affiliated securities. As of September 30, 2004, the market value of these investments was $52,945,476 or 2.3% of total net assets. See notes 3 and 4 in Notes to Financial Statements.
(c) Security considered illiquid investment and is fair valued under guidelines established by the Board of Directors. 8,576 shares of Progress Energy CVO, a restricted security with a cost basis of $0, were acquired between June 1999 and November 2002. As of September 30, 2004, the market value of this investment was $1,201 or 0.0% of total net assets. See note 2 in Notes to Financial Statements.
(d) Security has been deposited as initial margin on open futures contracts. Yield shown is effective yield at date of purchase. See note 2 in Notes to Financial Statements.
(e) This money market fund is advised by U.S. Bancorp Asset Management, Inc., which also serves as advisor to this Fund. See note 3 in Notes to Financial Statements.
(f) Security has demand features which qualify it as a short term security. The date disclosed is the next put date.
Cl – Class
REIT – Real Estate Investment Trust
CVO – Contingent Value Obligation
Schedule of Open Futures Contracts
| Description | | Number of
Contracts | | Market Value
Covered By
Contracts | | Settlement
Month | | Unrealized
Depreciation | |
S&P 500 Index
Futures Contracts
purchased | | | 54 | | | $ | 15,055 | | | Dec. 04 | | $ | (134 | ) | |
FIRST AMERICAN FUNDS Annual Report 2004
17
Schedule of Investments September 30, 2004
Mid Cap Index Fund
| DESCRIPTION | | SHARES | | VALUE (000) | |
| Common Stocks – 98.2% | | | |
| Consumer Discretionary – 18.2% | | | |
| 99 Cents Only Stores* | | | 23,186 | | | $ | 330 | | |
| Abercrombie & Fitch (a) | | | 31,492 | | | | 992 | | |
| Aeropostale* | | | 18,535 | | | | 486 | | |
| American Eagle Outfitters (a) | | | 23,944 | | | | 882 | | |
| American Greetings, Cl A* (a) | | | 22,760 | | | | 572 | | |
| AnnTaylor Stores* | | | 22,500 | | | | 527 | | |
| Applebee's International | | | 27,570 | | | | 697 | | |
| ArvinMeritor | | | 22,963 | | | | 431 | | |
| Bandag | | | 6,485 | | | | 284 | | |
| Barnes & Noble* (a) | | | 23,028 | | | | 852 | | |
| Belo, Cl A | | | 38,344 | | | | 864 | | |
| BLYTH | | | 15,084 | | | | 466 | | |
| Bob Evans Farms | | | 11,488 | | | | 312 | | |
| Borders Group | | | 25,600 | | | | 635 | | |
| BorgWarner | | | 18,488 | | | | 800 | | |
| Boyd Gaming | | | 28,503 | | | | 802 | | |
| Brinker International* (a) | | | 30,094 | | | | 937 | | |
| Caesars Entertainment* | | | 102,290 | | | | 1,708 | | |
| Callaway Golf | | | 25,118 | | | | 266 | | |
| CarMax* (a) | | | 34,609 | | | | 746 | | |
| Catalina Marketing, Cl C | | | 17,199 | | | | 397 | | |
| CBRL Group (a) | | | 16,271 | | | | 587 | | |
| Cheesecake Factory* (a) | | | 17,300 | | | | 751 | | |
| Chico's FAS* (a) | | | 29,770 | | | | 1,018 | | |
| Claire's Stores | | | 33,034 | | | | 827 | | |
| D.R. Horton (a) | | | 77,826 | | | | 2,577 | | |
| Dollar Tree Stores* (a) | | | 37,964 | | | | 1,023 | | |
| Emmis Communications, Cl A* (a) | | | 18,674 | | | | 337 | | |
| Entercom Communications* | | | 17,061 | | | | 557 | | |
| Foot Locker (a) | | | 49,686 | | | | 1,178 | | |
| Furniture Brands International | | | 18,724 | | | | 470 | | |
| Gentex (a) | | | 25,799 | | | | 906 | | |
| GTECH Holdings | | | 39,622 | | | | 1,003 | | |
| Harman International Industries (a) | | | 22,050 | | | | 2,376 | | |
| Harte-Hanks | | | 28,963 | | | | 724 | | |
| Hovnanian Enterprises, Cl A* (a) | | | 20,420 | | | | 819 | | |
| International Speedway, Cl A | | | 17,770 | | | | 887 | | |
| Krispy Kreme Doughnuts* (a) | | | 20,477 | | | | 259 | | |
| Lear | | | 22,900 | | | | 1,247 | | |
| Lee Enterprises (a) | | | 14,889 | | | | 690 | | |
| Lennar (a) | | | 52,112 | | | | 2,481 | | |
| Mandalay Resort Group | | | 22,508 | | | | 1,545 | | |
| Media General, Cl A (a) | | | 7,793 | | | | 436 | | |
| Michaels Stores | | | 22,795 | | | | 1,350 | | |
| Modine Manufacturing | | | 11,341 | | | | 341 | | |
| Mohawk Industries* (a) | | | 22,176 | | | | 1,761 | | |
| Neiman Marcus Group (a) | | | 16,083 | | | | 925 | | |
| O'Reilly Automotive* | | | 18,300 | | | | 701 | | |
| Outback Steakhouse | | | 24,824 | | | | 1,031 | | |
| Pacific Sunwear of California* (a) | | | 25,930 | | | | 546 | | |
| Payless ShoeSource* (a) | | | 22,548 | | | | 228 | | |
| PETsMART (a) | | | 48,258 | | | | 1,370 | | |
| Pier 1 Imports | | | 29,394 | | | | 531 | | |
| Reader's Digest Association, Cl A | | | 35,138 | | | | 513 | | |
| Regis | | | 14,680 | | | | 590 | | |
| Rent-A-Center* | | | 26,800 | | | | 693 | | |
| Ross Stores (a) | | | 49,850 | | | | 1,168 | | |
| Ruby Tuesday (a) | | | 22,720 | | | | 633 | | |
| Ryland Group (a) | | | 8,190 | | | | 759 | | |
| Saks* | | | 47,801 | | | | 576 | | |
| Scholastic* | | | 13,627 | | | | 421 | | |
| Six Flags* | | | 30,684 | | | | 167 | | |
| Superior Industries (a) | | | 8,864 | | | | 265 | | |
| Thor Industries | | | 18,970 | | | | 502 | | |
| Timberland, Cl A* (a) | | | 11,657 | | | | 662 | | |
Mid Cap Index Fund (continued)
| DESCRIPTION | | SHARES | | VALUE (000) | |
| Toll Brothers* (a) | | | 24,819 | | | $ | 1,150 | | |
| Tupperware (a) | | | 18,460 | | | | 313 | | |
| Urban Outfitters* | | | 26,840 | | | | 923 | | |
| Valassis Communications* (a) | | | 17,767 | | | | 526 | | |
| Washington Post, Cl B | | | 3,124 | | | | 2,874 | | |
| Westwood One* | | | 32,243 | | | | 637 | | |
| Williams-Sonoma* (a) | | | 38,831 | | | | 1,458 | | |
| | | | 60,298 | | |
| Consumer Staples – 4.4% | | | |
| BJ's Wholesale Club* (a) | | | 23,263 | | | | 636 | | |
| Church and Dwight (a) | | | 20,565 | | | | 577 | | |
| Constellation Brands, CI A* (a) | | | 35,206 | | | | 1,340 | | |
| Dean Foods* (a) | | | 52,539 | | | | 1,577 | | |
| Energizer Holdings* (a) | | | 27,384 | | | | 1,262 | | |
| Hormel Foods (a) | | | 46,227 | | | | 1,238 | | |
| JM Smucker | | | 19,544 | | | | 868 | | |
| Lancaster Colony | | | 11,485 | | | | 484 | | |
| PepsiAmericas | | | 46,128 | | | | 881 | | |
| Ruddick | | | 15,964 | | | | 314 | | |
| Smithfield Foods* | | | 38,199 | | | | 955 | | |
| Tootsie Roll Industries | | | 17,563 | | | | 513 | | |
| Tyson Foods, Cl A (a) | | | 117,633 | | | | 1,884 | | |
| Universal | | | 8,504 | | | | 380 | | |
| Whole Foods Market (a) | | | 20,514 | | | | 1,760 | | |
| | | | 14,669 | | |
| Energy – 8.1% | | | |
| Cooper Cameron* | | | 18,150 | | | | 995 | | |
| ENSCO International (a) | | | 50,361 | | | | 1,645 | | |
| FMC Technologies* | | | 22,444 | | | | 750 | | |
| Forest Oil* (a) | | | 19,484 | | | | 587 | | |
| Grant Prideco* (a) | | | 40,811 | | | | 836 | | |
| Hanover Compressor* (a) | | | 25,657 | | | | 345 | | |
| Helmerich & Payne | | | 16,823 | | | | 483 | | |
| Murphy Oil | | | 30,090 | | | | 2,611 | | |
| National-Oilwell* (a) | | | 28,648 | | | | 941 | | |
| Newfield Exploration* | | | 20,397 | | | | 1,249 | | |
| Noble Energy | | | 20,230 | | | | 1,178 | | |
| Overseas Shipholding Group | | | 13,135 | | | | 652 | | |
| Patterson-UTI Energy (a) | | | 55,546 | | | | 1,059 | | |
| Pioneer Natural Resources (a) | | | 48,402 | | | | 1,669 | | |
| Plains Exploration & Production* | | | 25,710 | | | | 613 | | |
| Pogo Producing | | | 21,328 | | | | 1,012 | | |
| Pride International* (a) | | | 45,349 | | | | 897 | | |
| Smith International* (a) | | | 34,964 | | | | 2,123 | | |
| Tidewater | | | 20,228 | | | | 658 | | |
| Varco International* | | | 32,554 | | | | 873 | | |
| Weatherford International* (a) | | | 44,260 | | | | 2,258 | | |
| Western Gas Resources (a) | | | 24,590 | | | | 703 | | |
| XTO Energy (a) | | | 87,018 | | | | 2,826 | | |
| | | | 26,963 | | |
| Financials – 18.8% | | | |
| A. G. Edwards (a) | | | 26,461 | | | | 916 | | |
| Allmerica Financial* | | | 17,652 | | | | 474 | | |
| AMB Property (a) | | | 27,586 | | | | 1,021 | | |
| American Financial Group (a) | | | 24,506 | | | | 732 | | |
| AmeriCredit* | | | 52,625 | | | | 1,099 | | |
| AmerUS Group, Cl A (a) | | | 12,980 | | | | 532 | | |
| Arthur J. Gallagher | | | 30,131 | | | | 998 | | |
| Associated Banc-Corp (a) | | | 36,430 | | | | 1,168 | | |
| Astoria Financial | | | 26,305 | | | | 934 | | |
| Bank of Hawaii | | | 17,502 | | | | 827 | | |
| Banknorth Group | | | 57,167 | | | | 2,001 | | |
| Brown & Brown | | | 22,980 | | | | 1,050 | | |
| City National (a) | | | 16,218 | | | | 1,053 | | |
| Colonial BancGroup (a) | | | 44,605 | | | | 912 | | |
The accompanying notes are an integral part of the financial statements.
FIRST AMERICAN FUNDS Annual Report 2004
18
Mid Cap Index Fund (continued)
| DESCRIPTION | | SHARES | | VALUE (000) | |
| Commerce Bancorp (a) | | | 26,022 | | | $ | 1,436 | | |
| Compass Bancshares (a) | | | 40,390 | | | | 1,770 | | |
| Cullen/Frost Bankers (a) | | | 17,160 | | | | 797 | | |
| Developers Diversified Realty (REIT) | | | 34,350 | | | | 1,344 | | |
| Dime Bancorp* | | | 23,400 | | | | 3 | | |
| Eaton Vance (a) | | | 22,670 | | | | 916 | | |
| Everest Re Group | | | 18,643 | | | | 1,386 | | |
| Fidelity National Financial | | | 57,538 | | | | 2,192 | | |
| First American | | | 29,523 | | | | 910 | | |
| FirstMerit (a) | | | 28,086 | | | | 739 | | |
| GATX (a) | | | 15,269 | | | | 407 | | |
| Greater Bay Bancorp (a) | | | 17,521 | | | | 504 | | |
| HCC Insurance Holdings (a) | | | 21,405 | | | | 645 | | |
| Hibernia, Cl A | | | 51,814 | | | | 1,368 | | |
| Highwoods Properties (REIT) | | | 17,390 | | | | 428 | | |
| Horace Mann Educators | | | 14,153 | | | | 249 | | |
| Hospitality Properties Trust (REIT) | | | 22,105 | | | | 939 | | |
| Independence Community Bank | | | 27,696 | | | | 1,082 | | |
| IndyMac Bancorp (a) | | | 21,642 | | | | 783 | | |
| Investors Financial Services (a) | | | 22,078 | | | | 996 | | |
| Jefferies Group (a) | | | 18,530 | | | | 639 | | |
| LaBranche* | | | 20,235 | | | | 171 | | |
| Legg Mason (a) | | | 33,122 | | | | 1,764 | | |
| Leucadia National (a) | | | 23,671 | | | | 1,341 | | |
| Liberty Property Trust (REIT) | | | 27,940 | | | | 1,113 | | |
| Mack-Cali Realty (REIT) | | | 19,910 | | | | 882 | | |
| Mercantile Bankshares | | | 25,555 | | | | 1,226 | | |
| MoneyGram International | | | 29,579 | | | | 505 | | |
| National Commerce Financial | | | 67,922 | | | | 2,324 | | |
| New Plan Excel Realty Trust (REIT) | | | 32,968 | | | | 824 | | |
| New York Community Bancorp (a) | | | 89,514 | | | | 1,839 | | |
| Ohio Casualty* | | | 20,919 | | | | 438 | | |
| Old Republic International | | | 60,387 | | | | 1,511 | | |
| PMI Group (a) | | | 31,944 | | | | 1,296 | | |
| Protective Life | | | 23,151 | | | | 910 | | |
| Radian Group (a) | | | 31,383 | | | | 1,451 | | |
| Raymond James Financial | | | 24,285 | | | | 586 | | |
| Rayonier (a) | | | 16,790 | | | | 760 | | |
| SEI Investments (a) | | | 34,937 | | | | 1,177 | | |
| Silicon Valley Bancshares* | | | 11,892 | | | | 442 | | |
| StanCorp Financial Group | | | 9,278 | | | | 661 | | |
| TCF Financial (a) | | | 46,464 | | | | 1,407 | | |
| United Dominion Realty Trust (REIT) (a) | | | 42,710 | | | | 847 | | |
| Unitrin | | | 22,804 | | | | 948 | | |
| W.R. Berkley | | | 28,005 | | | | 1,181 | | |
| Waddell & Reed Financial | | | 27,551 | | | | 606 | | |
| Washington Federal | | | 26,206 | | | | 659 | | |
| Webster Financial | | | 17,723 | | | | 875 | | |
| Westamerica Bancorporation | | | 10,819 | | | | 594 | | |
| Wilmington Trust | | | 21,869 | | | | 792 | | |
| | | | 62,380 | | |
| Health Care – 10.0% | | | |
| Apria Healthcare Group* | | | 16,558 | | | | 451 | | |
| Barr Pharmaceuticals* | | | 34,619 | | | | 1,434 | | |
| Beckman Coulter (a) | | | 20,313 | | | | 1,140 | | |
| Cephalon* (a) | | | 18,730 | | | | 897 | | |
| Charles River Laboratories International* (a) | | | 15,404 | | | | 706 | | |
| Community Health Systems* | | | 29,037 | | | | 775 | | |
| Covance* (a) | | | 20,964 | | | | 838 | | |
| Coventry Health Care* (a) | | | 29,862 | | | | 1,594 | | |
| Cytyc* (a) | | | 36,910 | | | | 891 | | |
| DENTSPLY International (a) | | | 26,899 | | | | 1,397 | | |
| Edwards Lifesciences* (a) | | | 19,641 | | | | 658 | | |
| First Health Group* | | | 30,583 | | | | 492 | | |
Mid Cap Index Fund (continued)
| DESCRIPTION | | SHARES | | VALUE (000) | |
| Health Net* (a) | | | 37,674 | | | $ | 931 | | |
| Henry Schein* (a) | | | 14,462 | | | | 901 | | |
| Hillenbrand Industries | | | 20,807 | | | | 1,051 | | |
| INAMED* | | | 11,770 | | | | 561 | | |
| Invitrogen* | | | 17,323 | | | | 953 | | |
| IVAX* (a) | | | 81,725 | | | | 1,565 | | |
| Lifepoint Hospitals* (a) | | | 12,834 | | | | 385 | | |
| Lincare Holdings* (a) | | | 33,206 | | | | 987 | | |
| Millennium Pharmaceuticals* (a) | | | 101,778 | | | | 1,395 | | |
| Omnicare (a) | | | 34,684 | | | | 984 | | |
| PacifiCare Health Systems* | | | 28,770 | | | | 1,056 | | |
| Par Pharmaceutical Companies* (a) | | | 11,430 | | | | 411 | | |
| Patterson Companies* (a) | | | 22,606 | | | | 1,731 | | |
| Perrigo | | | 22,857 | | | | 470 | | |
| Protein Design Labs* (a) | | | 31,728 | | | | 621 | | |
| Renal Care* | | | 22,280 | | | | 718 | | |
| Sepracor* (a) | | | 29,225 | | | | 1,426 | | |
| STERIS* (a) | | | 22,703 | | | | 498 | | |
| Triad Hospitals* (a) | | | 25,334 | | | | 873 | | |
| Universal Health Services (a) | | | 19,300 | | | | 840 | | |
| Valeant Pharmaceuticals International (a) | | | 28,026 | | | | 676 | | |
| Varian* | | | 11,112 | | | | 421 | | |
| Varian Medical Systems* (a) | | | 45,426 | | | | 1,570 | | |
| Vertex Pharmaceuticals* (a) | | | 29,181 | | | | 306 | | |
| VISX* (a) | | | 16,272 | | | | 335 | | |
| | | | 32,938 | | |
| Industrials – 12.5% | | | |
| Adesa* (a) | | | 29,467 | | | | 484 | | |
| AGCO* (a) | | | 30,116 | | | | 681 | | |
| AirTran Holdings* | | | 28,010 | | | | 279 | | |
| Alaska Air Group* | | | 8,841 | | | | 219 | | |
| Alexander & Baldwin | | | 14,196 | | | | 482 | | |
| Alliant Techsystems* | | | 12,390 | | | | 750 | | |
| AMETEK (a) | | | 22,350 | | | | 678 | | |
| Banta | | | 8,463 | | | | 336 | | |
| Brinks | | | 18,952 | | | | 572 | | |
| C. H. Robinson Worldwide | | | 28,529 | | | | 1,323 | | |
| Career Education* (a) | | | 33,956 | | | | 965 | | |
| Carlisle Companies | | | 10,899 | | | | 697 | | |
| ChoicePoint* | | | 29,520 | | | | 1,259 | | |
| CNF | | | 16,846 | | | | 691 | | |
| Copart* | | | 30,047 | | | | 569 | | |
| Corinthian Colleges* (a) | | | 30,410 | | | | 410 | | |
| DeVry* (a) | | | 23,792 | | | | 493 | | |
| Donaldson | | | 28,688 | | | | 814 | | |
| Dun & Bradstreet* (a) | | | 24,092 | | | | 1,414 | | |
| Dycom Industries* (a) | | | 17,563 | | | | 499 | | |
| Education Management* (a) | | | 24,430 | | | | 651 | | |
| Expeditors International of Washington (a) | | | 35,287 | | | | 1,824 | | |
| Fastenal (a) | | | 25,338 | | | | 1,459 | | |
| Federal Signal (a) | | | 15,898 | | | | 295 | | |
| Flowserve* | | | 18,306 | | | | 443 | | |
| Graco | | | 23,075 | | | | 773 | | |
| Granite Construction | | | 13,763 | | | | 329 | | |
| Harsco | | | 13,534 | | | | 608 | | |
| Herman Miller (a) | | | 24,744 | | | | 610 | | |
| HNI | | | 19,300 | | | | 764 | | |
| Hubbell, Cl B | | | 20,847 | | | | 935 | | |
| ITT Educational Services* (a) | | | 15,270 | | | | 550 | | |
| J.B. Hunt Transport Services (a) | | | 26,798 | | | | 995 | | |
| Jacobs Engineering Group* | | | 19,046 | | | | 729 | | |
| JetBlue Airways* (a) | | | 34,230 | | | | 716 | | |
| Kelly Services, Cl A | | | 11,526 | | | | 308 | | |
| Kennametal | | | 12,183 | | | | 550 | | |
| Korn/Ferry International* | | | 12,655 | | | | 231 | | |
FIRST AMERICAN FUNDS Annual Report 2004
19
Schedule of Investments September 30, 2004
Mid Cap Index Fund (continued)
| DESCRIPTION | | SHARES | | VALUE (000) | |
| L-3 Communications Holdings | | | 35,249 | | | $ | 2,362 | | |
| Laureate Education* (a) | | | 15,074 | | | | 561 | | |
| Manpower (a) | | | 30,014 | | | | 1,335 | | |
| Nordson | | | 11,829 | | | | 406 | | |
| Pentair (a) | | | 33,496 | | | | 1,169 | | |
| Precision Castparts | | | 21,575 | | | | 1,296 | | |
| Quanta Services* | | | 39,114 | | | | 237 | | |
| Republic Services | | | 51,285 | | | | 1,526 | | |
| Rollins | | | 15,176 | | | | 369 | | |
| Sequa, Cl A* | | | 3,454 | | | | 180 | | |
| Sotheby's Holdings, Cl A* | | | 20,846 | | | | 328 | | |
| SPX (a) | | | 25,204 | | | | 892 | | |
| Stericycle* (a) | | | 14,500 | | | | 666 | | |
| Swift Transportation* (a) | | | 26,873 | | | | 452 | | |
| Tecumseh Products, Cl A | | | 5,791 | | | | 242 | | |
| Teleflex | | | 13,247 | | | | 563 | | |
| Thomas & Betts* | | | 19,533 | | | | 524 | | |
| Trinity Industries (a) | | | 15,508 | | | | 483 | | |
| United Rentals* (a) | | | 29,096 | | | | 462 | | |
| Werner Enterprises | | | 26,360 | | | | 509 | | |
| York International (a) | | | 13,718 | | | | 433 | | |
| | | | 41,380 | | |
| Information Technology – 14.1% | | | |
| 3Com* (a) | | | 129,534 | | | | 547 | | |
| Activision* | | | 45,785 | | | | 635 | | |
| Acxiom | | | 28,650 | | | | 680 | | |
| ADTRAN (a) | | | 26,216 | | | | 595 | | |
| Advanced Fiber Communications* | | | 28,803 | | | | 458 | | |
| Advent Software* | | | 10,857 | | | | 183 | | |
| Alliance Data Systems* (a) | | | 26,630 | | | | 1,080 | | |
| Amphenol, Cl A* | | | 29,530 | | | | 1,012 | | |
| Arrow Electronics* | | | 38,250 | | | | 864 | | |
| Ascential Software* | | | 19,680 | | | | 265 | | |
| Atmel* (a) | | | 160,917 | | | | 583 | | |
| Avnet* (a) | | | 39,813 | | | | 682 | | |
| Avocent* (a) | | | 16,274 | | | | 424 | | |
| BISYS Group* | | | 40,192 | | | | 587 | | |
| Cabot Microelectronics* (a) | | | 8,290 | | | | 301 | | |
| Cadence Design Systems* (a) | | | 90,716 | | | | 1,183 | | |
| CDW (a) | | | 27,900 | | | | 1,619 | | |
| Ceridian* | | | 49,497 | | | | 911 | | |
| Certegy | | | 21,327 | | | | 794 | | |
| CheckFree* (a) | | | 28,928 | | | | 800 | | |
| Cognizant Technology Solutions* | | | 43,290 | | | | 1,321 | | |
| CommScope* (a) | | | 20,126 | | | | 435 | | |
| Credence Systems* (a) | | | 31,755 | | | | 229 | | |
| Cree* (a) | | | 24,783 | | | | 757 | | |
| CSG Systems International* | | | 17,341 | | | | 267 | | |
| Cypress Semiconductor* (a) | | | 41,204 | | | | 364 | | |
| Diebold (a) | | | 23,482 | | | | 1,097 | | |
| DST Systems* (a) | | | 27,873 | | | | 1,240 | | |
| Fair Isaac (a) | | | 23,560 | | | | 688 | | |
| Fairchild Semiconductor International, Cl A* | | | 39,808 | | | | 564 | | |
| Gartner, Cl A* (a) | | | 36,588 | | | | 428 | | |
| Harris (a) | | | 21,506 | | | | 1,182 | | |
| Imation | | | 11,715 | | | | 417 | | |
| Integrated Circuit Systems* (a) | | | 24,090 | | | | 518 | | |
| Integrated Device Technology* (a) | | | 35,417 | | | | 338 | | |
| International Rectifier* | | | 21,963 | | | | 753 | | |
| Intersil, Cl A (a) | | | 50,101 | | | | 798 | | |
| Jack Henry & Associates | | | 29,702 | | | | 558 | | |
| Keane* (a) | | | 21,224 | | | | 326 | | |
| KEMET* | | | 28,596 | | | | 231 | | |
| Lam Research* (a) | | | 44,754 | | | | 979 | | |
Mid Cap Index Fund (continued)
| DESCRIPTION | | SHARES | | VALUE (000) | |
| Lattice Semiconductor* | | | 37,369 | | | $ | 183 | | |
| LTX* | | | 19,715 | | | | 107 | | |
| Macromedia* | | | 22,929 | | | | 460 | | |
| Macrovision* (a) | | | 16,358 | | | | 394 | | |
| McAfee Inc.* (a) | | | 54,063 | | | | 1,087 | | |
| McDATA, Cl A* | | | 38,754 | | | | 195 | | |
| Mentor Graphics* (a) | | | 23,241 | | | | 255 | | |
| Micrel* | | | 30,835 | | | | 321 | | |
| Microchip Technology (a) | | | 69,499 | | | | 1,865 | | |
| MPS Group* | | | 35,095 | | | | 295 | | |
| National Instruments (a) | | | 26,160 | | | | 792 | | |
| Newport* | | | 14,137 | | | | 162 | | |
| Plantronics | | | 15,904 | | | | 688 | | |
| Plexus* | | | 14,235 | | | | 157 | | |
| Polycom* | | | 32,861 | | | | 651 | | |
| Powerwave Technologies* | | | 34,409 | | | | 212 | | |
| Quantum* (a) | | | 59,644 | | | | 138 | | |
| Retek* | | | 18,408 | | | | 84 | | |
| Reynolds & Reynolds, Cl A | | | 22,153 | | | | 547 | | |
| RF Micro Devices* | | | 62,281 | | | | 395 | | |
| RSA Security* (a) | | | 21,230 | | | | 410 | | |
| SanDisk* (a) | | | 53,930 | | | | 1,570 | | |
| Semtech* (a) | | | 25,020 | | | | 480 | | |
| Silicon Laboratories* (a) | | | 17,230 | | | | 570 | | |
| Storage Technology* (a) | | | 37,229 | | | | 940 | | |
| Sybase* | | | 32,039 | | | | 442 | | |
| Synopsys* (a) | | | 51,876 | | | | 821 | | |
| Tech Data* | | | 18,996 | | | | 732 | | |
| Titan* | | | 27,849 | | | | 389 | | |
| Transaction Systems Architects, Cl A* | | | 12,651 | | | | 235 | | |
| TriQuint Semiconductor* | | | 45,454 | | | | 177 | | |
| UTStarcom* (a) | | | 37,760 | | | | 608 | | |
| Vishay Intertechnology* | | | 54,247 | | | | 700 | | |
| Wind River Systems* (a) | | | 26,950 | | | | 329 | | |
| Zebra Technology, Cl A* (a) | | | 23,880 | | | | 1,457 | | |
| | | | 46,541 | | |
| Materials – 4.8% | | | |
| Airgas | | | 24,482 | | | | 589 | | |
| Albemarle | | | 13,723 | | | | 482 | | |
| Arch Coal (a) | | | 18,004 | | | | 639 | | |
| Bowater (a) | | | 18,675 | | | | 713 | | |
| Cabot | | | 20,794 | | | | 802 | | |
| Crompton | | | 38,261 | | | | 363 | | |
| Cytec Industries | | | 12,973 | | | | 635 | | |
| Ferro | | | 13,680 | | | | 298 | | |
| FMC* (a) | | | 11,984 | | | | 582 | | |
| Glatfelter | | | 14,502 | | | | 180 | | |
| IMC Global* (a) | | | 38,681 | | | | 673 | | |
| Longview Fibre | | | 16,925 | | | | 258 | | |
| Lubrizol | | | 21,558 | | | | 746 | | |
| Lyondell Chemical (a) | | | 59,410 | | | | 1,334 | | |
| Martin Marietta Materials | | | 16,208 | | | | 734 | | |
| Minerals Technologies | | | 6,753 | | | | 397 | | |
| Olin | | | 23,205 | | | | 464 | | |
| Packaging Corporation of America | | | 35,470 | | | | 868 | | |
| Peabody Energy | | | 21,179 | | | | 1,260 | | |
| Potlatch (a) | | | 9,838 | | | | 461 | | |
| RPM | | | 38,362 | | | | 677 | | |
| Scotts* | | | 11,390 | | | | 731 | | |
| Sensient Technologies (a) | | | 15,466 | | | | 335 | | |
| Sonoco Products (a) | | | 32,687 | | | | 864 | | |
| Valspar | | | 17,024 | | | | 795 | | |
| | | | 15,880 | | |
The accompanying notes are an integral part of the financial statements.
FIRST AMERICAN FUNDS Annual Report 2004
20
Mid Cap Index Fund (continued)
| DESCRIPTION | | SHARES/PAR (000) | | VALUE (000) | |
| Telecommunication Services – 0.6% | |
| Cincinnati Bell* | | | 81,813 | | | $ | 286 | | |
| Telephone & Data Systems (a) | | | 19,017 | | | | 1,601 | | |
| | | | 1,887 | | |
| Utilities – 6.7% | | | |
| AGL Resources | | | 21,397 | | | | 658 | | |
| Alliant Energy | | | 36,685 | | | | 913 | | |
| Aqua America | | | 31,005 | | | | 686 | | |
| Aquila* (a) | | | 78,685 | | | | 246 | | |
| Black Hills (a) | | | 10,657 | | | | 296 | | |
| DPL | | | 42,243 | | | | 869 | | |
| Duquesne Light Holdings (a) | | | 25,280 | | | | 454 | | |
| Energy East | | | 48,922 | | | | 1,232 | | |
| Equitable Resources (a) | | | 20,427 | | | | 1,109 | | |
| Great Plains Energy (a) | | | 24,643 | | | | 718 | | |
| Hawaiian Electric Industries (a) | | | 26,668 | | | | 708 | | |
| IDACORP | | | 12,642 | | | | 367 | | |
| MDU Resources Group | | | 38,683 | | | | 1,019 | | |
| National Fuel Gas (a) | | | 27,093 | | | | 768 | | |
| Northeast Utilities | | | 42,230 | | | | 819 | | |
| NSTAR | | | 17,711 | | | | 870 | | |
| OGE Energy (a) | | | 28,591 | | | | 721 | | |
| ONEOK | | | 33,998 | | | | 885 | | |
| Pepco Holdings (a) | | | 61,613 | | | | 1,226 | | |
| PNM Resources (a) | | | 19,999 | | | | 450 | | |
| Puget Energy | | | 32,887 | | | | 747 | | |
| Questar | | | 27,974 | | | | 1,282 | | |
| SCANA (a) | | | 36,598 | | | | 1,367 | | |
| Sierra Pacific Resources* (a) | | | 39,664 | | | | 355 | | |
| Vectren | | | 25,110 | | | | 632 | | |
| Westar Energy | | | 29,094 | | | | 588 | | |
| WGL Holdings | | | 16,122 | | | | 456 | | |
| Wisconsin Energy (a) | | | 39,279 | | | | 1,253 | | |
| WPS Resources | | | 11,987 | | | | 539 | | |
| | | | 22,233 | | |
Total Common Stocks
(Cost $299,009) | | | | | | | 325,169 | | |
| Short-Term Investments – 2.8% | |
| U.S. Treasury Obligation – 0.4% | |
U. S. Treasury Bill (b)
1.895%, 03/03/05 | | $ | 1,500 | | | | 1,488 | | |
| Total U.S. Treasury Obligation | | | | | | | 1,488 | | |
| Affiliated Money Market Fund – 2.4% | |
| First American Prime Obligations Fund, Cl Z (c) | | | 7,895,717 | | | | 7,896 | | |
| Total Affiliated Money Market Fund | | | | | | | 7,896 | | |
Total Short-Term Investments
(Cost $9,384) | | | | | | | 9,384 | | |
| Investments Purchased with Proceeds from Securities Lending – 46.3% | |
| Commercial Paper – 15.0% | |
Bluegrass
1.881%, 5/18/05 | | $ | 645 | | | | 645 | | |
| 1.891%, 8/18/05 | | | 512 | | | | 512 | | |
Concord Minutemen Capital
1.650%, 10/01/04 | | | 1,058 | | | | 1,058 | | |
| 1.680%, 10/05/04 | | | 2,352 | | | | 2,352 | | |
| 1.720%, 10/06/04 | | | 1,738 | | | | 1,738 | | |
| 1.740%, 10/14/04 | | | 1,163 | | | | 1,163 | | |
Descartes Funding Trust
1.760%, 11/15/04 | | | 1,307 | | | | 1,307 | | |
Mid Cap Index Fund (continued)
| DESCRIPTION | | PAR (000) | | VALUE (000) | |
Ford Credit Floor Plan
1.622%, 10/05/04 | | $ | 2,613 | | | $ | 2,613 | | |
| 1.526%, 10/06/04 | | | 1,829 | | | | 1,829 | | |
| 1.655%, 10/22/04 | | | 574 | | | | 574 | | |
Goldman Sachs
1.975%, 1/18/05 | | | 1,307 | | | | 1,307 | | |
Independence
1.830%, 4/15/05 | | | 1,615 | | | | 1,615 | | |
Jupiter Securities Corp
1.793%, 10/21/04 | | | 4,967 | | | | 4,967 | | |
Lakeside Funding
1.790%, 10/08/04 | | | 2,770 | | | | 2,770 | | |
Landesbank Baden
1.480%, 11/12/04 | | | 522 | | | | 522 | | |
Leaf's LLC
1.821%, 4/20/05 | | | 1,438 | | | | 1,438 | | |
Liquid Funding Ltd
1.743%, 10/13/04 | | | 1,828 | | | | 1,828 | | |
| 1.830%, 5/25/05 | | | 1,307 | | | | 1,307 | | |
MBNA Credit
1.683%, 10/12/04 | | | 1,270 | | | | 1,270 | | |
| 1.764%, 10/26/04 | | | 705 | | | | 705 | | |
Main Street Warehouse
1.742%, 10/04/04 | | | 1,725 | | | | 1,725 | | |
| 1.683%, 10/04/04 | | | 2,130 | | | | 2,130 | | |
| 1.742%, 10/08/04 | | | 1,306 | | | | 1,306 | | |
| 1.742%, 10/08/04 | | | 1,307 | | | | 1,307 | | |
Mortgage Interest Network
1.752%, 10/12/04 | | | 862 | | | | 862 | | |
| 1.763%, 10/14/04 | | | 914 | | | | 914 | | |
Netexis Banques
1.700%, 12/16/04 | | | 1,302 | | | | 1,302 | | |
Orchard Park
1.796%, 4/06/05 | | | 1,307 | | | | 1,307 | | |
| 1.766%, 7/06/05 | | | 2,697 | | | | 2,697 | | |
Park Granada LLC
1.622%, 10/01/04 | | | 2,300 | | | | 2,300 | | |
| 1.743%, 10/13/04 | | | 1,489 | | | | 1,489 | | |
Sigma Finance
1.512%, 11/29/04 | | | 651 | | | | 651 | | |
| Total Commercial Paper | | | | | | | 49,510 | | |
| Corporate Obligations – 12.4% | | | |
Allstate Life Global
1.780%, 10/14/05 | | | 2,614 | | | | 2,614 | | |
| 1.750%, 10/14/05 | | | 653 | | | | 653 | | |
Bayer Landbank NY
1.830%, 6/24/05 | | | 2,483 | | | | 2,483 | | |
Blue Heron Funding Ltd
1.850%, 5/18/05 | | | 732 | | | | 732 | | |
Castle Hill III
1.910%, 9/15/15 | | | 784 | | | | 784 | | |
Depfa Bank PLC
1.860%, 6/15/05 | | | 1,306 | | | | 1,306 | | |
Duke Funding VI
1.320%, 4/08/05 | | | 1,581 | | | | 1,581 | | |
General Electric Capital Corporation
1.838%, 10/07/05 | | | 1,308 | | | | 1,308 | | |
Jackson National Life
1.760%, 4/15/05 | | | 1,307 | | | | 1,307 | | |
Jefferson Pilot
1.788%, 8/17/05 | | | 1,307 | | | | 1,307 | | |
Liquid Funding Ltd
1.840%, 6/28/05 | | | 1,176 | | | | 1,176 | | |
FIRST AMERICAN FUNDS Annual Report 2004
21
Schedule of Investments September 30, 2004
Mid Cap Index Fund (continued)
| DESCRIPTION | | PAR (000) | | VALUE (000) | |
Merrill Lynch
1.696%, 10/01/05 | | $ | 2,614 | | | $ | 2,614 | | |
Metlife Global Funding
1.800%, 10/14/05 | | | 1,568 | | | | 1,568 | | |
| 1.880%, 10/28/05 | | | 1,098 | | | | 1,098 | | |
Morgan Stanley
1.850%, 12/26/08 | | | 1,307 | | | | 1,307 | | |
Natexis Banq NY
1.920%, 7/12/05 | | | 1,437 | | | | 1,437 | | |
Northlake CDO Ltd
1.895%, 3/07/05 | | | 784 | | | | 784 | | |
Premium Asset Trust
1.848%, 12/22/04 | | | 980 | | | | 980 | | |
| 1.760%, 5/13/05 | | | 1,829 | | | | 1,829 | | |
| 1.740%, 6/01/05 | | | 3,894 | | | | 3,894 | | |
| 1.770%, 10/14/05 | | | 1,045 | | | | 1,045 | | |
REMAC
1.840%, 9/29/05 | | | 1,437 | | | | 1,437 | | |
RMAC
1.740%, 6/12/05 | | | 1,508 | | | | 1,508 | | |
SMM Trust 2004
1.833%, 9/23/05 | | | 2,431 | | | | 2,431 | | |
Societe Generale NYC
1.960%, 12/08/04 | | | 2,614 | | | | 2,614 | | |
Svenska Handl
1.170%, 10/21/04 | | | 1,307 | | | | 1,307 | | |
| Total Corporate Obligations | | | | | | | 41,104 | | |
| Other Short-Term Investments – 3.2% | | | |
ARLO III Ltd
2.000%, 9/28/05 | | | 3,920 | | | | 3,920 | | |
Commonwealth Life
2.115%, 12/31/04 (d) | | | 1,319 | | | | 1,319 | | |
General Electric Capital Assurance
1.980%, 1/19/05 | | | 523 | | | | 523 | | |
HBOS Treasury Services
1.640%, 11/01/05 | | | 1,437 | | | | 1,437 | | |
Security Life Denver
1.900%, 12/30/04 | | | 3,398 | | | | 3,398 | | |
| Total Other Short-Term Investments | | | | | | | 10,597 | | |
| Repurchase Agreements – 15.7% | | | |
Bear Stearns
2.045%, dated 9/30/04, matures 10/01/04,
repurchase price $2,613,709
(collateralized by various securities:
Total market value $2,667,288) | | | 2,614 | | | | 2,614 | | |
Bear Stearns
2.060%, dated 9/30/04, matures 12/23/04,
repurchase price $787,837
(collateralized by various securities:
Total market value $800,029) | | | 784 | | | | 784 | | |
Citibank
1.945%, dated 9/30/04, matures 10/01/04,
repurchase price $5,227,403
(collateralized by corporate securities:
Total market value $5,535,267) | | | 5,227 | | | | 5,227 | | |
Citibank
1.925%, dated 9/30/04, matures 10/01/04,
repurchase price $1,306,850
(collateralized by various securities:
Total market value $1,335,877) | | | 1,307 | | | | 1,307 | | |
Mid Cap Index Fund (continued)
| DESCRIPTION | | PAR (000) | | VALUE (000) | |
Citibank
1.925%, dated 9/30/04, matures 10/01/04,
repurchase price $1,306,850
(collateralized by various securities:
Total market value $1,332,933) | | $ | 1,307 | | | $ | 1,307 | | |
Greenwich Capital Markets
1.950%, dated 9/30/04, matures 10/01/04,
repurchase price $7,841,105
(collateralized by U.S. government securities:
Total market value $7,997,596) | | | 7,841 | | | | 7,841 | | |
Goldman Sachs
2.025%, dated 9/30/04, matures 10/01/04,
repurchase price $1,829,595
(collateralized by various securities:
Total market value $1,886,077) | | | 1,829 | | | | 1,829 | | |
Goldman Sachs
2.025%, dated 9/30/04, matures 10/01/04,
repurchase price $784,112
(collateralized by various securities:
Total market value $808,338) | | | 784 | | | | 784 | | |
Goldman Sachs
2.025%, dated 9/30/04, matures 10/01/04,
repurchase price $784,112
(collateralized by various securities:
Total market value $808,338) | | | 784 | | | | 784 | | |
Goldman Sachs
2.025%, dated 9/30/04, matures 10/01/04,
repurchase price $1,960,280
(collateralized by corporate securities:
Total market value $2,020,804) | | | 1,960 | | | | 1,960 | | |
Goldman Sachs
1.425%, dated 9/30/04, matures 10/18/04,
repurchase price $3,269,278
(collateralized by corporate securities:
Total market value $3,333,642) | | | 3,267 | | | | 3,267 | | |
Goldman Sachs
1.480%, dated 9/30/04, matures 10/18/04,
repurchase price $1,961,621
(collateralized by various securities:
Total market value $2,020,805) | | | 1,960 | | | | 1,960 | | |
Goldman Sachs
2.205%, dated 9/30/04, matures 3/07/05,
repurchase price $1,319,426
(collateralized by corporate securities:
Total market value $1,333,467) | | | 1,307 | | | | 1,307 | | |
Lehman Brothers
2.055%, dated 9/30/04, matures 10/01/04,
repurchase price $5,227,418
(collateralized by collateralized mortgage obligations:
Total market value $5,331,663) | | | 5,227 | | | | 5,227 | | |
Lehman Brothers
1.910%, dated 9/30/04, matures 10/01/04,
repurchase price $7,841,096
(collateralized by U.S. government securities:
Total market value $7,997,620) | | | 7,840 | | | | 7,840 | | |
Lehman Brothers
1.935%, dated 9/30/04, matures 10/01/04,
repurchase price $5,227,401
(collateralized by collateralized mortgage obligations:
Total market value $5,747,649) | | | 5,227 | | | | 5,227 | | |
Merrill Lynch
1.925%, dated 9/30/04, matures 10/01/04,
repurchase price $2,613,700
(collateralized by corporate securities:
Total market value $2,744,295) | | | 2,614 | | | | 2,614 | | |
Total Repurchase Agreements
(Cost $51,879) | | | | | | | 51,879 | | |
The accompanying notes are an integral part of the financial statements.
FIRST AMERICAN FUNDS Annual Report 2004
22
Mid Cap Index Fund (concluded)
| DESCRIPTION | | | | VALUE (000) | |
Total Investments Purchased with
Proceeds from Securities Lending
(Cost $153,090) | | | | $ | 153,090 | | |
Total Investments – 147.3%
(Cost $461,483) | | | | | 487,643 | | |
| Other Assets and Liabilities, Net – (47.3)% | | | | | (156,468 | ) | |
| Total Net Assets – 100.0% | | | | $ | 331,175 | | |
* Non-income producing security
(a) This security or a portion of this security is out on loan at September 30, 2004. Total loaned securities had a market value of $148,685,304 at September 30, 2004. See note 2 in Notes to Financial Statements.
(b) Security has been deposited as initial margin on open futures contracts. Yield shown is effective yield at date of purchase. See note 2 in Notes to Financial Statements.
(c) Investment in affiliated security. This money market fund is advised by U.S. Bancorp Asset Management, Inc., which also serves as advisor to this Fund. See note 3 in Notes to Financial Statements.
(d) Security has demand features which qualify it as a short term security. The date disclosed is the next put date.
Cl – Class
REIT – Real Estate Investment Trust
Schedule of Open Futures Contracts
| Description | | Number of
Contracts | | Market Value
Covered By
Contracts | | Settlement
Month | | Unrealized
Appreciation | |
S&P Mid Cap 400
Futures Contracts
purchased | | | 18 | | | $ | 5,349 | | | Dec. 04 | | $ | 21 | | |
Small Cap Index Fund
| DESCRIPTION | | SHARES | | VALUE (000) | |
| Common Stocks – 98.8% | |
| Consumer Discretionary – 14.7% | |
| 1-800 Contacts* | | | 1,298 | | | $ | 20 | | |
| 1-800 Flowers* | | | 3,695 | | | | 31 | | |
| 4Kids Entertainment* | | | 2,306 | | | | 47 | | |
| 99 Cents Only Stores* (a) | | | 8,170 | | | | 116 | | |
| A.C. Moore Arts & Crafts* | | | 2,296 | | | | 57 | | |
| Aaron Rents (a) | | | 6,333 | | | | 138 | | |
| Action Performance | | | 2,586 | | | | 26 | | |
| Advanced Marketing Services | | | 2,374 | | | | 26 | | |
| ADVO | | | 5,063 | | | | 157 | | |
| Aeropostale* | | | 9,251 | | | | 242 | | |
| Aftermarket Technology* | | | 2,003 | | | | 25 | | |
| Alliance Gaming* | | | 8,585 | | | | 129 | | |
| Alloy* (a) | | | 5,605 | | | | 21 | | |
| Ambassadors Group | | | 1,336 | | | | 36 | | |
| AMC Entertainment* | | | 5,220 | | | | 100 | | |
| American Greetings, Cl A* (a) | | | 10,595 | | | | 266 | | |
| America's Car-Mart* | | | 942 | | | | 32 | | |
| Ameristar Casinos | | | 1,905 | | | | 58 | | |
| Applica* | | | 3,269 | | | | 13 | | |
| Arbitron* | | | 5,160 | | | | 189 | | |
| Arctic Cat | | | 2,294 | | | | 60 | | |
| Argosy Gaming* | | | 4,353 | | | | 171 | | |
| ArvinMeritor | | | 11,580 | | | | 217 | | |
| Asbury Automotive Group* | | | 1,870 | | | | 25 | | |
| Avatar Holdings* | | | 770 | | | | 33 | | |
| Aztar* | | | 5,760 | | | | 153 | | |
| Bandag | | | 1,794 | | | | 79 | | |
| Bassett Furniture | | | 1,652 | | | | 31 | | |
| Beasley Broadcast Group* | | | 898 | | | | 14 | | |
| Beazer Homes USA (a) | | | 2,284 | | | | 244 | | |
| Bebe Stores | | | 1,000 | | | | 21 | | |
| Big 5 Sporting Goods* | | | 3,809 | | | | 87 | | |
| BJs Restaurants* | | | 1,810 | | | | 29 | | |
| Blair | | | 1,359 | | | | 38 | | |
| Blount International* | | | 986 | | | | 13 | | |
| Blue Nile* | | | 630 | | | | 21 | | |
| Bluegreen* | | | 2,710 | | | | 30 | | |
| BLYTH | | | 4,750 | | | | 147 | | |
| Bob Evans Farms | | | 5,872 | | | | 159 | | |
| Boca Resorts, Cl A* | | | 3,994 | | | | 74 | | |
| Bombay Company* | | | 5,931 | | | | 43 | | |
| Bon-Ton Stores | | | 270 | | | | 3 | | |
| Boyd Gaming (a) | | | 7,598 | | | | 214 | | |
| Brookfield Homes | | | 2,487 | | | | 66 | | |
| Brookstone* | | | 3,343 | | | | 63 | | |
| Brown Shoe | | | 3,023 | | | | 76 | | |
| Buckle | | | 1,128 | | | | 31 | | |
| Buffalo Wild Wings* | | | 950 | | | | 27 | | |
| Building Materials Holding | | | 2,241 | | | | 62 | | |
| Burlington Coat Factory | | | 2,930 | | | | 62 | | |
| Cache* | | | 1,590 | | | | 24 | | |
| California Pizza Kitchen* | | | 3,301 | | | | 72 | | |
| Callaway Golf | | | 11,225 | | | | 119 | | |
| Carmike Cinemas | | | 1,262 | | | | 44 | | |
| Carters* | | | 1,100 | | | | 30 | | |
| Casual Male Retail Group* | | | 4,692 | | | | 25 | | |
| Catalina Marketing, Cl C | | | 8,700 | | | | 201 | | |
| Cato, Cl A | | | 3,118 | | | | 69 | | |
| CBRL Group (a) | | | 7,900 | | | | 285 | | |
| CEC Entertainment* | | | 6,236 | | | | 229 | | |
| Champion Enterprise* | | | 11,760 | | | | 121 | | |
| Charlotte Russe Holding* | | | 1,938 | | | | 22 | | |
| Charming Shoppes* | | | 19,199 | | | | 137 | | |
| Charter Communications, Cl A* (a) | | | 44,944 | | | | 120 | | |
| Cherokee | | | 1,054 | | | | 25 | | |
FIRST AMERICAN FUNDS Annual Report 2004
23
Schedule of Investments September 30, 2004
Small Cap Index Fund (continued)
| DESCRIPTION | | SHARES | | VALUE (000) | |
| Children's Place Retail Stores* | | | 2,968 | | | $ | 71 | | |
| Christopher & Banks | | | 6,267 | | | | 100 | | |
| Churchill Downs | | | 1,277 | | | | 50 | | |
| Circle Group Holdings* | | | 3,350 | | | | 6 | | |
| CKE Restaurants* (a) | | | 8,632 | | | | 95 | | |
| Coachmen Industries | | | 2,354 | | | | 37 | | |
| Coldwater Creek* (a) | | | 3,658 | | | | 76 | | |
| Cole National* | | | 2,255 | | | | 62 | | |
| Collins & Aikman* | | | 6,392 | | | | 27 | | |
| Conns* | | | 1,160 | | | | 16 | | |
| Cooper Tire & Rubber (a) | | | 10,766 | | | | 217 | | |
| Cosi* | | | 3,430 | | | | 18 | | |
| Cost Plus* (a) | | | 3,646 | | | | 129 | | |
| Courier | | | 1,073 | | | | 45 | | |
| Cross Media Marketing* (b) | | | 1,203 | | | | - | | |
| Crown Media Holdings, Cl A* | | | 2,428 | | | | 20 | | |
| CSK Auto* | | | 7,767 | | | | 103 | | |
| CSS Industries | | | 1,163 | | | | 36 | | |
| Cumulus Media, Cl A* | | | 8,225 | | | | 118 | | |
| Dave & Busters* | | | 1,850 | | | | 35 | | |
| Deb Shops | | | 649 | | | | 16 | | |
| Deckers Outdoor* (a) | | | 1,490 | | | | 51 | | |
| Department 56* | | | 2,207 | | | | 36 | | |
| DHB Industries* | | | 3,407 | | | | 48 | | |
| Dicks Sporting Goods* | | | 5,032 | | | | 179 | | |
| Dominion Homes* | | | 700 | | | | 17 | | |
| Dover Downs Gaming & Entertainment | | | 1,689 | | | | 17 | | |
| Dover Motorsports | | | 2,601 | | | | 11 | | |
| Dress Barn* | | | 3,264 | | | | 57 | | |
| Drew Industries* | | | 1,190 | | | | 43 | | |
| Drugstore.com* | | | 7,390 | | | | 25 | | |
| Electronics Boutique Holdings* (a) | | | 1,937 | | | | 66 | | |
| Emmis Communications, Cl A* (a) | | | 8,178 | | | | 148 | | |
| Empire Resorts* | | | 1,430 | | | | 11 | | |
| Entravision Communications* | | | 8,050 | | | | 61 | | |
| Escalade | | | 1,310 | | | | 18 | | |
| Ethan Allen Interiors (a) | | | 5,500 | | | | 191 | | |
| Exide Technologies* | | | 3,340 | | | | 53 | | |
| Finish Line, Cl A | | | 3,025 | | | | 94 | | |
| Fisher Communications* | | | 977 | | | | 47 | | |
| Fleetwood Enterprises* (a) | | | 8,948 | | | | 136 | | |
| Fred's | | | 6,526 | | | | 117 | | |
| Furniture Brands International (a) | | | 8,690 | | | | 218 | | |
| GameStop* | | | 2,459 | | | | 46 | | |
| Gander Mountain* | | | 1,020 | | | | 20 | | |
| Gaylord Entertainment* | | | 5,089 | | | | 158 | | |
| Genesco* (a) | | | 3,637 | | | | 86 | | |
| Goodyear Tire & Rubber* (a) | | | 25,393 | | | | 273 | | |
| Goody's Family Clothing | | | 3,142 | | | | 26 | | |
| Gray Television | | | 7,491 | | | | 89 | | |
| Grey Global Group | | | 140 | | | | 139 | | |
| Group 1 Automotive* (a) | | | 3,252 | | | | 89 | | |
| GSI Commerce* | | | 3,230 | | | | 28 | | |
| Guess?* | | | 2,483 | | | | 44 | | |
| Guitar Center* (a) | | | 4,067 | | | | 176 | | |
| Gymboree* | | | 5,097 | | | | 73 | | |
| Hancock Fabrics | | | 3,151 | | | | 38 | | |
| Handleman | | | 3,843 | | | | 79 | | |
| Harris Interactive* | | | 8,170 | | | | 54 | | |
| Hartmarx* | | | 4,640 | | | | 34 | | |
| Haverty Furniture | | | 3,097 | | | | 54 | | |
| Hayes Lemmerz International* | | | 6,300 | | | | 64 | | |
| Hibbett Sporting Goods* | | | 3,903 | | | | 80 | | |
| Hollinger International | | | 9,576 | | | | 166 | | |
| Hollywood Entertainment* | | | 8,781 | | | | 87 | | |
| Hooker Furniture | | | 1,146 | | | | 32 | | |
| Hot Topic* (a) | | | 8,046 | | | | 137 | | |
| IHOP (a) | | | 3,409 | | | | 130 | | |
Small Cap Index Fund (continued)
| DESCRIPTION | | SHARES | | VALUE (000) | |
| Information Holdings* | | | 1,973 | | | $ | 54 | | |
| Insight Communications* | | | 7,495 | | | | 66 | | |
| Insight Enterprises* | | | 8,077 | | | | 136 | | |
| Interactive Data* | | | 6,130 | | | | 115 | | |
| Interface, Cl A* | | | 7,388 | | | | 59 | | |
| Isle of Capri Casinos* | | | 2,255 | | | | 44 | | |
| J Jill Group* | | | 2,963 | | | | 59 | | |
| Jack in the Box* | | | 6,091 | | | | 193 | | |
| JAKKS Pacific* | | | 4,227 | | | | 97 | | |
| Jarden* | | | 4,538 | | | | 166 | | |
| Jo-Ann Stores* | | | 3,147 | | | | 88 | | |
| JOS A Bank Clothiers* (a) | | | 1,705 | | | | 47 | | |
| Journal Communications | | | 3,370 | | | | 59 | | |
| Journal Register* | | | 7,004 | | | | 132 | | |
| K2* | | | 6,935 | | | | 99 | | |
| Kellwood | | | 4,529 | | | | 165 | | |
| Kenneth Cole Productions | | | 1,395 | | | | 39 | | |
| Keystone Automotive Industries* | | | 2,533 | | | | 56 | | |
| Kimball International | | | 3,502 | | | | 49 | | |
| Kirkland's* | | | 1,851 | | | | 17 | | |
| Krispy Kreme Doughnuts* (a) | | | 9,160 | | | | 116 | | |
| K-Swiss, Cl A (a) | | | 4,312 | | | | 83 | | |
| La Quinta (REIT)* | | | 31,352 | | | | 245 | | |
| Lakes Entertainment* (a) | | | 2,560 | | | | 27 | | |
| Landry's Restaurants | | | 3,588 | | | | 98 | | |
| La-Z-Boy (a) | | | 8,780 | | | | 133 | | |
| LeapFrog Enterprises* (a) | | | 4,580 | | | | 93 | | |
| Levitt, Cl A | | | 2,559 | | | | 60 | | |
| Libbey | | | 2,178 | | | | 41 | | |
| Liberty | | | 2,408 | | | | 96 | | |
| Life Time Fitness | | | 5,620 | | | | 144 | | |
| Lifetime Hoan | | | 1,060 | | | | 16 | | |
| Lin TV, Cl A* (a) | | | 4,477 | | | | 87 | | |
| Linens 'N Things* (a) | | | 7,529 | | | | 174 | | |
| Lithia Motors | | | 2,385 | | | | 51 | | |
| LKQ* | | | 2,430 | | | | 44 | | |
| LodgeNet Entertainment* | | | 2,182 | | | | 29 | | |
| Lone Star Steakhouse & Saloon | | | 2,544 | | | | 66 | | |
| M/I Homes | | | 2,021 | | | | 86 | | |
| Magna Entertainment* | | | 6,288 | | | | 34 | | |
| Marcus | | | 3,288 | | | | 64 | | |
| Marine Products | | | 1,440 | | | | 26 | | |
| MarineMax* | | | 1,937 | | | | 44 | | |
| Martha Stewart Living* (a) | | | 1,946 | | | | 31 | | |
| Mediacom Communications* | | | 11,788 | | | | 77 | | |
| Men's Wearhouse* (a) | | | 5,277 | | | | 153 | | |
| Meritage Homes* | | | 1,770 | | | | 139 | | |
| MicroAge* (b) | | | 3,579 | | | | - | | |
| Midas* | | | 2,582 | | | | 42 | | |
| Modine Manufacturing | | | 3,968 | | | | 119 | | |
| Monaco Coach | | | 4,359 | | | | 94 | | |
| Monro Muffler Brake* | | | 1,563 | | | | 34 | | |
| Movado Group | | | 2,538 | | | | 43 | | |
| Movie Gallery | | | 4,435 | | | | 78 | | |
| MTR Gaming Group* | | | 3,874 | | | | 36 | | |
| Multimedia Games* | | | 3,944 | | | | 61 | | |
| National Presto Industries* | | | 783 | | | | 33 | | |
| Nautilus Group (a) | | | 4,775 | | | | 108 | | |
| Navarre* | | | 3,490 | | | | 51 | | |
| Navigant International* (a) | | | 2,957 | | | | 48 | | |
| Nevada Gold & Casinos* | | | 1,360 | | | | 16 | | |
| Nexstar Broadcasting Group, Cl A* | | | 1,680 | | | | 14 | | |
| Noble International | | | 1,060 | | | | 19 | | |
| Oakley | | | 3,449 | | | | 41 | | |
| Orbitz* (a) | | | 2,040 | | | | 55 | | |
The accompanying notes are an integral part of the financial statements.
FIRST AMERICAN FUNDS Annual Report 2004
24
Small Cap Index Fund (continued)
| DESCRIPTION | | SHARES | | VALUE (000) | |
| OshKosh B' Gosh, Cl A | | | 1,111 | | | $ | 22 | | |
| O'Charley's* | | | 3,541 | | | | 58 | | |
| Overstock.com* | | | 1,814 | | | | 67 | | |
| Oxford Industries | | | 2,216 | | | | 83 | | |
| P. F. Chang's China Bistro* (a) | | | 4,271 | | | | 207 | | |
| Palm Harbor Homes* | | | 1,584 | | | | 27 | | |
| Panera Bread, Cl A* (a) | | | 4,734 | | | | 178 | | |
| Papa John's International* | | | 1,942 | | | | 60 | | |
| Party City* | | | 1,908 | | | | 28 | | |
| Paxson Communications* | | | 7,566 | | | | 10 | | |
| Payless ShoeSource* (a) | | | 11,358 | | | | 115 | | |
| PC Mall* | | | 1,300 | | | | 20 | | |
| Penn National Gaming* | | | 5,339 | | | | 216 | | |
| Pep Boys – Manny Moe & Jack (a) | | | 9,630 | | | | 135 | | |
| Perry Ellis International* | | | 1,025 | | | | 23 | | |
| PetMed Express* | | | 1,640 | | | | 8 | | |
| Phillips Van-Heusen | | | 4,045 | | | | 90 | | |
| Pinnacle Entertainment* | | | 5,930 | | | | 82 | | |
| Playboy Enterprises, Cl B* | | | 3,264 | | | | 33 | | |
| Priceline.com* (a) | | | 3,986 | | | | 88 | | |
| Prime Hospitality* | | | 6,300 | | | | 77 | | |
| PRIMEDIA* | | | 22,021 | | | | 52 | | |
| ProQuest* (a) | | | 3,997 | | | | 103 | | |
| Provide Commerce* | | | 730 | | | | 15 | | |
| Pulitzer | | | 1,396 | | | | 69 | | |
| Quiksilver* (a) | | | 9,420 | | | | 239 | | |
| R.H. Donnelley* | | | 3,760 | | | | 186 | | |
| RARE Hospitality International* | | | 5,669 | | | | 151 | | |
| RC2* | | | 2,751 | | | | 91 | | |
| Reader's Digest Association, Cl A | | | 16,520 | | | | 241 | | |
| Reading International, Cl A* | | | 2,407 | | | | 19 | | |
| Red Robin Gourmet Burgers* | | | 1,996 | | | | 87 | | |
| Regent Communication* | | | 5,813 | | | | 33 | | |
| Rent-Way* | | | 4,376 | | | | 30 | | |
| Restoration Hardware* | | | 4,393 | | | | 23 | | |
| Retail Ventures* | | | 2,210 | | | | 17 | | |
| Rush Enterprises* | | | 970 | | | | 11 | | |
| Russ Berrie and Company | | | 1,339 | | | | 27 | | |
| Russell | | | 4,775 | | | | 80 | | |
| Ryans Restaurant Group* | | | 7,632 | | | | 113 | | |
| Saga Communications, Cl A* | | | 2,724 | | | | 46 | | |
| Salem Communications* | | | 1,600 | | | | 41 | | |
| Sauer-Danfoss | | | 1,680 | | | | 29 | | |
| Scholastic* | | | 5,040 | | | | 156 | | |
| Scientific Games* | | | 12,768 | | | | 244 | | |
| SCP Pool | | | 8,899 | | | | 238 | | |
| Select Comfort* | | | 6,078 | | | | 111 | | |
| Sharper Image* | | | 1,960 | | | | 42 | | |
| Shoe Carnival* | | | 1,228 | | | | 14 | | |
| Shopko* | | | 4,736 | | | | 82 | | |
| Shuffle Master* (a) | | | 3,869 | | | | 145 | | |
| Sinclair Broadcast Group, Cl A | | | 7,468 | | | | 55 | | |
| Six Flags* | | | 15,524 | | | | 84 | | |
| Skechers USA* | | | 3,312 | | | | 48 | | |
| Skyline | | | 1,134 | | | | 45 | | |
| Sonic* | | | 9,908 | | | | 254 | | |
| Sonic Automotive, Cl A | | | 4,615 | | | | 93 | | |
| Source Interlink Companies* | | | 3,281 | | | | 32 | | |
| Spanish Broadcasting System* | | | 6,168 | | | | 61 | | |
| Speedway Motorsports | | | 2,468 | | | | 82 | | |
| Sports Authority* (a) | | | 3,714 | | | | 86 | | |
| Sports Resorts International* | | | 367 | | | | 1 | | |
| Stage Stores* | | | 3,128 | | | | 107 | | |
| Stamps.com* | | | 2,708 | | | | 36 | | |
| Standard Motor Products | | | 2,008 | | | | 30 | | |
| Stanley Furniture | | | 937 | | | | 41 | | |
Small Cap Index Fund (continued)
| DESCRIPTION | | SHARES | | VALUE (000) | |
| Steak 'N Shake* | | | 4,258 | | | $ | 73 | | |
| Stein Mart* | | | 4,130 | | | | 63 | | |
| Steinway Musical Instruments* | | | 1,124 | | | | 31 | | |
| Steven Madden* | | | 2,179 | | | | 38 | | |
| Stoneridge* | | | 2,379 | | | | 34 | | |
| Strattec Security* | | | 618 | | | | 38 | | |
| Stride Rite | | | 6,523 | | | | 67 | | |
| Sturm, Ruger & Company | | | 3,531 | | | | 32 | | |
| Sunterra* | | | 3,100 | | | | 30 | | |
| Superior Industries (a) | | | 3,534 | | | | 106 | | |
| Systemax* | | | 1,610 | | | | 9 | | |
| TBC* | | | 3,297 | | | | 74 | | |
| Technical Olympic USA | | | 1,917 | | | | 54 | | |
| Tempur-Pedic International* | | | 3,080 | | | | 46 | | |
| Tenneco Automotive* (a) | | | 6,992 | | | | 92 | | |
| Thomas Nelson | | | 1,678 | | | | 33 | | |
| Thor Industries | | | 5,978 | | | | 158 | | |
| TiVo* (a) | | | 7,620 | | | | 50 | | |
| Too* | | | 5,741 | | | | 104 | | |
| Tower Automotive* (a) | | | 9,684 | | | | 20 | | |
| Tractor Supply* | | | 5,188 | | | | 163 | | |
| Trans World Entertainment* | | | 3,875 | | | | 38 | | |
| Triarc, Cl B | | | 5,962 | | | | 68 | | |
| Tuesday Morning* (a) | | | 4,299 | | | | 133 | | |
| Tupperware (a) | | | 7,503 | | | | 127 | | |
| UniFirst | | | 1,506 | | | | 43 | | |
| United Auto Group | | | 3,200 | | | | 80 | | |
| Universal Electronics* | | | 2,331 | | | | 39 | | |
| Vail Resorts* | | | 3,273 | | | | 59 | | |
| Valassis Communications* (a) | | | 8,700 | | | | 257 | | |
| Value Line | | | 210 | | | | 8 | | |
| ValueVision Media* | | | 3,000 | | | | 40 | | |
| Visteon (a) | | | 21,602 | | | | 173 | | |
| Warnaco Group, Cl A* | | | 7,659 | | | | 170 | | |
| WCI Communities* (a) | | | 5,645 | | | | 132 | | |
| WESCO International* | | | 3,003 | | | | 73 | | |
| West Marine* | | | 2,238 | | | | 48 | | |
| Weyco Group | | | 450 | | | | 17 | | |
| William Lyon Homes* | | | 701 | | | | 62 | | |
| Winnebago Industries (a) | | | 4,332 | | | | 150 | | |
| WMS Industries* (a) | | | 3,237 | | | | 83 | | |
| Wolverine World Wide (a) | | | 6,644 | | | | 167 | | |
| World Wrestling Entertainment | | | 2,135 | | | | 26 | | |
| Yankee Candle* (a) | | | 8,292 | | | | 240 | | |
| Young Broadcasting, Cl A* | | | 2,694 | | | | 29 | | |
| Zale* (a) | | | 8,854 | | | | 249 | | |
| | | | 24,800 | | |
| Consumer Staples – 2.7% | | | |
| Alico | | | 593 | | | | 25 | | |
| American Italian Pasta (a) | | | 2,674 | | | | 70 | | |
| Arden Group, Cl A | | | 216 | | | | 18 | | |
| Boston Beer, Cl A* | | | 1,140 | | | | 29 | | |
| Cal-Maine Foods (a) | | | 2,500 | | | | 27 | | |
| Casey's General Stores | | | 8,339 | | | | 155 | | |
| Central European Distribution* | | | 1,957 | | | | 44 | | |
| Central Garden & Pet* | | | 2,816 | | | | 86 | | |
| Chattem* | | | 2,693 | | | | 87 | | |
| Chiquita Brands International* | | | 6,795 | | | | 118 | | |
| Coca-Cola Bottling | | | 1,134 | | | | 61 | | |
| Corn Products International | | | 6,081 | | | | 280 | | |
| Darling International* | | | 11,020 | | | | 47 | | |
| Del Laboratories* | | | 814 | | | | 27 | | |
| Delta & Pine Land | | | 6,307 | | | | 169 | | |
| DIMON | | | 7,527 | | | | 44 | | |
| Elizabeth Arden* | | | 3,739 | | | | 79 | | |
FIRST AMERICAN FUNDS Annual Report 2004
25
Schedule of Investments September 30, 2004
Small Cap Index Fund (continued)
| DESCRIPTION | | SHARES | | VALUE (000) | |
| Farmer Brothers | | | 1,250 | | | $ | 33 | | |
| Flowers Foods | | | 5,929 | | | | 153 | | |
| Great Atlantic & Pacific Tea* | | | 2,758 | | | | 17 | | |
| Hain Celestial Group* | | | 5,063 | | | | 90 | | |
| Hansen Natural* | | | 1,000 | | | | 24 | | |
| Ingles Markets, Cl A | | | 1,520 | | | | 18 | | |
| Inter Parfums | | | 841 | | | | 11 | | |
| J & J Snack Foods* | | | 1,254 | | | | 54 | | |
| John B. Sanfilippo & Son* | | | 1,048 | | | | 27 | | |
| Lancaster Colony | | | 4,040 | | | | 170 | | |
| Lance | | | 4,278 | | | | 69 | | |
| Longs Drug Stores | | | 5,038 | | | | 122 | | |
| M & F Worldwide* | | | 1,695 | | | | 22 | | |
| Mannatech | | | 2,370 | | | | 33 | | |
| Maui Land & Pineapple* | | | 542 | | | | 17 | | |
| MGP Ingredients | | | 1,320 | | | | 13 | | |
| Nash-Finch | | | 2,055 | | | | 65 | | |
| National Beverage* | | | 1,740 | | | | 14 | | |
| Natures Sunshine Product | | | 1,588 | | | | 24 | | |
| NeighborCare* | | | 6,271 | | | | 159 | | |
| Nu Skin Enterprises (a) | | | 8,773 | | | | 206 | | |
| Omega Protein* | | | 992 | | | | 8 | | |
| Pantry* | | | 1,940 | | | | 49 | | |
| Pathmark Stores* | | | 5,021 | | | | 24 | | |
| Peets Coffee & Tea* | | | 1,964 | | | | 46 | | |
| Performance Food Group* | | | 7,740 | | | | 183 | | |
| Playtex Products* | | | 5,800 | | | | 37 | | |
| Ralcorp Holdings* | | | 4,882 | | | | 176 | | |
| Rayovac* | | | 5,746 | | | | 151 | | |
| Revlon* | | | 24,357 | | | | 61 | | |
| Robert Mondavi, Cl A* | | | 1,572 | | | | 62 | | |
| Ruddick | | | 5,509 | | | | 108 | | |
| Sanderson Farms | | | 1,722 | | | | 58 | | |
| Seaboard | | | 58 | | | | 34 | | |
| Smart & Final* | | | 2,085 | | | | 35 | | |
| Standard Commercial | | | 2,135 | | | | 34 | | |
| Star Scientific* (a) | | | 4,547 | | | | 27 | | |
| Topps | | | 5,913 | | | | 58 | | |
| United Natural Foods* | | | 6,614 | | | | 176 | | |
| Universal | | | 4,194 | | | | 187 | | |
| Usana Health Sciences* | | | 1,678 | | | | 58 | | |
| Vector Group (a) | | | 4,365 | | | | 66 | | |
| WD-40 Company | | | 2,846 | | | | 81 | | |
| Weis Markets | | | 1,521 | | | | 52 | | |
| Wild Oats Markets* | | | 4,829 | | | | 42 | | |
| Winn-Dixie Stores* (a) | | | 13,710 | | | | 42 | | |
| | | | 4,562 | | |
| Energy – 5.5% | | | |
| Atlas America* | | | 380 | | | | 8 | | |
| Atwood Oceanics* | | | 1,811 | | | | 86 | | |
| Berry Petroleum, Cl A | | | 3,015 | | | | 111 | | |
| Brigham Exploration* | | | 4,230 | | | | 40 | | |
| Cabot Oil & Gas (a) | | | 5,491 | | | | 247 | | |
| Cal Dive International* (a) | | | 6,378 | | | | 227 | | |
| Callon Petroleum* | | | 2,090 | | | | 26 | | |
| Carbo Ceramics | | | 2,119 | | | | 153 | | |
| Cheniere Energy* | | | 3,350 | | | | 66 | | |
| Cimarex Energy* (a) | | | 6,907 | | | | 241 | | |
| Clayton Williams Energy* | | | 844 | | | | 18 | | |
| Comstock Resources* | | | 5,783 | | | | 121 | | |
| Delta Petroleum* | | | 3,140 | | | | 41 | | |
| Denbury Resources* | | | 9,127 | | | | 232 | | |
| Dril-Quip* | | | 1,083 | | | | 24 | | |
| Edge Petroleum* | | | 2,160 | | | | 34 | | |
| Encore Acquisition* | | | 3,997 | | | | 138 | | |
Small Cap Index Fund (continued)
| DESCRIPTION | | SHARES | | VALUE (000) | |
| Energy Partners* | | | 4,170 | | | $ | 68 | | |
| Forest Oil* (a) | | | 8,400 | | | | 253 | | |
| Frontier Oil | | | 3,932 | | | | 93 | | |
| FX Energy* (a) | | | 4,710 | | | | 43 | | |
| Giant Industries* | | | 1,760 | | | | 43 | | |
| Global Industries* | | | 13,553 | | | | 84 | | |
| Grey Wolf* | | | 31,093 | | | | 152 | | |
| Gulf Island Fabrication | | | 1,336 | | | | 30 | | |
| GulfMark Offshore* | | | 2,407 | | | | 39 | | |
| Hanover Compressor* (a) | | | 12,823 | | | | 172 | | |
| Harvest Natural Resources* | | | 5,996 | | | | 100 | | |
| Helmerich & Payne | | | 8,110 | | | | 233 | | |
| Holly | | | 3,250 | | | | 83 | | |
| Hornbeck Offshore Services* (a) | | | 1,010 | | | | 17 | | |
| Houston Exploration* (a) | | | 2,286 | | | | 136 | | |
| Hydril* | | | 2,692 | | | | 116 | | |
| Input/Output* (a) | | | 10,628 | | | | 110 | | |
| KCS Energy* | | | 8,163 | | | | 114 | | |
| Key Energy Services* | | | 21,790 | | | | 241 | | |
| KFX* (a) | | | 7,536 | | | | 58 | | |
| Lone Star Technologies* | | | 4,804 | | | | 182 | | |
| Lufkin Industries | | | 1,088 | | | | 40 | | |
| Magnum Hunter Resources* | | | 14,478 | | | | 167 | | |
| Magnum Hunter Resources Warrant* | | | 1,160 | | | | - | | |
| Matrix Service* | | | 2,864 | | | | 15 | | |
| Maverick Tube* | | | 7,066 | | | | 218 | | |
| McMoRan Exploration* (a) | | | 2,204 | | | | 29 | | |
| Meridian Resource* | | | 10,160 | | | | 90 | | |
| Mission Resources* | | | 6,770 | | | | 43 | | |
| Newpark Resources* | | | 13,988 | | | | 84 | | |
| NS Group* | | | 3,057 | | | | 57 | | |
| Oceaneering International* | | | 4,164 | | | | 153 | | |
| Offshore Logistics* | | | 3,372 | | | | 116 | | |
| Oil States International* (a) | | | 4,851 | | | | 91 | | |
| Overseas Shipholding Group | | | 4,485 | | | | 223 | | |
| Parker Drilling* | | | 15,735 | | | | 58 | | |
| Penn Virginia | | | 3,044 | | | | 121 | | |
| Petroleum Development* | | | 2,715 | | | | 119 | | |
| Plains Exploration & Production* (a) | | | 12,856 | | | | 307 | | |
| Quicksilver Resources* | | | 4,924 | | | | 161 | | |
| Range Resources (a) | | | 11,273 | | | | 197 | | |
| Remington Oil & Gas* | | | 3,607 | | | | 95 | | |
| Resource America, Cl A | | | 2,477 | | | | 58 | | |
| RPC | | | 1,588 | | | | 28 | | |
| Seabulk International* | | | 972 | | | | 10 | | |
| SEACOR Holdings* | | | 3,099 | | | | 145 | | |
| Southwestern Energy* (a) | | | 6,020 | | | | 253 | | |
| Spinnaker Exploration* (a) | | | 4,189 | | | | 147 | | |
| St. Mary Land & Exploration | | | 4,768 | | | | 190 | | |
| Stone Energy* | | | 3,842 | | | | 168 | | |
| Superior Energy Services* | | | 9,047 | | | | 117 | | |
| Swift Energy* | | | 4,625 | | | | 111 | | |
| Syntroleum* | | | 4,680 | | | | 33 | | |
| Tesoro Petroleum* (a) | | | 10,937 | | | | 323 | | |
| Tetra Technologies* | | | 3,727 | | | | 116 | | |
| TODCO* (a) | | | 4,240 | | | | 74 | | |
| TransMontaigne* | | | 3,458 | | | | 20 | | |
| Unit* (a) | | | 6,290 | | | | 221 | | |
| Universal Compression Holdings* | | | 2,875 | | | | 98 | | |
| Veritas DGC* | | | 5,678 | | | | 129 | | |
| Vintage Petroleum | | | 8,481 | | | | 170 | | |
| W-H Energy Services* | | | 4,086 | | | | 85 | | |
| Whiting Petroleum* | | | 3,460 | | | | 105 | | |
| World Fuel Services | | | 1,687 | | | | 60 | | |
| | | | 9,225 | | |
The accompanying notes are an integral part of the financial statements.
FIRST AMERICAN FUNDS Annual Report 2004
26
Small Cap Index Fund (continued)
| DESCRIPTION | | SHARES | | VALUE (000) | |
| Financials – 22.2% | |
| 1st Source | | | 1,968 | | | $ | 50 | | |
| 21st Century Insurance Group | | | 3,694 | | | | 49 | | |
| ABC Bancorp | | | 1,630 | | | | 33 | | |
| Acadia Realty Trust (REIT) | | | 4,092 | | | | 60 | | |
| Accredited Home Lenders Holdings* (a) | | | 2,725 | | | | 105 | | |
| Ace Cash Express* | | | 1,500 | | | | 39 | | |
| Advanta, Cl B | | | 3,278 | | | | 79 | | |
| Affiliated Managers Group* (a) | | | 4,068 | | | | 218 | | |
| Affirmative Insurance Holdings* | | | 2,800 | | | | 44 | | |
| Affordable Residential Communities | | | 4,120 | | | | 60 | | |
| Alabama National | | | 2,178 | | | | 130 | | |
| Alexander's (REIT)* | | | 427 | | | | 85 | | |
| Alexandria Real Estate Equities | | | 3,234 | | | | 213 | | |
| Alfa | | | 5,506 | | | | 77 | | |
| AMCORE Financial | | | 4,191 | | | | 119 | | |
| American Equity Investment Life Holding* | | | 3,590 | | | | 34 | | |
| American Financial Realty (a) | | | 18,300 | | | | 258 | | |
| American Home Mortgage Investment (REIT) | | | 5,791 | | | | 162 | | |
| American Medical Security Group* | | | 1,976 | | | | 63 | | |
| American Physicians Capital* | | | 1,423 | | | | 44 | | |
| American West Bancorp* | | | 1,708 | | | | 32 | | |
| AmerUS Group, Cl A (a) | | | 6,369 | | | | 261 | | |
| AMLI Residential Properties Trust (REIT) | | | 4,219 | | | | 129 | | |
| Anchor Bancorp | | | 3,288 | | | | 85 | | |
| Anthracite Capital (REIT) | | | 8,883 | | | | 99 | | |
| Anworth Mortgage Asset (REIT) | | | 7,452 | | | | 85 | | |
| Apollo Investment | | | 10,350 | | | | 146 | | |
| Arbor Realty Trust | | | 1,170 | | | | 26 | | |
| Argonaut Group* | | | 4,136 | | | | 77 | | |
| Arrow Financial | | | 1,483 | | | | 45 | | |
| Ashford Hospitality Trust | | | 3,340 | | | | 31 | | |
| Asta Funding | | | 1,550 | | | | 25 | | |
| Baldwin & Lyons, Cl B | | | 1,340 | | | | 34 | | |
| BancFirst | | | 538 | | | | 34 | | |
| Bancorp Bank* | | | 1,150 | | | | 23 | | |
| BancorpSouth | | | 12,890 | | | | 296 | | |
| BancTrust Financial Group | | | 1,427 | | | | 27 | | |
| Bank Mutual | | | 13,144 | | | | 158 | | |
| Bank of Granite | | | 2,259 | | | | 44 | | |
| Bank of the Ozarks | | | 1,774 | | | | 53 | | |
| BankAtlantic Bancorp | | | 7,096 | | | | 130 | | |
| BankUnited Financial* | | | 4,438 | | | | 129 | | |
| Banner | | | 1,687 | | | | 50 | | |
| Bedford Property Investors (REIT) | | | 2,421 | | | | 73 | | |
| Berkshire Hills Bancorp | | | 894 | | | | 33 | | |
| Beverly Hills Bancorp | | | 2,210 | | | | 23 | | |
| BFC Financial* | | | 1,150 | | | | 13 | | |
| BioMed Realty Trust | | | 5,240 | | | | 92 | | |
| BKF Capital Group | | | 910 | | | | 27 | | |
| Boston Private Financial Holdings (a) | | | 4,555 | | | | 114 | | |
| Brandywine Realty Trust (REIT) (a) | | | 7,937 | | | | 226 | | |
| Bristol West Holdings | | | 2,520 | | | | 43 | | |
| Brookline Bancorp | | | 9,852 | | | | 154 | | |
| Bryn Mawr Bank | | | 1,174 | | | | 24 | | |
| Camden National | | | 1,288 | | | | 44 | | |
| Capital Automotive (REIT) | | | 5,196 | | | | 162 | | |
| Capital City Bank Group | | | 1,484 | | | | 57 | | |
| Capital Corporation of the West | | | 752 | | | | 32 | | |
| Capital Crossing Bank* | | | 710 | | | | 18 | | |
| Capital Lease Funding | | | 3,780 | | | | 42 | | |
| Capital Southwest | | | 460 | | | | 35 | | |
| Capital Trust | | | 1,620 | | | | 47 | | |
| Capitol Bancorp | | | 1,701 | | | | 50 | | |
| Capstead Mortgage (REIT) (a) | | | 2,522 | | | | 31 | | |
| CarrAmerica Realty (a) | | | 8,700 | | | | 284 | | |
Small Cap Index Fund (continued)
| DESCRIPTION | | SHARES | | VALUE (000) | |
| Cascade Bancorp | | | 2,775 | | | $ | 54 | | |
| Cash America International | | | 4,733 | | | | 116 | | |
| Cathay General Bancorp | | | 7,126 | | | | 265 | | |
| Cedar Shopping Centers | | | 2,750 | | | | 38 | | |
| Center Financial | | | 1,602 | | | | 30 | | |
| Central Coast Bancorp* | | | 1,493 | | | | 30 | | |
| Central Pacific Financial | | | 4,947 | | | | 136 | | |
| Century Bancorp, Cl A | | | 584 | | | | 19 | | |
| Ceres Group* | | | 5,030 | | | | 27 | | |
| Charter Financial | | | 665 | | | | 23 | | |
| CharterMac | | | 7,027 | | | | 155 | | |
| Chemical Financial | | | 3,995 | | | | 146 | | |
| Chittenden | | | 7,676 | | | | 209 | | |
| Citizens* (a) | | | 4,887 | | | | 29 | | |
| Citizens Banking | | | 7,231 | | | | 236 | | |
| Citizens First Bancorp | | | 1,424 | | | | 36 | | |
| City Bank | | | 1,288 | | | | 45 | | |
| City Holdings | | | 2,790 | | | | 92 | | |
| Clark* | | | 2,695 | | | | 36 | | |
| Clifton Savings Bancorp | | | 2,290 | | | | 27 | | |
| CNA Surety* | | | 2,596 | | | | 28 | | |
| Coastal Financial | | | 2,173 | | | | 31 | | |
| CoBiz (a) | | | 2,145 | | | | 35 | | |
| Colonial Properties Trust (REIT) | | | 3,164 | | | | 127 | | |
| Columbia Bancorp – Maryland | | | 969 | | | | 28 | | |
| Columbia Banking System | | | 2,338 | | | | 56 | | |
| Commerce Group | | | 3,850 | | | | 186 | | |
| Commercial Capital Bancorp | | | 6,066 | | | | 138 | | |
| Commercial Federal | | | 6,797 | | | | 183 | | |
| Commercial Net Lease Realty (REIT) | | | 8,616 | | | | 157 | | |
| Community Bank System | | | 4,510 | | | | 113 | | |
| Community Banks | | | 1,781 | | | | 52 | | |
| Community First Bankshares | | | 5,947 | | | | 191 | | |
| Community Trust Bancorp | | | 1,807 | | | | 56 | | |
| CompuCredit* | | | 3,112 | | | | 58 | | |
| Consolidated-Tomoka Land | | | 943 | | | | 33 | | |
| Cornerstone Realty Income Trust (REIT) | | | 8,366 | | | | 82 | | |
| Corporate Office Properties Trust (REIT) | | | 5,669 | | | | 145 | | |
| Correctional Properties Trust (REIT) | | | 1,834 | | | | 50 | | |
| Corus Bankshares | | | 2,596 | | | | 112 | | |
| Cousins Properties | | | 5,990 | | | | 206 | | |
| Crawford & Company | | | 2,143 | | | | 14 | | |
| Credit Acceptance* | | | 1,780 | | | | 34 | | |
| CRT Properties | | | 4,480 | | | | 96 | | |
| CVB Financial | | | 6,115 | | | | 136 | | |
| Danielson Holding* | | | 7,650 | | | | 47 | | |
| Delphi Financial Group | | | 4,121 | | | | 166 | | |
| Dime Community Bancshares | | | 5,164 | | | | 87 | | |
| Direct General | | | 2,640 | | | | 76 | | |
| Donegal Group, Cl A | | | 1,050 | | | | 20 | | |
| Downey Financial (a) | | | 3,270 | | | | 180 | | |
| East West Bancorp | | | 8,388 | | | | 282 | | |
| EastGroup Properties (REIT) | | | 3,501 | | | | 116 | | |
| Education Lending Group* (a) | | | 2,090 | | | | 31 | | |
| EMC Insurance Group | | | 368 | | | | 8 | | |
| Encore Capital Group* | | | 2,020 | | | | 38 | | |
| Enstar Group* | | | 532 | | | | 26 | | |
| Entertainment Properties Trust (REIT) (a) | | | 3,924 | | | | 148 | | |
| Equity Inns (REIT) | | | 7,582 | | | | 75 | | |
| Equity One (REIT) | | | 5,668 | | | | 111 | | |
| eSPEED, Cl A* | | | 4,019 | | | | 40 | | |
| Essex Property Trust (REIT) | | | 3,815 | | | | 274 | | |
| F.N.B | | | 7,720 | | | | 171 | | |
| F.N.B. – Virginia | | | 1,207 | | | | 32 | | |
| Farmers Capital Bank | | | 1,005 | | | | 34 | | |
| FBL Financial Group, Cl A | | | 2,072 | | | | 54 | | |
FIRST AMERICAN FUNDS Annual Report 2004
27
Schedule of Investments September 30, 2004
Small Cap Index Fund (continued)
| DESCRIPTION | | SHARES | | VALUE (000) | |
| Federal Agricultural Mortgage, Cl C* | | | 1,406 | | | $ | 31 | | |
| FelCor Lodging Trust (REIT)* | | | 9,355 | | | | 106 | | |
| Fidelity Bankshares | | | 2,198 | | | | 82 | | |
| Financial Federal* (a) | | | 2,884 | | | | 108 | | |
| Financial Institutions | | | 1,345 | | | | 30 | | |
| First Acceptance | | | 3,410 | | | | 24 | | |
| First Bancorp – North Carolina | | | 1,241 | | | | 42 | | |
| First Bancorp of Puerto Rico | | | 5,740 | | | | 277 | | |
| First Busey | | | 2,214 | | | | 42 | | |
| First Cash Financial Services* | | | 1,960 | | | | 39 | | |
| First Charter | | | 4,995 | | | | 121 | | |
| First Citizens Bancshares, Cl A | | | 1,015 | | | | 120 | | |
| First Commonwealth Financial – Pennsylvania | | | 11,073 | | | | 151 | | |
| First Community Bancorp | | | 2,175 | | | | 89 | | |
| First Community Bancshares – Nevada | | | 1,670 | | | | 55 | | |
| First Federal Capital | | | 3,327 | | | | 101 | | |
| First Financial – Indiana | | | 2,258 | | | | 71 | | |
| First Financial Bancorp – Ohio | | | 5,854 | | | | 100 | | |
| First Financial Bankshares | | | 2,280 | | | | 92 | | |
| First Financial Holdings | | | 2,007 | | | | 63 | | |
| First Indiana | | | 1,971 | | | | 40 | | |
| First Industrial Realty Trust (REIT) (a) | | | 6,644 | | | | 245 | | |
| First Merchants | | | 3,090 | | | | 76 | | |
| First Midwest Bancorp | | | 7,510 | | | | 260 | | |
| First National Bankshares of Florida | | | 7,986 | | | | 196 | | |
| First Niagara Financial Group (a) | | | 14,047 | | | | 188 | | |
| First Oak Brook Bancshares | | | 1,121 | | | | 35 | | |
| First of Long Island | | | 570 | | | | 24 | | |
| First Place Financial | | | 2,274 | | | | 45 | | |
| First Republic Bank – California (a) | | | 2,166 | | | | 100 | | |
| First State Bancorp – New Mexico | | | 1,274 | | | | 40 | | |
| FirstBank Fractional Shares (c) | | | - | | | | - | | |
| FirstFed Financial* | | | 2,833 | | | | 138 | | |
| Flagstar Bancorp | | | 5,244 | | | | 112 | | |
| Flushing Financial | | | 2,824 | | | | 54 | | |
| FPIC Insurance Group* (a) | | | 1,340 | | | | 35 | | |
| Franklin Bank* | | | 1,770 | | | | 30 | | |
| Frontier Financial | | | 2,699 | | | | 95 | | |
| G B & T Bancshares | | | 1,477 | | | | 33 | | |
| Gabelli Asset Management | | | 1,103 | | | | 47 | | |
| Gables Residential Trust (REIT) | | | 4,879 | | | | 167 | | |
| GATX | | | 8,227 | | | | 219 | | |
| German American | | | 1,547 | | | | 26 | | |
| Getty Realty (REIT) | | | 2,929 | | | | 77 | | |
| Glacier Bancorp (a) | | | 4,088 | | | | 119 | | |
| Gladstone Capital | | | 1,282 | | | | 29 | | |
| Glenborough Realty Trust (REIT) | | | 4,644 | | | | 96 | | |
| Glimcher Realty Trust (REIT) | | | 5,922 | | | | 144 | | |
| Global Signal | | | 8,440 | | | | 193 | | |
| Gold Banc | | | 6,686 | | | | 90 | | |
| Government Properties Trust | | | 3,220 | | | | 31 | | |
| Great American Financial Resources | | | 1,208 | | | | 18 | | |
| Great Southern Bancorp | | | 1,726 | | | | 54 | | |
| Greater Bay Bancorp (a) | | | 8,568 | | | | 246 | | |
| Greenhill & Company* | | | 840 | | | | 20 | | |
| Hancock Holding | | | 4,638 | | | | 147 | | |
| Hanmi Financial | | | 2,458 | | | | 74 | | |
| Harbor Florida Bancshares | | | 3,474 | | | | 108 | | |
| Harleysville Group | | | 2,158 | | | | 45 | | |
| Harleysville National | | | 4,428 | | | | 109 | | |
| Harris & Harris Group* | | | 2,590 | | | | 27 | | |
| Healthcare Realty Trust (REIT) | | | 7,710 | | | | 301 | | |
| Heartland Financial USA | | | 1,660 | | | | 31 | | |
| Heritage Property Investment Trust (REIT) | | | 4,534 | | | | 132 | | |
| Highland Hospitality | | | 5,770 | | | | 66 | | |
| Highwoods Properties (REIT) | | | 8,652 | | | | 213 | | |
Small Cap Index Fund (continued)
| DESCRIPTION | | SHARES | | VALUE (000) | |
| Hilb, Rogal & Hobbs (a) | | | 4,932 | | | $ | 179 | | |
| Home Properties (REIT) | | | 5,466 | | | | 216 | | |
| Horace Mann Educators | | | 7,127 | | | | 125 | | |
| Horizon Financial | | | 1,540 | | | | 30 | | |
| Hudson River | | | 5,066 | | | | 96 | | |
| IBERIABANK | | | 1,050 | | | | 61 | | |
| IMPAC Mortgage Holdings (REIT) | | | 11,017 | | | | 290 | | |
| Independence Holdings | | | 765 | | | | 14 | | |
| Independent Bank | | | 2,457 | | | | 76 | | |
| Independent Bank – Michigan | | | 3,097 | | | | 84 | | |
| Infinity Property & Casualty | | | 3,449 | | | | 102 | | |
| Innkeepers USA Trust (REIT) | | | 5,451 | | | | 68 | | |
| Integra Bank | | | 2,552 | | | | 55 | | |
| Interchange Financial Services | | | 1,836 | | | | 44 | | |
| Investment Technology Group* | | | 7,315 | | | | 112 | | |
| Investors Real Estate Trust (REIT) | | | 6,866 | | | | 69 | | |
| Irwin Financial | | | 2,925 | | | | 76 | | |
| ITLA Capital* | | | 888 | | | | 41 | | |
| Jones Lang LaSalle* | | | 5,322 | | | | 176 | | |
| Kansas City Life Insurance | | | 618 | | | | 26 | | |
| K-Fed Bancorp* | | | 950 | | | | 14 | | |
| Kilroy Realty (REIT) (a) | | | 4,741 | | | | 180 | | |
| Kite Realty Group Trust | | | 2,860 | | | | 38 | | |
| KNBT Bancorp | | | 5,100 | | | | 86 | | |
| Knight Trading Group* (a) | | | 19,521 | | | | 180 | | |
| Kramont Realty Trust (REIT) | | | 4,019 | | | | 75 | | |
| LaBranche* | | | 8,830 | | | | 75 | | |
| Lakeland Bancorp | | | 2,862 | | | | 47 | | |
| Lakeland Financial | | | 972 | | | | 33 | | |
| LandAmerica Financial Group | | | 3,158 | | | | 144 | | |
| Lasalle Hotel Properties (REIT) | | | 4,628 | | | | 128 | | |
| Lexington Corporate Properties Trust (REIT) | | | 8,039 | | | | 175 | | |
| LNR Property (a) | | | 2,860 | | | | 177 | | |
| LTC Properties (REIT) (a) | | | 2,458 | | | | 44 | | |
| Luminent Mortgage Capital | | | 6,090 | | | | 77 | | |
| Macatawa Bank | | | 1,543 | | | | 43 | | |
| MAF Bancorp | | | 4,573 | | | | 197 | | |
| Maguire Properties | | | 5,670 | | | | 138 | | |
| Main Street Banks | | | 2,271 | | | | 69 | | |
| MainSource Financial Group | | | 1,556 | | | | 32 | | |
| Manufactured Home Communities (REIT) (a) | | | 3,666 | | | | 122 | | |
| Marlin Business Services* | | | 990 | | | | 19 | | |
| MB Financial | | | 3,217 | | | | 128 | | |
| MBT Financial | | | 2,408 | | | | 47 | | |
| MCG Capital | | | 5,091 | | | | 88 | | |
| Mercantile Bank | | | 1,201 | | | | 42 | | |
| MeriStar Hospitality (REIT)* | | | 16,091 | | | | 88 | | |
| Metris* | | | 5,380 | | | | 53 | | |
| MFA Mortgage Investments (REIT) | | | 12,688 | | | | 117 | | |
| Mid-America Apartment Communities (REIT) | | | 2,973 | | | | 116 | | |
| Midland | | | 1,512 | | | | 41 | | |
| Mid-State Bancshares | | | 3,932 | | | | 101 | | |
| Midwest Banc Holdings | | | 1,799 | | | | 35 | | |
| Mission West Properties (REIT) | | | 2,968 | | | | 31 | | |
| Nara Bancorp | | | 3,068 | | | | 62 | | |
| NASB Financial | | | 510 | | | | 20 | | |
| National Financial Partners | | | 5,570 | | | | 199 | | |
| National Health Investors (REIT) | | | 3,641 | | | | 104 | | |
| National Penn Bancshares | | | 5,743 | | | | 147 | | |
| National Western Life Insurance, Cl A* | | | 361 | | | | 59 | | |
| Nationwide Health Properties (REIT) | | | 10,589 | | | | 220 | | |
| Navigators Group* | | | 1,432 | | | | 42 | | |
| NBC Capital | | | 1,029 | | | | 26 | | |
| NBT Bancorp | | | 5,495 | | | | 129 | | |
| Nelnet* | | | 1,350 | | | | 30 | | |
| NetB@nk | | | 8,901 | | | | 89 | | |
The accompanying notes are an integral part of the financial statements.
FIRST AMERICAN FUNDS Annual Report 2004
28
Small Cap Index Fund (continued)
| DESCRIPTION | | SHARES | | VALUE (000) | |
| New Century Financial | | | 4,740 | | | $ | 285 | | |
| Newcastle Investment (REIT) | | | 5,669 | | | | 174 | | |
| Northwest Bancorp | | | 3,149 | | | | 71 | | |
| NovaStar Financial (REIT) (a) | | | 4,172 | | | | 182 | | |
| NYMAGIC | | | 550 | | | | 12 | | |
| Oak Hill Financial | | | 580 | | | | 20 | | |
| OceanFirst Financial | | | 1,493 | | | | 36 | | |
| Ocwen Financial* (a) | | | 6,370 | | | | 58 | | |
| Ohio Casualty* | | | 10,232 | | | | 214 | | |
| Old National Bancorp | | | 11,070 | | | | 275 | | |
| Old Second Bancorp | | | 2,236 | | | | 63 | | |
| Omega Financial | | | 1,275 | | | | 44 | | |
| OMEGA Healthcare Investors (REIT) | | | 7,736 | | | | 83 | | |
| Oriental Financial Group | | | 2,829 | | | | 77 | | |
| Origen Financial | | | 1,370 | | | | 10 | | |
| Orleans Homebuilders* | | | 516 | | | | 12 | | |
| Pacific Capital Bancorp | | | 7,586 | | | | 224 | | |
| Park National | | | 2,210 | | | | 281 | | |
| Parkway Properties (REIT) | | | 1,831 | | | | 85 | | |
| Partners Trust Financial Group | | | 5,159 | | | | 53 | | |
| Peapack-Gladstone Financial | | | 1,209 | | | | 37 | | |
| Penn-America Group | | | 1,602 | | | | 22 | | |
| PennFed Financial Services | | | 941 | | | | 29 | | |
| PennRock Financial Savings | | | 1,283 | | | | 36 | | |
| Pennsylvania (REIT) | | | 5,245 | | | | 203 | | |
| Peoples Bancorp – Ohio | | | 1,771 | | | | 47 | | |
| Peoples Holding Company | | | 1,497 | | | | 49 | | |
| PFF Bancorp | | | 2,070 | | | | 79 | | |
| Philadelphia Consolidated Holding* | | | 2,977 | | | | 164 | | |
| Phoenix Companies (a) | | | 15,787 | | | | 164 | | |
| Piper Jaffray Companies* | | | 3,310 | | | | 131 | | |
| PMA Capital* | | | 4,509 | | | | 34 | | |
| Post Properties (REIT) | | | 6,338 | | | | 190 | | |
| Prentiss Properties Trust (REIT) | | | 7,049 | | | | 254 | | |
| Presidential Life | | | 3,553 | | | | 61 | | |
| Price Legacy (REIT) | | | 3,664 | | | | 69 | | |
| PrivateBancorp | | | 2,742 | | | | 74 | | |
| ProAssurance* | | | 4,648 | | | | 163 | | |
| Prosperity Bancshares | | | 2,766 | | | | 74 | | |
| Provident Bancorp | | | 6,611 | | | | 78 | | |
| Provident Bankshares | | | 5,430 | | | | 182 | | |
| Provident Financial Holdings | | | 742 | | | | 22 | | |
| Provident Financial Services | | | 12,946 | | | | 223 | | |
| PS Business Parks (REIT) | | | 2,629 | | | | 105 | | |
| R&G Financial | | | 4,641 | | | | 179 | | |
| RAIT Investment Trust (REIT) | | | 4,077 | | | | 112 | | |
| Ramco-Gershenson Properties Trust (REIT) (a) | | | 2,376 | | | | 64 | | |
| Realty Income (REIT) | | | 6,310 | | | | 284 | | |
| Redwood Trust (REIT) (a) | | | 2,672 | | | | 167 | | |
| Republic Bancorp | | | 10,678 | | | | 164 | | |
| Republic Bancorp, Cl A – Kentucky | | | 1,359 | | | | 32 | | |
| Rewards Network* | | | 2,664 | | | | 18 | | |
| Riggs National (a) | | | 2,648 | | | | 59 | | |
| RLI | | | 3,733 | | | | 140 | | |
| Royal Bancshares of Pennsylvania, Cl A | | | 713 | | | | 17 | | |
| S Y Bancorp | | | 1,976 | | | | 45 | | |
| S&T Bancorp | | | 3,952 | | | | 141 | | |
| Safety Insurance Group | | | 1,669 | | | | 37 | | |
| Sanders Morris Harris Group | | | 1,830 | | | | 22 | | |
| Sandy Spring Bancorp | | | 2,422 | | | | 79 | | |
| Santander Bancorp | | | 876 | | | | 22 | | |
| Saul Centers (REIT) | | | 2,191 | | | | 72 | | |
| SCBT Financial | | | 1,289 | | | | 38 | | |
| Seacoast Banking | | | 1,932 | | | | 41 | | |
| Security Bank | | | 778 | | | | 27 | | |
| Selective Insurance Group | | | 4,627 | | | | 172 | | |
Small Cap Index Fund (continued)
| DESCRIPTION | | SHARES | | VALUE (000) | |
| Senior Housing Properties Trust (REIT) (a) | | | 8,946 | | | $ | 159 | | |
| Signature Bank* | | | 930 | | | | 25 | | |
| Silicon Valley Bancshares* | | | 5,895 | | | | 219 | | |
| Simmons First National, Cl A | | | 2,449 | | | | 63 | | |
| Smithtown Bancorp | | | 870 | | | | 22 | | |
| Southern Community Financial | | | 2,480 | | | | 28 | | |
| Southside Bancshares | | | 1,557 | | | | 32 | | |
| Southwest Bancorp – Oklahoma | | | 1,784 | | | | 39 | | |
| Southwest Bancorp of Texas (a) | | | 11,458 | | | | 231 | | |
| Sovran Self Storage (REIT) | | | 2,481 | | | | 97 | | |
| State Auto Financial | | | 2,248 | | | | 65 | | |
| State Bancorp | | | 1,350 | | | | 31 | | |
| State Financial Services, Cl A | | | 962 | | | | 26 | | |
| Sterling Bancorp | | | 2,247 | | | | 61 | | |
| Sterling Bancshares | | | 7,474 | | | | 101 | | |
| Sterling Financial – Pennsylvania | | | 3,587 | | | | 96 | | |
| Sterling Financial – Washington* | | | 4,164 | | | | 147 | | |
| Stewart Information Services | | | 2,840 | | | | 112 | | |
| Stifel Financial* | | | 1,206 | | | | 24 | | |
| Suffolk Bancorp | | | 1,816 | | | | 55 | | |
| Summit Properties (REIT) | | | 4,685 | | | | 127 | | |
| Sun Bancorp – New Jersey* | | | 1,618 | | | | 35 | | |
| Sun Communities (REIT) | | | 2,688 | | | | 105 | | |
| Susquehanna Bancshares | | | 7,683 | | | | 189 | | |
| SWS Group | | | 2,421 | | | | 39 | | |
| Tanger Factory Outlet Centers (REIT) | | | 2,270 | | | | 102 | | |
| Tarragon Realty Investors* (a) | | | 1,486 | | | | 19 | | |
| Taubman Centers (REIT) | | | 8,297 | | | | 214 | | |
| Taylor Capital Group | | | 646 | | | | 16 | | |
| Tejon Ranch* | | | 1,267 | | | | 48 | | |
| Texas Capital Bancshares* | | | 4,540 | | | | 82 | | |
| Texas Regional Bancshares, Cl A | | | 6,852 | | | | 213 | | |
| TierOne | | | 3,101 | | | | 72 | | |
| Tompkins Trustco | | | 1,162 | | | | 54 | | |
| Town & Country Trust (REIT) | | | 2,910 | | | | 74 | | |
| Tradestation Group* | | | 3,131 | | | | 19 | | |
| Trammell Crow* | | | 5,464 | | | | 86 | | |
| Triad Guaranty* | | | 1,559 | | | | 86 | | |
| TriCo Bancshares | | | 1,870 | | | | 39 | | |
| TrustCo Bank Corporation of New York | | | 11,917 | | | | 153 | | |
| Trustmark | | | 7,490 | | | | 233 | | |
| U.S. Restaurant Properties (REIT) | | | 3,342 | | | | 56 | | |
| UICI | | | 6,303 | | | | 206 | | |
| UMB Financial | | | 2,519 | | | | 120 | | |
| Umpqua Holdings (a) | | | 7,295 | | | | 165 | | |
| Union Bankshares | | | 1,448 | | | | 45 | | |
| United Bankshares | | | 5,960 | | | | 207 | | |
| United Community Banks | | | 4,746 | | | | 115 | | |
| United Community Financial | | | 4,503 | | | | 51 | | |
| United Fire & Casualty | | | 1,204 | | | | 69 | | |
| United PanAm Financial* | | | 774 | | | | 14 | | |
| Universal American Financial* | | | 4,843 | | | | 63 | | |
| Universal Health Realty Income Trust (REIT) | | | 1,958 | | | | 59 | | |
| Univest Corporation of Pennsylvania | | | 1,270 | | | | 52 | | |
| Unizan Financial | | | 3,628 | | | | 100 | | |
| Urstadt Biddle Properties, Cl A (REIT) | | | 3,514 | | | | 54 | | |
| USB Holding | | | 2,116 | | | | 53 | | |
| USB Holding Company Fractional Share (c) | | | – | | | | – | | |
| USI Holdings* | | | 5,879 | | | | 80 | | |
| Vesta Insurance Group | | | 6,020 | | | | 27 | | |
| Virginia Commerce Bancorp* | | | 1,136 | | | | 31 | | |
| Virginia Financial Group | | | 1,199 | | | | 39 | | |
| Washington Real Estate Investment Trust (REIT) | | | 6,967 | | | | 211 | | |
| Washington Trust Bancorp | | | 2,203 | | | | 58 | | |
| Waypoint Financial | | | 4,995 | | | | 138 | | |
| WesBanco | | | 2,946 | | | | 86 | | |
FIRST AMERICAN FUNDS Annual Report 2004
29
Schedule of Investments September 30, 2004
Small Cap Index Fund (continued)
| DESCRIPTION | | SHARES | | VALUE (000) | |
| West Bancorp | | | 2,815 | | | $ | 47 | | |
| West Coast Bancorp – Oregon | | | 2,507 | | | | 52 | | |
| Westamerica Bancorporation | | | 5,180 | | | | 284 | | |
| Western Sierra Bancorp* | | | 1,072 | | | | 36 | | |
| Westfield Financial | | | 810 | | | | 19 | | |
| Wilshire Bancorp* | | | 1,120 | | | | 34 | | |
| Winston Hotels (REIT) | | | 3,870 | | | | 41 | | |
| Wintrust Financial | | | 3,375 | | | | 193 | | |
| World Acceptance* | | | 2,684 | | | | 62 | | |
| WSFS Financial | | | 1,001 | | | | 50 | | |
| Yardville National Bancorp | | | 1,454 | | | | 42 | | |
| Zenith National Insurance | | | 1,774 | | | | 75 | | |
| | | | 37,396 | | |
| Health Care – 12.8% | | | |
| Abaxis* | | | 2,910 | | | | 38 | | |
| Abgenix* (a) | | | 13,567 | | | | 134 | | |
| ABIOMED* | | | 2,540 | | | | 22 | | |
| Able Laboratories* (a) | | | 2,727 | | | | 52 | | |
| Adolor* | | | 6,481 | | | | 73 | | |
| Advanced Medical Optics* (a) | | | 5,955 | | | | 236 | | |
| Advanced Neuromodulation Systems* | | | 3,349 | | | | 102 | | |
| Advancis Pharmaceuticals* | | | 1,400 | | | | 11 | | |
| Advisory Board* | | | 2,948 | | | | 99 | | |
| Aksys* (a) | | | 1,344 | | | | 6 | | |
| Albany Molecular Research* (a) | | | 3,875 | | | | 37 | | |
| Alderwoods Group* | | | 6,671 | | | | 66 | | |
| Alexion Pharmaceuticals* | | | 4,512 | | | | 81 | | |
| Align Technology* | | | 8,687 | | | | 133 | | |
| Alkermes* (a) | | | 14,958 | | | | 173 | | |
| Alliance Imaging* | | | 2,094 | | | | 16 | | |
| Allscripts Healthcare Solutions* (a) | | | 4,570 | | | | 41 | | |
| Alpharma, Cl A | | | 6,553 | | | | 120 | | |
| AMEDISYS* | | | 2,180 | | | | 65 | | |
| America Service Group* | | | 1,180 | | | | 48 | | |
| American Healthways* | | | 4,822 | | | | 140 | | |
| American Medical Systems* | | | 4,213 | | | | 153 | | |
| AMERIGROUP* | | | 4,125 | | | | 232 | | |
| AMN Healthcare Services* | | | 1,915 | | | | 23 | | |
| Amsurg, Cl A* | | | 5,048 | | | | 107 | | |
| Analogic (a) | | | 1,829 | | | | 76 | | |
| Animas* | | | 710 | | | | 11 | | |
| Antigenetics* | | | 4,236 | | | | 26 | | |
| Applera* | | | 12,179 | | | | 142 | | |
| Apria Healthcare Group* | | | 8,330 | | | | 227 | | |
| Ariad Pharmaceuticals* | | | 8,724 | | | | 58 | | |
| Array Biopharma* | | | 3,980 | | | | 28 | | |
| Arrow International (a) | | | 3,086 | | | | 92 | | |
| Arthrocare* | | | 3,547 | | | | 104 | | |
| Aspect Medical Systems* | | | 2,047 | | | | 37 | | |
| AtheroGenics* (a) | | | 6,180 | | | | 204 | | |
| Atrix Laboratories* | | | 3,657 | | | | 112 | | |
| Avant Immunotherapeutics* | | | 12,402 | | | | 21 | | |
| Axonyx* | | | 8,550 | | | | 48 | | |
| Barrier Therapeutics* | | | 1,090 | | | | 13 | | |
| Bentley Pharmaceuticals* | | | 2,565 | | | | 27 | | |
| Beverly Enterprises* | | | 17,894 | | | | 135 | | |
| BioCryst Pharmaceuticals* | | | 2,730 | | | | 14 | | |
| Bioenvision* | | | 3,530 | | | | 28 | | |
| Biolase Technology (a) | | | 3,583 | | | | 29 | | |
| BioMarin Pharmaceutical* | | | 10,744 | | | | 56 | | |
| Bio-Rad Laboratories, Cl A* | | | 2,900 | | | | 148 | | |
| Bio-Reference Labs* | | | 1,290 | | | | 18 | | |
| Biosite* (a) | | | 2,158 | | | | 106 | | |
| BioVeris* | | | 3,424 | | | | 21 | | |
| Bone Care International* | | | 2,607 | | | | 63 | | |
Small Cap Index Fund (continued)
| DESCRIPTION | | SHARES | | VALUE (000) | |
| Bradley Pharmaceuticals* (a) | | | 2,259 | | | $ | 46 | | |
| Bruker BioSciences* | | | 3,570 | | | | 12 | | |
| CancerVax* (a) | | | 2,760 | | | | 22 | | |
| Candela* | | | 3,208 | | | | 37 | | |
| Caraco Pharmaceutical Laboratories* | | | 1,510 | | | | 12 | | |
| Cardiac Science* | | | 12,239 | | | | 23 | | |
| CardioDynamics International* | | | 6,011 | | | | 28 | | |
| Cell Genesys* | | | 7,457 | | | | 67 | | |
| Cell Therapeutics* (a) | | | 9,256 | | | | 63 | | |
| Centene* | | | 3,381 | | | | 144 | | |
| Cepheid* | | | 6,965 | | | | 60 | | |
| Cerner* (a) | | | 4,749 | | | | 205 | | |
| Chemed | | | 2,027 | | | | 113 | | |
| Ciphergen Biosystems* | | | 3,864 | | | | 15 | | |
| Closure Medical* | | | 1,149 | | | | 16 | | |
| Computer Programs & Systems | | | 959 | | | | 19 | | |
| Conceptus* | | | 4,252 | | | | 39 | | |
| CONMED* | | | 4,966 | | | | 131 | | |
| Connetics* | | | 5,240 | | | | 142 | | |
| Corcept Therapeutics* | | | 750 | | | | 6 | | |
| Corgentech* (a) | | | 1,280 | | | | 22 | | |
| Corixa* | | | 9,293 | | | | 39 | | |
| Corvel* | | | 1,056 | | | | 31 | | |
| Cross Country Healthcare* | | | 3,833 | | | | 59 | | |
| CTI Molecular Imaging* | | | 5,194 | | | | 42 | | |
| Cubist Pharmaceuticals* | | | 6,713 | | | | 66 | | |
| CuraGen* | | | 7,184 | | | | 40 | | |
| Curis* | | | 6,920 | | | | 31 | | |
| CV Therapeutics* (a) | | | 5,259 | | | | 66 | | |
| Cyberonics* (a) | | | 2,889 | | | | 59 | | |
| Cypress Biosciences* | | | 4,900 | | | | 57 | | |
| Cytogen* | | | 2,590 | | | | 27 | | |
| Cytokinetics* | | | 1,260 | | | | 17 | | |
| Datascope | | | 1,856 | | | | 69 | | |
| deCODE Genetics* | | | 8,010 | | | | 60 | | |
| Dendreon* | | | 9,643 | | | | 81 | | |
| Dendrite International* | | | 6,024 | | | | 97 | | |
| DepoMed* (a) | | | 3,520 | | | | 18 | | |
| Diagnostic Products | | | 3,498 | | | | 143 | | |
| Digene* | | | 2,342 | | | | 61 | | |
| Discovery Laboratories* | | | 7,799 | | | | 52 | | |
| Diversa* | | | 3,947 | | | | 33 | | |
| DJ Orthopedics* | | | 2,982 | | | | 53 | | |
| DOV Pharmaceutical* | | | 2,356 | | | | 40 | | |
| Durect* (a) | | | 5,064 | | | | 7 | | |
| DUSA Pharmaceuticals* | | | 2,500 | | | | 29 | | |
| Dyax* | | | 4,370 | | | | 33 | | |
| Dynavax Technologies* | | | 1,040 | | | | 6 | | |
| Eclipsys* | | | 6,181 | | | | 96 | | |
| Encore Medical* | | | 5,130 | | | | 26 | | |
| Encysive Pharmaceuticals* (a) | | | 9,476 | | | | 86 | | |
| Endocardial Solutions* | | | 3,660 | | | | 42 | | |
| Enzo Biochem* | | | 4,027 | | | | 60 | | |
| Enzon* | | | 7,317 | | | | 117 | | |
| EPIX Medical* | | | 3,807 | | | | 74 | | |
| eResearch Technology* | | | 7,423 | | | | 99 | | |
| Exactech* | | | 1,015 | | | | 21 | | |
| Exelixis* | | | 10,509 | | | | 85 | | |
| E-Z-EM* | | | 1,100 | | | | 20 | | |
| First Health Group* | | | 15,280 | | | | 246 | | |
| First Horizon Pharmaceutical* | | | 4,380 | | | | 88 | | |
| Genaera* | | | 8,750 | | | | 34 | | |
| Genelabs Technologies* | | | 14,690 | | | | 38 | | |
| Genencor International* | | | 1,369 | | | | 22 | | |
| Genesis HealthCare* | | | 3,315 | | | | 101 | | |
| Genta* | | | 10,118 | | | | 27 | | |
The accompanying notes are an integral part of the financial statements.
FIRST AMERICAN FUNDS Annual Report 2004
30
Small Cap Index Fund (continued)
| DESCRIPTION | | SHARES | | VALUE (000) | |
| Gentiva Health Services* | | | 4,213 | | | $ | 69 | | |
| Geron* | | | 7,524 | | | | 45 | | |
| GTx* | | | 910 | | | | 11 | | |
| Guilford Pharmaceuticals* (a) | | | 7,331 | | | | 37 | | |
| Haemonetics* | | | 3,151 | | | | 103 | | |
| Hanger Orthopedic Group* | | | 3,575 | | | | 18 | | |
| HealthExtras* | | | 2,769 | | | | 39 | | |
| Hollis-Eden Pharmaceuticals* | | | 2,299 | | | | 25 | | |
| Hologic* | | | 3,403 | | | | 66 | | |
| Hooper Holmes | | | 9,553 | | | | 43 | | |
| Human Genome Sciences* | | | 21,650 | | | | 236 | | |
| ICU Medical* (a) | | | 1,761 | | | | 46 | | |
| IDX Systems* | | | 3,463 | | | | 112 | | |
| I-Flow* | | | 3,030 | | | | 44 | | |
| ILEX Oncology* | | | 6,520 | | | | 164 | | |
| Illumina* | | | 4,850 | | | | 29 | | |
| Immucor* | | | 4,975 | | | | 123 | | |
| Immunicon* | | | 1,010 | | | | 10 | | |
| ImmunoGen* | | | 6,107 | | | | 31 | | |
| Immunomedics* | | | 7,526 | | | | 20 | | |
| Impax Laboratories* (a) | | | 8,115 | | | | 125 | | |
| Incyte* (a) | | | 10,185 | | | | 98 | | |
| Indevus Pharmaceuticals* | | | 6,902 | | | | 49 | | |
| InKine Pharmaceuticals* | | | 8,120 | | | | 41 | | |
| Inspire Pharmaceuticals* | | | 6,339 | | | | 100 | | |
| Integra LifeSciences* (a) | | | 3,388 | | | | 109 | | |
| InterMune* | | | 4,787 | | | | 56 | | |
| Intuitive Surgical* | | | 5,593 | | | | 138 | | |
| Invacare | | | 4,169 | | | | 192 | | |
| Inveresk Research Group* | | | 4,904 | | | | 181 | | |
| Inverness Medical Innovations* | | | 2,240 | | | | 47 | | |
| Isis Pharmaceuticals* | | | 8,646 | | | | 42 | | |
| Isolagen* | | | 3,690 | | | | 35 | | |
| Ista Pharmaceuticals* | | | 1,340 | | | | 16 | | |
| IVAX Diagnostics* | | | 1,030 | | | | 6 | | |
| Kensey Nash* | | | 1,588 | | | | 42 | | |
| Keryx Biopharmaceuticals* | | | 3,610 | | | | 40 | | |
| Kindred Healthcare* | | | 4,396 | | | | 107 | | |
| Kos Pharmaceuticals* | | | 1,992 | | | | 71 | | |
| Kosan Biosciences* | | | 3,520 | | | | 20 | | |
| K-V Pharmaceutical, Cl A* | | | 5,957 | | | | 107 | | |
| Kyphon* | | | 3,880 | | | | 96 | | |
| LabOne* | | | 3,098 | | | | 91 | | |
| Lannet* | | | 1,156 | | | | 11 | | |
| Laserscope* | | | 3,021 | | | | 61 | | |
| LCA-Vision | | | 1,720 | | | | 44 | | |
| Lexicon Genetics* | | | 10,568 | | | | 70 | | |
| LifeCell* | | | 4,740 | | | | 47 | | |
| Lifeline Systems* | | | 1,852 | | | | 45 | | |
| Lifepoint Hospitals* (a) | | | 6,379 | | | | 191 | | |
| Ligand Pharmaceuticals* | | | 12,333 | | | | 124 | | |
| Luminex* | | | 4,475 | | | | 32 | | |
| Magellan Health Services* | | | 4,490 | | | | 164 | | |
| Marshall Edwards* | | | 1,200 | | | | 11 | | |
| Matria Healthcare* | | | 1,720 | | | | 49 | | |
| Matthews International, Cl A | | | 5,373 | | | | 182 | | |
| Maxim Pharmaceuticals* (a) | | | 4,730 | | | | 13 | | |
| Maxygen* | | | 3,755 | | | | 37 | | |
| Medarex* (a) | | | 13,204 | | | | 97 | | |
| MedCath* | | | 1,010 | | | | 16 | | |
| Medical Action Industries* | | | 1,357 | | | | 23 | | |
| Medical Staffing Network Holdings* | | | 2,027 | | | | 12 | | |
| Medicines* | | | 7,964 | | | | 192 | | |
| Mentor (a) | | | 7,302 | | | | 246 | | |
| Merge Technologies* | | | 1,830 | | | | 32 | | |
| Merit Medical Systems* | | | 3,910 | | | | 59 | | |
Small Cap Index Fund (continued)
| DESCRIPTION | | SHARES | | VALUE (000) | |
| Micro Therapeutics* | | | 1,961 | | | $ | 8 | | |
| Microtek Medical Holdings* | | | 7,170 | | | | 23 | | |
| Mine Safety Appliances | | | 3,596 | | | | 146 | | |
| Molecular Devices* | �� | | 2,100 | | | | 49 | | |
| Molina Healthcare* | | | 1,730 | | | | 61 | | |
| Myogen* | | | 2,330 | | | | 19 | | |
| Myriad Genetics* | | | 5,113 | | | | 87 | | |
| NABI Biopharmaceuticals* | | | 9,611 | | | | 129 | | |
| Nanogen* (a) | | | 5,680 | | | | 22 | | |
| National Healthcare | | | 1,123 | | | | 32 | | |
| NDCHealth | | | 6,008 | | | | 96 | | |
| NeoPharm* | | | 2,872 | | | | 25 | | |
| Neose Technologies* | | | 3,953 | | | | 30 | | |
| Neurogen* | | | 4,170 | | | | 27 | | |
| Nitromed* | | | 1,640 | | | | 39 | | |
| Northfield Laboratories* (a) | | | 3,170 | | | | 42 | | |
| Noven Pharmaceuticals* | | | 3,898 | | | | 81 | | |
| NPS Pharmaceuticals* (a) | | | 6,212 | | | | 135 | | |
| Nutraceutical International* | | | 1,170 | | | | 16 | | |
| NuVasive* | | | 1,080 | | | | 11 | | |
| Nuvelo* | | | 4,729 | | | | 47 | | |
| OCA* (a) | | | 7,046 | | | | 33 | | |
| Ocular Sciences* (a) | | | 3,248 | | | | 156 | | |
| Odyssey Healthcare* | | | 6,105 | | | | 108 | | |
| Omnicell* | | | 3,629 | | | | 48 | | |
| Onyx Pharmaceuticals* (a) | | | 5,787 | | | | 249 | | |
| Option Care | | | 2,210 | | | | 34 | | |
| OraSure Technologies* | | | 6,624 | | | | 42 | | |
| OrthoLogic* | | | 5,758 | | | | 41 | | |
| Orthovita* | | | 7,750 | | | | 35 | | |
| Oscient Pharmaceuticals* (a) | | | 10,130 | | | | 36 | | |
| Owens & Minor | | | 6,288 | | | | 160 | | |
| Pain Therapeutics* | | | 4,307 | | | | 31 | | |
| Palatin Technologies* | | | 8,787 | | | | 26 | | |
| Palomar Medical Technologies* | | | 2,000 | | | | 44 | | |
| Par Pharmaceutical Companies* (a) | | | 5,710 | | | | 205 | | |
| PAREXEL International* | | | 4,361 | | | | 85 | | |
| PDI* | | | 1,410 | | | | 38 | | |
| Pediatrix Medical Group* | | | 4,087 | | | | 224 | | |
| Penwest Pharmaceuticals* | | | 2,773 | | | | 31 | | |
| Peregrine Pharmaceuticals* | | | 20,982 | | | | 34 | | |
| Perrigo | | | 10,203 | | | | 210 | | |
| Per-Se Technologies* | | | 3,783 | | | | 52 | | |
| Pharmacyclics* | | | 3,270 | | | | 34 | | |
| Pharmion* | | | 2,480 | | | | 128 | | |
| Pharmos* (a) | | | 14,680 | | | | 42 | | |
| PolyMedica | | | 4,386 | | | | 135 | | |
| Possis Medical* | | | 2,679 | | | | 42 | | |
| POZEN* | | | 4,002 | | | | 35 | | |
| Praecis Pharmaceuticals* | | | 8,735 | | | | 19 | | |
| Priority Healthcare, Cl B* | | | 4,498 | | | | 91 | | |
| Progenics Pharmaceutical* | | | 1,965 | | | | 29 | | |
| Province Healthcare* (a) | | | 8,592 | | | | 180 | | |
| ProxyMed Pharmacy* | | | 1,000 | | | | 10 | | |
| PSS World Medical* | | | 11,251 | | | | 113 | | |
| Psychiatric Solutions* | | | 1,650 | | | | 42 | | |
| Quidel* | | | 5,272 | | | | 24 | | |
| Radiation Therapy Services* | | | 3,750 | | | | 43 | | |
| Regeneration Technologies* | | | 3,873 | | | | 31 | | |
| Regeneron Pharmaceutical* | | | 6,330 | | | | 55 | | |
| RehabCare Group* | | | 2,705 | | | | 62 | | |
| Renovis* | | | 1,000 | | | | 8 | | |
| Res-Care* | | | 2,910 | | | | 34 | | |
| Rigel Pharmaceuticals* | | | 1,670 | | | | 42 | | |
| Salix Pharmaceuticals* | | | 6,005 | | | | 129 | | |
| Santarus* | | | 1,400 | | | | 13 | | |
FIRST AMERICAN FUNDS Annual Report 2004
31
Schedule of Investments September 30, 2004
Small Cap Index Fund (continued)
| DESCRIPTION | | SHARES | | VALUE (000) | |
| SciClone Pharmaceuticals* | | | 7,438 | | | $ | 26 | | |
| Seattle Genetics* | | | 5,207 | | | | 34 | | |
| Select Medical | | | 15,360 | | | | 206 | | |
| Serologicals* (a) | | | 4,170 | | | | 97 | | |
| SFBC International* | | | 2,334 | | | | 61 | | |
| Sierra Health Services* (a) | | | 3,836 | | | | 184 | | |
| SOLA International* | | | 5,338 | | | | 102 | | |
| Sonic Innovations* | | | 3,070 | | | | 14 | | |
| SonoSite* | | | 2,456 | | | | 64 | | |
| Specialty Laboratories* | | | 1,331 | | | | 14 | | |
| STERIS* (a) | | | 11,650 | | | | 256 | | |
| Stewart Enterprises, Cl A* | | | 17,924 | | | | 125 | | |
| Sunrise Senior Living* (a) | | | 2,710 | | | | 95 | | |
| SuperGen* (a) | | | 7,390 | | | | 46 | | |
| SurModics* (a) | | | 2,367 | | | | 56 | | |
| Sybron Dental Specialties* | | | 6,429 | | | | 191 | | |
| Symbion* | | | 1,380 | | | | 22 | | |
| Tanox* | | | 3,962 | | | | 67 | | |
| Techne* (a) | | | 6,863 | | | | 262 | | |
| Telik* | | | 7,288 | | | | 163 | | |
| Tercica* | | | 950 | | | | 9 | | |
| Third Wave Technologies* | | | 4,685 | | | | 32 | | |
| Thoratec* | | | 7,554 | | | | 73 | | |
| Transkaryotic Therapies* | | | 4,888 | | | | 87 | | |
| Trimeris* | | | 2,604 | | | | 39 | | |
| TriPath Imaging* | | | 4,594 | | | | 38 | | |
| TriZetto Group* | | | 5,232 | | | | 31 | | |
| United Surgical Partners* (a) | | | 4,692 | | �� | | 161 | | |
| United Therapeutics* | | | 3,154 | | | | 110 | | |
| Urologix* | | | 2,350 | | | | 15 | | |
| Valeant Pharmaceuticals International (a) | | | 13,980 | | | | 337 | | |
| Varian* | | | 5,791 | | | | 219 | | |
| Ventana Medical Systems* | | | 2,283 | | | | 115 | | |
| Ventiv Health* | | | 3,080 | | | | 52 | | |
| Vertex Pharmaceuticals* (a) | | | 13,145 | | | | 138 | | |
| Viasys Healthcare* | | | 5,138 | | | | 86 | | |
| Vicuron Pharmaceuticals* | | | 7,822 | | | | 115 | | |
| Vion Pharmaceuticals* | | | 9,240 | | | | 39 | | |
| VistaCare, Cl A* (a) | | | 1,502 | | | | 23 | | |
| VISX* (a) | | | 8,135 | | | | 168 | | |
| Vital Signs | | | 831 | | | | 27 | | |
| West Pharmaceutical Services | | | 4,782 | | | | 100 | | |
| Wilson Greatbatch Technologies* | | | 3,569 | | | | 64 | | |
| Wright Medical Group* | | | 4,431 | | | | 111 | | |
| Young Innovations | | | 780 | | | | 26 | | |
| ZILA* | | | 7,570 | | | | 31 | | |
| Zoll Medical* | | | 1,539 | | | | 51 | | |
| ZymoGenetics* | | | 3,237 | | | | 56 | | |
| | | | 21,536 | | |
| Industrials – 13.7% | | | |
| A. S. V.* | | | 1,302 | | | | 49 | | |
| A.O. Smith | | | 2,844 | | | | 69 | | |
| AAON* | | | 1,459 | | | | 25 | | |
| AAR* | | | 5,377 | | | | 67 | | |
| ABM Industries | | | 6,267 | | | | 126 | | |
| Aceto | | | 2,662 | | | | 38 | | |
| Actuant, Cl A* (a) | | | 3,954 | | | | 163 | | |
| Acuity Brands | | | 7,106 | | | | 169 | | |
| Administaff* | | | 3,607 | | | | 42 | | |
| AirTran Holdings* | | | 14,100 | | | | 140 | | |
| Alaska Air Group* | | | 4,935 | | | | 122 | | |
| Albany International, Cl A | | | 4,377 | | | | 130 | | |
| Alexander & Baldwin | | | 7,099 | | | | 241 | | |
| Amerco* | | | 1,550 | | | | 59 | | |
| America West Holdings, Cl B* (a) | | | 5,858 | | | | 32 | | |
Small Cap Index Fund (continued)
| DESCRIPTION | | SHARES | | VALUE (000) | |
| American Superconductor* | | | 4,070 | | | $ | 51 | | |
| American Woodmark | | | 1,784 | | | | 66 | | |
| Ameron International | | | 1,373 | | | | 45 | | |
| Angelica | | | 1,489 | | | | 37 | | |
| Apogee Enterprises (a) | | | 4,582 | | | | 59 | | |
| Applied Industrial Technology | | | 2,857 | | | | 102 | | |
| Applied Signal Technology | | | 1,586 | | | | 51 | | |
| Arkansas Best | | | 3,676 | | | | 135 | | |
| Armor Holdings* | | | 4,763 | | | | 198 | | |
| Artesyn Technologies* | | | 5,736 | | | | 57 | | |
| Asset Acceptance Capital* | | | 1,310 | | | | 22 | | |
| Astec Industries* | | | 2,361 | | | | 45 | | |
| Aviall* | | | 3,935 | | | | 80 | | |
| Baldor Electric | | | 5,497 | | | | 130 | | |
| Banta (a) | | | 4,152 | | | | 165 | | |
| Barnes Group (a) | | | 2,374 | | | | 65 | | |
| BE Aerospace* | | | 6,550 | | | | 60 | | |
| Bowne & Company | | | 5,842 | | | | 76 | | |
| Brady, Cl A | | | 3,035 | | | | 148 | | |
| Bright Horizons Family Solutions* | | | 2,205 | | | | 120 | | |
| C&D Technologies | | | 4,876 | | | | 93 | | |
| Capstone Turbine* | | | 13,890 | | | | 21 | | |
| Cascade | | | 1,776 | | | | 49 | | |
| Casella Waste Systems* | | | 3,279 | | | | 39 | | |
| CDI | | | 2,057 | | | | 42 | | |
| Central Freight Lines* | | | 1,430 | | | | 9 | | |
| Central Parking | | | 3,089 | | | | 41 | | |
| Century Business Services* | | | 10,541 | | | | 47 | | |
| Ceradyne* | | | 2,663 | | | | 117 | | |
| Charles River Associates* | | | 1,699 | | | | 65 | | |
| Circor International | | | 2,564 | | | | 50 | | |
| CLARCOR | | | 4,087 | | | | 195 | | |
| Coinstar* (a) | | | 3,558 | | | | 83 | | |
| Color Kinetics* | | | 2,980 | | | | 38 | | |
| Comfort Systems USA* | | | 6,420 | | | | 42 | | |
| CompX International* | | | 570 | | | | 9 | | |
| Consolidated Graphics* | | | 1,887 | | | | 79 | | |
| Continental Airlines, Cl B* | | | 11,051 | | | | 94 | | |
| Cornell Companies* | | | 2,222 | | | | 28 | | |
| Corrections Corporation of America* | | | 5,861 | | | | 207 | | |
| CoStar Group* | | | 2,676 | | | | 132 | | |
| Covenant Transport, Cl A* | | | 1,453 | | | | 28 | | |
| Cubic | | | 2,610 | | | | 60 | | |
| CUNO* | | | 2,826 | | | | 163 | | |
| Curtiss-Wright | | | 3,486 | | | | 200 | | |
| Delta Air Lines* (a) | | | 17,870 | | | | 59 | | |
| DiamondCluster, Cl A* | | | 3,900 | | | | 48 | | |
| Dollar Thrifty Automotive* | | | 4,225 | | | | 103 | | |
| DRS Technologies* | | | 3,954 | | | | 148 | | |
| Ducommun* | | | 1,215 | | | | 27 | | |
| Duratek* | | | 1,700 | | | | 30 | | |
| Dycom Industries* | | | 8,093 | | | | 230 | | |
| EDO | | | 2,611 | | | | 72 | | |
| EGL* (a) | | | 5,969 | | | | 181 | | |
| Electro Rent* | | | 3,005 | | | | 33 | | |
| ElkCorp | | | 3,292 | | | | 91 | | |
| EMCOR Group* | | | 2,528 | | | | 95 | | |
| Encore Wire* | | | 2,644 | | | | 35 | | |
| Energy Conversion Devices* | | | 3,359 | | | | 45 | | |
| Engineered Support Systems (a) | | | 3,714 | | | | 170 | | |
| Ennis Business Forms | | | 2,731 | | | | 58 | | |
| EnPro Industries* | | | 3,456 | | | | 83 | | |
| ESCO Technologies* | | | 2,161 | | | | 146 | | |
| Esterline Technologies* | | | 3,368 | | | | 103 | | |
| Exponent* | | | 1,000 | | | | 28 | | |
| ExpressJet Holdings* | | | 6,536 | | | | 65 | | |
The accompanying notes are an integral part of the financial statements.
FIRST AMERICAN FUNDS Annual Report 2004
32
Small Cap Index Fund (continued)
| DESCRIPTION | | SHARES | | VALUE (000) | |
| Exult* | | | 8,403 | | | $ | 44 | | |
| Federal Signal (a) | | | 8,026 | | | | 149 | | |
| First Advantage* | | | 520 | | | | 8 | | |
| Flanders* | | | 2,180 | | | | 19 | | |
| Florida East Coast Industries, Cl A | | | 3,349 | | | | 126 | | |
| Flowserve* | | | 9,050 | | | | 219 | | |
| FLYi* (a) | | | 7,570 | | | | 30 | | |
| Forward Air* (a) | | | 3,586 | | | | 144 | | |
| Franklin Electric | | | 2,702 | | | | 107 | | |
| Frontier Airlines* | | | 5,929 | | | | 46 | | |
| FTI Consulting* (a) | | | 7,105 | | | | 134 | | |
| FuelCell Energy* (a) | | | 7,050 | | | | 72 | | |
| G & K Services, Cl A | | | 2,911 | | | | 116 | | |
| Gardner Denver* | | | 3,298 | | | | 91 | | |
| GenCorp | | | 6,608 | | | | 90 | | |
| General Binding* | | | 1,001 | | | | 14 | | |
| General Cable* | | | 6,919 | | | | 74 | | |
| Genesee & Wyoming, Cl A* | | | 2,816 | | | | 71 | | |
| Genlyte Group* | | | 2,031 | | | | 131 | | |
| Geo Group* | | | 1,572 | | | | 32 | | |
| GEVITY HR | | | 3,952 | | | | 61 | | |
| Global Power Equipment* | | | 5,645 | | | | 42 | | |
| Gorman-Rupp | | | 1,353 | | | | 28 | | |
| Granite Construction | | | 5,555 | | | | 133 | | |
| Greenbrier Companies* | | | 947 | | | | 23 | | |
| Greg Manning Auctions* | | | 840 | | | | 9 | | |
| Griffon* (a) | | | 4,069 | | | | 86 | | |
| Healthcare Services Group | | | 2,480 | | | | 45 | | |
| Heartland Express (a) | | | 7,577 | | | | 140 | | |
| HEICO | | | 3,252 | | | | 57 | | |
| Heidrick & Struggles International* | | | 2,790 | | | | 80 | | |
| Herley Industries* | | | 1,910 | | | | 36 | | |
| Hexcel* | | | 3,664 | | | | 51 | | |
| Hub Group* | | | 1,200 | | | | 45 | | |
| Hudson Highland Group* | | | 1,665 | | | | 49 | | |
| IDEX | | | 8,028 | | | | 273 | | |
| II-VI* | | | 1,869 | | | | 65 | | |
| Imagistics International* | | | 2,781 | | | | 93 | | |
| Innovative Solutions and Support* | | | 1,160 | | | | 28 | | |
| Insituform Technologies, Cl A* | | | 4,458 | | | | 83 | | |
| Insurance Auto Auctions* | | | 1,445 | | | | 25 | | |
| Integrated Electrical Services* | | | 5,484 | | | | 26 | | |
| Intermagnetics General* | | | 4,666 | | | | 108 | | |
| Intersections* | | | 1,180 | | | | 17 | | |
| Invision Technologies* | | | 2,912 | | | | 131 | | |
| Ionics* (a) | | | 3,069 | | | | 83 | | |
| Jacuzzi Brands* | | | 12,579 | | | | 117 | | |
| JLG Industries | | | 7,380 | | | | 124 | | |
| John H. Harland | | | 4,625 | | | | 145 | | |
| Joy Global (a) | | | 8,484 | | | | 292 | | |
| Kadant* | | | 2,383 | | | | 44 | | |
| Kaman | | | 3,402 | | | | 41 | | |
| Kansas City Southern Industries* | | | 10,040 | | | | 152 | | |
| Kaydon (a) | | | 4,493 | | | | 129 | | |
| Kelly Services, Cl A | | | 2,936 | | | | 78 | | |
| Kennametal | | | 5,900 | | | | 266 | | |
| Kforce* | | | 4,260 | | | | 36 | | |
| Kirby* | | | 3,620 | | | | 145 | | |
| Knight Transportation* | | | 6,112 | | | | 131 | | |
| Korn/Ferry International* | | | 5,216 | | | | 95 | | |
| KVH Industries* | | | 2,404 | | | | 17 | | |
| Labor Ready* | | | 6,902 | | | | 97 | | |
| Laidlaw International* | | | 17,330 | | | | 285 | | |
| Landstar* (a) | | | 4,970 | | | | 292 | | |
| Lawson Products | | | 730 | | | | 30 | | |
| Layne Christensen* | | | 1,640 | | | | 25 | | |
Small Cap Index Fund (continued)
| DESCRIPTION | | SHARES | | VALUE (000) | |
| Learning Tree International* | | | 1,465 | | | $ | 21 | | |
| LECG* | | | 2,180 | | | | 37 | | |
| Lennox International (a) | | | 7,396 | | | | 110 | | |
| Lincoln Electric Holdings | | | 5,614 | | | | 176 | | |
| Lindsay Manufacturing | | | 1,895 | | | | 51 | | |
| LSI Industries | | | 3,292 | | | | 34 | | |
| MagneTek* | | | 3,950 | | | | 30 | | |
| Manitowoc | | | 4,454 | | | | 158 | | |
| Marten Transport* | | | 1,530 | | | | 27 | | |
| MasTec* | | | 3,917 | | | | 21 | | |
| McGrath Rentcorp | | | 1,609 | | | | 59 | | |
| Medis Technologies* (a) | | | 2,167 | | | | 24 | | |
| MemberWorks* (a) | | | 982 | | | | 26 | | |
| Mercury Computer Systems* (a) | | | 3,541 | | | | 95 | | |
| Mesa Air Group* | | | 5,292 | | | | 27 | | |
| Microvision* | | | 3,110 | | | | 18 | | |
| Middleby* | | | 740 | | | | 39 | | |
| Milacron* (a) | | | 4,590 | | | | 14 | | |
| Mobile Mini* | | | 2,400 | | | | 60 | | |
| Moog, Cl A* | | | 4,345 | | | | 158 | | |
| MTC Technologies* | | | 1,204 | | | | 33 | | |
| Mueller Industries | | | 5,571 | | | | 239 | | |
| NACCO Industries, Cl A | | | 785 | | | | 68 | | |
| Navigant Consulting* | | | 7,658 | | | | 168 | | |
| NCI Building Systems* | | | 3,245 | | | | 104 | | |
| NCO Group* | | | 4,507 | | | | 121 | | |
| Nordson | | | 4,431 | | | | 152 | | |
| Northwest Airlines* (a) | | | 12,474 | | | | 102 | | |
| NuCo2* | | | 1,140 | | | | 22 | | |
| Old Dominion Freight Lines* | | | 2,750 | | | | 79 | | |
| Orbital Sciences* | | | 8,124 | | | | 93 | | |
| Overnite | | | 4,670 | | | | 147 | | |
| PAM Transportation Services* | | | 1,786 | | | | 34 | | |
| Pacer International* (a) | | | 4,610 | | | | 76 | | |
| Penn Engineering & Manufacturing | | | 1,793 | | | | 33 | | |
| Perini* | | | 1,126 | | | | 16 | | |
| Pico Holdings* | | | 1,336 | | | | 25 | | |
| Pinnacle Airlines* | | | 3,240 | | | | 33 | | |
| Plug Power* | | | 8,085 | | | | 52 | | |
| Portfolio Recovery Associates* | | | 2,023 | | | | 59 | | |
| Powell Industries* | | | 1,137 | | | | 19 | | |
| Power-One* | | | 10,660 | | | | 69 | | |
| Pre-Paid Legal Services* | | | 1,744 | | | | 45 | | |
| PRG-Schultz International* | | | 6,840 | | | | 39 | | |
| Princeton Review* | | | 2,755 | | | | 21 | | |
| Quality Distribution* | | | 1,390 | | | | 8 | | |
| Quanta Services* | | | 12,021 | | | | 73 | | |
| Quixote | | | 1,257 | | | | 24 | | |
| RailAmerica* | | | 6,137 | | | | 68 | | |
| Raven Industries | | | 1,294 | | | | 58 | | |
| Regal-Beloit | | | 3,913 | | | | 95 | | |
| Reliance Steel & Aluminum | | | 4,706 | | | | 187 | | |
| Republic Airways Holdings* | | | 830 | | | | 7 | | |
| Resources Connection* | | | 3,856 | | | | 146 | | |
| Robbins & Myers | | | 1,811 | | | | 40 | | |
| Rollins | | | 3,257 | | | | 79 | | |
| Schawk | | | 1,511 | | | | 22 | | |
| School Specialty* | | | 3,757 | | | | 148 | | |
| SCS Transportation* | | | 2,481 | | | | 47 | | |
| Sequa, Cl A* | | | 1,036 | | | | 54 | | |
| Shaw Group* (a) | | | 10,552 | | | | 127 | | |
| SI International* | | | 840 | | | | 18 | | |
| Simpson Manufacturing (a) | | | 2,939 | | | | 186 | | |
| SITEL* | | | 9,720 | | | | 21 | | |
| SkyWest | | | 9,839 | | | | 148 | | |
| Sotheby's Holdings, Cl A* | | | 7,622 | | | | 120 | | |
FIRST AMERICAN FUNDS Annual Report 2004
33
Schedule of Investments September 30, 2004
Small Cap Index Fund (continued)
| DESCRIPTION | | SHARES | | VALUE (000) | |
| SOURCECORP* | | | 2,692 | | | $ | 60 | | |
| Spherion* | | | 10,076 | | | | 79 | | |
| Standard Register | | | 1,733 | | | | 18 | | |
| Standex International | | | 1,969 | | | | 48 | | |
| Stewart & Stevenson Services | | | 4,795 | | | | 85 | | |
| Strayer Education | | | 2,467 | | | | 284 | | |
| Swift Transportation* (a) | | | 8,280 | | | | 139 | | |
| Sypris Solutions | | | 1,128 | | | | 15 | | |
| Tecumseh Products, Cl A | | | 2,648 | | | | 111 | | |
| Teledyne Technologies* | | | 5,420 | | | | 136 | | |
| Teletech Holdings* (a) | | | 6,279 | | | | 59 | | |
| Tennant | | | 1,603 | | | | 65 | | |
| Terex* (a) | | | 8,231 | | | | 357 | | |
| Tetra Tech* (a) | | | 9,332 | | | | 118 | | |
| Thomas & Betts* (a) | | | 9,802 | | | | 263 | | |
| Thomas Industries | | | 2,423 | | | | 76 | | |
| Toro (a) | | | 3,794 | | | | 259 | | |
| TRC* | | | 1,518 | | | | 28 | | |
| Tredegar | | | 4,619 | | | | 84 | | |
| Trex* | | | 1,718 | | | | 76 | | |
| Trinity Industries (a) | | | 6,125 | | | | 191 | | |
| Triumph Group* | | | 2,642 | | | | 89 | | |
| U.S. Xpress Enterprises* | | | 964 | | | | 18 | | |
| Ultralife Batteries* | | | 2,340 | | | | 24 | | |
| United Industrial | | | 1,774 | | | | 58 | | |
| United Rentals* (a) | | | 7,196 | | | | 114 | | |
| United Stationers* | | | 5,646 | | | | 245 | | |
| Universal Forest Products | | | 2,716 | | | | 93 | | |
| Universal Technical Institute* | | | 2,360 | | | | 71 | | |
| URS* | | | 5,238 | | | | 140 | | |
| USF (a) | | | 4,628 | | | | 166 | | |
| USG* (a) | | | 5,746 | | | | 105 | | |
| Valence Technology* (a) | | | 9,043 | | | | 31 | | |
| Valmont Industries | | | 2,288 | | | | 48 | | |
| Vicor | | | 3,192 | | | | 32 | | |
| Volt Information Sciences* | | | 1,322 | | | | 38 | | |
| Wabash National* (a) | | | 4,525 | | | | 124 | | |
| Wabtec | | | 6,326 | | | | 118 | | |
| Walter Industries | | | 3,930 | | | | 63 | | |
| Washington Group International* | | | 4,213 | | | | 146 | | |
| Waste Connections* | | | 7,721 | | | | 245 | | |
| Water Pik Technologies* | | | 1,660 | | | | 25 | | |
| Watsco | | | 3,719 | | | | 112 | | |
| Watson Wyatt & Company Holdings | | | 5,378 | | | | 141 | | |
| Watts Water Technologies, Cl A | | | 3,965 | | | | 106 | | |
| Werner Enterprises (a) | | | 8,000 | | | | 154 | | |
| Woodward Governor | | | 1,619 | | | | 109 | | |
| York International (a) | | | 6,584 | | | | 208 | | |
| | | | 23,124 | | |
| Information Technology – 16.8% | | | |
| 24/7 Real Media* | | | 3,630 | | | | 14 | | |
| Accelrys* | | | 4,068 | | | | 27 | | |
| Actel* | | | 4,294 | | | | 65 | | |
| ActivCard* | | | 7,045 | | | | 43 | | |
| Actuate* | | | 8,630 | | | | 30 | | |
| Adaptec* | | | 18,210 | | | | 138 | | |
| ADE* | | | 1,580 | | | | 27 | | |
| Advanced Digital Information* | | | 10,711 | | | | 93 | | |
| Advanced Energy Industries* | | | 3,766 | | | | 35 | | |
| Advent Software* (a) | | | 3,938 | | | | 66 | | |
| Aeroflex* | | | 11,008 | | | | 116 | | |
| Agile Software* | | | 8,707 | | | | 69 | | |
| Agilysys | | | 4,789 | | | | 83 | | |
| Airspan Networks* | | | 5,140 | | | | 28 | | |
| Alliance Semiconductor* | | | 3,401 | | | | 12 | | |
Small Cap Index Fund (continued)
| DESCRIPTION | | SHARES | | VALUE (000) | |
| Altiris* | | | 3,464 | | | $ | 110 | | |
| AMIS Holdings* | | | 5,210 | | | | 70 | | |
| Anaren* | | | 3,448 | | | | 46 | | |
| Anixter International* (a) | | | 4,723 | | | | 166 | | |
| Ansoft* | | | 1,223 | | | | 19 | | |
| AnswerThink* | | | 7,510 | | | | 40 | | |
| ANSYS* | | | 2,564 | | | | 128 | | |
| Anteon International* | | | 4,320 | | | | 158 | | |
| Applied Films* | | | 2,458 | | | | 44 | | |
| aQuantive* | | | 7,927 | | | | 76 | | |
| Ariba* | | | 9,982 | | | | 93 | | |
| Arris Group* (a) | | | 14,514 | | | | 76 | | |
| Artisan Components* | | | 3,845 | | | | 112 | | |
| Ascential Software* | | | 9,894 | | | | 133 | | |
| AsiaInfo Holdings* | | | 5,892 | | | | 29 | | |
| Aspect Communication* | | | 6,784 | | | | 67 | | |
| Aspen Technology* (a) | | | 6,891 | | | | 48 | | |
| Asyst Technologies* | | | 7,837 | | | | 40 | | |
| Atari* | | | 1,539 | | | | 2 | | |
| Atheros Communications* | | | 1,550 | | | | 16 | | |
| ATMI* (a) | | | 5,210 | | | | 107 | | |
| Audiovox* | | | 2,868 | | | | 48 | | |
| August Technology* | | | 2,960 | | | | 20 | | |
| Authentidate Holding* | | | 4,830 | | | | 29 | | |
| Autobytel* | | | 6,932 | | | | 62 | | |
| Avanex* | | | 13,297 | | | | 27 | | |
| Axcelis Technologies* (a) | | | 16,591 | | | | 137 | | |
| BEI Technologies | | | 1,851 | | | | 51 | | |
| Bel Fuse | | | 1,820 | | | | 60 | | |
| Belden CDT | | | 7,819 | | | | 170 | | |
| Benchmark Electronics* (a) | | | 6,849 | | | | 204 | | |
| BISYS Group* | | | 20,090 | | | | 294 | | |
| Black Box (a) | | | 2,695 | | | | 100 | | |
| Blue Coat Systems* | | | 1,500 | | | | 22 | | |
| Borland Software* | | | 13,479 | | | | 113 | | |
| Brightpoint* | | | 3,070 | | | | 53 | | |
| Brocade Communications Systems* (a) | | | 43,290 | | | | 245 | | |
| Brooks Automation* | | | 7,435 | | | | 105 | | |
| Cabot Microelectronics* (a) | | | 4,142 | | | | 150 | | |
| CACI International, Cl A* (a) | | | 4,859 | | | | 256 | | |
| California Micro Devices* | | | 3,520 | | | | 27 | | |
| Captaris* | | | 5,360 | | | | 23 | | |
| Carreker* | | | 3,380 | | | | 26 | | |
| Carrier Access* | | | 3,340 | | | | 23 | | |
| Catapult Communications* | | | 1,035 | | | | 19 | | |
| CCC Information Services Group* | | | 2,120 | | | | 38 | | |
| C-COR.net* | | | 7,178 | | | | 61 | | |
| Checkpoint Systems* | | | 6,061 | | | | 94 | | |
| Cherokee International* | | | 1,180 | | | | 10 | | |
| Chordiant Software* | | | 12,870 | | | | 37 | | |
| CIBER* | | | 8,511 | | | | 64 | | |
| Cirrus Logic* (a) | | | 14,082 | | | | 67 | | |
| Clarus* | | | 2,210 | | | | 19 | | |
| CMGI* | | | 62,891 | | | | 76 | | |
| CNET Networks* | | | 21,282 | | | | 195 | | |
| Cognex | | | 6,669 | | | | 175 | | |
| Coherent* | | | 5,038 | | | | 131 | | |
| Cohu | | | 3,578 | | | | 53 | | |
| CommScope* (a) | | | 8,706 | | | | 188 | | |
| CompuCom Systems* | | | 3,624 | | | | 17 | | |
| Comtech Telecommunications* | | | 2,377 | | | | 64 | | |
| Concord Communications* | | | 3,048 | | | | 27 | | |
| Concur Technologies* | | | 4,368 | | | | 46 | | |
| Corillian* | | | 5,410 | | | | 25 | | |
| Covansys* | | | 3,350 | | | | 39 | | |
| Cray* | | | 14,298 | | | | 50 | | |
The accompanying notes are an integral part of the financial statements.
FIRST AMERICAN FUNDS Annual Report 2004
34
Small Cap Index Fund (continued)
| DESCRIPTION | | SHARES | | VALUE (000) | |
| Credence Systems* (a) | | | 14,241 | | | $ | 103 | | |
| CSG Systems International* | | | 9,004 | | | | 139 | | |
| CTS | | | 6,024 | | | | 76 | | |
| CyberGuard* | | | 2,856 | | | | 17 | | |
| CyberOptics* | | | 1,240 | | | | 19 | | |
| CyberSource* | | | 4,560 | | | | 22 | | |
| Cymer* (a) | | | 6,137 | | | | 176 | | |
| Daktronics* | | | 2,406 | | | | 59 | | |
| DDi* | | | 4,350 | | | | 22 | | |
| Digi International* | | | 3,580 | | | | 41 | | |
| Digimarc* | | | 2,578 | | | | 23 | | |
| Digital Insight* (a) | | | 5,854 | | | | 80 | | |
| Digital River* | | | 5,319 | | | | 158 | | |
| Digital Theater Systems* | | | 2,800 | | | | 51 | | |
| DigitalNet Holdings* | | | 1,020 | | | | 31 | | |
| Digitas* | | | 8,959 | | | | 69 | | |
| Diodes* | | | 1,191 | | | | 31 | | |
| Dionex* | | | 2,994 | | | | 164 | | |
| Ditech Communications* | | | 4,740 | | | | 106 | | |
| Dot Hill Systems* | | | 7,241 | | | | 58 | | |
| DoubleClick* (a) | | | 19,260 | | | | 114 | | |
| Drexler Technology* (a) | | | 1,623 | | | | 15 | | |
| DSP Group* | | | 4,870 | | | | 103 | | |
| DuPont Photomasks* | | | 2,447 | | | | 42 | | |
| E.piphany* | | | 12,683 | | | | 51 | | |
| Eagle Broadband* (a) | | | 33,710 | | | | 24 | | |
| EarthLink* | | | 23,052 | | | | 237 | | |
| Echelon* | | | 4,674 | | | | 37 | | |
| eCollege.com* | | | 2,654 | | | | 26 | | |
| eFunds* | | | 7,983 | | | | 148 | | |
| Electro Scientific Industries* | | | 4,700 | | | | 82 | | |
| Electronics for Imaging* (a) | | | 8,947 | | | | 145 | | |
| Embarcadero Technologies* | | | 3,542 | | | | 30 | | |
| Emulex* | | | 13,720 | | | | 158 | | |
| Entegris* | | | 7,279 | | | | 61 | | |
| Enterasys Networks* | | | 35,059 | | | | 56 | | |
| Entrust* | | | 10,609 | | | | 27 | | |
| Epicor Software* | | | 6,928 | | | | 83 | | |
| EPIQ Systems* (a) | | | 2,281 | | | | 36 | | |
| Equinix* | | | 1,620 | | | | 50 | | |
| ESS Technology* (a) | | | 5,592 | | | | 38 | | |
| Euronet Worldwide* | | | 3,749 | | | | 70 | | |
| Exar* (a) | | | 6,827 | | | | 97 | | |
| Excel Technologies* | | | 1,995 | | | | 52 | | |
| Extreme Networks* (a) | | | 18,019 | | | | 80 | | |
| F5 Networks* (a) | | | 5,746 | | | | 175 | | |
| FactSet Research Systems (a) | | | 3,400 | | | | 164 | | |
| FalconStor Software* (a) | | | 4,403 | | | | 33 | | |
| FARO Technologies* | | | 1,760 | | | | 36 | | |
| FEI* (a) | | | 3,976 | | | | 79 | | |
| FileNet* | | | 6,499 | | | | 113 | | |
| FindWhat.com* (a) | | | 4,271 | | | | 80 | | |
| Finisar* (a) | | | 27,604 | | | | 36 | | |
| FormFactor* (a) | | | 4,630 | | | | 90 | | |
| Forrester Research* | | | 2,275 | | | | 35 | | |
| FSI International* | | | 4,980 | | | | 21 | | |
| Gartner, Cl A* | | | 11,432 | | | | 134 | | |
| Gateway* (a) | | | 37,170 | | | | 184 | | |
| Genesis Microchip* | | | 5,352 | | | | 72 | | |
| Global Imaging Systems* | | | 3,852 | | | | 120 | | |
| Harmonic* | | | 11,990 | | | | 80 | | |
| Helix Technology | | | 4,163 | | | | 57 | | |
| Homestore* | | | 18,853 | | | | 44 | | |
| Hutchinson Technology* (a) | | | 4,159 | | | | 111 | | |
| Hypercom* | | | 8,501 | | | | 63 | | |
| Hyperion Solutions* (a) | | | 6,514 | | | | 221 | | |
Small Cap Index Fund (continued)
| DESCRIPTION | | SHARES | | VALUE (000) | |
| Identix* | | | 14,724 | | | $ | 98 | | |
| iGATE* | | | 3,474 | | | | 13 | | |
| Imation | | | 5,710 | | | | 203 | | |
| Inet Technologies* | | | 3,889 | | | | 49 | | |
| Infocrossing* (a) | | | 2,620 | | | | 41 | | |
| InFocus* | | | 6,609 | | | | 61 | | |
| Informatica* | | | 14,308 | | | | 84 | | |
| InfoSpace* (a) | | | 5,330 | | | | 253 | | |
| infoUSA* | | | 5,310 | | | | 47 | | |
| INTAC International* | | | 1,310 | | | | 11 | | |
| Integrated Device Technology* (a) | | | 17,590 | | | | 168 | | |
| Integrated Silicon Solution* | | | 5,956 | | | | 43 | | |
| InterCept* | | | 2,763 | | | | 52 | | |
| InterDigital Communications* | | | 9,270 | | | | 151 | | |
| Intergraph* | | | 6,095 | | | | 166 | | |
| InterNAP Network Services* | | | 39,460 | | | | 26 | | |
| Internet Capital Group* | | | 6,350 | | | | 41 | | |
| Internet Security Systems* (a) | | | 6,789 | | | | 115 | | |
| Inter-Tel | | | 3,430 | | | | 74 | | |
| Intervideo* | | | 1,430 | | | | 17 | | |
| InterVoice* | | | 5,997 | | | | 65 | | |
| Interwoven* | | | 6,748 | | | | 49 | | |
| Intevac* | | | 2,790 | | | | 18 | | |
| Intrado* | | | 2,879 | | | | 29 | | |
| Iomega* | | | 7,902 | | | | 37 | | |
| iPass* | | | 7,370 | | | | 44 | | |
| iPayment* | | | 1,755 | | | | 70 | | |
| Itron* | | | 3,323 | | | | 58 | | |
| iVillage* | | | 5,250 | | | | 31 | | |
| IXIA* | | | 4,415 | | | | 43 | | |
| IXYS* | | | 3,134 | | | | 22 | | |
| J2 Global Communications* | | | 3,140 | | | | 99 | | |
| JDA Software* | | | 4,295 | | | | 46 | | |
| Jupitermedia* | | | 2,610 | | | | 46 | | |
| Keane* (a) | | | 8,428 | | | | 129 | | |
| Keithley Instruments | | | 2,099 | | | | 37 | | |
| KEMET* | | | 14,424 | | | | 117 | | |
| Keynote Systems* | | | 2,568 | | | | 36 | | |
| Kintera* | | | 1,110 | | | | 10 | | |
| Komag* | | | 4,589 | | | | 64 | | |
| Kopin* | | | 11,697 | | | | 48 | | |
| Kronos* | | | 5,182 | | | | 230 | | |
| Kulicke & Soffa* | | | 8,485 | | | | 48 | | |
| Landauer | | | 1,362 | | | | 64 | | |
| Lattice Semiconductor* | | | 18,883 | | | | 93 | | |
| Lawson Software* | | | 9,272 | | | | 52 | | |
| Leadis Technology* | | | 4,590 | | | | 52 | | |
| LeCroy* | | | 1,300 | | | | 22 | | |
| Lexar Media* | | | 11,814 | | | | 99 | | |
| Lionbridge Technologies* | | | 7,777 | | | | 67 | | |
| Littelfuse* | | | 3,686 | | | | 127 | | |
| LookSmart* | | | 15,938 | | | | 23 | | |
| LTX* | | | 10,164 | | | | 55 | | |
| Macrovision* (a) | | | 8,230 | | | | 198 | | |
| Magma Design Automation* | | | 4,113 | | | | 62 | | |
| Manhattan Associates* | | | 5,034 | | | | 123 | | |
| ManTech International* | | | 2,806 | | | | 53 | | |
| Manugistics Group* | | | 9,161 | | | | 22 | | |
| MAPICS* | | | 4,238 | | | | 38 | | |
| MapInfo* | | | 3,370 | | | | 36 | | |
| Marchex* | | | 690 | | | | 9 | | |
| MarketWatch.com* | | | 1,740 | | | | 22 | | |
| MatrixOne* | | | 8,726 | | | | 44 | | |
| Mattson Technology* | | | 6,661 | | | | 51 | | |
| Maximus* | | | 3,117 | | | | 90 | | |
| Maxwell Technologies* | | | 1,770 | | | | 18 | | |
FIRST AMERICAN FUNDS Annual Report 2004
35
Schedule of Investments September 30, 2004
Small Cap Index Fund (continued)
| DESCRIPTION | | SHARES | | VALUE (000) | |
| McDATA, Cl A* | | | 19,610 | | | $ | 99 | | |
| Measurement Specialties* | | | 1,780 | | | | 44 | | |
| Mentor Graphics* (a) | | | 11,685 | | | | 128 | | |
| Merix* | | | 3,010 | | | | 31 | | |
| Methode Electronics, Cl A | | | 5,648 | | | | 72 | | |
| Metrologic Instruments* | | | 1,748 | | | | 28 | | |
| Micrel* | | | 11,419 | | | | 119 | | |
| Micromuse* | | | 13,060 | | | | 48 | | |
| Micros Systems* | | | 2,685 | | | | 134 | | |
| Microsemi* | | | 9,926 | | | | 140 | | |
| MicroStrategy* | | | 1,998 | | | | 82 | | |
| Microtune* | | | 8,580 | | | | 45 | | |
| Midway Games* | | | 7,699 | | | | 76 | | |
| Mindspeed Technologies* (a) | | | 16,605 | | | | 33 | | |
| MIPS Technologies, Cl A* | | | 6,840 | | | | 39 | | |
| MKS Instruments* (a) | | | 5,409 | | | | 83 | | |
| Mobility Electronics* | | | 4,120 | | | | 34 | | |
| Monolithic System Technology* | | | 3,897 | | | | 17 | | |
| MPS Group* | | | 17,540 | | | | 148 | | |
| MRO Software* | | | 3,265 | | | | 33 | | |
| MRV Communications* (a) | | | 17,620 | | | | 44 | | |
| MSC.Software* | | | 4,570 | | | | 37 | | |
| MTS Systems | | | 3,368 | | | | 72 | | |
| Mykrolis* | | | 6,881 | | | | 69 | | |
| National Processing* | | | 1,468 | | | | 39 | | |
| Neoforma* | | | 1,542 | | | | 14 | | |
| Net2Phone* | | | 5,955 | | | | 19 | | |
| Netegrity* | | | 5,478 | | | | 41 | | |
| NETGEAR* | | | 3,610 | | | | 44 | | |
| NetIQ* | | | 9,518 | | | | 102 | | |
| NetRatings* | | | 1,969 | | | | 35 | | |
| NetScout Systems* | | | 3,957 | | | | 21 | | |
| Network Equip Technologies* | | | 4,000 | | | | 26 | | |
| Newport* | | | 7,119 | | | | 82 | | |
| NIC* | | | 5,199 | | | | 28 | | |
| NMS Communications* | | | 7,760 | | | | 38 | | |
| Novatel Wireless* | | | 3,080 | | | | 72 | | |
| OmniVision Technologies* (a) | | | 9,362 | | | | 132 | | |
| ON Semiconductor* (a) | | | 20,085 | | | | 63 | | |
| Open Solutions* | | | 2,190 | | | | 55 | | |
| Openwave Systems* | | | 10,726 | | | | 95 | | |
| Oplink Communications* | | | 17,841 | | | | 32 | | |
| OPNET Technologies* | | | 1,965 | | | | 20 | | |
| Opsware* (a) | | | 8,559 | | | | 48 | | |
| Optical Communication Products* | | | 3,060 | | | | 6 | | |
| OSI Systems* | | | 2,433 | | | | 39 | | |
| Overland Storage* | | | 2,281 | | | | 32 | | |
| Packeteer* | | | 5,480 | | | | 59 | | |
| Palm* (a) | | | 6,979 | | | | 212 | | |
| Palmsource* | | | 2,442 | | | | 51 | | |
| Paradyne Networks* | | | 6,570 | | | | 30 | | |
| Parametric Technology* | | | 44,682 | | | | 236 | | |
| Park Electrochemical | | | 2,784 | | | | 59 | | |
| Paxar* | | | 5,769 | | | | 131 | | |
| PC Connection* | | | 1,202 | | | | 8 | | |
| PC-tel* | | | 3,354 | | | | 28 | | |
| PDF Solutions* | | | 2,438 | | | | 30 | | |
| PEC Solutions* | | | 2,246 | | | | 26 | | |
| Pegasus Solutions* | | | 3,884 | | | | 46 | | |
| Pegasystems* | | | 1,884 | | | | 13 | | |
| Pericom Semiconductor* | | | 3,692 | | | | 36 | | |
| Perot Systems, Cl A* | | | 12,692 | | | | 204 | | |
| Photon Dynamics* (a) | | | 2,778 | | | | 56 | | |
| Photronics* (a) | | | 5,426 | | | | 90 | | |
| Pinnacle Systems* | | | 11,488 | | | | 48 | | |
| Pixelworks* | | | 6,756 | | | | 68 | | |
Small Cap Index Fund (continued)
| DESCRIPTION | | SHARES | | VALUE (000) | |
| Planar Systems* | | | 2,441 | | | $ | 27 | | |
| PLATO Learning* | | | 3,840 | | | | 34 | | |
| Plexus* | | | 7,184 | | | | 79 | | |
| PLX Technology* | | | 3,590 | | | | 26 | | |
| Portal Software* | | | 5,378 | | | | 15 | | |
| Power Integrations* (a) | | | 4,601 | | | | 94 | | |
| Powerwave Technologies* | | | 17,390 | | | | 107 | | |
| Presstek* | | | 4,290 | | | | 41 | | |
| Progress Software* | | | 5,253 | | | | 105 | | |
| QAD | | | 2,134 | | | | 15 | | |
| Quality Systems* | | | 559 | | | | 28 | | |
| Quantum* (a) | | | 30,074 | | | | 69 | | |
| Quest Software* | | | 8,301 | | | | 92 | | |
| RadiSys* (a) | | | 3,126 | | | | 44 | | |
| RAE Systems* | | | 5,760 | | | | 32 | | |
| RealNetworks* (a) | | | 18,770 | | | | 87 | | |
| Redback Networks* | | | 5,206 | | | | 27 | | |
| Redback Networks – Warrant* (a) | | | 707 | | | | 2 | | |
| REMEC* | | | 10,269 | | | | 48 | | |
| Renaissance Learning | | | 1,273 | | | | 28 | | |
| Retek* | | | 9,311 | | | | 42 | | |
| RF Micro Devices* | | | 32,047 | | | | 203 | | |
| Rofin-Sinar Technologies* | | | 2,495 | | | | 73 | | |
| Rogers* | | | 2,766 | | | | 118 | | |
| RSA Security* (a) | | | 10,306 | | | | 199 | | |
| Rudolph Technologies* (a) | | | 2,142 | | | | 36 | | |
| S1* | | | 11,775 | | | | 94 | | |
| Safeguard Scientifics* (a) | | | 19,974 | | | | 37 | | |
| SAFENET* (a) | | | 3,962 | | | | 105 | | |
| Sapient* | | | 13,146 | | | | 100 | | |
| SBS Technologies* | | | 2,544 | | | | 31 | | |
| ScanSoft* | | | 13,475 | | | | 55 | | |
| ScanSource* | | | 2,090 | | | | 133 | | |
| SeaChange International* | | | 4,085 | | | | 65 | | |
| Secure Computing* | | | 5,936 | | | | 45 | | |
| SeeBeyond Technologies* | | | 8,274 | | | | 25 | | |
| Semitool* | | | 2,713 | | | | 21 | | |
| SERENA Software* (a) | | | 4,186 | | | | 70 | | |
| SigmaTel* | | | 4,100 | | | | 87 | | |
| Silicon Graphics* (a) | | | 43,564 | | | | 62 | | |
| Silicon Image* | | | 12,350 | | | | 156 | | |
| Silicon Storage Technology* | | | 13,544 | | | | 86 | | |
| Siliconix* | | | 976 | | | | 35 | | |
| SimpleTech* | | | 3,360 | | | | 12 | | |
| SIPEX* | | | 3,305 | | | | 17 | | |
| SiRF Technology Holdings* | | | 1,830 | | | | 26 | | |
| Skyworks Solutions* (a) | | | 24,978 | | | | 237 | | |
| Sohu.com* (a) | | | 3,687 | | | | 61 | | |
| Sonic Solutions* | | | 3,120 | | | | 51 | | |
| SonicWALL* | | | 9,919 | | | | 67 | | |
| Spatialight* (a) | | | 3,920 | | | | 23 | | |
| SpectraLink | | | 3,179 | | | | 30 | | |
| SPSS* | | | 2,367 | | | | 32 | | |
| SRA International, Cl A* | | | 2,168 | | | | 112 | | |
| SS&C Technologies | | | 2,264 | | | | 44 | | |
| Staktek Holdings* | | | 1,710 | | | | 7 | | |
| Standard Microsystems* | | | 3,072 | | | | 54 | | |
| StarTek | | | 1,815 | | | | 57 | | |
| Stellent* | | | 3,251 | | | | 25 | | |
| StorageNetworks* (c) | | | 15,089 | | | | - | | |
| Stratasys | | | 1,531 | | | | 48 | | |
| Stratex Networks | | | 14,048 | | | | 31 | | |
| Suntron* | | | 410 | | | | 2 | | |
| Supertex* | | | 1,482 | | | | 29 | | |
| Supportsoft* | | | 6,057 | | | | 59 | | |
| Sycamore Networks* | | | 29,133 | | | | 110 | | |
The accompanying notes are an integral part of the financial statements.
FIRST AMERICAN FUNDS Annual Report 2004
36
Small Cap Index Fund (continued)
| DESCRIPTION | | SHARES | | VALUE (000) | |
| Sykes Enterprises* | | | 4,179 | | | $ | 19 | | |
| Symmetricom* | | | 7,491 | | | | 71 | | |
| Synaptics* | | | 3,672 | | | | 74 | | |
| SYNNEX* | | | 1,090 | | | | 19 | | |
| Syntel | | | 1,224 | | | | 20 | | |
| Take-Two Interactive Software* (a) | | | 7,447 | | | | 245 | | |
| TALX | | | 2,279 | | | | 53 | | |
| TASER International* (a) | | | 4,020 | | | | 151 | | |
| Technitrol* | | | 6,734 | | | | 131 | | |
| Tekelec* (a) | | | 8,283 | | | | 138 | | |
| Terayon Communications* | | | 11,149 | | | | 24 | | |
| Terremark Worldwide* | | | 50,100 | | | | 32 | | |
| Tessera Technologies* | | | 4,020 | | | | 89 | | |
| ThermoGenesis* | | | 7,450 | | | | 36 | | |
| THQ* (a) | | | 6,355 | | | | 124 | | |
| Tier Technologies* | | | 2,767 | | | | 27 | | |
| TippingPoint Technologies* | | | 490 | | | | 12 | | |
| Titan* | | | 14,006 | | | | 196 | | |
| TNS* | | | 740 | | | | 14 | | |
| TransAct Technologies* | | | 1,430 | | | | 37 | | |
| Transaction Systems Architects, Cl A* | | | 6,211 | | | | 115 | | |
| Transmeta* | | | 24,857 | | | | 31 | | |
| Travelzoo* (a) | | | 260 | | | | 14 | | |
| Trident Microsystems* | | | 3,130 | | | | 32 | | |
| Trimble Navigation* (a) | | | 8,452 | | | | 267 | | |
| Tripath Technology* | | | 5,710 | | | | 10 | | |
| TriQuint Semiconductor* | | | 22,712 | | | | 89 | | |
| TTM Technologies* | | | 6,798 | | | | 60 | | |
| Tumbleweed Communications* | | | 7,960 | | | | 20 | | |
| Tyler Technologies* | | | 6,122 | | | | 54 | | |
| Ulticom* | | | 1,730 | | | | 26 | | |
| Ultimate Software Group* | | | 2,740 | | | | 34 | | |
| Ultratech* | | | 3,535 | | | | 55 | | |
| United Online* | | | 8,887 | | | | 85 | | |
| Universal Display* | | | 3,471 | | | | 29 | | |
| UNOVA* | | | 8,006 | | | | 112 | | |
| ValueClick* | | | 13,199 | | | | 125 | | |
| Varian Semiconductor Equipment Associates* (a) | | | 6,061 | | | | 187 | | |
| Veeco Instruments* | | | 4,317 | | | | 91 | | |
| Verint Systems* | | | 1,946 | | | | 72 | | |
| Verity* | | | 4,968 | | | | 64 | | |
| Verso Technologies* | | | 22,180 | | | | 21 | | |
| ViaSat* | | | 3,474 | | | | 70 | | |
| Vignette* | | | 48,189 | | | | 64 | | |
| Viisage Technology* | | | 4,600 | | | | 26 | | |
| Vitesse Semiconductor* | | | 36,225 | | | | 99 | | |
| WatchGuard Technologies* | | | 5,589 | | | | 26 | | |
| WebEx Communications* | | | 5,024 | | | | 110 | | |
| webMethods* | | | 7,716 | | | | 41 | | |
| Websense* | | | 3,827 | | | | 159 | | |
| Westell Technologies, Cl A* | | | 8,212 | | | | 42 | | |
| Wind River Systems* | | | 11,848 | | | | 145 | | |
| Witness Systems* | | | 3,430 | | | | 55 | | |
| WJ Communications* | | | 5,280 | | | | 13 | | |
| Woodhead Industries | | | 2,025 | | | | 28 | | |
| X-Rite | | | 3,304 | | | | 48 | | |
| Xybernaut* (a) | | | 29,520 | | | | 33 | | |
| Zhone Technologies* | | | 9,049 | | | | 28 | | |
| Zix* (a) | | | 3,480 | | | | 16 | | |
| Zoran* | | | 7,126 | | | | 112 | | |
| Zygo* | | | 2,984 | | | | 30 | | |
| | | | 28,361 | | |
| Materials – 6.2% | | | |
| A. Schulman | | | 5,028 | | | | 111 | | |
| Airgas | | | 10,040 | | | | 242 | | |
Small Cap Index Fund (continued)
| DESCRIPTION | | SHARES | | VALUE (000) | |
| AK Steel Holdings* (a) | | | 18,145 | | | $ | 148 | | |
| Albemarle | | | 5,314 | | | | 186 | | |
| Allegheny Technologies | | | 15,905 | | | | 290 | | |
| AMCOL International | | | 3,430 | | | | 66 | | |
| American Vanguard | | | 830 | | | | 30 | | |
| Anchor Glass Container | | | 1,640 | | | | 13 | | |
| AptarGroup | | | 6,100 | | | | 268 | | |
| Arch Chemicals | | | 3,886 | | | | 111 | | |
| Brush Engineered Metals* | | | 3,161 | | | | 65 | | |
| Buckeye Technologies* | | | 5,839 | | | | 65 | | |
| Calgon Carbon | | | 5,659 | | | | 41 | | |
| Cambrex | | | 4,355 | | | | 96 | | |
| Caraustar Industries* | | | 4,746 | | | | 80 | | |
| Carpenter Technology | | | 3,805 | | | | 182 | | |
| Century Aluminum* | | | 2,962 | | | | 82 | | |
| Chesapeake | | | 3,253 | | | | 78 | | |
| Cleveland-Cliffs* (a) | | | 1,784 | | | | 144 | | |
| Coeur D'Alene Mines* (a) | | | 35,807 | | | | 170 | | |
| Commercial Metals | | | 4,779 | | | | 190 | | |
| Compass Minerals International | | | 2,520 | | | | 56 | | |
| Crompton | | | 19,122 | | | | 181 | | |
| Crown Holdings* (a) | | | 27,558 | | | | 284 | | |
| Cytec Industries | | | 6,490 | | | | 318 | | |
| Deltic Timber (a) | | | 1,649 | | | | 66 | | |
| Eagle Materials | | | 3,143 | | | | 224 | | |
| Ferro | | | 6,990 | | | | 152 | | |
| FMC* (a) | | | 6,064 | | | | 295 | | |
| Georgia Gulf | | | 4,750 | | | | 212 | | |
| Gibraltar Steel | | | 2,613 | | | | 94 | | |
| Glatfelter | | | 4,780 | | | | 59 | | |
| GrafTech International* (a) | | | 16,870 | | | | 235 | | |
| Graphic Packaging* | | | 11,130 | | | | 72 | | |
| Great Lakes Chemical | | | 8,465 | | | | 217 | | |
| Greif, Cl A | | | 2,290 | | | | 97 | | |
| H B Fuller | | | 4,752 | | | | 130 | | |
| Headwaters* (a) | | | 5,605 | | | | 173 | | |
| Hecla Mining* | | | 20,295 | | | | 151 | | |
| Hercules* (a) | | | 18,354 | | | | 262 | | |
| IMC Global* (a) | | | 19,326 | | | | 336 | | |
| IMCO Recycling* | | | 2,280 | | | | 26 | | |
| Kronos Worldwide | | | 517 | | | | 21 | | |
| Longview Fibre | | | 8,526 | | | | 130 | | |
| MacDermid | | | 4,504 | | | | 130 | | |
| Metal Management* | | | 2,800 | | | | 51 | | |
| Metals USA* | | | 3,370 | | | | 60 | | |
| Millennium Chemicals* | | | 10,845 | | | | 230 | | |
| Minerals Technologies | | | 3,425 | | | | 202 | | |
| Myers Industries | | | 4,288 | | | | 47 | | |
| NewMarket Group* | | | 2,641 | | | | 55 | | |
| NL Industries | | | 1,319 | | | | 24 | | |
| NN | | | 2,555 | | | | 29 | | |
| Octel | | | 2,072 | | | | 44 | | |
| Olin | | | 11,125 | | | | 222 | | |
| OM Group* (a) | | | 4,730 | | | | 173 | | |
| Omnova Solutions* | | | 6,705 | | | | 40 | | |
| Oregon Steel Mills* | | | 4,430 | | | | 74 | | |
| PolyOne* | | | 16,389 | | | | 123 | | |
| Pope & Talbot | | | 2,632 | | | | 46 | | |
| Potlatch (a) | | | 4,917 | | | | 230 | | |
| Quaker Chemical | | | 1,378 | | | | 33 | | |
| Quanex | | | 2,745 | | | | 141 | | |
| Rock-Tenn, Cl A | | | 4,877 | | | | 77 | | |
| Royal Gold (a) | | | 3,076 | | | | 53 | | |
| RTI International Metals* | | | 3,535 | | | | 68 | | |
| Ryerson Tull | | | 3,922 | | | | 67 | | |
| Schnitzer Steel Industries, Cl A | | | 3,270 | | | | 106 | | |
| Schweitzer-Mauduit International | | | 2,504 | | | | 81 | | |
| Sensient Technologies (a) | | | 7,806 | | | | 169 | | |
FIRST AMERICAN FUNDS Annual Report 2004
37
Schedule of Investments September 30, 2004
Small Cap Index Fund (continued)
| DESCRIPTION | | SHARES | | VALUE (000) | |
| Silgan Holdings | | | 1,828 | | | $ | 85 | | |
| Spartech | | | 4,190 | | | | 105 | | |
| Steel Dynamics (a) | | | 6,244 | | | | 241 | | |
| Steel Technologies | | | 1,670 | | | | 43 | | |
| Stepan | | | 880 | | | | 21 | | |
| Stillwater Mining* | | | 6,704 | | | | 104 | | |
| Symyx Technologies* | | | 4,696 | | | | 111 | | |
| Terra Industries* (a) | | | 6,510 | | | | 56 | | |
| Texas Industries (a) | | | 3,529 | | | | 182 | | |
| Titanium Metals* | | | 1,050 | | | | 25 | | |
| U.S. Concrete* | | | 3,530 | | | | 22 | | |
| USEC | | | 13,521 | | | | 140 | | |
| Valhi | | | 1,693 | | | | 25 | | |
| W R Grace & Company* | | | 10,949 | | | | 103 | | |
| Wausau-Mosinee Paper | | | 7,623 | | | | 127 | | |
| Wellman | | | 5,327 | | | | 45 | | |
| Wheeling-Pittsburgh* | | | 1,350 | | | | 42 | | |
| | | | 10,501 | | |
| Telecommunication Services – 0.9% | | | |
| AirGate PCS* | | | 1,970 | | | | 39 | | |
| Alamosa Holdings* | | | 12,320 | | | | 94 | | |
| Alaska Communications Systems Holdings* | | | 1,460 | | | | 8 | | |
| Arch Wireless* | | | 2,960 | | | | 85 | | |
| AT Road* | | | 5,695 | | | | 24 | | |
| Boston Communications Group* | | | 3,061 | | | | 27 | | |
| Centennial Communications, Cl A* | | | 1,976 | | | | 12 | | |
| Cincinnati Bell* | | | 40,881 | | | | 143 | | |
| Commonwealth Telephone Enterprises* | | | 3,505 | | | | 153 | | |
| Corvis* | | | 64,958 | | | | 52 | | |
| CT Communications | | | 3,010 | | | | 42 | | |
| D & E Communications | | | 1,977 | | | | 23 | | |
| Dobson Communications, Cl A* | | | 18,369 | | | | 24 | | |
| EMS Technologies* | | | 1,789 | | | | 31 | | |
| General Communication* | | | 7,582 | | | | 69 | | |
| Golden Telecom | | | 2,295 | | | | 65 | | |
| Infonet Services, Cl B* | | | 9,263 | | | | 15 | | |
| ITC DeltaCom* | | | 2,090 | | | | 9 | | |
| Metrocall Holdings* (a) | | | 870 | | | | 56 | | |
| Neon Communications* (b) | | | 34,093 | | | | - | | |
| Network Plus* (b) | | | 1,155 | | | | - | | |
| North Pittsburgh | | | 2,399 | | | | 50 | | |
| Price Communications* | | | 6,696 | | | | 102 | | |
| Primus Telecommunications Group* (a) | | | 12,354 | | | | 18 | | |
| PTEK Holdings* | | | 10,501 | | | | 90 | | |
| SBA Communications* | | | 6,797 | | | | 48 | | |
| Shenandoah Telecommunications | | | 1,094 | | | | 28 | | |
| SureWest Communications | | | 2,326 | | | | 67 | | |
| Talk America Holdings* | | | 4,451 | | | | 23 | | |
| Time Warner Telecom, Cl A* | | | 8,283 | | | | 40 | | |
| Triton PCS Holdings, Cl A* | | | 6,787 | | | | 17 | | |
| UbiquiTel* | | | 11,740 | | | | 47 | | |
| Wiltel Communications (c) | | | 4,122 | | | | - | | |
| Wireless Facilities* (a) | | | 7,903 | | | | 55 | | |
| | | | 1,556 | | |
| Utilities – 3.3% | | | |
| American States Water | | | 2,554 | | | | 64 | | |
| Aquila* (a) | | | 39,322 | | | | 123 | | |
| Atmos Energy | | | 9,363 | | | | 236 | | |
| Avista | | | 8,075 | | | | 146 | | |
| Black Hills (a) | | | 5,408 | | | | 150 | | |
| California Water Service | | | 2,842 | | | | 83 | | |
| Calpine* (a) | | | 74,070 | | | | 215 | | |
| Cascade Natural Gas | | | 1,876 | | | | 40 | | |
| Central Vermont Public Service | | | 1,755 | | | | 35 | | |
| CH Energy Group | | | 2,512 | | | | 115 | | |
Small Cap Index Fund (continued)
| DESCRIPTION | | SHARES/PAR (000) | | VALUE (000) | |
| CLECO | | | 7,935 | | | $ | 137 | | |
| CMS Energy* | | | 27,292 | | | | 260 | | |
| Connecticut Water Service | | | 1,333 | | | | 35 | | |
| Duquesne Light Holdings (a) | | | 11,890 | | | | 214 | | |
| El Paso Electric* | | | 7,946 | | | | 128 | | |
| Empire District Electric | | | 3,739 | | | | 77 | | |
| Energen | | | 6,063 | | | | 313 | | |
| EnergySouth | | | 1,129 | | | | 31 | | |
| IDACORP | | | 6,377 | | | | 185 | | |
| Infrasource Services* | | | 1,440 | | | | 15 | | |
| Laclede Group | | | 3,461 | | | | 101 | | |
| MGE Energy | | | 3,297 | | | | 105 | | |
| Middlesex Water | | | 1,889 | | | | 34 | | |
| New Jersey Resources (a) | | | 4,598 | | | | 190 | | |
| NICOR (a) | | | 7,060 | | | | 259 | | |
| Northwestern Natural Gas | | | 4,561 | | | | 145 | | |
| NUI | | | 2,668 | | | | 36 | | |
| Otter Tail | | | 3,866 | | | | 99 | | |
| People's Energy (a) | | | 6,270 | | | | 261 | | |
| Piedmont Natural Gas (a) | | | 6,350 | | | | 279 | | |
| PNM Resources (a) | | | 10,083 | | | | 227 | | |
| Sierra Pacific Resources* (a) | | | 19,567 | | | | 175 | | |
| SJW | | | 1,078 | | | | 36 | | |
| South Jersey Industries | | | 2,296 | | | | 110 | | |
| Southern Union* (a) | | | 11,068 | | | | 227 | | |
| Southern Union Company Fractional Share* (c) | | | - | | | | - | | |
| Southwest Gas | | | 6,375 | | | | 153 | | |
| Southwest Water | | | 2,754 | | | | 34 | | |
| UIL Holdings | | | 1,932 | | | | 95 | | |
| UniSource Energy Holding | | | 5,703 | | | | 139 | | |
| WGL Holdings | | | 8,120 | | | | 229 | | |
| | | | 5,536 | | |
Total Common Stocks
(Cost $146,168) | | | | | | | 166,597 | | |
| Short-Term Investments – 4.7% | | | |
| U.S. Treasury Obligation – 0.4% | | | |
U. S. Treasury Bill (d)
1.810%, 03/03/05 | | $ | 700 | | | | 695 | | |
| Total U.S. Treasury Obligation | | | | | | | 695 | | |
| Affiliated Money Market Fund – 4.3% | | | |
| First American Prime Obligations Fund, Cl Z (e) | | | 7,255,140 | | | | 7,255 | | |
| Total Affiliated Money Market Fund | | | | | | | 7,255 | | |
Total Short-Term Investments
(Cost $7,950) | | | | | | | 7,950 | | |
| Investments Purchased with Proceeds from Securities Lending – 20.8% | | | |
| Commercial Paper – 6.7% | | | |
Bluegrass
1.881%, 5/18/05 | | $ | 148 | | | | 148 | | |
| 1.891%, 8/18/05 | | | 117 | | | | 117 | | |
Concord Minutemen Capital
1.650%, 10/01/04 | | | 242 | | | | 242 | | |
| 1.680%, 10/05/04 | | | 538 | | | | 538 | | |
| 1.720%, 10/06/04 | | | 398 | | | | 398 | | |
| 1.740%, 10/14/04 | | | 266 | | | | 266 | | |
Descartes Funding Trust
1.760%, 11/15/04 | | | 299 | | | | 299 | | |
Ford Credit Floor Plan
1.622%, 10/05/04 | | | 597 | | | | 597 | | |
| 1.526%, 10/06/04 | | | 419 | | | | 419 | | |
| 1.655%, 10/22/04 | | | 131 | | | | 131 | | |
The accompanying notes are an integral part of the financial statements.
FIRST AMERICAN FUNDS Annual Report 2004
38
Small Cap Index Fund (continued)
| DESCRIPTION | | PAR (000) | | VALUE (000) | |
Goldman Sachs
1.975%, 1/18/05 | | $ | 299 | | | $ | 299 | | |
Independence
1.830%, 4/15/05 | | | 370 | | | | 370 | | |
Jupiter Securities Corp
1.793%, 10/21/04 | | | 1,137 | | | | 1,137 | | |
Lakeside Funding
1.790%, 10/08/04 | | | 634 | | | | 634 | | |
Landesbank Baden
1.480%, 11/12/04 | | | 119 | | | | 119 | | |
Leaf's LLC
1.821%, 4/20/05 | | | 329 | | | | 329 | | |
Liquid Funding Ltd
1.743%, 10/13/04 418 418
1.830%, 5/25/05 | | | 299 | | | | 299 | | |
MBNA Credit
1.683%, 10/12/04 291 291
1.764%, 10/26/04 | | | 161 | | | | 161 | | |
Main Street Warehouse
1.742%, 10/04/04 395 395
1.683%, 10/04/04 487 487
1.742%, 1 0/08/04 299 299
1.742%, 10/08/04 | | | 299 | | | | 299 | | |
Mortgage Interest Network
1.752%, 10/12/04 197 197
1.763%, 10/14/04 | | | 209 | | | | 209 | | |
Netexis Banques
1.700%, 12/16/04 | | | 298 | | | | 298 | | |
Orchard Park
1.796%, 4/06/05 299 299
1.766%, 7/06/05 | | | 617 | | | | 617 | | |
| Park Granada LLC | |
| 1.622%, 10/01/04 | | | 526 | | | | 526 | | |
| 1.743%, 10/13/04 | | | 341 | | | | 341 | | |
Sigma Finance
1.512%, 11/29/04 | | | 149 | | | | 149 | | |
| Total Commercial Paper | | | | | | | 11,328 | | |
| Corporate Obligations – 5.6% | | | |
Allstate Life Global
1.780%, 10/14/05 598 598
1.750%, 10/14/05 | | | 150 | | | | 150 | | |
Bayer Landbank NY
1.830%, 6/24/05 | | | 568 | | | | 568 | | |
Blue Heron Funding
1.850%, 5/18/05 | | | 168 | | | | 168 | | |
Castle Hill III
1.910%, 9/15/15 | | | 179 | | | | 179 | | |
Depfa Bank PLC
1.860%, 6/15/05 | | | 299 | | | | 299 | | |
Duke Funding VI
1.320%, 4/08/05 | | | 362 | | | | 362 | | |
General Electric Capital Corporation
1.838%, 10/07/05 | | | 299 | | | | 299 | | |
Jackson National Life
1.760%, 4/15/05 | | | 299 | | | | 299 | | |
Jefferson Pilot Co
1.788%, 8/17/05 | | | 299 | | | | 299 | | |
Liquid Funding Ltd
1.840%, 6/28/05 | | | 269 | | | | 269 | | |
Merrill Lynch
1.696%, 10/01/05 | | | 598 | | | | 598 | | |
Metlife Global Funding
1.800%, 10/14/05 359 359
1.880%, 10/28/05 | | | 251 | | | | 251 | | |
Small Cap Index Fund (continued)
| DESCRIPTION | | PAR (000) | | VALUE (000) | |
Morgan Stanley
1.850%, 12/26/08 | | $ | 299 | | | $ | 299 | | |
Natexis Banq NY
1.920%, 7/12/05 | | | 329 | | | | 329 | | |
Northlake CDO Ltd
1.895%, 3/07/05 | | | 179 | | | | 179 | | |
Premium Asset Trust
1.848%, 12/22/04 224 224
1.760%, 5/13/05 419 419
1.740%, 6/01 /05 891 891
1.770%, 10/14/05 | | | 239 | | | | 239 | | |
REMAC
1.840%, 9/29/05 | | | 329 | | | | 329 | | |
RMAC
1.740%, 6/12/05 | | | 345 | | | | 345 | | |
SMM Trust 2004
1.833%, 9/23/05 | | | 556 | | | | 556 | | |
Societe Generale NYC
1.960%, 12/08/04 | | | 598 | | | | 598 | | |
Svenska Handl
1.170%, 10/21/04 | | | 299 | | | | 299 | | |
| Total Corporate Obligations | | | | | | | 9,405 | | |
| Other Short-Term Investments – 1.4% | |
ARLO III Ltd
2.000%, 9/28/05 | | | 897 | | | | 897 | | |
Commonwealth Life
2.115%, 12/31/04 (f) | | | 302 | | | | 302 | | |
General Electric Capital Assurance
1.980%, 1/19/05 | | | 120 | | | | 120 | | |
HBOS Treasury Services
1.640%, 11/01/05 | | | 329 | | | | 329 | | |
Security Life Denver
1.900%, 12/30/04 | | | 777 | | | | 777 | | |
| Total Other Short-Term Investments | | | | | | | 2,425 | | |
| Repurchase Agreements – 7.1% | |
Bear Stearns
2.045%, dated 9/30/04, matures 10/01/04,
repurchase price $598,016
(collateralized by various securities:
Total market value $610,275) | | | 598 | | | | 598 | | |
Bear Stearns
2.060%, dated 9/30/04, matures 12/23/04,
repurchase price $180,257
(collateralized by various securities:
Total market value $183,046) | | | 179 | | | | 179 | | |
Citibank
1.945%, dated 9/30/04, matures 10/01/04,
repurchase price $1,196,028
(collateralized by corporate securities:
Total market value $1,266,468) | | | 1,196 | | | | 1,196 | | |
Citibank
1.925%, dated 9/30/04, matures 10/01/04,
repurchase price $299,007
(collateralized by various securities:
Total market value $305,648) | | | 299 | | | | 299 | | |
Citibank
1.925%, dated 9/30/04, matures 10/01/04,
repurchase price $299,007
(collateralized by various securities:
Total market value $304,975) | | | 299 | | | | 299 | | |
Greenwich Capital Markets
1.950%, dated 9/30/04, matures 10/01/04,
repurchase price $1,794,043
(collateralized by U.S. government securities:
Total market value $1,829,848) | | | 1,794 | | | | 1,794 | | |
FIRST AMERICAN FUNDS Annual Report 2004
39
Schedule of Investments September 30, 2004
Small Cap Index Fund (continued)
| DESCRIPTION | | PAR (000) | | VALUE (000) | |
Goldman Sachs
2.025%, dated 9/30/04, matures 10/01/04,
repurchase price $418,611
(collateralized by various securities:
Total market value $431,534) | | $ | 419 | | | $ | 419 | | |
Goldman Sachs
2.025%, dated 9/30/04, matures 10/01/04,
repurchase price $179,405
(collateralized by various securities:
Total market value $184,948) | | | 179 | | | | 179 | | |
Goldman Sachs
2.025%, dated 9/30/04, matures 10/01/04,
repurchase price $179,405
(collateralized by various securities:
Total market value $184,947) | | | 179 | | | | 179 | | |
Goldman Sachs
2.025%, dated 9/30/04, matures 10/01/04,
repurchase price $448,512
(collateralized by corporate securities:
Total market value $462,360) | | | 449 | | | | 449 | | |
Goldman Sachs
1.425%, dated 9/30/04, matures 10/18/04,
repurchase price $748,010
(collateralized by corporate securities:
Total market value $762,737) | | | 747 | | | | 747 | | |
Goldman Sachs
1.480%, dated 9/30/04, matures 10/18/04,
repurchase price $448,818
(collateralized by various securities:
Total market value $462,360) | | | 448 | | | | 448 | | |
Goldman Sachs
2.205%, dated 9/30/04, matures 3/07/05,
repurchase price $301,884
(collateralized by corporate securities:
Total market value $305,097) | | | 299 | | | | 299 | | |
Lehman Brothers
2.055%, dated 9/30/04, matures 10/01/04,
repurchase price $1,196,032
(collateralized by collateralized mortgage obligations:
Total market value $1,219,883) | | | 1,196 | | | | 1,196 | | |
Lehman Brothers
1.910%, dated 9/30/04, matures 10/01/04,
repurchase price $1,794,041
(collateralized by U.S. government securities:
Total market value $1,829,853) | | | 1,794 | | | | 1,794 | | |
Lehman Brothers
1.935%, dated 9/30/04, matures 10/01/04,
repurchase price $1,196,028
(collateralized by collateralized mortgage obligations:
Total market value $1,315,061) | | | 1,196 | | | | 1,196 | | |
Merrill Lynch
1.925%, dated 9/30/04, matures 10/01/04,
repurchase price $598,014
(collateralized by corporate securities:
Total market value $627,894) | | | 598 | | | | 598 | | |
Total Repurchase Agreements
(Cost $11,869) | | | | | | | 11,869 | | |
Small Cap Index Fund (concluded)
| DESCRIPTION | | | | VALUE (000) | |
Total Investments Purchased with
Proceeds from Securities Lending
(Cost $35,027) | | | | $ | 35,027 | | |
Total Investments – 124.3%
(Cost $189,145) | | | | | 209,574 | | |
| Other Assets and Liabilities, Net – (24.3)% | | | | | (40,980 | ) | |
| Total Net Assets – 100.0% | | | | $ | 168,594 | | |
* Non-income producing security
(a) This security or a portion of this security is out on loan at September 30, 2004. Total loaned securities had a market value of $33,431,660 at September 30, 2004. See note 2 in Notes to Financial Statements.
(b) Securities considered illiquid investments under guidelines established by the Board of Directors when a trade or bid price is unavailable. As of September 30, 2004, the value of these investments was $2 or 0.0% of total net assets. See note 2 in Notes to Financial Statements.
(c) Securities considered illiquid investments and are fair valued under guidelines established by the Board of Directors. As of September 30, 2004, the fair value of these investments was $0 or 0.0% of total net assets. See note 2 in Notes to Financial Statements.
(d) Security has been deposited as initial margin on open futures contracts. Yield shown is effective yield at date of purchase. See note 2 in Notes to Financial Statements.
(e) Investment in affiliated security. This money market fund is advised by U.S. Bancorp Asset Management, Inc. which also serves as advisor to this Fund. See note 3 in Notes to Financial Statements.
(f) Security has demand features which qualify it as a short term security. The date disclosed is the next put date.
Cl – Class
REIT – Real Estate Investment Trust
Schedule of Open Futures Contracts
| Description | | Number of
Contracts | | Market Value
Covered By
Contracts | | Settlement
Month | | Unrealized
Appreciation | |
Russell 2000 Index
Futures Contracts
purchased | | | 5 | | | $ | 1,435 | | | Dec. 04 | | $ | 11 | | |
The accompanying notes are an integral part of the financial statements.
FIRST AMERICAN FUNDS Annual Report 2004
40
(This page has been left blank intentionally.)
Statements of Assets and Liabilities September 30, 2004, in thousands, except for per share data
| | | Equity
Index Fund | | Mid Cap
Index Fund | | Small Cap
Index Fund | |
| ASSETS: | | | |
| Investments in unaffiliated securities, at value*† | | $ | 2,852,591 | | | $ | 427,868 | | | $ | 190,450 | | |
| Investments in affiliated securities, at value** | | | 52,946 | | | | 7,896 | | | | 7,255 | | |
| Repurchase agreements, at value*** | | | 289,412 | | | | 51,879 | | | | 11,869 | | |
| Cash**** | | | 132 | | | | 21 | | | | 6 | | |
| Receivable for dividends and interest | | | 2,673 | | | | 208 | | | | 165 | | |
| Receivable for investment securities sold | | | - | | | | 2,040 | | | | 993 | | |
| Receivable for capital shares sold | | | 2,173 | | | | 185 | | | | 85 | | |
| Receivable for variation margin | | | - | | | | 49 | | | | 6 | | |
| Prepaid expenses and other assets | | | 48 | | | | 33 | | | | 31 | | |
| Total assets | | | 3,199,975 | | | | 490,179 | | | | 210,860 | | |
| LIABILITIES: | | | |
| Payable for investment securities purchased | | | 2,514 | | | | 2,596 | | | | 6,988 | | |
| Payable upon return of securities loaned | | | 854,142 | | | | 153,111 | | | | 35,032 | | |
| Payable for capital shares redeemed | | | 28,811 | | | | 3,179 | | | | 197 | | |
| Payable for variation margin | | | 16 | | | | - | | | | - | | |
| Payable for advisory, co-administration, and custodian fees | | | 524 | | | | 109 | | | | 43 | | |
| Payable for distribution and shareholder servicing fees | | | 131 | | | | 7 | | | | 5 | | |
| Accrued expenses and other liabilities | | | 18 | | | | 2 | | | | 1 | | |
| Total liabilities | | | 886,156 | | | | 159,004 | | | | 42,266 | | |
| Net assets | | $ | 2,313,819 | | | $ | 331,175 | | | $ | 168,594 | | |
| COMPOSITION OF NET ASSETS: | | | |
| Portfolio capital | | $ | 1,842,540 | | | $ | 294,248 | | | $ | 140,983 | | |
| Undistributed net investment income | | | 51 | | | | 40 | | | | 157 | | |
| Accumulated net realized gain (loss) on investments | | | (26,552 | ) | | | 10,706 | | | | 7,014 | | |
| Unrealized appreciation of investments | | | 497,914 | | | | 26,160 | | | | 20,429 | | |
| Unrealized appreciation (depreciation) of futures contracts | | | (134 | ) | | | 21 | | | | 11 | | |
| Net assets | | $ | 2,313,819 | | | $ | 331,175 | | | $ | 168,594 | | |
| * Investments in unaffiliated securities, at cost | | $ | 2,357,564 | | | $ | 401,708 | | | $ | 170,021 | | |
| ** Investments in affiliated securities, at cost | | $ | 50,059 | | | $ | 7,896 | | | $ | 7,255 | | |
| *** Repurchase agreements, at cost | | $ | 289,412 | | | $ | 51,879 | | | $ | 11,869 | | |
| **** Includes cash related to securities loaned | | $ | 117 | | | $ | 21 | | | $ | 5 | | |
| † Including securities loaned, at value | | $ | 824,435 | | | $ | 148,685 | | | $ | 33,432 | | |
| Class A: | | | |
| Net assets | | $ | 234,349 | | | $ | 11,987 | | | $ | 8,749 | | |
| Shares issued and outstanding ($0.0001 par value - 2 billion authorized) | | | 11,205 | | | | 1,013 | | | | 654 | | |
| Net asset value, and redemption price per share | | $ | 20.91 | | | $ | 11.84 | | | $ | 13.38 | | |
| Maximum offering price per share (1) | | $ | 22.13 | | | $ | 12.53 | | | $ | 14.16 | | |
| Class B: | | | |
| Net assets | | $ | 69,828 | | | $ | 3,133 | | | $ | 1,494 | | |
| Shares issued and outstanding ($0.0001 par value - 2 billion authorized) | | | 3,379 | | | | 269 | | | | 114 | | |
| Net asset value, offering price, and redemption price per share (2) | | $ | 20.66 | | | $ | 11.67 | | | $ | 13.15 | | |
| Class C: | | | |
| Net assets | | $ | 30,111 | | | $ | 2,653 | | | $ | 1,939 | | |
| Shares issued and outstanding ($0.0001 par value - 2 billion authorized) | | | 1,449 | | | | 227 | | | | 146 | | |
| Net asset value, offering price, and redemption price per share (2) | | $ | 20.78 | | | $ | 11.70 | | | $ | 13.26 | | |
| Class R: | | | |
| Net assets | | $ | 333 | | | $ | 1 | | | $ | 1 | | |
| Shares issued and outstanding ($0.0001 par value - 2 billion authorized) | | | 16 | | | | - | | | | - | | |
| Net asset value, offering price, and redemption price per share | | $ | 20.91 | | | $ | 11.83 | | | $ | 13.31 | | |
| Class Y: | | | |
| Net assets | | $ | 1,979,198 | | | $ | 313,401 | | | $ | 156,411 | | |
| Shares issued and outstanding ($0.0001 par value - 2 billion authorized) | | | 94,663 | | | | 26,462 | | | | 11,647 | | |
| Net asset value, offering price, and redemption price per share | | $ | 20.91 | | | $ | 11.84 | | | $ | 13.43 | | |
(1) The offering price is calculated by dividing the net asset value by 1 minus the maximum sales charge of 5.50%.
(2) Class B and C have a contingent deferred sales charge. For a description of this sales charge, see notes 1 and 3 in Notes to Financial Statements.
The accompanying notes are an integral part of the financial statements.
FIRST AMERICAN FUNDS Annual Report 2004
42
Statements of Operations For the fiscal year ended September 30, 2004, in thousands
| | | Equity
Index Fund | | Mid Cap
Index Fund | | Small Cap
Index Fund | |
| INVESTMENT INCOME: | | | |
| Interest from unaffiliated securities | | $ | 109 | | | $ | 15 | | | $ | 8 | | |
| Dividends from affiliated securities | | | 1,194 | | | | 168 | | | | 86 | | |
| Dividends from unaffiliated securities | | | 38,737 | | | | 3,665 | | | | 1,739 | | |
| Securities lending | | | 425 | | | | 74 | | | | 48 | | |
| Other income | | | 318 | | | | 18 | | | | 17 | | |
| Total investment income | | | 40,783 | | | | 3,940 | | | | 1,898 | | |
| EXPENSES: | | | |
| Investment advisory fees | | | 5,836 | | | | 800 | | | | 625 | | |
| Co-administration fees and expenses (including transfer agency fees) | | | 6,212 | | | | 875 | | | | 506 | | |
| Custodian fees | | | 234 | | | | 32 | | | | 16 | | |
| Directors' fees | | | 54 | | | | 7 | | | | 3 | | |
| Registration fees | | | 55 | | | | 19 | | | | 18 | | |
| Professional fees | | | 107 | | | | 13 | | | | 8 | | |
| Printing | | | 75 | | | | 10 | | | | 5 | | |
| Other | | | 123 | | | | 3 | | | | 15 | | |
| Distribution and shareholder servicing fees – Class A | | | 505 | | | | 23 | | | | 15 | | |
| Distribution and shareholder servicing fees – Class B | | | 749 | | | | 30 | | | | 13 | | |
| Distribution and shareholder servicing fees – Class C | | | 320 | | | | 25 | | | | 18 | | |
| Distribution and shareholder servicing fees – Class R | | | 86 | | | | 7 | | | | 6 | | |
| Total expenses | | | 14,356 | | | | 1,844 | | | | 1,248 | | |
| Less: Fee waivers | | | (4,058 | ) | | | (150 | ) | | | (135 | ) | |
| Total net expenses | | | 10,298 | | | | 1,694 | | | | 1,113 | | |
| Investment income – net | | | 30,485 | | | | 2,246 | | | | 785 | | |
REALIZED AND UNREALIZED GAINS ON INVESTMENTS AND
FUTURES CONTRACTS – NET: | | | |
| Net realized gain on unaffiliated investments | | | 4,194 | | | | 9,956 | | | | 6,383 | | |
| Net realized gain on futures contracts | | | 7,968 | | | | 1,639 | | | | 1,070 | | |
| Net change in unrealized appreciation or depreciation of unaffiliated investments | | | 233,457 | | | | 30,236 | | | | 15,627 | | |
| Net change in unrealized appreciation or depreciation of affiliated investments | | | 2,166 | | | | - | | | | - | | |
| Net change in unrealized appreciation or depreciation of futures contracts | | | 1,118 | | | | 152 | | | | 228 | | |
| Net gain on investments and futures contracts | | | 248,903 | | | | 41,983 | | | | 23,308 | | |
| Net increase in net assets resulting from operations | | $ | 279,388 | | | $ | 44,229 | | | $ | 24,093 | | |
FIRST AMERICAN FUNDS Annual Report 2004
43
Statements of Changes in Net Assets in thousands
| | | Equity
Index Fund | | Mid Cap
Index Fund | | Small Cap
Index Fund | |
| | | 10/1/03
to
9/30/04 | | 10/1/02
to
9/30/03 | | 10/1/03
to
9/30/04 | | 10/1/02
to
9/30/03 | | 10/1/03
to
9/30/04 | | 10/1/02
to
9/30/03 | |
| OPERATIONS: | |
| Investment income – net | | $ | 30,485 | | | $ | 24,772 | | | $ | 2,246 | | | $ | 1,510 | | | $ | 785 | | | $ | 679 | | |
| Net realized gain (loss) on unaffiliated investments | | | 4,194 | | | | (3,233 | ) | | | 9,956 | | | | 3,462 | | | | 6,383 | | | | (183 | ) | |
| Net realized loss on in-kind distributions | | | - | | | | (663 | ) | | | - | | | | - | | | | - | | | | - | | |
| Net realized gain on futures contracts | | | 7,968 | | | | 9,771 | | | | 1,639 | | | | 1,471 | | | | 1,070 | | | | 702 | | |
| Net change in unrealized appreciation or depreciation of unaffiliated investments | | | 233,457 | | | | 327,421 | | | | 30,236 | | | | 41,654 | | | | 15,627 | | | | 30,354 | | |
| Net change in unrealized appreciation or depreciation of affiliated investments | | | 2,166 | | | | - | | | | - | | | | - | | | | - | | | | - | | |
| Net change in unrealized appreciation or depreciation of futures contracts | | | 1,118 | | | | 1,044 | | | | 152 | | | | 313 | | | | 228 | | | | 107 | | |
| Net increase in net assets resulting from operations | | | 279,388 | | | | 359,112 | | | | 44,229 | | | | 48,410 | | | | 24,093 | | | | 31,659 | | |
| DISTRIBUTIONS TO SHAREHOLDERS FROM: | |
| Investment income – net: | |
| Class A | | | (2,311 | ) | | | (1,752 | ) | | | (42 | ) | | | (20 | ) | | | (15 | ) | | | (11 | ) | |
| Class B | | | (335 | ) | | | (330 | ) | | | (1 | ) | | | (1 | ) | | | - | | | | - | | |
| Class C | | | (141 | ) | | | (145 | ) | | | (1 | ) | | | (1 | ) | | | - | | | | (1 | ) | |
| Class R | | | (391 | ) | | | (570 | ) | | | (13 | ) | | | (18 | ) | | | (7 | ) | | | (33 | ) | |
| Class Y | | | (27,416 | ) | | | (21,115 | ) | | | (2,153 | ) | | | (1,472 | ) | | | (717 | ) | | | (639 | ) | |
| Net realized gain on investments: | |
| Class A | | | - | | | | - | | | | (99 | ) | | | (97 | ) | | | (25 | ) | | | - | | |
| Class B | | | - | | | | - | | | | (46 | ) | | | (41 | ) | | | (7 | ) | | | - | | |
| Class C | | | - | | | | - | | | | (33 | ) | | | (26 | ) | | | (10 | ) | | | - | | |
| Class R | | | - | | | | - | | | | (76 | ) | | | (95 | ) | | | (23 | ) | | | - | | |
| Class Y | | | - | | | | - | | | | (4,643 | ) | | | (5,505 | ) | | | (855 | ) | | | - | | |
| Tax return of capital | |
| Class A | | | (18 | ) | | | - | | | | - | | | | - | | | | - | | | | - | | |
| Class B | | | (3 | ) | | | - | | | | - | | | | - | | | | - | | | | - | | |
| Class C | | | (1 | ) | | | - | | | | - | | | | - | | | | - | | | | - | | |
| Class R | | | (3 | ) | | | - | | | | - | | | | - | | | | - | | | | - | | |
| Class Y | | | (210 | ) | | | - | | | | - | | | | - | | | | - | | | | - | | |
| Total distributions | | | (30,829 | ) | | | (23,912 | ) | | | (7,107 | ) | | | (7,276 | ) | | | (1,659 | ) | | | (684 | ) | |
| CAPITAL SHARE TRANSACTIONS (1): | |
| Class A: | |
| Proceeds from sales | | | 101,208 | | | | 25,928 | | | | 9,000 | | | | 1,994 | | | | 6,263 | | | | 1,423 | | |
| Reinvestment of distributions | | | 2,238 | | | | 1,673 | | | | 139 | | | | 116 | | | | 39 | | | | 11 | | |
| Payments for redemptions | | | (45,584 | ) | | | (37,906 | ) | | | (3,198 | ) | | | (1,218 | ) | | | (1,649 | ) | | | (639 | ) | |
| Increase (decrease) in net assets from Class A transactions | | | 57,862 | | | | (10,305 | ) | | | 5,941 | | | | 892 | | | | 4,653 | | | | 795 | | |
| Class B: | |
| Proceeds from sales | | | 4,621 | | | | 5,525 | | | | 628 | | | | 731 | | | | 446 | | | | 513 | | |
| Reinvestment of distributions | | | 329 | | | | 321 | | | | 46 | | | | 41 | | | | 7 | | | | - | | |
| Payments for redemptions | | | (15,132 | ) | | | (14,832 | ) | | | (304 | ) | | | (201 | ) | | | (118 | ) | | | (131 | ) | |
| Increase (decrease) in net assets from Class B transactions | | | (10,182 | ) | | | (8,986 | ) | | | 370 | | | | 571 | | | | 335 | | | | 382 | | |
| Class C: | |
| Proceeds from sales | | | 4,397 | | | | 13,645 | | | | 1,356 | | | | 843 | | | | 917 | | | | 744 | | |
| Reinvestment of distributions | | | 138 | | | | 142 | | | | 33 | | | | 25 | | | | 10 | | | | 1 | | |
| Payments for redemptions | | | (9,413 | ) | | | (9,354 | ) | | | (753 | ) | | | (162 | ) | | | (476 | ) | | | (151 | ) | |
| Increase (decrease) in net assets from Class C transactions | | | (4,878 | ) | | | 4,433 | | | | 636 | | | | 706 | | | | 451 | | | | 594 | | |
| Class R: | |
| Proceeds from sales | | | 11,681 | | | | 27,976 | | | | 1,049 | | | | 1,734 | | | | 1,722 | | | | 1,887 | | |
| Reinvestment of distributions | | | 389 | | | | 549 | | | | 79 | | | | 97 | | | | 29 | | | | 33 | | |
| Payments for redemptions | | | (71,464 | ) | | | (27,845 | ) | | | (5,895 | ) | | | (1,930 | ) | | | (5,464 | ) | | | (13,558 | ) | |
| Increase (decrease) in net assets from Class R transactions | | | (59,394 | ) | | | 680 | | | | (4,767 | ) | | | (99 | ) | | | (3,713 | ) | | | (11,638 | ) | |
| Class Y: | |
| Proceeds from sales | | | 533,400 | | | | 890,946 | | | | 108,384 | | | | 114,594 | | | | 91,307 | | | | 51,061 | | |
| Reinvestment of distributions | | | 19,144 | | | | 15,659 | | | | 3,958 | | | | 5,064 | | | | 1,001 | | | | 372 | | |
| Payments for redemptions | | | (556,690 | ) | | | (547,725 | ) | | | (73,284 | ) | | | (117,836 | ) | | | (75,927 | ) | | | (55,592 | ) | |
| Increase (decrease) in net assets from Class Y transactions | | | (4,146 | ) | | | 358,880 | | | | 39,058 | | | | 1,822 | | | | 16,381 | | | | (4,159 | ) | |
| Increase (decrease) in net assets from capital share transactions | | | (20,738 | ) | | | 344,702 | | | | 41,238 | | | | 3,892 | | | | 18,107 | | | | (14,026 | ) | |
| Total increase in net assets | | | 227,821 | | | | 679,902 | | | | 78,360 | | | | 45,026 | | | | 40,541 | | | | 16,949 | | |
| Net assets at beginning of period | | | 2,085,998 | | | | 1,406,096 | | | | 252,815 | | | | 207,789 | | | | 128,053 | | | | 111,104 | | |
| Net assets at end of period | | $ | 2,313,819 | | | $ | 2,085,998 | | | $ | 331,175 | | | $ | 252,815 | | | $ | 168,594 | | | $ | 128,053 | | |
| Undistributed net investment income at end of period | | $ | 51 | | | $ | 601 | | | $ | 40 | | | $ | 21 | | | $ | 157 | | | $ | 67 | | |
(1) See note 5 in Notes to Financial Statements for additional information.
The accompanying notes are an integral part of the financial statements.
FIRST AMERICAN FUNDS Annual Report 2004
44
FIRST AMERICAN FUNDS Annual Report 2004
45
Financial Highlights For a share outstanding throughout the periods ended September 30, unless otherwise indicated.
| | | Net Asset
Value
Beginning
of Period | | Net
Investment
Income | | Realized and
Unrealized
Gains or
(Losses) on
Investments | | Dividends
from Net
Investment
Income | | Distributions
from Net
Realized Gains | | Distributions
from Return
of Capital | | Net Asset
Value
End of
Period | |
| Equity Index Fund | |
| Class A | |
| | 2004 | (1) | | $ | 18.70 | | | $ | 0.23 | | | $ | 2.22 | | | $ | (0.24 | ) | | $ | - | | | $ | - | (5) | | $ | 20.91 | | |
| | 2003 | (1) | | | 15.31 | | | | 0.21 | | | | 3.38 | | | | (0.20 | ) | | | - | | | | - | | | | 18.70 | | |
| | 2002 | (1) | | | 19.50 | | | | 0.18 | | | | (4.19 | ) | | | (0.18 | ) | | | - | | | | - | | | | 15.31 | | |
| | 2001 | (1) | | | 27.75 | | | | 0.18 | | | | (7.43 | ) | | | (0.17 | ) | | | (0.83 | ) | | | - | | | | 19.50 | | |
| | 2000 | | | | 25.52 | | | | 0.17 | | | | 2.91 | | | | (0.17 | ) | | | (0.68 | ) | | | - | | | | 27.75 | | |
| Class B | |
| | 2004 | (1) | | $ | 18.48 | | | $ | 0.08 | | | $ | 2.19 | | | $ | (0.09 | ) | | $ | - | | | $ | - | (5) | | $ | 20.66 | | |
| | 2003 | (1) | | | 15.13 | | | | 0.08 | | | | 3.35 | | | | (0.08 | ) | | | - | | | | - | | | | 18.48 | | |
| | 2002 | (1) | | | 19.29 | | | | 0.03 | | | | (4.15 | ) | | | (0.04 | ) | | | - | | | | - | | | | 15.13 | | |
| | 2001 | (1) | | | 27.49 | | | | - | | | | (7.35 | ) | | | (0.02 | ) | | | (0.83 | ) | | | - | | | | 19.29 | | |
| | 2000 | | | | 25.34 | | | | - | | | | 2.84 | | | | (0.01 | ) | | | (0.68 | ) | | | - | | | | 27.49 | | |
| Class C | |
| | 2004 | (1) | | $ | 18.59 | | | $ | 0.08 | | | $ | 2.20 | | | $ | (0.09 | ) | | $ | - | | | $ | - | (5) | | $ | 20.78 | | |
| | 2003 | (1) | | | 15.23 | | | | 0.08 | | | | 3.36 | | | | (0.08 | ) | | | - | | | | - | | | | 18.59 | | |
| | 2002 | (1) | | | 19.41 | | | | 0.03 | | | | (4.17 | ) | | | (0.04 | ) | | | - | | | | - | | | | 15.23 | | |
| | 2001 | (1) | | | 27.66 | | | | - | | | | (7.40 | ) | | | (0.02 | ) | | | (0.83 | ) | | | - | | | | 19.41 | | |
| | 2000 | | | | 25.48 | | | | - | | | | 2.88 | | | | (0.02 | ) | | | (0.68 | ) | | | - | | | | 27.66 | | |
| Class R (1) | |
| | 2004 | (2) | | $ | 18.70 | | | $ | 0.23 | | | $ | 2.20 | | | $ | (0.22 | ) | | $ | - | | | $ | - | (5) | | $ | 20.91 | | |
| | 2003 | | | | 15.30 | | | | 0.21 | | | | 3.39 | | | | (0.20 | ) | | | - | | | | - | | | | 18.70 | | |
| | 2002 | | | | 19.50 | | | | 0.18 | | | | (4.20 | ) | | | (0.18 | ) | | | - | | | | - | | | | 15.30 | | |
| | 2001 | (3) | | | 18.80 | | | | - | | | | 0.70 | | | | - | | | | - | | | | - | | | | 19.50 | | |
| Class Y | |
| | 2004 | (1) | | $ | 18.69 | | | $ | 0.29 | | | $ | 2.22 | | | $ | (0.29 | ) | | $ | - | | | $ | - | (5) | | $ | 20.91 | | |
| | 2003 | (1) | | | 15.30 | | | | 0.25 | | | | 3.38 | | | | (0.24 | ) | | | - | | | | - | | | | 18.69 | | |
| | 2002 | (1) | | | 19.49 | | | | 0.23 | | | | (4.19 | ) | | | (0.23 | ) | | | - | | | | - | | | | 15.30 | | |
| | 2001 | (1) | | | 27.74 | | | | 0.23 | | | | (7.42 | ) | | | (0.23 | ) | | | (0.83 | ) | | | - | | | | 19.49 | | |
| | 2000 | | | | 25.51 | | | | 0.23 | | | | 2.91 | | | | (0.23 | ) | | | (0.68 | ) | | | - | | | | 27.74 | | |
(1) Per share data calculated using average shares outstanding method.
(2) Prior to July 1, 2004, Class R shares were named Class S shares, which had lower fees and expenses.
(3) Class of shares has been offered since September 24, 2001. All ratios for the period have been annualized, except total return and portfolio turnover.
(4) Total return does not reflect sales charges. Total return would have been lower had certain expenses not been waived.
(5) Includes a tax return of capital of less than $0.01.
The accompanying notes are an integral part of the financial statements.
FIRST AMERICAN FUNDS Annual Report 2004
46
| | | Total
Return (4) | | Net Assets
End of
Period (000) | | Ratio of
Expenses to
Average
Net Assets | | Ratio of Net
Investment
Income (Loss)
to Average
Net Assets | | Ratio of
Expenses to
Average
Net Assets
(Excluding
Waivers) | | Ratio of Net
Investment
Income (Loss)
to Average Net
Assets (Excluding
Waivers) | | Portfolio
Turnover
Rate | |
| Equity Index Fund | |
| Class A | |
| | 2004 | (1) | | | 13.12 | % | | $ | 234,349 | | | | 0.62 | % | | | 1.13 | % | | | 0.79 | % | | | 0.96 | % | | | 1 | % | |
| | 2003 | (1) | | | 23.58 | | | | 158,324 | | | | 0.62 | | | | 1.22 | | | | 0.80 | | | | 1.04 | | | | 1 | | |
| | 2002 | (1) | | | (20.75 | ) | | | 139,007 | | | | 0.62 | | | | 0.91 | | | | 0.80 | | | | 0.73 | | | | 8 | | |
| | 2001 | (1) | | | (26.95 | ) | | | 188,410 | | | | 0.60 | | | | 0.74 | | | | 1.14 | | | | 0.20 | | | | 6 | | |
| | 2000 | | | | 12.11 | | | | 134,180 | | | | 0.60 | | | | 0.62 | | | | 1.14 | | | | 0.08 | | | | 16 | | |
| Class B | |
| | 2004 | (1) | | | 12.31 | % | | $ | 69,828 | | | | 1.37 | % | | | 0.38 | % | | | 1.54 | % | | | 0.21 | % | | | 1 | % | |
| | 2003 | (1) | | | 22.72 | | | | 71,624 | | | | 1.37 | | | | 0.47 | | | | 1.55 | | | | 0.29 | | | | 1 | | |
| | 2002 | (1) | | | (21.40 | ) | | | 66,835 | | | | 1.37 | | | | 0.16 | | | | 1.55 | | | | (0.02 | ) | | | 8 | | |
| | 2001 | (1) | | | (27.49 | ) | | | 95,586 | | | | 1.35 | | | | (0.01 | ) | | | 1.89 | | | | (0.55 | ) | | | 6 | | |
| | 2000 | | | | 11.25 | | | | 121,092 | | | | 1.35 | | | | (0.13 | ) | | | 1.89 | | | | (0.67 | ) | | | 16 | | |
| Class C | |
| | 2004 | (1) | | | 12.28 | % | | $ | 30,111 | | | | 1.37 | % | | | 0.38 | % | | | 1.54 | % | | | 0.21 | % | | | 1 | % | |
| | 2003 | (1) | | | 22.65 | | | | 31,330 | | | | 1.37 | | | | 0.47 | | | | 1.55 | | | | 0.29 | | | | 1 | | |
| | 2002 | (1) | | | (21.38 | ) | | | 21,637 | | | | 1.37 | | | | 0.16 | | | | 1.55 | | | | (0.02 | ) | | | 8 | | |
| | 2001 | (1) | | | (27.51 | ) | | | 29,560 | | | | 1.35 | | | | (0.01 | ) | | | 1.89 | | | | (0.55 | ) | | | 6 | | |
| | 2000 | | | | 11.32 | | | | 34,811 | | | | 1.35 | | | | (0.13 | ) | | | 1.89 | | | | (0.67 | ) | | | 16 | | |
| Class R (1) | |
| | 2004 | (2) | | | 13.00 | % | | $ | 333 | | | | 0.62 | % | | | 1.13 | % | | | 0.79 | % | | | 0.96 | % | | | 1 | % | |
| | 2003 | | | | 23.66 | | | | 52,925 | | | | 0.62 | | | | 1.22 | | | | 0.80 | | | | 1.04 | | | | 1 | | |
| | 2002 | | | | (20.79 | ) | | | 42,964 | | | | 0.62 | | | | 0.93 | | | | 0.80 | | | | 0.75 | | | | 8 | | |
| | 2001 | (3) | | | 3.72 | | | | 38,220 | | | | 0.72 | | | | 0.89 | | | | 1.20 | | | | 0.41 | | | | 6 | | |
| Class Y | |
| | 2004 | (1) | | | 13.45 | % | | $ | 1,979,198 | | | | 0.37 | % | | | 1.38 | % | | | 0.54 | % | | | 1.21 | % | | | 1 | % | |
| | 2003 | (1) | | | 23.89 | | | | 1,771,795 | | | | 0.37 | | | | 1.46 | | | | 0.55 | | | | 1.28 | | | | 1 | | |
| | 2002 | (1) | | | (20.56 | ) | | | 1,135,653 | | | | 0.37 | | | | 1.16 | | | | 0.55 | | | | 0.98 | | | | 8 | | |
| | 2001 | (1) | | | (26.78 | ) | | | 1,567,607 | | | | 0.35 | | | | 0.99 | | | | 0.89 | | | | 0.45 | | | | 6 | | |
| | 2000 | | | | 12.38 | | | | 1,400,086 | | | | 0.35 | | | | 0.87 | | | | 0.89 | | | | 0.33 | | | | 16 | | |
FIRST AMERICAN FUNDS Annual Report 2004
47
Financial Highlights For a share outstanding throughout the periods ended September 30, unless otherwise indicated.
| | | Net Asset
Value
Beginning
of Period | | Net
Investment
Income (Loss) | | Realized and
Unrealized
Gains or
(Losses) on
Investments | | Dividends
from Net
Investment
Income | | Distributions
from Net
Realized Gains | | Net Asset
Value
End of
Period | | Total
Return (9) | |
| Mid Cap Index Fund (1) | |
| Class A | |
| | 2004 | (2) | | $ | 10.36 | | | $ | 0.05 | | | $ | 1.67 | | | $ | (0.05 | ) | | $ | (0.19 | ) | | $ | 11.84 | | | | 16.80 | % | |
| | 2003 | (2) | | | 8.51 | | | | 0.04 | | | | 2.08 | | | | (0.04 | ) | | | (0.23 | ) | | | 10.36 | | | | 25.45 | | |
| | 2002 | (2) | | | 9.38 | | | | 0.04 | | | | (0.49 | ) | | | (0.04 | ) | | | (0.38 | ) | | | 8.51 | | | | (5.45 | ) | |
| | 2001 | (2)(3) | | | 12.56 | | | | 0.05 | | | | (2.11 | ) | | | (0.05 | ) | | | (1.07 | ) | | | 9.38 | | | | (17.60 | ) | |
| | 2000 | (4)(5) | | | 10.00 | | | | 0.04 | | | | 2.56 | | | | (0.04 | ) | | | - | | | | 12.56 | | | | 26.48 | | |
| Class B | |
| | 2004 | (2) | | $ | 10.25 | | | $ | (0.03 | ) | | $ | 1.64 | | | $ | - | | | $ | (0.19 | ) | | $ | 11.67 | | | | 15.88 | % | |
| | 2003 | (2) | | | 8.44 | | | | (0.03 | ) | | | 2.07 | | | | - | | | | (0.23 | ) | | | 10.25 | | | | 24.63 | | |
| | 2002 | (2) | | | 9.33 | | | | (0.03 | ) | | | (0.48 | ) | | | - | | | | (0.38 | ) | | | 8.44 | | | | (6.07 | ) | |
| | 2001 | (2)(3) | | | 12.52 | | | | - | | | | (2.12 | ) | | | - | | | | (1.07 | ) | | | 9.33 | | | | (18.15 | ) | |
| | 2000 | (4)(5) | | | 10.00 | | | | (0.01 | ) | | | 2.56 | | | | (0.03 | ) | | | - | | | | 12.52 | | | | 25.65 | | |
| Class C (2) | |
| | 2004 | | | $ | 10.28 | | | $ | (0.03 | ) | | $ | 1.64 | | | $ | - | | | $ | (0.19 | ) | | $ | 11.70 | | | | 15.83 | % | |
| | 2003 | | | | 8.47 | | | | (0.03 | ) | | | 2.07 | | | | - | | | | (0.23 | ) | | | 10.28 | | | | 24.55 | | |
| | 2002 | | | | 9.38 | | | | (0.02 | ) | | | (0.51 | ) | | | - | | | | (0.38 | ) | | | 8.47 | | | | (6.22 | ) | |
| | 2001 | (6) | | | 9.07 | | | | - | | | | 0.31 | | | | - | | | | - | | | | 9.38 | | | | 3.42 | | |
| Class R (2) | |
| | 2004 | (7) | | $ | 10.36 | | | $ | 0.06 | | | $ | 1.65 | | | $ | (0.05 | ) | | $ | (0.19 | ) | | $ | 11.83 | | | | 16.62 | % | |
| | 2003 | | | | 8.50 | | | | 0.04 | | | | 2.09 | | | | (0.04 | ) | | | (0.23 | ) | | | 10.36 | | | | 25.60 | | |
| | 2002 | | | | 9.38 | | | | 0.04 | | | | (0.50 | ) | | | (0.04 | ) | | | (0.38 | ) | | | 8.50 | | | | (5.56 | ) | |
| | 2001 | (8) | | | 11.07 | | | | 0.04 | | | | (1.67 | ) | | | (0.06 | ) | | | - | | | | 9.38 | | | | (14.77 | ) | |
| Class Y | |
| | 2004 | (2) | | $ | 10.37 | | | $ | 0.08 | | | $ | 1.66 | | | $ | (0.08 | ) | | $ | (0.19 | ) | | $ | 11.84 | | | | 16.97 | % | |
| | 2003 | (2) | | | 8.51 | | | | 0.06 | | | | 2.09 | | | | (0.06 | ) | | | (0.23 | ) | | | 10.37 | | | | 25.86 | | |
| | 2002 | (2) | | | 9.38 | | | | 0.06 | | | | (0.49 | ) | | | (0.06 | ) | | | (0.38 | ) | | | 8.51 | | | | (5.23 | ) | |
| | 2001 | (2)(3) | | | 12.55 | | | | 0.08 | | | | (2.11 | ) | | | (0.07 | ) | | | (1.07 | ) | | | 9.38 | | | | (17.34 | ) | |
| | 2000 | (4)(5) | | | 10.00 | | | | 0.08 | | | | 2.55 | | | | (0.08 | ) | | | - | | | | 12.55 | | | | 26.62 | | |
(1) The financial highlights for the Mid Cap Index Fund as set forth herein include the historical financial highlights of the Firstar Mid Cap Index Fund.
The assets of the Firstar Fund were acquired by the First American Mid Cap Index Fund on September 24, 2001. In connection with such acquisition,
(i) Class A shares of the Firstar Mid Cap Index Fund were exchanged for Class A shares of the First American Mid Cap Index Fund, (ii) Firstar Class B shares
were exchanged for Class B shares of the First American Fund, (iii) Firstar Class Y shares were exchanged for Class S shares (now designated Class R shares)
of the First American Fund, and (iv) Firstar Institutional Class& nbsp;shares were exchanged for Class Y shares of the First American Fund.
(2) Per share data calculated using average shares outstanding method.
(3) For the period November 1, 2000, to September 30, 2001. Effective in 2001, the Fund's fiscal year end was changed from October 31 to September 30.
All ratios for the period have been annualized, except total return and portfolio turnover.
(4) Commenced operations on November 4, 1999. All ratios for the period have been annualized, except total return and portfolio turnover.
(5) For the fiscal period ended October 31.
(6) Class of shares has been offered since September 24, 2001. All ratios for the period have been annualized, except total return and portfolio turnover.
(7) Prior to July 1, 2004, Class R shares were named Class S shares, which had lower fees and expenses.
(8) Class of shares has been offered since November 27, 2000. All ratios for the period have been annualized, except total return and portfolio turnover.
(9) Total return does not reflect sales charges. Total return would have been lower had certain expenses not been waived.
The accompanying notes are an integral part of the financial statements.
FIRST AMERICAN FUNDS Annual Report 2004
48
| | | Net Assets
End of
Period (000) | | Ratio of
Expenses to
Average
Net Assets | | Ratio of Net
Investment
Income (Loss)
to Average
Net Assets | | Ratio of
Expenses to
Average
Net Assets
(Excluding
Waivers) | | Ratio of Net
Investment
Income (Loss)
to Average Net
Assets (Excluding
Waivers) | | Portfolio
Turnover
Rate | |
| Mid Cap Index Fund (1) | |
| Class A | |
| | 2004 | (2) | | $ | 11,987 | | | | 0.75 | % | | | 0.47 | % | | | 0.80 | % | | | 0.42 | % | | | 14 | % | |
| | 2003 | (2) | | | 5,332 | | | | 0.75 | | | | 0.45 | | | | 0.84 | | | | 0.36 | | | | 23 | | |
| | 2002 | (2) | | | 3,581 | | | | 0.75 | | | | 0.37 | | | | 0.83 | | | | 0.29 | | | | 19 | | |
| | 2001 | (2)(3) | | | 2,972 | | | | 0.75 | | | | 0.51 | | | | 0.80 | | | | 0.46 | | | | 43 | | |
| | 2000 | (4)(5) | | | 1,918 | | | | 0.75 | | | | 0.75 | | | | 0.90 | | | | 0.60 | | | | 45 | | |
| Class B | |
| | 2004 | (2) | | $ | 3,133 | | | | 1.50 | % | | | (0.27 | )% | | | 1.55 | % | | | (0.32 | )% | | | 14 | % | |
| | 2003 | (2) | | | 2,419 | | | | 1.50 | | | | (0.30 | ) | | | 1.59 | | | | (0.39 | ) | | | 23 | | |
| | 2002 | (2) | | | 1,475 | | | | 1.50 | | | | (0.37 | ) | | | 1.58 | | | | (0.45 | ) | | | 19 | | |
| | 2001 | (2)(3) | | | 1,265 | | | | 1.50 | | | | (0.24 | ) | | | 1.54 | | | | (0.28 | ) | | | 43 | | |
| | 2000 | (4)(5) | | | 905 | | | | 1.50 | | | | - | | | | 1.65 | | | | (0.15 | ) | | | 45 | | |
| Class C (2) | |
| | 2004 | | | $ | 2,653 | | | | 1.50 | % | | | (0.27 | )% | | | 1.55 | % | | | (0.32 | )% | | | 14 | % | |
| | 2003 | | | | 1,756 | | | | 1.50 | | | | (0.30 | ) | | | 1.59 | | | | (0.39 | ) | | | 23 | | |
| | 2002 | | | | 795 | | | | 1.50 | | | | (0.37 | ) | | | 1.58 | | | | (0.45 | ) | | | 19 | | |
| | 2001 | (6) | | | - | | | | - | | | | - | | | | - | | | | - | | | | 43 | | |
| Class R (2) | |
| | 2004 | (7) | | $ | 1 | | | | 0.75 | % | | | 0.49 | % | | | 0.80 | % | | | 0.44 | % | | | 14 | % | |
| | 2003 | | | | 4,134 | | | | 0.75 | | | | 0.46 | | | | 0.84 | | | | 0.37 | | | | 23 | | |
| | 2002 | | | | 3,393 | | | | 0.75 | | | | 0.37 | | | | 0.83 | | | | 0.29 | | | | 19 | | |
| | 2001 | (8) | | | 4,301 | | | | 0.75 | | | | 0.47 | | | | 0.80 | | | | 0.42 | | | | 43 | | |
| Class Y | |
| | 2004 | (2) | | $ | 313,401 | | | | 0.50 | % | | | 0.73 | % | | | 0.55 | % | | | 0.68 | % | | | 14 | % | |
| | 2003 | (2) | | | 239,174 | | | | 0.50 | | | | 0.71 | | | | 0.59 | | | | 0.62 | | | | 23 | | |
| | 2002 | (2) | | | 198,545 | | | | 0.50 | | | | 0.63 | | | | 0.58 | | | | 0.55 | | | | 19 | | |
| | 2001 | (2)(3) | | | 176,857 | | | | 0.50 | | | | 0.75 | | | | 0.53 | | | | 0.72 | | | | 43 | | |
| | 2000 | (4)(5) | | | 125,881 | | | | 0.50 | | | | 1.00 | | | | 0.65 | | | | 0.85 | | | | 45 | | |
FIRST AMERICAN FUNDS Annual Report 2004
49
Financial Highlights For a share outstanding throughout the periods ended September 30, unless otherwise indicated.
| | | Net Asset
Value
Beginning
of Period | | Net
Investment
Income (Loss) | | Realized and
Unrealized
Gains or
(Losses) on
Investments | | Dividends
from Net
Investment
Income | | Distributions
from Net
Realized Gains | | Net Asset
Value
End of
Period | | Total
Return (10) | |
| | Small Cap Index Fund (1) | | | | |
| Class A | |
| | 2004 | (2) | | $ | 11.47 | | | $ | 0.04 | | | $ | 1.98 | | | $ | (0.03 | ) | | $ | (0.08 | ) | | $ | 13.38 | | | | 17.71 | % | |
| | 2003 | (2) | | | 8.55 | | | | 0.04 | | | | 2.92 | | | | (0.04 | ) | | | - | | | | 11.47 | | | | 34.77 | | |
| | 2002 | (2) | | | 9.68 | | | | 0.05 | | | | (1.13 | ) | | | (0.05 | ) | | | - | | | | 8.55 | | | | (11.28 | ) | |
| | 2001 | (2)(3) | | | 12.23 | | | | (0.01 | ) | | | (1.49 | ) | | | - | | | | (1.05 | ) | | | 9.68 | | | | (12.76 | ) | |
| | 2000 | (4) | | | 10.18 | | | | (0.01 | ) | | | 2.20 | | | | - | | | | (0.14 | ) | | | 12.23 | | | | 21.81 | | |
| | 1999 | (5)(6) | | | 10.00 | | | | - | | | | 0.19 | | | | (0.01 | ) | | | - | | | | 10.18 | | | | 1.86 | | |
| Class B (2) | |
| | 2004 | | | $ | 11.33 | | | $ | (0.06 | ) | | $ | 1.96 | | | $ | - | | | $ | (0.08 | ) | | $ | 13.15 | | | | 16.83 | % | |
| | 2003 | | | | 8.47 | | | | (0.03 | ) | | | 2.90 | | | | (0.01 | ) | | | - | | | | 11.33 | | | | 33.87 | | |
| | 2002 | | | | 9.63 | | | | (0.03 | ) | | | (1.13 | ) | | | - | | | | - | | | | 8.47 | | | | (12.03 | ) | |
| | 2001 | (7) | | | 10.97 | | | | (0.01 | ) | | | (1.33 | ) | | | - | | | | - | | | | 9.63 | | | | (12.11 | ) | |
| Class C (2) | |
| | 2004 | | | $ | 11.43 | | | $ | (0.06 | ) | | $ | 1.97 | | | $ | - | | | $ | (0.08 | ) | | $ | 13.26 | | | | 16.77 | % | |
| | 2003 | | | | 8.54 | | | | (0.03 | ) | | | 2.93 | | | | (0.01 | ) | | | - | | | | 11.43 | | | | 33.94 | | |
| | 2002 | | | | 9.68 | | | | (0.03 | ) | | | (1.11 | ) | | | - | | | | - | | | | 8.54 | | | | (11.72 | ) | |
| | 2001 | (8) | | | 9.49 | | | | - | | | | 0.19 | | | | - | | | | - | | | | 9.68 | | | | 2.11 | | |
| Class R | |
| | 2004 | (2)(9) | | $ | 11.41 | | | $ | 0.03 | | | $ | 1.97 | | | $ | (0.02 | ) | | $ | (0.08 | ) | | $ | 13.31 | | | | 17.65 | % | |
| | 2003 | (2) | | | 8.52 | | | | 0.05 | | | | 2.88 | | | | (0.04 | ) | | | - | | | | 11.41 | | | | 34.54 | | |
| | 2002 | (2) | | | 9.64 | | | | 0.05 | | | | (1.12 | ) | | | (0.05 | ) | | | - | | | | 8.52 | | | | (11.26 | ) | |
| | 2001 | (2)(3) | | | 12.19 | | | | (0.01 | ) | | | (1.49 | ) | | | - | | | | (1.05 | ) | | | 9.64 | | | | (12.82 | ) | |
| | 2000 | (4) | | | 10.17 | | | | (0.01 | ) | | | 2.18 | | | | (0.01 | ) | | | (0.14 | ) | | | 12.19 | | | | 21.54 | | |
| | 1999 | (5)(6) | | | 10.00 | | | | - | | | | 0.17 | | | | - | | | | - | | | | 10.17 | | | | 1.74 | | |
| Class Y | |
| | 2004 | (2) | | $ | 11.51 | | | $ | 0.07 | | | $ | 1.99 | | | $ | (0.06 | ) | | $ | (0.08 | ) | | $ | 13.43 | | | | 18.02 | % | |
| | 2003 | (2) | | | 8.57 | | | | 0.07 | | | | 2.94 | | | | (0.07 | ) | | | - | | | | 11.51 | | | | 35.23 | | |
| | 2002 | (2) | | | 9.70 | | | | 0.07 | | | | (1.13 | ) | | | (0.07 | ) | | | - | | | | 8.57 | | | | (11.09 | ) | |
| | 2001 | (2)(3) | | | 12.24 | | | | 0.02 | | | | (1.50 | ) | | | (0.01 | ) | | | (1.05 | ) | | | 9.70 | | | | (12.56 | ) | |
| | 2000 | (4) | | | 10.19 | | | | 0.02 | | | | 2.19 | | | | (0.02 | ) | | | (0.14 | ) | | | 12.24 | | | | 21.93 | | |
| | 1999 | (5)(6) | | | 10.00 | | | | 0.01 | | | | 0.19 | | | | (0.01 | ) | | | - | | | | 10.19 | | | | 2.01 | | |
(1) The financial highlights for the Small Cap Index Fund as set forth herein include the historical financial highlights of the Firstar Small Cap Index Fund.
The assets of the Firstar Fund were acquired by the First American Small Cap Index Fund on September 24, 2001. In connection with such acquisition,
(i) Class A shares of the Firstar Small Cap Index Fund were exchanged for Class A shares of the First American Fund, (ii) Firstar Class B shares were exchanged
for Class B shares of the First American Fund, (iii) Firstar Class Y shares were exchanged for Class S shares (now designated Class R shares) of the First American Fund,
and (iv) Firstar Institutional Class shares were exchanged for Class Y shares of the First American Fund.
(2) Per share data calculated using average shares outstanding method.
(3) For the period November 1, 2000, to September 30, 2001. Effective in 2001, the Fund's fiscal year end was changed from October 31 to September 30.
All ratios for the period have been annualized, except total return and portfolio turnover.
(4) For the period December 1, 1999, to October 31, 2000. Effective in 2000, the Fund's fiscal year end was changed from November 30 to October 31.
All ratios for the period have been annualized, except total return and portfolio turnover.
(5) Commenced operations on December 30, 1998. All ratios for the period have been annualized, except total return and portfolio turnover.
(6) For the fiscal period ended November 30.
(7) Class of shares has been offered since December 11, 2000. All ratios for the period have been annualized, except total return and portfolio turnover.
(8) Class of shares has been offered since September 24, 2001. All ratios for the period have been annualized, except total return and portfolio turnover.
(9) Prior to July 1, 2004, Class R shares were named Class S shares, which had lower fees and expenses.
(10) Total return does not reflect sales charges. Total return would have been lower had certain expenses not been waived.
The accompanying notes are an integral part of the financial statements.
FIRST AMERICAN FUNDS Annual Report 2004
50
| | | Net Assets
End of
Period (000) | | Ratio of
Expenses to
Average
Net Assets | | Ratio of Net
Investment
Income (Loss)
to Average
Net Assets | | Ratio of Net
Expenses to
Average
Net Assets
(Excluding
Waivers) | | Investment
Income (Loss)
to Average Net
Assets (Excluding
Waivers) | | Portfolio
Turnover
Rate | |
| | Small Cap Index Fund (1) | | |
| Class A | |
| | 2004 | (2) | | $ | 8,749 | | | | 0.93 | % | | | 0.30 | % | | | 1.02 | % | | | 0.21 | % | | | 25 | % | |
| | 2003 | (2) | | | 3,480 | | | | 0.93 | | | | 0.42 | | | | 1.05 | | | | 0.30 | | | | 41 | | |
| | 2002 | (2) | | | 1,908 | | | | 0.93 | | | | 0.46 | | | | 1.09 | | | | 0.30 | | | | 49 | | |
| | 2001 | (2)(3) | | | 341 | | | | 0.91 | | | | (0.07 | ) | | | 0.94 | | | | (0.10 | ) | | | 102 | | |
| | 2000 | (4) | | | 177 | | | | 0.99 | | | | (0.11 | ) | | | 1.09 | | | | (0.21 | ) | | | 32 | | |
| | 1999 | (5)(6) | | | 134 | | | | 1.00 | | | | (0.15 | ) | | | 1.14 | | | | (0.29 | ) | | | 35 | | |
| Class B (2) | |
| | 2004 | | | $ | 1,494 | | | | 1.68 | % | | | (0.46 | )% | | | 1.77 | % | | | (0.55 | )% | | | 25 | % | |
| | 2003 | | | | 993 | | | | 1.68 | | | | (0.33 | ) | | | 1.80 | | | | (0.45 | ) | | | 41 | | |
| | 2002 | | | | 424 | | | | 1.68 | | | | (0.29 | ) | | | 1.84 | | | | (0.45 | ) | | | 49 | | |
| | 2001 | (7) | | | 107 | | | | 1.65 | | | | (0.84 | ) | | | 1.69 | | | | (0.88 | ) | | | 102 | | |
| Class C (2) | |
| | 2004 | | | $ | 1,939 | | | | 1.68 | % | | | (0.46 | )% | | | 1.77 | % | | | (0.55 | )% | | | 25 | % | |
| | 2003 | | | | 1,268 | | | | 1.68 | | | | (0.33 | ) | | | 1.80 | | | | (0.45 | ) | | | 41 | | |
| | 2002 | | | | 447 | | | | 1.68 | | | | (0.26 | ) | | | 1.84 | | | | (0.42 | ) | | | 49 | | |
| | 2001 | (8) | | | - | | | | - | | | | - | | | | - | | | | - | | | | 102 | | |
| Class R | |
| | 2004 | (2)(9) | | $ | 1 | | | | 0.93 | % | | | 0.24 | % | | | 0.99 | % | | | 0.18 | % | | | 25 | % | |
| | 2003 | (2) | | | 3,210 | | | | 0.93 | | | | 0.52 | | | | 1.05 | | | | 0.40 | | | | 41 | | |
| | 2002 | (2) | | | 13,576 | | | | 0.93 | | | | 0.42 | | | | 1.09 | | | | 0.26 | | | | 49 | | |
| | 2001 | (2)(3) | | | 13,886 | | | | 0.88 | | | | (0.05 | ) | | | 0.91 | | | | (0.08 | ) | | | 102 | | |
| | 2000 | (4) | | | 18,057 | | | | 0.99 | | | | (0.11 | ) | | | 1.09 | | | | (0.21 | ) | | | 32 | | |
| | 1999 | (5)(6) | | | 14,955 | | | | 0.92 | | | | (0.06 | ) | | | 1.12 | | | | (0.26 | ) | | | 35 | | |
| Class Y | |
| | 2004 | (2) | | $ | 156,411 | | | | 0.68 | % | | | 0.54 | % | | | 0.77 | % | | | 0.45 | % | | | 25 | % | |
| | 2003 | (2) | | | 119,102 | | | | 0.68 | | | | 0.68 | | | | 0.80 | | | | 0.56 | | | | 41 | | |
| | 2002 | (2) | | | 94,749 | | | | 0.68 | | | | 0.68 | | | | 0.84 | | | | 0.52 | | | | 49 | | |
| | 2001 | (2)(3) | | | 54,169 | | | | 0.66 | | | | 0.19 | | | | 0.68 | | | | 0.17 | | | | 102 | | |
| | 2000 | (4) | | | 60,771 | | | | 0.69 | | | | 0.19 | | | | 1.09 | | | | (0.21 | ) | | | 32 | | |
| | 1999 | (5)(6) | | | 45,331 | | | | 0.68 | | | | 0.18 | | | | 1.13 | | | | (0.27 | ) | | | 35 | | |
FIRST AMERICAN FUNDS Annual Report 2004
51
Notes to Financial Statements September 30, 2004
1 > Organization
The First American Equity Index Fund, Mid Cap Index Fund, and Small Cap Index Fund (each a "Fund" and collectively, the "Funds") are mutual funds offered by First American Investment Funds, Inc. ("FAIF") which is a member of the First American Family of Funds. As of September 30, 2004, FAIF offered 37 funds, including the Funds. FAIF is registered under the Investment Company Act of 1940, as amended, as an open-end management investment company. FAIF's articles of incorporation permit the Funds' board of directors to create additional funds in the future. The Equity Index Fund, Mid Cap Index Fund and Small Cap Index Fund are each diversified open-end management investment companies.
The Funds offer Class A, Class B, Class C, Class R, and Class Y shares. Prior to July 1, 2004, Class R shares were named Class S shares. Class A shares are sold with a front-end sales charge. Class B shares are subject to a contingent deferred sales charge for six years and automatically convert to Class A shares after eight years. Class C shares may be subject to a contingent deferred sales charge for 12 months, and will not convert to Class A shares. Class R shares have no sales charge and are offered only through certain tax-deferred retirement plans. Class Y shares have no sales charge and are offered only to qualifying institutional investors and certain other qualifying accounts.
The Funds' prospectuses provide descriptions of each Fund's investment objective, principal investment strategies and principal risks. All classes of shares have identical voting, dividend, liquidation, and other rights, and the same terms and conditions, except that the level of distribution and shareholder servicing fees charged may differ among classes. Each class has exclusive voting rights on any matters relating to that class' servicing or distribution arrangements.
2 > Summary of Significant Accounting Policies
The significant accounting policies followed by the Funds are as follows:
SECURITY VALUATIONS – Security valuations for the Funds' investments are furnished by one or more independent pricing services that have been approved by the Funds' board of directors. Investments in equity securities that are traded on a national securities exchange are stated at the last quoted sales price if readily available for such securities on each business day. For securities traded on the Nasdaq national market system, the Funds utilize the Nasdaq Official Closing Price which compares the last trade to the bid/ask range of a security. If the last trade falls within the bid/ask range, then that price will be the closing price. If the last trade is outside the bid/ask range, and falls above the ask, the ask will be the closing price. If the last trade is below the bid, the bid will be the closing price. Other equity securities traded in the over-the-counter market and listed equity securities for which no sale was reported on that date are stated at the last quoted bid price. Debt obligations exceeding 60 days to maturity are valued by an independent pricing service. The pricing service may employ methodologies that utilize actual market transactions, broker-dealer supplied valuations, or other formula-driven valuation techniques. These techniques generally consider such factors as yields or prices of bonds of comparable quality, type of issue, coupon, maturity, ratings, and general market conditions. Securities for which prices are not available from an independent pricing service, but where an active market exists, are valued using market quotations obtained from one or more dealers that make markets in the securities or from a widely-used quotation system. When market quotat ions are not readily available, securities are valued at fair value as determined in good faith by procedures established and approved by the Funds' board of directors. Some of the factors which may be considered by the board of directors in determining fair value are fundamental analytical data relating to the investment; the nature and duration of any restrictions on disposition; trading in similar securities of the same issuer or comparable companies; information from broker-dealers; and an evaluation of the forces that influence the market in which the securities are purchased and sold. If events occur that materially affect the value of securities (including non-U.S. securities) between the close of trading in those securities and the close of regular trading on the New York Stock Exchange, the securities will be valued at fair value. Price movements in futures contracts and ADRs, and various other indices, may be reviewed in the course of making a good faith determination of a security's fair value. Th e use of fair value pricing by a fund may cause the net asset value of its shares to differ significantly from net asset value that would be calculated without regard to such considerations. As of September 30, 2004, the Equity Index Fund and Small Cap Index Fund had fair valued securities with a total market value of $1,201 and $2 or 0.0% and 0.0%, respectively, of total net assets for the Fund. Mid Cap Index Fund had no fair valued securities. Debt obligations with 60 days or less remaining until maturity may be valued at their amortized cost, which approximates market value. Foreign securities are valued at the closing prices on the principal exchange on which they trade. The prices for foreign securities are reported in local currency and converted to U.S. dollars using currency exchange rates. Exchange rates are provided daily by recognized independent pricing agents. As of September 30, 2004, the Funds had no investments in
FIRST AMERICAN FUNDS Annual Report 2004
52
foreign securities. Investments in open-end mutual funds are valued at the respective net asset value of each underlying fund on the valuation date.
SECURITY TRANSACTIONS AND INVESTMENT INCOME – The Funds record security transactions on the trade date of the security purchase or sale. Dividend income is recorded on the ex-dividend date. Interest income, including amortization of bond premium and discount, is recorded on an accrual basis. Security gains and losses are determined on the basis of identified cost, which is the same basis used for federal income tax purposes.
DISTRIBUTIONS TO SHAREHOLDERS – Distributions from net investment income are declared and paid monthly. Any net realized capital gains on sales of a Fund's securities are distributed to shareholders at least annually.
FEDERAL TAXES – Each Fund is treated as a separate taxable entity. Each Fund intends to continue to qualify as a regulated investment company as provided in Subchapter M of the Internal Revenue Code, as amended, and to distribute all taxable income, if any, to its shareholders. Accordingly, no provision for federal income taxes is required.
Net investment income and net realized gains (losses) may differ for financial statement and tax purposes because of temporary or permanent book/tax differences. These differences are primarily due to losses deferred from wash sales, the tax recognition of mark to market gains (losses) on open futures contracts, proceeds from securities litigation, and the sale of Real Estate Investment Trust securities. To the extent these differences are permanent, reclassifications are made to the appropriate equity accounts in the period that the differences arise.
On the Statements of Assets and Liabilities the following reclassifications were made (000):
| Fund | | Accumulated
Net Realized
Gain (Loss) | | Undistributed
Net Investment
Income | | Portfolio
Capital | |
| Equity Index Fund | | $ | 441 | | | $ | (206 | ) | | $ | (235 | ) | |
| Mid Cap Index Fund | | | 17 | | | | (17 | ) | | | - | | |
| Small Cap Index Fund | | | (44 | ) | | | 44 | | | | - | | |
The character of distributions made during the year from net investment income or net realized gains may differ from its ultimate characterization for federal income tax purposes. In addition, due to the timing of dividend distributions, the fiscal year in which the amounts are distributed may differ from the year that the income or realized gains (losses) are recorded by the Fund. The distributions paid during the fiscal years ended September 30, 2004 and 2003, were characterized as follows (000):
| | | 2004 | |
| Fund | | Ordinary
Income | | Long Term
Gain | | Return
of Capital | | Total | |
| Equity Index Fund | | $ | 30,594 | | | $ | - | | | $ | 235 | | | $ | 30,829 | | |
| Mid Cap Index Fund | | | 3,008 | | | | 4,099 | | | | - | | | | 7,107 | | |
| Small Cap Index Fund | | | 1,059 | | | | 600 | | | | - | | | | 1,659 | | |
| | | 2003 | |
| Fund | | Ordinary
Income | | Long Term
Gain | | Total | |
| Equity Index Fund | | $ | 23,912 | | | $ | - | | | $ | 23,912 | | |
| Mid Cap Index Fund | | | 1,700 | | | | 5,576 | | | | 7,276 | | |
| Small Cap Index Fund | | | 576 | | | | 108 | | | | 684 | | |
As of September 30, 2004, the components of accumulated earnings (deficit) on a tax basis were as follows (000):
| | | Undistributed
Ordinary
Income | | Undistributed
Long Term
Capital Gains | | Accumulated
Capital and
Post-October
Losses | | Unrealized
Appreciation
(Depreciation) | | Total
Accumulated
Earnings
(Deficit) | |
| Equity Index Fund | | $ | - | | | $ | - | | | $ | (14,133 | ) | | $ | 485,546 | | | $ | 471,413 | | |
| Mid Cap Index Fund | | | 1,319 | | | | 10,085 | | | | - | | | | 25,503 | | | | 36,907 | | |
| Small Cap Index Fund | | | 3,377 | | | | 4,602 | | | | - | | | | 19,621 | | | | 27,600 | | |
FIRST AMERICAN FUNDS Annual Report 2004
53
Notes to Financial Statements September 30, 2004
The difference between book and tax basis unrealized appreciation is primarily due to the tax deferral of losses on wash sales and the amount of gain (loss) recognized for tax purposes due to mark to market adjustments on open futures contracts, and return of capital distributions related to Real Estate Investment Trust investments.
As of September 30, 2004, the following Fund had a capital loss carryforward (000):
| | | Expiration Year | |
| Fund | | 2010 | | 2011 | | Total | |
| Equity Index Fund | | $ | 3,232 | | | $ | 10,901 | | | $ | 14,133 | | |
FUTURES TRANSACTIONS – In order to gain exposure to or protect against changes in the market, the Funds may enter into S&P and Russell Index futures contracts and other stock index futures contracts.
Upon entering into a futures contract, the Fund is required to deposit cash or pledge U.S. government securities in an amount equal to five percent of the purchase price indicated in the futures contract (initial margin). Subsequent payments, which are dependent on the daily fluctuations in the value of the underlying security or securities, are made or received by the Fund each day (daily variation margin) and are recorded as unrealized gains (losses) until the contract is closed. When the contract is closed, the Fund records a realized gain (loss) equal to the difference between the proceeds from (or cost of) the closing transaction and the Fund's basis in the contract.
The Funds' investment in stock index futures contracts is designed to maintain sufficient liquidity to meet redemption requests and to increase the level of Fund assets devoted to replicating the composition of the S&P and Russell Indices while reducing transaction costs. Risks of entering into futures contracts, in general, include the possibility that there will not be a perfect price correlation between the futures contracts and the underlying securities. Second, it is possible that a lack of liquidity for futures contracts could exist in the secondary market, resulting in an inability to close a futures position prior to its maturity date. Third, the purchase of a futures contract involves the risk that a fund could lose more than the original margin deposit required to initiate a futures transaction. These contracts involve market risk in excess of the amount reflected in the Fund's statement of assets and liabilities. Unrealized gains (losses) on outstanding positions in futures contracts held at the close of the year will be recognized as capital gains (losses) for federal income tax purposes.
ILLIQUID OR RESTRICTED SECURITIES – A security may be considered illiquid if it lacks a readily available market or if its valuation has not changed for a certain period of time. Each Fund intends to invest no more than 15% of its net assets (determined at the time of purchase and reviewed periodically) in illiquid securities. Certain restricted securities may be considered illiquid. Restricted securities are often purchased in private placement transactions, are not registered under the Securities Act of 1933, may have contractual restrictions on resale, and may be valued un der methods approved by the Funds' board of directors as reflecting fair value. Certain restricted securities eligible for resale to qualified institutional investors, including Rule 144A securities, are not subject to the limitation on a Fund's investment in illiquid securities if they are determined to be liquid in accordance with procedures adopted by the Funds' board of directors.
As of September 30, 2004, Small Cap Index Fund held the following illiquid securities:
| Security | | Shares | | Dates Acquired | | Cost Basis | |
| Cross Media Marketing | | | 1,203 | | | 6/02 to 12/02 | | $ | 10 | | |
| FirstBank Fractional Shares | | | - | | | 1/04 | | | - | | |
| MicroAge | | | 3,579 | | | 1/99 to 12/99 | | | 29 | | |
| Neon Communications | | | 34,093 | | | 9/01 to 6/02 | | | 3 | | |
| Network Plus | | | 1,155 | | | 9/01 | | | 2 | | |
| Southern Union Company Fractional Shares | | | - | | | 11/03 | | | - | | |
| Storage Networks | | | 15,089 | | | 6/02 to 6/03 | | | 1 | | |
| USB Holding Company Fractional Shares | | | - | | | 6/03 | | | - | | |
| Wiltel Communications | | | 4,122 | | | 4/03 to 8/03 | | | - | | |
FIRST AMERICAN FUNDS Annual Report 2004
54
SECURITIES LENDING – In order to generate additional income, each Fund may lend securities representing up to one-third of the value of its total assets (which includes collateral for securities on loan) to broker-dealers, banks, or other institutional borrowers of securities. Each Fund's policy is to maintain collateral in the form of cash, U.S. government securities, or other high-grade debt obligations equal to at least 100% of the value of securities loaned. The collateral is then "marked-to-market" daily until the securities are returned. As with other extensions of credit, there may be risks of delay in recovery of the securities or even loss of rights in the collateral should the borrower of the security fail financially.
U.S. Bancorp Asset Management, Inc. ("USBAM") serves as the securities lending agent for the Funds in transactions involving the lending of portfolio securities on behalf of the Funds. USBAM acts as the securities lending agent pursuant to, and subject to compliance with conditions contained in, an exemptive order issued by the Securities and Exchange Commission ("SEC"). During the fiscal year ended September 30, 2004, USBAM received fees equal to 25% of the Funds' income from securities lending transactions. The Funds also paid an administrative fee to USBAM equal to 0.025% based on the cash collateral held for the securities on loan. Fees paid to USBAM by the Funds for the fiscal year ended September 30, 2004 were as follows (000):
| Fund | | Total | |
| Equity Index Fund | | $ | 374 | | |
| Mid Cap Index Fund | | | 68 | | |
| Small Cap Index Fund | | | 46 | | |
As of October 1, 2004, USBAM will receive fees equal to 35% of the Funds' income from securities lending transactions. The Funds will no longer pay an administrative fee to USBAM in connection with securities lending.
REPURCHASE AGREEMENTS – A repurchase agreement is an agreement by which the seller of a security agrees to repurchase the security sold at a mutually agreed upon time and price. At the time the Funds enter into a repurchase agreement, the value of the underlying collateral security (ies), including accrued interest, will be equal to or exceed the value of the repurchase agreement. Securities that serve to collateralize the repurchase agreement are held by each Fund's custodian in book entry or physical form in the custodial account of the Fund. Repurchase agreements are valued at cost plus accrued interest receivable.
Pursuant to an exemptive order issued by the SEC, the Funds may transfer uninvested cash balances from proceeds from securities lending into joint repurchase agreements for the First American Funds complex managed by USBAM. As set forth in the accompanying schedules of investments, each of the Funds included in this annual report has an interest in joint repurchase agreements dated September 30, 2004. Information regarding these agreements is as follows (000):
| Broker | | Rate | | Principal | | Collateral Value | | Security Type | | Coupon Rate | | Maturity | |
| Bear Stearns | | | 2.060 | % | | $ | 30,000 | | | $ | 30,611 | | | Commercial Loans | | | 0.000 | % | | | 2033-2034 | | |
| Bear Stearns | | | 2.045 | % | | | 100,000 | | | | 102,056 | | | Commercial Loans | | | 3.850%-6.230% | | | | 2004-2014 | | |
| Citibank 1.945% 200,000 | | | 211,790 | | | | Collateralized Mortgage Obligations | | | | 2.340%-9.700% | | | 2015-2034
Corporate Bonds | | | 0.000%-9.125% | | | | 2006-2042 | | |
| Citibank | | | 1.925 | % | | | 100,000 | | | | 102,114 | | | Israeli Government Bonds | | | 0.000 | % | | | 2005-2018 | | |
| | | | | | | | | | | | | | | Financing Corporation Bonds | | | 0.000%-10.350% | | | | 2017-2018 | | |
| | | | | | | | | | | | | | | Easy Growth TR Interest Certificates | | | 0.000 | % | | | 2005-2006 | | |
| | | | | | | | | | | | | | | Treasury Investors Growth Receipt (TIGER) | | | 0.000 | % | | | 2007 | | |
| | | | | | | | | | | | | | | Certificate of Accrual on Treasury Securities (CATS) | | | 0.000 | % | | | 2011 | | |
| | | | | | | | | | | | | | | U.S. Treasury Notes | | | 1.625%-5.000% | | | | 2005-2011 | | |
| | | | | | | | | | | | | | | U.S. Treasury Bill | | | 0.000 | % | | | 2004 | | |
| | | | | | | | | | | | | | | Resolution Funding Corporation Bonds | | | 8.625 | % | | | 2030 | | |
| | | | | | | | | | | | | | | International Finance Corporation Notes | | | 4.750%-5.250% | | | | 2006-2007 | | |
| | | | | | | | | | | | | | | Inter-American Development Bank Notes | | | 5.375%-8.500% | | | | 2006-2011 | | |
| | | | | | | | | | | | | | | Asian Development Bank Note | | | 4.50 | % | | | 2012 | | |
| Greenwich Capital Markets | | | 1.950 | % | | | 300,000 | | | | 306,004 | | | Federal Home Loan Mortgage Corporation Bonds | | | 0.000%-9.000% | | | | 2006-2034 | | |
| | | | | | | | | | | | | | | Federal National Mortgage Association Bonds | | | 0.000%-6.500% | | | | 2007-2042 | | |
| Goldman Sachs | | | 2.205 | % | | | 50,000 | | | | 51,021 | | | Commercial Loans | | | 0.00 | % | | | 2005-2011 | | |
| Goldman Sachs | | | 2.025 | % | | | 205,000 | | | | 211,342 | | | Mortgage Loans | | | 6.088%-6.722% | | | | 2010 | | |
| | | | | | | | | | | | | | | Commercial Loans | | | 0.00 | % | | | 2007 | | |
| Goldman Sachs | | | 1.480 | % | | | 75,000 | | | | 77,320 | | | Commercial Loans | | | 0.00 | % | | | 2004 | | |
| Goldman Sachs | | | 1.425 | % | | | 125,000 | | | | 127,552 | | | Commercial Loans | | | 0.00 | % | | | 2005-2020 | | |
| Lehman Brothers | | | 2.055 | % | | | 200,000 | | | | 204,000 | | | Home Equity Loans | | | 0.000%-14.101% | | | | 2010-2034 | | |
| Lehman Brothers | | | 1.935 | % | | | 200,000 | | | | 219,916 | | | Collateralized Mortgage Obligations | | | 0.000%-7.109% | | | | 2008-2044 | | |
| Lehman Brothers | | | 1.910 | % | | | 300,000 | | | | 306,005 | | | Federal Farm Credit Bank Note | | | 4.500 | % | | | 2009 | | |
| | | | | | | | | | | | | | | Federal Home Loan Bank Bonds | | | 0.000%-5.750% | | | | 2005-2018 | | |
| | | | | | | | | | | | | | | Federal Home Loan Mortgage Corporation Notes | | | 2.375%-3.550% | | | | 2006-2009 | | |
| | | | | | | | | | | | | | | Federal National Mortgage Association Bonds | | | 3.100%-6.000% | | | | 2007-2018 | | |
| Merrill Lynch | | | 1.925 | % | | | 100,000 | | | | 105,002 | | | Corporate Bonds | | | 0.000%-10.125% | | | | 2005-2043 | | |
FIRST AMERICAN FUNDS Annual Report 2004
55
Notes to Financial Statements September 30, 2004
OTHER INCOME – Income from settlement proceeds related to specific portfolio securities is recorded as an adjustment to realized or unrealized gains or losses. Income from settlement proceeds related to securities that are no longer included in the portfolio is recorded in other income. For the fiscal year ended September 30, 2004, the Equity Index Fund, the Mid Cap Index Fund and the Small Cap Index Fund recorded $318,338, $7,795 and $17,418, respectively, in other income for settlement proceeds related to securities no longer included in the portfolios.
EXPENSES – Expenses that are directly related to one of the Funds are charged directly to that Fund. Other operating expenses are generally allocated to the Funds on the basis of relative net assets of all Funds within the First American Fund complex. Class specific expenses, such as 12b-1 fees, are borne by that class. Income, other expenses, and realized and unrealized gains and losses of a Fund are allocated to each respective class in proportion to the relative net assets of each class.
INTERFUND LENDING PROGRAM – Pursuant to an exemptive order issued by the SEC, the Funds, along with other registered investment companies in the First American Family of Funds, may participate in an interfund lending program. This program provides an alternative credit facility allowing the Funds to borrow from, or lend money to, other participating Funds. The Funds did not have any interfund lending transactions during the fiscal year ended September 30, 2004.
DEFERRED COMPENSATION PLAN – Under a Deferred Compensation Plan (the Plan), non-interested directors of the First American Fund family may participate and elect to defer receipt of their annual compensation. Deferred amounts are treated as though equivalent dollar amounts had been invested in shares of selected open-end First American Funds as designated by the board of directors. All amounts in the Plan are 100% vested and accounts under the Plan are obligations of the Funds. Deferred amounts remain in the Funds until distributed in accordance with the Plan.
USE OF ESTIMATES IN PREPARATION OF FINANCIAL STATEMENTS – The preparation of financial statements, in conformity with U.S. generally accepted accounting principles, requires management to make estimates and assumptions that affect the reported amount of assets and liabilities and disclosure of contingent assets and liabilities at the date of the financial statements and the reported results of operations during the reporting period. Actual results could differ from those estimates.
3 > Fees and Expenses
ADVISORY FEES – Pursuant to an investment advisory agreement (the "Agreement"), USBAM manages each Fund's assets and furnishes related office facilities, equipment, research, and personnel. The Agreement requires each Fund to pay USBAM a monthly fee based upon average daily net assets. The annual fee for Equity Index Fund, Mid Cap Index Fund and Small Cap Index Fund is 0.25%, 0.25% and 0.40%, respectively. USBAM voluntarily waived fees during the fiscal year ended September 30, 2004 so that the total fund operating expenses, as a percentage of average daily net assets, did not exceed the following amounts:
| | | Share Class | |
| Fund | | A | | B | | C | | R* | | Y | |
| Equity Index Fund | | | 0.62 | % | | | 1.37 | % | | | 1.37 | % | | | 0.87 | % | | | 0.37 | % | |
| Mid Cap Index Fund | | | 0.75 | | | | 1.50 | | | | 1.50 | | | | 1.00 | | | | 0.50 | | |
| Small Cap Index Fund | | | 0.93 | | | | 1.68 | | | | 1.68 | | | | 1.18 | | | | 0.68 | | |
* Prior to July 1, 2004, Class R shares were designated Class S shares, which had lower fees and expenses of .62%, .75% and .93% for Equity Index Fund, Mid Cap Index Fund and Small Cap Index Fund, respectively.
The Funds may invest in related money market funds that are series of First American Funds, Inc. ("FAF"), subject to certain limitations. In order to avoid the payment of duplicative investment advisory fees to USBAM, which acts as the investment adviser to both the investing Funds and the related money market funds, USBAM will reimburse each investing Fund an amount equal to that portion of USBAM's investment advisory fee received from the related money market funds that is attributable to the assets of the investing Fund. For financial statement purposes, these reimbursements are recorded as investment income.
CO-ADMINISTRATION FEES – USBAM and U.S. Bancorp Fund Services, LLC ("USBFS") (collectively, the "Administrators") serve as co-administrators pursuant to a co-administration agreement between the Administrators and the Funds. USBAM is a subsidiary of U.S. Bank National Association ("U.S. Bank"). Both U.S. Bank and USBFS are direct subsidiaries of U.S. Bancorp. Under the co-administration agreement, the Administrators are compensated to provide, or compensate other
FIRST AMERICAN FUNDS Annual Report 2004
56
entities to provide, services to the Funds. These services include various legal, oversight and administrative services, accounting services, transfer agency and dividend disbursing services, and shareholder services. The Funds pay the Administrators at an annual rate, calculated daily and paid monthly, based on the average daily net assets of all open-end mutual funds in the First American Family of Funds, equal to each Fund's pro rata share of an amount equal to 0.25% of the aggregate average daily net assets up to $8 billion, 0.235% of the next $17 billion of the aggregate average daily assets, 0.22% of the next $25 billion of the aggregate average daily net assets, and 0.20% of the aggregate average daily net assets in excess of $50 billion. FAIF pays transfer agent fees of $18,500 per share class and additional per account fees for transfer agent services. These fees are allocated to each Fund based upon the Fund's pro rata share of aggregate average daily net assets of the funds that comprise FAIF. For the fiscal year ended September 30, 2004, administration fees paid to USBAM and USBFS by the Funds included in this annual report were as follows (000):
| Fund | | Amount | |
| Equity Index Fund | | $ | 6,150 | | |
| Mid Cap Index Fund | | | 843 | | |
| Small Cap Index Fund | | | 412 | | |
CUSTODIAN FEES – U.S. Bank serves as the Funds' custodian pursuant to a custodian agreement with FAIF. The fee for each Fund is equal to an annual rate of 0.01% of average daily net assets. These fees are computed daily and paid monthly.
DISTRIBUTION AND SHAREHOLDER SERVICING FEES – Quasar Distributors, LLC ("Quasar"), a subsidiary of U.S. Bancorp, serves as distributor of the Funds pursuant to a distribution agreement with FAIF. Under the distribution agreement, each of the Funds pays Quasar a monthly distribution and/or shareholder servicing fee equal to an annual rate of 0.25%, 1.00%, 1.00% and 0.50% of each Fund's average daily net assets of the Class A shares, Class B shares, Class C shares and Class R shares, respectively. No distribution or shareholder servicing fees are paid by Class Y shares. These fees may be used by Quasar to provide compensation for sales support, distribution activities, or shareholder servicing activities.
FAIF has also adopted and entered into a shareholder servicing plan and agreement with USBAM with respect to the Class R shares. Each Fund pays USBAM a monthly shareholder servicing fee equal to an annual rate of 0.15% of each Fund's average daily net assets of the Class R shares.
USBAM is currently waiving all fees under this plan and agreement. This waiver may be discontinued at any time.
Under these distribution and shareholder servicing agreements, the following amounts were retained by Quasar and USBAM or paid to affiliates of USBAM for the fiscal year ended September 30, 2004 (000):
| Fund | | Amount | |
| Equity Index Fund | | $ | 794 | | |
| Mid Cap Index Fund | | | 50 | | |
| Small Cap Index Fund | | | 33 | | |
OTHER FEES – In addition to the investment advisory fees, custodian fees, distribution and shareholder servicing fees, and co-administration fees, each Fund is responsible for paying most other operating expenses including fees and expenses of independent directors, registration fees, printing of shareholder reports, legal, auditing, insurance, and other miscellaneous expenses. For the fiscal year ended September 30, 2004, legal fees and expenses were paid to a law firm of which the Secretary and two Assistant Secretaries of the Funds were partners.
SALES CHARGES – A contingent deferred sales charge ("CDSC") is imposed on redemptions made in Class B shares. The CDSC varies depending on the number of years from time of payment for the purchase of Class B shares until the redemption of such shares. Class B shares automatically convert to Class A shares after eight years.
| Year Since Purchase | | CDSC as a
Percentage of Dollar
Amount Subject to Charge | |
| First | | | 5.00 | % | |
| Second | | | 5.00 | % | |
| Third | | | 4.00 | % | |
| Fourth | | | 3.00 | % | |
| Fifth | | | 2.00 | % | |
| Sixth | | | 1.00 | % | |
| Seventh | | | - | | |
| Eighth | | | - | | |
A CDSC of 1.00% is imposed on redemptions made in Class C shares for the first twelve months.
The CDSC for Class B shares and Class C shares is imposed on the value of the purchased shares or the value at the time of redemption, whichever is less.
For the fiscal year ended September 30, 2004, total sales charges retained by affiliates of USBAM for distributing the Funds' shares were as follows (000):
| Fund | | Amount | |
| Equity Index Fund | | $ | 531 | | |
| Mid Cap Index Fund | | | 68 | | |
| Small Cap Index Fund | | | 47 | | |
FIRST AMERICAN FUNDS Annual Report 2004
57
Notes to Financial Statements September 30, 2004
4 > Investment In Common Stock Of Affiliate
As disclosed in the Schedule of Investments, Equity Index Fund owns common stock issued by U.S. Bancorp. For the fiscal year ended September 30, 2004, Equity Index Fund recorded no realized gains or losses from sales of U.S. Bancorp common stock and $403,861 of dividend income from U.S. Bancorp common stock. At September 30, 2004, Equity Index Fund had an unrealized gain of $2,886,366 with respect to its investment in U.S. Bancorp common stock.
5 > Capital Share Transactions
FAIF has 420 billion shares of $0.0001 par value capital stock authorized. Capital share transactions for the Funds were as follows (000):
| | | Equity
Index Fund | | Mid Cap
Index Fund | | Small Cap
Index Fund | |
| | | 10/1/03
to
9/30/04 | | 10/1/02
to
9/30/03 | | 10/1/03
to
9/30/04 | | 10/1/02
to
9/30/03 | | 10/1/03
to
9/30/04 | | 10/1/02
to
9/30/03 | |
| Class A: | |
| Shares issued | | | 4,820 | | | | 1,495 | | | | 763 | | | | 217 | | | | 474 | | | | 147 | | |
| Shares issued in lieu of cash distributions | | | 108 | | | | 97 | | | | 13 | | | | 13 | | | | 3 | | | | 1 | | |
| Shares redeemed | | | (2,189 | ) | | | (2,208 | ) | | | (277 | ) | | | (137 | ) | | | (126 | ) | | | (68 | ) | |
| Total Class A transactions | | | 2,739 | | | | (616 | ) | | | 499 | | | | 93 | | | | 351 | | | | 80 | | |
| Class B: | |
| Shares issued | | | 225 | | | | 321 | | | | 55 | | | | 79 | | | | 34 | | | | 52 | | |
| Shares issued in lieu of cash distributions | | | 16 | | | | 19 | | | | 4 | | | | 4 | | | | 1 | | | | - | | |
| Shares redeemed | | | (737 | ) | | | (881 | ) | | | (26 | ) | | | (22 | ) | | | (9 | ) | | | (14 | ) | |
| Total Class B transactions | | | (496 | ) | | | (541 | ) | | | 33 | | | | 61 | | | | 26 | | | | 38 | | |
| Class C: | |
| Shares issued | | | 214 | | | | 806 | | | | 118 | | | | 91 | | | | 70 | | | | 74 | | |
| Shares issued in lieu of cash distributions | | | 7 | | | | 8 | | | | 3 | | | | 3 | | | | 1 | | | | - | | |
| Shares redeemed | | | (457 | ) | | | (550 | ) | | | (65 | ) | | | (17 | ) | | | (36 | ) | | | (15 | ) | |
| Total Class C transactions | | | (236 | ) | | | 264 | | | | 56 | | | | 77 | | | | 35 | | | | 59 | | |
| Class R: | |
| Shares issued | | | 564 | | | | 1,647 | | | | 91 | | | | 196 | | | | 131 | | | | 192 | | |
| Shares issued in lieu of cash distributions | | | 19 | | | | 32 | | | | 7 | | | | 10 | | | | 2 | | | | 3 | | |
| Shares redeemed | | | (3,398 | ) | | | (1,656 | ) | | | (497 | ) | | | (206 | ) | | | (414 | ) | | | (1,508 | ) | |
| Total Class R transactions | | | (2,815 | ) | | | 23 | | | | (399 | ) | | | - | | | | (281 | ) | | | (1,313 | ) | |
| Class Y: | |
| Shares issued | | | 25,834 | | | | 50,895 | | | | 9,346 | | | | 12,500 | | | | 6,867 | | | | 5,268 | | |
| Shares issued in lieu of cash distributions | | | 928 | | | | 904 | | | | 357 | | | | 560 | | | | 80 | | | | 39 | | |
| Shares redeemed | | | (26,886 | ) | | | (31,254 | ) | | | (6,301 | ) | | | (13,331 | ) | | | (5,648 | ) | | | (6,019 | ) | |
| Total Class Y transactions | | | (124 | ) | | | 20,545 | | | | 3,402 | | | | (271 | ) | | | 1,299 | | | | (712 | ) | |
| Net increase (decrease) in capital shares | | | (932 | ) | | | 19,675 | | | | 3,591 | | | | (40 | ) | | | 1,430 | | | | (1,848 | ) | |
6 > Investment Security Transactions
During the fiscal year ended September 30, 2004, purchases of securities and proceeds from sales of securities, other than temporary investments in short-term securities, were as follows (000):
| Fund | | Purchases | | Sales | |
| Equity Index Fund | | $ | 56,032 | | | $ | 17,542 | | |
| Mid Cap Index Fund | | | 81,441 | | | | 41,016 | | |
| Small Cap Index Fund | | | 61,935 | | | | 37,231 | | |
The aggregate gross unrealized appreciation and depreciation of securities held by the Funds and the total cost of securities (including cost of securities purchased with proceeds from securities lending) for federal income tax purposes at September 30, 2004, were as follows (000):
| Fund | | Aggregate
Gross
Appreciation | | Aggregate
Gross
Depreciation | | Net | | Federal
Income
Tax Cost | |
| Equity Index Fund | | $ | 778,595 | | | $ | (293,049 | ) | | $ | 485,546 | | | $ | 2,709,403 | | |
| Mid Cap Index Fund | | | 70,218 | | | | (44,715 | ) | | | 25,503 | | | | 462,140 | | |
| Small Cap Index Fund | | | 34,195 | | | | (14,574 | ) | | | 19,621 | | | | 189,953 | | |
FIRST AMERICAN FUNDS Annual Report 2004
58
7 > Indemnifications
The Funds enter into contracts that contain a variety of indemnifications. The Funds' maximum exposure under these arrangements is unknown. However, the Funds have not had prior claims or losses pursuant to these contracts and expect the risk of loss to be remote.
FIRST AMERICAN FUNDS Annual Report 2004
59
NOTICE TO SHAREHOLDERS September 30, 2004 (unaudited)
TAX INFORMATION
The information set forth below is for each Fund's fiscal year as required by federal laws. Most shareholders, however, must report distributions on a calendar year basis for income tax purposes, that may include distributions for portions of two fiscal years of a Fund. Accordingly, the information needed for income tax purposes will be sent in early 2005 on Form 1099. Please consult your tax advisor for proper treatment of this information.
Dear First American Fund Shareholders:
For the fiscal year ended September 30, 2004, each Fund has designated long-term capital gain dividends, dividends qualifying for the corporate dividends received deduction, and qualified dividend income with regard to distributions paid during the year as follows:
| Fund | | Long Term
Capital Gains
Distributions
(Tax Basis) (a) | | Ordinary
Income
Distributions
(Tax Basis) (a) | | Total
Distributions
(Tax Basis) | | Corporate
Dividends
Received
Deduction (b) | | Qualified
Dividend
Income (c) | |
| Equity Index Fund | | | - | % | | | 100 | % | | | 100 | % | | | 100 | % | | | 100 | % | |
| Mid Cap Index Fund | | | 58 | | | | 42 | | | | 100 | | | | 86 | | | | 59 | | |
| Small Cap Index Fund | | | 36 | | | | 64 | | | | 100 | | | | 27 | | | | 24 | | |
(a) Based on a percentage of the Fund's total distributions.
(b) Based on a percentage of ordinary income distributions of the Fund.
(c) For the fiscal year ended September 30, 2004 certain dividends paid by the funds may be subject to a maximum tax rate of 15%, as provided by the Internal Revenue Code 1(h). The Funds intend to designate up to the maximum amount of $38,154,713, $2,118,458, and $1,064,080 for the Equity Index Fund, Mid Cap Index Fund and Small Cap Index Fund, respectively. Complete information will be computed and reported in conjunction with your 2004 Form 1099-DIV. As of September 30, 2004, for the calendar year to date, qualified dividend income was 100% of each Fund's ordinary income distributions.
HOW TO OBTAIN A COPY OF THE FUNDS' PROXY VOTING POLICIES AND PROXY VOTING RECORD
A description of the policies and procedures that the Funds use to determine how to vote proxies relating to portfolio securities, as well as information regarding how the Funds voted proxies relating to portfolio securities during the most recent 12 month period ended June 30, is available (1) without charge upon request by calling 800.677.FUND; (2) at firstamericanfunds.com; and (3) on the U.S. Securities and Exchange Commission's website at http://www.sec.gov.
QUARTERLY PORTFOLIO HOLDINGS INFORMATION
Beginning with the quarter ending December 31, 2004, each Fund will file its complete schedule of portfolio holdings for the first and third quarters of each fiscal year with the Securities and Exchange Commission on Form N-Q. The Funds' Forms N-Q will be available (1) without charge upon request by calling 800.677.FUND; (2) at firstamericanfunds.com; and (3) on the U.S. Securities and Exchange Commission's website at http://www.sec.gov. In addition, you may review and copy the Funds' Forms N-Q at the Commission's Public Reference Room in Washington, D.C. You may obtain information on the operation of the Public Reference Room by calling 1-800-SEC-0330.
FIRST AMERICAN FUNDS Annual Report 2004
60
Directors and Officers of the Fund
Independent Directors
Name,
Address, and
Year of Birth | | Position(s)
Held
with Fund | | Term of Office
and Length of
Time Served | | Principal Occupation(s) During
Past 5 Years | | Number of
Portfolios in Fund
Complex Overseen
by Director | | Other
Directorships
Held by
Director † | |
Benjamin R. Field III,
P.O. Box 1329,
Minneapolis, MN 55440-1329
(1938) | | Director | | Term expiring earlier of death, resignation, removal, disqualification, or successor duly elected and qualified. Director of FAIF since September 2003 | | Retired; Senior Financial Advisor, Bemis Company, Inc. from May 2002 through June 2004; Senior Vice President, Chief Financial Officer & Treasurer, Bemis, through April 2002. | | First American Funds Complex: eleven registered investment companies, including fifty-six portfolios | | None | |
|
Mickey P. Foret,
P.O. Box 1329,
Minneapolis, MN 55440-1329
(1945) | | Director | | Term expiring earlier of death, resignation, removal, disqualification, or successor duly elected and qualified. Director of FAIF since September 2003 | | Consultant to Northwest Airlines, Inc. since 2002; Executive Vice President and Chief Financial Officer, Northwest Airlines, through 2002. | | First American Funds Complex: eleven registered investment companies, including fifty-six portfolios | | ADC Telecommun- ications, Inc.
Champion Airlines, Inc.
MAIR Holdings Inc. (a holding company for regional air carriers)
URS Corporation (an engineering firm) | |
|
Roger A. Gibson,
P.O. Box 1329,
Minneapolis, MN 55440-1329
(1946) | | Director | | Term expiring earlier of death, resignation, removal, disqualification, or successor duly elected and qualified. Director of FAIF since October 1997 | | Retired; Vice President, Cargo-United Airlines, from July 2001 through July 2004; Vice President, North America – Mountain Region for United Airlines, prior to July 2001. | | First American Funds Complex: eleven registered investment companies, including fifty-six portfolios | | None | |
|
Victoria J. Herget,
P.O. Box 1329,
Minneapolis, MN 55440-1329
(1951) | | Director | | Term expiring earlier of death, resignation, removal, disqualification, or successor duly elected and qualified. Director of FAIF since September 2003 | | Investment consultant and non-profit board member since 2001; Managing Director of Zurich Scudder Investments through 2001. | | First American Funds Complex: eleven registered investment companies, including fifty-six portfolios | | None | |
|
Leonard W. Kedrowski,
P.O. Box 1329,
Minneapolis, MN 55440-1329
(1941) | | Director | | Term expiring earlier of death, resignation, removal, disqualification, or successor duly elected and qualified. Director of FAIF since November 1993 | | Owner, Executive and Management Consulting, Inc., a management consulting firm; Board member, GC McGuiggan Corporation (dba Smyth Companies), a label printer; former Chief Executive Officer, Creative Promotions International, LLC, a promotional award programs and products company, through October 2003; Advisory Board member, Designer Doors, manufacturer of designer doors, through 2002. | | First American Funds Complex: eleven registered investment companies, including fifty-six portfolios | | None | |
|
FIRST AMERICAN FUNDS Annual Report 2004
61
NOTICE TO SHAREHOLDERS September 30, 2004 (unaudited)
Independent Directors - continued
Name,
Address, and
Year of Birth | | Position(s)
Held
with Fund | | Term of Office
and Length of
Time Served | | Principal Occupation(s) During
Past 5 Years | | Number of
Portfolios in Fund
Complex Overseen
by Director | | Other
Directorships
Held by
Director † | |
Richard K. Riederer,
P.O. Box 1329,
Minneapolis, MN 55440-1329
(1944) | | Director | | Term expiring earlier of death, resignation, removal, disqualification, or successor duly elected and qualified. Director of FAIF since August 2001 | | Retired; Director, President and Chief Executive Officer, Weirton Steel through 2001. | | First American Funds Complex: eleven registered investment companies, including fifty-six portfolios | | None | |
|
Joseph D. Strauss,
P.O. Box 1329,
Minneapolis, MN 55440-1329
(1940) | | Director | | Term expiring earlier of death, resignation, removal, disqualification, or successor duly elected and qualified. Director of FAIF since April 1991 | | Owner, Chairman and Chief Executive Officer, Excensus(TM), LLC, a consulting firm, since 2001; owner and President, Strauss Management Company, a Minnesota holding company for various organizational management business ventures; owner, Chairman and Chief Executive Officer, Community Resource Partnerships, Inc., a strategic planning, operations management, government relations, transportation planning and public relations organization; attorney at law. | | First American Funds Complex: eleven registered investment companies, including fifty-six portfolios | | None | |
|
Virginia L. Stringer,
P.O. Box 1329,
Minneapolis, MN 55440-1329
(1944) | | Chair; Director | | Chair Term three years. Directors Term expiring earlier of death, resignation, removal, disqualification, or successor duly elected and qualified. Chair of FAIF's Board since September 1997; Director of FAIF since August 1987 | | Owner and President, Strategic Management Resources, Inc., a management consulting firm; Executive Consultant to State Farm Insurance Company. | | First American Funds Complex: eleven registered investment companies, including fifty-six portfolios | | None | |
|
James M. Wade,
P.O. Box 1329,
Minneapolis, MN 55440-1329
(1943) | | Director | | Term expiring earlier of death, resignation, removal, disqualification, or successor duly elected and qualified. Director of FAIF since August 2001 | | Owner and President, Jim Wade Homes, a homebuilding company, since 1999. | | First American Funds Complex: eleven registered investment companies, including fifty-six portfolios | | None | |
|
† Includes only directorships in a company with a class of securities registered pursuant to Section 12 of the Securities Exchange Act or subject to the requirements of Section 15(d) of the Securities Exchange Act, or any company registered as an investment company under the Investment Company Act.
The Statement of Additional Information (SAI) includes additional information about fund directors and is available upon request without charge by calling 800-677-FUND or writing to First American Funds, P.O. Box 1330, Minneapolis, Minnesota, 55440-1330.
FIRST AMERICAN FUNDS Annual Report 2004
62
Officers
Position(s)
Name, Address, and
Year of Birth | | Term of Office
Held
with Fund | | and Length of
Time Served | | Principal Occupation(s) During Past 5 Years | |
Thomas S. Schreier, Jr.,
U.S. Bancorp Asset
Management, Inc.,
800 Nicollet Mall,
Minneapolis, MN 55402
(1962) * | | President | | Re-elected by the Board annually; President of FAIF since February 2001 | | Chief Executive Officer of the Advisor since May 2001; prior thereto, Chief Executive Officer of First American Asset Management since December 2000 and of Firstar Investment & Research Management Company ("FIRMCO") since February 2001; Senior Managing Director and Head of Equity Research of U.S. Bancorp Piper Jaffray from October 1998 through December 2000; prior to October 1998, Senior Airline Equity Analyst and a Director in the Equity Research Department of Credit Suisse First Boston. | |
|
Mark S. Jordahl,
U.S. Bancorp Asset
Management, Inc.
800 Nicollet Mall,
Minneapolis, MN 55402
(1960) * | | Vice President – Investments | | Re-elected by the Board annually; Vice President – Investments of FAIF since September 2001 | | Chief Investment Officer of U.S. Bancorp Asset Management, Inc. since September 2001; President and Chief Investment Officer, ING Investment Management – Americas, September 2000 to June 2001; Senior Vice President and Chief Investment Officer, ReliaStar Financial Corp., January 1998 to September 2000. | |
|
Jeffery M. Wilson,
U.S. Bancorp Asset
Management, Inc.
800 Nicollet Mall,
Minneapolis, MN 55402
(1956) * | | Vice President - Administration | | Re-elected by the Board annually; Vice President – Administration of FAIF since March 2000 | | Senior Vice President of U.S. Bancorp Asset Management, Inc. since May 2001; prior thereto, Senior Vice President of First American Asset Management. | |
|
Joseph M. Ulrey III,
U.S. Bancorp Asset
Management, Inc.
800 Nicollet Mall,
Minneapolis, MN 55402
(1958) * | | Treasurer | | Re-elected by the Board annually; Treasurer of FAIF since December 2003 | | Chief Financial Officer since September 2004 and Senior Managing Director, Fund Treasury, since December 2003; Senior Managing Director, Risk Management and Quantitative Analysis, since May 2001, U.S. Bancorp Asset Management, Inc. ("USBAM"); from May 2001 through December 2001, Senior Managing Director, Securities Lending and Money Market Funds, USBAM; prior thereto, Senior Managing Director, Securities Lending and Money Market Funds, First American Asset Management. | |
|
Douglas A. Paul,
U.S. Bancorp Asset
Management, Inc.
800 Nicollet Mall,
Minneapolis, MN 55402
(1947)* | | Chief Compliance Officer | | Re-elected by the Board annually; Chief Compliance Officer of FAIF since June 2004 | | Chief Compliance Officer of U.S. Bancorp Asset Management, Inc. since June 2004; prior thereto, Partner, Kirkpatrick & Lockhart LLP since March 2000; prior thereto, Director of Compliance, Associate General Counsel, Vice President, American Century Investments. | |
|
Kathleen L. Prudhomme,
U.S. Bancorp Asset
Management, Inc.
800 Nicollet Mall,
Minneapolis, MN 55402
(1953)* | | Assistant Secretary | | Re-elected by the Board annually; Assistant Secretary of FAIF since September 1998 | | Deputy General Counsel, U.S. Bancorp Asset Management, Inc. since November 2004; prior thereto, Partner, Dorsey & Whitney LLP, a Minneapolis-based law firm. | |
|
James D. Alt,
50 South Sixth Street,
Suite 1500,
Minneapolis, MN 55402
(1951) | | Secretary | | Re-elected by the Board annually; Assistant Secretary of FAIF from September 1998 through June 2002. Secretary of FAIF since June 2002 | | Partner, Dorsey & Whitney LLP, a Minneapolis-based law firm. | |
|
Michael J. Radmer,
50 South Sixth Street,
Suite 1500,
Minneapolis, MN 55402
(1945) | | Assistant Secretary | | Re-elected by the Board annually; Assistant Secretary of FAIF since March 2000; Secretary of FAIF from September 1999 through March 2000 | | Partner, Dorsey & Whitney LLP, a Minneapolis-based law firm. | |
|
James R. Arnold,
615 E. Michigan Street,
Milwaukee, WI 53202
(1957) * | | Assistant Secretary | | Re-elected by the Board annually; Assistant Secretary of FAIF since June 2003 | | Vice President, U.S. Bancorp Fund Services, LLC since March 2002; Senior Administration Services Manager, UMB Fund Services, Inc. through March 2002. | |
|
FIRST AMERICAN FUNDS Annual Report 2004
63
NOTICE TO SHAREHOLDERS September 30, 2004 (unaudited)
Officers - continued
Position(s)
Name, Address, and
Year of Birth | | Term of Office
Held
with Fund | | and Length of
Time Served | | Principal Occupation(s) During Past 5 Years | |
Douglas G. Hess,
615 E. Michigan Street,
Milwaukee, WI 53202
(1967) * | | Assistant Secretary | | Re-elected by the Board annually; Assistant Secretary of FAIF since September 2001 | | Vice President, U.S. Bancorp Fund Services, LLC. | |
|
* Messrs. Schreier, Jordahl, Wilson, Ulrey, Paul and Ms. Prudhomme are each officers of U.S. Bancorp Asset Management, Inc., which serves as investment adviser and co-administrator for FAIF. Messrs. Hess and Arnold are officers of U.S. Bancorp Fund Services, LLC, which is a subsidiary of U.S. Bancorp and which serves as co-administrator for FAIF.
FIRST AMERICAN FUNDS Annual Report 2004
64
Board of Directors First American Investment Funds, Inc.
Virginia Stringer
Chairperson of First American Investment Funds, Inc.
Owner and President of Strategic Management Resources, Inc.
Benjamin Field III
Director of First American Investment Funds, Inc.
Senior Financial Advisor to, and formerly Senior Vice President, Chief Financial Officer, and Treasurer of, Bemis Company, Inc.
Mickey Foret
Director of First American Investment Funds, Inc.
Consultant to, and formerly Executive Vice President and Chief Financial Officer of, Northwest Airlines, Inc.
Roger Gibson
Director of First American Investment Funds, Inc.
Retired; former Vice President of Cargo-United Airlines
Victoria Herget
Director of First American Investment Funds, Inc.
Investment Consultant; former Managing Director of Zurich Scudder Investments
Leonard Kedrowski
Director of First American Investment Funds, Inc.
Owner and President of Executive and Management Consulting, Inc.
Richard Riederer
Director of First American Investment Funds, Inc.
Retired; former President and Chief Executive Officer of Weirton Steel
Joseph Strauss
Director of First American Investment Funds, Inc.
Owner and President of Strauss Management Company
James Wade
Director of First American Investment Funds, Inc.
Owner and President of Jim Wade Homes
First American Investment Funds’ Board of Directors is comprised entirely of independent directors.

Direct fund correspondence to:
First American Funds
P.O. Box 1330
Minneapolis, MN 55440-1330
This report and the financial statements contained herein are not intended to be a forecast of future events, a guarantee of future results, or investment advice. Further, there is no assurance that certain securities will remain in or out of each fund’s portfolio. The views expressed in this report reflect those of the portfolio managers only through the period ended September 30, 2004. The portfolio managers’ views are subject to change at any time based upon market or other conditions.
This report is for the information of shareholders of the First American Investment Funds, Inc. It may also be used as sales literature when preceded or accompanied by a current prospectus, which contains information concerning investment objectives, risks, and charges and expenses of the Funds. Read the prospectus carefully before investing.
The figures in this report represent past performance and do not guarantee future results. The principal value of an investment and investment return will fluctuate so that an investor’s shares, when redeemed, may be worth more or less than their original cost.
INVESTMENT ADVISOR
U.S. Bancorp Asset Management, Inc.
800 Nicollet Mall
Minneapolis, Minnesota 55402
CO-ADMINISTRATORS
U.S. Bancorp Asset Management, Inc.
800 Nicollet Mall
Minneapolis, Minnesota 55402
U.S. Bancorp Fund Services, LLC
615 East Michigan Street
Milwaukee, Wisconsin 53202
CUSTODIAN
U.S. Bank National Association
180 East Fifth Street
St. Paul, Minnesota 55101
DISTRIBUTOR
Quasar Distributors, LLC
615 East Michigan Street
Milwaukee, Wisconsin 53202
INDEPENDENT REGISTERED PUBLIC ACCOUNTING FIRM
Ernst & Young LLP
220 South Sixth Street
Suite 1400
Minneapolis, Minnesota 55402
COUNSEL
Dorsey & Whitney LLP
50 South Sixth Street
Suite 1500
Minneapolis, Minnesota 55402
First American Funds
P.O. Box 1330
Minneapolis, MN 55440-1330
In an attempt to reduce shareholder costs and help eliminate duplication, First American Funds will try to limit their mailing to one report for each address that lists one or more shareholders with the same last name. If you would like additional copies, please call First American Investor Services at 800.677.FUND or visit firstamericanfunds.com.
0387-04 11/2004 AR-INDEX
Item 2—Code of Ethics - - Did registrant adopt a code of ethics, as of the end of the period covered by this report, that applies to the registrant’s principal executive officer, principal financial officer, principal accounting officer or controller, or persons performing similar functions, regardless of whether these individuals are employed by the registrant or a third party? If not, why not? Briefly describe any amendments or waivers that occurred during the period. State here if code of ethics/amendments/waivers are on website and give website address. State here if fund will send code of ethics to shareholders without charge upon request.
Response: The registrant has adopted a code of ethics (designated as the “Code of Ethical Conduct”) that applies to its principal executive officer and principal financial officer. The registrant undertakes to furnish a copy of such Code of Ethical Conduct to any person upon request, without charge, by calling 1-800-677-3863.
Item 3—Audit Committee Financial Expert - Did the registrant’s board of directors determine that the registrant either: (i) has at least one audit committee financial expert serving on its audit committee; or (ii) does not have an audit committee financial expert serving on its audit committee? If yes, disclose name of financial expert and whether he/she is “independent,” (fund may, but is not required, to disclose name/independence of more than one financial expert) If no, explain why not.
Response: The registrant’s Board of Directors has determined that Leonard Kedrowski, Benjamin Field, and Mickey Foret, members of the registrant’s Audit Committee, are each an “audit committee financial expert” and are “independent,” as these terms are defined in this Item. This designation will not increase the designees’ duties, obligations or liability as compared to their duties, obligations and liability as members of the Audit Committee and of the Board of Directors.
Item 4—Principal Accountant Fees and Services – Only disclosed annually.
(a) Audit Fees - Disclose aggregate fees billed for each of the last two fiscal years for professional services rendered by the principal accountant for the audit of the registrant’s annual financial statements or services that are normally provided by the accountant in connection with statutory and regulatory filings or engagements for those fiscal years.
Response: Ernst & Young LLP (“E&Y”) billed the registrant audit fees totaling $391,795 in the fiscal year ended September 30, 2004 and $312,163 in the fiscal year ended September 30, 2003, including fees associated with the annual audit, SEC Rule 17f-2 security count filings and filings of the registrant’s Form NCSR.
(b) Audit-Related Fees - - Disclose aggregate fees billed in each of the last two fiscal years for assurance and related services by the principal accountant that are reasonably related to the performance of the audit of the registrant’s financial statements and are not reported under paragraph (a) of this Item. Registrants shall describe the nature of the services comprising the fees disclosed under this category.
Response: Ernst & Young LLP (“E&Y”) billed the registrant audit-related fees totaling $36,134 in the fiscal year ended September 30, 2004 and $0 in the fiscal year ended September 30, 2003, for professional services associated with .
(c) Tax Fees - Disclose aggregate fees billed in each of the last two fiscal years for professional services rendered by the principal accountant for tax compliance, tax advice, and tax planning. Registrants shall describe the nature of the services comprising the fees disclosed under this category.
Response: E&Y billed the registrant fees of $115,034 in the fiscal year ended September 30, 2004 and $129,482 in the fiscal year ended September 30, 2003 for tax services, including tax compliance, tax advice and tax planning. Tax compliance, tax advice and tax planning services primarily relate to preparation of original and amended tax returns, timely RIC qualification reviews, and tax distribution analysis and planning.
(d) All Other Fees - Disclose aggregate fees billed in each of the last two fiscal years for products and services provided by the principal accountant, other than the services reported in paragraphs (a) through (c) of this Item. Registrants shall describe the nature of the services comprising the fees disclosed under this category.
Response: There were no fees billed by E&Y for other services to the registrant during the fiscal years ended September 30, 2003 and 2004.
(e)(1) Disclose the audit committee’s pre-approval policies and procedures pursuant to paragraph (c)(7) of Rule 2-01 of Regulation S-X.
Response: Set forth below are the audit committee’s pre-approval policies and procedures pursuant to paragraph (c)(7) of Rule 2-01 of Regulation S-X:
Audit Committee policy regarding pre-approval of services provided by the Independent Auditor
The Audit Committee of the First American Funds has responsibility for ensuring that all services performed by the independent audit firm for the funds do not impair the firm’s independence. This review is intended to provide reasonable oversight without removing management from its responsibility for day-to-day operations. In this regard, the Audit Committee should:
• Understand the nature of the professional services expected to be provided and their impact on auditor independence and audit quality
• Examine and evaluate the safeguards put into place by the Company and the auditor to safeguard independence
• Meet quarterly with the partner of the independent audit firm
• Consider approving categories of service that are not deemed to impair independence for a one-year period
It is important that a qualitative rather than a mere quantitative evaluation be performed by the Committee in discharging its responsibilities.
Policy for Audit and Non-Audit Services Provided to the Funds
On an annual basis, the Audit Committee of the First American Funds (“Committee”) will review and consider whether to pre-approve the financial plan for audit fees as well as categories of audit-related and non-audit services that may be performed by the Fund’s independent audit firm directly for the Funds. At least annually the Committee will receive a report from the independent audit firm of all audit and non-audit services, which were approved during the year.
The engagement of the independent audit firm for any non-audit service requires the written pre-approval of the Treasurer of the Funds and all non-audit services performed by the independent audit firm will be disclosed in the required SEC periodic filings.
In connection with the Audit Committee review and pre-approval responsibilities, the review by the Audit Committee will consist of the following:
Audit Services
The categories of audit services and related fees to be reviewed and considered for pre-approval annually by the Committee or its delegate include the following:
• Annual Fund financial statement audits
• Seed audits (related to new product filings, as required)
• SEC and regulatory filings and consents
Audit-related Services
In addition, the following categories of audit-related services are deemed to be consistent with the role of the independent firm and, as such, will be considered for pre-approval by the Committee or its delegate, on an annual basis.
• Accounting consultations
• Fund merger support services
• Other accounting related matters
• Agreed Upon Procedure Reports
• Attestation Reports
• Other Internal Control Reports
Notwithstanding any annual pre-approval of these categories of services, individual projects with an estimated fee in excess of $25,000 are subject to pre-approval by the Audit Committee Chair or its delegate on a case-by-case basis. Individual projects with an estimated fee in excess of $50,000 are subject to pre-approval by the Audit Committee or its delegate on a case-by-case basis.
Tax Services
The following categories of tax services are deemed to be consistent with the role of the independent audit firm and, as such, will be considered for pre-approval by the Committee or its delegate, on an annual basis.
• Tax compliance services related to the filing or amendment of the following:
• Federal, state and local income tax compliance, and
• Sales and use tax compliance
• Timely RIC qualification reviews
• Tax distribution analysis and planning
• Tax authority examination services
• Tax appeals support services
• Accounting methods studies
• Fund merger support services
• Tax consulting services and related projects
Notwithstanding any annual pre-approval of these categories of services, individual projects with an estimated fee in excess of $25,000 are subject to pre-approval by the Audit Committee Chair or its delegate on a case-by-case basis. Individual projects
with an estimated fee in excess of $50,000 are subject to pre-approval by the Audit Committee or its delegate on a case-by-case basis.
Other Non-audit Services
The SEC auditor independence rules adopted in response to the Sarbanes-Oxley Act specifically allow certain non-audit services. Because of the nature of these services, none of these services may be commenced by the independent firm without the prior approval of the Audit Committee. The Committee may delegate this responsibility to one or more of the Committee members, with the decisions presented to the full Committee at the next scheduled meeting.
Proscribed Services
In accordance with SEC rules on independence, the independent audit firm is prohibited from performing services in the following categories of non-audit services:
• Management functions
• Accounting and bookkeeping services
• Internal audit services
• Financial information systems design and implementation
• Valuation services supporting the financial statements
• Actuarial services supporting the financial statements
• Executive recruitment
• Expert services (e.g., litigation support)
• Investment banking
Policy for Pre-approval of Non-Audit Services Provided to Other Entities within the Investment Company Complex
The Audit Committee of the First American Funds is also responsible for pre-approving certain non-audit services provided to U.S. Bancorp Asset Management, U.S. Bank N.A., Quasar Distributors, U.S. Bancorp Fund Services, LLC and any other entity under common control with U.S. Bancorp Asset Management that provides ongoing services to the Funds. The only non-audit services provided to these entities which require pre-approval are those services that relate directly to the operations and financial reporting of the Funds.
Although the Audit Committee is not required to pre-approve all services provided to U.S. Bancorp Asset Management and affiliated service providers, the Audit Committee will annually receive a report from the independent audit firm on the aggregate fees for all services provided to U.S. Bancorp and affiliates.
(e)(2) Disclose the percentage of services described in each of paragraphs (b) through (d) of this Item that were approved by the audit committee pursuant to paragraph (c)(7)(i)(C) of Rule 2-01 of Regulation S-X.
Response: All of the services described in paragraphs (b) through (d) of Item 4 that were provided to the registrant on or after May 6, 2003, the effective date of SEC rules relating to the pre-approval of non-audit services, were pre-approved by the audit committee.
(f) If greater than 50%, disclose the percentage of hours expended on the principal accountant’s engagement to audit the registrant’s financial statements for the most recent fiscal year that were attributed to work performed by persons other than the principal accountant’s full-time, permanent employees.
Response: All services performed on the engagement to audit the registrant’s financial statements for the most recent fiscal year end were performed by the principal accountant’s full-time, permanent employees.
(g) Disclose the aggregate non-audit fees billed by the registrant’s accountant for services rendered to the registrant, and rendered to the registrant’s investment adviser (not including any sub-adviser whose role is primarily portfolio management and is subcontracted with or overseen by another investment adviser), and any entity controlling, controlled by, or under common control with the adviser that provides ongoing services to the registrant for each of the last two fiscal years of the registrant.
Response: The aggregate non-audit fees billed by E&Y to the registrant, the registrant’s investment adviser (not including any sub-adviser whose role is primarily portfolio management and is subcontracted with or overseen by another investment adviser), and any entity controlling, controlled by, or under common control with the adviser that provides ongoing services to the registrant, totaled $181,918 in the fiscal year ended September 30, 2004 and $261,682 in the fiscal year ended September 30, 2003, including services provided prior to May 6, 2003, the effective date of SEC rules relating to the pre-approval of non-audit services.
(h) Disclose whether the registrant’s audit committee has considered whether the provision of non-audit services that were rendered to the registrant’s investment adviser (not including any Subadvisor whose role is primarily portfolio management and is subcontracted with or overseen by another investment adviser), and any entity
controlling, controlled by, or under common control with the investment adviser that provides ongoing services to the registrant that were not pre-approved pursuant to paragraph (c)(7)(ii) of Rule 2-01 of Regulation S-X is compatible with maintaining the principal accountant’s independence.
Response: The registrant’s audit committee has determined that the provision of non-audit services to the registrant’s investment adviser, and any entity controlling, controlled by, or under common control with the investment adviser that provides ongoing services to the registrant, that were not pre-approved and that were rendered on or after May 6, 2003 (the effective date of SEC rules relating to the pre-approval of non-audit services), is compatible with maintaining E&Y’s independence.
Item 5—Audit Committee of Listed Registrants
(a) If the registrant is a listed issuer as defined in Rule 10A-3 under the Exchange Act (17 CFR 240.10A-3), state whether or not the registrant has a separately-designated standing audit committee established in accordance with Section 3(a)(58)(A) of the Exchange Act (15 U.S.C. 78c(a)(58)(A)). If the registrant has such a committee, however designated, identify each committee member. If the entire board of directors is acting as the registrant’s audit committee as specified in Section 3(a)(58)(B) of the Exchange Act (15 U.S.C. 78c(a)(58)(B)), so state.
(b) If applicable, provide the disclosure required by Rule 10A-3(d) under the Exchange Act (17 CFR 240.10A-3(d)) regarding an exemption from the listing standards for audit committees.
Response: Not applicable. Registrant is not a listed issuer.
Item 6—Schedule of Investments (applicable for periods ending on or after July 9, 2004) – File Schedule I – Investments in securities of unaffiliated issuers as of the close of the reporting period as set forth in Section 210.12-12 of Regulation S-X [17 CFR 210.12-12], unless the schedule is included as part of the report to shareholders filed under Item 1 of this Form.
Response: The schedule is included as part of the report to shareholders filed under Item 1 of this Form.
Item 7—Disclosure of Proxy Voting Policies and Procedures for Closed-End Management Investment Companies - For closed-end funds that contain voting securities in their portfolio, describe the policies and procedures that it uses to determine how to vote proxies relating to those portfolio securities.
Response: Not applicable
Item 8—Portfolio Managers of Closed-End Management Investment Companies.
(a) If the registrant is a closed-end management investment company that is filing an annual report on this Form N-CSR, provide the following information:
(1) State the name, title, and length of service of the person or persons employed by or associated with the registrant or an investment advisor of the registrant who are primarily responsible for the day-to-day management of the registrant’s portfolio (“Portfolio Manager”). Also state each Portfolio Manager’s business experience during the past 5 years.
(2) If a Portfolio Manager required to be identified in response to paragraph (a) (1) of this Item is primarily responsible for the day-to-day management of the portfolio of any other account, provided the following information:
(i) The Portfolio Manager’s name;
(ii) The number of other accounts managed within each of the following categories and the total assets in the account managed within each category:
(A) Registered investment companies;
(B) Other pooled investment vehicles; and
(C) Other accounts.
(iii) For each of the categories in paragraph (a) (2) (ii) of this Item, the number of accounts and the total assets in the accounts with respect to which the advisory fee is based on the performance of the account; and
(iv) A description of any material conflicts of interest that may arise in connection with the Portfolio Manager’s management of the registrant’s investments, on the one hand, and the investments of the other accounts included in response to paragraph (a) (2) (ii) of this Item, on the other. This description would include, for example, material conflicts between the investment strategy of the registrant and the investment strategy of other accounts managed by the Portfolio Manager and material conflicts in allocation of investment opportunities between the registrant and other accounts managed by the Portfolio Manager.
(3) Described the structure of, and the method used to determine, the compensation of each Portfolio Manager required to be identified in response to paragraph (a) (1) of this Item. For each type of compensation (e.g., salary, bonus, deferred compensation, retirement plans and arrangements), describe with specificity the criteria on which the type of compensation is based, for example, whether compensation is fixed, whether (and, if so, how) compensation is based on the registrant’s pre- or aftertax performance over a certain time period, and whether (and, if so, how) compensation is based on the value of assets held in the registrant’s portfolio. For example, if compensaton is based solely or in part on performance, identify any benchmark used
to measure performance and state the length of the period over which performance is measured.
(4) For each Portfolio Manager required to be identified in response to paragraph (a) (1) of this Item, state the dollar range of equity securities in the registrant beneficially owned by the Portfolio Manager using the following ranges: none, $1-$10,000, $10,001-$50,000, $50,001-$100,000, $100,001-$500,000, $500,001-$1,000,000, or over $1,000,000.
(b) If the registrant is a closed-end management investment company that is filing a report on this Form N-CSR other than an annual report, disclose any change, as of the date of filing, in any of the Portfolio Managers identified in response to paragraph (a) (1) of this Item in the registrant’s most recent annual report on Form N-CSR. In addition, for any newly identified Portfolio Manager, provided the information required by paragraph (a) (1) of this Item as the date of filing of the report and the information required by paragraphs (a) (2), (a) (3), and (a) (4) of this Item as of the most recent practicable date.
Response: Not applicable
Item 9—Purchases of Equity Securities by Closed-End Management Investment Company and Affiliated Purchasers
(a) If the registrant is a closed-end management investment company, in the following tabular format, provide the information specified in paragraph (b) of this Item with respect to any purchase made by or on behalf of the registrant or any “affiliated purchaser,” as defined in Rule 10b-18(a)(3) under the Exchange Act (17 CFR 240.10b-18(a)(3)), of shares or other units of any class of the registrant’s equity securities that is registered pursuant to Section 12 of the Exchange Act (15 U.S.C. 781).
Registrant Purchases of Equity Securities
Period (identify
beginning and
ending dates for
each Month) | | (a) Total Number
of Shares (or
Units) Purchased | | (b) Average Price
Paid per Share
(or Unit) | | (c) Total Number
of Shares (or Units)
Purchased as Part of
Publicly Announced
Plans or Programs | | (d) Maximum Number
(or Approximate
Dollar Value) of
Shares (or Units) that
May Yet Be Purchased
Under the Plans or
Programs | |
Month #1 | | | | | | | | | |
Month #2 | | | | | | | | | |
Month #3 | | | | | | | | | |
Month #4 | | | | | | | | | |
Month #5 | | | | | | | | | |
Month #6 | | | | | | | | | |
Month #7 | | | | | | | | | |
Total | | | | | | | | | |
(b) The table shall include the following information for each class of securities for each month included in the period covered by the report:
(1) The total number of shares (or units) purchased (column (a));
(2) The average price paid per share (or unit) (column (b));
(3) The number of shares (or units) purchased as part of publicly announced repurchase plans or programs (column (c)); and
(4) The maximum number (or approximate dollar value) of shares (or units) that may yet be purchased under the plans or programs (column (d)).
Response: Not applicable
Item 10—Submission of Matters to a Vote of Security Holders – Describe any material changes to the procedures by which shareholders may recommend nominees to the registrant’s board of directors, where those changes were implemented after the registrant last provided disclosure in response to the requirements of Item 7(d)(2)(ii)(G) of Schedule 14A (17 CFR 240.14a-101), or this Item.
Response: There have been no material changes to the procedures by which shareholders may recommend nominees to the registrant’s board of directors, where those changes were implemented after the registrant last provided disclosure in response to the requirements of Item 7(d)(2)(ii)(G) of Schedule 14A (17 CFR 240.14a-101), or this item.
Item 11—Controls and Procedures
(a) Disclose the conclusions of the registrant’s principal executive officer or officers and principal financial officer or officers, or persons performing similar functions, about the effectiveness of the registrant’s disclosure controls and procedures (as defined in Rule 30a-3(c) under the Act (17 CFR 270.30a-3(c))) based on their evaluation of these controls and procedures as of a date within 90 days of the filing date of the report that includes the disclosure required by this paragraph.
Response: The registrant’s Principal Executive Officer and Principal Financial Officer have evaluated the registrant’s disclosure controls and procedures within 90 days of the date of this filing and have concluded that the registrant’s disclosure controls and procedures were effective, as of that date, in ensuring that information required to be disclosed by the registrant in this Form N-CSR was recorded, processed, summarized and reported timely.
(b) Disclose any change in the registrant’s internal control over financial reporting (as defined in Rule 30a-3(c) under the Act (17 CFR 270.30a-3(c))) that occurred during the registrant’s last fiscal half-year (the registrant’s second fiscal half-year in the case of an annual report) that has materially affected, or is reasonably likely to materially affect, the registrant’s internal control over financial reporting.
Response: There were no changes in the registrant’s internal control over financial reporting that occurred during the registrant’s most recent fiscal half-year that have materially affected, or are reasonably likely to materially affect, the registrant’s internal control over financial reporting.
Item 12 — Exhibits
11(a) - Attach code of ethics or amendments/waivers, unless code of ethics or amendments/waivers is on website or offered to shareholders upon request without charge.
Response: This code of ethics is offered to shareholders upon request without charge.
11(b) - Attach certifications (4 in total pursuant to Sections 302 and 906 for PEO/PFO).
Response: Attached hereto.
Signatures
Pursuant to the requirements of the Securities Exchange Act of 1934 and the Investment Company Act of 1940, the registrant has duly caused this report to be signed on its behalf by the undersigned, thereunto duly authorized.
First American Investment Funds, Inc.
By: |
| /s/ Thomas S. Schreier, Jr. | |
| Thomas S. Schreier, Jr. |
| President |
Date: December 9, 2004
Pursuant to the requirements of the Securities Exchange Act of 1934 and the Investment Company Act of 1940, this report has been signed below by the following persons on behalf of the registrant and in the capacities and on the dates indicated.
By: |
| /s/ Thomas S. Schreier, Jr. | |
| Thomas S. Schreier, Jr. |
| President |
Date: December 9, 2004
By: |
| /s/ Charles D. Gariboldi | |
| |
| Charles D. Gariboldi |
| Treasurer |
Date: December 9, 2004