| | OMB APPROVAL |
| | OMB Number: 3235-0570 |
| | Expires: November 30, 2005 |
| | Estimated average burden
hours per response. . . . 5.0 |
UNITED STATES
SECURITIES AND EXCHANGE COMMISSION
Washington, D.C. 20549
FORM N-CSR
CERTIFIED SHAREHOLDER REPORT OF REGISTERED
MANAGEMENT INVESTMENT COMPANIES
Investment Company Act file number 811-05309
First American Investment Funds, Inc.
(Exact name of registrant as specified in charter)
800 Nicollet Mall, Minneapolis, MN | | 55402 |
(Address of principal executive offices) | | (Zip code) |
Charles D. Gariboldi 800 Nicollet Mall, Minneapolis, MN 55402
(Name and address of agent for service)
Registrant’s telephone number, including area code: 800-677-3863
Date of fiscal year end: September 30
Date of reporting period: September 30, 2004
Form N-CSR is to be used by management investment companies to file reports with the Commission not later than 10 days after the transmission to stockholders of any report that is required to be transmitted to stockholders under Rule 30e-1 under the Investment Company Act of 1940 (17 CFR 270.30e-1). The Commission may use the information provided on Form N-CSR in its regulatory, disclosure review, inspection, and policymaking roles.
A registrant is required to disclose the information specified by Form N-CSR, and the Commission will make this information public. A registrant is not required to respond to the collection of information contained in Form N-CSR unless the Form displays a currently valid Office of Management and Budget (“OMB”) control number. Please direct comments concerning the accuracy of the information collection burden estimate and any suggestions for reducing the burden to Secretary, Securities and Exchange Commission, 450 Fifth Street, NW, Washington, DC 20549-0609. The OMB has reviewed this collection of information under the clearance requirements of 44 U.S.C. Section 3507.
Item 1. Report to Shareholders

| 2004
Annual Report |
| |
| INCOME
FUNDS |
First American Income Funds
First American Income Funds are comprised of taxable bonds, which are debt obligations issued by a government, federal agency, or corporation to raise money. Investors lend money to the issuer until the bond matures and, in exchange, receive regular interest payments at a predetermined rate. Income funds generate income that is normally subject to federal, state, and local taxes.
TABLE OF CONTENTS
Message to Shareholders | |
Report of Independent Registered Public Accounting Firm | |
Schedule of Investments | |
Statements of Assets and Liabilities | |
Statements of Operations | |
Statements of Changes in Net Assets | |
Financial Highlights | |
Notes to Financial Statements | |
Notice to Shareholders | |
Mutual fund investing involves risk; principal loss is possible. |
| |
NOT FDIC INSURED NO BANK GUARANTEE MAY LOSE VALUE |
Message to SHAREHOLDERS November 15, 2004
Dear Shareholders:
We invite you to take a few minutes to review the results of the fiscal year ended September 30, 2004.
This report includes comparative performance graphs and tables, portfolio commentaries, complete listings of portfolio holdings, and additional fund information. We hope you will find this helpful in monitoring your investment portfolio.
Also, through our website, firstamericanfunds.com, we provide quarterly performance fact sheets on all First American funds, the economic outlook as viewed by our senior investment officers, and other information about fund investments and portfolio strategies.
Please contact your financial professional if you have questions about First American Funds or contact First American Investor Services at 800.677.FUND.
We appreciate your investment with First American Funds and look forward to serving your financial needs in the future.
Sincerely,
/s/ Virginia L. Stringer | | /s/ Thomas S. Schreier | |
Virginia L. Stringer | Thomas S. Schreier, Jr. |
Chairperson of the Board | President |
First American Investment Funds, Inc. | First American Investment Funds, Inc. |
1
Core Bond fund
Investment Objective: high current income consistent with limited risk to capital
How did the Fund perform for the fiscal year ended September 30, 2004?
The First American Core Bond Fund, Class Y shares, returned 2.87% for the fiscal year ended September 30, 2004 (Class A shares returned 2.60% at net asset value). By comparison, the Fund's benchmark, the Lehman Aggregate Bond Index*, returned 3.68% for the same period.
How did general economic and market conditions affect performance?
During the past year, we saw an improving economic environment that featured strong gains in productivity, and a significant rise in corporate profits. Sharp gains in payrolls from March through May 2004, along with higher inflation during the early months of the year, led the Federal Reserve to increase its target interest rate.
However, in spite of three 25-basis-point increases in the Federal Funds rate, long-term rates actually fell during the summer. Rapidly rising oil prices and heightened
geo-political uncertainty fueled fears of slower economic growth, which in turn pushed intermediate rates down by nearly 75 basis points.
During the course of the fiscal year, longer-term interest rates were nearly unchanged while short-term rates were 1% higher. This stability in longer-term rates resulted in fixed-income returns that were much better than those experienced in previous Fed tightening cycles.
What worked for the Fund and why?
The Fund was overweight relative to its benchmark in BBB-rated securities and asset-backed securities, both of which performed very well over the fiscal year. The Fund also benefited from tactical trading (short-term trading) of Treasury Inflation Protected Securities, which offered value at various points during the fiscal year. The Fund
was also positioned to benefit from a flatter yield curve as we built a substantial position in high-quality, one-year adjustable rate mortgages that boosted portfolio income with minor price volatility. As short-term interest rates rose throughout the year, the reset feature of the adjustable rate mortgages was advantageous in generating income.
What did not work for the Fund and why?
While our economic growth forecasts and predictions of Fed tightening were fairly accurate, we underestimated the extent, and perceived economic impact of the rise in crude oil prices in mid-2004. Concurrent with the onset of Fed tightening, we became overly defensive with our interest-rate strategy during a period of falling rates. As a result, while absolute returns were much better than we expected, the portfolio lagged the benchmark during the latter part of the fiscal year.
What strategic moves were made by the Fund and why?
We believe that the economy will continue to expand and inflationary pressures will mount, putting additional upward pressure on interest rates. Accordingly, the Fund's duration is shorter relative to the benchmark and we maintain a significant curve flattening strategy (underweighting intermediate-term securities within this Fund).
We continue to believe that there is upside potential in lower-rated investment-grade credit and are overweight in the BBB credit quality sector as credit fundamentals appear solid.
*Unlike mutual funds, index returns do not reflect any expenses, transaction costs, or cash flow effects.
Portfolio Allocation as of September 30, 20041 (% of net assets)
| Mortgage Backed | | | 43.6 | % | |
| Corporate Bond | | | 19.5 | % | |
| Asset Backed | | | 18.0 | % | |
| U.S. Government Agency | | | 17.4 | % | |
| Cash Equivalents | | | 2.4 | % | |
| General Obligations | | | 1.6 | % | |
| U.S. Treasury | | | 0.1 | % | |
Credit Quality Distribution as of September 30, 20042 (% of net assets)
| AAA/Aaa | | | 79.5 | % | |
| AA/Aa | | | 1.3 | % | |
| A | | | 4.5 | % | |
| BBB/Baa | | | 13.5 | % | |
| Nonrated | | | 1.2 | % | |
1Portfolio allocations are subject to change and are not recommendations to buy or sell any security.
2The ratings in the above table reflect either the only rating provided by Standard and Poor's or Moody's, or the highest rating provided by the respective rating agency.
Standard and Poor's and Moody's are nationally recognized independent rating agencies for bonds.
FIRST AMERICAN FUNDS Annual Report 2004
2
Core Bond fund continued
Annualized Performance1 as of September 30, 2004
| | | | | | | | | Since Inception | |
| | | 1 year | | 5 years | | 10 years | | 2/1/1999 | | 9/24/2001 | |
| Average annual return with sales charge (POP) | | | |
| Class A | | | (1.73 | %) | | | 5.49 | % | | | 6.19 | % | | | - | | | | - | | |
| Class B | | | (3.05 | %) | | | 5.32 | % | | | 5.86 | % | | | - | | | | - | | |
| Class C | | | 0.83 | % | | | 5.61 | % | | | - | | | | 4.42 | % | | | - | | |
| Average annual return without sales charge (NAV) | | | |
| Class A | | | 2.60 | % | | | 6.41 | % | | | 6.66 | % | | | - | | | | - | | |
| Class B | | | 1.83 | % | | | 5.64 | % | | | 5.86 | % | | | - | | | | - | | |
| Class C | | | 1.81 | % | | | 5.61 | % | | | - | | | | 4.42 | % | | | - | | |
| Class R4 | | | 2.53 | % | | | - | | | | - | | | | - | | | | 4.70 | % | |
| Class Y | | | 2.87 | % | | | 6.67 | % | | | 6.91 | % | | | - | | | | - | | |
| Lehman Aggregate Bond Index3 | | | 3.68 | % | | | 7.48 | % | | | 7.66 | % | | | 6.38 | % | | | 6.07 | % | |
Value of $10,000 Investment1, 2 as of September 30, 2004
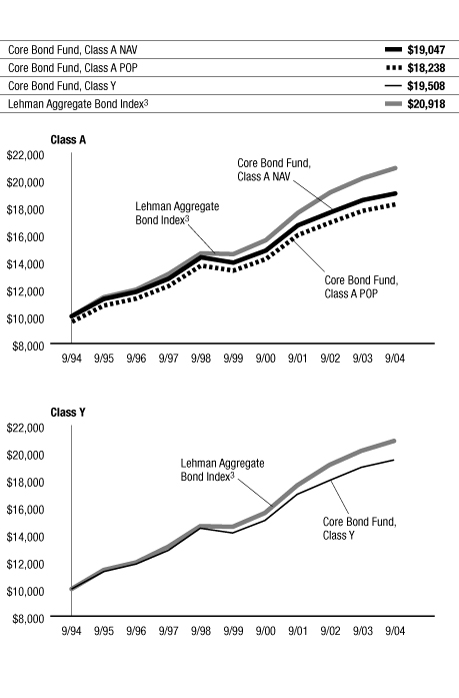
The performance data quoted on this page represents past performance and does not guarantee future results. The investment return and principal value of an investment will fluctuate so that an investor's shares, when redeemed, may be worth more or less than their original cost. Current performance of the Fund may be lower or higher than the performance data quoted. Performance data current to the most recent month-end may be obtained by calling 800.677.FUND.
1 Performance does not reflect the deduction of taxes that a shareholder would pay on fund distributions or redemption of fund shares. Performance reflects voluntary fee waivers in effect. In the absence of such fee waivers, total returns would be reduced. Index performance is for illustrative purposes only, does not reflect any expenses, transaction costs, or cash flow effects, and is not available for investment.
Total returns at net asset value ("NAV") reflect performance over the time period indicated without including the Fund's maximum sales charge and assume reinvestment of all distributions at NAV.
Total returns at public offering price ("POP") reflect performance over the time period indicated including maximum sales charges of 4.25% for Class A shares and the maximum contingent deferred sales charge ("CDSC") for Class B and Class C shares for the relevant period. Maximum CDSC is 5.00% for Class B shares, decreasing annually to 0% in the seventh year following purchase, and 1.00% for Class C shares. Total returns assume reinvestment of all distributions at NAV.
Investments in debt securities typically decrease in value when interest rates rise. This risk is usually greater for longer-term debt securities.
2 Performance for Class B, Class C, and Class R shares is not presented. Performance for these classes will vary due to different expense structures.
3 An unmanaged index comprised of the Lehman Government/Credit Bond Index, the Lehman Mortgage Backed Securities Index, and the Lehman Asset Backed Securities Index. The Lehman Government/Credit Bond Index is comprised of Treasury securities, other securities issued or guaranteed by the U.S. government or its agencies or instrumentalities, including U.S. agency mortgage securities, and investment-grade corporate debt securities. The Lehman Mortgage Backed Securities Index is comprised of the mortgage-backed pass-through securities of Ginnie Mae, Fannie Mae, and Freddie Mac. The Lehman Asset Backed Securities Index is comprised of debt securities rated investment grade or higher that are backed by credit card, auto, and home equity loans.
4 Prior to July 1, 2004, Class R shares were designated Class S shares, which had lower fees and expenses. Performance information prior to that date is based on the performance of the Class S shares. If current fees and expenses had been in effect for the entire period presented, performance would have been lower. Please refer to the prospectus for details.
FIRST AMERICAN FUNDS Annual Report 2004
3
Core Bond fund continued
Expense Example
As a shareholder of the Core Bond Fund, you incur two types of costs: (1) transaction costs, including sales charges (loads) on purchase payments; and (2) ongoing costs, including management fees; distribution and/or service (12b-1) fees; and other Fund expenses. This example is intended to help you understand your ongoing costs (in dollars) of investing in the Fund and to compare these costs with the ongoing costs of investing in other mutual funds. The example is based on an investment of $1,000 invested at the beginning of the period and held for the entire period from April 1, 2004, to September 30, 2004.
Actual Expenses
For each class, the first line of the table below provides information about actual account values and actual expenses. You may use the information in this line, together with the amount you invested, to estimate the expenses that you paid over the period. Simply divide your account value by $1,000 (for example, an $8,600 account value divided by $1,000 = 8.6), then multiply the result by the number in the first line under the heading entitled "Expenses Paid During Period" to estimate the expenses you paid on your account during this period.
Hypothetical Example for Comparison Purposes
For each class, the second line of the table below provides information about hypothetical account values and hypothetical expenses based on the Fund's actual expense ratio and an assumed rate of return of 5% per year before expenses, which is not the Fund's actual return. The hypothetical account values and expenses may not be used to estimate the actual ending account balance or expenses you paid for the period. You may use this information to compare the ongoing costs of investing in the Fund and other funds. To do so, compare this 5% hypothetical example with the 5% hypothetical examples that appear in the shareholder reports of the other funds.
Please note that the expenses shown in the table are meant to highlight your ongoing costs only and do not reflect any transactional costs, such as sales charges (loads). Therefore, the second line of the table for each class is useful in comparing ongoing costs only, and will not help you determine the relative total costs of owning different funds. In addition, if these transactional costs were included, your costs would have been higher.
Expense Examples
| | | Beginning Account
Value (4/1/2004) | | Ending Account
Value (9/30/2004) | | Expenses Paid During
Period1 (4/1/2004 to
9/30/2004) | |
| Class A Actual | | $ | 1,000.00 | | | $ | 999.30 | | | $ | 4.75 | | |
| Class A Hypothetical (5% return before expenses) | | $ | 1,000.00 | | | $ | 1,020.25 | | | $ | 4.80 | | |
| Class B Actual | | $ | 1,000.00 | | | $ | 995.50 | | | $ | 8.48 | | |
| Class B Hypothetical (5% return before expenses) | | $ | 1,000.00 | | | $ | 1,016.50 | | | $ | 8.57 | | |
| Class C Actual | | $ | 1,000.00 | | | $ | 995.50 | | | $ | 8.48 | | |
| Class C Hypothetical (5% return before expenses) | | $ | 1,000.00 | | | $ | 1,016.50 | | | $ | 8.57 | | |
| Class R Actual2 | | $ | 1,000.00 | | | $ | 998.60 | | | $ | 5.37 | | |
| Class R Hypothetical (5% return before expenses)2 | | $ | 1,000.00 | | | $ | 1,019.62 | | | $ | 5.43 | | |
| Class Y Actual | | $ | 1,000.00 | | | $ | 1,000.60 | | | $ | 3.50 | | |
| Class Y Hypothetical (5% return before expenses) | | $ | 1,000.00 | | | $ | 1,021.50 | | | $ | 3.54 | | |
1Expenses are equal to the Fund's annualized expense ratio of 0.95%, 1.70%, 1.70%, 1.08%, and 0.70% for Class A, Class B, Class C, Class R, and Class Y, respectively, mulitplied by the average account value over the period, multiplied by the number of days in the most recent half-year/366 days (to reflect the one-half year period).
2Prior to July 1, 2004, Class R had a different expense ratio. Had the current expense ratio been in place for the most recent one-half year, the actual and hypothetical expenses would have been $6.00 and $6.06, respectively.
FIRST AMERICAN FUNDS Annual Report 2004
4
Corporate Bond fund
Investment Objective: high current income consistent with prudent risk to capital
How did the Fund perform for the fiscal year ended September 30, 2004?
The First American Corporate Bond Fund, Class Y shares, returned 5.05% for the fiscal year ended September 30, 2004 (Class A shares returned 4.89% at net asset value). By comparison, the Fund's benchmark, the Lehman U.S. Credit A/Baa Bond Index*, returned 4.82% for the same period.
How did general economic and market conditions affect performance?
During the past year, we saw an improving economic environment that featured strong gains in productivity, and a significant rise in corporate profits. Sharp gains in payrolls from March through May 2004, along with higher inflation during the early months of the year, led the Federal Reserve to increase its target interest rate.
However, in spite of three 25-basis-point increases in the Federal Funds rate, long-term rates actually fell during the summer. Rapidly rising oil prices and heightened
geo-political uncertainty fueled fears of below-trend growth, which in turn pushed intermediate rates down by nearly 75 basis points.
During the course of the fiscal year, longer-term interest rates were nearly unchanged while short-term rates were 1% higher. This stability in longer-term rates resulted in fixed-income returns that were much better than those experienced in previous Fed tightening cycles.
What worked for the Fund and why?
The Fund's high-yield exposure – primarily in BBs – enhanced performance as high yield outperformed all fixed-income sectors. Average credit quality was slightly lower than the benchmark, aiding performance as lower
credit bonds outperformed. The Fund's overweight positions in utilities and autos and underweight position in banks were positive contributors to performance.
What did not work for the Fund and why?
The Fund's overweight positions in telecommunications and REITs and an underweight position in technology relative to the benchmark hurt the Fund's performance. The Fund's short duration strategy detracted from performance as long-term interest rates fell over the summer on fears of the impact of rising oil prices. Additionally, isolated event risk impacted a few holdings.
What strategic moves were made by the Fund and why?
The Fund's high-yield exposure was modestly increased during the year, as we believed that improving economic fundamentals would benefit lower rated companies. A short duration strategy was adopted given our view that low, longer-term interest rates were not reflective of the general economic conditions. We still believe that the economy will continue to expand and inflationary pressures will mount, putting additional upward pressure on interest rates. Accordingly, the Fund's duration is shorter relative to the benchmark.
The Fund continues to hold overweight positions in electric utilities, cable, and paper and underweight positions in food and beverage, banking, and technology sectors as the new fiscal year begins.
*Unlike mutual funds, index returns do not reflect any expenses, transaction costs, or cash flow effects.
Portfolio Allocation as of September 30, 20041 (% of net assets)
| Corporate Bond | | | 91.6 | % | |
| U.S. Government Agency | | | 2.7 | % | |
| Cash Equivalents | | | 2.0 | % | |
| Asset Backed | | | 1.4 | % | |
| Mortgage Backed | | | 1.0 | % | |
| Preferred Stock | | | 0.2 | % | |
| U.S. Treasury | | | 0.1 | % | |
Credit Quality Distribution as of September 30, 20042 (% of net assets)
| AAA/Aaa | | | 6.1 | % | |
| AA/Aa | | | 9.0 | % | |
| A | | | 34.4 | % | |
| BBB/Baa | | | 39.0 | % | |
| BB/Ba | | | 7.1 | % | |
| B | | | 2.5 | % | |
| Nonrated | | | 1.9 | % | |
1Portfolio allocations are subject to change and are not recommendations to buy or sell any security.
2The ratings in the above table reflect either the only rating provided by Standard and Poor's or Moody's, or the highest rating provided by the respective rating agency.
Standard and Poor's and Moody's are nationally recognized independent rating agencies for bonds.
FIRST AMERICAN FUNDS Annual Report 2004
5
Corporate Bond fund continued
Annualized Performance1 as of September 30, 2004
| | | | | Since Inception | |
| | | 1 year | | 2/1/20005 | | 9/24/20016 | |
| Average annual return with sales charge (POP) | |
| Class A | | | 0.47 | % | | | 6.48 | % | | | - | | |
| Class B | | | (1.03 | %) | | | 6.30 | % | | | - | | |
| Class C | | | 3.11 | % | | | 6.63 | % | | | - | | |
| Average annual return without sales charge (NAV) | |
| Class A | | | 4.89 | % | | | 7.47 | % | | | - | | |
| Class B | | | 3.97 | % | | | 6.64 | % | | | - | | |
| Class C | | | 4.11 | % | | | 6.63 | % | | | - | | |
| Class R4 | | | 4.82 | % | | | - | | | | 6.46 | % | |
| Class Y | | | 5.05 | % | | | 7.70 | % | | | - | | |
| Lehman U.S. Credit A/Baa Bond Index3 | | | 4.82 | % | | | 9.10 | % | | | 7.97 | % | |
Value of $10,000 Investment1, 2 as of September 30, 2004
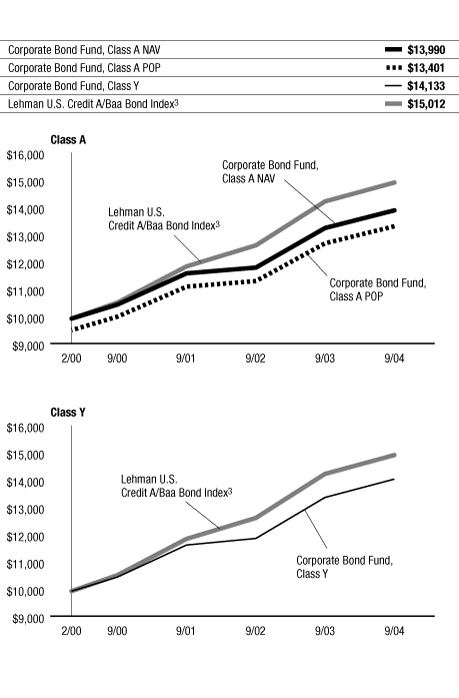
The performance data quoted on this page represents past performance and does not guarantee future results. The investment return and principal value of an investment will fluctuate so that an investor's shares, when redeemed, may be worth more or less than their original cost. Current performance of the Fund may be lower or higher than the performance data quoted. Performance data current to the most recent month-end may be obtained by calling 800.677.FUND.
1 Performance does not reflect the deduction of taxes that a shareholder would pay on fund distributions or redemption of fund shares. Performance reflects voluntary fee waivers in effect. In the absence of such fee waivers, total returns would be reduced. Index performance is for illustrative pu rposes only, does not reflect any expenses, transaction costs, or cash flow effects, and is not available for investment.
A significant portion of the Fund's portfolio may consist of lower-rated debt obligations, which are commonly called "high-yield" securities or "junk bonds." High-yield securities generally have more volatile prices and carry more risk to principal than investment-grade securities. The Fund may also invest in foreign securities. International investing involves risks not typically associated with domestic investing including risks of adverse currency fluctuations, potential political and economic instability, different accounting standards, limited liquidity, and volatile prices. Performance reflects voluntary fee waivers in effect. In the absence of such fee w aivers, total returns would be reduced.
Total returns at net asset value ("NAV") reflect performance over the time period indicated without including the Fund's maximum sales charge and assume reinvestment of all distributions at NAV.
Total returns at public offering price ("POP") reflect performance over the time period indicated including maximum sales charges of 4.25% for Class A shares and the maximum contingent deferred sales charge ("CDSC") for Class B and Class C shares for the relevant period. Maximum CDSC is 5.00% for Class B shares, decreasing annually to 0% in the seventh year following purchase, and 1.00% for Class C shares. Total returns assume reinvestment of all distributions at NAV.
Investments in debt securities typically decrease in value when interest rates rise. This risk is usually greater for longer-term debt securities.
2 Performance for Class B, Class C, and Class R shares is not presented. Performance for these classes will vary due to different expense structures.
3 An unmanaged index comprised of fixed-rate, dollar-denominated U.S. corporate securities with at least one year to final maturity. Securities must be rated BBB or A based on the lower of Moody's and Standard & Poor's ratings, and must have a minimum issue size of $250 million. Rule 144A securities with registration rights are included in the index.
4 Prior to July 1, 2004, Class R shares were designated Class S shares, which had lower fees and expenses. Performance information prior to that date is based on the performance of the Class S shares. If current fees and expenses had been in effect for the entire period presented, performance would have been lower. Please refer to the prospectus for details.
5 The performance since inception for the index is calculated from the previous month end prior to the inception of the class.
6 The performance since inception for the index is calculated from the month-end following the inception of the class.
FIRST AMERICAN FUNDS Annual Report 2004
6
Corporate Bond fund continued
Expense Example
As a shareholder of the Corporate Bond Fund, you incur two types of costs: (1) transaction costs, including sales charges (loads) on purchase payments; and (2) ongoing costs, including management fees; distribution and/or service (12b-1) fees; and other Fund expenses. This example is intended to help you understand your ongoing costs (in dollars) of investing in the Fund and to compare these costs with the ongoing costs of investing in other mutual funds. The example is based on an investment of $1,000 invested at the beginning of the period and held for the entire period from April 1, 2004, to September 30, 2004.
Actual Expenses
For each class, the first line of the table below provides information about actual account values and actual expenses. You may use the information in this line, together with the amount you invested, to estimate the expenses that you paid over the period. Simply divide your account value by $1,000 (for example, an $8,600 account value divided by $1,000 = 8.6), then multiply the result by the number in the first line under the heading entitled "Expenses Paid During Period" to estimate the expenses you paid on your account during this period.
Hypothetical Example for Comparison Purposes
For each class, the second line of the table below provides information about hypothetical account values and hypothetical expenses based on the Fund's actual expense ratio and an assumed rate of return of 5% per year before expenses, which is not the Fund's actual return. The hypothetical account values and expenses may not be used to estimate the actual ending account balance or expenses you paid for the period. You may use this information to compare the ongoing costs of investing in the Fund and other funds. To do so, compare this 5% hypothetical example with the 5% hypothetical examples that appear in the shareholder reports of the other funds.
Please note that the expenses shown in the table are meant to highlight your ongoing costs only and do not reflect any transactional costs, such as sales charges (loads). Therefore, the second line of the table for each class is useful in comparing ongoing costs only, and will not help you determine the relative total costs of owning different funds. In addition, if these transactional costs were included, your costs would have been higher.
Expense Examples
| | | Beginning Account
Value (4/1/2004) | | Ending Account
Value (9/30/2004) | | Expenses Paid During
Period1 (4/1/2004 to
9/30/2004) | |
| Class A Actual | | $ | 1,000.00 | | | $ | 1,003.30 | | | $ | 5.01 | | |
| Class A Hypothetical (5% return before expenses) | | $ | 1,000.00 | | | $ | 1,020.00 | | | $ | 5.05 | | |
| Class B Actual | | $ | 1,000.00 | | | $ | 999.00 | | | $ | 8.75 | | |
| Class B Hypothetical (5% return before expenses) | | $ | 1,000.00 | | | $ | 1,016.25 | | | $ | 8.82 | | |
| Class C Actual | | $ | 1,000.00 | | | $ | 1,000.30 | | | $ | 8.75 | | |
| Class C Hypothetical (5% return before expenses) | | $ | 1,000.00 | | | $ | 1,016.25 | | | $ | 8.82 | | |
| Class R Actual2 | | $ | 1,000.00 | | | $ | 1,002.70 | | | $ | 5.64 | | |
| Class R Hypothetical (5% return before expenses)2 | | $ | 1,000.00 | | | $ | 1,019.37 | | | $ | 5.68 | | |
| Class Y Actual | | $ | 1,000.00 | | | $ | 1,004.50 | | | $ | 3.76 | | |
| Class Y Hypothetical (5% return before expenses) | | $ | 1,000.00 | | | $ | 1,021.25 | | | $ | 3.79 | | |
1Expenses are equal to the Fund's annualized expense ratio of 1.00%, 1.75%, 1.75%, 1.13%, and 0.75% for Class A, Class B, Class C, Class R, and Class Y, respectively, mulitplied by the average account value over the period, multiplied by the number of days in the most recent half-year/366 days (to reflect the one-half year period).
2Prior to July 1, 2004, Class R had a different expense ratio. Had the current expense ratio been in place for the most recent one-half year, the actual and hypothetical expense would have been $6.26 and $6.31, respectively.
FIRST AMERICAN FUNDS Annual Report 2004
7
High Income Bond fund
Investment Objective: high current income
How did the Fund perform for the fiscal year ended September 30, 2004?
The First American High Income Bond Fund, Class Y shares, returned 11.69% for the fiscal year ended September 30, 2004 (Class A shares returned 11.30% at net asset value). By comparison, the Fund's benchmark, the Lehman Corporate High Yield Index*, returned 12.55% for the same period.
How did general economic and market conditions affect performance?
During the past year, we saw an improving economic environment that featured strong gains in productivity, and a significant rise in corporate profits. Sharp gains in payrolls from March through May 2004, along with higher inflation during the early months of the year, led the Federal Reserve to increase its target interest rate.
However, in spite of three 25-basis-point increases in the Federal Funds rate, long-term rates actually fell during the summer. Rapidly rising oil prices and heightened
geo-political uncertainty fueled fears of below-trend growth, which in turn pushed intermediate rates down by nearly 75 basis points.
During the course of the fiscal year, longer-term interest rates were nearly unchanged while short-term rates were 1% higher. This stability in longer-term rates resulted in fixed-income returns that were much better than those experienced in previous Fed tightening cycles.
What worked for the Fund and why?
Most of the decisions that affected the Fund during the year were related to individual security selection. Benefiting the Fund were selections in Alamosa, Alliance Imaging, Dynegy, Hollywood Entertainment, Huntsman Chemical, International Steel Group, Levi, Nalco Chemical, and PolyOne. Also contributing to good returns were positions taken in emerging markets, particularly in Russia and Brazil.
What did not work for the Fund and why?
Adverse security selection also impacted performance during the fiscal year. The Fund was hurt by overweights in names such as American Cellular, Bally's Total Fitness, Charter Communications, Duane Reade, Hanger Orthopedics, MGM Mirage, Muzak, Toys-R-Us, and United Airlines.
What strategic moves were made by the Fund and why?
Sector weights remained near the benchmark index, with overweight positions in the basic industries offset by underweight positions in healthcare and consumer cyclicals. Overall credit quality remained near that of the benchmark. We have begun to use the funded Dow Jones CDX (futures contract based on Dow Jones Credit Index) products as a way to enter and exit the market quickly in order to adjust portfolio quality and manage cash balances.
*Unlike mutual funds, index returns do not reflect any expenses, transaction costs, or cash flow effects.
Portfolio Allocation as of September 30, 20041 (% of net assets)
| Corporate Bonds | | | 94.2 | % | |
| Cash Equivalents | | | 2.1 | % | |
| U.S. Government Agency | | | 0.9 | % | |
| Preferred Stock | | | 0.4 | % | |
Credit Quality Distribution as of September 30, 20042 (% of net assets)
| Aaa | | | 3.0 | % | |
| Baa | | | 2.5 | % | |
| Ba | | | 32.8 | % | |
| B | | | 42.2 | % | |
| Caa | | | 12.4 | % | |
| Ca | | | 0.8 | % | |
| Nonrated | | | 6.3 | % | |
1Portfolio allocations are subject to change and are not recommendations to buy or sell any security.
2The ratings disclosed are provided by Moody's.
Moody's is a nationally recognized independent rating agency for bonds.
FIRST AMERICAN FUNDS Annual Report 2004
8
High Income Bond fund continued
Annualized Performance1 as of September 30, 2004
| | | | | Since Inception | |
| | | 1 year | | 8/30/2001 | | 9/24/2001 | |
| Average annual return with sales charge (POP) | |
| Class A | | | 6.52 | % | | | 5.05 | % | | | - | | |
| Class B | | | 5.52 | % | | | 5.01 | % | | | - | | |
| Class C | | | 9.51 | % | | | 5.76 | % | | | - | | |
| Average annual return without sales charge (NAV) | |
| Class A | | | 11.30 | % | | | 6.53 | % | | | - | | |
| Class B | | | 10.52 | % | | | 5.84 | % | | | - | | |
| Class C | | | 10.51 | % | | | 5.76 | % | | | - | | |
| Class R4 | | | 11.29 | % | | | - | | | | 8.40 | % | |
| Class Y | | | 11.69 | % | | | 6.85 | % | | | - | | |
| Lehman Corporate High Yield Index3 | | | 12.55 | % | | | 9.69 | % | | | 11.93 | % | |
Value of $10,000 Investment1, 2 as of September 30, 2004
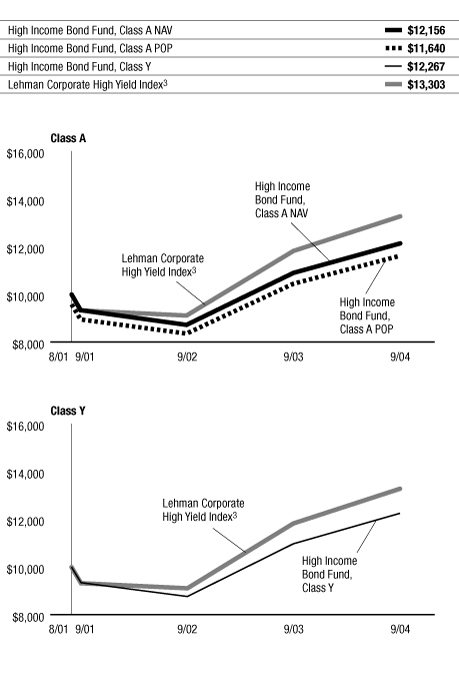
The performance data quoted on this page represents past performance and does not guarantee future results. The investment return and principal value of an investment will fluctuate so that an investor's shares, when redeemed, may be worth more or less than their original cost. Current performance of the Fund may be lower or higher than the performance data quoted. Performance data current to the most recent month-end may be obtained by calling 800.677.FUND.
1 Performance does not reflect the deduction of taxes that a shareholder would pay on fund distributions or redemption of fund shares. Performance reflects voluntary fee waivers in effect. In the absence of such fee waivers, total returns would be reduced. Index performance is for illustrative purposes only, does not reflect any expenses, transaction costs, or cash flow effects, and is not available for investment.
A significant portion of the Fund's portfolio may consist of lower-rated debt obligations, which are commonly called "high-yield" securities or "junk bonds." High-yield securities generally have more volatile prices and carry more risk to principal than investment-grade securities. The Fund may also invest in foreign securities including emerging markets. International investing involves risks not typically associated with domestic investing, including risks of adverse currency fluctuations, potential political and economic instability, different accounting standards, limited liquidity, and volatile prices. The risks of International investing are particularly significant in emerging markets.
Total returns at net asset value ("NAV") reflect performance over the time period indicated without including the Fund's maximum sales charge and assume reinvestment of all distributions at NAV.
Total returns at public offering price ("POP") reflect performance over the time period indicated including maximum sales charges of 4.25% for Class A shares and the maximum contingent deferred sales charge ("CDSC") for Class B and Class C shares for the relevant period. Maximum CDSC is 5.00% for Class B shares, decreasing annually to 0% in the seventh year following purchase, and 1.00% for Class C shares. Total returns assume reinvestment of all distributions at NAV.
2 Performance for Class B, Class C, and Class R shares is not presented. Performance for these classes will vary due to different expense structures.
3 An unmanaged index that covers the universe of fixed-rate, dollar-denominated, below-investment-grade debt with at least one year to final maturity. Payment-in-kind bonds, Eurobonds, and emerging markets debt securities are excluded, but SEC-registered Canadian and global bonds of issuers in non-emerging countries are included. Original issue zero coupon bonds, step-up coupon structures, and Rule 144A securities are also included.
4 Prior to July 1, 2004, Class R shares were designated Class S shares, which had lower fees and expenses. Performance information prior to that date is based on the performance of the Class S shares. If current fees and expenses had been in effect for the entire period presented, performance would have been lower. Please refer to the prospectus for details.
FIRST AMERICAN FUNDS Annual Report 2004
9
High Income Bond fund continued
Expense Example
As a shareholder of the High Income Bond Fund, you incur two types of costs: (1) transaction costs, including sales charges (loads) on purchase payments; and (2) ongoing costs, including management fees; distribution and/or service (12b-1) fees; and other Fund expenses. This example is intended to help you understand your ongoing costs (in dollars) of investing in the Fund and to compare these costs with the ongoing costs of investing in other mutual funds. The example is based on an investment of $1,000 invested at the beginning of the period and held for the entire period from April 1, 2004, to September 30, 2004.
Actual Expenses
For each class, the first line of the table below provides information about actual account values and actual expenses. You may use the information in this line, together with the amount you invested, to estimate the expenses that you paid over the period. Simply divide your account value by $1,000 (for example, an $8,600 account value divided by $1,000 = 8.6), then multiply the result by the number in the first line under the heading entitled "Expenses Paid During Period" to estimate the expenses you paid on your account during this period.
Hypothetical Example for Comparison Purposes
For each class, the second line of the table below provides information about hypothetical account values and hypothetical expenses based on the Fund's actual expense ratio and an assumed rate of return of 5% per year before expenses, which is not the Fund's actual return. The hypothetical account values and expenses may not be used to estimate the actual ending account balance or expenses you paid for the period. You may use this information to compare the ongoing costs of investing in the Fund and other funds. To do so, compare this 5% hypothetical example with the 5% hypothetical examples that appear in the shareholder reports of the other funds.
Please note that the expenses shown in the table are meant to highlight your ongoing costs only and do not reflect any transactional costs, such as sales charges (loads). Therefore, the second line of the table for each class is useful in comparing ongoing costs only, and will not help you determine the relative total costs of owning different funds. In addition, if these transactional costs were included, your costs would have been higher.
Expense Examples
| | | Beginning Account
Value (4/1/2004) | | Ending Account
Value (9/30/2004) | | Expenses Paid During
Period1 (4/1/2004 to
9/30/2004) | |
| Class A Actual | | $ | 1,000.00 | | | $ | 1,036.90 | | | $ | 5.09 | | |
| Class A Hypothetical (5% return before expenses) | | $ | 1,000.00 | | | $ | 1,020.00 | | | $ | 5.05 | | |
| Class B Actual | | $ | 1,000.00 | | | $ | 1,033.10 | | | $ | 8.89 | | |
| Class B Hypothetical (5% return before expenses) | | $ | 1,000.00 | | | $ | 1,016.25 | | | $ | 8.82 | | |
| Class C Actual | | $ | 1,000.00 | | | $ | 1,033.10 | | | $ | 8.89 | | |
| Class C Hypothetical (5% return before expenses) | | $ | 1,000.00 | | | $ | 1,016.25 | | | $ | 8.82 | | |
| Class R Actual2 | | $ | 1,000.00 | | | $ | 1,037.40 | | | $ | 5.73 | | |
| Class R Hypothetical (5% return before expenses)2 | | $ | 1,000.00 | | | $ | 1,019.37 | | | $ | 5.68 | | |
| Class Y Actual | | $ | 1,000.00 | | | $ | 1,038.10 | | | $ | 3.82 | | |
| Class Y Hypothetical (5% return before expenses) | | $ | 1,000.00 | | | $ | 1,034.35 | | | $ | 3.81 | | |
1Expenses are equal to the Fund's annualized expense ratio of 1.00%, 1.75%, 1.75%, 1.13%, and 0.75% for Class A, Class B, Class C, Class R, and Class Y, respectively, mulitplied by the average account value over the period, multiplied by the number of days in the most recent half-year/366 days (to reflect the one-half year period).
2Prior to July 1, 2004, Class R had a different expense ratio. Had the current expense ratio been in place for the most recent one-half year, the actual and hypothetical expenses would have been $6.37 and $6.31, respectively.
FIRST AMERICAN FUNDS Annual Report 2004
10
Intermediate Government Bond fund
Investment Objective: provide investors with current income that is exempt from state income tax, to the extent consistent with the preservation of capital
How did the Fund perform for the fiscal year ended September 30, 2004?
The First American Intermediate Government Bond Fund, Class Y shares, returned 1.14% for the fiscal year ended September 30, 2004 (Class A shares returned 0.98% at net asset value). By comparison, the Fund's benchmark, the Lehman Intermediate Treasury Bond Index*, returned 1.69% for the same period.
How did general economic and market conditions affect performance?
During the past year, we saw an improving economic environment that featured strong gains in productivity, and a significant rise in corporate profits. Sharp gains in payrolls from March through May 2004, along with higher inflation during the early months of the year, led the Federal Reserve to increase its target interest rate.
However, in spite of three 25-basis-point increases in the Federal Funds rate, long-term rates actually fell during the summer. Rapidly rising oil prices and heightened
geo-political uncertainty fueled fears of below-trend growth, which in turn pushed intermediate rates down by nearly 75 basis points.
During the course of the fiscal year, longer-term interest rates were nearly unchanged while short-term rates were 1% higher. This stability in longer-term rates resulted in fixed-income returns that were much better than those experienced in previous Fed tightening cycles.
What worked for the Fund and why?
The Fund maintained a shorter duration relative to the benchmark throughout the year, which had a positive impact on returns during most of the fiscal year. Bonds
generally decrease in value when interest rates rise, but the impact is generally greater for longer-term bonds. The Fund also benefited from tactical trading (short-term trading) of Treasury Inflation Protected Securities, which offered value at various points during the fiscal year.
What did not work for the Fund and why?
The Fund maintained a 30% position in U.S. Government Agency Securities during part of the year resulting in a negative impact on performance. This is a result of the increased scrutiny Fannie Mae faced regarding its accounting practices, which negatively impacted the overall sector. We reached a soft patch in the economy in 2004 due to a run up in oil prices and sluggish job growth. Our defensive duration strategy (shorter duration positioned for rising longer-term interest rates) negatively impacted the Fund as long-term interest rates fell and the bond market rallied later in the fiscal year.
What strategic moves were made by the Fund and why?
We continued to have a shorter duration strategy relative to the benchmark during the fiscal year. Strategically, we continued to follow a curve flattening strategy by reducing exposure in the intermediate part of the yield curve. As the yield curve flattens (short-term interest rates increase more than longer-term interest rates) intermediate maturities will experience poorer price performance. We also took a strateg ic allocation to Treasury Inflation Protected Securities that should be beneficial in an increasing inflationary environment.
*Unlike mutual funds, index returns do not reflect any expenses, transaction costs, or cash flow effects.
Portfolio Allocation as of September 30, 20041 (% of net assets)
| U.S. Government Agency | | | 92.3 | % | |
| Mortgage Backed | | | 6.6 | % | |
| Cash Equivalents | | | 0.2 | % | |
Credit Quality Distribution as of September 30, 20042 (% of net assets)
| AAA/Aaa | | | 99.1 | % | |
| Nonrated | | | 0.9 | % | |
1Portfolio allocations are subject to change and are not recommendations to buy or sell any security.
2The ratings in the above table reflect either the only rating provided by Standard and Poor's or Moody's, or the highest rating provided by the respective rating agency.
Standard and Poor's and Moody's are nationally recognized independent rating agencies for bonds.
FIRST AMERICAN FUNDS Annual Report 2004
11
Intermediate Government Bond fund continued
Annualized Performance1 as of September 30, 2004
| | | | | Since Inception3 | |
| | | 1 year | | 10/25/2002 | |
| Average annual return with sales charge (POP) | | | | | | | | | |
| Class A | | | (1.29 | %) | | | 1.13 | % | |
| Average annual return without sales charge (NAV) | | | | | | | | | |
| Class A | | | 0.98 | % | | | 2.33 | % | |
| Class Y | | | 1.14 | % | | | 2.47 | % | |
| Lehman Intermediate Treasury Bond Index2 | | | 1.69 | % | | | 2.60 | % | |
Value of $10,000 Investment1 as of September 30, 2004
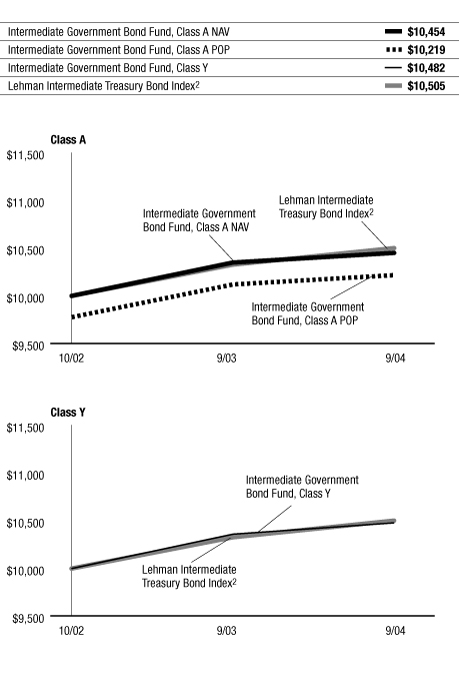
The performance data quoted on this page represents past performance and does not guarantee future results. The investment return and principal value of an investment will fluctuate so that an investor's shares, when redeemed, may be worth more or less than their original cost. Current performance of the Fund may be lower or higher than the performance data quoted. Performance data current to the most recent month-end may be obtained by calling 800.677.FUND.
1 Performance does not reflect the deduction of taxes that a shareholder would pay on fund distributions or redemption of fund shares. Performance reflects voluntary fee waivers in effect. In the absence of such fee waivers, total returns would be reduced. Index performance is for illustrative purposes only, does not reflect any expenses, transaction costs, or cash flow effects, and is not available for investment.
Total returns at net asset value ("NAV") reflect performance over the time period indicated without including the Fund's maximum sales charge and assume reinvestment of all distributions at NAV.
Total returns at public offering price ("POP") reflect performance over the time period indicated including maximum sales charges of 2.25% for Class A Shares. Total returns assume reinvestment of all distributions at NAV.
Investments in debt securities typically decrease in value when interest rates rise. This risk is usually greater for longer-term debt securities.
2 An unmanaged index comprised of public obligations of the U.S. Treasury with a remaining maturity between one and 10 years.
3 The performance since inception for the index is calculated from the month end following the Fund's inception.
FIRST AMERICAN FUNDS Annual Report 2004
12
Intermediate Government Bond fund continued
Expense Example
As a shareholder of the Intermediate Government Bond Fund, you incur two types of costs: (1) transaction costs, including sales charges (loads) on purchase payments; and (2) ongoing costs, including management fees; distribution and/or service (12b-1) fees; and other Fund expenses. This example is intended to help you understand your ongoing costs (in dollars) of investing in the Fund and to compare these costs with the ongoing costs of investing in other mutual funds. The example is based on an investment of $1,000 invested at the beginning of the period and held for the entire period from April 1, 2004, to September 30, 2004.
Actual Expenses
For each class, the first line of the table below provides information about actual account values and actual expenses. You may use the information in this line, together with the amount you invested, to estimate the expenses that you paid over the period. Simply divide your account value by $1,000 (for example, an $8,600 account value divided by $1,000 = 8.6), then multiply the result by the number in the first line under the heading entitled "Expenses Paid During Period" to estimate the expenses you paid on your account during this period.
Hypothetical Example for Comparison Purposes
For each class, the second line of the table below provides information about hypothetical account values and hypothetical expenses based on the Fund's actual expense ratio and an assumed rate of return of 5% per year before expenses, which is not the Fund's actual return. The hypothetical account values and expenses may not be used to estimate the actual ending account balance or expenses you paid for the period. You may use this information to compare the ongoing costs of investing in the Fund and other funds. To do so, compare this 5% hypothetical example with the 5% hypothetical examples that appear in the shareholder reports of the other funds.
Please note that the expenses shown in the table are meant to highlight your ongoing costs only and do not reflect any transactional costs, such as sales charges (loads). Therefore, the second line of the table for each class is useful in comparing ongoing costs only, and will not help you determine the relative total costs of owning different funds. In addition, if these transactional costs were included, your costs would have been higher.
Expense Examples
| | | Beginning Account
Value (4/1/2004) | | Ending Account
Value (9/30/2004) | | Expenses Paid During
Period1 (4/1/2004 to
9/30/2004) | |
| Class A Actual | | $ | 1,000.00 | | | $ | 993.40 | | | $ | 3.74 | | |
| Class A Hypothetical (5% return before expenses) | | $ | 1,000.00 | | | $ | 1,021.25 | | | $ | 3.79 | | |
| Class Y Actual | | $ | 1,000.00 | | | $ | 995.20 | | | $ | 2.99 | | |
| Class Y Hypothetical (5% return before expenses) | | $ | 1,000.00 | | | $ | 1,022.00 | | | $ | 3.03 | | |
1Expenses are equal to the Fund's annualized expense ratio of 0.75% and 0.60% for Class A and Class Y, respectively, mulitplied by the average account value over the period, multiplied by the number of days in the most recent half-year/366 days (to reflect the one-half year period).
FIRST AMERICAN FUNDS Annual Report 2004
13
Intermediate Term Bond fund
Investment Objective: current income to the extent consistent with preservation of capital
How did the Fund perform for the fiscal year ended September 30, 2004?
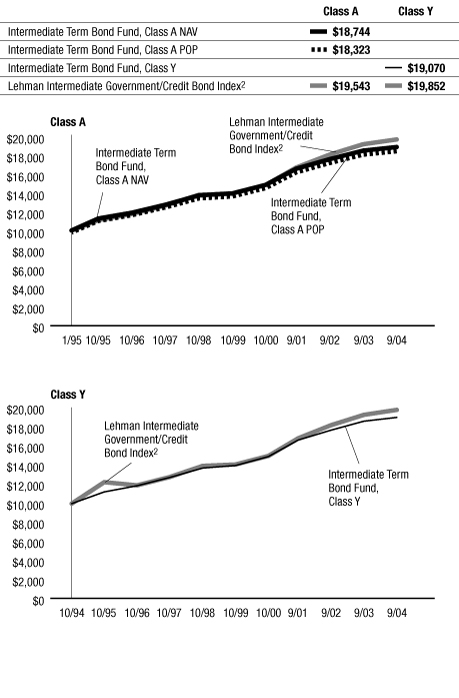
The First American Intermediate Term Bond Fund, Class Y shares, returned 2.22% for the fiscal year ended September 30, 2004 (Class A shares returned 2.06% at net asset value). By comparison, the Fund's benchmark, the Lehman Intermediate Government/Credit Bond Index*, returned 2.65% for the same period.
How did general economic and market conditions affect performance?
During the past year, we saw an improving economic environment that featured strong gains in productivity, and a significant rise in corporate profits. Sharp gains in payrolls from March through May 2004, along with higher inflation during the early months of the year, led the Federal Reserve to increase its target interest rate.
However, in spite of three 25-basis-point increases in the Federal Funds rate, long-term rates actually fell during the summer. Rapidly rising oil prices and heightened
geo-political uncertainty fueled fears of below-trend growth, which in turn pushed intermediate rates down by nearly 75 basis points.
During the course of the fiscal year, longer-term interest rates were nearly unchanged while short-term rates were 1% higher. This stability in longer-term rates resulted in fixed-income returns that were much better than those experienced in previous Fed tightening cycles.
What worked for the Fund and why?
The Fund was overweight relative to its benchmark in BBB-rated corporate bonds, mortgage-backed securities, and asset-backed securities. These strategies boosted performance as the combination of additional income
and strong price performance benefited the portfolio. The Fund was also positioned to benefit from a flatter yield curve as we built a substantial position in high-quality, one-year adjustable rate mortgages that boosted portfolio income with minor price volatility. As short-term interest rates rose throughout the year, the reset feature of the adjustable rate mortgages was advantageous in generating income.
What did not work for the Fund and why?
While our economic growth forecasts and predictions of Fed tightening were fairly accurate, we underestimated the extent, and perceived economic impact of the rise in crude oil prices in mid-2004. Concurrent with the onset of Fed tightening, we became overly defensive with our interest-rate strategy during a period of falling rates. As a result, while absolute returns were much better than we expected, the portfolio lagged the benchmark during the latter part of the fiscal year.
What strategic moves were made by the Fund and why?
We believe that the economy will continue to expand and inflationary pressures will mount, putting additional upward pressure on interest rates. Accordingly, the Fund's duration is shorter relative to the benchmark and we maintain a significant curve flattening strategy (underweight intermediate-term securities within the Fund).
We continue to believe that there is upside potential in lower-rated investment-grade bonds and have an overweight position in the BBB credit quality sector as credit fundamentals appear solid.
*Unlike mutual funds, index returns do not reflect any expenses, transaction costs, or cash flow effects.
Portfolio Allocation as of September 30, 20041 (% of net assets)
| Corporate Bonds | | | 31.0 | % | |
| Asset Backed | | | 27.1 | % | |
| U.S. Government Agency | | | 24.6 | % | |
| Mortgage Backed | | | 16.8 | % | |
Credit Quality Distribution as of September 30, 20042 (% of net assets)
| AAA/Aaa | | | 67.5 | % | |
| AA/Aa | | | 1.3 | % | |
| A | | | 8.6 | % | |
| BBB/Baa | | | 19.6 | % | |
| Nonrated | | | 3.0 | % | |
1Portfolio allocations are subject to change and are not recommendations to buy or sell any security.
2The ratings in the above table reflect either the only rating provided by Standard and Poor's or Moody's, or the highest rating provided by the respective rating agency.
Standard and Poor's and Moody's are nationally recognized independent rating agencies for bonds.
FIRST AMERICAN FUNDS Annual Report 2004
14
Intermediate Term Bond fund continued
Annualized Performance1 as of September 30, 2004
| | | | | | | | | Since Inception3 | |
| | | 1 year | | 5 years | | 10 years | | 1/9/1995 | |
| Average annual return with sales charge (POP) | | | | | | | | | | | | | | | | | |
| Class A | | | (0.23 | %) | | | 5.78 | % | | | - | | | | 6.43 | % | |
| Average annual return without sales charge (NAV) | | | | | | | | | | | | | | | | | |
| Class A | | | 2.06 | % | | | 6.26 | % | | | - | | | | 6.68 | % | |
| Class Y | | | 2.22 | % | | | 6.45 | % | | | 6.67 | % | | | - | | |
| Lehman Intermediate Government/Credit Bond Index2 | | | 2.65 | % | | | 7.13 | % | | | 7.10 | % | | | 7.18 | % | |
Value of $10,000 Investment1 as of September 30, 2004
The performance data quoted on this page represents past performance and does not guarantee future results. The investment return and principal value of an investment will fluctuate so that an investor's shares, when redeemed, may be worth more or less than their original cost. Current performance of the Fund may be lower or higher than the performance data quoted. Performance data current to the most recent month-end may be obtained by calling 800.677.FUND.
1 Performance does not reflect the deduction of taxes that a shareholder would pay on fund distributions or redemption of fund shares. Performance reflects voluntary fee waivers in effect. In the absence of such fee waivers, total returns would be reduced. Index performance is for illustrative purposes only, does not reflect any expenses, transaction costs, or cash flow effects, and is not available for investment.
Total returns at net asset value ("NAV") reflect performance over the time period indicated without including the Fund's maximum sales charge and assume reinvestment of all distributions at NAV.
Total returns at public offering price ("POP") reflect performance over the time period indicated including maximum sales charges of 2.25% for Class A shares for the relevant period. Total returns assume reinvestment of all distributions at NAV.
Investments in debt securities typically decrease in value when interest rates rise. This risk is usually greater for longer-term debt securities.
2 An unmanaged index of Treasury Securities, other securities issued or guaranteed by the U.S. government or its agencies or instrumentalities, and investment-grade corporate debt securities. In each case with maturities of one to 10 years.
3 The performance since inception for the index is calculated from the month end following the Fund's inception.
FIRST AMERICAN FUNDS Annual Report 2004
15
Intermediate Term Bond fund continued
Expense Example
As a shareholder of the Intermediate Term Bond Fund, you incur two types of costs: (1) transaction costs, including sales charges (loads) on purchase payments; and (2) ongoing costs, including management fees; distribution and/or service (12b-1) fees; and other Fund expenses. This example is intended to help you understand your ongoing costs (in dollars) of investing in the Fund and to compare these costs with the ongoing costs of investing in other mutual funds. The example is based on an investment of $1,000 invested at the beginning of the period and held for the entire period from April 1, 2004, to September 30, 2004.
Actual Expenses
For each class, the first line of the table below provides information about actual account values and actual expenses. You may use the information in this line, together with the amount you invested, to estimate the expenses that you paid over the period. Simply divide your account value by $1,000 (for example, an $8,600 account value divided by $1,000 = 8.6), then multiply the result by the number in the first line under the heading entitled "Expenses Paid During Period" to estimate the expenses you paid on your account during this period.
Hypothetical Example for Comparison Purposes
For each class, the second line of the table below provides information about hypothetical account values and hypothetical expenses based on the Fund's actual expense ratio and an assumed rate of return of 5% per year before expenses, which is not the Fund's actual return. The hypothetical account values and expenses may not be used to estimate the actual ending account balance or expenses you paid for the period. You may use this information to compare the ongoing costs of investing in the Fund and other funds. To do so, compare this 5% hypothetical example with the 5% hypothetical examples that appear in the shareholder reports of the other funds.
Please note that the expenses shown in the table are meant to highlight your ongoing costs only and do not reflect any transactional costs, such as sales charges (loads). Therefore, the second line of the table for each class is useful in comparing ongoing costs only, and will not help you determine the relative total costs of owning different funds. In addition, if these transactional costs were included, your costs would have been higher.
Expense Examples
| | | Beginning Account
Value (4/1/2004) | | Ending Account
Value (9/30/2004) | | Expenses Paid During
Period1 (4/1/2004 to
9/30/2004) | |
| Class A Actual | | $ | 1,000.00 | | | $ | 998.20 | | | $ | 3.75 | | |
| Class A Hypothetical (5% return before expenses) | | $ | 1,000.00 | | | $ | 1,021.25 | | | $ | 3.79 | | |
| Class Y Actual | | $ | 1,000.00 | | | $ | 999.00 | | | $ | 3.00 | | |
| Class Y Hypothetical (5% return before expenses) | | $ | 1,000.00 | | | $ | 1,022.00 | | | $ | 3.03 | | |
1Expenses are equal to the Fund's annualized expense ratio of 0.75% and 0.60% for Class A and Class Y, respectively, mulitplied by the average account value over the period, multiplied by the number of days in the most recent half-year/366 days (to reflect the one-half year period).
FIRST AMERICAN FUNDS Annual Report 2004
16
Short Term Bond fund
Investment Objective: current income while maintaining a high degree of principal stability
How did the Fund perform for the fiscal year ended September 30, 2004?
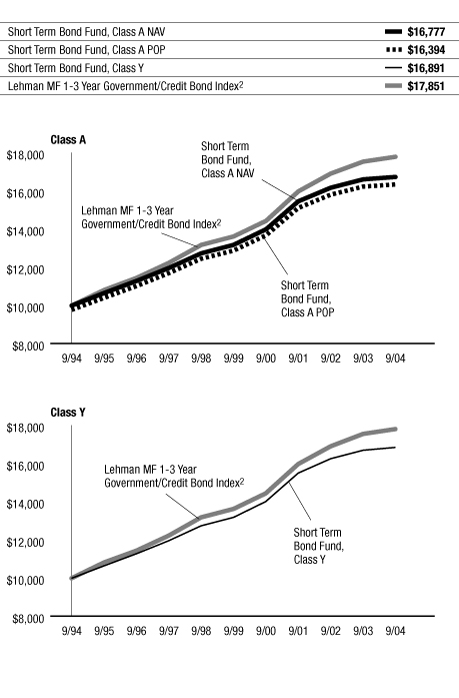
The First American Short Term Bond Fund, Class Y shares, returned 0.91% for the fiscal year ended September 30, 2004 (Class A shares returned 0.76% at net asset value). By comparison, the Fund's benchmark, the Lehman MF 1-3 Year Government/Credit Bond Index*, returned 1.44% for the same period.
How did general economic and market conditions affect performance?
During the past year, we saw an improving economic environment that featured strong gains in productivity, and a significant rise in corporate profits. Sharp gains in payrolls from March through May 2004, along with higher inflation during the early months of the year, led the Federal Reserve to increase its target interest rate.
However, in spite of three 25-basis-point increases in the Federal Funds rate, long-term rates actually fell during the summer. Rapidly rising oil prices and heightened
geo-political uncertainty fueled fears of below-trend growth, which in turn pushed intermediate rates down by nearly 75 basis points.
During the course of the fiscal year, longer-term interest rates were nearly unchanged while short-term rates were 1% higher. This stability in longer-term rates resulted in fixed-income returns that were much better than those experienced in previous Fed tightening cycles.
What worked for the Fund and why?
The portfolio was positioned for an increasing Federal Funds rate throughout 2004 and was managed with a duration shorter than its benchmark over this time frame. This modestly added to the portfolio performance, as
yields on short-term bonds were roughly 1% higher during the course of the fiscal year. The Fund was significantly overweight relative to the benchmark in lower-rated investment-grade corporate bonds and asset-backed securities. These sectors were among the top performing areas of investment-grade securities and had positive impact to performance.
What did not work for the Fund and why?
While our economic growth forecasts and predictions of Fed tightening were fairly accurate, we underestimated the extent, and perceived economic impact of the rise in crude oil prices in mid-2004. Concurrent with the onset of Fed tightening, we became overly defensive with our interest-rate strategy during a period of falling rates. As a result, while absolute returns were much better than we expected, the portfolio lagged the benchmark during the latter part of the fiscal year.
What strategic moves were made by the Fund and why?
We have increased the exposure to spread products (non-Treasury securities). We believe this will continue to increase the income of the portfolio in a low-yield environment. We also remain underweight relative to the benchmark in U.S. Government Agency securities and overweight in asset backed securities. Finally, we will continue to structure the Fund with a short duration strategy with the expectation of rising interest rates. The Fund is also positioned with a bias to a flattening yield curve (underweight intermediate maturities within this Fund's maturity range).
*Unlike mutual funds, index returns do not reflect any expenses, transaction costs, or cash flow effects.
Portfolio Allocation as of September 30, 20041 (% of net assets)
| Corporate Bonds | | | 36.9 | % | |
| Asset Backed | | | 33.1 | % | |
| Mortgage Backed | | | 14.8 | % | |
| U.S. Government Agency | | | 14.4 | % | |
| Cash Equivalents | | | 1.0 | % | |
Credit Quality Distribution as of September 30, 20042 (% of net assets)
| AAA/Aaa | | | 61.2 | % | |
| AA/Aa | | | 5.9 | % | |
| A | | | 20.1 | % | |
| BBB/Baa | | | 12.3 | % | |
| Nonrated | | | 0.5 | % | |
1Portfolio allocations are subject to change and are not recommendations to buy or sell any security.
2The ratings in the above table reflect either the only rating provided by Standard and Poor's or Moody's, or the highest rating provided by the respective rating agency.
Standard and Poor's and Moody's are nationally recognized independent rating agencies for bonds.
FIRST AMERICAN FUNDS Annual Report 2004
17
Short Term Bond fund continued
Annualized Performance1 as of September 30, 2004
| | | 1 year | | 5 years | | 10 years | |
| Average annual return with sales charge (POP) | | | | | | | | | | | | | |
| Class A | | | (1.54 | %) | | | 4.43 | % | | | 5.07 | % | |
| Average annual return without sales charge (NAV) | | | | | | | | | | | | | |
| Class A | | | 0.76 | % | | | 4.92 | % | | | 5.31 | % | |
| Class Y | | | 0.91 | % | | | 5.04 | % | | | 5.37 | % | |
| Lehman MF 1-3 Year Government/Credit Bond Index2 | | | 1.44 | % | | | 5.52 | % | | | 5.97 | % | |
Value of $10,000 Investment1 as of September 30, 2004
The performance data quoted on this page represents past performance and does not guarantee future results. The investment return and principal value of an investment will fluctuate so that an investor's shares, when redeemed, may be worth more or less than their original cost. Current performance of the Fund may be lower or higher than the performance data quoted. Performance data current to the most recent month-end may be obtained by calling 800.677.FUND.
1 Performance does not reflect the deduction of taxes that a shareholder would pay on fund distributions or redemption of fund shares. Performance reflects voluntary fee waivers in effect. In the absence of such fee waivers, total returns would be reduced. Index performance is for illustrative purposes only, does not reflect any expenses, transaction costs, or cash flow effects, and is not available for investment.
Total returns at net asset value ("NAV") reflect performance over the time period indicated without including the Fund's maximum sales charge and assume reinvestment of all distributions at NAV.
Total returns at public offering price ("POP") reflect performance over the time period indicated including maximum sales charges of 2.25% for Class A shares for the relevant period. Total returns assume reinvestment of all distributions at NAV.
Investments in debt securities typically decrease in value when interest rates rise. This risk is usually greater for longer-term debt securities.
2 An unmanaged index of one-to-three-year Treasury securities, other securities issued or guaranteed by the U.S. Government or its agencies or Instrumentalities, and investment-grade corporate debt securities.
FIRST AMERICAN FUNDS Annual Report 2004
18
Short Term Bond fund continued
Expense Example
As a shareholder of the Short Term Bond Fund, you incur two types of costs: (1) transaction costs, including sales charges (loads) on purchase payments; and (2) ongoing costs, including management fees; distribution and/or service (12b-1) fees; and other Fund expenses. This example is intended to help you understand your ongoing costs (in dollars) of investing in the Fund and to compare these costs with the ongoing costs of investing in other mutual funds. The example is based on an investment of $1,000 invested at the beginning of the period and held for the entire period from April 1, 2004, to September 30, 2004.
Actual Expenses
For each class, the first line of the table below provides information about actual account values and actual expenses. You may use the information in this line, together with the amount you invested, to estimate the expenses that you paid over the period. Simply divide your account value by $1,000 (for example, an $8,600 account value divided by $1,000 = 8.6), then multiply the result by the number in the first line under the heading entitled "Expenses Paid During Period" to estimate the expenses you paid on your account during this period.
Hypothetical Example for Comparison Purposes
For each class, the second line of the table below provides information about hypothetical account values and hypothetical expenses based on the Fund's actual expense ratio and an assumed rate of return of 5% per year before expenses, which is not the Fund's actual return. The hypothetical account values and expenses may not be used to estimate the actual ending account balance or expenses you paid for the period. You may use this information to compare the ongoing costs of investing in the Fund and other funds. To do so, compare this 5% hypothetical example with the 5% hypothetical examples that appear in the shareholder reports of the other funds.
Please note that the expenses shown in the table are meant to highlight your ongoing costs only and do not reflect any transactional costs, such as sales charges (loads). Therefore, the second line of the table for each class is useful in comparing ongoing costs only, and will not help you determine the relative total costs of owning different funds. In addition, if these transactional costs were included, your costs would have been higher.
Expense Examples
| | | Beginning Account
Value (4/1/2004) | | Ending Account
Value (9/30/2004) | | Expenses Paid During
Period1 (4/1/2004 to
9/30/2004) | |
| Class A Actual | | $ | 1,000.00 | | | $ | 997.20 | | | $ | 3.74 | | |
| Class A Hypothetical (5% return before expenses) | | $ | 1,000.00 | | | $ | 1,021.25 | | | $ | 3.79 | | |
| Class Y Actual | | $ | 1,000.00 | | | $ | 996.90 | | | $ | 3.00 | | |
| Class Y Hypothetical (5% return before expenses) | | $ | 1,000.00 | | | $ | 1,022.00 | | | $ | 3.03 | | |
1Expenses are equal to the Fund's annualized expense ratio of 0.75% and 0.60% for Class A and Class Y, respectively, mulitplied by the average account value over the period, multiplied by the number of days in the most recent half-year/366 days (to reflect the one-half year period).
FIRST AMERICAN FUNDS Annual Report 2004
19
U.S. Government Mortgage fund
Investment Objective: high current income to the extent consistent with the preservation of capital
How did the Fund perform for the fiscal year ended September 30, 2004?
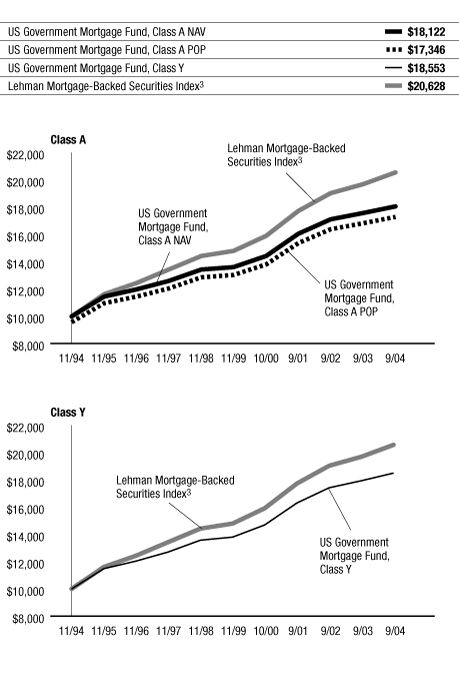
The First American U.S. Government Mortgage Fund, Class Y shares, returned 3.09% for the fiscal year ended September 30, 2004 (Class A shares returned 2.74% at net asset value). By comparison, the Fund's benchmark, the Lehman Mortgage-Backed Securities Index*, returned 4.36% for the same period.
How did general economic and market conditions affect performance?
During the past year, we saw an improving economic environment that featured strong gains in productivity, and a significant rise in corporate profits. Sharp gains in payrolls from March through May 2004, along with higher inflation during the early months of the year, led the Federal Reserve to increase its target interest rate.
However, in spite of three 25-basis-point increases in the Federal Funds rate, long-term rates actually fell during the summer. Rapidly rising oil prices and heightened
geo-political uncertainty fueled fears of below-trend growth, which in turn pushed intermediate rates down by nearly 75 basis points.
During the course of the fiscal year, longer-term interest rates were nearly unchanged while short-term rates were 1% higher. This stability in longer-term rates resulted in fixed-income returns that were much better than those experienced in previous Fed tightening cycles.
What worked for the Fund and why?
The Fund was positioned defensively with an emphasis on premium, higher-coupon mortgage securities, which benefited fund performance. The rise in mortgage rates, particularly on short-term maturities, resulted in a
significant decline in refinancing activity and a large slowdown in prepayments on these securities. Additionally, we opportunistically added to our non-agency mortgage exposure over the course of the fiscal year, which proved beneficial to the fund, as these securities outperformed agency securities.
What did not work for the Fund and why?
While our economic growth forecasts and predictions of Fed tightening were fairly accurate, we underestimated the duration, magnitude, and perceived economic impact of the rise in crude oil prices in mid-2004 and, concurrent with the onset of Fed tightening, became too defensive with our interest-rate strategy during a period of falling rates. As a result, the portfolio lagged the benchmark during the latter part of the fiscal year. Additionally, we expected that Fed tightening would result in underperformance of the mortgage sector as rates rose and mortgage duration extended. Accordingly, we underweighted longer-duration and lower-coupon mortgages, which ended up performing well as rates dropped in the third quarter.
What strategic moves were made by the Fund and why?
We believe that the economy will continue to expand and inflationary pressures will mount, putting additional upward pressure on interest rates. Accordingly, we have shortened the Fund's duration relative to the benchmark and positioned our mortgage allocation more defensively, focusing on shorter- and higher-quality mortgage securities as the sector currently appears to be fairly expensive based upon long-term valuations.
*Unlike mutual funds, index returns do not reflect any expenses, transaction costs, or cash flow effects.
Portfolio Allocation as of September 30, 20041 (% of net assets)
| Mortgage Backed | | | 99.1 | % | |
| U.S. Government Agency | | | 3.1 | % | |
| Cash Equivalents | | | 1.6 | % | |
| Asset Backed | | | 1.2 | % | |
Credit Quality Distribution as of September 30, 20042 (% of net assets)
| AAA/Aaa | | | 95.4 | % | |
| AA/Aa | | | 2.2 | % | |
| A | | | 0.5 | % | |
| Nonrated | | | 1.9 | % | |
1Portfolio allocations are subject to change and are not recommendations to buy or sell any security.
2The ratings in the above table reflect either the only rating provided by Standard and Poor's or Moody's, or the highest rating provided by the respective rating agency.
Standard and Poor's and Moody's are nationally recognized independent rating agencies for municipal bonds.
FIRST AMERICAN FUNDS Annual Report 2004
20
U.S. Government Mortgage fund continued
Annualized Performance1 as of September 30, 2004
| | | | | | | | | Since Inception | |
| | | 1 year | | 5 years | | 10 years | | 5/11/1995 | | 9/24/2001 | |
| Average annual return with sales charge (POP) | |
| Class A | | | (1.60 | %) | | | 5.05 | % | | | 5.67 | % | | | - | | | | - | | |
| Class B | | | (2.90 | %) | | | 4.64 | % | | | - | | | | 4.88 | % | | | - | | |
| Class C | | | 1.04 | % | | | - | | | | - | | | | - | | | | 3.26 | % | |
| Average annual return without sales charge (NAV) | |
| Class A | | | 2.74 | % | | | 5.96 | % | | | 6.13 | % | | | - | | | | - | | |
| Class B | | | 2.02 | % | | | 5.14 | % | | | - | | | | 4.88 | % | | | - | | |
| Class C | | | 2.02 | % | | | - | | | | - | | | | - | | | | 3.26 | % | |
| Class R4 | | | 2.74 | % | | | 5.86 | % | | | 6.08 | % | | | - | | | | - | | |
| Class Y | | | 3.09 | % | | | 6.15 | % | | | 6.38 | % | | | - | | | | - | | |
| Lehman Mortgage-Backed Securities Index3 | | | 4.36 | % | | | 6.95 | % | | | 7.47 | % | | | 6.99 | % | | | 5.20 | % | |
Value of $10,000 Investment1, 2 as of September 30, 2004
The performance data quoted on this page represents past performance and does not guarantee future results. The investment return and principal value of an investment will fluctuate so that an investor's shares, when redeemed, may be worth more or less than their original cost. Current performance of the Fund may be lower or higher than the performance data quoted. Performance data current to the most recent month-end may be obtained by calling 800.677.FUND.
1 Performance does not reflect the deduction of taxes that a shareholder would pay on fund distributions or redemption of fund shares. Performance reflects voluntary fee waivers in effect. In the absence of such fee waivers, total returns would be reduced. Index is for illustrative purposes only, does not reflect any expenses, transaction costs, or cash flow effects, and is not available for investment.
Total returns at net asset value ("NAV") reflect performance over the time period indicated without including the Fund's maximum sales charge and assume reinvestment of all distributions at NAV.
Total returns at public offering price ("POP") reflect performance over the time period indicated including maximum sales charges of 4.25% for Class A shares and the maximum contingent deferred sales charge ("CDSC") for Class B and Class C shares for the relevant period. Maximum CDSC is 5.00% for Class B shares, decreasing annually to 0% in the seventh year following purchase, and 1.00% for Class C shares. Total returns assume reinv estment of all distributions at NAV.
On September 24, 2001, the U.S. Government Mortgage Fund became the successor by merger to the Firstar U.S. Government Securities Fund, a series of Firstar Funds, Inc. Prior to the merger, the First American fund had no assets or liabilities. Performance presented prior to September 24, 2001, represents that of the Firstar U.S. Government Securities Fund. The Firstar U.S. Government Securities Fund was organized on November 27, 2000, and, prior to that, was a separate series of Mercantile Mutual Funds, Inc.
Investments in debt securities typically decrease in value when interest rates rise. This risk is usually greater for longer-term debt securities.
2 Performance for Class B, Class C, and Class R shares is not presented. Performance for these classes will vary due to different expense structures.
3 An unmanaged index comprised of the mortgage-backed pass-through securities of Ginnie Mae, Fannie Mae, and Freddie Mac. It is formed by grouping the universe of more than 600,000 individual fixed-rate MBS pools into approximately 3,500 generic aggregates. The aggregates included are priced daily using a matrix pricing routine based on trade price quotations by agency, program, coupon, and degree of seasoning.
4 Prior to July 1, 2004, Class R shares were designated Class S shares, which had lower fees and expenses. Performance information prior to that date is based on the performance of the Class S shares. If current fees and expenses had been in effect for the entire period presented, performance would have been lower. Please refer to the prospectus for details.
FIRST AMERICAN FUNDS Annual Report 2004
21
U.S. Government Mortgage fund continued
Expense Example
As a shareholder of the U.S. Government Mortgage Fund, you incur two types of costs: (1) transaction costs, including sales charges (loads) on purchase payments; and (2) ongoing costs, including management fees; distribution and/or service (12b-1) fees; and other Fund expenses. This example is intended to help you understand your ongoing costs (in dollars) of investing in the Fund and to compare these costs with the ongoing costs of investing in other mutual funds. The example is based on an investment of $1,000 invested at the beginning of the period and held for the entire period from April 1, 2004, to September 30, 2004.
Actual Expenses
For each class, the first line of the table below provides information about actual account values and actual expenses. You may use the information in this line, together with the amount you invested, to estimate the expenses that you paid over the period. Simply divide your account value by $1,000 (for example, an $8,600 account value divided by $1,000 = 8.6), then multiply the result by the number in the first line under the heading entitled "Expenses Paid During Period" to estimate the expenses you paid on your account during this period.
Hypothetical Example for Comparison Purposes
For each class, the second line of the table below provides information about hypothetical account values and hypothetical expenses based on the Fund's actual expense ratio and an assumed rate of return of 5% per year before expenses, which is not the Fund's actual return. The hypothetical account values and expenses may not be used to estimate the actual ending account balance or expenses you paid for the period. You may use this information to compare the ongoing costs of investing in the Fund and other funds. To do so, compare this 5% hypothetical example with the 5% hypothetical examples that appear in the shareholder reports of the other funds.
Please note that the expenses shown in the table are meant to highlight your ongoing costs only and do not reflect any transactional costs, such as sales charges (loads). Therefore, the second line of the table for each class is useful in comparing ongoing costs only, and will not help you determine the relative total costs of owning different funds. In addition, if these transactional costs were included, your costs would have been higher.
Expense Examples
| | | Beginning Account
Value (4/1/2004) | | Ending Account
Value (9/30/2004) | | Expenses Paid During
Period1 (4/1/2004 to
9/30/2004) | |
| Class A Actual | | $ | 1,000.00 | | | $ | 1,006.80 | | | $ | 4.77 | | |
| Class A Hypothetical (5% return before expenses) | | $ | 1,000.00 | | | $ | 1,020.25 | | | $ | 4.80 | | |
| Class B Actual | | $ | 1,000.00 | | | $ | 1,003.00 | | | $ | 8.51 | | |
| Class B Hypothetical (5% return before expenses) | | $ | 1,000.00 | | | $ | 1,016.50 | | | $ | 8.57 | | |
| Class C Actual | | $ | 1,000.00 | | | $ | 1,002.80 | | | $ | 8.51 | | |
| Class C Hypothetical (5% return before expenses) | | $ | 1,000.00 | | | $ | 1,016.50 | | | $ | 8.57 | | |
| Class R Actual2 | | $ | 1,000.00 | | | $ | 1,005.80 | | | $ | 5.39 | | |
| Class R Hypothetical (5% return before expenses)2 | | $ | 1,000.00 | | | $ | 1,019.62 | | | $ | 5.43 | | |
| Class Y Actual | | $ | 1,000.00 | | | $ | 1,008.00 | | | $ | 3.51 | | |
| Class Y Hypothetical (5% return before expenses) | | $ | 1,000.00 | | | $ | 1,021.50 | | | $ | 3.54 | | |
1Expenses are equal to the Fund's annualized expense ratio of 0.95%, 1.70%, 1.70%, 1.08%, and 0.70% for Class A, Class B, Class C, Class R, and Class Y, respectively, mulitplied by the average account value over the period, multiplied by the number of days in the most recent half-year/366 days (to reflect the one-half year period).
2Prior to July 1, 2004, Class R had a different expense ratio. Had the current expense ratio been in place for the most recent one-half year, the actual and hypothetical expenses would have been, $6.02 and $6.06, respectively.
FIRST AMERICAN FUNDS Annual Report 2004
22
Report of Independent Registered Public Accounting Firm
To the Shareholders and Board of Directors
First American Investment Funds, Inc.
We have audited the accompanying statements of assets and liabilities, including the schedules of investments of the Core Bond, Corporate Bond, High Income Bond, Intermediate Government Bond, Intermediate Term Bond, Short Term Bond, and U.S. Government Mortgage Funds (certain funds constituting First American Investment Funds, Inc.) (the "Funds") as of September 30, 2004, and the related statements of operations for the year then ended, statements of changes in net assets and financial highlights for each of the periods indicated therein, except as noted below. These financial statements and financial highlights are the responsibility of the Funds' management. Our responsibility is to express an opinion on these financial statements and financial highlights based on our audits. The financial highlights of the Intermediate Term Bond and U.S. Government Mortgage Funds for the periods presented through October 31, 2000 were audited by other auditors whose reports dated December 29, 2000 and January 21, 2000 expressed unqualified opinions on those financial highlights.
We conducted our audits in accordance with the standards of the Public Company Accounting Oversight Board (United States). Those standards require that we plan and perform the audit to obtain reasonable assurance about whether the financial statements and financial highlights are free of material misstatement. An audit includes examining,
on a test basis, evidence supporting the amounts and disclosures in the financial statements and financial highlights. Our procedures included confirmation of securities owned as of September 30, 2004, by correspondence with the custodian and brokers or by other appropriate auditing procedures where replies from brokers were not received. An audit also includes assessing the accounting principles used and significant estimates made by management, as well as evaluating the overall financial statement presentation. We believe that our audits provide a reasonable basis for our opinion.
In our opinion, the financial statements and financial highlights audited by us as referred to above present fairly, in all material respects, the financial position of the Funds listed above of the First American Investment Funds, Inc. at September 30, 2004, the results of their operations, the changes in their net assets and their financial highlights for each of the periods indicated herein, in conformity with U.S. generally accepted accounting principles.

Minneapolis, Minnesota
November 12, 2004
FIRST AMERICAN FUNDS Annual Report 2004
23
Schedule of Investments September 30, 2004
Core Bond Fund
| DESCRIPTION | | PAR (000) | | VALUE (000) | |
U.S. Government Agency Mortgage-Backed
Securities – 32.9% | | | |
| Adjustable Rate (a) – 2.3% | | | |
FHLMC Pool
3.406%, 05/01/25, #846757 | | $ | 514 | | | $ | 529 | | |
| 3.450%, 04/01/29, #847190 (b) | | | 4,558 | | | | 4,693 | | |
| 3.537%, 03/01/30, #847180 (b) | | | 6,274 | | | | 6,483 | | |
| 3.444%, 07/01/30, #847240 (b) | | | 6,896 | | | | 7,125 | | |
| 3.959%, 06/01/31, #846984 (b) | | | 3,744 | | | | 3,829 | | |
FNMA Pool
3.317%, 08/01/30, #555843 | | | 14,858 | | | | 15,311 | | |
| 4.001%, 03/01/31, #545359 | | | 2,539 | | | | 2,609 | | |
| 3.297%, 09/01/33, #725553 | | | 5,157 | | | | 5,314 | | |
| | | | 45,893 | | |
| Fixed Rate – 30.6% | | | |
FHLMC Gold Pool
4.000%, 10/01/10, #M80855 | | | 16,283 | | | | 16,293 | | |
| 6.500%, 05/01/17, #G11272 | | | 5,985 | | | | 6,339 | | |
| 5.000%, 05/01/18, #E96700 | | | 15,122 | | | | 15,369 | | |
| 6.500%, 01/01/28, #G00876 | | | 2,489 | | | | 2,627 | | |
| 6.500%, 09/01/28, #C14872 (b) | | | 3,255 | | | | 3,426 | | |
| 6.500%, 11/01/28, #C00676 (b) | | | 4,840 | | | | 5,094 | | |
| 6.500%, 12/01/28, #C00689 (b) | | | 3,335 | | | | 3,510 | | |
| 6.500%, 04/01/29, #C00742 | | | 2,043 | | | | 2,150 | | |
| 6.500%, 01/01/30, #C55738 | | | 1,847 | | | | 1,944 | | |
| 6.500%, 11/01/30, #G01149 | | | 389 | | | | 409 | | |
| 6.500%, 02/01/31, #C47895 | | | 126 | | | | 133 | | |
| 6.500%, 03/01/31, #G01244 (b) | | | 5,313 | | | | 5,592 | | |
| 6.500%, 05/01/31, #C51020 | | | 2,892 | | | | 3,037 | | |
| 6.000%, 11/01/33, #A15521 (b) | | | 7,908 | | | | 8,176 | | |
FHLMC Pool
7.500%, 04/01/07, #140151 | | | 1 | | | | 1 | | |
FNMA Pool
7.750%, 06/01/08, #001464 | | | 16 | | | | 17 | | |
| 3.790%, 07/01/13, #386314 (b) | | | 26,450 | | | | 25,503 | | |
| 5.500%, 02/01/14, #440780 (b) | | | 5,095 | | | | 5,306 | | |
| 7.000%, 02/01/15, #535206 | | | 1,389 | | | | 1,479 | | |
| 7.000%, 08/01/16, #591038 (b) | | | 3,141 | | | | 3,336 | | |
| 5.500%, 12/01/17, #673010 | | | 9,005 | | | | 9,308 | | |
| 6.000%, 12/01/17, #254547 (b) | | | 9,527 | | | | 9,984 | | |
| 5.000%, 06/01/18, #555545 (b) | | | 11,585 | | | | 11,781 | | |
| 5.000%, 11/01/18, #750989 (b) | | | 26,671 | | | | 27,123 | | |
| 4.500%, 06/01/19, #045181 | | | 7,512 | | | | 7,486 | | |
| 6.000%, 10/01/22, #254513 (b) | | | 8,629 | | | | 8,992 | | |
| 7.000%, 04/01/26, #340798 | | | 1,129 | | | | 1,200 | | |
| 7.000%, 05/01/26, #250551 | | | 1,025 | | | | 1,090 | | |
| 6.500%, 05/01/28, #415794 | | | 1,701 | | | | 1,792 | | |
| 6.500%, 02/01/29, #252255 (b) | | | 4,078 | | | | 4,292 | | |
| 6.500%, 03/01/29, #490758 (b) | | | 2,975 | | | | 3,131 | | |
| 6.500%, 07/01/29, #252570 | | | 2,161 | | | | 2,274 | | |
| 6.500%, 05/01/30, #535300 | | | 1,458 | | | | 1,535 | | |
| 6.500%, 02/01/31, #568895 | | | 127 | | | | 134 | | |
| 6.500%, 02/01/32, #627117 (b) | | | 12,672 | | | | 13,302 | | |
| 6.500%, 06/01/32, #545691 | | | 2,603 | | | | 2,733 | | |
| 6.500%, 07/01/32, #545759 (b) | | | 19,623 | | | | 20,610 | | |
| 7.000%, 07/01/32, #254379 (b) | | | 7,039 | | | | 7,459 | | |
| 7.000%, 07/01/32, #545813 (b) | | | 3,000 | | | | 3,180 | | |
| 7.000%, 07/01/32, #545815 | | | 2,083 | | | | 2,208 | | |
| 6.500%, 12/01/32, #669168 (b) | | | 5,714 | | | | 5,998 | | |
| 6.000%, 03/01/33, #688330 (b) | | | 14,003 | | | | 14,515 | | |
| 5.500%, 04/01/33, #694605 (b) | | | 15,985 | | | | 16,228 | | |
| 6.500%, 05/01/33, #555798 | | | 14,511 | | | | 15,241 | | |
| 5.500%, 06/01/33, #709033 (b) | | | 18,452 | | | | 18,733 | | |
| 5.500%, 07/01/33, #709446 (b) | | | 18,219 | | | | 18,497 | | |
| 5.500%, 07/01/33, #720735 (b) | | | 10,479 | | | | 10,638 | | |
Core Bond Fund (continued)
| DESCRIPTION | | PAR (000) | | VALUE (000) | |
| 5.500%, 07/01/33, #728667 | | $ | 7,573 | | | $ | 7,688 | | |
| 5.500%, 08/01/33, #733380 (b) | | | 17,470 | | | | 17,736 | | |
| 6.000%, 11/01/33, #772256 | | | 2,054 | | | | 2,127 | | |
| 6.000%, 11/01/33, #772130 | | | 1,616 | | | | 1,673 | | |
| 5.500%, 12/01/33, #751018 (b) | | | 17,580 | | | | 17,847 | | |
| 5.500%, 12/01/33, #756202 (b) | | | 12,022 | | | | 12,204 | | |
| 6.000%, 12/01/33, #756200 | | | 9,430 | | | | 9,763 | | |
| 5.500%, 01/01/34, #255028 (b) | | | 22,760 | | | | 23,107 | | |
| 5.000%, 04/01/34, #008072 | | | 20,385 | | | | 20,202 | | |
| 5.000%, 04/01/34, #008072 | | | 20,435 | | | | 20,252 | | |
| 5.500%, 05/01/34, #357571 (b) | | | 18,948 | | | | 19,209 | | |
| 5.500%, 10/01/34, #255411 | | | 18,990 | | | | 19,267 | | |
FNMA TBA (c)
5.000%, 03/01/18 | | | 19,045 | | | | 19,354 | | |
| 6.000%, 04/01/33 | | | 19,700 | | | | 20,377 | | |
| 5.500%, 06/01/33 | | | 14,350 | | | | 14,547 | | |
| 6.000%, 10/01/33 | | | 3,310 | | | | 3,424 | | |
GNMA Pool
4.750%, 08/20/23, #008259 | | | 4 | | | | 4 | | |
| 7.500%, 11/15/30, #537699 (b) | | | 1,799 | | | | 1,937 | | |
| 6.000%, 11/15/33, #612374 (b) | | | 17,057 | | | | 17,686 | | |
| | | | 597,609 | | |
Total U.S. Government Agency
Mortgage-Backed Securities
(Cost $640,450) | | | | | | | 643,502 | | |
| Corporate Bonds – 19.5% | | | |
| Banking – 1.2% | | | |
Credit Suisse First Boston
5.875%, 08/01/06 | | | 7,000 | | | | 7,355 | | |
First National Bank of Chicago
8.080%, 01/05/18 | | | 1,484 | | | | 1,798 | | |
Mizuho Finance
5.790%, 04/15/14 (d) | | | 6,230 | | | | 6,446 | | |
Washington Mutual
4.625%, 04/01/14 | | | 7,910 | | | | 7,578 | | |
| | | | 23,177 | | |
| Basic Industry – 0.8% | | | |
International Paper
4.000%, 04/01/10 | | | 7,300 | | | | 7,148 | | |
MeadWestvaco
6.800%, 11/15/32 | | | 3,700 | | | | 3,847 | | |
| 6.850%, 04/01/12 | | | 4,355 | | | | 4,853 | | |
| | | | 15,848 | | |
| Brokerage – 0.5% | | | |
Morgan Stanley
4.750%, 04/01/14 | | | 9,825 | | | | 9,482 | | |
| Communications – 3.9% | | | |
AT&T Broadband
8.375%, 03/15/13 | | | 6,165 | | | | 7,451 | | |
AT&T Wireless Services
7.875%, 03/01/11 | | | 4,050 | | | | 4,795 | | |
| 8.750%, 03/01/31 | | | 6,295 | | | | 8,256 | | |
Cox Communications
7.125%, 10/01/12 | | | 6,660 | | | | 7,244 | | |
Deutsche Telecom
8.750%, 06/15/30 | | | 5,490 | | | | 7,071 | | |
France Telecom
9.500%, 03/01/31 | | | 10,745 | | | | 14,180 | | |
News America Holdings
7.700%, 10/30/25 | | | 8,600 | | | | 10,114 | | |
Sprint Capital
8.750%, 03/15/32 (b) | | | 4,905 | | | | 6,225 | | |
The accompanying notes are an integral part of the financial statements.
FIRST AMERICAN FUNDS Annual Report 2004
24
Core Bond Fund (continued)
| DESCRIPTION | | PAR (000) | | VALUE (000) | |
Time Warner Entertainment
8.375%, 07/15/33 | | $ | 4,200 | | | $ | 5,116 | | |
Verizon Global Funding
7.750%, 12/01/30 | | | 2,440 | | | | 2,922 | | |
Verizon Wireless
5.375%, 12/15/06 | | | 3,300 | | | | 3,460 | | |
| | | | 76,834 | | |
| Consumer Cyclical – 2.6% | | | |
DaimlerChrysler
6.500%, 11/15/13 | | | 4,965 | | | | 5,394 | | |
Duty Free International
7.000%, 01/15/04 (e) (f) | | | 2,442 | | | | 146 | | |
Ford Motor Credit
7.000%, 10/01/13 | | | 10,945 | | | | 11,571 | | |
General Motors
8.375%, 07/15/33 | | | 8,520 | | | | 9,056 | | |
General Motors Acceptance
5.625%, 05/15/09 | | | 16,750 | | | | 17,048 | | |
Liberty Media
2.670%, 09/17/06 (a) | | | 7,240 | | | | 7,325 | | |
| | | | 50,540 | | |
| Consumer Non Cyclical – 1.5% | | | |
Bunge Limited Finance
5.350%, 04/15/14 (d) | | | 7,965 | | | | 7,999 | | |
Kraft Foods
4.625%, 11/01/06 | | | 9,850 | | | | 10,136 | | |
Tyson Foods
7.250%, 10/01/06 3,755 4,026
8.250%, 10/01/11 (b) | | | 6,500 | | | | 7,699 | | |
| | | | 29,860 | | |
| Electric – 2.2% | | | |
Duke Energy
6.450%, 10/15/32 | | | 5,970 | | | | 6,256 | | |
MidAmerican Energy Holdings
5.875%, 10/01/12 (b) | | | 8,845 | | | | 9,335 | | |
Pacific Gas & Electric
6.050%, 03/01/34 | | | 2,430 | | | | 2,453 | | |
Pepco Holdings
6.450%, 08/15/12 | | | 6,210 | | | | 6,759 | | |
Progress Energy
6.850%, 04/15/12 | | | 5,010 | | | | 5,602 | | |
TXU Energy
7.000%, 03/15/13 | | | 10,330 | | | | 11,624 | | |
| | | | 42,029 | | |
| Energy – 1.2% | | | |
Devon Financing
7.875%, 09/30/31 | | | 6,590 | | | | 8,047 | | |
Gazprom International
7.201%, 02/01/20 (d) | | | 5,170 | | | | 5,235 | | |
Kerr-McGee
6.950%, 07/01/24 3,275 3,448
7.875%, 09/15/31 (b) | | | 6,140 | | | | 7,215 | | |
| | | | 23,945 | | |
| Finance Companies – 2.2% | | | |
American General Finance
5.875%, 07/14/06 | | | 6,105 | | | | 6,398 | | |
Capital One Bank
4.875%, 05/15/08 5,500 5,693
4.250%, 12/01/08 | | | 3,955 | | | | 4,010 | | |
Countrywide Home Loans, Series L
4.000%, 03/22/11 | | | 11,405 | | | | 11,029 | | |
Core Bond Fund (continued)
| DESCRIPTION | | PAR (000) | | VALUE (000) | |
International Lease Finance
4.500%, 05/01/08 | | $ | 9,600 | | | $ | 9,856 | | |
Merrill Lynch Series B
5.360%, 02/01/07 | | | 6,355 | | | | 6,646 | | |
| | | | 43,632 | | |
| Foreign Agencies – 0.9% | | | |
KFW Bankengruppe
3.250%, 07/16/07 | | | 18,035 | | | | 18,091 | | |
| Natural Gas – 0.3% | |
Duke Energy Field Services
7.875%, 08/16/10 | | | 4,200 | | | | 4,894 | | |
| Sovereigns – 1.7% | |
Pemex Project
9.125%, 10/13/10 | | | 11,995 | | | | 14,256 | | |
Pemex Project Funding Master Trust
7.375%, 12/15/14 | | | 5,795 | | | | 6,311 | | |
United Mexican States
5.875%, 01/15/14 (b) 7,415 7,519
6.750%, 09/27/34 | | | 5,830 | | | | 5,591 | | |
| | | | 33,677 | | |
| Supranationals – 0.3% | | | |
Corporacion Andina De Fomento
5.200%, 05/21/13 | | | 5,545 | | | | 5,558 | | |
| Transportation – 0.2% | |
Hertz
7.625%, 06/01/12 | | | 3,300 | | | | 3,578 | | |
Total Corporate Bonds
(Cost $377,107) | | | | | | | 381,145 | | |
U.S. Government & Agency
Securities – 17.4% | |
| U.S. Agency Debentures – 6.9% | |
FHLMC
3.250%, 02/25/08, Callable 02/25/05 @ 100 (b) | | | 20,000 | | | | 19,745 | | |
| 4.125%, 09/01/09, Callable 09/01/05 @ 100 (b) | | | 21,180 | | | | 21,158 | | |
FNMA
3.750%, 05/17/07, Callable 05/17/05 @ 100 (b) | | | 40,710 | | | | 40,939 | | |
| 7.250%, 01/15/10 (b) | | | 8,595 | | | | 9,970 | | |
| 5.250%, 08/01/12 | | | 24,000 | | | | 24,790 | | |
| 4.625%, 10/15/14 (b) | | | 19,450 | | | | 19,379 | | |
| | | | 135,981 | | |
| U.S. Treasuries – 10.5% | | | |
U.S. Treasury Bonds
2.375%, 01/15/25 (b) (j) | | | 19,665 | | | | 20,485 | | |
| 6.125%, 11/15/27 (b) | | | 18,965 | | | | 22,011 | | |
| 5.500%, 08/15/28 (b) | | | 15,000 | | | | 16,127 | | |
| 5.250%, 11/15/28 | | | 14,170 | | | | 14,741 | | |
| 5.250%, 02/15/29 (b) | | | 35,155 | | | | 36,600 | | |
| 5.375%, 02/15/31 (b) | | | 22,600 | | | | 24,210 | | |
| U.S. Treasury Notes | |
| 2.000%, 11/30/04 (b) | | | 8,555 | | | | 8,558 | | |
| 2.000%, 07/15/14, Callable 09/01/05 @ 100 (b) (j) | | | 43,083 | | | | 44,052 | | |
| 4.250%, 08/15/14, Callable 09/01/05 @ 100 | | | 17,970 | | | | 18,155 | | |
| | | | 204,939 | | |
Total U.S. Government & Agency Securities
(Cost $335,705) | | | | | | | 340,920 | | |
FIRST AMERICAN FUNDS Annual Report 2004
25
Schedule of Investments September 30, 2004
Core Bond Fund (continued)
| DESCRIPTION | | PAR (000) | | VALUE (000) | |
CMO – Private Mortgage-Backed
Securities – 9.8% | |
| Adjustable Rate (a) – 5.1% | |
Granite Mortgages
Series 2003-1, Cl 1C
3.080%, 01/20/43 | | $ | 7,000 | | | $ | 7,142 | | |
MLCC Mortgage Investors
Series 2003-G, Cl A3
2.834%, 01/25/29 (a) | | | 15,754 | | | | 16,227 | | |
Series 2003-H, Cl A3A
2.886%, 01/25/29 (a) | | | 2,947 | | | | 3,036 | | |
Series 2004-B, Cl A3
2.899%, 05/25/29 | | | 11,708 | | | | 12,066 | | |
MLCC Mortgage Investors
Series 2004-A, Cl A1
1.845%, 04/25/29 | | | 7,379 | | | | 7,379 | | |
Sequoia Mortgage Trust
Series 2004-3, Cl A
1.400%, 05/20/34 (g) | | | 13,651 | | | | 13,612 | | |
Series 2004-4, Cl X1
0.800%, 05/20/34 (g) (k) | | | 326,886 | | | | 3,761 | | |
Series 2004-5, Cl A1
2.757%, 06/20/34 (g) | | | 15,316 | | | | 15,703 | | |
Series 2004-7, Cl A2
2.923%, 08/20/34 (g) | | | 12,269 | | | | 12,613 | | |
Structured Mortgage Loan Trust
Series 2004-11, Cl A
3.825%, 08/25/34 | | | 8,675 | | | | 8,946 | | |
| | | | 100,485 | | |
| Fixed Rate – 4.7% | | | |
Bank of America Mortgage Securities
Series 2004-G, Cl 2A3
4.232%, 08/25/34 | | | 12,370 | | | | 12,382 | | |
Series 2004-GG1, Cl A7
5.317%, 06/10/36 (b) | | | 3,555 | | | | 3,695 | | |
GRP/AG Real Estate Asset Trust
Series 2003-1, Cl A
5.970%, 11/25/32 (g) | | | 888 | | | | 896 | | |
Series 2004-1, Cl A
3.960%, 03/25/09 (d) (g) | | | 1,661 | | | | 1,665 | | |
Residential Asset Mortgage Products
Series 2003-SL1, Cl M1
7.319%, 04/25/31 | | | 8,959 | | | | 9,467 | | |
Residential Asset Securitization Trust
Series 2002-A12, Cl 1A1
5.200%, 11/25/32 | | | 5,135 | | | | 5,155 | | |
Washington Mutual
Series 2001-AR6, Cl A5
5.603%, 01/26/32 | | | 2,913 | | | | 2,946 | | |
Series 2002-AR4, Cl A7
5.598%, 04/25/32 | | | 2,406 | | | | 2,434 | | |
Series 2003-S10, Cl A2
5.000%, 10/25/18 | | | 14,129 | | | | 14,165 | | |
Wells Fargo Mortgage Backed Securities Trust
Series 2003-14, CI A1
4.750%, 12/25/18 (c) | | | 12,476 | | | | 12,482 | | |
Series 2003-D, Cl A1
4.906%, 02/25/33 | | | 10,002 | | | | 10,094 | | |
Series 2004-N, Cl A3
4.154%, 08/25/34 | | | 16,045 | | | | 16,061 | | |
Westam Mortgage Financial
Series 11, Cl A
6.360%, 08/29/20 | | | 141 | | | | 141 | | |
| | | | 91,583 | | |
Total CMO – Private Mortgage-Backed Securities
(Cost $192,254) | | | | | | | 192,068 | | |
Core Bond Fund (continued)
| DESCRIPTION | | PAR (000) | | VALUE (000) | |
| Asset-Backed Securities – 18.0% | |
| Automotive – 4.2% | |
Capital Auto Receivables Asset Trust
Series 2004-1, Cl A3
2.000%, 11/15/07 | | $ | 17,610 | | | $ | 17,426 | | |
Capital One Auto Finance Trust
Series 2001-A, Cl A4
5.400%, 05/15/08 | | | 8,104 | | | | 8,217 | | |
Nissan Auto Receivables Owner Trust
Series 2003-B, Cl A3
1.510%, 08/15/07 | | | 16,900 | | | | 16,807 | | |
Onyx Acceptance Auto Trust
Series 2003-D, Cl A3
2.400%, 12/15/07 | | | 2,625 | | | | 2,617 | | |
Series 2004-A, Cl A3
2.190%, 03/17/08 | | | 13,575 | | | | 13,459 | | |
WFS Financial Owner Trust
Series 2003-2, Cl A3
1.760%, 01/21/08 | | | 12,025 | | | | 11,977 | | |
World Omni Auto Receivables Trust
Series 2001-B, Cl A4
4.490%, 08/20/08 | | | 11,122 | | | | 11,247 | | |
| | | | 81,750 | | |
| Commercial – 4.9% | | | |
Bank of America - First Union NB
Commercial Mortgages
Series 2001-3, Cl A1
4.890%, 04/11/37 | | | 8,568 | | | | 8,869 | | |
Bear Stearns Commercial Mortgage Securities
Series 2004-T14, Cl A4
5.200%, 01/12/41 | | | 9,570 | | | | 9,868 | | |
Commercial Mortgage
Series 2004-CNL, Cl A1
2.060%, 09/15/06 (c) (d) | | | 7,765 | | | | 7,765 | | |
Deutsche Mortgage and Asset Receiving
Series 1998-C1, Cl A2
6.538%, 06/15/31 | | | 10,003 | | | | 10,688 | | |
GMAC Commercial Mortgage Securities
Series 2004-C2, Cl A1
3.896%, 08/10/38 | | | 11,819 | | | | 11,928 | | |
Greenwich Capital Commercial Funding
Series 2003-C1, Cl A2
3.285%, 07/05/35 | | | 14,170 | | | | 13,736 | | |
Morgan Stanley Capital Investments
Series 1999-FNV1, Cl A1
6.120%, 03/15/31 | | | 6,141 | | | | 6,433 | | |
Nomura Asset Securities
Series 1998-D6, Cl A1B
6.590%, 03/15/30 | | | 12,400 | | | | 13,550 | | |
Williams Street Funding
Series 2004-4, Cl A
1.930%, 09/23/10 (d) (e) | | | 13,890 | | | | 13,890 | | |
| | | | 96,727 | | |
| Credit Cards – 5.1% | | | |
American Express Credit Account
Series 2004-4, Cl C
2.044%, 03/15/12 (d) | | | 4,500 | | | | 4,506 | | |
Bank One Issuance Trust
Series 2002-A4, Cl A4
2.940%, 06/16/08 | | | 25,000 | | | | 25,127 | | |
Capital One Multi-Asset Execution Trust
Series 2003-A6, Cl A6
2.950%, 08/17/09 | | | 16,645 | | | | 16,645 | | |
The accompanying notes are an integral part of the financial statements.
FIRST AMERICAN FUNDS Annual Report 2004
26
Core Bond Fund (continued)
| DESCRIPTION | | PAR (000) | | VALUE (000) | |
Citibank Credit Card Issuance Trust
Series 2003-A2, Cl A2
2.700%, 01/15/08 | | $ | 11,825 | | | $ | 11,843 | | |
Series 2004-A3, Cl A3
1.729%, 07/24/11 | | | 21,000 | | | | 21,000 | | |
MBNA Credit Card Master Note Trust
Series 2003-C6, Cl C6
2.643%, 12/15/10 | | | 4,800 | | | | 4,916 | | |
Providian Gateway Master Trust
Series 2004-DA, Cl A
3.350%, 09/15/11 (d) | | | 15,310 | | | | 15,200 | | |
| | | | 99,237 | | |
| Equipment Leases – 0.8% | | | |
CNH Equipment Trust
Series 2003-B, Cl A3B
2.470%, 01/15/08 | | | 15,640 | | | | 15,598 | | |
| Home Equity – 3.0% | | | |
Amresco Residential Security Mortgage
Series 1997-3, Cl A9
6.960%, 03/25/27 | | | 2,375 | | | | 2,331 | | |
Contimortgage Home Equity Loan Trust
Series 1997-3, Cl A8
7.580%, 08/15/28 | | | 1,216 | | | | 1,257 | | |
Countrywide
Series 2004-4, Cl 3A1
1.715%, 11/25/23 6,619 6,620
Series 2003-BC1, Cl A1
1.850%, 03/25/33 | | | 4,834 | | | | 4,862 | | |
Countrywide Asset-Backed Certificates
Series 2003-SC1, Cl M2
2.590%, 09/25/23 (a) (g) | | | 5,000 | | | | 5,024 | | |
First Franklin Mortgage Loan
Series 2004-FFB, Cl A3
4.264%, 06/25/24 | | | 8,525 | | | | 8,519 | | |
Saxon Asset Securities Trust
Series 2004-1, Cl A
1.361%, 03/25/35 (a) (g) | | | 9,558 | | | | 9,575 | | |
Structured Asset Investment Loan Trust
Series 2003-BC5, Cl 2A
1.955%, 06/25/33 | | | 8,263 | | | | 8,269 | | |
Wells Fargo Home Equity Trust
Series 2004-2, Cl AI2
3.450%, 09/25/34 (e) | | | 12,330 | | | | 12,303 | | |
| | | | 58,760 | | |
| Transportation – 0.0% | | | |
Northwest Airlines
Series 1997-1, Cl 1C
7.039%, 07/02/08 | | | 261 | | | | 167 | | |
Total Asset-Backed Securities
(Cost $352,226) | | | | | | | 352,239 | | |
| Municipal Bonds – 1.6% | | | |
Harris County, Toll Road
5.000%, 08/15/33 | | | 15,350 | | | | 15,588 | | |
Miami-Dade County Aviation,
Miami International Airport
5.000%, 10/01/37 | | | 15,350 | | | | 15,586 | | |
Total Municipal Bonds
(Cost $30,407) | | | | | | | 31,174 | | |
Core Bond Fund (continued)
| DESCRIPTION | | PAR (000) | | VALUE (000) | |
CMO – U.S. Government Agency
Mortgage-Backed Securities – 0.9% | |
| Fixed Rate – 0.7% | |
FHLMC REMIC
Series 1998-M1, Cl A2
6.250%, 01/25/08 | | $ | 5,714 | | | $ | 6,069 | | |
Series 6, Cl C
9.050%, 06/15/19 | | | 60 | | | | 60 | | |
Series 1022, Cl J
6.000%, 12/15/20 | | | 82 | | | | 83 | | |
Series 162, Cl F
7.000%, 05/15/21 | | | 243 | | | | 243 | | |
Series 188, Cl H
7.000%, 09/15/21 | | | 548 | | | | 548 | | |
Series 1790, Cl A
7.000%, 04/15/22 | | | 231 | | | | 241 | | |
Series 1723, Cl PJ
7.000%, 02/15/24 (b) | | | 4,345 | | | | 4,421 | | |
FNMA REMIC
Series 1988-24, Cl G
7.000%, 10/25/18 | | | 132 | | | | 139 | | |
Series 1989-44, Cl H
9.000%, 07/25/19 | | | 107 | | | | 116 | | |
Series 1989-90, Cl E
8.700%, 12/25/19 | | | 18 | | | | 20 | | |
Series 1990-30, Cl E
6.500%, 03/25/20 | | | 79 | | | | 82 | | |
Series 1990-61, Cl H
7.000%, 06/25/20 | | | 87 | | | | 92 | | |
Series 1990-72, Cl B
9.000%, 07/25/20 | | | 59 | | | | 65 | | |
Series 1990-102, Cl J
6.500%, 08/25/20 | | | 76 | | | | 80 | | |
Series 1990-105, Cl J
6.500%, 09/25/20 | | | 813 | | | | 851 | | |
Series 1991-56, Cl M
6.750%, 06/25/21 | | | 328 | | | | 345 | | |
Series 1992-120, Cl C
6.500%, 07/25/22 | | | 125 | | | | 129 | | |
| | | | 13,584 | | |
| Z-Bonds (h) – 0.2% | | | |
FHLMC REMIC
Series 1118, Cl Z
8.250%, 07/15/21 | | | 137 | | | | 138 | | |
FNMA REMIC
Series 1991-134, Cl Z
7.000%, 10/25/21 | | | 564 | | | | 584 | | |
Series 1996-35, Cl Z
7.000%, 07/25/26 | | | 2,771 | | | | 2,910 | | |
| | | | 3,632 | | |
Total CMO – U.S. Government Agency
Mortgage-Backed Securities
(Cost $16,411) | | | | | | | 17,216 | | |
| Treasury Obligation – 0.1% | |
U. S. Treasury Bill
1.435%, 11/18/04 (i) | | | 1,500 | | | | 1,497 | | |
Total Treasury Obligation
(Cost $1,497) | | | | | | | 1,497 | | |
FIRST AMERICAN FUNDS Annual Report 2004
27
Schedule of Investments September 30, 2004
Core Bond Fund (continued)
| DESCRIPTION | | CONTRACTS/
SHARES/PAR (000) | | VALUE (000) | |
| Options Purchased – 0.0% | |
| Call Option Purchased – 0.0% | |
U.S. Treasury 5 Year Note, November 04
Futures Call, Expires 11/30/04,
Exercise Price $112.00 | | | 451 | | | $ | 35 | | |
| Put Options Purchased – 0.0% | |
U.S. Treasury 5 Year Note, December 04
Futures Put, Expires 12/30/04,
Exercise price $106.50 | | | 89 | | | | 1 | | |
U.S. Treasury 5 Year Note, December 04
Futures Put, Expires 12/30/04,
Exercise price $107.00 | | | 1,188 | | | | 37 | | |
U.S. Treasury 5 Year Note, December 04
Futures Put, Expires 12/30/04,
Exercise price $109.00 | | | 900 | | | | 169 | | |
U.S. Treasury 5 Year Note, December 04
Futures Put, Expires 12/30/04,
Exercise price $109.50 | | | 450 | | | | 134 | | |
U.S. Treasury 5 Year Note, December 04
Futures Put, Expires 12/30/04,
Exercise price $105.00 | | | 185 | | | | 3 | | |
| | | | | | | | 344 | | |
Total Options Purchased
(Cost $2,218) | | | | | | | 379 | | |
| Affiliated Money Market Fund – 2.4% | |
| First American Prime Obligations Fund, Cl Z (m) | | | 46,836,807 | | | | 46,837 | | |
Total Affiliated Money Market Fund
(Cost $46,837) | | | | | | | 46,837 | | |
Investments Purchased with Proceeds
from Securities Lending – 38.4% | |
| Commercial Paper – 12.4% | |
Bluegrass
1.881%, 5/18/05 | | $ | 3,162 | | | | 3,162 | | |
| 1.891%, 8/18/05 | | | 2,512 | | | | 2,512 | | |
Concord Minutemen Capital
1.650%, 10/01/04 | | | 5,191 | | | | 5,191 | | |
| 1.680%, 10/05/04 | | | 11,536 | | | | 11,536 | | |
| 1.720%, 10/06/04 | | | 8,524 | | | | 8,524 | | |
| 1.740%, 10/14/04 | | | 5,704 | | | | 5,704 | | |
Descartes Funding Trust
1.760%, 11/15/04 | | | 6,409 | | | | 6,409 | | |
Ford Credit Floor Plan
1.622%, 10/05/04 | | | 12,815 | | | | 12,815 | | |
| 1.526%, 10/06/04 | | | 8,972 | | | | 8,972 | | |
| 1.655%, 10/22/04 | | | 2,817 | | | | 2,817 | | |
Goldman Sachs
1.975%, 1/18/05 | | | 6,409 | | | | 6,409 | | |
Independence
1.830%, 4/15/05 | | | 7,921 | | | | 7,921 | | |
Jupiter Securities Corp
1.793%, 10/21/04 | | | 24,361 | | | | 24,361 | | |
Lakeside Funding
1.790%, 10/08/04 | | | 13,587 | | | | 13,587 | | |
Landesbank Baden
1.480%, 11/12/04 | | | 2,558 | | | | 2,558 | | |
Leaf's LLC
1.821%, 4/20/05 | | | 7,050 | | | | 7,050 | | |
Liquid Funding
1.743%, 10/13/04 | | | 8,967 | | | | 8,967 | | |
| 1.830%, 5/25/05 | | | 6,409 | | | | 6,409 | | |
Core Bond Fund (continued)
| DESCRIPTION | | PAR (000) | | VALUE (000) | |
MBNA Credit
1.683%, 10/12/04 | | $ | 6,229 | | | $ | 6,229 | | |
| 1.764%, 10/26/04 | | | 3,456 | | | | 3,456 | | |
Main Street Warehouse
1.742%, 10/04/04 | | | 8,458 | | | | 8,458 | | |
| 1.683%, 10/04/04 | | | 10,446 | | | | 10,446 | | |
| 1.742%, 10/08/04 | | | 6,406 | | | | 6,406 | | |
| 1.742%, 10/08/04 | | | 6,409 | | | | 6,409 | | |
Mortgage Interest Network
1.752%, 10/12/04 | | | 4,227 | | | | 4,227 | | |
| 1.763%, 10/14/04 | | | 4,483 | | | | 4,483 | | |
Netexis Banques
1.700%, 12/16/04 | | | 6,383 | | | | 6,383 | | |
Orchard Park
1.796%, 4/06/05 | | | 6,409 | | | | 6,409 | | |
| 1.766%, 7/06/05 | | | 13,227 | | | | 13,227 | | |
Park Granada LLC
1.622%, 10/01/04 | | | 11,279 | | | | 11,279 | | |
| 1.743%, 10/13/04 | | | 7,302 | | | | 7,302 | | |
Sigma Finance
1.512%, 11/29/04 | | | 3,194 | | | | 3,194 | | |
| Total Commercial Paper | | | | | | | 242,812 | | |
| Corporate Obligations – 10.3% | |
Allstate Life Global
1.780%, 10/14/05 | | | 12,818 | | | | 12,818 | | |
| 1.750%, 10/14/05 | | | 3,204 | | | | 3,204 | | |
Bayer Landbank NY
1.830%, 6/24/05 | | | 12,176 | | | | 12,176 | | |
Blue Heron Funding
1.850%, 5/18/05 | | | 3,589 | | | | 3,589 | | |
Castle Hill III
1.910%, 9/15/15 | | | 3,845 | | | | 3,845 | | |
Depfa Bank PLC
1.860%, 6/15/05 | | | 6,406 | | | | 6,406 | | |
Duke Funding VI
1.320%, 4/08/05 | | | 7,754 | | | | 7,754 | | |
General Electric Capital Corporation
1.838%, 10/07/05 | | | 6,416 | | | | 6,416 | | |
Jackson National Life
1.760%, 4/15/05 | | | 6,409 | | | | 6,409 | | |
Jefferson Pilot
1.788%, 8/17/05 | | | 6,409 | | | | 6,409 | | |
Liquid Funding
1.840%, 6/28/05 | | | 5,767 | | | | 5,767 | | |
Merrill Lynch
1.696%, 10/01/05 | | | 5,385 | | | | 5,385 | | |
Metlife Global Funding
1.800%, 10/14/05 | | | 12,819 | | | | 12,819 | | |
| 1.880%, 10/28/05 | | | 7,690 | | | | 7,690 | | |
Morgan Stanley
1.850%, 12/26/08 | | | 6,409 | | | | 6,409 | | |
Natexis Banq NY
1.920%, 7/12/05 | | | 7,050 | | | | 7,050 | | |
Northlake CDO
1.895%, 3/07/05 | | | 3,845 | | | | 3,845 | | |
Premium Asset Trust
1.848%, 12/22/04 | | | 4,807 | | | | 4,807 | | |
| 1.760%, 5/13/05 | | | 8,971 | | | | 8,971 | | |
| 1.740%, 6/01/05 | | | 19,098 | | | | 19,098 | | |
| 1.770%, 10/14/05 | | | 5,127 | | | | 5,127 | | |
REMAC
1.840%, 9/29/05 | | | 7,050 | | | | 7,050 | | |
The accompanying notes are an integral part of the financial statements.
FIRST AMERICAN FUNDS Annual Report 2004
28
Core Bond Fund (continued)
| DESCRIPTION | | PAR (000) | | VALUE (000) | |
RMAC
1.740%, 6/12/05 | | $ | 7,394 | | | $ | 7,394 | | |
SMM Trust 2004
1.833%, 9/23/05 | | | 11,920 | | | | 11,920 | | |
Societe Generale NYC
1.960%, 12/08/04 | | | 12,819 | | | | 12,819 | | |
Svenska Handl
1.170%, 10/21/04 | | | 6,409 | | | | 6,409 | | |
| Total Corporate Obligations | | | | | | | 201,586 | | |
| Other Short-Term Investments – 2.7% | | | |
ARLO III Ltd
2.000%, 9/28/05 | | | 19,226 | | | | 19,226 | | |
Commonwealth Life
2.115%, 12/31/04 (l) | | | 6,471 | | | | 6,471 | | |
General Electric Capital Assurance
1.980%, 1/19/05 | | | 2,564 | | | | 2,564 | | |
HBOS Treasury Services
1.640%, 11/01/05 | | | 7,047 | | | | 7,047 | | |
Security Life of Denver
1.900%, 12/30/04 | | | 16,663 | | | | 16,663 | | |
| Total Other Short-Term Investments | | | | | | | 51,971 | | |
| Repurchase Agreements – 13.0% | | | |
Bear Stearns
2.045%, dated 9/30/04, matures 10/01/04,
repurchase price $12,818,412
(collateralized by Various Securities:
Total Market Value $13,081,185) | | | 12,818 | | | | 12,818 | | |
Bear Stearns
2.060%, dated 9/30/04, matures 12/23/04,
repurchase price $3863788
(collateralized by Various Securities:
Total Market Value $3,923,584) | | | 3,845 | | | | 3,845 | | |
Citibank
1.945%, dated 9/30/04, matures 10/01/04,
repurchase price $25,636,753
(collateralized by Corporate Securities:
Total Market Value $27,146,612) | | | 25,635 | | | | 25,635 | | |
Citibank
1.925%, dated 9/30/04, matures 10/01/04,
repurchase price $6,409,184
(collateralized by Various Securities:
Total Market Value $6,551,541) | | | 6,409 | | | | 6,409 | | |
Citibank
1.925%, dated 9/30/04, matures 10/01/04,
repurchase price $6,409,185
(collateralized by Various Securities:
Total Market Value $6,537,106) | | | 6,409 | | | | 6,409 | | |
Greenwich Capital Markets
1.950%, dated 9/30/04, matures 10/01/04,
repurchase price $38,455,136
(collateralized by U.S. Government Securities:
Total Market Value $39,222,615) | | | 38,453 | | | | 38,453 | | |
Goldman Sachs
2.025%, dated 9/30/04, matures 10/01/04,
repurchase price $8,972,884
(collateralized by Various Securities:
Total Market Value $9,249,889) | | | 8,972 | | | | 8,972 | | |
Goldman Sachs
2.025%, dated 9/30/04, matures 10/01/04,
repurchase price $3,845,522
(collateralized by Various Securities:
Total Market Value $3,964,332) | | | 3,845 | | | | 3,845 | | |
Core Bond Fund (continued)
| DESCRIPTION | | PAR (000) | | VALUE (000) | |
Goldman Sachs
2.025%, dated 9/30/04, matures 10/01/04,
repurchase price $3,845,522
(collateralized by Various Securities:
Total Market Value $3,964,330) | | $ | 3,845 | | | $ | 3,845 | | |
Goldman Sachs
2.025%, dated 9/30/04, matures 10/01/04,
repurchase price $9,613,804
(collateralized by Corporate Securities:
Total Market Value $9,910,632) | | | 9,613 | | | | 9,613 | | |
Goldman Sachs
1.425%, dated 9/30/04, matures 10/18/04,
repurchase price $16,033,521
(collateralized by Corporate Securities:
Total Market Value $16,349,184) | | | 16,022 | | | | 16,022 | | |
Goldman Sachs
1.480%, dated 9/30/04, matures 10/18/04,
repurchase price $9,620,377
(collateralized by Various Securities:
Total Market Value $9,620,377) | | | 9,613 | | | | 9,613 | | |
Goldman Sachs
2.205%, dated 9/30/04, matures 3/07/05,
repurchase price $6,470,864
(collateralized by Corporate Securities:
Total Market Value $6,539,737) | | | 6,409 | | | | 6,409 | | |
Lehman Brothers
2.055%, dated 9/30/04, matures 10/01/04,
repurchase price $25,636,832
(collateralized by Collateralized Mortgage
Obligations: Total Market Value $26,148,076) | | | 25,636 | | | | 25,636 | | |
Lehman Brothers
1.910%, dated 9/30/04, matures 10/01/04,
repurchase price $38,455,093
(collateralized by U.S. Government Securities:
Total Market Value $39,222,733) | | | 38,453 | | | | 38,453 | | |
Lehman Brothers
1.935%, dated 9/30/04, matures 10/01/04,
repurchase price $25,636,746
(collateralized by Collateralized Mortgage
Obligations: Total Market Value $28,188,200) | | | 25,636 | | | | 25,636 | | |
Merrill Lynch
1.925%, dated 9/30/04, matures 10/01/04,
repurchase price $12,817,684
(collateralized by Corporate Securities:
Total Market Value $13,458,846) | | | 12,818 | | | | 12,818 | | |
| Total Repurchase Agreements | | | | | | | 254,431 | | |
Total Investments Purchased with Proceeds
from Securities Lending
(Cost $750,800) | | | | | | | 750,800 | | |
Total Investments – 141.0%
(Cost $2,745,912) | | | | | | | 2,757,777 | | |
| Other Assets and Liabilities, Net – (41.0)% | | | | | | | (802,323 | ) | |
| Total Net Assets – 100.0% | | | | | | $ | 1,955,454 | | |
(a) Variable Rate Security – The rate shown is the rate in effect as of
September 30, 2004.
(b) This security or a portion of this security is out on loan at September 30, 2004. Total loaned securities had a value of $729,884,792 at September 30, 2004. See note 2 in Notes to Financial Statements.
(c) Security purchased on a when-issued basis. On September 30, 2004, the total cost of investments purchased on a when-issued basis was $78,055,617 or 4.0% of total net assets. See note 2 in Notes to Financial Statements.
FIRST AMERICAN FUNDS Annual Report 2004
29
Schedule of Investments September 30, 2004
Core Bond Fund (concluded)
(d) Security sold within the terms of a private placement memorandum, exempt from registration under Rule 144A of the Securities Act of 1933, as amended, and may be sold only to dealers in that program or other "qualified institutional buyers." These securities have been determined to be liquid under the guidelines established by the Funds' board of directors. As of September 30, 2004, the value of these investments was $62,706,631 or 3.2% of total net assets. See note 2 in Notes to Financial Statements.
(e) Securities considered illiquid or restricted. As of September 30, 2004, the value of these investments was $26,339,573 or 1.3% of total net assets. See note 2 in Notes to Financial Statements.
(f) Security is fair valued. As of September 30, 2004, the fair value of these investments was $146,545 or 0.0% of total net assets. See note 2 in Notes to Financial Statements.
(g) Delayed Interest (Step-Bonds) – Represents securities that remain zero-coupon securities until a predetermined date at which time the stated coupon rate becomes effective and interest becomes payable at regular intervals. Interest rate shown represents current yield at September 30, 2004, based upon the estimated timing and amount of future interest and principal payments.
(h) Z-Bonds – Represents securities that pay no interest or principal during their accrual periods, but accrue additional principal at specified rates. Interest rate shown represents current yield based upon the cost basis and estimated future cash flows.
(i) Security has been deposited as initial margin on open futures contracts. Yield shown is effective yield at date of purchase. See note 2 in Notes to Financial Statements.
(j) U.S. Treasury inflation-protection securities (TIPS) are securities in which the principal amount is adjusted for inflation and the semiannual interest payments equal a fixed percentage of the inflation-adjusted principal amount.
(k) Interest only.
(l) Security has demand features which qualify it as a short-term security. The date disclosed is the next put date.
(m) Investment in affiliated security. This money market fund is advised by U.S. Bancorp Asset Management, Inc., which also serves as advisor to this Fund. See note 3 in Notes to Financial Statements.
Cl – Class
CMO – Collateralized Mortgage Obligation
FHLMC – Federal Home Loan Mortgage Corporation
FNMA – Federal National Mortgage Association
GNMA – Government National Mortgage Association
REMIC – Real Estate Mortgage Investment Conduit
TBA – To Be Announced
Schedule of Open Futures Contracts
| Description | | Number of
Contracts
Purchased
(Sold) | | Market Value
Covered By
Contracts | | Settlement
Month | | Unrealized
Appreciation
(Depreciation) | |
90 Day Eurodollar
June 05 Futures | | | (235 | ) | | | $ (28,680) | | | Jun. 05 | | $ | (268 | ) | |
90 Day Eurodollar
December 04 Futures | | | 525 | | | | 128,225 | | | Dec. 04 | | | 377 | | |
90 Day Eurodollar
December 05 Futures | | | (525 | ) | | | (126,984 | ) | | Dec. 05 | | | (1,108 | ) | |
U.S. Treasury 5 Year
December 04 Futures | | | (965 | ) | | | (106,874 | ) | | Dec. 04 | | | (71 | ) | |
2 Year U.S. Treasury
December 04 Futures | | | 182 | | | | 19,222 | | | Dec. 04 | | | (43 | ) | |
10 Year U.S. Treasury
December 04 Futures | | | (2,087 | ) | | | (150,665 | ) | | Dec. 04 | | | (594 | ) | |
U.S. Treasury Long Bond
December 04 Futures | | | 765 | | | | 40,445 | | | Dec. 04 | | | 367 | | |
| | | $ | (1,340 | ) | |
Corporate Bond Fund
| DESCRIPTION | | PAR (000) | | VALUE (000) | |
| Corporate Bonds – 91.6% | |
| Banking – 13.4% | |
Bank of America
6.250%, 04/15/12 (a) | | $ | 3,950 | | | $ | 4,363 | | |
CBA Capital Trust I,
Callable 06/30/15 @ 100 | |
| 5.805%, 12/31/49 (b) | | | 985 | | | | 1,010 | | |
Citigroup
5.625%, 08/27/12 | | | 1,470 | | | | 1,574 | | |
Credit Suisse First Boston
5.875%, 08/01/06 | | | 3,000 | | | | 3,152 | | |
| 7.125%, 07/15/32 (a) | | | 985 | | | | 1,159 | | |
First American Capital Trust I
8.500%, 04/15/12 | | | 740 | | | | 850 | | |
HBOS Capital Funding,
Callable 06/30/14 @ 100
6.071%, 12/29/49 (b) (c) | | | 2,000 | | | | 2,062 | | |
HSBC Capital Funding,
Callable 06/30/10 @ 100
9.547%, 12/31/49 (b) | | | 1,190 | | | | 1,499 | | |
ING Capital Funding Trust III,
Callable 12/31/10 @ 100
8.439%, 12/12/49 | | | 1,500 | | | | 1,812 | | |
J. P. Morgan Chase
5.125%, 09/15/14 | | | 5,000 | | | | 5,040 | | |
Mizuho Finance (Cayman),
Callable 04/27/09 @ 100
8.375%, 01/14/49 | | | 1,500 | | | | 1,623 | | |
NB Capital Trust IV,
Callable 04/15/17 @ 103.85
8.250%, 04/15/27 | | | 2,100 | | | | 2,429 | | |
North Fork Bancorp
5.875%, 08/15/12 | | | 1,975 | | | | 2,111 | | |
Popular North America
3.875%, 10/01/08 | | | 1,470 | | | | 1,483 | | |
Popular North American Capital Trust I
6.564%, 09/15/34 | | | 500 | | | | 508 | | |
SOC General Real Estate,
Callable 09/30/07 @ 100
7.640%, 12/29/49 (b) (c) | | | 1,465 | | | | 1,625 | | |
Wachovia
5.250%, 08/01/14 | | | 2,000 | | | | 2,049 | | |
Wells Fargo,
Callable 12/15/06 @ 103.98
7.960%, 12/15/26 | | | 2,000 | | | | 2,241 | | |
| | | | 36,590 | | |
| Basic Industry – 3.3% | | | |
Domtar
5.375%, 12/01/13 (a) | | | 1,000 | | | | 979 | | |
Dow Chemical
7.375%, 11/01/29 | | | 1,000 | | | | 1,164 | | |
IMC Global, Series B
10.875%, 06/01/08 | | | 750 | | | | 904 | | |
International Steel
6.500%, 04/15/14 (b) | | | 1,050 | | | | 1,050 | | |
MeadWestvaco
6.800%, 11/15/32 | | | 1,200 | | | | 1,248 | | |
Nova Chemicals
6.500%, 01/15/12 (d) | | | 1,000 | | | | 1,022 | | |
Tembec Industries
8.500%, 02/01/11 (d) | | | 980 | | | | 1,029 | | |
Weyerhaeuser
6.750%, 03/15/12 | | | 1,500 | | | | 1,682 | | |
| | | | 9,078 | | |
The accompanying notes are an integral part of the financial statements.
FIRST AMERICAN FUNDS Annual Report 2004
30
Corporate Bond Fund (continued)
| DESCRIPTION | | PAR (000) | | VALUE (000) | |
| Brokerage – 6.2% | |
Bear Stearns
7.800%, 08/15/07 | | $ | 1,950 | | | $ | 2,181 | | |
Goldman Sachs
5.500%, 11/15/14 | | | 2,470 | | | | 2,551 | | |
Goldman Sachs Capital I
6.345%, 02/15/34 | | | 1,500 | | | | 1,507 | | |
Lehman Brothers Holdings
4.000%, 01/22/08 | | | 2,550 | | | | 2,588 | | |
Merrill Lynch, Series C
4.125%, 01/15/09 | | | 2,950 | | | | 2,958 | | |
Morgan Stanley
6.100%, 04/15/06 | | | 1,975 | | | | 2,071 | | |
| 4.750%, 04/01/14 | | | 3,210 | | | | 3,098 | | |
| | | | 16,954 | | |
| Capital Goods – 3.1% | | | |
Allied Waste North America,
Callable 04/15/08 @ 103.94
7.875%, 04/15/13 | | | 740 | | | | 779 | | |
Boeing Capital
5.800%, 01/15/13 | | | 1,485 | | | | 1,595 | | |
Case New Holland,
Callable 08/01/07 @ 104.63
9.250%, 08/01/11 (b) | | | 495 | | | | 556 | | |
Goodrich
7.000%, 04/15/38 | | | 750 | | | | 805 | | |
Honeywell International
6.125%, 11/01/11 | | | 2,000 | | | | 2,187 | | |
Tyco International
6.875%, 01/15/29 | | | 980 | | | | 1,099 | | |
Waste Management
6.875%, 05/15/09 | | | 1,290 | | | | 1,439 | | |
| | | | 8,460 | | |
| Communications – 14.5% | | | |
AT&T
8.050%, 11/15/11 (a) | | | 1,000 | | | | 1,120 | | |
AT&T Broadband
8.375%, 03/15/13 | | | 3,000 | | | | 3,626 | | |
AT&T Wireless Services
7.500%, 05/01/07 | | | 985 | | | | 1,085 | | |
| 8.750%, 03/01/31 | | | 980 | | | | 1,285 | | |
BellSouth
6.550%, 06/15/34 | | | 1,000 | | | | 1,051 | | |
British Sky Broadcasting
8.200%, 07/15/09 | | | 2,375 | | | | 2,763 | | |
British Telecom
8.375%, 12/15/10 | | | 1,975 | | | | 2,383 | | |
Cablevision Systems
8.000%, 04/15/12 (b) | | | 980 | | | | 1,022 | | |
Citizens Communications
8.500%, 05/15/06 | | | 1,000 | | | | 1,069 | | |
Comcast Cable Communications
6.875%, 06/15/09 | | | 1,500 | | | | 1,666 | | |
Cox Communications
7.125%, 10/01/12 | | | 2,225 | | | | 2,420 | | |
Deutsche Telecom
8.500%, 06/15/10 | | | 1,480 | | | | 1,775 | | |
| 8.750%, 06/15/30 | | | 1,485 | | | | 1,913 | | |
France Telecom
9.500%, 03/01/31 | | | 1,265 | | | | 1,669 | | |
News America Holdings
7.750%, 01/20/24 | | | 1,480 | | | | 1,736 | | |
Qwest
8.875%, 03/15/12 (b) | | | 1,000 | | | | 1,102 | | |
Corporate Bond Fund (continued)
| DESCRIPTION | | PAR (000) | | VALUE (000) | |
Sprint Capital
8.375%, 03/15/12 (a) | | $ | 1,670 | | | $ | 2,022 | | |
| 8.750%, 03/15/32 (a) | | | 1,235 | | | | 1,567 | | |
Telefonos De Mexico SA de CV (Telmex), Series L
8.250%, 01/26/06 | | | 2,000 | | | | 2,145 | | |
Time Warner Entertainment
8.375%, 07/15/33 | | | 870 | | | | 1,060 | | |
Verizon Global Funding
7.250%, 12/01/10 | | | 1,485 | | | | 1,710 | | |
| 7.750%, 12/01/30 | | | 1,980 | | | | 2,371 | | |
Verizon Wireless
5.375%, 12/15/06 | | | 980 | | | | 1,027 | | |
| | | | 39,587 | | |
| Consumer Cyclical – 11.2% | | | |
AOL Time Warner
6.125%, 04/15/06 | | | 980 | | | | 1,024 | | |
| 7.625%, 04/15/31 | | | 1,185 | | | | 1,359 | | |
Centex
5.125%, 10/01/13 | | | 1,230 | | | | 1,226 | | |
D. R. Horton
5.000%, 01/15/09 | | | 990 | | | | 1,007 | | |
DaimlerChrysler
7.200%, 09/01/09 | | | 1,500 | | | | 1,686 | | |
| 6.500%, 11/15/13 | | | 2,000 | | | | 2,173 | | |
Ford Motor
7.450%, 07/16/31 | | | 1,555 | | | | 1,526 | | |
Ford Motor Credit
7.375%, 10/28/09 | | | 2,170 | | | | 2,376 | | |
| 7.250%, 10/25/11 | | | 3,400 | | | | 3,678 | | |
| 7.000%, 10/01/13 | | | 820 | | | | 867 | | |
General Motors
8.375%, 07/15/33 | | | 2,950 | | | | 3,135 | | |
General Motors Acceptance
5.625%, 05/15/09 | | | 3,985 | | | | 4,056 | | |
| 6.875%, 09/15/11 | | | 2,020 | | | | 2,121 | | |
Liberty Media
2.670%, 09/17/06 (c) | | | 1,250 | | | | 1,265 | | |
Park Place Entertainment
8.125%, 05/15/11 (a) | | | 1,000 | | | | 1,150 | | |
Viacom
6.625%, 05/15/11 | | | 1,735 | | | | 1,921 | | |
| | | | 30,570 | | |
| Consumer Non Cyclical – 6.9% | | | |
American Greetings
6.100%, 08/01/28 | | | 1,485 | | | | 1,556 | | |
Bunge Limited Finance
5.350%, 04/15/14 (b) | | | 945 | | | | 949 | | |
CIGNA
7.400%, 05/15/07 | | | 2,500 | | | | 2,733 | | |
Delhaize America
9.000%, 04/15/31 | | | 990 | | | | 1,205 | | |
Foster's Finance
4.875%, 10/01/14 (b) (e) | | | 2,000 | | | | 1,984 | | |
HCA Columbia Healthcare
8.750%, 09/01/10 | | | 1,000 | | | | 1,171 | | |
Highmark
6.800%, 08/15/13 (b) | | | 1,835 | | | | 2,002 | | |
Kraft Foods
6.250%, 06/01/12 | | | 1,240 | | | | 1,354 | | |
Kroger
7.500%, 04/01/31 | | | 980 | | | | 1,136 | | |
Medco Health Solutions
7.250%, 08/15/13 | | | 1,110 | | | | 1,226 | | |
FIRST AMERICAN FUNDS Annual Report 2004
31
Schedule of Investments September 30, 2004
Corporate Bond Fund (continued)
| DESCRIPTION | | PAR (000) | | VALUE (000) | |
Tyson Foods
8.250%, 10/01/11 (a) | | $ | 1,485 | | | $ | 1,759 | | |
Wyeth
5.250%, 03/15/13 | | | 1,690 | | | | 1,718 | | |
| | | | 18,793 | | |
| Electric – 7.8% | | | |
AES
7.750%, 03/01/14 | | | 750 | | | | 772 | | |
Consumers Energy, Series B
5.375%, 04/15/13 | | | 980 | | | | 1,007 | | |
DTE Energy
7.050%, 06/01/11 (a) | | | 1,500 | | | | 1,693 | | |
FirstEnergy. Series C
7.375%, 11/15/31 | | | 935 | | | | 1,053 | | |
FPL Group Capital
7.625%, 09/15/06 | | | 1,975 | | | | 2,143 | | |
MidAmerican Energy Holdings
5.875%, 10/01/12 | | | 990 | | | | 1,045 | | |
Monongahela Power
5.000%, 10/01/06 | | | 980 | | | | 1,002 | | |
National Rural Utilities
7.250%, 03/01/12 | | | 2,000 | | | | 2,312 | | |
Pacific Gas & Electric
6.050%, 03/01/34 | | | 840 | | | | 848 | | |
Pepco Holdings
6.450%, 08/15/12 | | | 1,490 | | | | 1,622 | | |
PPL Capital Funding
4.330%, 03/01/09 | | | 2,000 | | | | 1,997 | | |
Progress Energy
7.000%, 10/30/31 (a) | | | 1,000 | | | | 1,092 | | |
Southern Capital Funding, Series A
5.300%, 02/01/07 | | | 720 | | | | 752 | | |
TXU Energy
7.000%, 03/15/13 | | | 2,500 | | | | 2,813 | | |
Western Resources
7.125%, 08/01/09 | | | 1,000 | | | | 1,094 | | |
| | | | 21,245 | | |
| Energy – 4.1% | | | |
Amerada Hess
7.300%, 08/15/31 | | | 1,240 | | | | 1,347 | | |
Canadian Oil Sands
4.800%, 08/10/09 (b) | | | 1,000 | | | | 1,013 | | |
Devon Financing
7.875%, 09/30/31 | | | 1,000 | | | | 1,221 | | |
Duke Capital
5.668%, 08/15/14 | | | 1,500 | | | | 1,530 | | |
Encana Holdings Finance
5.800%, 05/01/14 | | | 1,000 | | | | 1,059 | | |
Gazprom International SA
7.201%, 02/01/20 (b) | | | 1,000 | | | | 1,012 | | |
Kerr-McGee
7.875%, 09/15/31 (a) | | | 1,530 | | | | 1,798 | | |
Petrobas International
9.750%, 07/06/11 | | | 990 | | | | 1,148 | | |
Sunoco
4.875%, 10/15/14 | | | 1,000 | | | | 989 | | |
| | | | 11,117 | | |
| Finance Companies – 5.9% | | | |
Core Investment Grade Trust
4.727%, 11/30/07 | | | 7,550 | | | | 7,773 | | |
Countrywide Home Loans, Series L
4.000%, 03/22/11 | | | 1,795 | | | | 1,736 | | |
Corporate Bond Fund (continued)
| DESCRIPTION | | PAR (000) | | VALUE (000) | |
Household Finance
4.625%, 01/15/08 | | $ | 1,675 | | | $ | 1,730 | | |
| 7.000%, 05/15/12 | | | 1,500 | | | | 1,716 | | |
International Lease Finance
4.500%, 05/01/08 | | | 1,970 | | | | 2,023 | | |
PHH
7.125%, 03/01/13 (a) | | | 980 | | | | 1,119 | | |
| | | | 16,097 | | |
| Industrial Other – 0.6% | | | |
Thermo Electron
7.625%, 10/30/08 | | | 1,460 | | | | 1,647 | | |
| Insurance – 2.7% | |
AFC Capital Trust
8.207%, 02/03/27 | | | 500 | | | | 503 | | |
Arch Capital Group
7.350%, 05/01/34 | | | 1,000 | | | | 1,045 | | |
AXA
8.600%, 12/15/30 | | | 980 | | | | 1,276 | | |
Fund American Companies
5.875%, 05/15/13 | | | 1,880 | | | | 1,925 | | |
Marsh & McLennan
7.125%, 06/15/09 | | | 1,375 | | | | 1,553 | | |
Zurich Capital Trust,
Callable 06/01/07 @ 104.19
8.376%, 06/01/37 (b) | | | 985 | | | | 1,132 | | |
| | | | 7,434 | | |
| Miscellaneous – 3.5% | | | |
Dow Jones
6.375%, 12/29/09 (b) | | | 4,500 | | | | 4,590 | | |
| 7.750%, 12/29/09 (b) | | | 5,000 | | | | 5,062 | | |
| | | | 9,652 | | |
| Natural Gas – 1.1% | | | |
Duke Energy
7.875%, 08/16/10 | | | 980 | | | | 1,142 | | |
Enterprise Products
5.600%, 10/15/14 (b) (e) | | | 1,200 | | | | 1,199 | | |
Kinder Morgan
7.300%, 08/15/33 | | | 625 | | | | 695 | | |
| | | | 3,036 | | |
| REITS – 2.1% | | | |
First Industrial
5.250%, 06/15/09 | | | 1,000 | | | | 1,027 | | |
Heritage Property Investment Trust
5.125%, 04/15/14 (b) | | | 1,000 | | | | 968 | | |
HRPT Properties Trust,
Callable 02/15/16 @ 100
6.250%, 08/15/16 | | | 1,000 | | | | 1,030 | | |
Post Apartment Homes
6.850%, 03/16/15 | | | 1,075 | | | | 1,085 | | |
Simon Property Group
7.750%, 01/20/11 | | | 1,450 | | | | 1,682 | | |
| | | | 5,792 | | |
| Sovereigns – 3.7% | | | |
Pemex Project
9.125%, 10/13/10 | | | 1,980 | | | | 2,353 | | |
Pemex Project Funding Master Trust
6.125%, 08/15/08 | | | 990 | | | | 1,044 | | |
| 7.375%, 12/15/14 | | | 4,000 | | | | 4,356 | | |
United Mexican States
5.875%, 01/15/14 (a) | | | 1,740 | | | | 1,764 | | |
| 6.750%, 09/27/34 | | | 610 | | | | 585 | | |
| | | | 10,102 | | |
The accompanying notes are an integral part of the financial statements.
FIRST AMERICAN FUNDS Annual Report 2004
32
Corporate Bond Fund (continued)
| DESCRIPTION | | PAR (000)/SHARES | | VALUE (000) | |
| Technology – 0.6% | | | |
Eastman Kodak
7.250%, 11/15/13 | | $ | 1,500 | | | $ | 1,650 | | |
| Transportation – 0.9% | | | |
American Airlines, Series 2001-1, Cl A2
6.817%, 05/23/11 (a) | | | 750 | | | | 666 | | |
Continental Airlines, Series 2001-1, Cl B
7.033%, 06/15/11 | | | 799 | | | | 627 | | |
Norfolk Southern
7.800%, 05/15/27 | | | 990 | | | | 1,206 | | |
| | | | 2,499 | | |
Total Corporate Bonds
(Cost $243,694) | | | | | | | 250,303 | | |
| U.S. Government & Agency Securities – 2.7% | | | |
| U.S. Treasuries – 2.7% | | | |
U.S. Treasury Notes
3.125%, 04/15/09 (a) | | | 1,365 | | | | 1,356 | | |
| 4.250%, 08/15/14 (a) | | | 6,000 | | | | 6,056 | | |
Total U.S. Government & Agency Securities
(Cost $7,398) | | | | | | | 7,412 | | |
| Asset-Backed Securities – 1.4% | | | |
| Home Equity – 1.1% | | | |
Ace Securities
Series 2003-OP1, Cl M3
2.740%, 12/25/33 (c) | | | 1,500 | | | | 1,518 | | |
GRMT Mortgage Loan Trust
Series 2001-1A, Cl M1
7.772%, 07/20/31 | | | 1,500 | | | | 1,580 | | |
| | | | 3,098 | | |
| Manufactured Housing – 0.3% | | | |
Green Tree Financial
Series 1996-8, Cl A7
8.050%, 10/15/27 | | | 692 | | | | 752 | | |
Total Asset-Backed Securities
(Cost $3,693) | | | | | | | 3,850 | | |
CMO – Private Mortgage-Backed
Security – 1.0% | | | |
| Adjustable Rate (c) – 1.0% | | | |
MLCC Mortgage Investors
Series 2003-H, Cl A3A
2.886%, 01/25/29 | | | 2,726 | | | | 2,808 | | |
Total CMO – Private Mortgage-Backed Security
(Cost $2,804) | | | | | | | 2,808 | | |
| Preferred Stock – 0.2% | | | |
| United States – 0.2% | | | |
iStar Financial, Series G,
Callable 12/19/08 @ 25 (REIT) | | | 24,900 | | | | 623 | | |
Total Preferred Stock
(Cost $623) | | | | | | | 623 | | |
| Treasury Obligation – 0.1% | | | |
U. S. Treasury Bill
1.435%, 11/18/04 (f) | | $ | 260 | | | | 259 | | |
Total Treasury Obligation
(Cost $259) | | | | | | | 259 | | |
Corporate Bond Fund (continued)
| DESCRIPTION | | CONTRACTS/
SHARES/PAR (000) | | VALUE (000) | |
| Options Purchased – 0.0% | | | |
| Call Option Purchased – 0.0% | | | |
U.S. Treasury 5 Year Note, November 2004
Futures Call, Expires 11/30/04, | |
| Exercise Price $112.00 | | | 59 | | | $ | 4 | | |
| Put Options Purchased – 0.0% | | | |
U.S. Treasury 5 Year Note, December 04
Futures Put, Expires 12/30/04,
Exercise price $106.50 | | | 12 | | | | - | | |
U.S. Treasury 5 Year Note, December 04
Futures Put, Expires 12/30/04,
Exercise price $107.00 | | | 154 | | | | 5 | | |
U.S. Treasury 5 Year Note, December 04
Futures Put, Expires 12/30/04,
Exercise price $109.00 | | | 120 | | | | 23 | | |
U.S. Treasury 5 Year Note, December 04
Futures Put, Expires 12/30/04,
Exercise price $109.50 | | | 60 | | | | 18 | | |
U.S. Treasury 5 Year Note, December 04
Futures Put, Expires 12/30/04,
Exercise price $105.00 | | | 25 | | | | - | | |
| | | | | | | | 46 | | |
Total Options Purchased
(Cost $292) | | | | | | | 50 | | |
| Affiliated Money Market Fund – 2.0% | | | |
| First American Prime Obligations Fund, Cl Z (h) | | | 5,272,867 | | | | 5,273 | | |
Total Affiliated Money Market Fund
(Cost $5,273) | | | | | | | 5,273 | | |
Investments Purchased with Proceeds
from Securities Lending – 18.5% | | | |
| Commercial Paper – 6.0% | | | |
Bluegrass
1.881%, 5/18/05 | | $ | 213 | | | | 213 | | |
| 1.891%, 8/18/05 | | | 170 | | | | 170 | | |
Concord Minutemen Capital
1.650%, 10/01/04 | | | 350 | | | | 350 | | |
| 1.680%, 10/05/04 | | | 779 | | | | 779 | | |
| 1.720%, 10/06/04 | | | 575 | | | | 575 | | |
| 1.740%, 10/14/04 | | | 385 | | | | 385 | | |
| Descartes Funding Trust | |
| 1.760%, 11/15/04 | | | 433 | | | | 433 | | |
Ford Credit Floor Plan
1.622%, 10/05/04 | | | 865 | | | | 865 | | |
| 1.526%, 10/06/04 | | | 606 | | | | 606 | | |
| 1.655%, 10/22/04 | | | 190 | | | | 190 | | |
| Goldman Sachs | |
| 1.975%, 1/18/05 | | | 433 | | | | 433 | | |
Independence
1.830%, 4/15/05 | | | 535 | | | | 535 | | |
Jupiter Securities Corp
1.793%, 10/21/04 | | | 1,644 | | | | 1,644 | | |
Lakeside Funding
1.790%, 10/08/04 | | | 917 | | | | 917 | | |
Landesbank Baden
1.480%, 11/12/04 | | | 173 | | | | 173 | | |
Leaf's LLC
1.821%, 4/20/05 | | | 476 | | | | 476 | | |
Liquid Funding
1.743%, 10/13/04 | | | 605 | | | | 605 | | |
| 1.830%, 5/25/05 | | | 433 | | | | 433 | | |
FIRST AMERICAN FUNDS Annual Report 2004
33
Schedule of Investments September 30, 2004
Corporate Bond Fund (continued)
| DESCRIPTION | | PAR (000) | | VALUE (000) | |
MBNA Credit
1.683%, 10/12/04 | | $ | 420 | | | $ | 420 | | |
| 1.764%, 10/26/04 | | | 233 | | | | 233 | | |
Main Street Warehouse
1.742%, 10/04/04 | | | 571 | | | | 571 | | |
| 1.683%, 10/04/04 | | | 705 | | | | 705 | | |
| 1.742%, 10/08/04 | | | 432 | | | | 432 | | |
| 1.742%, 10/08/04 | | | 433 | | | | 433 | | |
Mortgage Interest Network
1.752%, 10/12/04 | | | 285 | | | | 285 | | |
| 1.763%, 10/14/04 | | | 303 | | | | 303 | | |
Netexis Banques
1.700%, 12/16/04 | | | 431 | | | | 431 | | |
Orchard Park
1.796%, 4/06/05 | | | 433 | | | | 433 | | |
| 1.766%, 7/06/05 | | | 893 | | | | 893 | | |
Park Granada LLC
1.622%, 10/01/04 | | | 761 | | | | 761 | | |
| 1.743%, 10/13/04 | | | 493 | | | | 493 | | |
Sigma Finance
1.512%, 11/29/04 | | | 216 | | | | 216 | | |
| Total Commercial Paper | | | | | | | 16,391 | | |
| Corporate Obligations – 4.9% | | | |
Allstate Life Global
1.780%, 10/14/05 | | | 865 | | | | 865 | | |
| 1.750%, 10/14/05 | | | 216 | | | | 216 | | |
Bayer Landbank NY
1.830%, 6/24/05 | | | 822 | | | | 822 | | |
Blue Heron Funding
1.850%, 5/18/05 | | | 242 | | | | 242 | | |
Castle Hill III
1.910%, 9/15/15 | | | 260 | | | | 260 | | |
Depfa Bank PLC
1.860%, 6/15/05 | | | 432 | | | | 432 | | |
Duke Funding VI
1.320%, 4/08/05 | | | 523 | | | | 523 | | |
General Electric Capital Corporation
1.838%, 10/07/05 | | | 433 | | | | 433 | | |
Jackson National Life
1.760%, 4/15/05 | | | 433 | | | | 433 | | |
Jefferson Pilot
1.788%, 8/17/05 | | | 433 | | | | 433 | | |
Liquid Funding
1.840%, 6/28/05 | | | 389 | | | | 389 | | |
Merrill Lynch
1.696%, 10/01/05 | | | 865 | | | | 865 | | |
Metlife Global Funding
1.800%, 10/14/05 | | | 519 | | | | 519 | | |
| 1.880%, 10/28/05 | | | 364 | | | | 364 | | |
Morgan Stanley
1.850%, 12/26/08 | | | 433 | | | | 433 | | |
Natexis Banq NY
1.920%, 7/12/05 | | | 476 | | | | 476 | | |
Northlake CDO
1.895%, 3/07/05 | | | 260 | | | | 260 | | |
Premium Asset Trust
1.848%, 12/22/04 | | | 324 | | | | 324 | | |
| 1.760%, 5/13/05 | | | 606 | | | | 606 | | |
| 1.740%, 6/01/05 | | | 1,289 | | | | 1,289 | | |
| 1.770%, 10/14/05 | | | 346 | | | | 346 | | |
REMAC
1.840%, 9/29/05 | | | 476 | | | | 476 | | |
Corporate Bond Fund (continued)
| DESCRIPTION | | PAR (000) | | VALUE (000) | |
RMAC
1.740%, 6/12/05 | | $ | 499 | | | $ | 499 | | |
SMM Trust 2004
1.833%, 9/23/05 | | | 805 | | | | 805 | | |
Societe Generale NYC
1.960%, 12/08/04 | | | 865 | | | | 865 | | |
Svenska Handl
1.170%, 10/21/04 | | | 433 | | | | 433 | | |
| Total Corporate Obligations | | | | | | | 13,608 | | |
| Other Short-Term Investments – 1.3% | |
ARLO III Ltd
2.000%, 9/28/05 | | | 1,298 | | | | 1,298 | | |
Commonwealth Life
2.115%, 12/31/04 (g) | | | 437 | | | | 437 | | |
General Electric Capital Assurance
1.980%, 1/19/05 | | | 173 | | | | 173 | | |
HBOS Treasury Services
1.640%, 11/01/05 | | | 475 | | | | 475 | | |
Security Life of Denver
1.900%, 12/30/04 | | | 1,125 | | | | 1,125 | | |
| Total Other Short-Term Investments | | | | | | | 3,508 | | |
| Repurchase Agreements – 6.3% | |
Bear Stearns
2.045%, dated 9/30/04, matures 10/01/04,
repurchase price $865,292
(collateralized by Various Securities:
Total Market Value $883,031) | | | 865 | | | | 865 | | |
Bear Stearns
2.060%, dated 9/30/04, matures 12/23/04,
repurchase price $260,821
(collateralized by Various Securities:
Total Market Value $264,857) | | | 260 | | | | 260 | | |
Citibank
1.945%, dated 9/30/04, matures 10/01/04,
repurchase price $1,730,580
(collateralized by Corporate Securities:
Total Market Value $1,832,501) | | | 1,730 | | | | 1,730 | | |
Citibank
1.925%, dated 9/30/04, matures 10/01/04,
repurchase price $432,645
(collateralized by Various Securities:
Total Market Value $442,254) | | | 432 | | | | 432 | | |
Citibank
1.925%, dated 9/30/04, matures 10/01/04,
repurchase price $432,645
(collateralized by Various Securities:
Total Market Value $441,280) | | | 433 | | | | 433 | | |
Greenwich Capital Markets
1.950%, dated 9/30/04, matures 10/01/04,
repurchase price $2,595,870
(collateralized by U.S. Government Securities:
Total Market Value $2,647,678) | | | 2,596 | | | | 2,596 | | |
Goldman Sachs
2.025%, dated 9/30/04, matures 10/01/04,
repurchase price $605,704
(collateralized by Various Securities:
Total Market Value $624,403) | | | 605 | | | | 605 | | |
Goldman Sachs
2.025%, dated 9/30/04, matures 10/01/04,
repurchase price $259,588
(collateralized by Various Securities:
Total Market Value $267,608) | | | 260 | | | | 260 | | |
The accompanying notes are an integral part of the financial statements.
FIRST AMERICAN FUNDS Annual Report 2004
34
Corporate Bond Fund (continued)
| DESCRIPTION | | PAR (000) | | VALUE (000) | |
Goldman Sachs
2.025%, dated 9/30/04, matures 10/01/04,
repurchase price $259,588
(collateralized by Various Securities:
Total Market Value $267,608) | | $ | 260 | | | $ | 260 | | |
Goldman Sachs
2.025%, dated 9/30/04, matures 10/01/04,
repurchase price $648,969
(collateralized by Corporate Securities:
Total Market Value $669,006) | | | 649 | | | | 649 | | |
Goldman Sachs
1.425%, dated 9/30/04, matures 10/18/04,
repurchase price $1,082,325
(collateralized by Corporate Securities:
Total Market Value $1,103,633) | | | 1,082 | | | | 1,082 | | |
Goldman Sachs
1.480%, dated 9/30/04, matures 10/18/04,
repurchase price $649,413
(collateralized by Corporate Securities:
Total Market Value $669,006) | | | 649 | | | | 649 | | |
Goldman Sachs
2.205%, dated 9/30/04, matures 3/07/05,
repurchase price $436,808
(collateralized by Corporate Securities:
Total Market Value $441,457) | | | 433 | | | | 433 | | |
Lehman Brothers
2.055%, dated 9/30/04, matures 10/01/04,
repurchase price $1,730,585
(collateralized by Collateralized Mortgage
Obligations: Total Market Value $1,765,096) | | | 1,730 | | | | 1,730 | | |
Lehman Brothers
1.910%, dated 9/30/04, matures 10/01/04,
repurchase price $2,595,868
(collateralized by U.S. Government Securities:
Total Market Value $2,647,686) | | | 2,596 | | | | 2,596 | | |
Lehman Brothers
1.935%, dated 9/30/04, matures 10/01/04,
repurchase price $1,730,580
(collateralized by Collateralized Mortgage
Obligations: Total Market Value $1,902,813) | | | 1,730 | | | | 1,730 | | |
Merrill Lynch
1.925%, dated 9/30/04, matures 10/01/04,
repurchase price $865,290
(collateralized by Corporate Securities:
Total Market Value $908,524) | | | 865 | | | | 865 | | |
| Total Repurchase Agreements | | | | | | | 17,175 | | |
Total Investments Purchased with Proceeds
from Securities Lending
(Cost $50,682) | | | | | | | 50,682 | | |
Total Investments – 117.5%
(Cost $314,718) | | | | | | | 321,260 | | |
| Other Assets and Liabilities, Net – (17.5)% | | | | | | | (47,944 | ) | |
| Total Net Assets – 100.0% | | | | | | $ | 273,316 | | |
(a) This security or a portion of this security is out on loan at September 30, 2004. Total loaned securities had a value of $49,122,851 at September 30, 2004. See note 2 in Notes to Financial Statements.
(b) Security sold within the terms of a private placement memorandum, exempt from registration under Rule 144A of the Securities Act of 1933, as amended, and may be sold only to dealers in that program or other "qualified institutional buyers." These securities have been determined to be liquid under the guidelines established by the Funds' board of directors. As of September 30, 2004, the value of these investments was $29,837,550 or 10.9% of total net assets. See note 2 in Notes to Financial Statements.
Corporate Bond Fund (concluded)
(c) Variable Rate Security – The rate shown is the rate in effect as of
September 30, 2004.
(d) Represents a foreign high yield (non-investment grade) bond. On September 30, 2004, the value of these investments was $2,051,230, which represents 0.8% of total net assets.
(e) Security purchased on a when-issued basis. On September 30, 2004, the total cost of investments purchased on a when-issued basis was $3,198,978 or 1.2% of total net assets. See note 2 in Notes to Financial Statements.
(f) Security has been deposited as initial margin on open futures contracts. Yield shown is effective yield at date of purchase. See note 2 in Notes to Financial Statements.
(g) Security has demand features which qualify it as a short-term security. The date disclosed is the next put date.
(h) Investment in affiliated security. This money market fund is advised by U.S. Bancorp Asset Management, Inc., which also serves as advisor to this Fund. See note 3 in Notes to Financial Statements.
Cl – Class
CMO – Collateralized Mortgage Obligation
REIT – Real Estate Investment Trust
Schedule of Open Futures Contracts
| Description | | Number of
Contracts
Purchased
(Sold) | | Market Value
Covered By
Contracts | | Settlement
Month | | Unrealized
Appreciation
(Depreciation) | |
90 Day Eurodollar
June 05 Futures | | | (30 | ) | | $ | (3,646 | ) | | Jun. 05 | | $ | (34 | ) | |
90 Day Eurodollar
December 04 Futures | | | 75 | | | | 18,318 | | | Dec. 04 | | | 54 | | |
90 Day Eurodollar
December 05 Futures | | | (75 | ) | | | (18,141 | ) | | Dec. 05 | | | (158 | ) | |
U.S. Treasury 5 Year
December 04 Futures | | | (265 | ) | | | (29,348 | ) | | Dec. 04 | | | (20 | ) | |
10 Year U.S. Treasury
December 04 Futures | | | (314 | ) | | | (35,364 | ) | | Dec. 04 | | | (336 | ) | |
U.S. Treasury Long Bond
December 04 Futures | | | 190 | | | | 21,322 | | | Dec. 04 | | | 231 | | |
| | | $ | (263 | ) | |
FIRST AMERICAN FUNDS Annual Report 2004
35
Schedule of Investments September 30, 2004
High Income Bond Fund
| DESCRIPTION | | PAR (000) | | VALUE (000) | |
| High Yield Corporate Bonds – 93.2% | |
| Banking – 0.4% | |
Chevy Chase Bank,
Callable 12/01/08 @ 103.44
6.875%, 12/01/13 | | $ | 500 | | | $ | 507 | | |
First American Capital Trust I
8.500%, 04/15/12 | | | 750 | | | | 861 | | |
| | | | 1,368 | | |
| Basic Industry – 14.8% | | | |
Abitibi-Consolidated
8.550%, 08/01/10 (b) | | | 2,750 | | | | 2,994 | | |
| 7.750%, 06/15/11 (b) | | | 1,000 | | | | 1,046 | | |
AK Steel,
Callable 06/15/07 @ 103.875
7.750%, 06/15/12 (c) | | | 1,500 | | | | 1,466 | | |
Alpha Natural Resources,
Callable 06/01/08 @ 105
10.000%, 06/01/12 (a) | | | 1,000 | | | | 1,115 | | |
BCP Caylux,
Callable 06/15/09 @ 104.81
9.625%, 06/15/14 (a) | | | 2,000 | | | | 2,160 | | |
Borden U.S. Financial,
Callable 07/15/09 @ 104.50
9.000%, 07/15/14 (a) | | | 1,500 | | | | 1,575 | | |
| Bowater Canada | |
| 7.950%, 11/15/11 (b) (c) | | | 2,000 | | | | 2,147 | | |
Caraustar Industries,
Callable 04/01/06 @ 105.25
9.875%, 04/01/11 (c) | | | 2,000 | | | | 2,140 | | |
| Consolidated Energy | |
| 7.875%, 03/01/12 | | | 1,000 | | | | 1,115 | | |
| Equistar Chemical Funding | |
| 10.125%, 09/01/08 (c) | | | 2,250 | | | | 2,526 | | |
Geon
7.500%, 12/15/15 | | | 1,000 | | | | 882 | | |
Georgia-Pacific
8.125%, 05/15/11 (c) | | | 1,000 | | | | 1,165 | | |
| 8.875%, 05/15/31 | | | 1,000 | | | | 1,210 | | |
Gerdau Ameristeel,
Callable 07/15/07 @ 105.38
10.375%, 07/15/11 (c) | | | 1,000 | | | | 1,137 | | |
Huntsman ICI Chemicals,
Callable 12/02/04 @ 105.06
10.125%, 07/01/09 (c) | | | 1,000 | | | | 1,050 | | |
Callable 07/15/08 @ 105.75
11.500%, 07/15/12 (a) | | | 2,000 | | | | 2,200 | | |
Callable 10/18/04 @ 52.34
16.160%, 12/31/09 (l) | | | 1,000 | | | | 530 | | |
IMC Global, Series B
10.875%, 06/01/08 | | | 2,000 | | | | 2,410 | | |
International Steel
6.500%, 04/15/14 (a) | | | 2,000 | | | | 2,000 | | |
JSG Funding,
Callable 10/01/07 @ 104.81
9.625%, 10/01/12 (b) | | | 1,000 | | | | 1,130 | | |
Lyondell Chemical,
Callable 10/01/04 @ 105.44
10.875%, 05/01/09 (c) | | | 1,500 | | | | 1,590 | | |
Nalco,
Callable 11/15/07 @ 103.88
7.750%, 11/15/11 | | | 1,000 | | | | 1,061 | | |
High Income Bond Fund (continued)
| DESCRIPTION | | PAR (000) | | VALUE (000) | |
Nova Chemicals
6.500%, 01/15/12 | | $ | 1,000 | | | $ | 1,022 | | |
OM Group,
Callable 12/15/06 @ 104.63
9.250%, 12/15/11 | | | 1,500 | | | | 1,567 | | |
Polyone
8.875%, 05/01/12 | | | 1,300 | | | | 1,326 | | |
Rhodia
10.250%, 06/01/10 | | | 1,000 | | | | 1,035 | | |
Stone Container,
Callable 07/01/07 @ 104.19
8.375%, 07/01/12 | | | 2,000 | | | | 2,200 | | |
Tembec Industries
8.500%, 02/01/11 (b) | | | 2,070 | | | | 2,173 | | |
USEC
6.625%, 01/20/06 | | | 1,000 | | | | 1,007 | | |
| | | | 44,979 | | |
| Brokerage – 0.2% | | | |
E*Trade Financial,
Callable 06/15/08 @ 104
8.000%, 06/15/11 (a) | | | 750 | | | | 780 | | |
| Capital Goods – 6.5% | |
Allied Waste North America,
Callable 02/15/09 @ 103.06
6.125%, 02/15/14 | | | 1,000 | | | | 935 | | |
Callable 04/15/08 @ 103.94
7.875%, 04/15/13 | | | 2,000 | | | | 2,105 | | |
Anchor Glass Container,
Callable 02/15/08 @ 105.50
11.000%, 02/15/13 | | | 1,000 | | | | 1,140 | | |
BE Aerospace,
Callable 10/01/04 @ 104.75
9.500%, 11/01/08 (c) | | | 1,000 | | | | 1,032 | | |
Case New Holland,
Callable 08/01/07 @ 104.63
9.250%, 08/01/11 (a) | | | 2,000 | | | | 2,245 | | |
Crown European Holdings,
Callable 03/01/07 @ 104.75
9.500%, 03/01/11 (b) | | | 1,000 | | | | 1,115 | | |
Graham Packaging
8.500%, 10/15/12 (a) (d) | | | 250 | | | | 254 | | |
Graham Packaging
Callable 10/15/09 @ 104.94
9.875%, 10/15/14 (a) (d) | | | 750 | | | | 768 | | |
Greif Brothers,
Callable 08/01/07 @ 104.44
8.875%, 08/01/12 | | | 700 | | | | 777 | | |
L-3 Communications,
Callable 07/15/08 @ 103.06
6.125%, 07/15/13 (c) | | | 500 | | | | 506 | | |
Callable 01/15/09 @ 103.06
6.125%, 01/15/14 | | | 500 | | | | 506 | | |
Owens-Brockway Glass Container,
Callable 02/15/06 @ 104.44
8.875%, 02/15/09 | | | 1,000 | | | | 1,087 | | |
Owens-Illinois
8.100%, 05/15/07 | | | 2,000 | | | | 2,100 | | |
Sequa
9.000%, 08/01/09 | | | 1,000 | | | | 1,097 | | |
Terex,
Callable 01/15/09 @ 103.69
7.375%, 01/15/14 | | | 500 | | | | 525 | | |
The accompanying notes are an integral part of the financial statements.
FIRST AMERICAN FUNDS Annual Report 2004
36
High Income Bond Fund (continued)
| DESCRIPTION | | PAR (000) | | VALUE (000) | |
Texas Industries,
Callable 06/15/07 @ 105.13
10.250%, 06/15/11 (c) | | $ | 800 | | | $ | 920 | | |
United Rentals of North America,
Callable 02/15/08 @ 103.25
6.500%, 02/15/12 | | | 1,000 | | | | 962 | | |
Callable 02/15/09 @ 103.50
7.000%, 02/15/14 | | | 1,750 | | | | 1,557 | | |
| | | | 19,631 | | |
| Communications – 17.8% | | | |
Alamosa Delaware,
Callable 07/31/07 @ 105.50
11.000%, 07/31/10 | | | 650 | | | | 736 | | |
American Tower,
Callable 02/01/05 @ 104.69
9.375%, 02/01/09 (c) | | | 742 | | | | 791 | | |
Callable 05/01/08 @ 103.75
7.500%, 05/01/12 | | | 250 | | | | 255 | | |
AT&T
8.050%, 11/15/11 | | | 2,000 | | | | 2,240 | | |
| 8.750%, 11/15/31 | | | 2,000 | | | | 2,183 | | |
Cablevision Systems
8.000%, 04/15/12 (a) | | | 2,000 | | | | 2,085 | | |
CCO Holdings,
Callable 11/15/08 @ 104.38
8.750%, 11/15/13 | | | 1,000 | | | | 977 | | |
Centennial Communications,
Callable 06/15/08 @ 105.06
10.125%, 06/15/13 (c) | | | 500 | | | | 527 | | |
Charter Communications Holdings
8.000%, 04/30/12 (a) | | | 2,000 | | | | 1,992 | | |
Charter Communications Holdings,
Callable 10/01/04 @ 104.31
8.625%, 04/01/09 (c) | | | 2,000 | | | | 1,545 | | |
Callable 09/15/08 @ 105.12
10.250%, 09/15/10 | | | 1,000 | | | | 1,017 | | |
Citizens Communications
9.250%, 05/15/11 | | | 2,000 | | | | 2,194 | | |
Crown Castle International,
Callable 08/01/05 @ 105.38
10.750%, 08/01/11 (c) | | | 500 | | | | 556 | | |
CSC Holdings
7.875%, 02/15/18 | | | 500 | | | | 519 | | |
Series B
7.625%, 04/01/11 | | | 1,000 | | | | 1,050 | | |
Dex Media East,
Callable 11/15/07 @ 106.06
12.125%, 11/15/12 | | | 324 | | | | 402 | | |
Dex Media West,
Callable 08/15/08 @ 104.94
9.875%, 08/15/13 | | | 500 | | | | 587 | | |
Dex Media,
Callable 11/15/08 @ 104.50
0.000%, 11/15/13 (j) | | | 1,000 | | | | 730 | | |
DirecTV Holdings,
Callable 03/15/08 @ 104.19
8.375%, 03/15/13 | | | 2,000 | | | | 2,280 | | |
Dobson Communications,
Callable 10/01/08 @ 104.44
8.875%, 10/01/13 (c) | | | 500 | | | | 325 | | |
Echostar
6.625%, 10/01/14 (a) (d) | | | 2,000 | | | | 1,980 | | |
High Income Bond Fund (continued)
| DESCRIPTION | | PAR (000) | | VALUE (000) | |
Granite Broadcasting,
Callable 12/01/06 @ 109.75
9.750%, 12/01/10 | | $ | 1,000 | | | $ | 917 | | |
Horizon PCS,
Callable 07/15/08 @ 105.69
11.375%, 07/15/12 (a) | | | 900 | | | | 936 | | |
Houghton Mifflin,
Callable 02/01/08 @ 104.94
9.875%, 02/01/13 (c) | | | 1,000 | | | | 1,050 | | |
Insight Midwest,
Callable 11/01/05 @ 105.25
10.500%, 11/01/10 | | | 500 | | | | 549 | | |
IPSC Escrow,
Callable 05/01/08 @ 105.75
11.500%, 05/01/12 (a) | | | 1,000 | | | | 1,065 | | |
Level 3 Communications,
Callable 10/01/04 @ 104.56
9.125%, 05/01/08 (c) | | | 2,000 | | | | 1,480 | | |
MCI,
Callable 05/01/05 @ 102.45
5.908%, 05/01/07 | | | 1,000 | | | | 991 | | |
Callable 05/01/09 @ 103.37
7.735%, 05/01/14 | | | 2,500 | | | | 2,362 | | |
Nextel Communications,
Callable 11/15/04 @ 104.69
9.375%, 11/15/09 | | | 1,000 | | | | 1,056 | | |
Callable 03/15/09 @ 102.98
5.950%, 03/15/14 | | | 1,000 | | | | 985 | | |
Callable 08/01/08 @ 103.69
7.375%, 08/01/15 | | | 500 | | | | 536 | | |
Nextel Partners,
Callable 07/01/07 @ 104.06
8.125%, 07/01/11 (c) | | | 1,000 | | | | 1,062 | | |
Panamsat,
Callable 08/15/09 @ 104.50
9.000%, 08/15/14 (a) | | | 1,000 | | | | 1,040 | | |
Callable 11/01/09 @ 105.19
0.000%, 11/01/14 (a) (d) (j) | | | 1,700 | | | | 992 | | |
Paxson Communications,
Callable 07/15/05 @ 105.38
10.750%, 07/15/08 (c) | | | 750 | | | | 752 | | |
Primedia,
Callable 05/15/06 @ 104.44
8.875%, 05/15/11 | | | 800 | | | | 796 | | |
Qwest
8.875%, 03/15/12 (a) (c) | | | 2,000 | | | | 2,205 | | |
Qwest,
Callable 10/01/04 @ 103.36
7.500%, 06/15/23 | | | 1,000 | | | | 905 | | |
Qwest Services,
Callable 12/15/05 @ 106.50
13.000%, 12/15/07 (a) | | | 1,000 | | | | 1,144 | | |
Callable 12/15/06 @ 106.75
13.500%, 12/15/10 (a) | | | 2,000 | | | | 2,342 | | |
R. H. Donnelley Finance,
Callable 12/15/07 @ 105.44
10.875%, 12/15/12 (a) | | | 1,000 | | | | 1,212 | | |
Rogers Cable
6.250%, 06/15/13 (b) | | | 1,000 | | | | 978 | | |
Rogers Wireless
6.375%, 03/01/14 | | | 1,000 | | | | 920 | | |
SBA Communications,
Callable 12/15/07 @ 104.88
9.750%, 12/15/11 | | | 1,000 | | | | 815 | | |
FIRST AMERICAN FUNDS Annual Report 2004
37
Schedule of Investments September 30, 2004
High Income Bond Fund (continued)
| DESCRIPTION | | PAR (000) | | VALUE (000) | |
Shaw Communications
8.250%, 04/11/10 (b) | | $ | 1,000 | | | $ | 1,132 | | |
Sinclair Broadcast Group,
Callable 03/15/07 @ 104
8.000%, 03/15/12 | | | 1,000 | | | | 1,048 | | |
| | | | 54,241 | | |
| Consumer Cyclical – 14.7% | | | |
AMC Entertainment,
Callable 03/01/09 @ 104.00
8.000%, 03/01/14 (a) | | | 1,000 | | | | 940 | | |
Arvinmeritor
8.750%, 03/01/12 | | | 500 | | | | 556 | | |
Asbury Automotive Group,
Callable 06/15/07 @ 104.50
9.000%, 06/15/12 | | | 1,000 | | | | 1,055 | | |
Beazer Homes USA,
Callable 04/15/07 @ 104.19
8.375%, 04/15/12 | | | 1,000 | | | | 1,100 | | |
Buffets,
Callable 07/15/06 @ 105.63
11.250%, 07/15/10 | | | 500 | | | | 530 | | |
Collins & Aikman Products
12.875%, 08/15/12 (a) | | | 1,000 | | | | 915 | | |
D. R. Horton
5.000%, 01/15/09 | | | 500 | | | | 509 | | |
Dana
6.500%, 03/01/09 | | | 1,000 | | | | 1,059 | | |
Dominos, Series B,
Callable 07/01/07 @ 104.13
8.250%, 07/01/11 | | | 547 | | | | 589 | | |
Duane Reade,
Callable 08/01/08 @ 104.88
9.750%, 08/01/11 (a) | | | 1,000 | | | | 953 | | |
Dura Operating, Series B,
Callable 04/15/07 @ 104.31
8.625%, 04/15/12 (c) | | | 1,500 | | | | 1,489 | | |
Felcor Lodging (REIT)
8.500%, 06/01/11 (c) | | | 500 | | | | 550 | | |
Glenoit,
Callable 10/01/04 @ 103.67
11.000%, 04/15/07 (e) (f) | | | 100 | | | | - | | |
Goodyear Tire & Rubber
7.857%, 08/15/11 (c) | | | 1,000 | | | | 943 | | |
Hilton Hotels
8.250%, 02/15/11 | | | 1,000 | | | | 1,185 | | |
Host Marriott,
Callable 11/01/08 @ 103.56 (REIT)
7.125%, 11/01/13 | | | 1,000 | | | | 1,048 | | |
Inn of the Mountain Gods Resort,
Callable 11/15/07 @ 106
12.000%, 11/15/10 | | | 1,000 | | | | 1,140 | | |
IMAX,
Callable 12/01/07 @ 104.81
9.625%, 12/01/10 (a) (b) (c) | | | 1,000 | | | | 995 | | |
Isle of Capri Casinos,
Callable 03/01/09 @ 103.50
7.000%, 03/01/14 | | | 1,000 | | | | 1,005 | | |
J.C. Penney
8.000%, 03/01/10 | | | 1,000 | | | | 1,137 | | |
| 7.950%, 04/01/17 | | | 1,000 | | | | 1,155 | | |
Jean Coutu Group,
Callable 08/01/09 @ 104.25
8.500%, 08/01/14 (a) | | | 1,000 | | | | 993 | | |
High Income Bond Fund (continued)
| DESCRIPTION | | PAR (000) | | VALUE (000) | |
KB Home
5.750%, 02/01/14 | | $ | 1,000 | | | $ | 990 | | |
Levi Strauss
7.000%, 11/01/06 (c) | | | 1,000 | | | | 998 | | |
Mandalay Resort Group
9.375%, 02/15/10 | | | 1,000 | | | | 1,145 | | |
Series B
10.250%, 08/01/07 (c) | | | 1,000 | | | | 1,135 | | |
Meristar Hospitality
9.125%, 01/15/11 | | | 1,000 | | | | 1,048 | | |
MGM Mirage
8.375%, 02/01/11 (c) | | | 2,000 | | | | 2,205 | | |
| 5.875%, 02/27/14 | | | 1,000 | | | | 960 | | |
Oxford Industries,
Callable 06/01/07 @ 104.44
8.875%, 06/01/11 (a) | | | 500 | | | | 541 | | |
Park Place Entertainment
8.875%, 09/15/08 (c) | | | 1,000 | | | | 1,138 | | |
| 7.875%, 03/15/10 | | | 1,000 | | | | 1,128 | | |
Penn National Gaming,
Callable 03/15/06 @ 104.44
8.875%, 03/15/10 | | | 1,000 | | | | 1,100 | | |
Rite Aid
7.125%, 01/15/07 (c) | | | 1,000 | | | | 1,005 | | |
Royal Caribbean Cruises
8.000%, 05/15/10 (b) | | | 1,000 | | | | 1,128 | | |
Russell,
Callable 05/01/06 @ 104.63
9.250%, 05/01/10 | | | 500 | | | | 543 | | |
Saks
7.500%, 12/01/10 | | | 500 | | | | 536 | | |
Schuler Homes,
Callable 07/15/05 @ 104.69
9.375%, 07/15/09 | | | 1,000 | | | | 1,090 | | |
Service Corporation International
7.700%, 04/15/09 | | | 1,000 | | | | 1,080 | | |
Shaw Group,
Callable 03/15/07 @ 105.38
10.750%, 03/15/10 (c) | | | 1,000 | | | | 1,048 | | |
Six Flags,
Callable 04/15/08 @ 104.88
9.750%, 04/15/13 (c) | | | 1,000 | | | | 950 | | |
Tenneco Automotive, Series B,
Callable 10/15/04 @ 105.81
11.625%, 10/15/09 (c) | | | 1,000 | | | | 1,055 | | |
Toys R Us
7.375%, 10/15/18 | | | 2,000 | | | | 1,875 | | |
Warnaco,
Callable 06/15/08 @ 104.44
8.875%, 06/15/13 | | | 500 | | | | 556 | | |
WCI Communities,
Callable 05/01/07 @ 104.56
9.125%, 05/01/12 (c) | | | 1,000 | | | | 1,113 | | |
Wynn Las Vegas,
Callable 11/01/06 @ 112
12.000%, 11/01/10 (c) | | | 483 | | | | 595 | | |
| | | | 44,808 | | |
| Consumer NonCyclical – 7.6% | | | |
Alliance Imaging,
Callable 04/15/06 @ 105.19
10.375%, 04/15/11 (c) | | | 1,000 | | | | 1,080 | | |
Athena Neurosciences Financial
7.250%, 02/21/08 | | | 1,000 | | | | 1,014 | | |
The accompanying notes are an integral part of the financial statements.
FIRST AMERICAN FUNDS Annual Report 2004
38
High Income Bond Fund (continued)
| DESCRIPTION | | PAR (000) | | VALUE (000) | |
Dade Behring,
Callable 10/03/05 @ 105.96
11.910%, 10/03/10 | | $ | 4 | | | $ | 4 | | |
Del Monte,
Callable 12/15/07 @ 104.31
8.625%, 12/15/12 | | | 1,000 | | | | 1,115 | | |
Delhaize America
9.000%, 04/15/31 | | | 2,000 | | | | 2,434 | | |
Dole Foods,
Callable 03/15/07 @ 104.44
8.875%, 03/15/11 | | | 1,000 | | | | 1,093 | | |
Elizabeth Arden,
Callable 01/15/09 @ 103.88
7.750%, 01/15/14 (a) | | | 500 | | | | 525 | | |
| Fisher Scientific International | |
Callable 05/01/07 @ 104.06
8.125%, 05/01/12 | | | 869 | | | | 971 | | |
Callable 08/15/09 @ 103.38
6.750%, 08/15/14 (a) | | | 500 | | | | 525 | | |
HCA
5.750%, 03/15/14 | | | 1,000 | | | | 991 | | |
HCA Columbia Healthcare
8.750%, 09/01/10 | | | 2,000 | | | | 2,343 | | |
Iasis Healthcare Capital,
Callable 06/15/09 @ 104.38
8.750%, 06/15/14 (a) | | | 1,000 | | | | 1,048 | | |
Medco Health Solutions
7.250%, 08/15/13 | | | 1,000 | | | | 1,104 | | |
Prestige Brands,
Callable 04/15/08 @ 104.63
9.250%, 04/15/12 (a) | | | 1,000 | | | | 980 | | |
Roundy's,
Callable 06/15/07 @ 104.44
8.875%, 06/15/12 | | | 1,000 | | | | 1,080 | | |
Sealy Mattress,
Callable 06/15/09 @ 104.13
8.250%, 06/15/14 | | | 1,250 | | | | 1,259 | | |
Simmons,
Callable 01/15/09 @ 103.94
7.875%, 01/15/14 (a) (c) | | | 600 | | | | 624 | | |
Stater Brothers Holdings,
Callable 06/15/08 @ 104.06
8.125%, 06/15/12 (a) | | | 1,000 | | | | 1,045 | | |
Swift & Co.,
Callable 10/01/06 @ 106.25
12.500%, 01/01/10 | | | 750 | | | | 829 | | |
Tenet Healthcare
6.500%, 06/01/12 | | | 1,000 | | | | 893 | | |
Triad Hospitals,
Callable 11/15/08 @ 103.50
7.000%, 11/15/13 | | | 1,000 | | | | 1,013 | | |
U.S. Oncology,
Callable 08/15/08 @ 104.50
9.000%, 08/15/12 (a) | | | 750 | | | | 780 | | |
Vanguard Health Holding,
Callable 10/01/09 @ 104.50
9.000%, 10/01/14 (a) | | | 500 | | | | 503 | | |
| | | | 23,253 | | |
| Electric – 9.3% | | | |
AES
9.375%, 09/15/10 (c) | | | 2,000 | | | | 2,255 | | |
| 7.750%, 03/01/14 (c) | | | 685 | | | | 706 | | |
Allegheny Energy Supply
8.250%, 04/15/12 (a) (c) | | | 1,000 | | | | 1,105 | | |
High Income Bond Fund (continued)
| DESCRIPTION | | PAR (000) | | VALUE (000) | |
Calpine,
Callable 11/08/04 @ 100
8.750%, 07/15/07 $1,500 $1,193
Callable 07/15/07 @ 104.25
8.500%, 07/15/10 (a) | | | 2,500 | | | | 1,909 | | |
Calpine Generating
11.500%, 04/01/11 (a) | | | 1,000 | | | | 870 | | |
CMS Energy
7.500%, 01/15/09 (c) | | | 2,000 | | | | 2,100 | | |
Dynegy Holdings,
Callable 07/15/08 @ 105.06
10.125%, 07/15/13 (a) | | | 1,000 | | | | 1,146 | | |
Dynegy-Roseton Danskamme
Series A
7.270%, 11/08/10 | | | 1,000 | | | | 1,010 | | |
Series B
7.670%, 11/08/16 | | | 2,000 | | | | 1,905 | | |
Empresa Nacional de Electricidad
8.350%, 08/01/13 (b) | | | 1,000 | | | | 1,121 | | |
FirstEnergy, Series C
7.375%, 11/15/31 | | | 1,500 | | | | 1,689 | | |
Homer City Funding
8.137%, 10/01/19 | | | 990 | | | | 1,090 | | |
Illinova,
Callable 12/15/06 @ 105.75
11.500%, 12/15/10 | | | 1,000 | | | | 1,201 | | |
Midwest Generation,
Callable 05/01/09 @ 104.38
8.750%, 05/01/34 | | | 700 | | | | 761 | | |
Mirant Mid-Atlantic, Series C
10.060%, 12/30/28 | | | 952 | | | | 1,019 | | |
Mission Energy Holdings
13.500%, 07/15/08 | | | 500 | | | | 633 | | |
Nevada Power, Series E,
Callable 10/15/06 @ 105.44
10.875%, 10/15/09 | | | 1,000 | | | | 1,163 | | |
NRG Energy,
Callable 12/15/08 @ 104
8.000%, 12/15/13 (a) | | | 1,000 | | | | 1,070 | | |
Reliant Resources,
Callable 07/15/07 @ 104.63
9.250%, 07/15/10 | | | 1,500 | | | | 1,609 | | |
Sierra Pacific Resources,
Callable 03/15/09 @ 104.31
8.625%, 03/15/14 (a) | | | 1,500 | | | | 1,619 | | |
Teco Energy
7.200%, 05/01/11 | | | 1,000 | | | | 1,065 | | |
| | | | 28,239 | | |
| Energy – 4.4% | | | |
Amerada Hess
7.875%, 10/01/29 | | | 1,000 | | | | 1,154 | | |
Belden & Blake,
Callable 07/15/08 @ 104.38
8.750%, 07/15/12 (a) | | | 1,000 | | | | 1,058 | | |
Bluewater Finance,
Callable 02/15/07 @ 105.13
10.250%, 02/15/12 (b) | | | 2,000 | | | | 2,165 | | |
J. Ray McDermott,
Callable 12/15/08 @ 105.50
11.000%, 12/15/13 (a) (b) | | | 1,500 | | | | 1,635 | | |
Lone Star Technologies,
Callable 06/01/06 @ 104.50
9.000%, 06/01/11 | | | 1,000 | | | | 1,073 | | |
FIRST AMERICAN FUNDS Annual Report 2004
39
Schedule of Investments September 30, 2004
High Income Bond Fund (continued)
| DESCRIPTION | | PAR (000) | | VALUE (000) | |
Parker Drilling, Series B,
Callable 11/15/04 @ 105.06
10.125%, 11/15/09 (c) | | $ | 419 | | | $ | 446 | | |
Petrobras International Financie
7.750%, 09/15/14 | | | 1,000 | | | | 995 | | |
Petroleum Geo-Services,
Callable 11/05/07 @ 105
10.000%, 11/05/10 (b) | | | 1,000 | | | | 1,133 | | |
Premcor Refining,
Callable 02/01/08 @ 103.88
7.750%, 02/01/12 | | | 1,360 | | | | 1,482 | | |
Range Resources,
Callable 07/15/08 @ 103.69
7.375%, 07/15/13 | | | 1,300 | | | | 1,362 | | |
United Refining,
Callable 08/15/08 @ 105.25
10.500%, 08/15/12 (a) | | | 1,000 | | | | 980 | | |
| | | | 13,483 | | |
| Finance Companies – 0.2% | | | |
Dollar Financial Group,
Callable 11/15/07 @ 104.88
9.750%, 11/15/11 | | | 350 | | | | 371 | | |
Finova Group
7.500%, 11/15/09 | | | 810 | | | | 399 | | |
| | | | 770 | | |
| Industrial Other – 0.3% | | | |
Amsted Industries,
Callable 10/15/07 @ 105.13
10.250%, 10/15/11 (a) | | | 800 | | | | 882 | | |
Diamond Brands Operating,
Callable 10/01/04 @ 105.06
10.125%, 04/15/08 (e) (f) (i) | | | 50 | | | | - | | |
| | | | 882 | | |
| Insurance – 0.7% | | | |
AFC Capital Trust
8.207%, 02/03/27 | | | 1,000 | | | | 1,007 | | |
Ohio Casualty
7.300%, 06/15/14 | | | 1,000 | | | | 1,048 | | |
| | | | 2,055 | | |
| Miscellaneous – 7.4% | | | |
Dow Jones
6.375%, 12/29/09 (a) | | | 12,000 | | | | 12,240 | | |
| 7.750%, 12/29/09 (a) | | | 7,000 | | | | 7,088 | | |
Trac-X EM
6.500%, 12/20/08 (a) | | | 3,000 | | | | 3,090 | | |
| | | | 22,418 | | |
| Natural Gas – 4.6% | | | |
El Paso
6.950%, 12/15/07 (c) | | | 1,000 | | | | 1,005 | | |
| 7.750%, 01/15/32 | | | 1,500 | | | | 1,313 | | |
El Paso Natural Gas,
Callable 08/01/07 @ 103.81
7.625%, 08/01/10 | | | 1,400 | | | | 1,509 | | |
Enterprise Products
5.600%, 10/15/14 (a) (d) | | | 1,000 | | | | 1,002 | | |
| 6.875%, 03/01/33 | | | 1,000 | | | | 1,024 | | |
| 6.650%, 10/15/34 | | | 1,000 | | | | 1,000 | | |
Gulfterra Energy Partners,
Callable 12/01/07 @ 105.31
10.625%, 12/01/12 | | | 671 | | | | 849 | | |
High Income Bond Fund (continued)
| DESCRIPTION | | PAR (000) | | VALUE (000) | |
Sonat
6.750%, 10/01/07 (c) | | $ | 1,000 | | | $ | 988 | | |
Tennessee Gas Pipeline
7.500%, 04/01/17 | | | 1,500 | | | | 1,560 | | |
Williams
6.750%, 04/15/09 (a) | | | 2,500 | | | | 2,606 | | |
| 7.750%, 06/15/31 | | | 1,000 | | | | 1,015 | | |
| | | | 13,871 | | |
| REITS – 0.3% | | | |
LNR Property,
Callable 07/15/08 @ 103.81
7.625%, 07/15/13 | | | 800 | | | | 874 | | |
| Sovereigns – 0.5% | | | |
Federal Republic of Brazil
8.250%, 01/20/34 | | | 500 | | | | 447 | | |
Jamaica Government
10.625%, 06/20/17 | | | 1,000 | | | | 975 | | |
| | | | 1,422 | | |
| Technology – 2.6% | | | |
Avnet
9.750%, 02/15/08 | | | 1,000 | | | | 1,140 | | |
Flextronics International,
Callable 05/15/08 @ 103.25
6.500%, 05/15/13 (b) (c) | | | 1,000 | | | | 1,020 | | |
Freescale Semiconductor,
Callable 07/15/08 @ 103.44
6.875%, 07/15/11 (a) | | | 1,000 | | | | 1,035 | | |
IOS Capital
7.250%, 06/30/08 | | | 85 | | | | 90 | | |
| Iron Mountain | |
Callable 01/15/08 @ 103.87
7.750%, 01/15/15 | | | 500 | | | | 536 | | |
Callable 04/01/06 @ 104.31
8.625%, 04/01/13 | | | 500 | | | | 544 | | |
Lucent Technologies
5.500%, 11/15/08 (c) | | | 1,000 | | | | 1,000 | | |
Nortel Networks
6.125%, 02/15/06 (b) | | | 1,000 | | | | 1,020 | | |
Xerox
9.750%, 01/15/09 (c) | | | 500 | | | | 583 | | |
| 7.200%, 04/01/16 | | | 1,000 | | | | 1,025 | | |
| | | | 7,993 | | |
| Transportation – 0.9% | | | |
Continental Airlines, Series 2001-1, Cl B
7.033%, 12/15/12 | | | 811 | | | | 637 | | |
Delta Air Lines, Series 2000-1, Cl B
7.920%, 05/18/12 | | | 1,000 | | | | 500 | | |
Laidlaw International,
Callable 06/15/07 @ 105.38
10.750%, 06/15/11 | | | 750 | | | | 855 | | |
Northwest Airlines
7.875%, 03/15/08 | | | 1,000 | | | | 690 | | |
| | | | 2,682 | | |
Total High Yield Corporate Bonds
(Cost $271,425) | | | | | | | 283,749 | | |
| Corporate Bonds – 1.0% | | | |
| Energy – 0.7% | | | |
Gazprom International SA
7.201%, 02/01/20 (a) | | | 2,000 | | | | 2,025 | | |
The accompanying notes are an integral part of the financial statements.
FIRST AMERICAN FUNDS Annual Report 2004
40
High Income Bond Fund (continued)
| DESCRIPTION | | PAR (000)/SHARES | | VALUE (000) | |
| Transportation – 0.3% | |
American Airlines, Series 1999-1, Cl A2
7.024%, 04/15/11 | | $ | 1,000 | | | $ | 983 | | |
Total Corporate Bonds
(Cost $2,898) | | | | | | | 3,008 | | |
U.S. Government & Agency
Securities – 0.9% | |
| U.S. Treasuries – 0.9% | |
U.S. Treasury Notes
2.000%, 11/30/04 (c) | | | 1,000 | | | | 1,000 | | |
| 4.750%, 05/15/14 (c) | | | 1,500 | | | | 1,575 | | |
Total U.S. Government & Agency Securities
(Cost $2,494) | | | | | | | 2,575 | | |
| Preferred Stocks – 0.4% | |
| United States – 0.4% | |
Alamosa Holdings, Series B,
Callable 11/10/06 @ 312.50 | | | 1 | | | | 590 | | |
iStar Financial, Series G,
Callable 12/19/08 @ 25 (REIT) | | | 20,000 | | | | 500 | | |
| Nebco Evans Holdings (PIK) (f) (h) (i) | | | 300 | | | | - | | |
Pegasus Communications
Fractional Shares (e) (f) (h) (i) | | | 15,109 | | | | - | | |
Total Preferred Stocks
(Cost $831) | | | | | | | 1,090 | | |
| Common Stocks – 0.0% | |
| Bermuda – 0.0% | |
| NII Holdings, Class B (c) (h) | | | 1,869 | | | | 77 | | |
| United States – 0.0% | |
| Viatel Holdings (e) (h) (i) | | | 338 | | | | - | | |
Total Common Stocks
(Cost $148) | | | | | | | 77 | | |
U.S. Government Agency Mortgage-Backed
Security – 0.0% | |
| Fixed Rate – 0.0% | |
FNMA Pool
6.695%, 08/01/05, #109031 | | $ | 35 | | | | 35 | | |
Total U.S. Government Agency
Mortgage-Backed Security
(Cost $35) | | | | | | | 35 | | |
| Asset-Backed Security – 0.0% | |
| Manufactured Housing – 0.0% | |
Green Tree Financial
Series 1998-1, Cl A1
6.040%, 11/01/29 | | | 15 | | | | 15 | | |
Total Asset-Backed Security
(Cost $15) | | | | | | | 15 | | |
| Warrants – 0.0% | |
| Canada – 0.0% | |
| AT&T Canada, Expires 08/15/07 (e) (h) (i) | | | 100 | | | | - | | |
| United States – 0.0% | |
Sterling Chemical Holdings,
Expires 08/15/08 (e) (h) (i) | | | 100 | | | | - | | |
| UIH Australia Pacific, Expires 05/15/06 (e) (h) (i) | | | 150 | | | | - | | |
| | | | - | | |
Total Warrants
(Cost $3) | | | | | | | - | | |
High Income Bond Fund (continued)
| DESCRIPTION | | PAR (000)/
CONTRACTS/SHARES | | VALUE (000) | |
| Treasury Obligation – 0.0% | | | |
U. S. Treasury Bill
1.559%, 11/18/04 (g) | | $ | 50 | | | $ | 50 | | |
Total Treasury Obligation
(Cost $50) | | | | | | | 50 | | |
| Options Purchased – 0.0% | | | |
| Call Options Purchased 0.0% | | | |
U.S. Treasury 5 Year Note November 04
Futures Call, Expires 11/30/04,
Exercise price $112.00 | | | 63 | | | | 5 | | |
| Put Options Purchased 0.0% | | | |
U.S. Treasury 5 Year Note December 04
Futures Put, Expires 12/30/04,
Exercise price $106.50 | | | 13 | | | | - | | |
U.S. Treasury 5 Year Note December 04
Futures Put, Expires 12/30/04,
Exercise price $107.00 | | | 163 | | | | 5 | | |
U.S. Treasury 5 Year Note December 04
Futures Put, Expires 12/30/04,
Exercise price $109.00 | | | 120 | | | | 23 | | |
U.S. Treasury 5 Year Note December 04
Futures Put, Expires 12/30/04,
Exercise price $109.50 | | | 60 | | | | 18 | | |
U.S. Treasury 5 Year Note December 04
Futures Put, Expires 12/30/04,
Exercise price $105.00 | | | 25 | | | | - | | |
| | | | 46 | | |
Total Options Purchased
(Cost $302) | | | | | | | 51 | | |
| Affiliated Money Market Fund – 2.1% | | | |
First American Prime
Obligations Fund, Cl Z (m) | | | 6,543,442 | | | | 6,544 | | |
Total Affiliated Money Market Fund
(Cost $6,544) | | | | | | | 6,544 | | |
Investments Purchased with Proceeds from
Securities Lending – 29.6% | | | |
| Commercial Paper – 9.6% | | | |
Bluegrass
1.881%, 5/18/05 | | $ | 379 | | | | 379 | | |
| 1.891%, 8/18/05 | | | 301 | | | | 301 | | |
Concord Minutemen Capital
1.650%, 10/01/04 | | | 623 | | | | 623 | | |
| 1.680%, 10/05/04 | | | 1,384 | | | | 1,384 | | |
| 1.720%, 10/06/04 | | | 1,022 | | | | 1,022 | | |
| 1.740%, 10/14/04 | | | 684 | | | | 684 | | |
Descartes Funding Trust
1.760%, 11/15/04 | | | 769 | | | | 769 | | |
Ford Credit Floor Plan
1.622%, 10/05/04 | | | 1,537 | | | | 1,537 | | |
| 1.526%, 10/06/04 | | | 1,076 | | | | 1,076 | | |
| 1.655%, 10/22/04 | | | 338 | | | | 338 | | |
Goldman Sachs
1.975%, 1/18/05 | | | 769 | | | | 769 | | |
Independence
1.830%, 4/15/05 | | | 950 | | | | 950 | | |
Jupiter Securities
1.793%, 10/21/04 | | | 2,922 | | | | 2,922 | | |
Lakeside Funding
1.790%, 10/08/04 | | | 1,630 | | | | 1,630 | | |
FIRST AMERICAN FUNDS Annual Report 2004
41
Schedule of Investments September 30, 2004
High Income Bond Fund (continued)
| DESCRIPTION | | PAR (000) | | VALUE (000) | |
Landesbank Baden
1.480%, 11/12/04 | | $ | 307 | | | $ | 307 | | |
Leaf's
1.821%, 4/20/05 | | | 846 | | | | 846 | | |
Liquid Funding
1.743%, 10/13/04 | | | 1,075 | | | | 1,075 | | |
| 1.830%, 5/25/05 | | | 769 | | | | 769 | | |
MBNA Credit
1.683%, 10/12/04 | | | 747 | | | | 747 | | |
| 1.764%, 10/26/04 | | | 415 | | | | 415 | | |
Main Street Warehouse
1.742%, 10/04/04 | | | 1,014 | | | | 1,014 | | |
| 1.683%, 10/04/04 | | | 1,253 | | | | 1,253 | | |
| 1.742%, 10/08/04 | | | 768 | | | | 768 | | |
| 1.742%, 10/08/04 | | | 769 | | | | 769 | | |
Mortgage Interest Network
1.752%, 10/12/04 | | | 507 | | | | 507 | | |
| 1.763%, 10/14/04 | | | 538 | | | | 538 | | |
Netexis Banques
1.700%, 12/16/04 | | | 765 | | | | 765 | | |
Orchard Park
1.796%, 4/06/05 | | | 769 | | | | 769 | | |
| 1.766%, 7/06/05 | | | 1,586 | | | | 1,586 | | |
Park Granada
1.622%, 10/01/04 | | | 1,353 | | | | 1,353 | | |
| 1.743%, 10/13/04 | | | 876 | | | | 876 | | |
Sigma Finance
1.512%, 11/29/04 | | | 383 | | | | 383 | | |
| Total Commercial Paper | | | | | | | 29,124 | | |
| Corporate Obligations – 7.9% | |
Allstate Life Global
1.780%, 10/14/05 | | | 1,537 | | | | 1,537 | | |
| 1.750%, 10/14/05 | | | 384 | | | | 384 | | |
Bayer Landbank NY
1.830%, 6/24/05 | | | 1,460 | | | | 1,460 | | |
Blue Heron Funding
1.850%, 5/18/05 | | | 430 | | | | 430 | | |
Castle Hill III
1.910%, 9/15/15 | | | 461 | | | | 461 | | |
Depfa Bank
1.860%, 6/15/05 | | | 768 | | | | 768 | | |
Duke Funding VI
1.320%, 4/08/05 | | | 930 | | | | 930 | | |
General Electric Capital Corporation
1.838%, 10/07/05 | | | 769 | | | | 770 | | |
Jackson National Life
1.760%, 4/15/05 | | | 769 | | | | 769 | | |
Jefferson Pilot
1.788%, 8/17/05 | | | 769 | | | | 769 | | |
Liquid Funding
1.840%, 6/28/05 | | | 692 | | | | 692 | | |
Merrill Lynch
1.696%, 10/01/05 | | | 1,537 | | | | 1,538 | | |
Metlife Global Funding
1.800%, 10/14/05 | | | 922 | | | | 922 | | |
| 1.880%, 10/28/05 | | | 646 | | | | 646 | | |
Morgan Stanley
1.850%, 12/26/08 | | | 769 | | | | 769 | | |
Natexis Banq NY
1.920%, 7/12/05 | | | 846 | | | | 846 | | |
Northlake CDO
1.895%, 3/07/05 | | | 461 | | | | 461 | | |
Premium Asset Trust
1.848%, 12/22/04 | | | 577 | | | | 577 | | |
High Income Bond Fund (continued)
| DESCRIPTION | | PAR (000) | | VALUE (000) | |
| 1.760%, 5/13/05 | | $ | 1,076 | | | $ | 1,076 | | |
| 1.740%, 6/01/05 | | | 2,291 | | | | 2,291 | | |
| 1.770%, 10/14/05 | | | 615 | | | | 615 | | |
REMAC
1.840%, 9/29/05 | | | 845 | | | | 845 | | |
RMAC
1.740%, 6/12/05 | | | 887 | | | | 887 | | |
SMM Trust 2004
1.833%, 9/23/05 | | | 1,430 | | | | 1,430 | | |
Societe Generale NYC
1.960%, 12/08/04 | | | 1,537 | | | | 1,537 | | |
Svenska Handl
1.170%, 10/21/04 | | | 769 | | | | 769 | | |
| Total Corporate Obligations | | | | | | | 24,179 | | |
| Other Short-Term Investments – 2.1% | |
ARLO III
2.000%, 9/28/05 | | | 2,306 | | | | 2,306 | | |
Commonwealth Life
2.115%, 12/31/04 (k) | | | 776 | | | | 776 | | |
General Electric Capital Assurance
1.980%, 1/19/05 | | | 308 | | | | 308 | | |
HBOS Treasury Services
1.640%, 11/01/05 | | | 845 | | | | 845 | | |
Security Life of Denver
1.900%, 12/30/04 | | | 1,999 | | | | 1,999 | | |
| Total Other Short-Term Investments | | | | | | | 6,234 | | |
| Repurchase Agreements – 10.0% | |
Bear Stearns
2.045%, dated 9/30/04, matures 10/01/04,
repurchase price $1,538,509
(collateralized by Various Securities:
Total Market Value $1,569,027) | | | 1,537 | | | | 1,537 | | |
Bear Stearns
2.060%, dated 9/30/04, matures 12/23/04,
repurchase price $463,443
(collateralized by Various Securities:
Total Market Value $470,616) | | | 461 | | | | 461 | | |
Citibank
1.945%, dated 9/30/04, matures 10/01/04,
repurchase price $3,075,009
(collateralized by Corporate Securities:
Total Market Value $3,256,110) | | | 3,075 | | | | 3,075 | | |
Citibank
1.925%, dated 9/30/04, matures 10/01/04,
repurchase price $768,752
(collateralized by Various Securities:
Total Market Value $785,827) | | | 769 | | | | 769 | | |
Citibank
1.925%, dated 9/30/04, matures 10/01/04,
repurchase price $768,752
(collateralized by Various Securities:
Total Market Value $784,095) | | | 769 | | | | 769 | | |
Greenwich Capital Markets
1.950%, dated 9/30/04, matures 10/01/04,
repurchase price $4,612,514
(collateralized by U.S. Government Securities:
Total Market Value $4,704,570) | | | 4,612 | | | | 4,612 | | |
Goldman Sachs
2.025%, dated 9/30/04, matures 10/01/04,
repurchase price $1,076,256
(collateralized by Various Securities:
Total Market Value $1,109,481) | | | 1,076 | | | | 1,076 | | |
The accompanying notes are an integral part of the financial statements.
FIRST AMERICAN FUNDS Annual Report 2004
42
High Income Bond Fund (continued)
| DESCRIPTION | | PAR (000) | | VALUE (000) | |
Goldman Sachs
2.025%, dated 9/30/04, matures 10/01/04,
repurchase price $461,252
(collateralized by Various Securities:
Total Market Value $475,503) | | $ | 461 | | | $ | 461 | | |
Goldman Sachs
2.025%, dated 9/30/04, matures 10/01/04,
repurchase price $461,252
(collateralized by U.S. Government Secutities:
Total Market Value $475,503) | | | 461 | | | | 461 | | |
Goldman Sachs
2.025%, dated 9/30/04, matures 10/01/04,
repurchase price $1,153,131
(collateralized by Corporate Securities:
Total Market Value $1,188,734) | | | 1,153 | | | | 1,153 | | |
Goldman Sachs
1.425%, dated 9/30/04, matures 10/18/04,
repurchase price $1,923,146
(collateralized by Corporate Securities:
Total Market Value $1,961,008) | | | 1,922 | | | | 1,922 | | |
Goldman Sachs
1.480%, dated 9/30/04, matures 10/18/04,
repurchase price $1,153,919
(collateralized by Corporate Securities:
Total Market Value $1,188,734) | | | 1,153 | | | | 1,153 | | |
Goldman Sachs
2.205%, dated 9/30/04, matures 3/07/05,
repurchase price $776,150
(collateralized by Corporate Securities:
Total Market Value $784,411) | | | 769 | | | | 769 | | |
Lehman Brothers
2.055%, dated 9/30/04, matures 10/01/04,
repurchase price $3,075,019
(collateralized by Collateralized Mortgage Obligations:
Total Market Value $3,136,340) | | | 3,075 | | | | 3,075 | | |
Lehman Brothers
1.910%, dated 9/30/04, matures 10/01/04,
repurchase price $4,612,509
(collateralized by U.S. Government Securities:
Total Market Value $4,704,584) | | | 4,612 | | | | 4,612 | | |
Lehman Brothers
1.935%, dated 9/30/04, matures 10/01/04,
repurchase price $3,075,008
(collateralized by Collateralized Mortgage Obligations:
Total Market Value $3,381,043) | | | 3,075 | | | | 3,075 | | |
Merrill Lynch
1.925%, dated 9/30/04, matures 10/01/04,
repurchase price $1,537,504
(collateralized by Corporate Securities:
Total Market Value $1,614,326) | | | 1,538 | | | | 1,538 | | |
| Total Repurchase Agreements | | | | | | | 30,518 | | |
Total Investments Purchased with Proceeds
from Securities Lending
(Cost $90,055) | | | | | | | 90,055 | | |
Total Investments – 127.2%
(Cost $374,800) | | | | | | | 387,249 | | |
| Other Assets and Liabilities, Net – (27.2)% | | | | | | | (82,766 | ) | |
| Total Net Assets – 100.0% | | | | | | $ | 304,483 | | |
High Income Bond Fund (concluded)
(a) Security sold within the terms of a private placement memorandum, exempt from registration under Rule 144A of the Securities Act of 1933, as amended, and may be sold only to dealers in that program or other "qualified institutional buyers." These securities have been determined to be liquid under the guidelines established by the Funds' board of directors. As of September 30, 2004, the value of these investments was $82,816,600 or 27.2% of total net assets.
(b) Represents a foreign high yield (non-investment grade) bond. On September 30, 2004, the value of these investments was $22,933,079, which represents 7.5% of total net assets.
(c) This security or a portion of this security is out on loan at September 30, 2004. Total loaned securities had a value of $87,329,087 at September 30, 2004. See note 2 in Notes to Financial Statements.
(d) Security purchased on a when-issued basis. On September 30, 2004, the total cost of investments purchased on a when-issued basis was $6,004,610 or 2.0% of total net assets. See note 2 in Notes to Financial Statements.
(e) Securities considered illiquid or restricted. As of September 30, 2004, the value of these investments was $0 or 0.0% of total net assets. See note 2 in Notes to Financial Statements.
(f) Security currently in default.
(g) Security has been deposited as inital margin on open futures contracts. Yield shown is effective yield at date of purchase. See note 2 in Notes to Financial Statements.
(h) Non-income producing security.
(i) Security is fair valued. As of September 30, 2004, the fair value of these investments was $0 or 0.0% of total net assets. See note 2 in Notes to Financial Statements.
(j) Delayed Interest (Step-Bonds) – Represents securities that remain zero-coupon securities until a predetermined date at which time the stated coupon rate becomes effective and interest becomes payable at regular intervals. Interest rate shown represents current yield at September 30, 2004, based upon the estimated timing and amount of future interest and principal payments.
(k) Security has demand features which qualify it as a short-term security. The date disclosed is the next put date.
(l) The rate shown is the effective annual yield at the time of purchase.
(m) Investment in affiliated security. This money market fund is advised by U.S. Bancorp Asset Management, Inc., which also serves as advisor for this Fund. See note 3 in Notes to Financial Statements.
Cl – Class
FNMA – Federal National Mortgage Association
PIK – Payment-in-kind interest is generally paid by issuing additional par of the security rather than paying cash.
REIT – Real Estate Investment Trust
Schedule of Open Futures Contracts
| Description | | Number of
Contracts
Purchased
(Sold) | | Market Value
Covered By
Contracts | | Settlement
Month | | Unrealized
Appreciation
(Depreciation) | |
90 Day Eurodollar
December 04 Futures | | | 188 | | | $ | 18,318 | | | Dec. 04 | | $ | 53 | | |
90 Day Eurodollar
December 05 Futures | | | (188 | ) | | | (18,141 | ) | | Dec. 05 | | | (158 | ) | |
U.S. Treasury 5 Year
December 04 Futures | | | (270 | ) | | | (29,903 | ) | | Dec. 04 | | | (20 | ) | |
10 Year U.S. Treasury
December 04 Futures | | | (54 | ) | | | (6,082 | ) | | Dec. 04 | | | - | | |
U.S. Treasury Long Bond
December 04 Futures | | | 140 | | | | 15,711 | | | Dec. 04 | | | 170 | | |
| | | $ | 45 | | |
FIRST AMERICAN FUNDS Annual Report 2004
43
Schedule of Investments September 30, 2004
Intermediate Government Bond Fund
| DESCRIPTION | | PAR (000) | | VALUE (000) | |
U.S. Government & Agency
Securities – 92.3% | | | |
| U.S. Agency Debentures – 34.3% | | | |
FHLB
1.625%, 04/15/05 | | $ | 2,500 | | | $ | 2,493 | | |
| 5.250%, 08/15/06 | | | 5,000 | | | | 5,220 | | |
| FHLMC | |
| 2.375%, 05/19/06 , Callable 05/19/04 @ 100 | | | 3,500 | | | | 3,478 | | |
| 2.375%, 02/15/07 | | | 2,750 | | | | 2,712 | | |
| 4.875%, 03/15/07 | | | 2,000 | | | | 2,088 | | |
| 5.625%, 03/15/11 | | | 2,000 | | | | 2,166 | | |
| 6.375%, 08/01/11 | | | 1,850 | | | | 1,945 | | |
| 3.250%, 02/25/08, Callable 02/25/05 @ 100 | | | 2,000 | | | | 1,975 | | |
| 4.125%, 09/01/09, Callable 09/01/05 @ 100 | | | 2,900 | | | | 2,897 | | |
FNMA
2.500%, 06/15/06 | | | 5,000 | | | | 4,979 | | |
| 3.500%, 01/28/08 | | | 3,000 | | | | 2,988 | | |
| 6.375%, 06/15/09 | | | 2,750 | | | | 3,059 | | |
| 6.625%, 09/15/09 | | | 2,795 | | | | 3,149 | | |
| 7.250%, 01/15/10 | | | 2,650 | | | | 3,074 | | |
| 5.250%, 08/01/12 | | | 1,500 | | | | 1,549 | | |
| 4.625%, 10/15/14 | | | 1,350 | | | | 1,345 | | |
| | | | 45,117 | | |
| U.S. Treasuries – 58.0% | | | |
U.S. Treasury Bond (STRIPS)
0.000%, 11/15/11 (a) | | | 1,670 | | | | 1,581 | | |
U.S. Treasury Bonds
9.375%, 02/15/06 | | | 6,000 | | | | 6,570 | | |
| 12.750%, 11/15/10 | | | 2,335 | | | | 2,604 | | |
| 4.375%, 08/15/12 | | | 1,800 | | | | 1,855 | | |
| 13.250%, 05/15/14 | | | 2,400 | | | | 3,411 | | |
| 9.250%, 02/15/16 | | | 2,150 | | | | 3,096 | | |
| 7.250%, 05/15/16 | | | 2,250 | | | | 2,833 | | |
| 9.125%, 05/15/18 | | | 2,250 | | | | 3,290 | | |
| 8.125%, 08/15/19 | | | 2,500 | | | | 3,421 | | |
U.S. Treasury Notes
2.000%, 11/30/04 | | | 2,700 | | | | 2,701 | | |
| 1.625%, 01/31/05 | | | 5,500 | | | | 5,495 | | |
| 5.875%, 11/15/05 | | | 6,400 | | | | 6,656 | | |
| 6.500%, 10/15/06 | | | 6,000 | | | | 6,458 | | |
| 6.625%, 05/15/07 | | | 3,500 | | | | 3,837 | | |
| 2.750%, 08/15/07 | | | 3,600 | | | | 3,590 | | |
| 5.500%, 05/15/09 | | | 4,500 | | | | 4,929 | | |
| 6.000%, 08/15/09 | | | 4,500 | | | | 5,031 | | |
| 4.875%, 02/15/12 | | | 2,250 | | | | 2,397 | | |
| 2.000%, 01/15/14 (d) | | | 2,716 | | | | 2,782 | | |
| 2.000%, 07/15/14 (d) | | | 1,457 | | | | 1,490 | | |
| 4.250%, 08/15/14 | | | 2,250 | | | | 2,273 | | |
| | | | 76,300 | | |
Total U.S. Government & Agency Securities
(Cost $120,566) | | | | | | | 121,417 | | |
U.S. Government Agency
Mortgage-Backed Securities – 6.6% | | | |
| Adjustable Rate (b) – 3.6% | | | |
FHLMC Pool
3.311%, 10/01/32, #847317 | | | 850 | | | | 878 | | |
FNMA Pool
3.457%, 09/01/32, #725739 | | | 1,377 | | | | 1,432 | | |
| 3.336%, 10/01/32, #725110 (b) | | | 2,356 | | | | 2,433 | | |
| | | | 4,743 | | |
Intermediate Government Bond Fund (continued)
| DESCRIPTION | | PAR (000)/
CONTRACTS/SHARES | | VALUE (000) | |
| Fixed Rate – 3.0% | |
FHLMC, Series H013, Cl A3
3.150%, 05/15/10 | | $ | 1,950 | | | $ | 1,944 | | |
FHLMC, Series T-54, Cl 1A3
4.051%, 05/25/38 | | | 2,000 | | | | 2,001 | | |
| | | | 3,945 | | |
Total U.S. Government Agency
Mortgage-Backed Securities
(Cost $8,697) | | | | | | | 8,688 | | |
| Treasury Obligation – 0.0% | |
U. S. Treasury Bill
1.559%, 11/18/04 (c) | | | 75 | | | | 75 | | |
Total Treasury Obligation
(Cost $75) | | | | | | | 75 | | |
| Options Purchased – 0.0% | |
| Call Option Purchased 0.0% | |
U.S. Treasury 5 Year Note November 04
Futures Call, Expires 11/30/04,
Exercise price $112.00 | | | 33 | | | | 3 | | |
| Put Options Purchased 0.0% | |
U.S. Treasury 5 Year Note December 04
Futures Put, Expires 12/30/04,
Exercise price $106.50 | | | 6 | | | | - | | |
U.S. Treasury 5 Year Note December 04
Futures Put, Expires 12/30/04,
Exercise price $107.00 | | | 84 | | | | 3 | | |
U.S. Treasury 5 Year Note December 04
Futures Put, Expires 12/30/04,
Exercise price $109.00 | | | 60 | | | | 11 | | |
U.S. Treasury 5 Year Note December 04
Futures Put, Expires 12/30/04,
Exercise price $109.50 | | | 30 | | | | 9 | | |
U.S. Treasury 5 Year Note December 04
Futures Put, Expires 12/30/04,
Exercise price $105.00 | | | 13 | | | | - | | |
| | | | 23 | | |
Total Options Purchased
(Cost $154) | | | | | | | 26 | | |
| Affiliated Money Market Fund – 0.2% | |
| First American Prime Obligations Fund, Cl Z (e) | | | 231,586 | | | | 232 | | |
Total Affiliated Money Market Fund
(Cost $232) | | | | | | | 232 | | |
Total Investments – 99.1%
(Cost $129,724) | | | | | | | 130,438 | | |
| Other Assets and Liabilities, Net – 0.9% | | | | | | | 1,203 | | |
| Total Net Assets – 100.0% | | | | | | $ | 131,641 | | |
(a) Principal only.
(b) Variable Rate Security – The rate shown is the rate in effect as of September 30, 2004.
(c) Security has been deposited as initial margin on open futures contracts. Yield shown is effective yield at date of purchase. See note 2 in Notes to Financial Statements.
(d) U.S. Treasury inflation-protection securities (TIPS) are securities in which the principal amount is adjusted for inflation and the semiannual interest payments equal a fixed percentage of the inflation-adjusted principal amount.
(e) Investment in affiliated security. This money market fund is advised by U.S. Bancorp Asset Management, Inc., which also serves as advisor for this Fund. See note 3 in Notes to Financial Statements.
Cl – Class
The accompanying notes are an integral part of the financial statements.
FIRST AMERICAN FUNDS Annual Report 2004
44
Intermediate Government Bond Fund (concluded)
CMO – Collateralized Mortgage Obligation
FHLB – Federal Home Loan Bank
FHLMC – Federal Home Loan Mortgage Corporation
FNMA – Federal National Mortgage Association
STRIPS – Separate Trading of Registered Interest and Principal of Securities
Schedule of Open Futures Contracts
| Description | | Number of
Contracts
Purchased
(Sold) | | Market Value
Covered By
Contracts | | Settlement
Month | | Unrealized
Appreciation | |
90 Day Eurodollar
December 04 Futures | | | 113 | | | $ | 10,991 | | | Dec. 04 | | $ | 32 | | |
90 Day Eurodollar
December 05 Futures | | | (113 | ) | | | (10,884 | ) | | Dec. 05 | | | (95 | ) | |
90 Day Eurodollar
June 05 Futures | | | (25 | ) | | | (2,431 | ) | | Jun. 05 | | | (22 | ) | |
10 Year U.S. Treasury
December 04 Futures | | | (105 | ) | | | (11,826 | ) | | Dec. 04 | | | 6 | | |
U.S. Treasury Long Bond
December 04 Futures | | | 57 | | | | 6,396 | | | Dec. 04 | | | 32 | | |
U.S. Treasury 5 Year
December 04 Futures | | | (82 | ) | | | (9,082 | ) | | Dec. 04 | | | (6 | ) | |
| | | $ | (53 | ) | |
Intermediate Term Bond Fund
| DESCRIPTION | | PAR (000) | | VALUE (000) | |
| Corporate Bonds – 31.0% | |
| Banking – 1.2% | |
Credit Suisse First Boston
3.875%, 01/15/09 | | $ | 6,270 | | | $ | 6,268 | | |
Mizuho Finance
5.790%, 04/15/14 (a) | | | 4,150 | | | | 4,294 | | |
Washington Mutual
4.625%, 04/01/14 | | | 5,360 | | | | 5,135 | | |
| | | | 15,697 | | |
| Basic Industry – 1.3% | | | |
Alcan
5.200%, 01/15/14 | | | 4,160 | | | | 4,266 | | |
International Paper
4.000%, 04/01/10 | | | 4,915 | | | | 4,813 | | |
Meadwestvaco
6.850%, 04/01/12 (b) | | | 7,130 | | | | 7,945 | | |
| | | | 17,024 | | |
| Brokerage – 0.4% | | | |
Morgan Stanley
4.750%, 04/01/14 | | | 5,760 | | | | 5,559 | | |
| Capital Goods – 0.4% | |
Waste Management
6.875%, 05/15/09 | | | 4,880 | | | | 5,442 | | |
| Communications – 5.6% | |
AT&T Broadband
8.375%, 03/15/13 | | | 4,345 | | | | 5,251 | | |
AT&T Wireless Services
7.875%, 03/01/11 | | | 10,970 | | | | 12,989 | | |
Cox Communications
7.125%, 10/01/12 | | | 4,740 | | | | 5,156 | | |
Deutsche Telecom
8.500%, 06/15/10 | | | 3,690 | | | | 4,425 | | |
France Telecom
9.250%, 03/01/11 (b) (c) | | | 15,600 | | | | 18,587 | | |
News America
6.625%, 01/09/08 | | | 5,820 | | | | 6,369 | | |
Sprint Capital
8.375%, 03/15/12 (b) | | | 4,675 | | | | 5,661 | | |
Telecom De Puerto Rico
6.650%, 05/15/06 | | | 4,000 | | | | 4,203 | | |
Verizon Global Funding
7.250%, 12/01/10 | | | 3,750 | | | | 4,319 | | |
| 6.875%, 06/15/12 | | | 3,925 | | | | 4,440 | | |
| | | | 71,400 | | |
| Consumer Cyclical – 3.2% | | | |
DaimlerChrysler
6.500%, 11/15/13 | | | 4,300 | | | | 4,672 | | |
Ford Motor Credit
7.875%, 06/15/10 | | | 11,070 | | | | 12,359 | | |
General Motors Acceptance
7.750%, 01/19/10 | | | 12,485 | | | | 13,755 | | |
| 7.125%, 07/15/13 | | | 8,350 | | | | 8,733 | | |
Liberty Media
3.500%, 09/25/06 | | | 2,200 | | | | 2,193 | | |
| | | | 41,712 | | |
| Consumer NonCyclical – 3.0% | | | |
Bunge LTD Finance
4.375%, 12/15/08 | | | 9,320 | | | | 9,334 | | |
FIRST AMERICAN FUNDS Annual Report 2004
45
Schedule of Investments September 30, 2004
Intermediate Term Bond Fund (continued)
| DESCRIPTION | | PAR (000) | | VALUE (000) | |
Conagra Foods
7.875%, 09/15/10 | | $ | 4,260 | | | $ | 5,006 | | |
General Mills
6.000%, 02/15/12 (b) | | | 5,400 | | | | 5,814 | | |
Kraft Foods
4.625%, 11/01/06 | | | 6,750 | | | | 6,946 | | |
Kroger
7.450%, 03/01/08 | | | 4,000 | | | | 4,471 | | |
Tyson Foods
7.250%, 10/01/06 | | | 2,380 | | | | 2,552 | | |
| 8.250%, 10/01/11 (b) | | | 4,055 | | | | 4,803 | | |
| | | | 38,926 | | |
| Electric – 3.4% | | | |
Consumers Energy, Series B
5.375%, 04/15/13 | | | 3,580 | | | | 3,679 | | |
DTE Energy
7.050%, 06/01/11 (b) | | | 4,600 | | | | 5,191 | | |
FPL Group Capital
7.625%, 09/15/06 | | | 4,540 | | | | 4,926 | | |
MidAmerican Energy Holdings
3.500%, 05/15/08 | | | 4,600 | | | | 4,526 | | |
National Rural Utilities
5.750%, 08/28/09 | | | 3,850 | | | | 4,112 | | |
Pacific Gas & Electric
4.200%, 03/01/11 | | | 2,065 | | | | 2,038 | | |
Pepco Holdings
6.450%, 08/15/12 | | | 4,050 | | | | 4,408 | | |
Progress Energy
6.850%, 04/15/12 | | | 3,920 | | | | 4,383 | | |
Southern California Edison
5.000%, 01/15/14 | | | 2,000 | | | | 2,029 | | |
TXU Energy
7.000%, 03/15/13 | | | 6,895 | | | | 7,759 | | |
| | | | 43,051 | | |
| Energy – 1.7% | | | |
Anadarko Petroleum
6.125%, 03/15/12 | | | 8,030 | | | | 8,810 | | |
Gazprom International SA
7.201%, 02/01/20 (a) | | | 3,500 | | | | 3,544 | | |
Kerr McGee
6.875%, 09/15/11 | | | 8,235 | | | | 9,120 | | |
| | | | 21,474 | | |
| Finance Companies – 5.2% | | | |
American General
5.875%, 07/14/06 | | | 4,085 | | | | 4,281 | | |
Capital One Bank
5.750%, 09/15/10 | | | 7,000 | | | | 7,457 | | |
Core Investment Grade Trust
4.727%, 11/30/07 | | | 13,990 | | | | 14,404 | | |
Countrywide Home Loans, Series L
4.000%, 03/22/11 | | | 7,170 | | | | 6,934 | | |
International Lease Finance
4.500%, 05/01/08 | | | 6,400 | | | | 6,571 | | |
MBNA America Bank
4.625%, 08/03/09 | | | 5,760 | | | | 5,877 | | |
Merrill Lynch Series B
5.360%, 02/01/07 | | | 4,280 | | | | 4,476 | | |
Morgan Stanley
6.799%, 06/15/12 (a) | | | 14,532 | | | | 16,133 | | |
| | | | 66,133 | | |
Intermediate Term Bond Fund (continued)
| DESCRIPTION | | PAR (000) | | VALUE (000) | |
| Foreign Agencies – 0.9% | |
KFW Bankengruppe
3.250%, 07/16/07 | | $ | 11,500 | | | $ | 11,536 | | |
| Insurance – 1.3% | |
Aon
6.200%, 01/15/07 | | | 11,750 | | | | 12,555 | | |
Fund American Companies
5.875%, 05/15/13 | | | 4,190 | | | | 4,290 | | |
| | | | 16,845 | | |
| Natural Gas – 1.4% | | | |
Duke Energy
7.875%, 08/16/10 | | | 10,000 | | | | 11,651 | | |
Teppco Partners
7.625%, 02/15/12 | | | 4,950 | | | | 5,708 | | |
| | | | 17,359 | | |
| REITS – 0.4% | | | |
Mack-Cali Realty (REIT)
7.250%, 03/15/09 | | | 4,500 | | | | 5,025 | | |
| Sovereigns – 1.1% | |
Pemex Project Funding Master Trust
7.375%, 12/15/14 | | | 7,355 | | | | 8,010 | | |
United Mexican States
5.875%, 01/15/14 (b) | | | 6,385 | | | | 6,474 | | |
| | | | 14,484 | | |
| Supranationals – 0.3% | | | |
Corporacion Andina De Fomento
5.200%, 05/21/13 | | | 3,651 | | | | 3,660 | | |
| Transportation – 0.2% | |
Hertz
7.625%, 06/01/12 (b) | | | 2,000 | | | | 2,169 | | |
Total Corporate Bonds
(Cost $391,773) | | | | | | | 397,496 | | |
U.S. Government & Agency
Securities – 24.6% | |
| U.S. Agency Debentures – 14.6% | |
FHLB
1.625%, 06/15/05 (b) | | | 8,775 | | | | 8,737 | | |
| 1.875%, 06/15/06 (b) | | | 14,645 | | | | 14,437 | | |
FHLMC
2.875%, 11/03/06, Callable 11/03/04 @ 100 (b) | | | 28,400 | | | | 28,355 | | |
| 4.875%, 03/15/07 (b) | | | 10,725 | | | | 11,197 | | |
| 3.250%, 02/25/08, Callable 02/25/05 @ 100 | | | 13,000 | | | | 12,834 | | |
| 3.500%, 04/01/08, Callable 04/01/05 @ 100 | | | 12,700 | | | | 12,623 | | |
FNMA
3.125%, 07/15/06 (b) | | | 70 | | | | 70 | | |
| 5.250%, 04/15/07 (b) | | | 12,320 | | | | 12,977 | | |
| 6.375%, 06/15/09 (b) | | | 5,015 | | | | 5,579 | | |
| 7.250%, 01/15/10 | | | 11,700 | | | | 13,571 | | |
| 5.250%, 08/01/12 (b) | | | 13,000 | | | | 13,428 | | |
| 4.625%, 10/15/14 (b) | | | 12,875 | | | | 12,828 | | |
| 3.750%, 05/17/07, Callable 05/17/05 @ 100 | | | 13,535 | | | | 13,611 | | |
| 5.000%, 06/29/07, Callable 06/29/05 @ 100 (b) | | | 13,540 | | | | 13,772 | | |
| 3.875%, 11/17/08, Callable 11/17/05 @ 100 | | | 13,000 | | | | 12,997 | | |
| | | | 187,016 | | |
The accompanying notes are an integral part of the financial statements.
FIRST AMERICAN FUNDS Annual Report 2004
46
Intermediate Term Bond Fund (continued)
| DESCRIPTION | | PAR (000) | | VALUE (000) | |
| U.S. Treasuries – 10.0% | | | |
U.S. Treasury Bonds
9.250%, 02/15/16 (b) | | $ | 8,725 | | | $ | 12,564 | | |
| 7.250%, 05/15/16 (b) | | | 10,200 | | | | 12,844 | | |
| 9.125%, 05/15/18 (b) | | | 8,685 | | | | 12,698 | | |
| 8.125%, 08/15/19 (b) | | | 21,655 | | | | 29,633 | | |
U.S. Treasury Notes
4.000%, 06/15/09 (b) | | | 1,540 | | | | 1,584 | | |
| 3.500%, 08/15/09 (b) | | | 4,400 | | | | 4,425 | | |
| 2.000%, 07/15/14 (b) (h) | | | 39,360 | | | | 40,245 | | |
| 4.250%, 08/15/14 | | | 13,565 | | | | 13,705 | | |
| | | | 127,698 | | |
Total U.S. Government & Agency Securities
(Cost $311,943) | | | | | | | 314,714 | | |
| Asset-Backed Securities – 27.1% | | | |
| Automotive – 6.1% | | | |
Capital Auto Receivables Asset Trust
Series 2004-1, Cl A3
2.000%, 11/15/07 | | | 11,560 | | | | 11,440 | | |
Capital One Auto Finance Trust
Series 2001-A, Cl A4
5.400%, 05/15/08 | | | 4,052 | | | | 4,108 | | |
Honda Auto Receivables Owner Trust
Series 2002-4, Cl A4
2.700%, 03/17/08 | | | 7,345 | | | | 7,358 | | |
Series 2003-1, Cl A3
1.920%, 11/20/06 | | | 15,358 | | | | 15,337 | | |
Nissan Auto Receivables Owner Trust
Series 2003-B, Cl A3
1.510%, 08/15/07 | | | 9,750 | | | | 9,696 | | |
Onyx Acceptance Auto Trust
Series 2004-A, Cl A3
2.190%, 03/17/08 | | | 9,185 | | | | 9,107 | | |
Toyota Auto Receivables Owners Trust
Series 2002-B, Cl A4
4.390%, 05/15/09 | | | 6,000 | | | | 6,100 | | |
USAA Auto Owner Trust
Series 2003-1, Cl A4
2.040%, 02/16/10 | | | 1,495 | | | | 1,474 | | |
WFS Financial Owner Trust
Series 2003-2, Cl A3
1.760%, 01/21/08 | | | 14,270 | | | | 14,212 | | |
| | | | 78,832 | | |
| Commercial – 8.2% | | | |
Bear Stearns Commercial Mortgage Securities
Series 2004-T14, Cl A4
5.200%, 01/12/41 | | | 8,775 | | | | 9,048 | | |
Commercial Mortgage
Series 2004-CNL, Cl A1
2.060%, 09/15/06 (e) (f) | | | 5,255 | | | | 5,255 | | |
Deutsche Mortgage and Asset Receiving
Series 1998-C1, Cl A2
6.538%, 06/15/31 | | | 6,936 | | | | 7,411 | | |
GMAC Commercial Mortgage Securities
Series 2004-C2, Cl A1
3.896%, 08/10/38 | | | 8,171 | | | | 8,247 | | |
Greenwich Capital Commercial Funding
Series 2003-C1, Cl A2
3.285%, 07/05/35 | | | 5,000 | | | | 4,847 | | |
Series 2004-GG1, Cl A7
5.317%, 06/10/36 (b) | | | 7,385 | | | | 7,676 | | |
Intermediate Term Bond Fund (continued)
| DESCRIPTION | | PAR (000) | | VALUE (000) | |
GS Mortgage Securities II
Series 2004-GG2, Cl A1
3.109%, 08/10/38 | | $ | 10,060 | | | $ | 10,101 | | |
Series 2004-GG2, Cl A3
4.602%, 08/10/38 | | | 12,980 | | | | 13,272 | | |
Series 2003-C1, Cl A2A
3.590%, 01/10/40 | | | 13,840 | | | | 13,810 | | |
Morgan Stanley Capital Investments
Series 1999-FNV1, Cl A1
6.120%, 03/15/31 | | | 3,008 | | | | 3,151 | | |
Nomura Asset Securities
Series 1998-D6, Cl A1B
6.590%, 03/15/30 | | | 11,675 | | | | 12,758 | | |
Williams Street Funding
Series 2004-4, Cl A
1.930%, 09/23/10 | | | 9,405 | | | | 9,405 | | |
| | | | 104,981 | | |
| Credit Cards – 5.6% | | | |
American Express Credit Account
Series 004-4, Cl C
2.044%, 03/15/12 (a) | | | 3,100 | | | | 3,104 | | |
Bank One Issuance Trust
Series 2002-A4, Cl A4
2.940%, 06/16/08 | | | 13,770 | | | | 13,840 | | |
Capital One Multi-Asset Execution Trust
Series 2003-A6, Cl A6
2.950%, 08/17/09 | | | 7,500 | | | | 7,500 | | |
Citibank Credit Card Issuance Trust
Series 2004-A4, Cl A4
3.200%, 08/24/09 | | | 10,065 | | | | 10,062 | | |
Fleet Credit Card Master Trust
Series 2001-B, Cl A
5.600%, 12/15/08 | | | 10,820 | | | | 11,296 | | |
MBNA Credit Card Master Note Trust
Series 2003-A1, Cl A1
3.300%, 07/15/10 | | | 12,560 | | | | 12,541 | | |
Series 2003-C6, Cl C6
2.643%, 12/15/10 | | | 3,200 | | | | 3,277 | | |
Providian Gateway Master Trust
Series 2004-DA, Cl A
3.350%, 09/15/11 (a) | | | 10,355 | | | | 10,281 | | |
| | | | 71,901 | | |
| Equipment Leases – 0.9% | | | |
CNH Equipment Trust
Series 2003-A, Cl A2
1.460%, 02/15/06 | | | 1,453 | | | | 1,453 | | |
Series 2003-B, Cl A3B
2.470%, 01/15/08 | | | 9,895 | | | | 9,869 | | |
| | | | 11,322 | | |
| Home Equity – 6.3% | | | |
AFC Home Equity Loan Trust
Series 1996-4, Cl 1A7
6.860%, 03/25/27 | | | 1,402 | | | | 1,401 | | |
Amresco Residential Security Mortgage
Series 1997-3, Cl A9
6.960%, 03/25/27 | | | 1,621 | | | | 1,591 | | |
Contimortgage Home Equity Loan Trust
Series 1997-2, Cl A9
7.090%, 04/15/28 | | | 954 | | | | 956 | | |
Series 1997-3, Cl A9
7.120%, 08/15/28 | | | 1,368 | | | | 1,360 | | |
FIRST AMERICAN FUNDS Annual Report 2004
47
Schedule of Investments September 30, 2004
Intermediate Term Bond Fund (continued)
| DESCRIPTION | | PAR (000) | | VALUE (000) | |
Countrywide
Series 2004-4, Cl 3A1
1.715%, 11/25/23 | | $ | 4,203 | | | $ | 4,203 | | |
Series 2003-BC1, Cl A1
1.850%, 03/25/33 | | | 3,351 | | | | 3,370 | | |
Equity One
Series 2003-4, Cl AF3
3.531%, 10/25/34 | | | 18,915 | | | | 18,923 | | |
First Franklin Mortgage Loan
Series 2004-FFB, Cl A3
4.264%, 06/25/24 | | | 5,885 | | | | 5,881 | | |
Household Home Equity Loan Trust
Series 2002-3, Cl A
1.870%, 07/20/32 | | | 7,433 | | | | 7,447 | | |
Residential Asset Mortgage Products
Series 2004-RS4, Cl AI2
3.247%, 09/25/25 | | | 9,535 | | | | 9,491 | | |
Residential Funding Mortgage Securities
Series 2004-HI2, Cl A3
4.270%, 11/25/16 | | | 5,435 | | | | 5,482 | | |
Saxon Asset Securities Trust
Series 2004-1, Cl A
1.361%, 03/25/35 (c) (d) | | | 6,453 | | | | 6,464 | | |
Structured Asset Investment Loan Trust
Series 2003-BC5, Cl 2A
1.955%, 06/25/33 | | | 5,730 | | | | 5,734 | | |
Wells Fargo Home Equity Trust
Series 2004-2, Cl AI2
3.450%, 06/25/19 (f) | | | 8,415 | | | | 8,397 | | |
| | | | 80,700 | | |
| Manufactured Housing – 0.0% | | | |
Green Tree Financial
Series 1996-9, Cl A5
7.200%, 01/15/28 | | | 325 | | | | 325 | | |
Total Asset-Backed Securities
(Cost $348,028) | | | | | | | 348,061 | | |
CMO – U.S. Government Agency
Mortgage-Backed Securities – 1.2% | | | |
| Fixed Rate – 1.2% | | | |
FHLMC REMIC
Series 2389, Cl VA
6.000%, 02/15/11 (b) | | | 3,771 | | | | 3,978 | | |
Series 1167, Cl E
7.500%, 11/15/21 | | | 52 | | | | 52 | | |
Series 1286, Cl A
6.000%, 05/15/22 | | | 183 | | | | 184 | | |
Series 1633, Cl PK
6.000%, 09/15/22 | | | 535 | | | | 538 | | |
Series 1634, Cl PH
6.000%, 11/15/22 | | | 1,201 | | | | 1,216 | | |
FNMA REMIC
Series 1990-89, Cl K
6.500%, 07/25/20 | | | 37 | | | | 39 | | |
Series 2004-76, Cl CE
4.500%, 02/25/21 (f) | | | 9,670 | | | | 9,758 | | |
Total CMO – U.S. Government Agency
Mortgage-Backed Securities
(Cost $15,692) | | | | | | | 15,765 | | |
Intermediate Term Bond Fund (continued)
| DESCRIPTION | | PAR (000) | | VALUE (000) | |
U.S. Government Agency Mortgage-Backed
Securities – 3.9% | |
| Adjustable Rate (d) – 2.4% | |
FHLMC
3.450%, 02/01/29, #847190 | | $ | 4,265 | | | $ | 4,393 | | |
FHLMC Pool
3.558%, 01/01/28, #786281(b) | | | 4,118 | | | | 4,236 | | |
| 3.460%, 10/01/30, #847209 (b) | | | 7,821 | | | | 8,069 | | |
| 3.542%, 05/01/31, #847161 | | | 2,086 | | | | 2,154 | | |
| 3.483%, 09/01/33, #847210 (b) | | | 5,589 | | | | 5,776 | | |
FNMA Pool
3.428%, 09/01/33, #725111 (b) | | | 5,974 | | | | 6,207 | | |
| | | | 30,835 | | |
| Fixed Rate – 1.5% | | | |
FHLMC Gold Pool
5.500%, 09/01/06, #G40394 | | | 550 | | | | 558 | | |
| 4.000%, 10/01/10, #M80855 | | | 8,895 | | | | 8,901 | | |
FNMA Pool
6.000%, 07/01/06, #252632 | | | 215 | | | | 219 | | |
| 3.790%, 07/01/13, #386314 (b) | | | 10,164 | | | | 9,800 | | |
| | | | 19,478 | | |
Total U.S. Government Agency
Mortgage-Backed Securities
(Cost $50,691) | | | | | | | 50,313 | | |
CMO – Private Mortgage-Backed
Securities – 11.7% | |
| Adjustable Rate (d) – 5.4% | |
Granite Mortgages
Series 2003-1, Cl 1C
3.080%, 01/20/43 | | | 4,500 | | | | 4,591 | | |
MLCC Mortgage Investors
Series 2004-A, Cl A1
1.845%, 04/25/29 | | | 5,007 | | | | 5,007 | | |
MLCC Mortgage Investors
Series 2003-G, Cl A3
2.834%, 01/25/29 | | | 10,082 | | | | 10,384 | | |
Series 2003-H, Cl A3A
2.886%, 01/25/29 4,362 4,493
Series 2004-B, Cl A3
2.899%, 05/25/29 | | | 7,890 | | | | 8,132 | | |
Sequoia Mortgage Trust
Series 2004-3, Cl A
1.400%, 03/20/34 (c) | | | 9,426 | | | | 9,400 | | |
Series 2004-4, Cl X1
0.800%, 05/20/34 | | | 184,056 | | | | 2,117 | | |
Series 2004-5, Cl A1
2.757%, 06/20/34 | | | 10,502 | | | | 10,767 | | |
Series 2004-7, Cl A2
2.923%, 08/20/34 | | | 8,441 | | | | 8,678 | | |
Structured Mortgage Loan Trust
Series 2004-11, Cl A
3.825%, 08/25/34 | | | 5,994 | | | | 6,181 | | |
| | | | 69,750 | | |
| Fixed Rate – 6.3% | | | |
Bank of America Mortgage Securities
Series 2003-6, Cl 1A29
4.250%, 08/25/33 | | | 9,000 | | | | 9,056 | | |
CS First Boston Mortgage Securities
Series 2003-AR24, Cl 2A4
4.187%, 10/25/33 | | | 13,390 | | | | 13,556 | | |
The accompanying notes are an integral part of the financial statements.
FIRST AMERICAN FUNDS Annual Report 2004
48
Intermediate Term Bond Fund (continued)
| DESCRIPTION | | PAR (000)/CONTRACTS | | VALUE (000) | |
GRP/AG Real Estate Asset Trust
Series 2004-1, Cl A
3.960%, 03/25/09 (a) (c) | | $ | 1,125 | | | $ | 1,128 | | |
Series 2003-1, Cl A
5.970%, 11/25/32 (c) | | | 444 | | | | 448 | | |
IMPAC CMB Trust
Series 2003-12, Cl A1
1.470%, 12/25/33 (c) | | | 7,549 | | | | 7,570 | | |
Residential Accredit Loans
Series 1997-QS13, Cl M3
7.250%, 12/25/27 | | | 1,863 | | | | 1,842 | | |
Series 1998-KS1, Cl AI9
6.440%, 03/25/28 | | | 365 | | | | 366 | | |
Salomon Brothers Mortgage Securities
Series 1986-1, Cl A
6.000%, 12/25/11 | | | 200 | | | | 199 | | |
Washington Mutual
Series 2003-AR10, Cl A6
4.100%, 10/25/33 (d) | | | 10,560 | | | | 10,718 | | |
Series 2004-AR4, Cl A6
3.813%, 06/25/34 | | | 13,305 | | | | 13,123 | | |
Wells Fargo Mortgage Backed Securities Trust
Series 2003-J, Cl 2A5
4.470%, 10/25/33 | | | 11,500 | | | | 11,219 | | |
Series 2004-N, Cl A3
4.154%, 08/25/34 | | | 11,108 | | | | 11,119 | | |
Westam Mortgage Financial
Series 11, Cl A
6.360%, 08/26/20 | | | 86 | | | | 86 | | |
| | | | 80,430 | | |
Total CMO – Private Mortgage-Backed Securities
(Cost $150,160) | | | | | | | 150,180 | | |
| Treasury Obligation – 0.1% | | | |
U. S. Treasury Bill
1.559%, 11/18/04 (g) | | | 535 | | | | 534 | | |
Total Treasury Obligation
(Cost $534) | | | | | | | 534 | | |
| Options Purchased – 0.0% | | | |
| Call Option Purchased – 0.0% | | | |
U.S. Treasury 5 Year Note November 04
Futures Call, Expires 11/30/04,
Exercise price $112.00 | | | 284 | | | | 23 | | |
| Put Options Purchased – 0.0% | | | |
U.S. Treasury 5 Year Note December 04
Futures Put, Expires 12/30/04,
Exercise price $106.50 | | | 60 | | | | 1 | | |
U.S. Treasury 5 Year Note December 04
Futures Put, Expires 12/30/04,
Exercise price $107.00 | | | 798 | | | | 25 | | |
U.S. Treasury 5 Year Note December 04
Futures Put, Expires 12/30/04,
Exercise price $109.00 | | | 600 | | | | 113 | | |
U.S. Treasury 5 Year Note December 04
Futures Put, Expires 12/30/04,
Exercise price $109.50 | | | 300 | | | | 89 | | |
U.S. Treasury 5 Year Note December 04
Futures Put, Expires 12/30/04,
Exercise price $105.00 | | | 120 | | | | 2 | | |
| | | | 230 | | |
Total Options Purchased
(Cost $1,476) | | | | | | | 253 | | |
Intermediate Term Bond Fund (continued)
| DESCRIPTION | | PAR (000) | | VALUE (000) | |
Investments Purchased with Proceeds
from Securities Lending – 28.6% | |
| Commercial Paper – 9.2% | |
Bluegrass
1.881%, 5/18/05 | | $ | 1,546 | | | $ | 1,546 | | |
| 1.891%, 8/18/05 | | | 1,229 | | | | 1,229 | | |
Concord Minutemen Capital
1.650%, 10/01/04 | | | 2,539 | | | | 2,539 | | |
| 1.680%, 10/05/04 | | | 5,641 | | | | 5,641 | | |
| 1.720%, 10/06/04 | | | 4,168 | | | | 4,168 | | |
| 1.740%, 10/14/04 | | | 2,789 | | | | 2,789 | | |
Descartes Funding Trust
1.760%, 11/15/04 | | | 3,134 | | | | 3,134 | | |
Ford Credit Floor Plan
1.622%, 10/05/04 | | | 6,266 | | | | 6,266 | | |
| 1.526%, 10/06/04 | | | 4,388 | | | | 4,388 | | |
| 1.655%, 10/22/04 | | | 1,378 | | | | 1,378 | | |
Goldman Sachs
1.975%, 1/18/05 | | | 3,134 | | | | 3,134 | | |
Independence
1.830%, 4/15/05 | | | 3,874 | | | | 3,874 | | |
Jupiter Securities
1.793%, 10/21/04 | | | 11,913 | | | | 11,913 | | |
Lakeside Funding
1.790%, 10/08/04 | | | 6,644 | | | | 6,644 | | |
Landesbank Baden
1.480%, 11/12/04 | | | 1,251 | | | | 1,251 | | |
Leaf's
1.821%, 4/20/05 | | | 3,447 | | | | 3,447 | | |
Liquid Funding
1.743%, 10/13/04 | | | 4,385 | | | | 4,385 | | |
| 1.830%, 5/25/05 | | | 3,134 | | | | 3,134 | | |
MBNA Credit
1.683%, 10/12/04 | | | 3,046 | | | | 3,046 | | |
| 1.764%, 10/26/04 | | | 1,690 | | | | 1,690 | | |
Main Street Warehouse
1.742%, 10/04/04 | | | 4,136 | | | | 4,136 | | |
| 1.683%, 10/04/04 | | | 5,108 | | | | 5,108 | | |
| 1.742%, 10/08/04 | | | 3,133 | | | | 3,133 | | |
| 1.742%, 10/08/04 | | | 3,134 | | | | 3,134 | | |
Mortgage Interest Network
1.752%, 10/12/04 | | | 2,067 | | | | 2,067 | | |
| 1.763%, 10/14/04 | | | 2,192 | | | | 2,192 | | |
Netexis Banques
1.700%, 12/16/04 | | | 3,121 | | | | 3,121 | | |
Orchard Park
1.796%, 4/06/05 | | | 3,134 | | | | 3,134 | | |
| 1.766%, 7/06/05 | | | 6,468 | | | | 6,468 | | |
Park Granada
1.622%, 10/01/04 | | | 5,515 | | | | 5,515 | | |
| 1.743%, 10/13/04 | | | 3,570 | | | | 3,570 | | |
Sigma Finance
1.512%, 11/29/04 | | | 1,562 | | | | 1,562 | | |
| Total Commercial Paper | | | | | | | 118,736 | | |
| Corporate Obligations – 7.7% | |
Allstate Life Global
1.780%, 10/14/05 | | | 6,268 | | | | 6,268 | | |
| 1.750%, 10/14/05 | | | 1,567 | | | | 1,567 | | |
Bayer Landbank NY
1.830%, 6/24/05 | | | 5,954 | | | | 5,954 | | |
Blue Heron Funding
1.850%, 5/18/05 | | | 1,755 | | | | 1,755 | | |
FIRST AMERICAN FUNDS Annual Report 2004
49
Schedule of Investments September 30, 2004
Intermediate Term Bond Fund (continued)
| DESCRIPTION | | PAR (000) | | VALUE (000) | |
Castle Hill III
1.910%, 9/15/15 | | $ | 1,880 | | | $ | 1,880 | | |
Depfa Bank
1.860%, 6/15/05 | | | 3,133 | | | | 3,133 | | |
Duke Funding VI
1.320%, 4/08/05 | | | 3,792 | | | | 3,792 | | |
General Electric Capital Corporation
1.838%, 10/07/05 | | | 3,138 | | | | 3,138 | | |
Jackson National Life
1.760%, 4/15/05 | | | 3,134 | | | | 3,134 | | |
Jefferson Pilot
1.788%, 8/17/05 | | | 3,134 | | | | 3,134 | | |
Liquid Funding
1.840%, 6/28/05 | | | 2,820 | | | | 2,820 | | |
Merrill Lynch
1.696%, 10/01/05 | | | 6,268 | | | | 6,268 | | |
Metlife Global Funding
1.800%, 10/14/05 | | | 3,761 | | | | 3,761 | | |
| 1.880%, 10/28/05 | | | 2,633 | | | | 2,633 | | |
Morgan Stanley
1.850%, 12/26/08 | | | 3,134 | | | | 3,134 | | |
Natexis Banq NY
1.920%, 7/12/05 | | | 3,447 | | | | 3,447 | | |
Northlake CDO
1.895%, 3/07/05 | | | 1,880 | | | | 1,880 | | |
Premium Asset Trust
1.848%, 12/22/04 | | | 2,351 | | | | 2,351 | | |
| 1.760%, 5/13/05 | | | 4,387 | | | | 4,387 | | |
| 1.740%, 6/01/05 | | | 9,339 | | | | 9,339 | | |
| 1.770%, 10/14/05 | | | 2,507 | | | | 2,507 | | |
REMAC
1.840%, 9/29/05 | | | 3,447 | | | | 3,447 | | |
RMAC
1.740%, 6/12/05 | | | 3,616 | | | | 3,616 | | |
SMM Trust 2004
1.833%, 9/23/05 | | | 5,829 | | | | 5,829 | | |
Societe Generale NYC
1.960%, 12/08/04 | | | 6,268 | | | | 6,268 | | |
Svenska Handl
1.170%, 10/21/04 | | | 3,134 | | | | 3,134 | | |
| Total Corporate Obligations | | | | | | | 98,576 | | |
| Other Short-Term Investments – 2.0% | | | |
ARLO III
2.000%, 9/28/05 | | | 9,402 | | | | 9,402 | | |
Commonwealth Life
2.115%, 12/31/04 (h) | | | 3,165 | | | | 3,165 | | |
General Electric Capital Assurance
1.980%, 1/19/05 | | | 1,253 | | | | 1,253 | | |
HBOS Treasury Services
1.640%, 11/01/05 | | | 3,446 | | | | 3,446 | | |
Security Life of Denver
1.900%, 12/30/04 | | | 8,148 | | | | 8,148 | | |
| Total Other Short-Term Investments | | | | | | | 25,414 | | |
| Repurchase Agreements – 9.7% | | | |
Bear Stearns
2.045%, dated 9/30/04, matures 10/01/04,
repurchase price $6,268,260
(collateralized by Various Securities:
Total Market Value $6,396,757) | | | 6,268 | | | | 6,268 | | |
Bear Stearns
2.060%, dated 9/30/04, matures 12/23/04,
repurchase price $1,889,410
(collateralized by Various Securities:
Total Market Value $1,918,650) | | | 1,880 | | | | 1,880 | | |
Intermediate Term Bond Fund (continued)
| DESCRIPTION | | PAR (000) | | VALUE (000) | |
Citibank
1.945%, dated 9/30/04, matures 10/01/04,
repurchase price $12,536,486
(collateralized by Corporate Securities:
Total Market Value $13,274,813) | | $ | 12,536 | | | $ | 12,536 | | |
Citibank
1.925%, dated 9/30/04, matures 10/01/04,
repurchase price $3,134,120
(collateralized by Various Securities:
Total Market Value $3,203,732) | | | 3,134 | | | | 3,134 | | |
Citibank
1.925%, dated 9/30/04, matures 10/01/04,
repurchase price $3,134,120
(collateralized by Various Securities:
Total Market Value $3,196,674) | | | 3,134 | | | | 3,134 | | |
Greenwich Capital Markets
1.950%, dated 9/30/04, matures 10/01/04,
repurchase price $18,804,732
(collateralized by U.S. Government Securities:
Total Market Value $19,180,032) | | | 18,804 | | | | 18,804 | | |
Goldman Sachs
2.025%, dated 9/30/04, matures 10/01/04,
repurchase price $4,387,780
(collateralized by Various Securities:
Total Market Value $4,523,237) | | | 4,387 | | | | 4,387 | | |
Goldman Sachs
2.025%, dated 9/30/04, matures 10/01/04,
repurchase price $1,880,477
(collateralized by Various Securities:
Total Market Value $1,938,576) | | | 1,880 | | | | 1,880 | | |
Goldman Sachs
2.025%, dated 9/30/04, matures 10/01/04,
repurchase price $1,880,477
(collateralized by U.S. Government Securities:
Total Market Value $1,938,575) | | | 1,880 | | | | 1,880 | | |
Goldman Sachs
2.025%, dated 9/30/04, matures 10/01/04,
repurchase price $4,701,193
(collateralized by Corporate Securities:
Total Market Value $4,846,344) | | | 4,701 | | | | 4,701 | | |
Goldman Sachs
1.425%, dated 9/30/04, matures 10/18/04,
repurchase price $7,840,463
(collateralized by Corporate Securities:
Total Market Value $7,994,823) | | | 7,835 | | | | 7,835 | | |
Goldman Sachs
1.480%, dated 9/30/04, matures 10/18/04,
repurchase price $4,704,407
(collateralized by Corporate Securities:
Total Market Value $4,846,344) | | | 4,701 | | | | 4,701 | | |
Goldman Sachs
2.205%, dated 9/30/04, matures 3/07/05,
repurchase price $3,164,281
(collateralized by Corporate Securities:
Total Market Value $3,197,960) | | | 3,134 | | | | 3,134 | | |
Lehman Brothers
2.055%, dated 9/30/04, matures 10/01/04,
repurchase price $12,536,524
(collateralized by Collateralized Mortgage
Obligations: Total Market Value $12,786,525) | | | 12,536 | | | | 12,536 | | |
Lehman Brothers
1.910%, dated 9/30/04, matures 10/01/04,
repurchase price $18,804,711
(collateralized by U.S. Government Securities:
Total Market Value $19,180,090) | | | 18,804 | | | | 18,804 | | |
The accompanying notes are an integral part of the financial statements.
FIRST AMERICAN FUNDS Annual Report 2004
50
Intermediate Term Bond Fund (continued)
| DESCRIPTION | | PAR (000) | | VALUE (000) | |
Lehman Brothers
1.935%, dated 9/30/04, matures 10/01/04,
repurchase price $12,536,482
(collateralized by Collateralized Mortgage
Obligations: Total Market Value $13,784,155) | | $ | 12,536 | | | $ | 12,536 | | |
Merrill Lynch
1.925%, dated 9/30/04, matures 10/01/04,
repurchase price $6,268,239
(collateralized by Corporate Securities:
Total Market Value $6,581,435) | | | 6,268 | | | | 6,268 | | |
| Total Repurchase Agreements | | | | | 124,418 | | |
Total Investments Purchased with Proceeds
from Securities Lending
(Cost $367,144) | | | | | 367,144 | | |
Total Investments – 128.2%
(Cost $1,637,441) | | | | | 1,644,460 | | |
| Other Assets and Liabilities, Net – (28.2)% | | | | | (361,534 | ) | |
| Total Net Assets – 100.0% | | | | $ | 1,282,926 | | |
(a) Security sold within the terms of a private placement memorandum, exempt from registration under Rule 144A of the Securities Act of 1933, as amended, and may be sold only to dealers in that program or other "qualified institutional buyers." These securities have been determined to be liquid under the guidelines established by the Funds' board of directors. As of September 30, 2004, the value of these investments was $38,483,795 or 3.0% of total net assets.
(b) This security or a portion of this security is out on loan at September 30, 2004. Total loaned securities had a value of $357,282,109 at September 30, 2004. See note 2 in Notes to Financial Statements.
(c) Delayed Interest (Step-Bonds) – Represents securities that remain zero-coupon securities until a predetermined date at which time the stated coupon rate becomes effective and interest becomes payable at regular intervals. Interest rate shown represents current yield at September 30, 2004, based upon the estimated timing and amount of future interest and principal payments.
(d) Variable Rate Security – The rate shown is the rate in effect as of September 30, 2004.
(e) Security purchased on a when-issued basis. On September 30, 2004, the total cost of investments purchased on a when-issued basis was $5,255,000 or 0.4% of total net assets. See note 2 in Notes to Financial Statements.
(f) Securities considered illiquid or restricted. As of September 30, 2004, the value of these investments was $23,409,189 or 1.8% of total net assets. See note 2 in Notes to Financial Statements.
(g) Security has been deposited as initial margin on open futures contracts. Yield shown is effective yield at date of purchase. See note 2 in Notes to Financial Statements.
(h) Security has demand features which qualify it as a short-term security. The date disclosed is the next put date.
(i) U.S. Treasury inflation-protection securities (TIPS) are securities in which the principal amount is adjusted for inflation and the semiannual interest payments equal a fixed percentage of the inflation-adjusted principal amount.
Cl – Class
CMO – Collateralized Mortgage Obligation
FHLB – Federal Home Loan Bank
FHLMC – Federal Home Loan Mortgage Corporation
FNMA – Federal National Mortgage Association
REIT – Real Estate Investment Trust
REMIC – Real Estate Mortgage Investment Conuit
Intermediate Term Bond Fund (concluded)
Schedule of Open Futures Contracts
| Description | | Number of
Contracts
Purchased
(Sold) | | Market Value
Covered By
Contracts | | Settlement
Month | | Unrealized
Appreciation
(Depreciation) | |
90 Day Eurodollar
December 04 Futures | | | 900 | | | $ | 87,926 | | | Dec. 04 | | $ | 258 | | |
90 Day Eurodollar
December 05 Futures | | | (900 | ) | | | (87,075 | ) | | Dec. 05 | | | (760 | ) | |
90 Day Eurodollar
June 05 Futures | | | (193 | ) | | | (18,715 | ) | | Jun. 05 | | | (175 | ) | |
2 Year U. S Treasury
December 04 Futures | | | 104 | | | | 10,984 | | | Dec. 04 | | | (25 | ) | |
10 Year U.S. Treasury
December 04 Futures | | | (967 | ) | | | (108,909 | ) | | Dec. 04 | | | 61 | | |
U.S. Treasury Long Bond
December 04 Futures | | | 439 | | | | 49,264 | | | Dec. 04 | | | 154 | | |
U.S. Treasury 5 Year
December 04 Futures | | | (410 | ) | | | (45,408 | ) | | Dec. 04 | | | (30 | ) | |
| | | $ | (517 | ) | |
FIRST AMERICAN FUNDS Annual Report 2004
51
Schedule of Investments September 30, 2004
Short Term Bond Fund
| DESCRIPTION | | PAR (000) | | VALUE (000) | |
| Corporate Bonds – 36.9% | | | |
| Banking – 4.8% | | | |
Bank of America
4.750%, 10/15/06 | | $ | 6,000 | | | $ | 6,208 | | |
Bank One
7.625%, 08/01/05 | | | 7,000 | | | | 7,279 | | |
Credit Suisse First Boston
7.750%, 05/15/06 | | | 7,350 | | | | 7,899 | | |
Danske Bank
7.250%, 06/15/05 (a) | | | 10,000 | | | | 10,327 | | |
First Union
6.875%, 09/15/05 | | | 7,000 | | | | 7,269 | | |
J.P. Morgan Chase
6.875%, 01/15/07 | | | 4,000 | | | | 4,341 | | |
Key Bank
7.250%, 06/01/05 | | | 2,000 | | | | 2,058 | | |
| 7.125%, 08/15/06 | | | 4,000 | | | | 4,254 | | |
Mellon Funding
7.500%, 06/15/05 | | | 2,100 | | | | 2,174 | | |
| | | | 51,809 | | |
| Basic Industry – 0.2% | | | |
Alcan
1.446%, 12/08/04 (a) (e) | | | 2,000 | | | | 1,999 | | |
| Brokerage – 2.5% | | | |
Bear Stearns
6.500%, 05/01/06 | | | 10,900 | | | | 11,501 | | |
Goldman Sachs
7.250%, 10/01/05 (a) | | | 8,000 | | | | 8,360 | | |
Lehman Brothers Holdings, Series F
7.500%, 09/01/06 | | | 3,000 | | | | 3,246 | | |
Merrill Lynch, Series B
6.130%, 05/16/06 | | | 3,655 | | | | 3,836 | | |
| | | | 26,943 | | |
| Capital Goods – 2.1% | | | |
Boeing Capital
5.650%, 05/15/06 | | | 3,483 | | | | 3,634 | | |
Caterpillar Financial Services, Series F
4.690%, 04/25/05 | | | 10,000 | | | | 10,131 | | |
Hanson Overseas
6.750%, 09/15/05 | | | 8,000 | | | | 8,286 | | |
| | | | 22,051 | | |
| Communications – 4.2% | | | |
AT&T Wireless Services
7.350%, 03/01/06 | | | 5,000 | | | | 5,310 | | |
Comcast Cable Communications
6.200%, 11/15/08 | | | 4,000 | | | | 4,325 | | |
Deutsche Telekom
3.875%, 07/22/08 | | | 4,000 | | | | 4,015 | | |
Motorola
4.608%, 11/16/07 | | | 4,000 | | | | 4,109 | | |
Sprint Capital
6.125%, 11/15/08 | | | 4,000 | | | | 4,320 | | |
Telecom De Puerto Rico
6.650%, 05/15/06 | | | 10,000 | | | | 10,507 | | |
Telefonos De Mexico SA de CV (Telmex), Series L
8.250%, 01/26/06 | | | 8,000 | | | | 8,580 | | |
Verizon Wireless
5.375%, 12/15/06 | | | 4,000 | | | | 4,194 | | |
| | | | 45,360 | | |
Short Term Bond Fund (continued)
| DESCRIPTION | | PAR (000) | | VALUE (000) | |
| Consumer Cyclical – 5.7% | |
AOL Time Warner
5.625%, 05/01/05 | | $ | 8,000 | | | $ | 8,141 | | |
DaimlerChrysler, Series A
7.375%, 09/15/06 | | | 3,945 | | | | 4,246 | | |
Ford Motor Credit
6.875%, 02/01/06 | | | 9,000 | | | | 9,420 | | |
| 5.800%, 01/12/09 | | | 11,000 | | | | 11,374 | | |
General Motors Acceptance
6.750%, 01/15/06 | | | 9,000 | | | | 9,392 | | |
| 5.850%, 01/14/09 | | | 7,000 | | | | 7,230 | | |
May Department Stores
3.950%, 07/15/07 (a) | | | 2,000 | | | | 2,017 | | |
R. R. Donnelley & Sons, Series C
6.700%, 06/21/05 | | | 3,500 | | | | 3,592 | | |
Viacom
7.150%, 05/20/05 | | | 5,874 | | | | 6,043 | | |
| | | | 61,455 | | |
| Consumer NonCyclical – 4.2% | | | |
Boston Scientific
6.625%, 03/15/05 | | | 8,000 | | | | 8,149 | | |
Bunge LTD Finance
4.375%, 12/15/08 | | | 5,000 | | | | 5,007 | | |
Conagra Foods
7.500%, 09/15/05 (f) | | | 8,207 | | | | 8,573 | | |
Diageo Capital
6.125%, 08/15/05 | | | 6,090 | | | | 6,277 | | |
Gillette, Callable 10/15/04 @ 100
3.500%, 10/15/07 | | | 6,000 | | | | 5,994 | | |
Kraft Foods
4.625%, 11/01/06 | | | 5,500 | | | | 5,660 | | |
UnitedHealth Group
3.750%, 02/10/09 | | | 5,000 | | | | 4,953 | | |
| | | | 44,613 | | |
| Electric – 3.1% | | | |
Calenergy
7.630%, 10/15/07 | | | 6,255 | | | | 6,911 | | |
Dominion Resources, Series B
7.625%, 07/15/05 | | | 8,000 | | | | 8,315 | | |
DTE Energy
6.450%, 06/01/06 (f) | | | 5,000 | | | | 5,257 | | |
National Rural Utilities
6.000%, 05/15/06 | | | 8,000 | | | | 8,392 | | |
Pepco Holdings
3.750%, 02/15/06 (f) | | | 4,600 | | | | 4,648 | | |
| | | | 33,523 | | |
| Finance Companies – 3.9% | | | |
American General Finance
5.910%, 06/12/06 | | | 1,000 | | | | 1,048 | | |
CIT Group Holdings
6.625%, 06/15/05 | | | 4,000 | | | | 4,109 | | |
Countrywide Home Loan, Series K
3.500%, 12/19/05 (f) | | | 8,000 | | | | 8,078 | | |
General Electric Capital, Series A
5.350%, 03/30/06 (f) | | | 4,000 | | | | 4,152 | | |
Household Finance
8.000%, 05/09/05 | | | 7,000 | | | | 7,232 | | |
International Lease Finance
3.125%, 05/03/07 | | | 7,750 | | | | 7,701 | | |
MBNA America Bank
7.750%, 09/15/05 (a) | | | 9,215 | | | | 9,628 | | |
| | | | 41,948 | | |
The accompanying notes are an integral part of the financial statements.
FIRST AMERICAN FUNDS Annual Report 2004
52
Short Term Bond Fund (continued)
| DESCRIPTION | | PAR (000) | | VALUE (000) | |
| Foreign Local Governments – 0.5% | | | |
Bayerische Landesbank
2.500%, 03/30/06 | | $ | 5,500 | | | $ | 5,481 | | |
| Insurance – 2.1% | | | |
Allstate
7.875%, 05/01/05 | | | 2,700 | | | | 2,785 | | |
Aon
6.200%, 01/15/07 | | | 9,000 | | | | 9,617 | | |
Marsh & McLennan Companies
3.625%, 02/15/08 | | | 5,000 | | | | 5,003 | | |
St. Paul Companies
7.875%, 04/15/05 | | | 5,000 | | | | 5,133 | | |
| | | | 22,538 | | |
| Miscellaneous – 0.9% | | | |
Dow Jones, Series 2004-2
2.580%, 09/22/09 (a) | | | 10,000 | | | | 10,110 | | |
| Natural Gas – 0.8% | | | |
Duke Energy Field Services
5.750%, 11/15/06 | | | 7,915 | | | | 8,285 | | |
| REITS – 0.3% | | | |
First Industrial
5.250%, 06/15/09 | | | 3,000 | | | | 3,082 | | |
| Sovereigns – 0.4% | | | |
Pemex Project Funding Master Trust
6.125%, 08/15/08 | | | 4,000 | | | | 4,216 | | |
| Supranationals – 0.5% | | | |
Corporacion Andina De Fomento
7.250%, 03/01/07 | | | 5,000 | | | | 5,330 | | |
| Technology – 0.2% | | | |
Deluxe
3.500%, 10/01/07 (a) | | | 2,500 | | | | 2,494 | | |
| Transportation – 0.5% | | | |
CSX
2.750%, 02/15/06 | | | 5,000 | | | | 4,991 | | |
Total Corporate Bonds
(Cost $396,573) | | | | | | | 396,228 | | |
| Asset-Backed Securities – 33.1% | | | |
| Automotive – 7.8% | | | |
AESOP Funding II Series 2003-2A, Cl A1
2.740%, 06/20/07 (a) | | | 10,000 | | | | 9,988 | | |
Auto Bond Receivables Trust
Series 1993-I, Cl A
6.125%, 11/15/21 (b) (c) (l) | | | 106 | | | | - | | |
BMW Vehicle Owner Trust
Series 2003-A, Cl A3
1.940%, 02/25/07 | | | 4,636 | | | | 4,630 | | |
Capital Auto Receivables Asset Trust
Series 2002-5, Cl A3B
2.300%, 04/17/06 | | | 1,565 | | | | 1,566 | | |
Series 2003-3, Cl A2A
2.350%, 10/16/06 | | | 6,000 | | | | 5,990 | | |
Capital One Auto Finance Trust
Series 2003-A, Cl A4A
2.470%, 01/15/10 | | | 7,000 | | | | 6,943 | | |
Harley-Davidson Motorcycle Trust
Series 2003-2, Cl A2
2.070%, 02/15/11 | | | 7,000 | | | | 6,900 | | |
Short Term Bond Fund (continued)
| DESCRIPTION | | PAR (000) | | VALUE (000) | |
Honda Auto Receivables Owner Trust
Series 2003-1, Cl A3
1.920%, 11/20/06 | | $ | 4,000 | | | $ | 3,994 | | |
Series 2002-4, Cl A4
2.700%, 03/17/08 | | | 3,500 | | | | 3,506 | | |
Nissan Auto Lease Trust
Series 2002-A, Cl A3B
2.560%, 08/15/07 (a) | | | 3,738 | | | | 3,745 | | |
Nissan Auto Receivables Owner Trust
Series 2002-C, Cl A4
3.330%, 01/15/08 | | | 4,600 | | | | 4,643 | | |
Toyota Auto Receivables Owner Trust
Series 2003-B, Cl A4
2.790%, 01/15/10 | | | 2,000 | | | | 1,993 | | |
Series 2003-A, Cl A4
2.200%, 03/15/10 | | | 4,000 | | | | 3,950 | | |
Volkswagon Credit Auto Master Trust
Series 2000-1, Cl A
1.575%, 08/20/07 | | | 5,000 | | | | 5,007 | | |
Wells Fargo Financial Auto Owner Trust
Series 2004-A, Cl A3
2.060%, 06/16/08 | | | 7,000 | | | | 6,944 | | |
WFS Financial Owner Trust
Series 2004-3, Cl A3
3.300%, 03/17/09 | | | 5,000 | | | | 5,033 | | |
Series 2003-1, Cl A4
2.740%, 09/20/10 | | | 8,530 | | | | 8,495 | | |
| | | | 83,327 | | |
| Commercial – 5.4% | | | |
Banc of America Commercial Mortgage
Series 2004-2, Cl A1
2.764%, 11/10/38 | | | 7,553 | | | | 7,420 | | |
Bear Stearns Commercial Mortgage Securities
Series 2004-T14, Cl A1
3.570%, 01/12/41 | | | 5,757 | | | | 5,757 | | |
Commercial Mortgage
Series 2004-LB3A, Cl A1
3.765%, 07/10/37 | | | 7,419 | | | | 7,480 | | |
Commercial Mortgage
Series 2004-CNL, Cl A1
2.060%, 09/15/06 (a) (h) | | | 4,350 | | | | 4,350 | | |
GMAC Commercial Mortgage Securities
Series 2004-C2, Cl A1
3.896%, 08/10/38 | | | 4,949 | | | | 4,995 | | |
Greenwich Capital Commercial Funding
Series 2004-GG1, Cl A2
3.835%, 06/10/36 | | | 6,370 | | | | 6,420 | | |
GS Mortgage Securities
Series 2004-C1, Cl A1
3.659%, 10/10/28 | | | 5,975 | | | | 5,941 | | |
LB-UBS Commercial Mortgage Trust
Series 2004-C2, Cl A1
2.946%, 03/15/29 | | | 7,749 | | | | 7,567 | | |
Williams Street Funding
Series 2004-4, Cl A
1.930%, 09/23/10 (a) (b) | | | 7,790 | | | | 7,790 | | |
| | | | 57,720 | | |
| Credit Cards – 9.6% | | | |
American Express Credit Account
Series 2004-4, Cl C
2.044%, 03/15/12 (a) | | | 2,400 | | | | 2,403 | | |
Bank One Issuance Trust
Series 2002-A2, Cl A2
4.160%, 01/15/08 | | | 5,335 | | | | 5,398 | | |
FIRST AMERICAN FUNDS Annual Report 2004
53
Schedule of Investments September 30, 2004
Short Term Bond Fund (continued)
| DESCRIPTION | | PAR (000) | | VALUE (000) | |
Capital One Master Trust
Series 2001-3A, Cl C
2.663%, 03/16/09 (a) | | $ | 2,000 | | | $ | 2,016 | | |
Series 2001-5, Cl A
5.300%, 06/15/09 | | | 4,000 | | | | 4,179 | | |
Series 2001-8A, Cl A
4.600%, 08/17/09 | | | 6,000 | | | | 6,202 | | |
Capital One Multi-Asset Execution Trust
Series 2003-A6, Cl A6
2.950%, 08/17/09 | | | 7,000 | | | | 7,000 | | |
Citibank Credit Card Issuance Trust
Series 2002-A3, Cl A3
4.400%, 05/15/07 | | | 7,000 | | | | 7,091 | | |
Series 2001-A6, Cl A6
5.650%, 06/16/08 | | | 7,730 | | | | 8,095 | | |
Series 2004-A1, Cl A1
2.550%, 01/20/09 | | | 800 | | | | 792 | | |
Series 2004-A3, Cl A3
1.729%, 07/24/11 | | | 10,000 | | | | 10,000 | | |
Discover Card Master Trust I
Series 2000-9, Cl A
6.350%, 01/15/06 | | | 2,000 | | | | 2,094 | | |
Series 2001-6, Cl A
5.750%, 12/15/08 | | | 5,000 | | | | 5,247 | | |
Fleet Credit Card Master Trust II
Series 2000-A, Cl A
7.350%, 07/16/07 | | | 7,000 | | | | 7,133 | | |
Series 2000-C, Cl A
7.020%, 02/15/08 | | | 3,190 | | | | 3,318 | | |
Series 2003-A, Cl A
2.400%, 07/15/08 | | | 8,500 | | | | 8,482 | | |
Series 2001-A1, Cl A1
5.750%, 10/15/08 | | | 8,500 | | | | 8,905 | | |
Providian Gateway Master Trust
Series 2004-AA, Cl C
1.990%, 03/15/11 (a) | | | 7,000 | | | | 6,988 | | |
Series 2004-DA, Cl A
3.350%, 09/15/11 (a) | | | 2,625 | | | | 2,606 | | |
Sears Credit Account Master Trust
Series 1999-3, Cl A
6.450%, 11/17/09 | | | 1,167 | | | | 1,195 | | |
WFS Financial Owner Trust
Series 2002-4, Cl A3A
2.390%, 08/20/07 | | | 3,628 | | | | 3,628 | | |
| | | | 102,772 | | |
| Equipment Leases – 2.1% | | | |
CIT Equipment Collateral
Series 2004-VT1, Cl A3
2.200%, 03/20/08 | | | 7,400 | | | | 7,340 | | |
Series 2001-A, Cl A4
4.840%, 09/20/12 | | | 2,011 | | | | 2,025 | | |
| CNH Equipment Trust | |
Series 2003-B, Cl A2
1.710%, 05/15/06 | | | 8,800 | | | | 8,790 | | |
Series 2004-A, Cl A3B
2.950%, 10/15/08 (b) | | | 4,700 | | | | 4,689 | | |
| | | | 22,844 | | |
| Home Equity – 5.8% | | | |
Aames Mortgage Trust
Series 2002-1, Cl A2
5.378%, 06/25/29 (d) | | | 47 | | | | 47 | | |
Short Term Bond Fund (continued)
| DESCRIPTION | | PAR (000) | | VALUE (000) | |
Advanta Mortgage Loan Trust
Series 2000-2, Cl A4
7.930%, 04/25/23 (d) | | $ | 1,068 | | | $ | 1,096 | | |
Centex Home Equity
Series 2000-C, Cl A4
7.720%, 05/25/29 | | | 2,402 | | | | 2,485 | | |
Series 2003-C, Cl AV
1.355%, 09/26/33 (e) | | | 3,507 | | | | 3,511 | | |
Contimortgage Home Equity Loan Trust
Series 1998-2, Cl A7
6.570%, 03/15/23 | | | 1,674 | | | | 1,676 | | |
Emergent Home Equity Loan Trust
Series 1997-3, Cl A5
7.290%, 10/20/28 | | | 1,354 | | | | 1,379 | | |
Equivantage Home Equity Loan Trust
Series 1996-1, Cl A
6.550%, 10/25/25 | | | 387 | | | | 384 | | |
Series 1996-4, Cl A
6.750%, 01/25/28 | | | 1,147 | | | | 1,146 | | |
First Franklin Mortgage Loan
Series 2004-FFB, Cl A3
4.264%, 06/25/24 | | | 4,735 | | | | 4,732 | | |
FNMA
Series 2002-W11, Cl AF3
3.318%, 11/25/32 | | | 197 | | | | 196 | | |
GMAC Mortgage Corporation Loan Trust
Series 2004-HE2, Cl M1
3.950%, 10/25/33 (d) | | | 4,850 | | | | 4,754 | | |
Home Equity Mortgage Trust
Series 2004-2, Cl B1
3.350%, 08/25/34 | | | 2,200 | | | | 2,208 | | |
Household Home Equity Loan Trust
Series 2003-1, Cl A
1.541%, 10/20/32 (e) | | | 2,071 | | | | 2,076 | | |
IMC Home Equity Loan Trust
Series 1998-3, Cl A7
6.720%, 08/20/29 (d) | | | 3,621 | | | | 3,675 | | |
New Century Home Equity Loan Trust
Series 1997-NC6, Cl A7
7.190%, 01/25/29 (d) | | | 2,956 | | | | 2,960 | | |
Residential Asset Mortgage Products
Series 2002-RS6, Cl AI3
3.821%, 01/25/28 | | | 154 | | | | 154 | | |
Residential Funding Mortgage Securities
Series 2004-HI2, Cl A3
4.270%, 11/25/16 | | | 5,000 | | | | 5,043 | | |
Series 2003-HI1, Cl A6
4.600%, 03/25/21 | | | 6,915 | | | | 6,795 | | |
| Saxon Asset Securities Trust | |
Series 2001-1, Cl AF5
6.853%, 03/25/32 (d) | | | 3,088 | | | | 3,173 | | |
Series 2004-1, Cl M1
1.650%, 03/25/35 (d) | | | 8,000 | | | | 8,030 | | |
Wells Fargo Home Equity Trust
Series 2004-2, Cl AI2
3.450%, 06/25/19 (b) | | | 6,735 | | | | 6,720 | | |
| | | | 62,240 | | |
| Manufactured Housing – 0.0% | | | |
Oakwood Mortgage Investors
Series 1999-A, Cl A2
5.890%, 04/15/29 | | | 337 | | | | 337 | | |
The accompanying notes are an integral part of the financial statements.
FIRST AMERICAN FUNDS Annual Report 2004
54
Short Term Bond Fund (continued)
| DESCRIPTION | | PAR (000) | | VALUE (000) | |
| Utilities – 2.4% | | | |
Detroit Edison Securitization Funding
Series 2001-1, Cl A3
5.875%, 03/01/10 | | $ | 5,000 | | | $ | 5,285 | | |
Massachusetts RRB Special Purpose Trust
Series 1999-1, Cl A4
6.910%, 09/15/09 | | | 5,200 | | | | 5,571 | | |
Peco Energy Transition Trust
Series 1999-A, Cl A4
5.800%, 03/01/07 | | | 959 | | | | 973 | | |
Series 1999-A, Cl A6
6.050%, 03/01/09 | | | 9,315 | | | | 9,820 | | |
Public Service New Hampshire Funding
Series 2001-1, Cl A2
5.730%, 11/01/10 | | | 4,012 | | | | 4,236 | | |
| | | | 25,885 | | |
Total Asset-Backed Securities
(Cost $357,809) | | | | | | | 355,125 | | |
U.S. Government & Agency
Securities – 14.4% | | | |
| Fixed Rate – 1.3% | | | |
FNMA
6.625%, 09/15/09 (f) | | | 12,900 | | | | 14,535 | | |
| U.S. Agency Debentures – 9.0% | | | |
FHLB
2.500%, 12/15/05 (f) | | | 2,500 | | | | 2,501 | | |
FHLMC
2.280%, 12/02/04, Callable 12/02/04 @ 100 (f) | | | 7,000 | | | | 6,942 | | |
| 2.375%, 03/29/07, Callable 03/29/05 @ 100 (f) | | | 8,000 | | | | 7,821 | | |
FNMA
3.500%, 10/15/07, Callable 10/15/04 @ 100 (f) | | | 5,000 | | | | 5,002 | | |
| 2.000%, 06/09/06, Callable 12/09/04 @ 100 (f) | | | 7,000 | | | | 6,908 | | |
| 3.750%, 05/17/07, Callable 05/17/05 @ 100 (f) | | | 22,000 | | | | 22,124 | | |
| 5.500%, 05/02/06 (f) | | | 10,000 | | | | 10,411 | | |
| 4.750%, 01/02/07 (f) | | | 8,100 | | | | 8,377 | | |
| 4.000%, 09/02/08 (f) | | | 10,000 | | | | 10,119 | | |
| 4.250%, 05/15/09 | | | 10,000 | | | | 10,225 | | |
| 7.250%, 01/15/10 (f) | | | 5,000 | | | | 5,800 | | |
| | | | 96,230 | | |
| U.S. Treasuries – 4.1% | | | |
U.S. Treasury Bond (STRIPS)
0.000%, 11/15/11 (f) (g) | | | 11,200 | | | | 10,603 | | |
U.S. Treasury Notes
3.875%, 01/15/09 (f) (j) | | | 23,099 | | | | 26,011 | | |
| 3.875%, 05/15/09 (f) | | | 7,000 | | | | 7,168 | | |
| | | | 43,782 | | |
Total U.S. Government & Agency Securities
(Cost $154,067) | | | | | | | 154,547 | | |
U.S. Government Agency Mortgage-Backed
Securities – 6.5% | | | |
| Adjustable Rate (e) – 4.3% | | | |
FHLMC Pool
3.518%, 01/01/29, #846946 (f) | | | 1,316 | | | | 1,358 | | |
| 3.144%, 05/01/30, #847014 (f) | | | 1,364 | | | | 1,400 | | |
| 3.479%, 10/01/30, #847241 (f) | | | 6,112 | | | | 6,304 | | |
| 4.522%, 10/01/32, #847063 (f) | | | 2,000 | | | | 2,050 | | |
| 4.267%, 05/01/33, #780456 (f) | | | 3,802 | | | | 3,830 | | |
FNMA Pool
3.425%, 11/01/25, #433988 | | | 1,449 | | | | 1,489 | | |
| 3.392%, 02/01/28, #415285 | | | 666 | | | | 683 | | |
Short Term Bond Fund (continued)
| DESCRIPTION | | PAR (000) | | VALUE (000) | |
| 5.010%, 12/01/31, #535363 (f) | | $ | 3,374 | | | $ | 3,514 | | |
| 4.792%, 03/01/32, #545791 | | | 762 | | | | 787 | | |
| 4.492%, 10/01/32, #661645 (f) | | | 3,156 | | | | 3,194 | | |
| 4.629%, 12/01/32, #671884 (f) | | | 5,360 | | | | 5,434 | | |
| 3.861%, 03/01/33, #555369 (f) | | | 3,960 | | | | 4,048 | | |
| 2.974%, 04/01/34, #775389 (f) | | | 3,968 | | | | 4,100 | | |
| 4.278%, 07/01/34, #795242 (f) | | | 4,932 | | | | 4,965 | | |
GNMA Pool
4.750%, 08/20/21, #8824 | | | 488 | | | | 498 | | |
| 4.750%, 07/20/22, #8006 (f) | | | 561 | | | | 572 | | |
| 4.750%, 09/20/25, #8699 | | | 317 | | | | 323 | | |
| 4.375%, 04/20/26, #8847 | | | 328 | | | | 331 | | |
| 4.750%, 08/20/27, #80106 | | | 100 | | | | 102 | | |
| 4.375%, 01/20/28, #80154 | | | 168 | | | | 170 | | |
| 5.500%, 02/20/32, #80580 (f) | | | 575 | | | | 581 | | |
| | | | 45,733 | | |
| Fixed Rate – 2.2% | | | |
FHLMC Gold Pool
5.500%, 10/01/06, #M90680 | | | 261 | | | | 267 | | |
| FHLMC Gold TBA (h) | |
| 3.940%, 10/01/34 | | | 4,000 | | | | 4,142 | | |
FHLMC Pool
7.750%, 07/01/09, #184513 | | | 12 | | | | 13 | | |
| 3.902%, 12/01/26, #756591 | | | 1,437 | | | | 1,496 | | |
| 5.372%, 04/01/30, #972055 (f) | | | 1,327 | | | | 1,358 | | |
FNMA Pool
6.195%, 06/01/07, #410601 (f) | | | 4,957 | | | | 5,304 | | |
| 5.500%, 05/01/12, #254340 (f) | | | 2,367 | | | | 2,459 | | |
| 5.043%, 06/01/31, #625338 (f) | | | 1,406 | | | | 1,459 | | |
| 5.046%, 05/01/32, #634948 (f) | | | 1,355 | | | | 1,392 | | |
GNMA Pool
3.250%, 05/20/29, #80283 (f) | | | 938 | | | | 949 | | |
| 3.250%, 06/20/29, #80291 (f) | | | 1,640 | | | | 1,658 | | |
| 2.875%, 11/20/30, #80469 (f) | | | 996 | | | | 1,003 | | |
| 3.500%, 04/20/31, #80507 (f) | | | 579 | | | | 585 | | |
| 4.500%, 08/20/31, #80535 (f) | | | 2,160 | | | | 2,166 | | |
| | | | 24,251 | | |
Total U.S. Government Agency
Mortgage-Backed Securities
(Cost $70,161) | | | | | | | 69,984 | | |
CMO – U.S. Government Agency
Mortgage-Backed Securities – 2.1% | | | |
| Fixed Rate – 2.1% | | | |
| FHLMC REMIC | |
Series 2634, Cl LA
3.000%, 05/15/12 | | | 2,599 | | | | 2,602 | | |
Series 1002, Cl J
6.000%, 12/15/20 | | | 81 | | | | 82 | | |
Series 2738, Cl UA
3.570%, 12/15/23 (f) | | | 5,500 | | | | 5,476 | | |
Series 2589, Cl GK
4.000%, 03/15/26 (f) | | | 6,457 | | | | 6,497 | | |
| FNMA REMIC | |
Series 2004-76, Cl CE
4.500%, 02/25/21 (b) | | | 8,000 | | | | 8,073 | | |
Series 1992-150, Cl MA
5.500%, 09/25/22 | | | 228 | | | | 232 | | |
Total CMO – U.S. Government Agency
Mortgage-Backed Securities
(Cost $23,087) | | | | | | | 22,962 | | |
FIRST AMERICAN FUNDS Annual Report 2004
55
Schedule of Investments September 30, 2004
Short Term Bond Fund (continued)
| DESCRIPTION | | PAR (000)/SHARES | | VALUE (000) | |
CMO – Private Mortgage-Backed
Securities – 6.2% | | | |
| Adjustable Rate (e) – 3.3% | | | |
Granite Mortgages
Series 2003-1, Cl 1 C
3.080%, 01/20/43 | | $ | 5,000 | | | $ | 5,101 | | |
Series 2004-3, Cl 1C
2.466%, 09/20/44 (a) | | | 3,000 | | | | 3,017 | | |
MLCC Mortgage Investors
Series 2004-B, Cl A3
2.899%, 05/25/29 | | | 6,748 | | | | 6,954 | | |
Sequoia Mortgage Trust
Series 2004-4, Cl B2
2.320%, 05/20/34 | | | 4,350 | | | | 4,356 | | |
Sequoia Mortgage Trust
Series 2004-7, Cl A2
2.923%, 08/20/34 | | | 5,035 | | | | 5,176 | | |
Structured Mortgage Loan Trust
Series 2004-11, Cl A
3.825%, 08/25/34 | | | 4,727 | | | | 4,875 | | |
Washington Mutual
Series 2003-AR3, Cl A5
3.927%, 04/25/33 | | | 5,550 | | | | 5,560 | | |
| | | | 35,039 | | |
| Fixed Rate – 2.9% | | | |
IMPAC Secured Assets
Series 2004-2, Cl A2
3.926%, 08/25/34 | | | 5,000 | | | | 5,045 | | |
Merrill Lynch Mortgage Investors
Series 2003-A5, Cl 2A3
3.246%, 08/25/33 | | | 5,763 | | | | 5,749 | | |
Mortgage Capital Funding
Series 1997-MC1, Cl A3
7.288%, 07/20/27 | | | 4,009 | | | | 4,305 | | |
Residential Asset Securitization Trust
Series 2002-A12, Cl 1A1
5.200%, 11/25/32 | | | 4,598 | | | | 4,617 | | |
Washington Mutual
Series 2003-AR10, Cl A6
4.100%, 10/25/33 (e) | | | 5,000 | | | | 5,075 | | |
Wells Fargo Mortgage Backed Securities Trust
Series 2004-N, Cl A3
4.154%, 08/25/34 | | | 7,000 | | | | 7,007 | | |
| | | | 31,798 | | |
Total CMO – Private Mortgage-Backed Securities
(Cost $66,793) | | | | | | | 66,837 | | |
| Treasury Obligation – 0.0% | | | |
U. S. Treasury Bill
1.559%, 11/18/04 (i) | | | 410 | | | | 409 | | |
Total Treasury Obligation
(Cost $409) | | | | | | | 409 | | |
| Affiliated Money Market Fund – 1.0% | | | |
First American Prime
Obligations Fund, Cl Z (m) | | | 10,133,964 | | | | 10,134 | | |
Total Affiliated Money Market Fund
(Cost $10,134) | | | | | | | 10,134 | | |
Investments Purchased with Proceeds from
Securities Lending – 22.6% | | | |
| Commercial Paper – 7.3% | | | |
Bluegrass
1.881%, 5/18/05 | | $ | 1,020 | | | | 1,020 | | |
| 1.891%, 8/18/05 | | | 811 | | | | 811 | | |
Short Term Bond Fund (continued)
| DESCRIPTION | | PAR (000) | | VALUE (000) | |
Concord Minutemen Capital
1.650%, 10/01/04 | | $ | 1,675 | | | $ | 1,675 | | |
| 1.680%, 10/05/04 | | | 3,722 | | | | 3,722 | | |
| 1.720%, 10/06/04 | | | 2,750 | | | | 2,750 | | |
| 1.740%, 10/14/04 | | | 1,840 | | | | 1,840 | | |
Descartes Funding Trust
1.760%, 11/15/04 | | | 2,068 | | | | 2,068 | | |
Ford Credit Floor Plan
1.622%, 10/05/04 | | | 4,135 | | | | 4,135 | | |
| 1.526%, 10/06/04 | | | 2,895 | | | | 2,895 | | |
| 1.655%, 10/22/04 | | | 909 | | | | 909 | | |
Goldman Sachs
1.975%, 1/18/05 | | | 2,068 | | | | 2,068 | | |
Independence
1.830%, 4/15/05 | | | 2,556 | | | | 2,556 | | |
Jupiter Securities Corp
1.793%, 10/21/04 | | | 7,861 | | | | 7,861 | | |
Lakeside Funding
1.790%, 10/08/04 | | | 4,384 | | | | 4,384 | | |
Landesbank Baden
1.480%, 11/12/04 | | | 825 | | | | 825 | | |
Leaf's LLC
1.821%, 4/20/05 | | | 2,275 | | | | 2,275 | | |
Liquid Funding Ltd
1.743%, 10/13/04 | | | 2,893 | | | | 2,893 | | |
| 1.830%, 5/25/05 | | | 2,068 | | | | 2,068 | | |
MBNA Credit
1.683%, 10/12/04 | | | 2,010 | | | | 2,010 | | |
| 1.764%, 10/26/04 | | | 1,115 | | | | 1,115 | | |
Main Street Warehouse
1.742%, 10/04/04 | | | 2,729 | | | | 2,729 | | |
| 1.683%, 10/04/04 | | | 3,371 | | | | 3,371 | | |
| 1.742%, 10/08/04 | | | 2,067 | | | | 2,067 | | |
| 1.742%, 10/08/04 | | | 2,068 | | | | 2,068 | | |
Mortgage Interest Network
1.752%, 10/12/04 | | | 1,364 | | | | 1,364 | | |
| 1.763%, 10/14/04 | | | 1,447 | | | | 1,447 | | |
Netexis Banques
1.700%, 12/16/04 | | | 2,060 | | | | 2,060 | | |
Orchard Park
1.796%, 4/06/05 | | | 2,068 | | | | 2,068 | | |
| 1.766%, 7/06/05 | | | 4,268 | | | | 4,268 | | |
Park Granada LLC
1.622%, 10/01/04 | | | 3,639 | | | | 3,639 | | |
| 1.743%, 10/13/04 | | | 2,356 | | | | 2,356 | | |
Sigma Finance Inc
1.512%, 11/29/04 | | | 1,031 | | | | 1,031 | | |
| Total Commercial Paper | | | | | | | 78,348 | | |
| Corporate Obligations – 6.1% | | | |
Allstate Life Global
1.780%, 10/14/05 | | | 4,136 | | | | 4,136 | | |
| 1.750%, 10/14/05 | | | 1,034 | | | | 1,034 | | |
Bayer Landbank NY
1.830%, 6/24/05 | | | 3,929 | | | | 3,929 | | |
Blue Heron Fdg Ltd
1.850%, 5/18/05 | | | 1,158 | | | | 1,158 | | |
Castle Hill III
1.910%, 9/15/15 | | | 1,241 | | | | 1,241 | | |
Depfa Bank PLC
1.860%, 6/15/05 | | | 2,067 | | | | 2,067 | | |
Duke Funding VI
1.320%, 4/08/05 | | | 2,502 | | | | 2,502 | | |
General Electric Capital Corporation
1.838%, 10/07/05 | | | 2,070 | | | | 2,070 | | |
The accompanying notes are an integral part of the financial statements.
FIRST AMERICAN FUNDS Annual Report 2004
56
Short Term Bond Fund (continued)
| DESCRIPTION | | PAR (000) | | VALUE (000) | |
Jackson National Life
1.760%, 4/15/05 | | $ | 2,068 | | | $ | 2,068 | | |
Jefferson Pilot Co
1.788%, 8/17/05 | | | 2,068 | | | | 2,068 | | |
Liquid Funding Ltd
1.840%, 6/28/05 | | | 1,861 | | | | 1,861 | | |
Merrill Lynch
1.696%, 10/01/05 | | | 4,136 | | | | 4,136 | | |
Metlife Global Funding
1.800%, 10/14/05 | | | 2,481 | | | | 2,481 | | |
| 1.880%, 10/28/05 | | | 1,738 | | | | 1,738 | | |
Morgan Stanley
1.850%, 12/26/08 | | | 2,068 | | | | 2,068 | | |
Natexis Banq NY
1.920%, 7/12/05 | | | 2,275 | | | | 2,275 | | |
Northlake CDO Ltd
1.895%, 3/07/05 | | | 1,241 | | | | 1,241 | | |
Premium Asset Trust
1.848%, 12/22/04 | | | 1,551 | | | | 1,551 | | |
| 1.760%, 5/13/05 | | | 2,895 | | | | 2,895 | | |
| 1.740%, 6/01/05 | | | 6,162 | | | | 6,162 | | |
| 1.770%, 10/14/05 | | | 1,654 | | | | 1,654 | | |
REMAC
1.840%, 9/29/05 | | | 2,275 | | | | 2,275 | | |
RMAC
1.740%, 6/12/05 | | | 2,386 | | | | 2,386 | | |
SMM Trust 2004
1.833%, 9/23/05 | | | 3,846 | | | | 3,846 | | |
Societe Generale NYC
1.960%, 12/08/04 | | | 4,136 | | | | 4,136 | | |
Svenska Handl
1.170%, 10/21/04 | | | 2,068 | | | | 2,068 | | |
| Total Corporate Obligations | | | | | | | 65,046 | | |
| Other Short-Term Investments – 1.6% | | | |
ARLO III Ltd
2.000%, 9/28/05 | | | 6,204 | | | | 6,204 | | |
Commonwealth Life
2.115%, 12/31/04 (k) | | | 2,088 | | | | 2,088 | | |
General Electric Capital Assurance
1.980%, 1/19/05 | | | 827 | | | | 827 | | |
HBOS Treas Svcs Plc
1.640%, 11/01/05 | | | 2,274 | | | | 2,274 | | |
Security Life Denver
1.270%, 7/13/04 | | | 5,377 | | | | 5,377 | | |
| Total Other Short-Term Investments | | | | | | | 16,770 | | |
| Repurchase Agreements – 7.6% | | | |
Bear Stearns
2.045%, dated 9/30/04, matures 10/01/04,
repurchase price $4,136,137
(collateralized by Various Securities:
Total Market Value $4,220,927) | | | 4,136 | | | | 4,136 | | |
Bear Stearns
2.060%, dated 9/30/04, matures 12/23/04,
repurchase price $1,246,735
(collateralized by Various Securities:
Total Market Value $1,266,029) | | | 1,241 | | | | 1,241 | | |
Citibank
1.945%, dated 9/30/04, matures 10/01/04,
repurchase price $8,272,252
(collateralized by Corporate Securities:
Total Market Value $8,759,440) | | | 8,272 | | | | 8,272 | | |
Citibank
1.925%, dated 9/30/04, matures 10/01/04,
repurchase price $2,068,062 | | | | | | | | | |
Short Term Bond Fund (continued)
| DESCRIPTION | | PAR (000) | | VALUE (000) | |
(collateralized by Various Securities:
Total Market Value $2,113,996) | | $ | 2,068 | | | $ | 2,068 | | |
Citibank
1.925%, dated 9/30/04, matures 10/01/04,
repurchase price $2,068,062
(collateralized by Various Securities:
Total Market Value $2,109,338) | | | 2,068 | | | | 2,068 | | |
Greenwich Capital Markets
1.950%, dated 9/30/04, matures 10/01/04,
repurchase price $12,408,379
(collateralized by U.S. Government Securities:
Total Market Value $12,656,023) | | | 12,407 | | | | 12,407 | | |
Goldman Sachs
2.025%, dated 9/30/04, matures 10/01/04,
repurchase price $2,895,295
(collateralized by Various Securities:
Total Market Value $2,984,676) | | | 2,895 | | | | 2,895 | | |
Goldman Sachs
2.025%, dated 9/30/04, matures 10/01/04,
repurchase price $1,240,840
(collateralized by Various Securities:
Total Market Value $1,279,177) | | | 1,241 | | | | 1,241 | | |
Goldman Sachs
2.025%, dated 9/30/04, matures 10/01/04,
repurchase price $1,240,851
(collateralized by U.S. Government Securities:
Total Market Value $1,279,177) | | | 1,241 | | | | 1,241 | | |
Goldman Sachs
2.025%, dated 9/30/04, matures 10/01/04,
repurchase price $3,102,101
(collateralized by Corporate Securities:
Total Market Value $3,197,879) | | | 3,102 | | | | 3,102 | | |
Goldman Sachs
1.425%, dated 9/30/04, matures 10/18/04,
repurchase price $5,173,562
(collateralized by Corporate Securities:
Total Market Value $5,275,417) | | | 5,170 | | | | 5,170 | | |
Goldman Sachs
1.480%, dated 9/30/04, matures 10/18/04,
repurchase price $3,104,222
(collateralized by Corporate Securities:
Total Market Value $3,197,880) | | | 3,102 | | | | 3,102 | | |
Goldman Sachs
2.205%, dated 9/30/04, matures 3/07/05,
repurchase price $2,087,964
(collateralized by Corporate Securities:
Total Market Value $2,110,187) | | | 2,068 | | | | 2,068 | | |
Lehman Brothers
2.055%, dated 9/30/04, matures 10/01/04,
repurchase price $8,272,277
(collateralized by Collateralized
Mortgage Obligations:
Total Market Value $8,437,241) | | | 8,272 | | | | 8,272 | | |
Lehman Brothers
1.910%, dated 9/30/04, matures 10/01/04,
repurchase price $12,408,365
(collateralized by U.S. Government Securities:
Total Market Value $12,656,061) | | | 12,407 | | | | 12,407 | | |
Lehman Brothers
1.935%, dated 9/30/04, matures 10/01/04,
repurchase price $8,272,249
(collateralized by Collateralized Mortgage
Obligations: Total Market Value $9,095,531) | | | 8,272 | | | | 8,272 | | |
FIRST AMERICAN FUNDS Annual Report 2004
57
Schedule of Investments September 30, 2004
Short Term Bond Fund (continued)
| DESCRIPTION | | PAR (000) | | VALUE (000) | |
Merrill Lynch
1.925%, dated 9/30/04, matures 10/01/04,
repurchase price $4,136,124
(collateralized by Corporate Securities:
Total Market Value $4,342,787) | | $ | 4,136 | | | $ | 4,136 | | |
| Total Repurchase Agreements | | | | | 82,098 | | |
Total Investments Purchased with Proceeds
from Securities Lending
(Cost $242,262) | | | | | 242,262 | | |
Total Investments – 122.8%
(Cost $1,321,295) | | | | | 1,318,488 | | |
| Other Assets and Liabilities, Net – (22.8)% | | | | | (244,776 | ) | |
| Total Net Assets – 100.0% | | | | $ | 1,073,712 | | |
(a) Security sold within the terms of a private placement memorandum, exempt from registration under Rule 144A of the Securities Act of 1933, as amended, and may be sold only to dealers in that program or other "qualified institutional buyers." These securities have been determined to be liquid under the guidelines established by the Funds' board of directors. As of September 30, 2004, the value of these investments was $87,839,000 or 8.2% of total net assets.
(b) Securities considered illiquid or restricted. As of September 30, 2004, the value of these investments was $27,271,934 or 2.5% of total net assets. See note 2 in Notes to Financial Statements.
(c) Security is fair valued. As of September 30, 2004, the fair value of these investments was $0 or 0.0% of total net assets. See note 2 in Notes to Financial Statements.
(d) Delayed Interest (Step-Bonds) – Represents securities that remain zero-coupon securities until a predetermined date at which time the stated coupon rate becomes effective and interest becomes payable at regular intervals. Interest rate shown represents current yield at September 30, 2004, based upon the estimated timing and amount of future interest and principal payments.
(e) Variable Rate Security – The rate shown is the rate in effect as of September 30, 2004.
(f) This security or a portion of this security is out on loan at September 30, 2004. Total loaned securities had a value of $235,256,916 at September 30, 2004. See note 2 in Notes to Financial Statements.
(g) Principal only.
(h) Security purchased on a when-issued basis. On September 30, 2004, the total cost of investments purchased on a when-issued basis was $4,350,000 or 0.4% of total net assets. See note 2 in Notes to Financial Statements.
(i) Security has been deposited as initial margin on open futures contracts. Yield shown is effective yield at date of purchase. See note 2 in Notes to Financial Statements.
(j) U.S. Treasury inflation-protection securities (TIPS) are securities in which the principal amount is adjusted for inflation and the semiannual interest payments equal a fixed percentage of the inflation-adjusted principal amount.
(k) Security has demand features which qualify it as a short-term security. The date disclosed is the next put date.
(l) Security currently in default.
(m) Investment in affiliated security. This money market fund is advised by U.S. Bancorp Asset Management, Inc., which also serves as advisor for this Fund. See note 3 in Notes to Financial Statements.
Cl – Class
CMO – Collateralized Mortgage Obligation
FHLB – Federal Home Loan Bank
FHLMC – Federal Home Loan Mortgage Corporation
FNMA – Federal National Mortgage Association
GNMA – Government National Mortgage Association
REITS – Real Estate Investment Trusts
REMIC – Real Estate Mortgage Investment Conduit
STRIPS – Separate Trading of Registered Interest and Principal of Securities
Short Term Bond Fund (concluded)
Schedule of Open Futures Contracts
| Description | | Number of
Contracts
Purchased
(Sold) | | Market Value
Covered By
Contracts | | Settlement
Month | | Unrealized
Appreciation
(Depreciation) | |
90 Day Eurodollar
December 04 Futures | | | 713 | | | $ | 69,608 | | | Dec. 04 | | $ | 204 | | |
90 Day Eurodollar
December 05 Futures | | | (713 | ) | | | (68,934 | ) | | Dec. 05 | | | (602 | ) | |
2 Year U.S. Treasury
December 04 Futures | | | 1,434 | | | | 151,453 | | | Dec. 04 | | | (322 | ) | |
10 Year U.S. Treasury
December 04 Futures | | | (6,000 | ) | | | (676 | ) | | Dec. 04 | | | (2 | ) | |
U.S. Treasury Long Bond
December 04 Futures | | | 215 | | | | 24,127 | | | Dec. 04 | | | 262 | | |
U.S. Treasury 5 Year
December 04 Futures | | | (1,280 | ) | | | (141,764 | ) | | Dec. 04 | | | (64 | ) | |
| | | $ | (524 | ) | |
The accompanying notes are an integral part of the financial statements.
FIRST AMERICAN FUNDS Annual Report 2004
58
U.S. Government Mortgage Fund
| DESCRIPTION | | PAR (000) | | VALUE (000) | |
U.S. Government Agency Mortgage-Backed
Securities – 88.3% | |
| Adjustable Rate (a) – 2.5% | |
FNMA Pool
3.353%, 08/01/27, #545271 (b) | | $ | 2,757 | | | $ | 2,842 | | |
| 2.974%, 04/01/34, #775389 | | | 2,568 | | | | 2,653 | | |
| | | | 5,495 | | |
| Fixed Rate – 85.8% | | | |
FHLMC Gold Pool
8.500%, 03/01/06, #E00022 | | | 7 | | | | 8 | | |
| 7.500%, 04/01/08, #E45929 | | | 21 | | | | 23 | | |
| 7.000%, 07/01/11, #E20252 | | | 65 | | | | 70 | | |
| 7.000%, 11/01/11, #E65619 | | | 6 | | | | 6 | | |
| 7.500%, 09/01/12, #G10735 | | | 313 | | | | 334 | | |
| 5.500%, 05/01/13, #G10814 | | | 340 | | | | 354 | | |
| 6.000%, 10/01/13, #E72802 | | | 619 | | | | 652 | | |
| 5.500%, 01/01/14, #E00617 | | | 1,697 | | | | 1,766 | | |
| 7.000%, 09/01/14, #E00746 | | | 331 | | | | 352 | | |
| 5.000%, 05/01/18, #E96700 | | | 3,780 | | | | 3,842 | | |
| 6.000%, 03/01/21, #CP0428 | | | 824 | | | | 858 | | |
| 6.000%, 09/01/22, #C90580 | | | 1,205 | | | | 1,254 | | |
| 6.500%, 01/01/28, #G00876 | | | 792 | | | | 836 | | |
| 6.500%, 11/01/28, #C00676 | | | 1,712 | | | | 1,802 | | |
| 6.500%, 01/01/30, #C55738 | | | 2,342 | | | | 2,464 | | |
| 7.500%, 01/01/30, #C35768 | | | 190 | | | | 204 | | |
| 6.000%, 12/01/30, #C53880 | | | 3,608 | | | | 3,741 | | |
| 6.500%, 03/01/31, #G01244 (b) | | | 1,262 | | | | 1,328 | | |
| 7.000%, 06/01/32, #C68248 | | | 599 | | | | 635 | | |
| 5.000%, 09/01/33, #C01622 | | | 2,792 | | | | 2,770 | | |
FNMA Pool
7.000%, 11/01/11, #250738 | | | 31 | | | | 33 | | |
| 7.000%, 11/01/11, #349630 | | | 19 | | | | 20 | | |
| 7.000%, 11/01/11, #351122 | | | 27 | | | | 29 | | |
| 6.000%, 04/01/13, #425550 | | | 332 | | | | 350 | | |
| 6.500%, 08/01/13, #251901 | | | 286 | | | | 304 | | |
| 6.000%, 11/01/13, #556195 | | | 559 | | | | 590 | | |
| 6.000%, 12/01/13, #449173 | | | 816 | | | | 859 | | |
| 7.000%, 07/01/14, #252637 | | | 514 | | | | 547 | | |
| 7.000%, 10/01/14, #252799 | | | 220 | | | | 234 | | |
| 5.500%, 04/01/16, #580516 | | | 1,359 | | | | 1,410 | | |
| 6.500%, 07/01/17, #254373 | | | 1,770 | | | | 1,874 | | |
| 7.000%, 07/01/17, #254414 | | | 1,735 | | | | 1,842 | | |
| 5.500%, 12/01/17, #673010 | | | 1,261 | | | | 1,303 | | |
| 6.000%, 12/01/17, #254547 | | | 1,342 | | | | 1,407 | | |
| 5.000%, 04/01/18, #685197 | | | 3,718 | | | | 3,781 | | |
| 5.500%, 04/01/18, #695765 | | | 1,385 | | | | 1,432 | | |
| 4.500%, 05/01/18, #254720 | | | 5,970 | | | | 5,961 | | |
| 5.000%, 07/01/18, #555621 | | | 2,213 | | | | 2,251 | | |
| 5.000%, 11/01/18, #750989 | | | 4,418 | | | | 4,493 | | |
| 4.500%, 05/01/19, #775004 (b) | | | 4,885 | | | | 4,869 | | |
| 6.500%, 06/01/22, #254344 | | | 1,342 | | | | 1,417 | | |
| 6.000%, 10/01/22, #254513 (b) | | | 1,494 | | | | 1,556 | | |
| 6.500%, 10/01/27, #400141 | | | 84 | | | | 89 | | |
| 7.000%, 12/01/27, #313941 | | | 998 | | | | 1,060 | | |
| 6.500%, 10/01/28, #442671 | | | 598 | | | | 630 | | |
| 6.500%, 12/01/28, #323422 | | | 872 | | | | 918 | | |
| 6.500%, 02/01/29, #252255 (b) | | | 829 | | | | 873 | | |
| 7.000%, 09/01/31, #596680 | | | 1,826 | | | | 1,934 | | |
| 7.000%, 03/01/32, #635970 | | | 1,413 | | | | 1,498 | | |
| 6.500%, 06/01/32, #596712 | | | 5,162 | | | | 5,410 | | |
| 6.500%, 07/01/32, #545759 (b) | | | 5,553 | | | | 5,832 | | |
| 7.000%, 07/01/32, #545813 | | | 750 | | | | 795 | | |
| 7.000%, 07/01/32, #545815 (b) | | | 729 | | | | 773 | | |
| 6.000%, 08/01/32, #656269 | | | 1,660 | | | | 1,722 | | |
U.S. Government Mortgage Fund (continued)
| DESCRIPTION | | PAR (000) | | VALUE (000) | |
| 5.500%, 03/01/33, #689109 | | $ | 3,833 | �� | | $ | 3,899 | | |
| 5.500%, 04/01/33, #703392 (b) | | | 4,316 | | | | 4,381 | | |
| 5.500%, 05/01/33, #704523 | | | 3,613 | | | | 3,668 | | |
| 5.500%, 07/01/33, #720735 (b) | | | 2,506 | | | | 2,544 | | |
| 5.500%, 07/01/33, #726520 (b) | | | 4,368 | | | | 4,434 | | |
| 5.500%, 07/01/33, #728667 | | | 2,895 | | | | 2,939 | | |
| 4.500%, 08/01/33, #555680 | | | 2,804 | | | | 2,711 | | |
| 5.000%, 08/01/33, #736158 | | | 3,699 | | | | 3,669 | | |
| 5.500%, 08/01/33, #728855 | | | 3,053 | | | | 3,100 | | |
| 5.500%, 08/01/33, #730927 | | | 3,412 | | | | 3,464 | | |
| 5.500%, 08/01/33, #733380 (b) | | | 3,494 | | | | 3,547 | | |
| 5.000%, 09/01/33, #734566 | | | 4,483 | | | | 4,447 | | |
| 5.000%, 10/01/33, #747533 | | | 3,783 | | | | 3,753 | | |
| 5.500%, 12/01/33, #756202 (b) | | | 2,711 | | | | 2,752 | | |
| 5.500%, 01/01/34, #255028 (b) | | | 2,654 | | | | 2,694 | | |
| 6.000%, 01/01/34, #763687 | | | 3,824 | | | | 3,960 | | |
| 5.000%, 04/01/34, #778492 (b) | | | 4,771 | | | | 4,728 | | |
| 5.500%, 04/01/34, #774999 | | | 1,473 | | | | 1,494 | | |
| 5.000%, 07/01/34, #788645 | | | 3,500 | | | | 3,469 | | |
FNMA TBA (d)
5.500%, 04/01/33 | | | 3,500 | | | | 3,548 | | |
| 5.500%, 06/01/33 | | | 5,000 | | | | 5,069 | | |
| 6.000%, 10/01/33 | | | 6,100 | | | | 6,310 | | |
| 4.500%, 06/01/34 | | | 1,500 | | | | 1,444 | | |
GNMA Pool
8.000%, 01/15/07, #315126 | | | 9 | | | | 10 | | |
| 9.000%, 11/15/09, #359559 | | | 61 | | | | 65 | | |
| 8.000%, 10/15/10, #414750 | | | 97 | | | | 104 | | |
| 6.500%, 07/15/13, #462638 | | | 652 | | | | 697 | | |
| 8.500%, 06/15/21, #307921 | | | - | | | | - | | |
| 7.500%, 12/15/22, #347332 | | | 113 | | | | 123 | | |
| 7.000%, 09/15/27, #455304 | | | 43 | | | | 46 | | |
| 6.500%, 07/15/28, #780825 | | | 1,453 | | | | 1,540 | | |
| 7.000%, 11/15/29, #781113 (b) | | | 759 | | | | 811 | | |
| 7.000%, 07/15/31, #781324 (b) | | | 743 | | | | 793 | | |
| 6.500%, 08/20/31, #3120 | | | 732 | | | | 772 | | |
| 7.500%, 12/15/31, #570134 | | | 633 | | | | 681 | | |
| 6.500%, 02/15/32, #569621 | | | 1,071 | | | | 1,130 | | |
| 6.000%, 03/15/33, #603520 (b) | | | 2,024 | | | | 2,101 | | |
| 6.000%, 06/15/33, #553314 (b) | | | 3,619 | | | | 3,757 | | |
| 5.500%, 07/15/33, #553367 (b) | | | 2,694 | | | | 2,743 | | |
| 5.500%, 08/15/33, #604567 (b) | | | 5,733 | | | | 5,837 | | |
| 6.000%, 11/15/33, #612374 (b) | | | 2,279 | | | | 2,363 | | |
| 6.000%, 07/15/34, #631574 | | | 1,865 | | | | 1,933 | | |
| 6.000%, 09/15/34, #633605 | | | 2,861 | | | | 2,965 | | |
| | | | 191,890 | | |
Total U.S. Government Agency
Mortgage-Backed Securities
(Cost $195,714) | | | | | | | 197,385 | | |
CMO – Private Mortgage-Backed
Securities – 9.3% | |
| Adjustable Rate (a)– 0.7% | |
Sequoia Mortgage Trust
Series 2004-5, Cl X1
0.800%, 05/20/34 (h) | | | 121,188 | | | | 1,559 | | |
| Fixed Rate – 8.6% | |
Citicorp Mortgage Securities
Series 2004-5, Cl B3
5.267%, 08/25/34 | | | 2,246 | | | | 2,096 | | |
First Nationwide Trust
Series 2001-3, Cl 2A1
8.250%, 01/25/23 | | | 333 | | | | 338 | | |
FIRST AMERICAN FUNDS Annual Report 2004
59
Schedule of Investments September 30, 2004
U.S. Government Mortgage Fund (continued)
| DESCRIPTION | | PAR (000) | | VALUE (000) | |
GRP/AG Real Estate Asset Trust
Series 2004-1, Cl A
3.960%, 03/25/09 (c) (e) (f) | | $ | 536 | | | $ | 537 | | |
Residential Accredit Loans
Series 1997-QS13, Cl M3
7.250%, 12/25/27 | | | 1,297 | | | | 1,283 | | |
Residential Asset Mortgage Products
Series 2003-SL1, Cl M1
7.319%, 04/25/31 | | | 2,930 | | | | 3,096 | | |
Washington Mutual MSC Mortgage
Series 2003-MS9, Cl CB1
7.433%, 04/25/33 | | | 1,750 | | | | 1,838 | | |
Washington Mutual
Series 2003-S10, Cl A2
5.000%, 10/25/18 | | | 3,396 | | | | 3,405 | | |
Wells Fargo Mortgage Backed Securities Trust
Series 2003-14, Cl A1
4.750%, 12/25/18 | | | 4,951 | | | | 4,953 | | |
Series 2003-D, Cl A1
4.906%, 02/25/33 | | | 1,563 | | | | 1,577 | | |
| | | | 19,123 | | |
Total CMO – Private Mortgage-Backed Securities
(Cost $20,751) | | | | | | | 20,682 | | |
| U.S. Government & Agency Securities – 3.1% | | | |
| U.S. Agency Debenture – 1.0% | | | |
FNMA
4.625%, 10/15/14 (b) | | | 2,200 | | | | 2,192 | | |
| U.S. Treasuries – 2.1% | | | |
U. S. Treasury Bill
1.435%, 11/18/04 (f) | | | 220 | | | | 219 | | |
U.S. Treasury Note
2.000%, 07/15/14 (b) (g) | | | 4,321 | | | | 4,418 | | |
| | | | 4,637 | | |
Total U.S. Government & Agency Securities
(Cost $6,781) | | | | | | | 6,829 | | |
CMO – U.S. Government Agency
Mortgage-Backed Securities – 1.5% | | | |
| Fixed Rate – 1.5% | | | |
FHLMC REMIC
Series 2498, Cl UA
5.500%, 09/15/12 | | | 223 | | | | 224 | | |
Series 2382, Cl DA
5.500%, 10/15/30 | | | 713 | | | | 735 | | |
FNMA REMIC
Series 2002-W1, Cl 2A
7.500%, 02/25/42 | | | 2,263 | | | | 2,418 | | |
Total CMO – U.S. Government Agency
Mortgage-Backed Securities
(Cost $3,321) | | | | | | | 3,377 | | |
| Asset-Backed Securities – 1.2% | | | |
| Home Equity – 0.3% | | | |
First Plus Home Loan Trust
Series 1998-3, Cl A7
6.950%, 10/10/22 | | | 31 | | | | 30 | | |
GRMT Mortgage Loan Trust
Series 2001-1A, Cl M1
7.772%, 07/20/31 | | | 500 | | | | 527 | | |
| | | | 557 | | |
U.S. Government Mortgage Fund (continued)
| DESCRIPTION | | PAR (000)/
CONTRACTS/SHARES | | VALUE (000) | |
| Manufactured Housing – 0.9% | | | |
Oakwood Mortgage Investors
Series 1999-A, Cl A2
5.890%, 04/15/29 | | $ | 171 | | | $ | 171 | | |
Vanderbilt Mortgage Finance
Series 1999-B, Cl 1A4
6.545%, 04/07/18 | | | 1,885 | | | | 1,931 | | |
| | | | 2,102 | | |
Total Asset-Backed Securities
(Cost $2,677) | | | | | | | 2,659 | | |
| Commercial Paper – 2.2% | | | |
Falcon Asset Security
1.700%, 10/14/04 | | | 5,000 | | | | 4,997 | | |
Total Commercial Paper
(Cost $4,997) | | | | | | | 4,997 | | |
| Options Purchased – 0.0% | | | |
| Call Option Purchased – 0.0% | | | |
U.S. Treasury 5 Year Note, November 04
Futures Call, Expires 11/30/04
Exersise Price $112.00 | | | 51,000 | | | | 4 | | |
| Put Options Purchased – 0.0% | | | |
U.S. Treasury 5 Year Note, December 04
Futures Put, Expires 12/30/04
Exercise price $106.50 | | | 10 | | | | - | | |
U.S. Treasury 5 Year Note, December 04
Futures Put, Expires 12/30/04
Exercise price $107.00 | | | 135 | | | | 4 | | |
U.S. Treasury 5 Year Note, December 04
Futures Put, Expires 12/30/04
Exercise price $109.00 | | | 100 | | | | 19 | | |
U.S. Treasury 5 Year Note, December 04
Futures Put, Expires 12/30/04
Exercise price $109.50 | | | 50 | | | | 15 | | |
U.S. Treasury 5 Year Note, December 04
Futures Put, Expires 12/30/04
Exercise price $105.00 | | | 20 | | | | - | | |
| | | | | | | | 38 | | |
Total Options Purchased
(Cost $249) | | | | | | | 42 | | |
| Affiliated Money Market Fund – 1.6% | | | |
First American Government
Obligations Fund, Cl Z (j) | | | 3,614,801 | | | | 3,615 | | |
Total Affiliated Money Market Fund
(Cost $3,615) | | | | | | | 3,615 | | |
Investments Purchased with Proceeds
from Securities Lending – 31.4% | | | |
| Commercial Paper – 10.2% | | | |
Bluegrass
1.881%, 5/18/05 | | $ | 296 | | | | 296 | | |
| 1.891%, 8/18/05 | | | 235 | | | | 235 | | |
Concord Minutemen Capital
1.650%, 10/01/04 | | | 486 | | | | 486 | | |
| 1.680%, 10/05/04 | | | 1,079 | | | | 1,079 | | |
| 1.720%, 10/06/04 | | | 798 | | | | 798 | | |
| 1.740%, 10/14/04 | | | 534 | | | | 534 | | |
Descartes Funding Trust
1.760%, 11/15/04 | | | 600 | | | | 600 | | |
Ford Credit Floor Plan
1.622%, 10/05/04 | | | 1,199 | | | | 1,199 | | |
| 1.526%, 10/06/04 | | | 840 | | | | 840 | | |
| 1.655%, 10/22/04 | | | 264 | | | | 264 | | |
The accompanying notes are an integral part of the financial statements.
FIRST AMERICAN FUNDS Annual Report 2004
60
U.S. Government Mortgage Fund (continued)
| DESCRIPTION | | PAR (000) | | VALUE (000) | |
Goldman Sachs
1.975%, 1/18/05 | | $ | 600 | | | $ | 600 | | |
Independence
1.830%, 4/15/05 | | | 741 | | | | 741 | | |
Jupiter Securities Corp
1.793%, 10/21/04 | | | 2,279 | | | | 2,279 | | |
Lakeside Funding
1.790%, 10/08/04 | | | 1,271 | | | | 1,271 | | |
Landesbank Baden
1.480%, 11/12/04 | | | 239 | | | | 239 | | |
Leaf's LLC
1.821%, 4/20/05 | | | 659 | | | | 659 | | |
Liquid Funding
1.743%, 10/13/04 | | | 839 | | | | 839 | | |
| 1.830%, 5/25/05 | | | 600 | | | | 600 | | |
MBNA Credit
1.683%, 10/12/04 | | | 583 | | | | 583 | | |
| 1.764%, 10/26/04 | | | 323 | | | | 323 | | |
Main Street Warehouse
1.742%, 10/04/04 | | | 791 | | | | 791 | | |
| 1.683%, 10/04/04 | | | 977 | | | | 977 | | |
| 1.742%, 10/08/04 | | | 599 | | | | 599 | | |
| 1.742%, 10/08/04 | | | 600 | | | | 600 | | |
Mortgage Interest Network
1.752%, 10/12/04 | | | 396 | | | | 396 | | |
| 1.763%, 10/14/04 | | | 419 | | | | 419 | | |
Netexis Banques
1.700%, 12/16/04 | | | 597 | | | | 597 | | |
Orchard Park
1.796%, 4/06/05 | | | 600 | | | | 600 | | |
| 1.766%, 7/06/05 | | | 1,238 | | | | 1,238 | | |
Park Granada LLC
1.622%, 10/01/04 | | | 1,055 | | | | 1,055 | | |
| 1.743%, 10/13/04 | | | 683 | | | | 683 | | |
Sigma Finance
1.512%, 11/29/04 | | | 299 | | | | 299 | | |
| Total Commercial Paper | | | | | | | 22,719 | | |
| Corporate Obligations – 8.4% | |
Allstate Life Global
1.780%, 10/14/05 | | | 1,199 | | | | 1,199 | | |
| 1.750%, 10/14/05 | | | 300 | | | | 300 | | |
Bayer Landbank NY
1.830%, 6/24/05 | | | 1,139 | | | | 1,139 | | |
Blue Heron Funding
1.850%, 5/18/05 | | | 336 | | | | 336 | | |
Castle Hill III
1.910%, 9/15/15 | | | 360 | | | | 360 | | |
Depfa Bank PLC
1.860%, 6/15/05 | | | 599 | | | | 599 | | |
Duke Funding VI
1.320%, 4/08/05 | | | 725 | | | | 725 | | |
General Electric Capital Corporation
1.838%, 10/07/05 | | | 600 | | | | 600 | | |
Jackson National Life
1.760%, 4/15/05 | | | 600 | | | | 600 | | |
Jefferson Pilot
1.788%, 8/17/05 | | | 600 | | | | 600 | | |
Liquid Funding
1.840%, 6/28/05 | | | 540 | | | | 540 | | |
Merrill Lynch
1.696%, 10/01/05 | | | 1,199 | | | | 1,199 | | |
Metlife Global Funding
1.800%, 10/14/05 | | | 720 | | | | 720 | | |
| 1.880%, 10/28/05 | | | 504 | | | | 504 | | |
U.S. Government Mortgage Fund (continued)
| DESCRIPTION | | PAR (000) | | VALUE (000) | |
Morgan Stanley
1.850%, 12/26/08 | | $ | 600 | | | $ | 600 | | |
Natexis Banq NY
1.920%, 7/12/05 | | | 660 | | | | 660 | | |
Northlake CDO
1.895%, 3/07/05 | | | 360 | | | | 360 | | |
Premium Asset Trust
1.848%, 12/22/04 | | | 450 | | | | 450 | | |
| 1.760%, 5/13/05 | | | 839 | | | | 839 | | |
| 1.740%, 6/01/05 | | | 1,787 | | | | 1,787 | | |
| 1.770%, 10/14/05 | | | 480 | | | | 480 | | |
REMAC
1.840%, 9/29/05 | | | 660 | | | | 660 | | |
RMAC
1.740%, 6/12/05 | | | 692 | | | | 692 | | |
SMM Trust 2004
1.833%, 9/23/05 | | | 1,115 | | | | 1,115 | | |
Societe Generale NYC
1.960%, 12/08/04 | | | 1,199 | | | | 1,199 | | |
Svenska Handl
1.170%, 10/21/04 | | | 599 | | | | 599 | | |
| Total Corporate Obligations | | | | | | | 18,862 | | |
| Other Short-Term Investments – 2.2% | | | |
ARLO III Ltd
2.000%, 9/28/05 | | | 1,799 | | | | 1,799 | | |
Commonwealth Life
2.115%, 12/31/04 (i) | | | 606 | | | | 606 | | |
General Electric Capital Assurance
1.980%, 1/19/05 | | | 240 | | | | 240 | | |
HBOS Treasury Services
1.640%, 11/01/05 | | | 659 | | | | 659 | | |
Security Life of Denver
1.900%, 12/30/04 | | | 1,559 | | | | 1,559 | | |
| Total Other Short-Term Investments | | | | | | | 4,863 | | |
| Repurchase Agreements – 10.6% | | | |
Bear Stearns
2.045%, dated 9/30/04, matures 10/01/04,
repurchase price $1,199,390
(collateralized by Various Securities:
Total Market Value $1,223,977) | | | 1,199 | | | | 1,199 | | |
Bear Stearns
2.060%, dated 9/30/04, matures 12/23/04,
repurchase price $361,526
(collateralized by Various Securities:
Total Market Value $367,121) | | | 360 | | | | 360 | | |
Citibank
1.945%, dated 9/30/04, matures 10/01/04,
repurchase price $2,398,772
(collateralized by Corporate Securities:
Total Market Value $2,540,046) | | | 2,399 | | | | 2,399 | | |
Citibank
1.925%, dated 9/30/04, matures 10/01/04,
repurchase price $599,693
(collateralized by Various Securities:
Total Market Value $613,013) | | | 600 | | | | 600 | | |
Citibank
1.925%, dated 9/30/04, matures 10/01/04,
repurchase price $599,693
(collateralized by Various Securities:
Total Market Value $611,662) | | | 600 | | | | 600 | | |
Greenwich Capital Markets
1.950%, dated 9/30/04, matures 10/01/04,
repurchase price $3,598,159
(collateralized by U.S. Government Securities:
Total Market Value $3,669,970) | | | 3,598 | | | | 3,598 | | |
FIRST AMERICAN FUNDS Annual Report 2004
61
Schedule of Investments September 30, 2004
U.S. Government Mortgage Fund (continued)
| DESCRIPTION | | PAR (000) | | VALUE (000) | |
Goldman Sachs
2.025%, dated 9/30/04, matures 10/01/04,
repurchase price $839,572
(collateralized by Various Securities:
Total Market Value $865,491) | | $ | 840 | | | $ | 840 | | |
Goldman Sachs
2.025%, dated 9/30/04, matures 10/01/04,
repurchase price $359,817
(collateralized by Various Securities:
Total Market Value $370,934) | | | 360 | | | | 360 | | |
Goldman Sachs
2.025%, dated 9/30/04, matures 10/01/04,
repurchase price $359,817
(collateralized by Various Securities:
Total Market Value $370,934) | | | 360 | | | | 360 | | |
Goldman Sachs
2.025%, dated 9/30/04, matures 10/01/04,
repurchase price $899,542
(collateralized by Corporate Securities:
Total Market Value $927,315) | | | 899 | | | | 899 | | |
Goldman Sachs
1.425%, dated 9/30/04, matures 10/18/04,
repurchase price $1,500,220
(collateralized by Corporate Securities:
Total Market Value $1,529,756) | | | 1,499 | | | | 1,499 | | |
Goldman Sachs
1.480%, dated 9/30/04, matures 10/18/04,
repurchase price $900,157
(collateralized by Various Securities:
Total Market Value $927,315) | | | 899 | | | | 899 | | |
Goldman Sachs
2.205%, dated 9/30/04, matures 3/07/05,
repurchase price $605,464
(collateralized by Corporate Securities:
Total Market Value $611,908) | | | 600 | | | | 600 | | |
Lehman Brothers
2.055%, dated 9/30/04, matures 10/01/04,
repurchase price $2,398,780
(collateralized by Collateralized
Mortgage Obligations:
Total Market Value $2,446,616) | | | 2,399 | | | | 2,399 | | |
Lehman Brothers
1.910%, dated 9/30/04, matures 10/01/04,
repurchase price $3,598,155
(collateralized by U.S. Government Securities:
Total Market Value $3,669,981) | | | 3,598 | | | | 3,598 | | |
Lehman Brothers
1.935%, dated 9/30/04, matures 10/01/04,
repurchase price $2,398,772
(collateralized by Collateralized
Mortgage Obligations:
Total Market Value $2,637,506) | | | 2,398 | | | | 2,398 | | |
Merrill Lynch
1.925%, dated 9/30/04, matures 10/01/04,
repurchase price $1,199,386
(collateralized by Corporate Securities:
Total Market Value $1,259,313) | | | 1,199 | | | | 1,199 | | |
| Total Repurchase Agreements | | | | | | | 23,807 | | |
Total Investments Purchased with
Proceeds from Securities Lending
(Cost $70,251) | | | | | | | 70,251 | | |
Total Investments – 138.6%
(Cost $308,356) | | | | | | | 309,837 | | |
| Other Assets and Liabilities, Net – (38.6)% | | | | | | | (86,203 | ) | |
| Total Net Assets – 100.0% | | | | | | $ | 223,634 | | |
U.S. Government Mortgage Fund (concluded)
(a) Variable Rate Security – The rate shown is the rate in effect as of September 30, 2004.
(b) This security or a portion of this security is out on loan at September 30, 2004. Total loaned securities had a value of $67,977,350 at September 30, 2004. See note 2 in Notes to Financial Statements.
(c) Security sold within the terms of a private placement memorandum, exempt from registration under Rule 144A of the Securities Act of 1933, as amended, and may be sold only to dealers in that program or other "qualified institutional buyers." These securities have been determined to be liquid under the guidelines established by the Funds' board of directors. As of September 30, 2004, the value of these investments was $537,199 or 0.2% of total net assets.
(d) Security purchased on a when-issued basis. On September 30, 2004, the total cost of investments purchased on a when-issued basis was $16,393,771 or 7.3% of total net assets. See note 2 in Notes to Financial Statements.
(e) Delayed Interest (Step-Bonds) – Represents securities that remain zero-coupon securities until a predetermined date at which time the stated coupon rate becomes effective and interest becomes payable at regular intervals. Interest rate shown represents current yield at September 30, 2004, based upon the estimated timing and amount of future interest and principal payments.
(f) Security has been deposited as intial margin on open futures contracts. Yield shown is effective at date of purchase. See note 2 in Notes to Financial Statements.
(g) U.S. Treasury inflation-protection securities (TIPS) are securities in which the principal amount is adjusted for inflation and the semiannual interest payments equal a fixed percentage of the inflation-adjusted principal amount.
(h) Interest only.
(i) Security has demand features which qualify it as a short-term security. The date disclosed is the next put date.
(j) Investment in affiliated security. This money market fund is advised by U.S. Bancorp Asset Management, Inc., which also serves as advisor for this Fund. See note 3 in Notes to Financial Statements.
Cl – Class
CMO – Collateralized Mortgage Obligation
FHLMC – Federal Home Loan Mortgage Corporation
FNMA – Federal National Mortgage Association
GNMA – Government National Mortgage Association
REMIC – Real Estate Mortgage Investment Conduit
TBA – To be Announced
Schedule of Open Futures Contracts
| Description | | Number of
Contracts
Purchased (Sold) | | Market Value
Covered By
Contracts | | Settlement
Month | | Unrealized
Appreciation
(Depreciation) | |
90 Day Eurodollar
June 05 Futures | | | (30 | ) | | $ | (3,646 | ) | | Jun. 05 | | $ | (34 | ) | |
90 Day Eurodollar
December 04 Futures | | | 75 | | | | 18,318 | | | Dec. 04 | | | 54 | | |
90 Day Eurodollar
December 05 Futures | | | (75 | ) | | | (18,141 | ) | | Dec. 05 | | | (158 | ) | |
U.S. Treasury 5 Year
December 04 Futures | | | (285 | ) | | | (31,564 | ) | | Dec. 04 | | | (21 | ) | |
10 Year U.S. Treasury
December 04 Futures | | | (129 | ) | | | (14,529 | ) | | Dec. 04 | | | 31 | | |
U.S. Treasury Long Bond
December 04 Futures | | | 100 | | | | 11,222 | | | Dec. 04 | | | 122 | | |
| | | $ | (6 | ) | |
The accompanying notes are an integral part of the financial statements.
FIRST AMERICAN FUNDS Annual Report 2004
62
(This page has been left blank intentionally.)
Statements of Assets and Liabilities September 30, 2004, in thousands, except for per share data
| | | Core
Bond Fund | | Corporate
Bond Fund | | High Income
Bond Fund | | Intermediate
Government
Bond Fund | |
| ASSETS: | |
| Investments in unaffiliated securities, at value*† | | $ | 2,710,940 | | | $ | 315,987 | | | $ | 380,705 | | | $ | 130,206 | | |
| Investments in affiliated money market fund, at value** | | | 46,837 | | | | 5,273 | | | | 6,544 | | | | 232 | | |
| Cash*** | | | 3,085 | | | | 145 | | | | 999 | | | | - | | |
| Receivable for dividends and interest | | | 13,938 | | | | 4,050 | | | | 6,291 | | | | 1,474 | | |
| Receivable for investment securities sold | | | 29,671 | | | | 9,029 | | | | 7,054 | | | | 4 | | |
| Receivable for capital shares sold | | | 1,432 | | | | 399 | | | | 348 | | | | 1 | | |
| Receivable for variation margin | | | 3 | | | | - | | | | - | | | | - | | |
| Prepaid expenses and other assets | | | 48 | | | | 31 | | | | 33 | | | | 21 | | |
| Total assets | | | 2,805,954 | | | | 334,914 | | | | 401,974 | | | | 131,938 | | |
| LIABILITIES: | |
| Payable upon return of securities loaned | | | 750,903 | | | | 50,689 | | | | 90,067 | | | | - | | |
| Payable for investment securities purchased | | | 90,345 | | | | 10,647 | | | | 7,014 | | | | - | | |
| Payable for capital shares redeemed | | | 8,169 | | | | 49 | | | | 155 | | | | 149 | | |
| Payable for variation margin | | | - | | | | 34 | | | | 54 | | | | 9 | | |
| Payable for advisory, co-administration, and custodian fees | | | 1,012 | | | | 165 | | | | 168 | | | | 138 | | |
| Payable for distribution and shareholder servicing fees | | | 56 | | | | 12 | | | | 30 | | | | - | | |
| Accrued expenses and other liabilities | | | 15 | | | | 2 | | | | 3 | | | | 1 | | |
| Total liabilities | | | 850,500 | | | | 61,598 | | | | 97,491 | | | | 297 | | |
| Net assets | | $ | 1,955,454 | | | $ | 273,316 | | | $ | 304,483 | | | $ | 131,641 | | |
| COMPOSITION OF NET ASSETS: | |
| Portfolio capital | | $ | 1,942,715 | | | $ | 293,199 | | | $ | 310,392 | | | $ | 125,856 | | |
| Undistributed net investment income | | | 380 | | | | - | | | | 148 | | | | 165 | | |
| Accumulated net realized gain (loss) on investments | | | 1,834 | | | | (26,162 | ) | | | (18,551 | ) | | | 4,959 | | |
| Net unrealized appreciation (depreciation) of investments | | | 11,865 | | | | 6,542 | | | | 12,449 | | | | 714 | | |
| Net unrealized appreciation (depreciation) on futures contracts | | | (1,340 | ) | | | (263 | ) | | | 45 | | | | (53 | ) | |
| Net assets | | $ | 1,955,454 | | | $ | 273,316 | | | $ | 304,483 | | | $ | 131,641 | | |
| * Investments in unaffiliated securities, at cost | | $ | 2,699,075 | | | $ | 309,445 | | | $ | 368,256 | | | $ | 129,492 | | |
| ** Investments in affiliated money market fund, at cost | | $ | 46,837 | | | $ | 5,273 | | | $ | 6,544 | | | $ | 232 | | |
| *** Includes cash related to securities loaned | | $ | 103 | | | $ | 7 | | | $ | 12 | | | $ | - | | |
| † Including securities loaned, at value | | $ | 729,885 | | | $ | 49,123 | | | $ | 87,329 | | | $ | - | | |
| Class A: | |
| Net assets | | $ | 184,805 | | | $ | 21,034 | | | $ | 43,842 | | | $ | 1,872 | | |
| Shares issued and outstanding ($0.0001 par value - 2 billion authorized) | | | 16,401 | | | | 2,052 | | | | 4,640 | | | | 212 | | |
| Net asset value and redemption price per share | | $ | 11.27 | | | $ | 10.25 | | | $ | 9.45 | | | $ | 8.82 | | |
| Maximum offering price per share (1) | | $ | 11.77 | | | $ | 10.70 | | | $ | 9.87 | | | $ | 9.02 | | |
| Class B: | |
| Net assets | | $ | 21,046 | | | $ | 5,474 | | | $ | 8,521 | | | | - | | |
| Shares issued and outstanding ($0.0001 par value - 2 billion authorized) | | | 1,881 | | | | 536 | | | | 905 | | | | - | | |
| Net asset value, offering price, and redemption price per share (2) | | $ | 11.19 | | | $ | 10.21 | | | $ | 9.41 | | | | - | | |
| Class C: | |
| Net assets | | $ | 9,132 | | | $ | 3,789 | | | $ | 17,349 | | | | - | | |
| Shares issued and outstanding ($0.0001 par value - 2 billion authorized) | | | 813 | | | | 372 | | | | 1,842 | | | | - | | |
| Net asset value per share (2) | | $ | 11.24 | | | $ | 10.20 | | | $ | 9.42 | | | | - | | |
| Class R: | |
| Net assets | | $ | 1 | | | $ | 1 | | | $ | 1 | | | | - | | |
| Shares issued and outstanding ($0.0001 par value - 2 billion authorized) | | | - | | | | - | | | | 1 | | | | - | | |
| Net asset value, offering price, and redemption price per share | | $ | 11.30 | | | $ | 10.29 | | | $ | 9.60 | | | | - | | |
| Class Y: | |
| Net assets | | $ | 1,740,470 | | | $ | 243,018 | | | $ | 234,770 | | | $ | 129,769 | | |
| Shares issued and outstanding ($0.0001 par value - 2 billion authorized) | | | 154,498 | | | | 23,722 | | | | 24,830 | | | | 14,712 | | |
| Net asset value, offering price, and redemption price per share | | $ | 11.27 | | | $ | 10.24 | | | $ | 9.46 | | | $ | 8.82 | | |
(1) The offering price is calculated by dividing the net asset value by 1 minus the maximum sales charge. For a description of front-end sales charge,
see note 1 in Notes to Financial Statements.
(2) Class B and C have a contingent deferred sales charge. For a description of this sales charge, see notes 1 and 3 in Notes to Financial Statements.
The accompanying notes are an integral part of the financial statements.
FIRST AMERICAN FUNDS Annual Report 2004
64
| | | Intermediate Term
Bond Fund | | Short Term
Bond Fund | | U.S. Government
Mortgage Fund | |
| ASSETS: | |
| Investments in unaffiliated securities, at value*† | | $ | 1,644,460 | | | $ | 1,308,354 | | | $ | 306,222 | | |
| Investments in affiliated money market fund, at value** | | | - | | | | 10,134 | | | | 3,615 | | |
| Cash*** | | | 1,724 | | | | 33 | | | | 168 | | |
| Receivable for dividends and interest | | | 10,059 | | | | 8,916 | | | | 1,091 | | |
| Receivable for investment securities sold | | | 11,645 | | | | - | | | | 9,277 | | |
| Receivable for capital shares sold | | | 1,272 | | | | 1,163 | | | | 11 | | |
| Receivable for variation margin | | | - | | | | - | | | | - | | |
| Prepaid expenses and other assets | | | 30 | | | | 28 | | | | 31 | | |
| Total assets | | | 1,669,190 | | | | 1,328,628 | | | | 320,415 | | |
| LIABILITIES: | |
| Payable upon return of securities loaned | | | 367,194 | | | | 242,295 | | | | 70,260 | | |
| Payable for investment securities purchased | | | 13,602 | | | | 11,002 | | | | 25,778 | | |
| Payable for capital shares redeemed | | | 4,768 | | | | 1,063 | | | | 556 | | |
| Payable for variation margin | | | 37 | | | | 35 | | | | 26 | | |
| Payable for advisory, co-administration, and custodian fees | | | 644 | | | | 495 | | | | 136 | | |
| Payable for distribution and shareholder servicing fees | | | 8 | | | | 16 | | | | 23 | | |
| Accrued expenses and other liabilities | | | 11 | | | | 10 | | | | 2 | | |
| Total liabilities | | | 386,264 | | | | 254,916 | | | | 96,781 | | |
| Net assets | | $ | 1,282,926 | | | $ | 1,073,712 | | | $ | 223,634 | | |
| COMPOSITION OF NET ASSETS: | |
| Portfolio capital | | $ | 1,262,436 | | | $ | 1,079,351 | | | $ | 226,585 | | |
| Undistributed net investment income | | | 380 | | | | 548 | | | | 242 | | |
| Accumulated net realized gain (loss) on investments | | | 13,608 | | | | (2,856 | ) | | | (4,668 | ) | |
| Net unrealized appreciation (depreciation) of investments | | | 7,019 | | | | (2,807 | ) | | | 1,481 | | |
| Net unrealized appreciation (depreciation) on futures contracts | | | (517 | ) | | | (524 | ) | | | (6 | ) | |
| Net assets | | $ | 1,282,926 | | | $ | 1,073,712 | | | $ | 223,634 | | |
| * Investments in unaffiliated securities, at cost | | $ | 1,637,441 | | | $ | 1,311,611 | | | $ | 304,741 | | |
| ** Investments in affiliated money market fund, at cost | | $ | - | | | $ | 10,134 | | | $ | 3,615 | | |
| *** Includes cash related to securities loaned | | $ | 50 | | | $ | 33 | | | $ | 9 | | |
| † Including securities loaned, at value | | $ | 357,282 | | | $ | 235,257 | | | $ | 67,977 | | |
| Class A: | |
| Net assets | | $ | 63,219 | | | $ | 130,531 | | | $ | 32,815 | | |
| Shares issued and outstanding ($0.0001 par value - 2 billion authorized) | | | 6,168 | | | | 12,914 | | | | 3,060 | | |
| Net asset value and redemption price per share | | $ | 10.25 | | | $ | 10.11 | | | $ | 10.72 | | |
| Maximum offering price per share (1) | | $ | 10.49 | | | $ | 10.34 | | | $ | 11.20 | | |
| Class B: | |
| Net assets | | | - | | | | - | | | $ | 9,155 | | |
| Shares issued and outstanding ($0.0001 par value - 2 billion authorized) | | | - | | | | - | | | | 853 | | |
| Net asset value, offering price, and redemption price per share (2) | | | - | | | | - | | | $ | 10.74 | | |
| Class C: | |
| Net assets | | | - | | | | - | | | $ | 10,520 | | |
| Shares issued and outstanding ($0.0001 par value - 2 billion authorized) | | | - | | | | - | | | | 985 | | |
| Net asset value per share (2) | | | - | | | | - | | | $ | 10.68 | | |
| Class R: | |
| Net assets | | | - | | | | - | | | $ | 1 | | |
| Shares issued and outstanding ($0.0001 par value - 2 billion authorized) | | | - | | | | - | | | | - | | |
| Net asset value, offering price, and redemption price per share | | | - | | | | - | | | $ | 10.72 | | |
| Class Y: | |
| Net assets | | $ | 1,219,707 | | | $ | 943,181 | | | $ | 171,143 | | |
| Shares issued and outstanding ($0.0001 par value - 2 billion authorized) | | | 119,360 | | | | 93,271 | | | | 15,956 | | |
| Net asset value, offering price, and redemption price per share | | $ | 10.22 | | | $ | 10.11 | | | $ | 10.73 | | |
FIRST AMERICAN FUNDS Annual Report 2004
65
Statements of Operations For the period ended September 30, 2004, in thousands
| | | Core
Bond Fund | | Corporate
Bond Fund | | High Income
Bond Fund | | Intermediate
Government
Bond Fund | |
| INVESTMENT INCOME: | |
| Interest from unaffiliated securities | | $ | 87,923 | | | $ | 15,256 | | | $ | 23,087 | | | $ | 6,805 | | |
| Dividends from affiliated money market fund | | | 462 | | | | 29 | | | | 54 | | | | 46 | | |
| Dividends from unaffiliated securities | | | - | | | | 35 | | | | 42 | | | | - | | |
| Securities lending | | | 510 | | | | 45 | | | | 118 | | | | - | | |
| Other income | | | - | | | | - | | | | - | | | | 9 | | |
| Total investment income | | | 88,895 | | | | 15,365 | | | | 23,301 | | | | 6,860 | | |
| EXPENSES: | |
| Investment advisory fees | | | 10,397 | | | | 1,933 | | | | 1,975 | | | | 1,000 | | |
| Co-administration fees and expenses (including transfer agent fees) | | | 5,562 | | | | 757 | | | | 783 | | | | 536 | | |
| Custodian fees | | | 208 | | | | 28 | | | | 28 | | | | 20 | | |
| Directors' fees | | | 63 | | | | 6 | | | | 7 | | | | 5 | | |
| Registration fees | | | 24 | | | | 20 | | | | 21 | | | | - | | |
| Professional fees | | | 292 | | | | 14 | | | | 16 | | | | 8 | | |
| Printing | | | 53 | | | | 7 | | | | 7 | | | | 5 | | |
| Other | | | 42 | | | | 6 | | | | 6 | | | | 6 | | |
| Distribution and shareholder servicing fees – Class A | | | 468 | | | | 43 | | | | 107 | | | | 5 | | |
| Distribution and shareholder servicing fees – Class B | | | 244 | | | | 103 | | | | 92 | | | | - | | |
| Distribution and shareholder servicing fees – Class C | | | 111 | | | | 49 | | | | 193 | | | | - | | |
| Shareholder servicing fees – Class R | | | 54 | | | | 3 | | | | 1 | | | | - | | |
| Total expenses | | | 17,518 | | | | 2,969 | | | | 3,236 | | | | 1,585 | | |
| Less: Fee waivers | | | (2,084 | ) | | | (700 | ) | | | (727 | ) | | | (373 | ) | |
| Total net expenses | | | 15,434 | | | | 2,269 | | | | 2,509 | | | | 1,212 | | |
| Investment income – net | | | 73,461 | | | | 13,096 | | | | 20,792 | | | | 5,648 | | |
REALIZED AND UNREALIZED GAINS (LOSSES) ON INVESTMENTS, FUTURES CONTRACTS,
FOREIGN CURRENCY TRANSACTIONS, AND OPTIONS WRITTEN – NET: | |
| Net realized gain on investments | | | 18,668 | | | | 6,006 | | | | 12,424 | | | | 5,815 | | |
| Net realized loss on futures contracts | | | (4,060 | ) | | | (735 | ) | | | (261 | ) | | | (293 | ) | |
| Net realized gain on options written | | | 2,256 | | | | 104 | | | | 75 | | | | 279 | | |
| Net realized gain on forward foreign currency contracts and foreign currency transactions | | | - | | | | - | | | | 62 | | | | - | | |
| Net change in unrealized appreciation or depreciation of investments | | | (35,329 | ) | | | (5,034 | ) | | | (2,836 | ) | | | (10,413 | ) | |
| Net change in unrealized appreciation or depreciation of futures contracts | | | (1,340 | ) | | | (263 | ) | | | 45 | | | | (53 | ) | |
| Net change in unrealized appreciation or depreciation of options written | | | 343 | | | | - | | | | - | | | | 51 | | |
Net change in unrealized appreciation or depreciation of forward foreign currency contracts,
foreign currency, and translation of other assets and liabilities denominated in foreign currency | | | - | | | | - | | | | (4 | ) | | | - | | |
| Net realized gain (loss) on investments | | | (19,462 | ) | | | 78 | | | | 9,505 | | | | (4,614 | ) | |
| Net increase in net assets resulting from operations | | $ | 53,999 | | | $ | 13,174 | | | $ | 30,297 | | | $ | 1,034 | | |
The accompanying notes are an integral part of the financial statements.
FIRST AMERICAN FUNDS Annual Report 2004
66
| | | Intermediate Term
Bond Fund | | Short Term
Bond Fund | | U.S. Government
Mortgage Fund | |
| INVESTMENT INCOME: | |
| Interest from unaffiliated securities | | $ | 50,388 | | | $ | 30,065 | | | $ | 11,692 | | |
| Dividends from affiliated money market fund | | | 285 | | | | 145 | | | | 71 | | |
| Dividends from unaffiliated securities | | | - | | | | - | | | | - | | |
| Securities lending | | | 431 | | | | 204 | | | | 36 | | |
| Other income | | | - | | | | - | | | | - | | |
| Total investment income | | | 51,104 | | | | 30,414 | | | | 11,799 | | |
| EXPENSES: | |
| Investment advisory fees | | | 6,855 | | | | 5,357 | | | | 1,315 | | |
| Co-administration fees and expenses (including transfer agent fees) | | | 3,679 | | | | 2,886 | | | | 718 | | |
| Custodian fees | | | 137 | | | | 107 | | | | 26 | | |
| Directors' fees | | | 32 | | | | 25 | | | | 6 | | |
| Registration fees | | | 36 | | | | 48 | | | | 23 | | |
| Professional fees | | | 67 | | | | 54 | | | | 13 | | |
| Printing | | | 35 | | | | 28 | | | | 7 | | |
| Other | | | 25 | | | | 18 | | | | 6 | | |
| Distribution and shareholder servicing fees – Class A | | | 185 | | | | 372 | | | | 72 | | |
| Distribution and shareholder servicing fees – Class B | | | - | | | | - | | | | 102 | | |
| Distribution and shareholder servicing fees – Class C | | | - | | | | - | | | | 150 | | |
| Shareholder servicing fees – Class R | | | 11 | | | | 7 | | | | 21 | | |
| Total expenses | | | 11,062 | | | | 8,902 | | | | 2,459 | | |
| Less: Fee waivers | | | (2,715 | ) | | | (2,244 | ) | | | (272 | ) | |
| Total net expenses | | | 8,347 | | | | 6,658 | | | | 2,187 | | |
| Investment income – net | | | 42,757 | | | | 23,756 | | | | 9,612 | | |
REALIZED AND UNREALIZED GAINS (LOSSES) ON INVESTMENTS, FUTURES CONTRACTS,
FOREIGN CURRENCY TRANSACTIONS, AND OPTIONS WRITTEN – NET: | |
| Net realized gain on investments | | | 18,776 | | | | 3,167 | | | | 616 | | |
| Net realized loss on futures contracts | | | (1,075 | ) | | | (1,911 | ) | | | (630 | ) | |
| Net realized gain on options written | | | 1,321 | | | | - | | | | 269 | | |
| Net realized gain on forward foreign currency contracts and foreign currency transactions | | | - | | | | - | | | | - | | |
| Net change in unrealized appreciation or depreciation of investments | | | (32,178 | ) | | | (14,832 | ) | | | (3,225 | ) | |
| Net change in unrealized appreciation or depreciation of futures contracts | | | (517 | ) | | | (524 | ) | | | (6 | ) | |
| Net change in unrealized appreciation or depreciation of options written | | | 206 | | | | - | | | | 40 | | |
Net change in unrealized appreciation or depreciation of forward foreign currency contracts,
foreign currency, and translation of other assets and liabilities denominated in foreign currency | | | - | | | | - | | | | - | | |
| Net realized gain (loss) on investments | | | (13,467 | ) | | | (14,100 | ) | | | (2,936 | ) | |
| Net increase in net assets resulting from operations | | $ | 29,290 | | | $ | 9,656 | | | $ | 6,676 | | |
FIRST AMERICAN FUNDS Annual Report 2004
67
Statements of Changes in Net Assets in thousands
| | | Core
Bond Fund | | Corporate
Bond Fund | | High Income
Bond Fund | | Intermediate
Government
Bond Fund | |
| | | 10/01/03
to
09/30/04 | | 10/01/02
to
09/30/03 | | 10/01/03
to
09/30/04 | | 10/01/02
to
09/30/03 | | 10/01/03
to
09/30/04 | | 10/01/02
to
09/30/03 | | 10/01/03
to
09/30/04 | | 10/25/02 (1)
to
09/30/03 | |
| OPERATIONS: | | | |
| Investment income (loss) – net | | $ | 73,461 | | | $ | 71,504 | | | $ | 13,096 | | | $ | 14,162 | | | $ | 20,792 | | | $ | 16,135 | | | $ | 5,648 | | | $ | 15,152 | | |
| Net realized gain (loss) on investments | | | 18,668 | | | | 55,962 | | | | 6,006 | | | | 4,772 | | | | 12,424 | | | | (249 | ) | | | 5,815 | | | | 29,420 | | |
| Net realized gain (loss) on futures contracts | | | (4,060 | ) | | | 131 | | | | (735 | ) | | | 16 | | | | (261 | ) | | | - | | | | (293 | ) | | | - | | |
| Net realized gain (loss) on options written | | | 2,256 | | | | - | | | | 104 | | | | - | | | | 75 | | | | - | | | | 279 | | | | - | | |
| Net realized gain (loss) on forward foreign currency contracts and foreign currency transactions | | | - | | | | - | | | | - | | | | - | | | | 62 | | | | (31 | ) | | | - | | | | - | | |
| Net change in unrealized appreciation or depreciation of investments | | | (35,329 | ) | | | (34,740 | ) | | | (5,034 | ) | | | 11,176 | | | | (2,836 | ) | | | 27,108 | | | | (10,413 | ) | | | 11,127 | | |
| Net change in unrealized appreciation or depreciation of futures | | | (1,340 | ) | | | - | | | | (263 | ) | | | - | | | | 45 | | | | - | | | | (53 | ) | | | - | | |
| Net change in unrealized appreciation or depreciation of options written | | | 343 | | | | (343 | ) | | | - | | | | - | | | | - | | | | - | | | | 51 | | | | (51 | ) | |
Net change in unrealized appreciation or depreciation of forward foreign currency contracts,
foreign currency and translation of other assets and liabilities denominated in foreign currency | | | - | | | | - | | | | - | | | | - | | | | (4 | ) | | | 11 | | | | - | | | | - | | |
| Net increase in net assets resulting from operations | | | 53,999 | | | | 92,514 | | | | 13,174 | | | | 30,126 | | | | 30,297 | | | | 42,974 | | | | 1,034 | | | | 55,648 | | |
| DISTRIBUTIONS TO SHAREHOLDERS FROM: | | | |
| Investment income – net: | |
| Class A | | | (6,707 | ) | | | (6,386 | ) | | | (787 | ) | | | (562 | ) | | | (3,109 | ) | | | (2,492 | ) | | | (55 | ) | | | (54 | ) | |
| Class B | | | (691 | ) | | | (761 | ) | | | (390 | ) | | | (720 | ) | | | (601 | ) | | | (434 | ) | | | - | | | | - | | |
| Class C | | | (311 | ) | | | (394 | ) | | | (186 | ) | | | (243 | ) | | | (1,260 | ) | | | (929 | ) | | | - | | | | - | | |
| Class R | | | (773 | ) | | | (1,471 | ) | | | (59 | ) | | | (171 | ) | | | (30 | ) | | | (29 | ) | | | - | | | | - | | |
| Class Y | | | (70,747 | ) | | | (68,921 | ) | | | (11,683 | ) | | | (12,466 | ) | | | (15,894 | ) | | | (11,903 | ) | | | (5,443 | ) | | | (15,108 | ) | |
| Net realized gain on investments: | |
| Class A | | | (2,811 | ) | | | - | | | | - | | | | - | | | | - | | | | - | | | | (258 | ) | | | (1 | ) | |
| Class B | | | (404 | ) | | | - | | | | - | | | | - | | | | - | | | | - | | | | - | | | | - | | |
| Class C | | | (191 | ) | | | - | | | | - | | | | - | | | | - | | | | - | | | | - | | | | - | | |
| Class R | | | (591 | ) | | | - | | | | - | | | | - | | | | - | | | | - | | | | - | | | | - | | |
| Class Y | | | (28,710 | ) | | | - | | | | - | | | | - | | | | - | | | | - | | | | (29,444 | ) | | | (534 | ) | |
| Return of capital: | |
| Class A | | | - | | | | - | | | | (1 | ) | | | - | | | | - | | | | - | | | | - | | | | - | | |
| Class B | | | - | | | | - | | | | (1 | ) | | | - | | | | - | | | | - | | | | - | | | | - | | |
| Class C (3) | | | - | | | | - | | | | - | | | | - | | | | - | | | | - | | | | - | | | | - | | |
| Class R (3) | | | - | | | | - | | | | - | | | | - | | | | - | | | | - | | | | - | | | | - | | |
| Class Y | | | - | | | | - | | | | (17 | ) | | | - | | | | - | | | | - | | | | - | | | | - | | |
| Total distributions | | | (111,936 | ) | | | (77,933 | ) | | | (13,124 | ) | | | (14,162 | ) | | | (20,894 | ) | | | (15,787 | ) | | | (35,200 | ) | | | (15,697 | ) | |
| CAPITAL SHARE TRANSACTIONS (2): | | | |
| Class A: | |
| Proceeds from sales | | | 64,537 | | | | 44,693 | | | | 12,203 | | | | 12,184 | | | | 10,439 | | | | 17,072 | | | | 799 | | | | 4,608 | | |
| Reinvestment of distributions | | | 7,247 | | | | 4,658 | | | | 624 | | | | 416 | | | | 2,352 | | | | 1,708 | | | | 221 | | | | 44 | | |
| Payments for redemptions | | | (73,658 | ) | | | (67,122 | ) | | | (5,431 | ) | | | (8,330 | ) | | | (12,507 | ) | | | (22,686 | ) | | | (1,360 | ) | | | (2,133 | ) | |
| Shares issued in connection with the acquisition of Fund net assets | | | - | | | | 86,055 | | | | - | | | | - | | | | - | | | | 23,374 | | | | - | | | | - | | |
| Increase (decrease) in net assets from Class A transactions | | | (1,874 | ) | | | 68,284 | | | | 7,396 | | | | 4,270 | | | | 284 | | | | 19,468 | | | | (340 | ) | | | 2,519 | | |
| Class B: | |
| Proceeds from sales | | | 1,965 | | | | 4,276 | | | | 687 | | | | 1,645 | | | | 2,346 | | | | 3,119 | | | | - | | | | - | | |
| Reinvestment of distributions | | | 948 | | | | 663 | | | | 278 | | | | 503 | | | | 365 | | | | 238 | | | | - | | | | - | | |
| Payments for redemptions | | | (9,240 | ) | | | (8,849 | ) | | | (8,920 | ) | | | (8,300 | ) | | | (3,441 | ) | | | (1,301 | ) | | | - | | | | - | | |
| Shares issued in connection with the acquisition of Fund net assets | | | - | | | | 15,099 | | | | - | | | | - | | | | - | | | | 1,910 | | | | - | | | | - | | |
| Increase (decrease) in net assets from Class B transactions | | | (6,327 | ) | | | 11,189 | | | | (7,955 | ) | | | (6,152 | ) | | | (730 | ) | | | 3,966 | | | | - | | | | - | | |
| Class C: | |
| Proceeds from sales | | | 1,348 | | | | 3,466 | | | | 323 | | | | 1,163 | | | | 2,087 | | | | 6,021 | | | | - | | | | - | | |
| Reinvestment of distributions | | | 491 | | | | 384 | | | | 172 | | | | 229 | | | | 1,109 | | | | 835 | | | | - | | | | - | | |
| Payments for redemptions | | | (5,799 | ) | | | (5,856 | ) | | | (2,434 | ) | | | (1,248 | ) | | | (6,143 | ) | | | (4,896 | ) | | | - | | | | - | | |
| Shares issued in connection with the acquisition of Fund net assets | | | - | | | | 5,671 | | | | - | | | | - | | | | - | | | | 9,735 | | | | - | | | | - | | |
| Increase (decrease) in net assets from Class C transactions | | | (3,960 | ) | | | 3,665 | | | | (1,939 | ) | | | 144 | | | | (2,947 | ) | | | 11,695 | | | | - | | | | - | | |
| Class R: | |
| Proceeds from sales | | | 6,356 | | | | 13,667 | | | | 90 | | | | 344 | | | | 308 | | | | 562 | | | | - | | | | - | | |
| Reinvestment of distributions | | | 1,329 | | | | 1,428 | | | | 59 | | | | 164 | | | | 20 | | | | 11 | | | | - | | | | - | | |
| Payments for redemptions | | | (46,072 | ) | | | (39,383 | ) | | | (2,840 | ) | | | (1,599 | ) | | | (1,112 | ) | | | (90 | ) | | | - | | | | - | | |
| Shares issued in connection with the acquisition of Fund net assets | | | - | | | | 30,116 | | | | - | | | | - | | | | - | | | | 243 | | | | - | | | | - | | |
| Increase (decrease) in net assets from Class R transactions | | | (38,387 | ) | | | 5,828 | | | | (2,691 | ) | | | (1,091 | ) | | | (784 | ) | | | 726 | | | | - | | | | - | | |
| Class Y: | |
| Proceeds from sales | | | 394,559 | | | | 394,555 | | | | 55,561 | | | | 94,737 | | | | 94,505 | | | | 71,560 | | | | 21,991 | | | | 516,031 | | |
| Reinvestment of distributions | | | 40,091 | | | | 25,605 | | | | 1,623 | | | | 1,423 | | | | 2,351 | | | | 2,190 | | | | 26,896 | | | | 616 | | |
| Payments for redemptions | | | (599,130 | ) | | | (652,840 | ) | | | (60,124 | ) | | | (68,932 | ) | | | (48,429 | ) | | | (86,258 | ) | | | (220,111 | ) | | | (221,746 | ) | |
| Shares issued in connection with the acquisition of Common Trust Fund net assets | | | - | | | | 13,076 | | | | - | | | | - | | | | - | | | | - | | | | - | | | | - | | |
| Shares issued in connection with the acquisition of Fund net assets | | | - | | | | 957,884 | | | | - | | | | - | | | | - | | | | 36,227 | | | | - | | | | - | | |
| Increase (decrease) in net assets from Class Y transactions | | | (164,480 | ) | | | 738,280 | | | | (2,940 | ) | | | 27,228 | | | | 48,427 | | | | 23,719 | | | | (171,224 | ) | | | 294,901 | | |
| Increase (decrease) in net assets from capital share transactions | | | (215,028 | ) | | | 827,246 | | | | (8,129 | ) | | | 24,399 | | | | 44,250 | | | | 59,574 | | | | (171,564 | ) | | | 297,420 | | |
| Total increase (decrease) in net assets | | | (272,965 | ) | | | 841,827 | | | | (8,079 | ) | | | 40,363 | | | | 53,653 | | | | 86,761 | | | | (205,730 | ) | | | 337,371 | | |
| Net assets at beginning of period | | | 2,228,419 | | | | 1,386,592 | | | | 281,395 | | | | 241,032 | | | | 250,830 | | | | 164,069 | | | | 337,371 | | | | - | | |
| Net assets at end of period | | $ | 1,955,454 | | | $ | 2,228,419 | | | $ | 273,316 | | | $ | 281,395 | | | $ | 304,483 | | | $ | 250,830 | | | $ | 131,641 | | | $ | 337,371 | | |
| Undistributed (distributions in excess of) net investment income | | $ | 380 | | | $ | 983 | | | $ | - | | | $ | 9 | | | $ | 148 | | | $ | 245 | | | $ | 165 | | | $ | - | | |
(1) Commencement of operations.
(2) See note 4 in Notes to Financial Statements for additional information.
(3) For the Corporate Bond Fund from 10/1/03 to 9/30/04, due to the presentation of the financial statements in thousands, the number rounds to zero.
The accompanying notes are an integral part of the financial statements.
FIRST AMERICAN FUNDS Annual Report 2004
68
| | | Intermediate Term
Bond Fund | | Short Term
Bond Fund | | U.S. Government
Mortgage Fund | |
| | | 10/01/03
to
09/30/04 | | 10/01/02
to
09/30/03 | | 10/01/03
to
09/30/04 | | 10/01/02
to
09/30/03 | | 10/01/03
to
09/30/04 | | 10/01/02
to
09/30/03 | |
| OPERATIONS: | |
| Investment income (loss) – net | | $ | 42,757 | | | $ | 52,650 | | | $ | 23,756 | | | $ | 24,975 | | | $ | 9,612 | | | $ | 8,379 | | |
| Net realized gain (loss) on investments | | | 18,776 | | | | 31,050 | | | | 3,167 | | | | 3,108 | | | | 616 | | | | 100 | | |
| Net realized gain (loss) on futures contracts | | | (1,075 | ) | | | 77 | | | | (1,911 | ) | | | - | | | | (630 | ) | | | 81 | | |
| Net realized gain (loss) on options written | | | 1,321 | | | | - | | | | - | | | | - | | | | 269 | | | | - | | |
| Net realized gain (loss) on forward foreign currency contracts and foreign currency transactions | | | - | | | | - | | | | - | | | | - | | | | - | | | | - | | |
| Net change in unrealized appreciation or depreciation of investments | | | (32,178 | ) | | | (12,504 | ) | | | (14,832 | ) | | | (3,652 | ) | | | (3,225 | ) | | | (1,315 | ) | |
| Net change in unrealized appreciation or depreciation of futures | | | (517 | ) | | | - | | | | (524 | ) | | | - | | | | (6 | ) | | | - | | |
| Net change in unrealized appreciation or depreciation of options written | | | 206 | | | | (206 | ) | | | - | | | | - | | | | 40 | | | | (40 | ) | |
Net change in unrealized appreciation or depreciation of forward foreign currency contracts,
foreign currency and translation of other assets and liabilities denominated in foreign currency | | | - | | | | - | | | | - | | | | - | | | | - | | | | - | | |
| Net increase in net assets resulting from operations | | | 29,290 | | | | 71,067 | | | | 9,656 | | | | 24,431 | | | | 6,676 | | | | 7,205 | | |
| DISTRIBUTIONS TO SHAREHOLDERS FROM: | |
| Investment income – net: | |
| Class A | | | (2,199 | ) | | | (2,819 | ) | | | (3,287 | ) | | | (4,952 | ) | | | (1,210 | ) | | | (901 | ) | |
| Class B | | | - | | | | - | | | | - | | | | - | | | | (354 | ) | | | (325 | ) | |
| Class C | | | - | | | | - | | | | - | | | | - | | | | (525 | ) | | | (462 | ) | |
| Class R | | | (220 | ) | | | (459 | ) | | | (108 | ) | | | (226 | ) | | | (385 | ) | | | (898 | ) | |
| Class Y | | | (40,500 | ) | | | (50,535 | ) | | | (21,857 | ) | | | (21,801 | ) | | | (9,087 | ) | | | (8,765 | ) | |
| Net realized gain on investments: | |
| Class A | | | (840 | ) | | | (1 | ) | | | - | | | | - | | | | - | | | | (183 | ) | |
| Class B | | | - | | | | - | | | | - | | | | - | | | | - | | | | (75 | ) | |
| Class C | | | - | | | | - | | | | - | | | | - | | | | - | | | | (81 | ) | |
| Class R | | | (131 | ) | | | - | | | | - | | | | - | | | | - | | | | (238 | ) | |
| Class Y | | | (13,807 | ) | | | (13 | ) | | | - | | | | - | | | | - | | | | (1,877 | ) | |
| Return of capital: | |
| Class A | | | - | | | | - | | | | - | | | | - | | | | - | | | | - | | |
| Class B | | | - | | | | - | | | | - | | | | - | | | | - | | | | - | | |
| Class C (3) | | | - | | | | - | | | | - | | | | - | | | | - | | | | - | | |
| Class R (3) | | | - | | | | - | | | | - | | | | - | | | | - | | | | - | | |
| Class Y | | | - | | | | - | | | | - | | | | - | | | | - | | | | - | | |
| Total distributions | | | (57,697 | ) | | | (53,827 | ) | | | (25,252 | ) | | | (26,979 | ) | | | (11,561 | ) | | | (13,805 | ) | |
| CAPITAL SHARE TRANSACTIONS (2): | |
| Class A: | |
| Proceeds from sales | | | 26,236 | | | | 33,969 | | | | 29,602 | | | | 88,965 | | | | 18,795 | | | | 16,589 | | |
| Reinvestment of distributions | | | 1,995 | | | | 1,921 | | | | 2,563 | | | | 3,821 | | | | 1,048 | | | | 925 | | |
| Payments for redemptions | | | (42,101 | ) | | | (23,162 | ) | | | (58,743 | ) | | | (96,111 | ) | | | (11,208 | ) | | | (9,260 | ) | |
| Shares issued in connection with the acquisition of Fund net assets | | | - | | | | - | | | | - | | | | - | | | | - | | | | - | | |
| Increase (decrease) in net assets from Class A transactions | | | (13,870 | ) | | | 12,728 | | | | (26,578 | ) | | | (3,325 | ) | | | 8,635 | | | | 8,254 | | |
| Class B: | |
| Proceeds from sales | | | - | | | | - | | | | - | | | | - | | | | 1,290 | | | | 8,485 | | |
| Reinvestment of distributions | | | - | | | | - | | | | - | | | | - | | | | 313 | | | | 368 | | |
| Payments for redemptions | | | - | | | | - | | | | - | | | | - | | | | (3,679 | ) | | | (3,444 | ) | |
| Shares issued in connection with the acquisition of Fund net assets | | | - | | | | - | | | | - | | | | - | | | | - | | | | - | | |
| Increase (decrease) in net assets from Class B transactions | | | - | | | | - | | | | - | | | | - | | | | (2,076 | ) | | | 5,409 | | |
| Class C: | |
| Proceeds from sales | | | - | | | | - | | | | - | | | | - | | | | 1,119 | | | | 16,974 | | |
| Reinvestment of distributions | | | - | | | | - | | | | - | | | | - | | | | 508 | | | | 535 | | |
| Payments for redemptions | | | - | | | | - | | | | - | | | | - | | | | (9,603 | ) | | | (4,217 | ) | |
| Shares issued in connection with the acquisition of Fund net assets | | | - | | | | - | | | | - | | | | - | | | | - | | | | - | | |
| Increase (decrease) in net assets from Class C transactions | | | - | | | | - | | | | - | | | | - | | | | (7,976 | ) | | | 13,292 | | |
| Class R: | |
| Proceeds from sales | | | 4,442 | | | | 10,407 | | | | 1,901 | | | | 7,087 | | | | 1,517 | | | | 7,399 | | |
| Reinvestment of distributions | | | 323 | | | | 396 | | | | 92 | | | | 171 | | | | 359 | | | | 1,113 | | |
| Payments for redemptions | | | (16,683 | ) | | | (4,751 | ) | | | (10,658 | ) | | | (2,214 | ) | | | (19,037 | ) | | | (11,972 | ) | |
| Shares issued in connection with the acquisition of Fund net assets | | | - | | | | - | | | | - | | | | - | | | | - | | | | - | | |
| Increase (decrease) in net assets from Class R transactions | | | (11,918 | ) | | | 6,052 | | | | (8,665 | ) | | | 5,044 | | | | (17,161 | ) | | | (3,460 | ) | |
| Class Y: | |
| Proceeds from sales | | | 386,218 | | | | 688,524 | | | | 462,268 | | | | 647,898 | | | | 43,758 | | | | 85,238 | | |
| Reinvestment of distributions | | | 23,314 | | | | 20,564 | | | | 7,197 | | | | 8,107 | | | | 1,090 | | | | 1,673 | | |
| Payments for redemptions | | | (459,895 | ) | | | (407,391 | ) | | | (345,341 | ) | | | (306,375 | ) | | | (84,443 | ) | | | (48,569 | ) | |
| Shares issued in connection with the acquisition of Common Trust Fund net assets | | | - | | | | - | | | | - | | | | - | | | | - | | | | - | | |
| Shares issued in connection with the acquisition of Fund net assets | | | - | | | | - | | | | - | | | | - | | | | - | | | | - | | |
| Increase (decrease) in net assets from Class Y transactions | | | (50,363 | ) | | | 301,697 | | | | 124,124 | | | | 349,630 | | | | (39,595 | ) | | | 38,342 | | |
| Increase (decrease) in net assets from capital share transactions | | | (76,151 | ) | | | 320,477 | | | | 88,881 | | | | 351,349 | | | | (58,173 | ) | | | 61,837 | | |
| Total increase (decrease) in net assets | | | (104,558 | ) | | | 337,717 | | | | 73,285 | | | | 348,801 | | | | (63,058 | ) | | | 55,237 | | |
| Net assets at beginning of period | | | 1,387,484 | | | | 1,049,767 | | | | 1,000,427 | | | | 651,626 | | | | 286,692 | | | | 231,455 | | |
| Net assets at end of period | | $ | 1,282,926 | | | $ | 1,387,484 | | | $ | 1,073,712 | | | $ | 1,000,427 | | | $ | 223,634 | | | $ | 286,692 | | |
| Undistributed (distributions in excess of) net investment income | | $ | 380 | | | $ | (3 | ) | | $ | 548 | | | $ | 21 | | | $ | 242 | | | $ | 285 | | |
FIRST AMERICAN FUNDS Annual Report 2004
69
Financial Highlights For a share outstanding throughout the periods ended September 30, unless otherwise indicated.
| | | Net Asset
Value
Beginning
of Period | | Net
Investment
Income | | Realized and
Unrealized
Gains or
(Losses) on
Investments | | Dividends
from Net
Investment
Income | | Distributions
from Capital
Gains | | Net Asset
Value
End of
Period | | Total
Return (4) | |
| Core Bond Fund | | | |
| Class A | | | | | | | | | | | | | | | | | | | | | | | | | | | | | |
| 2004 (1) | | $ | 11.56 | | | $ | 0.38 | | | $ | (0.09 | ) | | $ | (0.41 | ) | | $ | (0.17 | ) | | $ | 11.27 | | | | 2.60 | % | |
| 2003 | | | 11.45 | | | | 0.42 | | | | 0.15 | | | | (0.46 | ) | | | - | | | | 11.56 | | | | 5.08 | | |
| 2002 | | | 11.37 | | | | 0.55 | | | | 0.08 | | | | (0.55 | ) | | | - | | | | 11.45 | | | | 5.77 | | |
| 2001 (1) | | | 10.69 | | | | 0.61 | | | | 0.69 | | | | (0.62 | ) | | | - | | | | 11.37 | | | | 12.50 | | |
| 2000 | | | 10.65 | | | | 0.61 | | | | 0.04 | | | | (0.61 | ) | | | - | | | | 10.69 | | | | 6.33 | | |
| Class B | | | | | | | | | | | | | | | | | | | | | | | | | | | | | |
| 2004 (1) | | $ | 11.48 | | | $ | 0.29 | | | $ | (0.09 | ) | | $ | (0.32 | ) | | $ | (0.17 | ) | | $ | 11.19 | | | | 1.83 | % | |
| 2003 | | | 11.38 | | | | 0.35 | | | | 0.12 | | | | (0.37 | ) | | | - | | | | 11.48 | | | | 4.23 | | |
| 2002 | | | 11.29 | | | | 0.47 | | | | 0.09 | | | | (0.47 | ) | | | - | | | | 11.38 | | | | 5.12 | | |
| 2001 | | | 10.63 | | | | 0.52 | | | | 0.68 | | | | (0.54 | ) | | | - | | | | 11.29 | | | | 11.59 | | |
| 2000 | | | 10.58 | | | | 0.53 | | | | 0.05 | | | | (0.53 | ) | | | - | | | | 10.63 | | | | 5.70 | | |
| Class C | | | | | | | | | | | | | | | | | | | | | | | | | | | | | |
| 2004 (1) | | $ | 11.53 | | | $ | 0.29 | | | $ | (0.09 | ) | | $ | (0.32 | ) | | $ | (0.17 | ) | | $ | 11.24 | | | | 1.81 | % | |
| 2003 | | | 11.42 | | | | 0.34 | | | | 0.14 | | | | (0.37 | ) | | | - | | | | 11.53 | | | | 4.30 | | |
| 2002 | | | 11.34 | | | | 0.47 | | | | 0.08 | | | | (0.47 | ) | | | - | | | | 11.42 | | | | 5.02 | | |
| 2001 (1) | | | 10.66 | | | | 0.52 | | | | 0.70 | | | | (0.54 | ) | | | - | | | | 11.34 | | | | 11.68 | | |
| 2000 | | | 10.64 | | | | 0.52 | | | | 0.04 | | | | (0.54 | ) | | | - | | | | 10.66 | | | | 5.50 | | |
| Class R | | | | | | | | | | | | | | | | | | | | | | | | | | | | | |
| 2004 (1) (2) | | $ | 11.56 | | | $ | 0.38 | | | $ | (0.10 | ) | | $ | (0.37 | ) | | $ | (0.17 | ) | | $ | 11.30 | | | | 2.53 | % | |
| 2003 | | | 11.45 | | | | 0.42 | | | | 0.15 | | | | (0.46 | ) | | | - | | | | 11.56 | | | | 5.08 | | |
| 2002 | | | 11.37 | | | | 0.55 | | | | 0.08 | | | | (0.55 | ) | | | - | | | | 11.45 | | | | 5.77 | | |
| 2001 (1) (3) | | | 11.28 | | | | 0.01 | | | | 0.08 | | | | - | | | | - | | | | 11.37 | | | | 0.80 | | |
| Class Y | | | | | | | | | | | | | | | | | | | | | | | | | | | | | |
| 2004 (1) | | $ | 11.56 | | | $ | 0.40 | | | $ | (0.08 | ) | | $ | (0.44 | ) | | $ | (0.17 | ) | | $ | 11.27 | | | | 2.87 | % | |
| 2003 | | | 11.45 | | | | 0.45 | | | | 0.15 | | | | (0.49 | ) | | | - | | | | 11.56 | | | | 5.34 | | |
| 2002 | | | 11.37 | | | | 0.58 | | | | 0.08 | | | | (0.58 | ) | | | - | | | | 11.45 | | | | 6.04 | | |
| 2001 (1) | | | 10.69 | | | | 0.63 | | | | 0.70 | | | | (0.65 | ) | | | - | | | | 11.37 | | | | 12.76 | | |
| 2000 | | | 10.65 | | | | 0.63 | | | | 0.04 | | | | (0.63 | ) | | | - | | | | 10.69 | | | | 6.59 | | |
(1) Per share data calculated using average shares outstanding method.
(2) Prior to July 1, 2004, Class R shares were named Class S shares, which had lower fees and expenses.
(3) Class of shares has been offered since September 24, 2001. All ratios for the period have been annualized, except total return and portfolio turnover.
(4) Total returns do not reflect sales charges. Total return would have been lower had certain expenses not been waived.
The accompanying notes are an integral part of the financial statements.
FIRST AMERICAN FUNDS Annual Report 2004
70
| | | Net Assets
End of
Period (000) | | Ratio of
Expenses to
Average
Net Assets | | Ratio of Net
Investment
Income
to Average
Net Assets | | Ratio of
Expenses to
Average
Net Assets
(Excluding
Waivers) | | Ratio of Net
Investment
Income
to Average Net
Assets (Excluding
Waivers) | | Portfolio
Turnover
Rate | |
| Core Bond Fund | | | |
| Class A | | | | | | | | | | | | | | | | | | | | | | | | | | | |
| 2004 (1) | | $ | 184,805 | | | | 0.95 | % | | | 3.30 | % | | | 1.05 | % | | | 3.20 | % | | | 182 | % | | | |
| 2003 | | | 191,754 | | | | 0.95 | | | | 3.58 | | | | 1.05 | | | | 3.48 | | | | 196 | | | | |
| 2002 | | | 122,354 | | | | 0.95 | | | | 4.93 | | | | 1.03 | | | | 4.85 | | | | 115 | | | | |
| 2001 (1) | | | 119,067 | | | | 0.95 | | | | 5.50 | | | | 1.13 | | | | 5.32 | | | | 81 | | | | |
| 2000 | | | 110,490 | | | | 0.95 | | | | 5.76 | | | | 1.14 | | | | 5.57 | | | | 54 | | | | |
| Class B | | | | | | | | | | | | | | | | | | | | | | | | | | | |
| 2004 (1) | | $ | 21,046 | | | | 1.70 | % | | | 2.58 | % | | | 1.80 | % | | | 2.48 | % | | | 182 | % | | | |
| 2003 | | | 28,096 | | | | 1.70 | | | | 2.83 | | | | 1.80 | | | | 2.73 | | | | 196 | | | | |
| 2002 | | | 16,741 | | | | 1.70 | | | | 4.17 | | | | 1.78 | | | | 4.09 | | | | 115 | | | | |
| 2001 | | | 15,071 | | | | 1.70 | | | | 4.75 | | | | 1.88 | | | | 4.57 | | | | 81 | | | | |
| 2000 | | | 11,550 | | | | 1.70 | | | | 5.02 | | | | 1.89 | | | | 4.83 | | | | 54 | | | | |
| Class C | | | | | | | | | | | | | | | | | | | | | | | | | | | |
| 2004 (1) | | $ | 9,132 | | | | 1.70 | % | | | 2.58 | % | | | 1.80 | % | | | 2.48 | % | | | 182 | % | | | |
| 2003 | | | 13,424 | | | | 1.70 | | | | 2.85 | | | | 1.80 | | | | 2.75 | | | | 196 | | | | |
| 2002 | | | 9,672 | | | | 1.70 | | | | 4.18 | | | | 1.78 | | | | 4.10 | | | | 115 | | | | |
| 2001 (1) | | | 7,148 | | | | 1.70 | | | | 4.65 | | | | 1.88 | | | | 4.47 | | | | 81 | | | | |
| 2000 | | | 566 | | | | 1.70 | | | | 5.02 | | | | 1.89 | | | | 4.83 | | | | 54 | | | | |
| Class R | | | | | | | | | | | | | | | | | | | | | | | | | | | |
| 2004 (1) (2) | | $ | 1 | | | | 0.95 | % | | | 3.37 | % | | | 1.05 | % | | | 3.27 | % | | | 182 | % | | | |
| 2003 | | | 39,236 | | | | 0.95 | | | | 3.58 | | | | 1.05 | | | | 3.48 | | | | 196 | | | | |
| 2002 | | | 33,270 | | | | 0.95 | | | | 4.93 | | | | 1.03 | | | | 4.85 | | | | 115 | | | | |
| 2001 (1) (3) | | | 35,062 | | | | 1.58 | | | | 6.36 | | | | 1.76 | | | | 6.18 | | | | 81 | | | | |
| Class Y | | | | | | | | | | | | | | | | | | | | | | | | | | | |
| 2004 (1) | | $ | 1,740,470 | | | | 0.70 | % | | | 3.58 | % | | | 0.80 | % | | | 3.48 | % | | | 182 | % | | | |
| 2003 | | | 1,955,909 | | | | 0.70 | | | | 3.83 | | | | 0.80 | | | | 3.73 | | | | 196 | | | | |
| 2002 | | | 1,204,555 | | | | 0.70 | | | | 5.18 | | | | 0.78 | | | | 5.10 | | | | 115 | | | | |
| 2001 (1) | | | 1,368,812 | | | | 0.70 | | | | 5.76 | | | | 0.88 | | | | 5.58 | | | | 81 | | | | |
| 2000 | | | 1,299,941 | | | | 0.70 | | | | 6.03 | | | | 0.89 | | | | 5.84 | | | | 54 | | | | |
FIRST AMERICAN FUNDS Annual Report 2004
71
Financial Highlights For a share outstanding throughout the periods ended September 30, unless otherwise indicated.
| | | Net Asset
Value
Beginning
of Period | | Net
Investment
Income | | Realized and
Unrealized
Gains or
(Losses) on
Investments | | Dividends
from Net
Investment
Income | | Distributions
from Capital
Gains | | Distributions
from Return of
Capital | | Net Asset
Value
End of
Period | |
| Corporate Bond Fund | |
| Class A | | | | | | | | | | | | | | | | | | | | | | | | | | | | | |
| 2004 (1) | | $ | 10.23 | | | $ | 0.46 | | | $ | 0.03 | | | $ | (0.47 | ) | | $ | - | | | $ | - | (6) | | $ | 10.25 | | |
| 2003 | | | 9.60 | | | | 0.51 | | | | 0.63 | | | | (0.51 | ) | | | - | | | | - | | | | 10.23 | | |
| 2002 | | | 10.01 | | | | 0.57 | | | | (0.39 | ) | | | (0.58 | ) | | | (0.01 | ) | | | - | | | | 9.60 | | |
| 2001 (1) | | | 10.03 | | | | 0.72 | | | | 0.35 | | | | (0.73 | ) | | | (0.36 | ) | | | - | | | | 10.01 | | |
| 2000 (2) | | | 10.00 | | | | 0.48 | | | | 0.02 | | | | (0.47 | ) | | | - | | | | - | | | | 10.03 | | |
| Class B | | | | | | | | | | | | | | | | | | | | | | | | | | | | | |
| 2004 (1) | | $ | 10.20 | | | $ | 0.39 | | | $ | 0.01 | | | $ | (0.39 | ) | | $ | - | | | $ | - | (6) | | $ | 10.21 | | |
| 2003 | | | 9.57 | | | | 0.44 | | | | 0.63 | | | | (0.44 | ) | | | - | | | | - | | | | 10.20 | | |
| 2002 | | | 9.98 | | | | 0.49 | | | | (0.38 | ) | | | (0.51 | ) | | | (0.01 | ) | | | - | | | | 9.57 | | |
| 2001 (1) | | | 10.02 | | | | 0.66 | | | | 0.32 | | | | (0.66 | ) | | | (0.36 | ) | | | - | | | | 9.98 | | |
| 2000 (2) | | | 10.00 | | | | 0.45 | | | | 0.01 | | | | (0.44 | ) | | | - | | | | - | | | | 10.02 | | |
| Class C | | | | | | | | | | | | | | | | | | | | | | | | | | | | | |
| 2004 (1) | | $ | 10.18 | | | $ | 0.39 | | | $ | 0.02 | | | $ | (0.39 | ) | | $ | - | | | $ | - | (6) | | $ | 10.20 | | |
| 2003 | | | 9.55 | | | | 0.44 | | | | 0.63 | | | | (0.44 | ) | | | - | | | | - | | | | 10.18 | | |
| 2002 | | | 9.97 | | | | 0.49 | | | | (0.40 | ) | | | (0.50 | ) | | | (0.01 | ) | | | - | | | | 9.55 | | |
| 2001 (1) | | | 10.01 | | | | 0.63 | | | | 0.35 | | | | (0.66 | ) | | | (0.36 | ) | | | - | | | | 9.97 | | |
| 2000 (2) | | | 10.00 | | | | 0.45 | | | | (0.01 | ) | | | (0.43 | ) | | | - | | | | - | | | | 10.01 | | |
| Class R | | | | | | | | | | | | | | | | | | | | | | | | | | | | | |
| 2004 (1) (3) | | $ | 10.23 | | | $ | 0.48 | | | $ | - | | | $ | (0.42 | ) | | $ | - | | | $ | - | (6) | | $ | 10.29 | | |
| 2003 | | | 9.60 | | | | 0.51 | | | | 0.63 | | | | (0.51 | ) | | | - | | | | - | | | | 10.23 | | |
| 2002 | | | 10.01 | | | | 0.56 | | | | (0.38 | ) | | | (0.58 | ) | | | (0.01 | ) | | | - | | | | 9.60 | | |
| 2001 (1) (4) | | | 9.93 | | | | 0.01 | | | | 0.07 | | | | - | | | | - | | | | - | | | | 10.01 | | |
| Class Y | | | | | | | | | | | | | | | | | | | | | | | | | | | | | |
| 2004 (1) | | $ | 10.23 | | | $ | 0.49 | | | $ | 0.01 | | | $ | (0.49 | ) | | $ | - | | | $ | - | (6) | | $ | 10.24 | | |
| 2003 | | | 9.59 | | | | 0.54 | | | | 0.64 | | | | (0.54 | ) | | | - | | | | - | | | | 10.23 | | |
| 2002 | | | 10.00 | | | | 0.59 | | | | (0.39 | ) | | | (0.60 | ) | | | (0.01 | ) | | | - | | | | 9.59 | | |
| 2001 (1) | | | 10.03 | | | | 0.75 | | | | 0.33 | | | | (0.75 | ) | | | (0.36 | ) | | | - | | | | 10.00 | | |
| 2000 (2) | | | 10.00 | | | | 0.49 | | | | 0.02 | | | | (0.48 | ) | | | - | | | | - | | | | 10.03 | | |
(1) Per share data calculated using average shares outstanding method.
(2) Commenced operations on February 1, 2000. All ratios for the period have been annualized, except total return and portfolio turnover.
(3) Prior to July 1, 2004, Class R shares were named Class S shares, which had lower fees and expenses.
(4) Class of shares have been offered offered since September 24, 2001. All ratios for the period have been annualized, except total return and portfolio turnover.
(5) Total returns do not reflect sales charges. Total return would have been lower had certain expenses not been waived.
(6) Includes a tax return of capital of less than $0.01.
The accompanying notes are an integral part of the financial statements.
FIRST AMERICAN FUNDS Annual Report 2004
72
| | | Total
Return (5) | | Net Assets
End of
Period (000) | | Ratio of
Expenses to
Average
Net Assets | | Ratio of Net
Investment
Income
to Average
Net Assets | | Ratio of
Expenses to
Average
Net Assets
(Excluding
Waivers) | | Ratio of Net
Investment
Income
to Average Net
Assets (Excluding
Waivers) | | Portfolio
Turnover
Rate | |
| Corporate Bond Fund | |
| Class A | | | | | | | | | | | | | | | | | | | | | | | | | | | | | |
| 2004 (1) | | | 4.89 | % | | $ | 21,034 | | | | 1.00 | % | | | 4.54 | % | | | 1.25 | % | | | 4.29 | % | | | 132 | % | |
| 2003 | | | 12.26 | | | | 13,522 | | | | 1.00 | | | | 5.15 | | | | 1.26 | | | | 4.89 | | | | 91 | | |
| 2002 | | | 1.83 | | | | 8,663 | | | | 1.00 | | | | 5.77 | | | | 1.27 | | | | 5.50 | | | | 117 | | |
| 2001 (1) | | | 10.94 | | | | 9,820 | | | | 0.75 | | | | 6.95 | | | | 1.20 | | | | 6.50 | | | | 187 | | |
| 2000 (2) | | | 5.17 | | | | 771 | | | | 0.72 | | | | 7.52 | | | | 1.24 | | | | 7.00 | | | | 124 | | |
| Class B | | | | | | | | | | | | | | | | | | | | | | | | | | | | | |
| 2004 (1) | | | 3.97 | % | | $ | 5,474 | | | | 1.75 | % | | | 3.83 | % | | | 2.00 | % | | | 3.58 | % | | | 132 | % | |
| 2003 | | | 11.46 | | | | 13,576 | | | | 1.75 | | | | 4.46 | | | | 2.01 | | | | 4.20 | | | | 91 | | |
| 2002 | | | 1.07 | | | | 18,728 | | | | 1.75 | | | | 5.02 | | | | 2.02 | | | | 4.75 | | | | 117 | | |
| 2001 (1) | | | 10.06 | | | | 22,608 | | | | 1.65 | | | | 6.45 | | | | 2.11 | | | | 5.99 | | | | 187 | | |
| 2000 (2) | | | 4.70 | | | | 103 | | | | 1.48 | | | | 6.86 | | | | 1.99 | | | | 6.35 | | | | 124 | | |
| Class C | | | | | | | | | | | | | | | | | | | | | | | | | | | | | |
| 2004 (1) | | | 4.11 | % | | $ | 3,789 | | | | 1.75 | % | | | 3.81 | % | | | 2.00 | % | | | 3.56 | % | | | 132 | % | |
| 2003 | | | 11.50 | | | | 5,752 | | | | 1.75 | | | | 4.43 | | | | 2.01 | | | | 4.17 | | | | 91 | | |
| 2002 | | | 0.98 | | | | 5,283 | | | | 1.75 | | | | 5.02 | | | | 2.02 | | | | 4.75 | | | | 117 | | |
| 2001 (1) | | | 10.10 | | | | 5,209 | | | | 1.50 | | | | 6.07 | | | | 1.94 | | | | 5.63 | | | | 187 | | |
| 2000 (2) | | | 4.54 | | | | 143 | | | | 1.48 | | | | 6.79 | | | | 1.99 | | | | 6.28 | | | | 124 | | |
| Class R | | | | | | | | | | | | | | | | | | | | | | | | | | | | | |
| 2004 (1) (3) | | | 4.83 | % | | $ | 1 | | | | 1.00 | % | | | 4.64 | % | | | 1.25 | % | | | 4.39 | % | | | 132 | % | |
| 2003 | | | 12.25 | | | | 2,668 | | | | 1.00 | | | | 5.21 | | | | 1.26 | | | | 4.95 | | | | 91 | | |
| 2002 | | | 1.84 | | | | 3,557 | | | | 1.00 | | | | 5.77 | | | | 1.27 | | | | 5.50 | | | | 117 | | |
| 2001 (1) (4) | | | 0.81 | | | | 3,237 | | | | 0.89 | | | | 7.60 | | | | 1.36 | | | | 7.13 | | | | 187 | | |
| Class Y | | | | | | | | | | | | | | | | | | | | | | | | | | | | | |
| 2004 (1) | | | 5.05 | % | | $ | 243,018 | | | | 0.75 | % | | | 4.80 | % | | | 1.00 | % | | | 4.55 | % | | | 132 | % | |
| 2003 | | | 12.65 | | | | 245,877 | | | | 0.75 | | | | 5.42 | | | | 1.01 | | | | 5.16 | | | | 91 | | |
| 2002 | | | 2.08 | | | | 204,801 | | | | 0.75 | | | | 6.03 | | | | 1.02 | | | | 5.76 | | | | 117 | | |
| 2001 (1) | | | 11.09 | | | | 185,392 | | | | 0.51 | | | | 7.26 | | | | 0.95 | | | | 6.82 | | | | 187 | | |
| 2000 (2) | | | 5.32 | | | | 89,990 | | | | 0.48 | | | | 7.75 | | | | 0.99 | | | | 7.24 | | | | 124 | | |
FIRST AMERICAN FUNDS Annual Report 2004
73
Financial Highlights For a share outstanding throughout the periods ended September 30, unless otherwise indicated.
| | | Net Asset
Value
Beginning
of Period | | Net
Investment
Income | | Realized and
Unrealized
Gains
(Losses) on
Investments | | Dividends
from Net
Investment
Income | | Distributions
from Net
Realized Gains | | Return of
Capital | | Net Asset
Value
End of
Period | |
| High Income Bond Fund (1) | | | |
| Class A | | | | | | | | | | | | | | | | | | | | | | | | | | | | | |
| 2004 (2) | | $ | 9.13 | | | $ | 0.68 | | | $ | 0.32 | | | $ | (0.68 | ) | | $ | - | | | $ | - | | | $ | 9.45 | | |
| 2003 (2) | | | 7.90 | | | | 0.68 | | | | 1.24 | | | | (0.69 | ) | | | - | | | | - | | | | 9.13 | | |
| 2002 | | | 9.23 | | | | 0.65 | | | | (1.21 | ) | | | (0.70 | ) | | | - | | | | (0.07 | ) | | | 7.90 | | |
| 2001 (2) (3) | | | 9.93 | | | | 0.02 | | | | (0.68 | ) | | | (0.04 | ) | | | - | | | | - | | | | 9.23 | | |
| Class B | | | | | | | | | | | | | | | | | | | | | | | | | | | | | |
| 2004 (2) | | $ | 9.09 | | | $ | 0.61 | | | $ | 0.32 | | | $ | (0.61 | ) | | $ | - | | | $ | - | | | $ | 9.41 | | |
| 2003 (2) | | | 7.87 | | | | 0.61 | | | | 1.24 | | | | (0.63 | ) | | | - | | | | - | | | | 9.09 | | |
| 2002 | | | 9.19 | | | | 0.69 | | | | (1.31 | ) | | | (0.63 | ) | | | - | | | | (0.07 | ) | | | 7.87 | | |
| 2001 (2) (3) | | | 9.88 | | | | 0.02 | | | | (0.67 | ) | | | (0.04 | ) | | | - | | | | - | | | | 9.19 | | |
| Class C | | | | | | | | | | | | | | | | | | | | | | | | | | | | | |
| 2004 (2) | | $ | 9.10 | | | $ | 0.61 | | | $ | 0.32 | | | $ | (0.61 | ) | | $ | - | | | $ | - | | | $ | 9.42 | | |
| 2003 (2) | | | 7.89 | | | | 0.61 | | | | 1.23 | | | | (0.63 | ) | | | - | | | | - | | | | 9.10 | | |
| 2002 | | | 9.21 | | | | 0.64 | | | | (1.27 | ) | | | (0.62 | ) | | | - | | | | (0.07 | ) | | | 7.89 | | |
| 2001 (2) (3) | | | 9.90 | | | | 0.05 | | | | (0.70 | ) | | | (0.04 | ) | | | - | | | | - | | | | 9.21 | | |
| Class R | | | | | | | | | | | | | | | | | | | | | | | | | | | | | |
| 2004 (2) (4) | | $ | 9.21 | | | $ | 0.69 | | | $ | 0.32 | | | $ | (0.62 | ) | | $ | - | | | $ | - | | | $ | 9.60 | | |
| 2003 (2) | | | 7.98 | | | | 0.71 | | | | 1.22 | | | | (0.70 | ) | | | - | | | | - | | | | 9.21 | | |
| 2002 | | | 9.32 | | | | 0.73 | | | | (1.30 | ) | | | (0.70 | ) | | | - | | | | (0.07 | ) | | | 7.98 | | |
| 2001 (2) (5) | | | 9.50 | | | | 0.01 | | | | (0.19 | ) | | | - | | | | - | | | | - | | | | 9.32 | | |
| Class Y | | | | | | | | | | | | | | | | | | | | | | | | | | | | | |
| 2004 (2) | | $ | 9.13 | | | $ | 0.70 | | | $ | 0.34 | | | $ | (0.71 | ) | | $ | - | | | $ | - | | | $ | 9.46 | | |
| 2003 (2) | | | 7.92 | | | | 0.69 | | | | 1.24 | | | | (0.72 | ) | | | - | | | | - | | | | 9.13 | | |
| 2002 | | | 9.24 | | | | 0.74 | | | | (1.28 | ) | | | (0.71 | ) | | | - | | | | (0.07 | ) | | | 7.92 | | |
| 2001 (2) (3) | | | 9.92 | | | | 0.05 | | | | (0.69 | ) | | | (0.04 | ) | | | - | | | | - | | | | 9.24 | | |
| Intermediate Government Bond Fund | | | |
| Class A | | | | | | | | | | | | | | | | | | | | | | | | | | | | | |
| 2004 | | $ | 10.01 | | | $ | 0.24 | | | $ | (0.16 | ) | | $ | (0.24 | ) | | $ | (1.03 | ) | | $ | - | | | $ | 8.82 | | |
| 2003 (6) | | | 10.00 | | | | 0.32 | | | | 0.02 | | | | (0.33 | ) | | | - | | | | - | | | | 10.01 | | |
| Class Y | | | | | | | | | | | | | | | | | | | | | | | | | | | | | |
| 2004 | | $ | 10.01 | | | $ | 0.26 | | | $ | (0.17 | ) | | $ | (0.25 | ) | | $ | (1.03 | ) | | $ | - | | | $ | 8.82 | | |
| 2003 (6) | | | 10.00 | | | | 0.34 | | | | 0.01 | | | | (0.34 | ) | | | - | | | | - | | | | 10.01 | | |
| Intermediate Term Bond Fund (7) | | | |
| Class A | | | | | | | | | | | | | | | | | | | | | | | | | | | | | |
| 2004 (2) | | $ | 10.46 | | | $ | 0.31 | | | $ | (0.10 | ) | | $ | (0.31 | ) | | $ | (0.11 | ) | | $ | - | | | $ | 10.25 | | |
| 2003 | | | 10.35 | | | | 0.39 | | | | 0.12 | | | | (0.40 | ) | | | - | | | | - | | | | 10.46 | | |
| 2002 | | | 10.26 | | | | 0.50 | | | | 0.10 | | | | (0.50 | ) | | | - | | | | (0.01 | ) | | | 10.35 | | |
| 2001 (2) (8) | | | 9.70 | | | | 0.54 | | | | 0.55 | | | | (0.51 | ) | | | (0.02 | ) | | | - | | | | 10.26 | | |
| 2000 (9) | | | 9.68 | | | | 0.58 | | | | 0.02 | | | | (0.58 | ) | | | - | | | | - | | | | 9.70 | | |
| 1999 (9) | | | 10.07 | | | | 0.54 | | | | (0.38 | ) | | | (0.54 | ) | | | (0.01 | ) | | | - | | | | 9.68 | | |
| Class Y | | | | | | | | | | | | | | | | | | | | | | | | | | | | | |
| 2004 (2) | | $ | 10.43 | | | $ | 0.33 | | | $ | (0.11 | ) | | $ | (0.32 | ) | | $ | (0.11 | ) | | $ | - | | | $ | 10.22 | | |
| 2003 | | | 10.32 | | | | 0.41 | | | | 0.12 | | | | (0.42 | ) | | | - | | | | - | | | | 10.43 | | |
| 2002 | | | 10.23 | | | | 0.52 | | | | 0.10 | | | | (0.52 | ) | | | - | | | | (0.01 | ) | | | 10.32 | | |
| 2001 (2) (8) | | | 9.68 | | | | 0.56 | | | | 0.54 | | | | (0.53 | ) | | | (0.02 | ) | | | - | | | | 10.23 | | |
| 2000 (9) | | | 9.66 | | | | 0.60 | | | | 0.02 | | | | (0.60 | ) | | | - | | | | - | | | | 9.68 | | |
| 1999 (9) | | | 10.04 | | | | 0.56 | | | | (0.37 | ) | | | (0.56 | ) | | | (0.01 | ) | | | - | | | | 9.66 | | |
(1) The financial highlights for the High Income Bond Fund as set forth herein include the historical financial highlights of the First American High Yield Bond Fund Class A shares, Class B shares, Class C shares, Class S shares, and Class Y shares. The assets of the First American High Yield Bond Fund were acquired by High Income Bond Fund on March 14, 2003. In connection with such acquisition, Class A shares, Class B shares, Class C shares, Class S shares, and Class Y shares of the First American High Yield Bond Fund were exchanged for Class A shares, Class B shares, Class C shares, Class S shares, and Class Y shares of High Income Bond Fund respectively. Historical per share amounts have been adjusted to reflect the conversion ratios util ized for the merger of the High Income Bond Fund and the First American High Yield Bond Fund.
(2) Per share data calculated using average shares outstanding method.
(3) Commenced operations on August 30, 2001. All ratios for the period have been annualized, except total return and portfolio turnover.
(4) Prior to July 1, 2004, Class R shares were named Class S shares, which had lower fees and expenses.
(5) Class of shares has been offered since September 24, 2001. All ratios for the period have been annualized, except total return and portfolio turnover.
(6) Commenced operations on October 25, 2002. All ratios for the period have been annualized, except total return and portfolio turnover.
The accompanying notes are an integral part of the financial statements.
FIRST AMERICAN FUNDS Annual Report 2004
74
| | | Total
Return (10) | | Net Assets
End of
Period (000) | | Ratio of
Expenses to
Average
Net Assets | | Ratio of Net
Investment
Income
to Average
Net Assets | | Ratio of
Expenses to
Average
Net Assets
(Excluding
Waivers) | | Ratio of Net
Investment
Income
to Average Net
Assets (Excluding
Waivers) | | Portfolio
Turnover
Rate | |
| High Income Bond Fund (1) | | | |
| Class A | | | | | | | | | | | | | | | | | | | | | | | | | | | | | |
| 2004 (2) | | | 11.30 | % | | $ | 43,842 | | | | 1.00 | % | | | 7.25 | % | | | 1.26 | % | | | 6.99 | % | | | 80 | % | |
| 2003 (2) | | | 25.30 | | | | 42,013 | | | | 1.06 | | | | 7.72 | | | | 1.24 | | | | 7.54 | | | | 122 | | |
| 2002 | | | (6.66 | ) | | | 23,900 | | | | 1.10 | | | | 7.64 | | | | 1.47 | | | | 7.27 | | | | 86 | | |
| 2001 (2) (3) | | | (6.55 | ) | | | 161 | | | | 1.10 | | | | 6.53 | | | | 1.33 | | | | 6.30 | | | | 53 | | |
| Class B | | | | | | | | | | | | | | | | | | | | | | | | | | | | | |
| 2004 (2) | | | 10.52 | % | | $ | 8,521 | | | | 1.75 | % | | | 6.50 | % | | | 2.01 | % | | | 6.24 | % | | | 80 | % | |
| 2003 (2) | | | 24.33 | | | | 8,939 | | | | 1.81 | | | | 7.00 | | | | 1.99 | | | | 6.82 | | | | 122 | | |
| 2002 | | | (7.26 | ) | | | 774 | | | | 1.80 | | | | 7.49 | | | | 2.28 | | | | 7.01 | | | | 86 | | |
| 2001 (2) (3) | | | (6.47 | ) | | | 40 | | | | 1.77 | | | | 6.02 | | | | 2.02 | | | | 5.77 | | | | 53 | | |
| Class C | | | | | | | | | | | | | | | | | | | | | | | | | | | | | |
| 2004 (2) | | | 10.51 | % | | $ | 17,349 | | | | 1.75 | % | | | 6.50 | % | | | 2.01 | % | | | 6.24 | % | | | 80 | % | |
| 2003 (2) | | | 24.14 | | | | 19,685 | | | | 1.80 | | | | 7.01 | | | | 1.98 | | | | 6.83 | | | | 122 | | |
| 2002 | | | (7.34 | ) | | | 7,213 | | | | 1.83 | | | | 7.08 | | | | 2.26 | | | | 6.65 | | | | 86 | | |
| 2001 (2) (3) | | | (6.50 | ) | | | 3,749 | | | | 1.94 | | | | 5.53 | | | | 2.21 | | | | 5.26 | | | | 53 | | |
| Class R | | | | | | | | | | | | | | | | | | | | | | | | | | | | | |
| 2004 (2) (4) | | | 11.29 | % | | $ | 1 | | | | 1.00 | % | | | 7.33 | % | | | 1.26 | % | | | 7.07 | % | | | 80 | % | |
| 2003 (2) | | | 25.11 | | | | 777 | | | | 1.00 | | | | 7.86 | | | | 1.18 | | | | 7.68 | | | | 122 | | |
| 2002 | | | (6.66 | ) | | | 87 | | | | 1.01 | | | | 8.46 | | | | 1.57 | | | | 7.90 | | | | 86 | | |
| 2001 (2) (5) | | | (1.90 | ) | | | - | | | | - | | | | 1.23 | | | | - | | | | 1.23 | | | | 53 | | |
| Class Y | | | | | | | | | | | | | | | | | | | | | | | | | | | | | |
| 2004 (2) | | | 11.69 | % | | $ | 234,770 | | | | 0.75 | % | | | 7.49 | % | | | 1.01 | % | | | 7.23 | % | | | 80 | % | |
| 2003 (2) | | | 25.29 | | | | 179,416 | | | | 0.83 | | | | 7.97 | | | | 1.01 | | | | 7.79 | | | | 122 | | |
| 2002 | | | (6.33 | ) | | | 21,157 | | | | 0.82 | | | | 8.19 | | | | 1.27 | | | | 7.74 | | | | 86 | | |
| 2001 (2) (3) | | | (6.47 | ) | | | 8,308 | | | | 0.96 | | | | 6.06 | | | | 1.23 | | | | 5.79 | | | | 53 | | |
| Intermediate Government Bond Fund | | | |
| Class A | | | | | | | | | | | | | | | | | | | | | | | | | | | | | |
| 2004 | | | 0.98 | % | | $ | 1,872 | | | | 0.75 | % | | | 2.69 | % | | | 1.03 | % | | | 2.41 | % | | | 53 | % | |
| 2003 (6) | | | 3.53 | | | | 2,502 | | | | 0.75 | | | | 3.22 | | | | 1.05 | | | | 2.92 | | | | 74 | | |
| Class Y | | | | | | | | | | | | | | | | | | | | | | | | | | | | | |
| 2004 | | | 1.14 | % | | $ | 129,769 | | | | 0.60 | % | | | 2.84 | % | | | 0.78 | % | | | 2.66 | % | | | 53 | % | |
| 2003 (6) | | | 3.64 | | | | 334,869 | | | | 0.60 | | | | 3.68 | | | | 0.80 | | | | 3.48 | | | | 74 | | |
| Intermediate Term Bond Fund (7) | | | |
| Class A | | | | | | | | | | | | | | | | | | | | | | | | | | | | | |
| 2004 (2) | | | 2.06 | % | | $ | 63,219 | | | | 0.75 | % | | | 2.97 | % | | | 1.04 | % | | | 2.68 | % | | | 169 | % | |
| 2003 | | | 5.09 | | | | 78,682 | | | | 0.75 | | | | 3.89 | | | | 1.05 | | | | 3.59 | | | | 133 | | |
| 2002 | | | 6.11 | | | | 65,291 | | | | 0.75 | | | | 4.96 | | | | 1.02 | | | | 4.69 | | | | 40 | | |
| 2001 (2) (8) | | | 11.46 | | | | 61,225 | | | | 0.85 | | | | 5.62 | | | | 0.96 | | | | 5.51 | | | | 30 | | |
| 2000 (9) | | | 6.41 | | | | 27,431 | | | | 0.82 | | | | 6.08 | | | | 0.95 | | | | 5.95 | | | | 18 | | |
| 1999 (9) | | | 1.66 | | | | 33,779 | | | | 0.81 | | | | 5.47 | | | | 0.95 | | | | 5.33 | | | | 64 | | |
| Class Y | | | | | | | | | | | | | | | | | | | | | | | | | | | | | |
| 2004 (2) | | | 2.22 | % | | $ | 1,219,707 | | | | 0.60 | % | | | 3.12 | % | | | 0.79 | % | | | 2.93 | % | | | 169 | % | |
| 2003 | | | 5.25 | | | | 1,296,529 | | | | 0.60 | | | | 4.05 | | | | 0.80 | | | | 3.85 | | | | 133 | | |
| 2002 | | | 6.29 | | | | 978,406 | | | | 0.60 | | | | 5.11 | | | | 0.77 | | | | 4.94 | | | | 40 | | |
| 2001 (2) (8) | | | 11.61 | | | | 878,695 | | | | 0.60 | | | | 5.83 | | | | 0.70 | | | | 5.73 | | | | 30 | | |
| 2000 (9) | | | 6.67 | | | | 408,708 | | | | 0.57 | | | | 6.33 | | | | 0.70 | | | | 6.20 | | | | 18 | | |
| 1999 (9) | | | 1.91 | | | | 284,047 | | | | 0.56 | | | | 5.71 | | | | 0.70 | | | | 5.57 | | | | 64 | | |
(7) The financial highlights for the Intermediate Term Bond Fund as set forth herein include the historical financial highlights of the Firstar Intermediate Bond Fund Class A shares, Class Y shares, and Class I shares. The assets of the Firstar Intermediate Bond Fund were acquired by Intermediate Term Bond Fund on September 24, 2001. In connection with such acquisition, Class A shares, Class Y shares, and Class I shares of the Firstar Intermediate Bond Fund were exchanged for Class A shares, Class S shares, and Class Y shares of Intermediate Term Bond Fund, respectively. Historical per-share amounts have been adjusted to reflect the conversion ratios utilized for the merger of the Intermediate Term Bond Fund and the Firstar Intermediate Bond Fund.
(8) For the period November 1, 2000 to September 30, 2001. Effective in 2001, the Fund's fiscal year end was changed from October 31 to September 30. All ratios for the period have been annualized, except total return and portfolio turnover.
(9) For the fiscal year ended October 31.
(10) Total return does not reflect sales charges. Total return would have been lower had certain expenses not been waived.
FIRST AMERICAN FUNDS Annual Report 2004
75
Financial Highlights For a share outstanding throughout the periods ended September 30, unless otherwise indicated.
| | | Net Asset
Value
Beginning
of Period | | Net
Investment
Income | | Realized and
Unrealized
Gains
(Losses) on
Investments | | Dividends
from Net
Investment
Income | | Distributions
from Net
Realized Gains | | Return of
Capital | | Net Asset
Value
End of
Period | |
| Short Term Bond Fund | | | |
| Class A | | | | | | | | | | | | | | | | | | | | | | | | | | | | | |
| 2004 (1) | | $ | 10.26 | | | $ | 0.23 | | | $ | (0.15 | ) | | $ | (0.23 | ) | | $ | - | | | $ | - | | | $ | 10.11 | | |
| 2003 | | | 10.29 | | | | 0.28 | | | | (0.01 | ) | | | (0.30 | ) | | | - | | | | - | | | | 10.26 | | |
| 2002 | | | 10.27 | | | | 0.42 | | | | 0.04 | | | | (0.43 | ) | | | - | | | | (0.01 | ) | | | 10.29 | | |
| 2001 (1) | | | 9.91 | | | | 0.61 | | | | 0.40 | | | | (0.65 | ) | | | - | | | | - | | | | 10.27 | | |
| 2000 | | | 9.86 | | | | 0.58 | | | | 0.02 | | | | (0.55 | ) | | | - | | | | - | | | | 9.91 | | |
| Class Y | | | | | | | | | | | | | | | | | | | | | | | | | | | | | |
| 2004 (1) | | $ | 10.26 | | | $ | 0.25 | | | $ | (0.16 | ) | | $ | (0.24 | ) | | $ | - | | | $ | - | | | $ | 10.11 | | |
| 2003 | | | 10.30 | | | | 0.30 | | | | (0.02 | ) | | | (0.32 | ) | | | - | | | | - | | | | 10.26 | | |
| 2002 | | | 10.27 | | | | 0.43 | | | | 0.05 | | | | (0.44 | ) | | | - | | | | (0.01 | ) | | | 10.30 | | |
| 2001 (1) | | | 9.91 | | | | 0.63 | | | | 0.39 | | | | (0.66 | ) | | | - | | | | - | | | | 10.27 | | |
| 2000 | | | 9.87 | | | | 0.59 | | | | 0.01 | | | | (0.56 | ) | | | - | | | | - | | | | 9.91 | | |
| U.S. Government Mortgage Fund | | | |
| Class A (2) | | | | | | | | | | | | | | | | | | | | | | | | | | | | | |
| 2004 (1) | | $ | 10.89 | | | $ | 0.38 | | | $ | (0.09 | ) | | $ | (0.46 | ) | | $ | - | | | $ | - | | | $ | 10.72 | | |
| 2003 | | | 11.16 | | | | 0.35 | | | | (0.05 | ) | | | (0.45 | ) | | | (0.12 | ) | | | - | | | | 10.89 | | |
| 2002 | | | 11.01 | | | | 0.50 | | | | 0.20 | | | | (0.55 | ) | | | - | | | | - | | | | 11.16 | | |
| 2001 (1) (3) | | | 10.44 | | | | 0.51 | | | | 0.60 | | | | (0.54 | ) | | | - | | | | - | | | | 11.01 | | |
| 2000 (4) | | | 10.34 | | | | 0.53 | | | | 0.08 | | | | (0.51 | ) | | | - | | | | - | | | | 10.44 | | |
| 1999 (5) | | | 10.74 | | | | 0.54 | | | | (0.40 | ) | | | (0.54 | ) | | | - | | | | - | | | | 10.34 | | |
| Class B (2) | | | | | | | | | | | | | | | | | | | | | | | | | | | | | |
| 2004 (1) | | $ | 10.90 | | | $ | 0.30 | | | $ | (0.08 | ) | | $ | (0.38 | ) | | $ | - | | | $ | - | | | $ | 10.74 | | |
| 2003 | | | 11.18 | | | | 0.28 | | | | (0.06 | ) | | | (0.38 | ) | | | (0.12 | ) | | | - | | | | 10.90 | | |
| 2002 | | | 11.03 | | | | 0.42 | | | | 0.20 | | | | (0.47 | ) | | | - | | | | - | | | | 11.18 | | |
| 2001 (1) (3) | | | 10.45 | | | | 0.43 | | | | 0.62 | | | | (0.47 | ) | | | - | | | | - | | | | 11.03 | | |
| 2000 (4) | | | 10.36 | | | | 0.45 | | | | 0.08 | | | | (0.44 | ) | | | - | | | | - | | | | 10.45 | | |
| 1999 (5) | | | 10.74 | | | | 0.47 | | | | (0.38 | ) | | | (0.47 | ) | | | - | | | | - | | | | 10.36 | | |
| Class C | | | | | | | | | | | | | | | | | | | | | | | | | | | | | |
| 2004 (1) | | $ | 10.84 | | | $ | 0.30 | | | $ | (0.09 | ) | | $ | (0.37 | ) | | $ | - | | | $ | - | | | $ | 10.68 | | |
| 2003 | | | 11.13 | | | | 0.29 | | | | (0.08 | ) | | | (0.38 | ) | | | (0.12 | ) | | | - | | | | 10.84 | | |
| 2002 | | | 11.00 | | | | 0.46 | | | | 0.15 | | | | (0.48 | ) | | | - | | | | - | | | | 11.13 | | |
| 2001 (1) (6) | | | 10.98 | | | | 0.05 | | | | (0.03 | ) | | | - | | | | - | | | | - | | | | 11.00 | | |
| Class R (2) | | | | | | | | | | | | | | | | | | | | | | | | | | | | | |
| 2004 (1) (7) | | $ | 10.85 | | | $ | 0.39 | | | $ | (0.10 | ) | | $ | (0.42 | ) | | $ | - | | | $ | - | | | $ | 10.72 | | |
| 2003 | | | 11.12 | | | | 0.30 | | | | - | | | | (0.45 | ) | | | (0.12 | ) | | | - | | | | 10.85 | | |
| 2002 | | | 10.97 | | | | 0.49 | | | | 0.20 | | | | (0.54 | ) | | | - | | | | - | | | | 11.12 | | |
| 2001 (1) (3) | | | 10.40 | | | | 0.62 | | | | 0.49 | | | | (0.54 | ) | | | - | | | | - | | | | 10.97 | | |
| 2000 (4) | | | 10.31 | | | | 0.53 | | | | 0.07 | | | | (0.51 | ) | | | - | | | | - | | | | 10.40 | | |
| 1999 (5) | | | 10.70 | | | | 0.53 | | | | (0.38 | ) | | | (0.54 | ) | | | - | | | | - | | | | 10.31 | | |
| Class Y (2) | | | | | | | | | | | | | | | | | | | | | | | | | | | | | |
| 2004 (1) | | $ | 10.89 | | | $ | 0.41 | | | $ | (0.08 | ) | | $ | (0.49 | ) | | $ | - | | | $ | - | | | $ | 10.73 | | |
| 2003 | | | 11.16 | | | | 0.37 | | | | (0.04 | ) | | | (0.48 | ) | | | (0.12 | ) | | | - | | | | 10.89 | | |
| 2002 | | | 11.01 | | | | 0.53 | | | | 0.19 | | | | (0.57 | ) | | | - | | | | - | | | | 11.16 | | |
| 2001 (1) (3) | | | 10.44 | | | | 0.53 | | | | 0.60 | | | | (0.56 | ) | | | - | | | | - | | | | 11.01 | | |
| 2000 (4) | | | 10.34 | | | | 0.55 | | | | 0.08 | | | | (0.53 | ) | | | - | | | | - | | | | 10.44 | | |
| 1999 (5) | | | 10.74 | | | | 0.58 | | | | (0.41 | ) | | | (0.57 | ) | | | - | | | | - | | | | 10.34 | | |
(1) Per share data calculated using average shares outstanding method.
(2) The financial highlights for the U.S. Government Mortgage Fund as set forth herein include the historical financial highlights of the Firstar U. S. Government Securities Fund Class A shares, Class B shares, Class Y shares, and Class I shares. The assets of the Firstar U.S. Government Securities Fund were acquired by the U. S. Government Mortgage Fund on September 24, 2001. In connection with such acquisition, Class A shares, Class B shares, Class Y shares, and Class I shares of the Firstar U.S. Government Securities Fund were exchanged for Class A shares, Class B shares, Class S shares, and Class Y shares of U.S. Government Mortgage Fund, respectively.
(3) For the period November 1, 2000 to September 30, 2001. Effective in 2001, the Fund's fiscal year end was changed from October 31 to September 30. All ratios for the period have been annualized, except total return and portofolio turnover.
(4) For the period December 1, 1999 to October 31, 2000. The Fund's fiscal year end was changed from November 30 to October 31. All ratios for the period have been annualized, except total return and portfolio turnover.
(5) For the fiscal year ended November 30.
(6) Class of shares has been offered since September 24, 2001. All ratios for the period have been annualized, except total return and portfolio turnover.
(7) Prior to July 1, 2004, Class R shares were named Class S shares, which had lower fees and expenses.
(8) Total return does not reflect sales charges. Total return would have been lower had certain expenses not been waived.
The accompanying notes are an integral part of the financial statements.
FIRST AMERICAN FUNDS Annual Report 2004
76
| | | Total
Return (8) | | Net Assets
End of
Period (000) | | Ratio of
Expenses to
Average
Net Assets | | Ratio of Net
Investment
Income
to Average
Net Assets | | Ratio of
Expenses to
Average
Net Assets
(Excluding
Waivers) | | Ratio of Net
Investment
Income
to Average Net
Assets (Excluding
Waivers) | | Portfolio
Turnover
Rate | |
| Short Term Bond Fund | |
| Class A | | | | | | | | | | | | | | | | | | | | | | | | | | | | | |
| 2004 (1) | | | 0.76 | % | | $ | 130,531 | | | | 0.75 | % | | | 2.28 | % | | | 1.05 | % | | | 1.98 | % | | | 89 | % | |
| 2003 | | | 2.71 | | | | 159,451 | | | | 0.75 | | | | 2.75 | | | | 1.05 | | | | 2.45 | | | | 60 | | |
| 2002 | | | 4.59 | | | | 163,358 | | | | 0.75 | | | | 4.06 | | | | 1.04 | | | | 3.77 | | | | 59 | | |
| 2001 (1) | | | 10.48 | | | | 133,177 | | | | 0.60 | | | | 6.04 | | | | 1.15 | | | | 5.49 | | | | 69 | | |
| 2000 | | | 6.30 | | | | 80,992 | | | | 0.60 | | | | 6.12 | | | | 1.13 | | | | 5.59 | | | | 95 | | |
| Class Y | | | | | | | | | | | | | | | | | | | | | | | | | | | | | |
| 2004 (1) | | | 0.91 | % | | $ | 943,181 | | | | 0.60 | % | | | 2.43 | % | | | 0.80 | % | | | 2.23 | % | | | 89 | % | |
| 2003 | | | 2.76 | | | | 832,266 | | | | 0.60 | | | | 2.84 | | | | 0.80 | | | | 2.64 | | | | 60 | | |
| 2002 | | | 4.85 | | | | 484,583 | | | | 0.60 | | | | 4.18 | | | | 0.79 | | | | 3.99 | | | | 59 | | |
| 2001 (1) | | | 10.64 | | | | 277,244 | | | | 0.46 | | | | 6.24 | | | | 1.02 | | | | 5.68 | | | | 69 | | |
| 2000 | | | 6.29 | | | | 92,092 | | | | 0.51 | | | | 5.94 | | | | 0.98 | | | | 5.47 | | | | 95 | | |
| U.S. Government Mortgage Fund | |
| Class A (2) | | | | | | | | | | | | | | | | | | | | | | | | | | | | | |
| 2004 (1) | | | 2.74 | % | | $ | 32,815 | | | | 0.95 | % | | | 3.53 | % | | | 1.05 | % | | | 3.43 | % | | | 127 | % | |
| 2003 | | | 2.79 | | | | 24,667 | | | | 0.95 | | | | 2.98 | | | | 1.06 | | | | 2.87 | | | | 175 | | |
| 2002 | | | 6.53 | | | | 16,985 | | | | 0.95 | | | | 4.61 | | | | 1.08 | | | | 4.48 | | | | 197 | | |
| 2001 (1) (3) | | | 10.88 | | | | 7,751 | | | | 1.04 | | | | 5.15 | | | | 1.19 | | | | 5.00 | | | | 22 | | |
| 2000 (4) | | | 6.05 | | | | 3,644 | | | | 1.04 | | | | 5.36 | | | | 1.15 | | | | 5.25 | | | | 23 | | |
| 1999 (5) | | | 1.37 | | | | 4,620 | | | | 0.98 | | | | 5.15 | | | | 1.09 | | | | 5.04 | | | | 26 | | |
| Class B (2) | | | | | | | | | | | | | | | | | | | | | | | | | | | | | |
| 2004 (1) | | | 2.02 | % | | $ | 9,155 | | | | 1.70 | % | | | 2.79 | % | | | 1.80 | % | | | 2.69 | % | | | 127 | % | |
| 2003 | | | 1.96 | | | | 11,397 | | | | 1.70 | | | | 2.22 | | | | 1.81 | | | | 2.11 | | | | 175 | | |
| 2002 | | | 5.79 | | | | 6,235 | | | | 1.70 | | | | 3.85 | | | | 1.83 | | | | 3.72 | | | | 197 | | |
| 2001 (1) (3) | | | 10.25 | | | | 2,039 | | | | 1.71 | | | | 4.37 | | | | 1.86 | | | | 4.22 | | | | 22 | | |
| 2000 (4) | | | 5.27 | | | | 139 | | | | 1.74 | | | | 4.66 | | | | 1.85 | | | | 4.55 | | | | 23 | | |
| 1999 (5) | | | 0.86 | | | | 282 | | | | 1.68 | | | | 4.47 | | | | 1.79 | | | | 4.36 | | | | 26 | | |
| Class C | | | | | | | | | | | | | | | | | | | | | | | | | | | | | |
| 2004 (1) | | | 2.02 | % | | $ | 10,520 | | | | 1.70 | % | | | 2.79 | % | | | 1.80 | % | | | 2.69 | % | | | 127 | % | |
| 2003 | | | 1.91 | | | | 18,801 | | | | 1.70 | | | | 2.19 | | | | 1.81 | | | | 2.08 | | | | 175 | | |
| 2002 | | | 5.78 | | | | 5,834 | | | | 1.70 | | | | 3.92 | | | | 1.83 | | | | 3.79 | | | | 197 | | |
| 2001 (1) (6) | | | 0.18 | | | | 105 | | | | 0.82 | | | | 5.26 | | | | 1.12 | | | | 4.96 | | | | 22 | | |
| Class R (2) | | | | | | | | | | | | | | | | | | | | | | | | | | | | | |
| 2004 (1) (7) | | | 2.74 | % | | $ | 1 | | | | 0.95 | % | | | 3.58 | % | | | 1.05 | % | | | 3.48 | % | | | 127 | % | |
| 2003 | | | 2.79 | | | | 17,296 | | | | 0.95 | | | | 3.04 | | | | 1.06 | | | | 2.93 | | | | 175 | | |
| 2002 | | | 6.55 | | | | 21,355 | | | | 0.95 | | | | 4.59 | | | | 1.08 | | | | 4.46 | | | | 197 | | |
| 2001 (1) (3) | | | 10.94 | | | | 19,092 | | | | 0.97 | | | | 6.52 | | | | 1.15 | | | | 6.34 | | | | 22 | | |
| 2000 (4) | | | 5.96 | | | | 5,145 | | | | 1.04 | | | | 5.36 | | | | 1.15 | | | | 5.25 | | | | 23 | | |
| 1999 (5) | | | 1.45 | | | | 8,584 | | | | 0.98 | | | | 5.17 | | | | 1.09 | | | | 5.06 | | | | 26 | | |
| Class Y (2) | | | | | | | | | | | | | | | | | | | | | | | | | | | | | |
| 2004 (1) | | | 3.09 | % | | $ | 171,143 | | | | 0.70 | % | | | 3.79 | % | | | 0.80 | % | | | 3.69 | % | | | 127 | % | |
| 2003 | | | 3.03 | | | | 214,531 | | | | 0.70 | | | | 3.27 | | | | 0.81 | | | | 3.16 | | | | 175 | | |
| 2002 | | | 6.79 | | | | 181,046 | | | | 0.70 | | | | 4.84 | | | | 0.83 | | | | 4.71 | | | | 197 | | |
| 2001 (1) (3) | | | 11.14 | | | | 183,883 | | | | 0.71 | | | | 5.37 | | | | 0.85 | | | | 5.23 | | | | 22 | | |
| 2000 (4) | | | 6.34 | | | | 53,896 | | | | 0.74 | | | | 5.66 | | | | 1.15 | | | | 5.25 | | | | 23 | | |
| 1999 (5) | | | 1.67 | | | | 72,483 | | | | 0.68 | | | | 5.45 | | | | 1.09 | | | | 5.04 | | | | 26 | | |
FIRST AMERICAN FUNDS Annual Report 2004
77
Notes to Financial Statements September 30, 2004
1 > Organization
The First American Core Bond Fund, Corporate Bond Fund, High Income Bond Fund, Intermediate Government Bond Fund, Intermediate Term Bond Fund, Short Term Bond Fund, and U.S. Government Mortgage Fund (each a "Fund" and collectively, the "Funds") are mutual funds offered by First American Investment Funds, Inc. ("FAIF"), which is a member of the First American Family of funds. As of September 30, 2004, FAIF offered 37 Funds, including the Funds. FAIF is registered under the Investment Company Act of 1940, as amended, as an open-end management investment company. FAIF's articles of incorporation permit the Funds' board of directors to create additional funds in the future. Each Fund is a diversified open-end management investment company.
FAIF offers Class A, Class B, Class C, Class R, and Class Y shares. Prior to July 1, 2004, Class R shares were named Class S shares. Class A shares of Intermediate Government Bond Fund, Intermediate Term Bond Fund, and Short Term Bond Fund are sold with a front-end sales charge of 2.25%. Class A shares of Core Bond Fund, Corporate Bond Fund, High Income Bond Fund, and U.S. Government Mortgage Fund are sold with a front-end sales charge of 4.25%. Class B shares are subject to a contingent deferred sales charge for six years and automatically convert to Class A shares after eight years. Class C shares are subject to a contingent deferred sales charge for 12 months, and will not convert to Class A shares. Class R shares have no sales charge and are offered only through certain tax-deferred retirement plans. Class Y shares h ave no sales charge and are offered only to qualifying institutional investors and certain other qualifying accounts. Class B and Class C shares are not offered by Intermediate Government Bond Fund, Intermediate Term Bond Fund, or Short Term Bond Fund. Class R shares are not offered by Intermediate Government Bond Fund.
The Funds' prospectuses provide descriptions of each Fund's investment objective, principal investment strategies and principal risks. All classes of shares in a Fund have identical voting, dividend, liquidation, and other rights, and the same terms and conditions, except that the level of distribution and shareholder servicing fees charged may differ among classes. Each class has exclusive voting rights on any matters relating to that class' servicing or distribution arrangements.
2 > Summary of Significant Accounting Policies
The significant accounting policies followed by the Funds are as follows:
SECURITY VALUATIONS – Security valuations for the Funds' investments are furnished by one or more independent pricing services that have been approved by the Funds' board of directors. Investments in equity securities that are traded on a national securities exchange (or reported on the Nasdaq national market system) are stated at the last quoted sales price if readily available for such securities on each business day. For securities traded on the Nasdaq national market system, the Funds utilize the Nasdaq Official Closing Price which compares the last trade to the bid/ask range of a security. If the last trade falls within the bid/ask range, then that price will be the closing price. If the last trade is outside the bid/ask range, and falls above the ask, the ask price will be the clos ing price. If the last trade is below the bid, the bid will be the closing price. Other equity securities traded in the over-the-counter market and listed equity securities for which no sale was reported on that date are stated at the last quoted bid price. Debt obligations exceeding 60 days to maturity are valued by an independent pricing service. The pricing service may employ methodologies that utilize actual market transactions, broker-dealer supplied valuations, or other formula driven valuation techniques. These techniques generally consider such factors as yields or prices of bonds of comparable quality, type of issue, coupon, maturity, ratings, and general market conditions. Securities for which prices are not available from an independent pricing service, but where an active market exists, are valued using market quotations obtained from one or more dealers that make markets in the securities or from a widely used quotation system. When market quotations are not readily available, securities ar e valued at fair value as determined in good faith by procedures established and approved by the Funds' board of directors. Some of the factors which may be considered by the board of directors in determining fair value are fundamental analytical data relating to the investment; the nature and duration of any restrictions on disposition; trading in similar securities of the same issuer or comparable companies; information from broker-dealers; and an evaluation of the forces that influence the market in which the securities are purchased and sold. If events occur that materially affect the value of securities (including non-U.S. securities) between the close of trading in those securities and the close of regular trading on the New York Stock
FIRST AMERICAN FUNDS Annual Report 2004
78
Exchange, the securities will be valued at fair value. Price movements in futures contracts and ADRs (American Depositary Receipts), and various other indices, may be reviewed in the course of making a good faith determination of a security's fair value. The use of fair value pricing by a fund may cause the net asset value of its shares to differ significantly from net asset value that would be calculated without regard to such considerations. As of September 30, 2004, Core Bond Fund, High Income Bond Fund, and Short Term Bond Fund held fair value securities with a value of $146,545, $0, and $0, respectively, or 0.0%, 0.0%, and 0.0% of total net assets, respectively. Debt obligations with 60 days or less remaining until maturity may be valued at their amortized cost, which approximates market value. Foreign securities are valued at the closing prices on the principal exchanges on which they trade. T he prices for foreign securities are reported in local currency and converted to U.S. dollars using currency exchange rates. Exchange rates are provided daily by recognized independent pricing agents. Investments in open-end mutual funds are valued at the respective net asset value of each underlying fund on the valuation date.
SECURITY TRANSACTIONS AND INVESTMENT INCOME – The Funds record security transactions on the trade date of the security purchase or sale. Dividend income is recorded on the ex-dividend date. Interest income, including amortization of bond premium and discount, is recorded on an accrual basis. Security gains and losses are determined on the basis of identified cost, which is the same basis used for federal income tax purposes.
DISTRIBUTIONS TO SHAREHOLDERS – Distributions from net investment income are declared and paid monthly. Any net realized capital gains on sales of a Fund's securities are distributed to shareholders at least annually.
FEDERAL TAXES – Each Fund is treated as a separate taxable entity. Each Fund intends to continue to qualify as a regulated investment company as provided in Subchapter M of the Internal Revenue Code, as amended, and to distribute all taxable income, if any, to its shareholders. Accordingly, no provision for federal income taxes is required.
Net investment income and net realized gains (losses) may differ for financial statement and tax purposes because of temporary or permanent book/tax differences. These differences are primarily due to losses deferred due to wash sales, paydowns on pass through obligations, expiring capital loss carryforwards, and tax mark to market adjustments under Section 311(e) of the Taxpayer Relief Act of 1997. To the extent these differences are permanent, reclassifications are made to the appropriate equity accounts in the period that the differences arise.
On the Statements of Assets and Liabilities, the following reclassifications were made (000):
| Fund | | Accumulated
Net Realized
Gain (Loss) | | Undistributed
Net Investment
Income | | Additional
Paid In
Capital | |
| Core Bond Fund | | $ | (5,165 | ) | | $ | 5,165 | | | $ | - | | |
| Corporate Bond Fund | | | - | | | | 19 | | | | (19 | ) | |
| High Income Bond Fund | | | (5 | ) | | | 5 | | | | - | | |
| Intermediate Government Bond Fund | | | (15 | ) | | | 15 | | | | - | | |
| Intermediate Term Bond Fund | | | (545 | ) | | | 545 | | | | - | | |
| Short Term Bond Fund | | | (199 | ) | | | 2,023 | | | | (1,824 | ) | |
| U.S. Government Mortgage Fund | | | (1,906 | ) | | | 1,906 | | | | - | | |
The character of distributions made during the year from net investment income or net realized gains may differ from its ultimate characterization for federal income tax purposes. In addition, due to the timing of dividend distributions, the fiscal year in which the amounts are distributed may differ from the year that the income or realized gains (losses) were recorded by the Fund. The distributions paid during the fiscal years ended September 30, 2004 and 2003, were characterized as follows (000):
| | | 2004 | |
| Fund | | Ordinary
Income | | Long Term
Gain | | Return
of Capital | | Total | |
| Core Bond Fund | | $ | 79,871 | | | $ | 32,065 | | | | - | | | $ | 111,936 | | |
| Corporate Bond Fund | | | 13,105 | | | | - | | | | 19 | | | | 13,124 | | |
| High Income Bond Fund | | | 20,894 | | | | - | | | | - | | | | 20,894 | | |
| Intermediate Government Bond Fund | | | 7,590 | | | | 27,610 | | | | - | | | | 35,200 | | |
| Intermediate Term Bond Fund | | | 43,278 | | | | 14,419 | | | | - | | | | 57,697 | | |
| Short Term Bond Fund | | | 25,252 | | | | - | | | | - | | | | 25,252 | | |
| U.S. Government Mortgage Fund | | | 11,561 | | | | - | | | | - | | | | 11,561 | | |
| | | 2003 | |
| Fund | | Ordinary
Income | | Long Term
Gain | | Total | |
| Core Bond Fund | | $ | 77,933 | | | $ | - | | | $ | 77,933 | | |
| Corporate Bond Fund | | | 14,162 | | | | - | | | | 14,162 | | |
| High Income Bond Fund | | | 15,787 | | | | - | | | | 15,787 | | |
| Intermediate Government Bond Fund | | | 15,162 | | | | 535 | | | | 15,697 | | |
| Intermediate Term Bond Fund | | | 53,813 | | | | 14 | | | | 53,827 | | |
| Short Term Bond Fund | | | 26,979 | | | | - | | | | 26,979 | | |
| U.S. Government Mortgage Fund | | | 11,426 | | | | 2,379 | | | | 13,805 | | |
FIRST AMERICAN FUNDS Annual Report 2004
79
Notes to Financial Statements September 30, 2004
As of September 30, 2004, the components of accumulated earnings (deficit) on a tax basis were (000):
| Fund | | Undistributed
Ordinary
Income | | Undistributed
Long Term
Capital Gains | | Accumulated
Capital and
Post-October
Losses | | Unrealized
Appreciation
(Depreciation) | | Total
Accumulated
Earnings
(Deficit) | |
| Core Bond Fund | | $ | 382 | | | $ | 1,282 | | | $ | - | | | $ | 12,417 | | | $ | 14,081 | | |
| Corporate Bond Fund | | | - | | | | - | | | | (26,390 | ) | | | 6,770 | | | | (19,620 | ) | |
| High Income Bond Fund | | | 148 | | | | - | | | | (18,775 | ) | | | 12,673 | | | | (5,954 | ) | |
| Intermediate Government Bond Fund | | | 165 | | | | 4,768 | | | | - | | | | 905 | | | | 5,838 | | |
| Intermediate Term Bond Fund | | | 382 | | | | 11,785 | | | | - | | | | 8,842 | | | | 21,209 | | |
| Short Term Bond Fund | | | 549 | | | | - | | | | (3,380 | ) | | | (2,282 | ) | | | (5,113 | ) | |
| U.S. Government Mortgage Fund | | | 242 | | | | - | | | | (4,872 | ) | | | 1,685 | | | | (2,945 | ) | |
The difference between book and tax basis unrealized appreciation (depreciation) is primarily due to the tax deferral of losses on wash sales and tax mark to market adjustments made under Section 311(e) of the Taxpayer Relief Act of 1997.
As of September 30, 2004, the following Funds had capital loss carryforwards (000):
| Fund | | 2006 | | 2007 | | 2008 | | 2009 | | 2010 | | 2011 | | 2012 | | Total | |
| Corporate Bond Fund | | $ | 15,243 | | | $ | 7,438 | | | $ | - | | | $ | - | | | $ | - | | | $ | 3,709 | | | $ | - | | | $ | 26,390 | | |
| High Income Bond Fund | | | - | | | | - | | | | - | | | | - | | | | 9,280 | | | | 9,495 | | | | - | | | | 18,775 | | |
| Short Term Bond Fund | | | 604 | | | | 632 | | | | 145 | | | | - | | | | - | | | | 4 | | | | - | | | | 1,385 | | |
| U.S. Government Mortgage Fund | | | - | | | | - | | | | - | | | | - | | | | - | | | | - | | | | 3,145 | | | | 3,145 | | |
In accordance with Section 382 of the Internal Revenue Code, utilization of all or a portion of the above capital loss carryovers is limited on an annual basis for Corporate Bond Fund to $6,352,310, per tax year for a portion of their capital loss carryover.
Certain Funds incurred a loss for tax purposes for the period from November 1, 2003 to September 30, 2004. As permitted by tax regulations, the Funds intend to elect to defer and treat these losses as arising in the fiscal year ending September 30, 2005. The following Funds had deferred losses (000):
| Fund | | Amount | |
| Short Term Bond Fund | | $ | 1,995 | | |
| U.S. Government Mortgage Fund | | | 1,727 | | |
FUTURES TRANSACTIONS – In order to protect against changes in interest rates and to maintain sufficient liquidity to meet redemption requests, each Fund may enter into interest rate futures. Upon entering into a futures contract, the Fund is required to deposit cash or pledge U.S. government securities in an amount equal to five percent of the purchase price indicated in the futures contract (initial margin). Subsequent payments, which are dependent on the daily fluctuations in the value of the underlying security or securities, are made or received by the Fund each day (dail y variation margin) and are recorded as unrealized gains (losses) until the contract is closed. When the contract is closed, the Fund records a realized gain (loss) equal to the difference between the proceeds from (or cost of) the closing transaction and the Fund's basis in the contract.
Risks of entering into futures contracts, in general, include the possibility that there will not be a perfect price correlation between the futures contracts and the underlying securities. Second, it is possible that a lack of liquidity for futures contracts could exist in the secondary market, resulting in an inability to close a futures position prior to its maturity date. Third, the purchase of a futures contract involves the risk that a fund could lose more than the original margin deposit required to initiate a futures transaction. These contracts involve market risk in excess of the amount reflected in the Fund's statement of assets and liabilities. Unrealized gains (losses) on outstanding positions in futures contracts held at the close of the year will be recognized as capital gains (losses) for federal income tax purposes.
OPTIONS TRANSACTIONS – The Funds may utilize options in an attempt to manage market or business risk or enhance their yield. When a call or put option is written, an amount equal to the premium received is recorded as a liability. The liability is marked-to-market daily to reflect the current market value of the option written. When a written option expires, a gain is
FIRST AMERICAN FUNDS Annual Report 2004
80
realized in the amount of the premium originally received. If a closing purchase contract is entered into, a gain or loss is realized in the amount of the original premium less the cost of the closing transaction. If a written call is exercised, a gain or loss is realized from the sale of the underlying security, and the proceeds from such sale are increased by the premium originally received. If a written put option is exercised, the amount of the premium originally received reduces the cost of the security that is purchased upon exercise of the option.
Purchased options are recorded as investments and marked-to-market daily to reflect the current market value of the option contract. If a purchased option expires, a loss is realized in the amount of the cost of the option. If a closing transaction is entered into, a gain or loss is realized, to the extent that the proceeds from the sale are greater or less than the cost of the option. If a put option is exercised, a gain or loss is realized from the sale of the underlying security by adjusting the proceeds from such sale by the amount of the premium originally paid. If a call option is exercised, the cost of the security purchased upon exercise is increased by the premium originally paid.
FOREIGN CURRENCY TRANSLATION – The books and records of the High Income Bond Fund relating to the Fund's non-U.S. dollar denominated investments are maintained in U.S. dollars on the following basis:
• market value of investment securities, assets, and liabilities are translated at the current rate of exchange; and
• purchases and sales of investment securities, income, and expenses are translated at the relevant rates of exchange prevailing on the respective dates of such transactions.
The High Income Bond Fund does not isolate the portion of gains and losses on investments in debt securities that is due to changes in the foreign exchange rates from that which is due to changes in market prices of debt securities. The High Income Bond Fund does isolate the effect of fluctuations in foreign currency rates when determining the gain or loss upon sale or maturity of foreign currency denominated debt obligations pursuant to the federal income tax regulations. Such amounts are categorized as foreign currency gain or loss for both financial reporting and income tax reporting purposes.
The High Income Bond Fund reports certain foreign currency-related transactions as components of realized gains for financial reporting purposes, whereas such components are treated as ordinary income for federal income tax purposes.
SECURITIES PURCHASED ON A WHEN-ISSUED BASIS – Delivery and payment for securities that have been purchased by a Fund on a forward-commitment or when-issued basis can take place up to a month or more after the transaction date. During this period, such securities are subject to market fluctuations and the portfolio maintains, in a segregated account with its custodian, assets with a market value equal to or greater than the amount of its purchase commitments. The purchase of securities on a when-issued or forward-commitment basis may increase the volatility of the Fund's net a sset value if the Fund makes such purchases while remaining substantially fully invested. At September 30, 2004, the following Funds had outstanding when-issued commitments (000):
| Fund | | Cost | | Segregated
Assets | |
| Core Bond Fund | | $ | 78,056 | | | $ | 260,979 | | |
| Corporate Bond Fund | | | 3,199 | | | | 50,327 | | |
| High Income Bond Fund | | | 6,005 | | | | 19,025 | | |
| Intermediate Term Bond Fund | | | 5,255 | | | | 81,085 | | |
| Short Term Bond Fund | | | 4,350 | | | | 167,388 | | |
| U.S. Government Mortgage Fund | | | 16,394 | | | | 64,251 | | |
In connection with the ability to purchase securities on a when-issued basis, each Fund may also enter into dollar rolls in which the Fund sells securities purchased on a forward-commitment basis and simultaneously contracts with a counterparty to repurchase similar (same type, coupon, and maturity), but not identical securities on a specified future date. Dollar rolls are considered a form of leverage.
ILLIQUID OR RESTRICTED SECURITIES – A security may be considered illiquid if it lacks a readily available market or if its valuation has not changed for a certain period of time. Each Fund intends to invest no more than 15% of its net assets (determined at the time of purchase and reviewed periodically) in illiquid securities. Certain restricted securities may be considered illiquid. Restricted securities are often purchased in private placement transactions, are not registered under the Securities Act of 1933, may have contractual restrictions on resale, and may be valued un der methods approved by the Funds' board of directors as reflecting fair value. Certain restricted securities eligible for resale to qualified institutional investors, including Rule 144A securities, are not subject to the limitation on a Funds' investment in illiquid securities if they are determined to be liquid in accordance with procedures adopted by the Fund's board of directors. At September 30, 2004, Core Bond Fund, High Income
FIRST AMERICAN FUNDS Annual Report 2004
81
Notes to Financial Statements September 30, 2004
Bond Fund, Intermediate Term Bond Fund, and Short Term Bond Fund had investments in illiquid securities with a total market value of $26,340, $0, $23,409, and $27,272, respectively, or 1.3%, 0.0%, 1.8%, and 2.5%, respectively, of total net assets.
Information concerning illiquid securities, including restricted securities considered to be illiquid, is as follows (000):
Core Bond Fund
| Security | | Par | | Dates
Acquired | | Cost Basis | |
| Duty Free International | | $ | 2,442 | | | 1/99-7/99 | | $ | 2,438 | | |
| Wells Fargo Home Equity Trust | | | 12,330 | | | 8/04 | | | 12,328 | | |
| William Street Funding | | | 13,890 | | | 9/04 | | | 13,890 | | |
High Income Bond Fund
| Security | | Shares/Par | | Dates
Acquired | | Cost Basis | |
| AT&T Canada | | $ | 100 | | | 1/98 | | $ | - | | |
| Diamond Brands Operating | | | 50 | | | 4/98 | | | 50 | | |
| Glenoit | | | 100 | | | 3/97-8/97 | | | 101 | | |
Pegasus Communications
Fractional Shares | | | - | | | 1/03 | | | - | | |
| Sterling Chemical Holdings | | | 100 | | | 10/96 | | | 3 | | |
| UIH Australia Pacific | | | 150 | | | 12/97 | | | - | | |
| Viatel Holdings | | | 338 | | | 9/02 | | | - | | |
Intermediate Term Bond Fund
| Security | | Par | | Dates
Acquired | | Cost Basis | |
| Commercial Mortgage | | $ | 5,255 | | | 9/04 | | $ | 5,255 | | |
| FNMA REMIC | | | 9,670 | | | 9/04 | | | 9,758 | | |
| Wells Fargo Home Equity Trust | | | 8,415 | | | 8/04 | | | 8,413 | | |
Short Term Bond Fund
| Security | | Par | | Dates
Acquired | | Cost Basis | |
| Auto Bond Receivables Trust | | $ | 106 | | | 11/98-11/00 | | $ | 106 | | |
| CNH Equipment Trust | | | 4,700 | | | 9/04 | | | 4,700 | | |
| FNMA REMIC | | | 8,000 | | | 9/04 | | | 8,073 | | |
| Wells Fargo Home Equity Trust | | | 6,735 | | | 9/04 | | | 6,720 | | |
| William Street Funding | | | 7,790 | | | 9/04 | | | 7,790 | | |
SECURITIES LENDING – In order to generate additional income, a Fund may lend securities representing up to one-third of the value of its total assets (which includes collateral for securities on loan) to broker-dealers, banks, or other institutional borrowers of securities. Each Fund's policy is to maintain collateral in the form of cash, U.S. government securities, or other high-grade debt obligations equal to at least 100% of the value of securities loaned. The collateral is then "marked to market" daily until the securities are returned. As with other extensions of cr edit, there may be risks of delay in recovery of the securities or even loss of rights in the collateral should the borrower of the security fail financially.
U.S. Bancorp Asset Management, Inc. ("USBAM") serves as the securities lending agent for the Funds in transactions involving the lending of portfolio securities on behalf of the Funds. USBAM acts as the securities lending agent pursuant to, and subject to compliance with conditions contained in, an exemptive order issued by the Securities and Exchange Commission ("SEC"). During the fiscal year ended September 30, 2004, USBAM received fees equal to 25% of the Funds' income from securities lending transactions. The Funds also paid an administrative fee to USBAM equal to 0.025% based on the cash collateral held for the securities on loan. Fees paid to USBAM by the Funds for the fiscal year ended September 30, 2004 were as follows (000):
| Fund | | Amount | |
| Core Bond Fund | | $ | 435 | | |
| Corporate Bond Fund | | | 39 | | |
| High Income Bond Fund | | | 108 | | |
| Intermediate Term Bond Fund | | | 361 | | |
| Short Term Bond Fund | | | 172 | | |
| U.S. Government Mortgage Fund | | | 32 | | |
As of October 1, 2004, USBAM will receive fees equal to 35% of the Funds' income from securities lending transactions. The Funds will no longer pay an administrative fee to USBAM in connection with securities lending.
REPURCHASE AGREEMENTS – A repurchase agreement is an agreement by which the seller of a security agrees to repurchase the security sold at a mutually agreed upon time and price. At the time the Funds enter into a repurchase agreement, the value of the underlying collateral security (ies), including accrued interest, will be equal to or exceed the value of the repurchase agreement. Securities that serve to collateralize the repurchase agreement are held by each Fund's custodian in book entry or physical form in the custodial account of the Fund. Repurchase agreements are valued at cost plus accrued interest receivable.
FIRST AMERICAN FUNDS Annual Report 2004
82
Pursuant to an exemptive order issued by the SEC, the Funds may transfer uninvested cash balances from proceeds from securities lending into joint repurchase agreements for the First American Funds complex managed by USBAM. As set forth in the accompanying Schedules of Investments, each of the Funds included in this annual report along with other Funds in the First American Funds complex have an interest in joint repurchase agreements dated September 30, 2004. Information regarding these agreements is as follows (000):
Broker | |
Rate | |
Principal | | Collateral
Value | |
Security Type | |
Coupon Rate | |
Maturity | |
| Bear Stearns | | | 2.060 | % | | $ | 30,000 | | | $ | 30,611 | | | Commercial Loans | | | 0.000 | % | | | 2033-2034 | | |
| Bear Stearns | | | 2.045 | % | | | 100,000 | | | | 102,056 | | | Commercial Loans | | | 3.850%-6.230% | | | | 2004-2014 | | |
| Citibank | | | 1.945 | % | | | 200,000 | | | | 211,790 | | | Collateralized Mortgage Obligations | | | 2.340%-9.700% | | | | 2015-2034 | | |
| | | | | | | Corporate Bonds | | 0.000%-9.125% | | 2006-2042 | |
| Citibank | | | 1.925 | % | | | 100,000 | | | | 102,114 | | | Israeli Government Bonds | | | 0.000 | % | | | 2005-2018 | | |
| | | | | | | Financing Corporation Bonds | | 0.000%-10.350% | | 2017-2018 | |
| | | | | | | Easy Growth TR Interest Certificates | | 0.000% | | 2005-2006 | |
| | | | | | | Treasury Investors Growth Receipt (TIGER) | | 0.000% | | 2007 | |
| | | | | | | Certificate of Accrual on Treasury Securities (CATS) | | 0.000% | | 2011 | |
| | | | | | | U.S. Treasury Notes | | 1.625%-5.000% | | 2005-2011 | |
| | | | | | | U.S. Treasury Bill | | 0.000% | | 2004 | |
| | | | | | | Resolution Funding Corporation Bonds | | 8.625% | | 2030 | |
| | | | | | | International Finance Corporation Notes | | 4.750%-5.250% | | 2006-2007 | |
| | | | | | | Inter-American Development Bank Notes | | 5.375%-8.500% | | 2006-2011 | |
| | | | | | | Asian Development Bank Note | | 4.50% | | 2012 | |
| Greenwich Capital Markets | | | 1.950 | % | | | 300,000 | | | | 306,004 | | | Federal Home Loan Mortgage Corporation Bonds | | | 0.000%-9.000% | | | | 2006-2034 | | |
| | | | | | | Federal National Mortgage Association Bonds | | 0.000%-6.500% | | 2007-2042 | |
| Goldman Sachs | | | 2.205 | % | | | 50,000 | | | | 51,021 | | | Commercial Loans | | | 0.00 | % | | | 2005-2011 | | |
| Goldman Sachs | | | 2.025 | % | | | 205,000 | | | | 211,342 | | | Mortgage Loans | | | 6.088%-6.722% | | | | 2010 | | |
| | | | | | | Commercial Loans | | 0.00% | | 2007 | |
| Goldman Sachs | | | 1.480 | % | | | 75,000 | | | | 77,320 | | | Commercial Loans | | | 0.00 | % | | | 2004 | | |
| Goldman Sachs | | | 1.425 | % | | | 125,000 | | | | 127,552 | | | Commercial Loans | | | 0.00 | % | | | 2005-2020 | | |
| Lehman Brothers | | | 2.055 | % | | | 200,000 | | | | 204,000 | | | Home Equity Loans | | | 0.000%-14.101% | | | | 2010-2034 | | |
| Lehman Brothers | | | 1.935 | % | | | 200,000 | | | | 219,916 | | | Collateralized Mortgage Obligations | | | 0.000%-7.109% | | | | 2008-2044 | | |
| Lehman Brothers | | | 1.910 | % | | | 300,000 | | | | 306,005 | | | Federal Farm Credit Bank Note | | | 4.500 | % | | | 2009 | | |
| | | | | | | Federal Home Loan Bank Bonds | | 0.000%-5.750% | | 2005-2018 | |
| | | | | | | Federal Home Loan Mortgage Corporation Notes | | 2.375%-3.550% | | 2006-2009 | |
| | | | | | | Federal National Mortgage Association Bonds | | 3.100%-6.000% | | 2007-2018 | |
| Merrill Lynch | | | 1.925 | % | | | 100,000 | | | | 105,002 | | | Corporate Bonds | | | 0.000%-10.125% | | | | 2005-2043 | | |
EXPENSES – Expenses that are directly related to one of the Funds are charged directly to that Fund. Other operating expenses are allocated to the Funds on the basis of relative net assets of all Funds within the First American Fund complex. Class specific expenses, such as 12b-1 fees, are borne by that class. Income, other expenses, and realized and unrealized gains and losses of a Fund are allocated to each respective class in proportion to the relative net assets of each class.
INTERFUND LENDING PROGRAM – Pursuant to an exemptive order issued by the SEC, the Funds, along with other registered investment companies in the First American Family of Funds, may participate in an interfund lending program. This program provides an alternative credit facility allowing the Funds to borrow from, or lend money to, other participating Funds. The Funds did not have any interfund lending transactions during the fiscal year ended September 30, 2004.
DEFERRED COMPENSATION PLAN – Under a Deferred Compensation Plan (the "Plan"), non-interested directors of the First American Fund family may participate and elect to defer receipt of their annual compensation. Deferred amounts are treated as though equivalent dollar amounts had been invested in shares of selected open-end First American Funds as designated by the Directors. All amounts in the Plan are 100% vested and accounts under the Plan are obligations of the Funds. Deferred amounts remain in the Funds until distributed in accordance with the Plan.
USE OF ESTIMATES IN THE PREPARATION OF FINANCIAL STATEMENTS – The preparation of financial statements, in conformity with U.S. generally accepted accounting principles, requires management to make estimates and assumptions that affect the reported amount of assets and liabilities and disclosure of contingent assets and liabilities at the date of the financial statements and the reported results of operations during the reporting period. Actual results could differ from those estimates.
FIRST AMERICAN FUNDS Annual Report 2004
83
Notes to Financial Statements September 30, 2004
3 > Fees and Expenses
ADVISORY FEES – Pursuant to an investment advisory agreement (the "Agreement"), USBAM manages each Fund's assets and furnishes related office facilities, equipment, research and personnel. The Agreement requires each Fund to pay USBAM a monthly fee based upon average daily net assets. The annual fee for each Fund is as follows:
| Core Bond Fund | | | 0.50 | % | |
| Corporate Bond Fund | | | 0.70 | | |
| High Income Bond Fund | | | 0.70 | | |
| Intermediate Government Bond Fund | | | 0.50 | | |
| Intermediate Term Bond Fund | | | 0.50 | | |
| Short Term Bond Fund | | | 0.50 | | |
| U.S. Government Mortgage Fund | | | 0.50 | | |
USBAM voluntarily waived fees during the fiscal year ended September 30, 2004 so that total fund operating expenses, as a percentage of average daily net assets, did not exceed the following amounts:
| | | Share Class | |
| Fund | | A | | B | | C | | R* | | Y | |
| Core Bond Fund | | | 0.95 | % | | | 1.70 | % | | | 1.70 | % | | | 1.20 | % | | | 0.70 | % | |
| Corporate Bond Fund | | | 1.00 | | | | 1.75 | | | | 1.75 | | | | 1.25 | | | | 0.75 | | |
| High Income Bond Fund | | | 1.00 | | | | 1.75 | | | | 1.75 | | | | 1.25 | | | | 0.75 | | |
Intermediate Government
Bond Fund | | | 0.75 | | | | NA | | | | NA | | | | NA | | | | 0.60 | | |
| Intermediate Term Bond Fund | | | 0.75 | | | | NA | | | | NA | | | | NA | | | | 0.60 | | |
| Short Term Bond Fund | | | 0.75 | | | | NA | | | | NA | | | | NA | | | | 0.60 | | |
| U.S. Government Mortgage Fund | | | 0.95 | | | | 1.70 | | | | 1.70 | | | | 1.20 | | | | 0.70 | | |
* Prior to July 1, 2004, Class R shares were designated Class S shares, which had lower fees and expenses. During the period from October 1, 2003 to June 30, 2004, USBAM voluntarily waived fees for this class so that the total operating expenses, as a percentage of average daily net assets, did not exceed 0.95%, 1.00%, 1.00%, and 0.95% for Core Bond Fund, Corporate Bond Fund, High Income Bond Fund, and U.S. Government Mortgage Fund, respectively.
NA = Not Applicable
The Funds may invest in related money market funds that are series of First American Funds, Inc. ("FAF"), subject to certain limitations. In order to avoid the payment of duplicative investment advisory fees to USBAM, which acts as the investment adviser to both the investing Funds and the related money market funds, USBAM will reimburse each investing Fund an amount equal to that portion of USBAM's investment advisory fee received from the related money market funds that is attributable to the assets of the investing Fund. For financial statement purposes, these reimbursements are recorded as investment income.
CO-ADMINISTRATION FEES – USBAM and U.S. Bancorp Fund Services, LLC ("USBFS") (collectively, the "Administrators"), serve as the co-administrators pursuant to a co-administration agreement between the Administrators and the Funds. USBAM is a subsidiary of U.S. Bank National Association ("U.S. Bank"). Both U.S. Bank and USBFS are direct subsidiaries of U.S. Bancorp. Under the co-administration agreement, the Administrators are compensated to provide, or compensate other entitie s to provide, services to the Funds. These services include various legal, oversight and administrative services, accounting services, transfer agency and dividend disbursing services, and shareholder services. The Funds pay the Administrators at an annual rate, calculated daily and paid monthly, based on the average daily net assets of all open-end mutual funds in the First American Family of Funds, equal to each Fund's pro rata share of an amount equal to 0.25% of the aggregate average daily net assets up to $8 billion, 0.235% of the next $17 billion of the aggregate average daily net assets, 0.22% of the next $25 billion of the aggregate average daily net assets, and 0.20% of the aggregate average daily net assets of all open-end mutual funds in the First American Family of Funds in excess of $50 billion. FAIF pays transfer agent fees of $18,500 per share class and additional per account fees for transfer agent services. These fees are allocated to each Fund based upon the Fund's pro rata share of th e aggregate average daily net assets of the Funds that comprise FAIF. For the fiscal year ended September 30, 2004, administration fees paid to USBAM and USBFS by the Funds included in this annual report were as follows (000):
| Fund | | Amount | |
| Core Bond Fund | | $ | 5,474 | | |
| Corporate Bond Fund | | | 727 | | |
| High Income Bond Fund | | | 744 | | |
| Intermediate Government Bond Fund | | | 525 | | |
| Intermediate Term Bond Fund | | | 3,610 | | |
| Short Term Bond Fund | | | 2,822 | | |
| U.S. Government Mortgage Fund | | | 692 | | |
CUSTODIAN FEES – U.S. Bank serves as the Funds' custodian pursuant to a custodian agreement with FAIF. The fee for each Fund is equal to an annual rate of 0.01% of average daily net assets. These fees are computed daily and paid monthly.
DISTRIBUTION AND SHAREHOLDER SERVICING FEES – Quasar Distributors, LLC ("Quasar"), a subsidiary of U.S. Bancorp, serves as the distributor of the Funds pursuant to a distribution agreement with FAIF. Under the distribution agreement, each Fund pays Quasar a monthly distribution and/or shareholder servicing fee equal to an annual rate of 0.25%, 1.00%, 1.00% and 0.50% of each Fund's average daily net assets of the Class A shares, Class B shares, Class C shares, and Class R shares, respectively. No distribution or shareholder servicing fees are paid by Class& nbsp;Y shares. These fees may be used by Quasar to
FIRST AMERICAN FUNDS Annual Report 2004
84
provide compensation for sales support, distribution activities, or shareholder servicing activities.
Quasar is currently waiving fees equal to 0.10% of average daily net assets for Class A and Class R shares of the Intermediate Term Bond Fund and Short Term Bond Fund, and Class A shares of Intermediate Government Bond Fund. For the fiscal year ended September 30, 2004, total distribution and shareholder servicing fees waived by Quasar for these Funds were as follows (000):
| Fund | | Amount | |
| Intermediate Government Bond Fund | | $ | 2 | | |
| Intermediate Term Bond Fund | | | 74 | | |
| Short Term Bond Fund | | | 149 | | |
FAIF has also adopted and entered into a shareholder servicing plan and agreement with USBAM with respect to the Class R shares. Each Fund, except Intermediate Government Bond Fund, pays USBAM a monthly shareholder servicing fee equal to an annual rate of 0.15% of the average daily net assets of the Fund's Class R shares. USBAM is currently waiving all fees under this plan and agreement. This waiver may be discontinued at any time.
Under these distribution and shareholder servicing agreements, the following amounts were retained by Quasar and USBAM or paid to affiliates of USBAM for the fiscal year ended September 30, 2004 (000):
| Fund | | Amount | |
| Core Bond Fund | | $ | 501 | | |
| Corporate Bond Fund | | | 92 | | |
| High Income Bond Fund | | | 172 | | |
| Intermediate Government Bond Fund | | | 3 | | |
| Intermediate Term Bond Fund | | | 75 | | |
| Short Term Bond Fund | | | 152 | | |
| U.S. Government Mortgage Fund | | | 224 | | |
OTHER FEES – In addition to the investment advisory fees, custodian fees, distribution and shareholder servicing fees, and co-administration fees, each Fund is responsible for paying most other operating expenses including fees and expenses of independent directors, registration fees, printing of shareholder reports, legal, auditing, insurance, and other miscellaneous expenses. For the fiscal year ended September 30, 2004, legal fees and expenses were paid to a law firm of which the Secretary and two Assistant Secretaries of the Funds were partners.
SALES CHARGES – A contingent deferred sales charge ("CDSC") is imposed on redemptions made in the Class B shares. The CDSC varies depending on the number of years from time of payment for the purchase of Class B shares until the redemption of such shares. Class B shares automatically convert to Class A shares after eight years.
| Year Since Purchase | | Contingent Deferred Sales Charge
as a Percentage of Dollar
Amount Subject to Charge | |
| First | | | 5.00 | % | |
| Second | | | 5.00 | % | |
| Third | | | 4.00 | % | |
| Fourth | | | 3.00 | % | |
| Fifth | | | 2.00 | % | |
| Sixth | | | 1.00 | % | |
| Seventh | | | 0.00 | % | |
| Eighth | | | 0.00 | % | |
A CDSC of 1.00% is imposed on redemptions made in Class C shares for the first 12 months.
The CDSC for Class B and Class C shares is imposed on the value of the purchased shares, or the value at the time of redemption, whichever is less.
For the fiscal year ended September 30, 2004, total sales charges retained by affiliates of USBAM for distributing the Funds' shares were as follows (000):
| Fund | | Amount | |
| Core Bond Fund | | $ | 338 | | |
| Corporate Bond Fund | | | 97 | | |
| High Income Bond Fund | | | 231 | | |
| Intermediate Government Bond Fund | | | 3 | | |
| Intermediate Term Bond Fund | | | 126 | | |
| Short Term Bond Fund | | | 227 | | |
| U.S. Government Mortgage Fund | | | 166 | | |
FIRST AMERICAN FUNDS Annual Report 2004
85
Notes to Financial Statements September 30, 2004
4 > Capital Share Transactions
FAIF has 420 billion shares of $0.0001 par value capital stock authorized. Capital share transactions for the Funds were as follows (000):
| | | Core
Bond Fund | | Corporate
Bond Fund | | High Income
Bond Fund | |
| | | 10/1/03
to
9/30/04 | | 10/1/02
to
9/30/03 | | 10/1/03
to
9/30/04 | | 10/1/02
to
9/30/03 | | 10/1/03
to
9/30/04 | | 10/1/02
to
9/30/03 | |
| Class A: | |
| Shares issued | | | 5,711 | | | | 3,888 | | | | 1,206 | | | | 1,219 | | | | 1,128 | | | | 1,965 | | |
| Shares issued in lieu of cash distributions | | | 642 | | | | 406 | | | | 61 | | | | 42 | | | | 252 | | | | 195 | | |
| Shares redeemed | | | (6,534 | ) | | | (5,859 | ) | | | (536 | ) | | | (842 | ) | | | (1,343 | ) | | | (2,576 | ) | |
| Shares issued in connection with the acquisition of Fund net assets | | | - | | | | 7,465 | | | | - | | | | - | | | | - | | | | 2,765 | | |
| Total Class A transactions | | | (181 | ) | | | 5,900 | | | | 731 | | | | 419 | | | | 37 | | | | 2,349 | | |
| Class B: | |
| Shares issued | | | 175 | | | | 374 | | | | 68 | | | | 168 | | | | 251 | | | | 355 | | |
| Shares issued in lieu of cash distributions | | | 85 | | | | 58 | | | | 27 | | | | 51 | | | | 39 | | | | 27 | | |
| Shares redeemed | | | (825 | ) | | | (776 | ) | | | (890 | ) | | | (846 | ) | | | (368 | ) | | | (151 | ) | |
| Shares issued in connection with the acquisition of Fund net assets | | | - | | | | 1,319 | | | | - | | | | - | | | | - | | | | 227 | | |
| Total Class B transactions | | | (565 | ) | | | 975 | | | | (795 | ) | | | (627 | ) | | | (78 | ) | | | 458 | | |
| Class C: | |
| Shares issued | | | 119 | | | | 303 | | | | 32 | | | | 117 | | | | 222 | | | | 697 | | |
| Shares issued in lieu of cash distributions | | | 43 | | | | 34 | | | | 17 | | | | 23 | | | | 119 | | | | 95 | | |
| Shares redeemed | | | (514 | ) | | | (512 | ) | | | (242 | ) | | | (128 | ) | | | (662 | ) | | | (564 | ) | |
| Shares issued in connection with the acquisition of Fund net assets | | | - | | | | 493 | | | | - | | | | - | | | | - | | | | 1,155 | | |
| Total Class C transactions | | | (352 | ) | | | 318 | | | | (193 | ) | | | 12 | | | | (321 | ) | | | 1,383 | | |
| Class R: | |
| Shares issued | | | 559 | | | | 1,193 | | | | 9 | | | | 35 | | | | 33 | | | | 64 | | |
| Shares issued in lieu of cash distributions | | | 117 | | | | 125 | | | | 5 | | | | 17 | | | | 2 | | | | 2 | | |
| Shares redeemed | | | (4,070 | ) | | | (3,442 | ) | | | (275 | ) | | | (162 | ) | | | (119 | ) | | | (10 | ) | |
| Shares issued in connection with the acquisition of Fund net assets | | | - | | | | 2,613 | | | | - | | | | - | | | | - | | | | 28 | | |
| Total Class R transactions | | | (3,394 | ) | | | 489 | | | | (261 | ) | | | (110 | ) | | | (84 | ) | | | 84 | | |
| Class Y: | |
| Shares issued | | | 34,846 | | | | 34,386 | | | | 5,441 | | | | 9,523 | | | | 10,084 | | | | 8,148 | | |
| Shares issued in lieu of cash distributions | | | 3,549 | | | | 2,233 | | | | 160 | | | | 144 | | | | 251 | | | | 254 | | |
| Shares redeemed | | | (53,065 | ) | | | (56,896 | ) | | | (5,916 | ) | | | (6,976 | ) | | | (5,149 | ) | | | (10,014 | ) | |
| Shares issued in connection with the acquisition of Common Trust Fund net assets | | | - | | | | 1,166 | | | | - | | | | - | | | | - | | | | - | | |
| Shares issued in connection with the acquisition of Fund net assets | | | - | | | | 83,108 | | | | - | | | | - | | | | - | | | | 4,283 | | |
| Total Class Y transactions | | | (14,670 | ) | | | 63,997 | | | | (315 | ) | | | 2,691 | | | | 5,186 | | | | 2,671 | | |
| Net increase (decrease) in capital shares | | | (19,162 | ) | | | 71,679 | | | | (833 | ) | | | 2,385 | | | | 4,740 | | | | 6,945 | | |
FIRST AMERICAN FUNDS Annual Report 2004
86
| | | Intermediate
Government
Bond Fund | | Intermediate Term
Bond Fund | | Short Term
Bond Fund | | U.S. Government
Mortgage Fund | |
| | | 10/1/03
to
9/30/04 | | 10/25/02 (1)
to
9/30/03 | | 10/1/03
to
9/30/04 | | 10/1/02
to
9/30/03 | | 10/1/03
to
9/30/04 | | 10/1/02
to
9/30/03 | | 10/1/03
to
9/30/04 | | 10/1/02
to
9/30/03 | |
| Class A: | |
| Shares issued | | | 88 | | | | 460 | | | | 2,566 | | | | 3,265 | | | | 2,907 | | | | 8,665 | | | | 1,742 | | | | 1,505 | | |
| Shares issued in lieu of cash distributions | | | 25 | | | | 4 | | | | 195 | | | | 186 | | | | 252 | | | | 373 | | | | 97 | | | | 84 | | |
| Shares redeemed | | | (151 | ) | | | (214 | ) | | | (4,118 | ) | | | (2,233 | ) | | | (5,787 | ) | | | (9,367 | ) | | | (1,045 | ) | | | (845 | ) | |
| Total Class A transactions | | | (38 | ) | | | 250 | | | | (1,357 | ) | | | 1,218 | | | | (2,628 | ) | | | (329 | ) | | | 794 | | | | 744 | | |
| Class B: | |
| Shares issued | | | - | | | | - | | | | - | | | | - | | | | - | | | | - | | | | 119 | | | | 769 | | |
| Shares issued in lieu of cash distributions | | | - | | | | - | | | | - | | | | - | | | | - | | | | - | | | | 29 | | | | 34 | | |
| Shares redeemed | | | - | | | | - | | | | - | | | | - | | | | - | | | | - | | | | (341 | ) | | | (315 | ) | |
| Total Class B transactions | | | - | | | | - | | | | - | | | | - | | | | - | | | | - | | | | (193 | ) | | | 488 | | |
| Class C: | |
| Shares issued | | | - | | | | - | | | | - | | | | - | | | | - | | | | - | | | | 104 | | | | 1.548 | | |
| Shares issued in lieu of cash distributions | | | - | | | | - | | | | - | | | | - | | | | - | | | | - | | | | 47 | | | | 49 | | |
| Shares redeemed | | | - | | | | - | | | | - | | | | - | | | | - | | | | - | | | | (900 | ) | | | (387 | ) | |
| Total Class C transactions | | | - | | | | - | | | | - | | | | - | | | | - | | | | - | | | | (749 | ) | | | 1,210 | | |
| Class R: | |
| Shares issued | | | - | | | | - | | | | 430 | | | | 1,008 | | | | 186 | | | | 691 | | | | 140 | | | | 674 | | |
| Shares issued in lieu of cash distributions | | | - | | | | - | | | | 31 | | | | 38 | | | | 9 | | | | 17 | | | | 33 | | | | 102 | | |
| Shares redeemed | | | - | | | | - | | | | (1,635 | ) | | | (459 | ) | | | (1,045 | ) | | | (216 | ) | | | (1,768 | ) | | | (1,101 | ) | |
| Total Class R transactions | | | - | | | | - | | | | (1,174 | ) | | | 587 | | | | (850 | ) | | | 492 | | | | (1,595 | ) | | | (325 | ) | |
| Class Y: | |
| Shares issued | | | 2,458 | | | | 55,539 | | | | 37,708 | | | | 67,006 | | | | 45,435 | | | | 63,085 | | | | 4,048 | | | | 7,760 | | |
| Shares issued in lieu of cash distributions | | | 3,028 | | | | 62 | | | | 2,280 | | | | 1,996 | | | | 709 | | | | 790 | | | | 101 | | | | 153 | | |
| Shares redeemed | | | (24,241 | ) | | | (22,134 | ) | | | (44,985 | ) | | | (39,422 | ) | | | (33,963 | ) | | | (29,845 | ) | | | (7,894 | ) | | | (4,428 | ) | |
| Total Class Y transactions | | | (18,755 | ) | | | 33,467 | | | | (4,997 | ) | | | 29,580 | | | | 12,181 | | | | 34,030 | | | | (3,745 | ) | | | 3,485 | | |
| Net increase (decrease) in capital shares | | | (18,793 | ) | | | 33,717 | | | | (7,528 | ) | | | 31,385 | | | | 8,703 | | | | 34,193 | | | | (5,488 | ) | | | 5,602 | | |
(1) Commencement of operations.
FIRST AMERICAN FUNDS Annual Report 2004
87
Notes to Financial Statements September 30, 2004
5 > Investment Security Transactions
During the fiscal year ended September 30, 2004, purchases of securities and proceeds from sales of securities, other than temporary investments in short-term securities, were as follows (000):
| | | U.S. Government
Securities | | Other Investment
Securities | |
| Fund | | Purchases | | Sales | | Purchases | | Sales | |
| Core Bond Fund | | $ | 2,398,321 | | | $ | 2,617,581 | | | $ | 1,264,100 | | | $ | 1,297,349 | | |
| Corporate Bond Fund | | | 85,714 | | | | 90,607 | | | | 269,366 | | | | 274,377 | | |
| High Income Bond Fund | | | 5,099 | | | | 3,627 | | | | 250,832 | | | | 213,165 | | |
Intermediate Government
Bond Fund | | | 115,814 | | | | 312,302 | | | | - | | | | - | | |
| Intermediate Term Bond Fund | | | 1,307,122 | | | | 1,445,086 | | | | 919,867 | | | | 834,126 | | |
| Short Term Bond Fund | | | 406,219 | | | | 667,239 | | | | 672,754 | | | | 266,042 | | |
| U.S. Government Mortgage Fund | | | 292,961 | | | | 325,268 | | | | 27,936 | | | | 46,379 | | |
The aggregate gross unrealized appreciation and depreciation of securities held by the Funds and the total cost of securities (including cost of securities purchased with proceeds from securities lending) for federal income tax purposes at September 30, 2004, were as follows (000):
| Fund | | Aggregate
Gross
Appreciation | | Aggregate
Gross
Depreciation | | Net | | Federal
Income
Tax
Cost | |
| Core Bond Fund | | $ | 26,505 | | | $ | (14,088 | ) | | $ | 12,417 | | | $ | 2,745,360 | | |
| Corporate Bond Fund | | | 8,631 | | | | (1,861 | ) | | | 6,770 | | | | 314,490 | | |
| High Income Bond Fund | | | 15,988 | | | | (3,315 | ) | | | 12,673 | | | | 374,576 | | |
Intermediate Government
Bond Fund | | | 1,883 | | | | (978 | ) | | | 905 | | | | 129,533 | | |
| Intermediate Term Bond Fund | | | 15,711 | | | | (6,869 | ) | | | 8,842 | | | | 1,635,086 | | |
| Short Term Bond Fund | | | 4,397 | | | | (6,679 | ) | | | (2,282 | ) | | | 1,320,771 | | |
| U.S. Government Mortgage Fund | | | 3,044 | | | | (1,359 | ) | | | 1,685 | | | | 308,152 | | |
6 > Options Written
Transactions in written options for the fiscal year ended September 30, 2004, were as follows (000):
| | | Put Options Written | | Call Options Written | |
| | | Number of
Contracts | | Premium
Amount | | Number of
Contracts | | Premium
Amount | |
| Core Bond Fund | | | |
| Balance at September 30, 2003 | | | 300 | | | $ | 182 | | | | 600 | | | $ | 366 | | |
| Opened | | | 2,567 | | | | 1,498 | | | | 1,085 | | | | 626 | | |
| Expired | | | (1,295 | ) | | | (807 | ) | | | (785 | ) | | | (440 | ) | |
| Closed | | | (1,572 | ) | | | (873 | ) | | | (900 | ) | | | (552 | ) | |
| Balance at September 30, 2004 | | | - | | | $ | - | | | | - | | | $ | - | | |
| Corporate Bond Fund | | | |
| Balance at September 30, 2003 | | | - | | | $ | - | | | | - | | | $ | - | | |
| Opened | | | 249 | | | | 140 | | | | 25 | | | | 8 | | |
| Expired | | | (45 | ) | | | (26 | ) | | | (25 | ) | | | (8 | ) | |
| Closed | | | (204 | ) | | | (114 | ) | | | - | | | | - | | |
| Balance at September 30, 2004 | | | - | | | $ | - | | | | - | | | $ | - | | |
| | | Put Options Written | | Call Options Written | |
| | | Number of
Contracts | | Premium
Amount | | Number of
Contracts | | Premium
Amount | |
| Intermediate Government Bond Fund | | | |
| Balance at September 30, 2003 | | | 45 | | | $ | 27 | | | | 90 | | | $ | 55 | | |
| Opened | | | 256 | | | | 148 | | | | 154 | | | | 91 | | |
| Expired | | | (171 | ) | | | (107 | ) | | | (109 | ) | | | (63 | ) | |
| Closed | | | (130 | ) | | | (68 | ) | | | (135 | ) | | | (83 | ) | |
| Balance at September 30, 2004 | | | - | | | $ | - | | | | - | | | $ | - | | |
| Intermediate Term Bond Fund | | | |
| Balance at September 30, 2003 | | | 180 | | | $ | 109 | | | | 360 | | | $ | 219 | | |
| Opened | | | 1,680 | | | | 977 | | | | 660 | | | | 379 | | |
| Expired | | | (805 | ) | | | (501 | ) | | | (480 | ) | | | (267 | ) | |
| Closed | | | (1,055 | ) | | | (585 | ) | | | (540 | ) | | | (331 | ) | |
| Balance at September 30, 2004 | | | - | | | $ | - | | | | - | | | $ | - | | |
| Short Term Bond Fund | | | |
| Balance at September 30, 2003 | | | - | | | $ | - | | | | - | | | $ | - | | |
| Opened | | | 1,250 | | | | 202 | | | | - | | | | - | | |
| Expired | | | (625 | ) | | | (101 | ) | | | - | | | | - | | |
| Closed | | | (625 | ) | | | (101 | ) | | | - | | | | - | | |
| Balance at September 30, 2004 | | | - | | | $ | - | | | | - | | | $ | - | | |
| U.S. Government Mortgage Fund | | | |
| Balance at September 30, 2003 | | | 35 | | | $ | 21 | | | | 70 | | | $ | 43 | | |
| Opened | | | 326 | | | | 184 | | | | 131 | | | | 74 | | |
| Expired | | | (125 | ) | | | (79 | ) | | | (96 | ) | | | (52 | ) | |
| Closed | | | (236 | ) | | | (126 | ) | | | (105 | ) | | | (65 | ) | |
| Balance at September 30, 2004 | | | - | | | $ | - | | | | - | | | $ | - | | |
7 > Concentration of Risks
Each Fund (other than Intermediate Government Bond Fund and U.S. Government Mortgage Fund) may invest in foreign securities. A Fund's investment in foreign securities subjects it to special risks associated with foreign investing and to a decline in net asset value resulting from changes in exchange rates between the United States dollar and foreign currencies. Because of the special risks associated with foreign investing, a Fund investing in foreign securities may be subject to greater volatility than most mutual funds which invest primarily in domestic securities.
The High Income Bond Fund invests in lower-rated (i.e., rated Ba or lower by Moody's or BB or lower by Standard & Poor's) corporate and foreign debt obligations, which are commonly referred to as "junk bonds." Lower-rated securities will usually offer higher yields than higher-rated securities. However, there is more risk associated with these investments. These lower-rated bonds may be more susceptible to real or perceived adverse economic conditions than investment grade bonds. Lower-rated securities tend to have more price volatility and carry more risk to principal than higher-rated securities.
FIRST AMERICAN FUNDS Annual Report 2004
88
The rating of long-term securities as a percentage of total value of investments at the fiscal year ended September 30, 2004, were as follows (unaudited):
Standard & Poor's/
Moody's Ratings | | High Income
Bond Fund | |
| AAA/Aaa | | | 3.3 | % | |
| BBB/Baa | | | 1.0 | | |
| BB/Ba | | | 29.3 | | |
| B/B | | | 38.8 | | |
| CCC/Caa | | | 17.2 | | |
| C | | | 1.7 | | |
| NR | | | 8.7 | | |
| | | | 100 | % | |
Securities rated by only one agency are shown in that category. Securities rated by both agencies are shown with their highest rating.
8 > Fund Mergers
On March 13, 2003, shareholders of Bond IMMDEXTM Fund and High Yield Bond Fund approved the Agreement and Plan of Reorganization, recommended by the Funds' board of directors, providing for the merger into Core Bond Fund and High Income Bond Fund, respectively, at the close of business March 14, 2003. The following table summarizes the mergers (000) as of 3/13/03:
| Acquired Fund | | Acquiring Fund | | Acquired
Funds Net
Assets | | Shares Issued to
Shareholders of
Acquired Fund | | Acquiring Fund
Net Assets | | Combined
Net Assets | | Tax Status
of Transfer | |
| Bond IMMDEXTM Fund | | Core Bond Fund (1) | | $ | 1,094,825 | (2) | | | | | | $ | 1,339,160 | | | $ | 2,433,985 | | | Non-taxable | |
| Class A | | Class A | | | | | 7,465 | | | | | | | | |
| Class B | | Class B | | | | | 1,319 | | | | | | | | |
| Class C | | Class C | | | | | 493 | | | | | | | | |
| Class S | | Class S | | | | | 2,613 | | | | | | | | |
| Class Y | | Class Y | | | | | 83,108 | | | | | | | | |
| High Yield Bond Fund (1) | | High Income Bond Fund | | | 71,489 | (3) | | | | | | | 156,457 | | | | 227,946 | | | Non-taxable | |
| Class A | | Class A | | | | | 2,765 | | | | | | | | |
| Class B | | Class B | | | | | 227 | | | | | | | | |
| Class C | | Class C | | | | | 1,155 | | | | | | | | |
| Class S | | Class S | | | | | 28 | | | | | | | | |
| Class Y | | Class Y | | | | | 4,283 | | | | | | | | |
(1) Accounting survivor.
(2) Includes unrealized appreciation in the amount $17,432 and tax losses deferred due to wash sales and deferred compensation of $44.
(3) Includes capital loss carryforward of $4,575 and unrealized depreciation of $358.
On October 25, 2002, the Core Bond Fund acquired substantially all of the assets of the Common Stock Income Common Trust Fund (KS) (sponsored by U.S. Bank) in exchange for Class Y shares of Core Bond Fund. In addition, Intermediate Government Bond Fund shell portfolio acquired substantially all of the assets of the U.S. Government Bond Common Trust Fund (sponsored by U.S. Bank) in exchange for Class Y shares of Intermediate Government Bond Fund. The following table illustrates the specifics of the common trust conversions into the Core Bond Fund and the Intermediate Government Bond Fund included in this annual report (000) as of 10/25/02:
| Acquired Fund | | Acquiring Fund | | Acquired
Funds Net
Assets | | Shares Issued to
Shareholders of
Acquired Fund | | Acquiring Fund
Net Assets | | Combined
Net Assets | | Tax Status
of Transfer | |
| Common Stock Income Common Trust Fund | | Core Bond Fund – Class Y | | $ | 13,076 | (1) | | | 1,166 | | | $ | 1,318,694 | | | $ | 1,331,770 | | | Non-taxable | |
| U.S. Government Bond Common Trust Fund | | Intermediate Government
Bond Fund – Class Y (2) | | | 520,605 | | | | 52,061 | | | | - | | | | 520,605 | | | Non-taxable | |
(1) Includes unrealized appreciation of $792.
(2) Shell portfolio
9 > Indemnifications
The Funds enter into contracts that contain a variety of indemnifications. The Funds' maximum exposure under these arrangements is unknown. However, the Funds have not had prior claims or losses pursuant to these contracts and expect the risk of loss to be remote.
FIRST AMERICAN FUNDS Annual Report 2004
89
NOTICE TO SHAREHOLDERS September 30, 2004 (unaudited)
TAX INFORMATION
The information set forth below is for each Fund's fiscal year as required by federal laws. Most shareholders, however, must report distributions on a calendar year basis for income tax purposes, which may include distributions for portions of two fiscal years of a fund. Accordingly, the information needed for income tax purposes will be sent in early 2005 on Form 1099. Please consult your tax advisor for proper treatment of this information.
Dear First American Shareholders:
For the fiscal year ended September 30, 2004, each Fund has designated long term capital gains and ordinary income with regard to distributions paid during the year as follows:
| Fund | | Long Term
Capital Gains
Distributions
(Tax Basis) (a) | | Ordinary
Income
Distributions
(Tax Basis) (a) | | Return
of
Capital
(Tax Basis) | | Total
Distributions
(Tax Basis) (b) | |
| Core Bond Fund | | | 29 | % | | | 71 | % | | | - | % | | | 100 | % | |
| Corporate Bond Fund | | | - | | | | 100 | | | | - | | | | 100 | | |
| High Income Bond Fund | | | - | | | | 100 | | | | - | | | | 100 | | |
| Intermediate Government Bond Fund | | | 78 | | | | 22 | | | | - | | | | 100 | | |
| Intermediate Term Bond Fund | | | 25 | | | | 75 | | | | - | | | | 100 | | |
| Short Term Bond Fund | | | - | | | | 100 | | | | - | | | | 100 | | |
| U.S. Government Mortgage Fund | | | - | | | | 100 | | | | - | | | | 100 | | |
(a) Based on a percentage of the Fund's total distributions.
(b) None of the distributions made by these Funds are eligible for the dividends received deduction or are characterized as qualified dividend income.
HOW TO OBTAIN A COPY OF A FUNDS' PROXY VOTING POLICIES AND PROXY VOTING RECORD
A description of the policies and procedures that the Funds use to determine how to vote proxies relating to portfolio securities, as well as information regarding how the Funds voted proxies relating to portfolio securities during the most recent 12 month period ended June 30, is available (1) without charge upon request by calling 800.677.FUND; (2) at firstamericanfunds.com; and (3) on the U.S. Securities and Exchange Commission's website at http://www.sec.gov.
QUARTERLY PORTFOLIO HOLDINGS INFORMATION
Beginning with the quarter ending December 31, 2004, each Fund will file its complete schedule of portfolio holdings for the first and third quarters of each fiscal year with the Securities and Exchange Commission on Form N-Q. The Funds' Forms N-Q will be available (1) without charge upon request by calling 800.677.FUND; (2) at firstamericanfunds.com; and (3) on the U.S. Securities and Exchange Commission's website at http://www.sec.gov. In addition, you may review and copy the Funds' Forms N-Q at the Commission's Public Reference Room in Washington, D.C. You may obtain information on the operation of the Public Reference Room by calling 1-800-SEC-0330.
FIRST AMERICAN FUNDS Annual Report 2004
90
Directors and Officers of the Funds
Independent Directors
Name, Address, and
Year of Birth | | Position(s)
Held
with Fund | | Term of Office
and Length of
Time Served | | Principal Occupation(s)
During Past 5 Years | | Number of Portfolios
in Fund Complex
Overseen by Director | | Other
Directorships
Held by
Director † | |
Benjamin R. Field III, P.O. Box 1329,
Minneapolis, MN 55440-1329 (1938) | | Director | | Term expiring earlier of death, resignation, removal, disqualification, or successor duly elected and qualified. Director of FAIF, since September 2003 | | Retired; Senior Financial Advisor, Bemis Company, Inc. from May 2002 through June 2004; Senior Vice President, Chief Financial Officer & Treasurer, Bemis, through April 2002. | | First American Funds Complex: eleven registered investment companies, including fifty-six portfolios | | None | |
|
Mickey P. Foret,
P.O. Box 1329,
Minneapolis, MN 55440-1329 (1945) | | Director | | Term expiring earlier of death, resignation, removal, disqualification, or successor duly elected and qualified. Director of FAIF since September 2003 | | Consultant to Northwest Airlines, Inc. since 2002; Executive Vice President and Chief Financial Officer, Northwest Airlines, through 2002. | | First American Funds Complex: eleven registered investment companies, including fifty-six portfolios | | ADC Telecommunications, Inc.
Champion Airlines, Inc.
MAIR Holdings Inc. (a regional airlines holding company)
URS Corporation (an engineering firm) | |
|
Roger A. Gibson,
P.O. Box 1329,
Minneapolis, MN 55440-1329 (1946) | | Director | | Term expiring earlier of death, resignation, removal, disqualification, or successor duly elected and qualified. Director of FAIF since October 1997 | | Retired; Vice President, Cargo-United Airlines, from July 2001 through July 2004; Vice President, North America – Mountain Region for United Airlines, prior to July 2001. | | First American Funds Complex: eleven registered investment companies, including fifty-six portfolios | | None | |
|
Victoria J. Herget,
P.O. Box 1329,
Minneapolis, MN 55440-1329 (1951) | | Director | | Term expiring earlier of death, resignation, removal, disqualification, or successor duly elected and qualified. Director of FAIF since September 2003 | | Investment consultant and non-profit board member since 2001; Managing Director of Zurich Scudder Investments through 2001. | | First American Funds Complex: eleven registered investment companies, including fifty-six portfolios | | None | |
|
Leonard W. Kedrowski, P.O. Box 1329,
Minneapolis, MN 55440-1329 (1941) | | Director | | Term expiring earlier of death, resignation, removal, disqualification, or successor duly elected and qualified. Director of FAIF since November 1993 | | Owner, Executive and Management Consulting, Inc., a management consulting firm; Board member, GC McGuiggan Corporation (dba Smyth Companies), a label printer; former Chief Executive Officer, Creative Promotions International, LLC, a promotional award programs and products company, through October 2003; Advisory Board member, Designer Doors, manufacturer of designer doors, through 2002. | | First American Funds Complex: eleven registered investment companies, including fifty-six portfolios | | None | |
|
Richard K. Riederer, P.O. Box 1329,
Minneapolis, MN 55440-1329 (1944) | | Director | | Term expiring earlier of death, resignation, removal, disqualification, or successor duly elected and qualified. Director of FAIF since August 2001 | | Retired; Director, President and Chief Executive Officer, Weirton Steel through 2001. | | First American Funds Complex: eleven registered investment companies, including fifty-six portfolios | | None | |
|
FIRST AMERICAN FUNDS Annual Report 2004
91
NOTICE TO SHAREHOLDERS September 30, 2004 (unaudited)
Independent Directors - continued
Name, Address, and
Year of Birth | | Position(s)
Held
with Fund | | Term of Office
and Length of
Time Served | | Principal Occupation(s)
During Past 5 Years | | Number of Portfolios
in Fund Complex
Overseen by Director | | Other
Directorships
Held by
Director † | |
Joseph D. Strauss,
P.O. Box 1329,
Minneapolis, MN 55440-1329 (1940) | | Director | | Term expiring earlier of death, resignation, removal, disqualification, or successor duly elected and qualified. Director of FAIF since April 1991 | | Owner, Chairman and Chief Executive Officer, Excensus(TM), LLC, a consulting firm, since 2001; owner and President, Strauss Management Company, a Minnesota holding company for various organizational management business ventures; owner, Chairman and Chief Executive Officer, Community Resource Partnerships, Inc., a strategic planning, operations management, government relations, transportation planning and public relations organization; attorney at law. | | First American Funds Complex: eleven registered investment companies, including fifty-six portfolios | | None | |
|
Virginia L. Stringer,
P.O. Box 1329,
Minneapolis, MN 55440-1329 (1944) | | Chair; Director | | Chair Term three years. Directors Term expiring earlier of death, resignation, removal, disqualification, or successor duly elected and qualified. Chair of FAIF's Board since September 1997; Director of FAIF since August 1987 | | Owner and President, Strategic Management Resources, Inc., a management consulting firm; Executive Consultant to State Farm Insurance Company. | | First American Funds Complex: eleven registered investment companies, including fifty-six portfolios | | None | |
|
James M. Wade,
P.O. Box 1329,
Minneapolis, MN 55440-1329 (1943) | | Director | | Term expiring earlier of death, resignation, removal, disqualification, or successor duly elected and qualified. Director of FAIF since August 2001 | | Owner and President, Jim Wade Homes, a homebuilding company, since 1999. | | First American Funds Complex: eleven registered investment companies, including fifty-six portfolios | | None | |
|
† Includes only directorships in a company with a class of securities registered pursuant to Section 12 of the Securities Exchange Act or subject to the requirements of Section 15(d) of the Securities Exchange Act, or any company registered as an investment company under the Investment Company Act.
The Statement of Additional Information (SAI) includes additional information about fund directors and is available upon request without charge by calling 800-677-FUND or writing to First American Funds, P.O. Box 1330, Minneapolis, Minnesota, 55440-1330.
FIRST AMERICAN FUNDS Annual Report 2004
92
Officers
Name, Address, and
Year of Birth | | Position(s)
Held | | Term of Office
and Length of
with Fund | | Principal Occupation(s) During Past 5 Years
Time Served | |
Thomas S. Schreier, Jr.,
U.S. Bancorp Asset
Management, Inc.,
800 Nicollet Mall,
Minneapolis, MN 55402 (1962)* | | President | | Re-elected by the Board annually; President of FAIF since February 2001 | | Chief Executive Officer of the Advisor since May 2001; prior thereto, Chief Executive Officer of First American Asset Management since December 2000 and of Firstar Investment & Research Management Company ("FIRMCO") since February 2001; Senior Managing Director and Head of Equity Research of U.S. Bancorp Piper Jaffray from October 1998 through December 2000; prior to October 1998, Senior Airline Equity Analyst and a Director in the Equity Research Department of Credit Suisse First Boston. | |
|
Mark S. Jordahl,
U.S. Bancorp Asset
Management, Inc.
800 Nicollet Mall,
Minneapolis, MN 55402 (1960)* | | Vice President – Investments | | Re-elected by the Board annually; Vice President – Investments of FAIF since September 2001 | | Chief Investment Officer of U.S. Bancorp Asset Management, Inc. since September 2001; President and Chief Investment Officer, ING Investment Management–Americas, September 2000 to June 2001; Senior Vice President and Chief Investment Officer, ReliaStar Financial Corp., January 1998 to September 2000. | |
|
Jeffery M. Wilson,
U.S. Bancorp Asset
Management, Inc.
800 Nicollet Mall,
Minneapolis, MN 55402 (1956)* | | Vice President – Administration | | Re-elected by the Board annually; Vice President – Administration of FAIF since March 2000 | | Senior Vice President of U.S. Bancorp Asset Management, Inc. since May 2001; prior thereto, Senior Vice President of First American Asset Management. | |
|
Joseph M. Ulrey III,
U.S. Bancorp Asset
Management, Inc.
800 Nicollet Mall,
Minneapolis, MN 55402 (1958)* | | Treasurer | | Re-elected by the Board annually; Treasurer of FAIF since December 2003 | | Chief Financial Officer since September 2004 and Senior Managing Director, Fund Treasury, since December 2003 and Senior Managing Director, Risk Management and Quantitative Analysis, since May 2001, U.S. Bancorp Asset Management, Inc. ("USBAM"); from May 2001 through December 2001, Senior Managing Director, Securities Lending and Money Market Funds, USBAM; prior thereto, Senior Managing Director, Securities Lending and Money Market Funds, First American Asset Management. | |
|
Douglas A. Paul,
U.S. Bancorp Asset
Management, Inc.
800 Nicollet Mall,
Minneapolis, MN 55402 (1947)* | | Chief Compliance Officer | | Re-elected by the Board annually; Chief Compliance Officer of FAIF since June 2004 | | Chief Compliance Officer of U.S. Bancorp Asset Management, Inc. since June 2004; prior thereto, Partner, Kirkpatrick & Lockhart LLP since March 2000; prior thereto, Director of Compliance, Associate General Counsel, Vice President, American Century Investments. | |
|
Kathleen L. Prudhomme,
U.S. Bancorp Asset
Management, Inc.
800 Nicollet Mall,
Minneapolis, MN 55402 (1953)* | | Assistant Secretary | | Re-elected by the Board annually; Assistant Secretary of FAIF since September 1998 | | Deputy General Counsel, U.S. Bancorp Asset Management, Inc. since November 2004; prior thereto, Partner, Dorsey & Whitney LLP, a Minneapolis-based law firm. | |
|
James D. Alt,
50 South Sixth Street,
Suite 1500, Minneapolis, MN 55402 (1951) | | Secretary | | Re-elected by the Board annually; Assistant Secretary of FAIF from September 1998 through June 2002. Secretary of FAIF since June 2002 | | Partner, Dorsey & Whitney LLP, a Minneapolis-based law firm. | |
|
Michael J. Radmer,
50 South Sixth Street,
Suite 1500, Minneapolis, MN 55402 (1945) | | Assistant Secretary | | Re-elected by the Board annually; Assistant Secretary of FAIF since March 2000; Secretary of FAIF from September 1999 through March 2000 | | Partner, Dorsey & Whitney LLP, a Minneapolis-based law firm. | |
|
James R. Arnold,
615 E. Michigan Street, Milwaukee, WI 53202 (1957)* | | Assistant Secretary | | Re-elected by the Board annually; Assistant Secretary of FAIF since June 2003 | | Vice President, U.S. Bancorp Fund Services, LLC since March 2002; Senior Administration Services Manager, UMB Fund Services, Inc. through March 2002. | |
|
Douglas G. Hess,
615 E. Michigan Street,
Milwaukee, WI 53202 (1967)* | | Assistant Secretary | | Re-elected by the Board annually; Assistant Secretary of FAIF since September 2001 | | Vice President, U.S. Bancorp Fund Services, LLC. | |
|
* Messrs. Schreier, Jordahl, Wilson, Ulrey, Paul and Ms. Prudhomme are each officers of U.S. Bancorp Asset Management, Inc., which serves as investment adviser and co-administrator for FAIF. Messrs. Hess and Arnold are officers of U.S. Bancorp Fund Services, LLC, which is a subsidiary of U.S. Bancorp and which serves as co-administrator for FAIF.
FIRST AMERICAN FUNDS Annual Report 2004
93
(This page has been left blank intentionally.)
(This page has been left blank intentionally.)
(This page has been left blank intentionally.)
Board of Directors First American Investment Funds, Inc.
Virginia Stringer
Chairperson of First American Investment Funds, Inc.
Owner and President of Strategic Management Resources, Inc.
Benjamin Field III
Director of First American Investment Funds, Inc.
Senior Financial Advisor to, and formerly Senior Vice President, Chief Financial Officer, and Treasurer of, Bemis Company, Inc.
Mickey Foret
Director of First American Investment Funds, Inc.
Consultant to, and formerly Executive Vice President and Chief Financial Officer of, Northwest Airlines, Inc.
Roger Gibson
Director of First American Investment Funds, Inc.
Retired; former Vice President of Cargo-United Airlines
Victoria Herget
Director of First American Investment Funds, Inc.
Investment Consultant; former Managing Director of Zurich Scudder Investments
Leonard Kedrowski
Director of First American Investment Funds, Inc.
Owner and President of Executive and Management Consulting, Inc.
Richard Riederer
Director of First American Investment Funds, Inc.
Retired; former President and Chief Executive Officer of Weirton Steel
Joseph Strauss
Director of First American Investment Funds, Inc.
Owner and President of Strauss Management Company
James Wade
Director of First American Investment Funds, Inc.
Owner and President of Jim Wade Homes
First American Investment Funds’ Board of Directors is comprised entirely of independent directors.

Direct fund correspondence to:
First American Funds
P.O. Box 1330
Minneapolis, MN 55440-1330
This report and the financial statements contained herein are not intended to be a forecast of future events, a guarantee of future results, or investment advice. Further, there is no assurance that certain securities will remain in or out of each fund’s portfolio. The views expressed in this report reflect those of the portfolio managers only through the period ended September 30, 2004. The portfolio managers’ views are subject to change at any time based upon market or other conditions.
This report is for the information of shareholders of the First American Investment Funds, Inc. It may also be used as sales literature when preceded or accompanied by a current prospectus, which contains information concerning investment objectives, risks, and charges and expenses of the Funds. Read the prospectus carefully before investing.
The figures in this report represent past performance and do not guarantee future results. The principal value of an investment and investment return will fluctuate so that an investor’s shares, when redeemed, may be worth more or less than their original cost.
INVESTMENT ADVISOR
U.S. Bancorp Asset Management, Inc.
800 Nicollet Mall
Minneapolis, Minnesota 55402
CO-ADMINISTRATORS
U.S. Bancorp Asset Management, Inc.
800 Nicollet Mall
Minneapolis, Minnesota 55402
U.S. Bancorp Fund Services, LLC
615 East Michigan Street
Milwaukee, Wisconsin 53202
CUSTODIAN
U.S. Bank National Association
180 East Fifth Street
St. Paul, Minnesota 55101
DISTRIBUTOR
Quasar Distributors, LLC
615 East Michigan Street
Milwaukee, Wisconsin 53202
INDEPENDENT REGISTERED PUBLIC ACCOUNTING FIRM
Ernst & Young LLP
220 South Sixth Street
Suite 1400
Minneapolis, Minnesota 55402
COUNSEL
Dorsey & Whitney LLP
50 South Sixth Street
Suite 1500
Minneapolis, Minnesota 55402
First American Funds
P.O. Box 1330
Minneapolis, MN 55440-1330
In an attempt to reduce shareholder costs and help eliminate duplication, First American Funds will try to limit their mailing to one report for each address that lists one or more shareholders with the same last name. If you would like additional copies, please call First American Investor Services at 800.677.FUND or visit firstamericanfunds.com.
0390-04 11/2004 AR-INCOME
Item 2—Code of Ethics - Did registrant adopt a code of ethics, as of the end of the period covered by this report, that applies to the registrant’s principal executive officer, principal financial officer, principal accounting officer or controller, or persons performing similar functions, regardless of whether these individuals are employed by the registrant or a third party? If not, why not? Briefly describe any amendments or waivers that occurred during the period. State here if code of ethics/amendments/waivers are on website and give website address. State here if fund will send code of ethics to shareholders without charge upon request.
Response: The registrant has adopted a code of ethics (designated as the “Code of Ethical Conduct”) that applies to its principal executive officer and principal financial officer. The registrant undertakes to furnish a copy of such Code of Ethical Conduct to any person upon request, without charge, by calling 1-800-677-3863.
Item 3—Audit Committee Financial Expert - Did the registrant’s board of directors determine that the registrant either: (i) has at least one audit committee financial expert serving on its audit committee; or (ii) does not have an audit committee financial expert serving on its audit committee? If yes, disclose name of financial expert and whether he/she is “independent,” (fund may, but is not required, to disclose name/independence of more than one financial expert) If no, explain why not.
Response: The registrant’s Board of Directors has determined that Leonard Kedrowski, Benjamin Field, and Mickey Foret, members of the registrant’s Audit Committee, are each an “audit committee financial expert” and are “independent,” as these terms are defined in this Item. This designation will not increase the designees’ duties, obligations or liability as compared to their duties, obligations and liability as members of the Audit Committee and of the Board of Directors.
Item 4—Principal Accountant Fees and Services – Only disclosed annually.
(a) Audit Fees - Disclose aggregate fees billed for each of the last two fiscal years for professional services rendered by the principal accountant for the audit of the registrant’s annual financial statements or services that are normally provided by the accountant in connection with statutory and regulatory filings or engagements for those fiscal years.
Response: Ernst & Young LLP (“E&Y”) billed the registrant audit fees totaling $391,795 in the fiscal year ended September 30, 2004 and $312,163 in the fiscal year ended September 30, 2003, including fees associated with the annual audit, SEC Rule 17f-2 security count filings and filings of the registrant’s Form NCSR.
(b) Audit-Related Fees - Disclose aggregate fees billed in each of the last two fiscal years for assurance and related services by the principal accountant that are reasonably related to the performance of the audit of the registrant’s financial statements and are not reported under paragraph (a) of this Item. Registrants shall describe the nature of the services comprising the fees disclosed under this category.
Response: Ernst & Young LLP (“E&Y”) billed the registrant audit-related fees totaling $36,134 in the fiscal year ended September 30, 2004 and $0 in the fiscal year ended September 30, 2003, for professional services associated with .
(c) Tax Fees - Disclose aggregate fees billed in each of the last two fiscal years for professional services rendered by the principal accountant for tax compliance, tax advice, and tax planning. Registrants shall describe the nature of the services comprising the fees disclosed under this category.
Response: E&Y billed the registrant fees of $115,034 in the fiscal year ended September 30, 2004 and $129,482 in the fiscal year ended September 30, 2003 for tax services, including tax compliance, tax advice and tax planning. Tax compliance, tax advice and tax planning services primarily relate to preparation of original and amended tax returns, timely RIC qualification reviews, and tax distribution analysis and planning.
(d) All Other Fees - Disclose aggregate fees billed in each of the last two fiscal years for products and services provided by the principal accountant, other than the services reported in paragraphs (a) through (c) of this Item. Registrants shall describe the nature of the services comprising the fees disclosed under this category.
Response: There were no fees billed by E&Y for other services to the registrant during the fiscal years ended September 30, 2003 and 2004.
(e)(1) Disclose the audit committee’s pre-approval policies and procedures pursuant to paragraph (c)(7) of Rule 2-01 of Regulation
S-X.
Response: Set forth below are the audit committee’s pre-approval policies and procedures pursuant to paragraph (c)(7) of Rule
2-01 of Regulation S-X:
Audit Committee policy regarding pre-approval of services provided by the Independent Auditor
The Audit Committee of the First American Funds has responsibility for ensuring that all services performed by the independent audit firm for the funds do not impair the firm’s independence. This review is intended to provide reasonable oversight without removing management from its responsibility for day-to-day operations. In this regard, the Audit Committee should:
• Understand the nature of the professional services expected to be provided and their impact on auditor independence and audit quality
• Examine and evaluate the safeguards put into place by the Company and the auditor to safeguard independence
• Meet quarterly with the partner of the independent audit firm
• Consider approving categories of service that are not deemed to impair independence for a one-year period
It is important that a qualitative rather than a mere quantitative evaluation be performed by the Committee in discharging its responsibilities.
Policy for Audit and Non-Audit Services Provided to the Funds
On an annual basis, the Audit Committee of the First American Funds (“Committee”) will review and consider whether to pre-approve the financial plan for audit fees as well as categories of audit-related and non-audit services that may be performed by the Fund’s independent audit firm directly for the Funds. At least annually the Committee will receive a report from the independent audit firm of all audit and non-audit services, which were approved during the year.
The engagement of the independent audit firm for any non-audit service requires the written pre-approval of the Treasurer of the Funds and all non-audit services performed by the independent audit firm will be disclosed in the required SEC periodic filings.
In connection with the Audit Committee review and pre-approval responsibilities, the review by the Audit Committee will consist of the following:
Audit Services
The categories of audit services and related fees to be reviewed and considered for pre-approval annually by the Committee or its delegate include the following:
• Annual Fund financial statement audits
• Seed audits (related to new product filings, as required)
• SEC and regulatory filings and consents
Audit-related Services
In addition, the following categories of audit-related services are deemed to be consistent with the role of the independent firm and, as such, will be considered for pre-approval by the Committee or its delegate, on an annual basis.
• Accounting consultations
• Fund merger support services
• Other accounting related matters
• Agreed Upon Procedure Reports
• Attestation Reports
• Other Internal Control Reports
Notwithstanding any annual pre-approval of these categories of services, individual projects with an estimated fee in excess of $25,000 are subject to pre-approval by the Audit Committee Chair or its delegate on a case-by-case basis. Individual projects with an estimated fee in excess of $50,000 are subject to pre-approval by the Audit Committee or its delegate on a case-by-case basis.
Tax Services
The following categories of tax services are deemed to be consistent with the role of the independent audit firm and, as such, will be considered for pre-approval by the Committee or its delegate, on an annual basis.
• Tax compliance services related to the filing or amendment of the following:
• Federal, state and local income tax compliance, and
• Sales and use tax compliance
• Timely RIC qualification reviews
• Tax distribution analysis and planning
• Tax authority examination services
• Tax appeals support services
• Accounting methods studies
• Fund merger support services
• Tax consulting services and related projects
Notwithstanding any annual pre-approval of these categories of services, individual projects with an estimated fee in excess of $25,000 are subject to pre-approval by the Audit Committee Chair or its delegate on a case-by-case basis. Individual projects
with an estimated fee in excess of $50,000 are subject to pre-approval by the Audit Committee or its delegate on a case-by-case basis.
Other Non-audit Services
The SEC auditor independence rules adopted in response to the Sarbanes-Oxley Act specifically allow certain non-audit services. Because of the nature of these services, none of these services may be commenced by the independent firm without the prior approval of the Audit Committee. The Committee may delegate this responsibility to one or more of the Committee members, with the decisions presented to the full Committee at the next scheduled meeting.
Proscribed Services
In accordance with SEC rules on independence, the independent audit firm is prohibited from performing services in the following categories of non-audit services:
• Management functions
• Accounting and bookkeeping services
• Internal audit services
• Financial information systems design and implementation
• Valuation services supporting the financial statements
• Actuarial services supporting the financial statements
• Executive recruitment
• Expert services (e.g., litigation support)
• Investment banking
Policy for Pre-approval of Non-Audit Services Provided to Other Entities within the Investment Company Complex
The Audit Committee of the First American Funds is also responsible for pre-approving certain non-audit services provided to U.S. Bancorp Asset Management, U.S. Bank N.A., Quasar Distributors, U.S. Bancorp Fund Services, LLC and any other entity under common control with U.S. Bancorp Asset Management that provides ongoing services to the Funds. The only non-audit services provided to these entities which require pre-approval are those services that relate directly to the operations and financial reporting of the Funds.
Although the Audit Committee is not required to pre-approve all services provided to U.S. Bancorp Asset Management and affiliated service providers, the Audit Committee will annually receive a report from the independent audit firm on the aggregate fees for all services provided to U.S. Bancorp and affiliates.
(e)(2) Disclose the percentage of services described in each of paragraphs (b) through (d) of this Item that were approved by the audit committee pursuant to paragraph (c)(7)(i)(C) of Rule 2-01 of Regulation S-X.
Response: All of the services described in paragraphs (b) through (d) of Item 4 that were provided to the registrant on or after May 6, 2003, the effective date of SEC rules relating to the pre-approval of non-audit services, were pre-approved by the audit committee.
(f) If greater than 50%, disclose the percentage of hours expended on the principal accountant’s engagement to audit the registrant’s financial statements for the most recent fiscal year that were attributed to work performed by persons other than the principal accountant’s full-time, permanent employees.
Response: All services performed on the engagement to audit the registrant’s financial statements for the most recent fiscal year end were performed by the principal accountant’s full-time, permanent employees.
(g) Disclose the aggregate non-audit fees billed by the registrant’s accountant for services rendered to the registrant, and rendered to the registrant’s investment adviser (not including any sub-adviser whose role is primarily portfolio management and is subcontracted with or overseen by another investment adviser), and any entity controlling, controlled by, or under common control with the adviser that provides ongoing services to the registrant for each of the last two fiscal years of the registrant.
Response: The aggregate non-audit fees billed by E&Y to the registrant, the registrant’s investment adviser (not including any sub-adviser whose role is primarily portfolio management and is subcontracted with or overseen by another investment adviser), and any entity controlling, controlled by, or under common control with the adviser that provides ongoing services to the registrant, totaled $181,918 in the fiscal year ended September 30, 2004 and $261,682 in the fiscal year ended September 30, 2003, including services provided prior to May 6, 2003, the effective date of SEC rules relating to the pre-approval of non-audit services.
(h) Disclose whether the registrant’s audit committee has considered whether the provision of non-audit services that were rendered to the registrant’s investment adviser (not including any Subadvisor whose role is primarily portfolio management and is subcontracted with or overseen by another investment adviser), and any entity
controlling, controlled by, or under common control with the investment adviser that provides ongoing services to the registrant that were not pre-approved pursuant to paragraph (c)(7)(ii) of Rule 2-01 of Regulation S-X is compatible with maintaining the principal accountant’s independence.
Response: The registrant’s audit committee has determined that the provision of non-audit services to the registrant’s investment adviser, and any entity controlling, controlled by, or under common control with the investment adviser that provides ongoing services to the registrant, that were not pre-approved and that were rendered on or after May 6, 2003 (the effective date of SEC rules relating to the pre-approval of non-audit services), is compatible with maintaining E&Y’s independence.
Item 5—Audit Committee of Listed Registrants
(a) If the registrant is a listed issuer as defined in Rule 10A-3 under the Exchange Act (17 CFR 240.10A-3), state whether or not the registrant has a separately-designated standing audit committee established in accordance with Section 3(a)(58)(A) of the Exchange Act (15 U.S.C. 78c(a)(58)(A)). If the registrant has such a committee, however designated, identify each committee member. If the entire board of directors is acting as the registrant’s audit committee as specified in Section 3(a)(58)(B) of the Exchange Act (15 U.S.C. 78c(a)(58)(B)), so state.
(b) If applicable, provide the disclosure required by Rule 10A-3(d) under the Exchange Act (17 CFR 240.10A-3(d)) regarding an exemption from the listing standards for audit committees.
Response: Not applicable. Registrant is not a listed issuer.
Item 6—Schedule of Investments (applicable for periods ending on or after July 9, 2004) – File Schedule I – Investments in securities of unaffiliated issuers as of the close of the reporting period as set forth in Section 210.12-12 of Regulation S-X [17 CFR 210.12-12], unless the schedule is included as part of the report to shareholders filed under Item 1 of this Form.
Response: The schedule is included as part of the report to shareholders filed under Item 1 of this Form.
Item 7—Disclosure of Proxy Voting Policies and Procedures for Closed-End Management Investment Companies—For closed-end funds that contain voting securities in their portfolio, describe the policies and procedures that it uses to determine how to vote proxies relating to those portfolio securities.
Response: Not applicable
Item 8—Portfolio Managers of Closed-End Management Investment Companies.
(a) If the registrant is a closed-end management investment company that is filing an annual report on this Form N-CSR, provide the following information:
(1) State the name, title, and length of service of the person or persons employed by or associated with the registrant or an investment advisor of the registrant who are primarily responsible for the day-to-day management of the registrant’s portfolio (“Portfolio Manager”). Also state each Portfolio Manager’s business experience during the past 5 years.
(2) If a Portfolio Manager required to be identified in response to paragraph (a) (1) of this Item is primarily responsible for the day-to-day management of the portfolio of any other account, provided the following information:
(i) The Portfolio Manager’s name;
(ii) The number of other accounts managed within each of the following categories and the total assets in the account managed within each category:
(A) Registered investment companies;
(B) Other pooled investment vehicles; and
(C) Other accounts.
(iii) For each of the categories in paragraph (a) (2) (ii) of this Item, the number of accounts and the total assets in the accounts with respect to which the advisory fee is based on the performance of the account; and
(iv) A description of any material conflicts of interest that may arise in connection with the Portfolio Manager’s management of the registrant’s investments, on the one hand, and the investments of the other accounts included in response to paragraph (a) (2) (ii) of this Item, on the other. This description would include, for example, material conflicts between the investment strategy of the registrant and the investment strategy of other accounts managed by the Portfolio Manager and material conflicts in allocation of investment opportunities between the registrant and other accounts managed by the Portfolio Manager.
(3) Described the structure of, and the method used to determine, the compensation of each Portfolio Manager required to be identified in response to paragraph (a) (1) of this Item. For each type of compensation (e.g., salary, bonus, deferred compensation, retirement plans and arrangements), describe with specificity the criteria on which the type of compensation is based, for example, whether compensation is fixed, whether (and, if so, how) compensation is based on the registrant’s pre- or aftertax performance over a certain time period, and whether (and, if so, how) compensation is based on the value of assets held in the registrant’s portfolio. For example, if compensaton is based solely or in part on performance, identify any benchmark used
to measure performance and state the length of the period over which performance is measured.
(4) For each Portfolio Manager required to be identified in response to paragraph (a) (1) of this Item, state the dollar range of equity securities in the registrant beneficially owned by the Portfolio Manager using the following ranges: none, $1-$10,000, $10,001-$50,000, $50,001-$100,000, $100,001-$500,000, $500,001-$1,000,000, or over $1,000,000.
(b) If the registrant is a closed-end management investment company that is filing a report on this Form N-CSR other than an annual report, disclose any change, as of the date of filing, in any of the Portfolio Managers identified in response to paragraph (a) (1) of this Item in the registrant’s most recent annual report on Form N-CSR. In addition, for any newly identified Portfolio Manager, provided the information required by paragraph (a) (1) of this Item as the date of filing of the report and the information required by paragraphs (a) (2), (a) (3), and (a) (4) of this Item as of the most recent practicable date.
Response: Not applicable
Item 9—Purchases of Equity Securities by Closed-End Management Investment Company and Affiliated Purchasers (applicable for periods ending on or after June 15, 2004)
(a) If the registrant is a closed-end management investment company, in the following tabular format, provide the information specified in paragraph (b) of this Item with respect to any purchase made by or on behalf of the registrant or any “affiliated purchaser,” as defined in Rule 10b-18(a)(3) under the Exchange Act (17 CFR 240.10b-18(a)(3)), of shares or other units of any class of the registrant’s equity securities that is registered pursuant to Section 12 of the Exchange Act (15 U.S.C. 781).
Registrant Purchases of Equity Securities
Period (identify
beginning and
ending dates for
each Month) | | (a) Total Number
of Shares (or
Units) Purchased | | (b) Average Price
Paid per Share
(or Unit) | | (c) Total Number
of Shares (or Units)
Purchased as Part of
Publicly Announced
Plans or Programs | | (d) Maximum Number
(or Approximate
Dollar Value) of
Shares (or Units) that
May Yet Be Purchased
Under the Plans or
Programs |
Month #1 | | | | | | | | |
Month #2 | | | | | | | | |
Month #3 | | | | | | | | |
Month #4 | | | | | | | | |
Month #5 | | | | | | | | |
Month #6 | | | | | | | | |
Month #7 | | | | | | | | |
Total | | | | | | | | |
(b) The table shall include the following information for each class of securities for each month included in the period covered by the report:
(1) The total number of shares (or units) purchased (column (a));
(2) The average price paid per share (or unit) (column (b));
(3) The number of shares (or units) purchased as part of publicly announced repurchase plans or programs (column (c)); and
(4) The maximum number (or approximate dollar value) of shares (or units) that may yet be purchased under the plans or programs (column (d)).
Response: Not applicable
Item 10—Submission of Matters to a Vote of Security Holders – Describe any material changes to the procedures by which shareholders may recommend nominees to the registrant’s board of directors, where those changes were implemented after the registrant last provided disclosure in response to the requirements of Item 7(d)(2)(ii)(G) of Schedule 14A (17 CFR 240.14a-101), or this Item.
Response: There have been no material changes to the procedures by which shareholders may recommend nominees to the registrant’s board of directors, where those changes were implemented after the registrant last provided disclosure in response to the requirements of Item 7(d)(2)(ii)(G) of Schedule 14A (17 CFR 240.14a-101), or this item.
Item 11—Controls and Procedures
(a) Disclose the conclusions of the registrant’s principal executive officer or officers and principal financial officer or officers, or persons performing similar functions, about the effectiveness of the registrant’s disclosure controls and procedures (as defined in Rule 30a-3(c) under the Act (17 CFR 270.30a-3(c))) based on their evaluation of these controls and procedures as of a date within 90 days of the filing date of the report that includes the disclosure required by this paragraph.
Response: The registrant’s Principal Executive Officer and Principal Financial Officer have evaluated the registrant’s disclosure controls and procedures within 90 days of the date of this filing and have concluded that the registrant’s disclosure controls and procedures were effective, as of that date, in ensuring that information required to be disclosed by the registrant in this Form
N-CSR was recorded, processed, summarized and reported timely.
(b) Disclose any change in the registrant’s internal control over financial reporting (as defined in Rule 30a-3(c) under the Act (17 CFR 270.30a-3(c))) that occurred during the registrant’s last fiscal half-year (the registrant’s second fiscal half-year in the case of an annual report) that has materially affected, or is reasonably likely to materially affect, the registrant’s internal control over financial reporting.
Response: There were no changes in the registrant’s internal control over financial reporting that occurred during the registrant’s most recent fiscal half-year that have materially affected, or are reasonably likely to materially affect, the registrant’s internal control over financial reporting.
Item 12 – Exhibits
11(a) - Attach code of ethics or amendments/waivers, unless code of ethics or amendments/waivers is on website or offered to shareholders upon request without charge.
Response: This code of ethics is offered to shareholders upon request without charge.
11(b) - Attach certifications (4 in total pursuant to Sections 302 and 906 for PEO/PFO).
Response: Attached hereto.
Signatures
Pursuant to the requirements of the Securities Exchange Act of 1934 and the Investment Company Act of 1940, the registrant has duly caused this report to be signed on its behalf by the undersigned, thereunto duly authorized.
First American Investment Funds, Inc.
By: | /s/ Thomas S. Schreier, Jr. | |
| Thomas S. Schreier, Jr. |
| President |
Date: December 9, 2004
Pursuant to the requirements of the Securities Exchange Act of 1934 and the Investment Company Act of 1940, this report has been signed below by the following persons on behalf of the registrant and in the capacities and on the dates indicated.
By: | /s/ Thomas S. Schreier, Jr. | |
| Thomas S. Schreier, Jr. |
| President |
Date: December 9, 2004
By: | /s/ Charles D. Gariboldi | |
| |
| Charles D. Gariboldi |
| Treasurer |
Date: December 9, 2004